

Compact Muon Solenoid
LHC, CERN
| CMS-PAS-EXO-22-016 | ||
| Search for a high mass dimuon resonance associated with b quark jets at $ \sqrt{s}= $ 13 TeV | ||
| CMS Collaboration | ||
| 21 May 2023 | ||
| Abstract: A search for high-mass dimuon resonance production in association with one or more b quark jets is presented. The study uses proton-proton collision data collected with the CMS detector at the LHC corresponding to an integrated luminosity of 138 fb$ ^{-1} $ at a center-of-mass energy of 13 TeV. Model-independent limits are derived on the number of events with b quark jets. Results are also interpreted in a lepton flavor-universal model with Z' boson couplings to a $ \mathrm{bb} $ quark pair ($ g_{\mathrm{b}} $), an $ \mathrm{sb} $ quark pair ($ g_{\mathrm{b}}\delta_{\mathrm{bs}} $), and any same-flavor charged lepton ($ g_{\ell} $) or neutrino pair ($ g_{\nu} $), with $ g_{\nu}=g_{\ell} $. For a Z' boson with a mass of 350 GeV (2 TeV) and $ \delta_{\mathrm{bs}}\leq $ 0.25, the majority of the parameter space with 0.0057 $ < g_{\ell} < $ 0.35 (0.25 $ < g_{\ell} < $ 0.43) and 0.0079 $ < g_{\mathrm{b}} < $ 0.46 (0.34 $ < g_{\mathrm{b}} < $ 0.57) is excluded at 95% confidence level. Finally, constraints are set on a specific Z' model with parameters consistent with low-energy $ \mathrm{b}\to\mathrm{s}\ell\ell $ measurements. In this scenario, most of the allowed parameter space is excluded for a Z' boson with a mass $ \leq $ 500 GeV while the constraints are less stringent for higher Z' mass hypotheses. | ||
|
Links:
CDS record (PDF) ;
Physics Briefing ;
CADI line (restricted) ;
These preliminary results are superseded in this paper, JHEP 10 (2023) 043. The superseded preliminary plots can be found here. |
||
| Figures | |

png pdf |
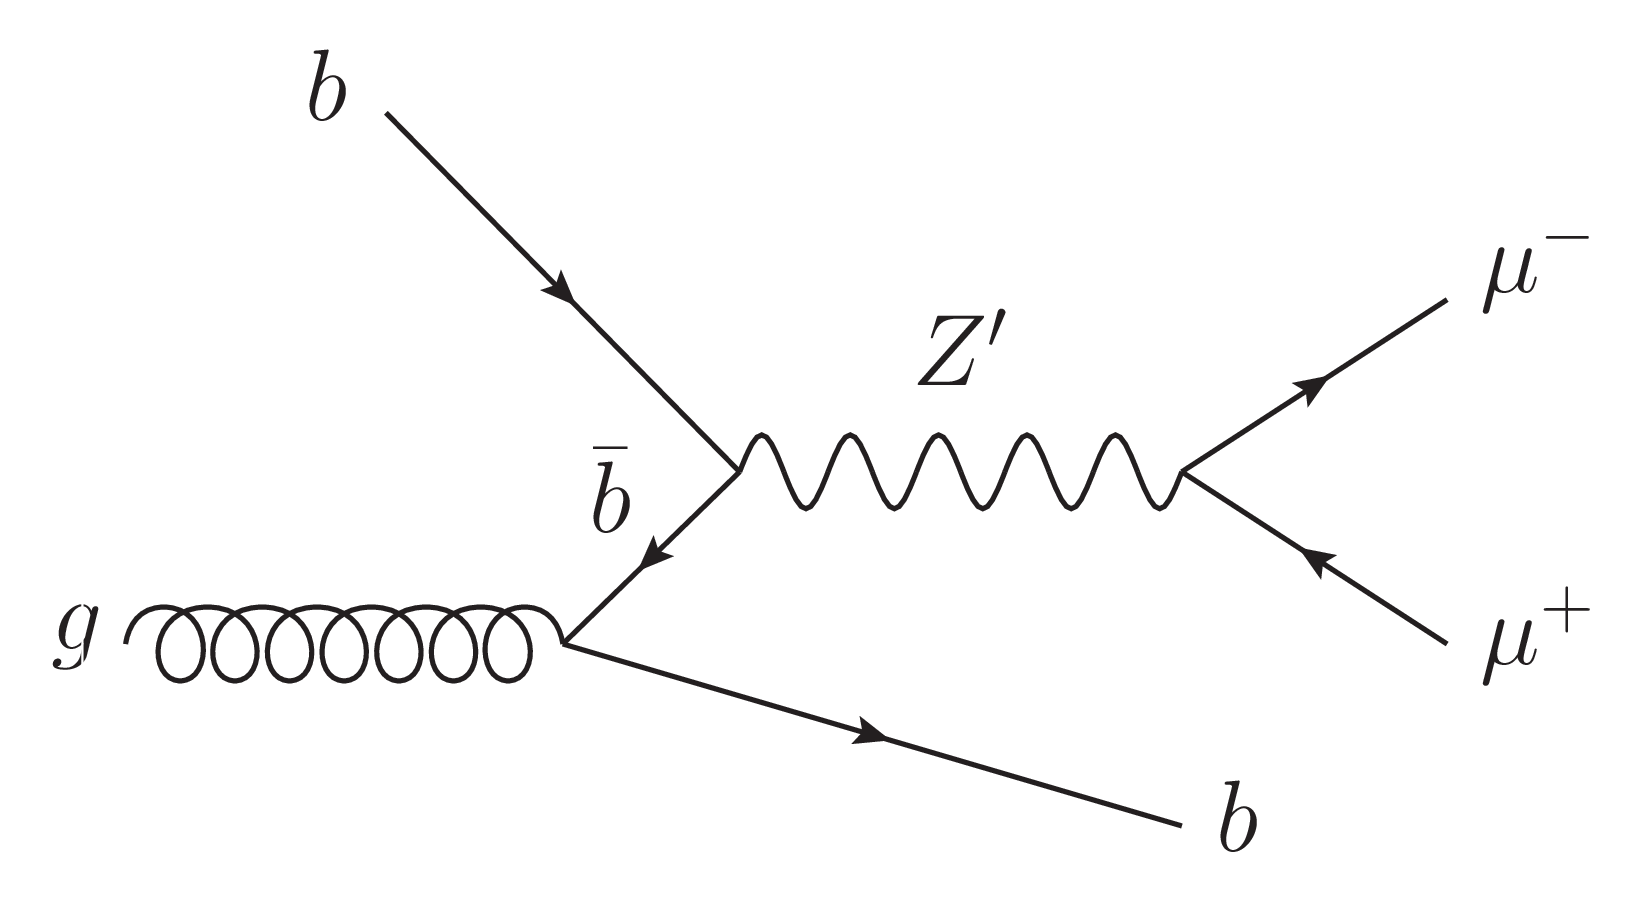
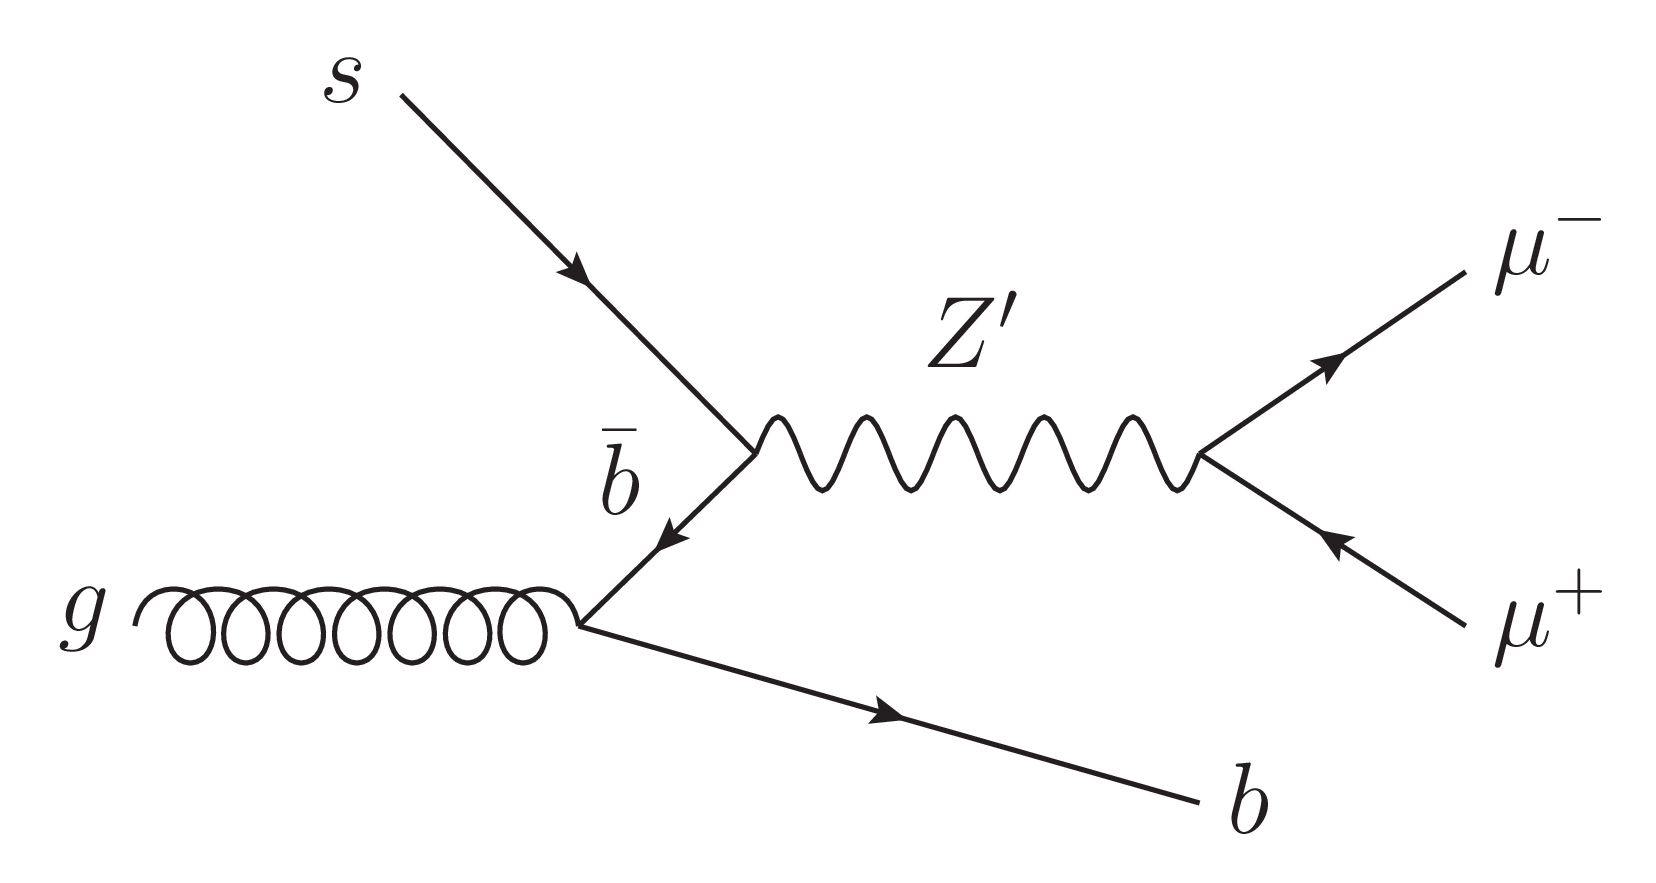
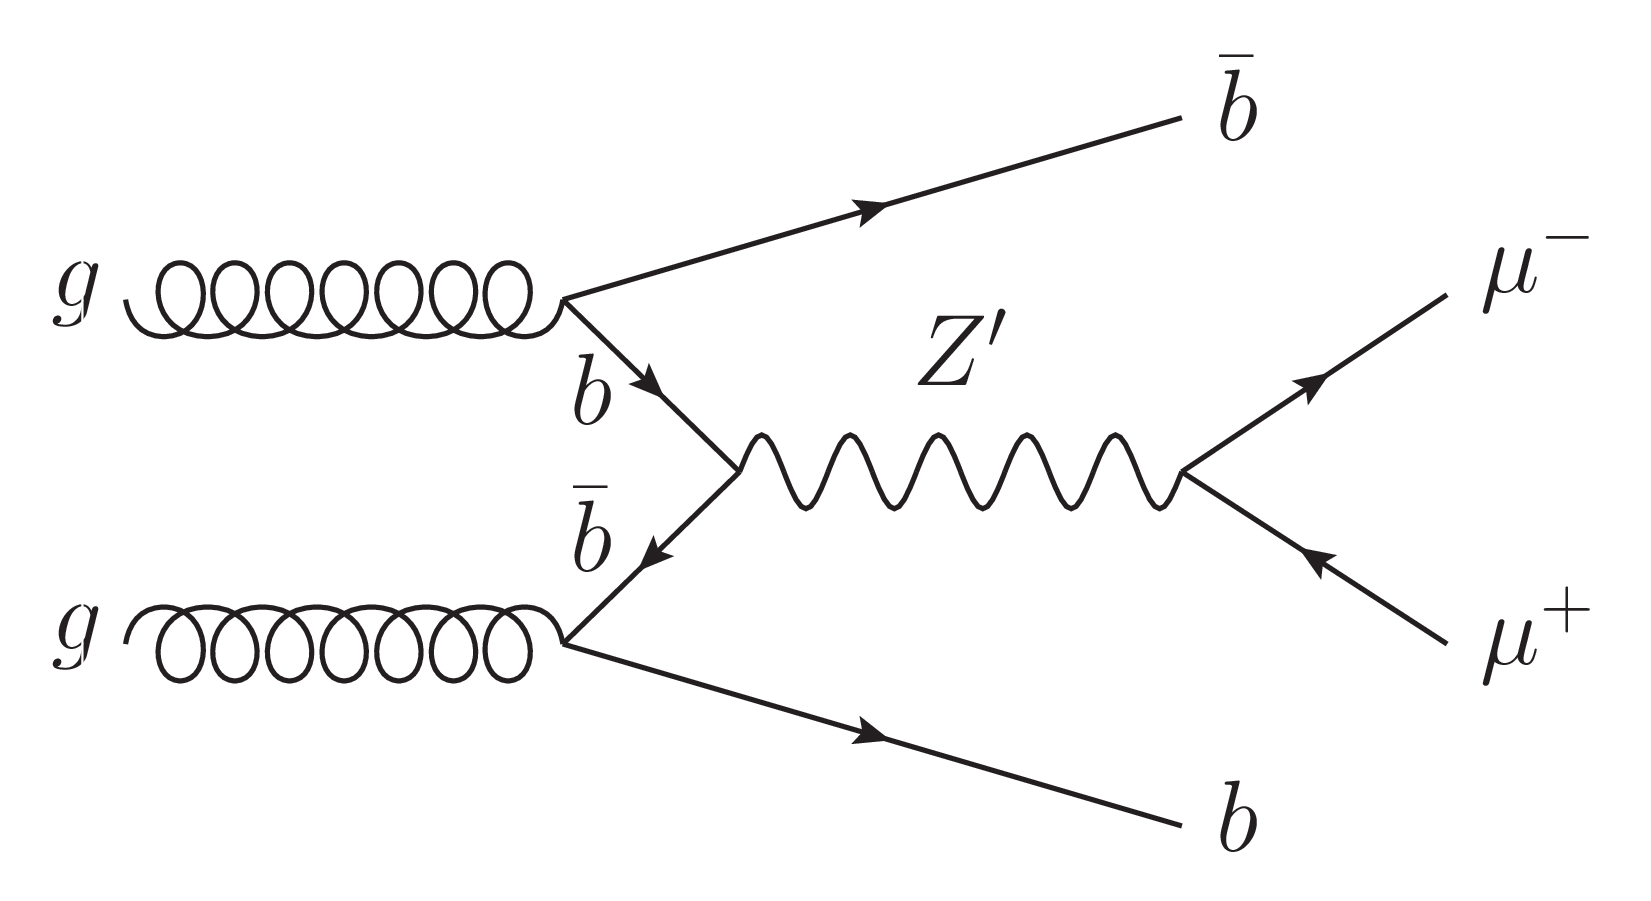
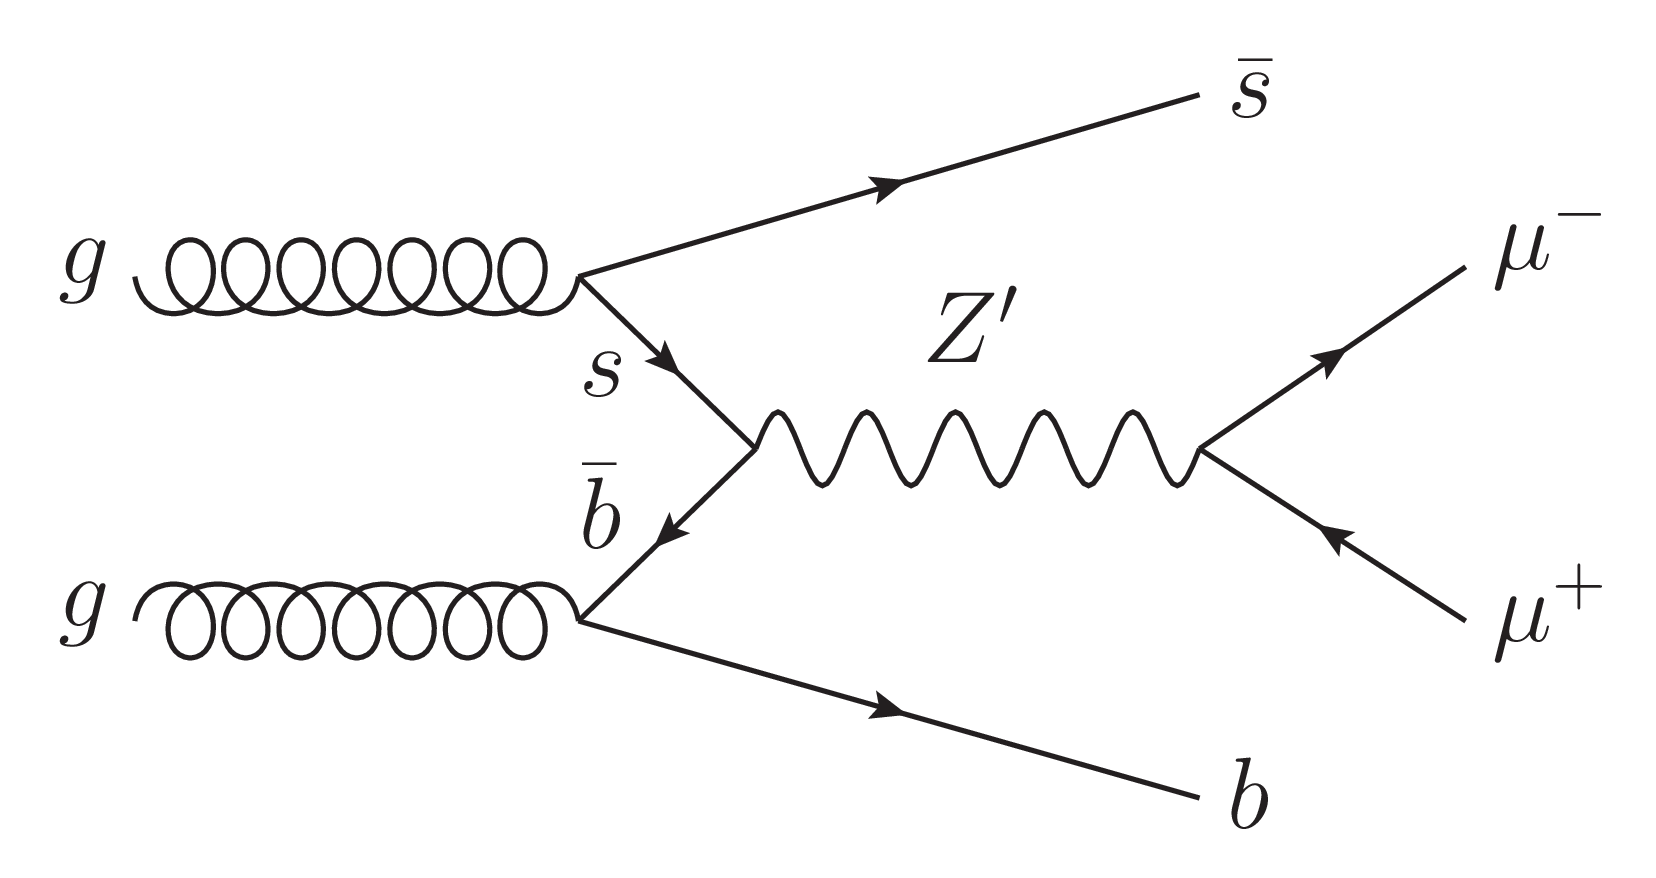
Figure 1:
Feynman diagrams of $ {\mathrm{Z}^{'}} \to \mu^{+} \mu^{-} $ with a Z' produced via $ \mathrm{b} \overline{\mathrm{b}} \to {\mathrm{Z}^{'}} $ or $ \mathrm{s} \overline{\mathrm{b}} \to {\mathrm{Z}^{'}} $, and at least one b quark in the final state. While a $ {\mathrm{Z}^{'}} \mathrm{b}\mathrm{b} $ coupling may be present in any generic model, a $ {\mathrm{Z}^{'}} \mathrm{s}\mathrm{b} $ coupling could arise through flavor mixing between second and third generation quarks. |
png pdf |
Figure 1-a:
Feynman diagrams of $ {\mathrm{Z}^{'}} \to \mu^{+} \mu^{-} $ with a Z' produced via $ \mathrm{b} \overline{\mathrm{b}} \to {\mathrm{Z}^{'}} $ or $ \mathrm{s} \overline{\mathrm{b}} \to {\mathrm{Z}^{'}} $, and at least one b quark in the final state. While a $ {\mathrm{Z}^{'}} \mathrm{b}\mathrm{b} $ coupling may be present in any generic model, a $ {\mathrm{Z}^{'}} \mathrm{s}\mathrm{b} $ coupling could arise through flavor mixing between second and third generation quarks. |
png pdf |
Figure 1-b:
Feynman diagrams of $ {\mathrm{Z}^{'}} \to \mu^{+} \mu^{-} $ with a Z' produced via $ \mathrm{b} \overline{\mathrm{b}} \to {\mathrm{Z}^{'}} $ or $ \mathrm{s} \overline{\mathrm{b}} \to {\mathrm{Z}^{'}} $, and at least one b quark in the final state. While a $ {\mathrm{Z}^{'}} \mathrm{b}\mathrm{b} $ coupling may be present in any generic model, a $ {\mathrm{Z}^{'}} \mathrm{s}\mathrm{b} $ coupling could arise through flavor mixing between second and third generation quarks. |
png pdf |
Figure 1-c:
Feynman diagrams of $ {\mathrm{Z}^{'}} \to \mu^{+} \mu^{-} $ with a Z' produced via $ \mathrm{b} \overline{\mathrm{b}} \to {\mathrm{Z}^{'}} $ or $ \mathrm{s} \overline{\mathrm{b}} \to {\mathrm{Z}^{'}} $, and at least one b quark in the final state. While a $ {\mathrm{Z}^{'}} \mathrm{b}\mathrm{b} $ coupling may be present in any generic model, a $ {\mathrm{Z}^{'}} \mathrm{s}\mathrm{b} $ coupling could arise through flavor mixing between second and third generation quarks. |
png pdf |
Figure 1-d:
Feynman diagrams of $ {\mathrm{Z}^{'}} \to \mu^{+} \mu^{-} $ with a Z' produced via $ \mathrm{b} \overline{\mathrm{b}} \to {\mathrm{Z}^{'}} $ or $ \mathrm{s} \overline{\mathrm{b}} \to {\mathrm{Z}^{'}} $, and at least one b quark in the final state. While a $ {\mathrm{Z}^{'}} \mathrm{b}\mathrm{b} $ coupling may be present in any generic model, a $ {\mathrm{Z}^{'}} \mathrm{s}\mathrm{b} $ coupling could arise through flavor mixing between second and third generation quarks. |
png pdf |
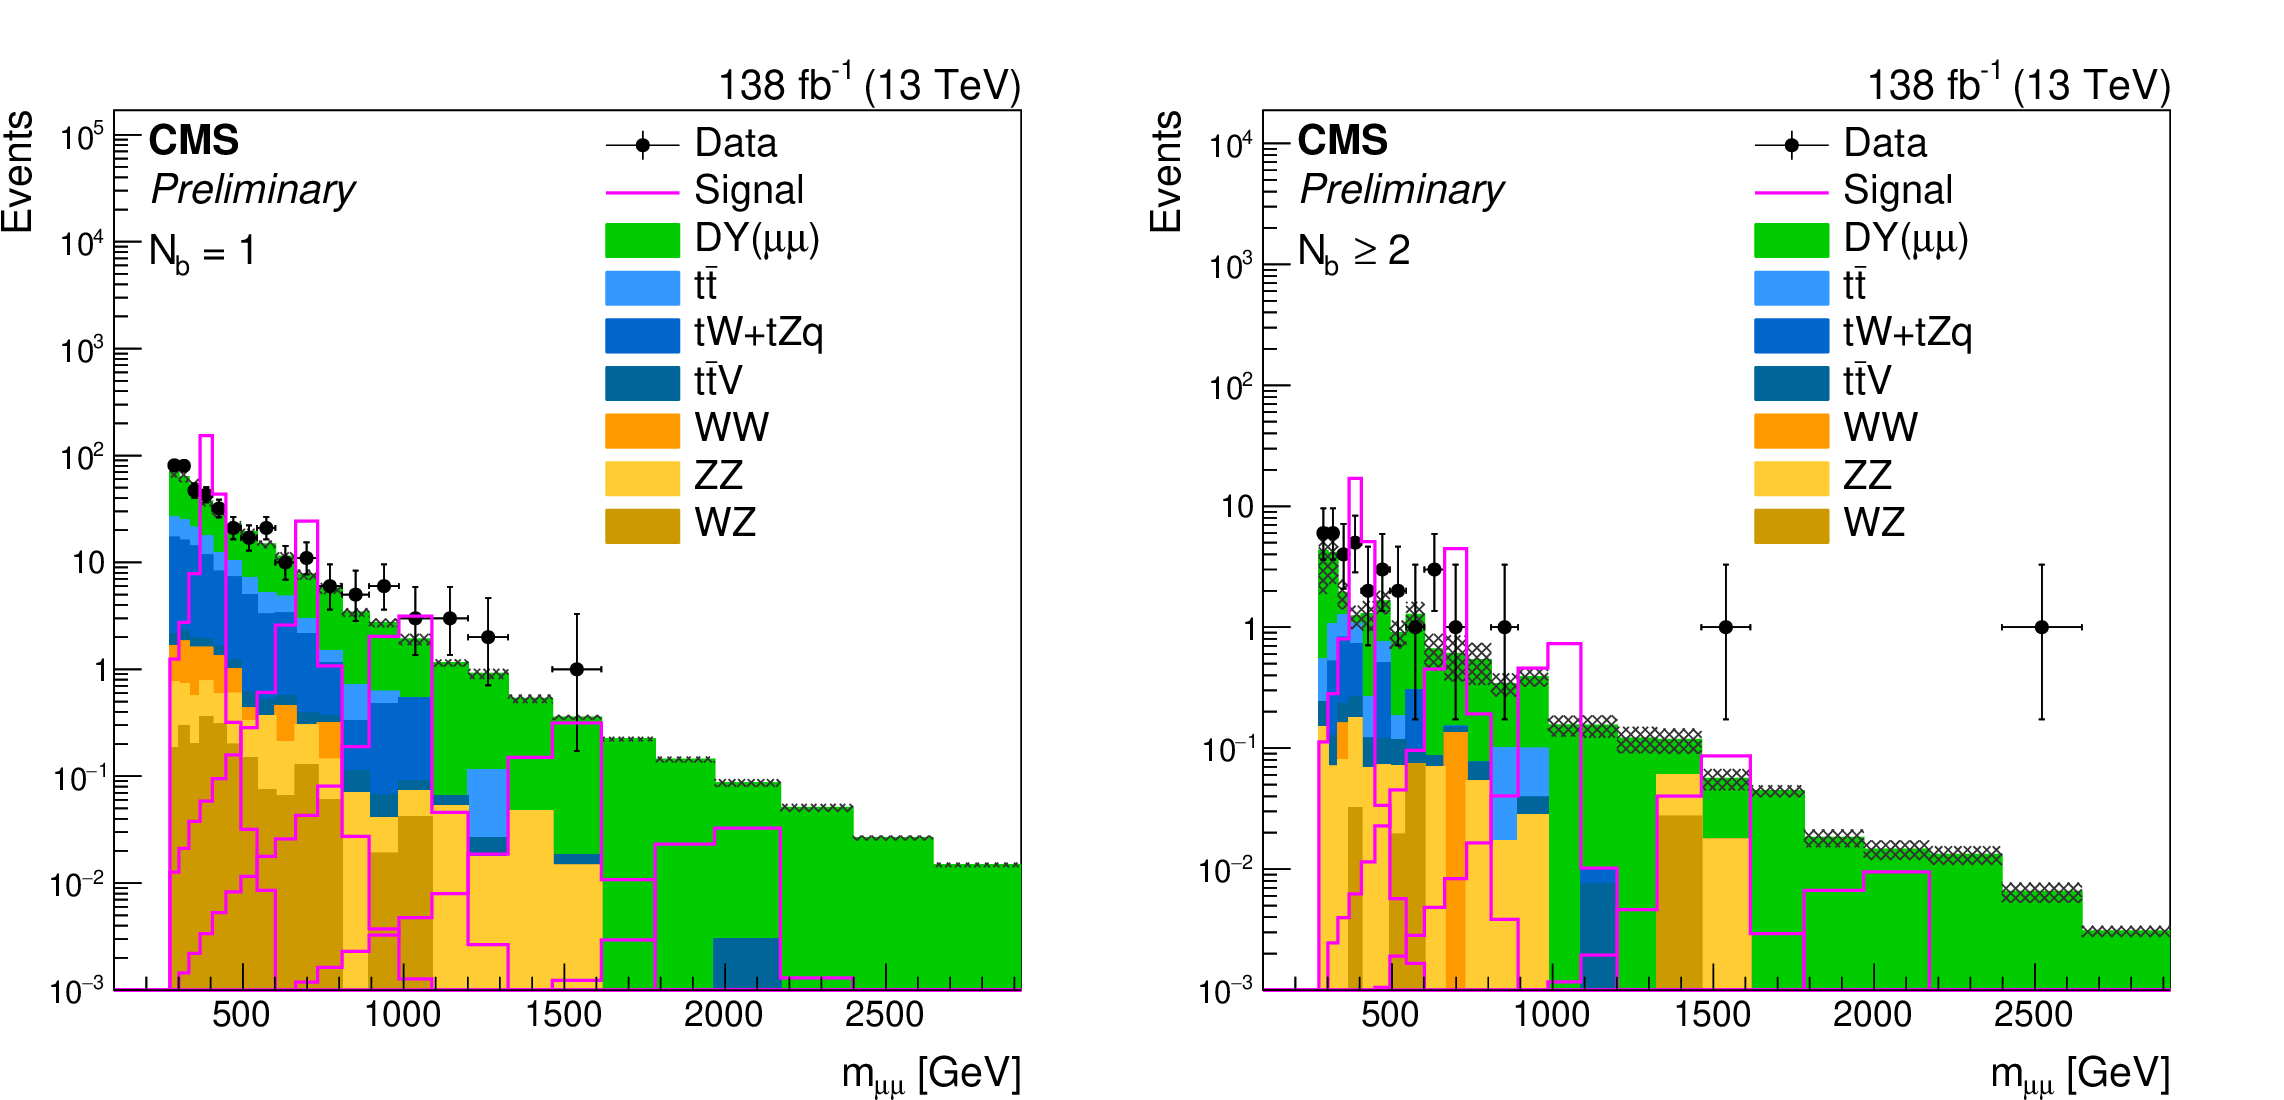
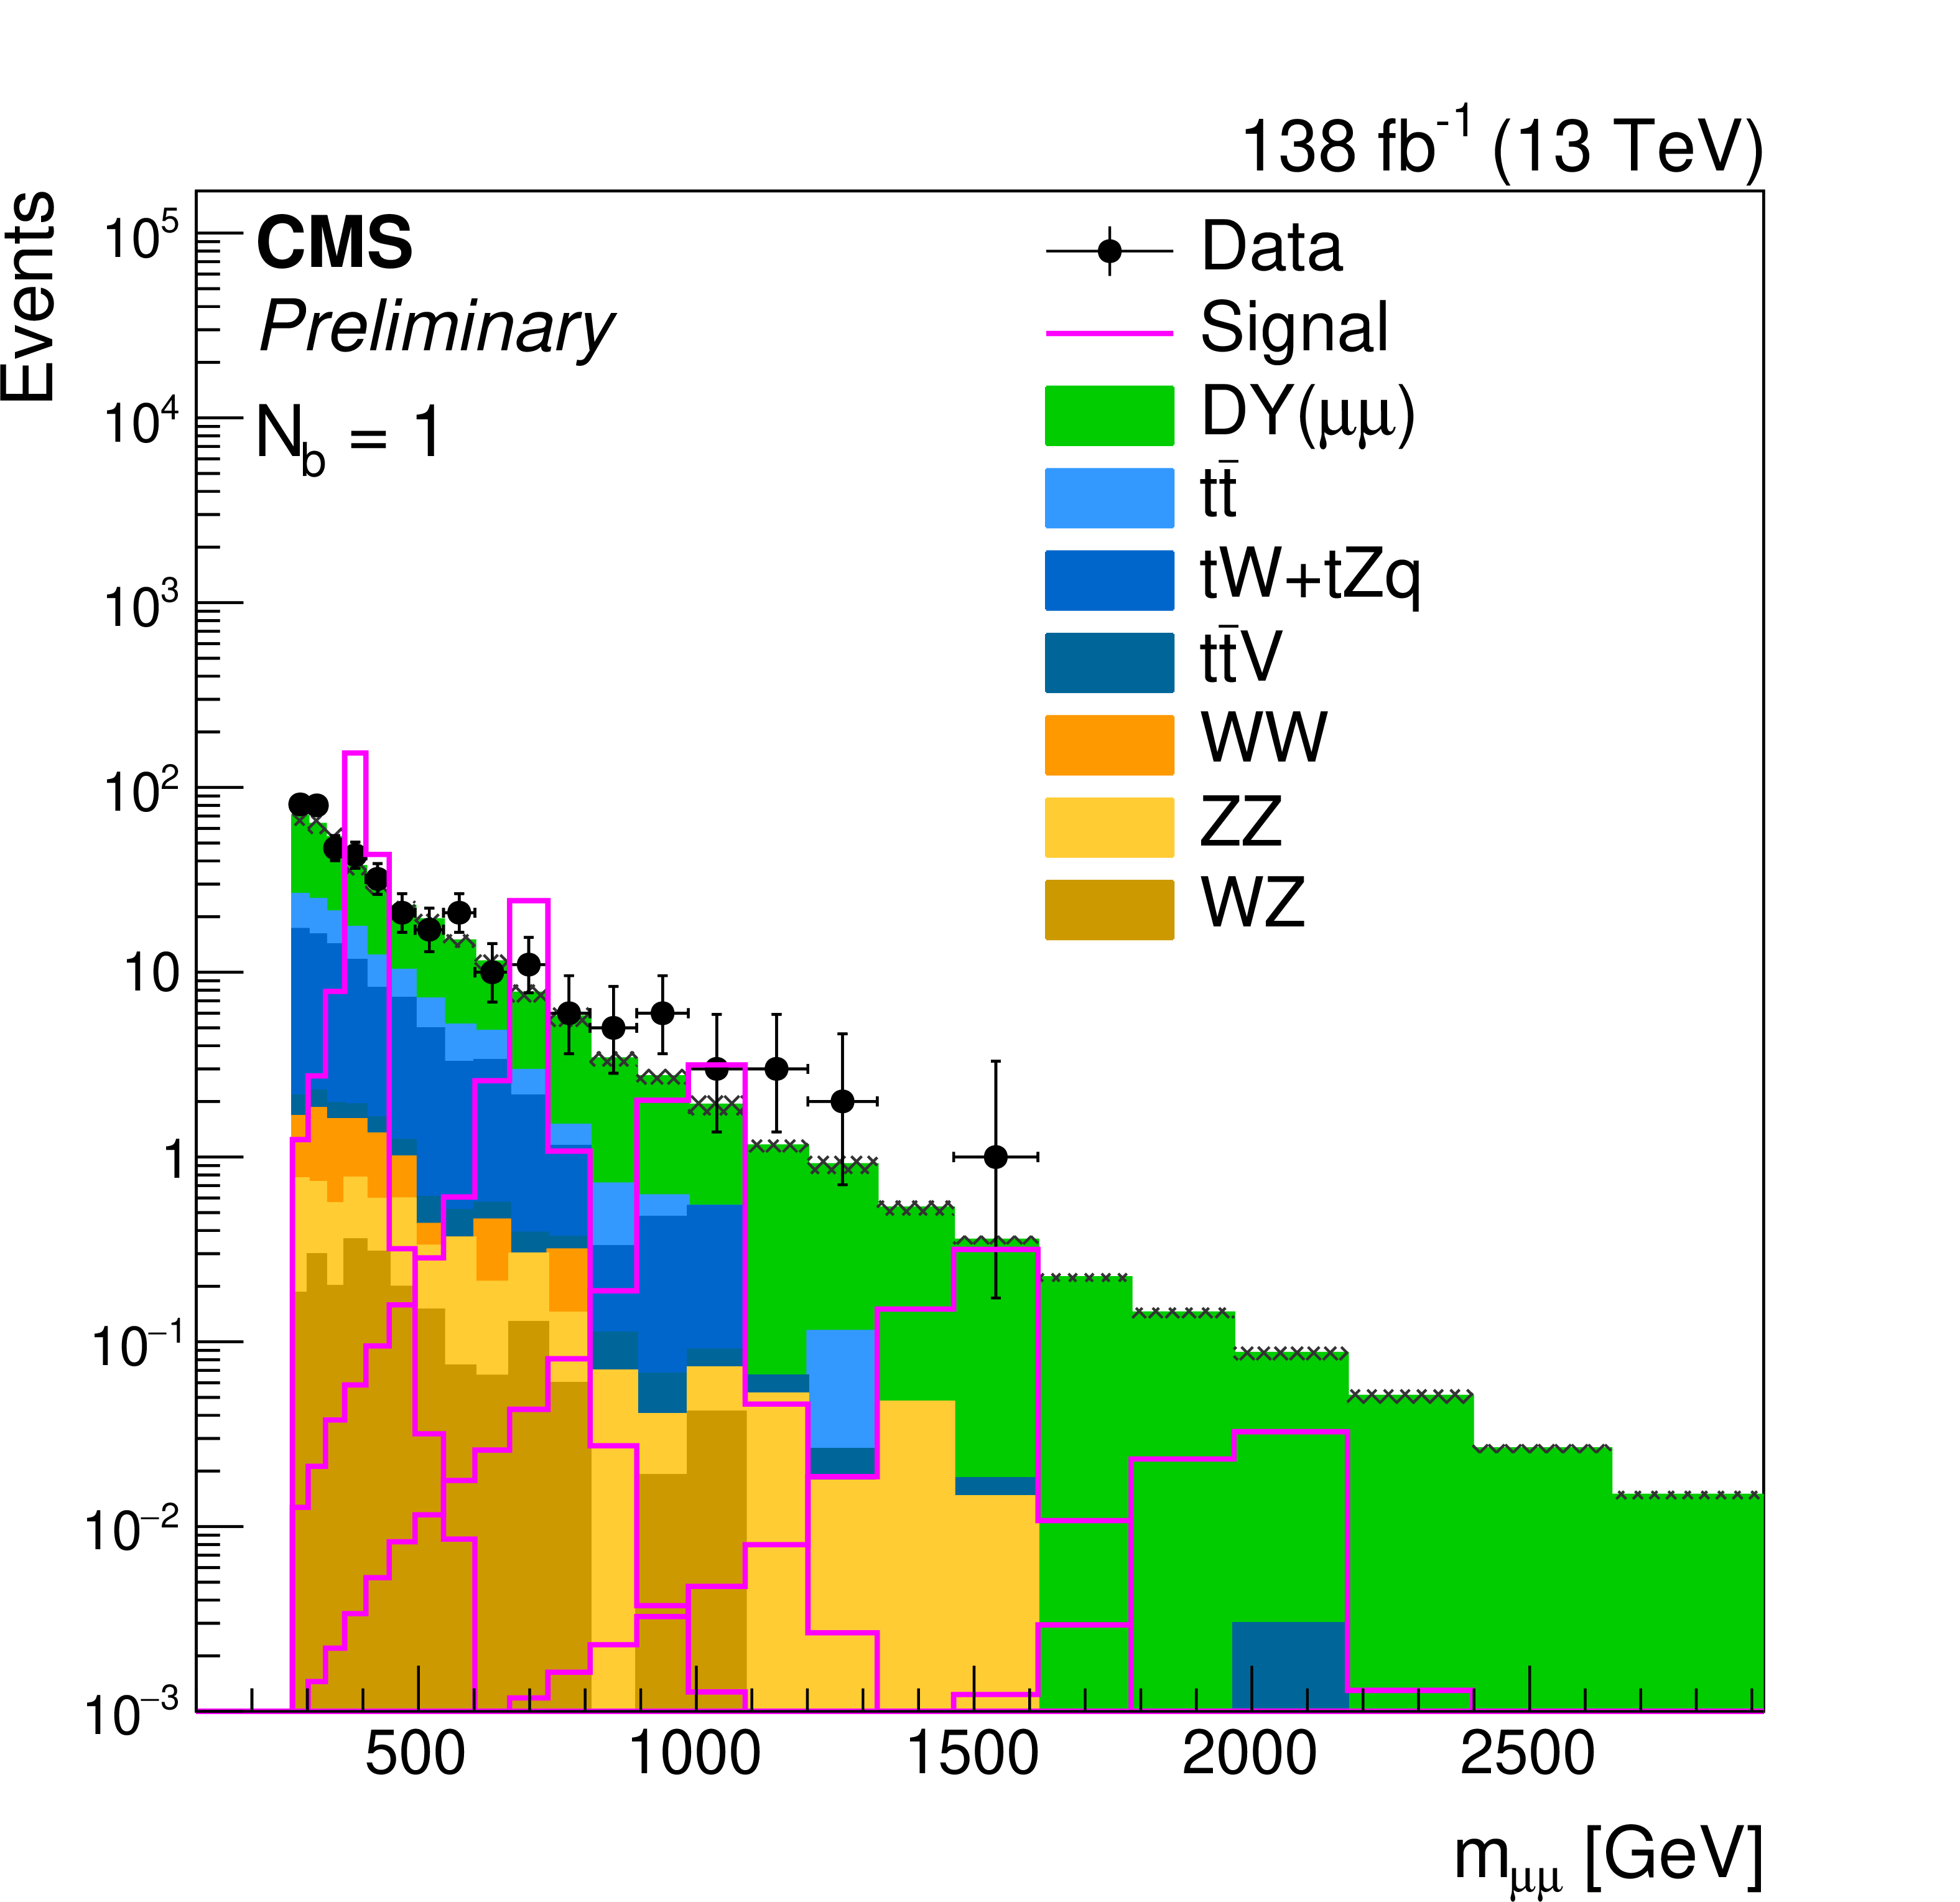
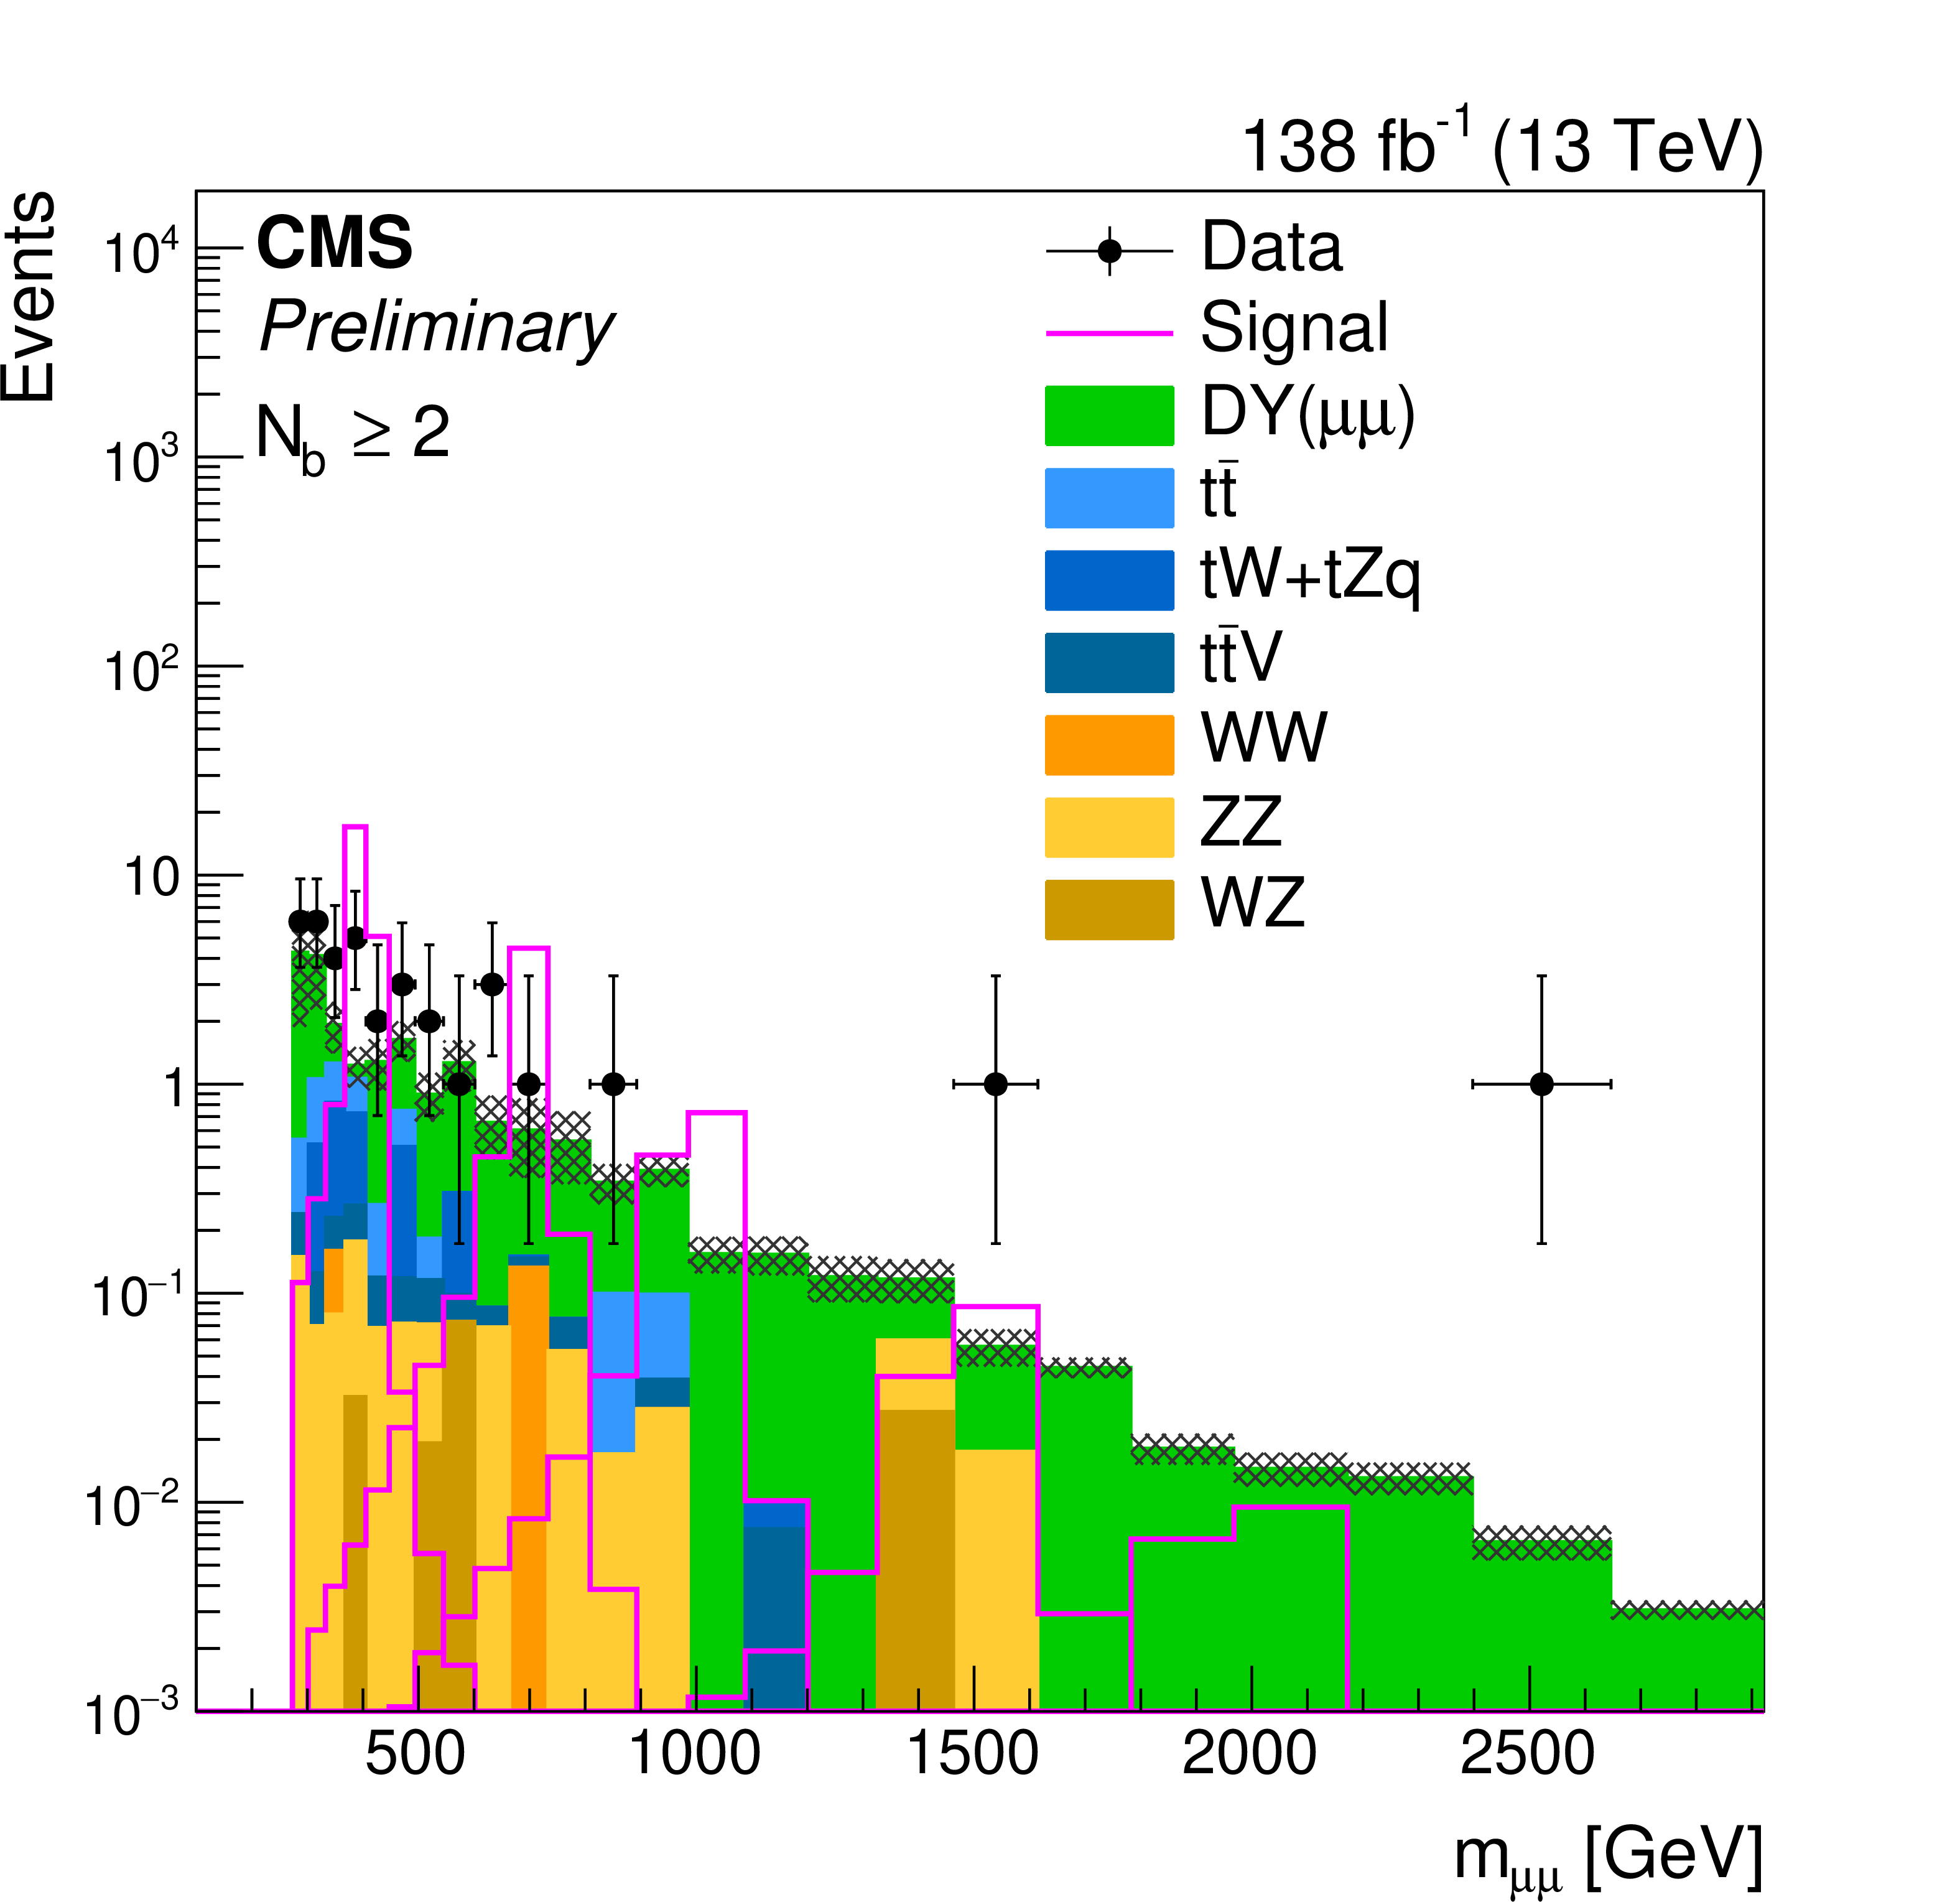
Figure 2:
Distributions of $ m_{\mu\mu} $ in the signal regions. The event categories $ N_{\mathrm{b}}= $ 1 and $ N_{\mathrm{b}}\geq $ 2 are shown on the left and right, respectively. The stacked histogram displays the expected distribution from the simulation of the SM backgrounds, while the overlaid open histograms illustrate the size and shape of the Z' contribution from the lepton flavor-universal model described in Eq. 1, for a variety of Z' mass hypotheses. For illustration purposes, we choose couplings $ g_{\ell} = g_{\nu} = g_{\mathrm{b}} = $ 0.05 and $ \delta_{\mathrm{b}\mathrm{s}}= $ 0. The observed data are shown as black points with statistical error bars. The SM background simulation is only used for illustration purposes, as the background is estimated directly from data across the full $ m_{\mu\mu} $ range of interest. |
png pdf |
Figure 2-a:
Distributions of $ m_{\mu\mu} $ in the signal regions. The event categories $ N_{\mathrm{b}}= $ 1 and $ N_{\mathrm{b}}\geq $ 2 are shown on the left and right, respectively. The stacked histogram displays the expected distribution from the simulation of the SM backgrounds, while the overlaid open histograms illustrate the size and shape of the Z' contribution from the lepton flavor-universal model described in Eq. 1, for a variety of Z' mass hypotheses. For illustration purposes, we choose couplings $ g_{\ell} = g_{\nu} = g_{\mathrm{b}} = $ 0.05 and $ \delta_{\mathrm{b}\mathrm{s}}= $ 0. The observed data are shown as black points with statistical error bars. The SM background simulation is only used for illustration purposes, as the background is estimated directly from data across the full $ m_{\mu\mu} $ range of interest. |
png pdf |
Figure 2-b:
Distributions of $ m_{\mu\mu} $ in the signal regions. The event categories $ N_{\mathrm{b}}= $ 1 and $ N_{\mathrm{b}}\geq $ 2 are shown on the left and right, respectively. The stacked histogram displays the expected distribution from the simulation of the SM backgrounds, while the overlaid open histograms illustrate the size and shape of the Z' contribution from the lepton flavor-universal model described in Eq. 1, for a variety of Z' mass hypotheses. For illustration purposes, we choose couplings $ g_{\ell} = g_{\nu} = g_{\mathrm{b}} = $ 0.05 and $ \delta_{\mathrm{b}\mathrm{s}}= $ 0. The observed data are shown as black points with statistical error bars. The SM background simulation is only used for illustration purposes, as the background is estimated directly from data across the full $ m_{\mu\mu} $ range of interest. |
png pdf |
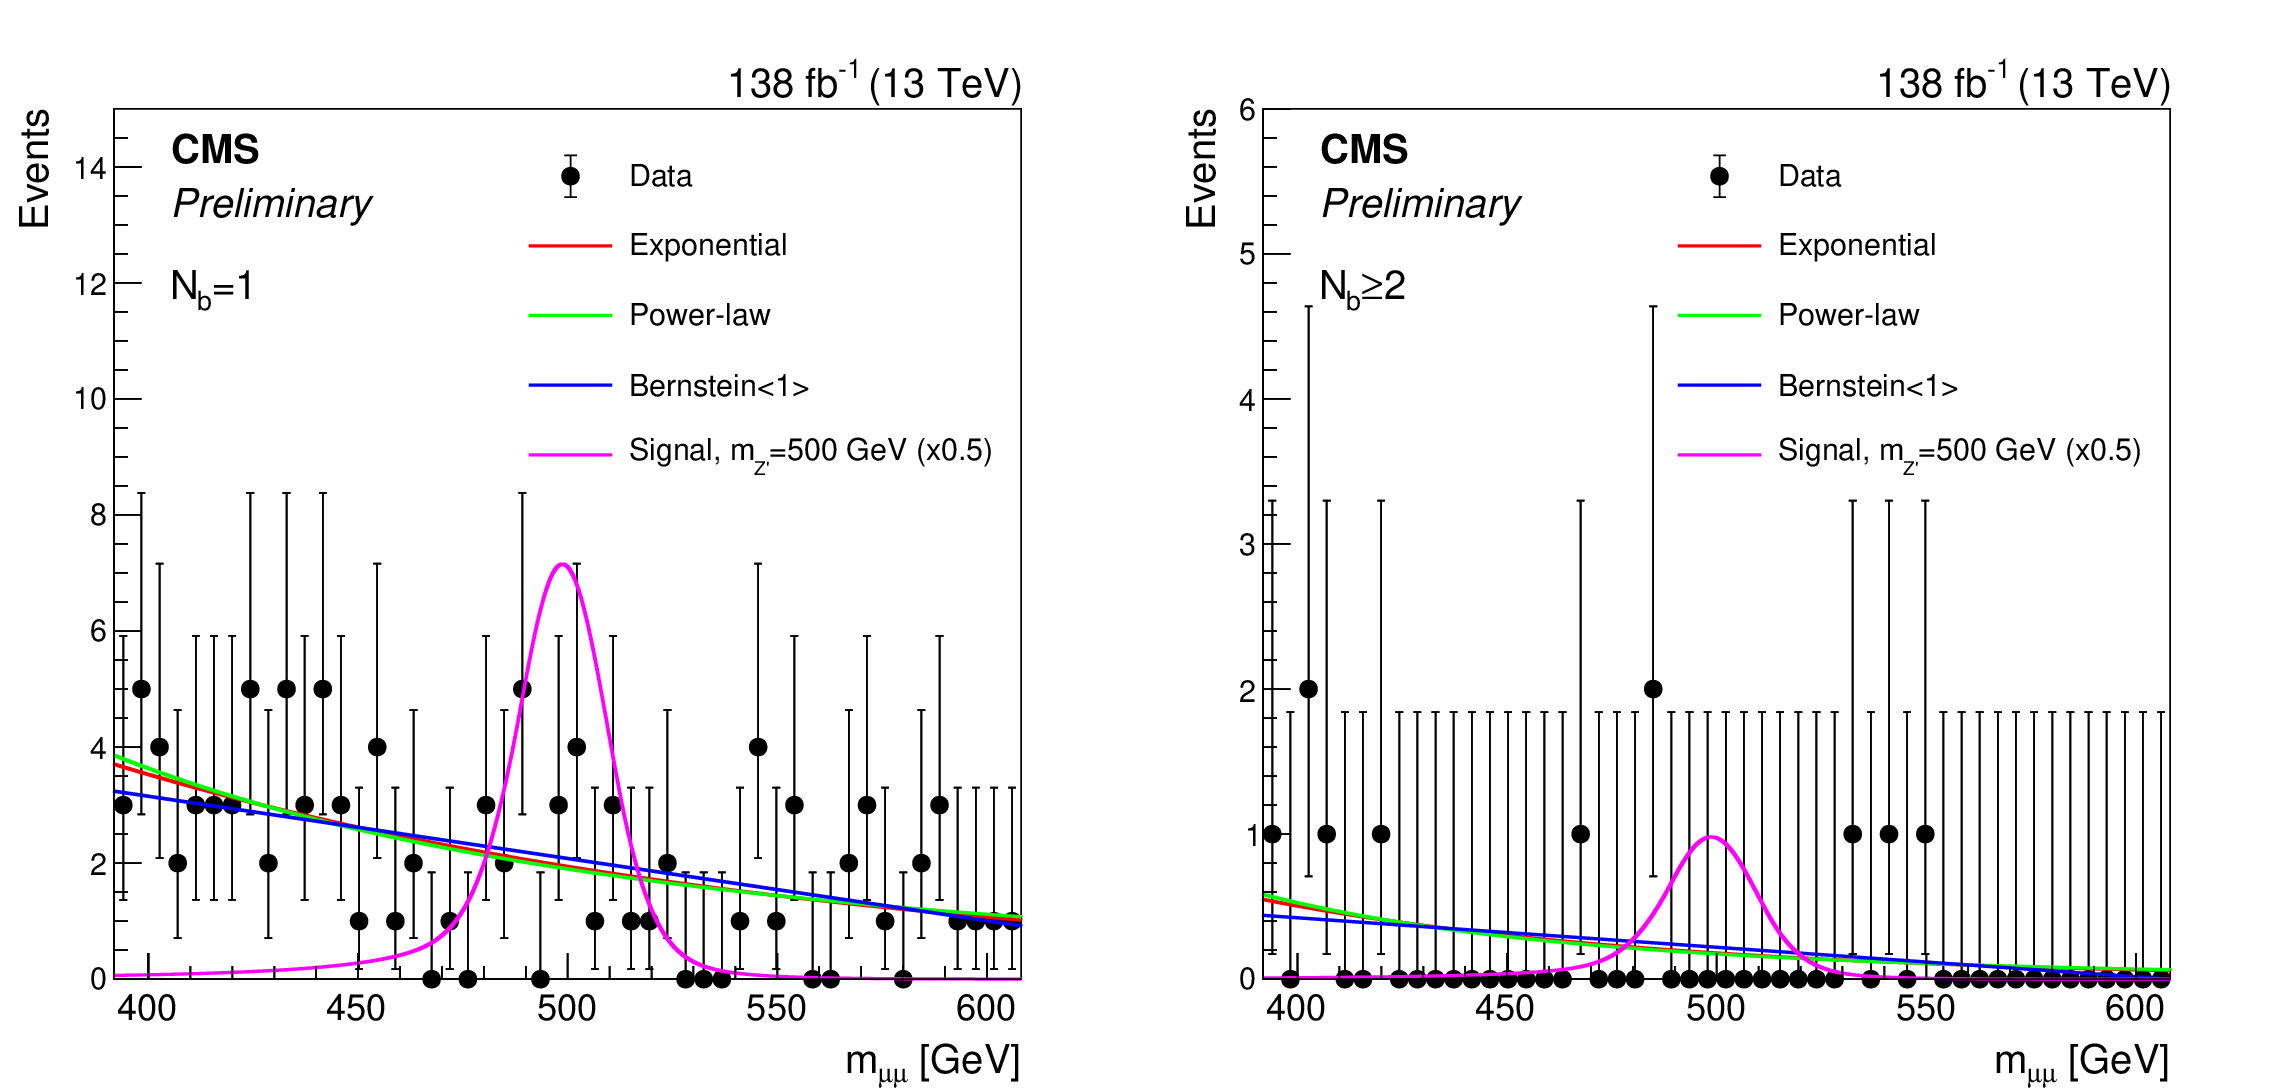
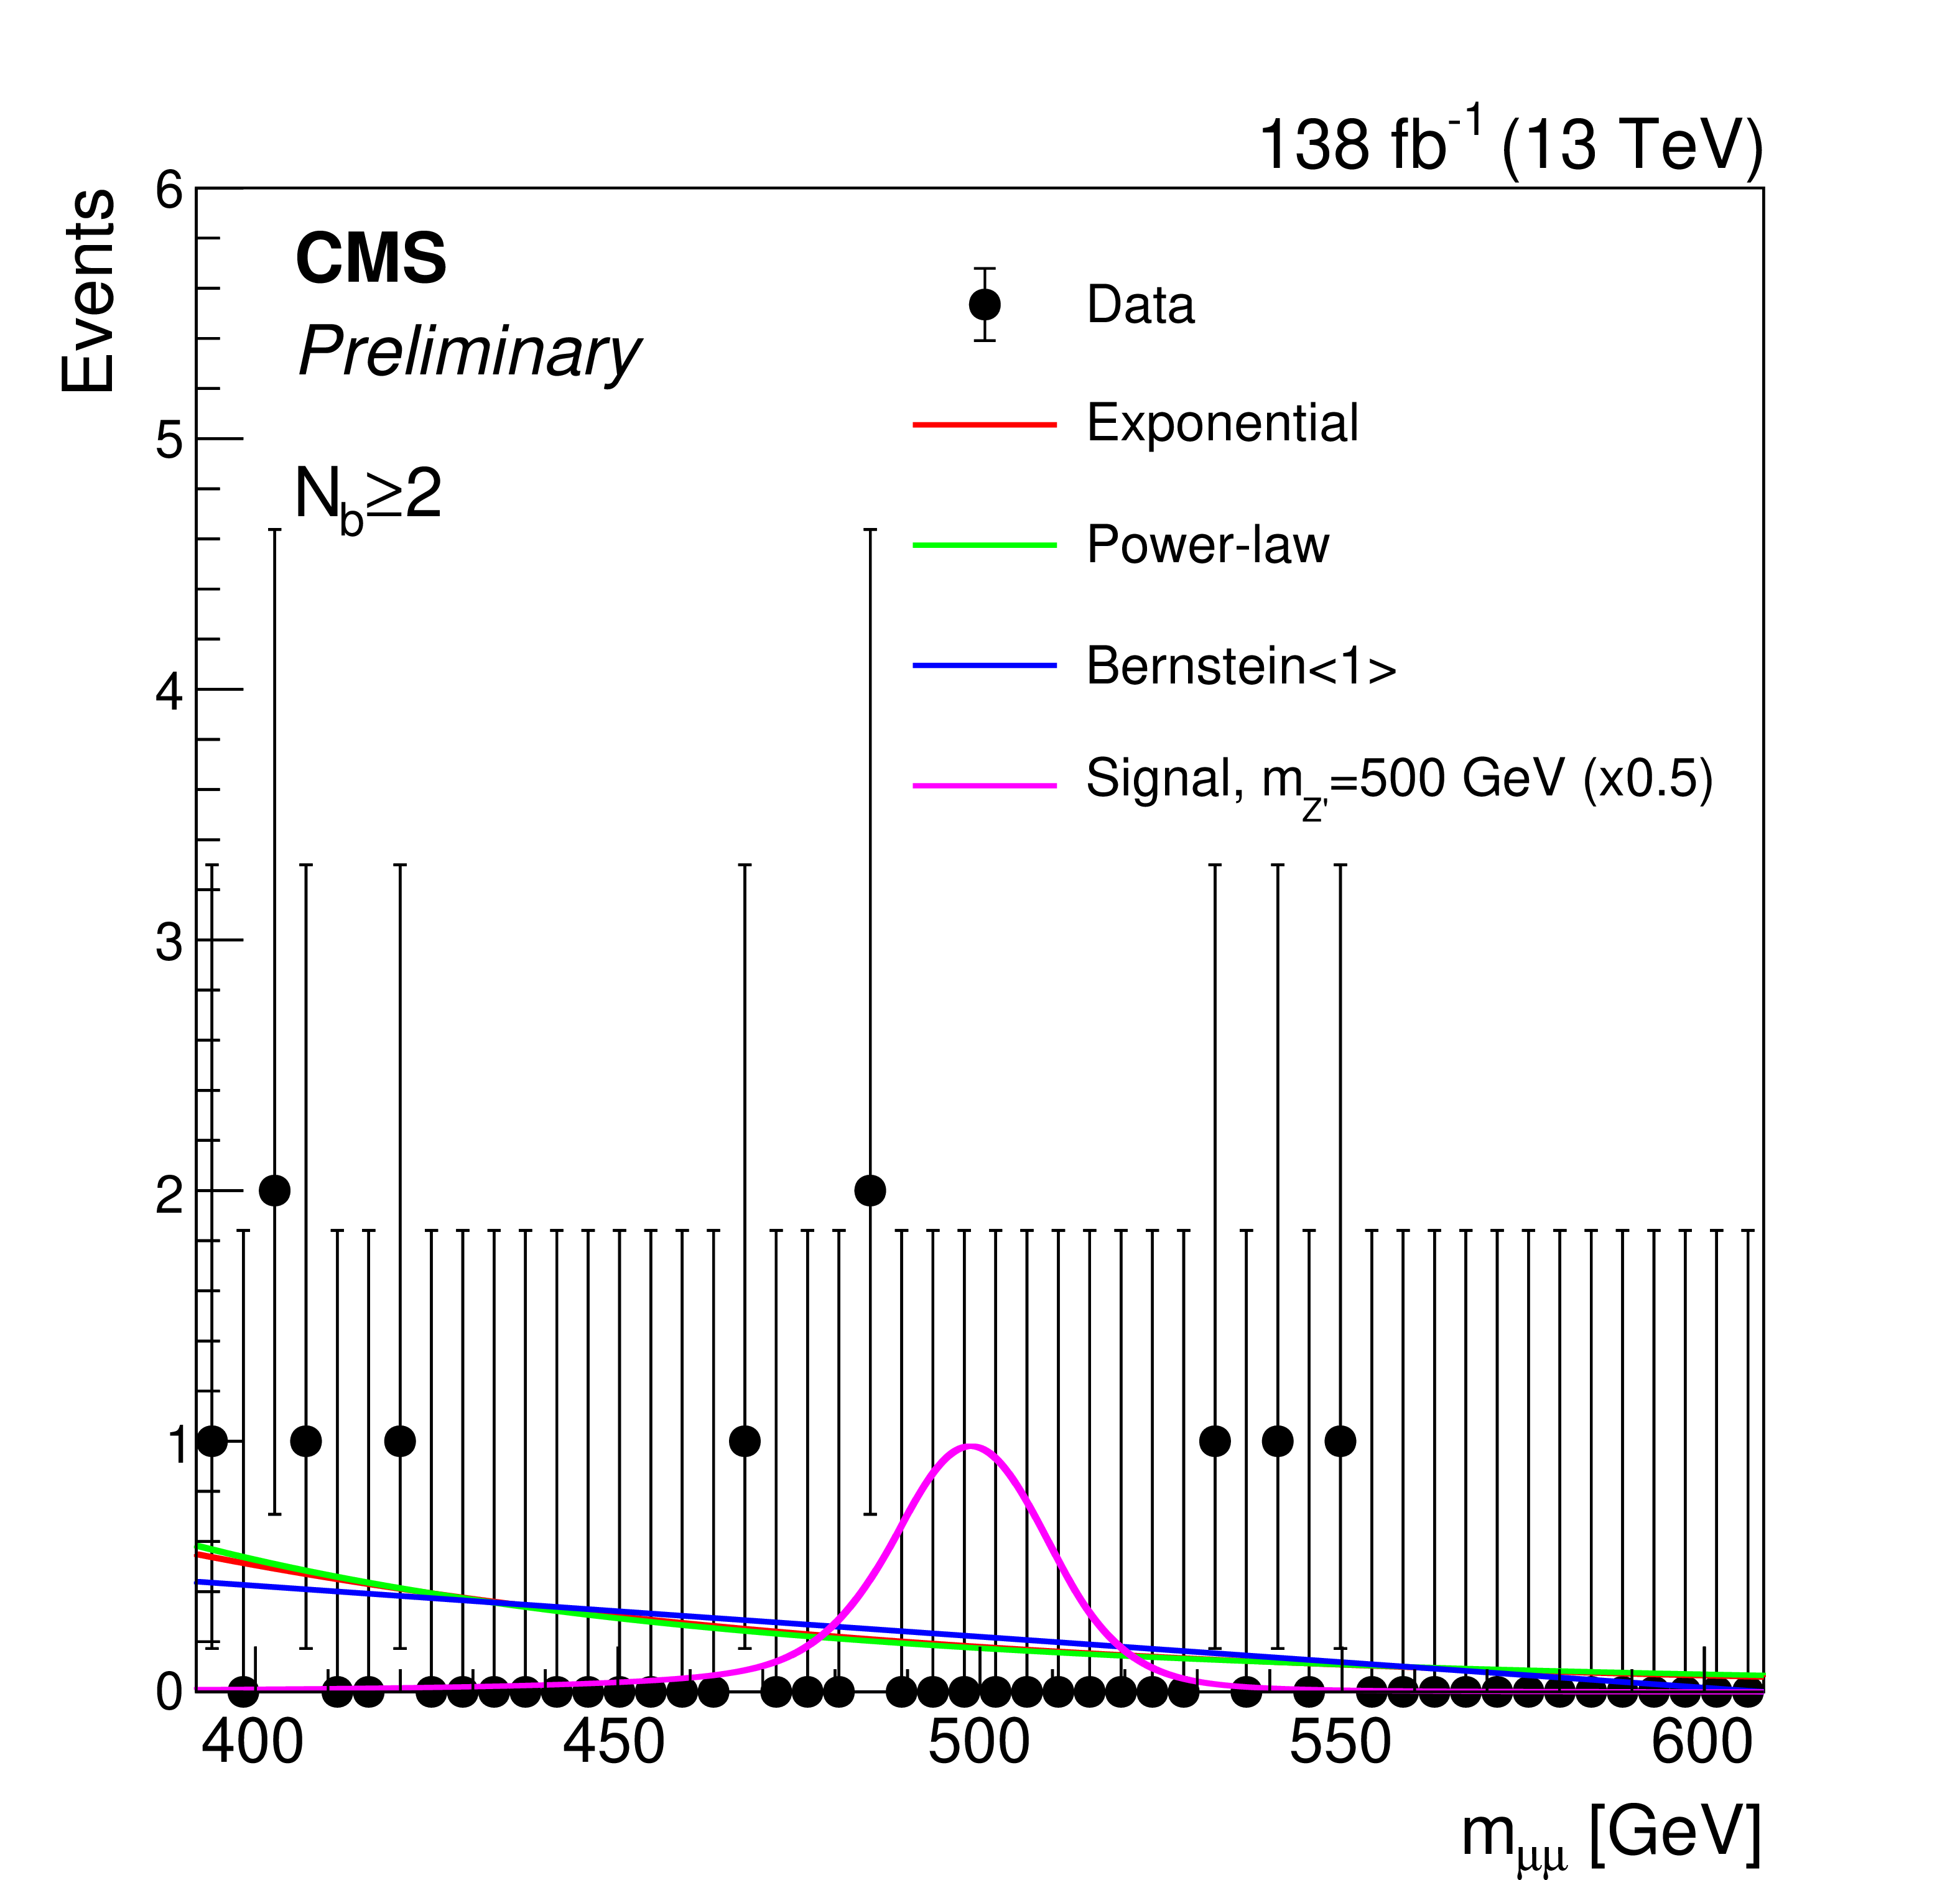
Figure 3:
Invariant mass $ m_{\mu\mu} $ distributions in the event categories with (left) $ N_{\mathrm{b}}= $ 1 and (right) $ N_{\mathrm{b}}\geq $ 2 shown together with the corresponding selected background functional forms used as input to the discrete profiling method [38] when probing the $ m_{{\mathrm{Z}^{'}} }= $ 500 GeV hypothesis. For illustration purposes, we overlay the expected a signal distribution for the lepton flavor-universal model described in Eq. 1, with couplings $ g_{\ell} = g_{\nu} = g_{\mathrm{b}} = $ 0.05 and $ \delta_{\mathrm{b}\mathrm{s}}= $ 0. The signal distribution is scaled by a factor of 0.5 to improve visibility. |

png pdf |
Figure 3-a:
Invariant mass $ m_{\mu\mu} $ distributions in the event categories with (left) $ N_{\mathrm{b}}= $ 1 and (right) $ N_{\mathrm{b}}\geq $ 2 shown together with the corresponding selected background functional forms used as input to the discrete profiling method [38] when probing the $ m_{{\mathrm{Z}^{'}} }= $ 500 GeV hypothesis. For illustration purposes, we overlay the expected a signal distribution for the lepton flavor-universal model described in Eq. 1, with couplings $ g_{\ell} = g_{\nu} = g_{\mathrm{b}} = $ 0.05 and $ \delta_{\mathrm{b}\mathrm{s}}= $ 0. The signal distribution is scaled by a factor of 0.5 to improve visibility. |
png pdf |
Figure 3-b:
Invariant mass $ m_{\mu\mu} $ distributions in the event categories with (left) $ N_{\mathrm{b}}= $ 1 and (right) $ N_{\mathrm{b}}\geq $ 2 shown together with the corresponding selected background functional forms used as input to the discrete profiling method [38] when probing the $ m_{{\mathrm{Z}^{'}} }= $ 500 GeV hypothesis. For illustration purposes, we overlay the expected a signal distribution for the lepton flavor-universal model described in Eq. 1, with couplings $ g_{\ell} = g_{\nu} = g_{\mathrm{b}} = $ 0.05 and $ \delta_{\mathrm{b}\mathrm{s}}= $ 0. The signal distribution is scaled by a factor of 0.5 to improve visibility. |
png pdf |
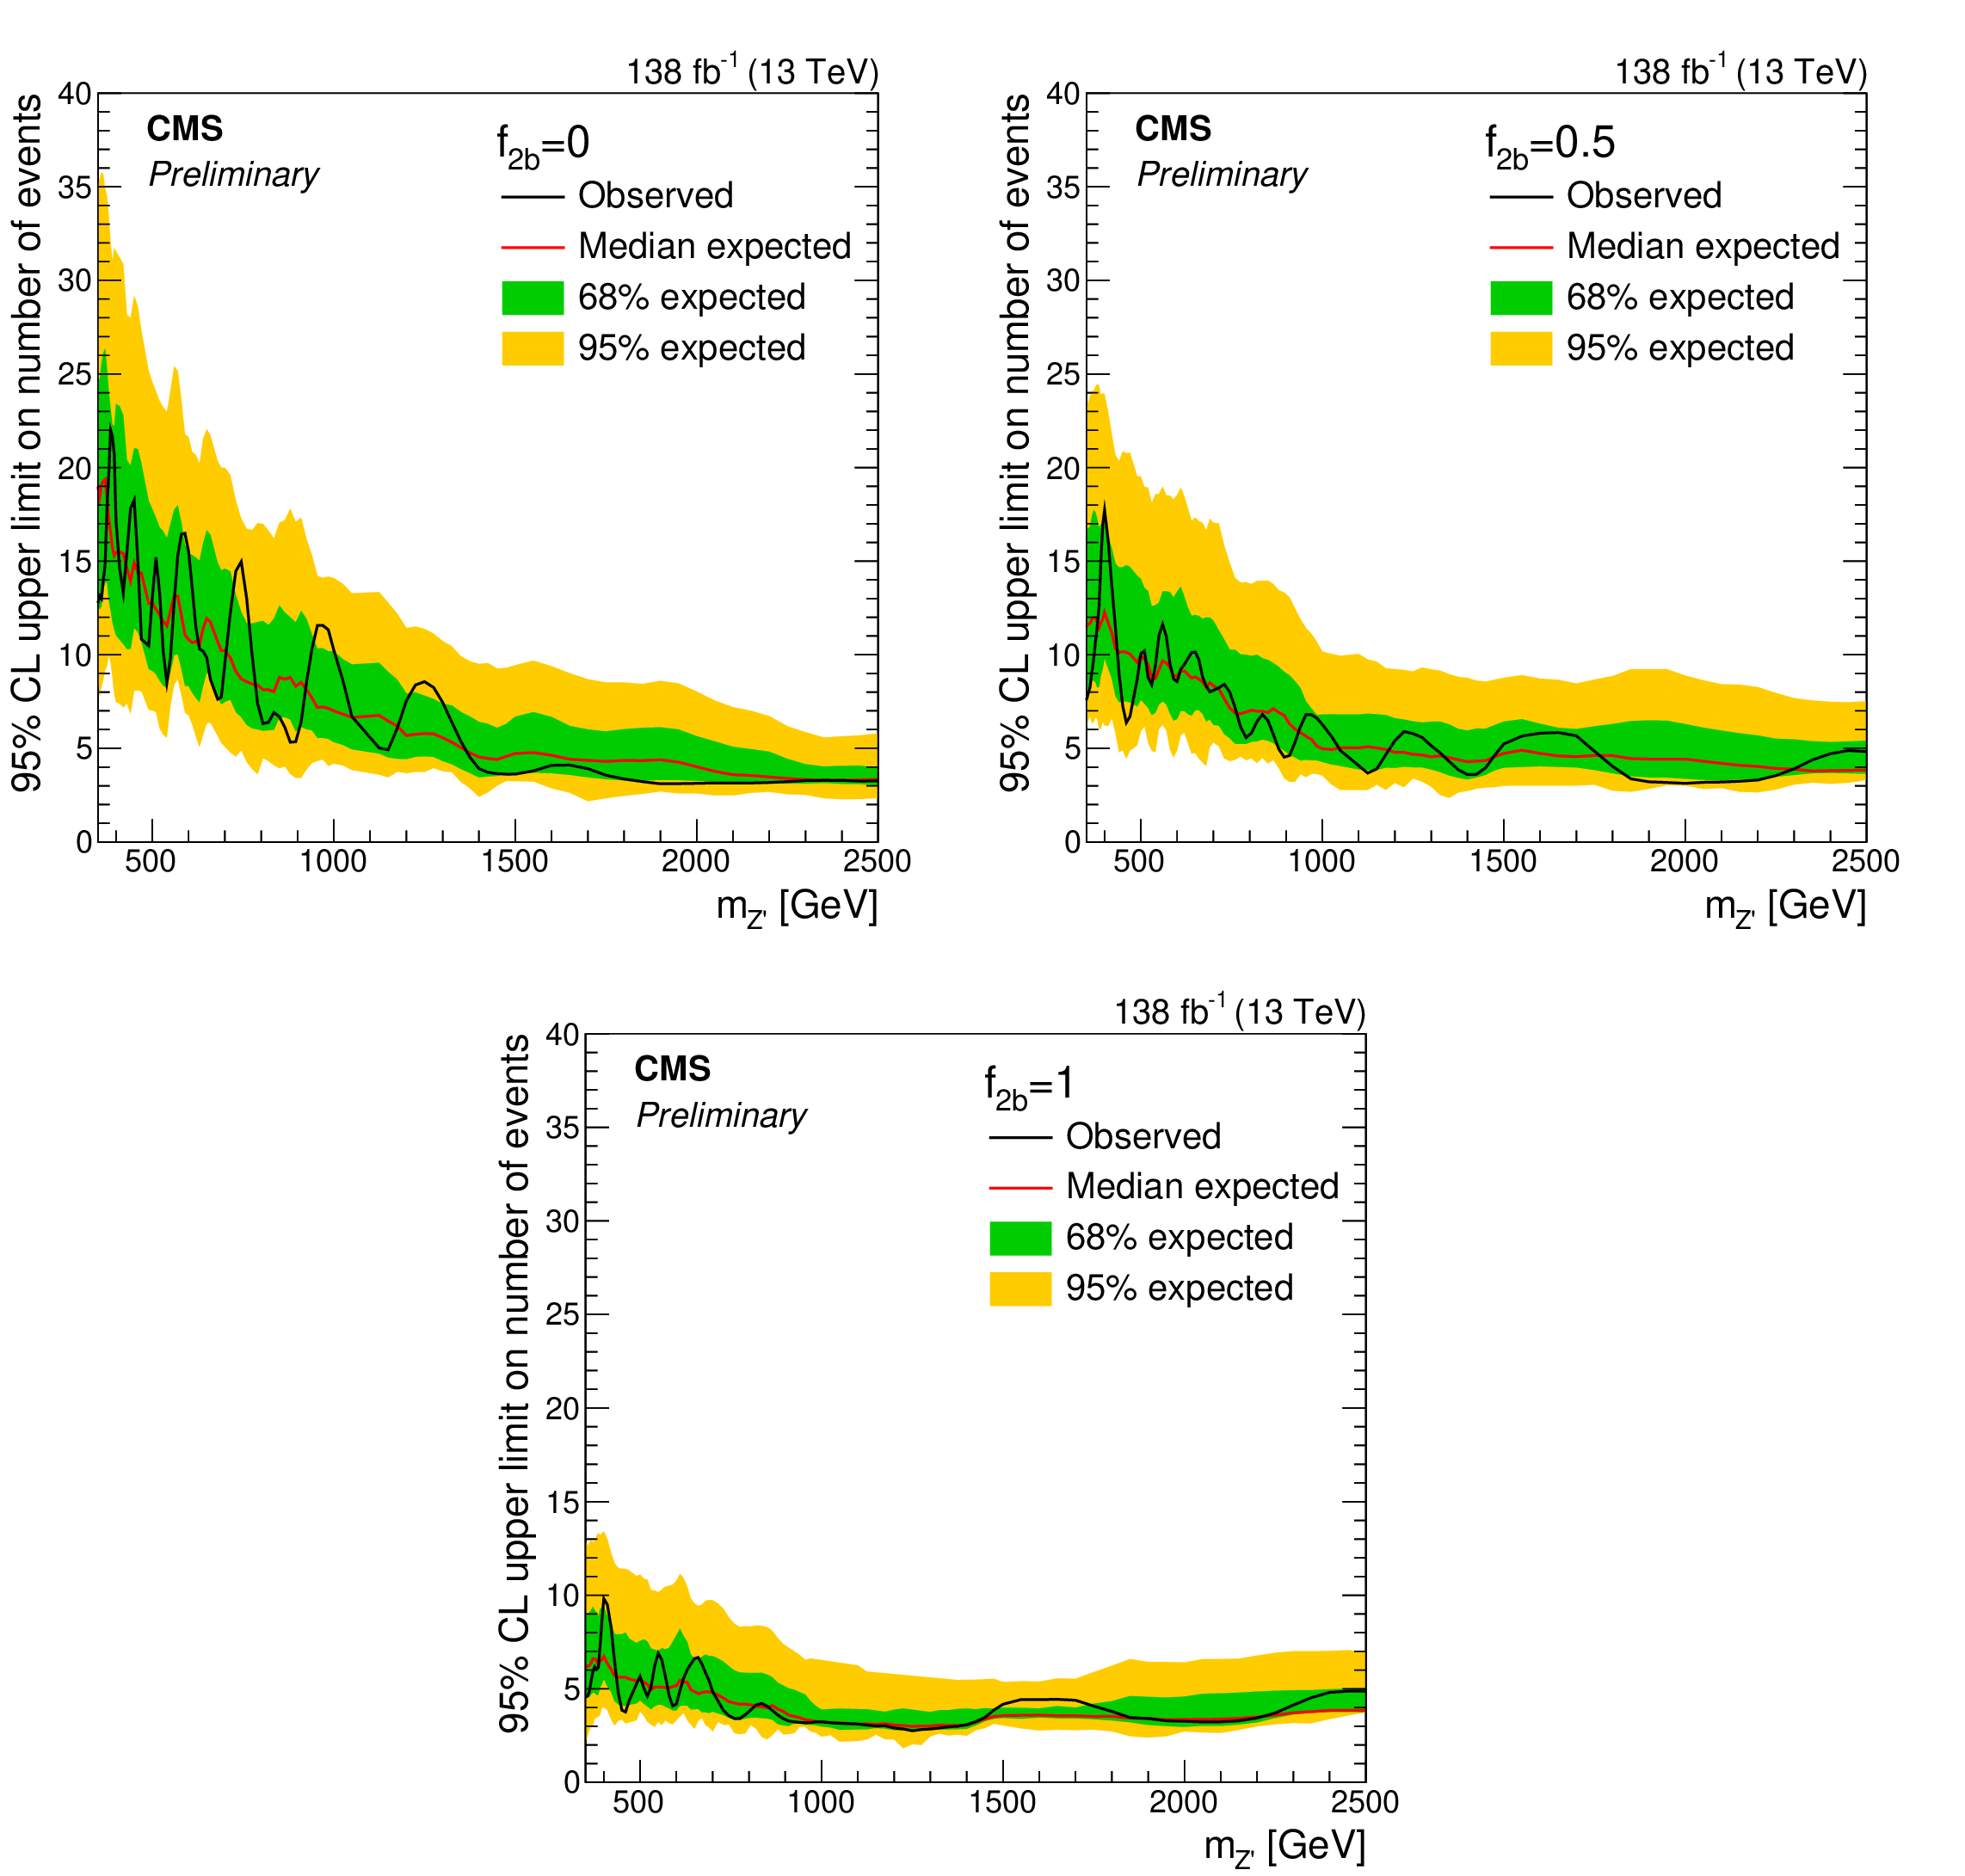
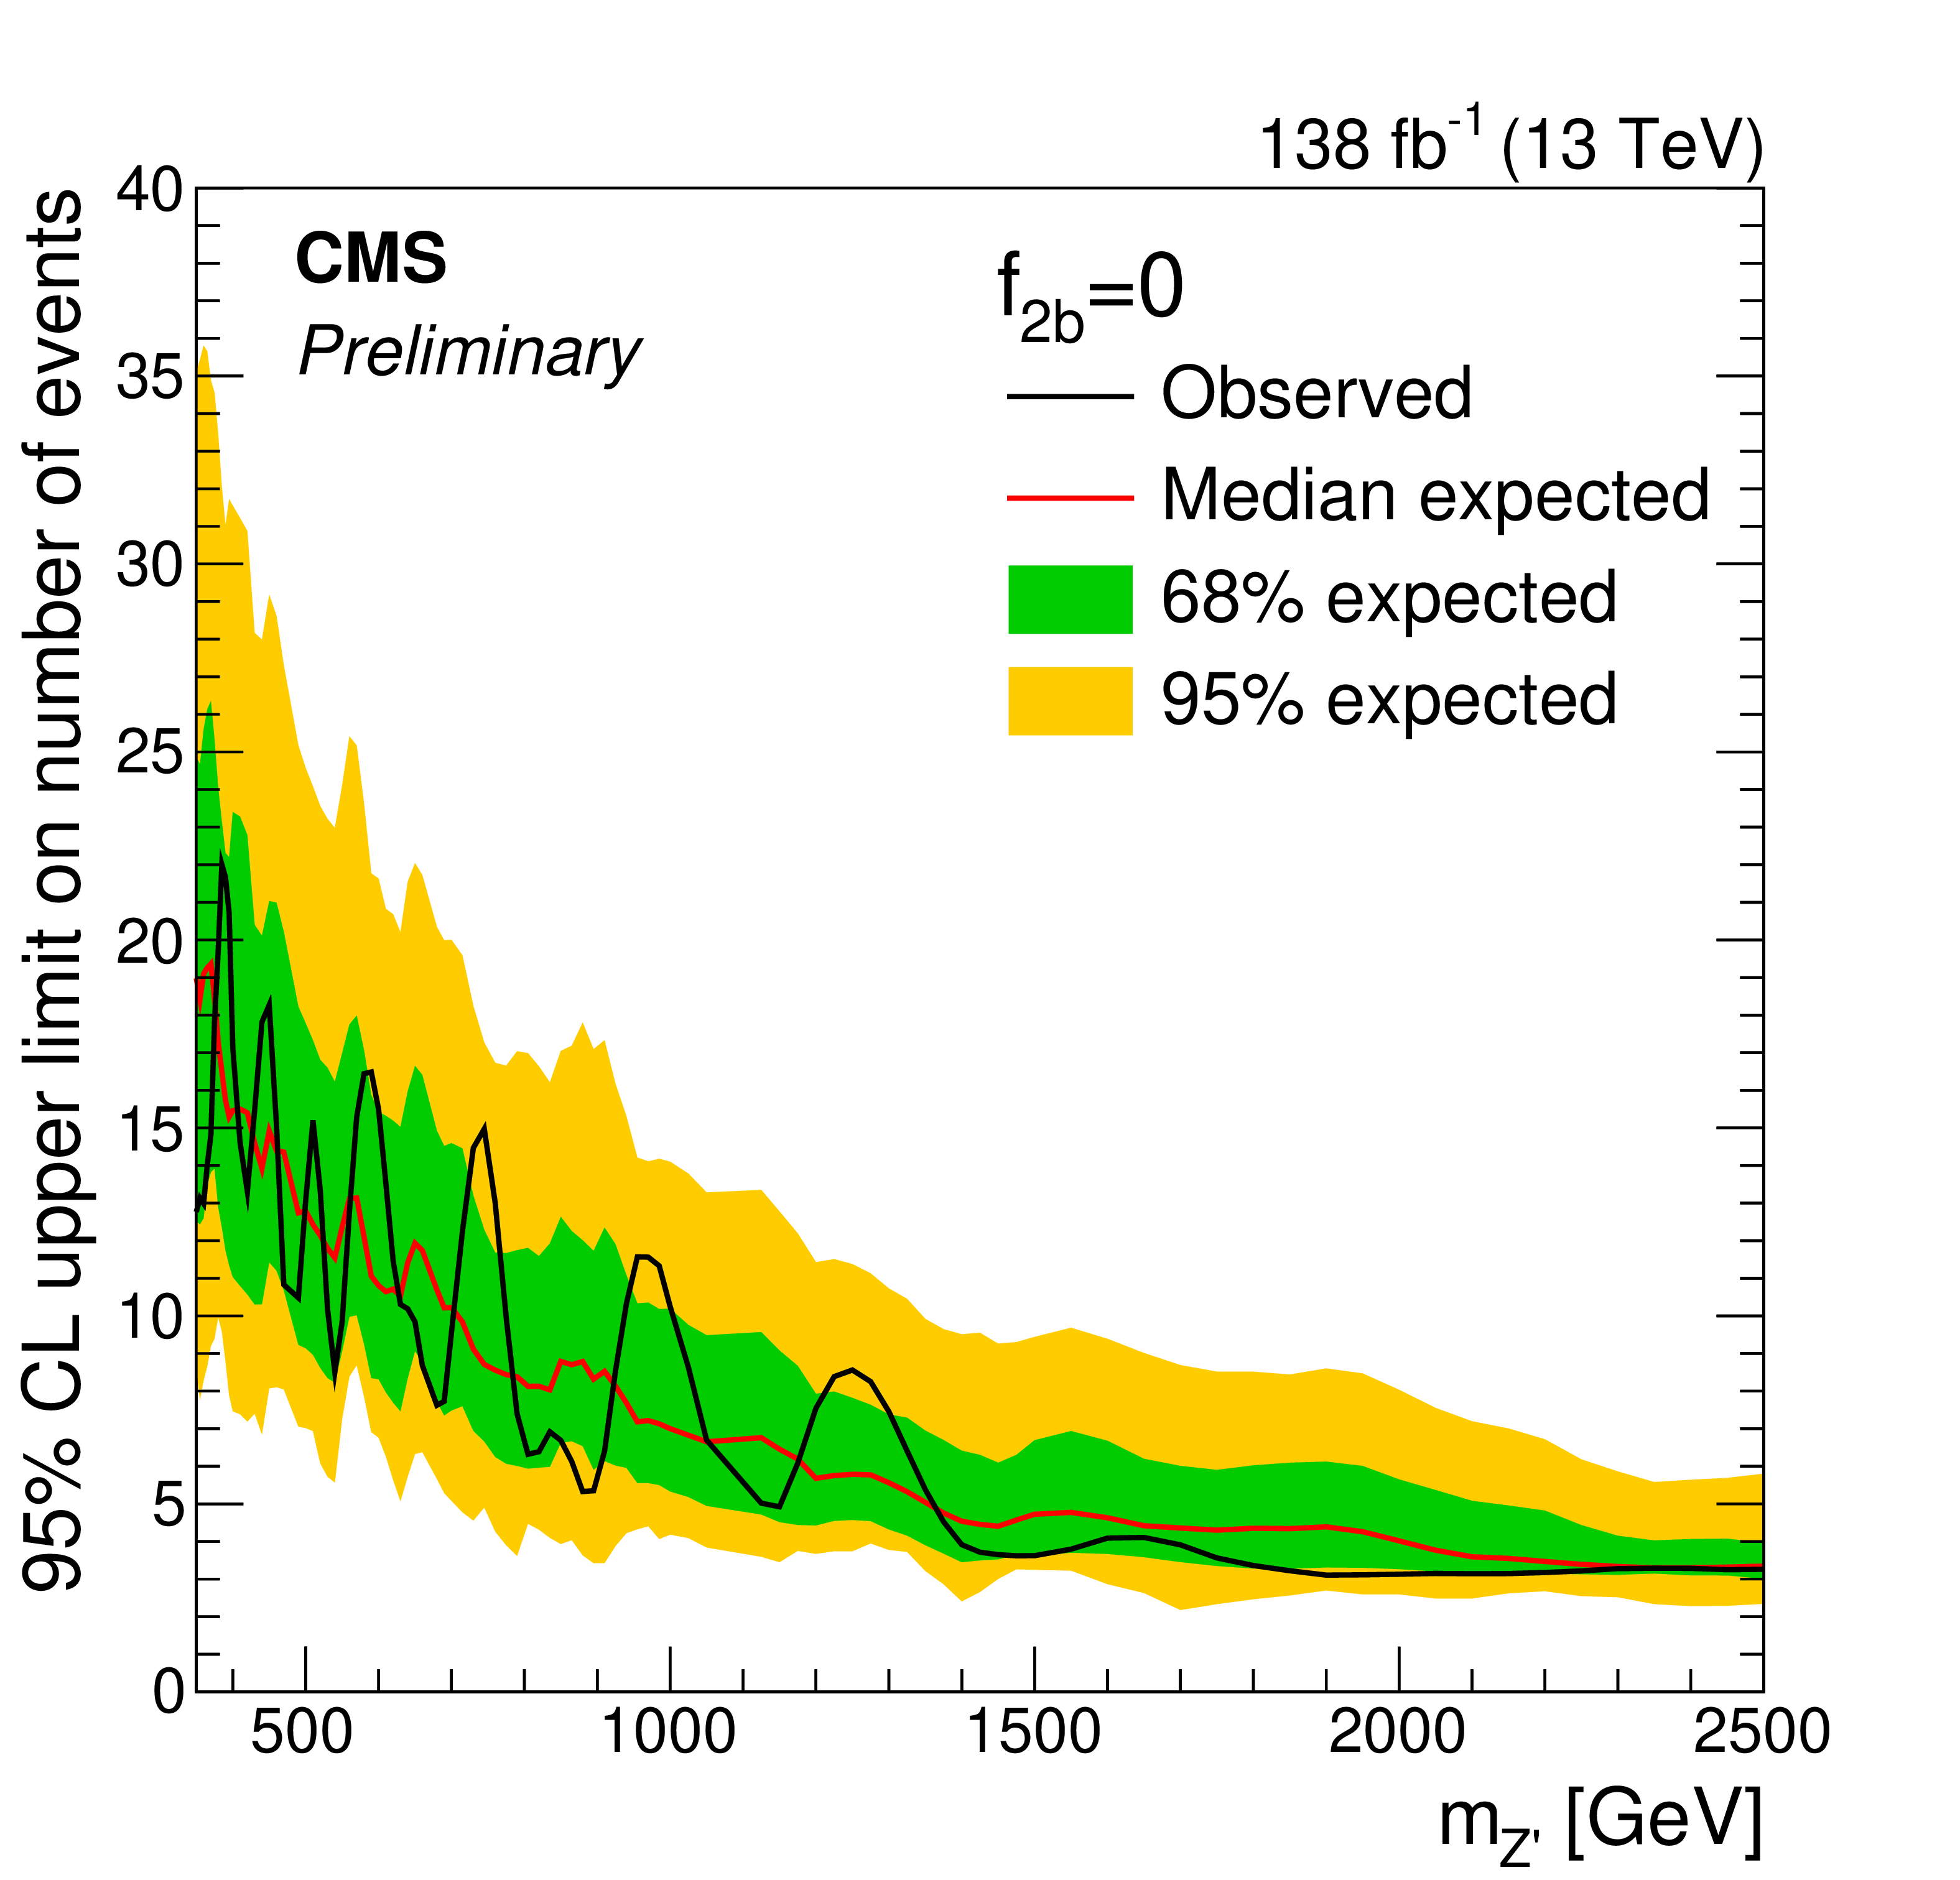
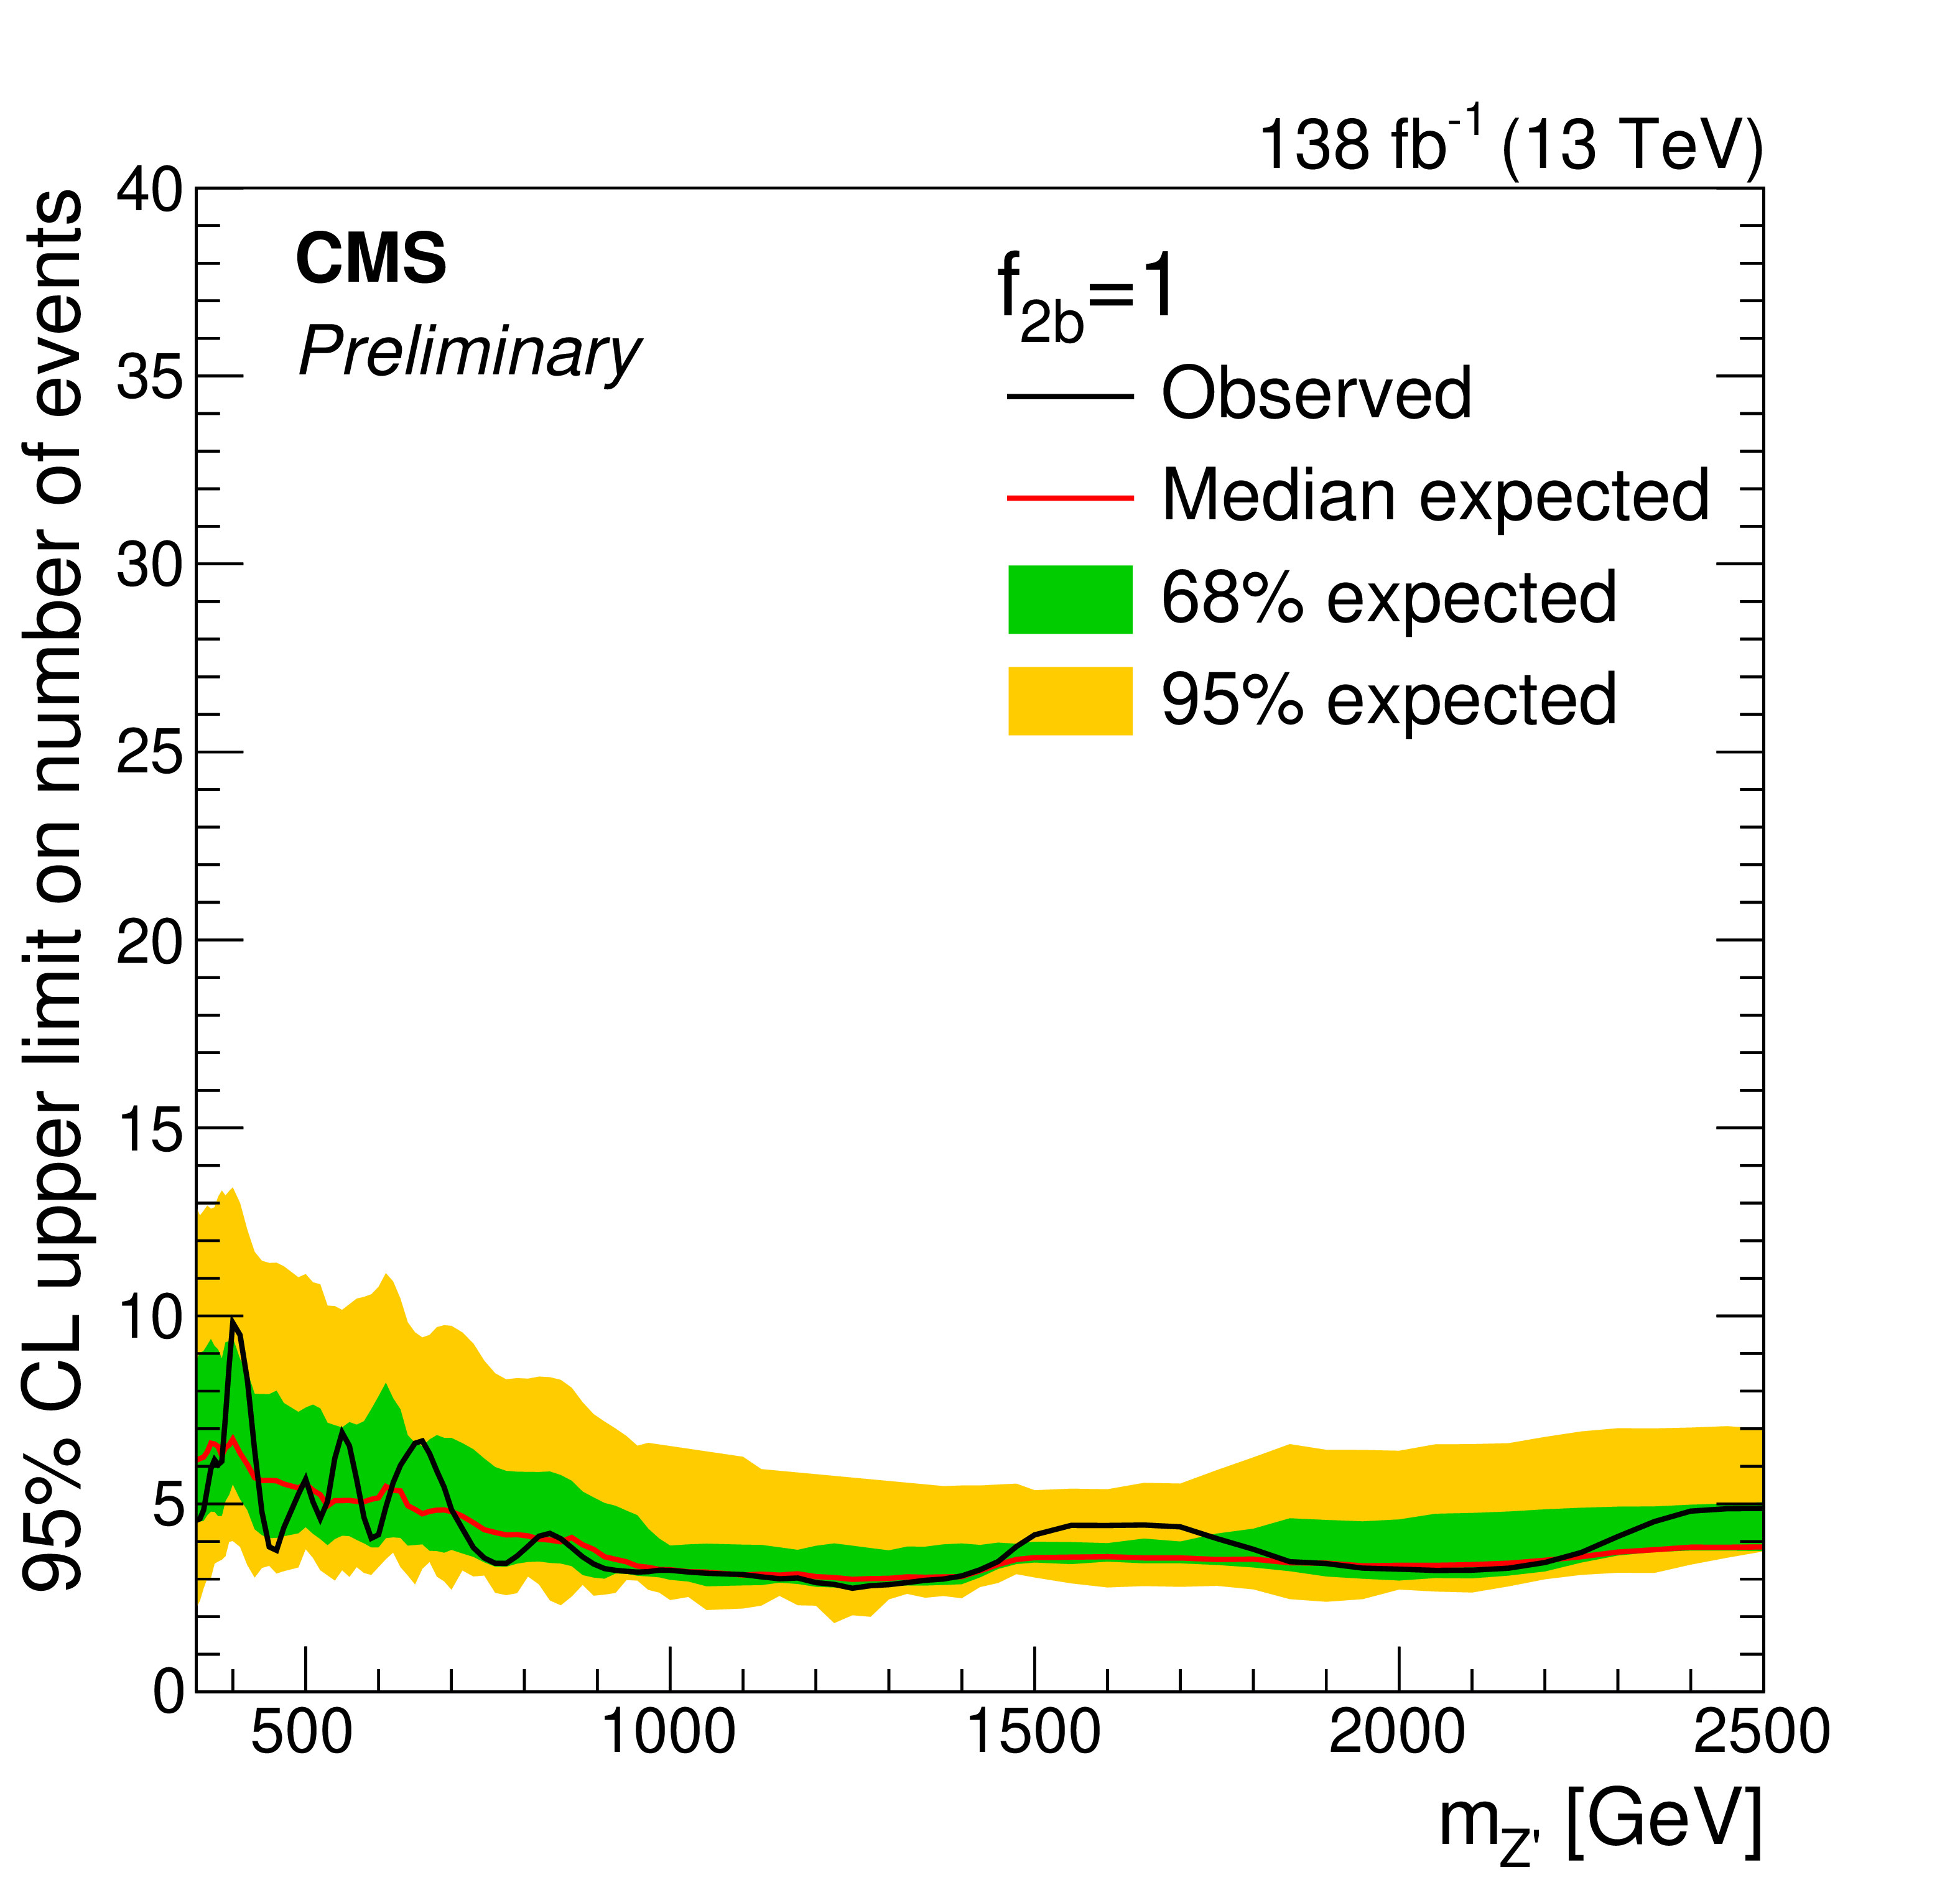
Figure 4:
Exclusion limits at 95% CL on the number of selected BSM events with $ N_{\mathrm{b}} \geq $ 1 as a function of $ m_{{\mathrm{Z}^{'}} } $, for the different representative values of $ f_{2\mathrm{b}}= $ 0 (top left), 0.5 (top right), and 1 (bottom). The quantity $ f_{2\mathrm{b}} $ is the fraction of BSM events passing the analysis selection that have at least two b quark jets. The solid black (red) line represents the observed (median expected) exclusion. The inner green (outer yellow) band indicates the region containing 68 (95)% of the distribution of limits expected under the background-only hypothesis. |
png pdf |
Figure 4-a:
Exclusion limits at 95% CL on the number of selected BSM events with $ N_{\mathrm{b}} \geq $ 1 as a function of $ m_{{\mathrm{Z}^{'}} } $, for the different representative values of $ f_{2\mathrm{b}}= $ 0 (top left), 0.5 (top right), and 1 (bottom). The quantity $ f_{2\mathrm{b}} $ is the fraction of BSM events passing the analysis selection that have at least two b quark jets. The solid black (red) line represents the observed (median expected) exclusion. The inner green (outer yellow) band indicates the region containing 68 (95)% of the distribution of limits expected under the background-only hypothesis. |

png pdf |
Figure 4-b:
Exclusion limits at 95% CL on the number of selected BSM events with $ N_{\mathrm{b}} \geq $ 1 as a function of $ m_{{\mathrm{Z}^{'}} } $, for the different representative values of $ f_{2\mathrm{b}}= $ 0 (top left), 0.5 (top right), and 1 (bottom). The quantity $ f_{2\mathrm{b}} $ is the fraction of BSM events passing the analysis selection that have at least two b quark jets. The solid black (red) line represents the observed (median expected) exclusion. The inner green (outer yellow) band indicates the region containing 68 (95)% of the distribution of limits expected under the background-only hypothesis. |
png pdf |
Figure 4-c:
Exclusion limits at 95% CL on the number of selected BSM events with $ N_{\mathrm{b}} \geq $ 1 as a function of $ m_{{\mathrm{Z}^{'}} } $, for the different representative values of $ f_{2\mathrm{b}}= $ 0 (top left), 0.5 (top right), and 1 (bottom). The quantity $ f_{2\mathrm{b}} $ is the fraction of BSM events passing the analysis selection that have at least two b quark jets. The solid black (red) line represents the observed (median expected) exclusion. The inner green (outer yellow) band indicates the region containing 68 (95)% of the distribution of limits expected under the background-only hypothesis. |
png pdf |
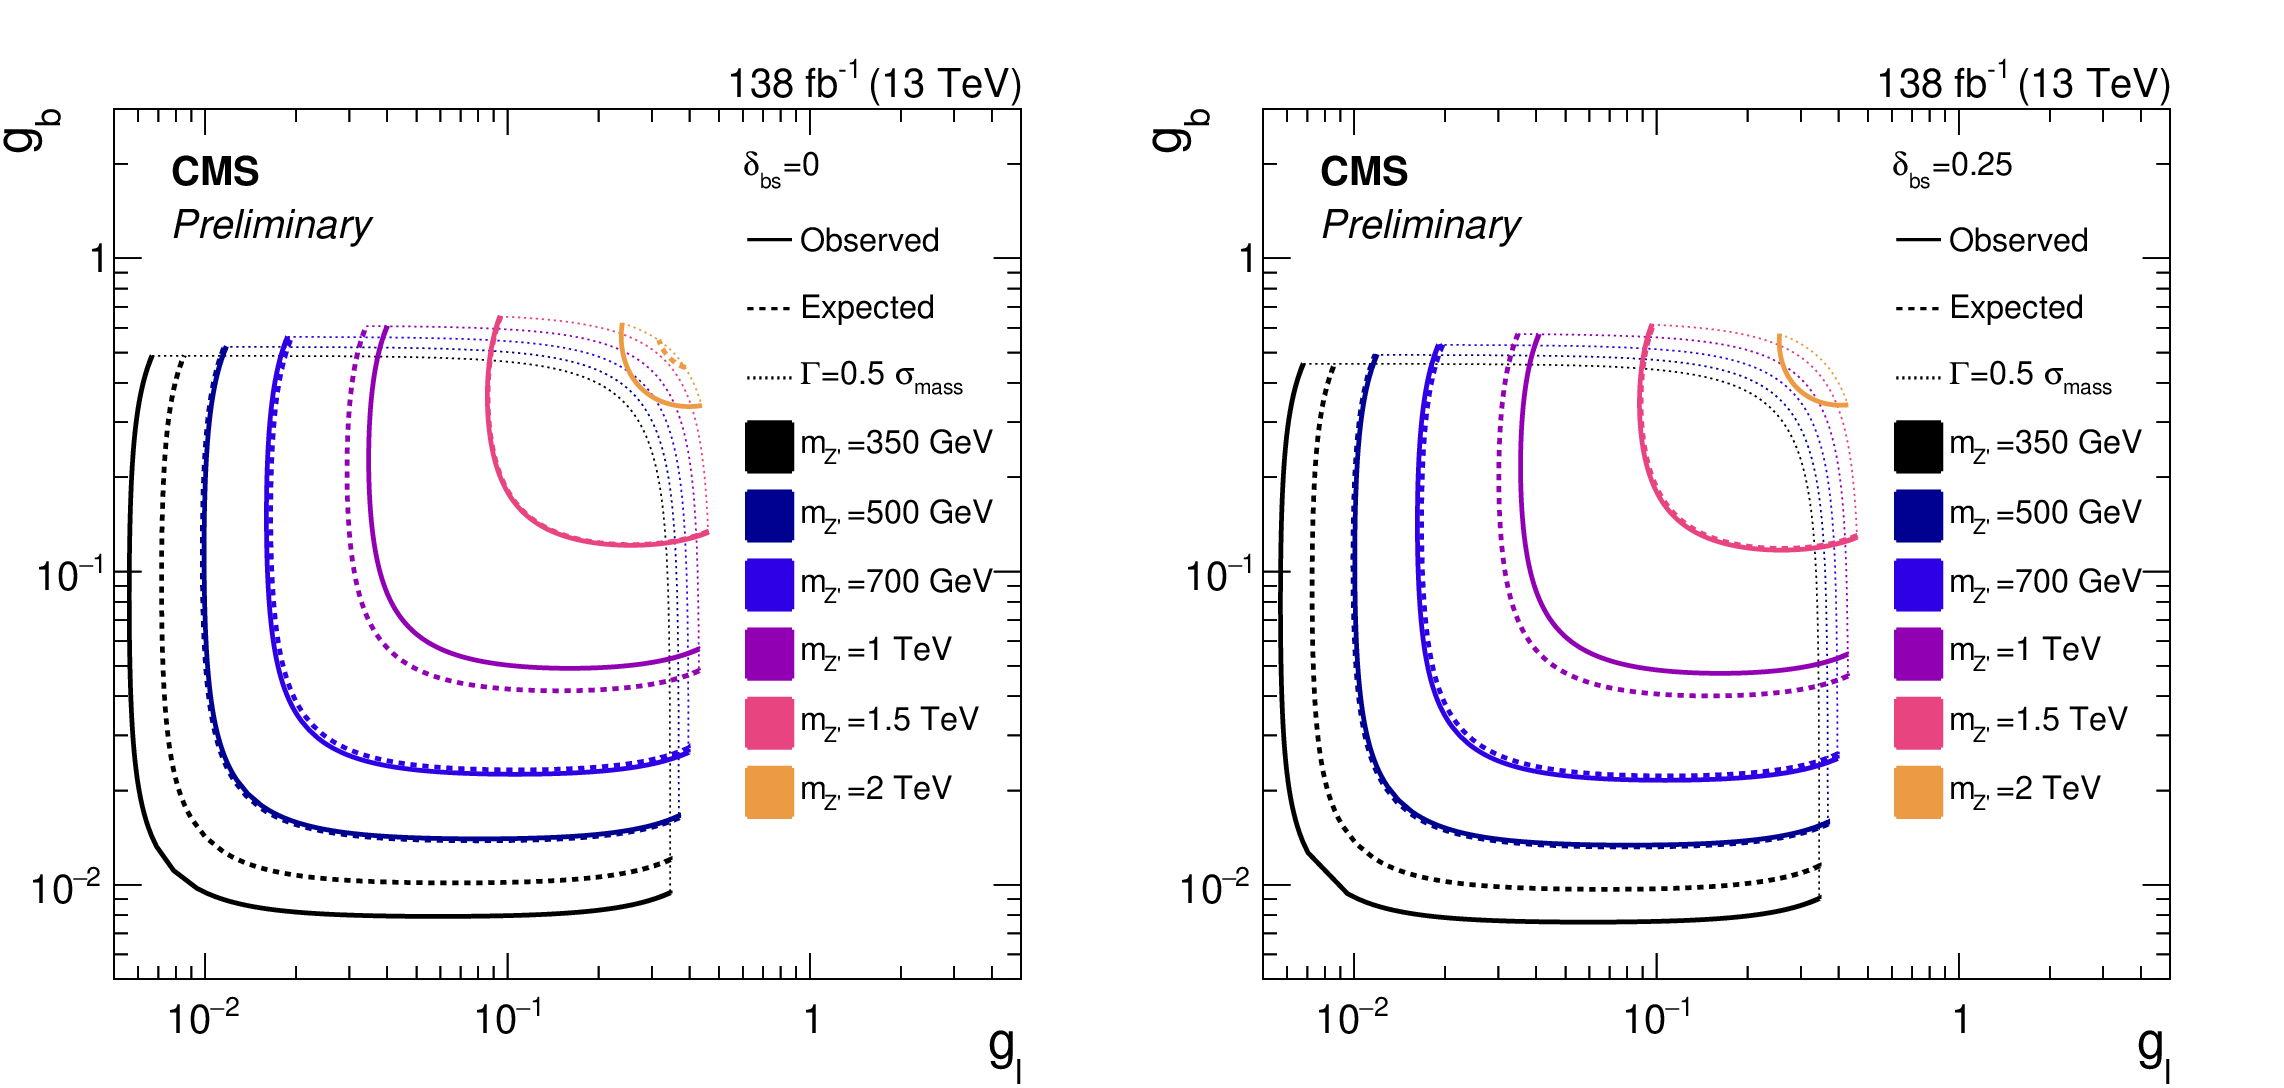
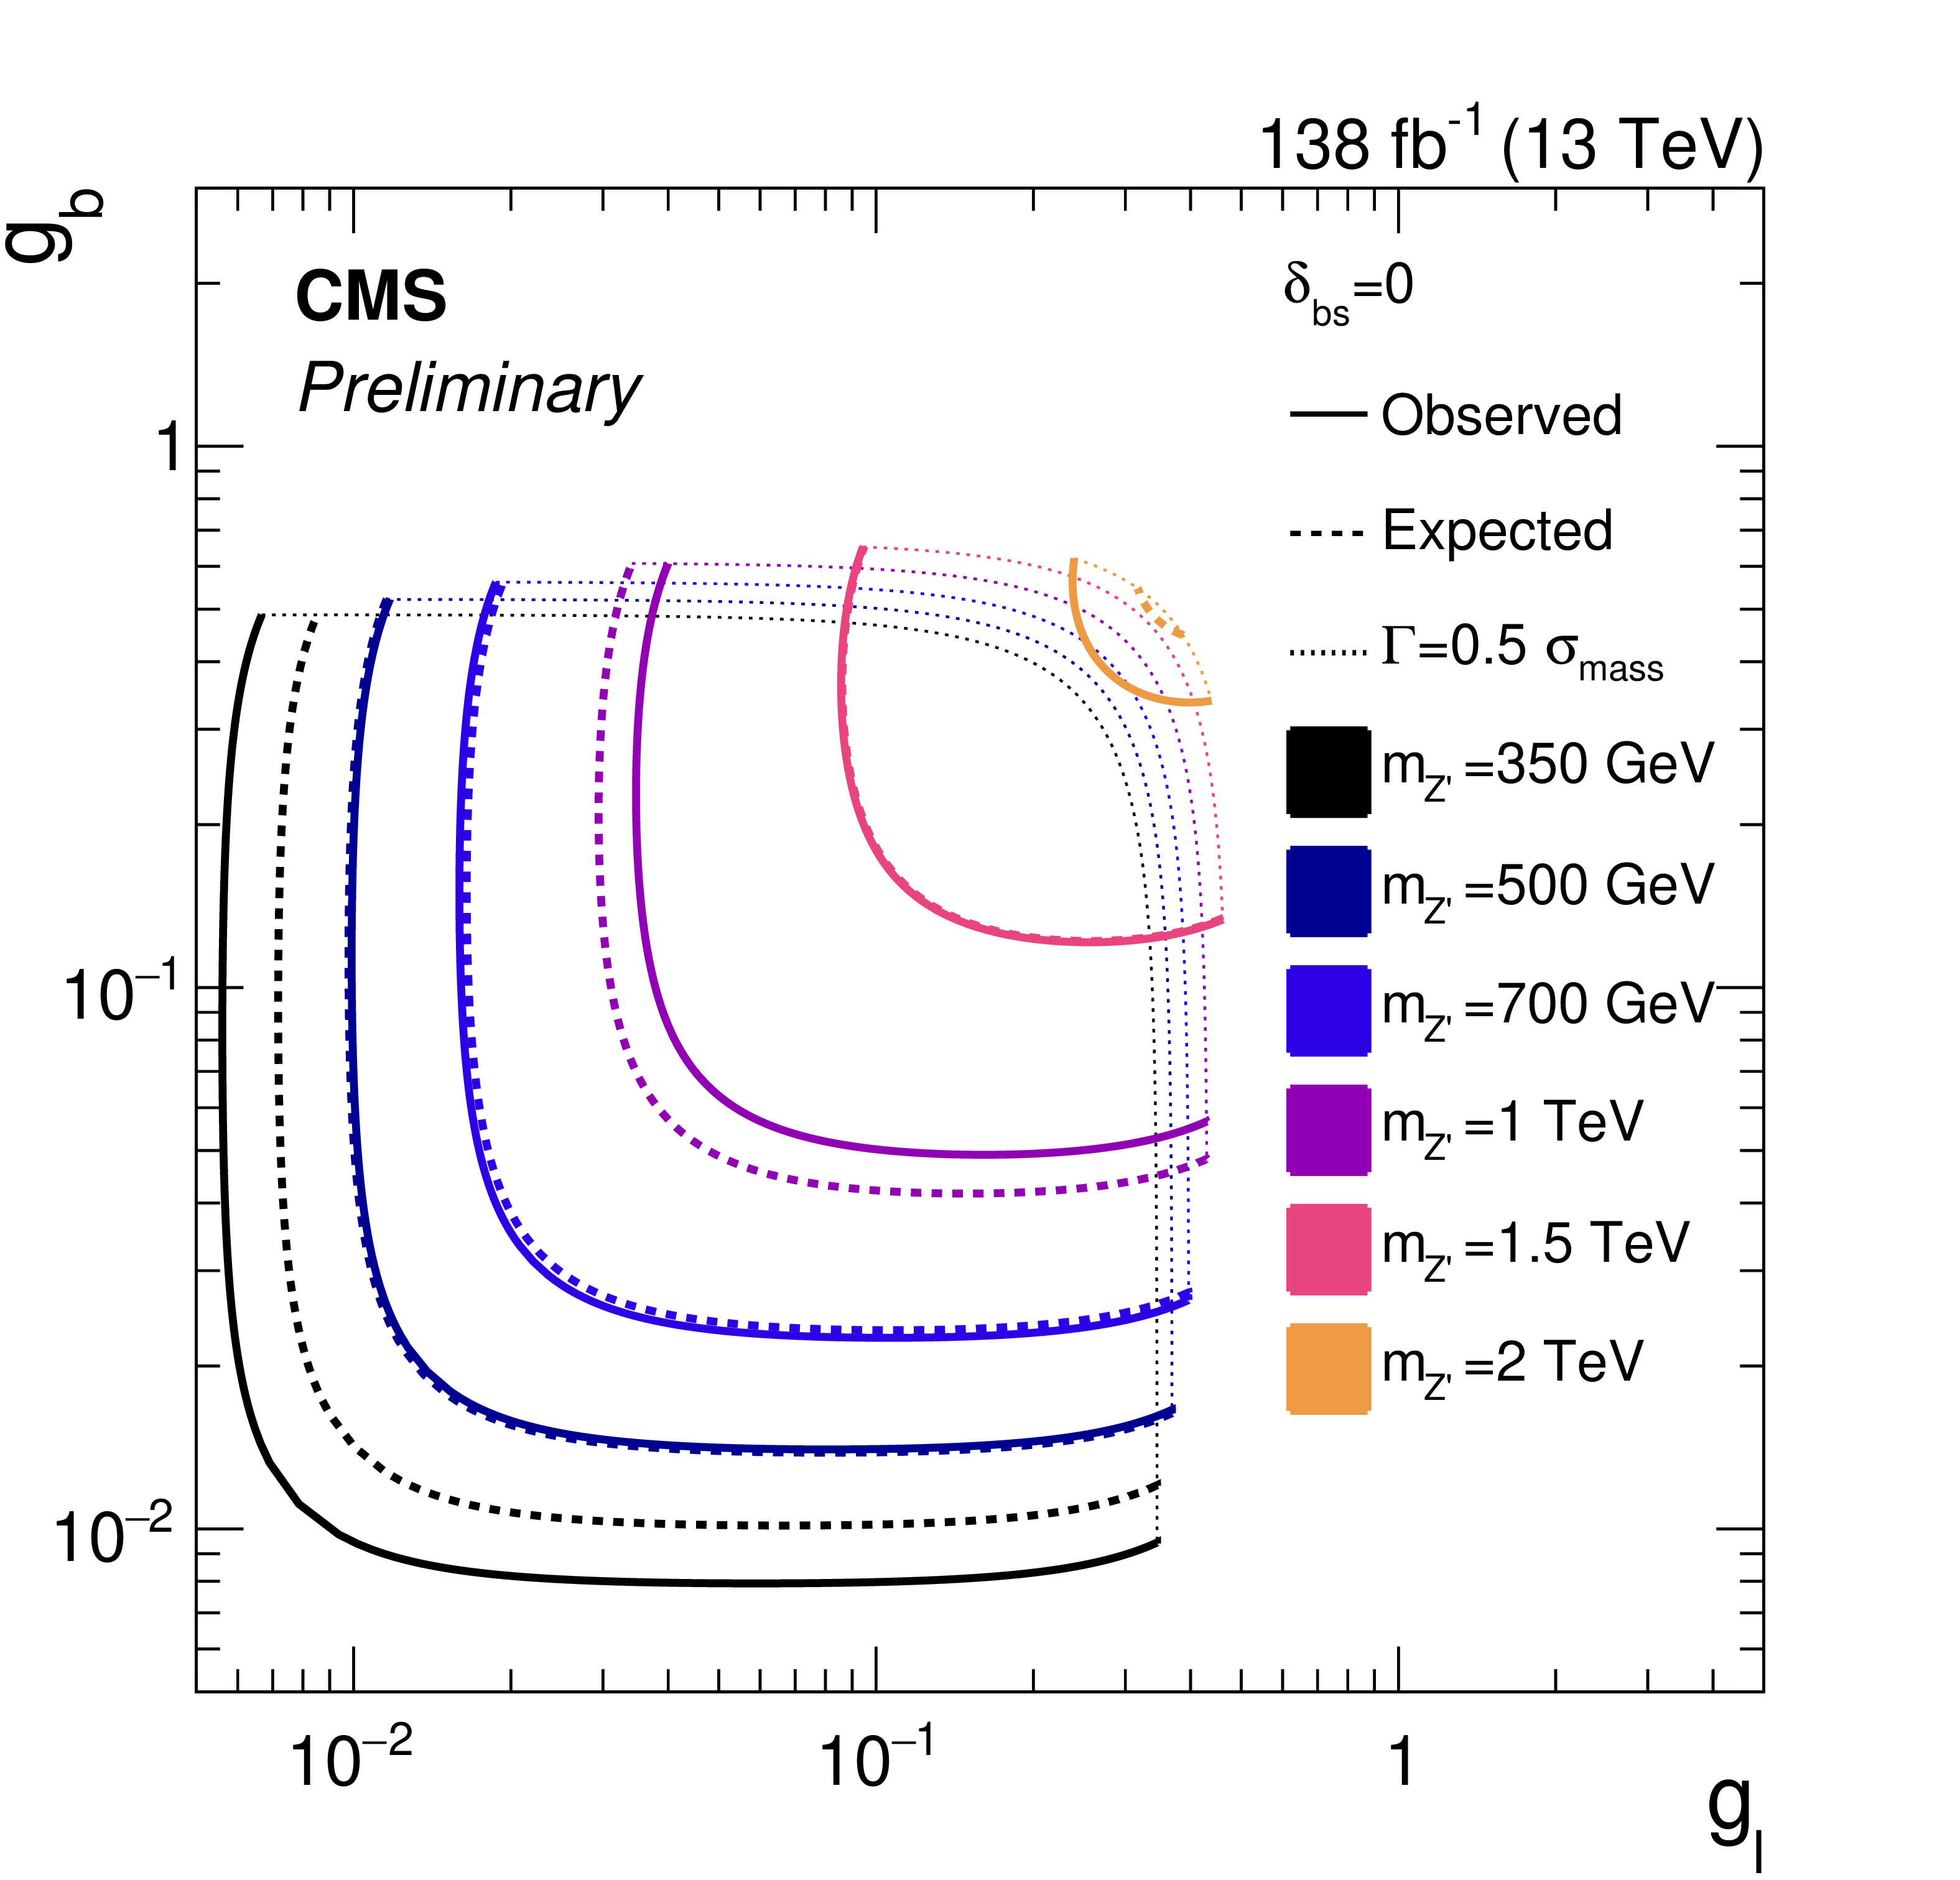
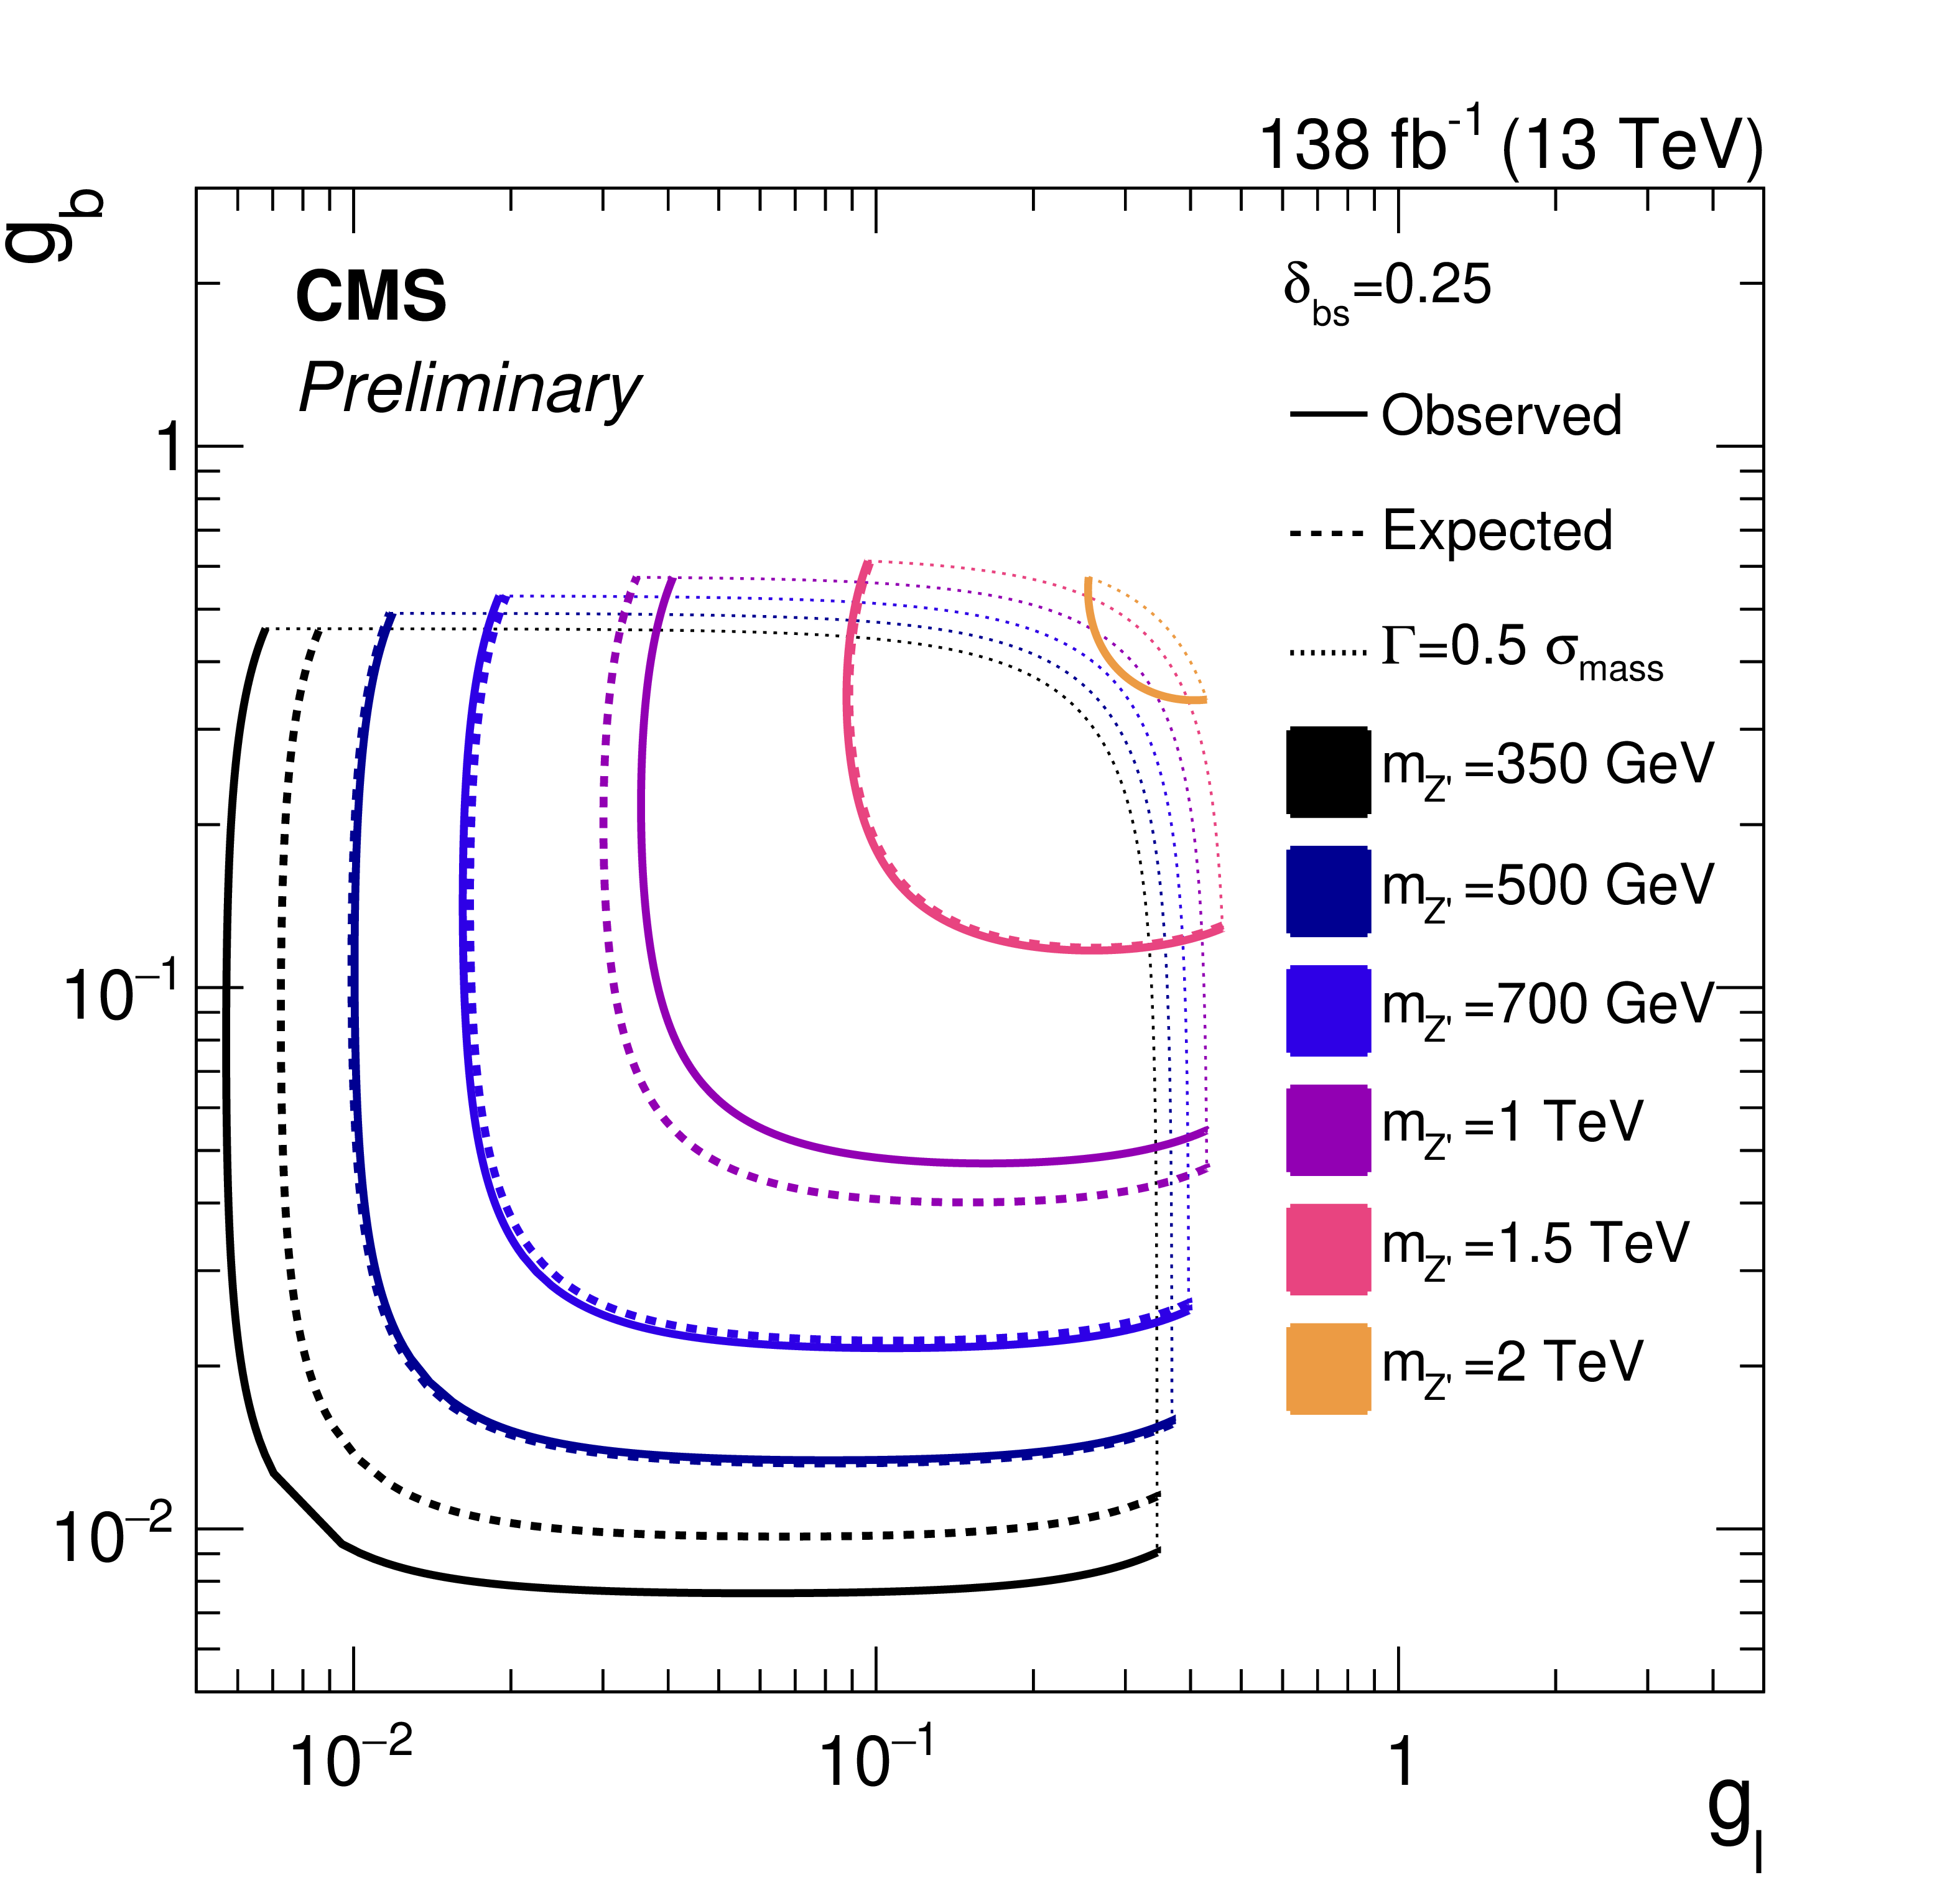
Figure 5:
Observed (solid) and median expected (dashed) exclusion limits at 95% CL in the $ g_{\mathrm{b}} $--$ g_{\ell} $ plane for the lepton flavor-universal model. The scenarios considered have $ \delta_{\mathrm{b}\mathrm{s}} $ values of either 0 (left) or 0.25 (right). In all cases, we assume $ g_{\nu} = g_{\ell} $. The curves extend only up to coupling values at which the Z' width is equal to half of the $ \mu\mu $ invariant mass resolution, marked by the dotted curves. Beyond these coupling values, the narrow width approximation intrinsic to the search strategy is not considered valid. The enclosed regions are excluded. |
png pdf |
Figure 5-a:
Observed (solid) and median expected (dashed) exclusion limits at 95% CL in the $ g_{\mathrm{b}} $--$ g_{\ell} $ plane for the lepton flavor-universal model. The scenarios considered have $ \delta_{\mathrm{b}\mathrm{s}} $ values of either 0 (left) or 0.25 (right). In all cases, we assume $ g_{\nu} = g_{\ell} $. The curves extend only up to coupling values at which the Z' width is equal to half of the $ \mu\mu $ invariant mass resolution, marked by the dotted curves. Beyond these coupling values, the narrow width approximation intrinsic to the search strategy is not considered valid. The enclosed regions are excluded. |
png pdf |
Figure 5-b:
Observed (solid) and median expected (dashed) exclusion limits at 95% CL in the $ g_{\mathrm{b}} $--$ g_{\ell} $ plane for the lepton flavor-universal model. The scenarios considered have $ \delta_{\mathrm{b}\mathrm{s}} $ values of either 0 (left) or 0.25 (right). In all cases, we assume $ g_{\nu} = g_{\ell} $. The curves extend only up to coupling values at which the Z' width is equal to half of the $ \mu\mu $ invariant mass resolution, marked by the dotted curves. Beyond these coupling values, the narrow width approximation intrinsic to the search strategy is not considered valid. The enclosed regions are excluded. |
png pdf |
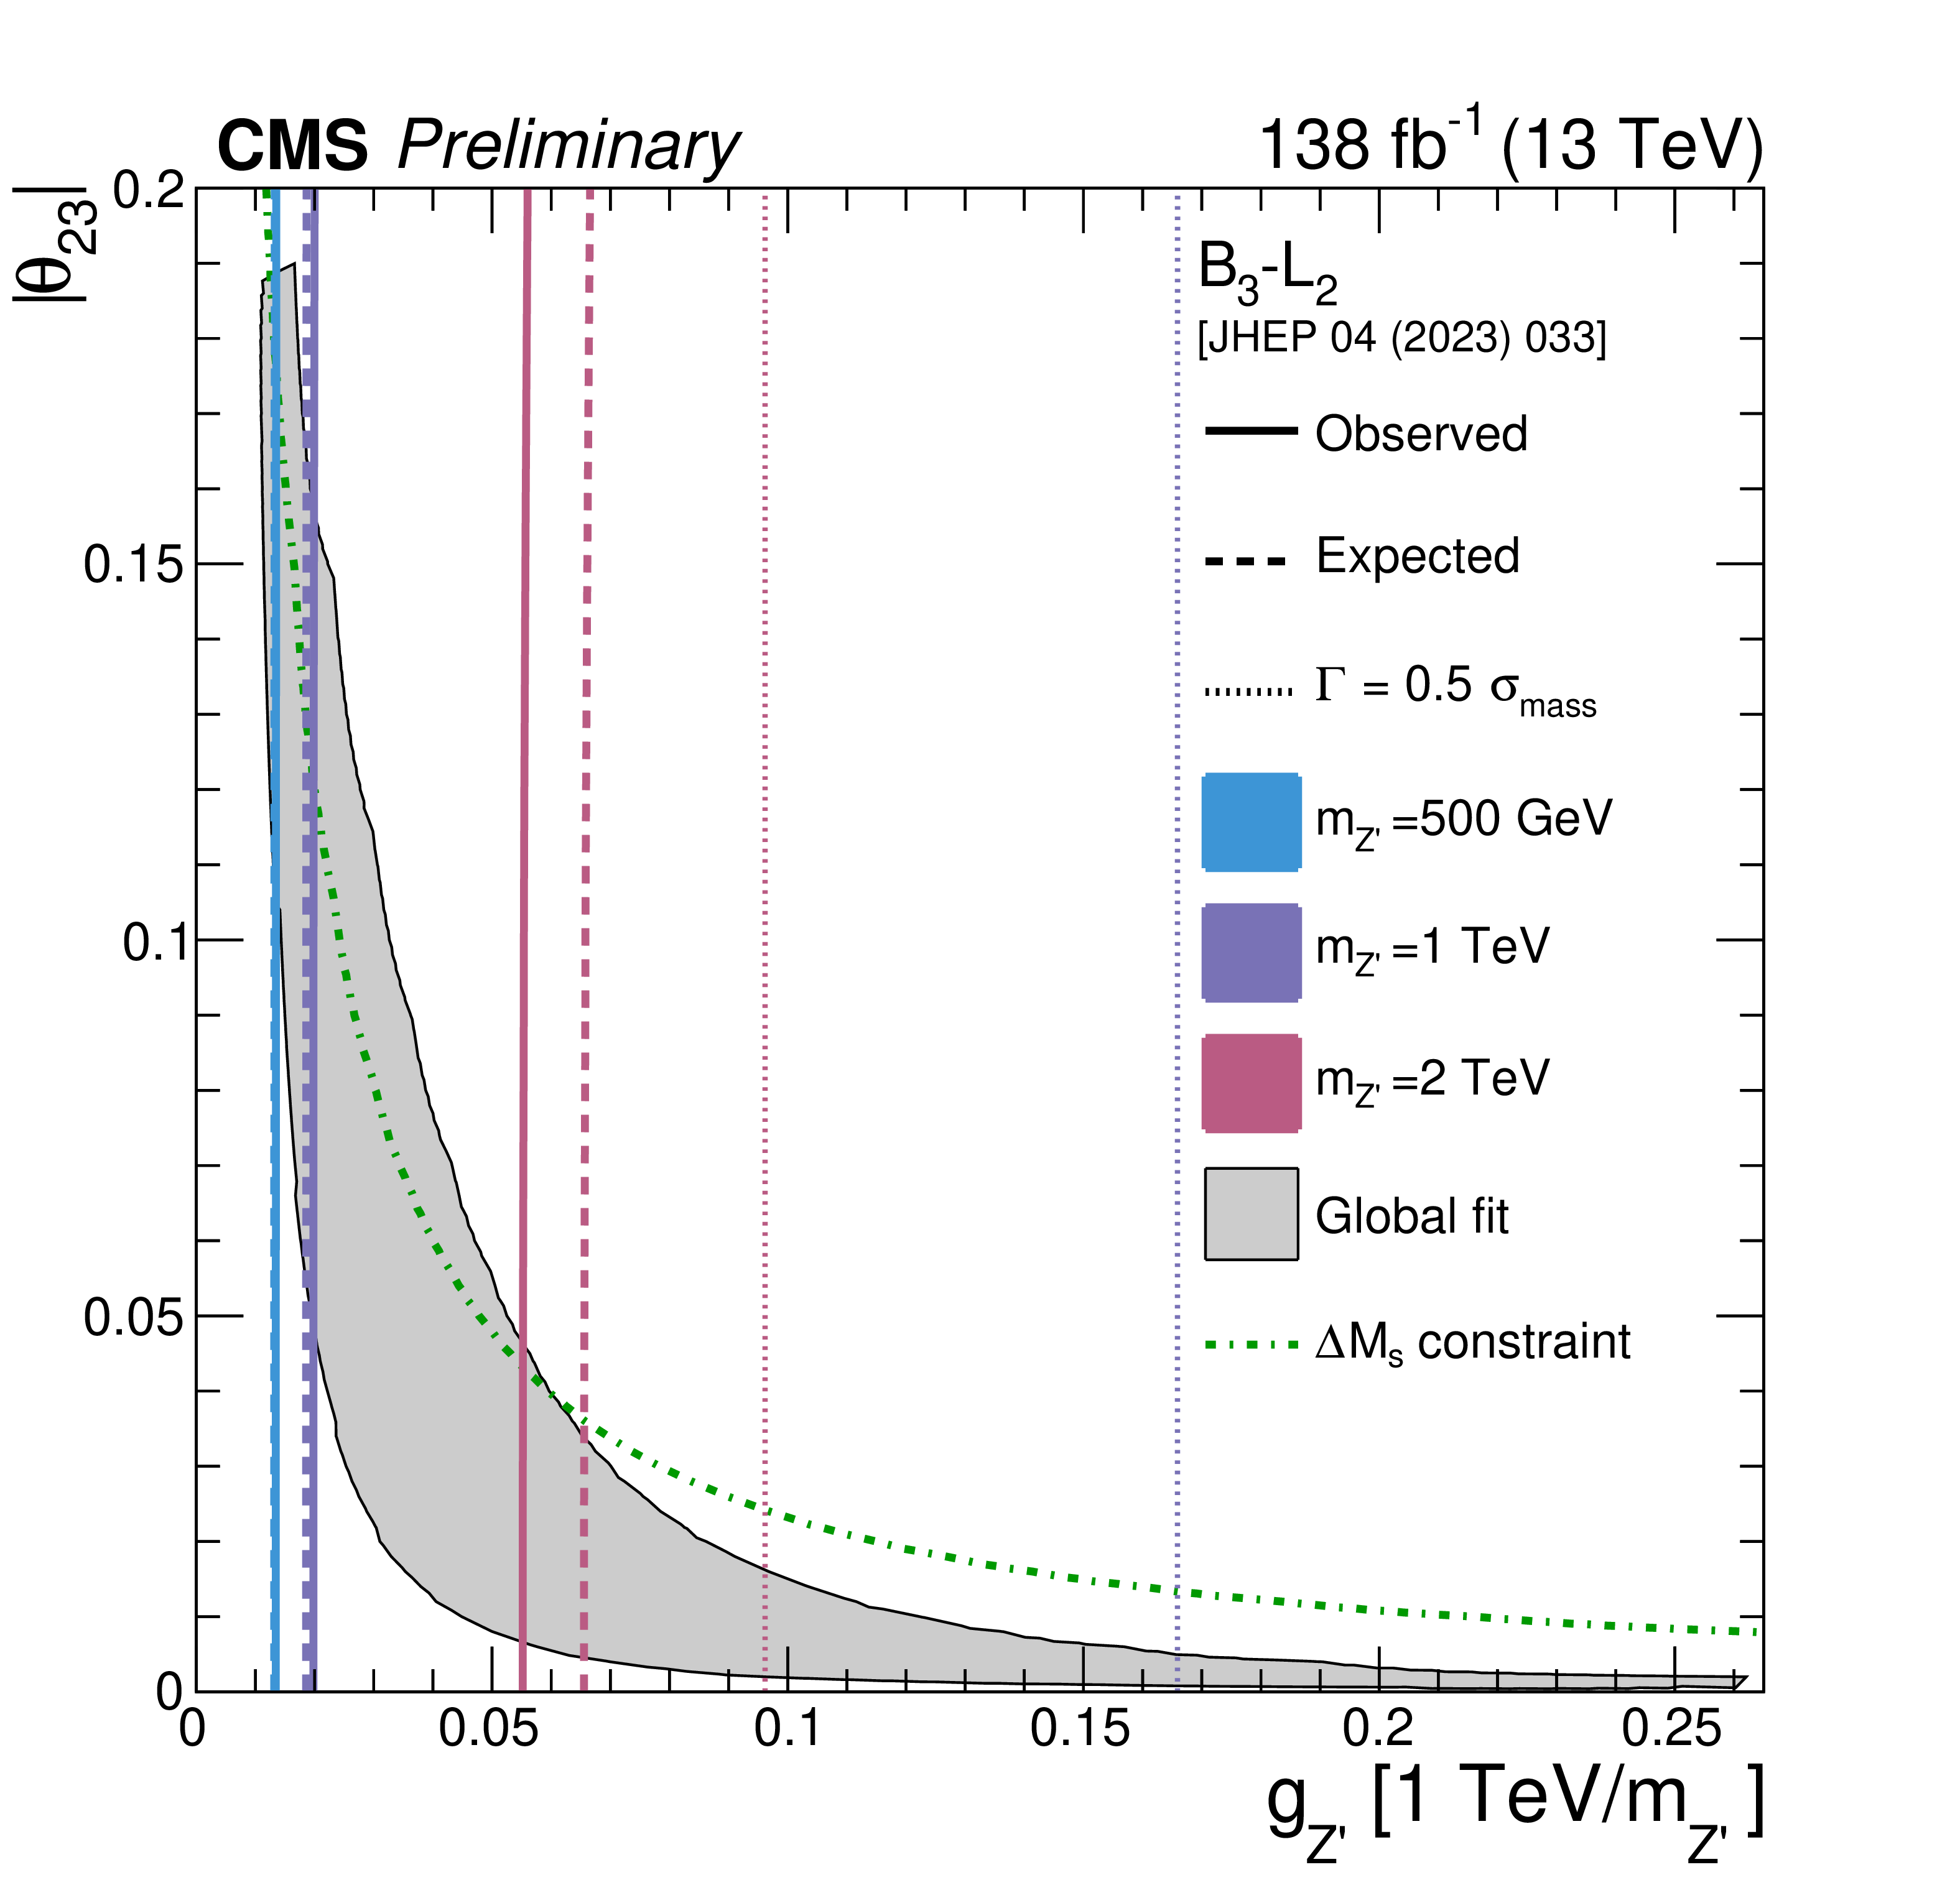
Figure 6:
Exclusion limits at 95% CL in the $ |\theta_{23}| $--$ g_{{\mathrm{Z}^{'}} } $ plane for the $ B_3-L_2 $ model [3], for representative values of $ m_{{\mathrm{Z}^{'}} } $. The solid (dashed) curves represent the observed (median expected) exclusions. The dotted lines denote the coupling values at which the Z' width equals one half of the $ \mu\mu $ invariant mass resolution. Beyond these coupling values, the narrow width approximation intrinsic to the search strategy is not considered valid. For a given mass, the region enclosed between the solid (dashed) and the dotted lines is (expected to be) excluded. The dotted line for $ m_{{\mathrm{Z}^{'}} } = $ 500 GeV lies beyond the displayed $ g_{{\mathrm{Z}^{'}} } $ range and is, therefore, not shown. The shaded gray area represents the region preferred by the global fit from Ref. [3] at 95% CL, while the region above the green dash-dotted curve is incompatible at 95% CL with the measurement of the mass difference between the mass eigenstates of the neutral $ \mathrm{B}_{s} $ mesons. |
| Tables | |
png pdf |
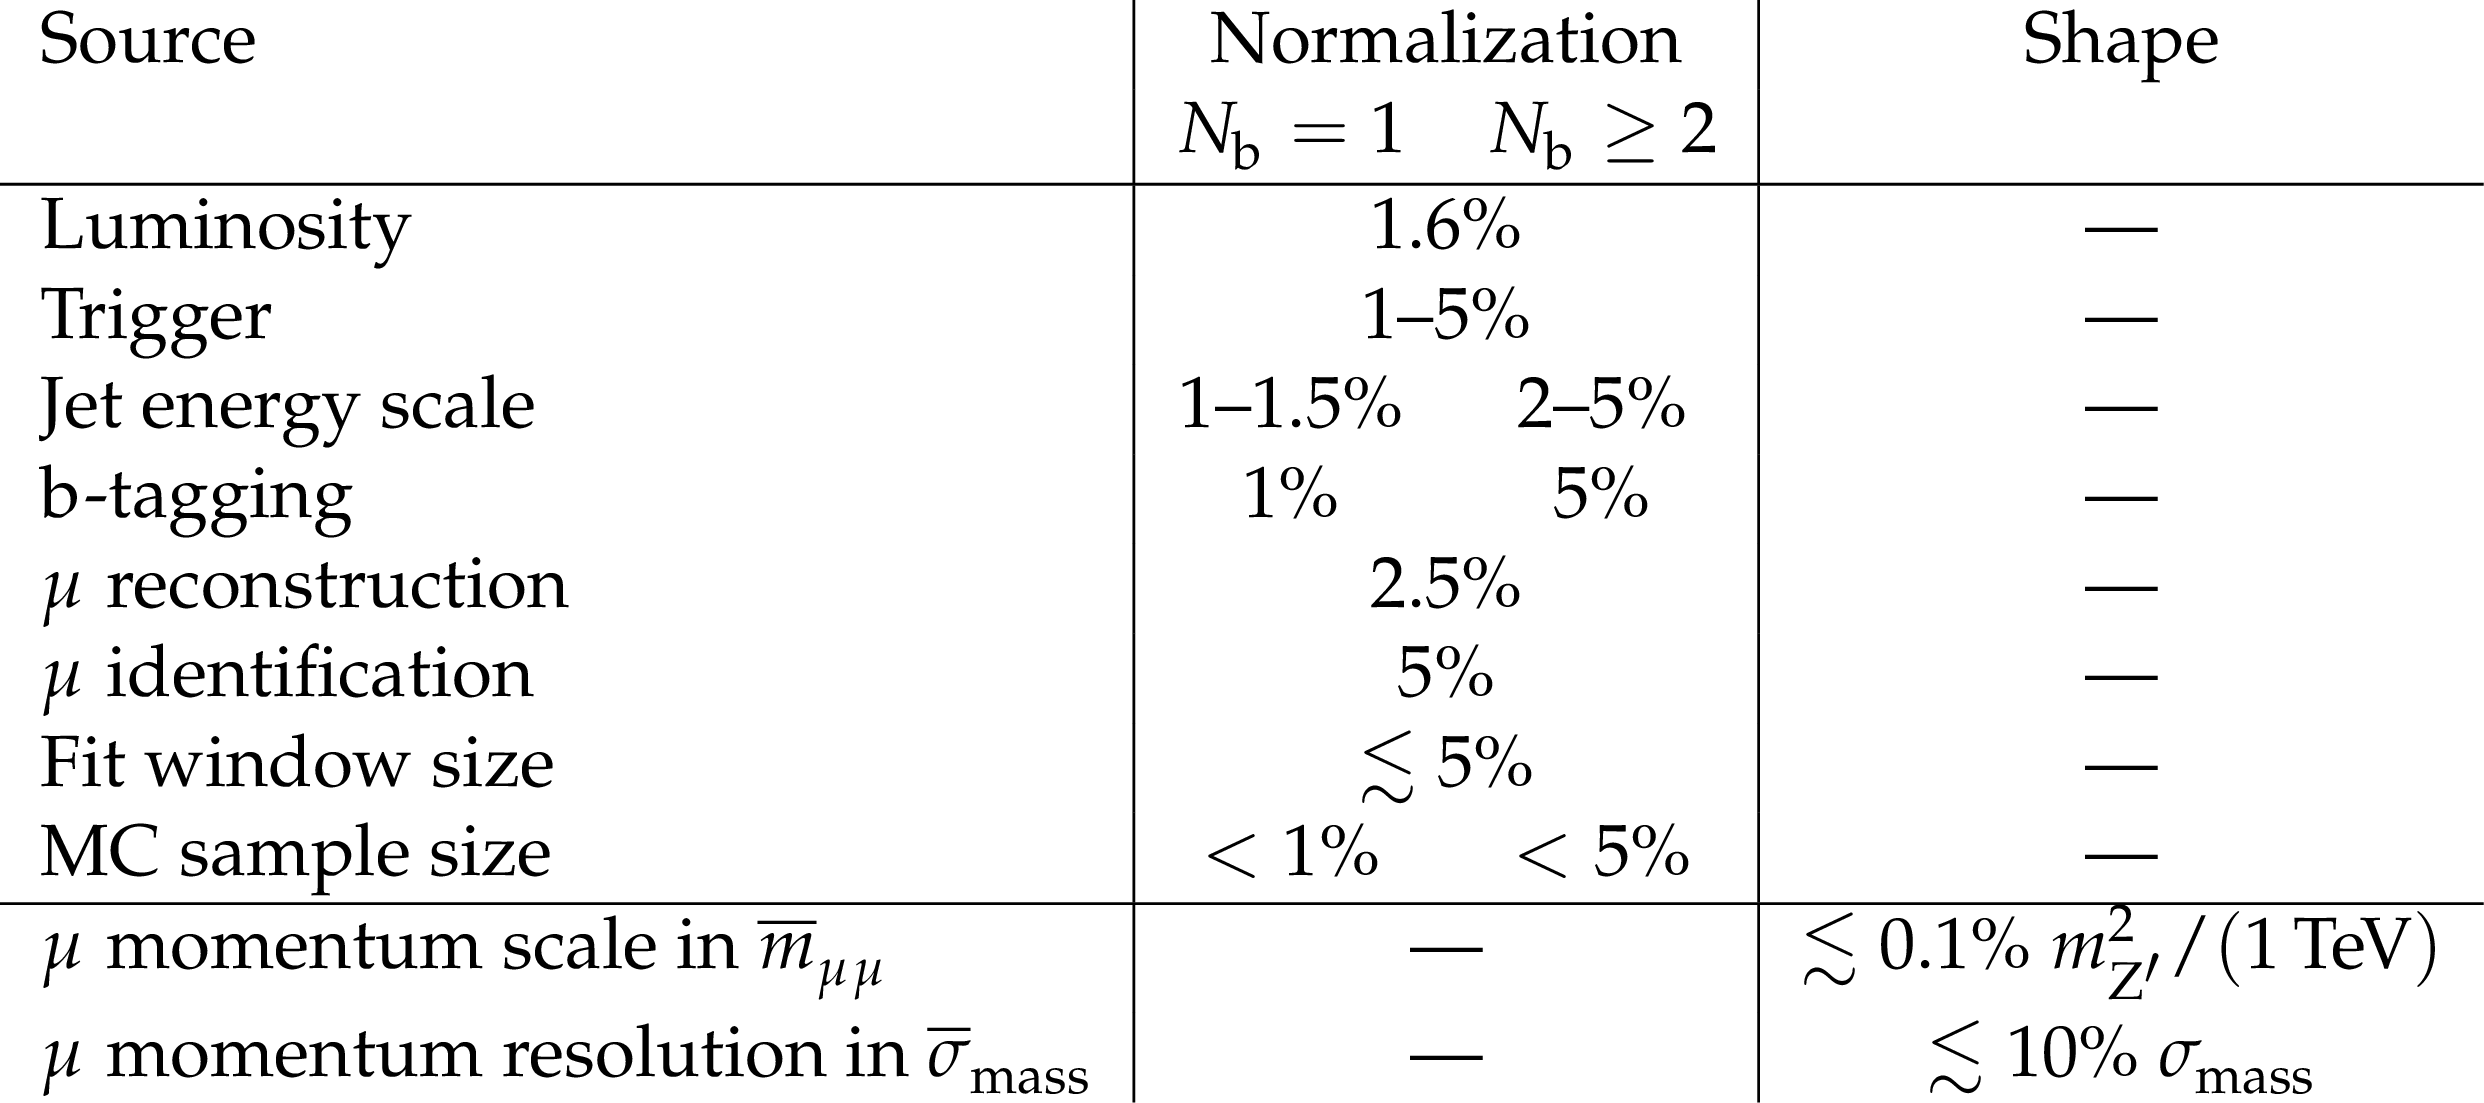
Table 1:
Summary of signal uncertainties relevant in this analysis. The uncertainties are grouped based on whether they affect the normalization or the shape of the signal. The fit parameter $ \overline{m}_{\mu\mu} $ corresponds to the position of the maximum of the $ m_{\mu\mu} $ distribution after detector effects, and $ \overline{\sigma}_{\text{mass}} $ is the resolution parameter used in the fit, distinguished from the values of $ \sigma_{\text{mass}} $ extracted from simulation. |
| Summary |
| A search for high-mass dimuon resonance production in association with one or more b quark jets is presented, using data collected with the CMS experiment at the LHC that correspond to an integrated luminosity of 138 fb$^{-1}$ at a center-of-mass energy of 13 TeV. Model-independent limits are derived on the total number of signal events with $ N_{\mathrm{b}}= $ 1 and $ \geq $ 2, varying the relative fraction of events with $ N_{\mathrm{b}}\geq $ 2. The limits are presented as a function of the analyzed dimuon resonance mass values. Results are also interpreted in terms of a lepton flavor-universal model that involves Z' boson couplings to b quarks ($ g_{\mathrm{b}} $) and muons, where the Z' boson couplings to all neutrinos ($ g_{\nu} $) and to all charged leptons ($ g_{\ell} $) are assumed to be equal, the $ g_{\mathrm{b}} $ coupling scales both $ {\mathrm{Z}^{'}} \mathrm{b}\mathrm{b} $ and $ {\mathrm{Z}^{'}} \mathrm{s}\mathrm{b} $ interactions, and a separate $ \delta_{\mathrm{b}\mathrm{s}} $ coupling solely scales the $ {\mathrm{Z}^{'}} \mathrm{s}\mathrm{b} $ interaction. The exclusions in this model are presented in terms of the coupling strengths $ g_{\ell} $ and $ g_{\mathrm{b}} $, and $ m_{{\mathrm{Z}^{'}} } $. For a Z' boson with a mass of 350 GeV (2 TeV) and $ \delta_{\mathrm{b}\mathrm{s}}\leq $ 0.25, the majority of the parameter space with 0.0057 $ < g_{\ell} < $ 0.35 (0.25 $ < g_{\ell} < $ 0.43) and 0.0079 $ < g_{\mathrm{b}} < $ 0.46 (0.34 $ < g_{\mathrm{b}} < $ 0.57) is excluded at 95% confidence level. Finally, constraints are set on a model where the production of a Z' boson is predicted to have implications in low-energy $ \mathrm{b}\to\mathrm{s}\ell\ell $ observables. In this scenario, most of the allowed parameter space is excluded for a Z' boson with a mass $ \leq $ 500 GeV while the constraints are less stringent for higher Z' mass hypotheses. |
| References | ||||
| 1 | A. Leike | The Phenomenology of extra neutral gauge bosons | Phys. Rept. 317 (1999) 143 | hep-ph/9805494 |
| 2 | P. Langacker | The Physics of Heavy Z' Gauge Bosons | Rev. Mod. Phys. 81 (2009) 1199 | 0801.1345 |
| 3 | B. Allanach and J. Davighi | The Rumble in the Meson: a leptoquark versus a Z' to fit $ \mathrm{b} \to \mathrm{s} \mu^{+} \mu^{-} $ anomalies including 2022 LHCb $ \textrm{R}_{\mathrm{K}^{*}} $ measurements | JHEP 04 (2023) 033 | 2211.11766 |
| 4 | CMS Collaboration | Search for resonant and nonresonant new phenomena in high-mass dilepton final states at $ \sqrt{s}= $ 13 TeV | JHEP 07 (2021) 208 | CMS-EXO-19-019 2103.02708 |
| 5 | ATLAS Collaboration | Search for high-mass dilepton resonances using 139 fb$^{-1}$ of $ \mathrm{p}\mathrm{p} $ collision data collected at $ \sqrt{s}= $ 13 TeV with the ATLAS detector | PLB 796 (2019) 68 | 1903.06248 |
| 6 | Particle Data Group Collaboration | Review of Particle Physics | PTEP 2022 (2022) 083C01 | |
| 7 | ATLAS Collaboration | Search for New Phenomena in Final States with Two Leptons and One or No $ b $-Tagged Jets at $ \sqrt{s} = $ 13 TeV Using the ATLAS Detector | PRL 127 (2021) 141801 | 2105.13847 |
| 8 | ATLAS Collaboration | Search for scalar resonances decaying into $ \mu^{+}\mu^{-} $ in events with and without b-tagged jets produced in proton-proton collisions at $ \sqrt{s}= $ 13 TeV with the ATLAS detector | JHEP 07 (2019) 117 | 1901.08144 |
| 9 | CMS Collaboration | Search for MSSM Higgs bosons decaying to $ \mu^{+}\mu^{-} $ in proton-proton collisions at $ \sqrt{s}= $ 13 TeV | Phys. Lett. B 13499 (2019) 2 | CMS-HIG-18-010 1907.03152 |
| 10 | CMS Collaboration | Search for long-lived particles decaying into muon pairs in proton-proton collisions at $ \sqrt{s}= $ 13 TeV collected with a dedicated high-rate data stream | JHEP 04 (2022) 062 | CMS-EXO-20-014 2112.13769 |
| 11 | CMS Collaboration | The CMS experiment at the CERN LHC | JINST 3 (2008) S08004 | |
| 12 | CMS Collaboration | Performance of the CMS Level-1 trigger in proton-proton collisions at $ \sqrt{s} = $ 13 TeV | JINST 15 (2020) P10017 | CMS-TRG-17-001 2006.10165 |
| 13 | CMS Collaboration | The CMS trigger system | JINST 12 (2017) P01020 | CMS-TRG-12-001 1609.02366 |
| 14 | CMS Collaboration | Particle-flow reconstruction and global event description with the cms detector | JINST 12 (2017) P10003 | CMS-PRF-14-001 1706.04965 |
| 15 | CMS Collaboration | Technical proposal for the Phase-II upgrade of the Compact Muon Solenoid | CMS Technical Proposal CERN-LHCC-2015-010, CMS-TDR-15-02, 2015 CDS |
|
| 16 | CMS Collaboration | Performance of the CMS muon detector and muon reconstruction with proton-proton collisions at $ \sqrt{s}= $ 13 TeV | JINST 13 (2018) P06015 | CMS-MUO-16-001 1804.04528 |
| 17 | CMS Collaboration | Performance of the reconstruction and identification of high-momentum muons in proton-proton collisions at $ \sqrt{s} = $ 13 TeV | JINST 15 (2020) P02027 | CMS-MUO-17-001 1912.03516 |
| 18 | CMS Collaboration | Measurements of inclusive W and Z cross sections in $ \mathrm{p}\mathrm{p} $ collisions at $ \sqrt{s}= $ 7 TeV | JHEP 01 (2011) 080 | CMS-EWK-10-002 1012.2466 |
| 19 | CMS Collaboration | Performance of the CMS muon trigger system in proton-proton collisions at $ \sqrt{s} = $ 13 TeV | JINST 16 (2021) P07001 | CMS-MUO-19-001 2102.04790 |
| 20 | CMS Collaboration | Electron and photon reconstruction and identification with the CMS experiment at the CERN LHC | JINST 16 (2021) P05014 | CMS-EGM-17-001 2012.06888 |
| 21 | M. Cacciari, G. P. Salam, and G. Soyez | FastJet user manual | EPJC 72 (2012) 1896 | 1111.6097 |
| 22 | E. Bols et al. | Jet flavour classification using DeepJet | JINST 15 (2020) 12012 | 2008.10519 |
| 23 | CMS Collaboration | Performance summary of AK4 jet b tagging with data from proton-proton collisions at 13 TeV with the CMS detector | CMS Detector Performance Summary CMS-DP-2023-005, 2023 CDS |
|
| 24 | D. Bertolini, P. Harris, M. Low, and N. Tran | Pileup per particle identification | JHEP 10 (2014) 059 | 1407.6013 |
| 25 | CMS Collaboration | Performance of missing transverse momentum reconstruction in proton-proton collisions at $ \sqrt{s} = $ 13 TeV using the CMS detector | JINST 14 (2019) P07004 | CMS-JME-17-001 1903.06078 |
| 26 | S. Frixione, P. Nason, and C. Oleari | Matching NLO QCD computations with parton shower simulations: the POWHEG method | JHEP 11 (2007) 070 | 0709.2092 |
| 27 | S. Alioli, P. Nason, C. Oleari, and E. Re | NLO single-top production matched with shower in POWHEG: s- and t-channel contributions | JHEP 09 (2009) 111 | 0907.4076 |
| 28 | T. Melia, P. Nason, R. Rontsch, and G. Zanderighi | W+W-, WZ and ZZ production in the POWHEG BOX | JHEP 11 (2011) 078 | 1107.5051 |
| 29 | P. Nason and G. Zanderighi | $ W^+ W^- $, $ W Z $ and $ Z Z $ production in the POWHEG-BOX-V2 | EPJC 74 (2014) 2702 | 1311.1365 |
| 30 | J. Alwall et al. | The automated computation of tree-level and next-to-leading order differential cross sections, and their matching to parton shower simulations | JHEP 07 (2014) 079 | 1405.0301 |
| 31 | R. Frederix and S. Frixione | Merging meets matching in MC@NLO | JHEP 12 (2012) 061 | 1209.6215 |
| 32 | T. Sjöstrand et al. | An introduction to PYTHIA 8.2 | Comput. Phys. Commun. 191 (2015) 159 | 1410.3012 |
| 33 | CMS Collaboration | Extraction and validation of a new set of CMS PYTHIA8 tunes from underlying-event measurements | EPJC 80 (2020) 4 | CMS-GEN-17-001 1903.12179 |
| 34 | NNPDF Collaboration | Parton distributions from high-precision collider data | EPJC 77 (2017) 663 | 1706.00428 |
| 35 | \GEANTfour Collaboration | GEANT 4---a simulation toolkit | NIM A 506 (2003) 250 | |
| 36 | M. J. Oreglia | A study of the reactions $ \psi^\prime \to \gamma \gamma \psi $ | PhD thesis, Stanford University, SLAC Report SLAC-R-236, see Appendix D, 1980 link |
|
| 37 | J. E. Gaiser | Charmonium spectroscopy from radiative decays of the $ J/\psi $ and $ \psi^\prime $ | PhD thesis, Stanford University, SLAC Report SLAC-R-255, 1982 link |
|
| 38 | P. D. Dauncey, M. Kenzie, N. Wardle, and G. J. Davies | Handling uncertainties in background shapes: the discrete profiling method | JINST 10 (2015) P04015 | 1408.6865 |
| 39 | CMS Collaboration | Precision luminosity measurement in proton-proton collisions at $ \sqrt{s} = $ 13 TeV in 2015 and 2016 at CMS | EPJC 81 (2021) 800 | CMS-LUM-17-003 2104.01927 |
| 40 | CMS Collaboration | CMS luminosity measurement for the 2017 data-taking period at $ \sqrt{s} = $ 13 TeV | CMS Physics Analysis Summary, 2018 CMS-PAS-LUM-17-004 |
CMS-PAS-LUM-17-004 |
| 41 | CMS Collaboration | CMS luminosity measurement for the 2018 data-taking period at $ \sqrt{s} = $ 13 TeV | CMS Physics Analysis Summary, 2019 CMS-PAS-LUM-18-002 |
CMS-PAS-LUM-18-002 |
| 42 | A. L. Read | Presentation of search results: The $ \text{CL}_\text{s} $ technique | JPG 28 (2002) 2693 | |
| 43 | T. Junk | Confidence level computation for combining searches with small statistics | NIM A 434 (1999) 435 | hep-ex/9902006 |
| 44 | G. Cowan, K. Cranmer, E. Gross, and O. Vitells | Asymptotic formulae for likelihood-based tests of new physics | EPJC 71 (2011) 1554 | 1007.1727 |
| 45 | ATLAS and CMS Collaborations | Procedure for the LHC Higgs boson search combination in summer 2011 | ATL-PHYS-PUB-2011-011, CMS NOTE-2011/005, 2011 link |
|
|
|
Compact Muon Solenoid LHC, CERN |
|

|

|

|

|

|