

Compact Muon Solenoid
LHC, CERN
| CMS-PAS-EXO-21-005 | ||
| Search for prompt production of a GeV scale resonance decaying to a pair of muons in proton-proton collisions at $ \sqrt{s}= $ 13 TeV | ||
| CMS Collaboration | ||
| 24 March 2023 | ||
| Abstract: A search for prompt low-mass dimuon resonances is performed using the 13 TeV proton-proton collision data collected by the Compact Muon Solenoid (CMS) detector during the 2017--2018 operation of the CERN's Large Hadron Collider and corresponding to an integrated luminosity of 96.6 fb$^{-1}$. The search exploits a dedicated scouting trigger stream allowing CMS to record events with two muons with transverse momenta as low as 3 GeV by trading off recording the full event information. The search is performed by looking for narrow resonance peaks in the dimuon mass continuum in the ranges from 1.1-2.6 and from 4.2-7.9 GeV. The largest excess is observed in the boosted dimuon category at a dimuon mass of 2.41 GeV with the local significance of 3.2 standard deviations, with the global significance of the excess being 1.3 standard deviations. Model-independent limits on production rates of dimuon resonances within the experimental fiducial acceptance are set. Limits on parameters for two specific models, a dark photon model and a two Higgs doublet model with an extra scalar, are also set. This document has been revised with respect to the version dated March 11th, 2023. | ||
|
Links:
CDS record (PDF) ;
Physics Briefing ;
CADI line (restricted) ;
These preliminary results are superseded in this paper, JHEP 12 (2023) 070. The superseded preliminary plots can be found here. |
||
| Figures & Tables | Summary | Additional Figures | References | CMS Publications |
|---|
| Figures | |
png pdf |
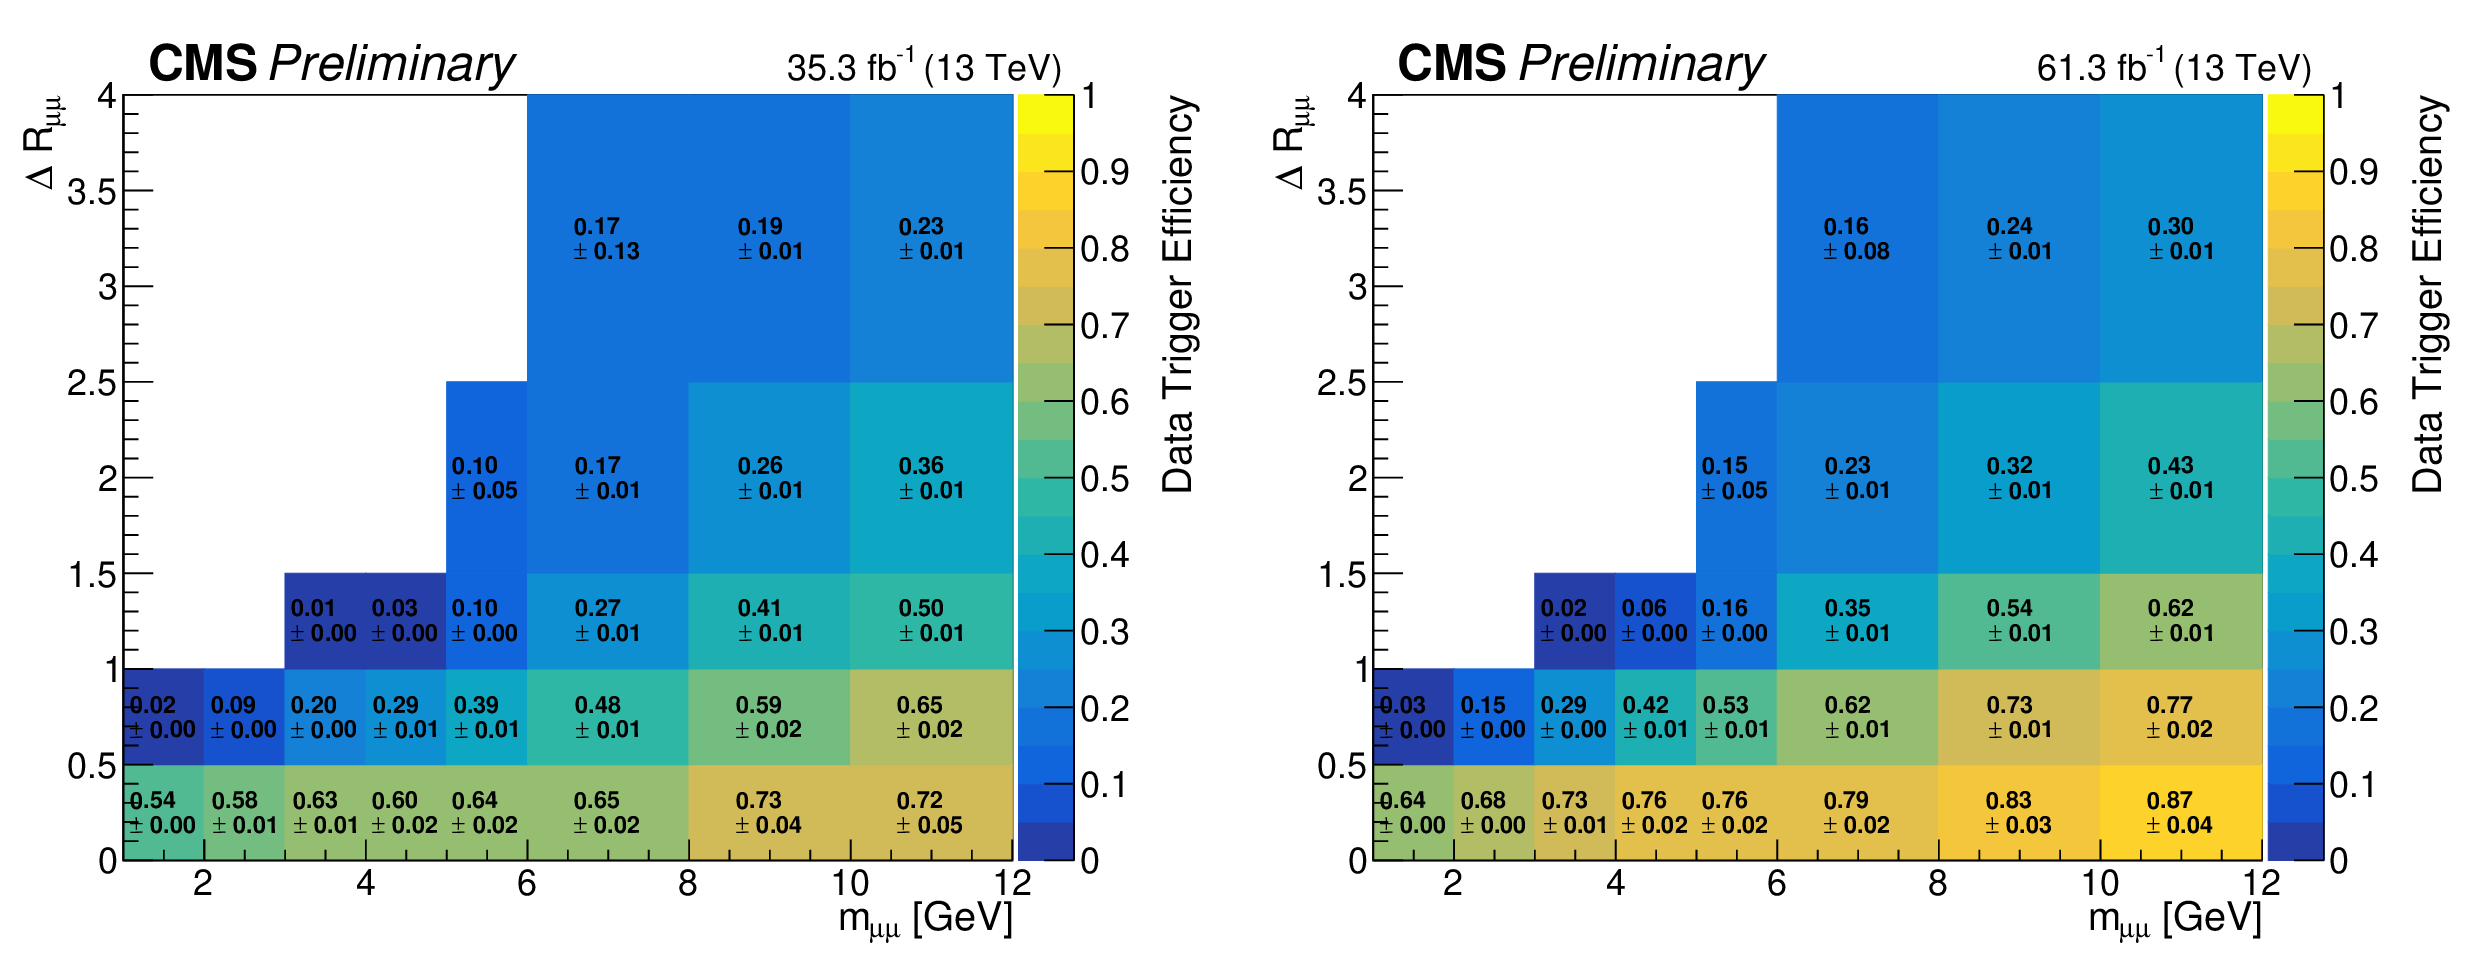
Figure 1:
The 2017 (left) and 2018 (right) measured efficiencies of the dimuon scouting trigger and logical OR of all L1 triggers using 2017 data. The value of each cell shows the probability that a valid pair of muons which satisfy the trigger requirements will cause the dimuon scouting trigger to fire. The $ x $-axis shows the dimuon mass and includes the entire relevant range for this analysis. The $ y $-axis shows the angular separation, $ \Delta R $, between the two muons. |
png pdf |
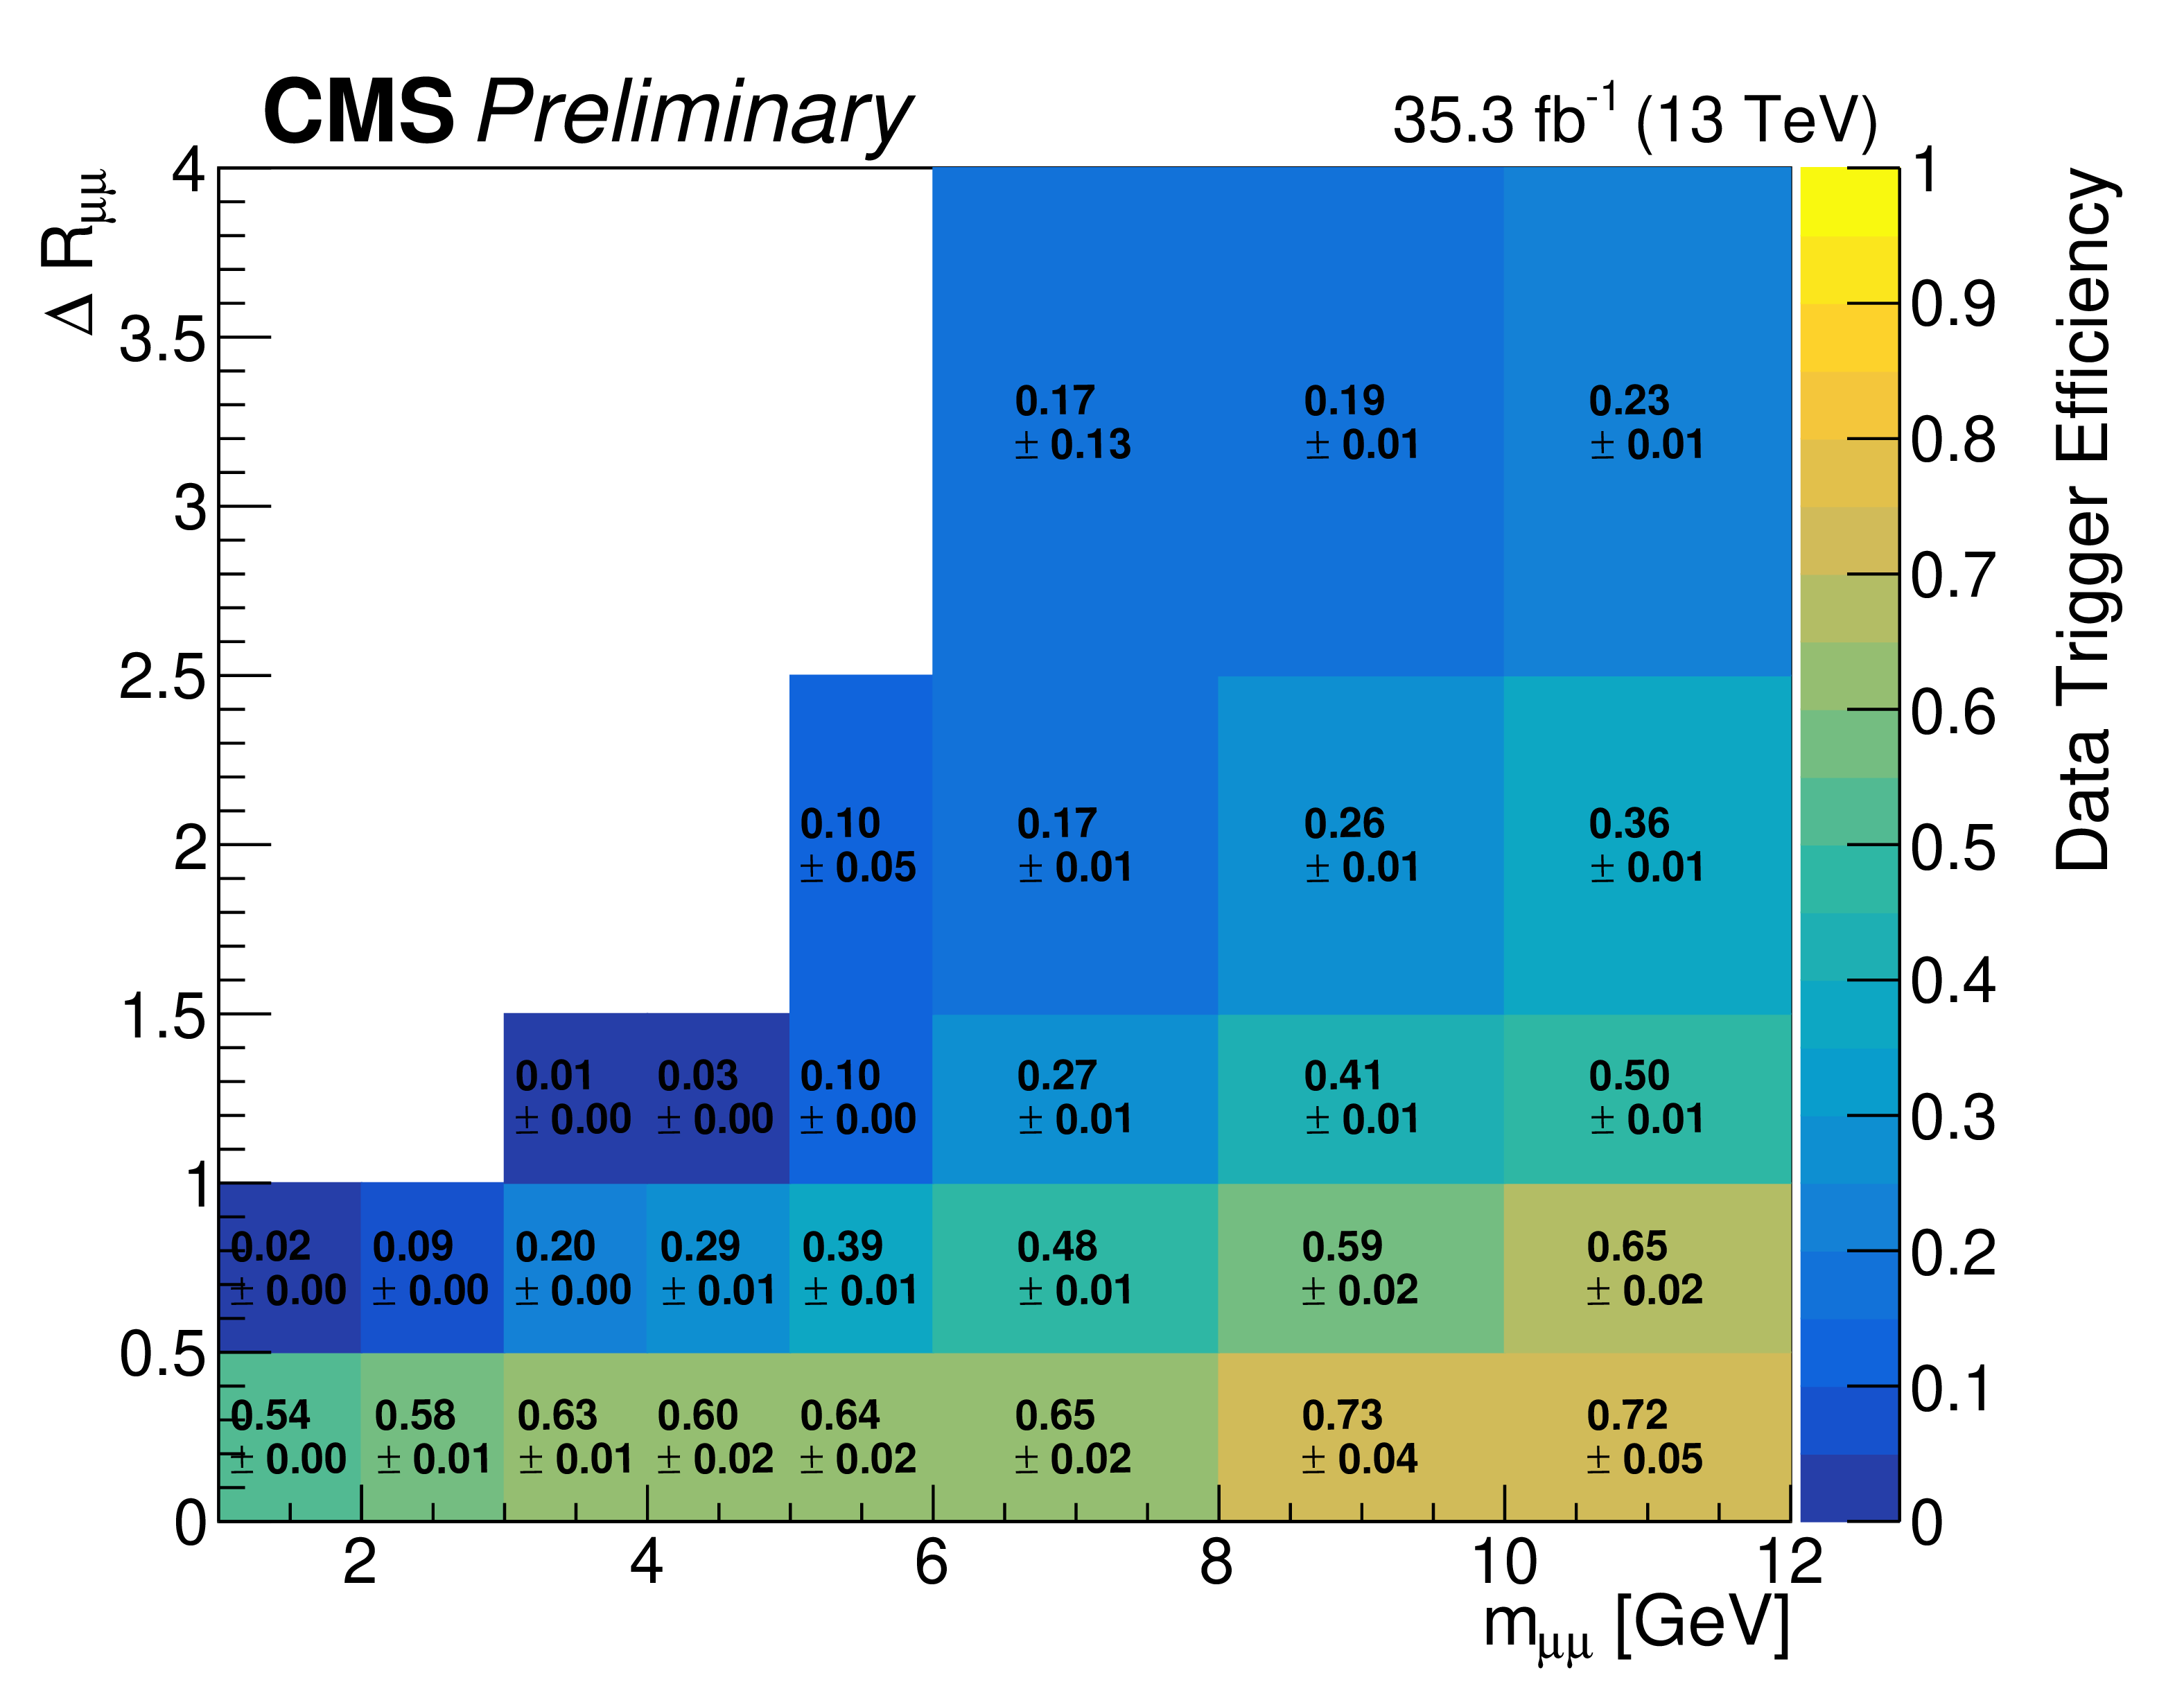
Figure 1-a:
The 2017 (left) and 2018 (right) measured efficiencies of the dimuon scouting trigger and logical OR of all L1 triggers using 2017 data. The value of each cell shows the probability that a valid pair of muons which satisfy the trigger requirements will cause the dimuon scouting trigger to fire. The $ x $-axis shows the dimuon mass and includes the entire relevant range for this analysis. The $ y $-axis shows the angular separation, $ \Delta R $, between the two muons. |

png pdf |
Figure 1-b:
The 2017 (left) and 2018 (right) measured efficiencies of the dimuon scouting trigger and logical OR of all L1 triggers using 2017 data. The value of each cell shows the probability that a valid pair of muons which satisfy the trigger requirements will cause the dimuon scouting trigger to fire. The $ x $-axis shows the dimuon mass and includes the entire relevant range for this analysis. The $ y $-axis shows the angular separation, $ \Delta R $, between the two muons. |

png pdf |
Figure 2:
The $ m_{\mu\mu} $ distribution obtained with the scouting data collected during 2017 and 2018 with two sets of selections: the $ \Upsilon{\textrm{(1S)}} $-trained muon identification MVA with the transverse displacement of vertex less than 0.015 cm (blue), and the $ \mathrm{J}/\psi $-trained muon MVA identification with the vertex transverse displacement of less than 3.5 standard deviations (red). |
png pdf |
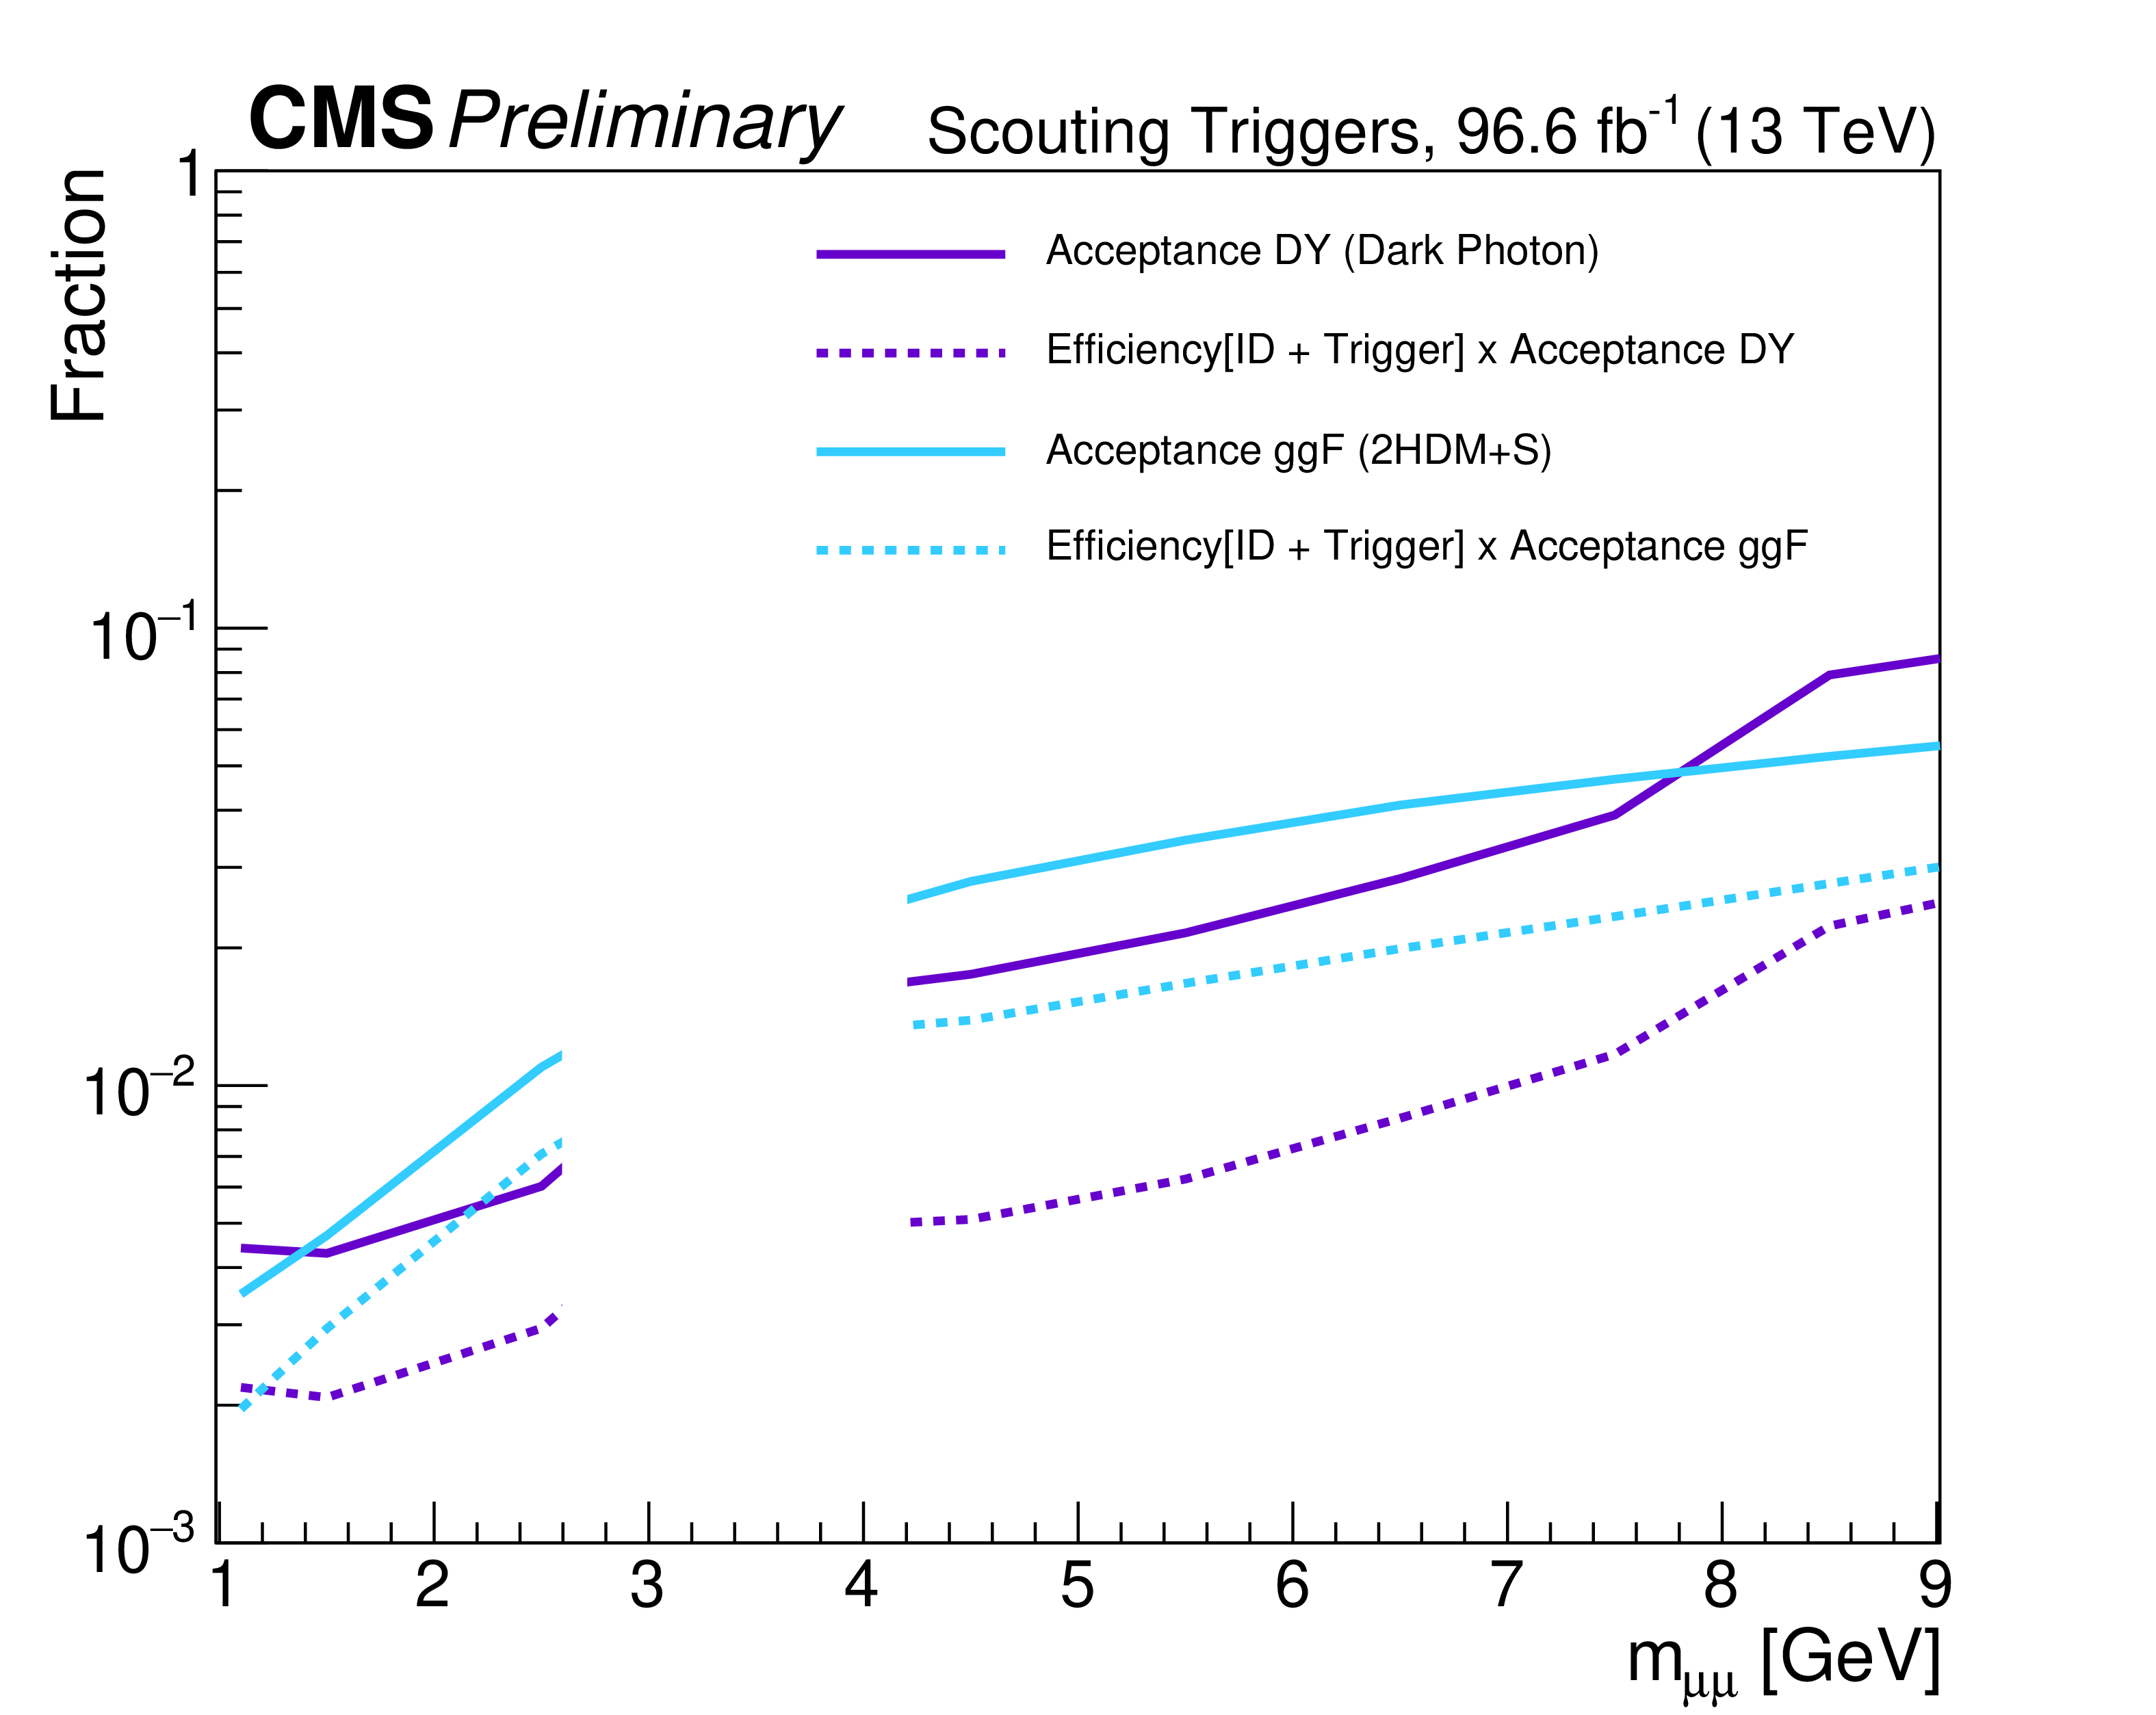
Figure 3:
The signal acceptance and reconstruction efficiency are extracted from DY (purple) and pseudoscalar (cyan) simulations. The occluded region at 3.5--4.5 GeV indicates the transition between the $ \mathrm{J}/\psi $-trained and $ \Upsilon{\textrm{(1S)}} $-trained muon MVA identifications. |

png pdf |
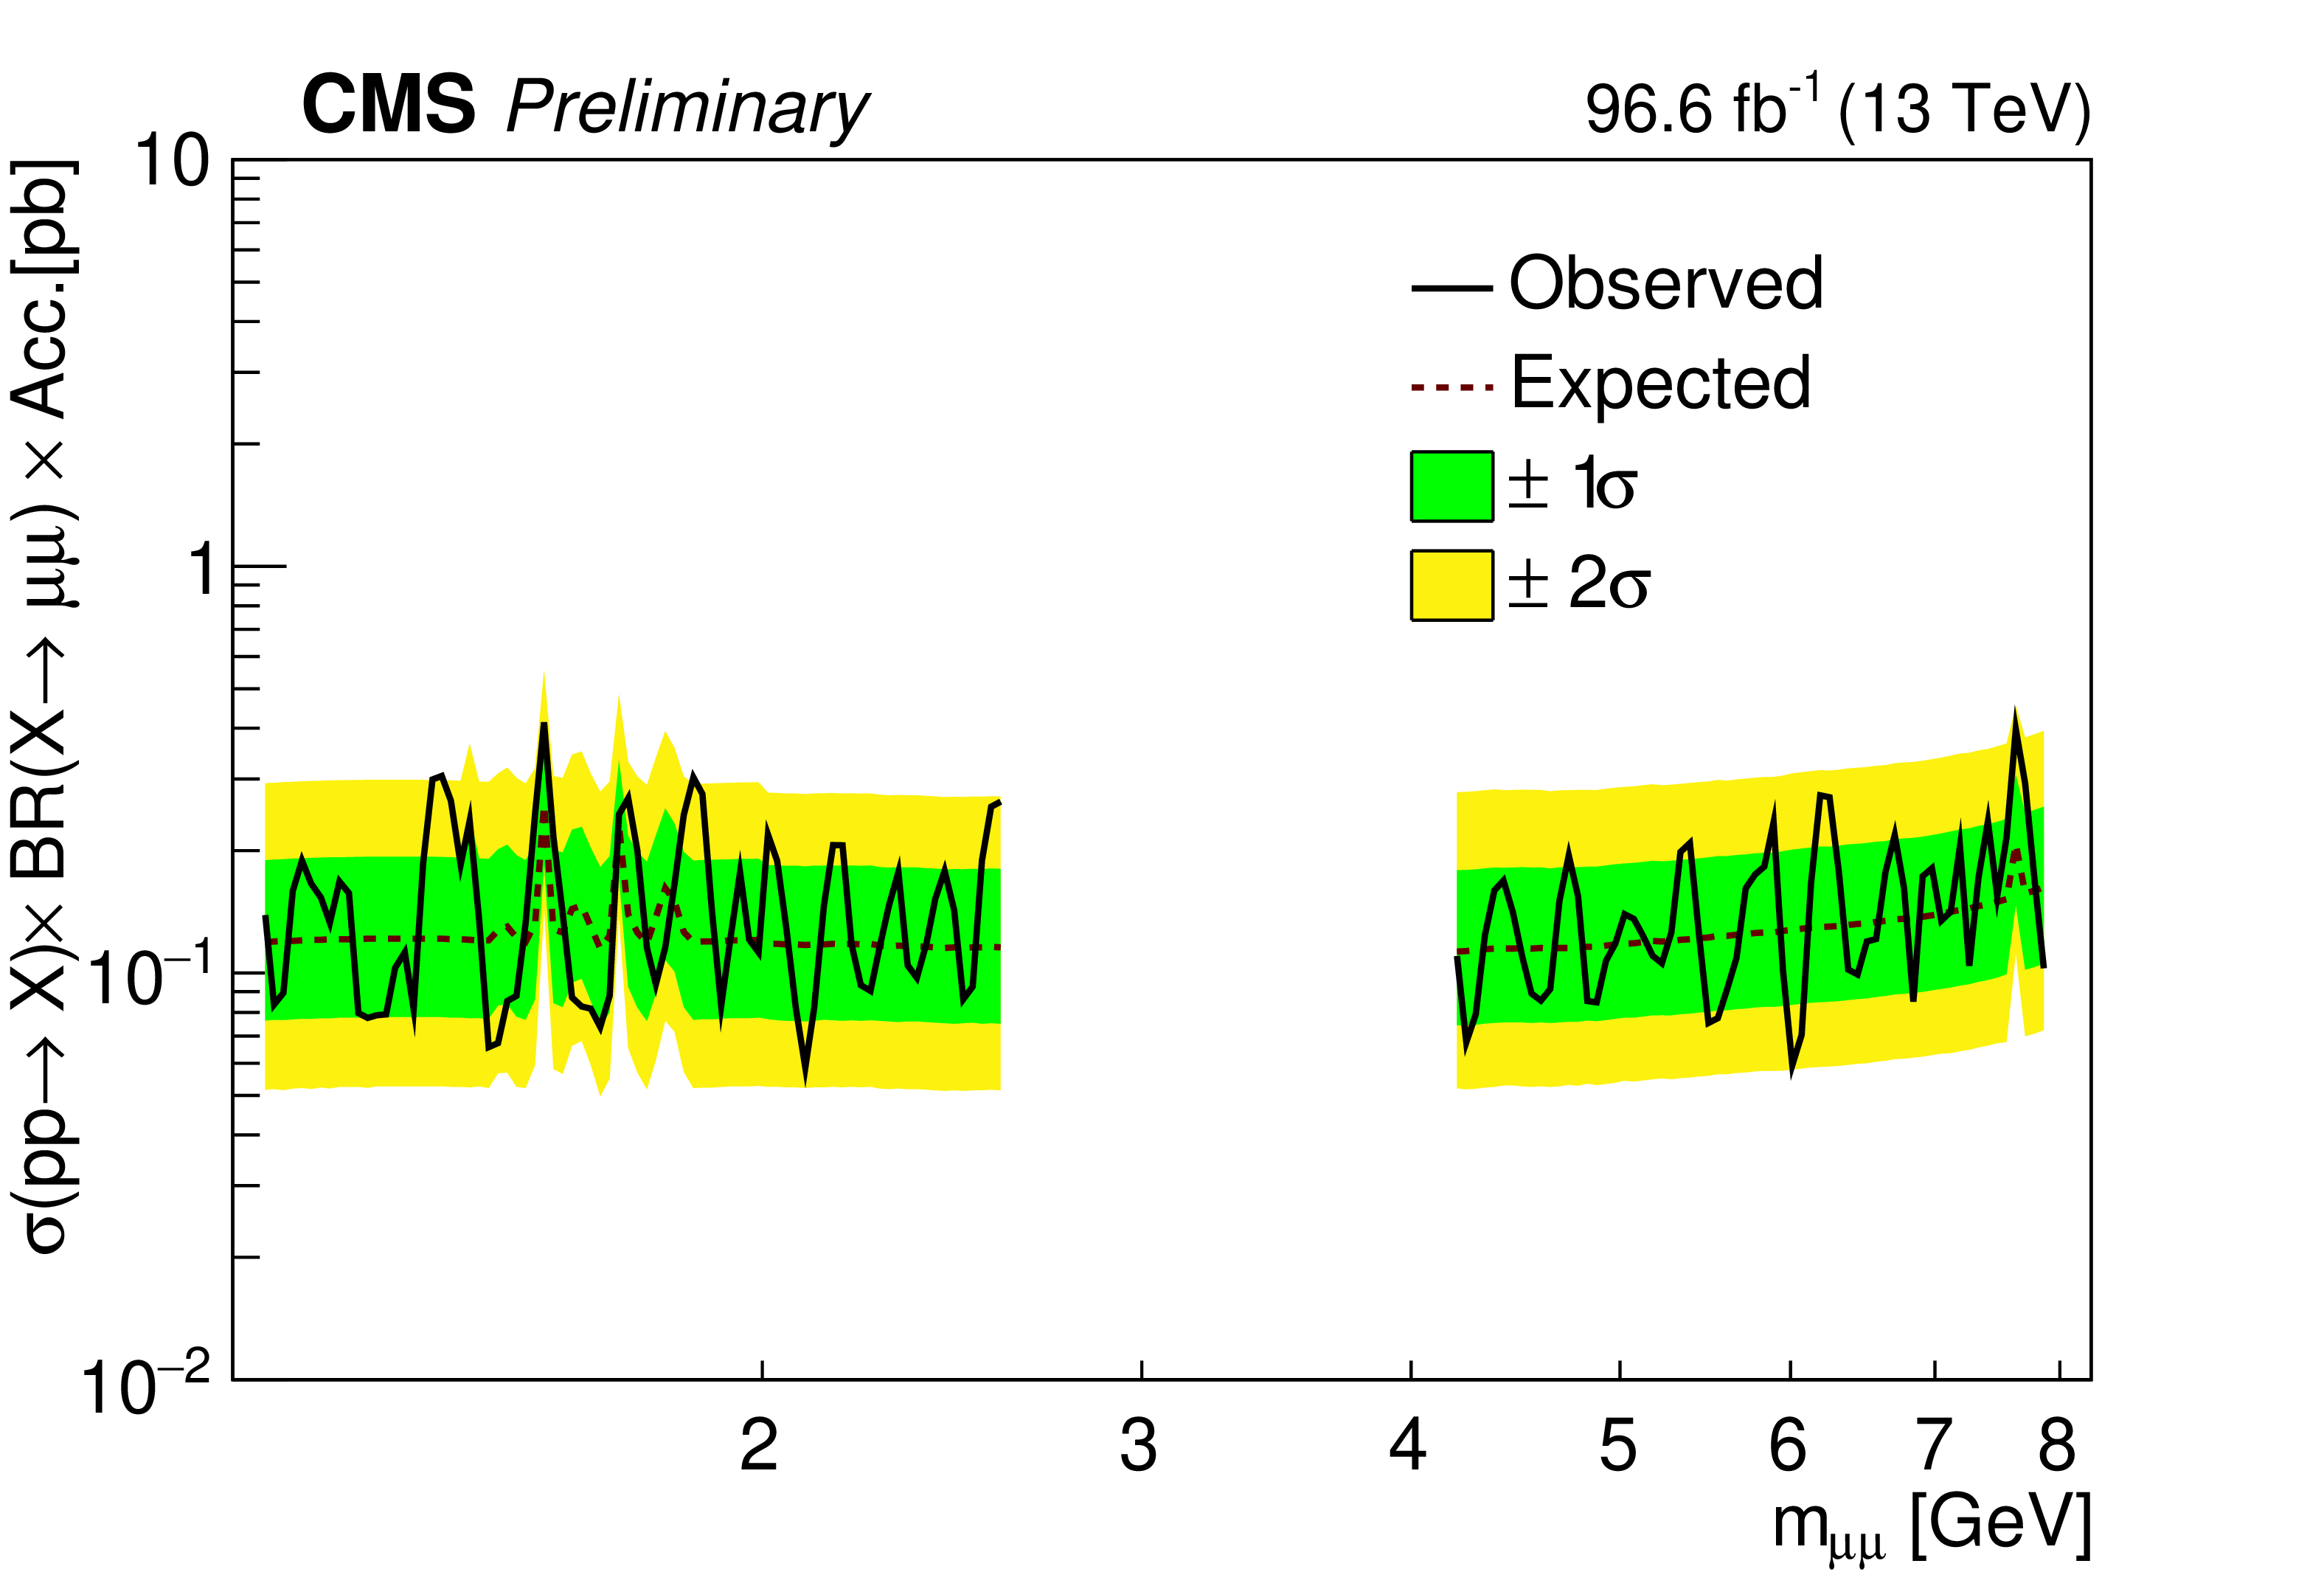
Figure 4:
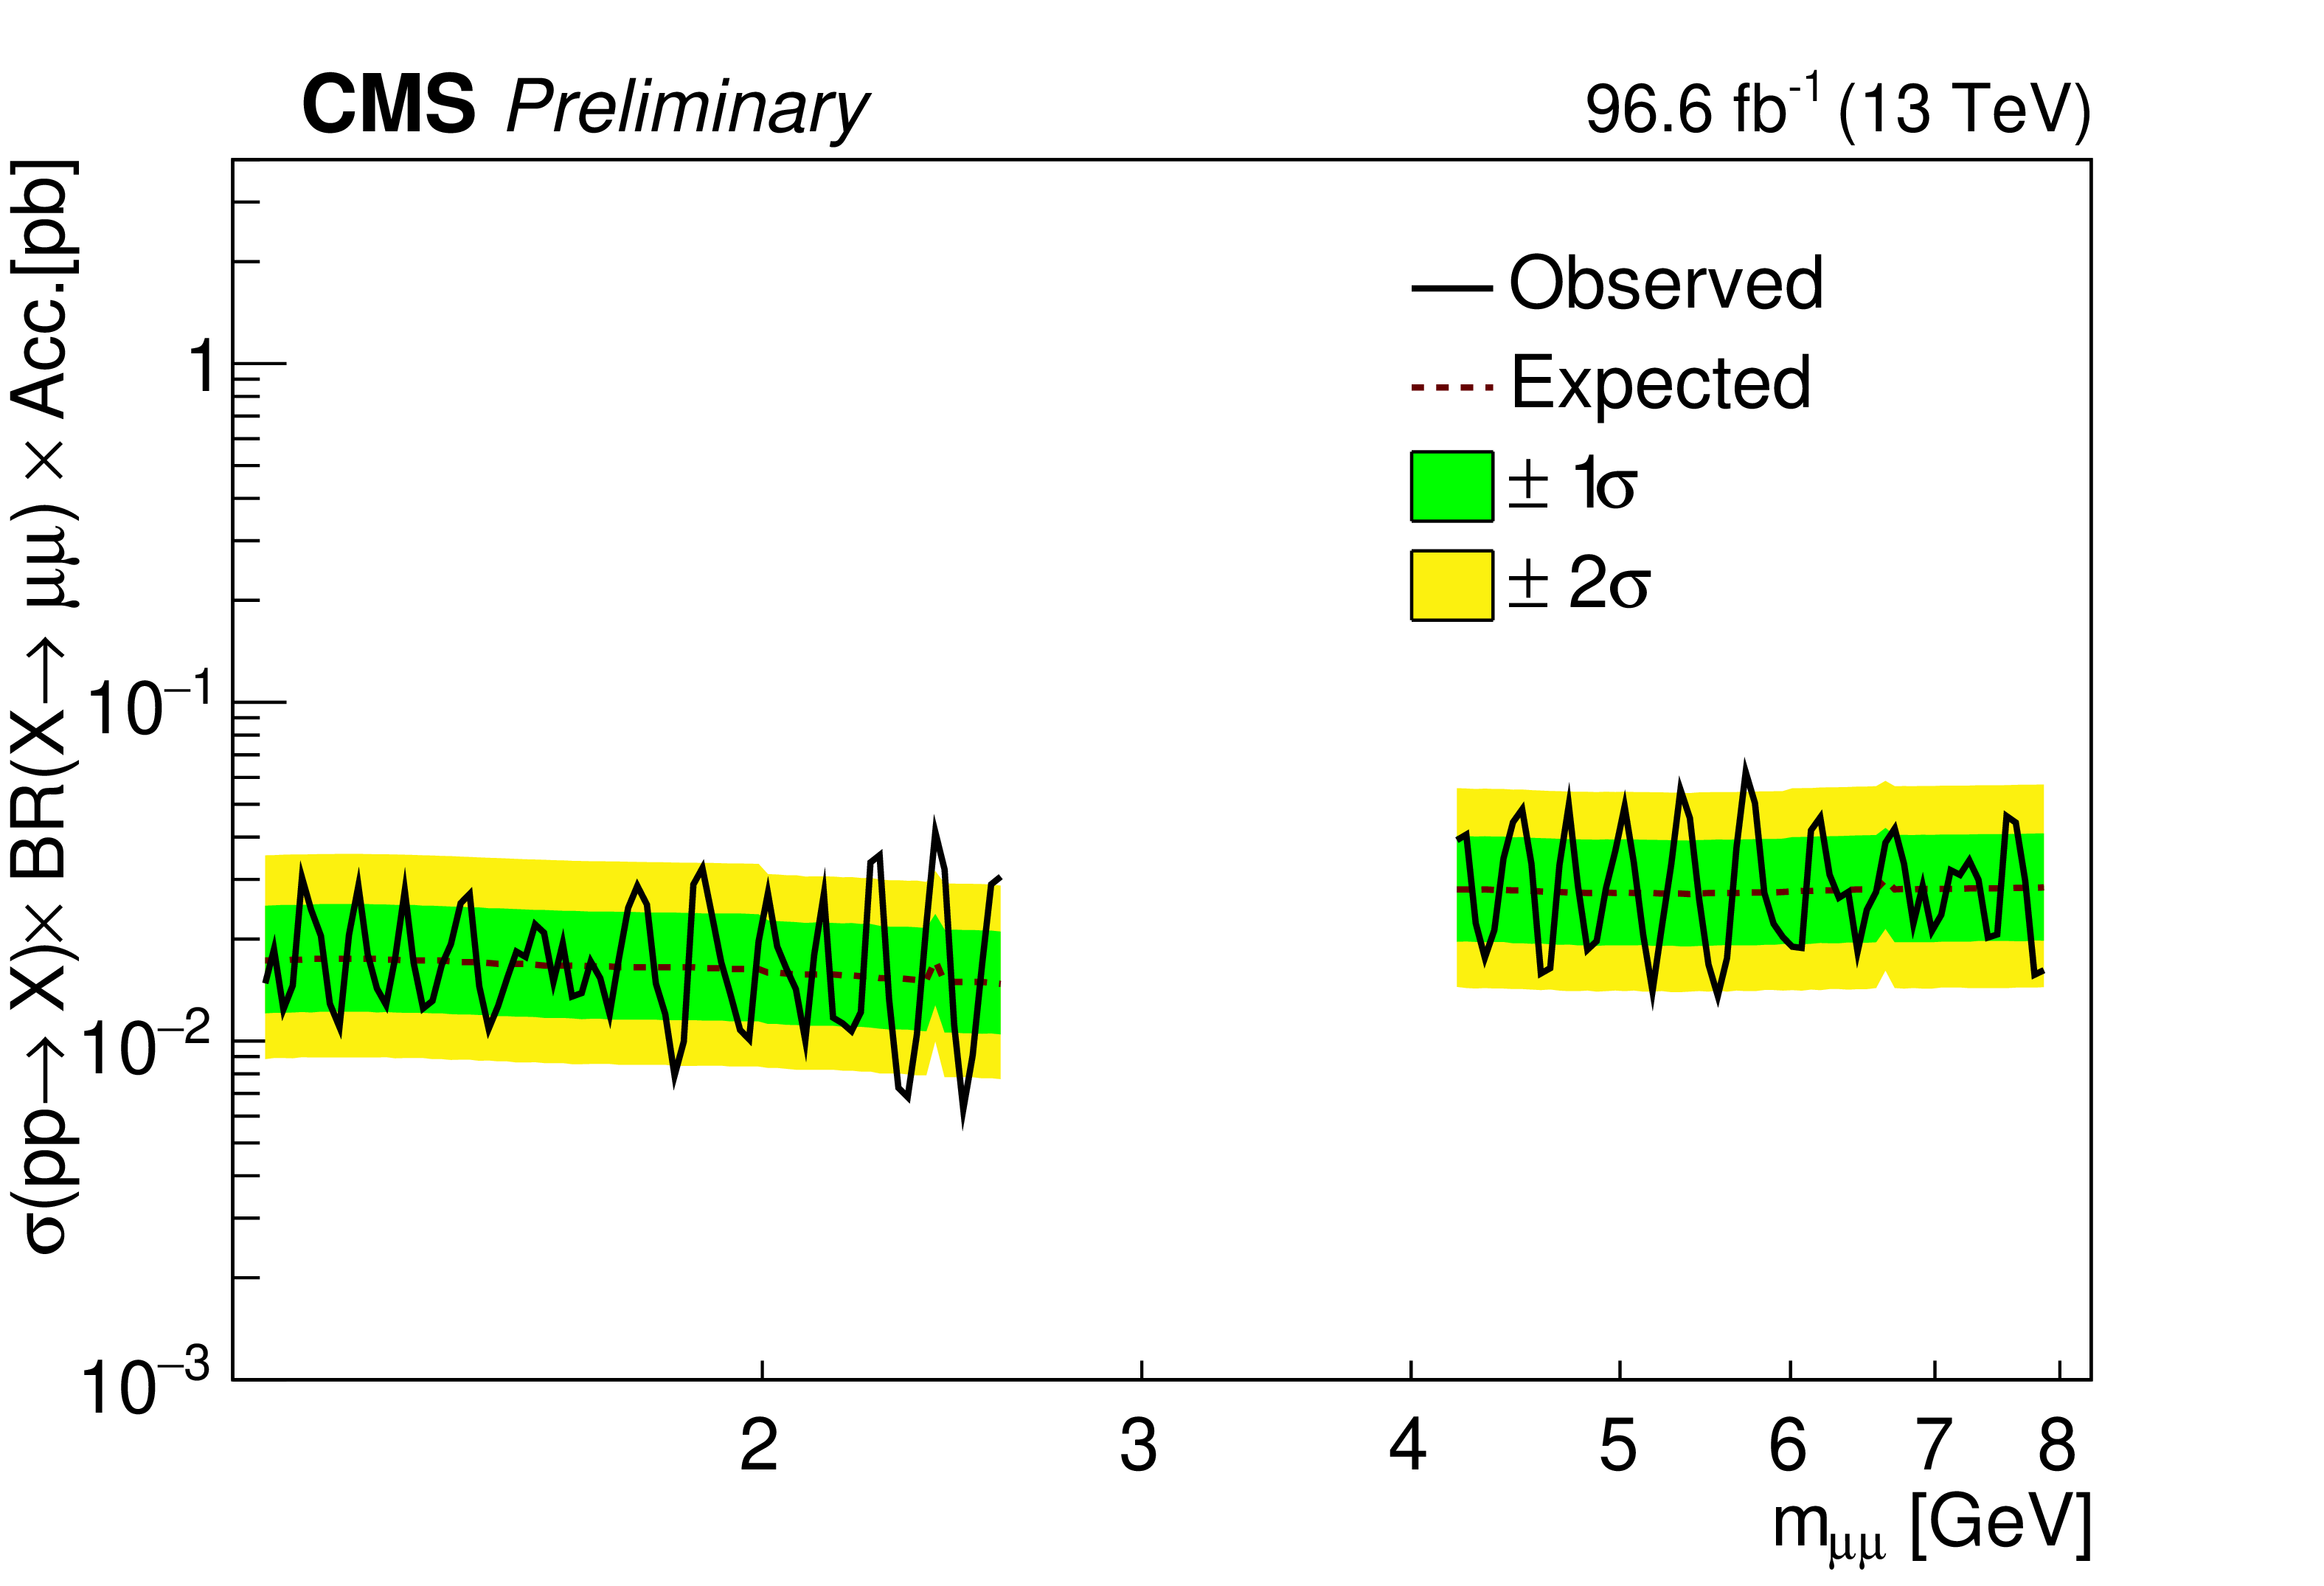
Left: Expected and observed model independent upper limits at 95% CL on the product of the signal cross section ($ \sigma $) times branching fraction to a pair of muons for the inclusive dimuon selection. Right: The model independent limits for the high-$ p_{\mathrm{T}} $ selection. The mass region dominated by the $ \mathrm{J}/\psi $ and $ \psi^{\prime} $ resonances is not considered in the fit. |
png pdf |
Figure 4-a:
Left: Expected and observed model independent upper limits at 95% CL on the product of the signal cross section ($ \sigma $) times branching fraction to a pair of muons for the inclusive dimuon selection. Right: The model independent limits for the high-$ p_{\mathrm{T}} $ selection. The mass region dominated by the $ \mathrm{J}/\psi $ and $ \psi^{\prime} $ resonances is not considered in the fit. |
png pdf |
Figure 4-b:
Left: Expected and observed model independent upper limits at 95% CL on the product of the signal cross section ($ \sigma $) times branching fraction to a pair of muons for the inclusive dimuon selection. Right: The model independent limits for the high-$ p_{\mathrm{T}} $ selection. The mass region dominated by the $ \mathrm{J}/\psi $ and $ \psi^{\prime} $ resonances is not considered in the fit. |
png pdf |
Figure 5:
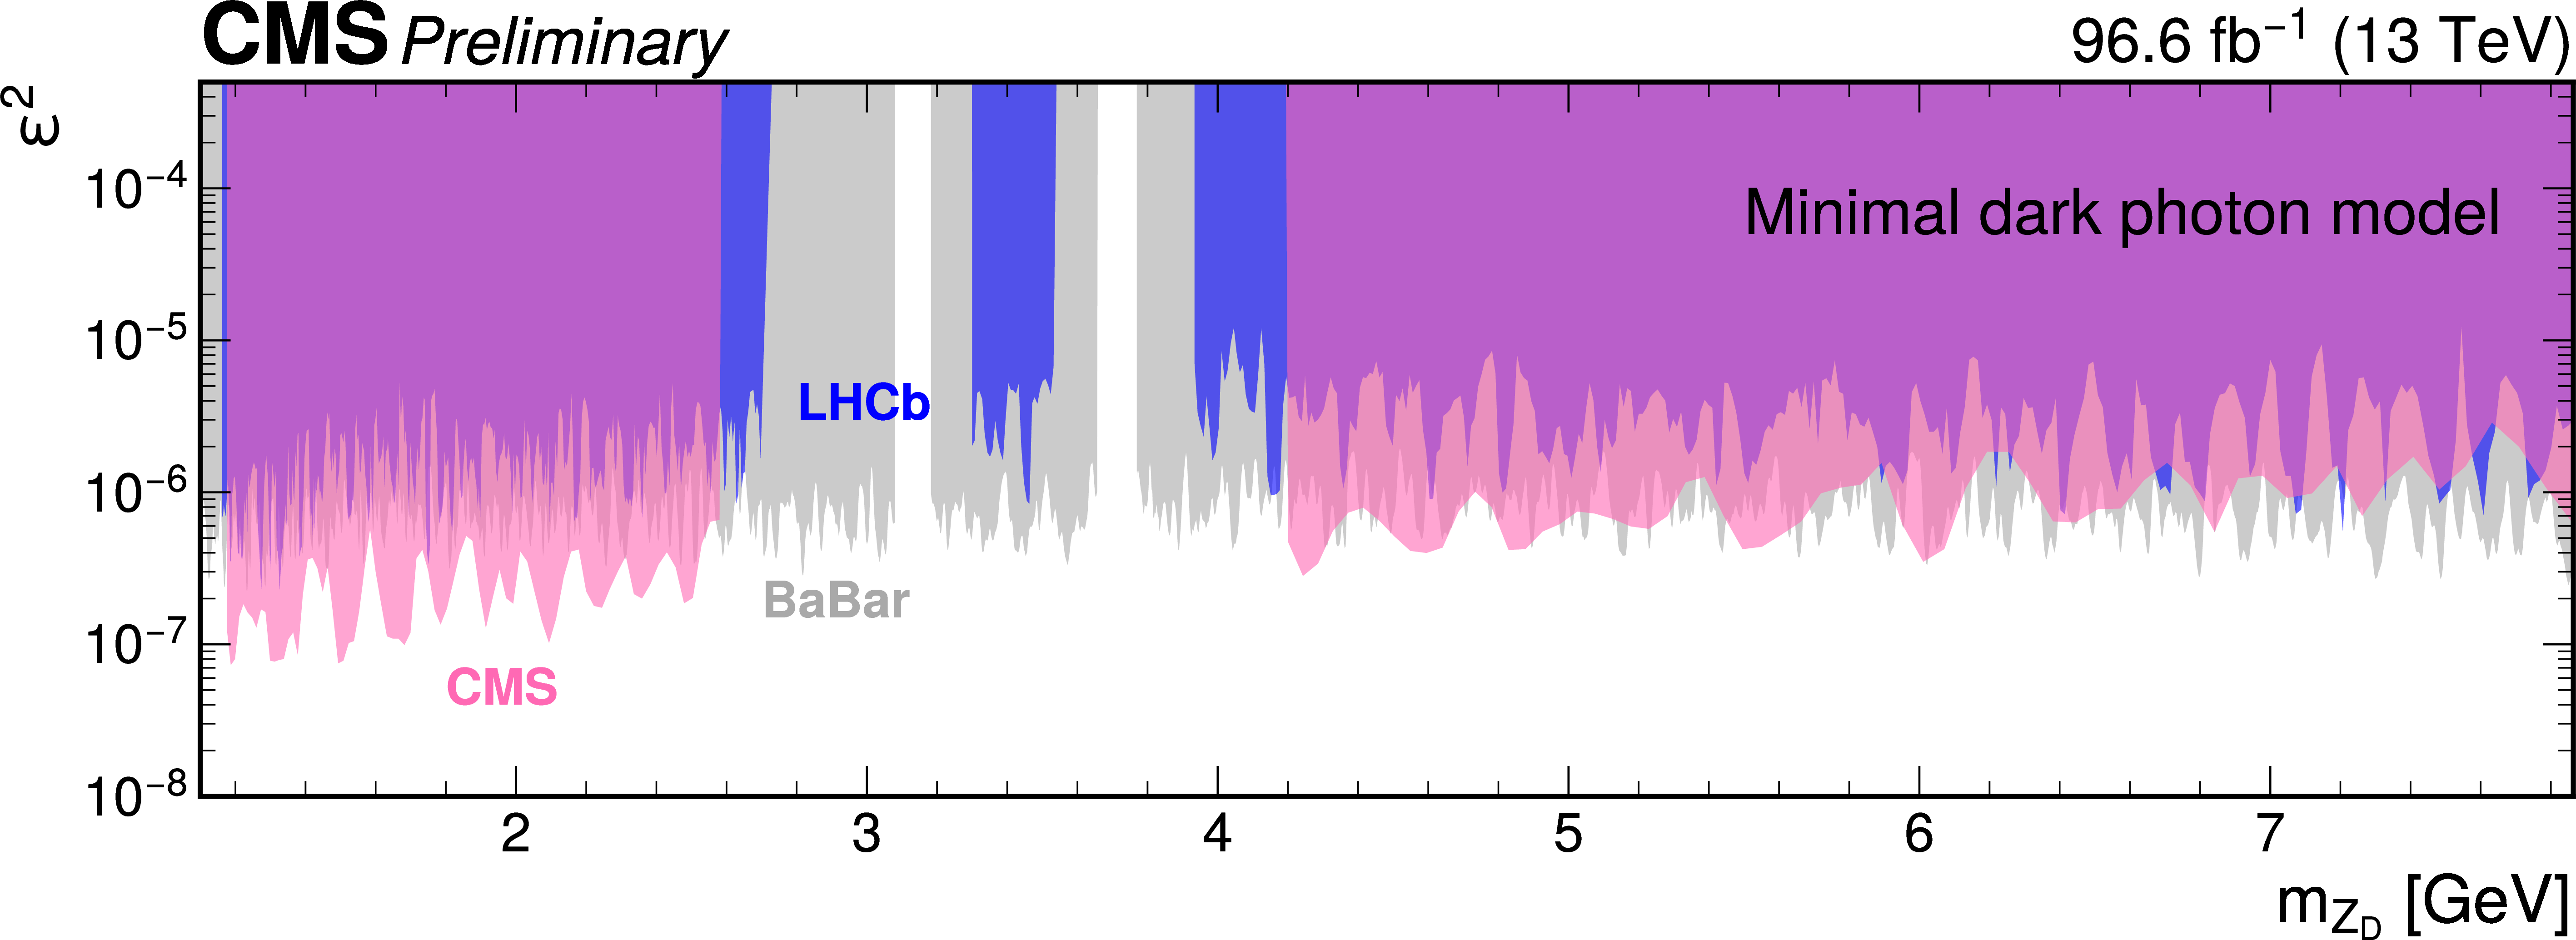
Observed upper limits at 90% CL on the square of the kinetic mixing coefficient $ \epsilon $ in the minimal model of a dark photon from the CMS search in the mass ranges 1.1--2.6 to 4.2--7.9 GeV (pink). The CMS limits are compared with the existing limits at 90% CL provided by the LHCb experiment [14] (blue) and BaBar experiment [12] (gray). |

png pdf |
Figure 6:
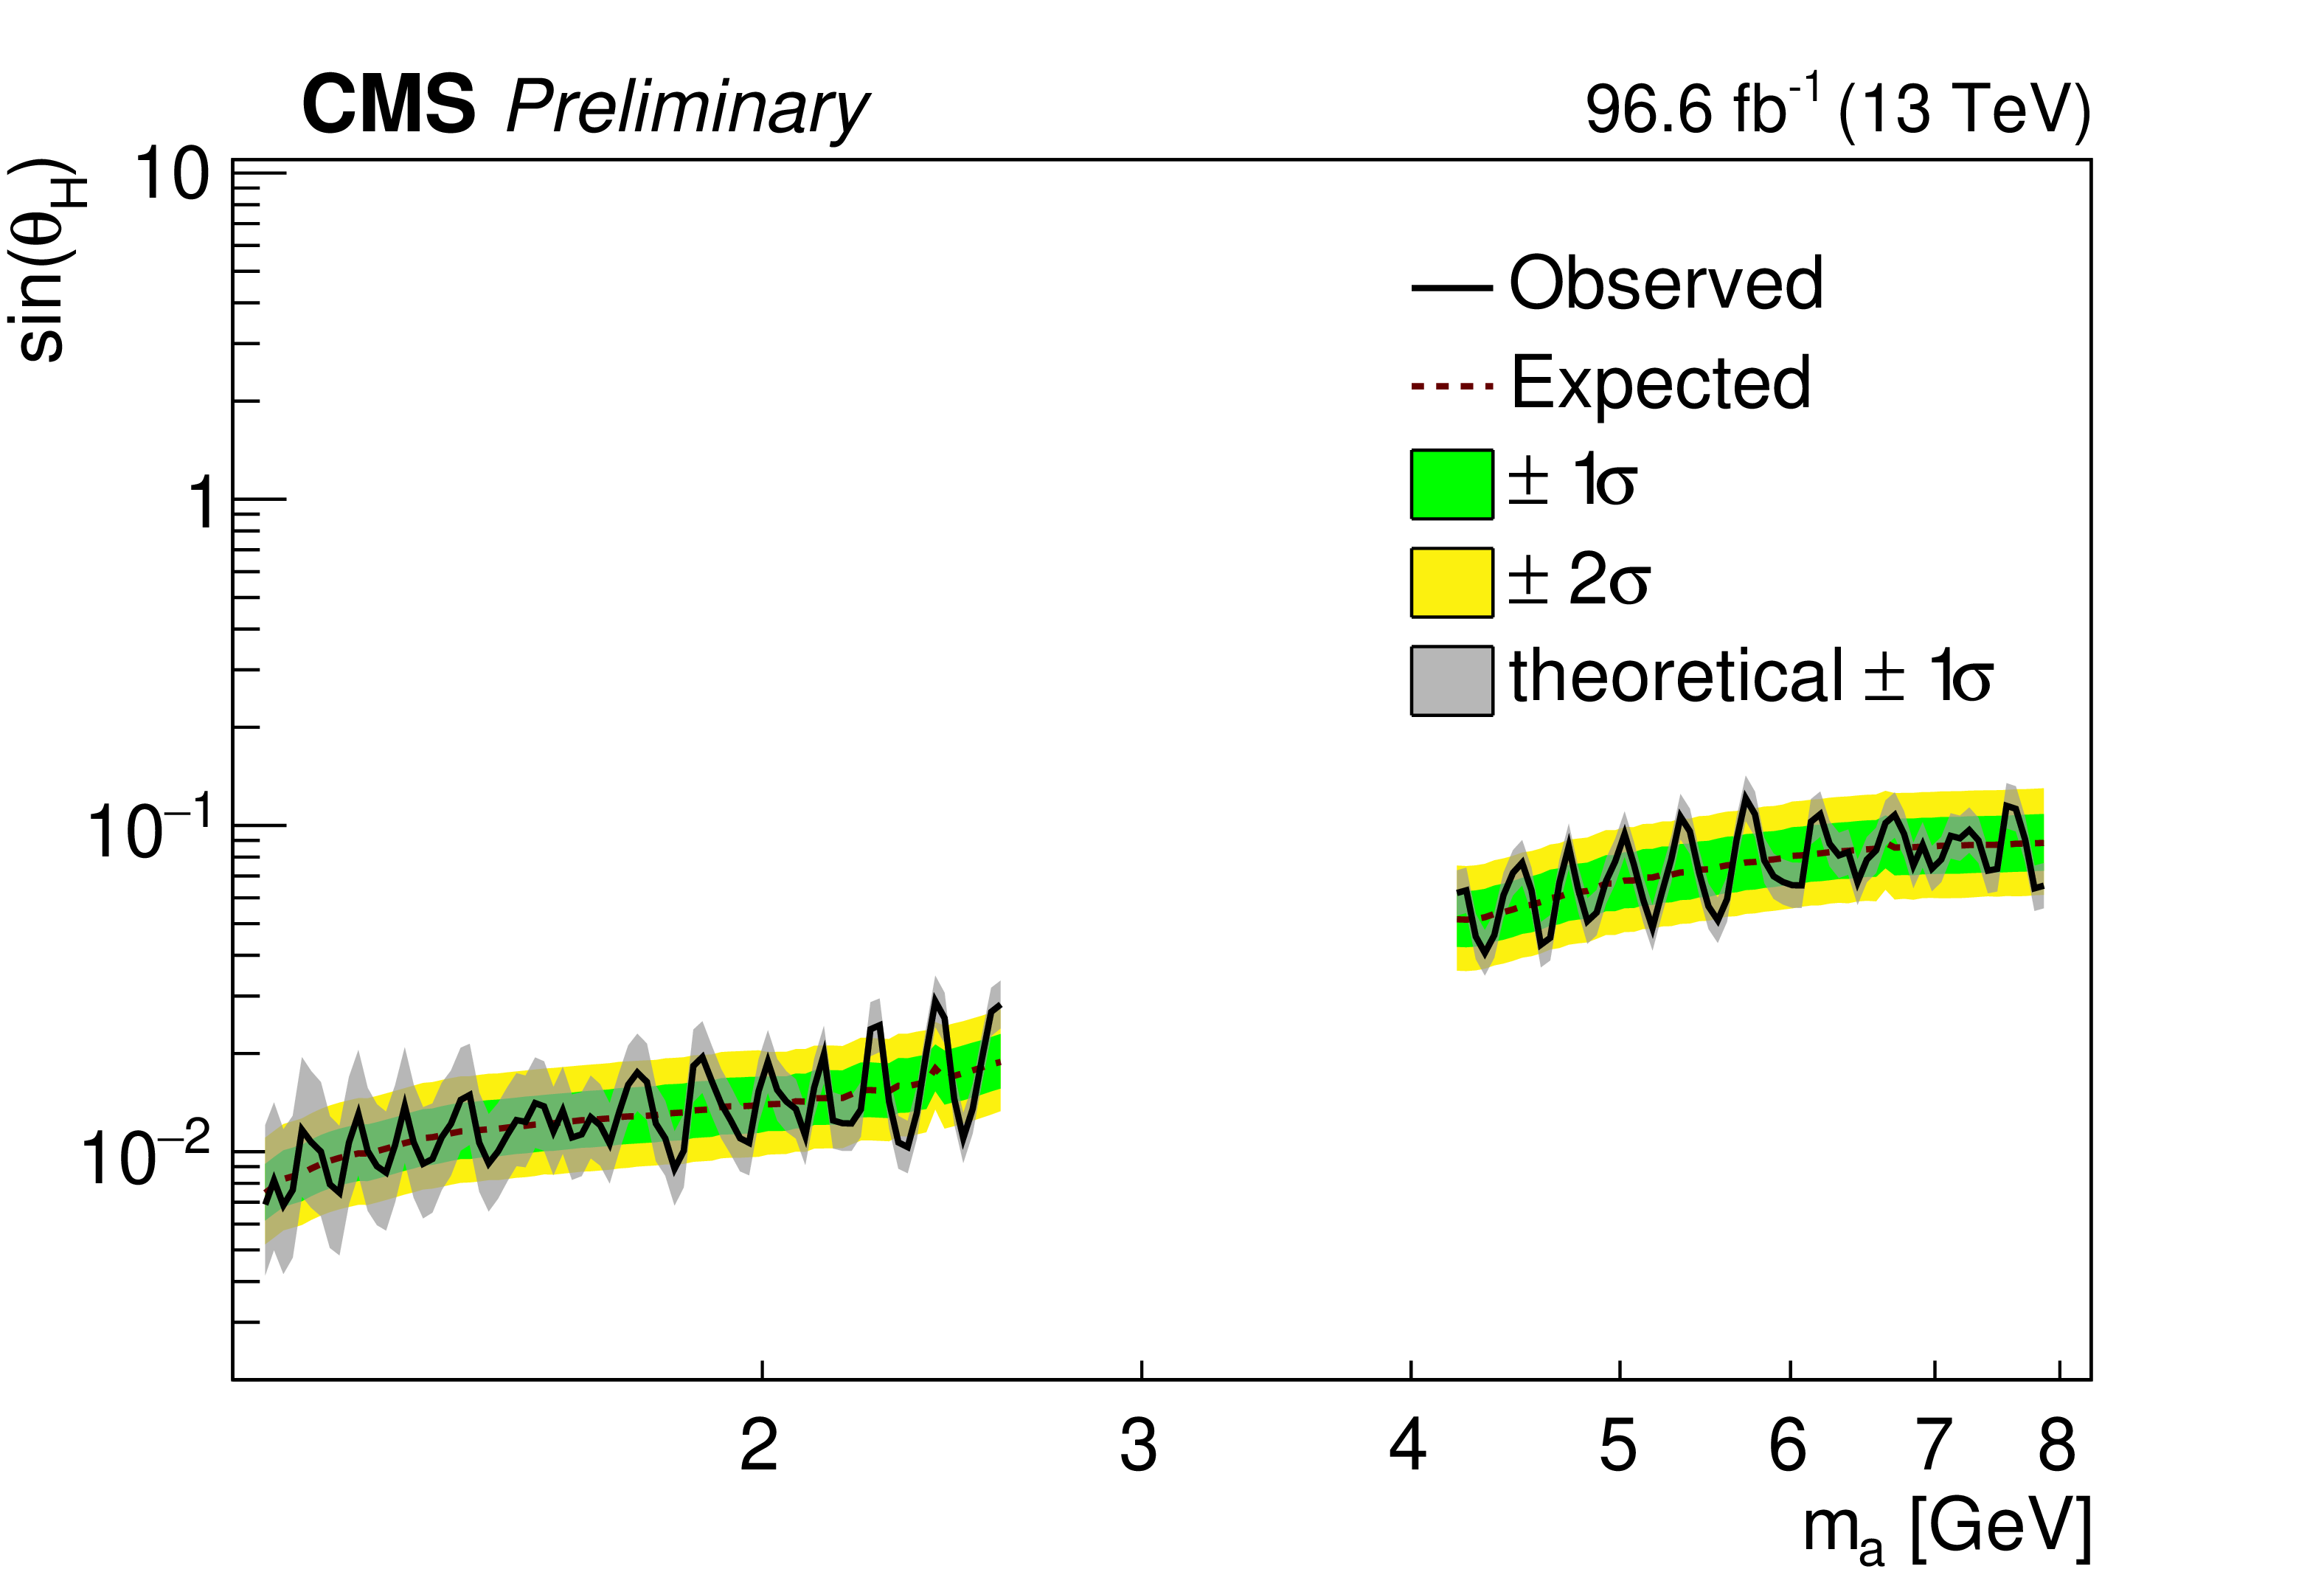
Observed upper limits at 90% CL on the mixing angle $ \theta_{\rm H} $ for the 2HDM+S scenario from the CMS search in the mass ranges 1.1-2.6 to 4.2-7.9 GeV (pink). The CMS limits are compared with the existing limits at 90% CL provided by the LHCb experiment [42] (blue) and BaBar experiment [12] (gray). |
| Tables | |
png pdf |
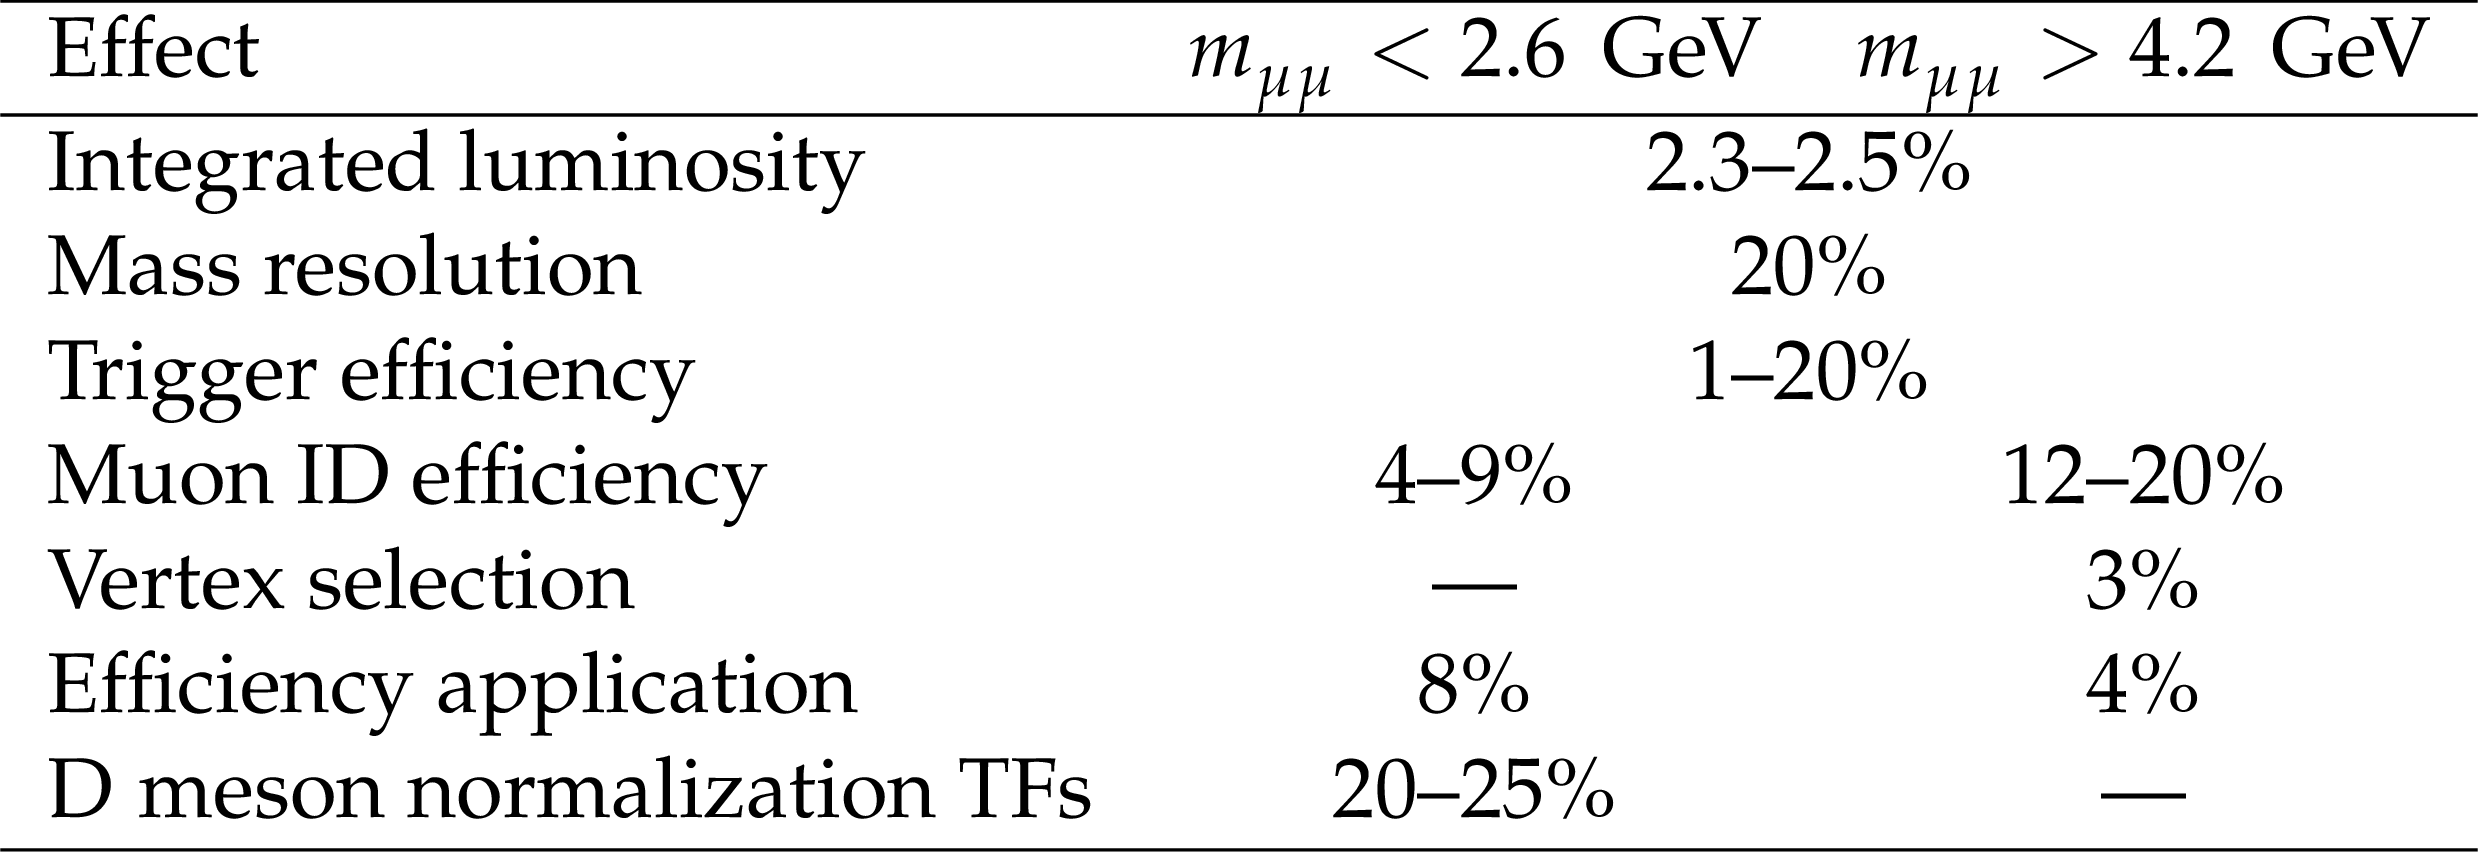
Table 1:
Summary of the experimental systematic uncertainties for a signal model in the model-independent search for a dimuon resonance. |
| Summary |
| In summary, we present a search for a prompt narrow resonance decaying to a pair of muons using proton-proton collision data recorded by the CMS experiment at $ \sqrt{s}= $ 13 TeV in 2017 and 2018. The search is performed in the dimuon mass region between 1.1-2.6 GeV and 4.2-7.9 GeV using data collected with high-rate dimuon triggers in a dedicated dimuon scouting stream, corresponding to an integrated luminosity of 96.6 fb$ ^{-1} $. Compared with the previous prompt resonance search for larger resonance masses [15], a dedicated multivariate analysis method is used to identify muons to achieve a higher sensitivity. No significant excess of events above the expectation from the standard model background is observed. Model-independent limits on production rates of dimuon resonances within the experimental fiducial acceptance are set. Competitive limits have been set both in the minimal dark photon and two Higgs doublet plus scalar models. The squared kinetic mixing coefficient $ \epsilon^2 $ in the dark photon model above 10$^{-6} $ is mostly excluded in the mass range of the search. In the two Higgs doublet plus scalar model, the mixing angle $ \sin(\theta_{\rm H}) $ above 0.08 is mostly excluded in the mass range of the search with fixed $ \tan\beta= $ 0.5. |
| Additional Figures | |
png pdf |
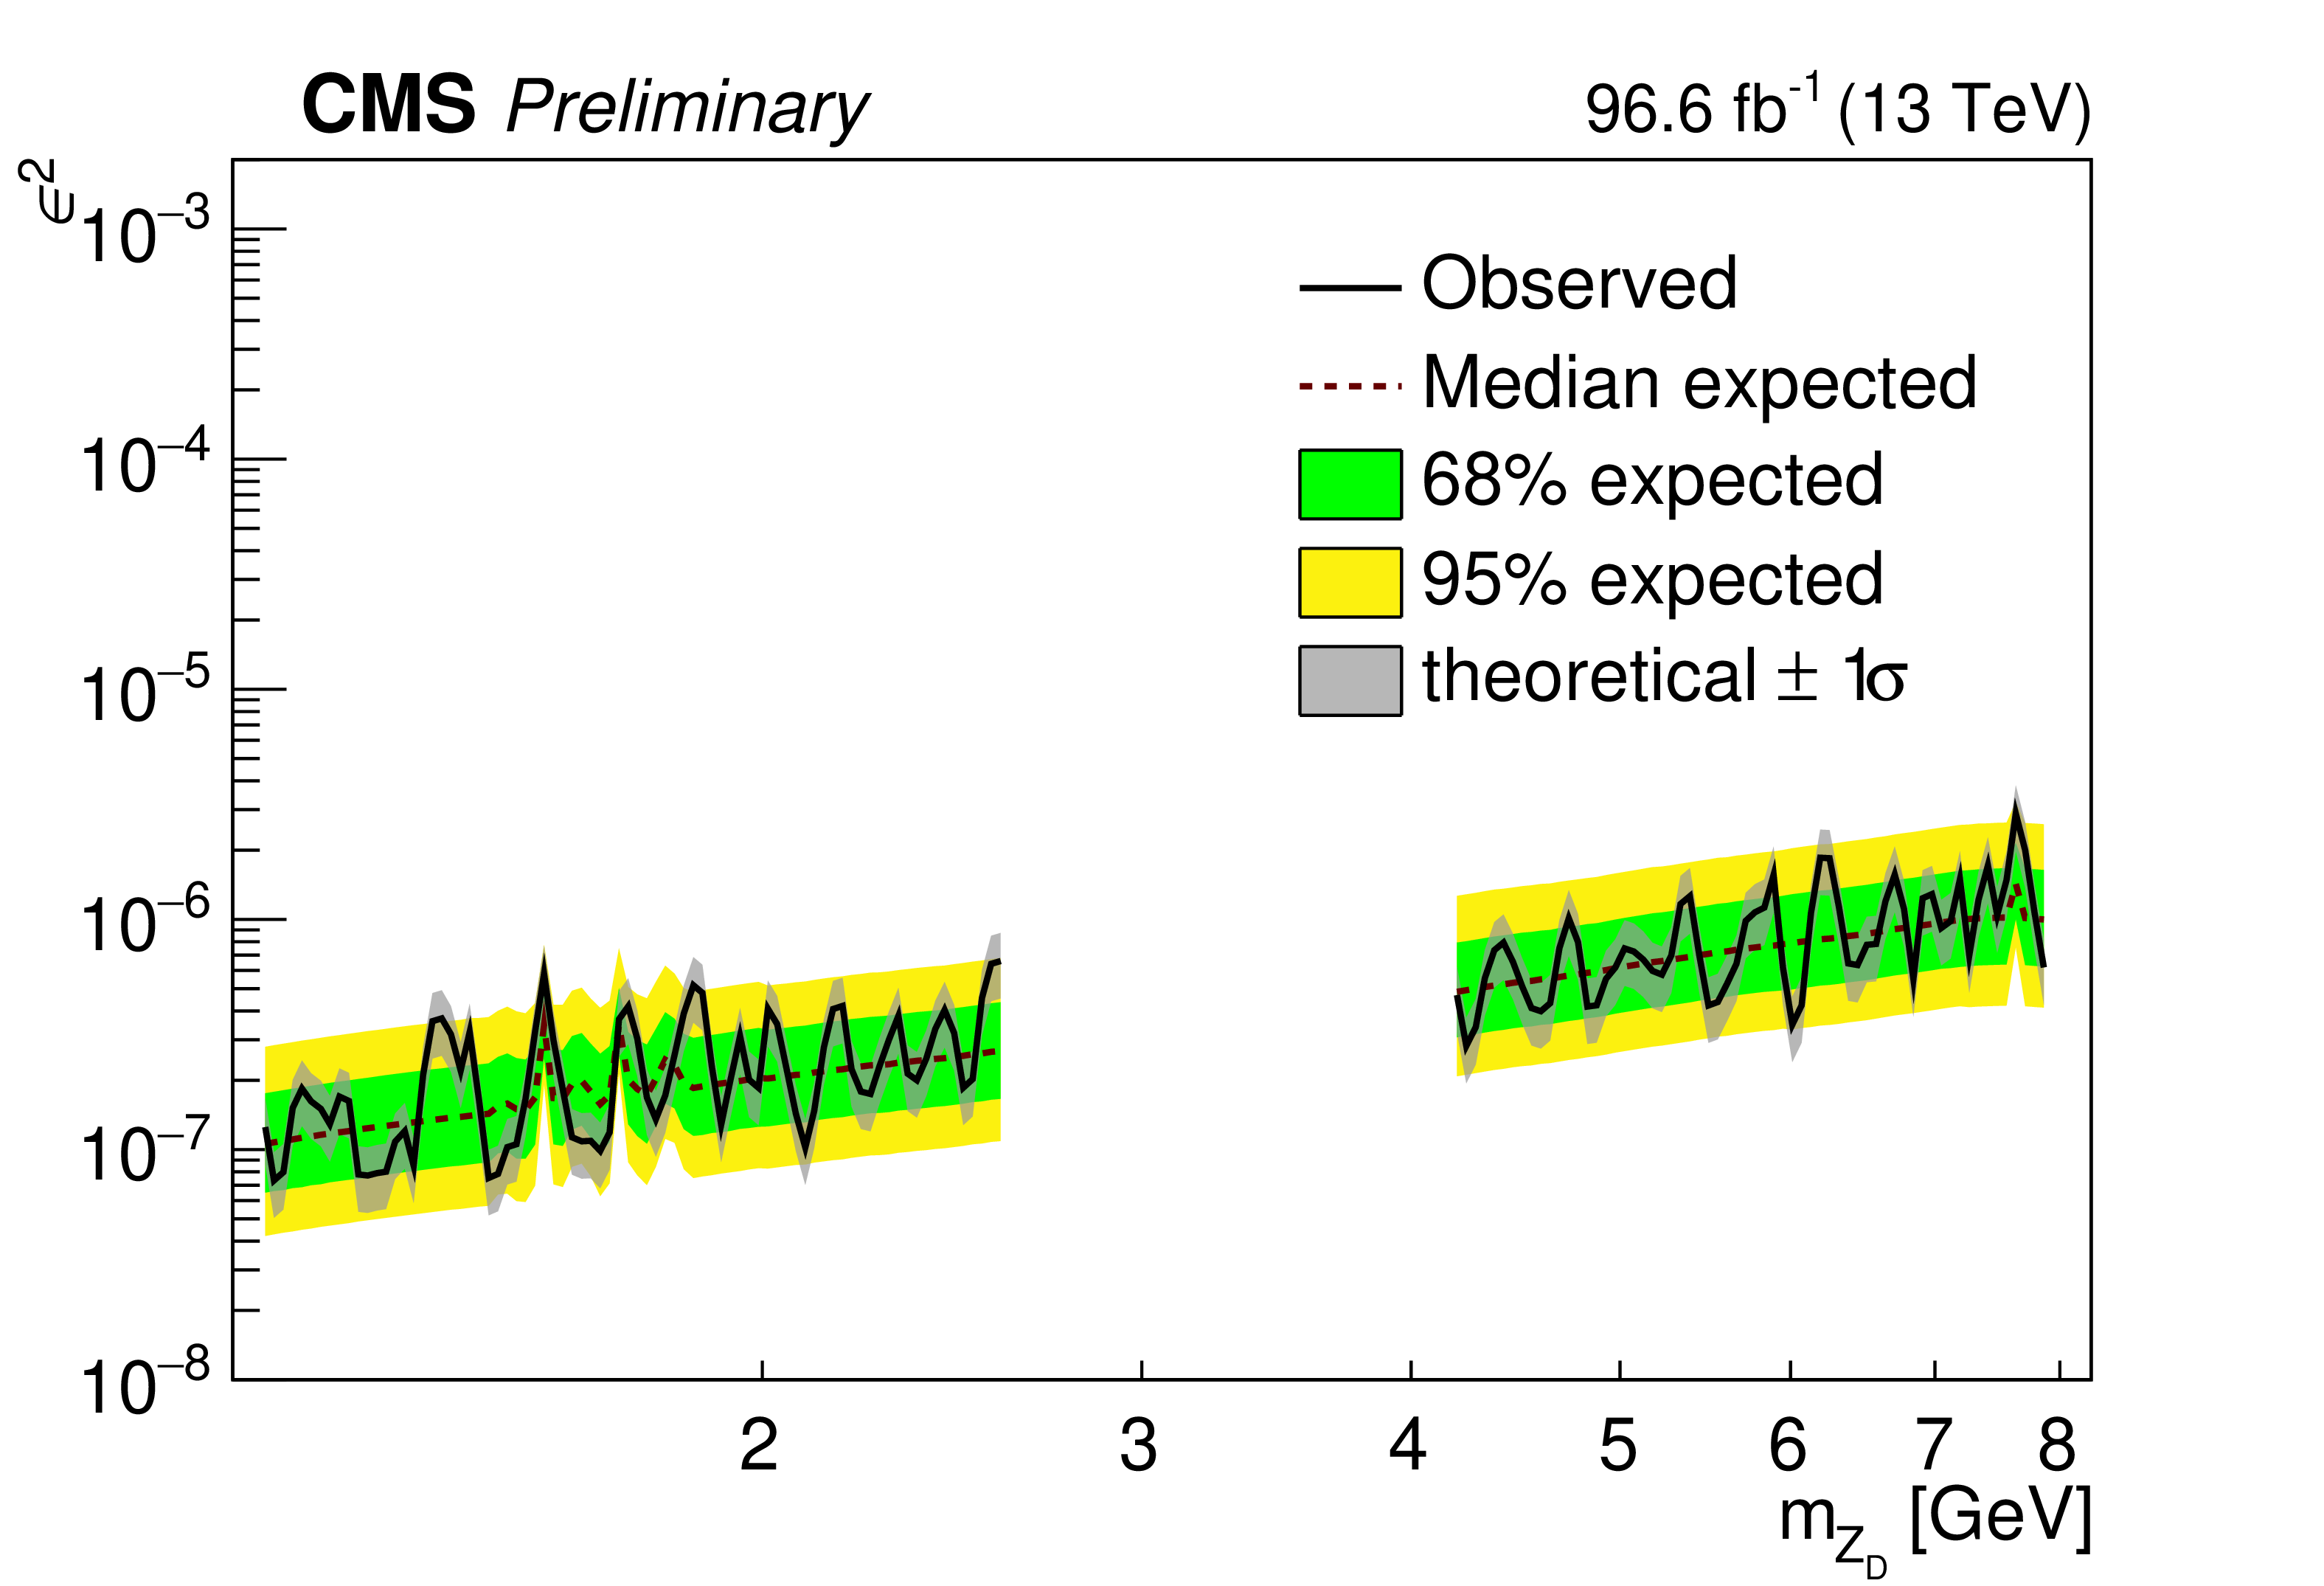
Additional Figure 1:
Upper limits at 90% CL on the square of the kinetic mixing coefficient $ \epsilon $ in the minimal model of a dark photon from the CMS search in the mass ranges 1.1-2.6 to 4.2-7.9 GeV using 2017 and 2018 scouting data which corresponds to an integrated luminosity of 96.6 fb$ ^{-1} $. The theoretical uncertainty includes the variation of QCD scales when calculating the production cross section, as well as the variance in fiducial acceptance between dark photon signal events produced using two different generators; DYTurbo-1.2 and MADGRAPH5_aMC@NLO v3.4.1. |
png pdf |
Additional Figure 2:
Upper limits at 90% CL on the mixing angle $ \theta_{\rm H} $ for the 2HDM+S scenario the CMS search in the mass ranges 1.1-2.6 to 4.2-7.9 GeV using 2017 and 2018 scouting data which corresponds to an integrated luminosity of 96.6 fb$ ^{-1} $. The theoretical uncertainty includes the variation of QCD scales when calculating the production cross section, as well as the variance in fiducial acceptance between scalar signal events produced using two different generators; PYTHIA 8.230 and MADGRAPH5_aMC@NLO v3.4.1. |
png pdf |
Additional Figure 3:
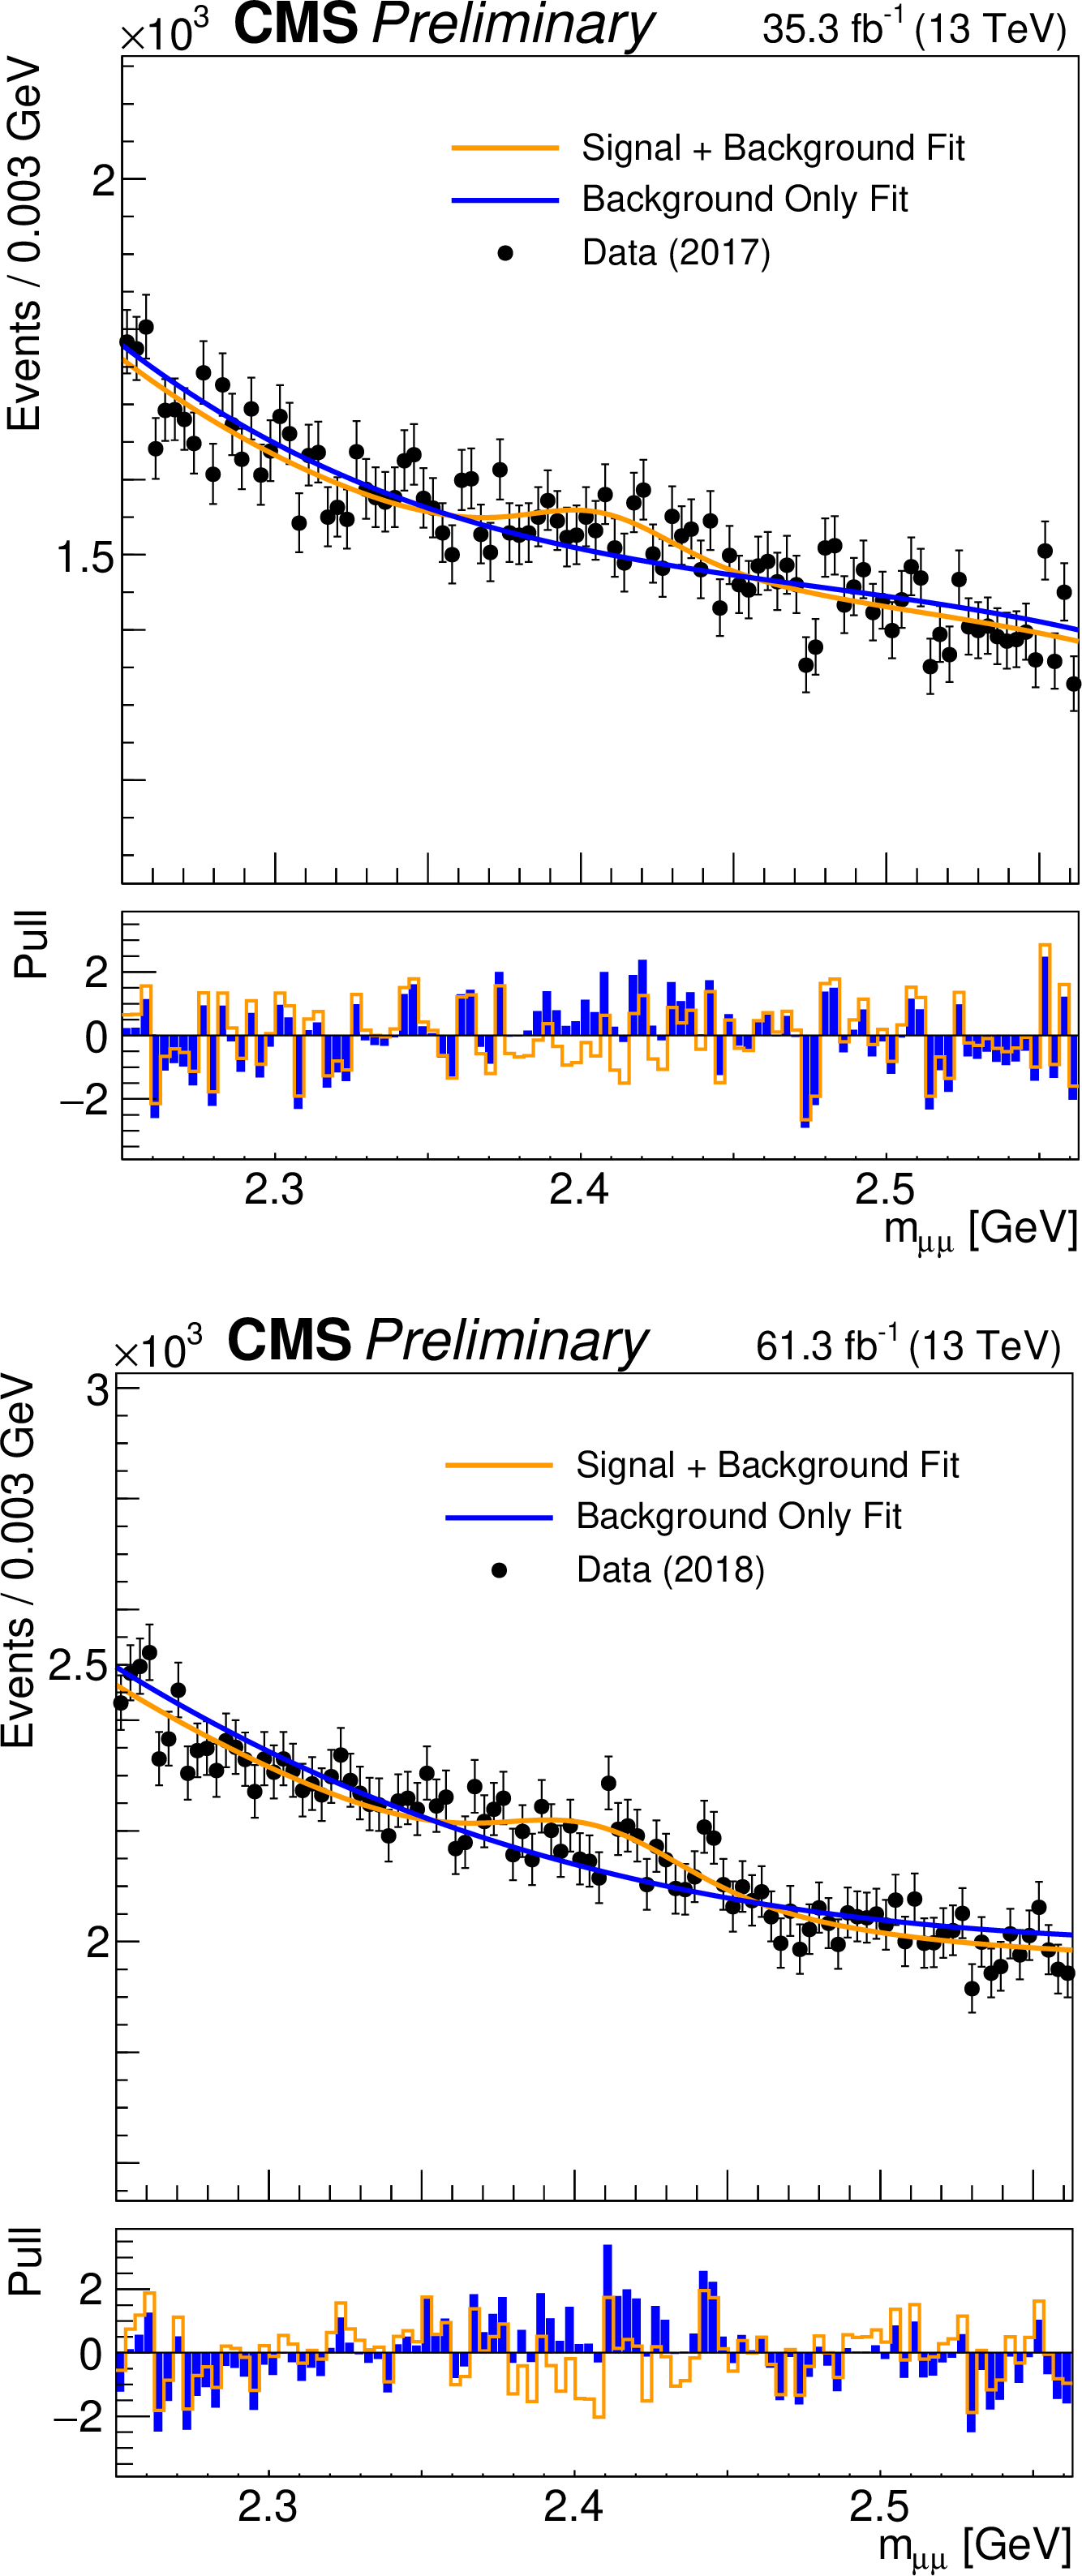
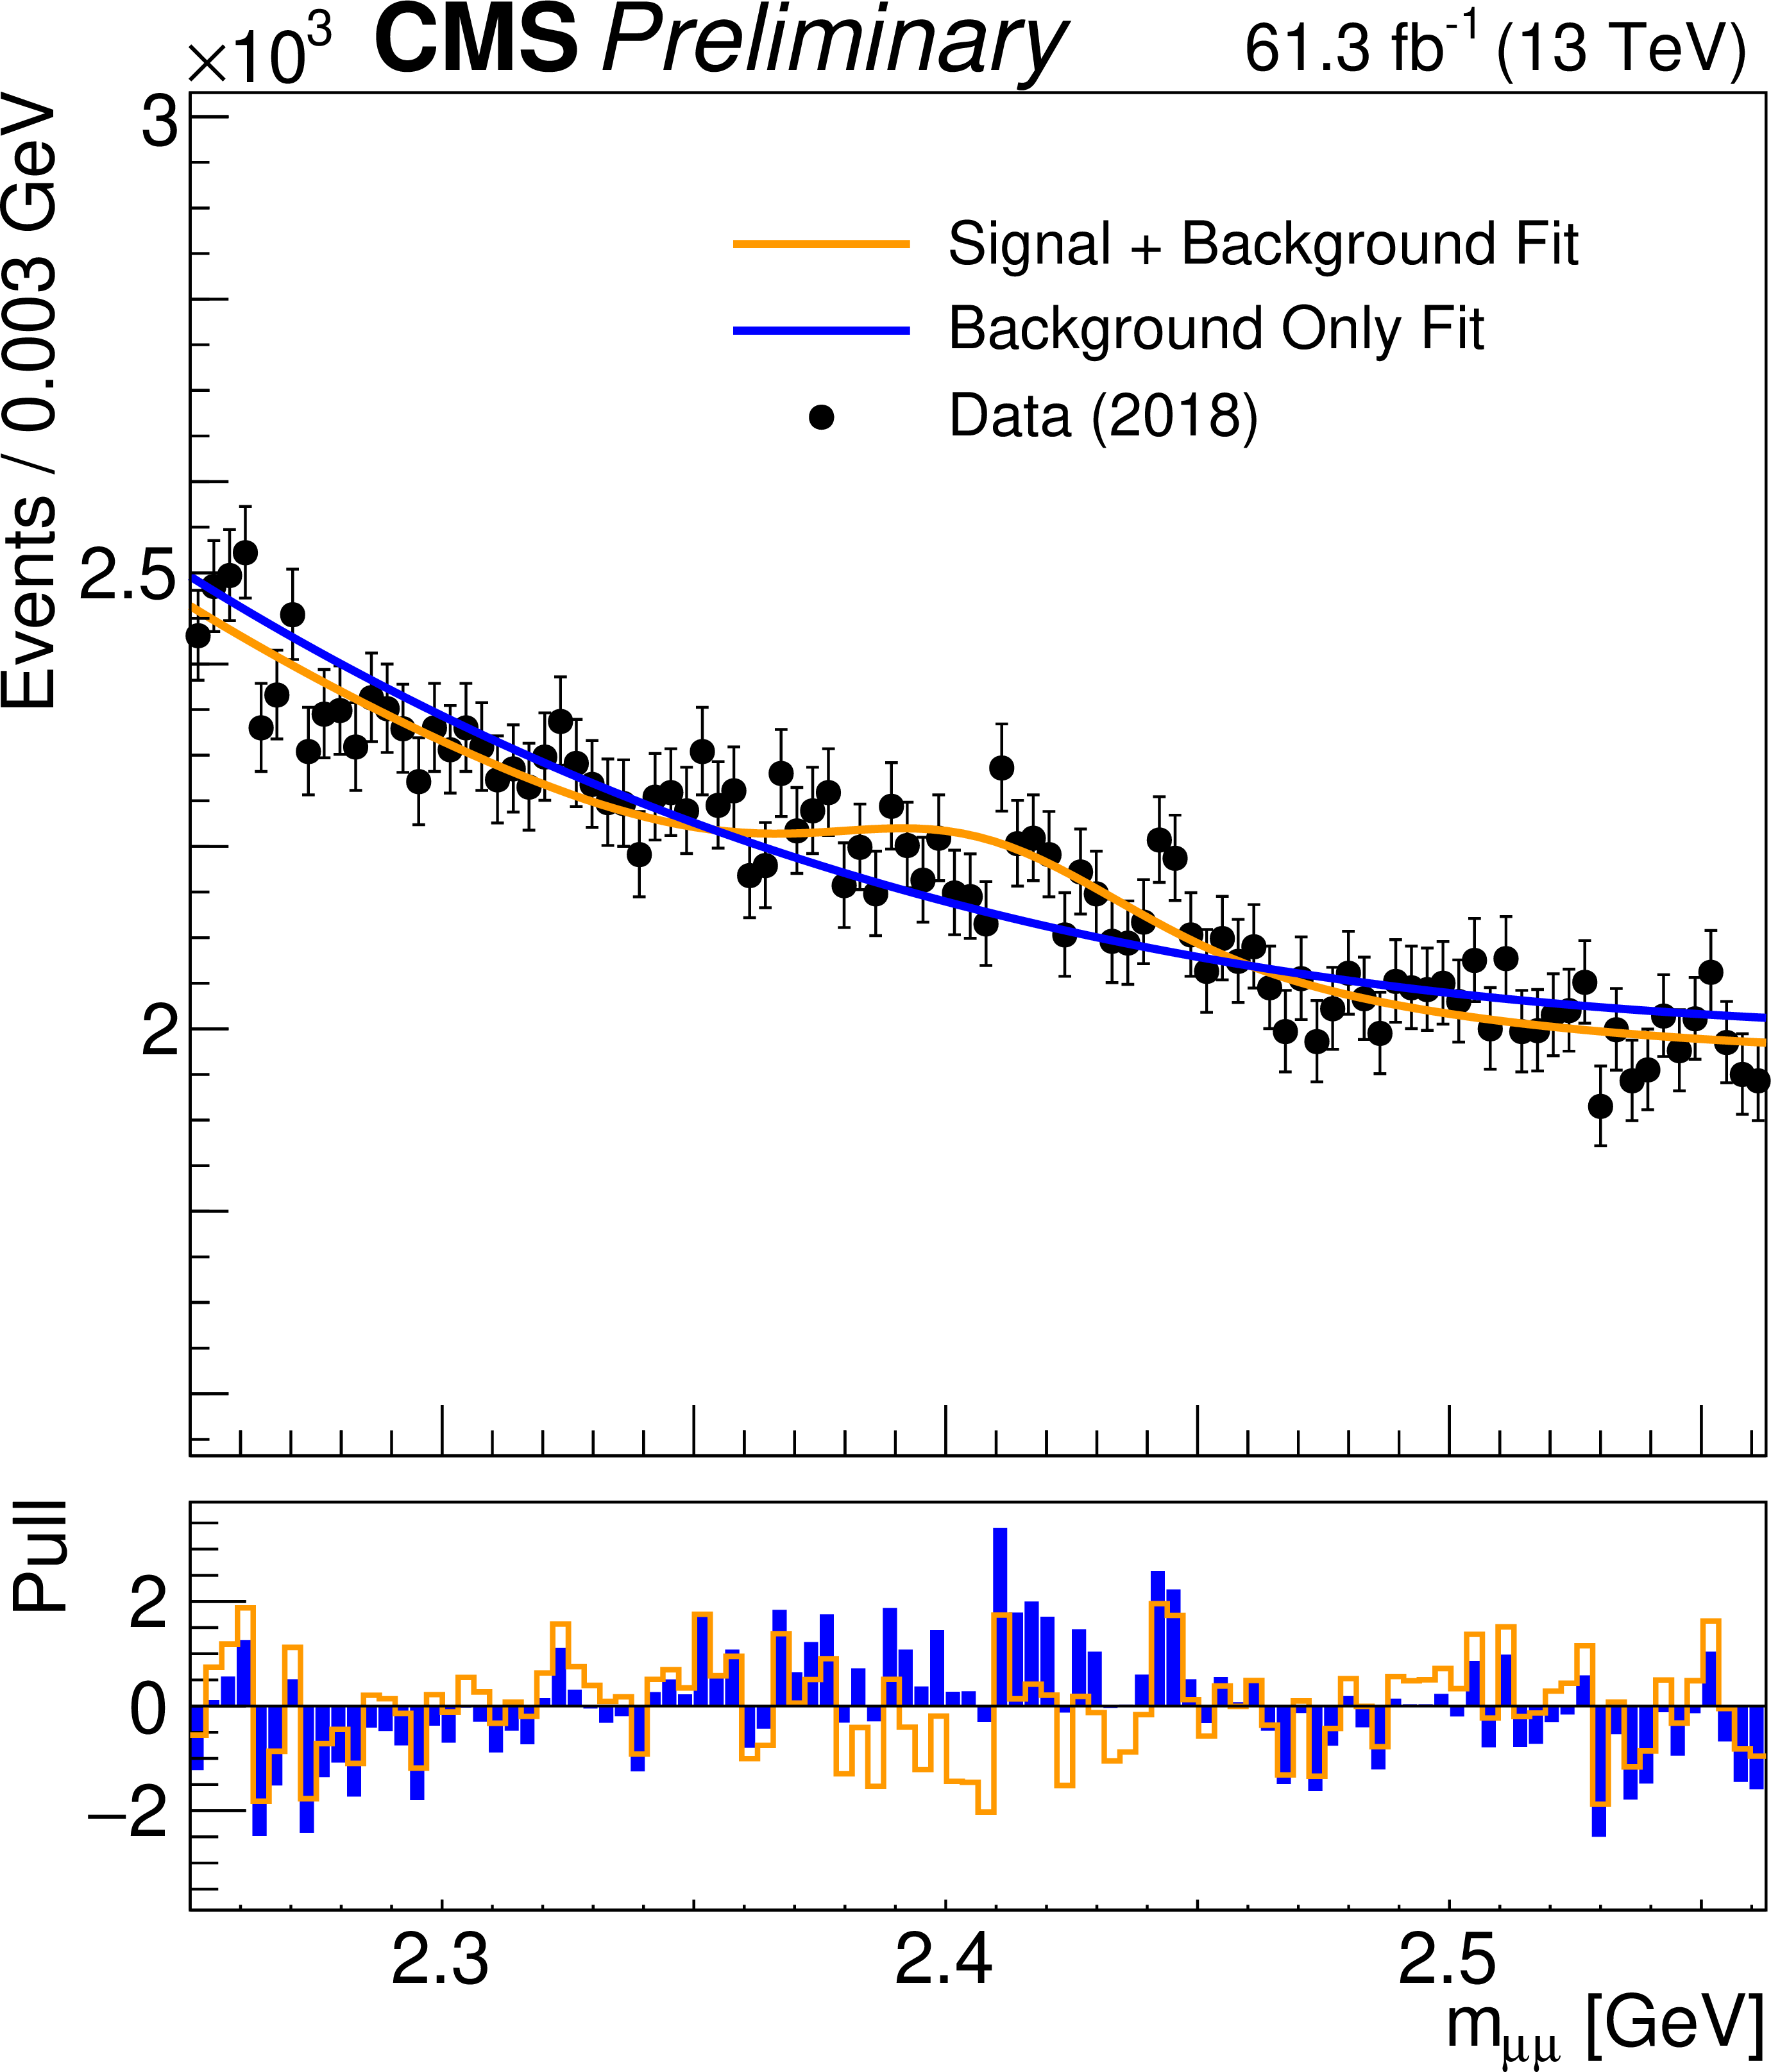
Background only and signal plus background fits, for the mass window 2.25-2.56 GeV with 3.24 $ \sigma $ excess in 2017 (top) and 2018 (bottom). This excess is observed only in the mass distribution with the dimuon high-$ p_{\mathrm{T}} $ selection and therefore only affects the limit on the scalar model. The lower pads show the difference between the data and corresponding pdf, divided by the statistical uncertainty of the data in that bin. |

png pdf |
Additional Figure 3-a:
Background only and signal plus background fits, for the mass window 2.25-2.56 GeV with 3.24 $ \sigma $ excess in 2017 (top) and 2018 (bottom). This excess is observed only in the mass distribution with the dimuon high-$ p_{\mathrm{T}} $ selection and therefore only affects the limit on the scalar model. The lower pads show the difference between the data and corresponding pdf, divided by the statistical uncertainty of the data in that bin. |
png pdf |
Additional Figure 3-b:
Background only and signal plus background fits, for the mass window 2.25-2.56 GeV with 3.24 $ \sigma $ excess in 2017 (top) and 2018 (bottom). This excess is observed only in the mass distribution with the dimuon high-$ p_{\mathrm{T}} $ selection and therefore only affects the limit on the scalar model. The lower pads show the difference between the data and corresponding pdf, divided by the statistical uncertainty of the data in that bin. |
png pdf |
Additional Figure 4:
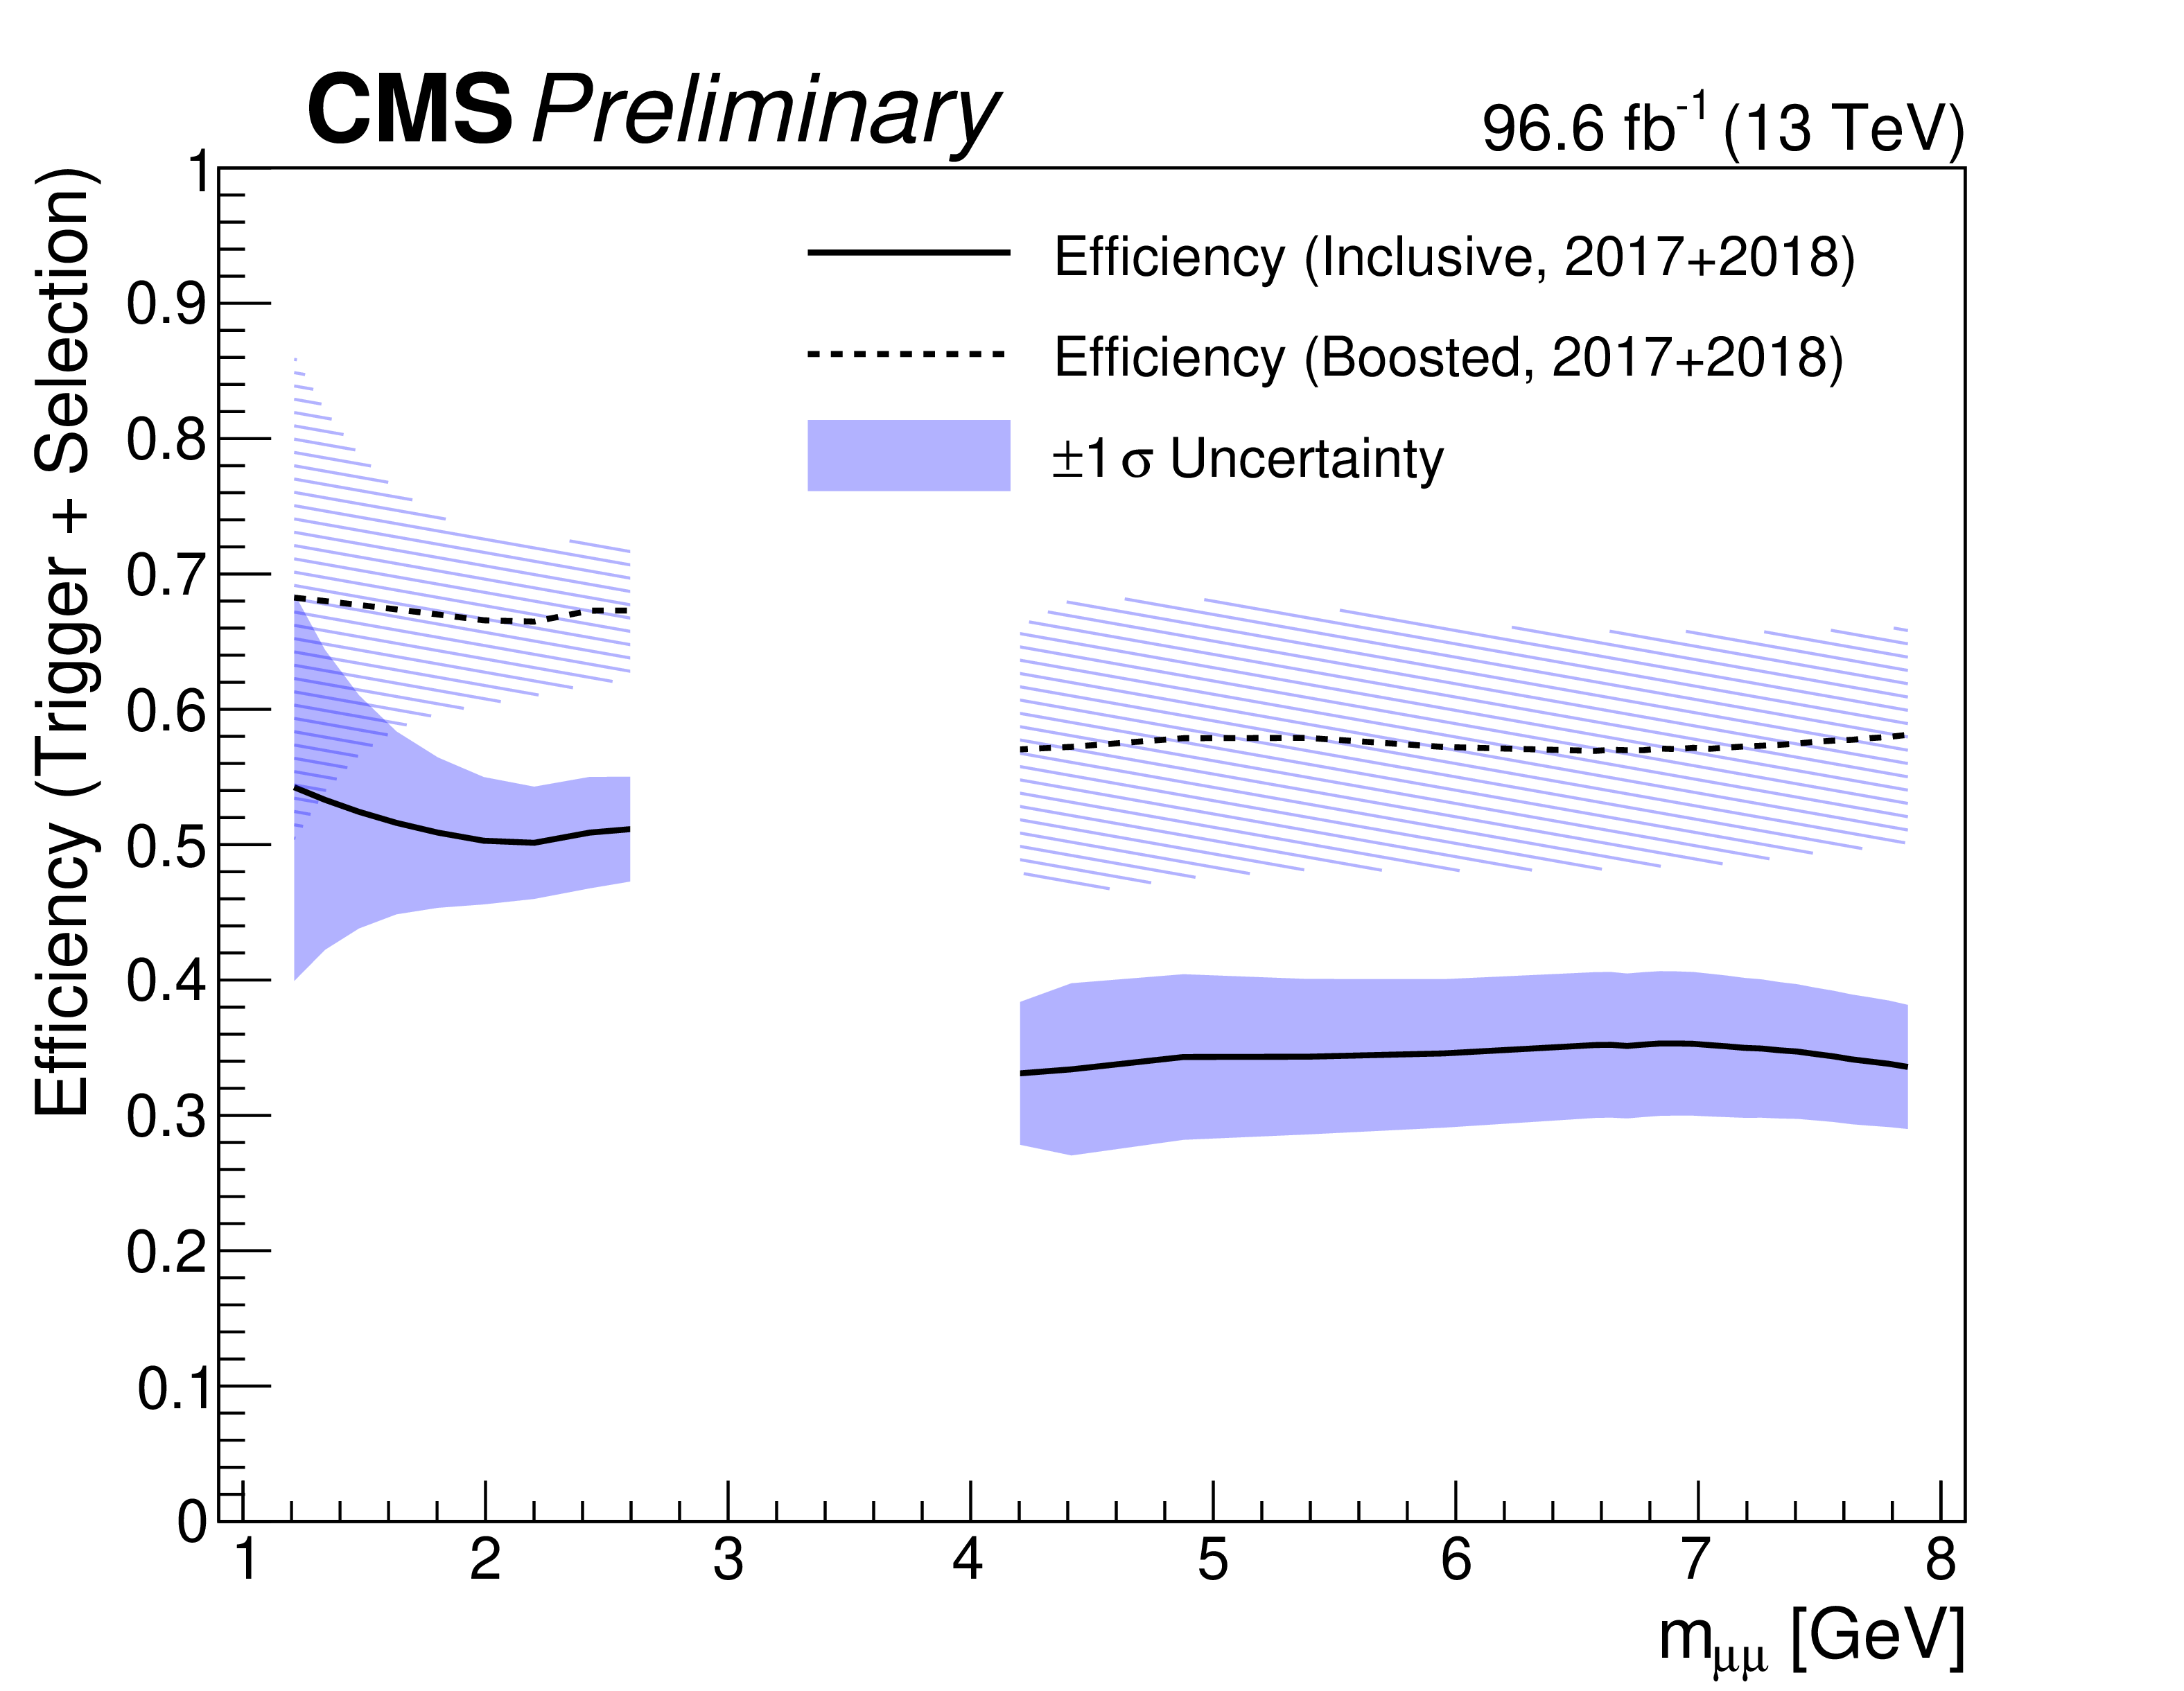
The combined efficiency of the dimuon scouting trigger and the MVA muon selection, averaged between 2017 and 2018, weighted by the integrated luminosity of each year. The solid line shows the efficiency of the inclusive selection used for the limit on the dark photon model. The dashed line shows the efficiency of the boosted selection optimized for the scalar model. |

png pdf |
Additional Figure 5:
Theory cross-section times branching fraction to muons times acceptance for the dark photon and 2HDM+S models. The dark photon theory cross section is calculated using MADGRAPH5_aMC@NLO v3.4.1 assuming $ \epsilon = $ 0.02, and the acceptance is derived using DYTurbo-1.2. The 2HDM+S model theory cross section is calculated using HIGLU at NNLO assuming $ \sin(\theta_{\rm H}) = $ 1, and the acceptance is derived from PYTHIA 8.230. |

png pdf |
Additional Figure 6:
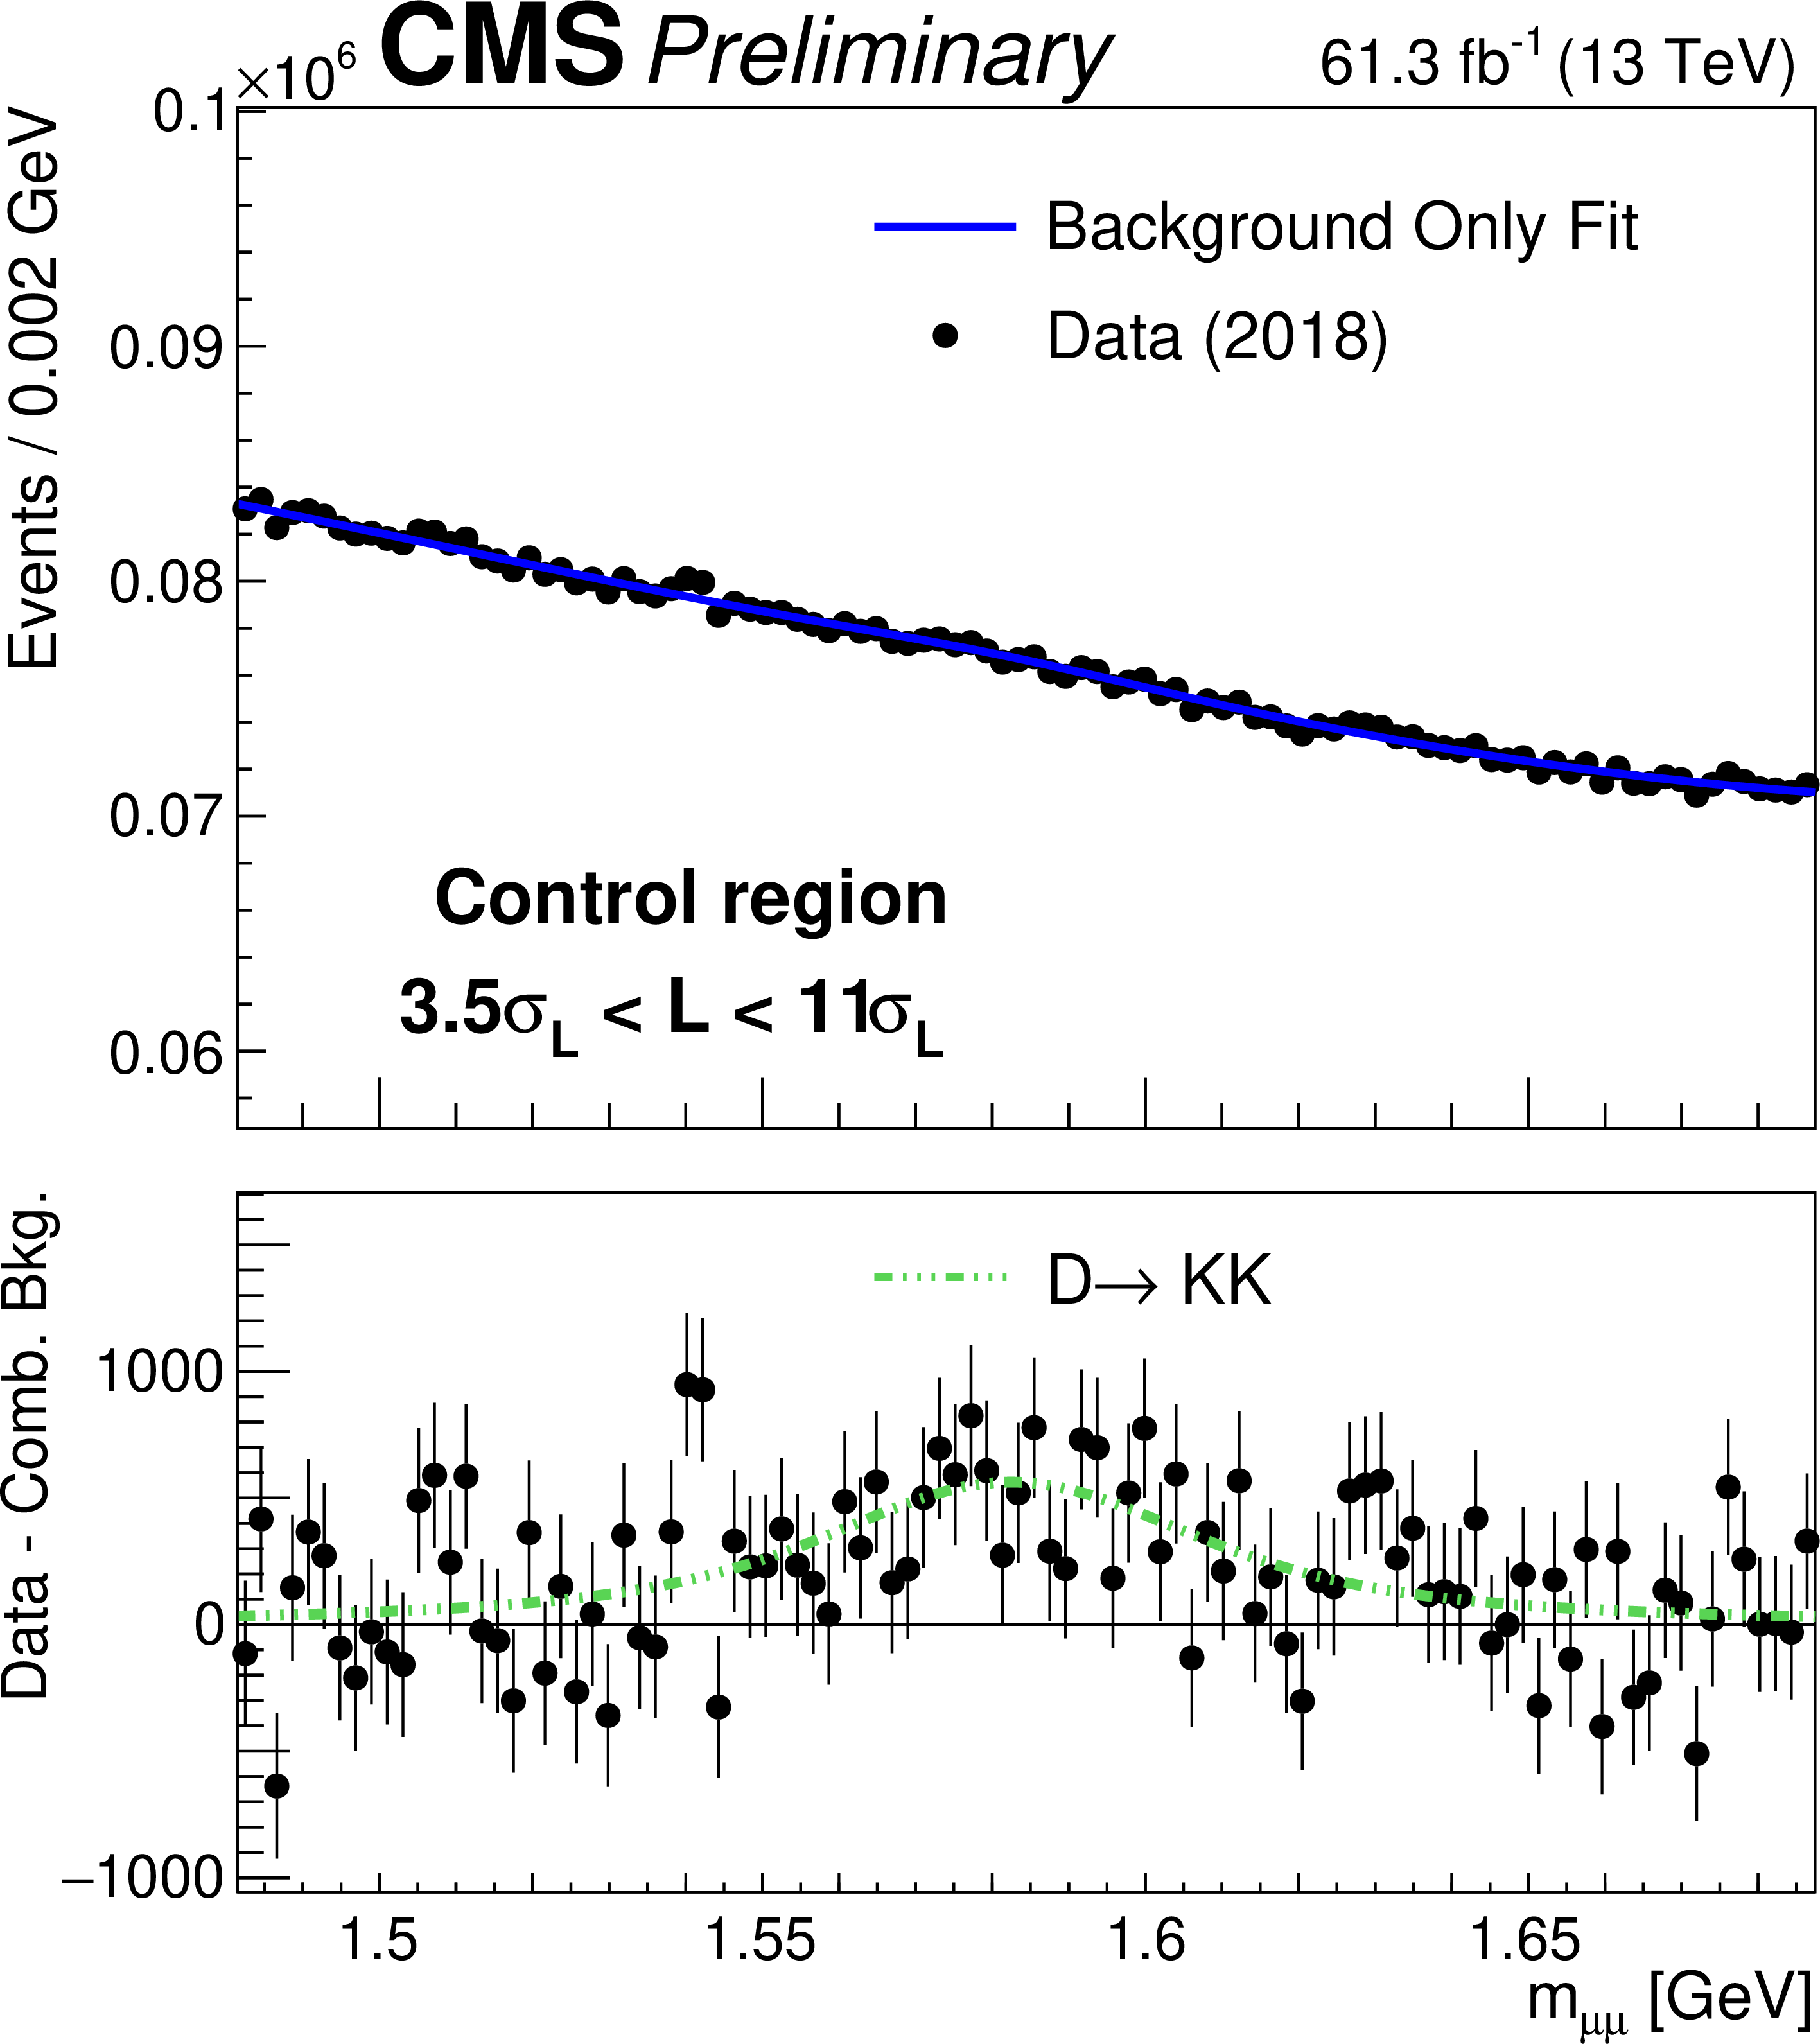
The contribution of $ \mathrm{D}\to \mathrm{K}\mathrm{K} $ in the simultaneous fit in signal region (left) and control regions (right) in 2018 data for the inclusive dimuon selection. The background contains non-peaking combinatorial background and $ \mathrm{D}\to \mathrm{K}\mathrm{K} $ background. In the bottom panel, the combinatorial background component in the signal plus background fit is subtracted from the observed data (``Data - Comb. Bkg.''). |

png pdf |
Additional Figure 6-a:
The contribution of $ \mathrm{D}\to \mathrm{K}\mathrm{K} $ in the simultaneous fit in signal region (left) and control regions (right) in 2018 data for the inclusive dimuon selection. The background contains non-peaking combinatorial background and $ \mathrm{D}\to \mathrm{K}\mathrm{K} $ background. In the bottom panel, the combinatorial background component in the signal plus background fit is subtracted from the observed data (``Data - Comb. Bkg.''). |
png pdf |
Additional Figure 6-b:
The contribution of $ \mathrm{D}\to \mathrm{K}\mathrm{K} $ in the simultaneous fit in signal region (left) and control regions (right) in 2018 data for the inclusive dimuon selection. The background contains non-peaking combinatorial background and $ \mathrm{D}\to \mathrm{K}\mathrm{K} $ background. In the bottom panel, the combinatorial background component in the signal plus background fit is subtracted from the observed data (``Data - Comb. Bkg.''). |
png pdf |
Additional Figure 7:
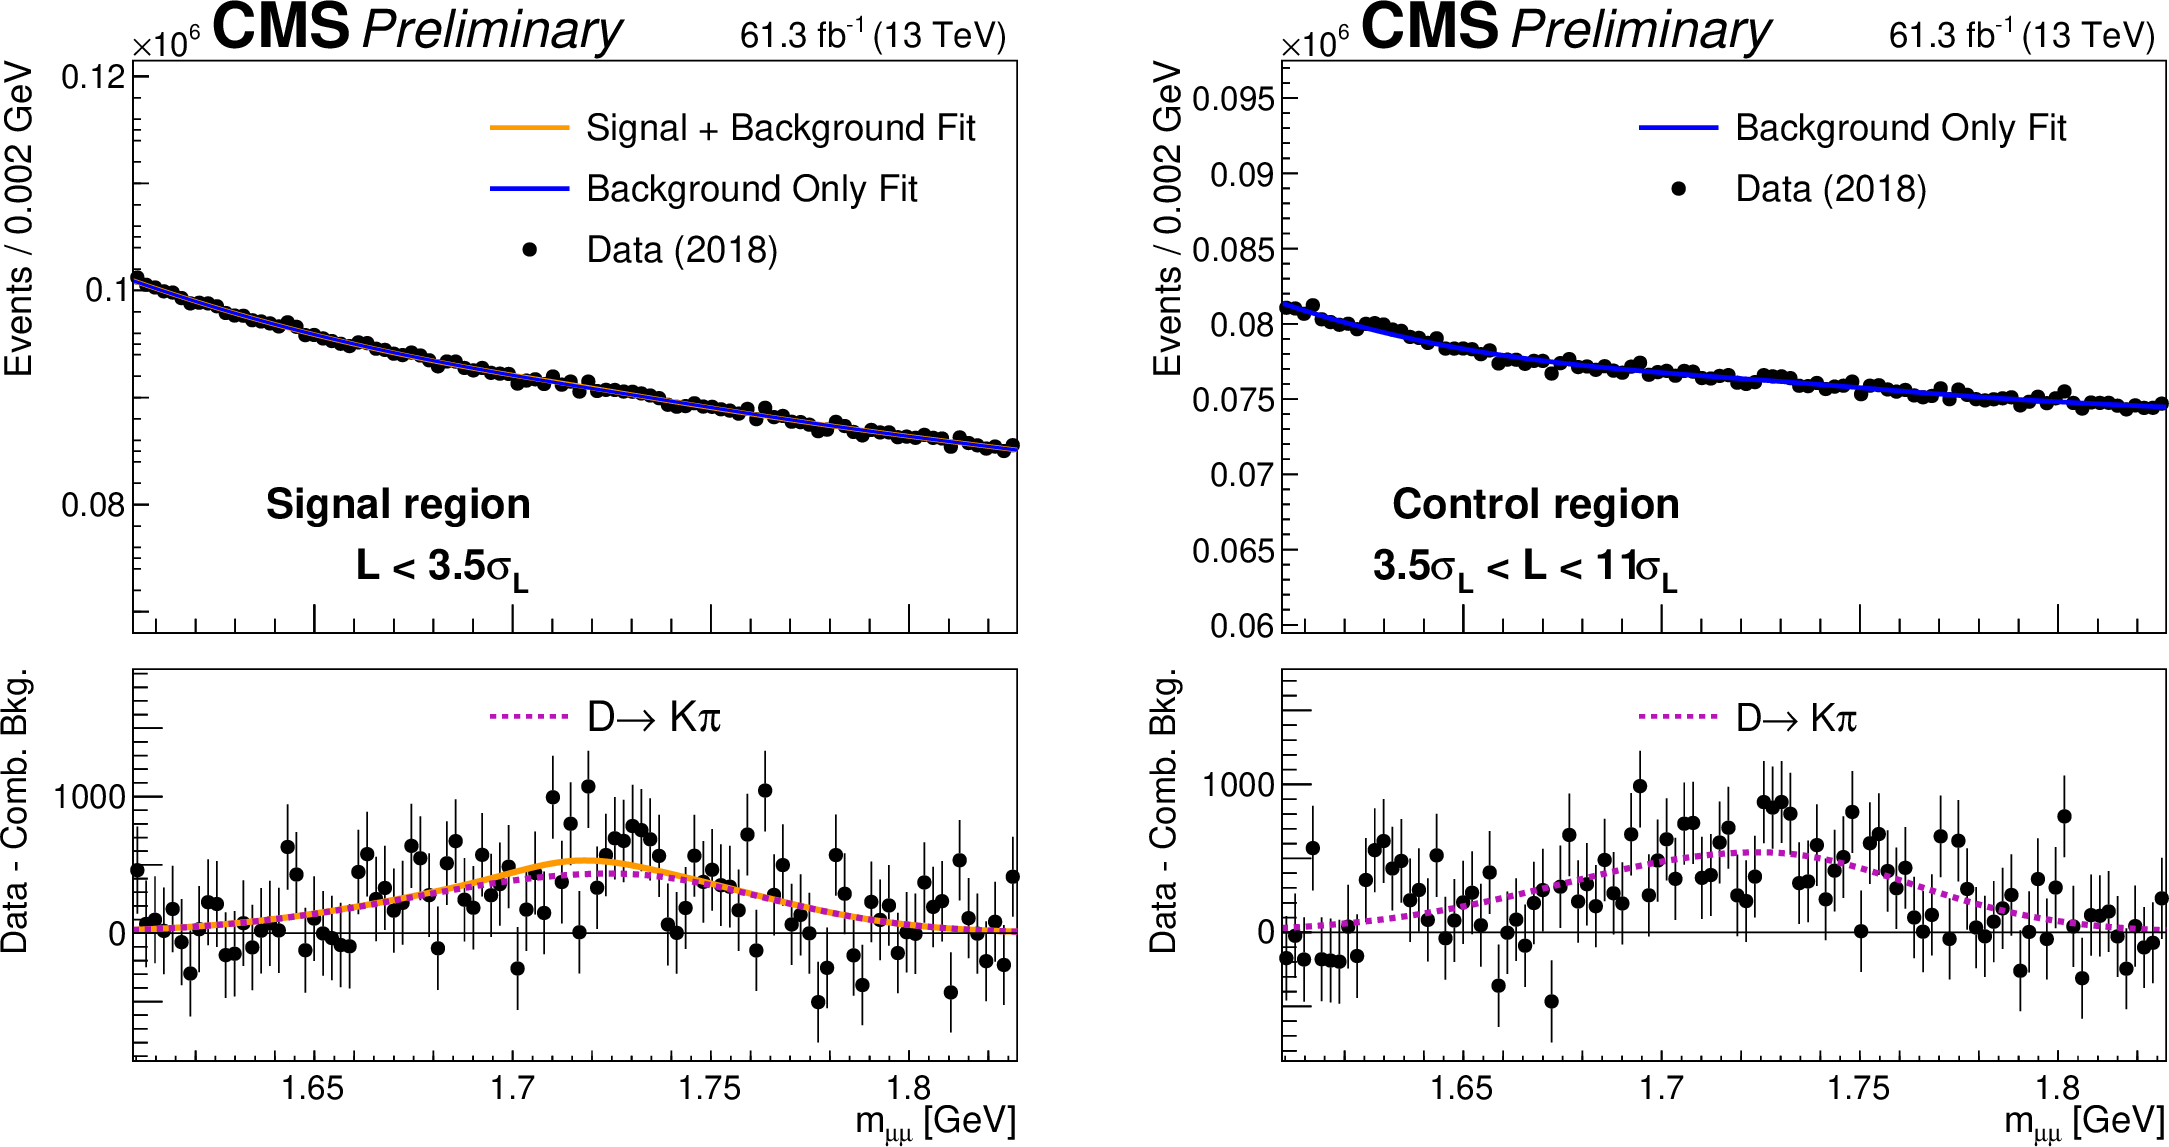
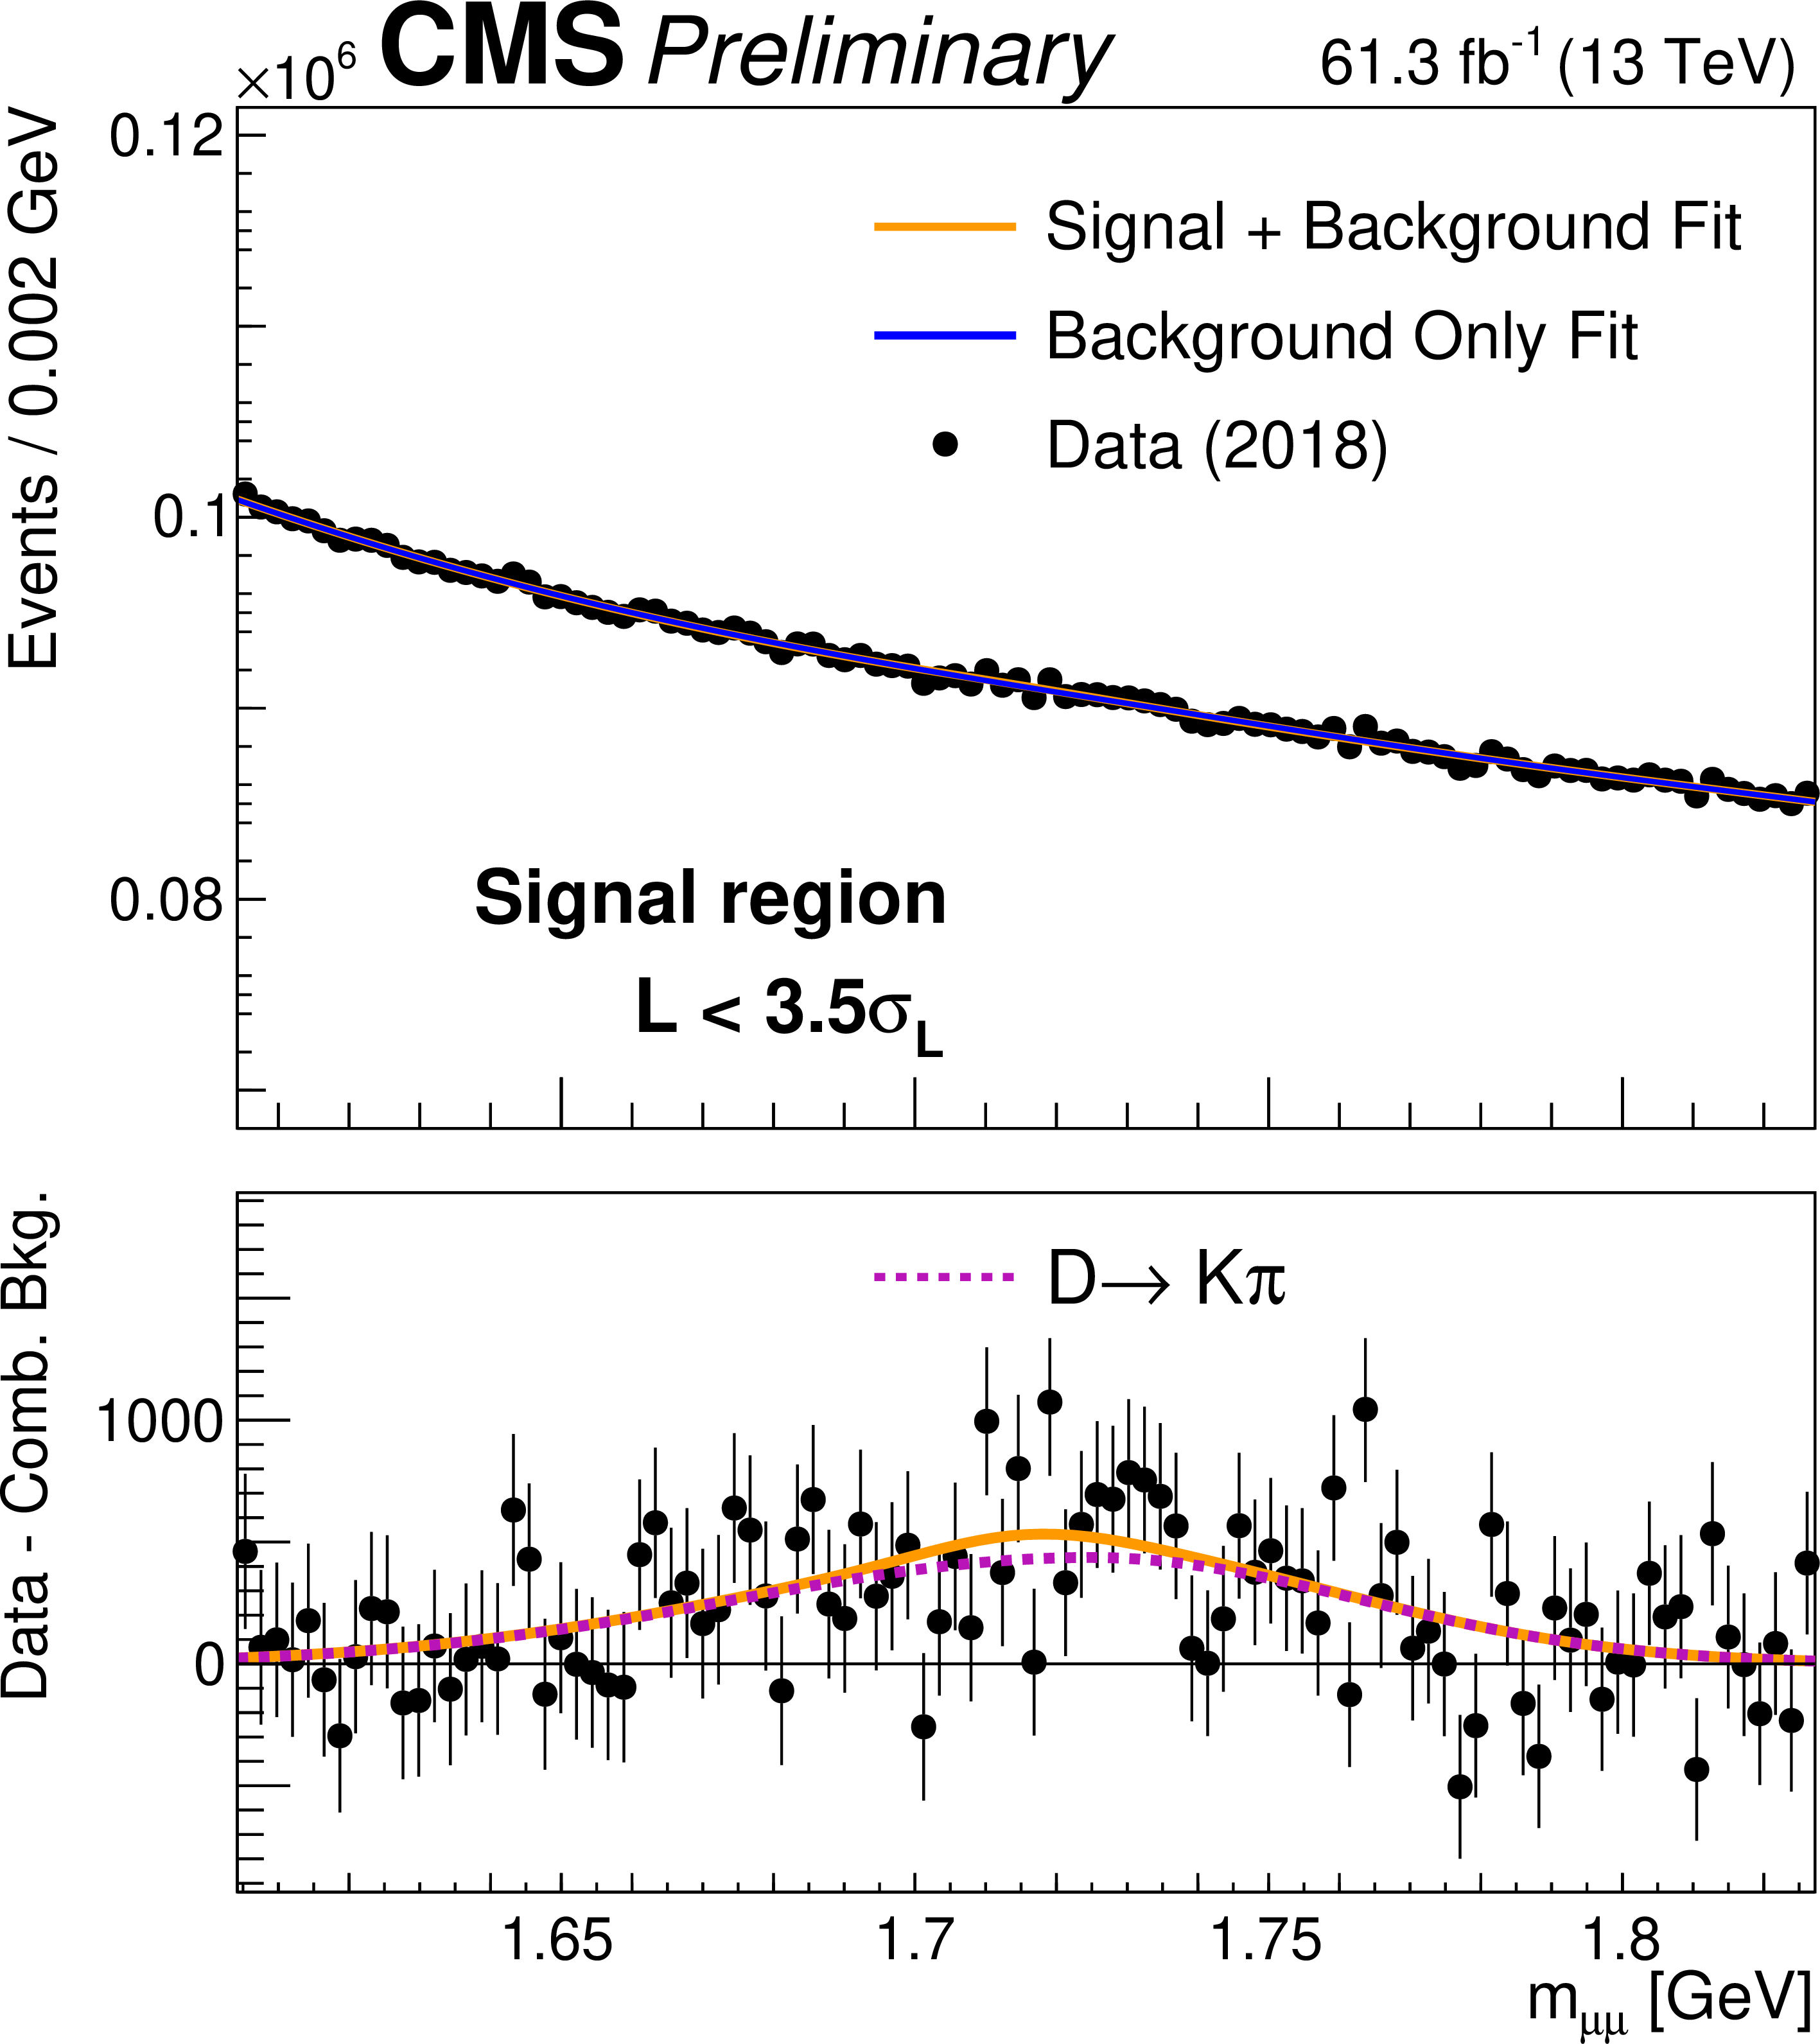
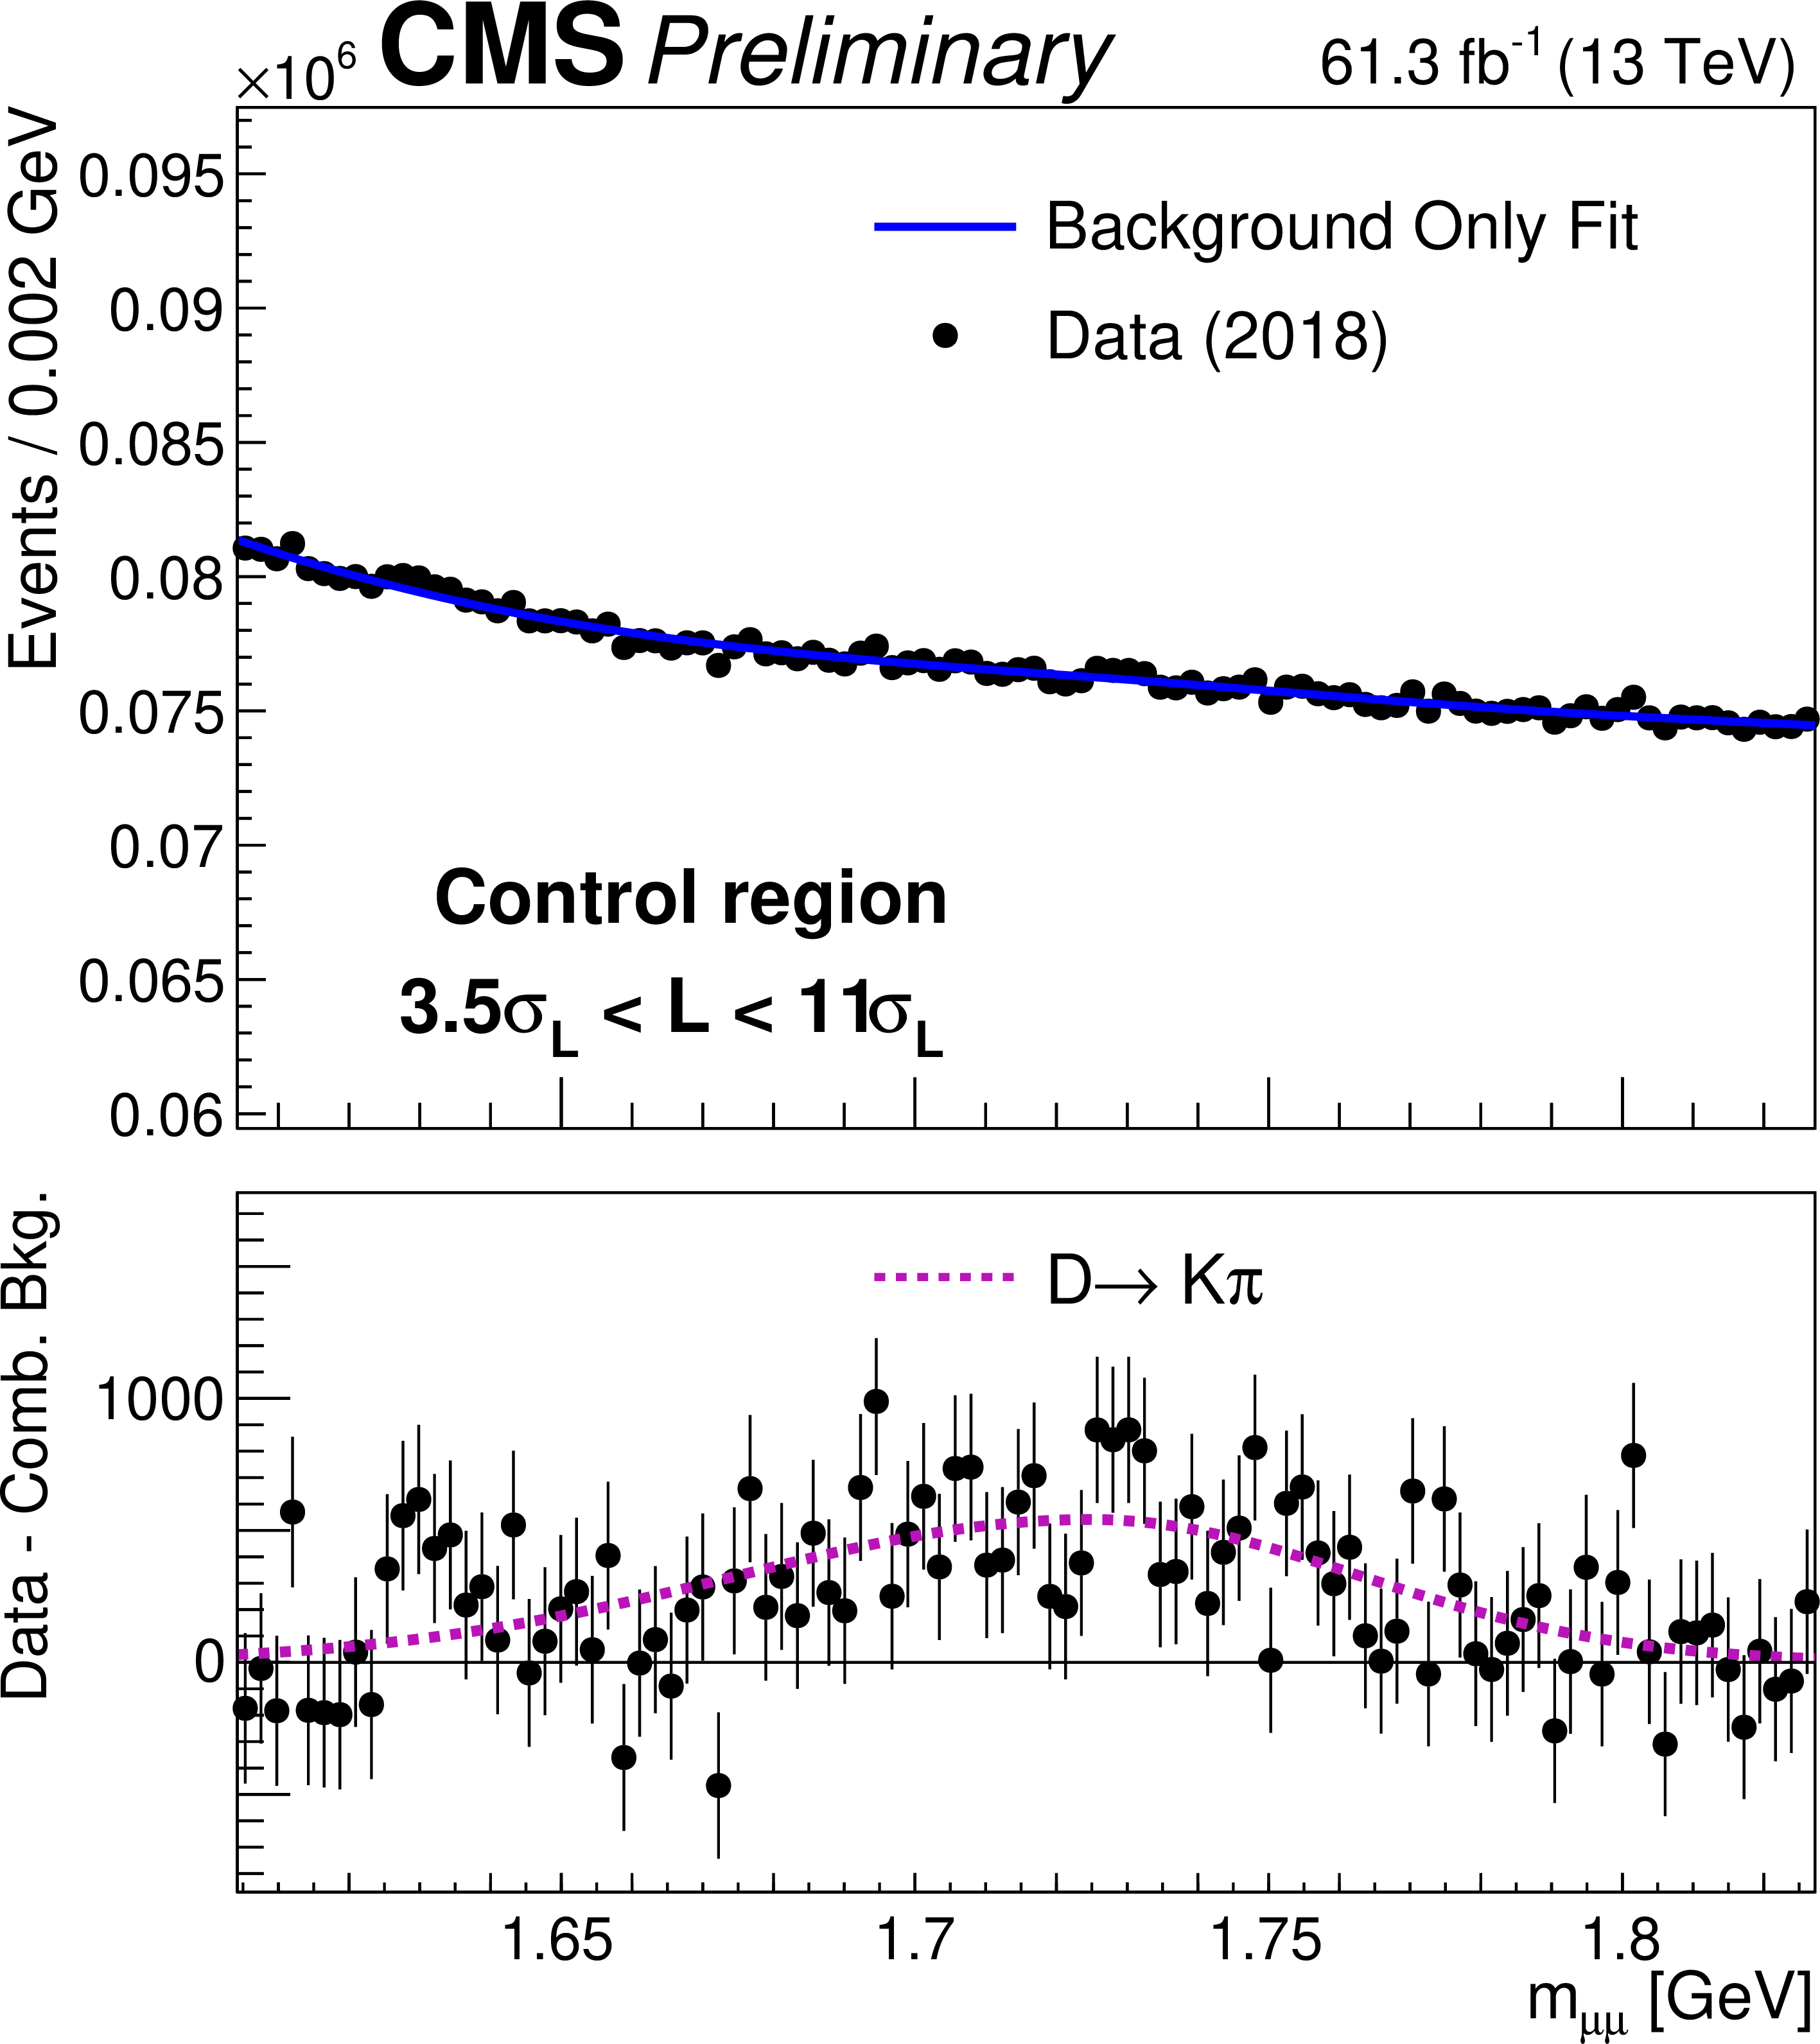
The contribution of $ \mathrm{D}\to\mathrm{K}\pi $ in the simultaneous fit in signal region (left) and control regions (right) in 2018 data for the inclusive dimuon selection. The background contains non-peaking combinatorial background and $ \mathrm{D}\to\mathrm{K}\pi $ background. In the bottom panel, the combinatorial background component in the signal plus background fit is subtracted from the observed data (``Data - Comb. Bkg.''). |
png pdf |
Additional Figure 7-a:
The contribution of $ \mathrm{D}\to\mathrm{K}\pi $ in the simultaneous fit in signal region (left) and control regions (right) in 2018 data for the inclusive dimuon selection. The background contains non-peaking combinatorial background and $ \mathrm{D}\to\mathrm{K}\pi $ background. In the bottom panel, the combinatorial background component in the signal plus background fit is subtracted from the observed data (``Data - Comb. Bkg.''). |
png pdf |
Additional Figure 7-b:
The contribution of $ \mathrm{D}\to\mathrm{K}\pi $ in the simultaneous fit in signal region (left) and control regions (right) in 2018 data for the inclusive dimuon selection. The background contains non-peaking combinatorial background and $ \mathrm{D}\to\mathrm{K}\pi $ background. In the bottom panel, the combinatorial background component in the signal plus background fit is subtracted from the observed data (``Data - Comb. Bkg.''). |

png pdf |
Additional Figure 8:
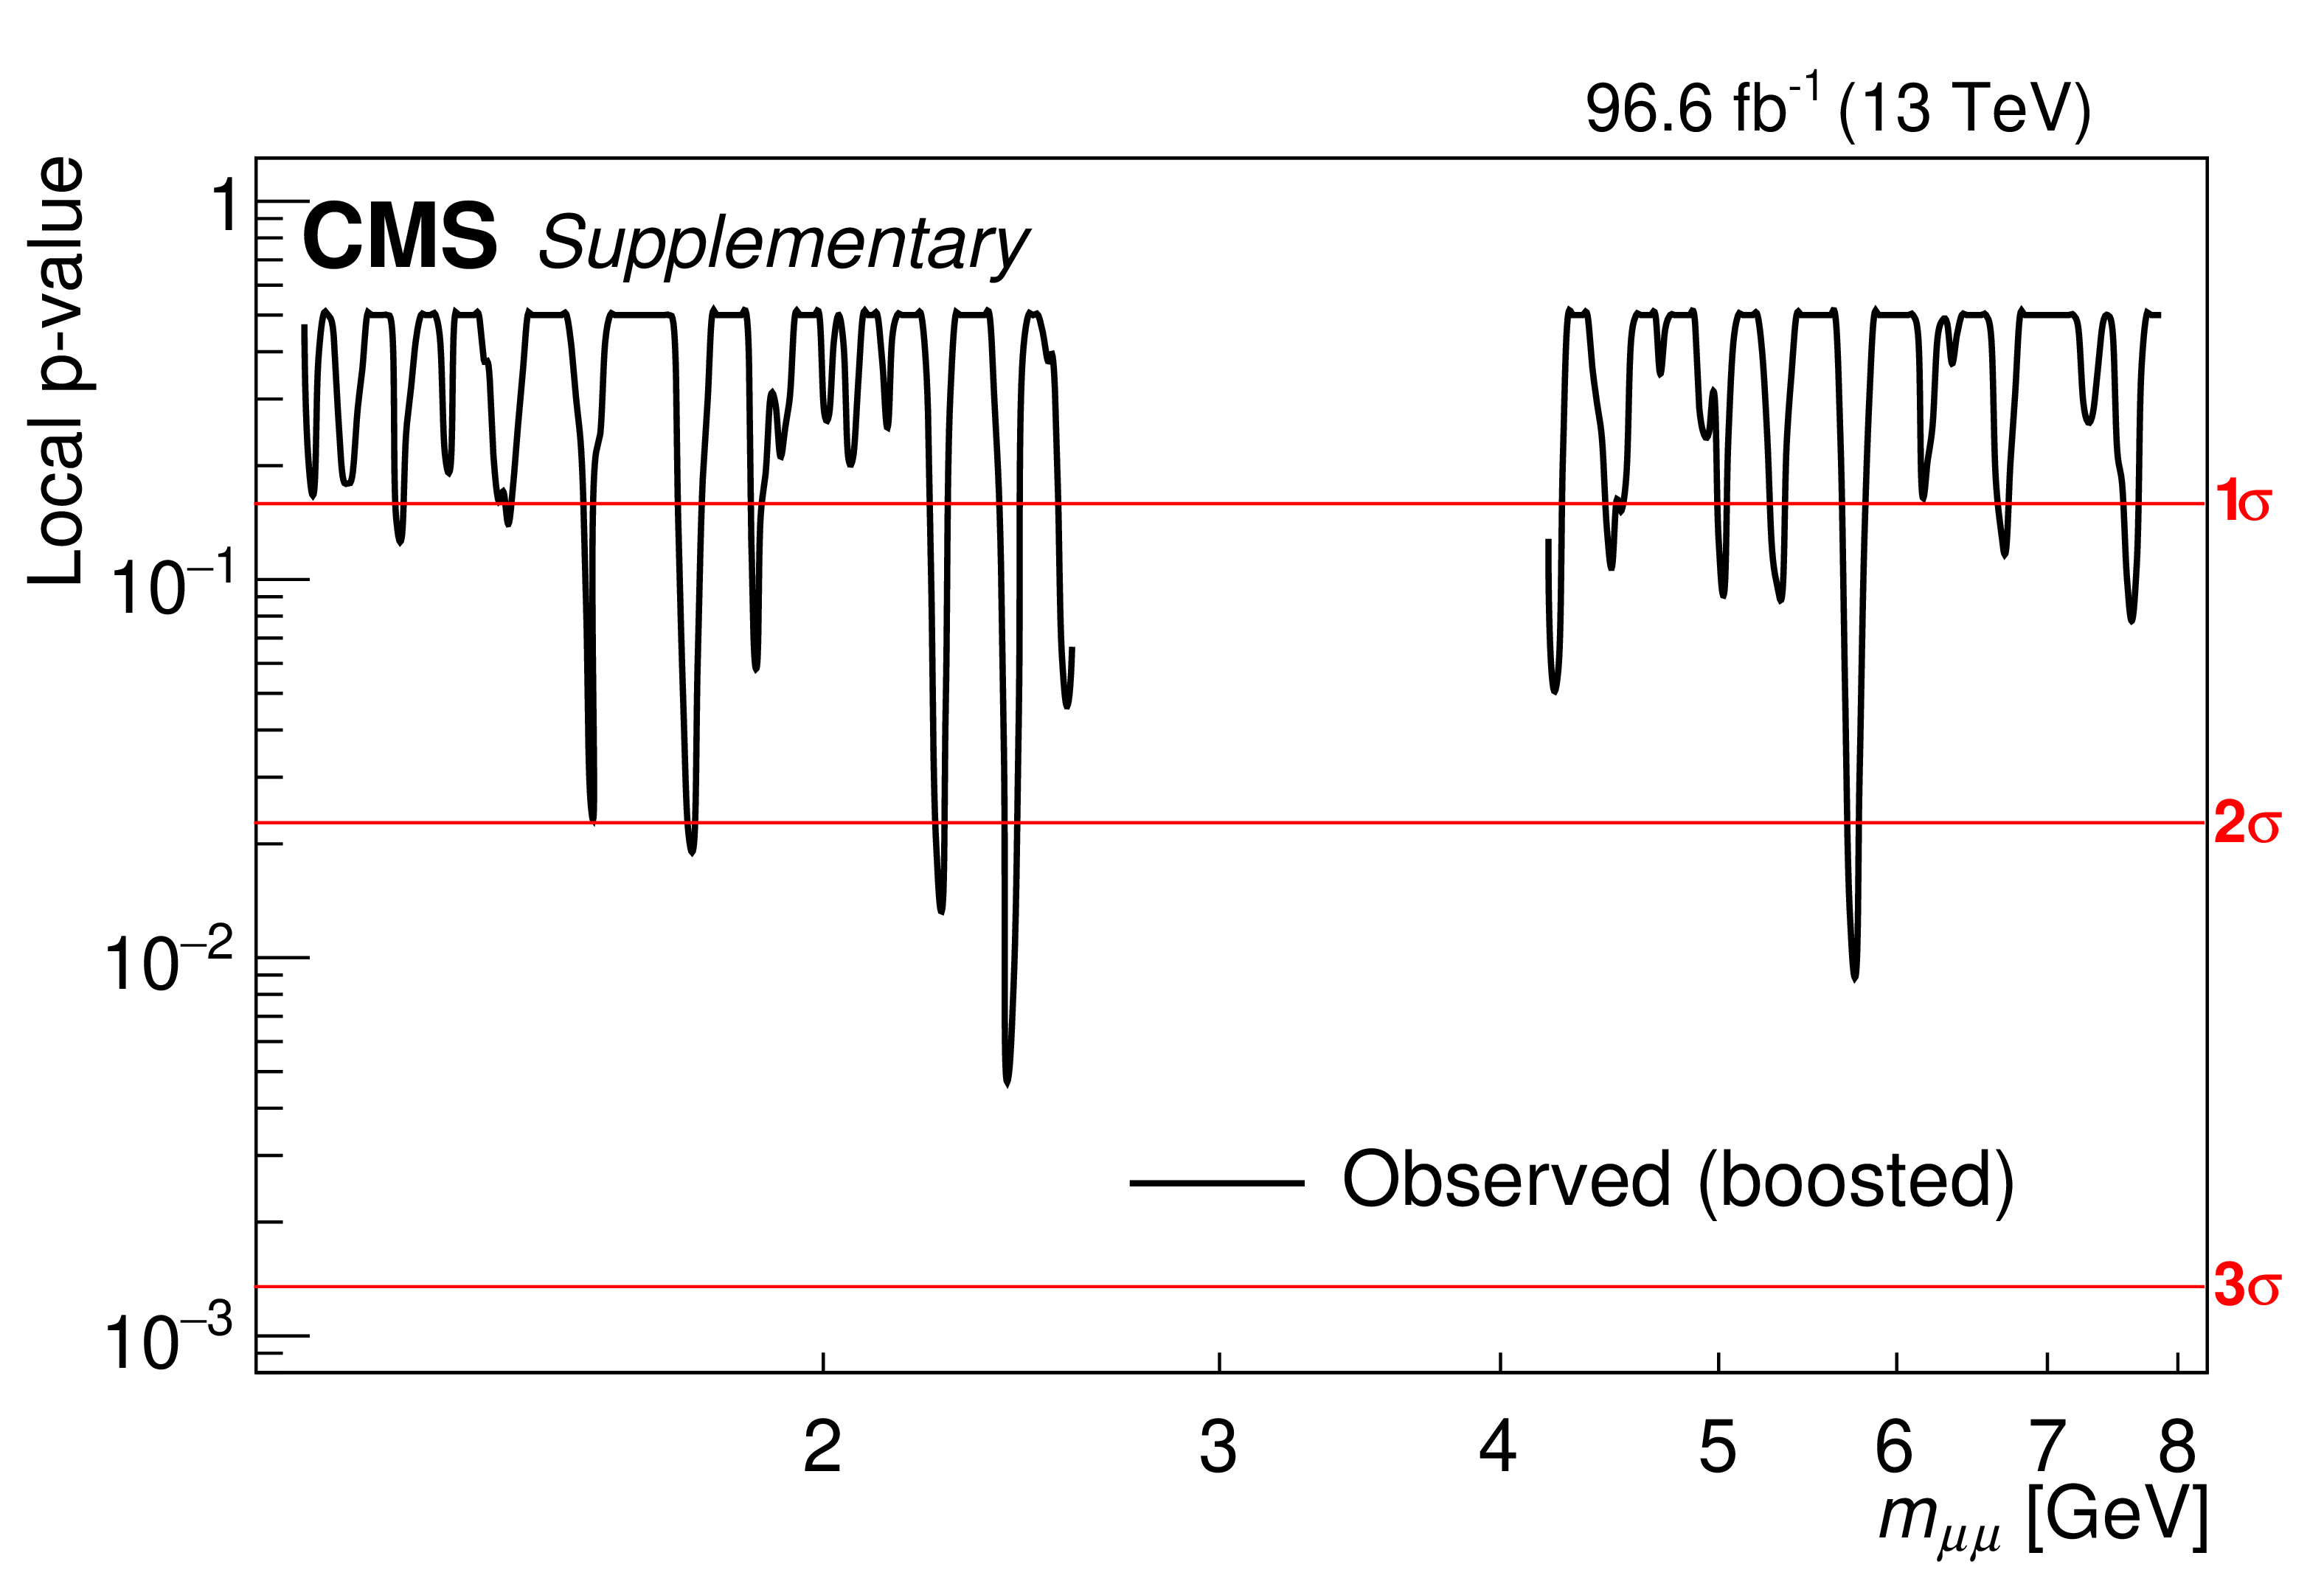
The observed local p-value for the inclusive dimuon selection (left) and high-$ p_{\mathrm{T}} $ selection (right). The mass region dominated by the J$ /\psi $ and $\psi $(2S) resonances is excluded from the search. |

png pdf |
Additional Figure 8-a:
The observed local p-value for the inclusive dimuon selection (left) and high-$ p_{\mathrm{T}} $ selection (right). The mass region dominated by the J$ /\psi $ and $\psi $(2S) resonances is excluded from the search. |
png pdf |
Additional Figure 8-b:
The observed local p-value for the inclusive dimuon selection (left) and high-$ p_{\mathrm{T}} $ selection (right). The mass region dominated by the J$ /\psi $ and $\psi $(2S) resonances is excluded from the search. |

png pdf |
Additional Figure 9:
The ROC curves of J$ /\psi $-trained and $ \Upsilon $-trained muon MVA identification in comparison to the cut-based identification used in the previous CMS dark photon search. |
| References | ||||
| 1 | J. J. Aubert et al. | Experimental observation of a heavy particle $ J $ | PRL 33 (1974) 1404 | |
| 2 | J. E. Augustin et al. | Discovery of a narrow resonance in $ {e}^{+}{e}^{-} $ annihilation | PRL 33 (1974) 1406 | |
| 3 | S. W. Herb et al. | Observation of a dimuon resonance at 9.5 GeV in 400-GeV proton-nucleus collisions | PRL 39 (1977) 252 | |
| 4 | UA1 Collaboration | Experimental observation of lepton pairs of invariant mass around 95 GeV/c$ ^2 $ at the CERN SPS collider | PLB 126 (1983) 398 | |
| 5 | ATLAS Collaboration | Observation of a new particle in the search for the Standard Model Higgs boson with the ATLAS detector at the LHC | PLB 716 (2012) 1 | 1207.7214 |
| 6 | CMS Collaboration | Observation of a new boson at a mass of 125 GeV with the CMS experiment at the LHC | PLB 716 (2012) 30 | CMS-HIG-12-028 1207.7235 |
| 7 | ATLAS Collaboration | Search for high-mass dilepton resonances using 139 fb$ ^{-1} $ of $ pp $ collision data collected at $ \sqrt{s}= $13 TeV with the ATLAS detector | PLB 796 (2019) 68 | 1903.06248 |
| 8 | CMS Collaboration | Search for resonant and nonresonant new phenomena in high-mass dilepton final states at $ \sqrt{s} = $ 13 TeV | JHEP 07 (2021) | CMS-EXO-19-019 2103.02708 |
| 9 | CMS Collaboration | Search for high mass dijet resonances with a new background prediction method in proton-proton collisions at $ \sqrt{s} = $ 13 TeV | JHEP 05 (2020) 033 | CMS-EXO-19-012 1911.03947 |
| 10 | CMS Collaboration | Search for physics beyond the standard model in high-mass diphoton events from proton-proton collisions at $ \sqrt{s} = $ 13 TeV | PRD 98 (2018) 092001 | CMS-EXO-17-017 1809.00327 |
| 11 | N. Arkani-Hamed, D. P. Finkbeiner, T. R. Slatyer, and N. Weiner | A theory of dark matter | PRD 79 (2009) | 0810.0713 |
| 12 | BaBar Collaboration | Search for a dark photon in $ e^+e^- $ collisions at BaBar | PRL 113 (2014) 201801 | 1406.2980 |
| 13 | LHCb Collaboration | Search for dark photons produced in 13 TeV $ pp $ collisions | PRL 120 (2018) 061801 | 1710.02867 |
| 14 | LHCb Collaboration | Search for $ A'\to\mu^+\mu^- $ decays | PRL 124 (2020) 041801 | 1910.06926 |
| 15 | CMS Collaboration | Search for a narrow resonance lighter than 200 GeV decaying to a pair of muons in proton-proton collisions at $ \sqrt{s} = $ 13 TeV | PRL 124 (2020) 131802 | CMS-EXO-19-018 1912.04776 |
| 16 | P. Galison and A. Manohar | Two Z's or not two Z's? | PLB 136 (1984) 279 | |
| 17 | B. Holdom | Two U(1)'s and $ \epsilon $ charge shifts | PLB 166 (1986) 196 | |
| 18 | D. Curtin, R. Essig, S. Gori, and J. Shelton | Illuminating dark photons with high-energy colliders | JHEP 02 (2015) 157 | 1412.0018 |
| 19 | U. Haisch, J. F. Kamenik, A. Malinauskas, and M. Spira | Collider constraints on light pseudoscalars | JHEP 03 (2018) | |
| 20 | CMS Collaboration | The CMS experiment at the CERN LHC | JINST 3 (2008) S08004 | |
| 21 | CMS Collaboration | Search for narrow resonances in dijet final states at $ \sqrt{s}= $8 TeV with the novel CMS technique of data scouting | PRL 117 (2016) 031802 | |
| 22 | CMS Collaboration | Search for dijet resonances in proton-proton collisions at $ \sqrt{s} = $ 13 TeV and constraints on dark matter and other models | Physics Letters B 769 (2017) 520 | |
| 23 | S. Mukherjee | Data Scouting: A New Trigger Paradigm | for the CMS Collaboration, in 5th Large Hadron Collider Physics Conference, 2017 | 1708.06925 |
| 24 | T. Sjöstrand et al. | An introduction to PYTHIA 8.2 | Comput. Phys. Commun. 191 (2015) 159 | 1410.3012 |
| 25 | S. Gopalakrishna, S. Jung, and J. D. Wells | Higgs boson decays to four fermions through an abelian hidden sector | PRD 78 (2008) 055002 | 0801.3456 |
| 26 | D. Curtin et al. | Exotic decays of the 125 GeV Higgs boson | PRD 90 (2014) 075004 | |
| 27 | J. Alwall et al. | The automated computation of tree-level and next-to-leading order differential cross sections, and their matching to parton shower simulations | JHEP 07 (2014) | |
| 28 | NNPDF Collaboration | Parton distributions for the LHC Run II | JHEP 04 (2015) 040 | 1410.8849 |
| 29 | CMS Collaboration | Event generator tunes obtained from underlying event and multiparton scattering measurements | EPJC 76 (2016) 155 | CMS-GEN-14-001 1512.00815 |
| 30 | GEANT4 Collaboration | GEANT4--a simulation toolkit | NIM A 506 (2003) 250 | |
| 31 | B. P. Roe et al. | Boosted decision trees, an alternative to artificial neural networks | NIM A 543 (2005) 577 | physics/0408124 |
| 32 | CMS Collaboration | Performance of CMS muon reconstruction in pp collision events at $ \sqrt{s} = $ 7 TeV | JINST 7 (2012) P10002 | |
| 33 | J. E. Gaiser | Charmonium Spectroscopy from Radiative Decays of the J/$ \Psi $ and $ \Psi^{\prime} $ | PhD thesis, Stanford University, SLAC Report SLAC-R-255, 1982 link |
|
| 34 | S. Bernstein | Démonstration du théor\ème de Weierstrass fondée sur le calcul des probabilitiés | Comm. Soc. Math. Kharkov 13 (1912) 1 | |
| 35 | R. A. Fisher | On the interpretation of $ \chi^{2} $ from contingency tables, and the calculation of P | J. R. Stat. Soc. 85 (1922) 87 | |
| 36 | P. D. Dauncey, M. Kenzie, N. Wardle, and G. J. Davies | Handling uncertainties in background shapes: the discrete profiling method | JINST 10 (2015) P04015 | 1408.6865 |
| 37 | CMS Collaboration | CMS luminosity measurement for the 2017 data-taking period at $ \sqrt{s}= $ 13 TeV | CMS Physics Analysis Summary, 2018 link |
CMS-PAS-LUM-17-001 |
| 38 | CMS Collaboration | CMS luminosity measurement for the 2018 data-taking period at $ \sqrt{s}= $ 13 TeV | CMS Physics Analysis Summary, 2019 link |
CMS-PAS-LUM-18-002 |
| 39 | A. L. Read | Presentation of search results: The CL(s) technique | JPG 28 (2002) 2693 | |
| 40 | G. Cowan, K. Cranmer, E. Gross, and O. Vitells | Asymptotic formulae for likelihood-based tests of new physics | EPJC 71 (2011) 1554 | 1007.1727 |
| 41 | T. Junk | Confidence level computation for combining searches with small statistics | NIM A 434 (1999) 435 | hep-ex/9902006 |
| 42 | LHCb Collaboration | Searches for low-mass dimuon resonances | JHEP 10 (2020) 156 | 2007.03923 |
| 43 | K. R. Dienes, C. F. Kolda, and J. March-Russell | Kinetic mixing and the supersymmetric gauge hierarchy | NPB 492 (1997) 104 | hep-ph/9610479 |
| 44 | S. Camarda et al. | Dyturbo: Fast predictions for drell-yan processes | EPJC 80 (2020) 251 | 1910.07049 |
| 45 | P. Ilten, Y. Soreq, M. Williams, and W. Xue | Serendipity in dark photon searches | JHEP 06 (2018) 004 | 1801.04847 |
|
|
Compact Muon Solenoid LHC, CERN |
|

|

|

|

|

|