

Compact Muon Solenoid
LHC, CERN
| CMS-PAS-EXO-18-005 | ||
| Search for vector-like leptons in multilepton final states in pp collisions at $\sqrt{s} = $ 13 TeV | ||
| CMS Collaboration | ||
| July 2018 | ||
| Abstract: A search for an SU(2) doublet of vector-like leptons with preferential couplings to the third generation standard model leptons is presented studying multilepton final states. The data sample corresponds to 41.4 fb$^{-1}$ of integrated luminosity in pp collisions at $\sqrt{s} = $ 13 TeV collected by the CMS experiment at the Large Hadron Collider in 2017. Events are categorized based on the multiplicity of light leptons and taus. The missing transverse momentum and the scalar sum of transverse momenta of leptons are used to discriminate the signal against standard model backgrounds. The observations are consistent with the expectations from the standard model processes. These results are used to exclude vector-like leptons in the mass range of 130-690 GeV. | ||
|
Links:
CDS record (PDF) ;
CADI line (restricted) ;
These preliminary results are superseded in this paper, PRD. 100 (2019) 052003. The superseded preliminary plots can be found here. |
||
| Figures | |
png pdf |
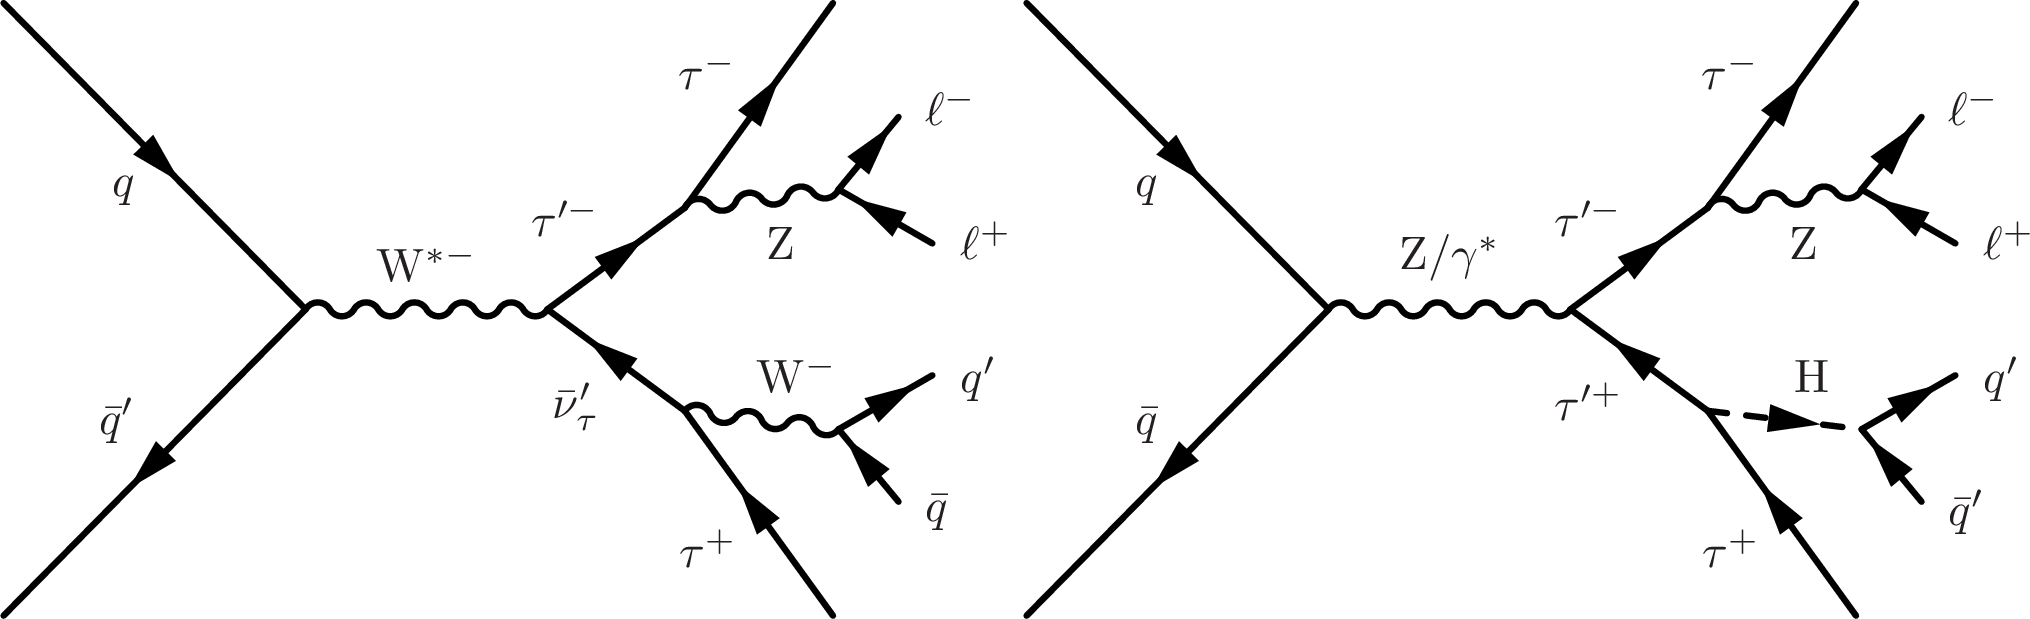
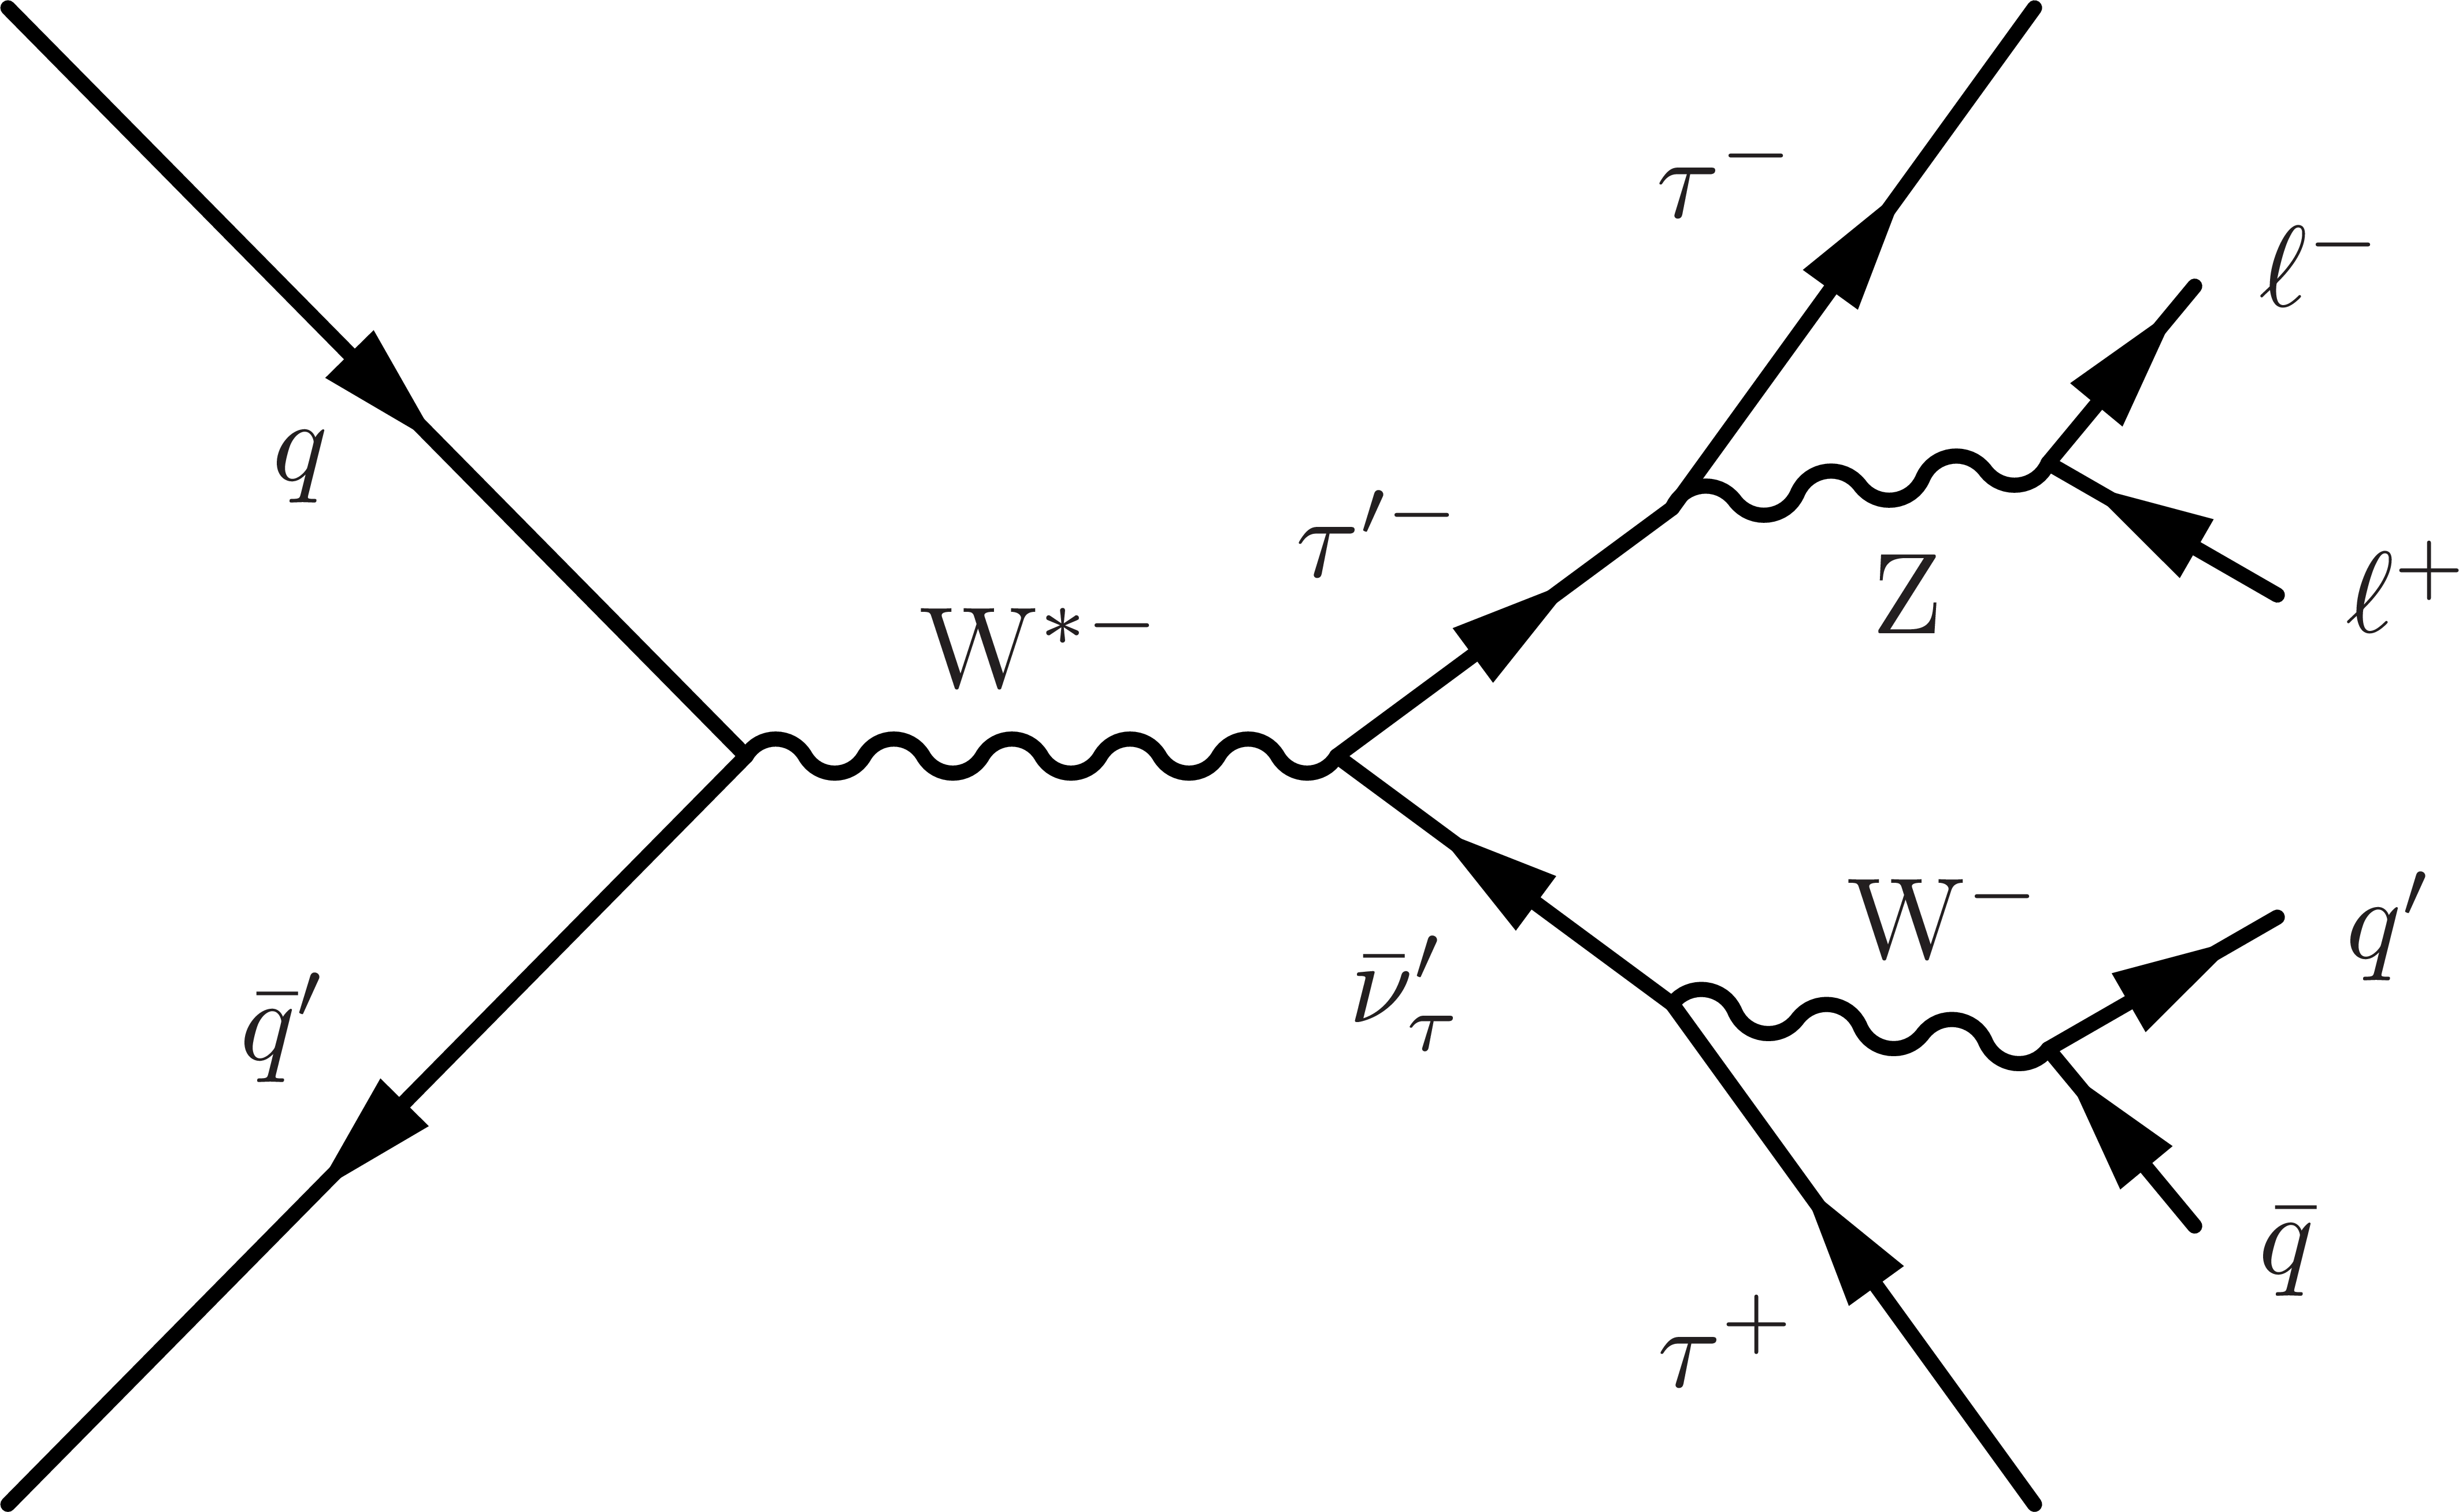
Figure 1:
Associated production of ($ {\tau}'$, $ {\nu _{\tau}}'$) pairs via an off-shell W (left) and Z (right) boson, as well as possible subsequent decay chains that result in multileptonic final states. |
png pdf |
Figure 1-a:
Associated production of ($ {\tau}'$, $ {\nu _{\tau}}'$) pairs via an off-shell W (left) and Z (right) boson, as well as possible subsequent decay chains that result in multileptonic final states. |

png pdf |
Figure 1-b:
Associated production of ($ {\tau}'$, $ {\nu _{\tau}}'$) pairs via an off-shell W (left) and Z (right) boson, as well as possible subsequent decay chains that result in multileptonic final states. |
png pdf |
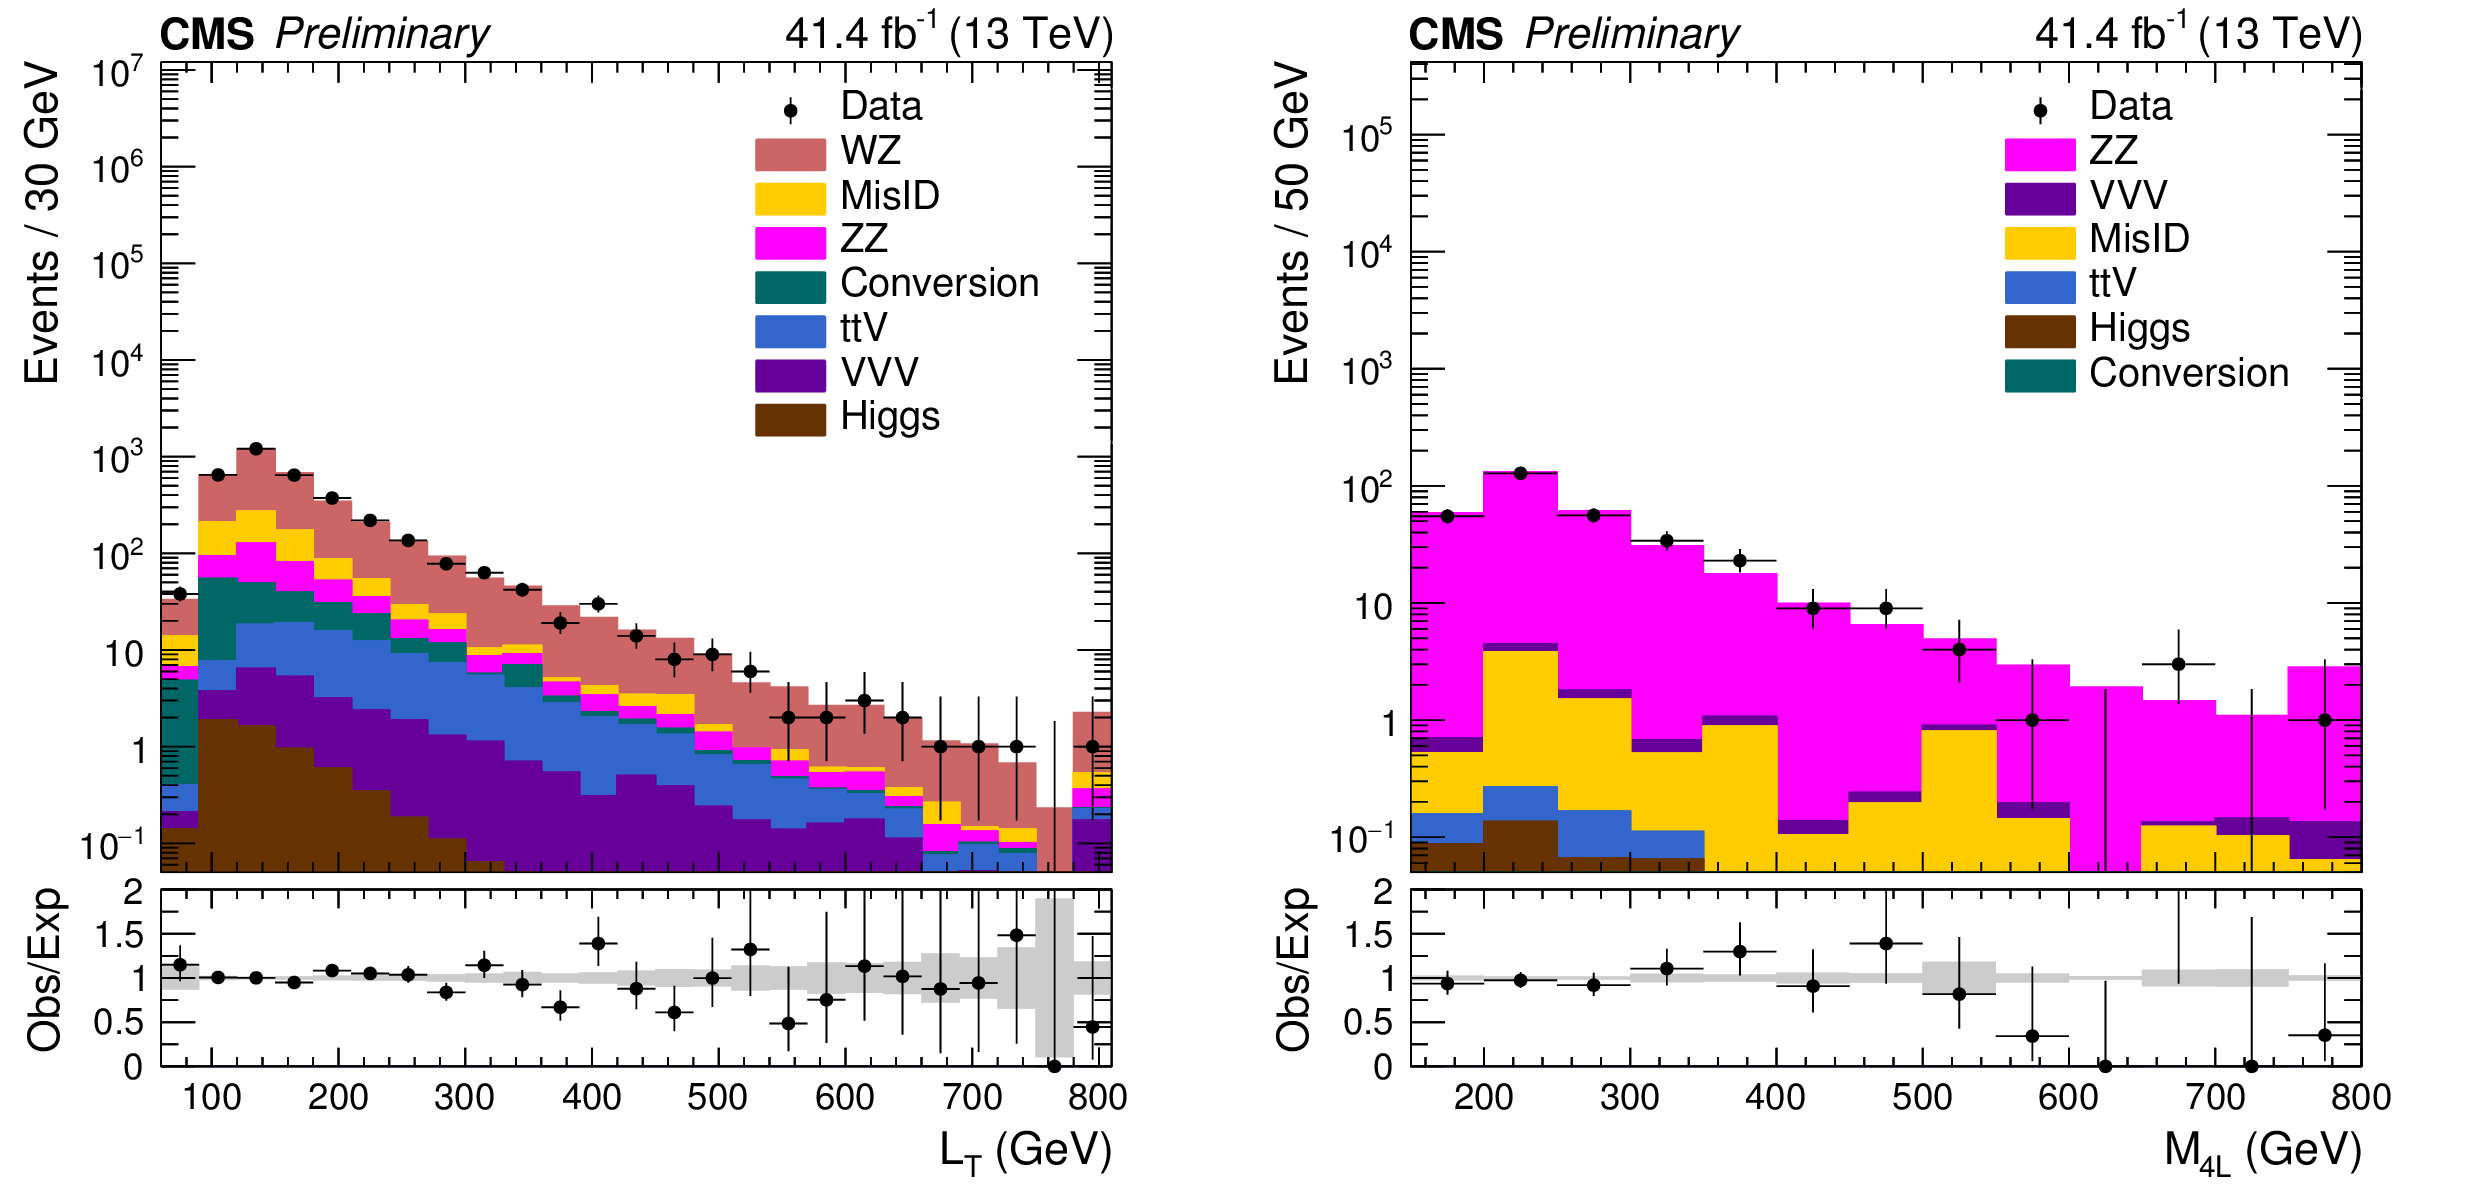
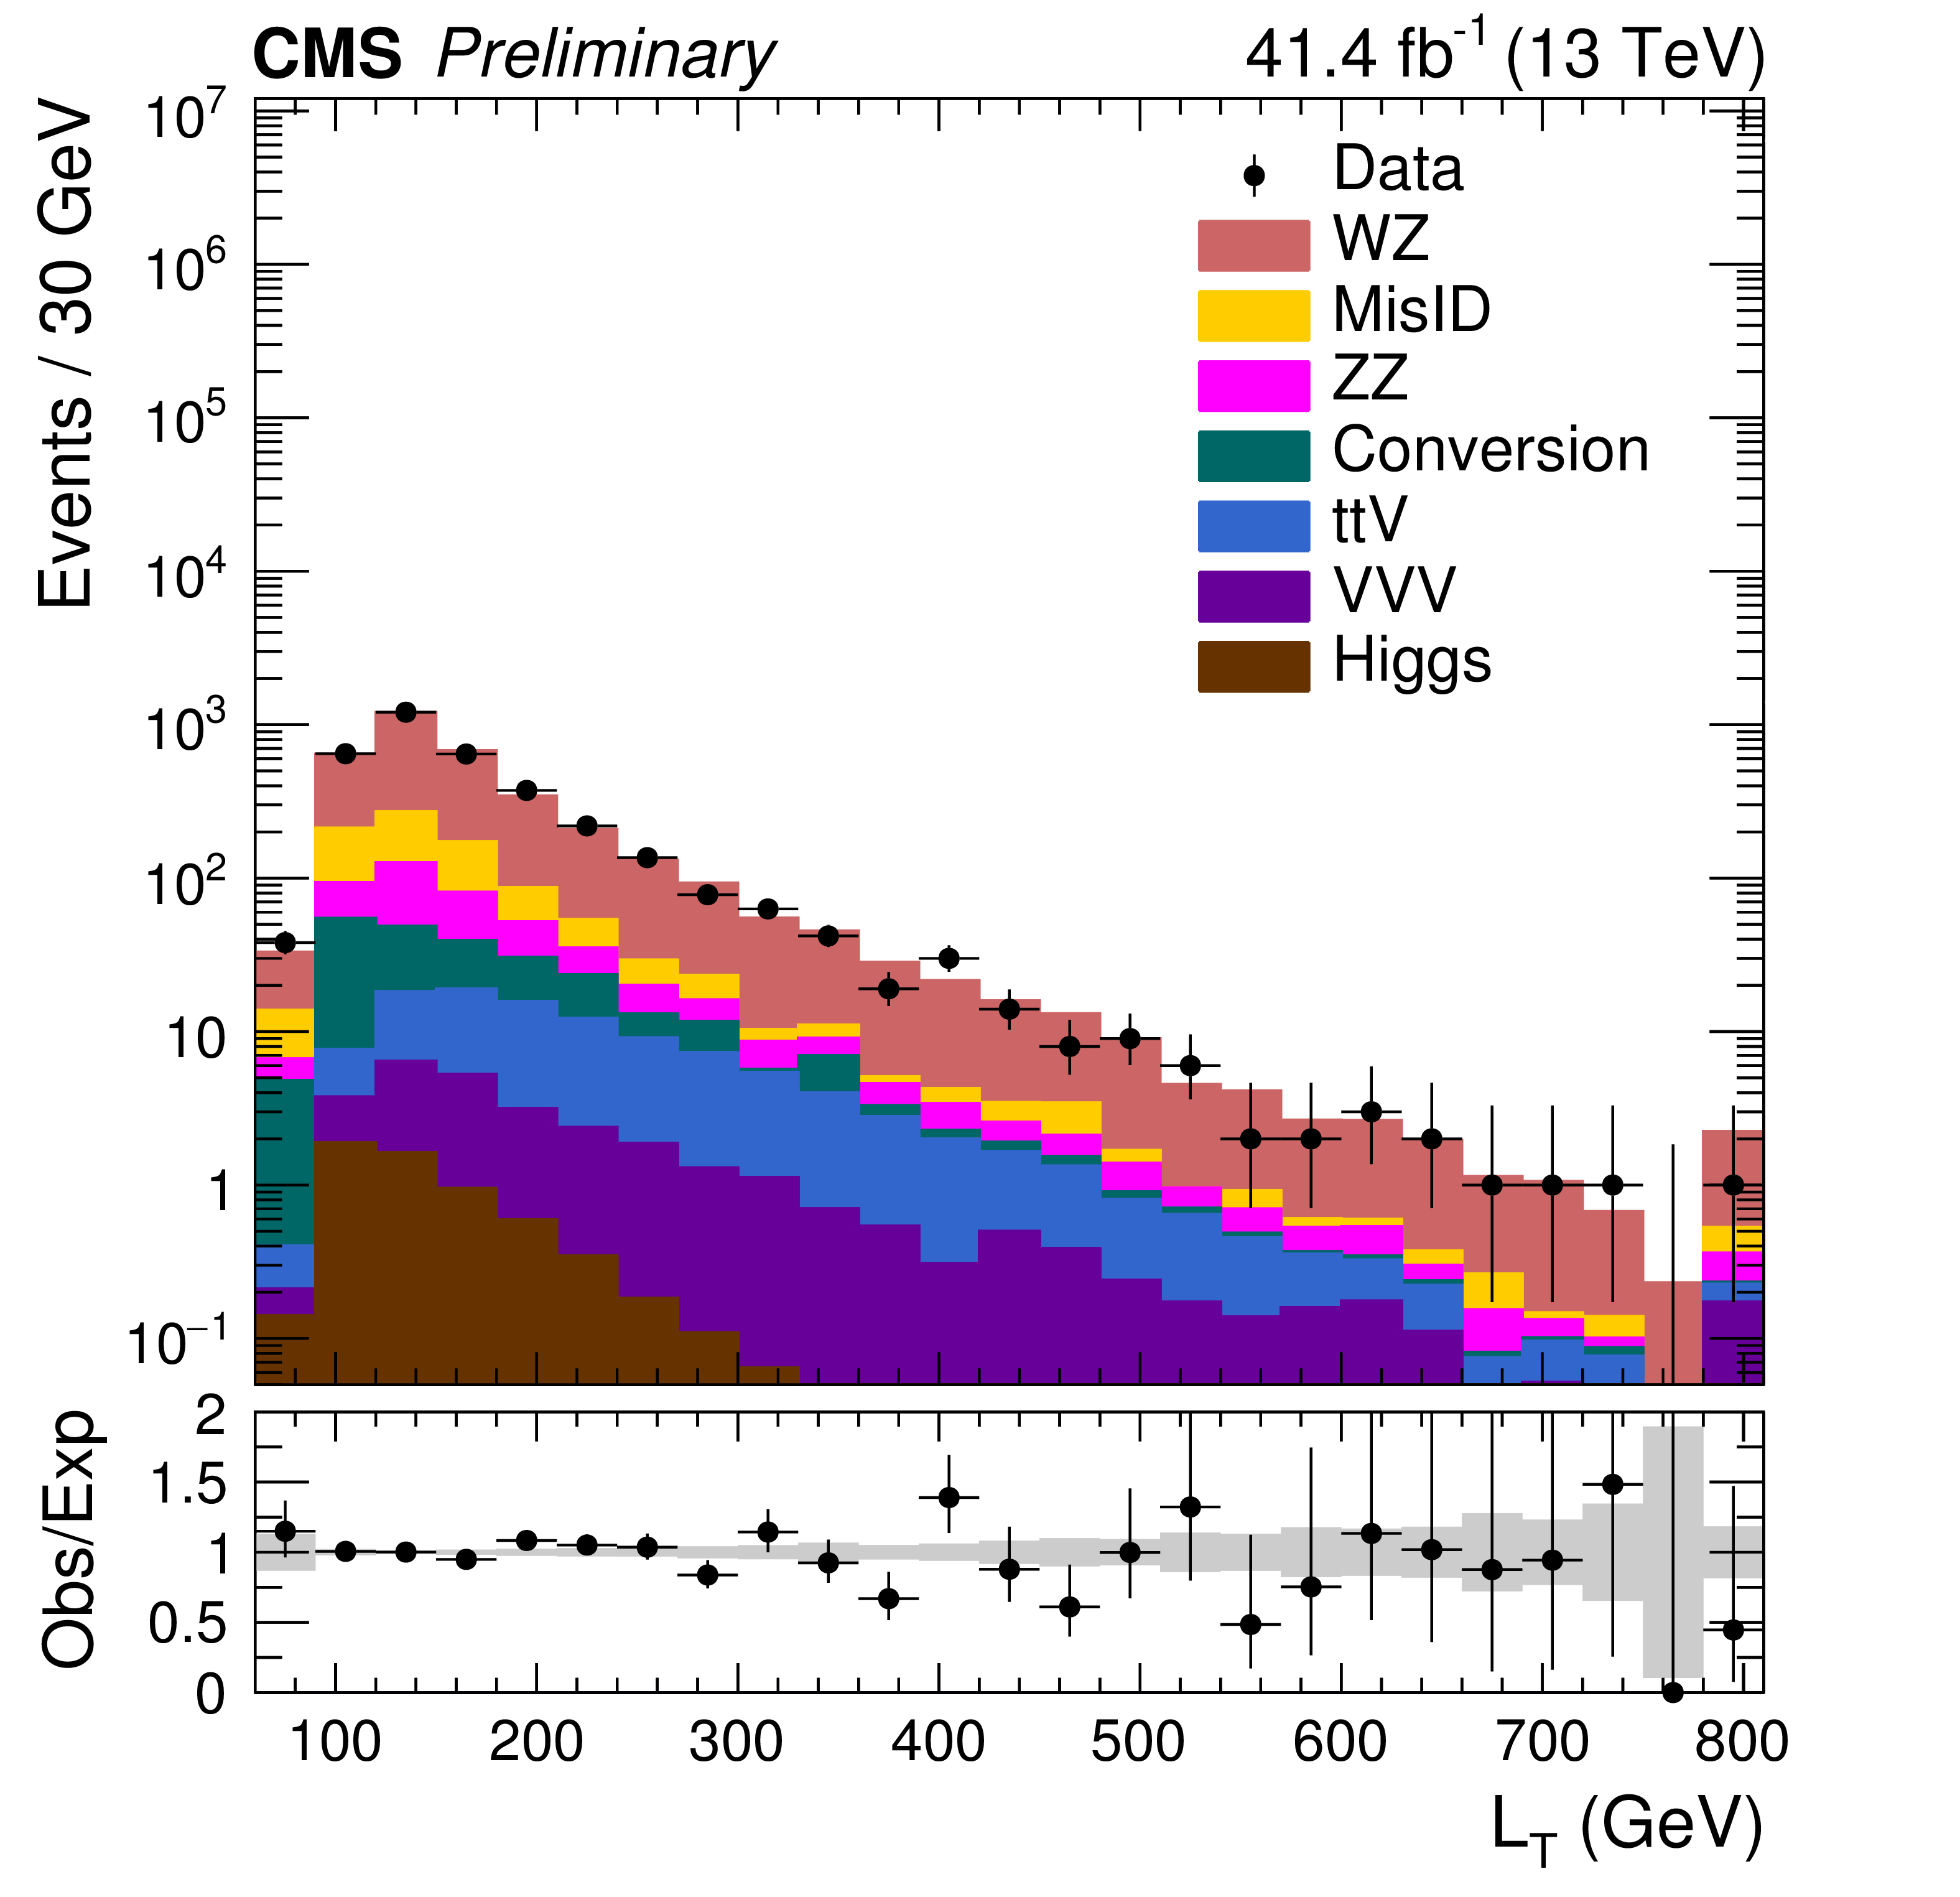
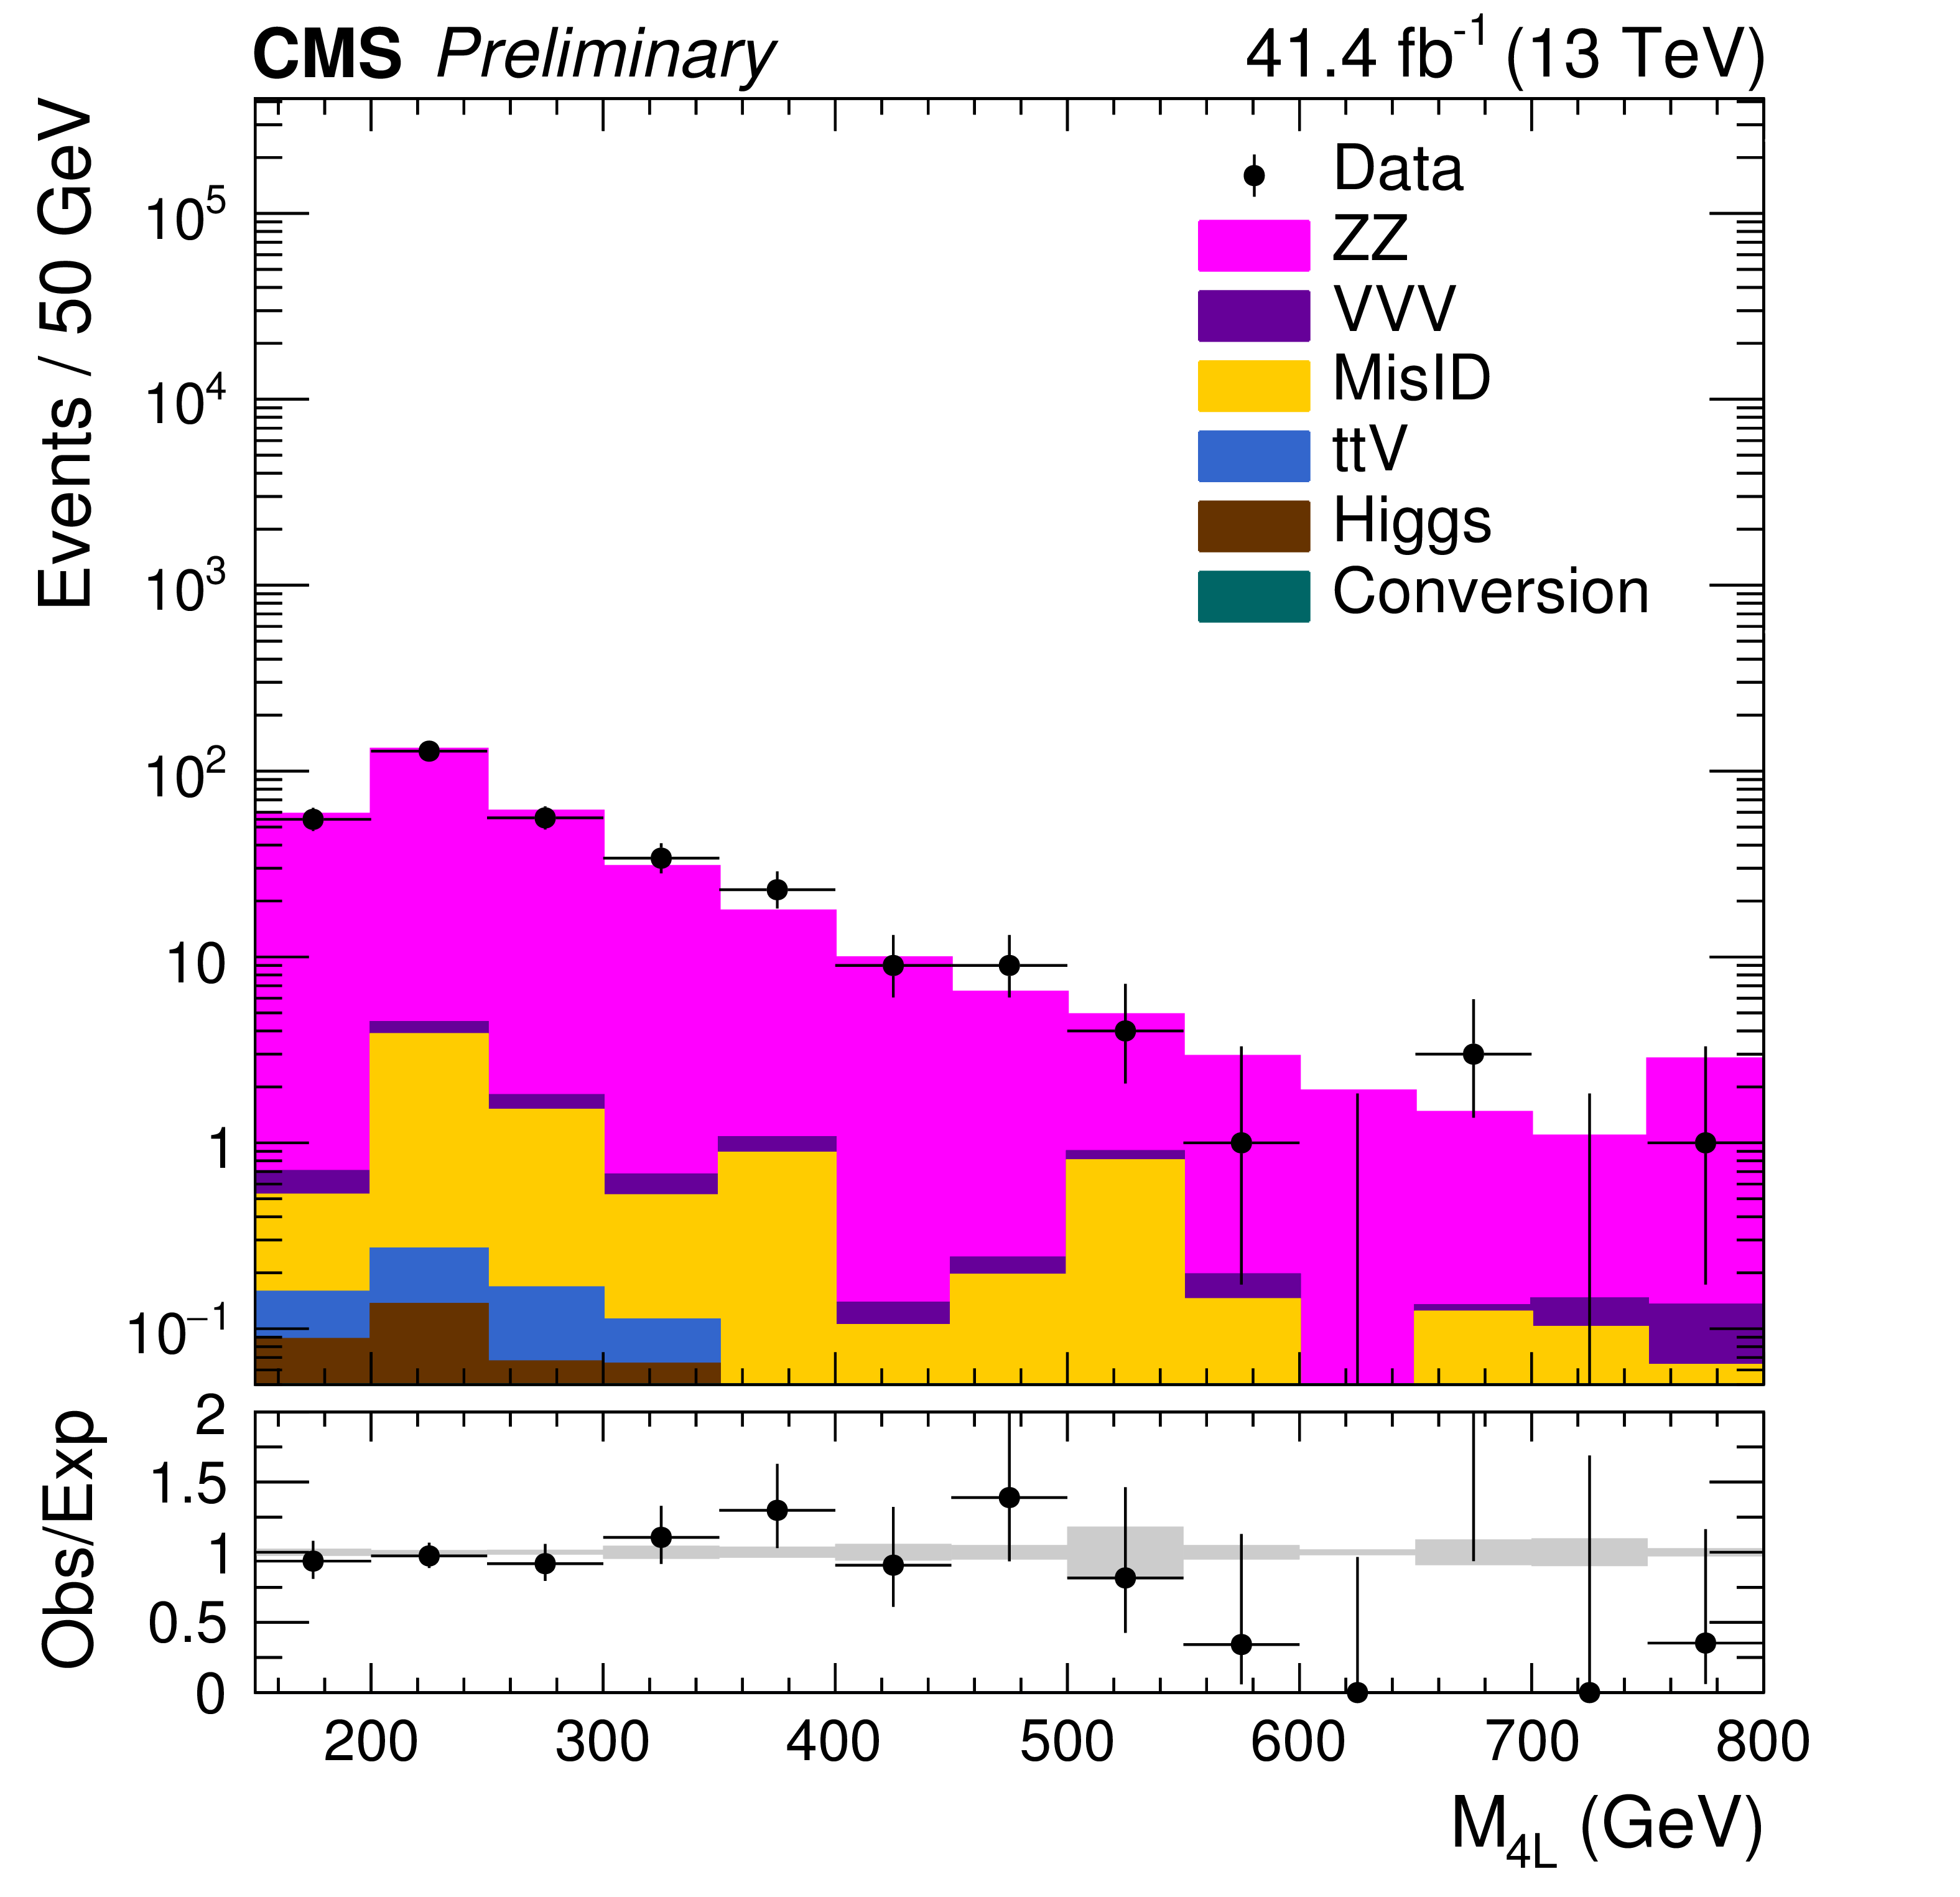
Figure 2:
The ${\textrm {L}_\textrm {T}}$ distribution in a WZ enriched selection of events with three light leptons and one OSSF pair with mass on-Z, 50 $ < {E_{\mathrm {T}}^{\text {miss}}} < $100 GeV (left), and the $ M_{4\ell}$ distribution in a ZZ enriched selection of events with four light leptons and two OSSF pairs both of which are on-Z, and $ {E_{\mathrm {T}}^{\text {miss}}} < $ 50 GeV (right). The total SM background is shown as a stack of all contributing processes after applying the respective normalization factors. The gray band in the lower panel represents the statistical uncertainty on the expected background. The highest bin includes overflow events. |
png pdf |
Figure 2-a:
The ${\textrm {L}_\textrm {T}}$ distribution in a WZ enriched selection of events with three light leptons and one OSSF pair with mass on-Z, 50 $ < {E_{\mathrm {T}}^{\text {miss}}} < $100 GeV (left), and the $ M_{4\ell}$ distribution in a ZZ enriched selection of events with four light leptons and two OSSF pairs both of which are on-Z, and $ {E_{\mathrm {T}}^{\text {miss}}} < $ 50 GeV (right). The total SM background is shown as a stack of all contributing processes after applying the respective normalization factors. The gray band in the lower panel represents the statistical uncertainty on the expected background. The highest bin includes overflow events. |
png pdf |
Figure 2-b:
The ${\textrm {L}_\textrm {T}}$ distribution in a WZ enriched selection of events with three light leptons and one OSSF pair with mass on-Z, 50 $ < {E_{\mathrm {T}}^{\text {miss}}} < $100 GeV (left), and the $ M_{4\ell}$ distribution in a ZZ enriched selection of events with four light leptons and two OSSF pairs both of which are on-Z, and $ {E_{\mathrm {T}}^{\text {miss}}} < $ 50 GeV (right). The total SM background is shown as a stack of all contributing processes after applying the respective normalization factors. The gray band in the lower panel represents the statistical uncertainty on the expected background. The highest bin includes overflow events. |
png pdf |
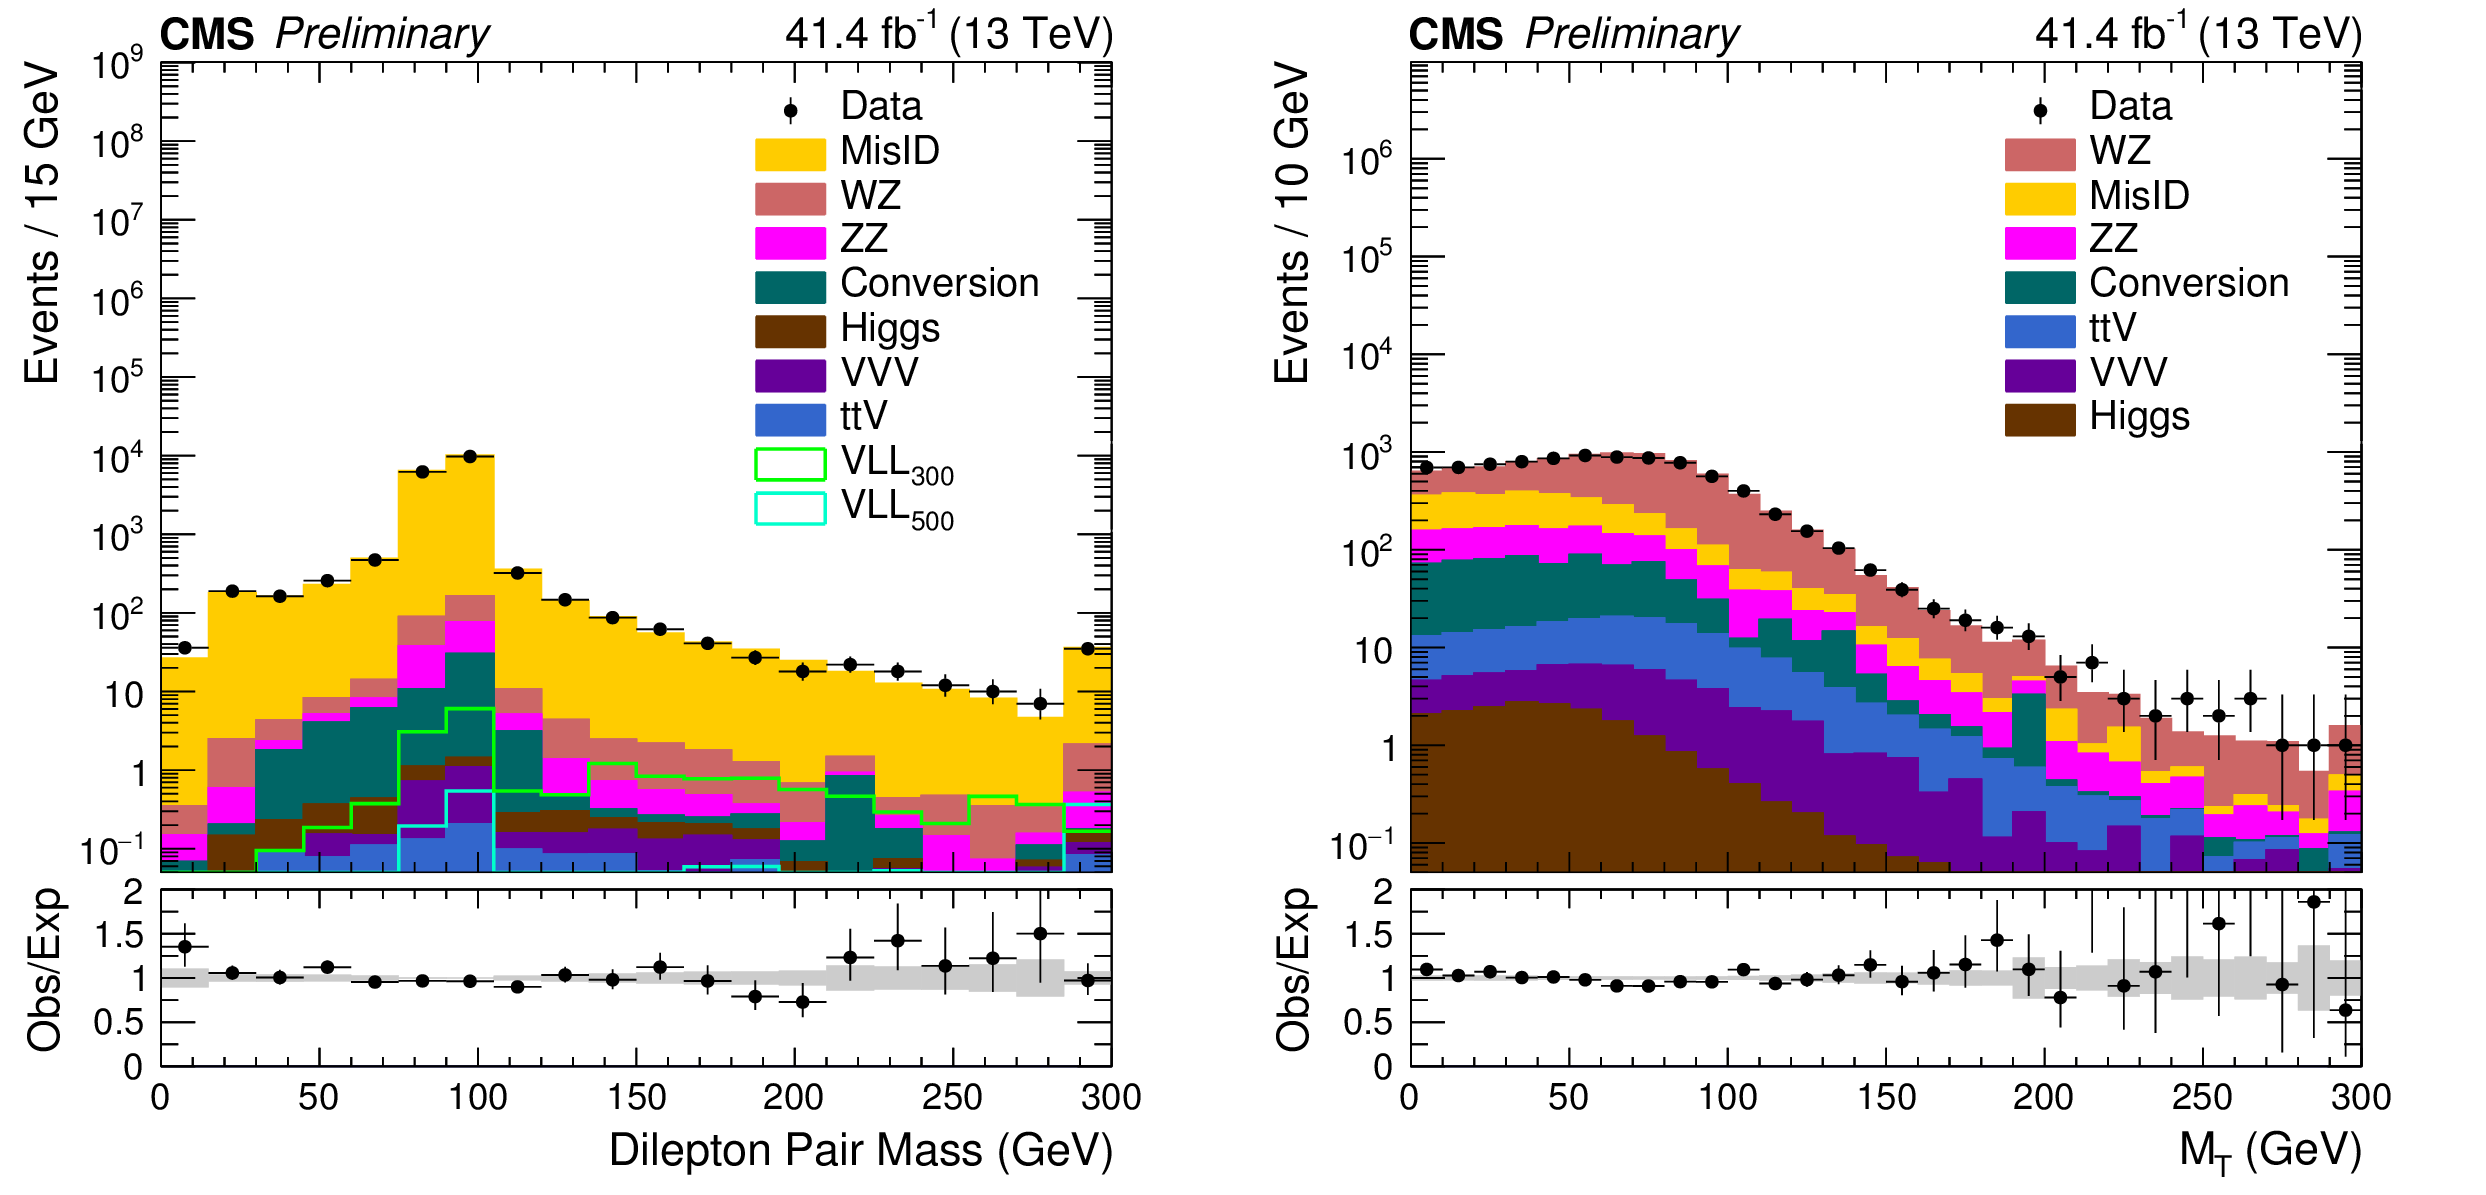
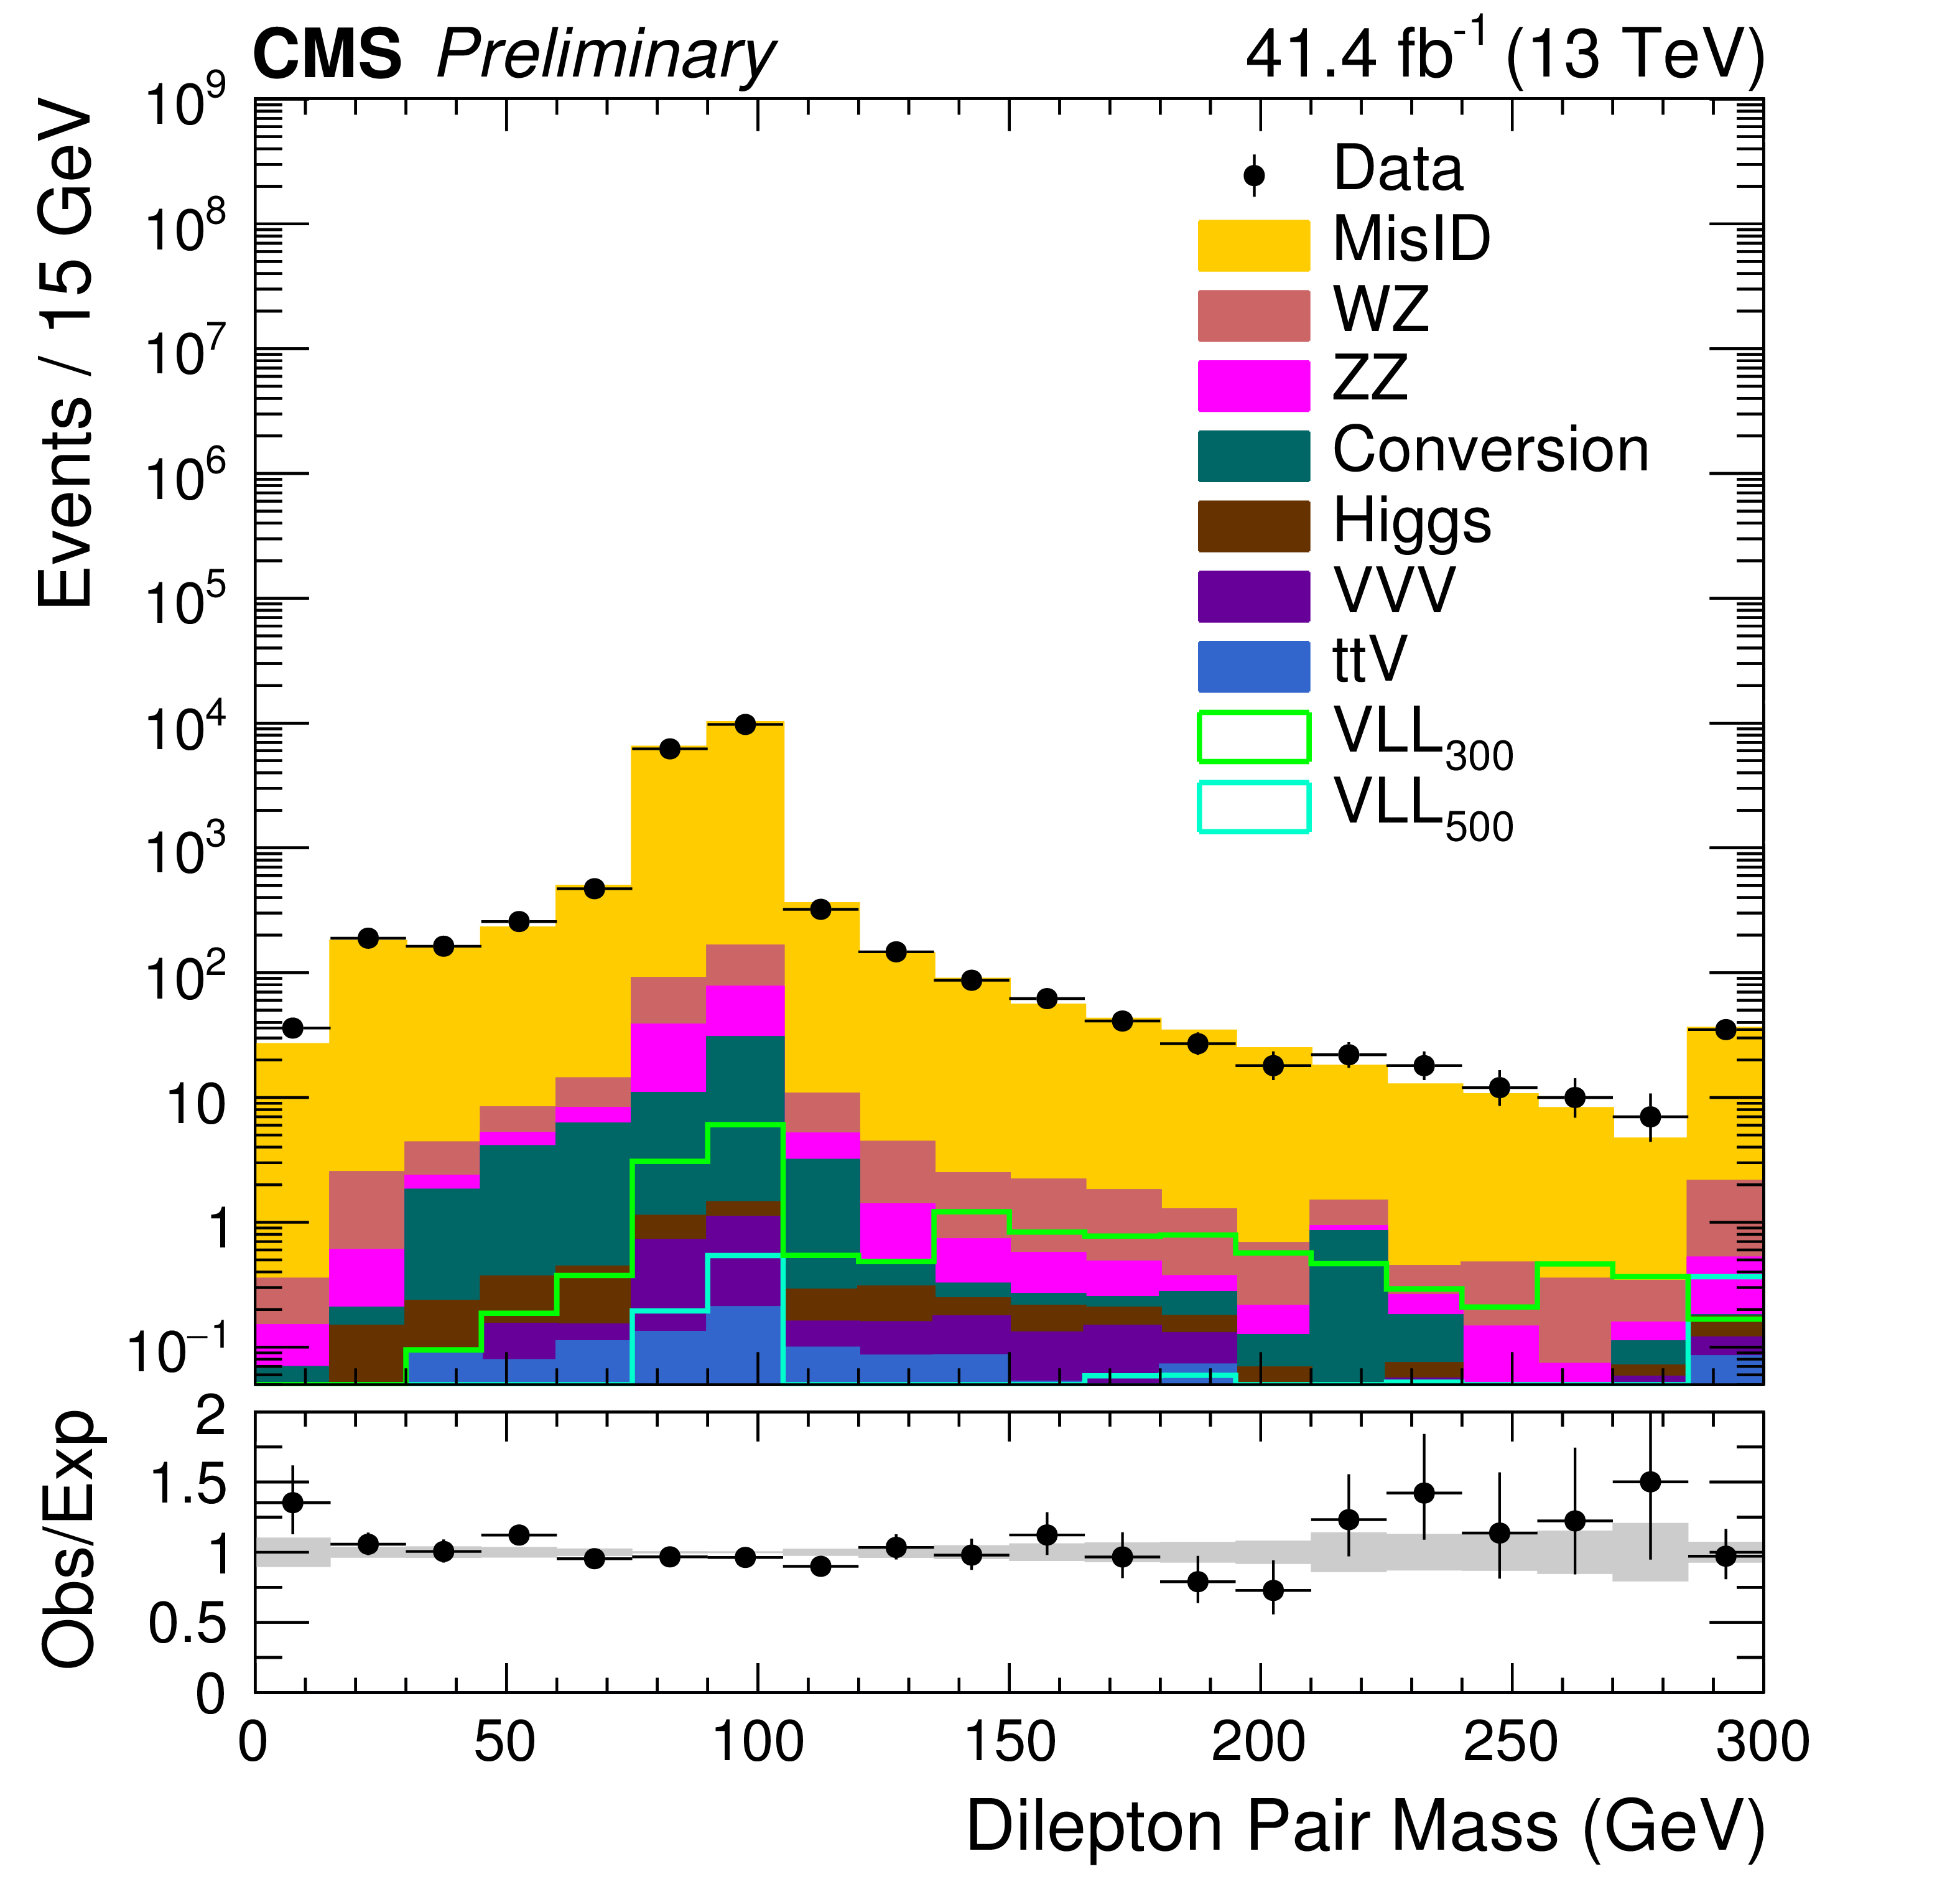
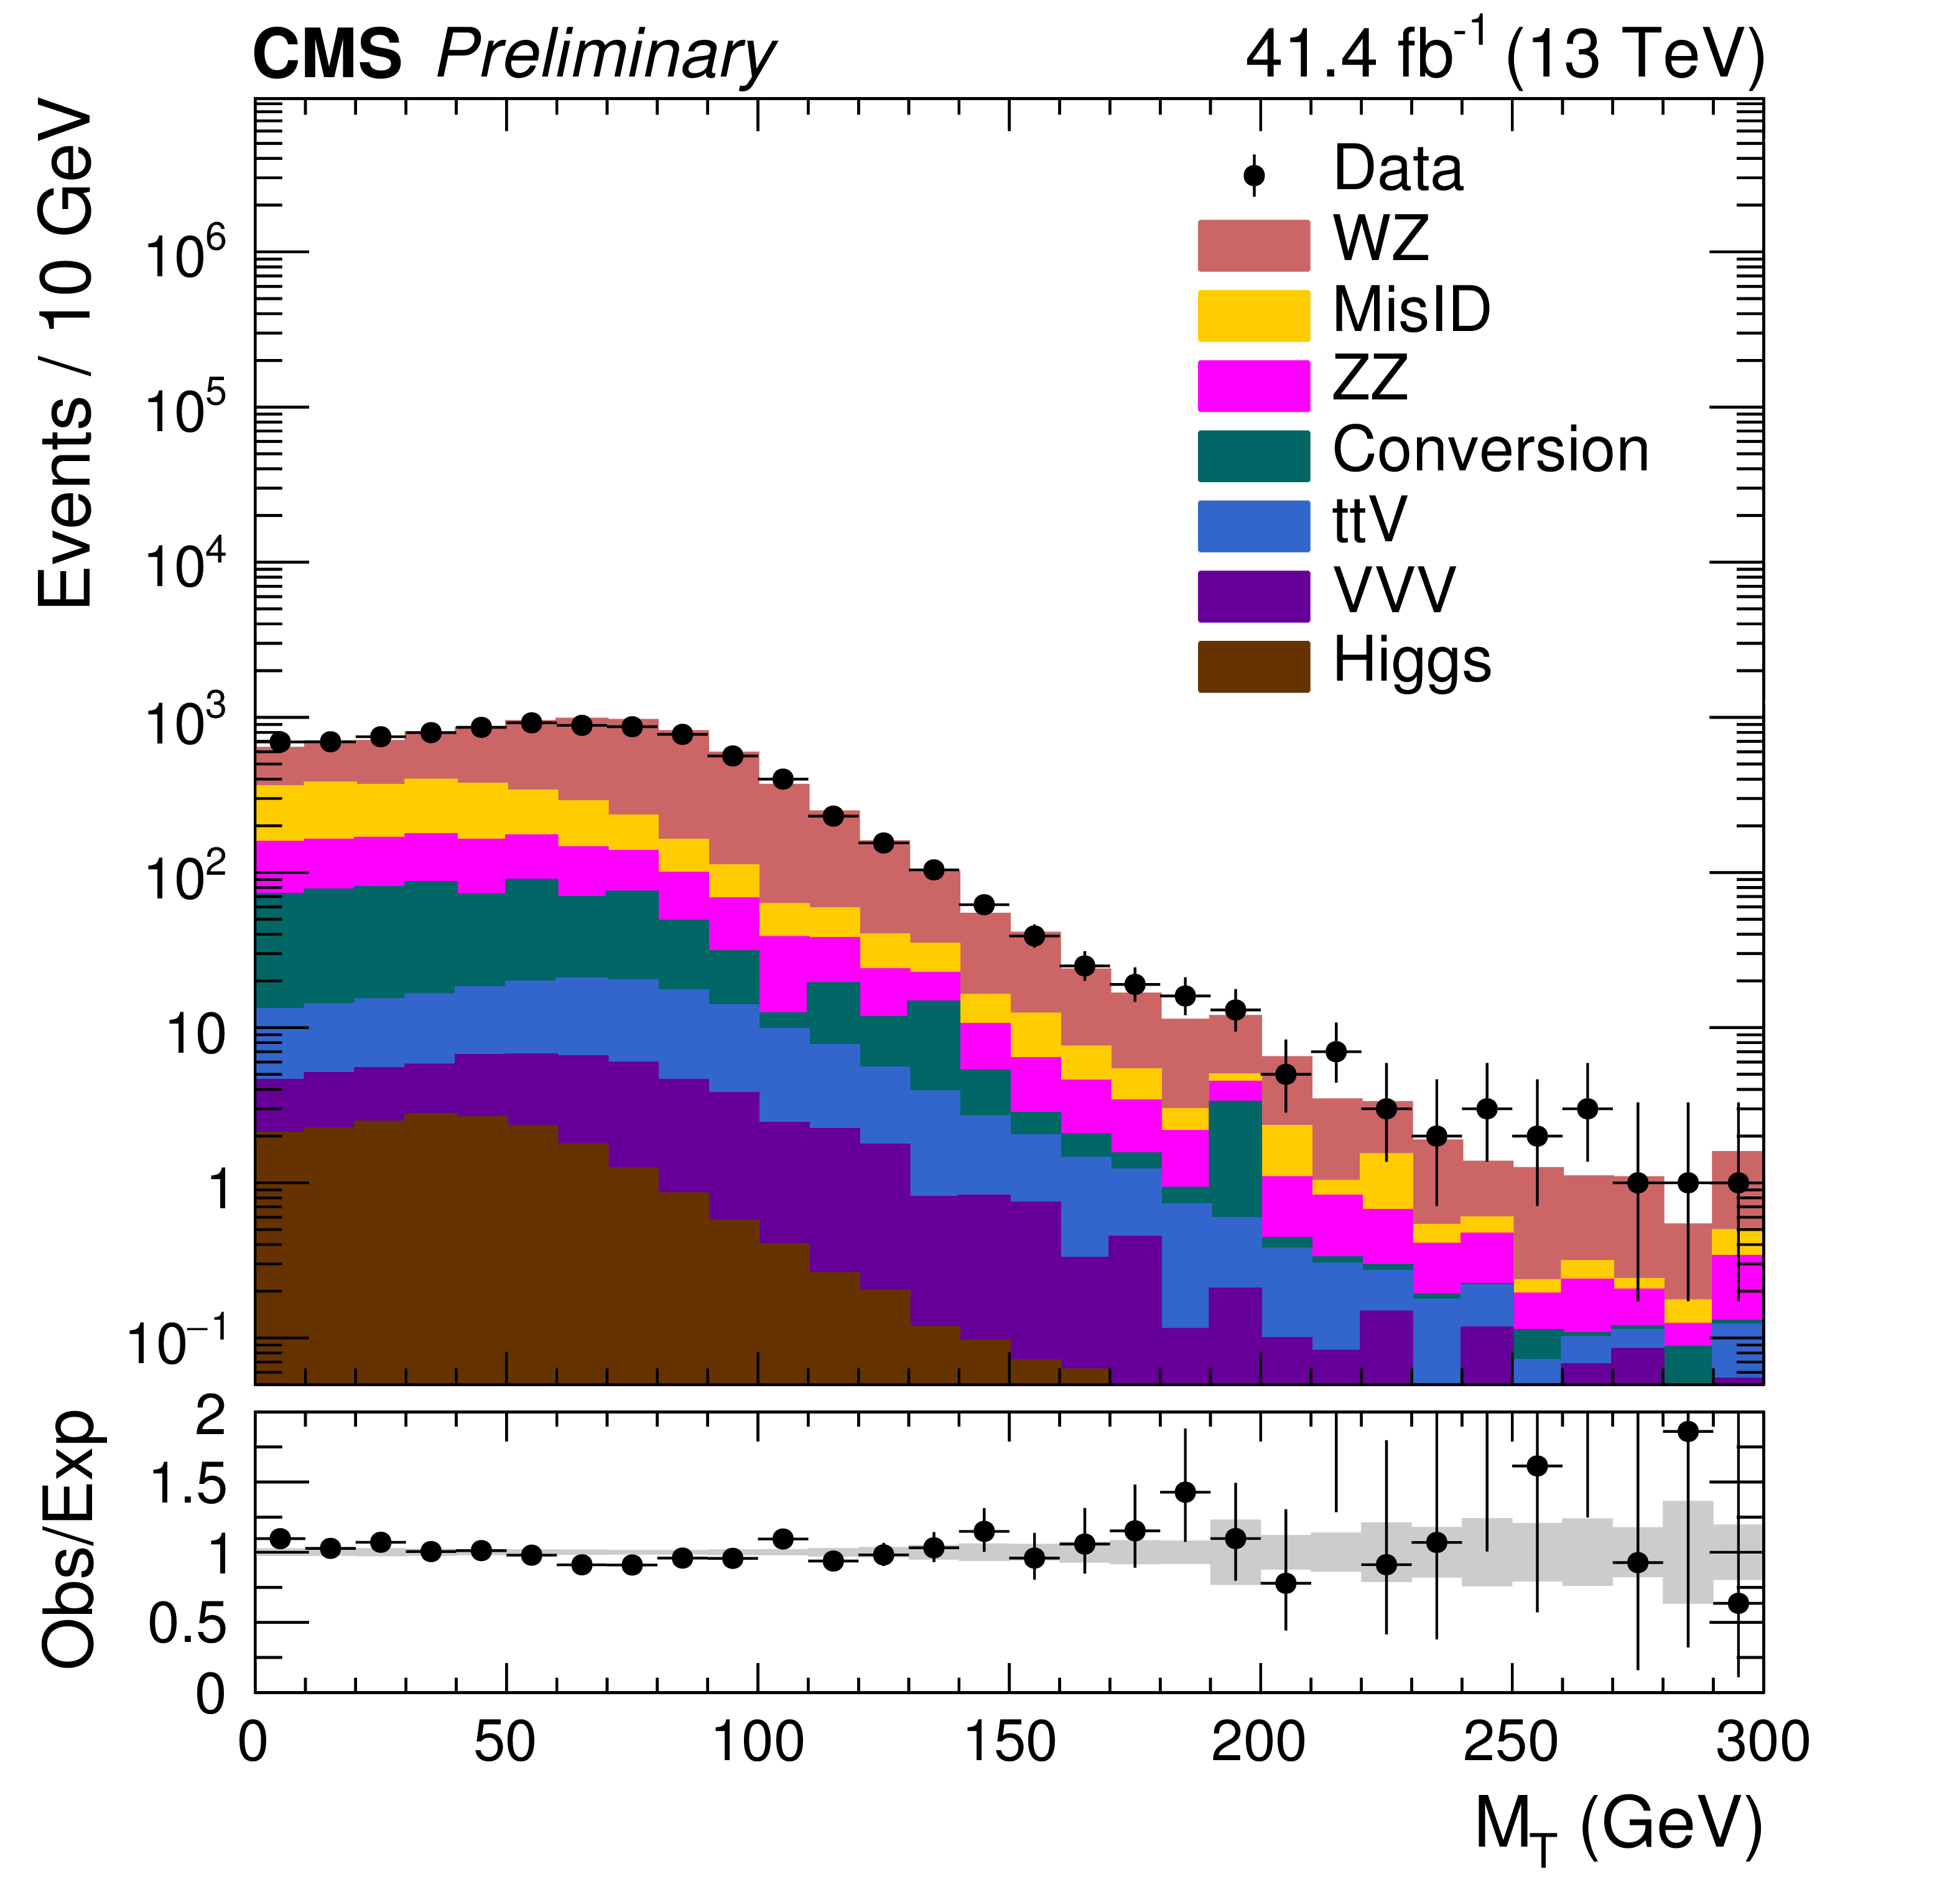
Figure 3:
The light lepton pair mass distribution in a fake tau enriched selection of events with 2 OS e/$ {{\mu}}$ +$ {\tau}$, $ {E_{\mathrm {T}}^{\text {miss}}} < $ 50 GeV (left), and the ${\textrm {M}_\textrm {T}}$ distribution in a selection of events with three light leptons and one OSSF pair with mass on-Z, ${E_{\mathrm {T}}^{\text {miss}}} < $ 100 GeV (right). The total SM background is shown as a stack of all contributing processes, and the gray band in the lower panel represents the statistical uncertainty on the expected background. The highest bin includes overflow events. |
png pdf |
Figure 3-a:
The light lepton pair mass distribution in a fake tau enriched selection of events with 2 OS e/$ {{\mu}}$ +$ {\tau}$, $ {E_{\mathrm {T}}^{\text {miss}}} < $ 50 GeV (left), and the ${\textrm {M}_\textrm {T}}$ distribution in a selection of events with three light leptons and one OSSF pair with mass on-Z, ${E_{\mathrm {T}}^{\text {miss}}} < $ 100 GeV (right). The total SM background is shown as a stack of all contributing processes, and the gray band in the lower panel represents the statistical uncertainty on the expected background. The highest bin includes overflow events. |
png pdf |
Figure 3-b:
The light lepton pair mass distribution in a fake tau enriched selection of events with 2 OS e/$ {{\mu}}$ +$ {\tau}$, $ {E_{\mathrm {T}}^{\text {miss}}} < $ 50 GeV (left), and the ${\textrm {M}_\textrm {T}}$ distribution in a selection of events with three light leptons and one OSSF pair with mass on-Z, ${E_{\mathrm {T}}^{\text {miss}}} < $ 100 GeV (right). The total SM background is shown as a stack of all contributing processes, and the gray band in the lower panel represents the statistical uncertainty on the expected background. The highest bin includes overflow events. |
png pdf |
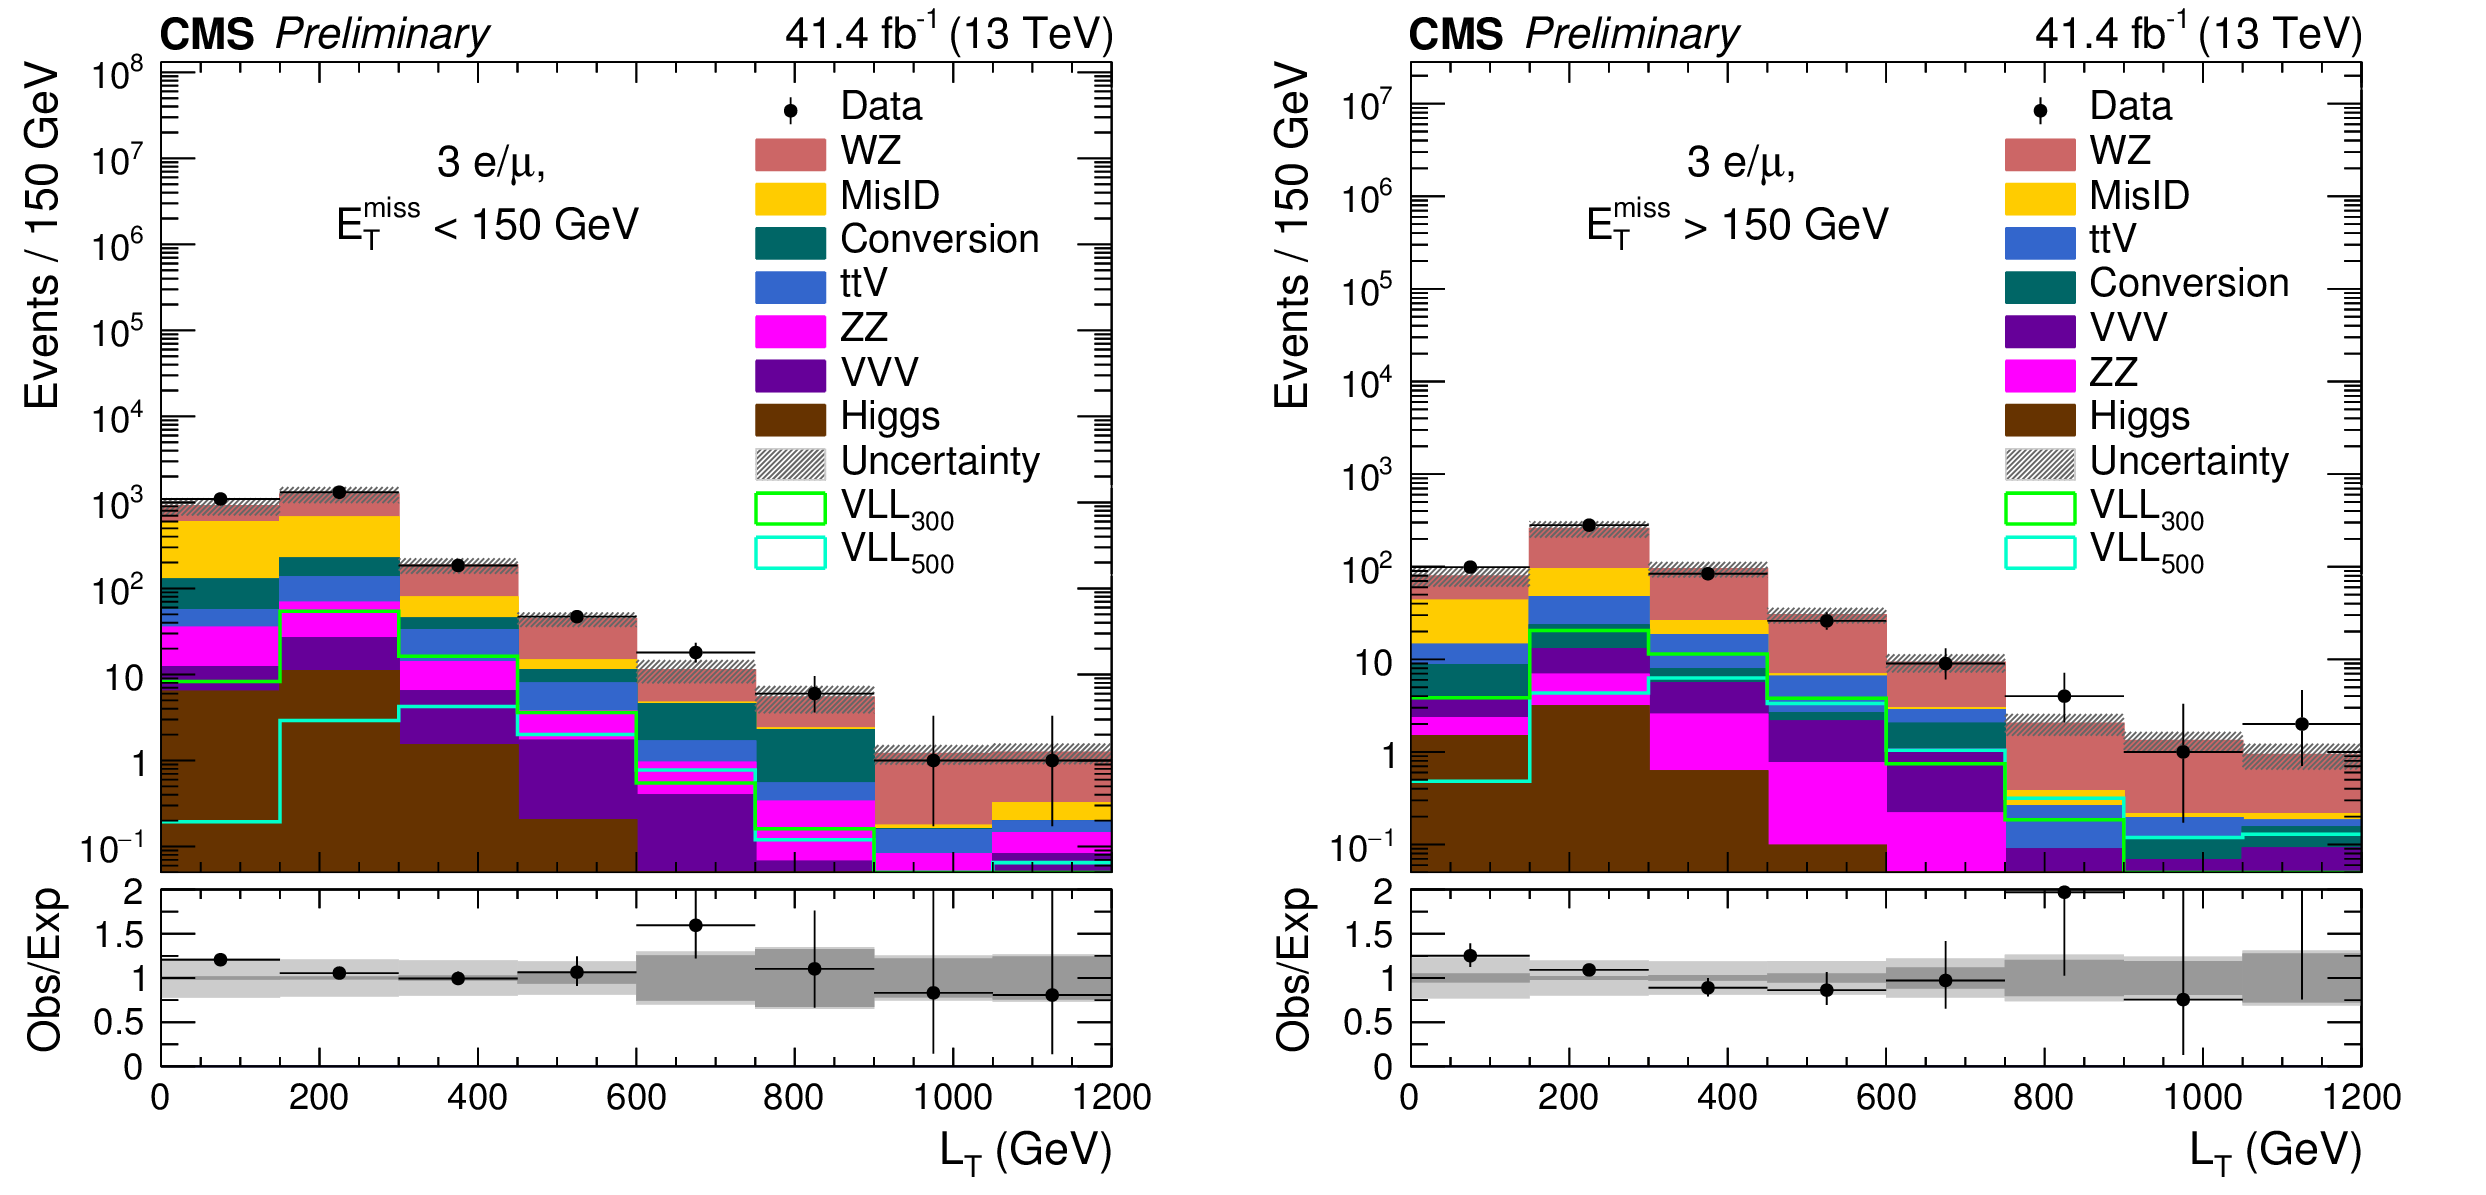
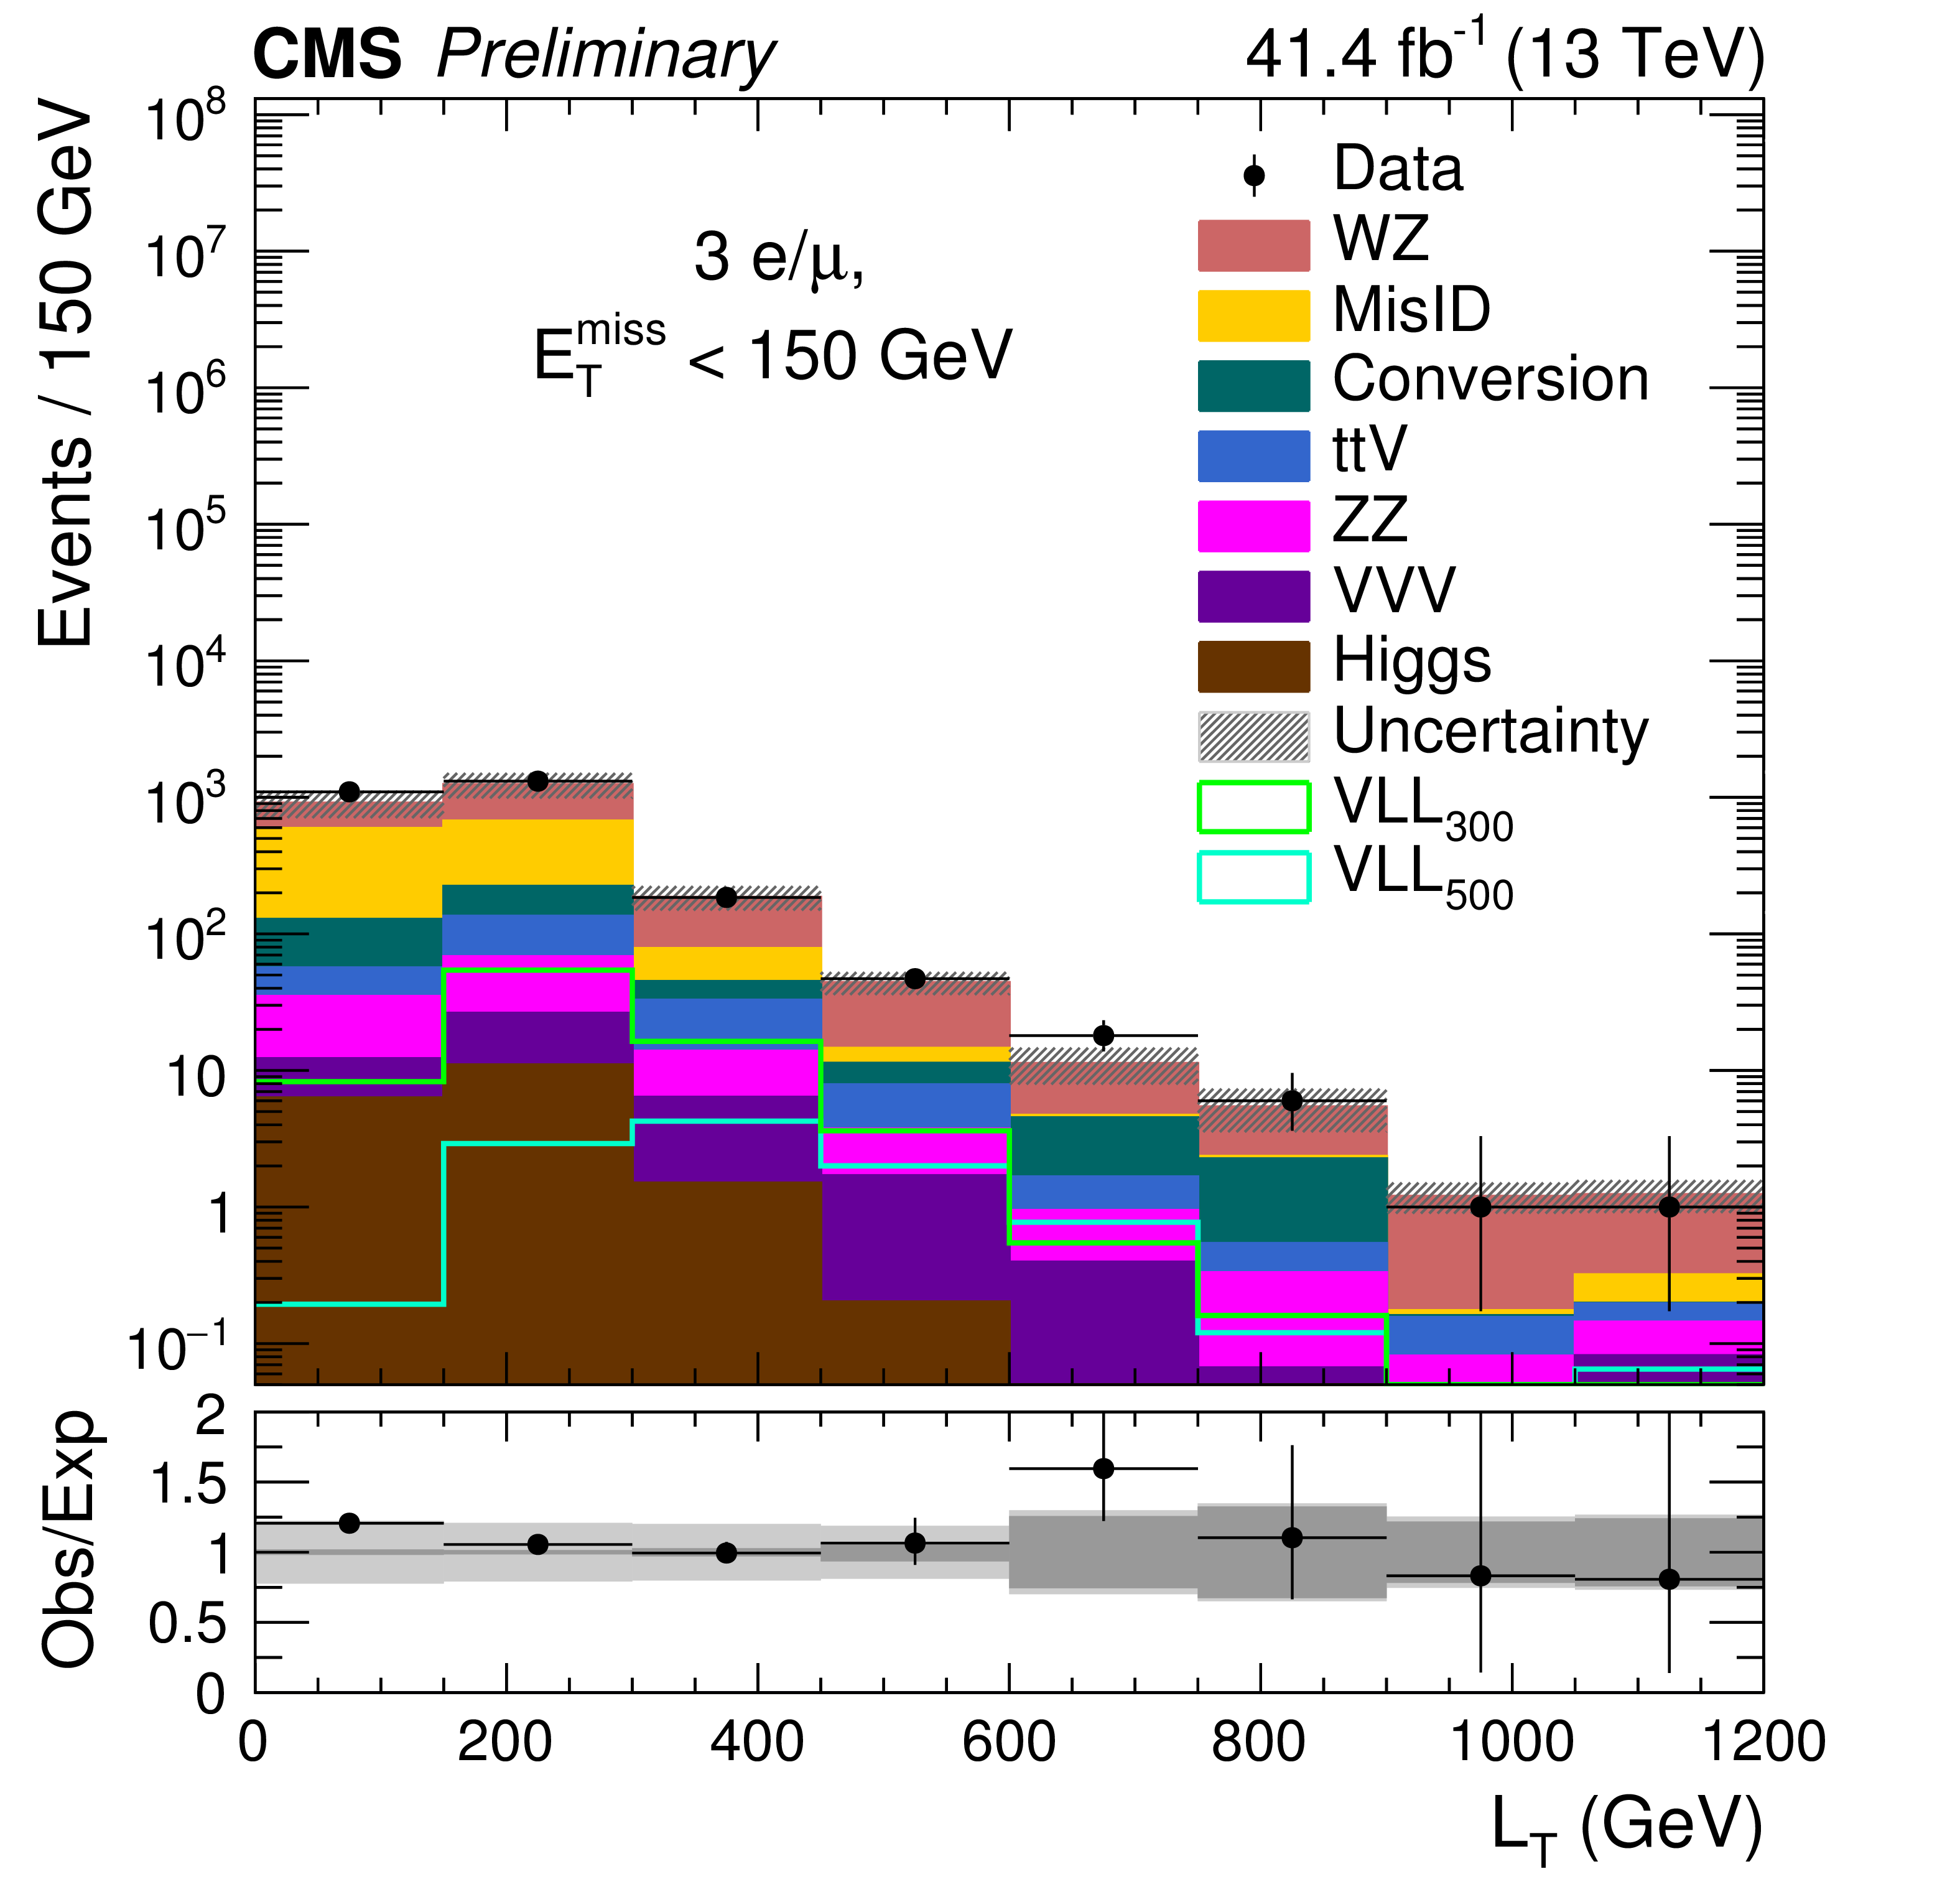
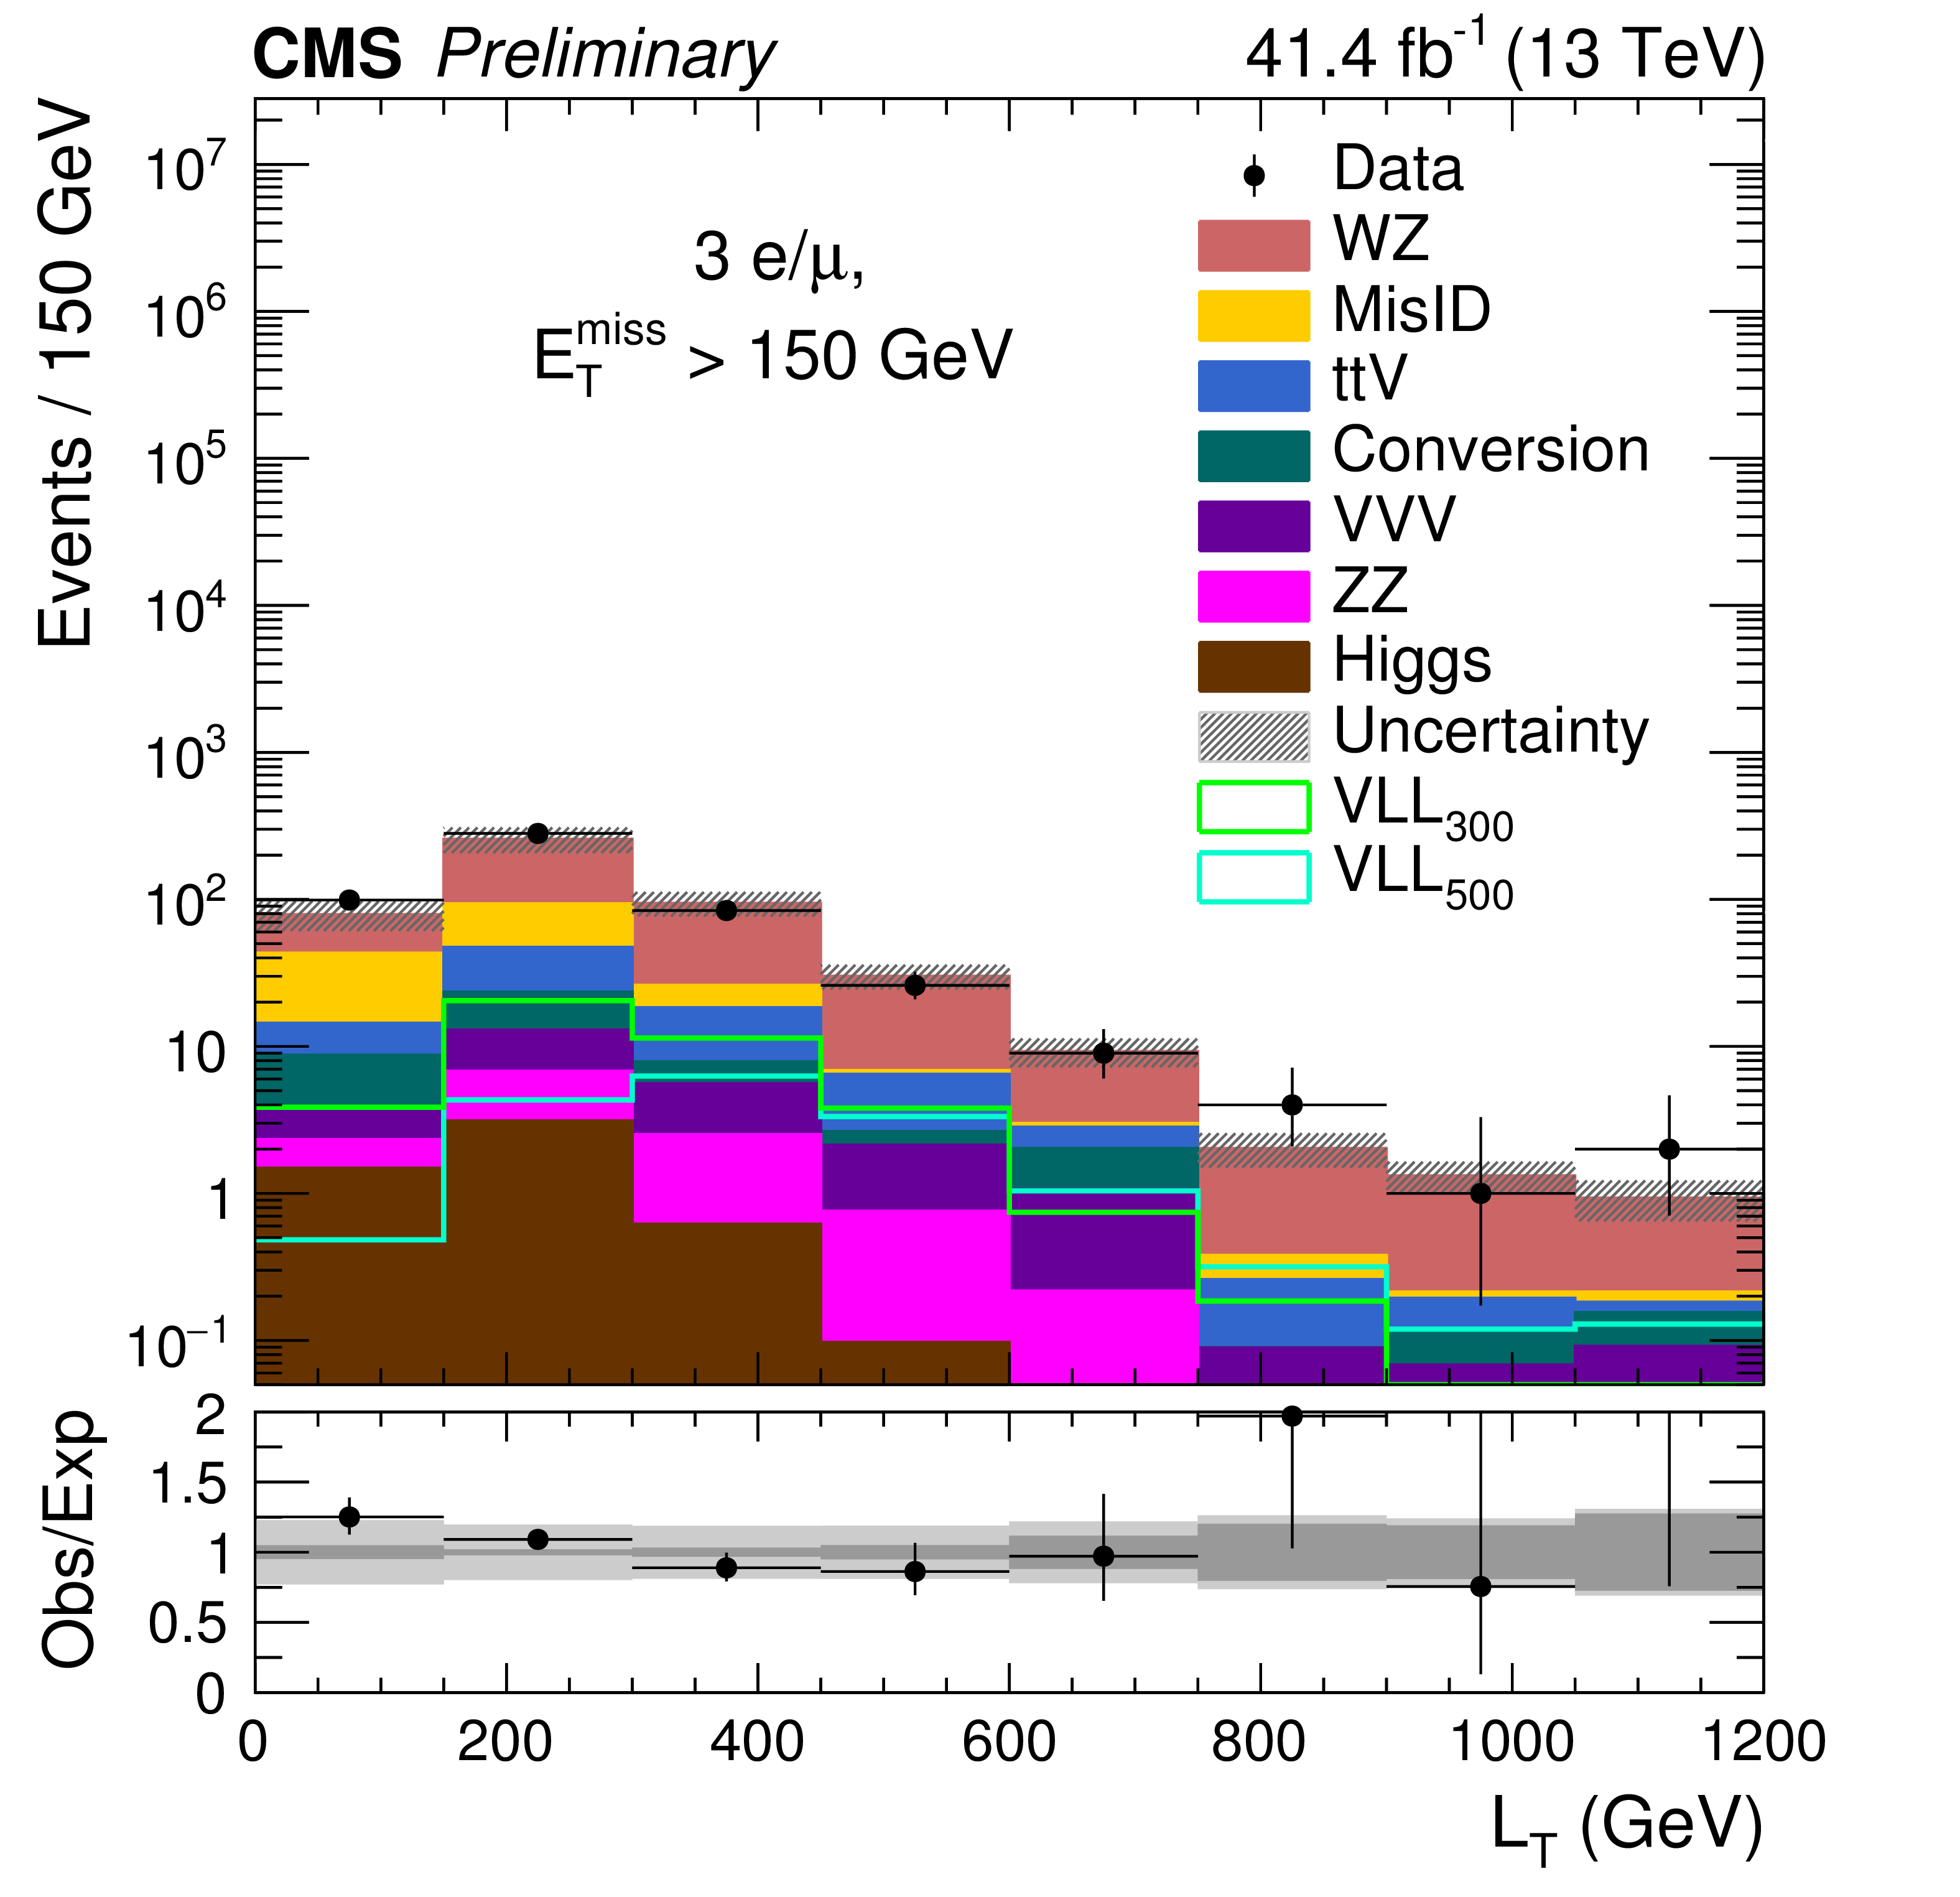
Figure 4:
The $ {\textrm {L}_\textrm {T}} $ distribution for events with three light leptons with $ {E_{\mathrm {T}}^{\text {miss}}} < $ 150 GeV (left) and with $ {E_{\mathrm {T}}^{\text {miss}}} > $ 150 GeV (right). The total SM background is shown as a stack of all contributing processes. The predictions for signal models with $m_{\tau '/\nu '} = $ 300 GeV and $m_{\tau '/\nu '} = $ 500 GeV (sum of all production and decay modes) are also shown as solid lines. The hatched gray band in the upper panel, and the dark and light gray bands in the lower panel represent the total, statistical, and systematic uncertainties on the expected background, respectively. The highest bin includes overflow events. |
png pdf |
Figure 4-a:
The $ {\textrm {L}_\textrm {T}} $ distribution for events with three light leptons with $ {E_{\mathrm {T}}^{\text {miss}}} < $ 150 GeV (left) and with $ {E_{\mathrm {T}}^{\text {miss}}} > $ 150 GeV (right). The total SM background is shown as a stack of all contributing processes. The predictions for signal models with $m_{\tau '/\nu '} = $ 300 GeV and $m_{\tau '/\nu '} = $ 500 GeV (sum of all production and decay modes) are also shown as solid lines. The hatched gray band in the upper panel, and the dark and light gray bands in the lower panel represent the total, statistical, and systematic uncertainties on the expected background, respectively. The highest bin includes overflow events. |
png pdf |
Figure 4-b:
The $ {\textrm {L}_\textrm {T}} $ distribution for events with three light leptons with $ {E_{\mathrm {T}}^{\text {miss}}} < $ 150 GeV (left) and with $ {E_{\mathrm {T}}^{\text {miss}}} > $ 150 GeV (right). The total SM background is shown as a stack of all contributing processes. The predictions for signal models with $m_{\tau '/\nu '} = $ 300 GeV and $m_{\tau '/\nu '} = $ 500 GeV (sum of all production and decay modes) are also shown as solid lines. The hatched gray band in the upper panel, and the dark and light gray bands in the lower panel represent the total, statistical, and systematic uncertainties on the expected background, respectively. The highest bin includes overflow events. |
png pdf |
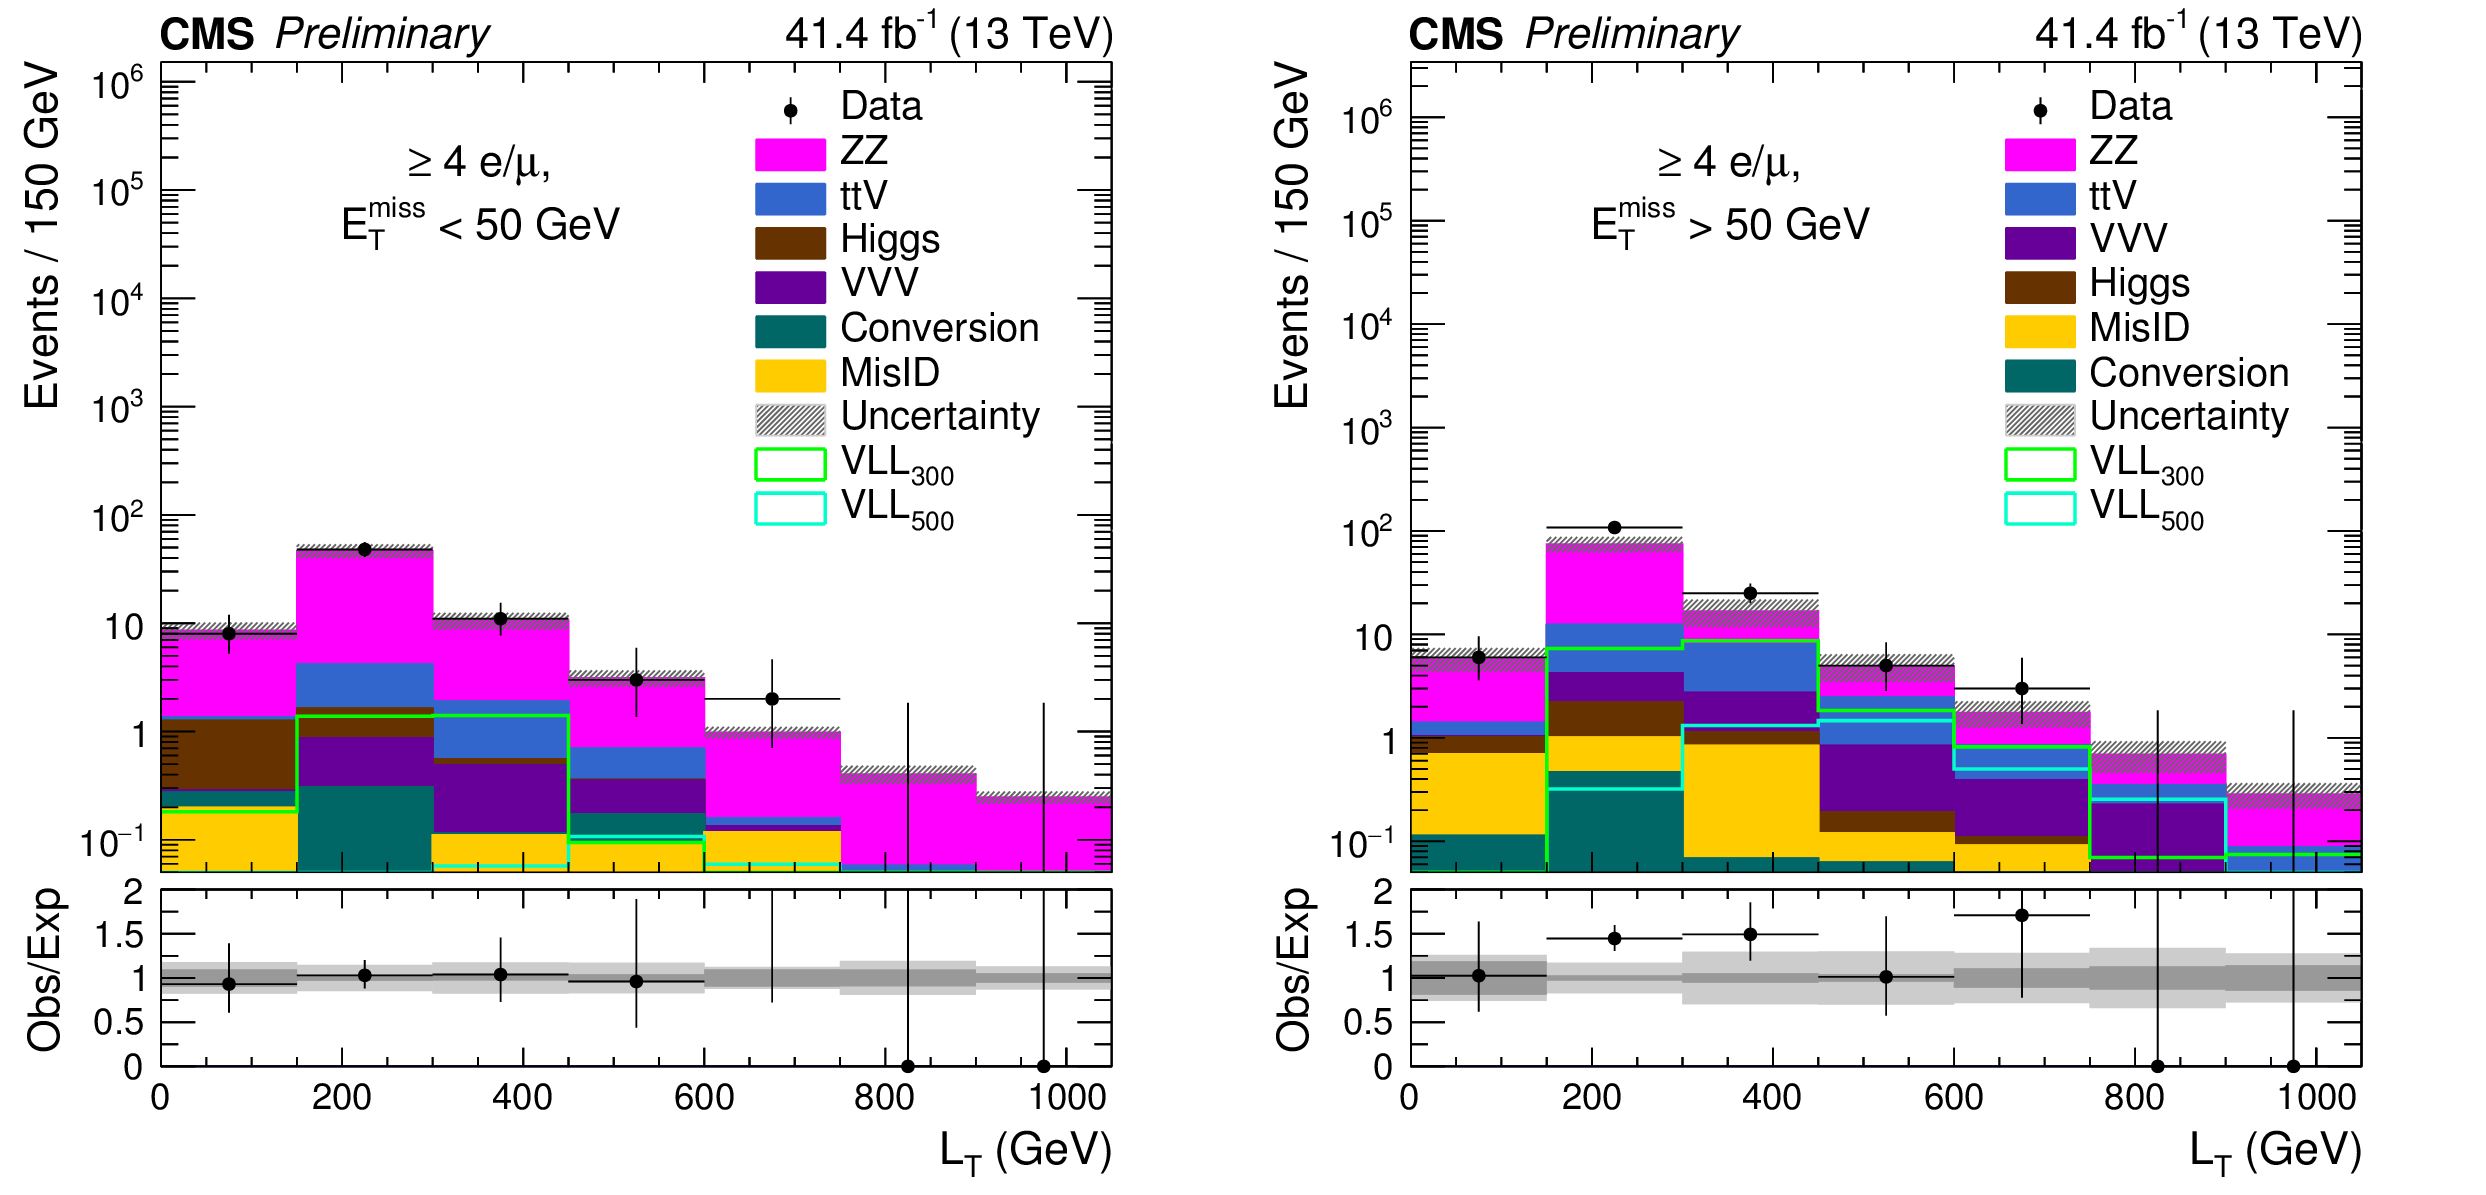
Figure 5:
The $ {\textrm {L}_\textrm {T}} $ distribution for events with four or more light leptons with $ {E_{\mathrm {T}}^{\text {miss}}} < $ 50 GeV (left) and with $ {E_{\mathrm {T}}^{\text {miss}}} > $ 50 GeV (right). The total SM background is shown as a stack of all contributing processes. The predictions for signal models with $m_{\tau '/\nu '} = $ 300 GeV and $m_{\tau '/\nu '} = $ 500 GeV (sum of all production and decay modes) are also shown as solid lines. The hatched gray band in the upper panel, and the dark and light gray bands in the lower panel represent the total, statistical, and systematic uncertainties on the expected background, respectively. The highest bin includes overflow events. |
png pdf |
Figure 5-a:
The $ {\textrm {L}_\textrm {T}} $ distribution for events with four or more light leptons with $ {E_{\mathrm {T}}^{\text {miss}}} < $ 50 GeV (left) and with $ {E_{\mathrm {T}}^{\text {miss}}} > $ 50 GeV (right). The total SM background is shown as a stack of all contributing processes. The predictions for signal models with $m_{\tau '/\nu '} = $ 300 GeV and $m_{\tau '/\nu '} = $ 500 GeV (sum of all production and decay modes) are also shown as solid lines. The hatched gray band in the upper panel, and the dark and light gray bands in the lower panel represent the total, statistical, and systematic uncertainties on the expected background, respectively. The highest bin includes overflow events. |
png pdf |
Figure 5-b:
The $ {\textrm {L}_\textrm {T}} $ distribution for events with four or more light leptons with $ {E_{\mathrm {T}}^{\text {miss}}} < $ 50 GeV (left) and with $ {E_{\mathrm {T}}^{\text {miss}}} > $ 50 GeV (right). The total SM background is shown as a stack of all contributing processes. The predictions for signal models with $m_{\tau '/\nu '} = $ 300 GeV and $m_{\tau '/\nu '} = $ 500 GeV (sum of all production and decay modes) are also shown as solid lines. The hatched gray band in the upper panel, and the dark and light gray bands in the lower panel represent the total, statistical, and systematic uncertainties on the expected background, respectively. The highest bin includes overflow events. |
png pdf |
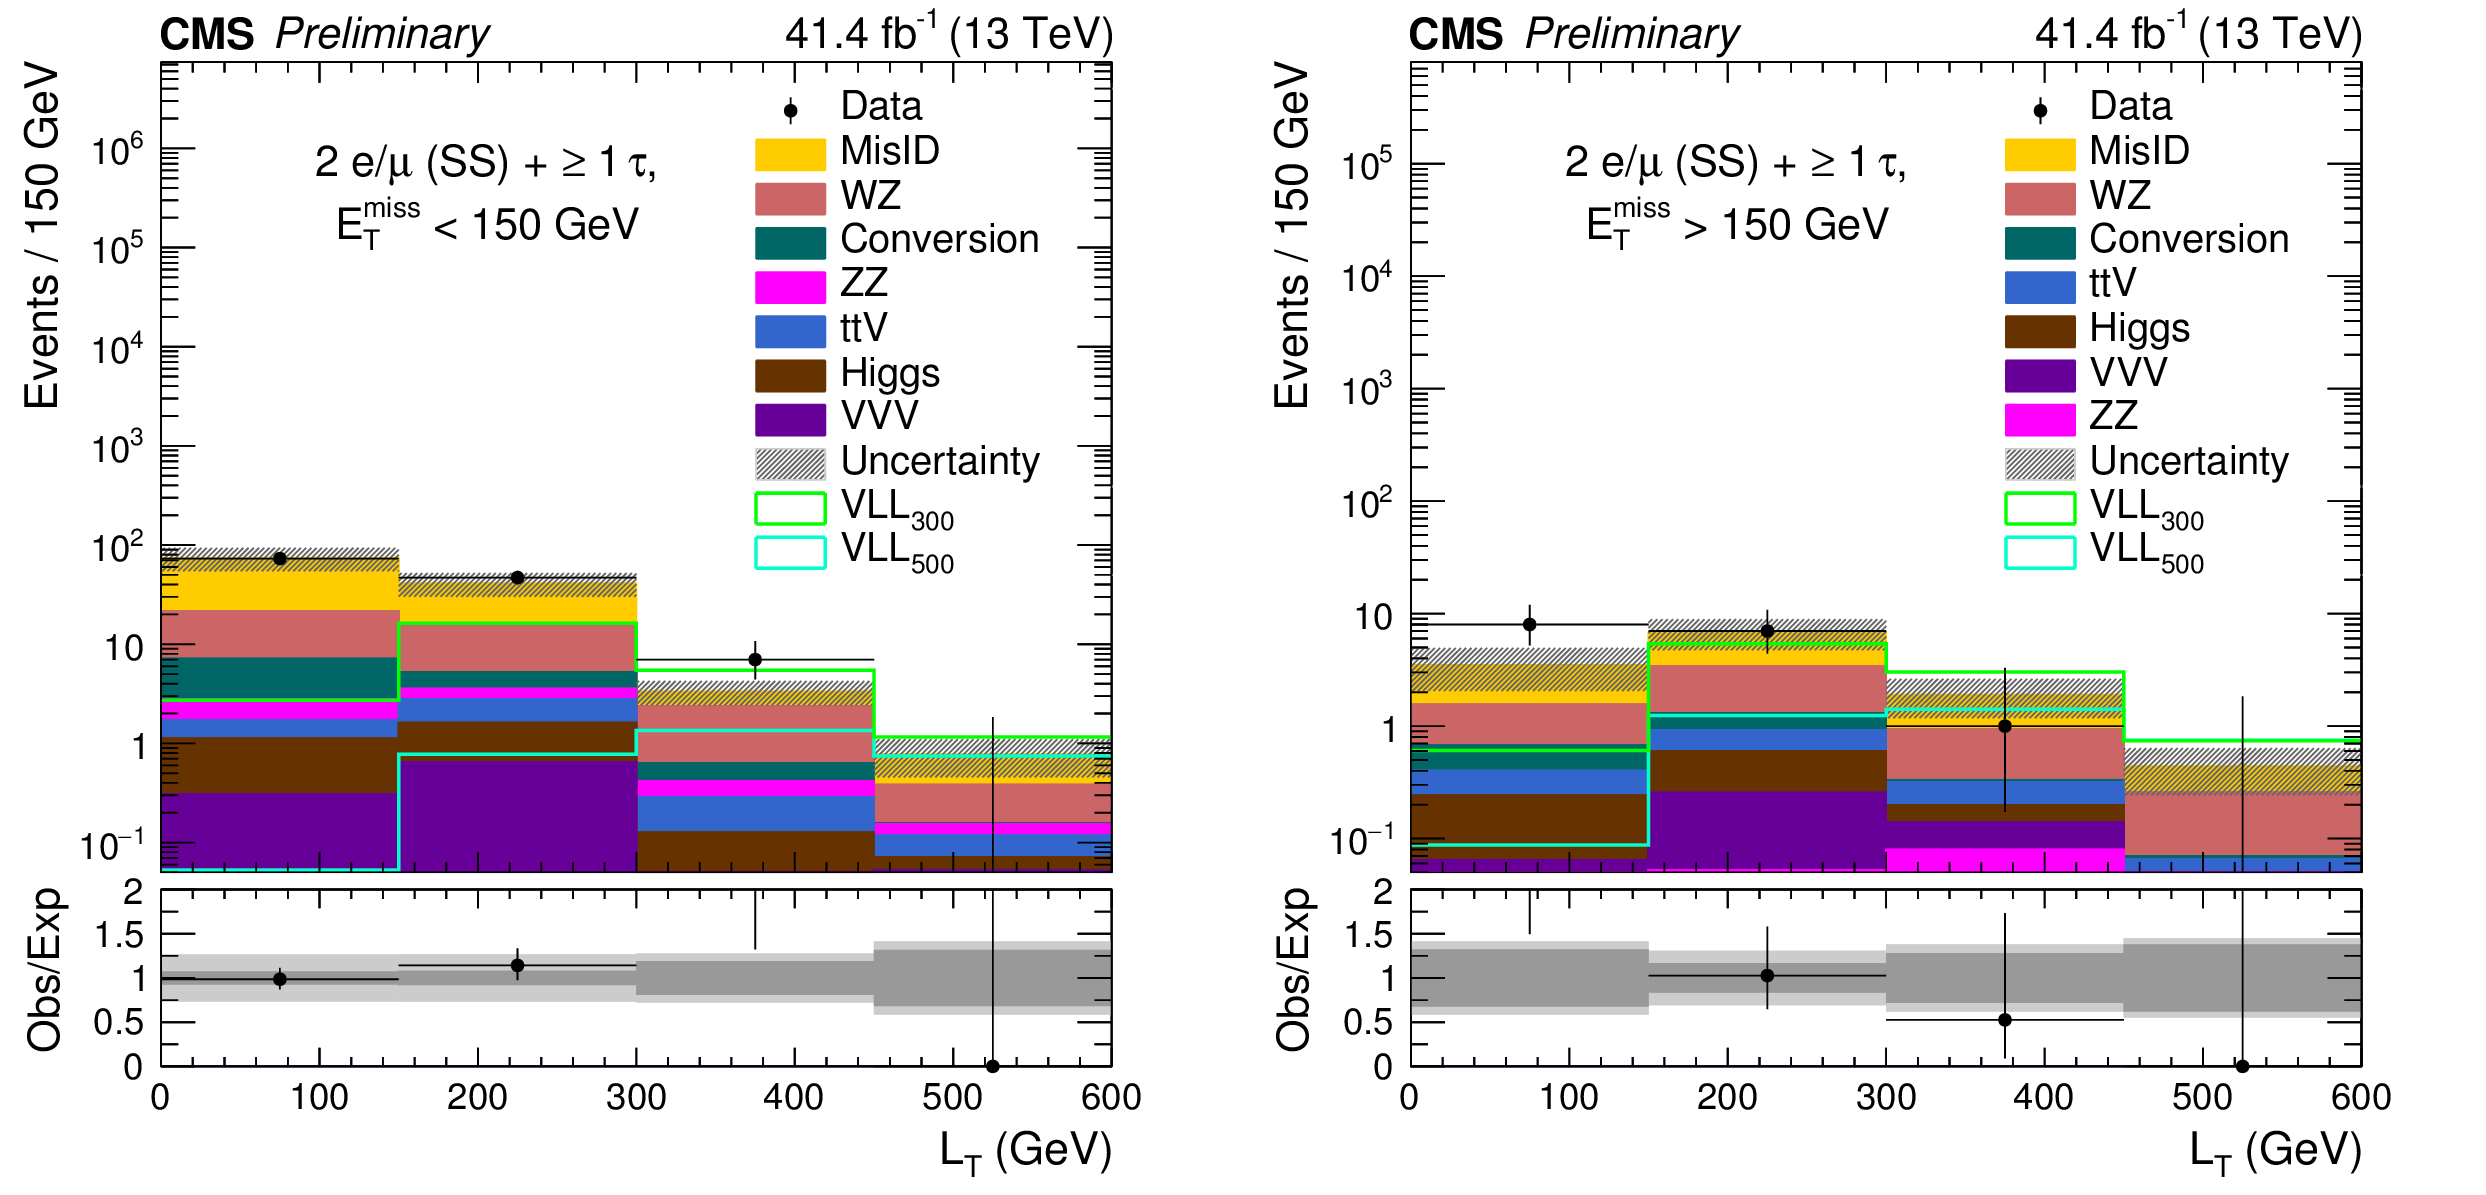
Figure 6:
The $ {\textrm {L}_\textrm {T}} $ distribution for events with two opposite charge light leptons and a hadronically decaying $\tau $ lepton with 50 $ < {E_{\mathrm {T}}^{\text {miss}}} < $ 150 GeV (left) and with $ {E_{\mathrm {T}}^{\text {miss}}} > $ 150 GeV (right). The total SM background is shown as a stack of all contributing processes. The predictions for signal models with $m_{\tau '/\nu '} = $ 300 GeV and $m_{\tau '/\nu '} = $ 500 GeV (sum of all production and decay modes) are also shown as solid lines. The hatched gray band in the upper panel, and the dark and light gray bands in the lower panel represent the total, statistical, and systematic uncertainties on the expected background, respectively. The highest bin includes overflow events. |

png pdf |
Figure 6-a:
The $ {\textrm {L}_\textrm {T}} $ distribution for events with two opposite charge light leptons and a hadronically decaying $\tau $ lepton with 50 $ < {E_{\mathrm {T}}^{\text {miss}}} < $ 150 GeV (left) and with $ {E_{\mathrm {T}}^{\text {miss}}} > $ 150 GeV (right). The total SM background is shown as a stack of all contributing processes. The predictions for signal models with $m_{\tau '/\nu '} = $ 300 GeV and $m_{\tau '/\nu '} = $ 500 GeV (sum of all production and decay modes) are also shown as solid lines. The hatched gray band in the upper panel, and the dark and light gray bands in the lower panel represent the total, statistical, and systematic uncertainties on the expected background, respectively. The highest bin includes overflow events. |
png pdf |
Figure 6-b:
The $ {\textrm {L}_\textrm {T}} $ distribution for events with two opposite charge light leptons and a hadronically decaying $\tau $ lepton with 50 $ < {E_{\mathrm {T}}^{\text {miss}}} < $ 150 GeV (left) and with $ {E_{\mathrm {T}}^{\text {miss}}} > $ 150 GeV (right). The total SM background is shown as a stack of all contributing processes. The predictions for signal models with $m_{\tau '/\nu '} = $ 300 GeV and $m_{\tau '/\nu '} = $ 500 GeV (sum of all production and decay modes) are also shown as solid lines. The hatched gray band in the upper panel, and the dark and light gray bands in the lower panel represent the total, statistical, and systematic uncertainties on the expected background, respectively. The highest bin includes overflow events. |
png pdf |
Figure 7:
The $ {\textrm {L}_\textrm {T}} $ distribution for events with two same charge light leptons and a hadronically decaying $\tau $ lepton with 50 $ < {E_{\mathrm {T}}^{\text {miss}}} < $ 150 GeV (left) and with $ {E_{\mathrm {T}}^{\text {miss}}} > $ 150 GeV (right). The total SM background is shown as a stack of all contributing processes. The predictions for signal models with $m_{\tau '/\nu '} = $ 300 GeV and $m_{\tau '/\nu '} = $ 500 GeV (sum of all production and decay modes) are also shown as solid lines. The hatched gray band in the upper panel, and the dark and light gray bands in the lower panel represent the total, statistical, and systematic uncertainties on the expected background, respectively. The highest bin includes overflow events. |
png pdf |
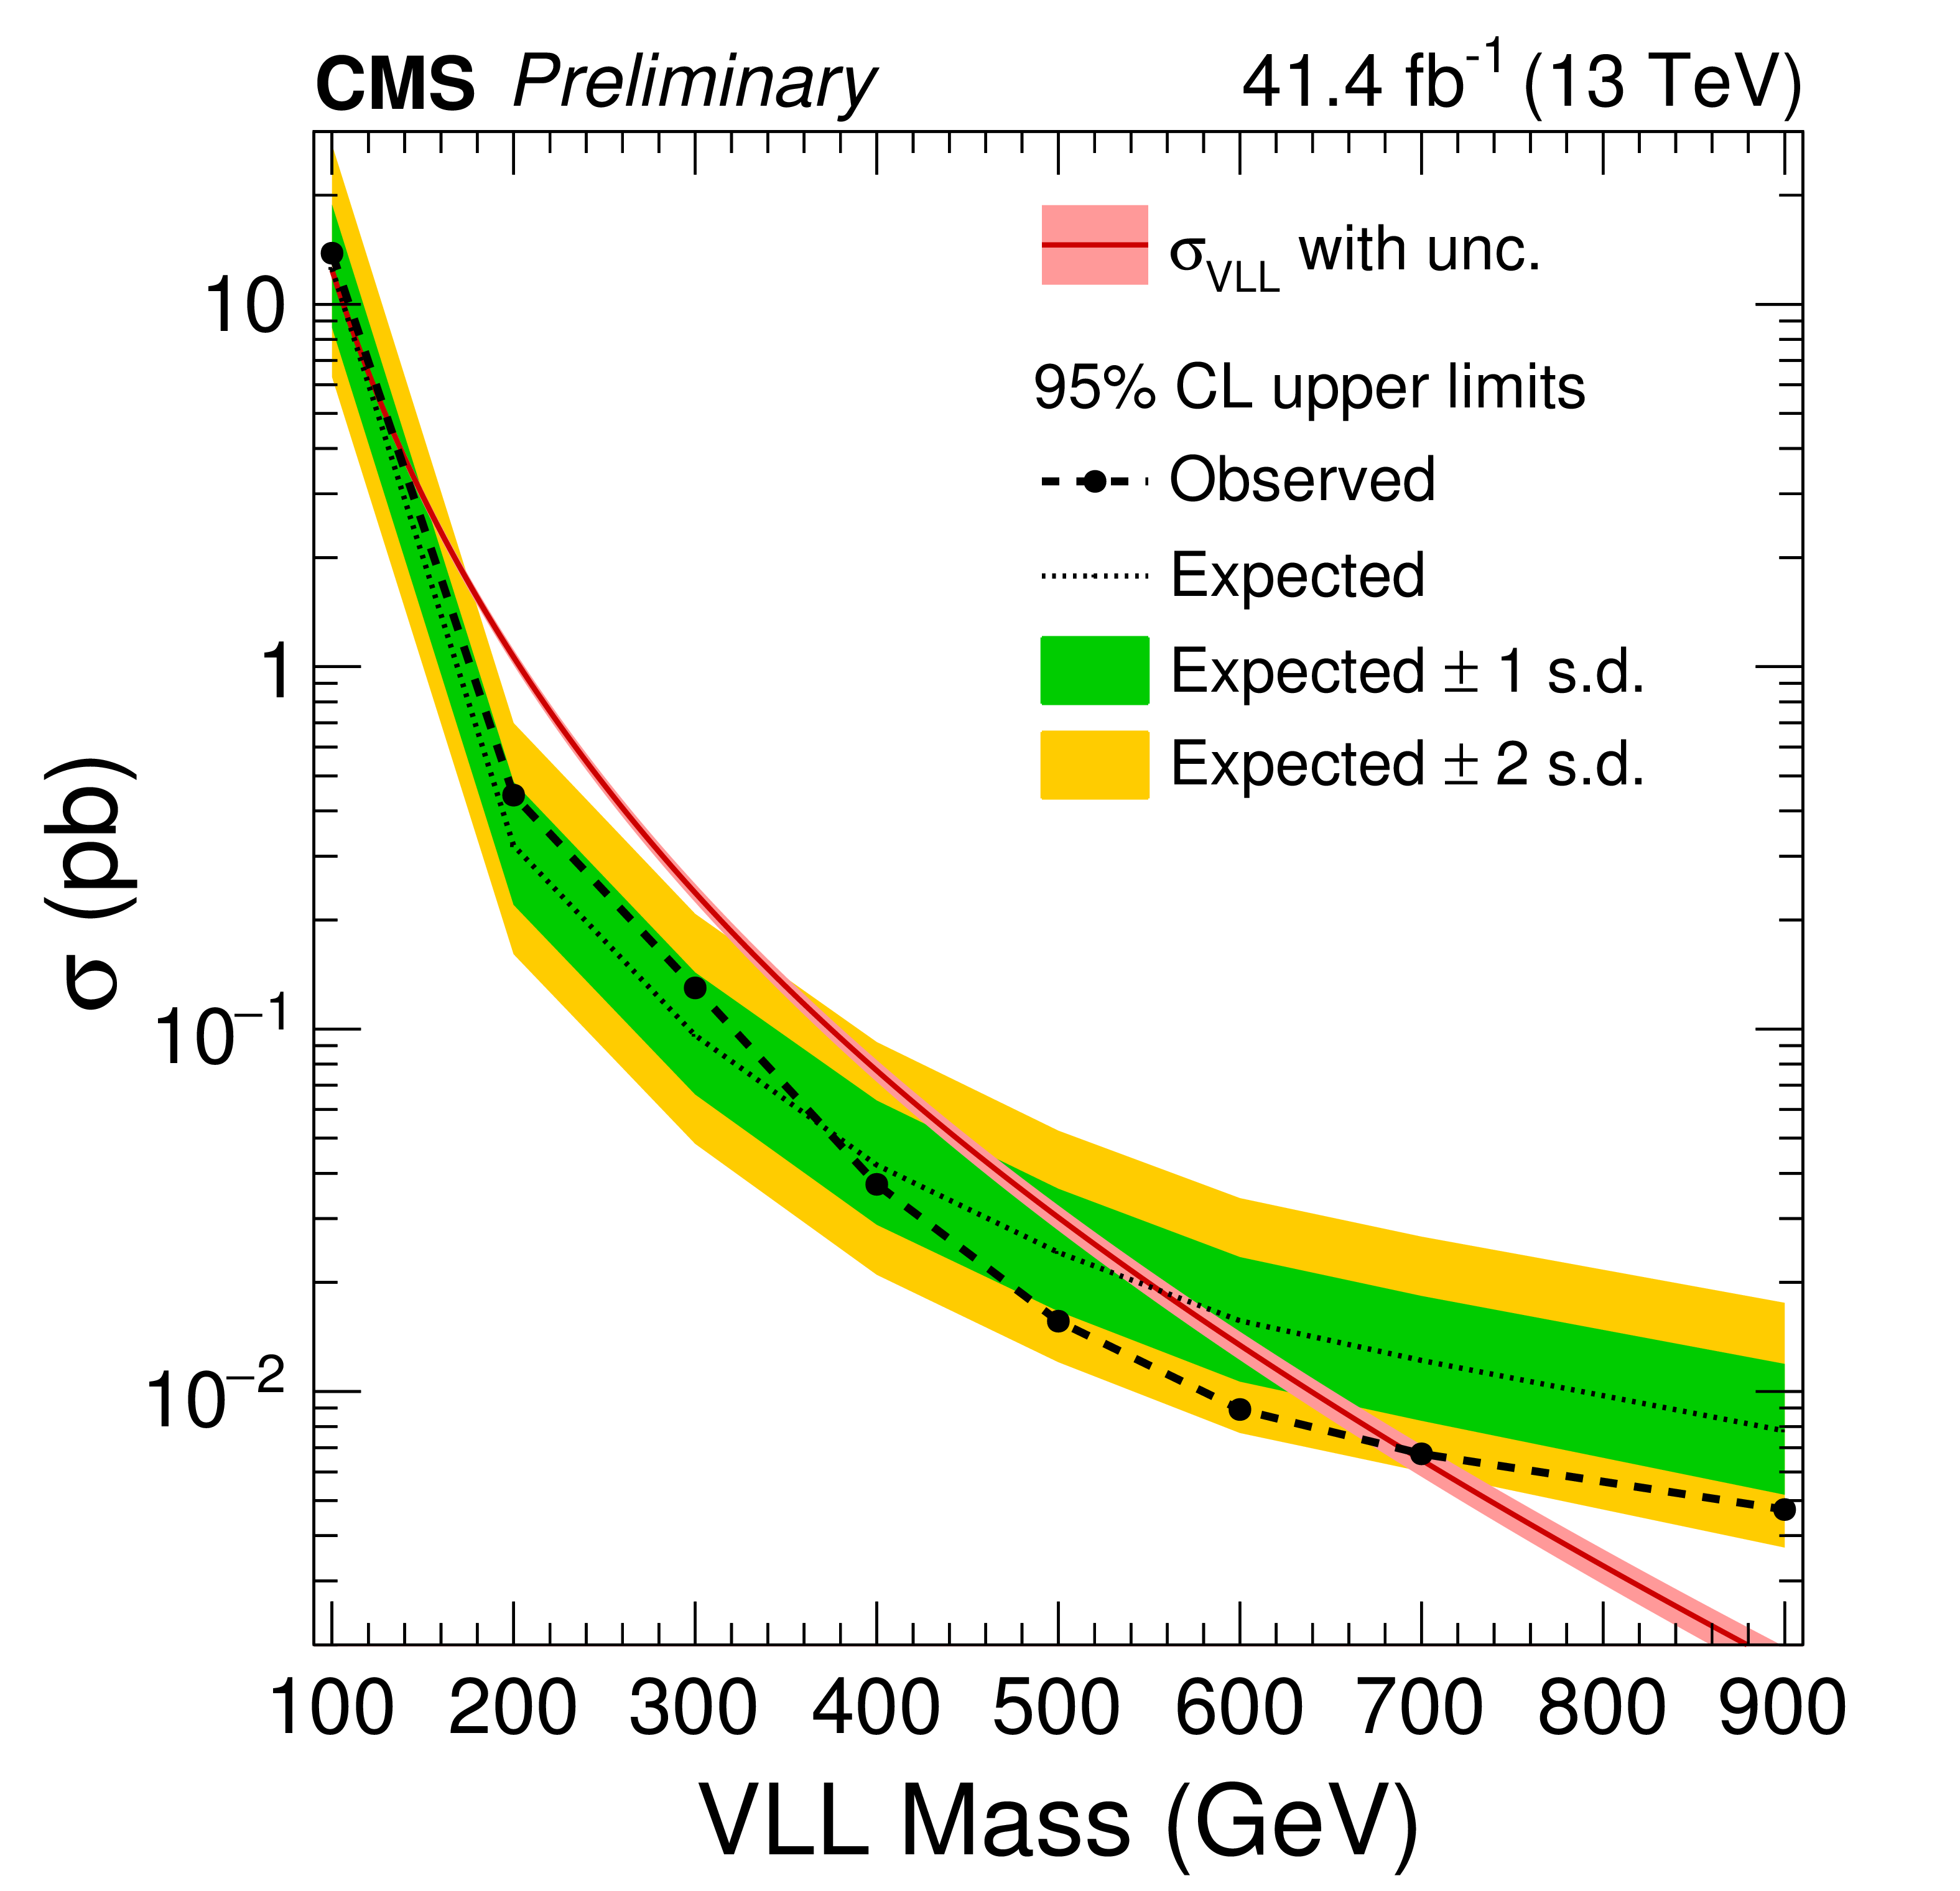
Figure 8:
The 95% confidence level upper limits on the cross section for production of VLL pairs ($\tau '^{+} \tau '^{-}$, $\tau '^{\pm} \nu '$ and $\nu ' \nu '$). Also shown is the theoretical prediction for the cross section of the VLL production. The observed (expected) exclusion limit on the masses of vector-like leptons is in the range of 130-690 (110-560) GeV. |
| Tables | |
png pdf |
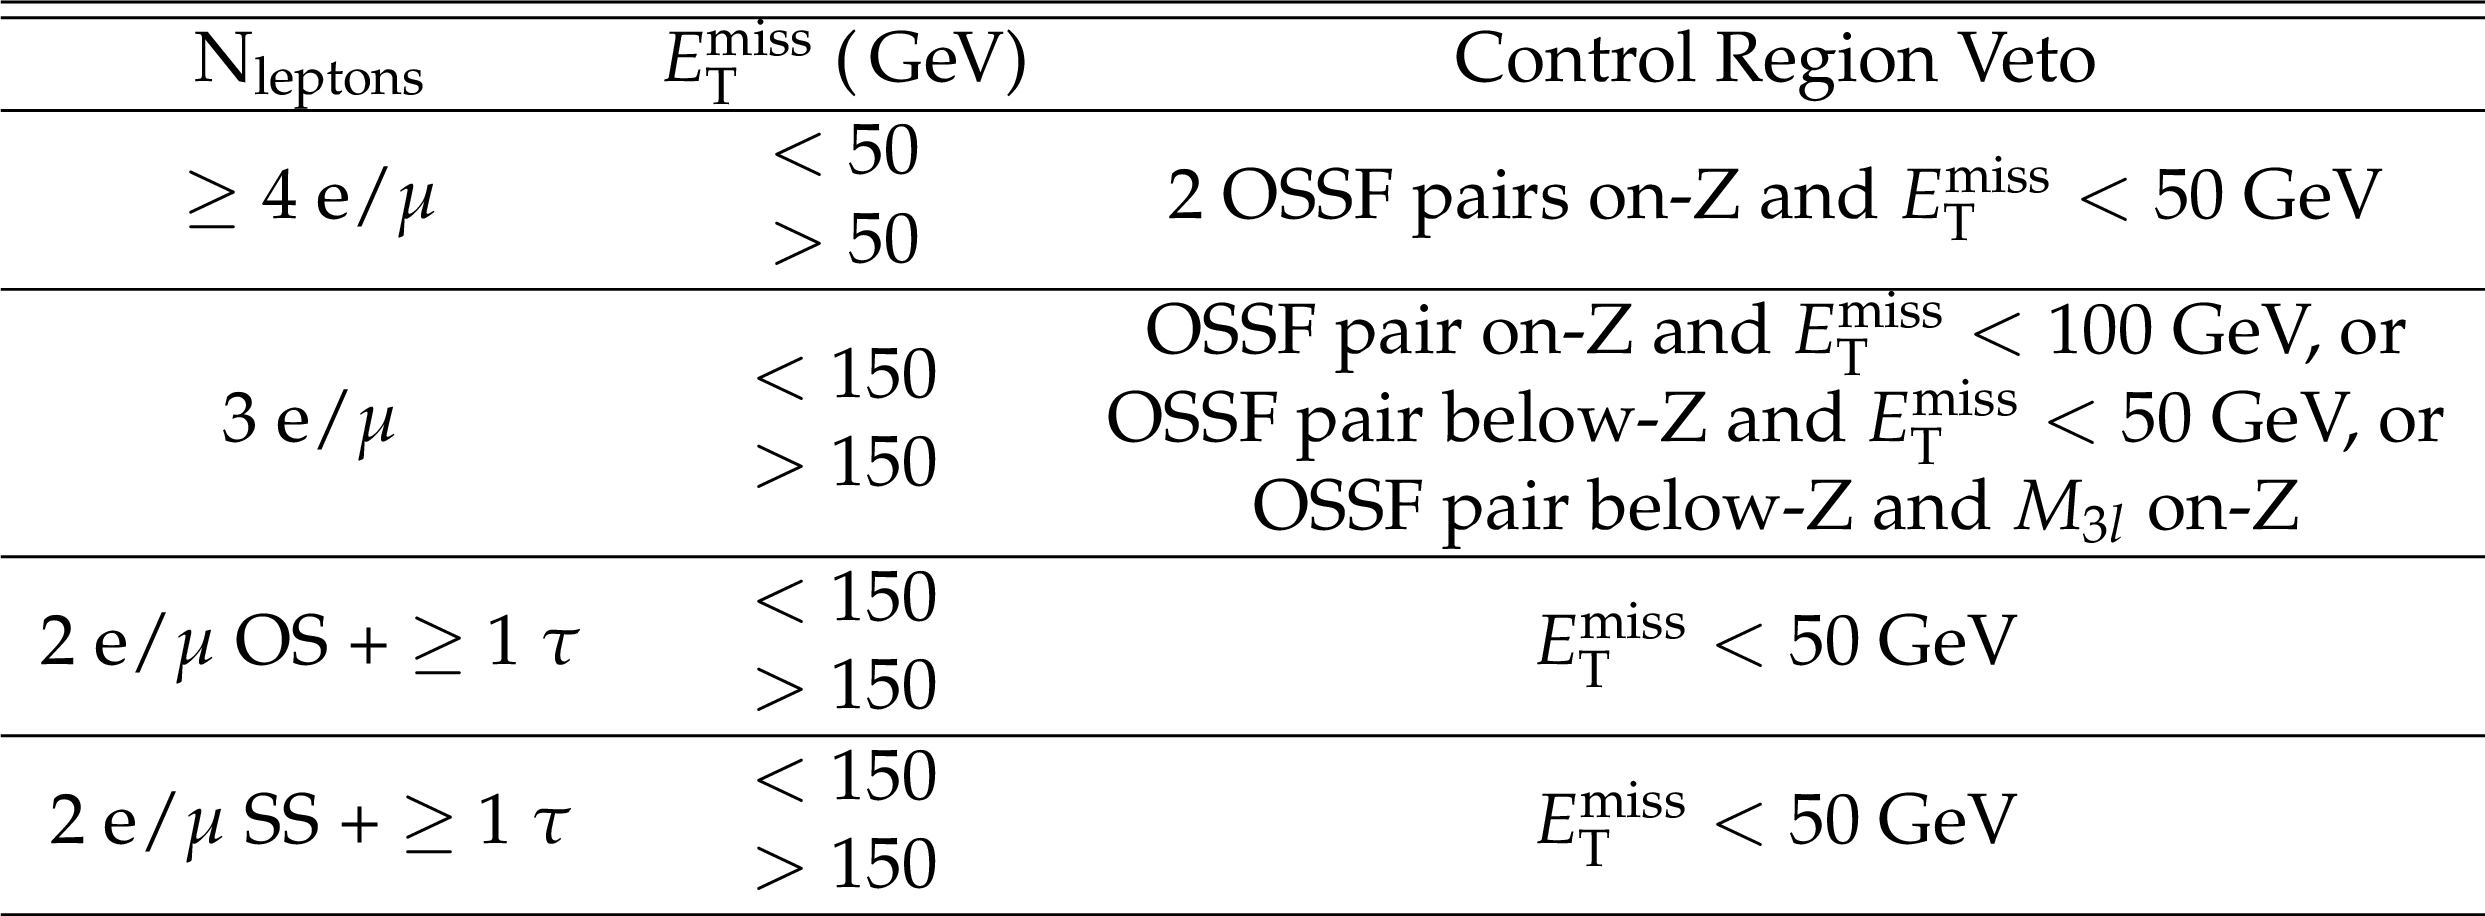
Table 1:
Signal regions as defined in this analysis. The on-Z (below-Z) selection is defined as an OSSF lepton pair with mass between 76 and 106 GeV (less than 76 GeV). |
| Summary |
| In summary, we performed a search for vector-like leptons in multilepton final states using 41.4 fb$^{-1}$ of proton-proton collision data at $\sqrt{s} = $ 13 TeV, collected using the CMS detector in 2017. We observe no significant discrepancies between the background prediction and the data. We exclude, at 95% confidence level, vector-like leptons with masses above 130 GeV and below 690 GeV. |
| References | ||||
| 1 | A. Falkowski, D. M. Straub, and A. Vicente | Vector-like leptons: Higgs decays and collider phenomenology | JHEP 05 (2014) 092 | 1312.5329 |
| 2 | T. Moroi and Y. Okada | Radiative corrections to Higgs masses in the supersymmetric model with an extra family and antifamily | MPLA7 (1992) 187--200 | |
| 3 | K. S. Babu, I. Gogoladze, M. U. Rehman, and Q. Shafi | Higgs Boson Mass, Sparticle Spectrum and Little Hierarchy Problem in Extended MSSM | PRD78 (2008) 055017 | 0807.3055 |
| 4 | S. P. Martin | Extra vector-like matter and the lightest Higgs scalar boson mass in low-energy supersymmetry | PRD81 (2010) 035004 | 0910.2732 |
| 5 | M. Endo, K. Hamaguchi, S. Iwamoto, and N. Yokozaki | Higgs Mass and Muon Anomalous Magnetic Moment in Supersymmetric Models with Vector-Like Matters | PRD84 (2011) 075017 | 1108.3071 |
| 6 | M. Sher | Charged leptons with nanosecond lifetimes | PRD52 (1995) 3136--3138 | hep-ph/9504257 |
| 7 | S. D. Thomas and J. D. Wells | Phenomenology of Massive Vectorlike Doublet Leptons | PRL 81 (1998) 34--37 | hep-ph/9804359 |
| 8 | P. H. Frampton, P. Q. Hung, and M. Sher | Quarks and leptons beyond the third generation | PR 330 (2000) 263 | hep-ph/9903387 |
| 9 | R. Dermisek | Insensitive Unification of Gauge Couplings | PLB713 (2012) 469--472 | 1204.6533 |
| 10 | J. Halverson, N. Orlofsky, and A. Pierce | Vectorlike Leptons as the Tip of the Dark Matter Iceberg | PRD90 (2014), no. 1, 015002 | 1403.1592 |
| 11 | R. Dermisek and A. Raval | Explanation of the Muon g-2 Anomaly with Vectorlike Leptons and its Implications for Higgs Decays | PRD88 (2013) 013017 | 1305.3522 |
| 12 | R. Dermisek | Unification of gauge couplings in the standard model with extra vectorlike families | PRD87 (2013), no. 5, 055008 | 1212.3035 |
| 13 | N. Kumar and S. P. Martin | Vectorlike leptons at the Large Hadron Collider | PRD92 (2015), no. 11, 115018 | 1510.03456 |
| 14 | CMS Collaboration | Search for Evidence of the Type-III Seesaw Mechanism in Multilepton Final States in Proton-Proton Collisions at $ \sqrt{s}=13\text{}\text{}\mathrm{TeV} $ | PRL 119 (2017), no. 22, 221802 | CMS-EXO-17-006 1708.07962 |
| 15 | L3 Collaboration | Search for heavy neutral and charged leptons in $ e^{+} e^{-} $ annihilation at LEP | PLB517 (2001) 75--85 | hep-ex/0107015 |
| 16 | ATLAS Collaboration | Search for heavy lepton resonances decaying to a $ Z $ boson and a lepton in $ pp $ collisions at $ \sqrt{s}= $ 8 TeV with the ATLAS detector | JHEP 09 (2015) 108 | 1506.01291 |
| 17 | CMS Collaboration | The CMS experiment at the CERN LHC | JINST 3 (2008) S08004 | CMS-00-001 |
| 18 | J. Alwall et al. | MadGraph 5 : Going Beyond | JHEP 06 (2011) 128 | 1106.0522 |
| 19 | P. Nason | A New method for combining NLO QCD with shower Monte Carlo algorithms | JHEP 11 (2004) 040 | hep-ph/0409146 |
| 20 | S. Frixione, P. Nason, and C. Oleari | Matching NLO QCD computations with Parton Shower simulations: the POWHEG method | JHEP 11 (2007) 070 | 0709.2092 |
| 21 | Y. Gao et al. | Spin determination of single-produced resonances at hadron colliders | PRD81 (2010) 075022 | 1001.3396 |
| 22 | S. Bolognesi et al. | On the spin and parity of a single-produced resonance at the LHC | PRD86 (2012) 095031 | 1208.4018 |
| 23 | I. Anderson et al. | Constraining anomalous HVV interactions at proton and lepton colliders | PRD89 (2014) 035007 | 1309.4819 |
| 24 | A. V. Gritsan, R. Röntsch, M. Schulze, and M. Xiao | Constraining anomalous Higgs boson couplings to the heavy flavor fermions using matrix element techniques | PRD94 (2016) 055023 | 1606.03107 |
| 25 | T. Sjostrand, S. Mrenna, and P. Z. Skands | PYTHIA 6.4 Physics and Manual | JHEP 05 (2006) 026 | hep-ph/0603175 |
| 26 | T. Sjostrand et al. | An Introduction to PYTHIA 8.2 | CPC 191 (2015) 159 | 1410.3012 |
| 27 | GEANT4 Collaboration | GEANT4: A Simulation toolkit | NIMA506 (2003) 250 | |
| 28 | CMS Collaboration | Particle-flow reconstruction and global event description with the CMS detector | JINST 12 (2017), no. 10, P10003 | CMS-PRF-14-001 1706.04965 |
| 29 | CMS Collaboration | Performance of CMS muon reconstruction in $ pp $ collision events at $ \sqrt{s}= $ 7 TeV | JINST 7 (2012) P10002 | CMS-MUO-10-004 1206.4071 |
| 30 | CMS Collaboration | Performance of Electron Reconstruction and Selection with the CMS Detector in Proton-Proton Collisions at âs = 8 TeV | JINST 10 (2015), no. 06, P06005 | CMS-EGM-13-001 1502.02701 |
| 31 | CMS Collaboration | Reconstruction and identification of Ï lepton decays to hadrons and ν$ _Ï $ at CMS | JINST 11 (2016), no. 01, P01019 | CMS-TAU-14-001 1510.07488 |
| 32 | M. Cacciari, G. P. Salam, and G. Soyez | The Anti-k(t) jet clustering algorithm | JHEP 04 (2008) 063 | 0802.1189 |
| 33 | M. Cacciari, G. P. Salam, and G. Soyez | FastJet user manual | EPJC 72 (2012) 1896 | 1111.6097 |
| 34 | CMS Collaboration | Determination of Jet Energy Calibration and Transverse Momentum Resolution in CMS | JINST 6 (2011) P11002 | CMS-JME-10-011 1107.4277 |
| 35 | CMS Collaboration | Measurement of the $ t\bar{t} $ production cross section in the dilepton channel in $ pp $ collisions at $ \sqrt{s}= $ 7 TeV | JHEP 11 (2012) 067 | CMS-TOP-11-005 1208.2671 |
| 36 | CMS Collaboration | CMS luminosity measurement for the 2017 data-taking period at $ \sqrt{s} = $ 13 TeV | CMS-PAS-LUM-17-004 | CMS-PAS-LUM-17-004 |
| 37 | T. Junk | Confidence Level Computation for Combining Searches with Small Statistics | NIMA434 (1999) 435 | hep-ex/9902006 |
| 38 | A. L. Read | Modified frequentist analysis of search results (The CL(s) method) | in Workshop on confidence limits, CERN, Geneva, Switzerland, 17-18 Jan 2000: Proceedings, p. 812000 | |
| 39 | A. L. Read | Presentation of search results: The CL(s) technique | JPG 28 (2002) 2693 | |
| 40 | ATLAS and CMS Collaborations | Procedure for the LHC Higgs boson search combination in summer 2011 | CMS NOTE-2011/005, ATL-PHYS-PUB-2011-11 | |
|
|
Compact Muon Solenoid LHC, CERN |
|

|

|

|

|

|