

Compact Muon Solenoid
LHC, CERN
| CMS-PAS-BPH-23-004 | ||
| Measurement of time-dependent $ CP $ violation in $ B_s^0 \to \mathrm{J}/\psi\, \phi(1020) $ decays with the CMS detector | ||
| CMS Collaboration | ||
| 8 April 2024 | ||
| Abstract: A study of $ CP $ violation in $ B_s^0 \to \mathrm{J}/\psi\, \phi(1020) $ decays is presented, based on the data collected by the CMS experiment at the LHC. The measurement is based on a data sample of roughly 491 000 reconstructed signal events corresponding to an integrated luminosity of 96.5 fb$^{-1}$, collected in proton-proton collisions at 13 TeV in 2017-2018. A time- and flavor-dependent angular analysis of the $ \mu^+ \mu^-\,\mathrm{K}^+ \mathrm{K}^- $ final state is performed to extract the values of the $ CP $-violating phase $ \phi_s $, the decay width difference ($ \Delta\Gamma_s $), and absolute mass difference ($ \Delta m_s $) between the light and heavy $ B_s^0 $ mass eigenstates, their average decay width $ \Gamma_s $, and the direct $ CP $ violation parameter $ |\lambda| $. The analysis utilizes a pioneering inclusive flavor tagging framework based on state-of-the-art machine learning techniques, achieving exceptional performance by exploiting both opposite-side and same-side information. The measurement yields $ \phi_s = -$73 $ \pm $ 23 (stat) $ \pm $ 7 (syst) mrad, $ \Delta\Gamma_s = $ 0.0761 $ \pm $ 0.0043 (stat) $ \pm $ 0.0019 (syst) ps$^{-1} $, $ \Delta m_s = $ 17.757 $ \pm $ 0.035 (stat) $ \pm $ 0.017 (syst) $ \ \hslash$ps$^{-1} $, $ \Gamma_s = $ 0.6613 $ \pm $ 0.0015 (stat) $ \pm $ 0.0028 (syst) ps$^{-1}$, and $ |\lambda| = $ 1.011 $ \pm $ 0.014 (stat) $ \pm $ 0.012 (syst). These results exhibit a level of precision on par with the most precise single measurements to date and agree with the standard model predictions. A combination with the previous CMS results obtained at 8 TeV is also performed, yielding $ \phi_s = - $74 $ \pm $ 23 mrad and $ \Delta\Gamma_s = $ 0.0780 $ \pm $ 0.0045 ps$^{-1}$. The weak phase $ \phi_s $ is found different from zero by 3.2 standard deviations, indicating evidences for $ CP $ violation in $ B_s^0 \to \mathrm{J}/\psi\, \mathrm{K}^+ \mathrm{K}^- $ decays. | ||
|
Links:
CDS record (PDF) ;
Physics Briefing ;
CADI line (restricted) ;
These preliminary results are superseded in this paper, Submitted to PRL. The superseded preliminary plots can be found here. |
||
| Figures & Tables | Summary | Additional Figures | References | CMS Publications |
|---|
| Figures | |
png pdf |
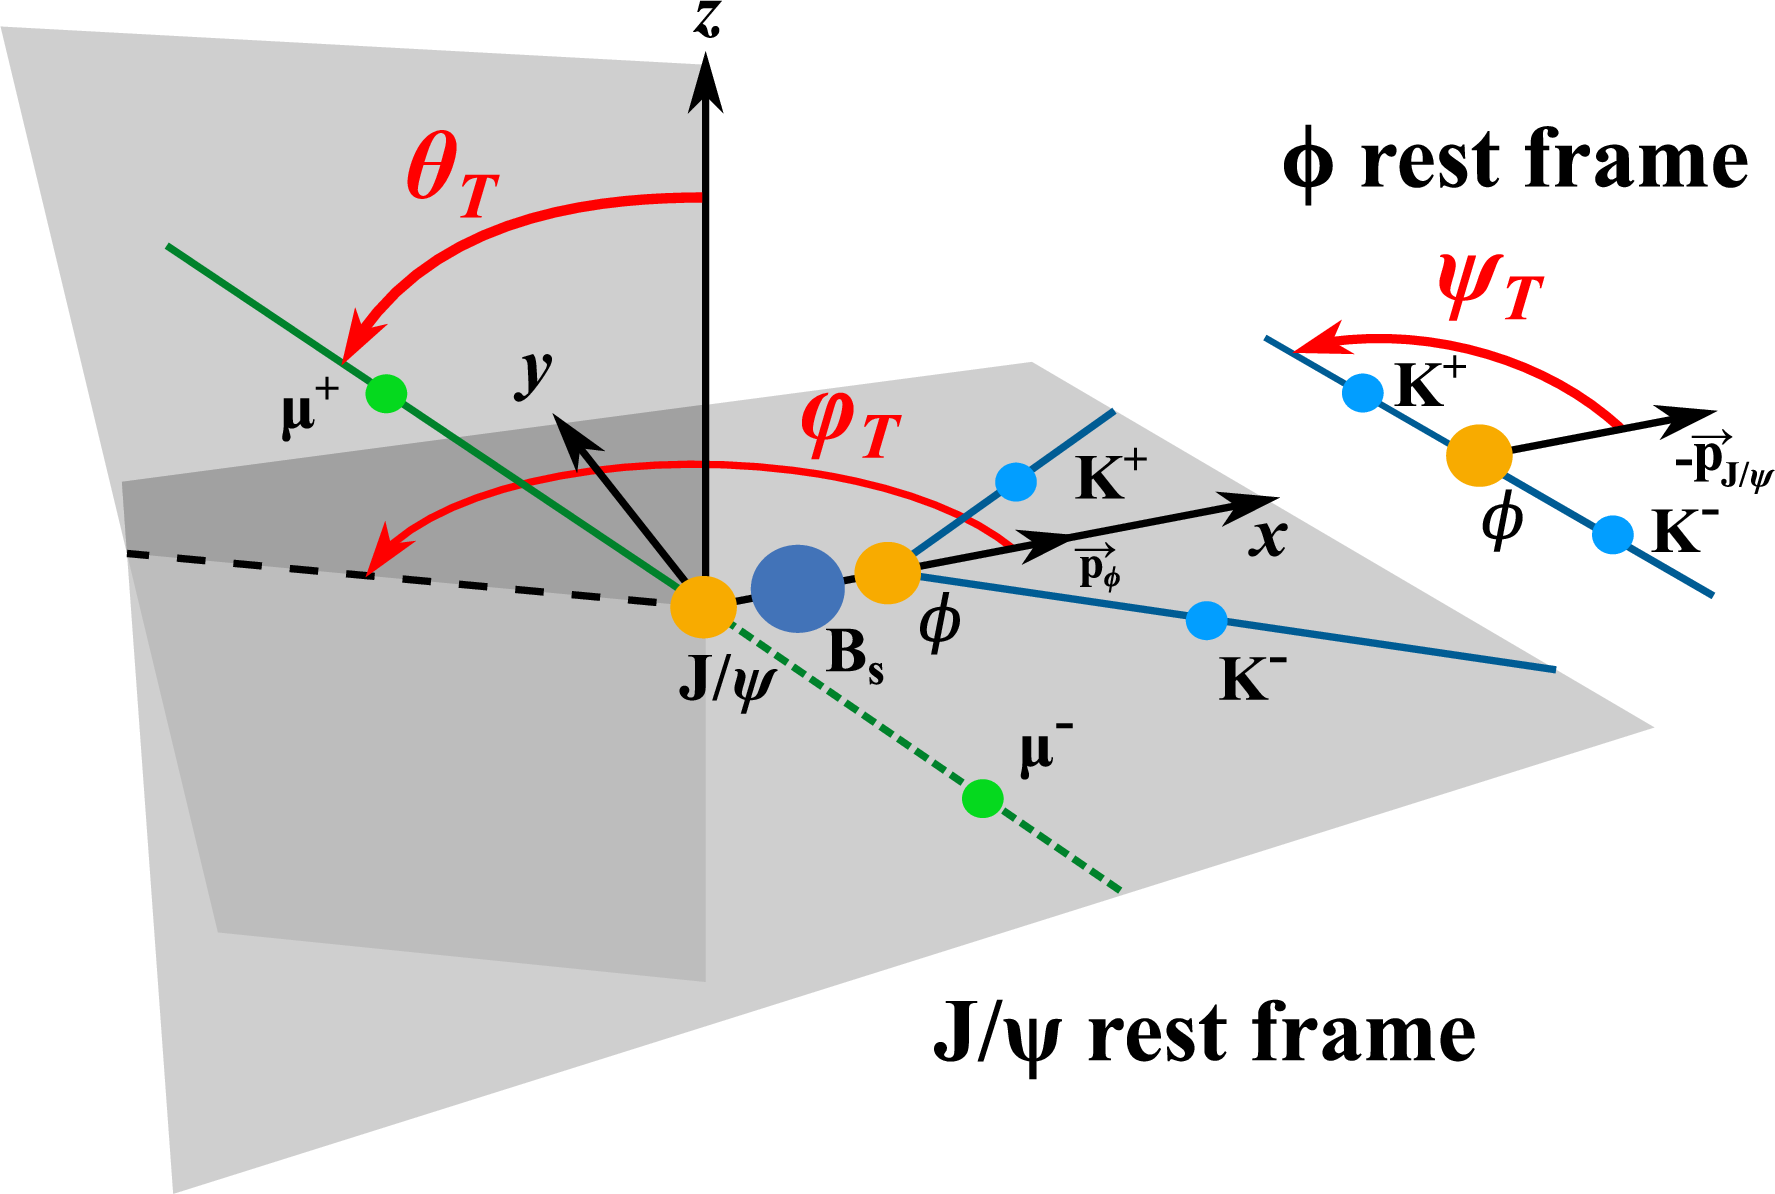
Figure 1:
Definition of the three angles $ \theta_{T} $, $ \psi_{T} $, and $ \varphi_{T} $ describing the $ \mathrm{B}_{s}^{0} \to \mathrm{J}/\psi\,\phi \to \mu^{+}\mu^{-}\,\mathrm{K^+}\mathrm{K^-} $ decay. |
png pdf |
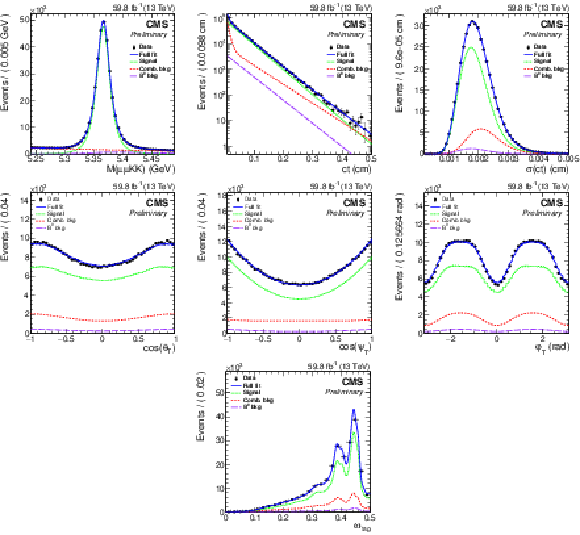
Figure 2:
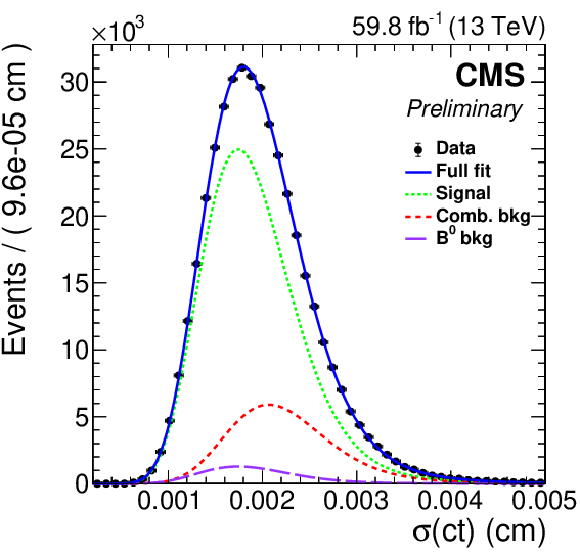
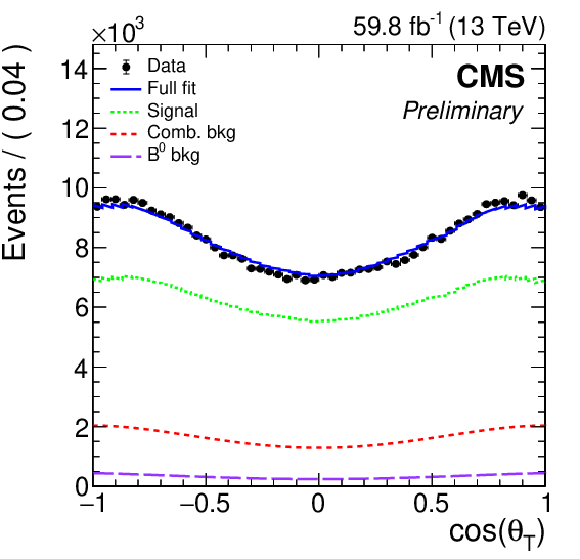
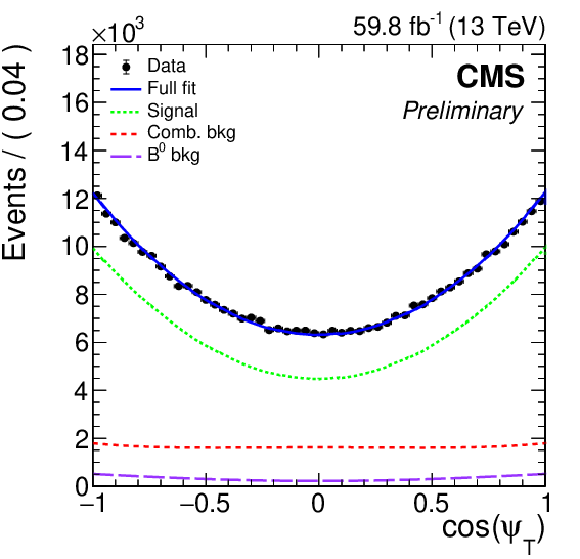
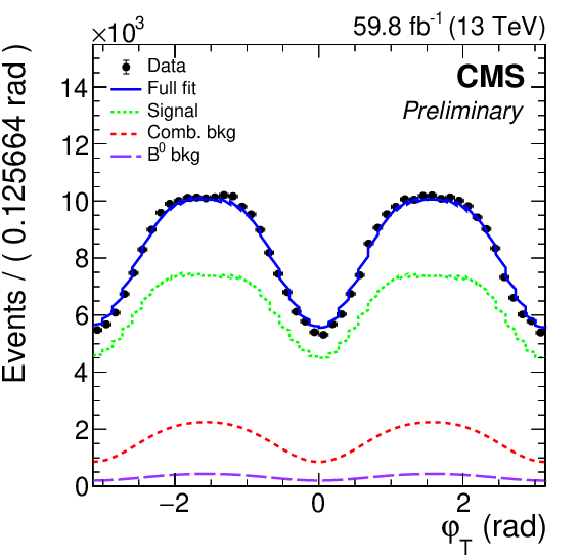
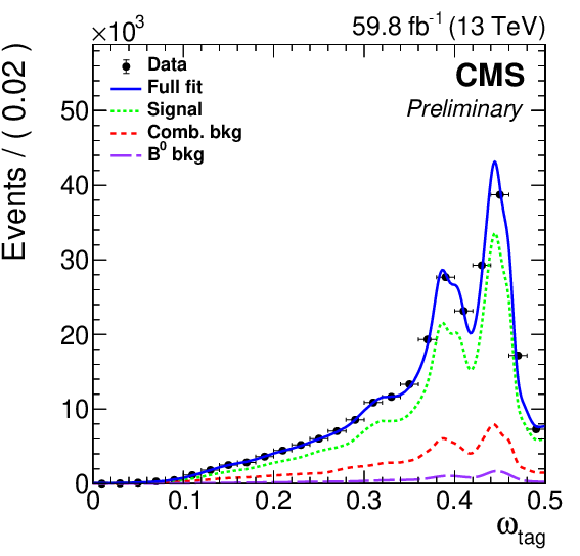
The distributions for the input observables of the selected candidates and the projections from the fit for the standard trigger category (2018). |
png pdf |
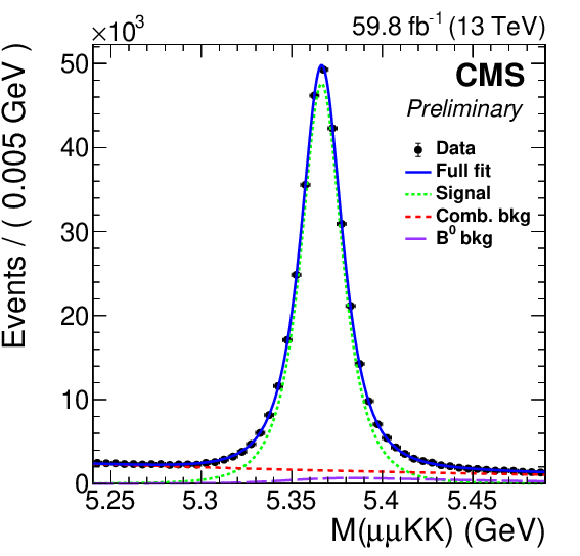
Figure 2-a:
The distributions for the input observables of the selected candidates and the projections from the fit for the standard trigger category (2018). |
png pdf |
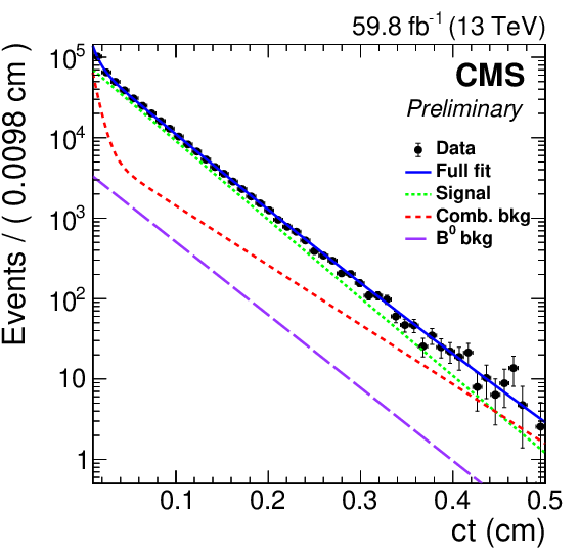
Figure 2-b:
The distributions for the input observables of the selected candidates and the projections from the fit for the standard trigger category (2018). |
png pdf |
Figure 2-c:
The distributions for the input observables of the selected candidates and the projections from the fit for the standard trigger category (2018). |
png pdf |
Figure 2-d:
The distributions for the input observables of the selected candidates and the projections from the fit for the standard trigger category (2018). |
png pdf |
Figure 2-e:
The distributions for the input observables of the selected candidates and the projections from the fit for the standard trigger category (2018). |
png pdf |
Figure 2-f:
The distributions for the input observables of the selected candidates and the projections from the fit for the standard trigger category (2018). |
png pdf |
Figure 2-g:
The distributions for the input observables of the selected candidates and the projections from the fit for the standard trigger category (2018). |
png pdf |
Figure 3:
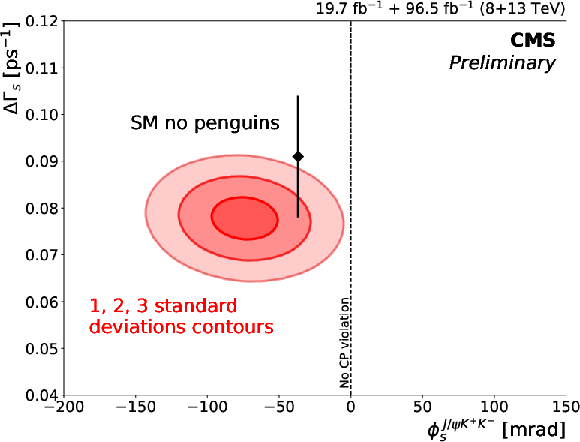
The two-dimensional one, two, and three standard deviations contours in the $ \phi_s$-$\Delta\Gamma_s $ plane for the combined results. The contours take into account both statistical and systematic uncertainties. The SM prediction is represented by the black rectangle, with the central value indicated with the black diamond [2,3,63]. The dashed line indicates the $ \phi_s = $ 0 value, corresponding to no CPV in the $ \mathrm{B}_{s}^{0} $ meson decay/mixing interference. |
| Tables | |

png pdf |
Table 1:
Angular and time-dependent terms of the $ \mathrm{B}_{s}^{0} $ signal model. The terms for the decay of the $ \overline{\mathrm{B}}_{s}^{0} $ meson are obtained by inverting the signs of the $ c_i $ and $ d_i $ terms. |
png pdf |
Table 2:
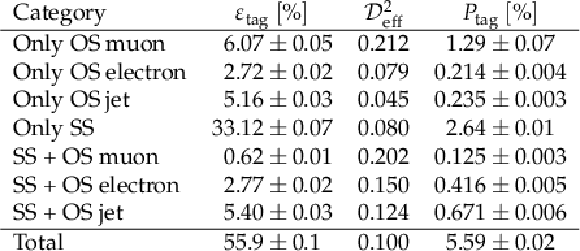
Calibrated flavor tagging performance as measured in the $ \mathrm{B}_{s}^{0} $ data sample. The effective dilution is obtained from the measured $ \varepsilon_{\text{tag}} $ and $ P_{\text{tag}} $. The uncertainties are statistical only. |

png pdf |
Table 3:
Summary of the systematic uncertainties. The dashes ($ \text{---} $) mean that the corresponding uncertainty is not assigned. The total systematic uncertainty is obtained as the quadratic sum of the individual contributions. |
png pdf |
Table 4:
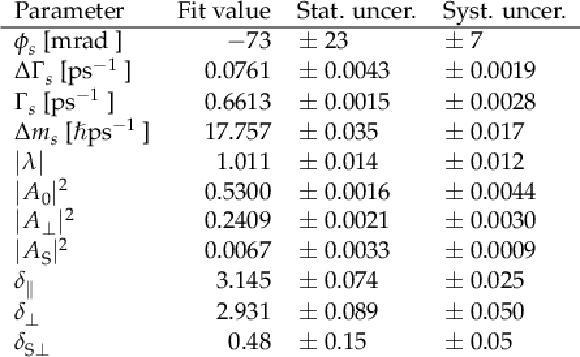
Results of the fit to data for the main physics parameters. |
| Summary |
| The $ CP $ violating phase $ \phi_s $ is measured by analyzing a total of 491 270 $ \pm $ 950 $ \mathrm{B}_{s}^{0} \to \mathrm{J}/\psi\,\phi(1020) \to \mu^{+}\mu^{-}\,\mathrm{K^+}\mathrm{K^-} $ signal events, recorded by the CMS experiment at the LHC in proton-proton collisions at $ \sqrt{s} = $ 13 TeV, representing an integrated luminosity of 96.5 fb$^{-1}$. The study employs an innovative inclusive flavor tagging framework that relies on cutting-edge machine learning methods. This novel framework achieves excellent performance by leveraging information from both opposite-side and same-side techniques, corresponding to a tagging power of $ {\approx} $5.6%. The CPV phase $ \phi_s $ is measured to be $-$73 $ \pm $ 23 (stat) $ \pm $ 7 (syst) mrad. In addition, the decay width and absolute mass differences $ \Delta\Gamma_s $ and $ \Delta m_s $ between the light and heavy $ \mathrm{B}_{s}^{0} $ mass eigenstates, their average decay width $ \Gamma_s $, and the direct $ CP $ violation parameter $ |\lambda| $, have been measured. All measured values are in agreement with their theoretical predictions and world-average values. The results presented in this Note are combined our previous measurement at $ \sqrt{s} = $ 8 TeV [11], yielding $ \phi_s = -$74 $ \pm $ 23 mrad, consistent with the SM prediction and indicating evidences for CPV in $ \mathrm{B}_{s}^{0} \to \mathrm{J}/\psi\,\mathrm{K^+}\mathrm{K^-} $. The combined results superseed those from the previous CMS measurements and are comparable in precision to the world's most precise single measurements, reported by the LHCb Collaboration [17]. |
| Additional Figures | |
png pdf |
Additional Figure 1:
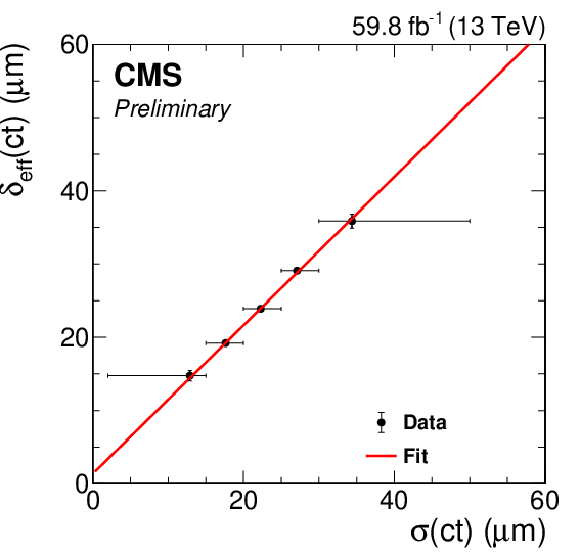
The $ ct $ uncertainty calibration fits for the 2018 data sample. The measured effective $ ct $ resolution is reported on the $ y $-axis, while the average value of $ \sigma_{ct} $ in the various bins is reported on the $ x $-axis. The fit results are shown with a solid red line. The error bars in the x-axis represent the bins' edges and are not used in the fit. |
png pdf |
Additional Figure 2:
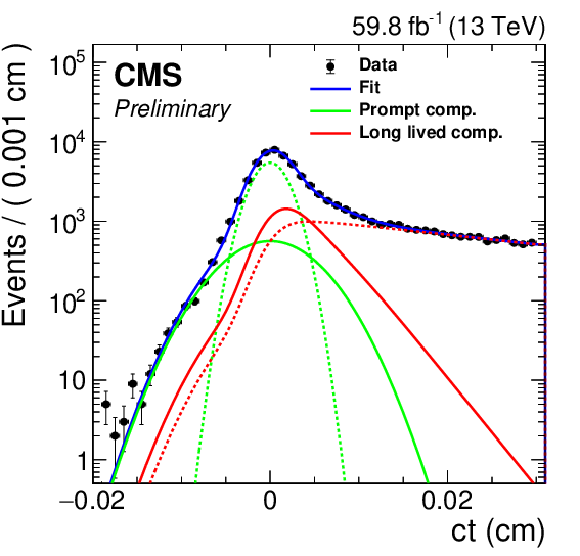
Proper decay length distribution in prompt events for the 2018 data sample. The solid blue line represents the fit to data used to calibrate the PDL resolution. The long-lived components are shown in red, while the components of the resolution function are shown in green. The resolution is modeled with two gaussian distributions. |
png pdf |
Additional Figure 3:
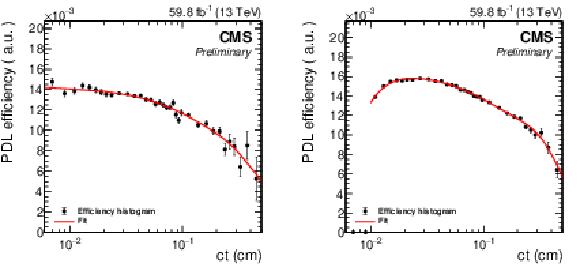
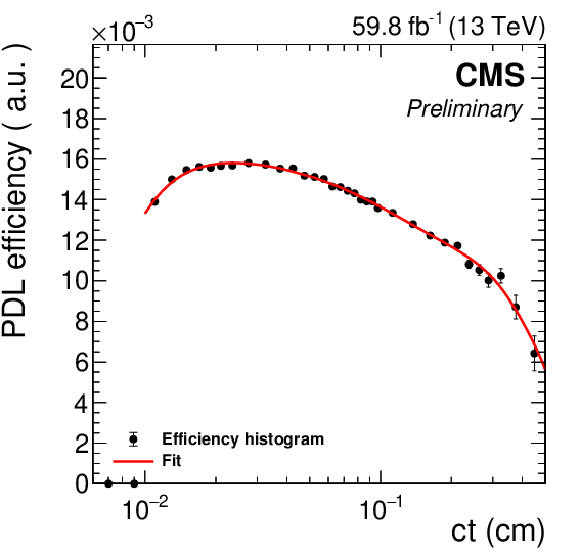
PDL efficiency in the muon-tagging (left) and standard (right) trigger categories for 2018 data. The red line represents the efficiency function fit. All corrections are applied. |
png pdf |
Additional Figure 3-a:
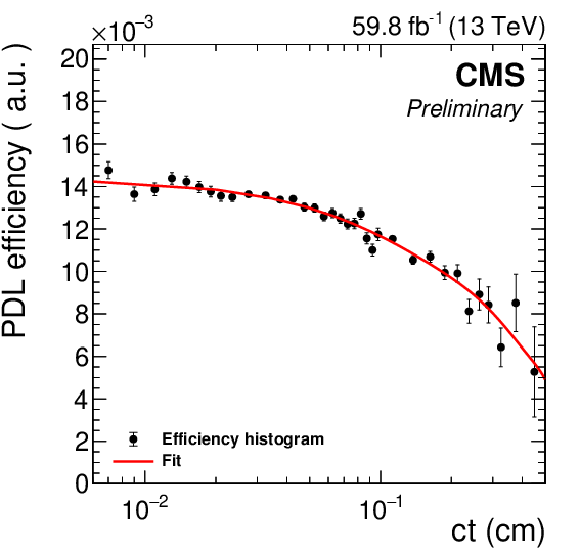
PDL efficiency in the muon-tagging (left) and standard (right) trigger categories for 2018 data. The red line represents the efficiency function fit. All corrections are applied. |
png pdf |
Additional Figure 3-b:
PDL efficiency in the muon-tagging (left) and standard (right) trigger categories for 2018 data. The red line represents the efficiency function fit. All corrections are applied. |
png pdf |
Additional Figure 4:
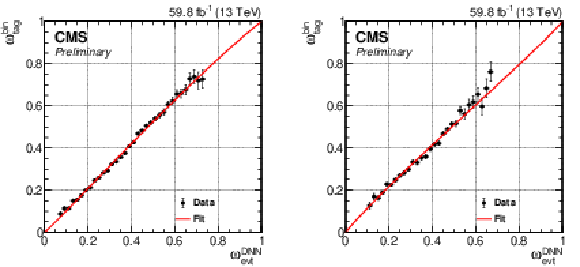
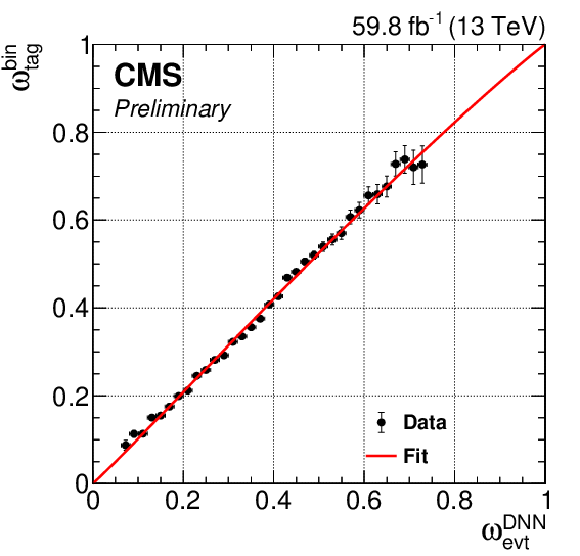
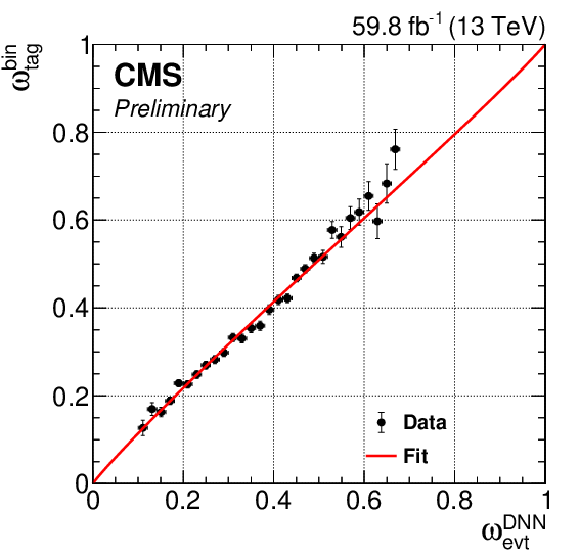
Results of the mistag probability calibration fit for the OS-muon tagger on $ {\mathrm{B}^{+}} \to \mathrm{J}/\psi\,\mathrm{K^+} $ decays from data. The solid red line shows the calibration fit to data (solid markers). The left plot refers to the muon-tagging trigger category (2018), while the right plot to standard one (2018). |
png pdf |
Additional Figure 4-a:
Results of the mistag probability calibration fit for the OS-muon tagger on $ {\mathrm{B}^{+}} \to \mathrm{J}/\psi\,\mathrm{K^+} $ decays from data. The solid red line shows the calibration fit to data (solid markers). The left plot refers to the muon-tagging trigger category (2018), while the right plot to standard one (2018). |
png pdf |
Additional Figure 4-b:
Results of the mistag probability calibration fit for the OS-muon tagger on $ {\mathrm{B}^{+}} \to \mathrm{J}/\psi\,\mathrm{K^+} $ decays from data. The solid red line shows the calibration fit to data (solid markers). The left plot refers to the muon-tagging trigger category (2018), while the right plot to standard one (2018). |
png pdf |
Additional Figure 5:
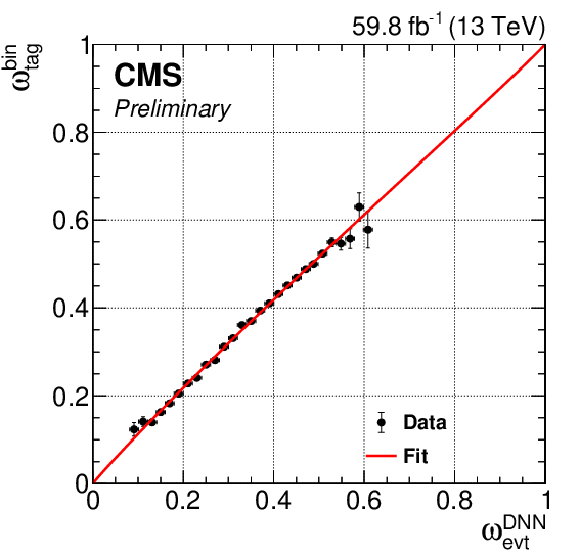
Results of the mistag probability calibration fit for the OS-electron tagger on $ {\mathrm{B}^{+}} \to \mathrm{J}/\psi\,\mathrm{K^+} $ decays from 2018 data. The solid red line shows the calibration fit to data (solid markers). |
png pdf |
Additional Figure 6:
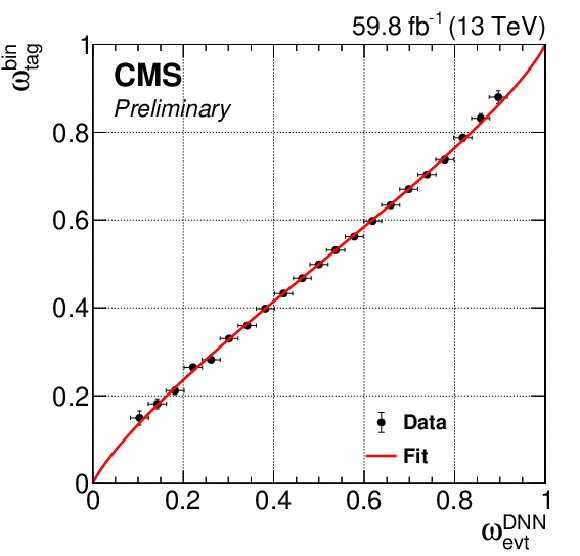
Results of the mistag probability calibration fit for the OS-jet tagger on $ {\mathrm{B}^{+}} \to \mathrm{J}/\psi\,\mathrm{K^+} $ decays from 2018 data. The solid red line shows the calibration fit to data (solid markers). |
png pdf |
Additional Figure 7:
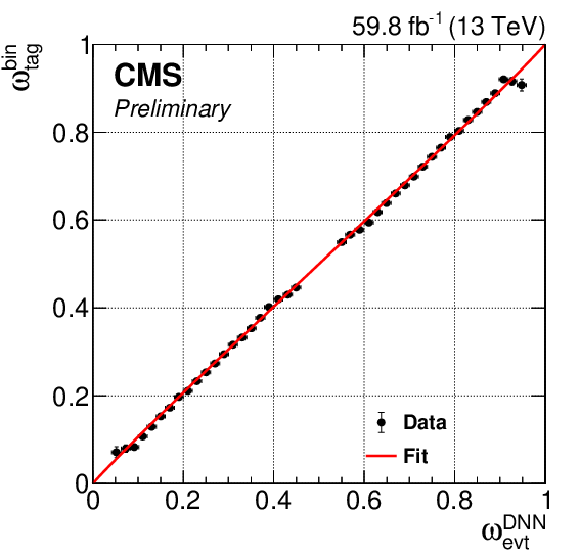
Results of the mistag probability calibration fit for the Same-Side tagger on $ {\mathrm{B}^{+}} \to \mathrm{J}/\psi\,\mathrm{K^+} $ decays from 2018 data. The solid red line shows the calibration fit to data (solid markers). Events with score between 0.46 and 0.54 are considered untagged and not used for the calibration. |
png pdf |
Additional Figure 8:
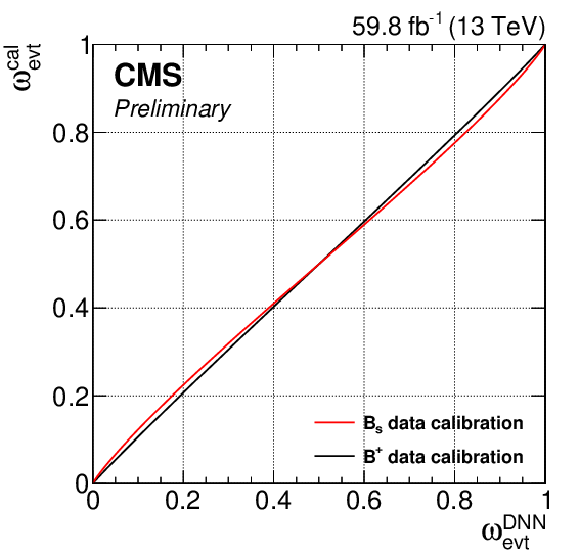
Comparison of the calibration curves before (black, $ {\mathrm{B}^{+}} $) and after (red, $ \mathrm{B}_{s}^{0} $) the application of the corrections from simulation to the calibration obtained in $ {\mathrm{B}^{+}} \to \mathrm{J}/\psi\,\mathrm{K^+} $ decays. The plot refers to 2018 data. The red function is the one used as calibration for the CPV measurement. |
png pdf |
Additional Figure 9:
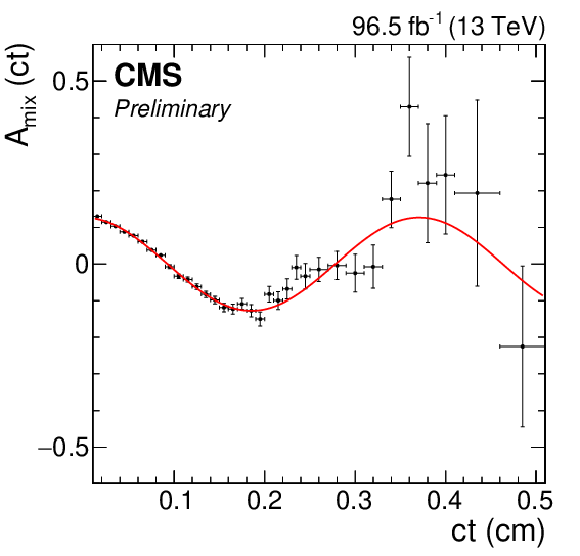
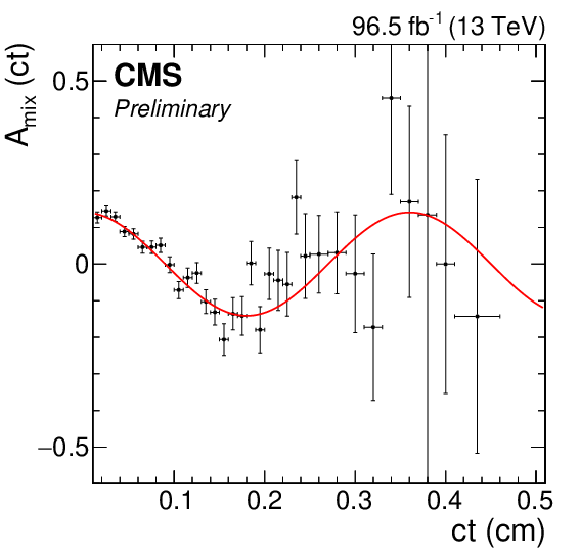
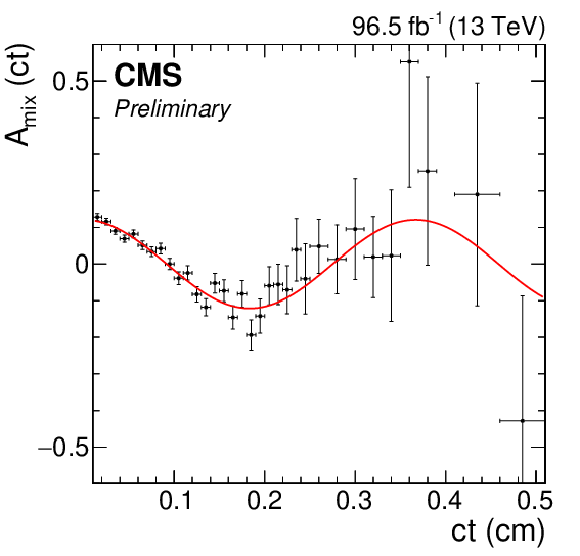
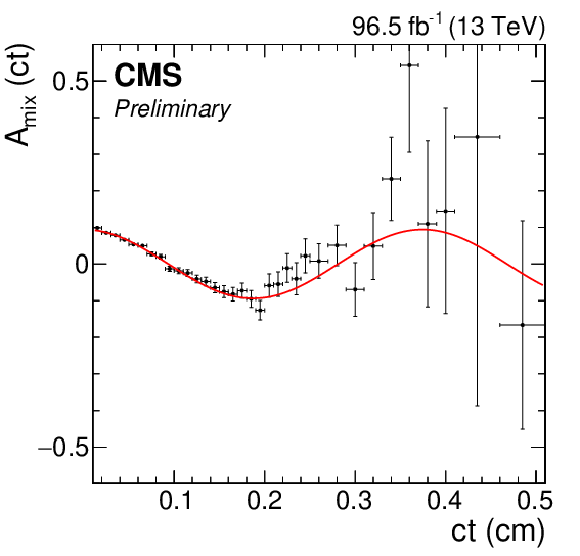
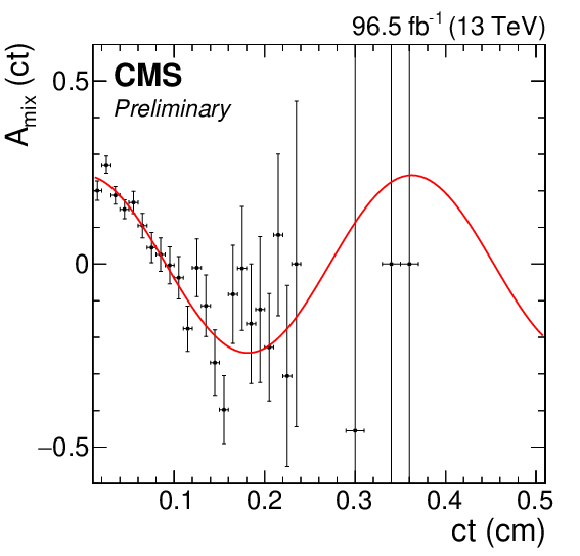
The $ {\mathrm{B}^0} $ mixing asymmetry as a function of the proper decay length as measured in the $ {\mathrm{B}^0} \to \mathrm{J}/\psi\,\mathrm{K}^{*}(892)^{0} $ control data sample as a validation to the tagging framework. |
png pdf |
Additional Figure 10:
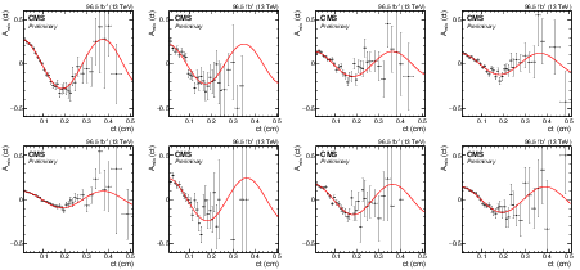
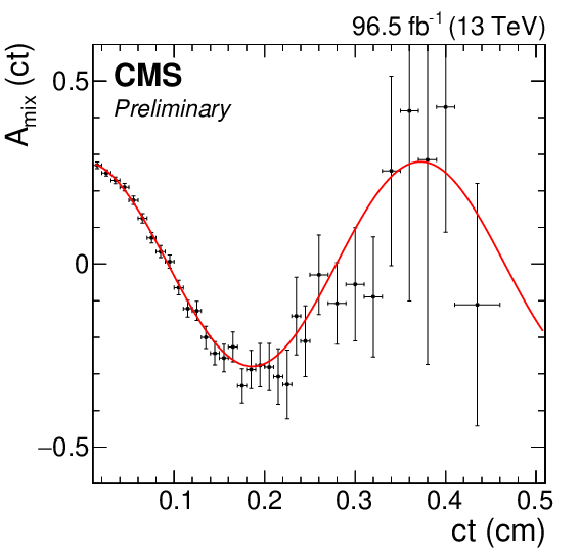
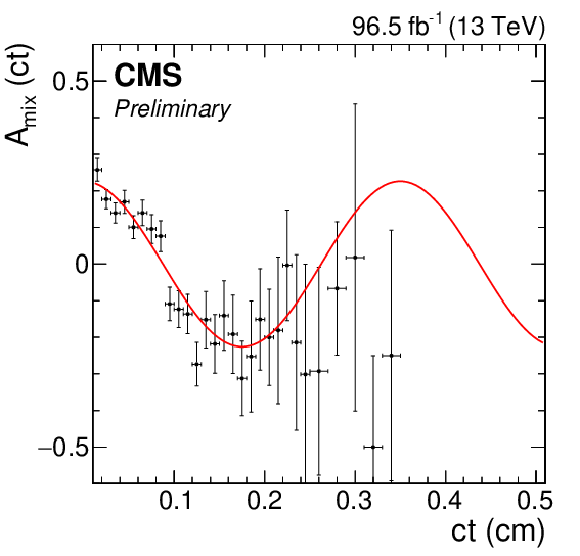
The $ {\mathrm{B}^0} $ mixing asymmetry as a function of the proper decay length as measured in the $ {\mathrm{B}^0} \to \mathrm{J}/\psi\,\mathrm{K}^{*}(892)^{0} $ control data sample in the different tagging categories. Top row, from left to right: only OS muon (muon-tagging trigger category), only OS muon (standard trigger category), only OS electron, and only OS jet. Bottom row, from left to right: only Same Side, SS + OS muon, SS + OS electron, and SS + OS jet. All categories are mutually exclusive. |
png pdf |
Additional Figure 10-a:
The $ {\mathrm{B}^0} $ mixing asymmetry as a function of the proper decay length as measured in the $ {\mathrm{B}^0} \to \mathrm{J}/\psi\,\mathrm{K}^{*}(892)^{0} $ control data sample in the different tagging categories. Top row, from left to right: only OS muon (muon-tagging trigger category), only OS muon (standard trigger category), only OS electron, and only OS jet. Bottom row, from left to right: only Same Side, SS + OS muon, SS + OS electron, and SS + OS jet. All categories are mutually exclusive. |
png pdf |
Additional Figure 10-b:
The $ {\mathrm{B}^0} $ mixing asymmetry as a function of the proper decay length as measured in the $ {\mathrm{B}^0} \to \mathrm{J}/\psi\,\mathrm{K}^{*}(892)^{0} $ control data sample in the different tagging categories. Top row, from left to right: only OS muon (muon-tagging trigger category), only OS muon (standard trigger category), only OS electron, and only OS jet. Bottom row, from left to right: only Same Side, SS + OS muon, SS + OS electron, and SS + OS jet. All categories are mutually exclusive. |
png pdf |
Additional Figure 10-c:
The $ {\mathrm{B}^0} $ mixing asymmetry as a function of the proper decay length as measured in the $ {\mathrm{B}^0} \to \mathrm{J}/\psi\,\mathrm{K}^{*}(892)^{0} $ control data sample in the different tagging categories. Top row, from left to right: only OS muon (muon-tagging trigger category), only OS muon (standard trigger category), only OS electron, and only OS jet. Bottom row, from left to right: only Same Side, SS + OS muon, SS + OS electron, and SS + OS jet. All categories are mutually exclusive. |
png pdf |
Additional Figure 10-d:
The $ {\mathrm{B}^0} $ mixing asymmetry as a function of the proper decay length as measured in the $ {\mathrm{B}^0} \to \mathrm{J}/\psi\,\mathrm{K}^{*}(892)^{0} $ control data sample in the different tagging categories. Top row, from left to right: only OS muon (muon-tagging trigger category), only OS muon (standard trigger category), only OS electron, and only OS jet. Bottom row, from left to right: only Same Side, SS + OS muon, SS + OS electron, and SS + OS jet. All categories are mutually exclusive. |
png pdf |
Additional Figure 10-e:
The $ {\mathrm{B}^0} $ mixing asymmetry as a function of the proper decay length as measured in the $ {\mathrm{B}^0} \to \mathrm{J}/\psi\,\mathrm{K}^{*}(892)^{0} $ control data sample in the different tagging categories. Top row, from left to right: only OS muon (muon-tagging trigger category), only OS muon (standard trigger category), only OS electron, and only OS jet. Bottom row, from left to right: only Same Side, SS + OS muon, SS + OS electron, and SS + OS jet. All categories are mutually exclusive. |
png pdf |
Additional Figure 10-f:
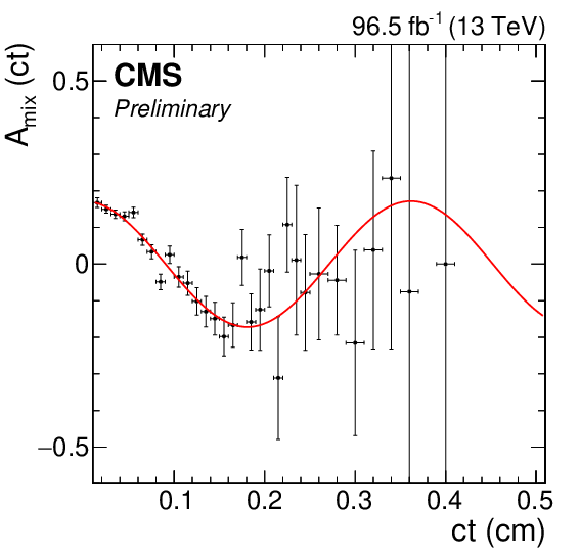
The $ {\mathrm{B}^0} $ mixing asymmetry as a function of the proper decay length as measured in the $ {\mathrm{B}^0} \to \mathrm{J}/\psi\,\mathrm{K}^{*}(892)^{0} $ control data sample in the different tagging categories. Top row, from left to right: only OS muon (muon-tagging trigger category), only OS muon (standard trigger category), only OS electron, and only OS jet. Bottom row, from left to right: only Same Side, SS + OS muon, SS + OS electron, and SS + OS jet. All categories are mutually exclusive. |
png pdf |
Additional Figure 10-g:
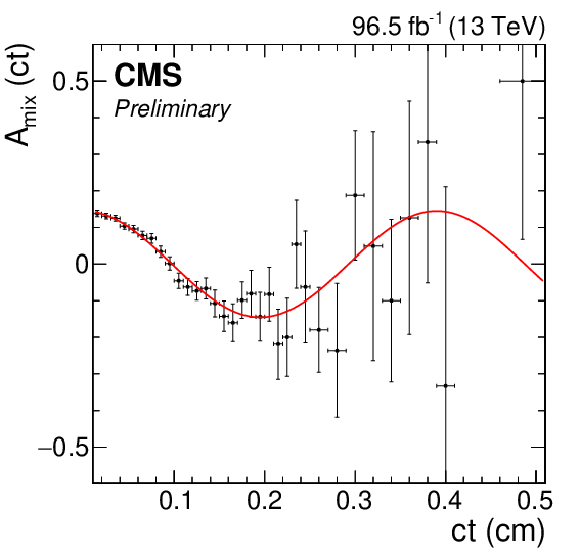
The $ {\mathrm{B}^0} $ mixing asymmetry as a function of the proper decay length as measured in the $ {\mathrm{B}^0} \to \mathrm{J}/\psi\,\mathrm{K}^{*}(892)^{0} $ control data sample in the different tagging categories. Top row, from left to right: only OS muon (muon-tagging trigger category), only OS muon (standard trigger category), only OS electron, and only OS jet. Bottom row, from left to right: only Same Side, SS + OS muon, SS + OS electron, and SS + OS jet. All categories are mutually exclusive. |
png pdf |
Additional Figure 10-h:
The $ {\mathrm{B}^0} $ mixing asymmetry as a function of the proper decay length as measured in the $ {\mathrm{B}^0} \to \mathrm{J}/\psi\,\mathrm{K}^{*}(892)^{0} $ control data sample in the different tagging categories. Top row, from left to right: only OS muon (muon-tagging trigger category), only OS muon (standard trigger category), only OS electron, and only OS jet. Bottom row, from left to right: only Same Side, SS + OS muon, SS + OS electron, and SS + OS jet. All categories are mutually exclusive. |
png pdf |
Additional Figure 11:
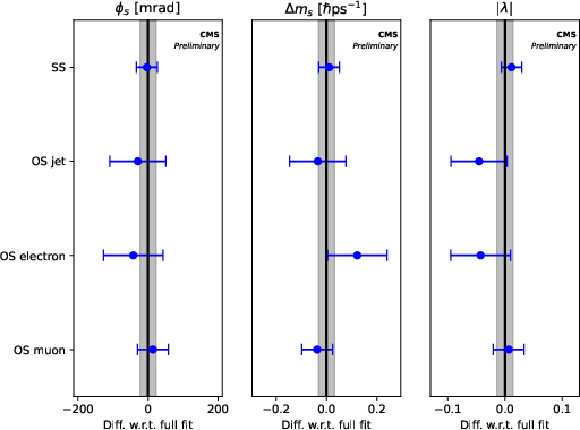
Results of the fits when using only one of the four flavor tagging algorithms with respect to the reference fit. Only parameters sensitive to the flavor information are shown. Only statistical uncertainties are considered. The grey area represents the statistical uncertainty of the full fit. |
png pdf |
Additional Figure 12:
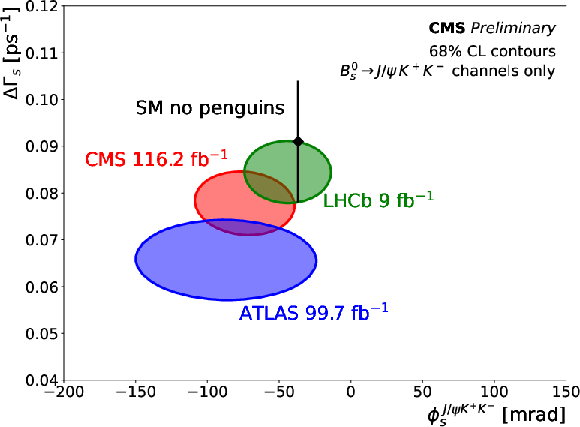
The two-dimensional 68.3% CL contours in the $ \phi_s$-$\Delta\Gamma_s $ plane for the combined 8+13 TeV CMS (red), ATLAS (blue) [23], and LHCb (green) [17] results. The LHCb results refer only to $ \mathrm{B}_{s}^{0} \to \mathrm{J}/\psi \mathrm{K^+}\mathrm{K^-} $ measurements in the $ m(\mathrm{K^+}\mathrm{K^-}) $ region of the $ \phi(1020) $ resonance. The contours account for both statistical and systematic uncertainties. The SM prediction is represented by the black rectangle [2,3,63] |
| References | ||||
| 1 | M. Z. Barel, K. D. Bruyn, R. Fleischer, and E. Malami | In pursuit of new physics with $ {B}_d^0 \to {J}/\psi {K}^0 $ and $ {B}_s^0 \to {J}/\psi\phi $ decays at the high-precision frontier | Journal of Physics G: (Apr, ) 065002, 2021 Journal of Physics G 48 (2021) 065002 |
|
| 2 | The CKMfitter Group Collaboration | Predictions of selected flavour observables within the Standard Model | PRD 84 (2011) 033005 | 1106.4041 |
| 3 | M. Bona et al. | New UT fit analysis of the unitarity triangle in the Cabibbo--Kobayashi--Maskawa scheme | Rendiconti Lincei. Scienze Fisiche e Naturali 34 (2023) 37 | |
| 4 | C.-W. Chiang et al. | New physics in $ \mathrm{B}_{s}^{0} \to \mathrm{J}/\psi\phi $: a general analysis | JHEP 04 (2010) 031 | 0910.2929 |
| 5 | M. Artuso, G. Borissov, and A. Lenz | CP violation in the $ \mathrm{B}_{s}^{0} $ system | Rev. Mod. Phys. 88 (2016) 045002 | 1511.09466 |
| 6 | D0 Collaboration | Measurement of $ \mathrm{B}_{s}^{0} $ mixing parameters from the flavor-tagged decay $ \mathrm{B}_{s}^{0} \to \mathrm{J}/\psi\phi $ | PRL 101 (2008) 241801 | 0802.2255 |
| 7 | D0 Collaboration | Measurement of the CP-violating phase $ \phi_{\mathrm{s}}^{\mathrm{J}/\psi\phi} $ using the flavor-tagged decay $ \mathrm{B}_{s}^{0} \to \mathrm{J}/\psi\phi $ in 8 fb$ ^{-1} $ of p$ \overline{\textrm{p}} $ collisions | PRD 85 (2012) 032006 | 1109.3166 |
| 8 | CDF Collaboration | First flavor-tagged determination of bounds on mixing-induced CP violation in $ \mathrm{B}_{s}^{0} \to \mathrm{J}/\psi\phi $ decays | PRL 100 (2008) 161802 | 0712.2397 |
| 9 | CDF Collaboration | Measurement of the CP-violating phase $ \beta_{\mathrm{s}}^{\mathrm{J}/\psi\phi} $ in $ \mathrm{B}_{s}^{0} \to \mathrm{J}/\psi\phi $ decays with the CDF II detector | PRD 85 (2012) 072002 | 1112.1726 |
| 10 | CDF Collaboration | Measurement of the bottom-strange meson mixing phase in the full CDF data set | PRL 109 (2012) 171802 | 1208.2967 |
| 11 | CMS Collaboration | Measurement of the CP-violating weak phase $ \phi_s $ and the decay width difference $ \Delta\Gamma_s $ using the $ \mathrm{B}_{s}^{0} \to \mathrm{J}/\psi\,\phi $ decay channel in $ pp $ collisions at $ \sqrt{s} = $ 8 TeV | PLB 757 (2016) 97 | CMS-BPH-13-012 1507.07527 |
| 12 | CMS Collaboration | Measurement of the $ CP $-violating phase $ \phi_s $ in the $ \mathrm{B}_{s}^{0} \to \mathrm{J}/\psi\,\phi \to \mu^{+}\mu^{-}\,\mathrm{K^+}\mathrm{K^-} $ channel in proton-proton collisions at $ \sqrt{s} = $ 13 TeV | Physics Letters B 816 (2021) 136188 | |
| 13 | LHCb Collaboration | Measurement of the CP-violating phase $ \phi_s $ in $ \overline{\mathrm{B}}_{s}^{0} \to \mathrm{J}/\psi\pi^+\pi^- $ decays | PLB 713 (2012) 378 | 1204.5675 |
| 14 | LHCb Collaboration | Measurement of CP violation and the $ \mathrm{B}_{s}^{0} $ meson decay width difference with $ \mathrm{B}_{s}^{0} \to \mathrm{J}/\psi\mathrm{K}^+\mathrm{K}^- $ and $ \mathrm{B}_{s}^{0} \to \mathrm{J}/\psi\pi^+\pi^- $ decays | PRD 87 (2013) 112010 | 1304.2600 |
| 15 | LHCb Collaboration | Measurement of the CP-violating phase $ \phi_s $ in $ \overline{\mathrm{B}}_{s}^{0}\to \mathrm{J}/\psi\pi^+\pi^- $ decays | PLB 736 (2014) 186 | 1405.4140 |
| 16 | LHCb Collaboration | Precision measurement of CP violation in $ \mathrm{B}_{s}^{0} \to \mathrm{J}/\psi\mathrm{K}^+\mathrm{K}^- $ decays | PRL 114 (2015) 041801 | 1411.3104 |
| 17 | LHCb Collaboration | Improved measurement of $ CP $ violation parameters in $ {B}_{s}^{0}\rightarrow{J}/\psi{K}^{+}{K}^{-} $ decays in the vicinity of the $ \phi(1020) $ resonance | PRL 132 (2024) 051802 | |
| 18 | LHCb Collaboration | Measurement of the CP-violating phase $ \phi_s $ in $ \overline{\mathrm{B}}_{s}^{0} \to \mathrm{D}_{s}^{+}\mathrm{D}_{s}^{-} $ decays | PRL 113 (2014) 211801 | 1409.4619 |
| 19 | LHCb Collaboration | First study of the CP-violating phase and decay-width difference in $ \mathrm{B}_{s}^{0} \to \psi(2S)\phi $ | PLB 762 (2016) 253 | 1608.04855 |
| 20 | ATLAS Collaboration | Time-dependent angular analysis of the decay $ \mathrm{B}_{s}^{0} \to \mathrm{J}/\psi\phi $ and extraction of $ \Delta\Gamma_s $ and the CP-violating weak phase $ \phi_s $ by ATLAS | JHEP 12 (2012) 072 | 1208.0572 |
| 21 | ATLAS Collaboration | Flavor tagged time-dependent angular analysis of the $ \mathrm{B}_{s}^{0} \to \mathrm{J}/\psi\phi $ decay and extraction of $ \Delta\Gamma_s $ and the weak phase $ \phi_s $ in ATLAS | PRD 90 (2014) 052007 | 1407.1796 |
| 22 | ATLAS Collaboration | Measurement of the CP-violating phase $ \phi_s $ and the $ \mathrm{B}_{s} $ meson decay width difference with $ \mathrm{B}_{s}^{0} \to \mathrm{J}/\psi\phi $ decays in ATLAS | JHEP 12 (2016) 072 | 1601.03297 |
| 23 | ATLAS Collaboration | Measurement of the CP-violating phase $ \phi_s $ in $ \mathrm{B}_{s}^{0} \to \mathrm{J}/\psi\,\phi $ decays in ATLAS at 13 TeV | EPJC 81 (2021) 342 | |
| 24 | A. S. Dighe, I. Dunietz, and R. Fleischer | Extracting CKM phases and $ \mathrm{B}_{s}^{0} $--$ \overline{\mathrm{B}}_{s}^{0} $ mixing parameters from angular distributions of non-leptonic B decays | EPJC 6 (1999) 647 | hep-ph/9804253 |
| 25 | A. S. Dighe, I. Dunietz, H. J. Lipkin, and J. L. Rosner | Angular distributions and lifetime differences in $ \mathrm{B}_{s}^{0} \to \mathrm{J}/\psi\phi $ decays | PLB 369 (1996) 144 | hep-ph/9511363 |
| 26 | G. C. Branco, L. Lavoura, and J. P. Silva | CP Violation | volume 103 of International Series of Monographs on Physics. Clarendon Press, Oxford, UK, ISBN~003997, 1999 | |
| 27 | LHCb Collaboration | Determination of the sign of the decay width difference in the $ B_s $ system | PRL 108 (2012) 241801 | 1202.4717 |
| 28 | CMS Collaboration | The CMS experiment at the CERN LHC | JINST 3 (2008) S08004 | |
| 29 | CMS Collaboration | Development of the CMS detector for the CERN LHC Run 3 | Accepted by JINST, 2023 | CMS-PRF-21-001 2309.05466 |
| 30 | CMS Collaboration | Performance of the CMS Level-1 trigger in proton-proton collisions at $ \sqrt{s} = $ 13\,TeV | JINST 15 (2020) P10017 | CMS-TRG-17-001 2006.10165 |
| 31 | CMS Collaboration | The CMS trigger system | JINST 12 (2017) P01020 | CMS-TRG-12-001 1609.02366 |
| 32 | CMS Collaboration | Electron and photon reconstruction and identification with the CMS experiment at the CERN LHC | JINST 16 (2021) P05014 | CMS-EGM-17-001 2012.06888 |
| 33 | CMS Collaboration | Performance of the CMS muon detector and muon reconstruction with proton-proton collisions at $ \sqrt{s}= $ 13 TeV | JINST 13 (2018) P06015 | CMS-MUO-16-001 1804.04528 |
| 34 | CMS Collaboration | Description and performance of track and primary-vertex reconstruction with the CMS tracker | JINST 9 (2014) P10009 | CMS-TRK-11-001 1405.6569 |
| 35 | CMS Collaboration | Particle-flow reconstruction and global event description with the CMS detector | JINST 12 (2017) P10003 | CMS-PRF-14-001 1706.04965 |
| 36 | CMS Collaboration | Performance of reconstruction and identification of $ \tau $ leptons decaying to hadrons and $ \nu_\tau $ in pp collisions at $ \sqrt{s}= $ 13 TeV | JINST 13 (2018) P10005 | CMS-TAU-16-003 1809.02816 |
| 37 | CMS Collaboration | Jet energy scale and resolution in the CMS experiment in pp collisions at 8 TeV | JINST 12 (2017) P02014 | CMS-JME-13-004 1607.03663 |
| 38 | CMS Collaboration | Performance of missing transverse momentum reconstruction in proton-proton collisions at $ \sqrt{s} = $ 13\,TeV using the CMS detector | JINST 14 (2019) P07004 | CMS-JME-17-001 1903.06078 |
| 39 | CMS Tracker Group Collaboration | The CMS phase-1 pixel detector upgrade | JINST 16 (2021) P02027 | 2012.14304 |
| 40 | CMS Collaboration | Track impact parameter resolution for the full pseudo rapidity coverage in the 2017 dataset with the CMS phase-1 pixel detector | CMS Detector Performance Summary CMS-DP-2020-049, 2020 CDS |
|
| 41 | R. Frühwirth | Application of Kalman filtering to track and vertex fitting | NIM A 262 (1987) 444 | |
| 42 | Particle Data Group Collaboration | Review of Particle Physics | PTEP 2022 (2022) 083C01 | |
| 43 | T. Sjöstrand et al. | An introduction to PYTHIA 8.2 | Comput. Phys. Commun. 191 (2015) 159 | 1410.3012 |
| 44 | CMS Collaboration | Extraction and validation of a new set of CMS PYTHIA8 tunes from underlying-event measurements | EPJC 80 (2020) 4 | CMS-GEN-17-001 1903.12179 |
| 45 | NNPDF Collaboration | Parton distributions from high-precision collider data | EPJC 77 (2017) 663 | 1706.00428 |
| 46 | D. J. Lange | The EvtGen particle decay simulation package | NIM A 462 (2001) 152 | |
| 47 | E. Barberio, B. van Eijk, and Z. W\c a s | PHOTOS --- a universal Monte Carlo for QED radiative corrections in decays | Comput. Phys. Commun. 66 (1991) 115 | |
| 48 | E. Barberio and Z. W\c a s | PHOTOS --- a universal Monte Carlo for QED radiative corrections: version 2.0 | Comput. Phys. Commun. 79 (1994) 291 | |
| 49 | GEANT4 Collaboration | GEANT 4 --- a simulation toolkit | NIM A 506 (2003) 250 | |
| 50 | F. Chollet et al. | Keras | link | |
| 51 | D. Kingma and J. Ba | Adam: a method for stochastic pptimization | International Conference on Learning Representations (2014) | 1412.6980 |
| 52 | M. Zaheer et al. | Deep Sets | 1703.06114 | |
| 53 | CMS Collaboration | Identification of heavy-flavour jets with the CMS detector in pp collisions at 13 TeV | JINST 13 (2018) P05011 | CMS-BTV-16-002 1712.07158 |
| 54 | D.-A. Clevert, T. Unterthiner, and S. Hochreiter | Fast and accurate Deep Network learning by Exponential Linear Units (ELUs) | 1511.07289 | |
| 55 | J. Platt et al. | Probabilistic outputs for support vector machines and comparisons to regularized likelihood methods | Advances in large margin classifiers 10 (1999) 61 | |
| 56 | W. Verkerke and D. Kirkby | The RooFit toolkit for data modeling | physics/0306116 | |
| 57 | I. Antcheva et al. | ROOT --- A C++ framework for petabyte data storage, statistical analysis and visualization | Comput. Phys. Commun. 180 (2009) 2499 | 1508.07749 |
| 58 | M. Rosenblatt | Remarks on some nonparametric estimates of a density function | Ann. Math. Statist. 27 (1956) 832 | |
| 59 | E. Parzen | On estimation of a probability density function and mode | Ann. Math. Statist. 33 (1962) 1065 | |
| 60 | N. L. Johnson | Systems of frequency curves generated by methods of translation | Biometrika 36 (1949) 149 | |
| 61 | B. Efron and R. J. Tibshirani | An introduction to the bootstrap | Number 57 in Monographs on Statistics and Applied Probability. Chapman & Hall/CRC, Boca Raton, Florida, USA, 1993 | |
| 62 | M. Williams | How good are your fits? Unbinned multivariate goodness-of-fit tests in high energy physics | Journal of Instrumentation 5 (Sep, ) P09004, 2010 link |
|
| 63 | A. Lenz and G. Tetlalmatzi-Xolocotzi | Model-independent bounds on new physics effects in non-leptonic tree-level decays of B-mesons | JHEP 07 (2020) 177 | 1912.07621 |
| 64 | L. Lyons, D. Gibaut, and P. Clifford | How to combine correlated estimates of a single physical quantity | NIM A 270 (1988) 110 | |
| 65 | A. Valassi | Combining correlated measurements of several different physical quantities | NIM A 500 (2003) 391 | |

|
Compact Muon Solenoid LHC, CERN |

|

|

|

|

|

|