

Compact Muon Solenoid
LHC, CERN
| CMS-SMP-22-012 ; CERN-EP-2024-253 | ||
| Search for rare decays of the Z and Higgs bosons to a $ \mathrm{J}/\psi $ or $\psi(2\text{S})$ meson and a photon in proton-proton collisions at $ \sqrt{s} = $ 13 TeV | ||
| CMS Collaboration | ||
| 22 November 2024 | ||
| Phys. Lett. B 865 (2025) 139462 | ||
| Abstract: A search is presented for rare decays of the Z and Higgs bosons to a photon and a $ \mathrm{J}/\psi $ or a $\psi(2\text{S})$ meson, with the charmonium state subsequentially decaying to a pair of muons. The data set corresponds to an integrated luminosity of 123 fb$ ^{-1} $ of proton-proton collisions at a center-of-mass energy of 13 TeV collected with the CMS detector at the LHC. No evidence for branching fractions of these rare decay channels larger than predicted in the standard model is observed. Upper limits at 95% confidence level are set: $ \mathcal{B}(\mathrm{H}\to\mathrm{J}/\psi\gamma) < $ 2.6 $\times$ 10$^{-4} $, $ \mathcal{B}(\mathrm{H}\to\psi(2\text{S})\gamma) < $ 9.9 $\times$ 10$^{-4} $, $ \mathcal{B}(\mathrm{Z}\to\mathrm{J}/\psi\gamma) < $ 0.6 $\times$ 10$^{-6} $, and $ \mathcal{B}(\mathrm{Z}\to\psi(2\text{S})\gamma) < $ 1.3 $\times$ 10$^{-6} $. The ratio of the Higgs boson coupling modifiers $ \kappa_{\mathrm{c}}/\kappa_{\gamma} $ is constrained to be in the interval ($-$157, $+$199) at 95% confidence level. Assuming $ \kappa_{\gamma}= $ 1, this interval becomes ($-$166, $+$208). | ||
| Links: e-print arXiv:2411.15000 [hep-ex] (PDF) ; CDS record ; inSPIRE record ; HepData record ; CADI line (restricted) ; | ||
| Figures | |
png pdf |
Figure 1:
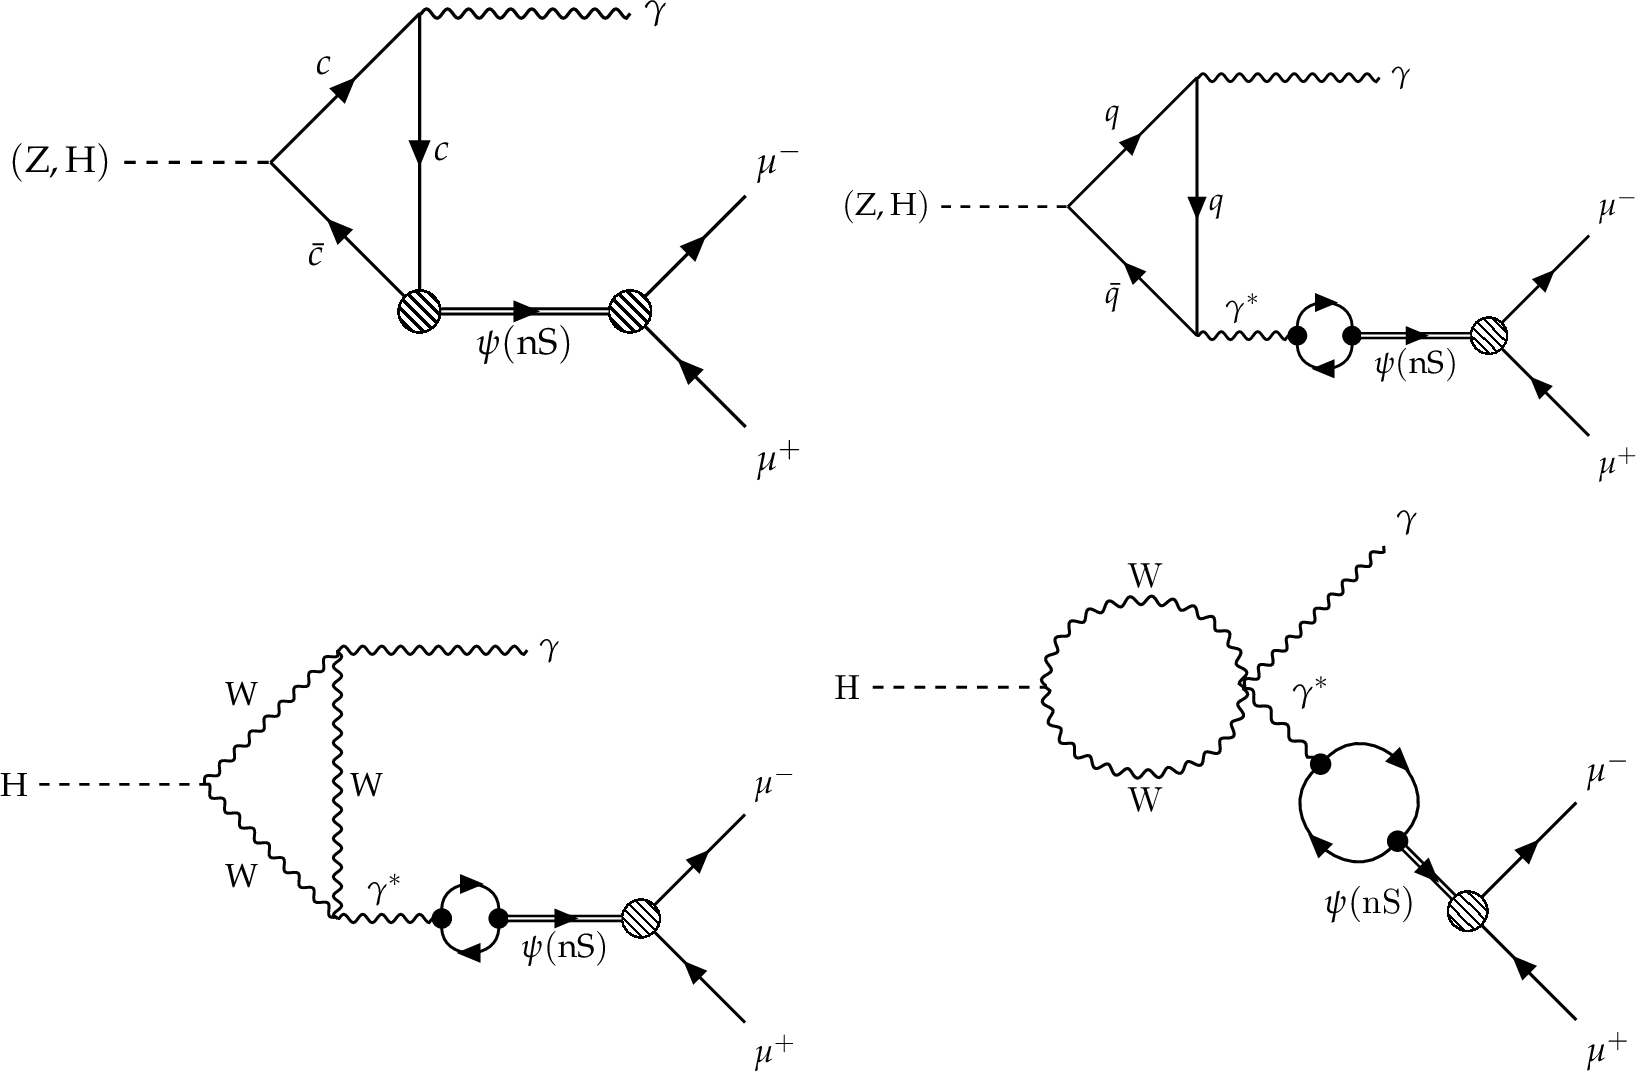
Leading-order Feynman diagrams of Z and Higgs boson rare decays to $ \mathrm{J}/\psi $ or $\psi(2\text{S})$, and a photon, through the direct (upper left) and indirect (upper right, lower left, and lower right) processes. These four diagrams are considered as the signal of this analysis. |

png pdf |
Figure 1-a:
Leading-order Feynman diagrams of Z and Higgs boson rare decays to $ \mathrm{J}/\psi $ or $\psi(2\text{S})$, and a photon, through the direct (upper left) and indirect (upper right, lower left, and lower right) processes. These four diagrams are considered as the signal of this analysis. |

png pdf |
Figure 1-b:
Leading-order Feynman diagrams of Z and Higgs boson rare decays to $ \mathrm{J}/\psi $ or $\psi(2\text{S})$, and a photon, through the direct (upper left) and indirect (upper right, lower left, and lower right) processes. These four diagrams are considered as the signal of this analysis. |

png pdf |
Figure 1-c:
Leading-order Feynman diagrams of Z and Higgs boson rare decays to $ \mathrm{J}/\psi $ or $\psi(2\text{S})$, and a photon, through the direct (upper left) and indirect (upper right, lower left, and lower right) processes. These four diagrams are considered as the signal of this analysis. |
png pdf |
Figure 1-d:
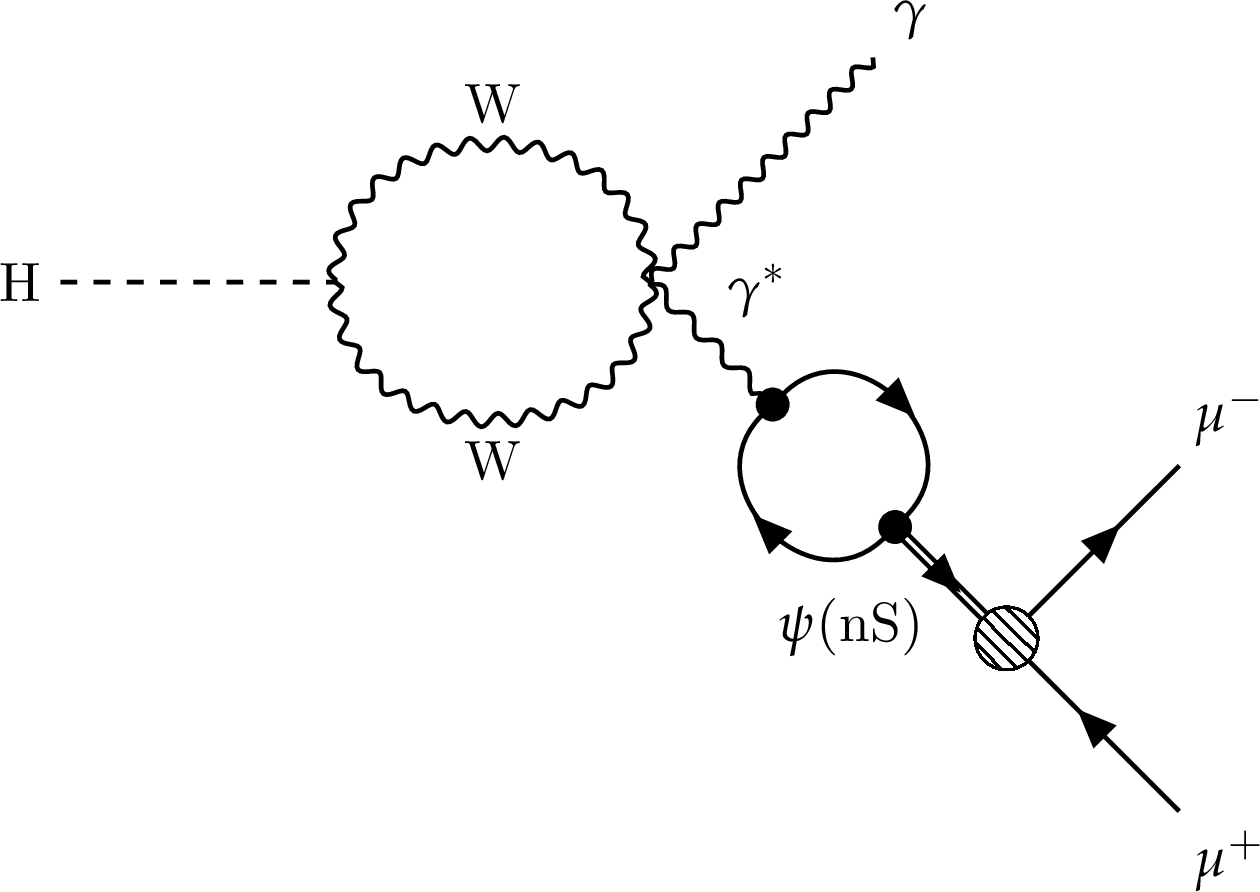
Leading-order Feynman diagrams of Z and Higgs boson rare decays to $ \mathrm{J}/\psi $ or $\psi(2\text{S})$, and a photon, through the direct (upper left) and indirect (upper right, lower left, and lower right) processes. These four diagrams are considered as the signal of this analysis. |
png pdf |
Figure 2:
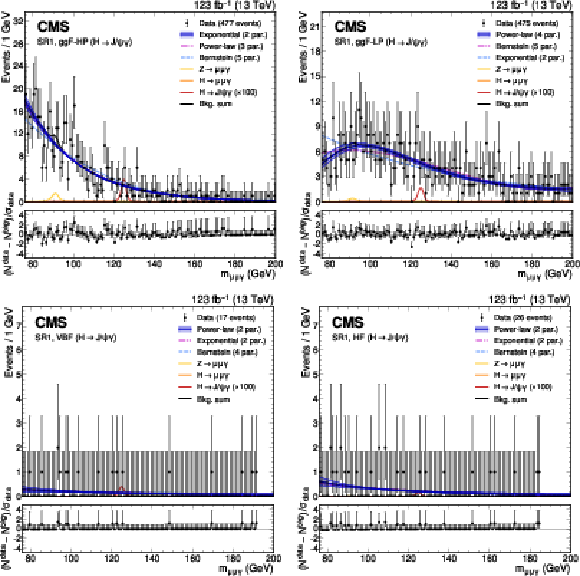
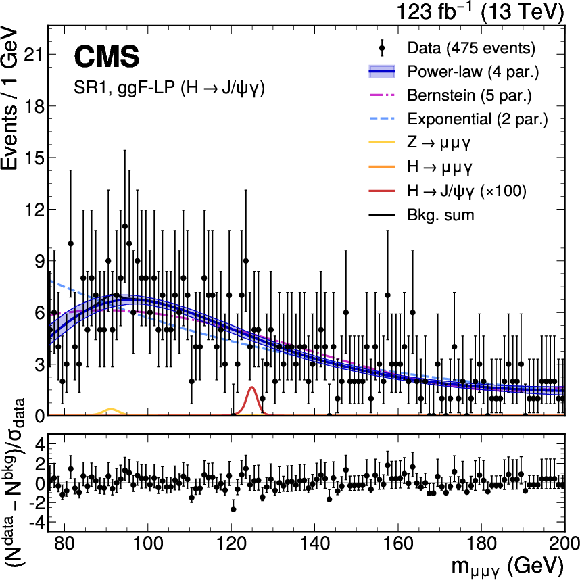
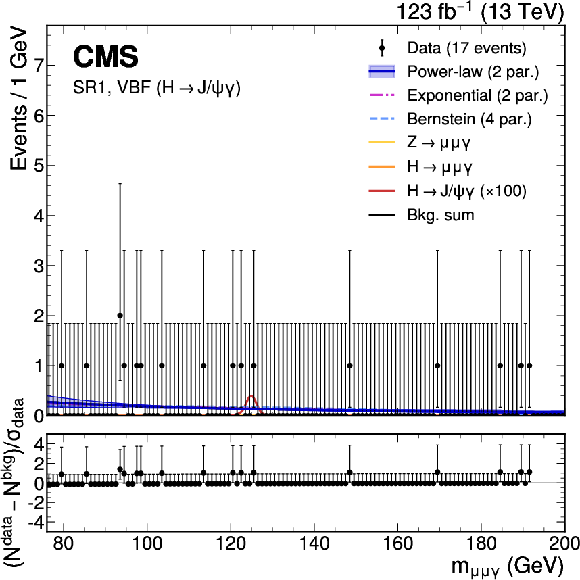
The upper panels show the background-only fit using the power-law, exponential, and Bernstein polynomial functions with the optimal number of parameters determined with the F-test, and ranked according to the fit $ \chi^2 $. The resonant background contributions are added with the normalization fixed to the SM expectation. The vertical error bars on the data points show the statistical uncertainty. The bottom panels show the pulls for the fit result for the model with lowest $ \chi^2 $. Upper left: $ \mathrm{H}\to\mathrm{J}/\psi\gamma $ ggF-HP category. Upper right: $ \mathrm{H}\to\mathrm{J}/\psi\gamma $ ggF-LP category. Lower left: $ \mathrm{H}\to\mathrm{J}/\psi\gamma $ VBF category. Lower right: $ \mathrm{H}\to\mathrm{J}/\psi\gamma $ HF category. |
png pdf |
Figure 2-a:
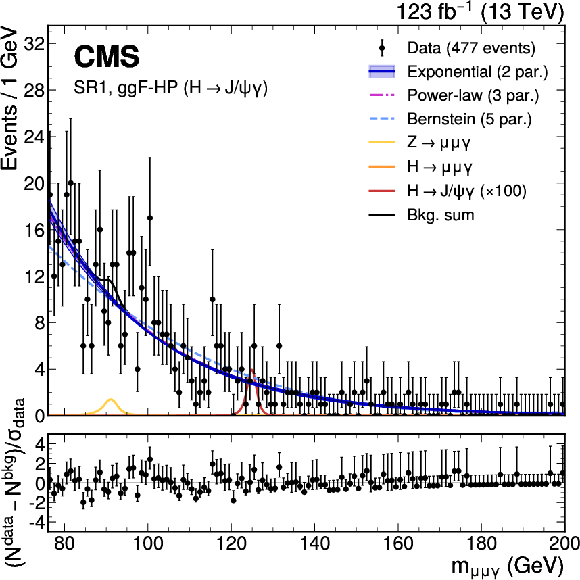
The upper panels show the background-only fit using the power-law, exponential, and Bernstein polynomial functions with the optimal number of parameters determined with the F-test, and ranked according to the fit $ \chi^2 $. The resonant background contributions are added with the normalization fixed to the SM expectation. The vertical error bars on the data points show the statistical uncertainty. The bottom panels show the pulls for the fit result for the model with lowest $ \chi^2 $. Upper left: $ \mathrm{H}\to\mathrm{J}/\psi\gamma $ ggF-HP category. Upper right: $ \mathrm{H}\to\mathrm{J}/\psi\gamma $ ggF-LP category. Lower left: $ \mathrm{H}\to\mathrm{J}/\psi\gamma $ VBF category. Lower right: $ \mathrm{H}\to\mathrm{J}/\psi\gamma $ HF category. |
png pdf |
Figure 2-b:
The upper panels show the background-only fit using the power-law, exponential, and Bernstein polynomial functions with the optimal number of parameters determined with the F-test, and ranked according to the fit $ \chi^2 $. The resonant background contributions are added with the normalization fixed to the SM expectation. The vertical error bars on the data points show the statistical uncertainty. The bottom panels show the pulls for the fit result for the model with lowest $ \chi^2 $. Upper left: $ \mathrm{H}\to\mathrm{J}/\psi\gamma $ ggF-HP category. Upper right: $ \mathrm{H}\to\mathrm{J}/\psi\gamma $ ggF-LP category. Lower left: $ \mathrm{H}\to\mathrm{J}/\psi\gamma $ VBF category. Lower right: $ \mathrm{H}\to\mathrm{J}/\psi\gamma $ HF category. |
png pdf |
Figure 2-c:
The upper panels show the background-only fit using the power-law, exponential, and Bernstein polynomial functions with the optimal number of parameters determined with the F-test, and ranked according to the fit $ \chi^2 $. The resonant background contributions are added with the normalization fixed to the SM expectation. The vertical error bars on the data points show the statistical uncertainty. The bottom panels show the pulls for the fit result for the model with lowest $ \chi^2 $. Upper left: $ \mathrm{H}\to\mathrm{J}/\psi\gamma $ ggF-HP category. Upper right: $ \mathrm{H}\to\mathrm{J}/\psi\gamma $ ggF-LP category. Lower left: $ \mathrm{H}\to\mathrm{J}/\psi\gamma $ VBF category. Lower right: $ \mathrm{H}\to\mathrm{J}/\psi\gamma $ HF category. |

png pdf |
Figure 2-d:
The upper panels show the background-only fit using the power-law, exponential, and Bernstein polynomial functions with the optimal number of parameters determined with the F-test, and ranked according to the fit $ \chi^2 $. The resonant background contributions are added with the normalization fixed to the SM expectation. The vertical error bars on the data points show the statistical uncertainty. The bottom panels show the pulls for the fit result for the model with lowest $ \chi^2 $. Upper left: $ \mathrm{H}\to\mathrm{J}/\psi\gamma $ ggF-HP category. Upper right: $ \mathrm{H}\to\mathrm{J}/\psi\gamma $ ggF-LP category. Lower left: $ \mathrm{H}\to\mathrm{J}/\psi\gamma $ VBF category. Lower right: $ \mathrm{H}\to\mathrm{J}/\psi\gamma $ HF category. |
png pdf |
Figure 3:
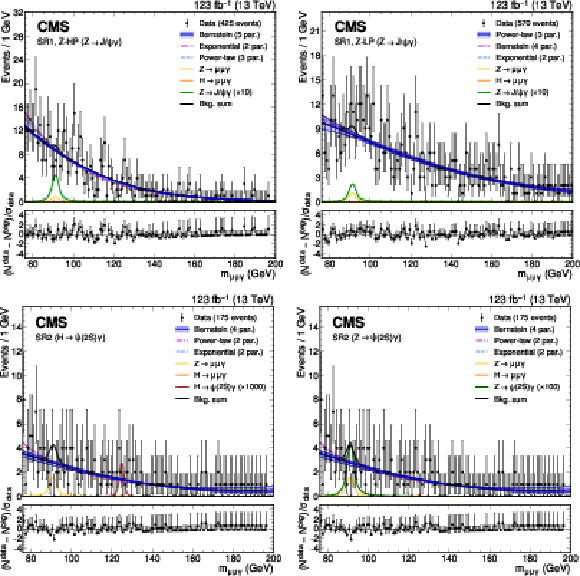
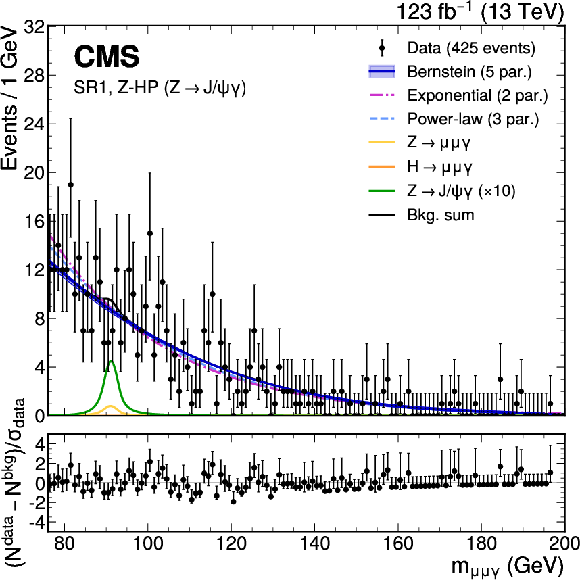
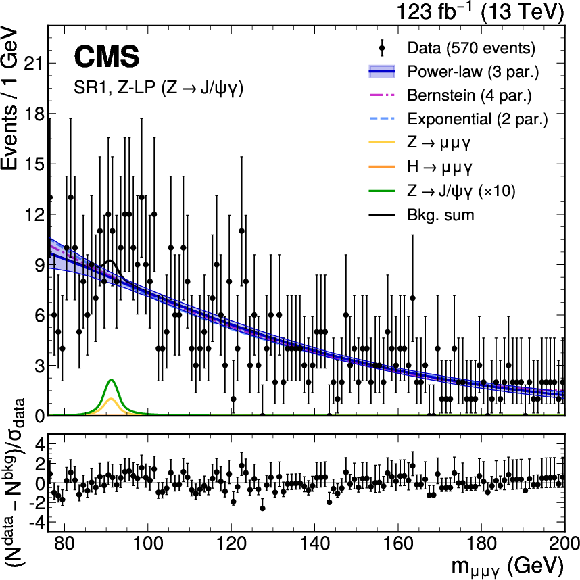
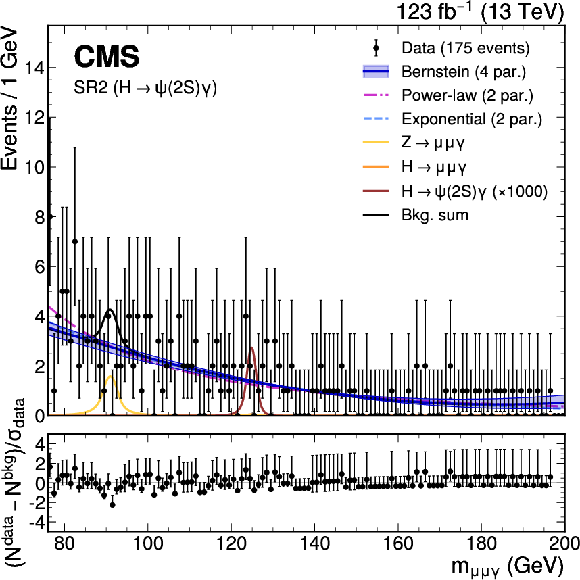
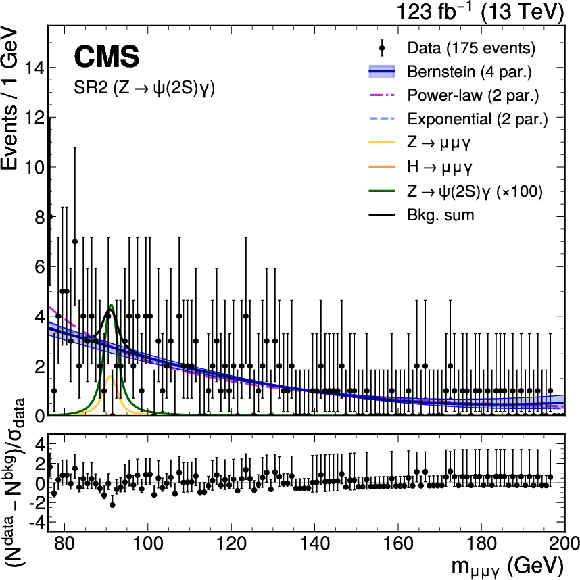
The upper panels show the background-only fit using the power-law, exponential, and Bernstein polynomial functions with the optimal number of parameters determined with the F-test, and ranked according to the fit $ \chi^2 $. The resonant background contributions are added with the normalization fixed to the SM expectation. The vertical error bars on the data points show the statistical uncertainty. The bottom panels show the pulls for the fit result for the model with lowest $ \chi^2 $. Upper left: $ \mathrm{Z}\to\mathrm{J}/\psi\gamma $ HP category. Upper right: $ \mathrm{Z}\to\mathrm{J}/\psi\gamma $ LP category. Lower left: $ \mathrm{H}\to\psi(2\text{S})\gamma $ category. Lower right: $ \mathrm{Z}\to\psi(2\text{S})\gamma $ category. |
png pdf |
Figure 3-a:
The upper panels show the background-only fit using the power-law, exponential, and Bernstein polynomial functions with the optimal number of parameters determined with the F-test, and ranked according to the fit $ \chi^2 $. The resonant background contributions are added with the normalization fixed to the SM expectation. The vertical error bars on the data points show the statistical uncertainty. The bottom panels show the pulls for the fit result for the model with lowest $ \chi^2 $. Upper left: $ \mathrm{Z}\to\mathrm{J}/\psi\gamma $ HP category. Upper right: $ \mathrm{Z}\to\mathrm{J}/\psi\gamma $ LP category. Lower left: $ \mathrm{H}\to\psi(2\text{S})\gamma $ category. Lower right: $ \mathrm{Z}\to\psi(2\text{S})\gamma $ category. |
png pdf |
Figure 3-b:
The upper panels show the background-only fit using the power-law, exponential, and Bernstein polynomial functions with the optimal number of parameters determined with the F-test, and ranked according to the fit $ \chi^2 $. The resonant background contributions are added with the normalization fixed to the SM expectation. The vertical error bars on the data points show the statistical uncertainty. The bottom panels show the pulls for the fit result for the model with lowest $ \chi^2 $. Upper left: $ \mathrm{Z}\to\mathrm{J}/\psi\gamma $ HP category. Upper right: $ \mathrm{Z}\to\mathrm{J}/\psi\gamma $ LP category. Lower left: $ \mathrm{H}\to\psi(2\text{S})\gamma $ category. Lower right: $ \mathrm{Z}\to\psi(2\text{S})\gamma $ category. |
png pdf |
Figure 3-c:
The upper panels show the background-only fit using the power-law, exponential, and Bernstein polynomial functions with the optimal number of parameters determined with the F-test, and ranked according to the fit $ \chi^2 $. The resonant background contributions are added with the normalization fixed to the SM expectation. The vertical error bars on the data points show the statistical uncertainty. The bottom panels show the pulls for the fit result for the model with lowest $ \chi^2 $. Upper left: $ \mathrm{Z}\to\mathrm{J}/\psi\gamma $ HP category. Upper right: $ \mathrm{Z}\to\mathrm{J}/\psi\gamma $ LP category. Lower left: $ \mathrm{H}\to\psi(2\text{S})\gamma $ category. Lower right: $ \mathrm{Z}\to\psi(2\text{S})\gamma $ category. |
png pdf |
Figure 3-d:
The upper panels show the background-only fit using the power-law, exponential, and Bernstein polynomial functions with the optimal number of parameters determined with the F-test, and ranked according to the fit $ \chi^2 $. The resonant background contributions are added with the normalization fixed to the SM expectation. The vertical error bars on the data points show the statistical uncertainty. The bottom panels show the pulls for the fit result for the model with lowest $ \chi^2 $. Upper left: $ \mathrm{Z}\to\mathrm{J}/\psi\gamma $ HP category. Upper right: $ \mathrm{Z}\to\mathrm{J}/\psi\gamma $ LP category. Lower left: $ \mathrm{H}\to\psi(2\text{S})\gamma $ category. Lower right: $ \mathrm{Z}\to\psi(2\text{S})\gamma $ category. |
png pdf |
Figure 4:
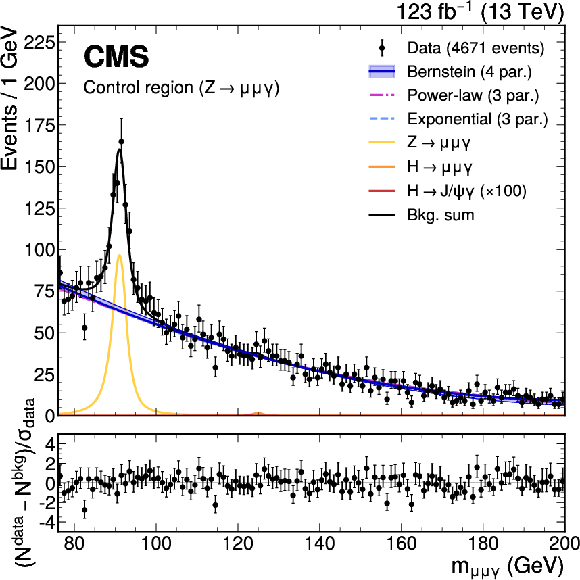
The upper panel shows the results of the main background fit in the CR, using the power-law, exponential, and Bernstein polynomial functions with the optimal number of parameters determined with the F-test, and ranked according to the fit $ \chi^2 $. The vertical error bars on the data points show the statistical uncertainty. The bottom panel shows the pulls for the fit result for the model with lowest $ \chi^2 $. |
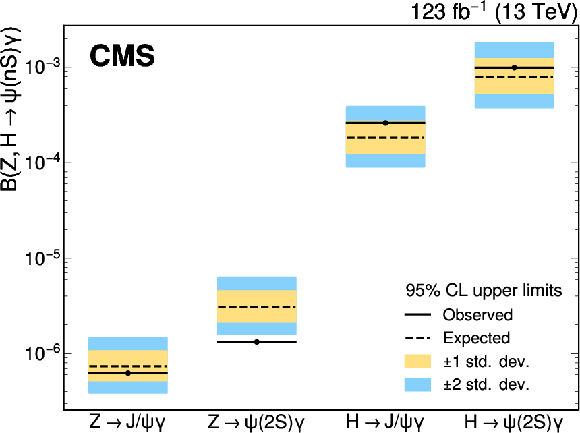
png pdf |
Figure 5:
Observed and expected (with ${\pm}$1, ${\pm}$2 standard deviation bands) exclusion limits on the branching fraction of the $ (\mathrm{H},\mathrm{Z}) \to \psi(n\text{S})\gamma $ decays. |
| Tables | |

png pdf |
Table 1:
The SM predictions of the branching fractions of the Higgs and Z boson decays to $ \psi(n\text{S})\gamma $ used in this analysis, and measured branching fractions for the $ \psi(n\text{S})\to\mu\mu $ decays. |

png pdf |
Table 2:
Summary of the selections of the eight signal regions (SRs) and the control region (CR). The SR1 category require a $ m_{\mu\mu} $ value compatible with the $ \mathrm{J}/\psi $ mass hypothesis, and is further slotted depending on the value of the LD variable (Z-HP, Z-LP), the Higgs boson production mode (ggF, VBF, HF), and the value of the $ \cos\theta^* $ variable (ggF-HP, ggF-LP). The SR2 category requires a $ m_{\mu\mu} $ value compatible with the $\psi(2\text{S})$ mass hypothesis and is not further categorized. The CR category is made orthogonal to the SRs by vetoing $ m_{\mu\mu} $ values compatible with the $ \psi(n\text{S}) $ mass hypotheses. |

png pdf |
Table 3:
Sources and types of systematic uncertainties described in Section 6. Normalization (norm.) uncertainties yield a variation in the number of events equal to the reported value. Other uncertainties also vary the shape of the mean and the width of the resonant background and signal $ m_{\mu\mu\gamma} $ distributions by the indicated amount. Uncertainties in the same line are treated as correlated. |

png pdf |
Table 4:
Observed (expected) upper limits at 95% CL on the normalized values with respect to the SM expectation, denoted as the signal strength parameter $ \mu $, of the product of the cross section $ \sigma $ and the branching fraction $ \mathcal{B} $ of the $ (\mathrm{H},\mathrm{Z}) \to \psi(n\text{S})\gamma $ decays, and the branching fraction, assuming a SM Z and H boson cross section. The results are compared with previous ones [22,24]. |
| Summary |
| A search for rare decays of the Z and H bosons to a photon and a $ \psi(n\text{S}) $ meson decaying to a pair of muons is presented. The data were collected by the CMS experiment in proton-proton collisions at $ \sqrt{s}= $ 13 TeV during 2016--2018 and correspond to an integrated luminosity of 123 fb$ ^{-1} $. No statistically significant excess has been observed over the standard model expectations. Upper limits at 95% confidence level are set on the branching fractions: 0.6 $ \times$ 10$^{-6} $ and 1.3 $ \times$ 10$^{-6} $ for the $ \mathrm{Z}\to\mathrm{J}/\psi\gamma $ and $ \mathrm{Z}\to\psi(2\text{S})\gamma $ decays, respectively, and 2.6 $ \times$ 10$^{-4} $ and 9.9 $ \times$ 10$^{-4} $ for the $ \mathrm{H}\to\mathrm{J}/\psi\gamma $ and $ \mathrm{H}\to\psi(2\text{S})\gamma $ decays, respectively. The limit for $ \mathrm{H}\to\mathrm{J}/\psi\gamma $ translates to an interval constraint on the $ \kappa_{\mathrm{c}}/\kappa_{\gamma} $ ratio of the Higgs boson coupling modifiers of $ (-157,\, +199) $. If the standard model value of $ \kappa_{\gamma}= $ 1 is assumed, the observed interval becomes $ (-166,\, +208) $. |
| References | ||||
| 1 | ATLAS Collaboration | Observation of a new particle in the search for the standard model Higgs boson with the ATLAS detector at the LHC | PLB 716 (2012) 1 | 1207.7214 |
| 2 | CMS Collaboration | Observation of a new boson at a mass of 125 GeV with the CMS experiment at the LHC | PLB 716 (2012) 30 | CMS-HIG-12-028 1207.7235 |
| 3 | CMS Collaboration | Observation of a new boson with mass near 125 GeV in pp collisions at $ \sqrt{s} $ = 7 and 8 TeV | JHEP 06 (2013) 081 | CMS-HIG-12-036 1303.4571 |
| 4 | F. Englert and R. Brout | Broken symmetry and the mass of gauge vector mesons | PRL 13 (1964) 321 | |
| 5 | P. W. Higgs | Broken symmetries and the masses of gauge bosons | PRL 13 (1964) 508 | |
| 6 | CMS Collaboration | A portrait of the Higgs boson by the CMS experiment ten years after the discovery. | Nature 607 (2022) 60 | CMS-HIG-22-001 2207.00043 |
| 7 | ATLAS Collaboration | A detailed map of Higgs boson interactions by the ATLAS experiment ten years after the discovery | Nature 607 (2022) 52 | 2207.00092 |
| 8 | CMS Collaboration | Search for Higgs boson decay to a charm quark-antiquark pair in proton-proton collisions at $ \sqrt{\mathrm{s}} $ = 13 TeV | PRL 131 (2023) 061801 | CMS-HIG-21-008 2205.05550 |
| 9 | CMS Collaboration | Search for Higgs boson and observation of $ Z $ boson through their decay into a charm quark-antiquark pair in boosted topologies in proton-proton collisions at $ \sqrt{s}= $ 13 TeV | PRL 131 (2023) 041801 | 2211.14181 |
| 10 | ATLAS Collaboration | Direct constraint on the Higgs-charm coupling from a search for Higgs boson decays into charm quarks with the ATLAS detector | EPJC 82 (2022) 717 | 2201.11428 |
| 11 | G. T. Bodwin, F. Petriello, S. Stoynev, and M. Velasco | Higgs boson decays to quarkonia and the $ \mathrm{H} \overline{\mathrm{c}}\mathrm{c} $ coupling | PRD 88 (2013) 053003 | 1306.5770 |
| 12 | C. Delaunay, T. Golling, G. Perez, and Y. Soreq | Enhanced Higgs boson coupling to charm pairs | PRD 89 (2014) 033014 | 1310.7029 |
| 13 | D. d'Enterria and V. D. Le | Rare and exclusive few-body decays of the Higgs, Z, W bosons, and the top quark | J. Phys. G, 2024 link |
2312.11211 |
| 14 | LHC Higgs Cross Section Working Group | Handbook of LHC Higgs cross sections: 4. Deciphering the nature of the Higgs sector | CERN Yellow Reports: Monographs, 2018 link |
1610.07922 |
| 15 | G. T. Bodwin et al. | Relativistic corrections to Higgs boson decays to quarkonia | PRD 90 (2014) 113010 | 1407.6695 |
| 16 | T.-C. Huang and F. Petriello | Rare exclusive decays of the Z-boson revisited | PRD 92 (2015) 014007 | 1411.5924 |
| 17 | M. König and M. Neubert | Exclusive radiative Higgs decays as probes of light-quark Yukawa couplings | JHEP 08 (2015) 012 | 1505.03870 |
| 18 | G. T. Bodwin, H. S. Chung, J.-H. Ee, and J. Lee | $ Z $-boson decays to a vector quarkonium plus a photon | PRD 97 (2018) 016009 | 1709.09320 |
| 19 | G. T. Bodwin, H. S. Chung, J.-H. Ee, and J. Lee | Addendum: New approach to the resummation of logarithms in Higgs-boson decays to a vector quarkonium plus a photon [Phys. Rev. D 95, 054018 (2017)] | PRD 96 (2017) 116014 | 1710.09872 |
| 20 | N. Brambilla et al. | Order $ v^4 $ corrections to Higgs boson decay into $ J/\psi + \gamma $ | PRD 100 (2019) 054038 | 1907.06473 |
| 21 | W.-L. Sang, D.-S. Yang, and Y.-D. Zhang | Z-boson radiative decays to an S-wave quarkonium at NNLO and NLL accuracy | PRD 108 (2023) 014021 | 2302.06439 |
| 22 | G.-Y. Wang, X.-C. Zheng, X.-G. Wu, and G.-Z. Xu | $ Z $-boson decays into $ S $-wave quarkonium plus a photon up to $ {\cal O}(\alpha_{s} v^2) $ corrections | 2312.08796 | |
| 23 | Particle Data Group Collaboration | Review of Particle Physics | PRD 110 (2024) 030001 | |
| 24 | CMS Collaboration | Search for rare decays of Z and Higgs bosons to J$ /\psi $ and a photon in proton-proton collisions at $ \sqrt{s} = $ 13 TeV | EPJC 79 (2019) 94 | CMS-SMP-17-012 1810.10056 |
| 25 | ATLAS Collaboration | Searches for exclusive Higgs and Z boson decays into $ J/\psi\gamma $, $ \psi(2S)\gamma $, and $ \Upsilon(nS)\gamma $ at $ \sqrt{s}= $ 13 TeV with the ATLAS detector | PLB 786 (2018) 134 | 1807.00802 |
| 26 | ATLAS Collaboration | Searches for exclusive Higgs and Z boson decays into a vector quarkonium state and a photon using 139 fb$ ^{-1} $ of ATLAS $ \sqrt{s}= $ 13 TeV proton-proton collision data | EPJC 83 (2023) 781 | 2208.03122 |
| 27 | CMS Collaboration | HEPData record for this analysis | link | |
| 28 | CMS Collaboration | The CMS experiment at the CERN LHC | JINST 3 (2008) S08004 | |
| 29 | CMS Collaboration | Performance of the CMS Level-1 trigger in proton-proton collisions at $ \sqrt{s} = $ 13 TeV | JINST 15 (2020) P10017 | CMS-TRG-17-001 2006.10165 |
| 30 | CMS Collaboration | The CMS trigger system | JINST 12 (2017) P01020 | CMS-TRG-12-001 1609.02366 |
| 31 | CMS Collaboration | Description and performance of track and primary-vertex reconstruction with the CMS tracker | JINST 9 (2014) P10009 | CMS-TRK-11-001 1405.6569 |
| 32 | CMS Tracker Collaboration | The CMS phase-1 pixel detector upgrade | JINST 16 (2021) P02027 | 2012.14304 |
| 33 | CMS Collaboration | Track impact parameter resolution for the full pseudorapidity coverage in the 2017 dataset with the CMS phase-1 pixel detector | CMS Detector Performance Summary CMS-DP-2020-049, 2020 CDS |
|
| 34 | CMS Collaboration | Performance of photon reconstruction and identification with the CMS detector in proton-proton collisions at $ \sqrt{s} $ = 8 TeV | JINST 10 (2015) P08010 | CMS-EGM-14-001 1502.02702 |
| 35 | CMS Collaboration | Electron and photon reconstruction and identification with the CMS experiment at the CERN LHC | JINST 16 (2021) P05014 | CMS-EGM-17-001 2012.06888 |
| 36 | CMS Collaboration | Performance of the CMS muon detector and muon reconstruction with proton-proton collisions at $ \sqrt{s}= $ 13 TeV | JINST 13 (2018) P06015 | CMS-MUO-16-001 1804.04528 |
| 37 | CMS Collaboration | Particle-flow reconstruction and global event description with the CMS detector | JINST 12 (2017) P10003 | CMS-PRF-14-001 1706.04965 |
| 38 | M. Cacciari, G. P. Salam, and G. Soyez | The anti-$ k_{\mathrm{T}} $ jet clustering algorithm | JHEP 04 (2008) 063 | 0802.1189 |
| 39 | M. Cacciari, G. P. Salam, and G. Soyez | FastJet user manual | EPJC 72 (2012) 1896 | 1111.6097 |
| 40 | M. Cacciari, G. P. Salam, and G. Soyez | The catchment area of jets | JHEP 04 (2008) 005 | 0802.1188 |
| 41 | CMS Collaboration | Pileup mitigation at CMS in 13 TeV data | JINST 15 (2020) P09018 | CMS-JME-18-001 2003.00503 |
| 42 | CMS Collaboration | Identification of heavy-flavour jets with the CMS detector in pp collisions at 13 TeV | JINST 13 (2018) P05011 | CMS-BTV-16-002 1712.07158 |
| 43 | J. Alwall et al. | The automated computation of tree-level and next-to-leading order differential cross sections, and their matching to parton shower simulations | JHEP 07 (2014) 079 | 1405.0301 |
| 44 | P. Faccioli and C. Lourenço | Particle polarization in high energy physics: an introduction and case studies on vector particle production at the LHC | Lecture Notes in Physics. Springer, 2022 link |
|
| 45 | Y. Li and F. Petriello | Combining QCD and electroweak corrections to dilepton production in FEWZ | PRD 86 (2012) 094034 | 1208.5967 |
| 46 | CMS Collaboration | Extraction and validation of a new set of CMS PYTHIA8 tunes from underlying-event measurements | EPJC 80 (2020) 4 | CMS-GEN-17-001 1903.12179 |
| 47 | NNPDF Collaboration | Parton distributions with QED corrections | NPB 877 (2013) 290 | 1308.0598 |
| 48 | NNPDF Collaboration | Unbiased global determination of parton distributions and their uncertainties at NNLO and at LO | NPB 855 (2012) 153 | 1107.2652 |
| 49 | GEANT4 Collaboration | GEANT 4---a simulation toolkit | NIM A 506 (2003) 250 | |
| 50 | J. E. Gaiser | Charmonium spectroscopy from radiative decays of the J/$ \psi $ and $ \psi' $ | PhD thesis, SLAC, Appendix F, 1982 link |
|
| 51 | M. H. Kutner, C. J. Nachtsheim, J. Neter, and W. Li | Applied linear statistical models | Irwin, Fifth edition. ISBN~9780256117363, 1996 | |
| 52 | P. D. Dauncey, M. Kenzie, N. Wardle, and G. J. Davies | Handling uncertainties in background shapes: the discrete profiling method | JINST 10 (2015) P04015 | 1408.6865 |
| 53 | CMS Collaboration | Precision luminosity measurement in proton-proton collisions at $ \sqrt{s} = $ 13 TeV in 2015 and 2016 at CMS | EPJC 81 (2021) 800 | CMS-LUM-17-003 2104.01927 |
| 54 | CMS Collaboration | CMS luminosity measurement for the 2017 data-taking period at $ \sqrt{s} = $ 13 TeV | CMS Physics Analysis Summary, 2018 CMS-PAS-LUM-17-004 |
CMS-PAS-LUM-17-004 |
| 55 | CMS Collaboration | CMS luminosity measurement for the 2018 data-taking period at $ \sqrt{s} = $ 13 TeV | CMS Physics Analysis Summary, 2019 CMS-PAS-LUM-18-002 |
CMS-PAS-LUM-18-002 |
| 56 | NNPDF Collaboration | Parton distributions for the LHC Run II | JHEP 04 (2015) 040 | 1410.8849 |
| 57 | J. Butterworth et al. | PDF4LHC recommendations for LHC Run II | JPG 43 (2016) 23001 | 1510.03865 |
| 58 | CMS and ATLAS Collaborations | Procedure for the LHC Higgs boson search combination in Summer 2011 | CMS-NOTE-2011-005, ATL-PHYS-PUB-2011-11, 2011 | |
| 59 | T. Junk | Confidence level computation for combining searches with small statistics | NIM A 434 (1999) 435 | hep-ex/9902006 |
| 60 | A. L. Read | Presentation of search results: the CL$ _{\mathrm{s}} $ technique | JPG 28 (2002) 2693 | |
| 61 | G. Cowan, K. Cranmer, E. Gross, and O. Vitells | Asymptotic formulae for likelihood-based tests of new physics | EPJC 71 (2011) 1554 | 1007.1727 |
| 62 | LHC Higgs Cross Section Working Group | Handbook of LHC Higgs cross sections: 3. Higgs properties | CERN-2013-004, 2013 link |
1307.1347 |
| 63 | CMS Collaboration | Measurements of Higgs boson production cross sections and couplings in the diphoton decay channel at $ \sqrt{\mathrm{s}} $ = 13 TeV | JHEP 07 (2021) 027 | CMS-HIG-19-015 2103.06956 |
| 64 | G. Perez, Y. Soreq, E. Stamou, and K. Tobioka | Constraining the charm Yukawa and Higgs-quark coupling universality | PRD 92 (2015) 033016 | 1503.00290 |

|
Compact Muon Solenoid LHC, CERN |

|

|

|

|

|

|