

Compact Muon Solenoid
LHC, CERN
| CMS-HIN-22-004 ; CERN-EP-2025-290 | ||
| Dependence of two-particle azimuthal correlations on the forward rapidity gap width in $ \mathrm{p}\text{Pb} $ collisions at $ \sqrt{\smash[b]{s_{_{\mathrm{NN}}}}} = $ 8.16 TeV | ||
| CMS Collaboration | ||
| 29 May 2026 | ||
| Submitted to Physical Review C | ||
| Abstract: One of the most striking features of relativistic heavy ion collisions is the presence of collective flow of thousands of produced particles. This flow can be characterized by the Fourier coefficients ($ {V_{n\Delta}} $) of the azimuthal angular distributions of charged particles, and its existence can be explained by the formation of a quark gluon plasma, which behaves as a fluid. Surprisingly, the angular distributions of particles from very small systems such as proton-lead ($ \mathrm{p}\text{Pb} $), proton-proton (pp), electron-positron, and photon-proton ($ \gamma\mathrm{p} $) collisions also exhibit non-zero Fourier coefficients, raising the question of whether collective flow is present. This paper presents measurements of $ {V_{n\Delta}} $ from a sample of $ \mathrm{p}\text{Pb} $ events at $ \sqrt{\smash[b]{s_{_{\mathrm{NN}}}}}= $ 8.16 TeV that are enriched in photon-lead ($ \gamma\text{Pb} $) and pomeron-lead ($ \mathbb{P} \mathrm{p} $) interactions by requiring no particles in the proton-going region. Measurements are made as a function of the forward rapidity gap width (the rapidity range in which no particles are found), the transverse momentum of the particles, and the multiplicity of particles in the event. The results are compared to previous measurements of pp, $ \mathrm{p}\text{Pb} $, and $ \gamma\mathrm{p}+\mathbb{P} \mathrm{p} $ events as well as modern event generators. | ||
| Links: e-print arXiv:2606.00171 [hep-ex] (PDF) ; CDS record ; inSPIRE record ; HepData record ; CADI line (restricted) ; | ||
| Figures | |
png pdf |
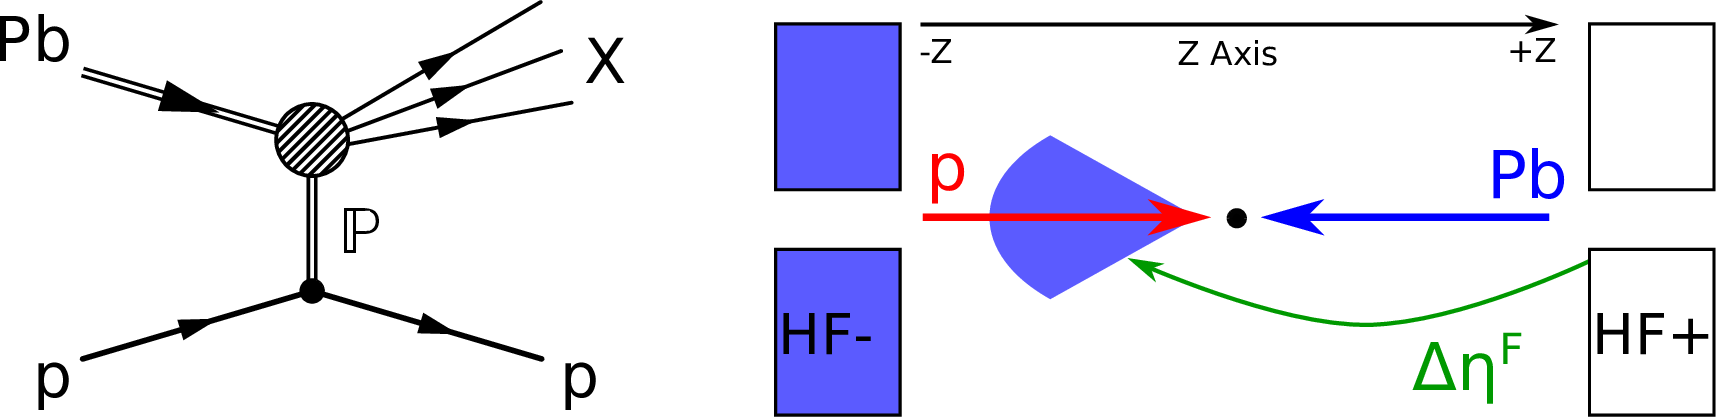
Figure 1:
Sketch of a single-diffractive $ \mathrm{p}\text{Pb} $ event (left). The interaction proceeds via the exchange of a pomeron ($ \mathbb{P} $); the proton remains intact or dissociates into a low-mass state, and the nucleus breaks up (X). A single-diffractive event as seen in the detector (right). Activity is observed only in one side of the detector and a large forward rapidity gap ($ {\Delta\eta^{\mathrm{F}} } $) is present. The blue cone represents the outgoing particles from the interaction, while the blue shading indicates the detected activity. Both diagrams are extracted from Ref. [52]. |
png pdf |
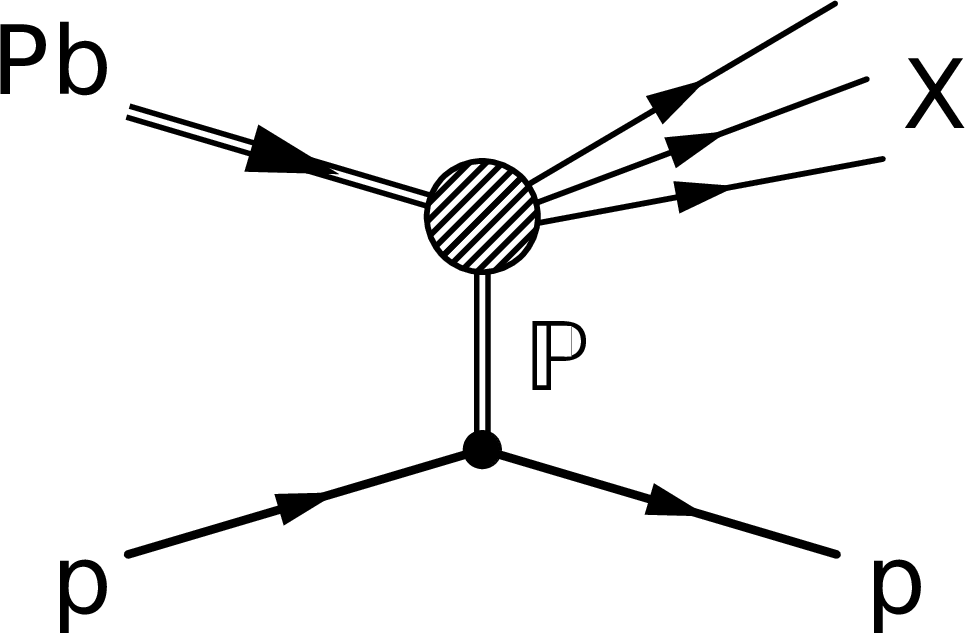
Figure 1-a:
Sketch of a single-diffractive $ \mathrm{p}\text{Pb} $ event (left). The interaction proceeds via the exchange of a pomeron ($ \mathbb{P} $); the proton remains intact or dissociates into a low-mass state, and the nucleus breaks up (X). A single-diffractive event as seen in the detector (right). Activity is observed only in one side of the detector and a large forward rapidity gap ($ {\Delta\eta^{\mathrm{F}} } $) is present. The blue cone represents the outgoing particles from the interaction, while the blue shading indicates the detected activity. Both diagrams are extracted from Ref. [52]. |
png pdf |
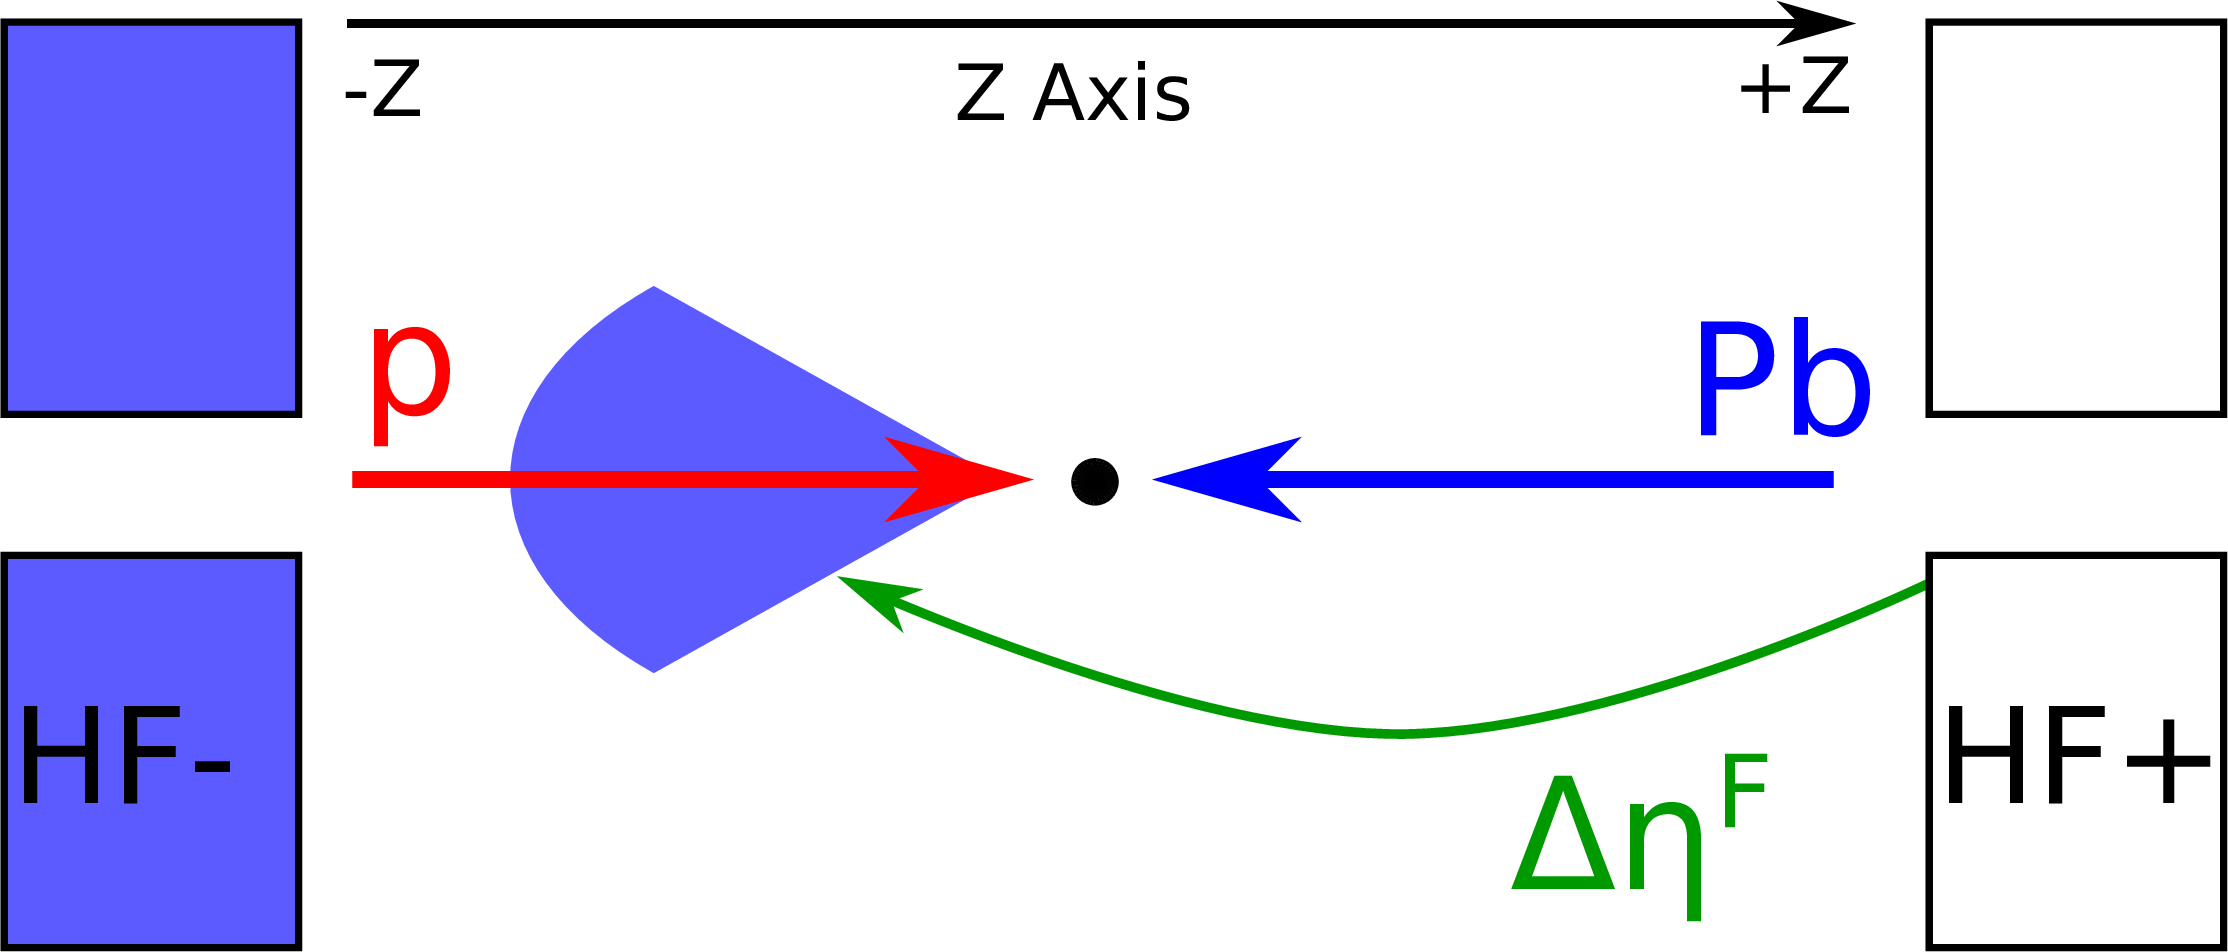
Figure 1-b:
Sketch of a single-diffractive $ \mathrm{p}\text{Pb} $ event (left). The interaction proceeds via the exchange of a pomeron ($ \mathbb{P} $); the proton remains intact or dissociates into a low-mass state, and the nucleus breaks up (X). A single-diffractive event as seen in the detector (right). Activity is observed only in one side of the detector and a large forward rapidity gap ($ {\Delta\eta^{\mathrm{F}} } $) is present. The blue cone represents the outgoing particles from the interaction, while the blue shading indicates the detected activity. Both diagrams are extracted from Ref. [52]. |
png pdf |
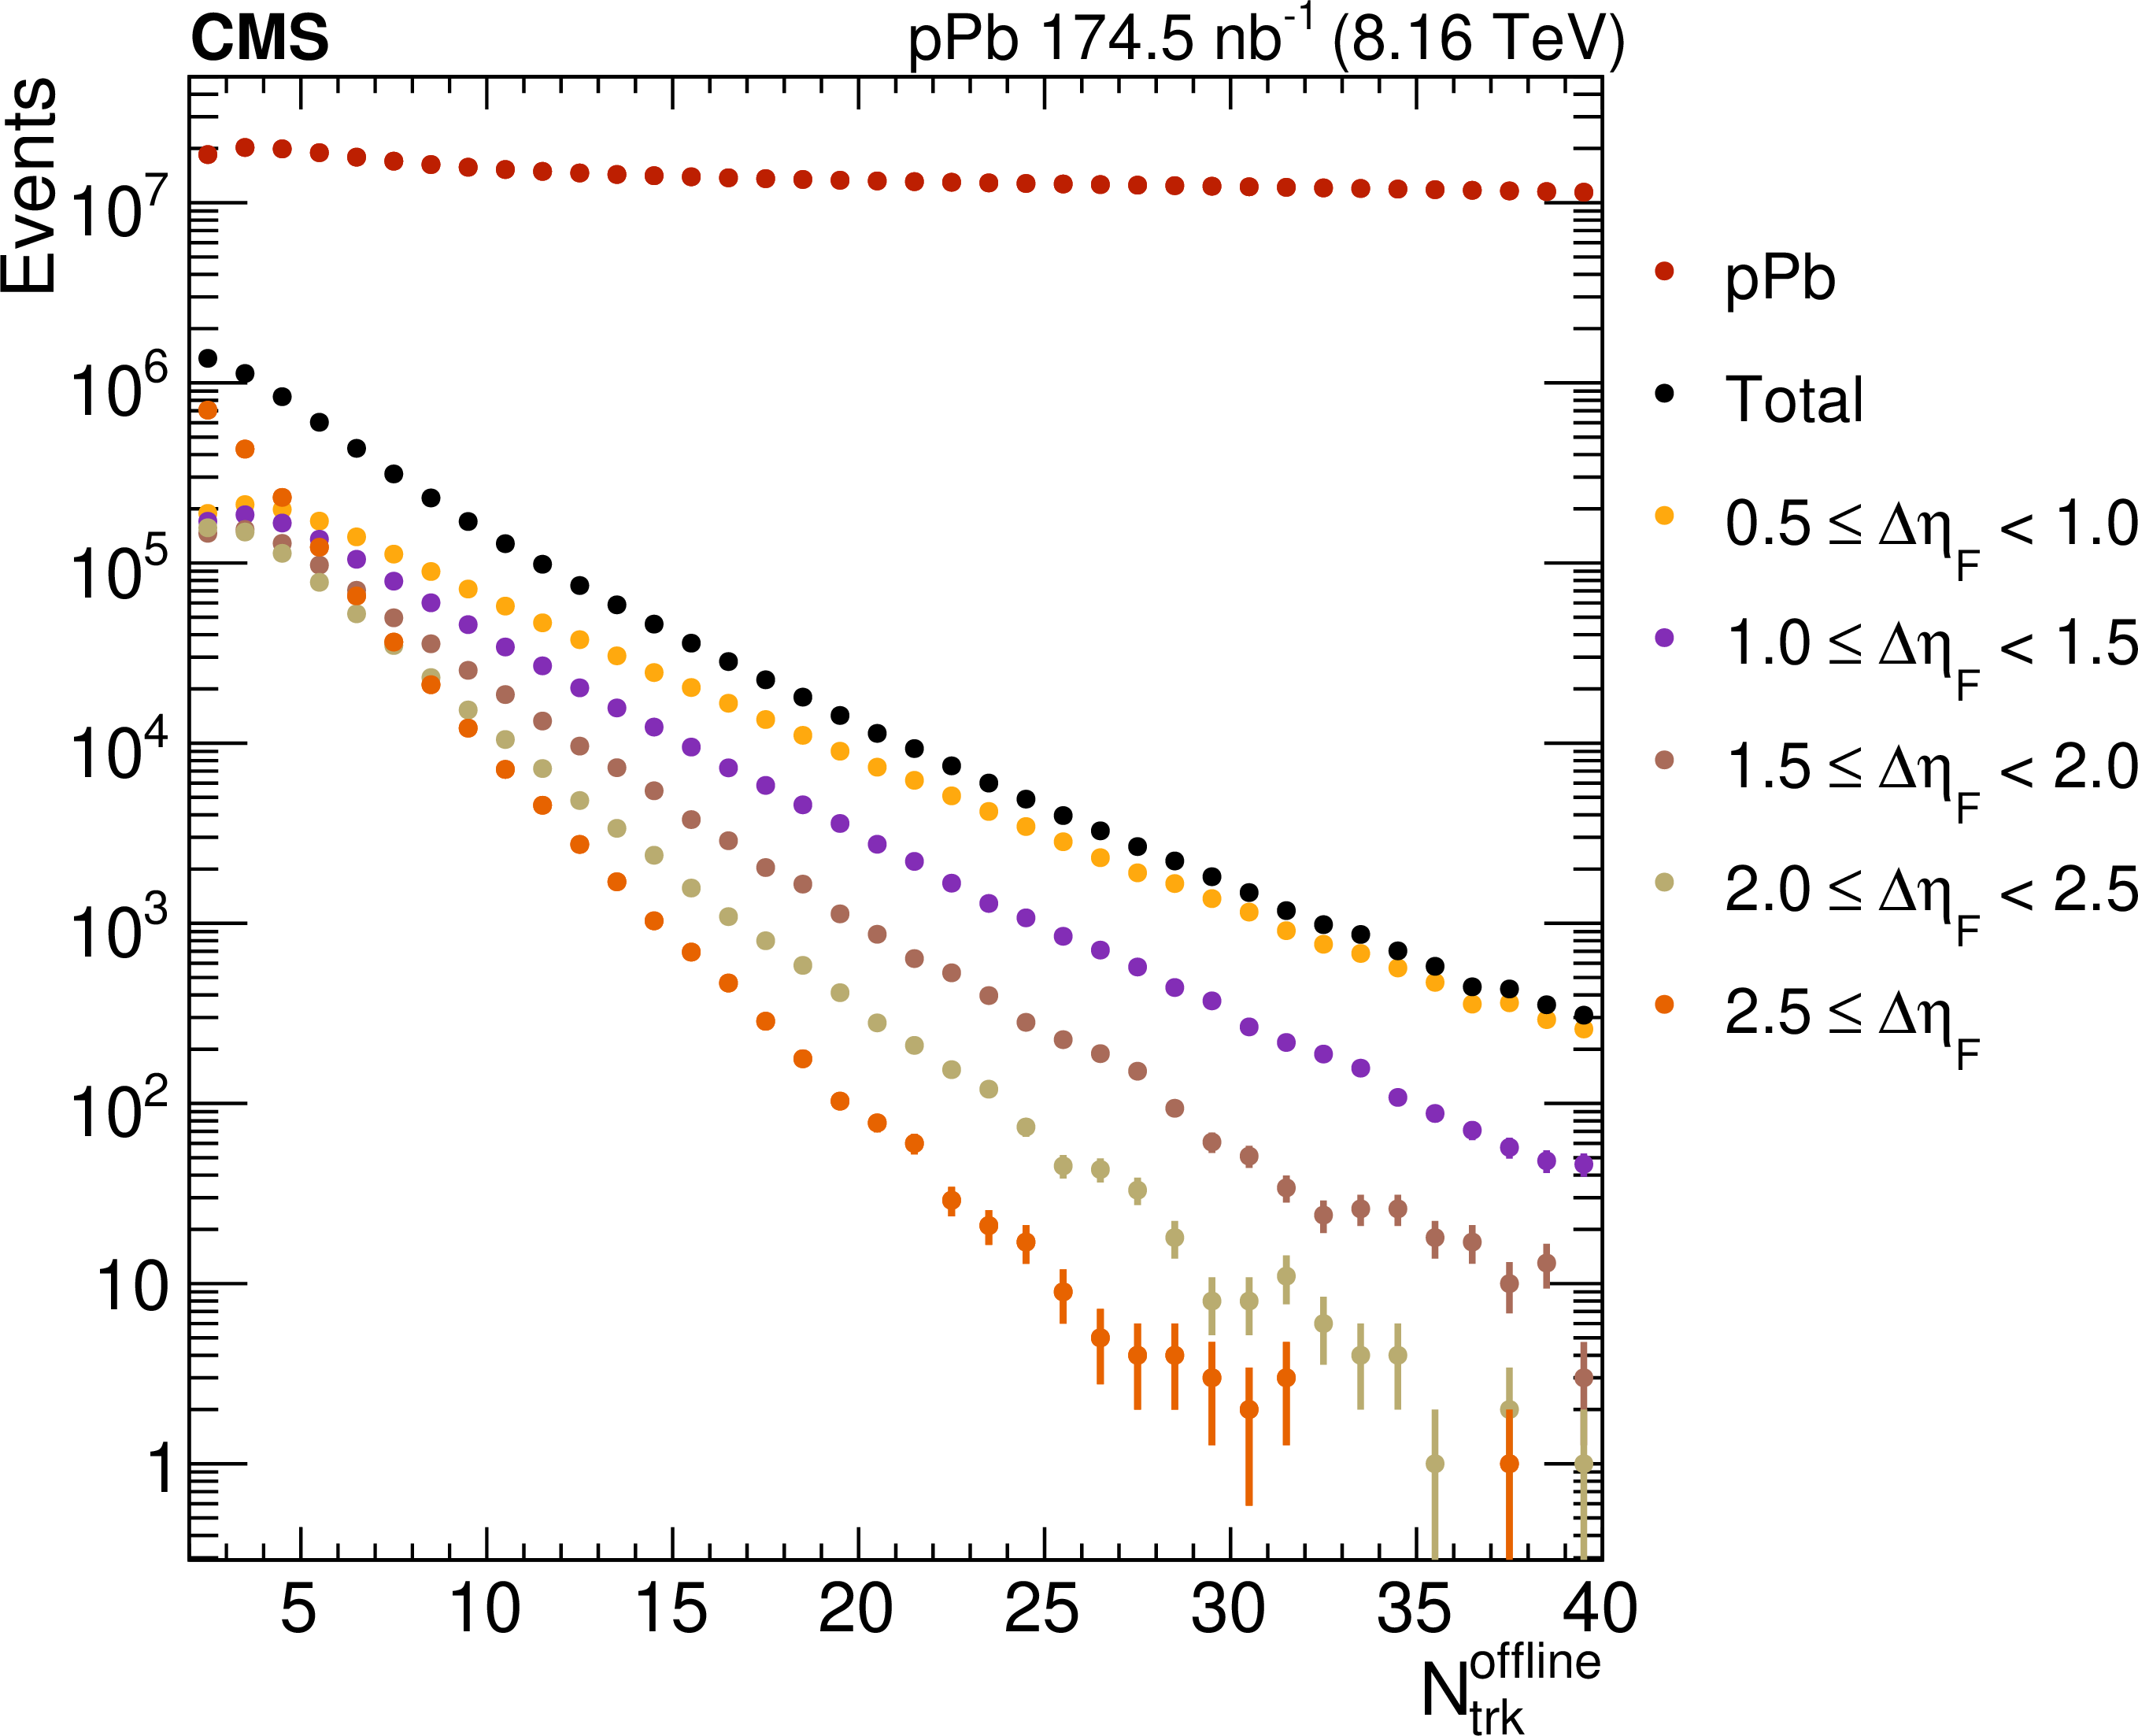
Figure 2:
The $ N_{\text{trk}}^{\text{offline}} $ spectra for inclusive $ \mathrm{p}\text{Pb} $ events (labeled ``$ \mathrm{p}\text{Pb} $'', from Ref. [45]) and events from the nominal sample in different $ {\Delta\eta^{\mathrm{F}} } $ bins. The data points are located in the center of the bin of their corresponding $ N_{\text{trk}}^{\text{offline}} $ category. The vertical bars indicate the size of the statistical uncertainties. |
png pdf |
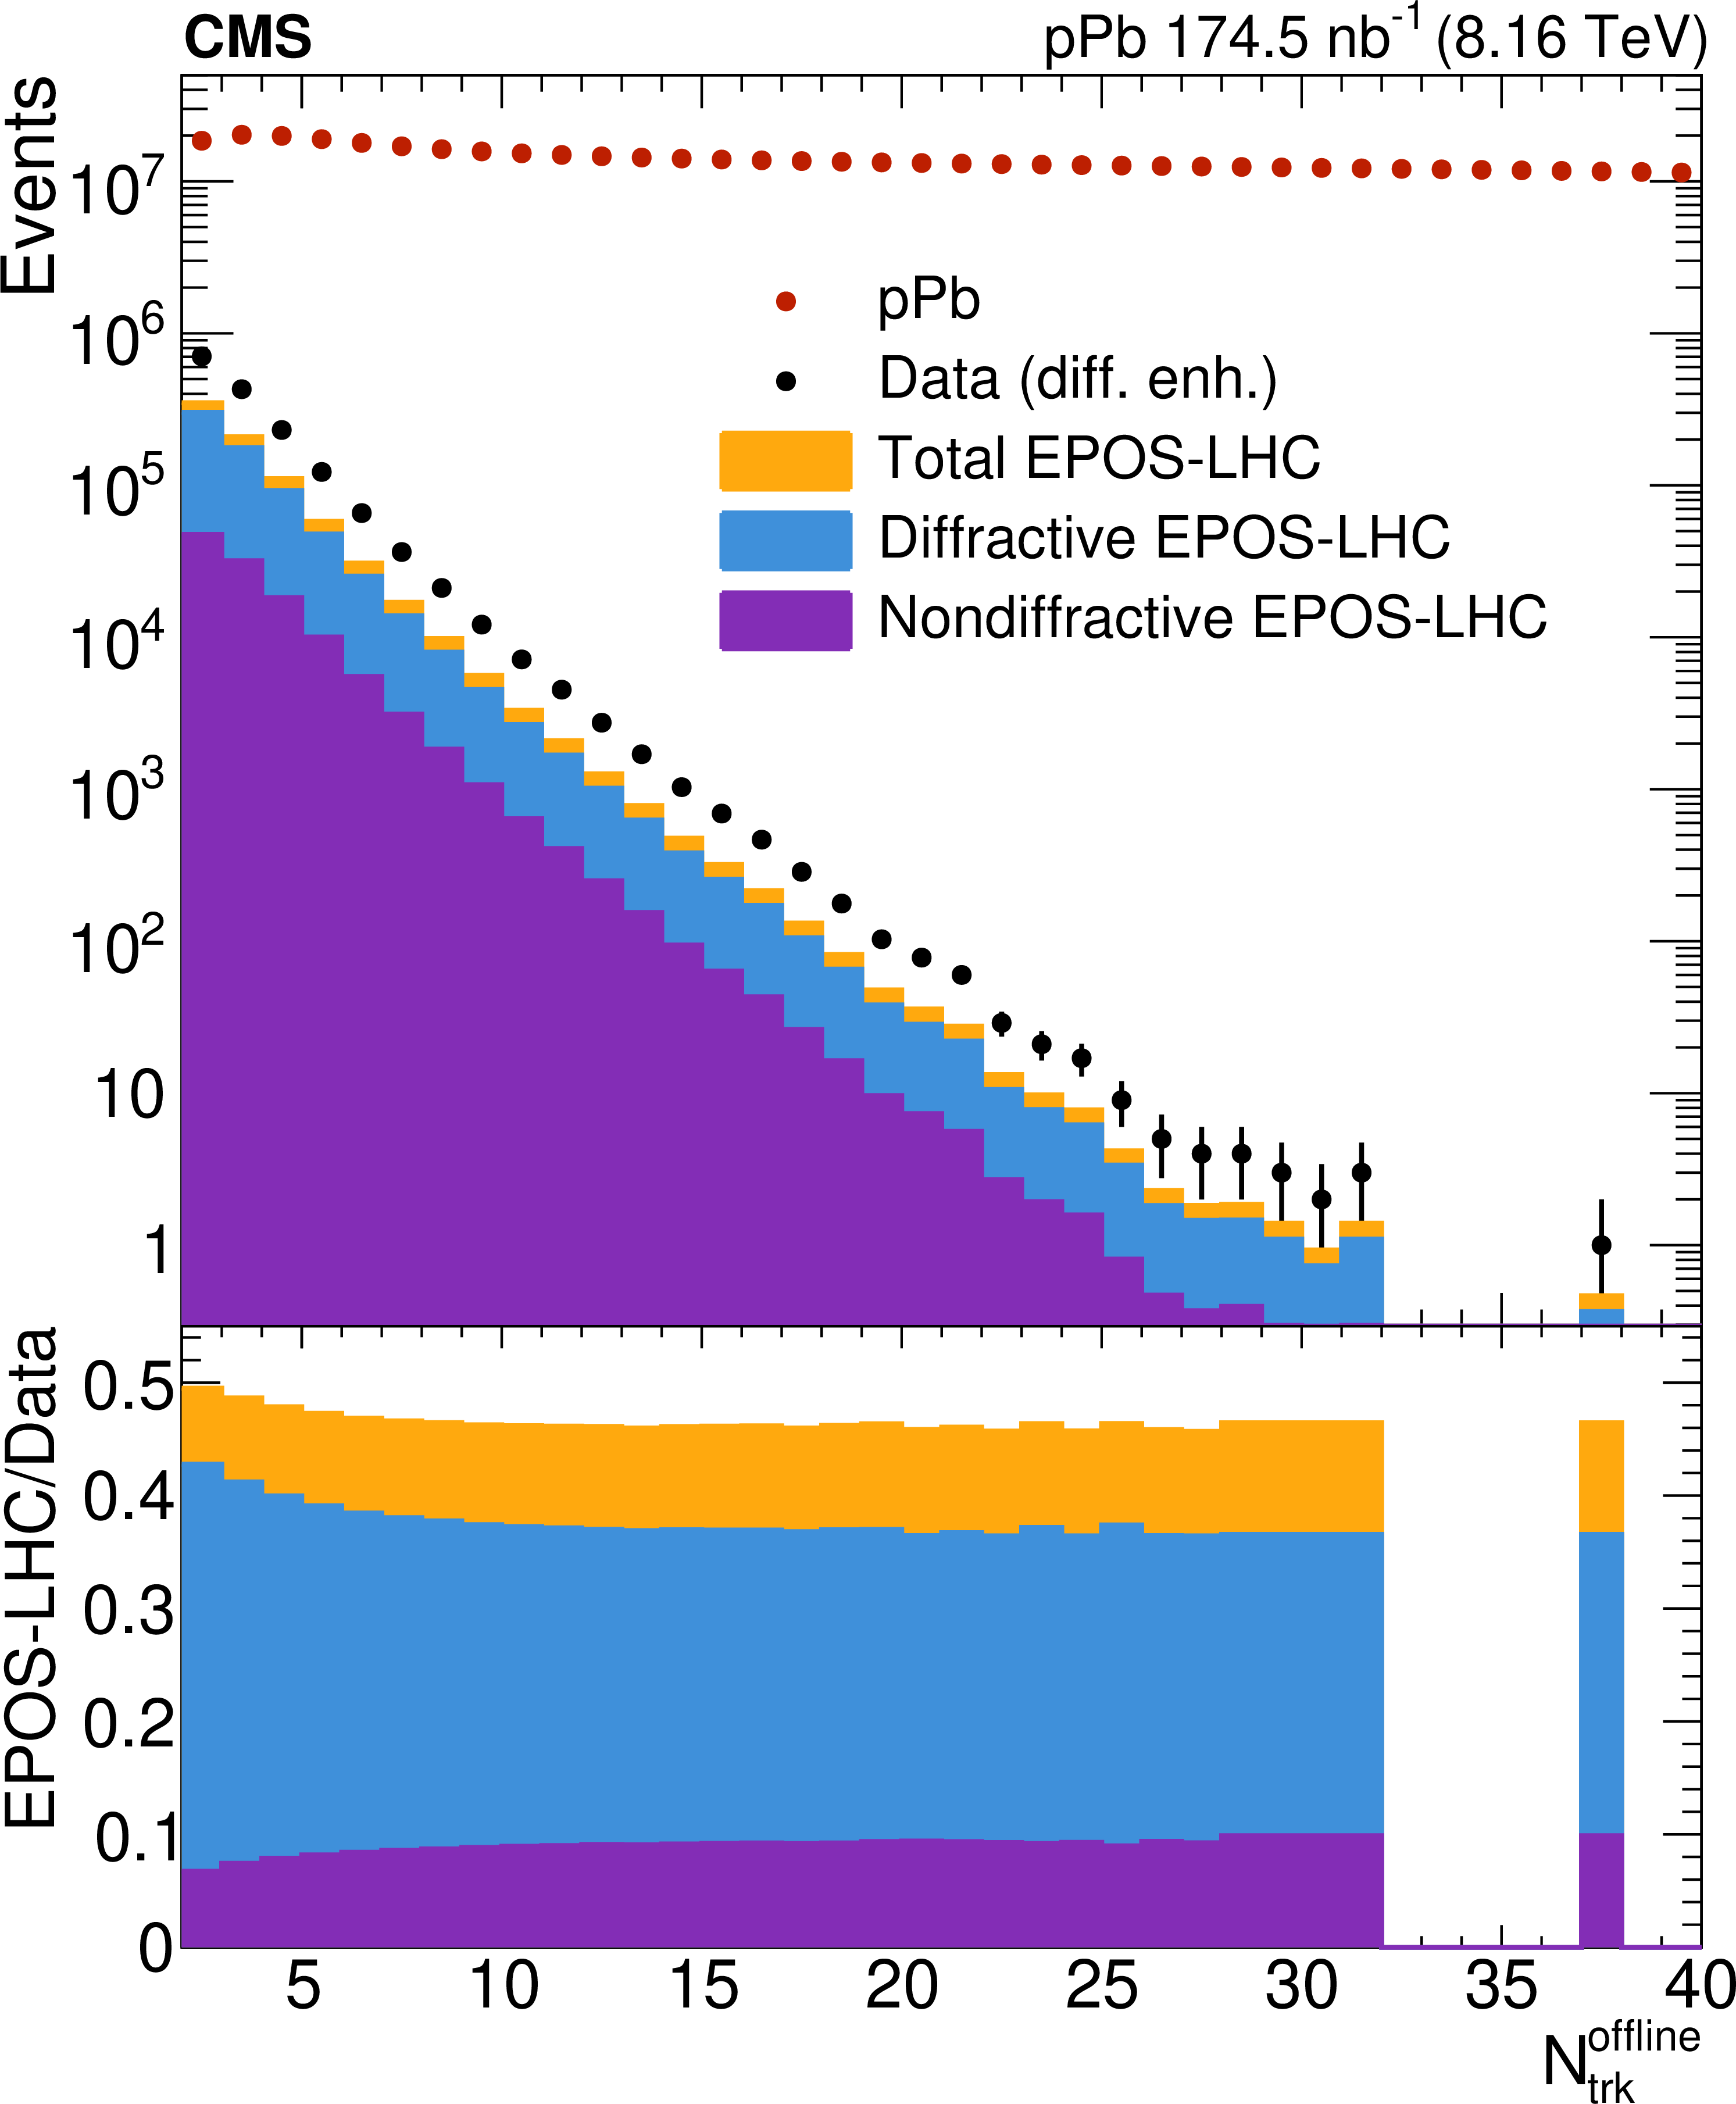
Figure 3:
The $ N_{\text{trk}}^{\text{offline}} $ spectra for inclusive $ \mathrm{p}\text{Pb} $ events (labeled ``$ \mathrm{p}\text{Pb} $'', from Ref. [45]) and inclusive diffraction-enhanced events (labeled ``Data (diff. enh.)''). The distribution for the inclusive diffraction-enhanced events is the same as that shown in orange in Fig. 2 ($ {\Delta\eta^{\mathrm{F}} } > $ 2.5). Predictions based on weighting the data by the fractional cross sections from EPOS-LHC are also shown. The lower panel shows the ratio of the predictions to the data. The vertical bars indicate the size of the statistical uncertainties. |
png pdf |
Figure 4:
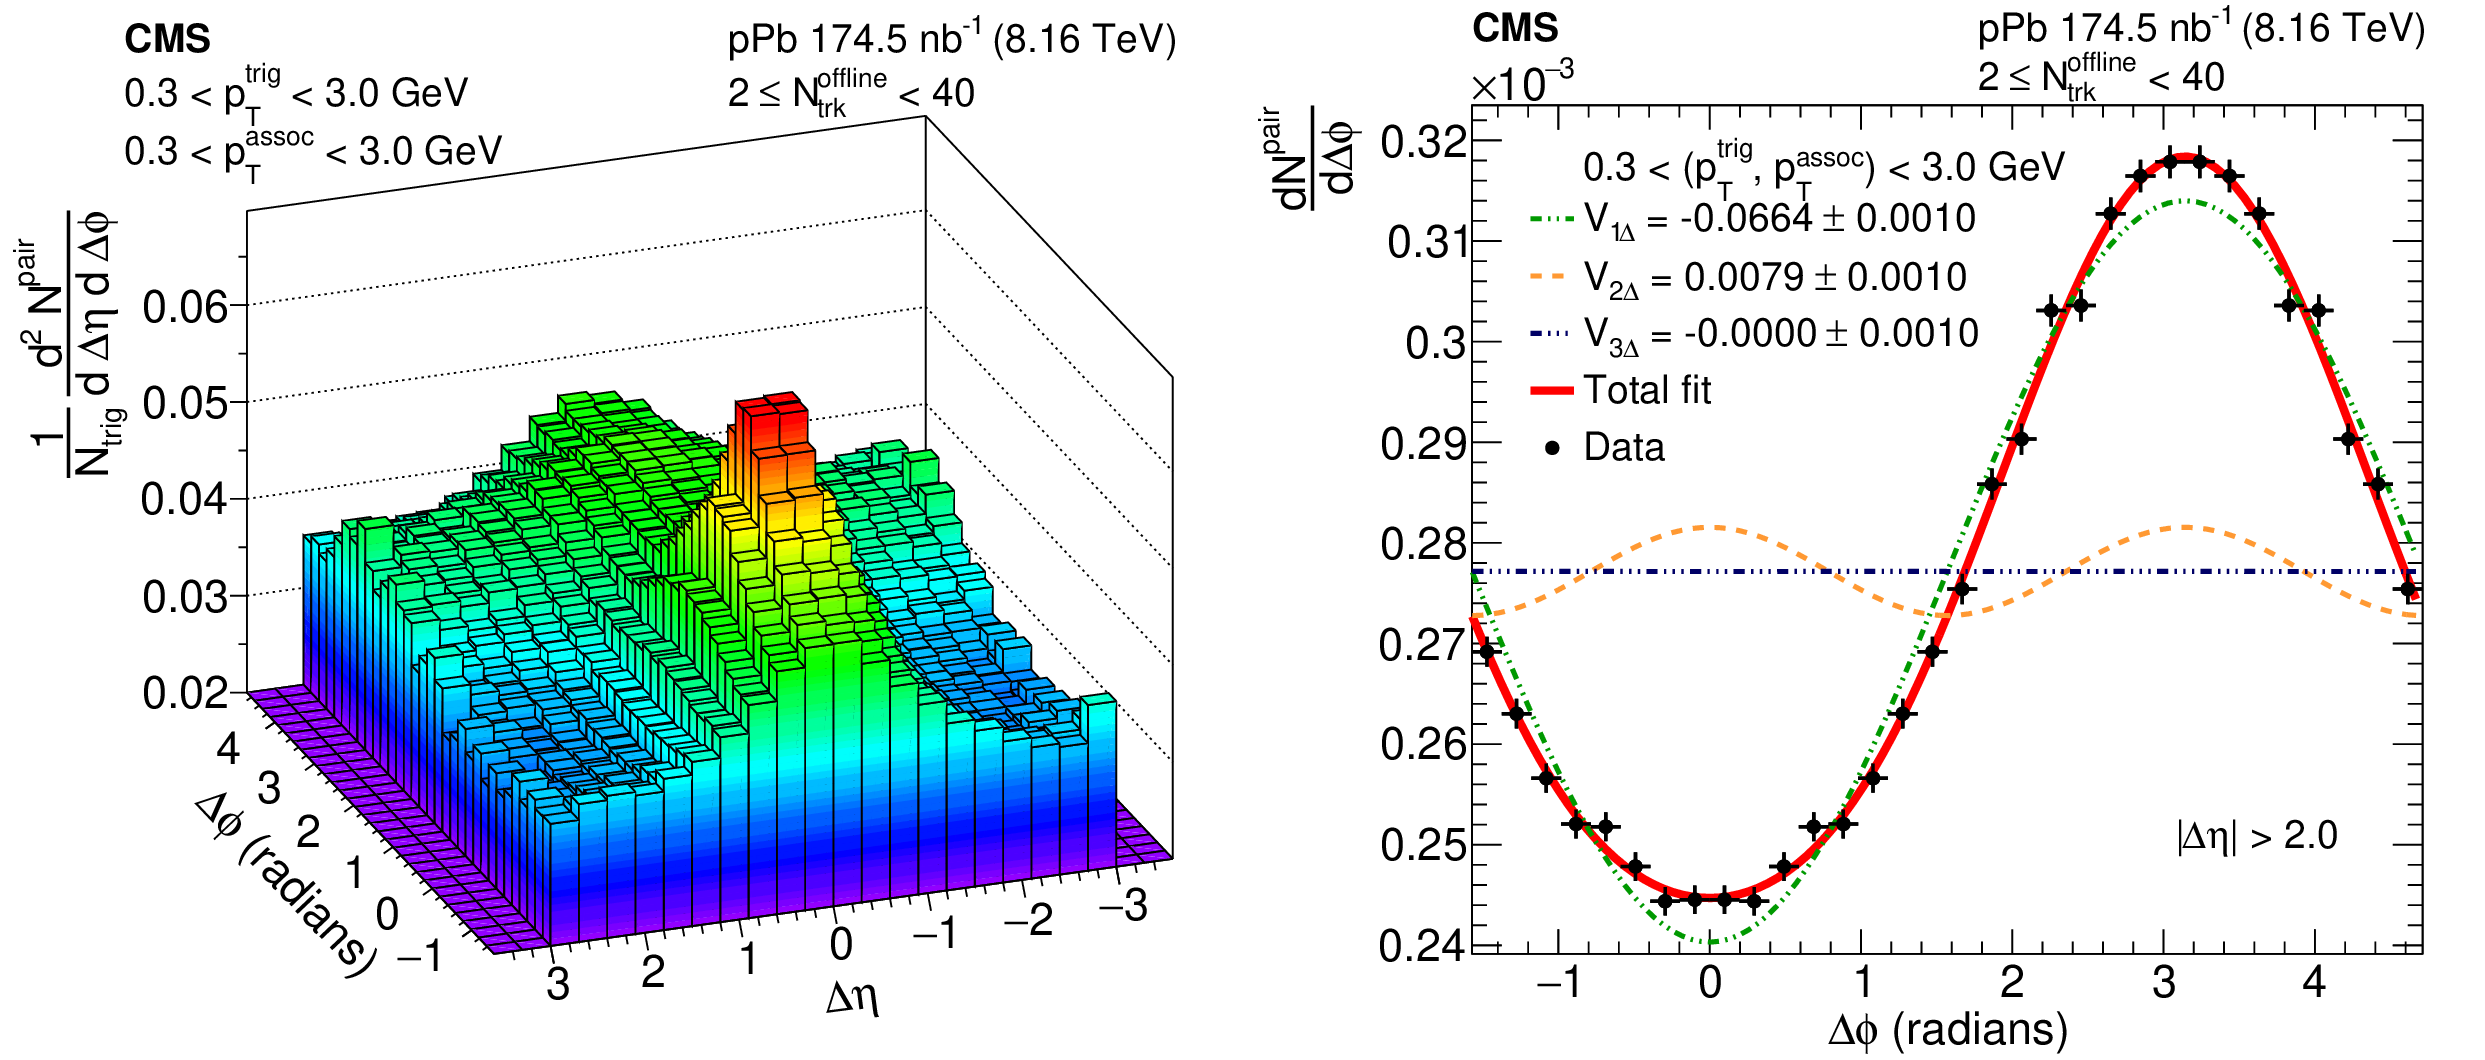
The 2D correlation distribution for multiplicity (left) and its projection on the $ {\Delta\phi} $ axis (right) for $ |{\Delta\eta}| > $ 2, 2 $ \leq N_{\text{trk}}^{\text{offline}} < $ 40, and 0.3 $ < p_{\mathrm{T}}^{\text{trig}} < $ 3.0 GeV. The filled circles indicate the data and the vertical bars indicate the size of the statistical uncertainties. The one-dimensional $ {\Delta\phi} $ distributions are symmetrized by construction around $ {\Delta\phi} = $ 0 and $ {\Delta\phi} = \pi $, so all the data are contained in $ [0, \pi] $ and are averaged over $ |{\Delta\eta}| > $ 2. The plotted range in $ {\Delta\phi} $ extends to $ [-\pi, 3\pi/2] $ for visualization purposes. The Fourier coefficients $ {V_{n\Delta}} $ are fitted over the $ {\Delta\phi} $ range $ [0, \pi] $. The dashed lines show the resulting components $ {V_{1\Delta}} $, $ {V_{2\Delta}} $, and $ {V_{3\Delta}} $, along with the fitted values and statistical uncertainties. |
png pdf |
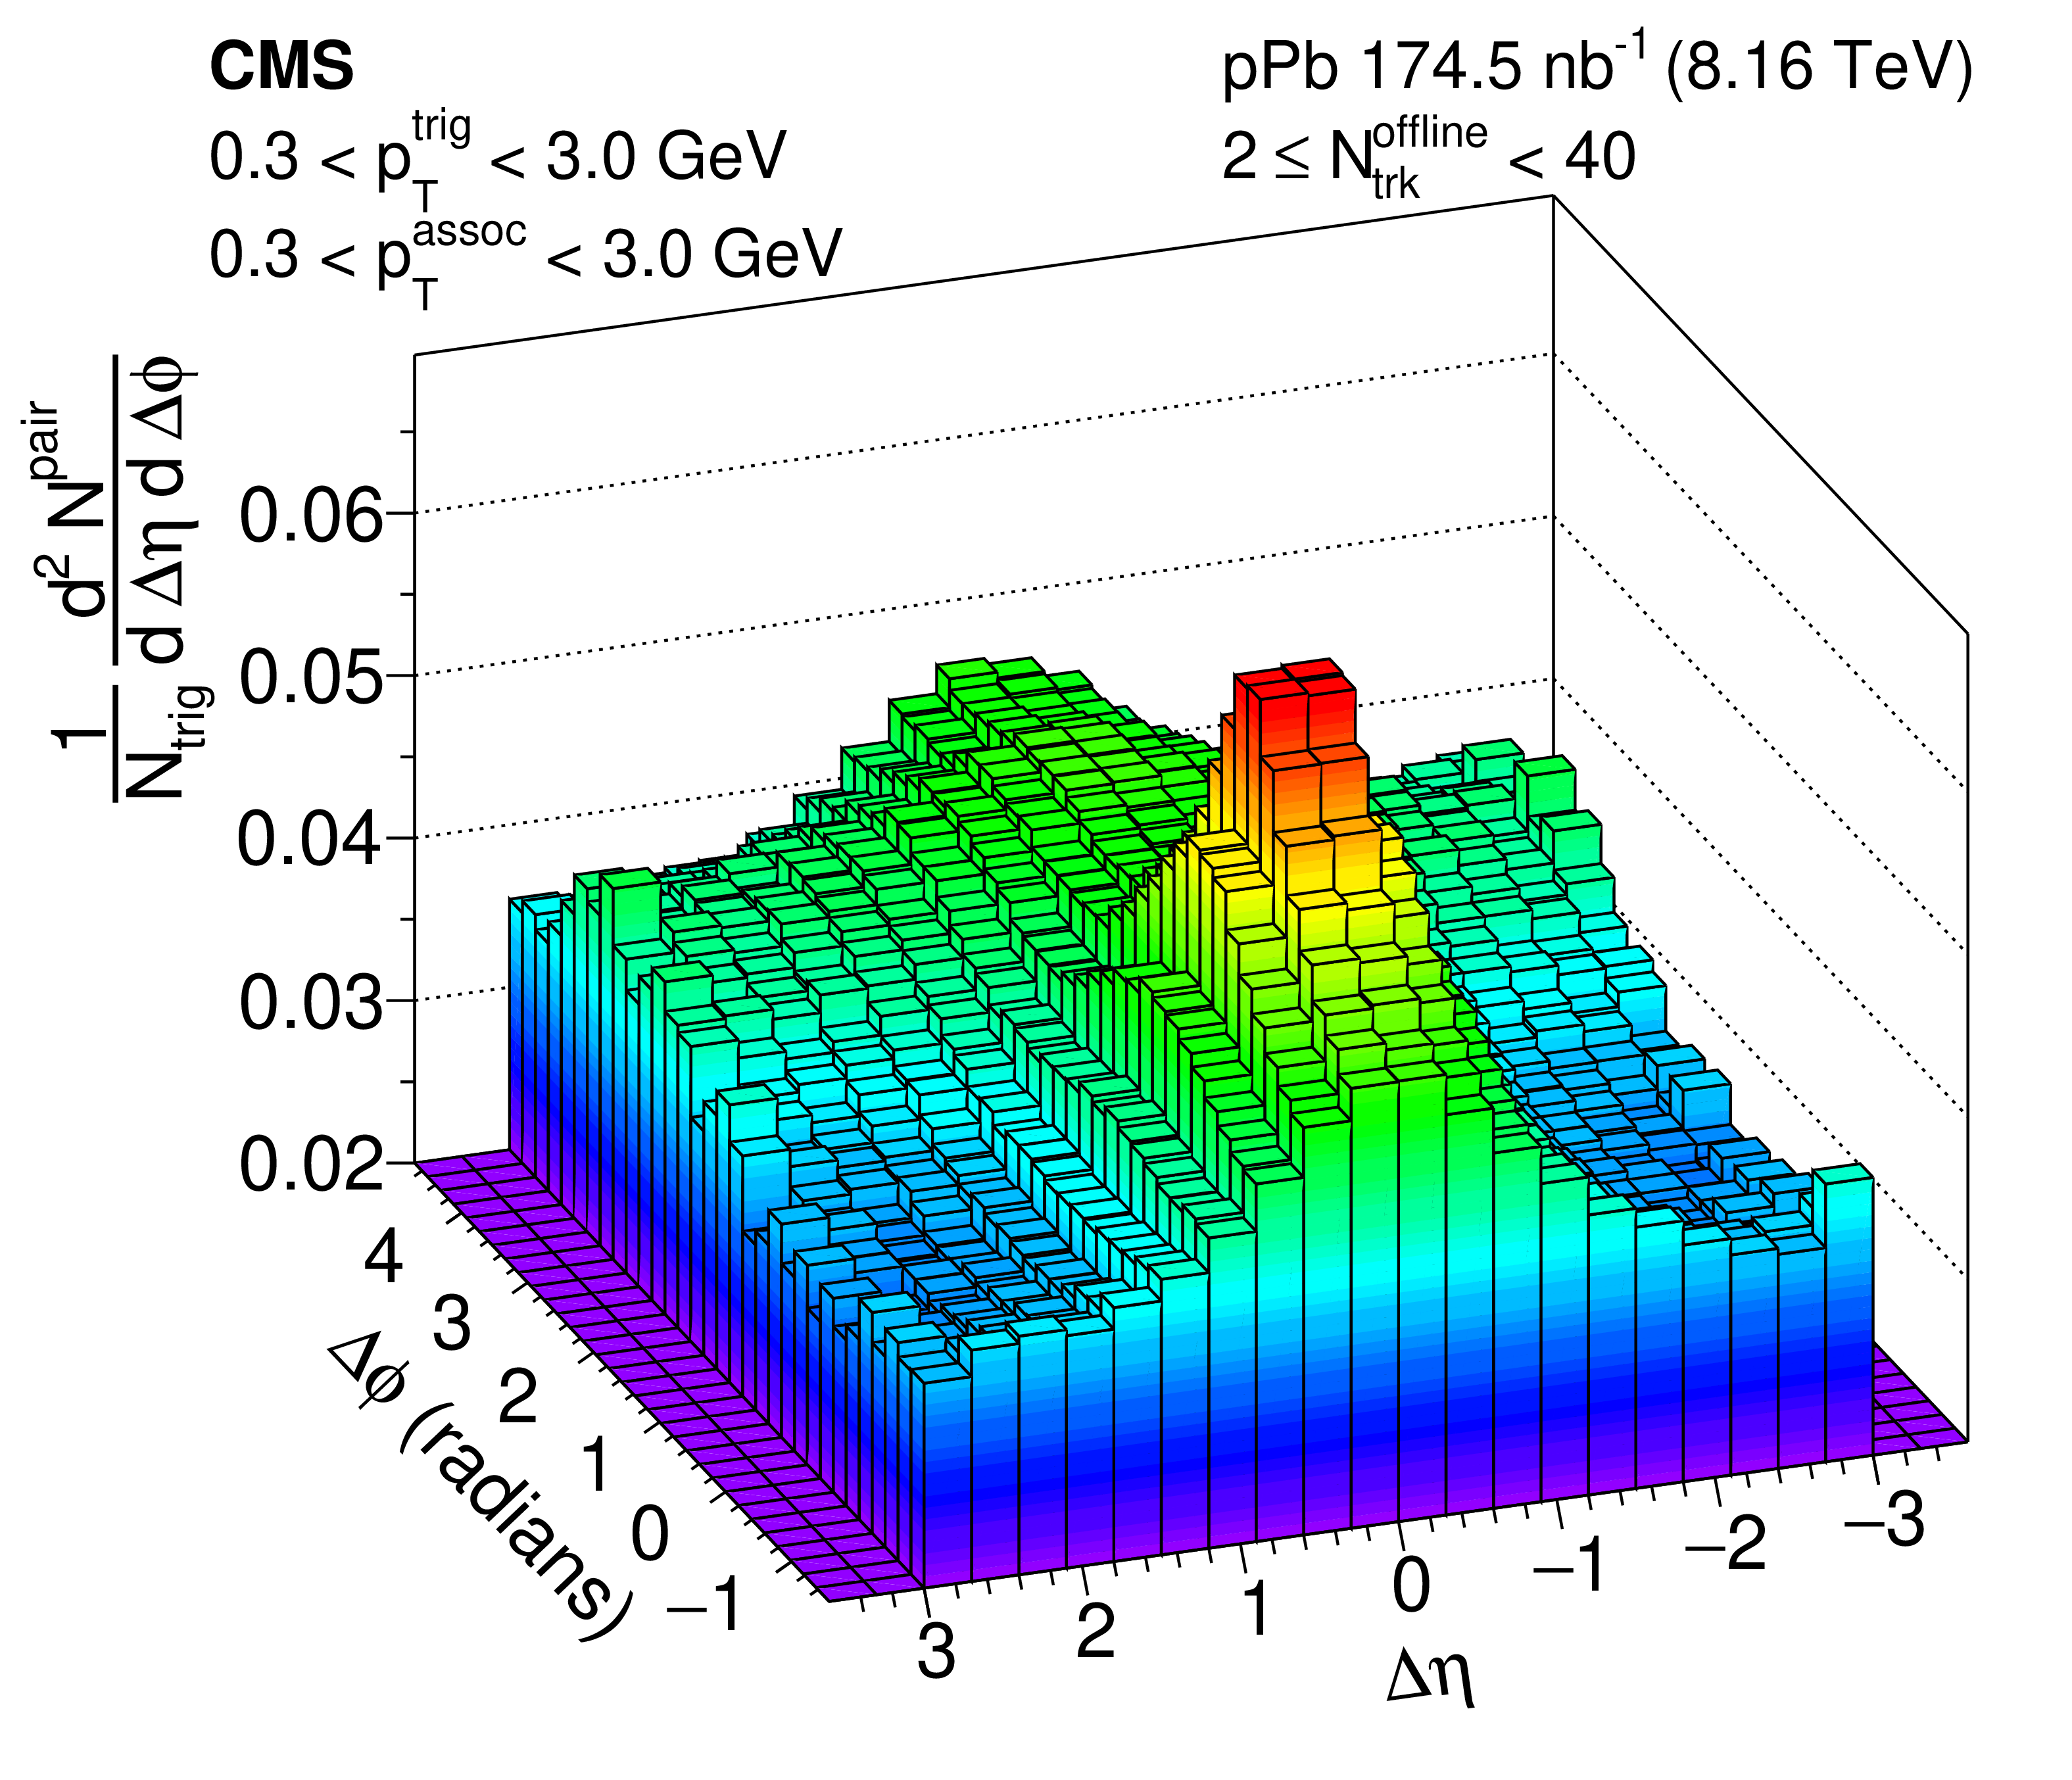
Figure 4-a:
The 2D correlation distribution for multiplicity (left) and its projection on the $ {\Delta\phi} $ axis (right) for $ |{\Delta\eta}| > $ 2, 2 $ \leq N_{\text{trk}}^{\text{offline}} < $ 40, and 0.3 $ < p_{\mathrm{T}}^{\text{trig}} < $ 3.0 GeV. The filled circles indicate the data and the vertical bars indicate the size of the statistical uncertainties. The one-dimensional $ {\Delta\phi} $ distributions are symmetrized by construction around $ {\Delta\phi} = $ 0 and $ {\Delta\phi} = \pi $, so all the data are contained in $ [0, \pi] $ and are averaged over $ |{\Delta\eta}| > $ 2. The plotted range in $ {\Delta\phi} $ extends to $ [-\pi, 3\pi/2] $ for visualization purposes. The Fourier coefficients $ {V_{n\Delta}} $ are fitted over the $ {\Delta\phi} $ range $ [0, \pi] $. The dashed lines show the resulting components $ {V_{1\Delta}} $, $ {V_{2\Delta}} $, and $ {V_{3\Delta}} $, along with the fitted values and statistical uncertainties. |
png pdf |
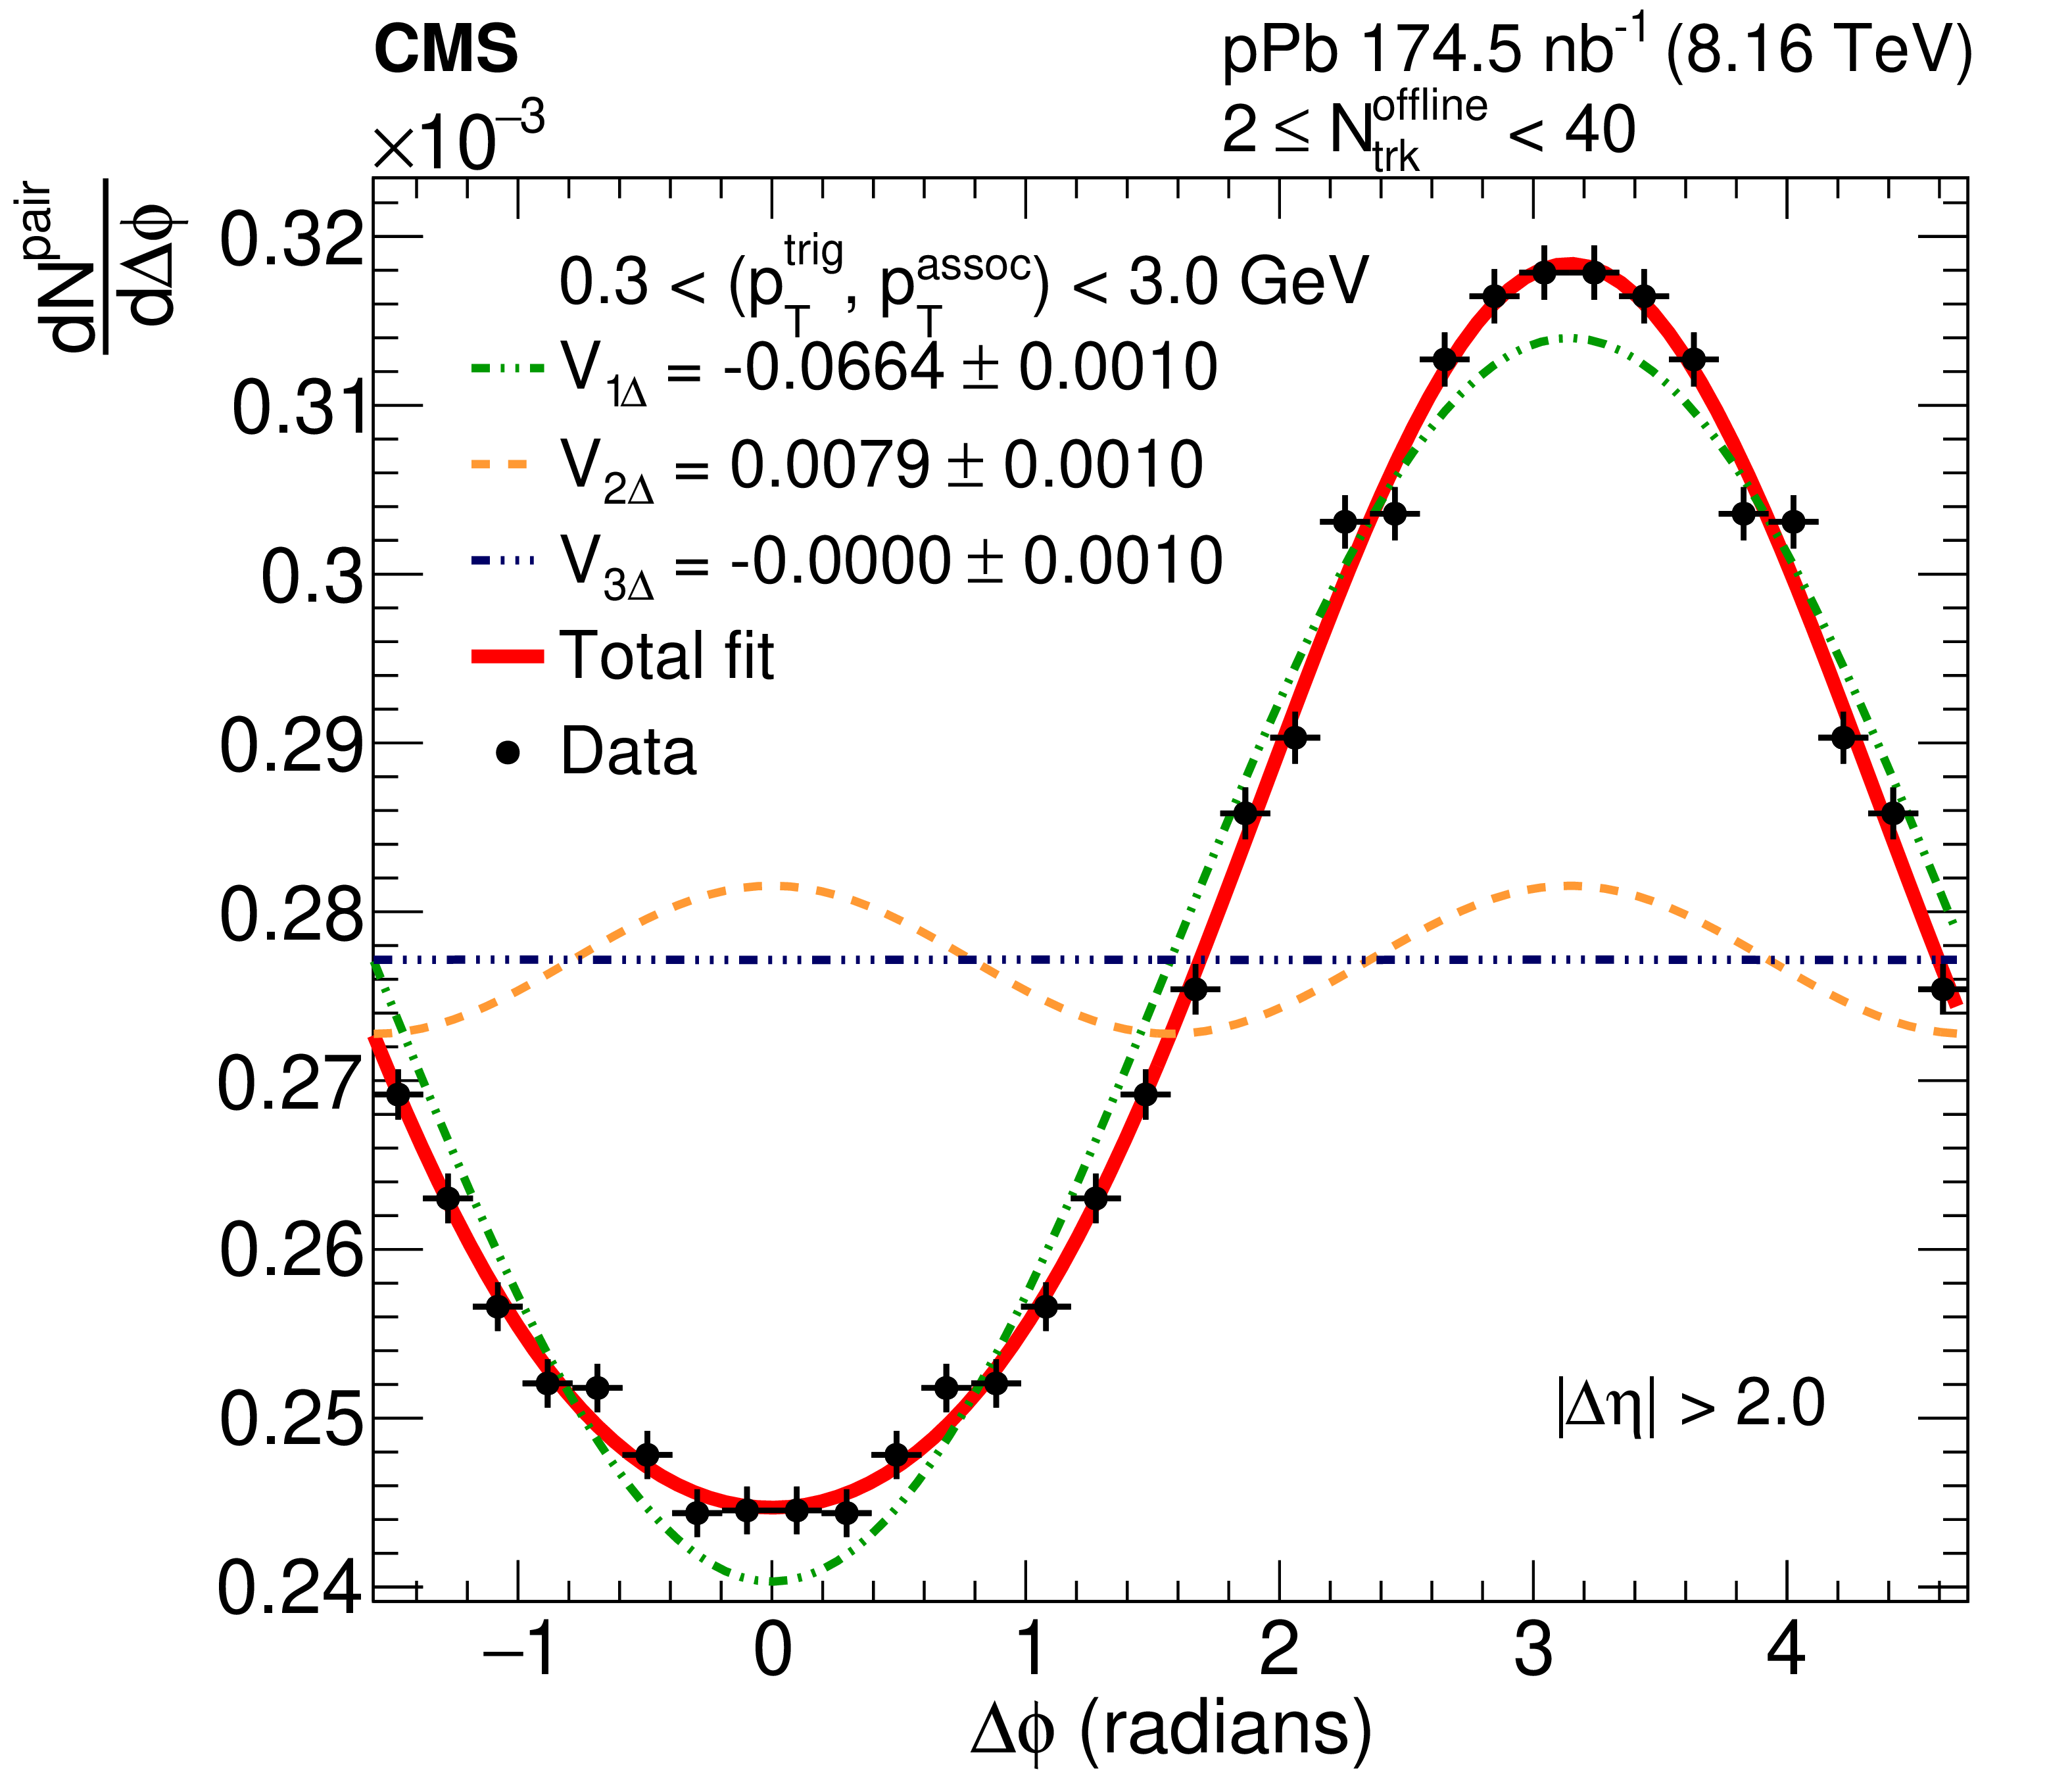
Figure 4-b:
The 2D correlation distribution for multiplicity (left) and its projection on the $ {\Delta\phi} $ axis (right) for $ |{\Delta\eta}| > $ 2, 2 $ \leq N_{\text{trk}}^{\text{offline}} < $ 40, and 0.3 $ < p_{\mathrm{T}}^{\text{trig}} < $ 3.0 GeV. The filled circles indicate the data and the vertical bars indicate the size of the statistical uncertainties. The one-dimensional $ {\Delta\phi} $ distributions are symmetrized by construction around $ {\Delta\phi} = $ 0 and $ {\Delta\phi} = \pi $, so all the data are contained in $ [0, \pi] $ and are averaged over $ |{\Delta\eta}| > $ 2. The plotted range in $ {\Delta\phi} $ extends to $ [-\pi, 3\pi/2] $ for visualization purposes. The Fourier coefficients $ {V_{n\Delta}} $ are fitted over the $ {\Delta\phi} $ range $ [0, \pi] $. The dashed lines show the resulting components $ {V_{1\Delta}} $, $ {V_{2\Delta}} $, and $ {V_{3\Delta}} $, along with the fitted values and statistical uncertainties. |
png pdf |
Figure 5:
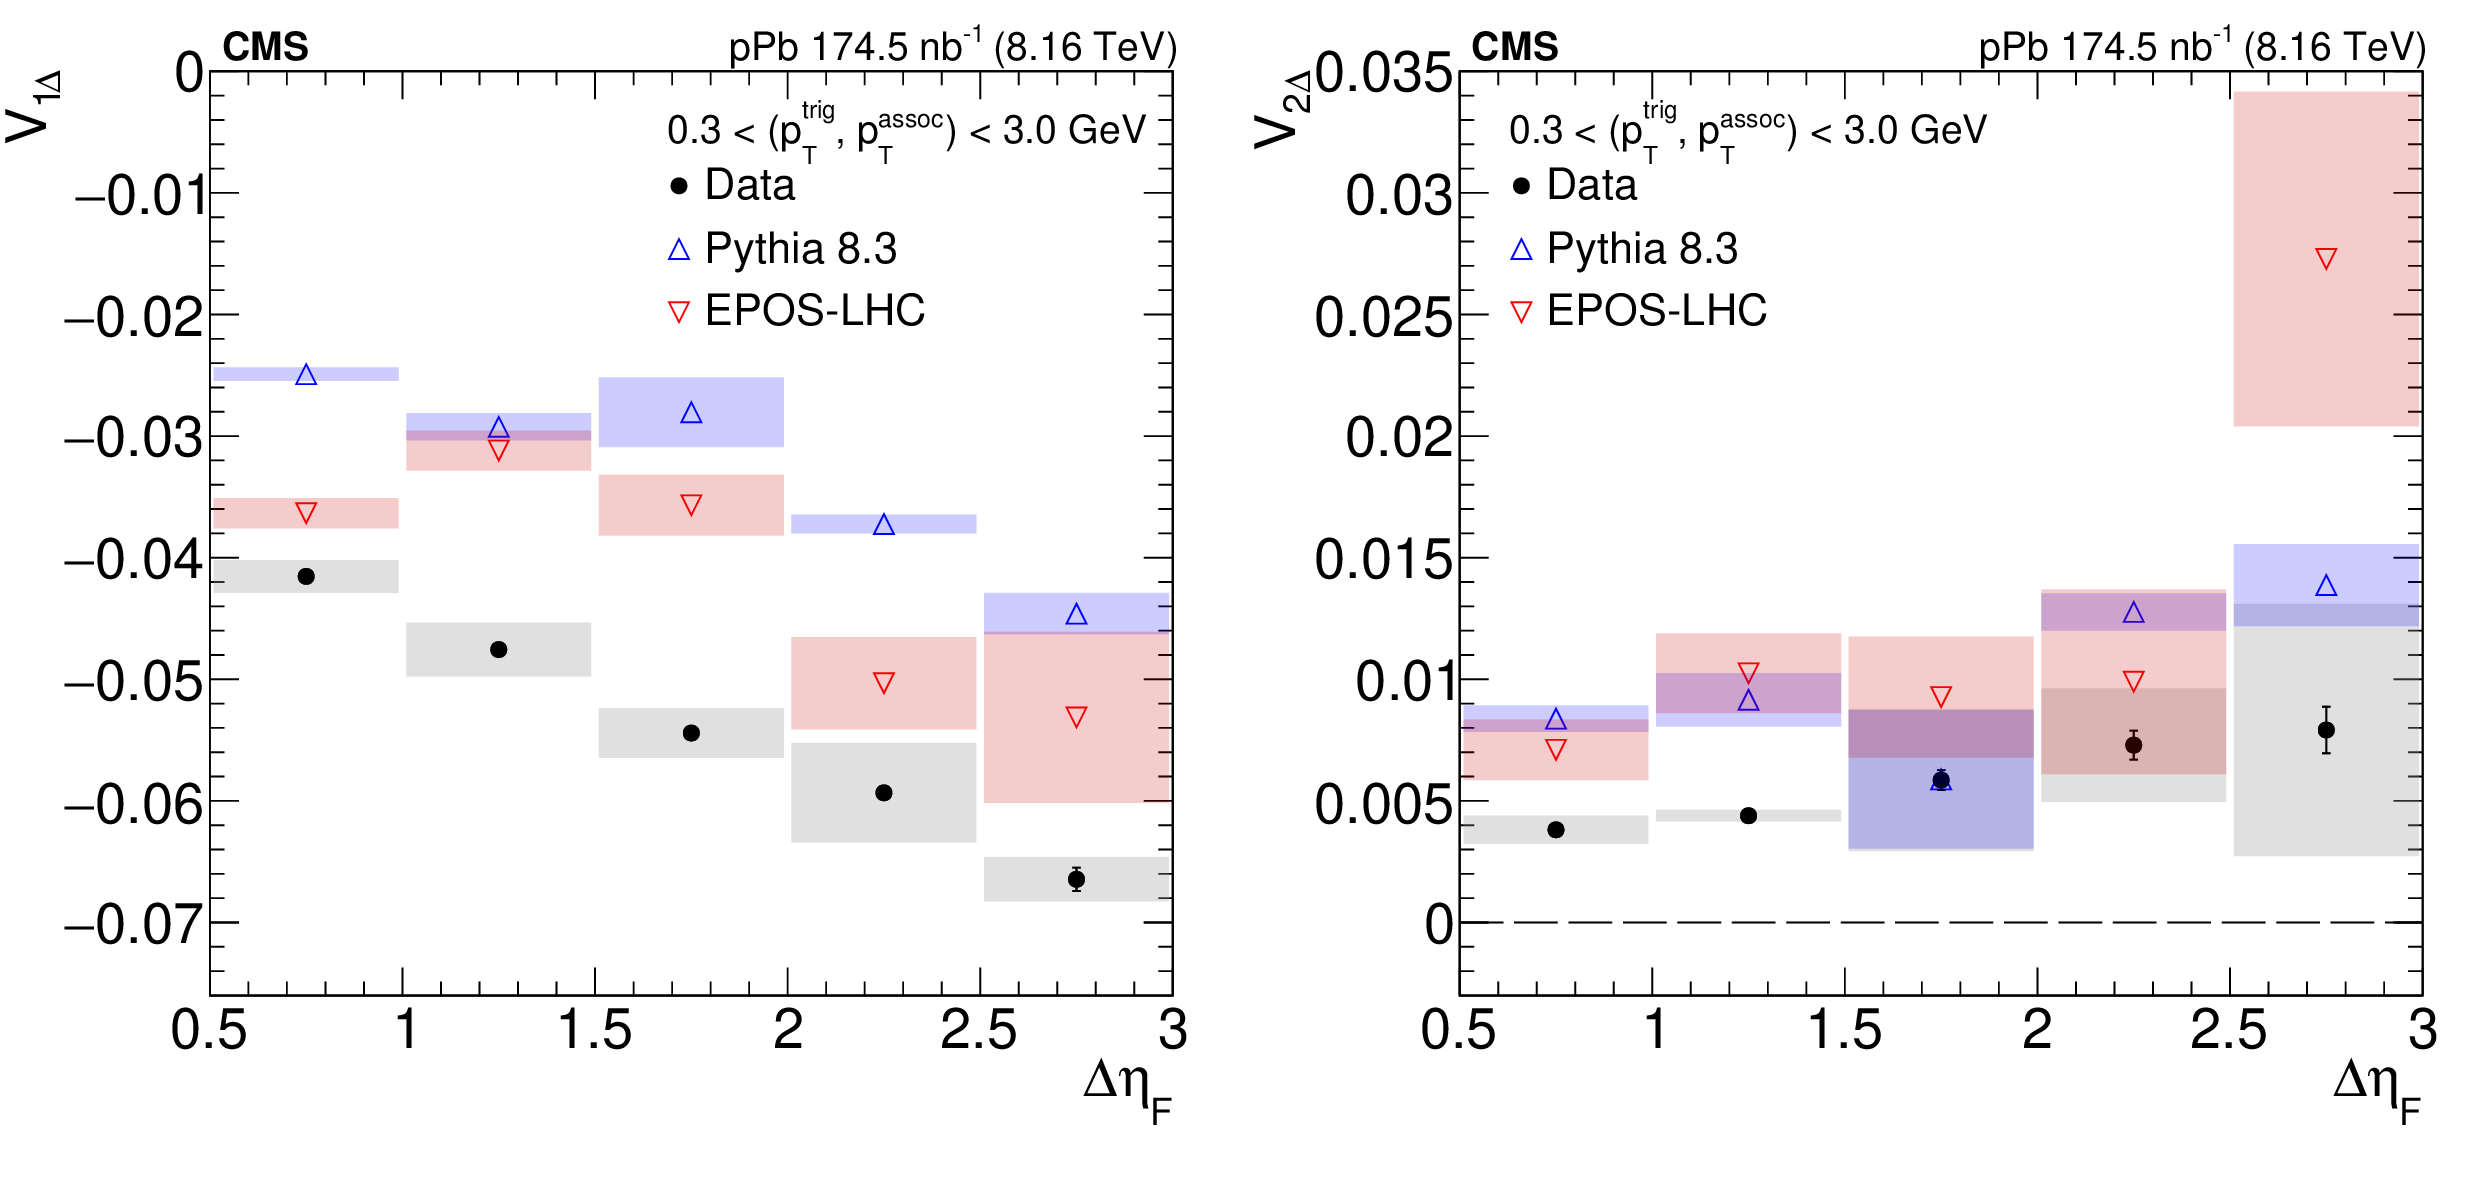
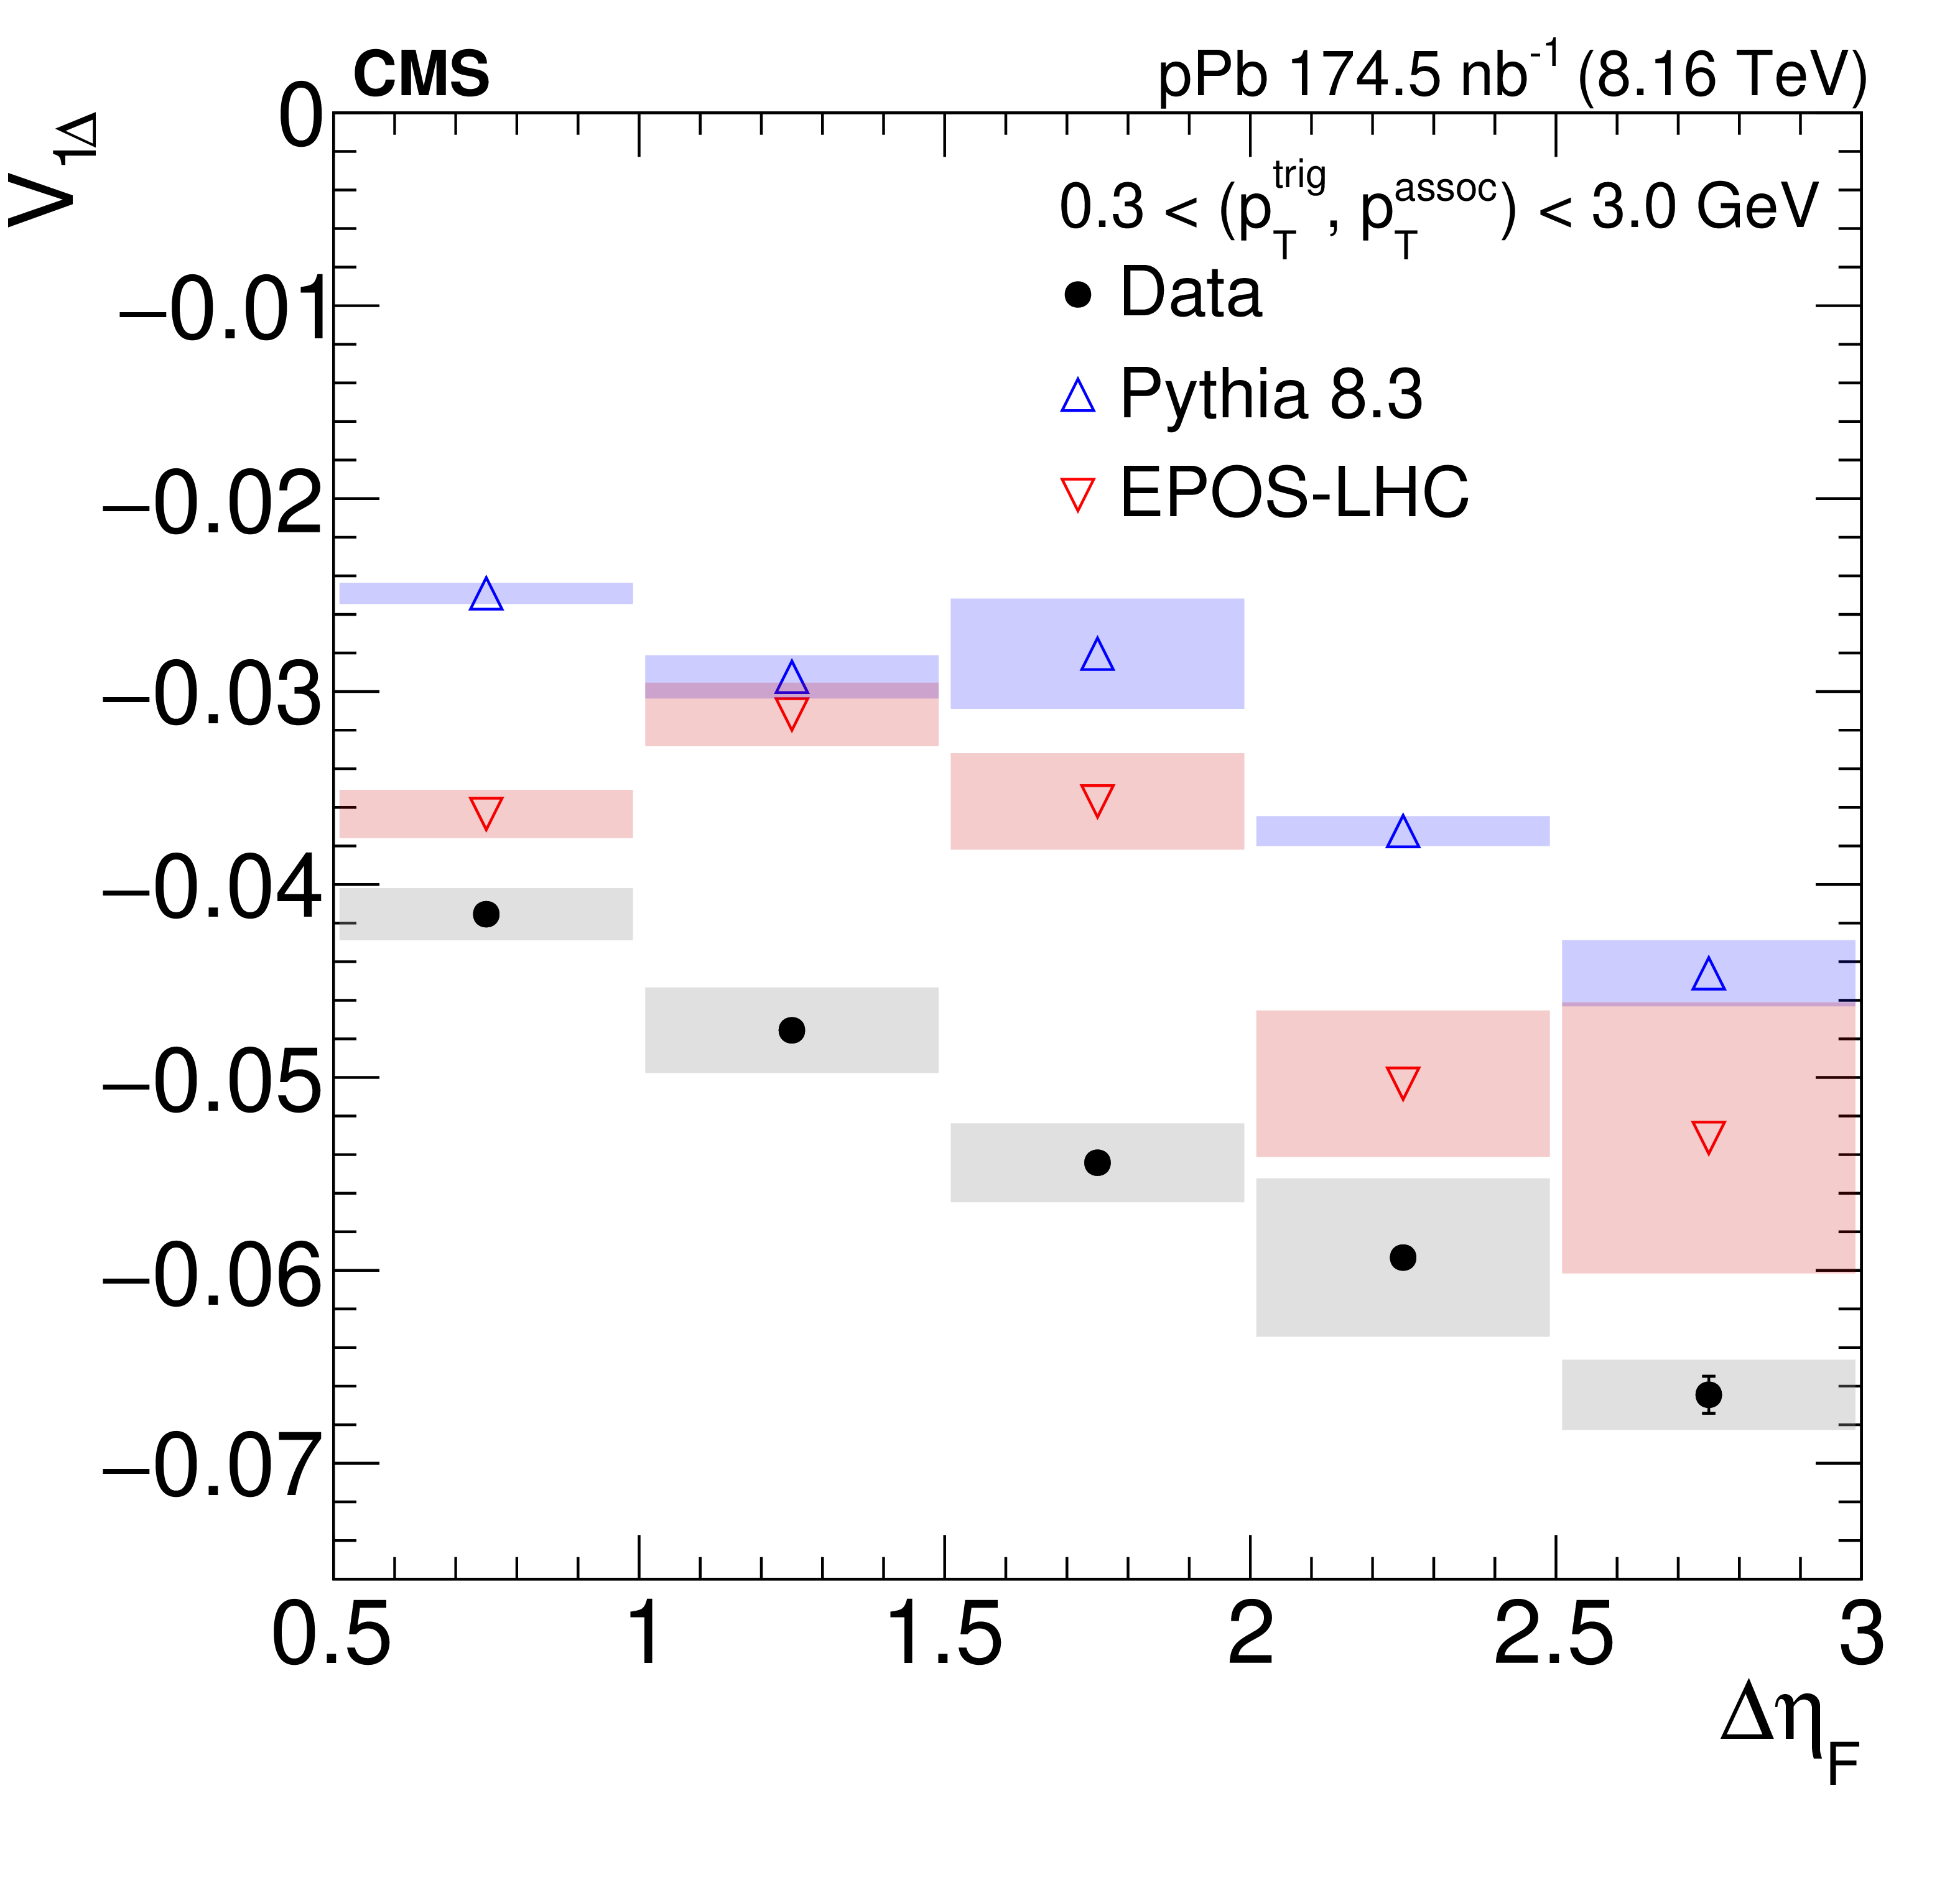
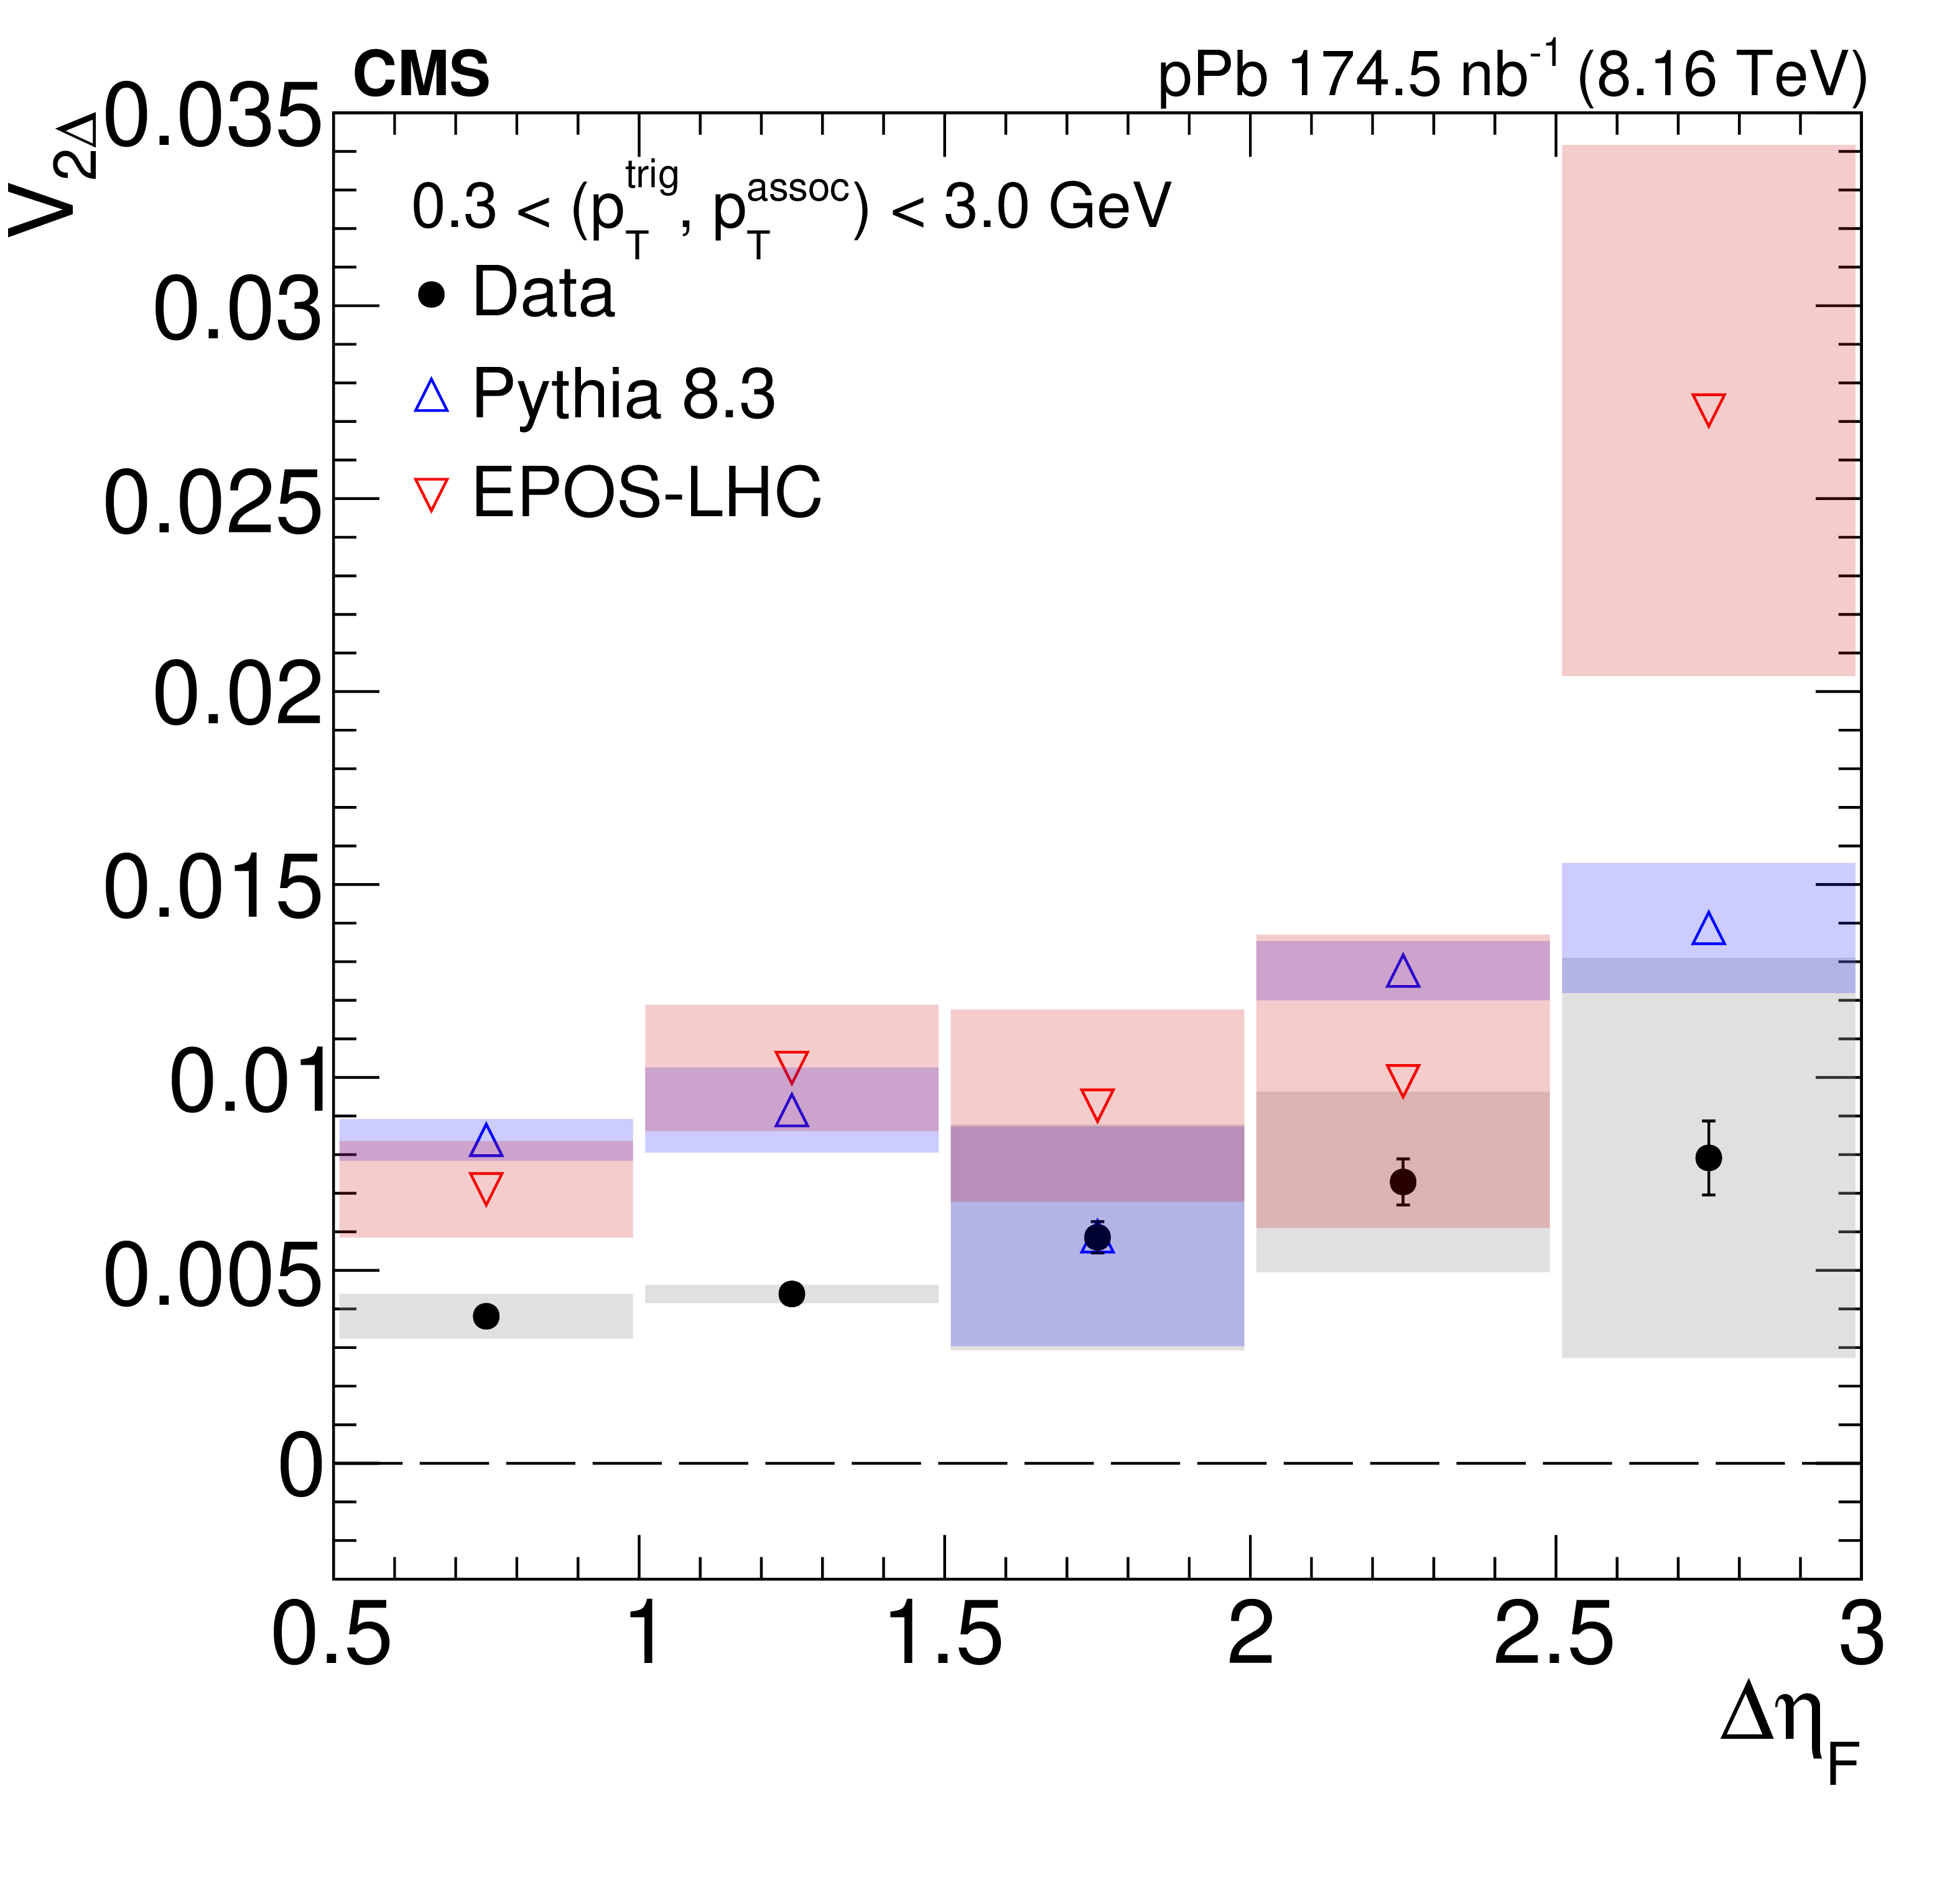
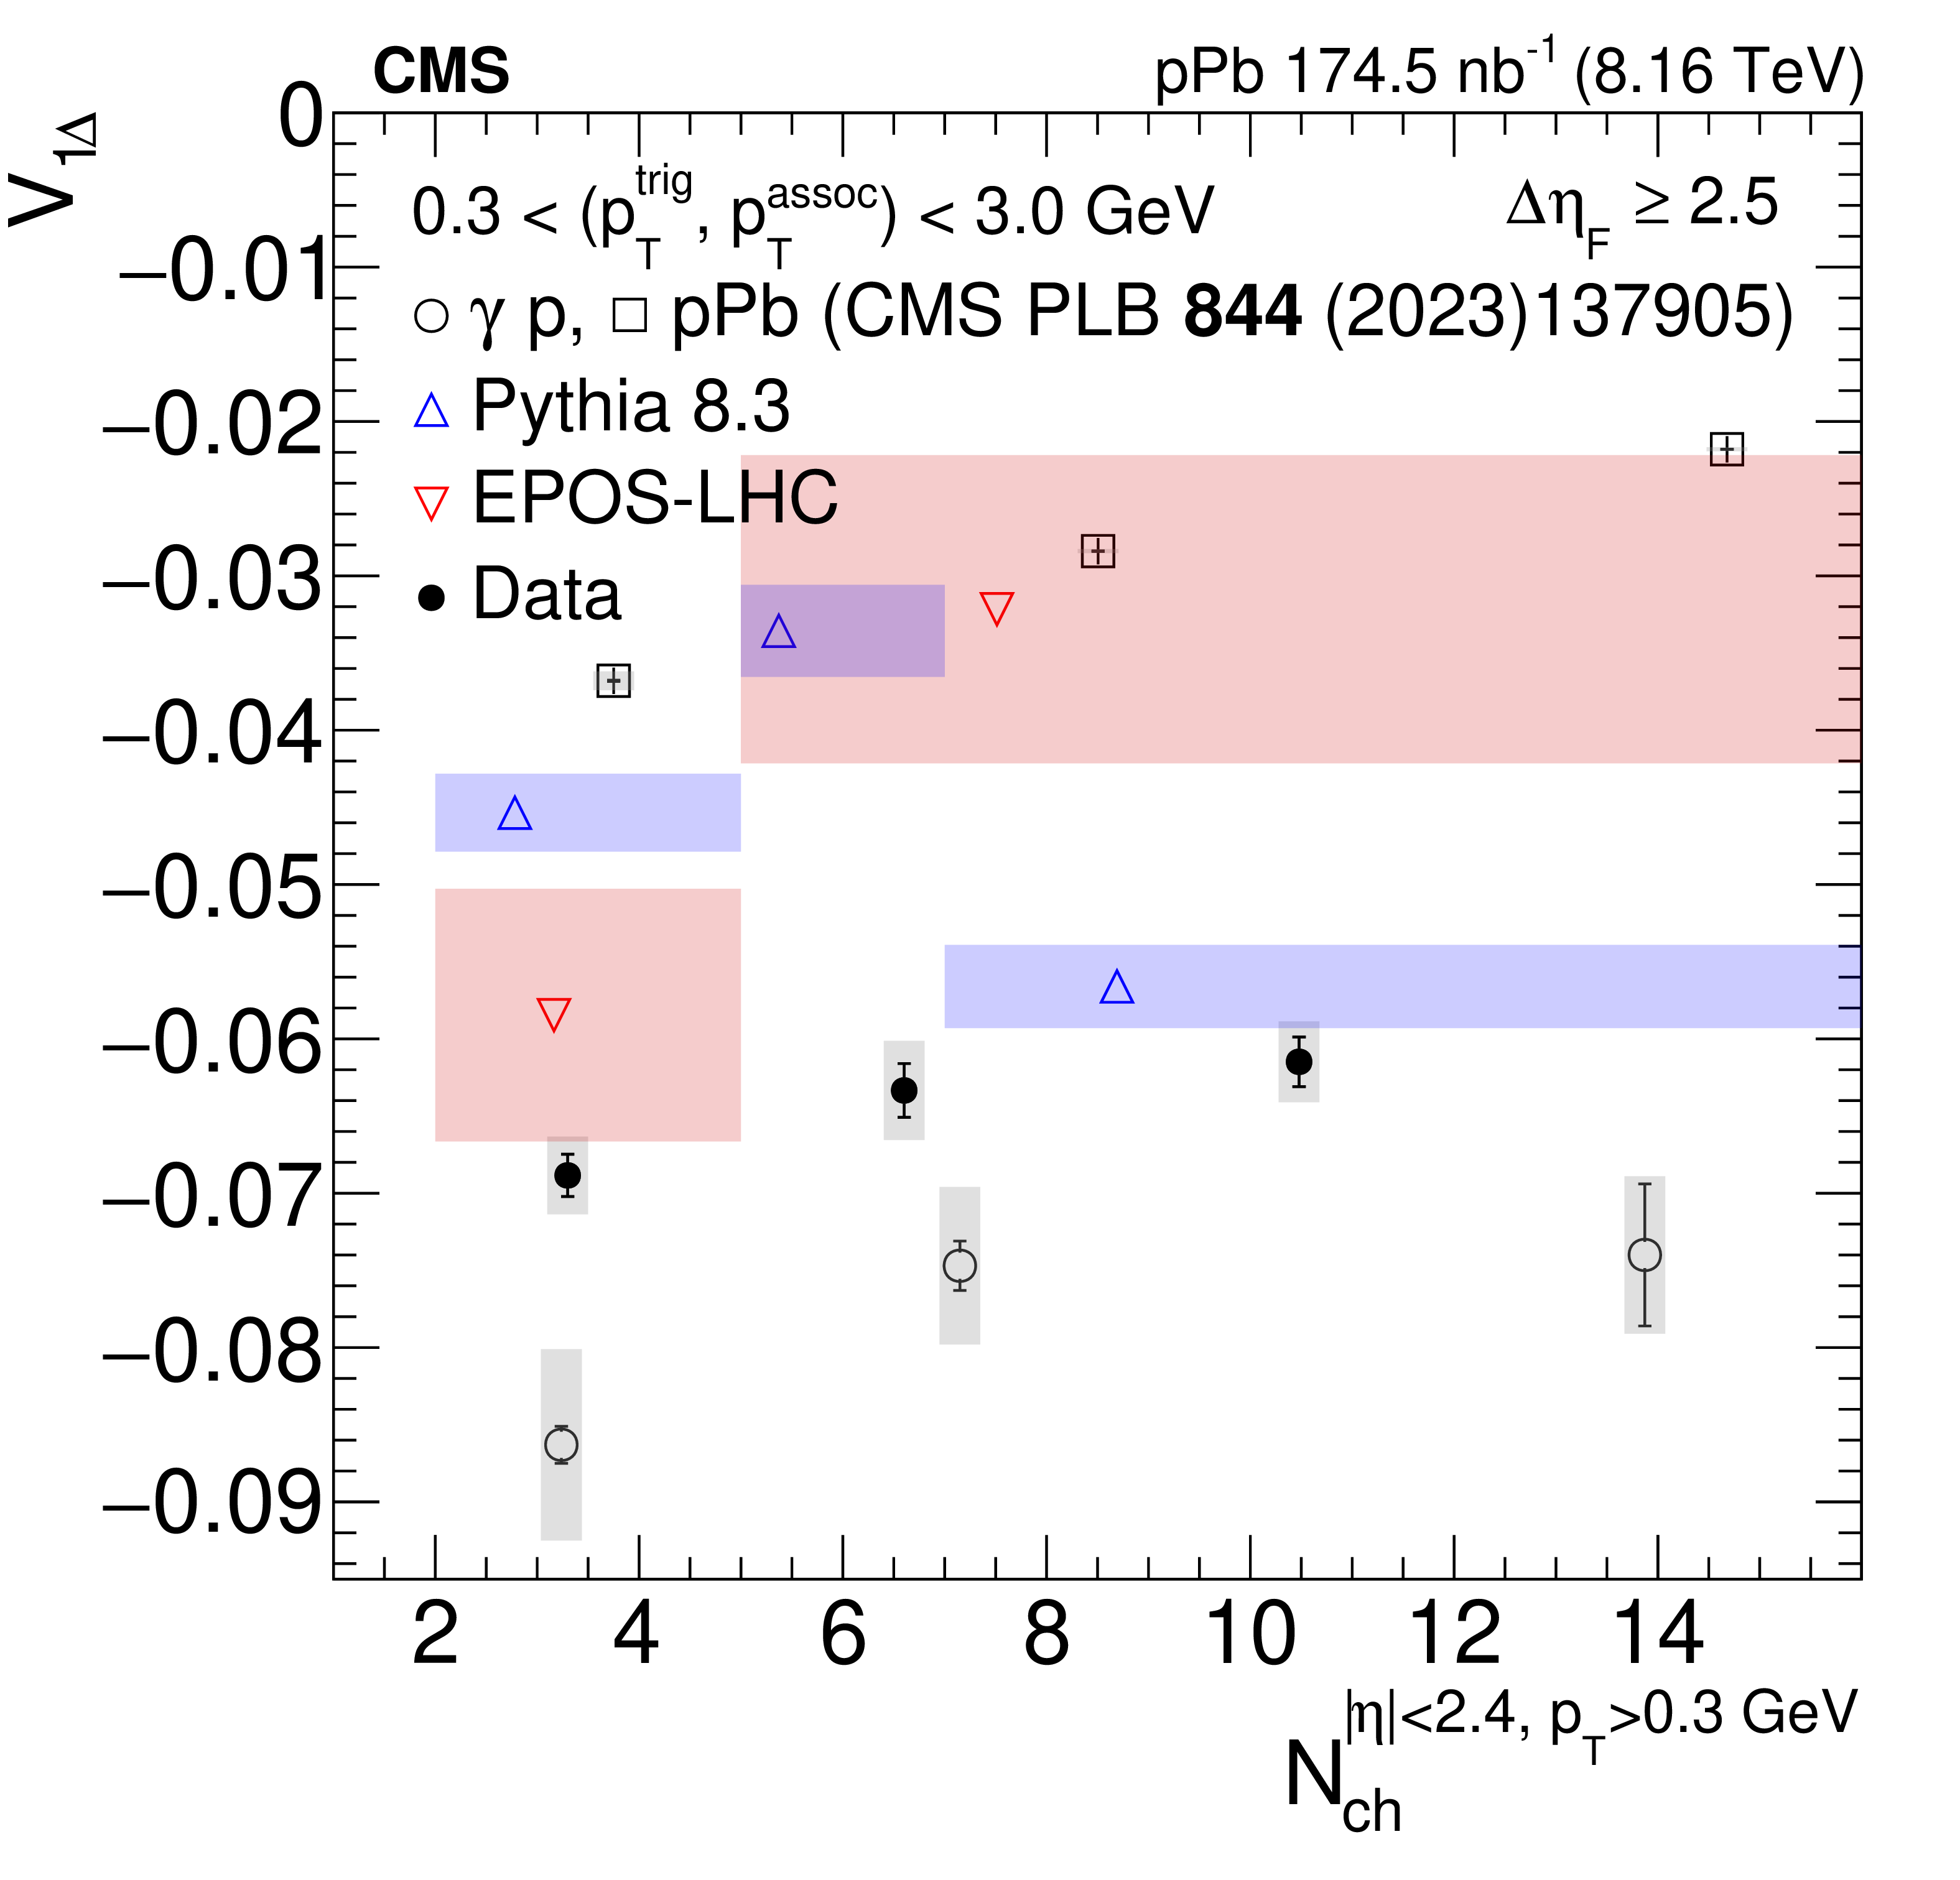
Summary of measurements of $ {V_{1\Delta}} $ (left) and $ {V_{2\Delta}} $ (right) as a function of $ {\Delta\eta^{\mathrm{F}} } $. The results are for tracks with 0.3 $ < p_{\mathrm{T}}^{\text{trig}} < $ 3.0 GeV. The filled circles indicate the data. The open triangles indicate the simulation, in blue for PYTHIA 8.3.10 and red inverse-triangles for EPOS-LHC. The data points are plotted at the center of the corresponding $ {\Delta\eta^{\mathrm{F}} } $ bin. The height of the shaded bands indicates the systematic and statistical uncertainties for data and simulation, respectively. The vertical bars indicate the size of the statistical uncertainties for data. The width of the shaded bands indicate the size of the $ {\Delta\eta^{\mathrm{F}} } $ bin. |
png pdf |
Figure 5-a:
Summary of measurements of $ {V_{1\Delta}} $ (left) and $ {V_{2\Delta}} $ (right) as a function of $ {\Delta\eta^{\mathrm{F}} } $. The results are for tracks with 0.3 $ < p_{\mathrm{T}}^{\text{trig}} < $ 3.0 GeV. The filled circles indicate the data. The open triangles indicate the simulation, in blue for PYTHIA 8.3.10 and red inverse-triangles for EPOS-LHC. The data points are plotted at the center of the corresponding $ {\Delta\eta^{\mathrm{F}} } $ bin. The height of the shaded bands indicates the systematic and statistical uncertainties for data and simulation, respectively. The vertical bars indicate the size of the statistical uncertainties for data. The width of the shaded bands indicate the size of the $ {\Delta\eta^{\mathrm{F}} } $ bin. |
png pdf |
Figure 5-b:
Summary of measurements of $ {V_{1\Delta}} $ (left) and $ {V_{2\Delta}} $ (right) as a function of $ {\Delta\eta^{\mathrm{F}} } $. The results are for tracks with 0.3 $ < p_{\mathrm{T}}^{\text{trig}} < $ 3.0 GeV. The filled circles indicate the data. The open triangles indicate the simulation, in blue for PYTHIA 8.3.10 and red inverse-triangles for EPOS-LHC. The data points are plotted at the center of the corresponding $ {\Delta\eta^{\mathrm{F}} } $ bin. The height of the shaded bands indicates the systematic and statistical uncertainties for data and simulation, respectively. The vertical bars indicate the size of the statistical uncertainties for data. The width of the shaded bands indicate the size of the $ {\Delta\eta^{\mathrm{F}} } $ bin. |
png pdf |
Figure 6:
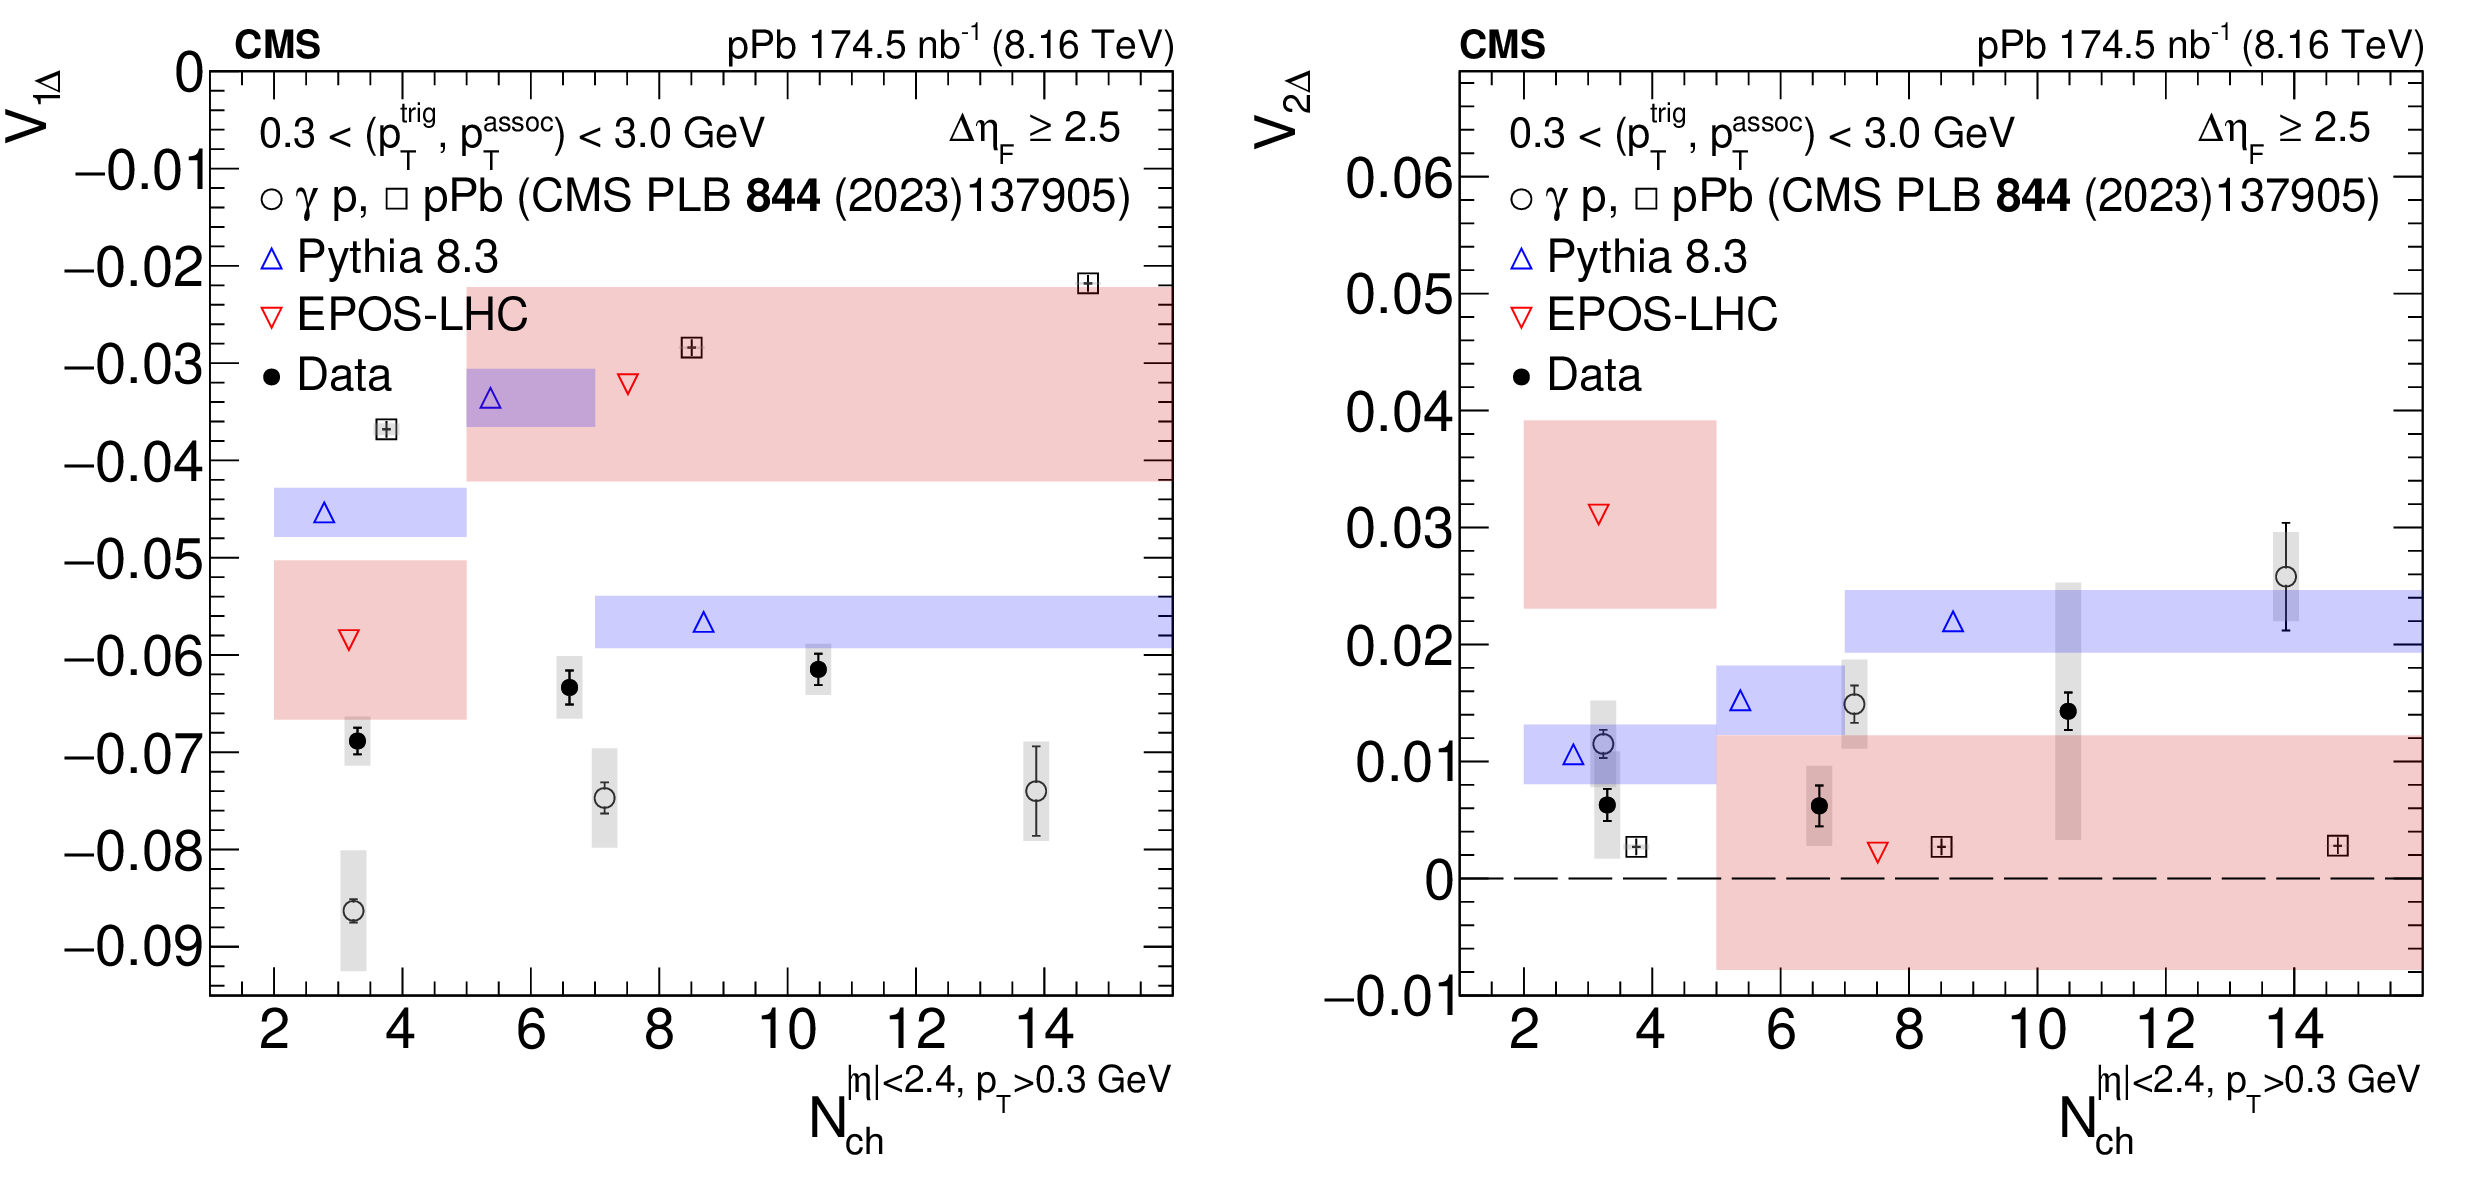
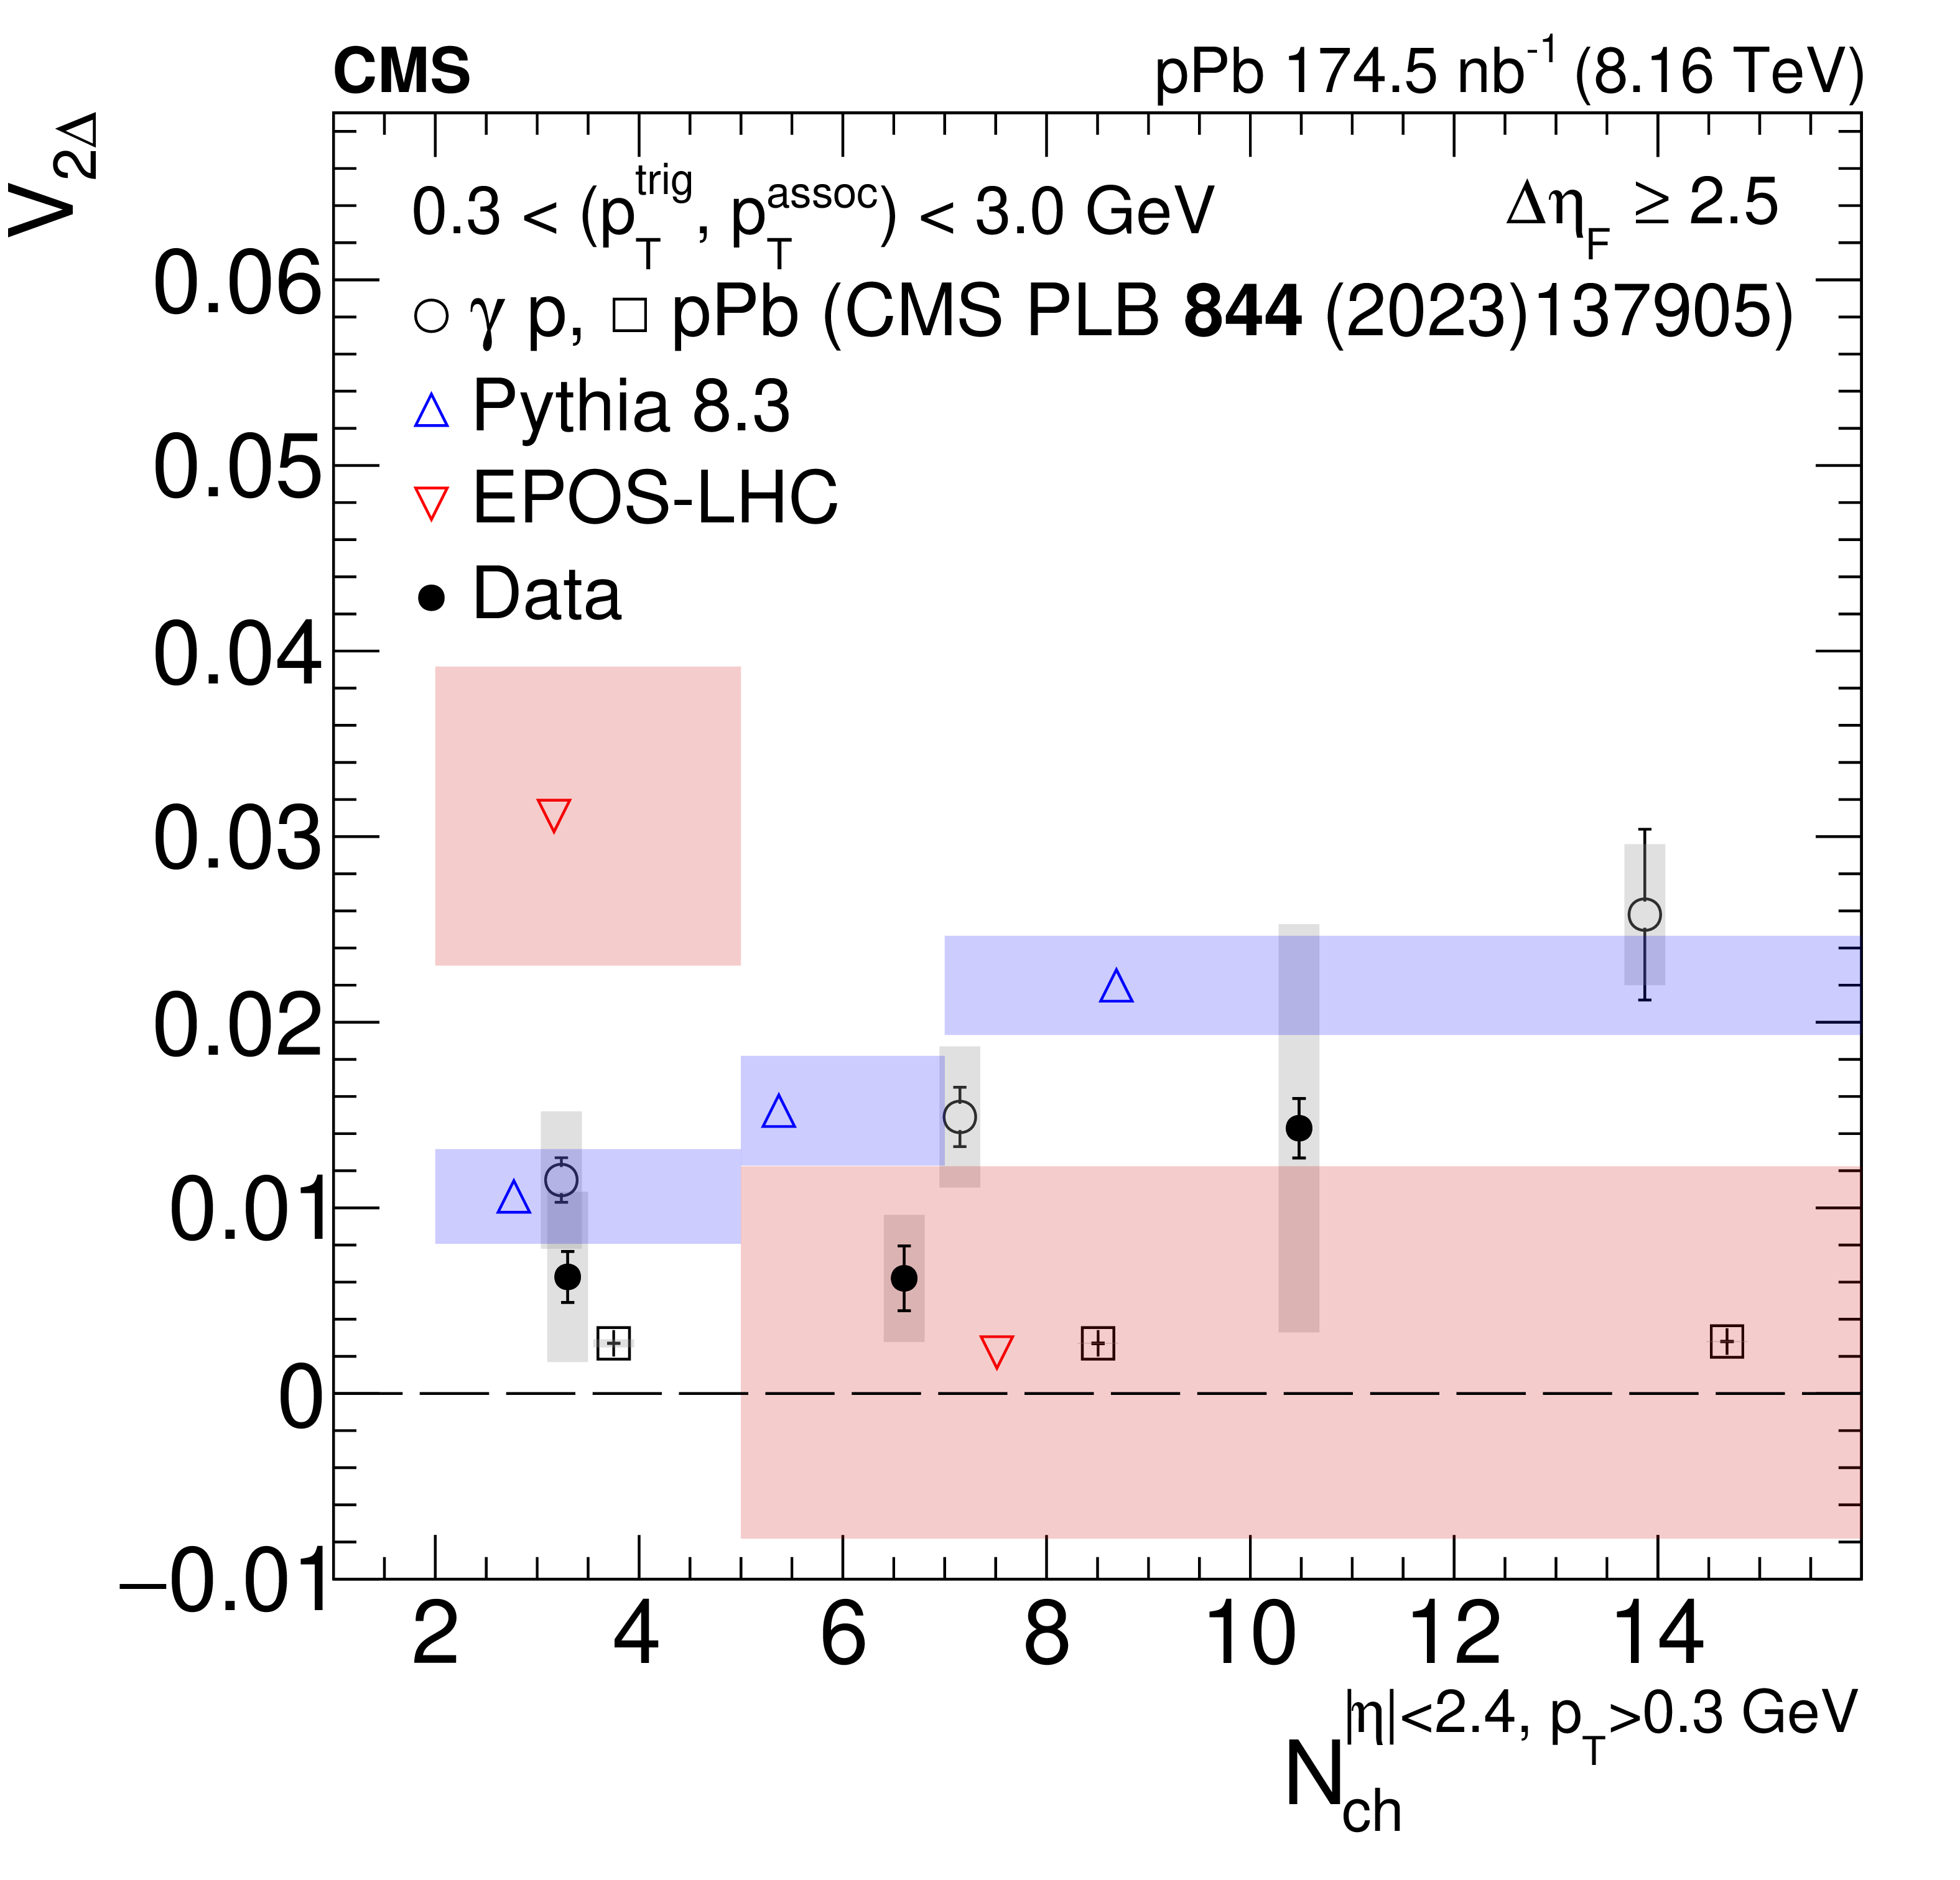
Summary of measurements of $ {V_{1\Delta}} $ (left) and $ {V_{2\Delta}} $ (right) for the diffraction-enhanced events for different classes of $ N_{\text{ch}}^{|\eta| < 2.4, p_{\mathrm{T}} > 0.3 \text{GeV}} $. The results are for tracks with 0.3 $ < p_{\mathrm{T}}^{\text{trig}} < $ 3.0 GeV. The filled circles indicate the data. The open triangles indicate the simulation, in blue for PYTHIA 8.3.10 and red inverse triangles for EPOS-LHC. The data points are plotted at the mean of $ N_{\text{ch}}^{|\eta| < 2.4, p_{\mathrm{T}} > 0.3 \text{GeV}} $ within the corresponding $ N_{\text{trk}}^{\text{offline}} $ bin. The height of the shaded bands indicates the systematic and statistical uncertainties for data and simulation, respectively. The vertical bars indicate the size of the statistical uncertainties for data. The inclusive $ \mathrm{p}\text{Pb} $ and $ \gamma\mathrm{p} $ results from Ref. [45] are also shown as open circles and open squares, respectively. |
png pdf |
Figure 6-a:
Summary of measurements of $ {V_{1\Delta}} $ (left) and $ {V_{2\Delta}} $ (right) for the diffraction-enhanced events for different classes of $ N_{\text{ch}}^{|\eta| < 2.4, p_{\mathrm{T}} > 0.3 \text{GeV}} $. The results are for tracks with 0.3 $ < p_{\mathrm{T}}^{\text{trig}} < $ 3.0 GeV. The filled circles indicate the data. The open triangles indicate the simulation, in blue for PYTHIA 8.3.10 and red inverse triangles for EPOS-LHC. The data points are plotted at the mean of $ N_{\text{ch}}^{|\eta| < 2.4, p_{\mathrm{T}} > 0.3 \text{GeV}} $ within the corresponding $ N_{\text{trk}}^{\text{offline}} $ bin. The height of the shaded bands indicates the systematic and statistical uncertainties for data and simulation, respectively. The vertical bars indicate the size of the statistical uncertainties for data. The inclusive $ \mathrm{p}\text{Pb} $ and $ \gamma\mathrm{p} $ results from Ref. [45] are also shown as open circles and open squares, respectively. |
png pdf |
Figure 6-b:
Summary of measurements of $ {V_{1\Delta}} $ (left) and $ {V_{2\Delta}} $ (right) for the diffraction-enhanced events for different classes of $ N_{\text{ch}}^{|\eta| < 2.4, p_{\mathrm{T}} > 0.3 \text{GeV}} $. The results are for tracks with 0.3 $ < p_{\mathrm{T}}^{\text{trig}} < $ 3.0 GeV. The filled circles indicate the data. The open triangles indicate the simulation, in blue for PYTHIA 8.3.10 and red inverse triangles for EPOS-LHC. The data points are plotted at the mean of $ N_{\text{ch}}^{|\eta| < 2.4, p_{\mathrm{T}} > 0.3 \text{GeV}} $ within the corresponding $ N_{\text{trk}}^{\text{offline}} $ bin. The height of the shaded bands indicates the systematic and statistical uncertainties for data and simulation, respectively. The vertical bars indicate the size of the statistical uncertainties for data. The inclusive $ \mathrm{p}\text{Pb} $ and $ \gamma\mathrm{p} $ results from Ref. [45] are also shown as open circles and open squares, respectively. |
| Tables | |
png pdf |
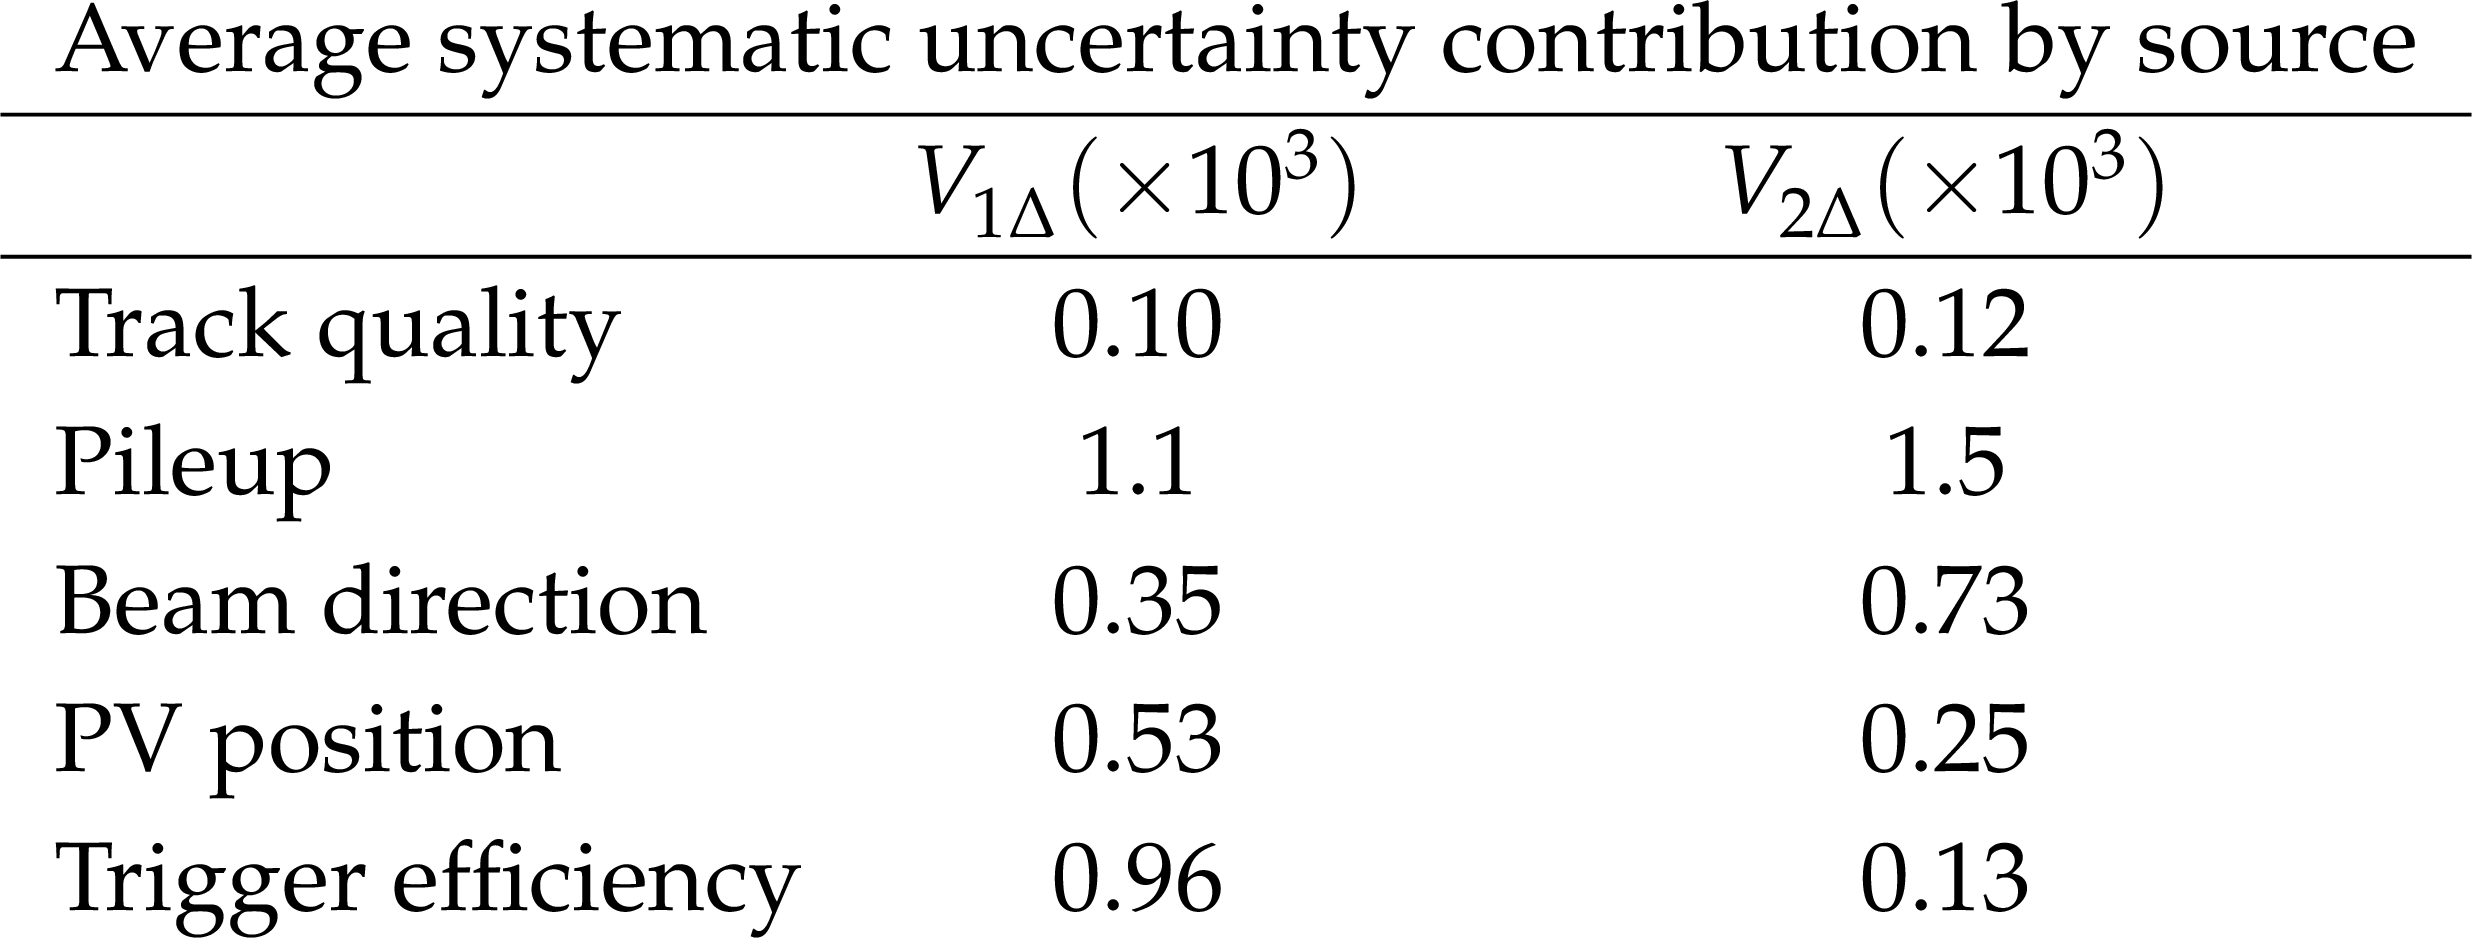
Table 1:
Unweighted average systematic uncertainty contribution by source for the nominal selection. |
png pdf |
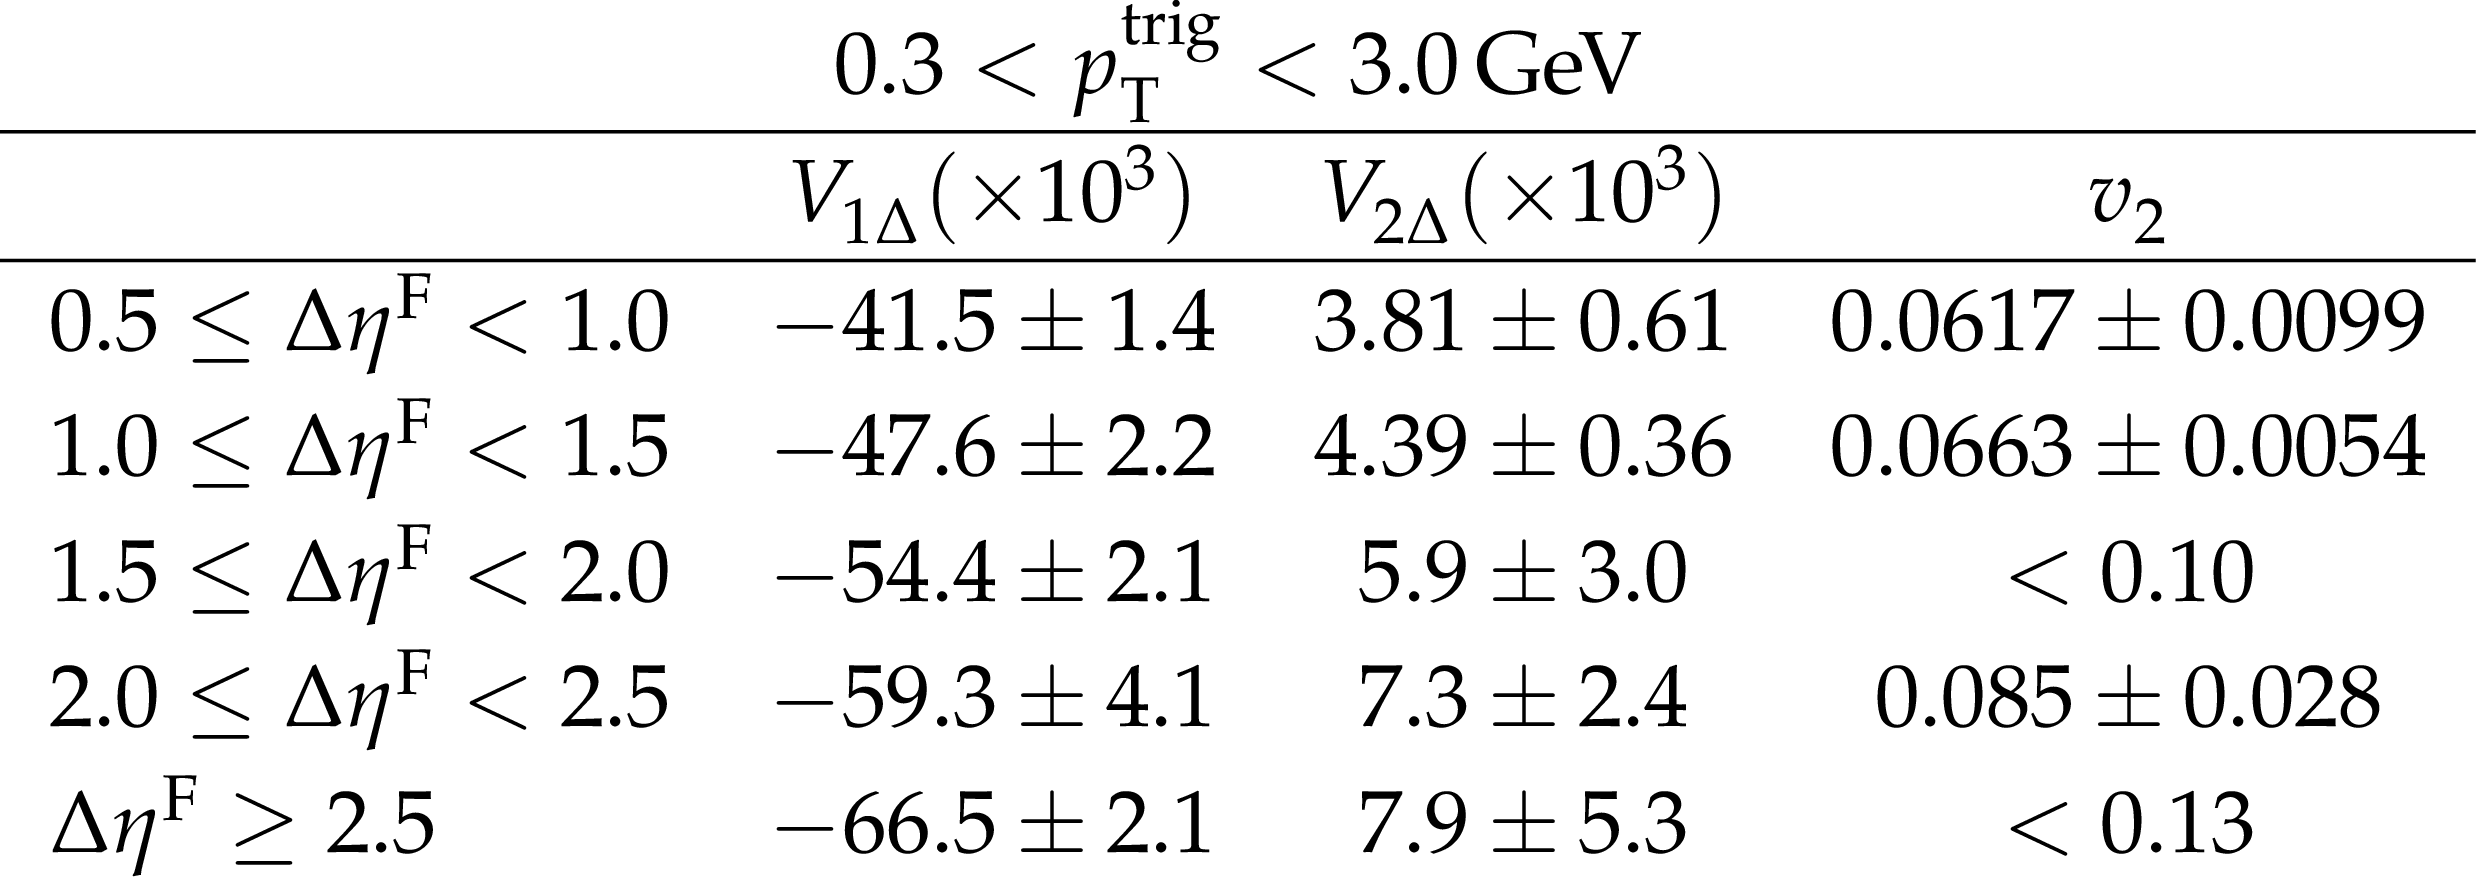
Table 2:
Measured values of $ {V_{n\Delta}} $ as a function of $ {\Delta\eta^{\mathrm{F}} } $. The uncertainties include both statistical and systematic components. The table shows the $ v_2 $ results when they are nonzero. For the other cases, upper limits at 95% CL are displayed with the $ < $ symbol. |
png pdf |
Table 3:
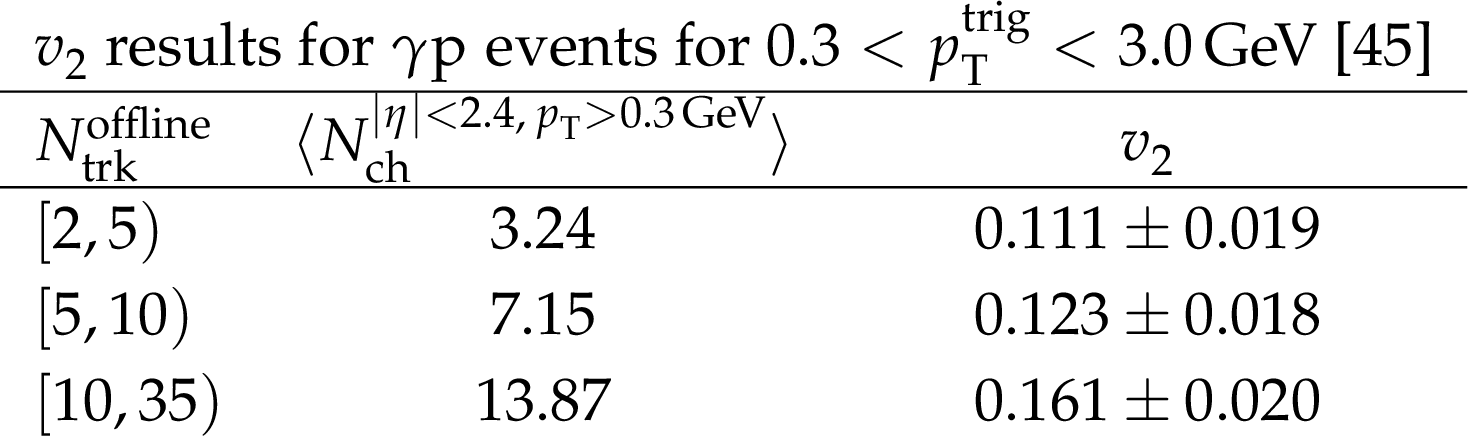
Measured values of $ {V_{n\Delta}} $ for the diffractive-enhanced sample as a function of $ \langle N_{\text{ch}}^{|\eta| < 2.4, p_{\mathrm{T}} > 0.3 \text{GeV}} \rangle $ and $ N_{\text{trk}}^{\text{offline}} $ for both $ p_{\mathrm{T}}^{\text{trig}} $ bins. The uncertainties include both statistical and systematic components. The table also shows the 95% CL upper limits on $ v_2 $ displayed with the $ < $ symbol. In the lower table, $ v_2 $ values for $ \gamma\mathrm{p} $ events for 0.3 $ < p_{\mathrm{T}}^{\text{trig}} < $ 3.0 GeV [45] in similar $ N_{\text{ch}}^{|\eta| < 2.4, p_{\mathrm{T}} > 0.3 \text{GeV}} $ ranges are given. |
| Summary |
| Long-range azimuthal $ (\phi) $ two-particle correlations have been studied for in proton-lead ($ \mathrm{p}\text{Pb} $) events at $ \sqrt{\smash[b]{s_{_{\mathrm{NN}}}}}= $ 8.16 TeV as a function of the forward rapidity gap width ($ {\Delta\eta^{\mathrm{F}} } $) and the charged-particle multiplicity ($ N_{\text{ch}}^{|\eta| < 2.4, p_{\mathrm{T}} > 0.3 \text{GeV}} $), where $ p_{\mathrm{T}} $ is the transverse momentum. Varying $ {\Delta\eta^{\mathrm{F}} } $ provides a continuous handle on the degree of exclusivity of the selected $ \mathrm{p}\text{Pb} $ events and therefore complements inclusive small-system correlation measurements. Events have been selected by requiring energy deposition in one of the forward calorimeters and no activity in the forward calorimeter on the opposite side. In addition, we require no energy in the region 2.5 $ < \eta < $ 3, favoring events with activity in the direction of the outgoing Pb beam. For events with $ {\Delta\eta^{\mathrm{F}} } > $ 2.5, the fraction of diffractive events is enhanced, and these events were further studied as a function of charged particle multiplicity. The average track multiplicity is lower in the diffractive sample than for inclusive $ \mathrm{p}\text{Pb} $ events, but larger than for photon-proton ($ \gamma\mathrm{p} $) events. The slope of the multiplicity distribution becomes steeper with increasing $ {\Delta\eta^{\mathrm{F}} } $. The mean track multiplicity $ \langle N_{\text{trk}}^{\text{offline}} \rangle $ decreases by 48% when $ {\Delta\eta^{\mathrm{F}} } $ changes from 0.5 $ < {\Delta\eta^{\mathrm{F}} } < $ 1.0 to $ {\Delta\eta^{\mathrm{F}} } > $ 2.5. The two-dimensional two-particle correlation functions have been averaged over $ |{\Delta\eta}| > $ 2 and the resulting $ {\Delta\phi} $ distributions have been studied in terms of their Fourier coefficients $ {V_{1\Delta}} $ and $ {V_{2\Delta}} $, as a function of $ {\Delta\eta^{\mathrm{F}} } $ and $ N_{\text{ch}}^{|\eta| < 2.4, p_{\mathrm{T}} > 0.3 \text{GeV}} $. The measured values of $ {V_{1\Delta}} $ are negative and decrease with $ {\Delta\eta^{\mathrm{F}} } $, while the central values of $ {V_{2\Delta}} $ increase monotonically with $ {\Delta\eta^{\mathrm{F}} } $, although they are consistent with zero within uncertainties in two of the bins. The results have been compared with the predictions of the PYTHIA 8.3.10 model, which does not include collective effects, and with EPOS-LHC model, which includes such effects. The measured values of the elliptic flow coefficient ($ v_2 $) are provided for the bins $ [0.5,1) $, $ [1,1.5) $, $ [2,2.5) $. In the other bins, the $ v_2 $ results are consistent with zero. In these bins, 95% confidence level upper limits have been determined; they are stable across the $ {\Delta\eta^{\mathrm{F}} } $ and $ N_{\text{ch}}^{|\eta| < 2.4, p_{\mathrm{T}} > 0.3 \text{GeV}} $ regions studied, indicating comparable sensitivity in all bins, and reach values up to 0.13 for the most inclusive $ N_{\text{trk}}^{\text{offline}} $ bin. The values of the upper limits are similar to the values measured in $ \gamma\mathrm{p} $ events. These results constrain scenarios in which ridge-like correlations are expected to persist universally across small systems independent of event topology. They also provide a reference for models that predict reduced collective response when the multiparton interactions and color reconnection processes are suppressed. |
| References | ||||
| 1 | CMS Collaboration | Observation of long-range, near-side angular correlations in proton-proton collisions at the LHC | JHEP 09 (2010) 091 | CMS-QCD-10-002 1009.4122 |
| 2 | ATLAS Collaboration | Observation of long-range elliptic azimuthal anisotropies in $ \sqrt{s} = $ 13 and 2.76 TeV pp collisions with the ATLAS detector | PRL 116 (2016) 172301 | 1509.04776 |
| 3 | CMS Collaboration | Measurement of long-range near-side two-particle angular correlations in pp collisions at $ \sqrt{s} = $ 13 TeV | PRL 116 (2015) 172302 | CMS-FSQ-15-002 1510.03068 |
| 4 | CMS Collaboration | Evidence for collectivity in pp collisions at the LHC | PLB 765 (2017) 193 | CMS-HIN-16-010 1606.06198 |
| 5 | ATLAS Collaboration | Measurement of azimuthal anisotropy of muons from charm and bottom hadrons in pp collisions at $ \sqrt{s}= $ 13 TeV with the ATLAS detector | PRL 124 (2020) 082301 | 1909.01650 |
| 6 | PHENIX Collaboration | Measurement of long-range angular correlations and azimuthal anisotropies in high-multiplicity pAu collisions at $ \sqrt{\smash[b]{s_{_{\mathrm{NN}}}}} = $ 200 GeV | Phys. Rev. C 95 (2017) 034910 | 1609.02894 |
| 7 | PHENIX Collaboration | Creation of quark-gluon plasma droplets with three distinct geometries | Nature Phys. 15 (2019) 214 | 1805.02973 |
| 8 | CMS Collaboration | Observation of long-range near-side angular correlations in pPb collisions at the LHC | PLB 718 (2013) 795 | CMS-HIN-12-015 1210.5482 |
| 9 | ATLAS Collaboration | Observation of associated near-side and away-side long-range correlations in $ \sqrt{\smash[b]{s_{_{\mathrm{NN}}}}} = $ 5.02 TeV proton-lead collisions with the ATLAS detector | PRL 110 (2013) 182302 | 1212.5198 |
| 10 | ATLAS Collaboration | Measurement with the ATLAS detector of multi-particle azimuthal correlations in pPb collisions at $ \sqrt{\smash[b]{s_{_{\mathrm{NN}}}}} = $ 5.02 TeV | PLB 725 (2013) 60 | 1303.2084 |
| 11 | ALICE Collaboration | Long-range angular correlations on the near and away side in $ p- $Pb collisions at $ \sqrt{\smash[b]{s_{_{\mathrm{NN}}}}} = $ 5.02 TeV | PLB 719 (2013) 29 | 1212.2001 |
| 12 | LHCb Collaboration | Measurements of long-range near-side angular correlations in $ \sqrt{\smash[b]{s_{_{\mathrm{NN}}}}} = $ 5 TeV proton-lead collisions in the forward region | PLB 762 (2016) 473 | 1512.00439 |
| 13 | ALICE Collaboration | Long-range angular correlations of $ \pi $, K and p in pPb collisions at $ \sqrt{\smash[b]{s_{_{\mathrm{NN}}}}} = $ 5.02 TeV | PLB 726 (2013) 164 | 1307.3237 |
| 14 | CMS Collaboration | Evidence for collective multiparticle correlations in p-Pb collisions | PRL 115 (2015) 012301 | CMS-HIN-14-006 1502.05382 |
| 15 | CMS Collaboration | Long-range two-particle correlations of strange hadrons with charged particles in pPb and PbPb collisions at LHC energies | PLB 742 (2015) 200 | CMS-HIN-14-002 1409.3392 |
| 16 | ATLAS Collaboration | Measurement of multi-particle azimuthal correlations in pp, pPb and low multiplicity PbPb collisions with the ATLAS detector | Eur. Phys. J. C. 77 (2017) 428 | 1705.04176 |
| 17 | ATLAS Collaboration | Measurement of long-range multiparticle azimuthal correlations with the subevent cumulant method in pp and pPb collisions with the ATLAS detector at the CERN large hadron collider | Phys. Rev. C 97 (2018) 024904 | 1708.03559 |
| 18 | CMS Collaboration | Studies of charm and beauty hadron long-range correlations in pp and pPb collisions at LHC energies | PLB 813 (2021) 136036 | CMS-HIN-19-009 2009.07065 |
| 19 | STAR Collaboration | Elliptic flow in AuAu collisions at $ \sqrt{\smash[b]{s_{_{\mathrm{NN}}}}} = $ 130 GeV | PRL 86 (2001) 402 | nucl-ex/0009011 |
| 20 | PHOBOS Collaboration | System size dependence of cluster properties from two-particle angular correlations in CuCu and AuAu collisions at $ \sqrt{\smash[b]{s_{_{\mathrm{NN}}}}} = $ 200 GeV | Phys. Rev. C 81 (2010) 024904 | 0812.1172 |
| 21 | CMS Collaboration | Long-range and short-range dihadron angular correlations in central PbPb collisions at a nucleon-nucleon center of mass energy of 2.76 TeV | JHEP 10 (2011) 076 | CMS-HIN-11-001 1105.2438 |
| 22 | CMS Collaboration | Centrality dependence of dihadron correlations and azimuthal anisotropy harmonics in PbPb collisions at $ \sqrt{\smash[b]{s_{_{\mathrm{NN}}}}} = $ 2.76 TeV | EPJC 72 (2012) 2012 | CMS-HIN-11-006 1201.3158 |
| 23 | STAR Collaboration | Long range rapidity correlations and jet production in high energy nuclear collisions | Phys. Rev. C 80 (2009) 064912 | 0909.0191 |
| 24 | STAR Collaboration | Three-particle coincidence of the long range pseudorapidity correlation in high energy nucleus-nucleus collisions | PRL 105 (2010) 022301 | 0912.3977 |
| 25 | PHENIX Collaboration | Formation of dense partonic matter in relativistic nucleus-nucleus collisions at RHIC: experimental evaluation by the PHENIX collaboration | Nucl. Phys. A 757 (2005) 184 | nucl-ex/0410003 |
| 26 | STAR Collaboration | Beam-energy dependence of identified two-particle angular correlations in $ \sqrt{\smash[b]{s_{_{\mathrm{NN}}}}} = $ 7.7--200 GeV AuAu collisions | Phys. Rev. C 101 (2020) 014916 | 1906.09204 |
| 27 | STAR Collaboration | Correlation measurements between flow harmonics in AuAu collisions at RHIC | PLB 783 (2018) 459 | 1803.03876 |
| 28 | CMS Collaboration | Overview of high-density QCD studies with the CMS experiment at the LHC | Phys. Rept. 1115 (2025) 219 | CMS-HIN-23-011 2405.10785 |
| 29 | S. Voloshin and Y. Zhang | Flow study in relativistic nuclear collisions by fourier expansion of azimuthal particle distributions | Z. Phys. C 70 (1996) 665 | hep-ph/9407282 |
| 30 | B. Alver and G. Roland | Collision geometry fluctuations and triangular flow in heavy-ion collisions | Phys. Rev. C 81 (2010) 054905 | 1003.0194 |
| 31 | B. H. Alver, C. Gombeaud, M. Luzum, and J.-Y. Ollitrault | Triangular flow in hydrodynamics and transport theory | Phys. Rev. C 82 (2010) 034913 | 1007.5469 |
| 32 | B. Schenke, S. Jeon, and C. Gale | Elliptic and triangular flow in event-by-event D=3+1 viscous hydrodynamics | PRL 106 (2011) 042301 | 1009.3244 |
| 33 | C. S. Z. Qiu and U. Heinz | Hydrodynamic elliptic and triangular flow in Pb-Pb collisions at $ \sqrt{\smash[b]{s_{_{\mathrm{NN}}}}} = $ 2.76 TeV | PLB 707 (2012) 151 | 1110.3033 |
| 34 | CMS Collaboration | Elliptic flow of charm and strange hadrons in high-multiplicity pPb collisions at $ \sqrt{\smash[b]{s_{_{\mathrm{NN}}}}} = $ 8.16 TeV | PRL 121 (2018) 082301 | CMS-HIN-17-003 1804.09767 |
| 35 | CMS Collaboration | Centrality and pseudorapidity dependence of the transverse energy density in pPb collisions at $ \sqrt{\smash[b]{s_{_{\mathrm{NN}}}}} = $ 5.02 TeV | Phys. Rev. C 100 (2019) 024902 | CMS-HIN-14-014 1810.05745 |
| 36 | ALICE Collaboration | Multi-strange baryon production in pPb collisions at $ \sqrt{\smash[b]{s_{_{\mathrm{NN}}}}} = $ 5.02 TeV | PLB 758 (2016) 389 | 1512.07227 |
| 37 | PHENIX Collaboration | Elliptic flow of identified hadrons in AuAu collisions at $ \sqrt{\smash[b]{s_{_{\mathrm{NN}}}}} = $ 200 GeV | PRL 91 (2003) 182301 | nucl-ex/0305013 |
| 38 | STAR Collaboration | Distributions of charged hadrons associated with high transverse momentum particles in pp and AuAu collisions at $ \sqrt{\smash[b]{s_{_{\mathrm{NN}}}}} = $ 200 GeV | PRL 95 (2005) 152301 | nucl-ex/0501016 |
| 39 | Belle Collaboration | Measurement of two-particle correlations of hadrons in e$ ^+ $e$ ^- $ collisions at Belle | PRL 128 (2022) 142005 | 2201.01694 |
| 40 | K. Dusling, W. Li, and B. Schenke | Novel collective phenomena in high-energy proton--proton and proton--nucleus collisions | Int. J. Mod. Phys. E 25 (2016) 1630002 | 1509.07939 |
| 41 | J. L. Nagle and J. Orjuela Koop | A quasiparticle transport explanation for collectivity in the smallest of collision systems (pp and e$ ^{+} $e$ ^{-} $) | Nucl. Phys. A 982 (2019) 455 | 1807.04619 |
| 42 | A. Badea et al. | Measurements of two-particle correlations in $ e^+e^- $ collisions at 91 GeV with ALEPH archived data | PRL 123 (2019) 212002 | 1906.00489 |
| 43 | Electron-Positron Alliance Collaboration | Long-range near-side correlation in e$ ^+ $e$ ^- $ collisions at 183-209 GeV with ALEPH archived data | PLB 856 (2024) 138957 | 2312.05084 |
| 44 | ZEUS Collaboration | Two-particle azimuthal correlations as a probe of collective behaviour in deep inelastic $ ep $ scattering at HERA | JHEP 04 (2020) 070 | 1912.07431 |
| 45 | CMS Collaboration | Two-particle azimuthal correlations in \ensuremath\gammap interactions using pPb collisions at $ \sqrt{\smash[b]{s_{_{\mathrm{NN}}}}} = $ 8.16 TeV | PLB 844 (2023) 137905 | CMS-HIN-18-008 2204.13486 |
| 46 | ALICE Collaboration | First observation of ultra-long-range azimuthal correlations in low multiplicity pp and p-Pb collisions at the LHC | 4, 2025 | 2504.02359 |
| 47 | ATLAS Collaboration | Two-particle azimuthal correlations in photonuclear ultraperipheral PbPb collisions at 5.02 TeV with ATLAS | Phys. Rev. C 104 (2021) 014903 | 2101.10771 |
| 48 | CMS Collaboration | Observation of long-range collective flow in OO and NeNe collisions and implications for nuclear structure studies | 10, 2025 | CMS-HIN-25-009 2510.02580 |
| 49 | CMS Collaboration | Observation of enhanced long-range elliptic anisotropies inside high-multiplicity jets in pp collisions at $ \sqrt{\smash[b]{s_{_{\mathrm{NN}}}}} = $ 13 TeV | PRL 133 (2024) 142301 | CMS-HIN-21-013 2312.17103 |
| 50 | CMS Collaboration | The CMS experiment at the CERN LHC | JINST 3 (2008) S08004 | |
| 51 | T. Regge | Introduction to complex orbital momenta | Nuovo Cim. 14 (1959) 951 | |
| 52 | CMS Collaboration | First measurement of the forward rapidity gap distribution in pPb collisions at $ \sqrt{\smash[b]{s_{_{\mathrm{NN}}}}} = $ 8.16 TeV | PRD 108 (2023) 092004 | CMS-HIN-18-019 2301.07630 |
| 53 | T. Pierog et al. | EPOS LHC: test of collective hadronization with data measured at the CERN large hadron collider | Phys. Rev. C 92 (2015) 034906 | 1306.0121 |
| 54 | CMS Collaboration | HEPData record for this analysis | link | |
| 55 | G. Ingelman and P. E. Schlein | Jet structure in high mass diffractive scattering | PLB 152 (1985) 256 | |
| 56 | C. Bierlich, G. Gustafson, L. Lönnblad, and H. Shah | The Angantyr model for heavy-ion collisions in PYTHIA8 | JHEP 10 (2018) 134 | 1806.10820 |
| 57 | CMS Collaboration | CMS technical design report for the phase 1 upgrade of the hadron calorimeter | technical report, 9, 2012 link |
|
| 58 | CMS Collaboration | Particle-flow reconstruction and global event description with the CMS detector | JINST 12 (2017) P10003 | CMS-PRF-14-001 1706.04965 |
| 59 | CMS Collaboration | CMS luminosity measurement using 2016 proton-nucleus collisions at nucleon-nucleon center-of-mass energy of 8.16 TeV | CMS Physics Analysis Summary, 2018 CMS-PAS-LUM-17-002 |
CMS-PAS-LUM-17-002 |
| 60 | CMS Collaboration | Observation of correlated azimuthal anisotropy fourier harmonics in pp and pPb collisions at the LHC | PRL 120 (2018) 092301 | CMS-HIN-16-022 1709.09189 |
| 61 | CMS Collaboration | The CMS trigger system | JINST 12 (2017) P01020 | CMS-TRG-12-001 1609.02366 |
| 62 | C. Bierlich et al. | A comprehensive guide to the physics and usage of PYTHIA 8.3 | SciPost Phys. Codeb. 2022 (2022) 8 | 2203.11601 |
| 63 | \GEANTfour Collaboration | GEANT 4---a simulation toolkit | NIM A 506 (2003) 250 | |
| 64 | CMS Collaboration | Description and performance of track and primary-vertex reconstruction with the CMS tracker | JINST 9 (2014) P10009 | CMS-TRK-11-001 1405.6569 |
| 65 | CMS Collaboration | Measurement of tracking efficiency | CMS Physics Analysis Summary, 2010 CMS-PAS-TRK-10-002 |
|
| 66 | ALICE Collaboration | Anomalous evolution of the near-side jet peak shape in Pb-Pb collisions at $ \sqrt{\smash[b]{s_{_{\mathrm{NN}}}}} = $ 2.76 TeV | PRL 119 (2017) 102301 | 1609.06643 |
| 67 | R. Barlow | Systematic errors: facts and fictions | in Conference on Advanced Statistical Techniques in Particle Physics, 2002 | hep-ex/0207026 |
|
|
Compact Muon Solenoid LHC, CERN |
|

|

|

|

|

|