

Compact Muon Solenoid
LHC, CERN
| CMS-EXO-18-004 ; CERN-EP-2018-280 | ||
| Search for excited leptons in $ \ell \ell \gamma $ final states in proton-proton collisions at $\sqrt{s} = $ 13 TeV | ||
| CMS Collaboration | ||
| 7 November 2018 | ||
| JHEP 04 (2019) 015 | ||
| Abstract: A search is presented for excited electrons and muons in $ \ell \ell \gamma $ final states at the LHC. The search is based on a data sample corresponding to an integrated luminosity of 35.9 fb$^{-1}$ of proton-proton collisions at a center-of-mass energy of 13 TeV, collected with the CMS detector in 2016. This is the first search for excited leptons at $\sqrt{s} = $ 13 TeV. The observation is consistent with the standard model background prediction, and the most stringent exclusion limits to date are set on the excited lepton mass and the compositeness scale, at 95% confidence level. Excited electrons and muons are excluded for masses below 3.9 and 3.8 TeV, respectively, under the assumption that the excited lepton mass equals the compositeness scale. The best observed limit on the compositeness scale is obtained with an excited lepton mass of around 1.0 TeV, excluding values below 25 TeV for both excited electrons and muons. | ||
| Links: e-print arXiv:1811.03052 [hep-ex] (PDF) ; CDS record ; inSPIRE record ; CADI line (restricted) ; | ||
| Figures | |

png pdf |
Figure 1:
The Feynman diagram of the production of excited leptons in $ {\ell \ell {\gamma}} $ final states. |

png pdf |
Figure 2:
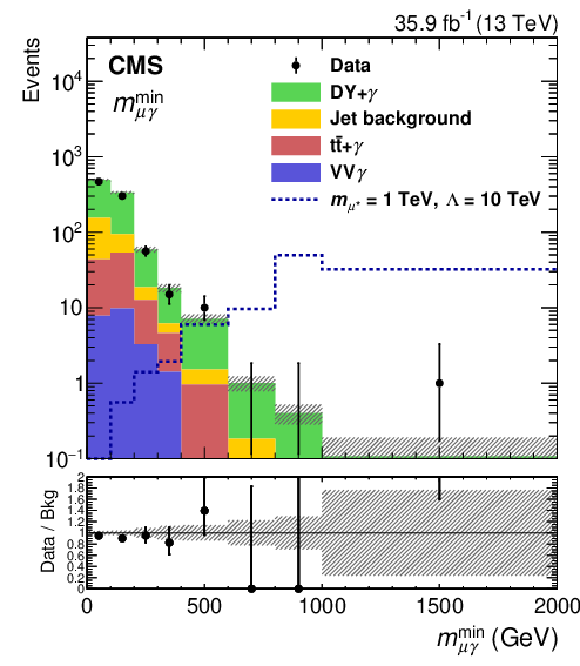
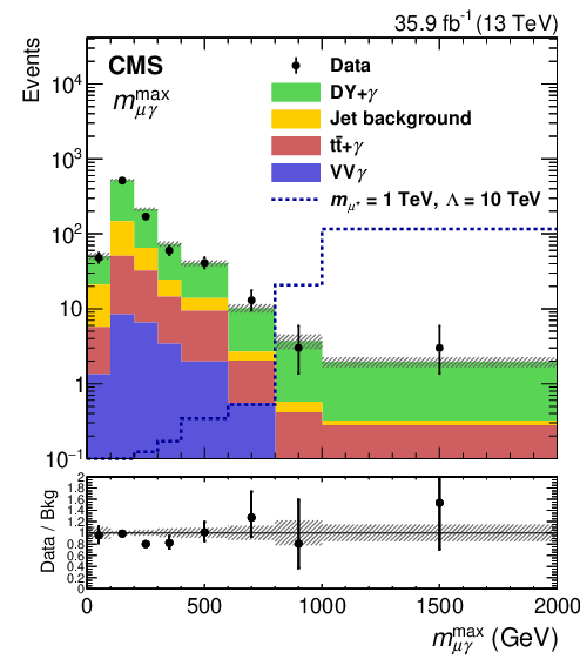
The distributions of $ {m_{\ell {\gamma}}^\text {min}} $ (left column) and $ {m_{\ell {\gamma}}^\text {max}} $ (right column) in the $ {{\mathrm {e}} {\mathrm {e}} {\gamma}} $ channel (upper row) and the $ {{{\mu}} {{\mu}} {\gamma}} $ channel (lower row). The points with error bars denote the data and the stacked histograms show the predictions for each of the backgrounds. The uncertainty bands of the SM prediction include only statistical uncertainties. Signal events for $ {m_{\ell ^*}} = $ 1 TeV at $\Lambda = $ 10 TeV are also shown as dotted lines. The last bin of each distribution includes overflow events. |

png pdf |
Figure 2-a:
Distribution of $ {m_{\ell {\gamma}}^\text {min}} $ in the $ {{\mathrm {e}} {\mathrm {e}} {\gamma}} $ channel. The points with error bars denote the data and the stacked histograms show the predictions for each of the backgrounds. The uncertainty band of the SM prediction includes only statistical uncertainties. Signal events for $ {m_{\ell ^*}} = $ 1 TeV at $\Lambda = $ 10 TeV are also shown as a dotted line. The last bin includes overflow events. |

png pdf |
Figure 2-b:
Distribution of $ {m_{\ell {\gamma}}^\text {max}} $ in the $ {{\mathrm {e}} {\mathrm {e}} {\gamma}} $ channel. The points with error bars denote the data and the stacked histograms show the predictions for each of the backgrounds. The uncertainty band of the SM prediction includes only statistical uncertainties. Signal events for $ {m_{\ell ^*}} = $ 1 TeV at $\Lambda = $ 10 TeV are also shown as a dotted line. The last bin includes overflow events. |
png pdf |
Figure 2-c:
Distribution of $ {m_{\ell {\gamma}}^\text {min}} $ in the $ {{{\mu}} {{\mu}} {\gamma}} $ channel. The points with error bars denote the data and the stacked histograms show the predictions for each of the backgrounds. The uncertainty band of the SM prediction includes only statistical uncertainties. Signal events for $ {m_{\ell ^*}} = $ 1 TeV at $\Lambda = $ 10 TeV are also shown as a dotted line. The last bin includes overflow events. |
png pdf |
Figure 2-d:
Distribution of $ {m_{\ell {\gamma}}^\text {max}} $ in the $ {{\mathrm {e}} {\mathrm {e}} {\gamma}} $ $ {{{\mu}} {{\mu}} {\gamma}} $ channel. The points with error bars denote the data and the stacked histograms show the predictions for each of the backgrounds. The uncertainty band of the SM prediction includes only statistical uncertainties. Signal events for $ {m_{\ell ^*}} = $ 1 TeV at $\Lambda = $ 10 TeV are also shown as a dotted line. The last bin includes overflow events. |

png pdf |
Figure 3:
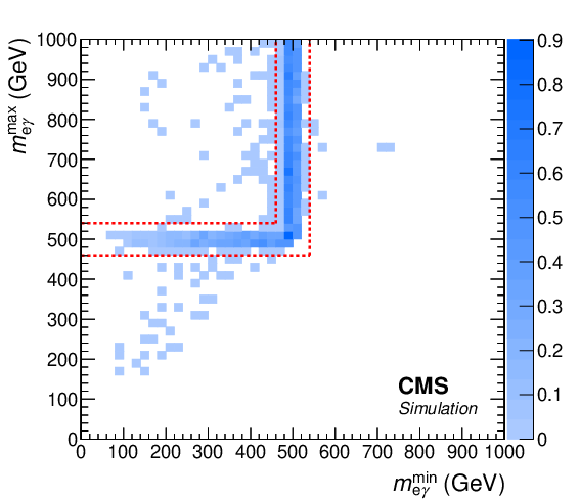
The two-dimensional distributions of ${m_{\ell {\gamma}}^\text {max}}$ versus ${m_{\ell {\gamma}}^\text {min}} $ of excited electrons with a mass of 500 GeV (left) and of excited muons with a mass of 750 GeV (right), after the event selection, normalized to the expected signal cross section at $\Lambda = $ 10 TeV. The red dashed lines denote the boundary of the L-shaped search window. |
png pdf |
Figure 3-a:
The two-dimensional distributions of ${m_{\ell {\gamma}}^\text {max}}$ versus ${m_{\ell {\gamma}}^\text {min}} $ of excited electrons with a mass of 500 GeV, after the event selection, normalized to the expected signal cross section at $\Lambda = $ 10 TeV. The red dashed lines denote the boundary of the L-shaped search window. |

png pdf |
Figure 3-b:
The two-dimensional distributions of ${m_{\ell {\gamma}}^\text {max}}$ versus ${m_{\ell {\gamma}}^\text {min}} $ of excited muons with a mass of 750 GeV, after the event selection, normalized to the expected signal cross section at $\Lambda = $ 10 TeV. The red dashed lines denote the boundary of the L-shaped search window. |

png pdf |
Figure 4:
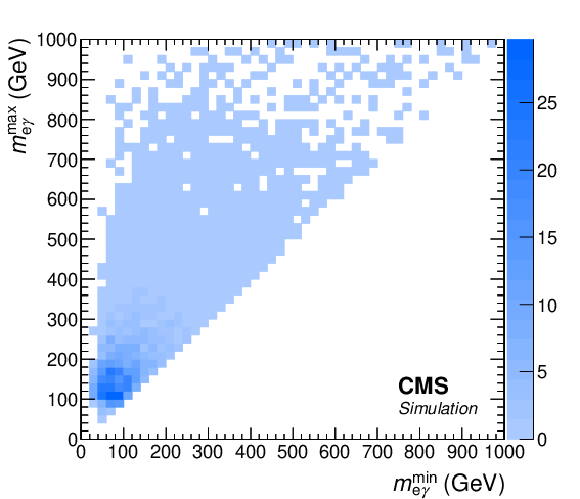
The two-dimensional distributions of ${m_{\ell {\gamma}}^\text {max}}$ versus ${m_{\ell {\gamma}}^\text {min}}$ of DY+$ {\gamma}$ background events in the ${{\mathrm {e}} {\mathrm {e}} {\gamma}}$ (left) and ${{{\mu}} {{\mu}} {\gamma}}$ (right) channels, after the event selection, normalized to the cross section for DY+$ {\gamma}$ production. |
png pdf |
Figure 4-a:
The two-dimensional distributions of ${m_{\ell {\gamma}}^\text {max}}$ versus ${m_{\ell {\gamma}}^\text {min}}$ of DY+$ {\gamma}$ background events in the ${{\mathrm {e}} {\mathrm {e}} {\gamma}}$ channel, after the event selection, normalized to the cross section for DY+$ {\gamma}$ production. |

png pdf |
Figure 4-b:
The two-dimensional distributions of ${m_{\ell {\gamma}}^\text {max}}$ versus ${m_{\ell {\gamma}}^\text {min}}$ of DY+$ {\gamma}$ background events in the ${{{\mu}} {{\mu}} {\gamma}}$ channel, after the event selection, normalized to the cross section for DY+$ {\gamma}$ production. |

png pdf |
Figure 5:
The product of signal acceptance and efficiency as a function of the generated resonance mass for the $ {{\mathrm {e}} {\mathrm {e}} {\gamma}} $ (lower) and $ {{{\mu}} {{\mu}} {\gamma}} $ (upper) channels. Each marker denotes the value measured from the simulated signal sample at a given mass point, and the lines represent polynomial fits to the measured values. |
png pdf |
Figure 6:
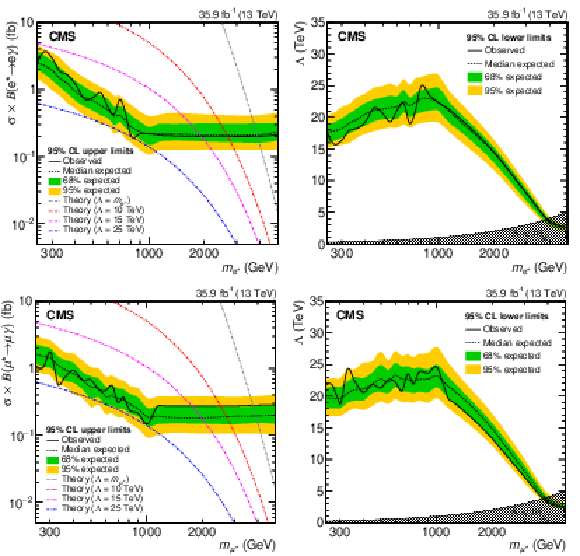
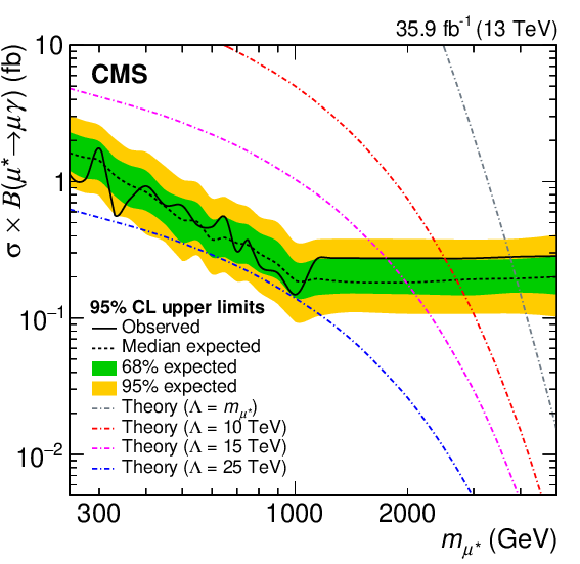
Observed (solid) and expected (dashed) 95% CL upper limits on the product of the production cross section and branching fraction (left column) and lower limits on the compositeness scale (right column) as a function of signal mass $ {m_{\ell ^*}} $, together with the 68% (green, inner) and 95% (yellow, outer) quantiles of the expected limit, for $ {{\mathrm {e}}^*} $ (upper row) and ${{{\mu}}^*}$ (lower row). |

png pdf |
Figure 6-a:
Observed (solid) and expected (dashed) 95% CL upper limits on the product of the production cross section and branching fraction as a function of signal mass $ {m_{{\mathrm {e}} ^*}} $, together with the 68% (green, inner) and 95% (yellow, outer) quantiles of the expected limit, for $ {{\mathrm {e}}^*} $. |

png pdf |
Figure 6-b:
Observed (solid) and expected (dashed) 95% CL lower limits on the compositeness scale as a function of signal mass $ {m_{{\mathrm {e}} ^*}} $, together with the 68% (green, inner) and 95% (yellow, outer) quantiles of the expected limit, for $ {{\mathrm {e}}^*} $. |
png pdf |
Figure 6-c:
Observed (solid) and expected (dashed) 95% CL upper limits on the product of the production cross section and branching fraction as a function of signal mass $ {m_{\mu ^*}} $, together with the 68% (green, inner) and 95% (yellow, outer) quantiles of the expected limit, for ${{{\mu}}^*}$. |

png pdf |
Figure 6-d:
Observed (solid) and expected (dashed) 95% CL lower limits on the compositeness scale as a function of signal mass $ {m_{\mu ^*}} $, together with the 68% (green, inner) and 95% (yellow, outer) quantiles of the expected limit, for ${{{\mu}}^*}$. |
| Tables | |

png pdf |
Table 1:
Summary of the systematic uncertainties (in %) in the signal yield, the prompt photon background prediction, and the jet background prediction. |

png pdf |
Table 2:
The observed yield and the SM prediction in the search window of the given ${m_{\ell ^*}}$ in the ${{\mathrm {e}} {\mathrm {e}} {\gamma}}$ channel. The symbols ${N_\text {data}}$, ${N_\text {prompt}}$, and ${N_\text {jet}}$ represent the number of events in data, the prompt photon background prediction, and the jet background estimate, respectively, together with statistical and systematical uncertainties. |

png pdf |
Table 3:
The observed yield and the SM prediction in the search window of the given ${m_{\ell ^*}}$ in the ${{{\mu}} {{\mu}} {\gamma}}$ channel. The symbols ${N_\text {data}}$, ${N_\text {prompt}}$, and ${N_\text {jet}}$ represent the number of events in data, the prompt photon background prediction, and the jet background estimate, respectively, together with statistical and systematical uncertainties. |

png pdf |
Table 4:
Summary of the observed (expected) lower limits on $ {m_{\ell ^*}} $, assuming ${\Lambda = {m_{\ell ^*}}}$, and the best observed (expected) lower limits on $\Lambda $ in the mass range 0.5-1.0 TeV. |
| Summary |
| A search has been presented for excited electrons and muons in $ \ell \ell \gamma $ final states at the LHC. The search is based on a data sample corresponding to an integrated luminosity of 35.9 fb$^{-1}$ of proton-proton collisions at a center-of-mass energy of 13 TeV, collected with the CMS detector in 2016. No significant excess over the standard model prediction is observed in the data, and 95% confidence level upper and lower limits are set on the signal production cross sections and the compositeness scale, respectively, as a function of the excited lepton mass. The observed limits on the signal cross section range from 3.7 to 0.2 fb as a function of $ m_{\ell*} $. Excited electrons and muons are excluded for masses below 3.9 and 3.8 TeV, respectively, under the assumption that the excited lepton mass equals the compositeness scale. The best observed limit on the compositeness scale is obtained with an excited lepton mass of around 1.0 TeV, excluding a compositeness scale below 25 TeV for both excited electrons and muons. These are the first results of a search at $\sqrt{s} = $ 13 TeV for excited leptons and also the most stringent limits on the excited lepton mass and the compositeness scale to date. |
| References | ||||
| 1 | O. W. Greenberg and C. A. Nelson | Composite models of leptons | PRD 10 (1974) 2567 | |
| 2 | J. C. Pati, A. Salam, and J. A. Strathdee | Are quarks composite? | PLB 59 (1975) 265 | |
| 3 | O. W. Greenberg and J. Sucher | A quantum structure dynamic model of quarks, leptons, weak vector bosons, and Higgs mesons | PLB 99 (1981) 339 | |
| 4 | H. Terazawa, M. Yasuè, K. Akama, and M. Hayshi | Observable effects of the possible substructure of leptons and quarks | PLB 112 (1982) 387 | |
| 5 | M. Abolins et al. | Testing the compositeness of quarks and leptons | in Elementary Particles and Future Facilities (Snowmass 1982), p. 274 1982eConf C8206282 | |
| 6 | E. Eichten, K. D. Lane, and M. E. Peskin | New tests for quark and lepton substructure | PRL 50 (1983) 811 | |
| 7 | H. Harari | Composite models for quarks and leptons | PR 104 (1984) 159 | |
| 8 | U. Baur, M. Spira, and P. M. Zerwas | Excited quark and lepton production at hadron colliders | PRD 42 (1990) 815 | |
| 9 | S. Bhattacharya, S. S. Chauhan, B. C. Choudhary, and D. Choudhury | Search for excited quarks in $ \mathrm{q}\mathrm{\bar{q}}\rightarrow\gamma\gamma $ at the CERN LHC | PRD 76 (2007) 115017 | 0705.3472 |
| 10 | S. Bhattacharya, S. S. Chauhan, B. C. Choudhary, and D. Choudhury | Quark excitations through the prism of direct photon plus jet at the LHC | PRD 80 (2009) 015014 | 0901.3927 |
| 11 | CMS Collaboration | Search for excited leptons in pp collisions at $ \sqrt{s} = $ 7 TeV | PLB 720 (2013) 309 | CMS-EXO-11-034 1210.2422 |
| 12 | CMS Collaboration | Search for excited leptons in proton-proton collisions at $ \sqrt{s} = $ 8 TeV | JHEP 03 (2016) 125 | CMS-EXO-14-015 1511.01407 |
| 13 | ALEPH Collaboration | Search for excited leptons at 130--140 GeV | PLB 385 (1996) 445 | |
| 14 | DELPHI Collaboration | Search for composite and exotic fermions at LEP 2 | EPJC 8 (1999) 41 | hep-ex/9811005 |
| 15 | OPAL Collaboration | Search for unstable heavy and excited leptons at LEP 2 | EPJC 14 (2000) 73 | hep-ex/0001056 |
| 16 | L3 Collaboration | Search for excited leptons at LEP | PLB 568 (2003) 23 | hep-ex/0306016 |
| 17 | H1 Collaboration | Search for excited electrons in ep collisions at HERA | PLB 666 (2008) 131 | 0805.4530 |
| 18 | CDF Collaboration | Search for excited and exotic electrons in the e$ \gamma $ decay channel in $ {\mathrm{p}}\mathrm{\bar{p}} $ collisions at $ \sqrt{s} = $ 1.96 TeV | PRL 94 (2005) 101802 | hep-ex/0410013 |
| 19 | CDF Collaboration | Search for excited and exotic muons in the $ \mu\gamma $ decay channel in $ {\mathrm{p}}\mathrm{\bar{p}} $ collisions at $ \sqrt{s} = $ 1.96 TeV | PRL 97 (2006) 191802 | hep-ex/0606043 |
| 20 | D0 Collaboration | Search for excited muons in $ {\mathrm{p}}\mathrm{\bar{p}} $ collisions at $ \sqrt{s} = $ 1.96 TeV | PRD 73 (2006) 111102 | hep-ex/0604040 |
| 21 | D0 Collaboration | Search for excited electrons in $ {\mathrm{p}}\mathrm{\bar{p}} $ collisions at $ \sqrt{s} = $ 1.96 TeV | PRD 77 (2008) 091102 | 0801.0877 |
| 22 | ATLAS Collaboration | Search for excited leptons in proton-proton collisions at $ \sqrt{s} = $ 7 TeV with the ATLAS detector | PRD 85 (2012) 072003 | 1201.3293 |
| 23 | ATLAS Collaboration | Search for excited electrons and muons in $ \sqrt{s} = $ 8 TeV proton-proton collisions with the ATLAS detector | New J. Phys. 15 (2013) 093011 | 1308.1364 |
| 24 | ATLAS Collaboration | A search for an excited muon decaying to a muon and two jets in $ {\mathrm{p}}{\mathrm{p}} $ collisions at $ \sqrt{s} = $ 8 TeV with the ATLAS detector | New J. Phys. 18 (2016) 073021 | 1601.05627 |
| 25 | CMS Collaboration | The CMS trigger system | JINST 12 (2017) P01020 | CMS-TRG-12-001 1609.02366 |
| 26 | CMS Collaboration | The CMS experiment at the CERN LHC | JINST 3 (2008) S08004 | CMS-00-001 |
| 27 | T. Sjostrand et al. | An introduction to PYTHIA 8.2 | CPC 191 (2015) 159 | 1410.3012 |
| 28 | CMS Collaboration | Event generator tunes obtained from underlying event and multiparton scattering measurements | EPJC 76 (2016) 155 | CMS-GEN-14-001 1512.00815 |
| 29 | S. Majhi | QCD corrections to excited lepton (pair) production at the LHC | PRD 88 (2013) 074028 | 1210.8307 |
| 30 | J. Alwall et al. | The automated computation of tree-level and next-to-leading order differential cross sections, and their matching to parton shower simulations | JHEP 07 (2014) 079 | 1405.0301 |
| 31 | T. Gehrmann et al. | $ \mathrm{W^{+}}\mathrm{W^{-}} $ production at hadron colliders in next-to-next-to-leading-order QCD | PRL 113 (2014) 212001 | 1408.5243 |
| 32 | J. M. Campbell and R. K. Ellis | MCFM for the Tevatron and the LHC | NPPS 205 (2010) 10 | 1007.3492 |
| 33 | NNPDF Collaboration | Parton distributions for the LHC Run II | JHEP 04 (2015) 040 | 1410.8849 |
| 34 | GEANT4 Collaboration | GEANT4--a simulation toolkit | NIMA 506 (2003) 250 | |
| 35 | CMS Collaboration | Particle-flow reconstruction and global event description with the CMS detector | JINST 12 (2017) P10003 | CMS-PRF-14-001 1706.04965 |
| 36 | M. Cacciari, G. P. Salam, and G. Soyez | The anti-$ {k_{\mathrm{T}}} $ jet clustering algorithm | JHEP 04 (2008) 063 | 0802.1189 |
| 37 | M. Cacciari, G. P. Salam, and G. Soyez | FastJet user manual | EPJC 72 (2012) 1896 | 1111.6097 |
| 38 | CMS Collaboration | Performance of electron reconstruction and selection with the CMS detector in proton-proton collisions at $ \sqrt{s} = $ 8 TeV | JINST 10 (2015) P06005 | CMS-EGM-13-001 1502.02701 |
| 39 | CMS Collaboration | Performance of the CMS muon detector and muon reconstruction with proton-proton collisions at $ \sqrt{s} = $ 13 TeV | JINST 13 (2018) P06015 | CMS-MUO-16-001 1804.04528 |
| 40 | CMS Collaboration | Performance of photon reconstruction and identification with the CMS detector in proton-proton collisions at $ \sqrt{s} = $ 8 TeV | JINST 10 (2015) P08010 | CMS-EGM-14-001 1502.02702 |
| 41 | CMS Collaboration | Electron and photon performance in CMS with the full 2016 data sample | CDS | |
| 42 | CMS Collaboration | Search for resonances in the dilepton mass distribution in $ {\mathrm{p}}{\mathrm{p}} $ collisions at $ \sqrt{s} = $ 7 TeV | JHEP 05 (2011) 093 | CMS-EXO-10-013 1103.0981 |
| 43 | CMS Collaboration | Search for high-mass resonances in dilepton final states in proton-proton collisions at $ \sqrt{s} = $ 13 TeV | JHEP 06 (2018) 120 | CMS-EXO-16-047 1803.06292 |
| 44 | CMS Collaboration | CMS luminosity measurements for the 2016 data-taking period | CMS-PAS-LUM-17-001 | CMS-PAS-LUM-17-001 |
| 45 | J. Butterworth et al. | PDF4LHC recommendations for LHC Run II | JPG 43 (2016) 023001 | 1510.03865 |
| 46 | ATLAS and CMS Collaborations, LHC Higgs Combination Group | Procedure for the LHC Higgs boson search combination in Summer 2011 | ATL-PHYS-PUB-2011-11, CMS NOTE 2011/005 | |
| 47 | T. Junk | Confidence level computation for combining searches with small statistics | NIMA 434 (1999) 435 | hep-ex/9902006 |
| 48 | A. L. Read | Presentation of search results: the CLs technique | JPG 28 (2002) 2693 | |

|
Compact Muon Solenoid LHC, CERN |

|

|

|

|

|

|