

Compact Muon Solenoid
LHC, CERN
| CMS-PAS-TOP-25-003 | ||
| Measurement of single top quark and $ \mathrm{t} \overline{\mathrm{t}} $ production cross sections in association with a photon in proton-proton collisions at $ \sqrt{s}= $ 13 TeV | ||
| CMS Collaboration | ||
| 2026-03-18 | ||
| Abstract: Measurements of fiducial inclusive and differential cross sections for photon-associated production of single top quarks $ \mathrm{t}\gamma\mathrm{q} $ and top quark pairs $ \mathrm{t\bar{t}}\gamma $ are performed in proton--proton collisions at a center-of-mass energy of 13$ \mathrm{TeV} $. A sample of events is selected, containing a single isolated electron or muon, an isolated photon, and at least two jets, including one identified as originating from a b quark. The data were recorded with the CMS detector at the CERN LHC and correspond to an integrated luminosity of 138 fb$ ^{-1} $. A profile likelihood fit is employed to unfold the cross sections, account for systematic uncertainties, and determine the correlations between the two signal processes in a single global fit. The fiducial $ \mathrm{t}\gamma\mathrm{q} $ and $ \mathrm{t\bar{t}}\gamma $ cross sections are measured to be 237 $ _{-17}^{+17} $ fb and 1445 $ _{-81}^{+81} $ fb, respectively, in a phase space requiring events with a high momentum, isolated photon. Differential measurements as a function of lepton, photon, light jet, and top quark kinematic observables are performed at the particle and parton levels. All results are found to be in good agreement with theoretical predictions. | ||
| Links: CDS record (PDF) ; Physics Briefing ; CADI line (restricted) ; | ||
| Figures | |
png pdf |
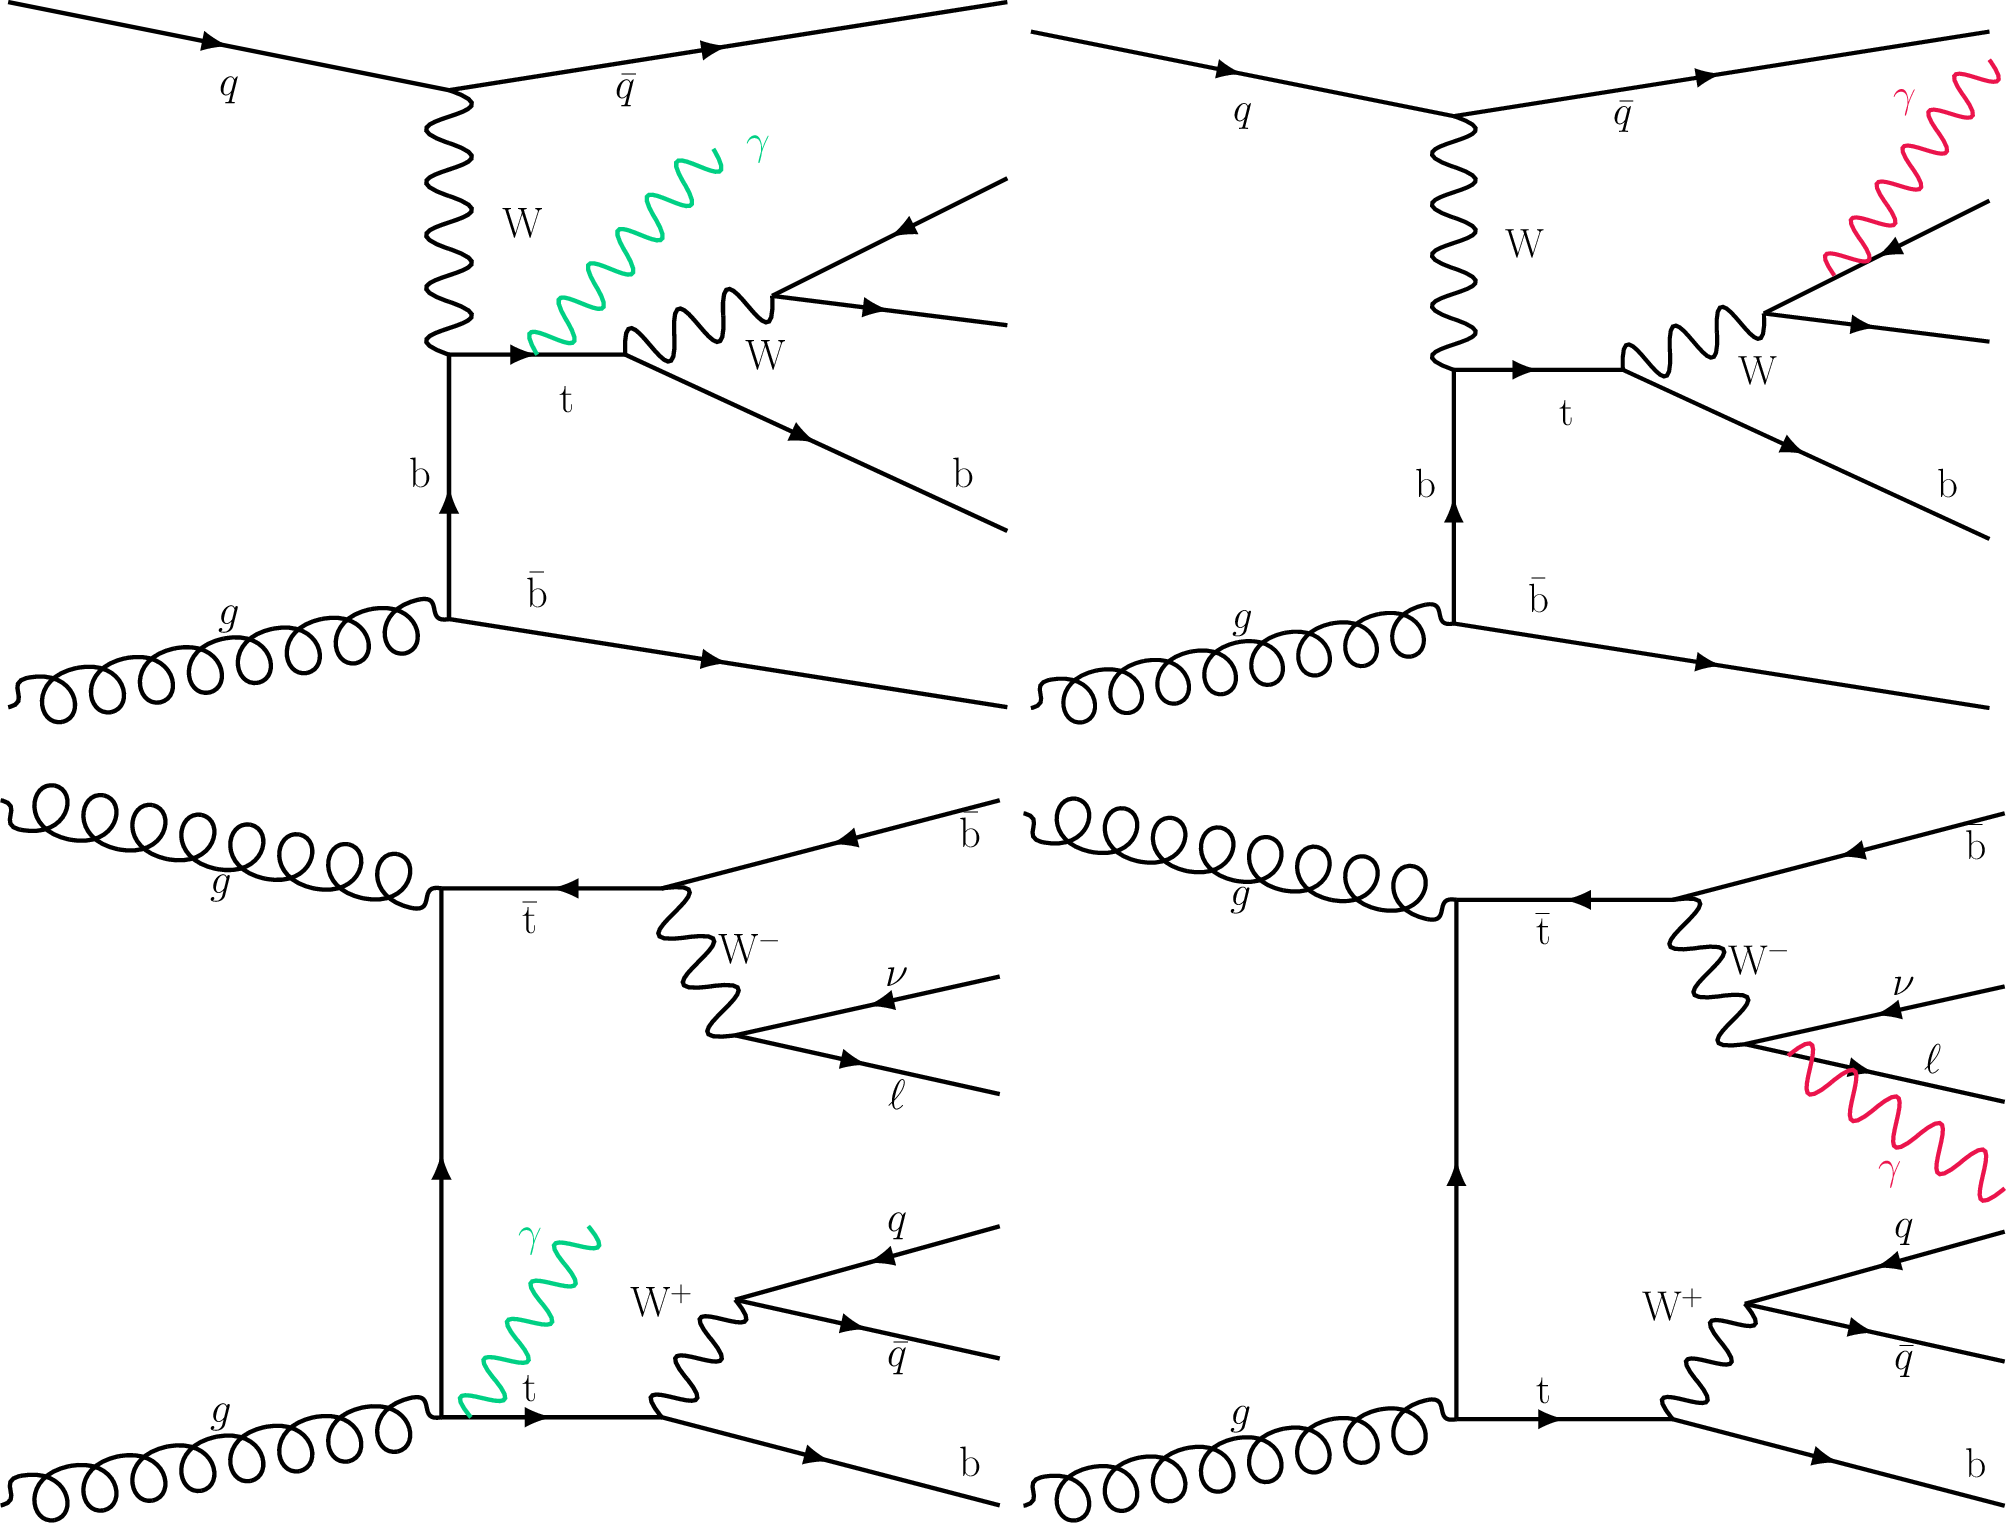
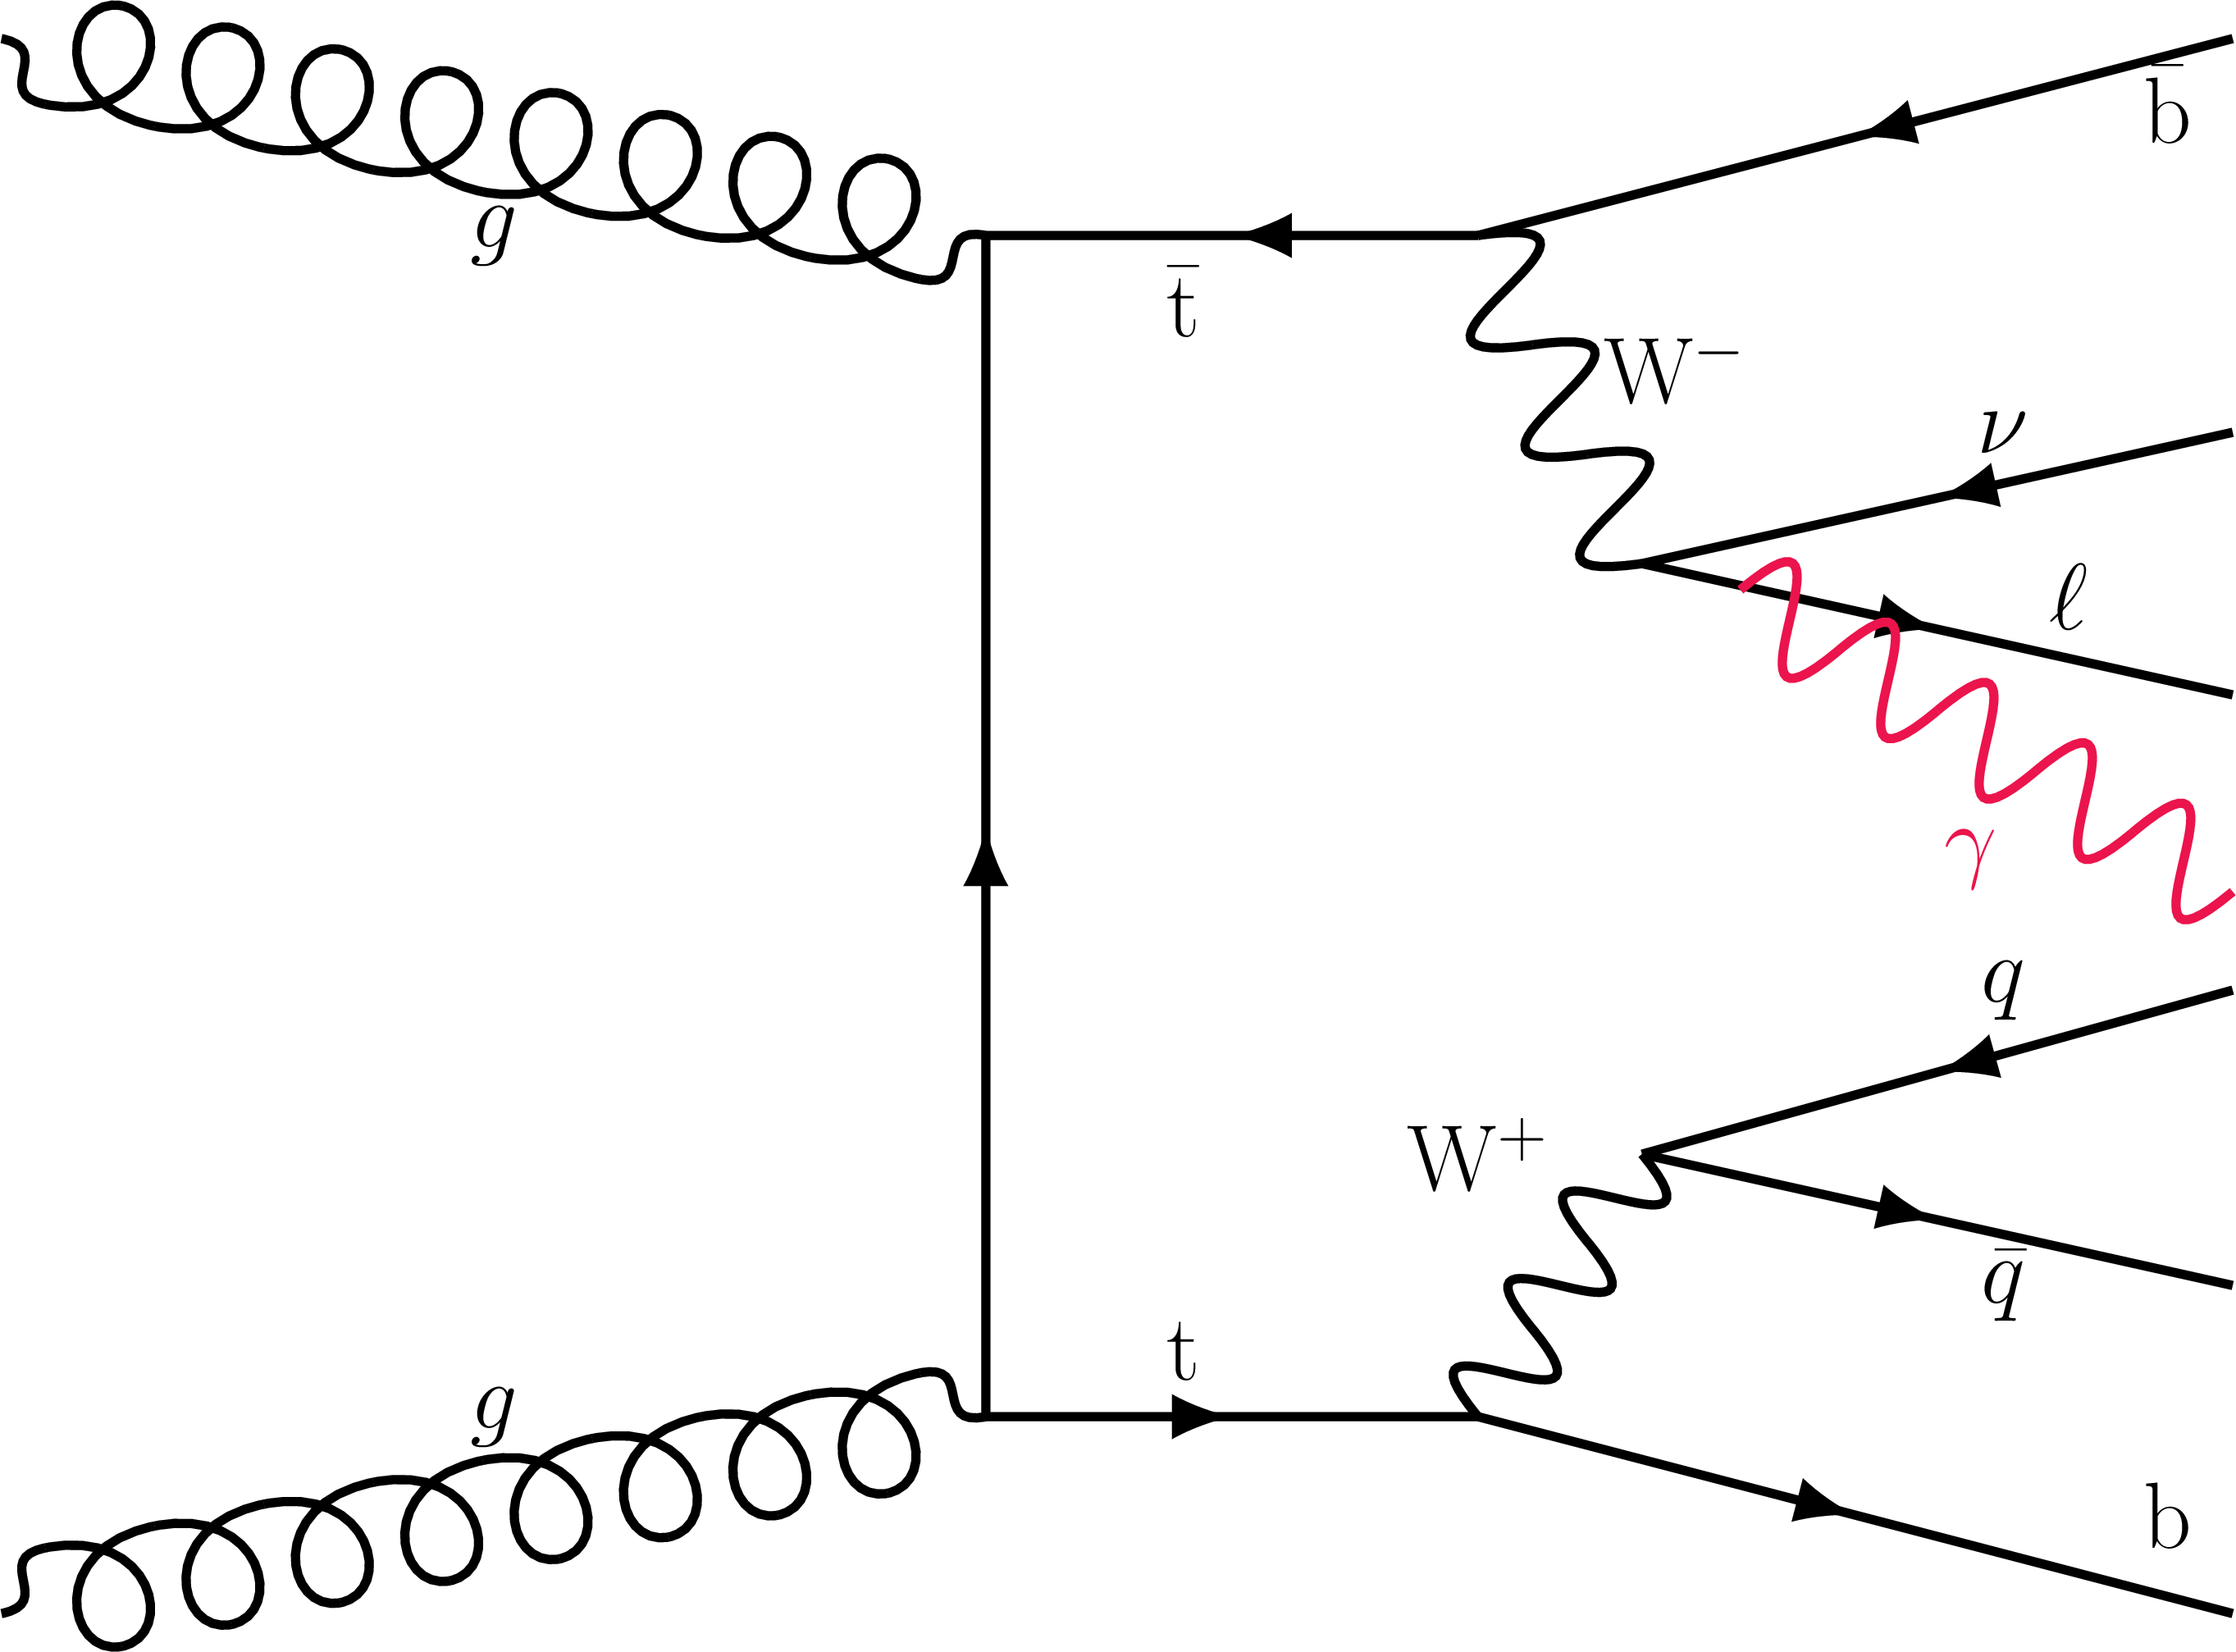
Figure 1:
Representative Feynman diagrams for $ \mathrm{t}\gamma\mathrm{q} $ (up) and $ {\mathrm{t}\overline{\mathrm{t}}} \gamma $ (down) showing photon from top quark (left) or top quark decay products (right). |
png pdf |
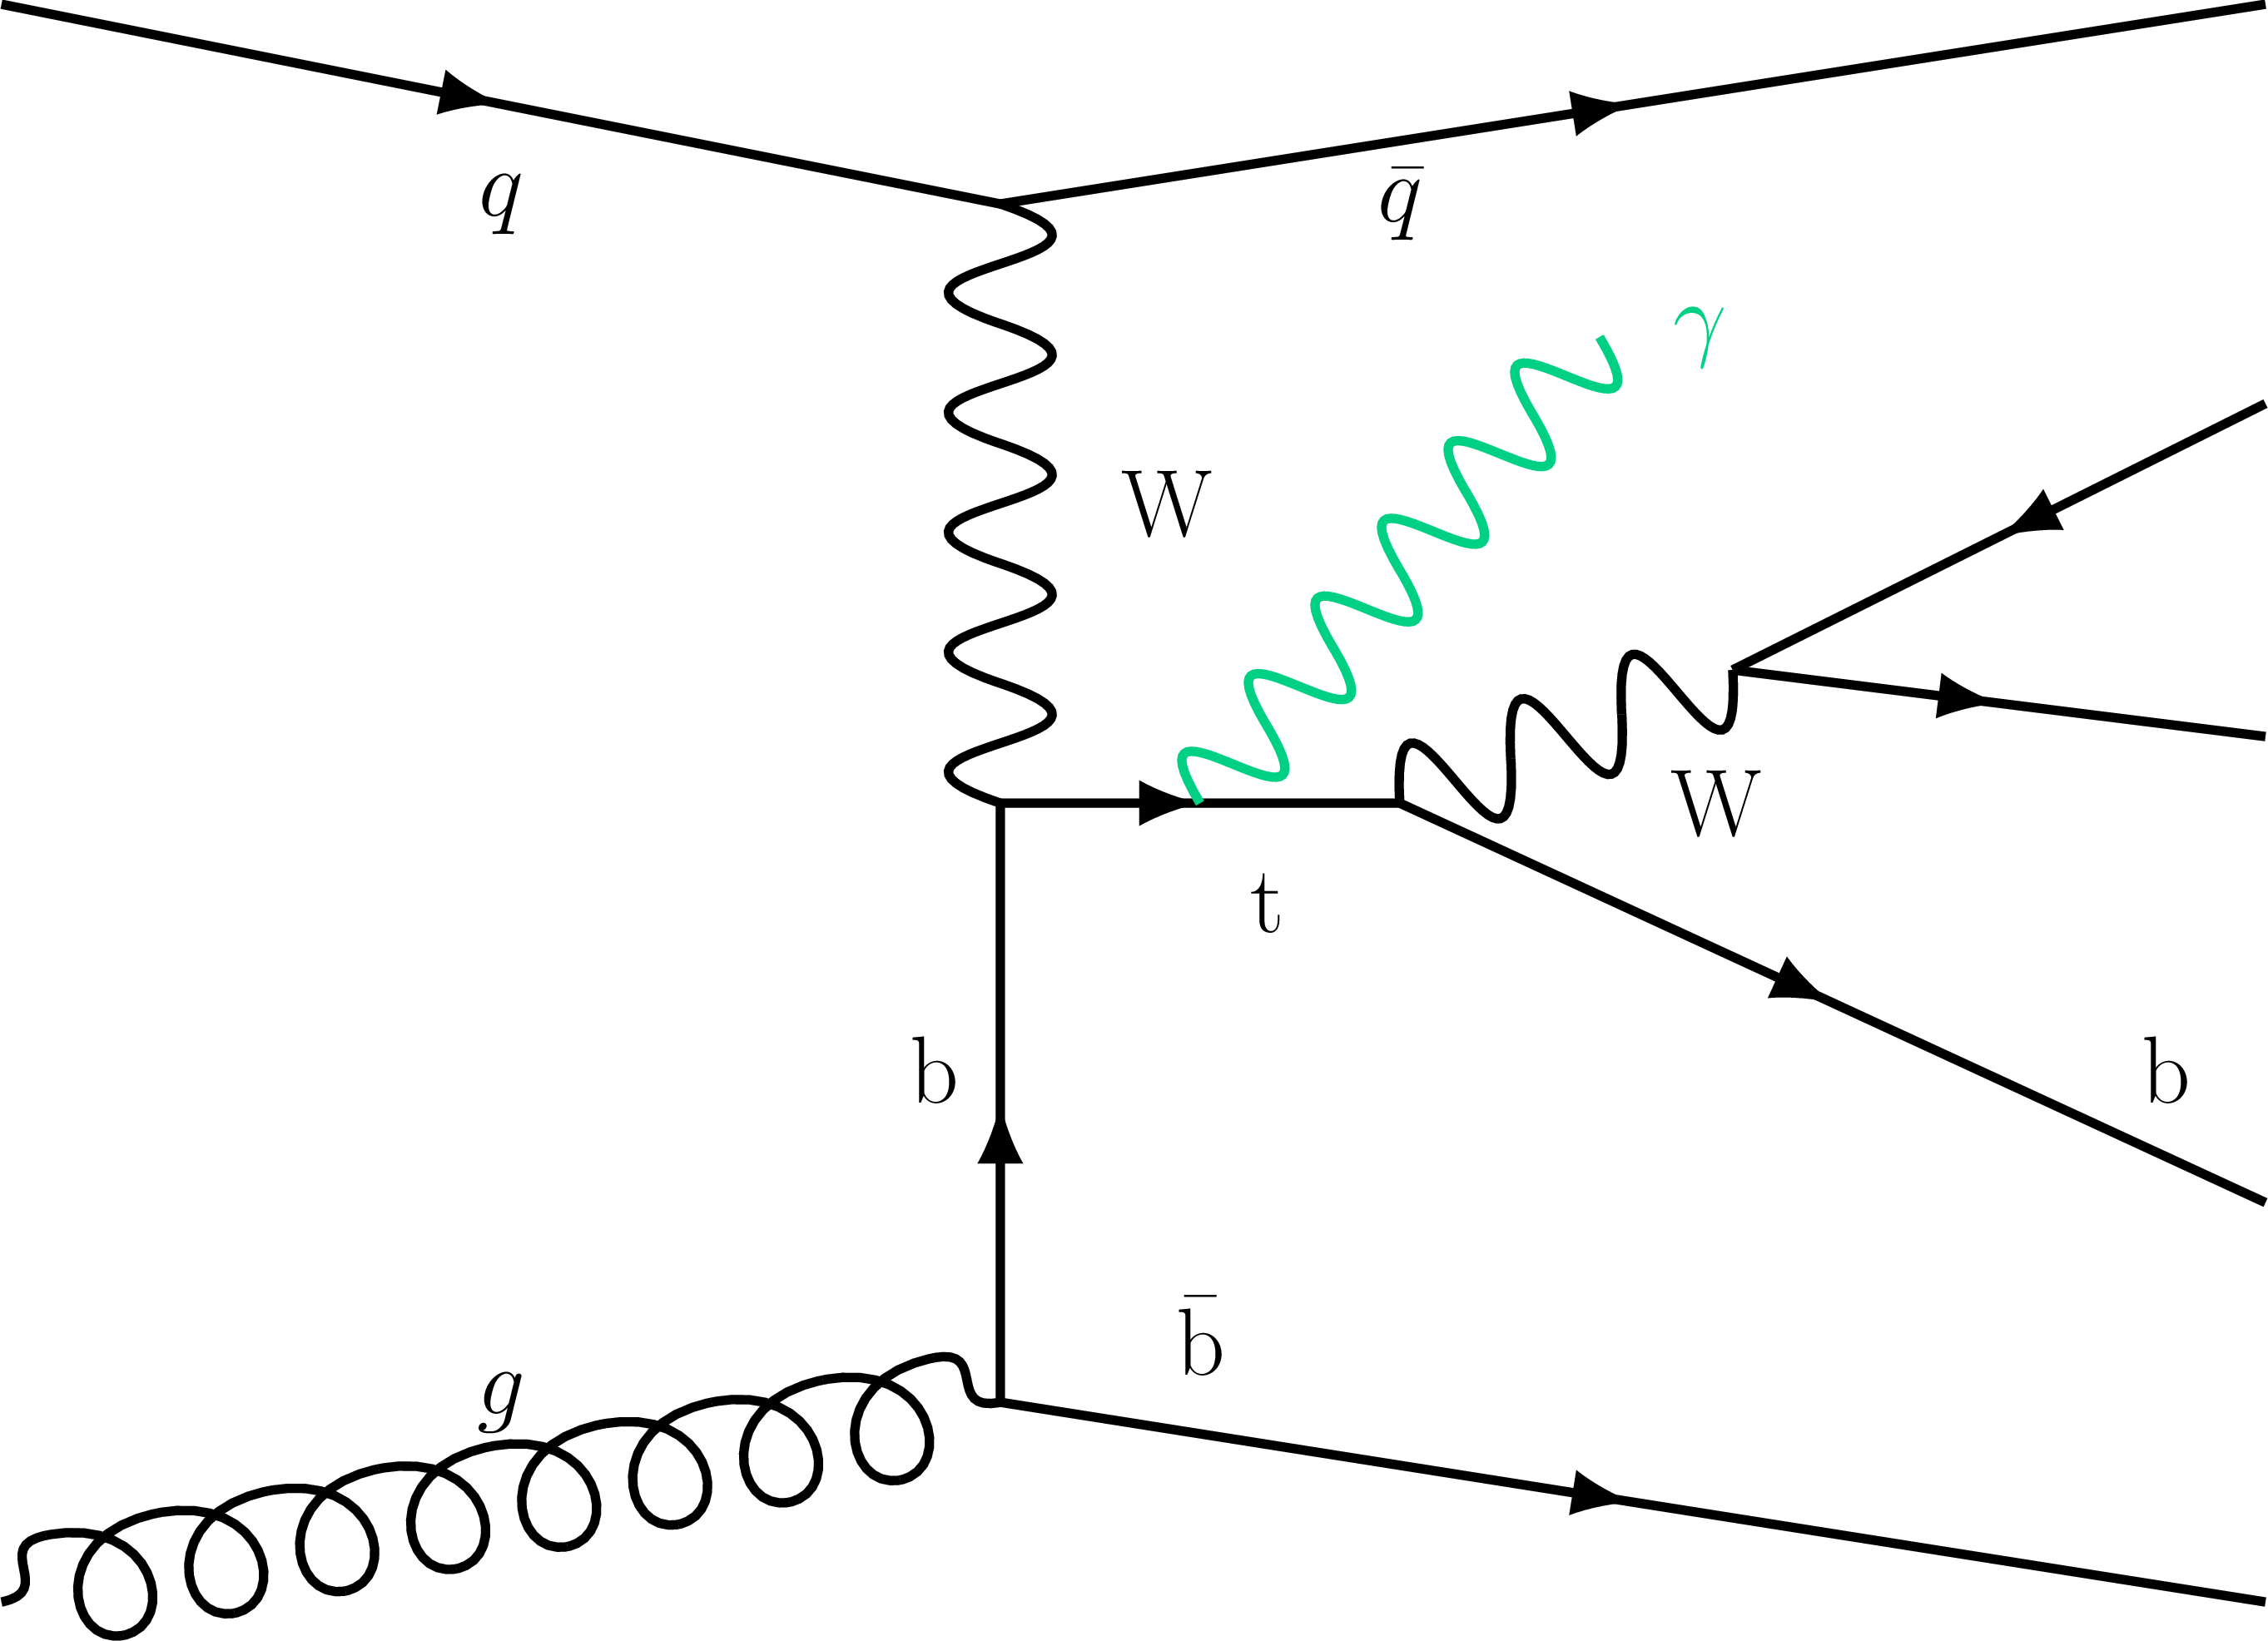
Figure 1-a:
Representative Feynman diagrams for $ \mathrm{t}\gamma\mathrm{q} $ (up) and $ {\mathrm{t}\overline{\mathrm{t}}} \gamma $ (down) showing photon from top quark (left) or top quark decay products (right). |
png pdf |
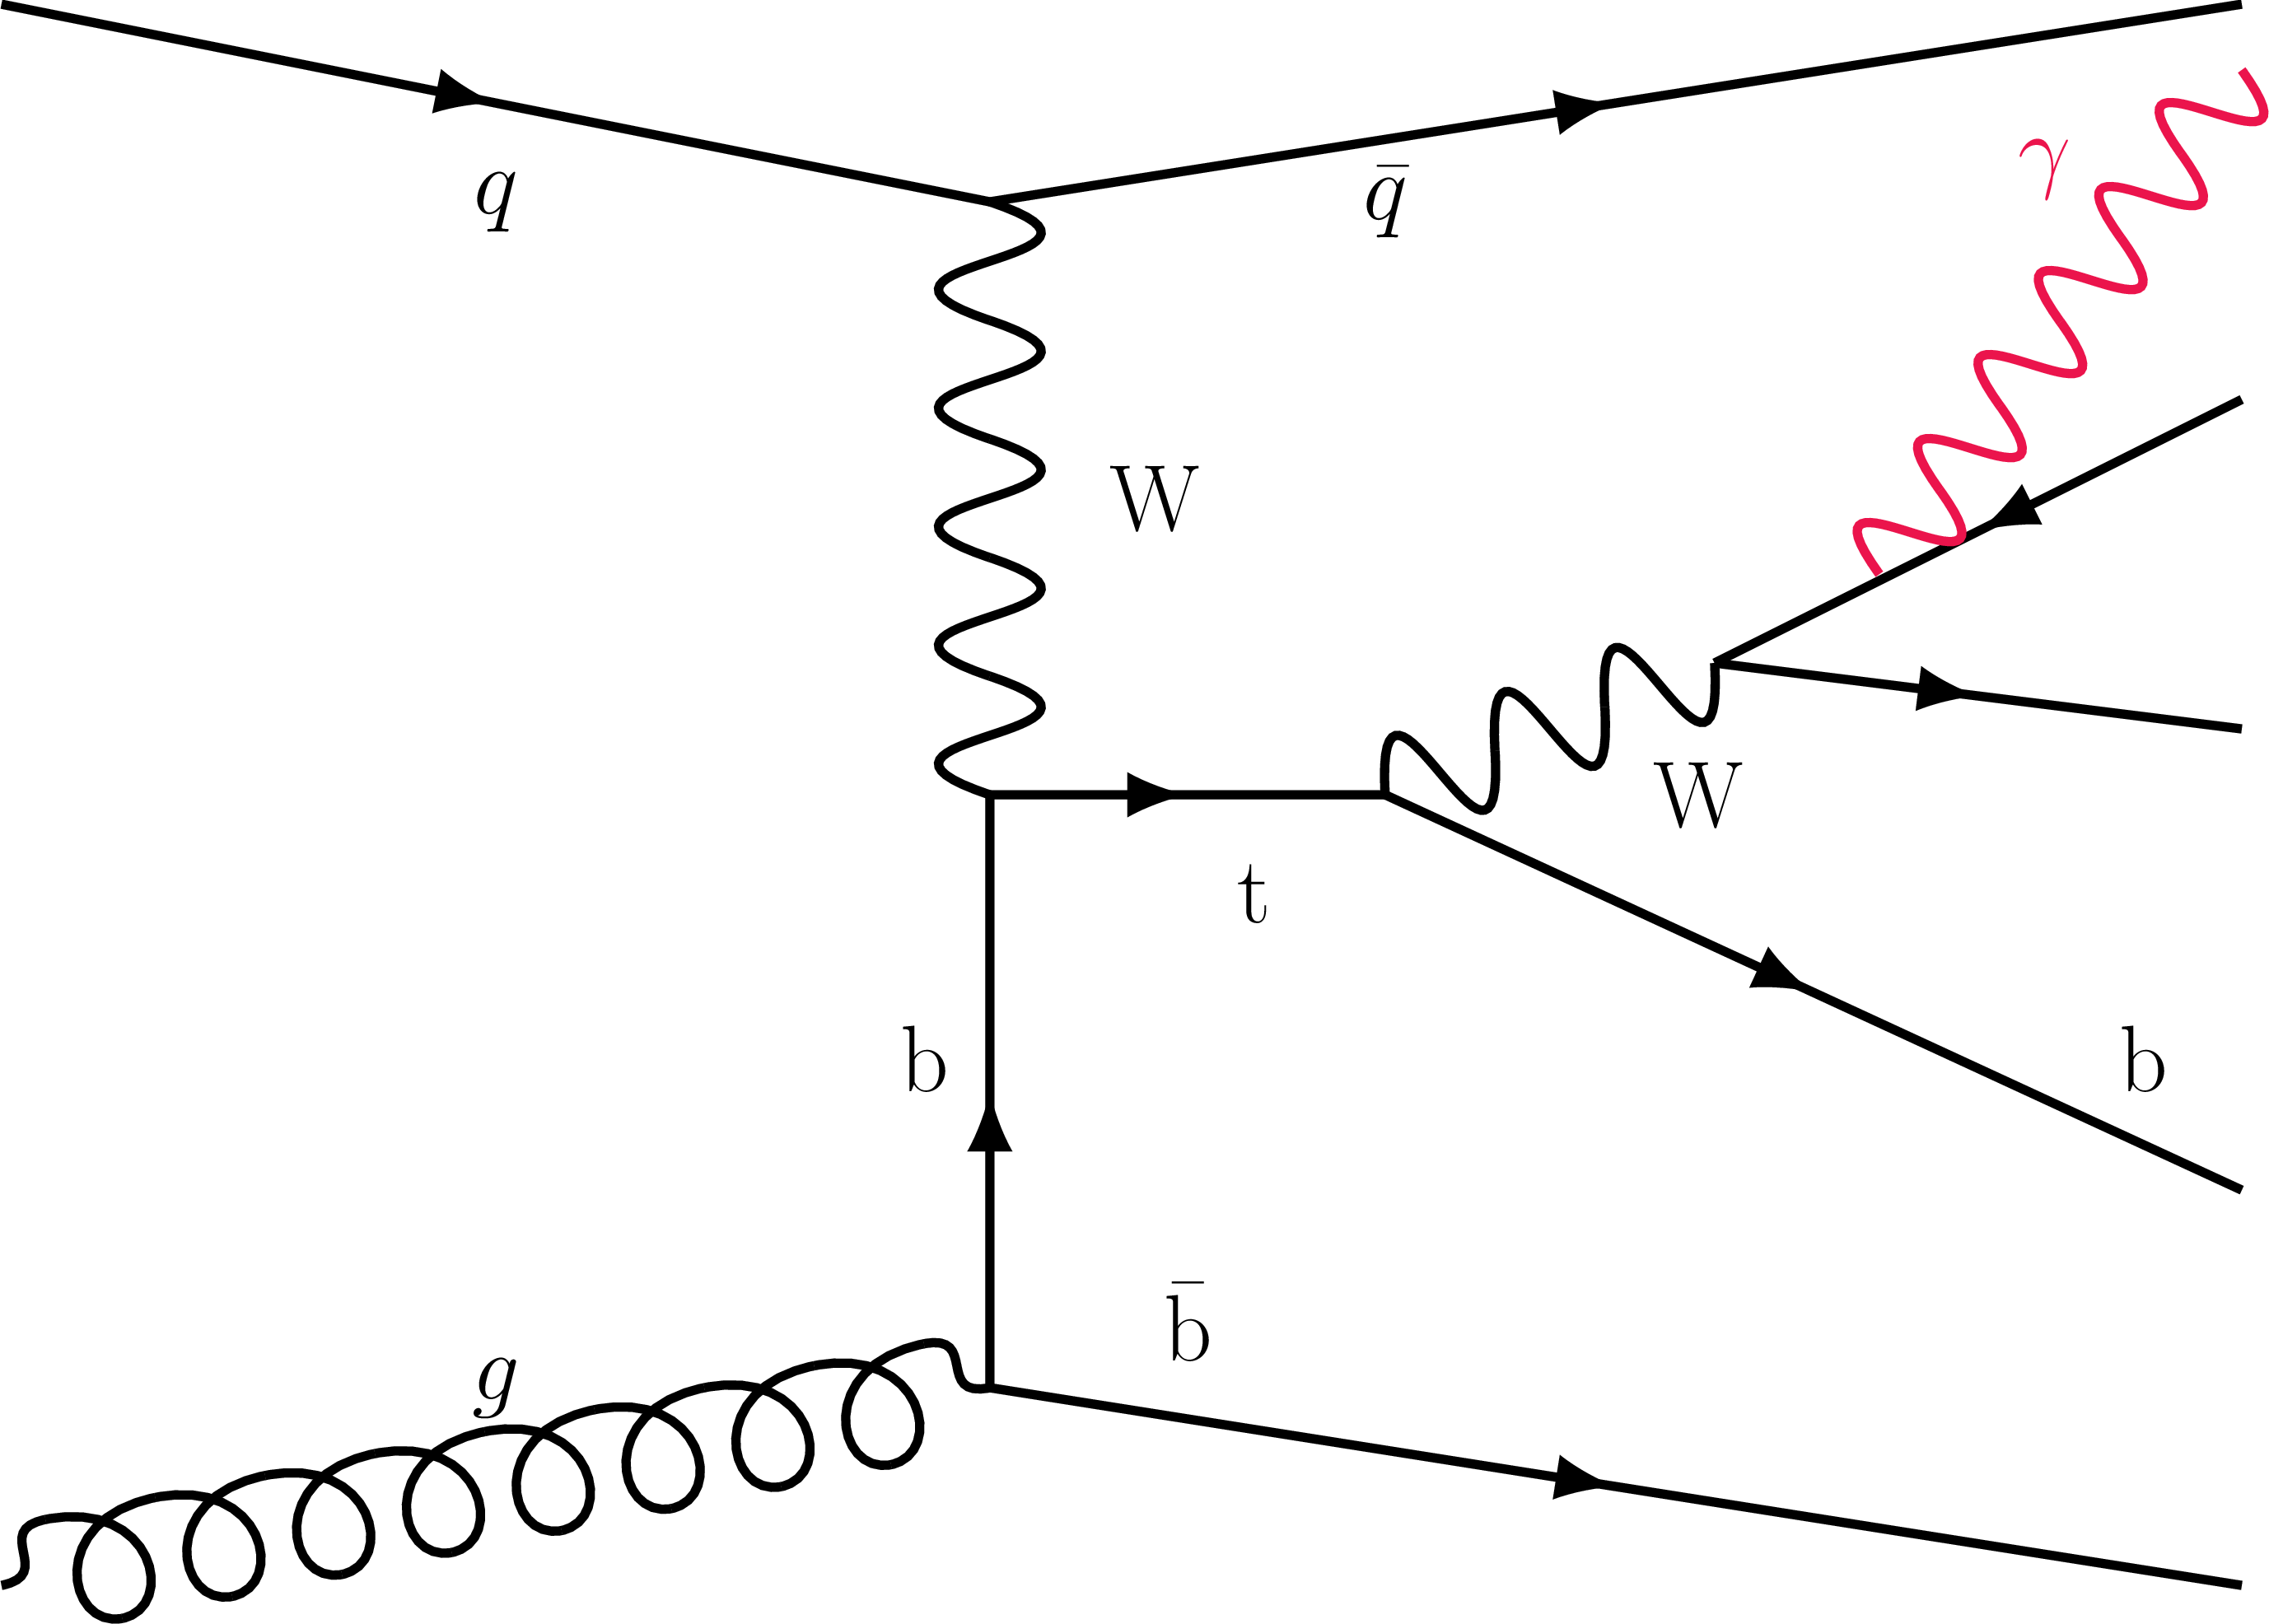
Figure 1-b:
Representative Feynman diagrams for $ \mathrm{t}\gamma\mathrm{q} $ (up) and $ {\mathrm{t}\overline{\mathrm{t}}} \gamma $ (down) showing photon from top quark (left) or top quark decay products (right). |
png pdf |
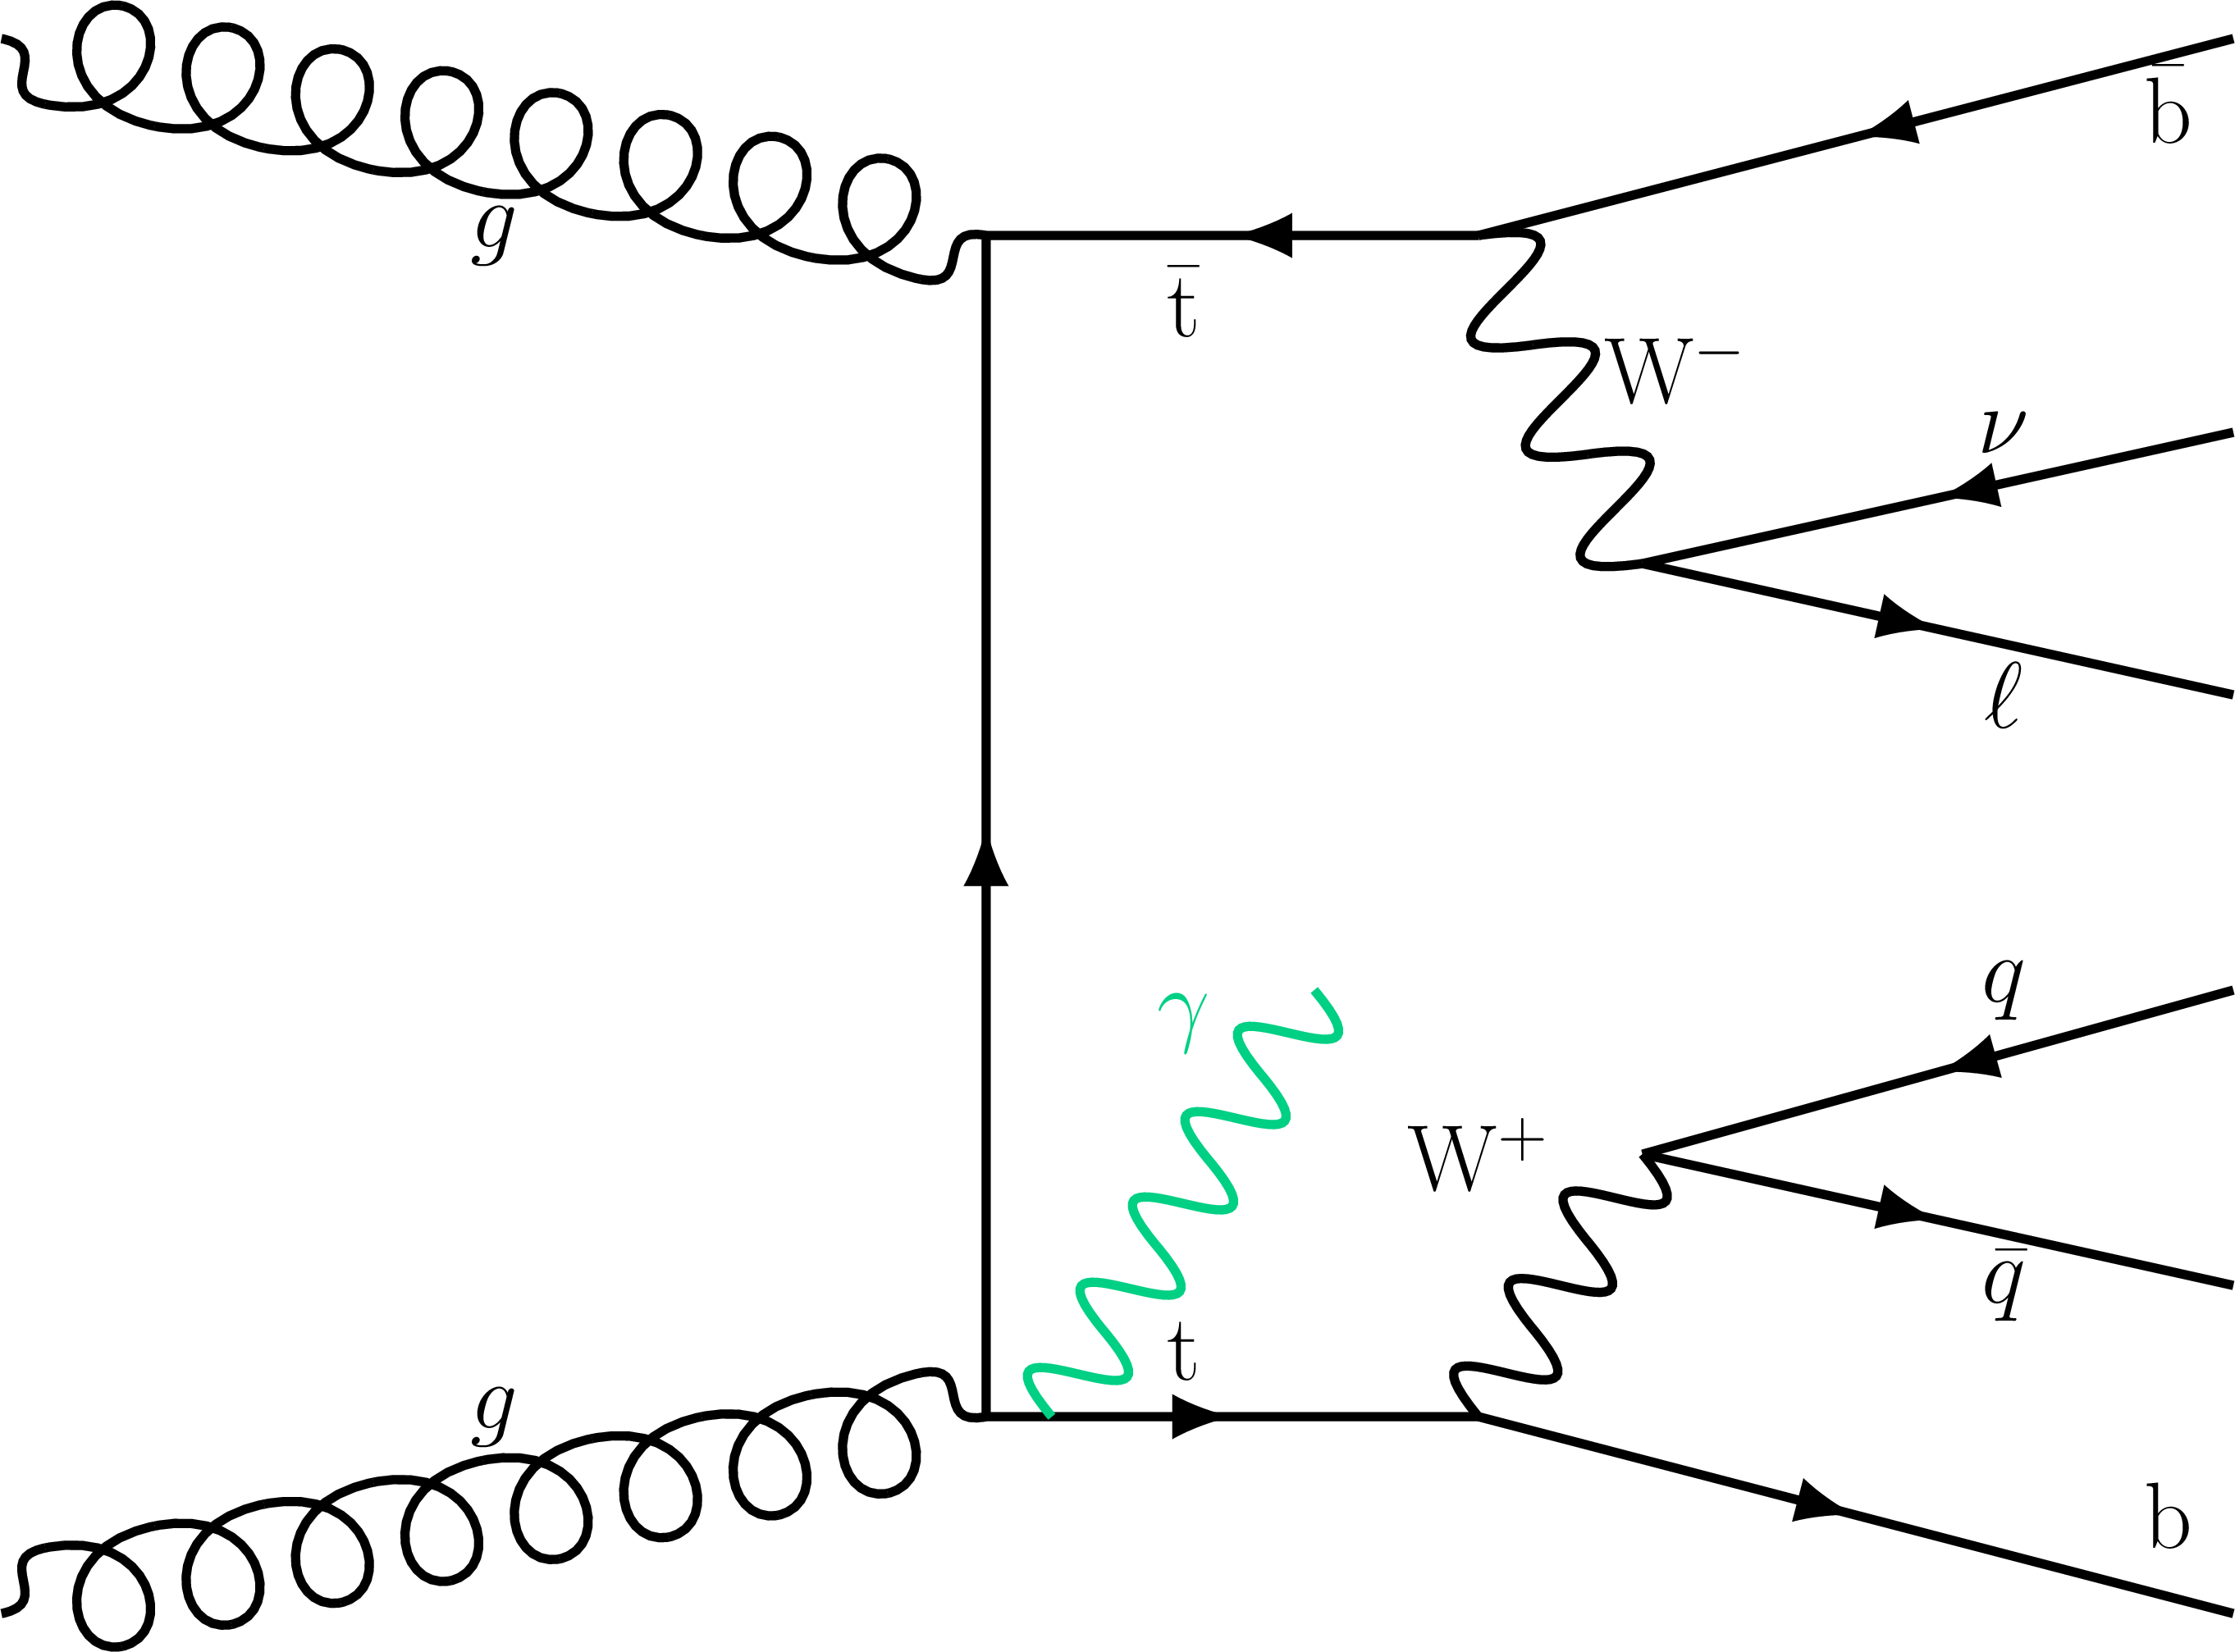
Figure 1-c:
Representative Feynman diagrams for $ \mathrm{t}\gamma\mathrm{q} $ (up) and $ {\mathrm{t}\overline{\mathrm{t}}} \gamma $ (down) showing photon from top quark (left) or top quark decay products (right). |
png pdf |
Figure 1-d:
Representative Feynman diagrams for $ \mathrm{t}\gamma\mathrm{q} $ (up) and $ {\mathrm{t}\overline{\mathrm{t}}} \gamma $ (down) showing photon from top quark (left) or top quark decay products (right). |
png pdf |
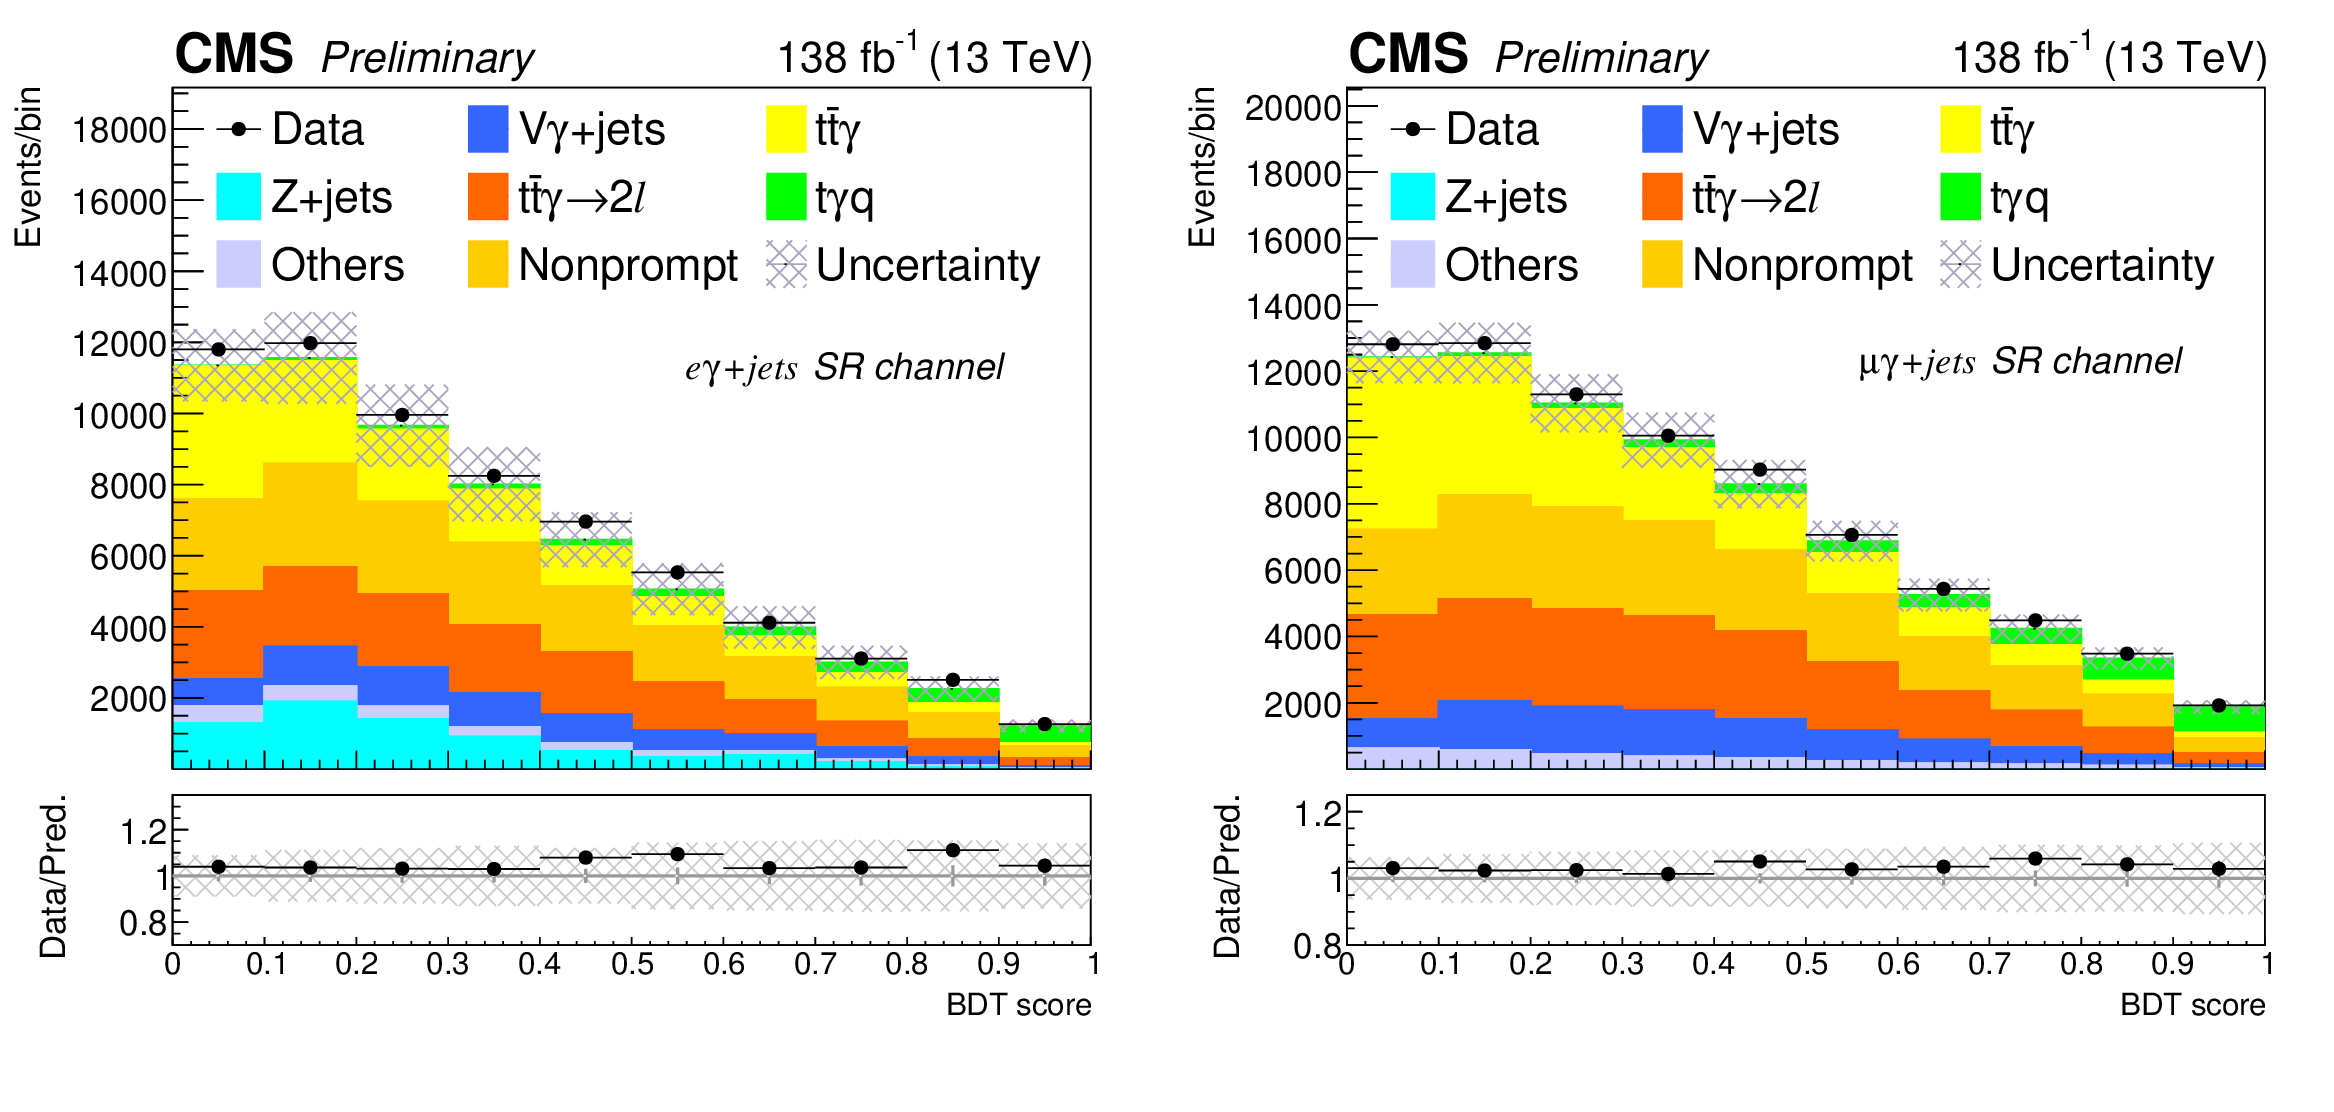
Figure 2:
The BDT score distribution before the fit in the electron (left) and muon (right) channels, where the misID contribution is normalized using factors from the maximum likelihood fit. The hatched bands represent the total uncertainty in prediction. The lower panel shows the ratio of the data to the total prediction. |
png pdf |
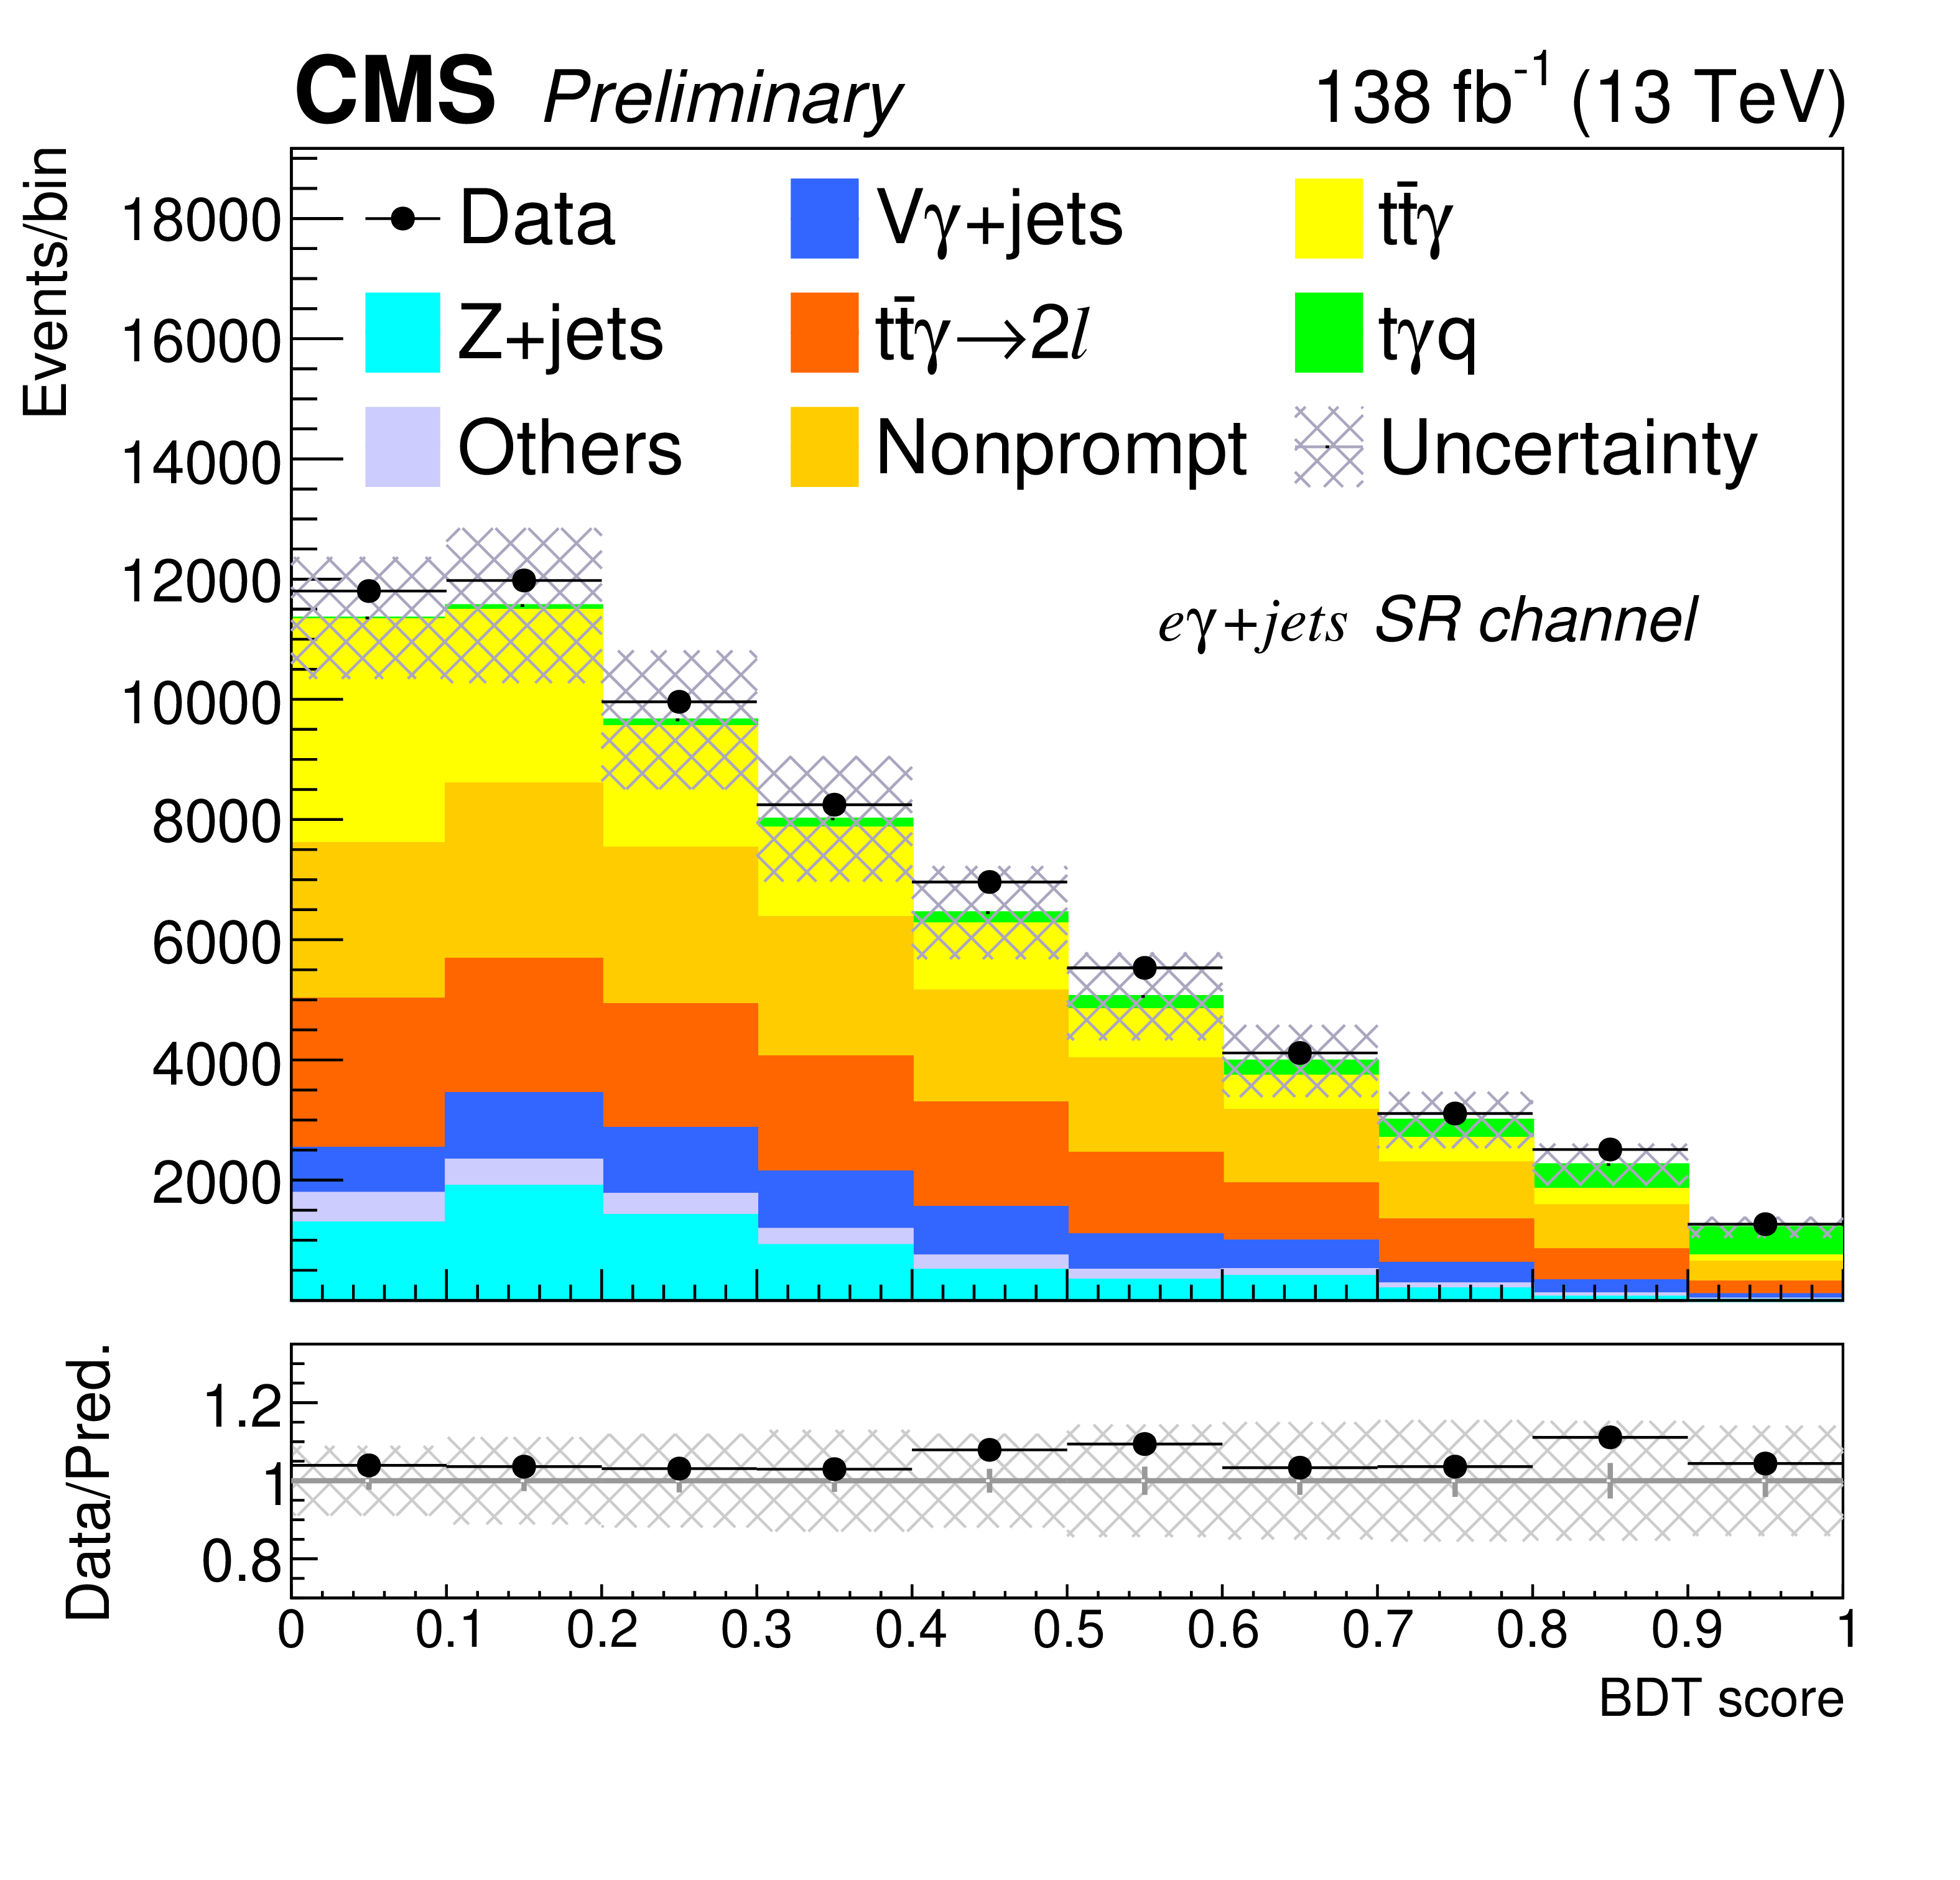
Figure 2-a:
The BDT score distribution before the fit in the electron (left) and muon (right) channels, where the misID contribution is normalized using factors from the maximum likelihood fit. The hatched bands represent the total uncertainty in prediction. The lower panel shows the ratio of the data to the total prediction. |
png pdf |
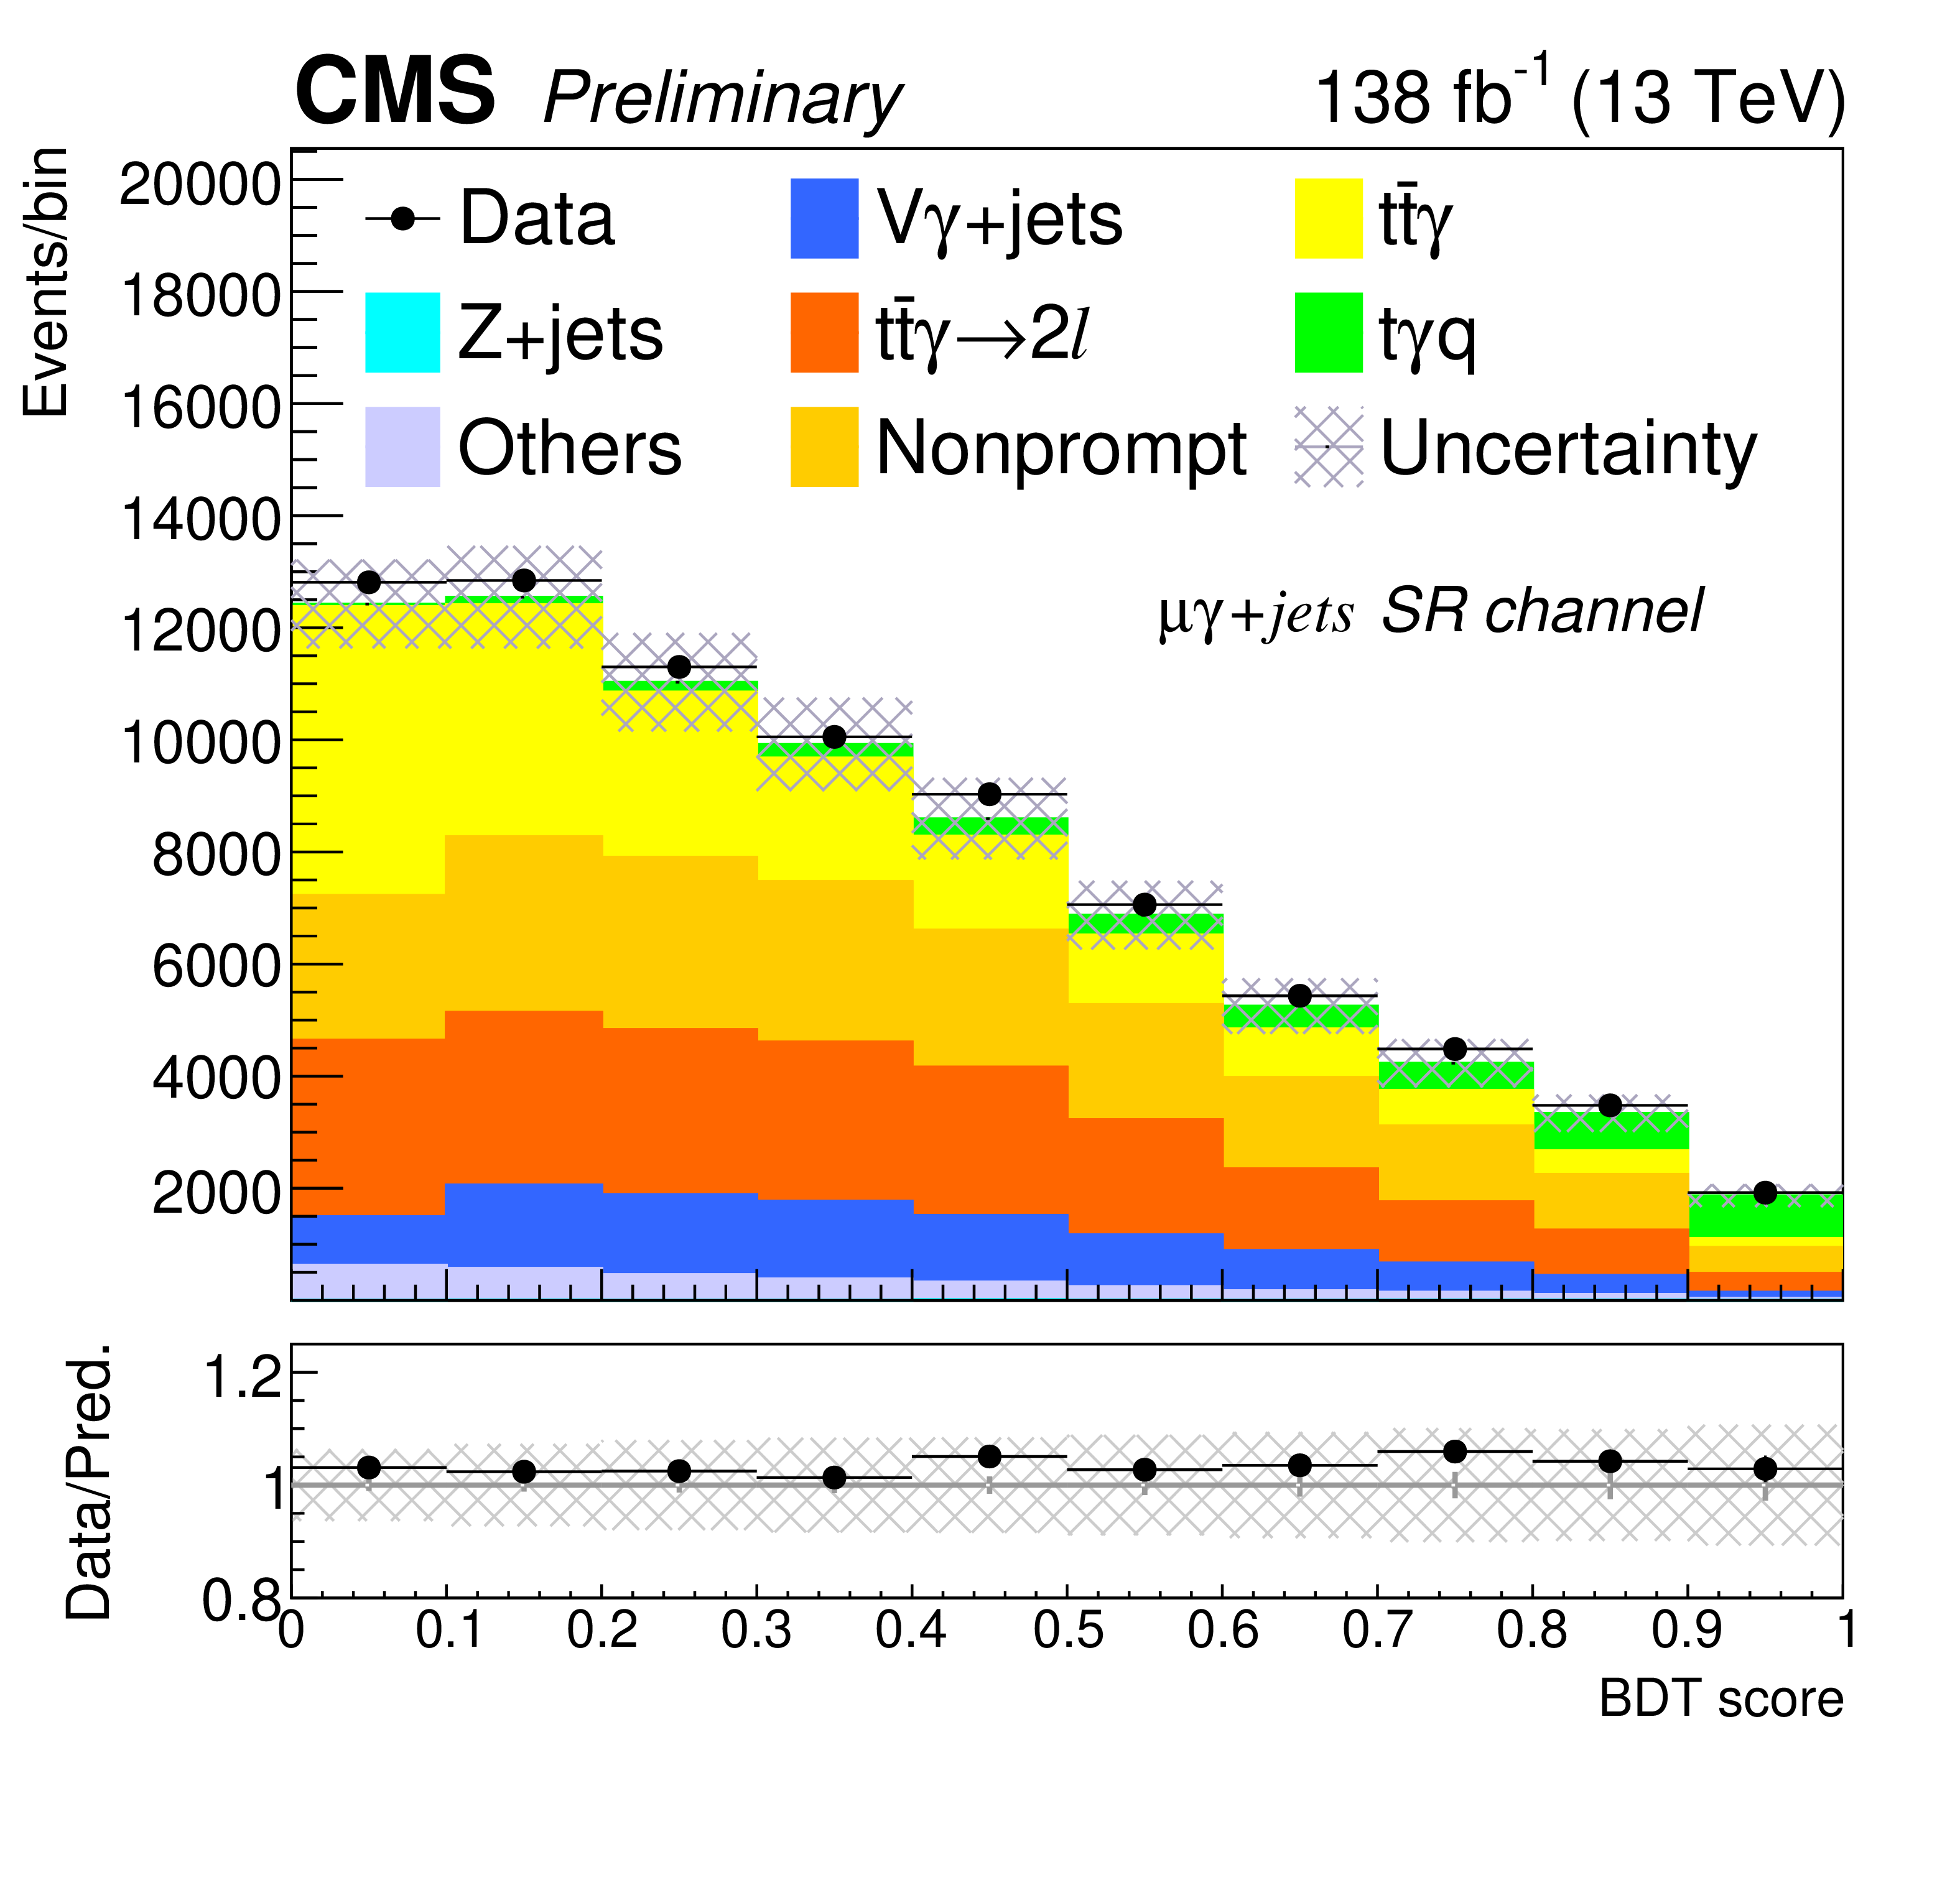
Figure 2-b:
The BDT score distribution before the fit in the electron (left) and muon (right) channels, where the misID contribution is normalized using factors from the maximum likelihood fit. The hatched bands represent the total uncertainty in prediction. The lower panel shows the ratio of the data to the total prediction. |
png pdf |
Figure 3:
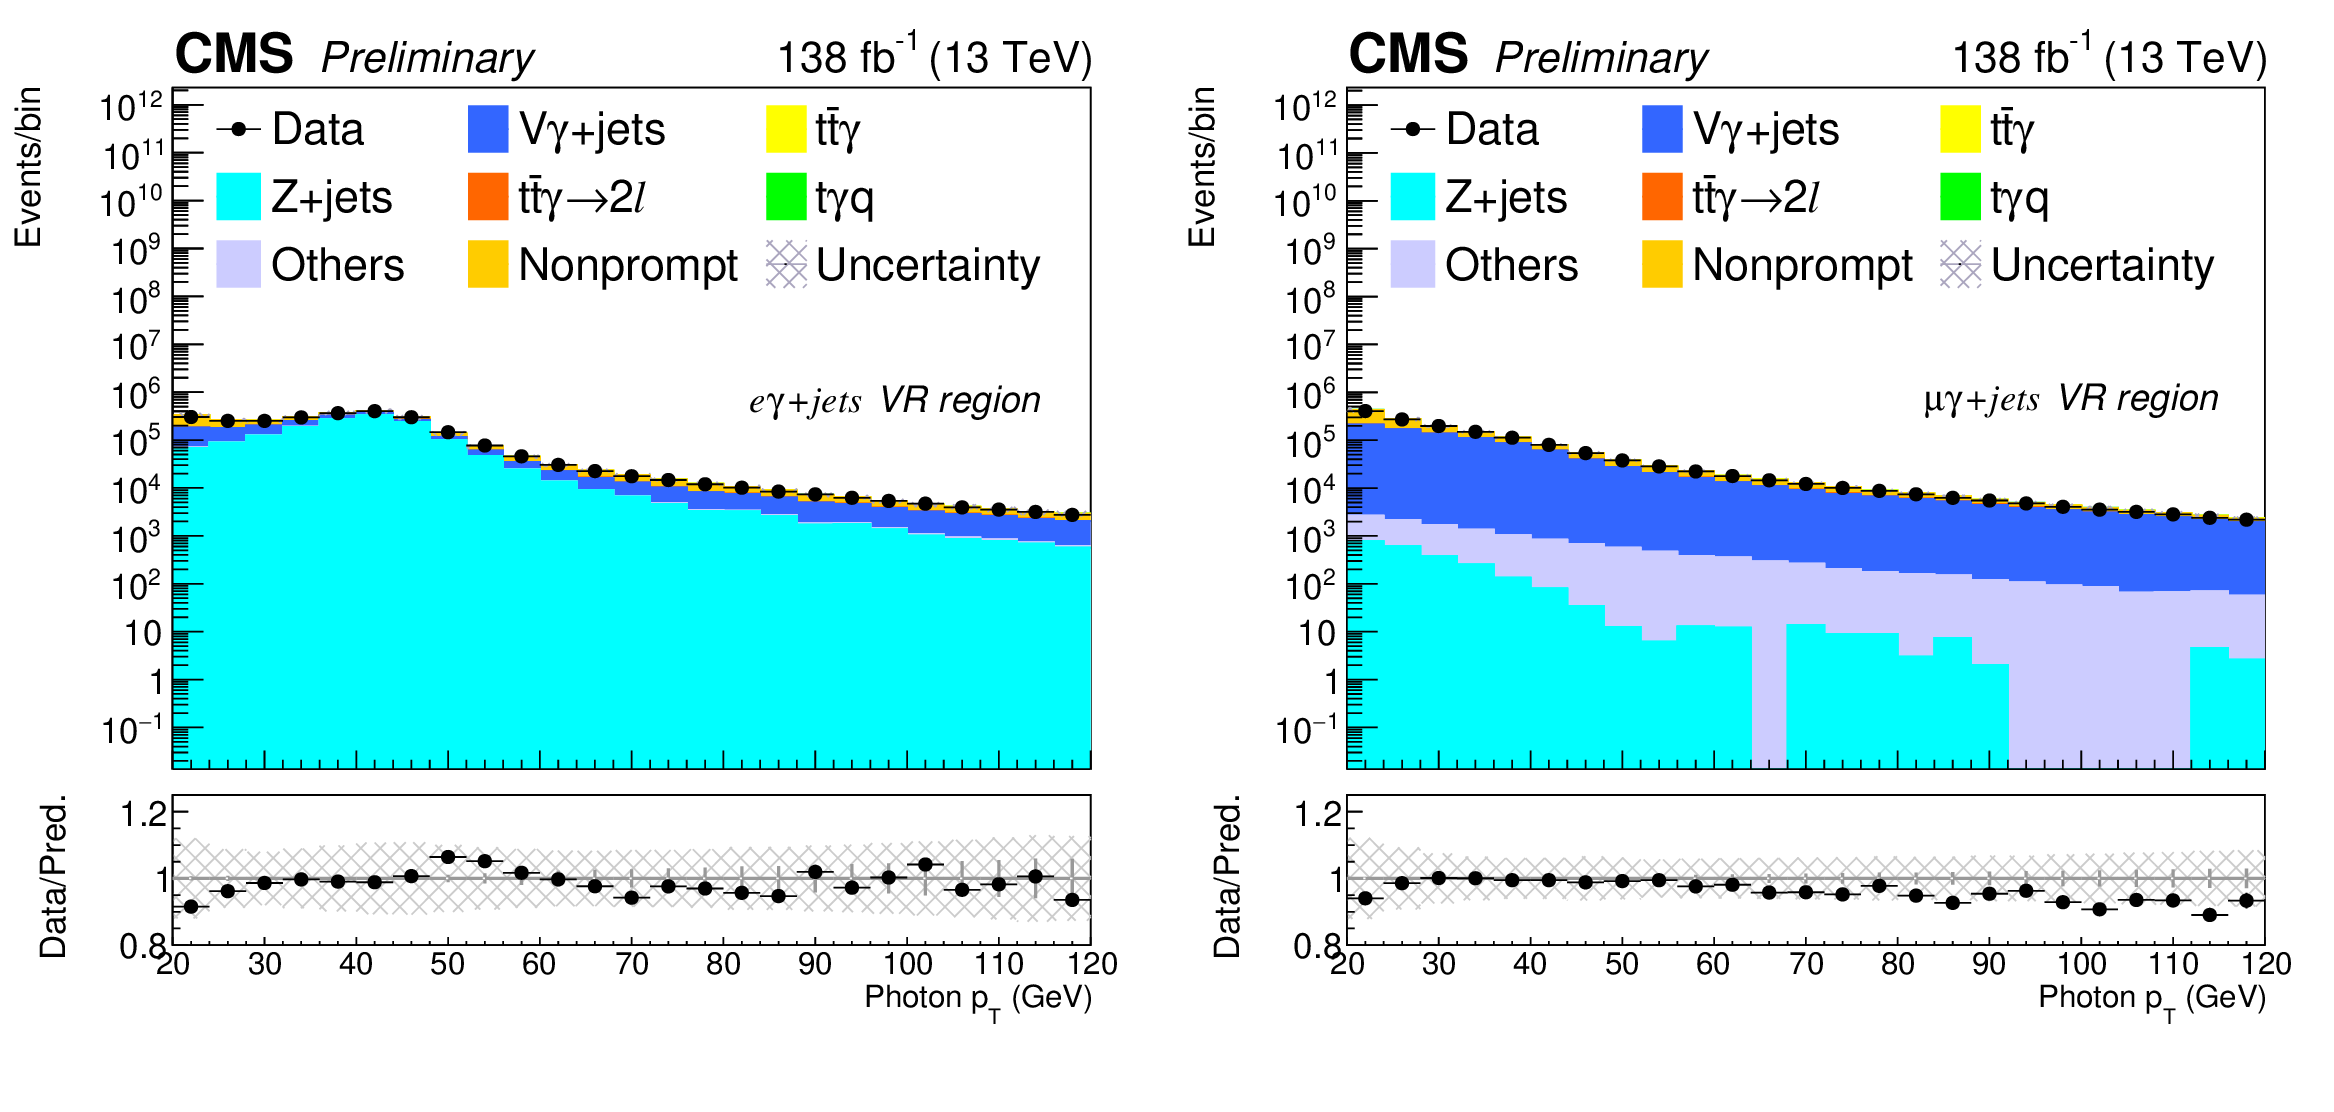
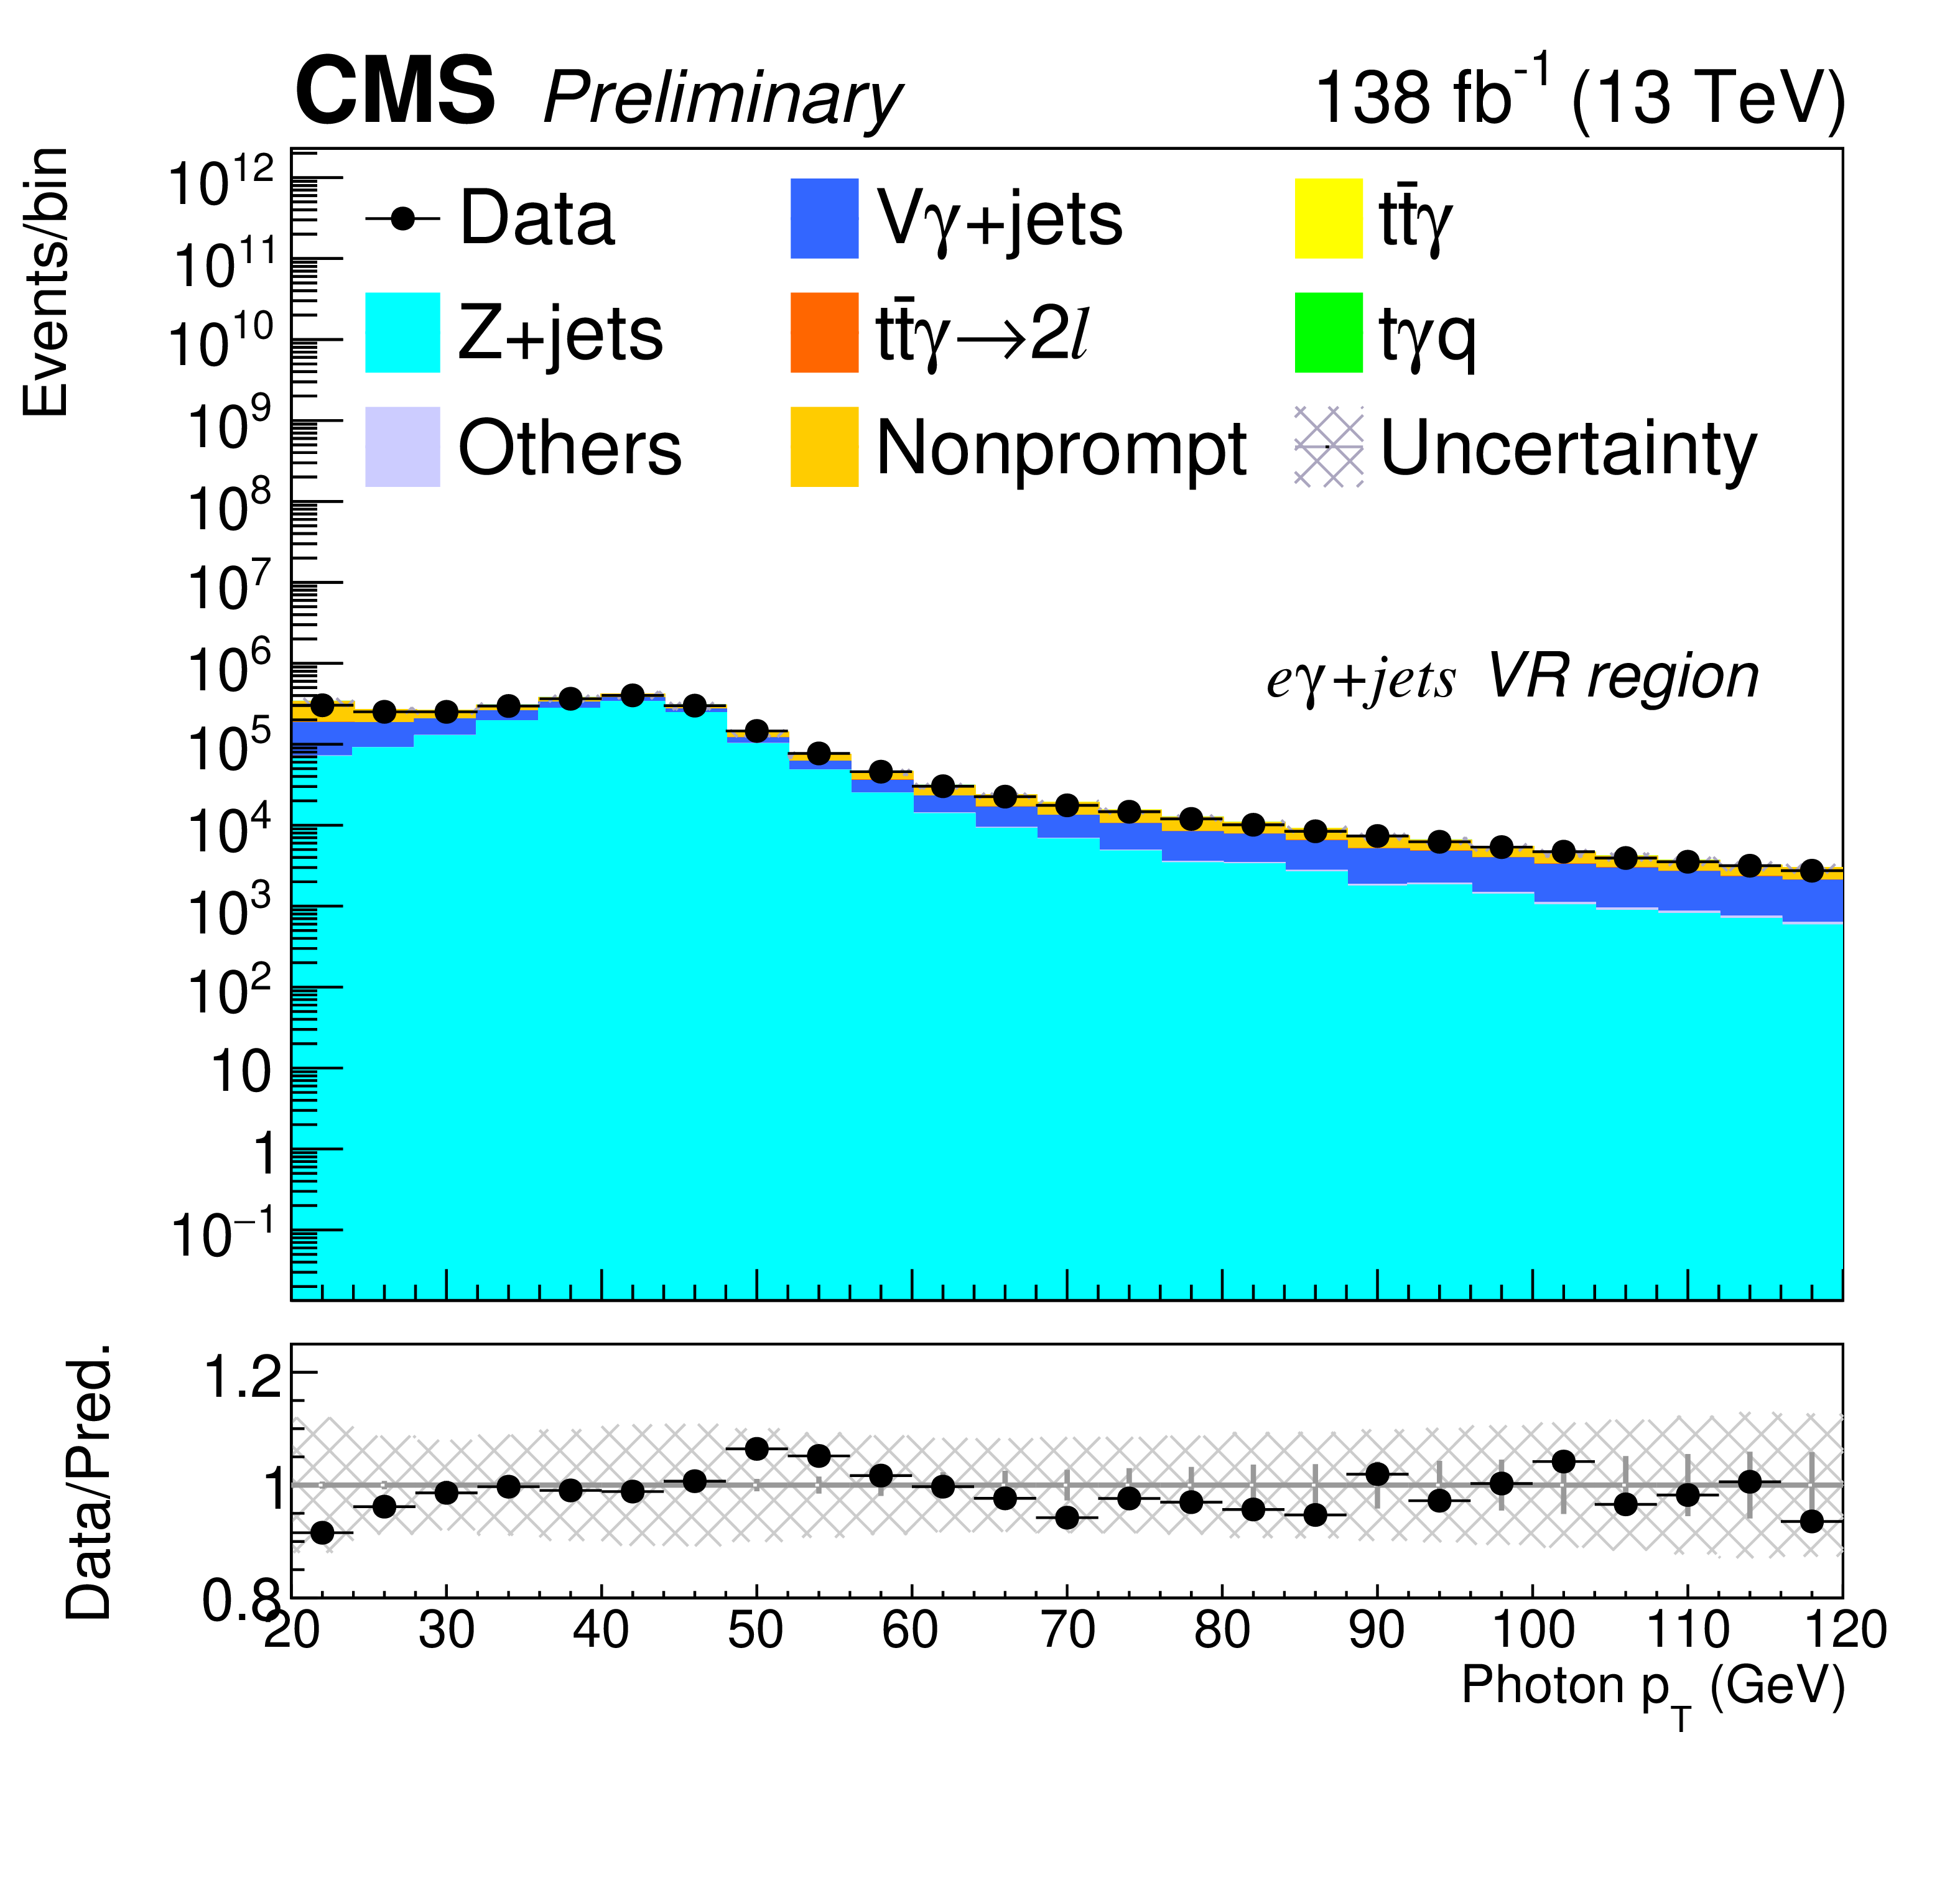
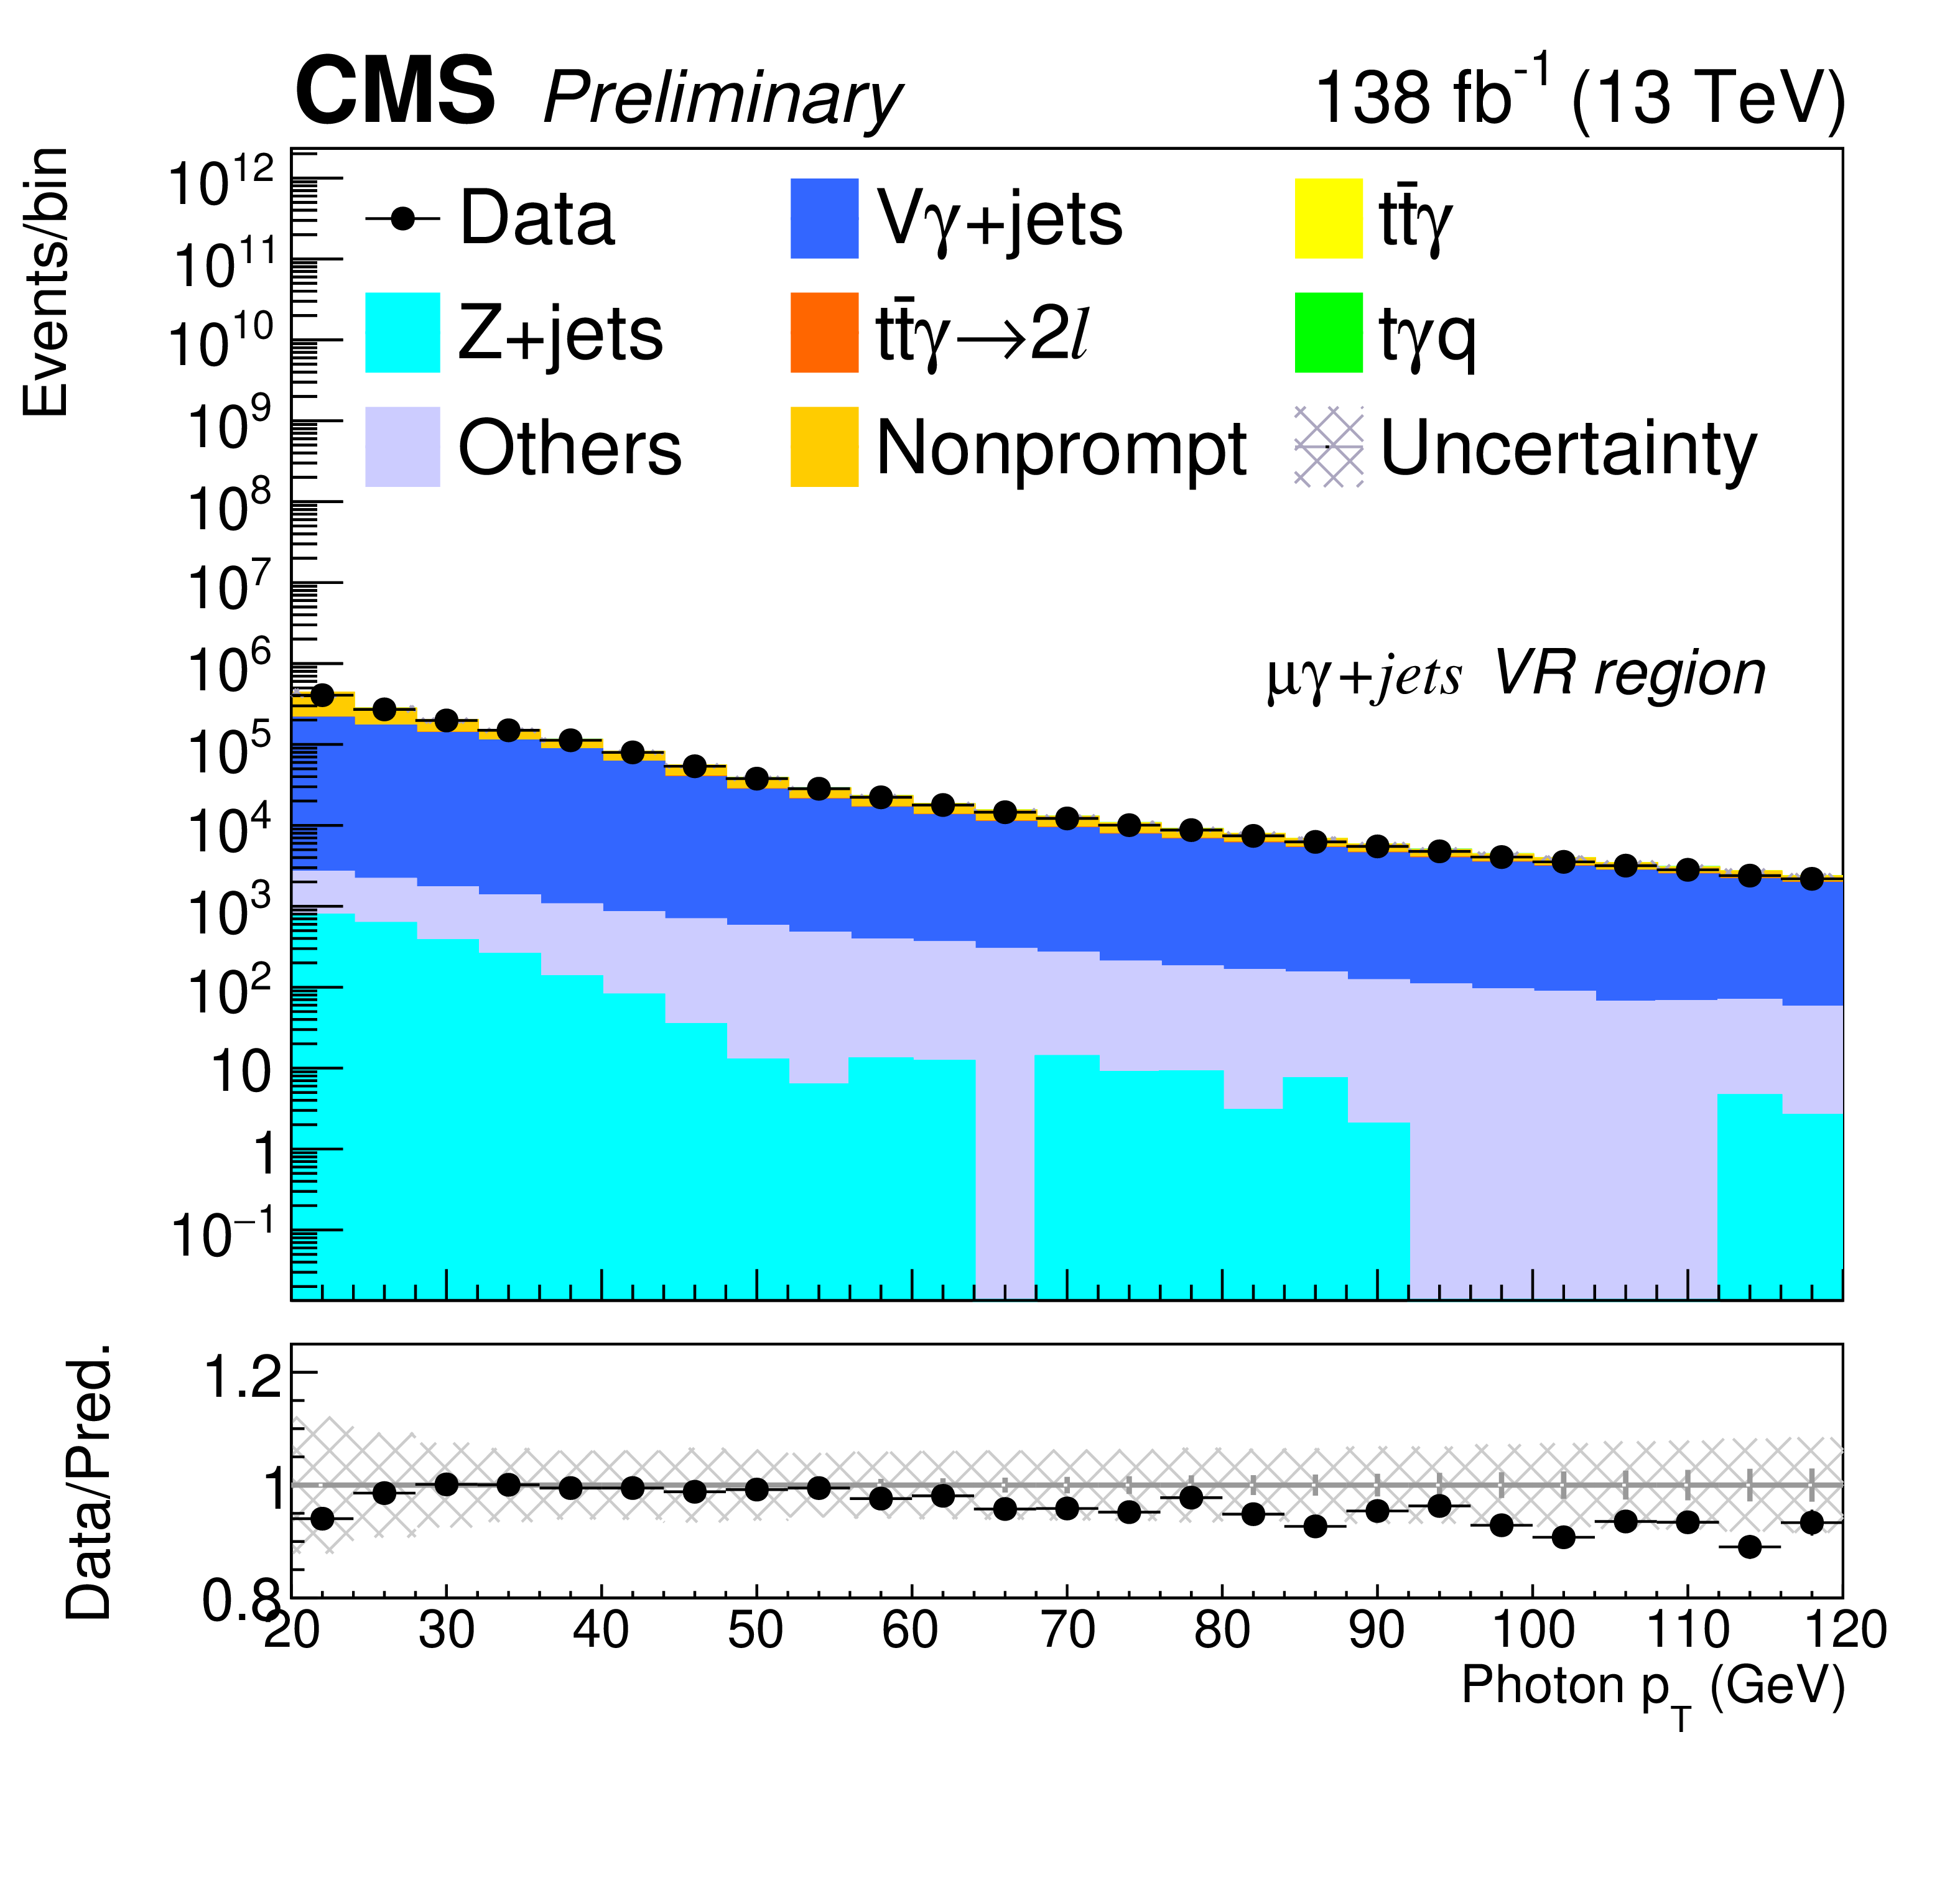
The photon $ p_{\mathrm{T}} $ distribution in the $ \mathrm{V}\gamma $ validation region before the fit in the electron (right) and muon (left) channels. The misID contribution in $ \mathrm{Z}+ $jets is normalized using factors derived from the $ m_{\ell\gamma} $ distribution. The hatched bands represent the total uncertainty in prediction. The lower panel shows the ratio of the data to the total prediction. |
png pdf |
Figure 3-a:
The photon $ p_{\mathrm{T}} $ distribution in the $ \mathrm{V}\gamma $ validation region before the fit in the electron (right) and muon (left) channels. The misID contribution in $ \mathrm{Z}+ $jets is normalized using factors derived from the $ m_{\ell\gamma} $ distribution. The hatched bands represent the total uncertainty in prediction. The lower panel shows the ratio of the data to the total prediction. |
png pdf |
Figure 3-b:
The photon $ p_{\mathrm{T}} $ distribution in the $ \mathrm{V}\gamma $ validation region before the fit in the electron (right) and muon (left) channels. The misID contribution in $ \mathrm{Z}+ $jets is normalized using factors derived from the $ m_{\ell\gamma} $ distribution. The hatched bands represent the total uncertainty in prediction. The lower panel shows the ratio of the data to the total prediction. |
png pdf |
Figure 4:
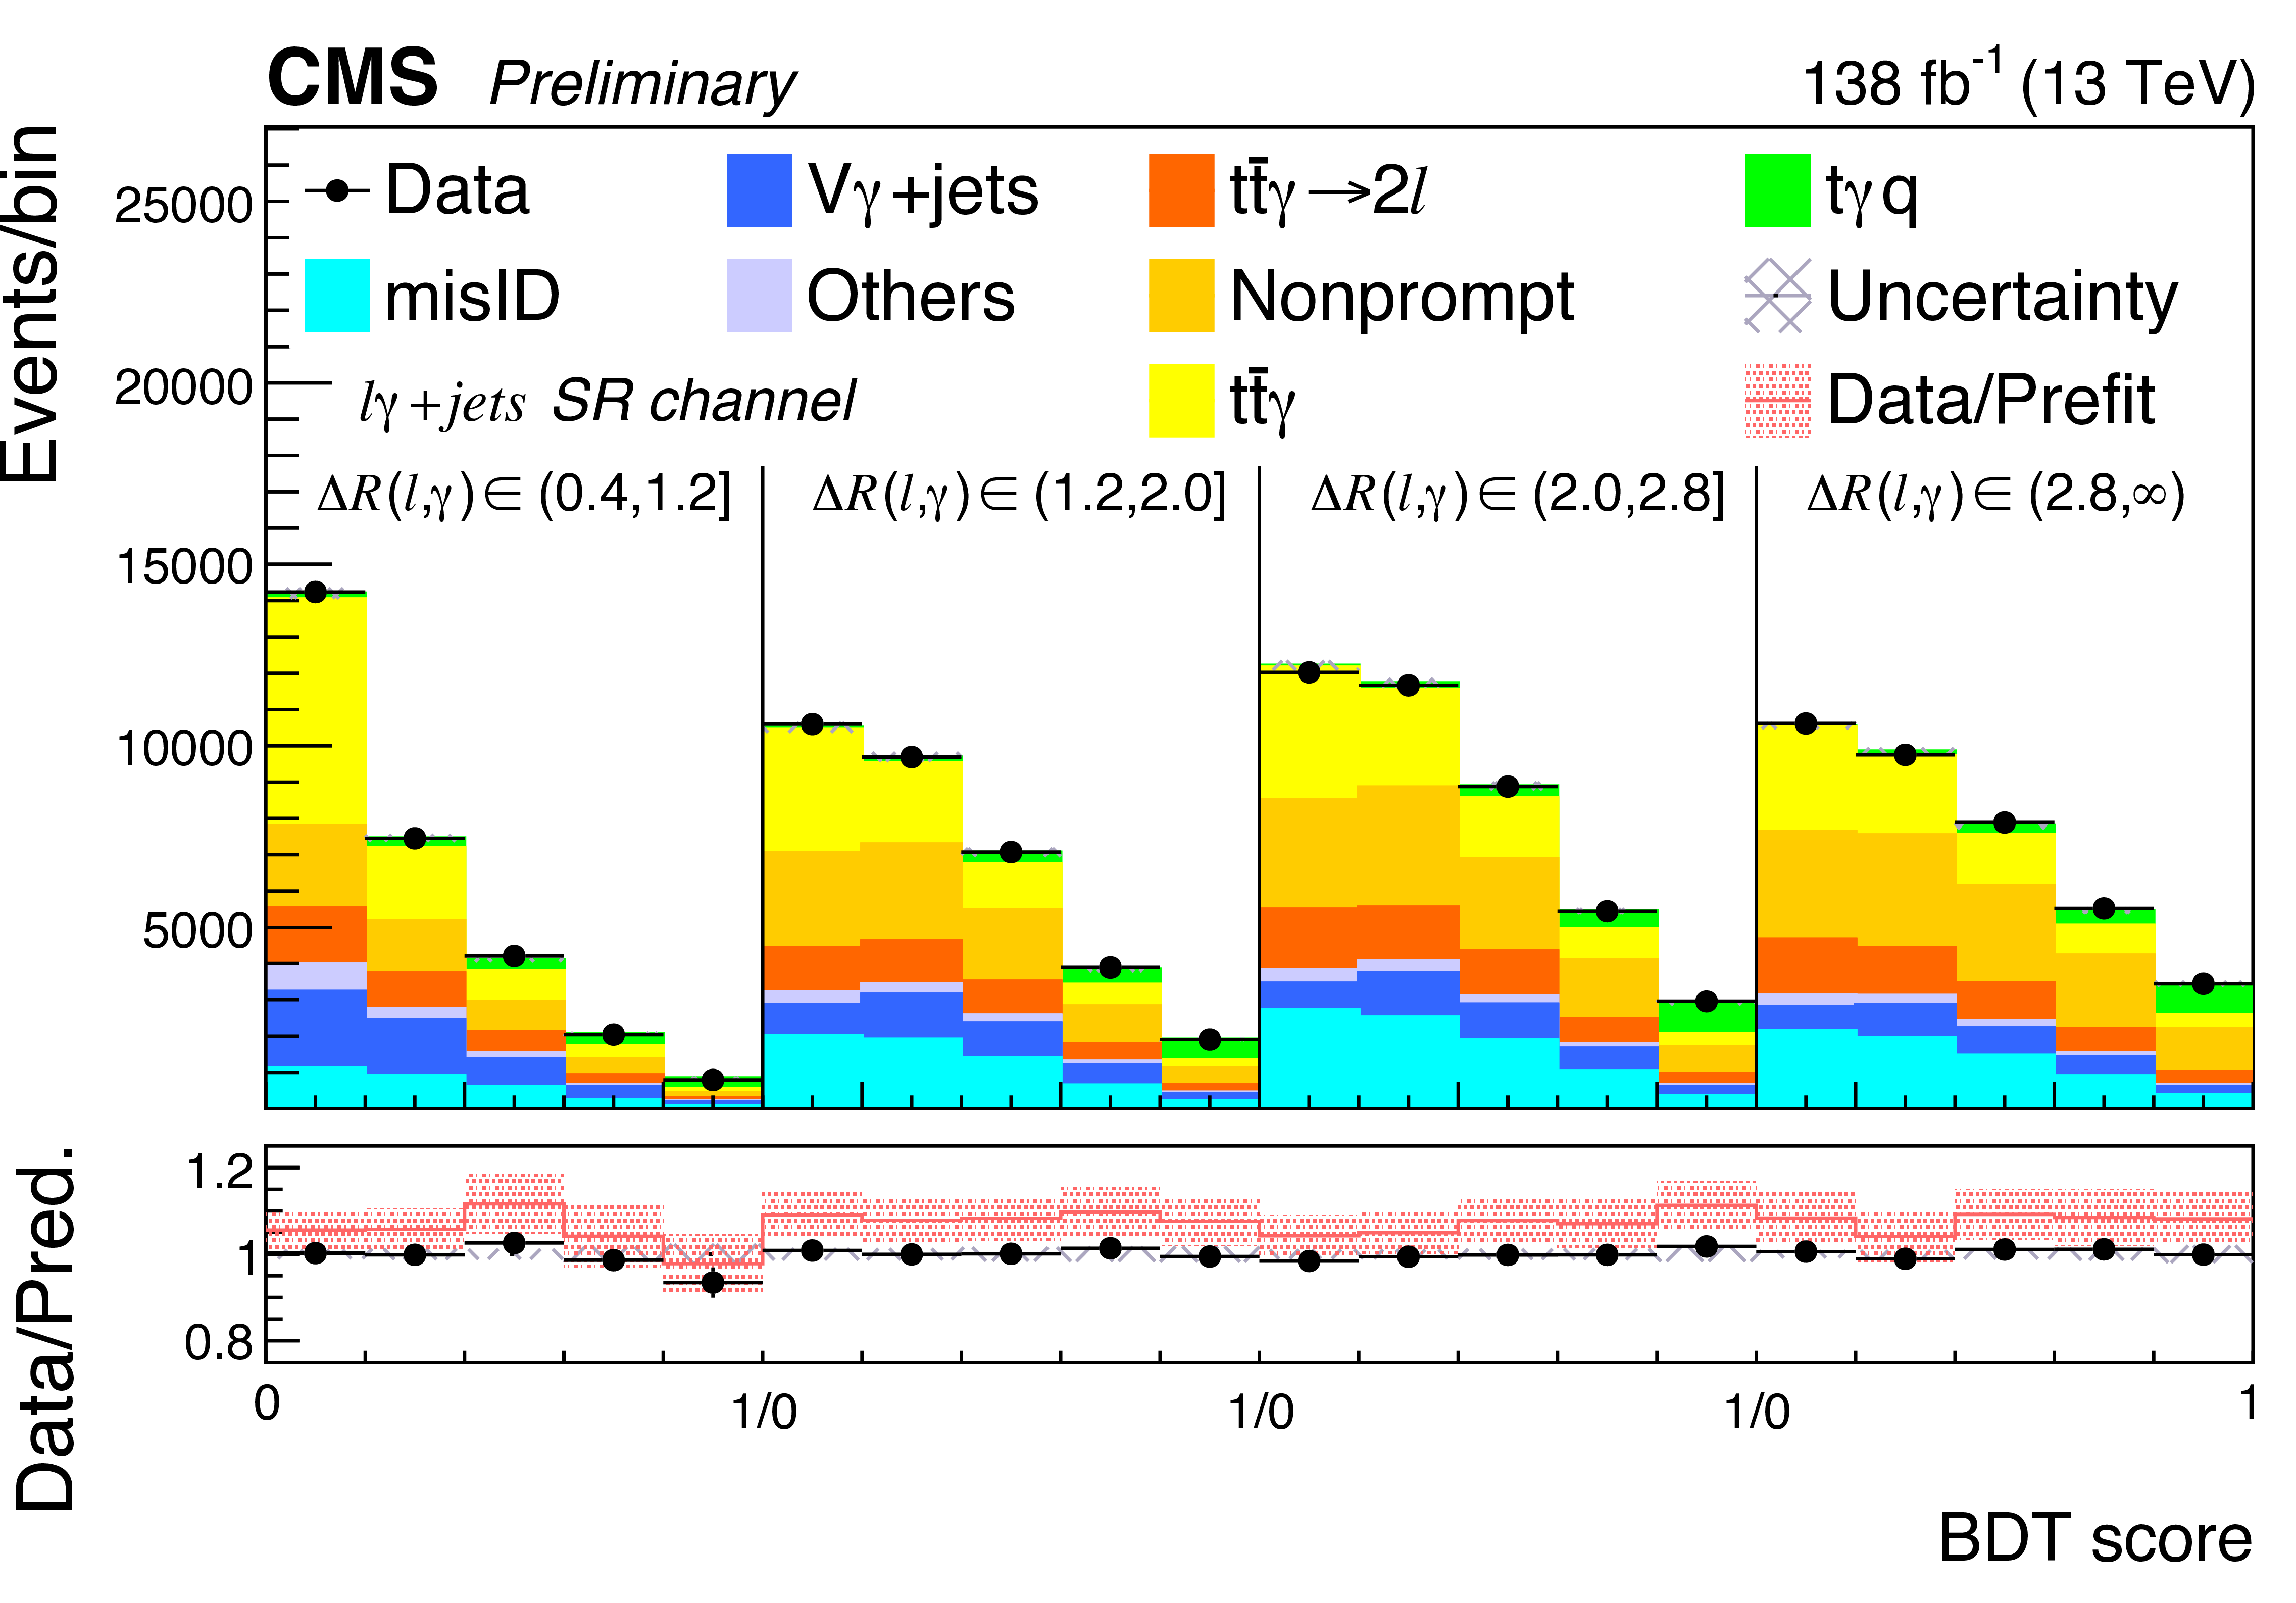
The unrolled 2D distribution of BDT score and $ \Delta R(\ell,\gamma) $ after the maximum likelihood fit in SR for the combined electron and muon channels from full Run 2 data and simulated samples. The lower panels show the ratio of the observed to the predicted event yields, and the red band represents the ratio of data to the prediction before the fit with uncertainties from data statistics and prediction propagated. |
png pdf |
Figure 5:
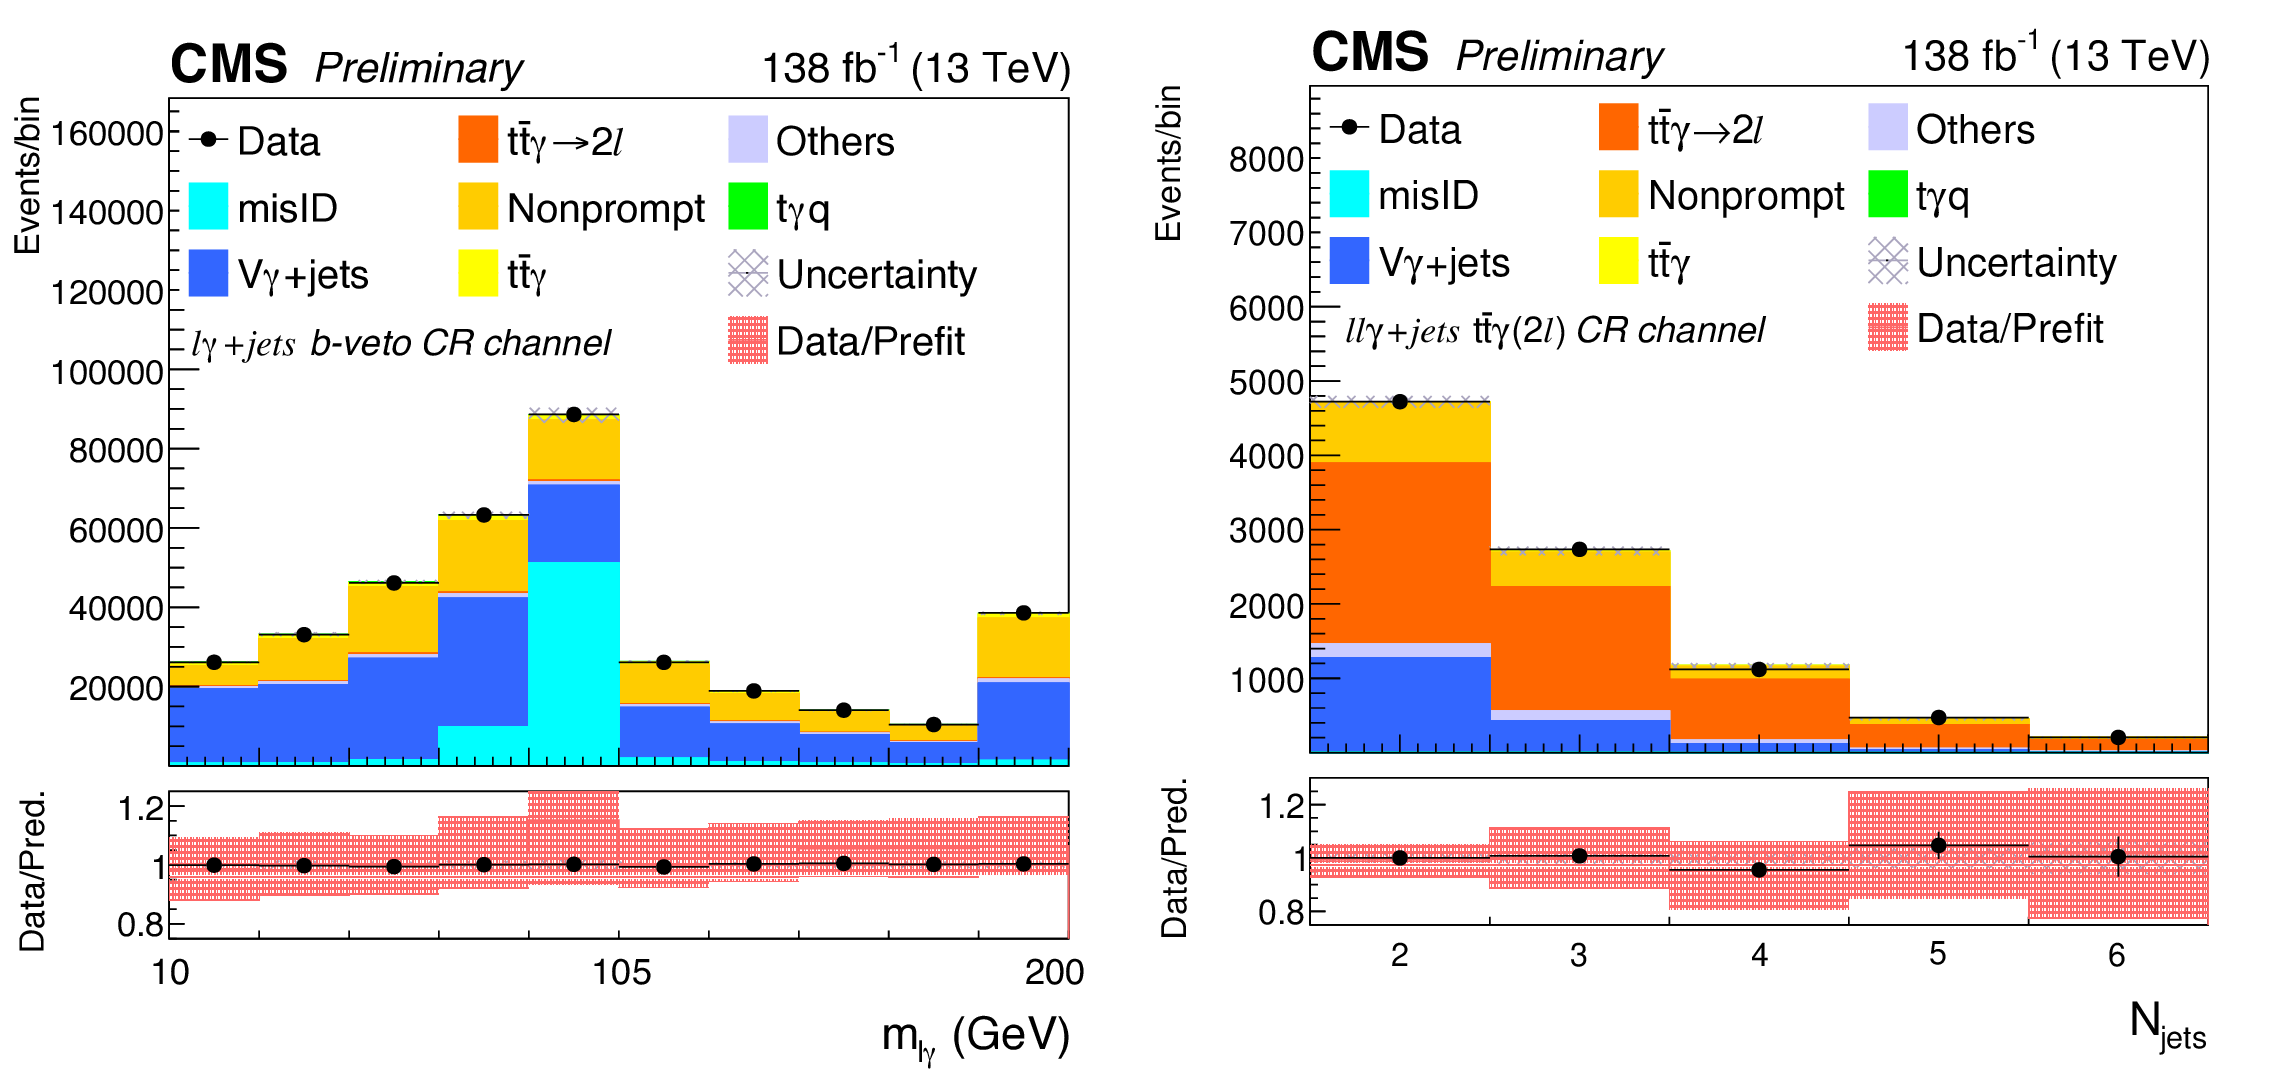
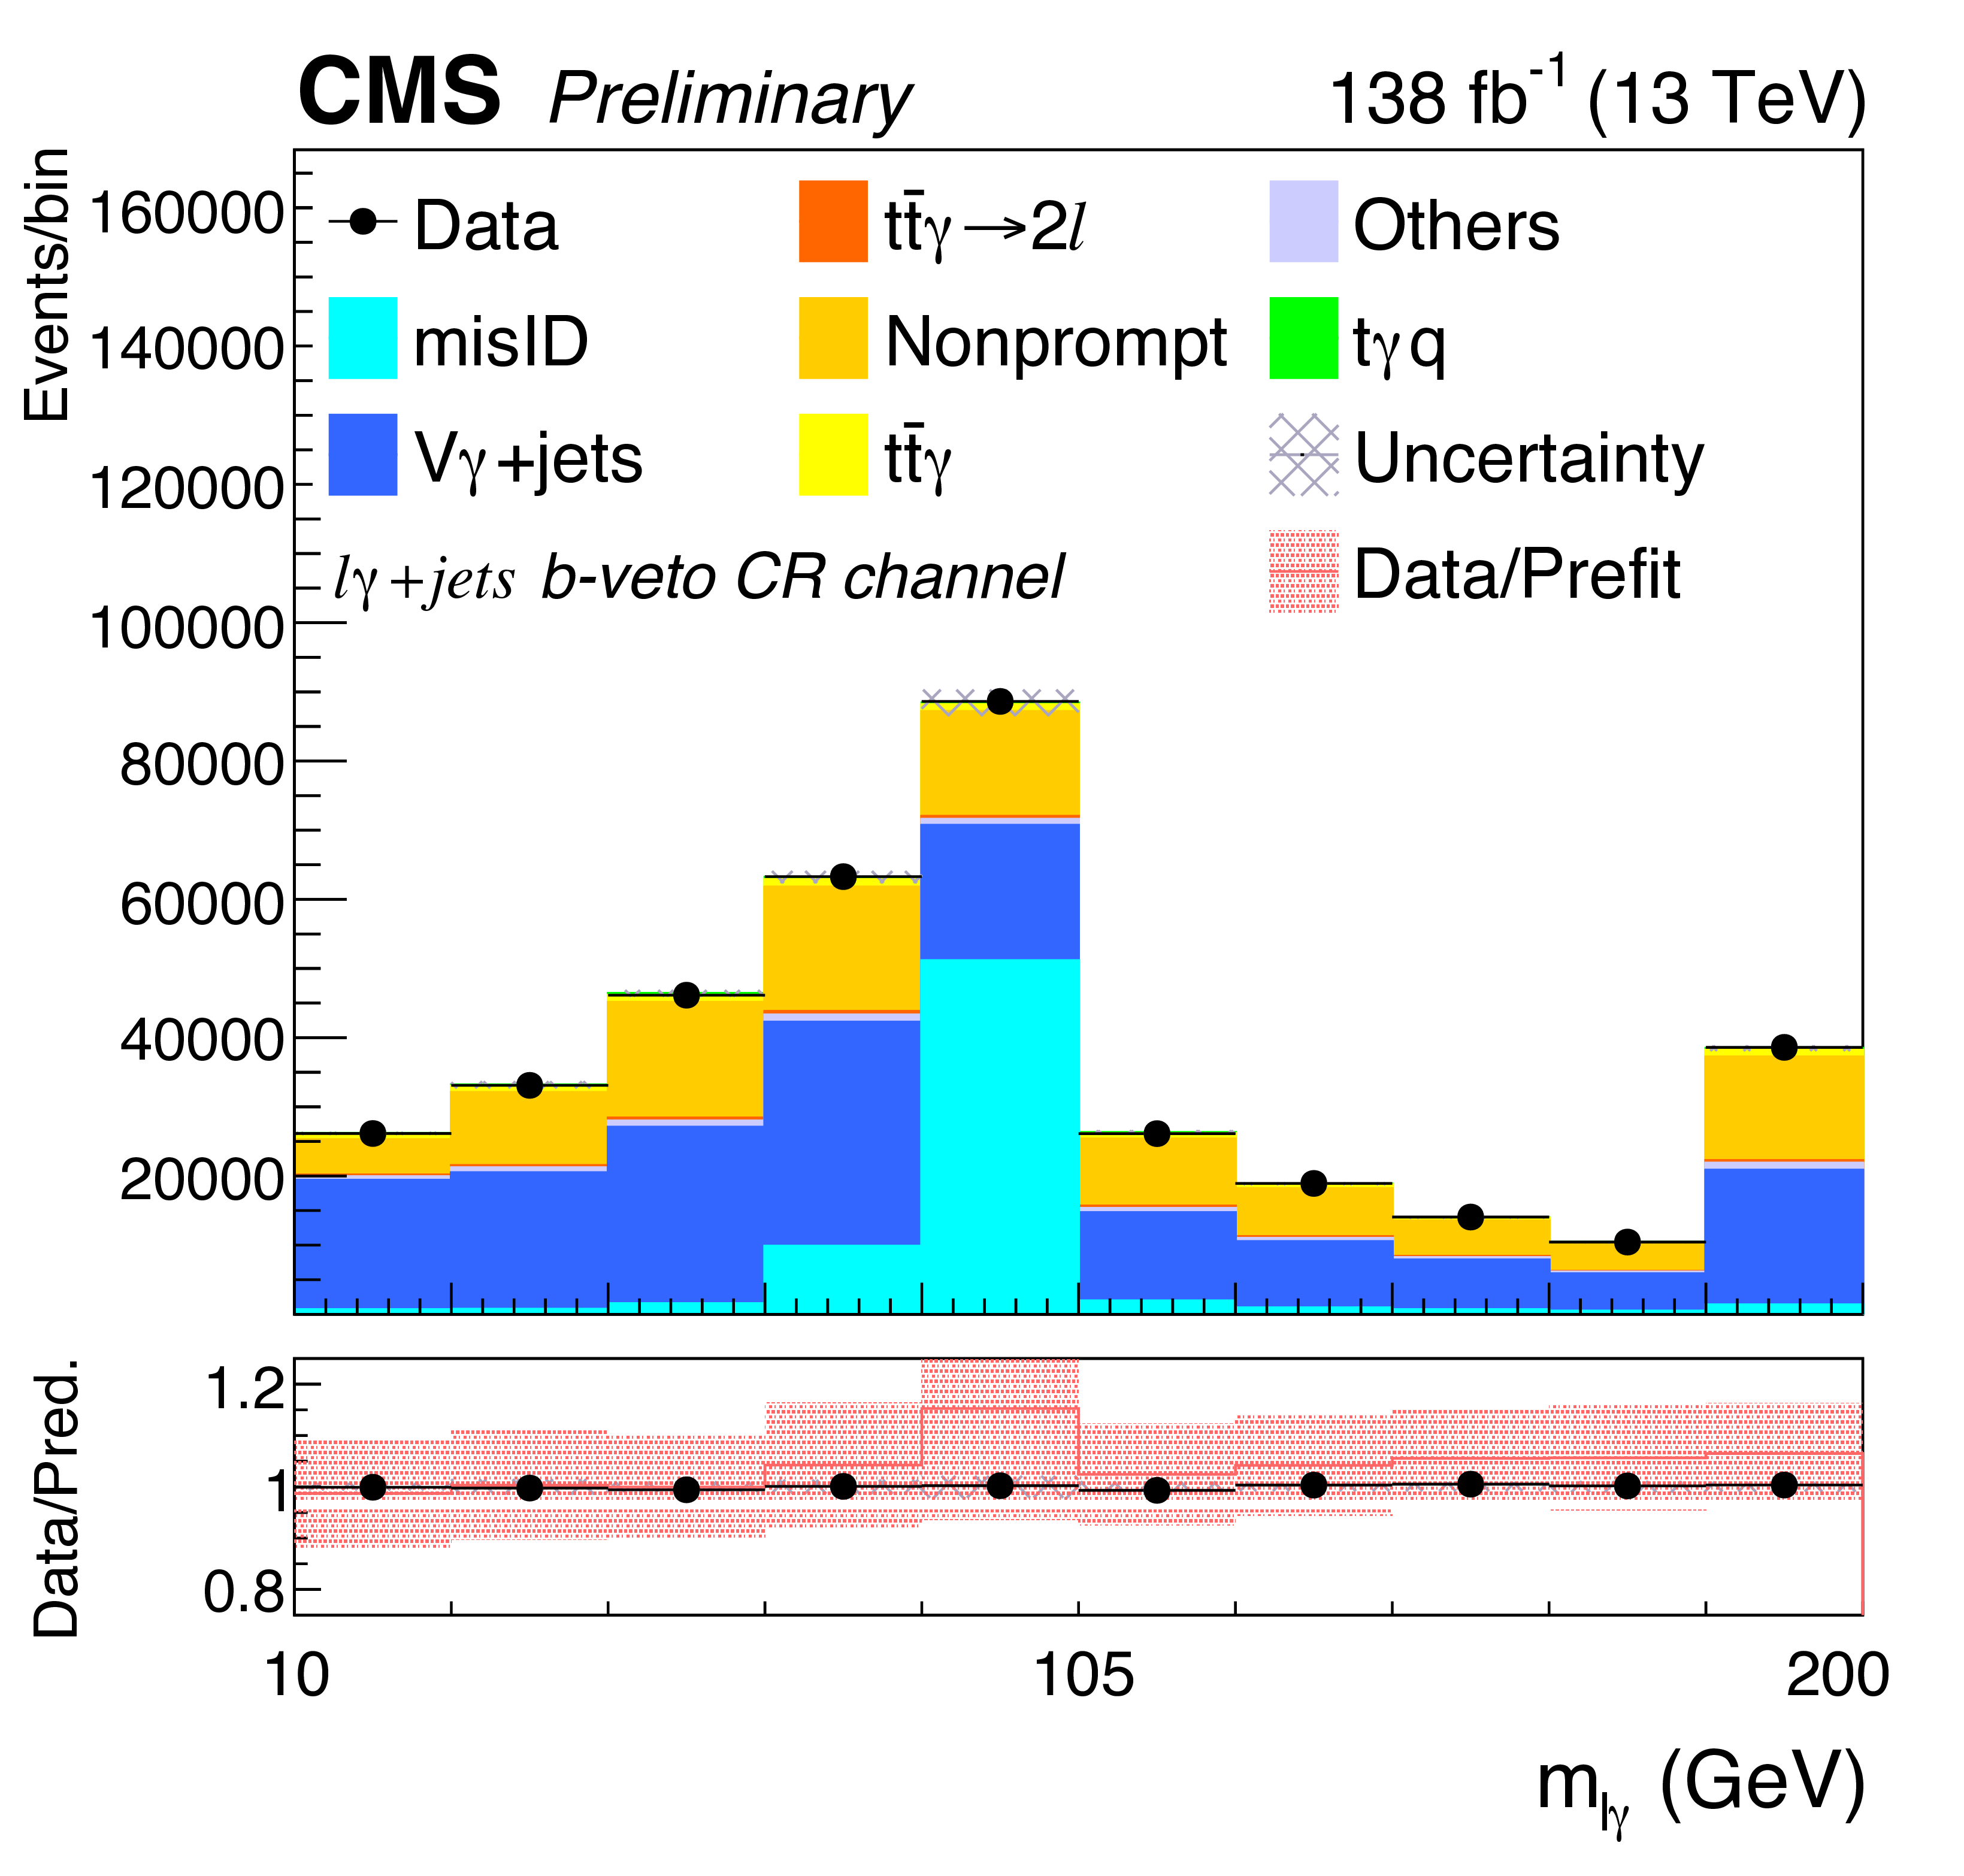
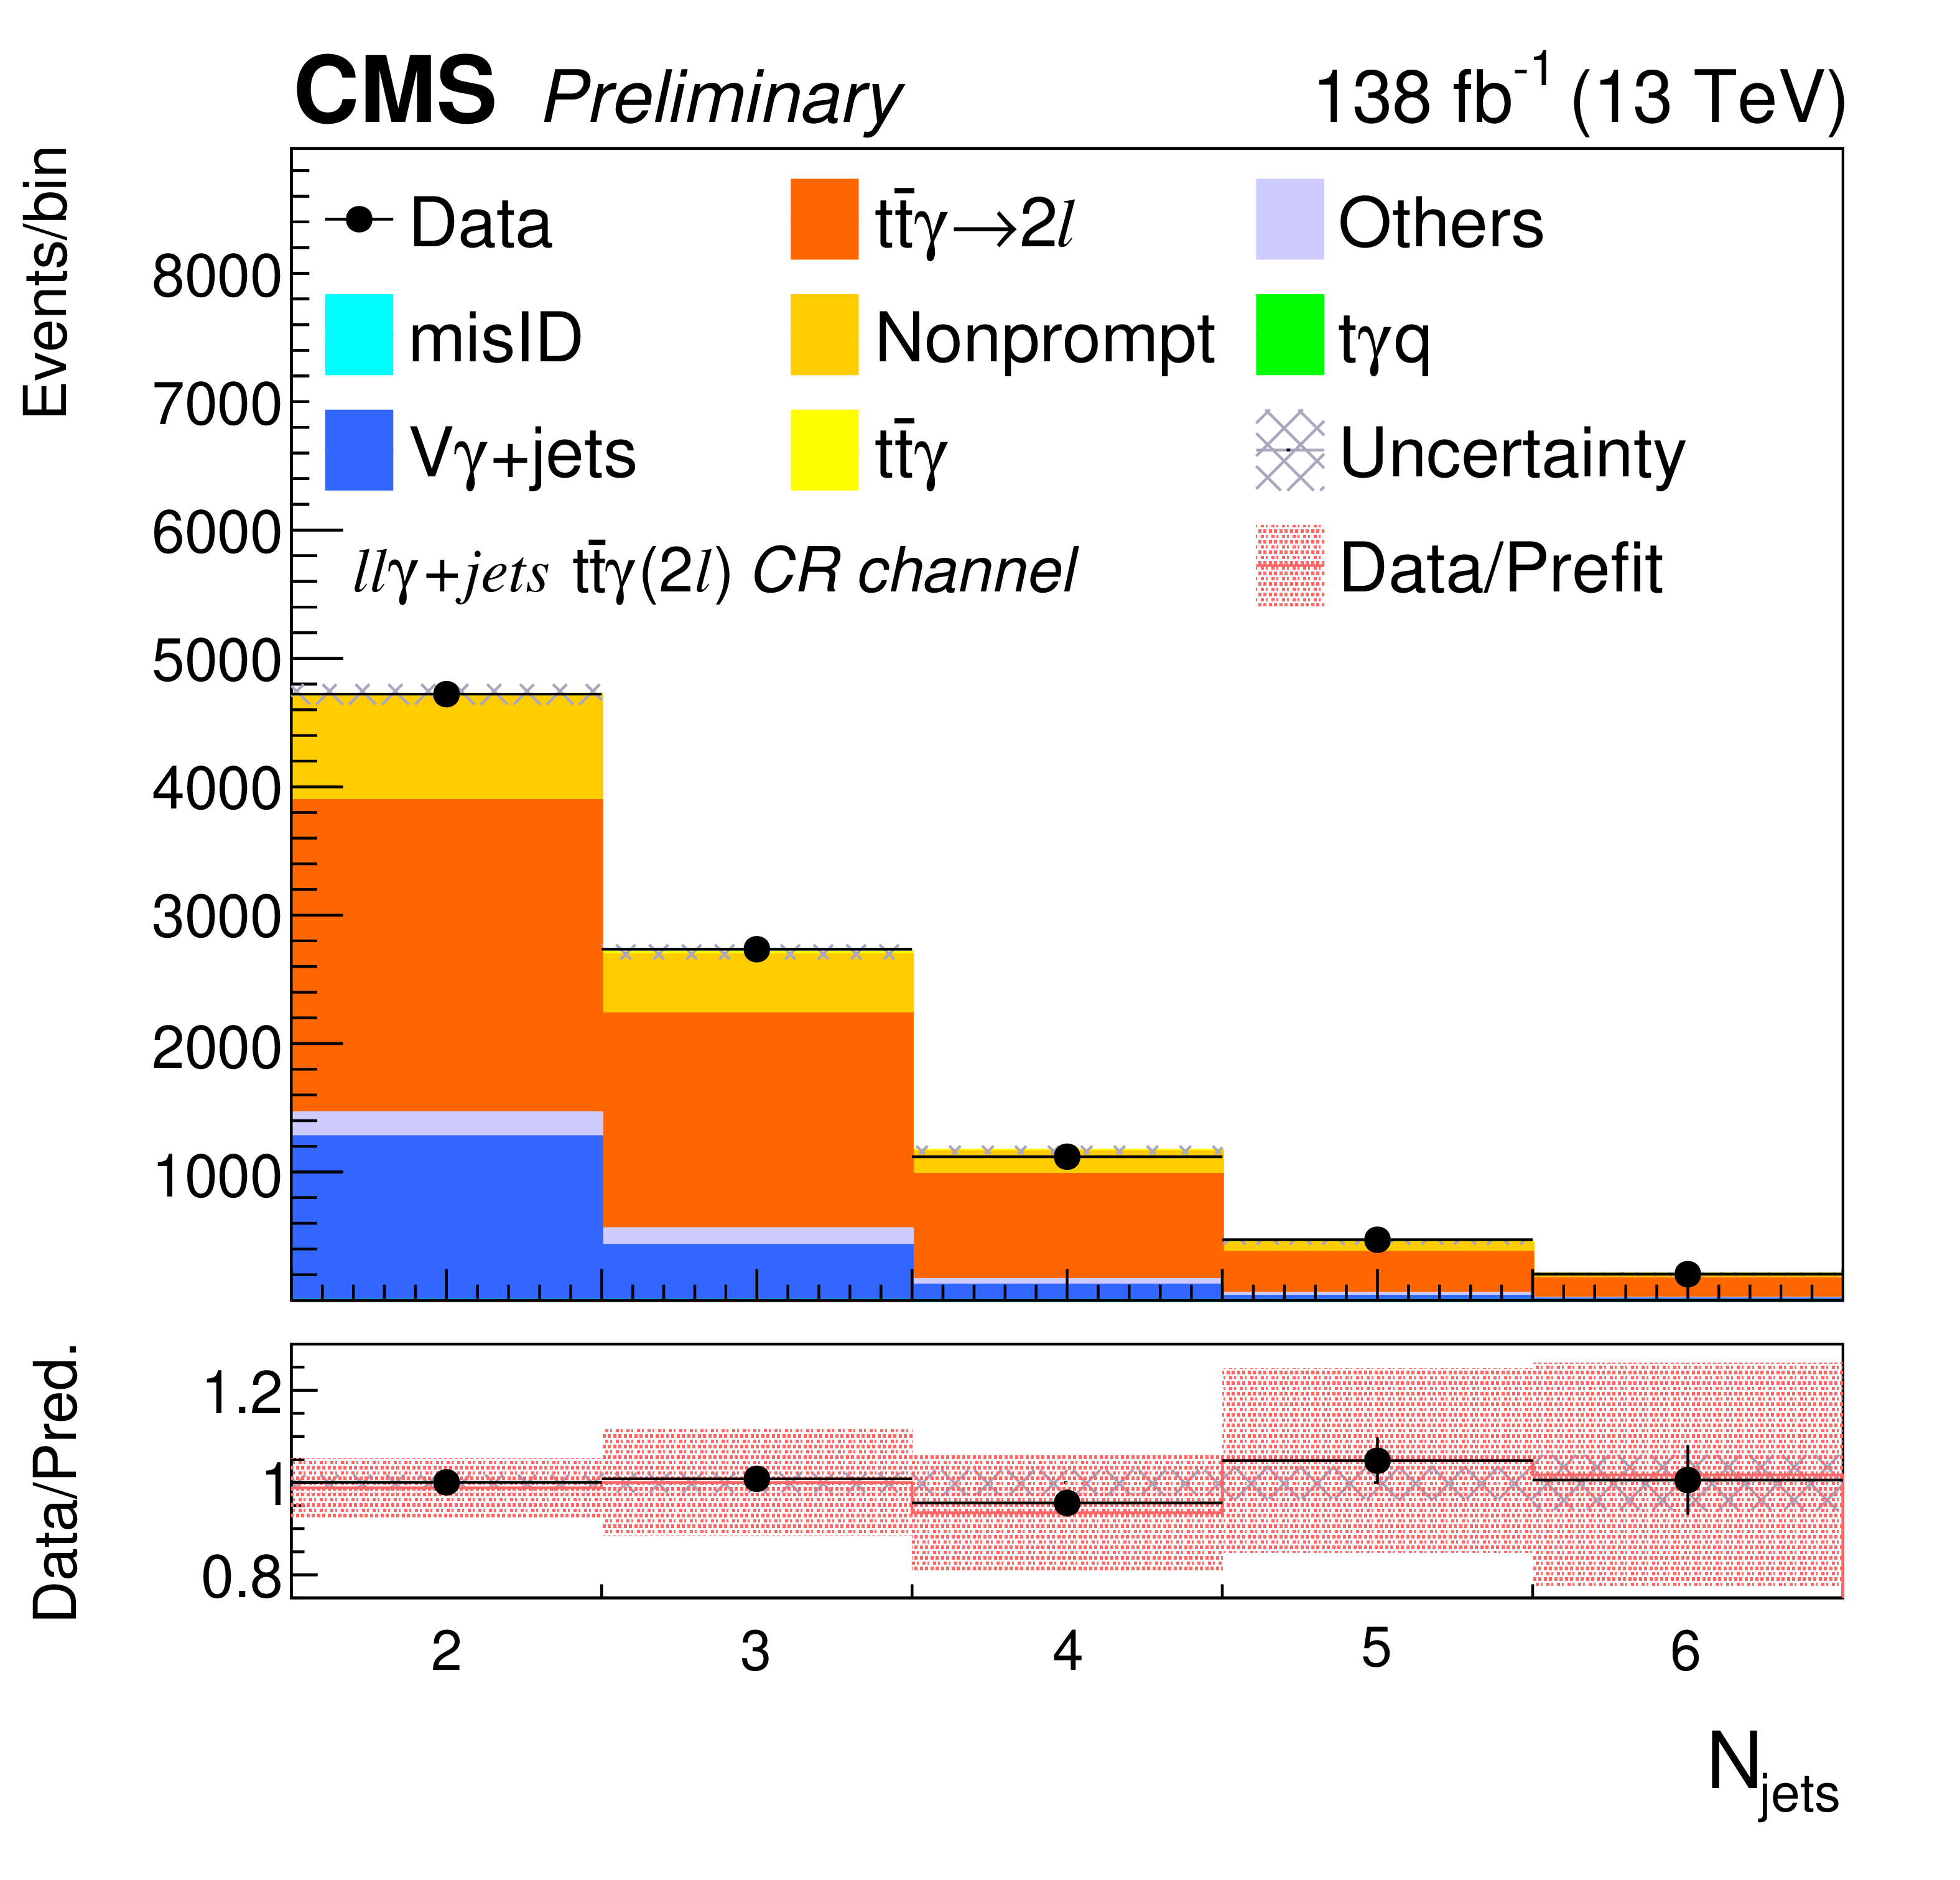
The distributions of $ m_{\ell\gamma} $ in b-veto CR (left) and $ N_{\mathrm{jets}} $ in the 2 $ \ell $ CR (right) after the maximum likelihood fit for the combined electron and muon channels from full Run 2 data and simulated samples. The lower panels show the ratio of the observed to the predicted event yields, and the red band represents the ratio of data to the prediction before the fit with uncertainties from data statistics and prediction propagated. |
png pdf |
Figure 5-a:
The distributions of $ m_{\ell\gamma} $ in b-veto CR (left) and $ N_{\mathrm{jets}} $ in the 2 $ \ell $ CR (right) after the maximum likelihood fit for the combined electron and muon channels from full Run 2 data and simulated samples. The lower panels show the ratio of the observed to the predicted event yields, and the red band represents the ratio of data to the prediction before the fit with uncertainties from data statistics and prediction propagated. |
png pdf |
Figure 5-b:
The distributions of $ m_{\ell\gamma} $ in b-veto CR (left) and $ N_{\mathrm{jets}} $ in the 2 $ \ell $ CR (right) after the maximum likelihood fit for the combined electron and muon channels from full Run 2 data and simulated samples. The lower panels show the ratio of the observed to the predicted event yields, and the red band represents the ratio of data to the prediction before the fit with uncertainties from data statistics and prediction propagated. |
png pdf |
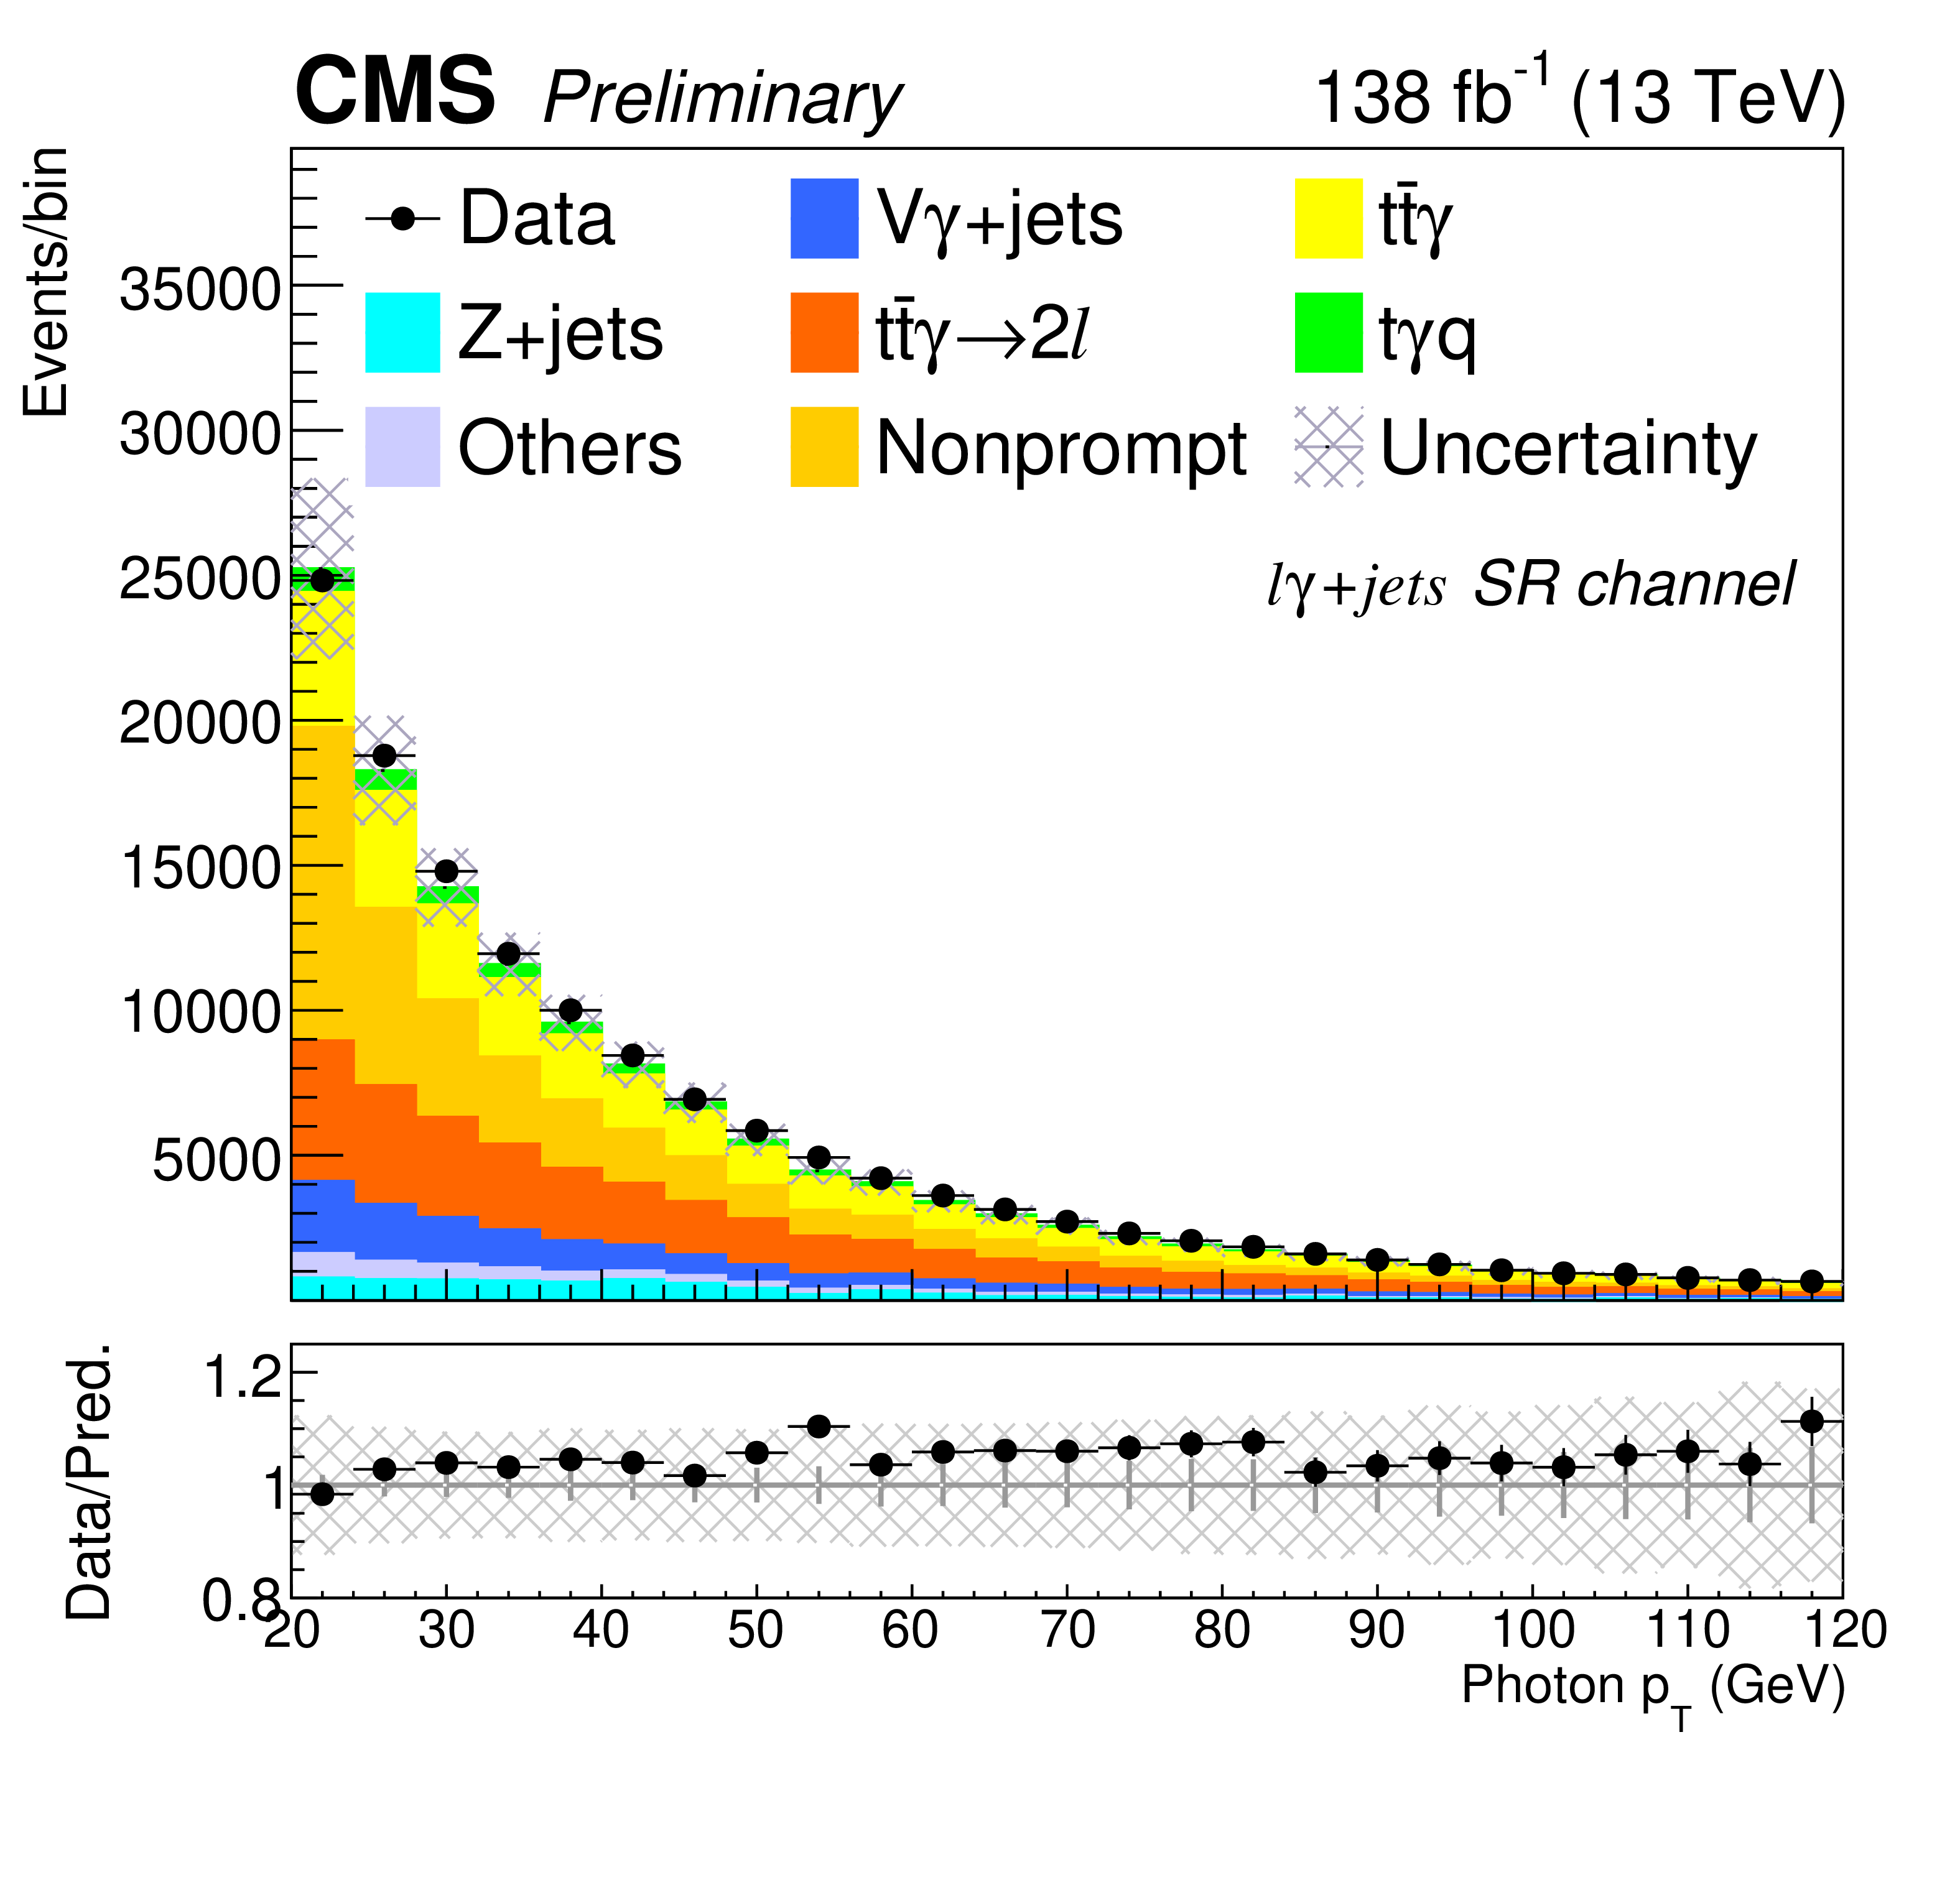
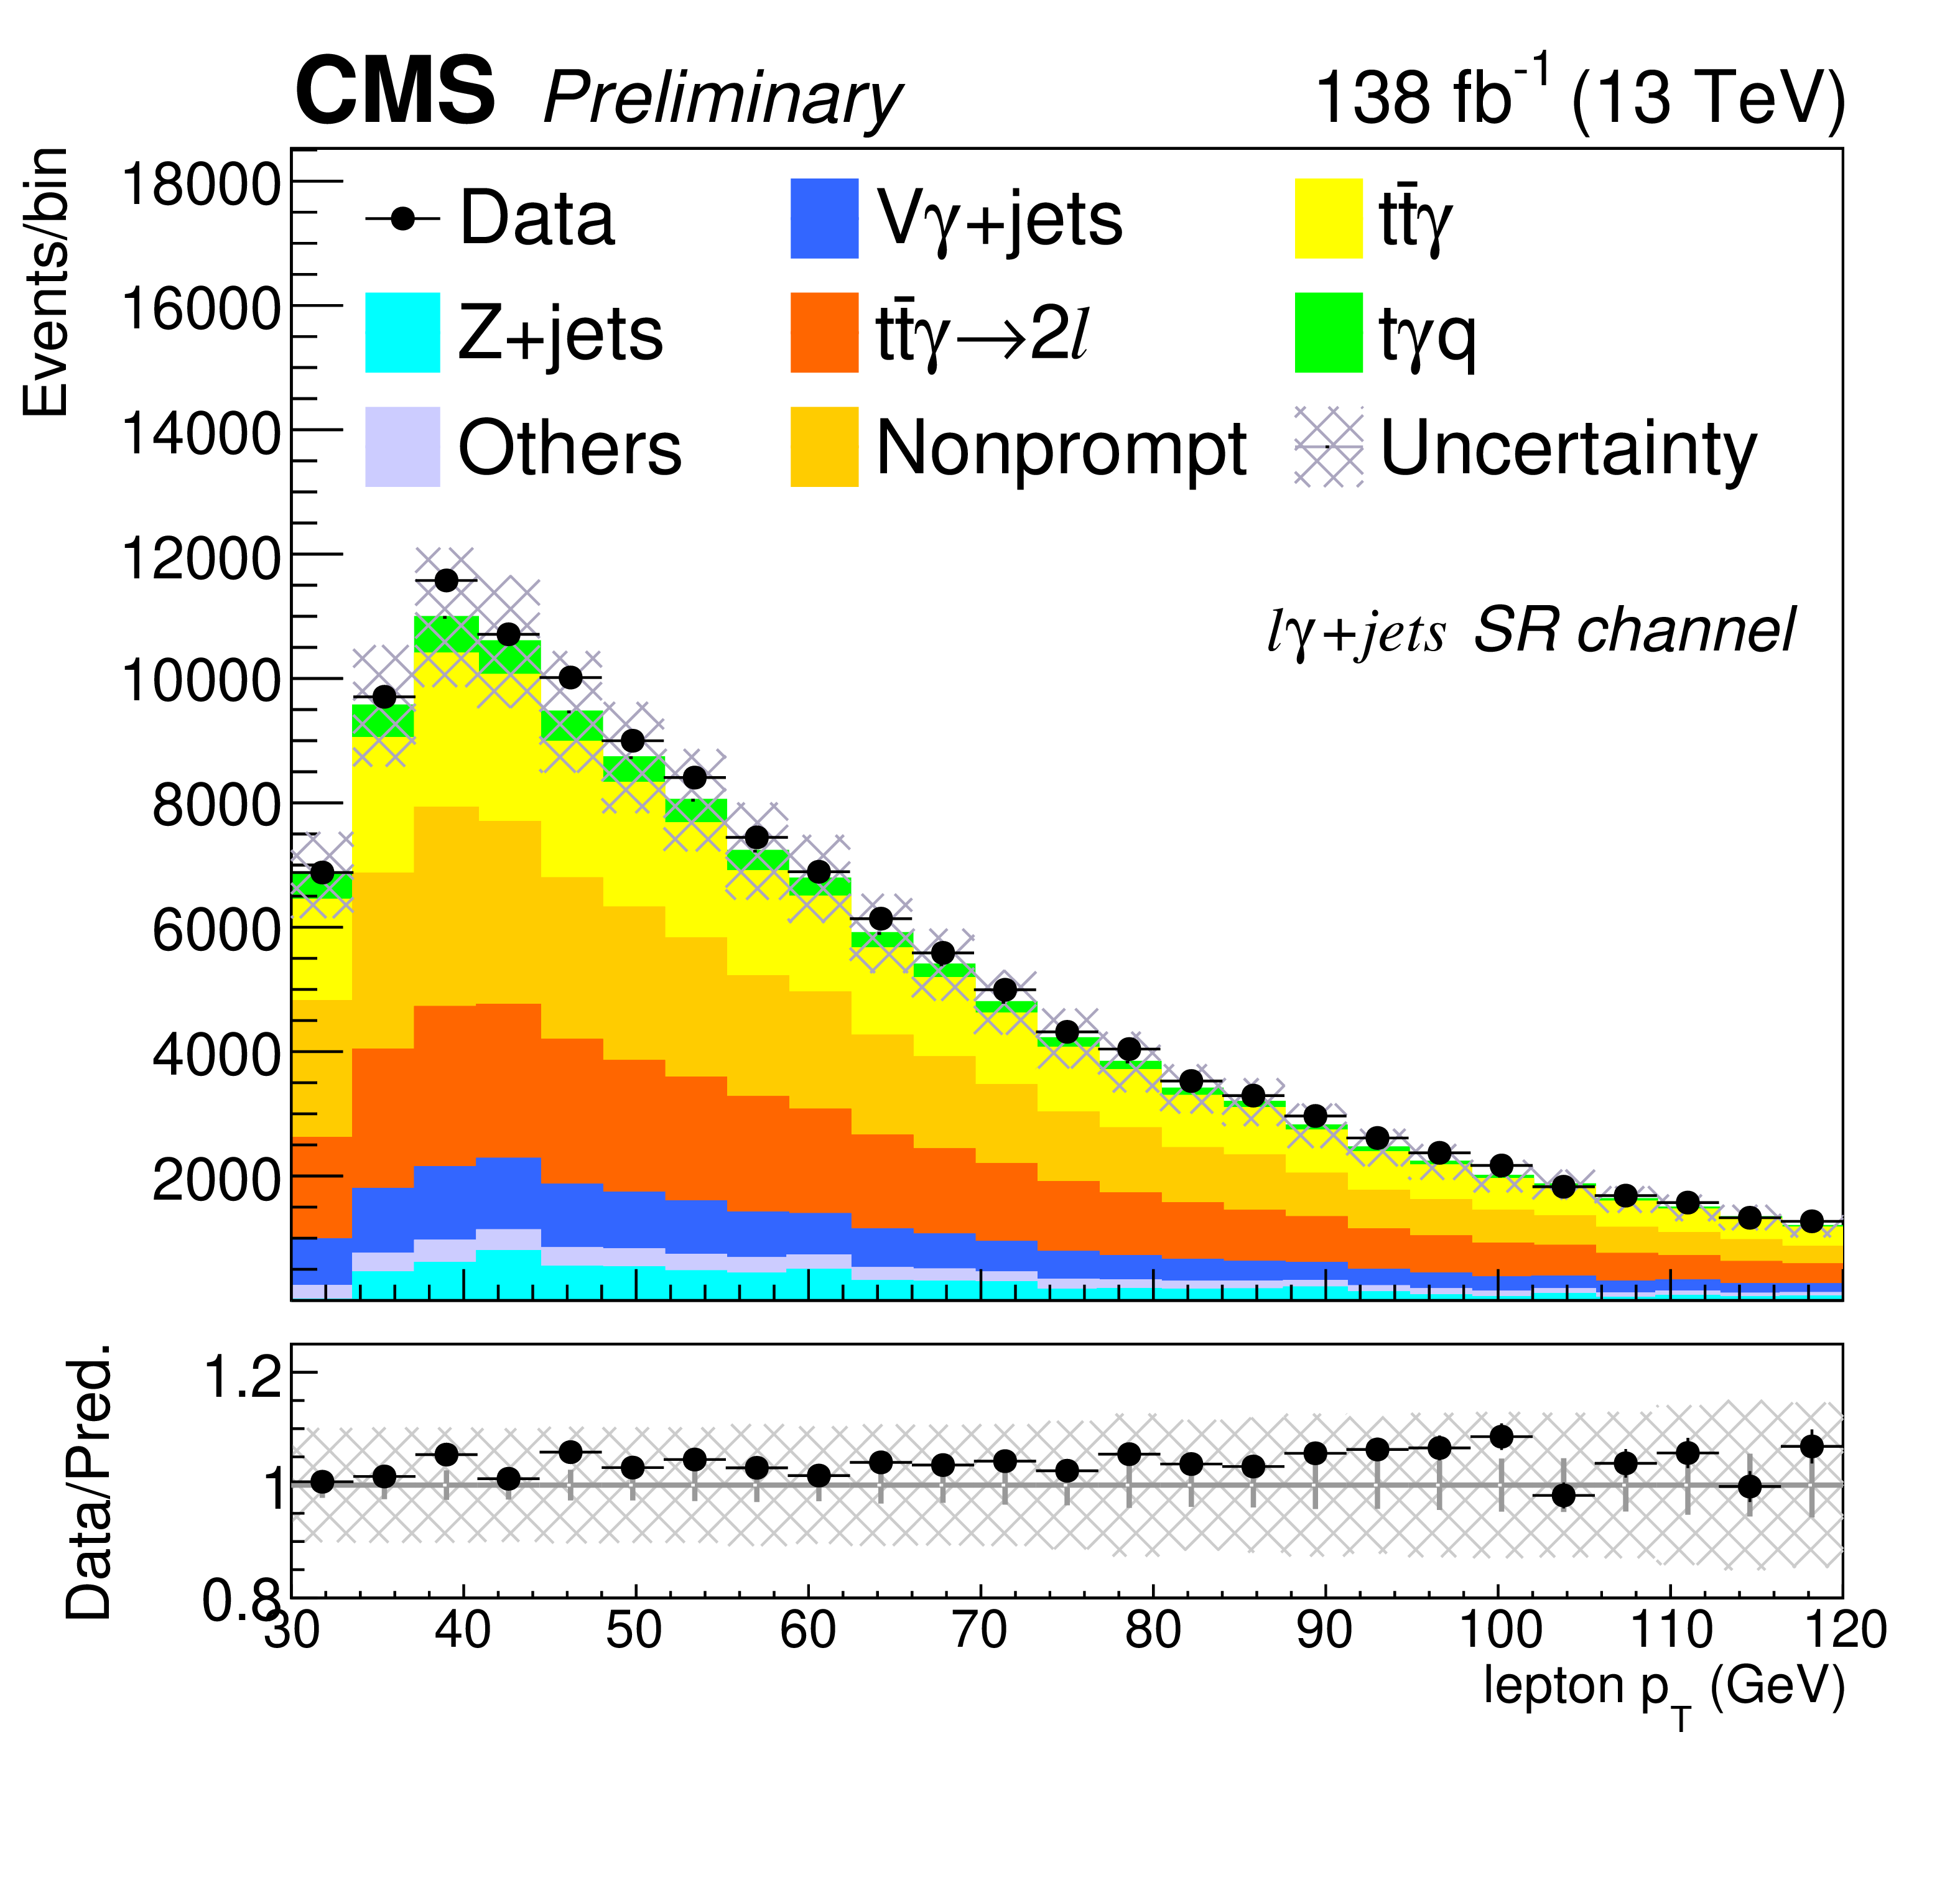
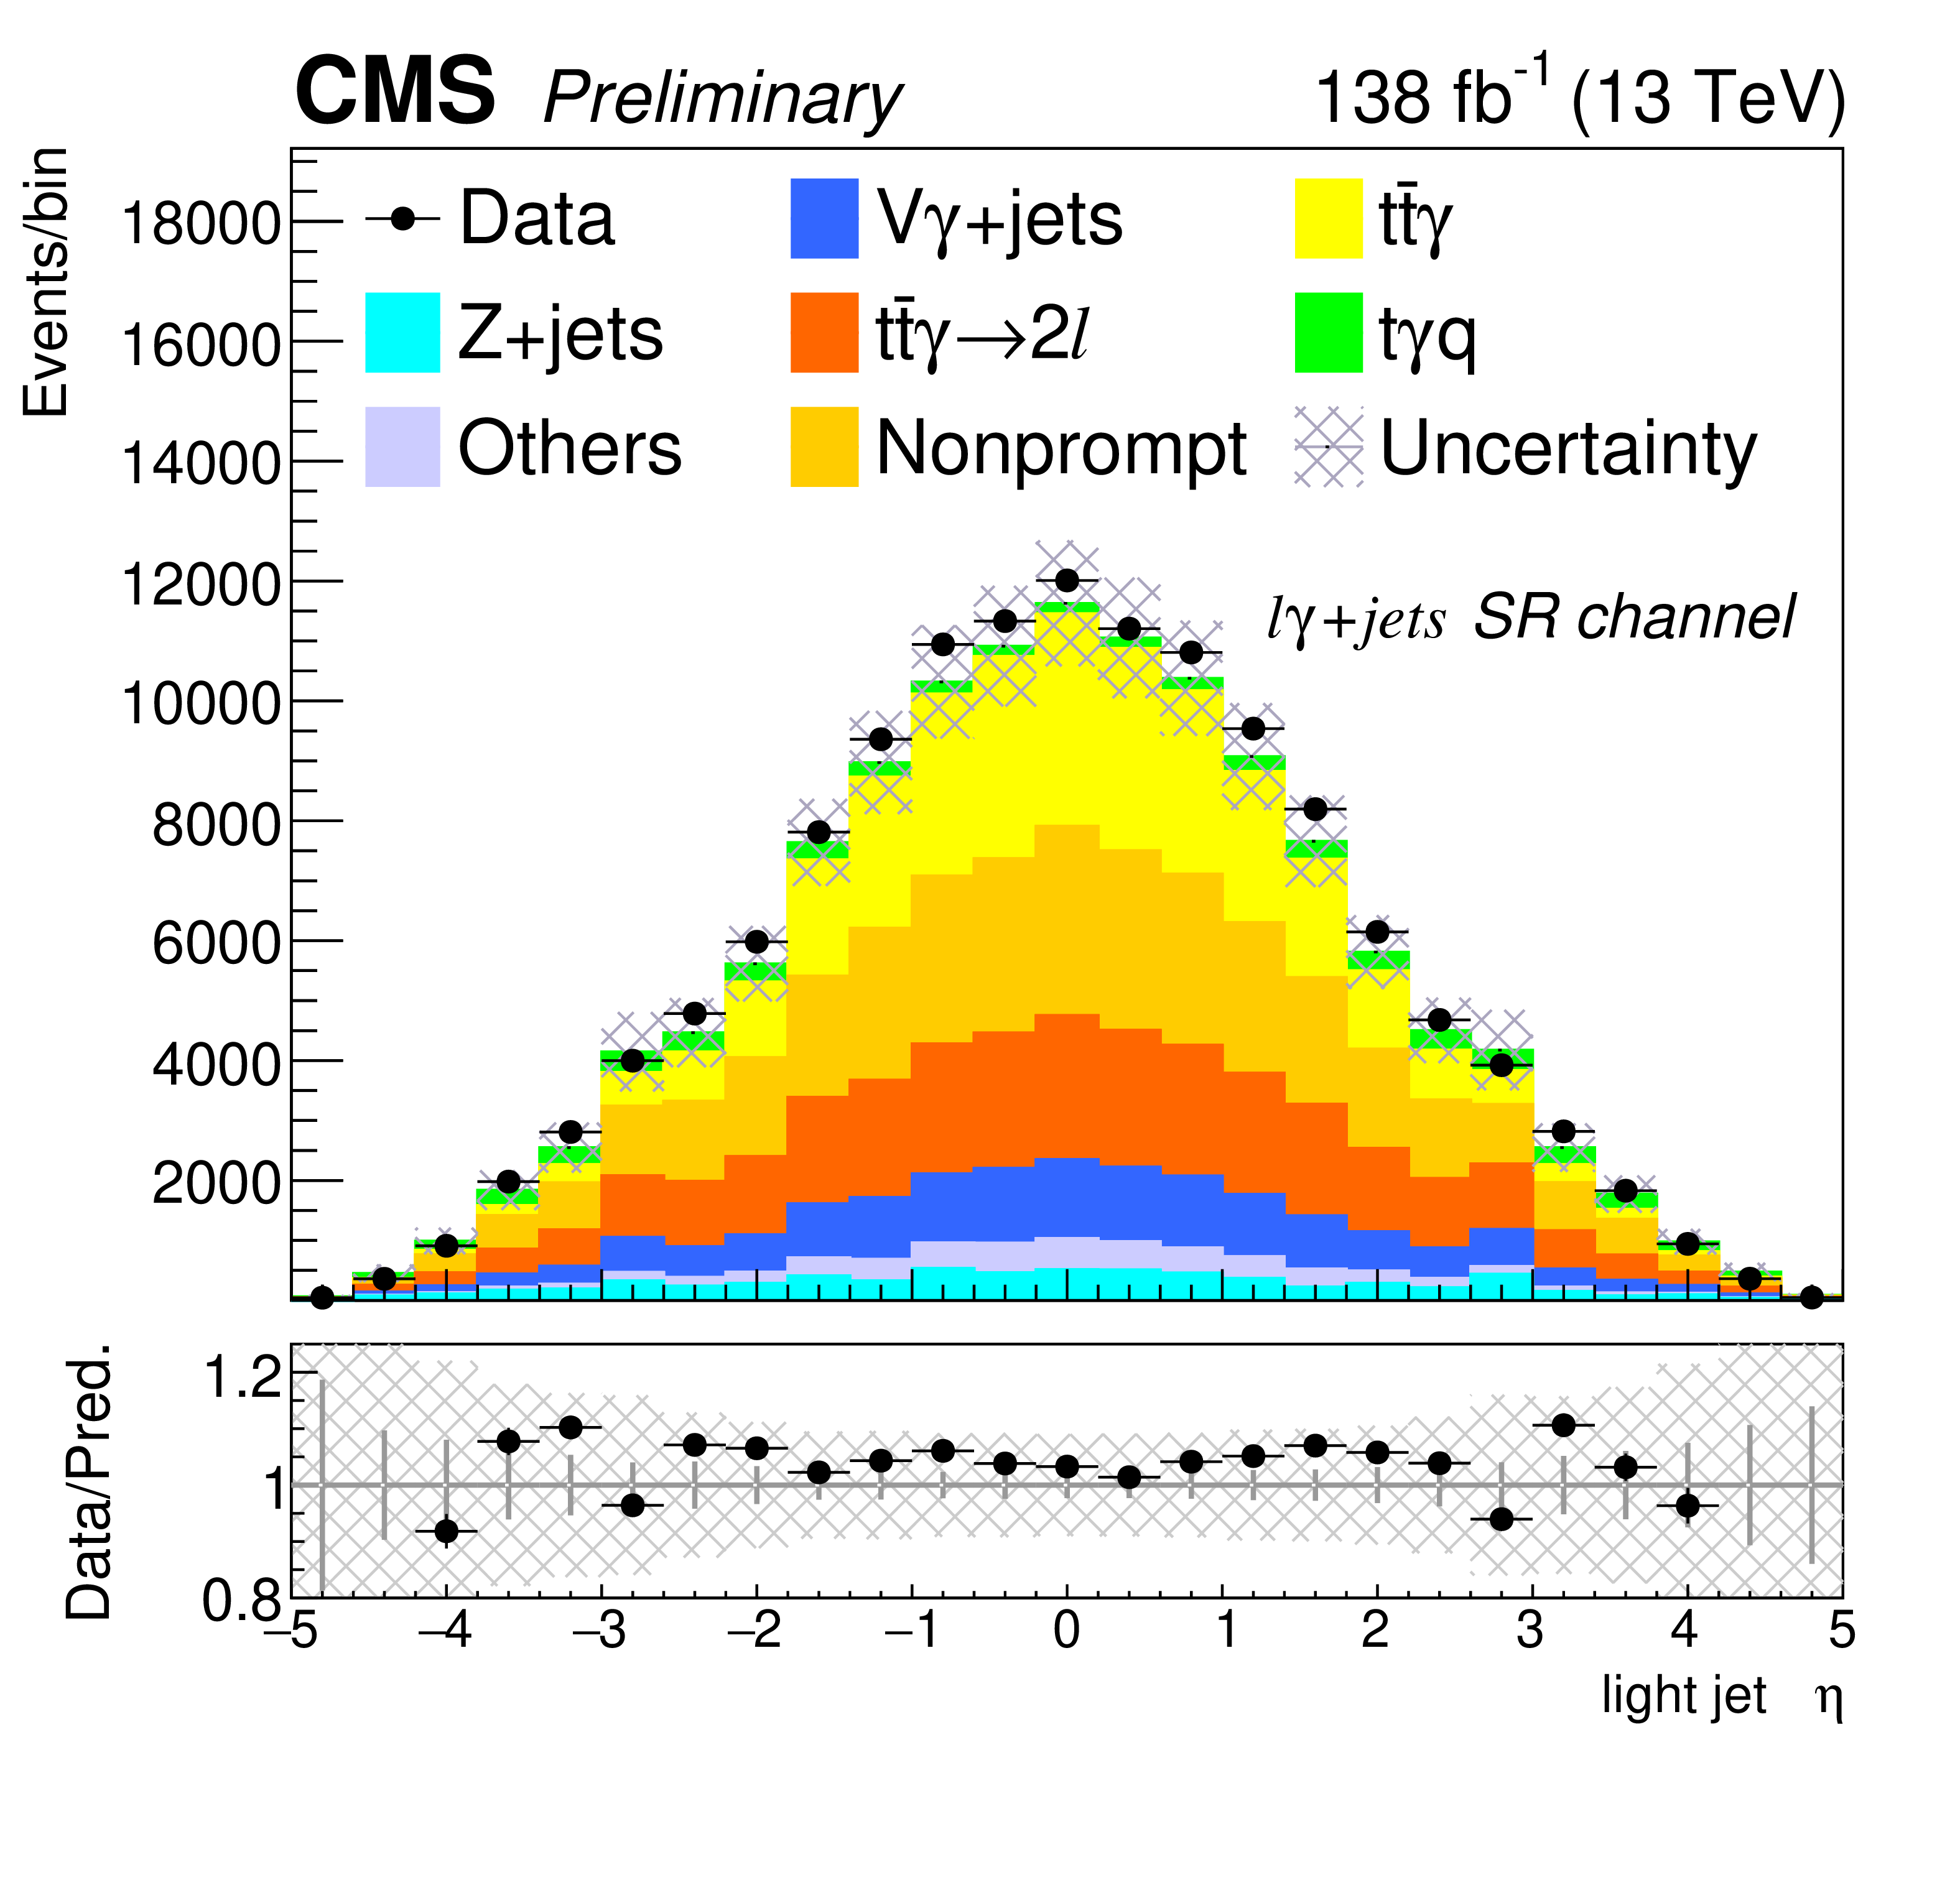
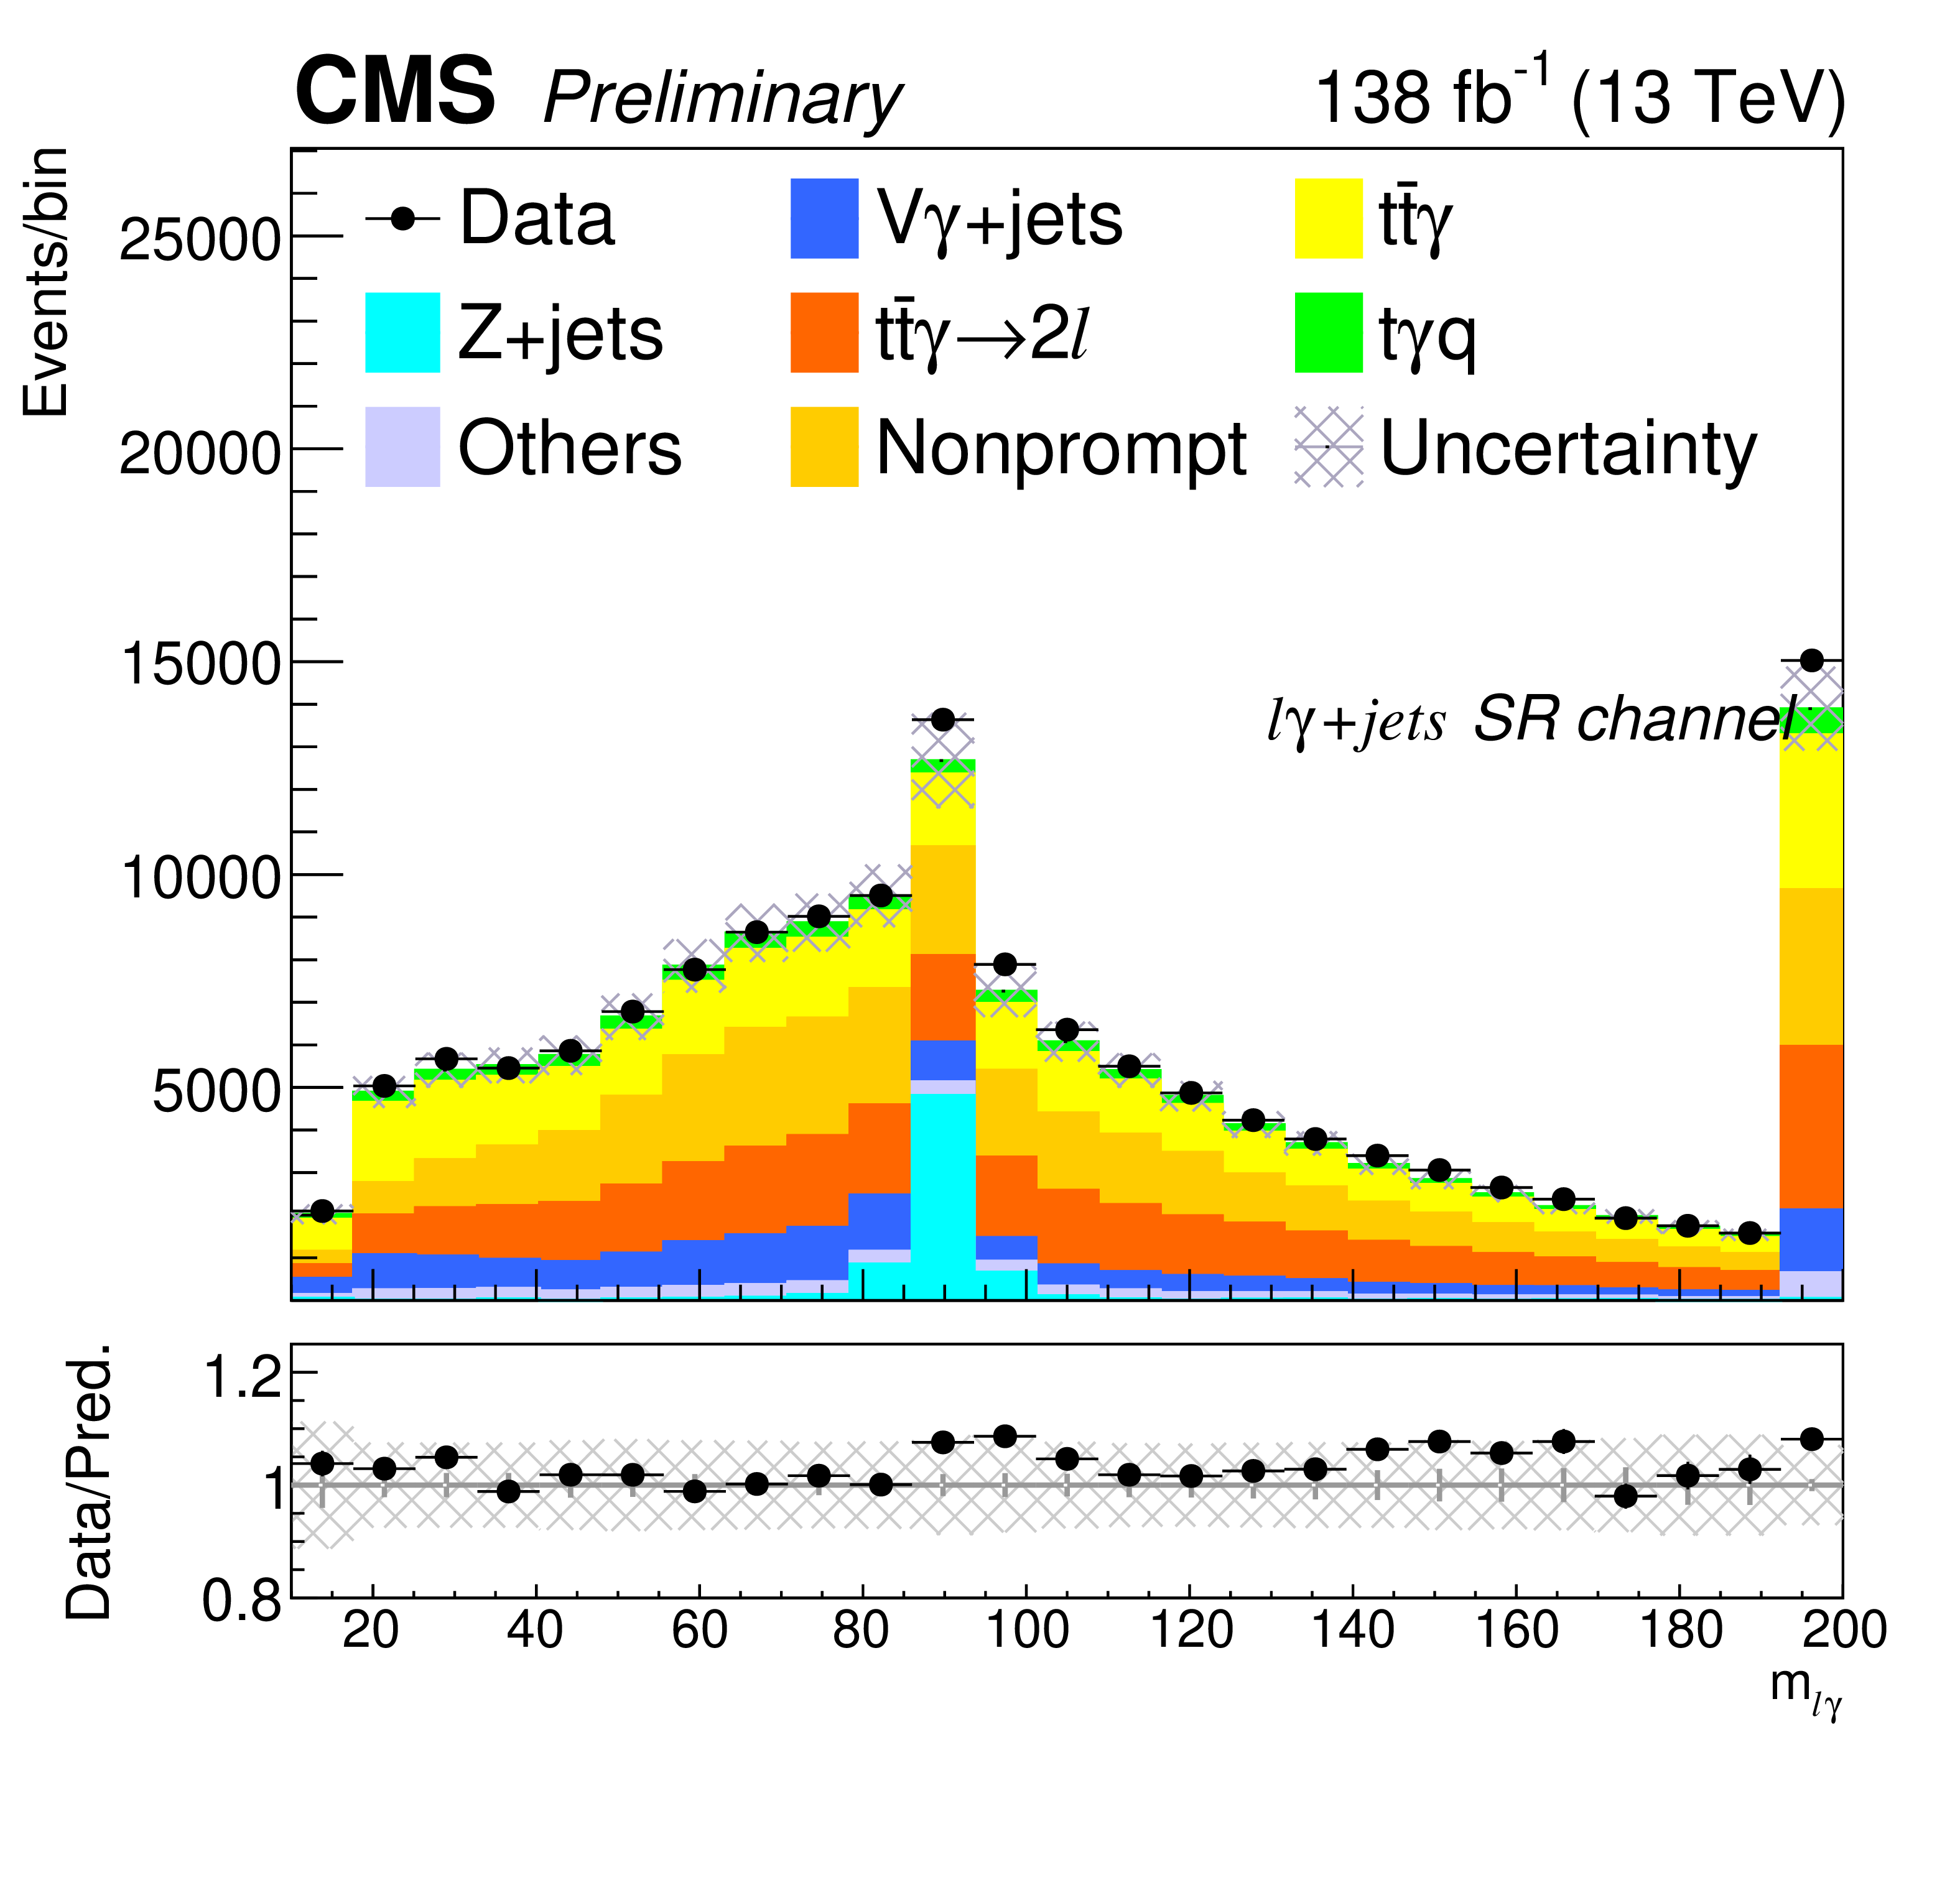
Figure 6:
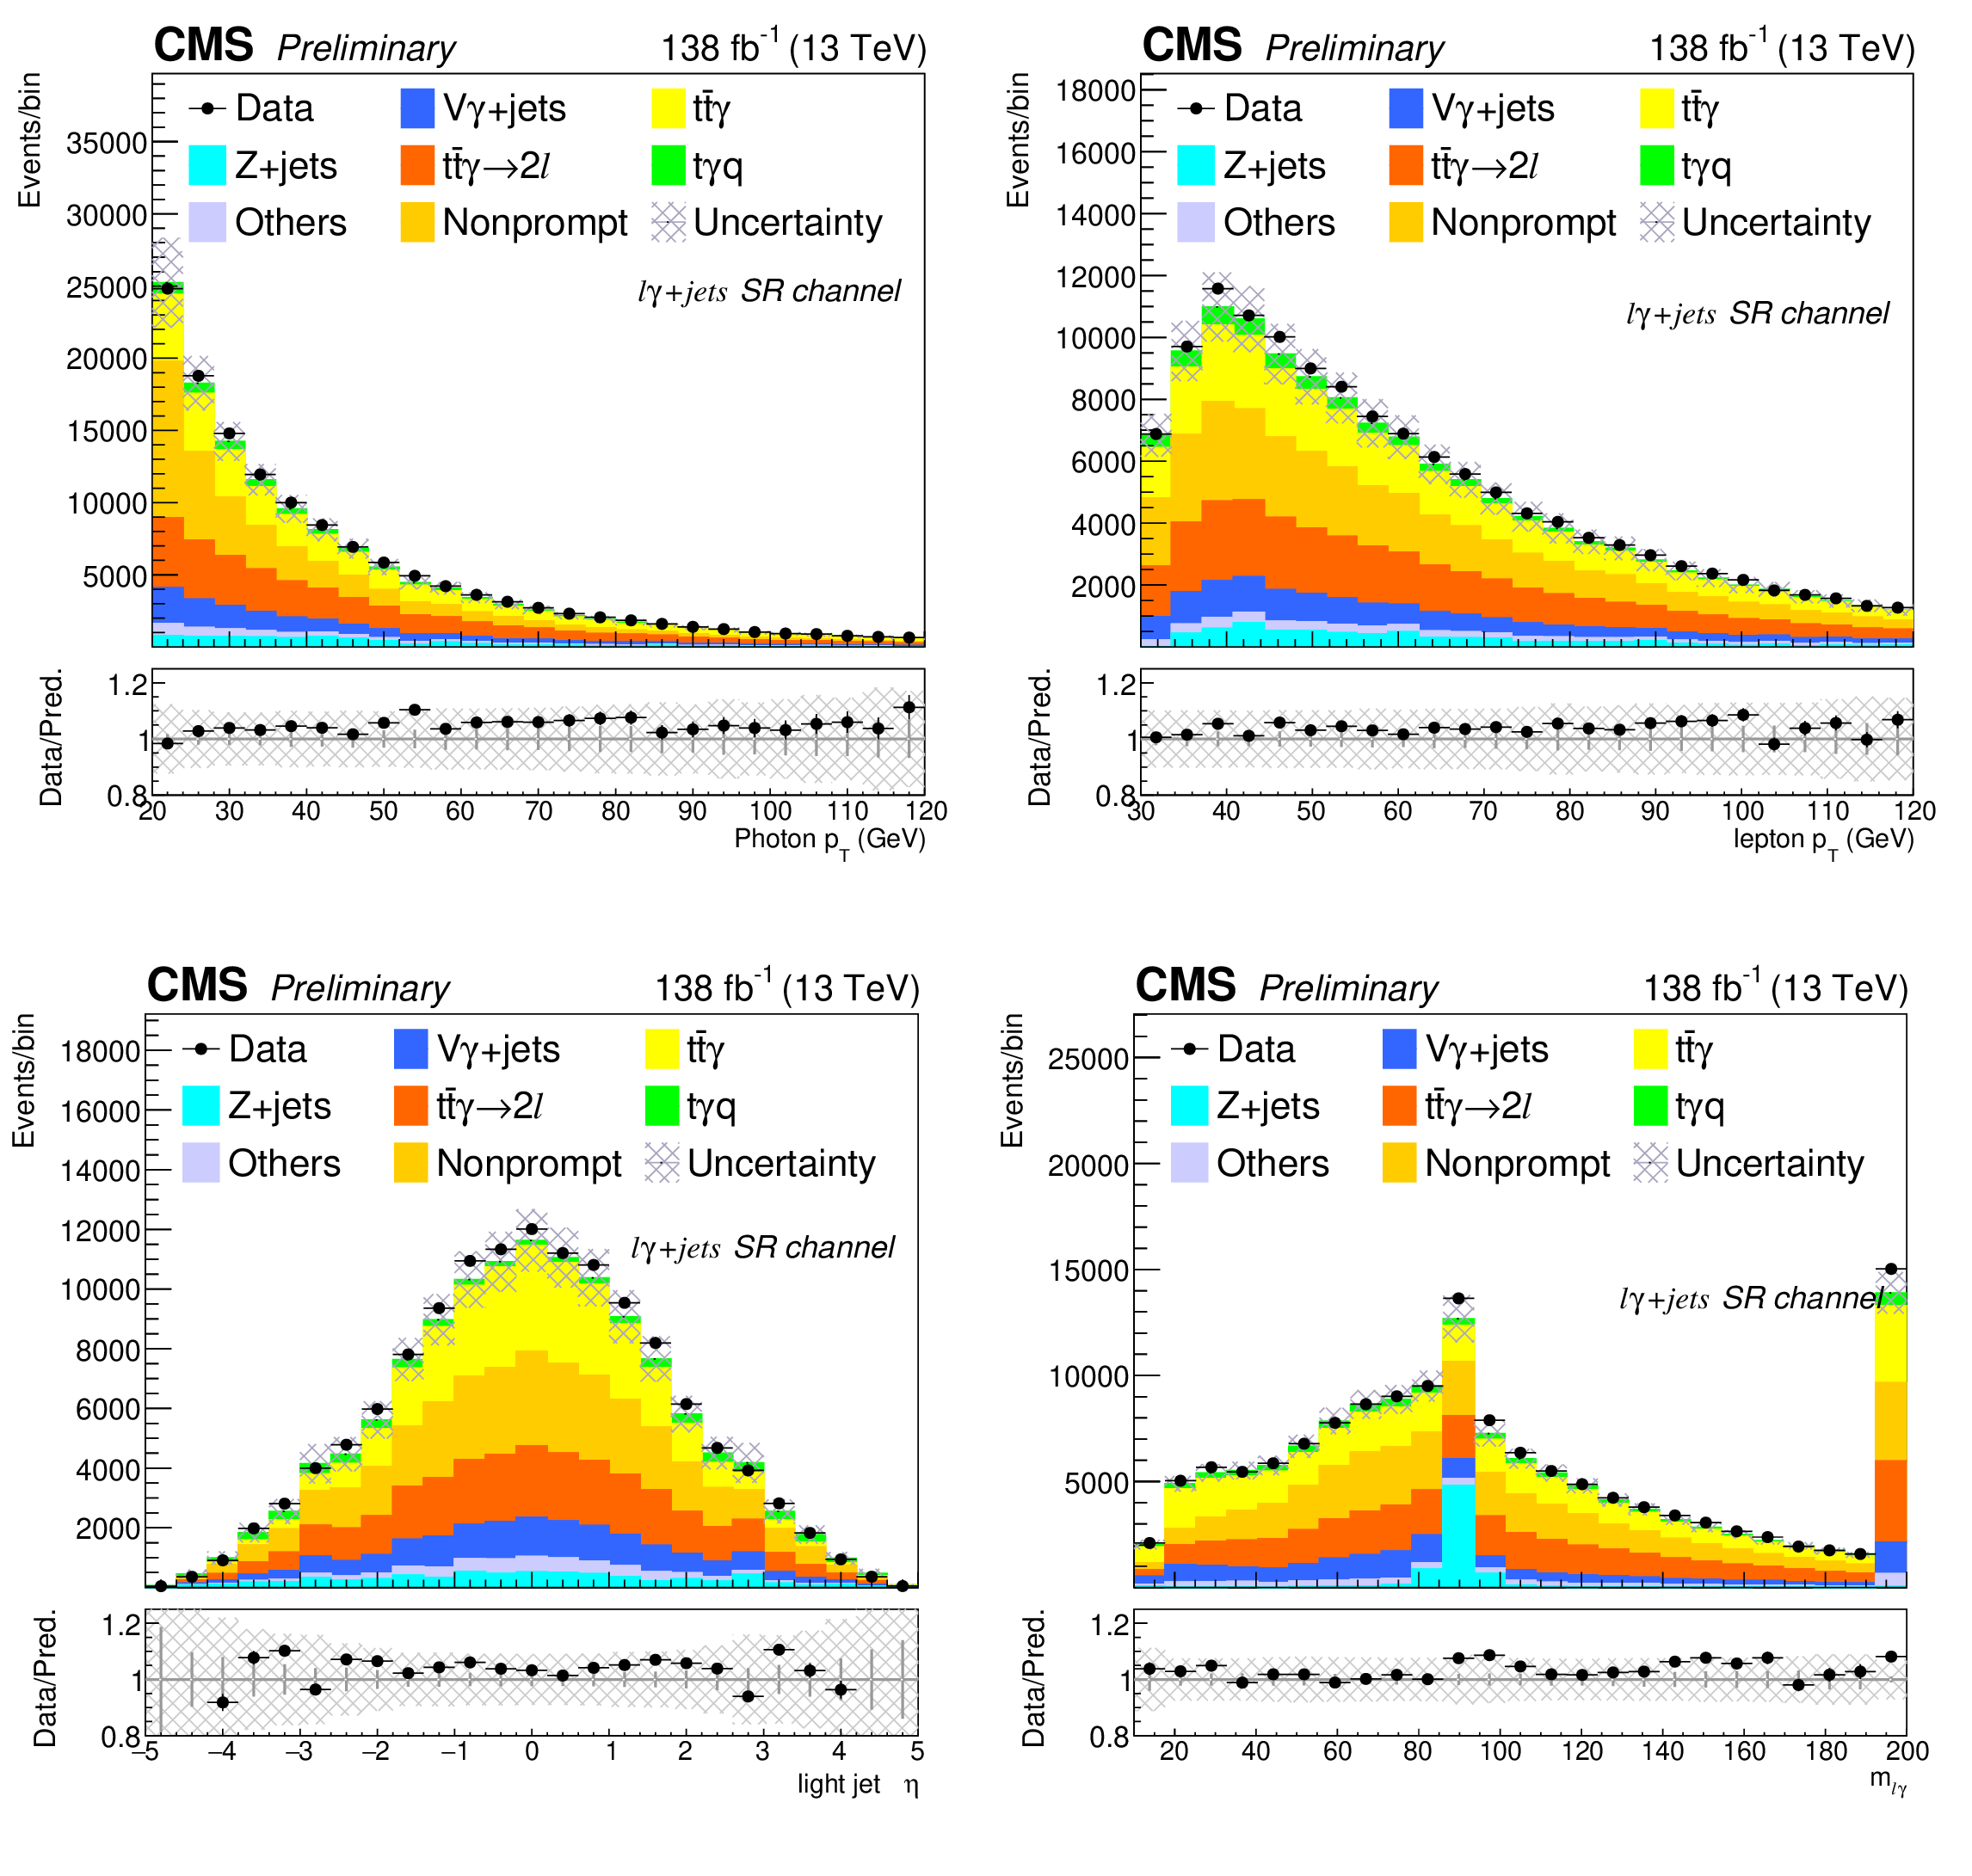
The distributions of leading photon $ p_{\mathrm{T}} $, leading lepton $ p_{\mathrm{T}} $, leading light jet pseudorapidity, and $ m_{\ell\gamma} $ before the fit for the combined lepton flavor channels from full Run 2 data and simulated samples, where the misID contribution is normalized to factors derived from the inclusive measurement fit. The lower panels show the ratio of the observed to the predicted event yields. |
png pdf |
Figure 6-a:
The distributions of leading photon $ p_{\mathrm{T}} $, leading lepton $ p_{\mathrm{T}} $, leading light jet pseudorapidity, and $ m_{\ell\gamma} $ before the fit for the combined lepton flavor channels from full Run 2 data and simulated samples, where the misID contribution is normalized to factors derived from the inclusive measurement fit. The lower panels show the ratio of the observed to the predicted event yields. |
png pdf |
Figure 6-b:
The distributions of leading photon $ p_{\mathrm{T}} $, leading lepton $ p_{\mathrm{T}} $, leading light jet pseudorapidity, and $ m_{\ell\gamma} $ before the fit for the combined lepton flavor channels from full Run 2 data and simulated samples, where the misID contribution is normalized to factors derived from the inclusive measurement fit. The lower panels show the ratio of the observed to the predicted event yields. |
png pdf |
Figure 6-c:
The distributions of leading photon $ p_{\mathrm{T}} $, leading lepton $ p_{\mathrm{T}} $, leading light jet pseudorapidity, and $ m_{\ell\gamma} $ before the fit for the combined lepton flavor channels from full Run 2 data and simulated samples, where the misID contribution is normalized to factors derived from the inclusive measurement fit. The lower panels show the ratio of the observed to the predicted event yields. |
png pdf |
Figure 6-d:
The distributions of leading photon $ p_{\mathrm{T}} $, leading lepton $ p_{\mathrm{T}} $, leading light jet pseudorapidity, and $ m_{\ell\gamma} $ before the fit for the combined lepton flavor channels from full Run 2 data and simulated samples, where the misID contribution is normalized to factors derived from the inclusive measurement fit. The lower panels show the ratio of the observed to the predicted event yields. |
png pdf |
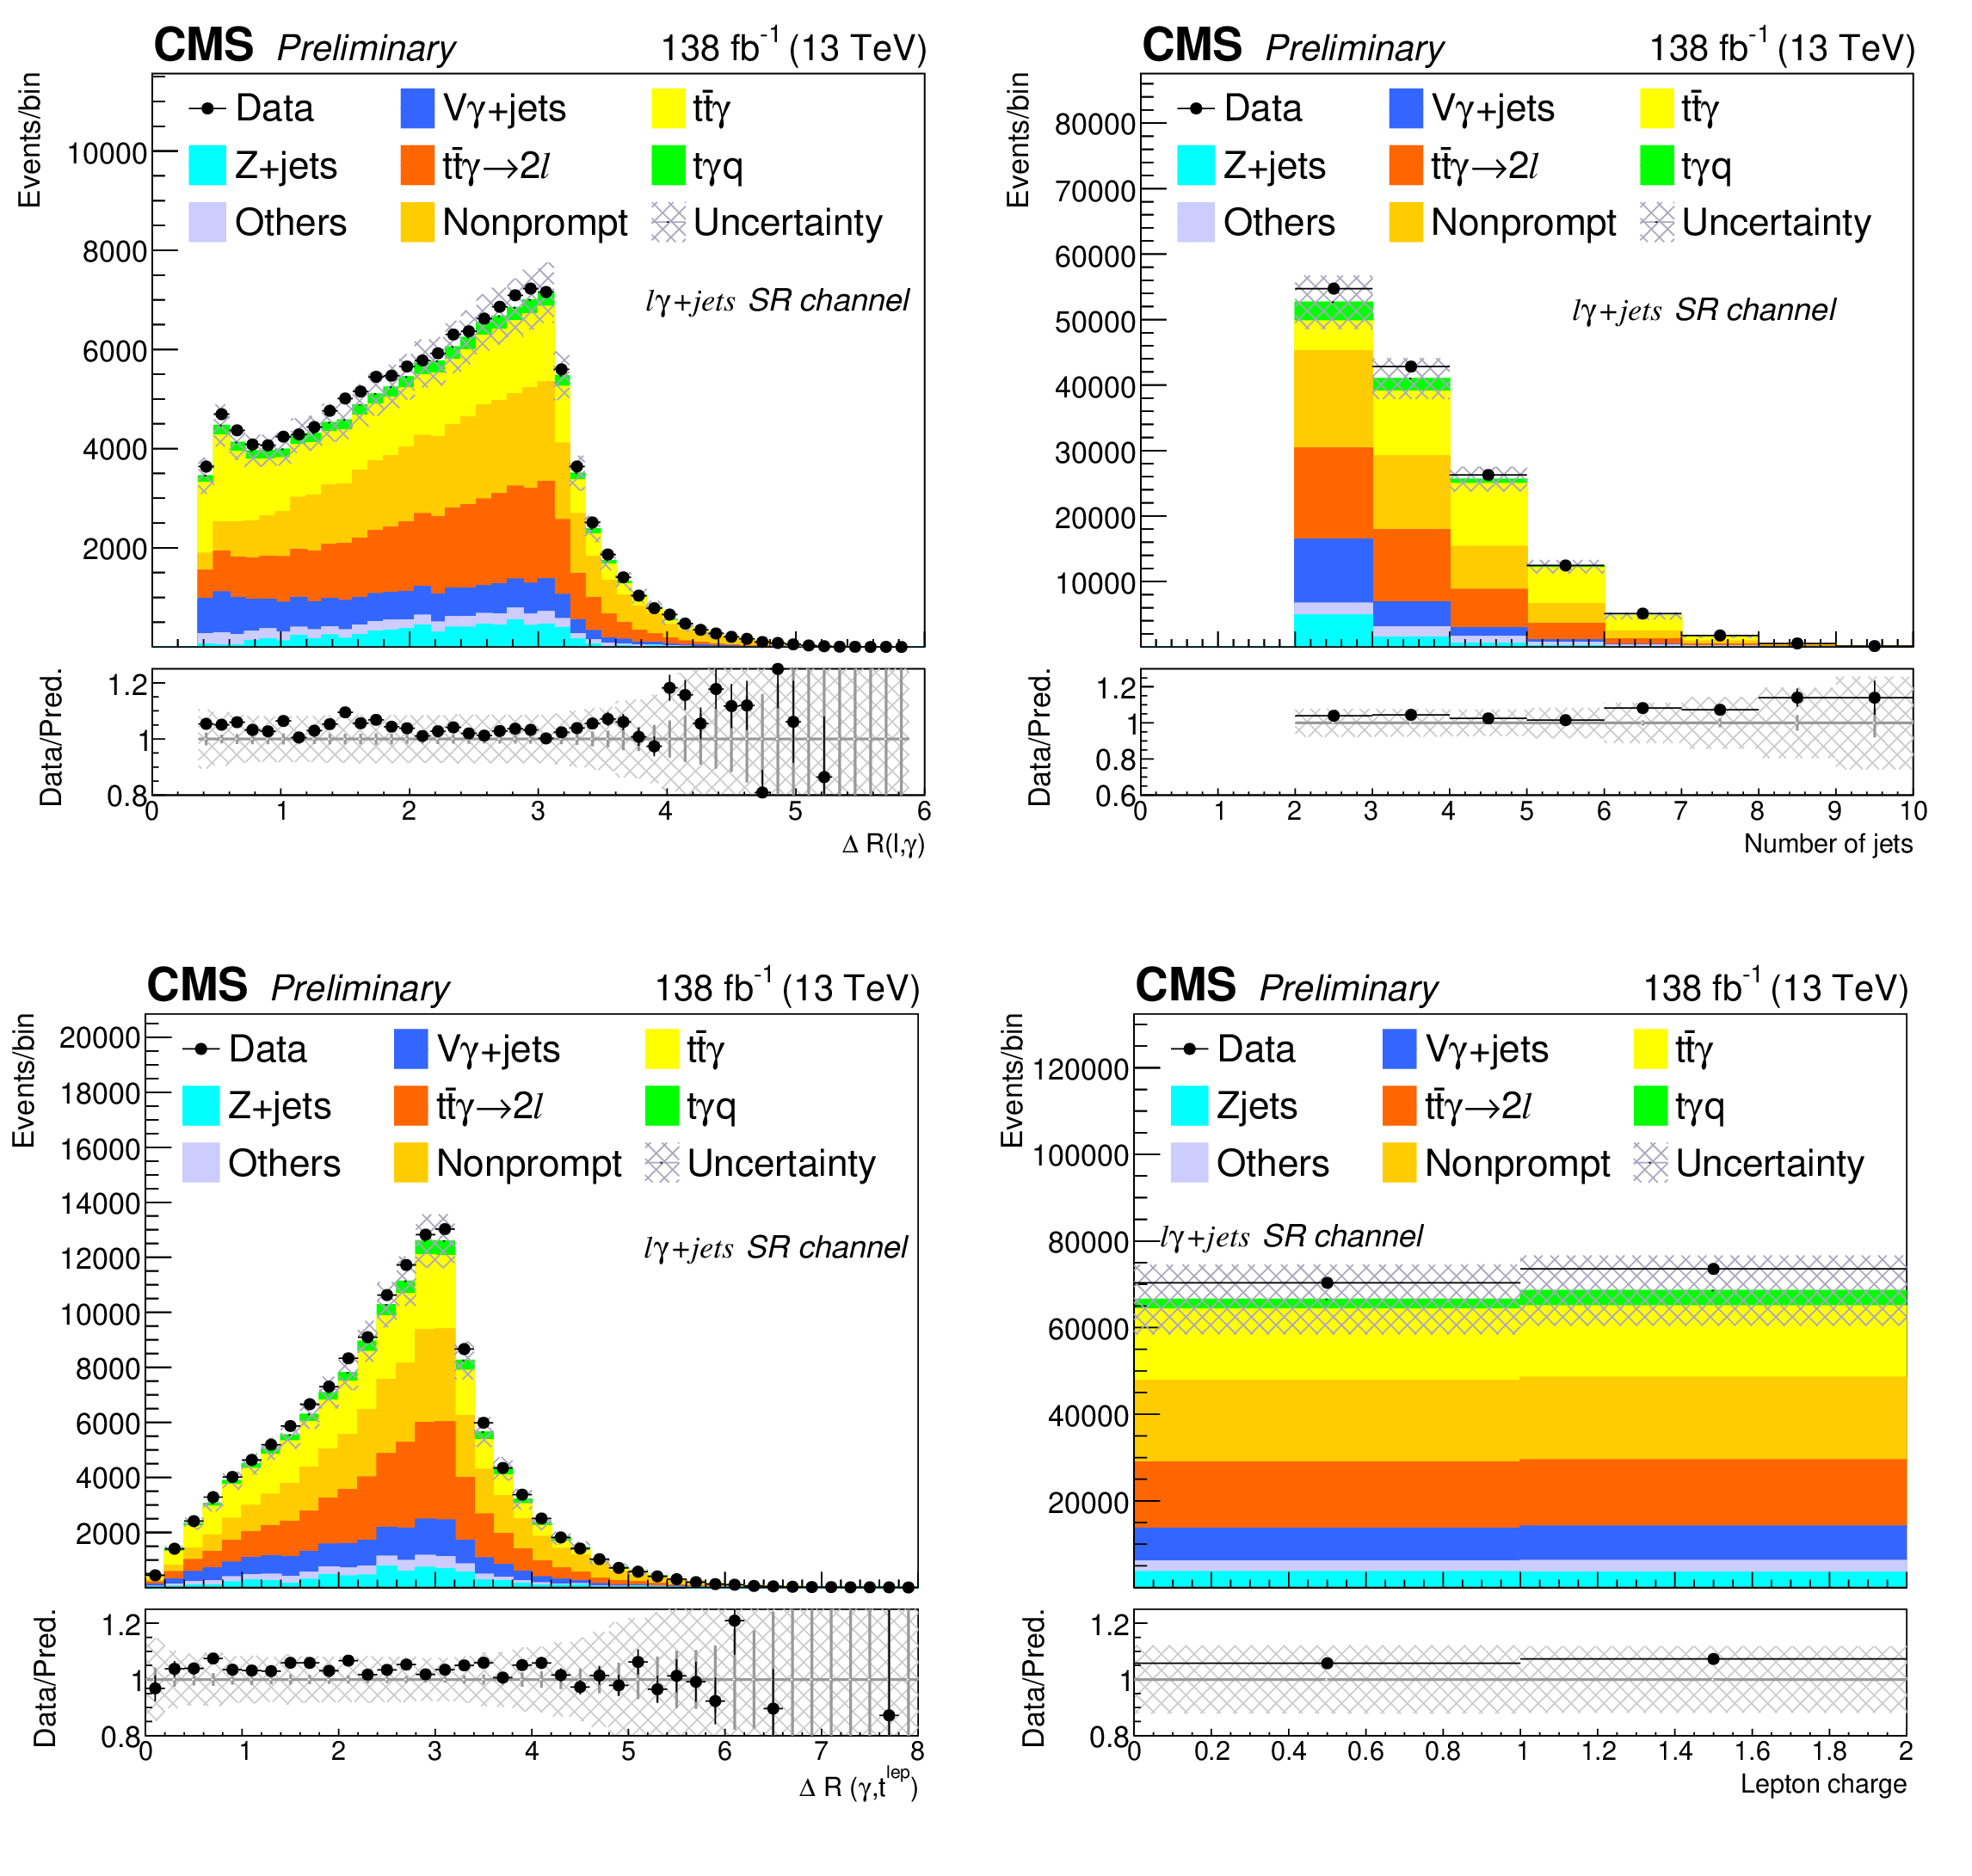
Figure 7:
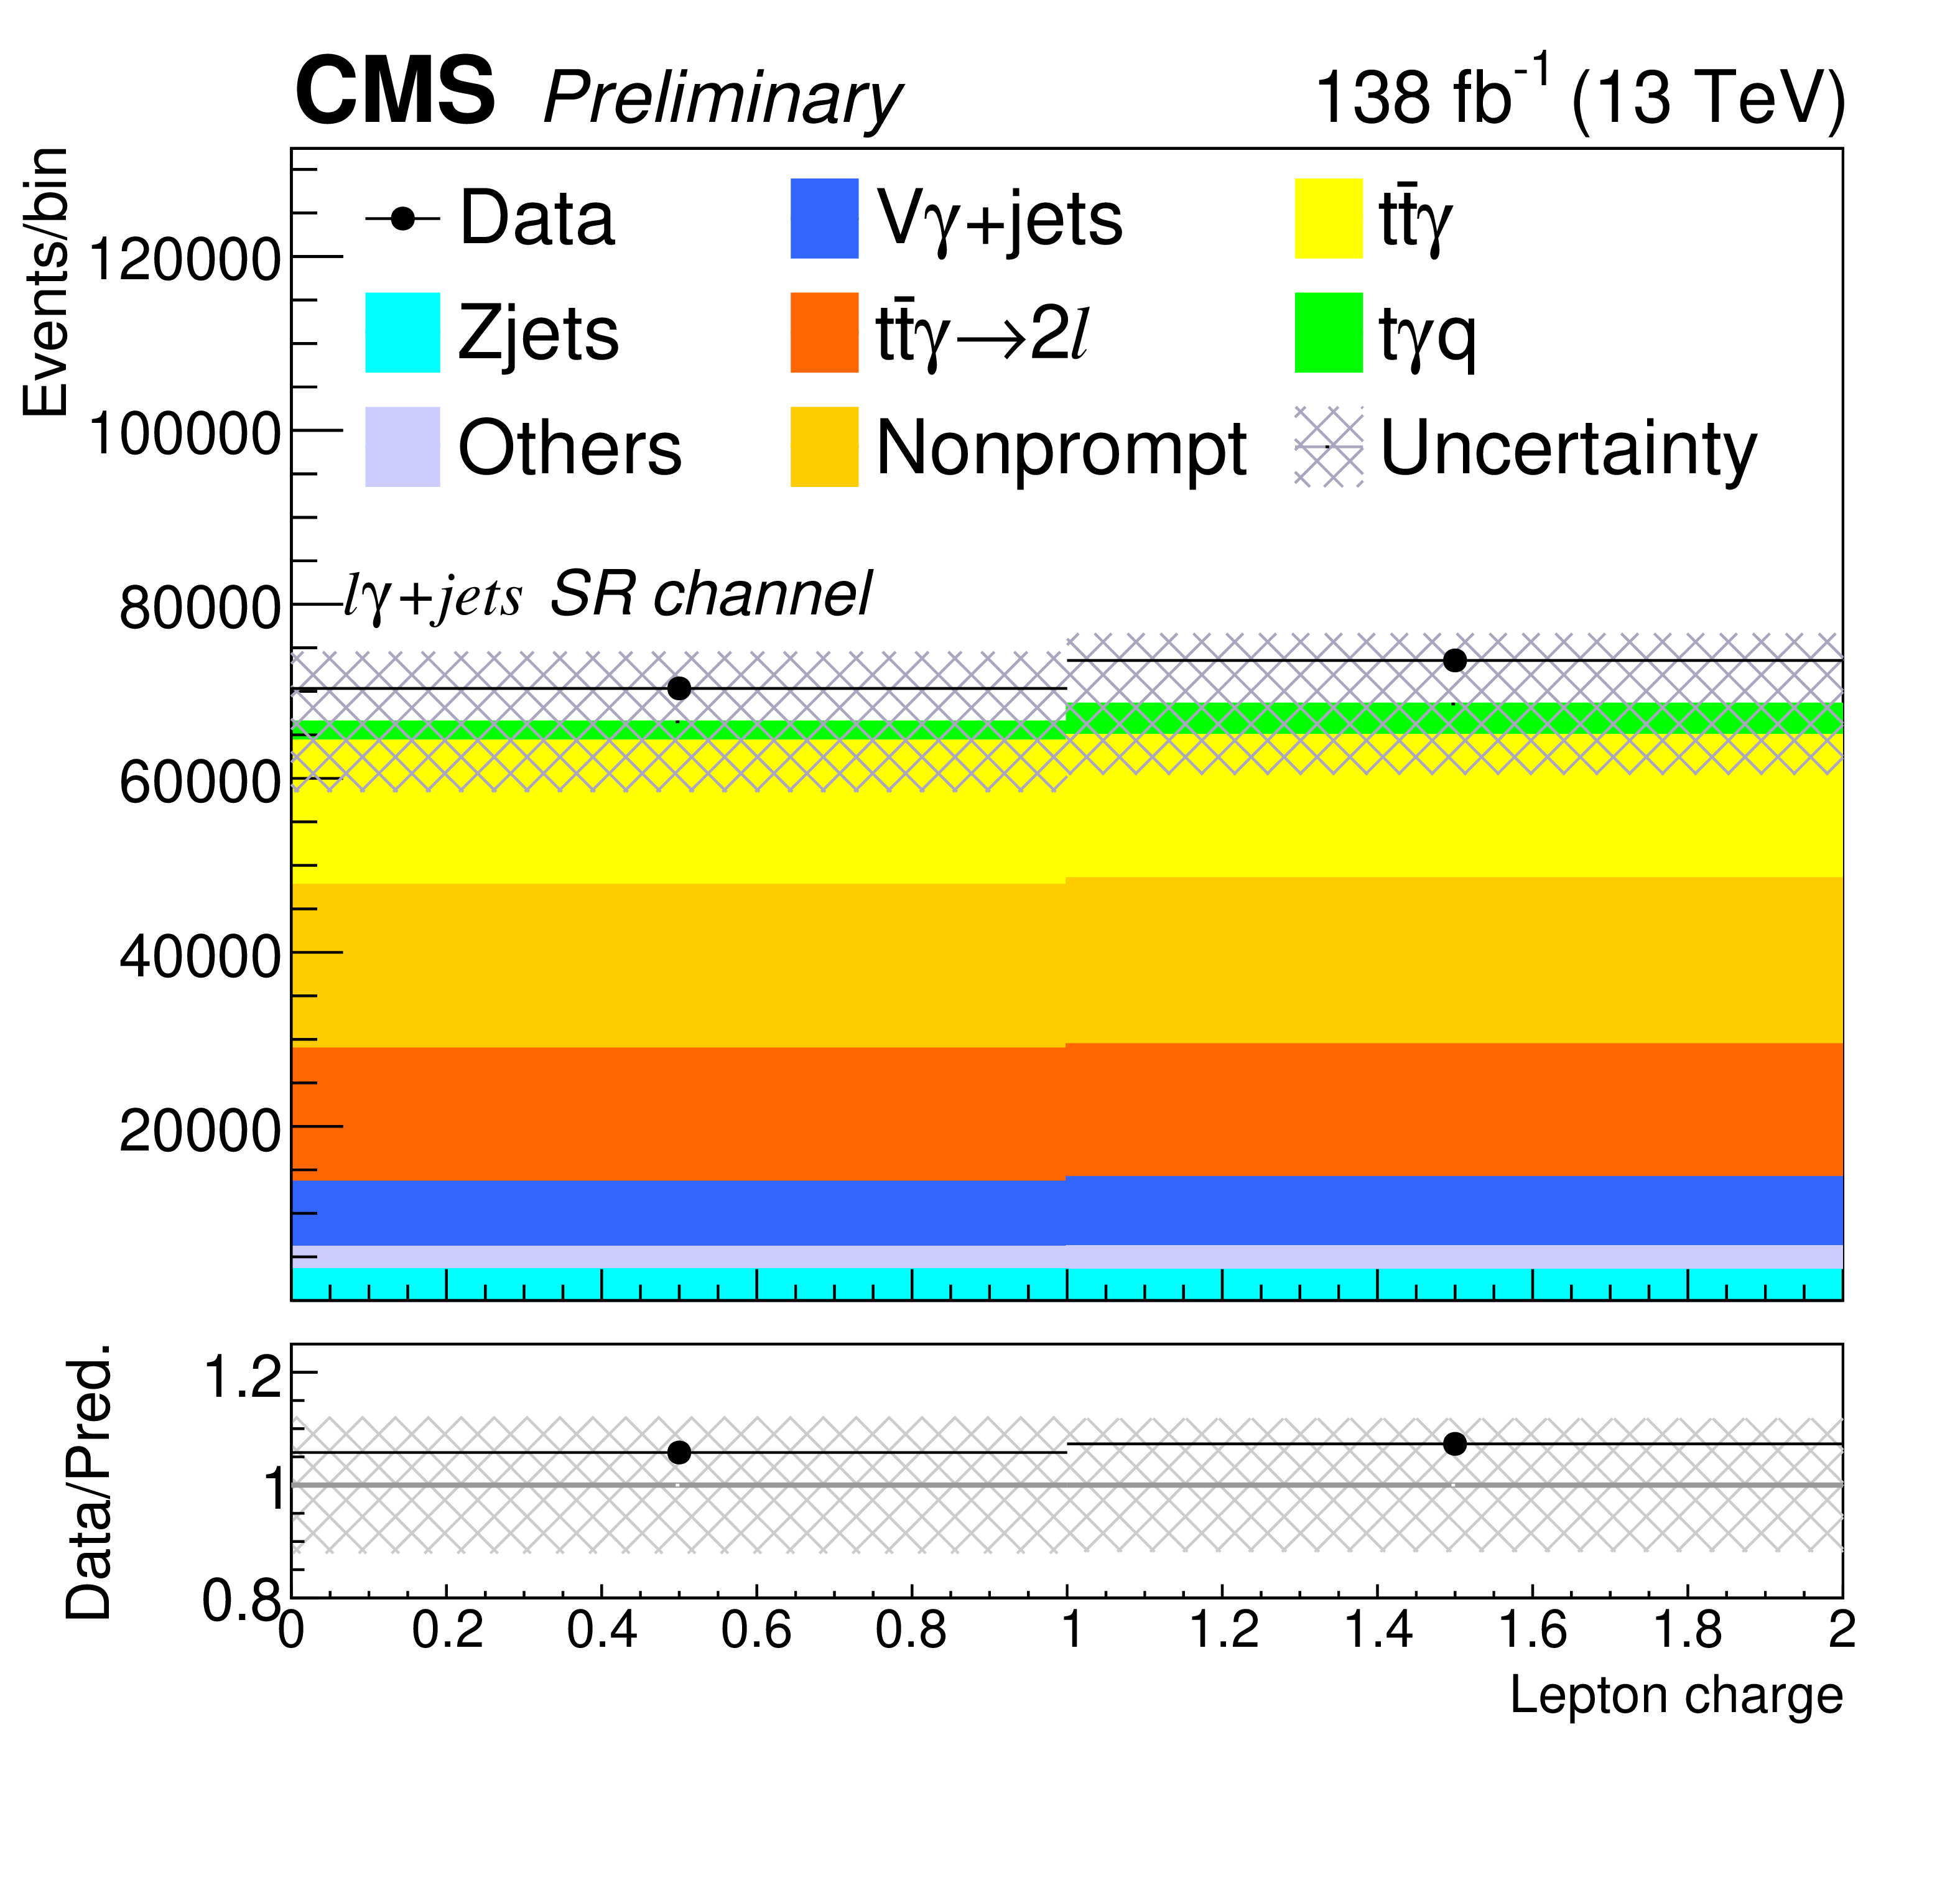
The distributions of $ \Delta R(\ell,\gamma) $, $ N_{\mathrm{jets}} $, $ \Delta R(\mathrm{t},\gamma) $, and lepton charge before the fit for the combined lepton flavor channels from full Run 2 data and simulated samples, where the misID contribution is normalized to factors derived from the inclusive measurement fit. The lower panels show the ratio of the observed to the predicted event yields. |
png pdf |
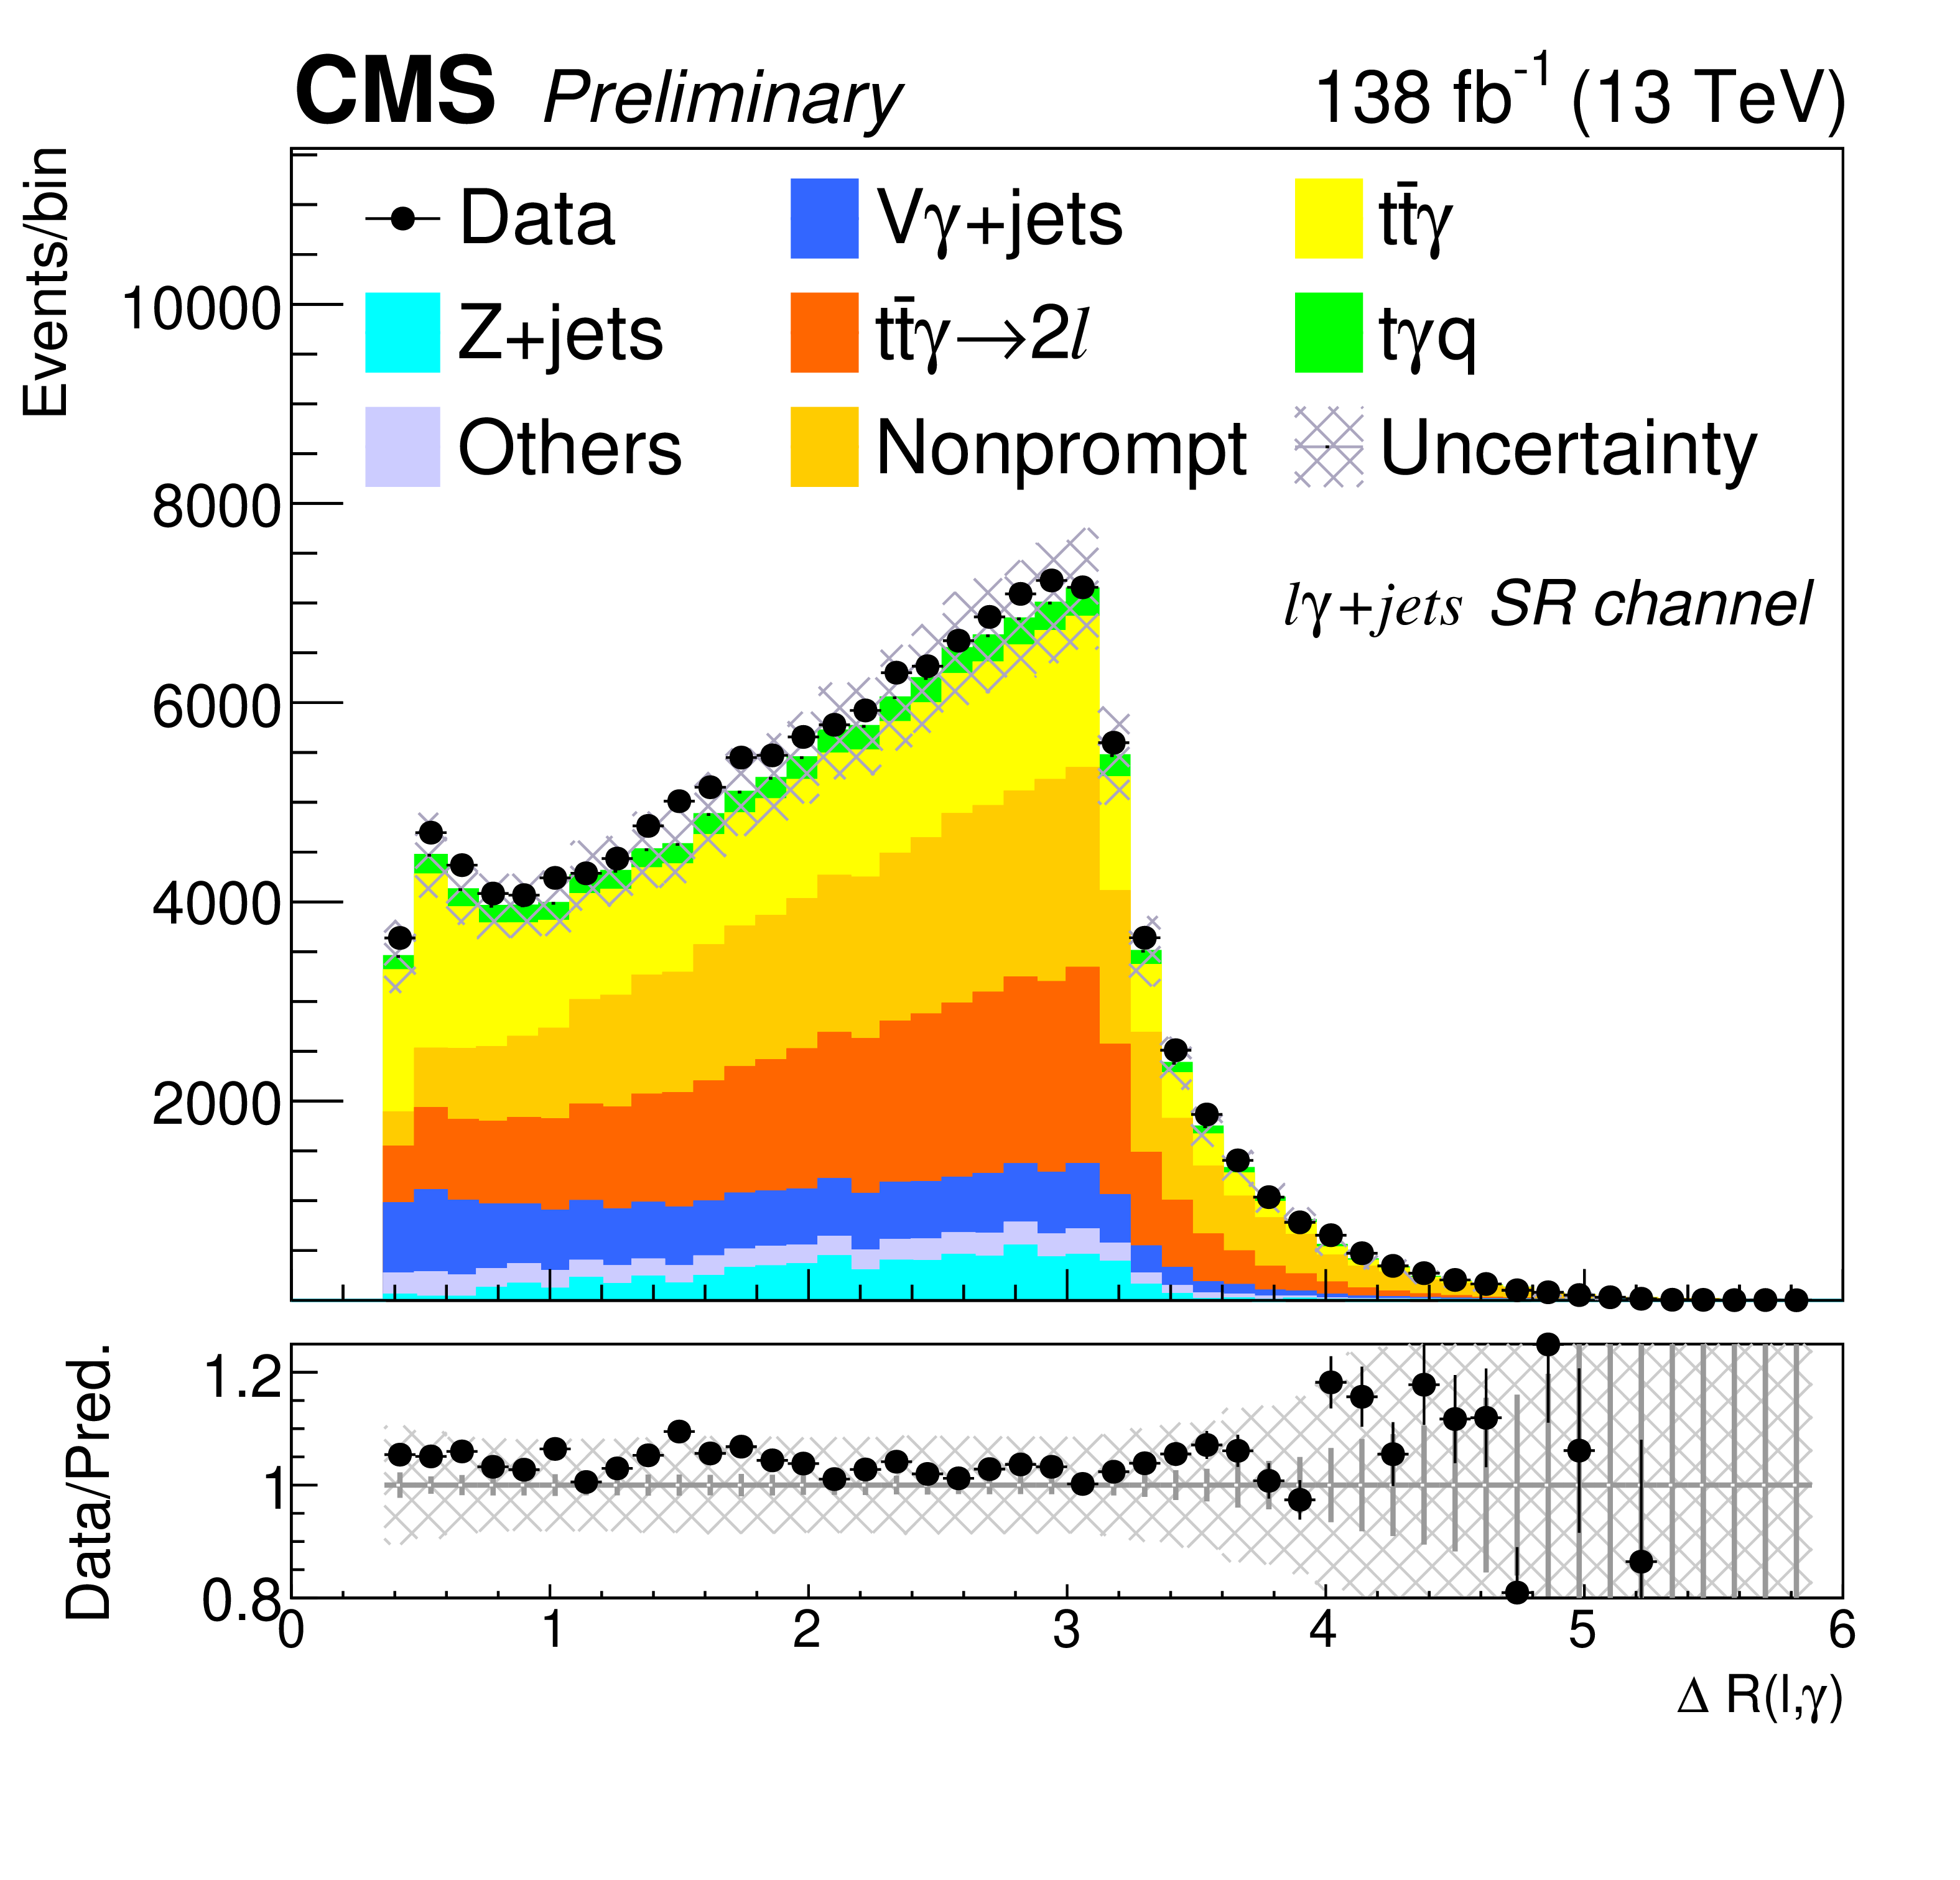
Figure 7-a:
The distributions of $ \Delta R(\ell,\gamma) $, $ N_{\mathrm{jets}} $, $ \Delta R(\mathrm{t},\gamma) $, and lepton charge before the fit for the combined lepton flavor channels from full Run 2 data and simulated samples, where the misID contribution is normalized to factors derived from the inclusive measurement fit. The lower panels show the ratio of the observed to the predicted event yields. |
png pdf |
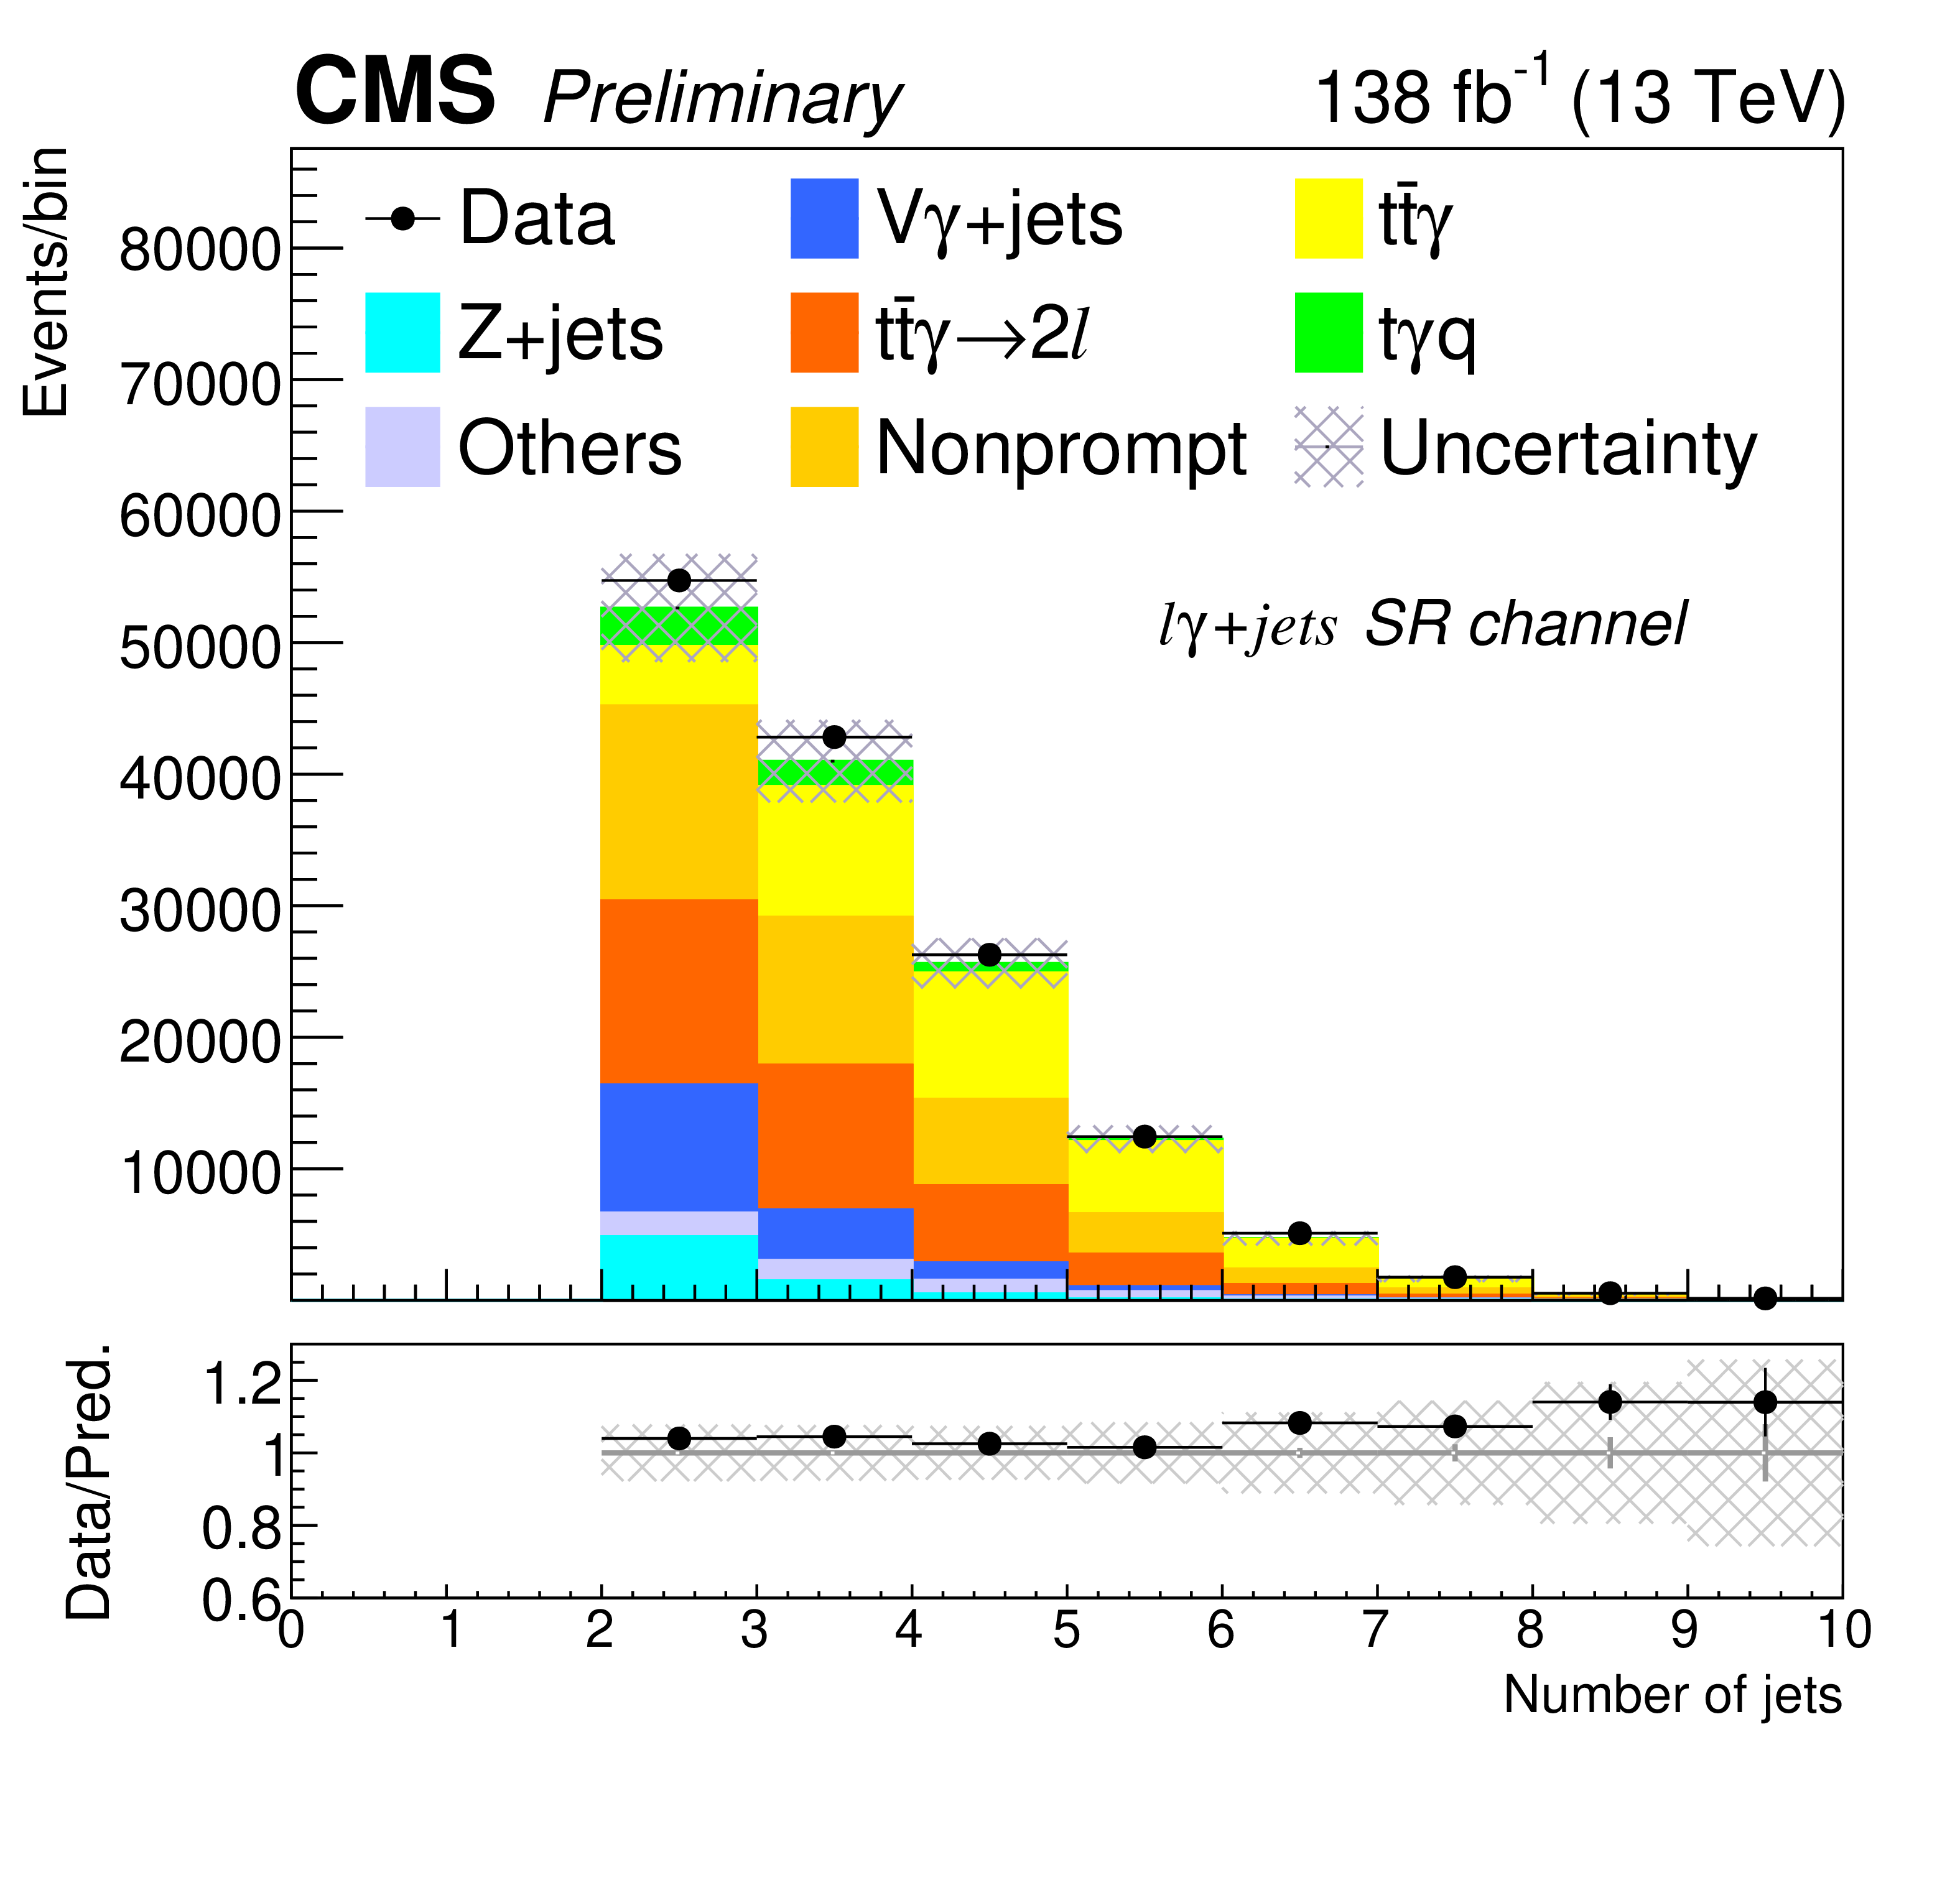
Figure 7-b:
The distributions of $ \Delta R(\ell,\gamma) $, $ N_{\mathrm{jets}} $, $ \Delta R(\mathrm{t},\gamma) $, and lepton charge before the fit for the combined lepton flavor channels from full Run 2 data and simulated samples, where the misID contribution is normalized to factors derived from the inclusive measurement fit. The lower panels show the ratio of the observed to the predicted event yields. |
png pdf |
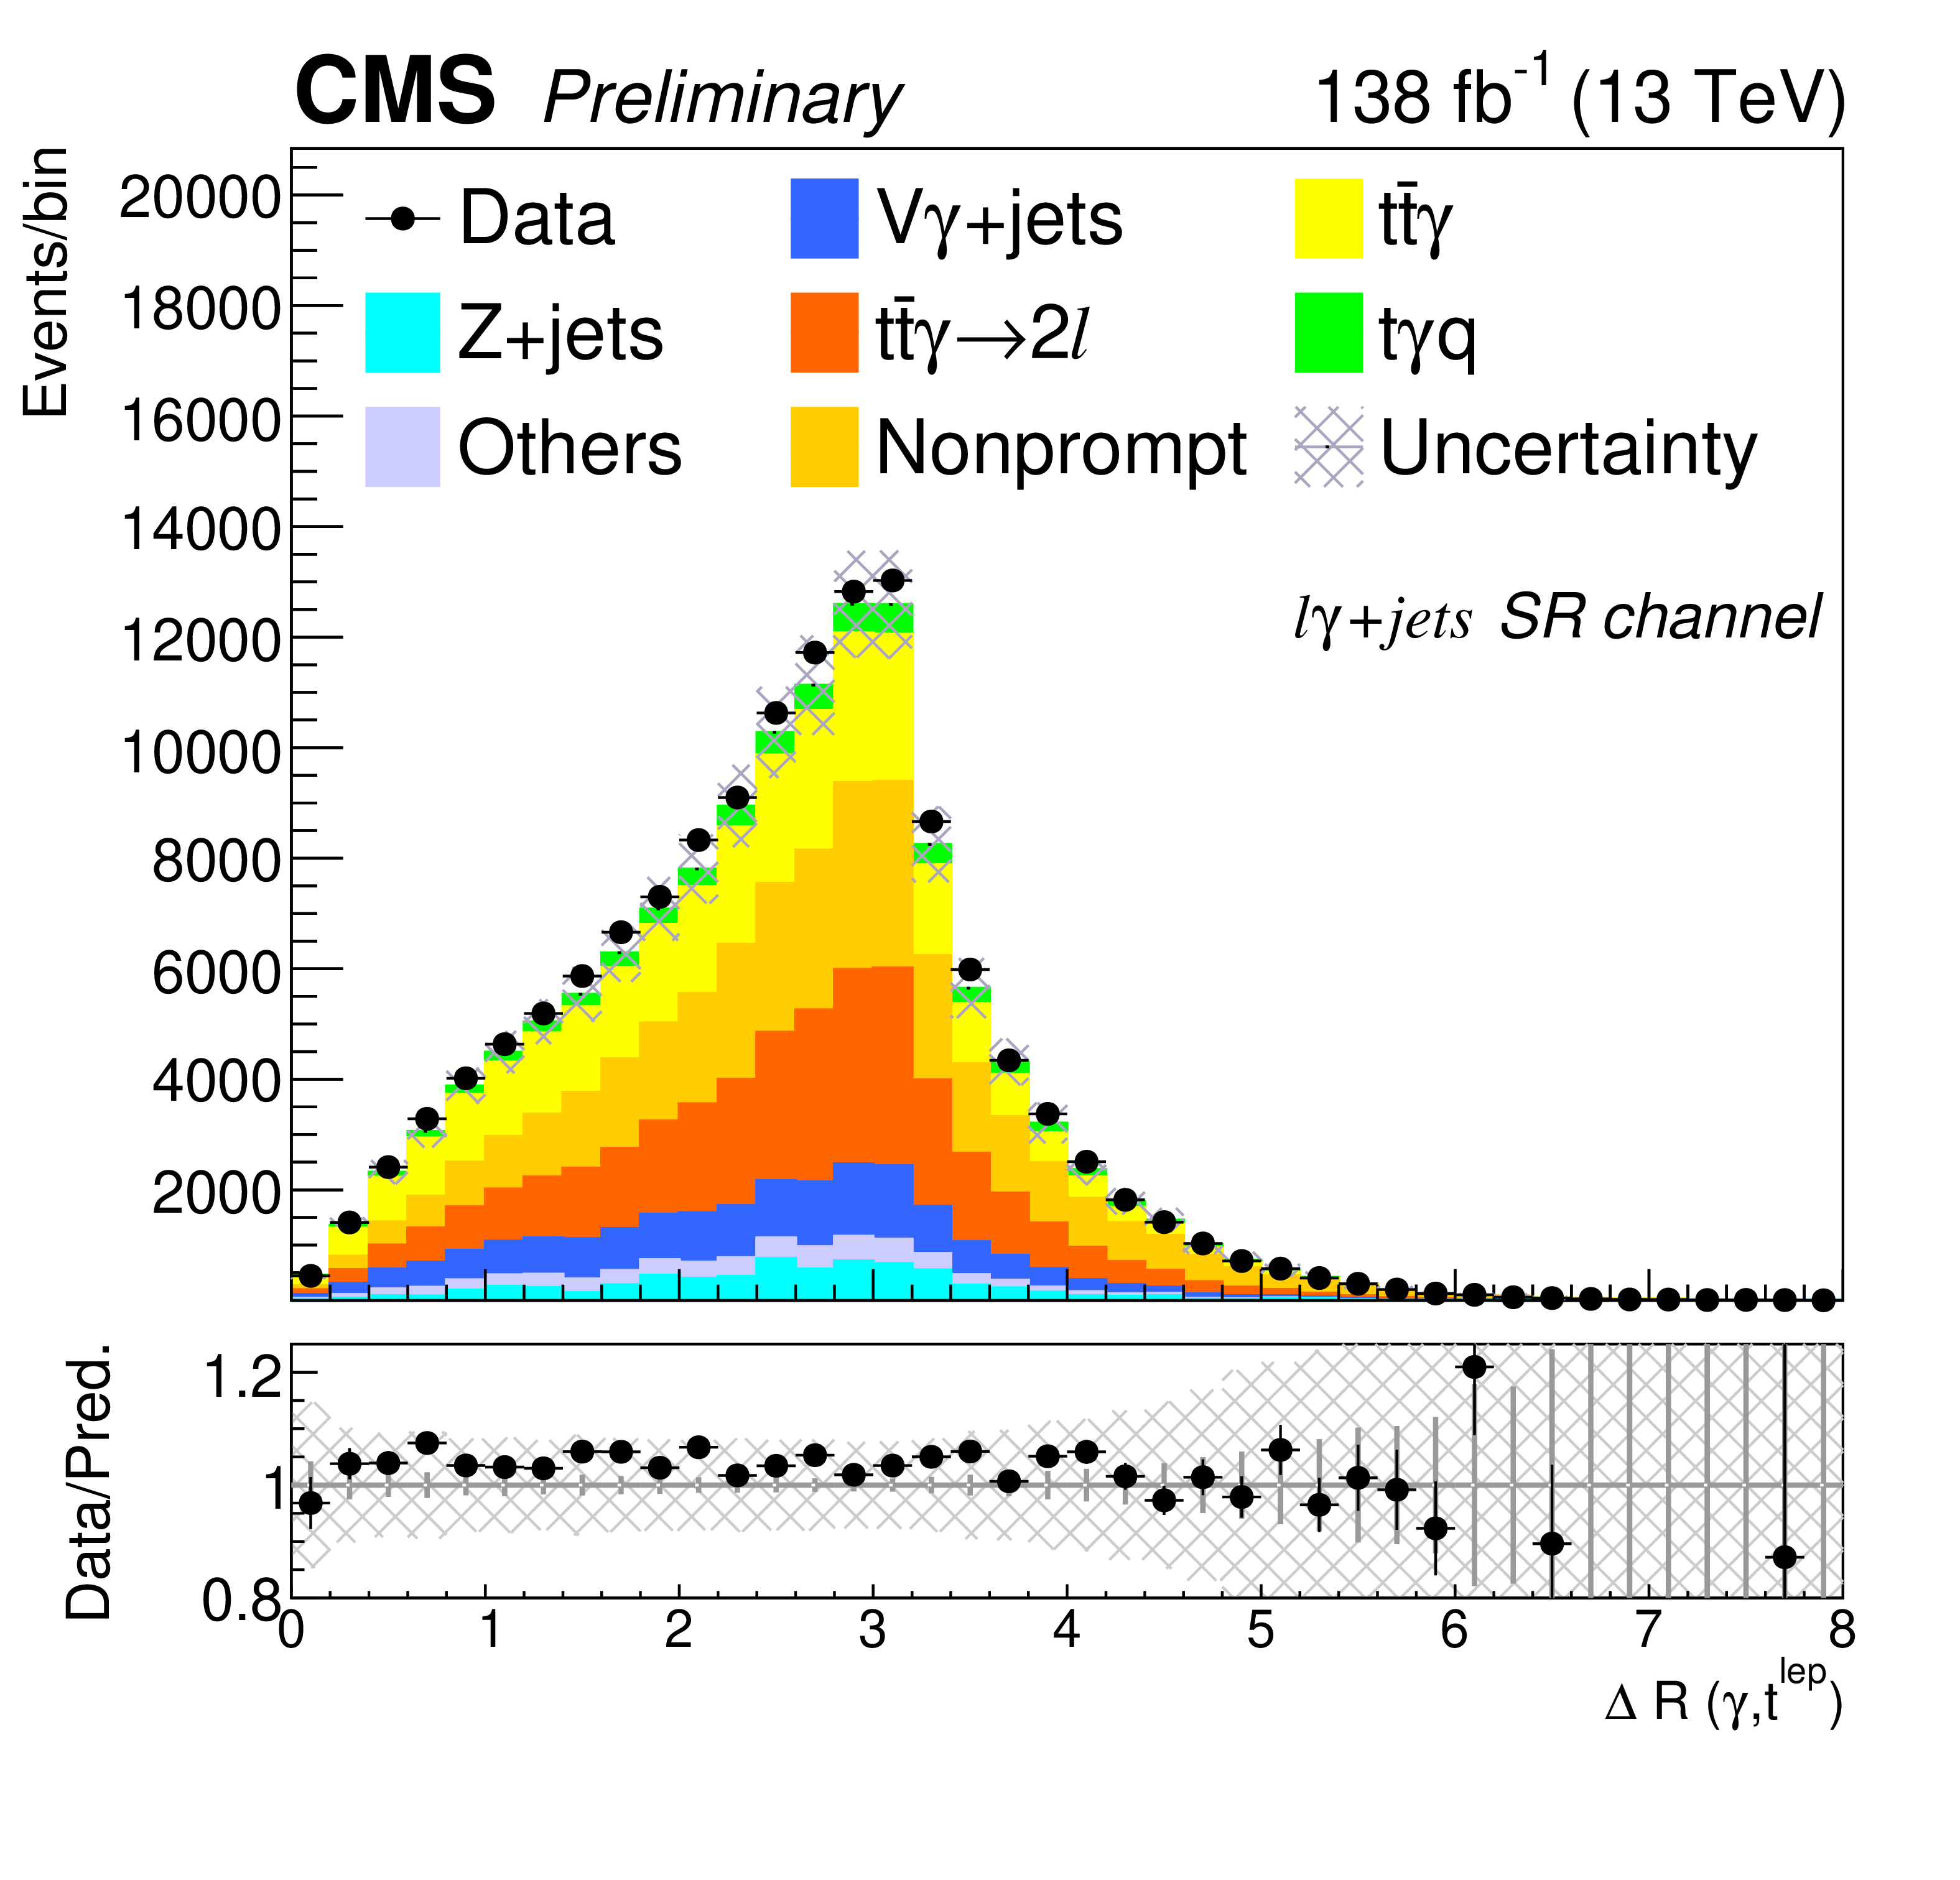
Figure 7-c:
The distributions of $ \Delta R(\ell,\gamma) $, $ N_{\mathrm{jets}} $, $ \Delta R(\mathrm{t},\gamma) $, and lepton charge before the fit for the combined lepton flavor channels from full Run 2 data and simulated samples, where the misID contribution is normalized to factors derived from the inclusive measurement fit. The lower panels show the ratio of the observed to the predicted event yields. |
png pdf |
Figure 7-d:
The distributions of $ \Delta R(\ell,\gamma) $, $ N_{\mathrm{jets}} $, $ \Delta R(\mathrm{t},\gamma) $, and lepton charge before the fit for the combined lepton flavor channels from full Run 2 data and simulated samples, where the misID contribution is normalized to factors derived from the inclusive measurement fit. The lower panels show the ratio of the observed to the predicted event yields. |
png pdf |
Figure 8:
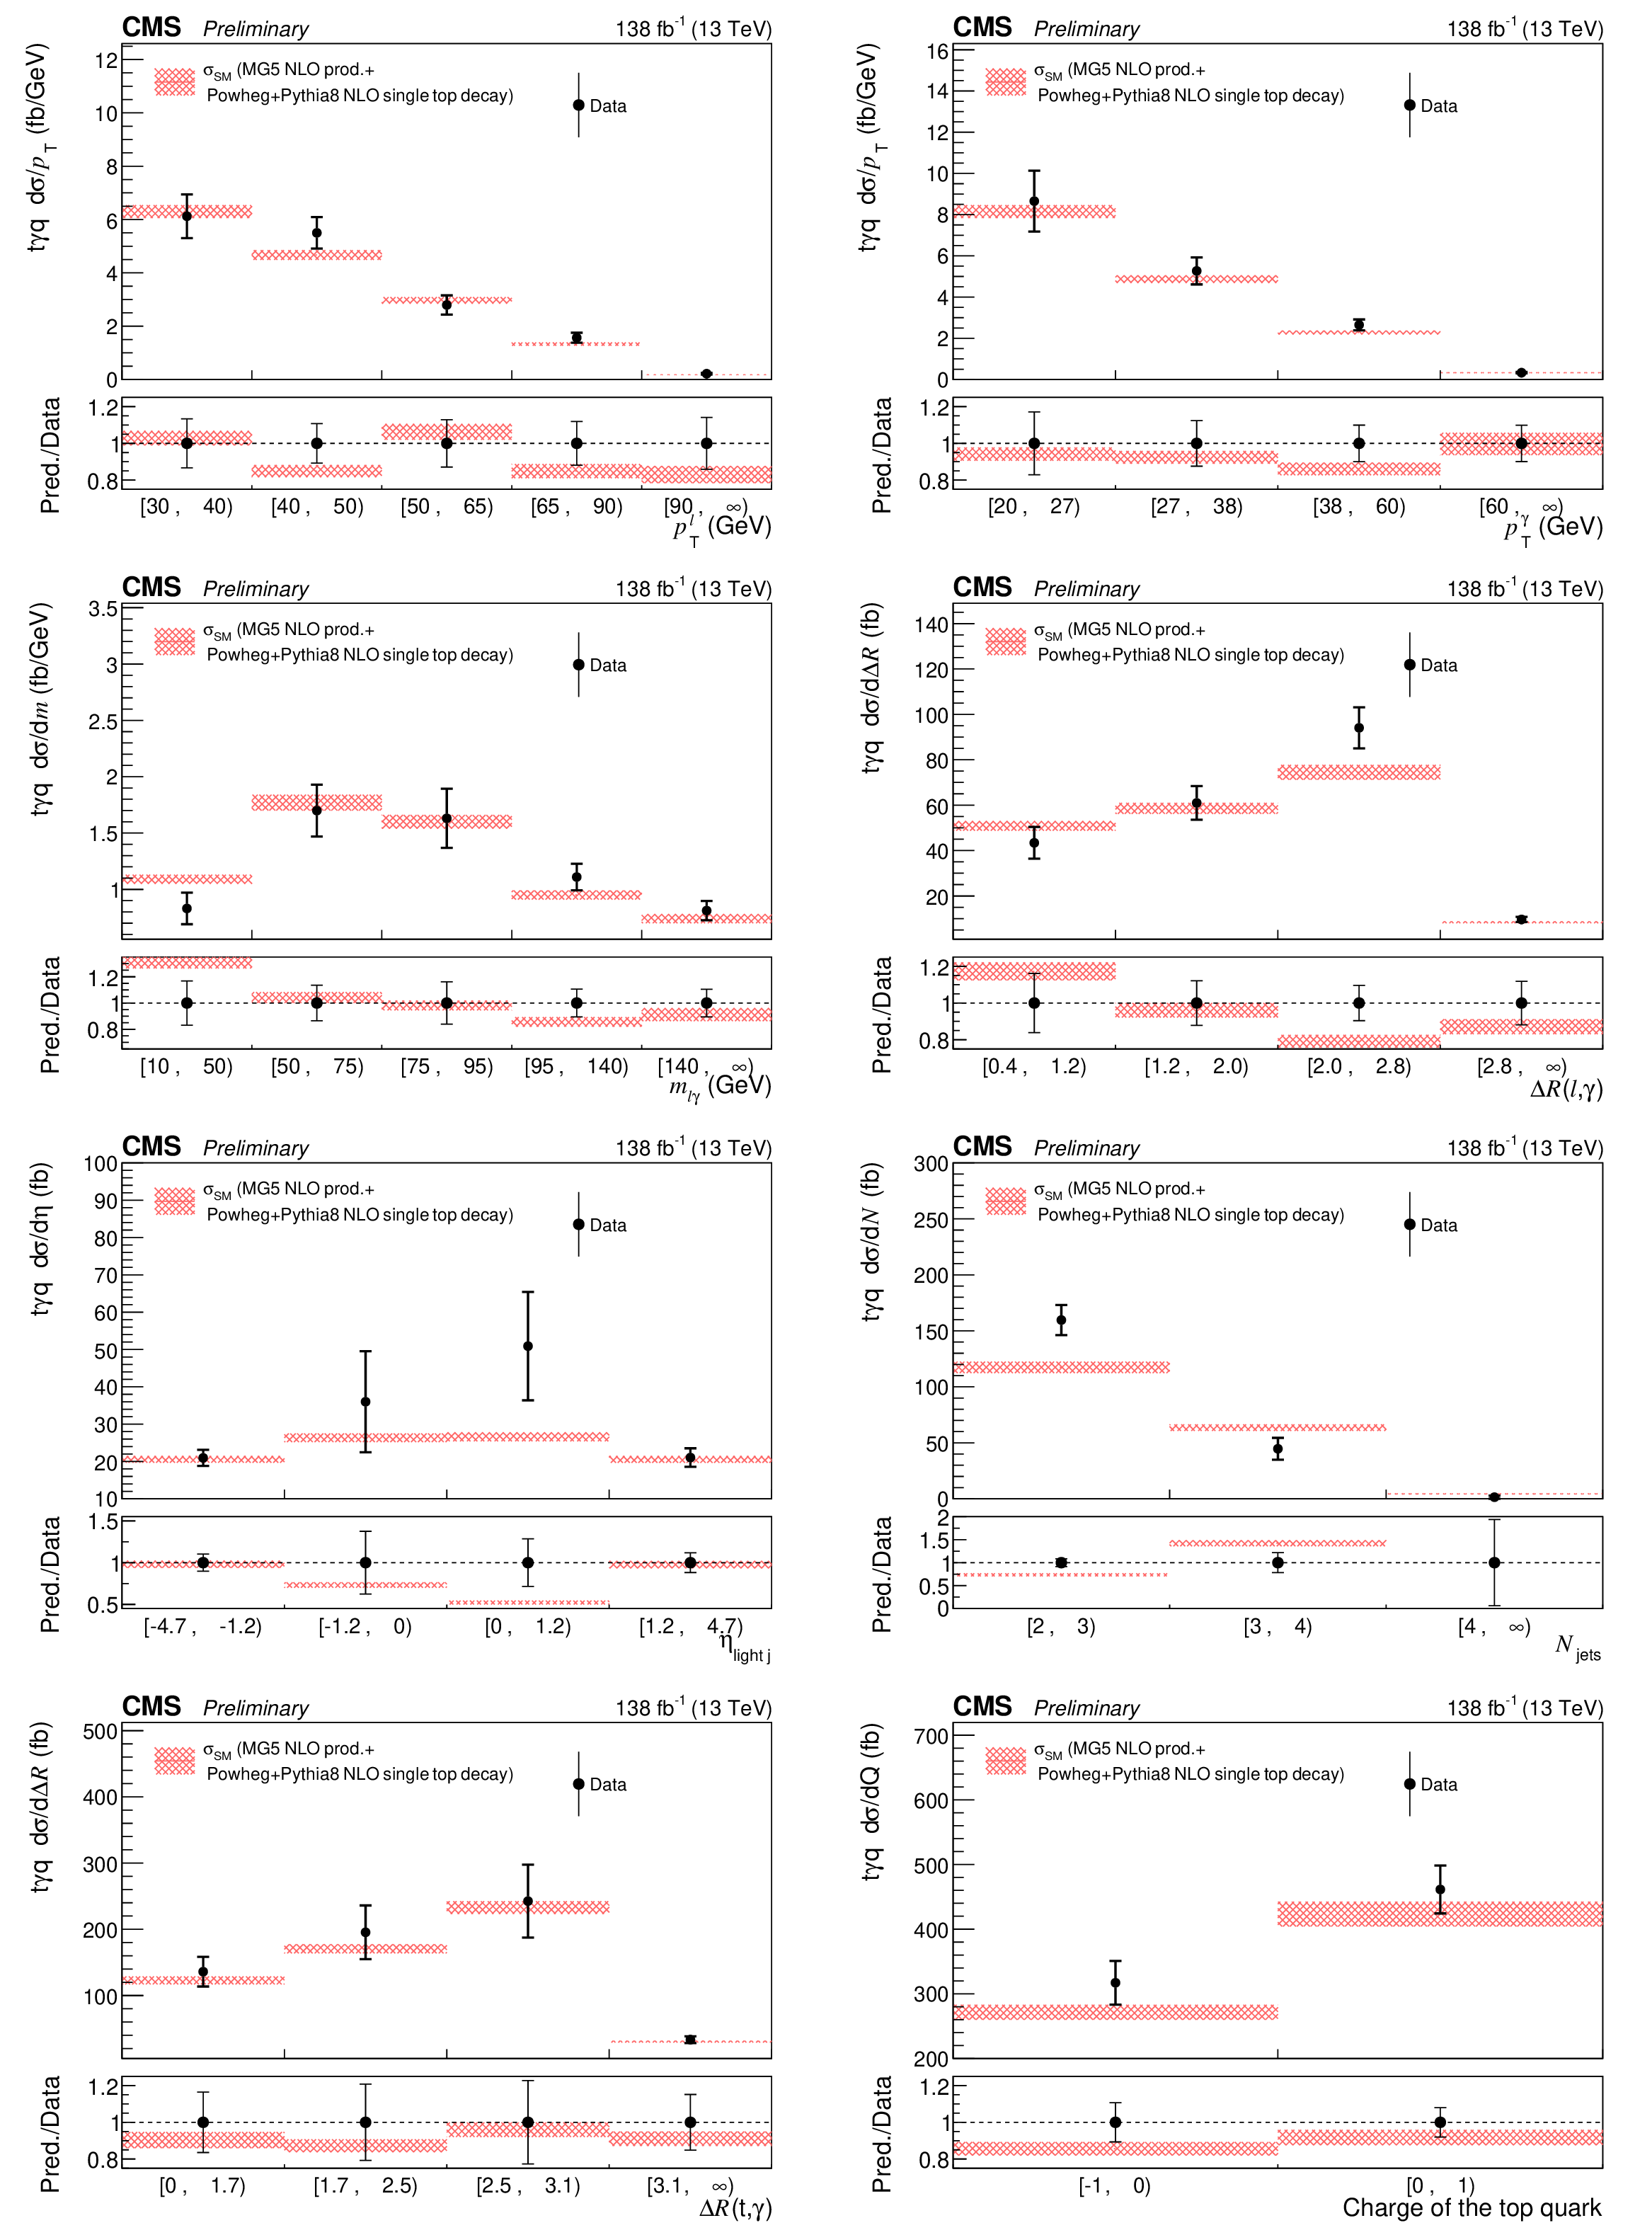
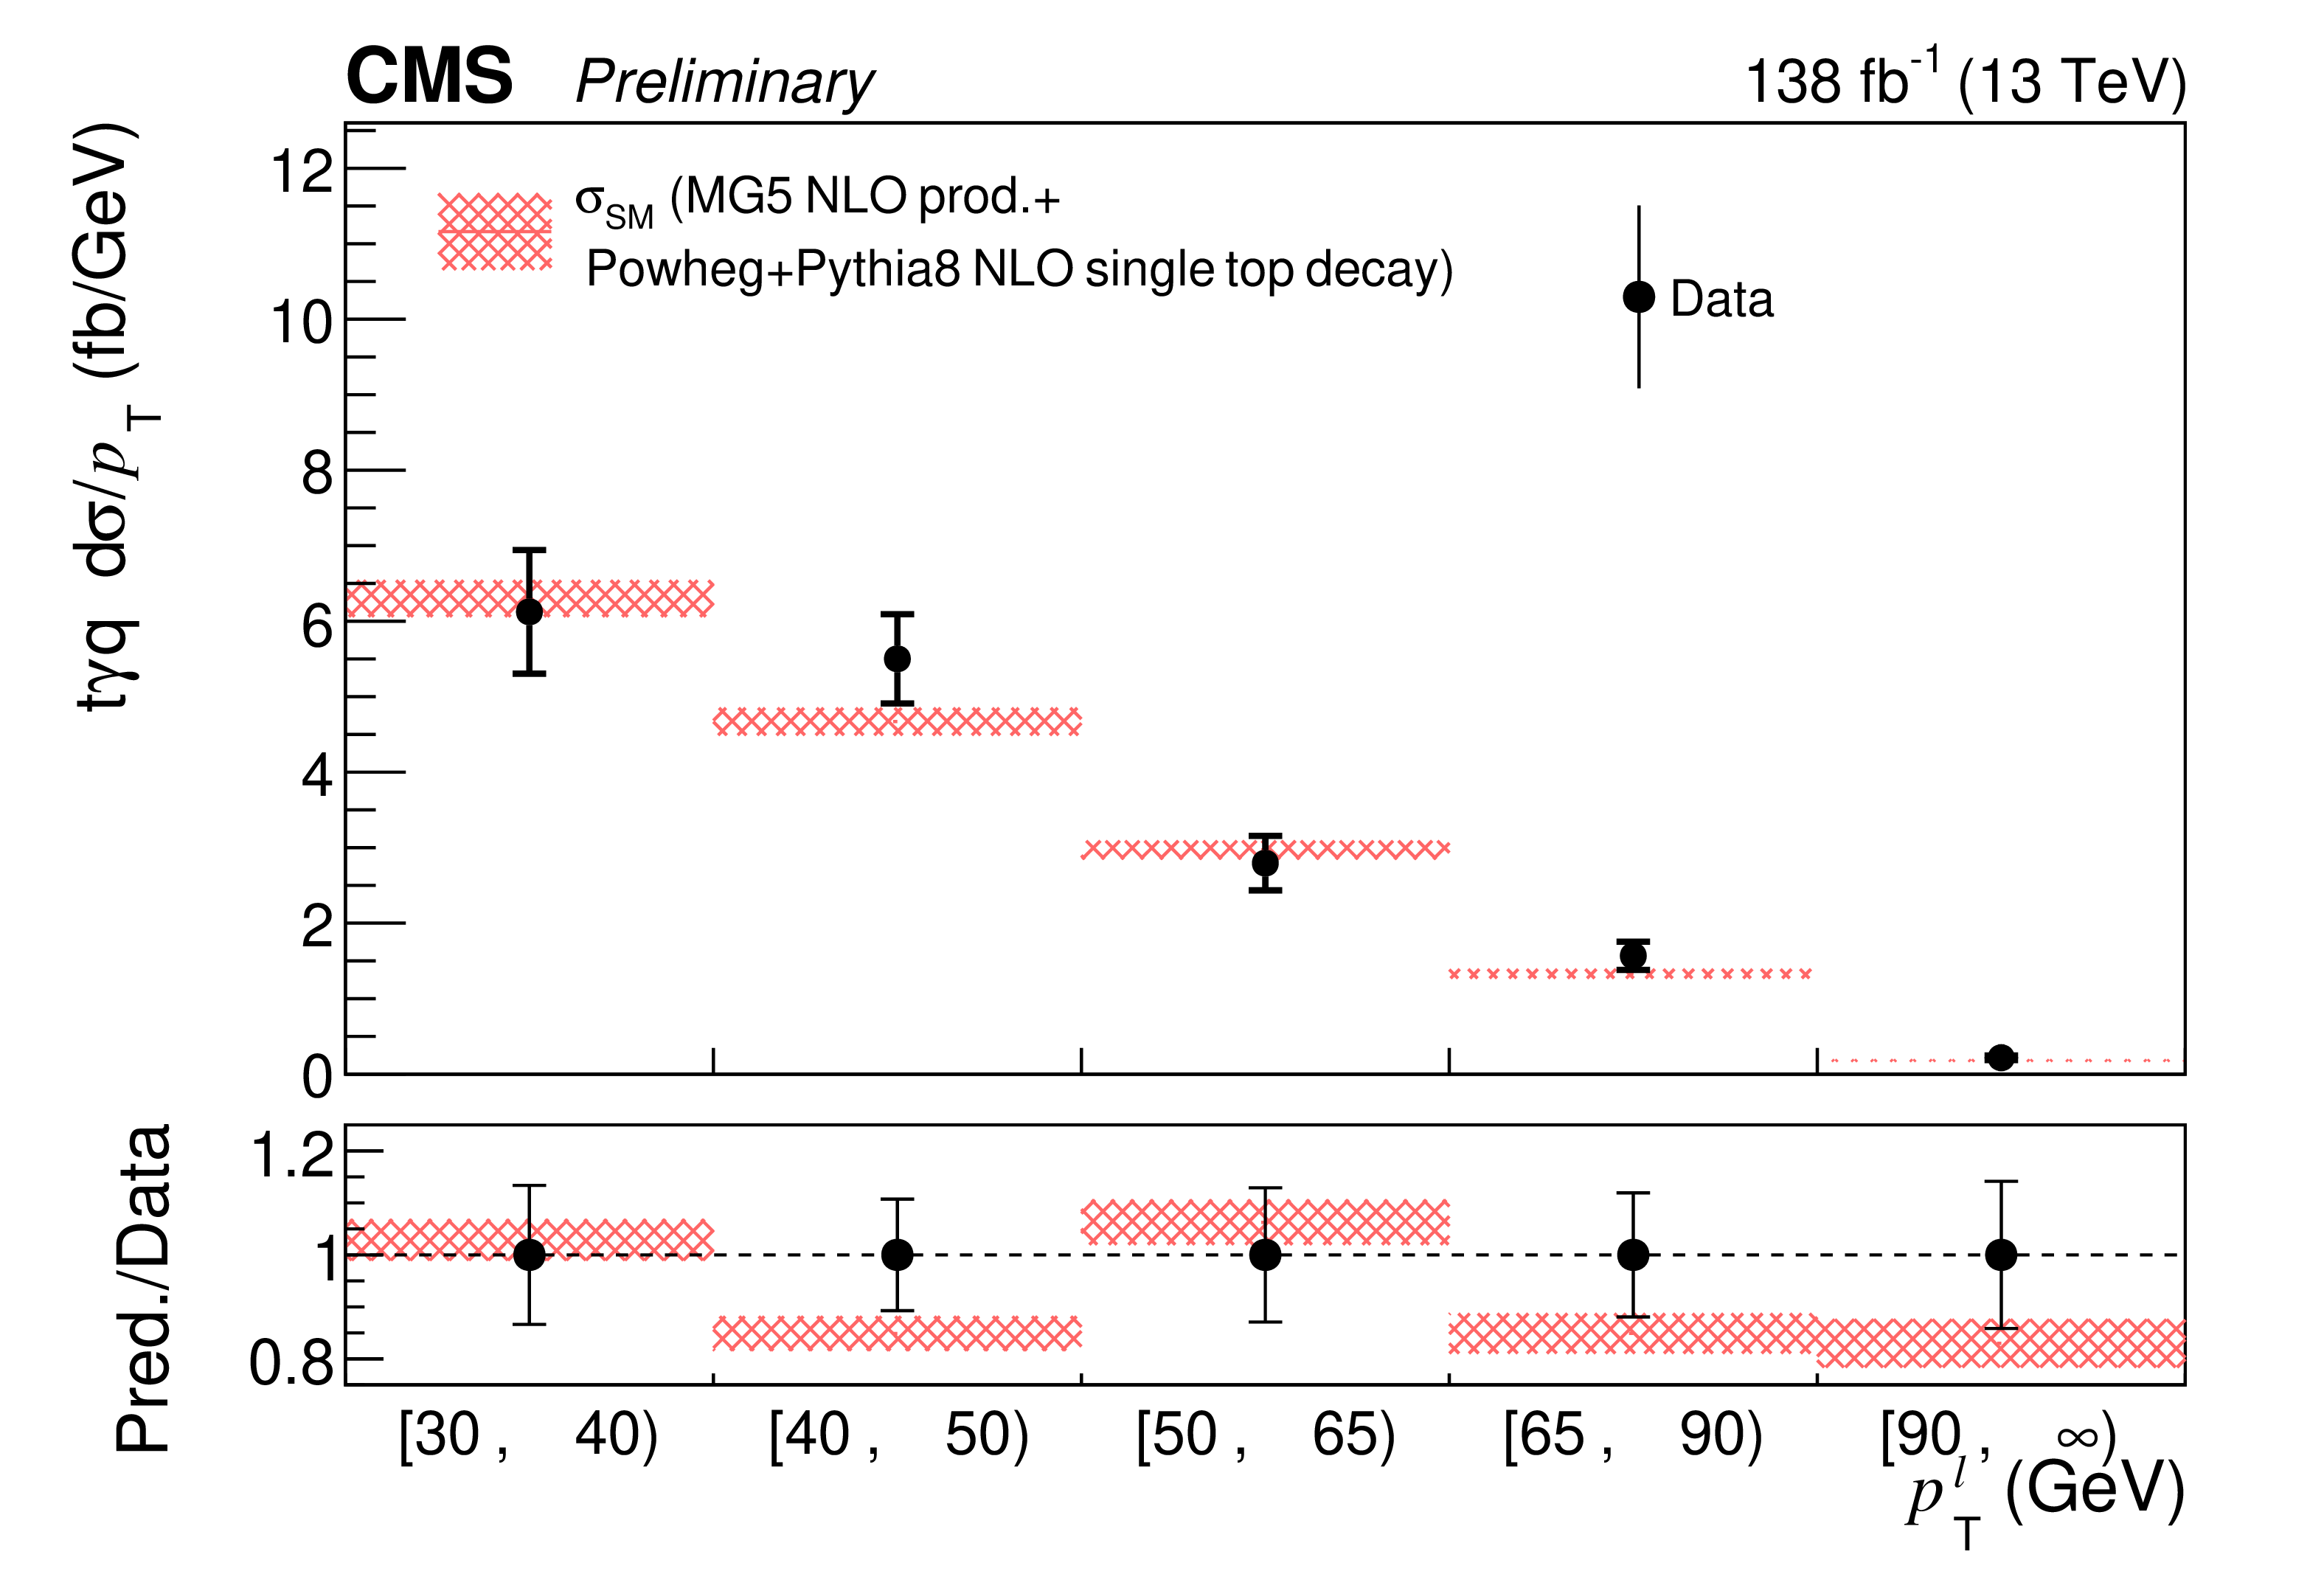
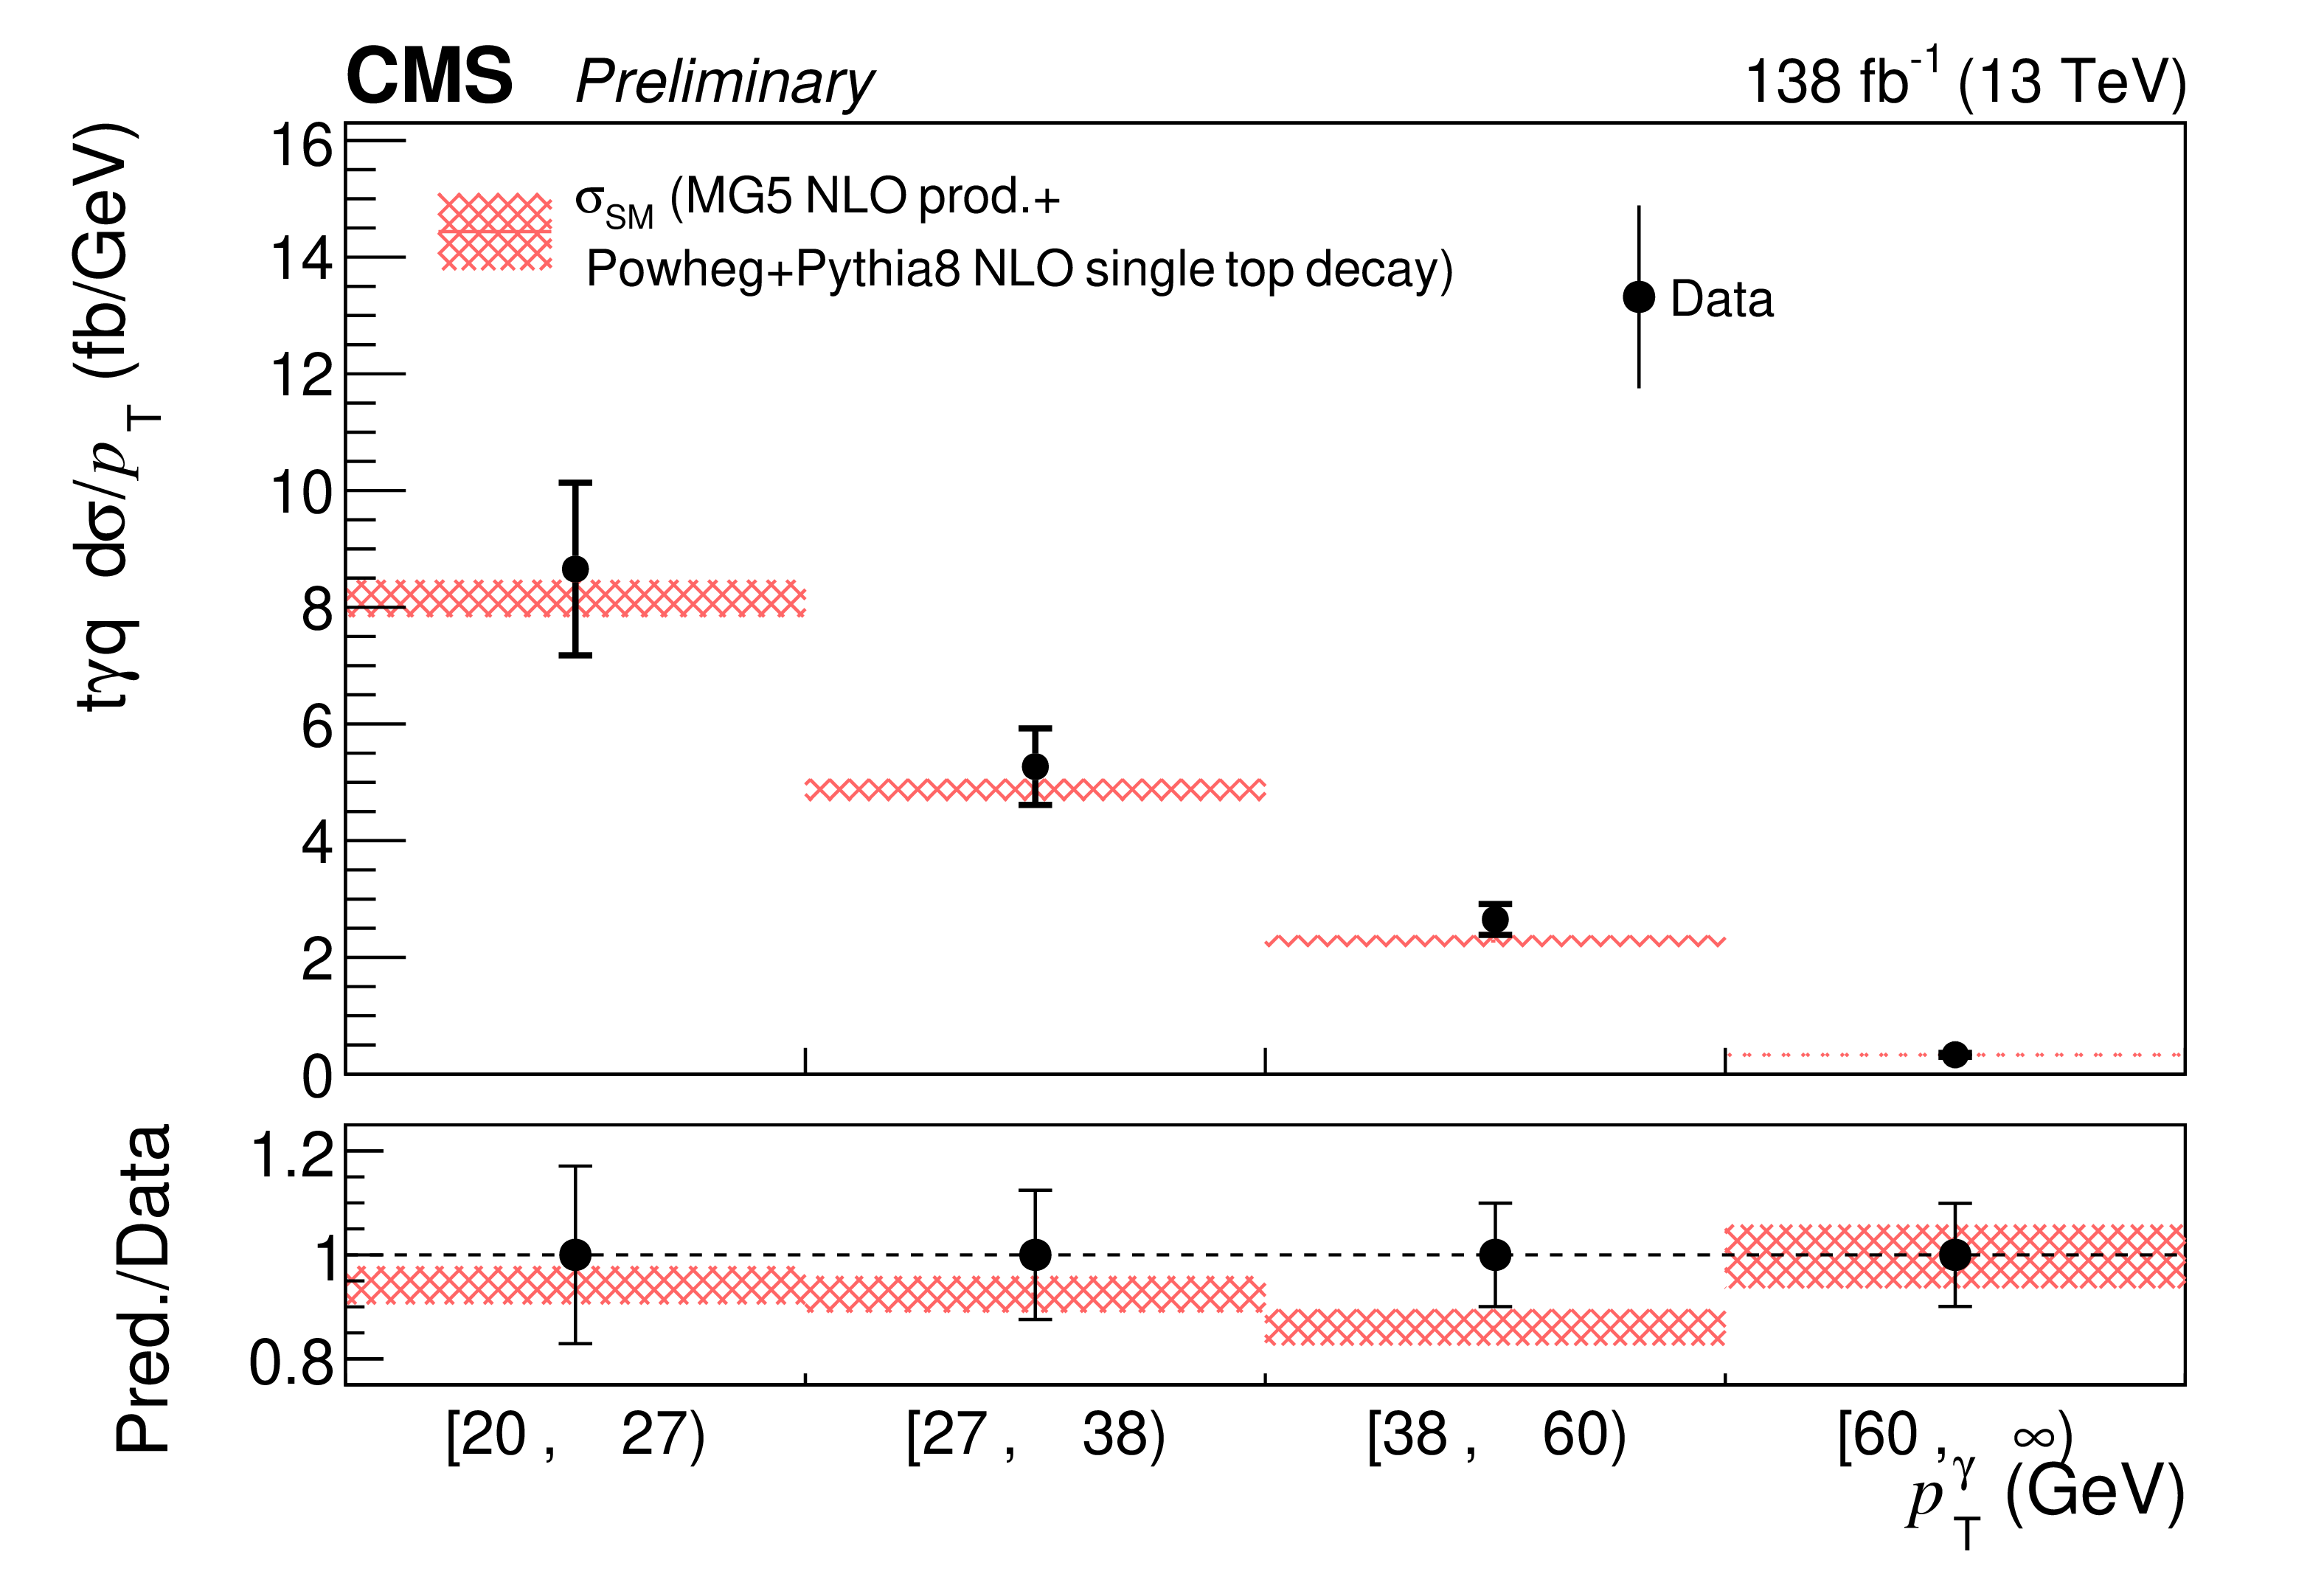
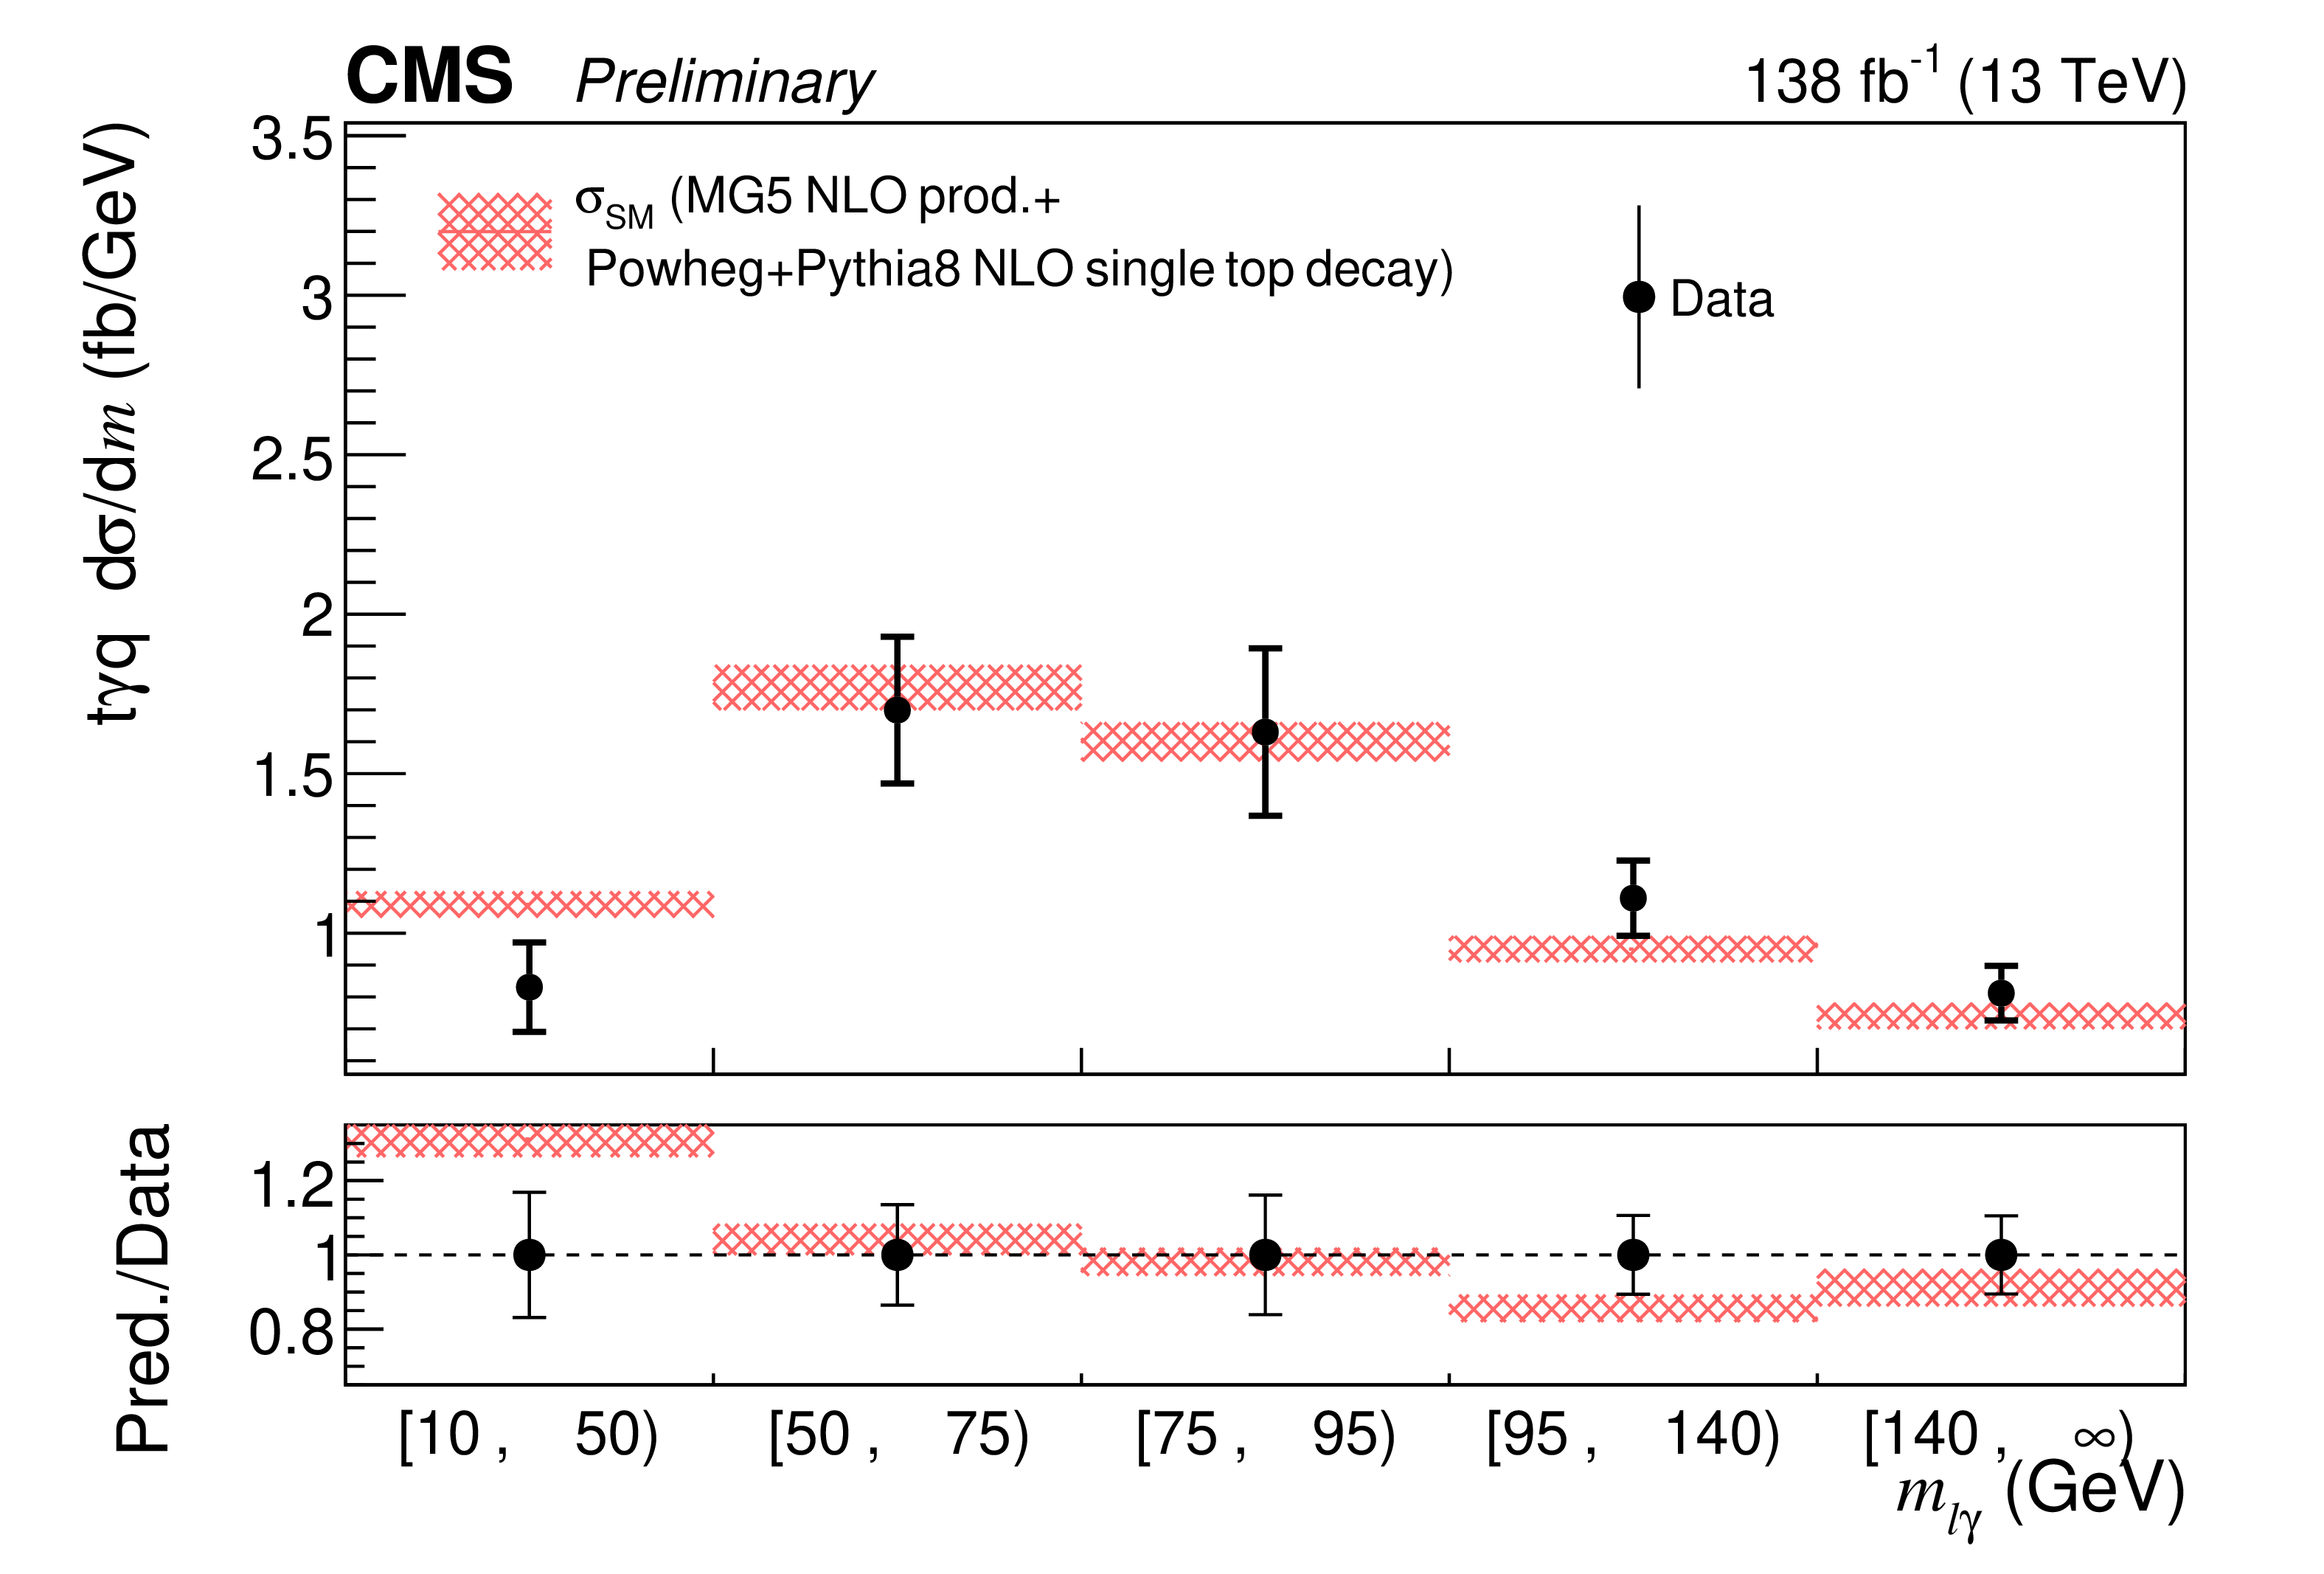
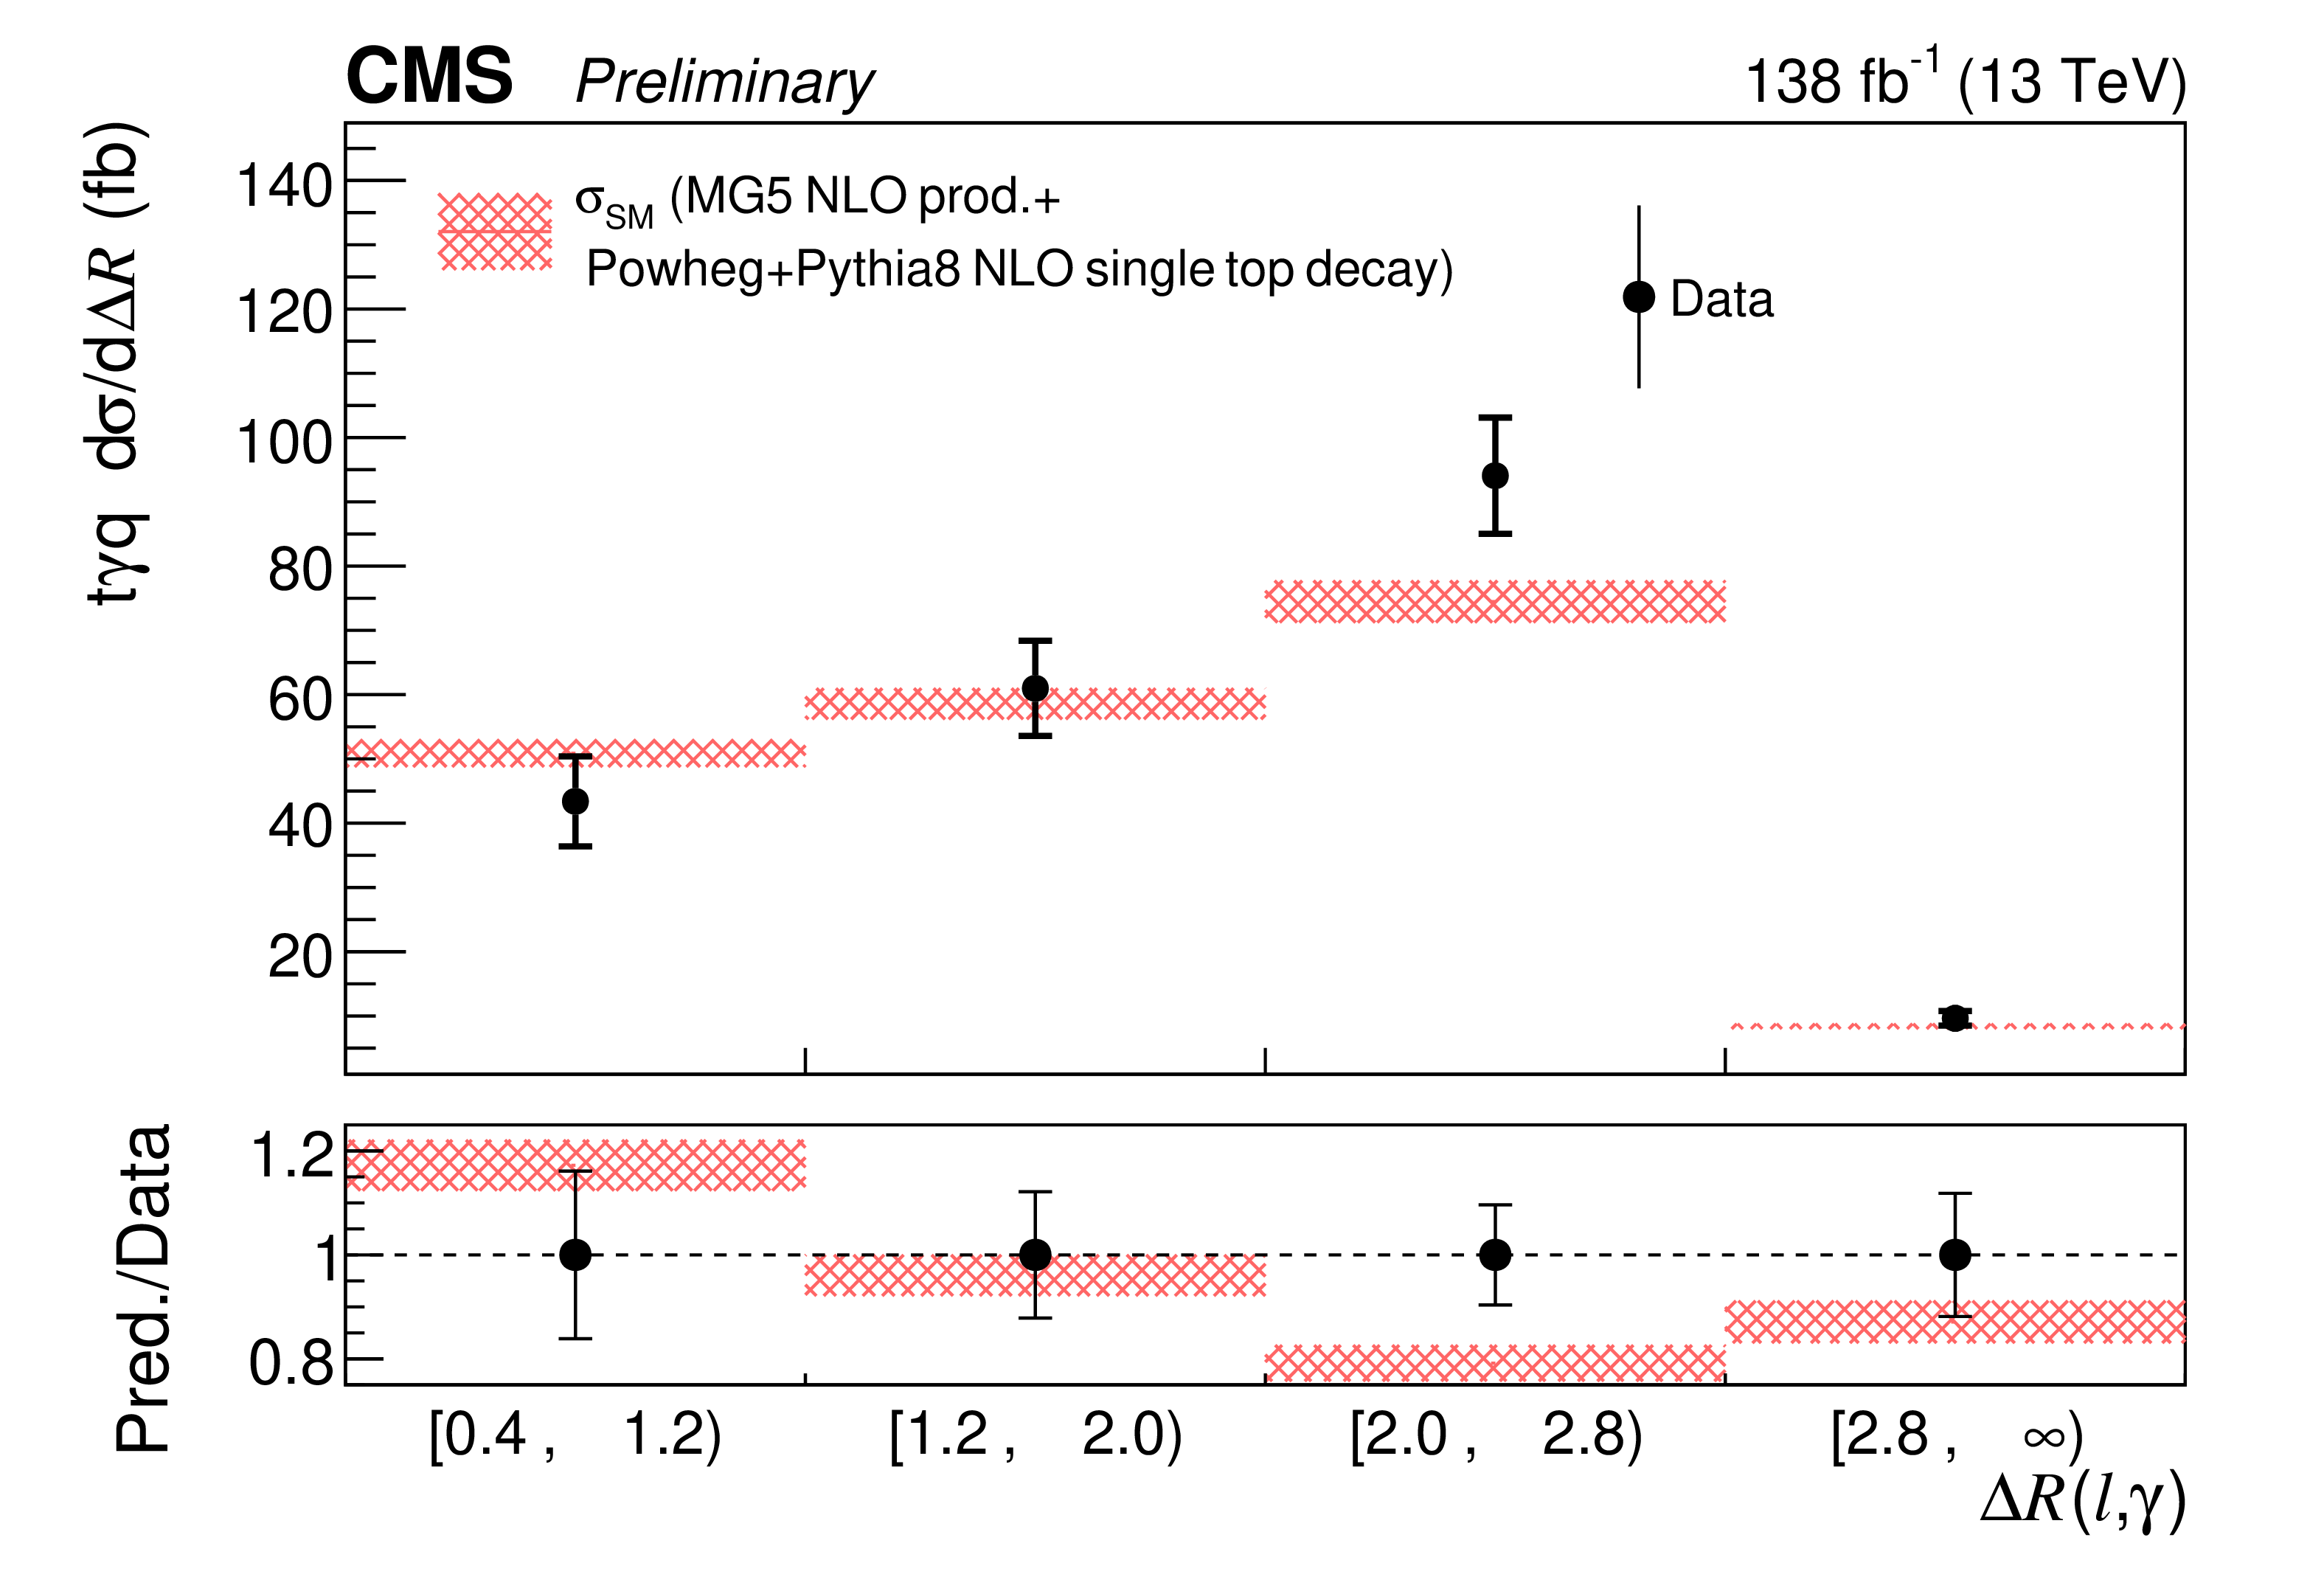
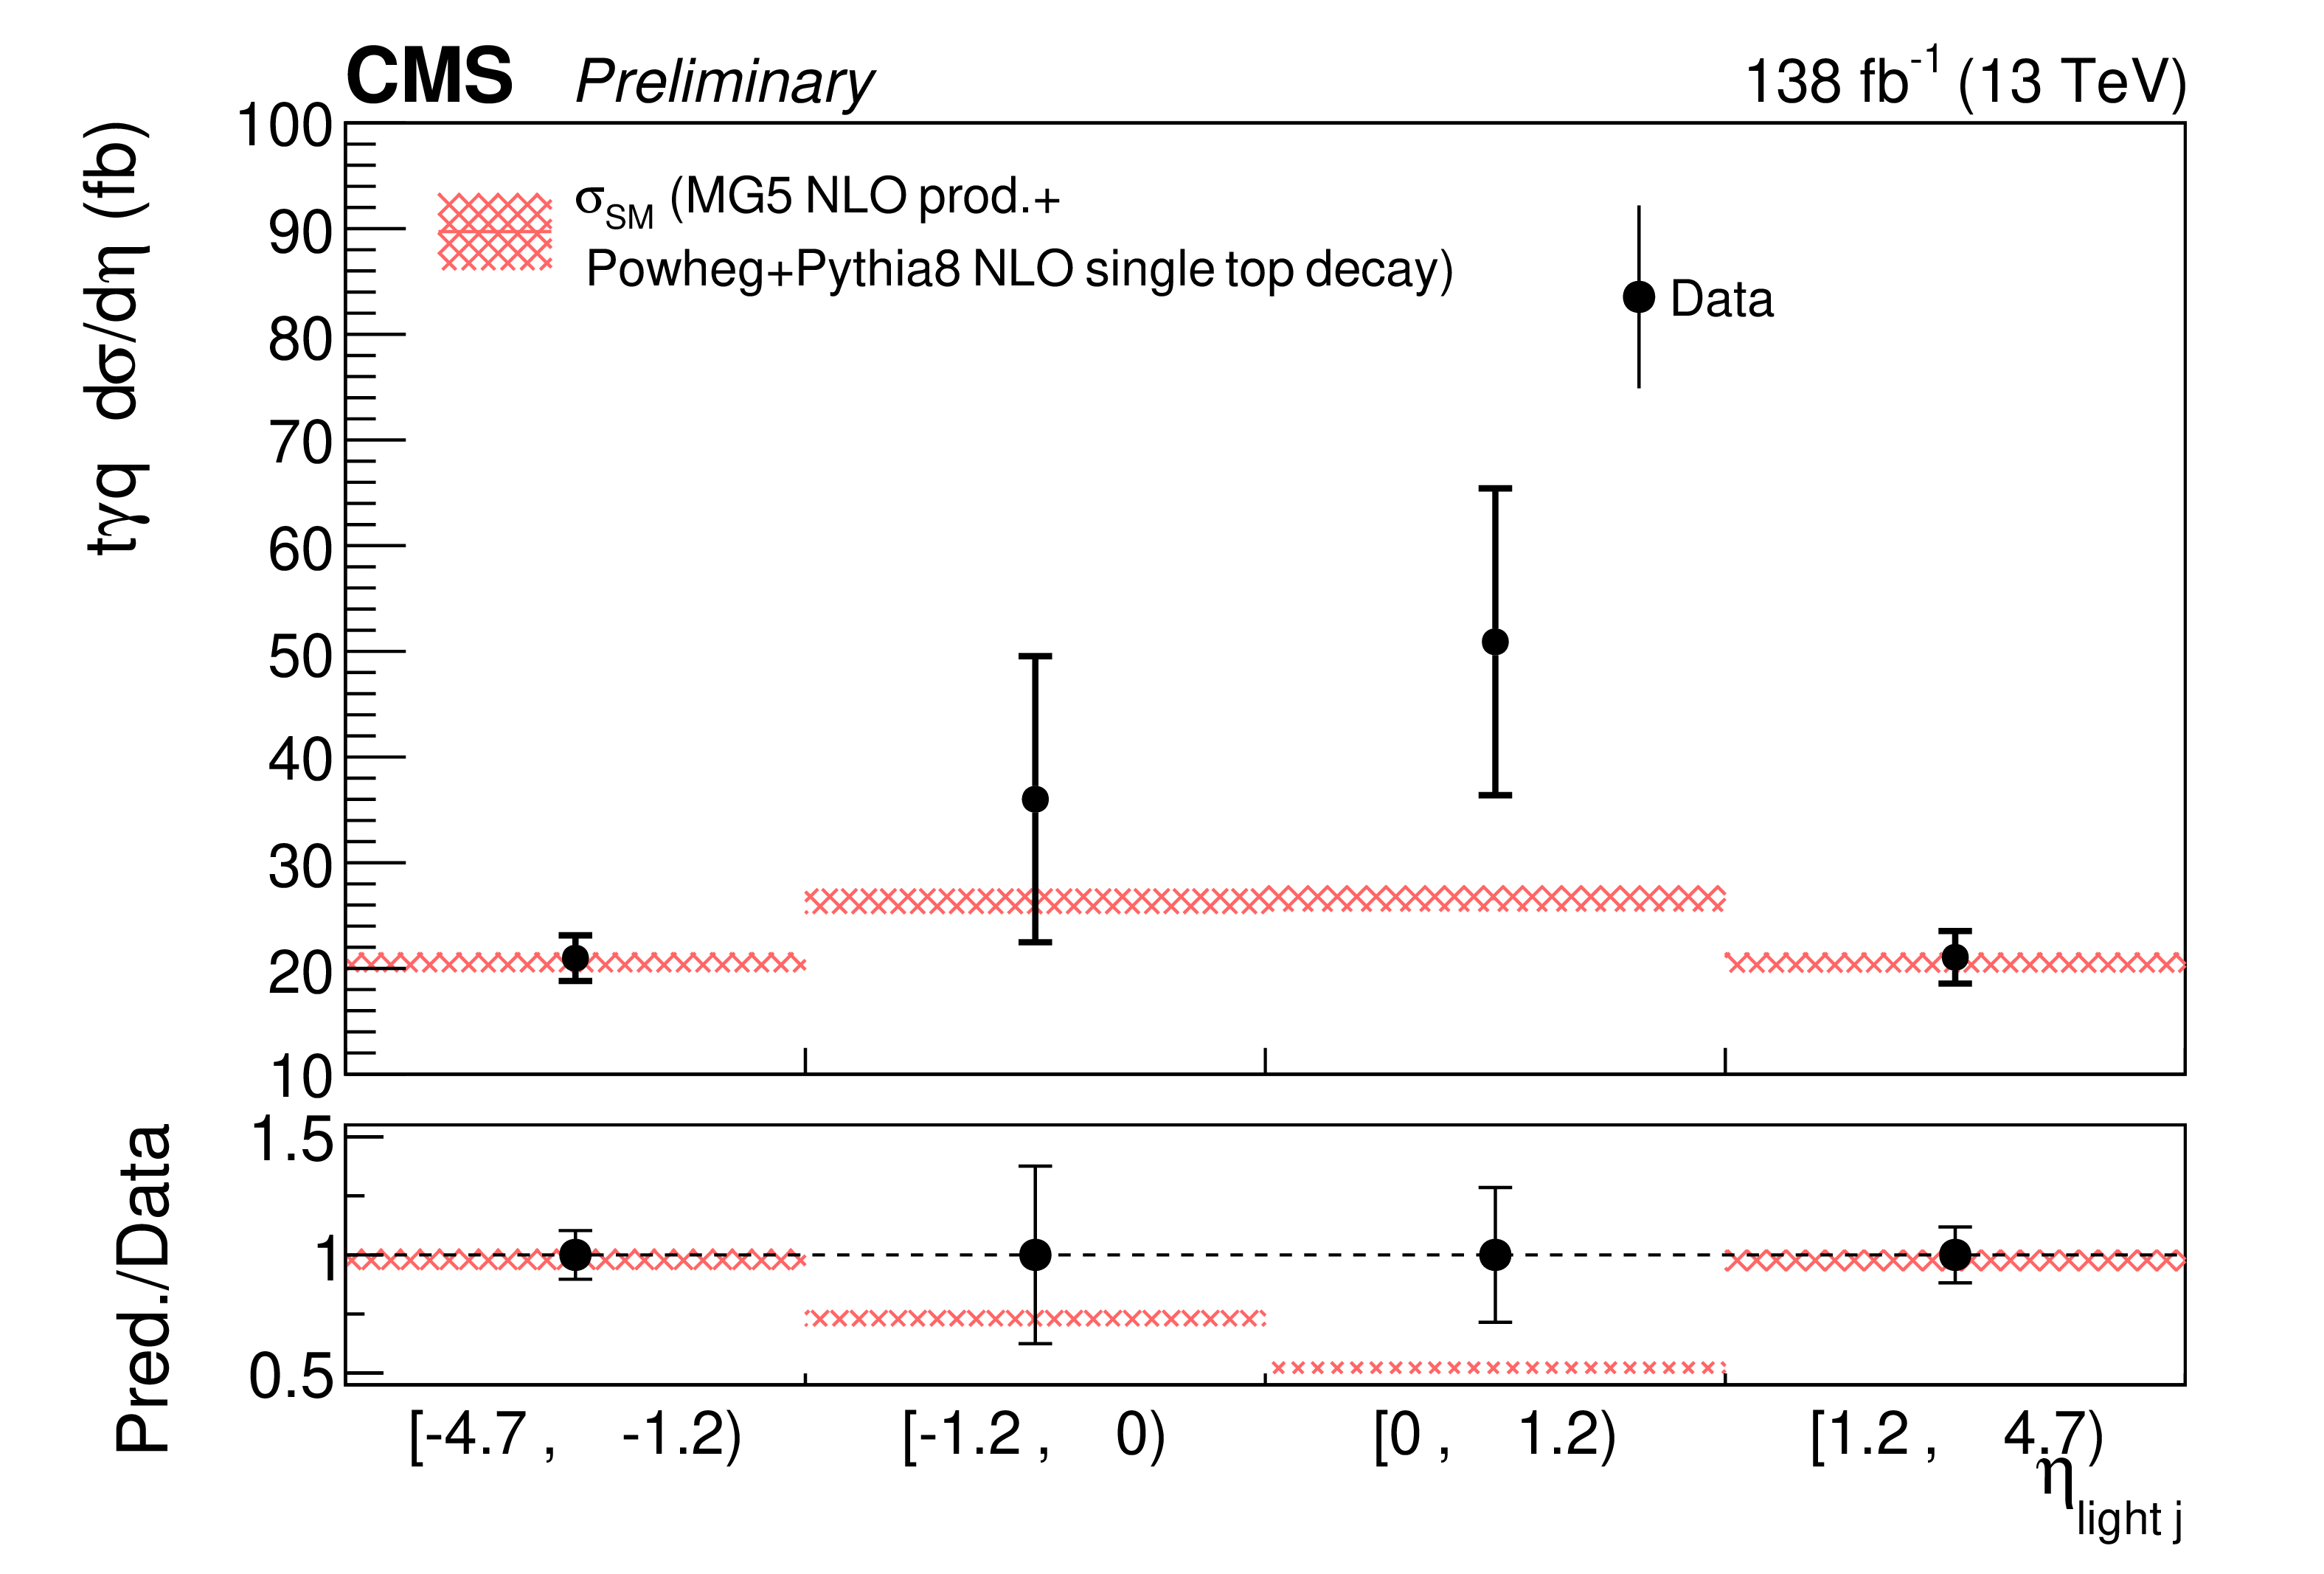
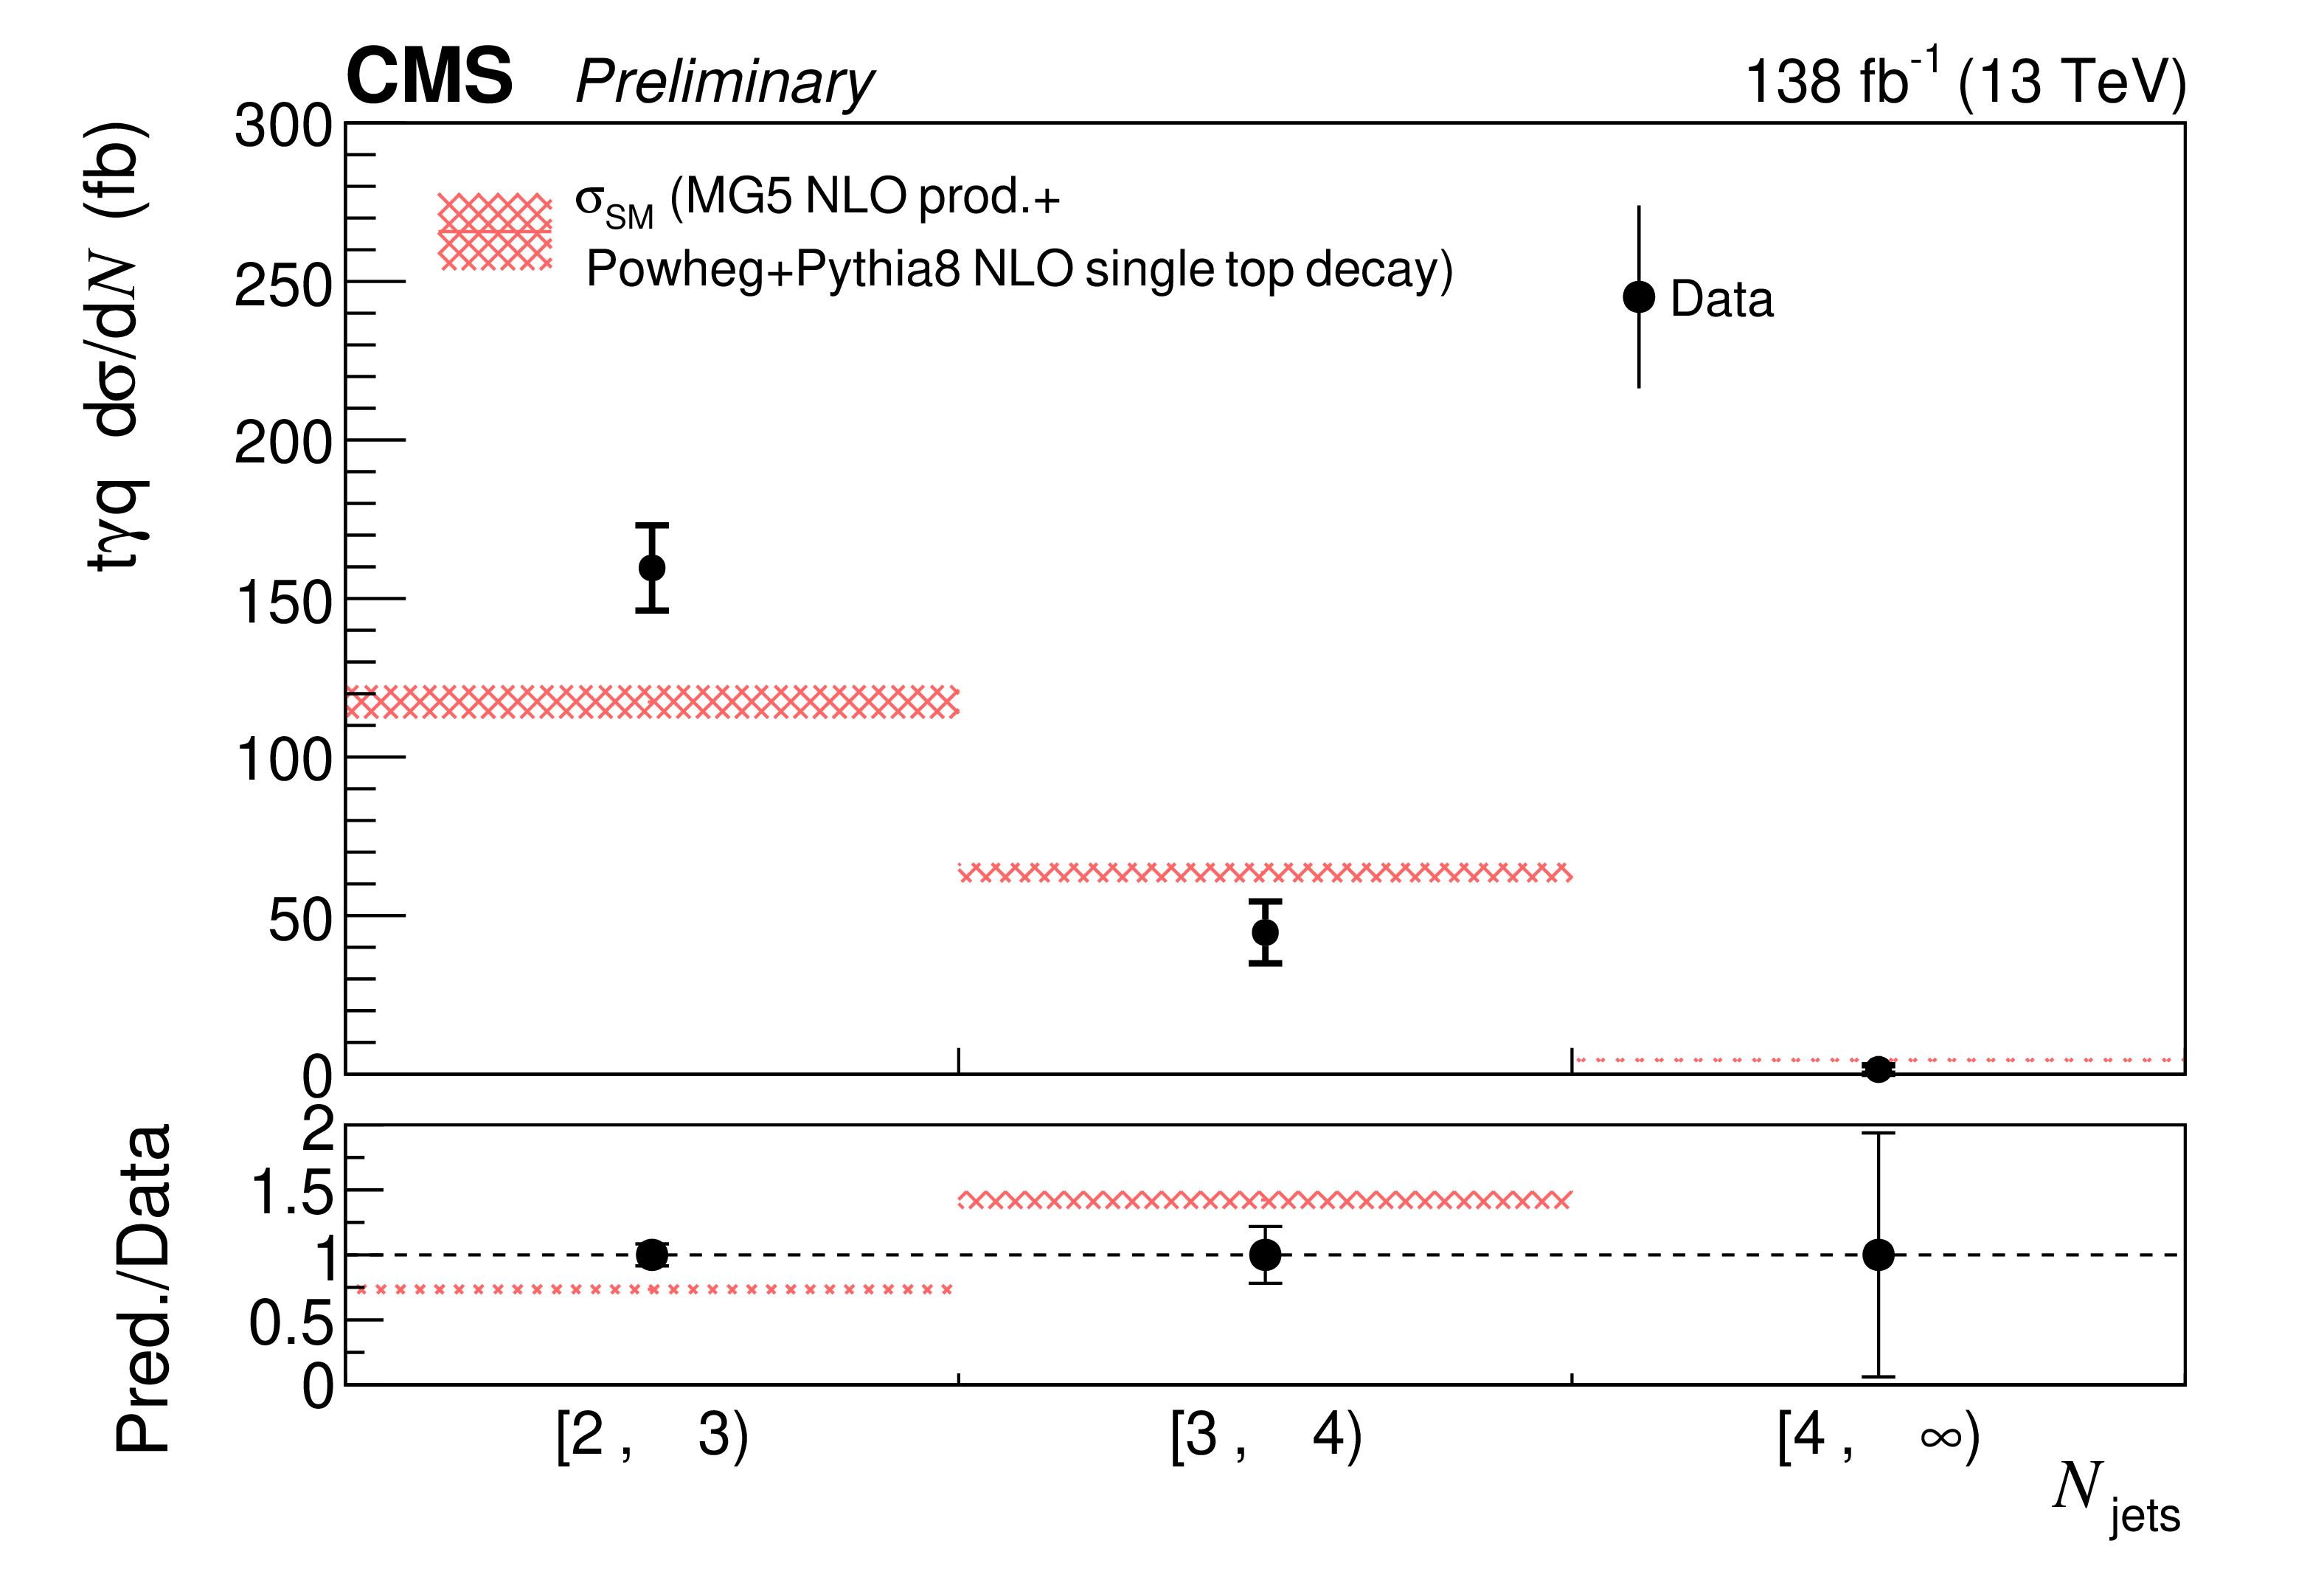
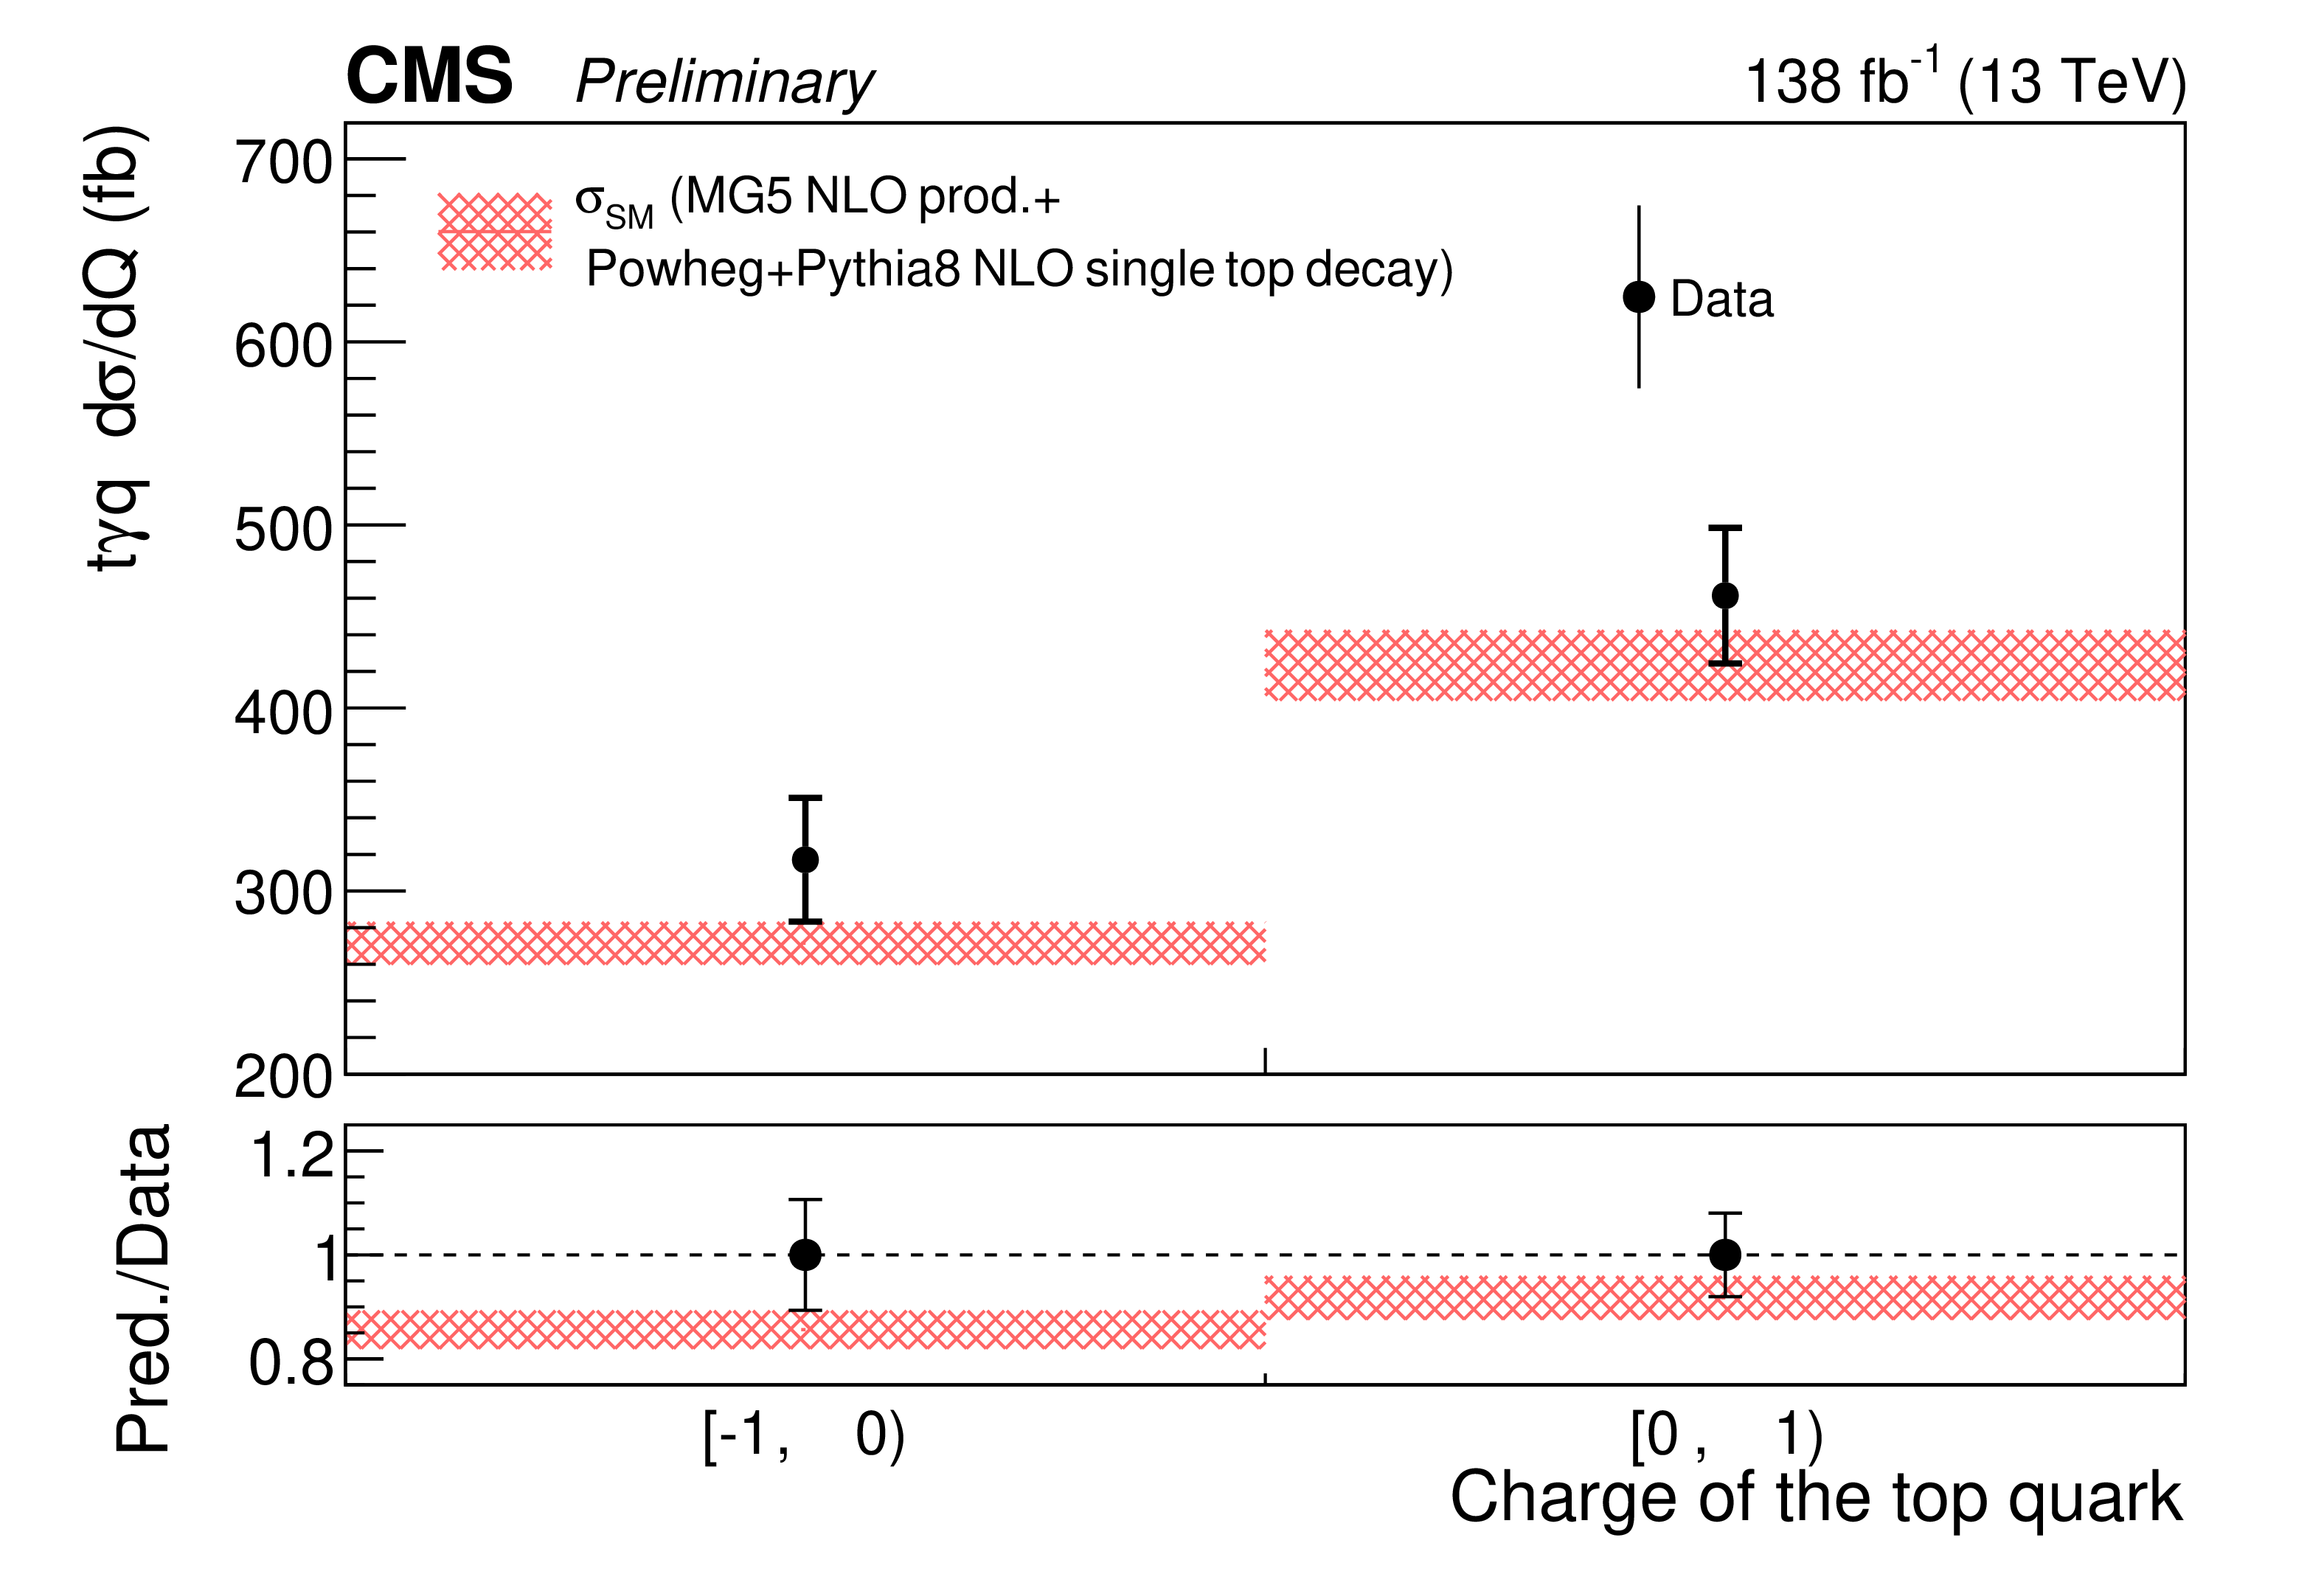
The measured differential cross sections normalized to the bin width for $ \mathrm{t}\gamma $q as a function of $ p_{\mathrm{T}}^{\ell} $, $ p_{\mathrm{T}}^{\gamma} $, $ m_{\ell\gamma} $, $ \Delta R(\ell,\gamma) $, $ \eta_{\mathrm{light j}} $, $ N_{\mathrm{jets}} $ at particle level, as well as the $ \Delta R(\mathrm{top}_{\ell},\gamma) $ and top quark charge at parton level. The black points with error bars represent the data and their uncertainties, whereas the red bands represent the total theoretical uncertainties from the simulated samples. The last bin includes overflow events. |
png pdf |
Figure 8-a:
The measured differential cross sections normalized to the bin width for $ \mathrm{t}\gamma $q as a function of $ p_{\mathrm{T}}^{\ell} $, $ p_{\mathrm{T}}^{\gamma} $, $ m_{\ell\gamma} $, $ \Delta R(\ell,\gamma) $, $ \eta_{\mathrm{light j}} $, $ N_{\mathrm{jets}} $ at particle level, as well as the $ \Delta R(\mathrm{top}_{\ell},\gamma) $ and top quark charge at parton level. The black points with error bars represent the data and their uncertainties, whereas the red bands represent the total theoretical uncertainties from the simulated samples. The last bin includes overflow events. |
png pdf |
Figure 8-b:
The measured differential cross sections normalized to the bin width for $ \mathrm{t}\gamma $q as a function of $ p_{\mathrm{T}}^{\ell} $, $ p_{\mathrm{T}}^{\gamma} $, $ m_{\ell\gamma} $, $ \Delta R(\ell,\gamma) $, $ \eta_{\mathrm{light j}} $, $ N_{\mathrm{jets}} $ at particle level, as well as the $ \Delta R(\mathrm{top}_{\ell},\gamma) $ and top quark charge at parton level. The black points with error bars represent the data and their uncertainties, whereas the red bands represent the total theoretical uncertainties from the simulated samples. The last bin includes overflow events. |
png pdf |
Figure 8-c:
The measured differential cross sections normalized to the bin width for $ \mathrm{t}\gamma $q as a function of $ p_{\mathrm{T}}^{\ell} $, $ p_{\mathrm{T}}^{\gamma} $, $ m_{\ell\gamma} $, $ \Delta R(\ell,\gamma) $, $ \eta_{\mathrm{light j}} $, $ N_{\mathrm{jets}} $ at particle level, as well as the $ \Delta R(\mathrm{top}_{\ell},\gamma) $ and top quark charge at parton level. The black points with error bars represent the data and their uncertainties, whereas the red bands represent the total theoretical uncertainties from the simulated samples. The last bin includes overflow events. |
png pdf |
Figure 8-d:
The measured differential cross sections normalized to the bin width for $ \mathrm{t}\gamma $q as a function of $ p_{\mathrm{T}}^{\ell} $, $ p_{\mathrm{T}}^{\gamma} $, $ m_{\ell\gamma} $, $ \Delta R(\ell,\gamma) $, $ \eta_{\mathrm{light j}} $, $ N_{\mathrm{jets}} $ at particle level, as well as the $ \Delta R(\mathrm{top}_{\ell},\gamma) $ and top quark charge at parton level. The black points with error bars represent the data and their uncertainties, whereas the red bands represent the total theoretical uncertainties from the simulated samples. The last bin includes overflow events. |
png pdf |
Figure 8-e:
The measured differential cross sections normalized to the bin width for $ \mathrm{t}\gamma $q as a function of $ p_{\mathrm{T}}^{\ell} $, $ p_{\mathrm{T}}^{\gamma} $, $ m_{\ell\gamma} $, $ \Delta R(\ell,\gamma) $, $ \eta_{\mathrm{light j}} $, $ N_{\mathrm{jets}} $ at particle level, as well as the $ \Delta R(\mathrm{top}_{\ell},\gamma) $ and top quark charge at parton level. The black points with error bars represent the data and their uncertainties, whereas the red bands represent the total theoretical uncertainties from the simulated samples. The last bin includes overflow events. |
png pdf |
Figure 8-f:
The measured differential cross sections normalized to the bin width for $ \mathrm{t}\gamma $q as a function of $ p_{\mathrm{T}}^{\ell} $, $ p_{\mathrm{T}}^{\gamma} $, $ m_{\ell\gamma} $, $ \Delta R(\ell,\gamma) $, $ \eta_{\mathrm{light j}} $, $ N_{\mathrm{jets}} $ at particle level, as well as the $ \Delta R(\mathrm{top}_{\ell},\gamma) $ and top quark charge at parton level. The black points with error bars represent the data and their uncertainties, whereas the red bands represent the total theoretical uncertainties from the simulated samples. The last bin includes overflow events. |
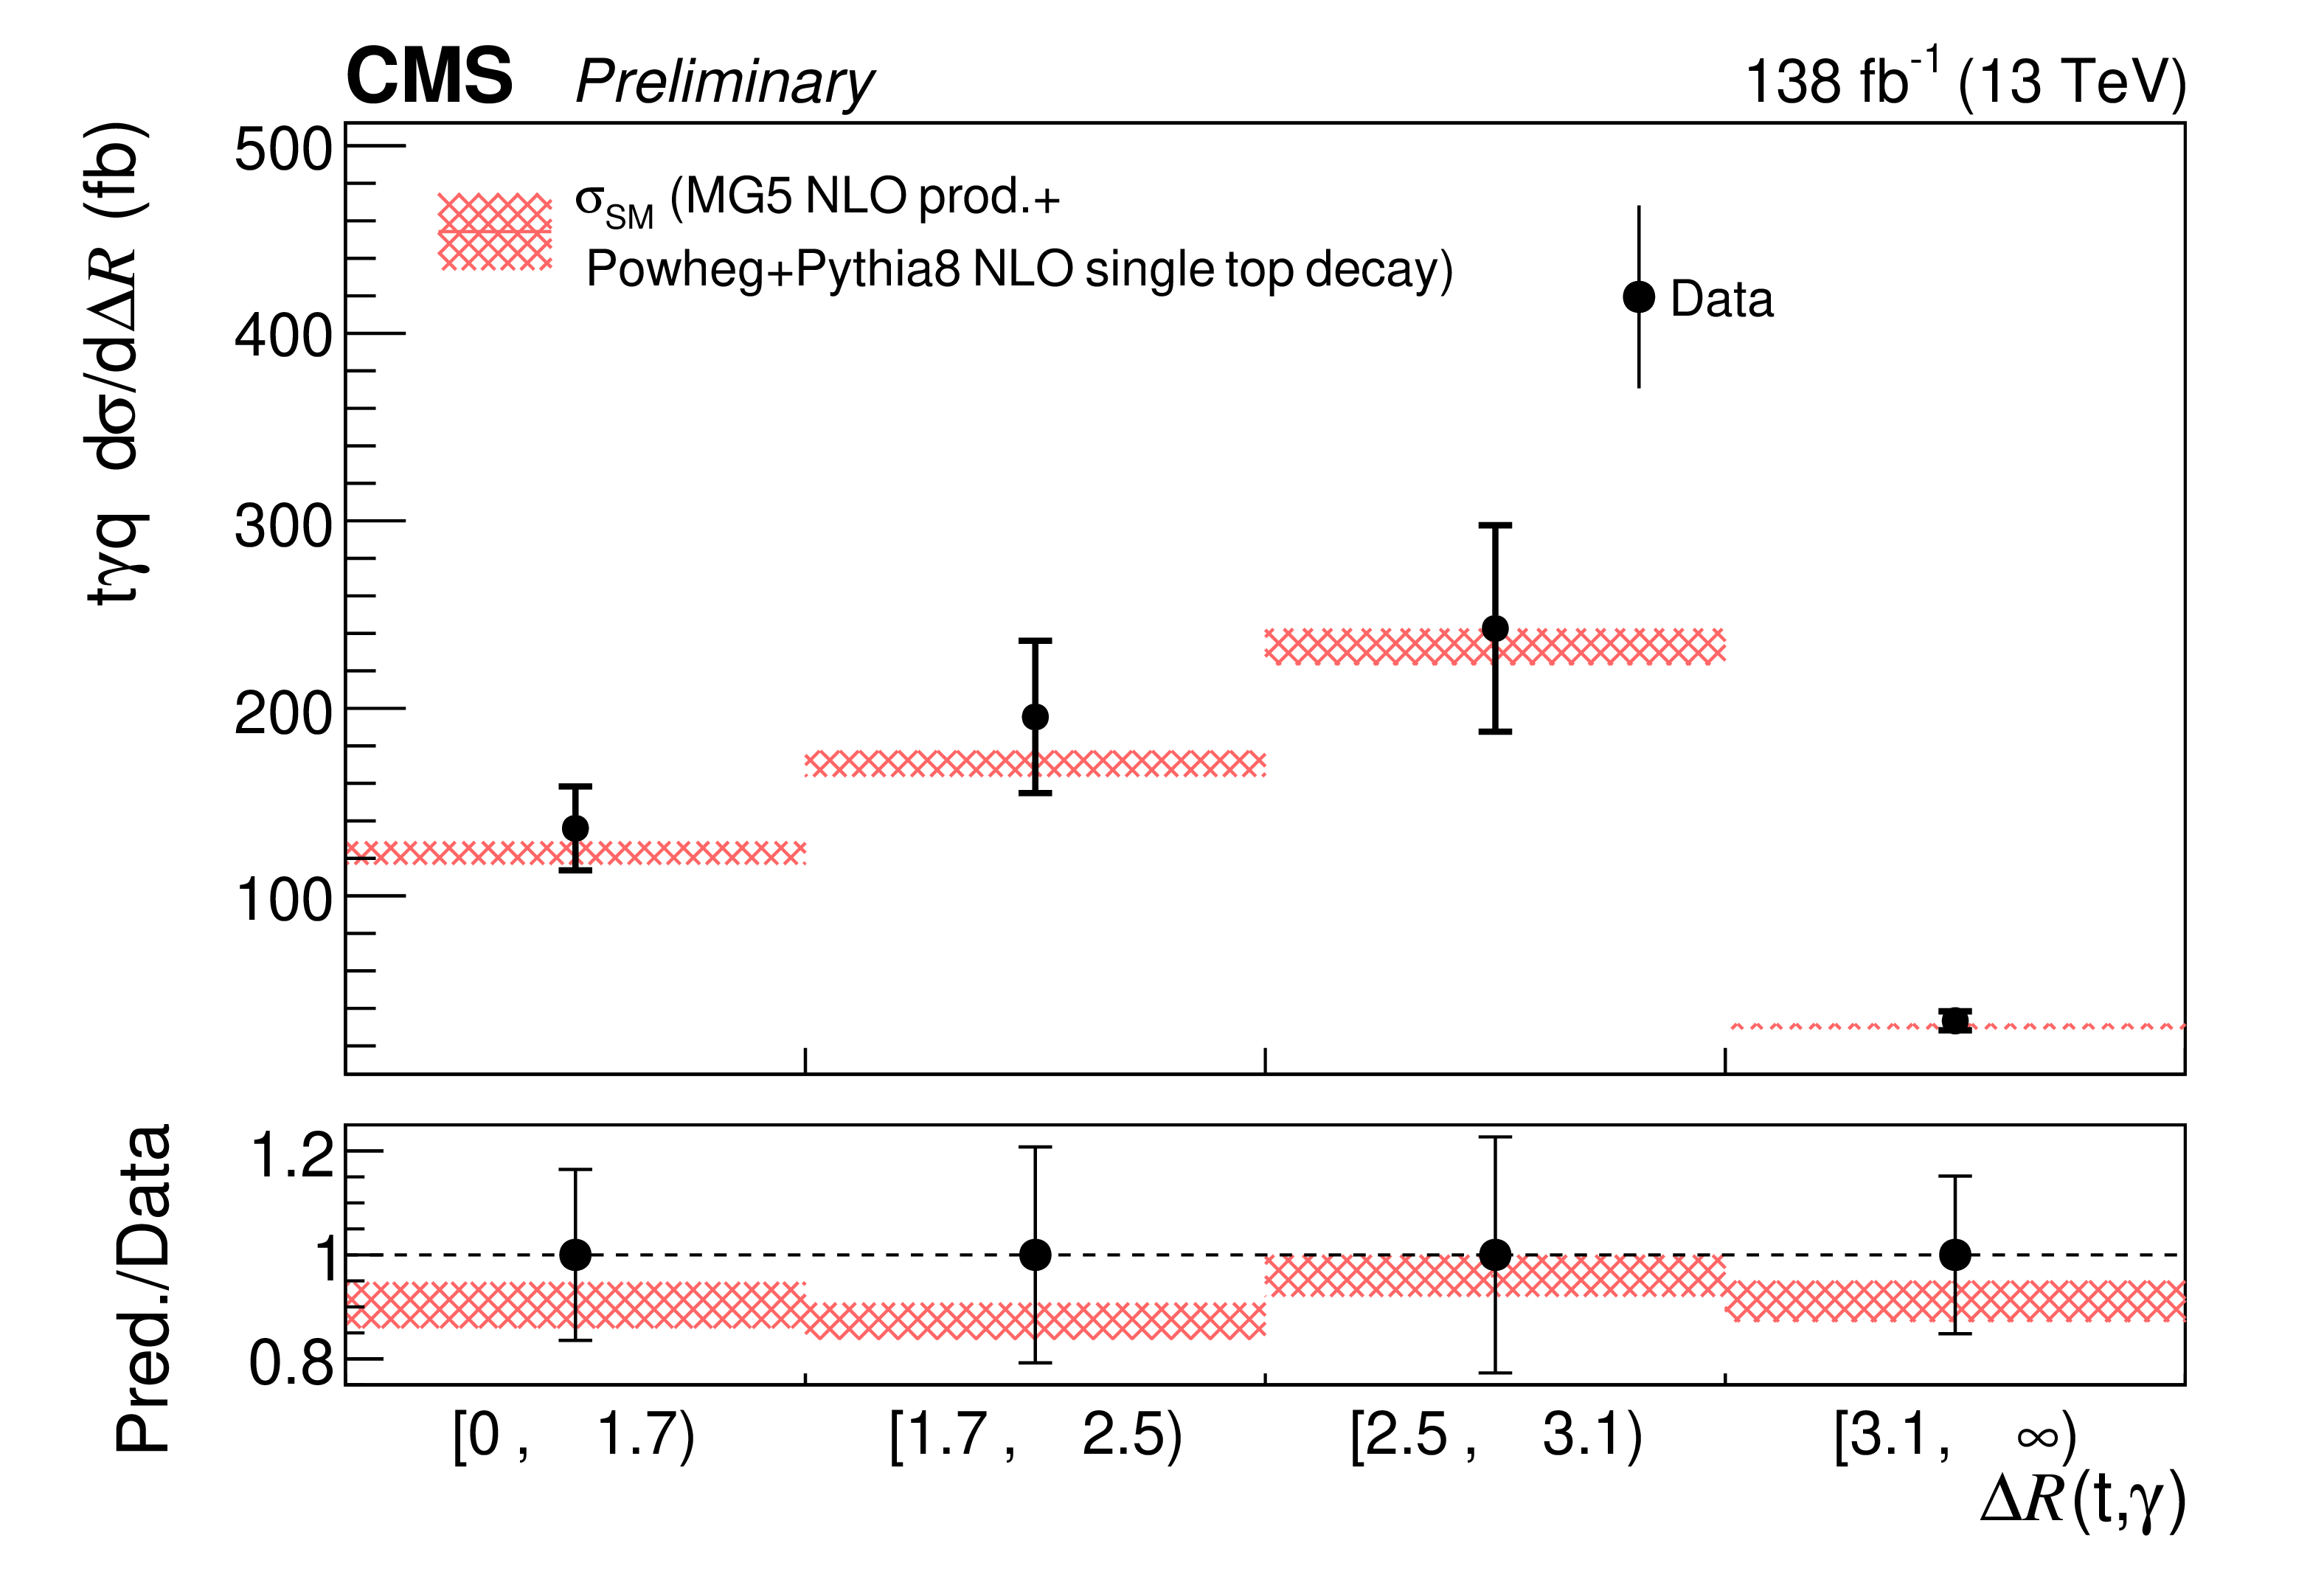
png pdf |
Figure 8-g:
The measured differential cross sections normalized to the bin width for $ \mathrm{t}\gamma $q as a function of $ p_{\mathrm{T}}^{\ell} $, $ p_{\mathrm{T}}^{\gamma} $, $ m_{\ell\gamma} $, $ \Delta R(\ell,\gamma) $, $ \eta_{\mathrm{light j}} $, $ N_{\mathrm{jets}} $ at particle level, as well as the $ \Delta R(\mathrm{top}_{\ell},\gamma) $ and top quark charge at parton level. The black points with error bars represent the data and their uncertainties, whereas the red bands represent the total theoretical uncertainties from the simulated samples. The last bin includes overflow events. |
png pdf |
Figure 8-h:
The measured differential cross sections normalized to the bin width for $ \mathrm{t}\gamma $q as a function of $ p_{\mathrm{T}}^{\ell} $, $ p_{\mathrm{T}}^{\gamma} $, $ m_{\ell\gamma} $, $ \Delta R(\ell,\gamma) $, $ \eta_{\mathrm{light j}} $, $ N_{\mathrm{jets}} $ at particle level, as well as the $ \Delta R(\mathrm{top}_{\ell},\gamma) $ and top quark charge at parton level. The black points with error bars represent the data and their uncertainties, whereas the red bands represent the total theoretical uncertainties from the simulated samples. The last bin includes overflow events. |
png pdf |
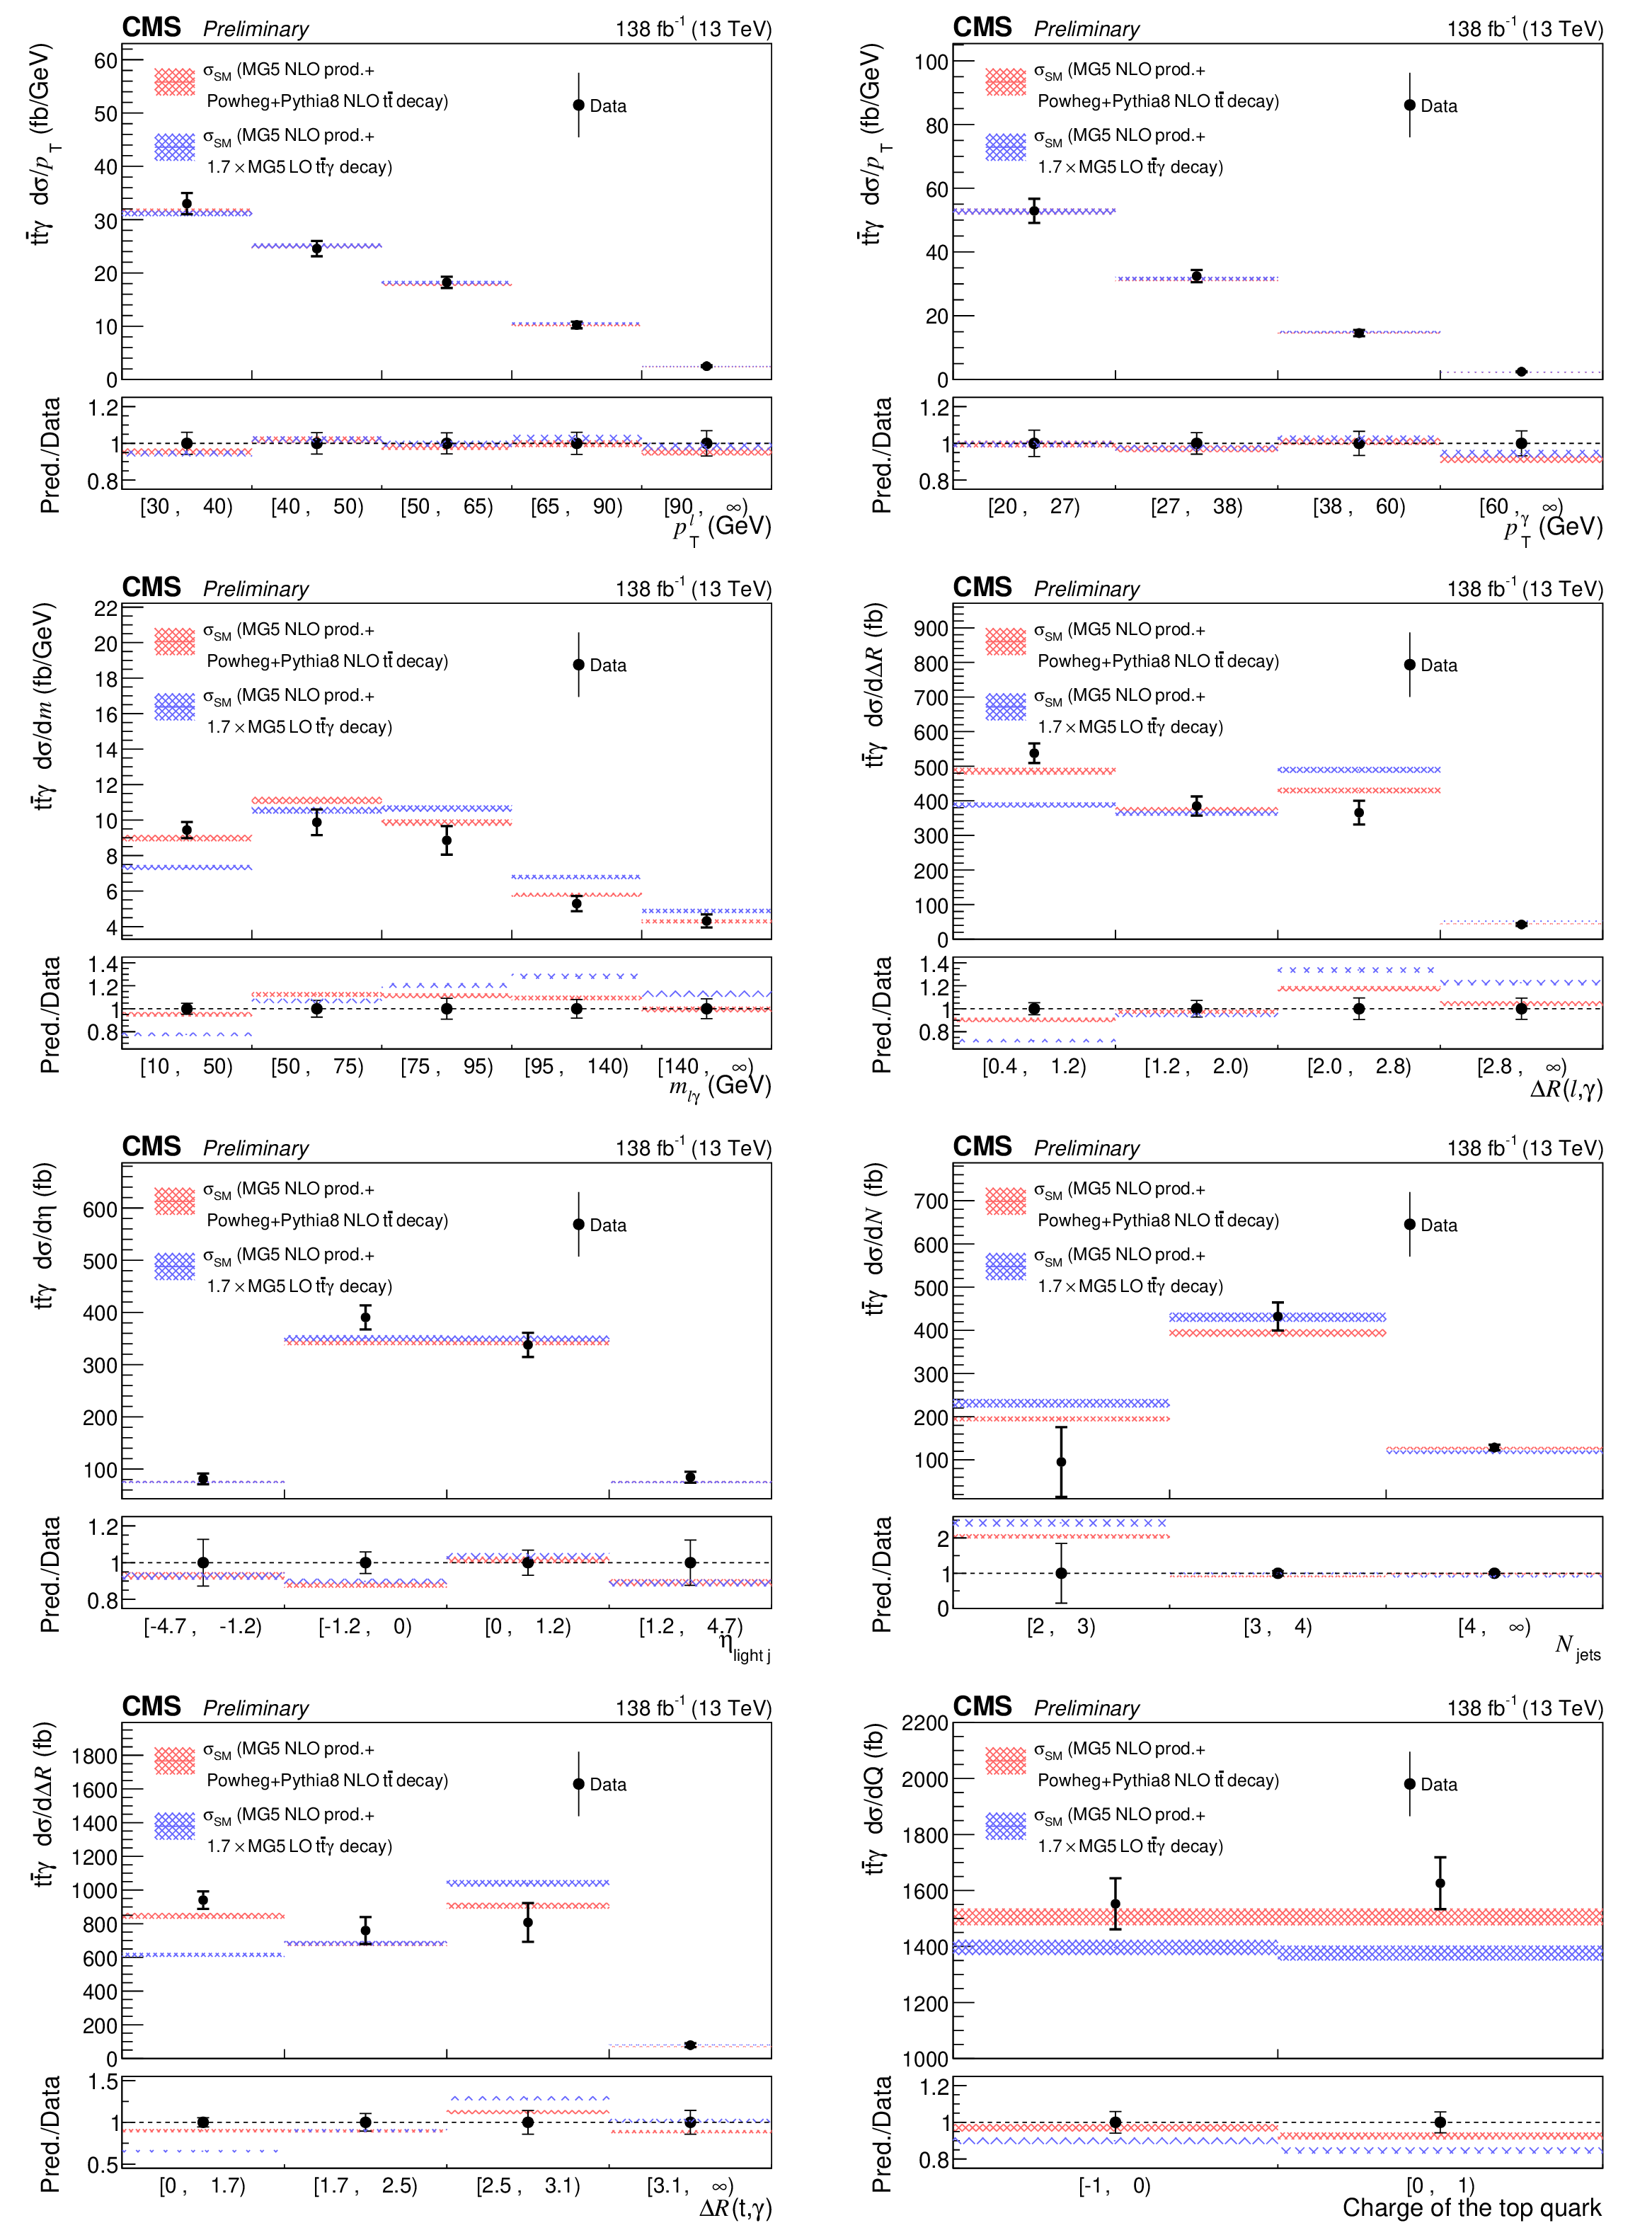
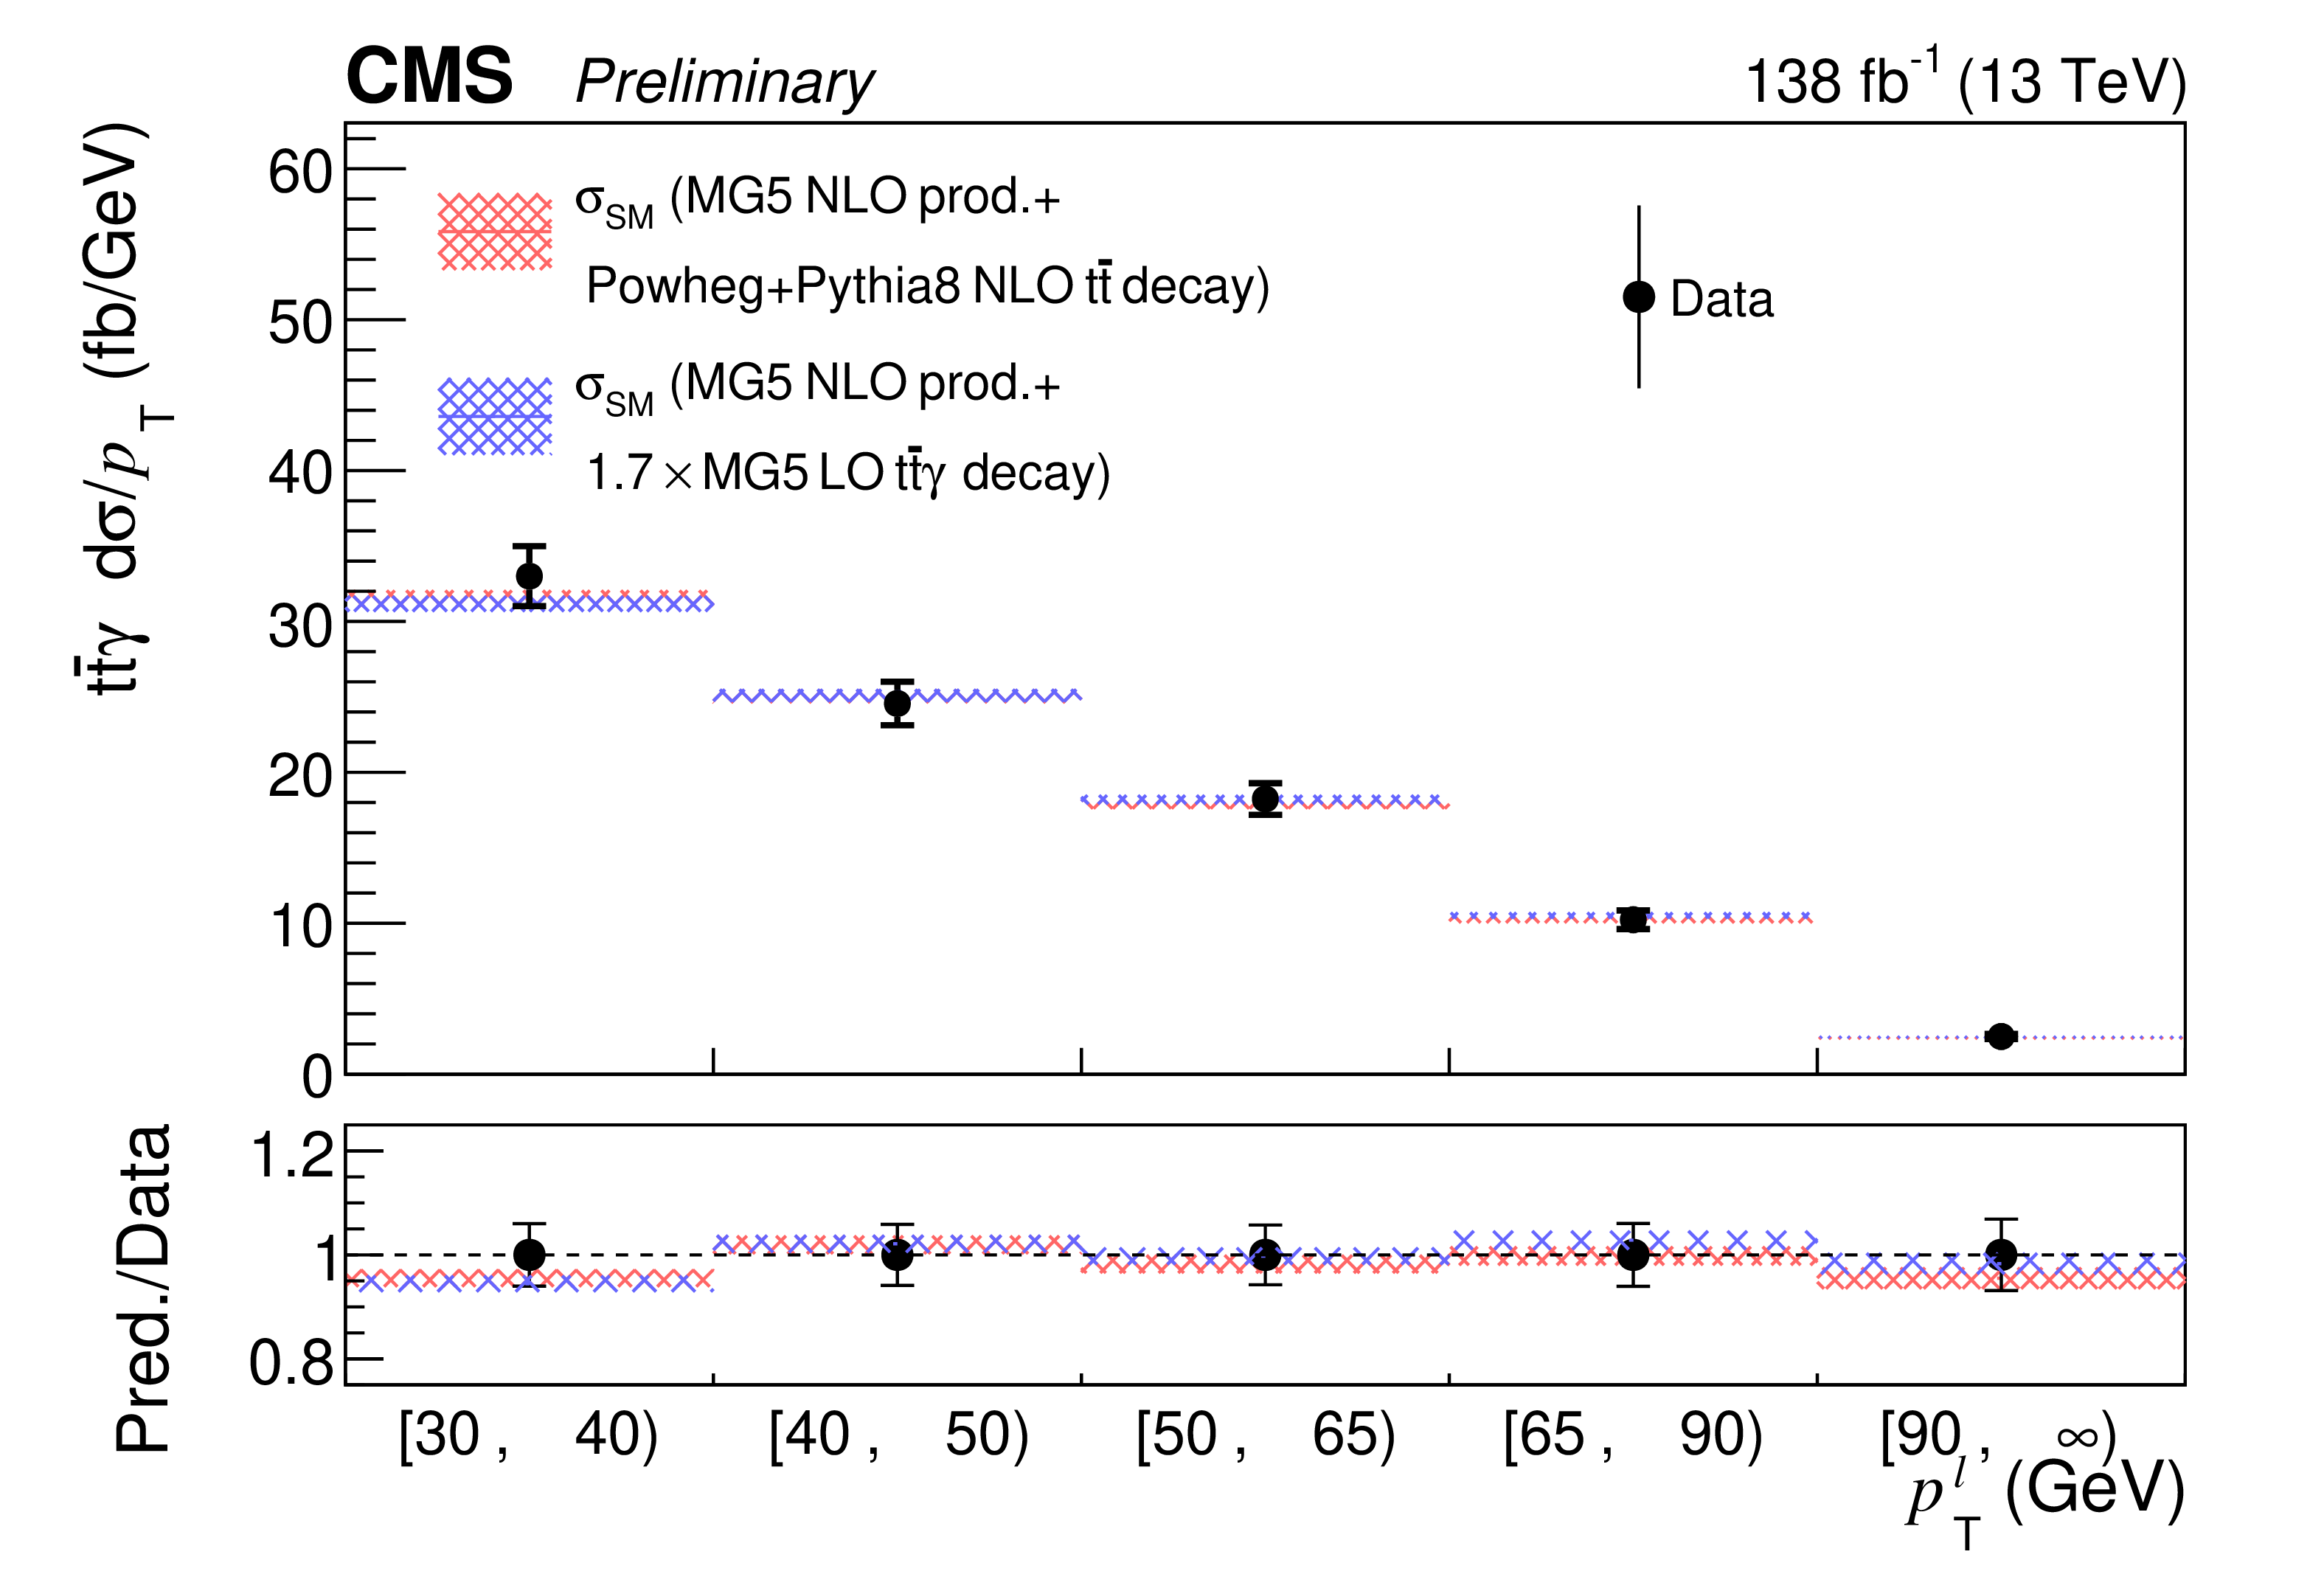
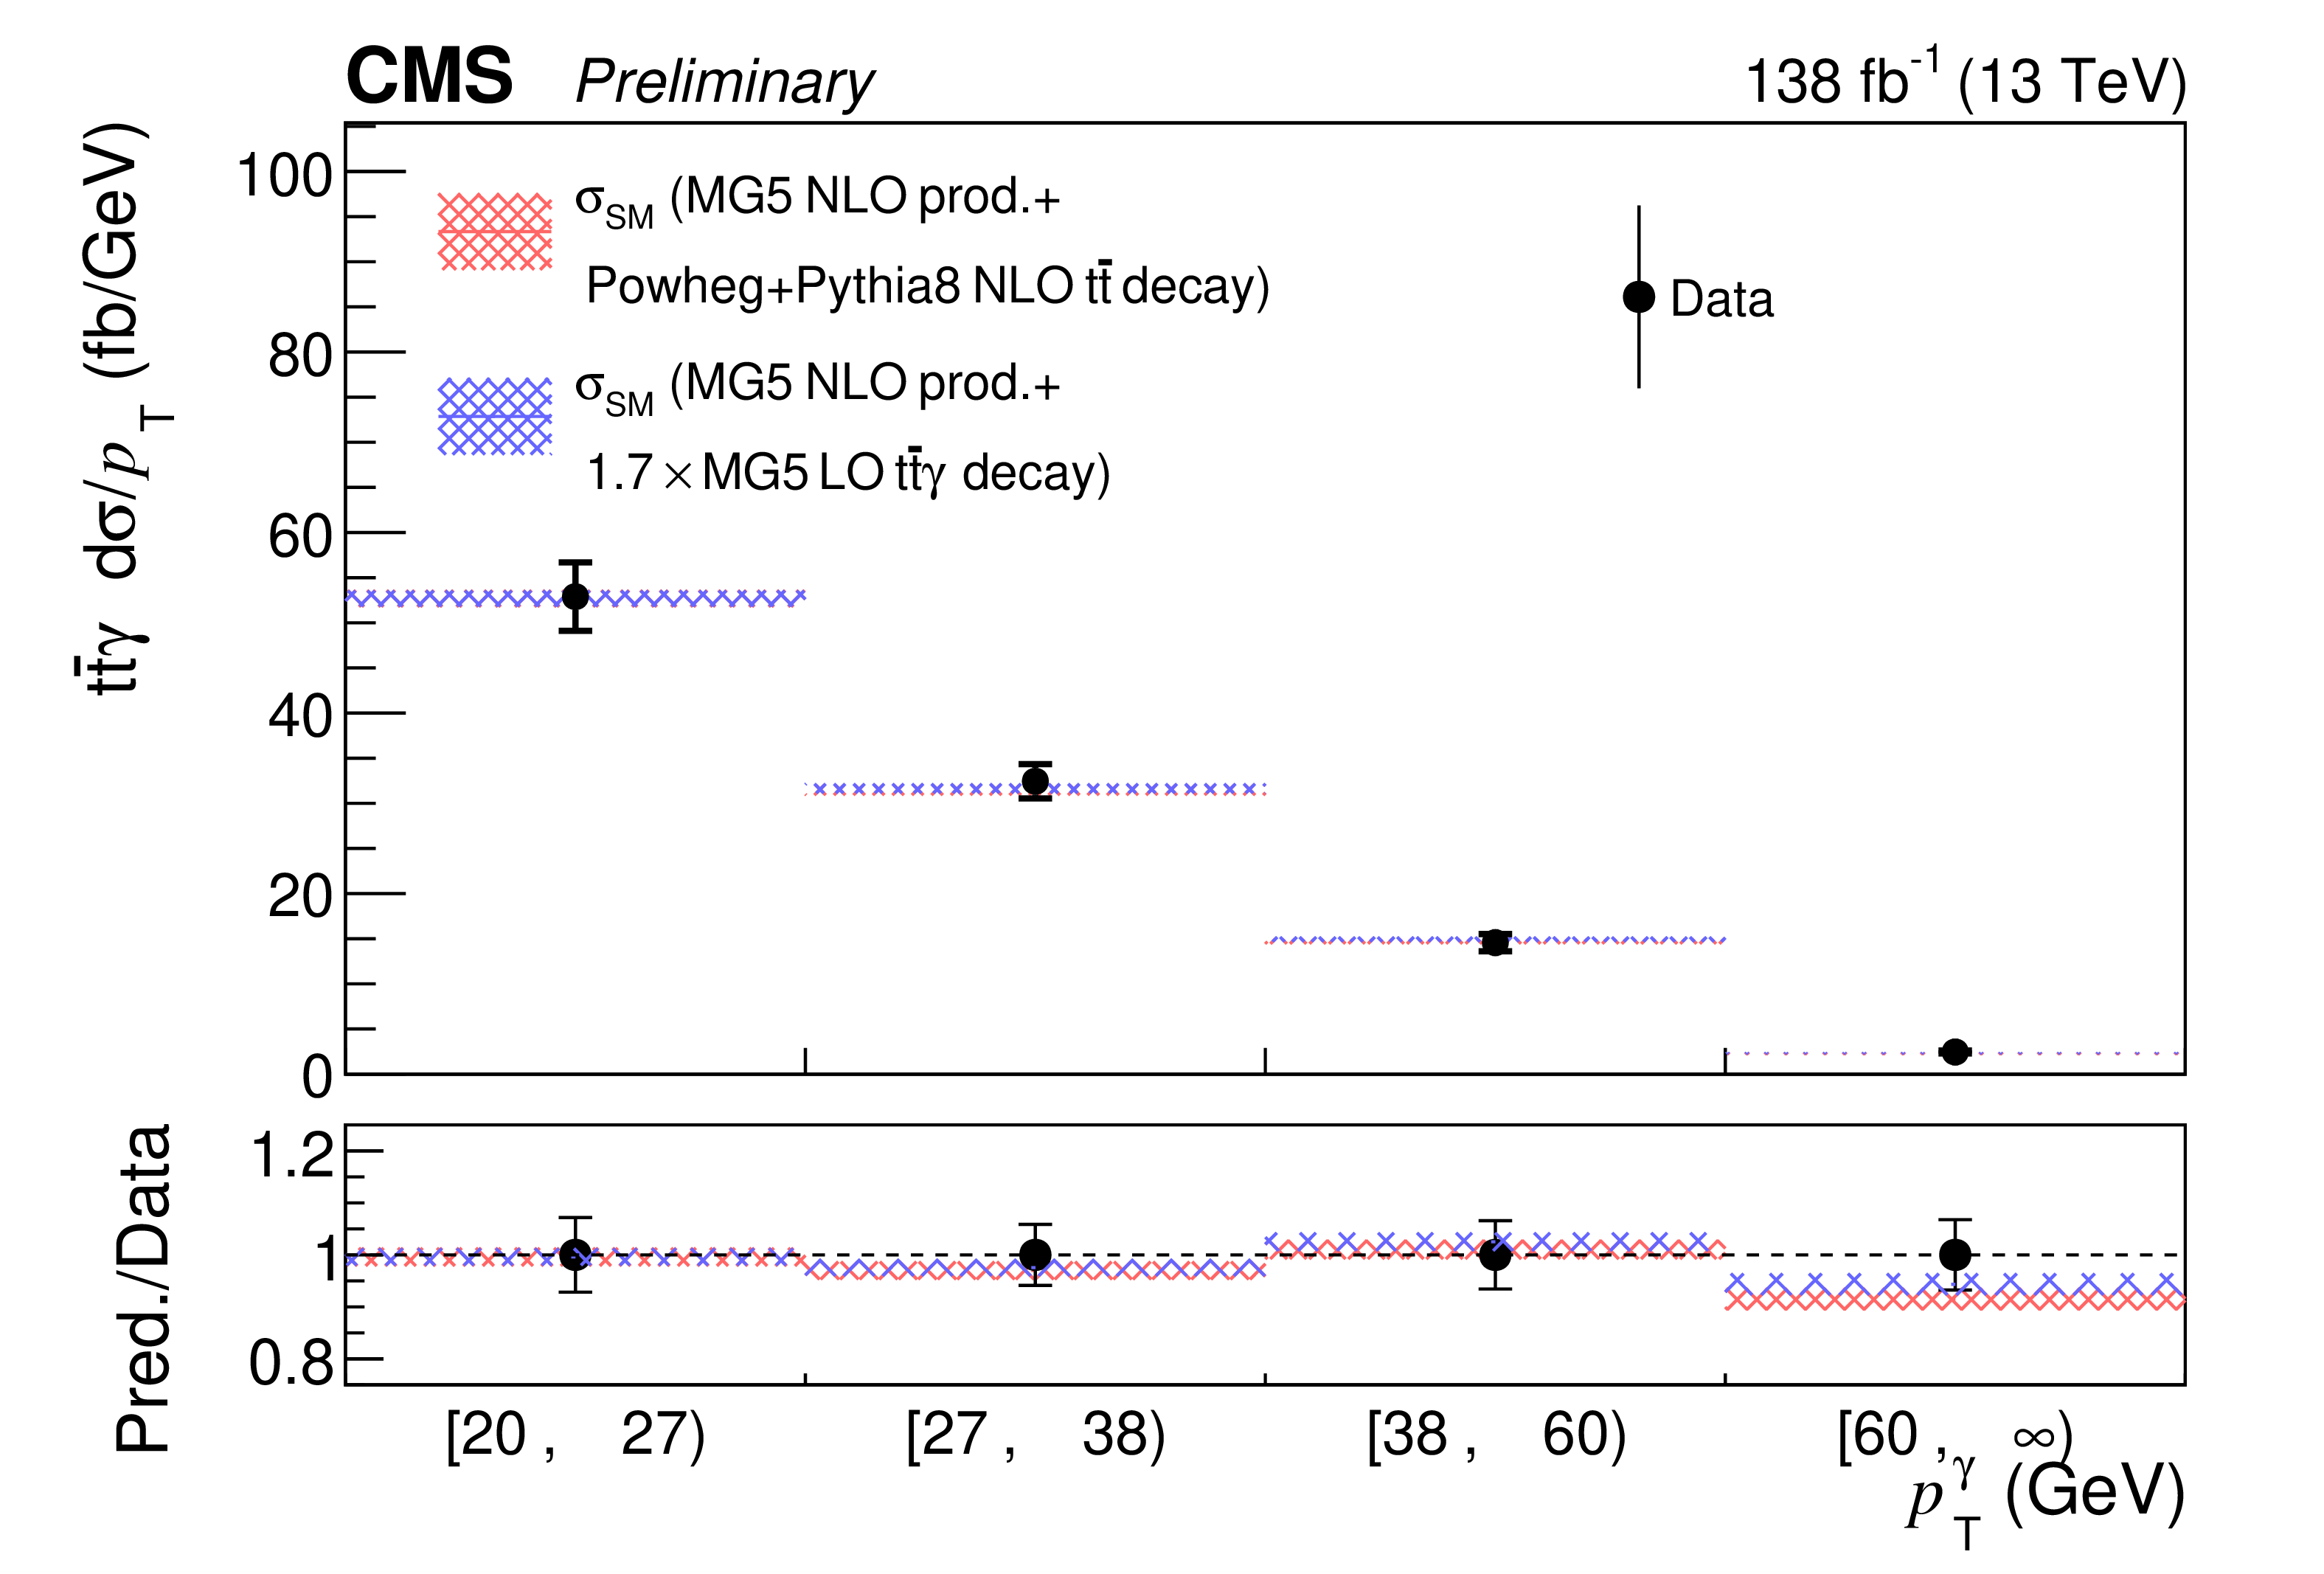
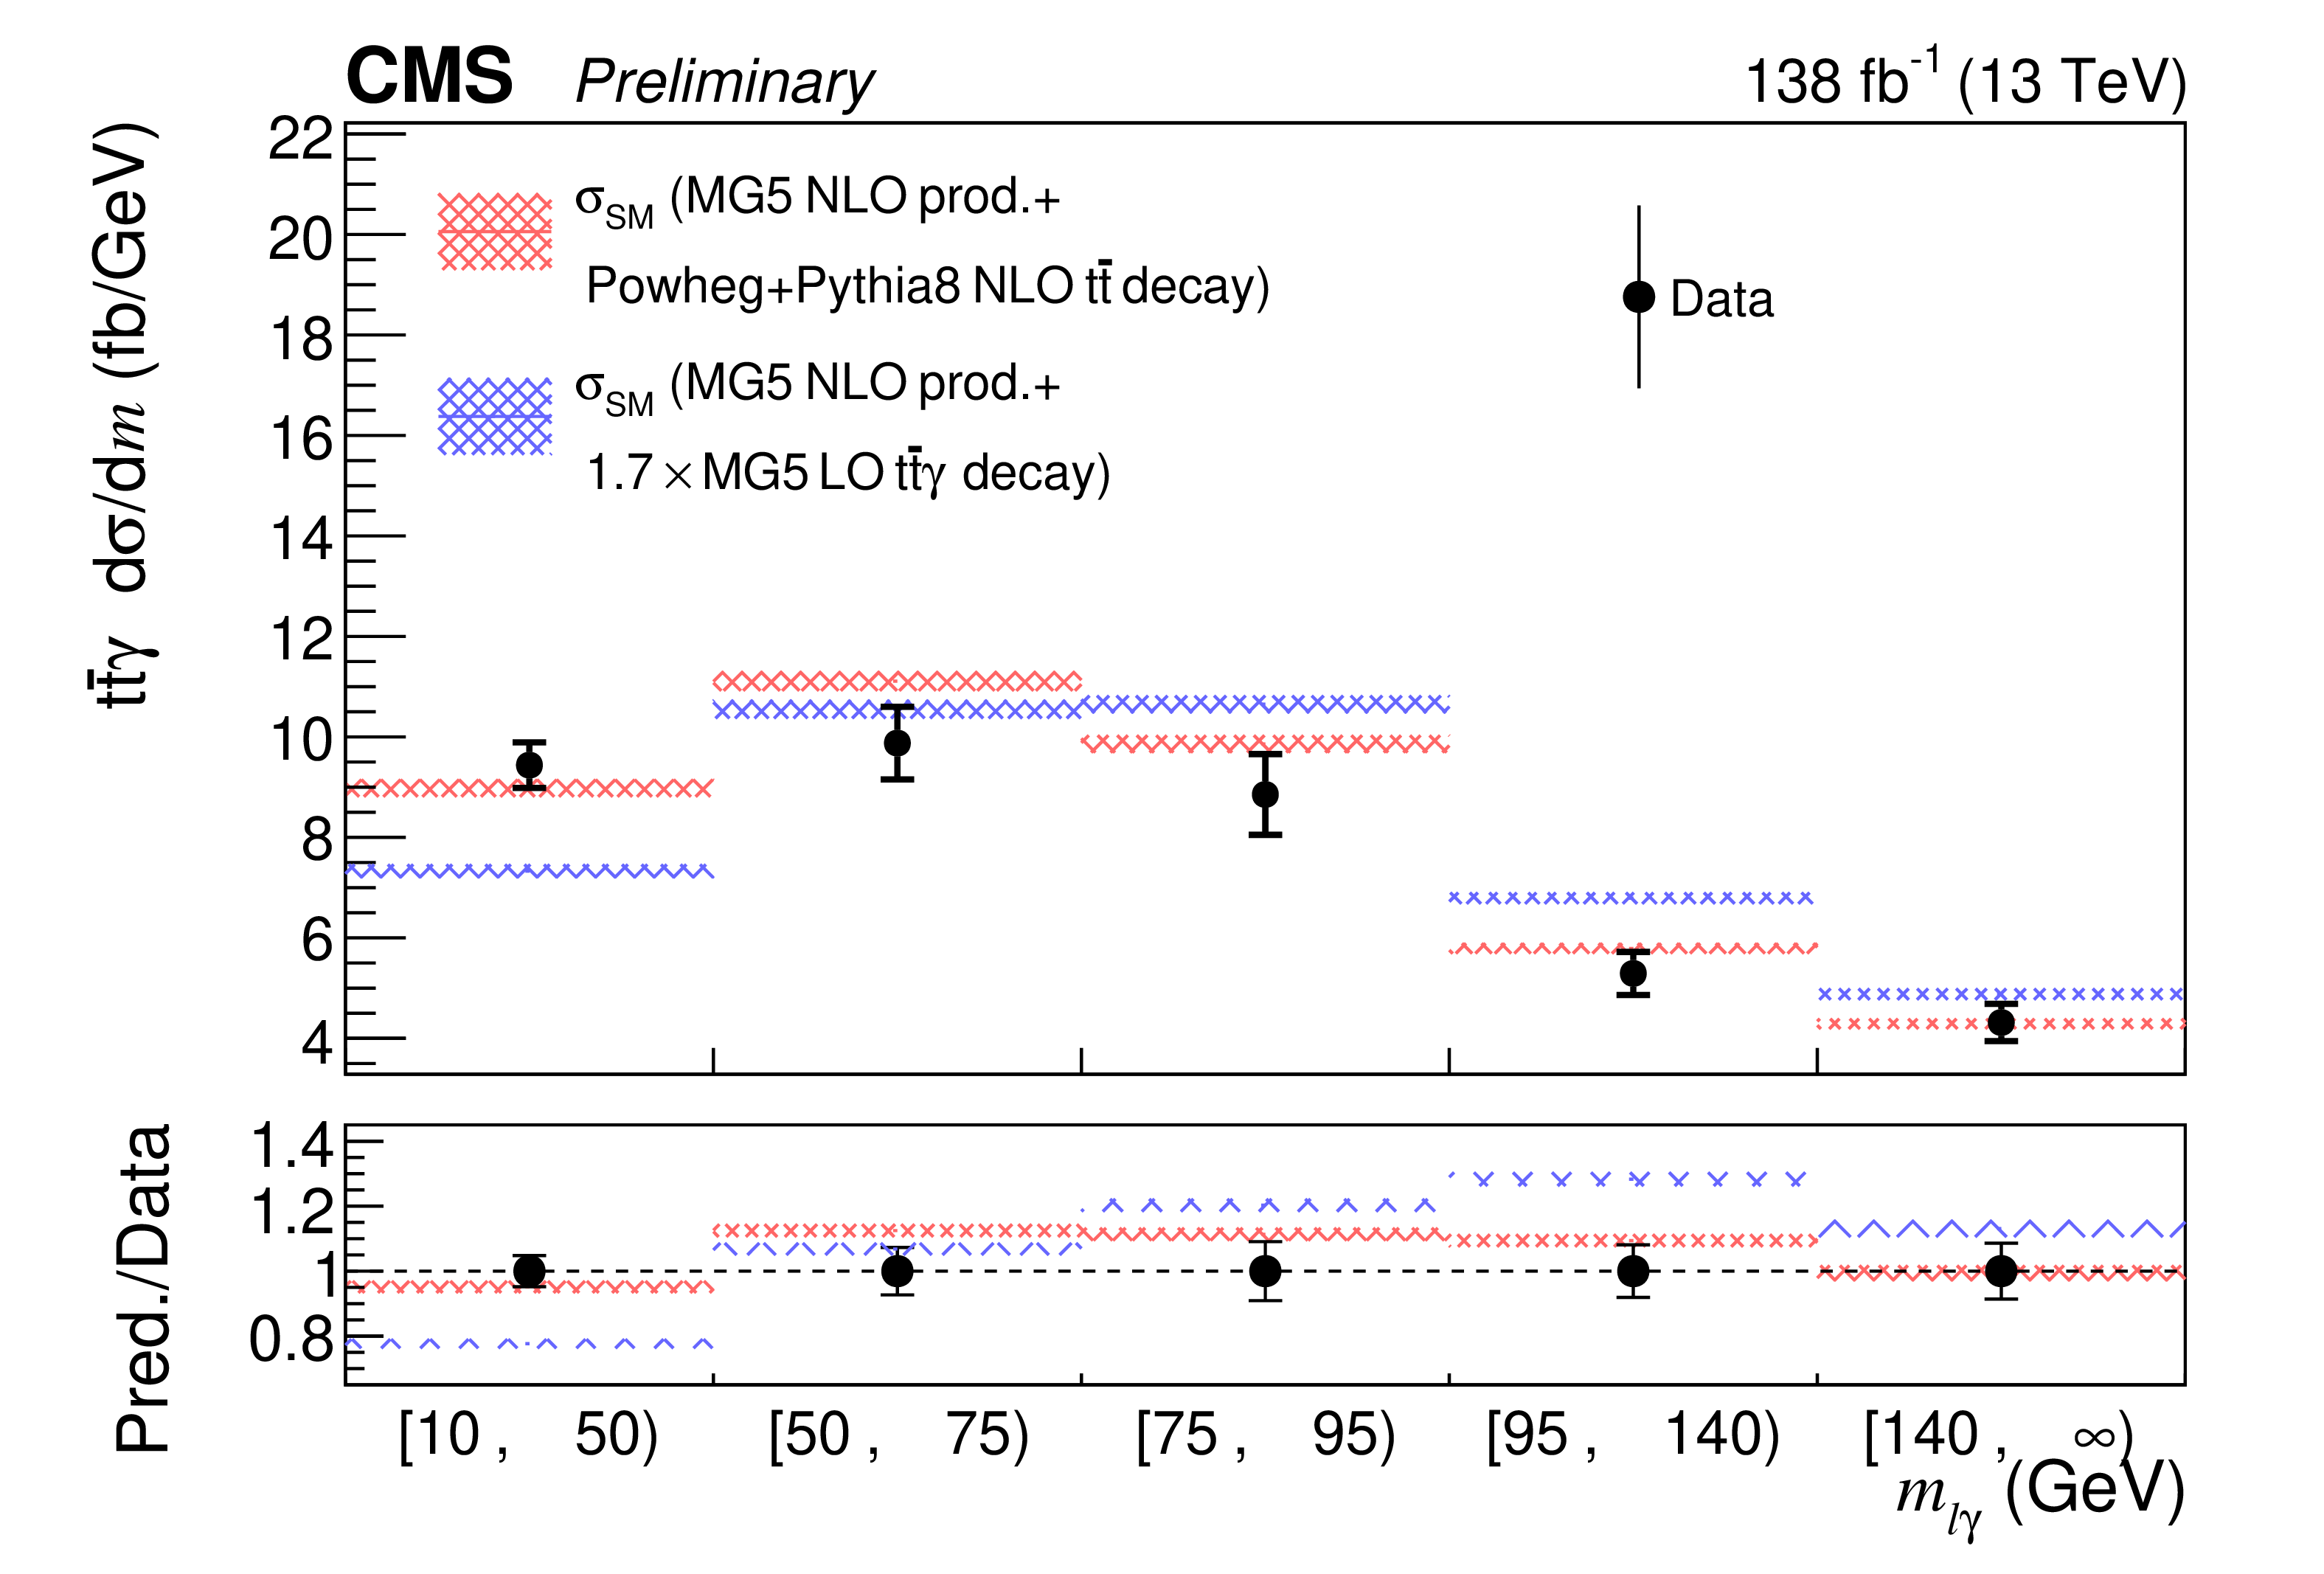
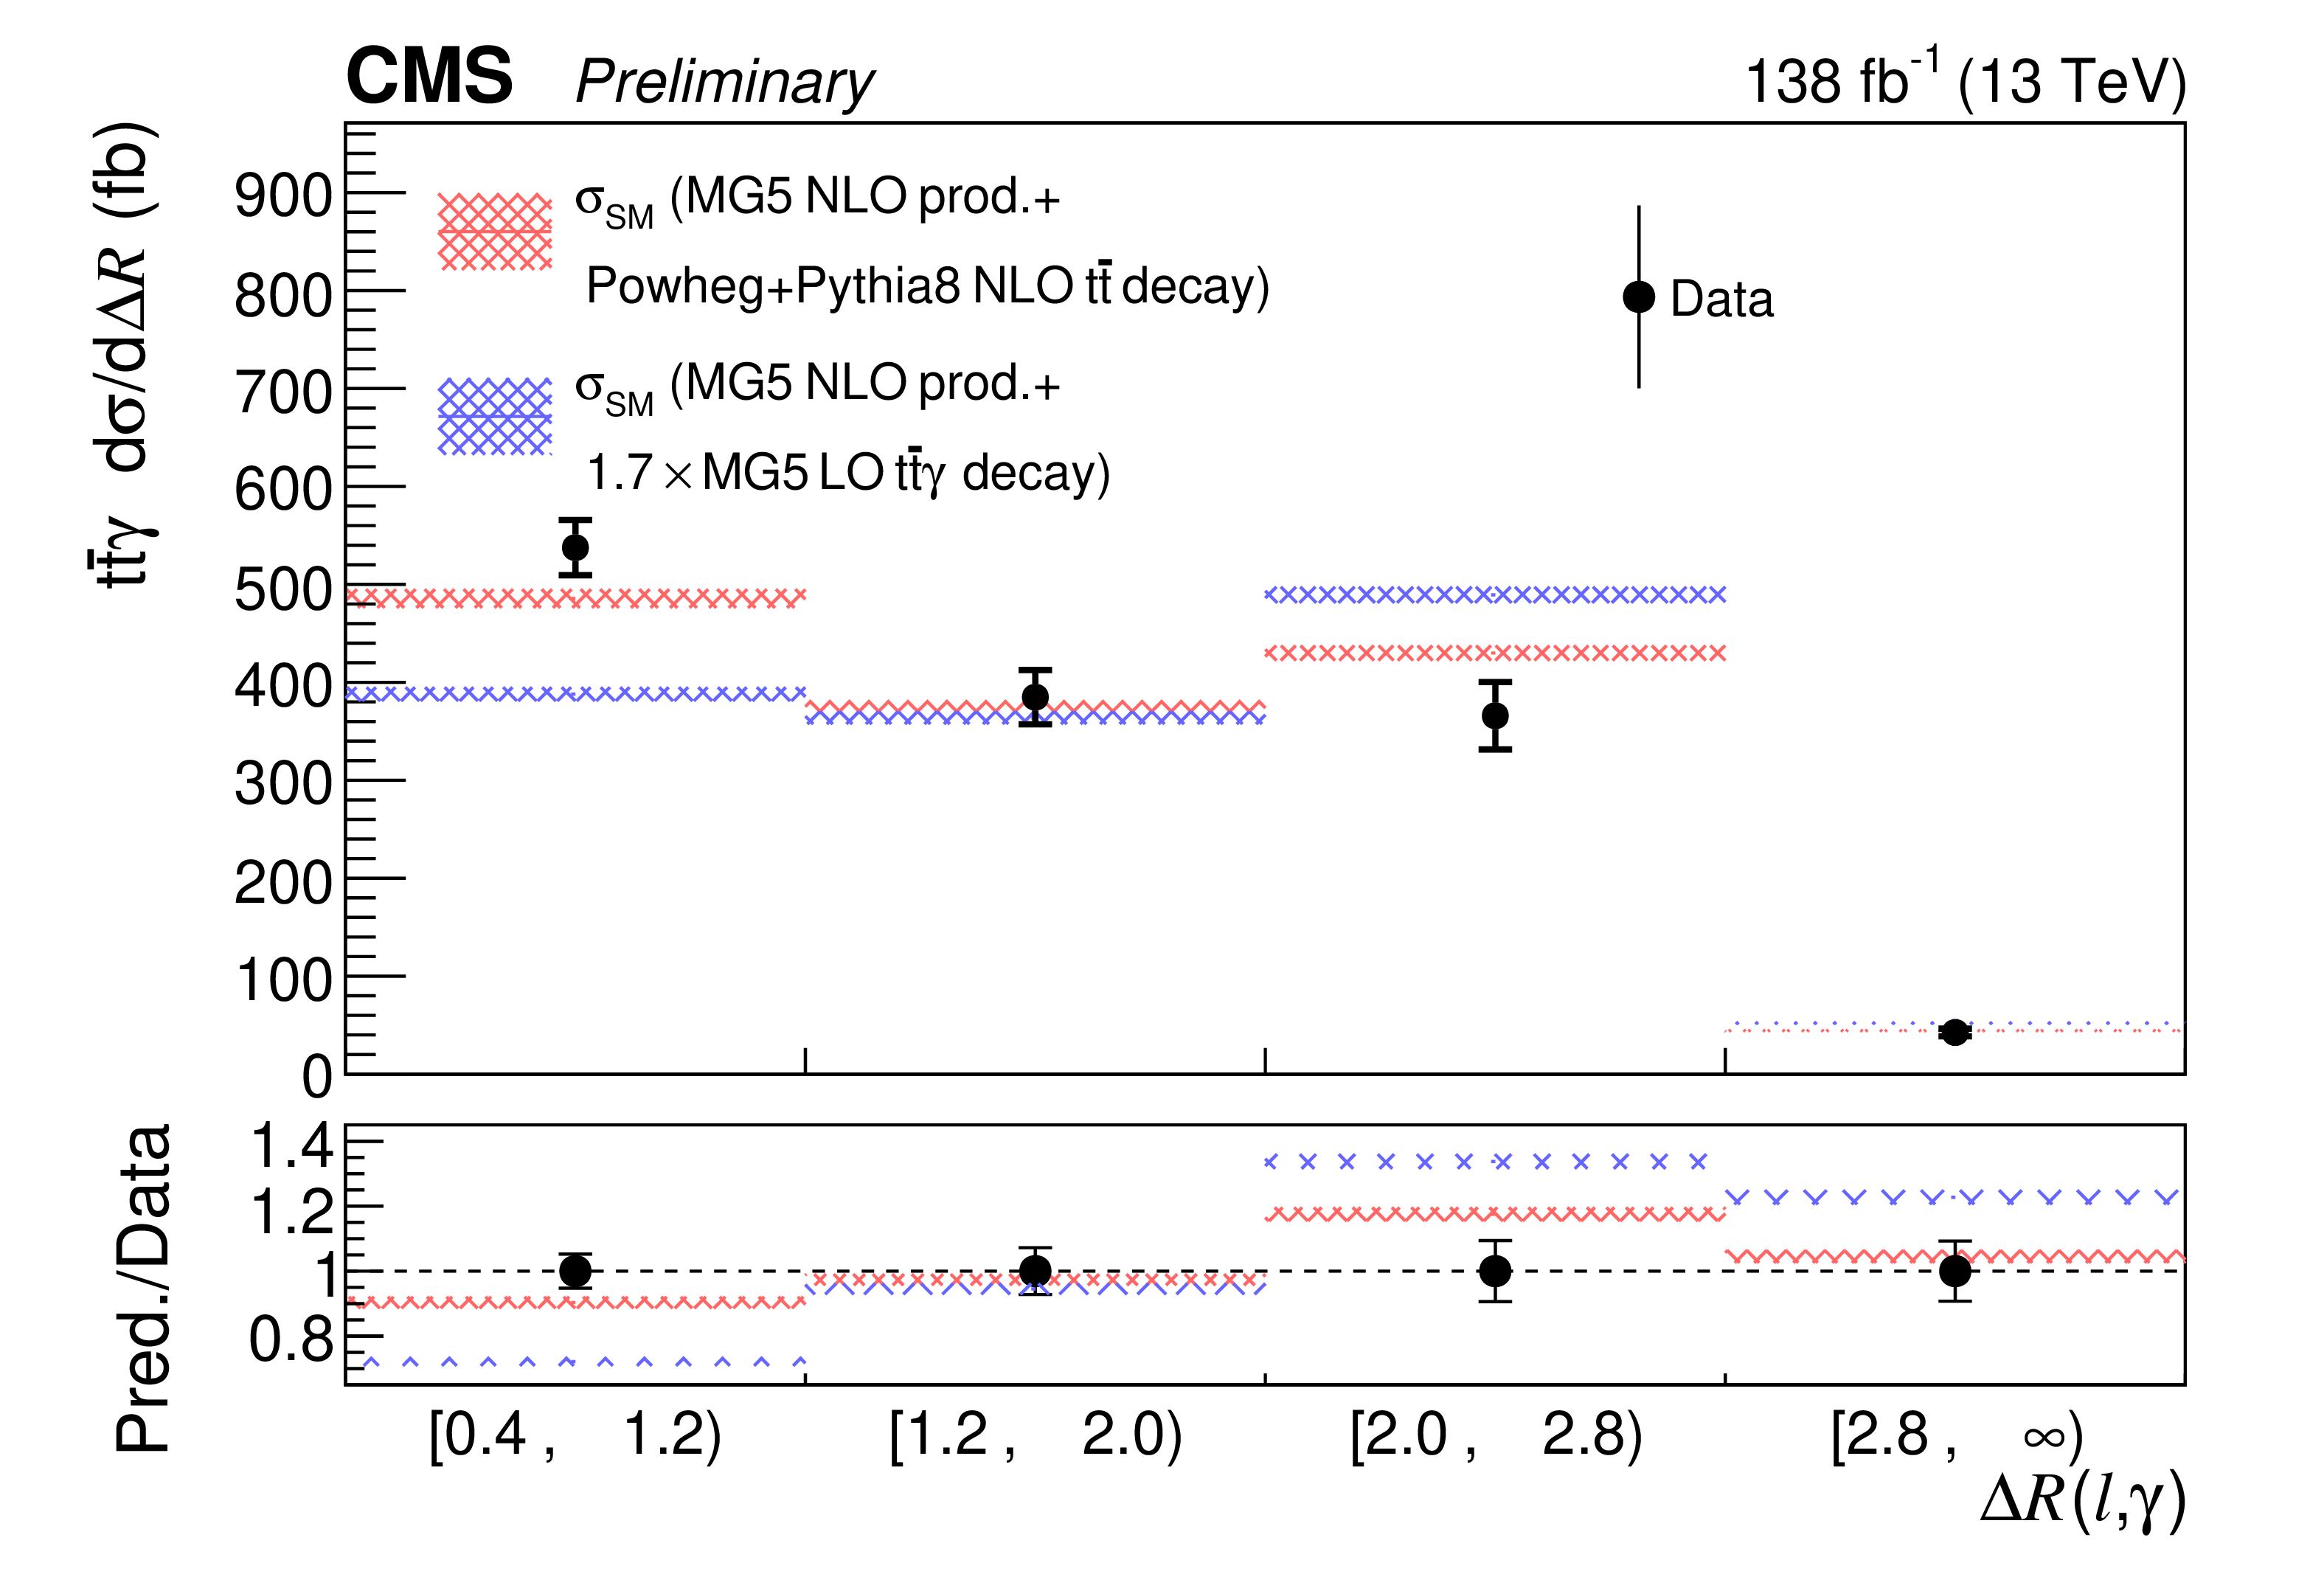
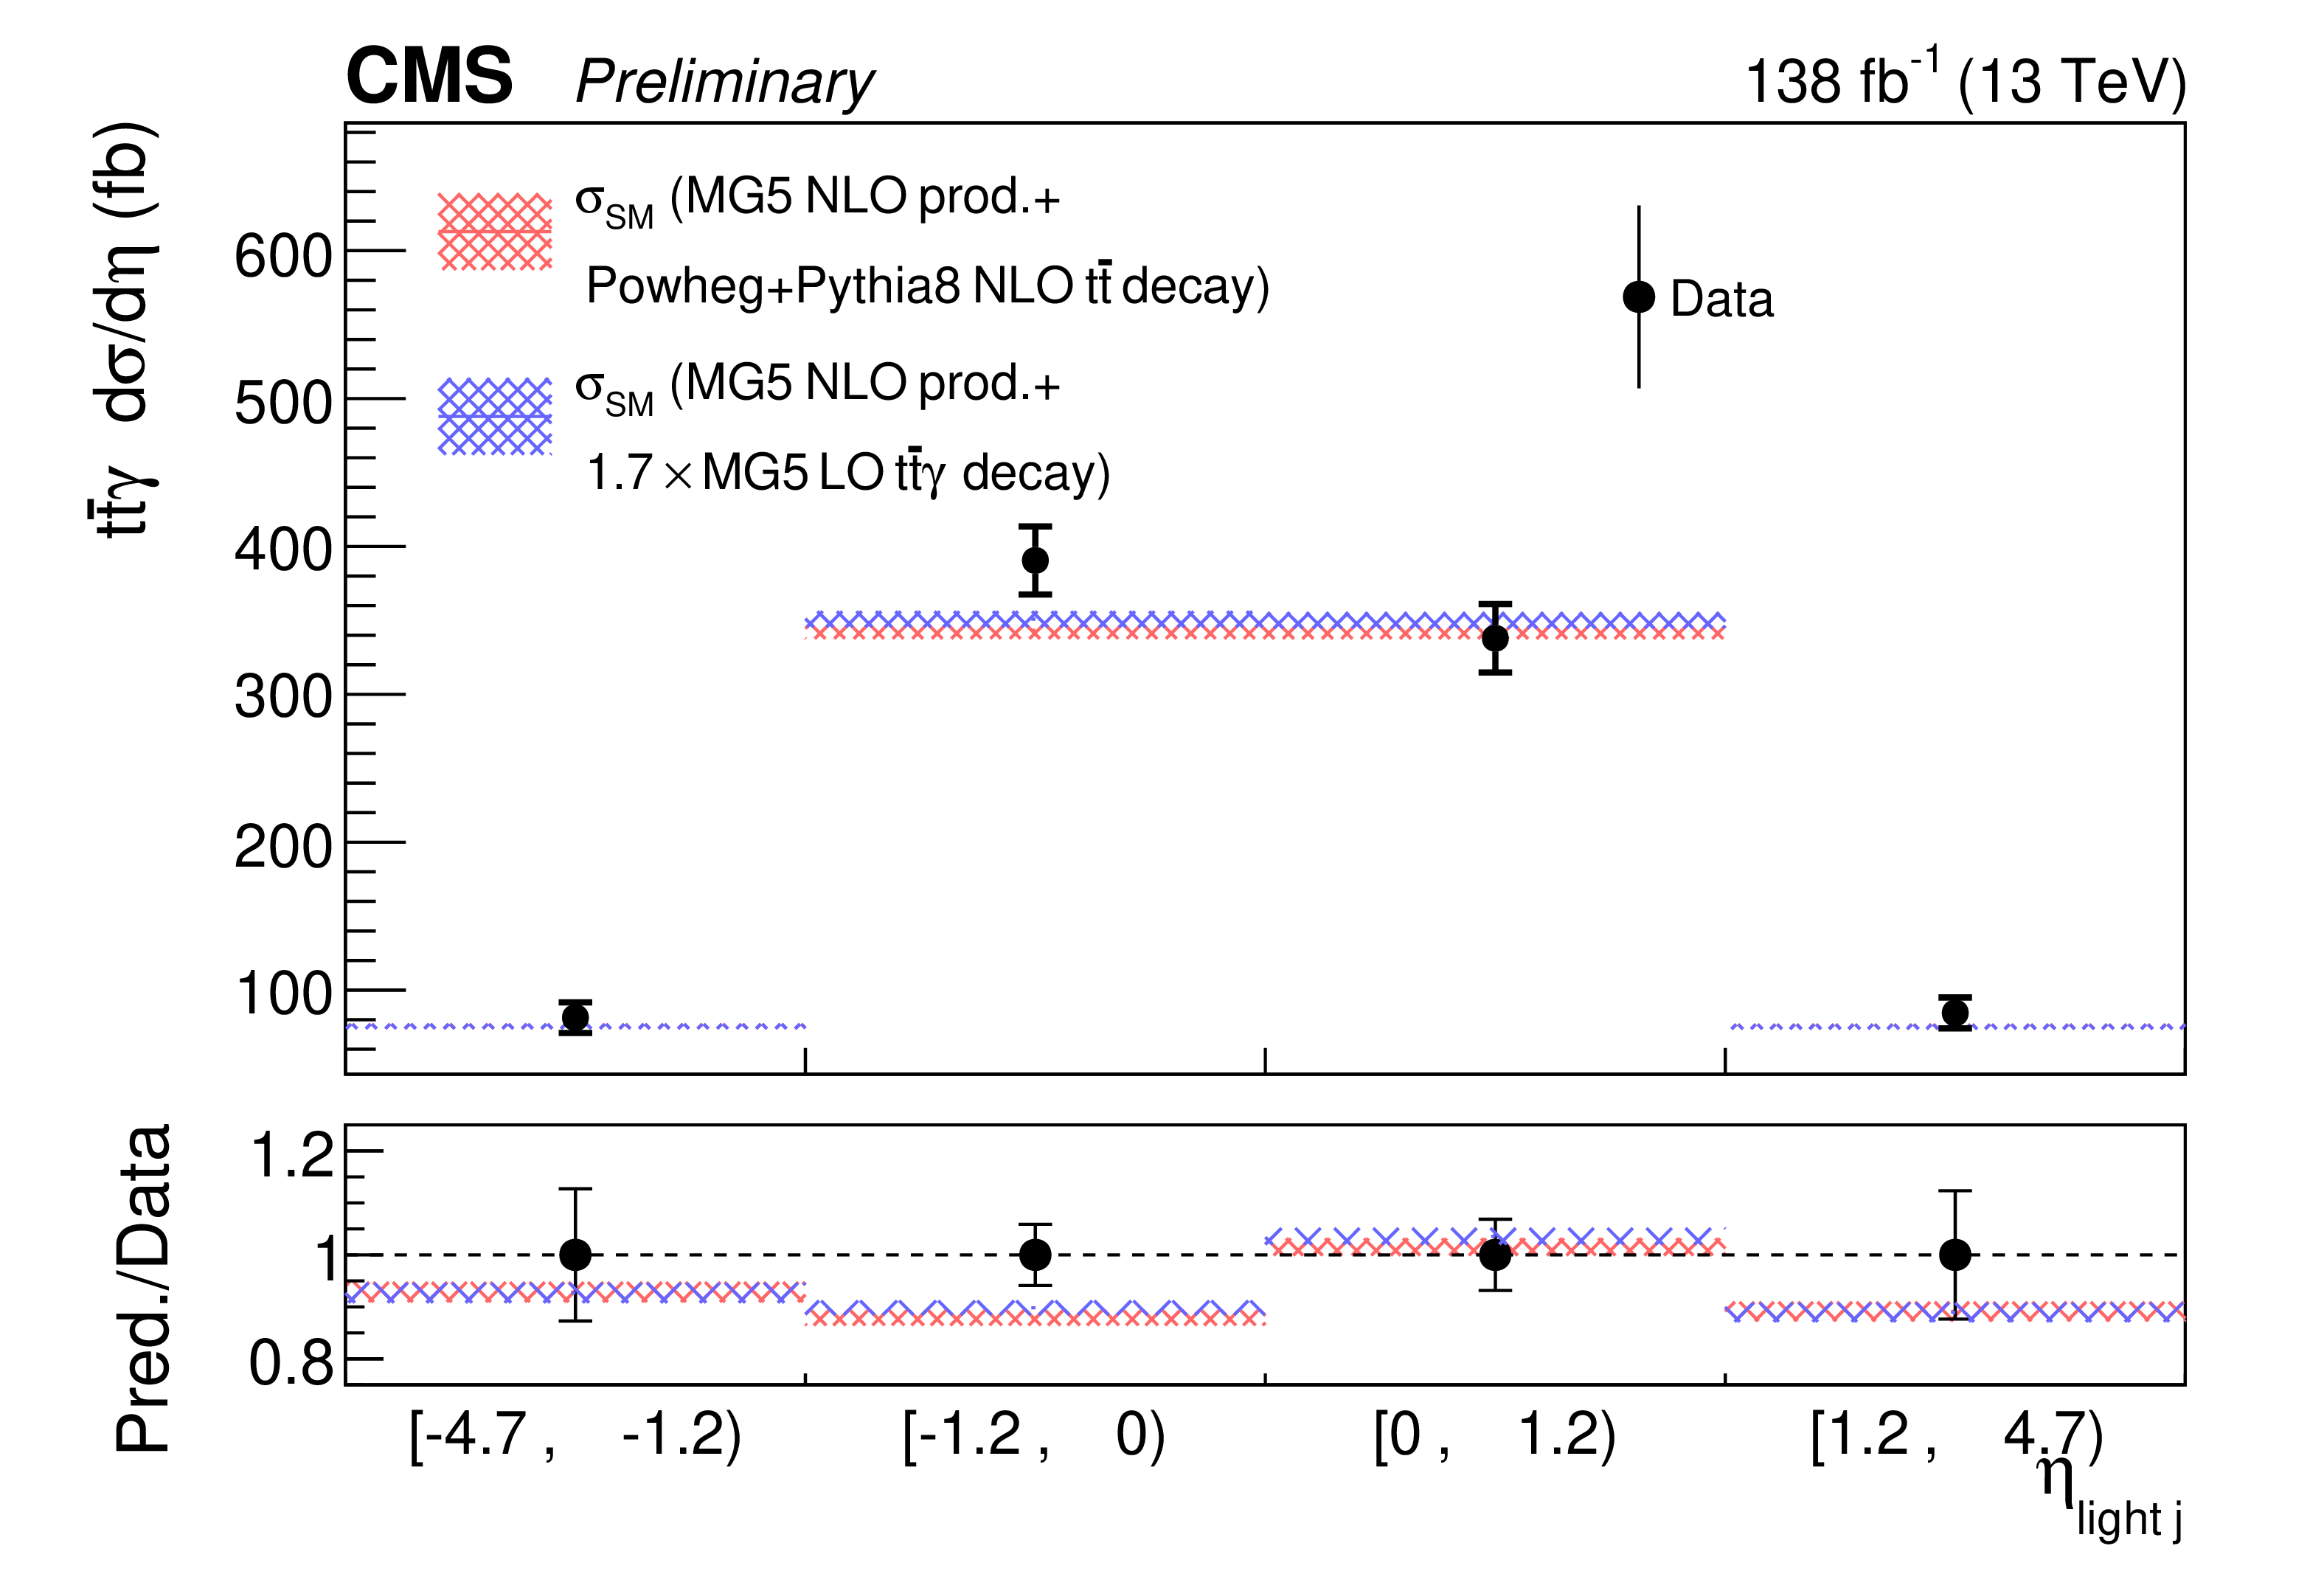
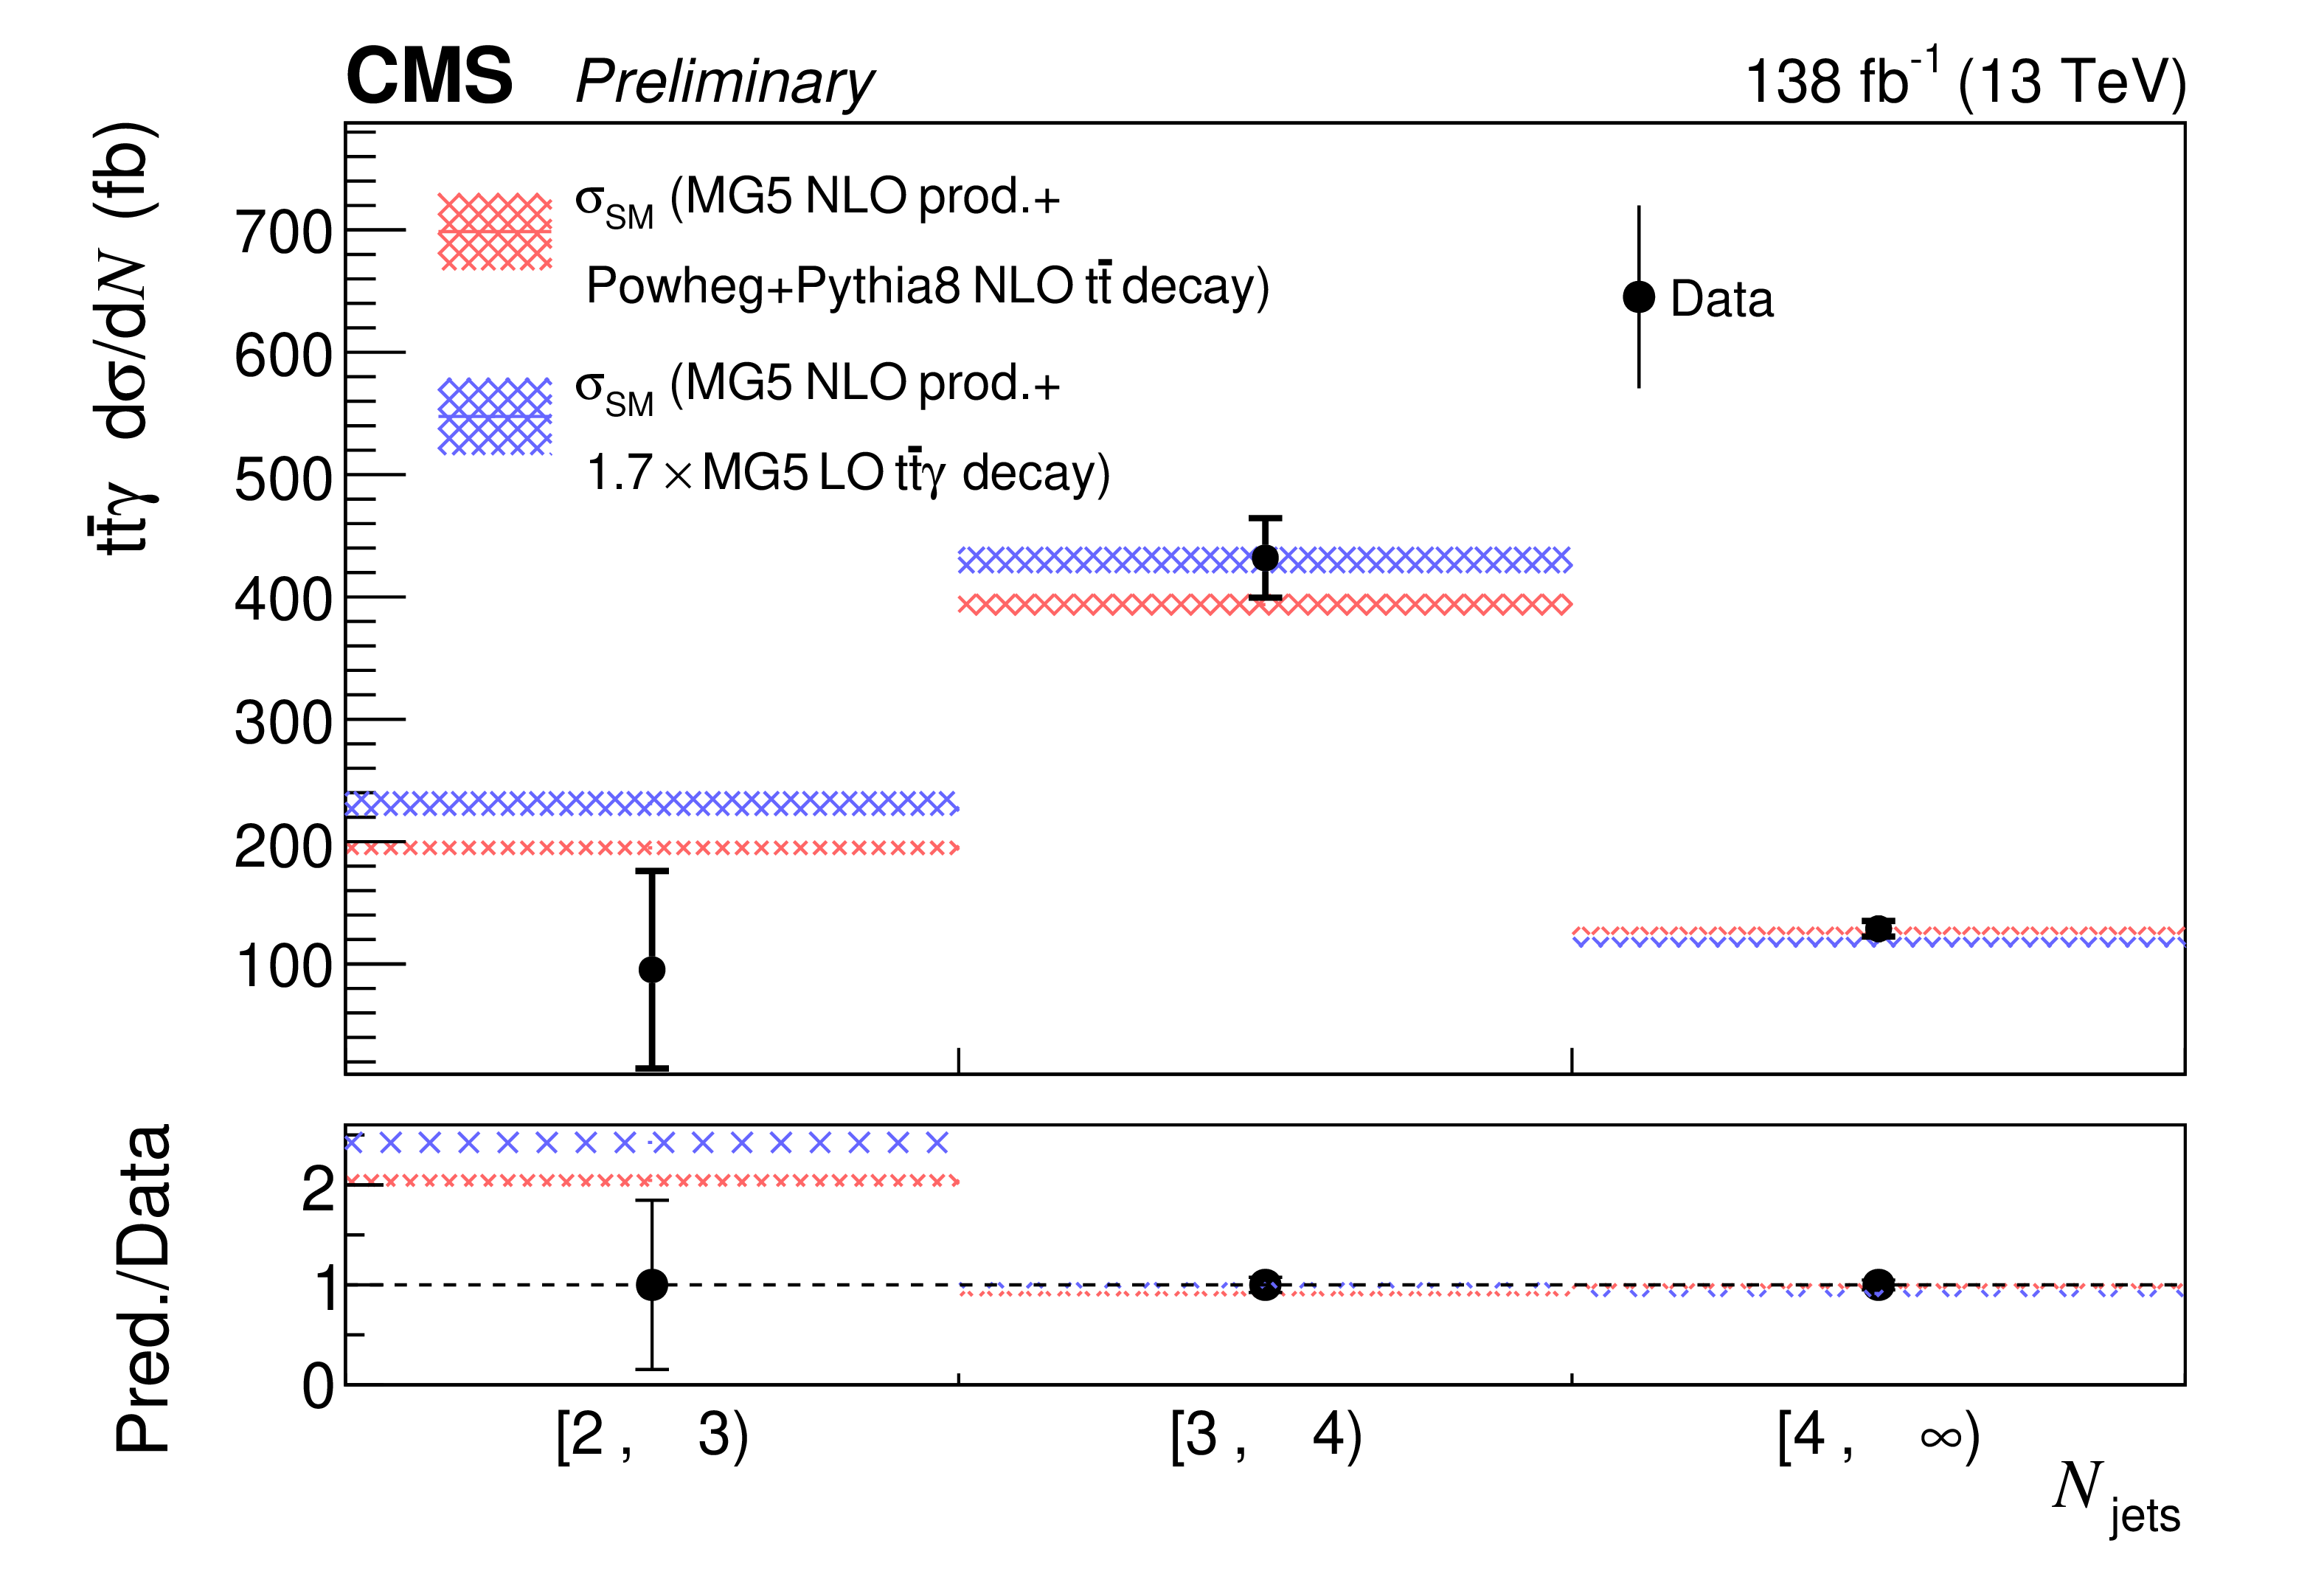
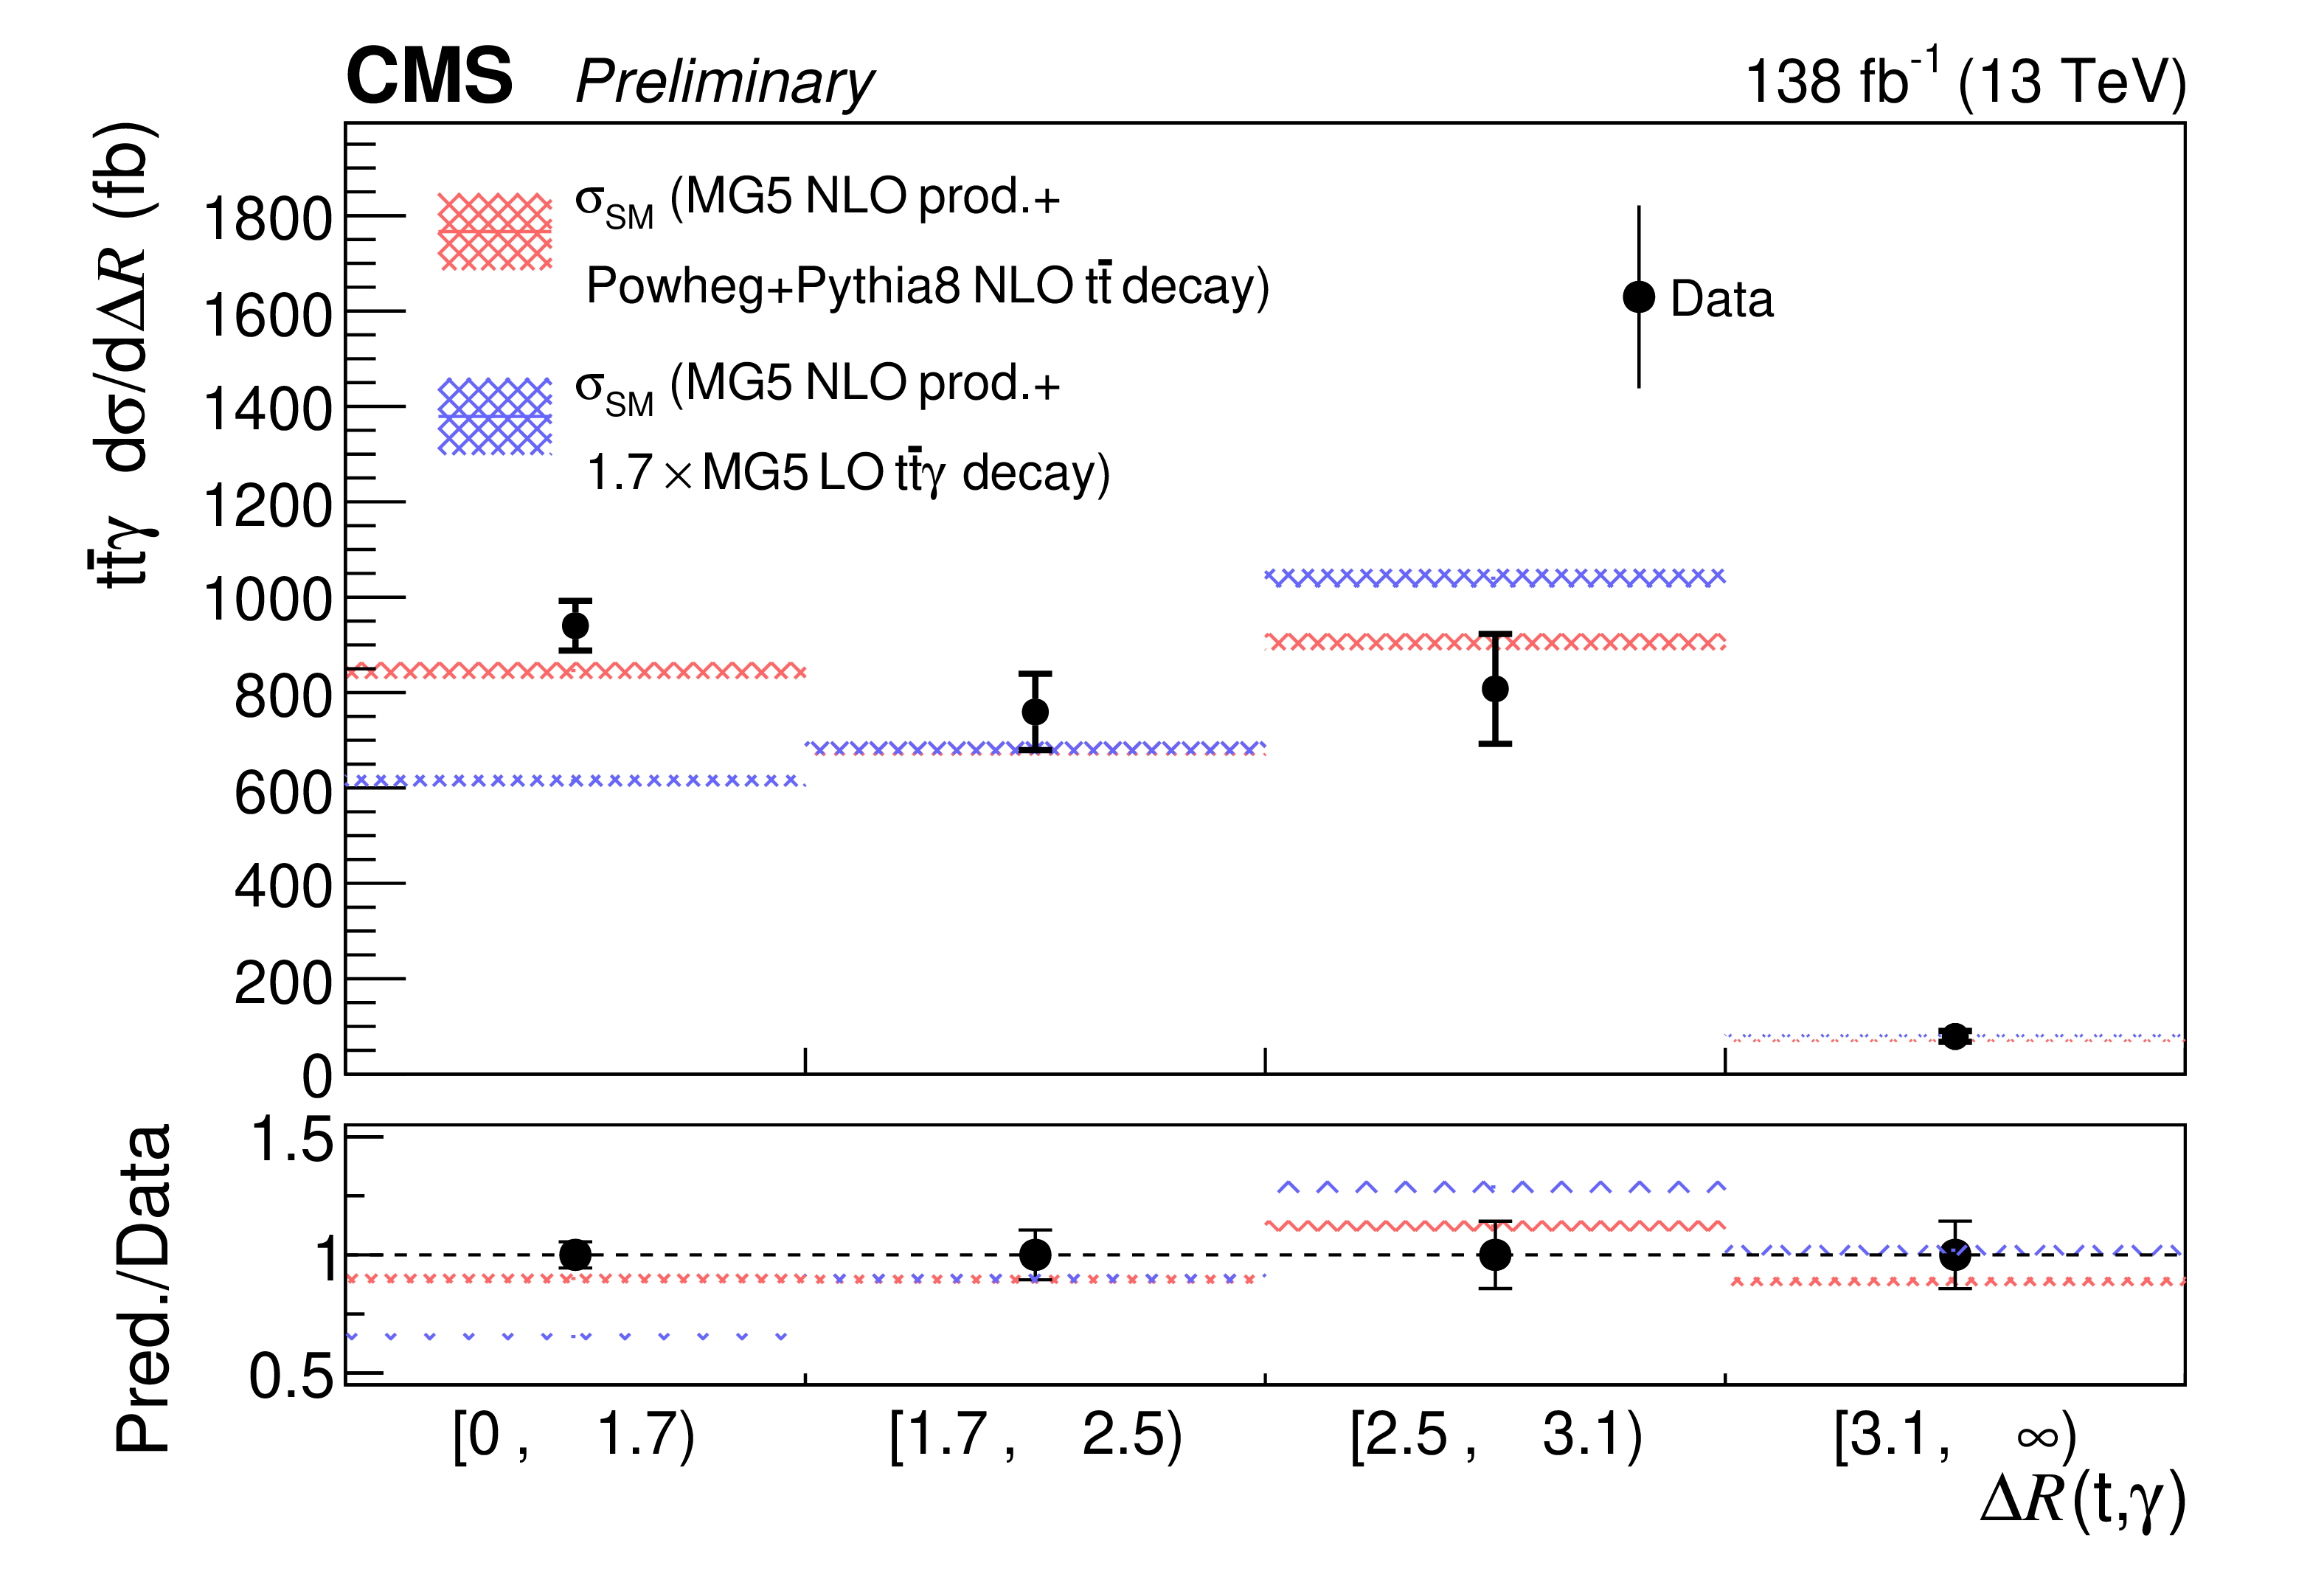
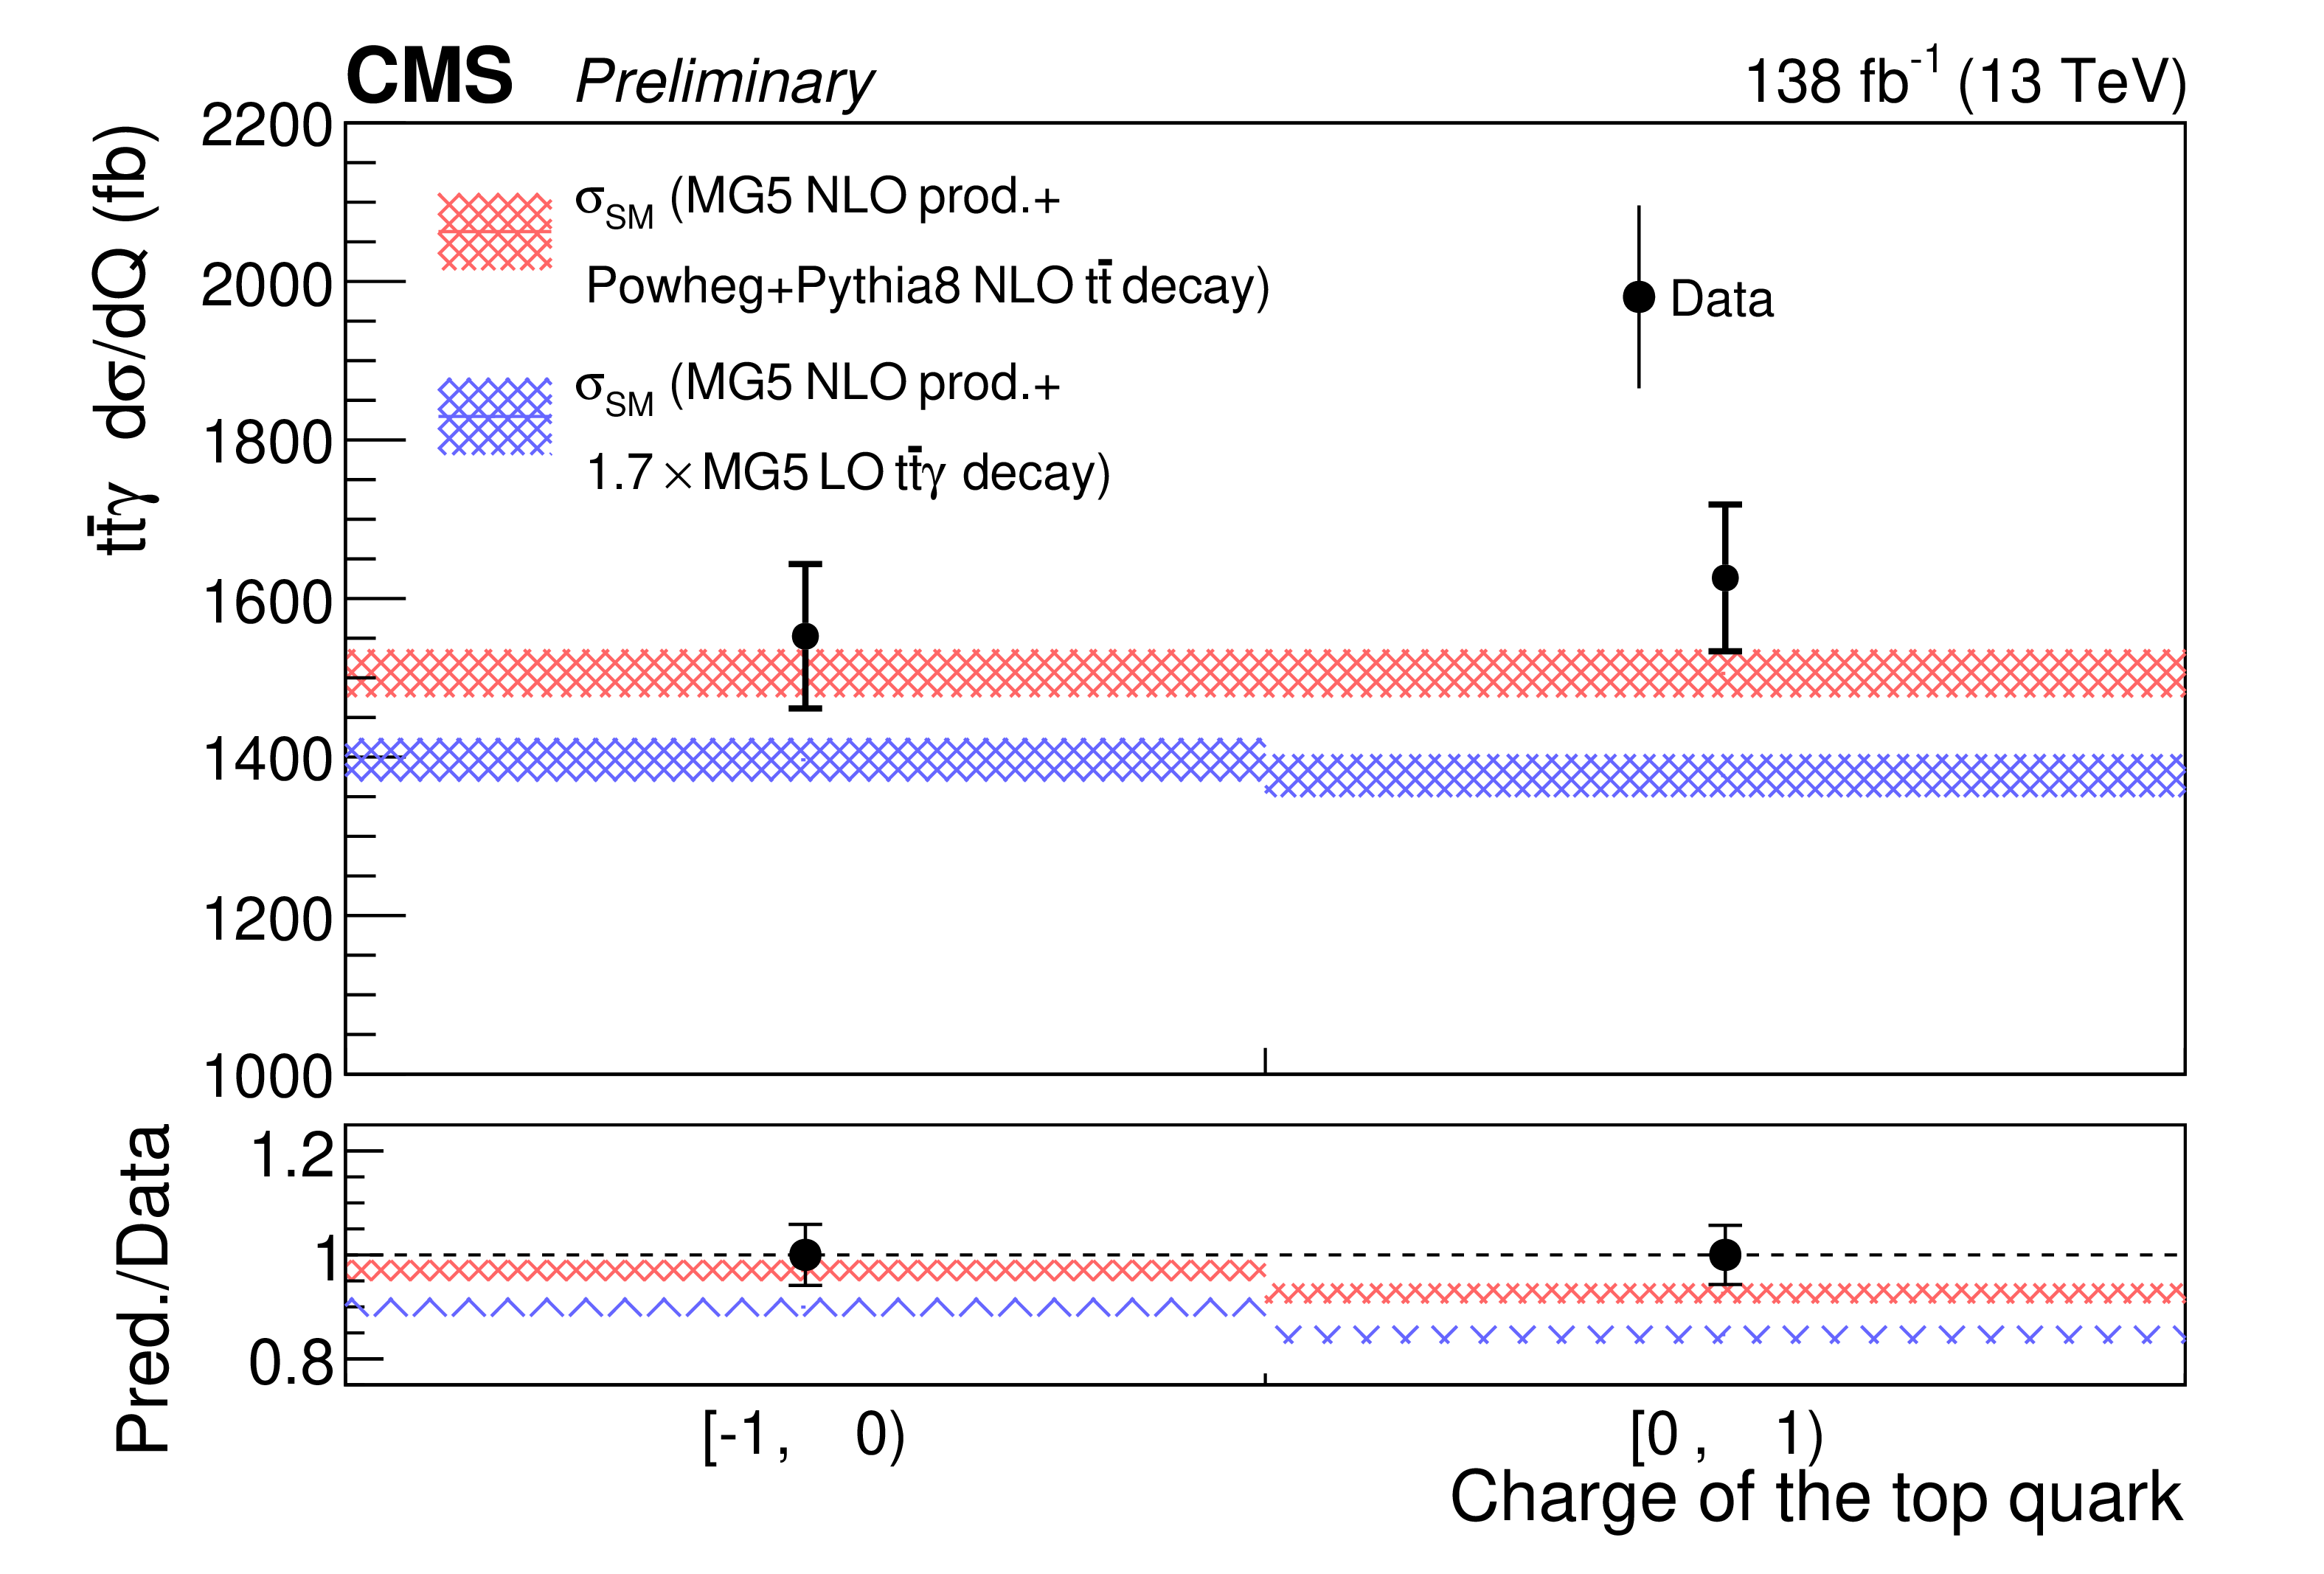
Figure 9:
The measured differential cross sections normalized to the bin width for $ {\mathrm{t}\overline{\mathrm{t}}} \gamma $ as a function of $ p_{\mathrm{T}}^{\ell} $, $ p_{\mathrm{T}}^{\gamma} $, $ m_{\ell\gamma} $, $ \Delta R(\ell,\gamma) $, $ \eta_{\mathrm{light j}} $, $ N_{\mathrm{jets}} $ at particle level, as well as the $ \Delta R(\mathrm{top}_{\ell},\gamma) $ and top quark charge at parton level. The black points with error bars represent the data and their uncertainties, whereas the red and purple bands represent the total theoretical uncertainties from the different simulated samples. The last bin includes overflow events. |
png pdf |
Figure 9-a:
The measured differential cross sections normalized to the bin width for $ {\mathrm{t}\overline{\mathrm{t}}} \gamma $ as a function of $ p_{\mathrm{T}}^{\ell} $, $ p_{\mathrm{T}}^{\gamma} $, $ m_{\ell\gamma} $, $ \Delta R(\ell,\gamma) $, $ \eta_{\mathrm{light j}} $, $ N_{\mathrm{jets}} $ at particle level, as well as the $ \Delta R(\mathrm{top}_{\ell},\gamma) $ and top quark charge at parton level. The black points with error bars represent the data and their uncertainties, whereas the red and purple bands represent the total theoretical uncertainties from the different simulated samples. The last bin includes overflow events. |
png pdf |
Figure 9-b:
The measured differential cross sections normalized to the bin width for $ {\mathrm{t}\overline{\mathrm{t}}} \gamma $ as a function of $ p_{\mathrm{T}}^{\ell} $, $ p_{\mathrm{T}}^{\gamma} $, $ m_{\ell\gamma} $, $ \Delta R(\ell,\gamma) $, $ \eta_{\mathrm{light j}} $, $ N_{\mathrm{jets}} $ at particle level, as well as the $ \Delta R(\mathrm{top}_{\ell},\gamma) $ and top quark charge at parton level. The black points with error bars represent the data and their uncertainties, whereas the red and purple bands represent the total theoretical uncertainties from the different simulated samples. The last bin includes overflow events. |
png pdf |
Figure 9-c:
The measured differential cross sections normalized to the bin width for $ {\mathrm{t}\overline{\mathrm{t}}} \gamma $ as a function of $ p_{\mathrm{T}}^{\ell} $, $ p_{\mathrm{T}}^{\gamma} $, $ m_{\ell\gamma} $, $ \Delta R(\ell,\gamma) $, $ \eta_{\mathrm{light j}} $, $ N_{\mathrm{jets}} $ at particle level, as well as the $ \Delta R(\mathrm{top}_{\ell},\gamma) $ and top quark charge at parton level. The black points with error bars represent the data and their uncertainties, whereas the red and purple bands represent the total theoretical uncertainties from the different simulated samples. The last bin includes overflow events. |
png pdf |
Figure 9-d:
The measured differential cross sections normalized to the bin width for $ {\mathrm{t}\overline{\mathrm{t}}} \gamma $ as a function of $ p_{\mathrm{T}}^{\ell} $, $ p_{\mathrm{T}}^{\gamma} $, $ m_{\ell\gamma} $, $ \Delta R(\ell,\gamma) $, $ \eta_{\mathrm{light j}} $, $ N_{\mathrm{jets}} $ at particle level, as well as the $ \Delta R(\mathrm{top}_{\ell},\gamma) $ and top quark charge at parton level. The black points with error bars represent the data and their uncertainties, whereas the red and purple bands represent the total theoretical uncertainties from the different simulated samples. The last bin includes overflow events. |
png pdf |
Figure 9-e:
The measured differential cross sections normalized to the bin width for $ {\mathrm{t}\overline{\mathrm{t}}} \gamma $ as a function of $ p_{\mathrm{T}}^{\ell} $, $ p_{\mathrm{T}}^{\gamma} $, $ m_{\ell\gamma} $, $ \Delta R(\ell,\gamma) $, $ \eta_{\mathrm{light j}} $, $ N_{\mathrm{jets}} $ at particle level, as well as the $ \Delta R(\mathrm{top}_{\ell},\gamma) $ and top quark charge at parton level. The black points with error bars represent the data and their uncertainties, whereas the red and purple bands represent the total theoretical uncertainties from the different simulated samples. The last bin includes overflow events. |
png pdf |
Figure 9-f:
The measured differential cross sections normalized to the bin width for $ {\mathrm{t}\overline{\mathrm{t}}} \gamma $ as a function of $ p_{\mathrm{T}}^{\ell} $, $ p_{\mathrm{T}}^{\gamma} $, $ m_{\ell\gamma} $, $ \Delta R(\ell,\gamma) $, $ \eta_{\mathrm{light j}} $, $ N_{\mathrm{jets}} $ at particle level, as well as the $ \Delta R(\mathrm{top}_{\ell},\gamma) $ and top quark charge at parton level. The black points with error bars represent the data and their uncertainties, whereas the red and purple bands represent the total theoretical uncertainties from the different simulated samples. The last bin includes overflow events. |
png pdf |
Figure 9-g:
The measured differential cross sections normalized to the bin width for $ {\mathrm{t}\overline{\mathrm{t}}} \gamma $ as a function of $ p_{\mathrm{T}}^{\ell} $, $ p_{\mathrm{T}}^{\gamma} $, $ m_{\ell\gamma} $, $ \Delta R(\ell,\gamma) $, $ \eta_{\mathrm{light j}} $, $ N_{\mathrm{jets}} $ at particle level, as well as the $ \Delta R(\mathrm{top}_{\ell},\gamma) $ and top quark charge at parton level. The black points with error bars represent the data and their uncertainties, whereas the red and purple bands represent the total theoretical uncertainties from the different simulated samples. The last bin includes overflow events. |
png pdf |
Figure 9-h:
The measured differential cross sections normalized to the bin width for $ {\mathrm{t}\overline{\mathrm{t}}} \gamma $ as a function of $ p_{\mathrm{T}}^{\ell} $, $ p_{\mathrm{T}}^{\gamma} $, $ m_{\ell\gamma} $, $ \Delta R(\ell,\gamma) $, $ \eta_{\mathrm{light j}} $, $ N_{\mathrm{jets}} $ at particle level, as well as the $ \Delta R(\mathrm{top}_{\ell},\gamma) $ and top quark charge at parton level. The black points with error bars represent the data and their uncertainties, whereas the red and purple bands represent the total theoretical uncertainties from the different simulated samples. The last bin includes overflow events. |
| Tables | |
png pdf |
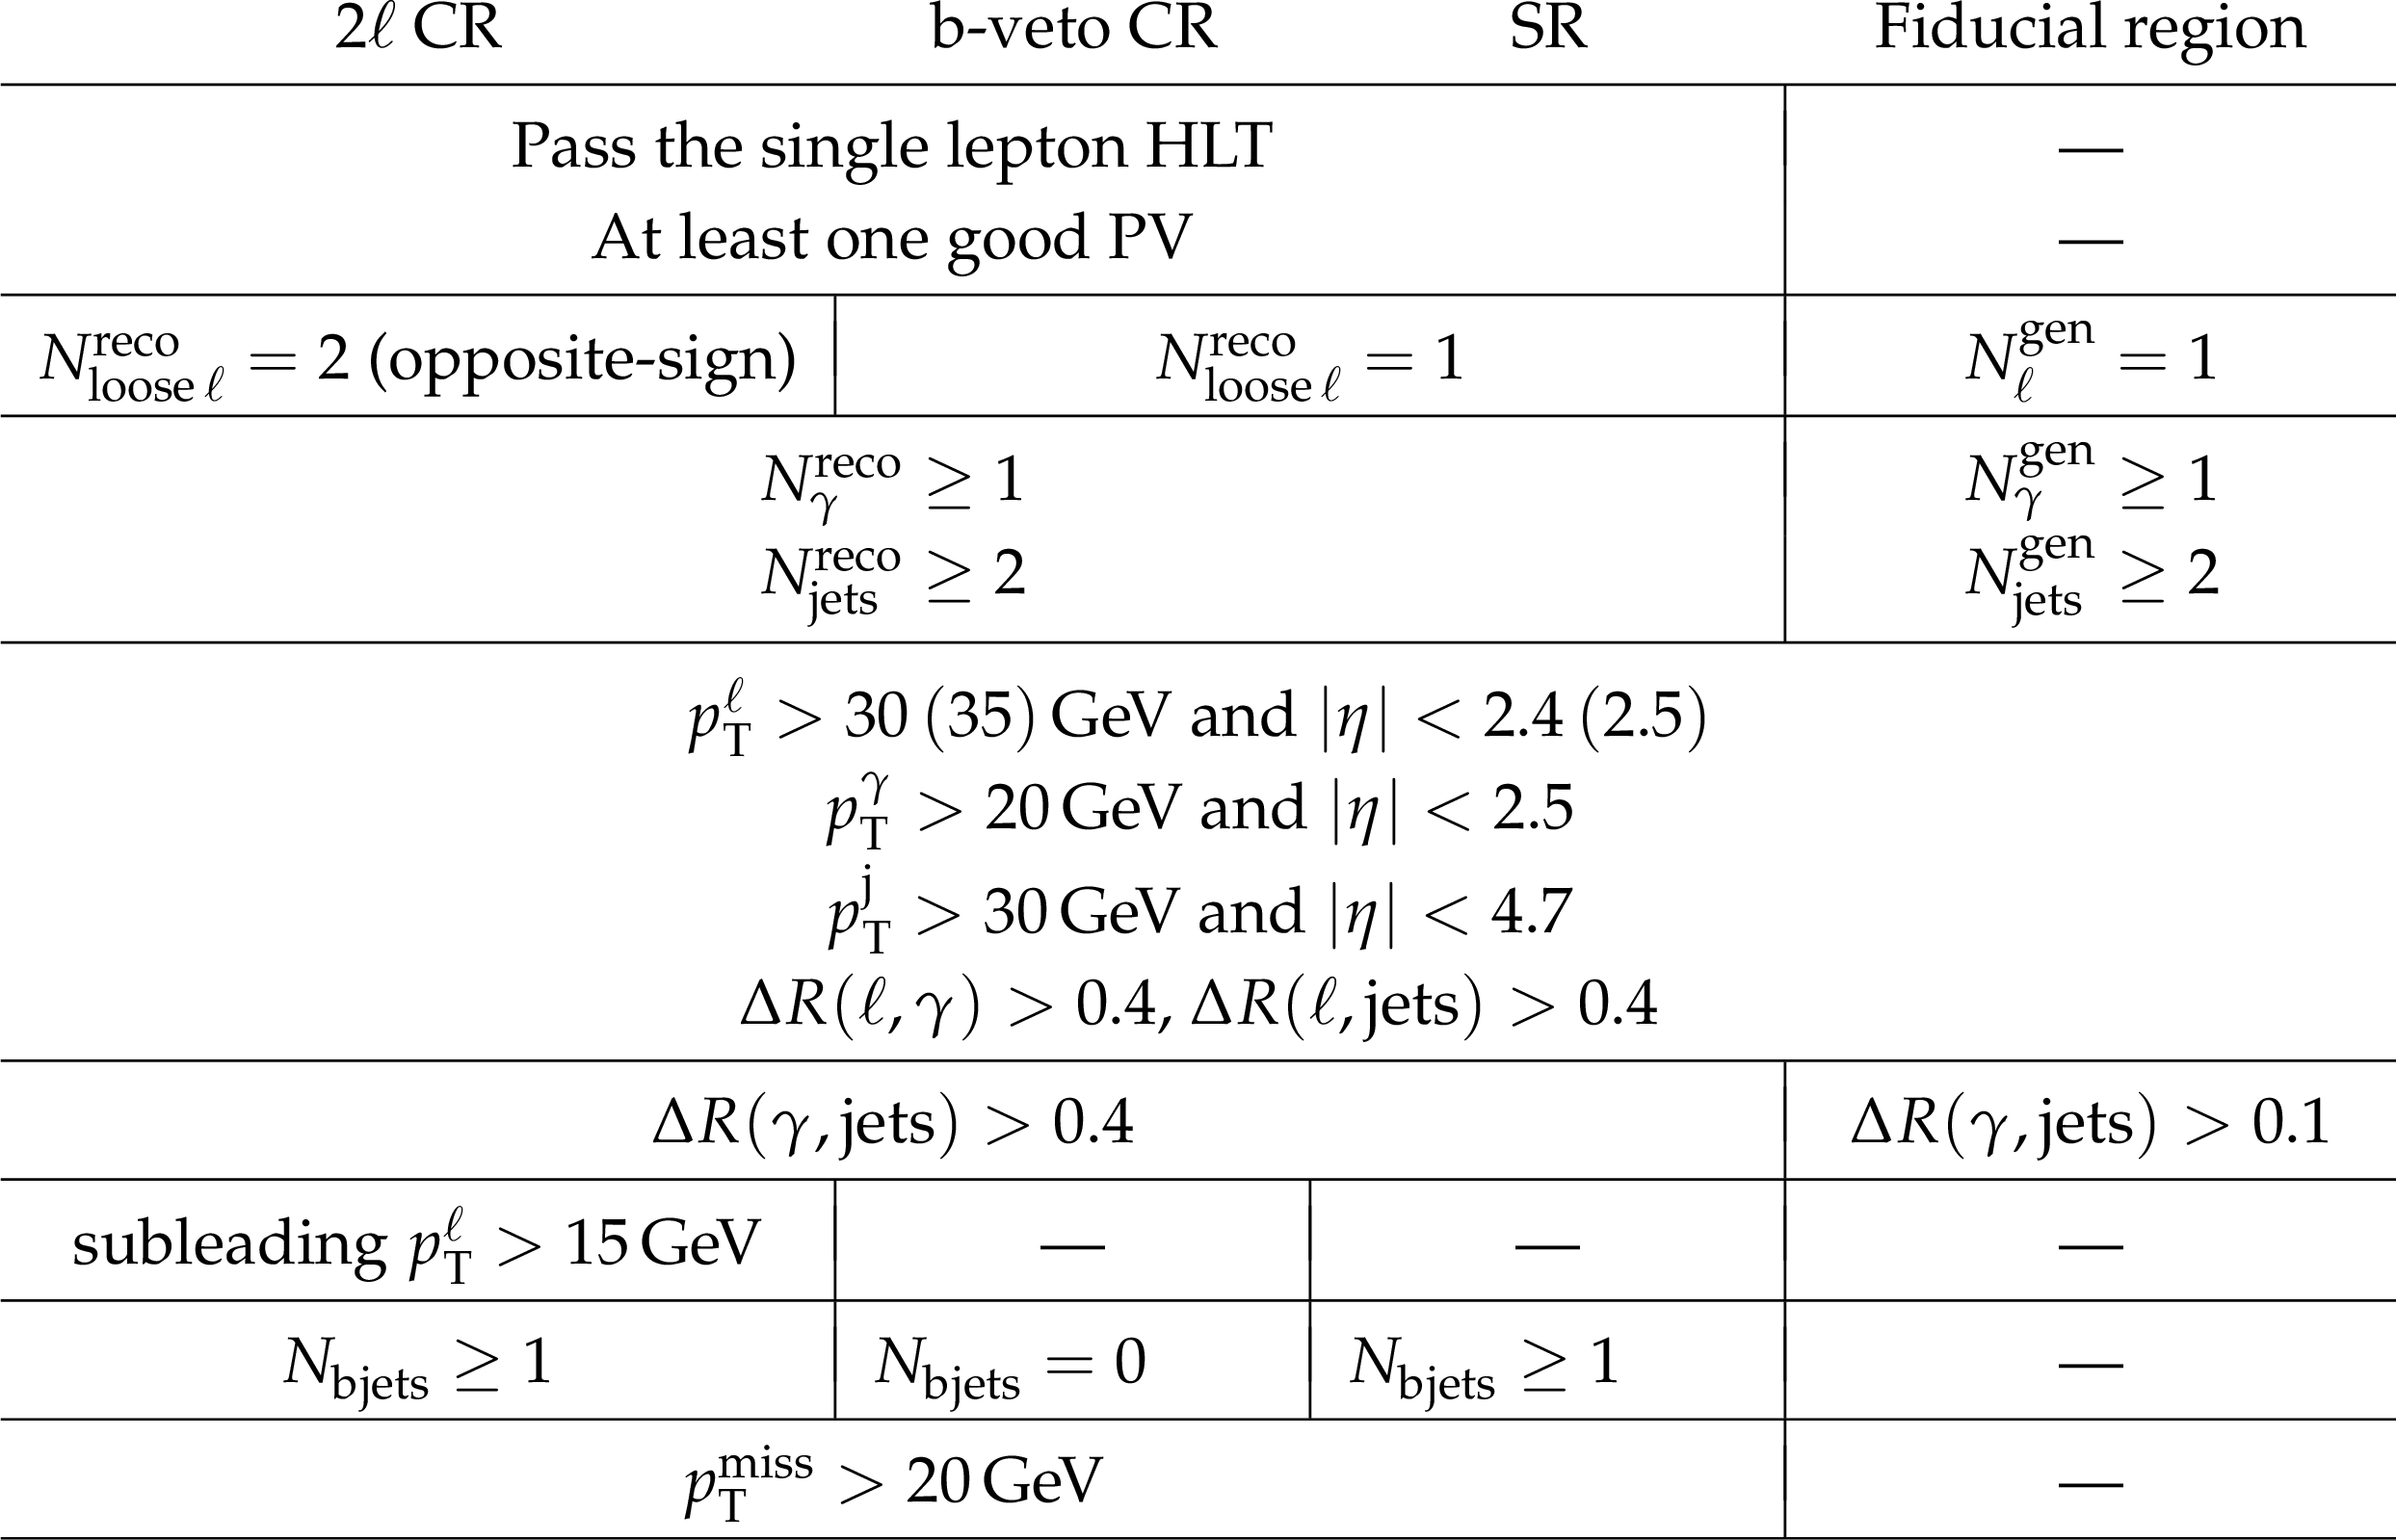
Table 1:
A summary of the selection used in the different regions employed in the analysis, where "---" means that the requirement is not applied. |
png pdf |
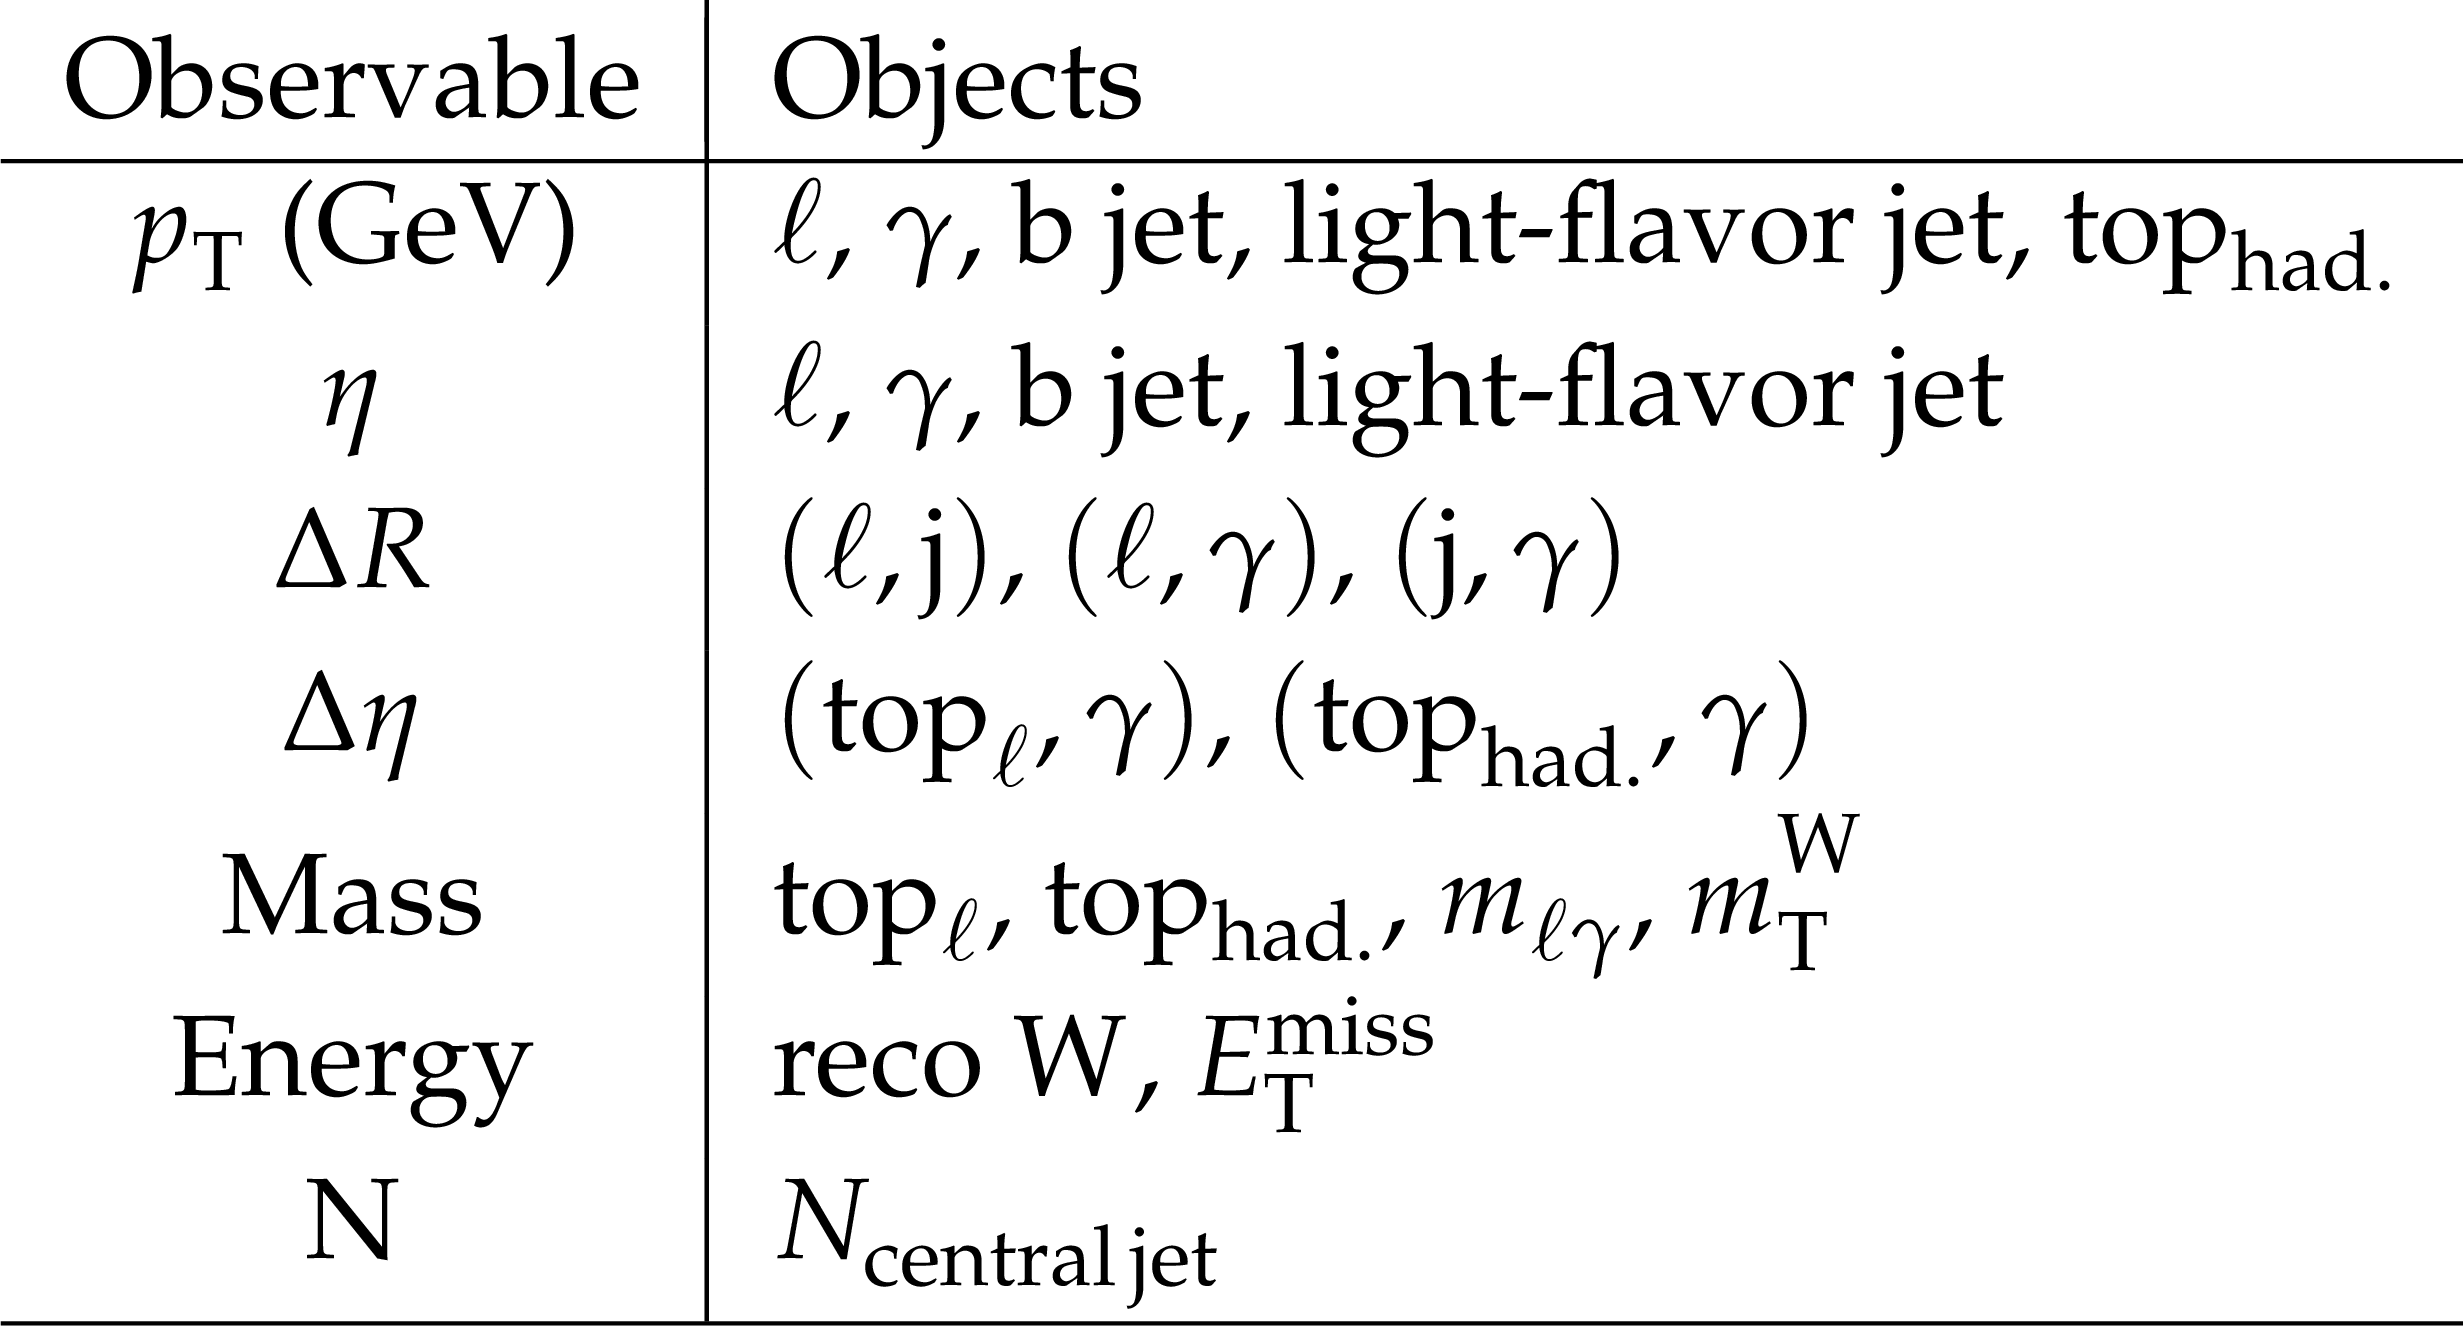
Table 2:
A summary of the input variables for training the BDT model. |
png pdf |
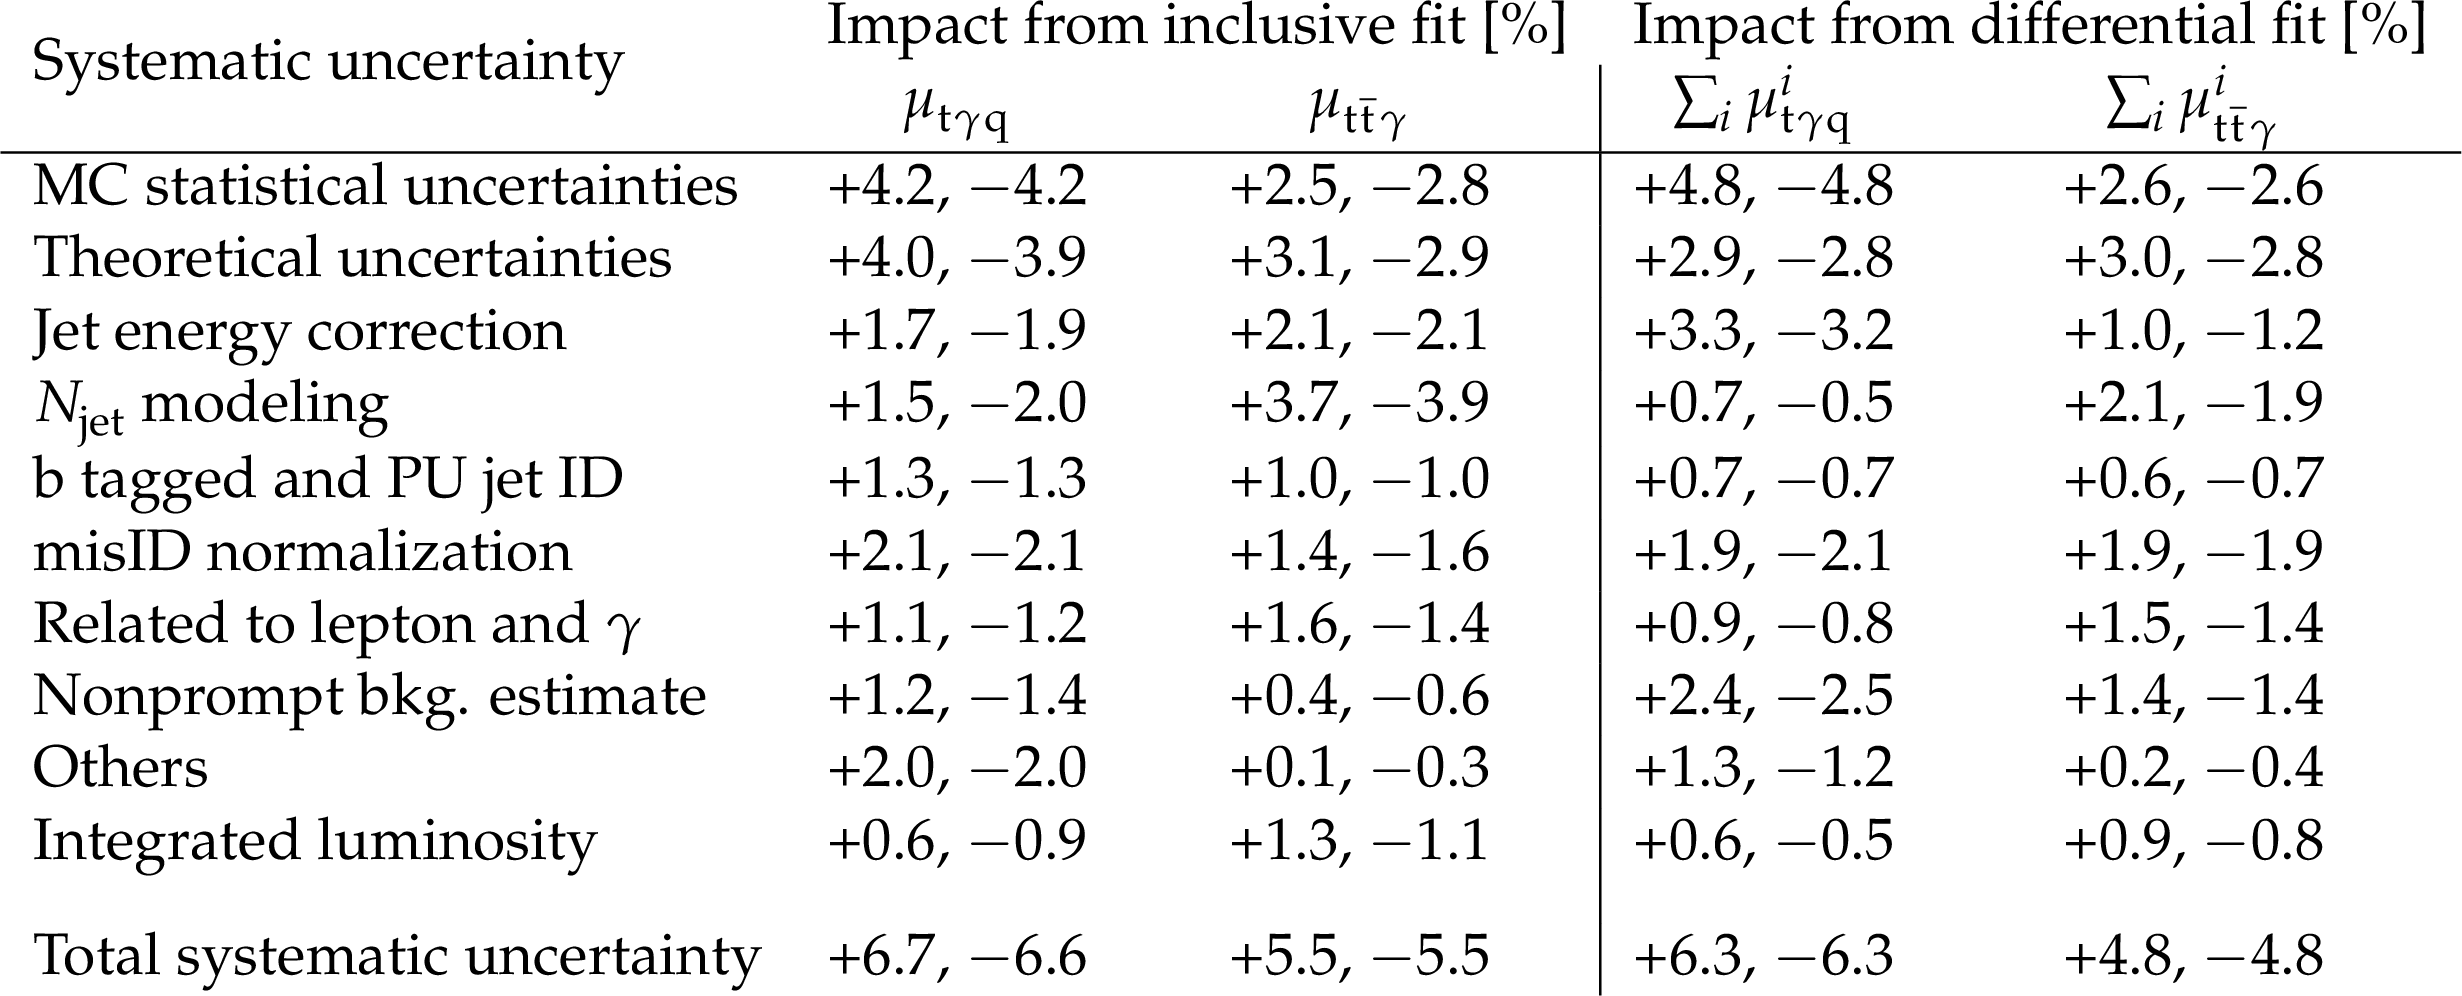
Table 3:
The impact of the systematic uncertainties on the signal strength from inclusive and photon $ p_{\mathrm{T}} $ differential measurements for $ \mathrm{t}\gamma\mathrm{q} $ and $ {\mathrm{t}\overline{\mathrm{t}}} \gamma $, respectively. The uncertainties derived from the differential measurement are obtained by combining the bin-by-bin nuisance impacts using the signal-yield fractions as weights, and propagating them to the inclusive signal strength while accounting for the correlations among the differential signal strength parameters via the post-fit POI covariance matrix. |
png pdf |
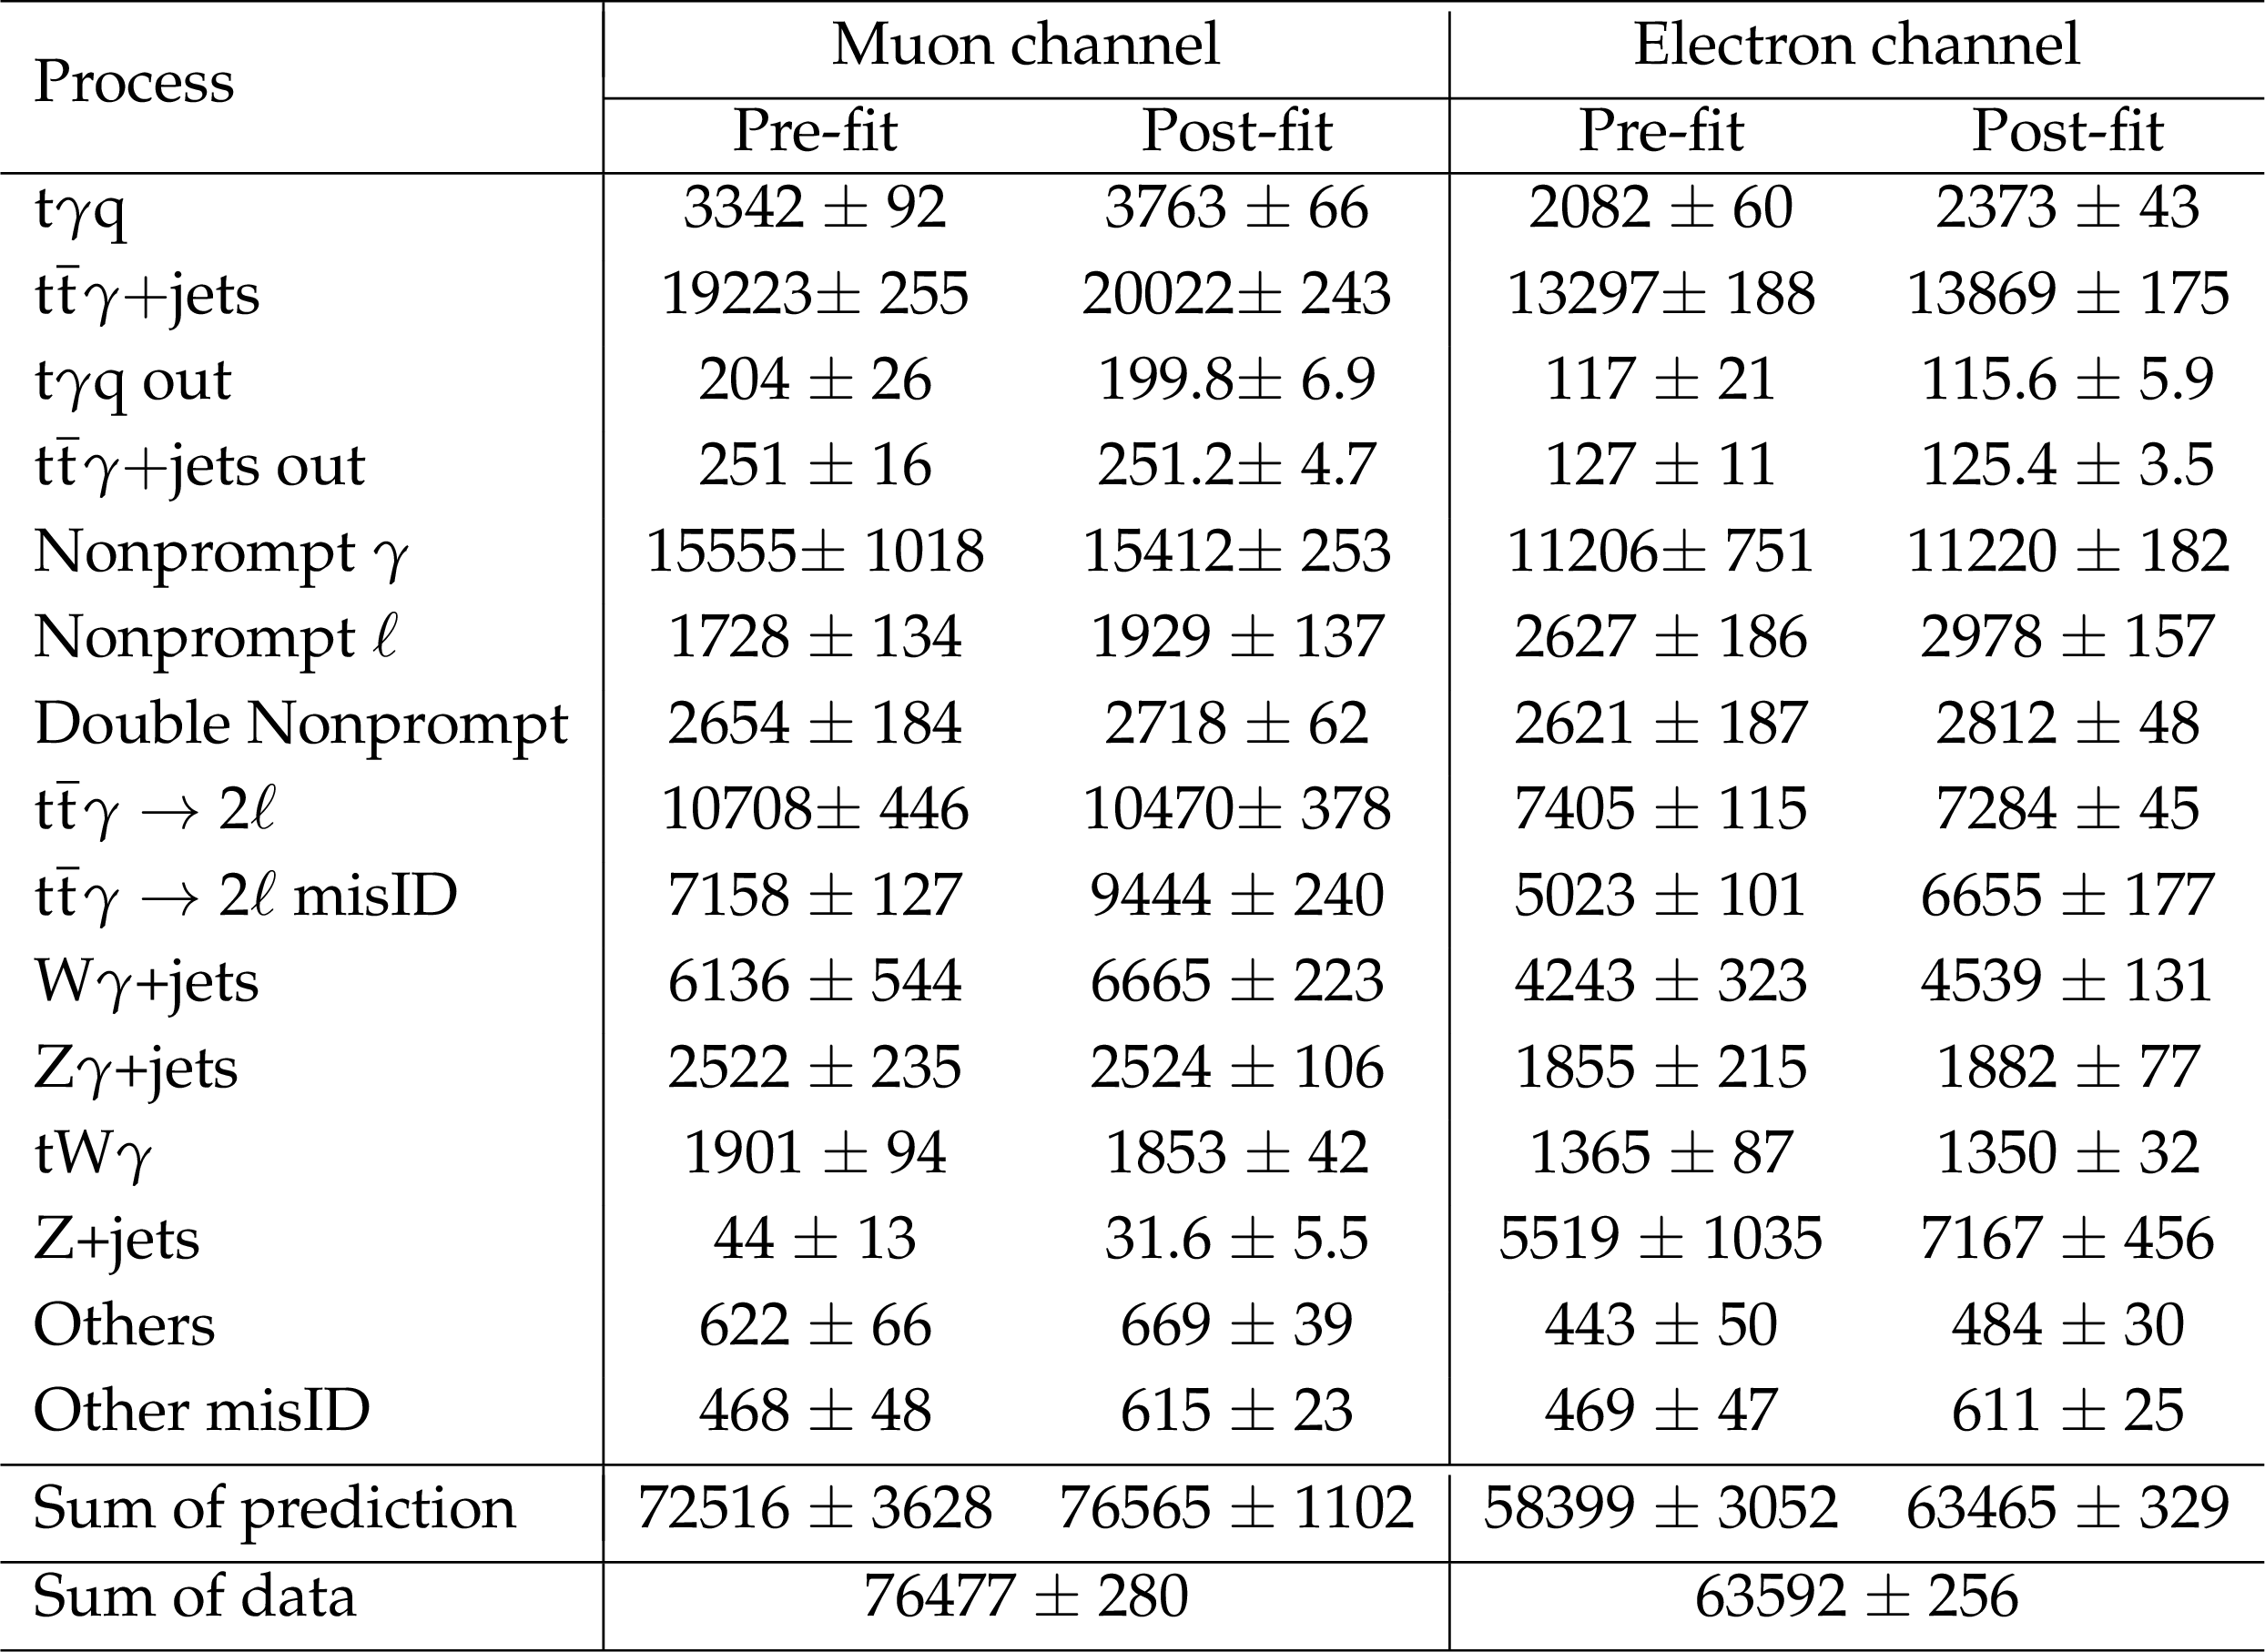
Table 4:
The event yields from the Asimov data before the fit and unblinded data after the maximum likelihood fit in the signal region. ``Other misID'' is the sum of electron misID contribution from all processes except for signals, $ {\mathrm{t}\overline{\mathrm{t}}} \gamma\rightarrow2\ell $, and Z+jets. The uncertainty for the sum of prediction is with consideration of the correlation among different processes and bins. |
| Summary |
| The inclusive and differential cross sections in a fiducial phase space are measured for the $ \mathrm{t}\gamma\mathrm{q} $ and $ {\mathrm{t}\overline{\mathrm{t}}} \gamma $ processes, where FSR photons are included in the signal process. Using the $ \mathrm{pp} $ collision data recorded with the CMS detector at a center-of-mass energy of 13 TeV, corresponding to an integrated luminosity of 138 fb$ ^{-1} $, the measured fiducial inclusive cross sections are $ \sigma^{\text{mea.}}_{\mathrm{t}\gamma\mathrm{q}} = 237_{-17}^{+17} $ fb and $ \sigma^{\text{mea.}}_{{\mathrm{t}\overline{\mathrm{t}}} \gamma} = 1445_{-81}^{+81} $ fb. The differential cross sections are measured as functions of several key kinematic observables in the fiducial region at the particle level, and as functions of $ \Delta R(\mathrm{t},\gamma) $ and the top quark charge at parton level. Within uncertainties, the measurements are in agreement with the SM predictions. With the larger data sample expected from Run 3 of the LHC, these measurements will enable more detailed studies of the production dynamics, including multidifferential measurements and improved sensitivity to possible deviations from the SM. \newpage |
| References | ||||
| 1 | CMS Collaboration | Measurement of top quark pair production in association with a Z boson in proton-proton collisions at $ \sqrt{s}= $ 13 TeV | JHEP 03 (2020) 056 | CMS-TOP-18-009 1907.11270 |
| 2 | ATLAS Collaboration | Measurement of the $ t\bar{t}Z $ and $ t\bar{t}W $ cross sections in proton-proton collisions at $ \sqrt{s}= $ 13 TeV with the ATLAS detector | PRD 99 (2019) no. 7 | 1901.03584 |
| 3 | CMS Collaboration | Measurement of the cross section of top quark-antiquark pair production in association with a W boson in proton-proton collisions at $ \sqrt{s} = $ 13 TeV | JHEP 07 (2023) 219 | CMS-TOP-21-011 2208.06485 |
| 4 | ATLAS Collaboration | Observation of Higgs boson production in association with a top quark pair at the LHC with the ATLAS detector | PLB 784 (2018) 173 | 1806.00425 |
| 5 | CMS Collaboration | Observation of $ \mathrm{t\overline{t}} $H production | PRL 120 (2018) no. 23 | CMS-HIG-17-035 1804.02610 |
| 6 | CMS Collaboration | Measurements of inclusive and differential cross sections for top quark production in association with a Z boson in proton-proton collisions at $ \sqrt{s} = $ 13 TeV | JHEP 02 (2025) 177 | CMS-TOP-23-004 2410.23475 |
| 7 | CMS Collaboration | Measurement of inclusive and differential cross sections for single top quark production in association with a W boson in proton-proton collisions at $ \sqrt{s} = $ 13 TeV | JHEP 07 (2023) 046 | CMS-TOP-21-010 2208.00924 |
| 8 | ATLAS Collaboration | Observation of Single-Top-Quark Production in Association with a Photon Using the ATLAS Detector | PRL 131 (2023) no. 18 | 2302.01283 |
| 9 | CMS Collaboration | Evidence for the associated production of a single top quark and a photon in proton-proton collisions at $ \sqrt{s}= $ 13 TeV | PRL 121 (2018) no. 22 | CMS-TOP-17-016 1808.02913 |
| 10 | ATLAS Collaboration | Measurements of inclusive and differential cross-sections of $ t\overline{t}\gamma $ production in pp collisions at $ \sqrt{s} = $ 13 TeV with the ATLAS detector | JHEP 10 (2024) 191 | 2403.09452 |
| 11 | CMS Collaboration | Measurement of the inclusive and differential t$ \overline{t} $\ensuremath\gamma cross sections in the single-lepton channel and EFT interpretation at $ \sqrt{s} = $ 13 TeV | JHEP 12 (2021) 180 | CMS-TOP-18-010 2107.01508 |
| 12 | CMS Collaboration | Measurement of the inclusive and differential $ \mathrm{t\bar{t}}\gamma $ cross sections in the dilepton channel and effective field theory interpretation in proton-proton collisions at $ \sqrt{s} = $ 13 TeV | JHEP 05 (2022) 091 | CMS-TOP-21-004 2201.07301 |
| 13 | CMS Collaboration | Inclusive and differential measurements of the $ \mathrm{t\bar{t}}\gamma $ cross section and the $ \mathrm{t\bar{t}}\gamma/\mathrm{t\bar{t}} $ cross section ratio in proton-proton collisions at $ \sqrt{s} = $ 13 TeV | link | CMS-TOP-23-002 2511.01995 |
| 14 | CMS Collaboration | The CMS experiment at the CERN LHC | JINST 3 (2008) S08004 | |
| 15 | CMS Collaboration | The CMS trigger system | JINST 12 (2017) P01020 | CMS-TRG-12-001 1609.02366 |
| 16 | CMS Collaboration | Precision luminosity measurement in proton-proton collisions at $ \sqrt{s} = $ 13 TeV in 2015 and 2016 at CMS | EPJC 81 (2021) 800 | CMS-LUM-17-003 2104.01927 |
| 17 | CMS Collaboration | CMS luminosity measurement for the 2017 data-taking period at $ \sqrt{s} = $ 13 TeV | Technical Report, CERN, Geneva, 2018 CMS-PAS-LUM-17-004 |
CMS-PAS-LUM-17-004 |
| 18 | CMS Collaboration | CMS luminosity measurement for the 2018 data-taking period at $ \sqrt{s} = $ 13 TeV | Technical Report, CERN, Geneva, 2019 CMS-PAS-LUM-18-002 |
CMS-PAS-LUM-18-002 |
| 19 | J. Alwall et al. | The automated computation of tree-level and next-to-leading order differential cross sections, and their matching to parton shower simulations | JHEP 07 (2014) 079 | 1405.0301 |
| 20 | S. Alioli, P. Nason, C. Oleari, and E. Re | A general framework for implementing NLO calculations in shower Monte Carlo programs: the POWHEG BOX | JHEP 06 (2010) 043 | 1002.2581 |
| 21 | K. Melnikov, M. Schulze, and A. Scharf | QCD corrections to top quark pair production in association with a photon at hadron colliders | PRD 83 (2011) 074013 | 1102.1967 |
| 22 | T. Sjöstrand et al. | An introduction to PYTHIA 8.2 | Comput. Phys. Commun. 191 (2015) 159 | 1410.3012 |
| 23 | R. Frederix and S. Frixione | Merging meets matching in MC@NLO | JHEP 12 (2012) 061 | 1209.6215 |
| 24 | CMS Collaboration | Event generator tunes obtained from underlying event and multiparton scattering measurements | EPJC 76 (2016) 155 | CMS-GEN-14-001 1512.00815 |
| 25 | NNPDF Collaboration | Parton distributions from high-precision collider data | , EPJC 77 (2017) no. 10 |
1706.00428 |
| 26 | GEANT4 Collaboration | GEANT 4--a simulation toolkit | NIM A 506 (2003) 250 | |
| 27 | CMS Collaboration | Particle-flow reconstruction and global event description with the CMS detector | JINST 12 (2017) P10003 | CMS-PRF-14-001 1706.04965 |
| 28 | CMS Collaboration | Description and performance of track and primary-vertex reconstruction with the CMS tracker | JINST 9 (2014) no. 10 | CMS-TRK-11-001 1405.6569 |
| 29 | M. Cacciari, G. P. Salam, and G. Soyez | The anti-$ k_{\mathrm{T}} $ jet clustering algorithm | JHEP 04 (2008) 063 | 0802.1189 |
| 30 | M. Cacciari, G. P. Salam, and G. Soyez | FastJet user manual | EPJC 72 (2012) 1896 | 1111.6097 |
| 31 | CMS Collaboration | Electron and photon reconstruction and identification with the CMS experiment at the CERN LHC | JINST 16 (2021) no. 05 | CMS-EGM-17-001 2012.06888 |
| 32 | CMS Collaboration | Performance of Electron Reconstruction and Selection with the CMS Detector in Proton-Proton Collisions at \ensuremath\sqrts = 8 TeV | JINST 10 (2015) no. 06 | CMS-EGM-13-001 1502.02701 |
| 33 | W. Adam, R. Fr \"u hwirth, A. Strandlie, and T. Todorov | Reconstruction of electrons with the gaussian-sum filter in the CMS tracker at the LHC | Journal of Physics G: Nuclear and Particle Physics 3 (2005) 1, N9 | |
| 34 | CMS Collaboration | Performance of the CMS muon detector and muon reconstruction with proton-proton collisions at $ \sqrt{s}= $ 13 TeV | JINST 13 (2018) no. 06 | CMS-MUO-16-001 1804.04528 |
| 35 | CMS Collaboration | Jet algorithms performance in 13 TeV data | technical report, CERN, Geneva, 2017 CDS |
|
| 36 | CMS Collaboration | Pileup mitigation at CMS in 13 TeV data | JINST 15 (2020) P09018 | CMS-JME-18-001 2003.00503 |
| 37 | CMS Collaboration | Identification of heavy-flavour jets with the CMS detector in pp collisions at 13 TeV | JINST 13 (2018) no. 05 | CMS-BTV-16-002 1712.07158 |
| 38 | CMS Collaboration | Performance of missing transverse momentum reconstruction in proton-proton collisions at $ \sqrt{s} = $ 13 TeV using the CMS detector | JINST 14 (2019) no. 07 | CMS-JME-17-001 1903.06078 |
| 39 | CMS Collaboration | Measurement of the W boson helicity in events with a single reconstructed top quark in pp collisions at $ \sqrt{s}= $ 8 TeV | JHEP 01 (2015) 053 | CMS-TOP-12-020 1410.1154 |
| 40 | T. Chen and C. Guestrin | Xgboost: A scalable tree boosting system | in ACM SIGKDD International Conference on Knowledge Discovery and Data Mining, KDD 16, ACM, 2016 Proceedings of the 2 (2016) 785 |
|
| 41 | J. Bergstra et al. | Hyperopt: A Python library for model selection and hyperparameter optimization | Computational Science and Discovery 8 (2015) 014008 | |
| 42 | CMS Collaboration | Measurement of the W$ \gamma $ Production Cross Section in Proton-Proton Collisions at $ \sqrt {s} = $ 13 TeV and Constraints on Effective Field Theory Coefficients | PRL 126 (2021) no. 25 | CMS-SMP-19-002 2102.02283 |
| 43 | CMS Collaboration | Measurement of the inelastic proton-proton cross section at $ \sqrt{s}= $ 13 TeV | JHEP 07 (2018) 161 | CMS-FSQ-15-005 1802.02613 |
| 44 | W. S. Cleveland | Robust locally weighted regression and smoothing scatterplots | Journal of the American Statistical Association 74 (1979) 829 | |
| 45 | J. Butterworth et al. | PDF4LHC recommendations for LHC Run II | JPG 43 (2016) 023001 | 1510.03865 |
| 46 | R. J. Barlow and C. Beeston | Fitting using finite Monte Carlo samples | Comput. Phys. Commun. 77 (1993) 219 | |
| 47 | G. Cowan, K. Cranmer, E. Gross, and O. Vitells | Asymptotic formulae for likelihood-based tests of new physics | EPJC 71 (2011) 1554 | 1007.1727 |
| 48 | CMS Collaboration | The CMS Statistical Analysis and Combination Tool: Combine | Comput. Softw. Big Sci. 8 (2024) | CMS-CAT-23-001 2404.06614 |
|
|
Compact Muon Solenoid LHC, CERN |
|

|

|

|

|

|