

Compact Muon Solenoid
LHC, CERN
| CMS-PAS-TOP-17-016 | ||
| Search for top+photon production in pp collisions at 13 TeV in the muon+jets channel | ||
| CMS Collaboration | ||
| June 2018 | ||
| Abstract: A search for events with a single top quark produced in association with a photon is performed. The analysis is based on data corresponding to an integrated luminosity of 35.9 fb$^{-1}$ of pp collisions at $\sqrt{s} = $ 13 TeV recorded by the CMS experiment at the LHC in 2016. The events are selected by requiring the presence of a muon ($\mu$), a photon ($\gamma$), an undetected neutrino ($\nu$), and at least two jets (j) from which one is identified as a b jet. A multivariate analysis based on topological and kinematic properties is employed to discriminate the signal from the background processes. An excess above the background-only hypothesis is observed, with a significance corresponding to 4.4 standard deviations. A fiducial cross section is measured for photons with transverse momentum greater than 25 GeV and in the central region of the detector that are well separated from muons and jets. The measured cross section times branching fraction is $\mathcal{B}(\mathrm{ t \rightarrow\mu\nu b) \sigma (t \gamma j }) = $ 115 $\pm$ 17 (stat) $_{-27}^{+33}$ (syst) fb, which agrees with the standard model prediction. | ||
|
Links:
CDS record (PDF) ;
inSPIRE record ;
CADI line (restricted) ;
These preliminary results are superseded in this paper, PRL 121 (2018) 221802. The superseded preliminary plots can be found here. |
||
| Figures | |

png pdf |
Figure 1:
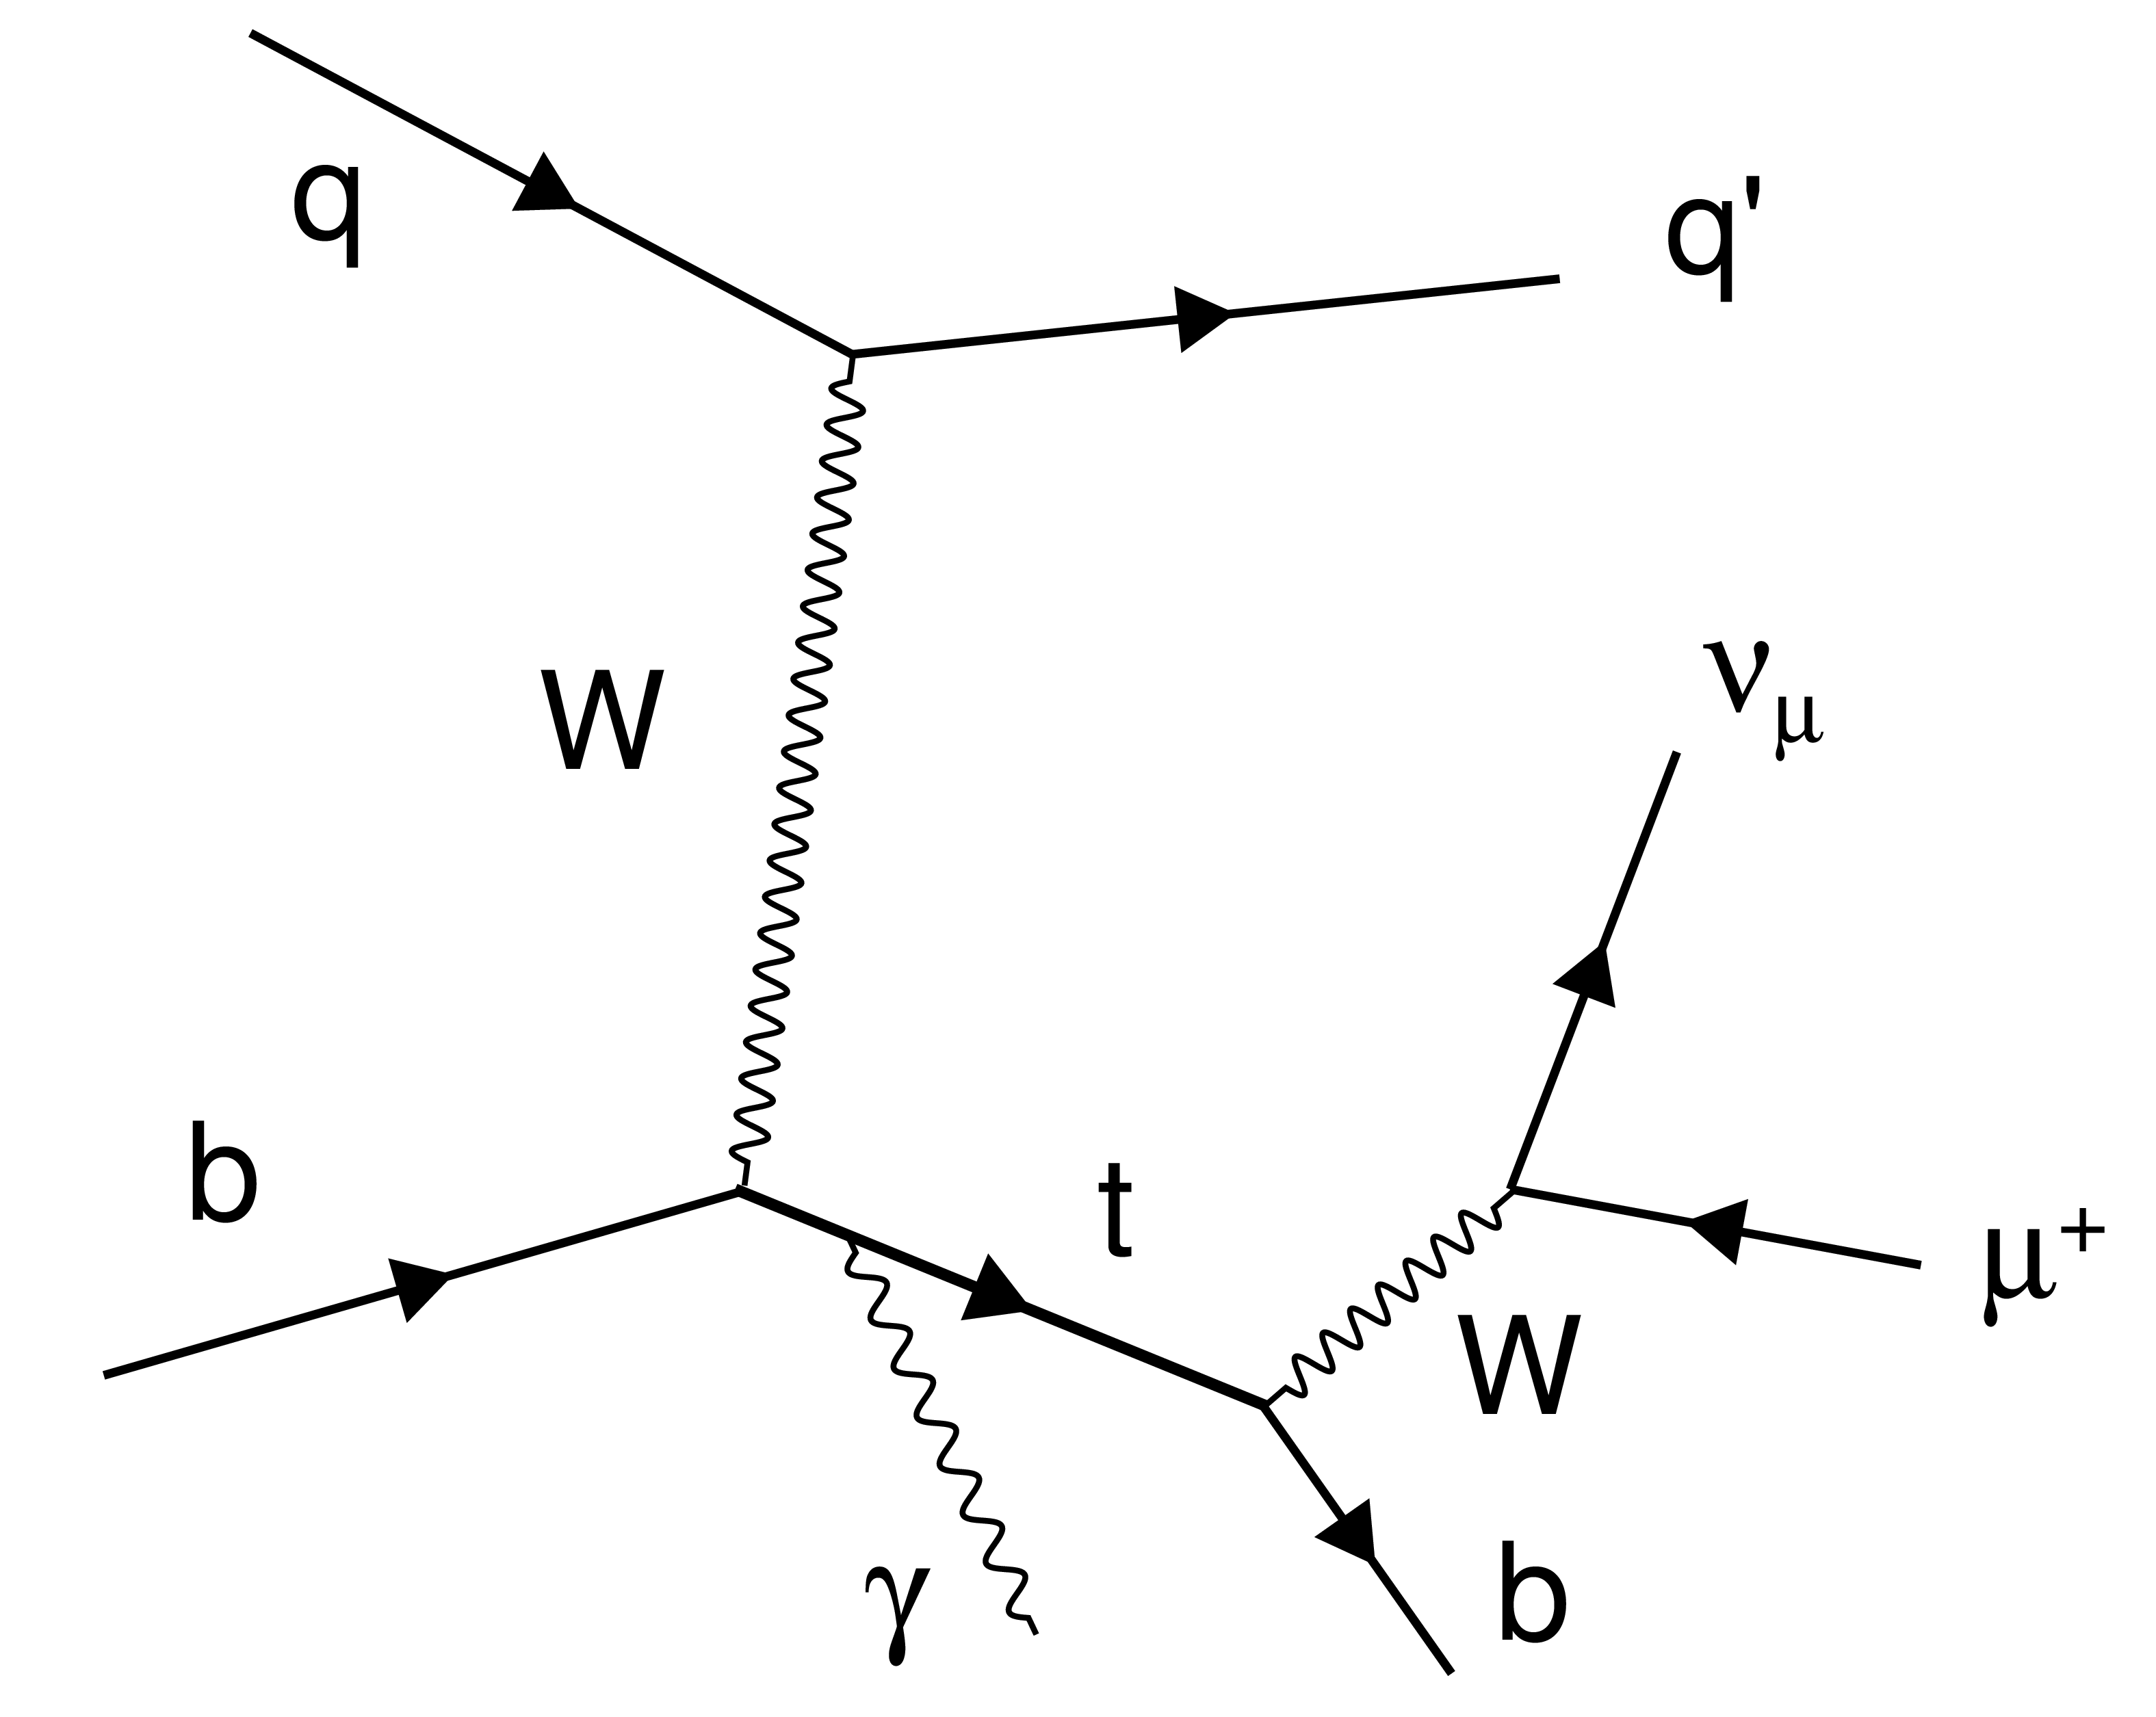
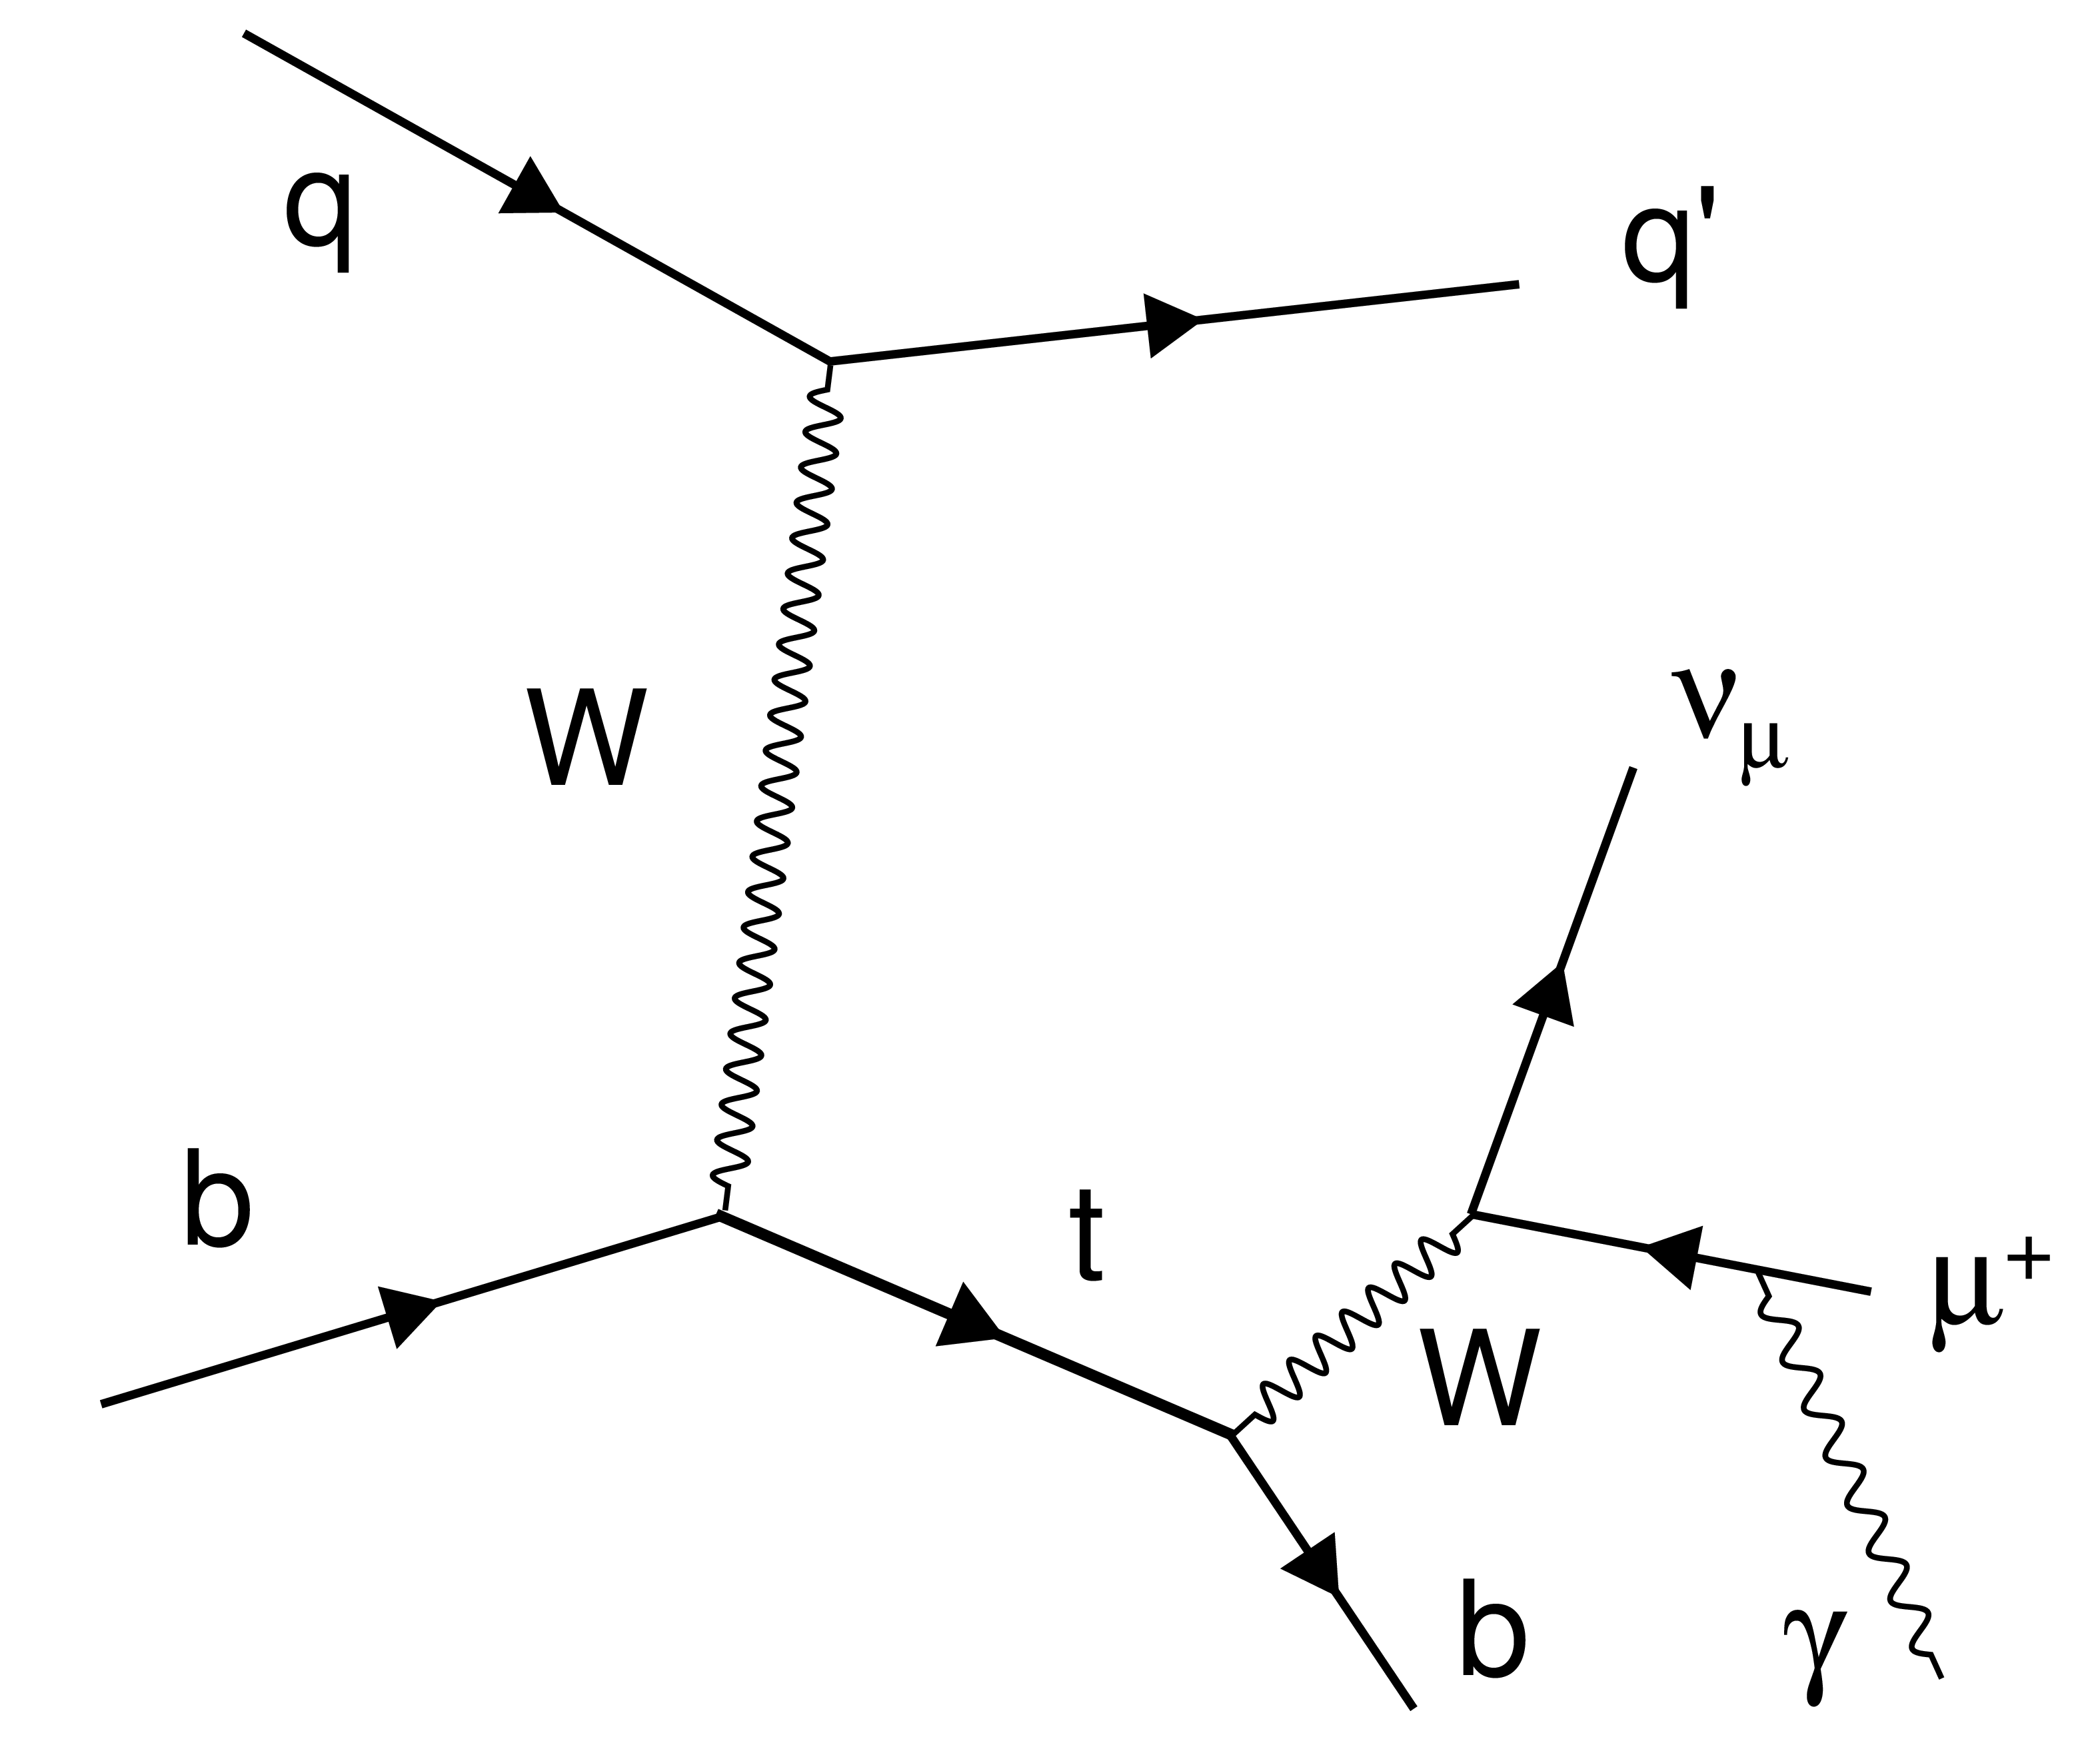
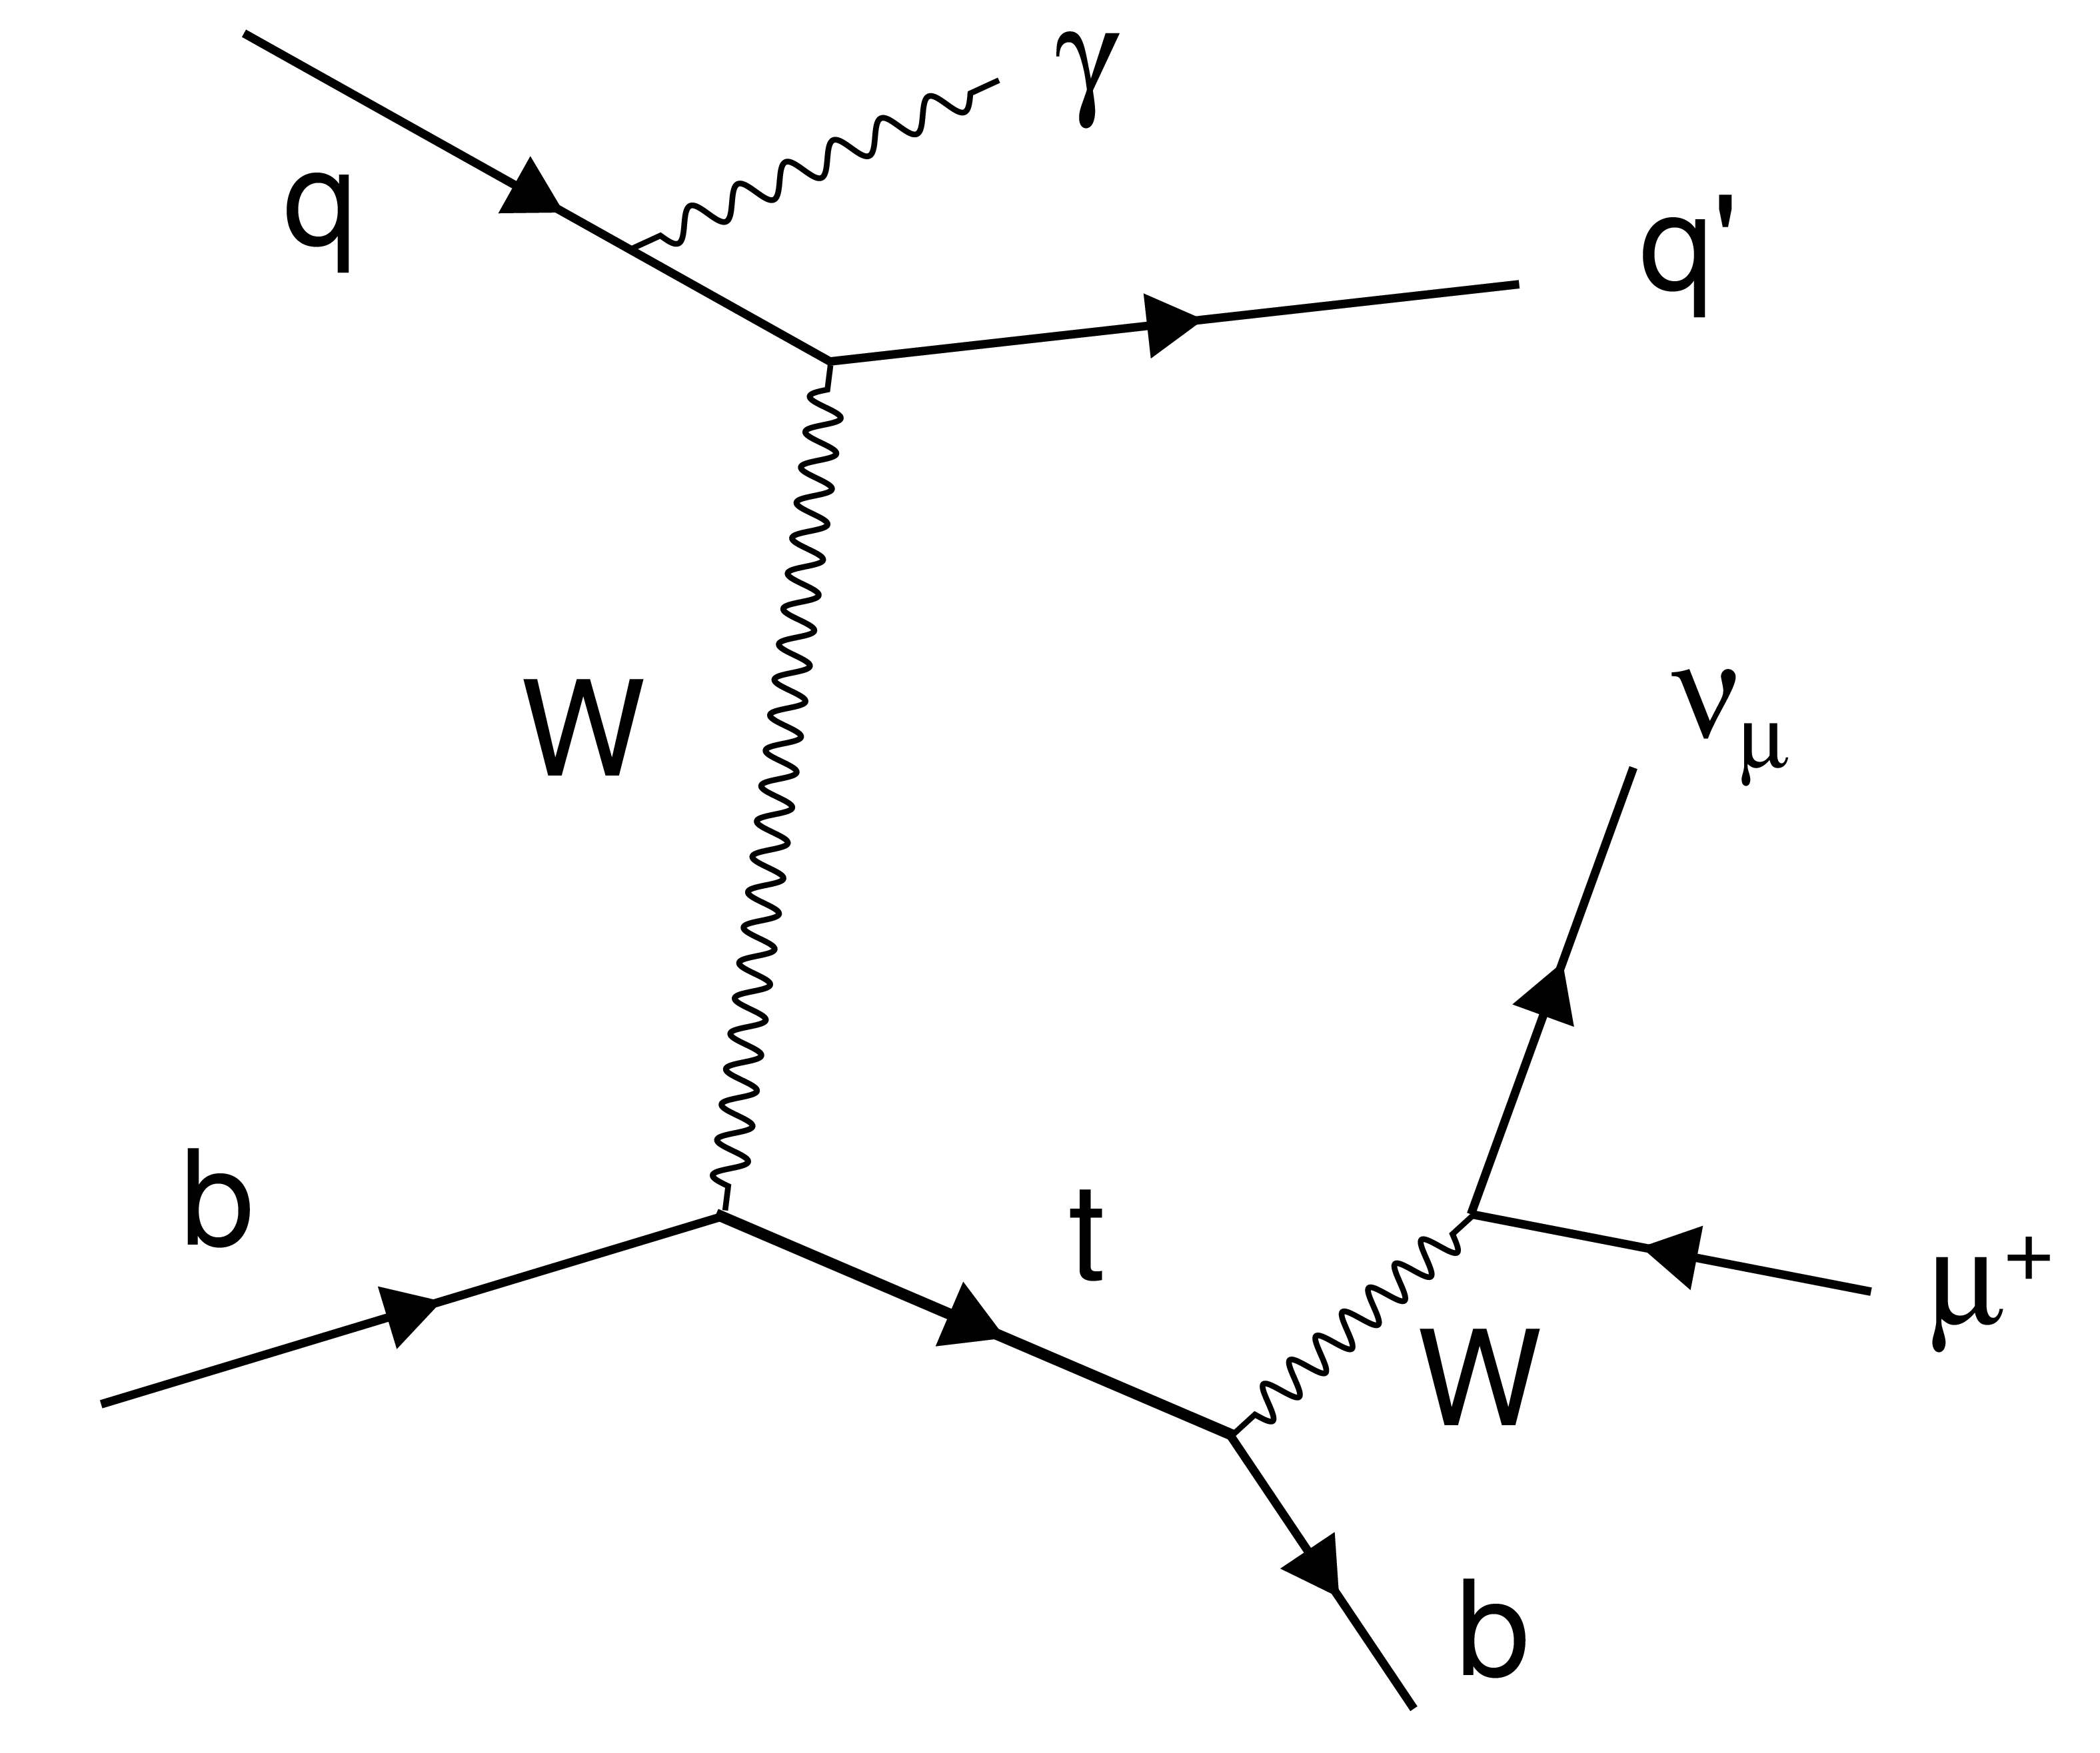
Representative Feynman diagrams for single top quark production in association with a photon in the $t$ channel, including the leptonic decay of the W boson in the top quark decay. |
png pdf |
Figure 1-a:
Representative Feynman diagrams for single top quark production in association with a photon in the $t$ channel, including the leptonic decay of the W boson in the top quark decay. |
png pdf |
Figure 1-b:
Representative Feynman diagrams for single top quark production in association with a photon in the $t$ channel, including the leptonic decay of the W boson in the top quark decay. |
png pdf |
Figure 1-c:
Representative Feynman diagrams for single top quark production in association with a photon in the $t$ channel, including the leptonic decay of the W boson in the top quark decay. |
png pdf |
Figure 2:
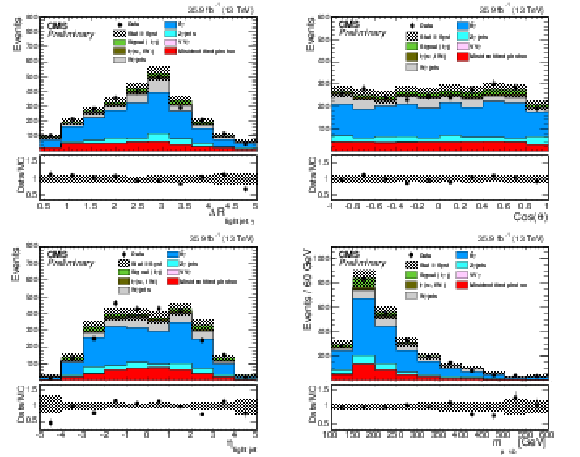
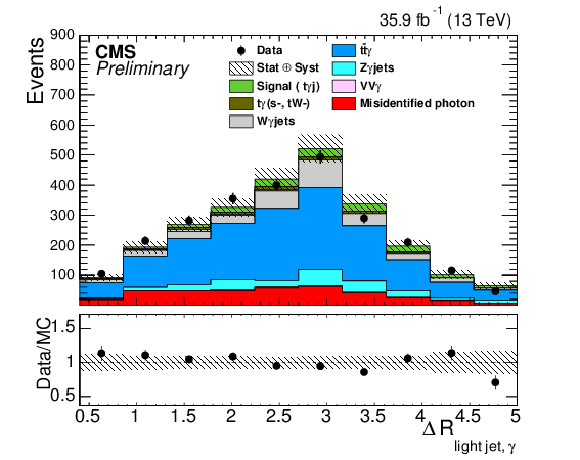
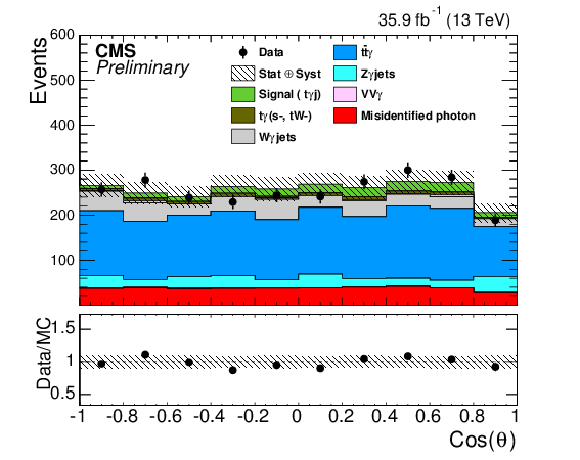
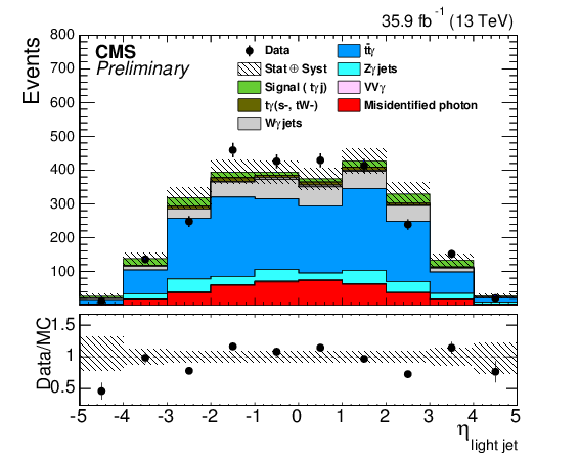
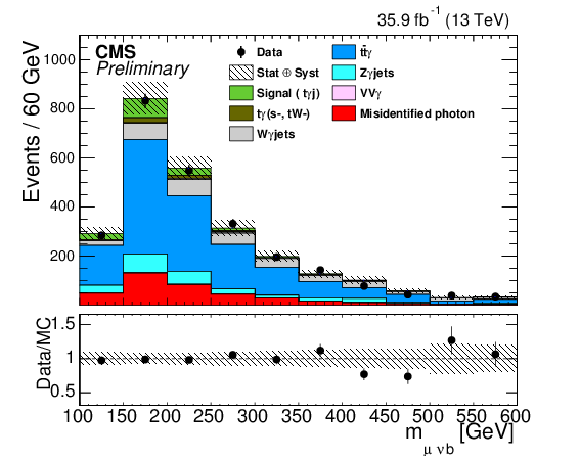
Distributions of some of the input variables to the BDT: $\Delta R({\text light jet},\gamma)$ (top-left), cosine of the angle between the muon candidate and the light jet in the top quark rest frame (top-right), pseudorapidity of the light jet (bottom-left), and reconstructed top quark mass (bottom-right) after the final event selection for data (points), and the SM prediction (histograms). The hatched band shows the statistical and systematic uncertainties in the estimated signal and background yields and the vertical bars on the points represent the statistical uncertainties in data. |
png pdf |
Figure 2-a:
Distributions of some of the input variables to the BDT: $\Delta R({\text light jet},\gamma)$ (top-left), cosine of the angle between the muon candidate and the light jet in the top quark rest frame (top-right), pseudorapidity of the light jet (bottom-left), and reconstructed top quark mass (bottom-right) after the final event selection for data (points), and the SM prediction (histograms). The hatched band shows the statistical and systematic uncertainties in the estimated signal and background yields and the vertical bars on the points represent the statistical uncertainties in data. |
png pdf |
Figure 2-b:
Distributions of some of the input variables to the BDT: $\Delta R({\text light jet},\gamma)$ (top-left), cosine of the angle between the muon candidate and the light jet in the top quark rest frame (top-right), pseudorapidity of the light jet (bottom-left), and reconstructed top quark mass (bottom-right) after the final event selection for data (points), and the SM prediction (histograms). The hatched band shows the statistical and systematic uncertainties in the estimated signal and background yields and the vertical bars on the points represent the statistical uncertainties in data. |
png pdf |
Figure 2-c:
Distributions of some of the input variables to the BDT: $\Delta R({\text light jet},\gamma)$ (top-left), cosine of the angle between the muon candidate and the light jet in the top quark rest frame (top-right), pseudorapidity of the light jet (bottom-left), and reconstructed top quark mass (bottom-right) after the final event selection for data (points), and the SM prediction (histograms). The hatched band shows the statistical and systematic uncertainties in the estimated signal and background yields and the vertical bars on the points represent the statistical uncertainties in data. |
png pdf |
Figure 2-d:
Distributions of some of the input variables to the BDT: $\Delta R({\text light jet},\gamma)$ (top-left), cosine of the angle between the muon candidate and the light jet in the top quark rest frame (top-right), pseudorapidity of the light jet (bottom-left), and reconstructed top quark mass (bottom-right) after the final event selection for data (points), and the SM prediction (histograms). The hatched band shows the statistical and systematic uncertainties in the estimated signal and background yields and the vertical bars on the points represent the statistical uncertainties in data. |
png pdf |
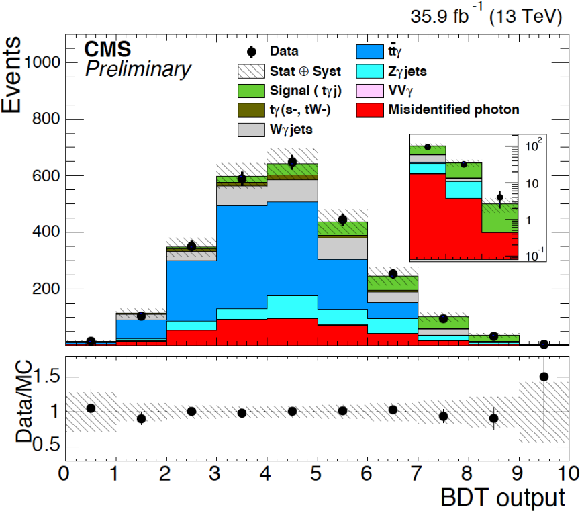
Figure 3:
The BDT output distribution for data and SM predictions after the fit. The inset presents a zoom on the last three bins. |
| Tables | |
png pdf |
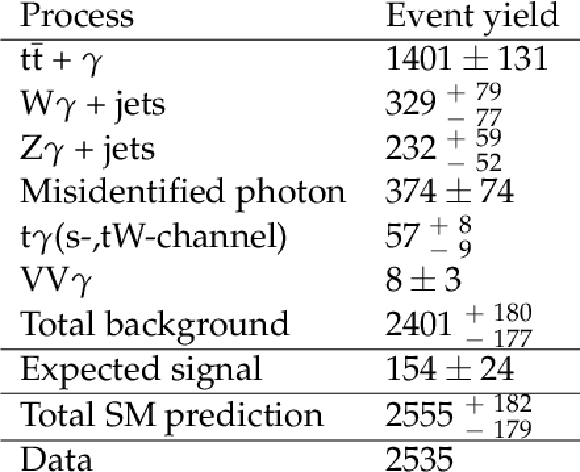
Table 1:
Event yields after the event selection in data and for each SM contribution. The expected yields are presented with the statistical and systematic uncertainties combined. |
| Summary |
| References | ||||
| 1 | M. Fael and T. Gehrmann | Probing top quark electromagnetic dipole moments in single-top-plus-photon production | PRD 88 (2013) 033003 | 1307.1349 |
| 2 | S. M. Etesami, S. Khatibi, and M. Mohammadi Najafabadi | Measuring anomalous WW $ \gamma $ and t $ \bar{\text {t}}\gamma $ couplings using top+$ \gamma $ production at the LHC | EPJC 76 (2016) 533 | 1606.02178 |
| 3 | CDF Collaboration | Evidence for $ t\bar{t}\gamma $ Production and Measurement of $ \sigma_{t\bar{t}\gamma} / \sigma_{t\bar{t}} $ | PRD 84 (2011) 031104 | 1106.3970 |
| 4 | ATLAS Collaboration | Measurement of the $ t\bar{t}\gamma $ production cross section in proton-proton collisions at $ \sqrt{s} = $ 8 TeV with the ATLAS detector | JHEP 11 (2017) 086 | 1706.03046 |
| 5 | CMS Collaboration | Measurement of the semileptonic $ \mathrm{t}\overline{\mathrm{t}}+\gamma $ production cross section in pp collisions at $ \sqrt{s}= $ 8 TeV | JHEP 10 (2017) 006 | CMS-TOP-14-008 1706.08128 |
| 6 | J. Alwall et al. | The automated computation of tree-level and next-to-leading order differential cross sections, and their matching to parton shower simulations | JHEP 07 (2014) 079 | 1405.0301 |
| 7 | NNPDF Collaboration | Parton distributions for the LHC Run II | JHEP 04 (2015) 040 | 1410.8849 |
| 8 | P. Nason | A New method for combining NLO QCD with shower Monte Carlo algorithms | JHEP 11 (2004) 040 | hep-ph/0409146 |
| 9 | S. Frixione, P. Nason, and C. Oleari | Matching NLO QCD computations with Parton Shower simulations: the POWHEG method | JHEP 11 (2007) 070 | 0709.2092 |
| 10 | S. Alioli, P. Nason, C. Oleari, and E. Re | A general framework for implementing NLO calculations in shower Monte Carlo programs: the POWHEG BOX | JHEP 06 (2010) 043 | 1002.2581 |
| 11 | J. M. Campbell, R. K. Ellis, P. Nason, and E. Re | Top-Pair Production and Decay at NLO Matched with Parton Showers | JHEP 04 (2015) 114 | 1412.1828 |
| 12 | CMS Collaboration | Event generator tunes obtained from underlying event and multiparton scattering measurements | EPJC 76 (2016) 155 | CMS-GEN-14-001 1512.00815 |
| 13 | GEANT4 Collaboration | GEANT4---a simulation toolkit | NIMA 506 (2003) 250 | |
| 14 | CMS Collaboration | Description and performance of track and primary-vertex reconstruction with the CMS tracker | JINST 9 (2014) P10009 | CMS-TRK-11-001 1405.6569 |
| 15 | M. Cacciari, G. P. Salam, and G. Soyez | The anti-$ k_t $ jet clustering algorithm | JHEP 04 (2008) 063 | 0802.1189 |
| 16 | M. Cacciari, G. P. Salam, and G. Soyez | FastJet user manual | EPJC 72 (2012) 1896 | 1111.6097 |
| 17 | CMS Collaboration | Identification of heavy-flavour jets with the CMS detector in pp collisions at 13 TeV | JINST 13 (2018) P05011 | CMS-BTV-16-002 1712.07158 |
| 18 | CMS Collaboration | Particle-flow reconstruction and global event description with the CMS detector | JINST 12 (2017) P10003 | CMS-PRF-14-001 1706.04965 |
| 19 | CMS Collaboration | Performance of photon reconstruction and identification with the CMS detector in proton-proton collisions at sqrt(s) = 8 TeV | JINST 10 (2015) P08010 | CMS-EGM-14-001 1502.02702 |
| 20 | M. Cacciari and G. P. Salam | Pileup subtraction using jet areas | PLB 659 (2008) 119 | 0707.1378 |
| 21 | CMS Collaboration | Measurement of the $ t $-channel single top quark production cross section in $ pp $ collisions at $ \sqrt{s}= $ 7 TeV | PRL 107 (2011) 091802 | CMS-TOP-10-008 1106.3052 |
| 22 | CMS Collaboration | Measurement of $ W\gamma $ and $ Z\gamma $ production in $ pp $ collisions at $ \sqrt{s} = $ 7 TeV | PLB 701 (2011) 535 | CMS-EWK-10-008 1105.2758 |
| 23 | CMS Collaboration | Measurement of electroweak-induced production of W$ \gamma $ with two jets in pp collisions at $ \sqrt{s}= $ 8 TeV and constraints on anomalous quartic gauge couplings | JHEP 06 (2017) 106 | CMS-SMP-14-011 1612.09256 |
| 24 | CMS Collaboration | Jet algorithms performance in 13 TeV data | CDS | |
| 25 | CMS Collaboration | Jet energy scale and resolution in the CMS experiment in pp collisions at 8 TeV | JINST 12 (2017), no. 02, P02014 | CMS-JME-13-004 1607.03663 |
| 26 | CMS Collaboration | Measurement of inclusive W and Z boson production cross sections in pp collisions at $ \sqrt{s} = $ 8 TeV | PRL 112 (2014) 191802 | CMS-SMP-12-011 1402.0923 |
| 27 | CMS Collaboration | Performance of CMS muon reconstruction in $ pp $ collision events at $ \sqrt{s}= $ 7 TeV | JINST 7 (2012) P10002 | CMS-MUO-10-004 1206.4071 |
| 28 | CMS Collaboration | Performance of electron reconstruction and selection with the CMS detector in proton-proton collisions at $ \sqrt{s}= $ 8 TeV | JINST 10 (2015) P06005 | CMS-EGM-13-001 1502.02701 |
| 29 | CMS Collaboration | Measurement of the $ W\gamma $ and $ Z\gamma $ inclusive cross sections in $ pp $ collisions at $ \sqrt{s} = $ 7 TeV and limits on anomalous triple gauge boson couplings | PRD 89 (2014) 092005 | CMS-EWK-11-009 1308.6832 |
| 30 | CMS Collaboration | Measurement of the inelastic proton-proton cross section at $ \sqrt{s}= $ 13 TeV | Submitted to: JHEP (2018) | CMS-FSQ-15-005 1802.02613 |
| 31 | CMS Collaboration | CMS luminosity measurement for the 2015 data taking period | CMS-PAS-LUM-15-001 | CMS-PAS-LUM-15-001 |
| 32 | CMS Collaboration | Measurement of the cross section for electroweak production of Z$ \gamma $ in association with two jets and constraints on anomalous quartic gauge couplings in proton–proton collisions at $ \sqrt{s} = $ 8 TeV | PLB 770 (2017) 380 | CMS-SMP-14-018 1702.03025 |
| 33 | CMS Collaboration | Measurement of the $ {{\mathrm{W}}^{+}}\mathrm{W}^{-} $ cross section in pp collisions at $ \sqrt{s} = $ 8 TeV and limits on anomalous gauge couplings | EPJC 76 (2016) | |
| 34 | CMS Collaboration | Cross section measurement of $ t $-channel single top quark production in pp collisions at $ \sqrt s = $ 13 TeV | PLB 772 (2017) 752 | CMS-TOP-16-003 1610.00678 |
| 35 | M. Bahr et al. | Herwig++ Physics and Manual | EPJC 58 (2008) 639 | 0803.0883 |
| 36 | H. Voss, A. Hocker, J. Stelzer, and F. Tegenfeldt | TMVA, the toolkit for multivariate data analysis with ROOT | in XIth International Workshop on Advanced Computing and Analysis Techniques in Physics Research (ACAT), p. 40 2007 | physics/0703039 |

|
Compact Muon Solenoid LHC, CERN |

|

|

|

|

|

|