

Compact Muon Solenoid
LHC, CERN
| CMS-PAS-TOP-16-017 | ||
| Measurement of the top pair-production in association with a W or Z boson in pp collisions at 13 TeV | ||
| CMS Collaboration | ||
| August 2016 | ||
| Abstract: We present a measurement of the cross section of top quark pairs produced in association with a W or Z boson, in proton-proton collisions at the LHC at a center-of-mass energy of 13 TeV. The data sample used corresponds to an integrated luminosity of 12.9 fb$^{-1}$ collected in 2016. The measurement is performed in same-sign, three- and four-lepton final states where the jet and b-jet multiplicities are exploited to enhance the signal-to-background ratio. The $\mathrm{t\overline{t}W}$ and $\mathrm{t\overline{t}Z}$ production cross sections are measured to be $\sigma(\mathrm{t\overline{t}Z})= $ 0.70 $^{+0.16}_{-0.15}$ (stat) $^{+0.14}_{-0.12}$ (syst) pb and $\sigma(\mathrm{t\overline{t}W})=$ 0.98 $^{+0.23}_{-0.22}$ (stat) $^{+0.22}_{-0.18}$ (syst) pb with an expected (observed) significance of 2.6 (3.9) and 5.8 (4.6) standard deviations from the background-only hypothesis respectively. The measured cross sections are in agreement with the standard model prediction. | ||
| Links: CDS record (PDF) ; inSPIRE record ; CADI line (restricted) ; | ||
| Figures & Tables | Summary | Additional Figures & Tables | References | CMS Publications |
|---|
| Figures | |
png |
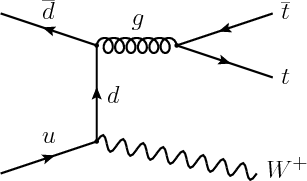
Figure 1-a:
The leading order Feynman diagram for $ { {\mathrm {t}\overline {\mathrm {t}}} {\mathrm {Z}}} $, $ { {\mathrm {t}\overline {\mathrm {t}}} {\mathrm {W}}} $ production at the LHC. The charge conjugate of the diagrams shown is implied. |
png |
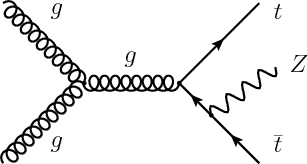
Figure 1-b:
The leading order Feynman diagram for $ { {\mathrm {t}\overline {\mathrm {t}}} {\mathrm {Z}}} $, $ { {\mathrm {t}\overline {\mathrm {t}}} {\mathrm {W}}} $ production at the LHC. The charge conjugate of the diagrams shown is implied. |

png pdf |
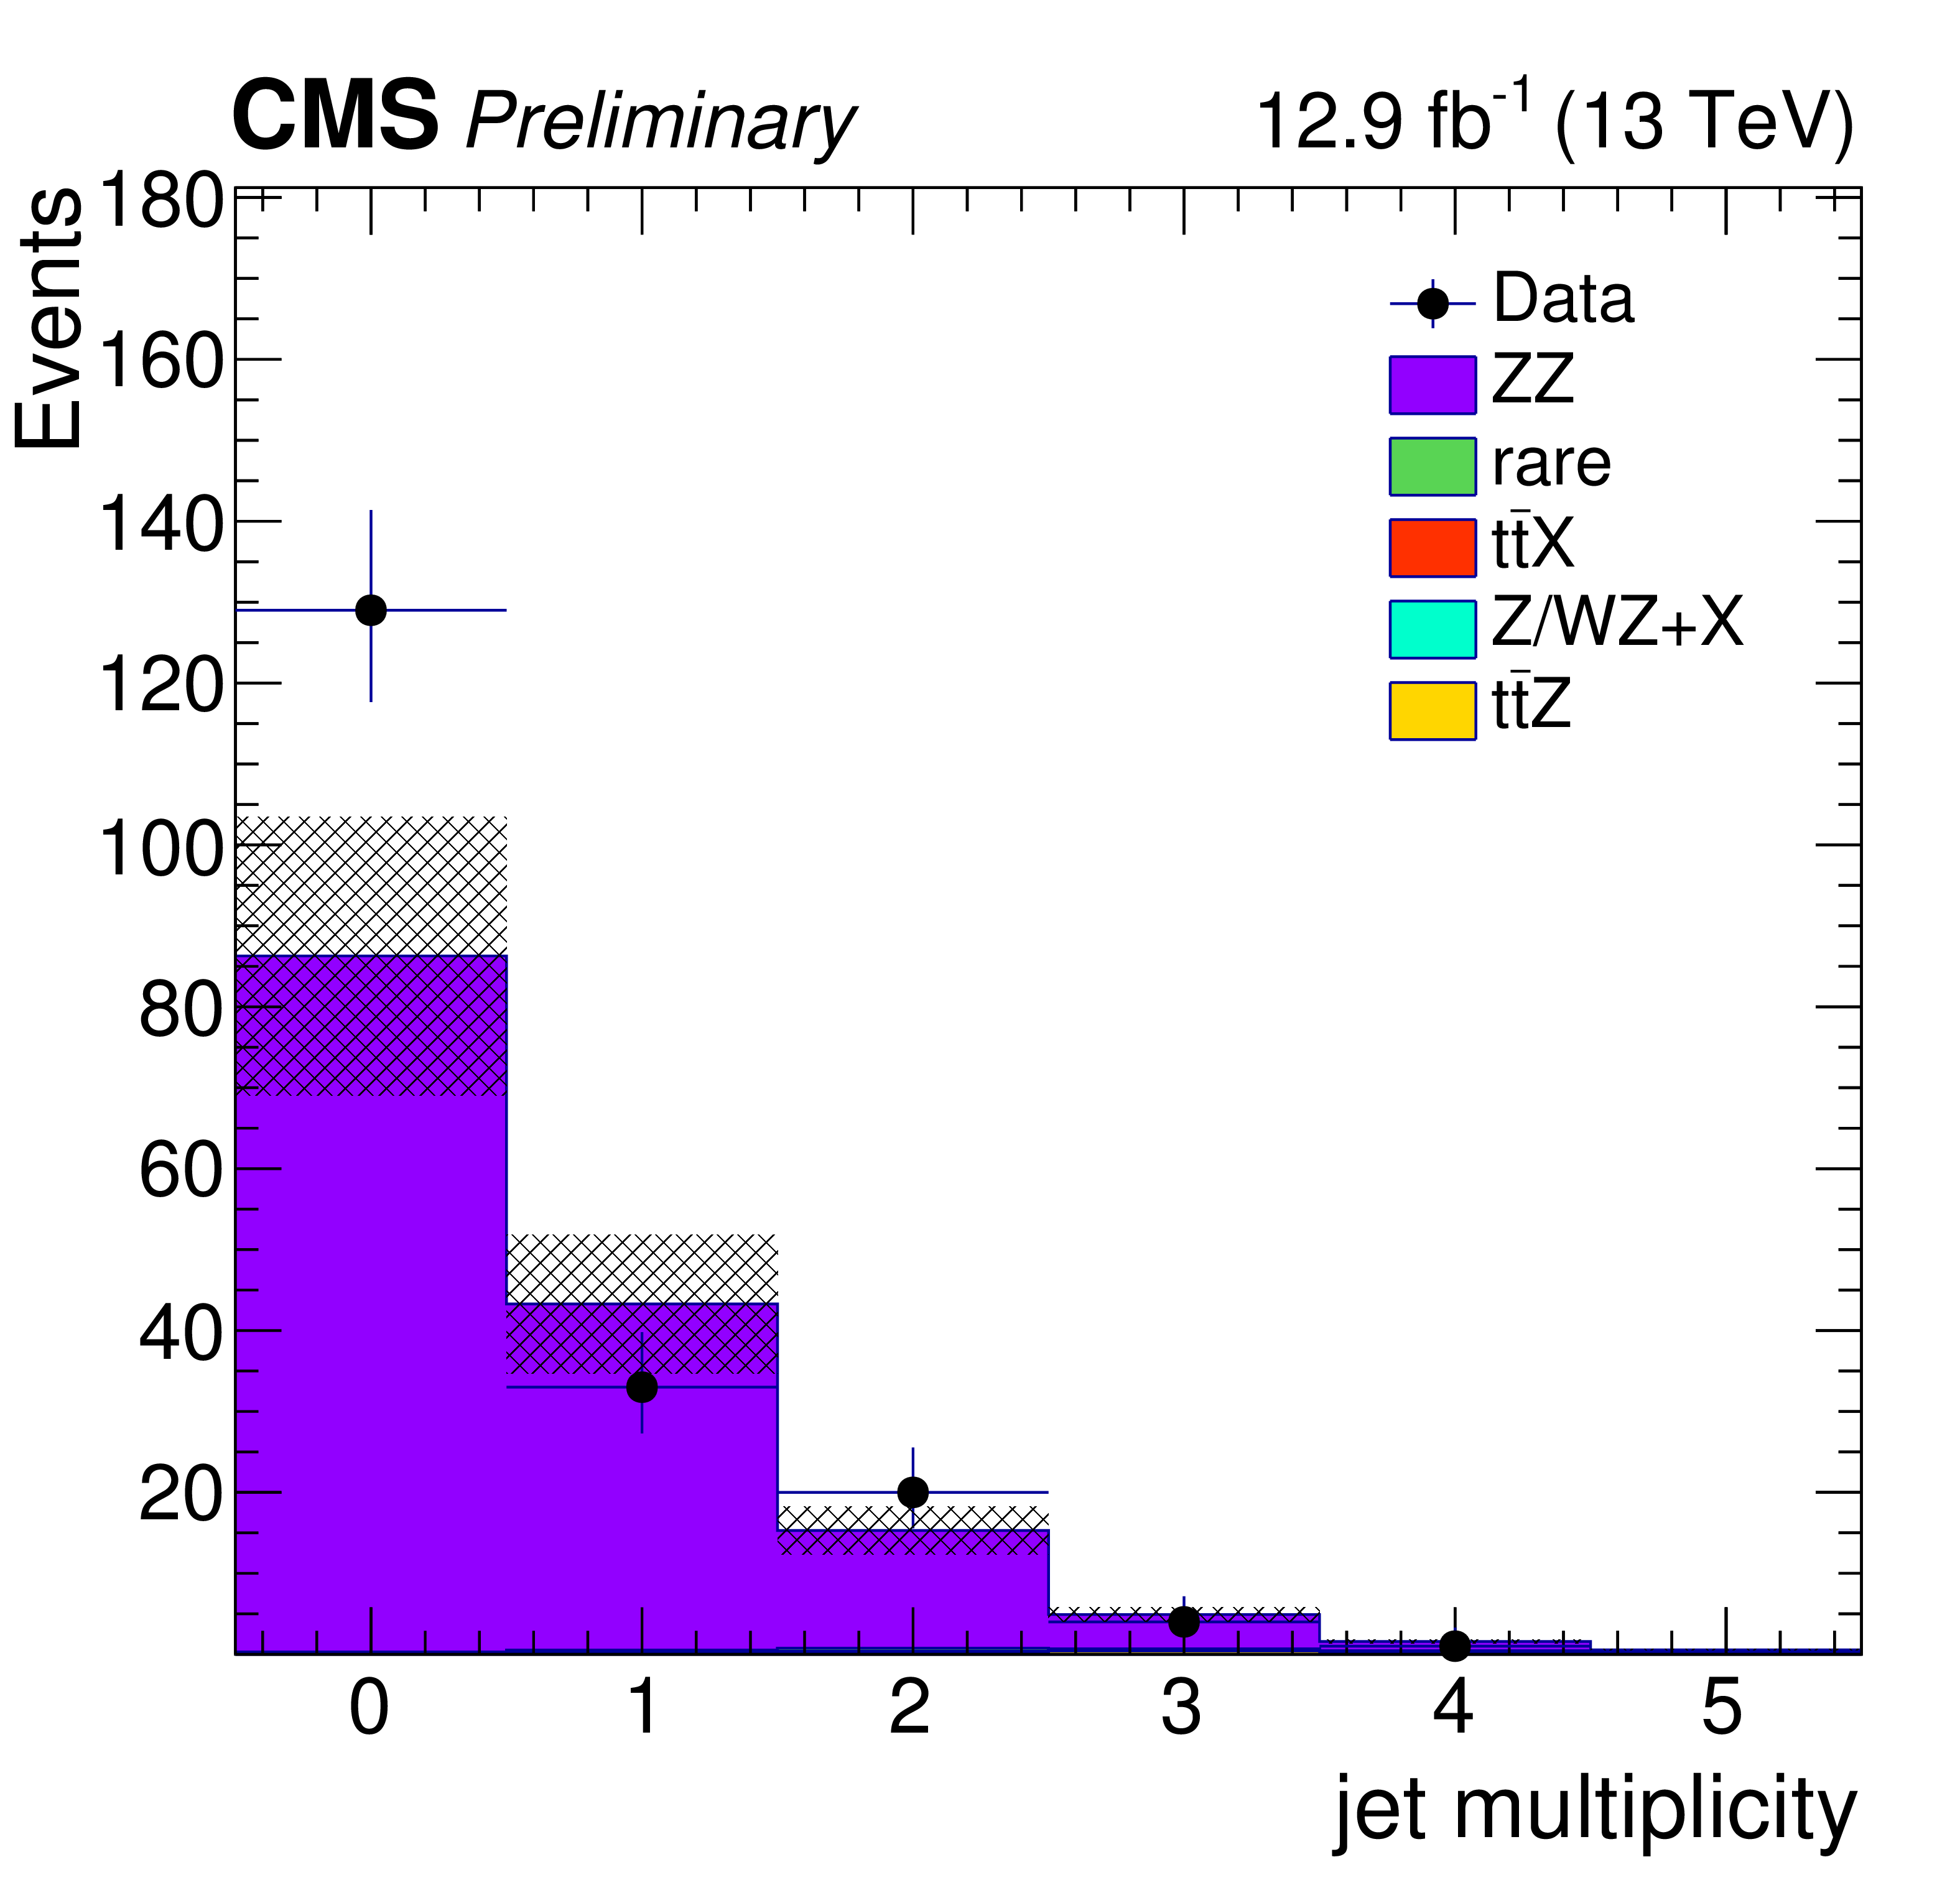
Figure 2-a:
Distribution of different kinematic variables in data compared to the simulated expectations. From (a) to (f): jet multplicity and b-jet multiplicity (a,b), ${H_{\mathrm {T}}}$ and Missing transverse momentum(c,d), trailing lepton ${p_{\mathrm {T}}}$ and event counts (e,f). |
png pdf |
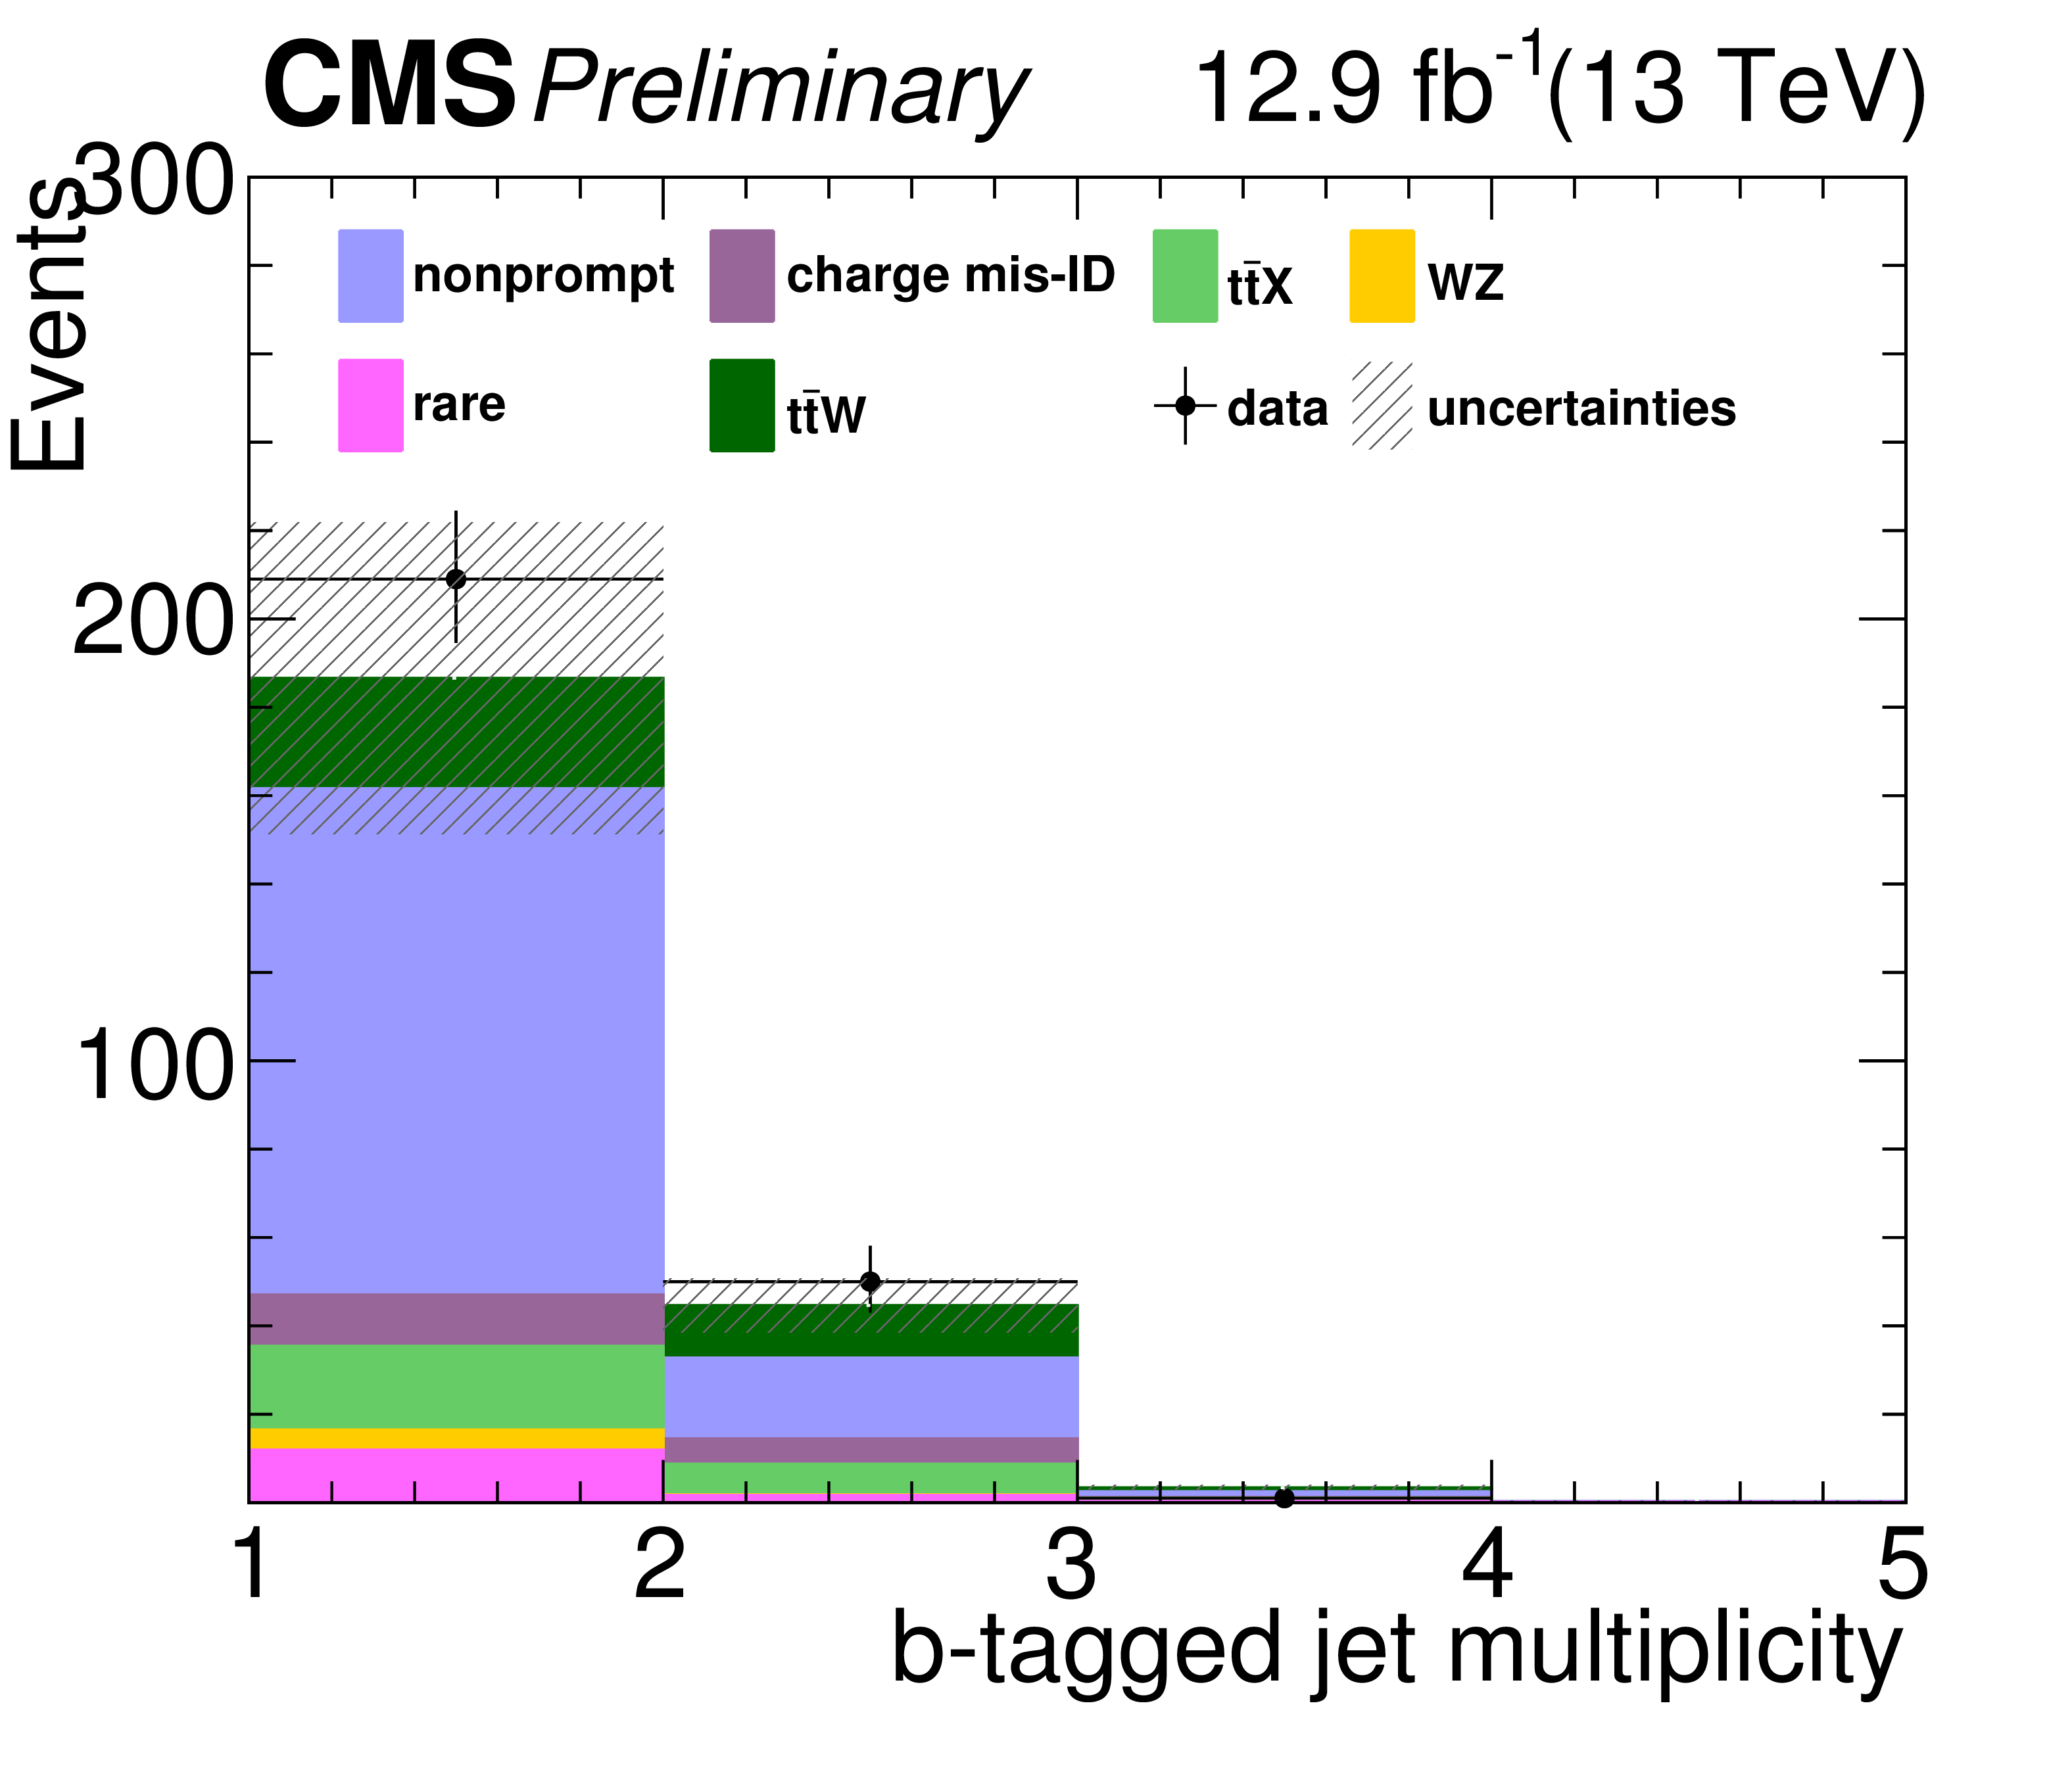
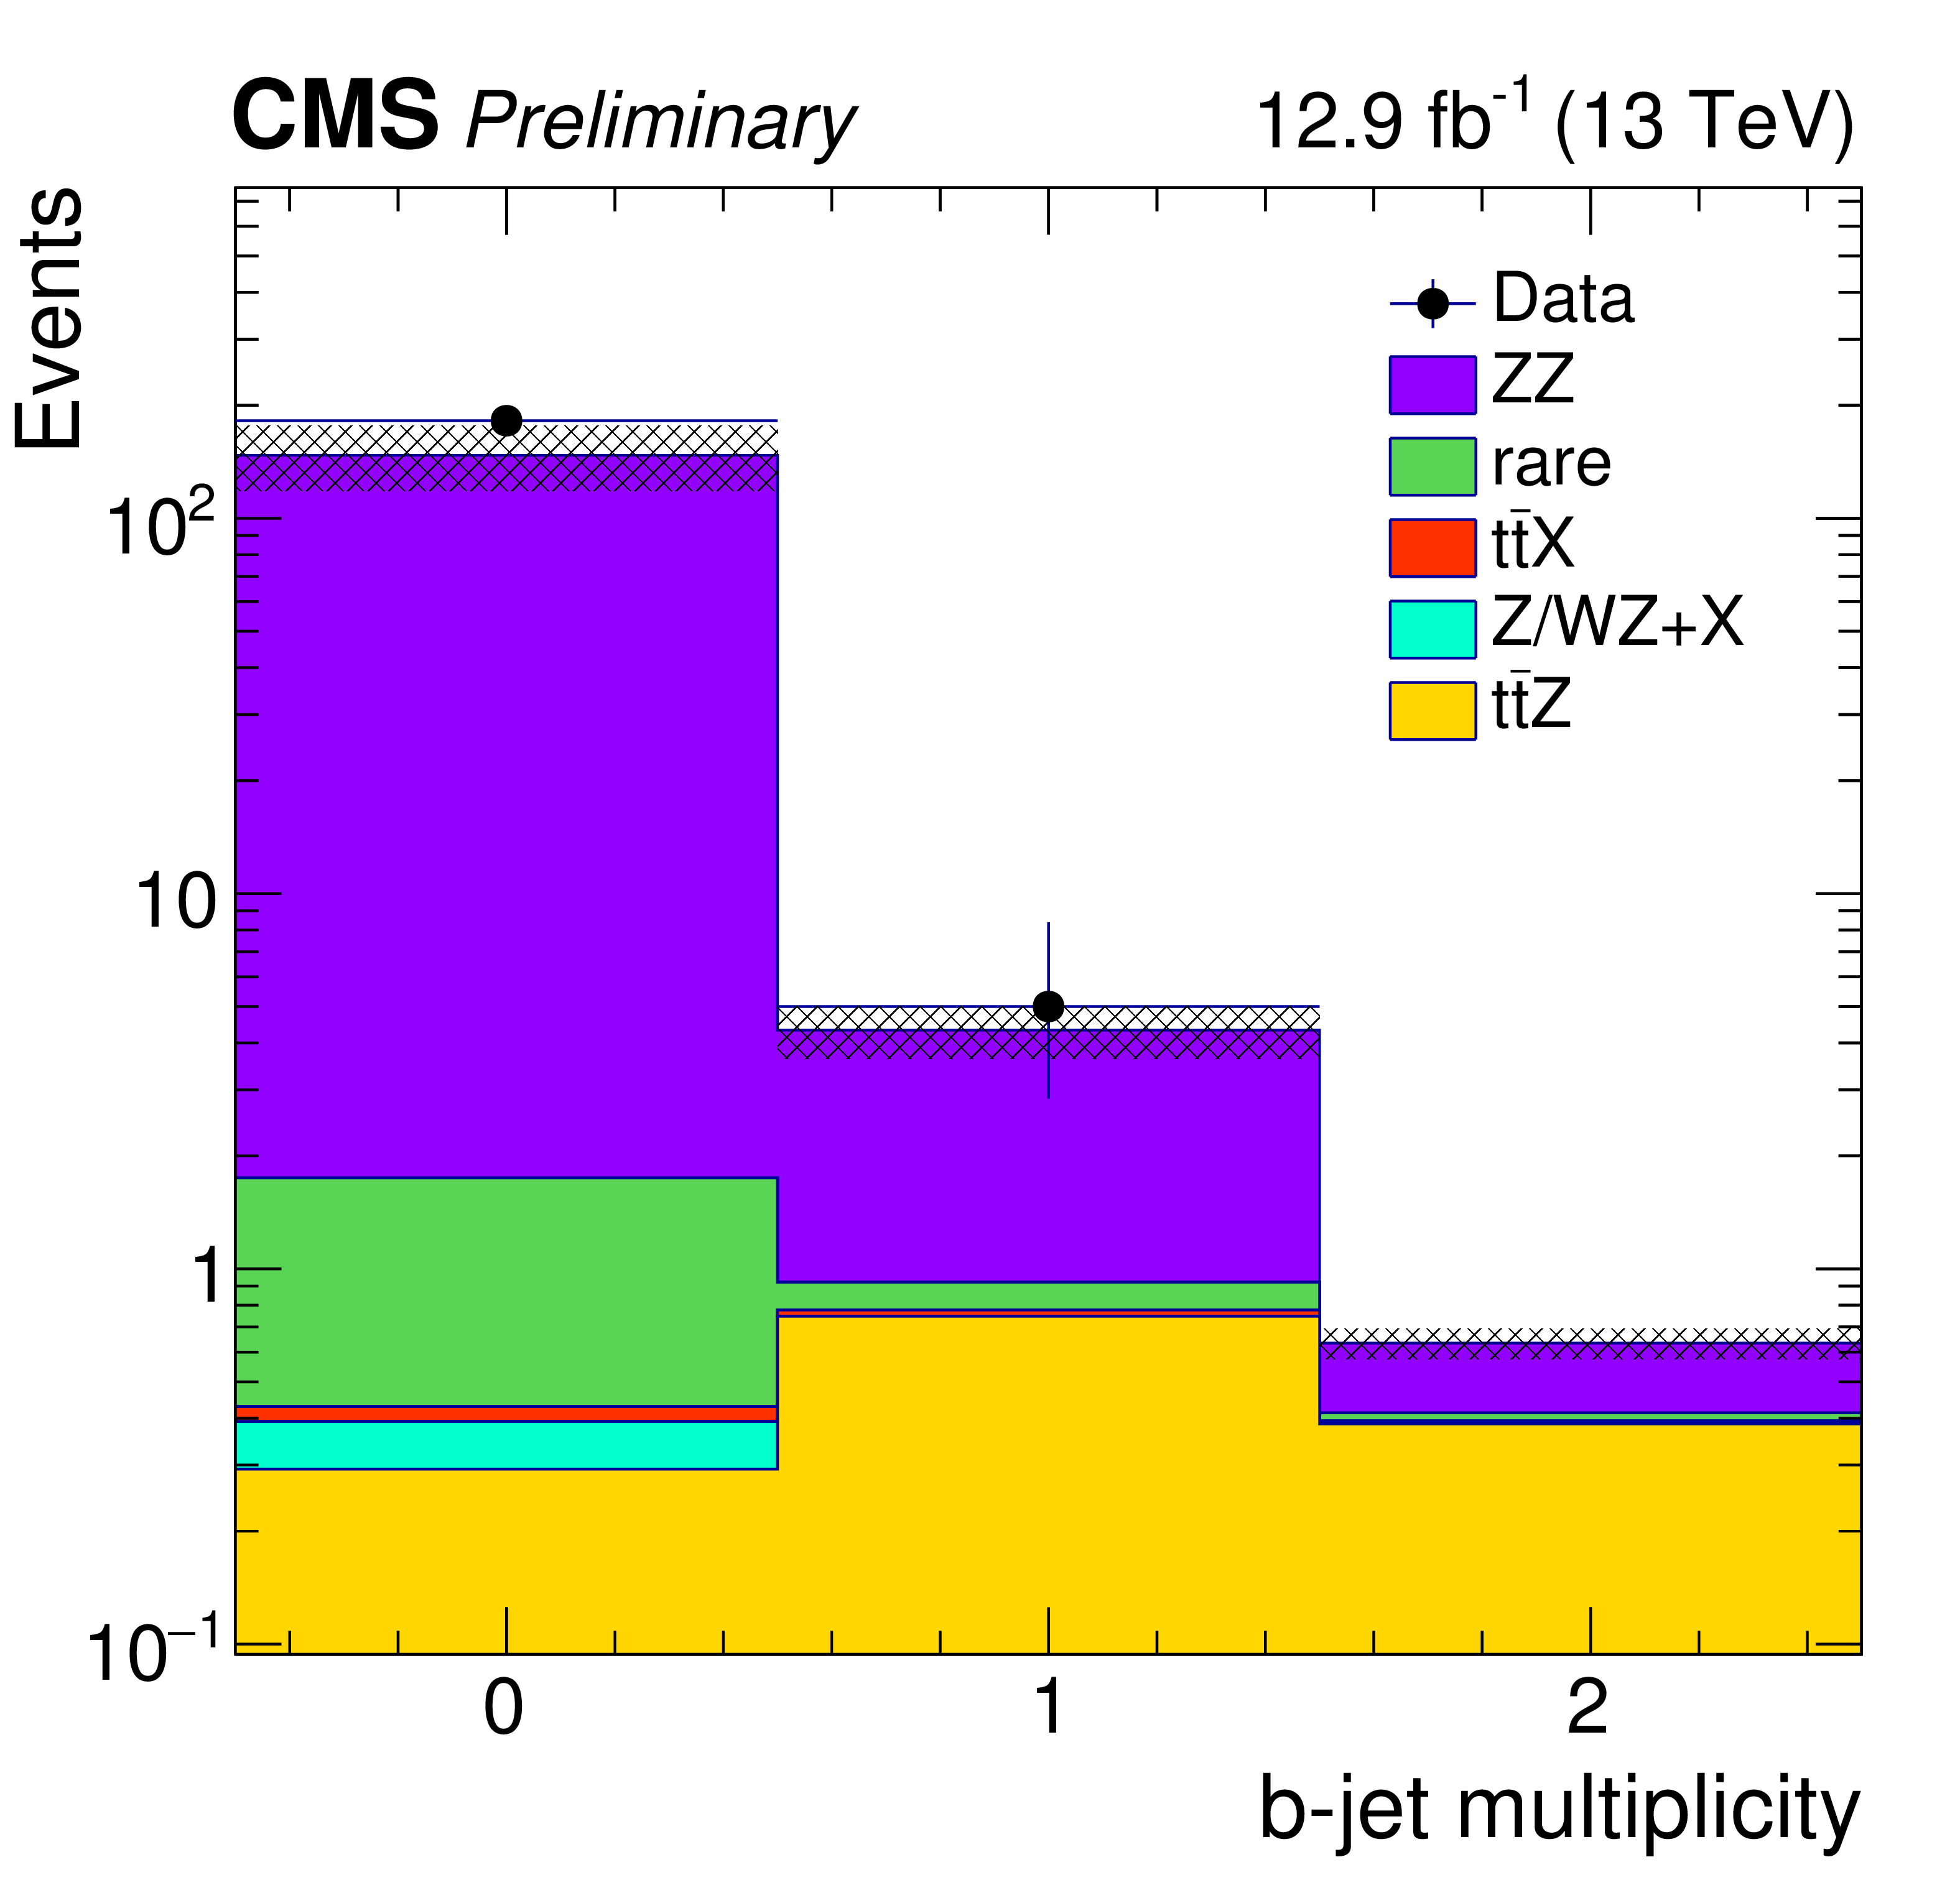
Figure 2-b:
Distribution of different kinematic variables in data compared to the simulated expectations. From (a) to (f): jet multplicity and b-jet multiplicity (a,b), ${H_{\mathrm {T}}}$ and Missing transverse momentum(c,d), trailing lepton ${p_{\mathrm {T}}}$ and event counts (e,f). |
png pdf |
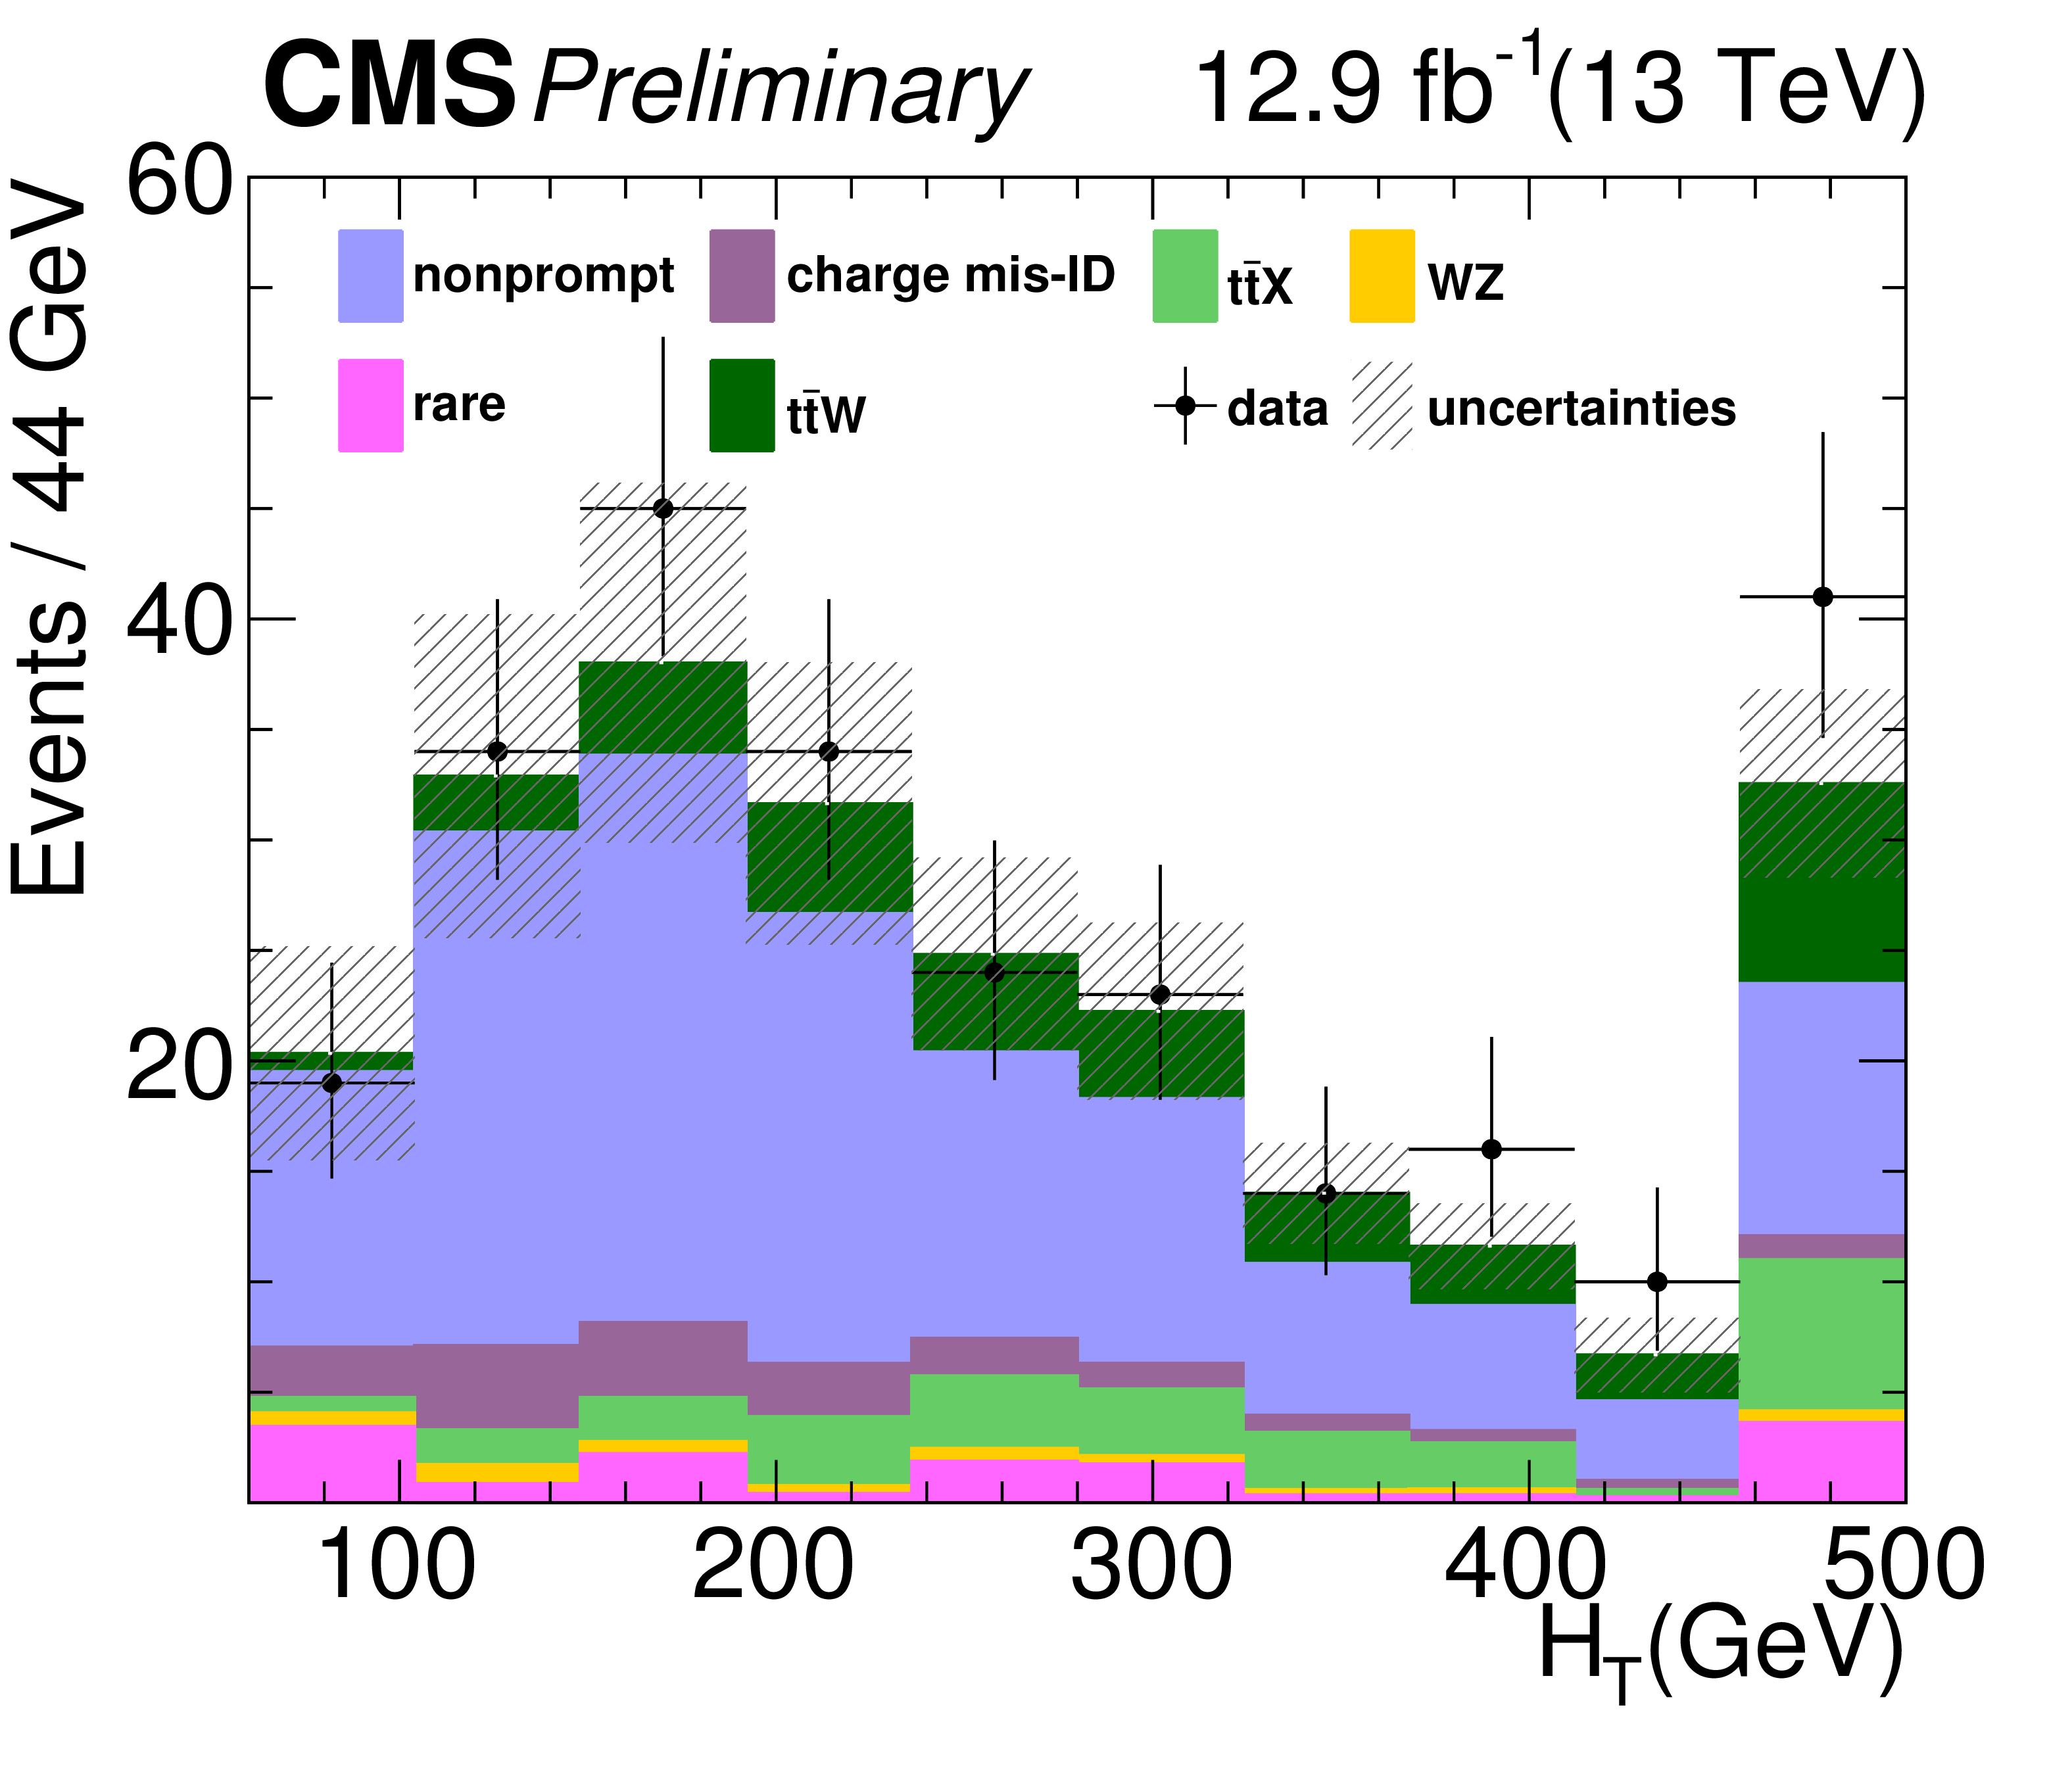
Figure 2-c:
Distribution of different kinematic variables in data compared to the simulated expectations. From (a) to (f): jet multplicity and b-jet multiplicity (a,b), ${H_{\mathrm {T}}}$ and Missing transverse momentum(c,d), trailing lepton ${p_{\mathrm {T}}}$ and event counts (e,f). |
png pdf |
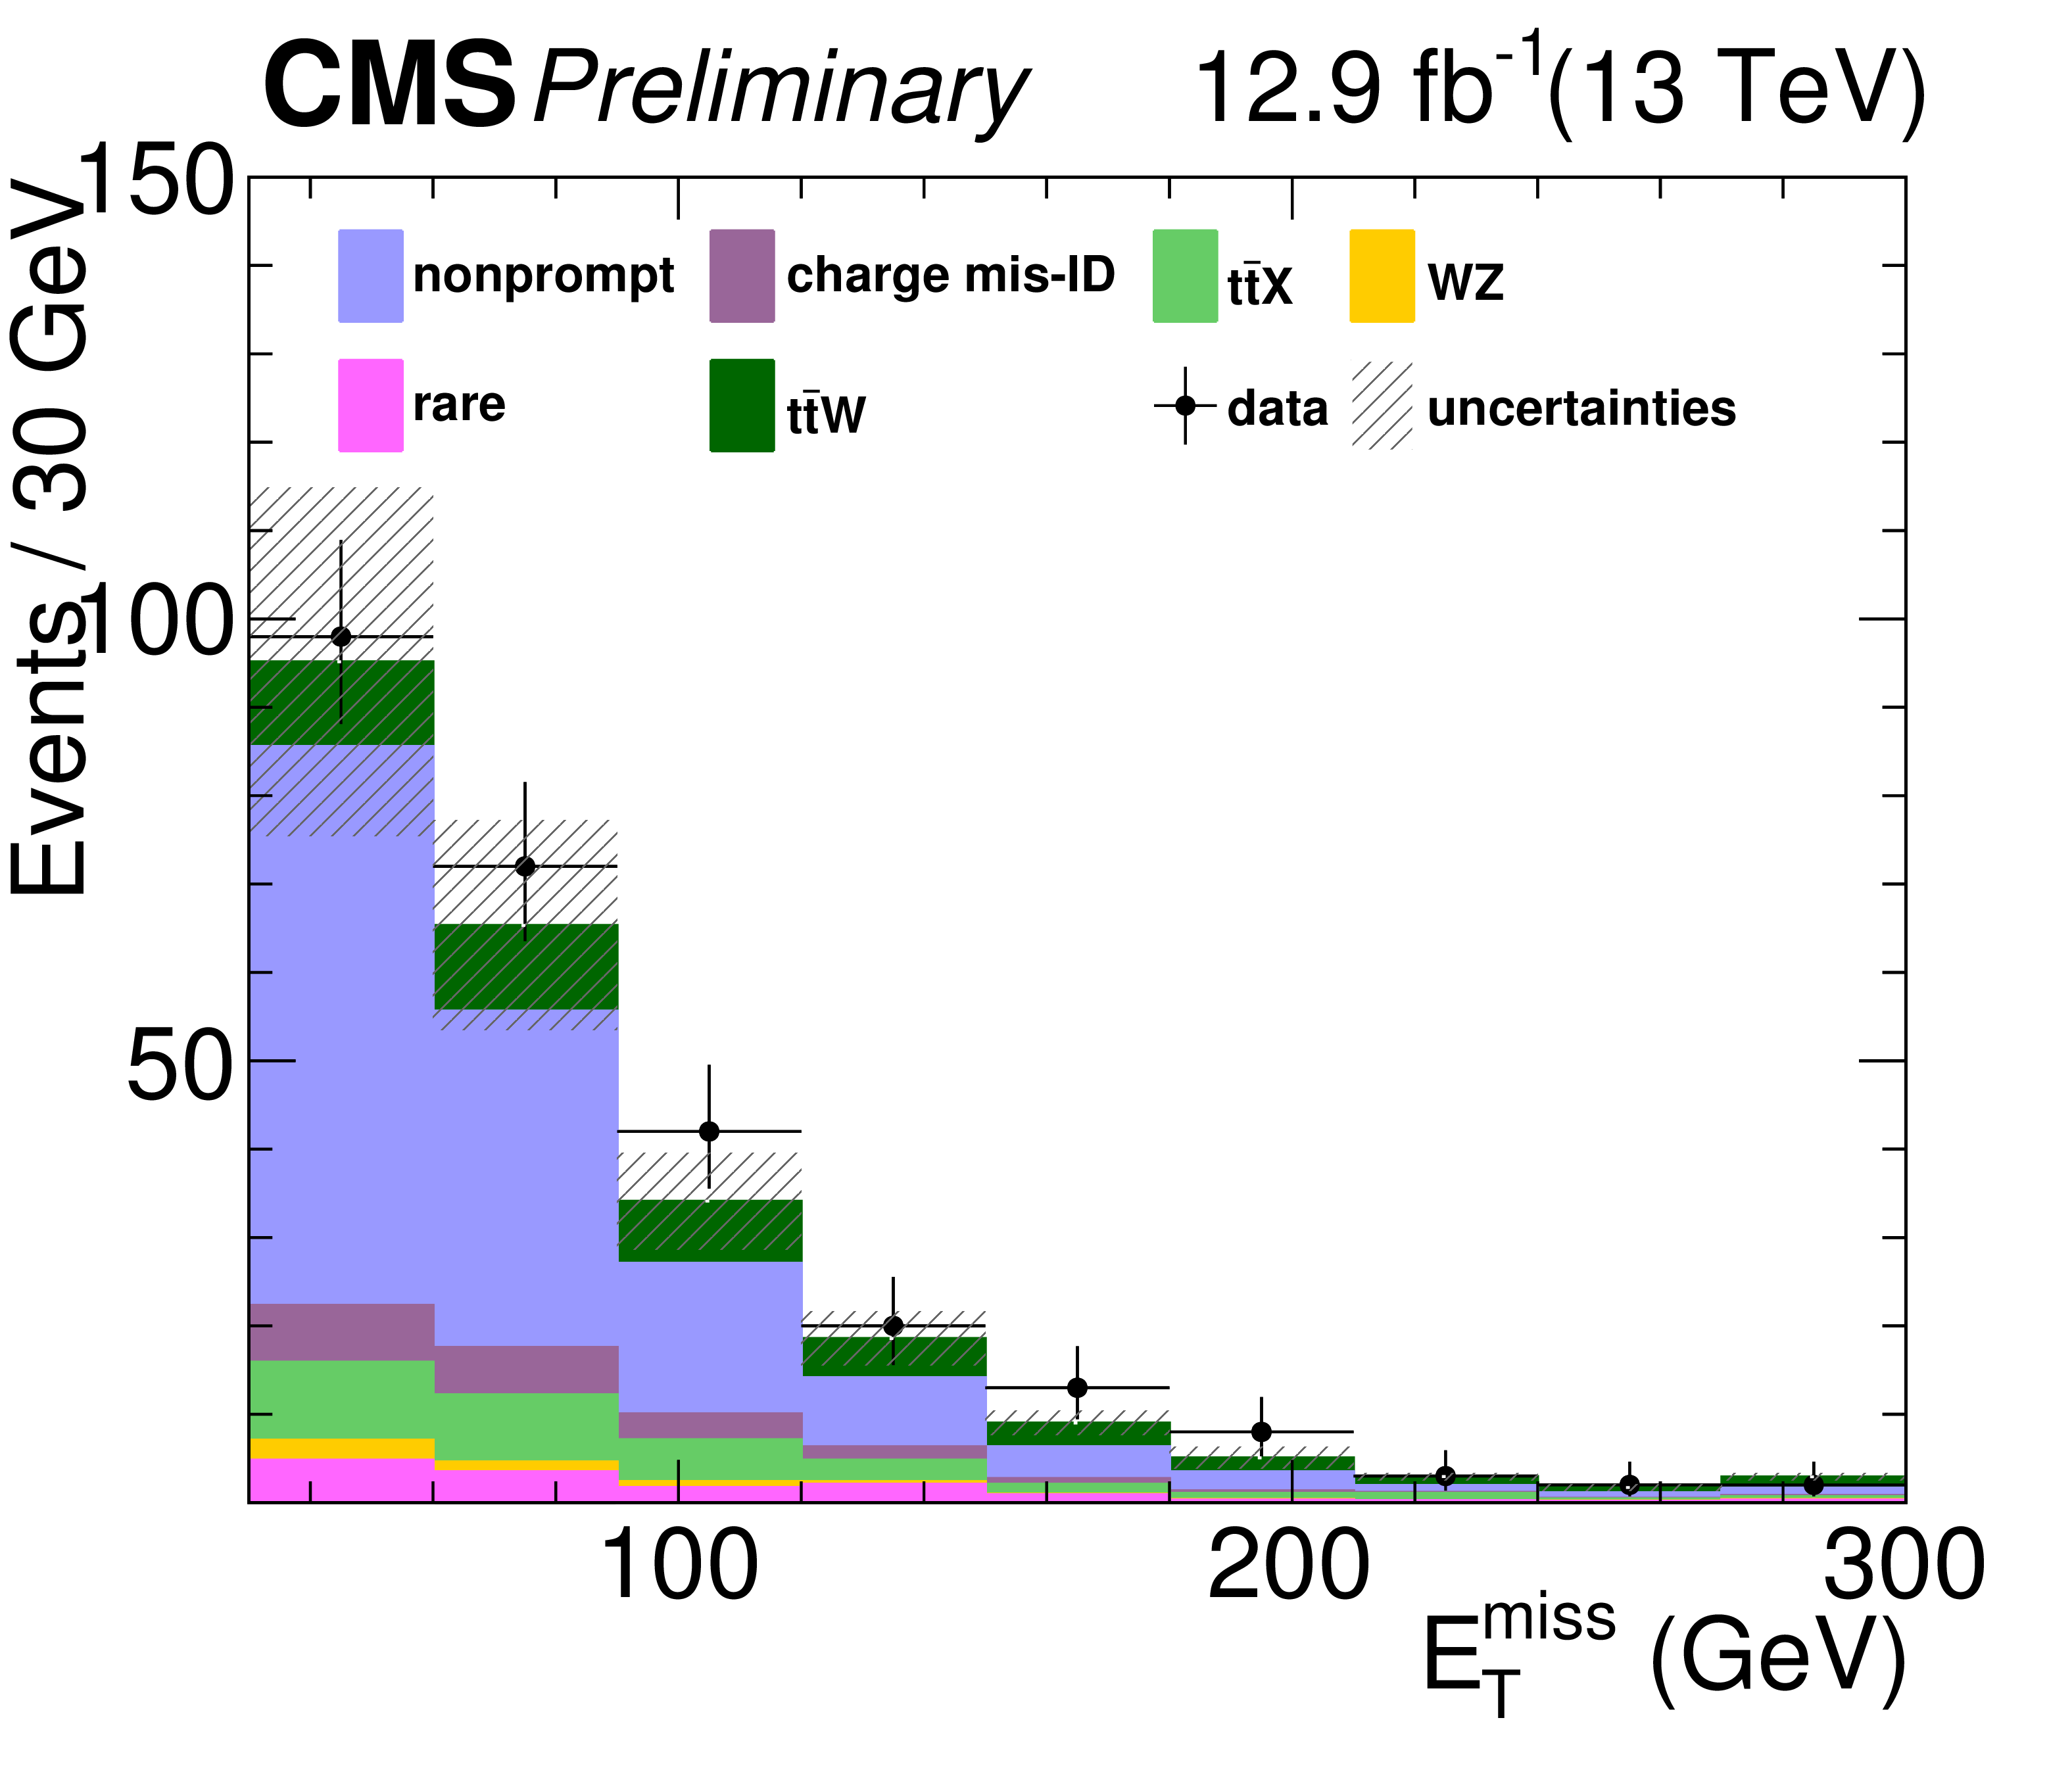
Figure 2-d:
Distribution of different kinematic variables in data compared to the simulated expectations. From (a) to (f): jet multplicity and b-jet multiplicity (a,b), ${H_{\mathrm {T}}}$ and Missing transverse momentum(c,d), trailing lepton ${p_{\mathrm {T}}}$ and event counts (e,f). |
png pdf |
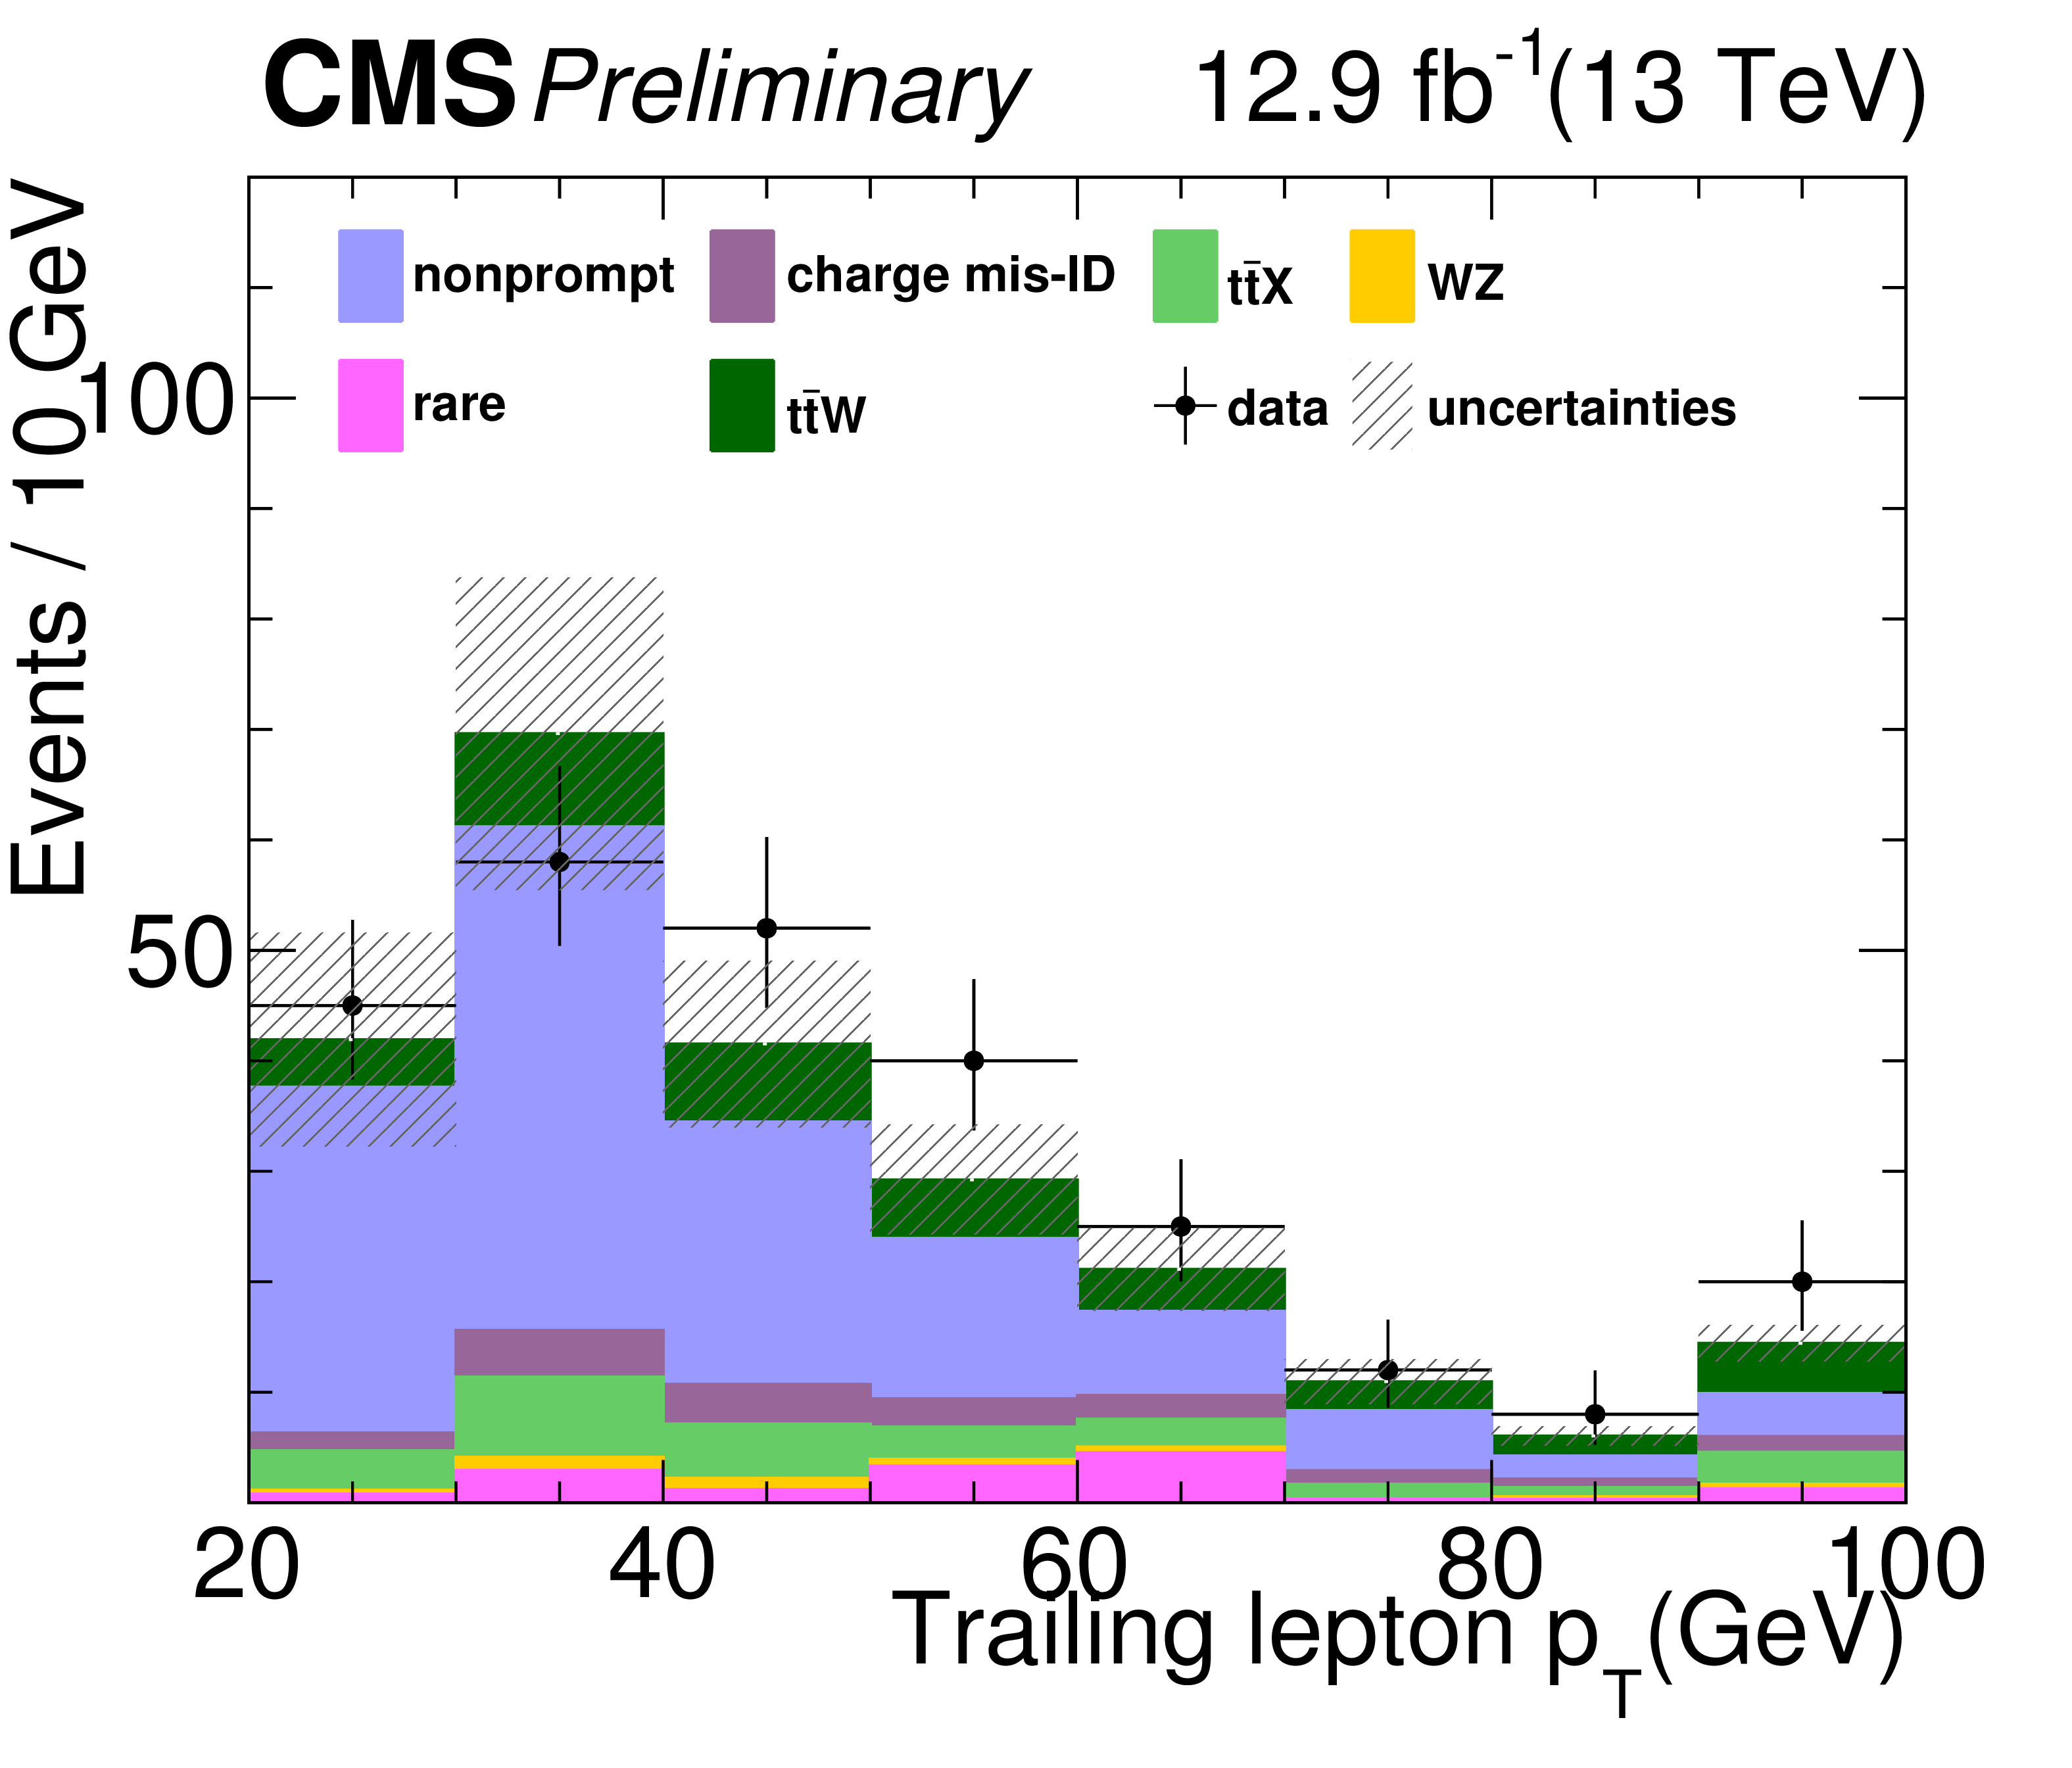
Figure 2-e:
Distribution of different kinematic variables in data compared to the simulated expectations. From (a) to (f): jet multplicity and b-jet multiplicity (a,b), ${H_{\mathrm {T}}}$ and Missing transverse momentum(c,d), trailing lepton ${p_{\mathrm {T}}}$ and event counts (e,f). |
png pdf |
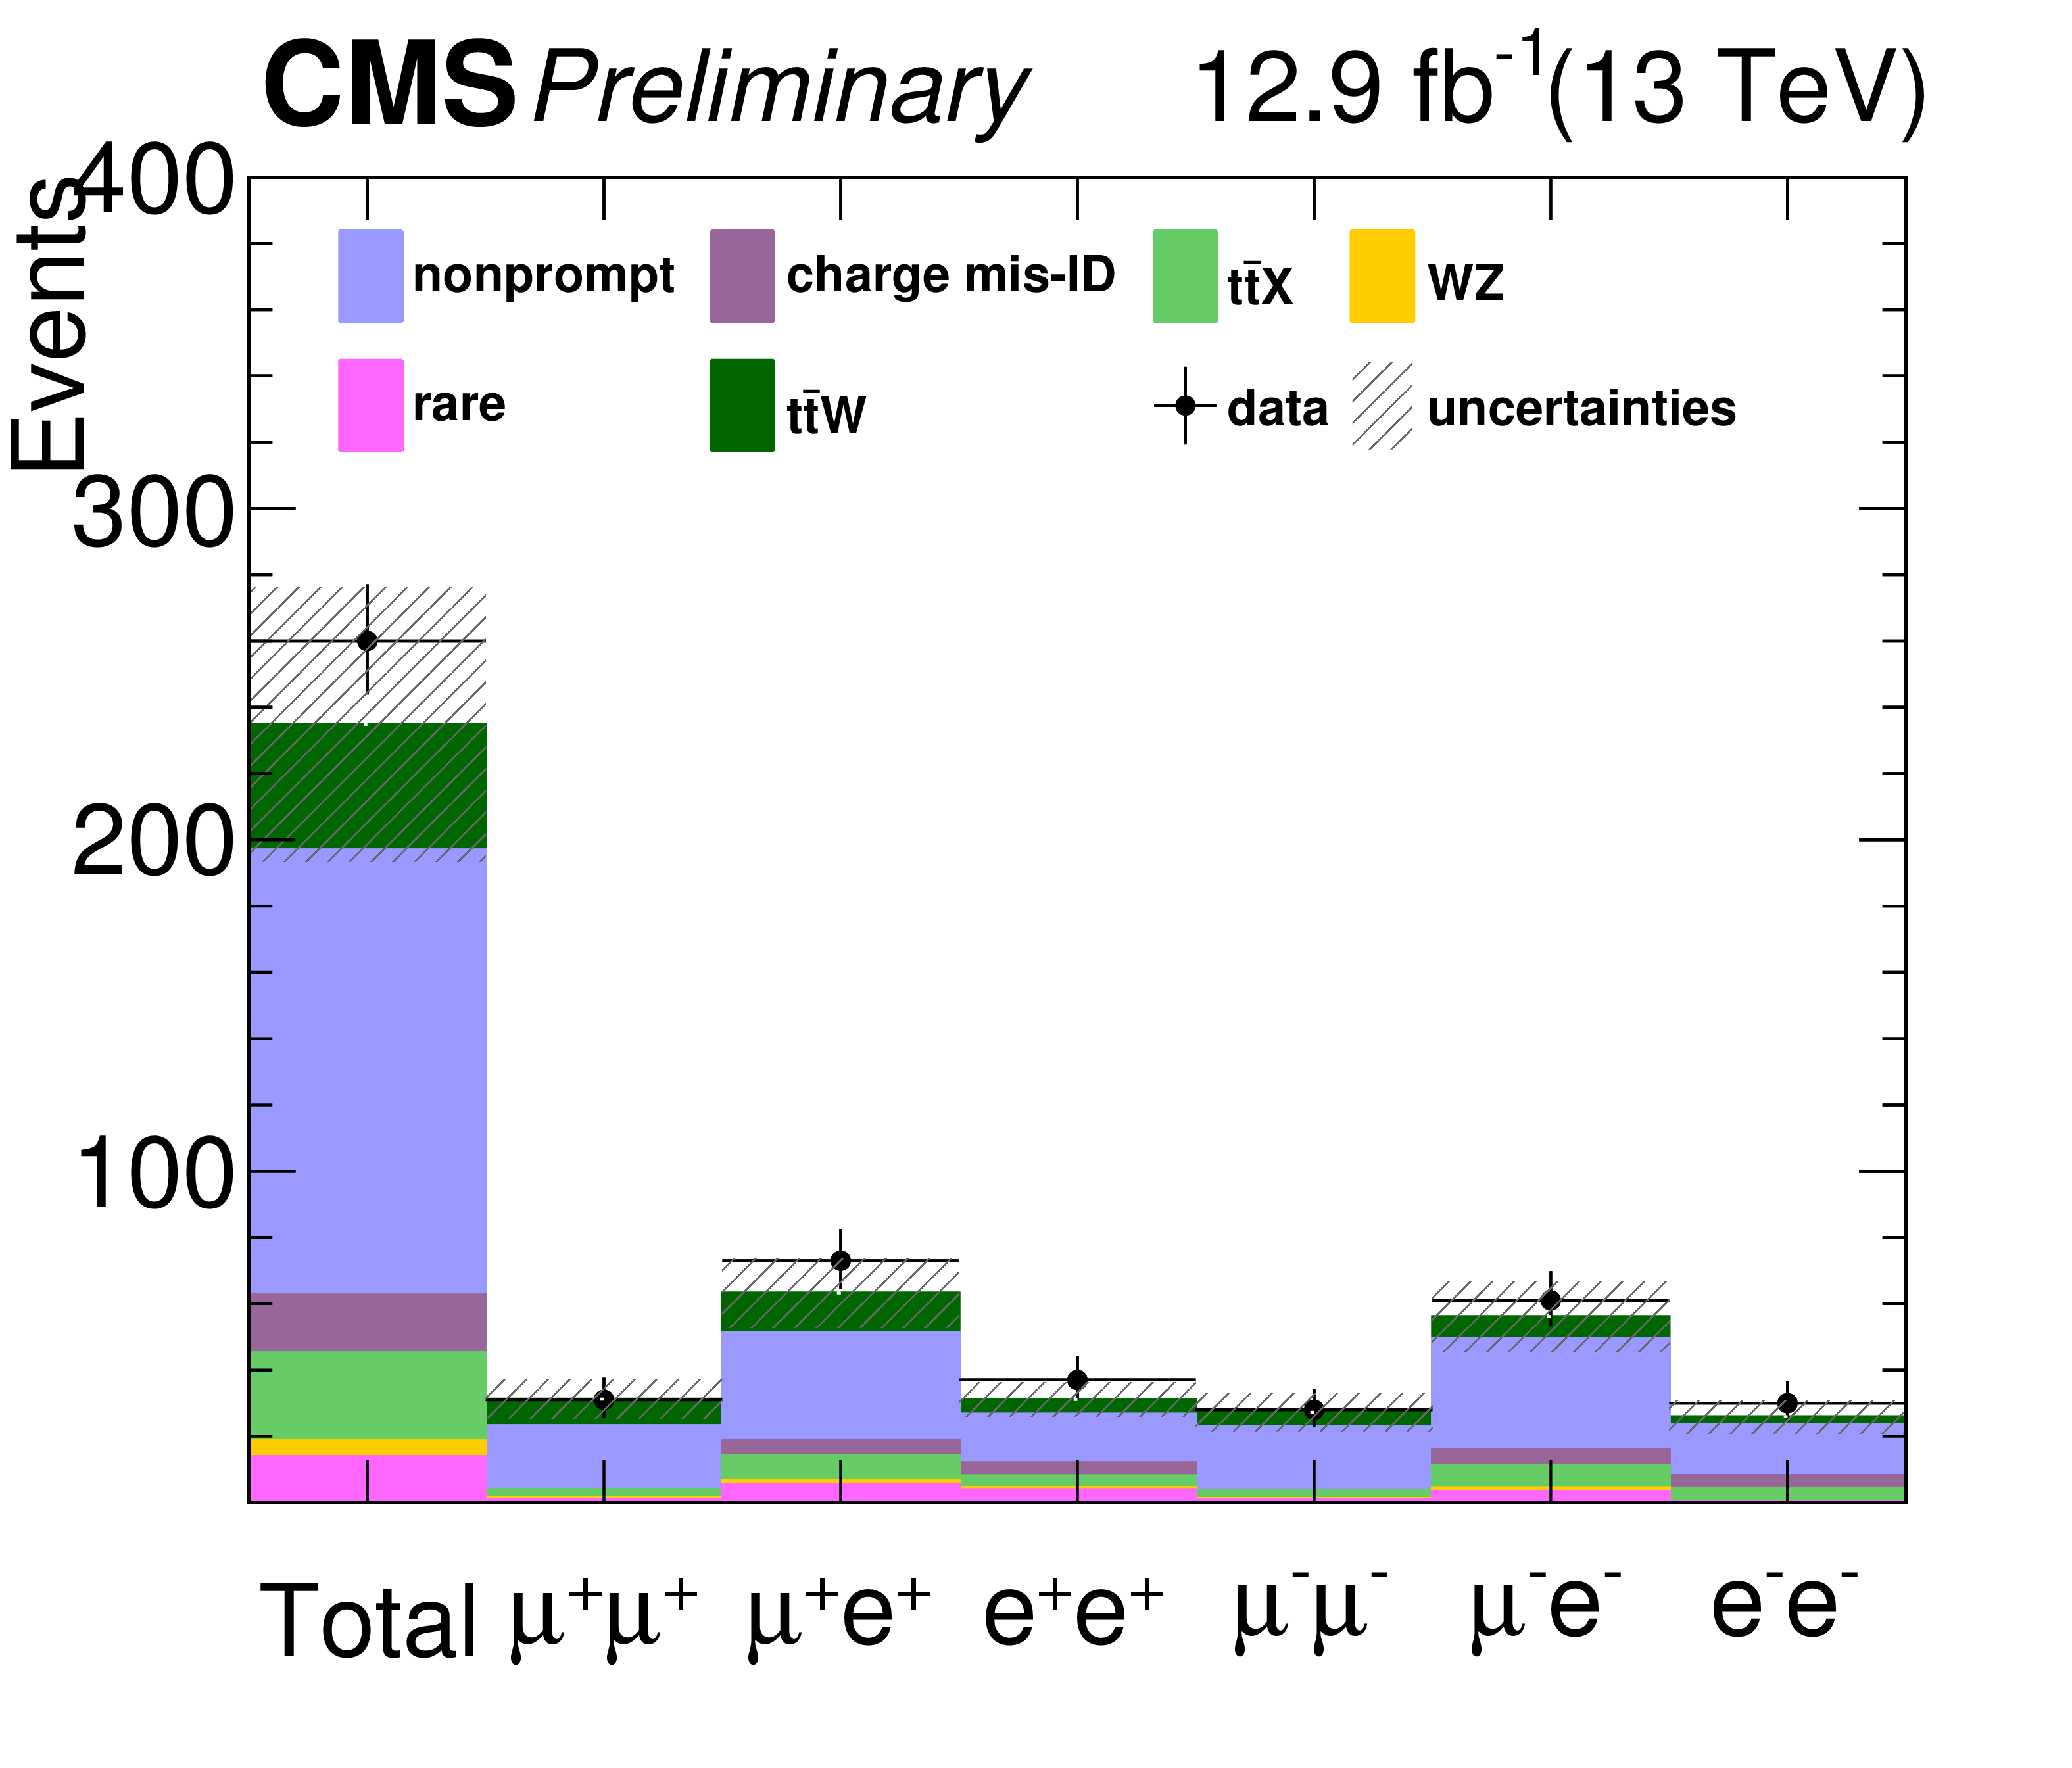
Figure 2-f:
Distribution of different kinematic variables in data compared to the simulated expectations. From (a) to (f): jet multplicity and b-jet multiplicity (a,b), ${H_{\mathrm {T}}}$ and Missing transverse momentum(c,d), trailing lepton ${p_{\mathrm {T}}}$ and event counts (e,f). |
png pdf |
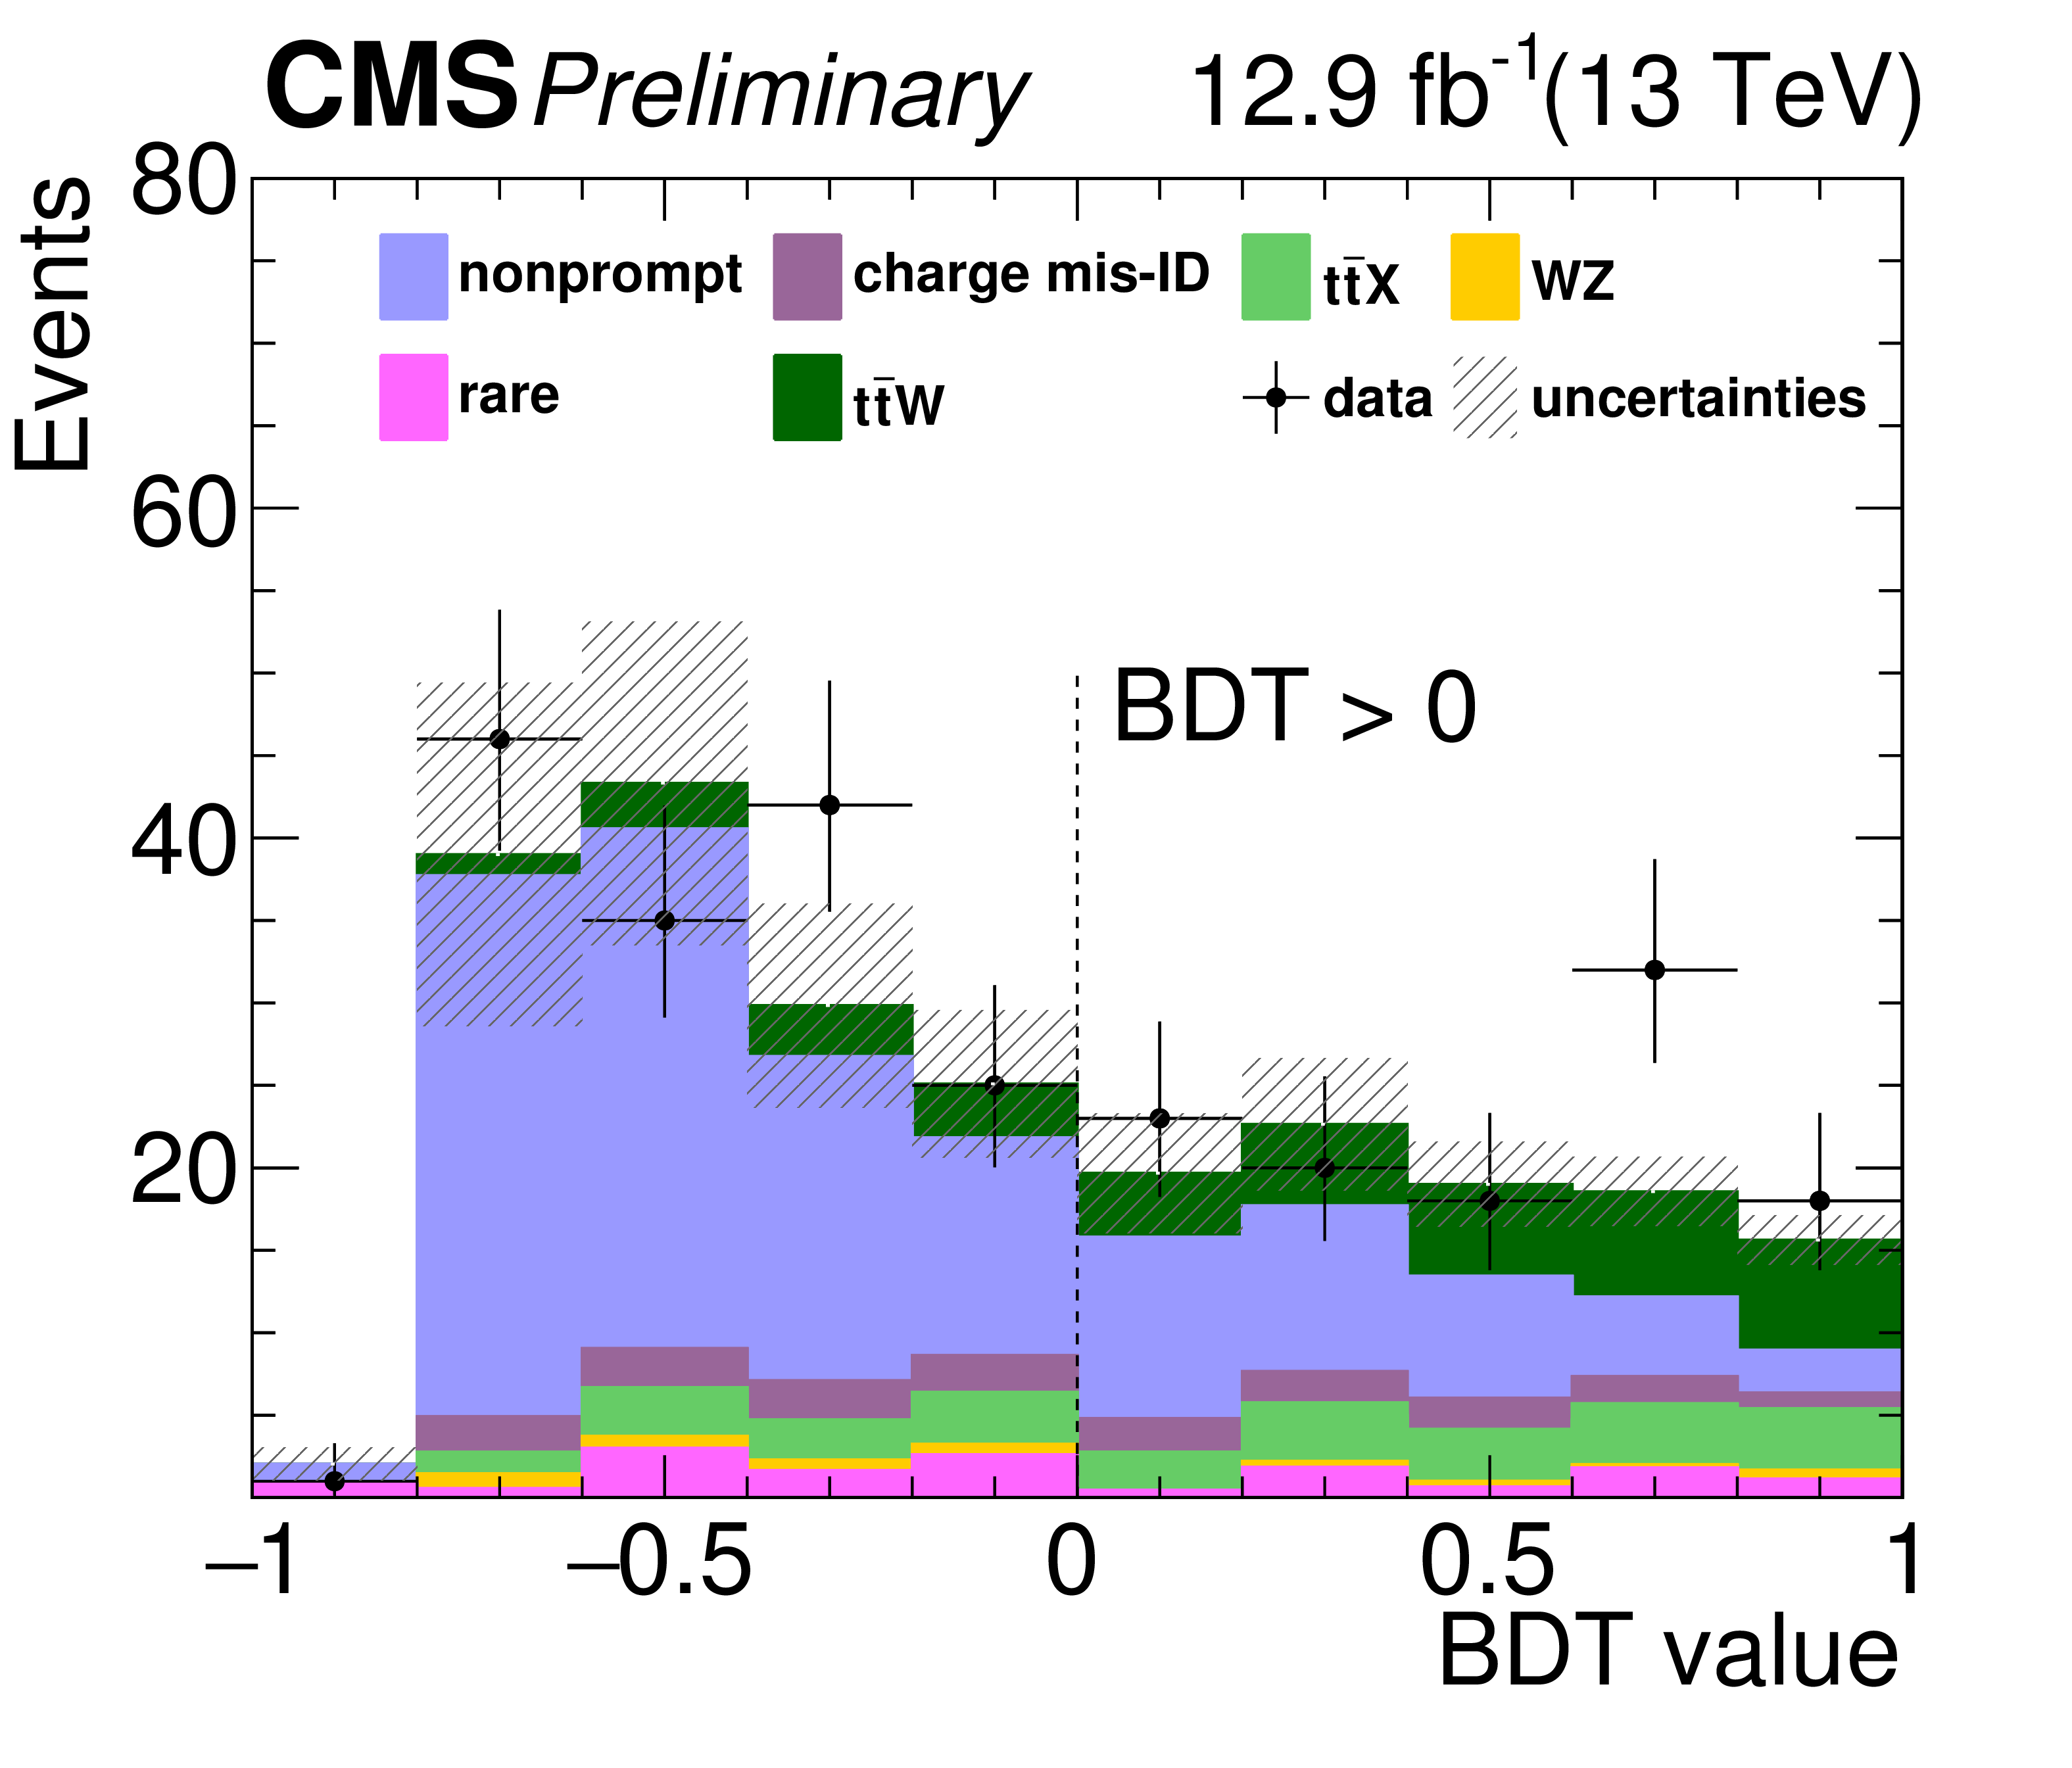
Figure 3:
BDT value distribution for background and signal processes. The expected contribution from the different background processes are stacked as well as the expected contribution from the signal. The shaded band represents the uncertainty in the prediction of the background and the signal processes. Events with BDT value higher than 0 are selected. |
png pdf |
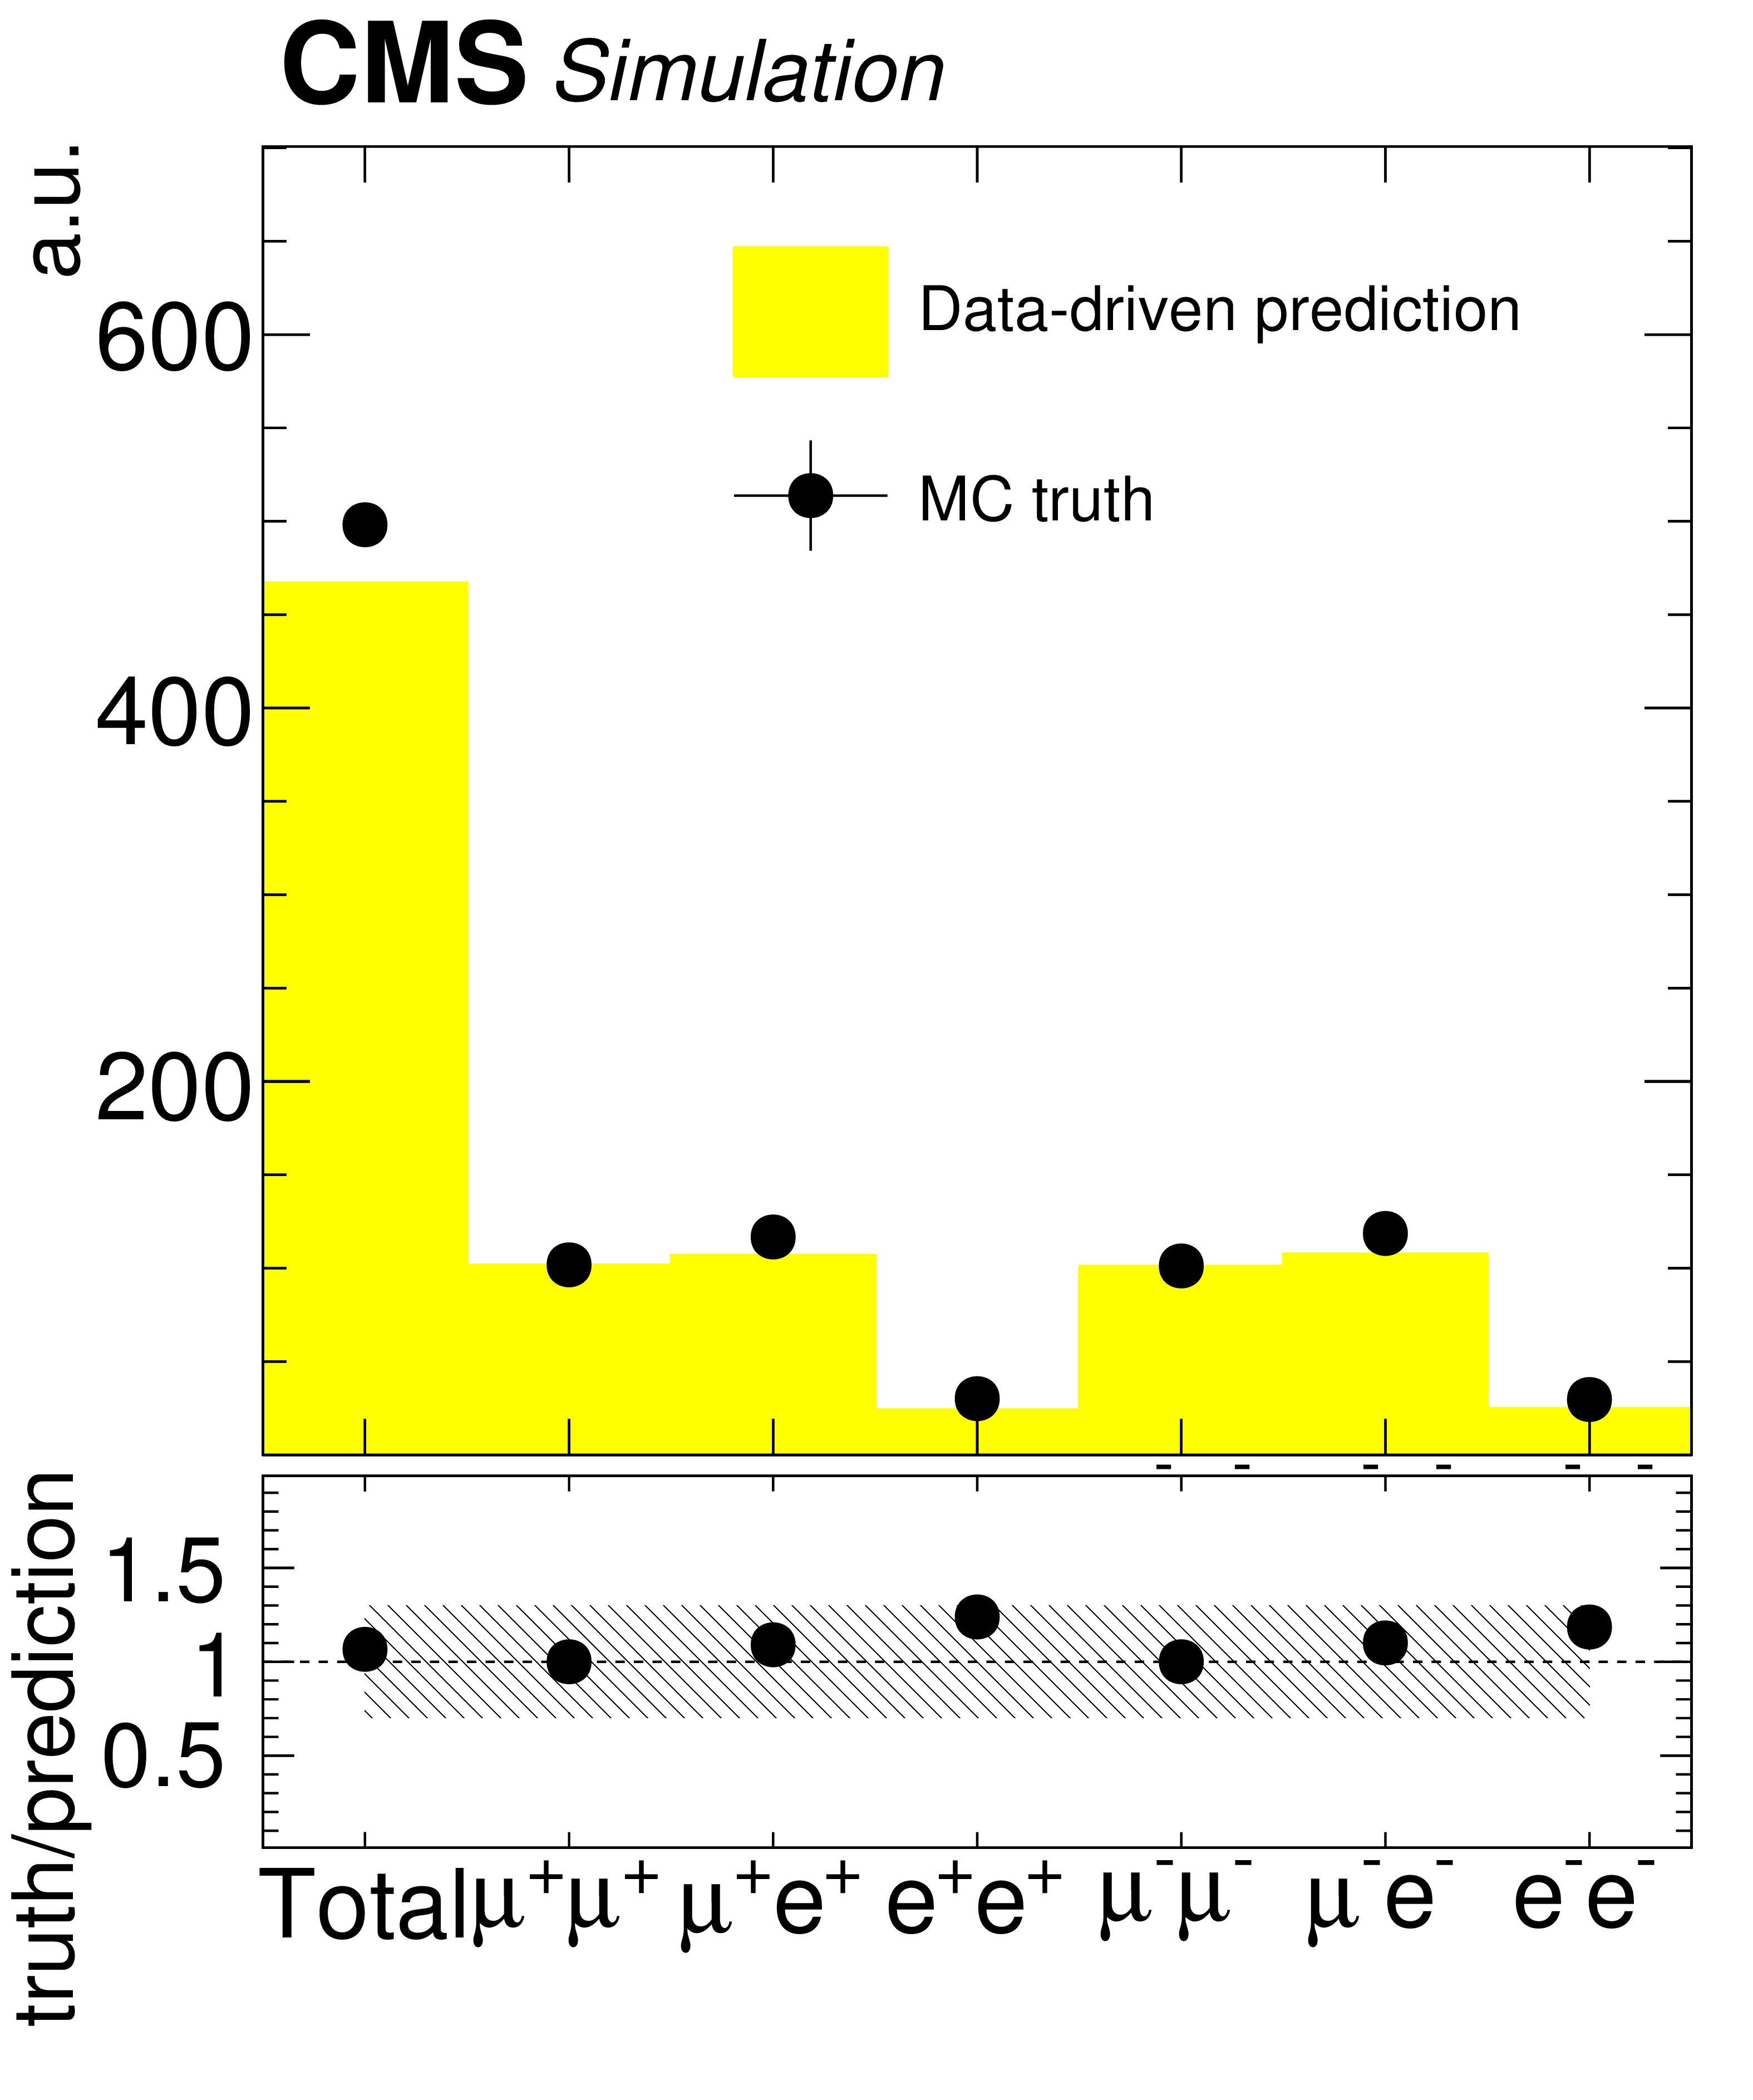
Figure 4-a:
Validation plots of the data-driven prediction method for the nonprompt lepton background in $ {\mathrm {t}\overline {\mathrm {t}}} $ in same-sign dilepton channel (a) and in Z+jets (b) and $ {\mathrm {t}\overline {\mathrm {t}}} $ (c) in three-lepton channel. The plots in the top panel show the number of total events by lepton channel and in the bottom panel the plots show the ratio of the predicted to observed yields. A hatched band is drawn to illustrate the coverage of the 30% relative systematic uncertainty |
png pdf |
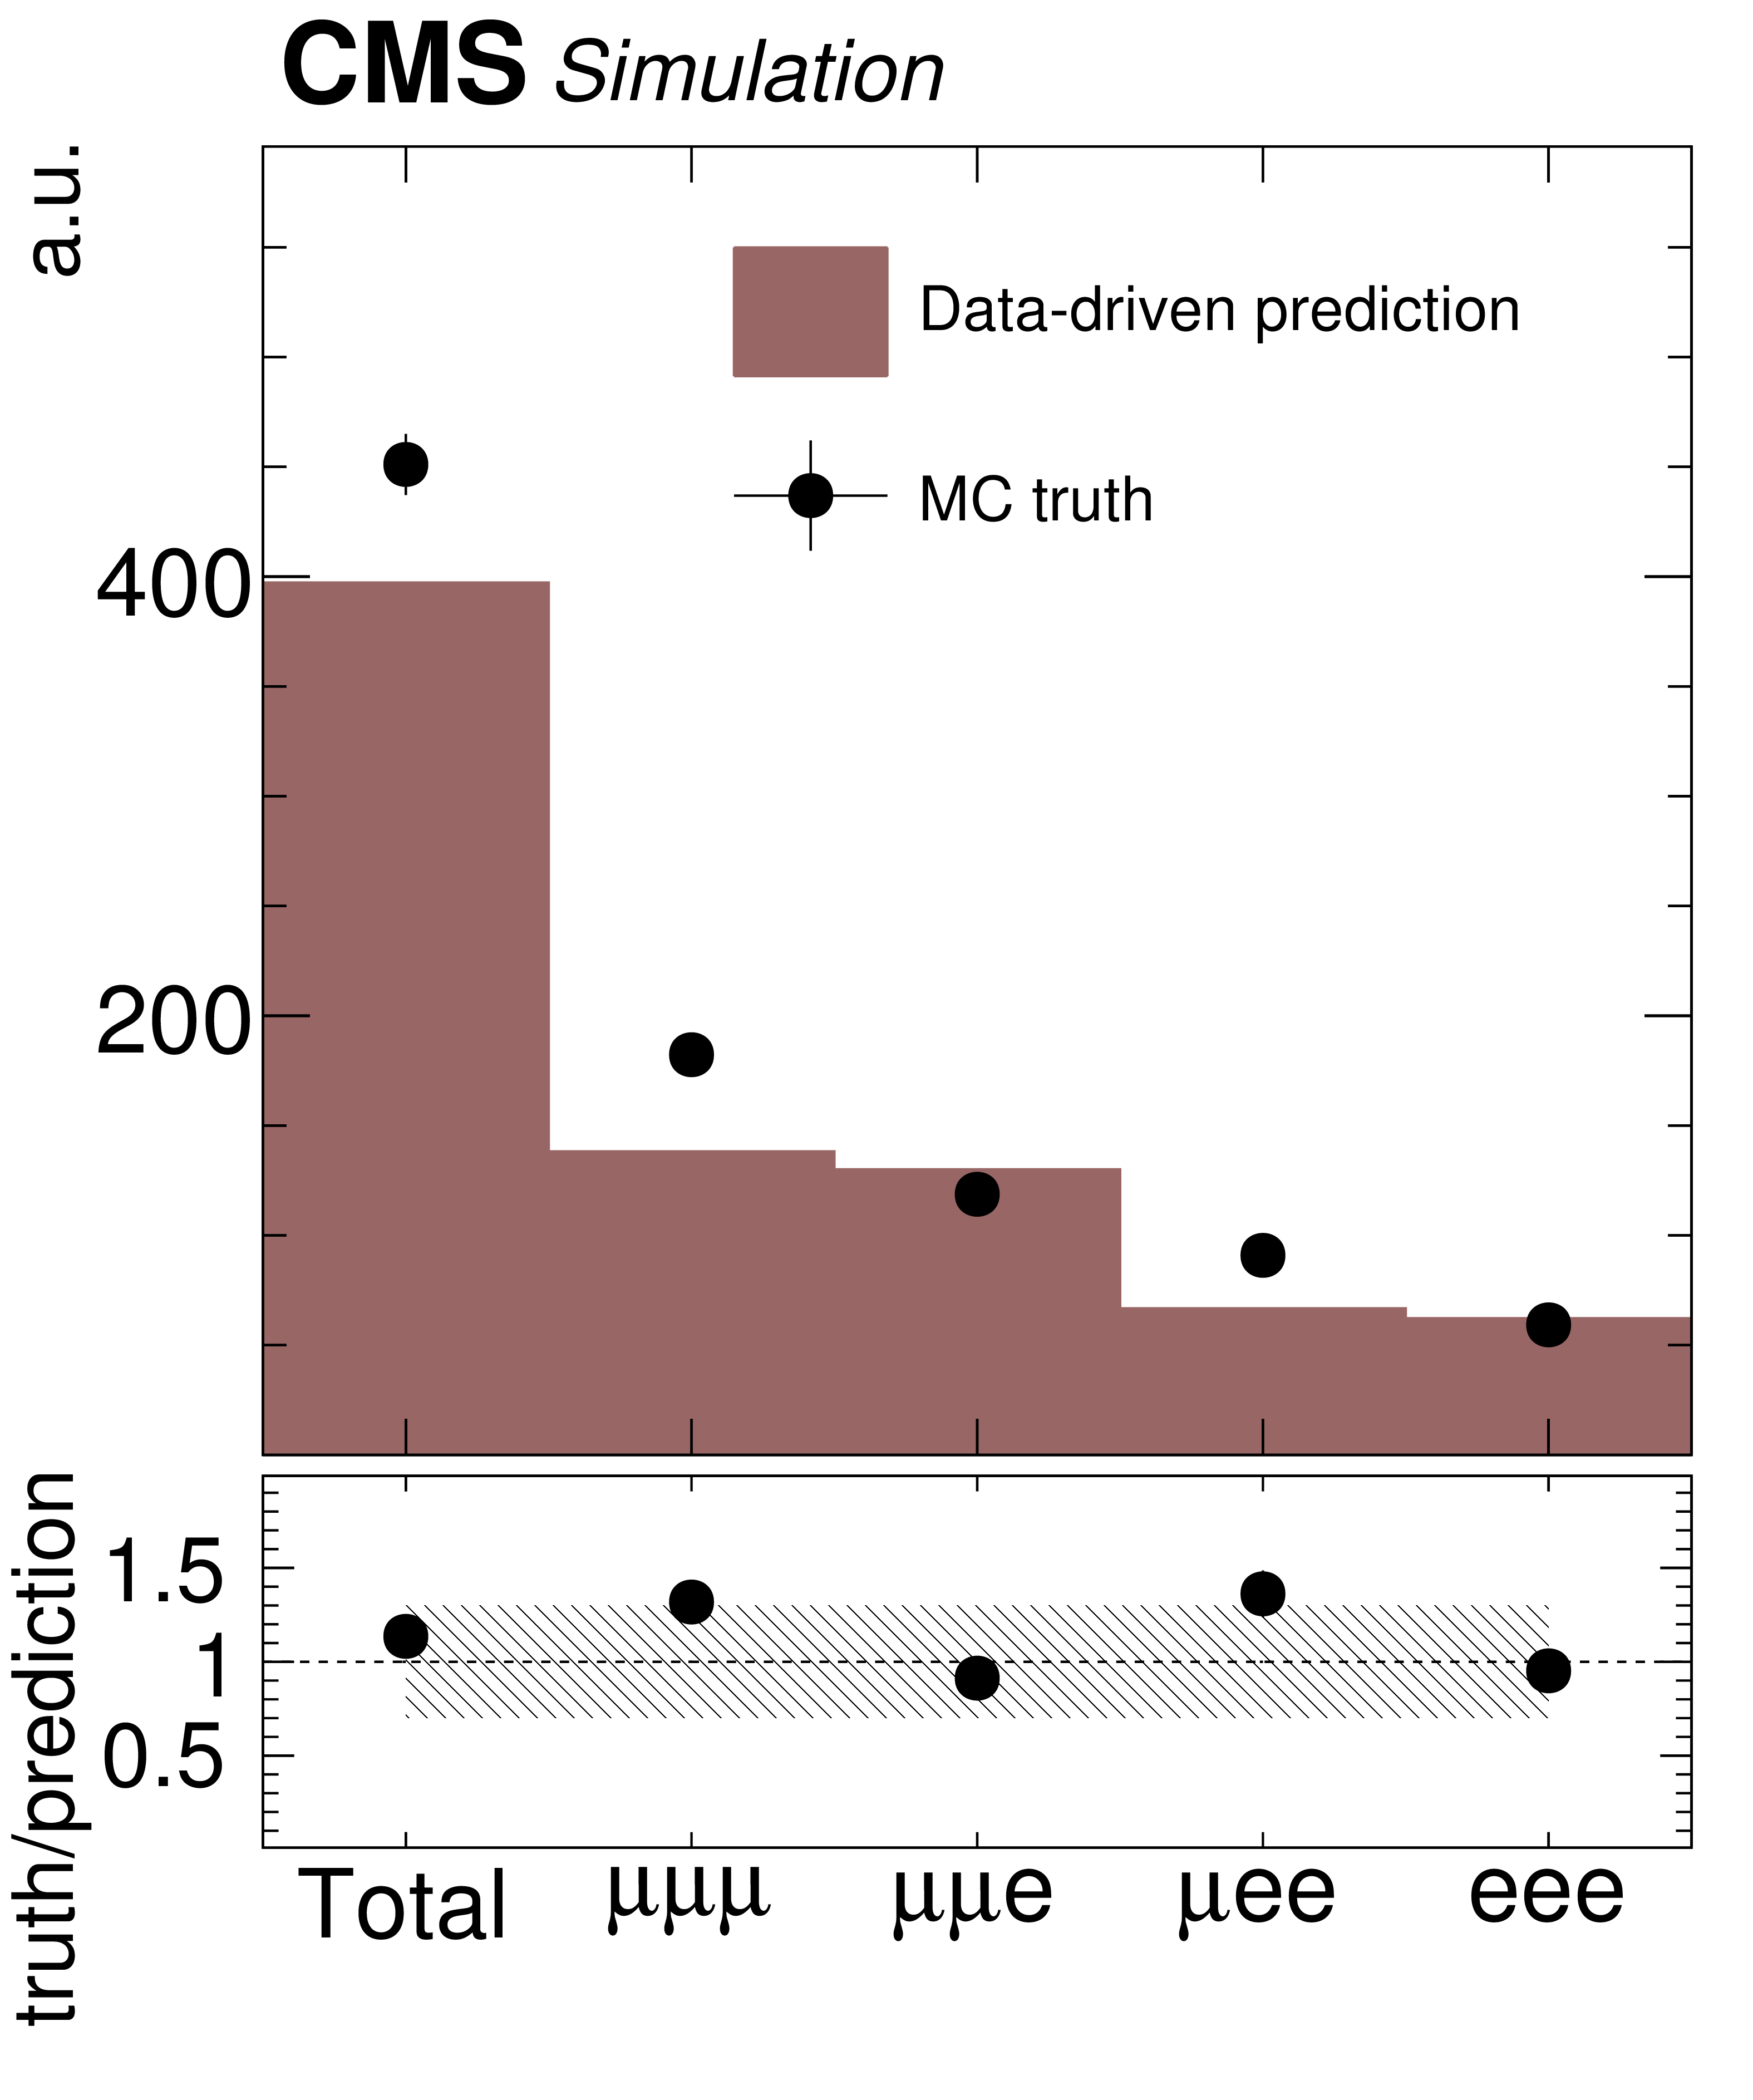
Figure 4-b:
Validation plots of the data-driven prediction method for the nonprompt lepton background in $ {\mathrm {t}\overline {\mathrm {t}}} $ in same-sign dilepton channel (a) and in Z+jets (b) and $ {\mathrm {t}\overline {\mathrm {t}}} $ (c) in three-lepton channel. The plots in the top panel show the number of total events by lepton channel and in the bottom panel the plots show the ratio of the predicted to observed yields. A hatched band is drawn to illustrate the coverage of the 30% relative systematic uncertainty |
png pdf |
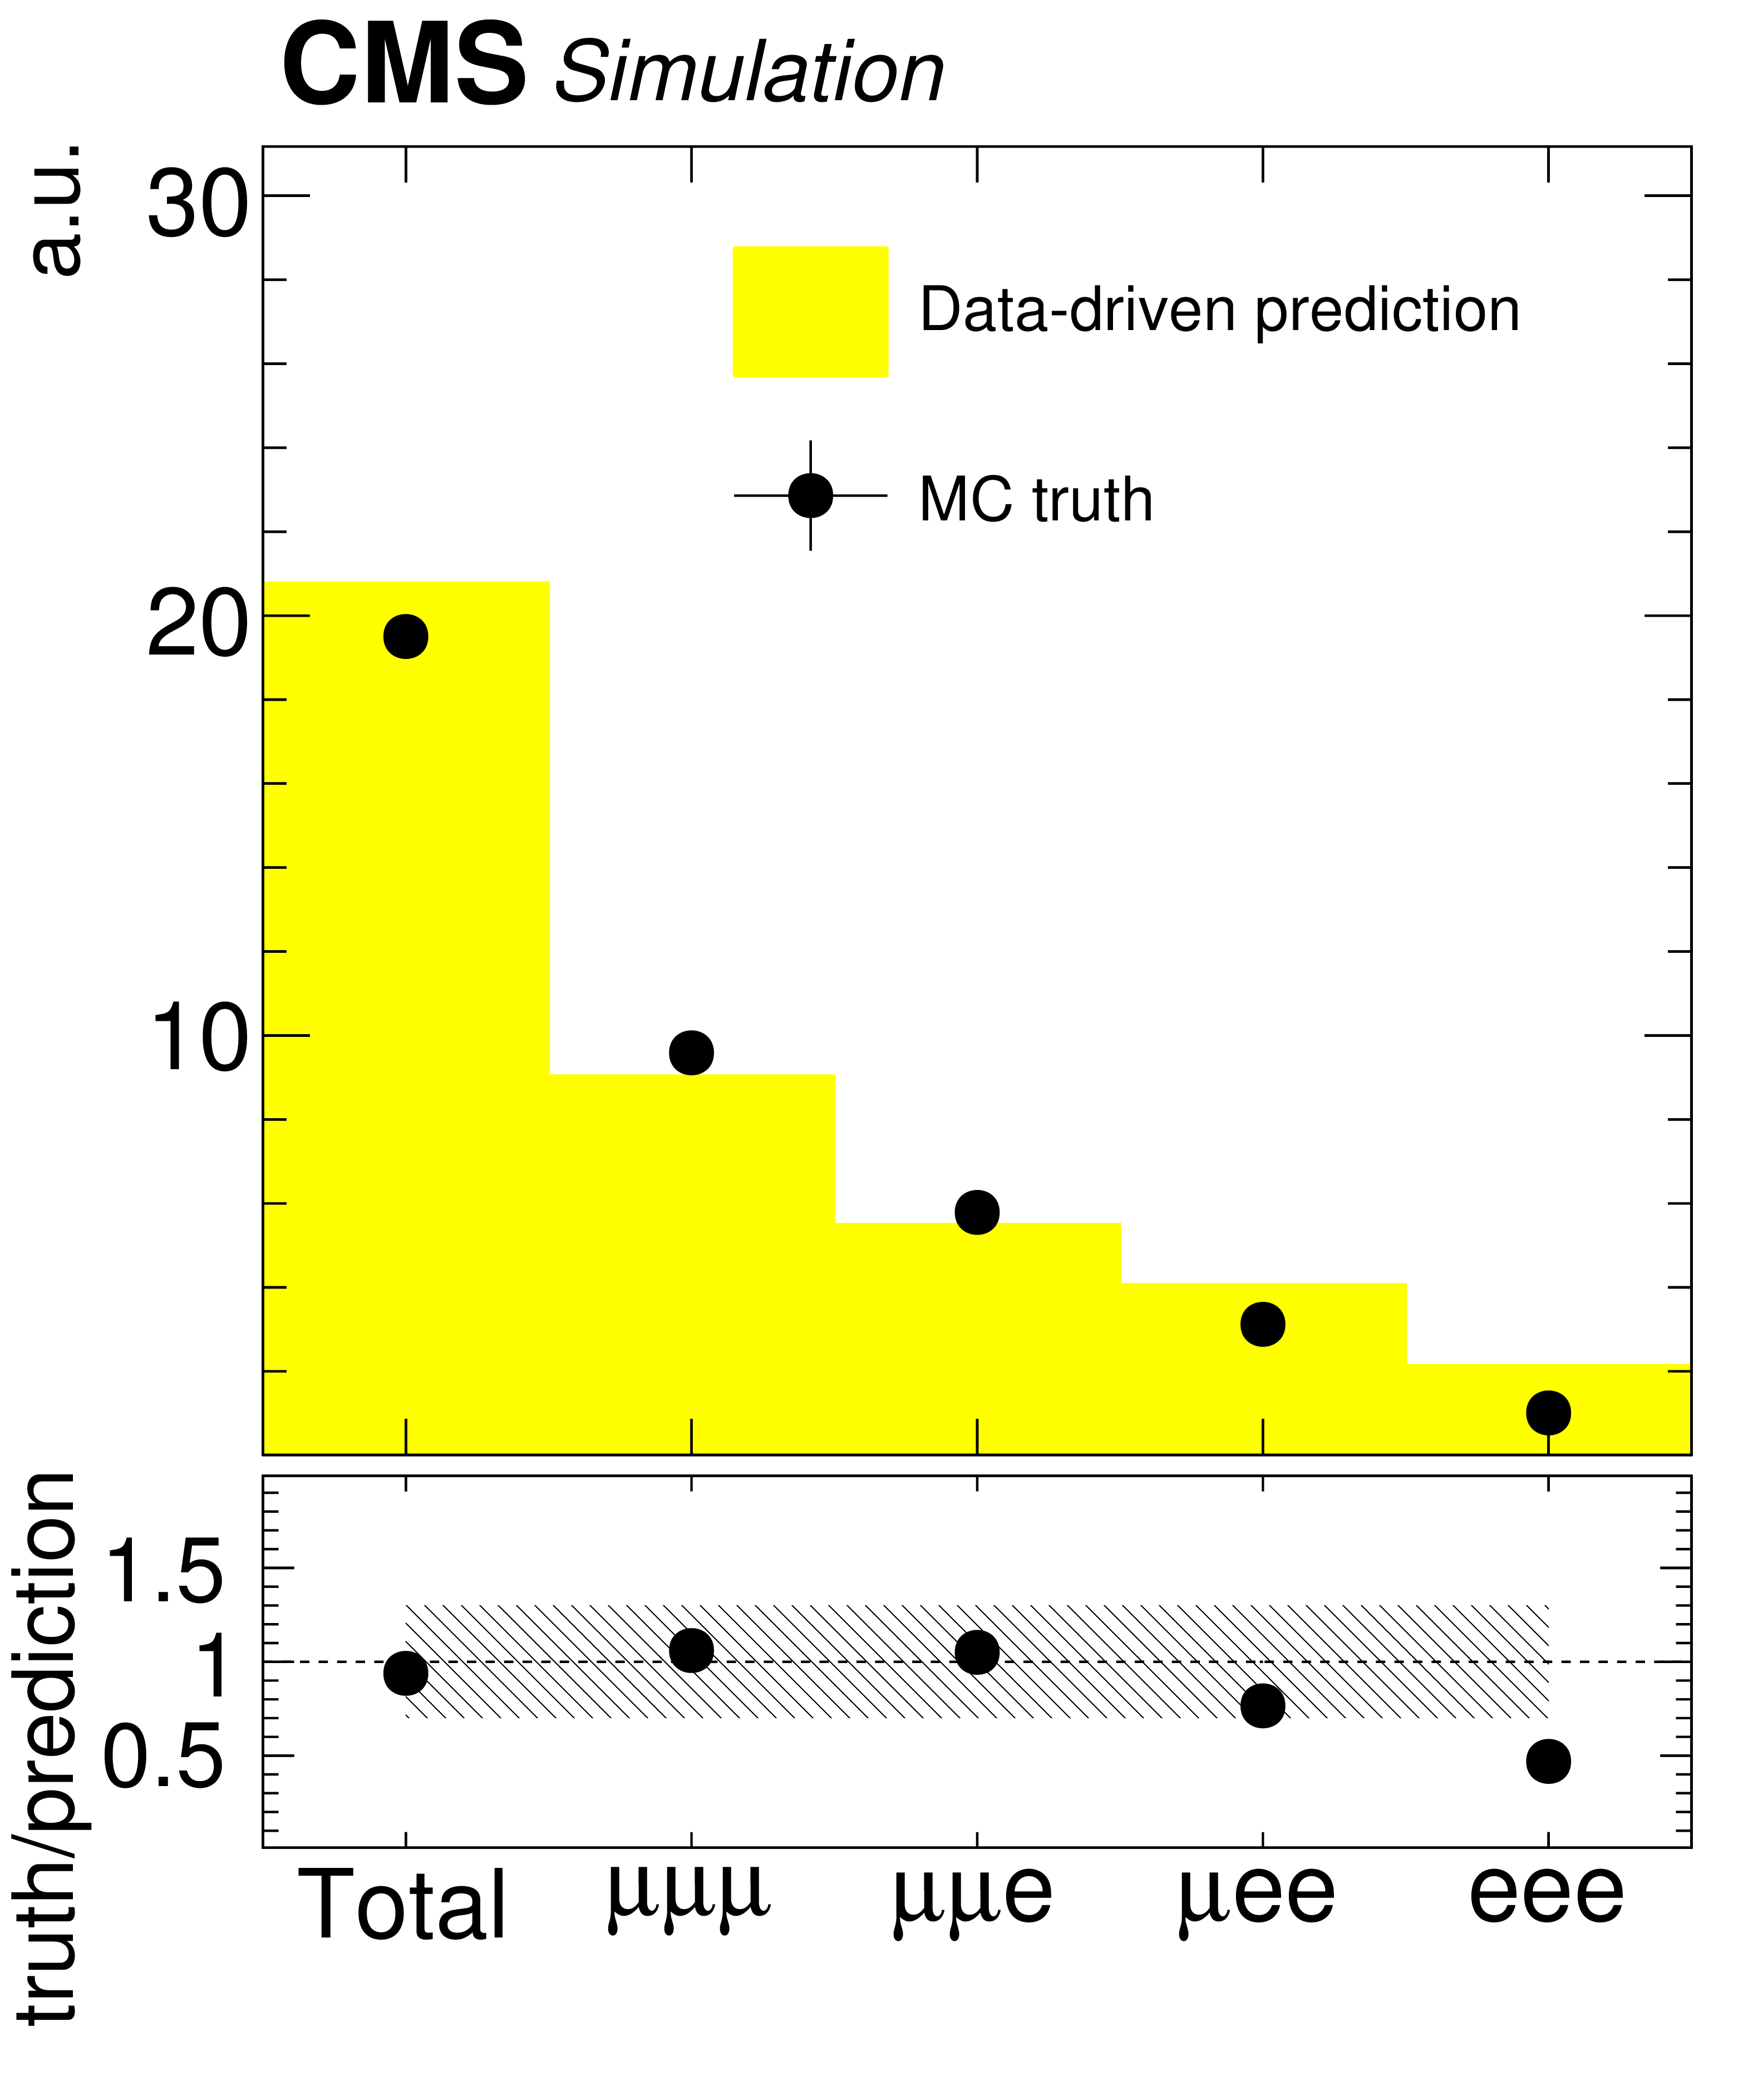
Figure 4-c:
Validation plots of the data-driven prediction method for the nonprompt lepton background in $ {\mathrm {t}\overline {\mathrm {t}}} $ in same-sign dilepton channel (a) and in Z+jets (b) and $ {\mathrm {t}\overline {\mathrm {t}}} $ (c) in three-lepton channel. The plots in the top panel show the number of total events by lepton channel and in the bottom panel the plots show the ratio of the predicted to observed yields. A hatched band is drawn to illustrate the coverage of the 30% relative systematic uncertainty |
png pdf |
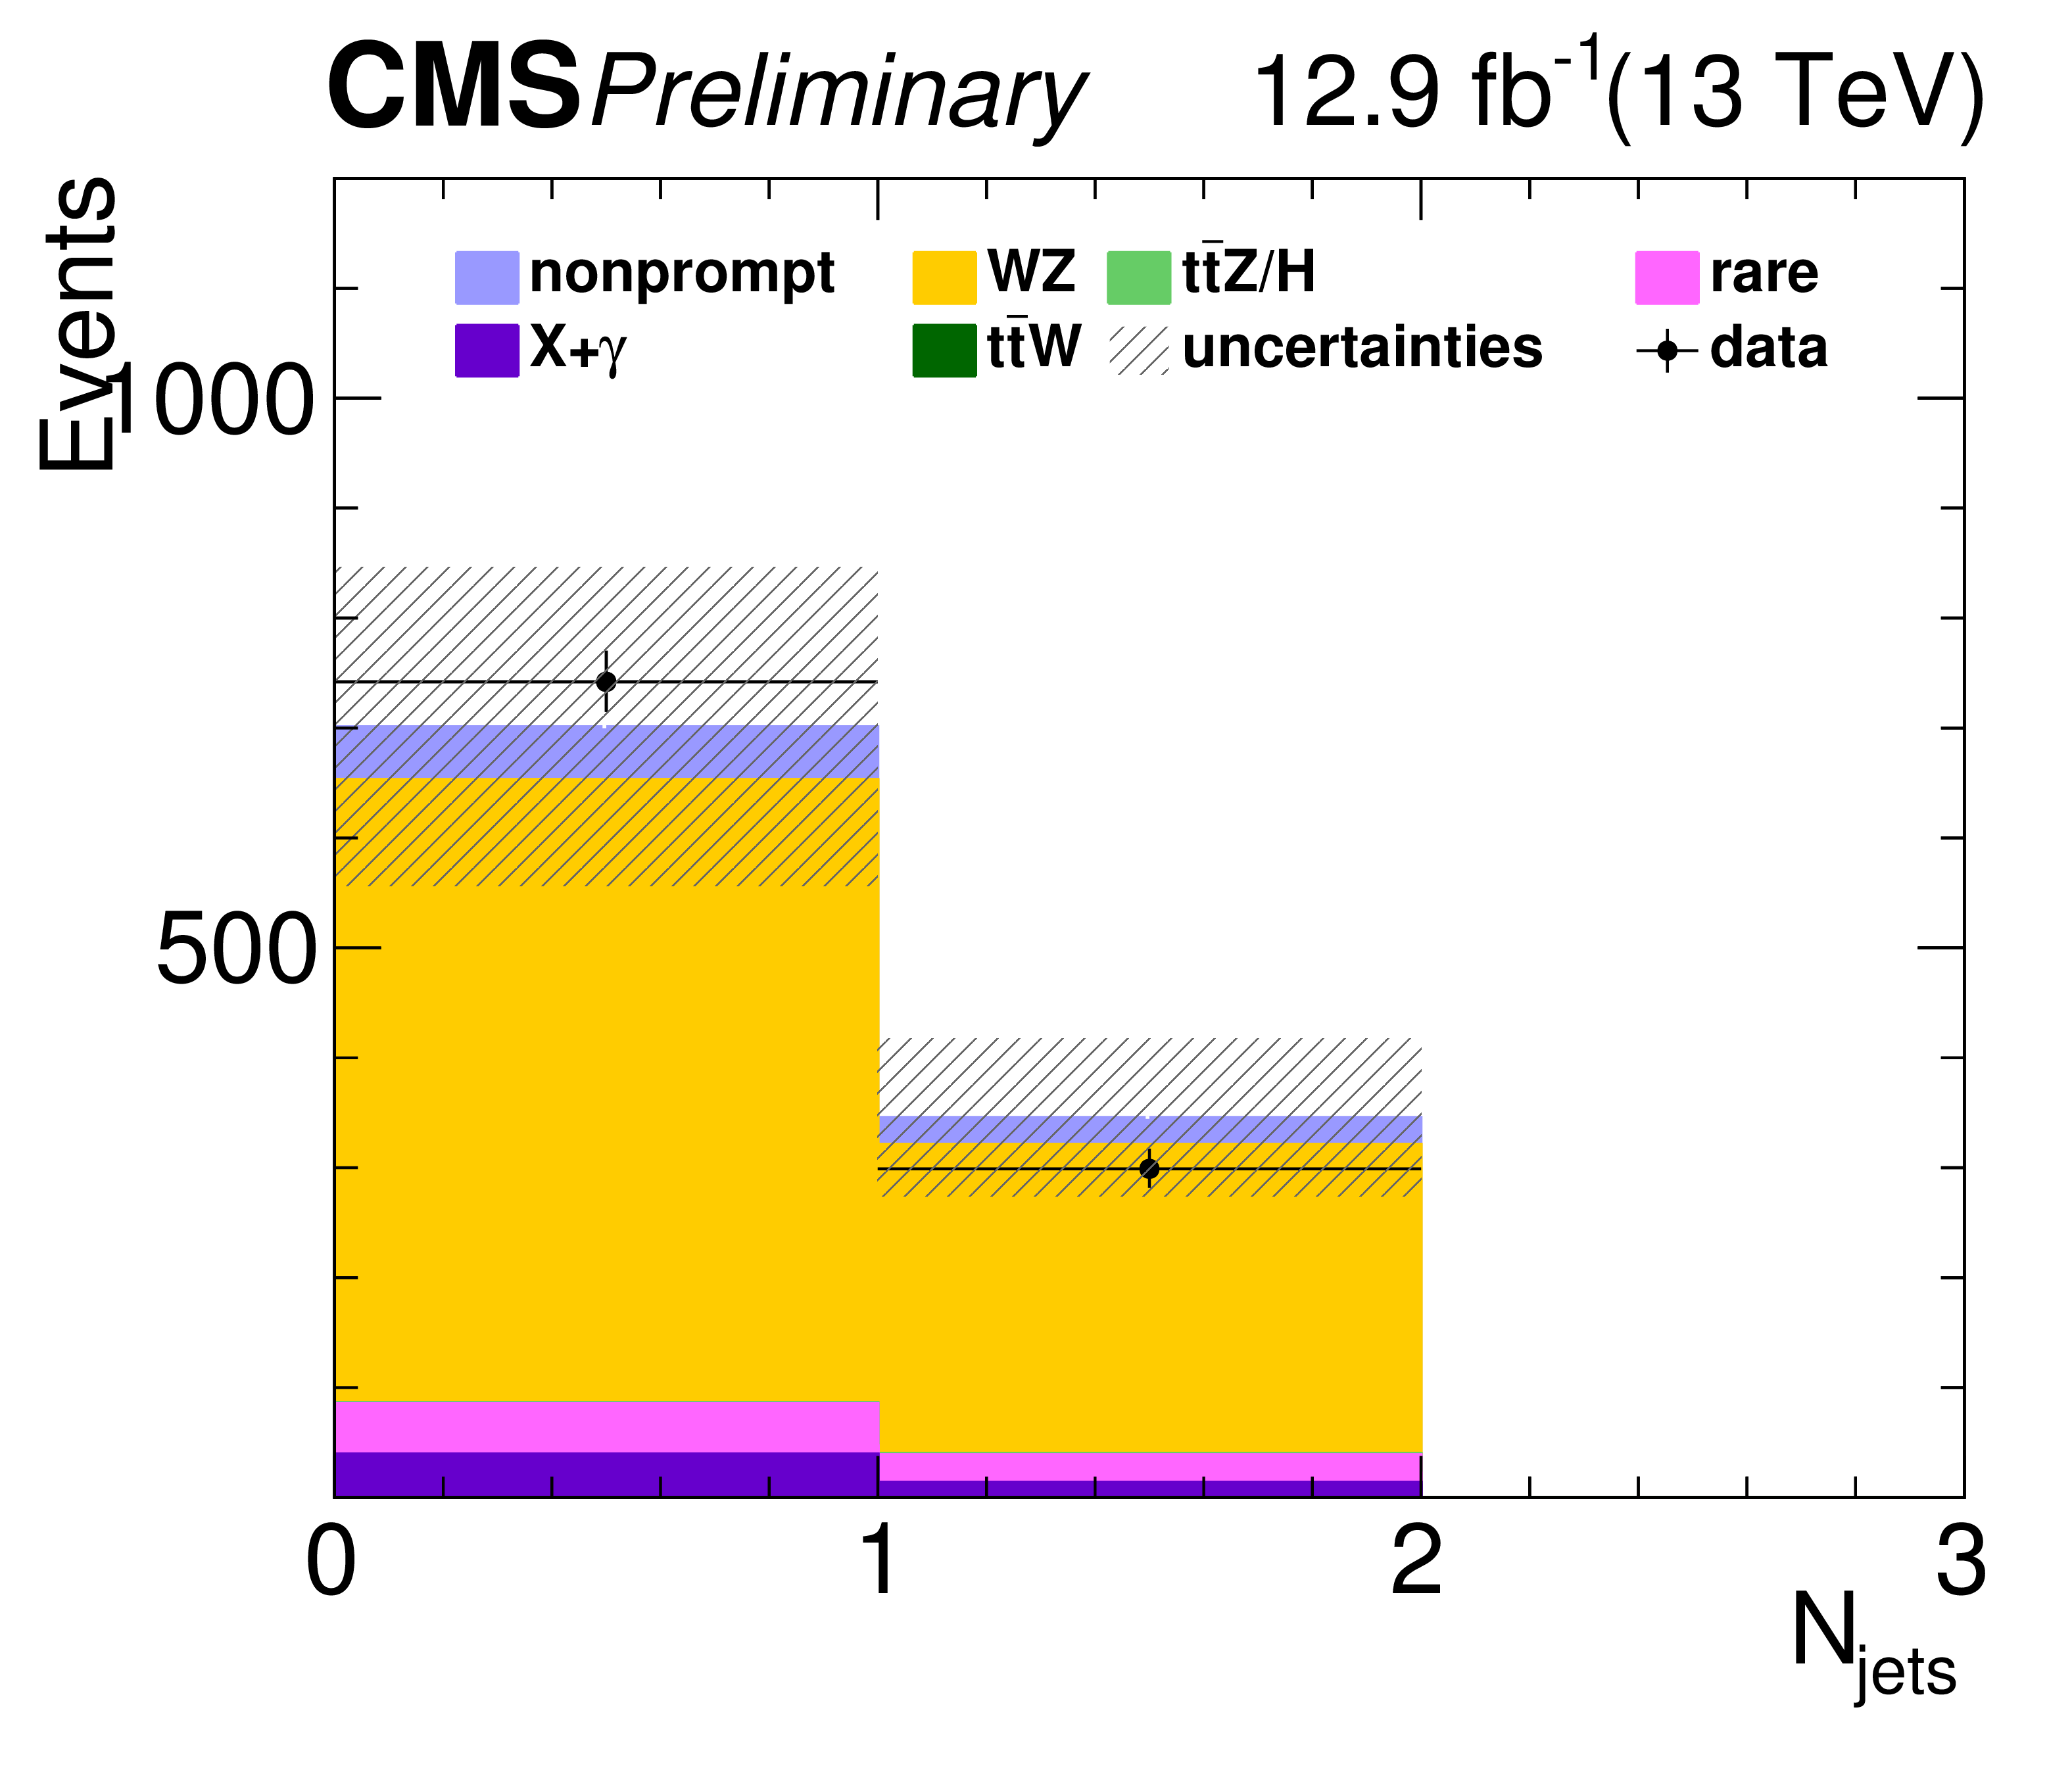
Figure 5-a:
WZ control region plots: Distributions of the total yields versus lepton channel, jet multiplicity, transverse mass of the lepton and the missing energy and the reconstructed invariant mass of the Z boson candidates. |
png pdf |
Figure 5-b:
WZ control region plots: Distributions of the total yields versus lepton channel, jet multiplicity, transverse mass of the lepton and the missing energy and the reconstructed invariant mass of the Z boson candidates. |
png pdf |
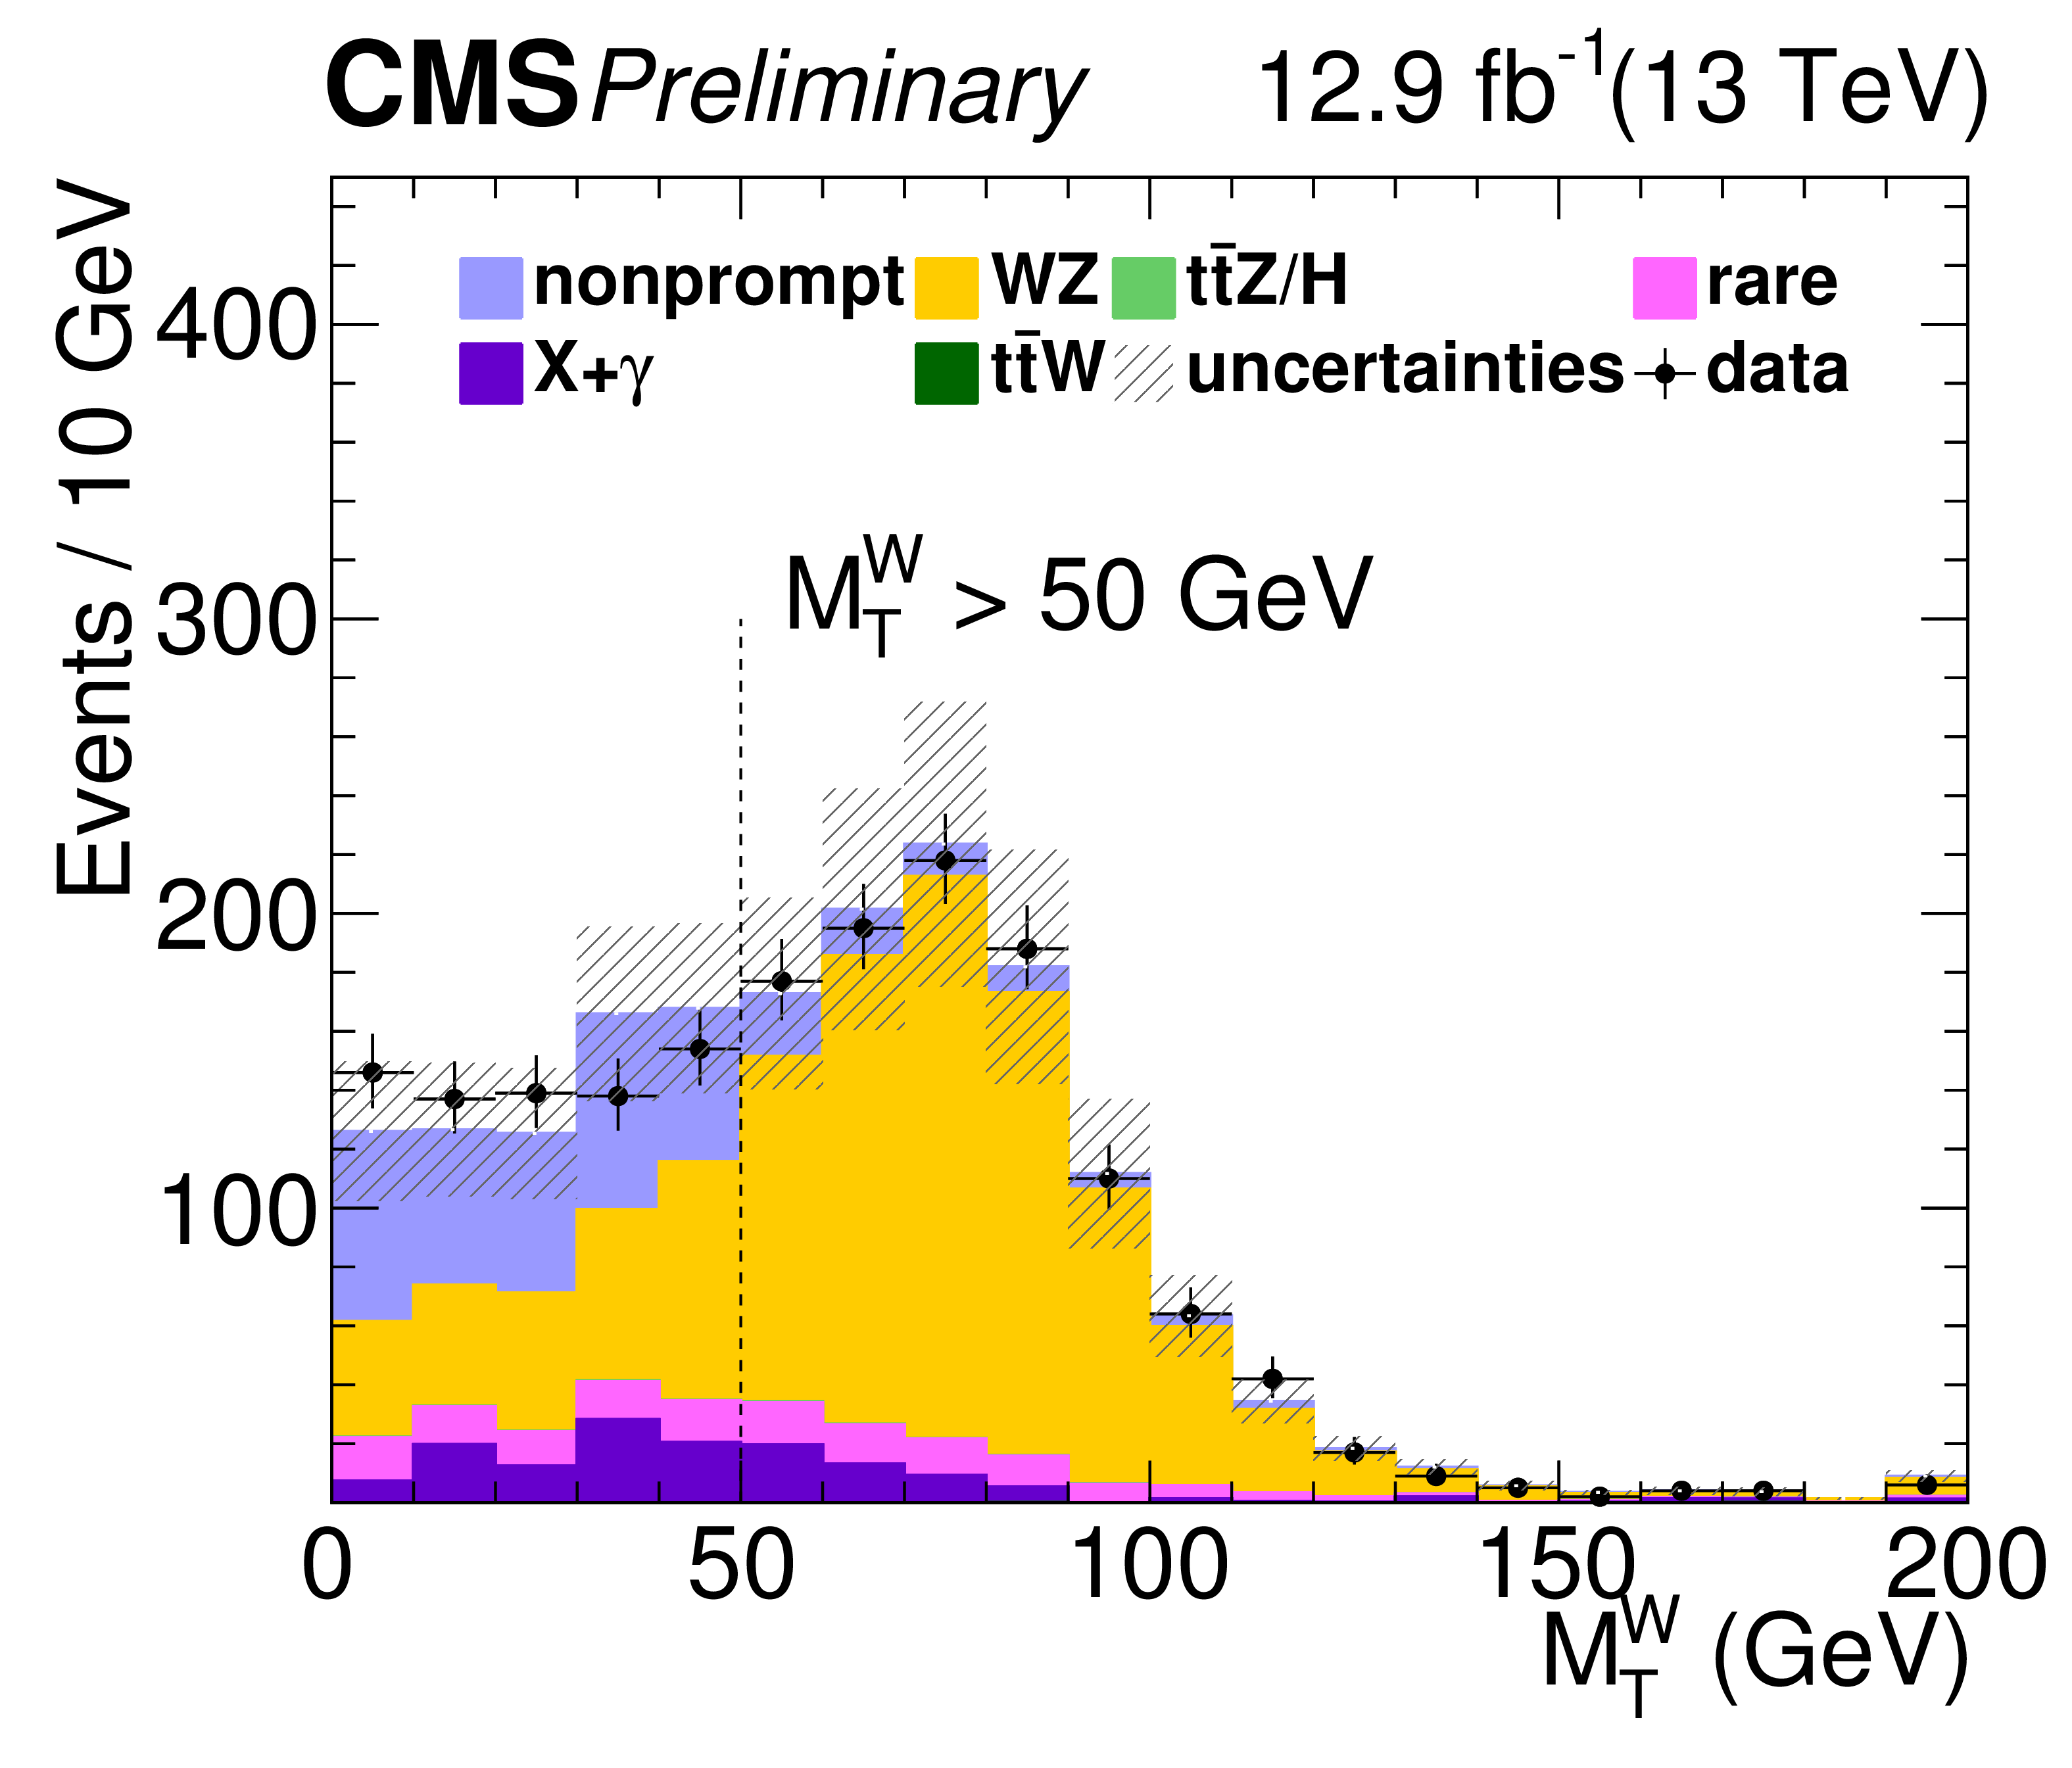
Figure 5-c:
WZ control region plots: Distributions of the total yields versus lepton channel, jet multiplicity, transverse mass of the lepton and the missing energy and the reconstructed invariant mass of the Z boson candidates. |
png pdf |
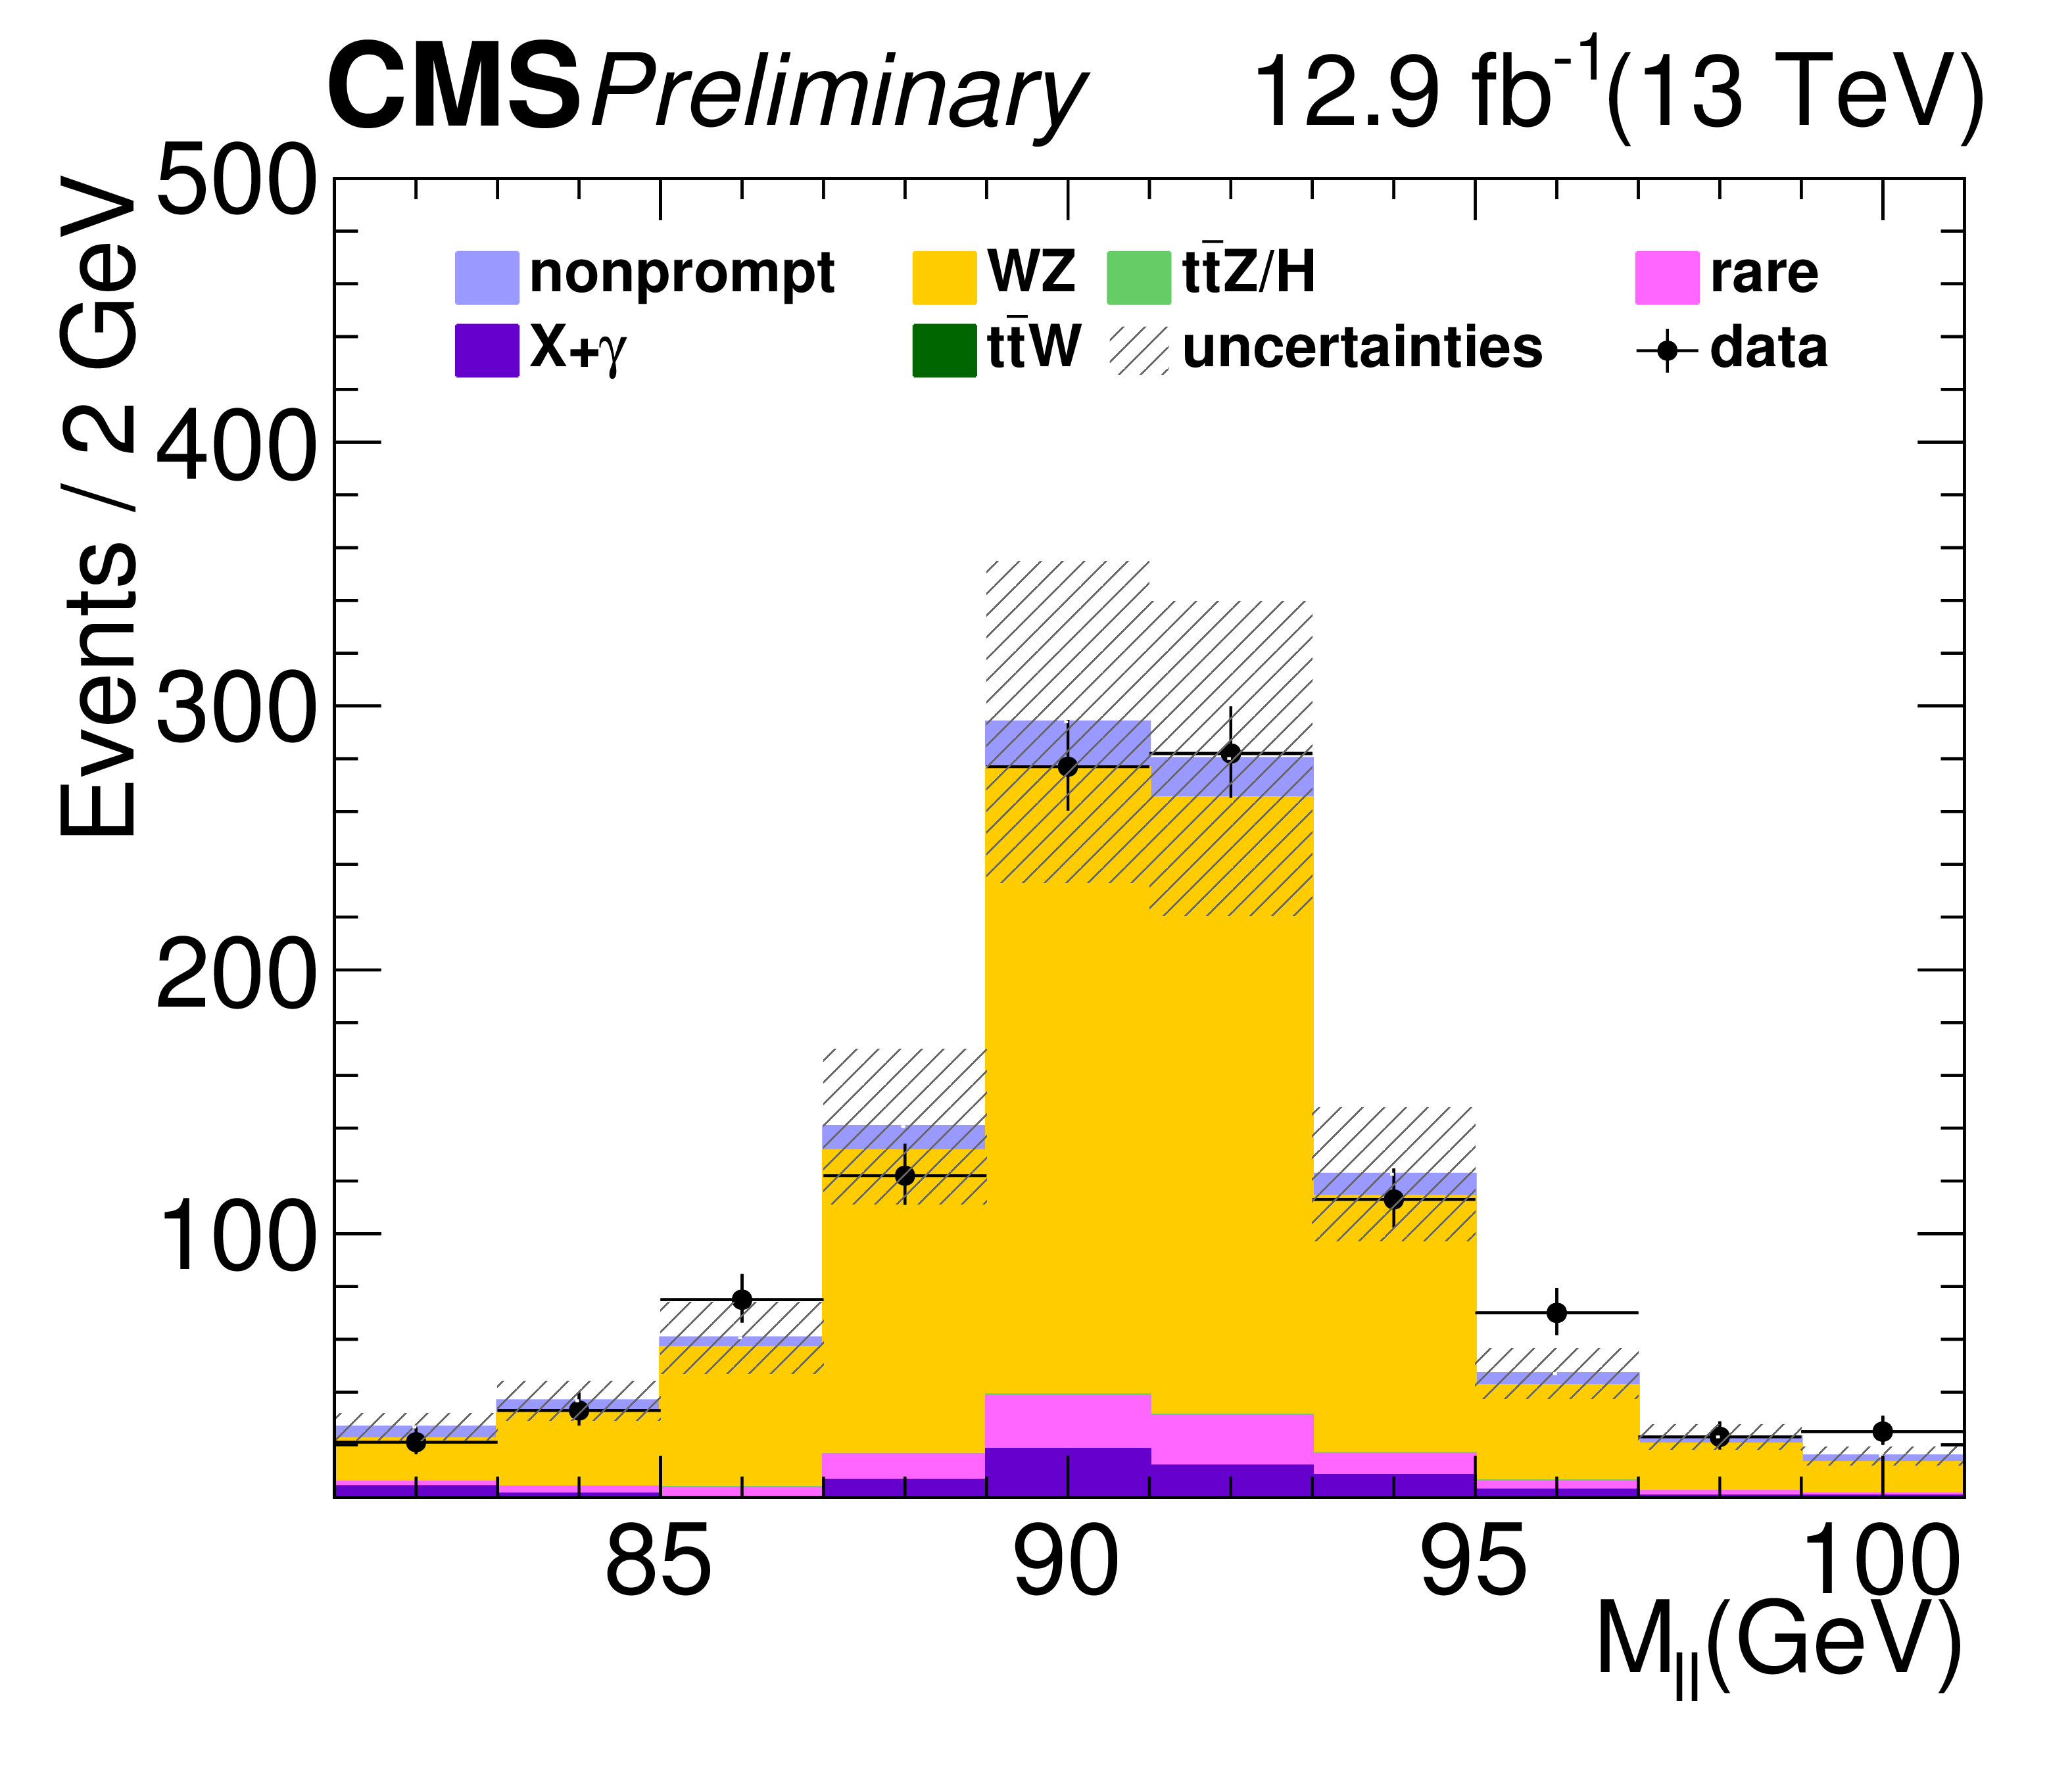
Figure 5-d:
WZ control region plots: Distributions of the total yields versus lepton channel, jet multiplicity, transverse mass of the lepton and the missing energy and the reconstructed invariant mass of the Z boson candidates. |
png pdf |
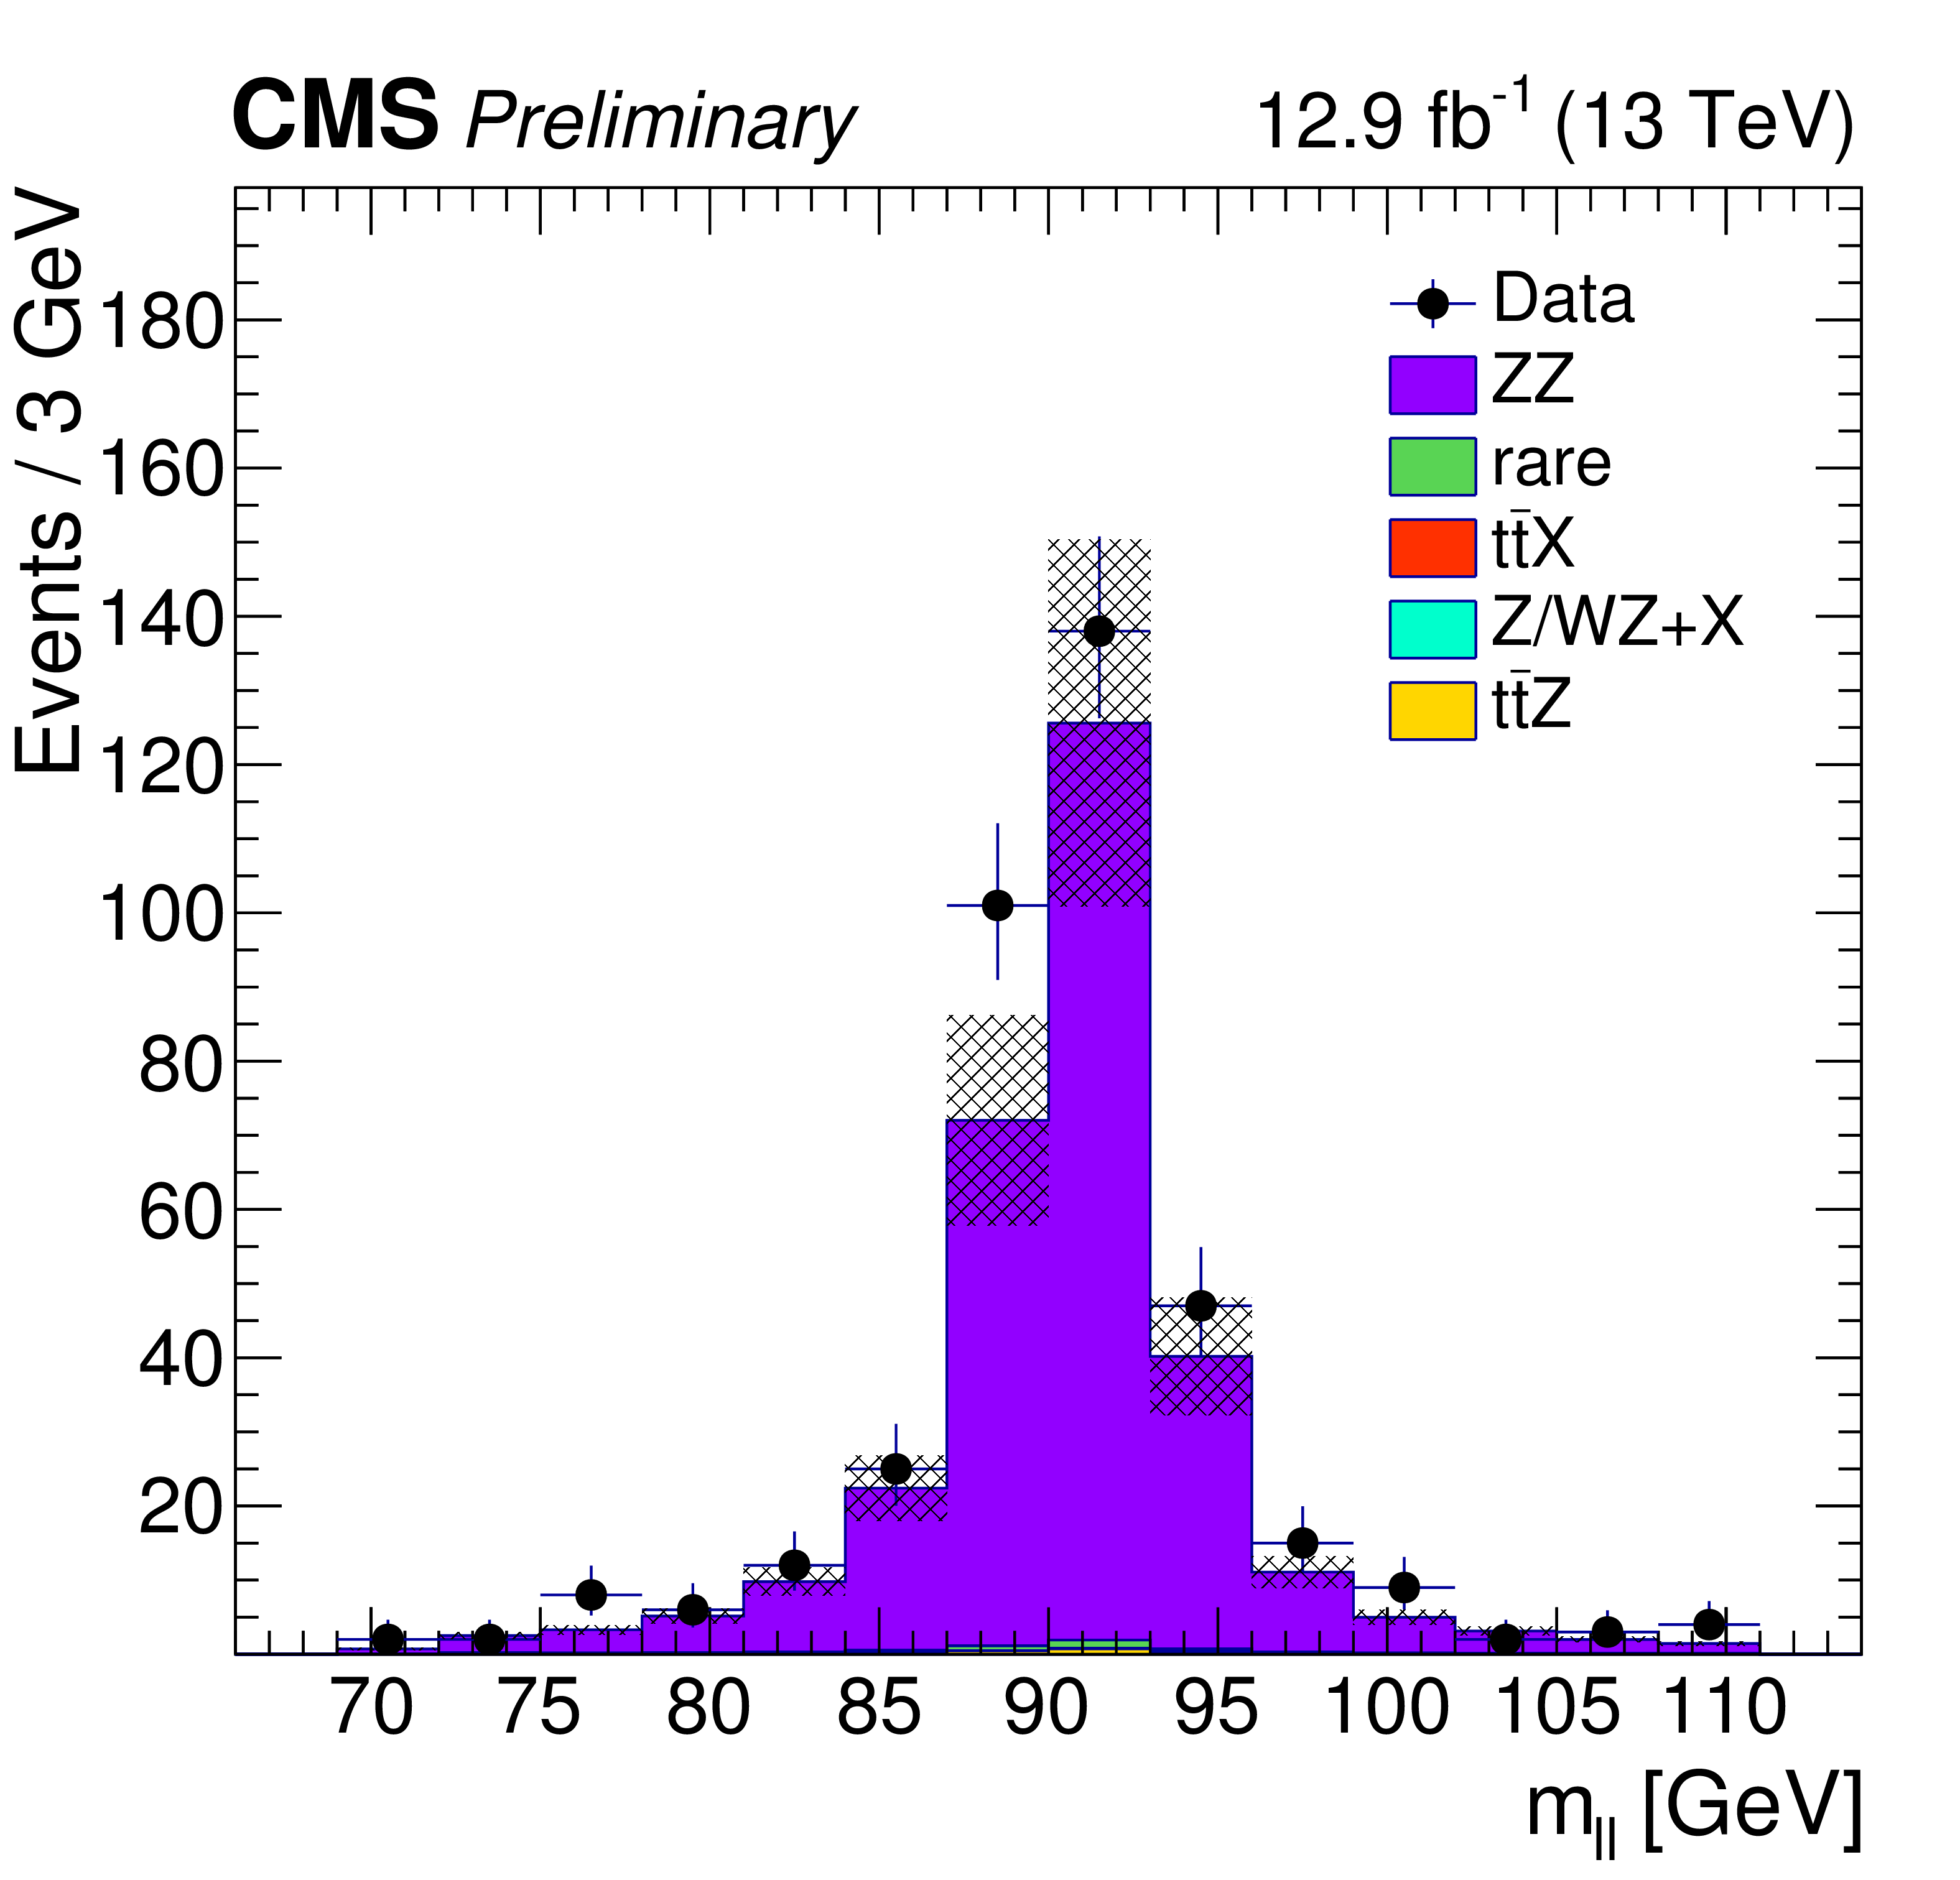
Figure 6-a:
Data-MC comparison for the Z candidates mass (a), jet multiplicity (b) and b-jet multiplicity (c) in a ZZ-dominated background control region |
png pdf |
Figure 6-b:
Data-MC comparison for the Z candidates mass (a), jet multiplicity (b) and b-jet multiplicity (c) in a ZZ-dominated background control region |
png pdf |
Figure 6-c:
Data-MC comparison for the Z candidates mass (a), jet multiplicity (b) and b-jet multiplicity (c) in a ZZ-dominated background control region |
png pdf |
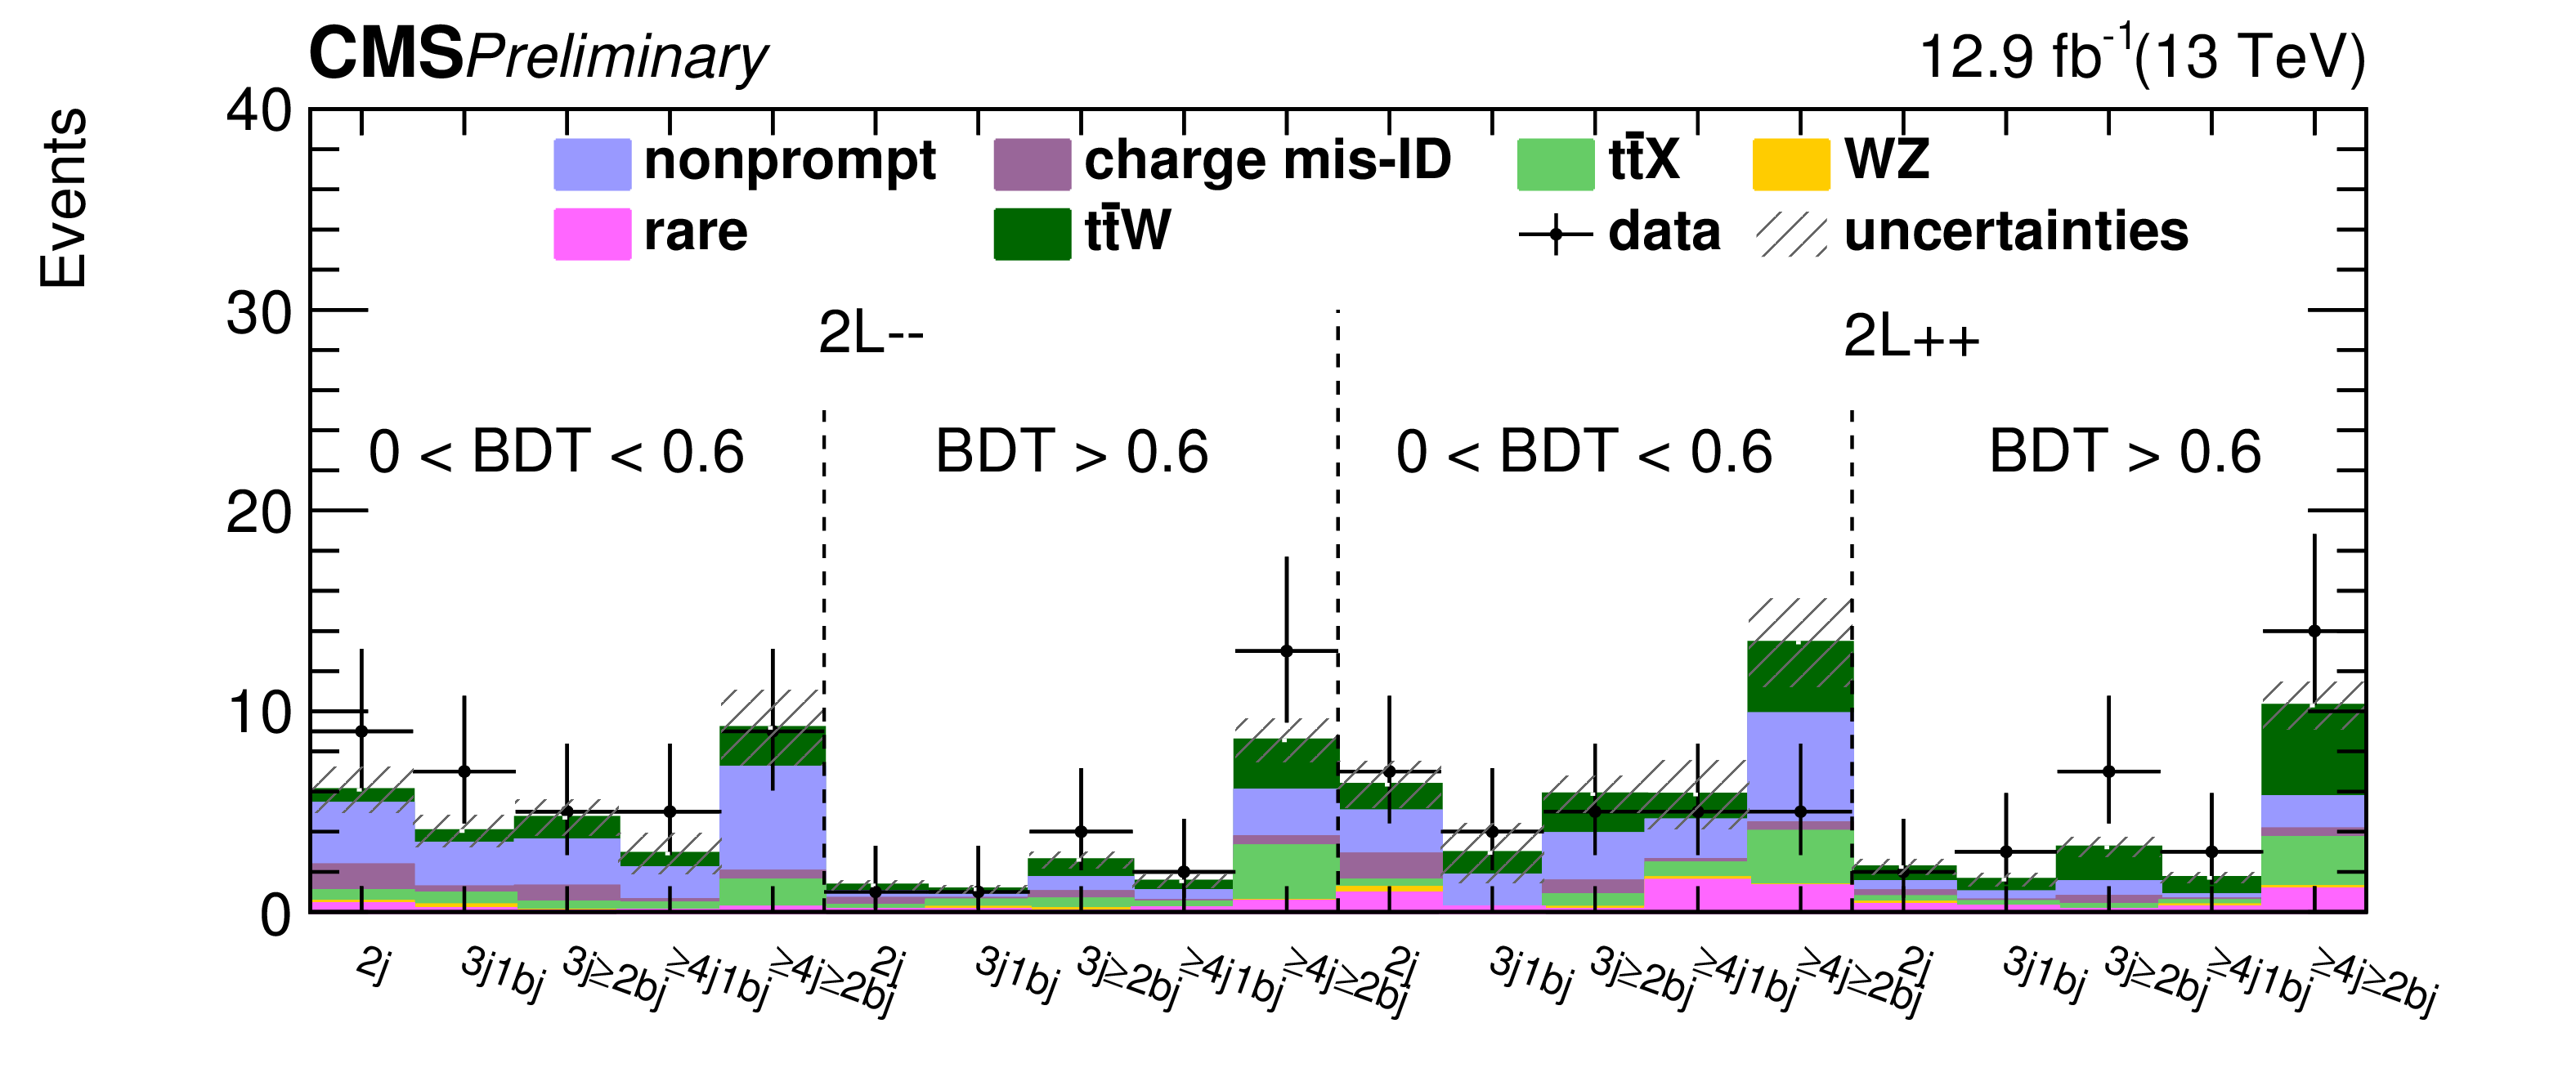
Figure 7:
Predicted and observed yields in each analysis bin in the same-sign dilepton analysis. Bins 1-10 correspond to minus-minus events; bins 11-20 to plus-plus events. Within each charge sign set, first 5 bins correspond to 0 $ < $ BDT $ < $ 0.6, second 5 bins to 0.6 $ < $ BDT. The order of categories within each 5-bin set is : 2 jets; 3 jets 1, b-tag; 3 jets, $\geq $ 2 b-tags; $\geq $ 4 jets 1, b-tag; $\geq $ 4 jets, $\geq $ 2 b-tags. The hatched band shows the total pre-fit uncertainty associated to signal and background predictions where major sources of the uncertainties are uncorrelated and summed in quadrature. |
png pdf |
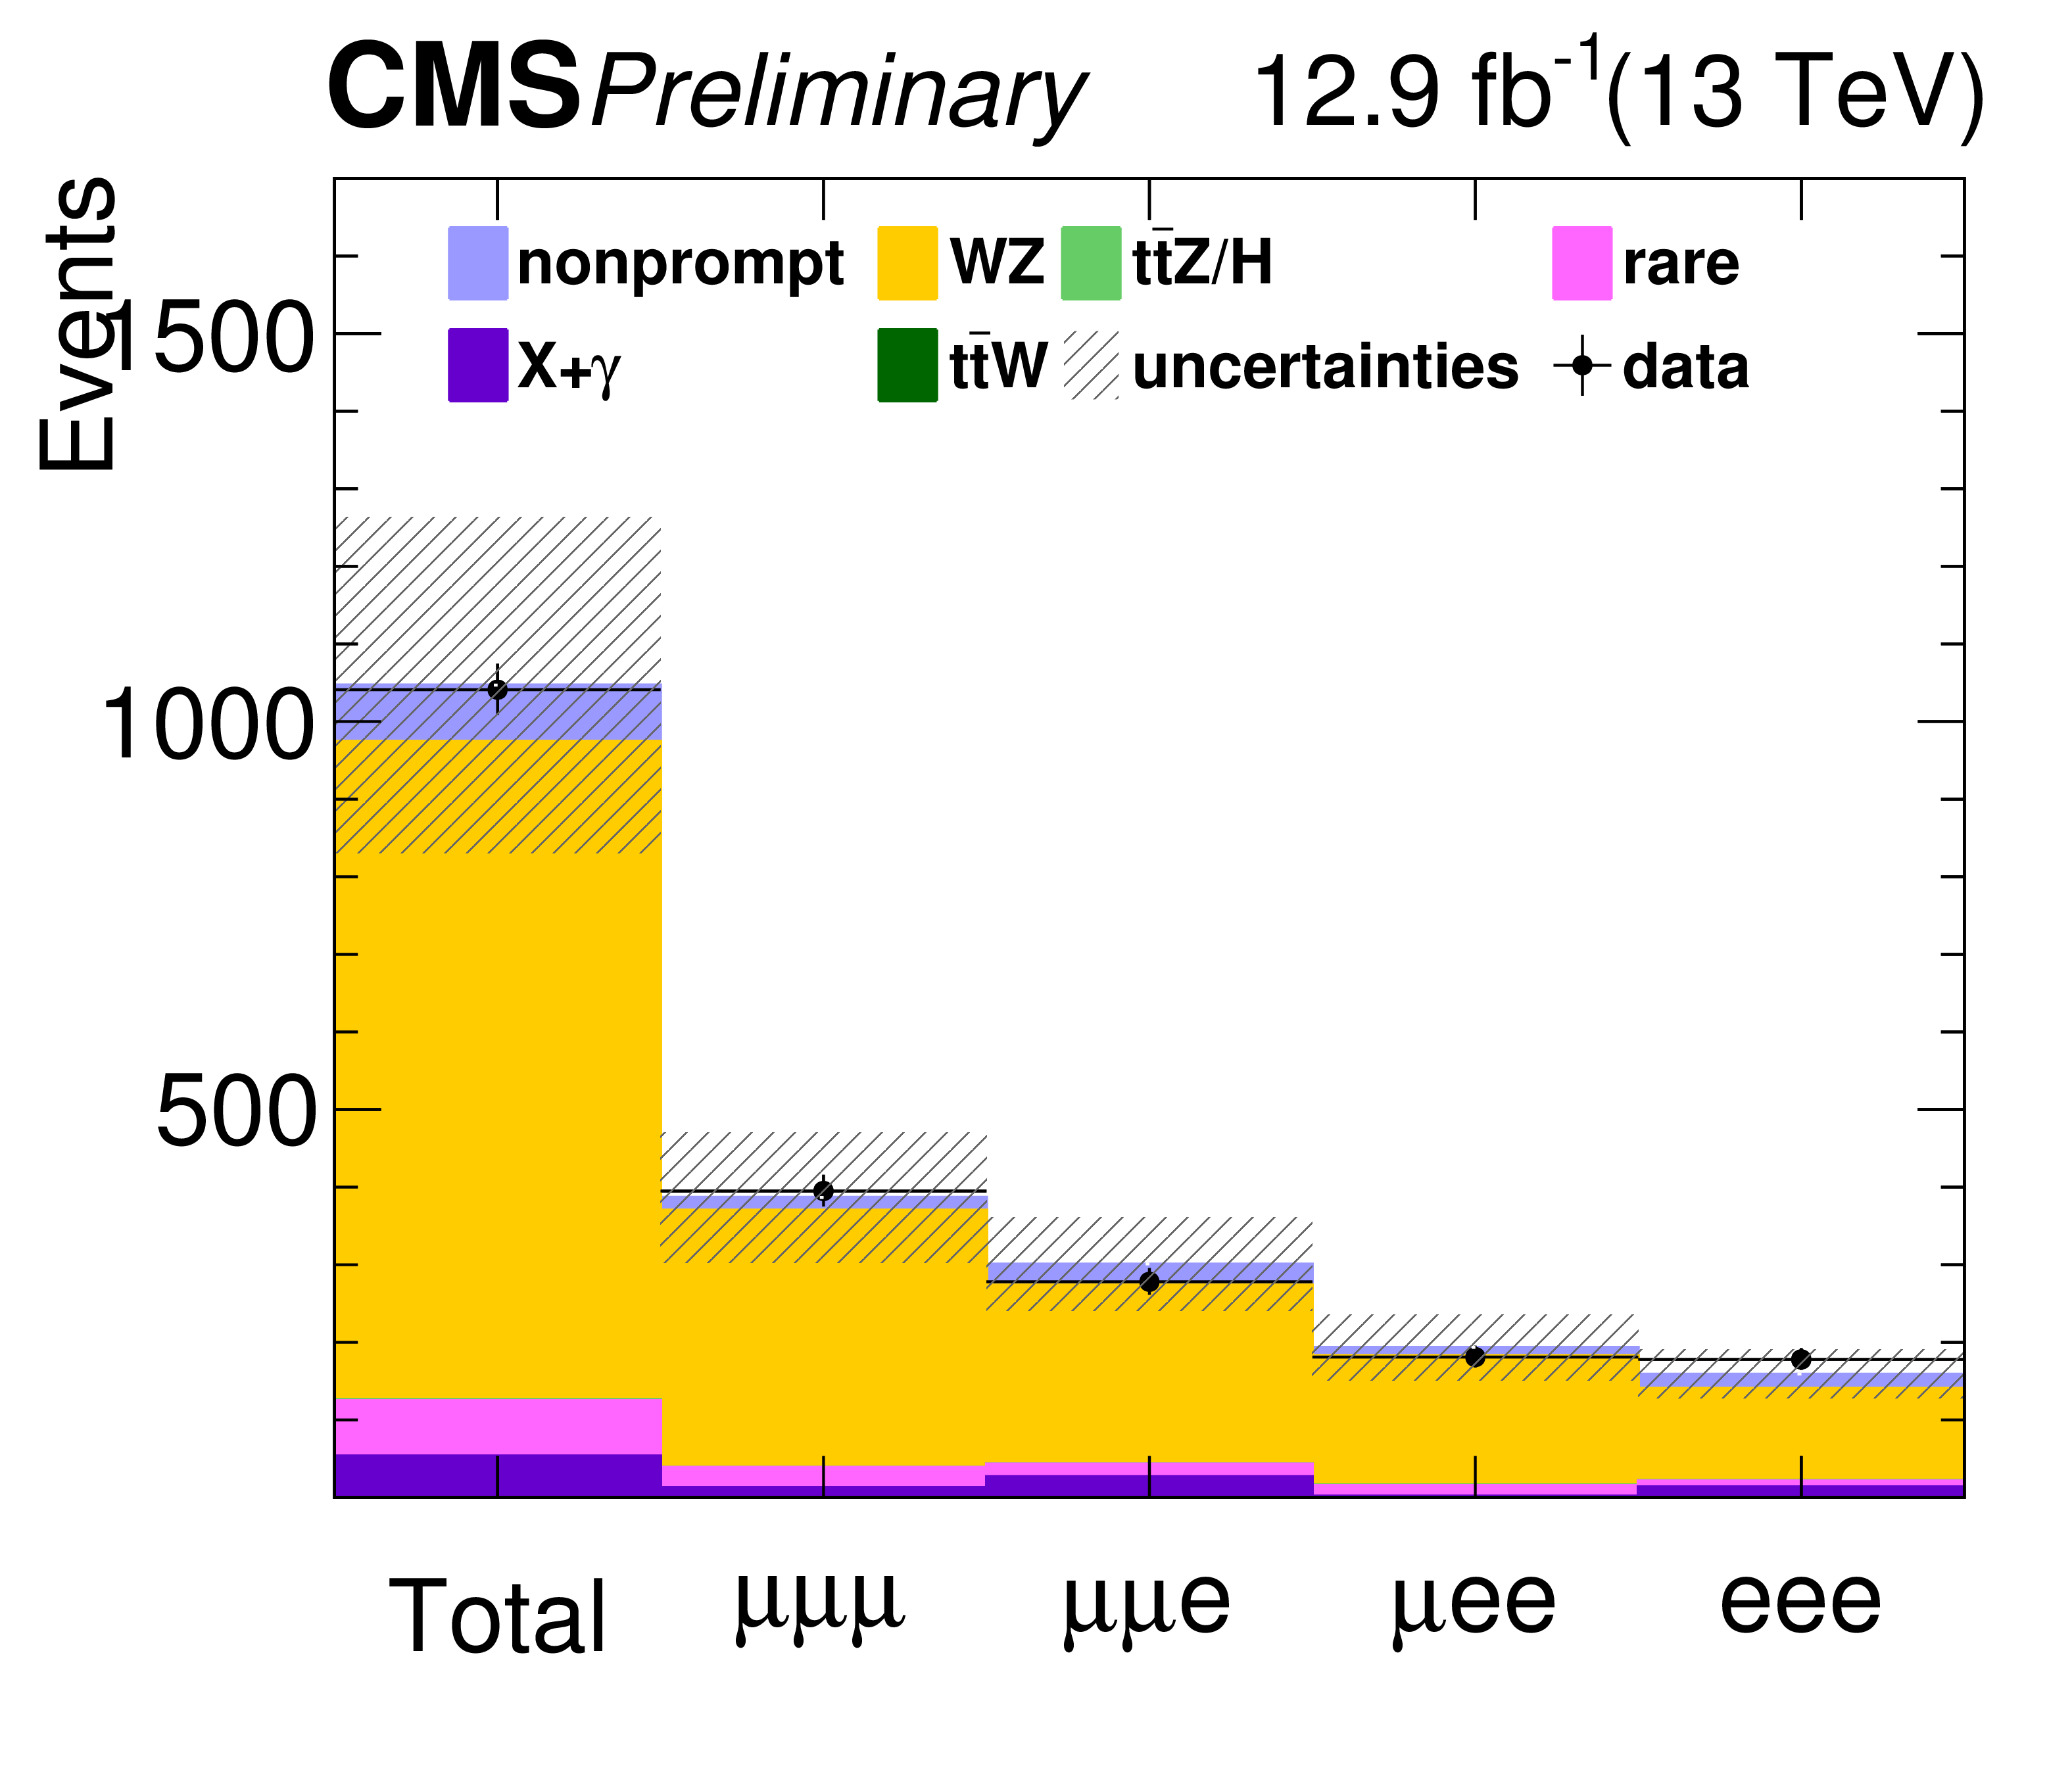
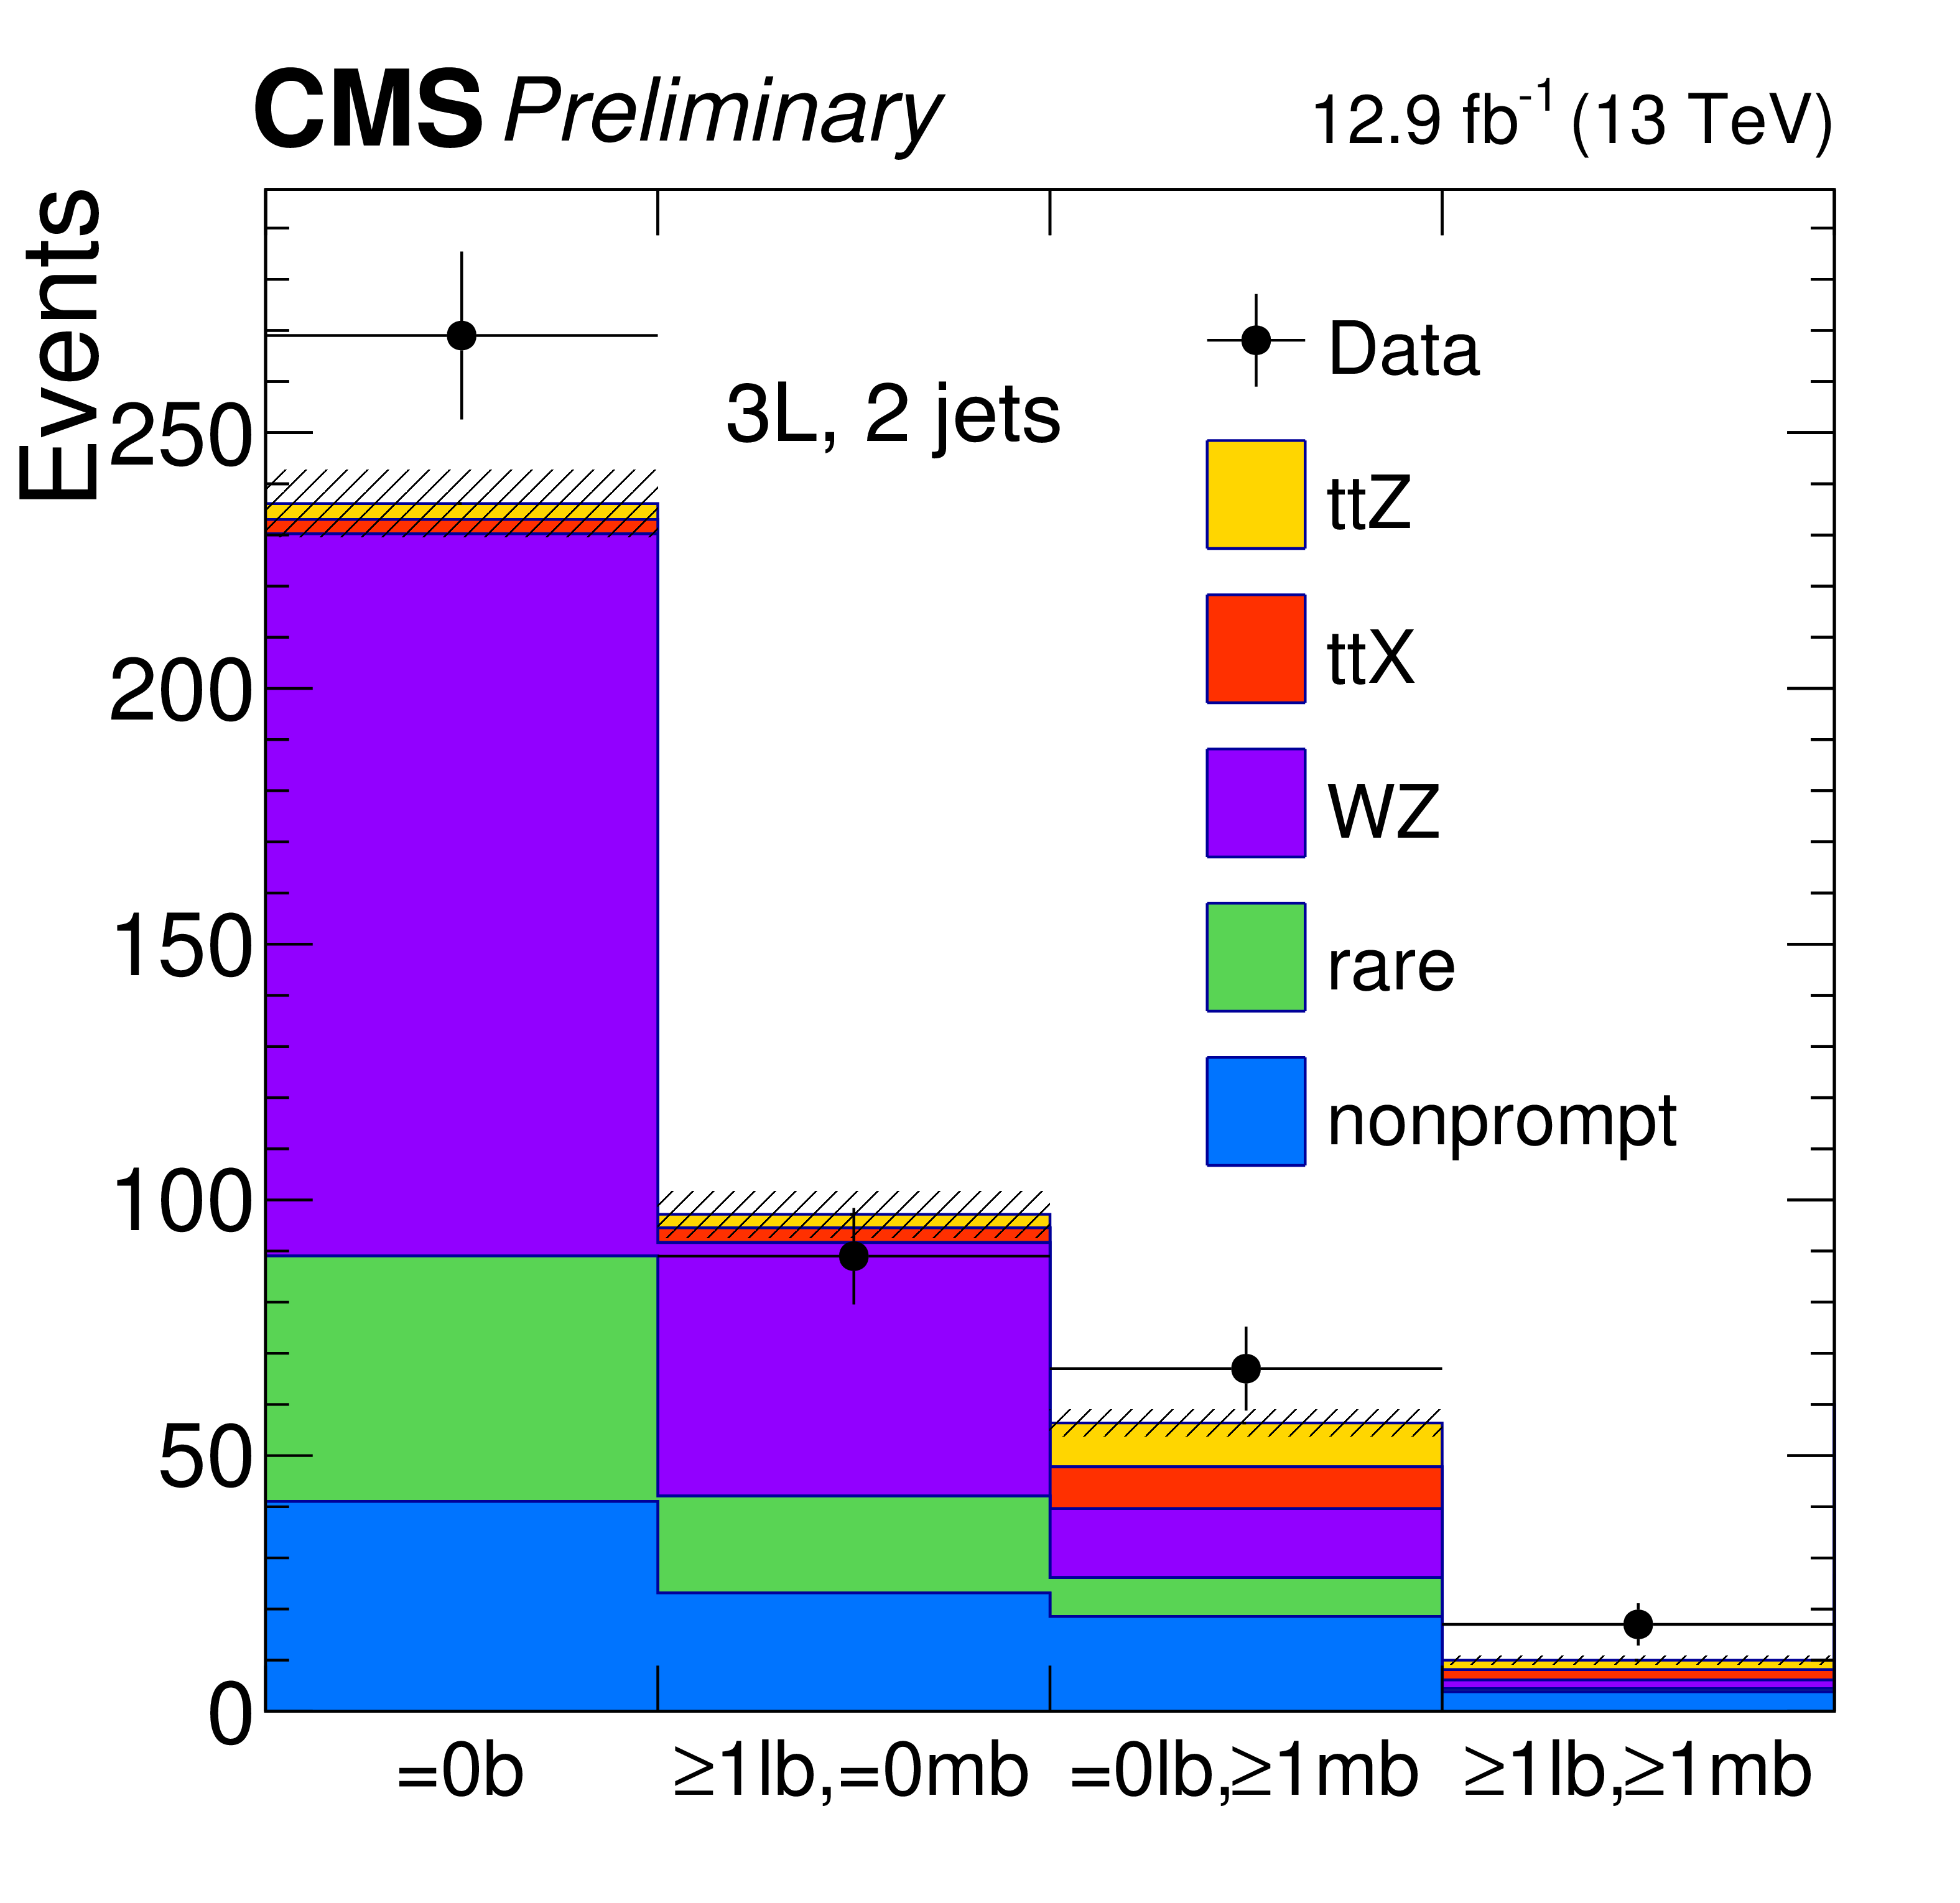
Figure 8:
Predicted and observed yields in $ {N_\text {jets}} = $ 2 category in the three-lepton analyses. The characters "b", "lb" and "mb" in the x-axis labels represent "b-jet", "loose b-jet" and "medium b-jet" respectively. The hatched band shows the total pre-fit uncertainty associated to signal and background predictions where major sources of the uncertainties are uncorrelated and summed in quadrature. |
png pdf |
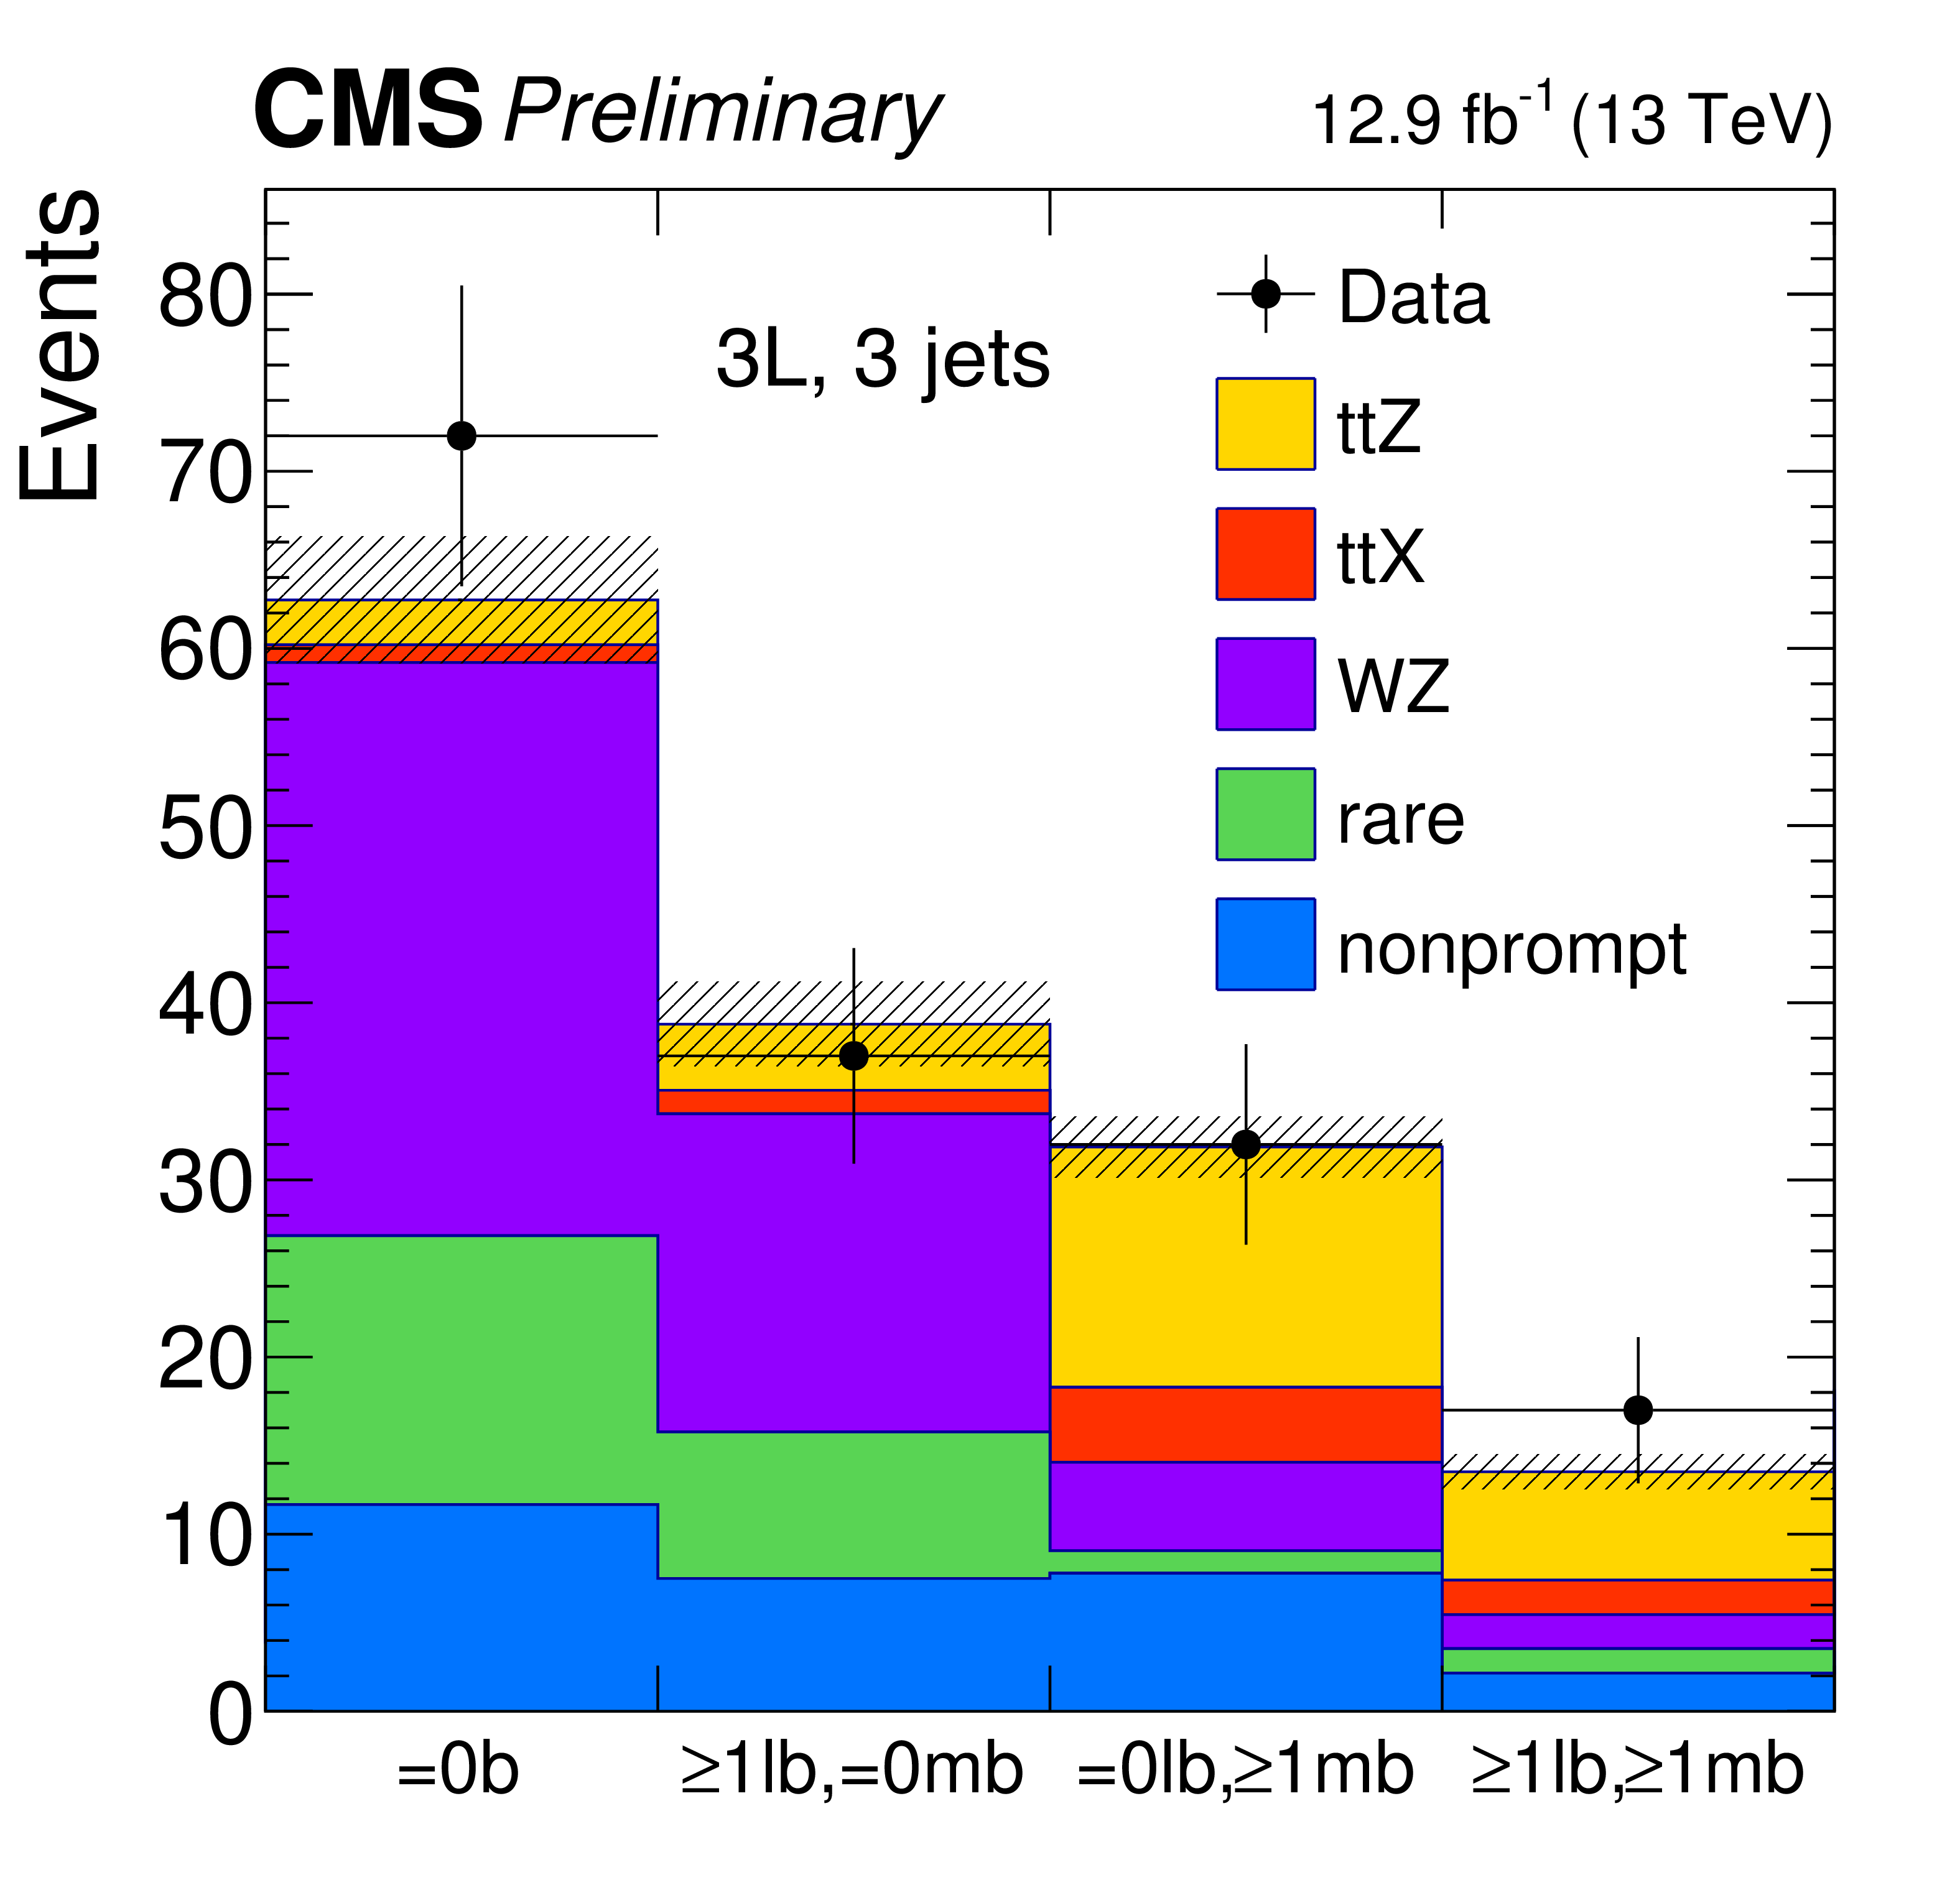
Figure 9:
Predicted and observed yields in $ {N_\text {jets}} =$ 3 category in the three-lepton analyses. The characters "b", "lb" and "mb" in the x-axis labels represent "b-jet", "loose b-jet" and "medium b-jet" respectively. The hatched band shows the total pre-fit uncertainty associated to signal and background predictions where major sources of the uncertainties are uncorrelated and summed in quadrature. |
png pdf |
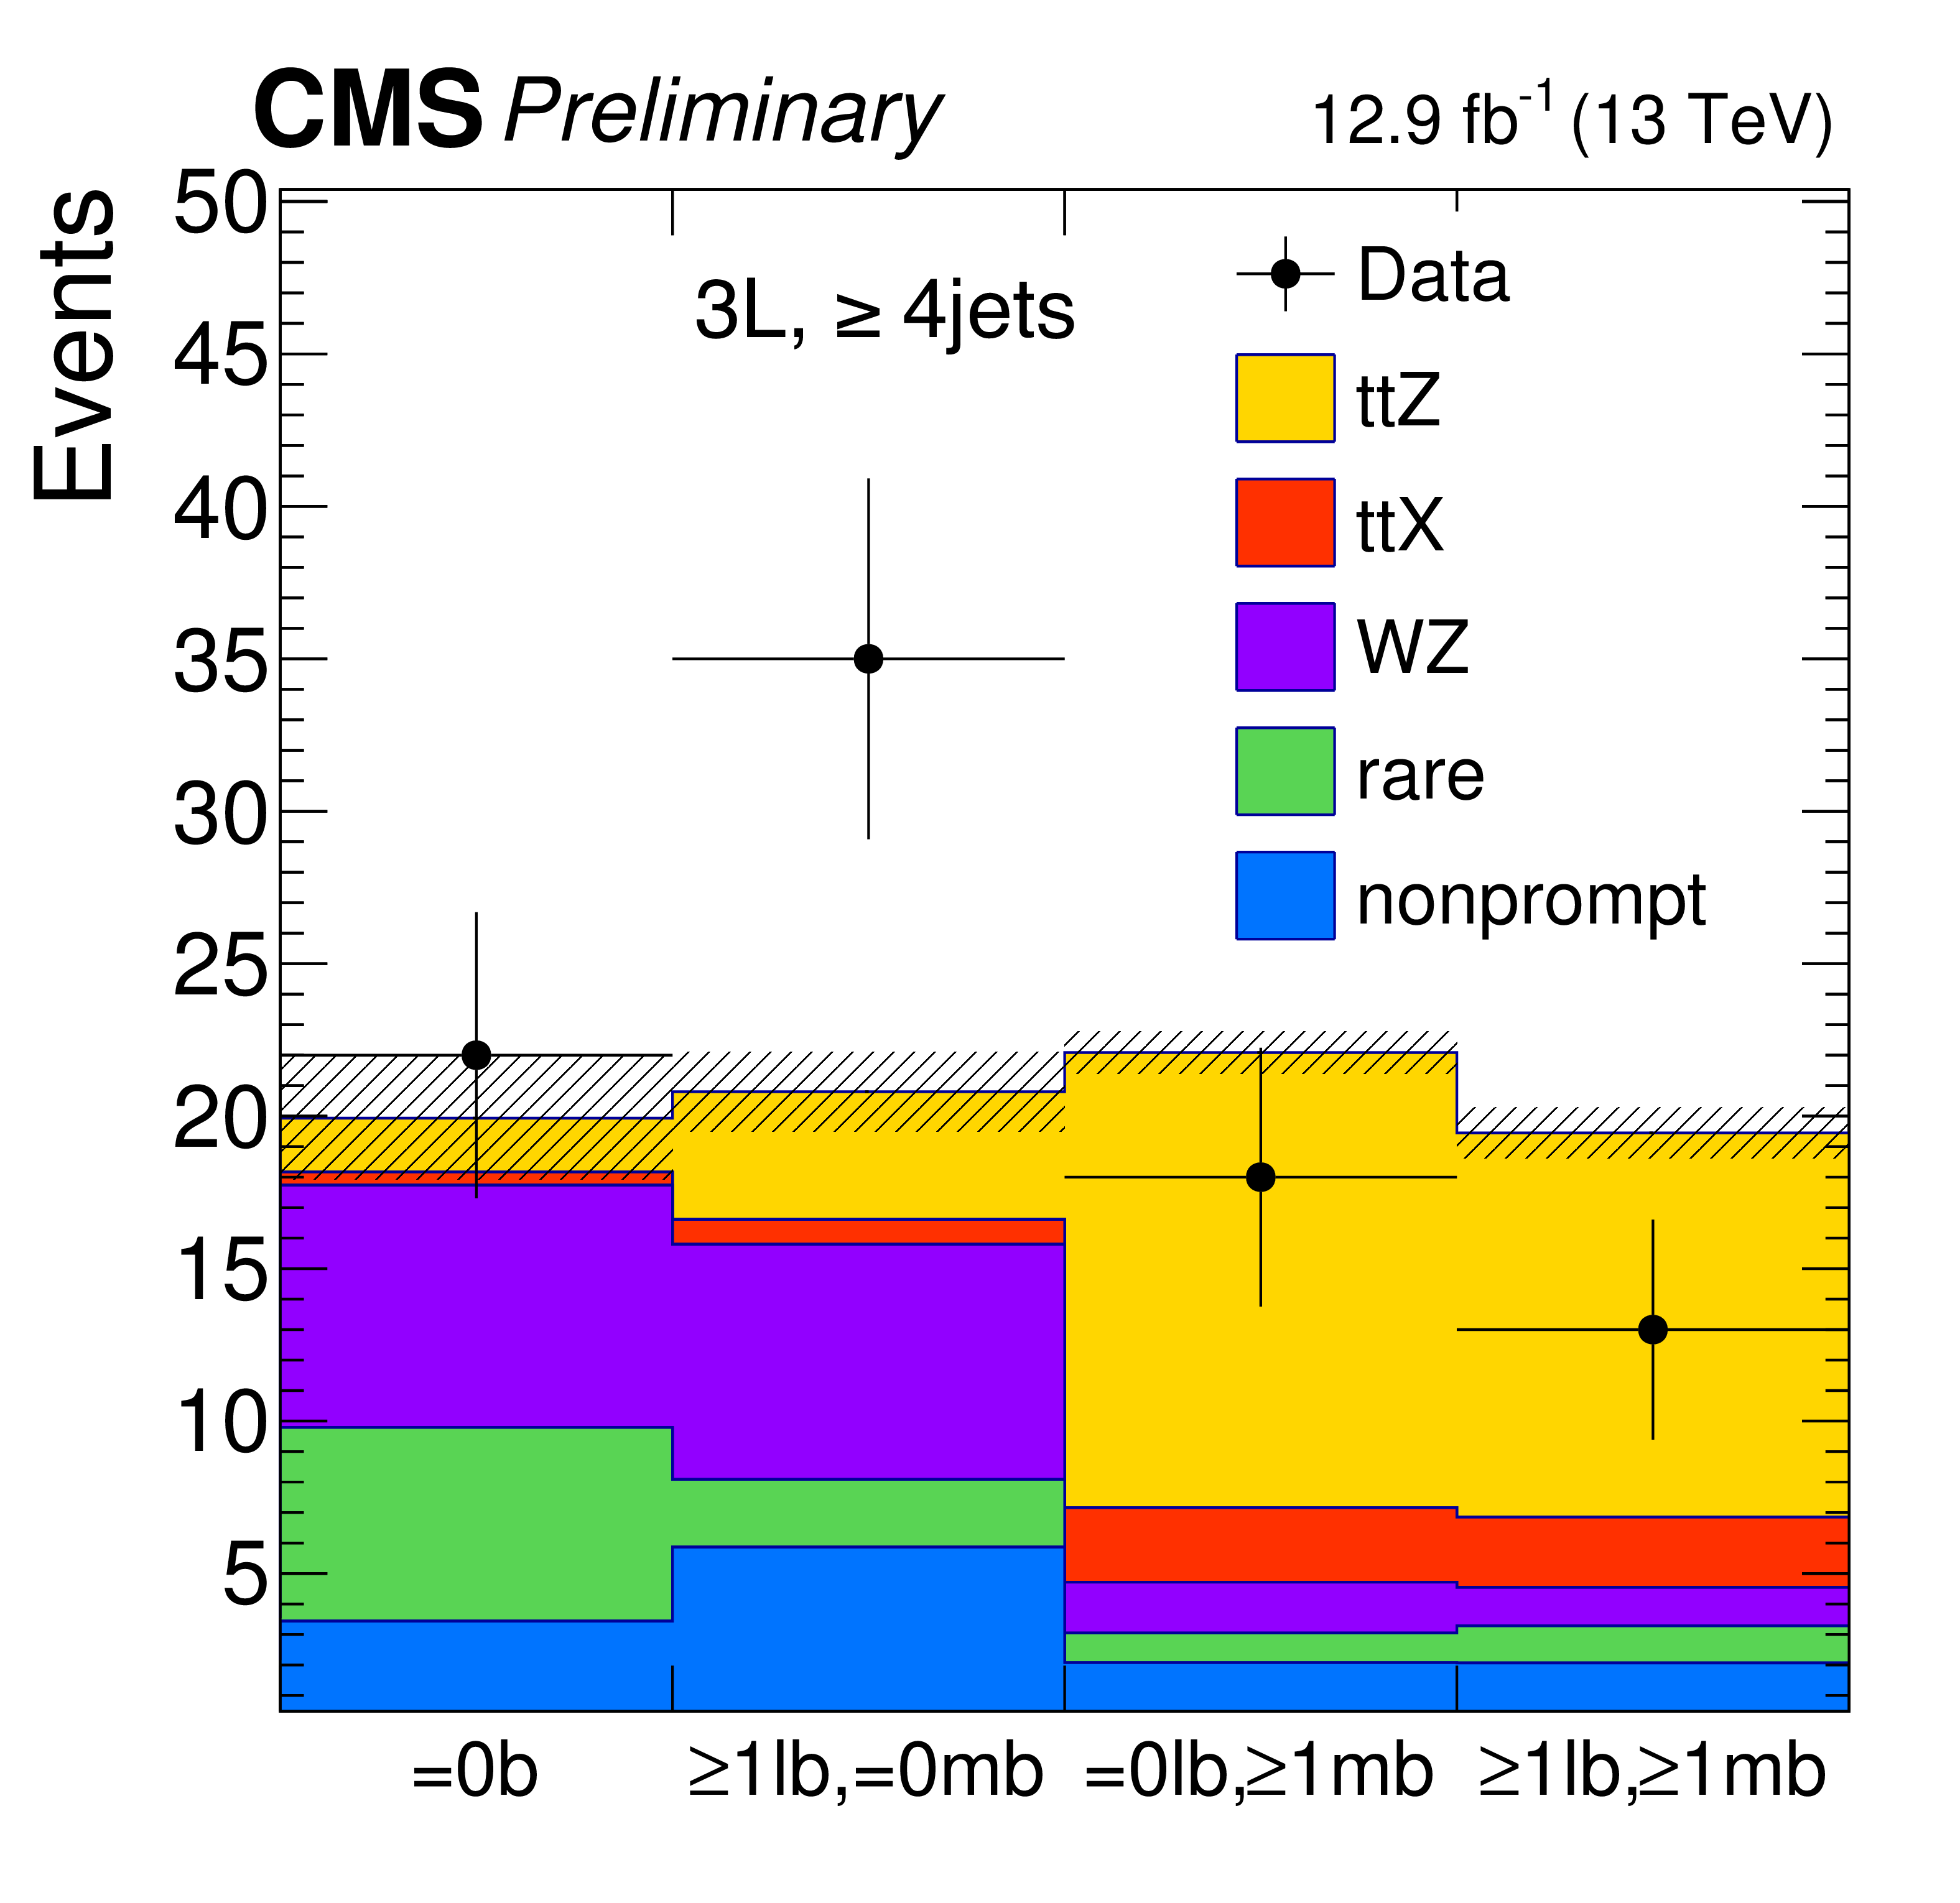
Figure 10:
Predicted and observed yields in $ {N_\text {jets}} \geq $ 4 category in the three-lepton analyses. The characters "b", "lb" and "mb" in the x-axis labels represent "b-jet", "loose b-jet" and "medium b-jet" respectively. The hatched band shows the total pre-fit uncertainty associated to signal and background predictions where major sources of the uncertainties are uncorrelated and summed in quadrature. |
png pdf |
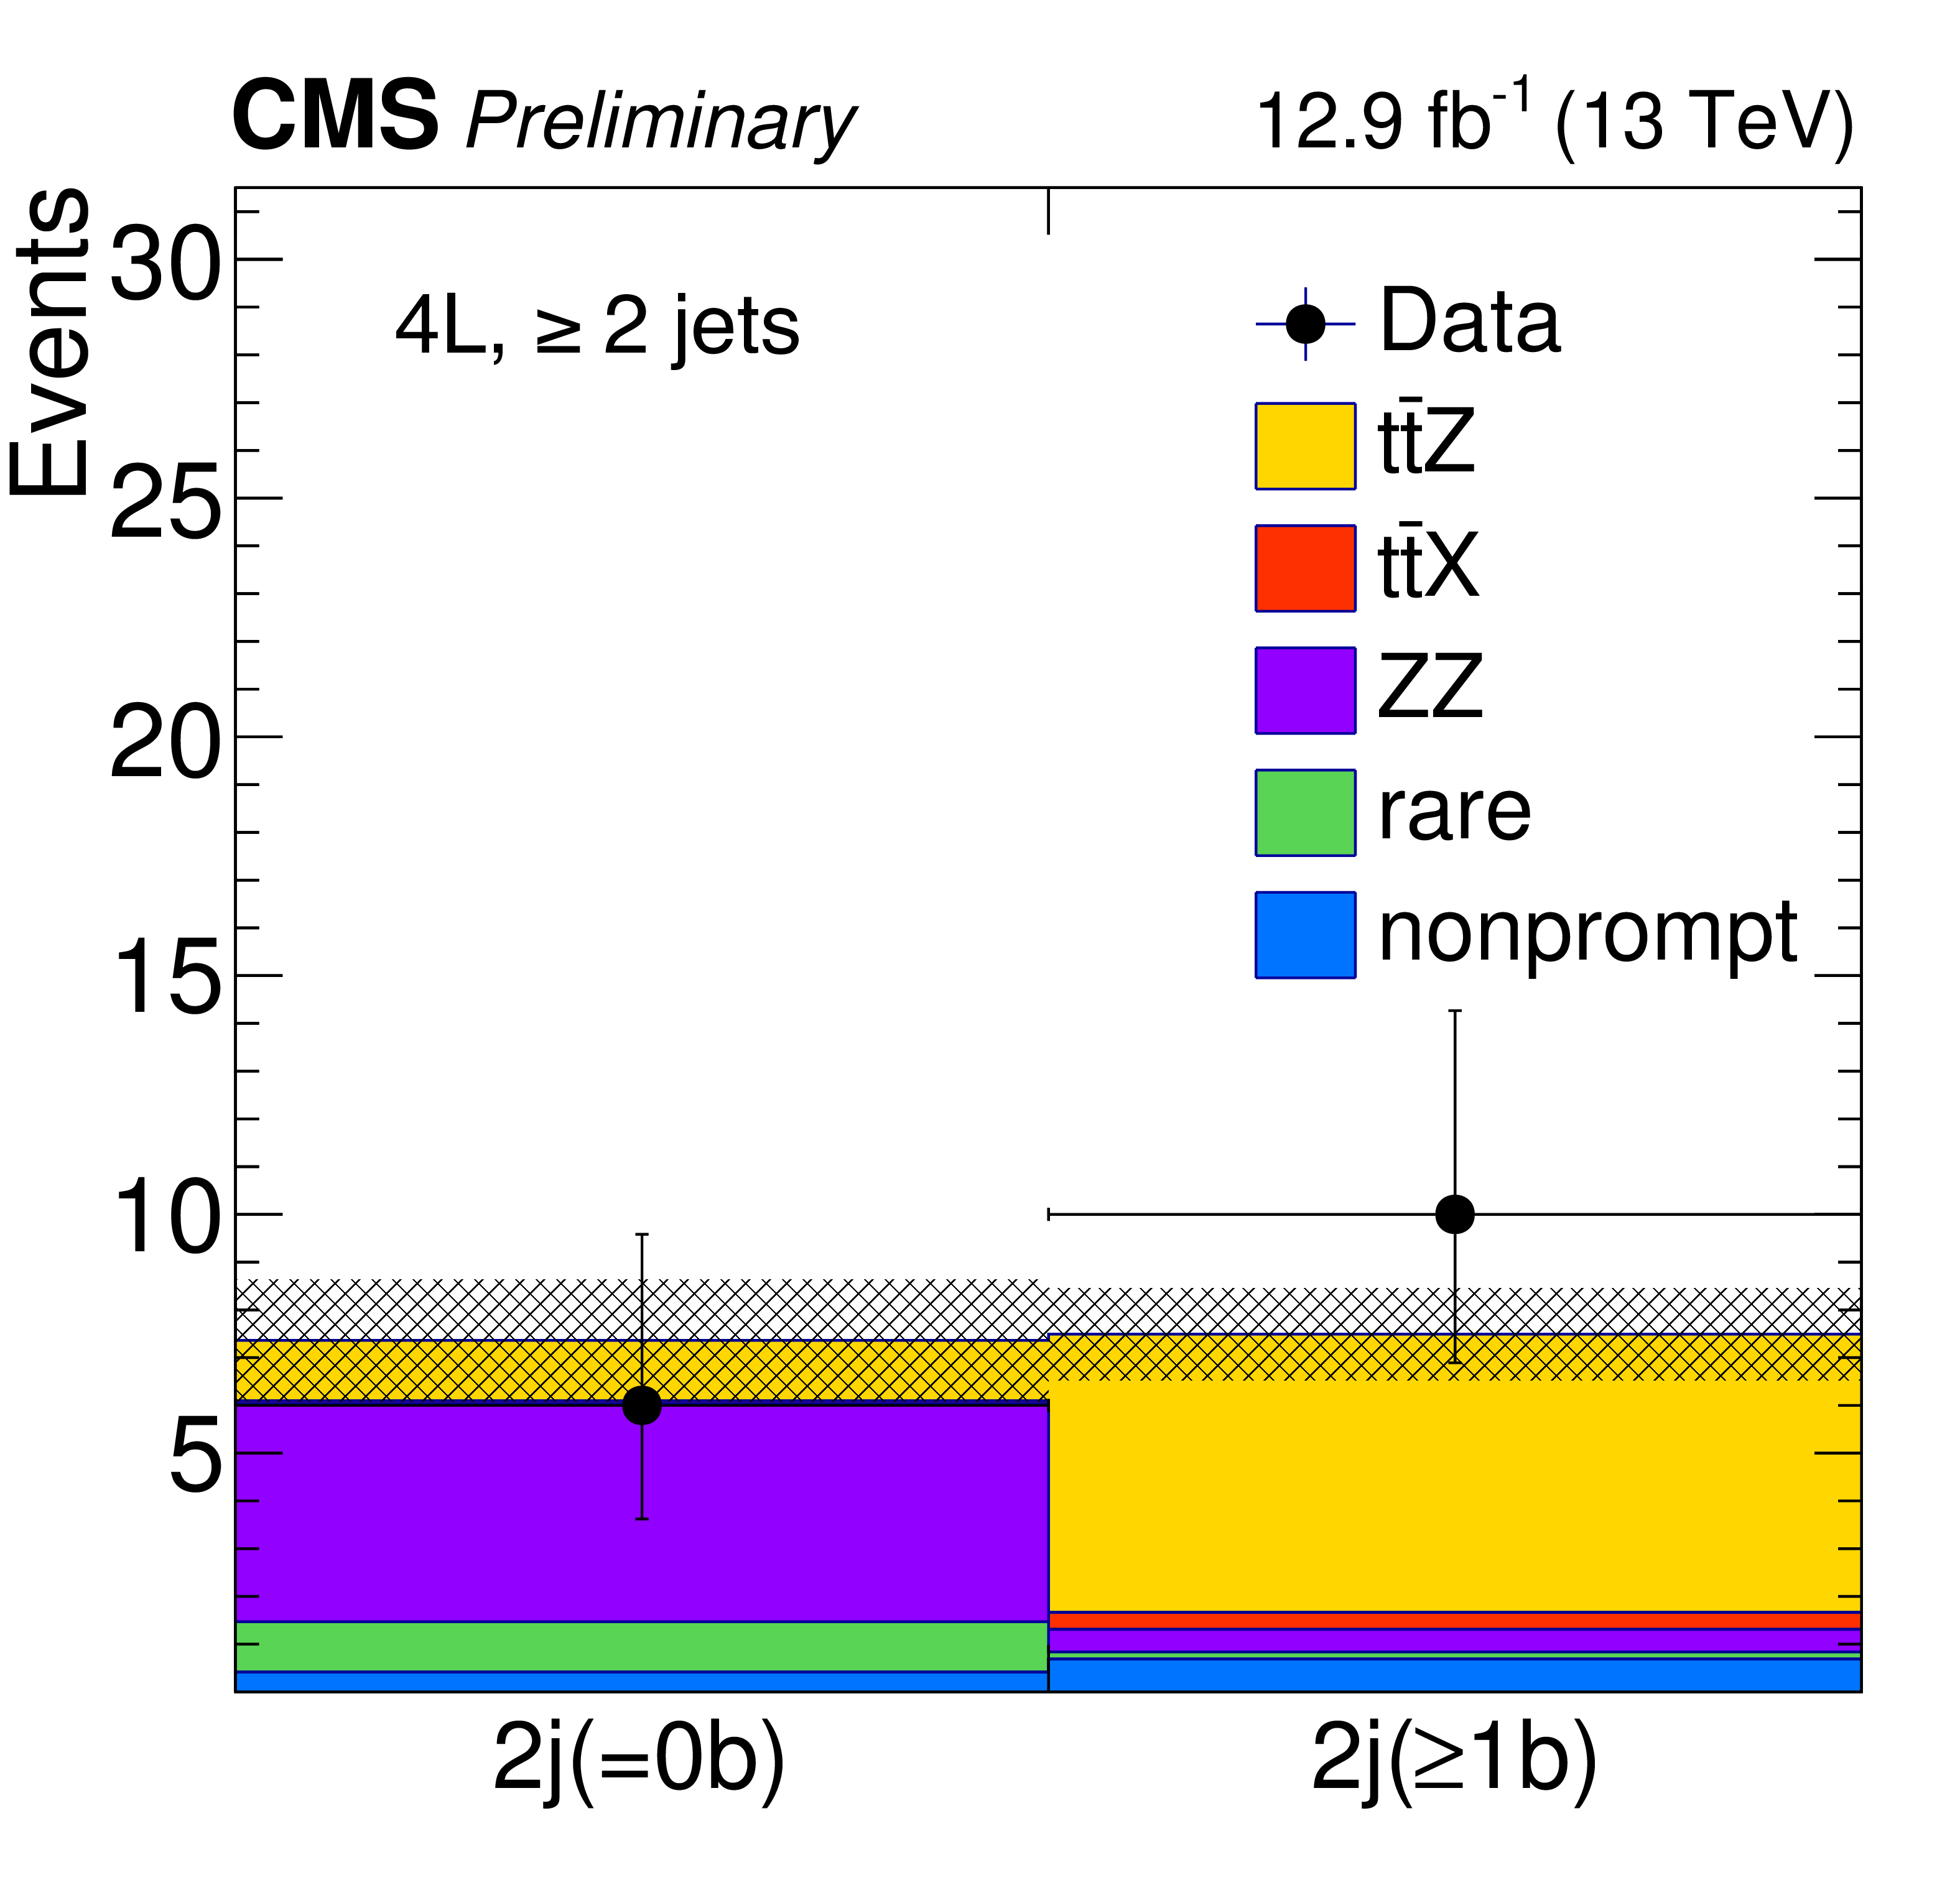
Figure 11:
Predicted and observed yields in each analysis bin in the four-lepton analyses. The characters "j" and "b" in the x-axis labels represent "jet" and "b-jet", respectively. The hatched band shows the total pre-fit uncertainty associated to signal and background predictions where major sources of the uncertainties are uncorrelated and summed in quadrature. |
png pdf |
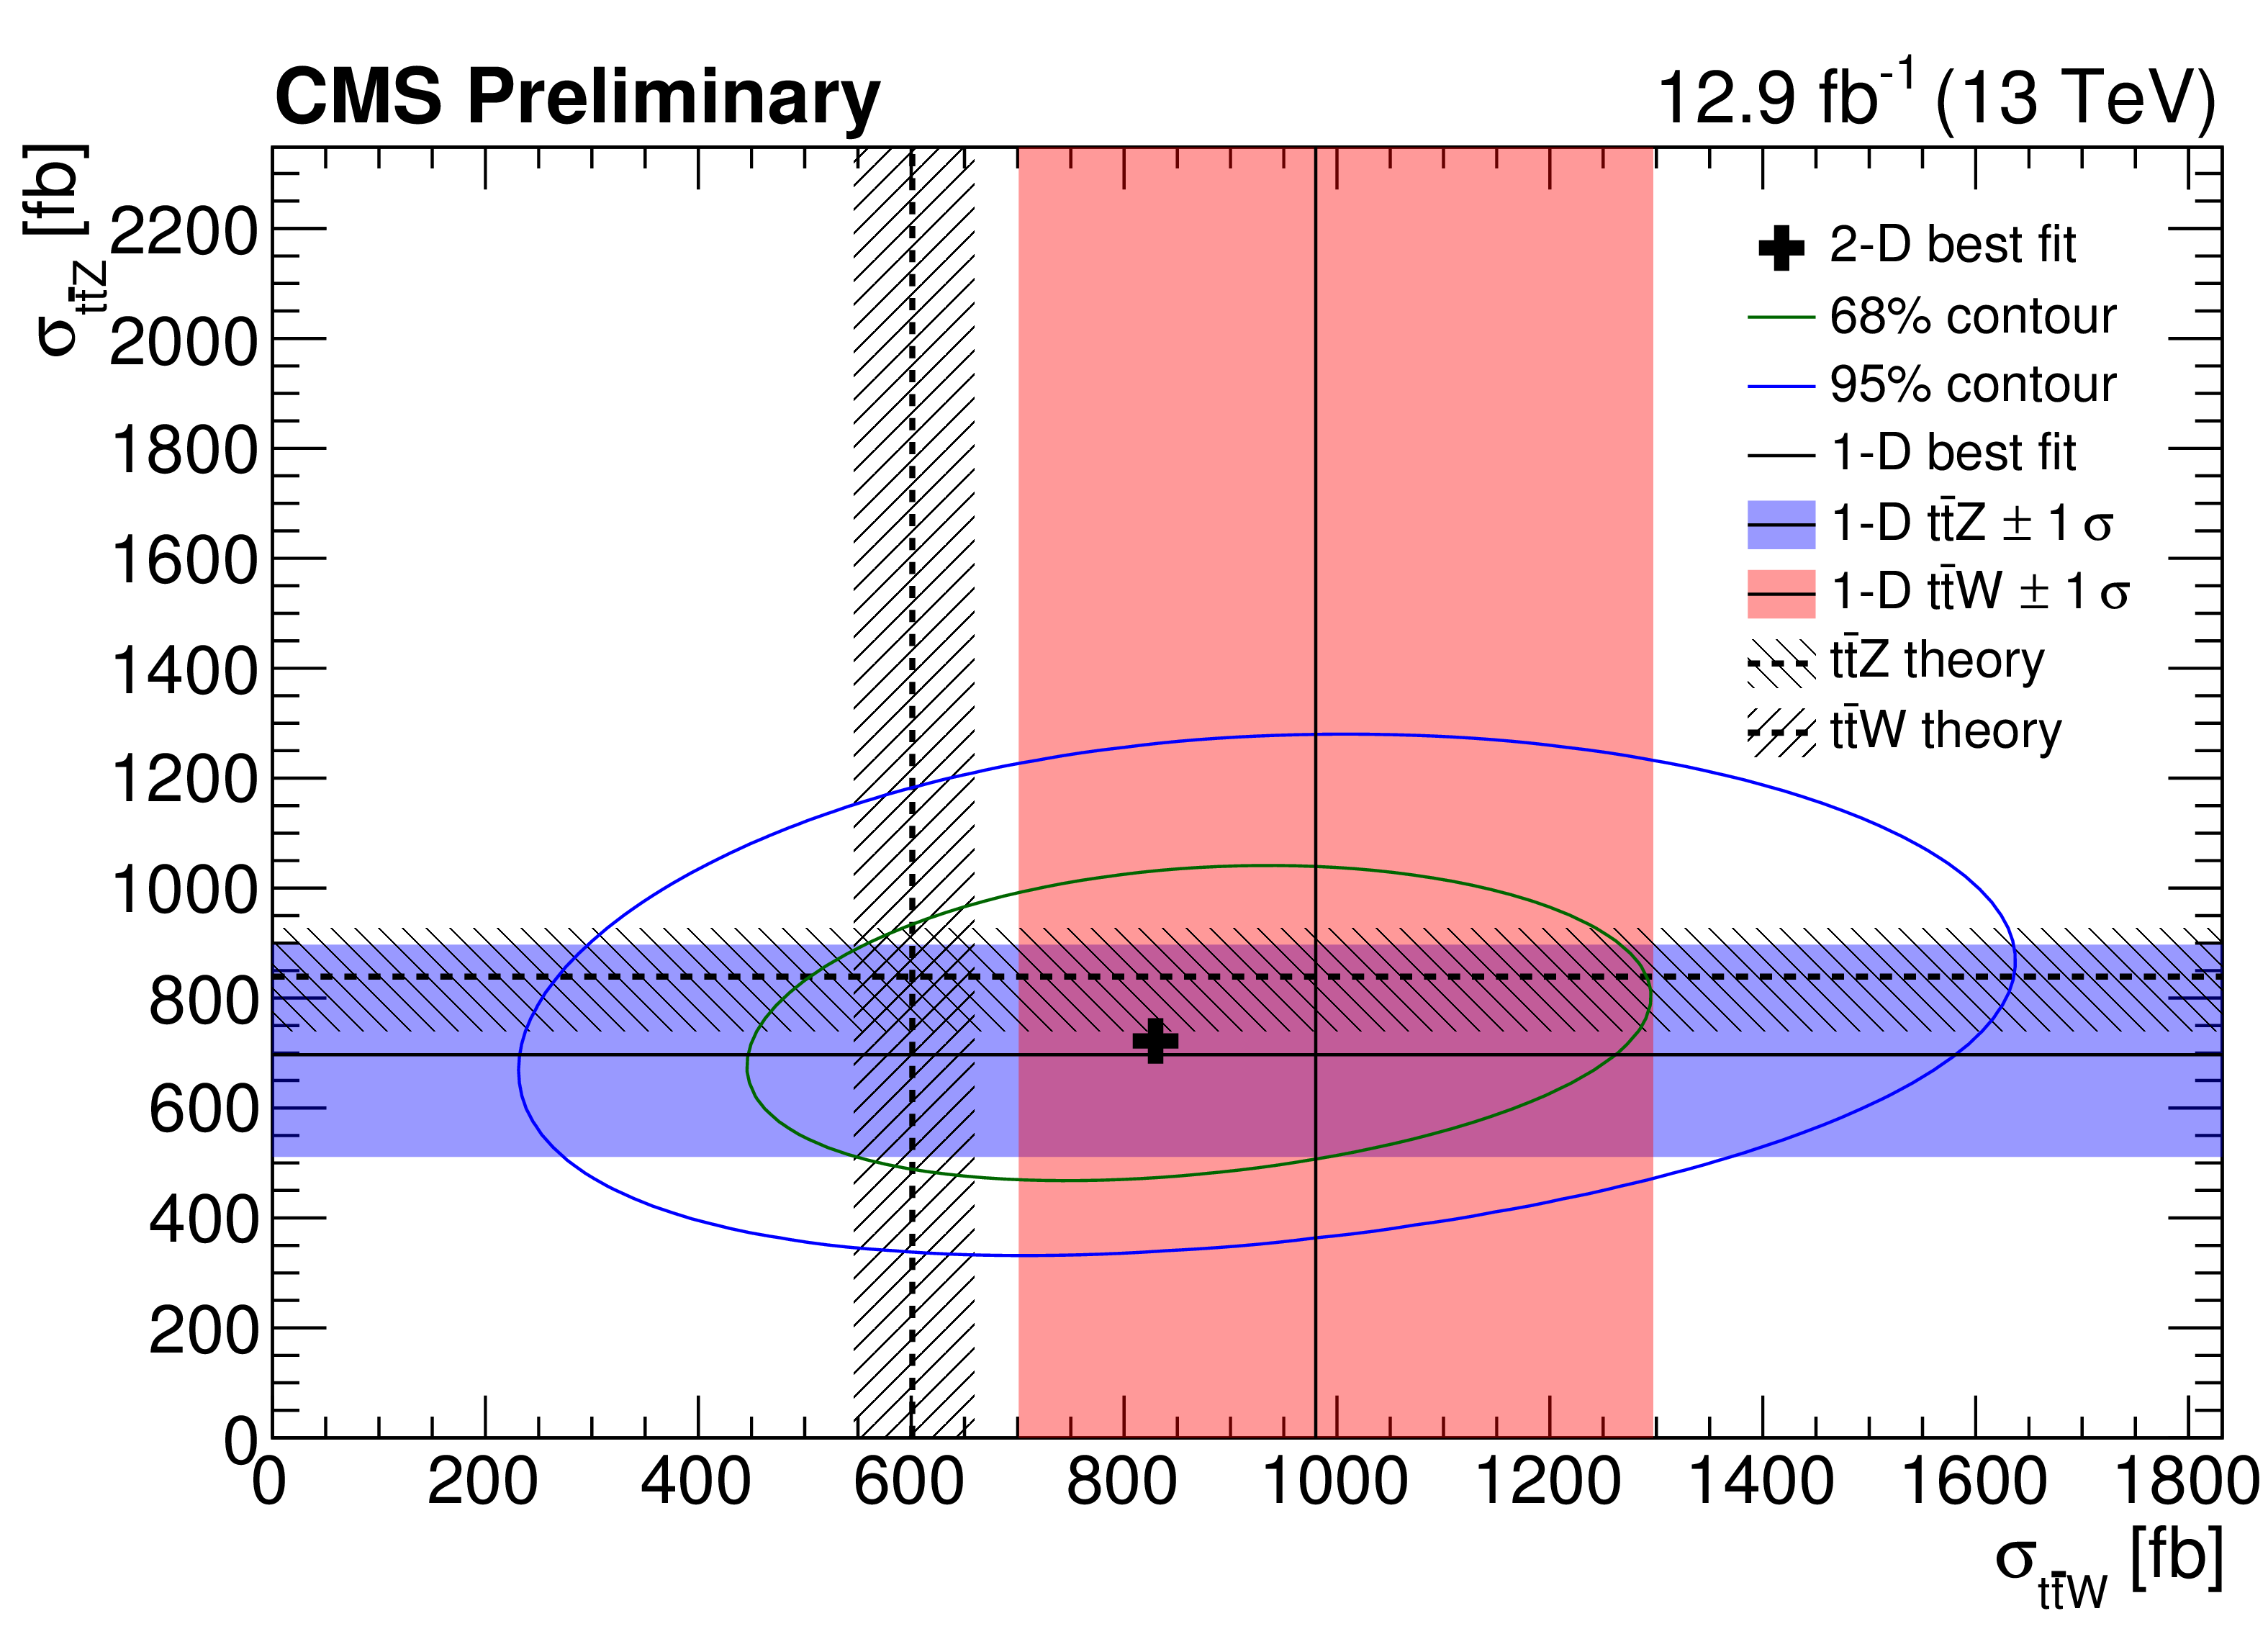
Figure 12:
The result of the two-dimensional best fit for ${ {\mathrm {t}\overline {\mathrm {t}}} {\mathrm {W}}}$ and ${ {\mathrm {t}\overline {\mathrm {t}}} {\mathrm {Z}}}$ cross sections (cross symbol) is shown along with its 68 and 95% confidence level contours. The result of this fit is superimposed with the separate ${ {\mathrm {t}\overline {\mathrm {t}}} {\mathrm {W}}}$ and ${ {\mathrm {t}\overline {\mathrm {t}}} {\mathrm {Z}}}$ cross section measurements, and the corresponding 1$\sigma $ bands, obtained from the dilepton, and the trilepton/four-lepton channels, respectively. The figure also shows the predictions from theory and the corresponding uncertainties. |
| Tables | |
png pdf |
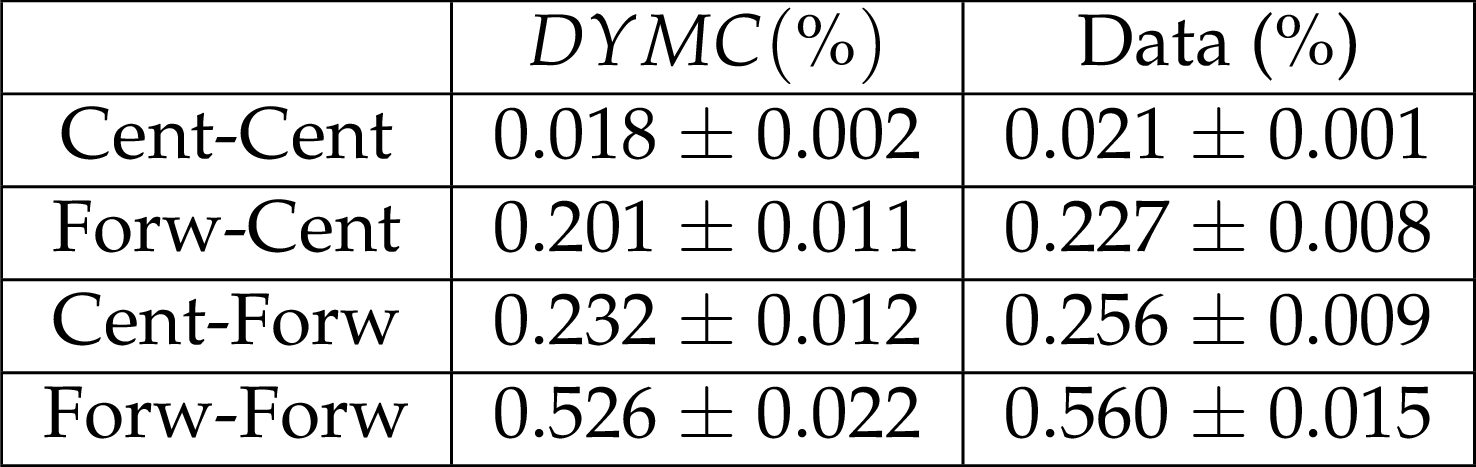
Table 1:
Charge mis-ID rates for dielectron events. Events are classified according to the pseudorapidity of the electrons, with the forward-central category containing a forward leading electron and the central-forward category containing a central leading electron. Charge mis-ID rates were calculated using events falling in the Z-mass window. |
png pdf |
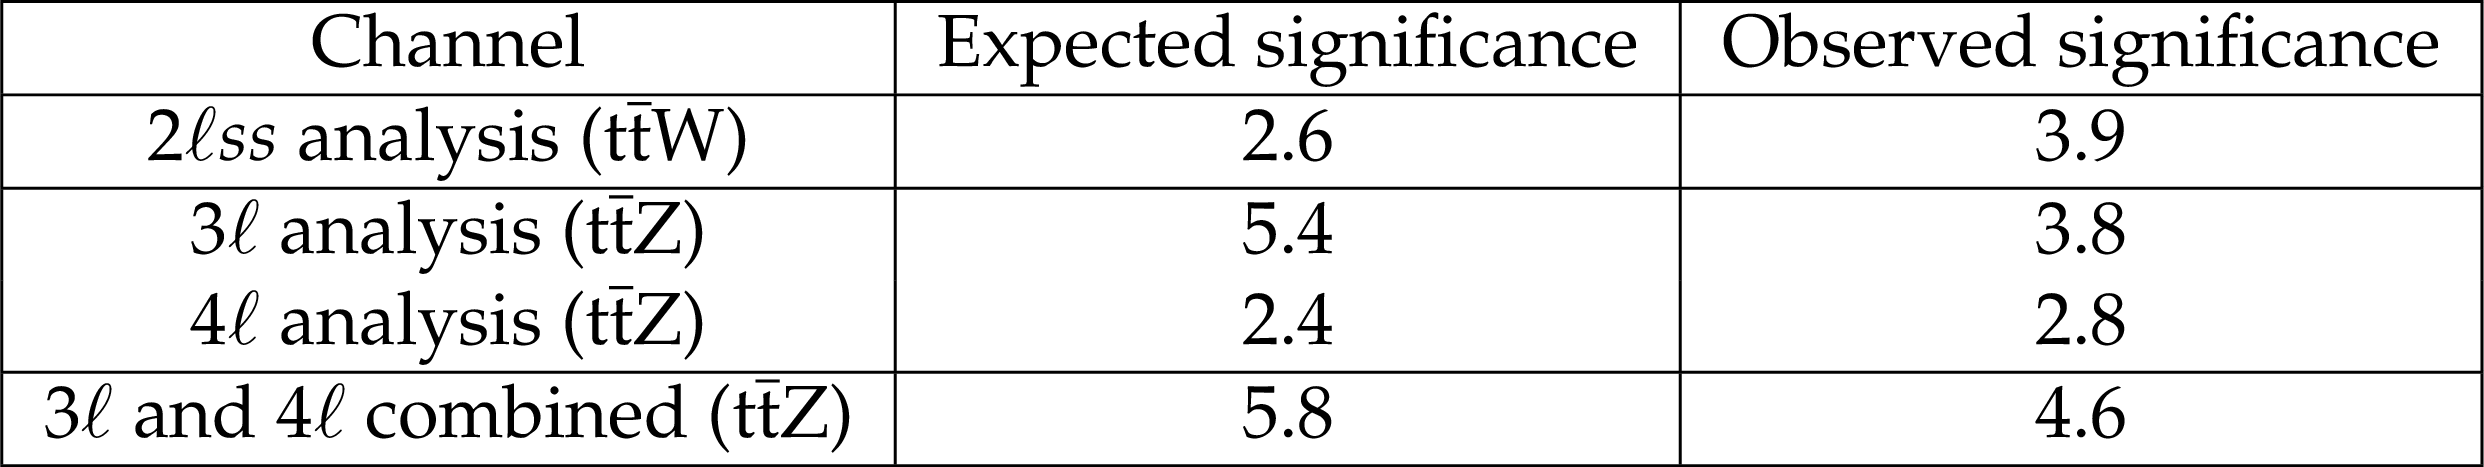
Table 2:
Summary of expected and observed significance for ${ {\mathrm {t}\overline {\mathrm {t}}} {\mathrm {W}}}$ in the same-sign 2-lepton channel and for ${ {\mathrm {t}\overline {\mathrm {t}}} {\mathrm {Z}}}$ in the 3-lepton, 4-lepton channels and in the two channels combined. |
| Summary |
| A measurement of top quark pair production in association with a W or a Z boson using 13 TeV data is presented. The analysis is performed in the same-sign dilepton final state for ${\mathrm{ t \bar{t} }\mathrm{ W }} $ and the three- and four-lepton final states for ${\mathrm{ t \bar{t} }\mathrm{ Z }} $, and these three are used to extract the cross sections of ${\mathrm{ t \bar{t} }\mathrm{ W }} $ and ${\mathrm{ t \bar{t} }\mathrm{ Z }} $ production. The same-sign dilepton channel achieves a significance of 3.9 standard deviations, the three-lepton analysis 3.8 standard deviations, while the four-lepton analysis 2.8 standard devitations. From the combination of three- and four-lepton channels a significance of 4.6 standard deviations for ${\mathrm{ t \bar{t} }\mathrm{ Z }} $ is obtained. The measured cross sections are $\sigma({\mathrm{ t \bar{t} }\mathrm{ Z }} )=$ 0.70 $^{+0.16}_{-0.15}$ (stat) $^{+0.14}_{-0.12}$ (syst) pb and $\sigma({\mathrm{ t \bar{t} }\mathrm{ W }} )=$ 0.98 $^{+0.23}_{-0.22}$ (stat) $^{+0.22}_{-0.18}$ (syst) pb, in agreement with the standard model predictions. |
| Additional Figures | |
png pdf |
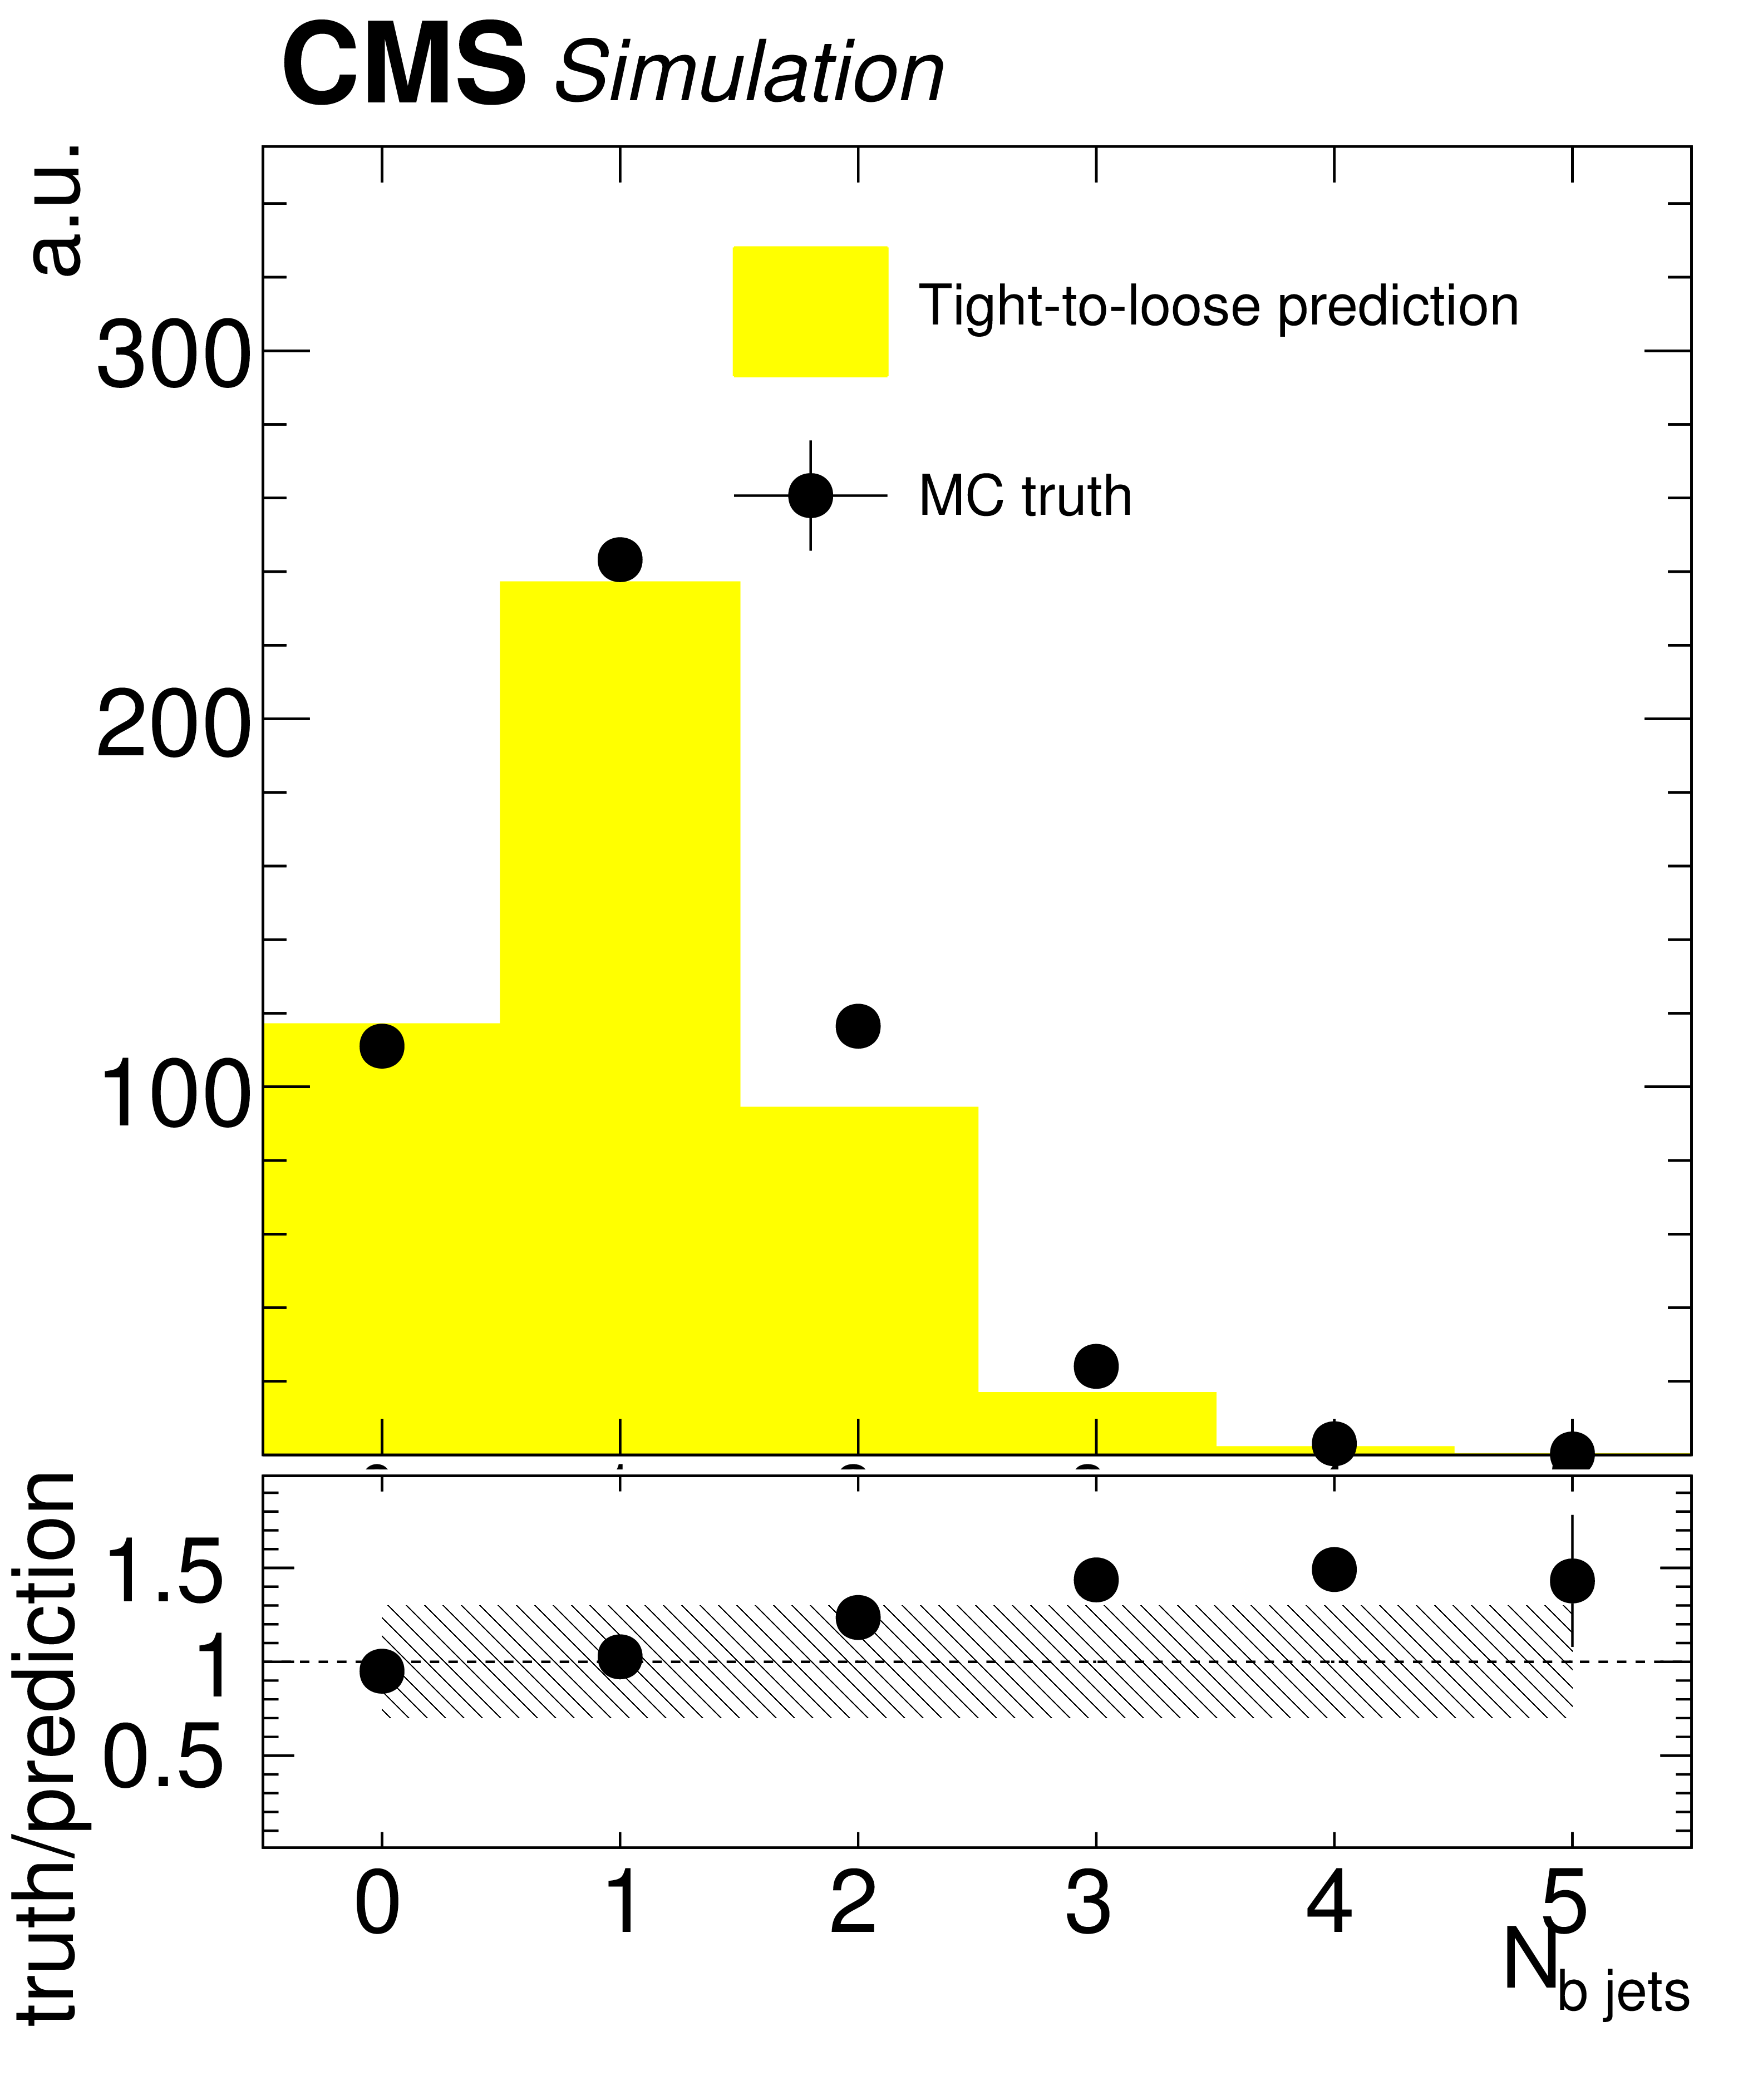
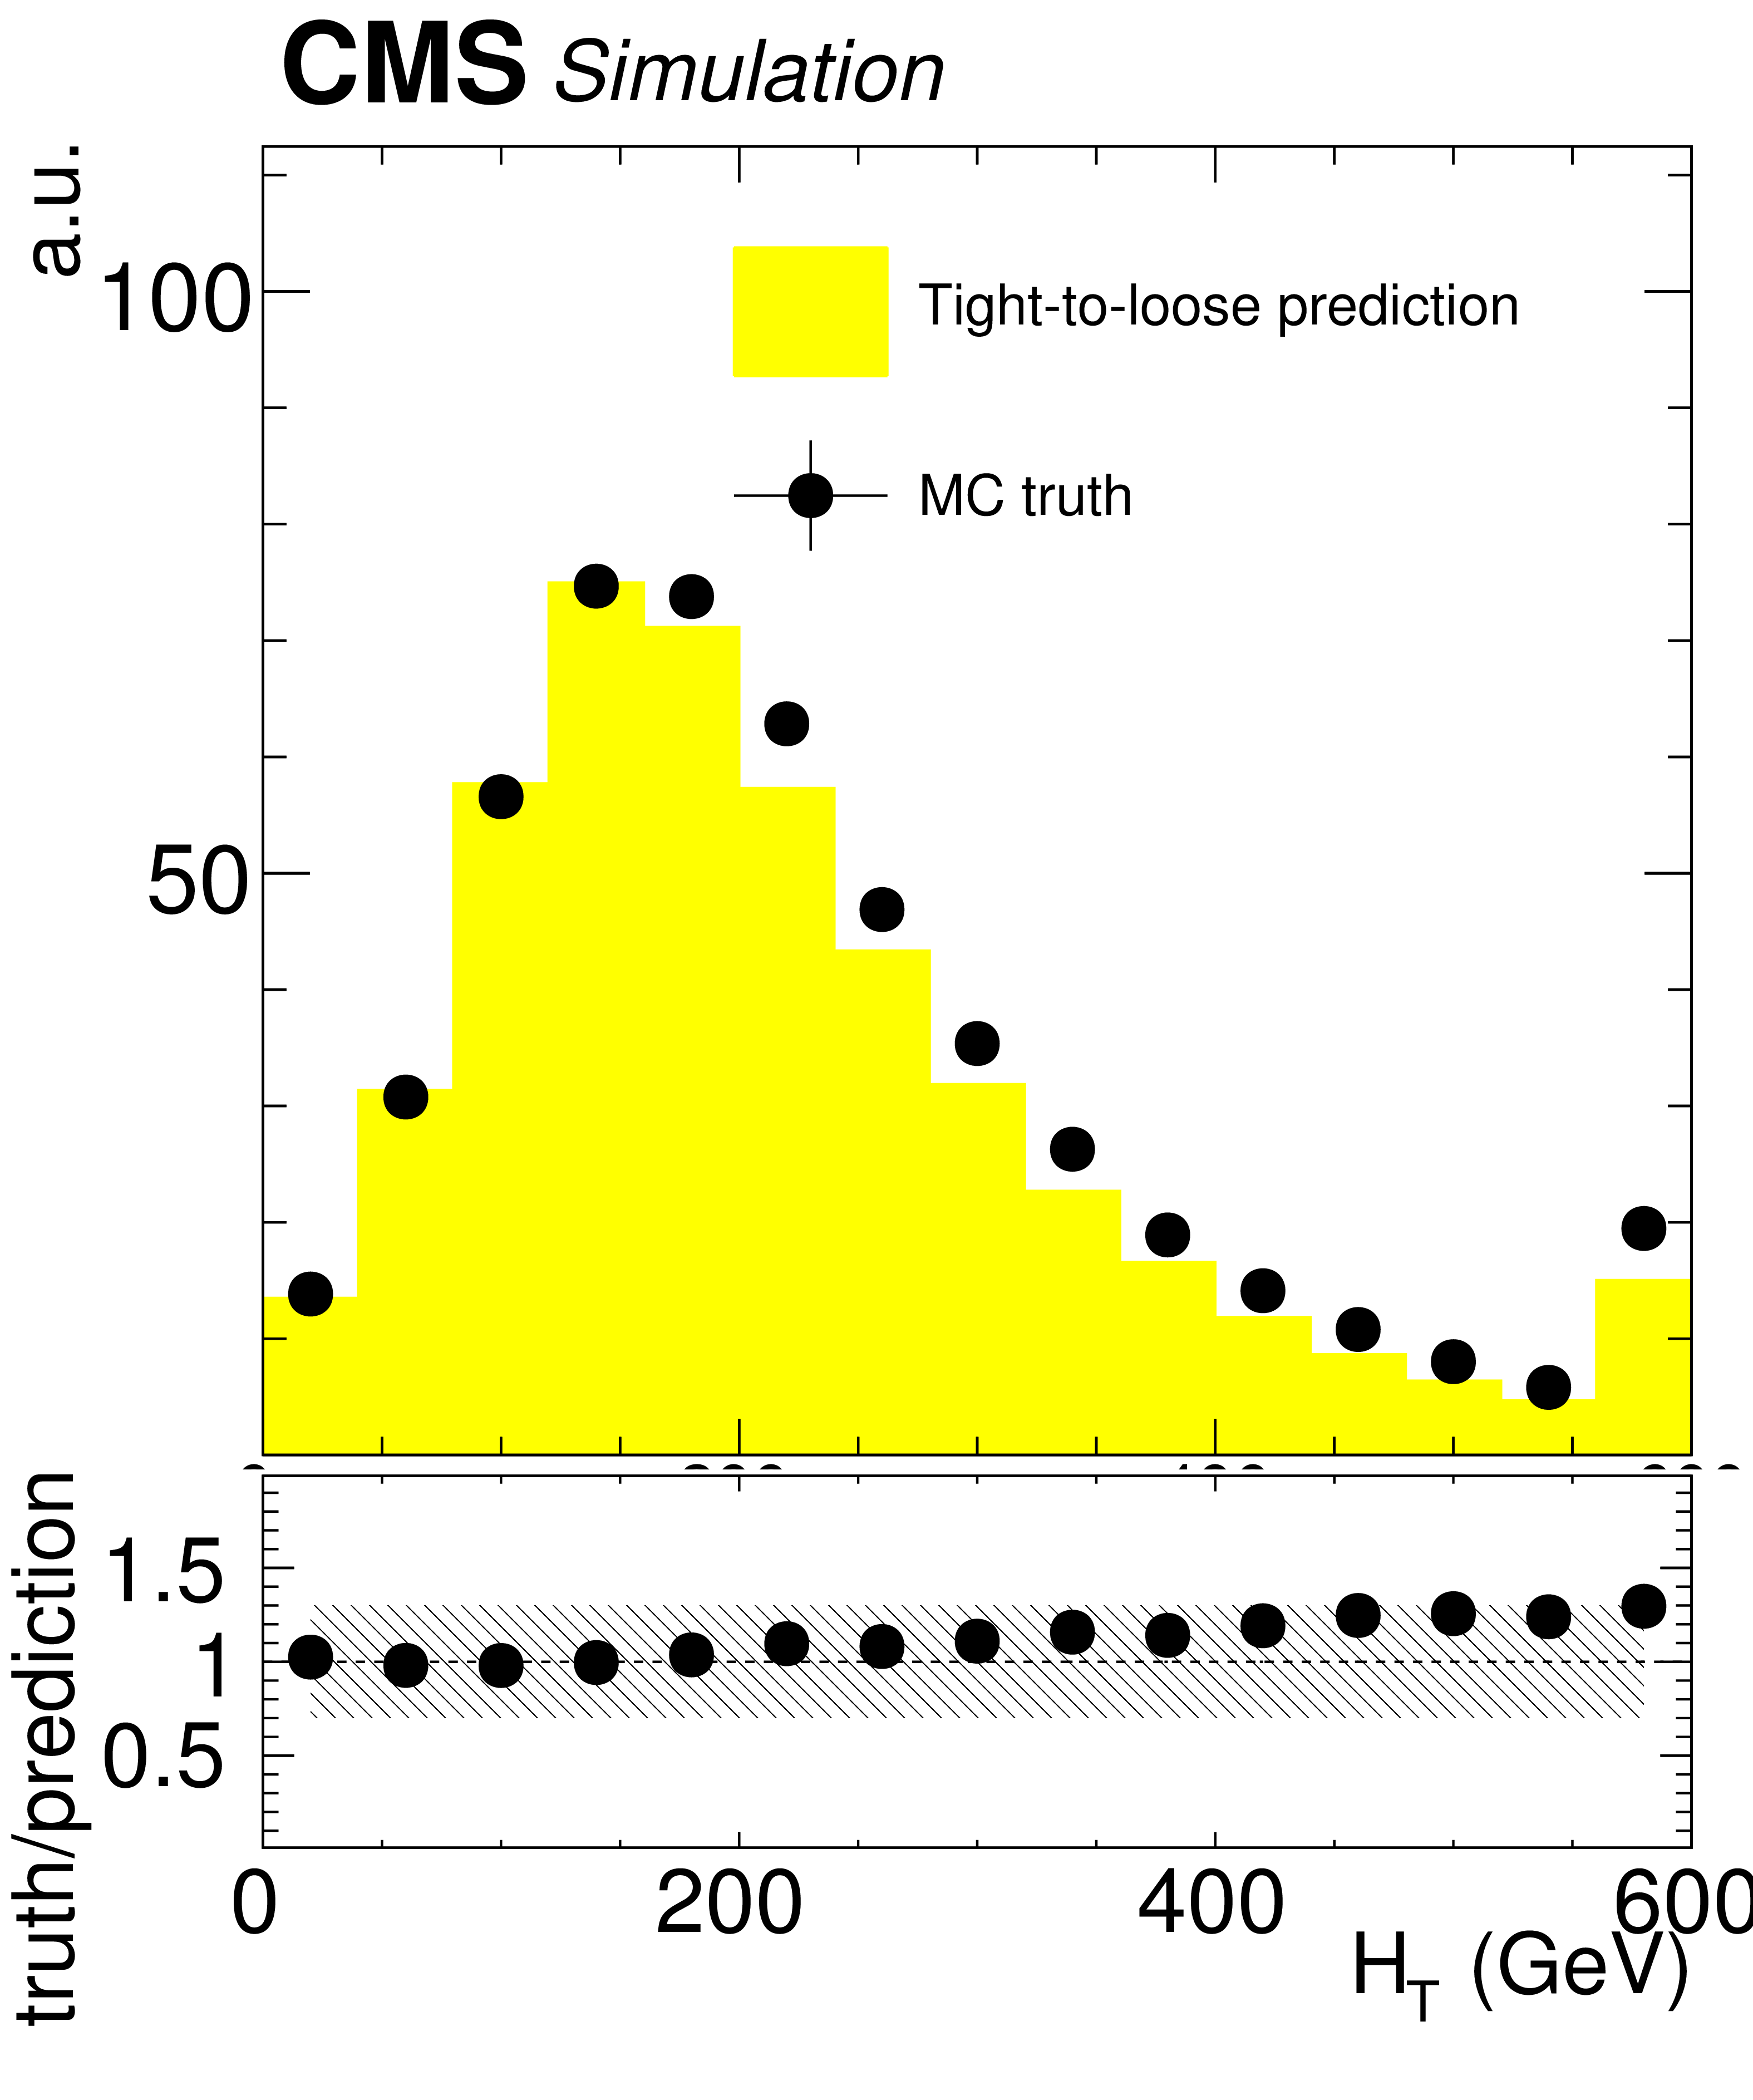
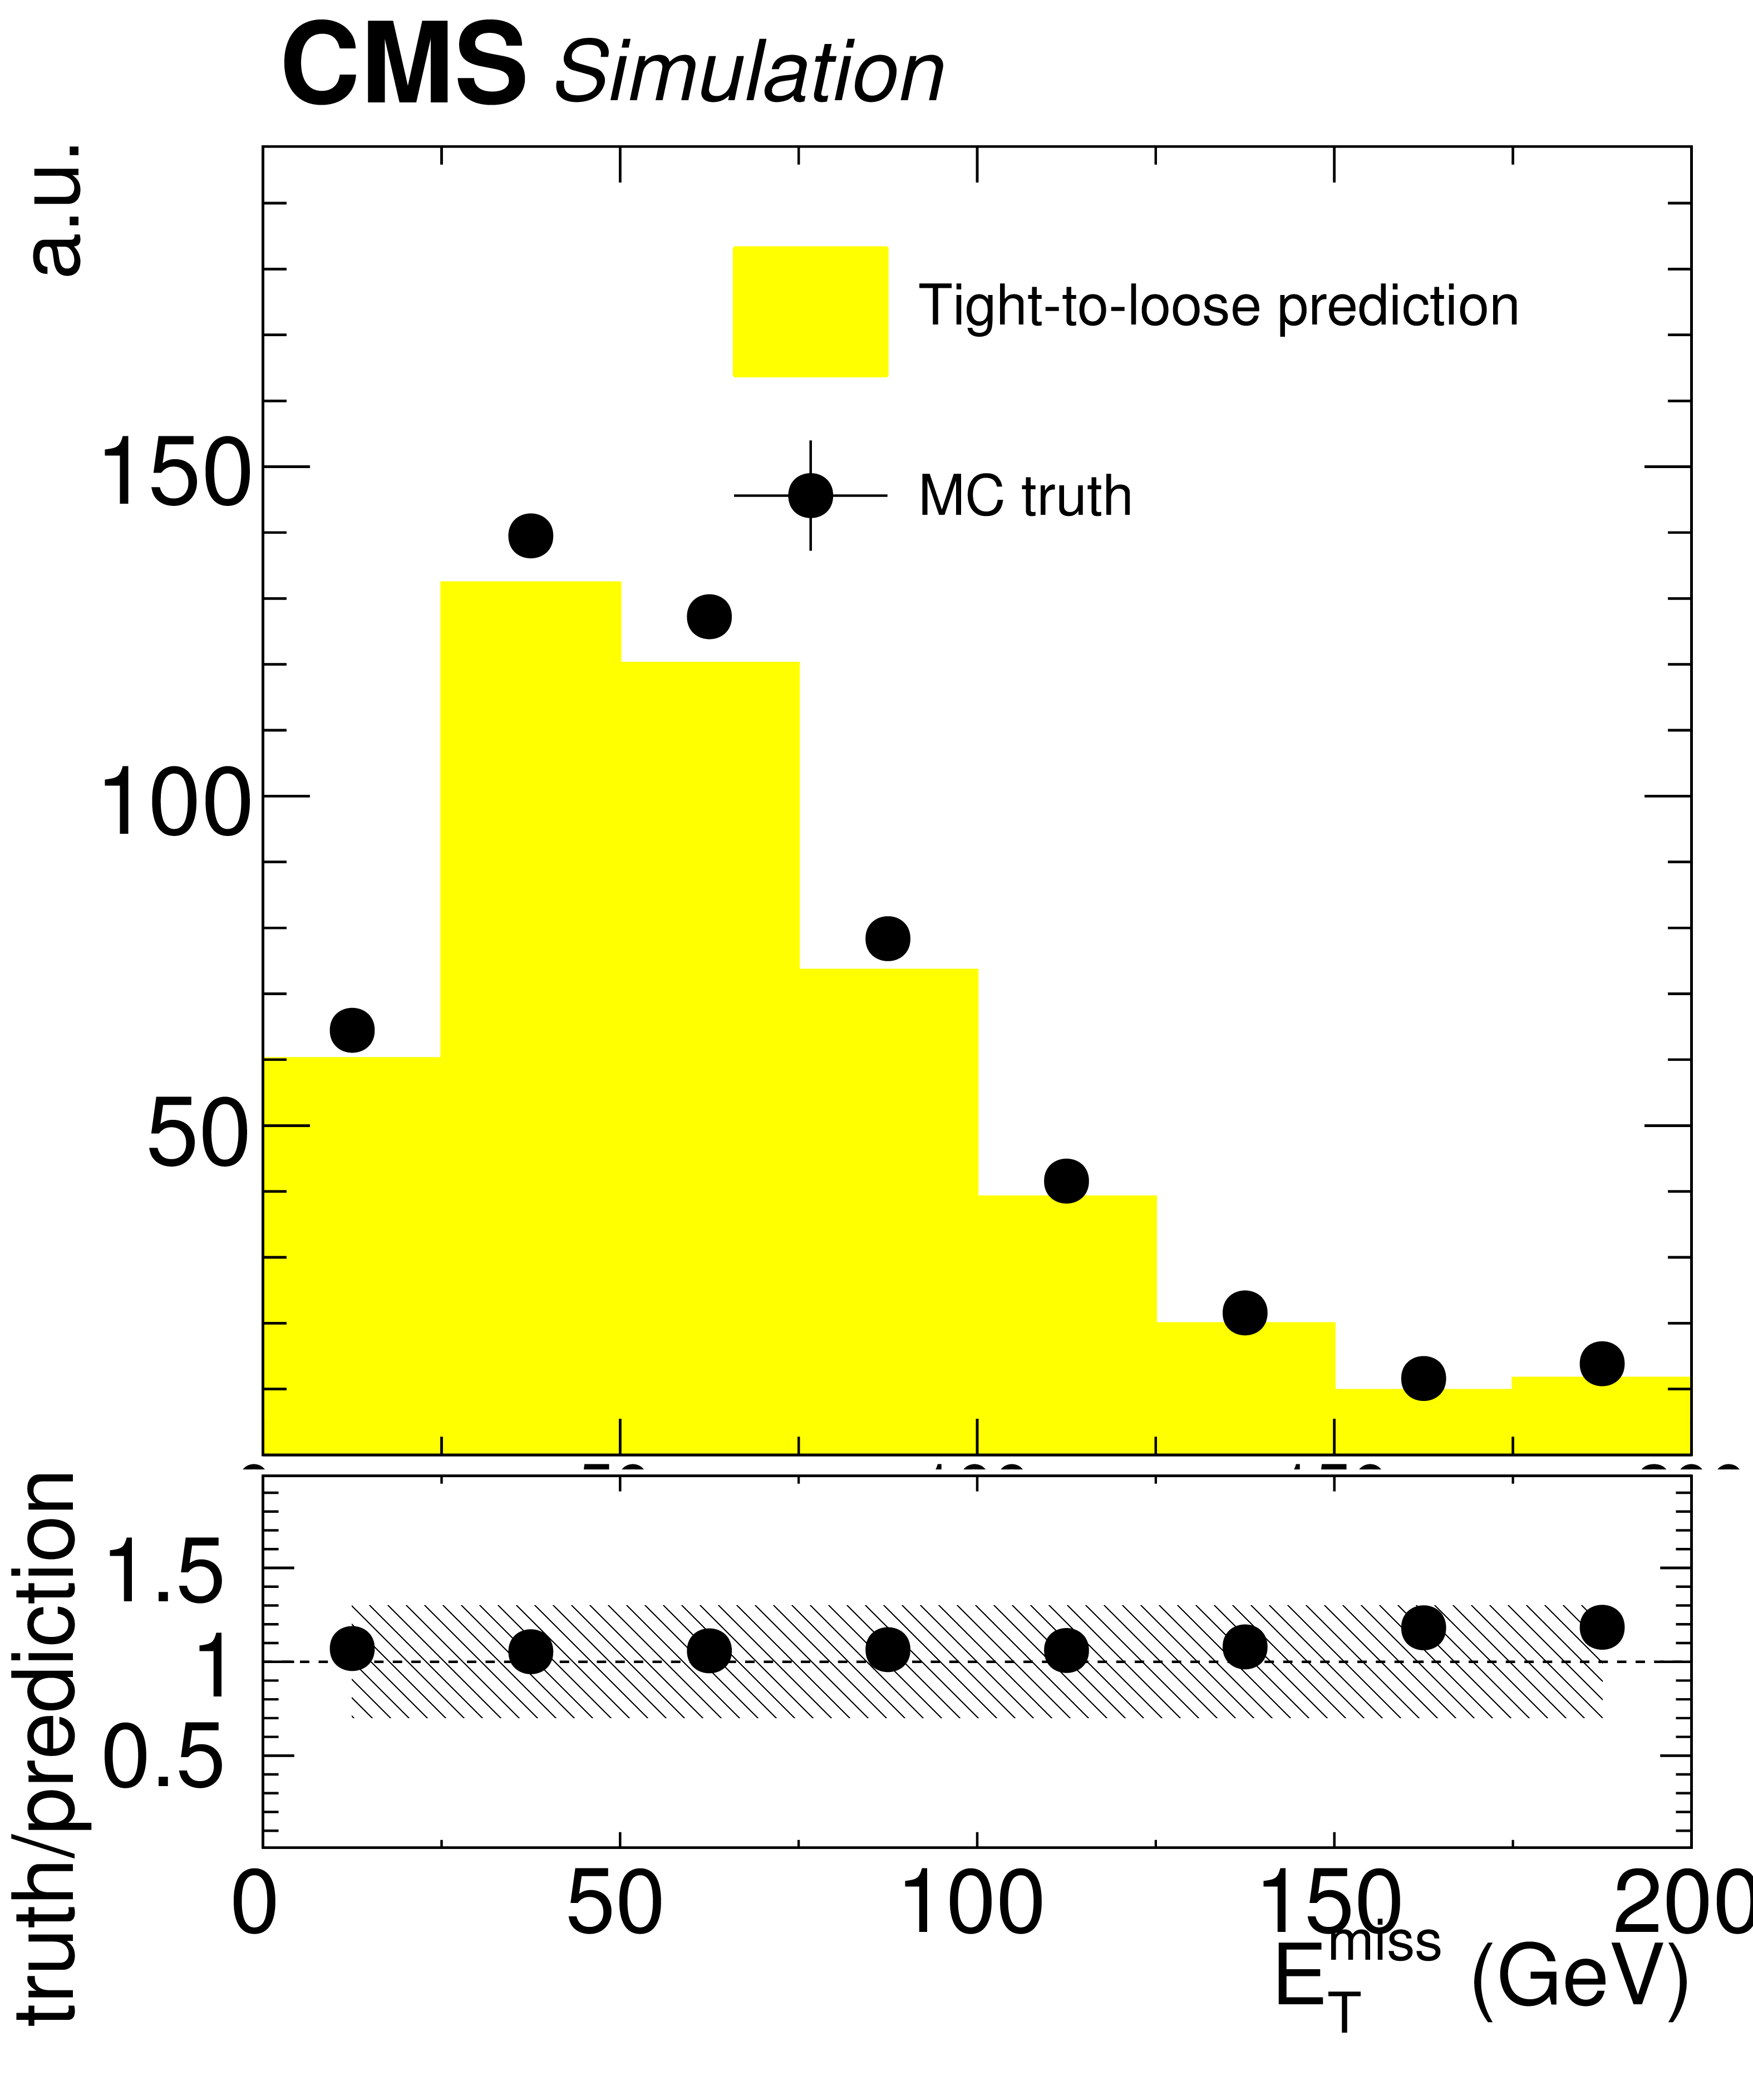
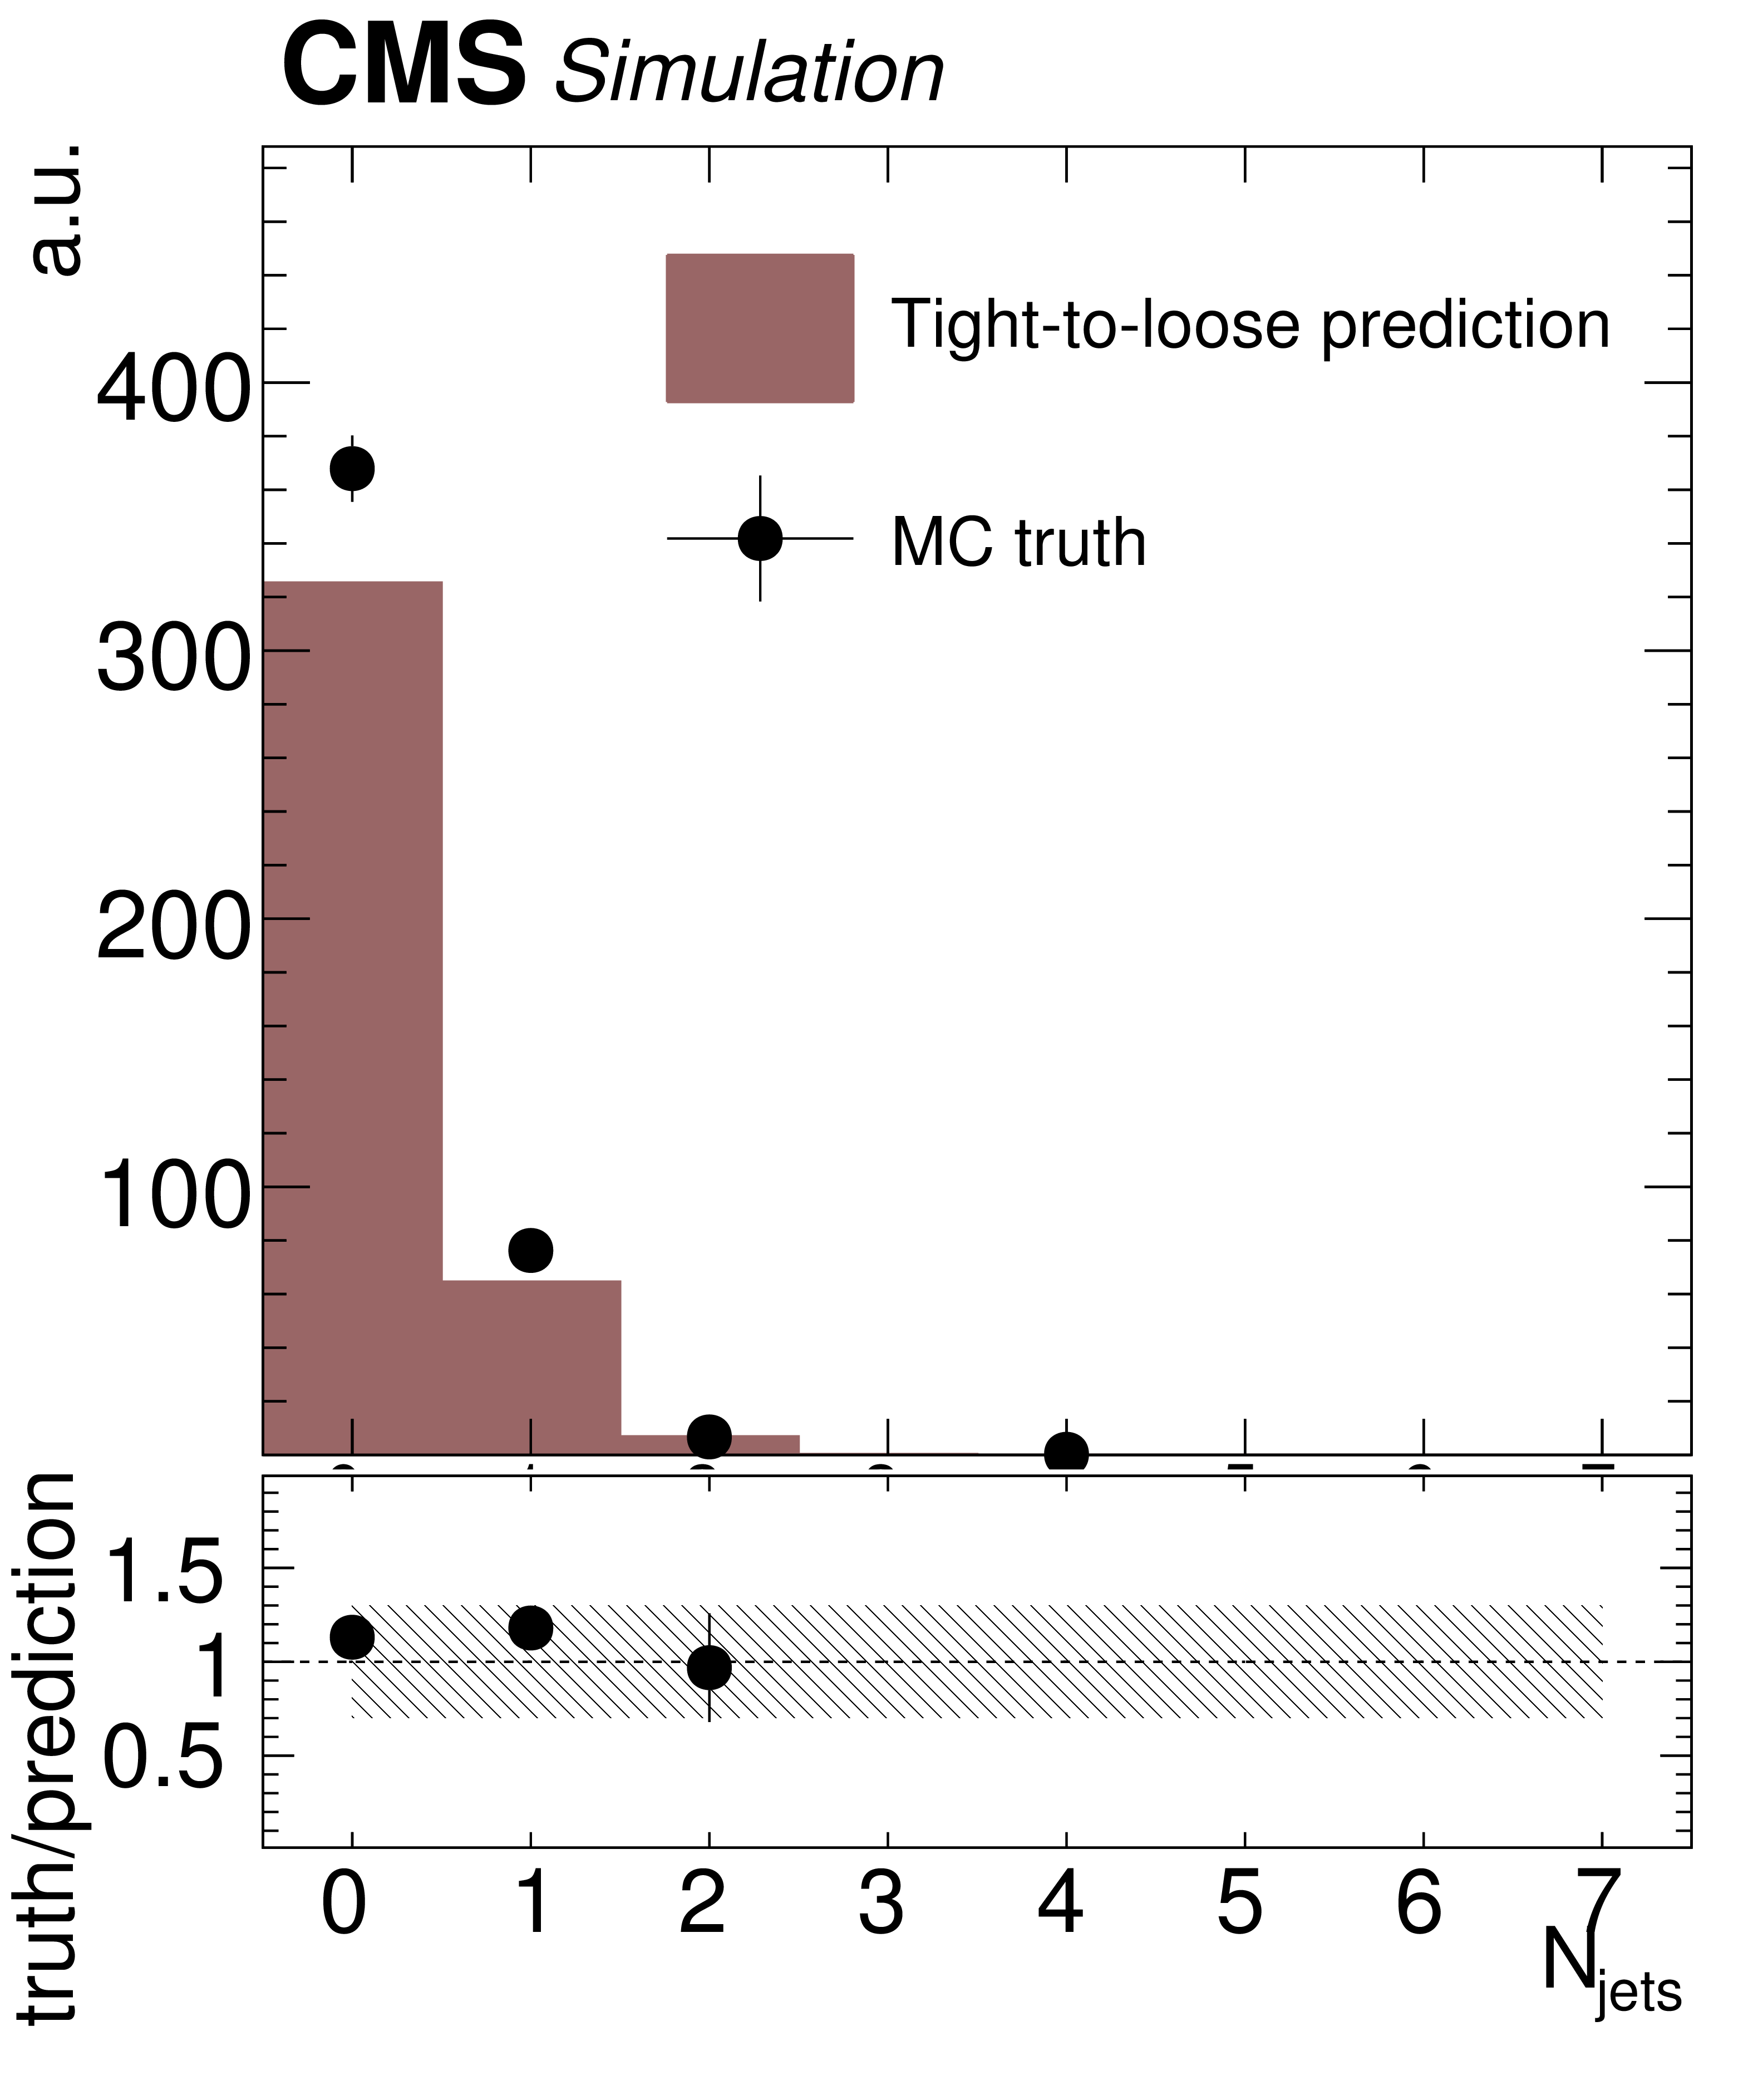
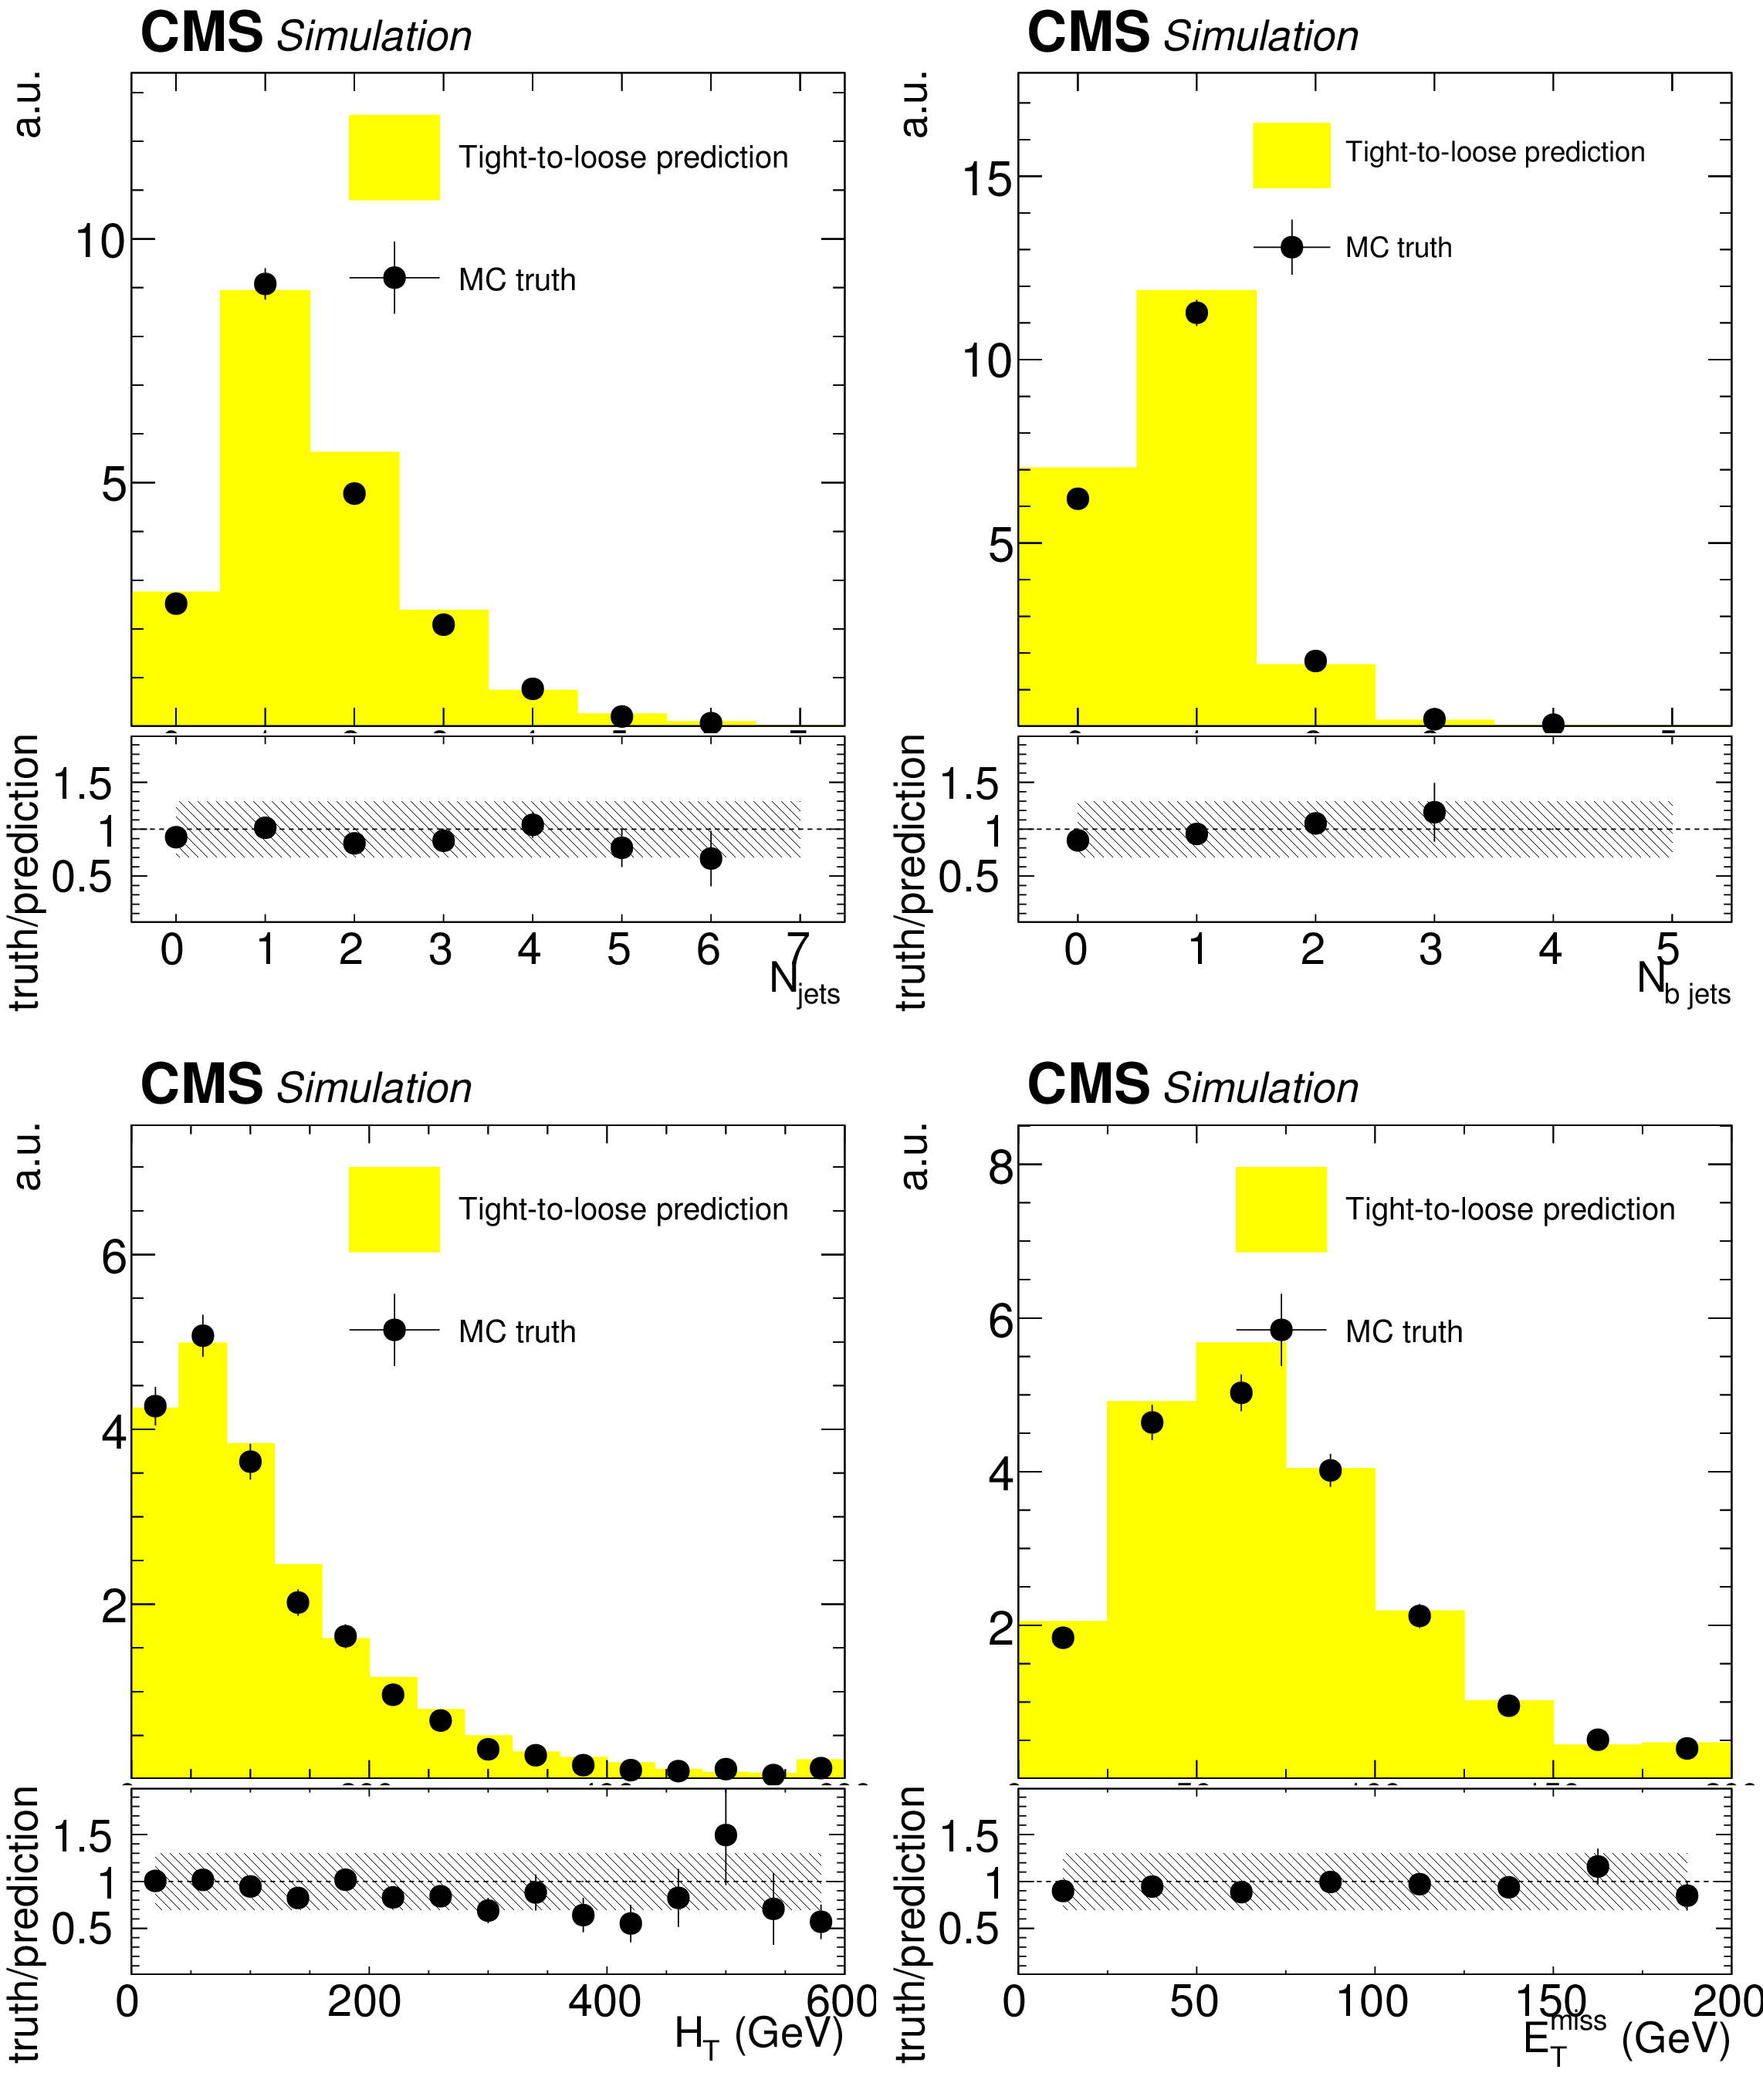
Additional Figure 1:
Fake background estimation closure with fake rate measured in QCD measurement region. Shown are the distributions of the hadronic activity $ {H_{\mathrm {T}}} $, the (b-)jet multiplicity ${N_\text {jets}}$ ($ {N_\text {b-jets}} $) and missing transverse energy for events with same-sign dilepton pair as obtained from a ${\mathrm{ t } {}\mathrm{ \bar{t} } }$ MadGraph sample. 30% uncertainty covers the discrepancy between observed and predicted yields (light hashed) |
png pdf |
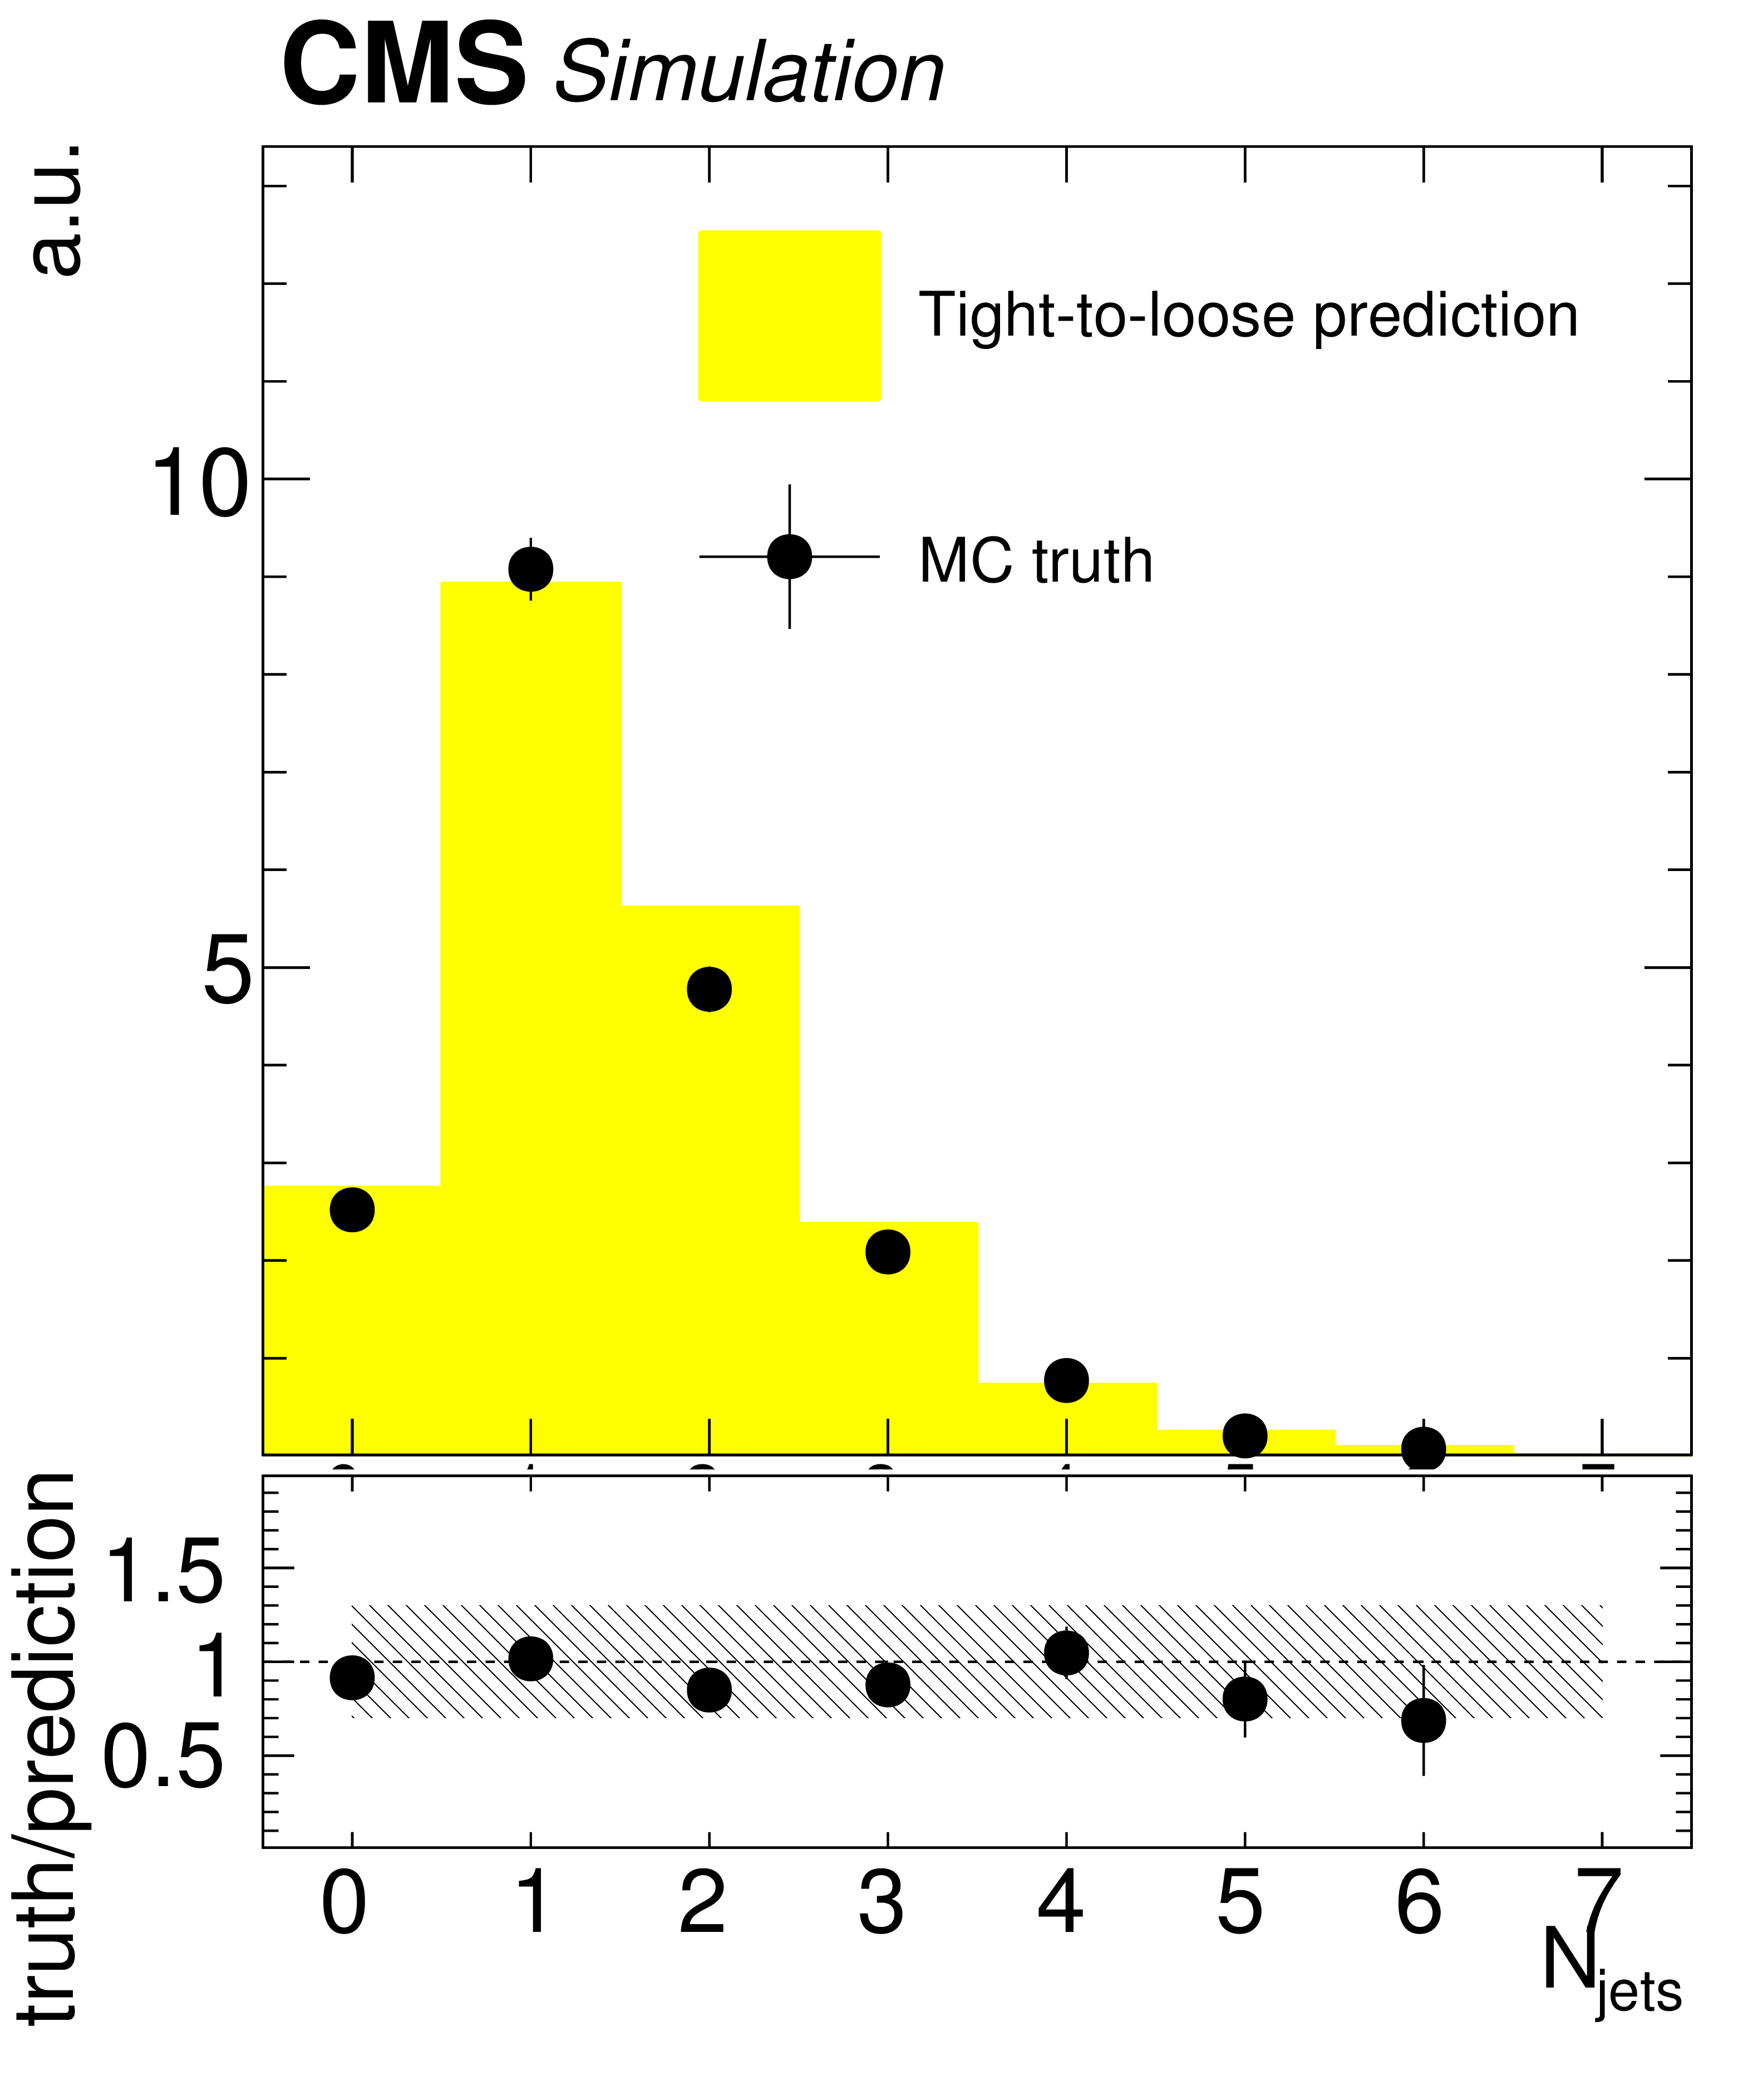
Additional Figure 1-a:
Fake background estimation closure with fake rate measured in QCD measurement region. Shown is the distribution of the jet multiplicity ${N_\text {jets}}$ for events with same-sign dilepton pair as obtained from a ${\mathrm{ t } {}\mathrm{ \bar{t} } }$ MadGraph sample. 30% uncertainty covers the discrepancy between observed and predicted yields (light hashed) |
png pdf |
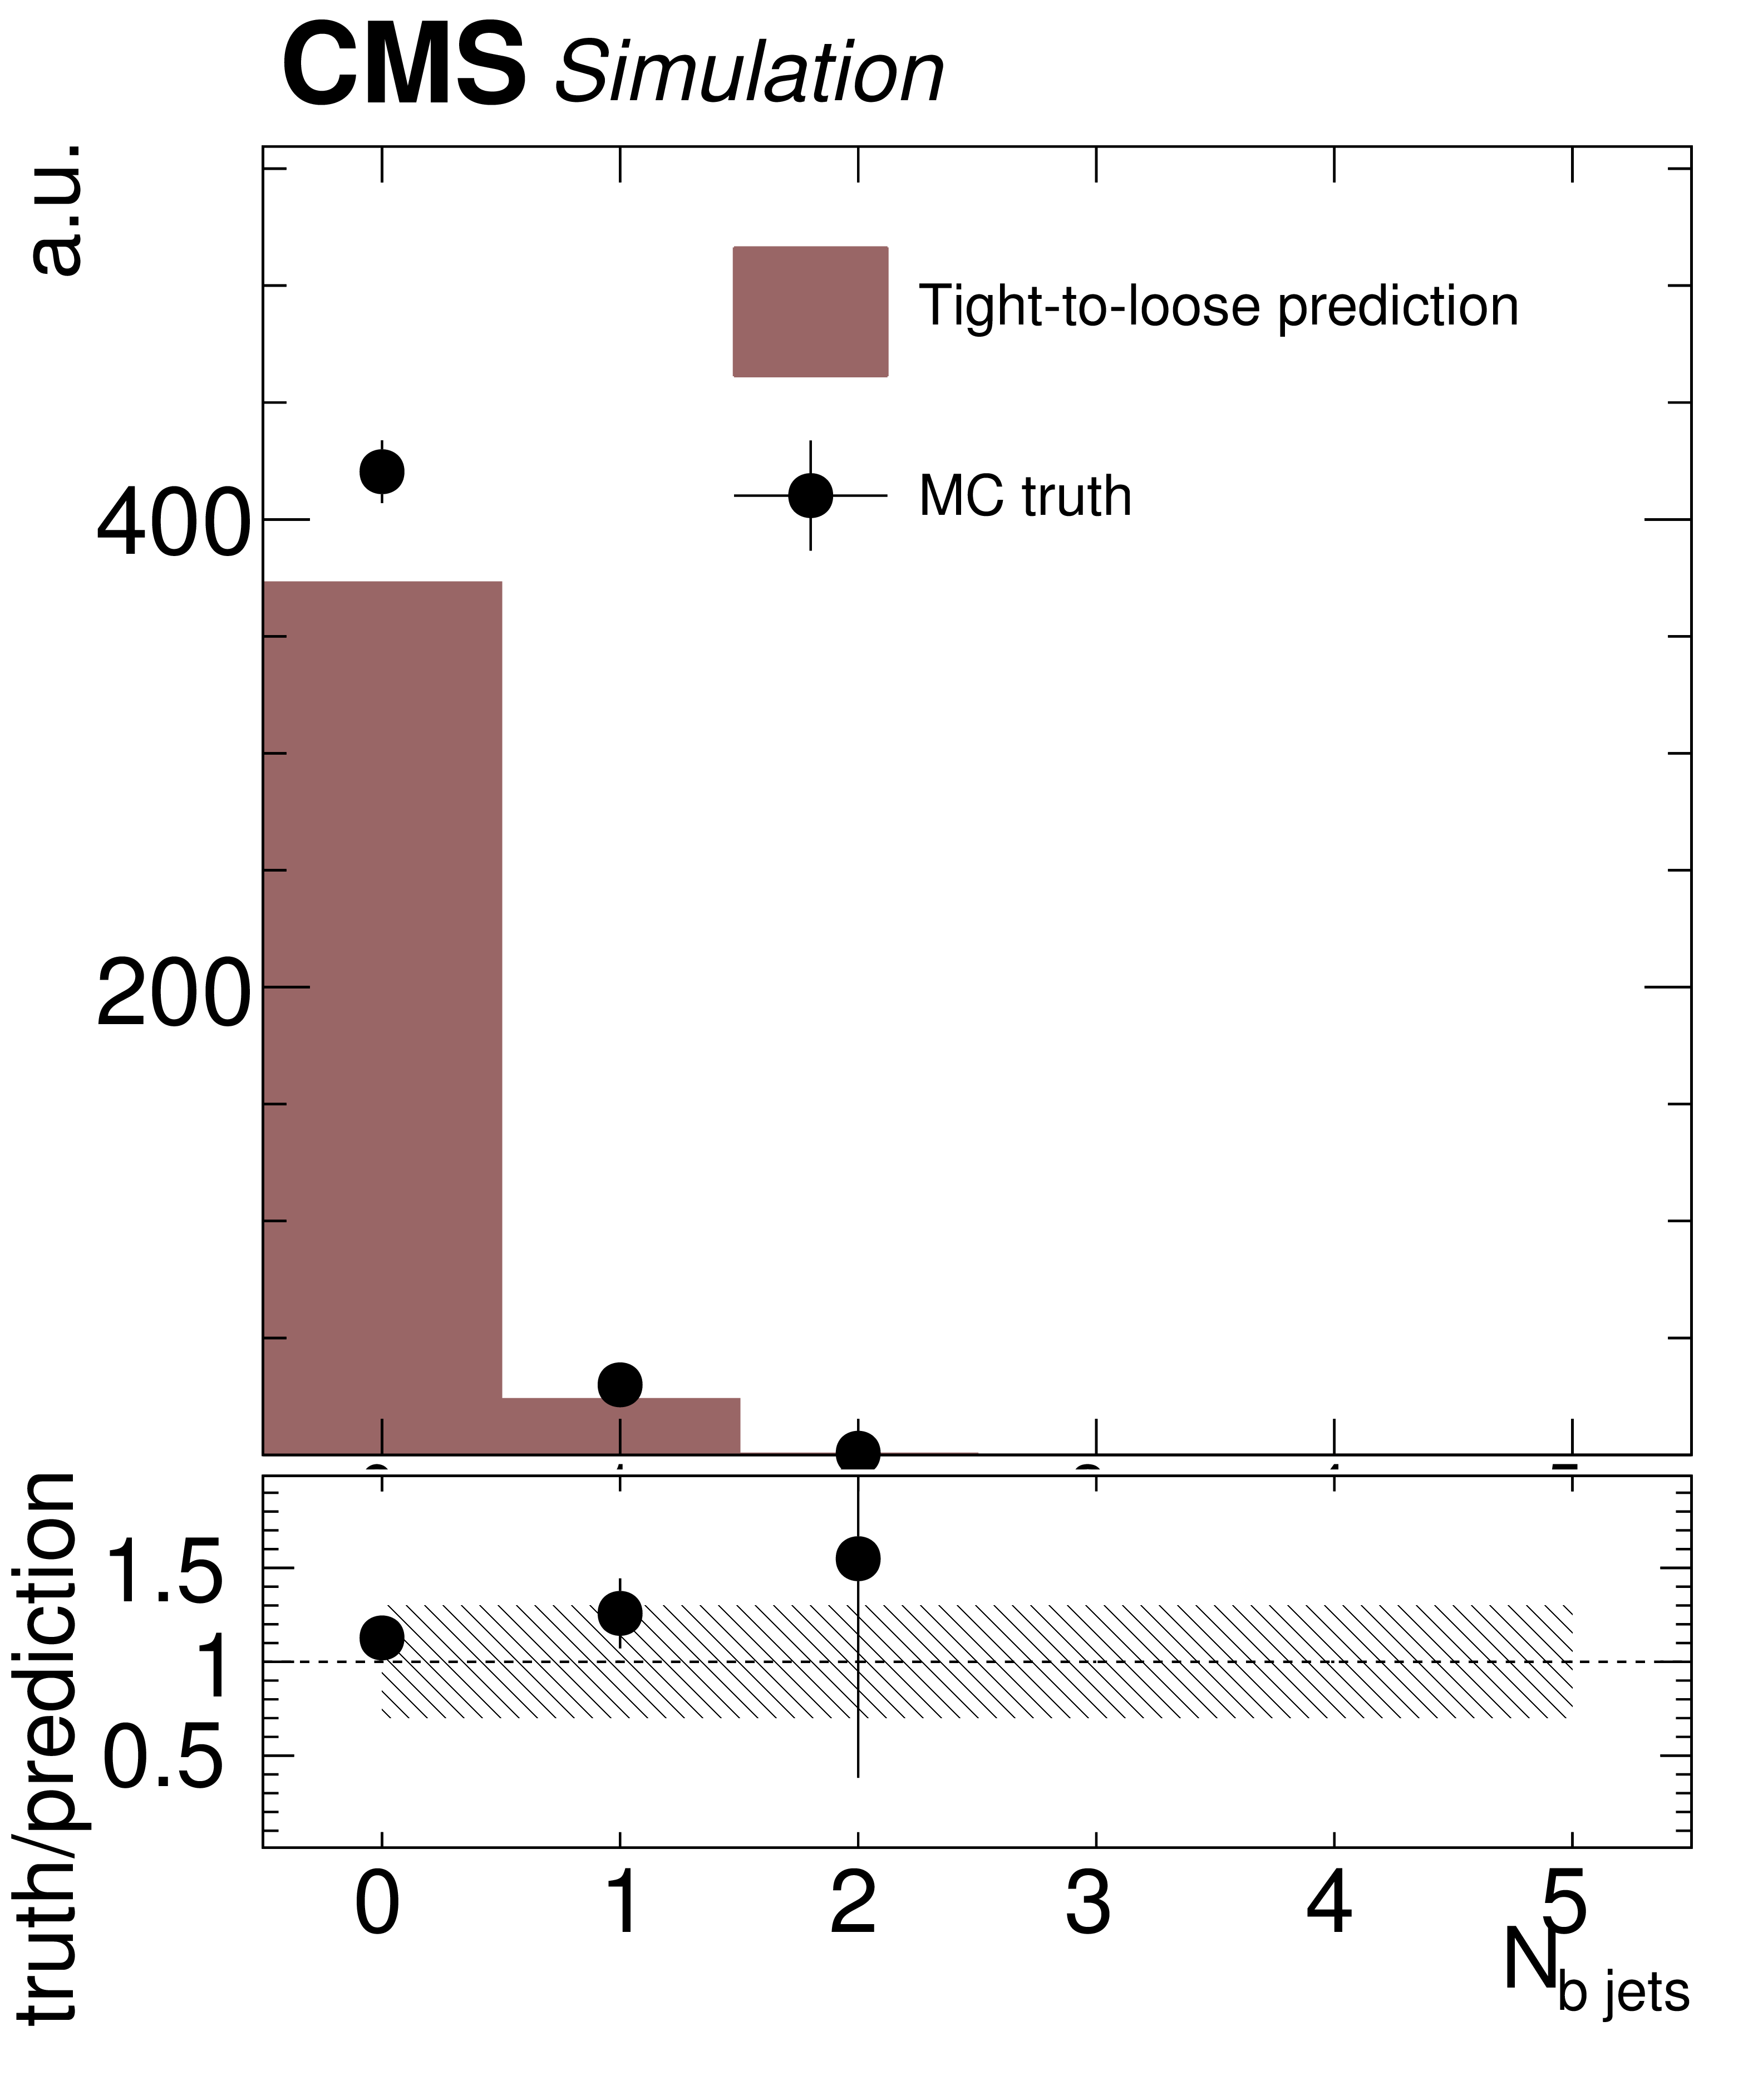
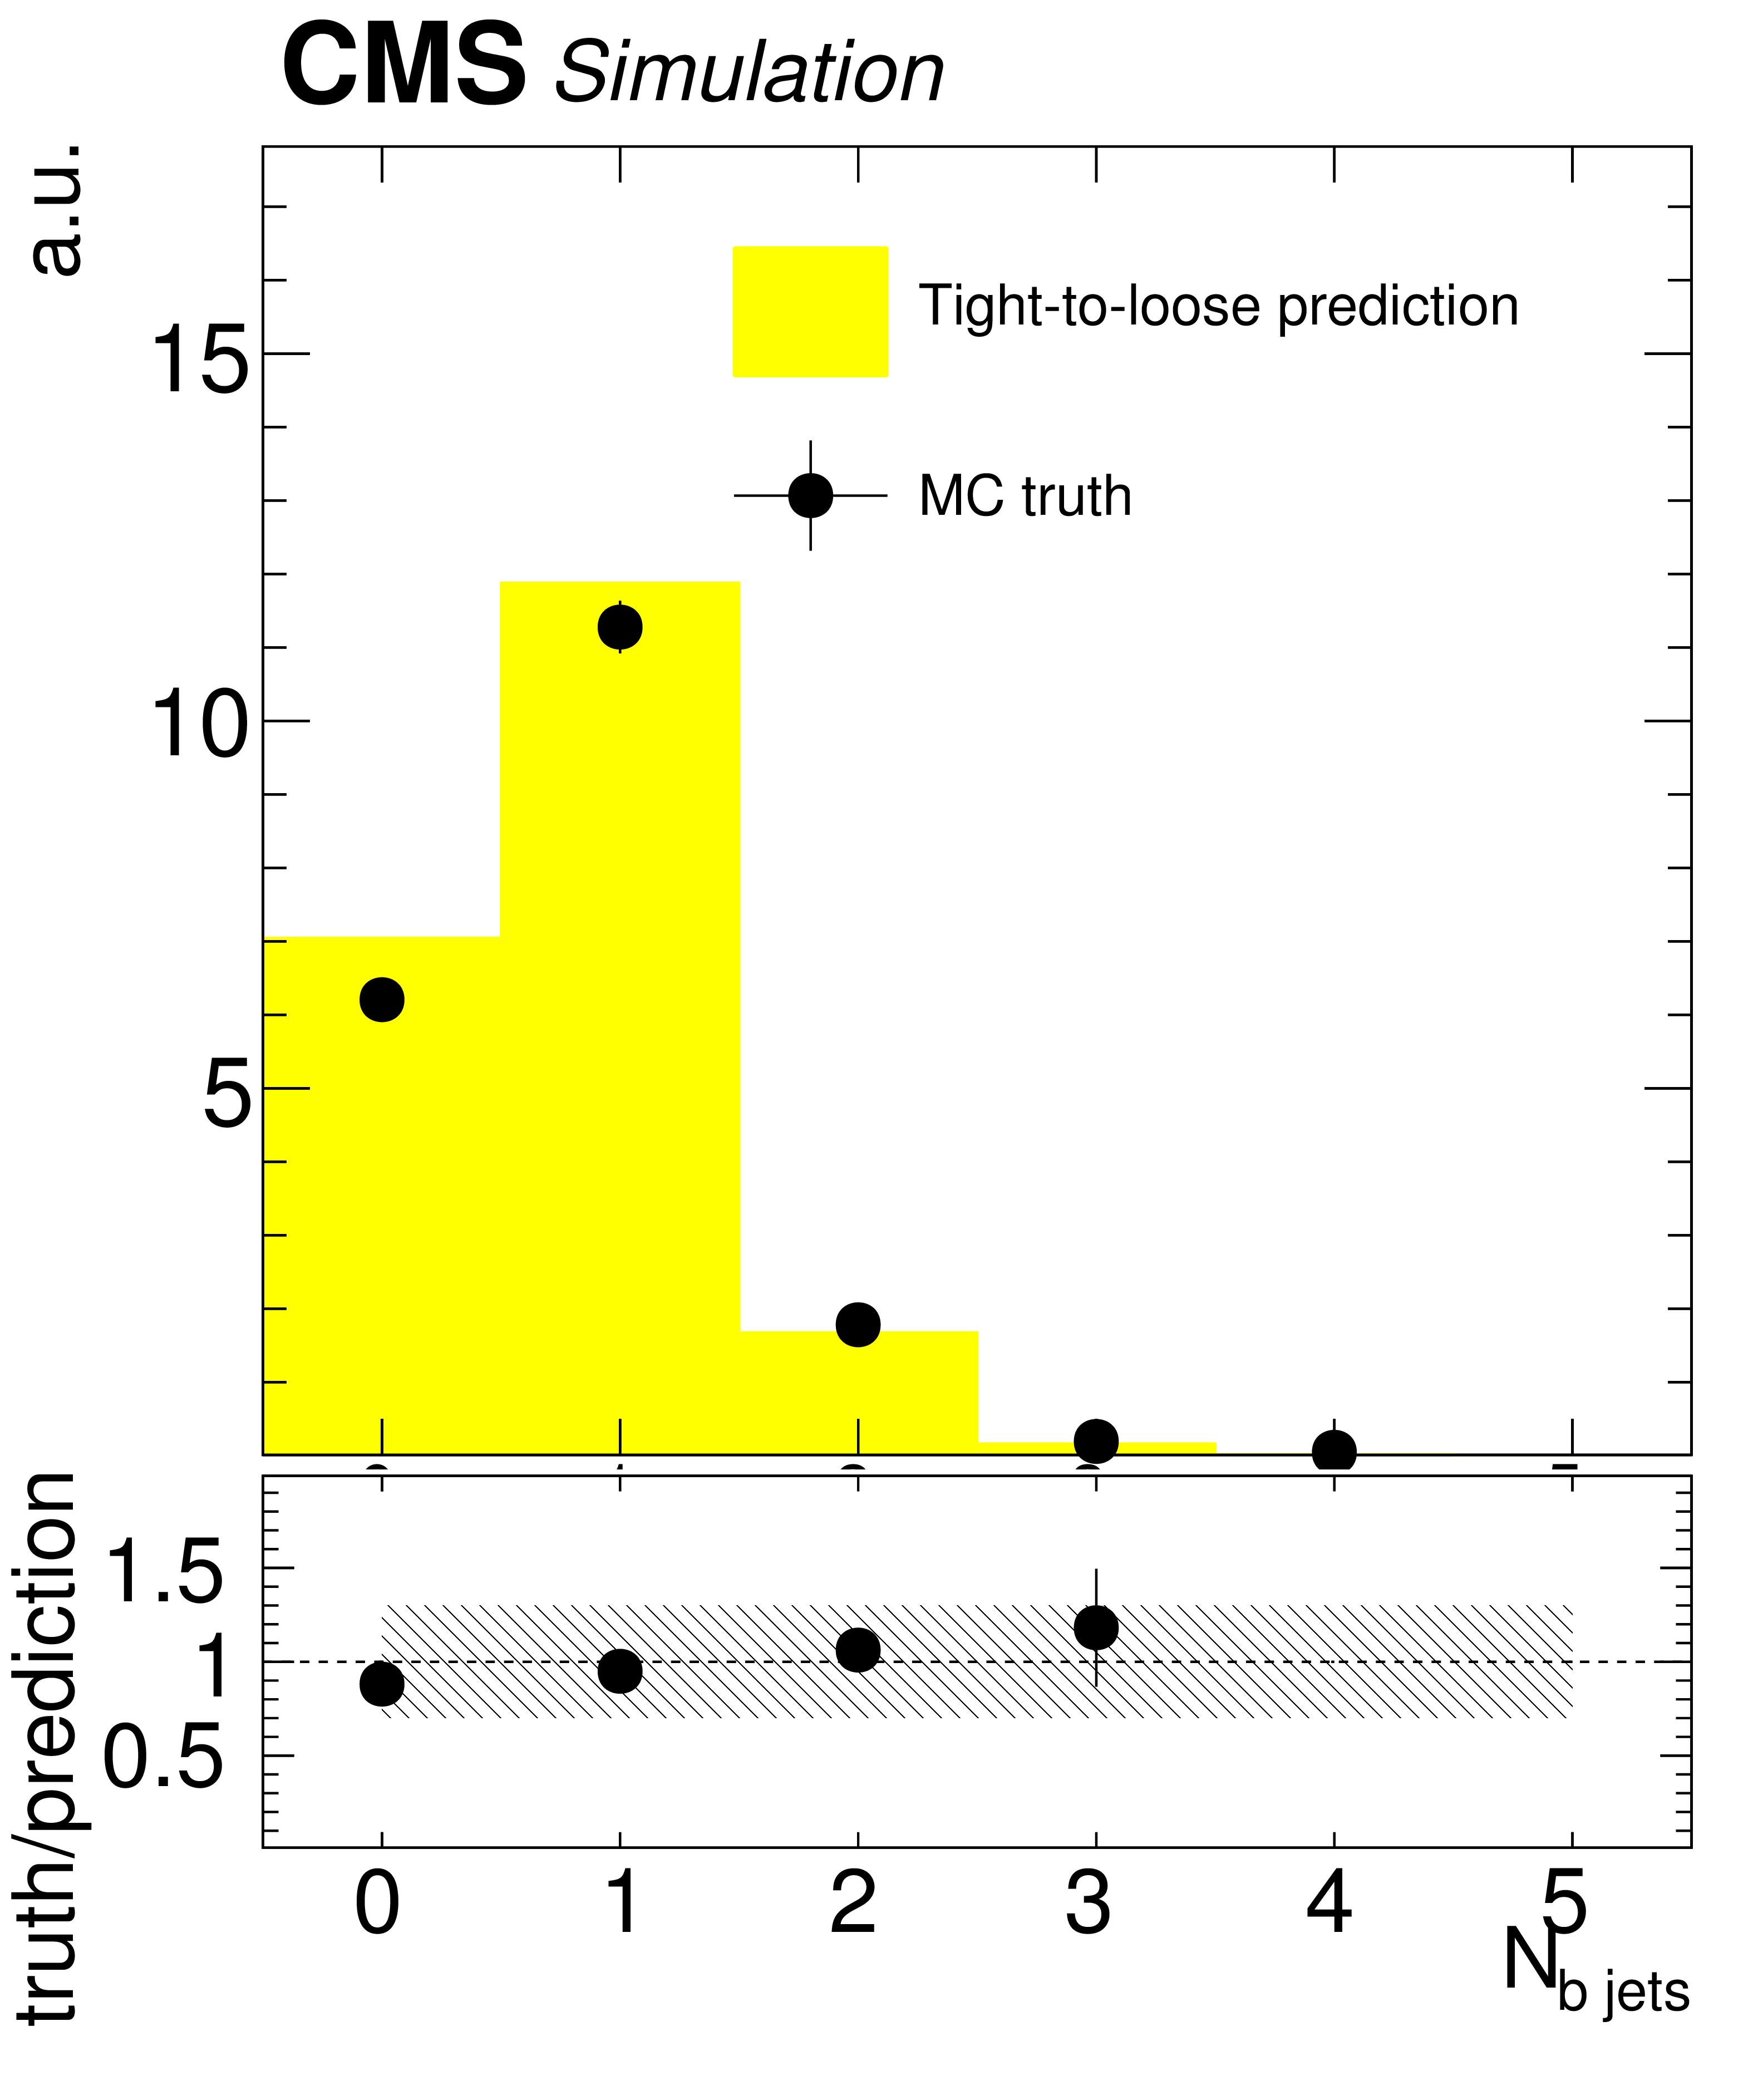
Additional Figure 1-b:
Fake background estimation closure with fake rate measured in QCD measurement region. Shown is the distribution of the b-jet multiplicity $ {N_\text {b-jets}} $ for events with same-sign dilepton pair as obtained from a ${\mathrm{ t } {}\mathrm{ \bar{t} } }$ MadGraph sample. 30% uncertainty covers the discrepancy between observed and predicted yields (light hashed) |
png pdf |
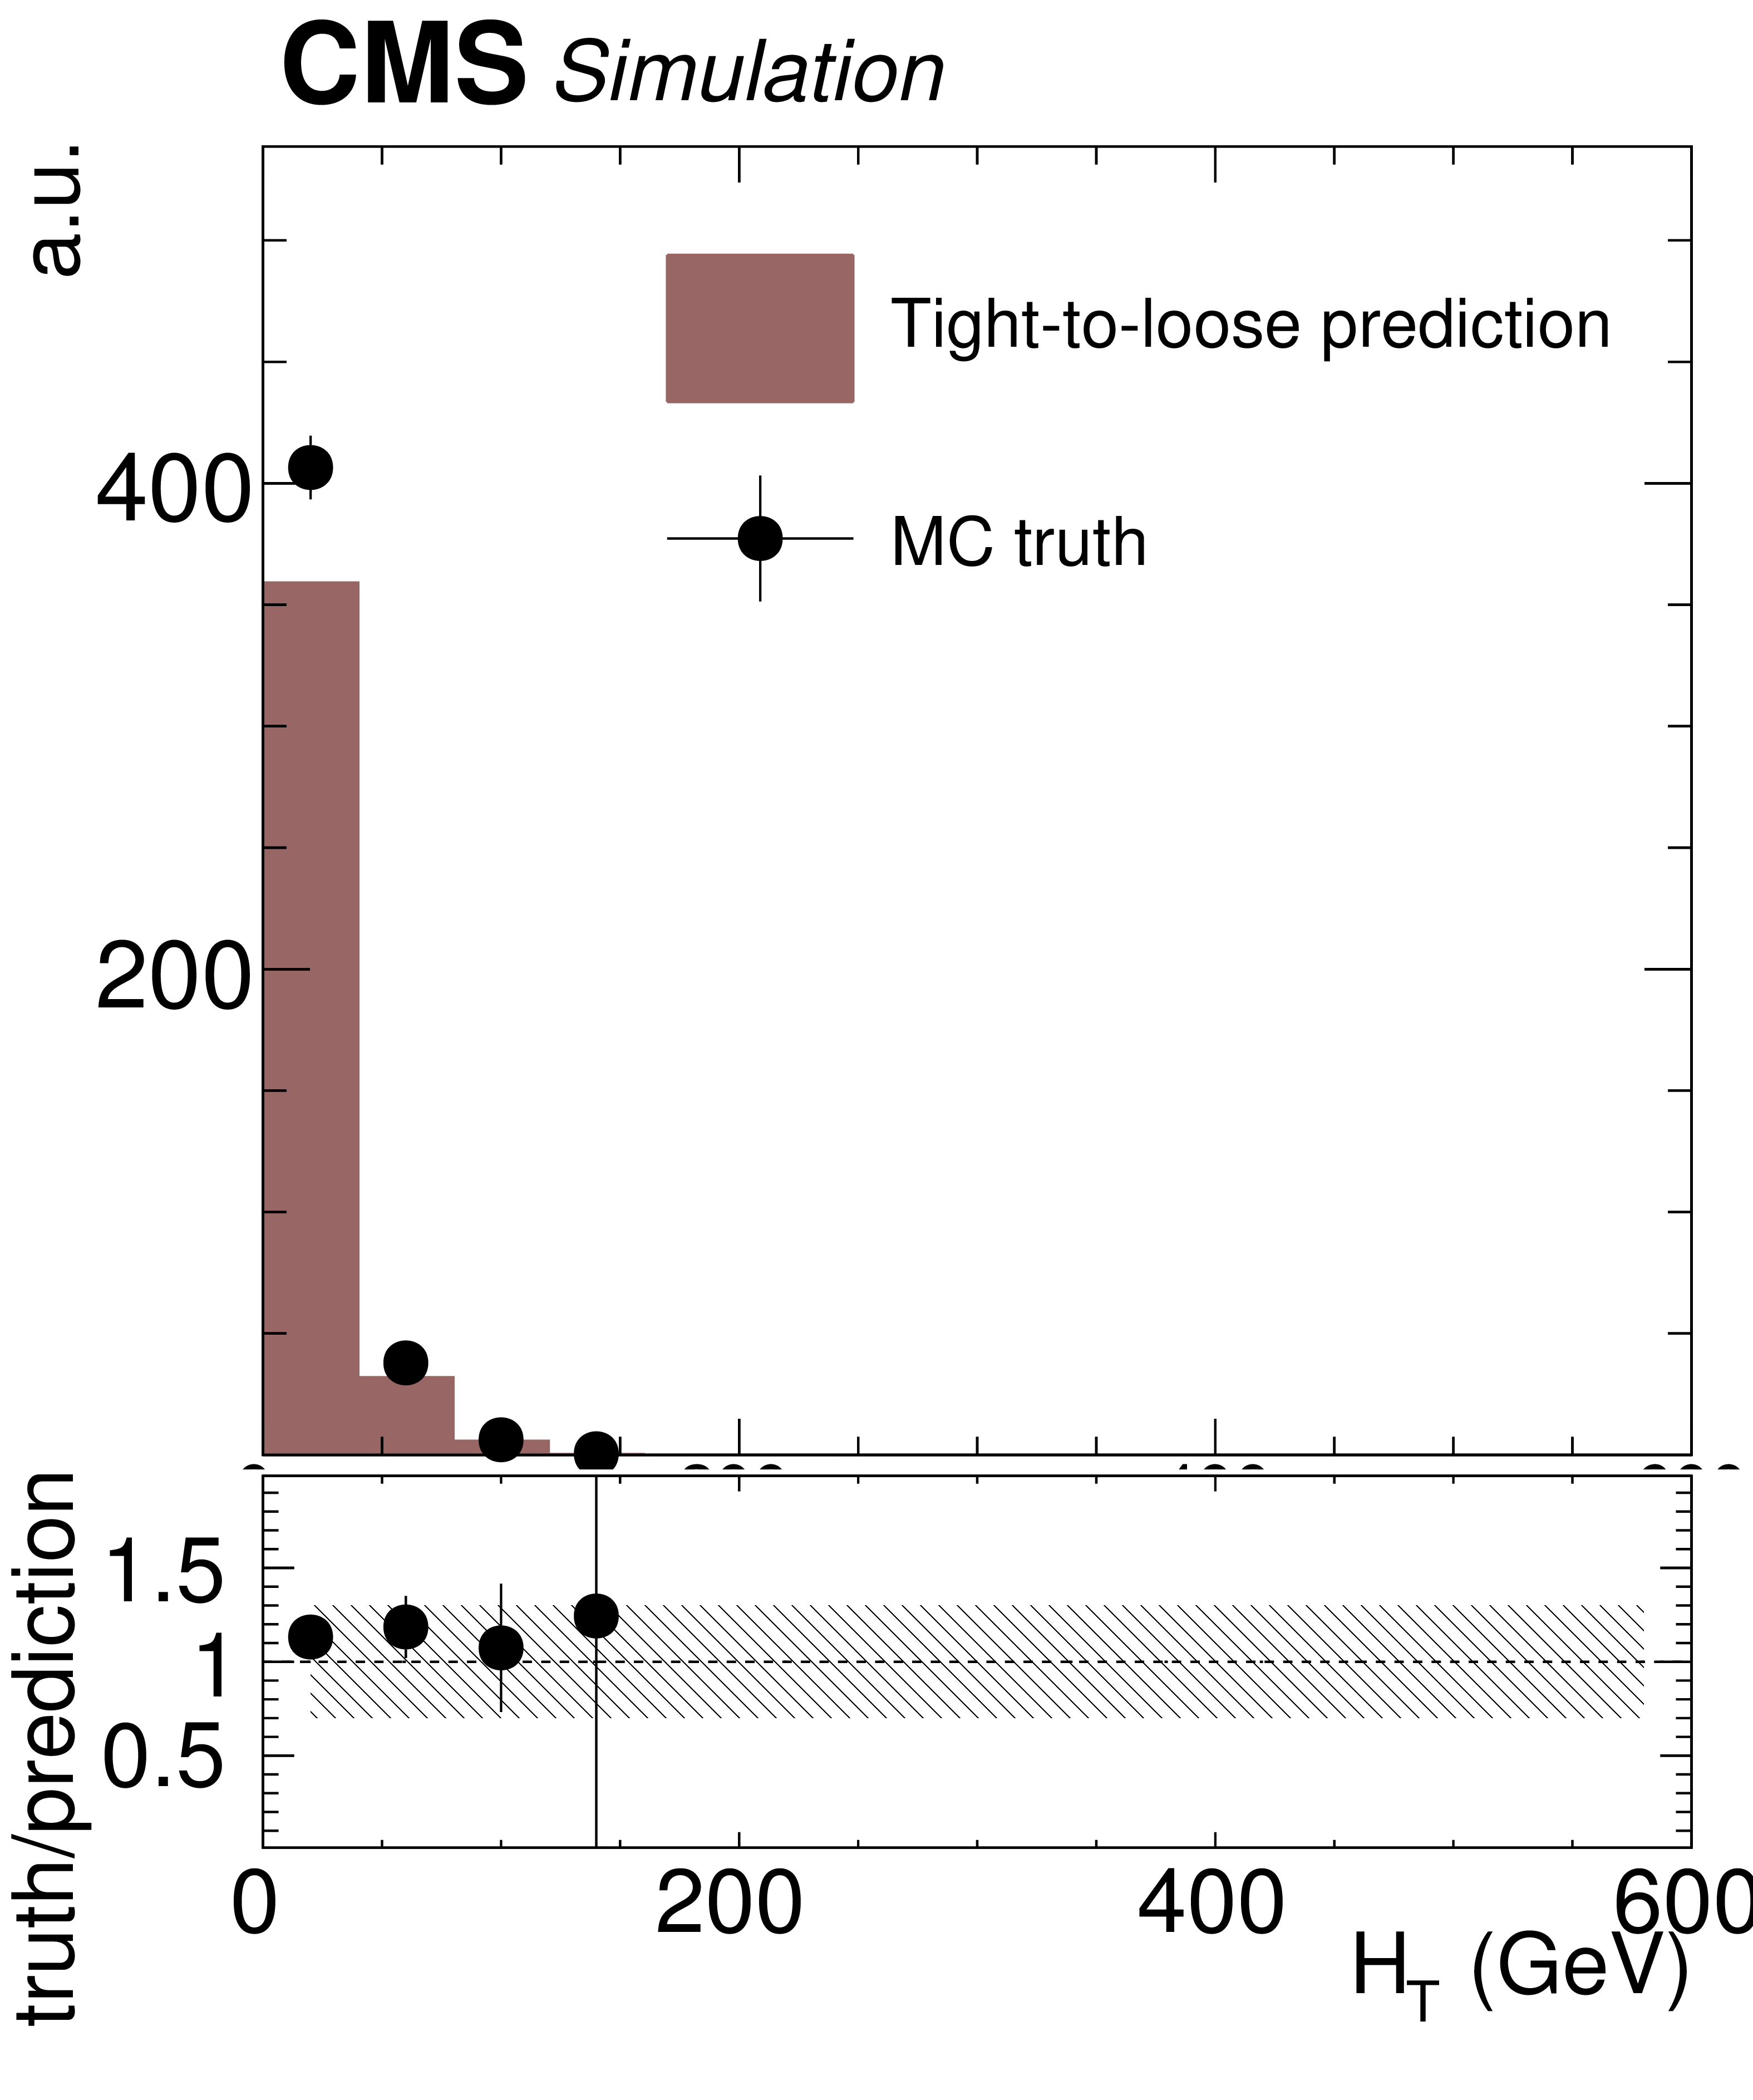
Additional Figure 1-c:
Fake background estimation closure with fake rate measured in QCD measurement region. Shown is the distribution of the hadronic activity $ {H_{\mathrm {T}}} $ for events with same-sign dilepton pair as obtained from a ${\mathrm{ t } {}\mathrm{ \bar{t} } }$ MadGraph sample. 30% uncertainty covers the discrepancy between observed and predicted yields (light hashed) |
png pdf |
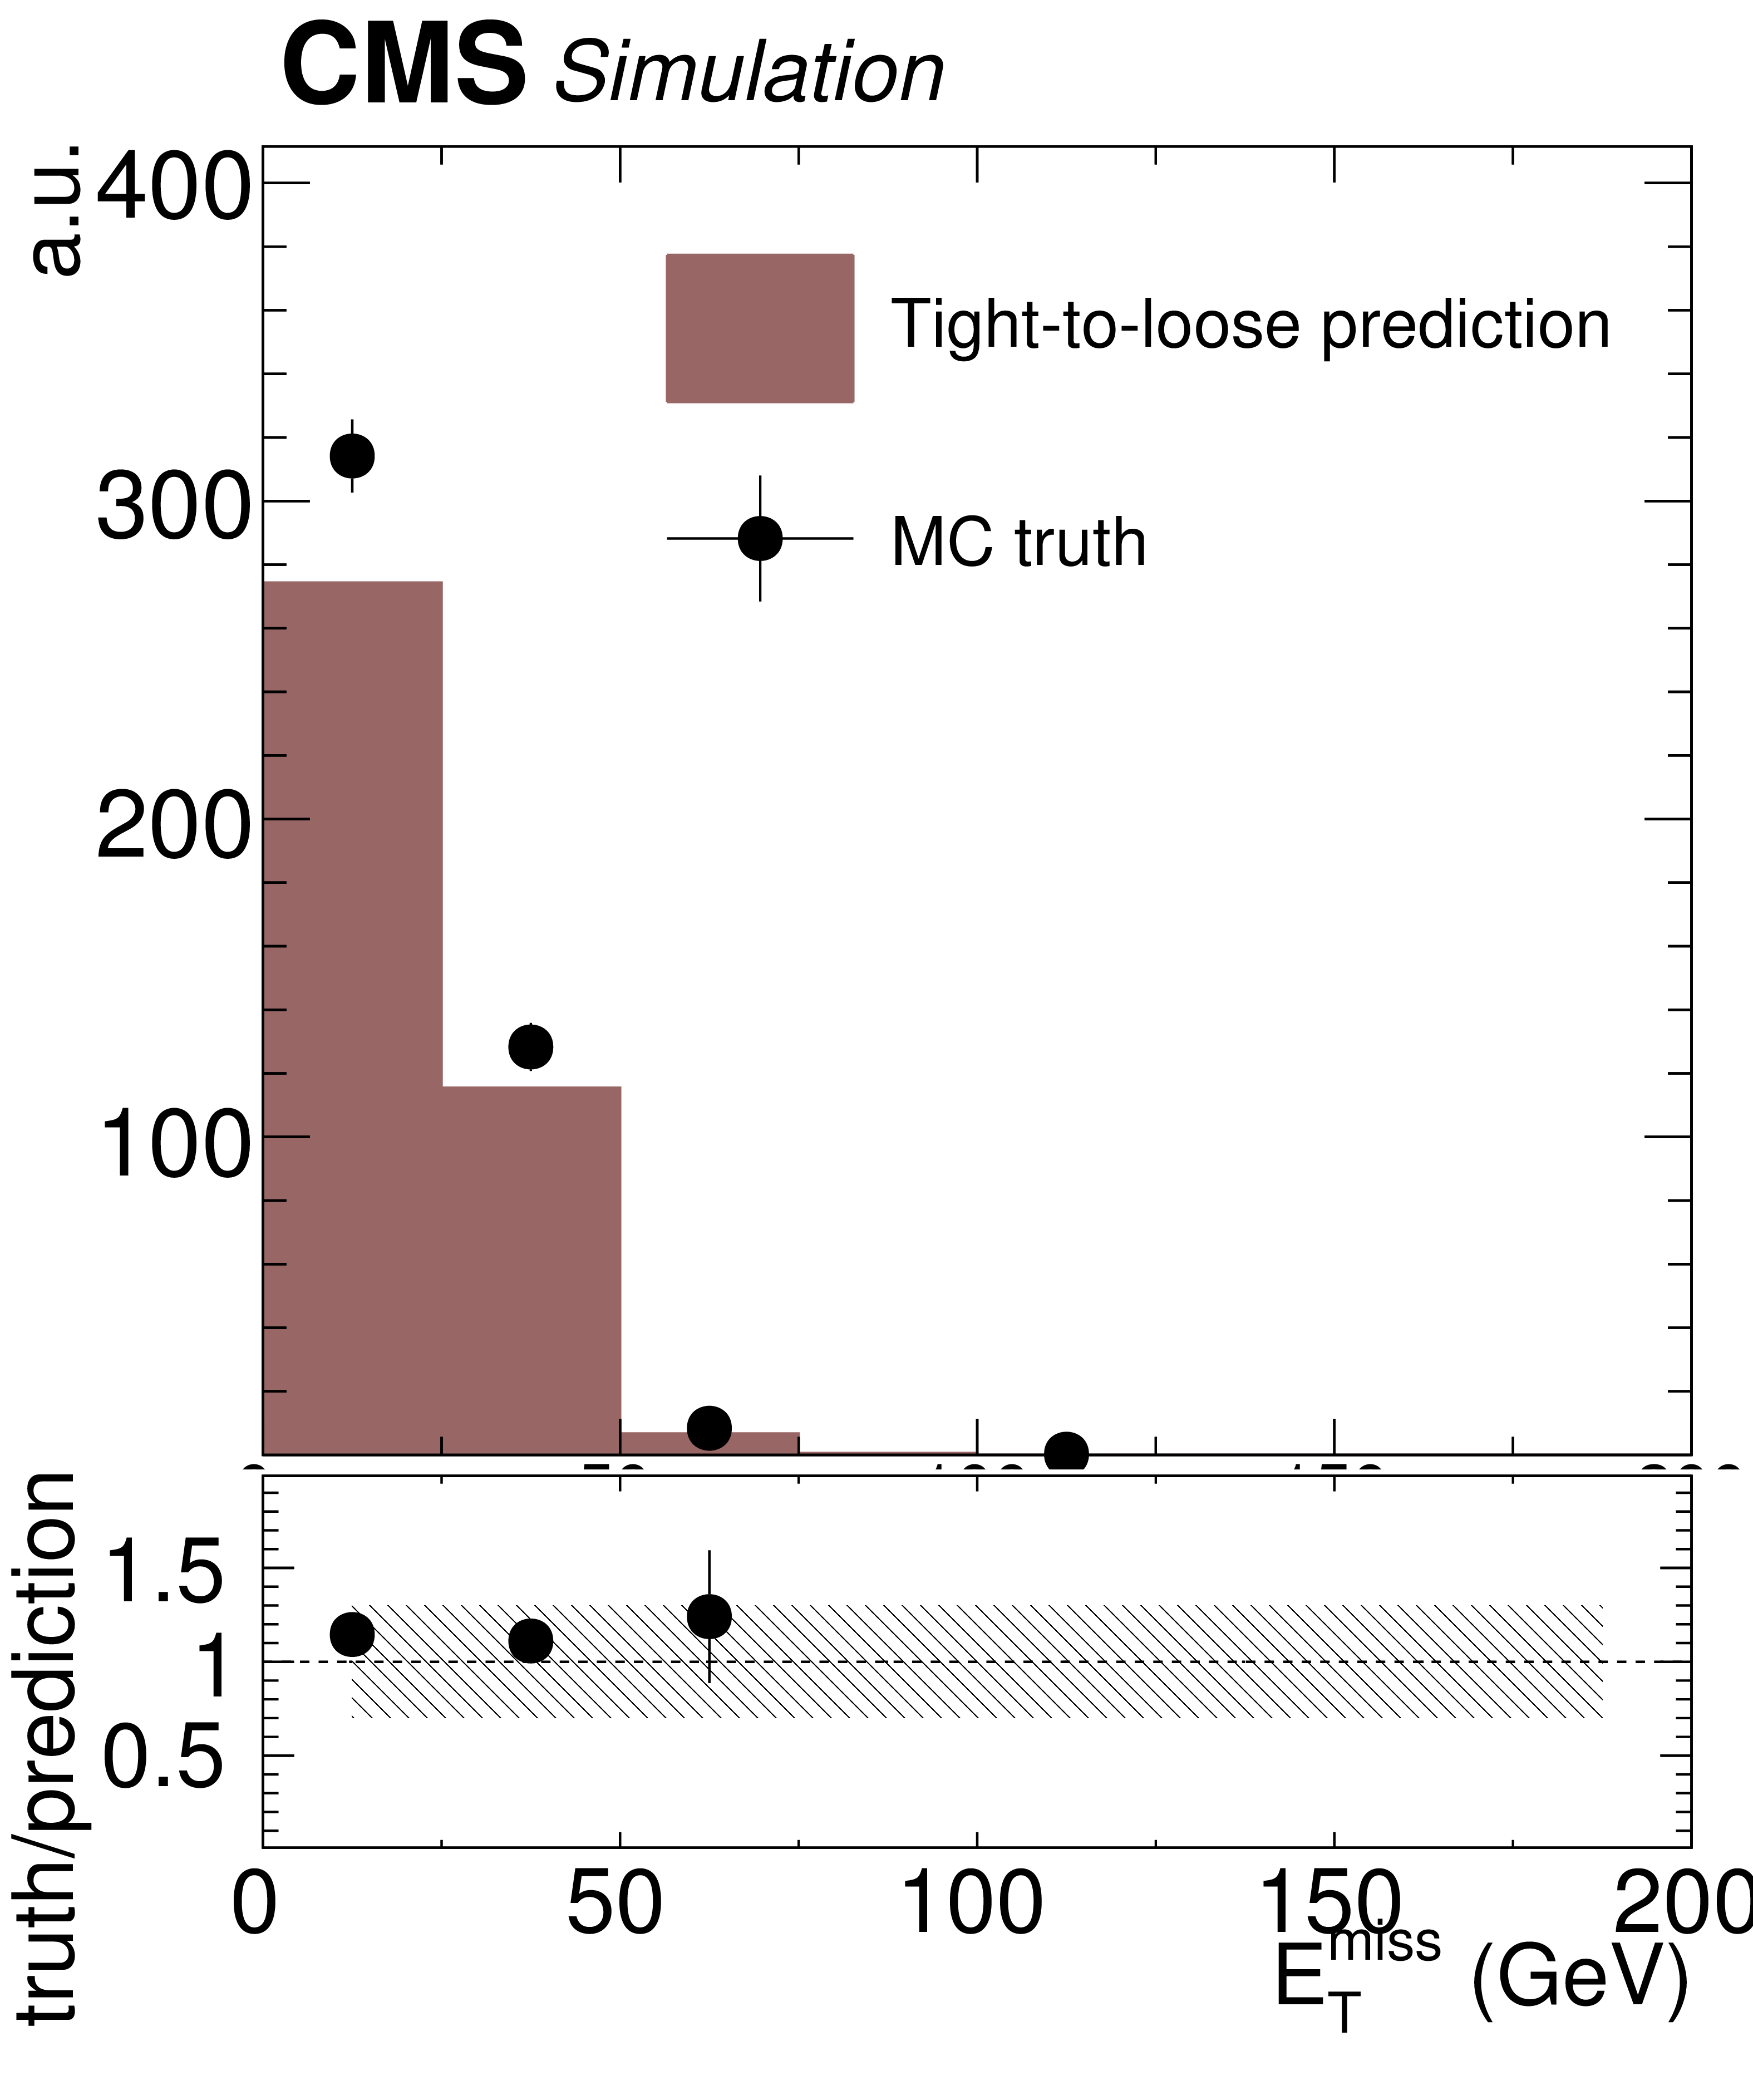
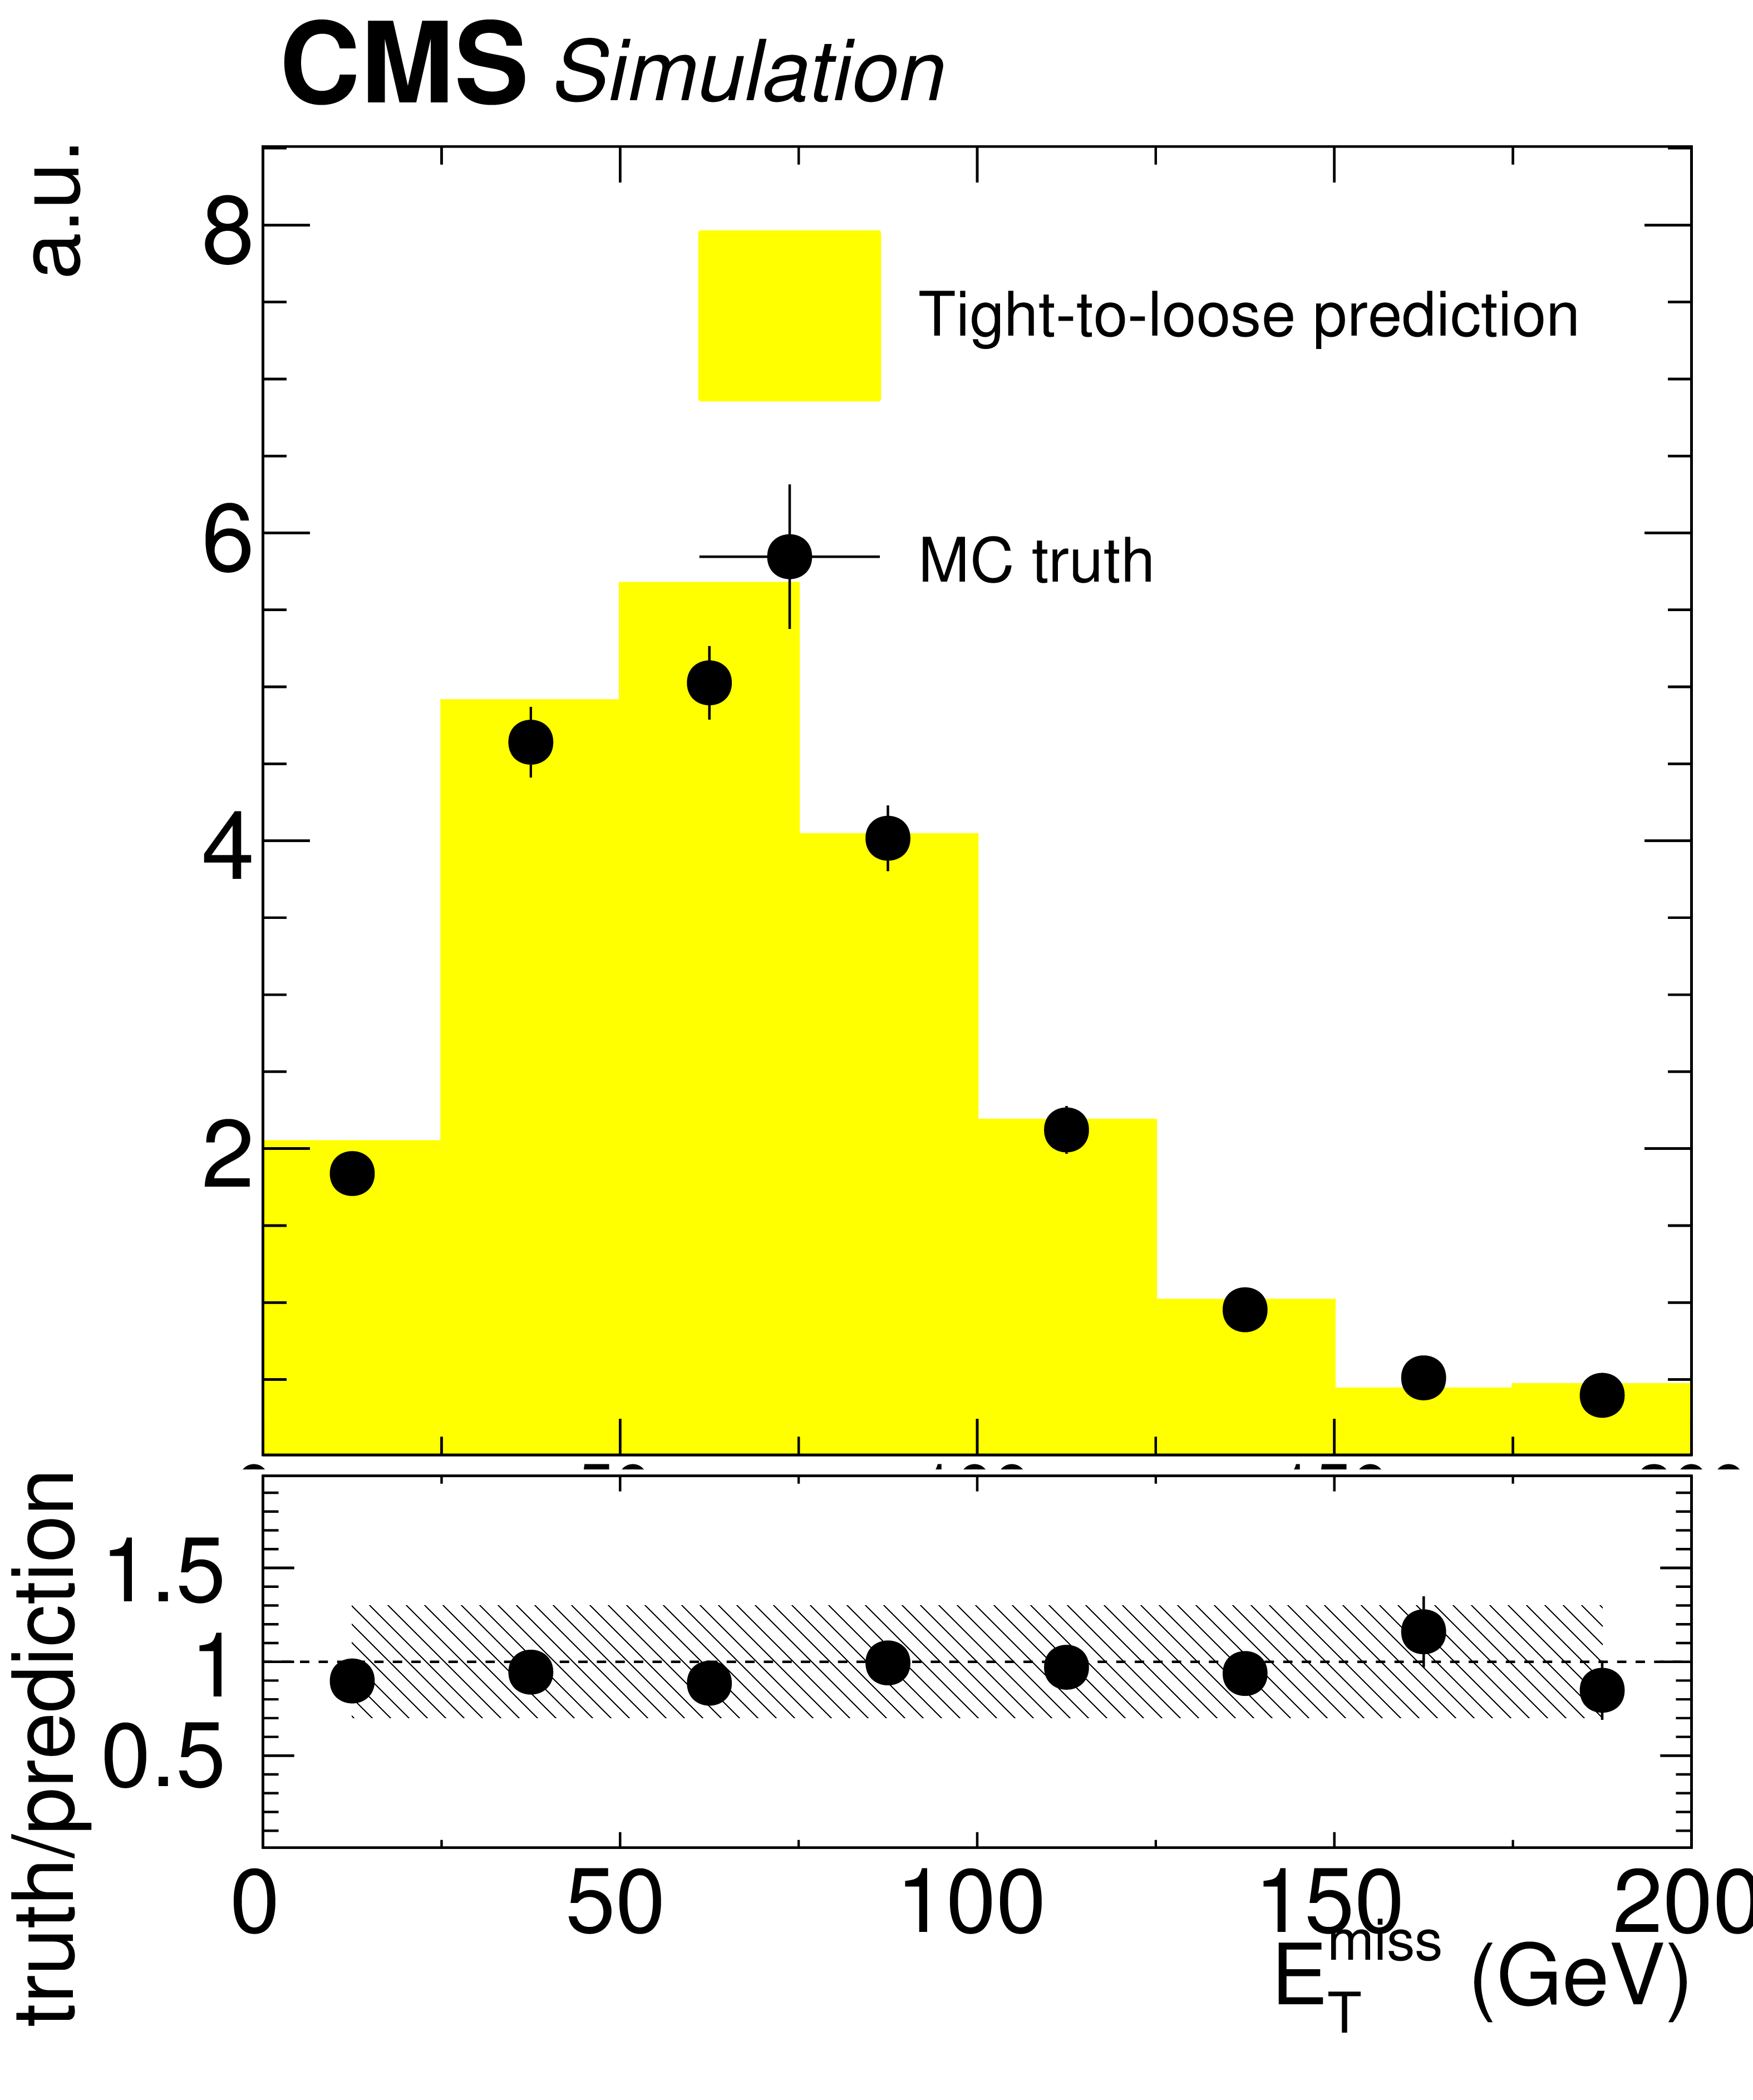
Additional Figure 1-d:
Fake background estimation closure with fake rate measured in QCD measurement region. Shown is the distribution of the missing transverse energy for events with same-sign dilepton pair as obtained from a ${\mathrm{ t } {}\mathrm{ \bar{t} } }$ MadGraph sample. 30% uncertainty covers the discrepancy between observed and predicted yields (light hashed) |
png pdf |
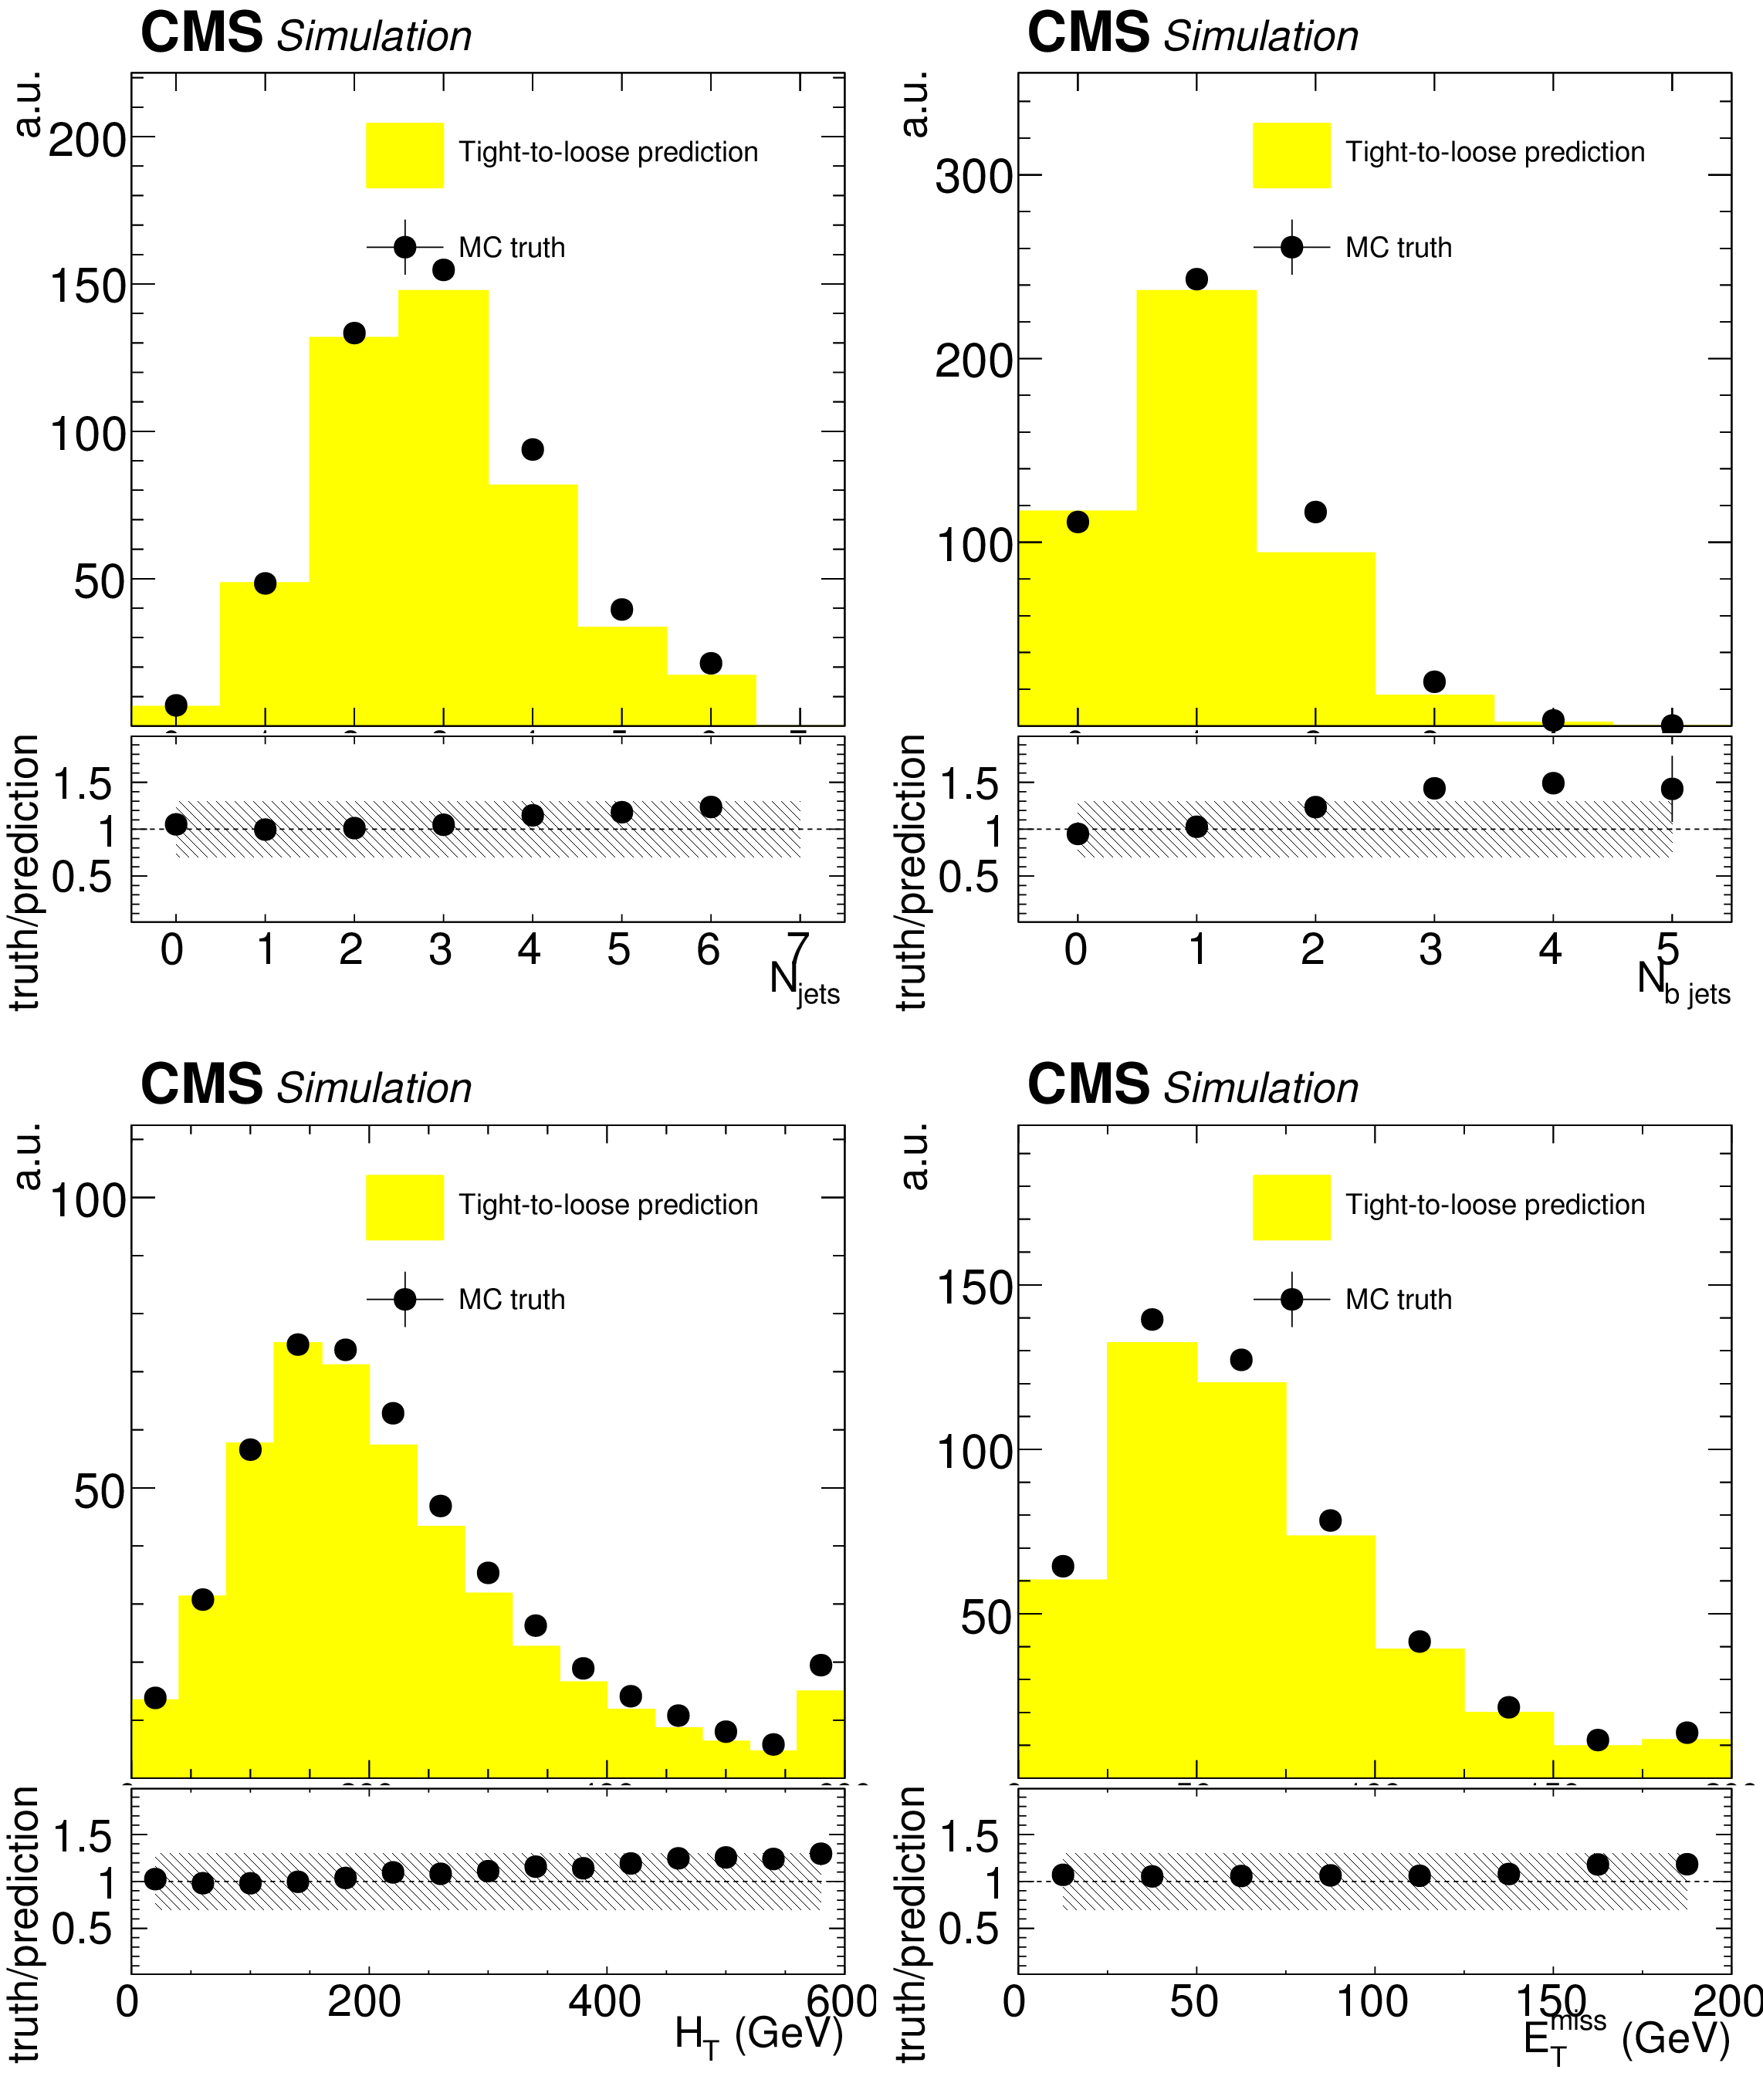
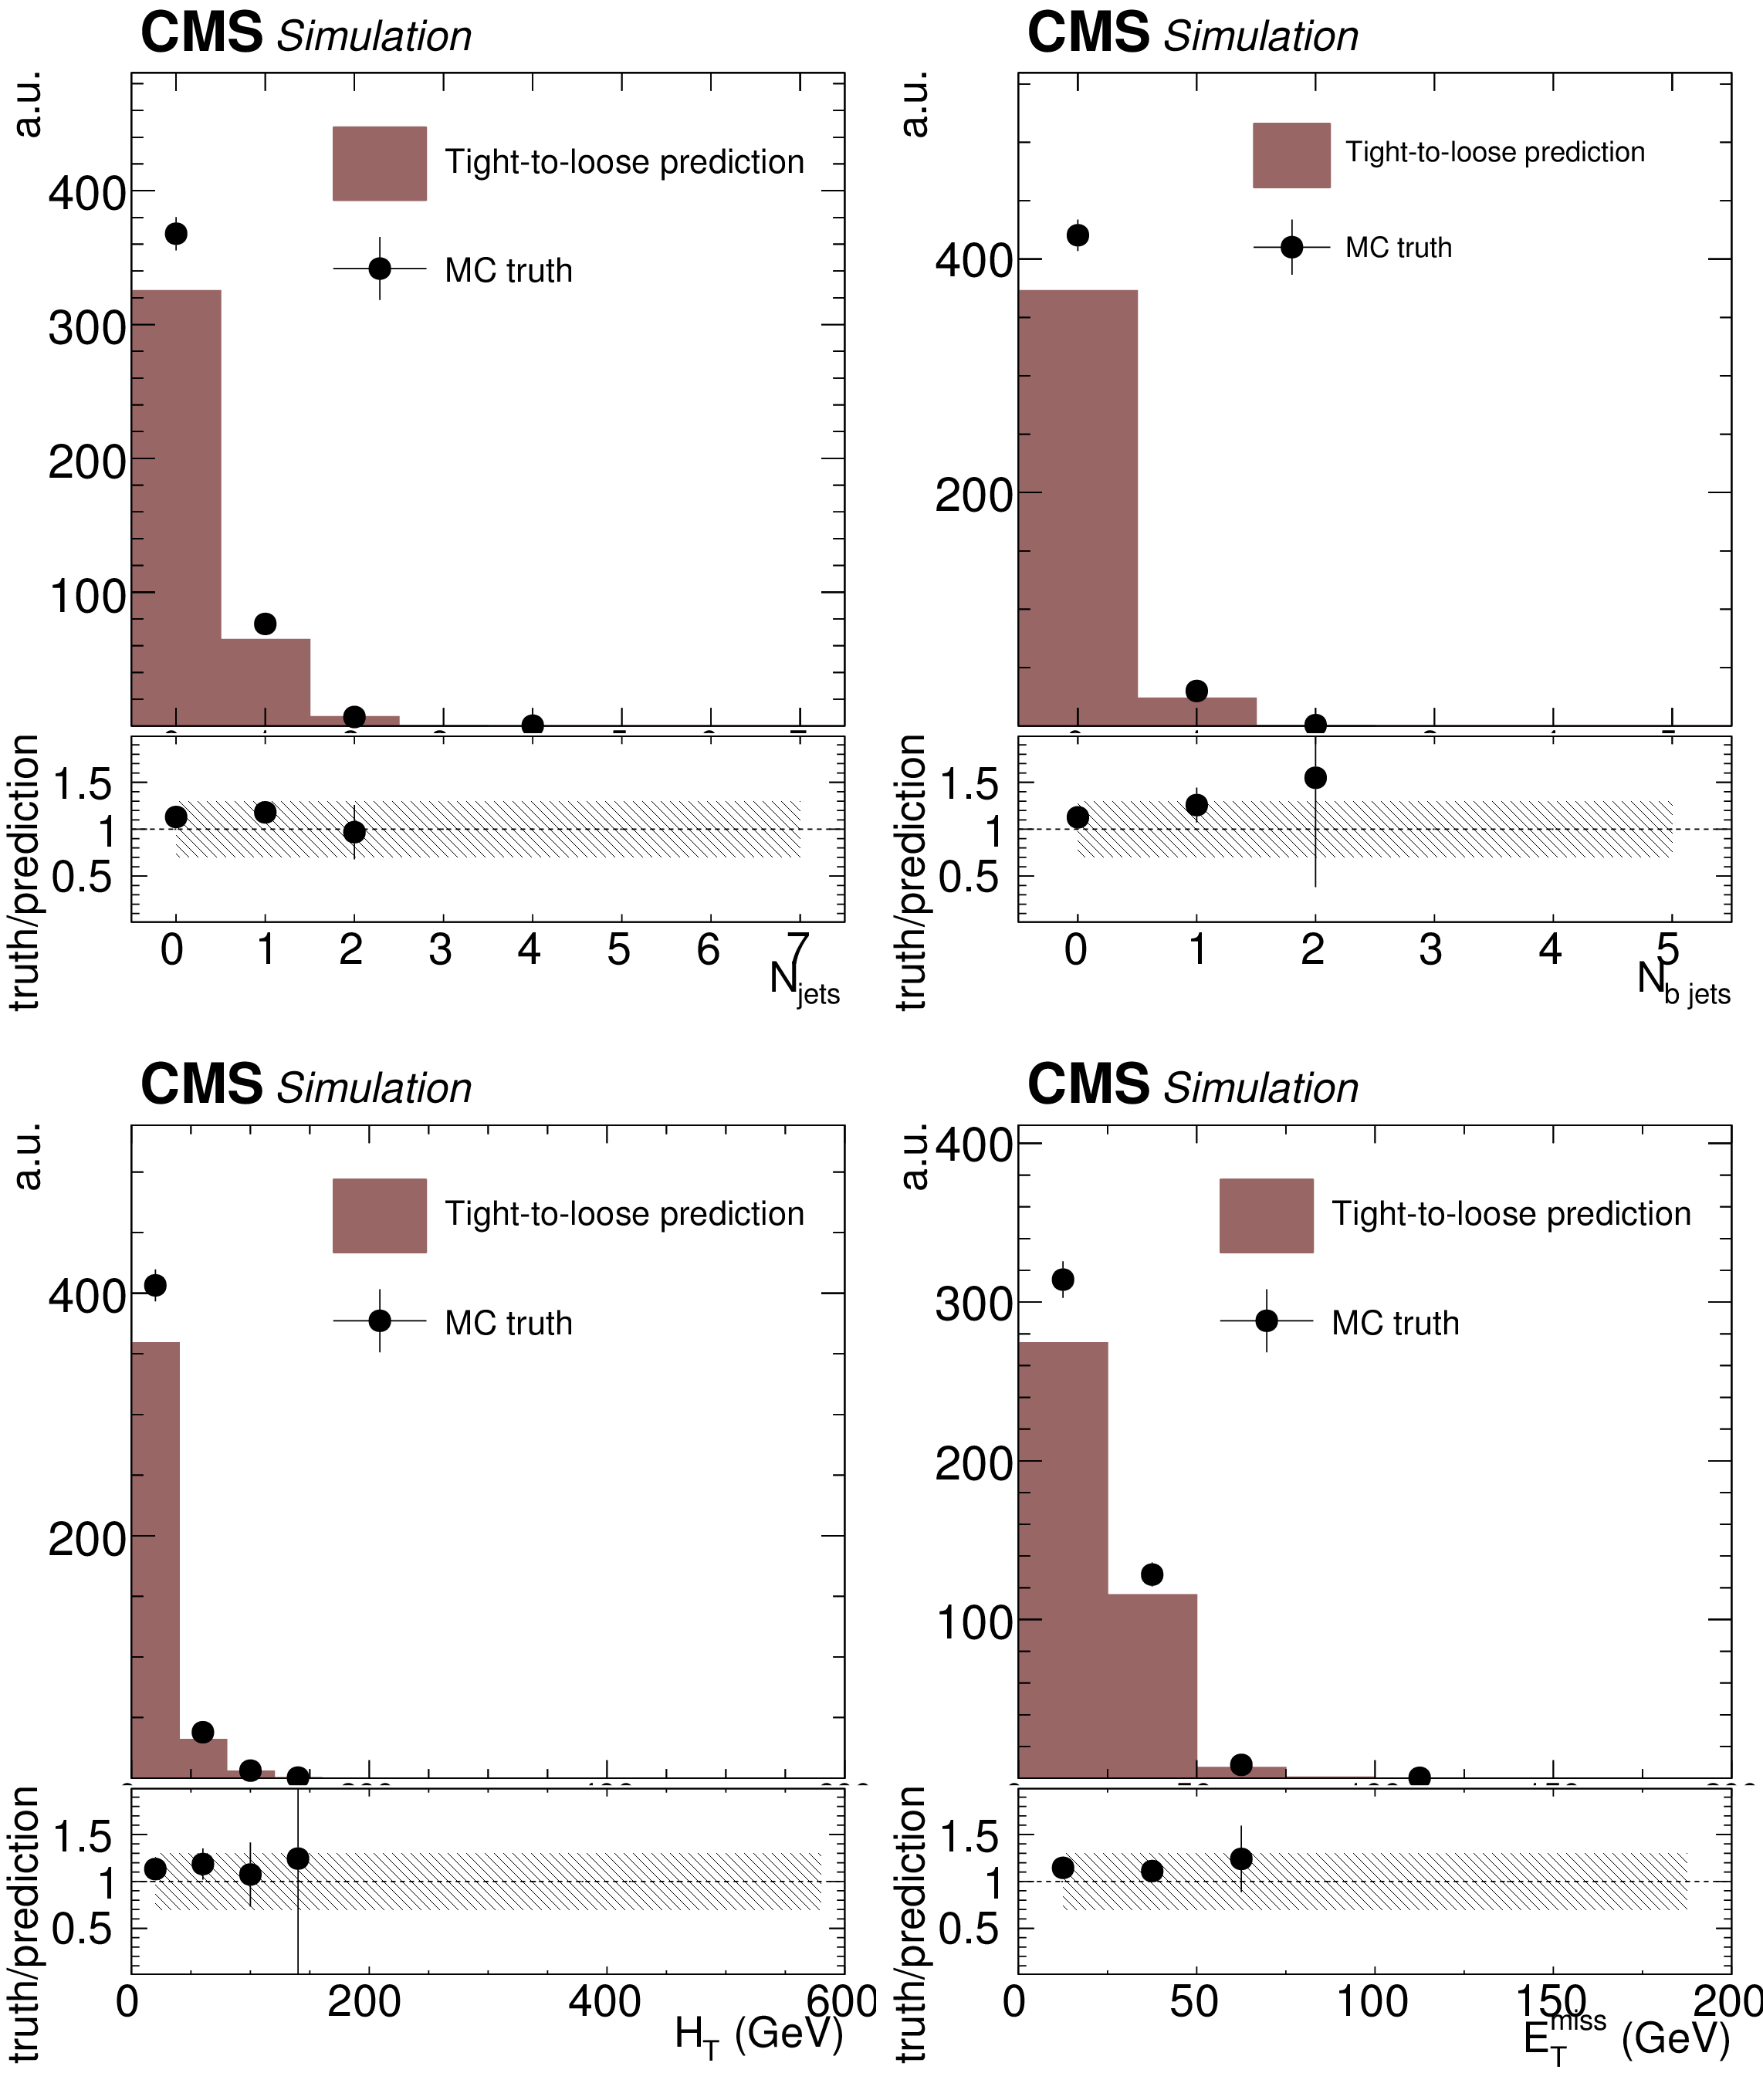
Additional Figure 2:
Fake background estimation closure with fake rate measured in QCD measurement region. Shown are the distributions of the hadronic activity $ {H_{\mathrm {T}}} $, the (b-)jet multiplicity ${N_\text {jets}}$ ($ {N_\text {b-jets}} $) and missing transverse energy for events with three-leptons as obtained from a DYMadGraph sample. 30% uncertainty covers the discrepancy between observed and predicted yields (light hashed). |
png pdf |
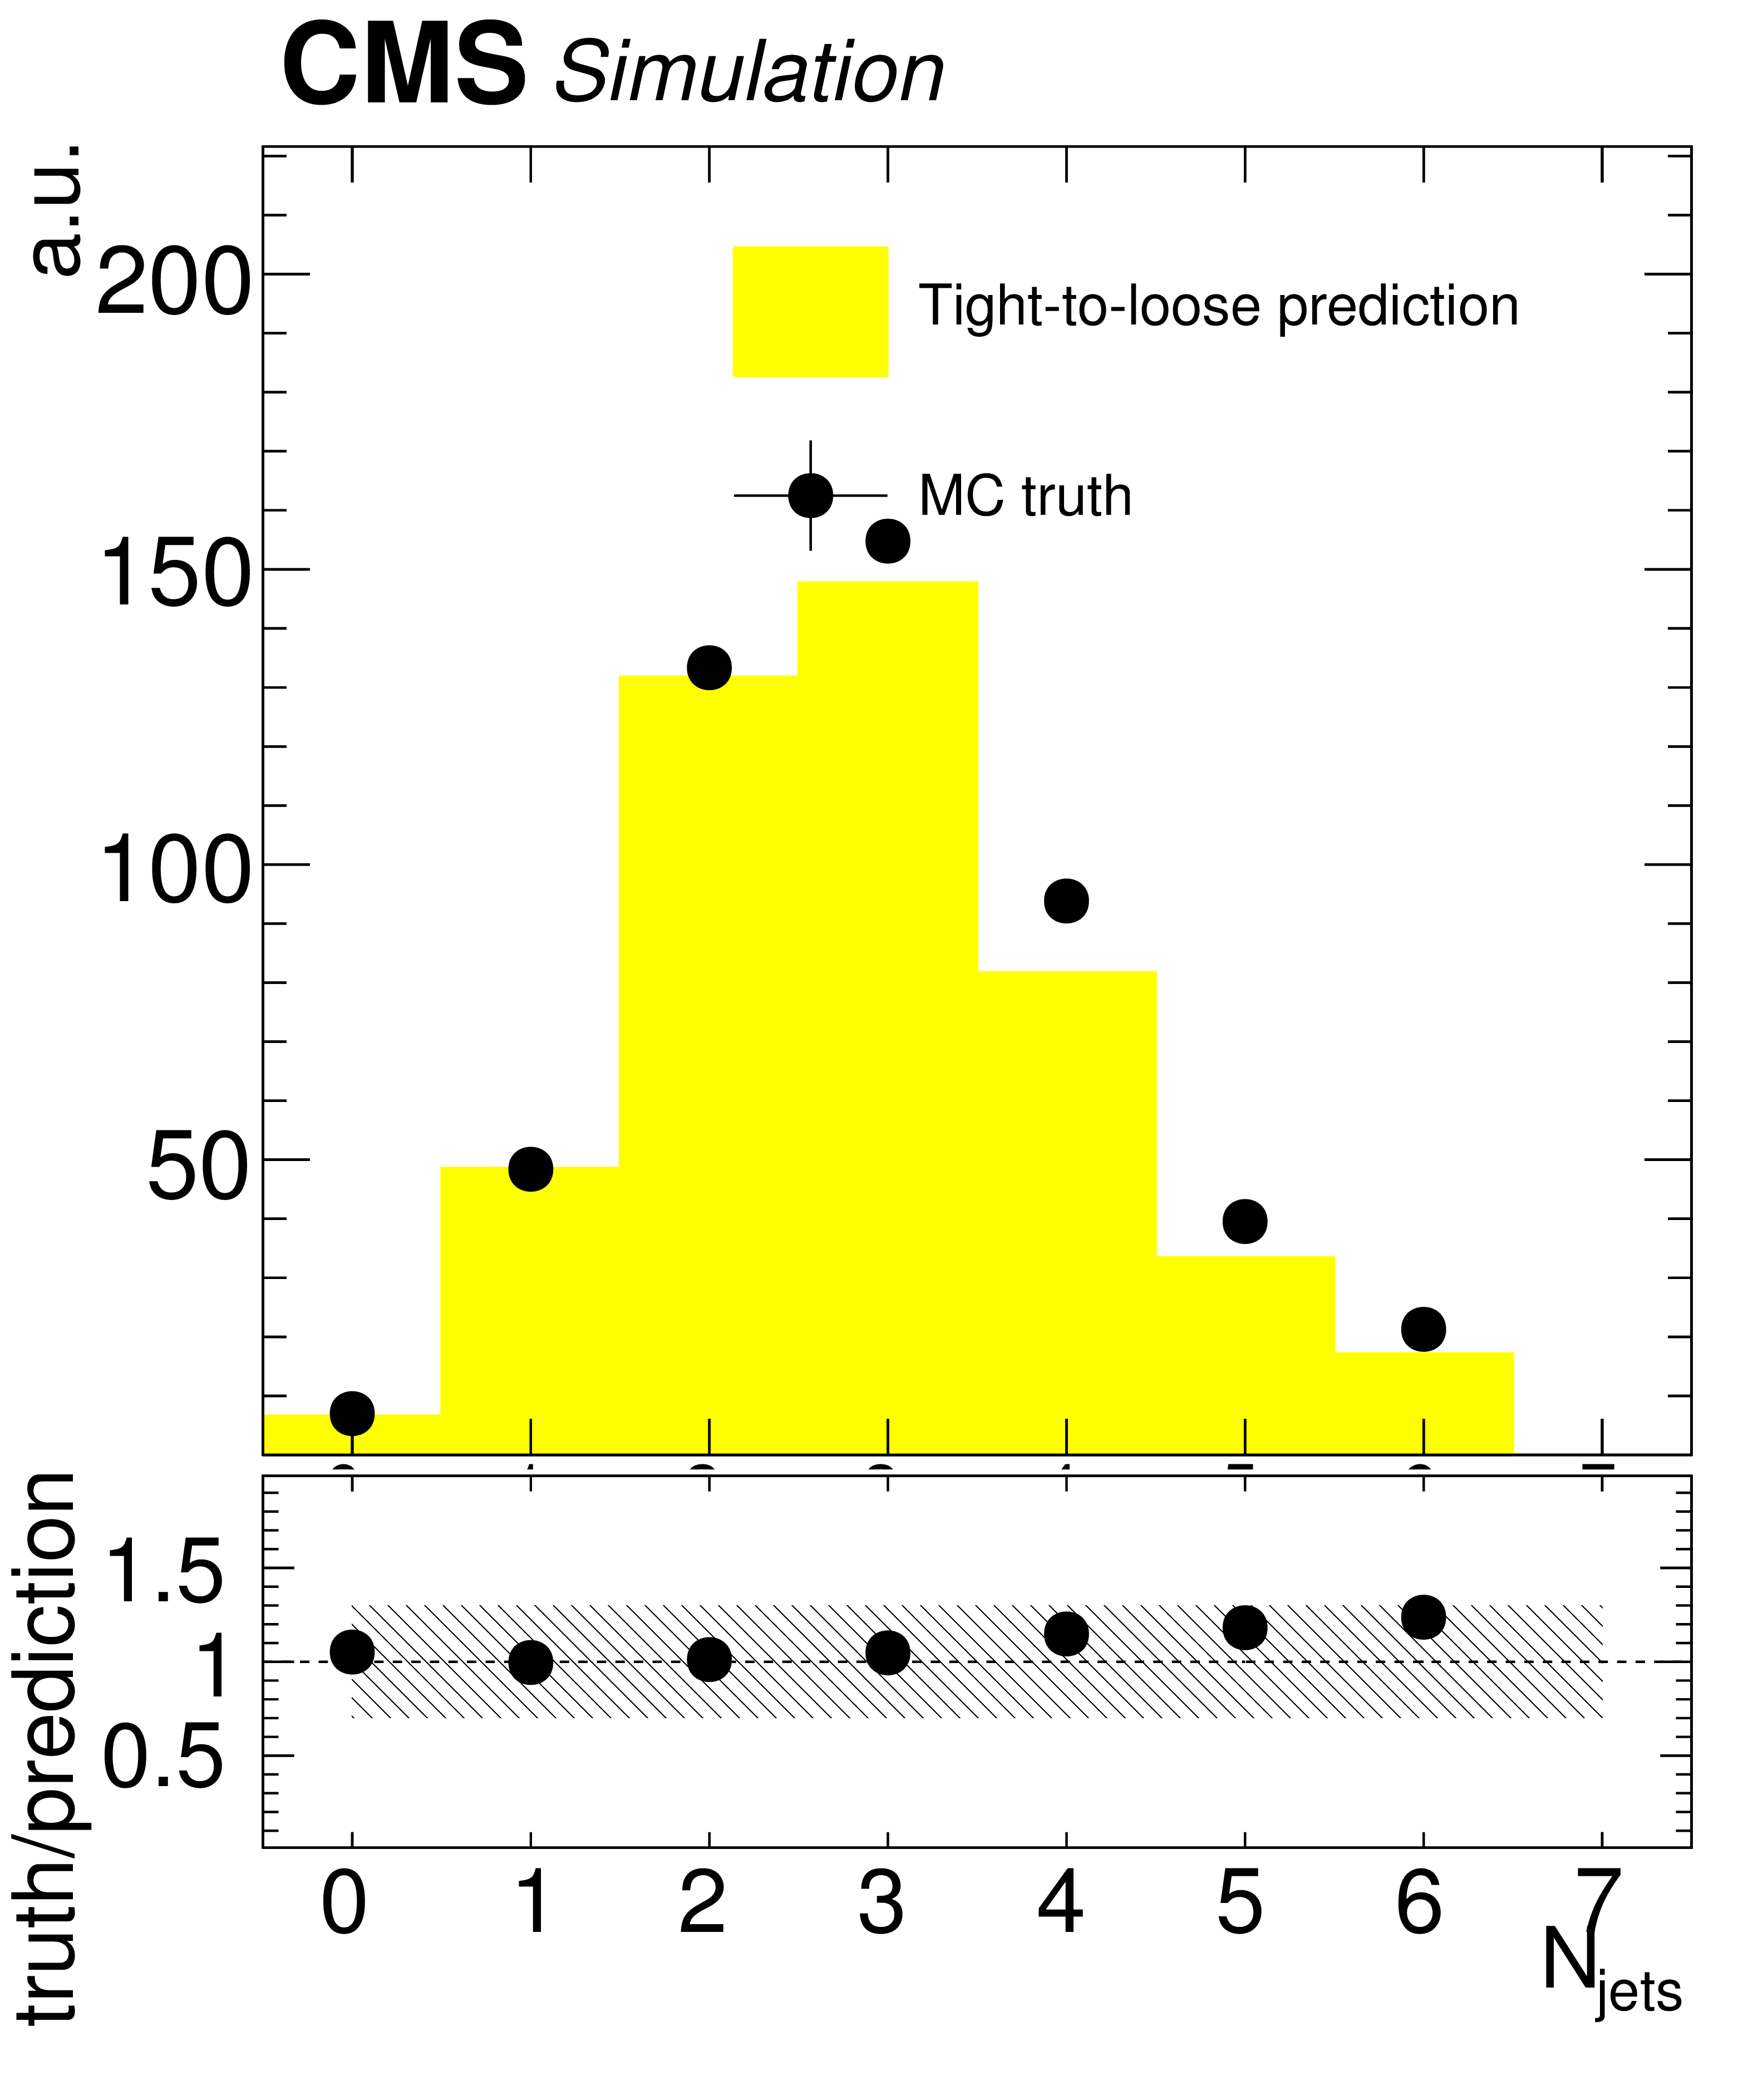
Additional Figure 2-a:
Fake background estimation closure with fake rate measured in QCD measurement region. Shown is the distribution of the jet multiplicity ${N_\text {jets}}$ for events with three-leptons as obtained from a DYMadGraph sample. 30% uncertainty covers the discrepancy between observed and predicted yields (light hashed). |
png pdf |
Additional Figure 2-b:
Fake background estimation closure with fake rate measured in QCD measurement region. Shown is the distribution of the b-jet multiplicity $ {N_\text {b-jets}} $ for events with three-leptons as obtained from a DYMadGraph sample. 30% uncertainty covers the discrepancy between observed and predicted yields (light hashed). |
png pdf |
Additional Figure 2-c:
Fake background estimation closure with fake rate measured in QCD measurement region. Shown is the distribution of the hadronic activity $ {H_{\mathrm {T}}} $ for events with three-leptons as obtained from a DYMadGraph sample. 30% uncertainty covers the discrepancy between observed and predicted yields (light hashed). |
png pdf |
Additional Figure 2-d:
Fake background estimation closure with fake rate measured in QCD measurement region. Shown is the distribution of the missing transverse energy for events with three-leptons as obtained from a DYMadGraph sample. 30% uncertainty covers the discrepancy between observed and predicted yields (light hashed). |
png pdf |
Additional Figure 3:
Fake background estimation closure with fake rate measured in QCD measurement region. Shown are the distributions of the hadronic activity $ {H_{\mathrm {T}}} $, the (b-)jet multiplicity ${N_\text {jets}}$ ($ {N_\text {b-jets}} $) and missing transverse energy for events with three-leptons as obtained from a ${\mathrm{ t } {}\mathrm{ \bar{t} } }$ MadGraph sample. 30% uncertainty covers the discrepancy between observed and predicted yields (light hashed). |
png pdf |
Additional Figure 3-a:
Fake background estimation closure with fake rate measured in QCD measurement region. Shown is the distribution of the jet multiplicity ${N_\text {jets}}$ and missing transverse energy for events with three-leptons as obtained from a ${\mathrm{ t } {}\mathrm{ \bar{t} } }$ MadGraph sample. 30% uncertainty covers the discrepancy between observed and predicted yields (light hashed). |
png pdf |
Additional Figure 3-b:
Fake background estimation closure with fake rate measured in QCD measurement region. Shown is the distribution of the b-jet multiplicity $ {N_\text {b-jets}} $ for events with three-leptons as obtained from a ${\mathrm{ t } {}\mathrm{ \bar{t} } }$ MadGraph sample. 30% uncertainty covers the discrepancy between observed and predicted yields (light hashed). |

png pdf |
Additional Figure 3-c:
Fake background estimation closure with fake rate measured in QCD measurement region. Shown is the distribution of the hadronic activity $ {H_{\mathrm {T}}} $ for events with three-leptons as obtained from a ${\mathrm{ t } {}\mathrm{ \bar{t} } }$ MadGraph sample. 30% uncertainty covers the discrepancy between observed and predicted yields (light hashed). |
png pdf |
Additional Figure 3-d:
Fake background estimation closure with fake rate measured in QCD measurement region. Shown is the missing transverse energy for events with three-leptons as obtained from a ${\mathrm{ t } {}\mathrm{ \bar{t} } }$ MadGraph sample. 30% uncertainty covers the discrepancy between observed and predicted yields (light hashed). |
| Additional Tables | |
png pdf |
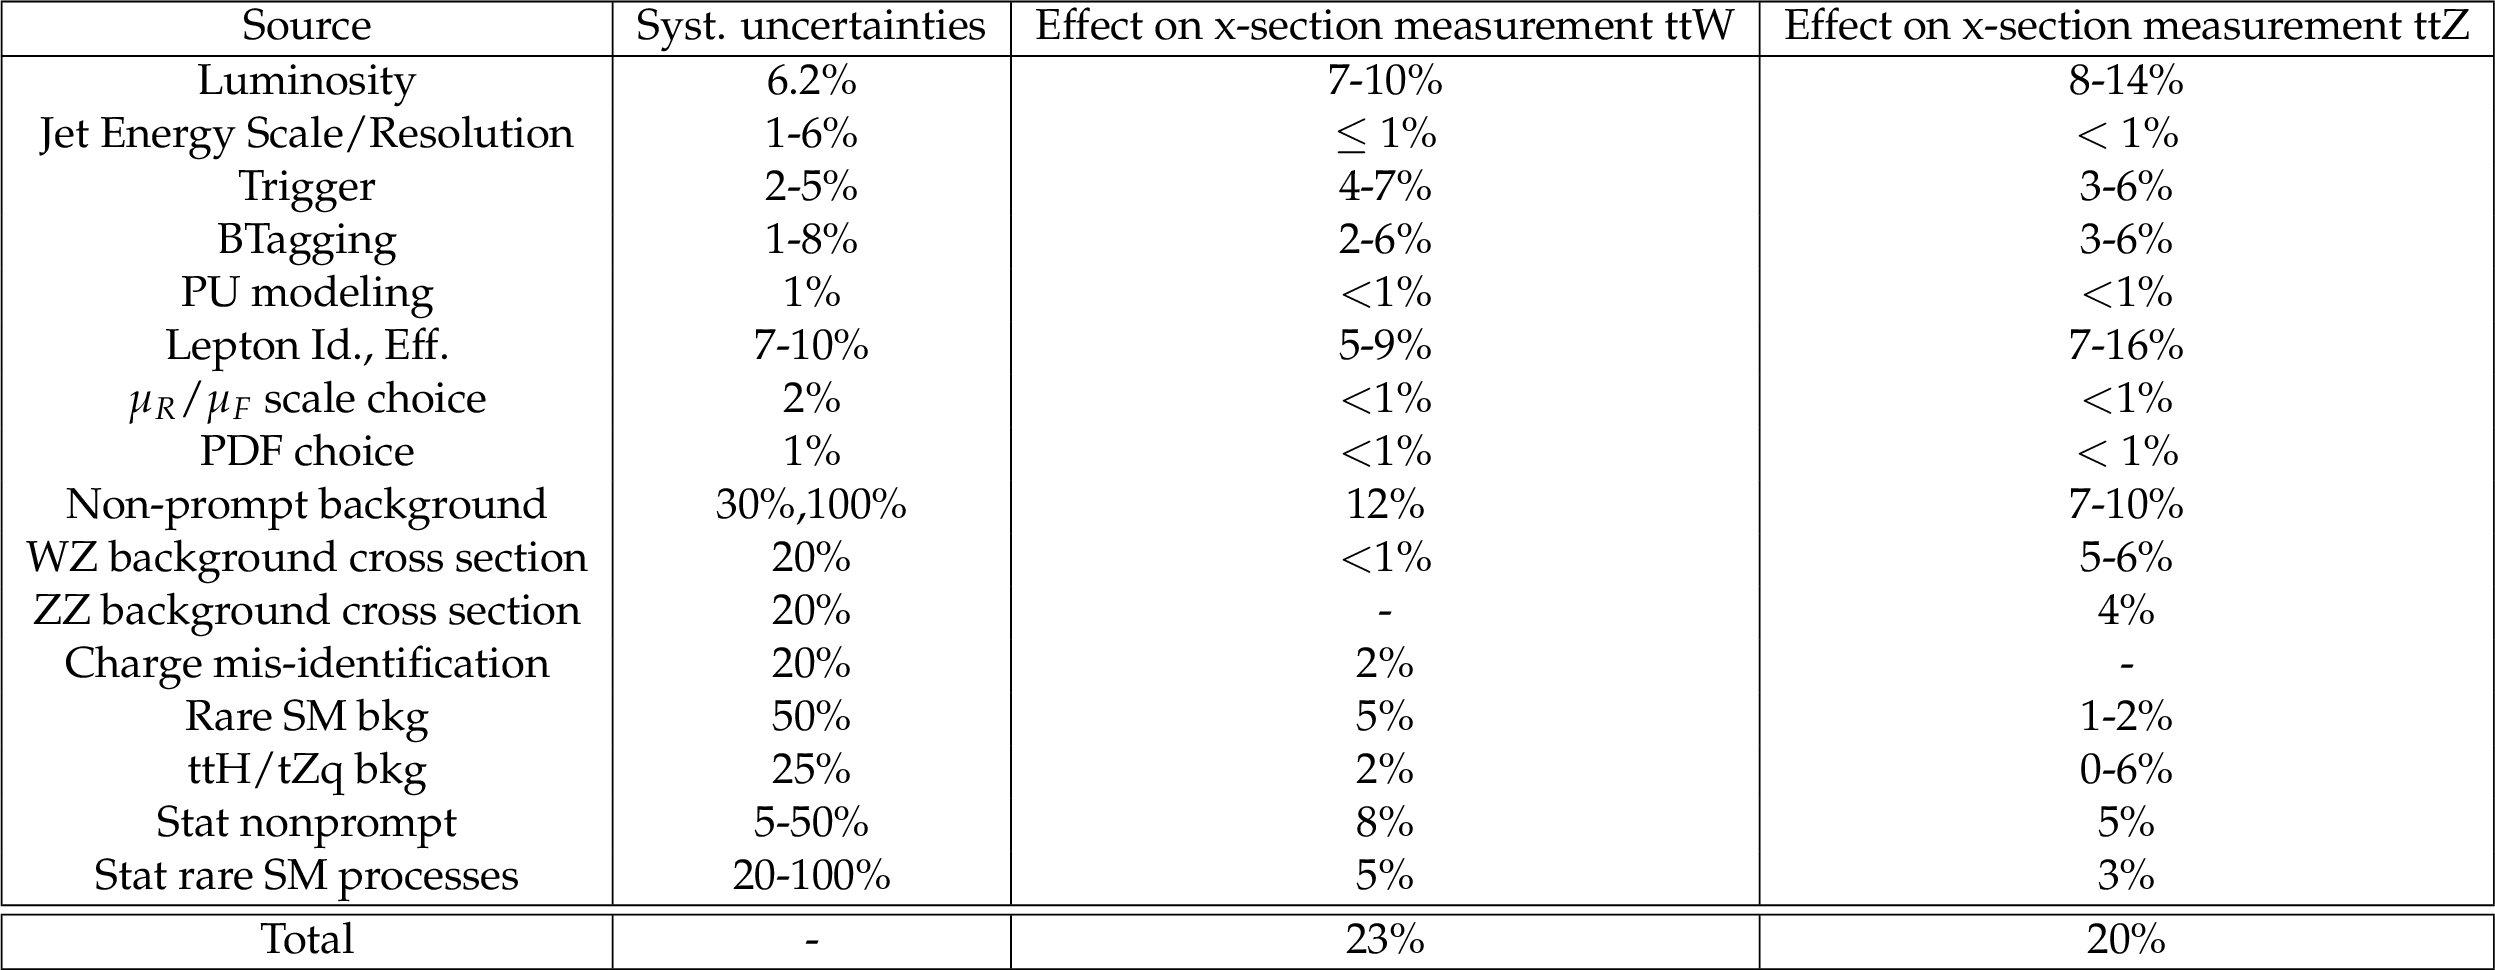
Additional Table 1:
Systematic uncertainties for different type of backgrounds. Three columns reflect the assigned uncertainty on each type of background and an effect on cross-section measurement of ${{\mathrm{ t } {}\mathrm{ \bar{t} } } \mathrm{ W } }$ and ${{\mathrm{ t } {}\mathrm{ \bar{t} } } \mathrm{ Z } }$ processes. Uncertainties on the integrated luminosity, lepton reconstruction and nonprompt background have the greatest effect both on the $\mathrm{ t \bar{t} W }$ and $\mathrm{ t \bar{t} Z }$ cross-section measurement. Uncertainty on WZ and ZZ background gives a significant contribution to the systematic uncertainty of $\mathrm{ t \bar{t} Z }$ cross section measurement. |
| References | ||||
| 1 | S. Frixione et al. | Electroweak and QCD corrections to top-pair hadroproduction in association with heavy bosons | JHEP 06 (2015) 184 | 1504.03446 |
| 2 | J. Alwall et al. | The automated computation of tree-level and next-to-leading order differential cross sections, and their matching to parton shower simulations | JHEP 07 (2014) 079 | 1405.0301 |
| 3 | B. Mellado Garcia, P. Musella, M. Grazzini, and R. Harlander | CERN Report 4: Part I Standard Model Predictions | Technical Report LHCHXSWG-DRAFT-INT-2016-008 | |
| 4 | CMS Collaboration | Measurement of associated production of vector bosons and $ \mathrm{ t \bar{t} } $ in pp collisions at $ \sqrt{s} = $ 7 TeV | PRL 110 (2013) 172002 | CMS-TOP-12-014 1303.3239 |
| 5 | CMS Collaboration | Measurement of top quark-antiquark pair production in association with a W or Z boson in pp collisions at $ \sqrt{s} = 8 $ $ \,\text {TeV} $ | Eur. Phys. J.C 74 (2014), no. 9 | CMS-TOP-12-036 1406.7830 |
| 6 | CMS Collaboration | Observation of top quark pairs produced in association with a vector boson in pp collisions at $ \sqrt{s}=8 $ TeV | JHEP 01 (2016) 096 | CMS-TOP-14-021 1510.01131 |
| 7 | ATLAS Collaboration | Measurement of the $ t\overline{t}W $ and $ t\overline{t}Z $ production cross sections in pp collisions at $ \sqrt{s}=8 $ TeV with the ATLAS detector | JHEP 11 (2015) 172 | 1509.05276 |
| 8 | CMS Collaboration | Measurement of the cross section of top quark pair production in association with a Z boson in pp collisions at 13 TeV | CMS-PAS-TOP-16-009 | CMS-PAS-TOP-16-009 |
| 9 | ATLAS Collaboration | Measurement of the $ t\bar{t}Z $ and $ t\bar{t}W $ production cross sections in multilepton final states using 3.2 $ fb$^{-1}$ $ of pp collisions. | ATLAS Conference Note ATLAS-CONF-2016-003 | |
| 10 | CMS Collaboration | The CMS experiment at the CERN LHC | JINST 3 (2008) S08004 | CMS-00-001 |
| 11 | J. Alwall et al. | $ MadGraph $ 5 : Going Beyond | JHEP 06 (2011) 128 | 1106.0522 |
| 12 | S. Frixione and B. R. Webber | Matching NLO QCD computations and parton shower simulations | JHEP 06 (2002) 29 | hep-ph/0204244 |
| 13 | T. Sj\"ostrand, S. Mrenna, and P. Skands | PYTHIA 6.4 physics and manual | JHEP 05 (2006) 026 | hep-ph/0603175 |
| 14 | T. Sjostrand et al. | An Introduction to PYTHIA 8.2 | CPC 191 (2015) 159--177 | 1410.3012 |
| 15 | S. Alioli et al. | NLO single-top production matched with shower in POWHEG: $ s $- and $ t $-channel contributions | JHEP 09 (2009) 111 | 0907.4076 |
| 16 | S. Alioli et al. | A general framework for implementing NLO calculations in shower Monte Carlo programs: the POWHEG BOX | JHEP 06 (2010) 043 | 1002.2581 |
| 17 | GEANT4 Collaboration | $ Geant 4 $ -- a simulation toolkit | NIMA 506 (2003) 250 | |
| 18 | CMS Collaboration | Commissioning of the Particle-Flow Reconstruction in Minimum-Bias and Jet Events from $ \mathrm{ p }\mathrm{ p } $ Collisions at 7 TeV | CDS | |
| 19 | M. Cacciari, G. P. Salam, and G. Soyez | FastJet User Manual | EPJC 72 (2012) 1896 | 1111.6097 |
| 20 | M. Cacciari and G. P. Salam | Dispelling the $ N^{3} $ myth for the $ k_t $ jet-finder | PLB 641 (2006) 57--61 | hep-ph/0512210 |
| 21 | M. Cacciari, G. P. Salam, and G. Soyez | The anti-$ k_t $ jet clustering algorithm | JHEP 04 (2008) 063 | 0802.1189 |
| 22 | CMS Collaboration | Pileup Removal Algorithms | CMS-PAS-JME-14-001 | CMS-PAS-JME-14-001 |
| 23 | CMS Collaboration | Identification of $ \mathrm{b }-quark $ jets with the CMS experiment | JINST 8 (2013) 04013 | CMS-BTV-12-001 1211.4462 |
| 24 | Particle Data Group | Review of particle physics | CPC 38 (2014) 090001 | |
| 25 | A. Hoecker, P. Speckmayer, J. Stelzer, J. Therhaag, E. von Toerne, H. Voss Collaboration | TMVA 4, Toolkit for Multivariate Data Analysis with ROOT, Users Guide | Technical Report CERN-OPEN-2007-007 | |
| 26 | C. Collaboration | Search for new physics in same-sign dilepton events in proton-proton collisions at $ \sqrt{s} $ = 13 TeV | \it Accepted by EPJC | |
| 27 | J. Campbell, R. K. Ellis, and R. Röntsch | Single top production in association with a Z boson at the LHC | Phys. Rev.D 87 (2013) 114006 | 1302.3856 |
| 28 | CMS Collaboration | Measurement of the ZZ production cross section in $ \ell\ell\ell'\ell' $ decays in pp collisions at $ \sqrt{s} = 13 $ TeV | CMS-PAS-SMP-15-005 | CMS-PAS-SMP-15-005 |
| 29 | CMS Collaboration | CMS luminosity measurement for the 2015 data taking period | CMS-PAS-LUM-15-001 | CMS-PAS-LUM-15-001 |
| 30 | CMS Collaboration | Identification of b-quark jets with the CMS experiment | JINST 8 (2013) P04013 | CMS-BTV-12-001 1211.4462 |
| 31 | NNPDF Collaboration | Parton distributions for the LHC Run II | JHEP 04 (2015) 040 | 1410.8849 |
| 32 | ATLAS and CMS Collaborations | Procedure for the LHC Higgs boson search combination in summer 2011 | ATL-PHYS-PUB-2011-011, CMS NOTE-2011/005 | |
| 33 | G. Cowan, K. Cranmer, E. Gross, and O. Vitells | Asymptotic formulae for likelihood-based tests of new physics | Eur. Phys. J.C 71 (2011) 1554, , [Erratum: Eur. Phys. J.C73,2501(2013)] | 1007.1727 |
|
|
Compact Muon Solenoid LHC, CERN |
|

|

|

|

|

|