

Compact Muon Solenoid
LHC, CERN
| CMS-PAS-TOP-16-009 | ||
| Measurement of the cross section of top quark pair production in association with a Z boson in pp collisions at 13 TeV | ||
| CMS Collaboration | ||
| March 2016 | ||
| Abstract: We present a measurement of the cross section of top quark pair production in association with a Z boson, using proton-proton collisions at a center-of-mass energy of 13 TeV. The data sample used corresponds to an integrated luminosity of 2.7 fb$^{-1}$. The measurement is performed in three- and four-lepton final states where the jet and b-jet multiplicities were exploited to enhance the signal over background ratio. The $\mathrm{t\overline{t}Z}$ production cross section is measured to be 1065 $^{+352}_{-313}$ (stat) $^{+168}_{-142}$ (syst) fb with a significance of 3.6 standard deviations from the background-only hypothesis. | ||
| Links: CDS record (PDF) ; inSPIRE record ; CADI line (restricted) ; | ||
| Figures & Tables | Summary | Additional Figures | CMS Publications |
|---|
| Figures | |
png |
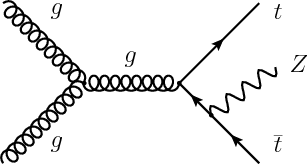
Figure 1:
The leading order Feynman diagram for $ { {\mathrm{ t \bar{t} } } \mathrm{ Z } } $ production at the LHC. |
png pdf |
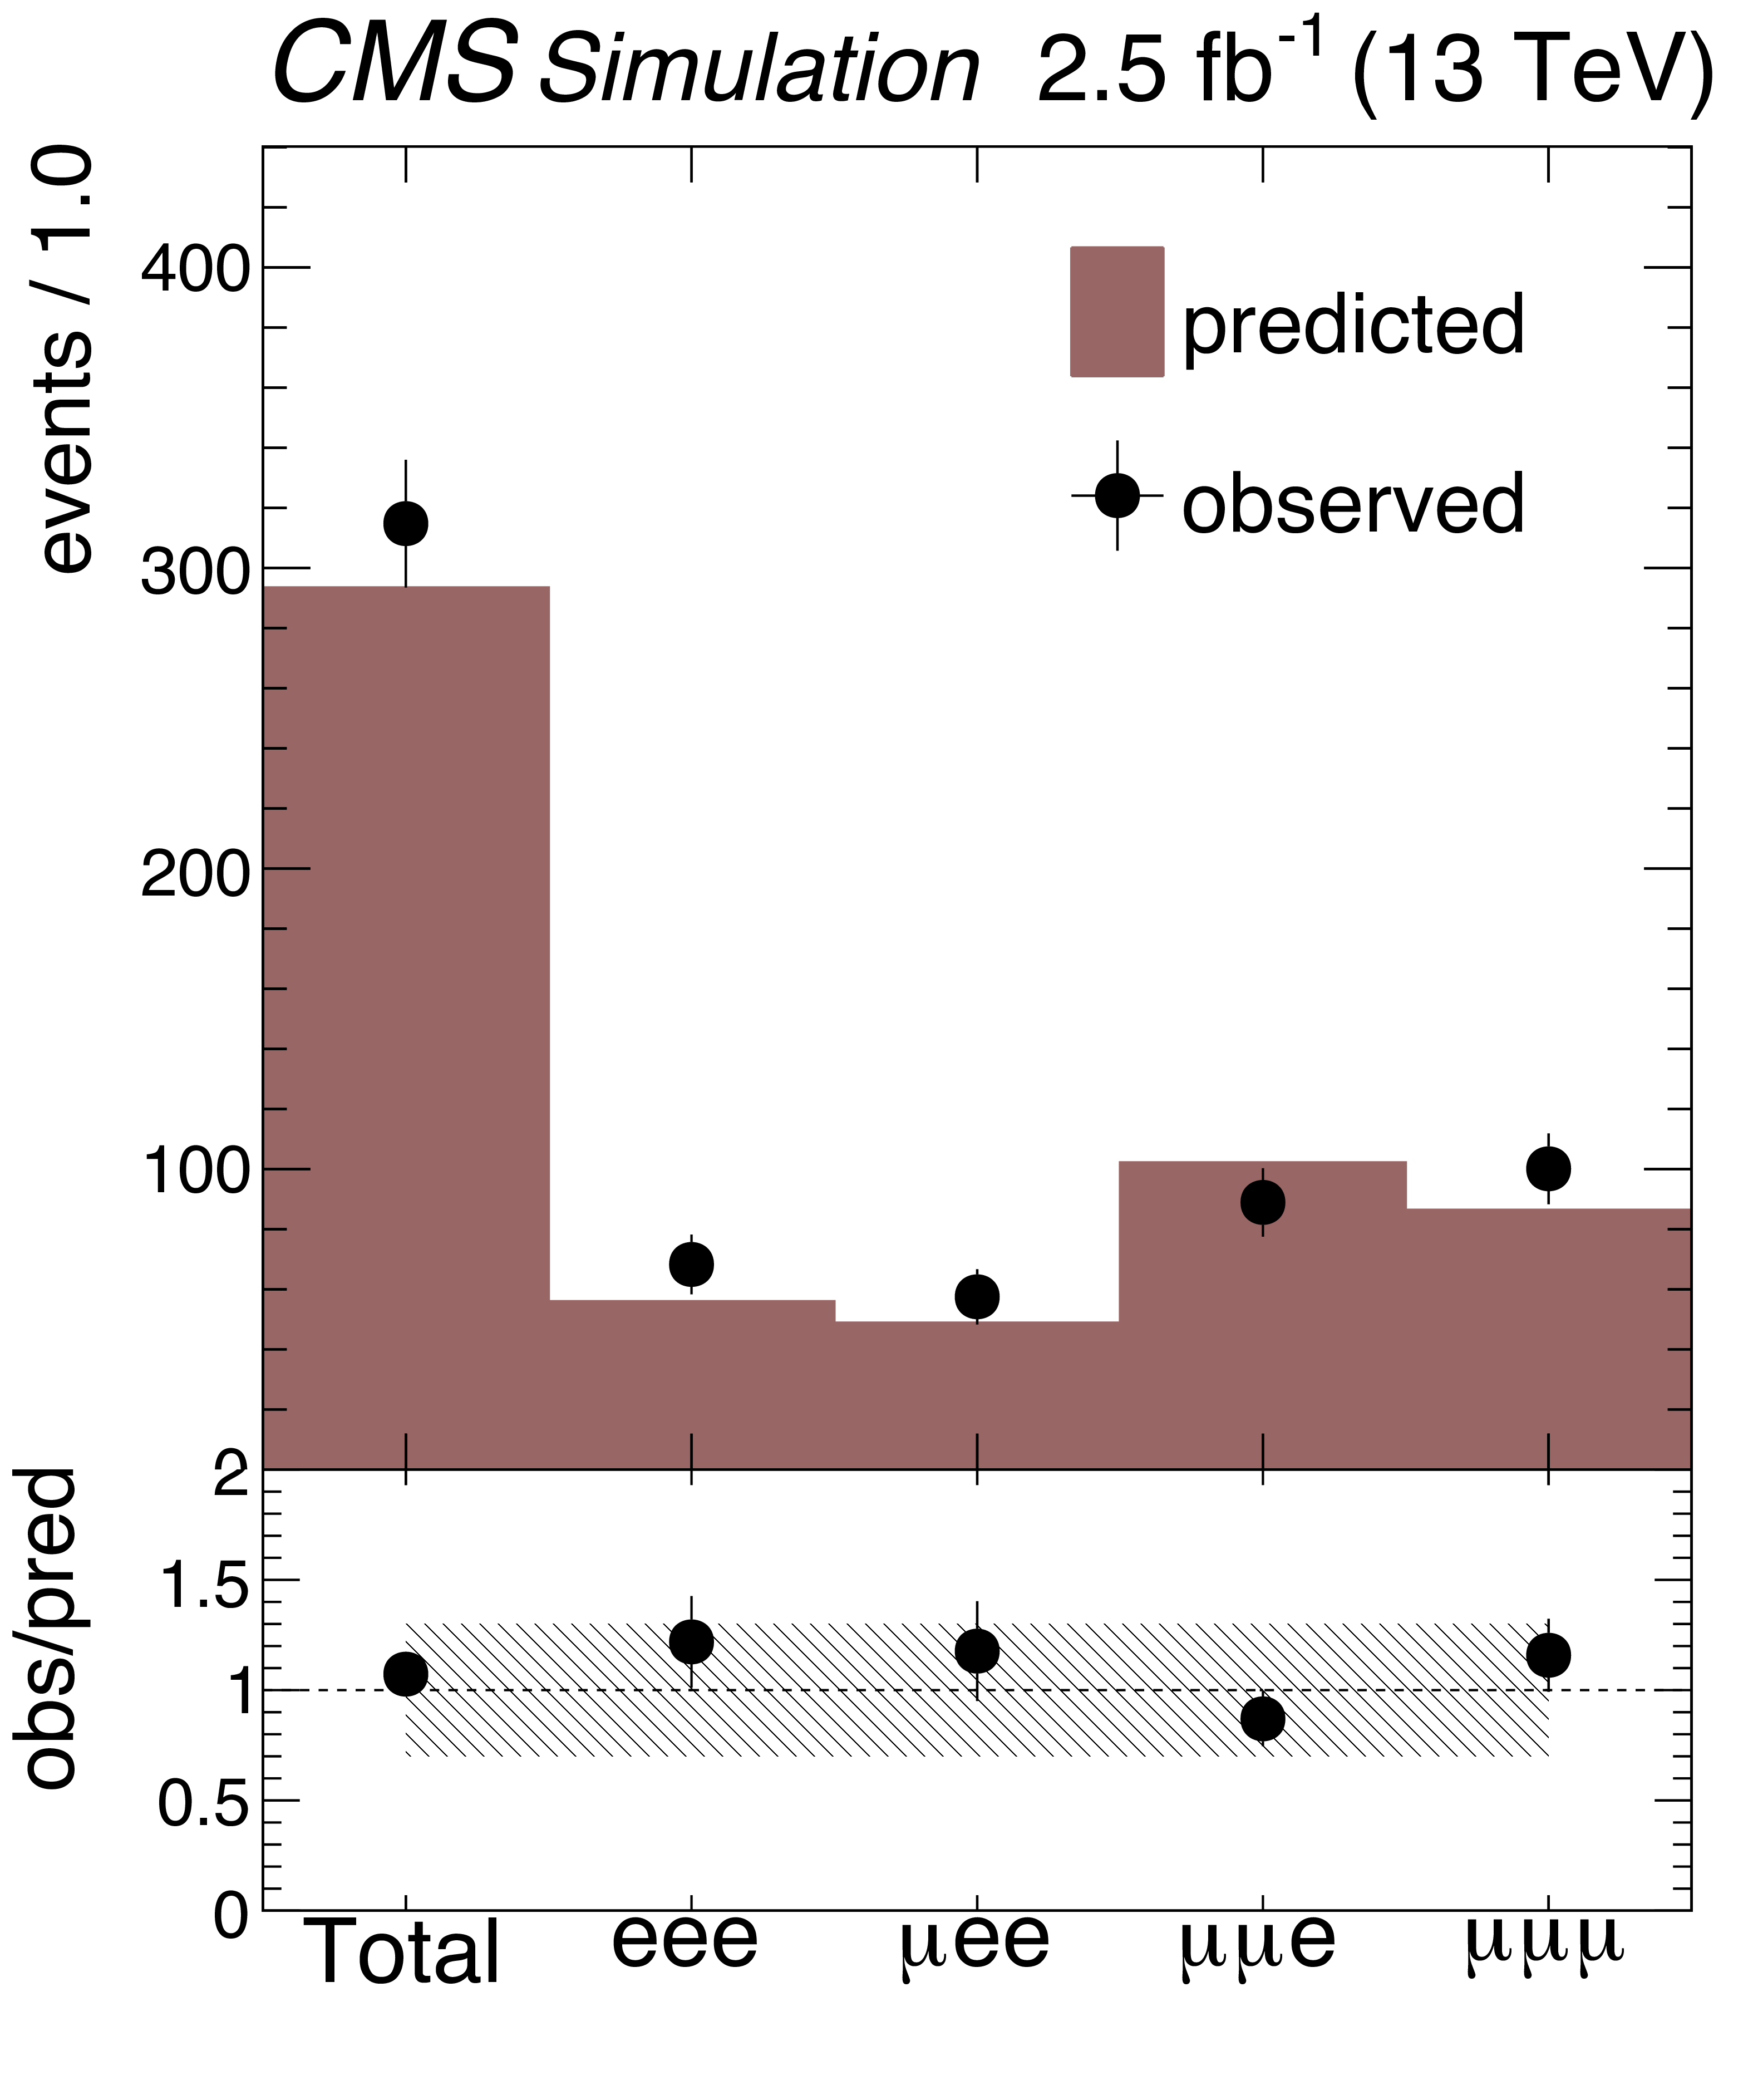
Figure 2-a:
Validation plots of the data-driven prediction method for non-prompt lepton background in Z+jets (a) and $ \mathrm{ t \bar{t} } $ (b). The plots show the number of total events by lepton channel where the bottom plots show the ratio of the predicted to observed yields. A 30% hatched band is drawn to illustrate the appropriateness of the systematic uncertainty |
png pdf |
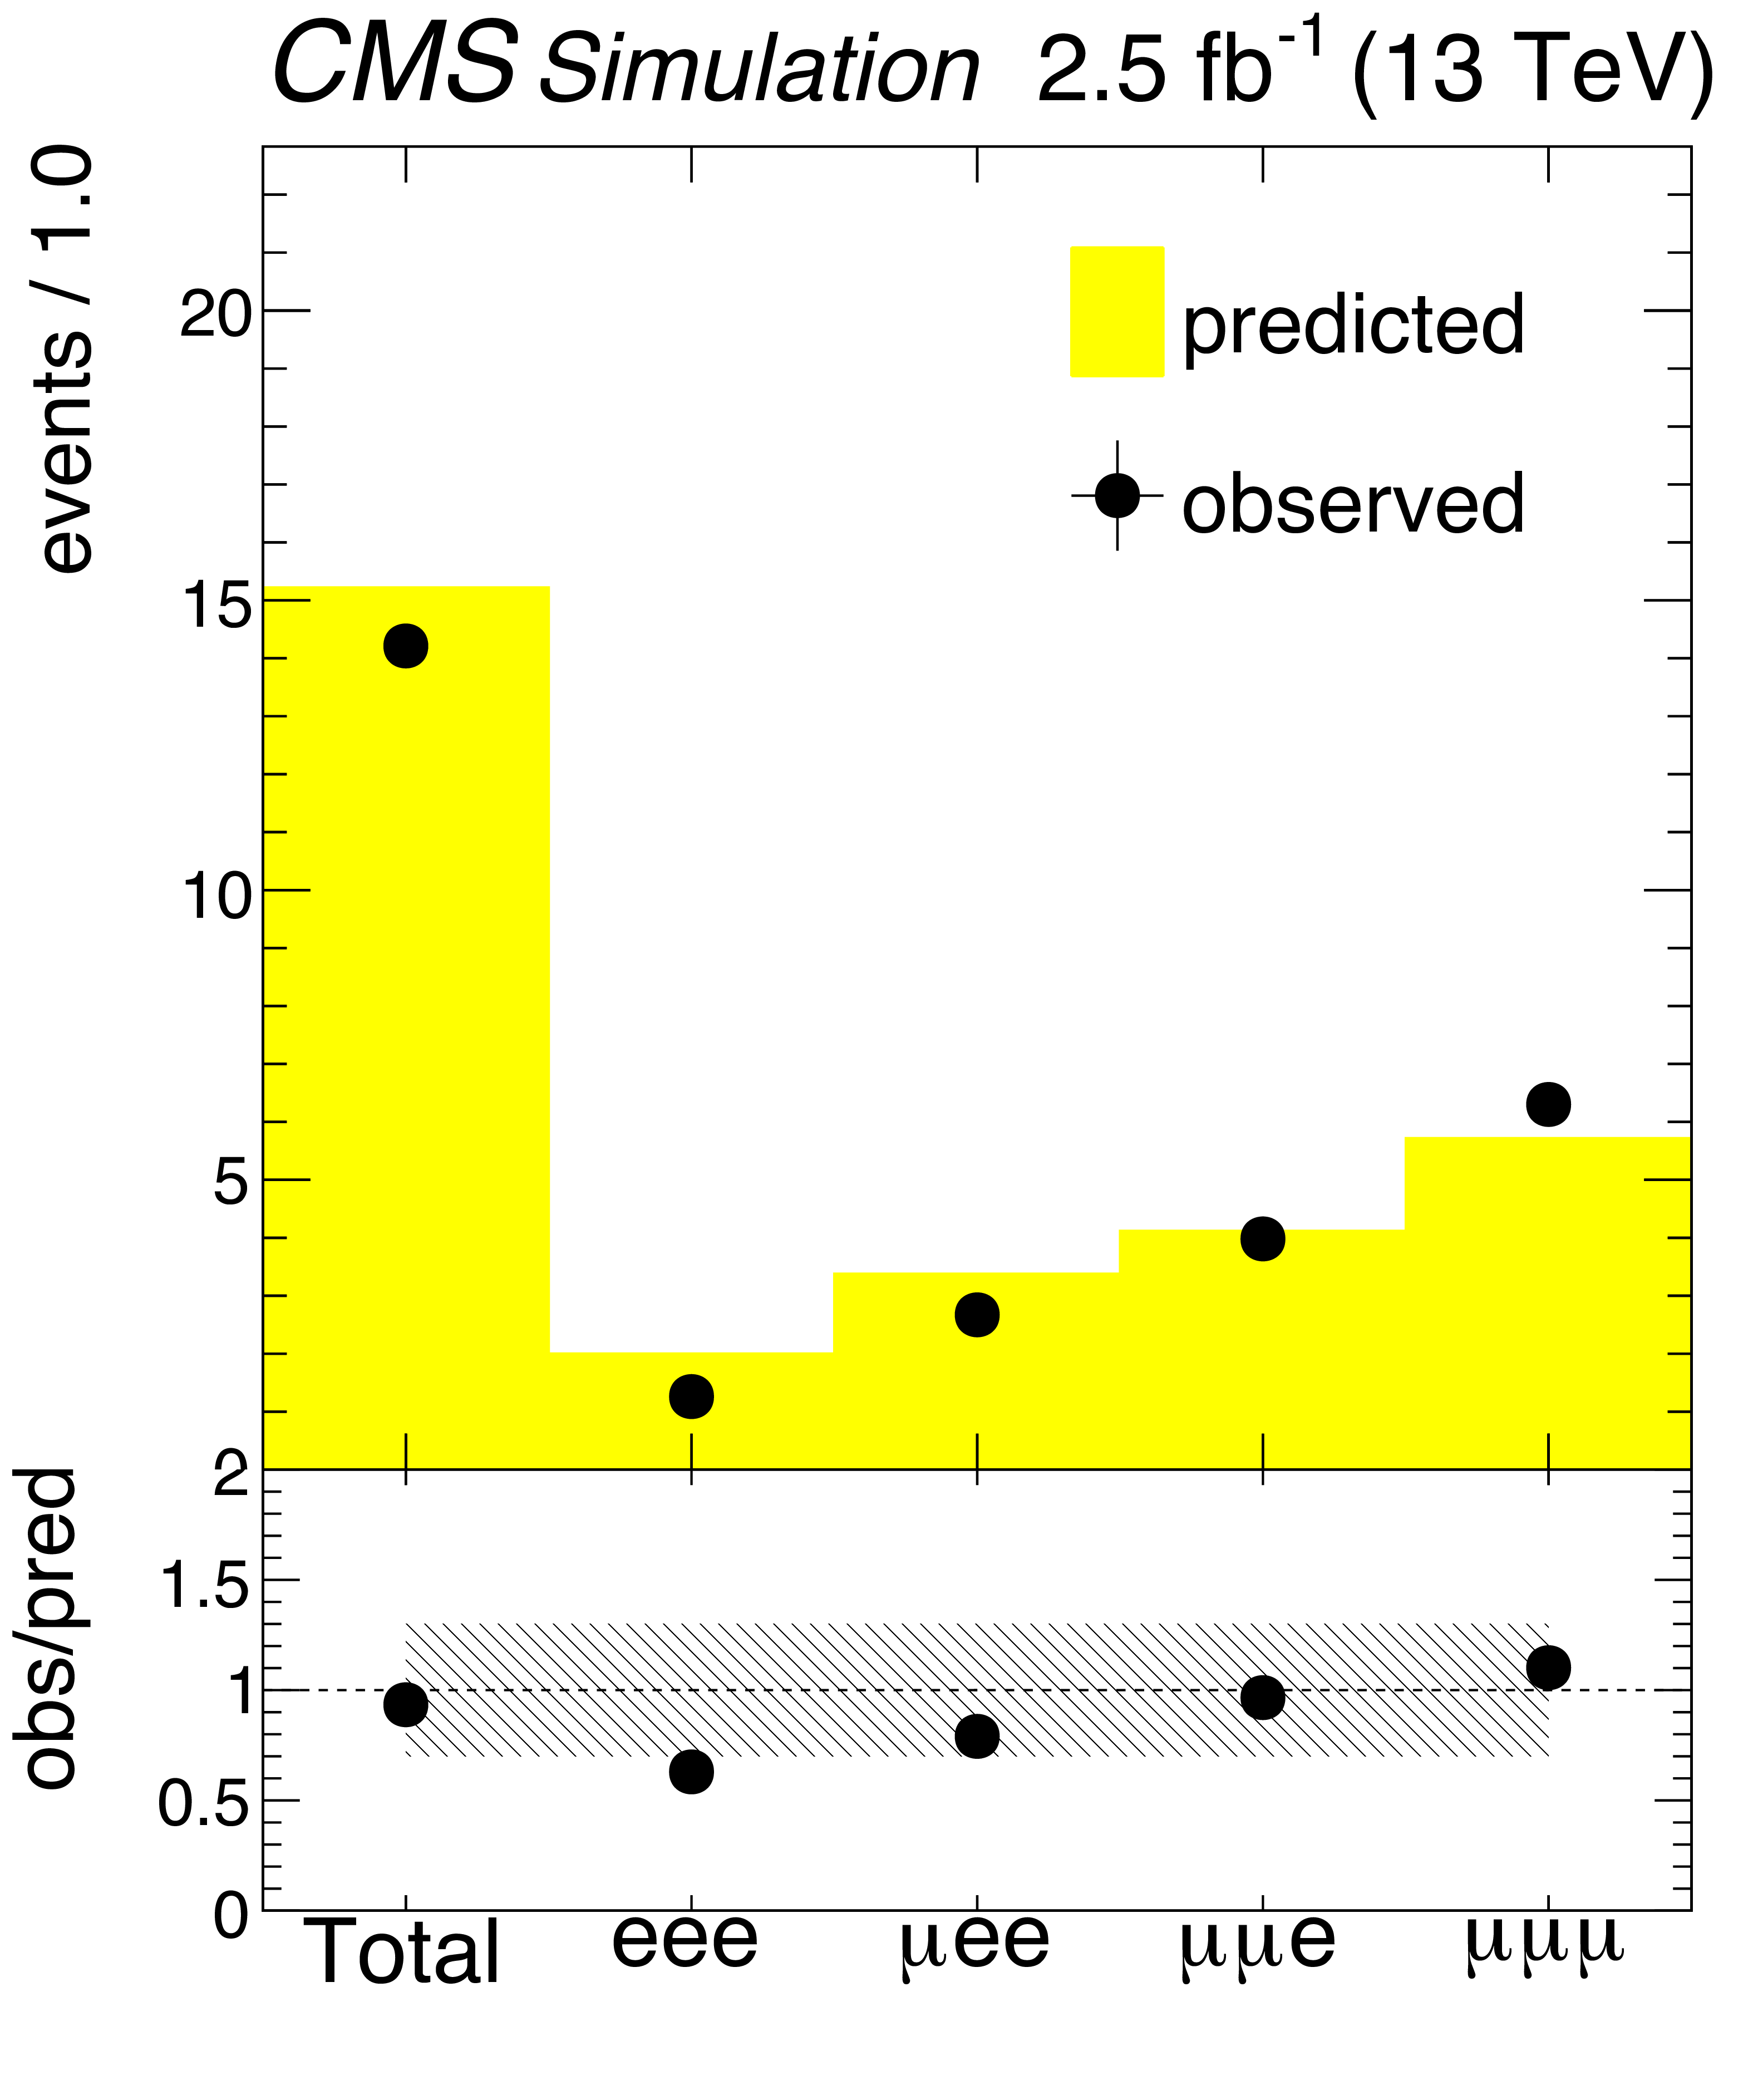
Figure 2-b:
Validation plots of the data-driven prediction method for non-prompt lepton background in Z+jets (a) and $ \mathrm{ t \bar{t} } $ (b). The plots show the number of total events by lepton channel where the bottom plots show the ratio of the predicted to observed yields. A 30% hatched band is drawn to illustrate the appropriateness of the systematic uncertainty |
png pdf |
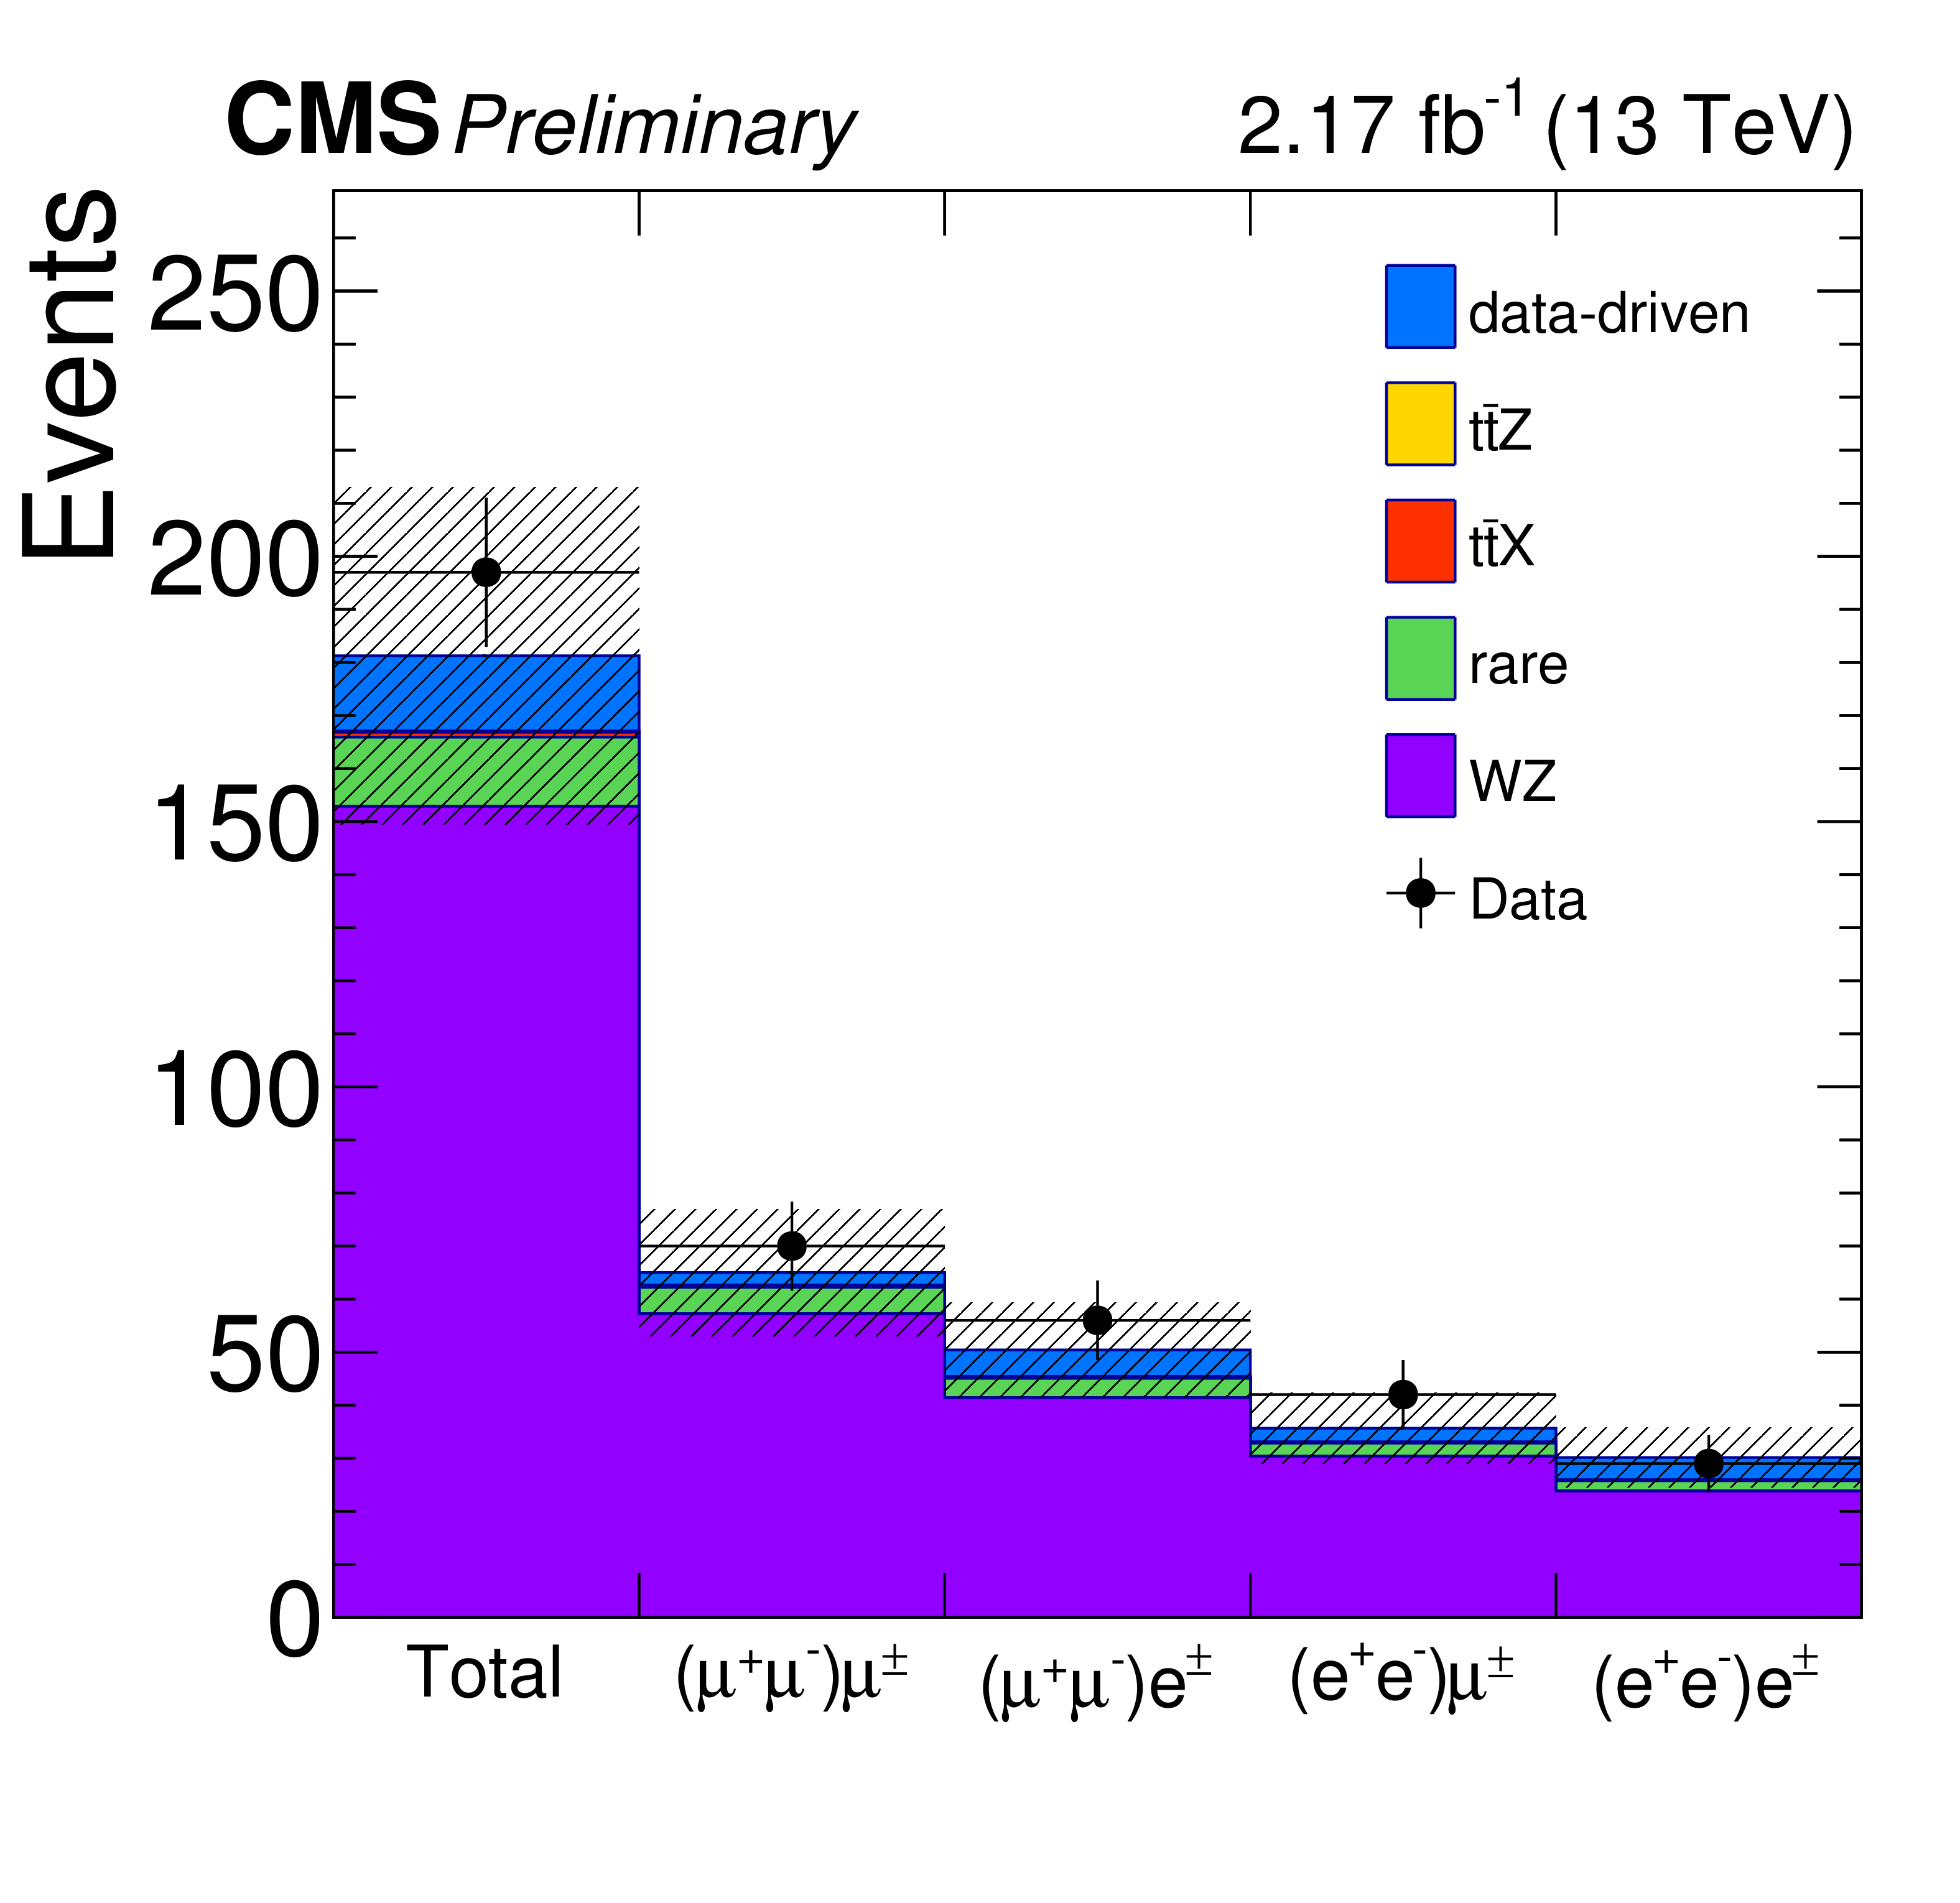
Figure 3-a:
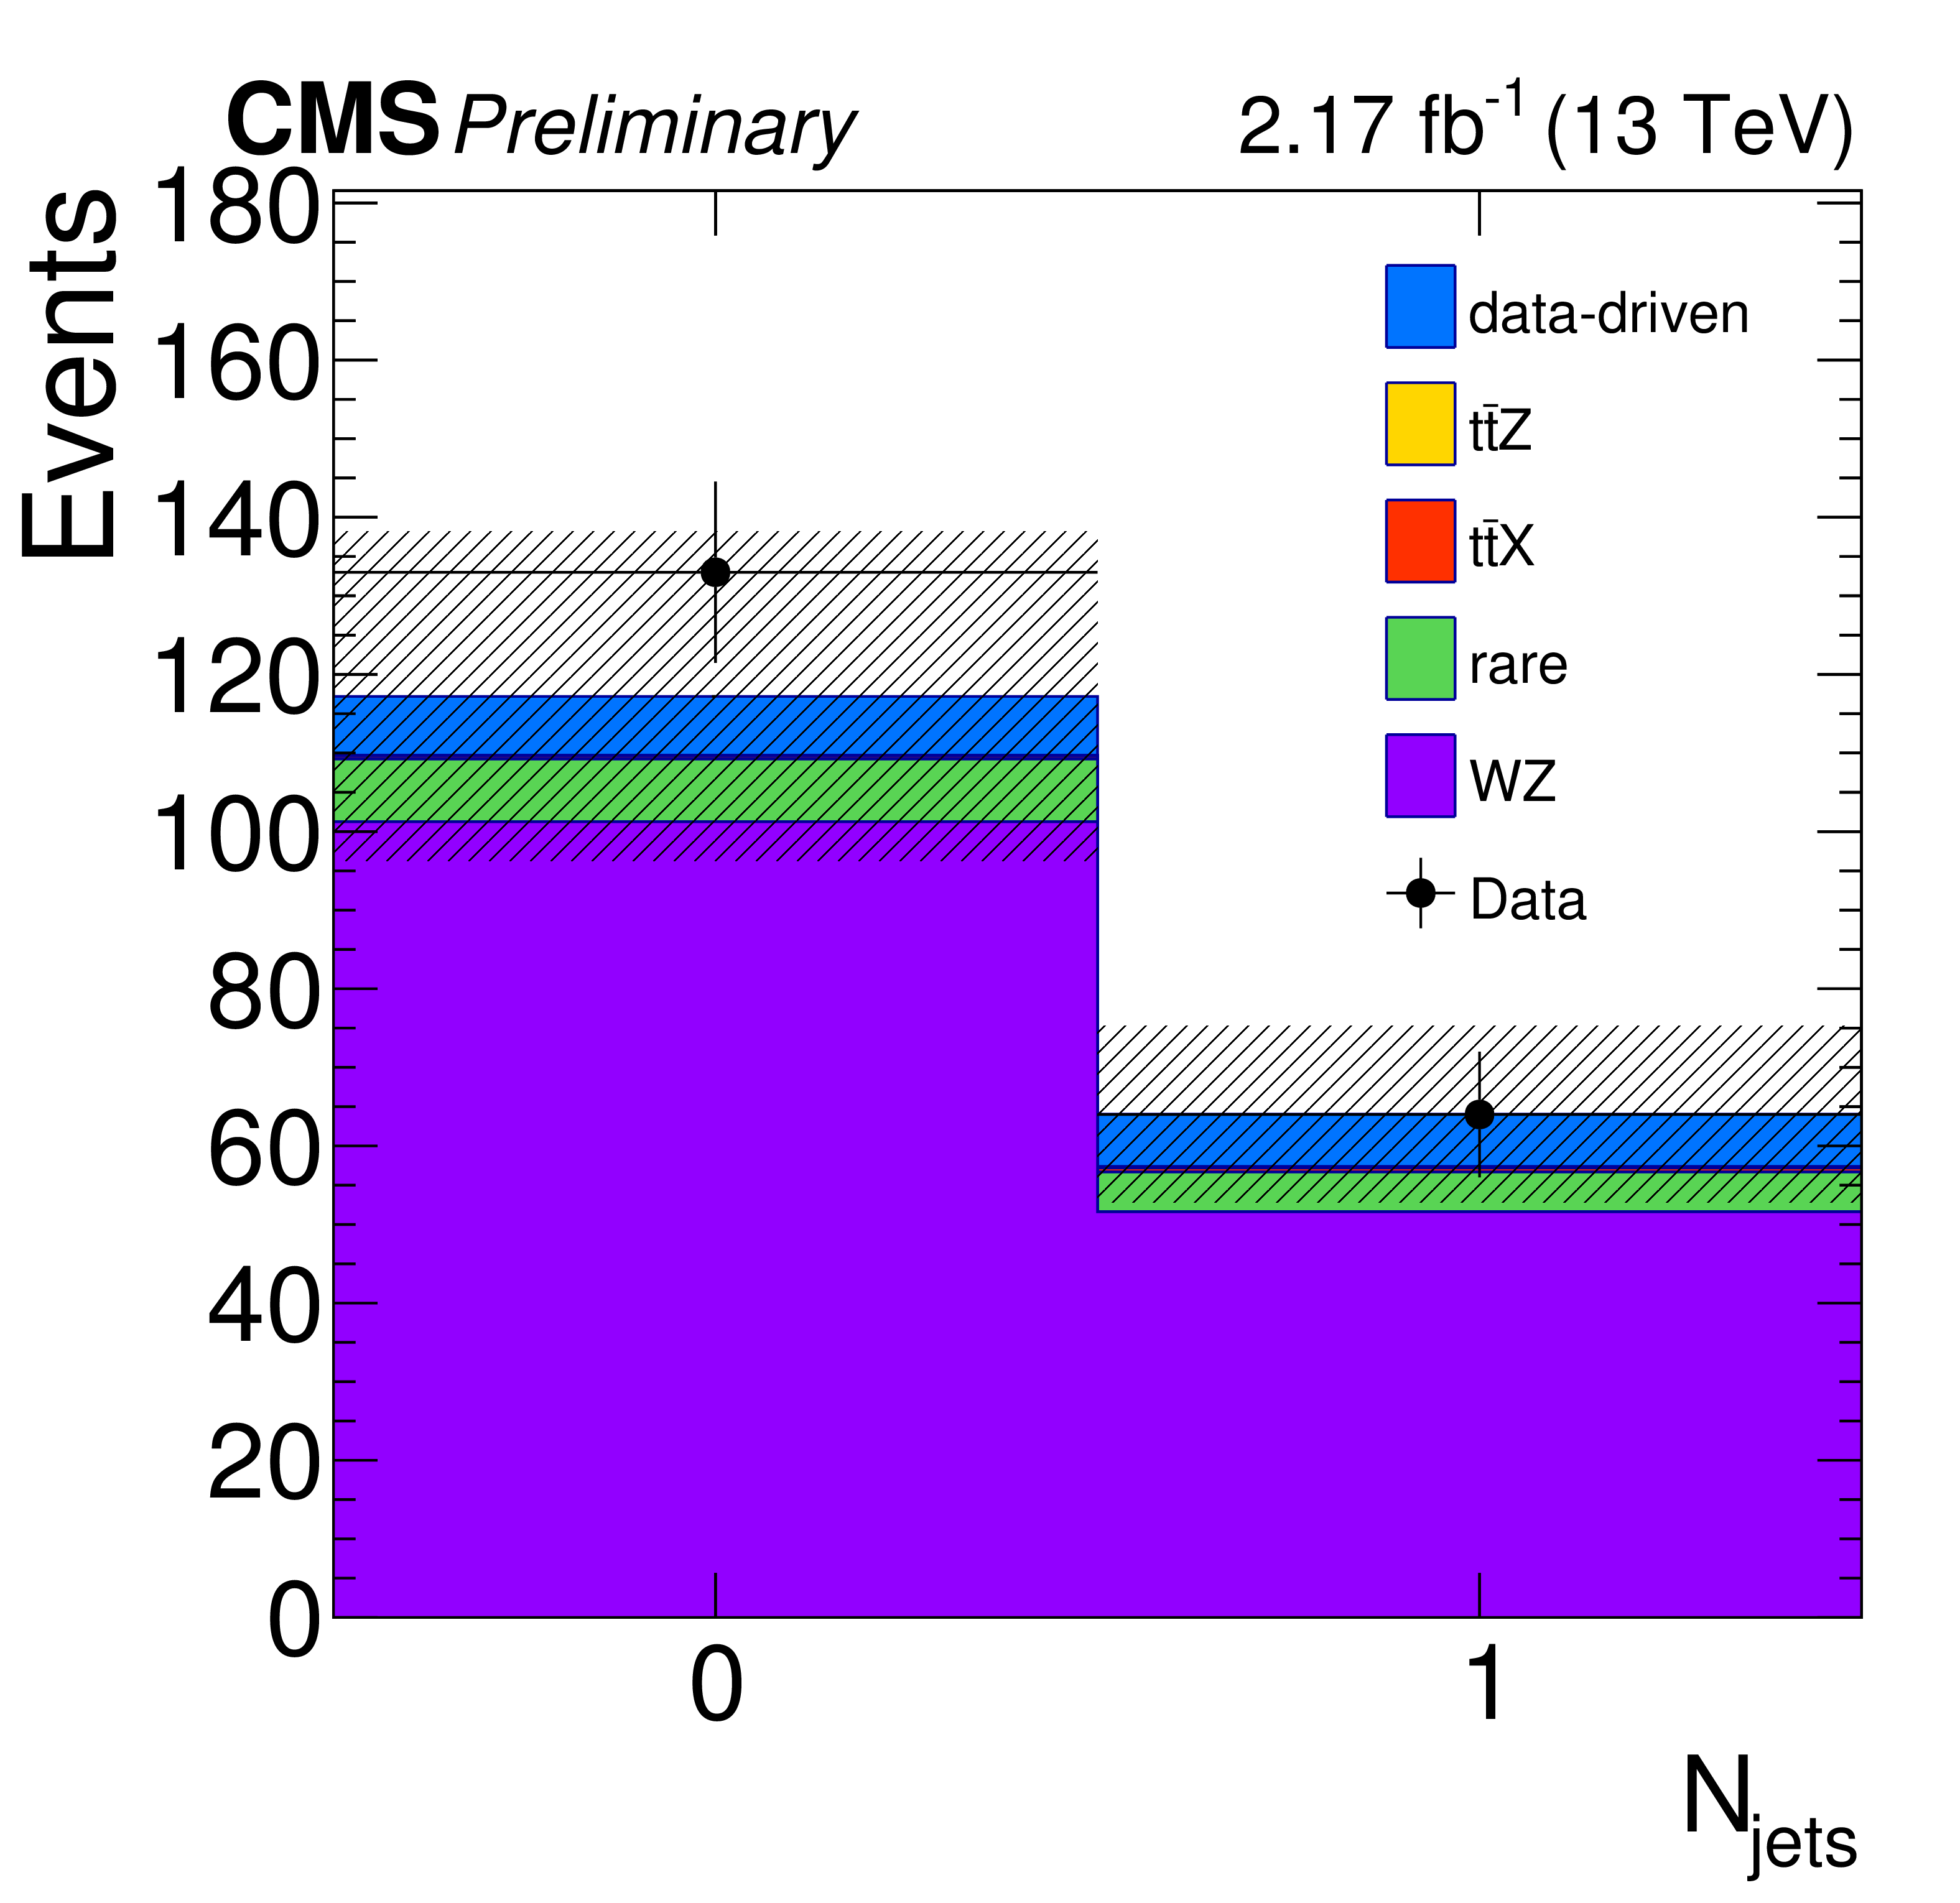
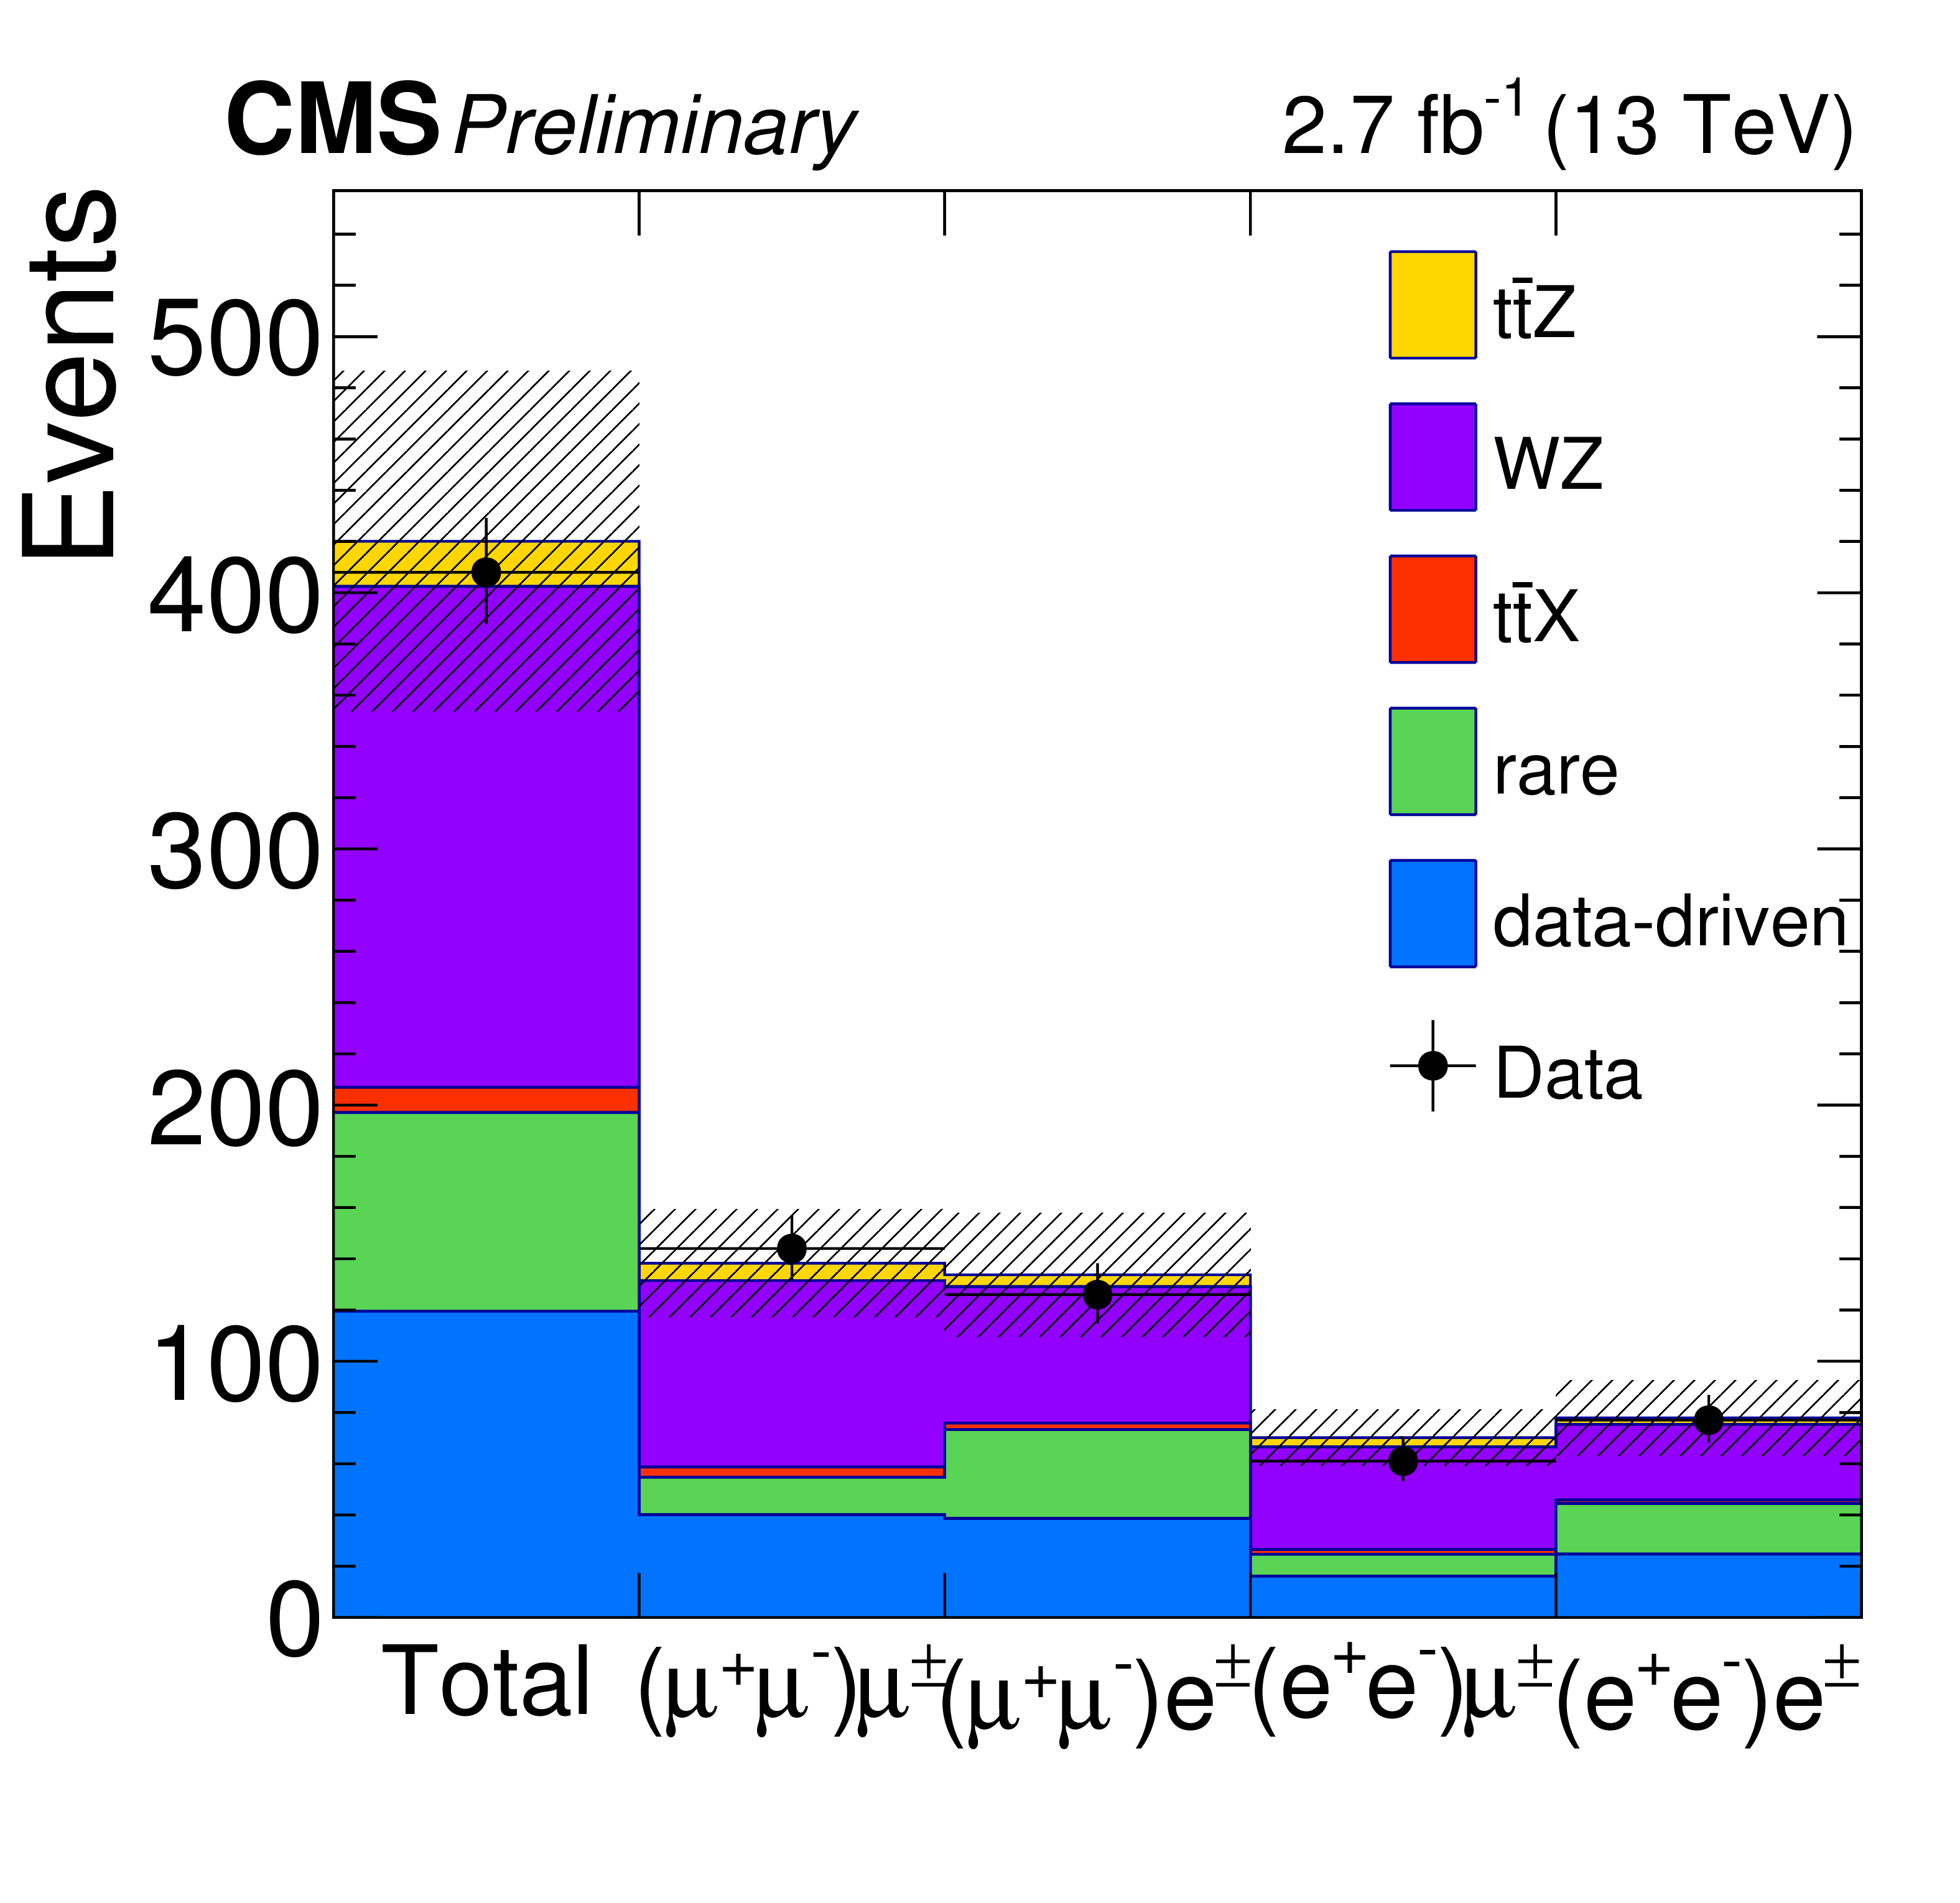
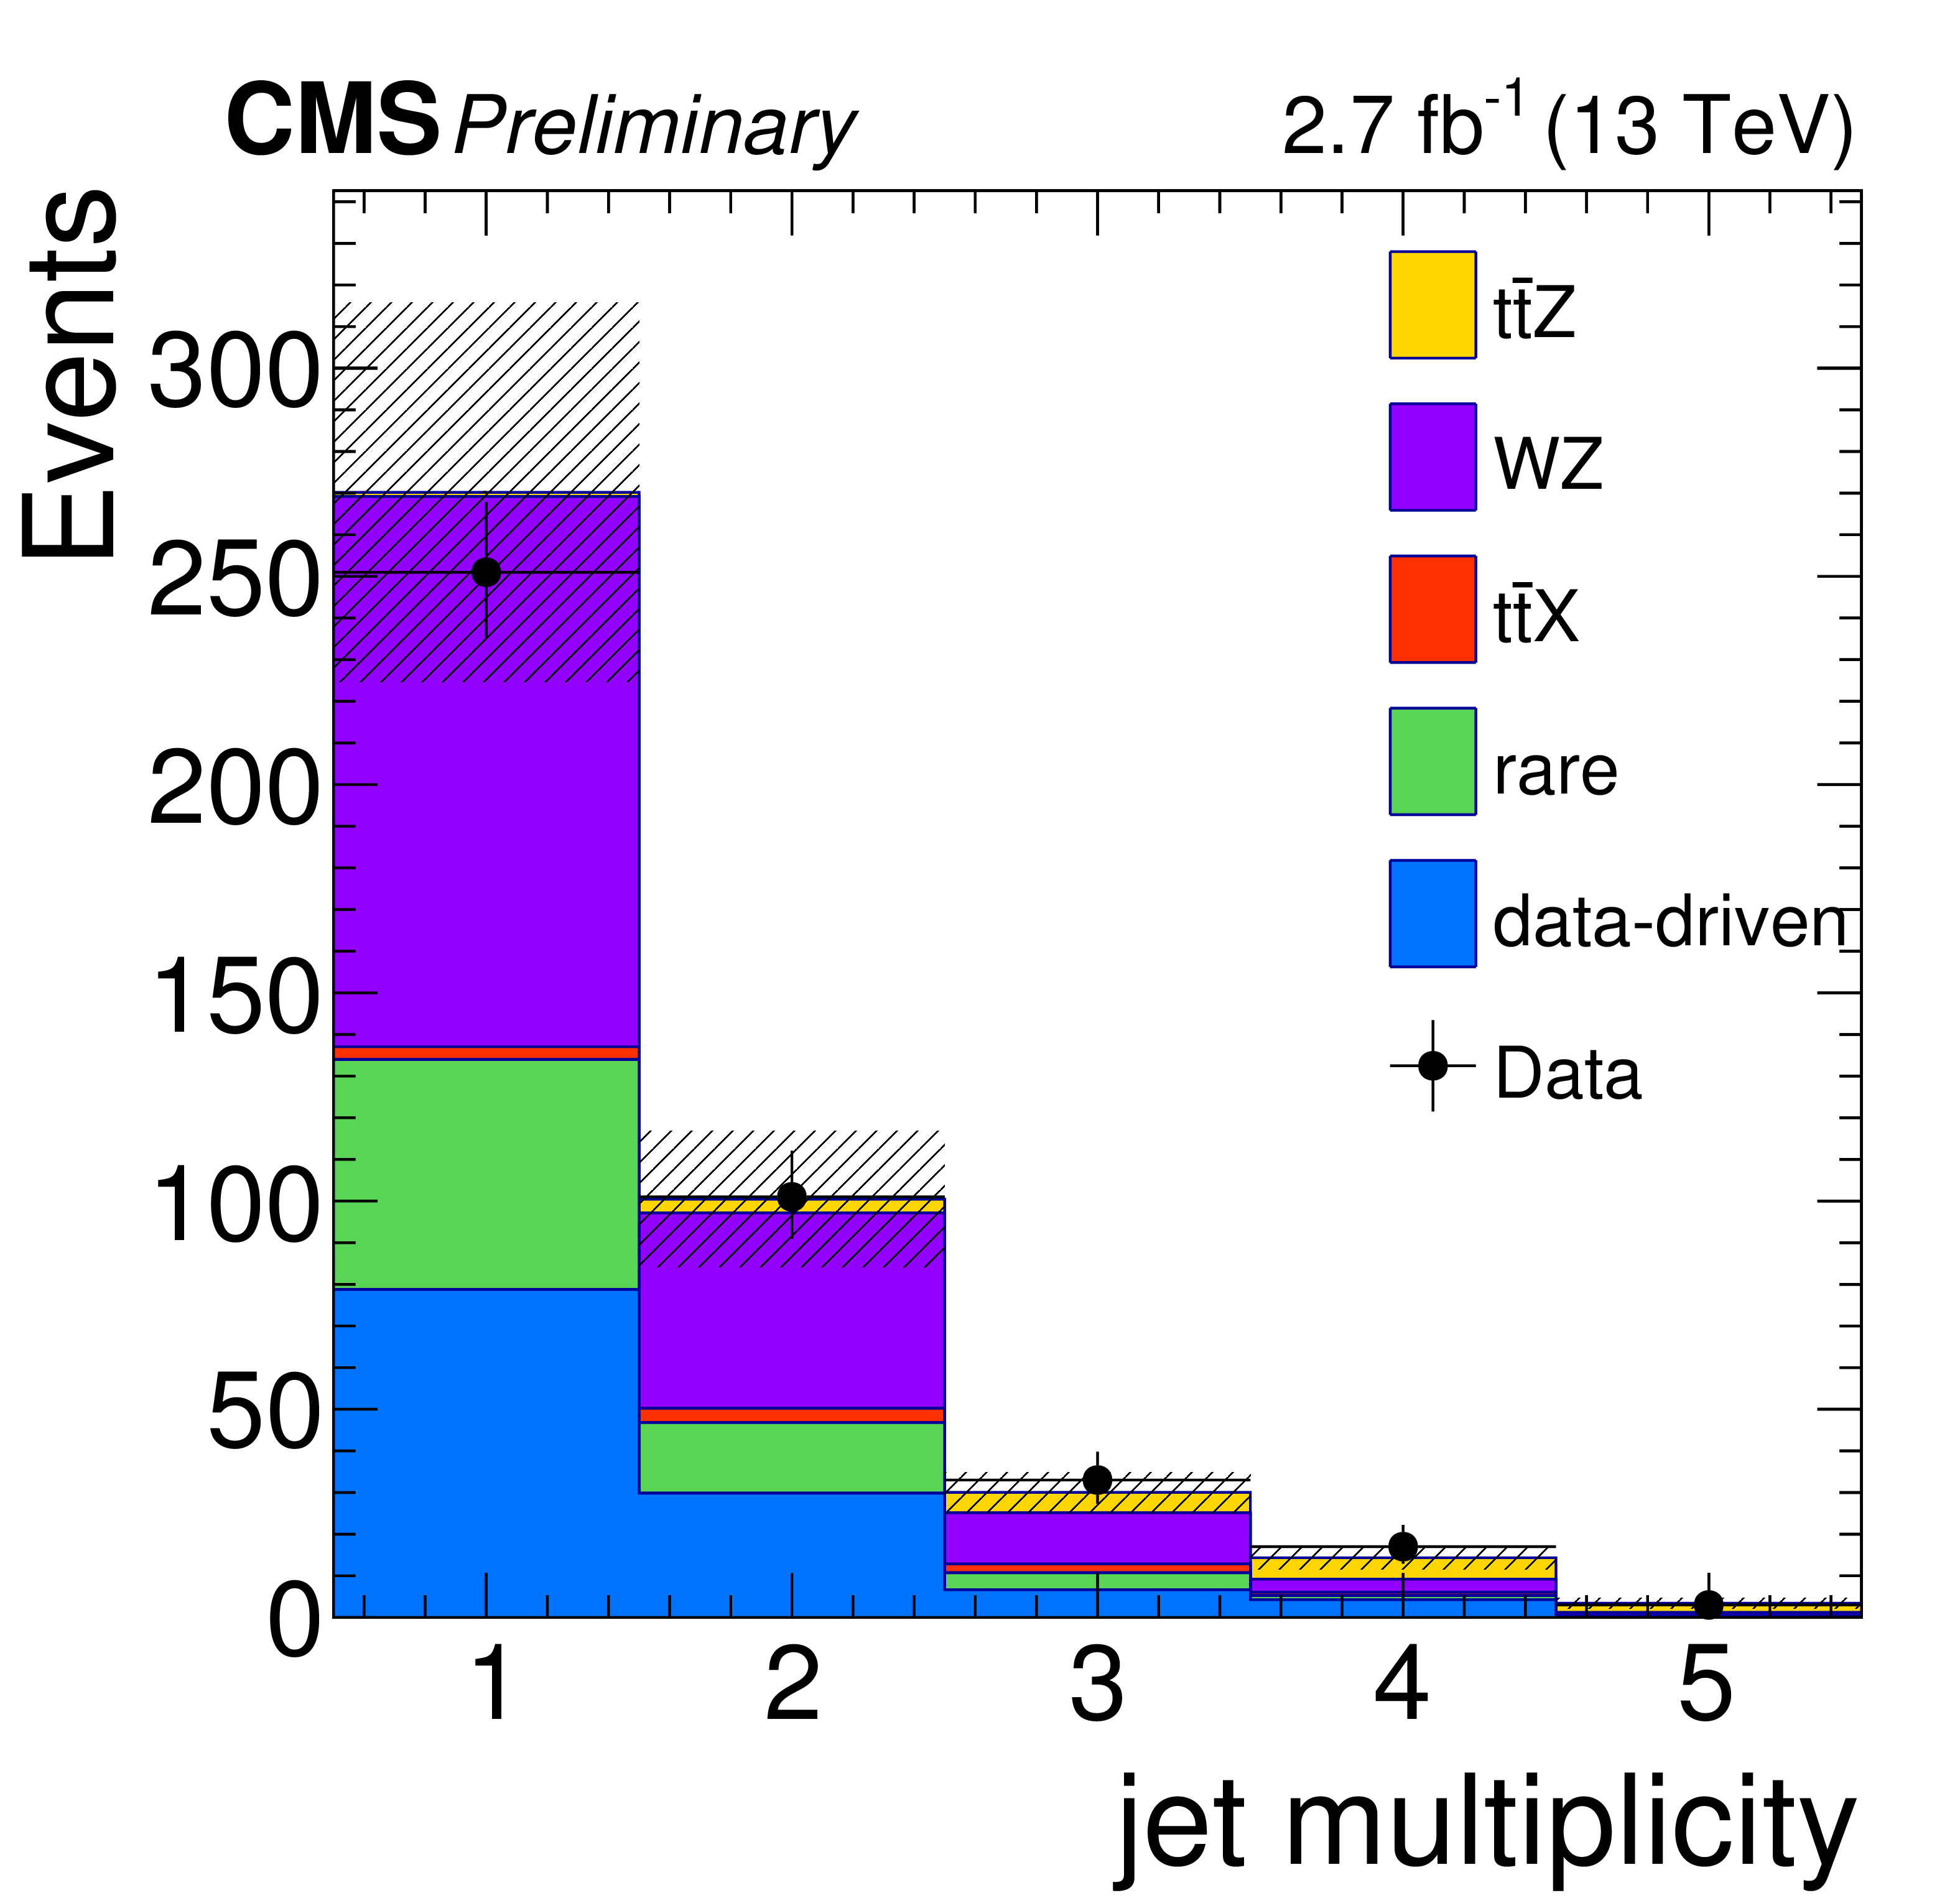
WZ control region plots: Distributions of the total yields versus lepton channels, jet multiplicity, transverse mass of the lepton and the missing energy and the reconstructed invariant mass of the Z boson candidates for 2.17 fb$^{-1}$ of integrated luminosity. The $ {M_\text {T}} ^{\ell \nu }$ cut is not applied for $ {M_\text {T}} ^{\ell \nu }$ distribution. |
png pdf |
Figure 3-b:
WZ control region plots: Distributions of the total yields versus lepton channels, jet multiplicity, transverse mass of the lepton and the missing energy and the reconstructed invariant mass of the Z boson candidates for 2.17 fb$^{-1}$ of integrated luminosity. The $ {M_\text {T}} ^{\ell \nu }$ cut is not applied for $ {M_\text {T}} ^{\ell \nu }$ distribution. |
png pdf |
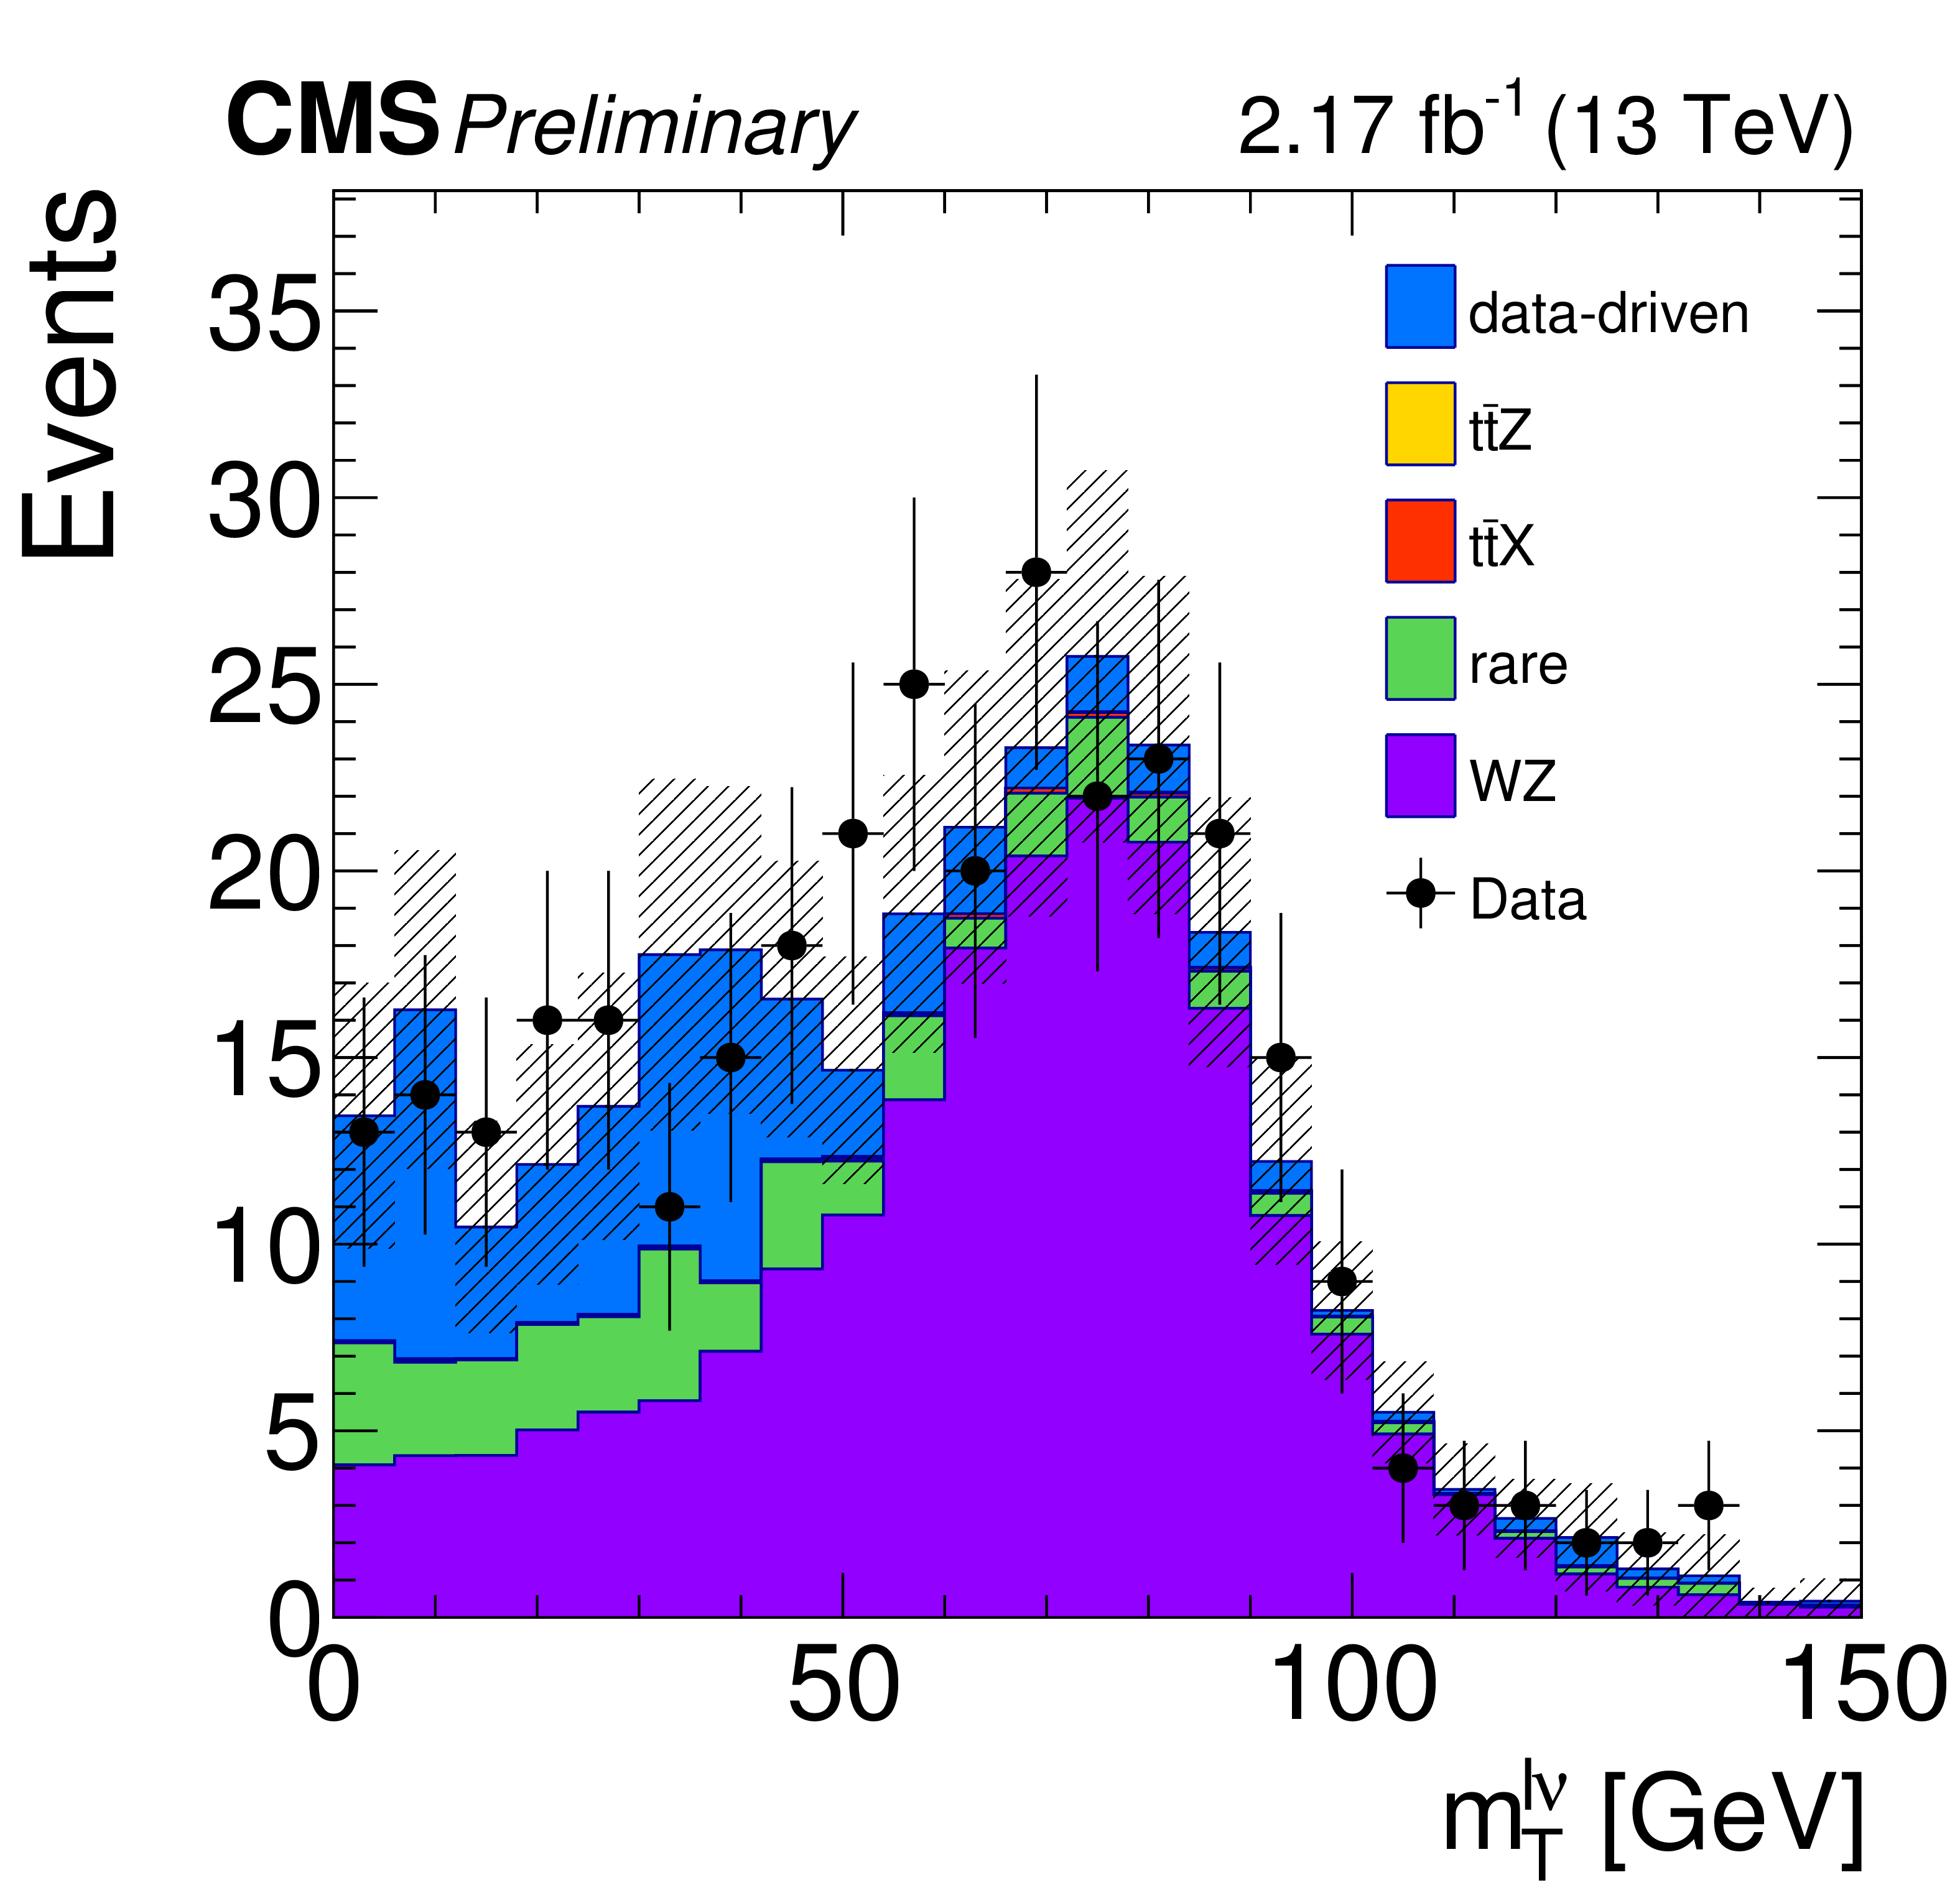
Figure 3-c:
WZ control region plots: Distributions of the total yields versus lepton channels, jet multiplicity, transverse mass of the lepton and the missing energy and the reconstructed invariant mass of the Z boson candidates for 2.17 fb$^{-1}$ of integrated luminosity. The $ {M_\text {T}} ^{\ell \nu }$ cut is not applied for $ {M_\text {T}} ^{\ell \nu }$ distribution. |
png pdf |
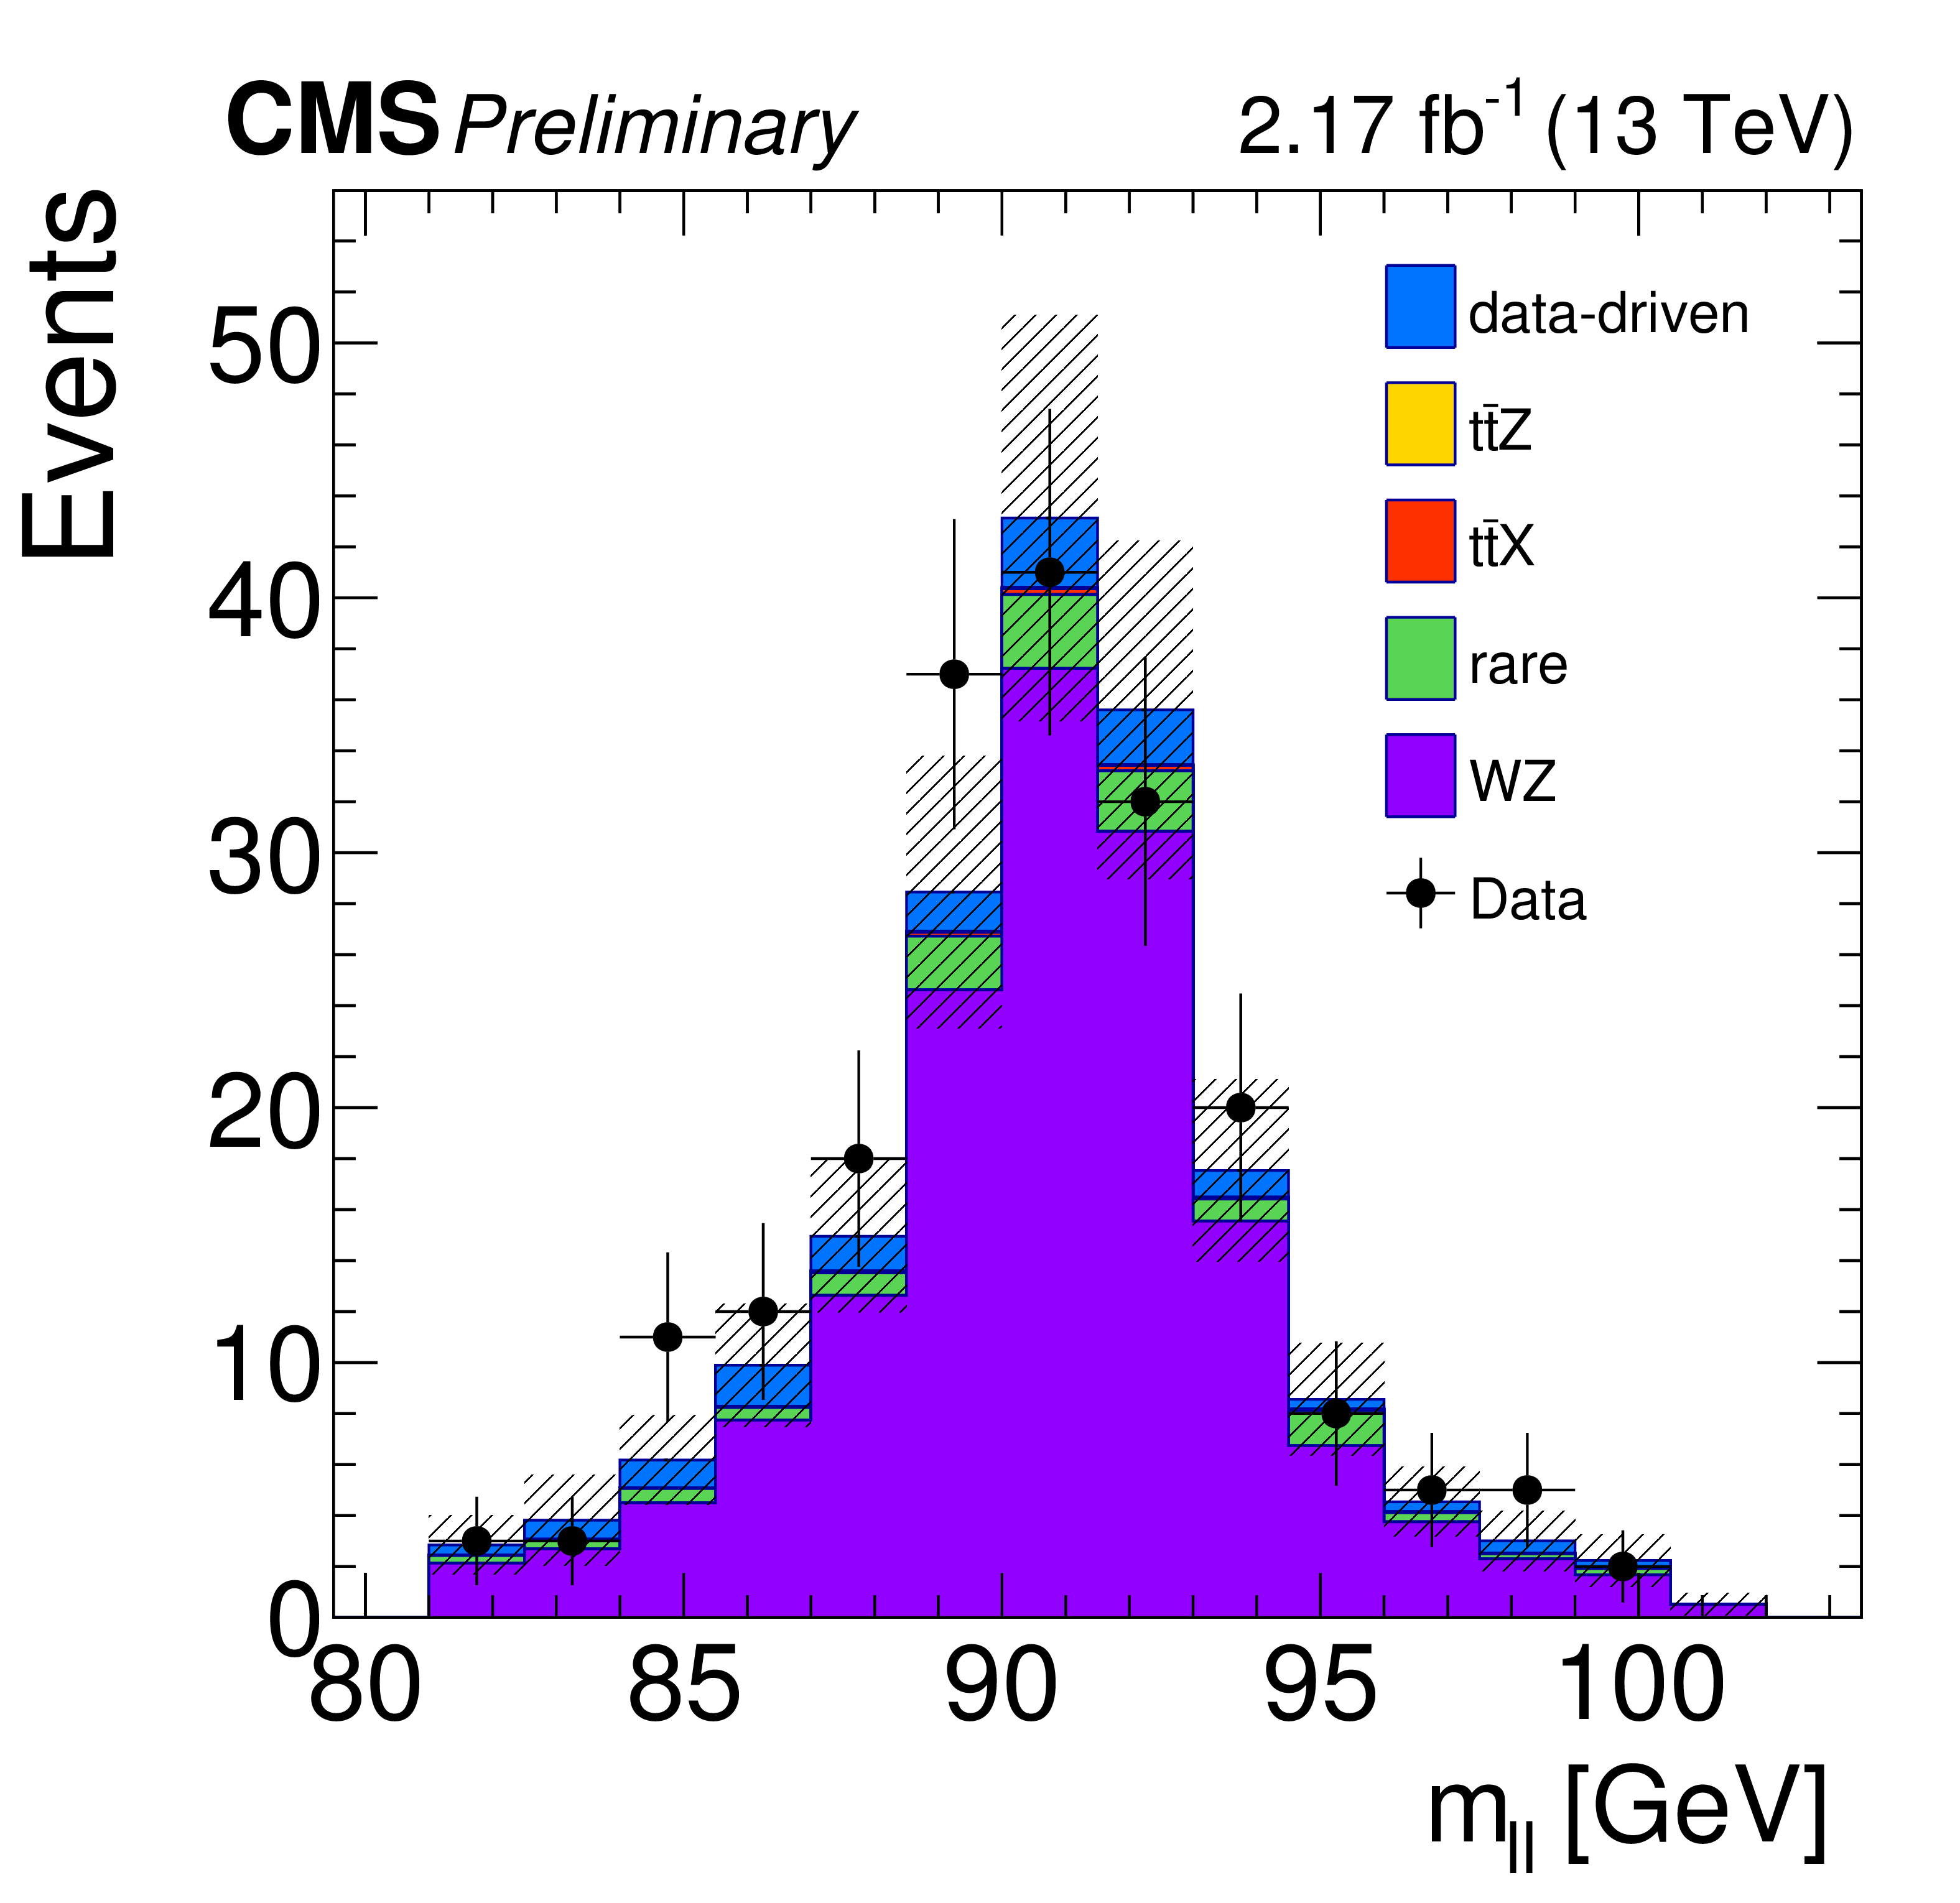
Figure 3-d:
WZ control region plots: Distributions of the total yields versus lepton channels, jet multiplicity, transverse mass of the lepton and the missing energy and the reconstructed invariant mass of the Z boson candidates for 2.17 fb$^{-1}$ of integrated luminosity. The $ {M_\text {T}} ^{\ell \nu }$ cut is not applied for $ {M_\text {T}} ^{\ell \nu }$ distribution. |
png pdf |
Figure 4-a:
Expected and observed yields by lepton channel and jet multiplicity after 3 lepton, ${\mathrm {m}_{\ell \ell }}$ and ${N_\text {jets}} \ge$ 1 requirements. The hatched band shows the total uncertainty on the expected yields. |
png pdf |
Figure 4-b:
Expected and observed yields by lepton channel and jet multiplicity after 3 lepton, ${\mathrm {m}_{\ell \ell }}$ and ${N_\text {jets}} \ge$ 1 requirements. The hatched band shows the total uncertainty on the expected yields. |
png pdf |
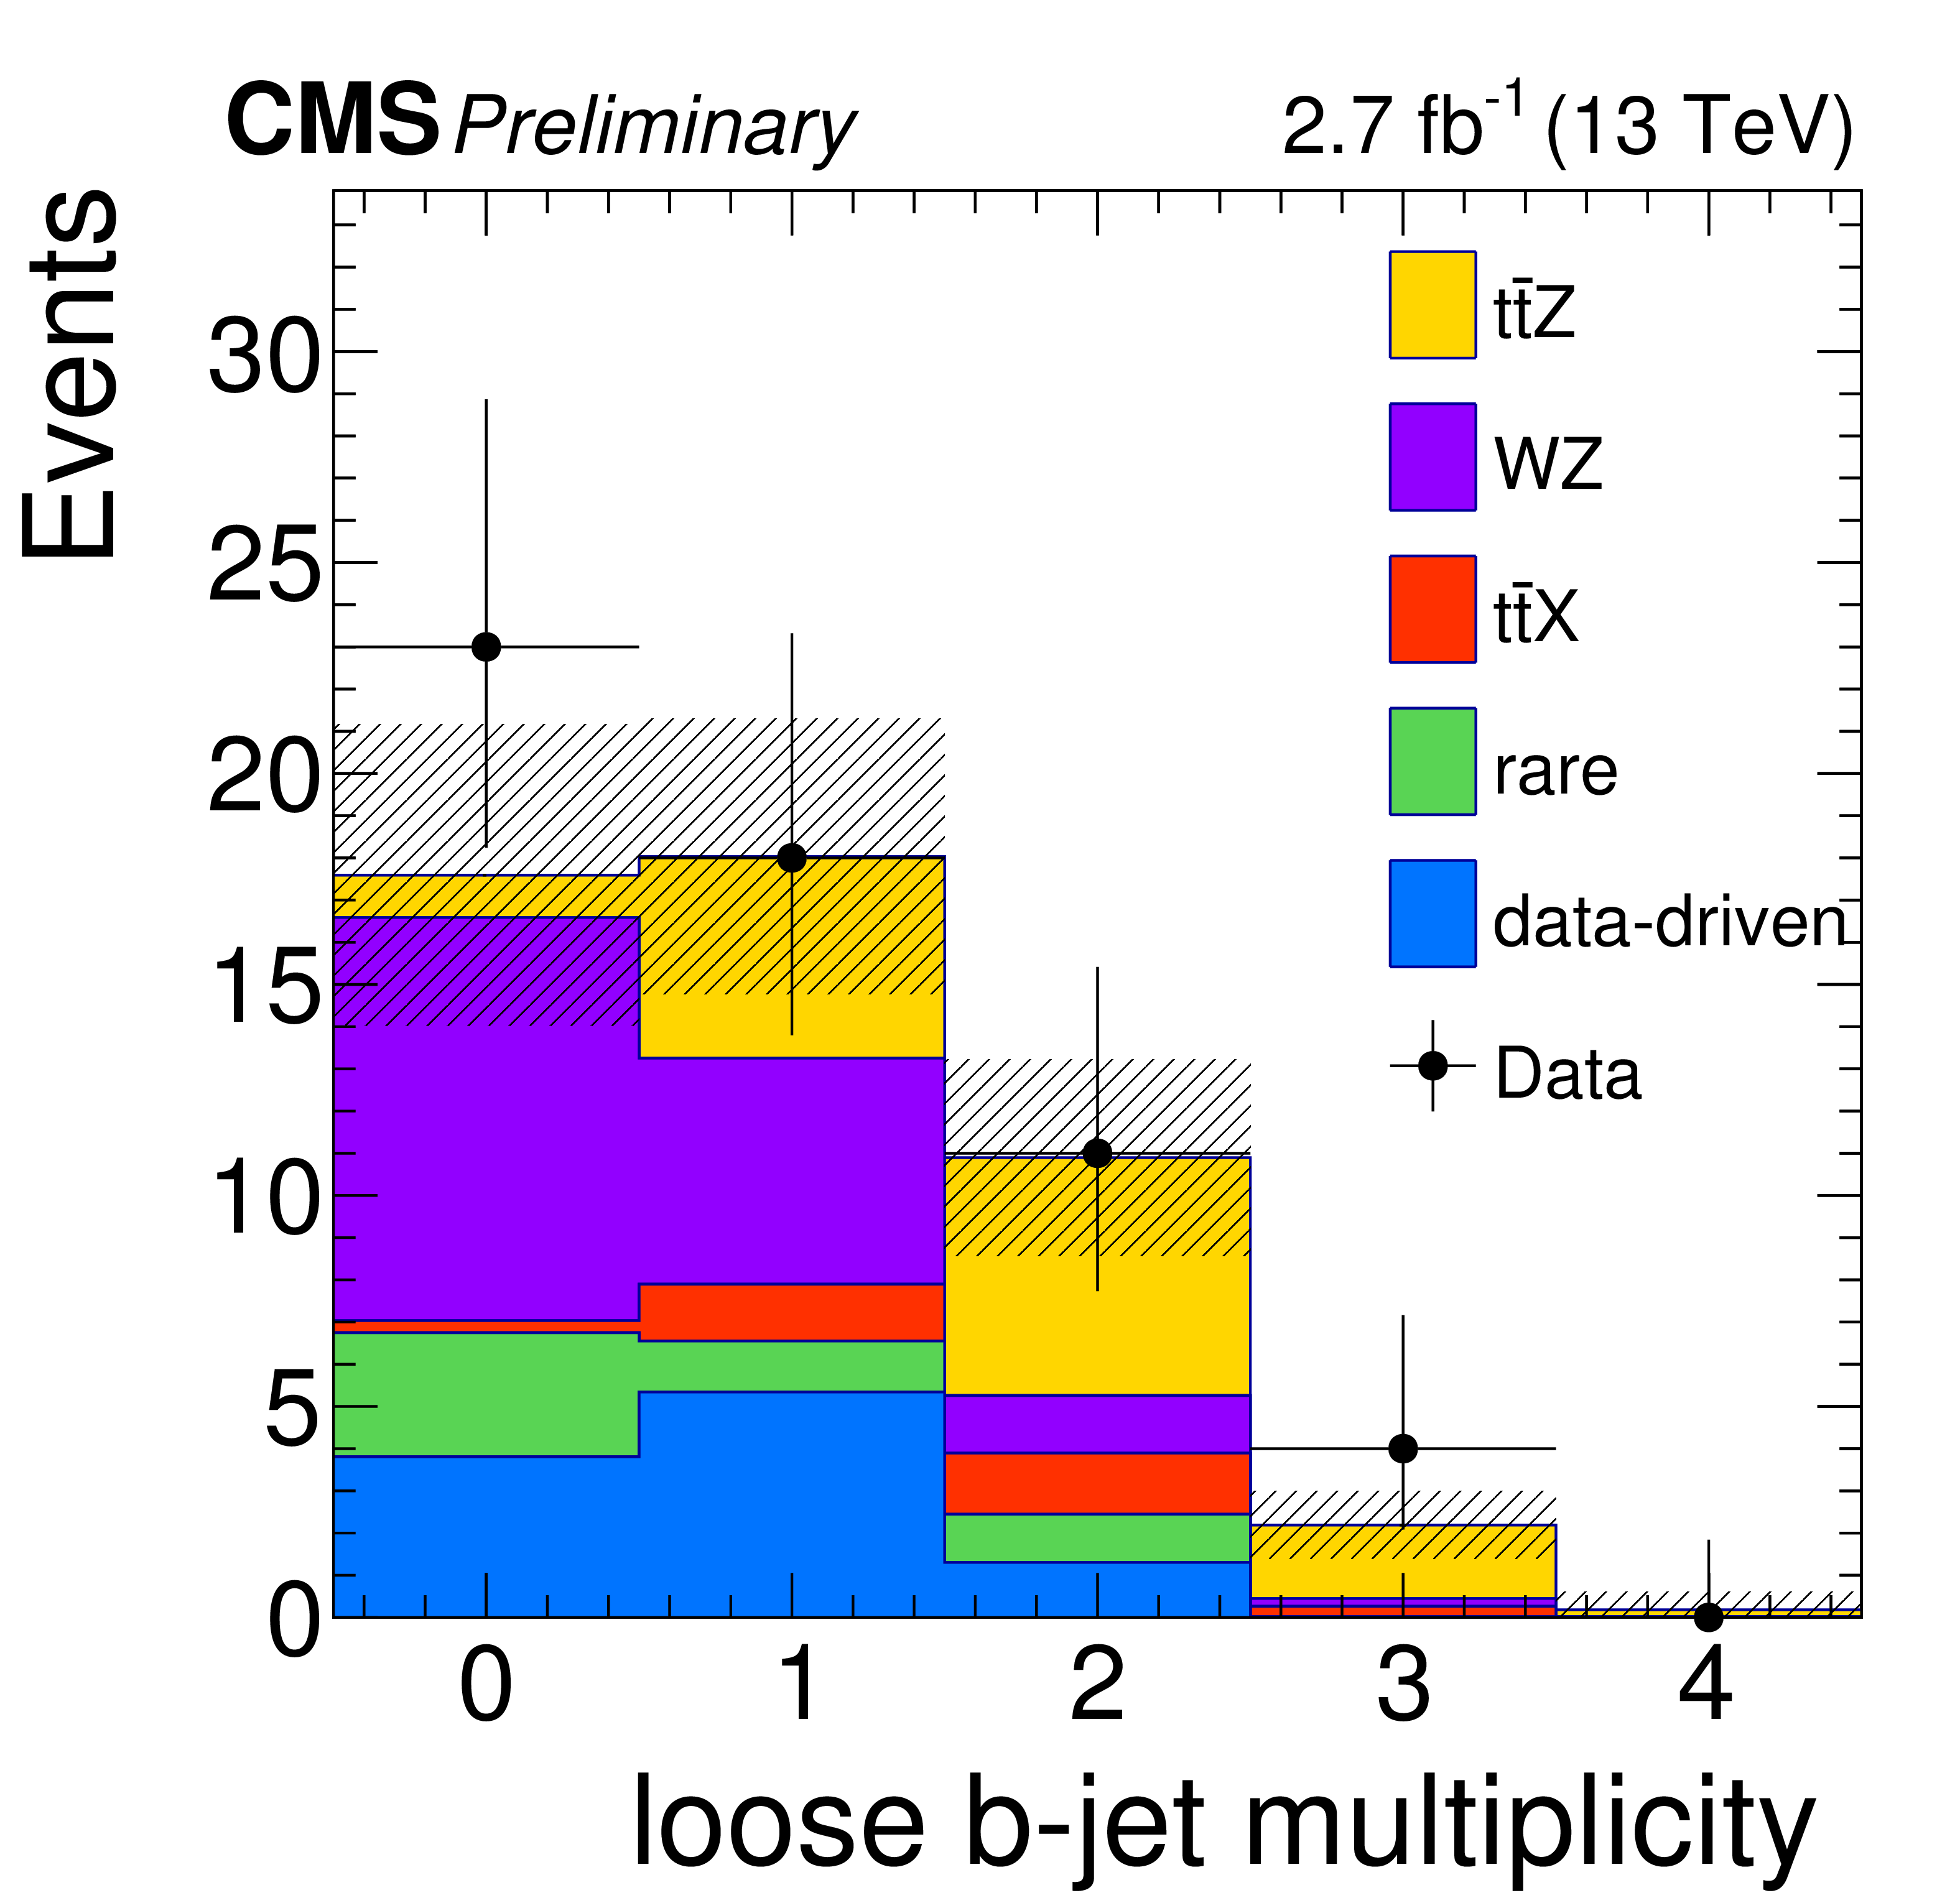
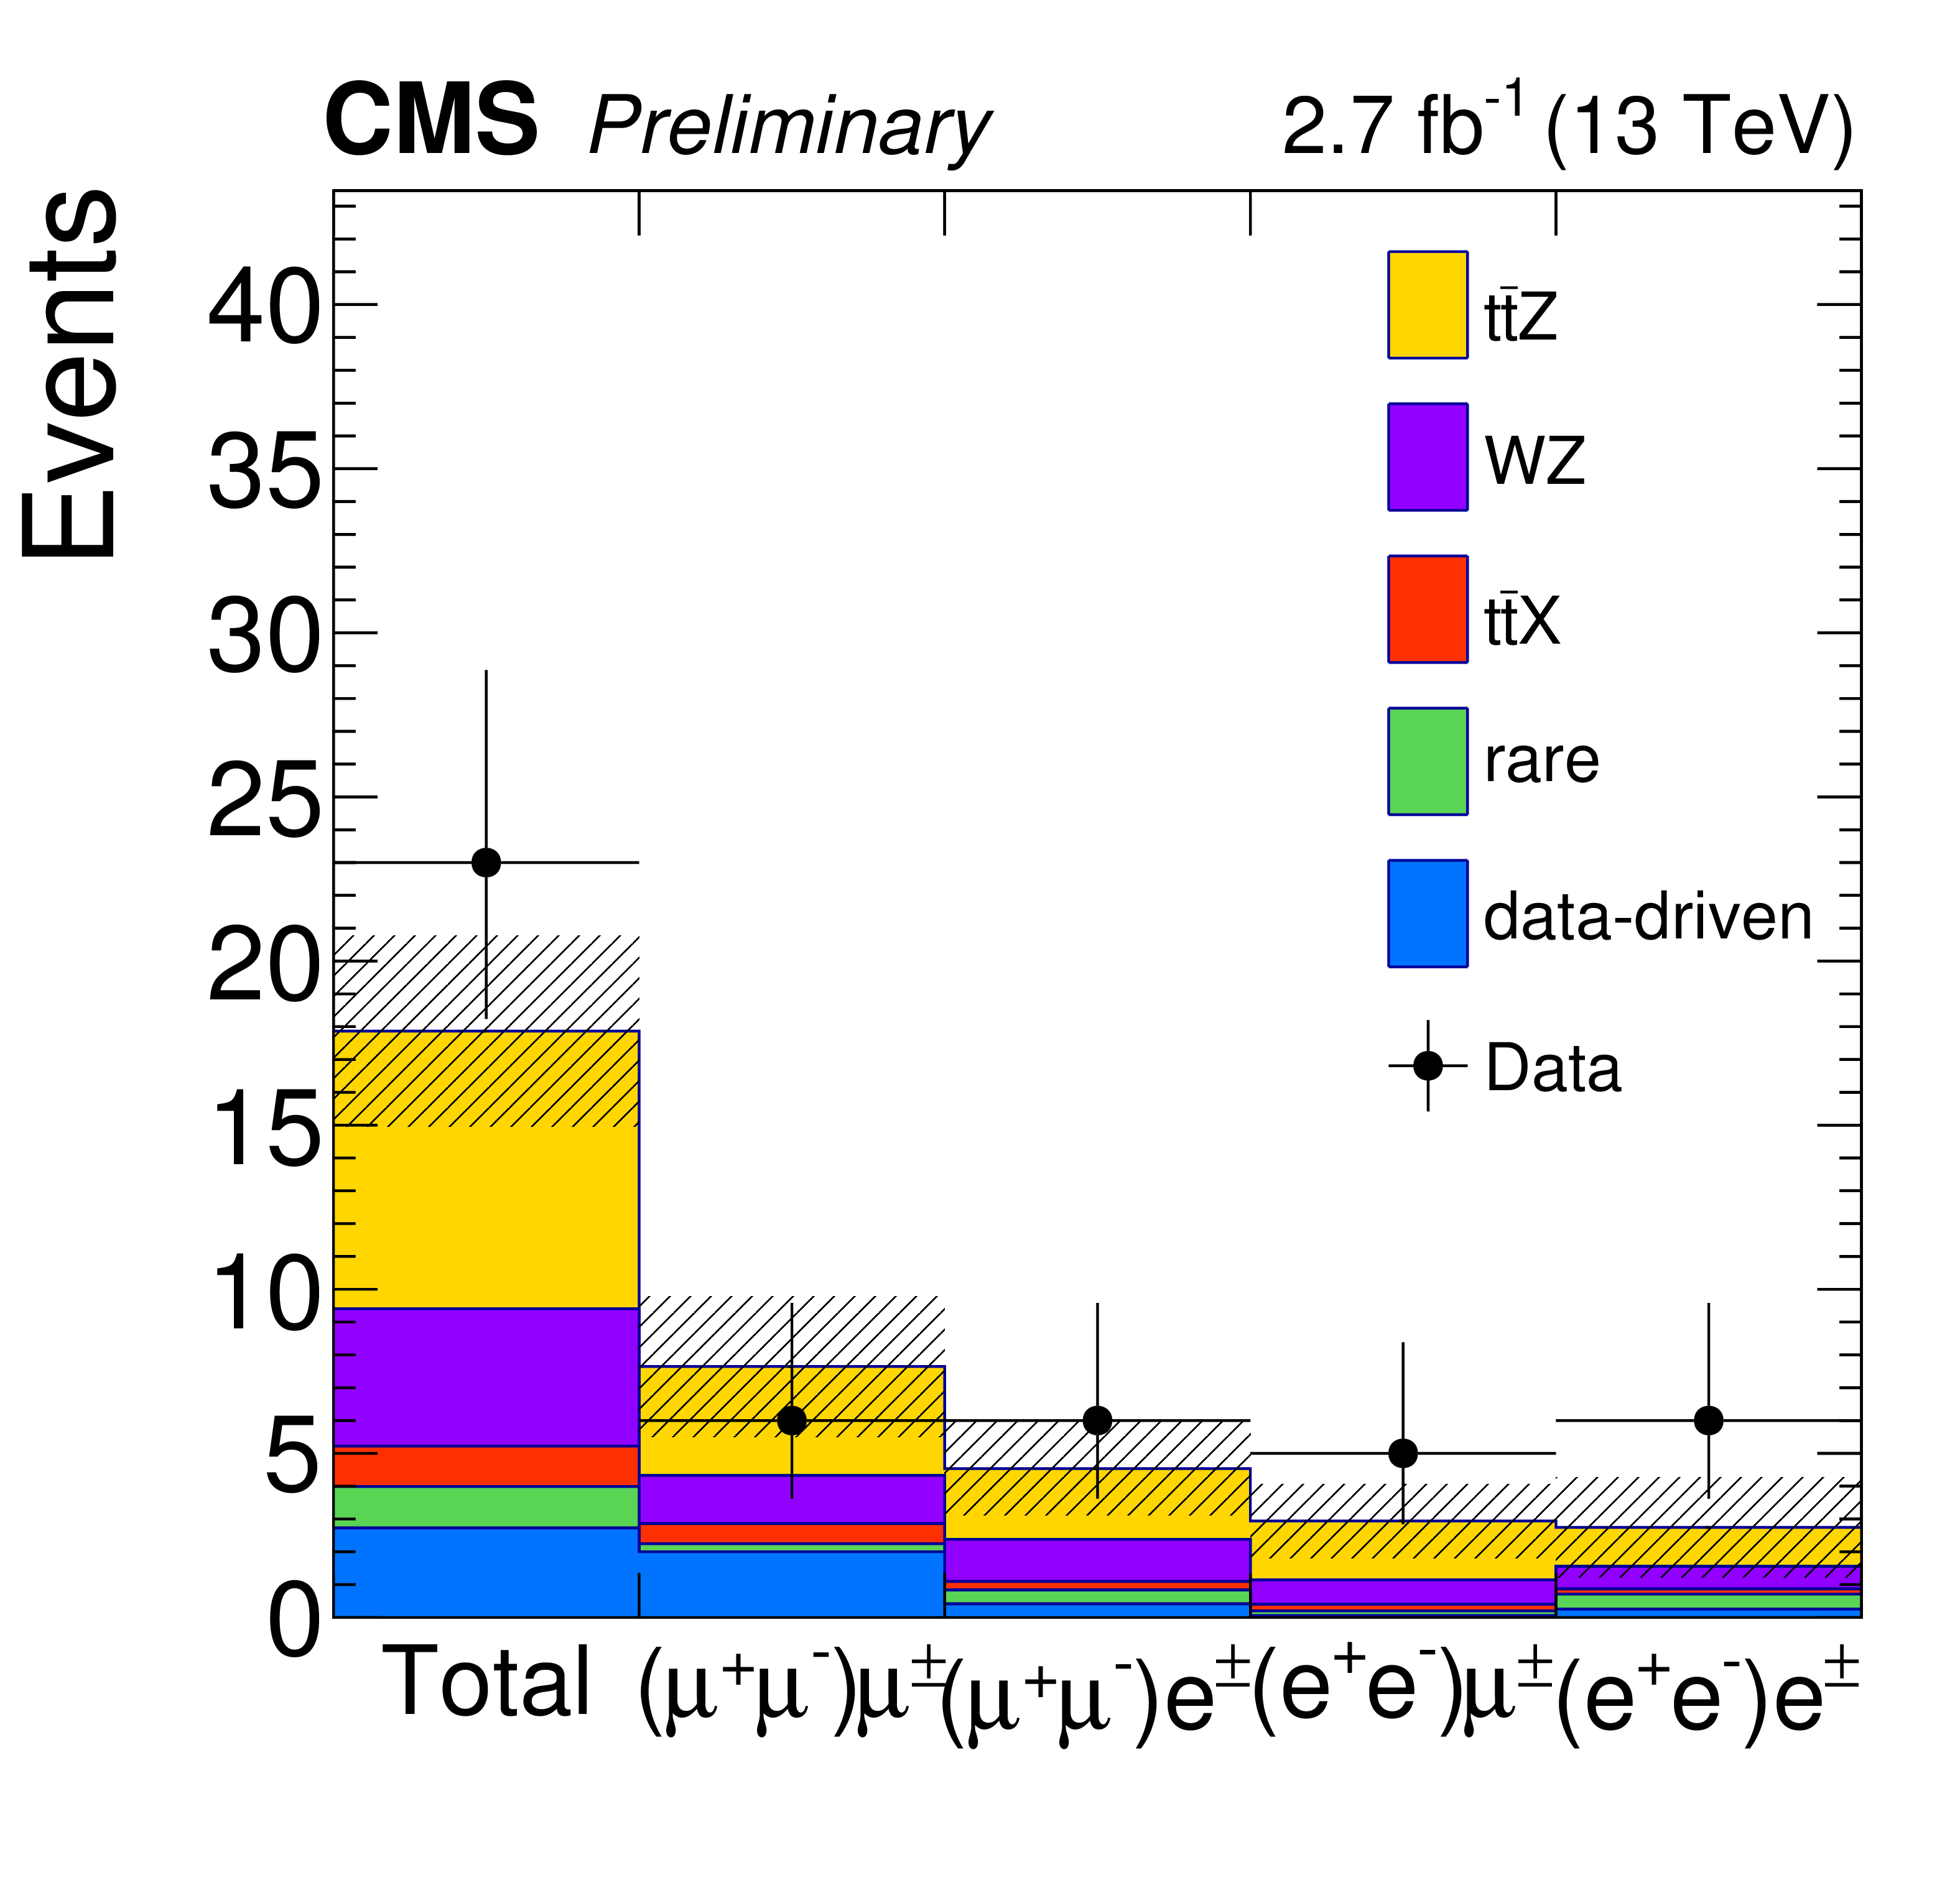
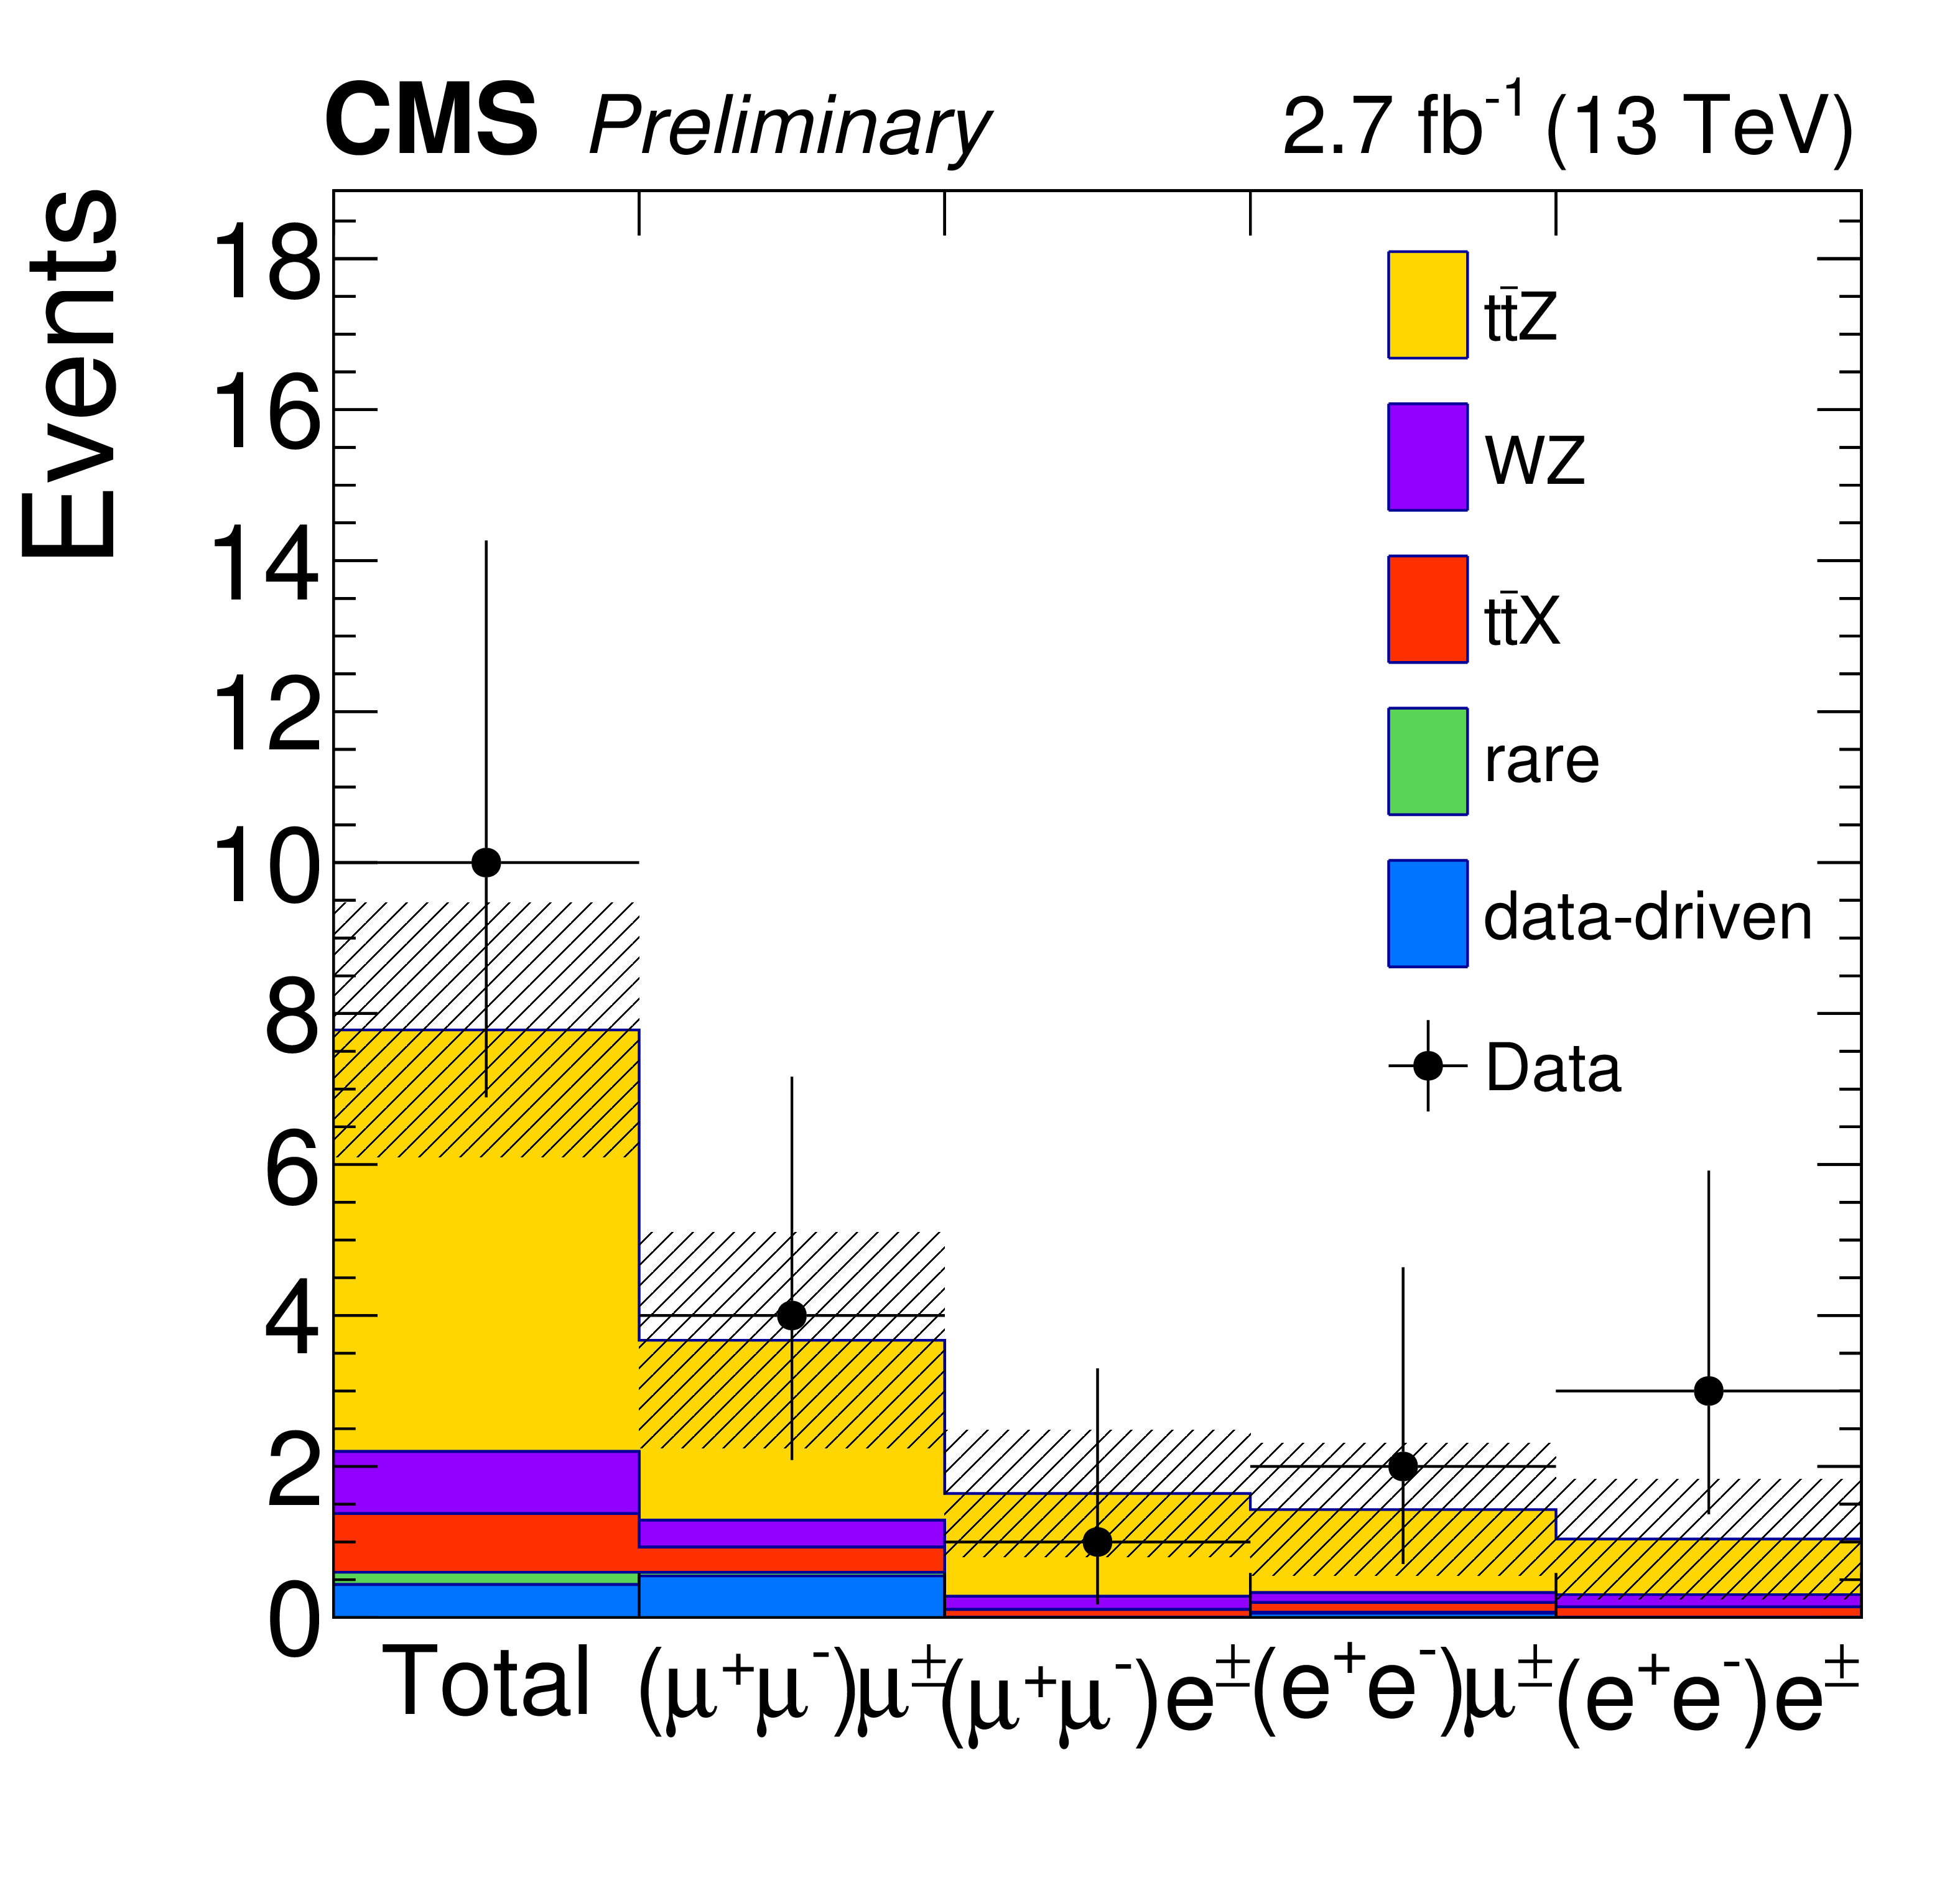
Figure 5-a:
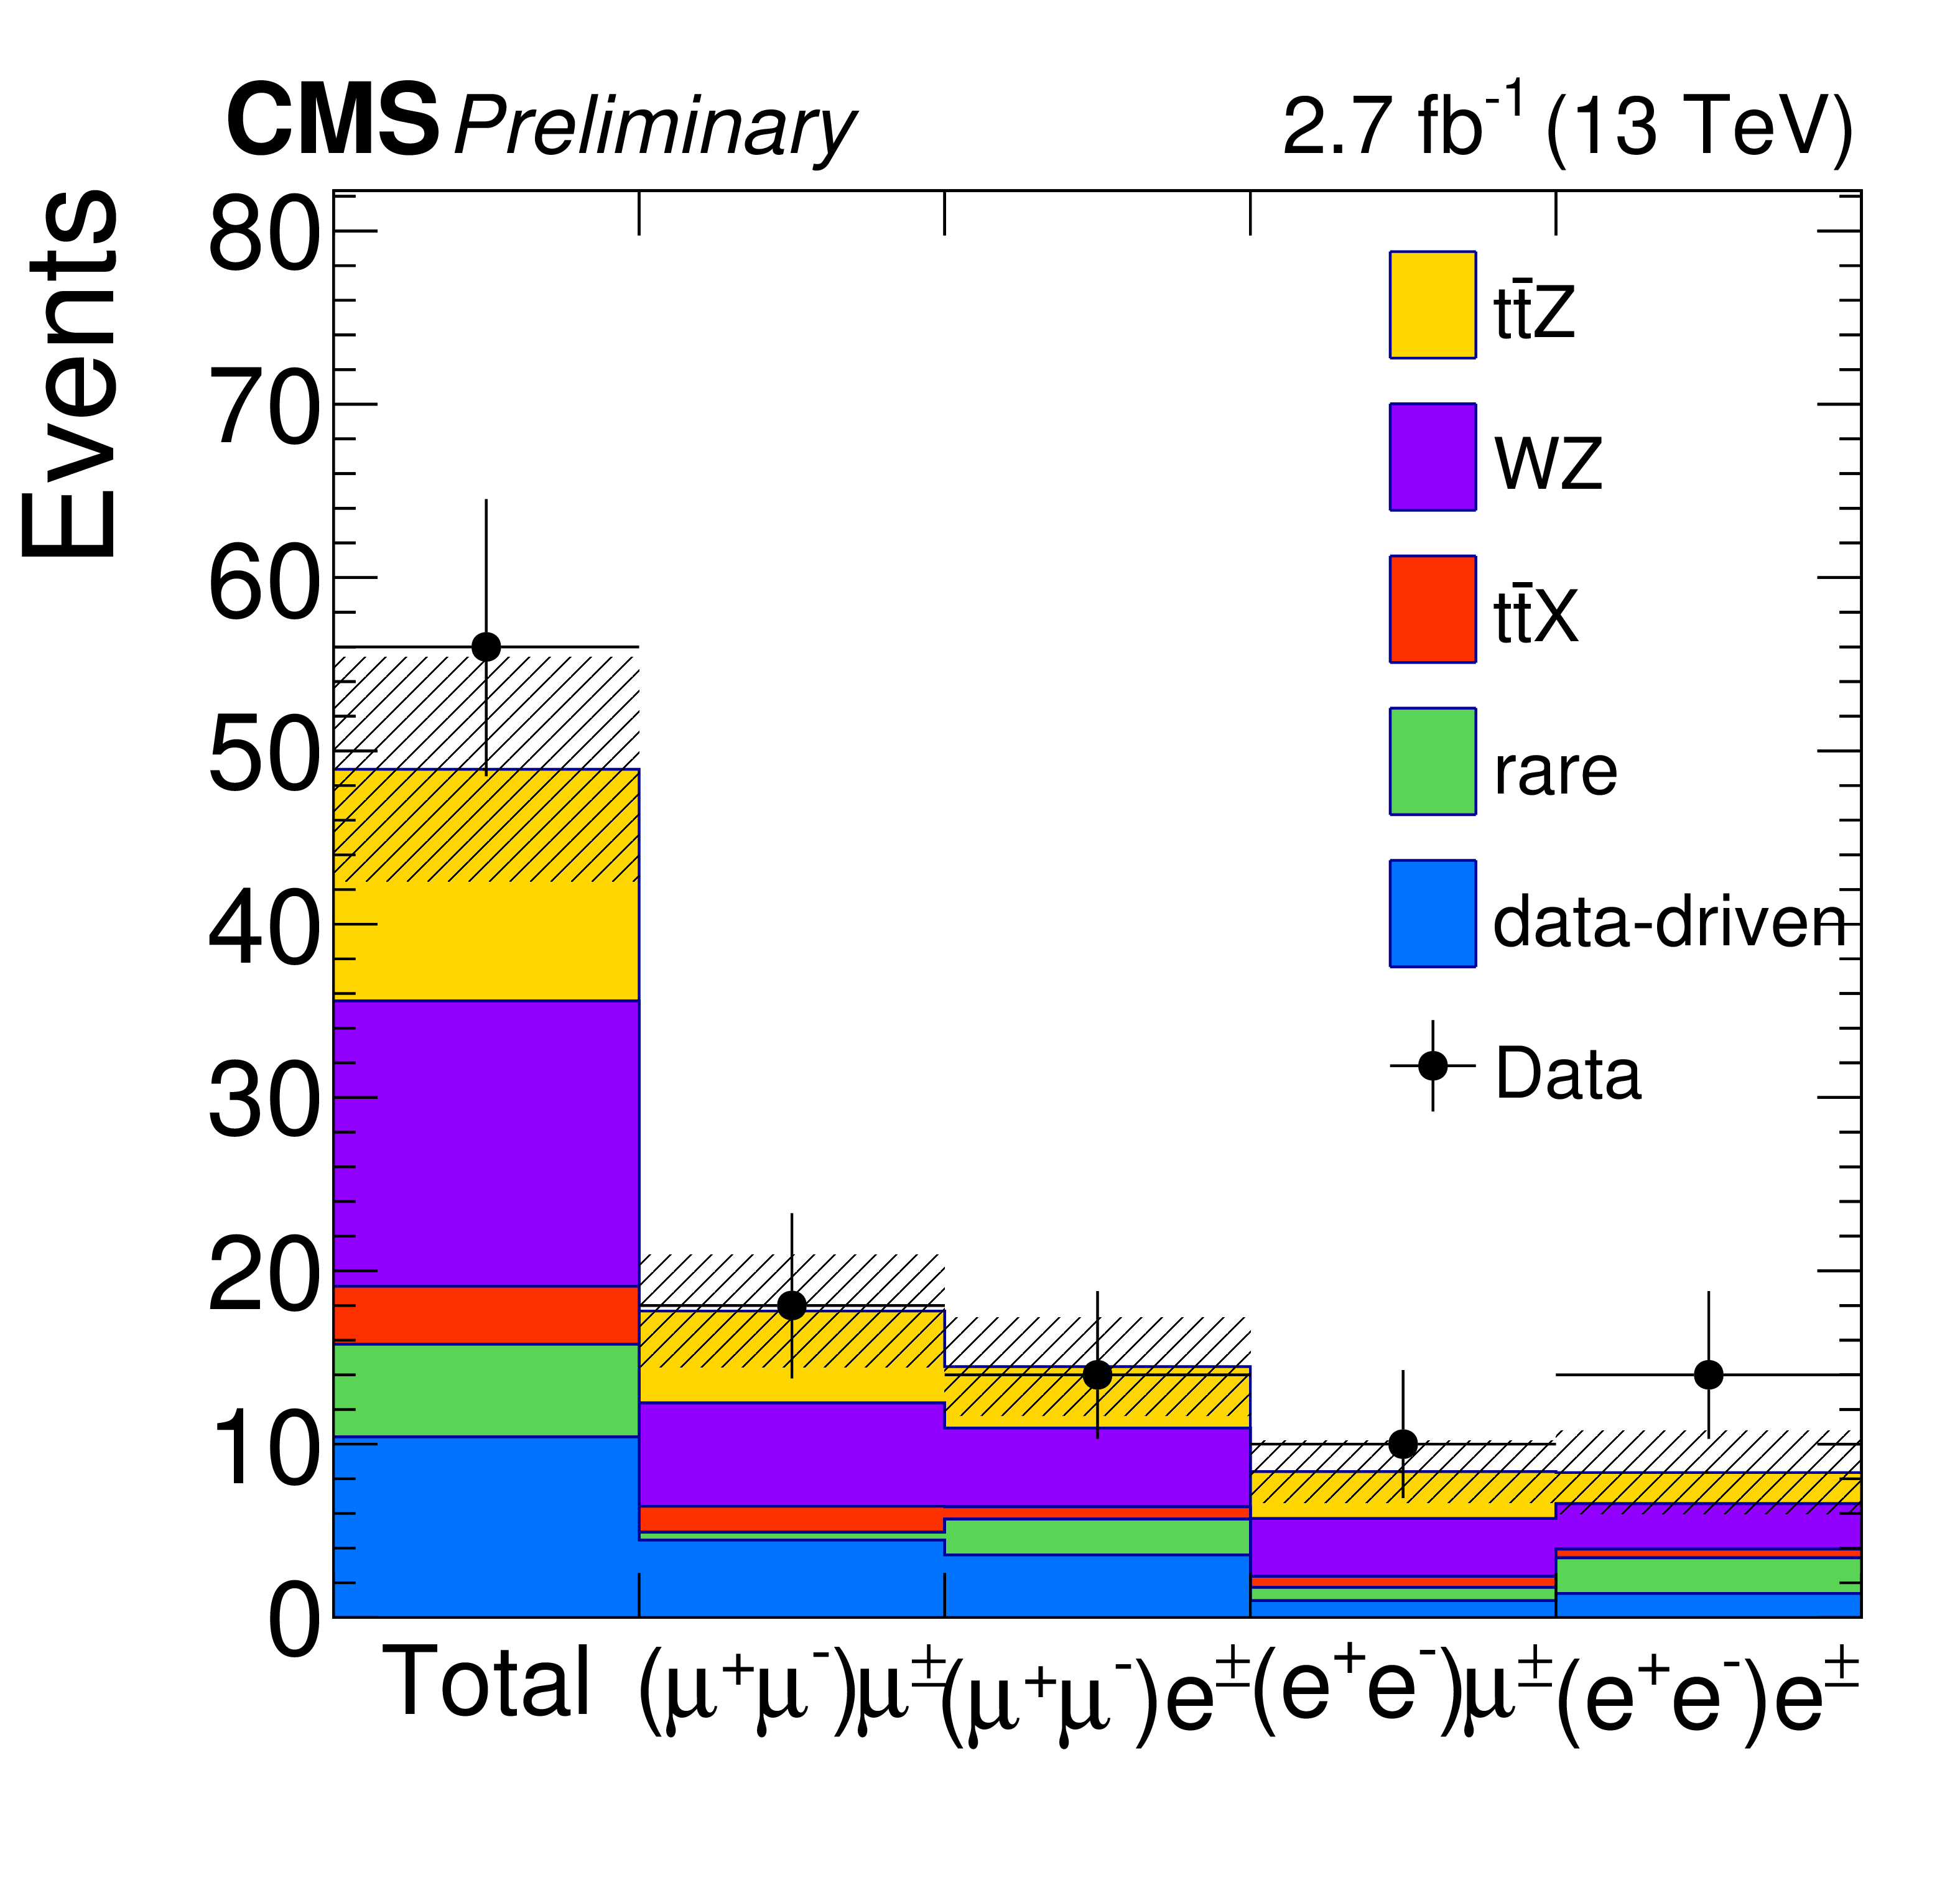
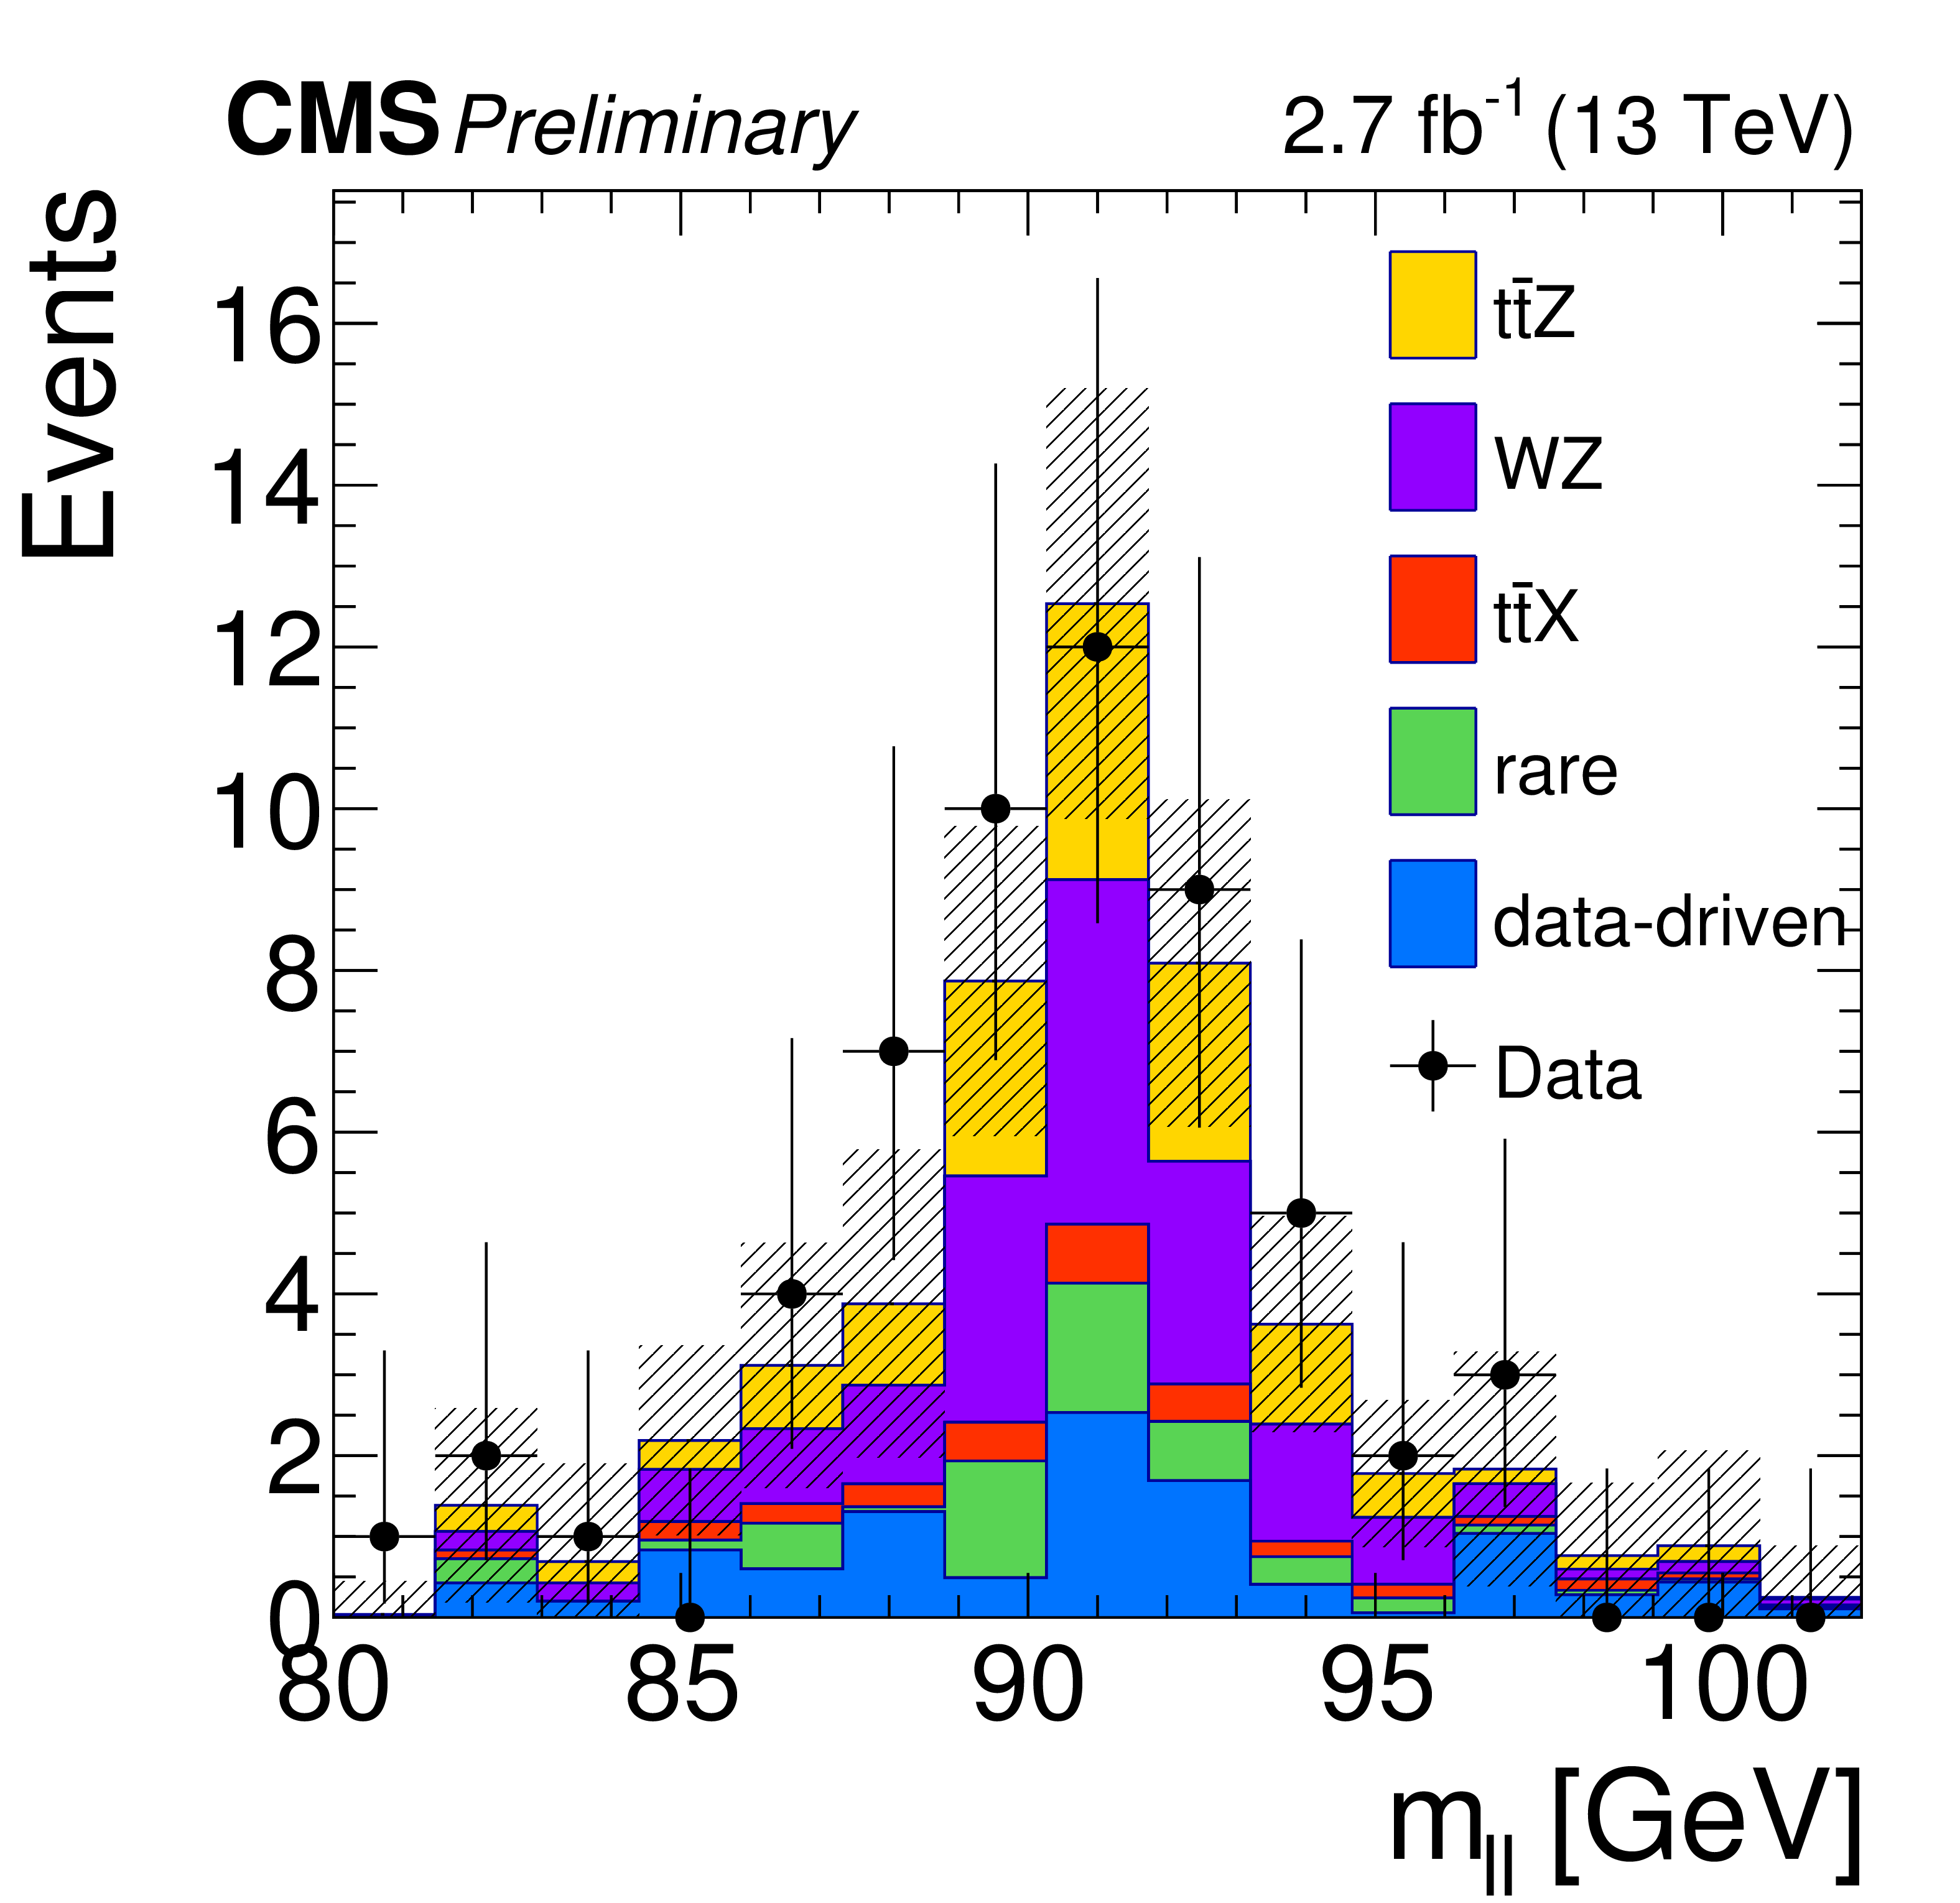
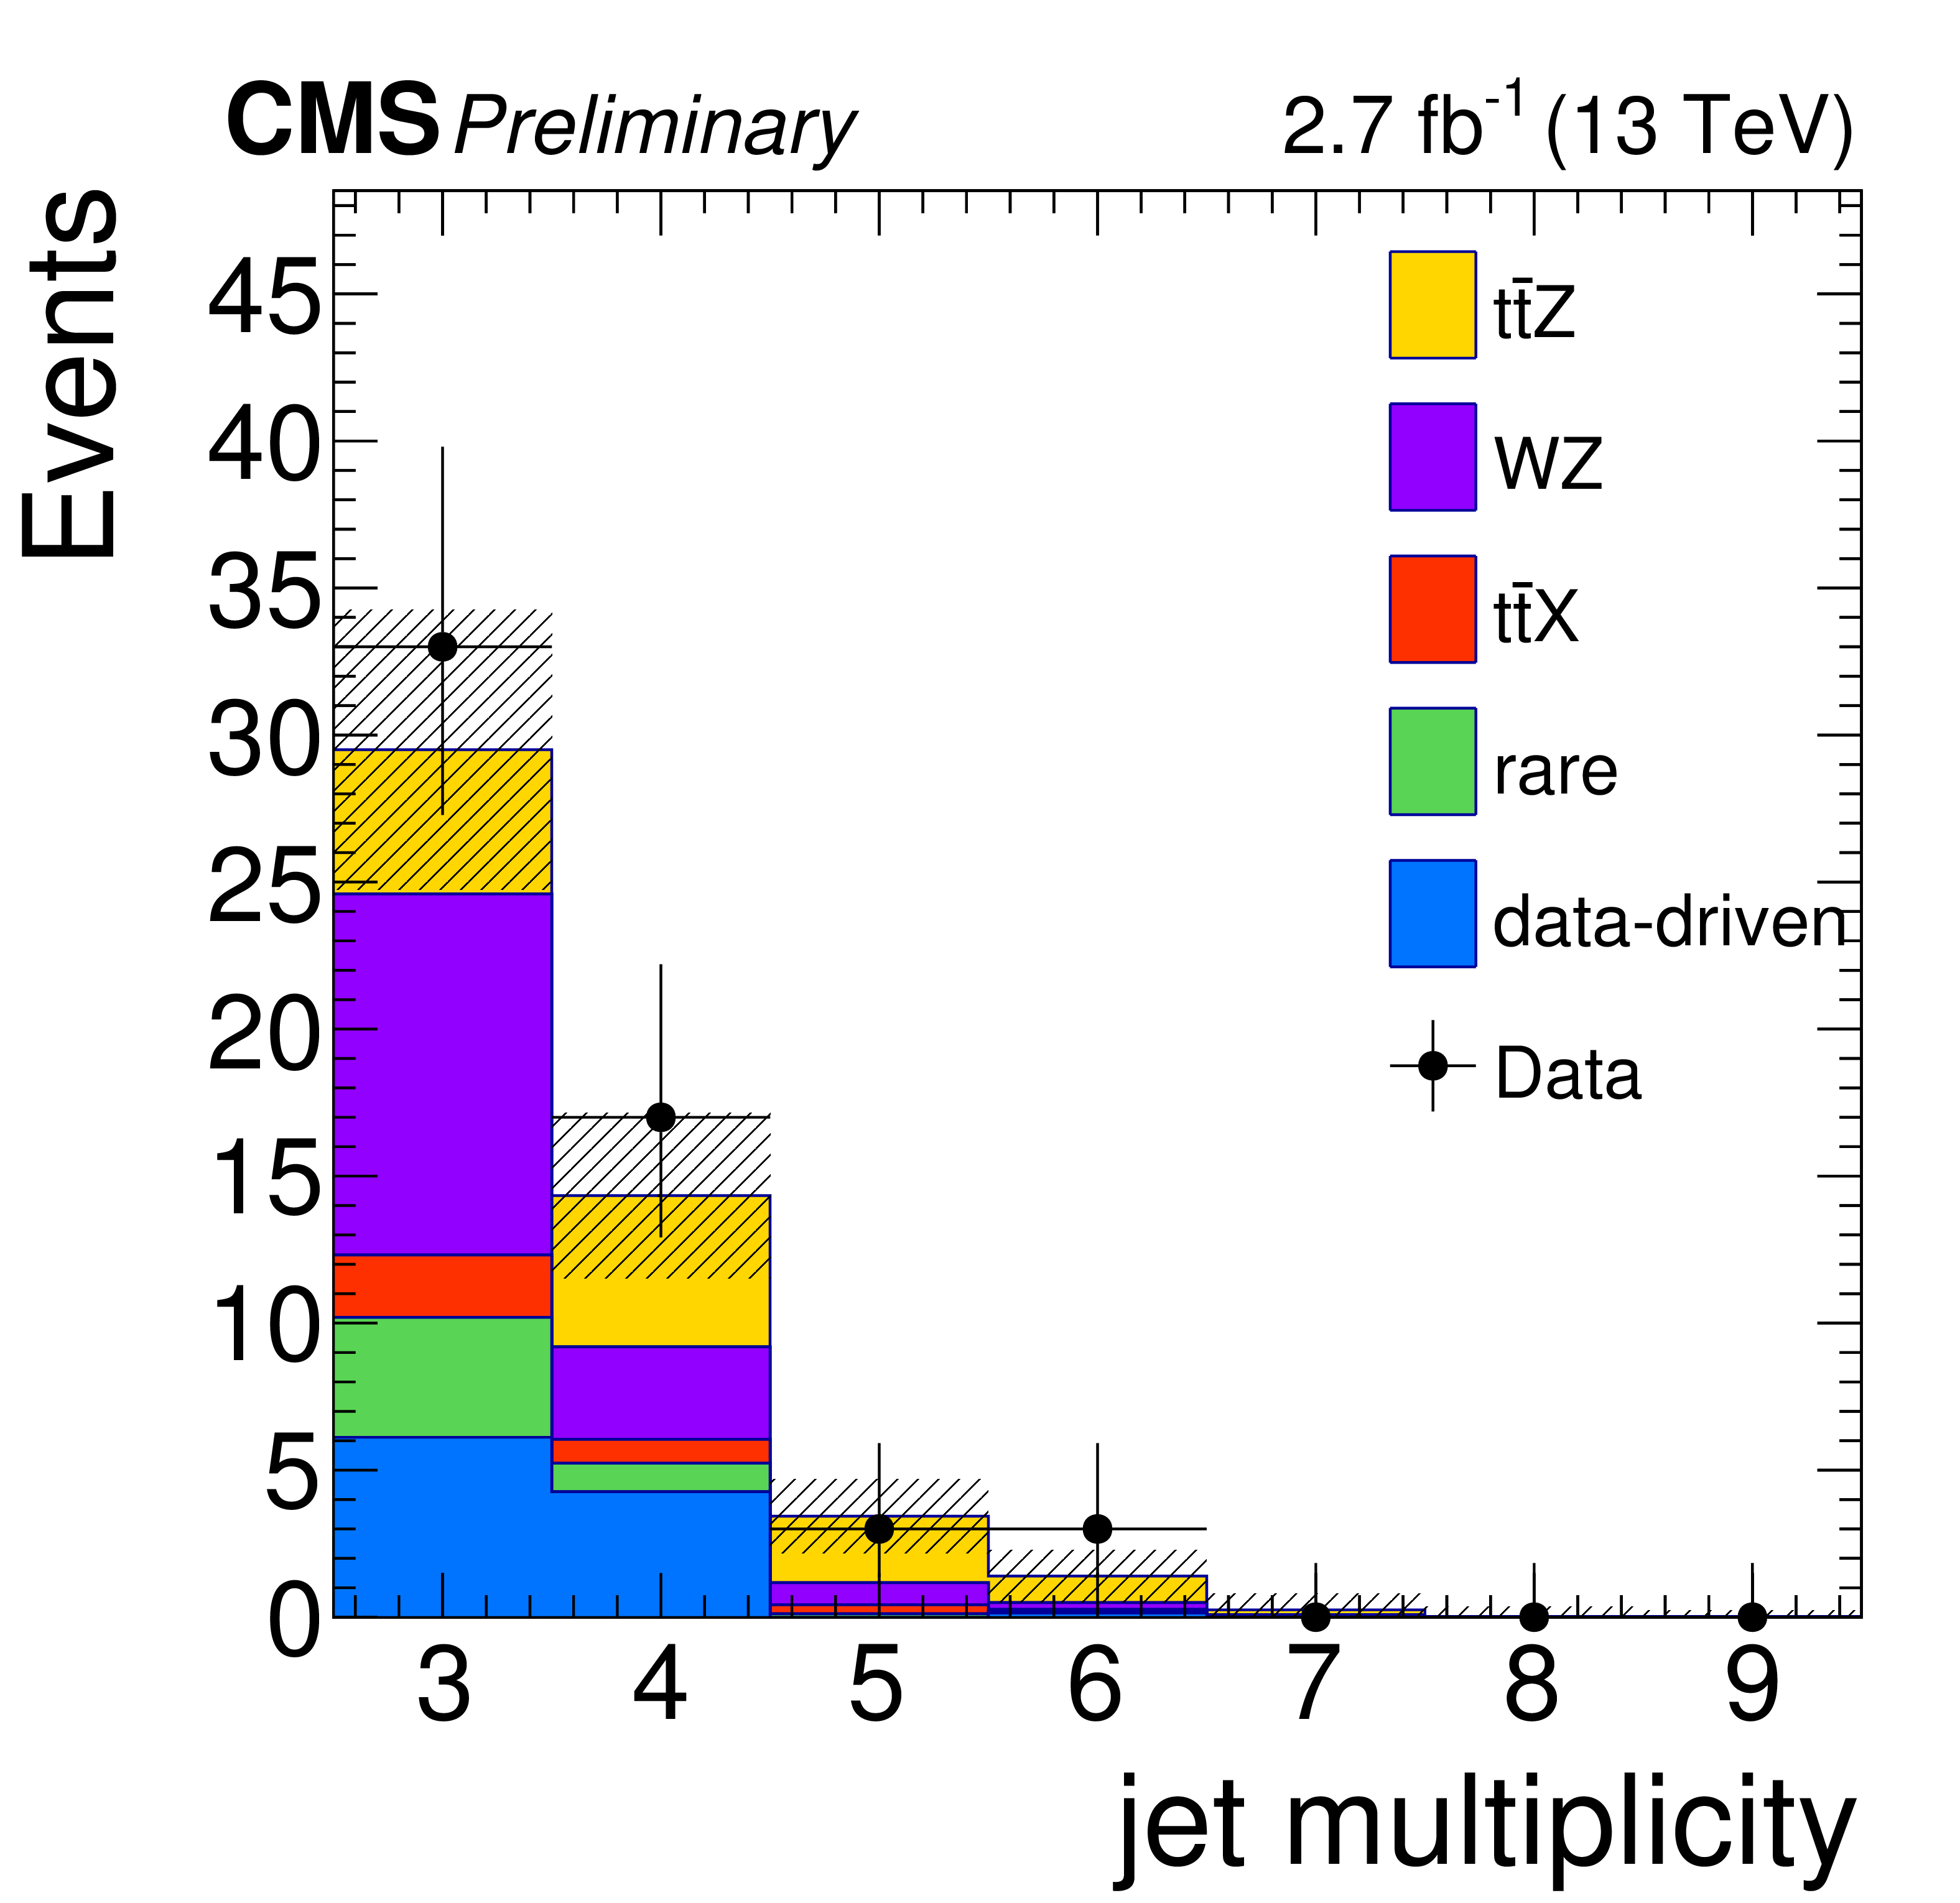
Expected and observed distributions after 3 lepton, ${\mathrm {m}_{\ell \ell }}$ and ${N_\text {jets}} \ge$ 3 requirements. The plots are yields by lepton channel (a), Z-boson candidate dilepton mass distribution (b), jet multiplicity (c), b-tagged jet multiplicity (d). The hatched band shows the total uncertainty on the expected yields. |
png pdf |
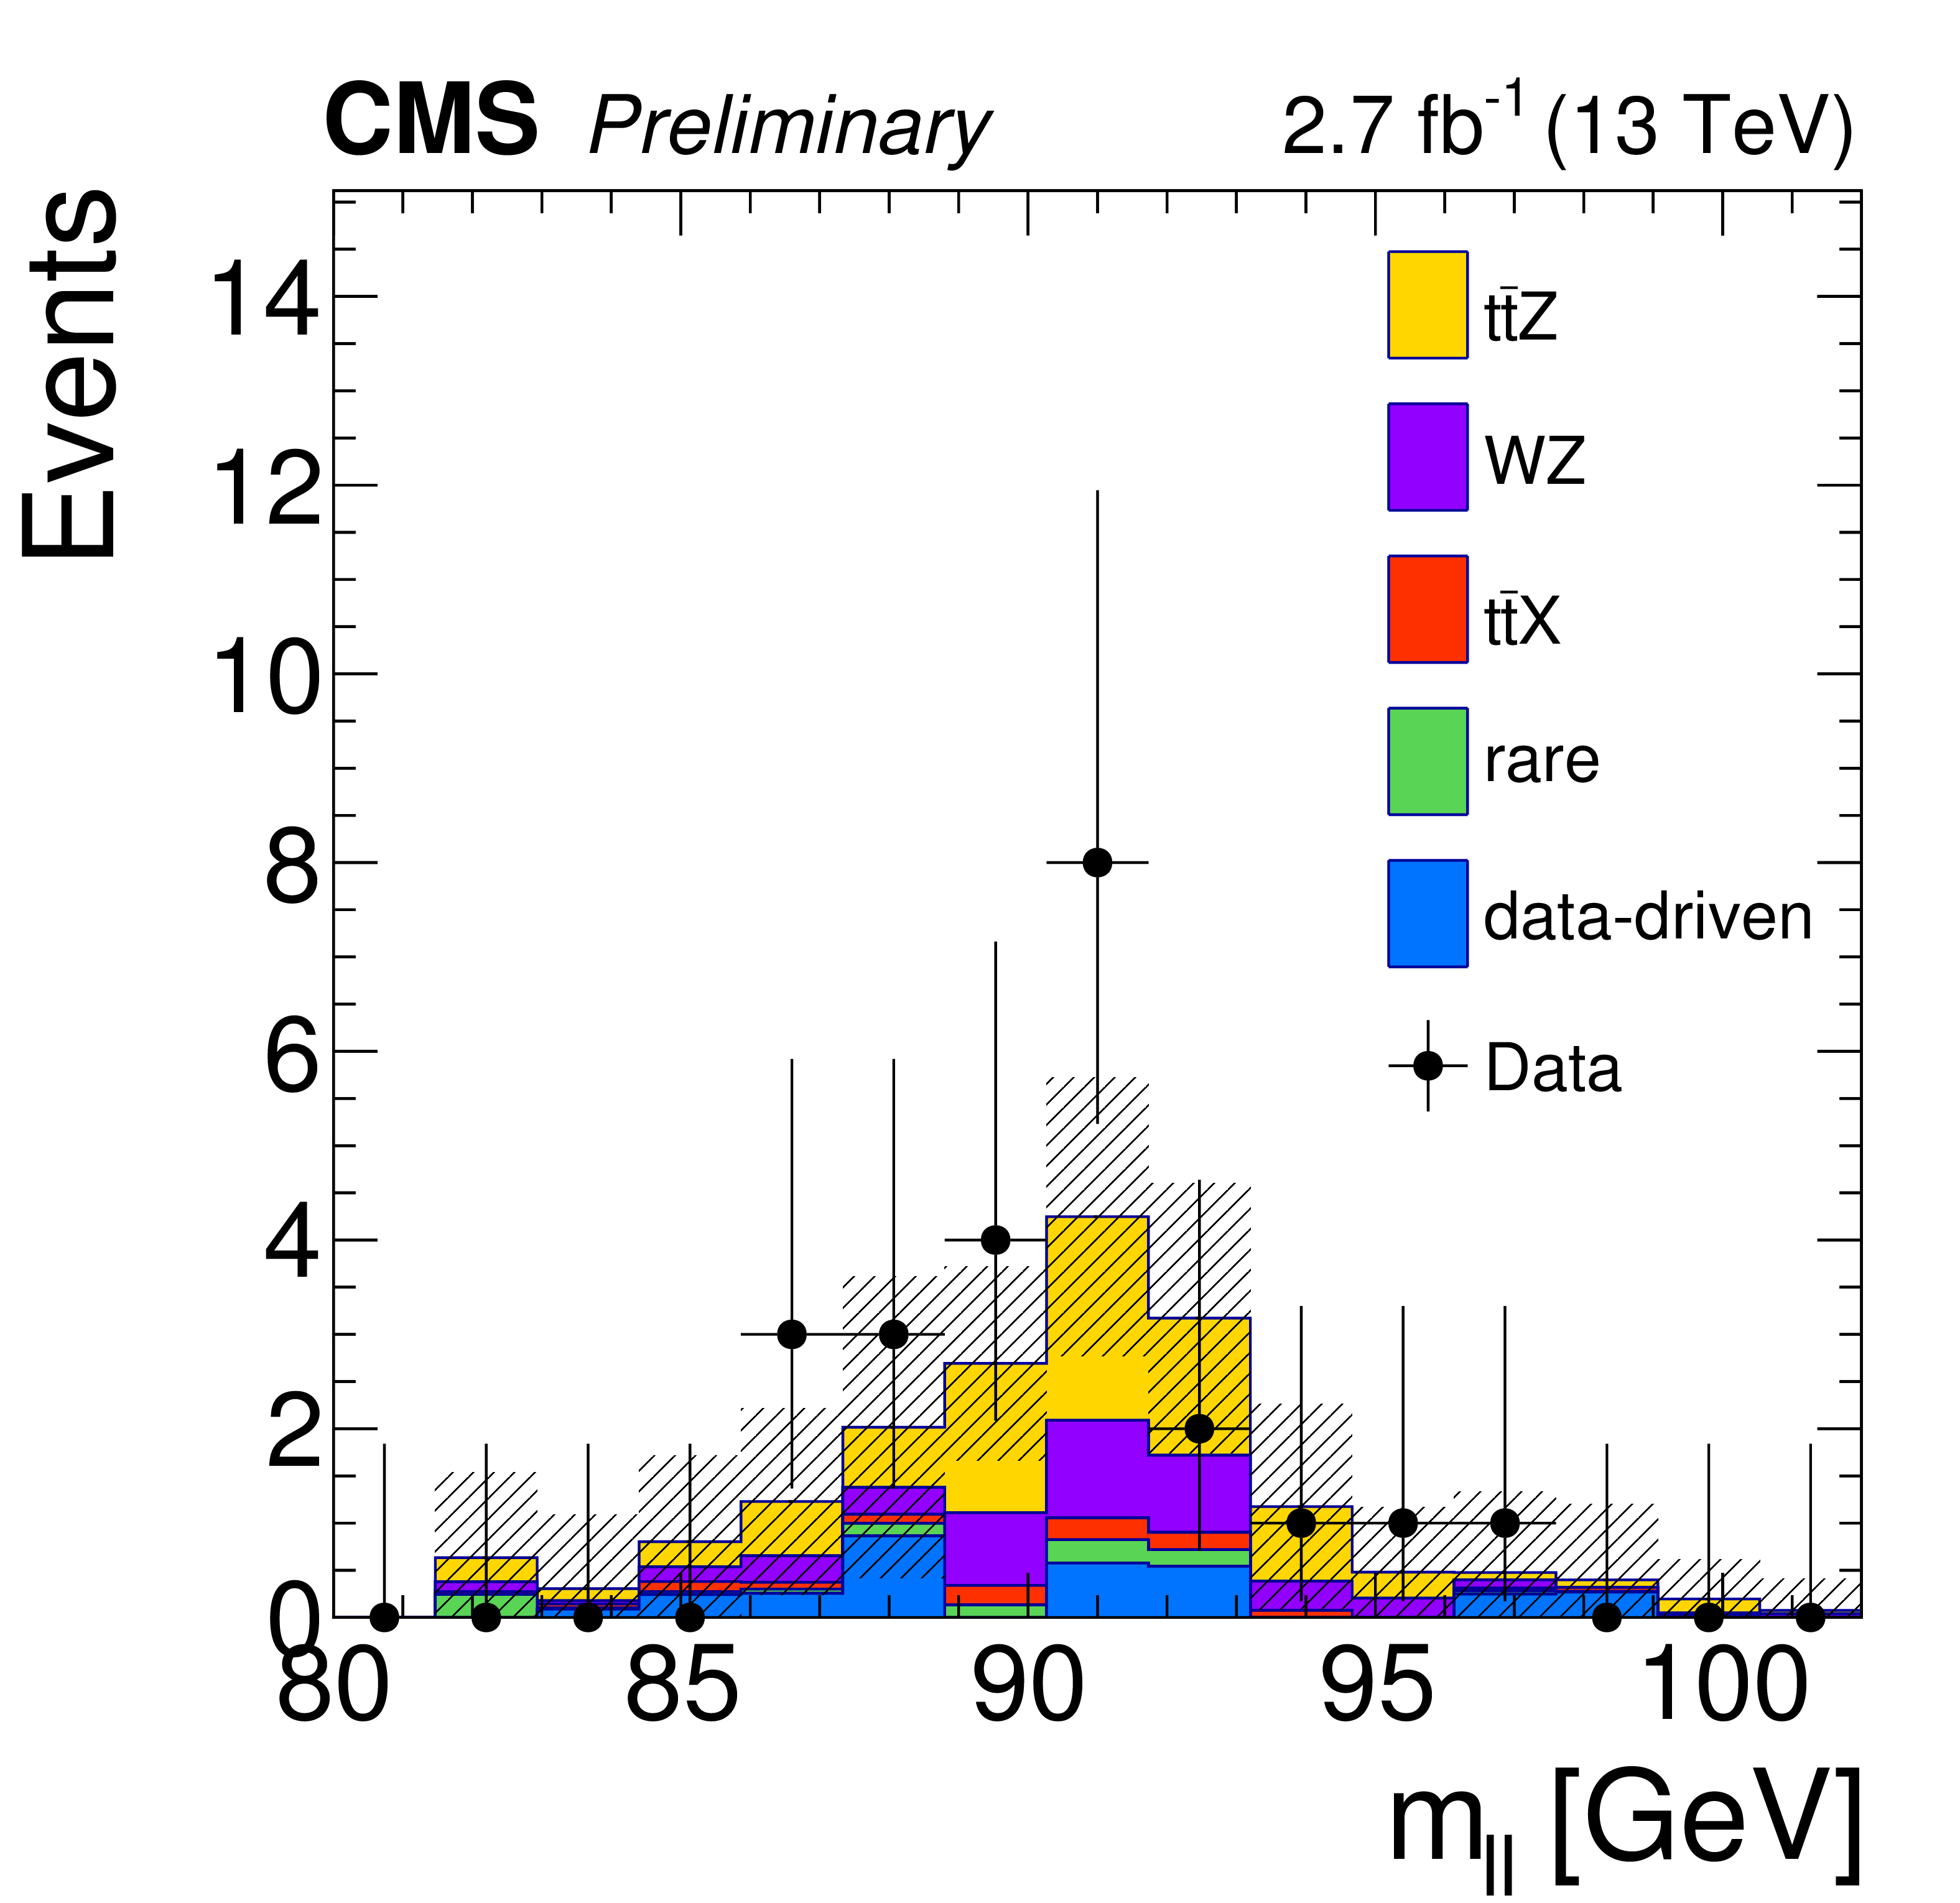
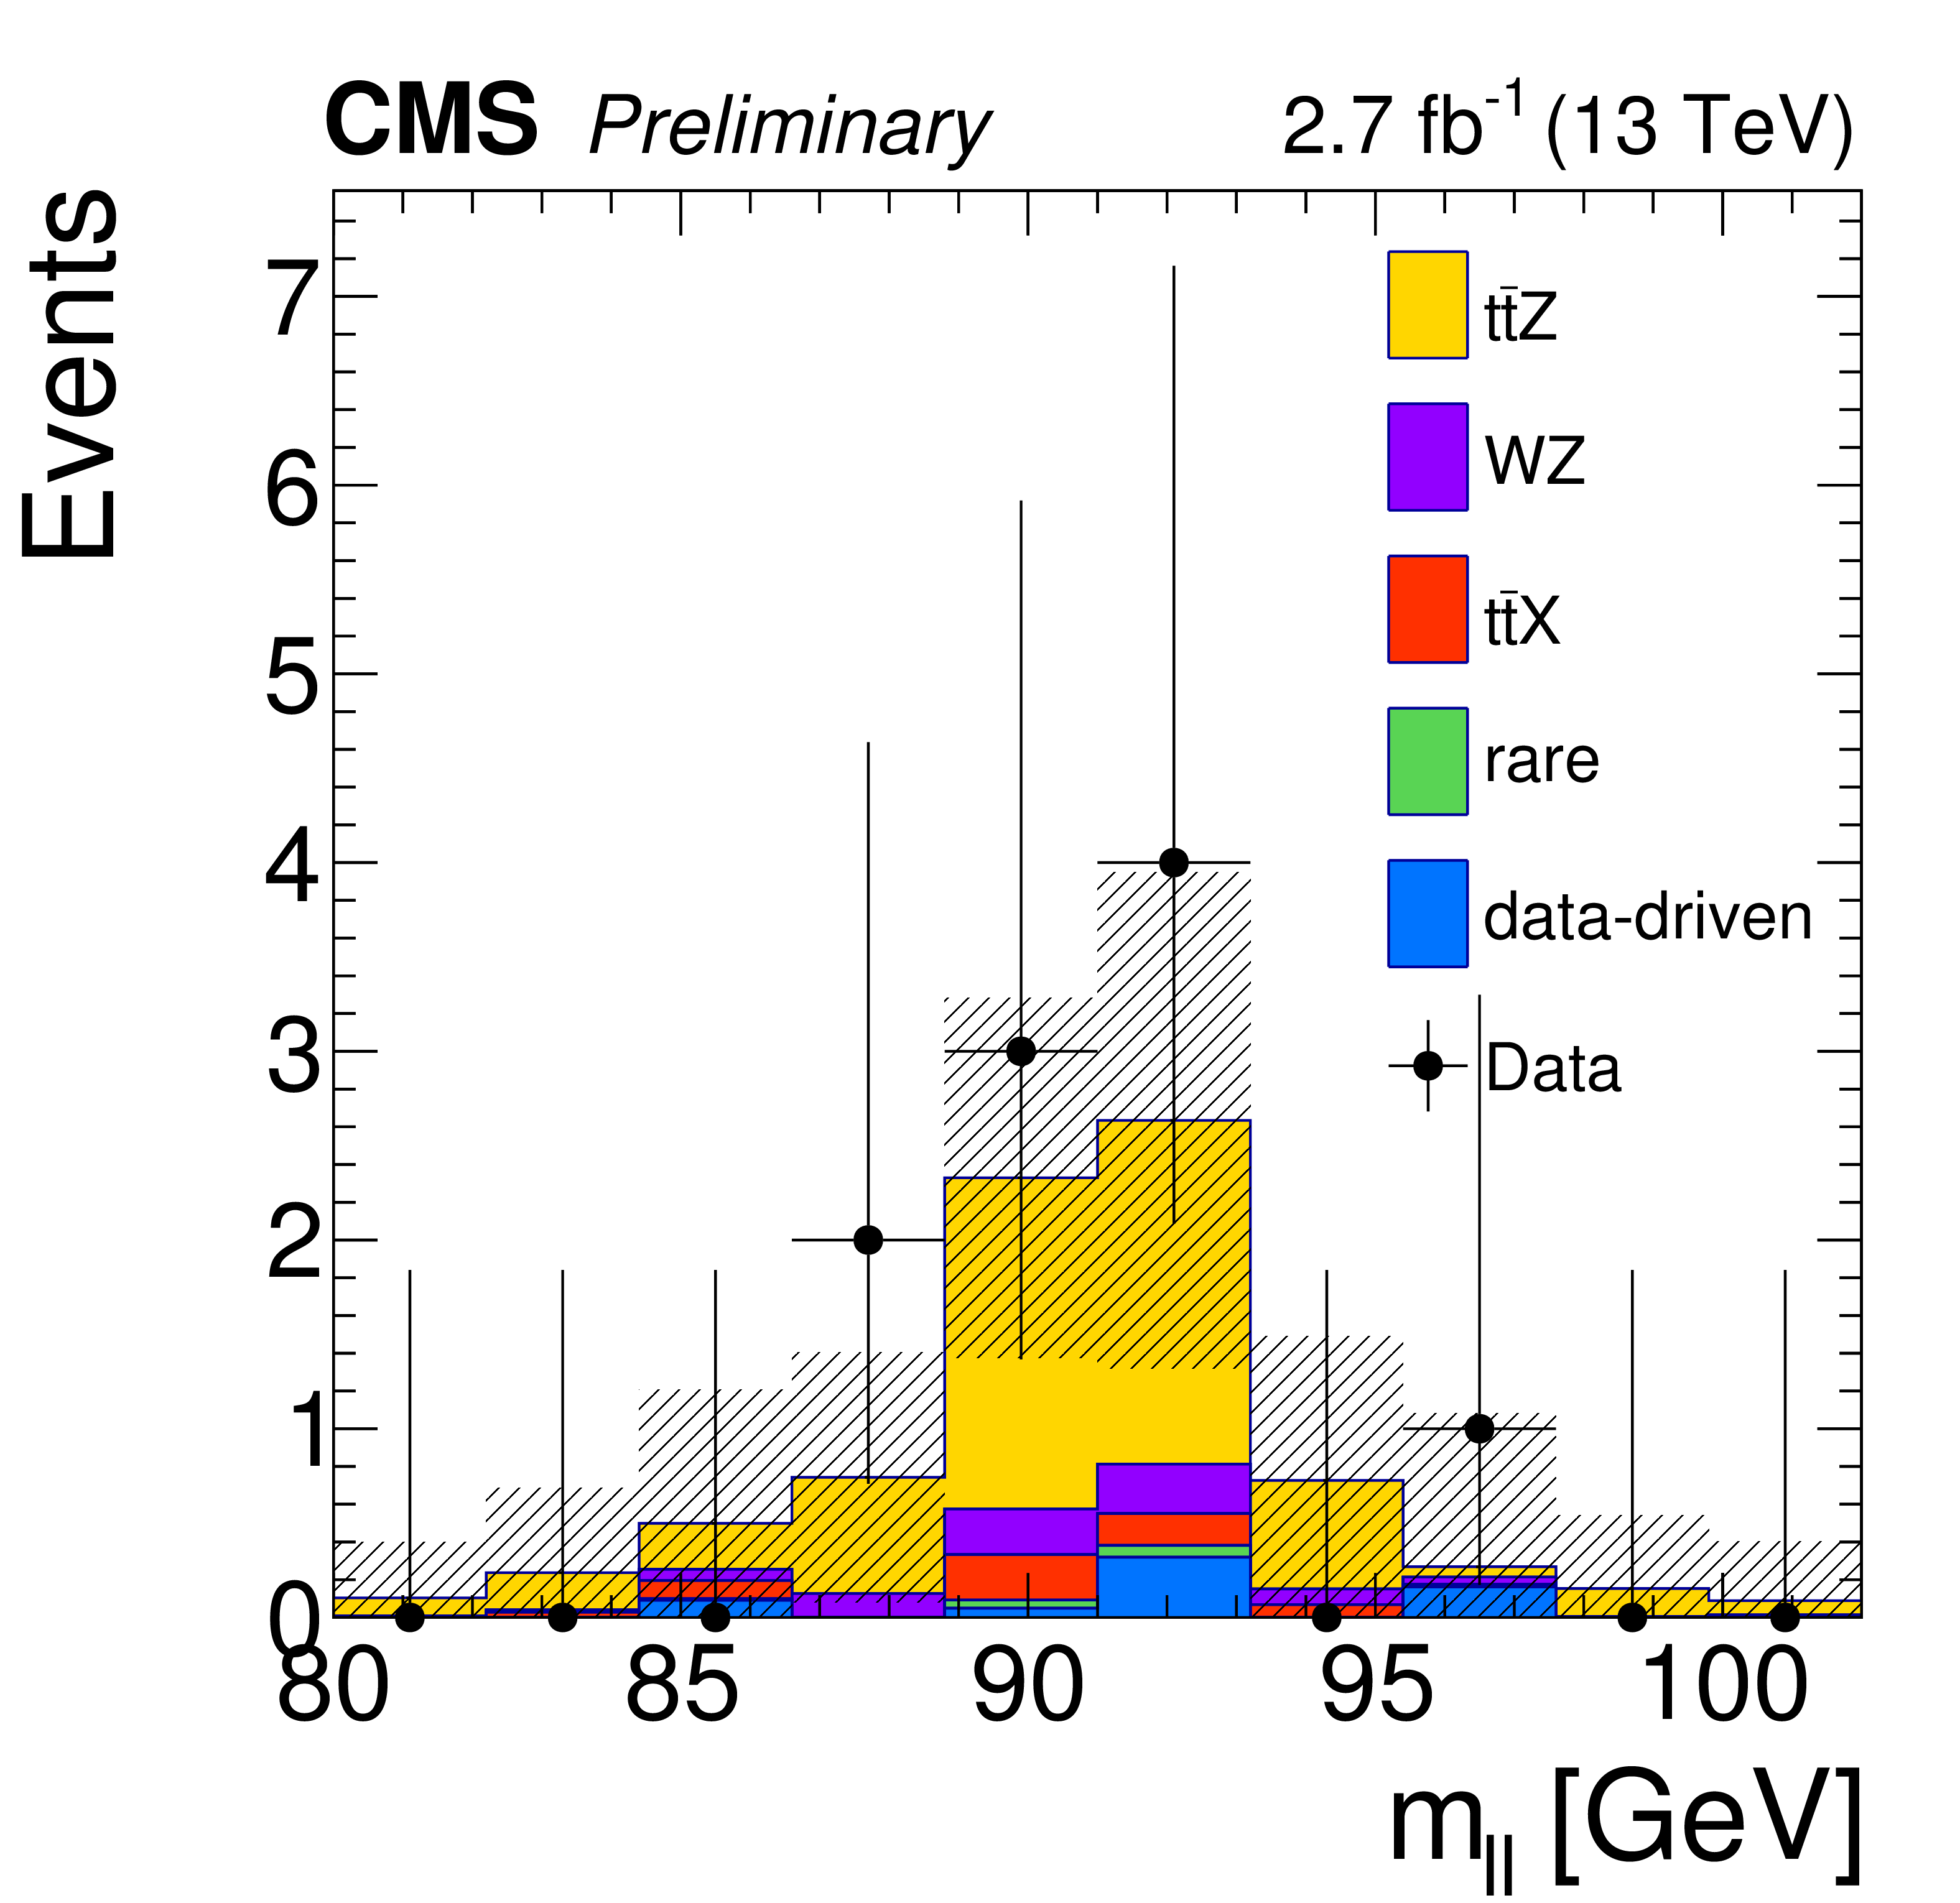
Figure 5-b:
Expected and observed distributions after 3 lepton, ${\mathrm {m}_{\ell \ell }}$ and ${N_\text {jets}} \ge$ 3 requirements. The plots are yields by lepton channel (a), Z-boson candidate dilepton mass distribution (b), jet multiplicity (c), b-tagged jet multiplicity (d). The hatched band shows the total uncertainty on the expected yields. |
png pdf |
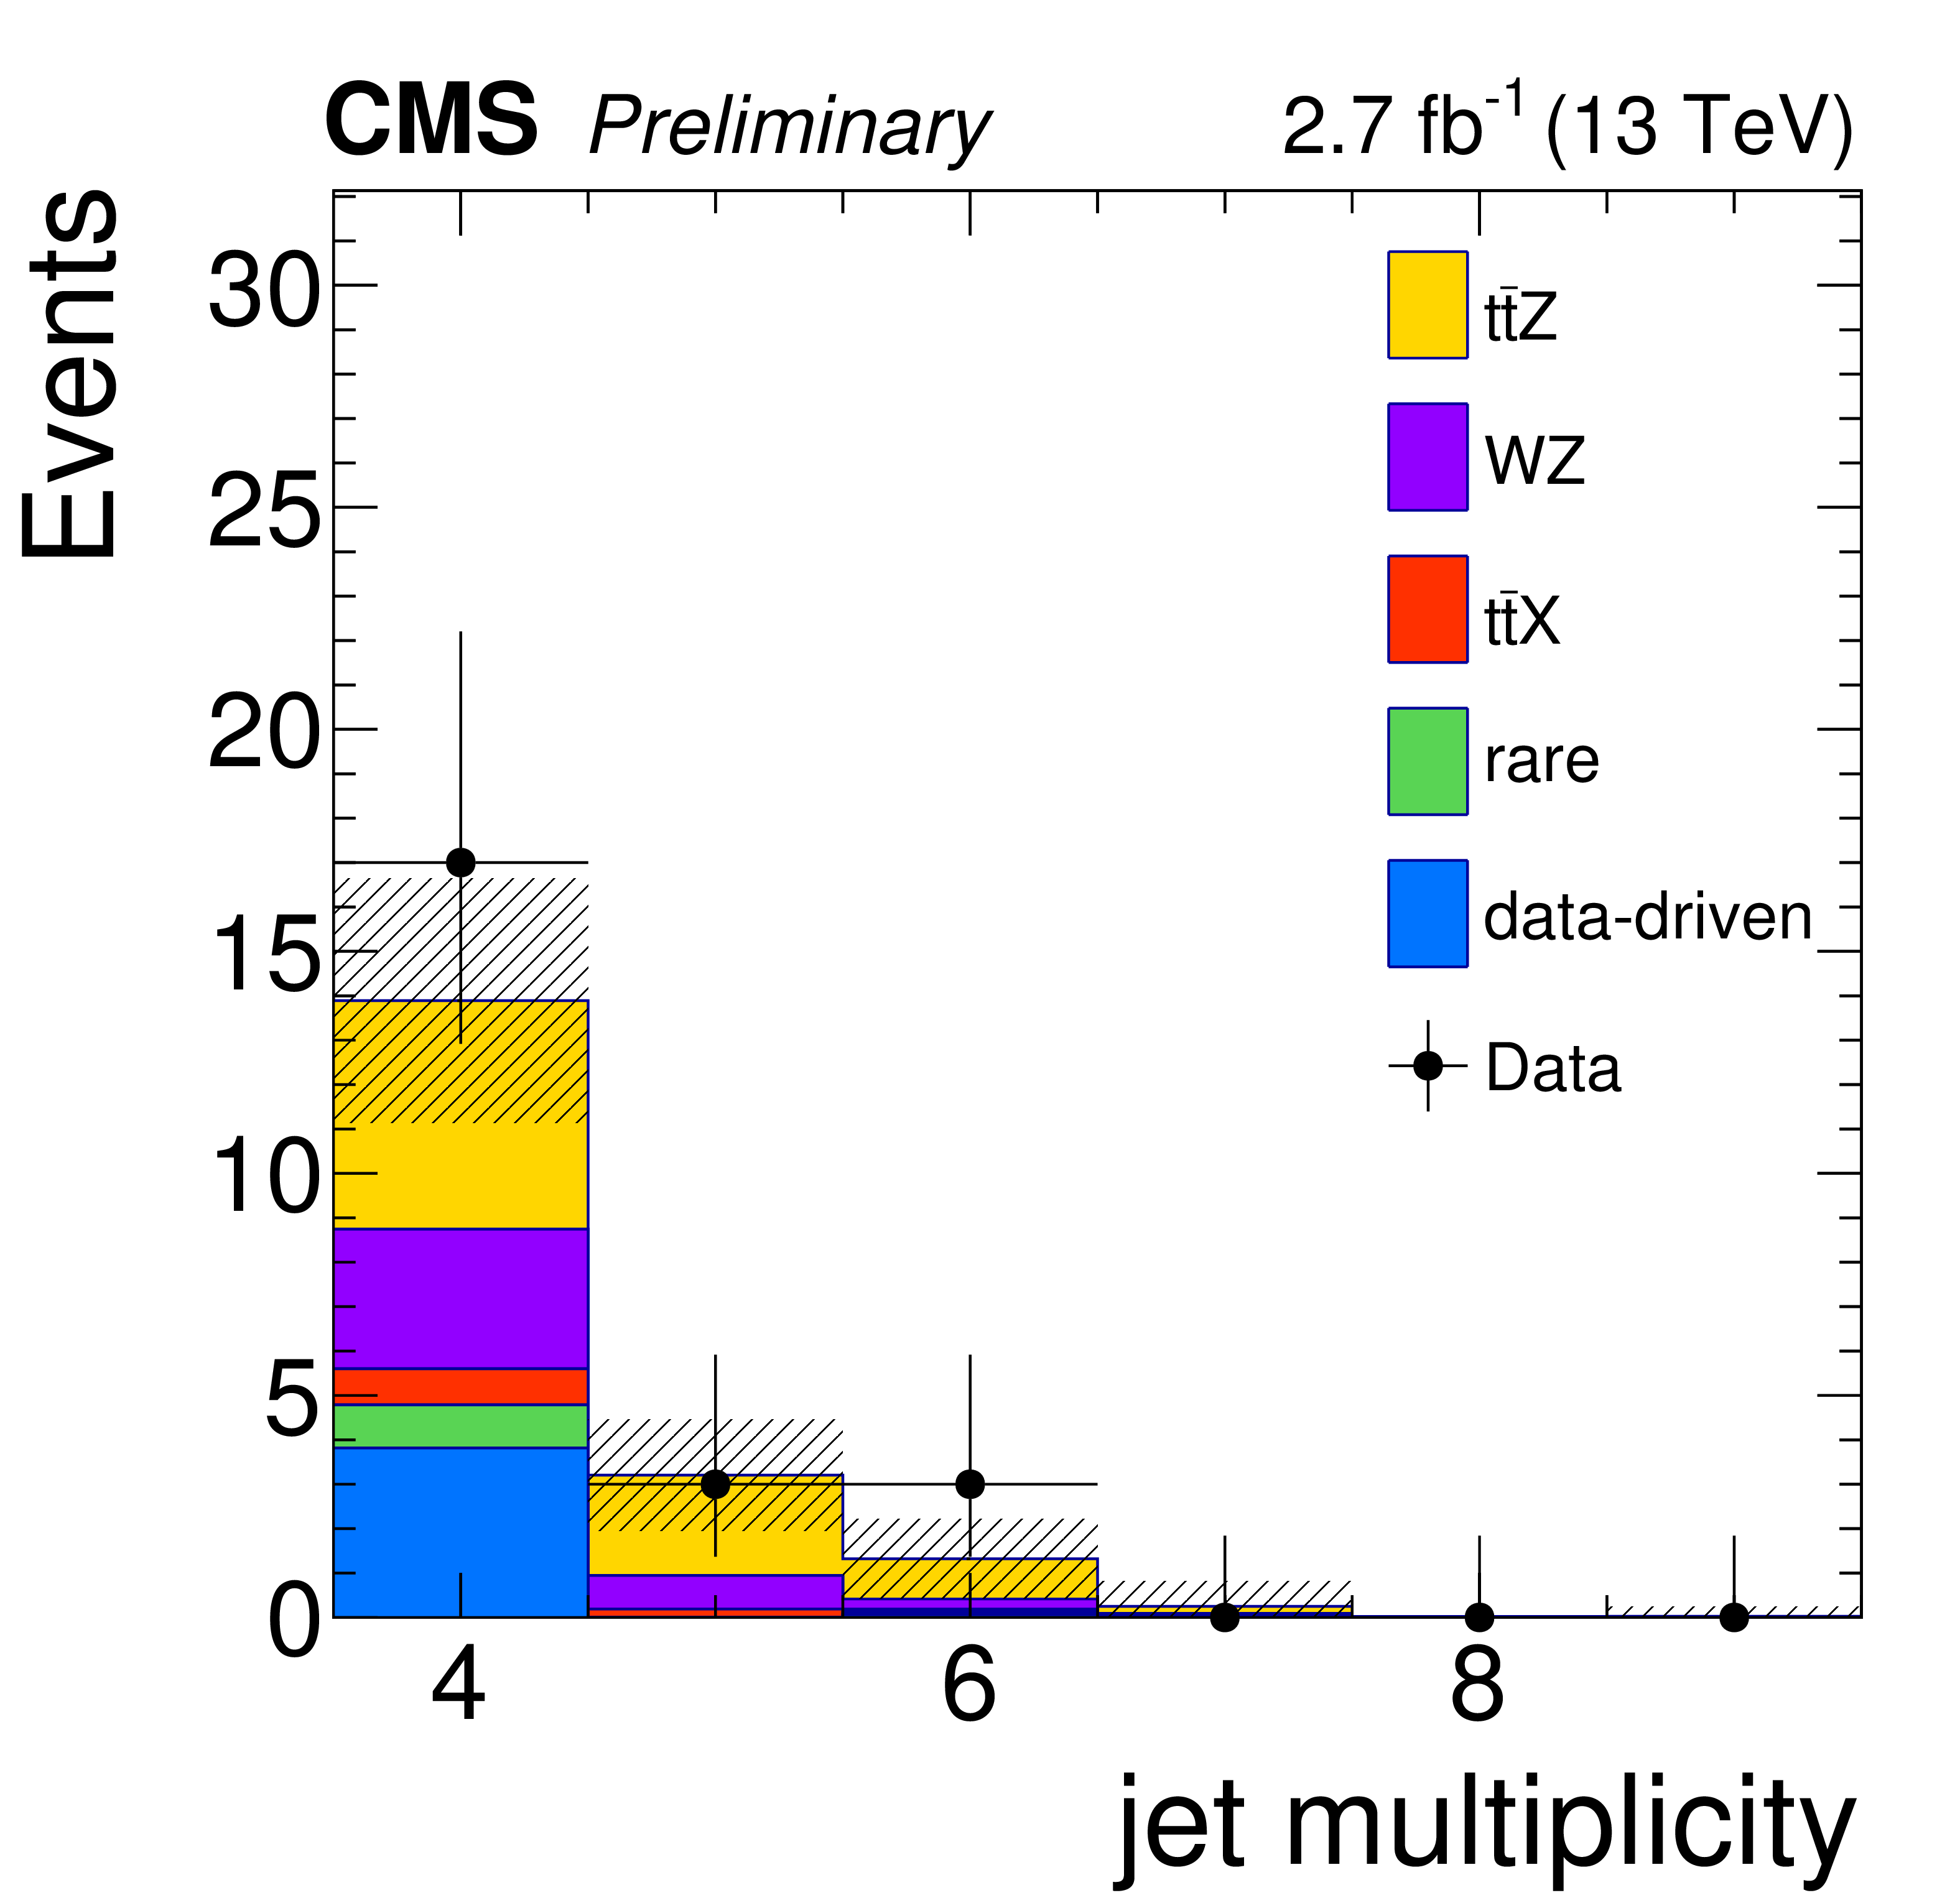
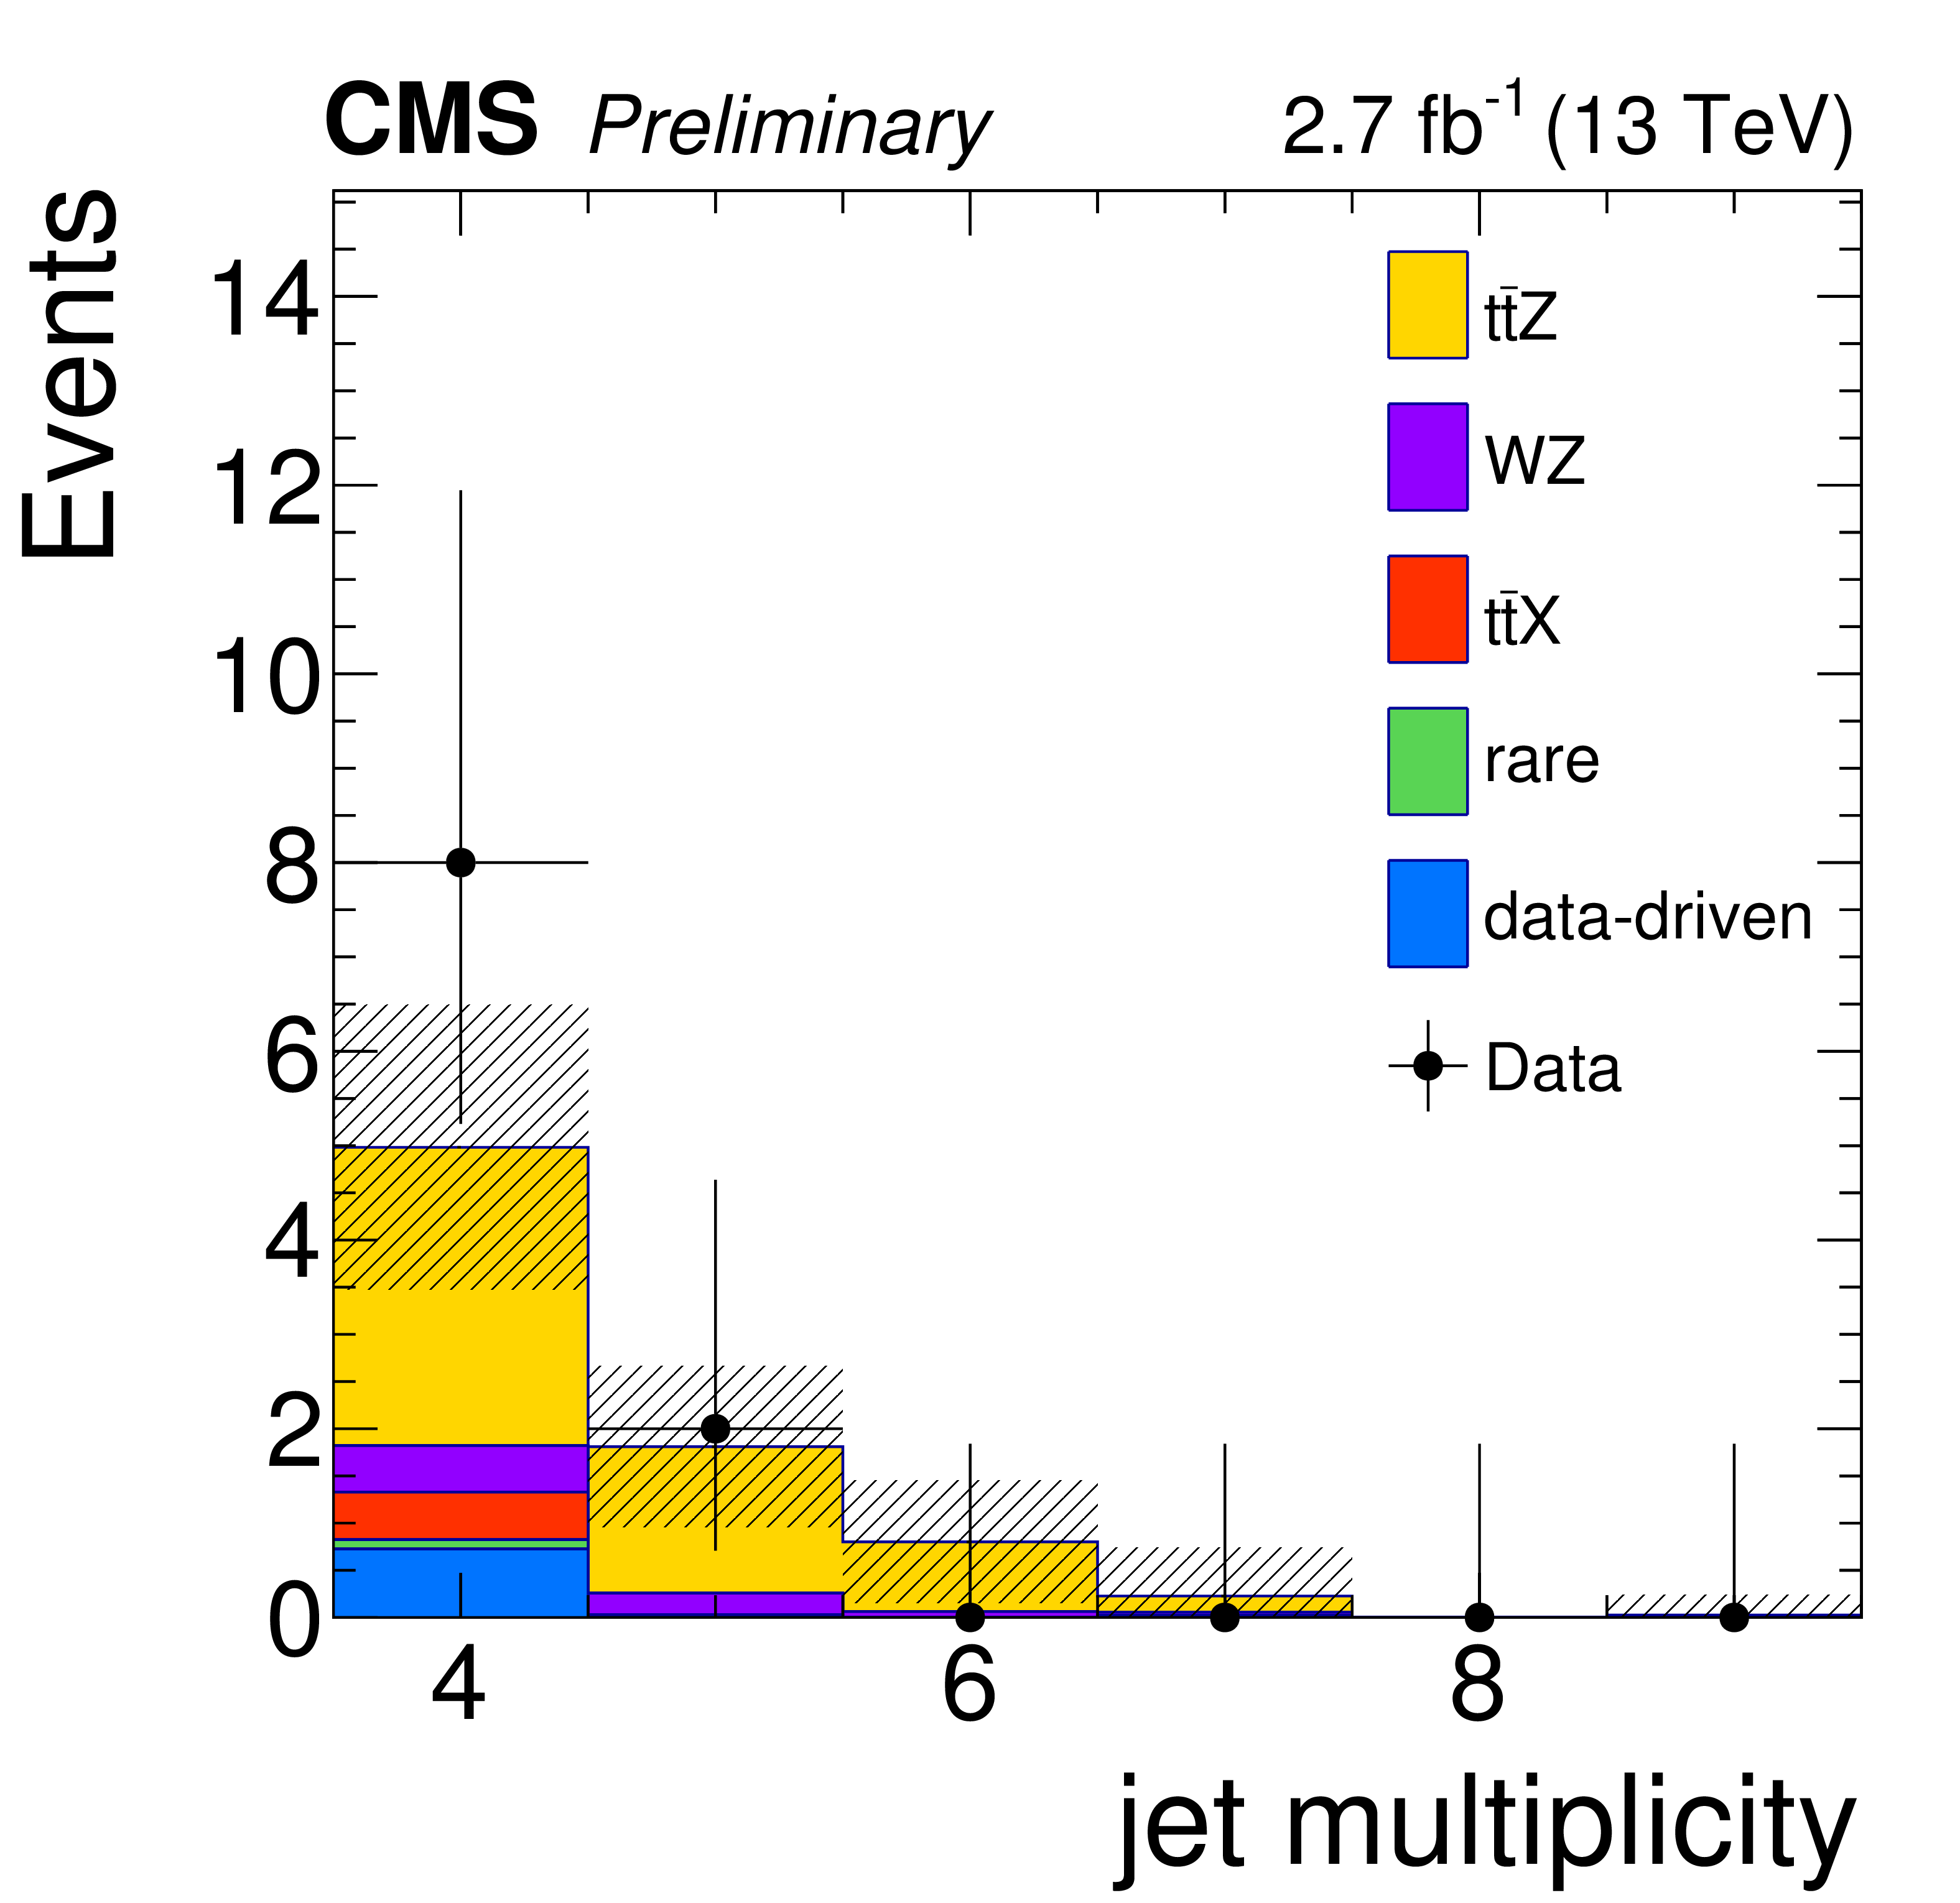
Figure 5-c:
Expected and observed distributions after 3 lepton, ${\mathrm {m}_{\ell \ell }}$ and ${N_\text {jets}} \ge$ 3 requirements. The plots are yields by lepton channel (a), Z-boson candidate dilepton mass distribution (b), jet multiplicity (c), b-tagged jet multiplicity (d). The hatched band shows the total uncertainty on the expected yields. |
png pdf |
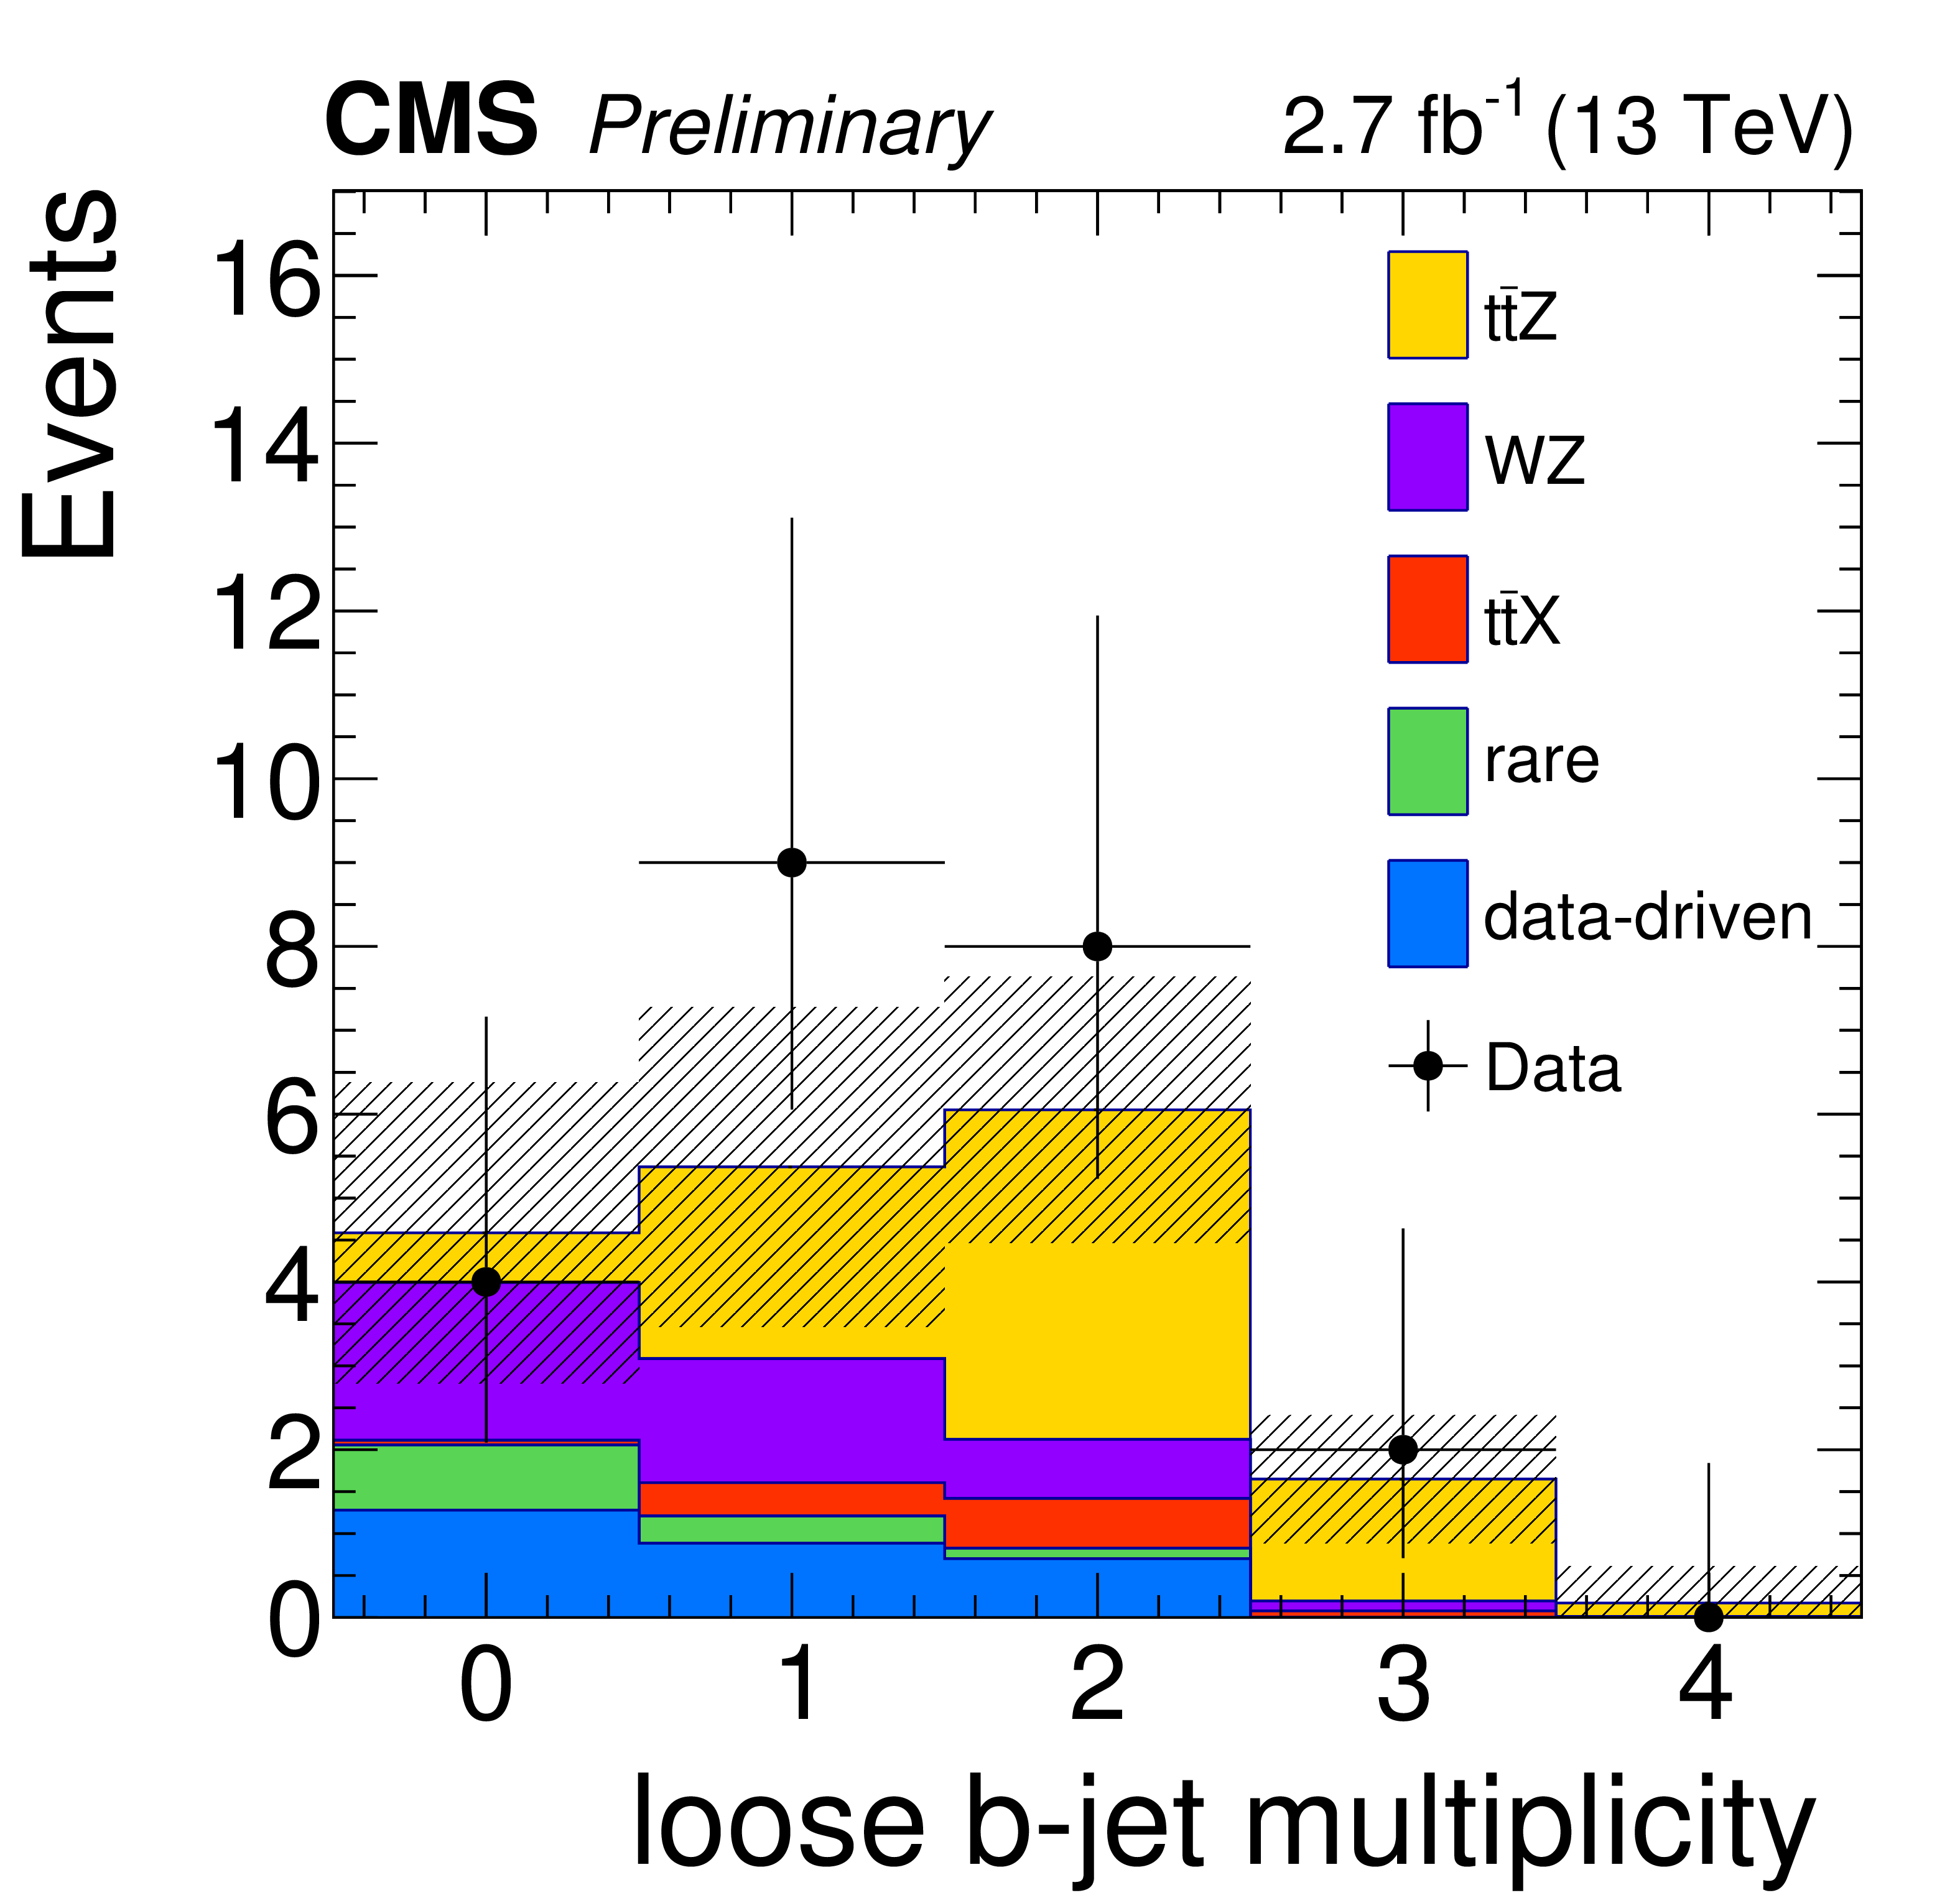
Figure 5-d:
Expected and observed distributions after 3 lepton, ${\mathrm {m}_{\ell \ell }}$ and ${N_\text {jets}} \ge$ 3 requirements. The plots are yields by lepton channel (a), Z-boson candidate dilepton mass distribution (b), jet multiplicity (c), b-tagged jet multiplicity (d). The hatched band shows the total uncertainty on the expected yields. |
png pdf |
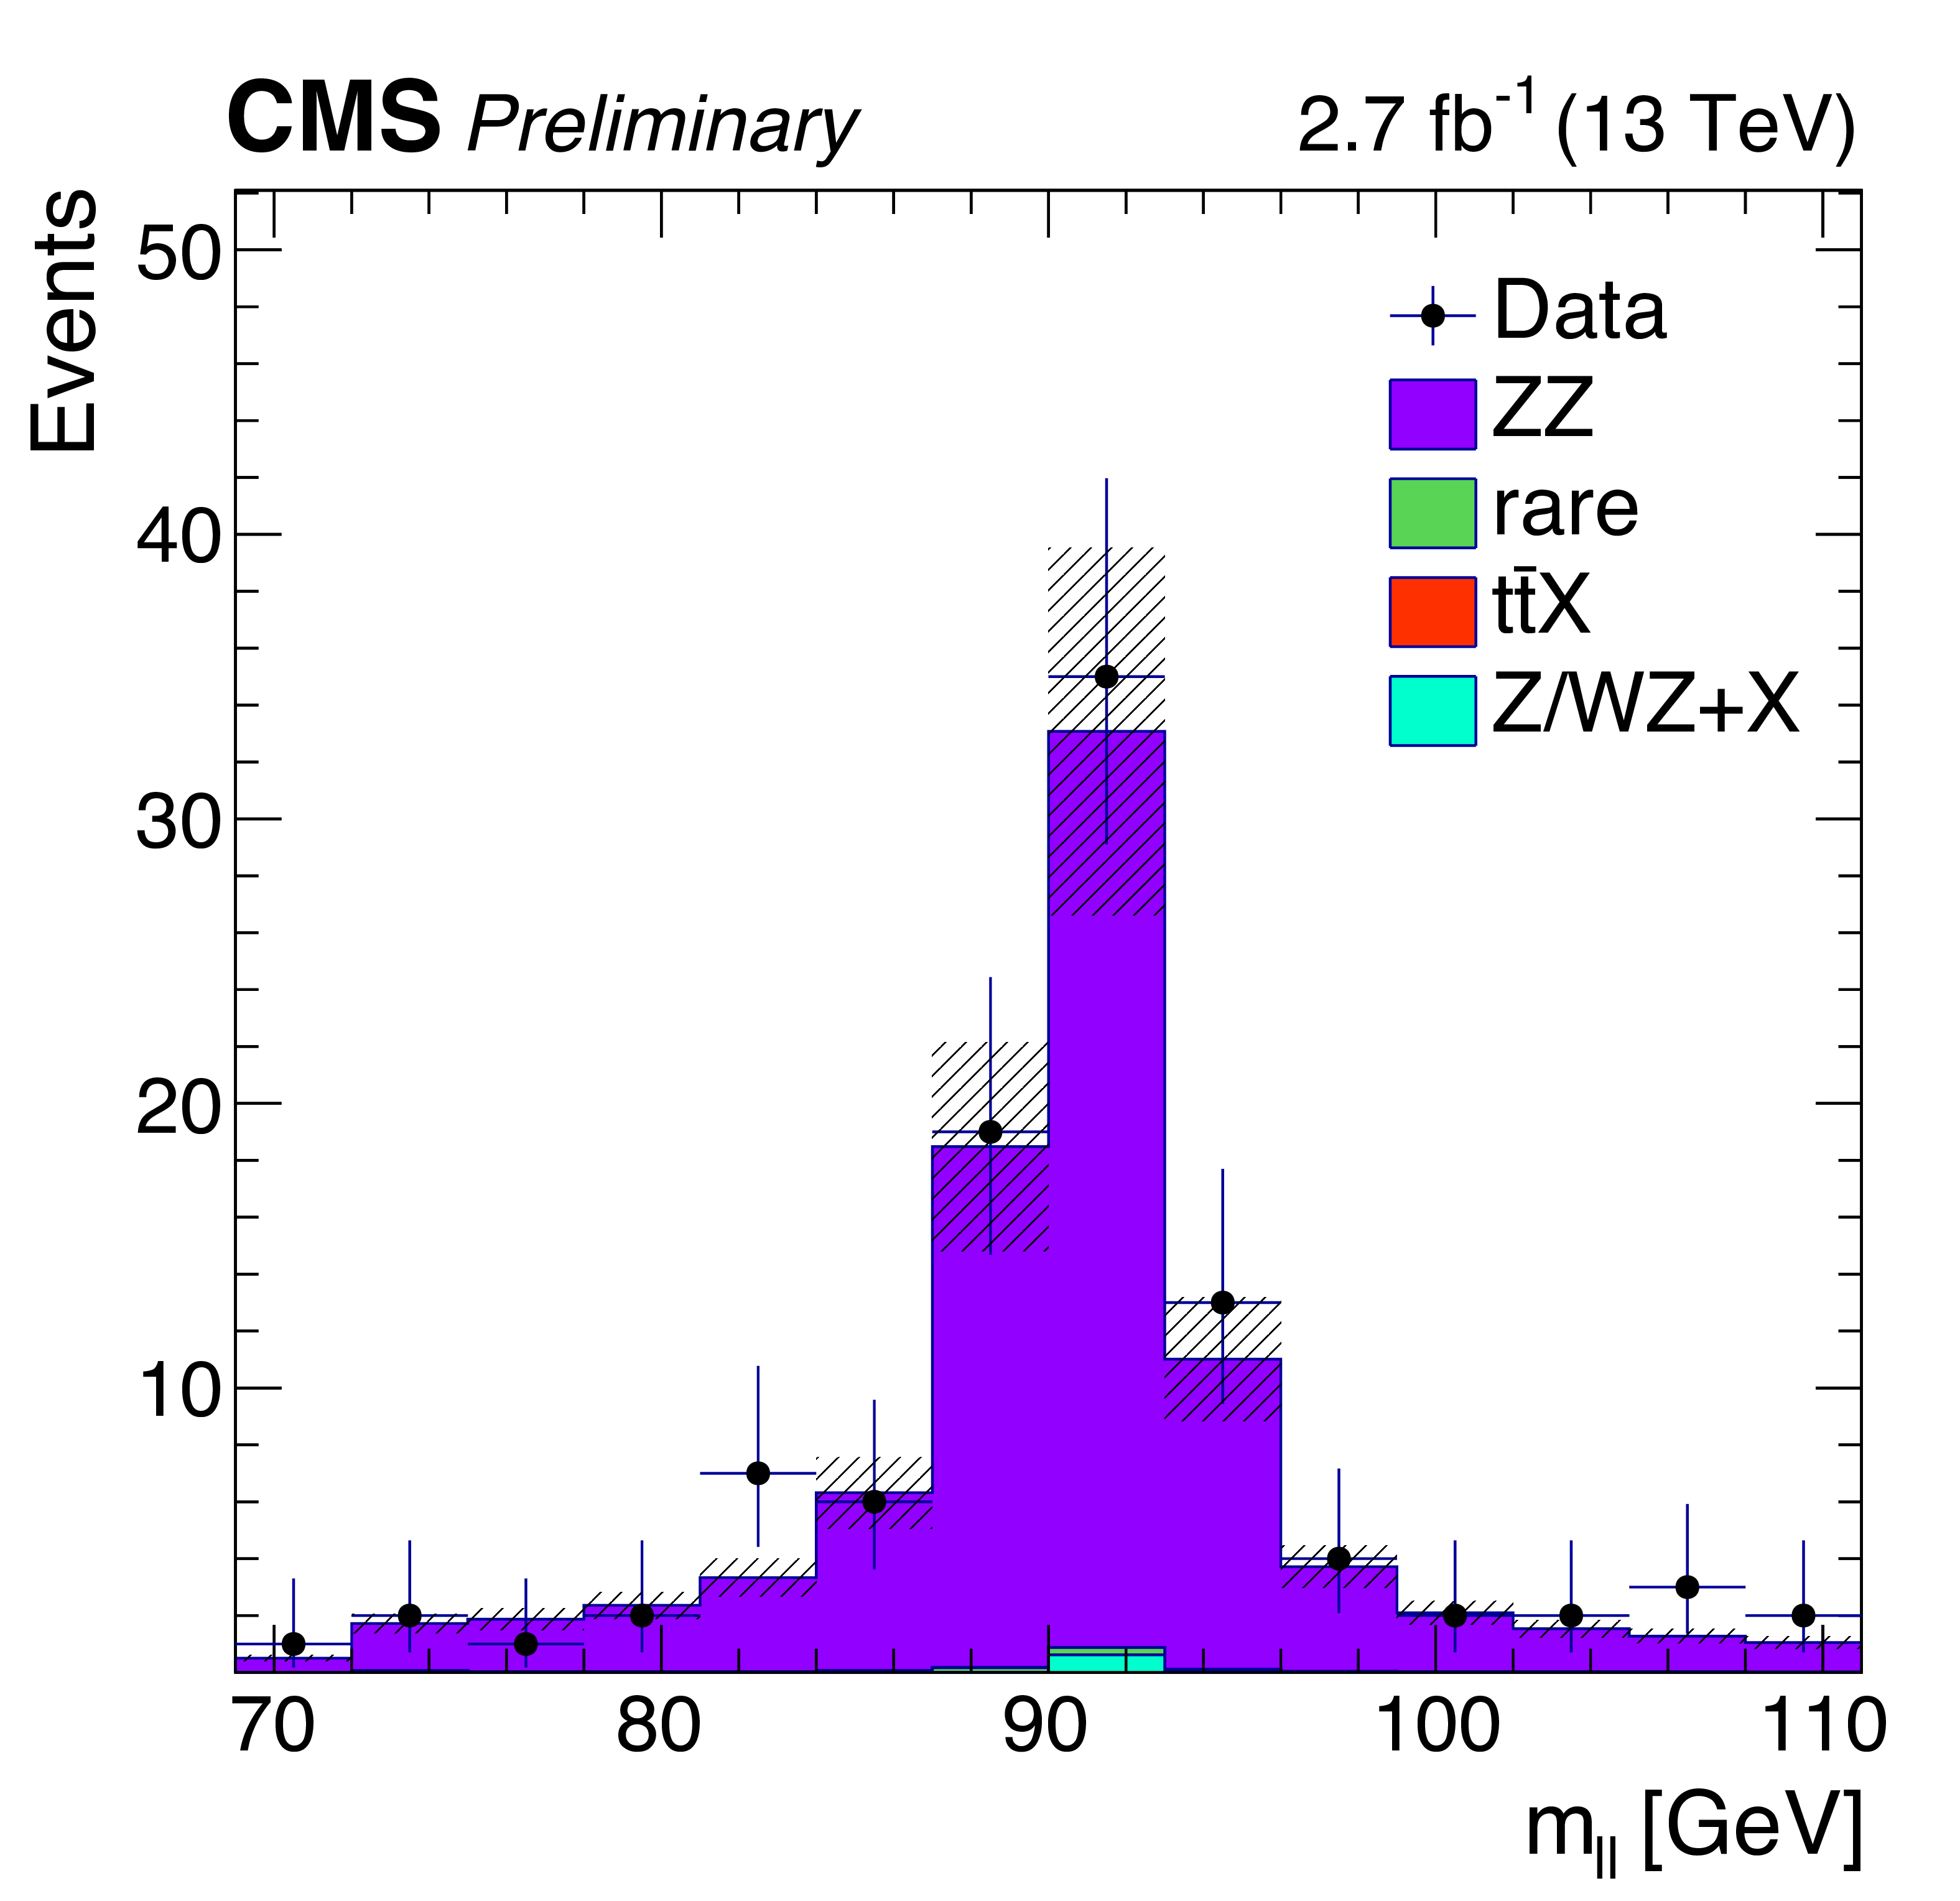
Figure 6-a:
Data-MC comparison for the Z candidates mass (a), jet multiplicity (b) and b-jet multiplicity (c) in a ZZ-dominated background control region |
png pdf |
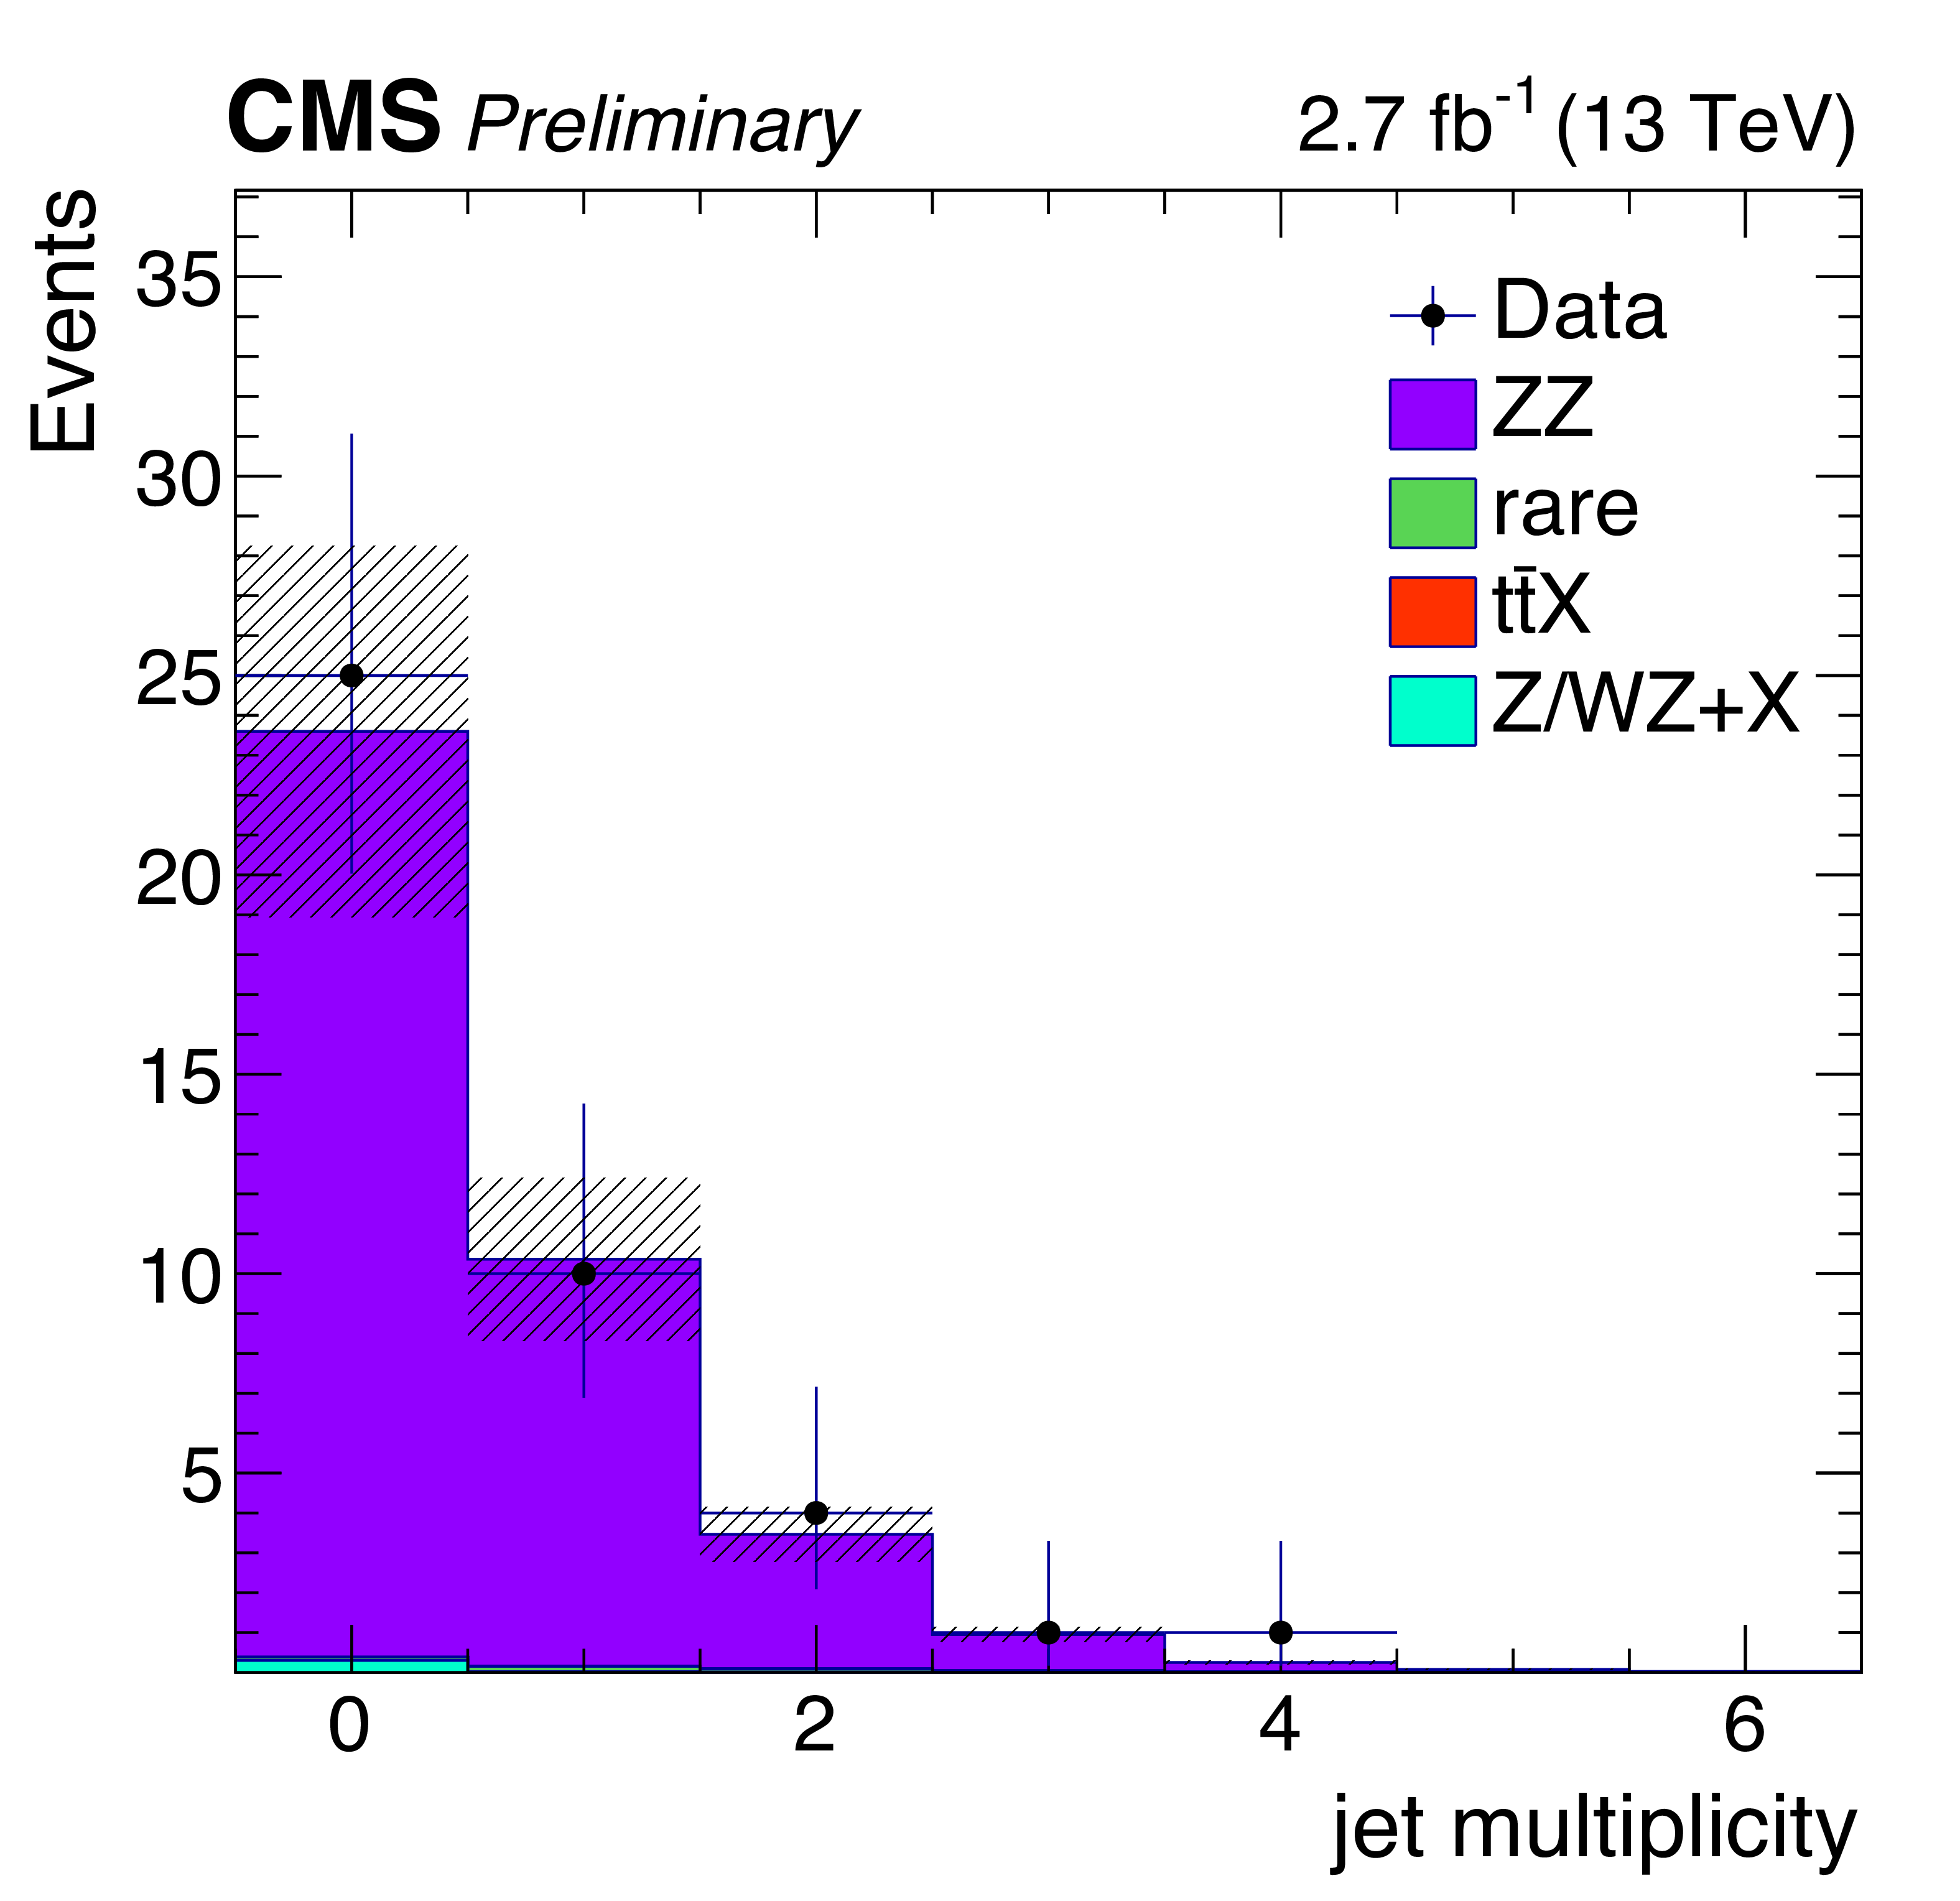
Figure 6-b:
Data-MC comparison for the Z candidates mass (a), jet multiplicity (b) and b-jet multiplicity (c) in a ZZ-dominated background control region |
png pdf |
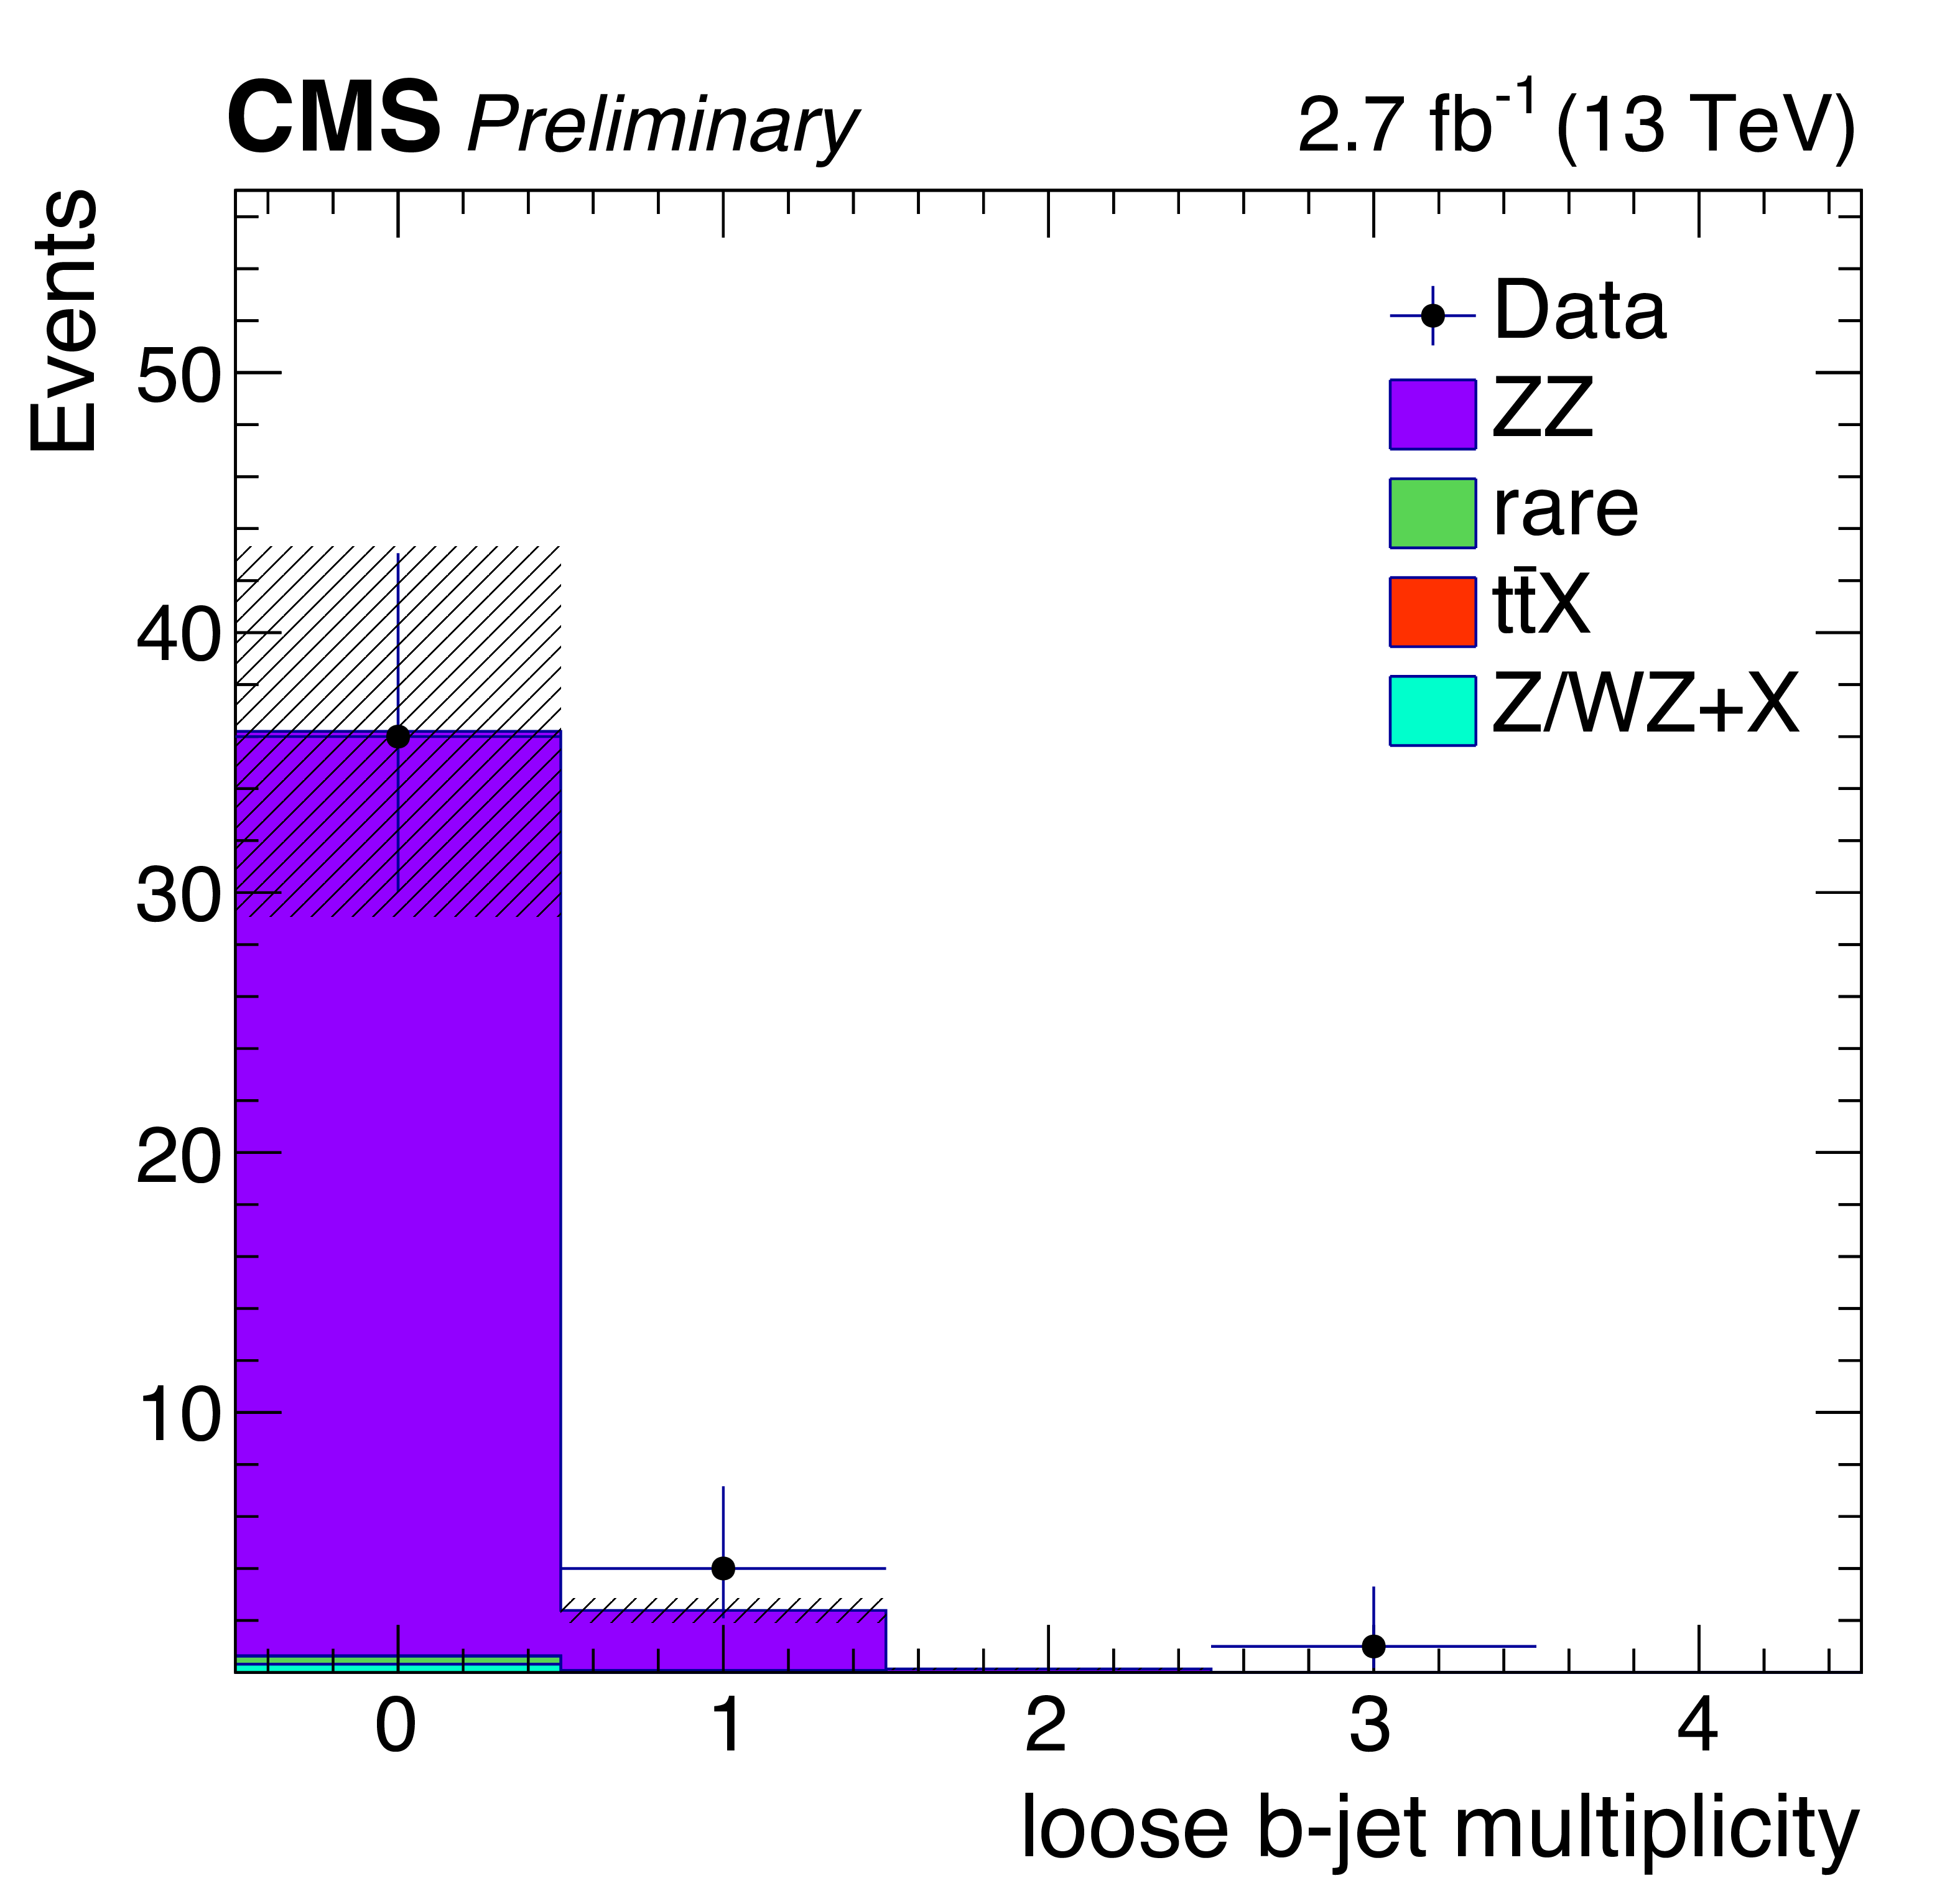
Figure 6-c:
Data-MC comparison for the Z candidates mass (a), jet multiplicity (b) and b-jet multiplicity (c) in a ZZ-dominated background control region |
png pdf |
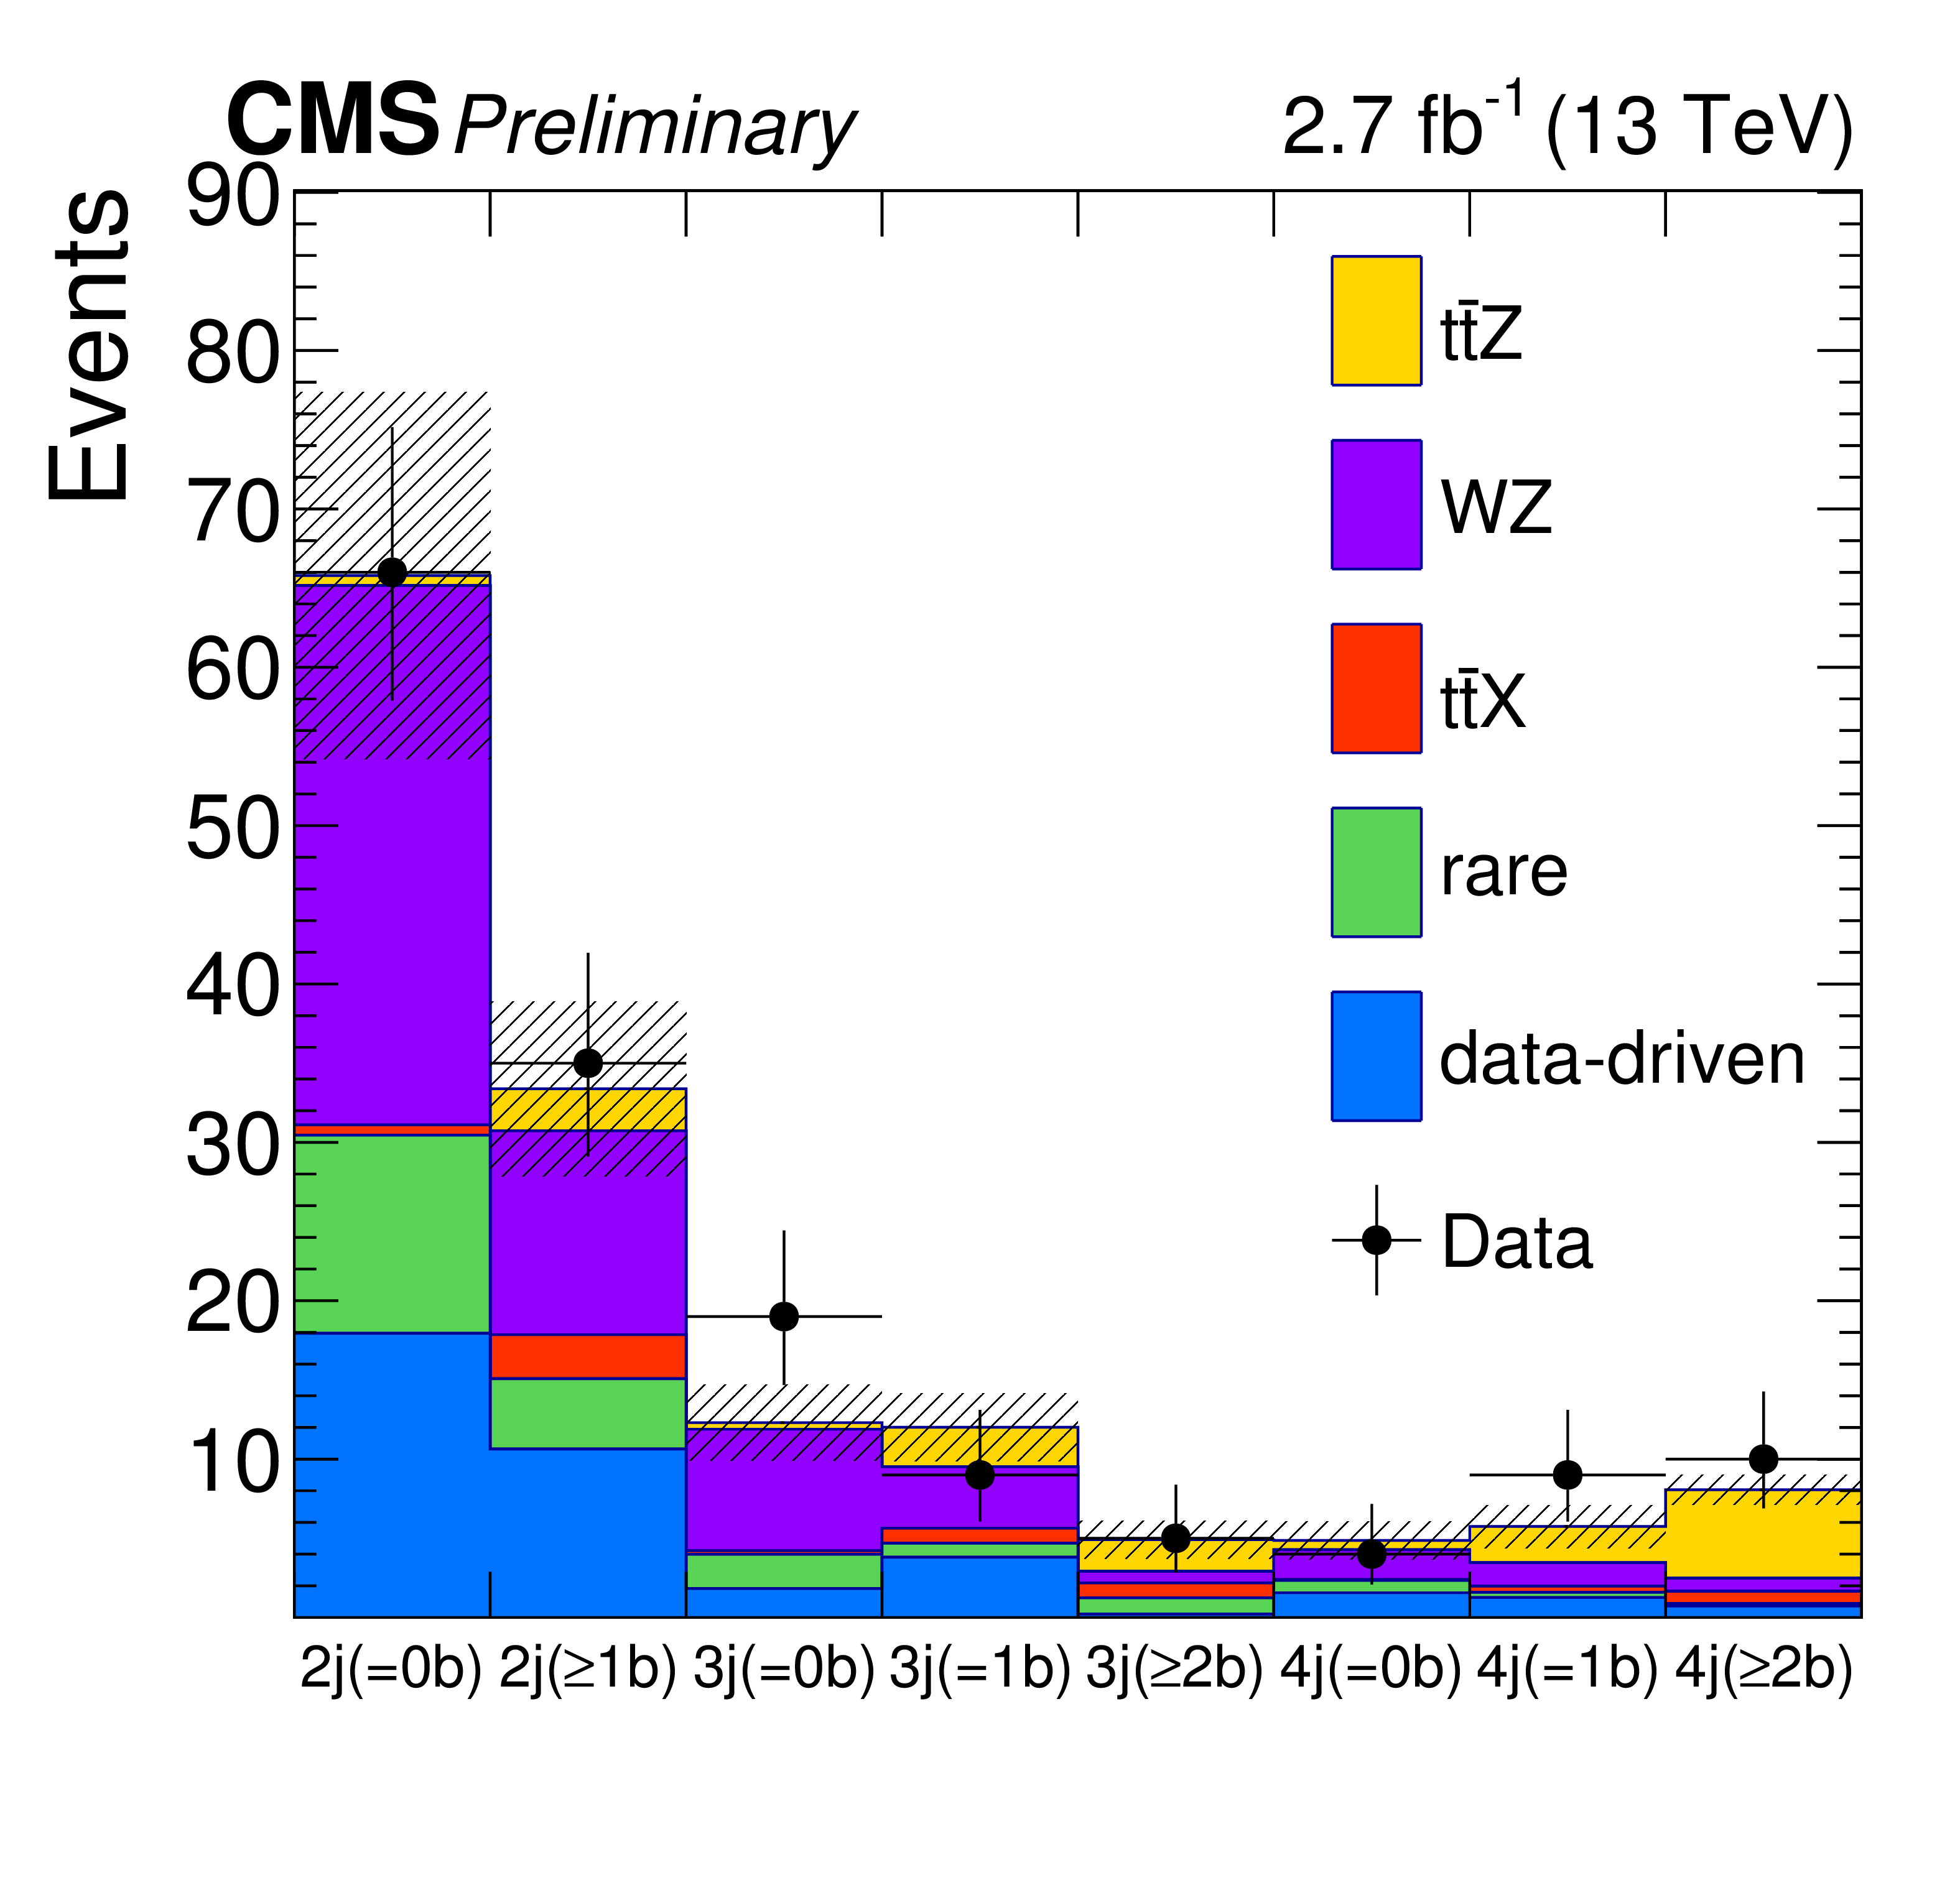
Figure 7:
Predicted and observed yields in each analysis bin in the three-lepton analyses. The characters "j" and "b" in the x-axis labels represent "jet" and "b-jet", respectively. The hatched band shows the total pre-fit uncertainty associated to signal and background predictions where major sources of the uncertainties are uncorrelated and summed in quadrature. |
png pdf |
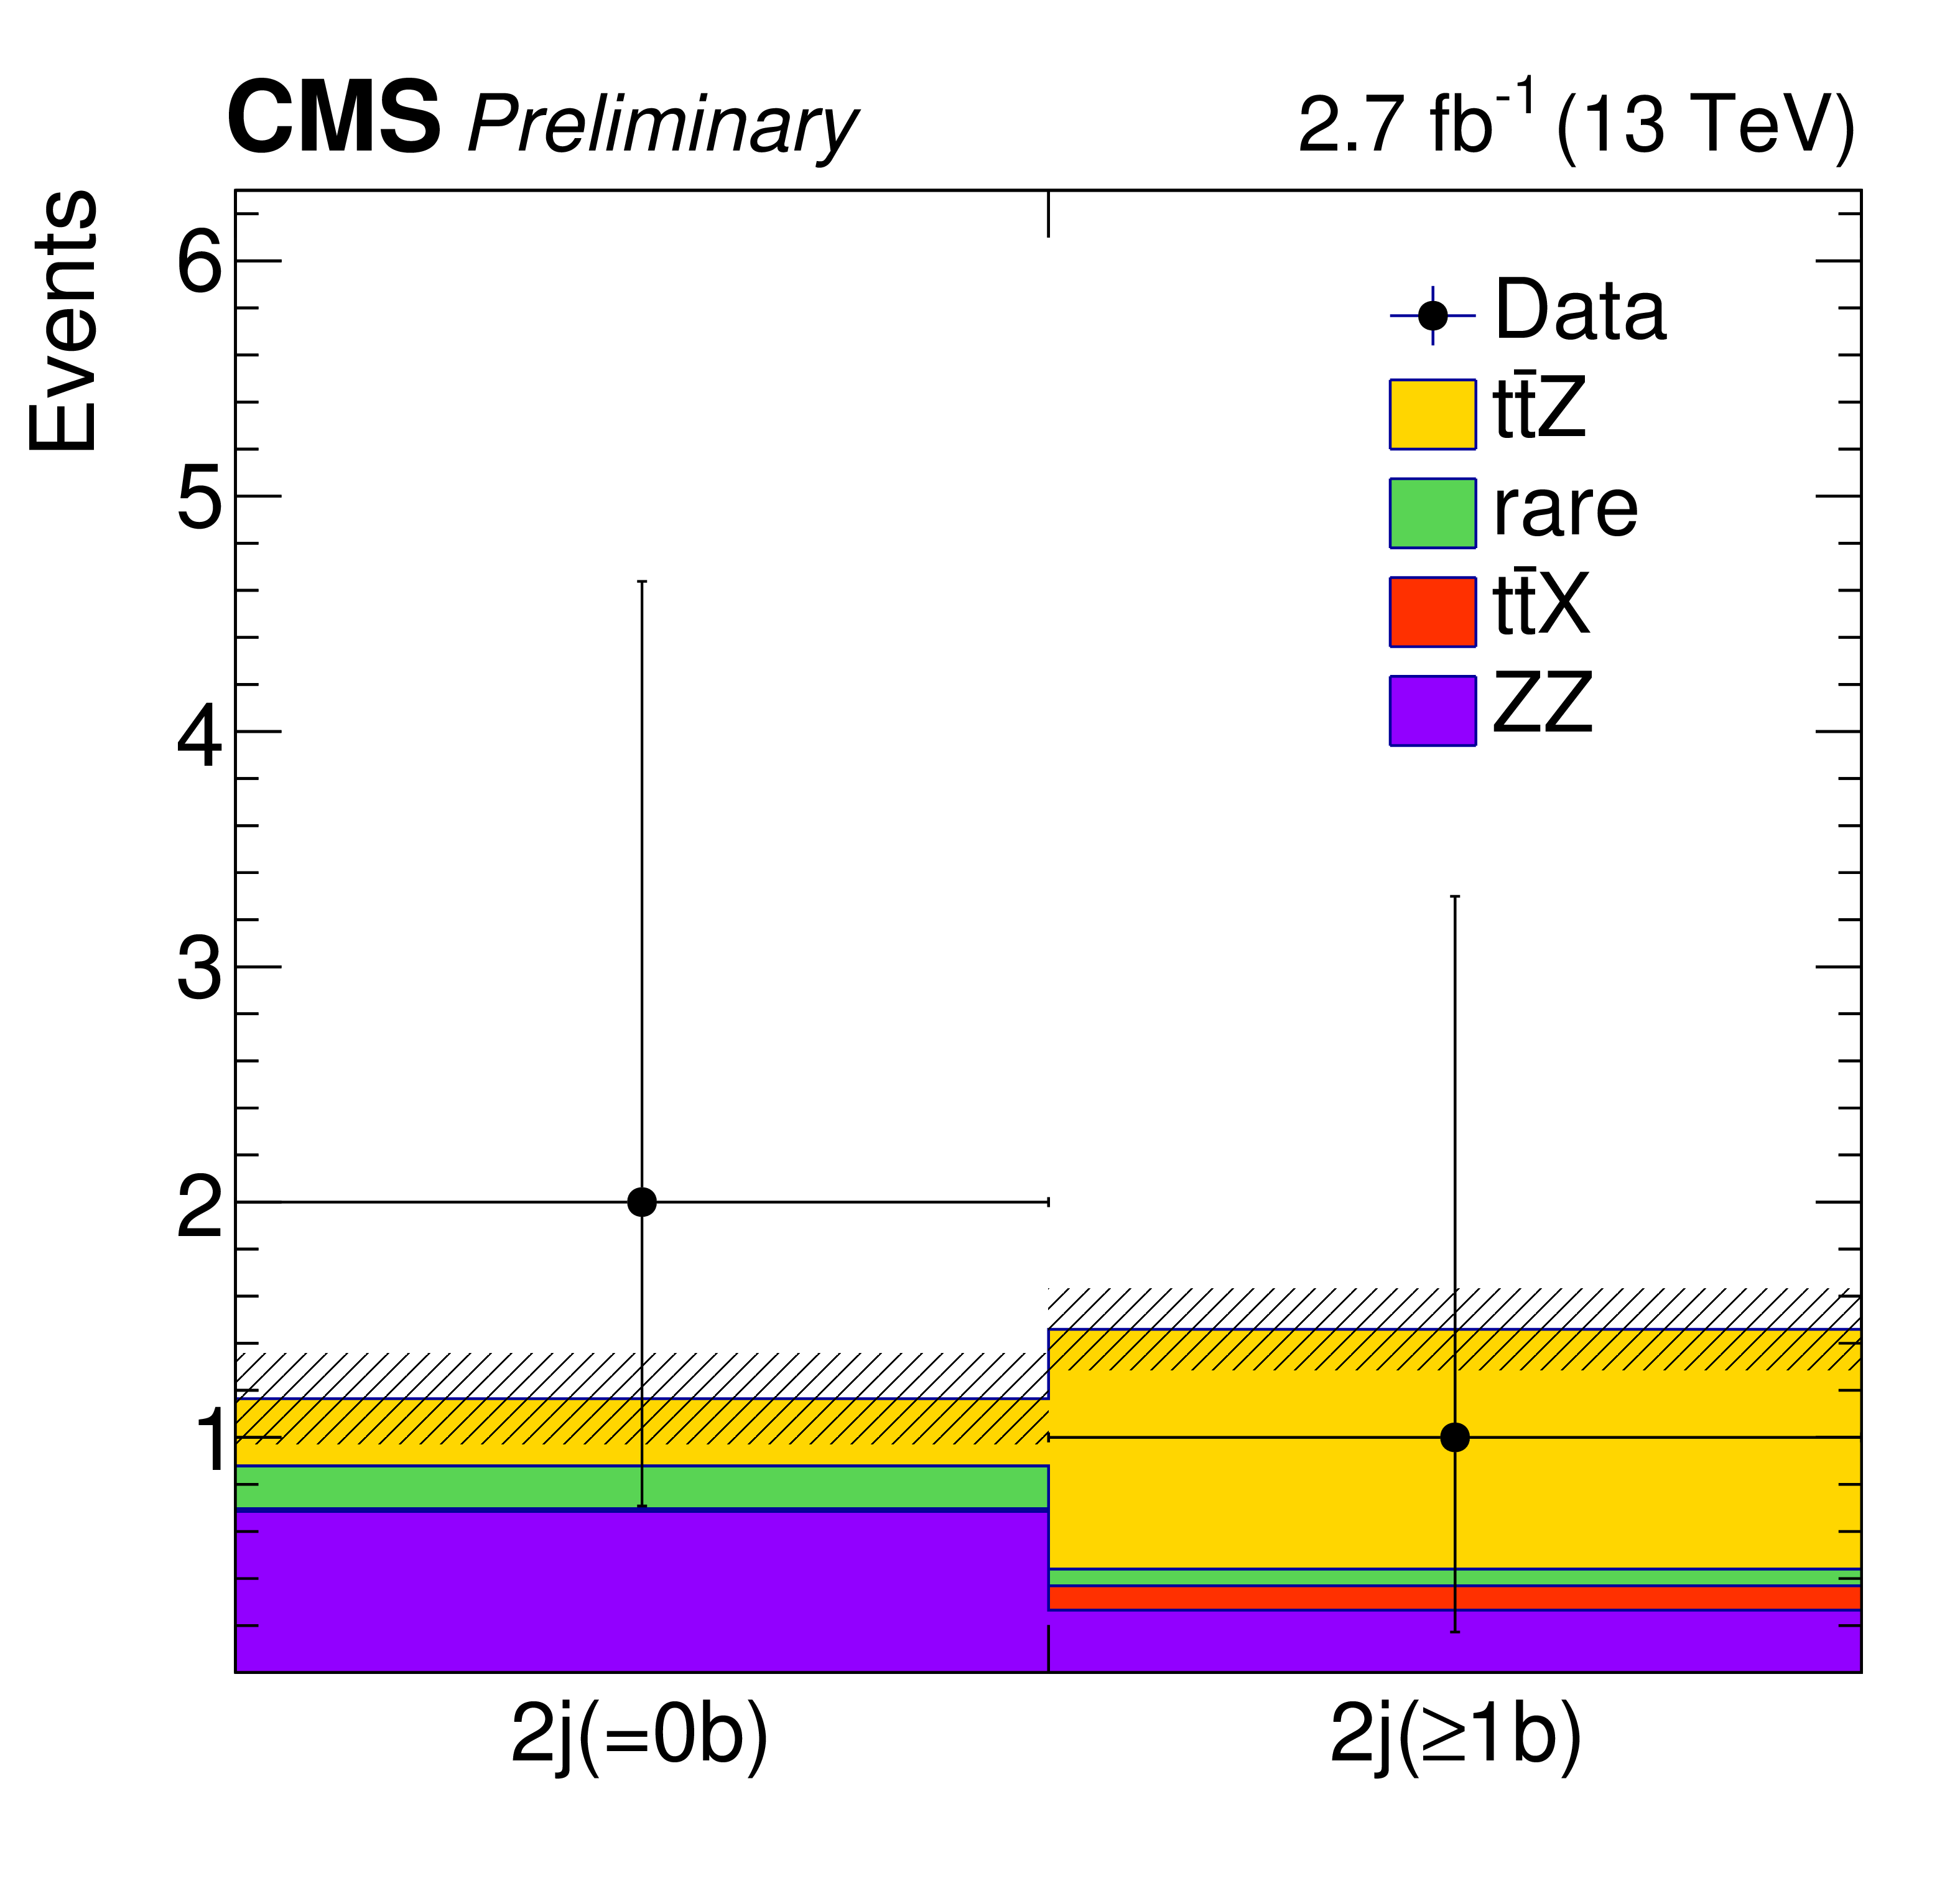
Figure 8:
Predicted and observed yields in each analysis bin in the four-lepton analyses. The characters "j" and "b" in the x-axis labels represent "jet" and "b-jet", respectively. The hatched band shows the total pre-fit uncertainty associated to signal and background predictions where major sources of the uncertainties are uncorrelated and summed in quadrature. |
| Tables | |
png pdf |
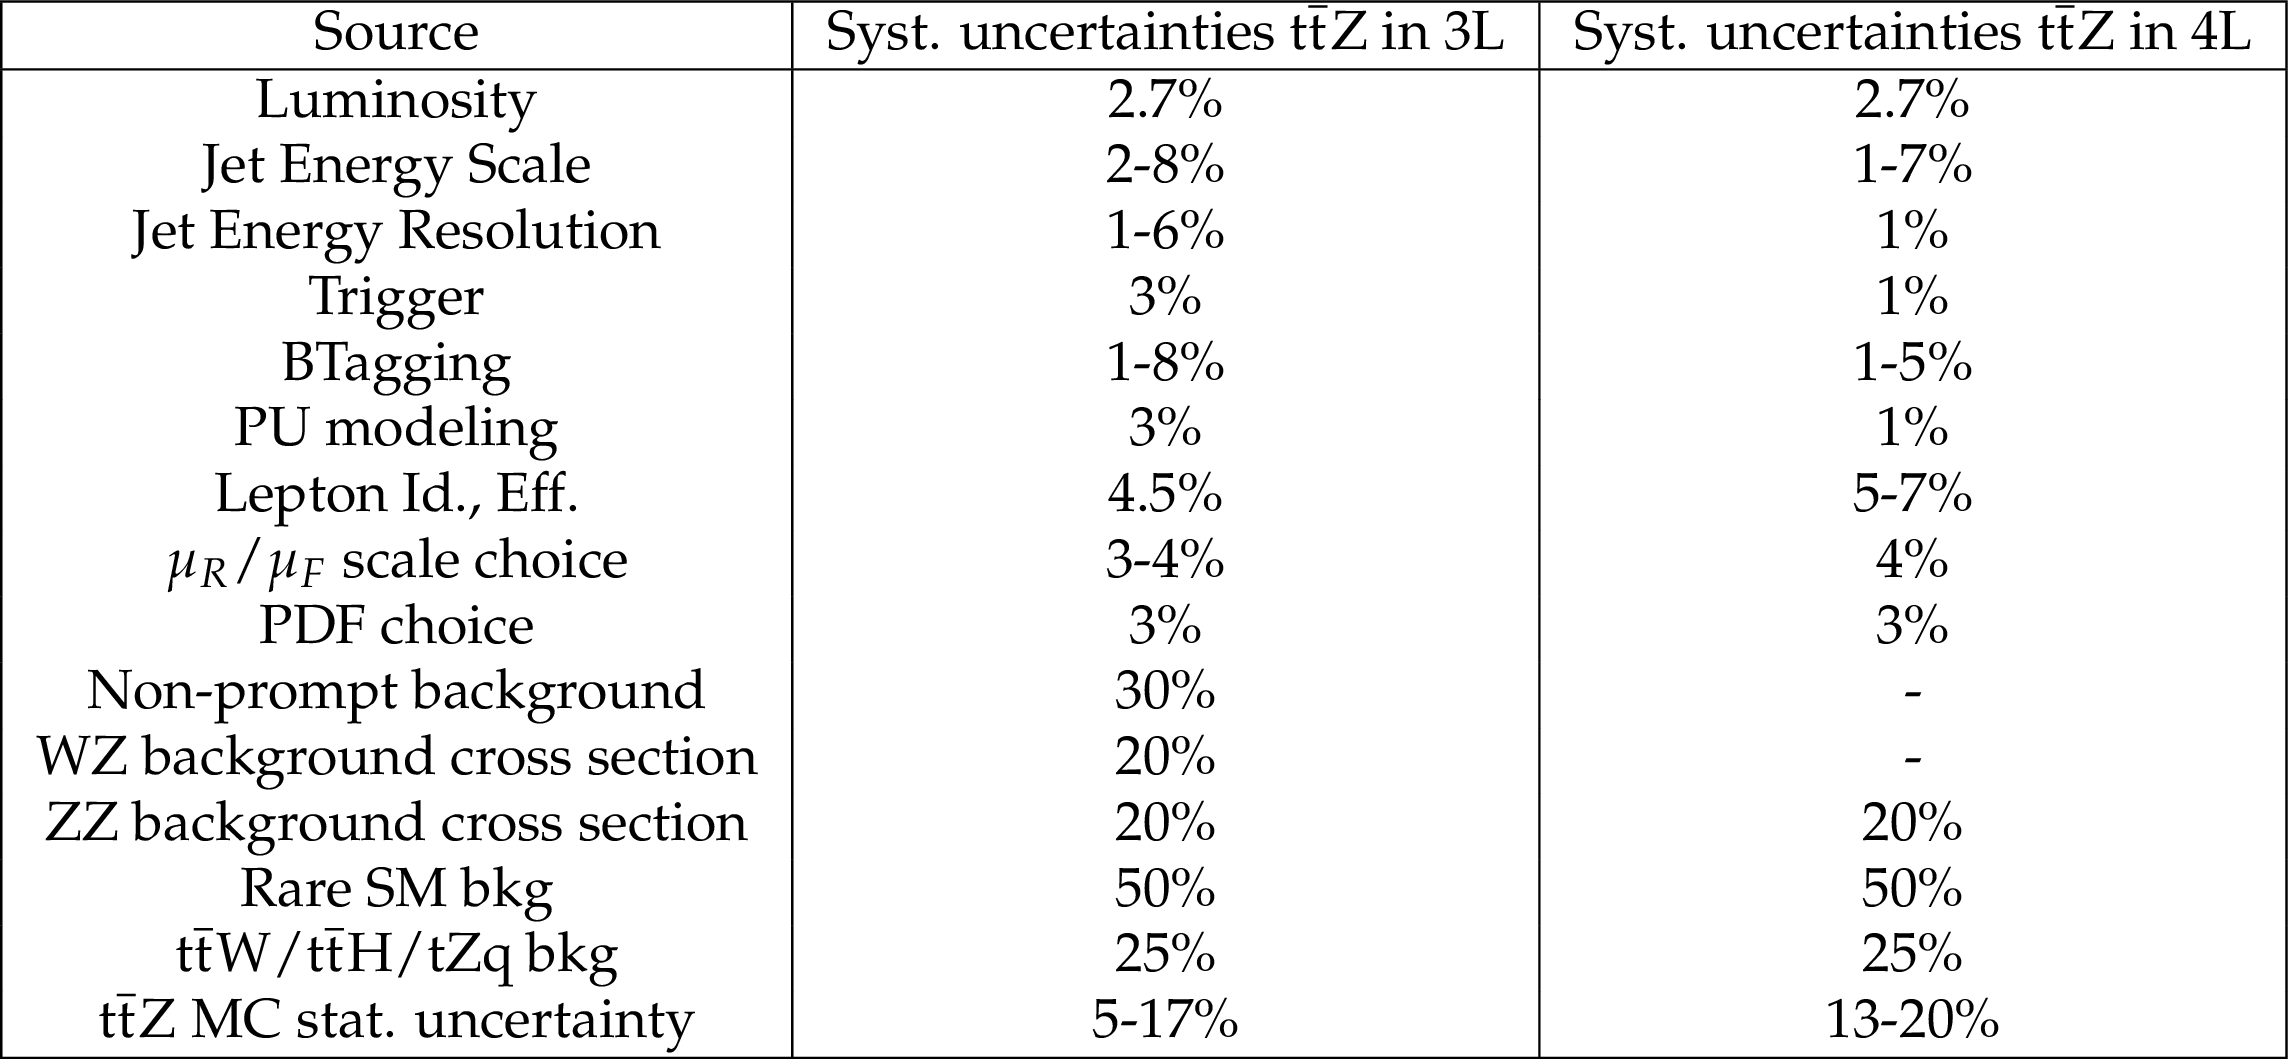
Table 1:
Summary of pre-fit systematic uncertainties. |
png pdf |
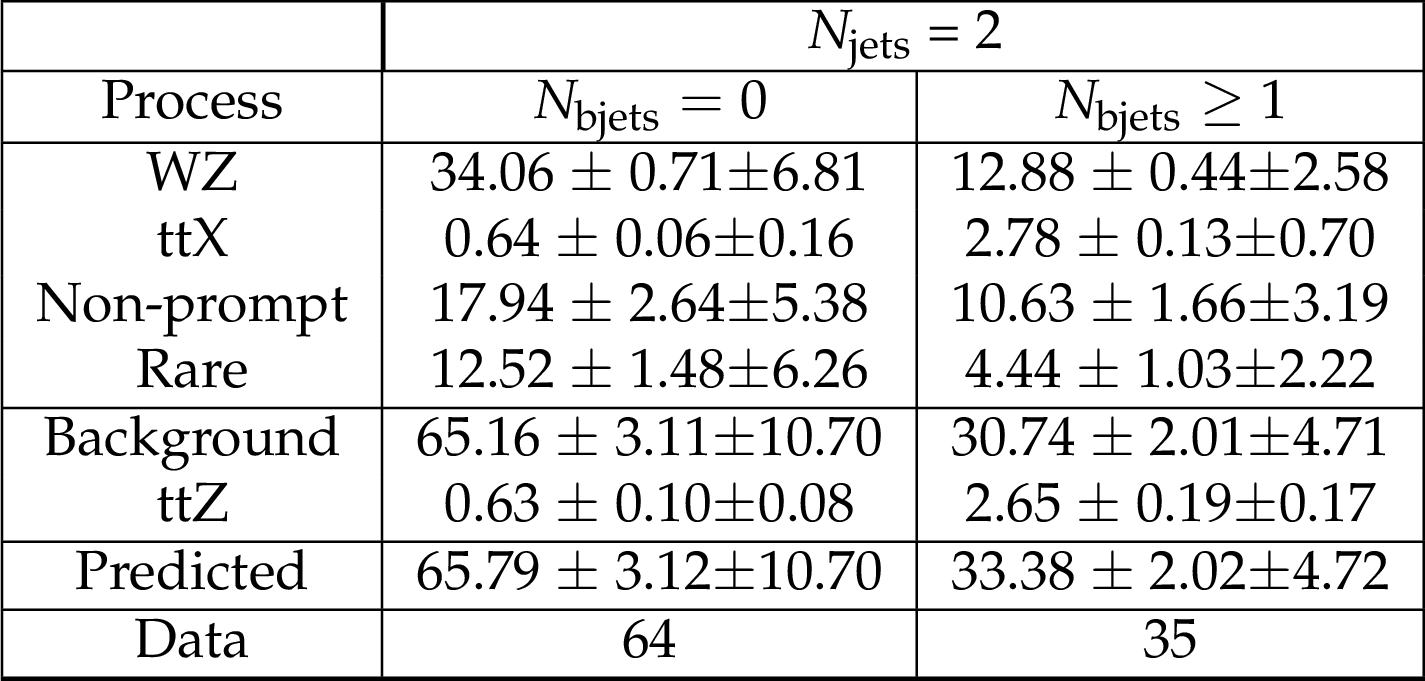
Table 2:
$ \mathrm{ t \bar{t} Z} $ in three-lepton final states: predicted signal and background event yields in $ {N_\text {jets}} =$ 2 category. The first and second uncertainty values are statistical and systematic, respectively. |
png pdf |
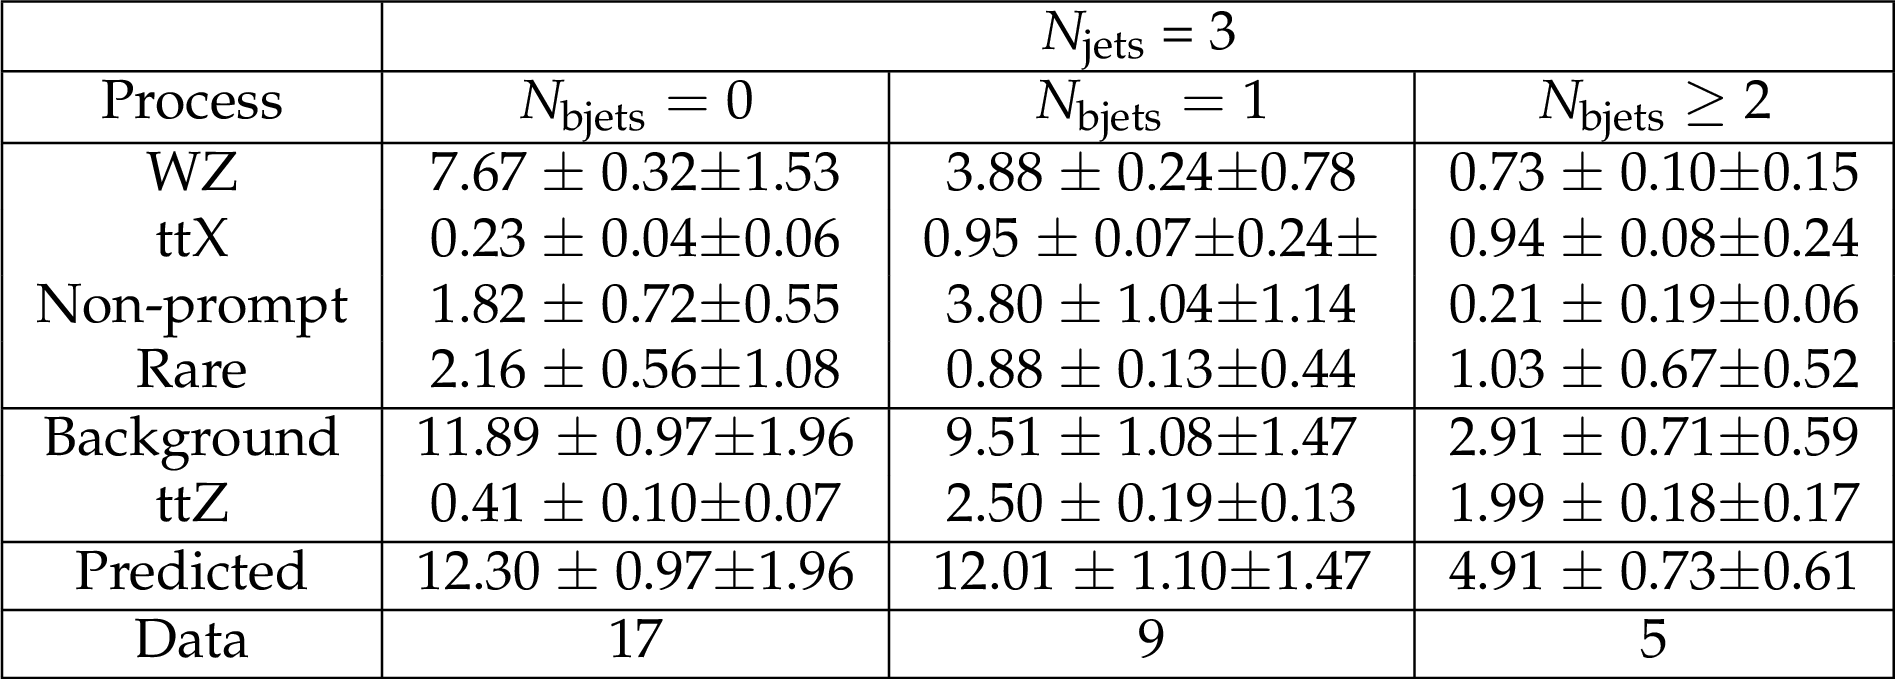
Table 3:
$ \mathrm{ t \bar{t} Z } $ in three-lepton final states: predicted signal and background event yields in $ {N_\text {jets}} =$ 3 category. The first and second uncertainty values are statistical and systematic, respectively. |
png pdf |
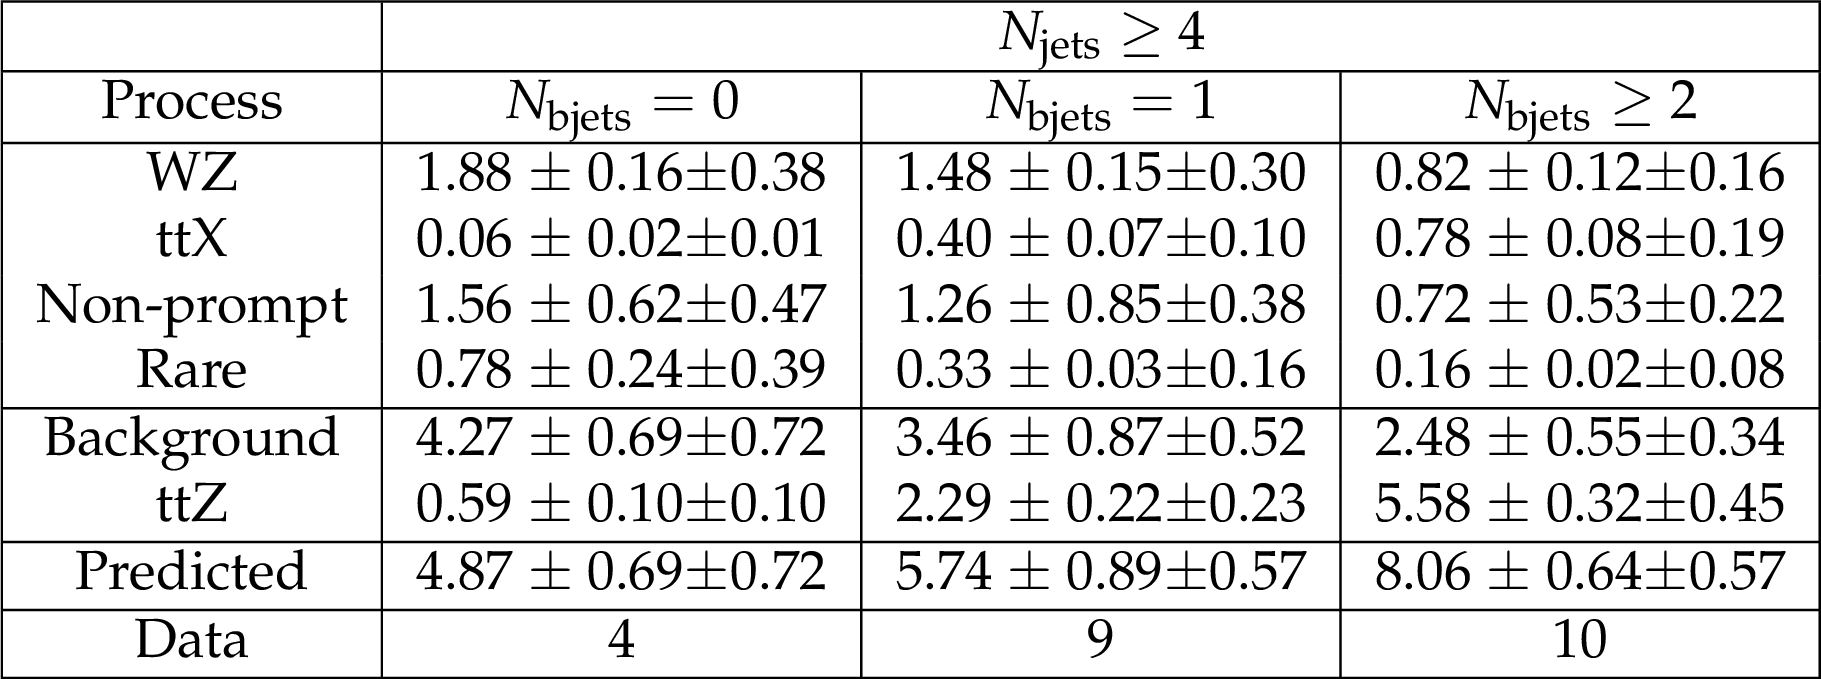
Table 4:
$ \mathrm{ t \bar{t} Z } $ in three-lepton final states: predicted signal and background event yields in $ {N_\text {jets}} \ge$ 4 category. The first and second uncertainty values are statistical and systematic, respectively. |
png pdf |
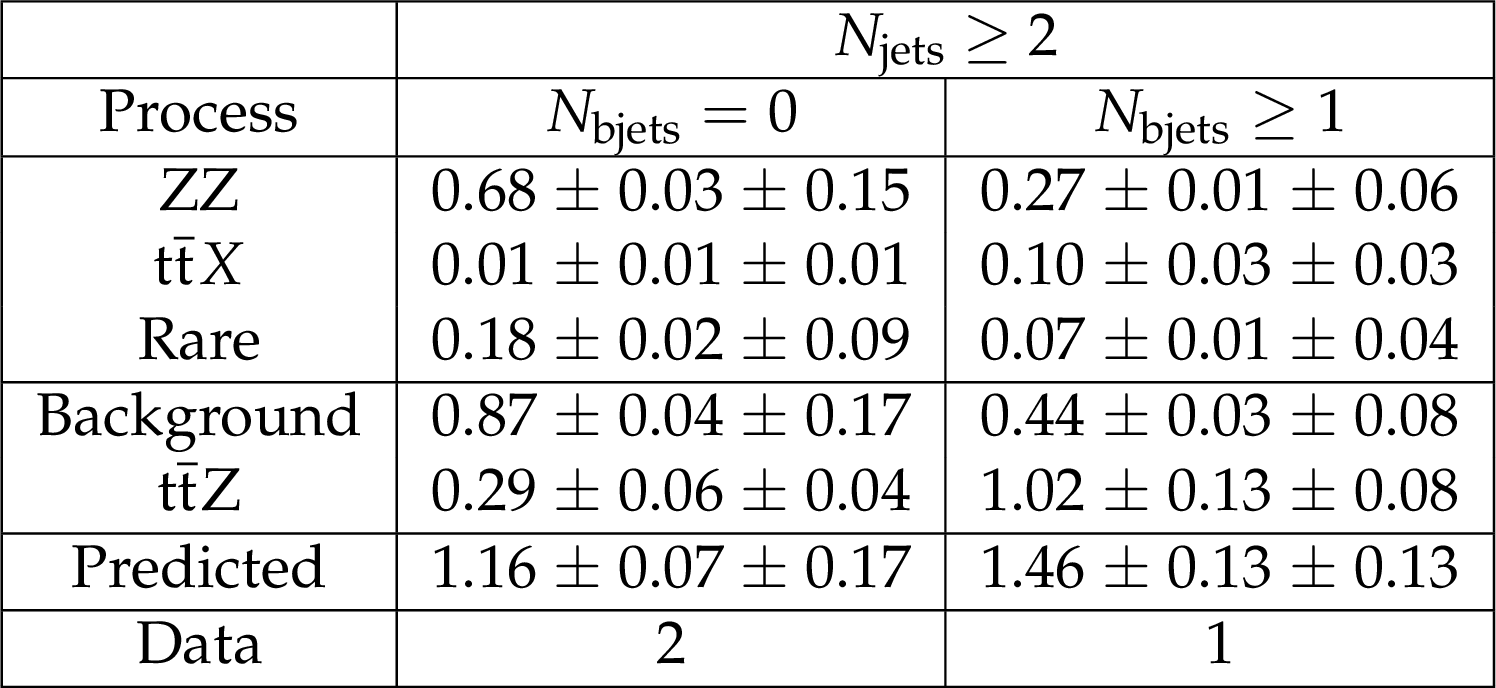
Table 5:
$ \mathrm{ t \bar{t} Z } $ in four-lepton final states: predicted signal, background and observed event yields in each analysis bin. The first and second uncertainty values are statistical and systematic, respectively. |
png pdf |
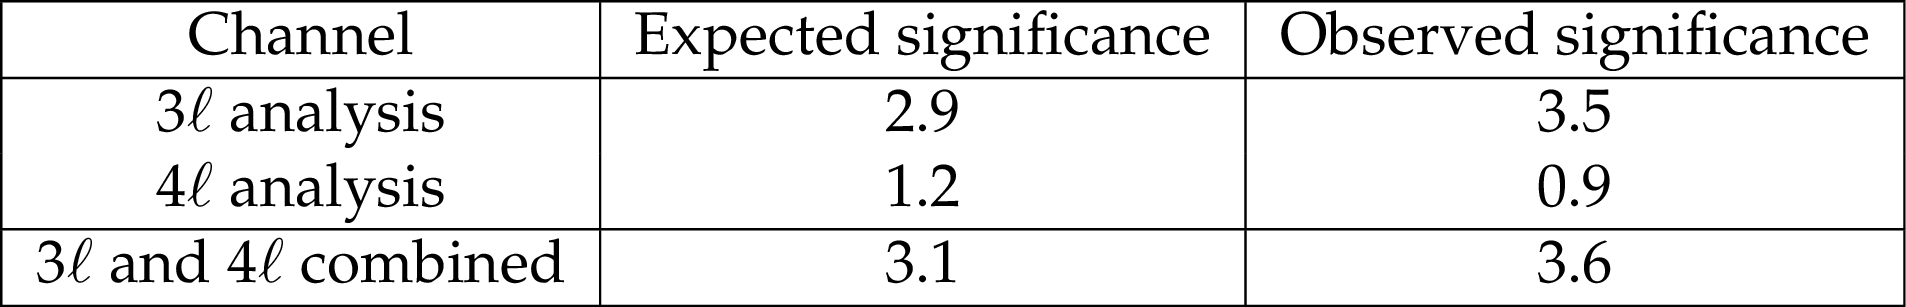
Table 6:
Summary of expected and observed significance of the $ \mathrm{ t \bar{t} Z } $ signal for the 3-lepton channel, 4-lepton channel and the two channels combined. |
| Summary |
| A measurement of top quark pair production in association with a Z boson using 13 TeV CMS data has been presented. The analysis is performed in three-lepton and four-lepton final states, and these two are combined to extract the cross section of the $ \mathrm{ t \bar{t} Z } $. The $ \mathrm{ t \bar{t} Z } $ three-lepton channel achieves a significance of 3.5 standard deviations and the four-lepton channel 0.9 standard deviations. From the combination of these two channels a significance of 3.6 standard deviations from the background-only hypothesis are obtained. The measured cross section is $\sigma( \mathrm{ t \bar{t} Z } )=$ 1065 $^{+352}_{-313}$ (stat) $^{+168}_{-142}$ (syst) fb, which is in agreement with the Standard Model prediction within uncertainties. |
| Additional Figures | |
png pdf |
Additional Figure 1-a:
Expected and observed distributions after 3 lepton, ${\mathrm {m}_{\ell \ell }}$ and ${N_\text {jets}} \ge$ 4 requirements. The plots show the total number of events by lepton channel (a), Z-boson candidate dilepton mass distribution (b), jet multiplicity (c), b-tagged jet multiplicity (d). The hatched band shows the total uncertainty on the expected yields. |
png pdf |
Additional Figure 1-b:
Expected and observed distributions after 3 lepton, ${\mathrm {m}_{\ell \ell }}$ and ${N_\text {jets}} \ge$ 4 requirements. The plots show the total number of events by lepton channel (a), Z-boson candidate dilepton mass distribution (b), jet multiplicity (c), b-tagged jet multiplicity (d). The hatched band shows the total uncertainty on the expected yields. |
png pdf |
Additional Figure 1-c:
Expected and observed distributions after 3 lepton, ${\mathrm {m}_{\ell \ell }}$ and ${N_\text {jets}} \ge$ 4 requirements. The plots show the total number of events by lepton channel (a), Z-boson candidate dilepton mass distribution (b), jet multiplicity (c), b-tagged jet multiplicity (d). The hatched band shows the total uncertainty on the expected yields. |
png pdf |
Additional Figure 1-d:
Expected and observed distributions after 3 lepton, ${\mathrm {m}_{\ell \ell }}$ and ${N_\text {jets}} \ge$ 4 requirements. The plots show the total number of events by lepton channel (a), Z-boson candidate dilepton mass distribution (b), jet multiplicity (c), b-tagged jet multiplicity (d). The hatched band shows the total uncertainty on the expected yields. |
png pdf |
Additional Figure 2-a:
Expected and observed distributions after 3 lepton, ${\mathrm {m}_{\ell \ell }} $, ${N_\text {jets}} \ge$ 4 and ${N_\text {bjets}} \ge$ 2 requirements. The plots show the total number of events by lepton channel (a), Z-boson candidate dilepton mass distribution (b), jet multiplicity (c), b-tagged jet multiplicity (d). The hatched band shows the total uncertainty on the expected yields. |
png pdf |
Additional Figure 2-b:
Expected and observed distributions after 3 lepton, ${\mathrm {m}_{\ell \ell }} $, ${N_\text {jets}} \ge$ 4 and ${N_\text {bjets}} \ge$ 2 requirements. The plots show the total number of events by lepton channel (a), Z-boson candidate dilepton mass distribution (b), jet multiplicity (c), b-tagged jet multiplicity (d). The hatched band shows the total uncertainty on the expected yields. |
png pdf |
Additional Figure 2-c:
Expected and observed distributions after 3 lepton, ${\mathrm {m}_{\ell \ell }} $, ${N_\text {jets}} \ge$ 4 and ${N_\text {bjets}} \ge$ 2 requirements. The plots show the total number of events by lepton channel (a), Z-boson candidate dilepton mass distribution (b), jet multiplicity (c), b-tagged jet multiplicity (d). The hatched band shows the total uncertainty on the expected yields. |

png pdf |
Additional Figure 2-d:
Expected and observed distributions after 3 lepton, ${\mathrm {m}_{\ell \ell }} $, ${N_\text {jets}} \ge$ 4 and ${N_\text {bjets}} \ge$ 2 requirements. The plots show the total number of events by lepton channel (a), Z-boson candidate dilepton mass distribution (b), jet multiplicity (c), b-tagged jet multiplicity (d). The hatched band shows the total uncertainty on the expected yields. |

png pdf |
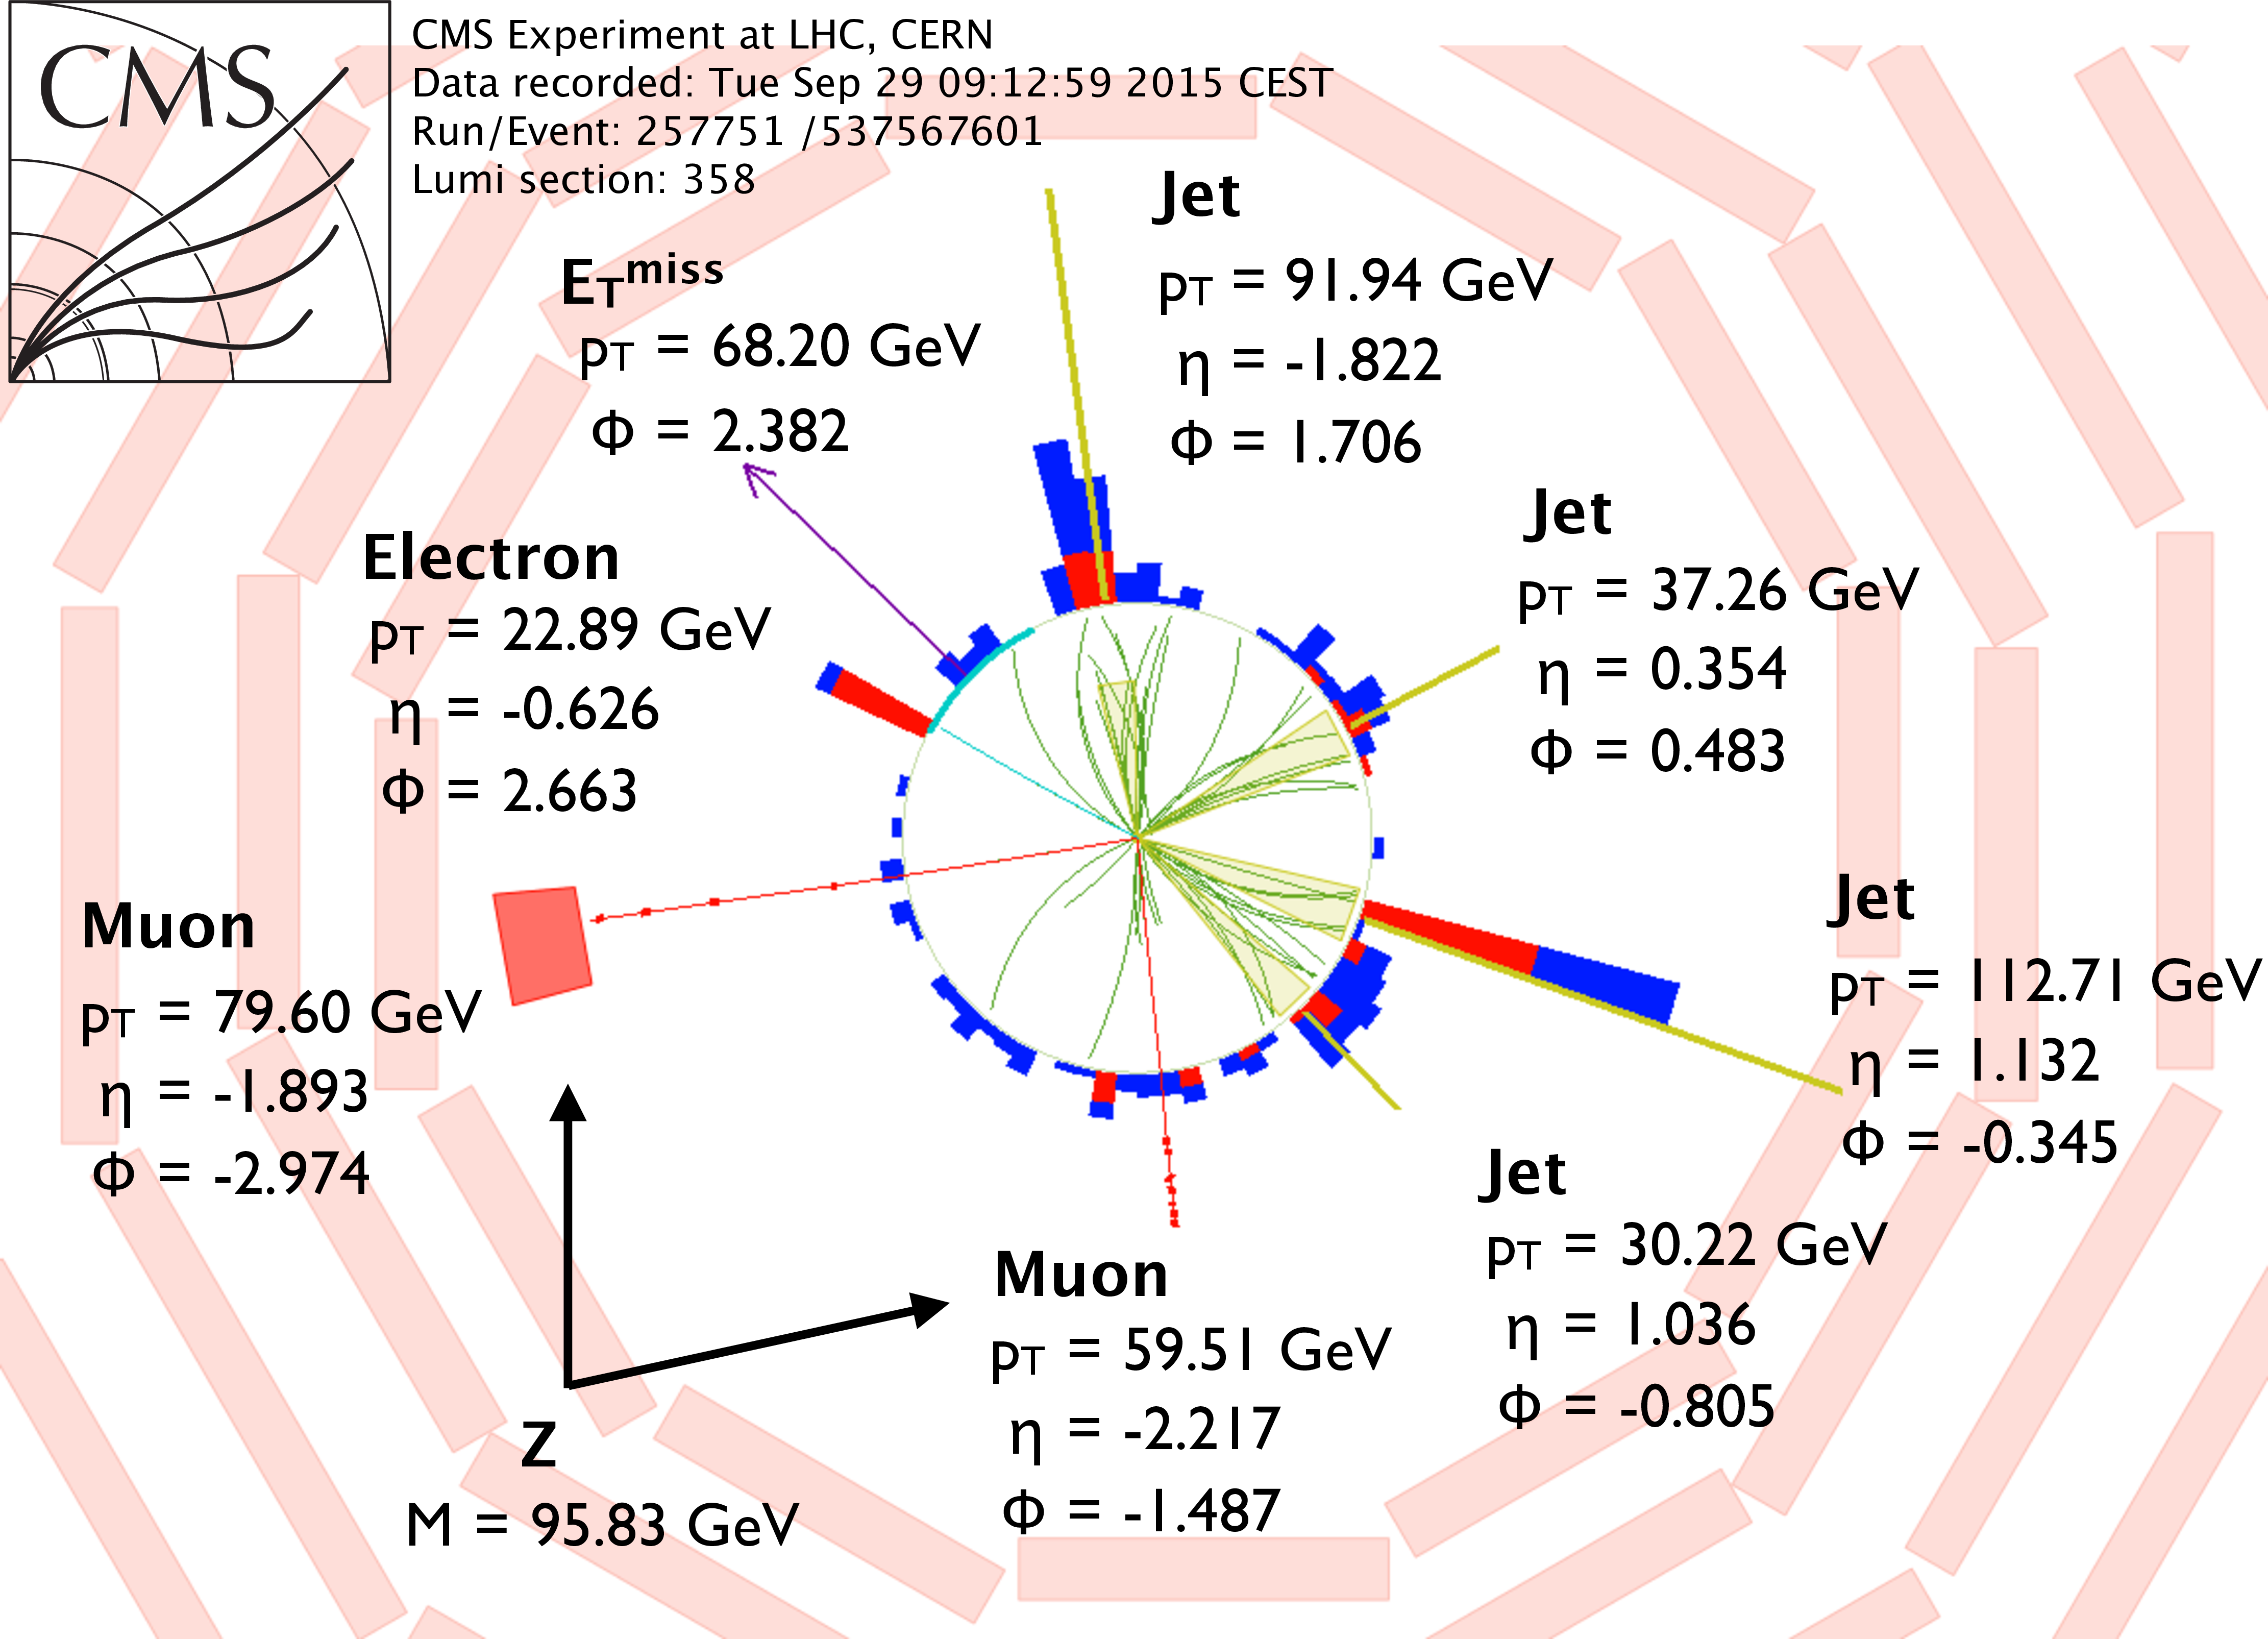
Additional Figure 3:
Display of the reconstructed tracks (green lines), calorimeter energy deposits (red for ECAL, blue for HCAL), jets (yellow cones), muons (red lines) and missing transverse energy (purple arrow) in one event selected in data, in which a pair of opposite sign muons with a mass close to the Z is reconstructed. |
png pdf |
Additional Figure 4:
Display of the reconstructed tracks (green lines), calorimeter energy deposits (red for ECAL, blue for HCAL), jets (yellow cones), muons (red lines) and missing transverse energy (purple arrow) in one event selected in data, in which a pair of opposite sign muons with a mass close to the Z is reconstructed. This event display corresponds to the same event as in Additional Fig.3 in the transverse plane. |
png pdf |
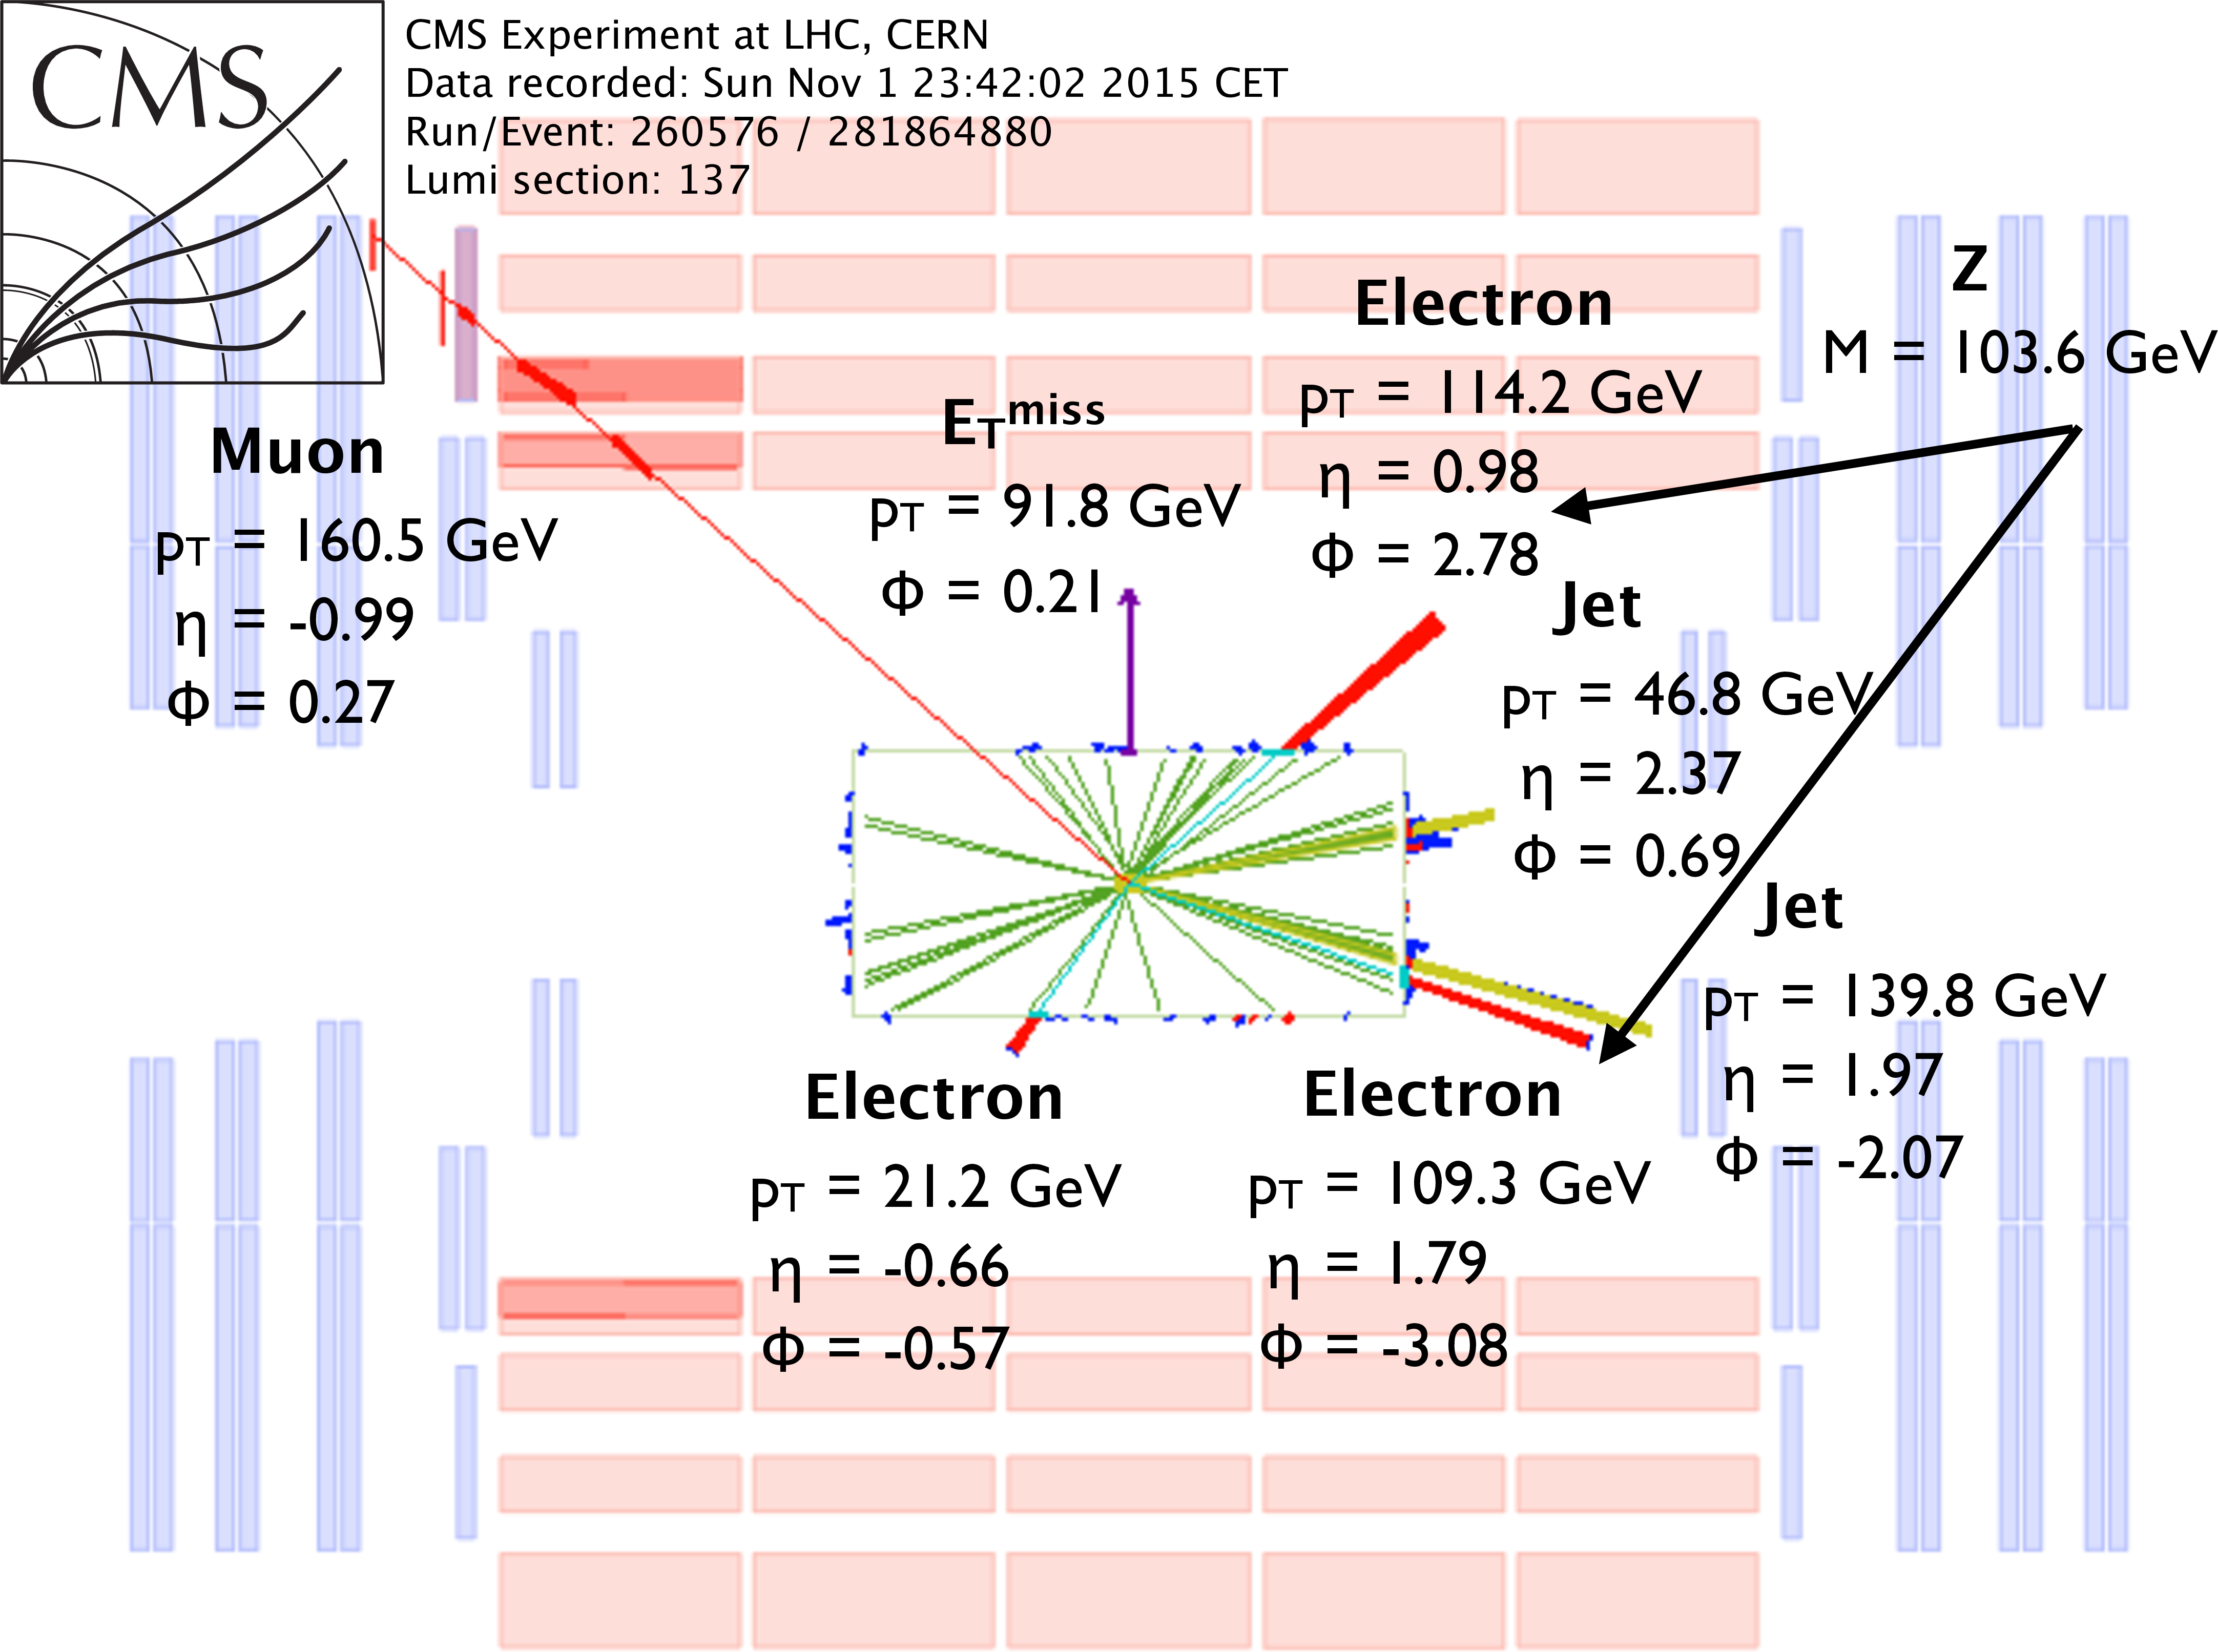
Additional Figure 5:
Display of the reconstructed tracks (green lines), calorimeter energy deposits (red for ECAL, blue for HCAL), jets (yellow cones), muons (red lines) and missing transverse energy (purple arrow) in one event selected in data, in which a pair of opposite sign electrons with a mass close to the Z is reconstructed. |
png pdf |
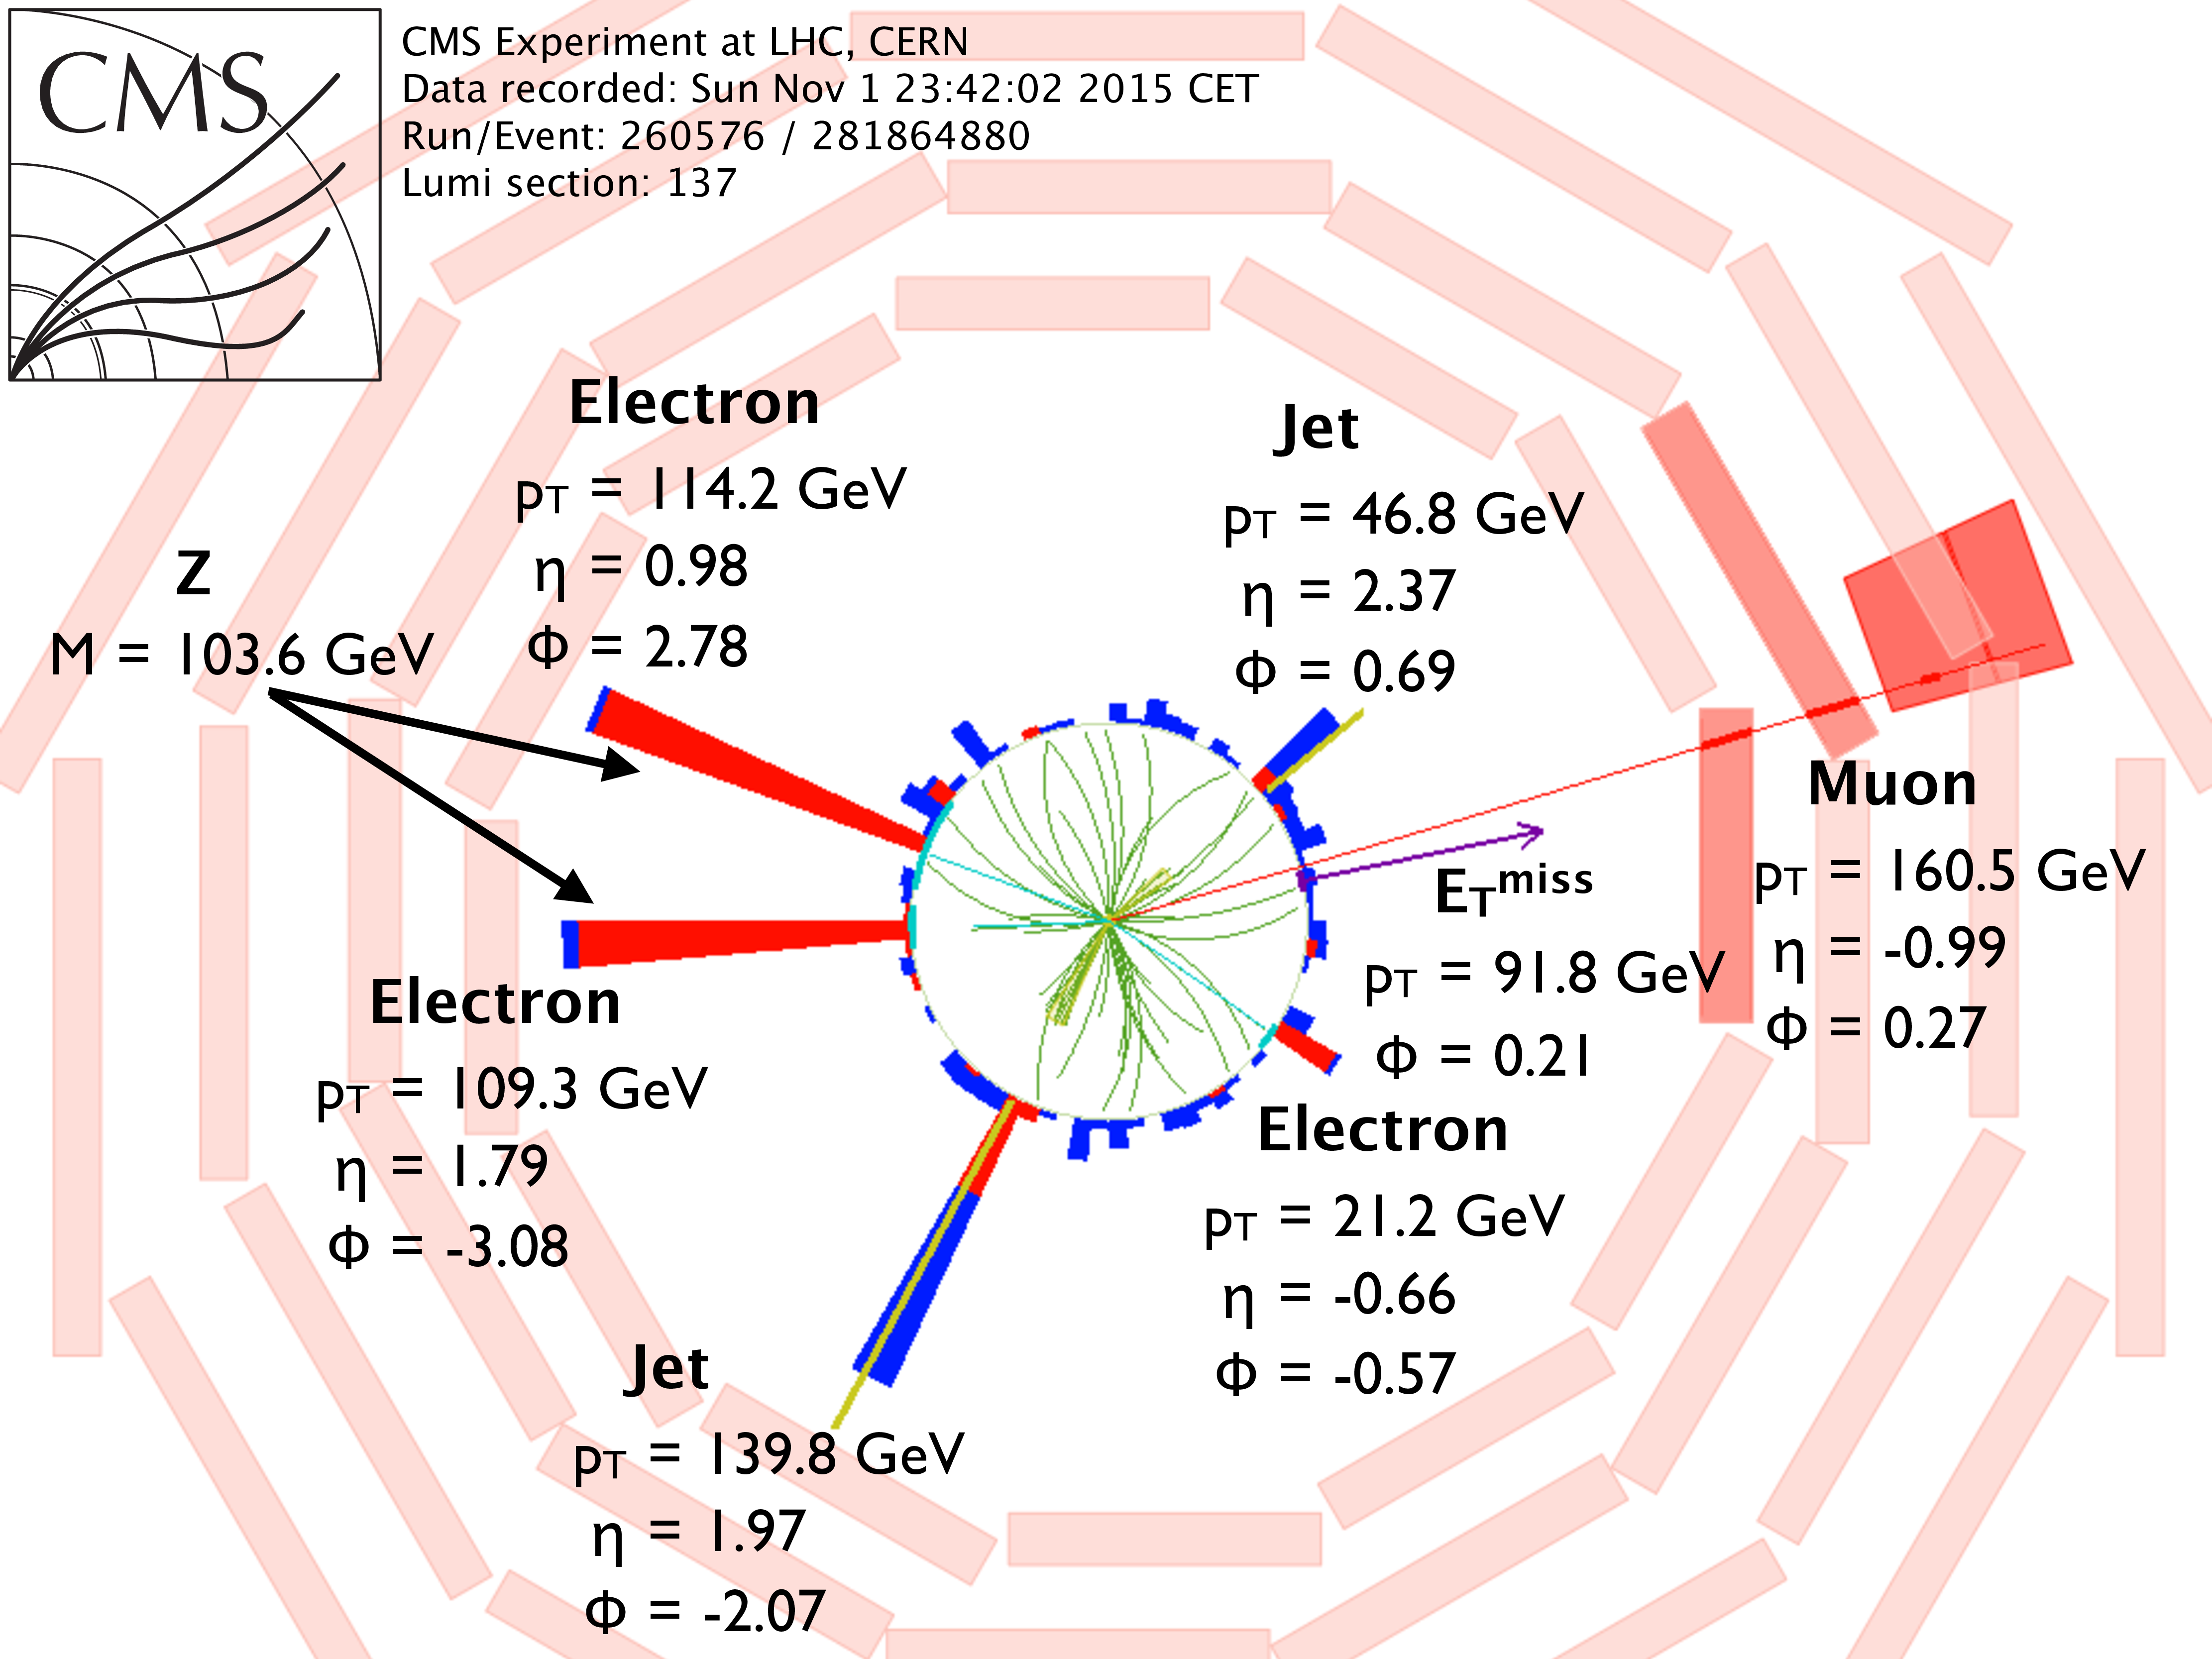
Additional Figure 6:
Display of the reconstructed tracks (green lines), calorimeter energy deposits (red for ECAL, blue for HCAL), jets (yellow cones), muons (red lines) and missing transverse energy (purple arrow) in one event selected in data, in which a pair of opposite sign electrons with a mass close to the Z is reconstructed. This event display corresponds to the same event as in Additional Fig.5 in the transverse plane. |
|
|
Compact Muon Solenoid LHC, CERN |
|

|

|

|

|

|