

Compact Muon Solenoid
LHC, CERN
| CMS-PAS-TOP-16-004 | ||
| Measurement of the differential cross section for $t$-channel single-top-quark production at $\sqrt{s}=$ 13 TeV | ||
| CMS Collaboration | ||
| May 2016 | ||
| Abstract: A measurement of differential cross sections for $t$-channel single-top-quark production in proton-proton collisions at a centre-of-mass energy of 13 TeV is presented. The cross sections are measured as functions of the transverse momentum and the absolute value of the rapidity of the top quark. The analyzed data were recorded in the year 2015 by the CMS experiment and correspond to an integrated luminosity of 2.3 fb$^{-1}$. A maximum-likelihood fit to a multivariate discriminator is used to infer the signal and background fractions from the data. Unfolding to parton level is performed. The measured cross sections are compared with theoretical predictions to next-to-leading order matched with parton showering as implemented in Monte Carlo generators. General agreement is found within uncertainties. | ||
| Links: CDS record (PDF) ; inSPIRE record ; CADI line (restricted) ; | ||
| Figures | |
png pdf |
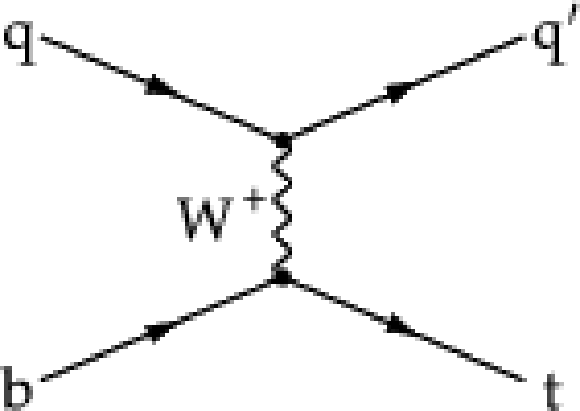
Figure 1-a:
Born-level Feynman diagrams for single top quark production in the $t$ channel: (a) (2)$\rightarrow $(2) and (b) (2)$\rightarrow $(3) processes. Corresponding diagrams exist for single-top-antiquark production. |
png pdf |
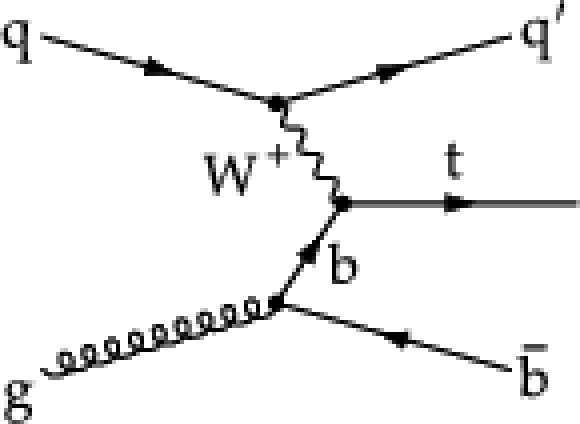
Figure 1-b:
Born-level Feynman diagrams for single top quark production in the $t$ channel: (a) (2)$\rightarrow $(2) and (b) (2)$\rightarrow $(3) processes. Corresponding diagrams exist for single-top-antiquark production. |
png pdf |
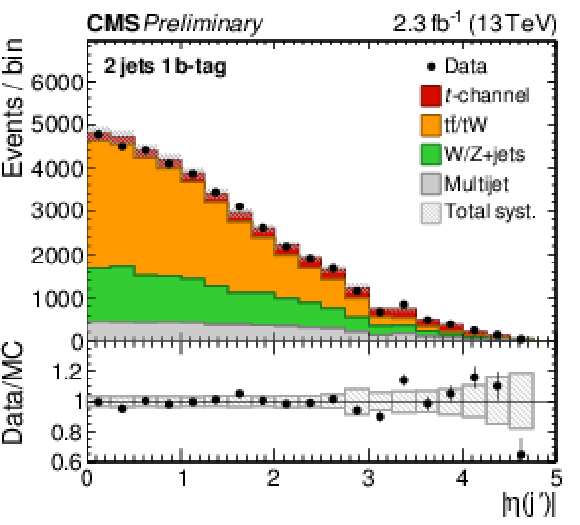
Figure 2-a:
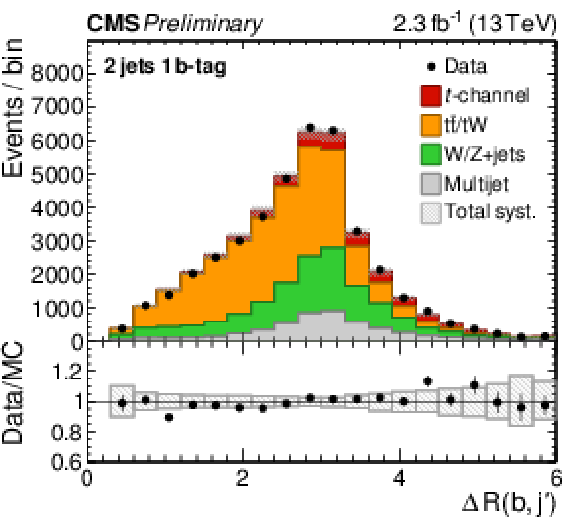
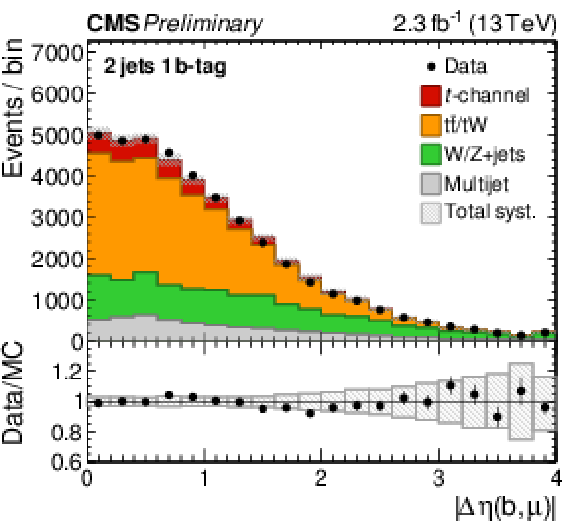
Distributions of discriminating observables used in the BDT training: (a) the absolute value of the pseudorapidity of the non-tagged jet; (b) the mass of the reconstructed top quark candidate; (c) the $\Delta R$ distance between the two selected jets; (d) the absolute difference in pseudorapidity between the b-tagged jet and the selected muon. The simulations of the different processes are normalized to the inclusive ML fit result. The ratio of yields in data and simulation is displayed under the histograms. The hatched band denotes the total systematic uncertainty scaled to the fit results. The first and last bin includes the under- and overflow of events, respectively. |
png pdf |
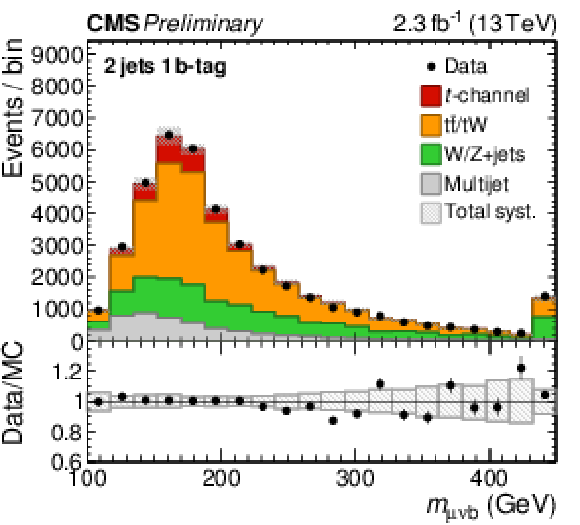
Figure 2-b:
Distributions of discriminating observables used in the BDT training: (a) the absolute value of the pseudorapidity of the non-tagged jet; (b) the mass of the reconstructed top quark candidate; (c) the $\Delta R$ distance between the two selected jets; (d) the absolute difference in pseudorapidity between the b-tagged jet and the selected muon. The simulations of the different processes are normalized to the inclusive ML fit result. The ratio of yields in data and simulation is displayed under the histograms. The hatched band denotes the total systematic uncertainty scaled to the fit results. The first and last bin includes the under- and overflow of events, respectively. |
png pdf |
Figure 2-c:
Distributions of discriminating observables used in the BDT training: (a) the absolute value of the pseudorapidity of the non-tagged jet; (b) the mass of the reconstructed top quark candidate; (c) the $\Delta R$ distance between the two selected jets; (d) the absolute difference in pseudorapidity between the b-tagged jet and the selected muon. The simulations of the different processes are normalized to the inclusive ML fit result. The ratio of yields in data and simulation is displayed under the histograms. The hatched band denotes the total systematic uncertainty scaled to the fit results. The first and last bin includes the under- and overflow of events, respectively. |
png pdf |
Figure 2-d:
Distributions of discriminating observables used in the BDT training: (a) the absolute value of the pseudorapidity of the non-tagged jet; (b) the mass of the reconstructed top quark candidate; (c) the $\Delta R$ distance between the two selected jets; (d) the absolute difference in pseudorapidity between the b-tagged jet and the selected muon. The simulations of the different processes are normalized to the inclusive ML fit result. The ratio of yields in data and simulation is displayed under the histograms. The hatched band denotes the total systematic uncertainty scaled to the fit results. The first and last bin includes the under- and overflow of events, respectively. |
png pdf |
Figure 3-a:
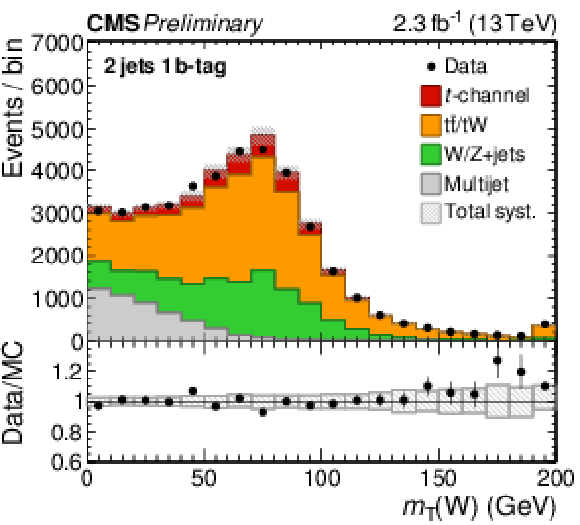
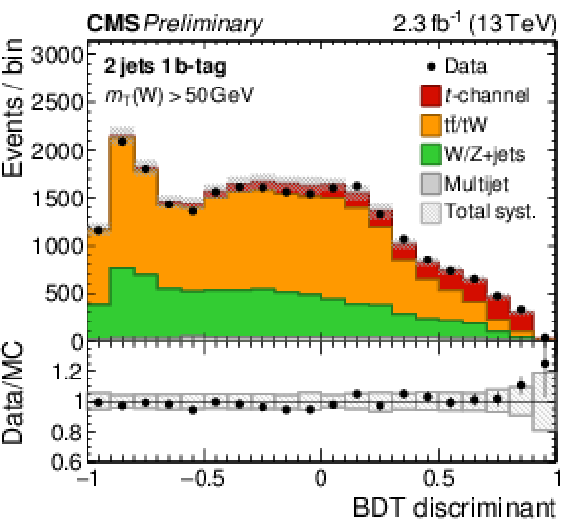
Distributions of the fit variables: (a) the transverse W boson mass distribution and (b) the BDT discriminant after selecting only events with $ {m_{\mathrm {T}}(\mathrm {W})} >$ 50 GeV. The simulations of the different processes are normalized to the inclusive ML fit result. The ratio of yields in data and simulation is displayed under the histograms. The hatched band denotes the total systematic uncertainty scaled to the fit results. The first and last bin includes the under- and overflow of events, respectively. |
png pdf |
Figure 3-b:
Distributions of the fit variables: (a) the transverse W boson mass distribution and (b) the BDT discriminant after selecting only events with $ {m_{\mathrm {T}}(\mathrm {W})} >$ 50 GeV. The simulations of the different processes are normalized to the inclusive ML fit result. The ratio of yields in data and simulation is displayed under the histograms. The hatched band denotes the total systematic uncertainty scaled to the fit results. The first and last bin includes the under- and overflow of events, respectively. |
png pdf |
Figure 4-a:
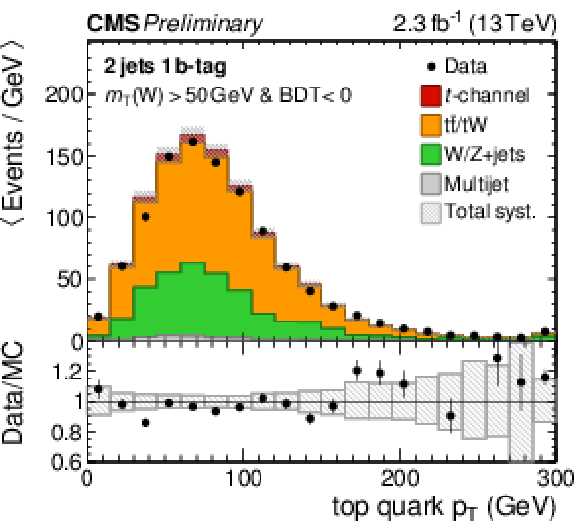
Distributions of (a,b) the transverse momentum and (c,d) the rapidity of the reconstructed top quark in 2j1t for events with $ {m_{\mathrm {T}}(\mathrm {W})} >$ 50 GeV: (a,c) signal-depleted region ($\mathrm {BDT}< $ 0), (b,d) signal-enhanced region($\mathrm {BDT}> $ 0.6). The simulations of the different processes are normalized to the inclusive ML fit result. The ratio of yields in data and simulation is displayed under the histograms. The hatched band denotes the total systematic uncertainty scaled to the fit results. The average number of events per bin is normalized to the bin width. The first and last bin includes the under- and overflow of events, respectively. |
png pdf |
Figure 4-b:
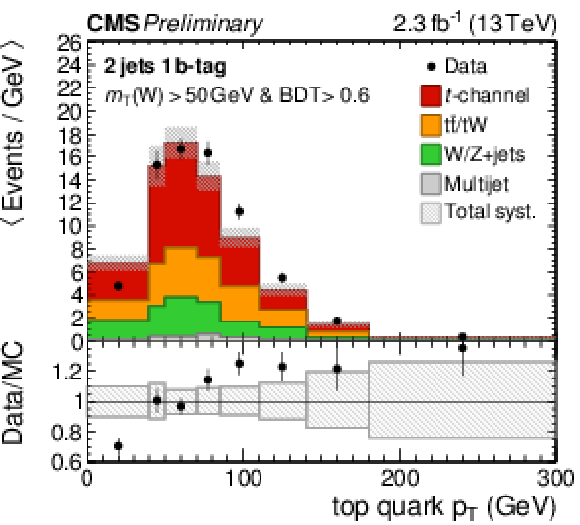
Distributions of (a,b) the transverse momentum and (c,d) the rapidity of the reconstructed top quark in 2j1t for events with $ {m_{\mathrm {T}}(\mathrm {W})} >$ 50 GeV: (a,c) signal-depleted region ($\mathrm {BDT}< $ 0), (b,d) signal-enhanced region($\mathrm {BDT}> $ 0.6). The simulations of the different processes are normalized to the inclusive ML fit result. The ratio of yields in data and simulation is displayed under the histograms. The hatched band denotes the total systematic uncertainty scaled to the fit results. The average number of events per bin is normalized to the bin width. The first and last bin includes the under- and overflow of events, respectively. |
png pdf |
Figure 4-c:
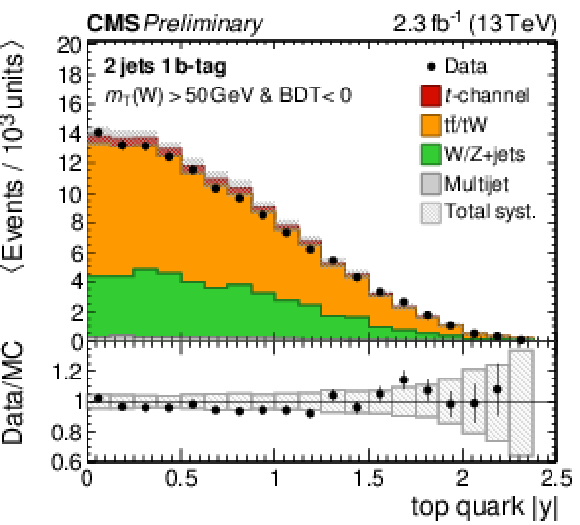
Distributions of (a,b) the transverse momentum and (c,d) the rapidity of the reconstructed top quark in 2j1t for events with $ {m_{\mathrm {T}}(\mathrm {W})} >$ 50 GeV: (a,c) signal-depleted region ($\mathrm {BDT}< $ 0), (b,d) signal-enhanced region($\mathrm {BDT}> $ 0.6). The simulations of the different processes are normalized to the inclusive ML fit result. The ratio of yields in data and simulation is displayed under the histograms. The hatched band denotes the total systematic uncertainty scaled to the fit results. The average number of events per bin is normalized to the bin width. The first and last bin includes the under- and overflow of events, respectively. |
png pdf |
Figure 4-d:
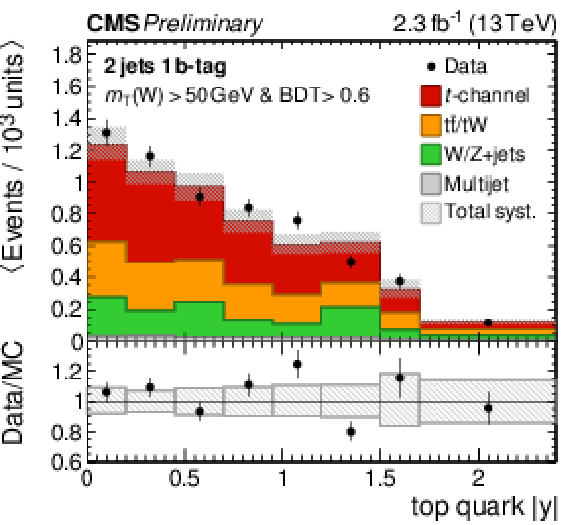
Distributions of (a,b) the transverse momentum and (c,d) the rapidity of the reconstructed top quark in 2j1t for events with $ {m_{\mathrm {T}}(\mathrm {W})} >$ 50 GeV: (a,c) signal-depleted region ($\mathrm {BDT}< $ 0), (b,d) signal-enhanced region($\mathrm {BDT}> $ 0.6). The simulations of the different processes are normalized to the inclusive ML fit result. The ratio of yields in data and simulation is displayed under the histograms. The hatched band denotes the total systematic uncertainty scaled to the fit results. The average number of events per bin is normalized to the bin width. The first and last bin includes the under- and overflow of events, respectively. |
png pdf |
Figure 5-a:
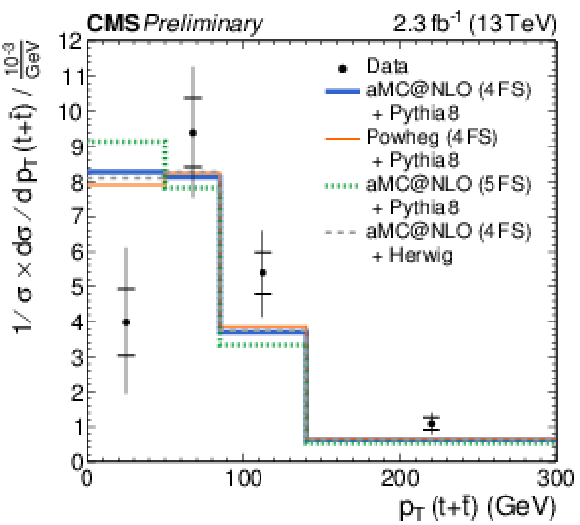
Measured differential cross section of $t$-channel single top quark production as a function of the top quark (a) transverse momentum and (b) rapidity. Horizontal ticks on the error bars indicate the statistical uncertainty and vertical bars indicate the total uncertainty per bin. |
png pdf |
Figure 5-b:
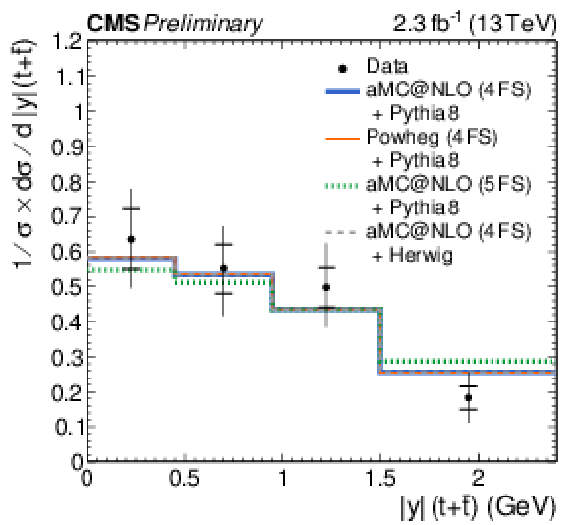
Measured differential cross section of $t$-channel single top quark production as a function of the top quark (a) transverse momentum and (b) rapidity. Horizontal ticks on the error bars indicate the statistical uncertainty and vertical bars indicate the total uncertainty per bin. |
| Summary |
| The differential cross section of t-channel production of single top quarks has been measured as a function of the transverse momentum and rapidity of the top quark using a dataset corresponding to a total integrated luminosity of 2.3 fb$^{-1}$ at $\sqrt{s} =$ 13 TeV, collected with the CMS detector. Within the experimental uncertainties, no significant deviation is observed with respect to the theoretical predictions based on NLO+PS generators in the 4FS or 5FS. |
| References | ||||
| 1 | CDF Collaboration | First Observation of Electroweak Single Top Quark Production | PRL 103 (2009) 092002 | 0903.0885 |
| 2 | D0 Collaboration | Observation of Single Top Quark Production | PRL 103 (2009) 092001 | 0903.0850 |
| 3 | CMS Collaboration | Measurement of the $ t $-channel single top quark production cross section in pp collisions at $ \sqrt{s} = 7 $ TeV | PRL 107 (2011) 091802 | CMS-TOP-10-008 1106.3052 |
| 4 | ATLAS Collaboration | Measurement of the $ t $-channel single top-quark production cross section in pp collisions at $ \sqrt{s}=7 $ TeV with the ATLAS detector | PLB7 17 (2012) 330 | 1205.3130 |
| 5 | ATLAS Collaboration | Comprehensive measurements of $ t $-channel single top-quark production cross sections at $ \sqrt{s} = 7 $ TeV with the ATLAS detector | PRD 90 (2014) 112006 | 1406.7844 |
| 6 | CMS Collaboration | Measurement of the single-top-quark $ t $-channel cross section in pp collisions at $ \sqrt{s}=7 $ TeV | JHEP 1212 (2012) 035 | CMS-TOP-11-021 1209.4533 |
| 7 | CMS Collaboration | Measurement of the $ t $-channel single-top-quark production cross section and of the $ V_\mathrm{tb} $ CKM matrix element in pp collisions at $ \sqrt{s} $= 8 TeV | JHEP 1406 (2014) 090 | CMS-TOP-12-038 1403.7366 |
| 8 | F. Maltoni, G. Ridolfi, and M. Ubiali | b-initiated processes at the LHC: a reappraisal | JHEP 07 (2012) 022 [Erratum: JHEP 04 (2013) 095] | 1203.6393 |
| 9 | J. M. Campbell, R. Frederix, F. Maltoni, and F. Tramontano | Next-to-Leading-Order Predictions for $ t $-Channel Single-Top Production at Hadron Colliders | PRL 102 (2009) 182003 | 0903.0005 |
| 10 | CMS Collaboration | Single top $ t $-channel differential cross section at 8 TeV | CMS-PAS-TOP-14-004 | CMS-PAS-TOP-14-004 |
| 11 | CMS Collaboration | CMS Luminosity Measurement for the 2015 Data Taking Period | CMS-PAS-LUM-15-001 | CMS-PAS-LUM-15-001 |
| 12 | J. Alwall et al. | The automated computation of tree-level and next-to-leading order differential cross sections, and their matching to parton shower simulations | JHEP 07 (2014) 079 | 1405.0301 |
| 13 | T. Sj\"ostrand, S. Mrenna, and P. Z. Skands | PYTHIA 6.4 Physics and Manual | JHEP 0605 (2006) 026 | hep-ph/0603175 |
| 14 | T. Sj\"ostrand, S. Mrenna, and P. Z. Skands | A Brief Introduction to PYTHIA 8.1 | CPC 178 (2008) 852 | 0710.3820 |
| 15 | CMS Collaboration | Event generator tunes obtained from underlying event and multiparton scattering measurements | EPJC76 (2016) 155 | CMS-GEN-14-001 1512.00815 |
| 16 | S. Alioli, P. Nason, C. Oleari, and E. Re | NLO single-top production matched with shower in POWHEG: $ s $- and $ t $-channel contributions | JHEP 09 (2009) 111 [Erratum: JHEP 02 (2010) 011] | 0907.4076 |
| 17 | J. Bellm et al. | Herwig 7.0 / Herwig++ 3.0 Release Note | 1512.01178 | |
| 18 | M. H. Seymour and A. Siodmok | Constraining MPI models using $ \sigma_{eff} $ and recent Tevatron and LHC Underlying Event data | JHEP 10 (2013) 113 | 1307.5015 |
| 19 | S. Frixione, P. Nason, and C. Oleari | Matching NLO QCD computations with Parton Shower simulations: the POWHEG method | JHEP 11 (2007) 070 | 0709.2092 |
| 20 | S. Alioli, P. Nason, C. Oleari, and E. Re | A general framework for implementing NLO calculations in shower Monte Carlo programs: the POWHEG BOX | JHEP 1006 (2010) 043 | 1002.2581 |
| 21 | GEANT4 Collaboration | GEANT4 - a simulation toolkit | NIMA 506 (2003) 250 | |
| 22 | M. Aliev et al. | HATHOR: HAdronic Top and Heavy quarks crOss section calculatoR | CPC 182 (2011) 1034 | 1007.1327 |
| 23 | M. Czakon and A. Mitov | Top++: A Program for the Calculation of the Top-Pair Cross-Section at Hadron Colliders | CPC 185 (2014) 2930 | 1112.5675 |
| 24 | CMS Collaboration | Measurement of the differential cross section for top quark pair production in pp collisions at $ \sqrt{s} = 8 $ TeV | EPJC 75 (2015) 542 | CMS-TOP-12-028 1505.04480 |
| 25 | CMS Collaboration | Measurement of the inclusive and differential $ \mathrm{t\bar{t}} $ production cross sections in lepton + jets final states at 13 TeV | CMS-PAS-TOP-16-008 | CMS-PAS-TOP-16-008 |
| 26 | CMS Collaboration | Measurement of the differential cross section for $ \mathrm{t \bar t} $ production in the dilepton final state at $ \sqrt{s}=13 \mathrm{TeV} $ | CMS-PAS-TOP-16-011 | CMS-PAS-TOP-16-011 |
| 27 | CMS Collaboration | Particle-Flow Event Reconstruction in CMS and Performance for Jets, Taus, and $ E_{\mathrm{T}}^{\text{miss}}$ | CDS | |
| 28 | CMS Collaboration | Commissioning of the particle flow event reconstruction with the first LHC collisions recorded in the CMS detector | CDS | |
| 29 | CMS Collaboration | Performance of CMS muon reconstruction in pp collision events at $ \sqrt{s}=7 $ TeV | JINST 7 (2012) P10002 | CMS-MUO-10-004 1206.4071 |
| 30 | M. Cacciari, G. P. Salam, and G. Soyez | The anti-$ \mathrm{k_{t}} $ jet clustering algorithm | JHEP 04 (2008) 063 | 0802.1189 |
| 31 | CMS Collaboration | Pileup Removal Algorithms | CMS-PAS-JME-14-001 | CMS-PAS-JME-14-001 |
| 32 | CMS Collaboration | Identification of b-quark jets with the CMS experiment | JINST 8 (2013) 04013 | CMS-BTV-12-001 1211.4462 |
| 33 | CMS Collaboration | Identification of b quark jets at the CMS Experiment in the LHC Run 2 | CMS-PAS-BTV-15-001 | CMS-PAS-BTV-15-001 |
| 34 | L. Breiman, J. Friedman, R. A. Olshen, and C. J. Stone | Classification and regression trees | Chapman and Hall/CRC,1984 | |
| 35 | J. H. Friedman | Recent advances in predictive (machine) learning | J. Classif. 23 (2006) 175 | |
| 36 | S. Schmitt | TUnfold: an algorithm for correcting migration effects in high energy physics | JINST 7 (2012) T10003 | 1205.6201 |
| 37 | A. Tikhonov | Solution of Incorrectly Formulated Problems and the Regularization Method | Soviet Math. Dokl. 5 (1963) 1035 | |
| 38 | V. Blobel | An Unfolding method for high-energy physics experiments | in Advanced statistical techniques in particle physics. Proceedings, Conference, Durham, UK, March 2002 | hep-ex/0208022 |
| 39 | CMS Collaboration | Identification of b quark jets at the CMS Experiment in the LHC Run 2 | CMS-PAS-BTV-15-001 | CMS-PAS-BTV-15-001 |
| 40 | NNPDF Collaboration | Parton distributions for the LHC Run II | JHEP 04 (2015) 040 | 1410.8849 |

|
Compact Muon Solenoid LHC, CERN |

|

|

|

|

|

|