

Compact Muon Solenoid
LHC, CERN
| CMS-PAS-TOP-16-008 | ||
| Measurement of the inclusive and differential $\mathrm{ t \bar{t} }$ production cross sections in lepton + jets final states at 13 TeV | ||
| CMS Collaboration | ||
| March 2016 | ||
| Abstract: The differential cross section for the production of top quark pairs in proton-proton collisions at 13 TeV is measured as a function of various kinematic variables of the top quarks and the top quark-antiquark system as well as jet multiplicities. This analysis is based on data collected by the CMS experiment at the LHC corresponding to an integrated luminosity of 2.3 fb$^{-1}$. The measurements are performed in the lepton + jets decay channel with an electron or a muon in the final state. The differential cross sections are presented at particle level, within a phase space close to the experimental acceptance, and at parton level in the full phase space. The measured cross sections are compared to several theoretical calculations. No significant deviation from the standard model prediction is observed. | ||
|
Links:
CDS record (PDF) ;
inSPIRE record ;
CADI line (restricted) ;
These preliminary results are superseded in this paper, PRD 95 (2017) 092001. The superseded preliminary plots can be found here. |
||
| Figures & Tables | Additional Figures | CMS Publications |
|---|
| Figures | |
png pdf |
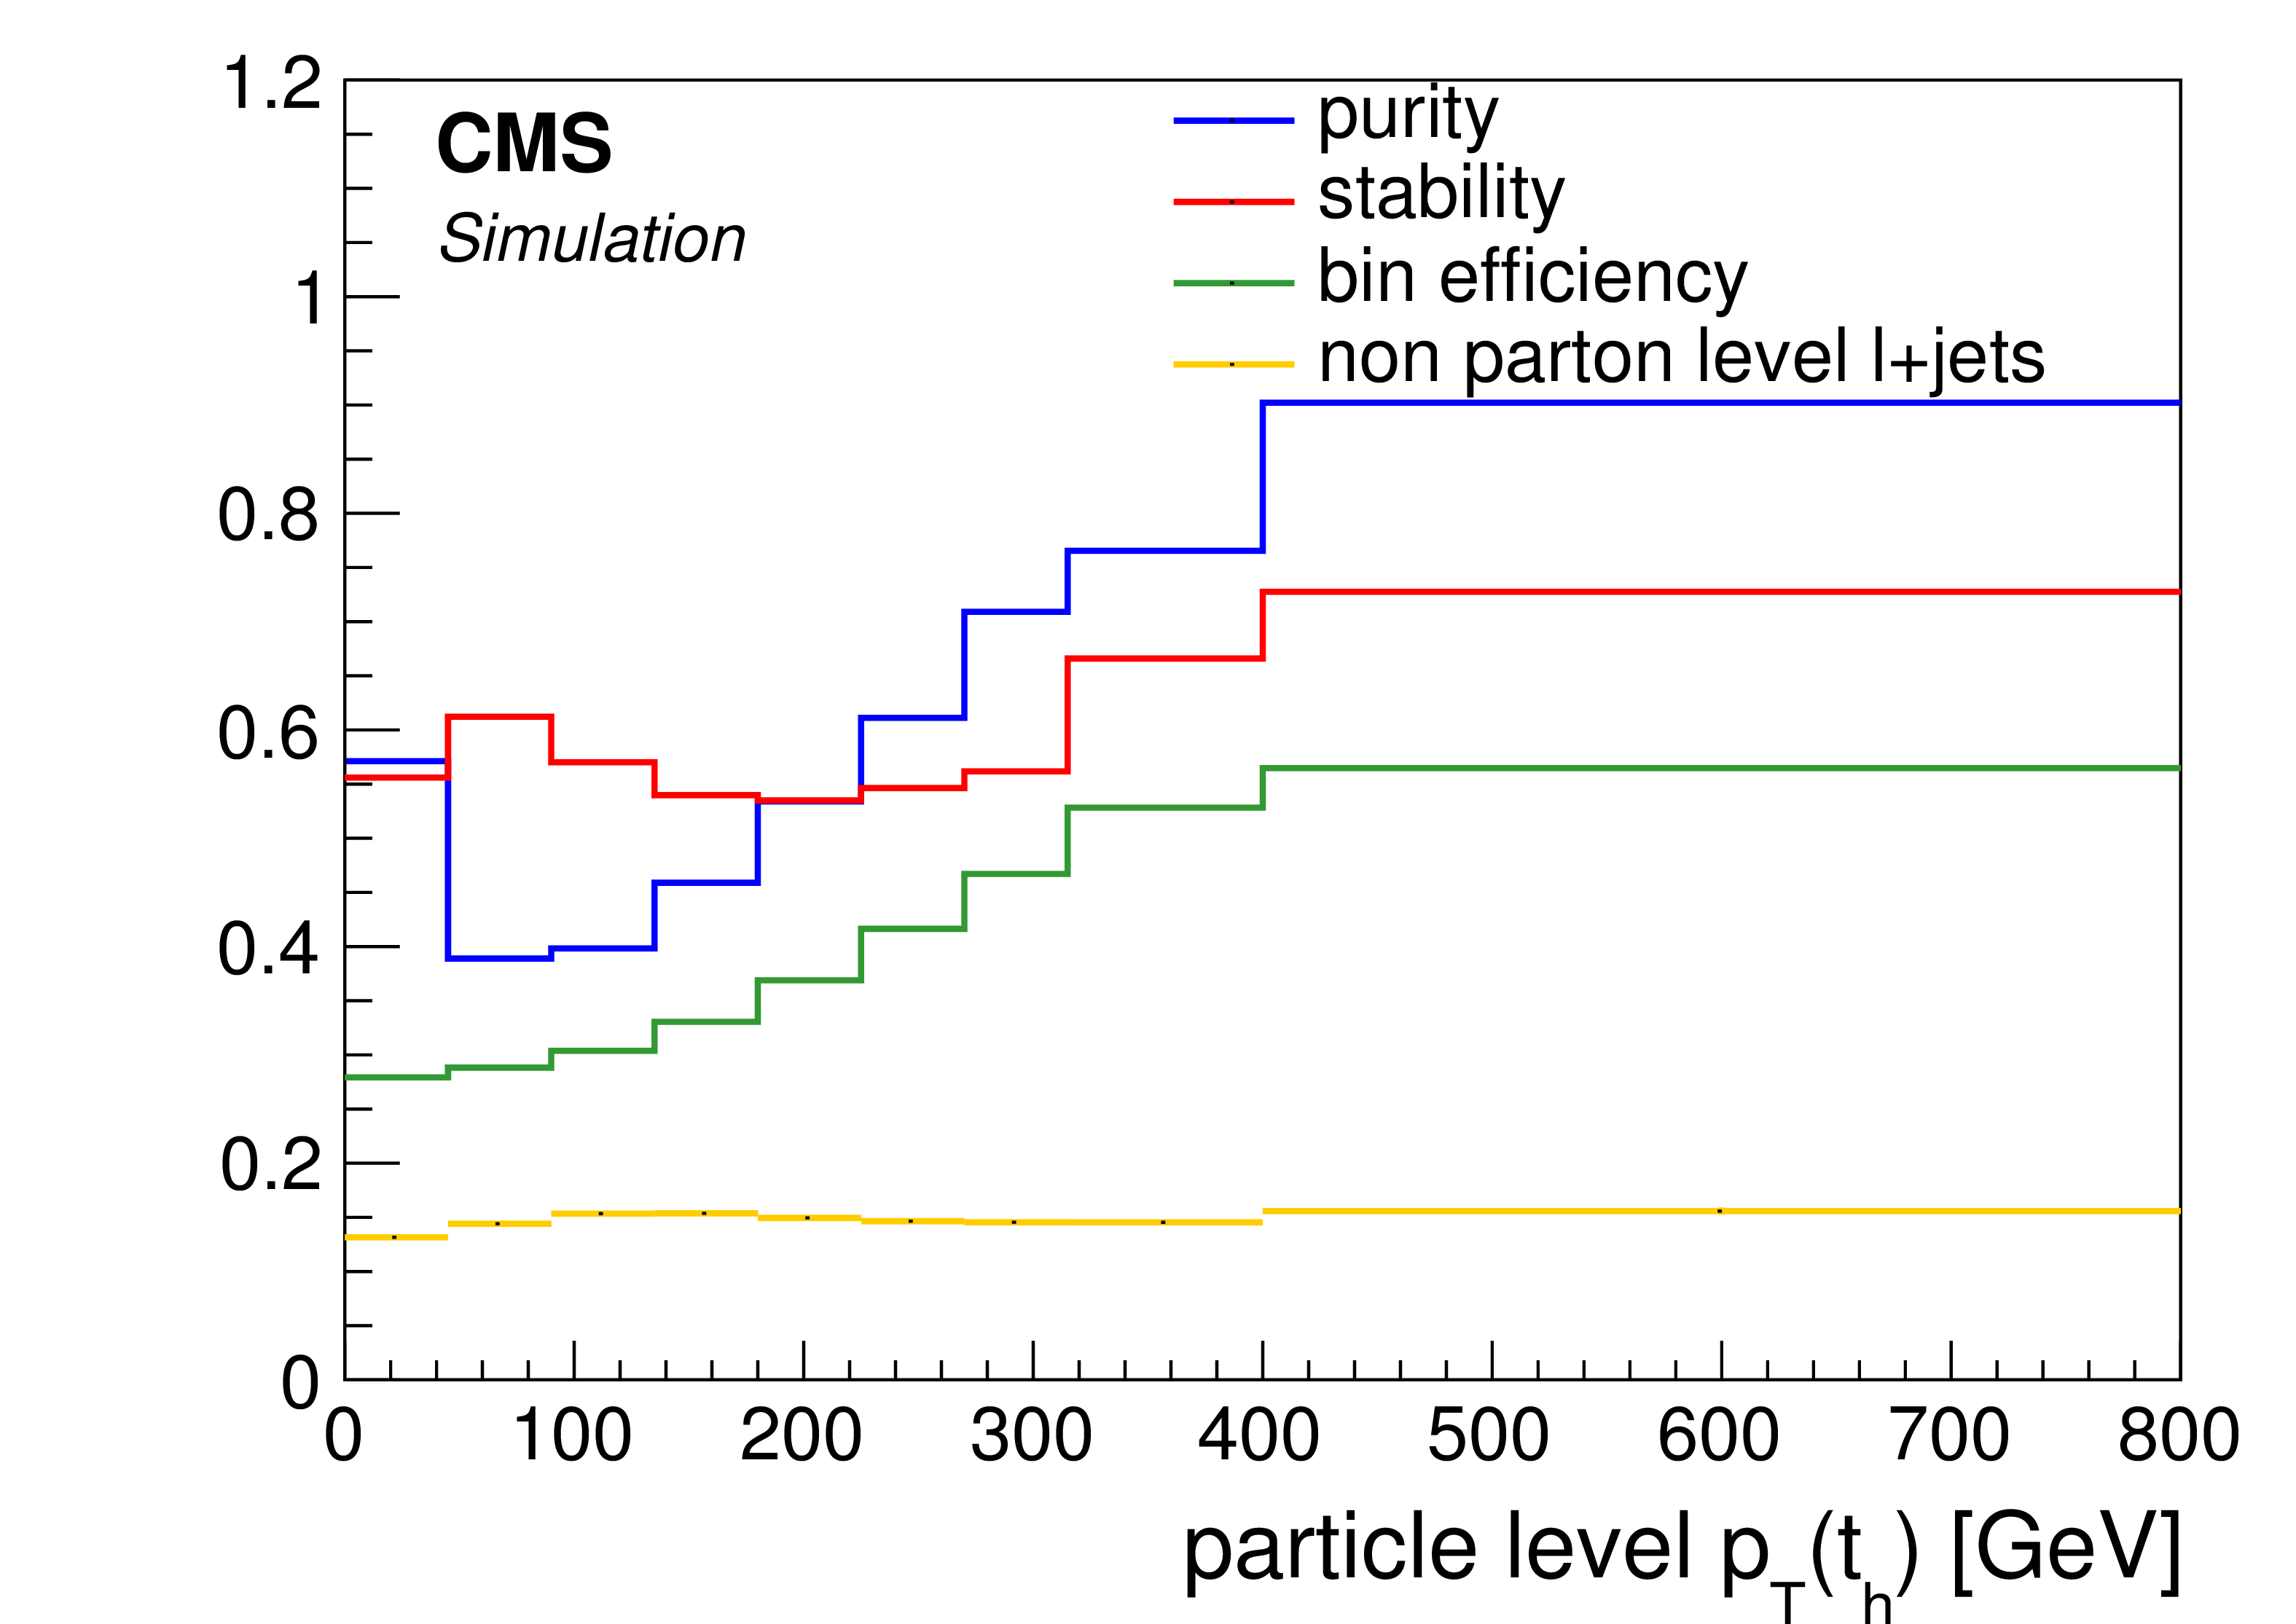
Figure 1-a:
Relation between the $ {p_{\mathrm {T}}} $ of the hadronically top quark proxy at particle level and the top quark at parton level extracted from the POWHEG plus PYTHIA-8 simulation. a: (yellow) fraction of events with a top quark proxy pair that are not $\ell $+jets events at parton level, (green) ratio of particle and parton level top quarks, (blue) fraction of parton level top quarks in the same bin at particle level, (red) fraction of particle level top quarks in the same bin at parton level. b: bin migrations between particle and parton level. Each column is normalized to the number of events at parton level in the full phase space. |
png pdf |
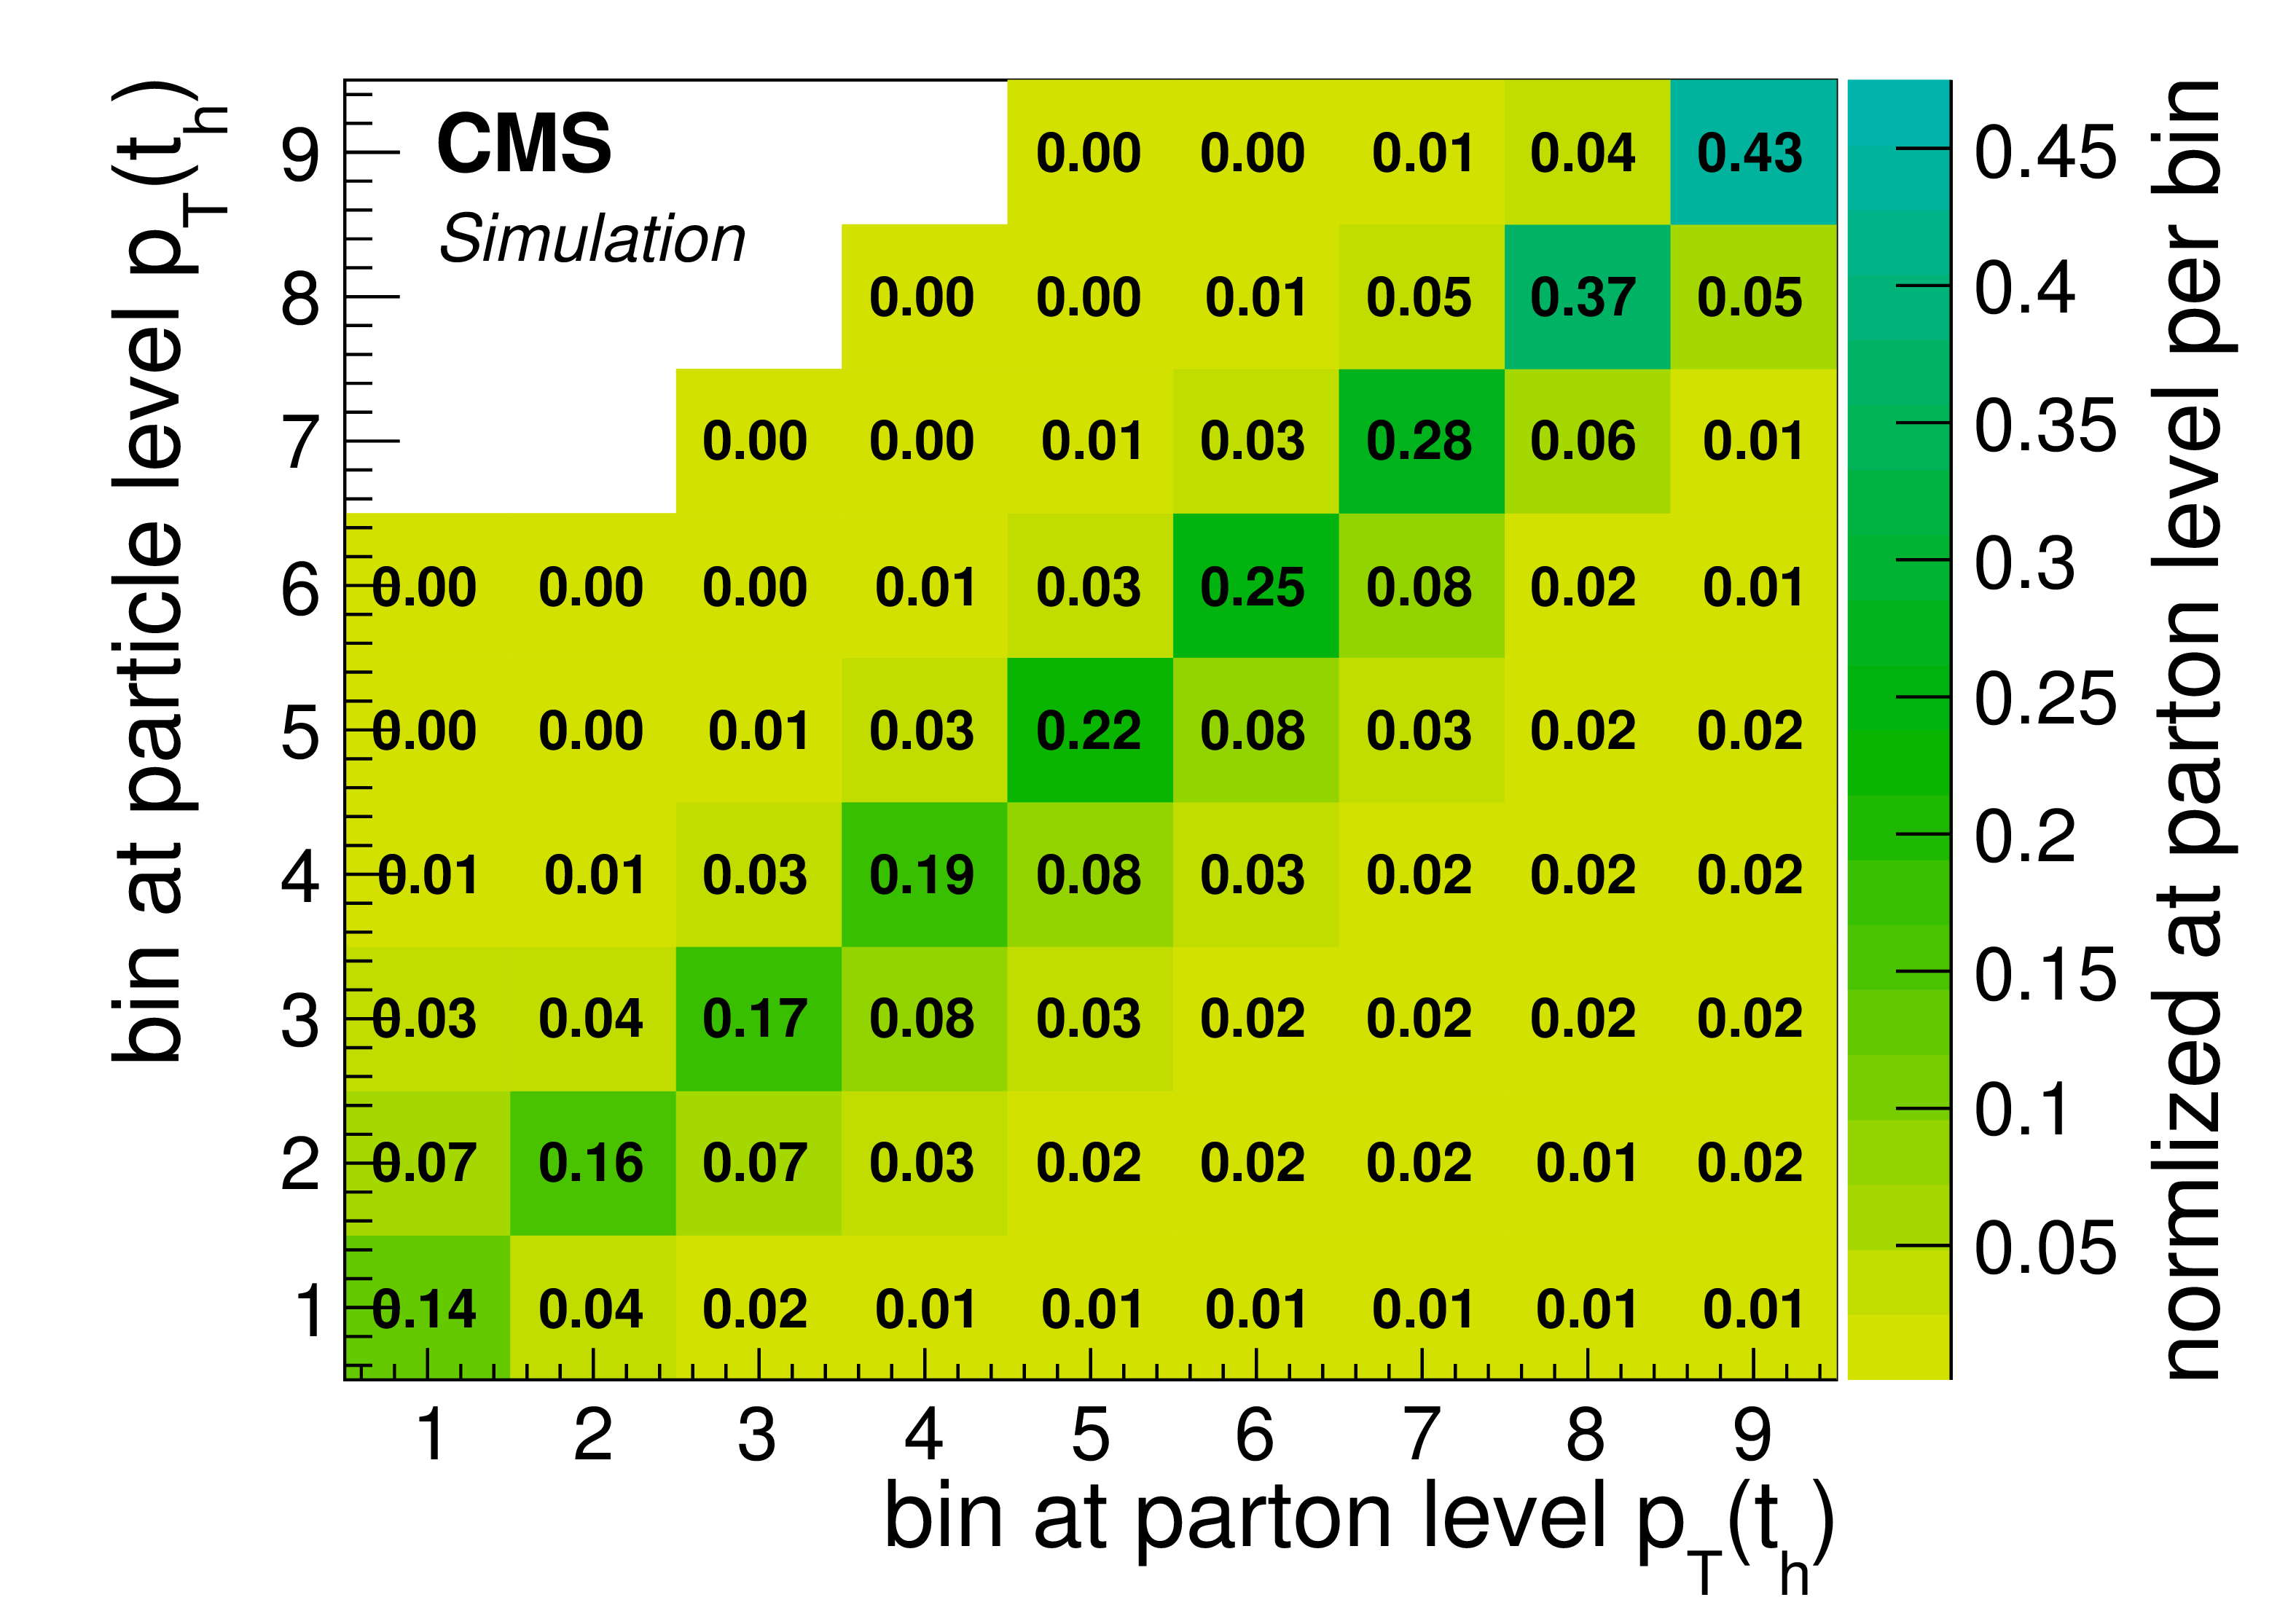
Figure 1-b:
Relation between the $ {p_{\mathrm {T}}} $ of the hadronically top quark proxy at particle level and the top quark at parton level extracted from the POWHEG plus PYTHIA-8 simulation. a: (yellow) fraction of events with a top quark proxy pair that are not $\ell $+jets events at parton level, (green) ratio of particle and parton level top quarks, (blue) fraction of parton level top quarks in the same bin at particle level, (red) fraction of particle level top quarks in the same bin at parton level. b: bin migrations between particle and parton level. Each column is normalized to the number of events at parton level in the full phase space. |
png pdf |
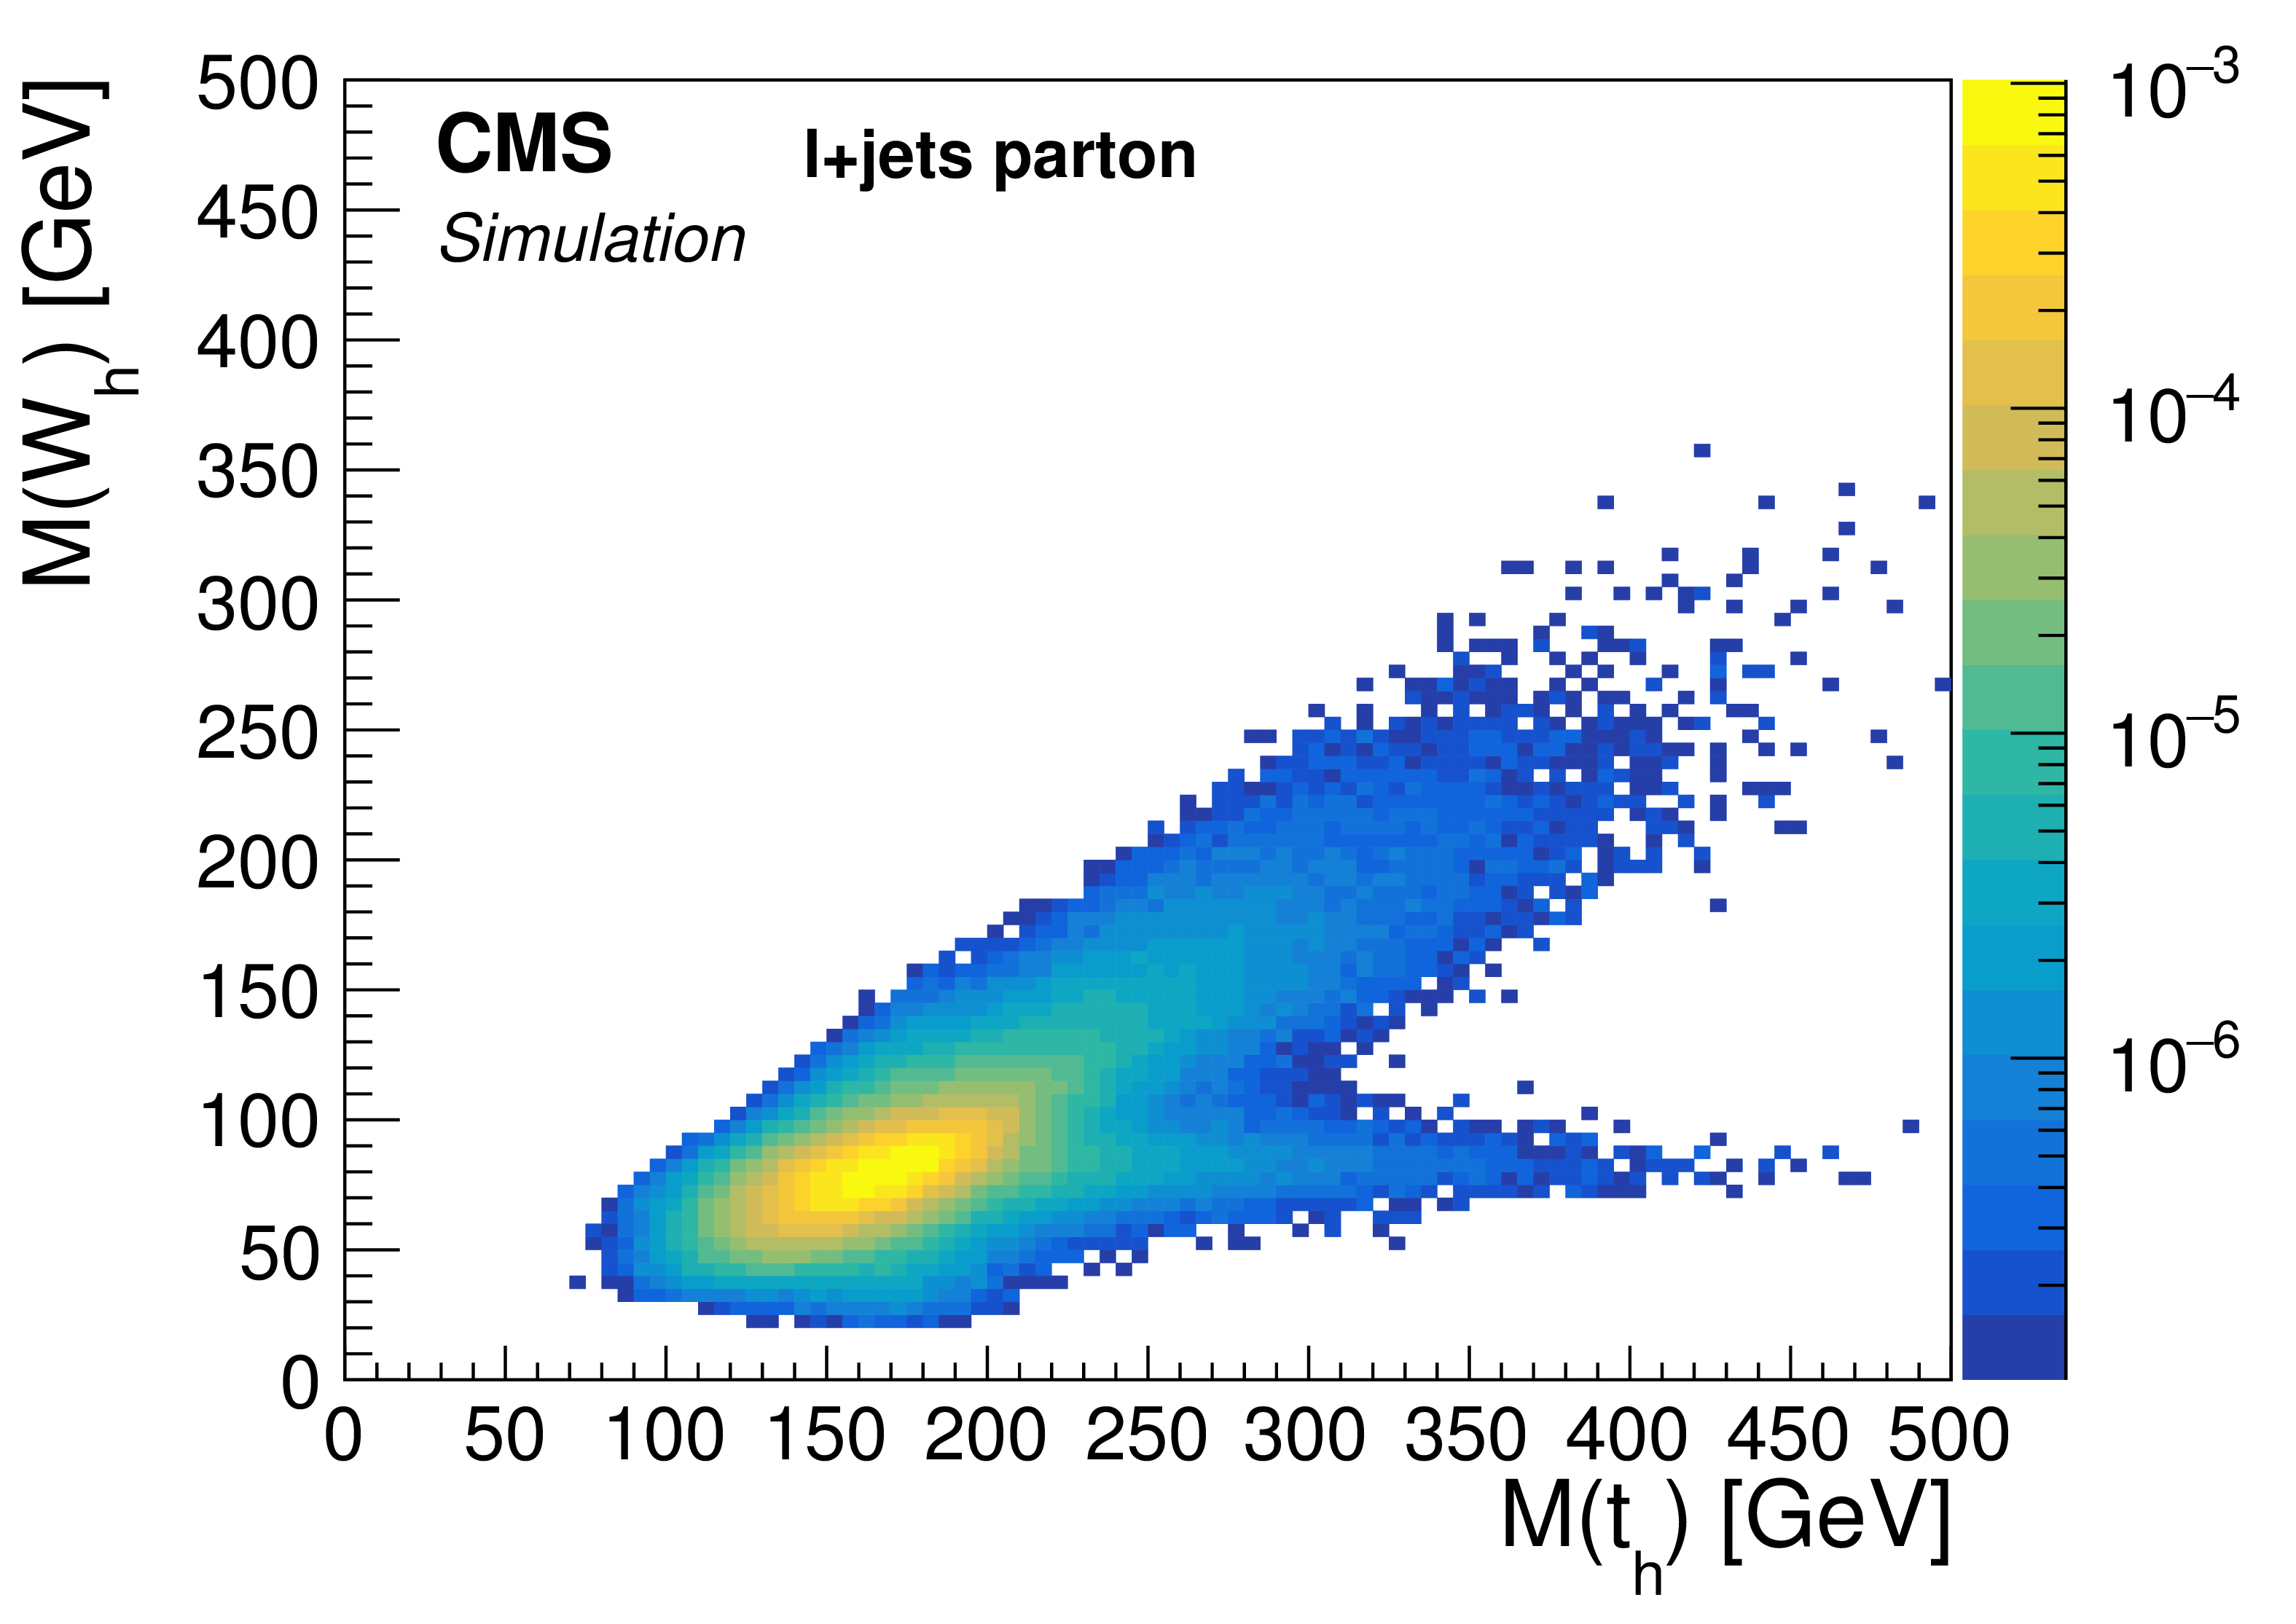
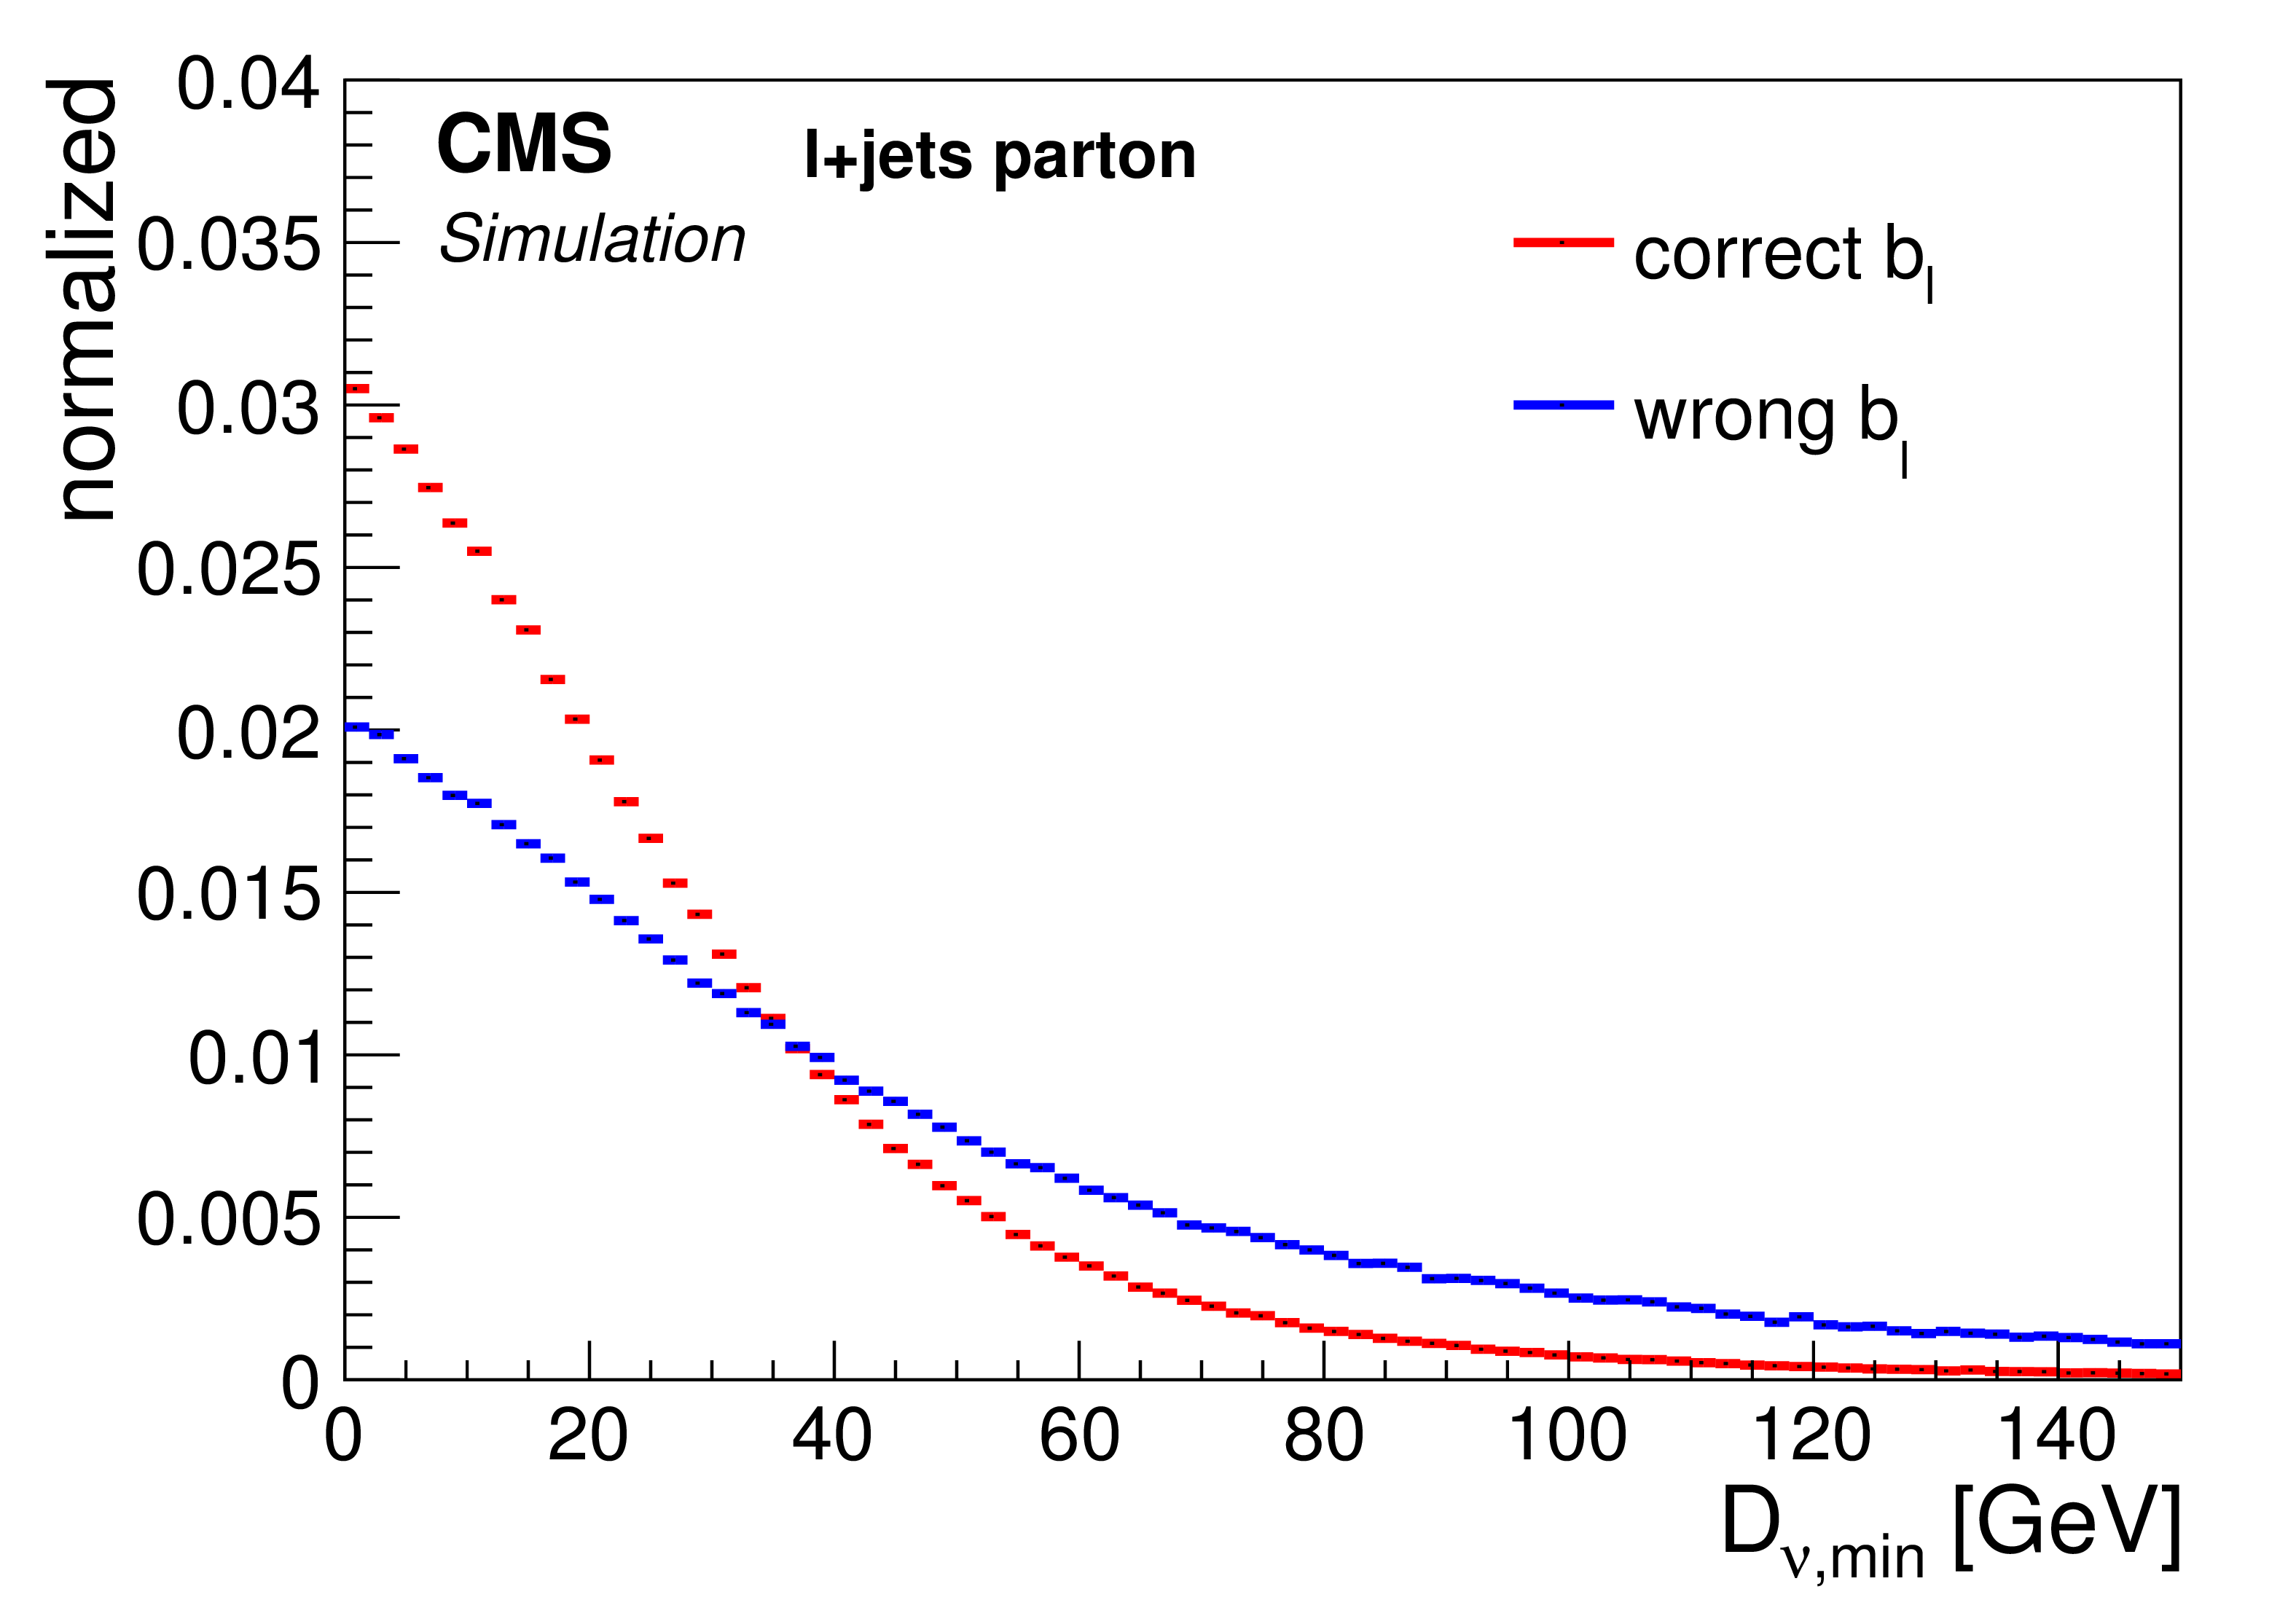
Figure 2-a:
a,b: normalized two dimensional mass distribution of $m_2$ and $m_3$ for the parton (a) and the particle (b) level measurements. c,d: normalized distributions of $ {D_{\nu ,\mathrm {min}}} $ for correctly and wrongly selected b jets of the leptonically decaying top quarks. The distributions are taken from the POWHEG simulation. |
png pdf |
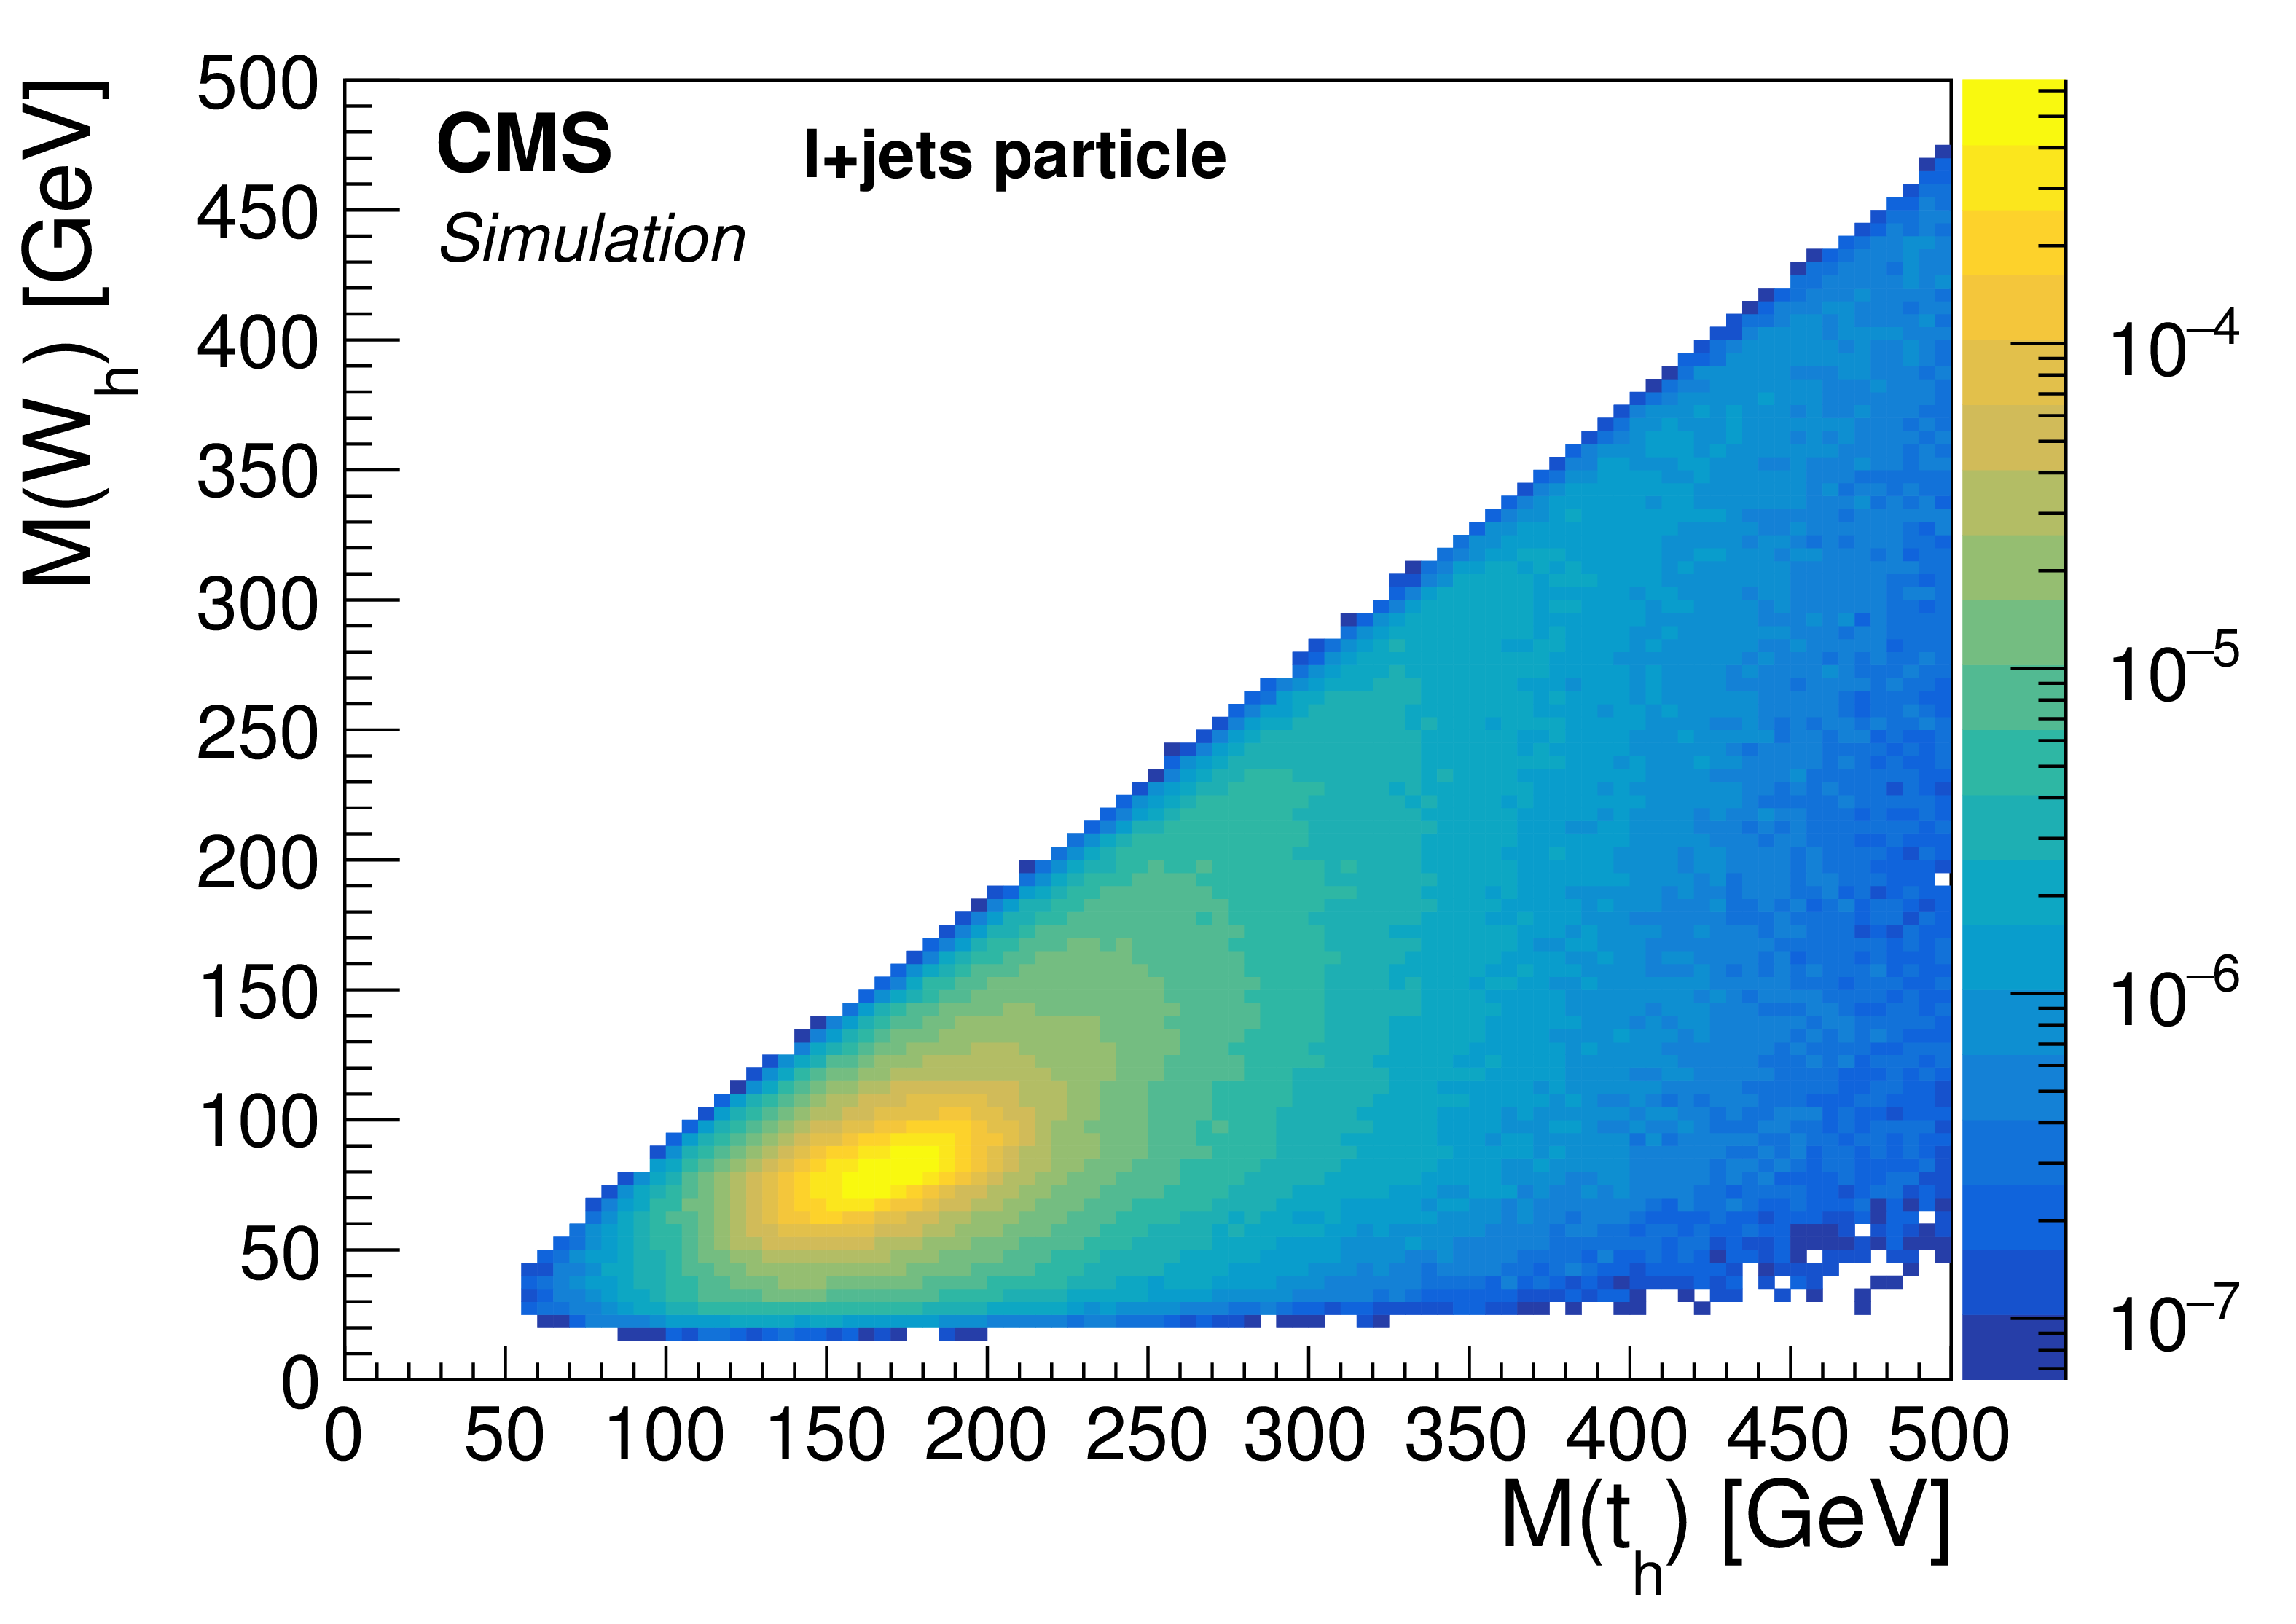
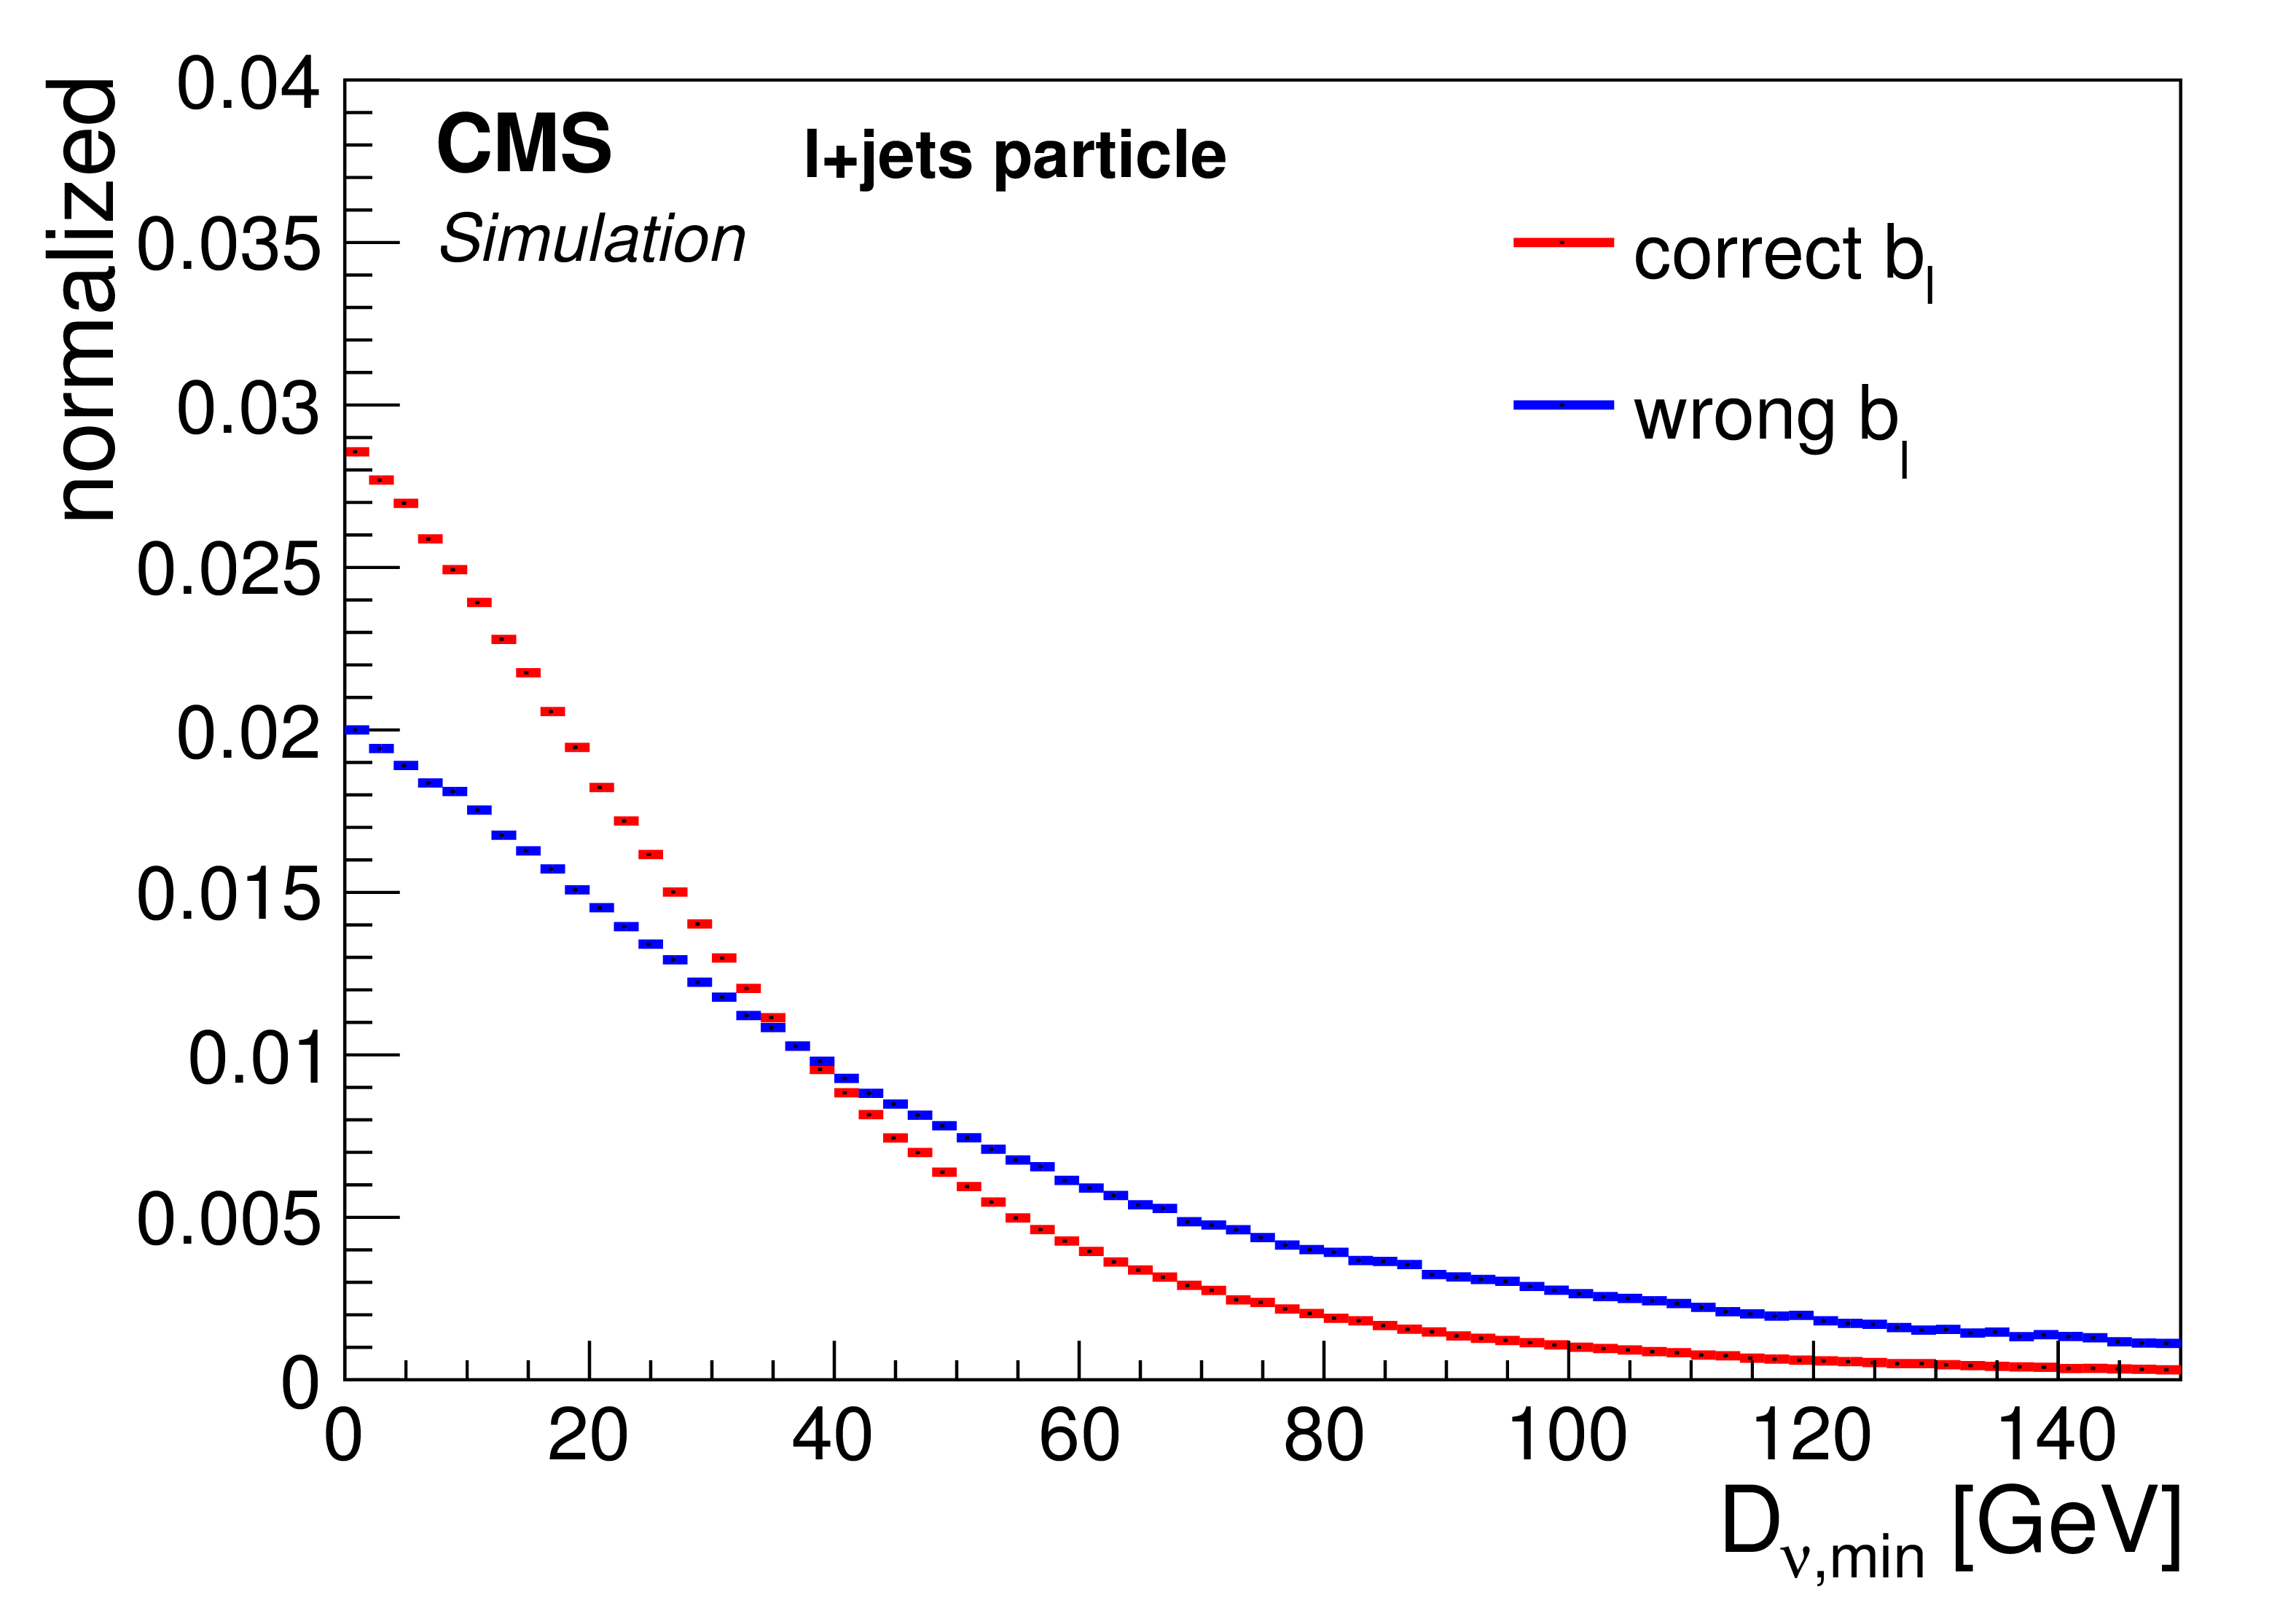
Figure 2-b:
a,b: normalized two dimensional mass distribution of $m_2$ and $m_3$ for the parton (a) and the particle (b) level measurements. c,d: normalized distributions of $ {D_{\nu ,\mathrm {min}}} $ for correctly and wrongly selected b jets of the leptonically decaying top quarks. The distributions are taken from the POWHEG simulation. |
png pdf |
Figure 2-c:
a,b: normalized two dimensional mass distribution of $m_2$ and $m_3$ for the parton (a) and the particle (b) level measurements. c,d: normalized distributions of $ {D_{\nu ,\mathrm {min}}} $ for correctly and wrongly selected b jets of the leptonically decaying top quarks. The distributions are taken from the POWHEG simulation. |
png pdf |
Figure 2-d:
a,b: normalized two dimensional mass distribution of $m_2$ and $m_3$ for the parton (a) and the particle (b) level measurements. c,d: normalized distributions of $ {D_{\nu ,\mathrm {min}}} $ for correctly and wrongly selected b jets of the leptonically decaying top quarks. The distributions are taken from the POWHEG simulation. |
png pdf |
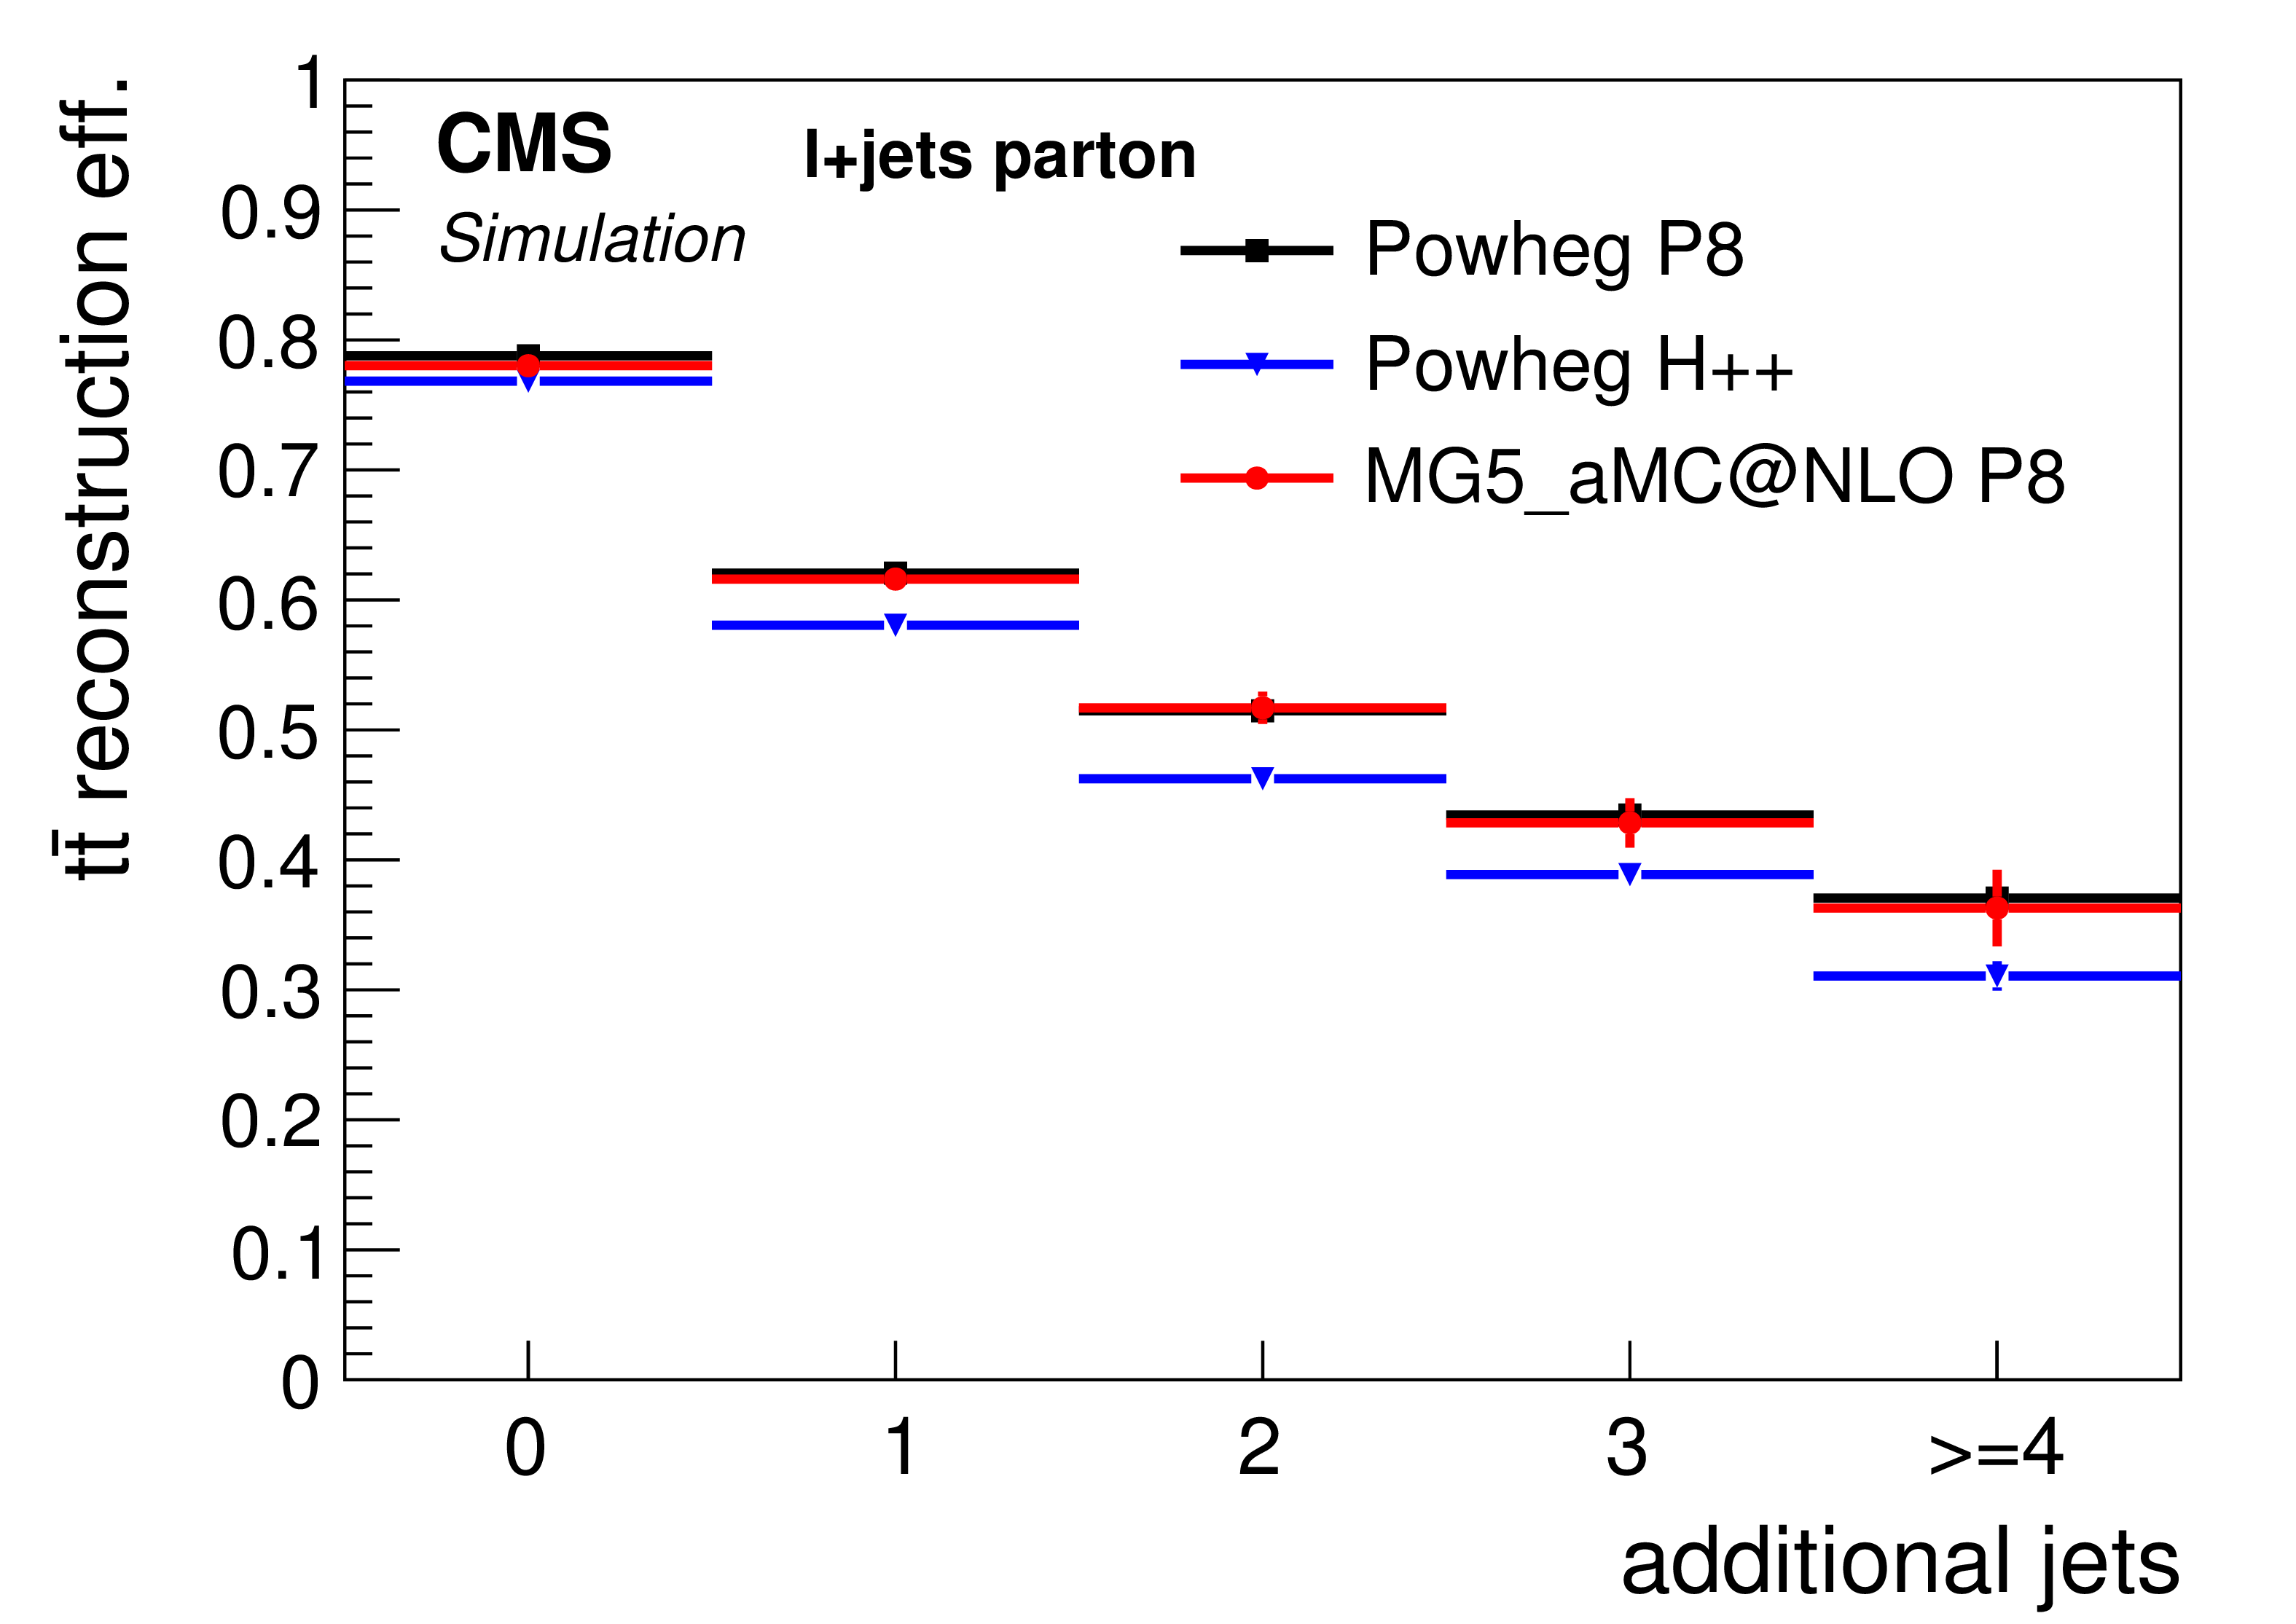
Figure 3-a:
Reconstruction efficiency of the $ \mathrm{ t \bar{t} } $ system as function of number of additional jets for the parton (a) and particle (b) level measurements using different simulations. |
png pdf |
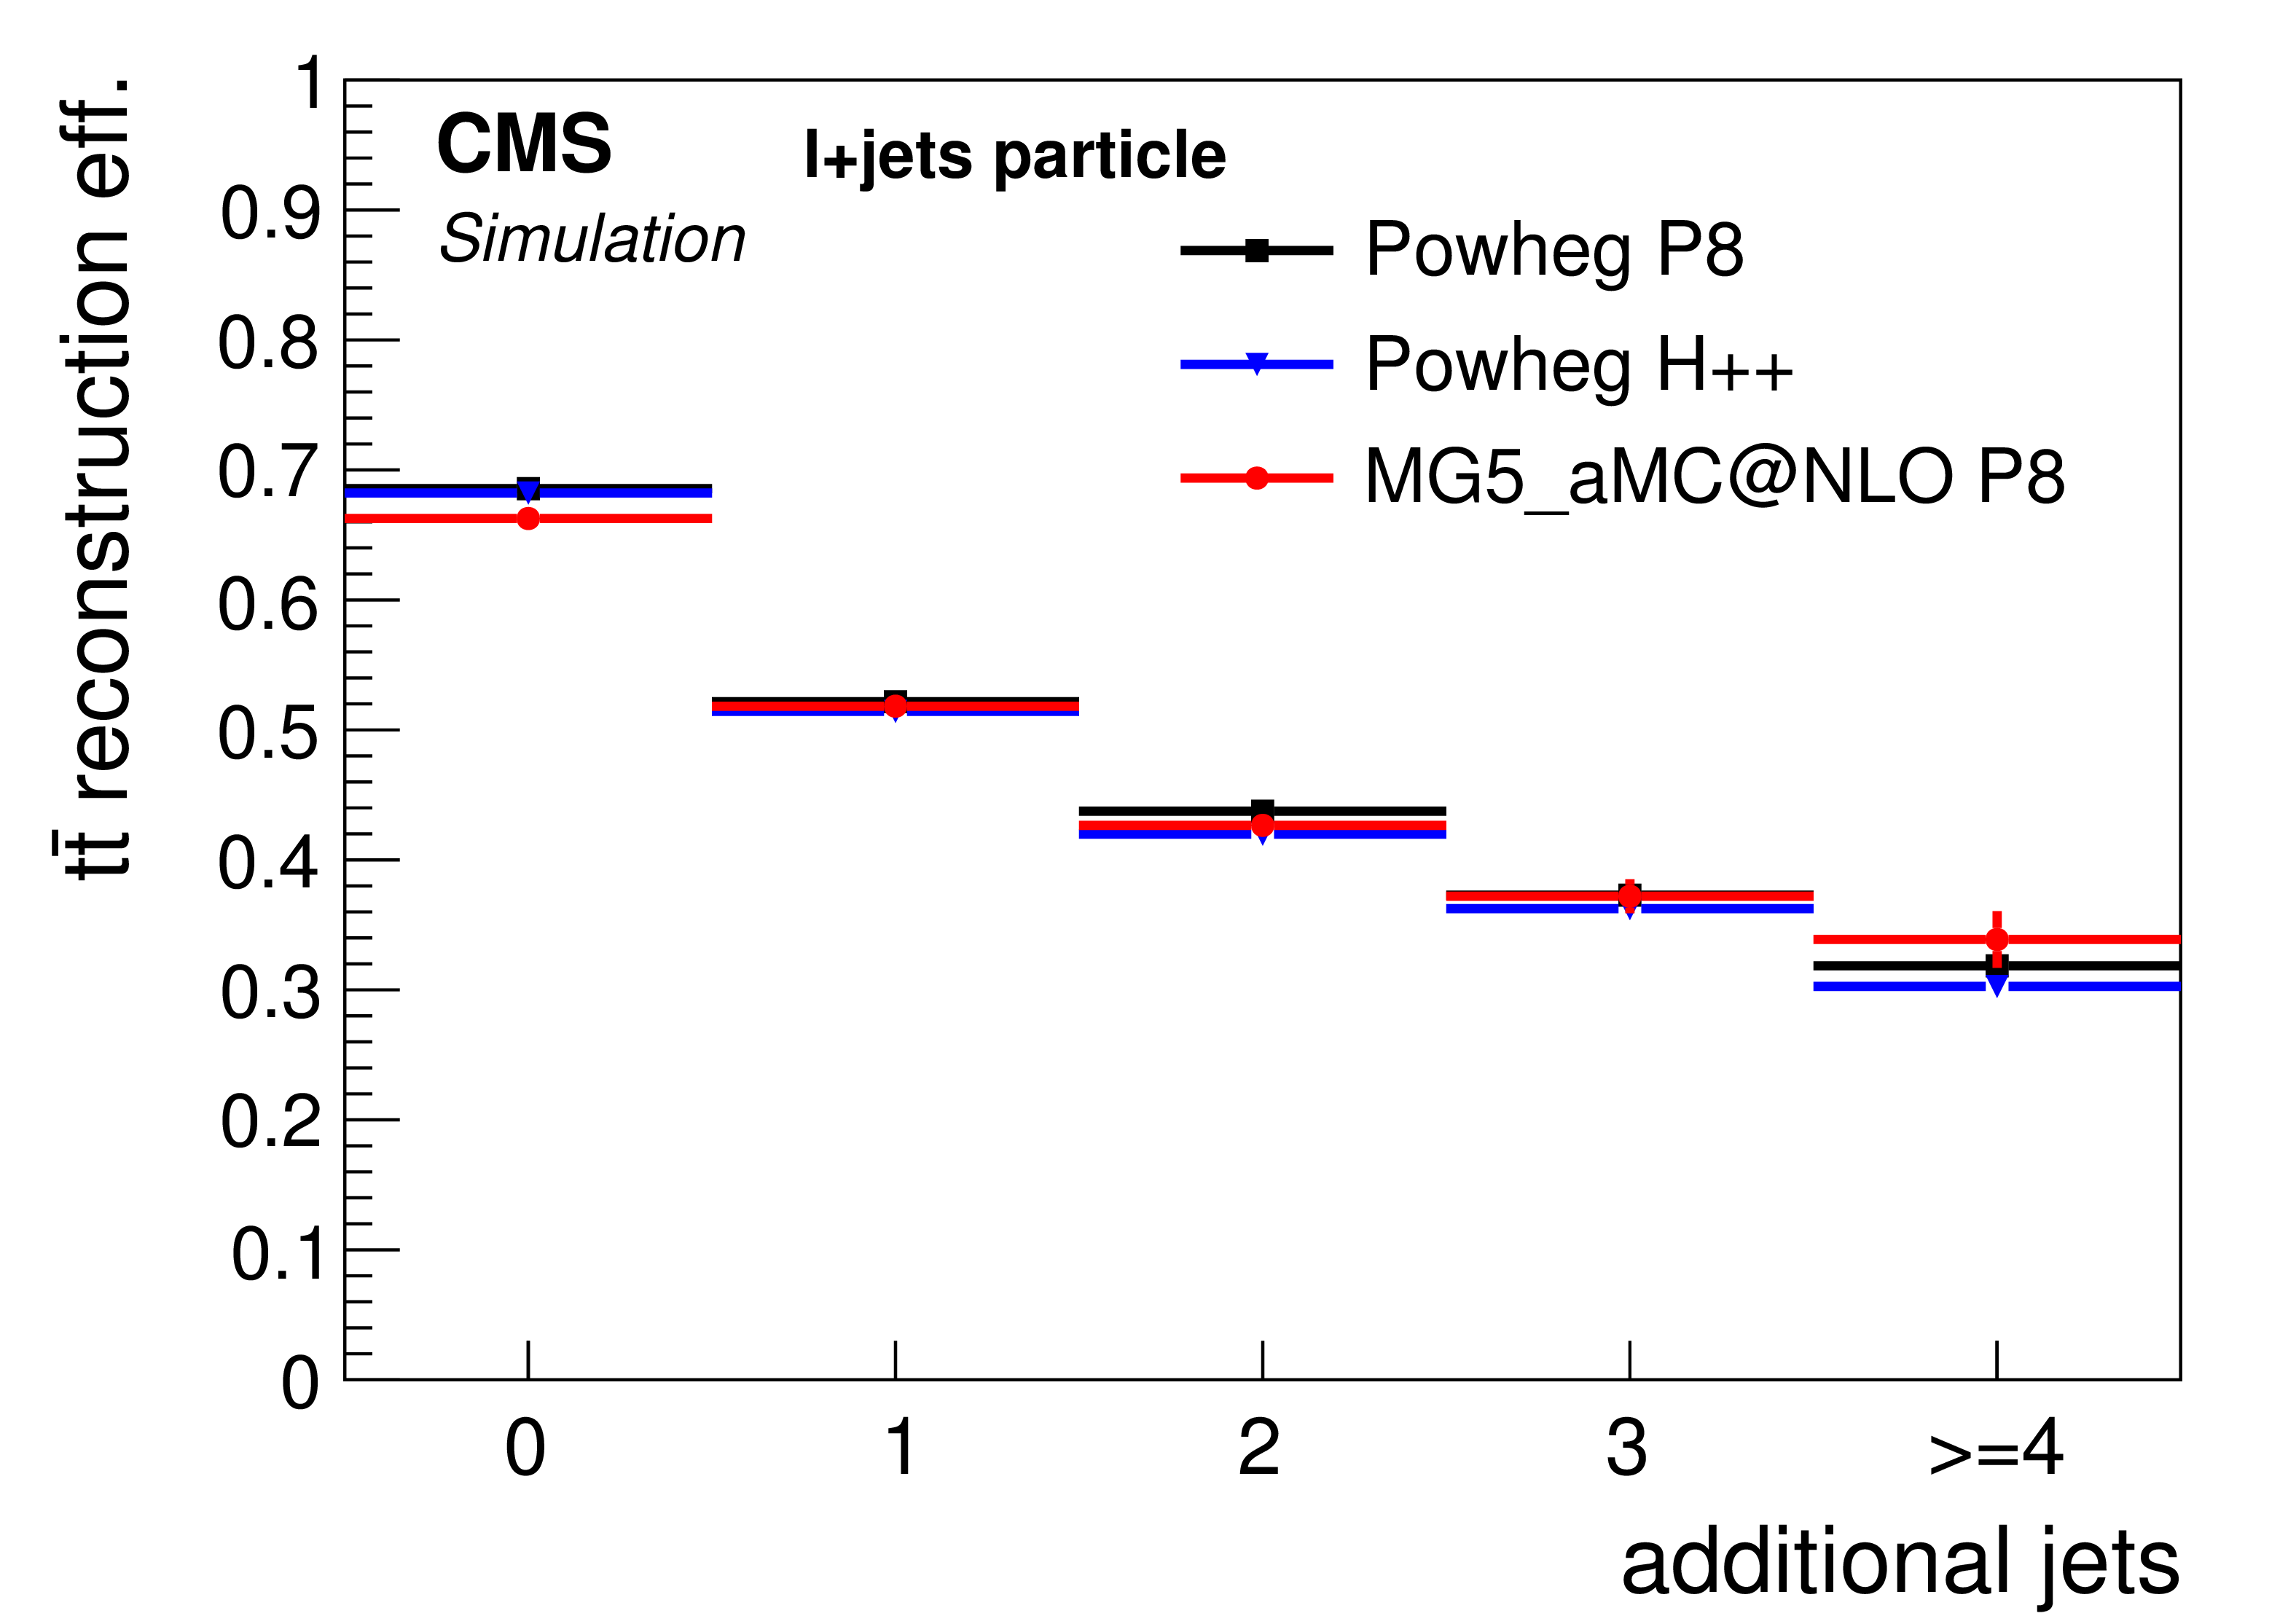
Figure 3-b:
Reconstruction efficiency of the $ \mathrm{ t \bar{t} } $ system as function of number of additional jets for the parton (a) and particle (b) level measurements using different simulations. |
png pdf |
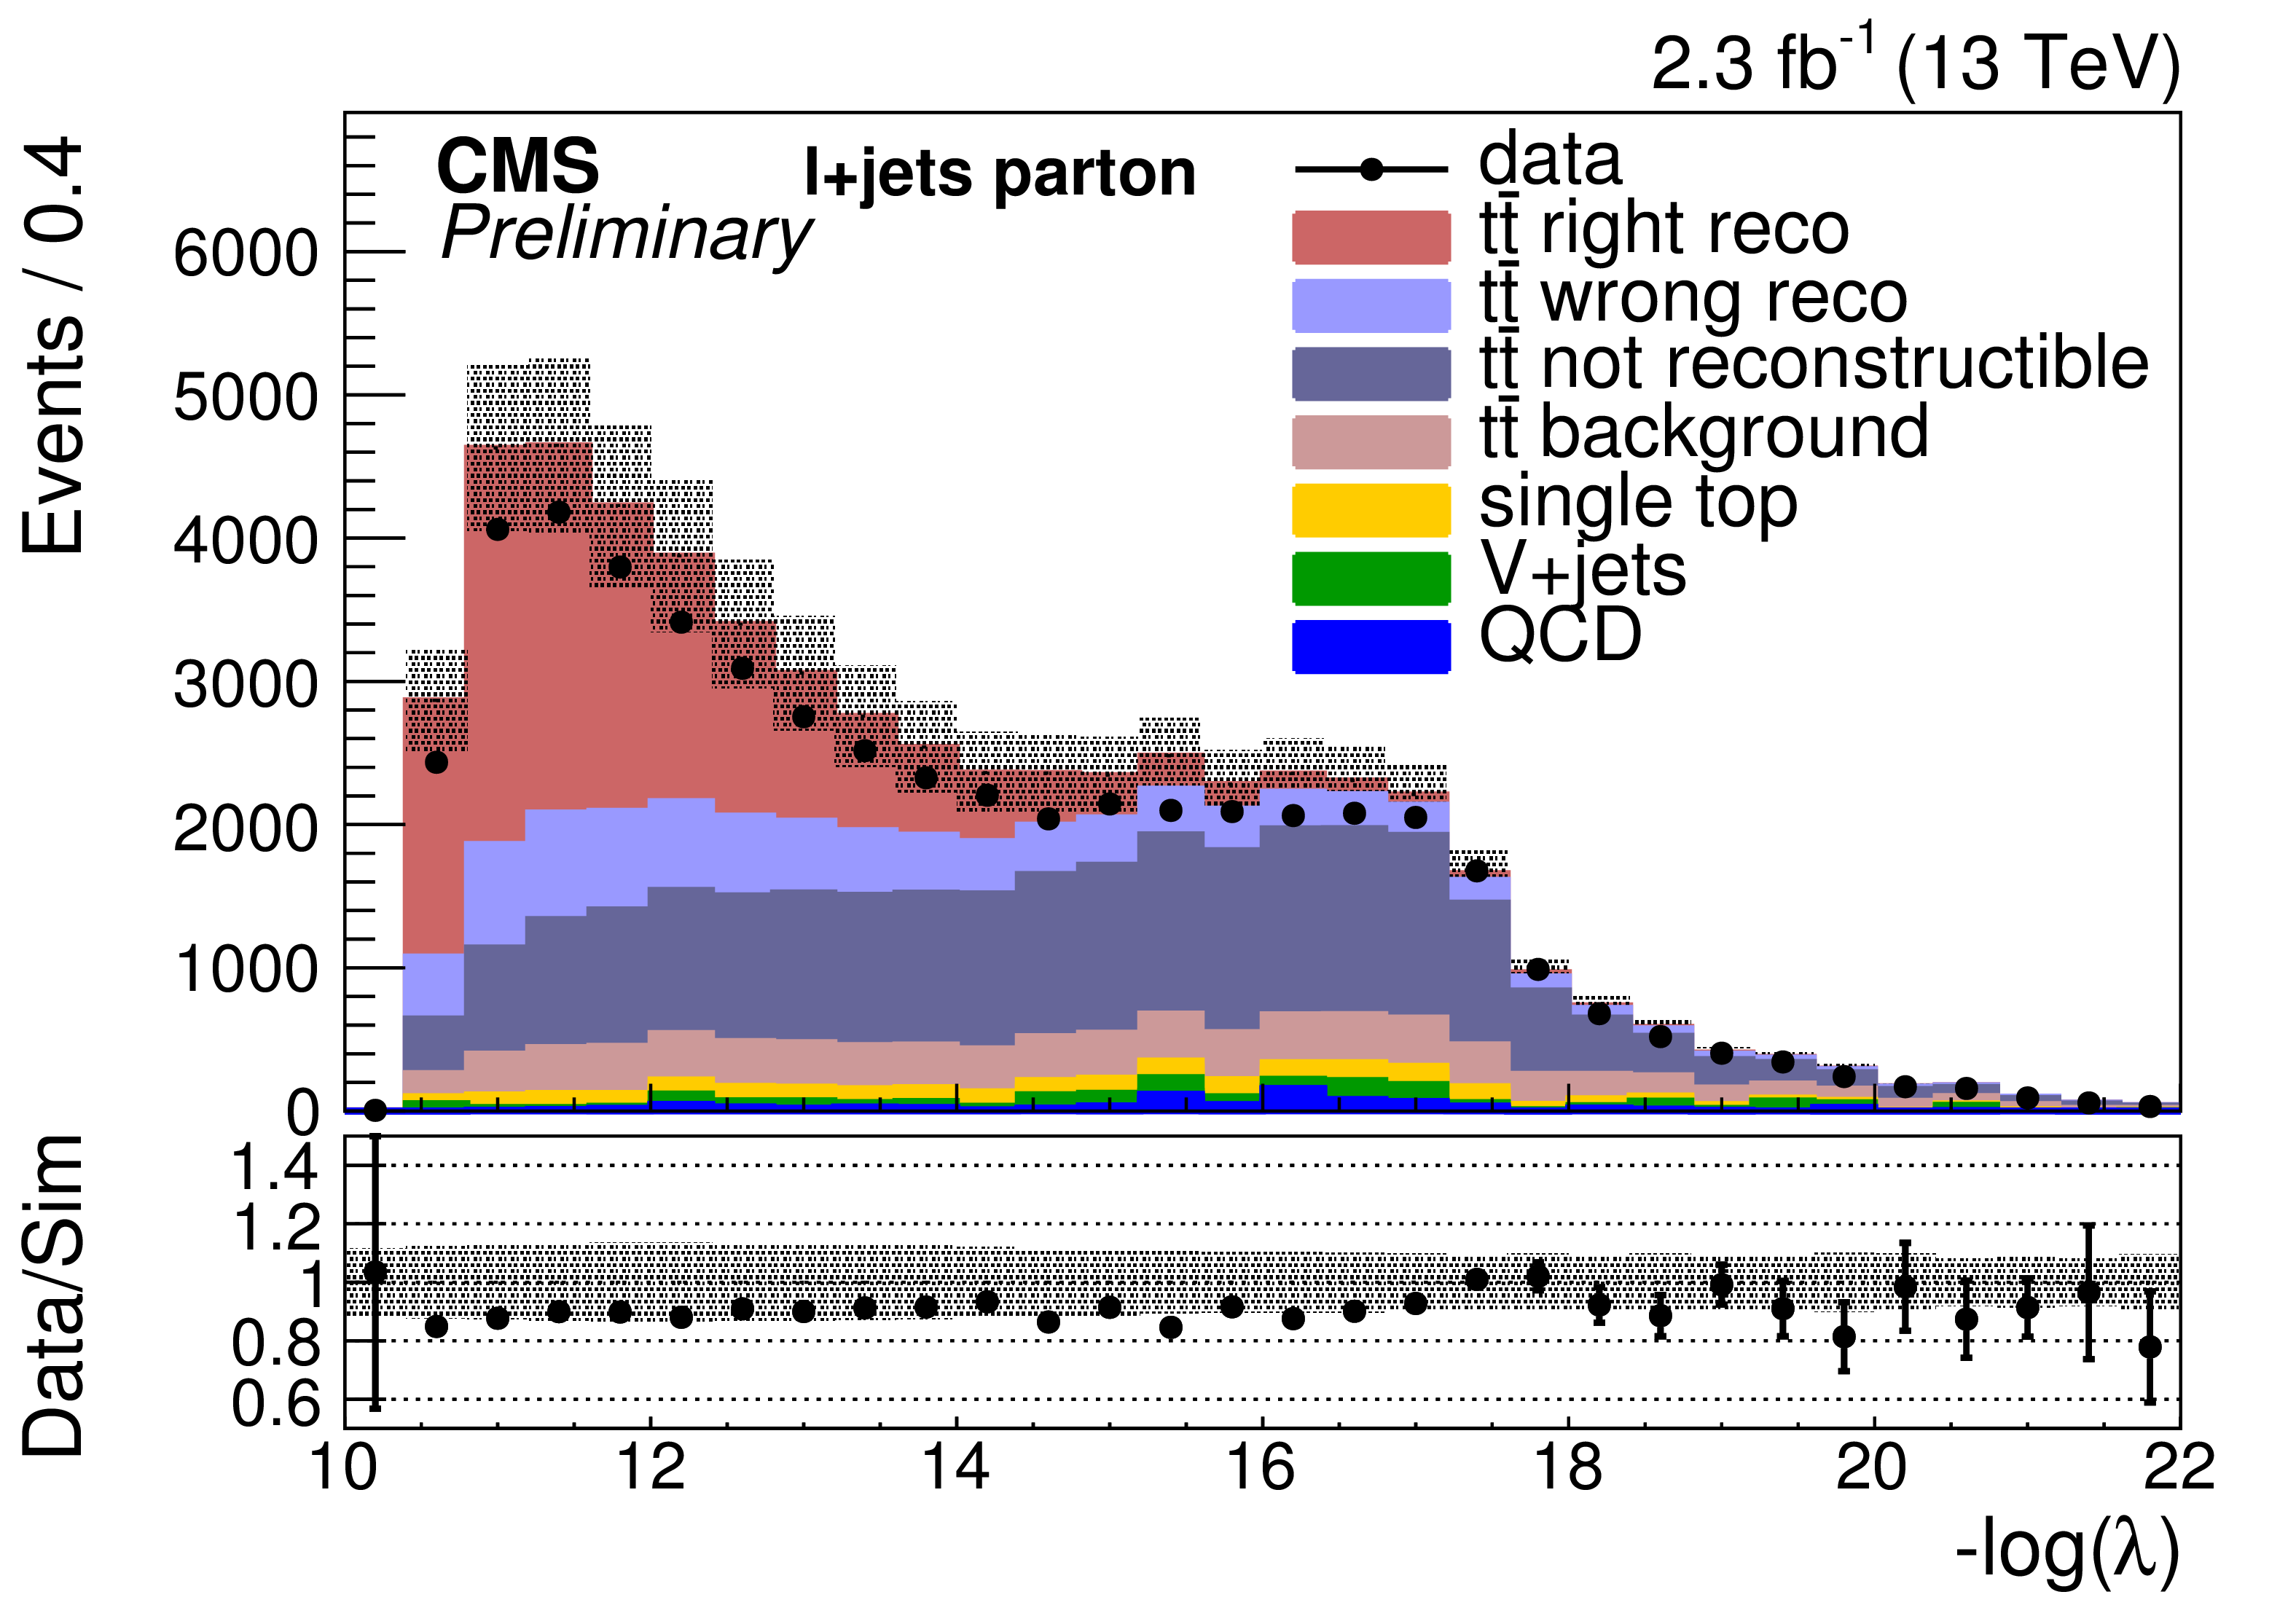
Figure 4-a:
Distribution of the negative log-likelihood for the selected best permutation in the parton (a) and the particle (b) level measurements in data and simulation. The simulation of POWHEG together with PYTHIA-8 is used to describe the $ \mathrm{ t \bar{t} } $ production. Experimental and statistical uncertainties are shown for the simulation that is normalized to the measured integrated luminosity. |
png pdf |
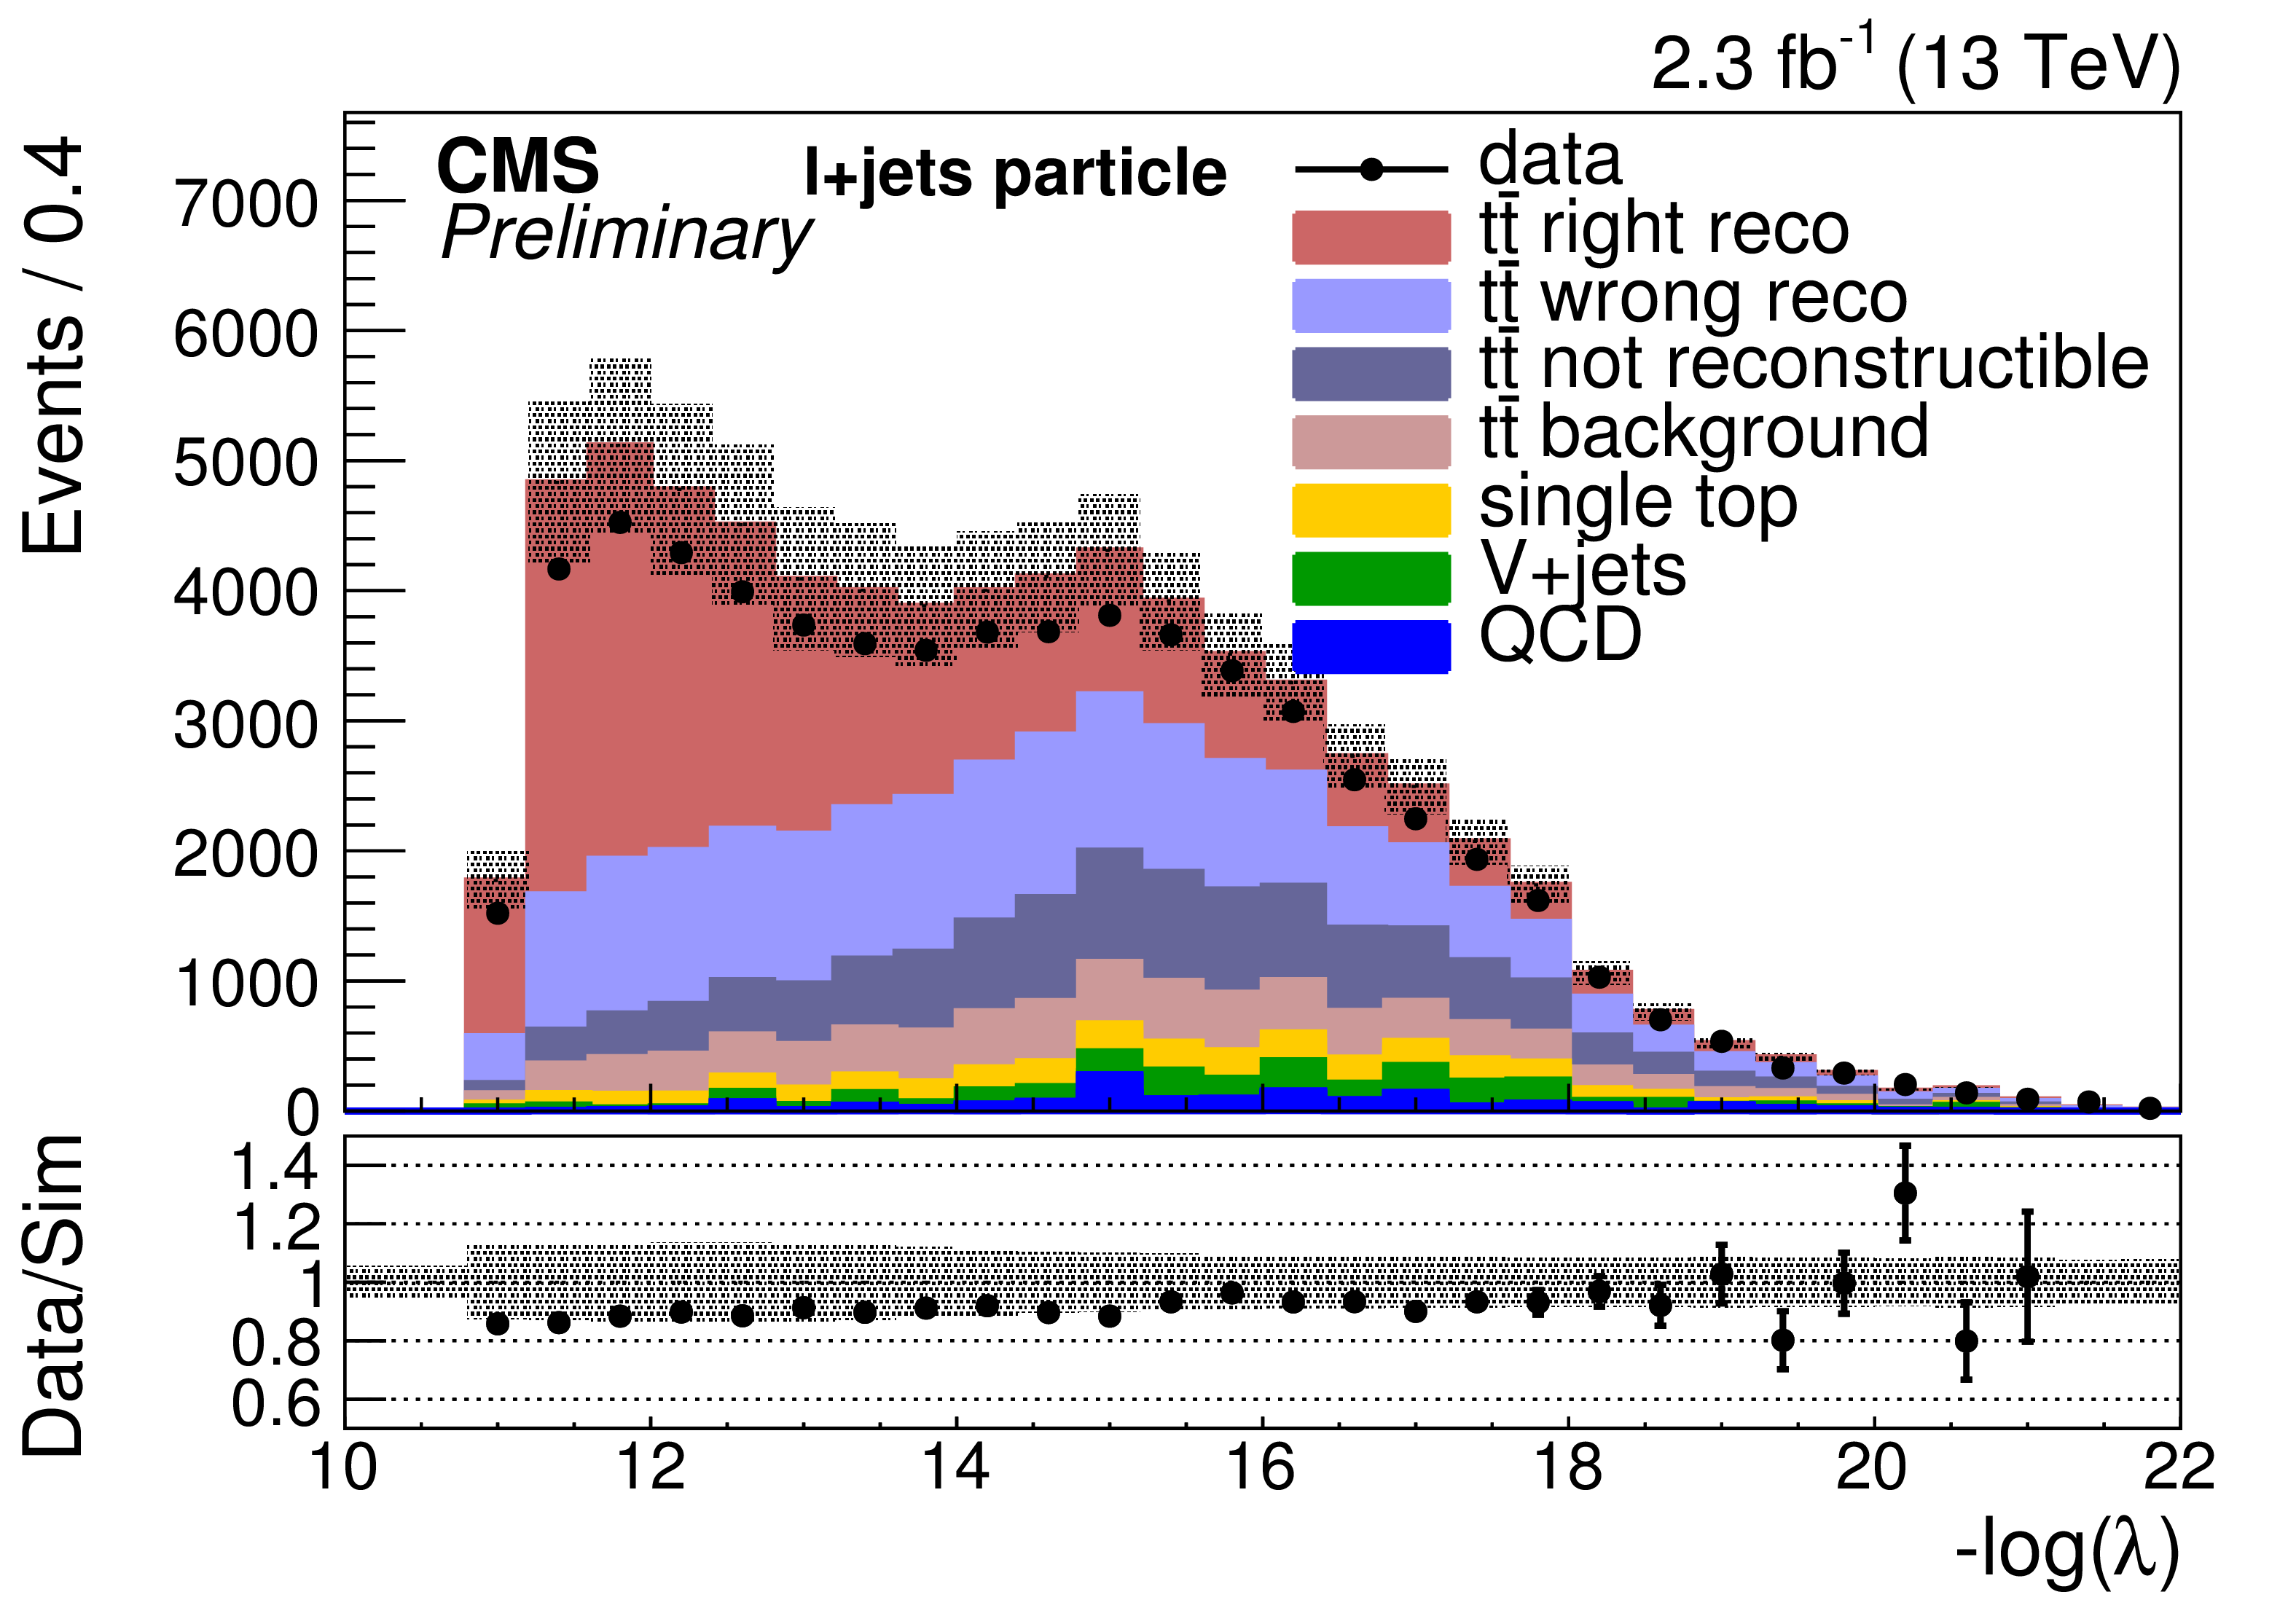
Figure 4-b:
Distribution of the negative log-likelihood for the selected best permutation in the parton (a) and the particle (b) level measurements in data and simulation. The simulation of POWHEG together with PYTHIA-8 is used to describe the $ \mathrm{ t \bar{t} } $ production. Experimental and statistical uncertainties are shown for the simulation that is normalized to the measured integrated luminosity. |

png pdf |
Figure 5-a:
Comparisons of the reconstructed top quark $ {p_{\mathrm {T}}} $ (a,b) and $|y|$ (c,d) in the data and the simulation for the parton (a,c) and the particle (b,d) level. The simulation of POWHEG together with PYTHIA-8 is used to describe the $ \mathrm{ t \bar{t} } $ production. Experimental and statistical uncertainties are shown for the simulation that is normalized according to the measured integrated luminosity. |
png pdf |
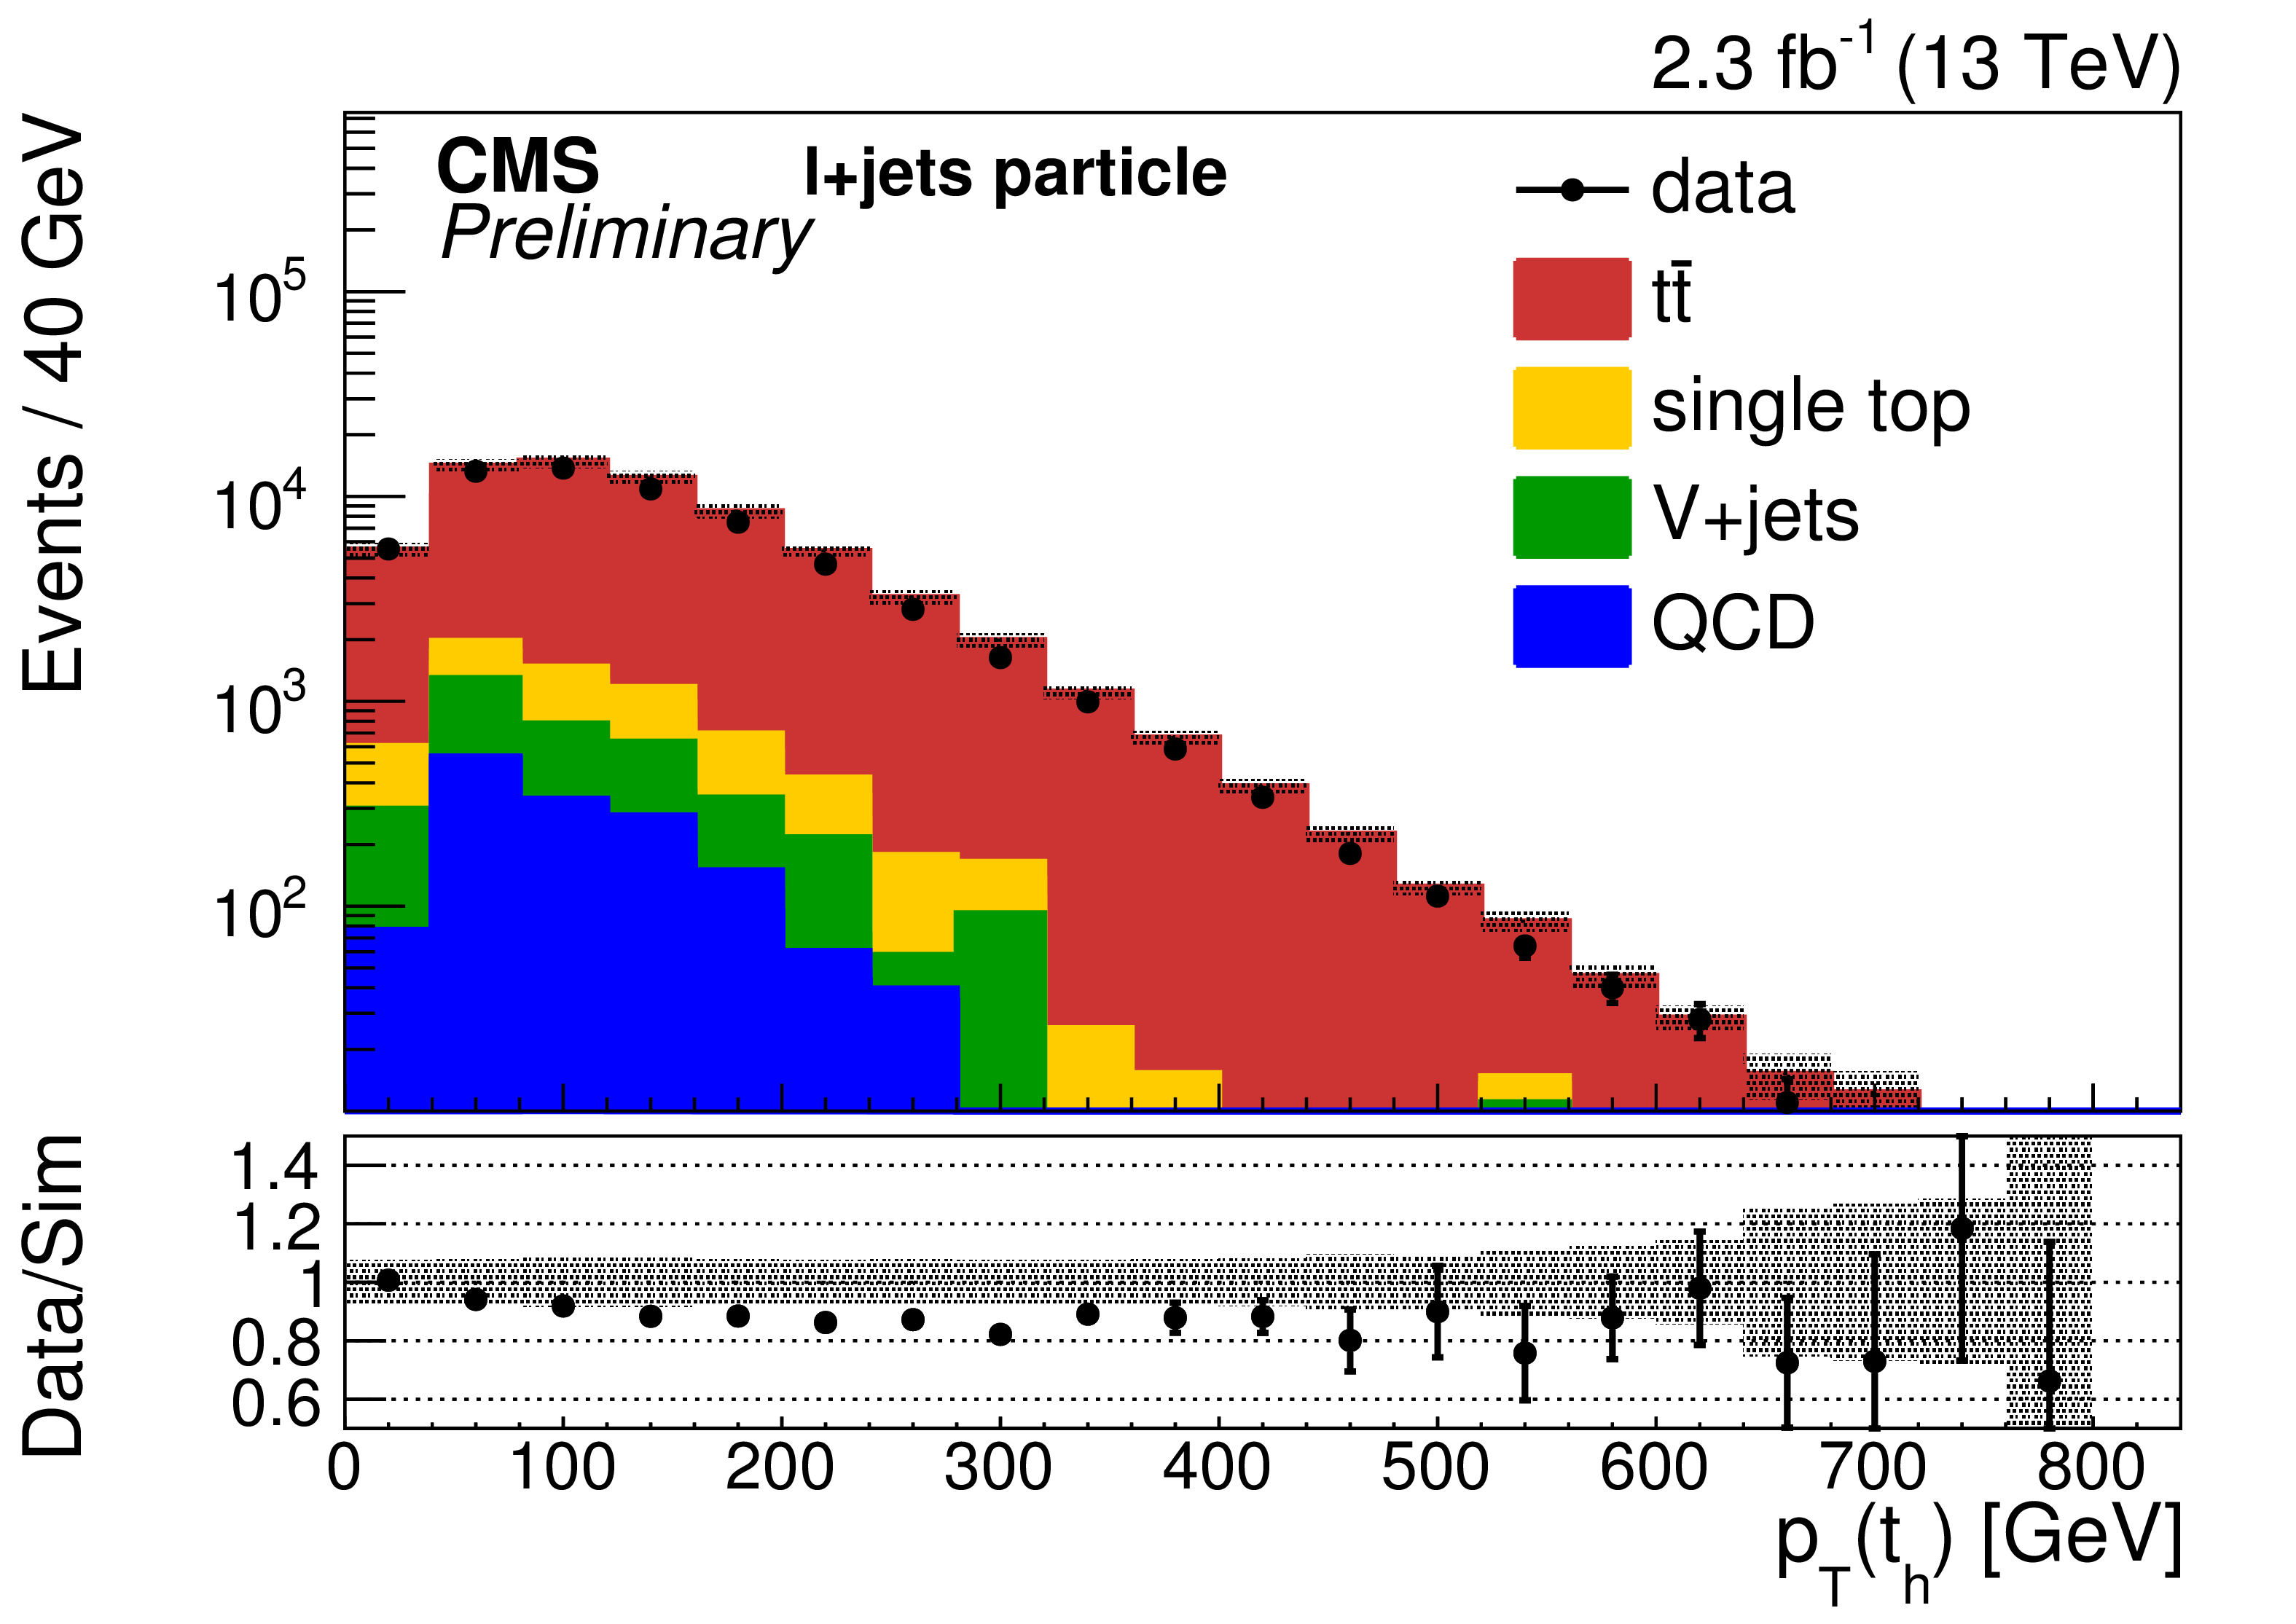
Figure 5-b:
Comparisons of the reconstructed top quark $ {p_{\mathrm {T}}} $ (a,b) and $|y|$ (c,d) in the data and the simulation for the parton (a,c) and the particle (b,d) level. The simulation of POWHEG together with PYTHIA-8 is used to describe the $ \mathrm{ t \bar{t} } $ production. Experimental and statistical uncertainties are shown for the simulation that is normalized according to the measured integrated luminosity. |
png pdf |
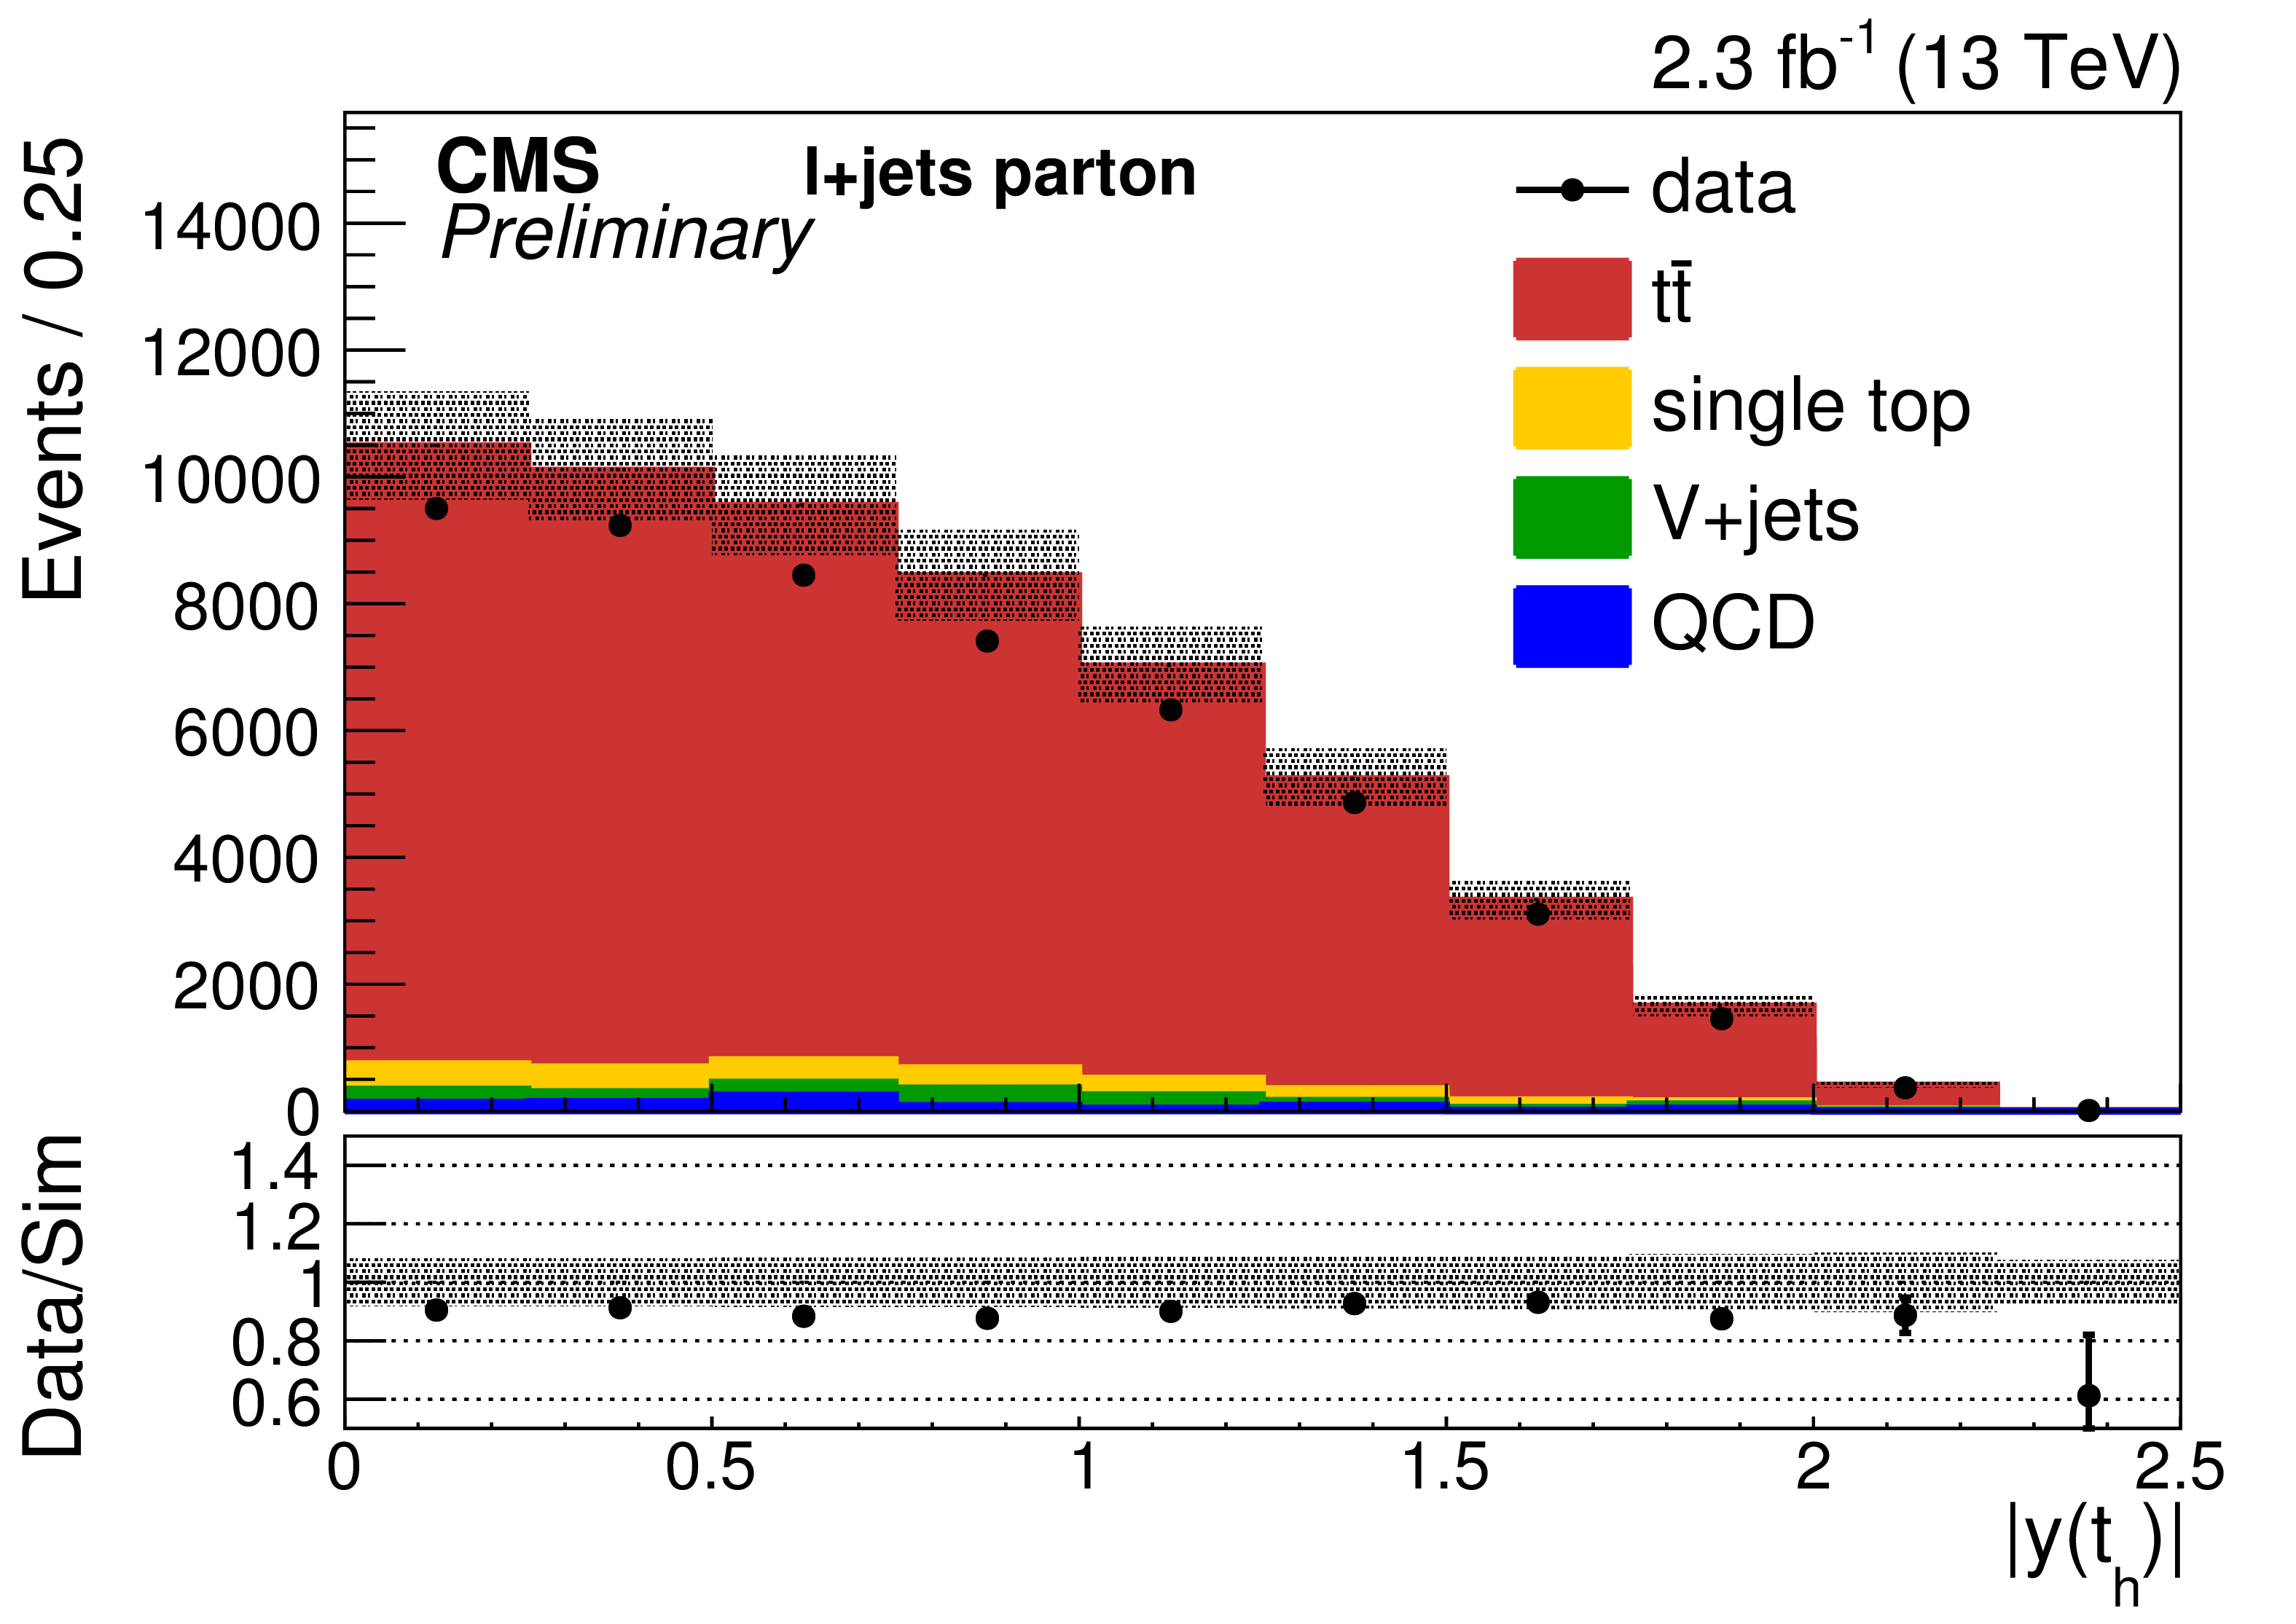
Figure 5-c:
Comparisons of the reconstructed top quark $ {p_{\mathrm {T}}} $ (a,b) and $|y|$ (c,d) in the data and the simulation for the parton (a,c) and the particle (b,d) level. The simulation of POWHEG together with PYTHIA-8 is used to describe the $ \mathrm{ t \bar{t} } $ production. Experimental and statistical uncertainties are shown for the simulation that is normalized according to the measured integrated luminosity. |
png pdf |
Figure 5-d:
Comparisons of the reconstructed top quark $ {p_{\mathrm {T}}} $ (a,b) and $|y|$ (c,d) in the data and the simulation for the parton (a,c) and the particle (b,d) level. The simulation of POWHEG together with PYTHIA-8 is used to describe the $ \mathrm{ t \bar{t} } $ production. Experimental and statistical uncertainties are shown for the simulation that is normalized according to the measured integrated luminosity. |
png pdf |
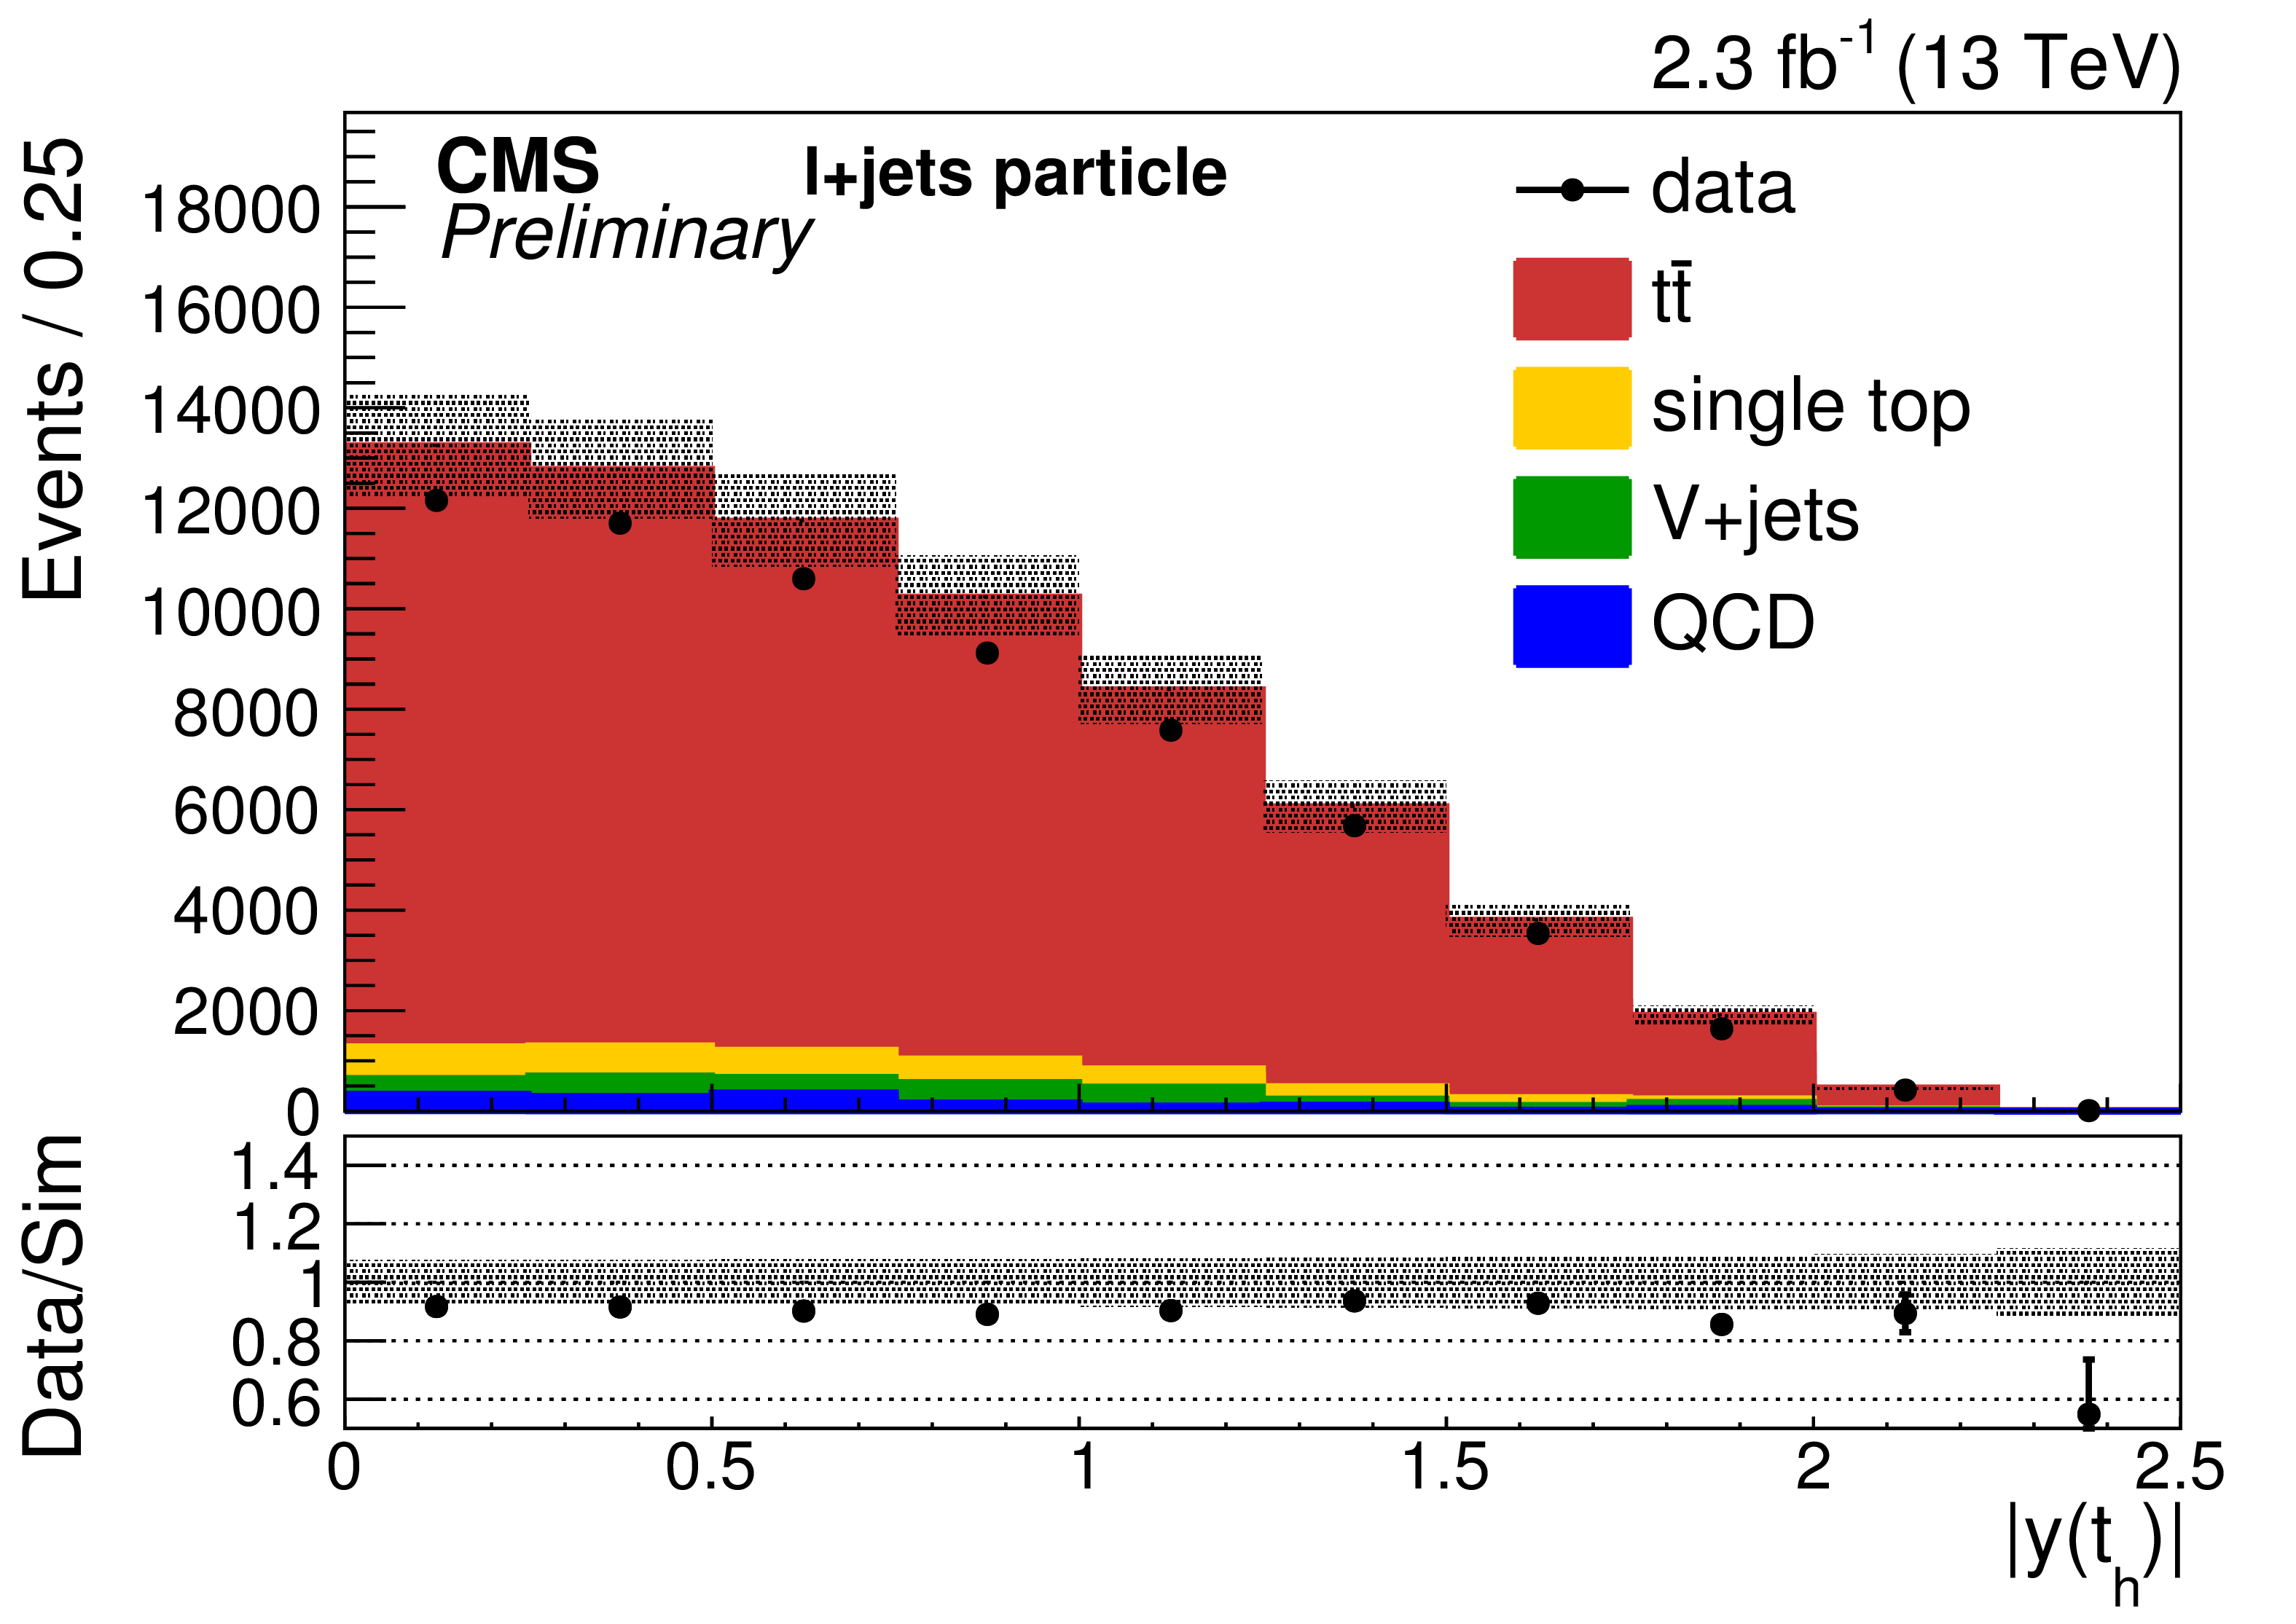
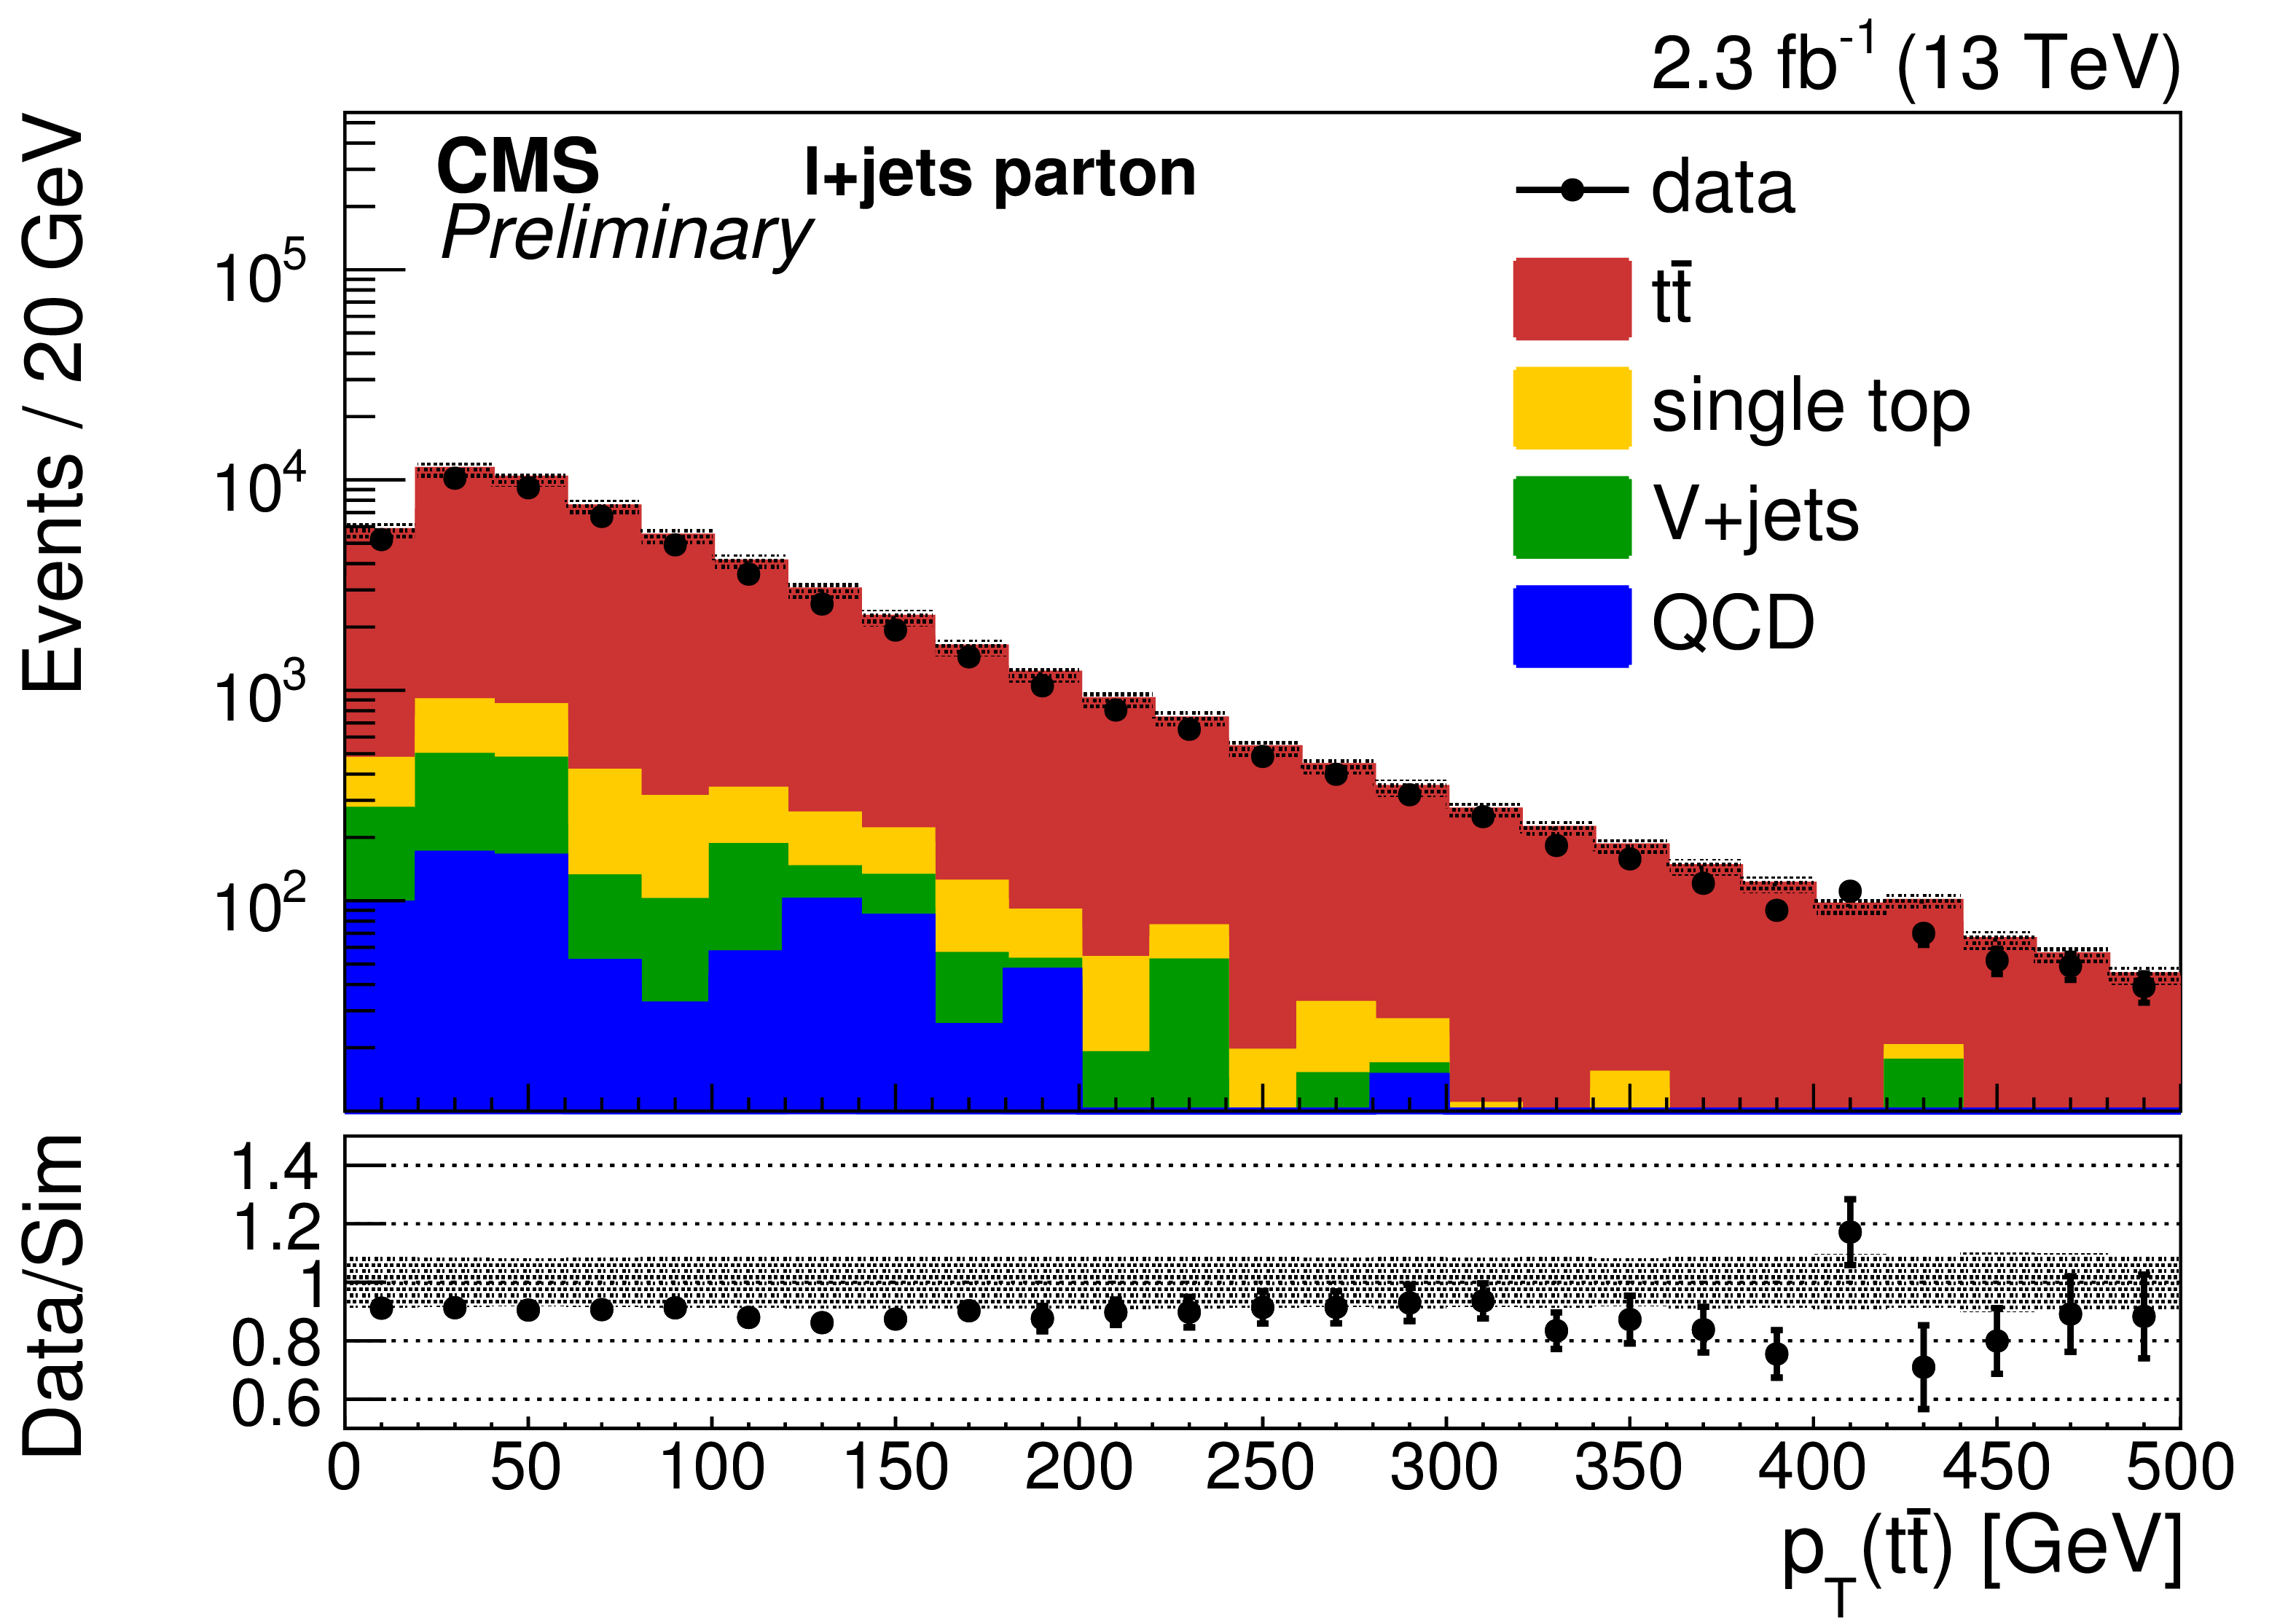
Figure 6-a:
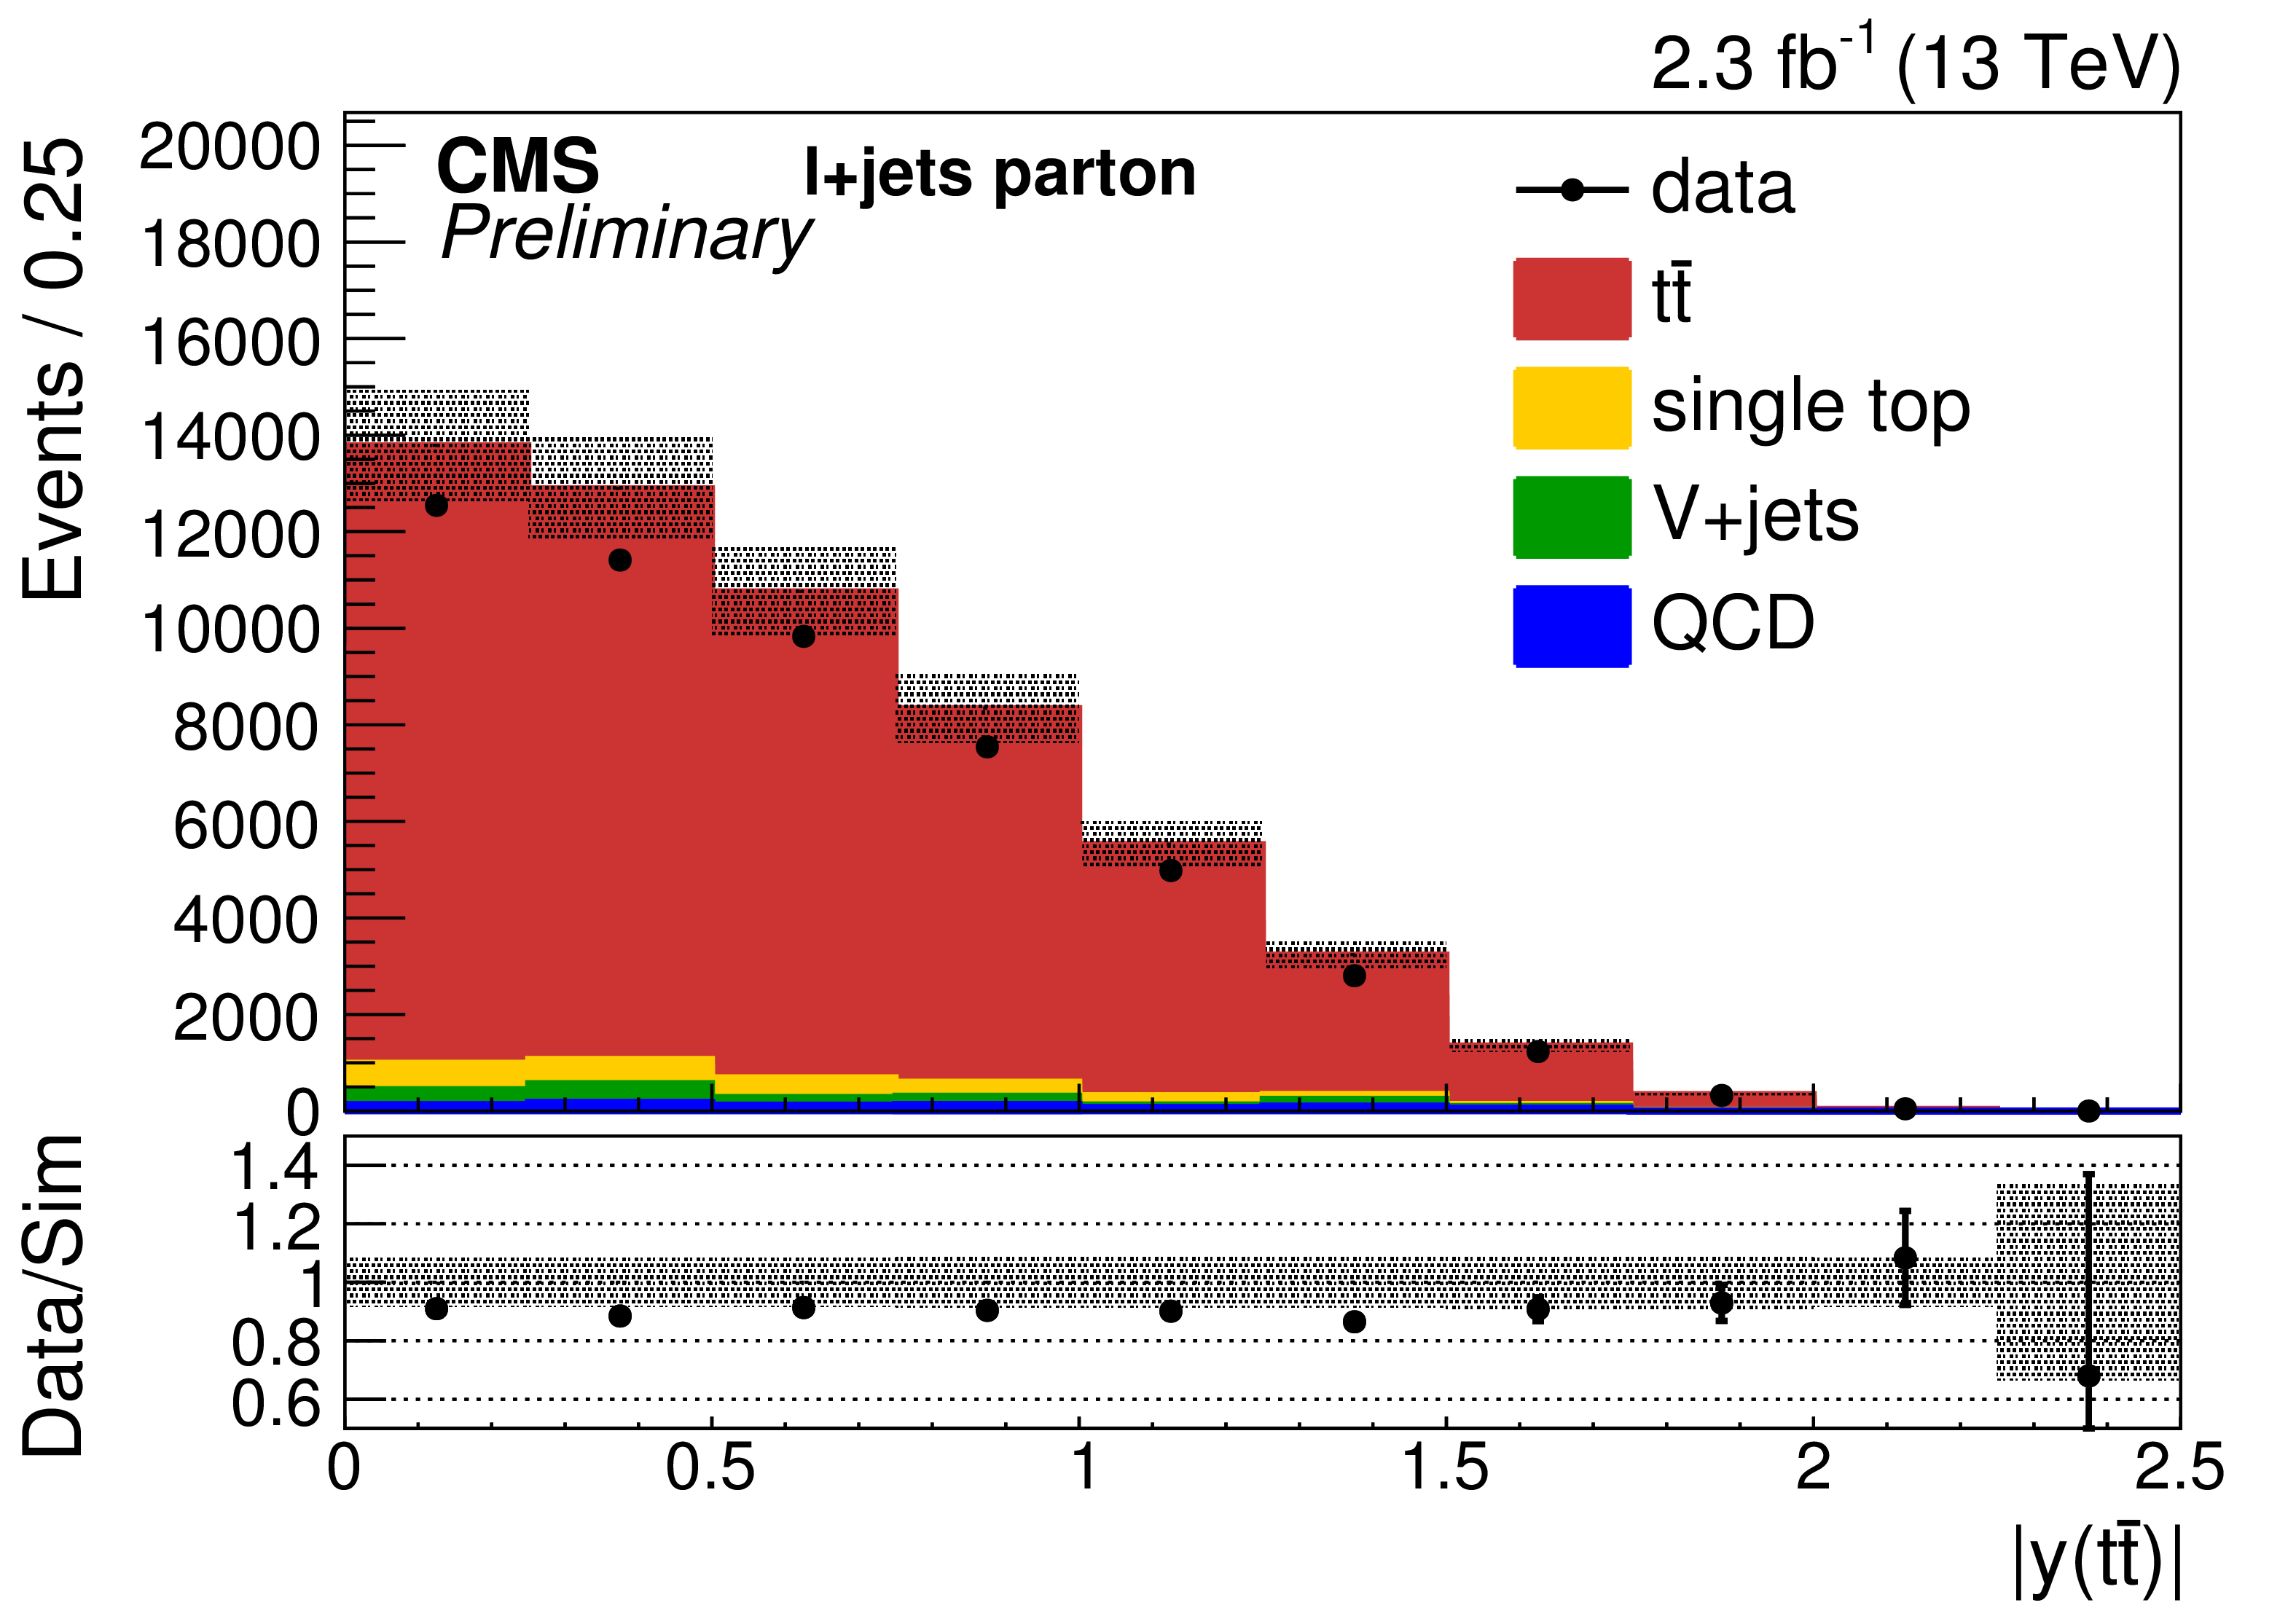
Comparisons of the reconstructed distributions of $ {p_{\mathrm {T}}} ( \mathrm{ t \bar{t} } )$ (a,b) and $|y( \mathrm{ t \bar{t} } )|$ (c,d) for the parton (a,c) and the particle (b,d) level measurements in the data and the simulation. e,f: distributions of $M( \mathrm{ t \bar{t} } )$ (a) and jet multiplicities (f). The simulation of POWHEG together with PYTHIA-8 is used to describe the $ \mathrm{ t \bar{t} } $ production. Experimental and statistical uncertainties are shown for the simulation that is normalized according to the measured integrated luminosity. |
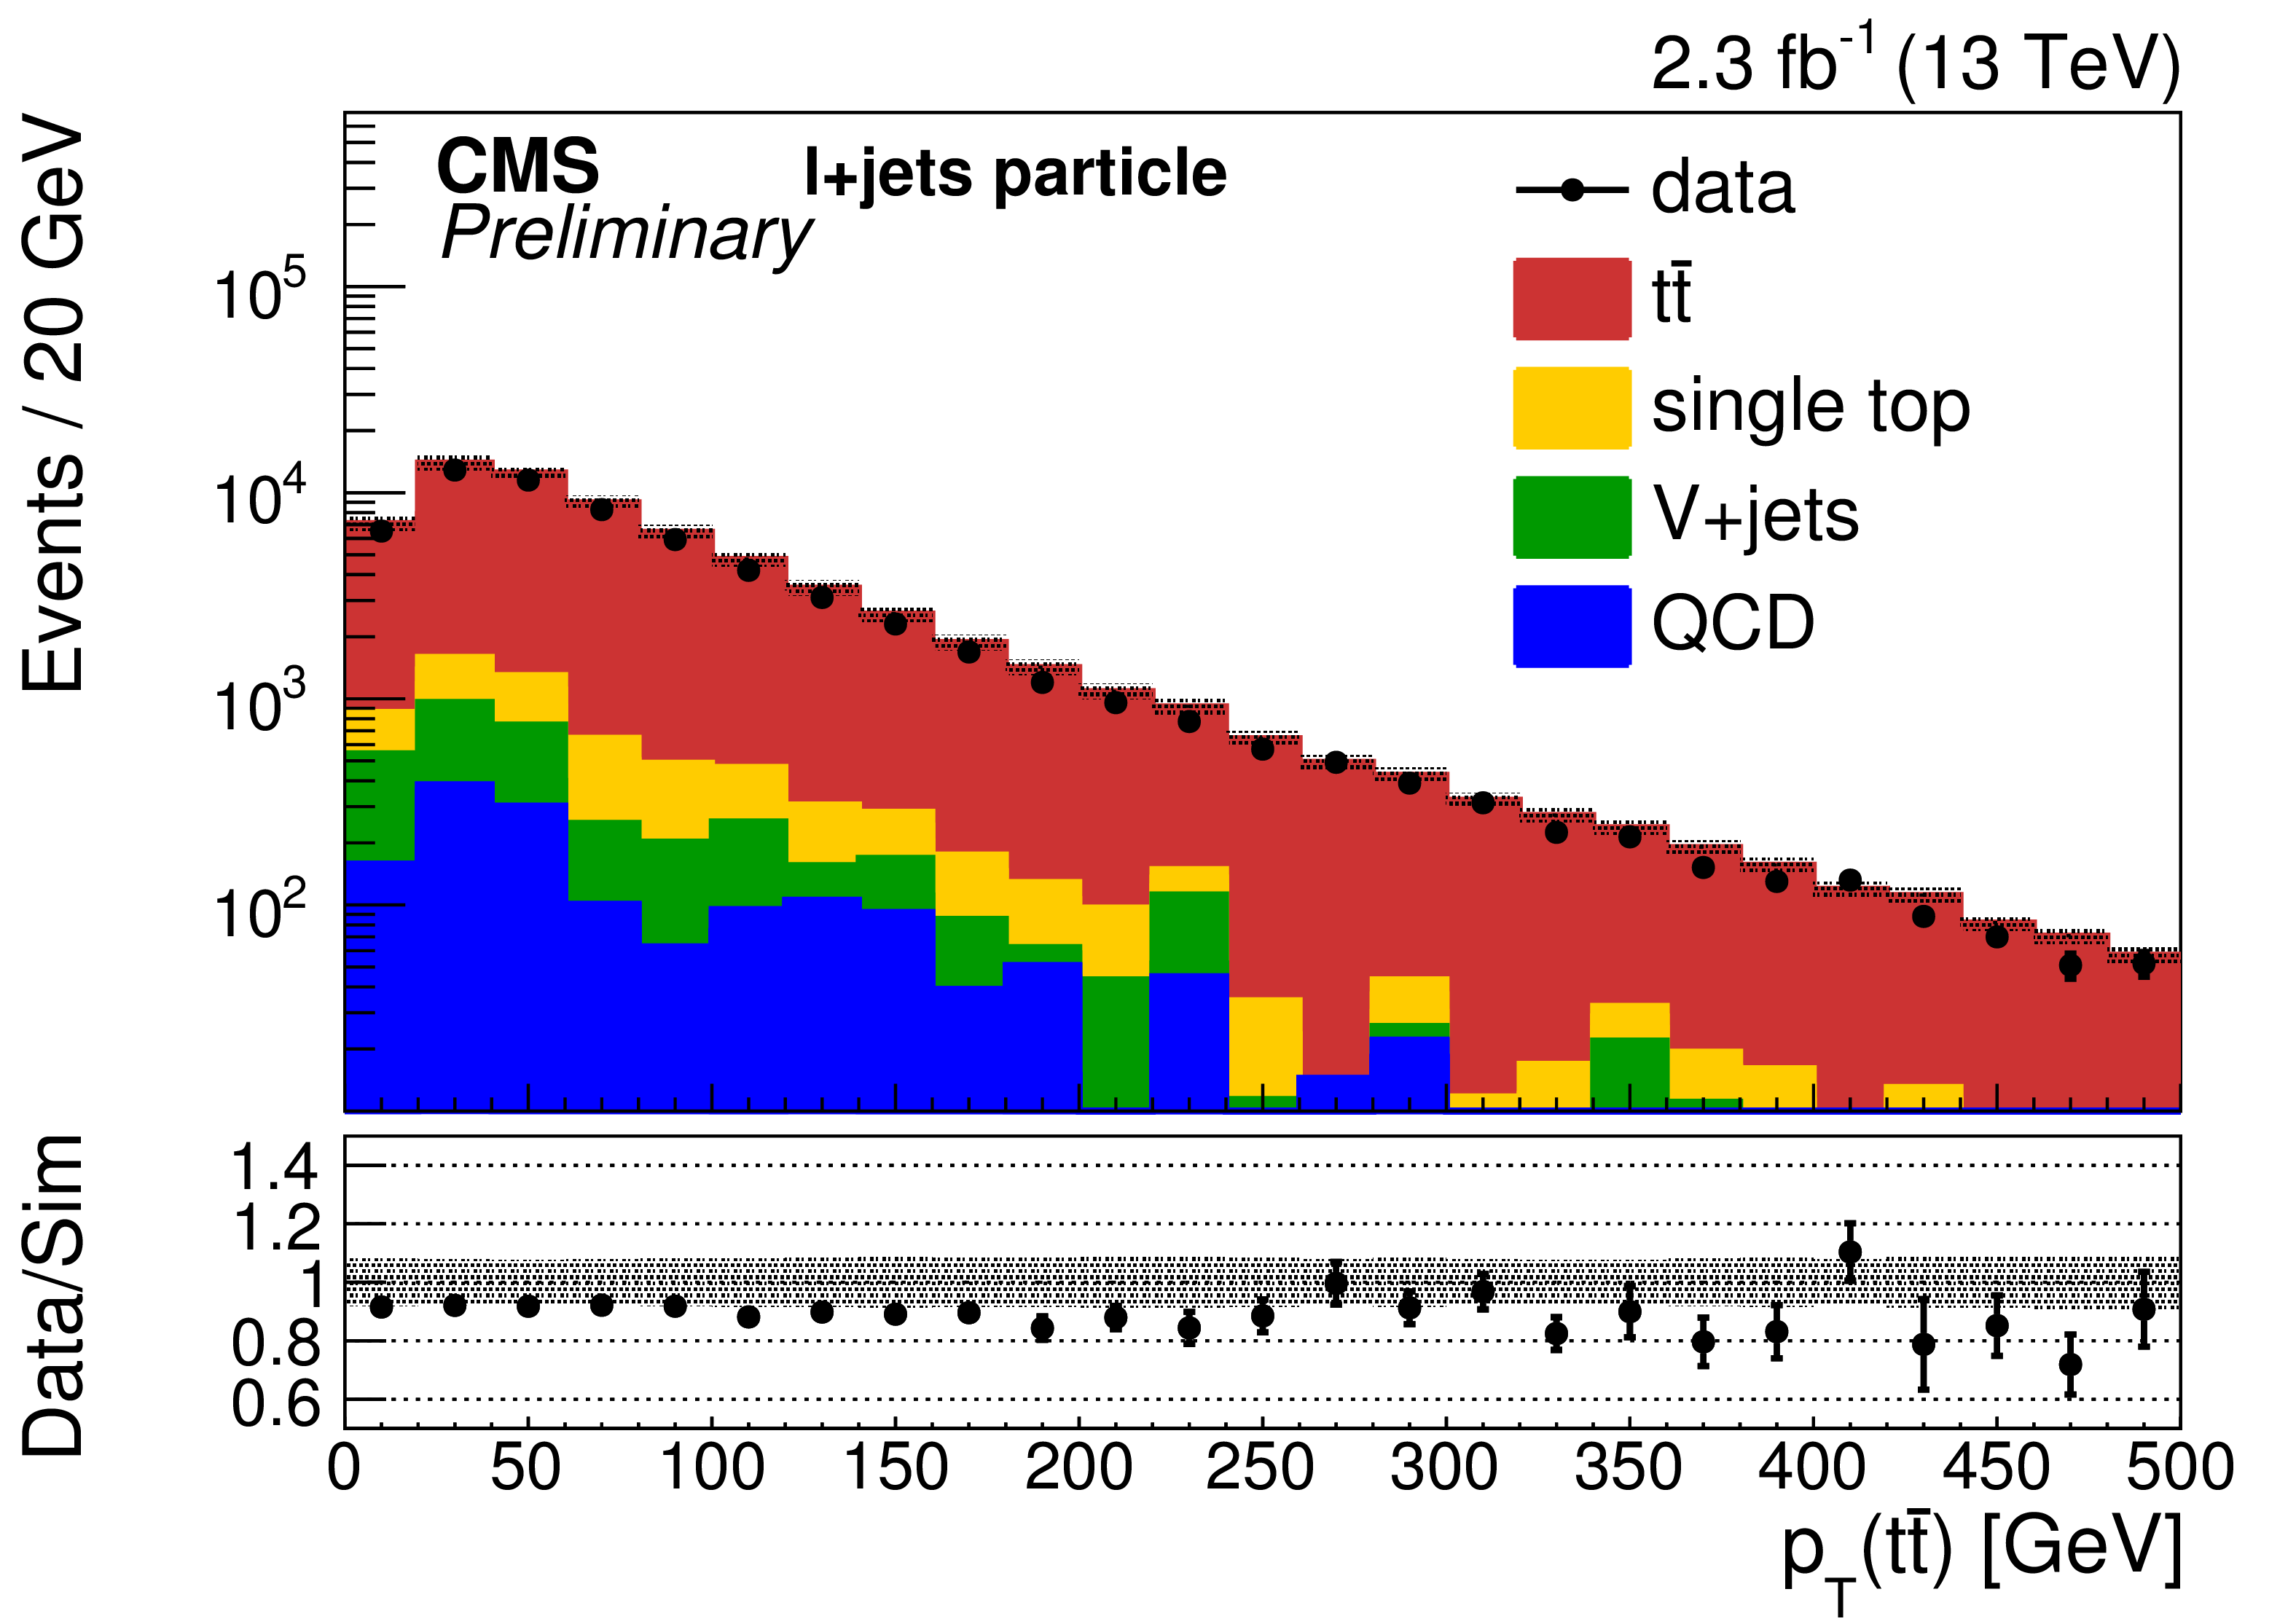
png pdf |
Figure 6-b:
Comparisons of the reconstructed distributions of $ {p_{\mathrm {T}}} ( \mathrm{ t \bar{t} } )$ (a,b) and $|y( \mathrm{ t \bar{t} } )|$ (c,d) for the parton (a,c) and the particle (b,d) level measurements in the data and the simulation. e,f: distributions of $M( \mathrm{ t \bar{t} } )$ (a) and jet multiplicities (f). The simulation of POWHEG together with PYTHIA-8 is used to describe the $ \mathrm{ t \bar{t} } $ production. Experimental and statistical uncertainties are shown for the simulation that is normalized according to the measured integrated luminosity. |
png pdf |
Figure 6-c:
Comparisons of the reconstructed distributions of $ {p_{\mathrm {T}}} ( \mathrm{ t \bar{t} } )$ (a,b) and $|y( \mathrm{ t \bar{t} } )|$ (c,d) for the parton (a,c) and the particle (b,d) level measurements in the data and the simulation. e,f: distributions of $M( \mathrm{ t \bar{t} } )$ (a) and jet multiplicities (f). The simulation of POWHEG together with PYTHIA-8 is used to describe the $ \mathrm{ t \bar{t} } $ production. Experimental and statistical uncertainties are shown for the simulation that is normalized according to the measured integrated luminosity. |

png pdf |
Figure 6-d:
Comparisons of the reconstructed distributions of $ {p_{\mathrm {T}}} ( \mathrm{ t \bar{t} } )$ (a,b) and $|y( \mathrm{ t \bar{t} } )|$ (c,d) for the parton (a,c) and the particle (b,d) level measurements in the data and the simulation. e,f: distributions of $M( \mathrm{ t \bar{t} } )$ (a) and jet multiplicities (f). The simulation of POWHEG together with PYTHIA-8 is used to describe the $ \mathrm{ t \bar{t} } $ production. Experimental and statistical uncertainties are shown for the simulation that is normalized according to the measured integrated luminosity. |
png pdf |
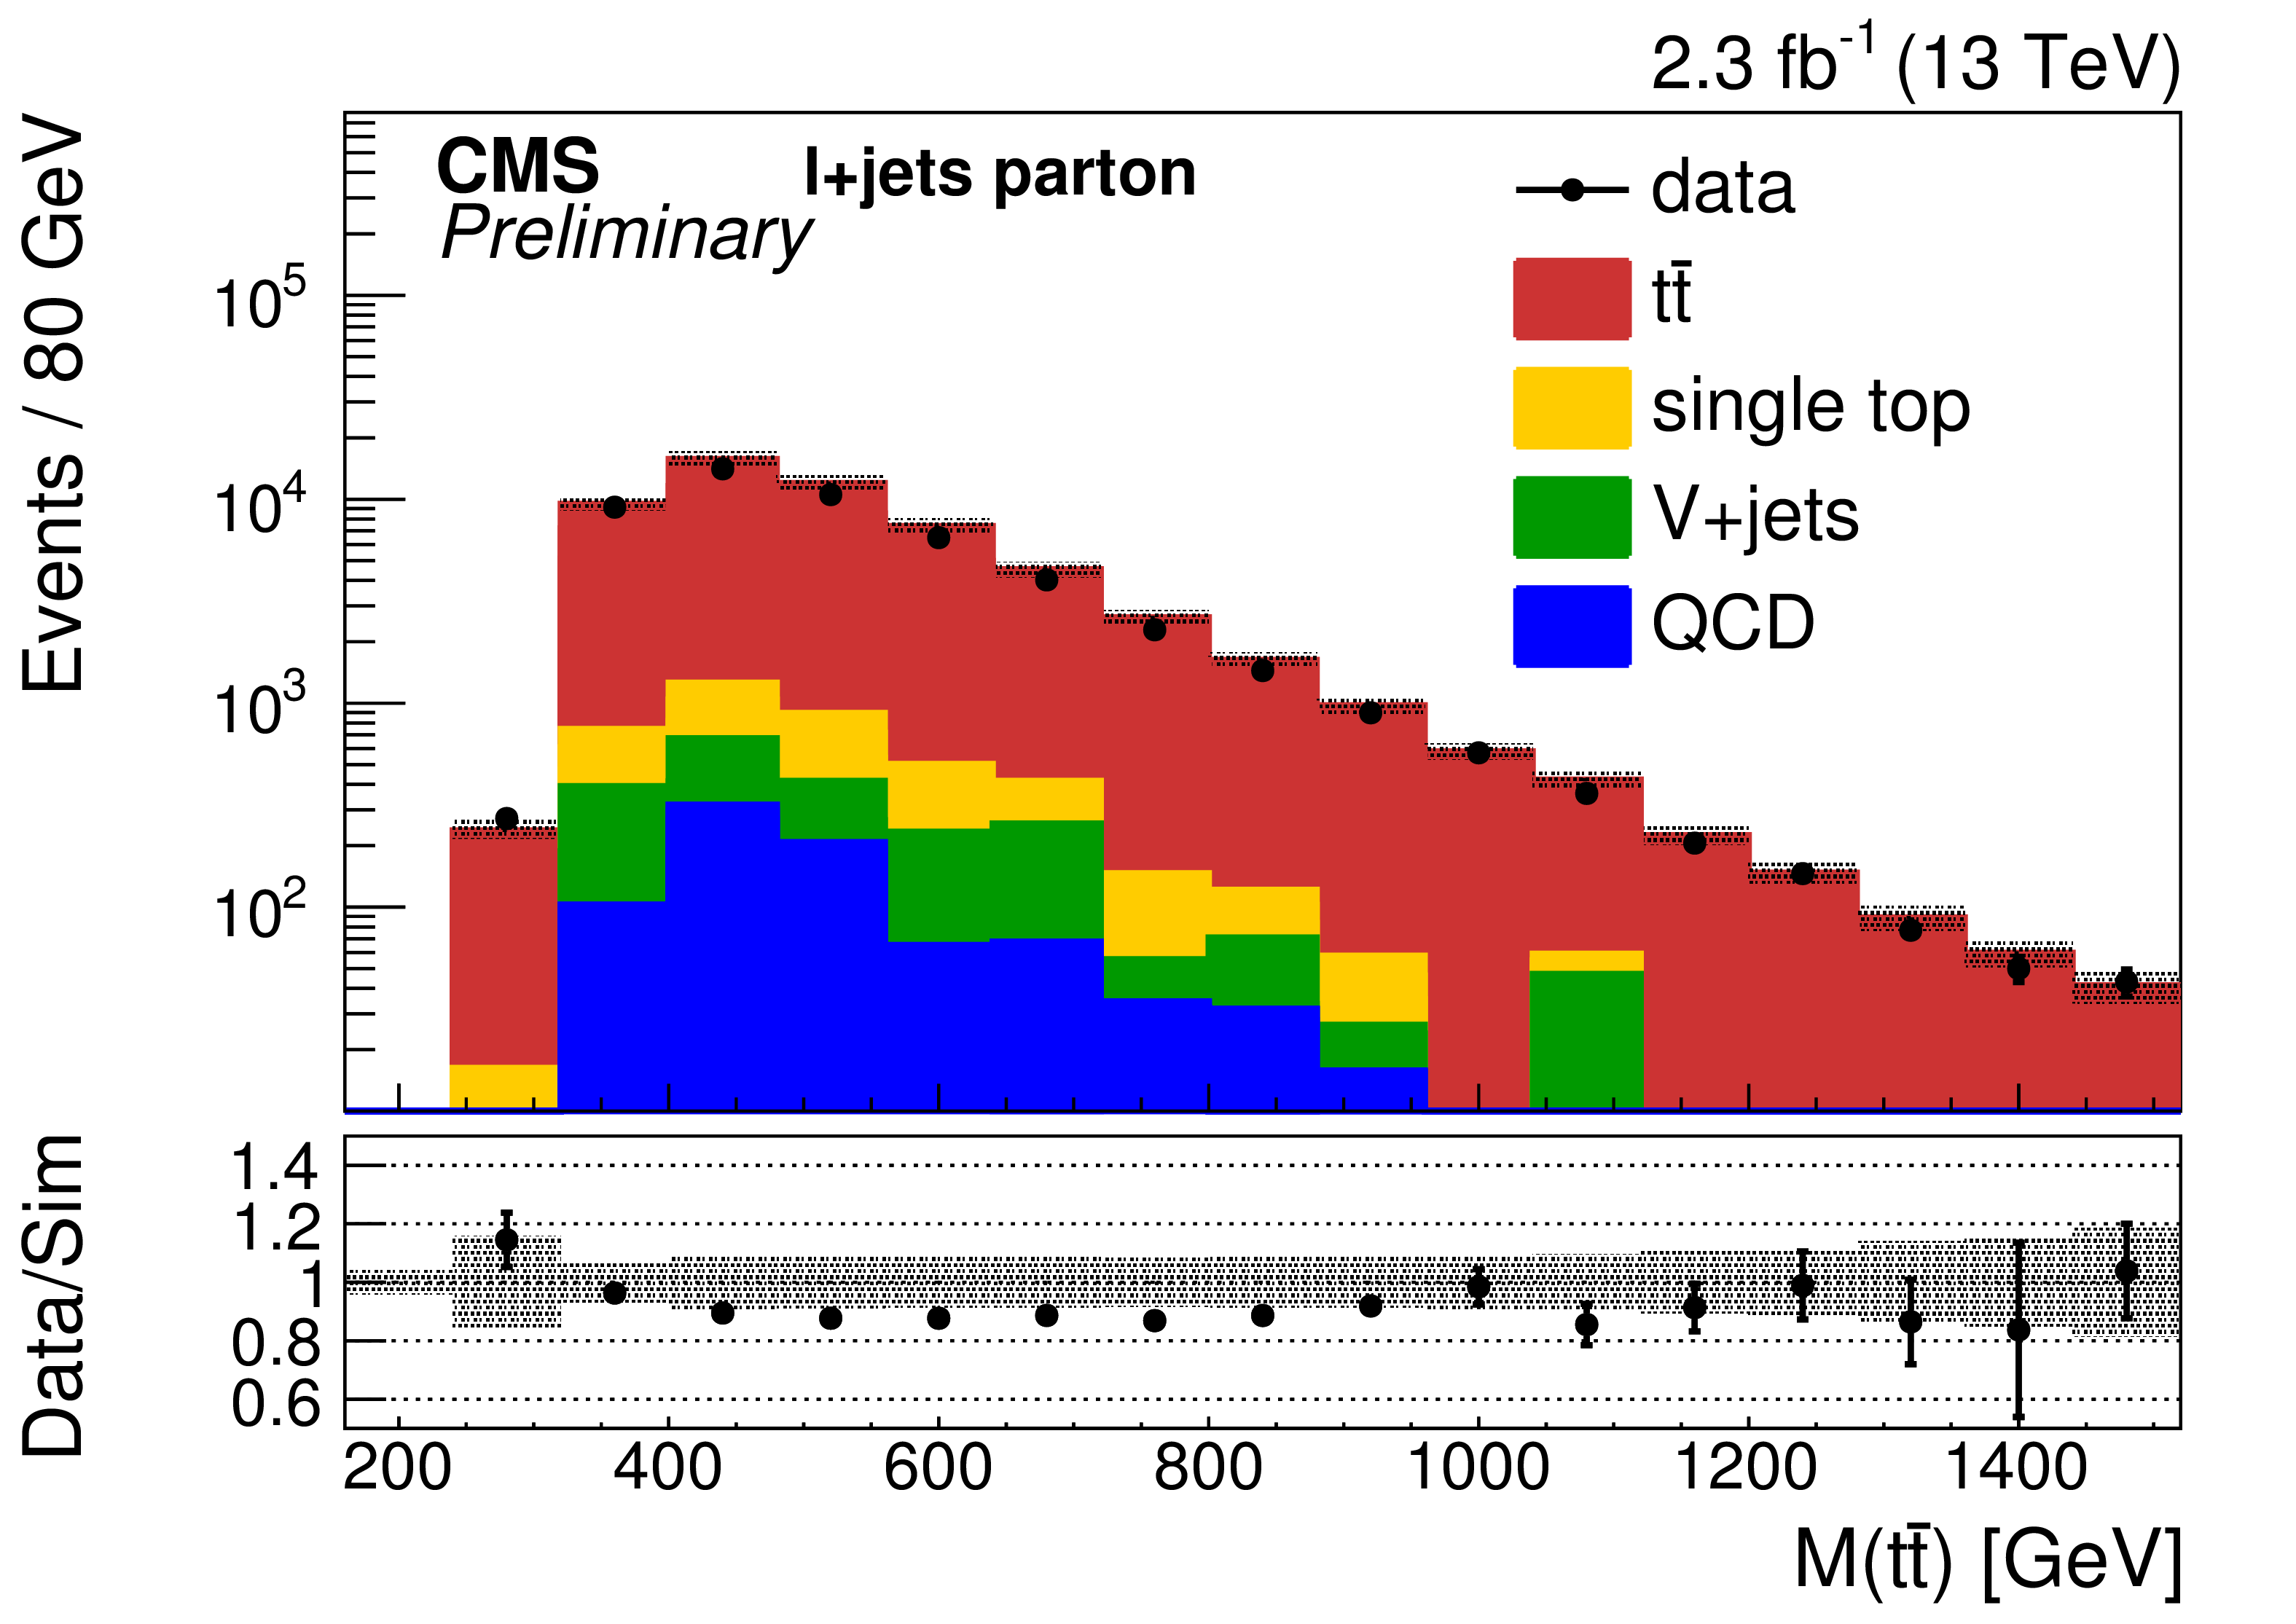
Figure 6-e:
Comparisons of the reconstructed distributions of $ {p_{\mathrm {T}}} ( \mathrm{ t \bar{t} } )$ (a,b) and $|y( \mathrm{ t \bar{t} } )|$ (c,d) for the parton (a,c) and the particle (b,d) level measurements in the data and the simulation. e,f: distributions of $M( \mathrm{ t \bar{t} } )$ (a) and jet multiplicities (f). The simulation of POWHEG together with PYTHIA-8 is used to describe the $ \mathrm{ t \bar{t} } $ production. Experimental and statistical uncertainties are shown for the simulation that is normalized according to the measured integrated luminosity. |
png pdf |
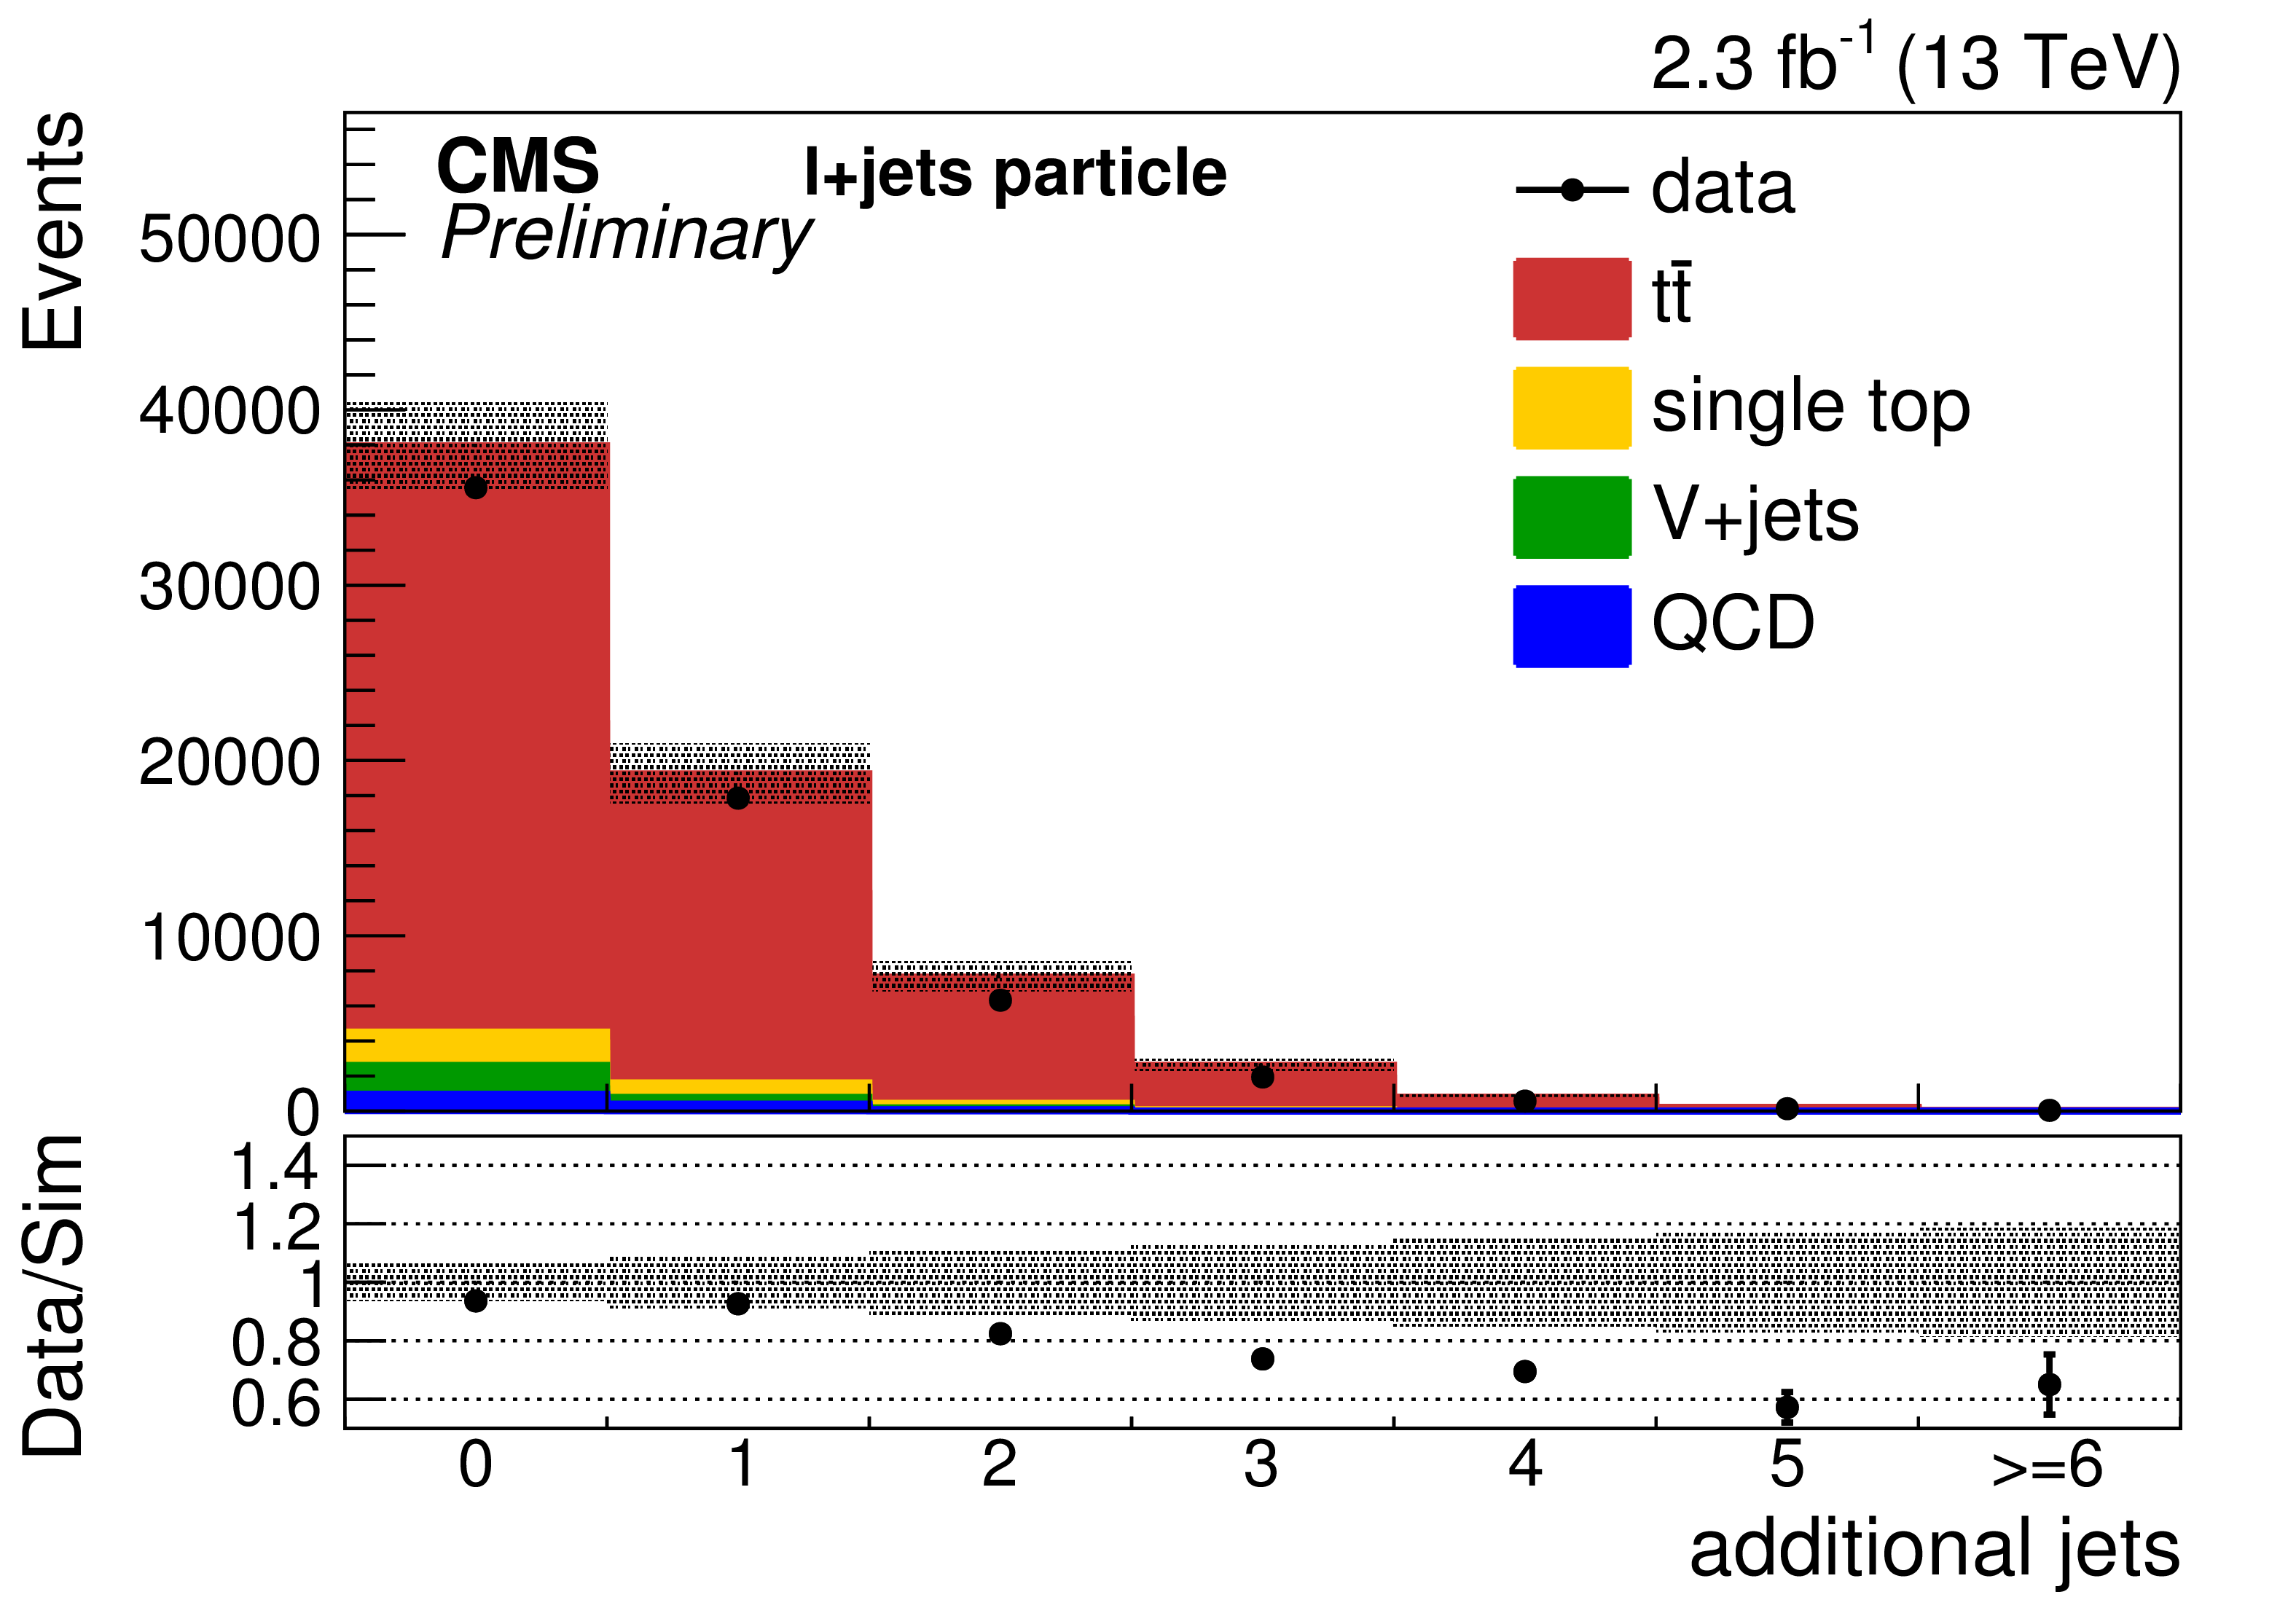
Figure 6-f:
Comparisons of the reconstructed distributions of $ {p_{\mathrm {T}}} ( \mathrm{ t \bar{t} } )$ (a,b) and $|y( \mathrm{ t \bar{t} } )|$ (c,d) for the parton (a,c) and the particle (b,d) level measurements in the data and the simulation. e,f: distributions of $M( \mathrm{ t \bar{t} } )$ (a) and jet multiplicities (f). The simulation of POWHEG together with PYTHIA-8 is used to describe the $ \mathrm{ t \bar{t} } $ production. Experimental and statistical uncertainties are shown for the simulation that is normalized according to the measured integrated luminosity. |

png pdf |
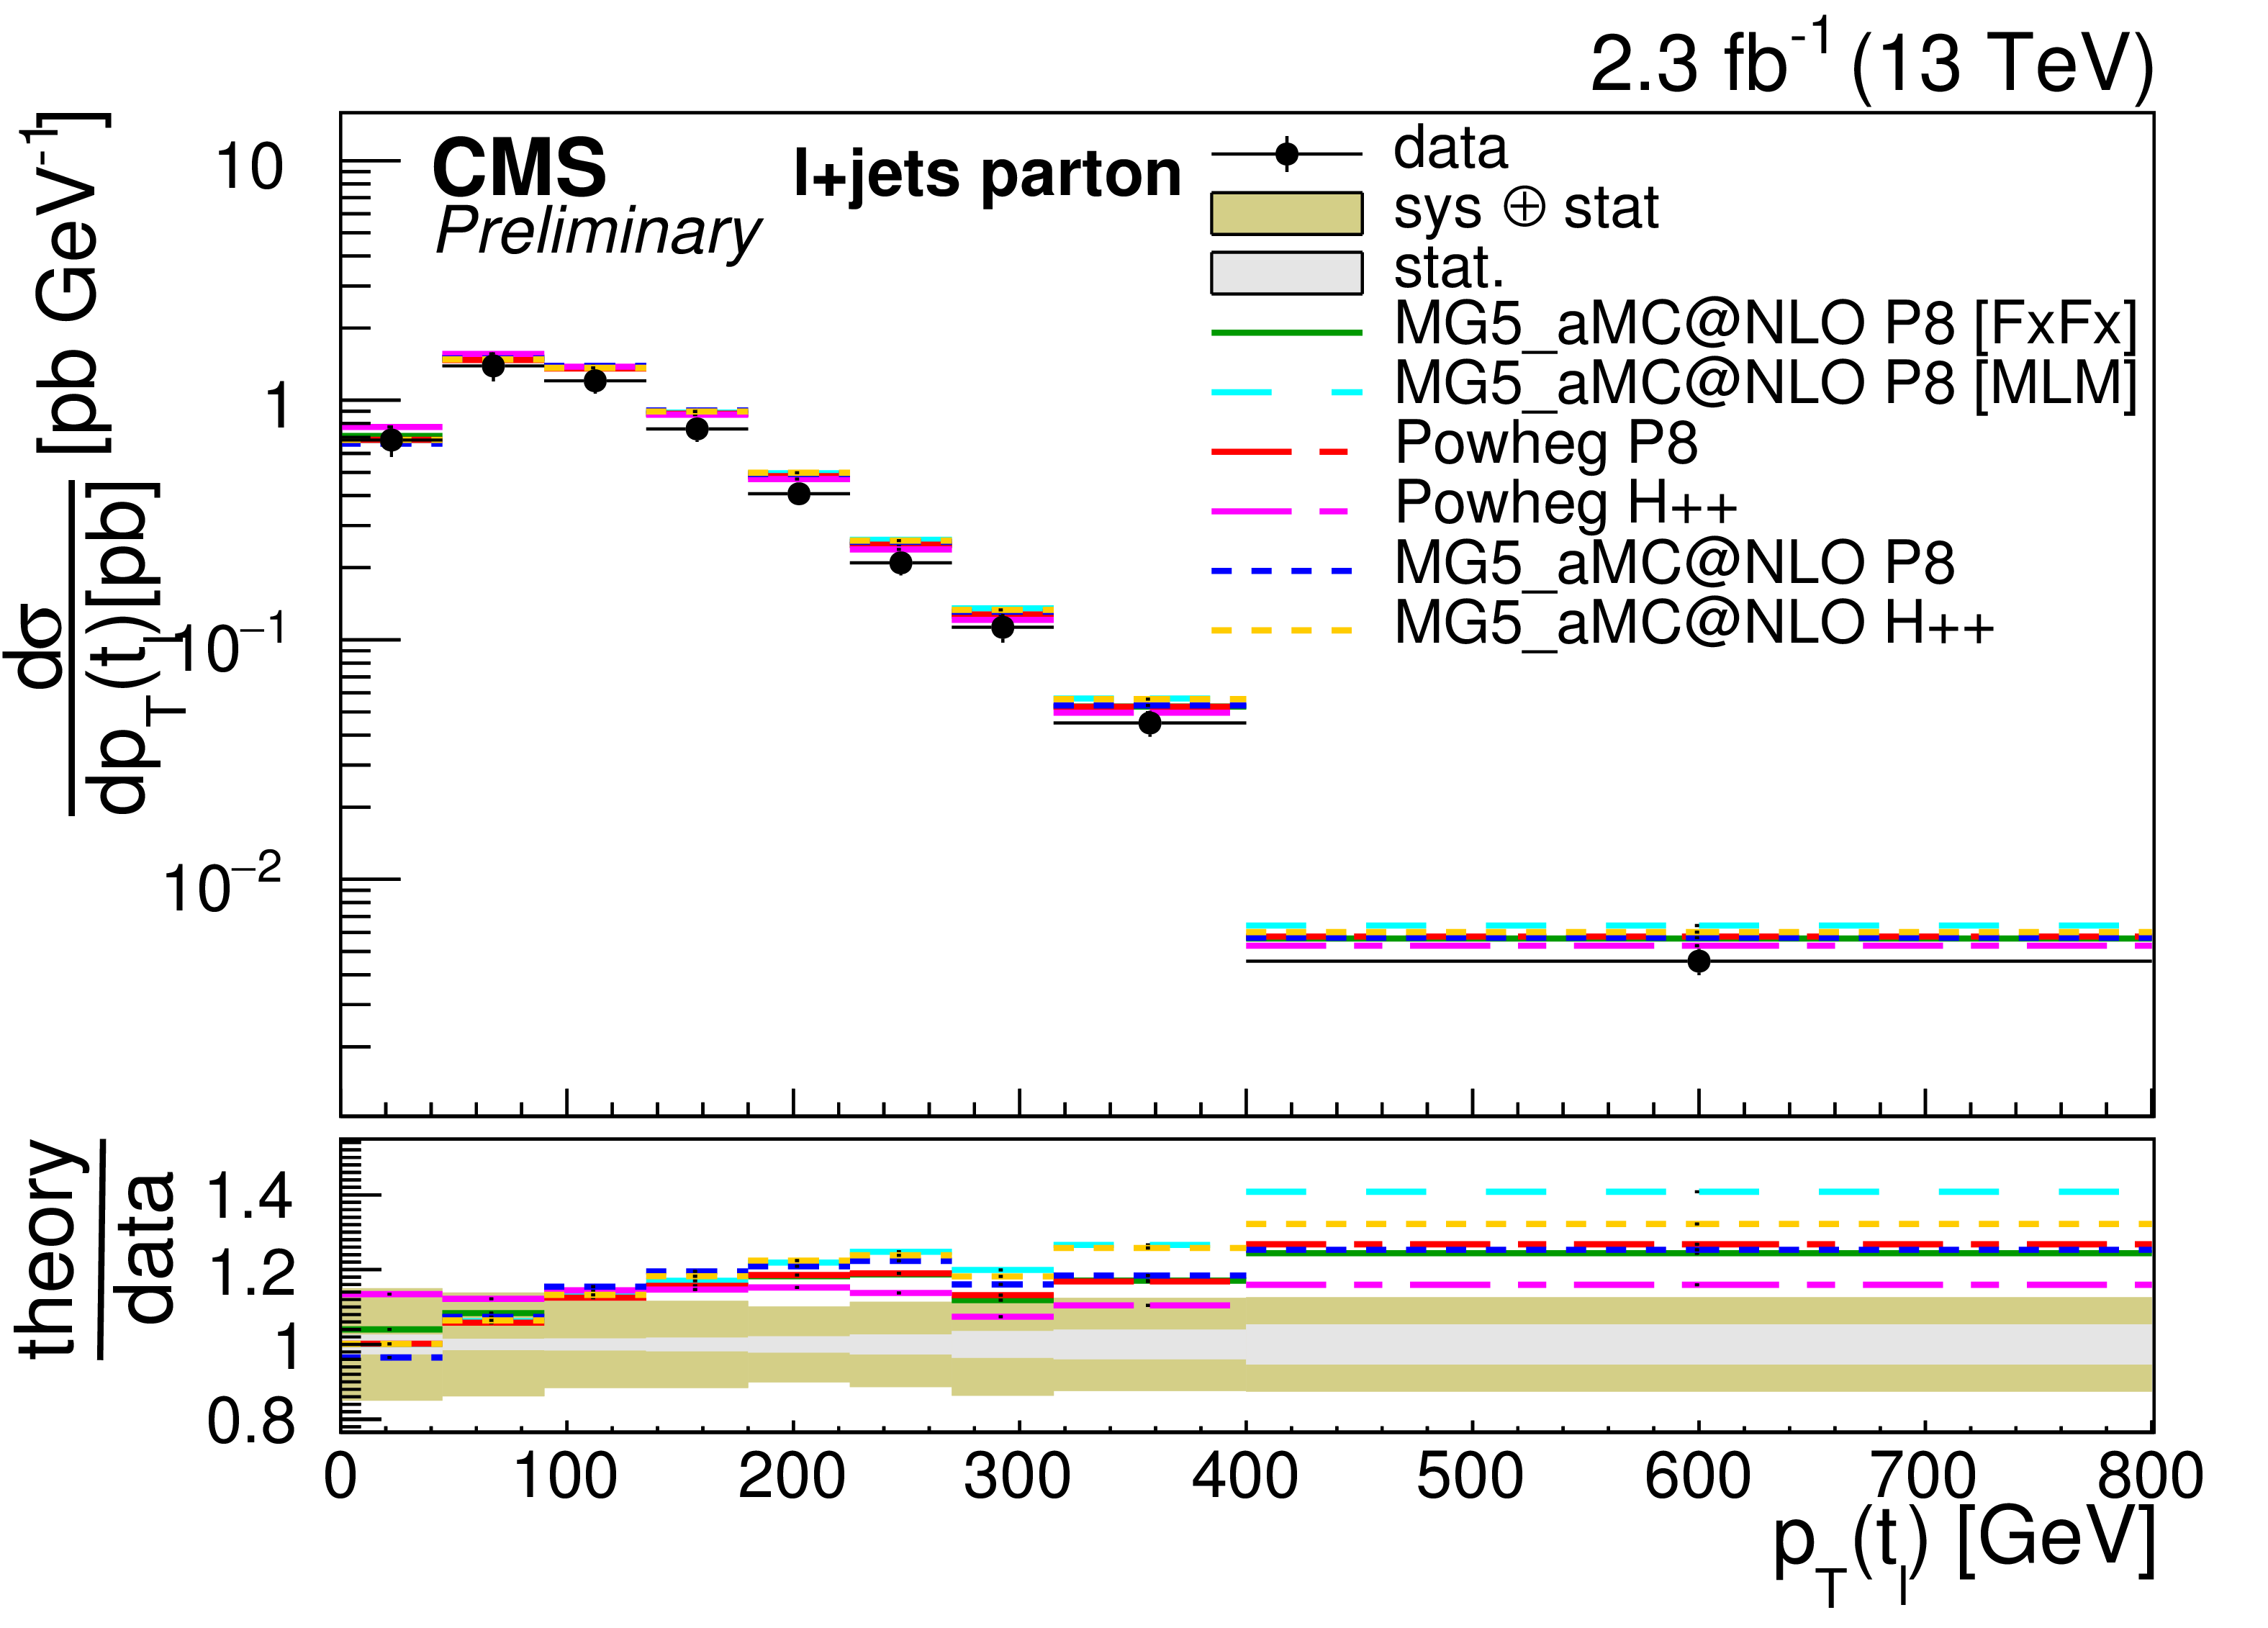
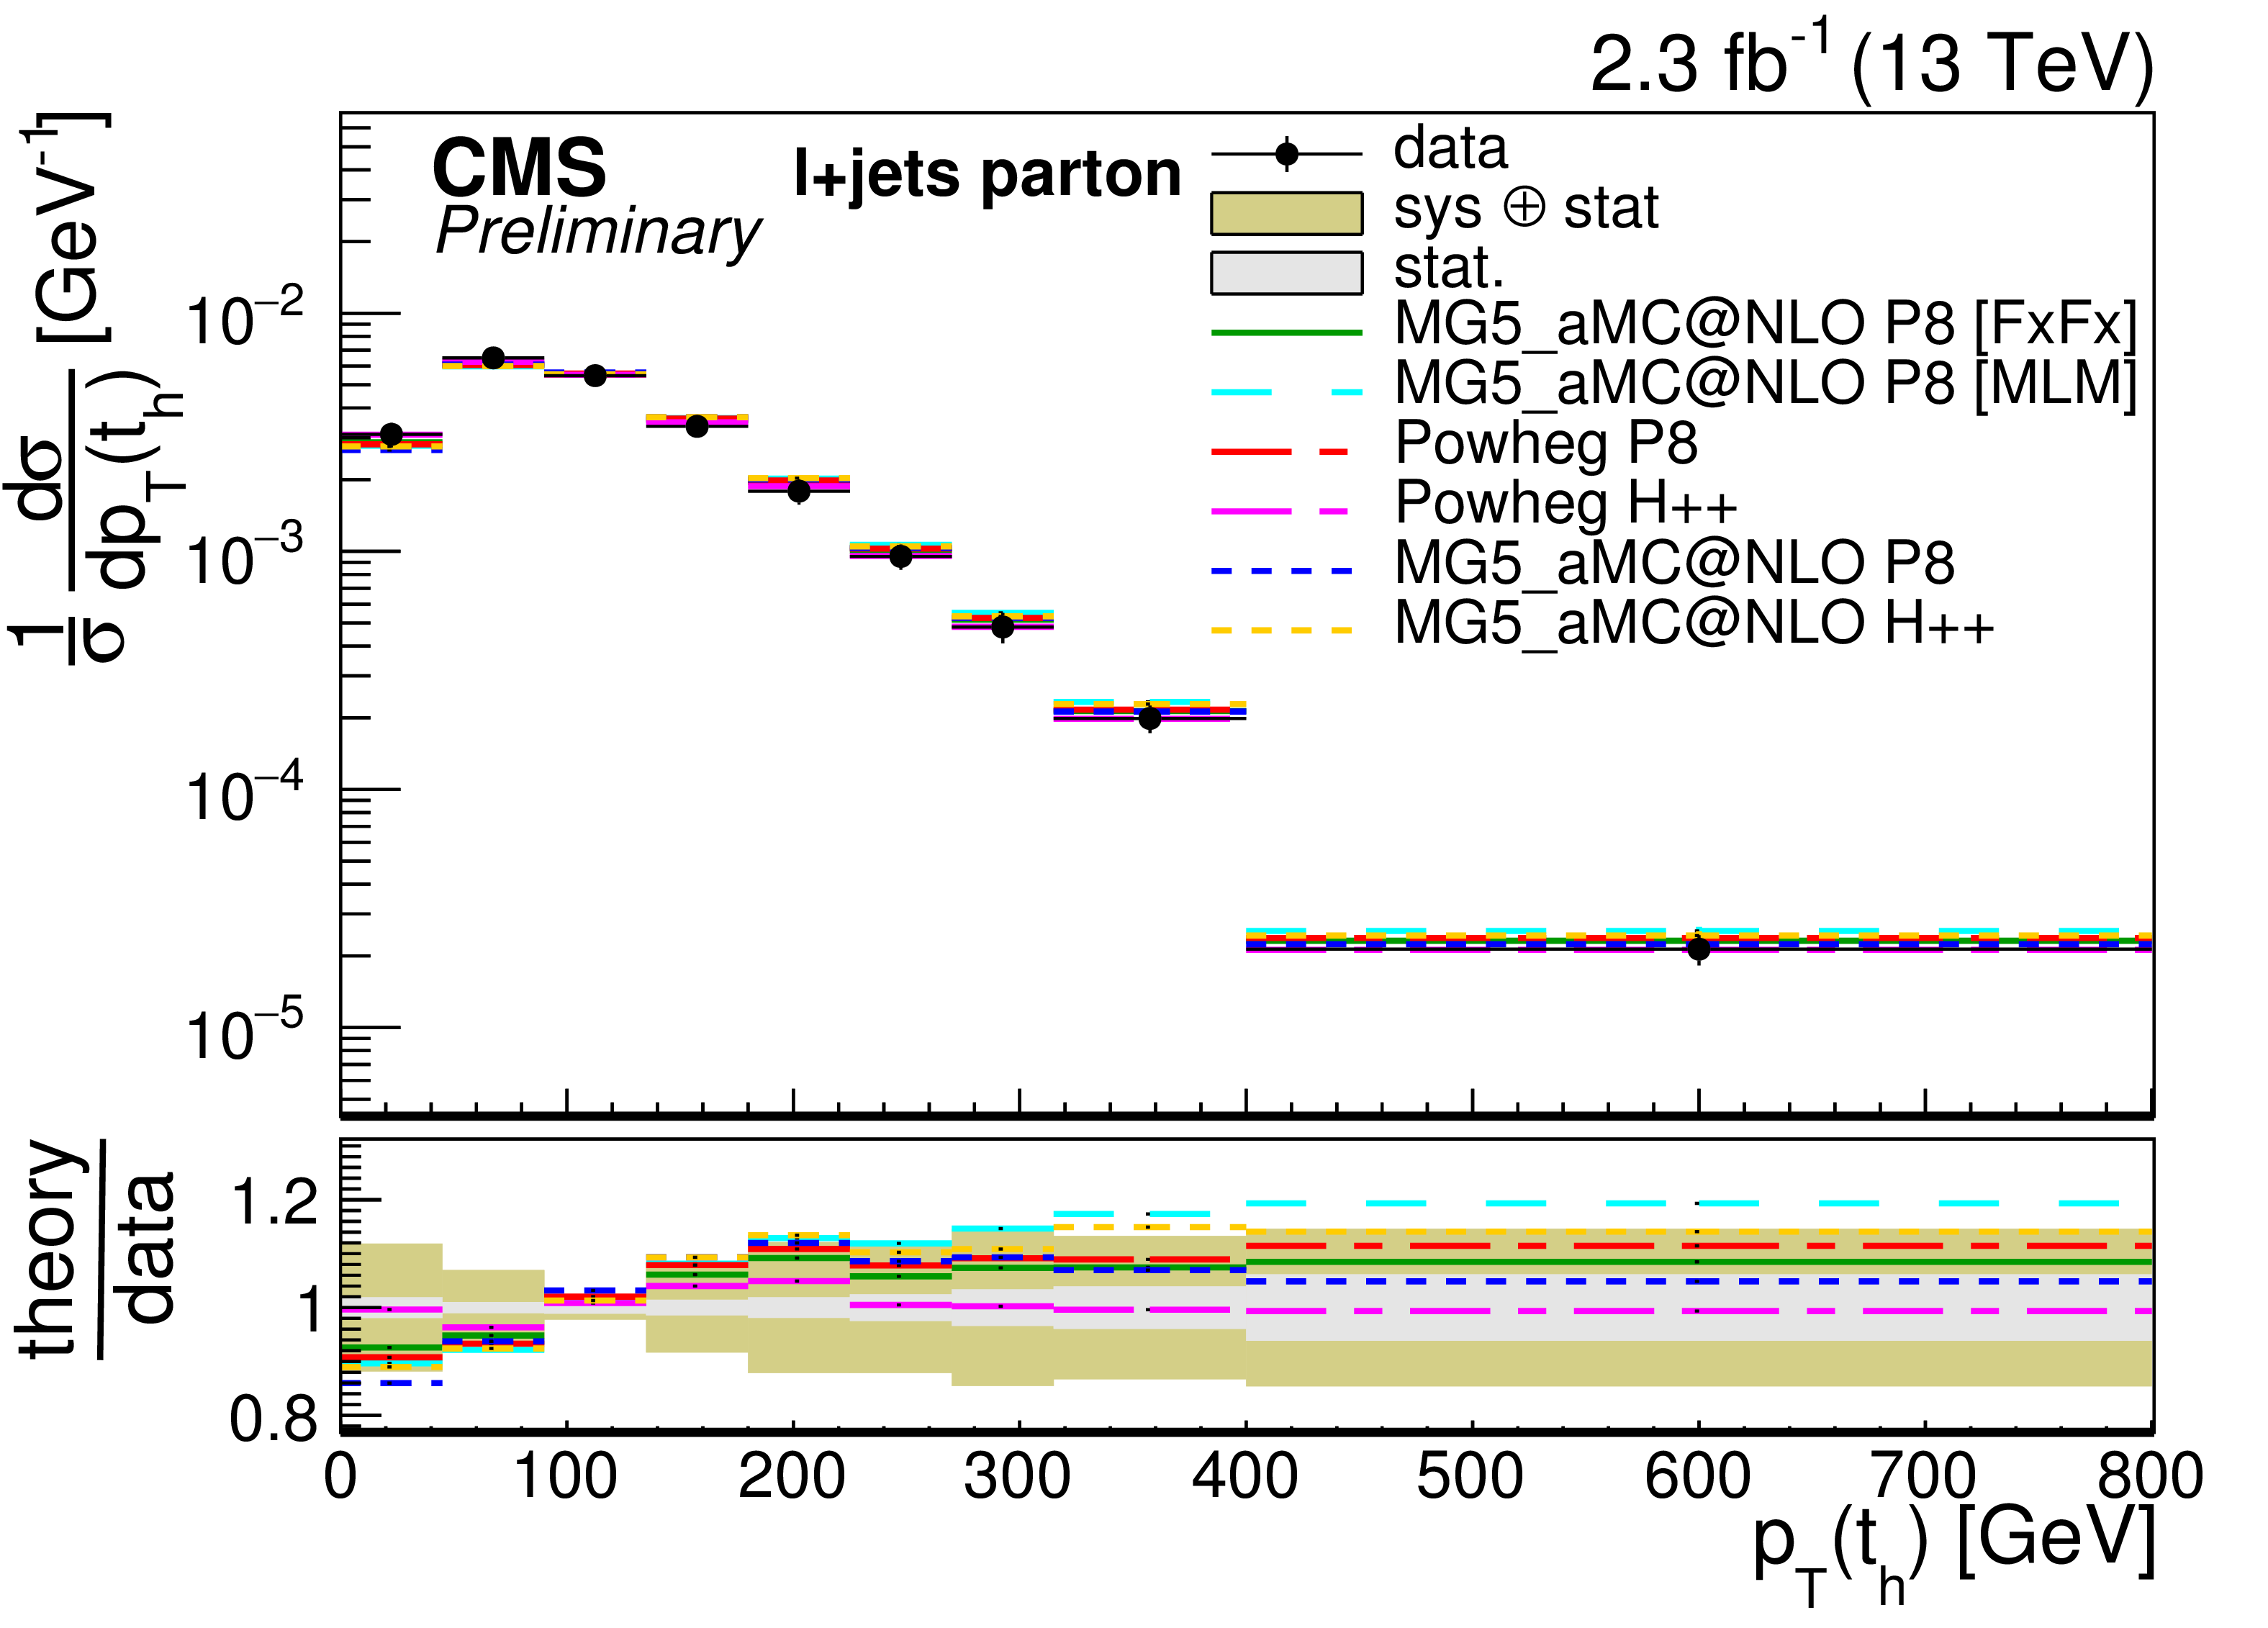
Figure 7-a:
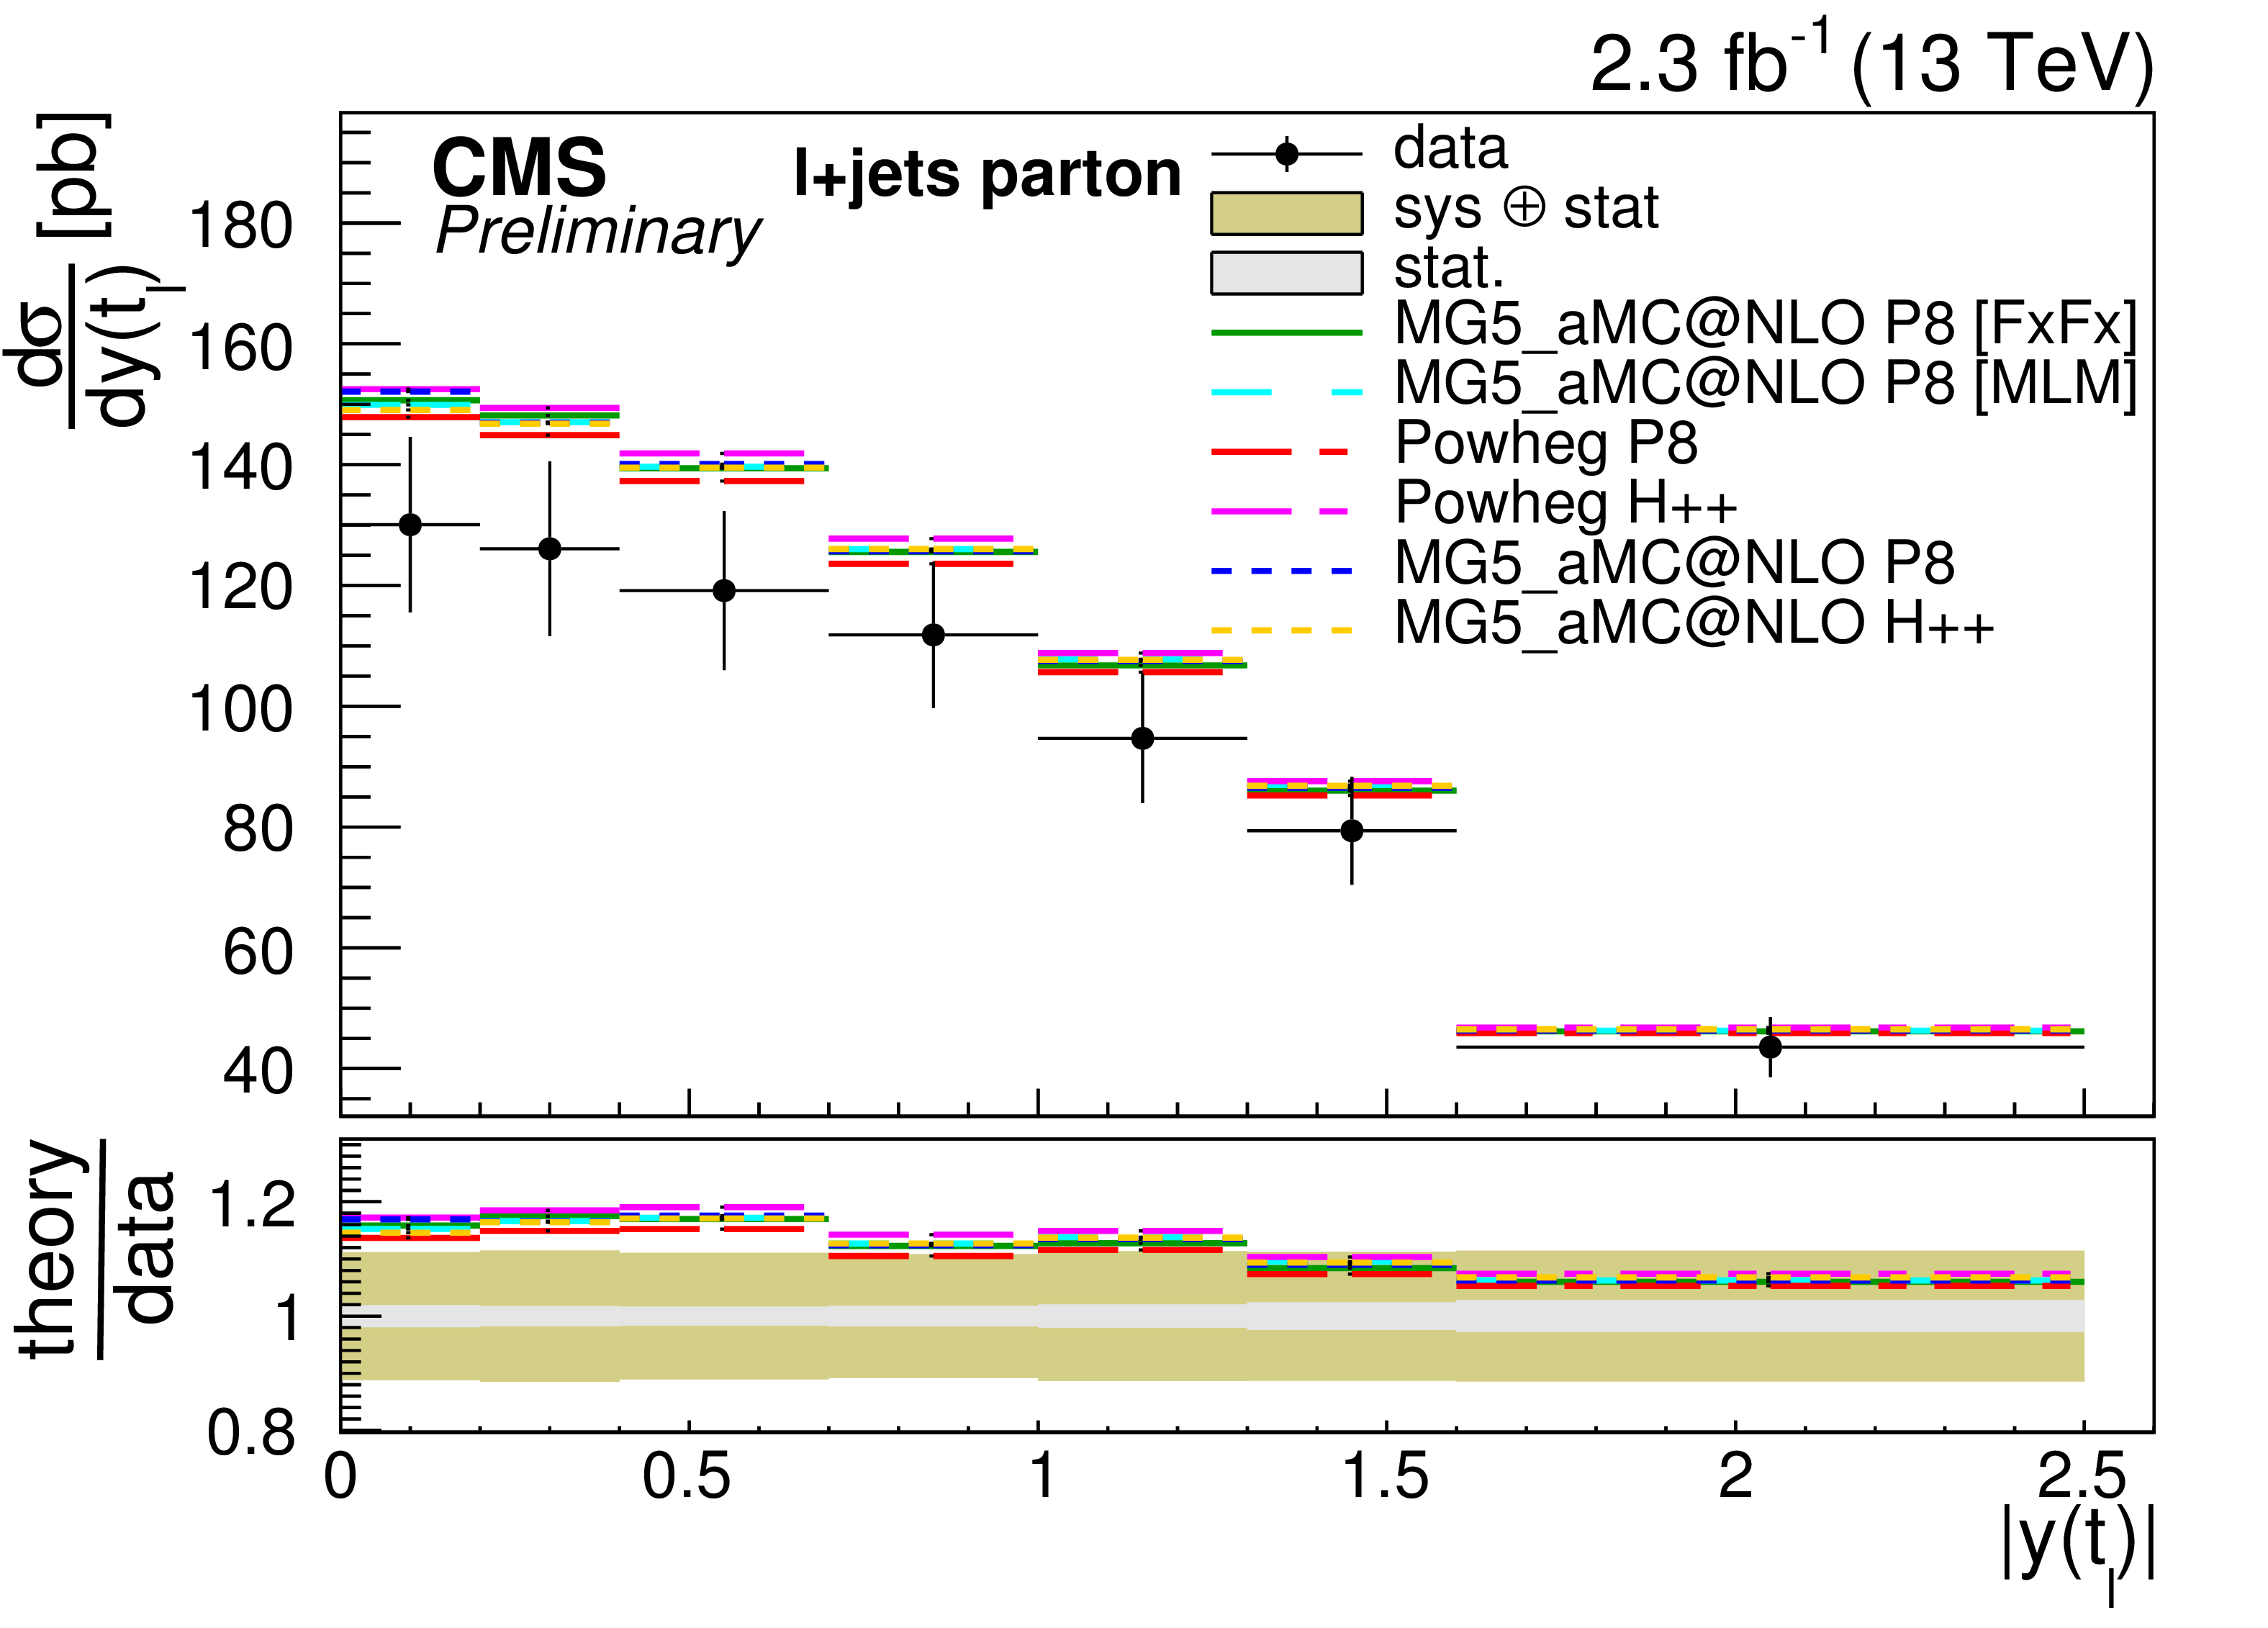
Differential cross sections at parton level as a function of $ {p_{\mathrm {T}}} ( {\mathrm {t} })$ and $|y( {\mathrm {t} })|$ compared to the predictions of POWHEG and MG5-aMC@NLO plus PYTHIA-8 (P8) or HERWIG++ (H++) and the multijet simulations MG5-aMC@NLO (MLM) and MG5-aMC@NLO (FxFx). |
png pdf |
Figure 7-b:
Differential cross sections at parton level as a function of $ {p_{\mathrm {T}}} ( {\mathrm {t} })$ and $|y( {\mathrm {t} })|$ compared to the predictions of POWHEG and MG5-aMC@NLO plus PYTHIA-8 (P8) or HERWIG++ (H++) and the multijet simulations MG5-aMC@NLO (MLM) and MG5-aMC@NLO (FxFx). |
png pdf |
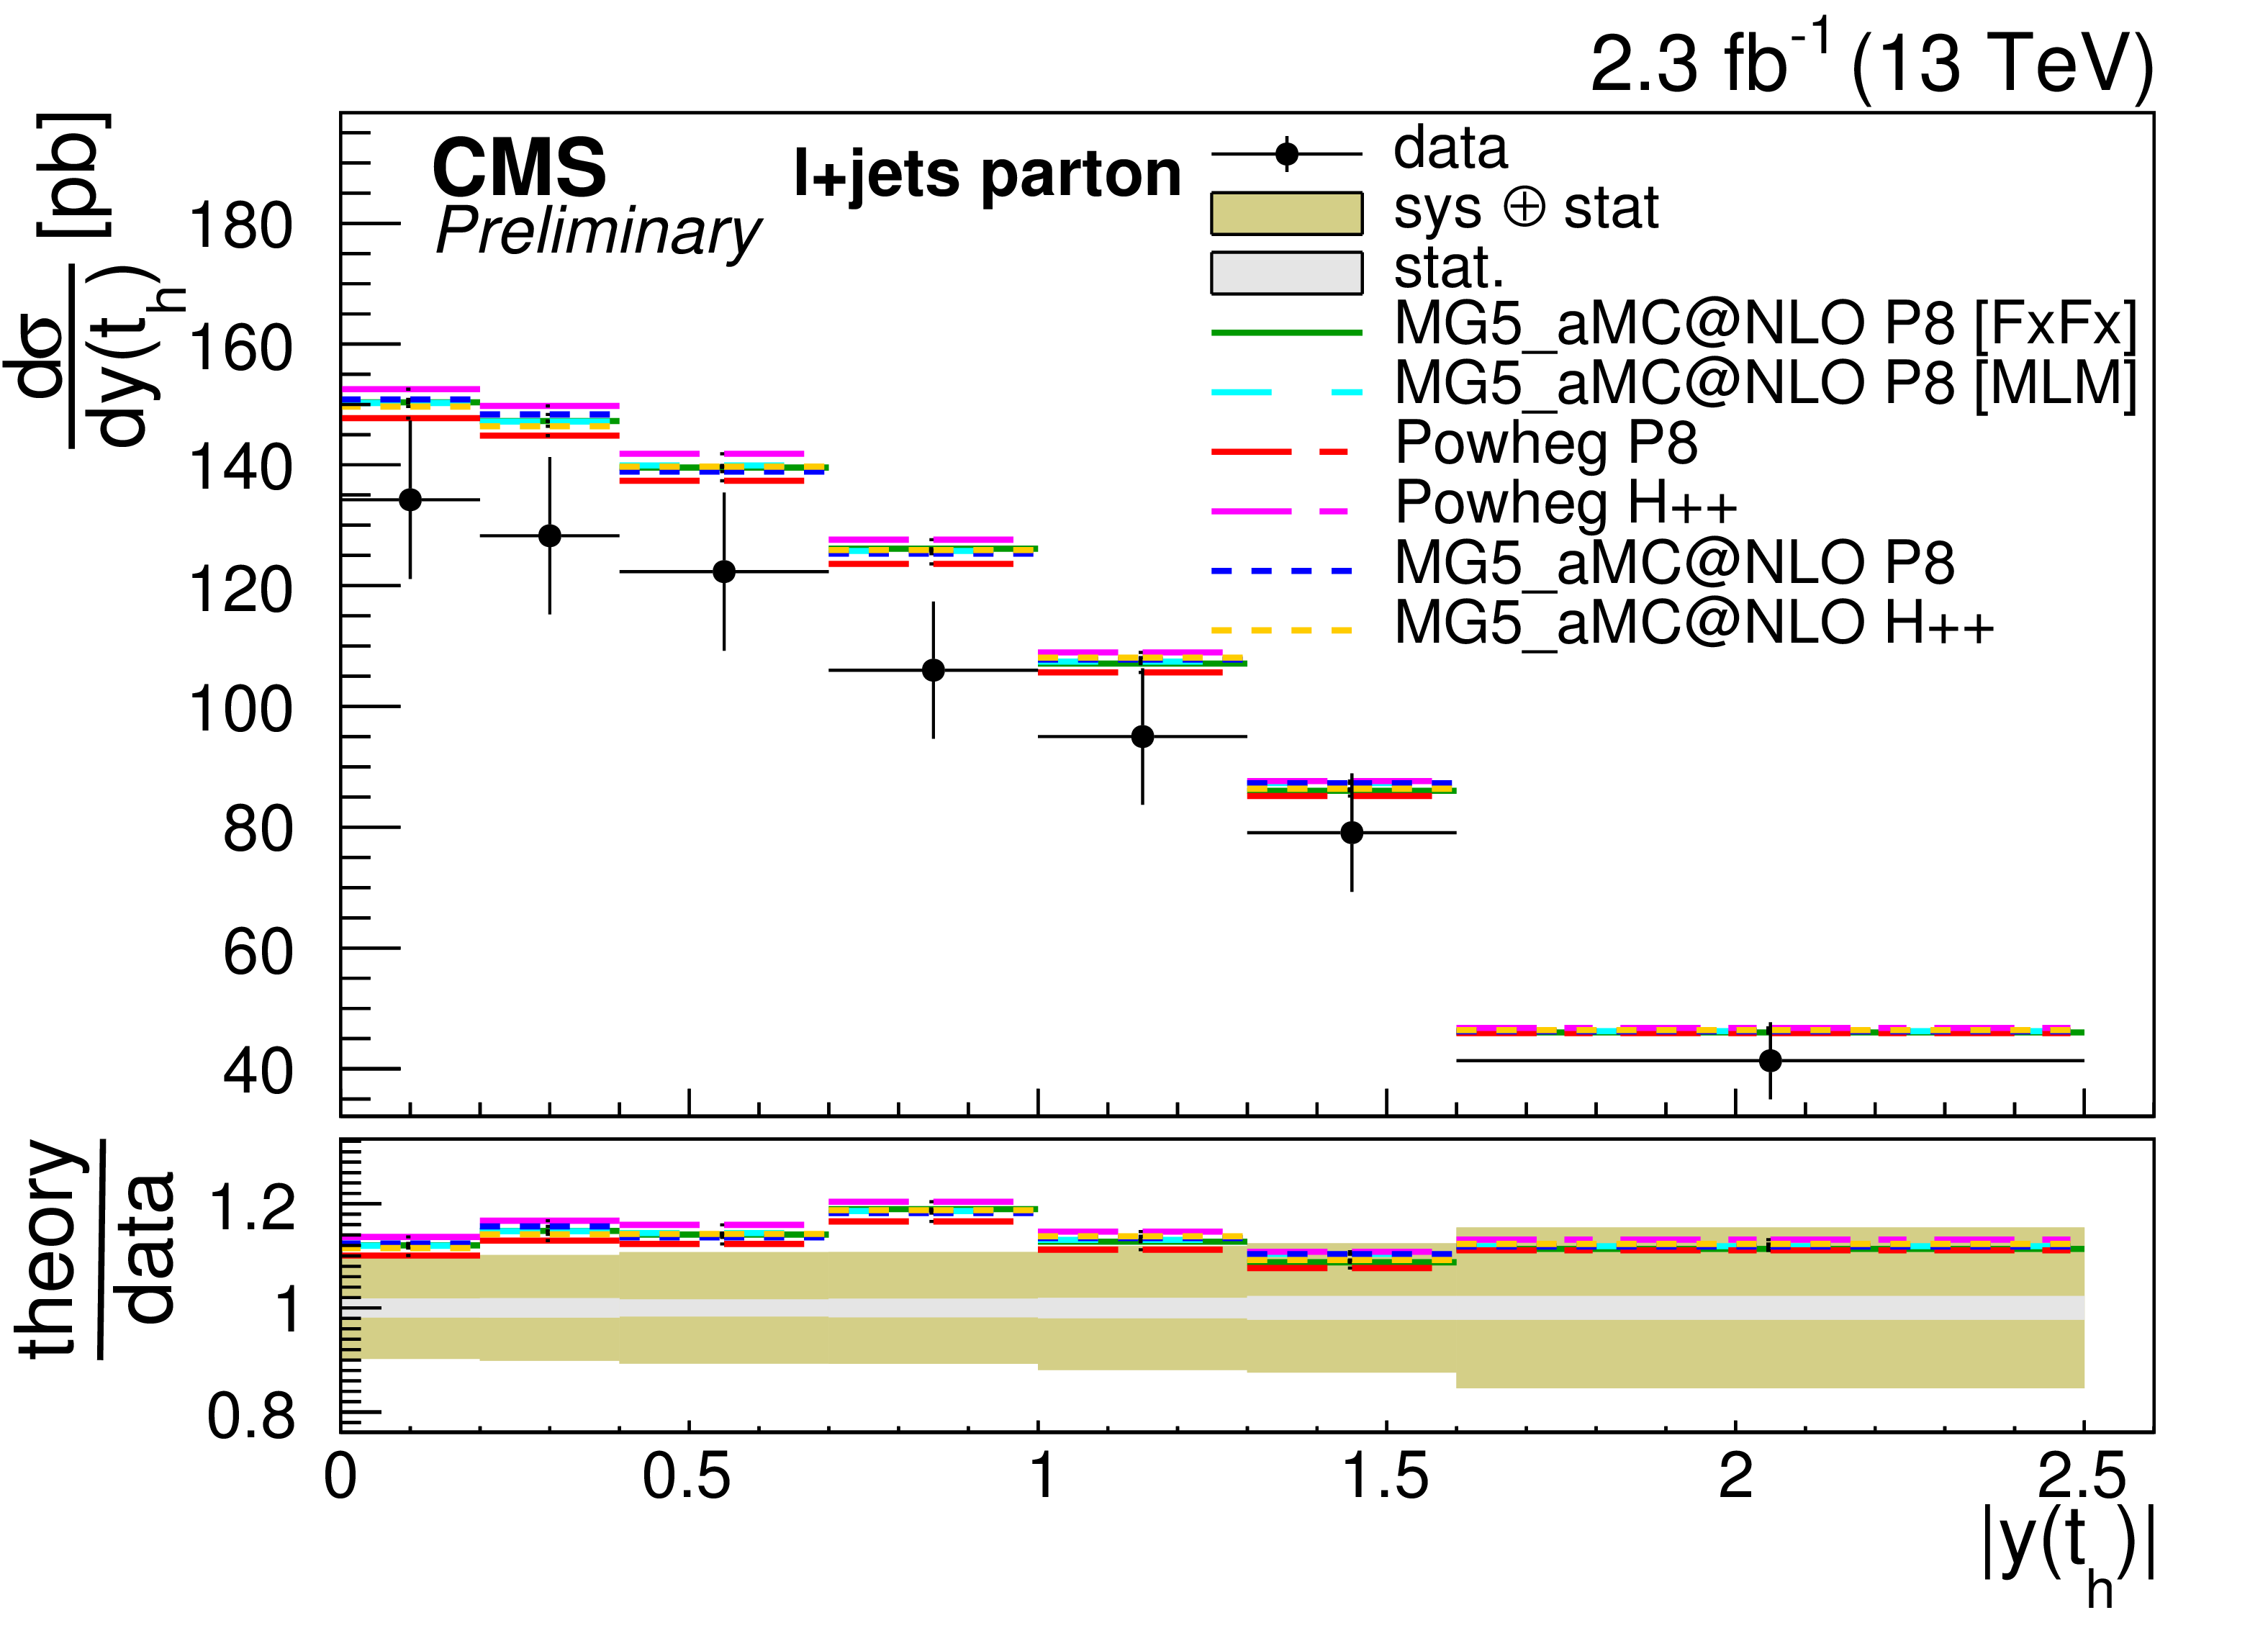
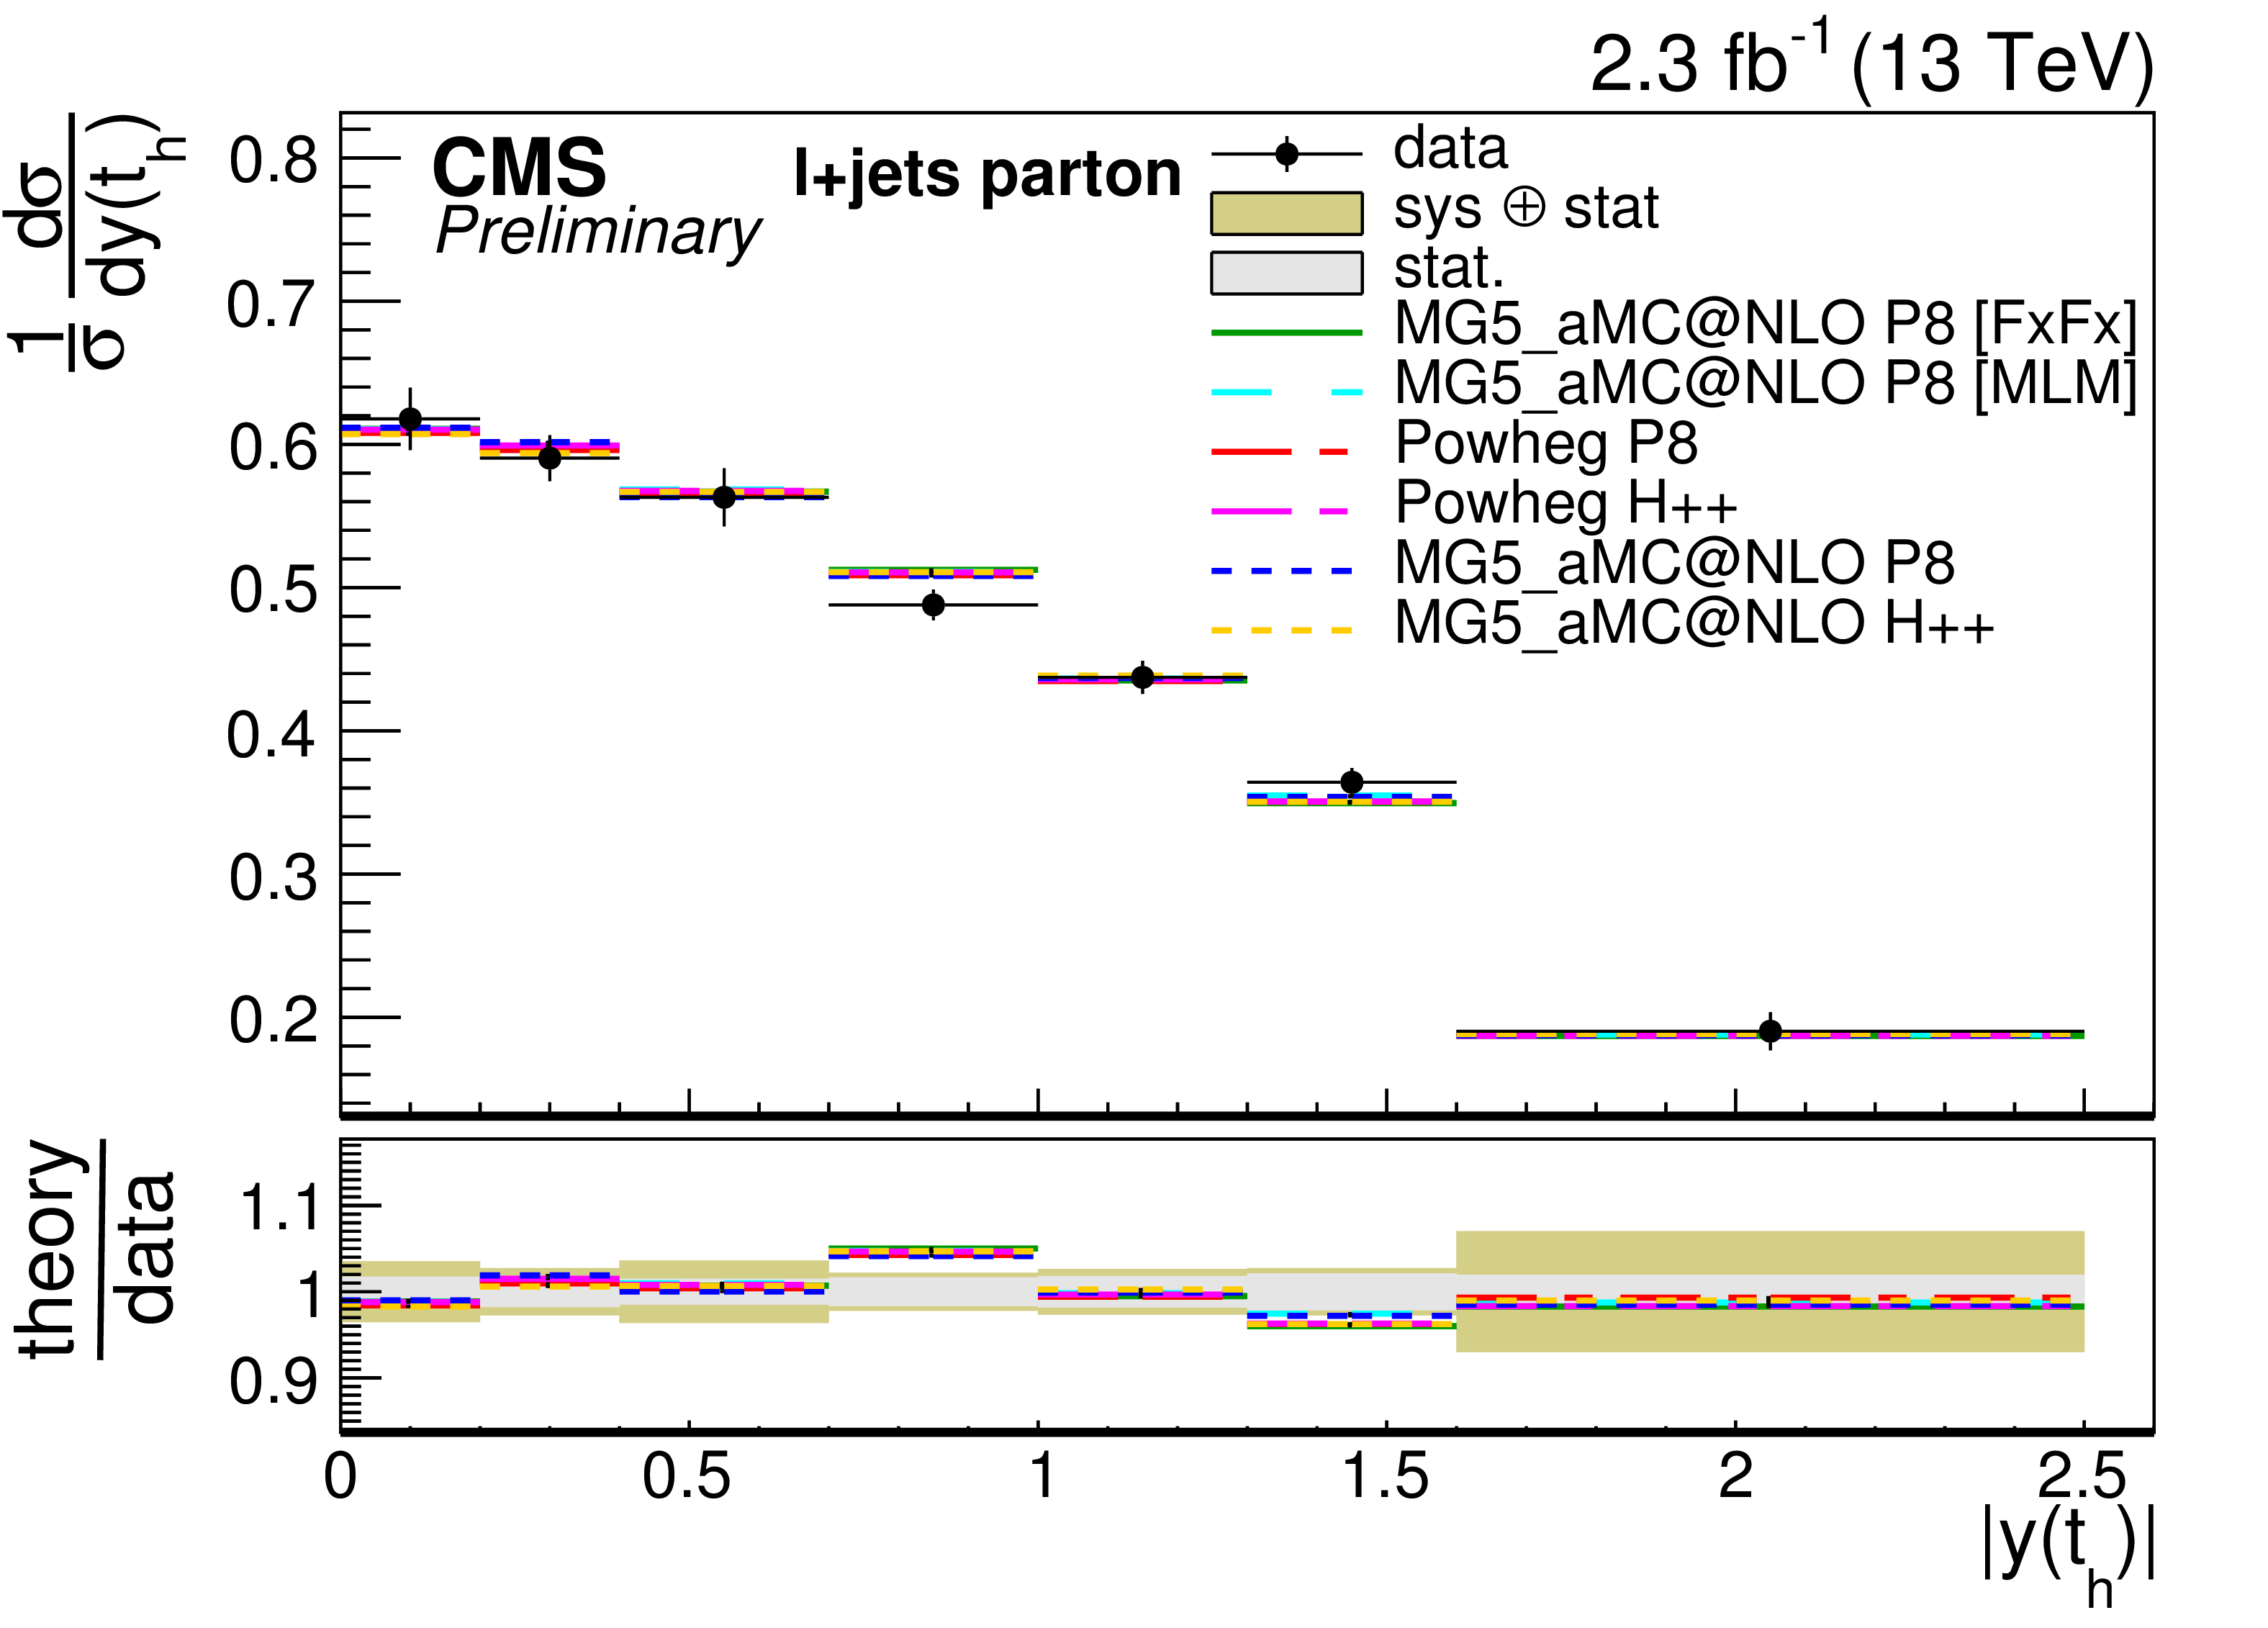
Figure 7-c:
Differential cross sections at parton level as a function of $ {p_{\mathrm {T}}} ( {\mathrm {t} })$ and $|y( {\mathrm {t} })|$ compared to the predictions of POWHEG and MG5-aMC@NLO plus PYTHIA-8 (P8) or HERWIG++ (H++) and the multijet simulations MG5-aMC@NLO (MLM) and MG5-aMC@NLO (FxFx). |
png pdf |
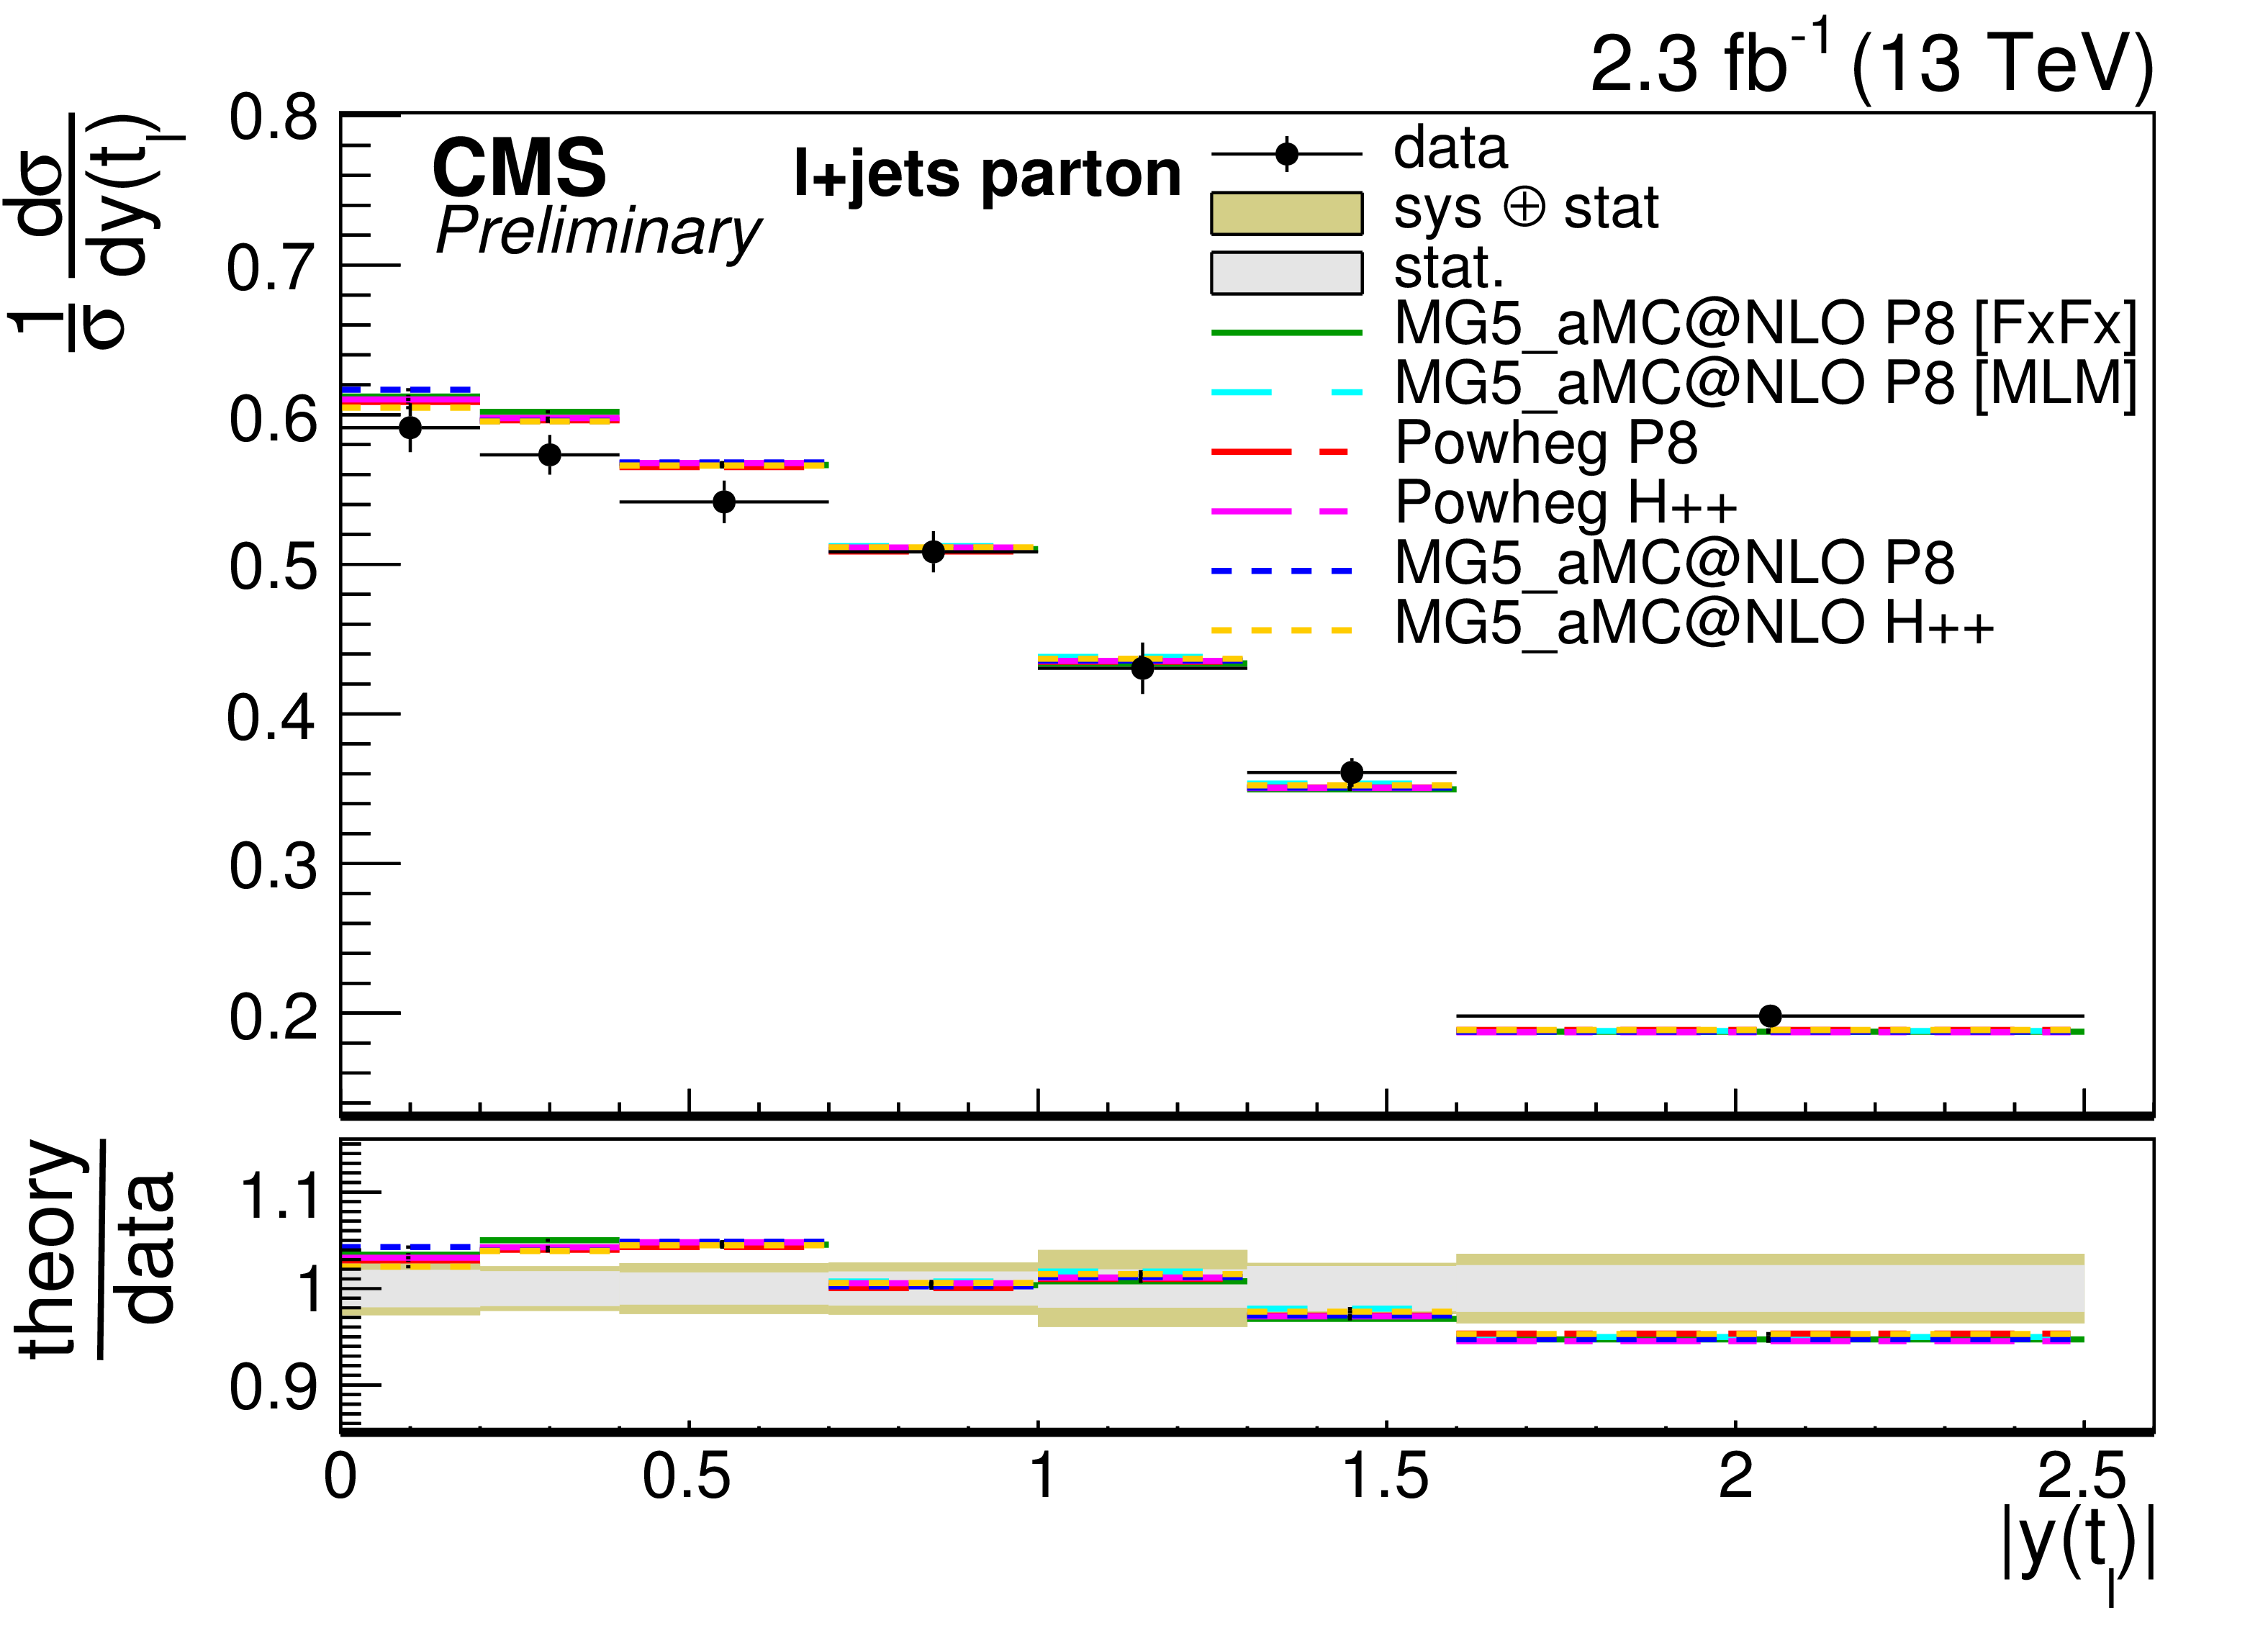
Figure 7-d:
Differential cross sections at parton level as a function of $ {p_{\mathrm {T}}} ( {\mathrm {t} })$ and $|y( {\mathrm {t} })|$ compared to the predictions of POWHEG and MG5-aMC@NLO plus PYTHIA-8 (P8) or HERWIG++ (H++) and the multijet simulations MG5-aMC@NLO (MLM) and MG5-aMC@NLO (FxFx). |
png pdf |
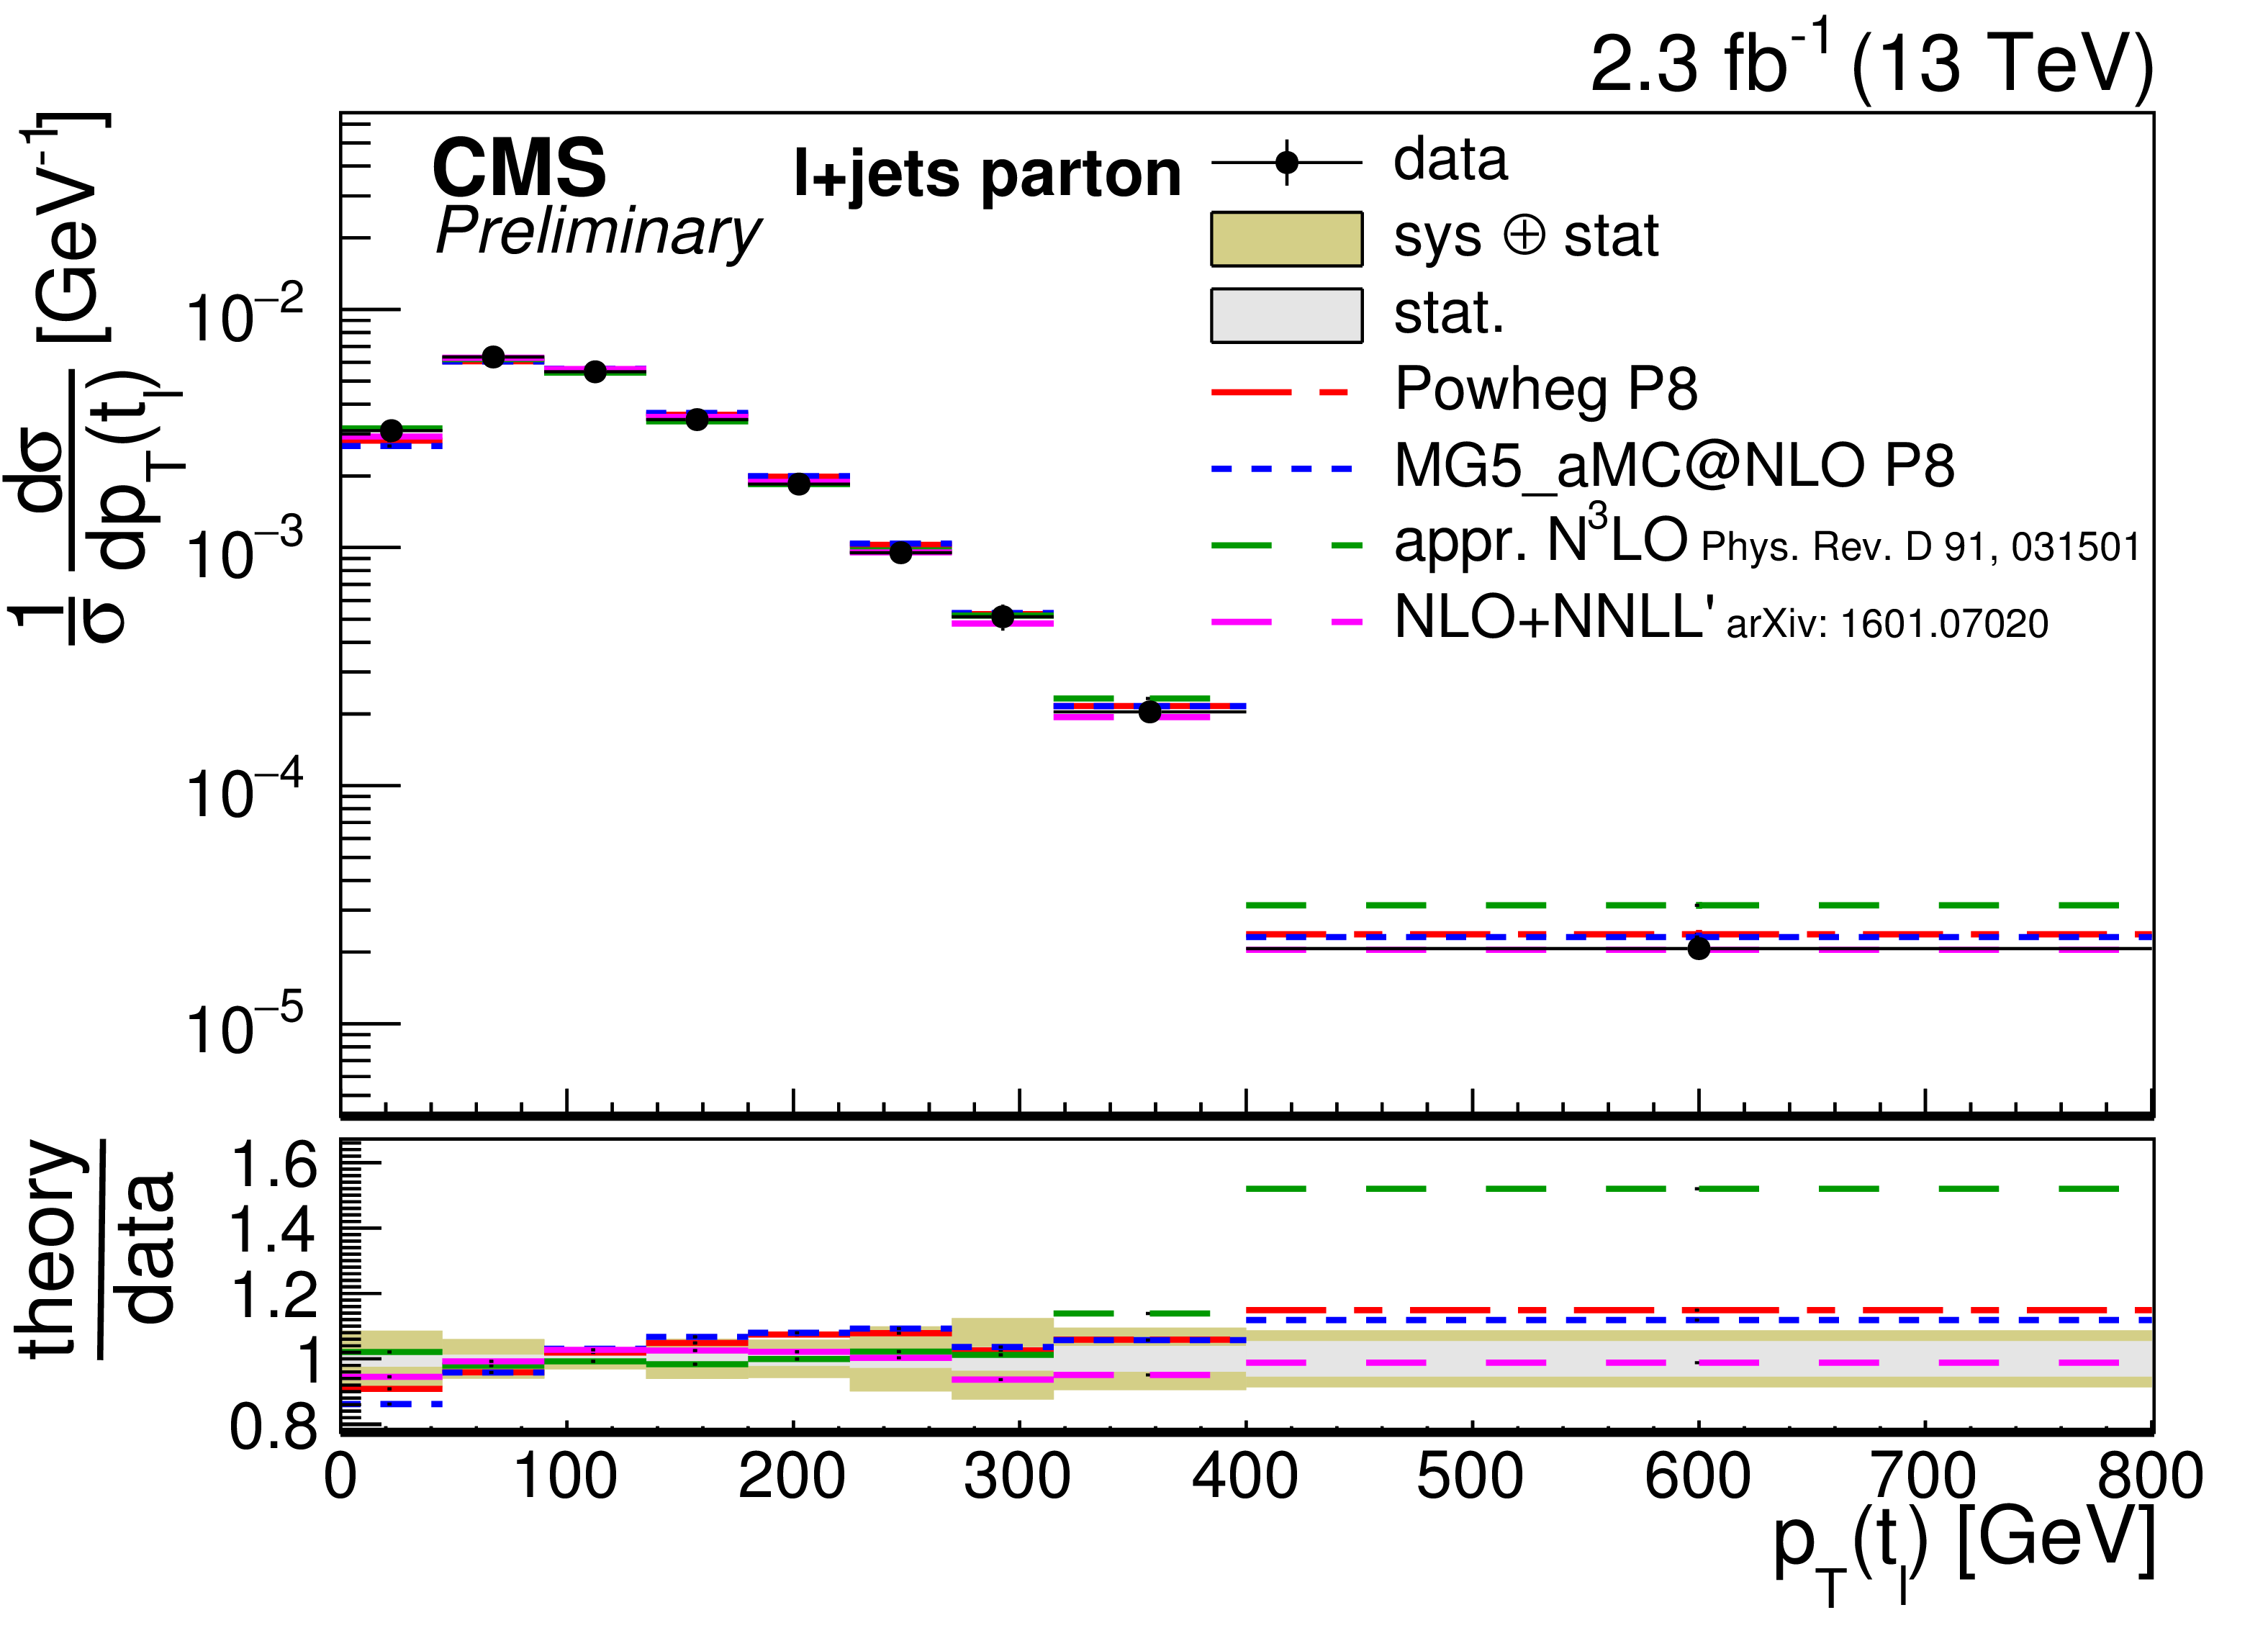
Figure 8-a:
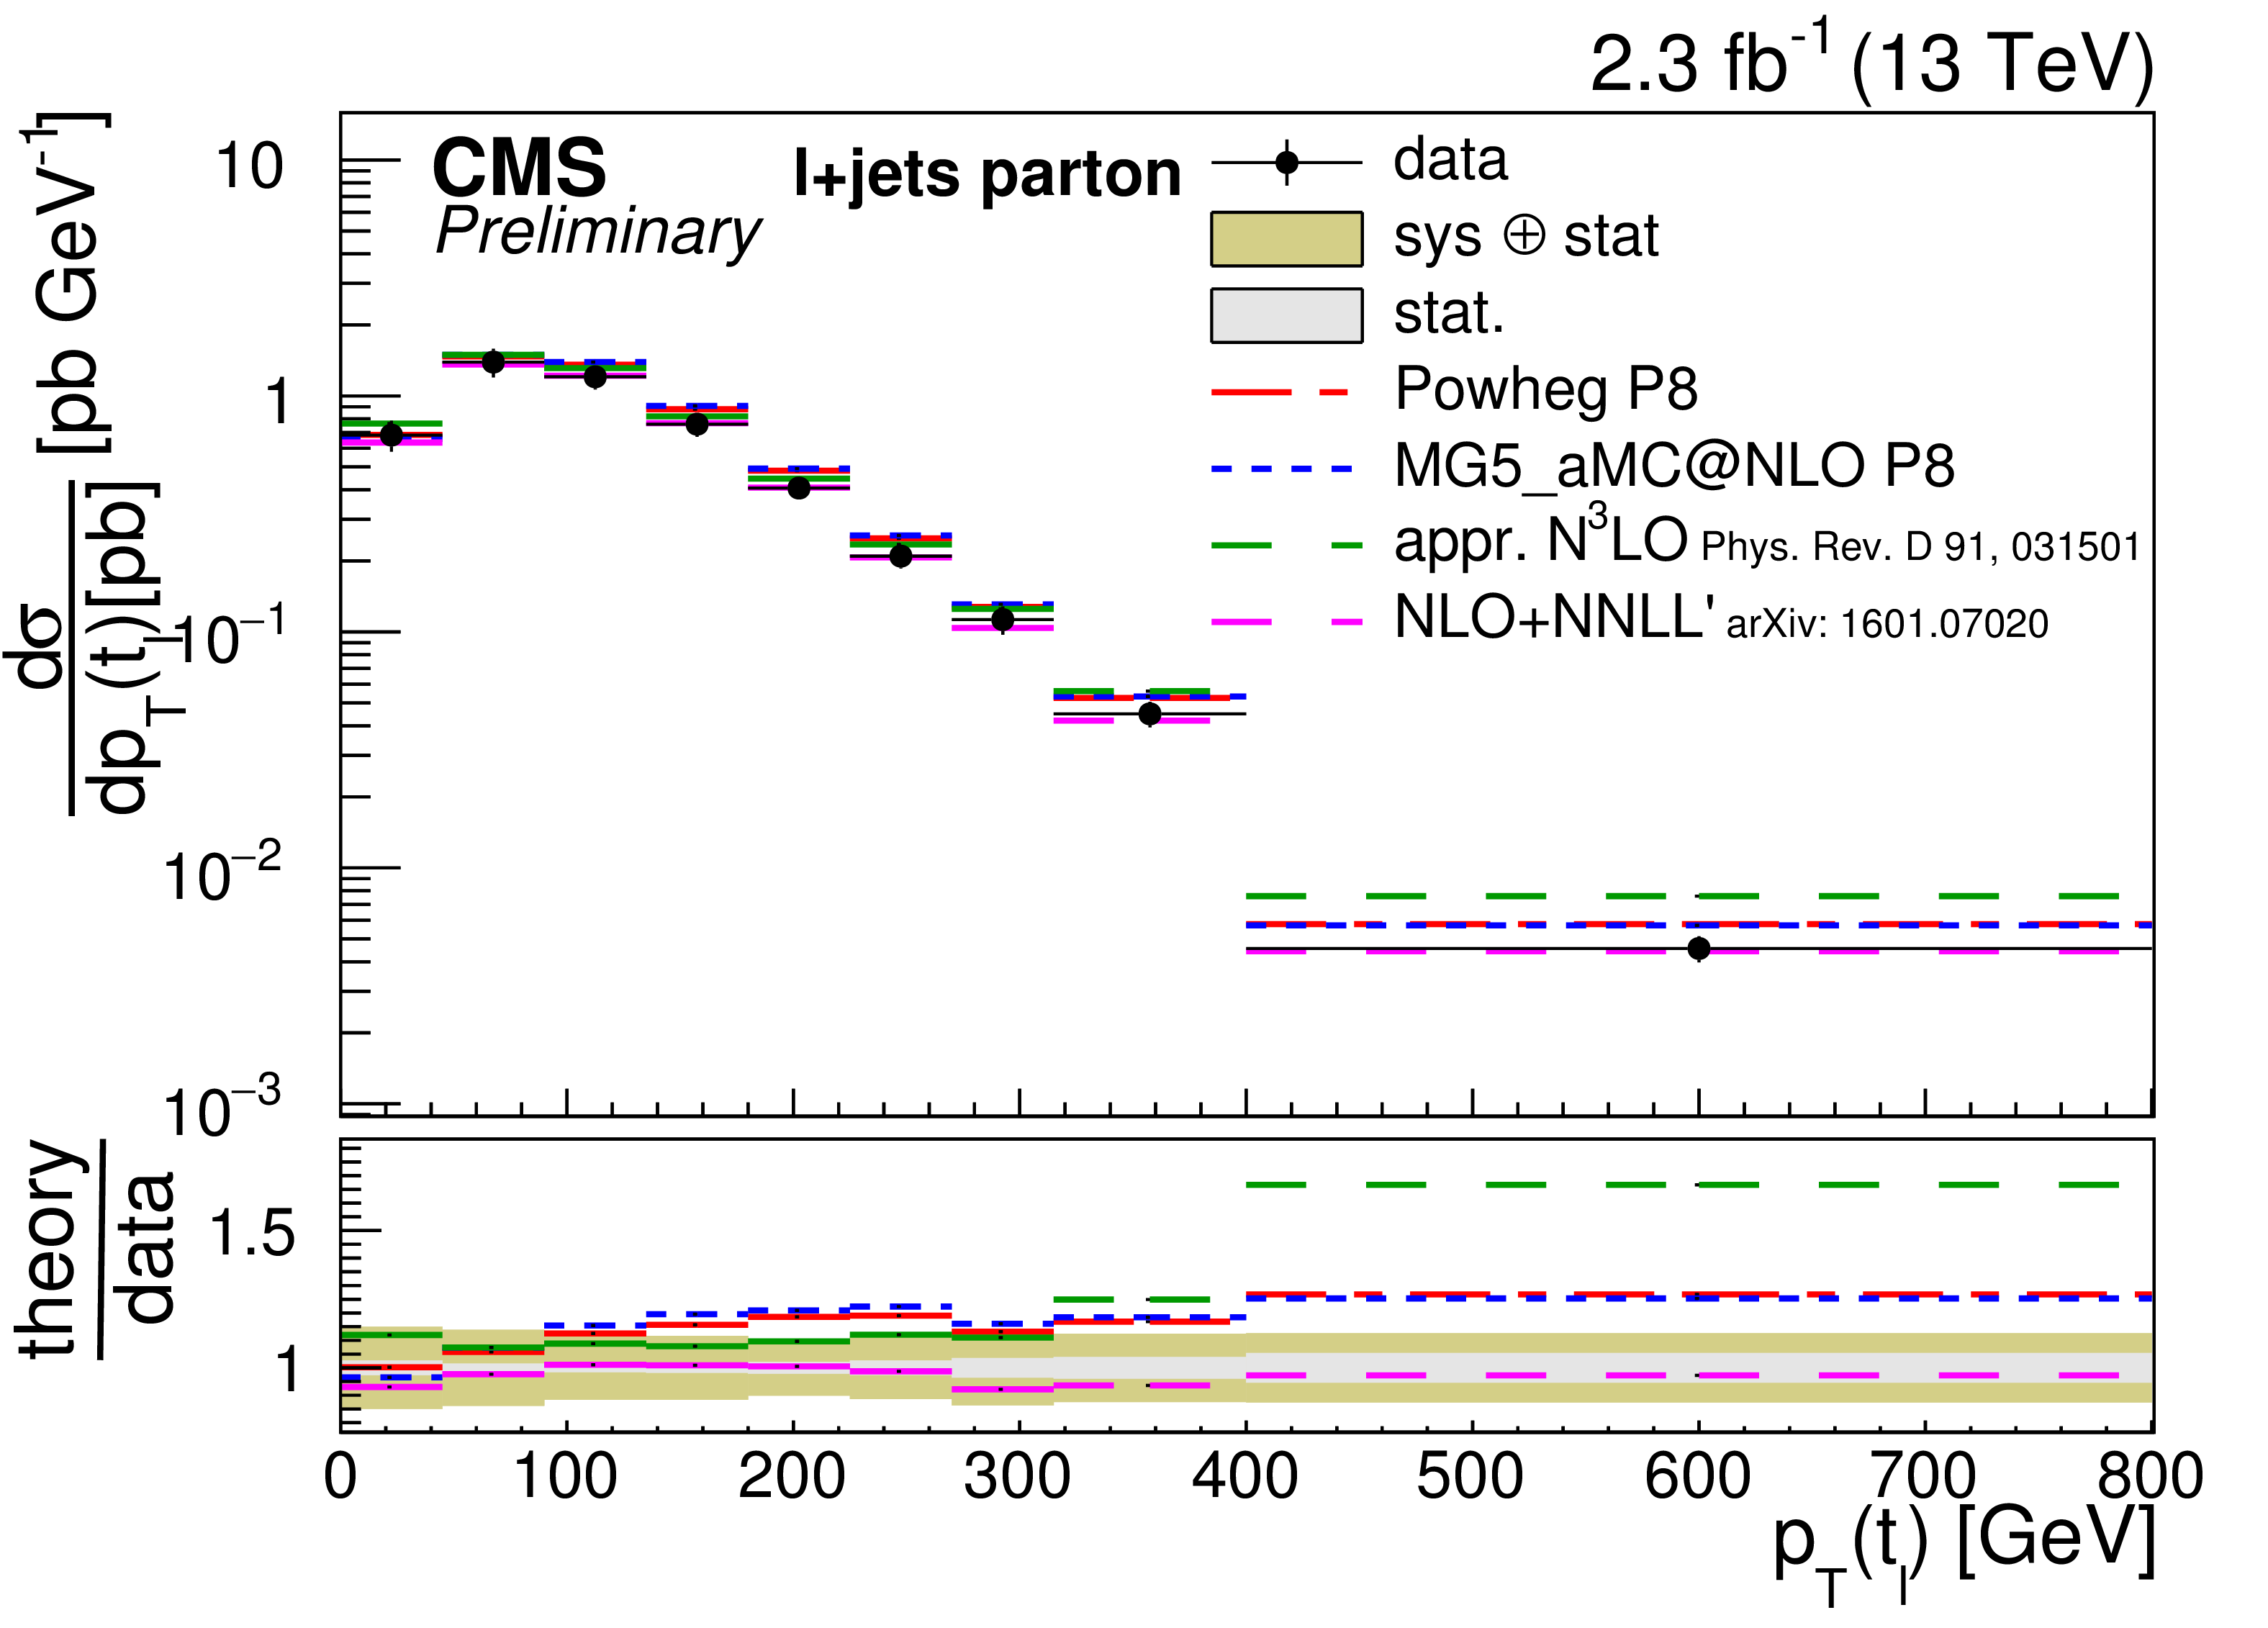
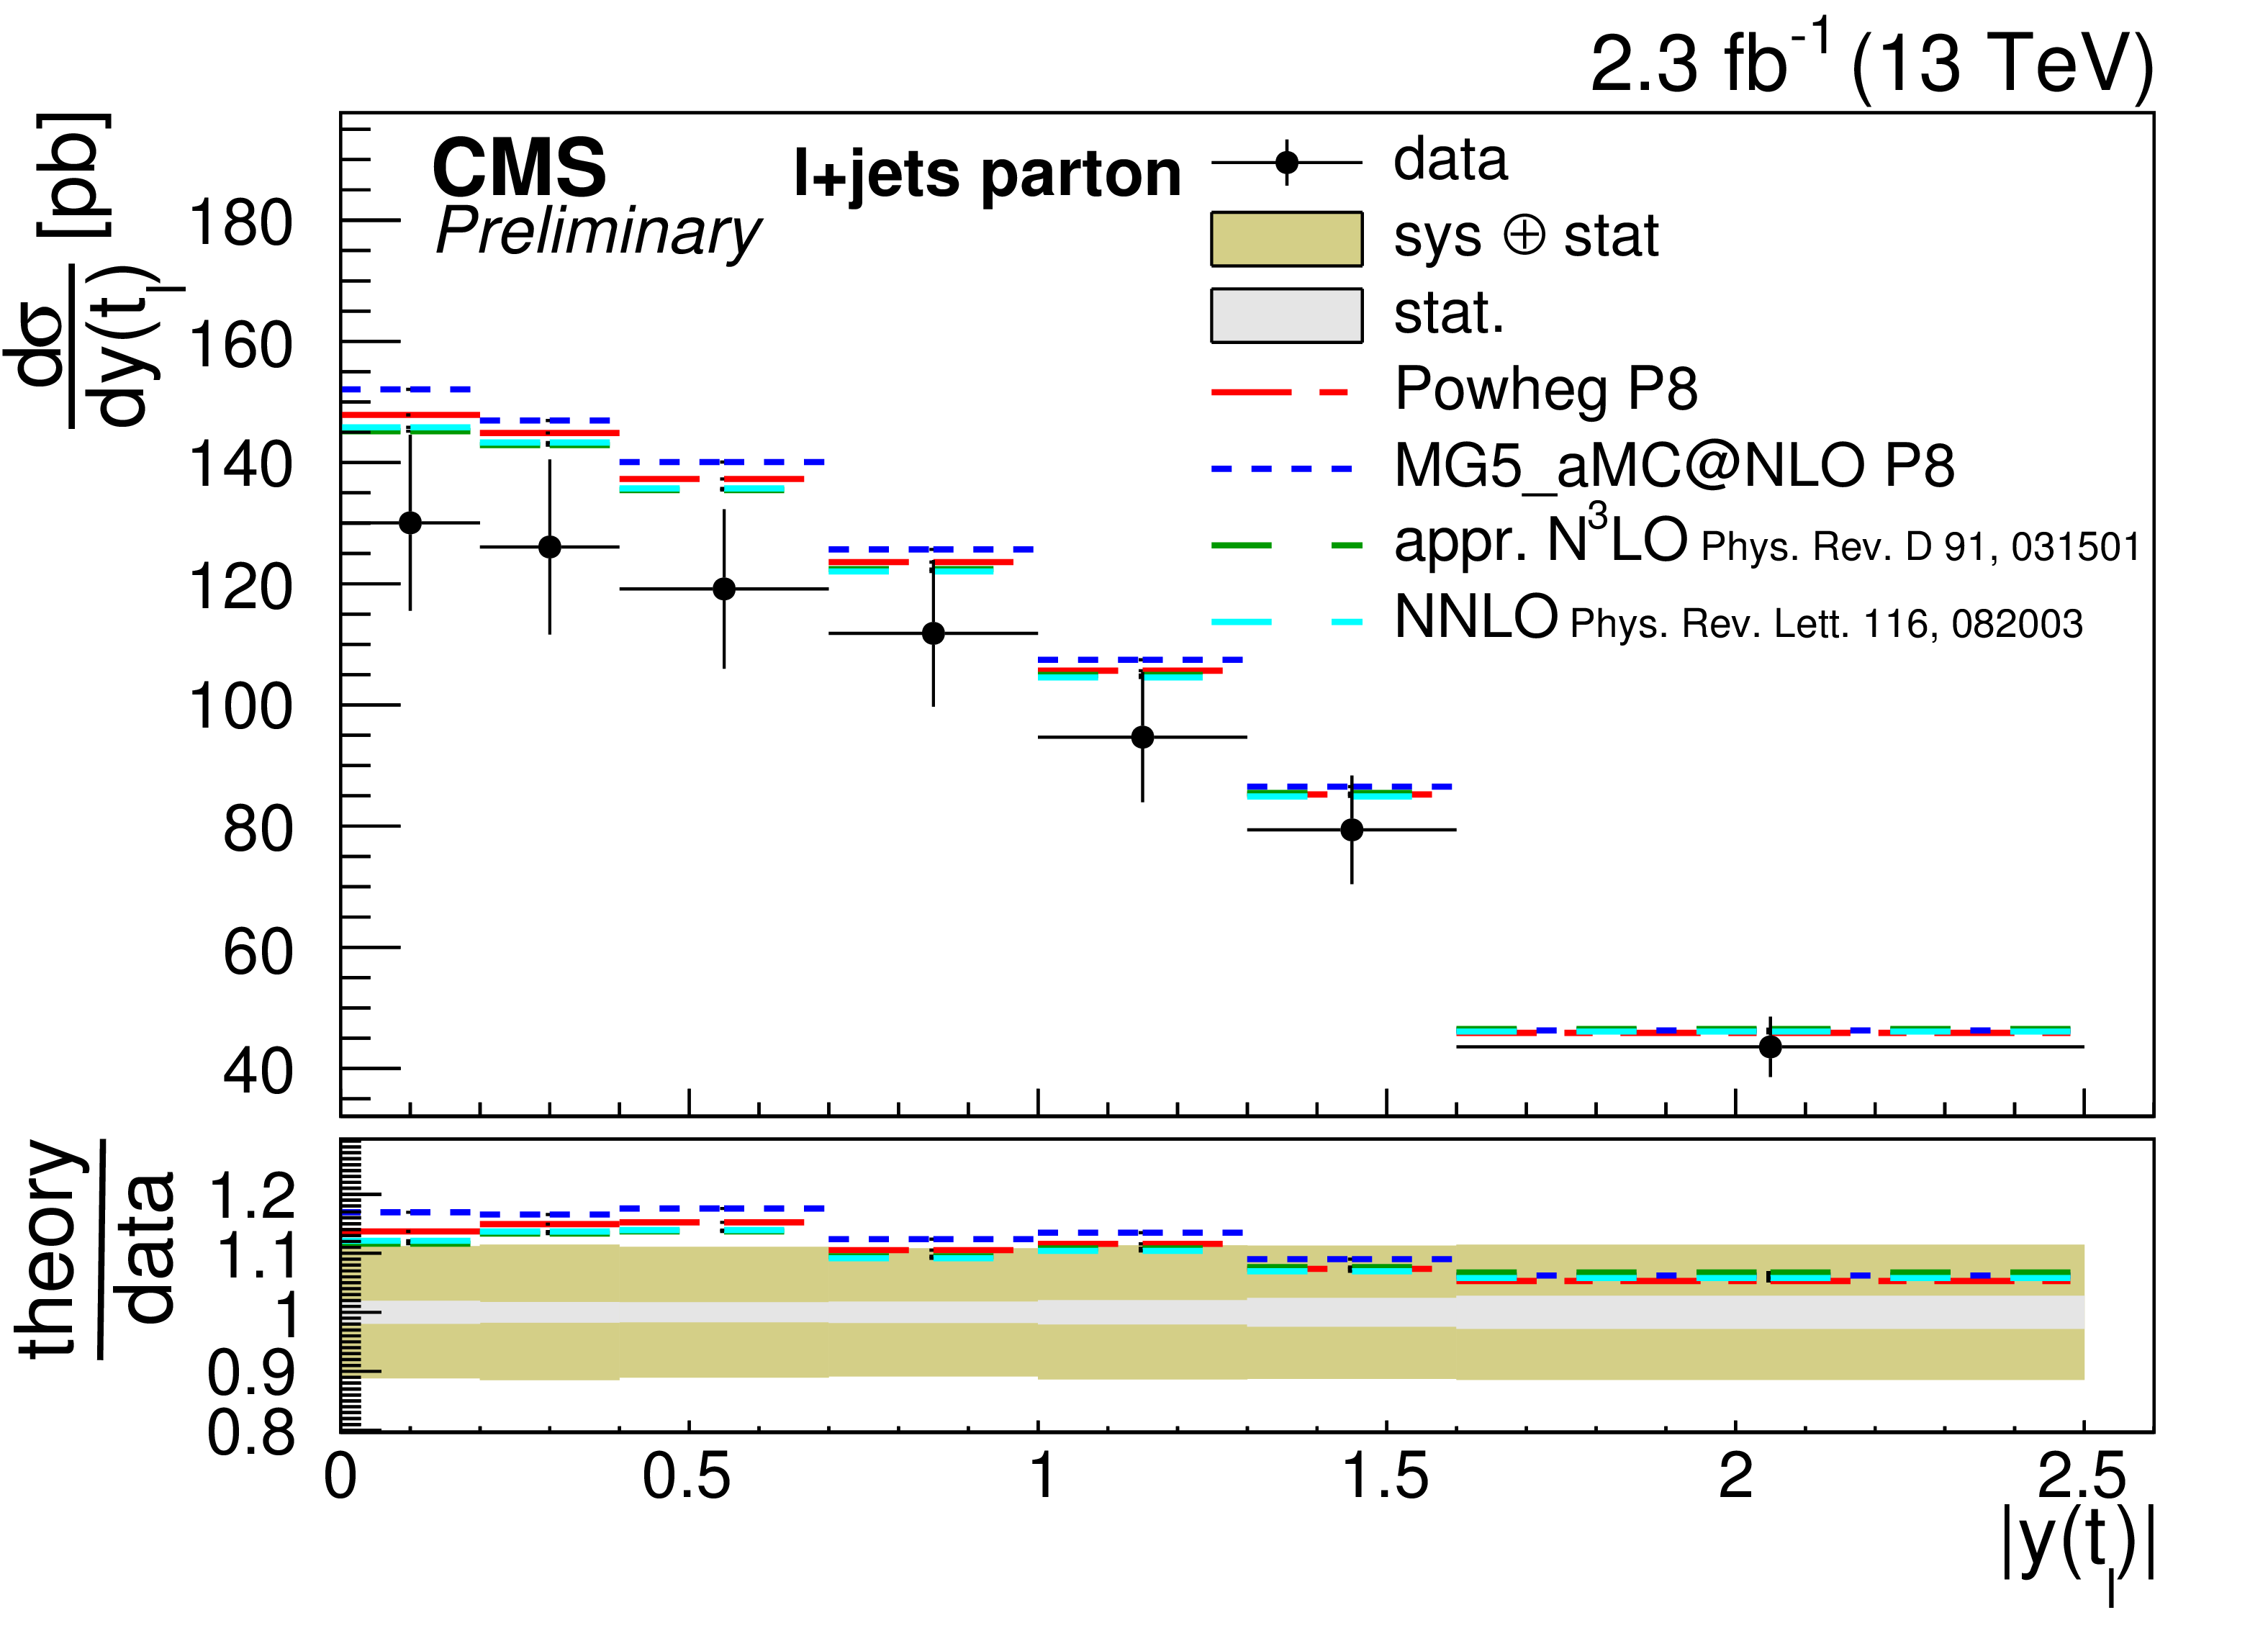
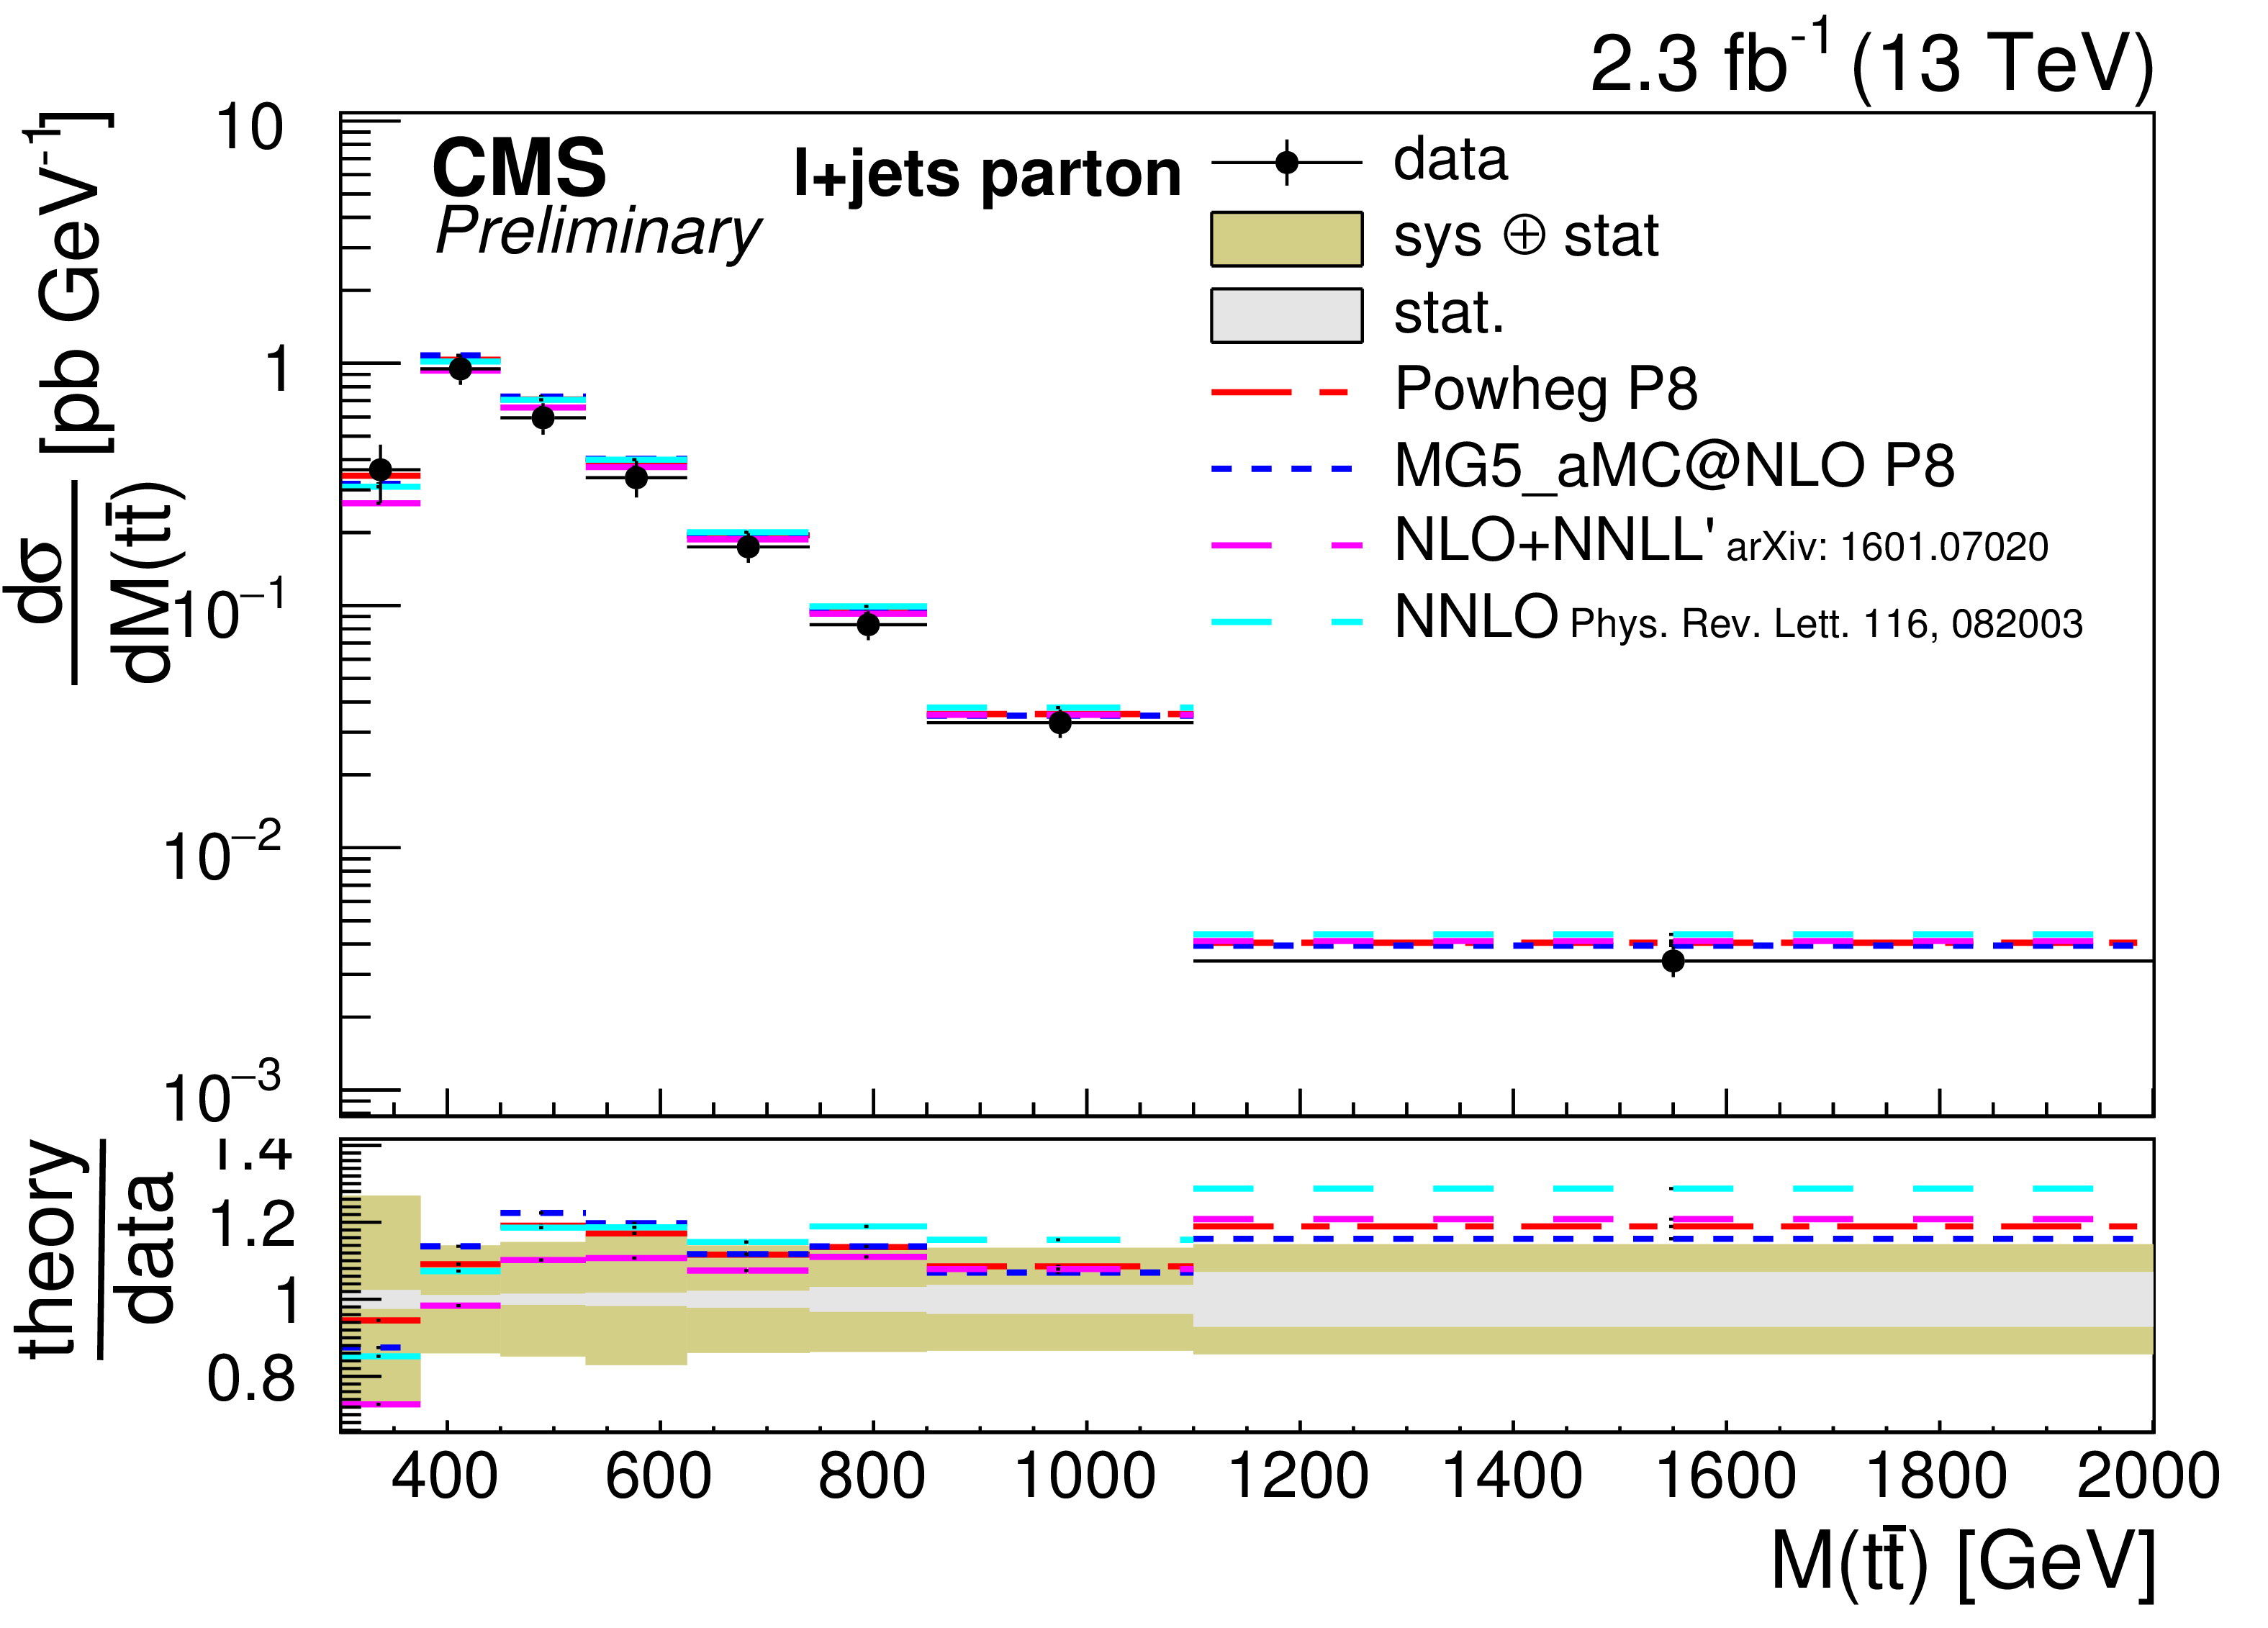
Differential cross sections at parton level as a function of $ {p_{\mathrm {T}}} ( {\mathrm {t} })$, $|y( {\mathrm {t} })|$, and $M( \mathrm{ t \bar{t} } )$ compared to the predictions of an approximate NNNLO calculation [29,30] and a NLO+NNLL' calculation [31]. |

png pdf |
Figure 8-b:
Differential cross sections at parton level as a function of $ {p_{\mathrm {T}}} ( {\mathrm {t} })$, $|y( {\mathrm {t} })|$, and $M( \mathrm{ t \bar{t} } )$ compared to the predictions of an approximate NNNLO calculation [29,30] and a NLO+NNLL' calculation [31]. |
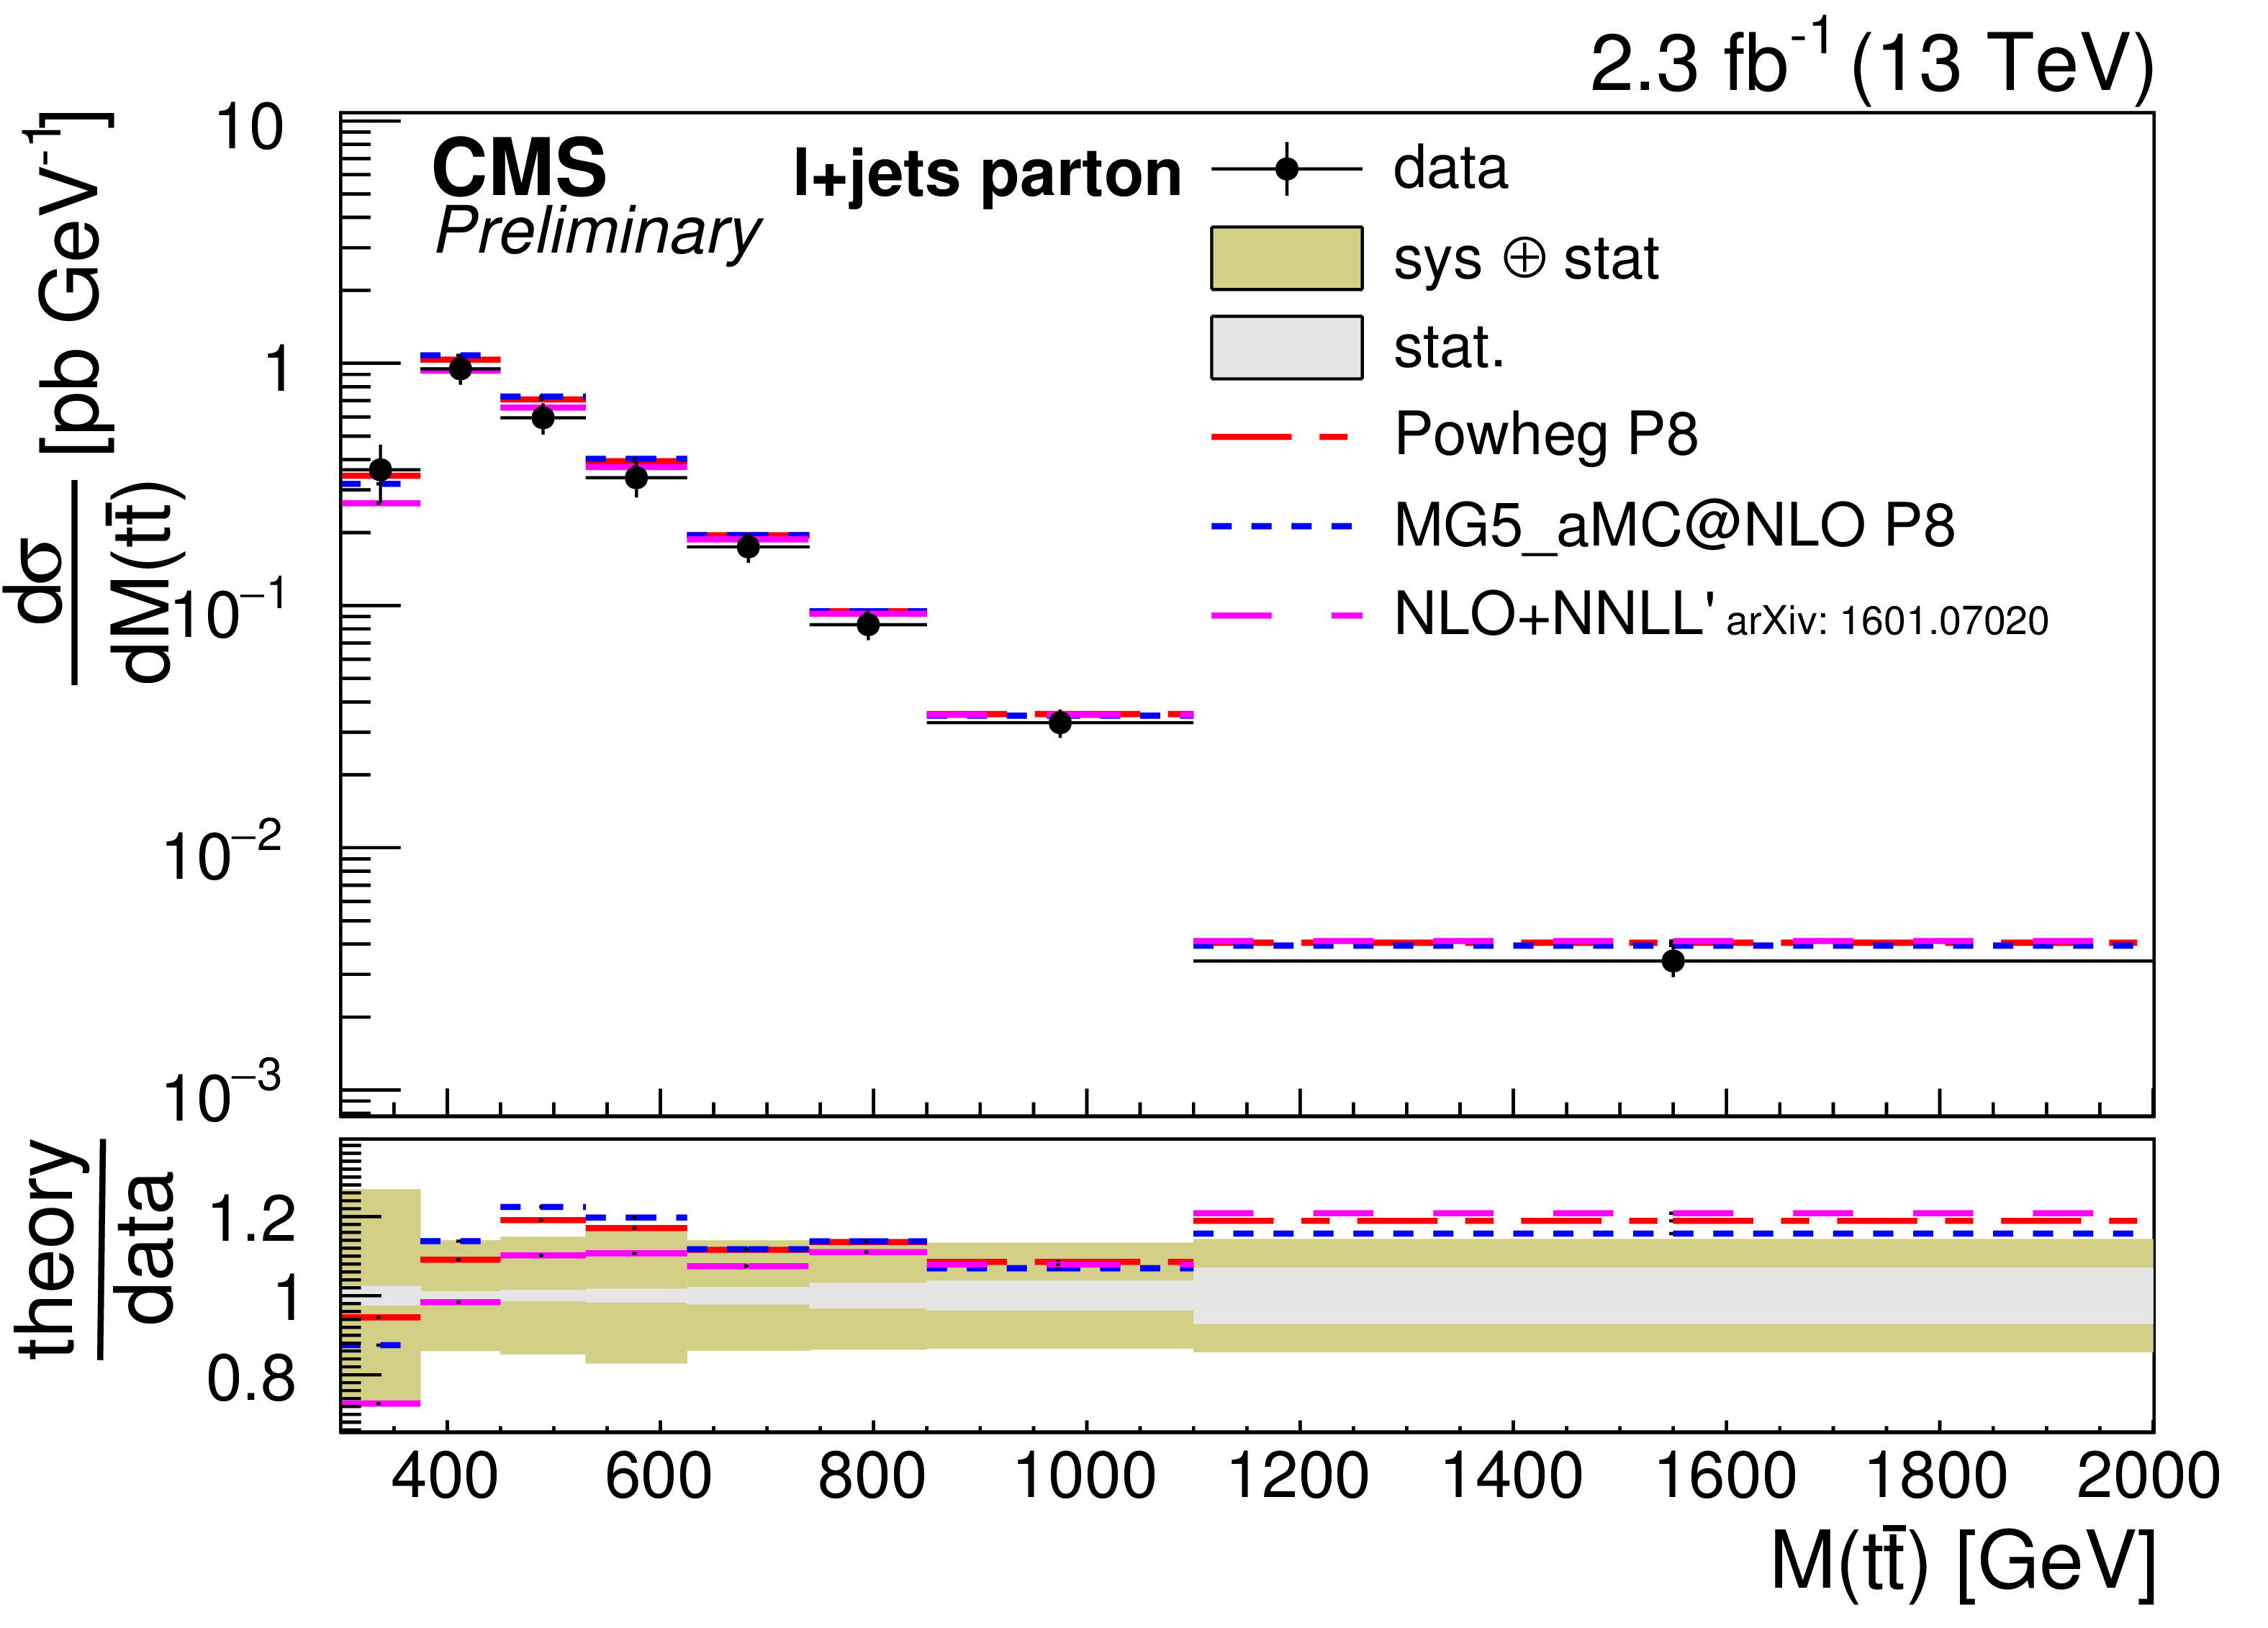
png pdf |
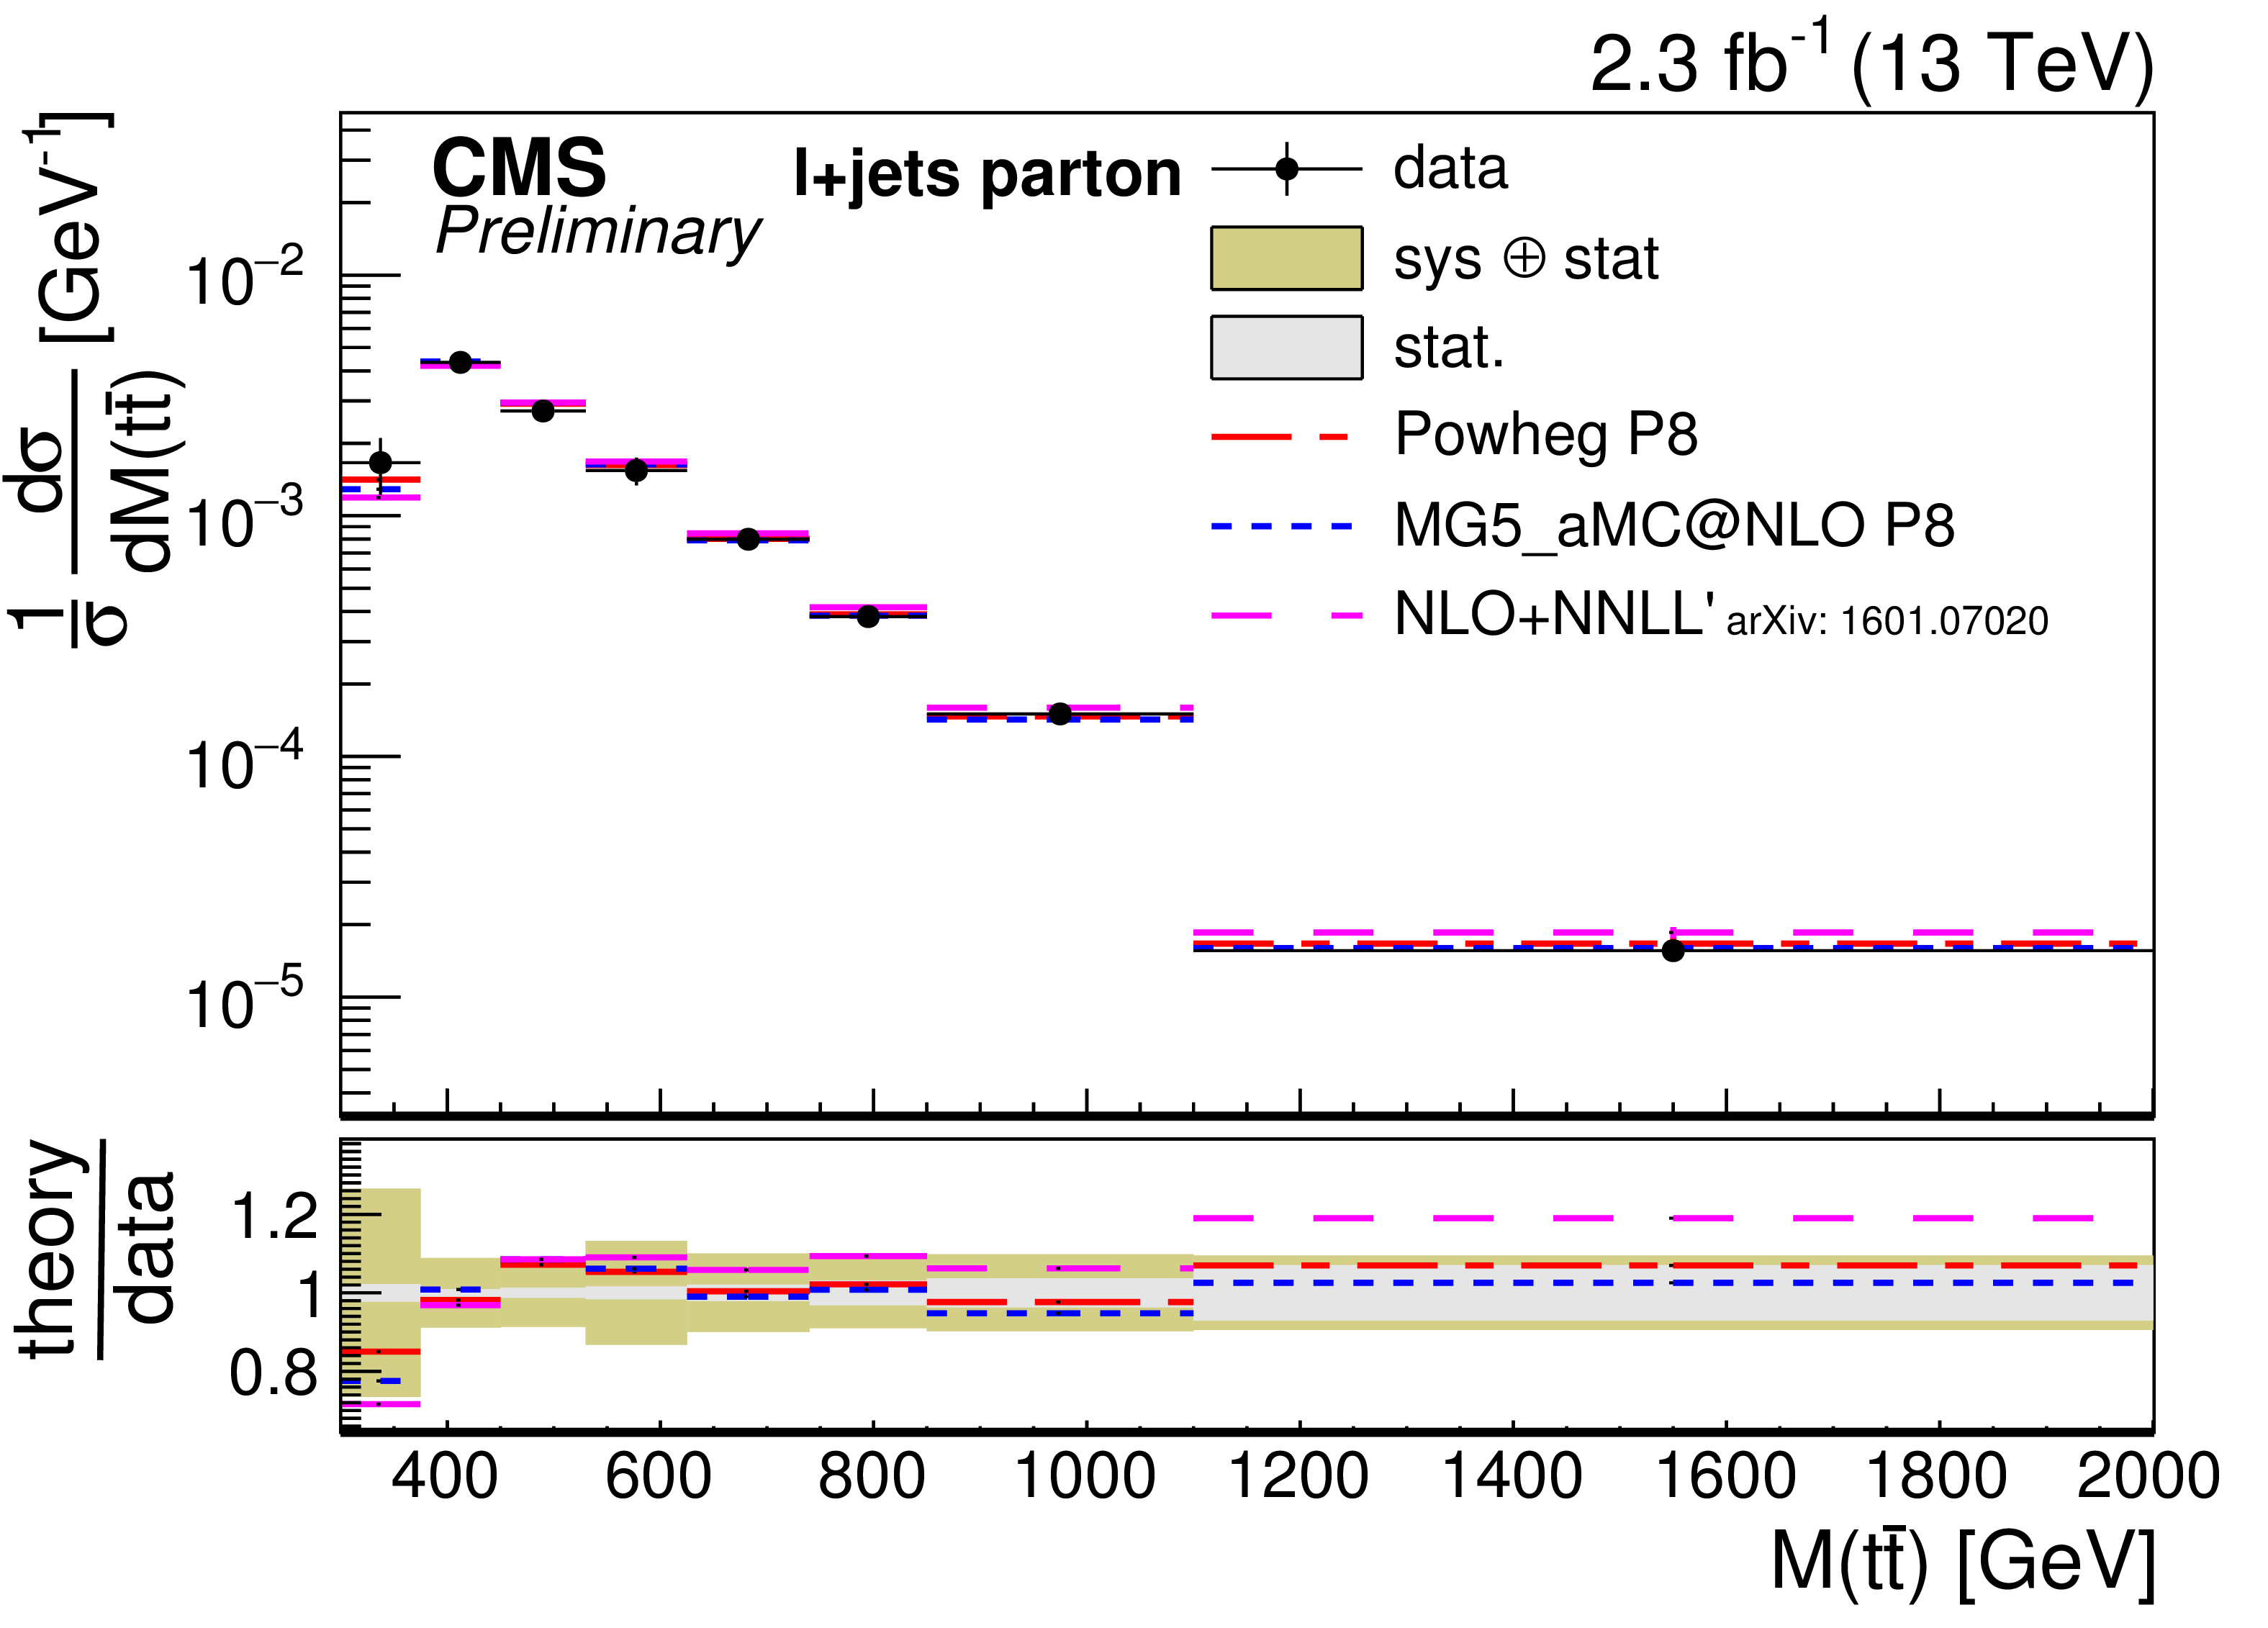
Figure 8-c:
Differential cross sections at parton level as a function of $ {p_{\mathrm {T}}} ( {\mathrm {t} })$, $|y( {\mathrm {t} })|$, and $M( \mathrm{ t \bar{t} } )$ compared to the predictions of an approximate NNNLO calculation [29,30] and a NLO+NNLL' calculation [31]. |
png pdf |
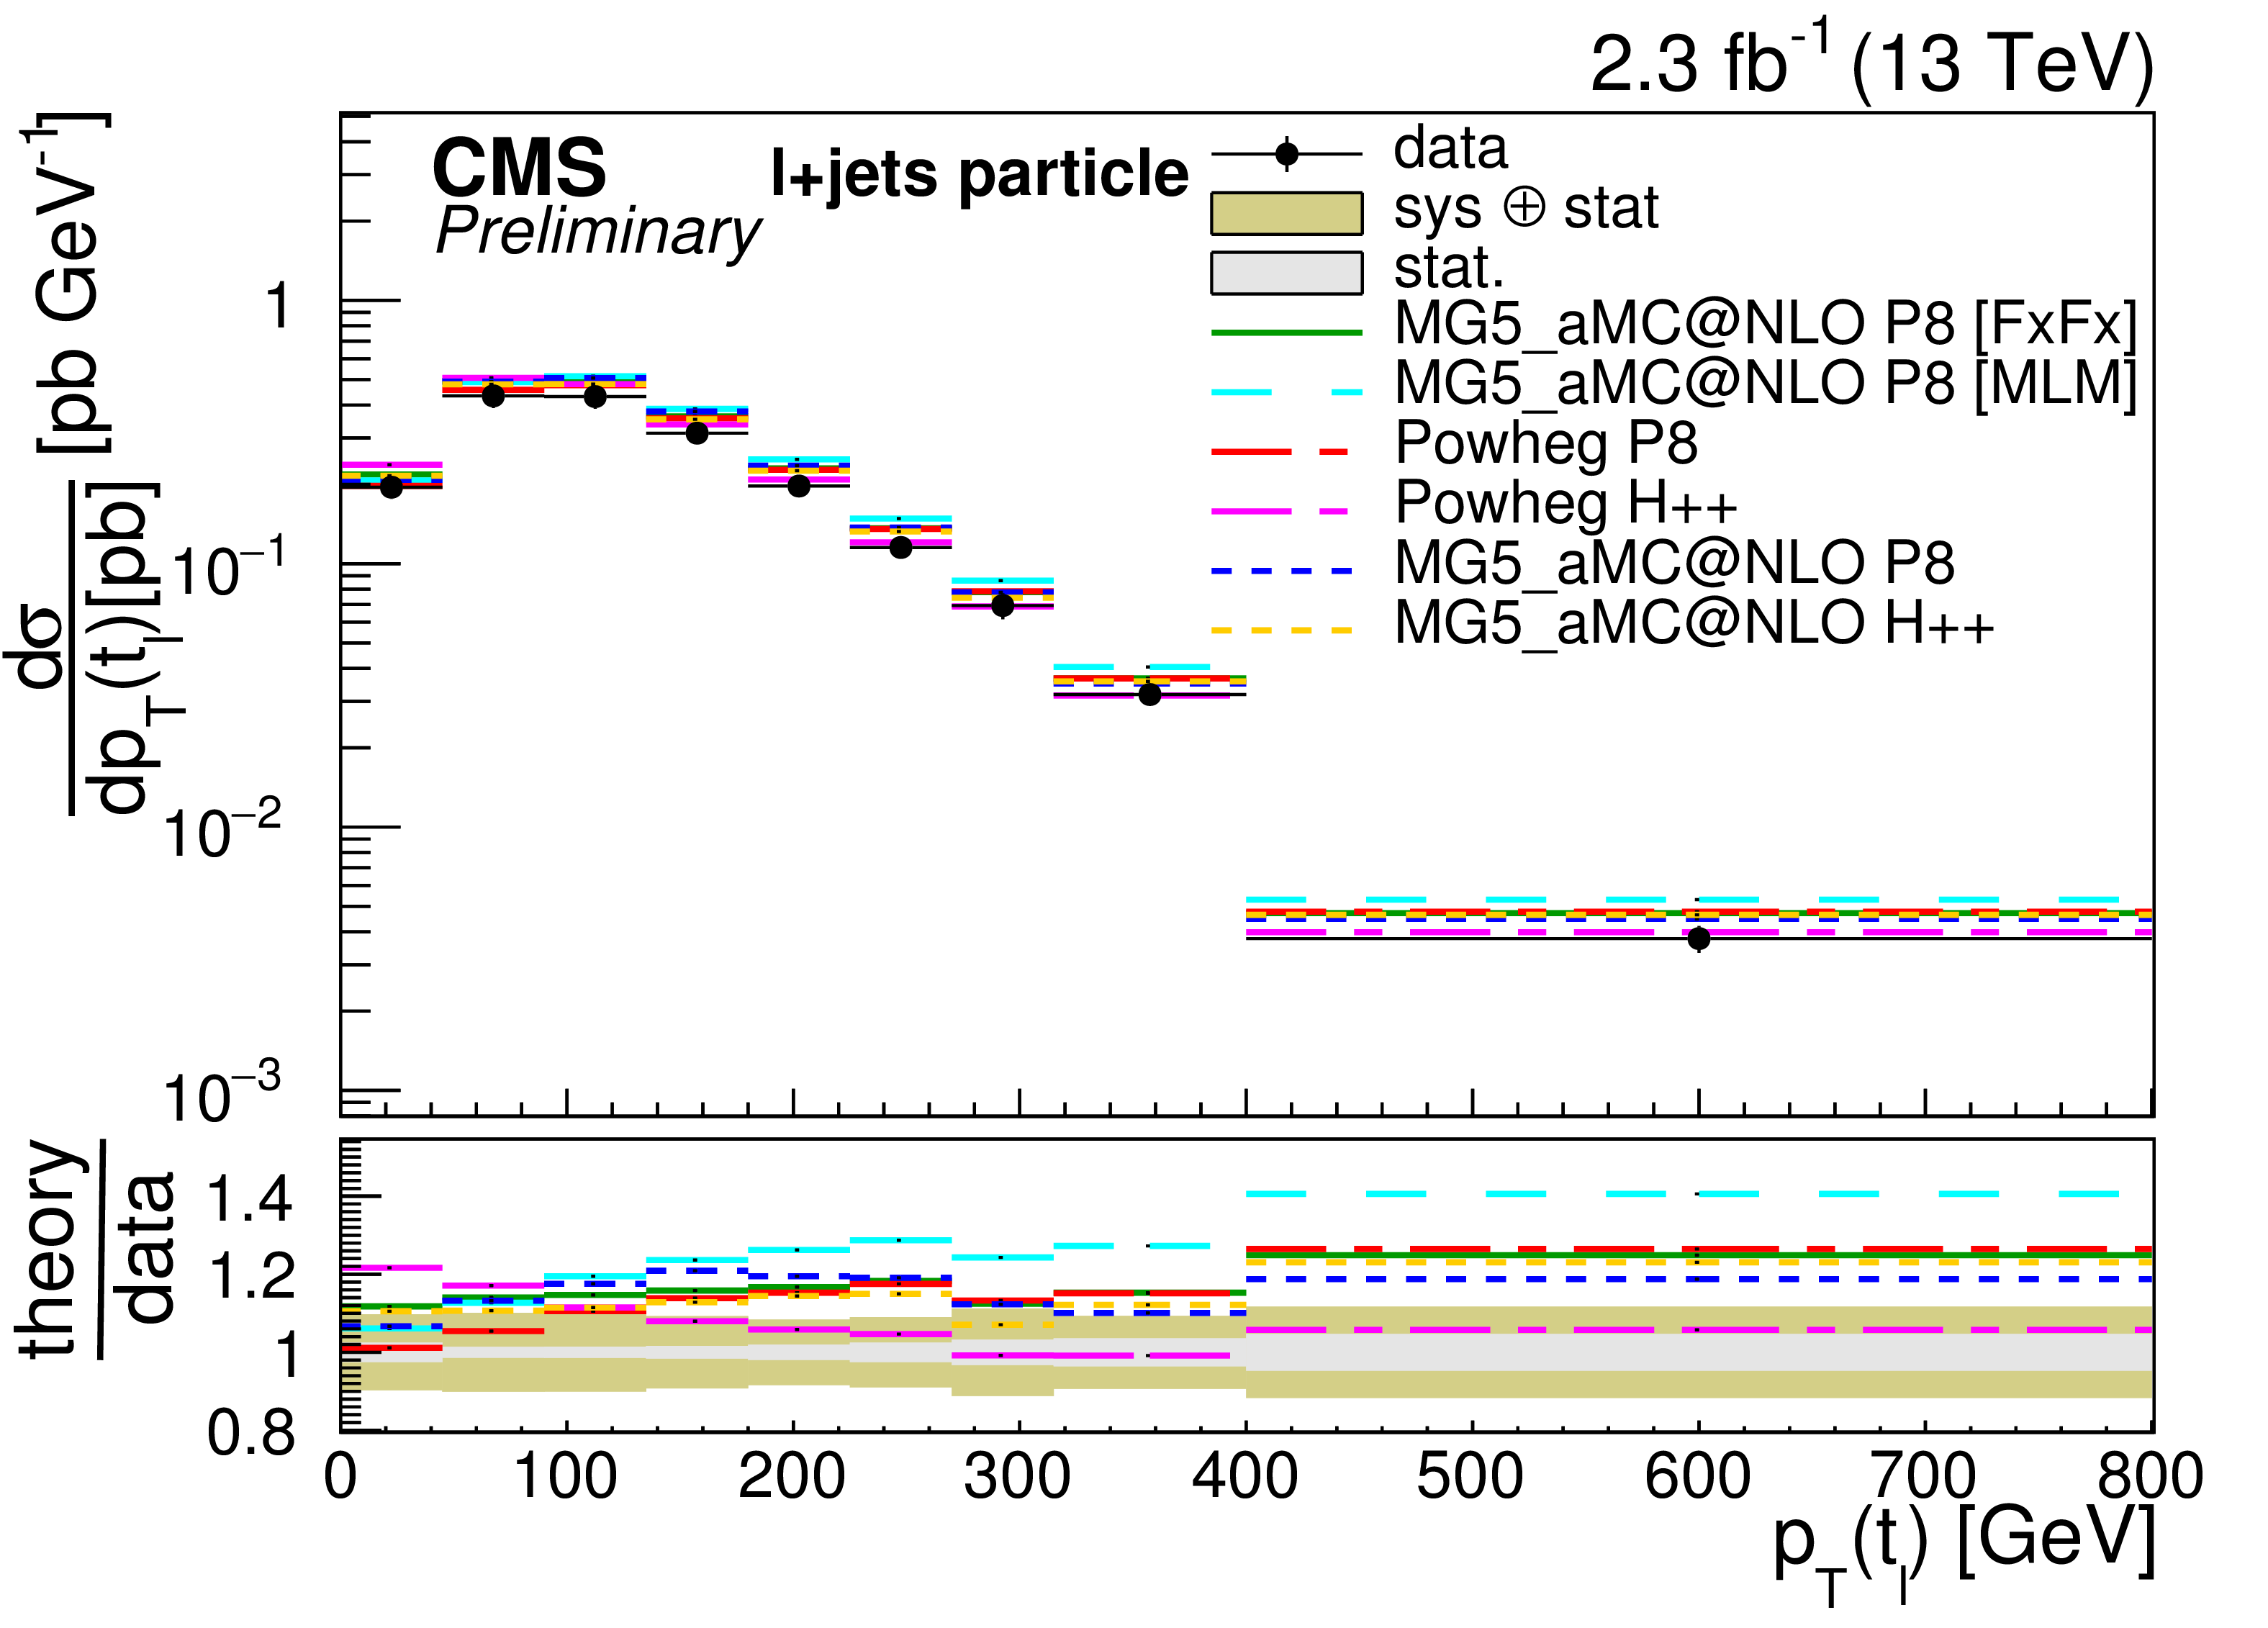
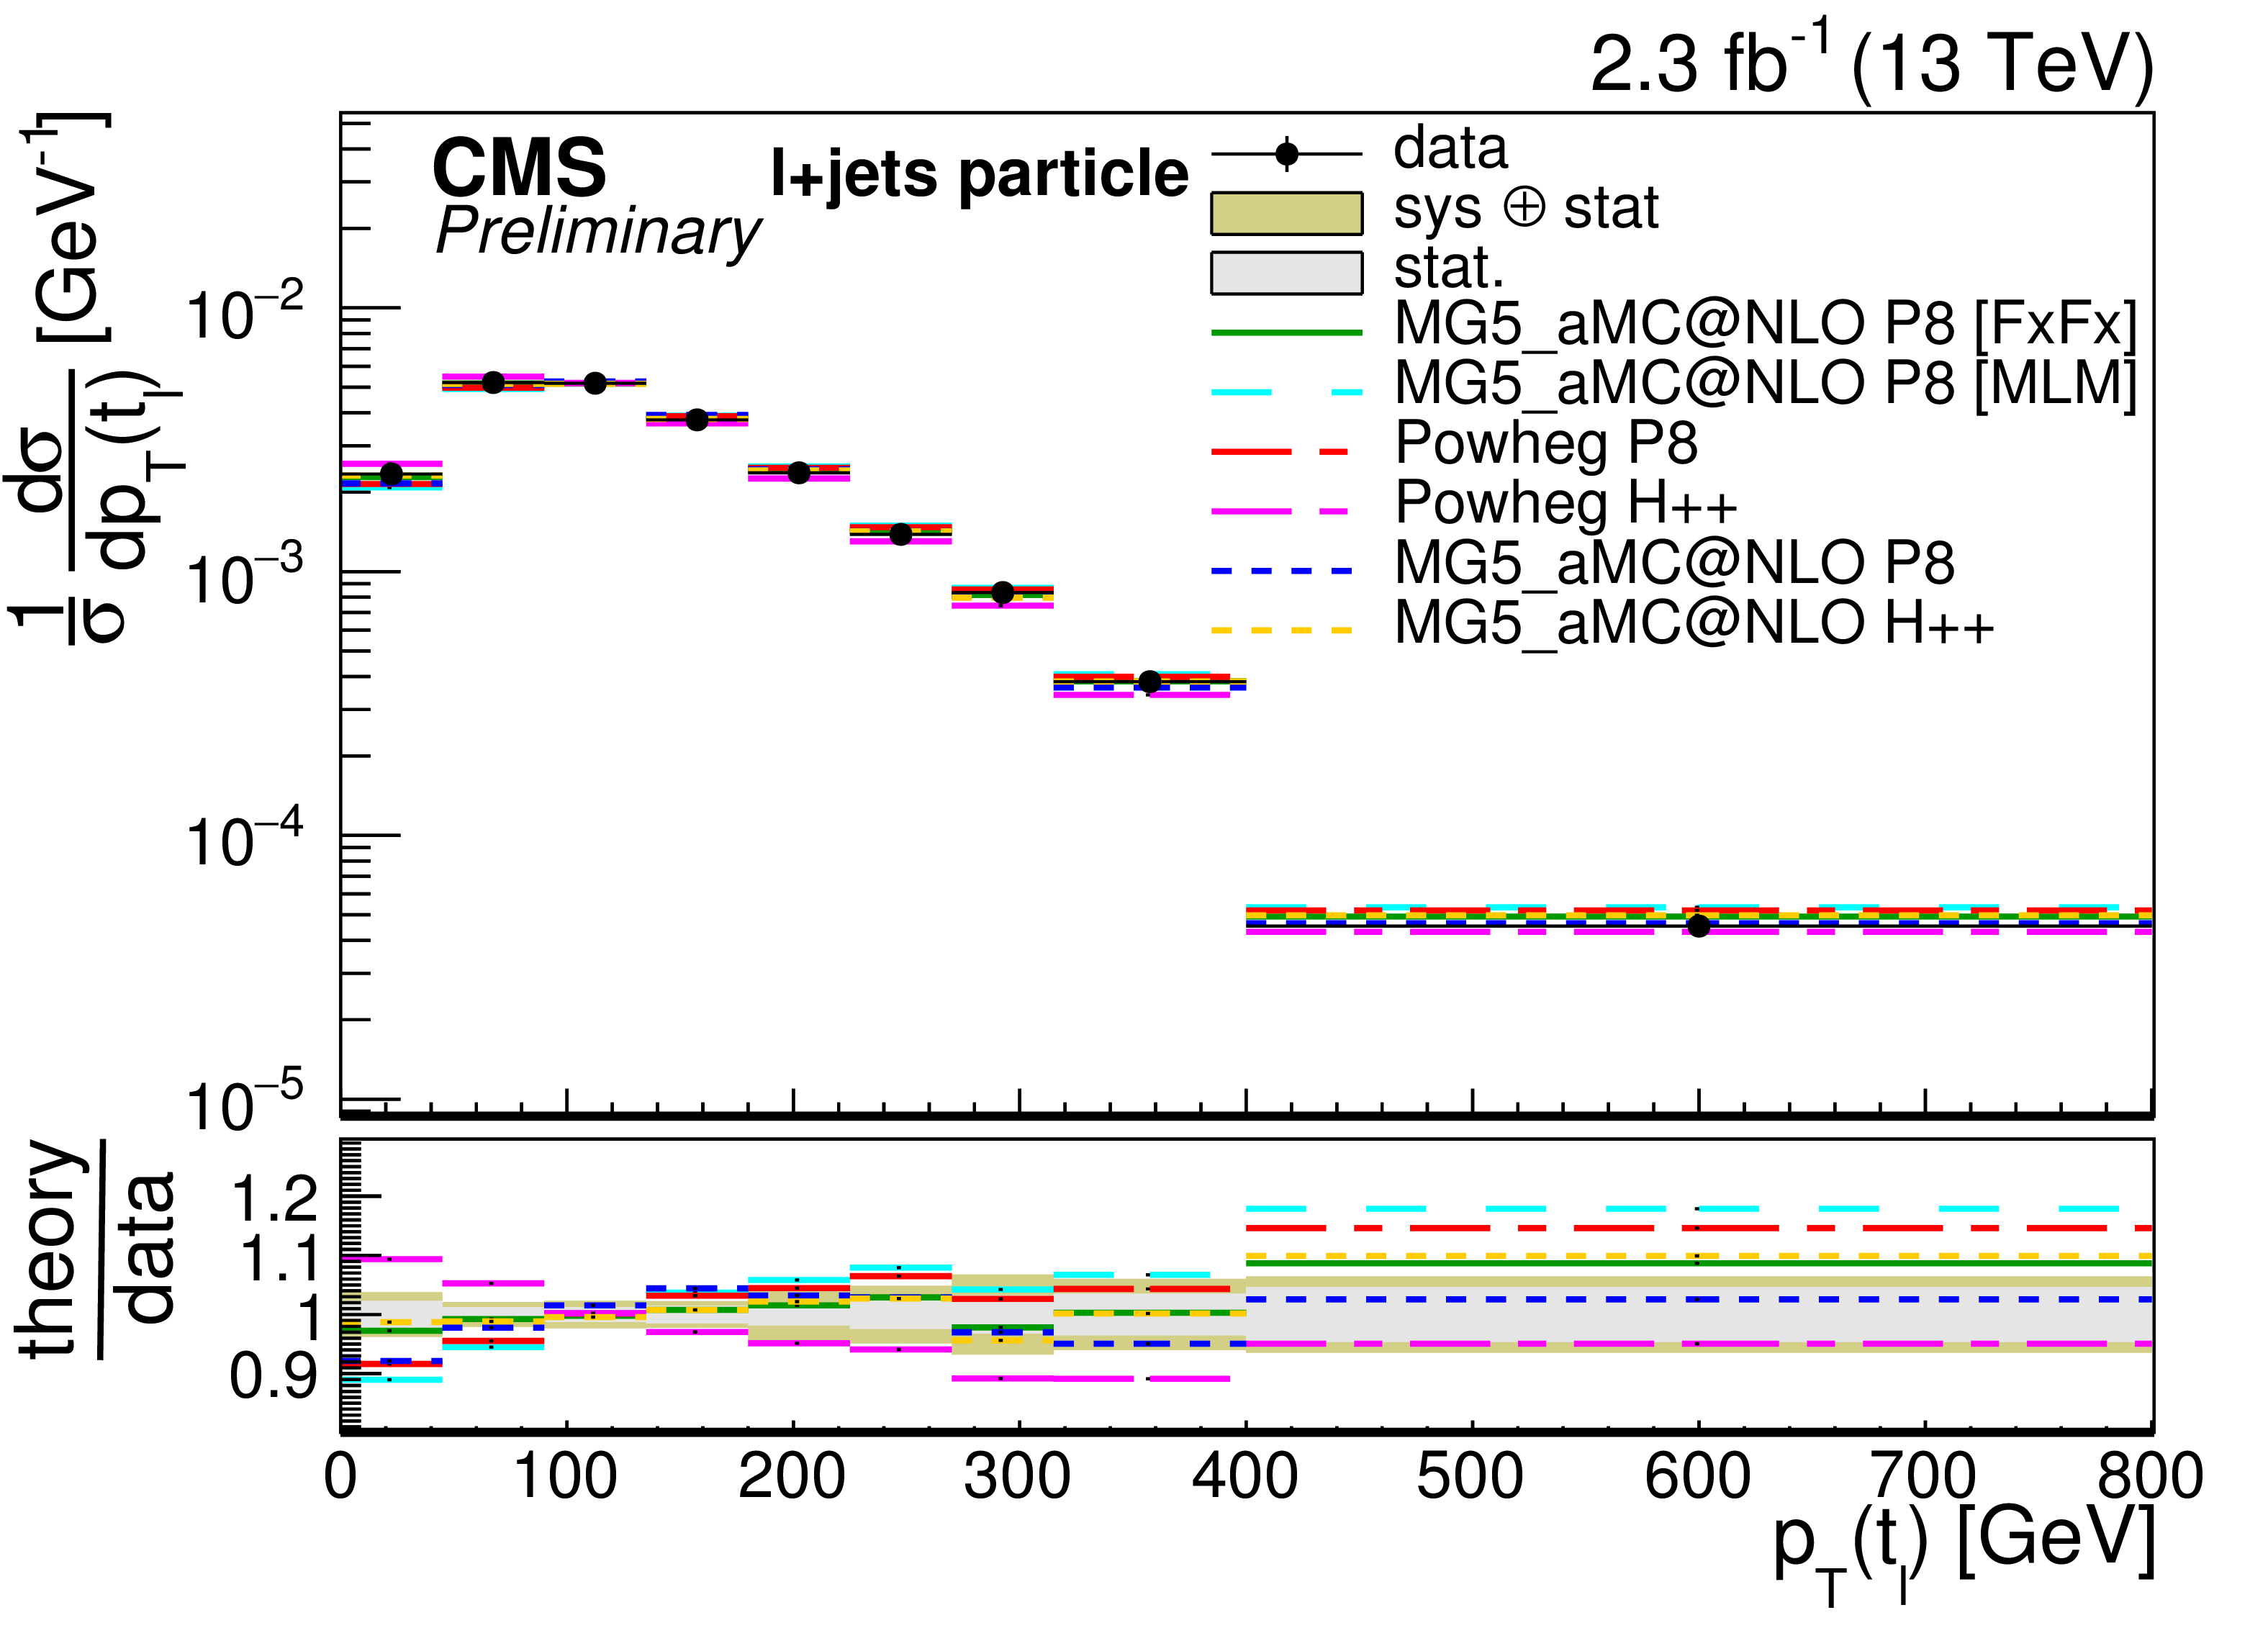
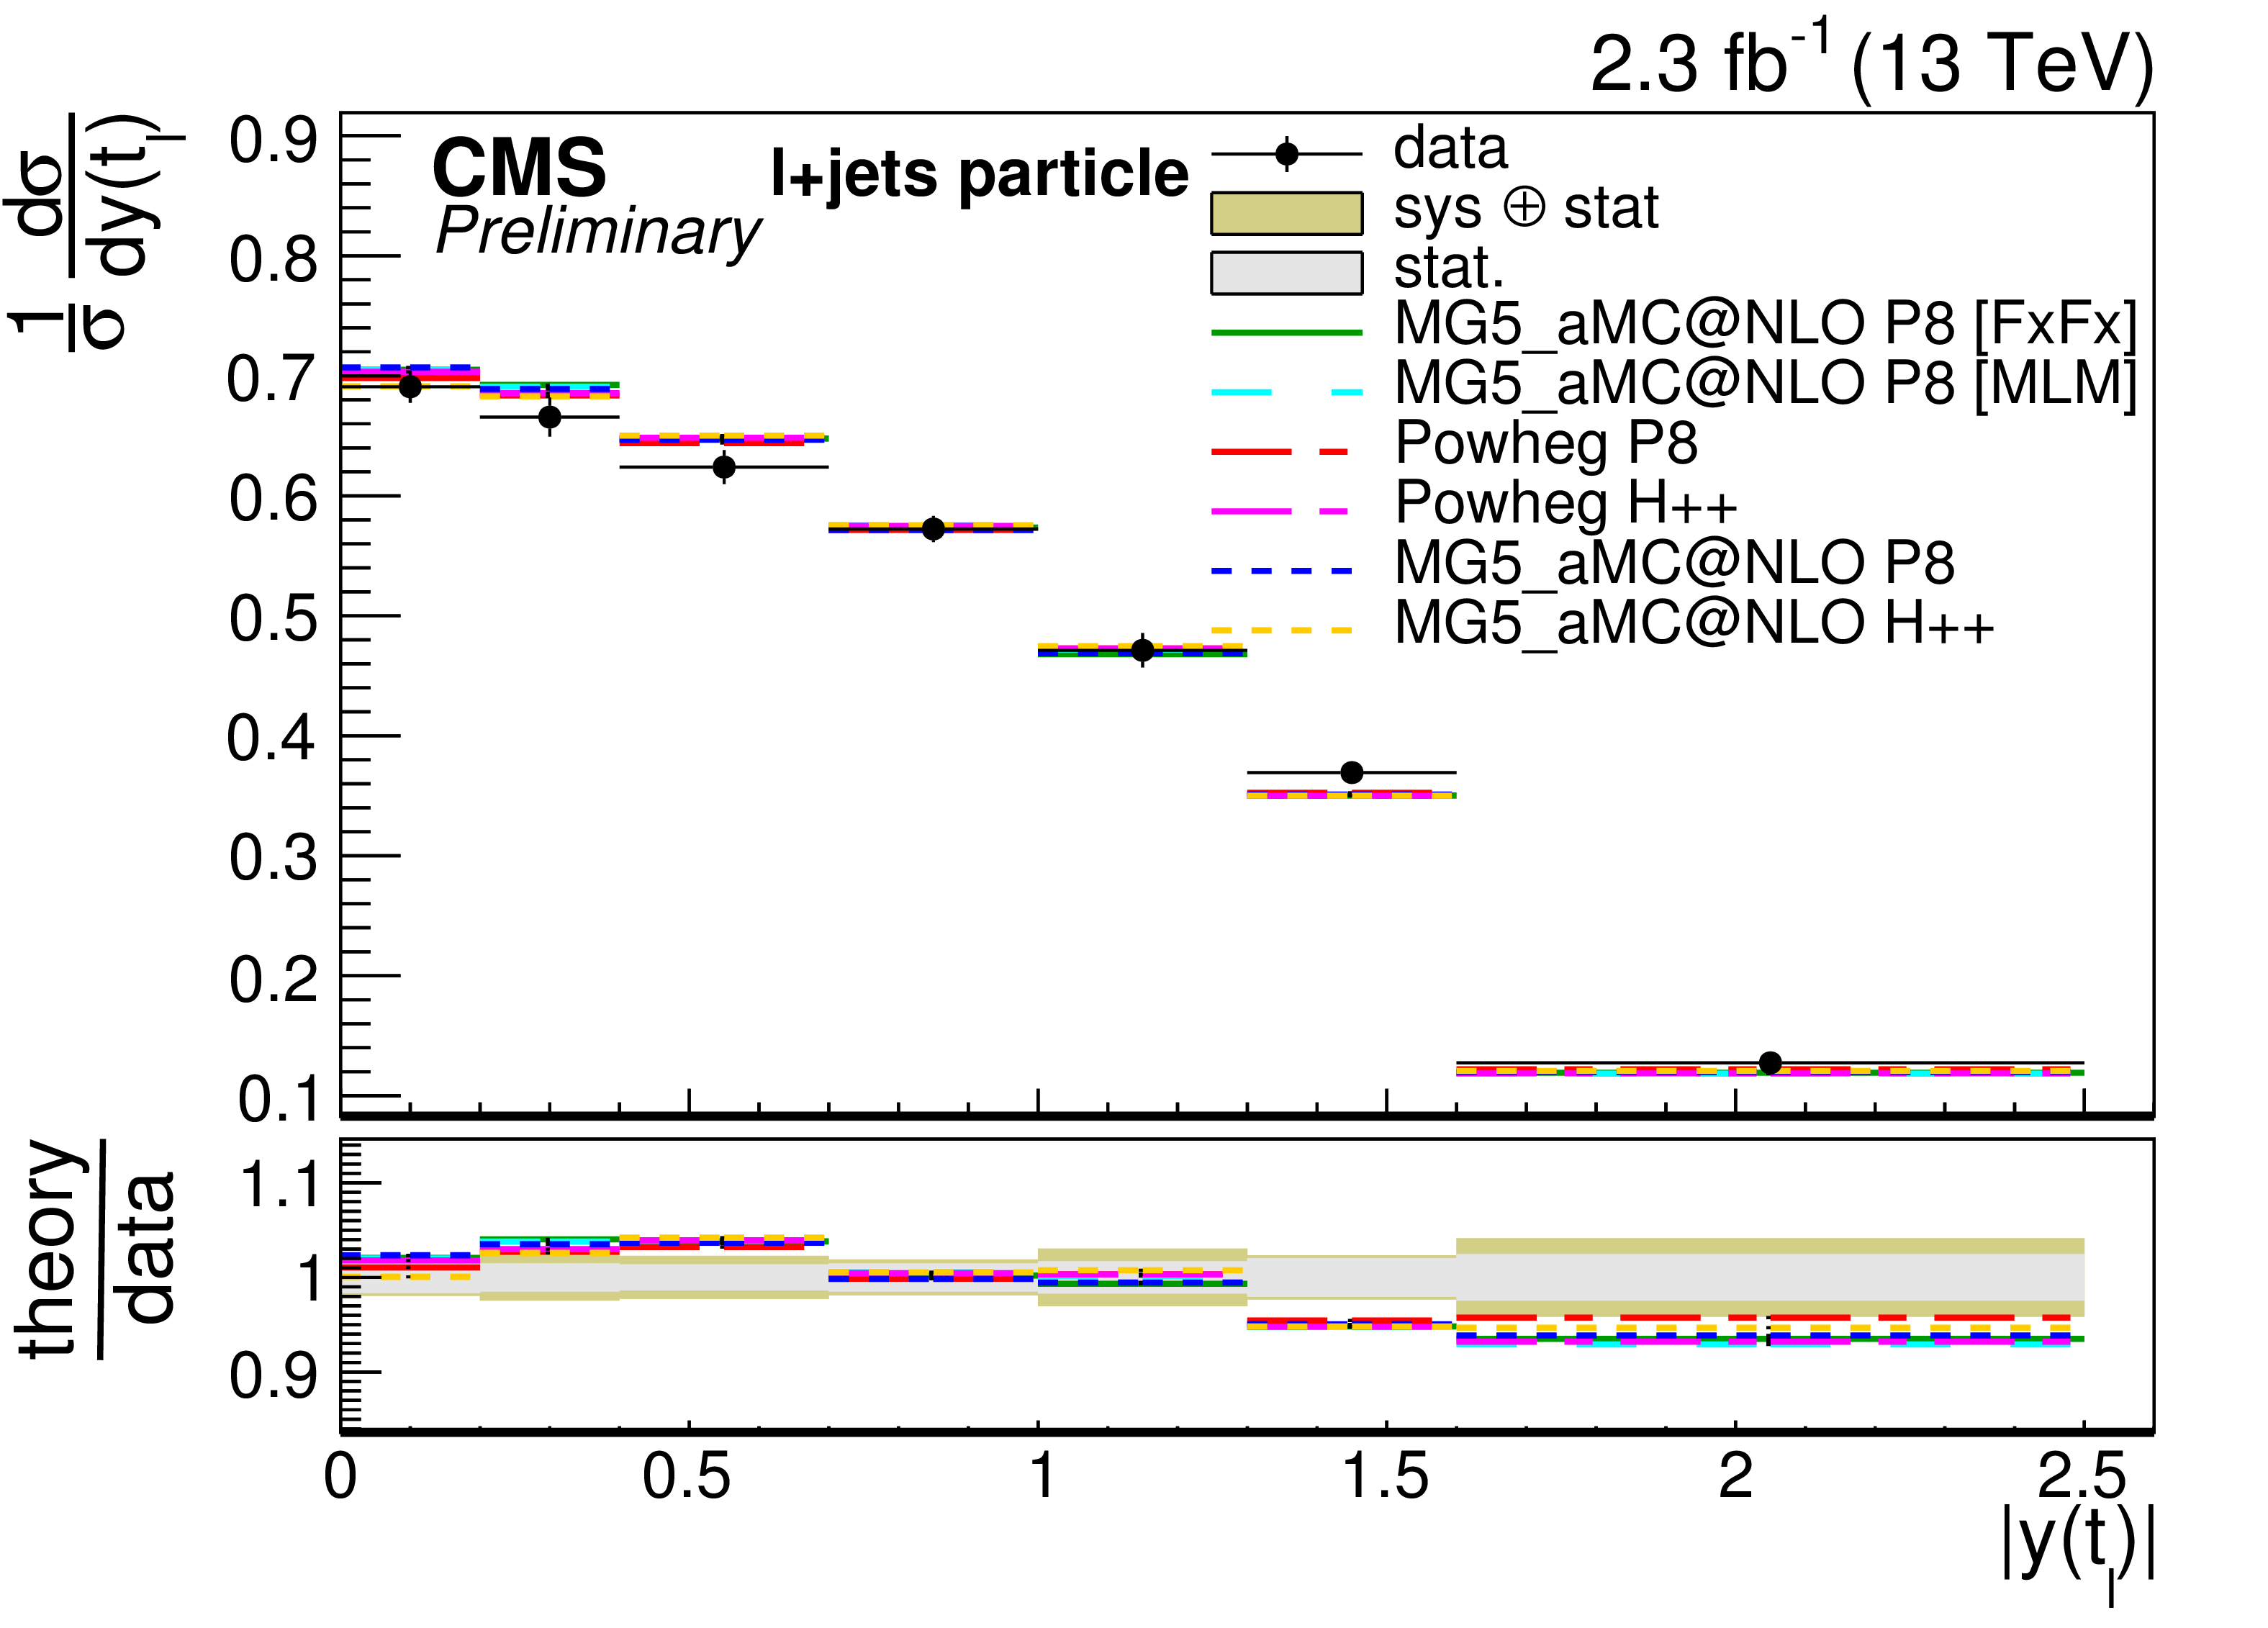
Figure 9-a:
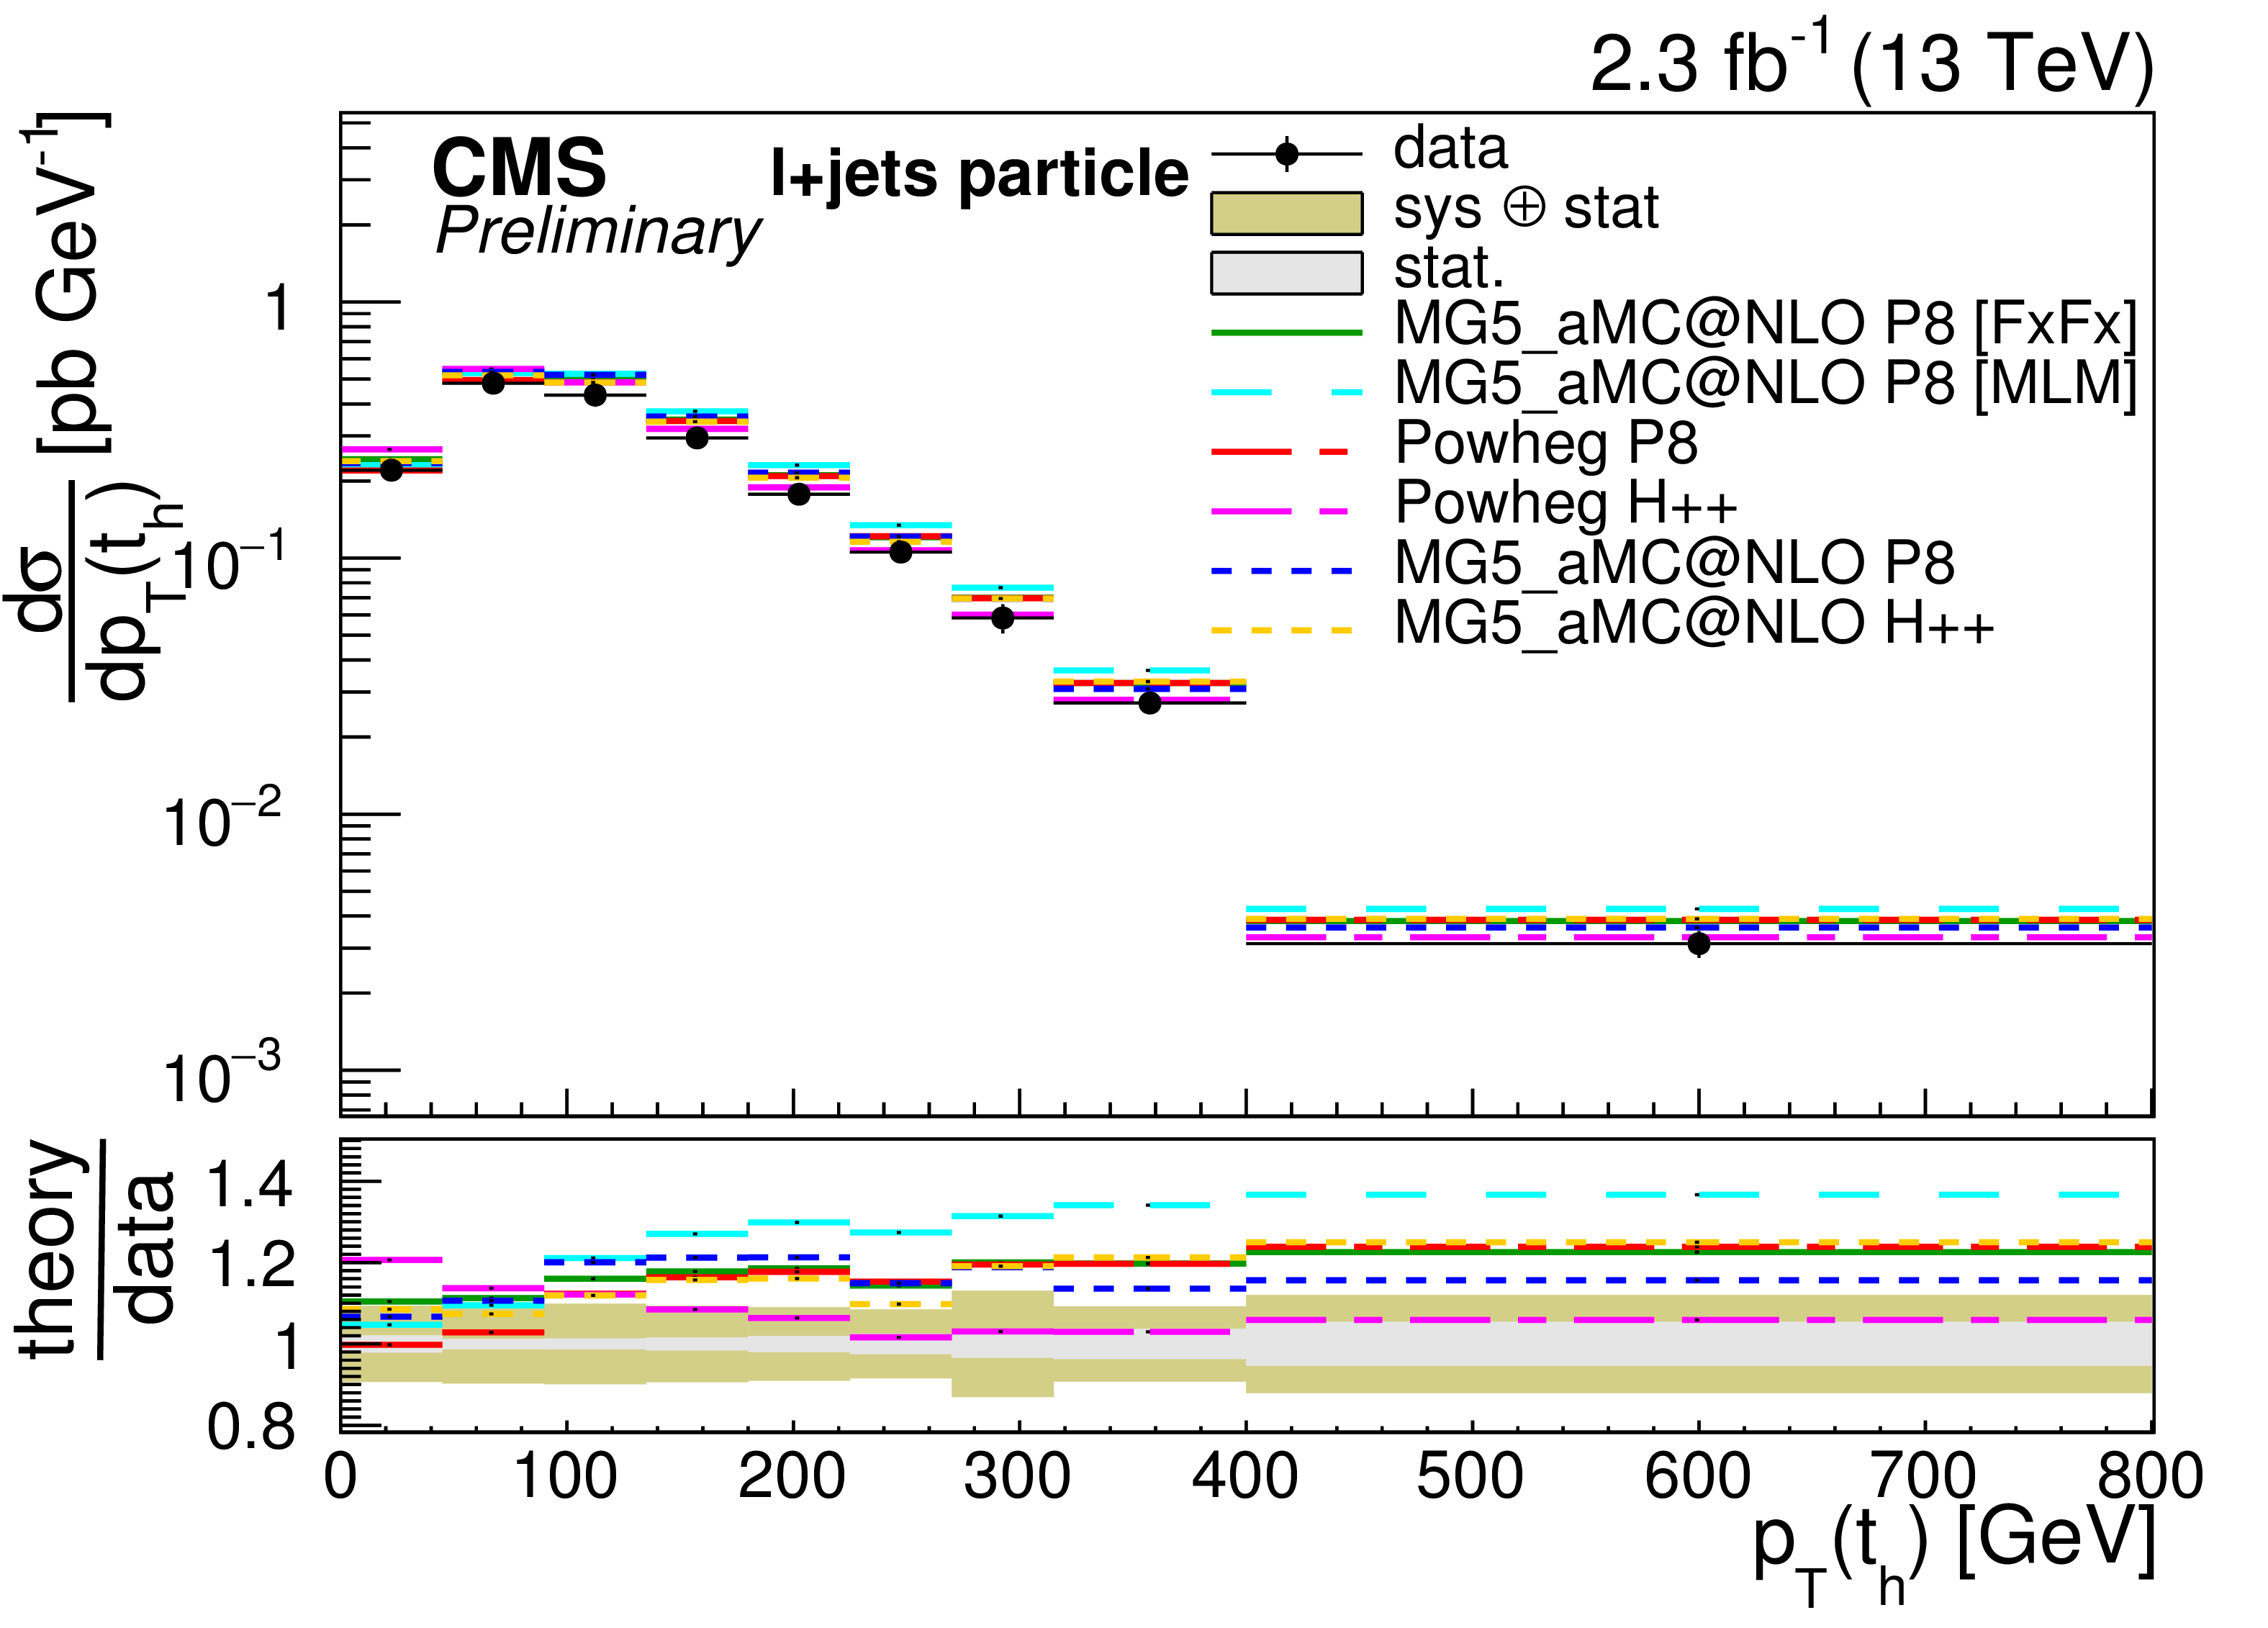
Differential cross sections at particle level as a function of $ {p_{\mathrm {T}}} ( {\mathrm {t} })$ and $|y( {\mathrm {t} })|$ compared to the predictions of POWHEG and MG5-aMC@NLO plus PYTHIA-8 (P8) or HERWIG++ (H++) and the multijet simulations MG5-aMC@NLO (MLM) and MG5-aMC@NLO (FxFx). |
png pdf |
Figure 9-b:
Differential cross sections at particle level as a function of $ {p_{\mathrm {T}}} ( {\mathrm {t} })$ and $|y( {\mathrm {t} })|$ compared to the predictions of POWHEG and MG5-aMC@NLO plus PYTHIA-8 (P8) or HERWIG++ (H++) and the multijet simulations MG5-aMC@NLO (MLM) and MG5-aMC@NLO (FxFx). |
png pdf |
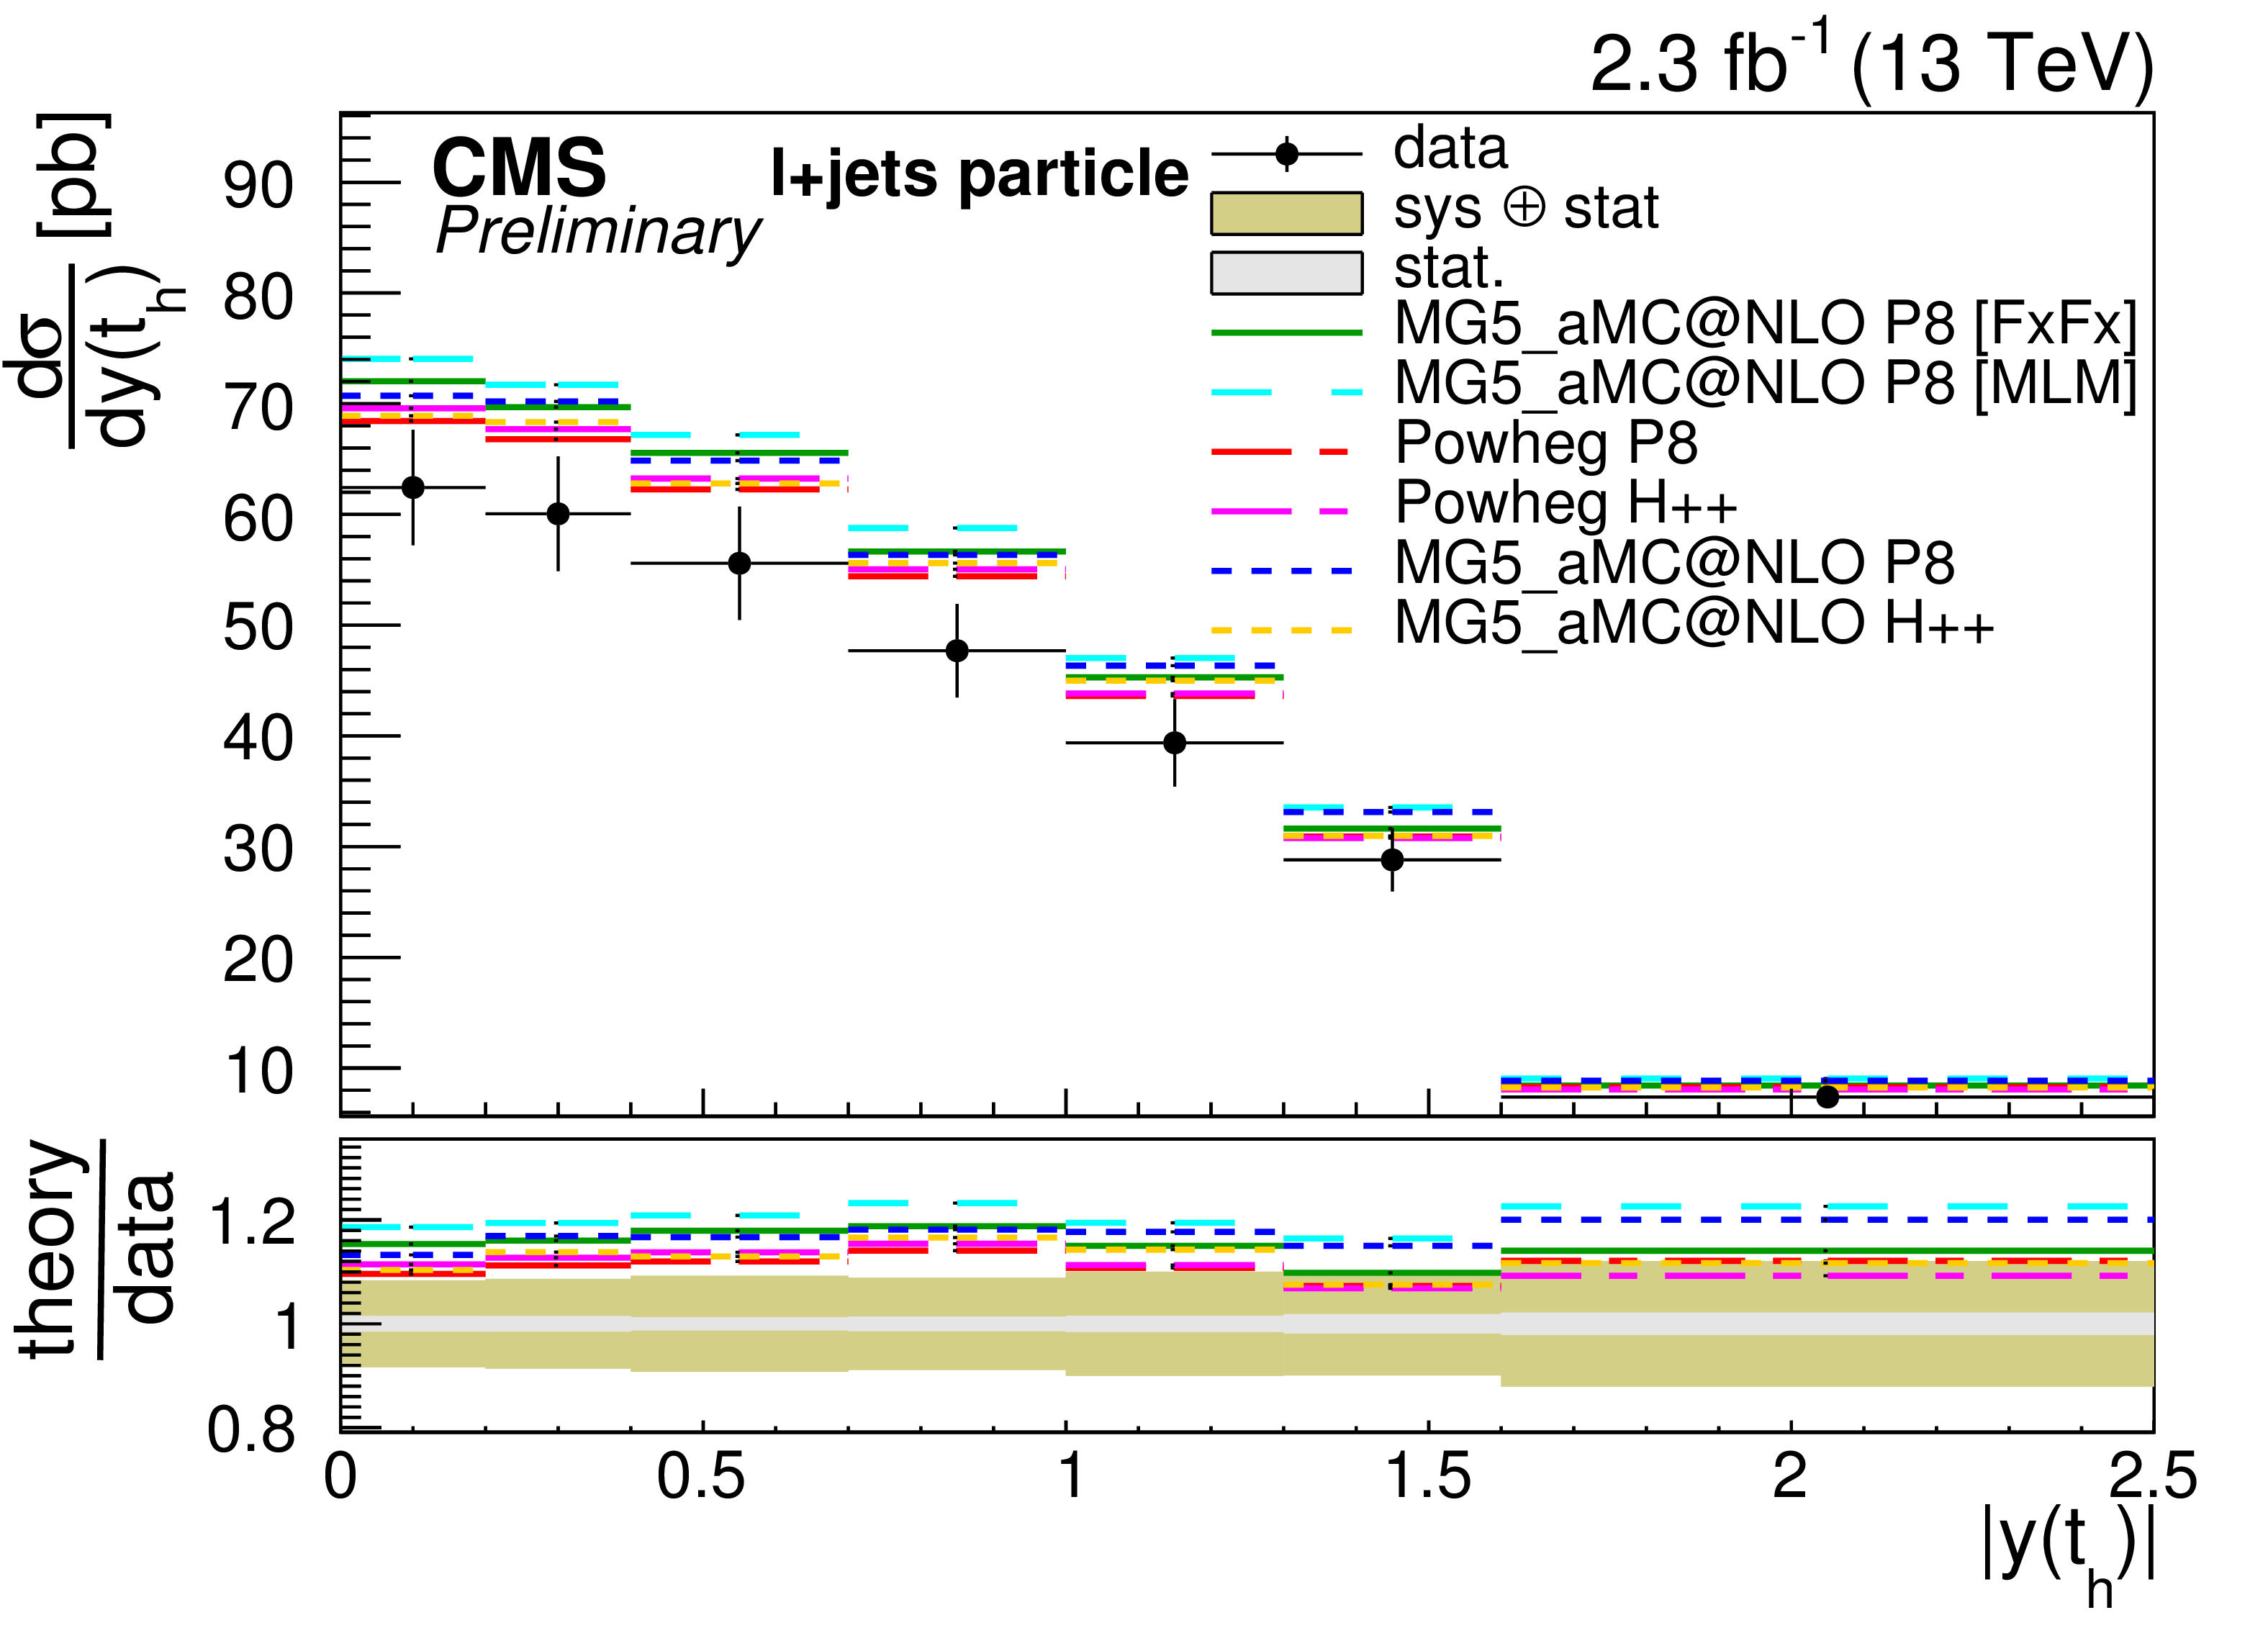
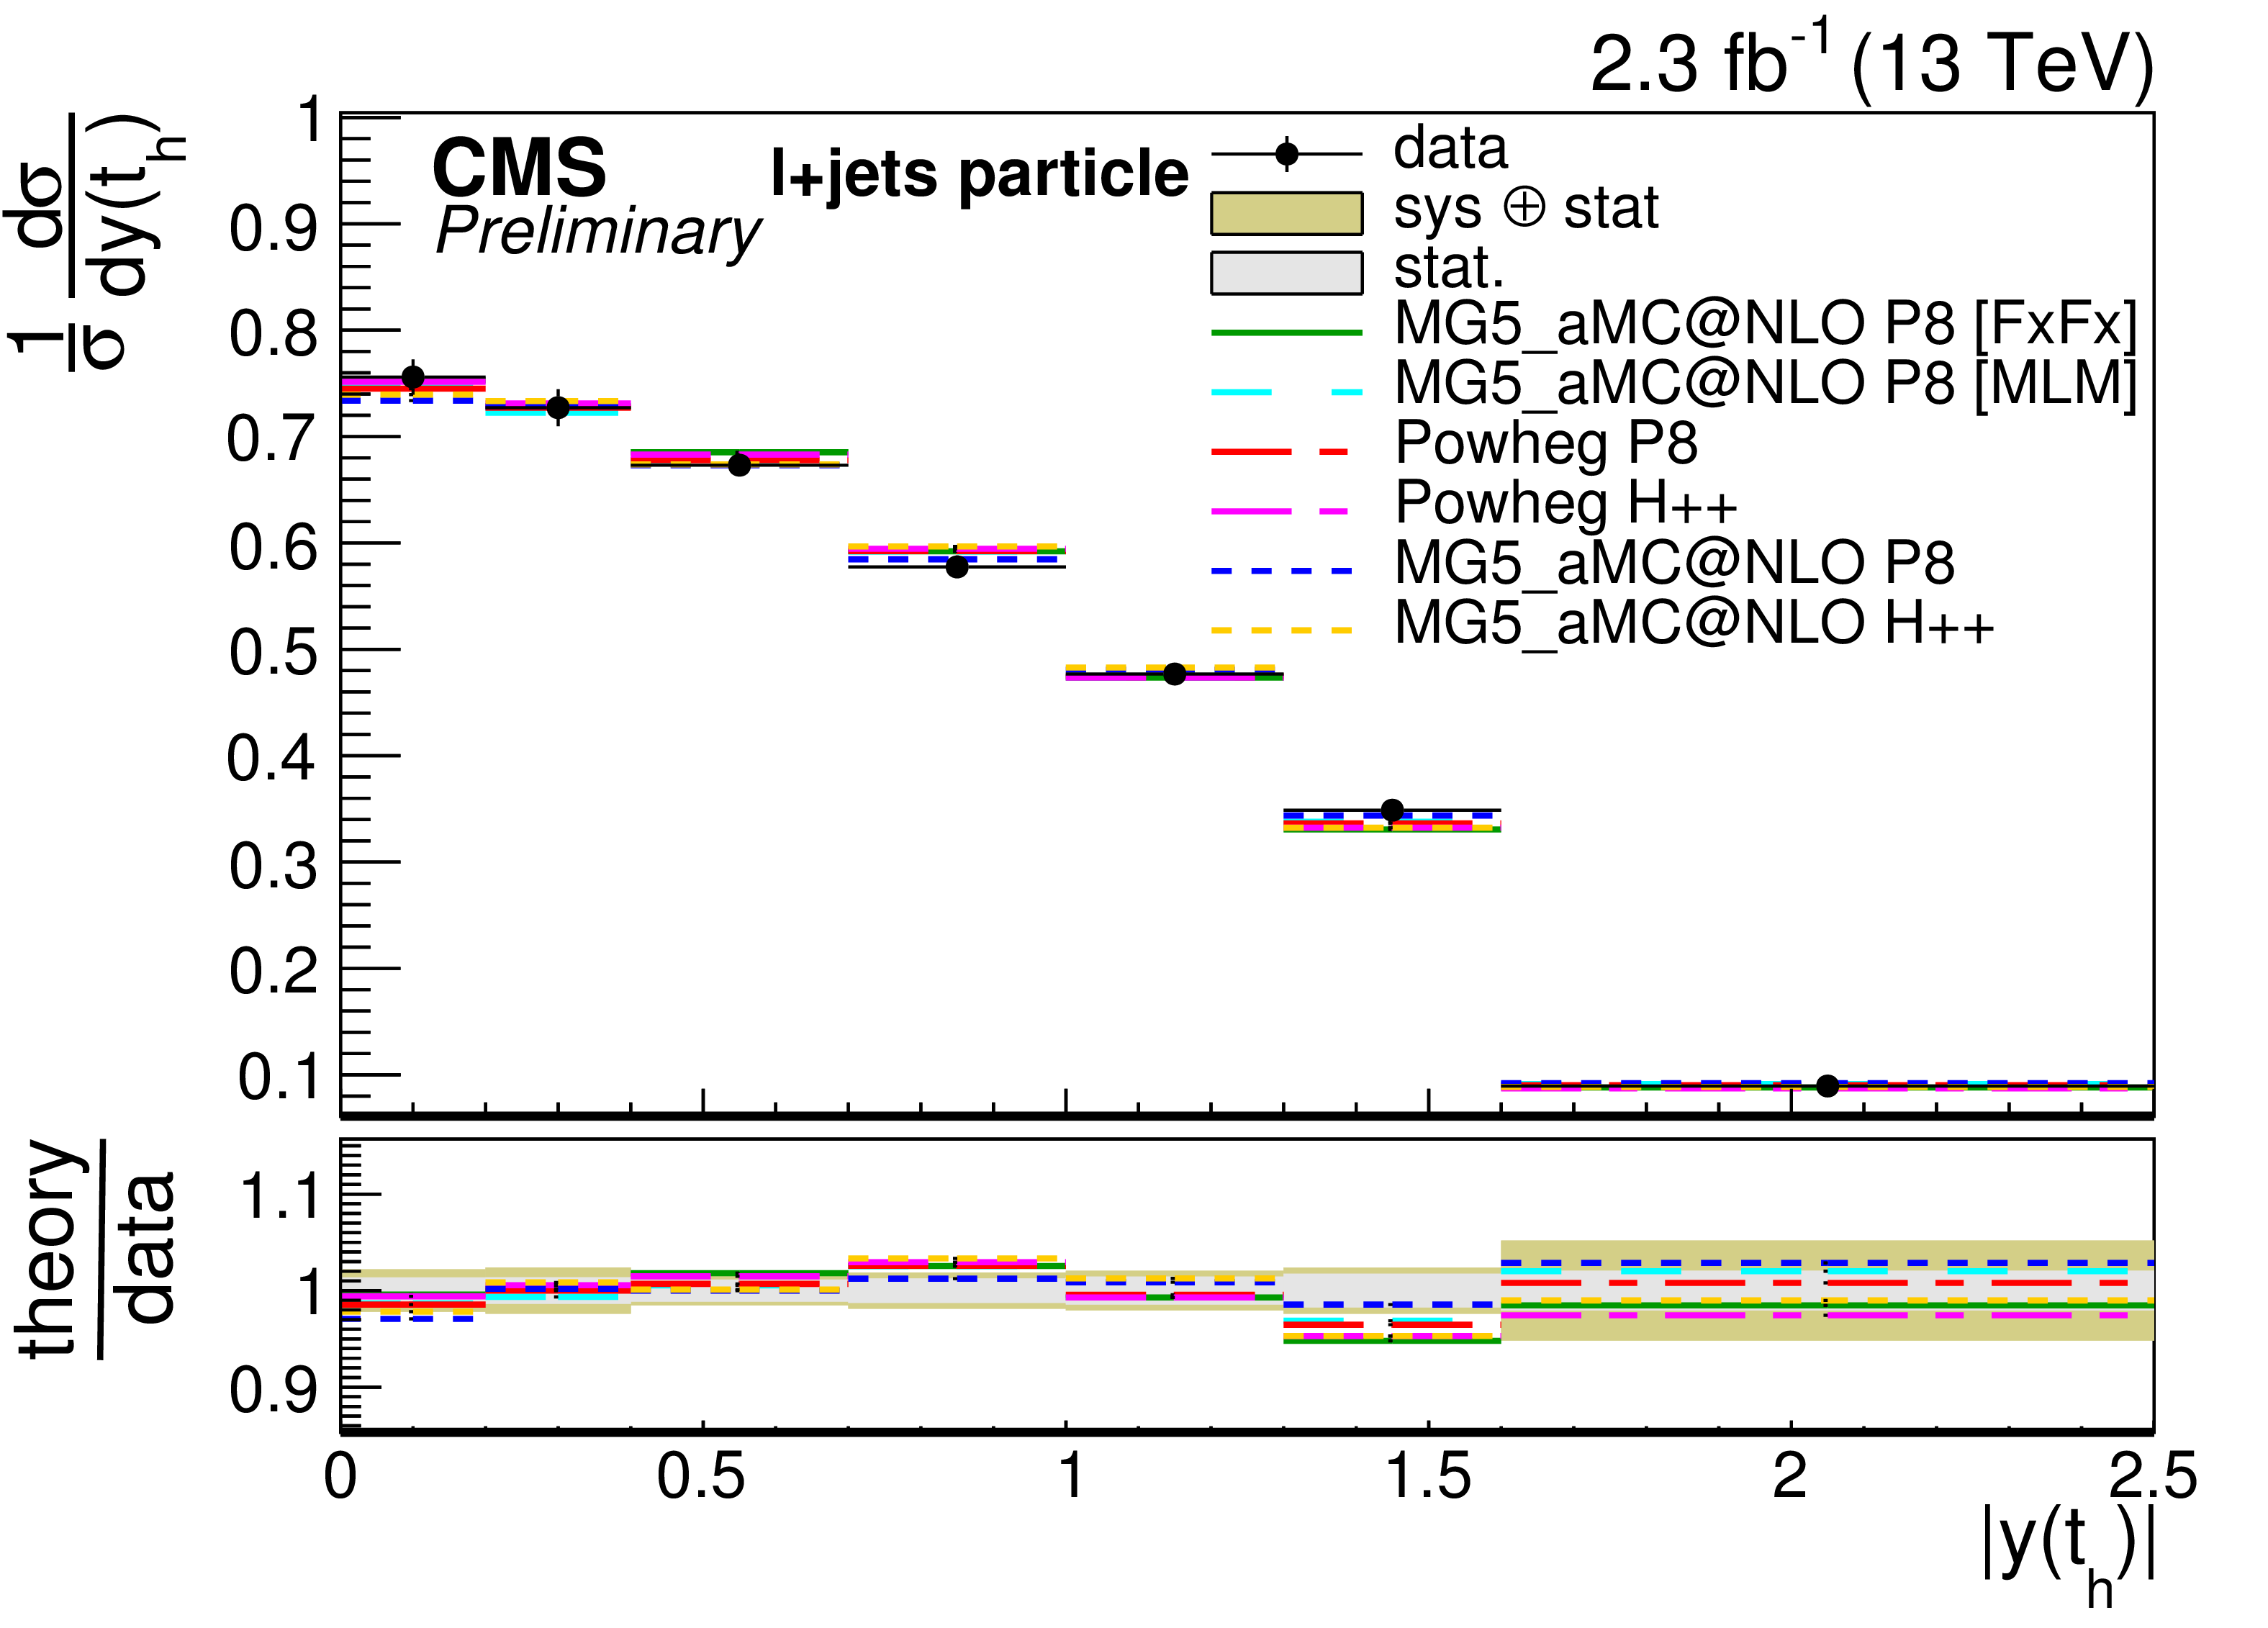
Figure 9-c:
Differential cross sections at particle level as a function of $ {p_{\mathrm {T}}} ( {\mathrm {t} })$ and $|y( {\mathrm {t} })|$ compared to the predictions of POWHEG and MG5-aMC@NLO plus PYTHIA-8 (P8) or HERWIG++ (H++) and the multijet simulations MG5-aMC@NLO (MLM) and MG5-aMC@NLO (FxFx). |
png pdf |
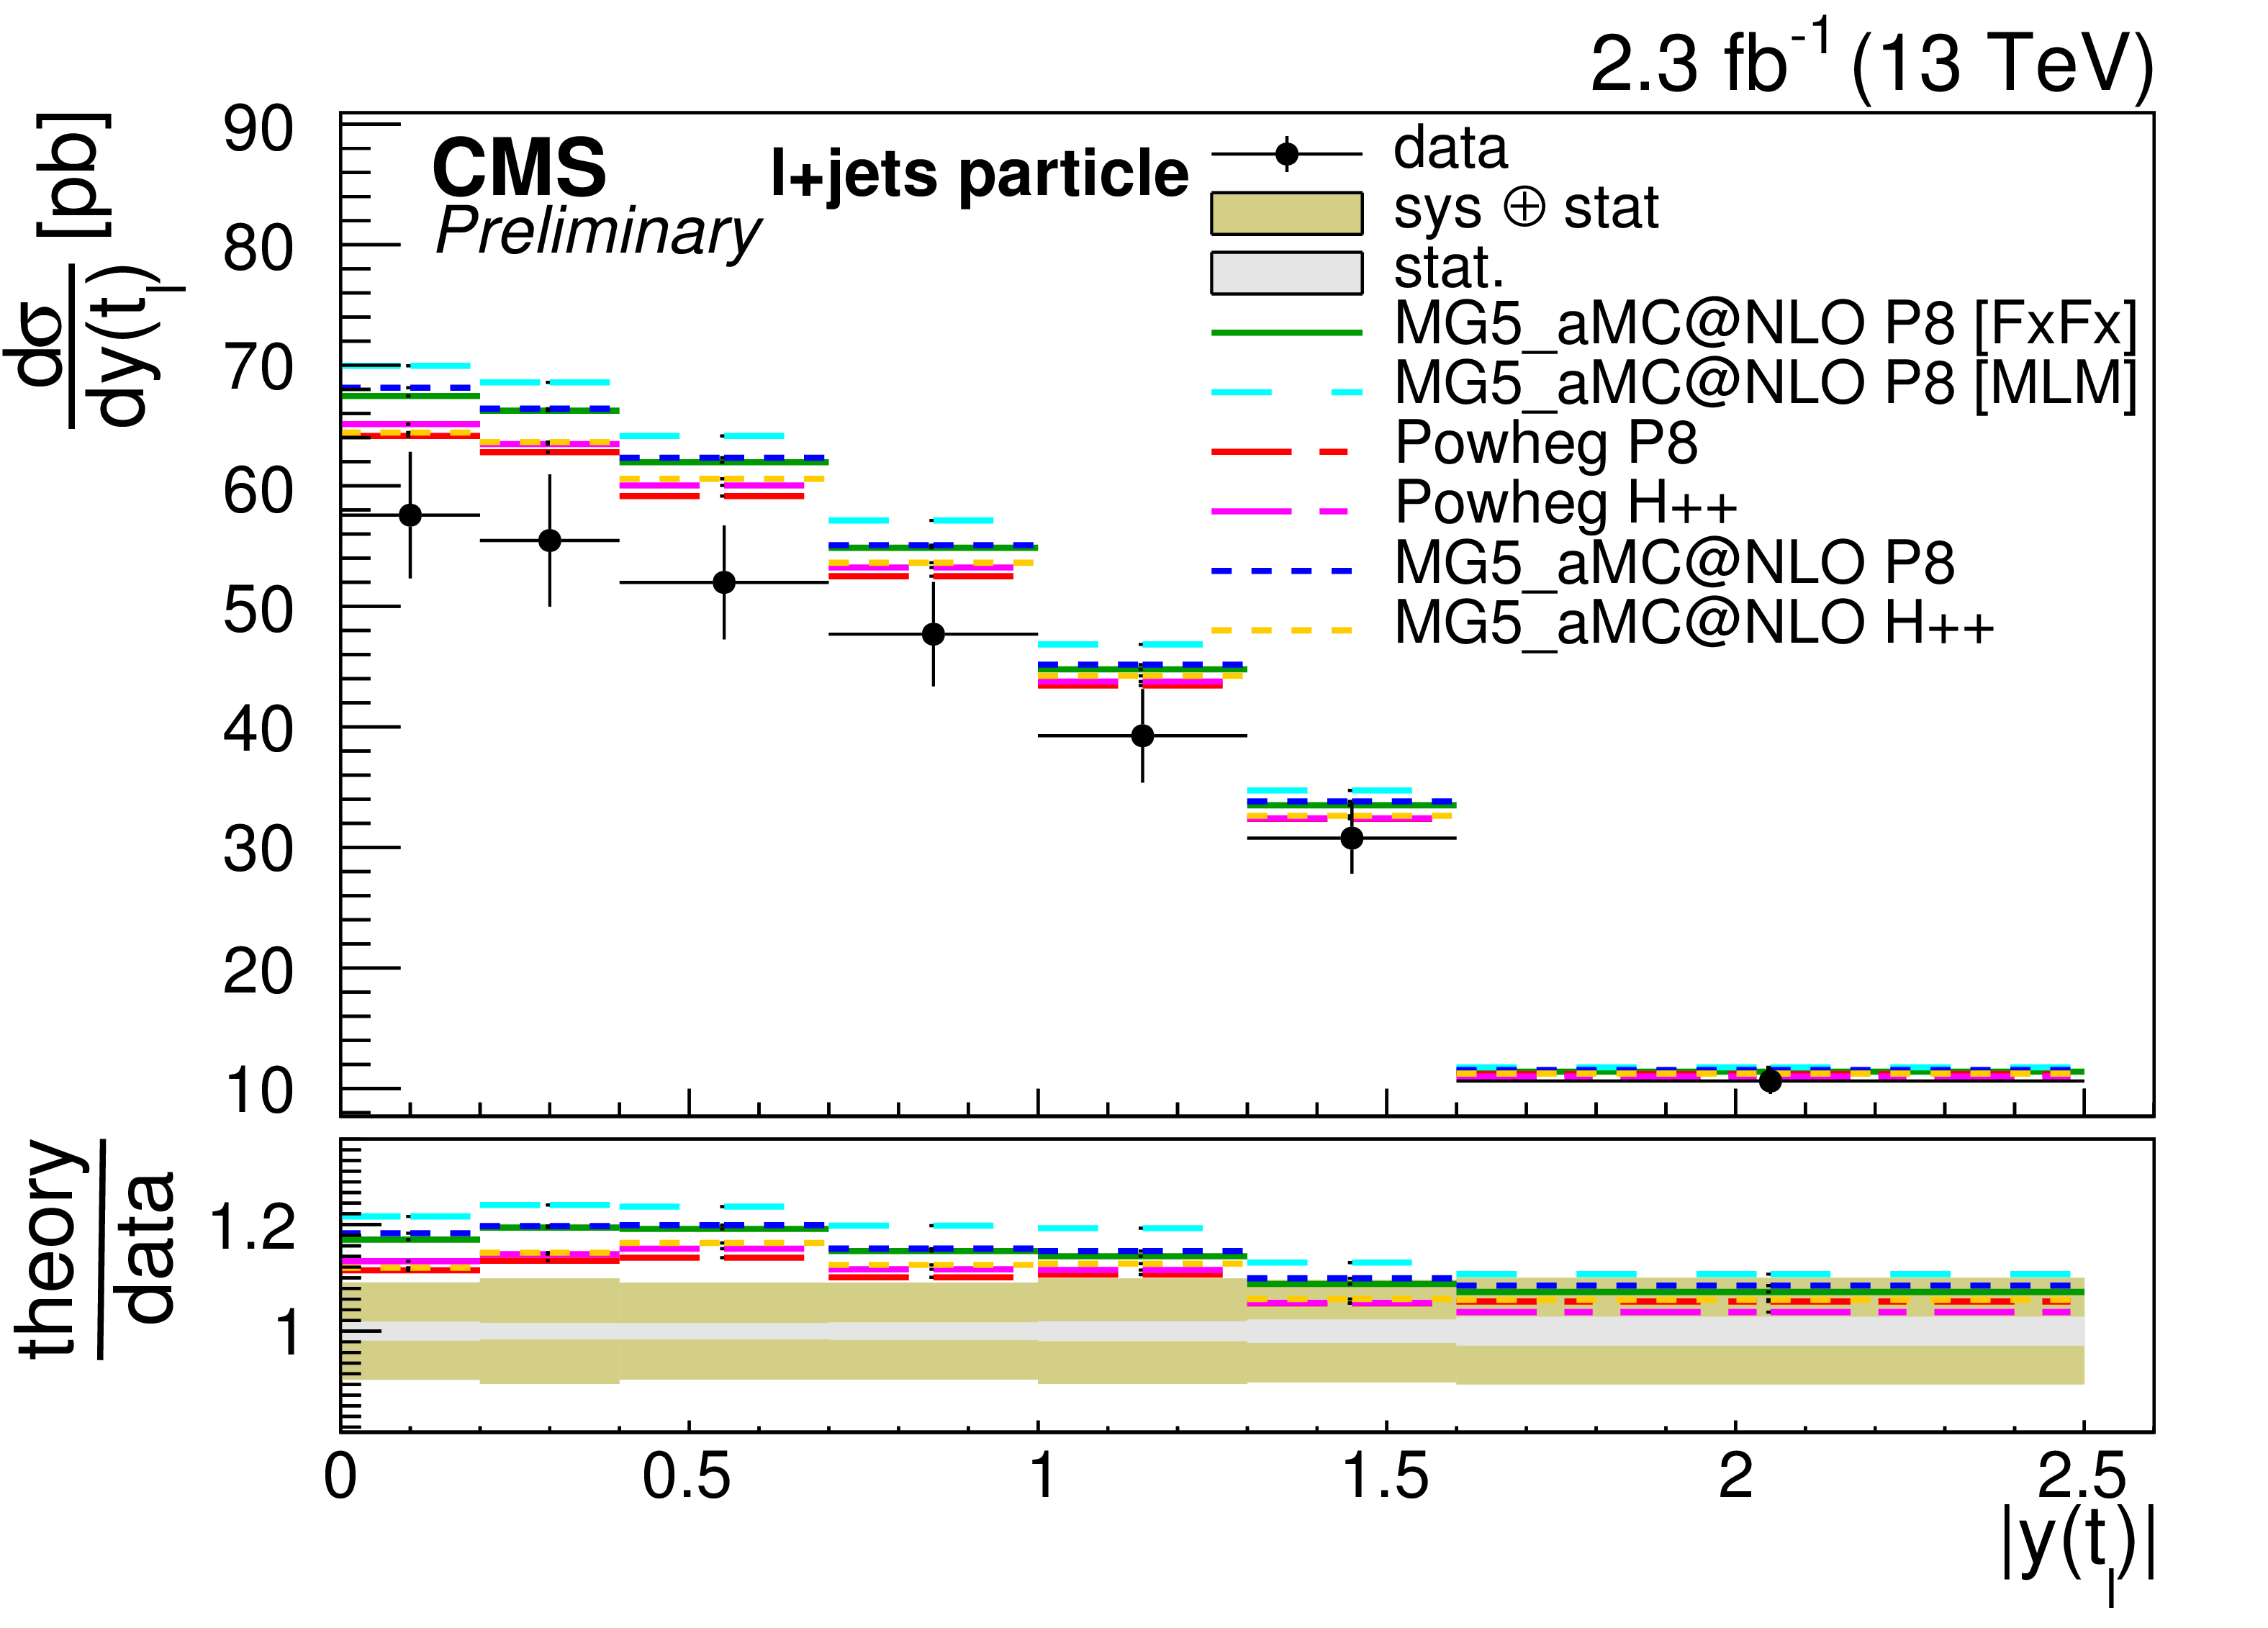
Figure 9-d:
Differential cross sections at particle level as a function of $ {p_{\mathrm {T}}} ( {\mathrm {t} })$ and $|y( {\mathrm {t} })|$ compared to the predictions of POWHEG and MG5-aMC@NLO plus PYTHIA-8 (P8) or HERWIG++ (H++) and the multijet simulations MG5-aMC@NLO (MLM) and MG5-aMC@NLO (FxFx). |
png pdf |
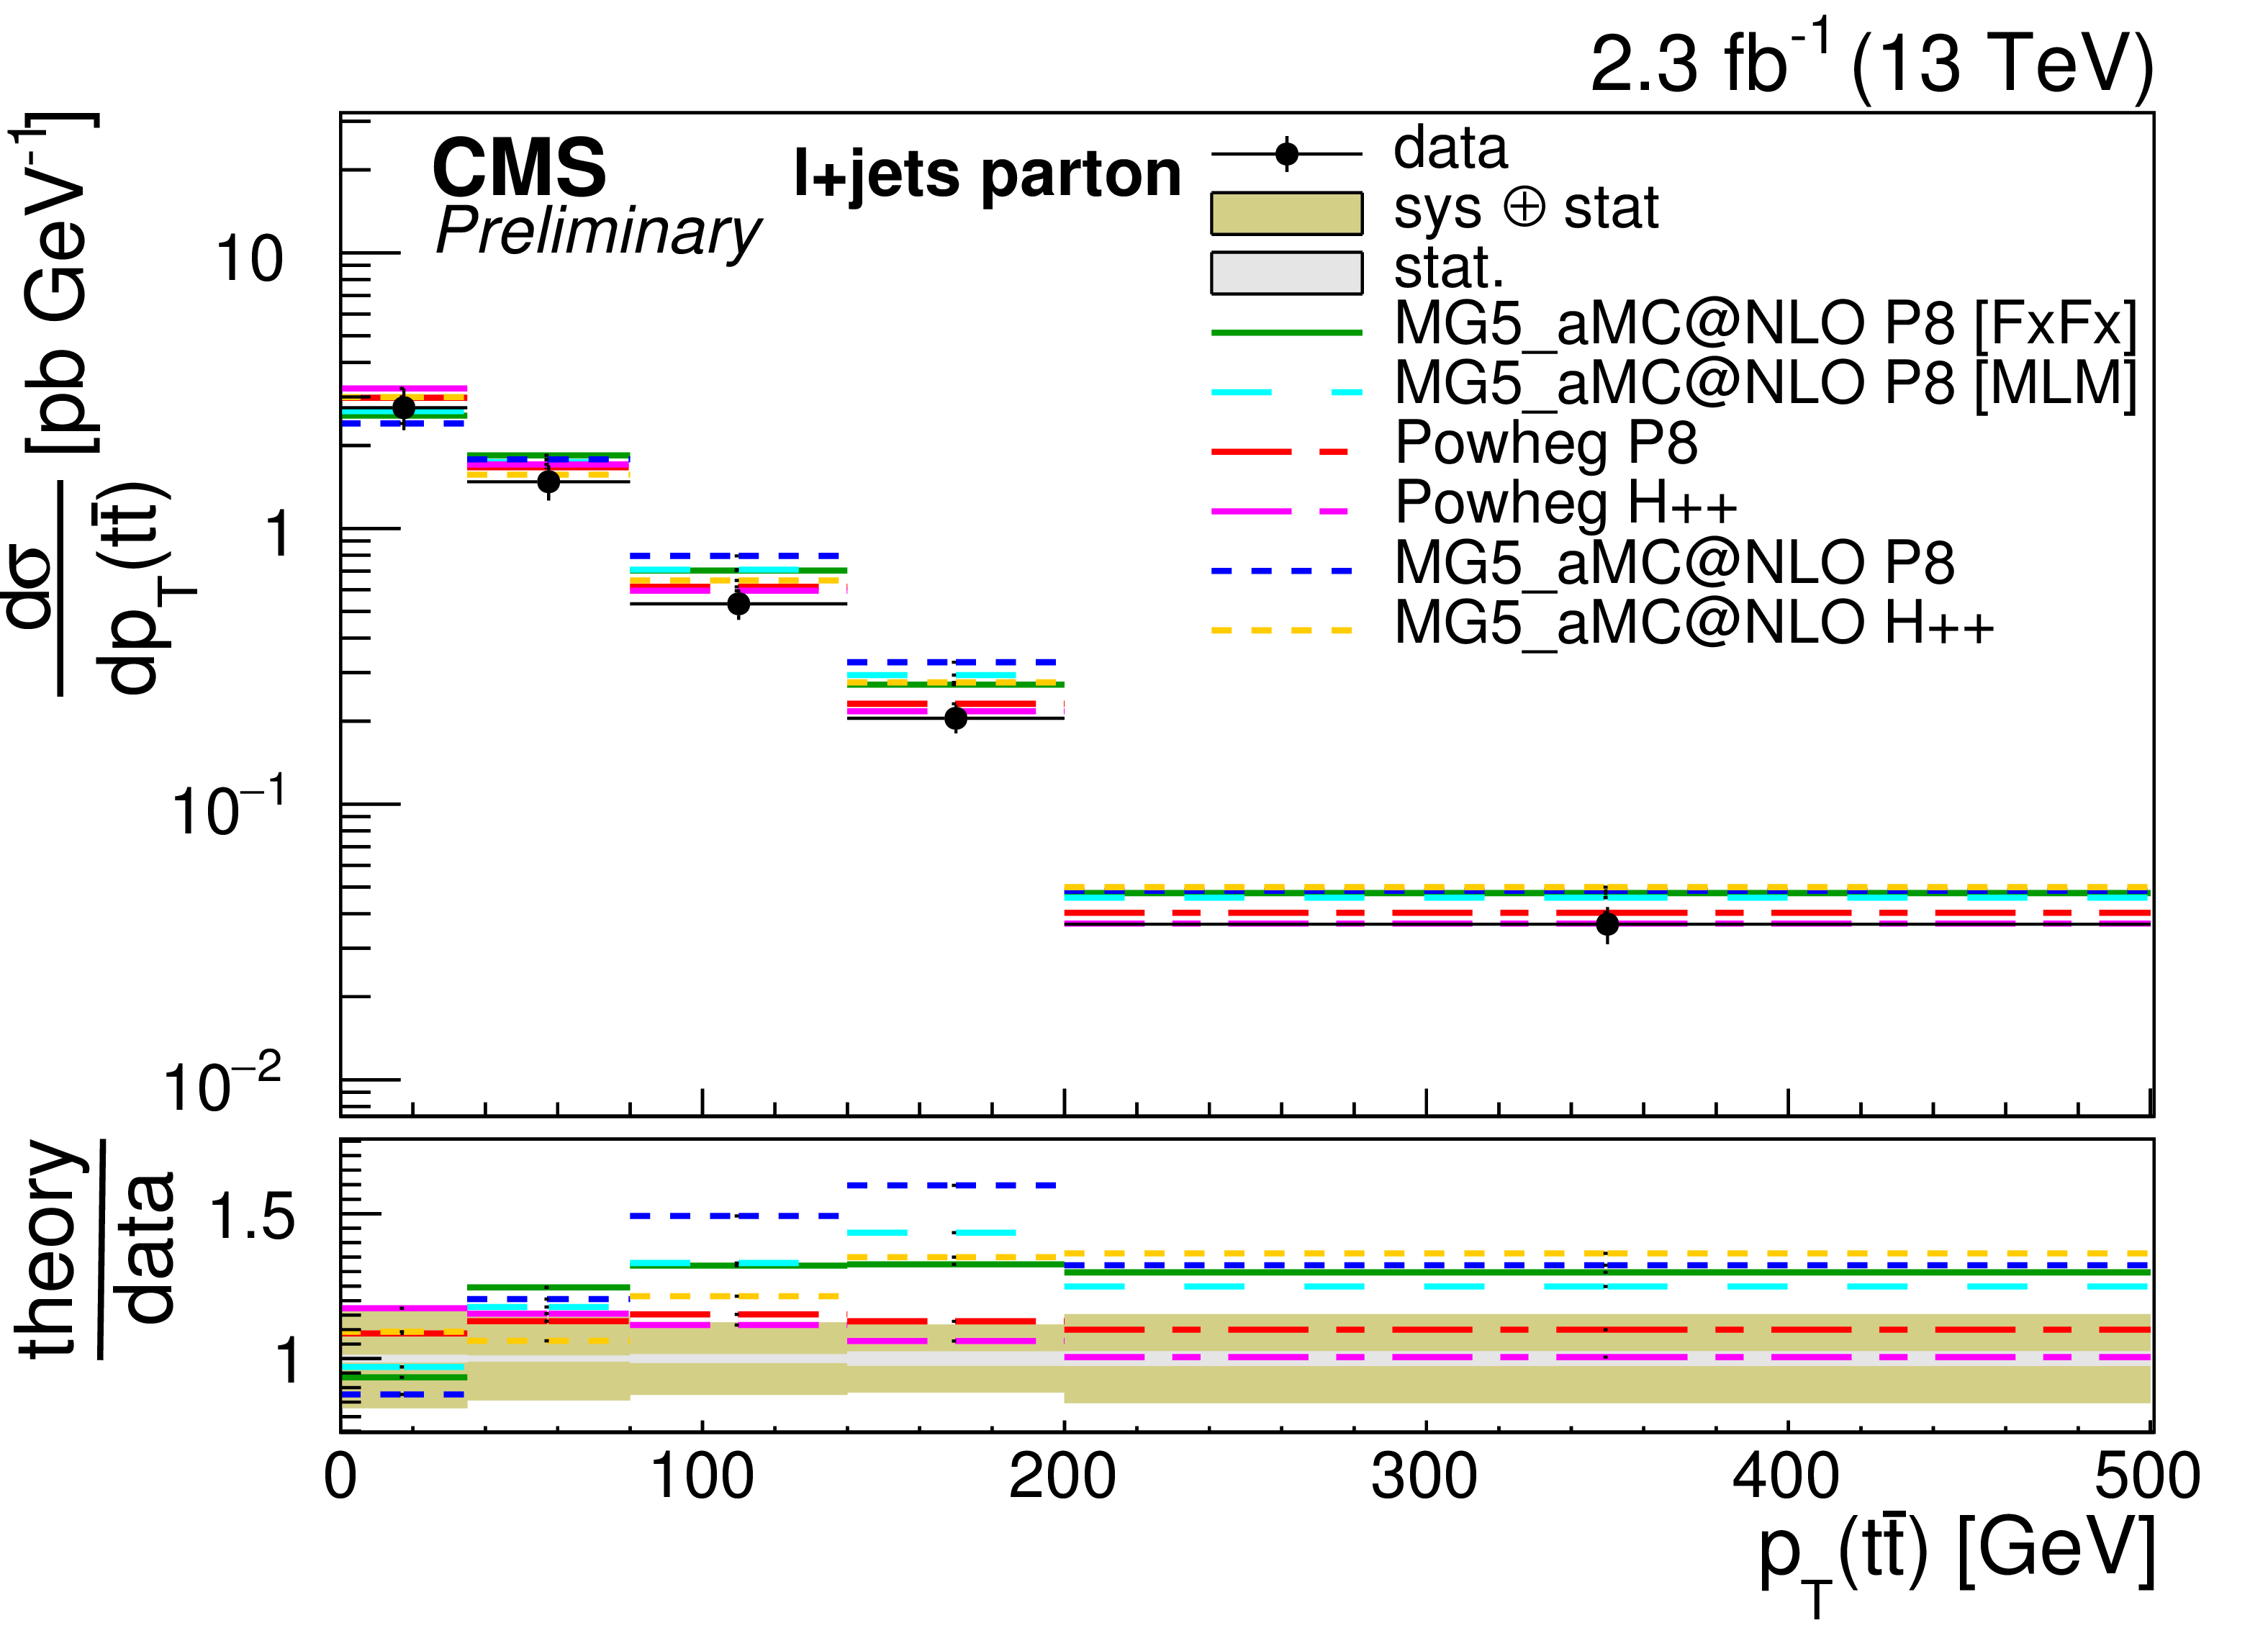
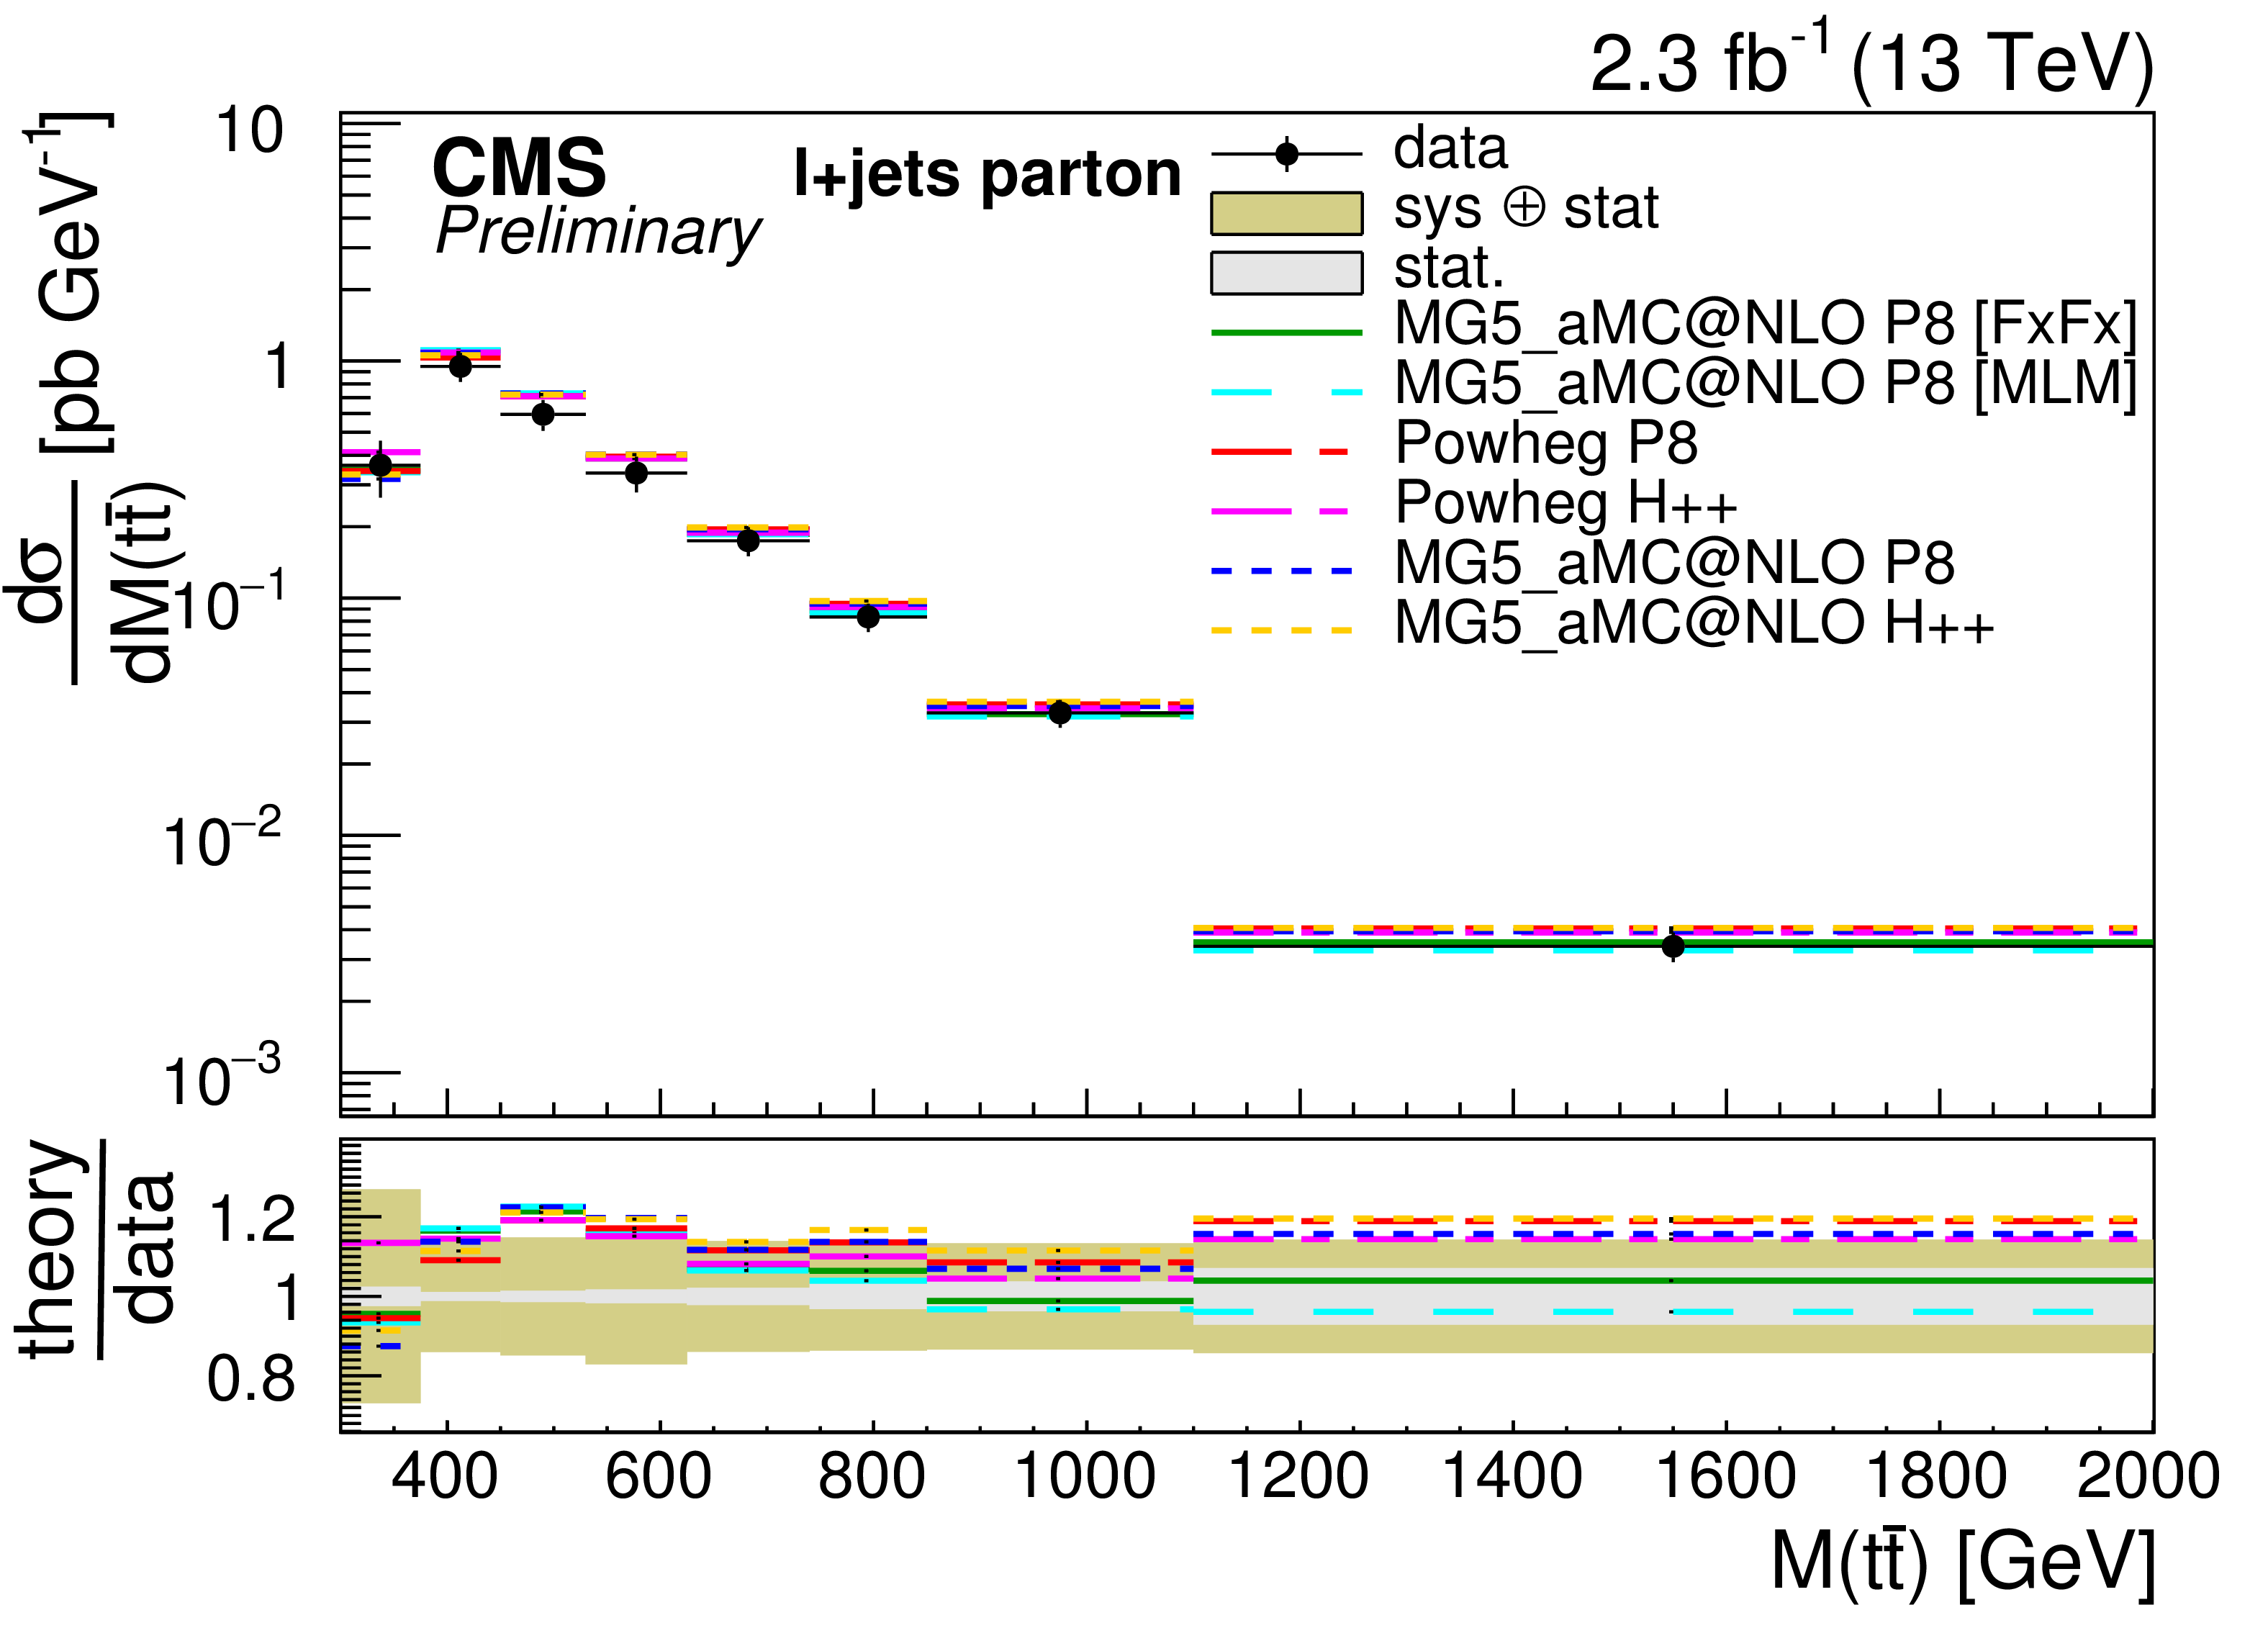
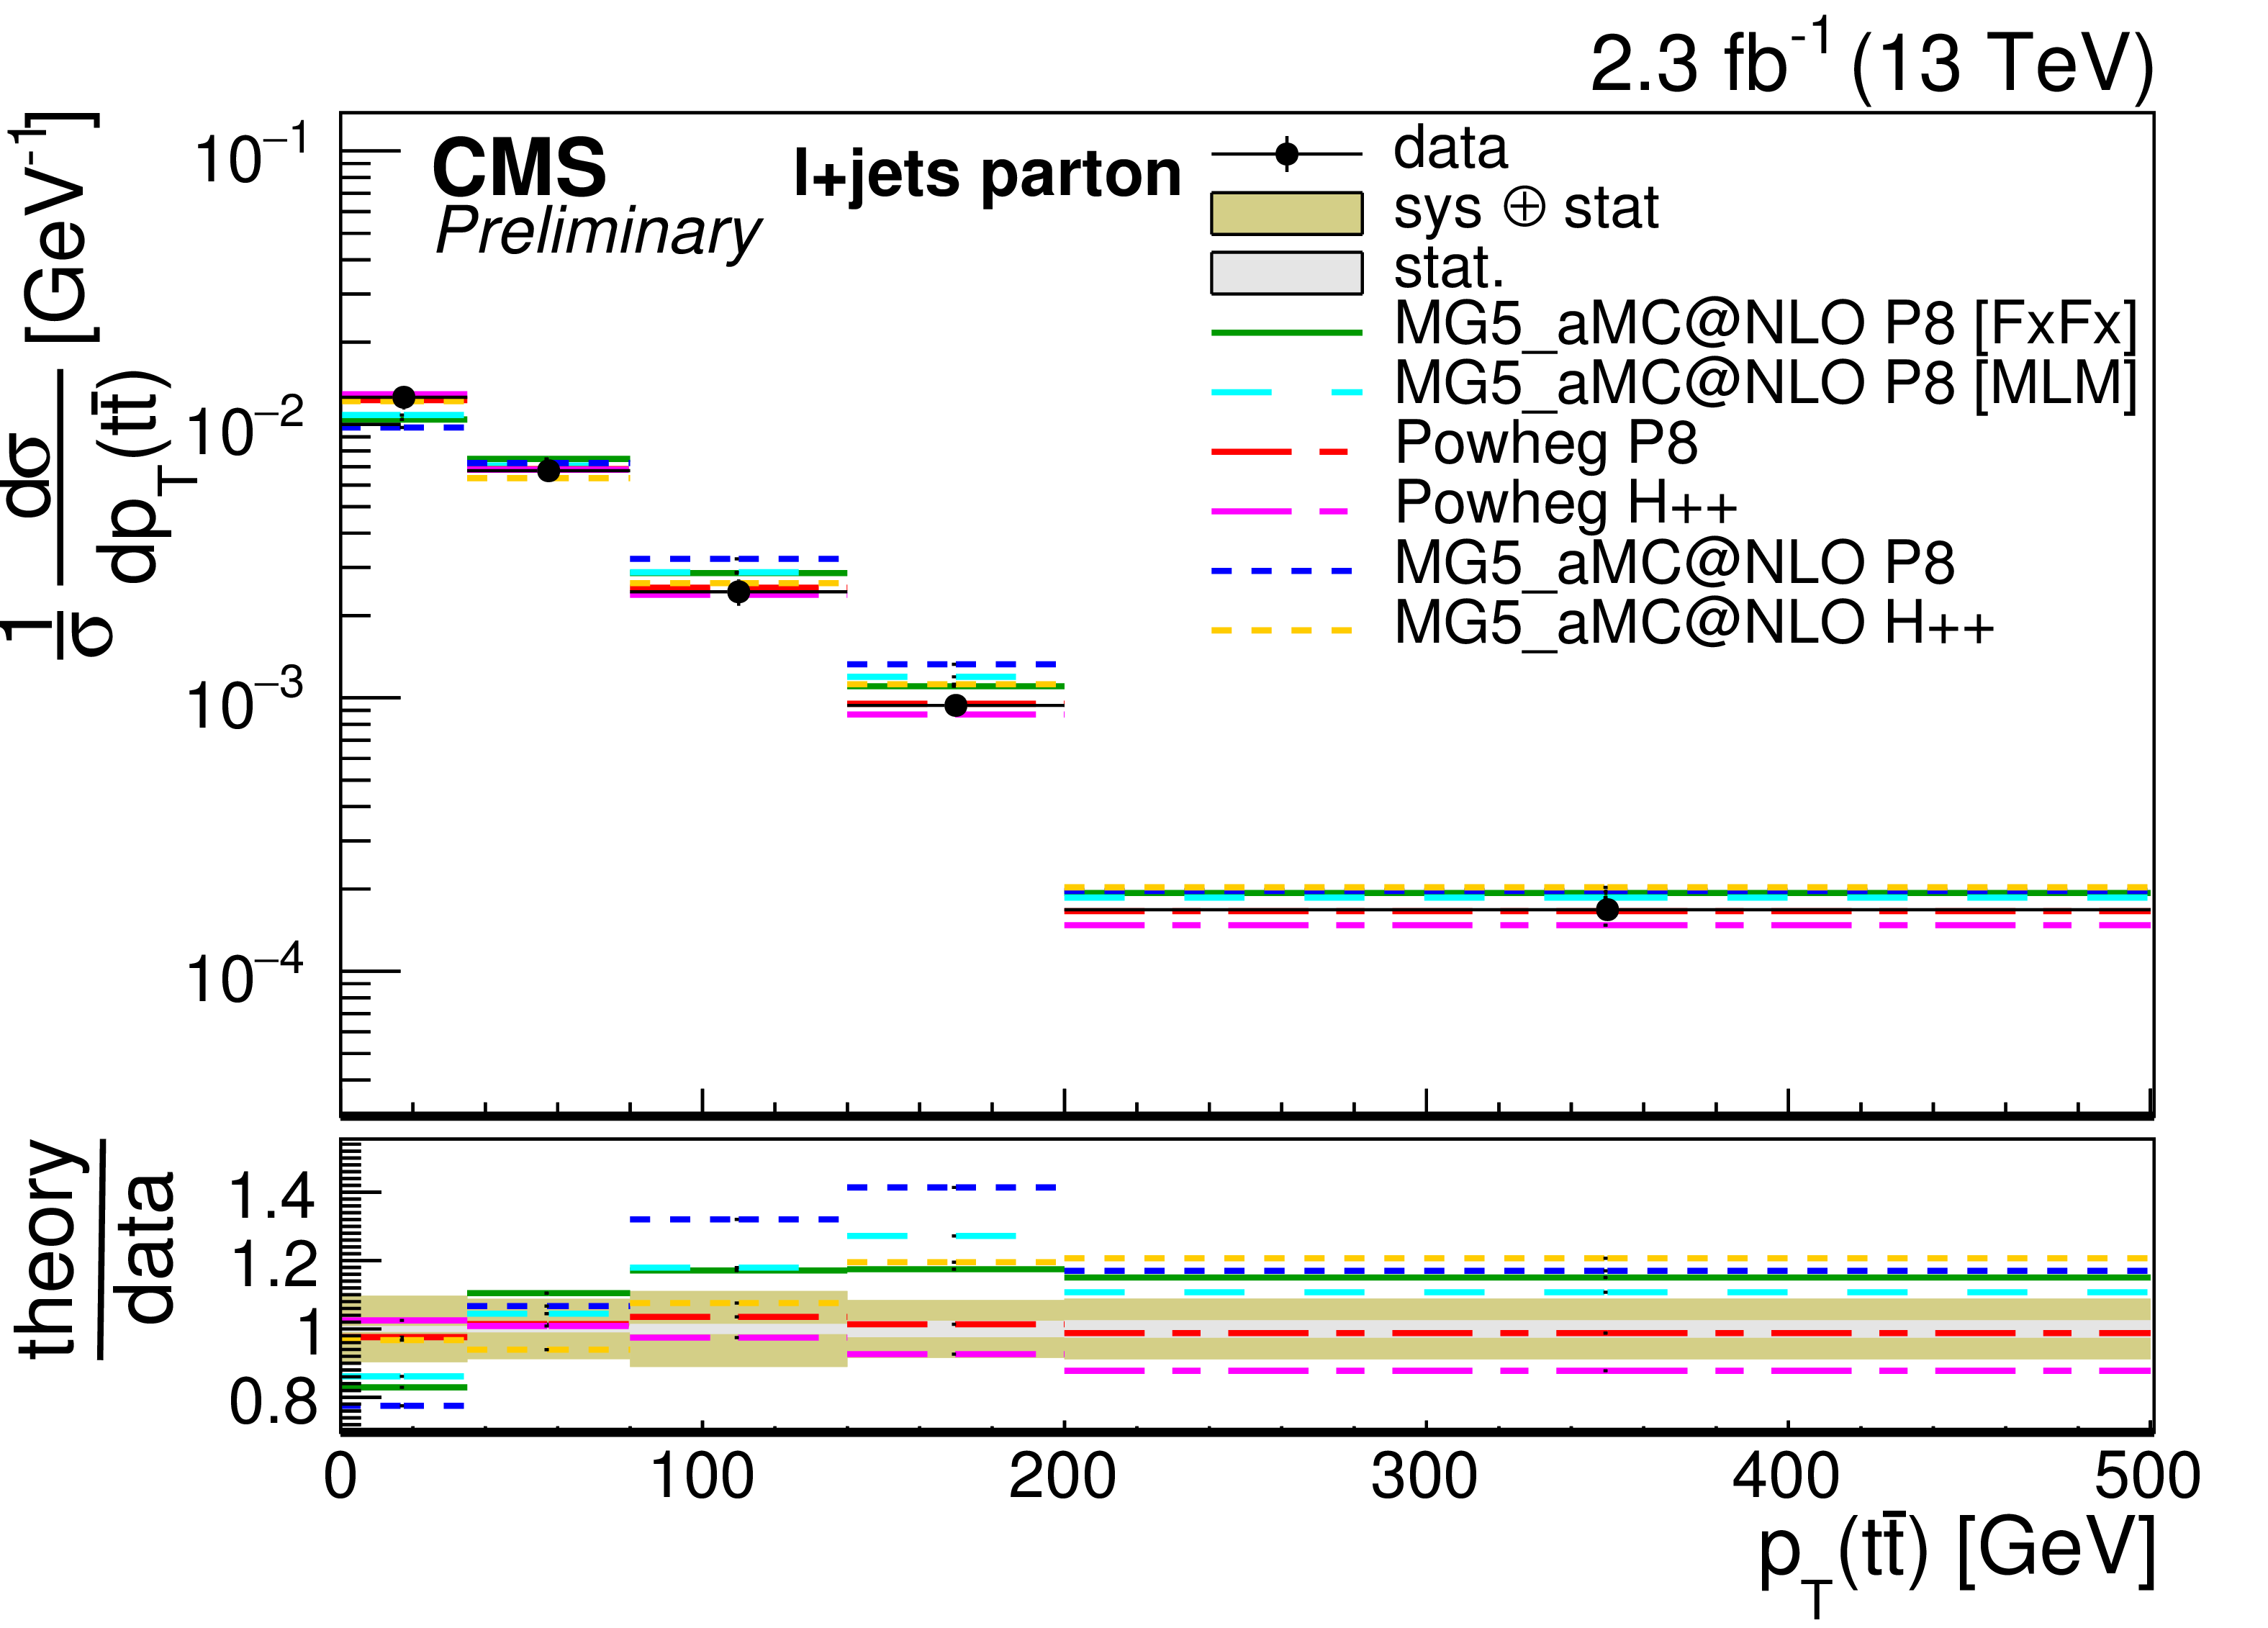
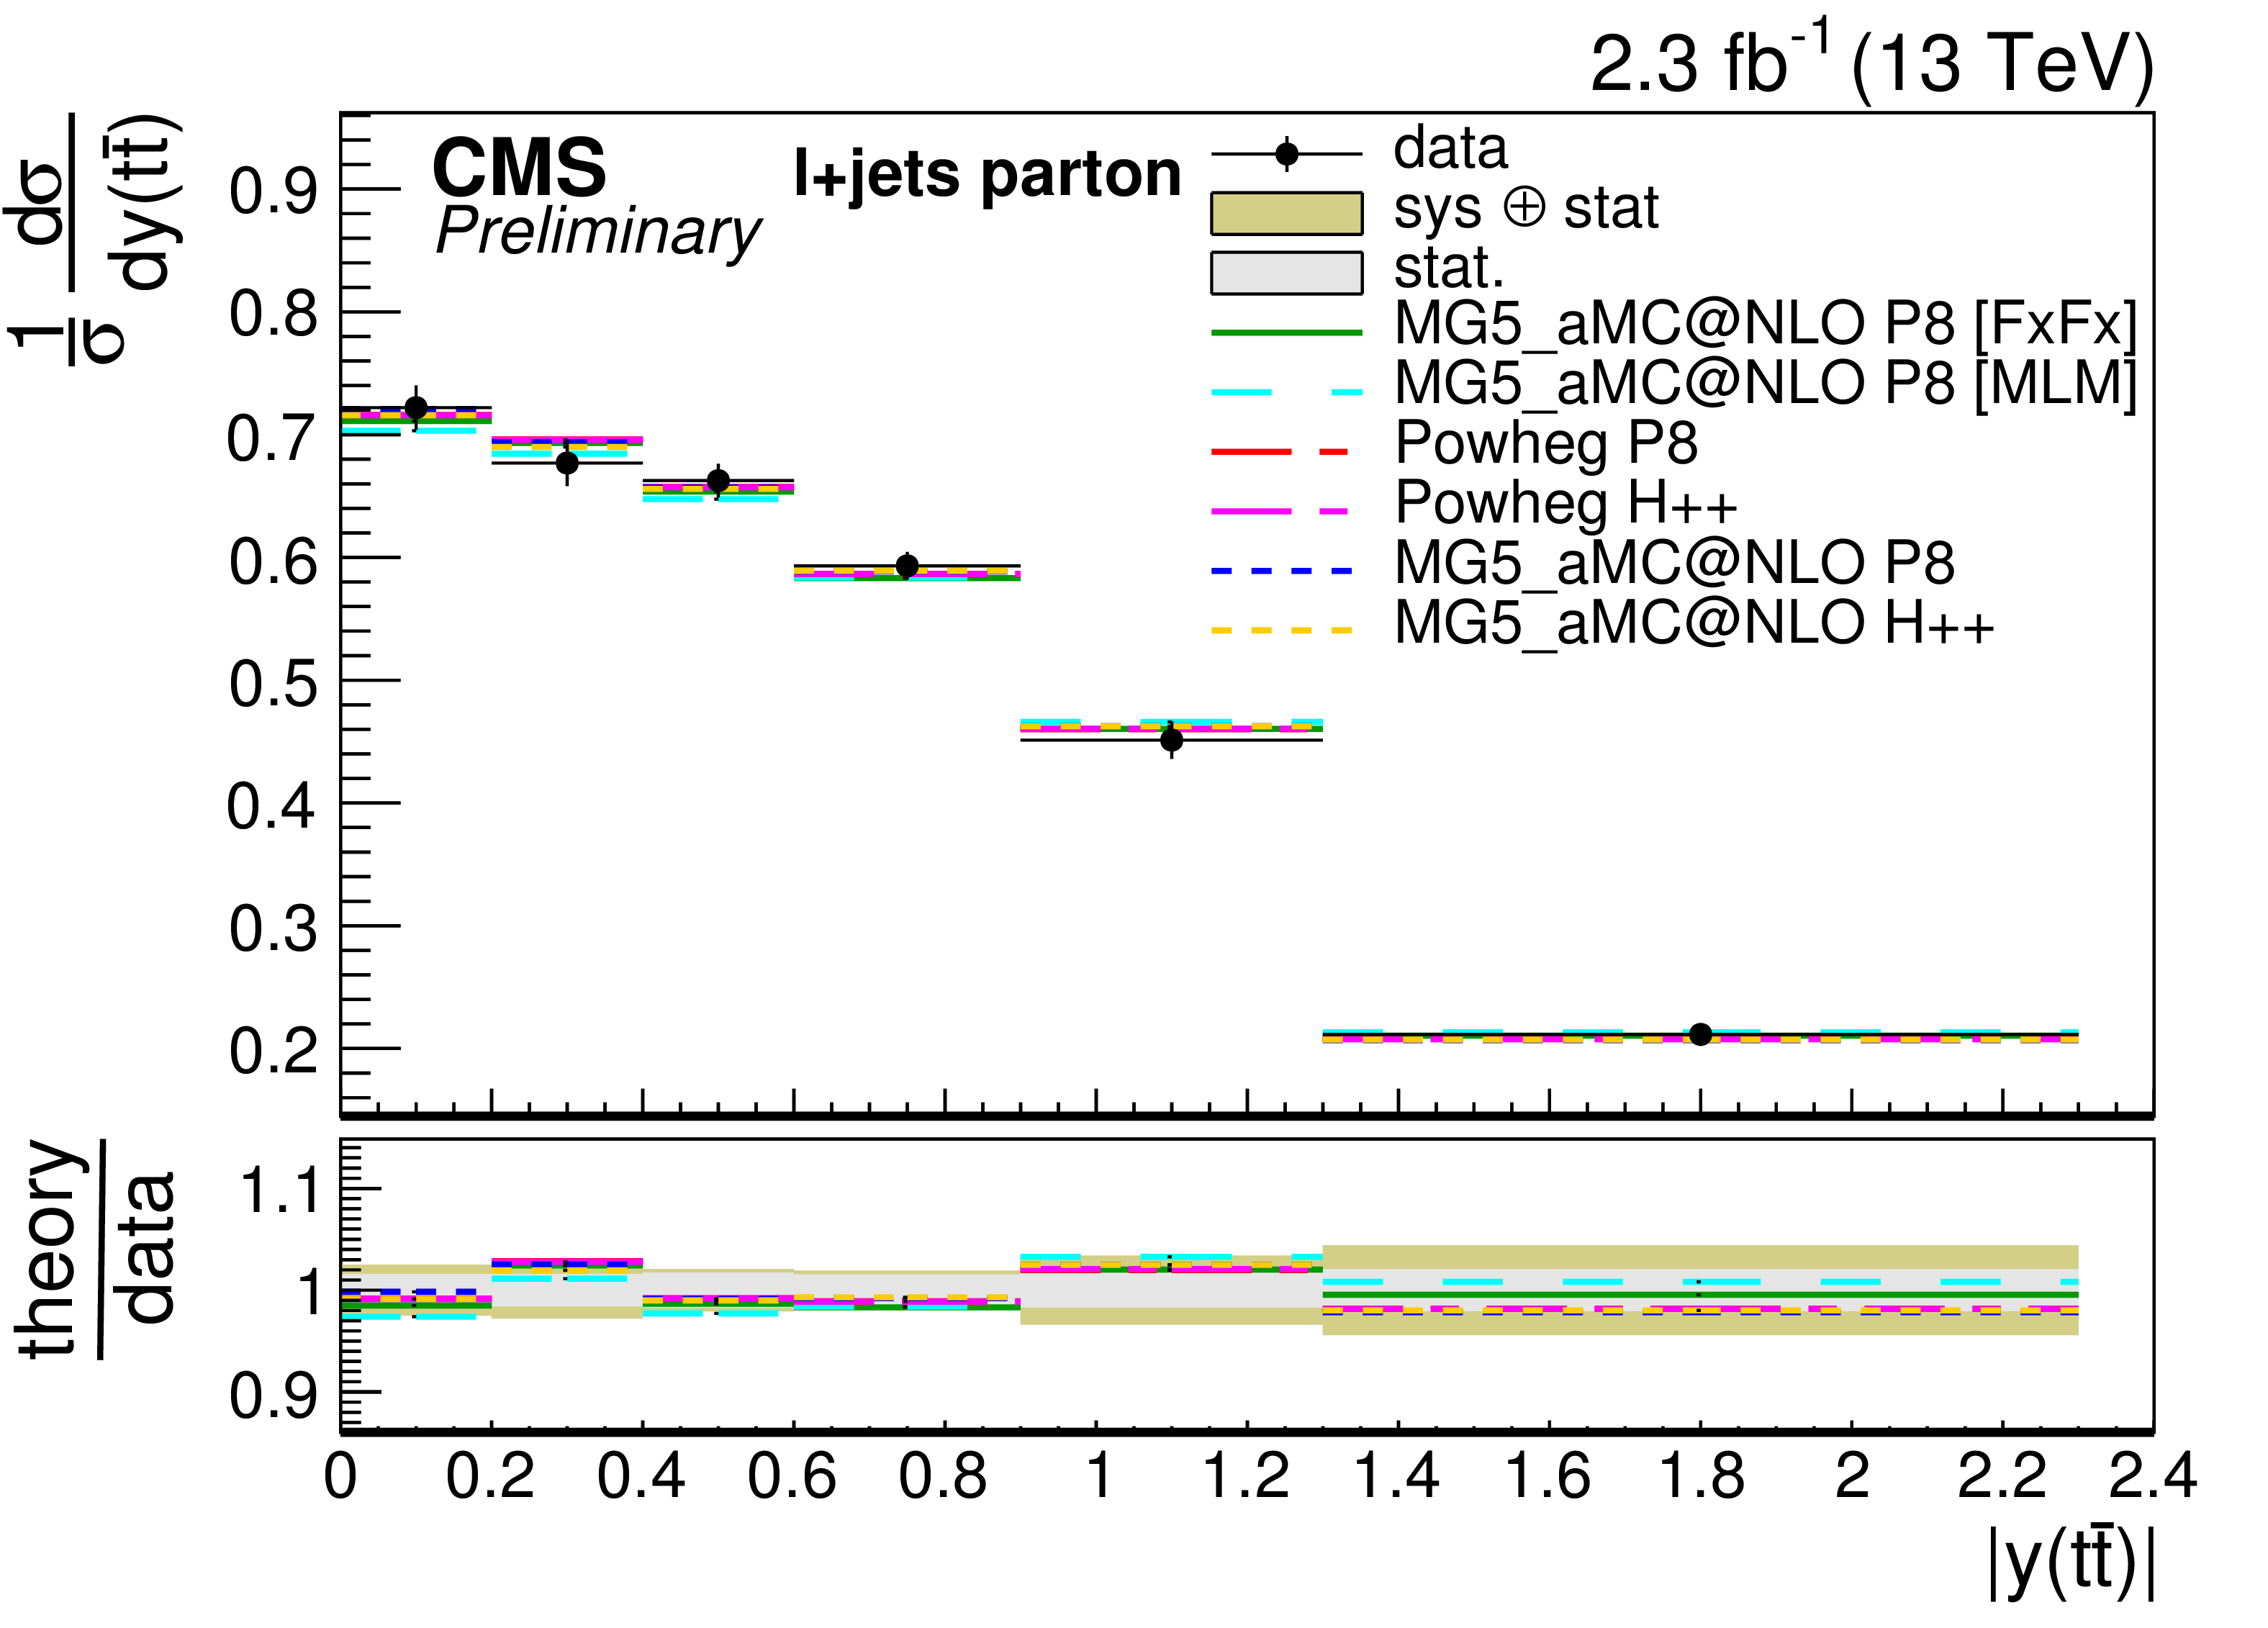
Figure 10-a:
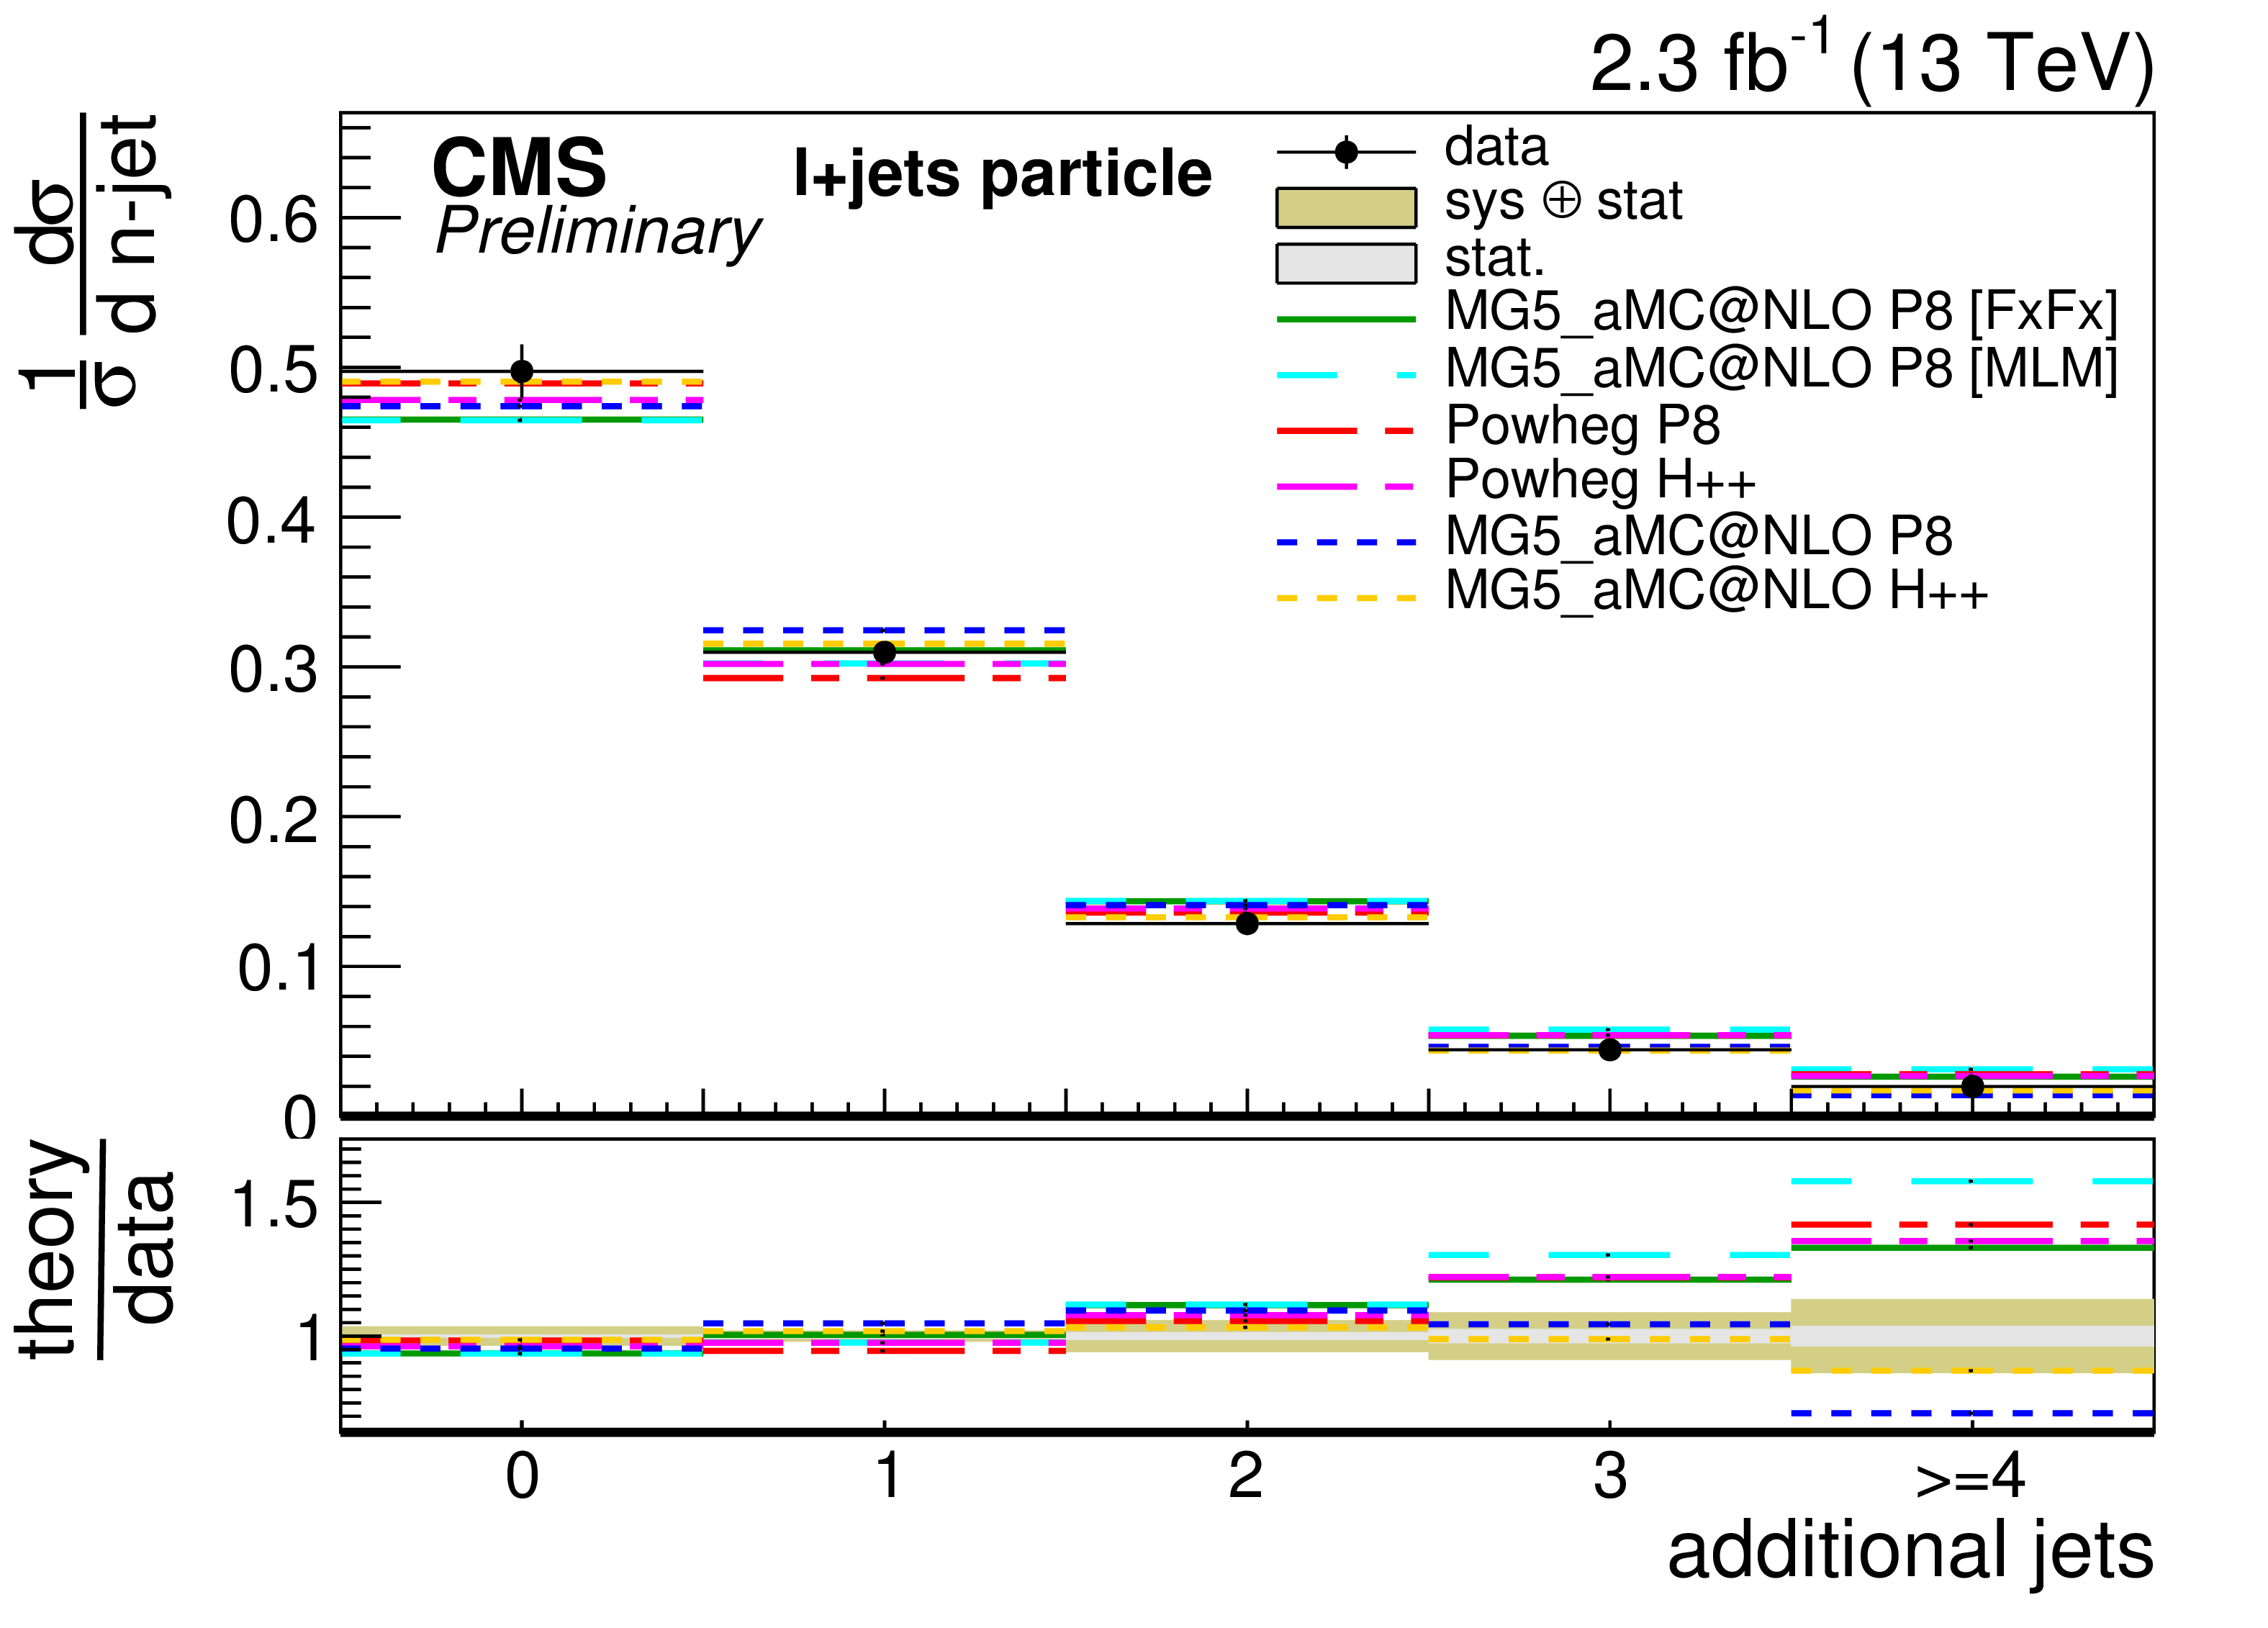
Differential cross sections as a function of $ {p_{\mathrm {T}}} ( \mathrm{ t \bar{t} } )$, $|y( \mathrm{ t \bar{t} } )|$, $M( \mathrm{ t \bar{t} } )$, and the number of additional jets compared to the predictions of POWHEG and MG5-aMC@NLO plus PYTHIA-8 (P8) or HERWIG++ (H++) and the multijet simulations MG5-aMC@NLO (MLM) and MG5-aMC@NLO (FxFx). |

png pdf |
Figure 10-b:
Differential cross sections as a function of $ {p_{\mathrm {T}}} ( \mathrm{ t \bar{t} } )$, $|y( \mathrm{ t \bar{t} } )|$, $M( \mathrm{ t \bar{t} } )$, and the number of additional jets compared to the predictions of POWHEG and MG5-aMC@NLO plus PYTHIA-8 (P8) or HERWIG++ (H++) and the multijet simulations MG5-aMC@NLO (MLM) and MG5-aMC@NLO (FxFx). |
png pdf |
Figure 10-c:
Differential cross sections as a function of $ {p_{\mathrm {T}}} ( \mathrm{ t \bar{t} } )$, $|y( \mathrm{ t \bar{t} } )|$, $M( \mathrm{ t \bar{t} } )$, and the number of additional jets compared to the predictions of POWHEG and MG5-aMC@NLO plus PYTHIA-8 (P8) or HERWIG++ (H++) and the multijet simulations MG5-aMC@NLO (MLM) and MG5-aMC@NLO (FxFx). |

png pdf |
Figure 10-d:
Differential cross sections as a function of $ {p_{\mathrm {T}}} ( \mathrm{ t \bar{t} } )$, $|y( \mathrm{ t \bar{t} } )|$, $M( \mathrm{ t \bar{t} } )$, and the number of additional jets compared to the predictions of POWHEG and MG5-aMC@NLO plus PYTHIA-8 (P8) or HERWIG++ (H++) and the multijet simulations MG5-aMC@NLO (MLM) and MG5-aMC@NLO (FxFx). |

png pdf |
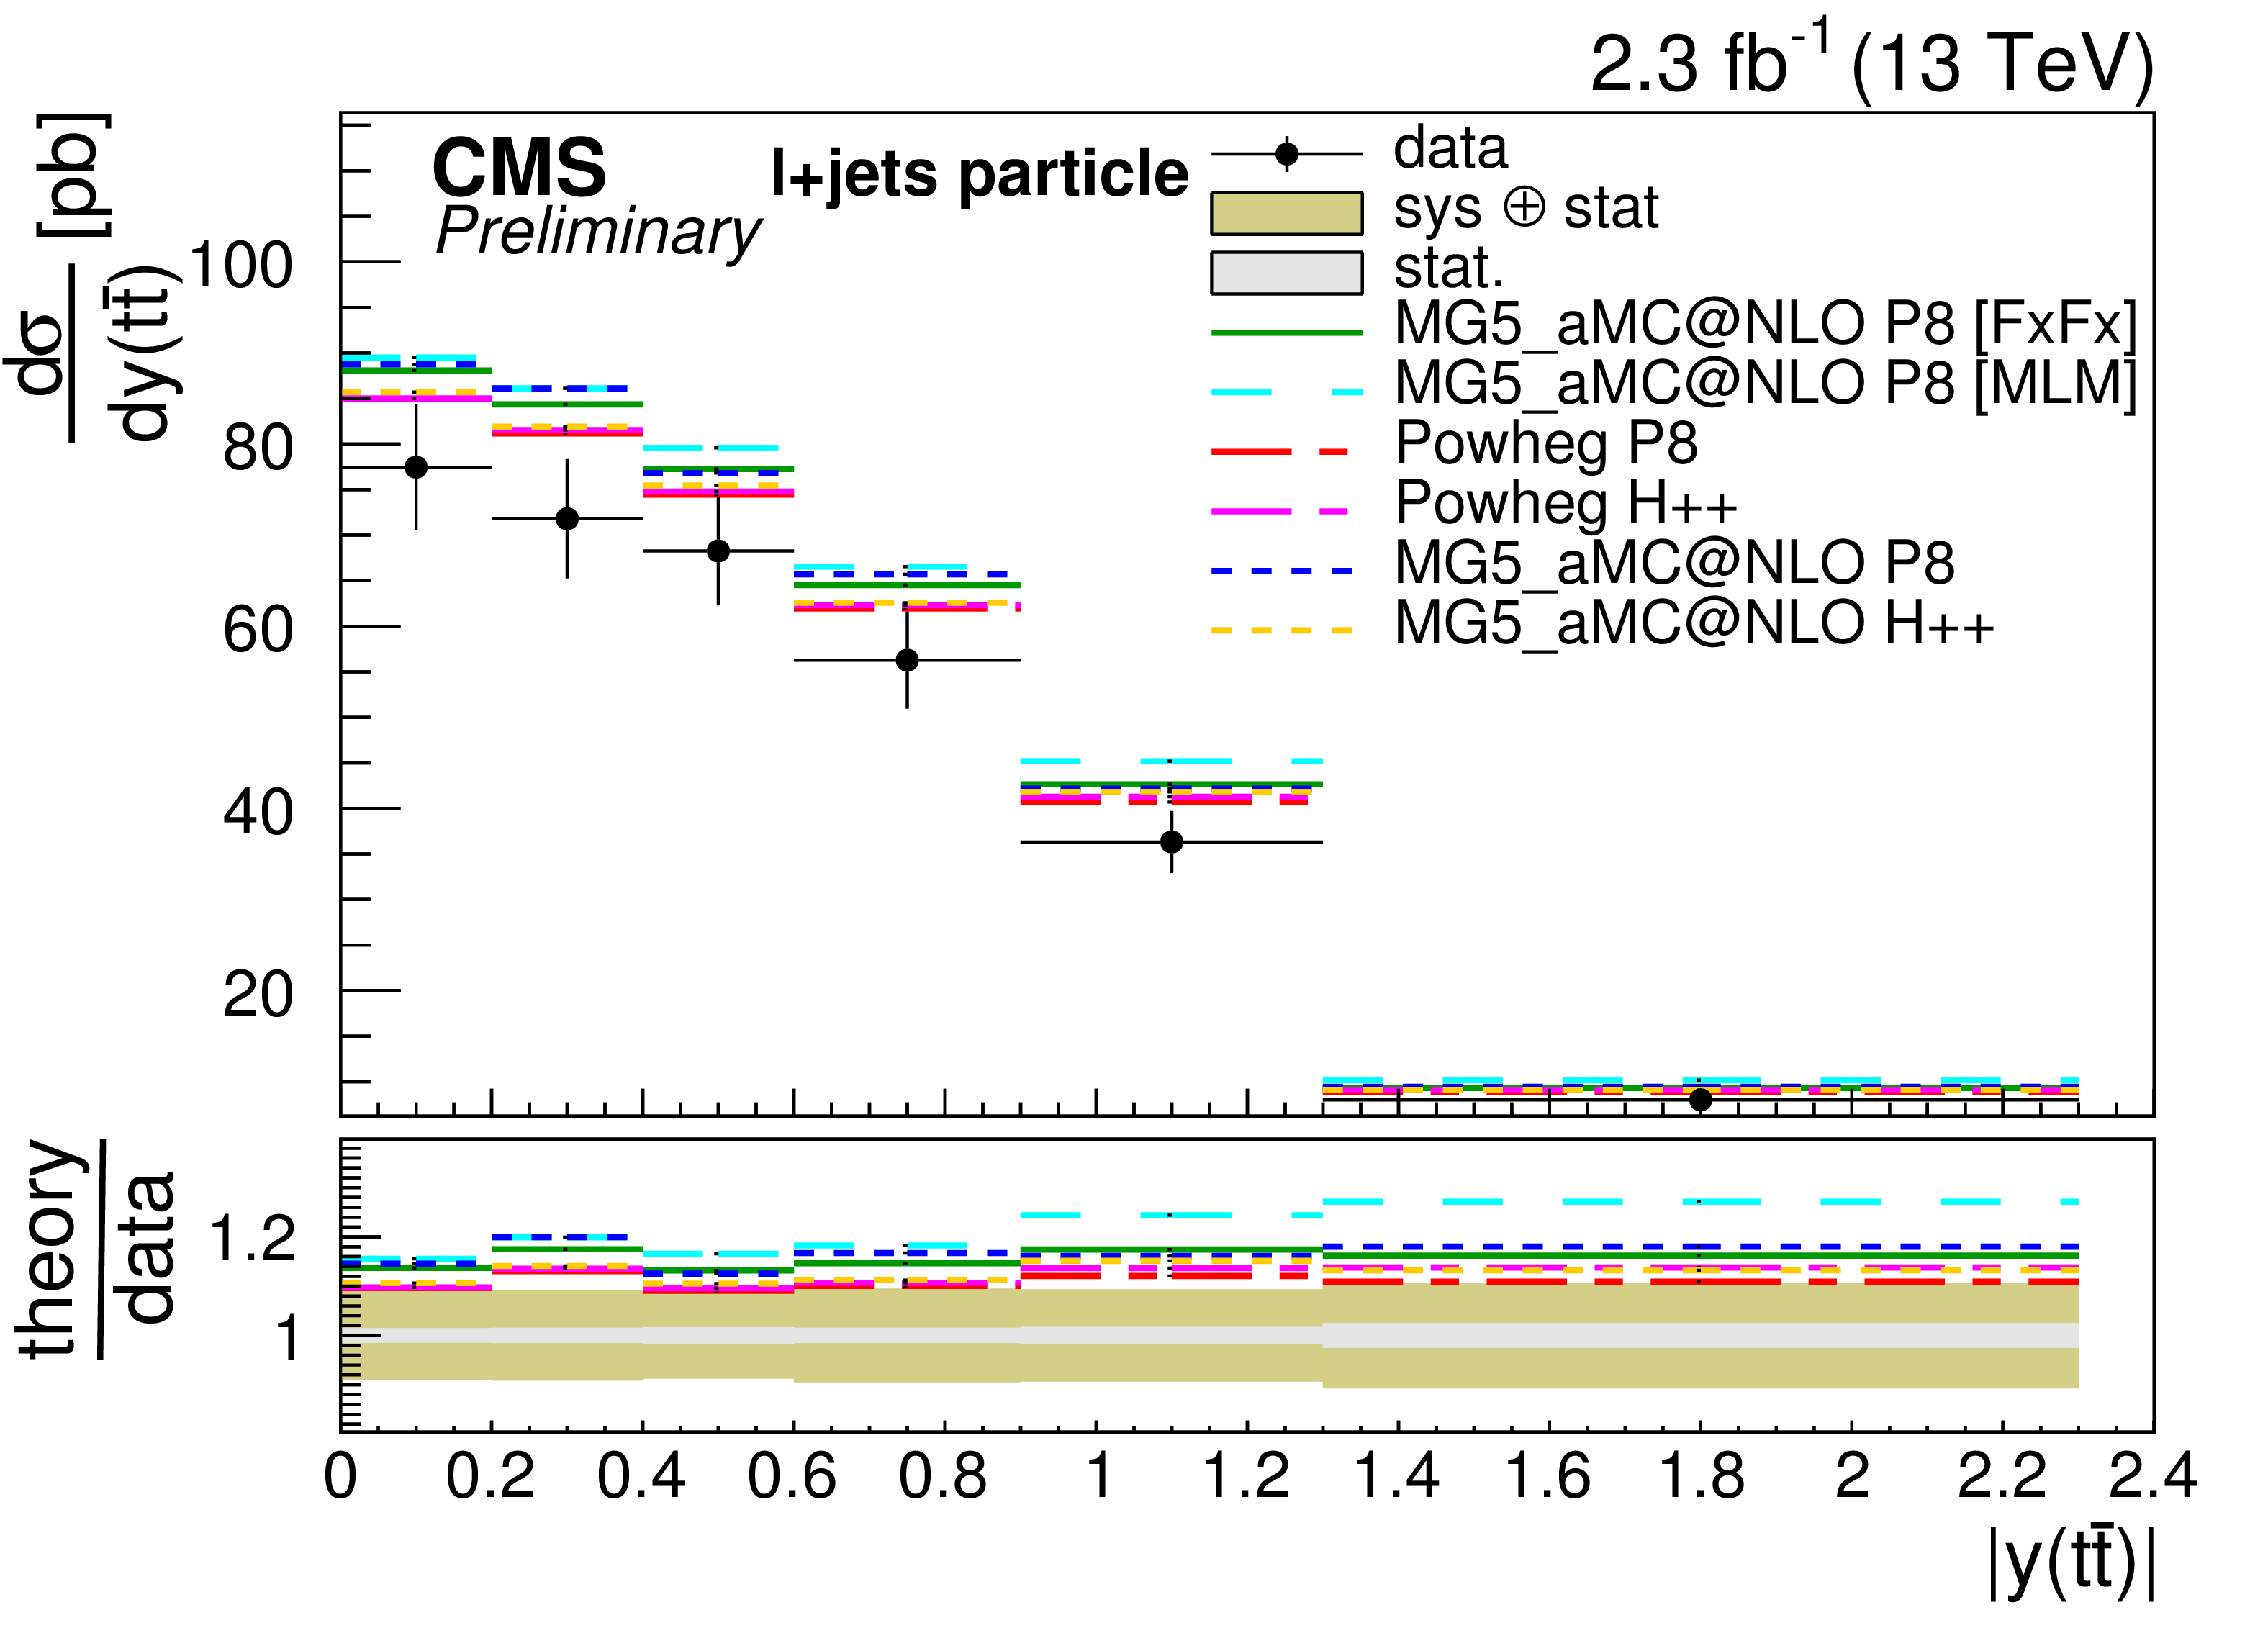
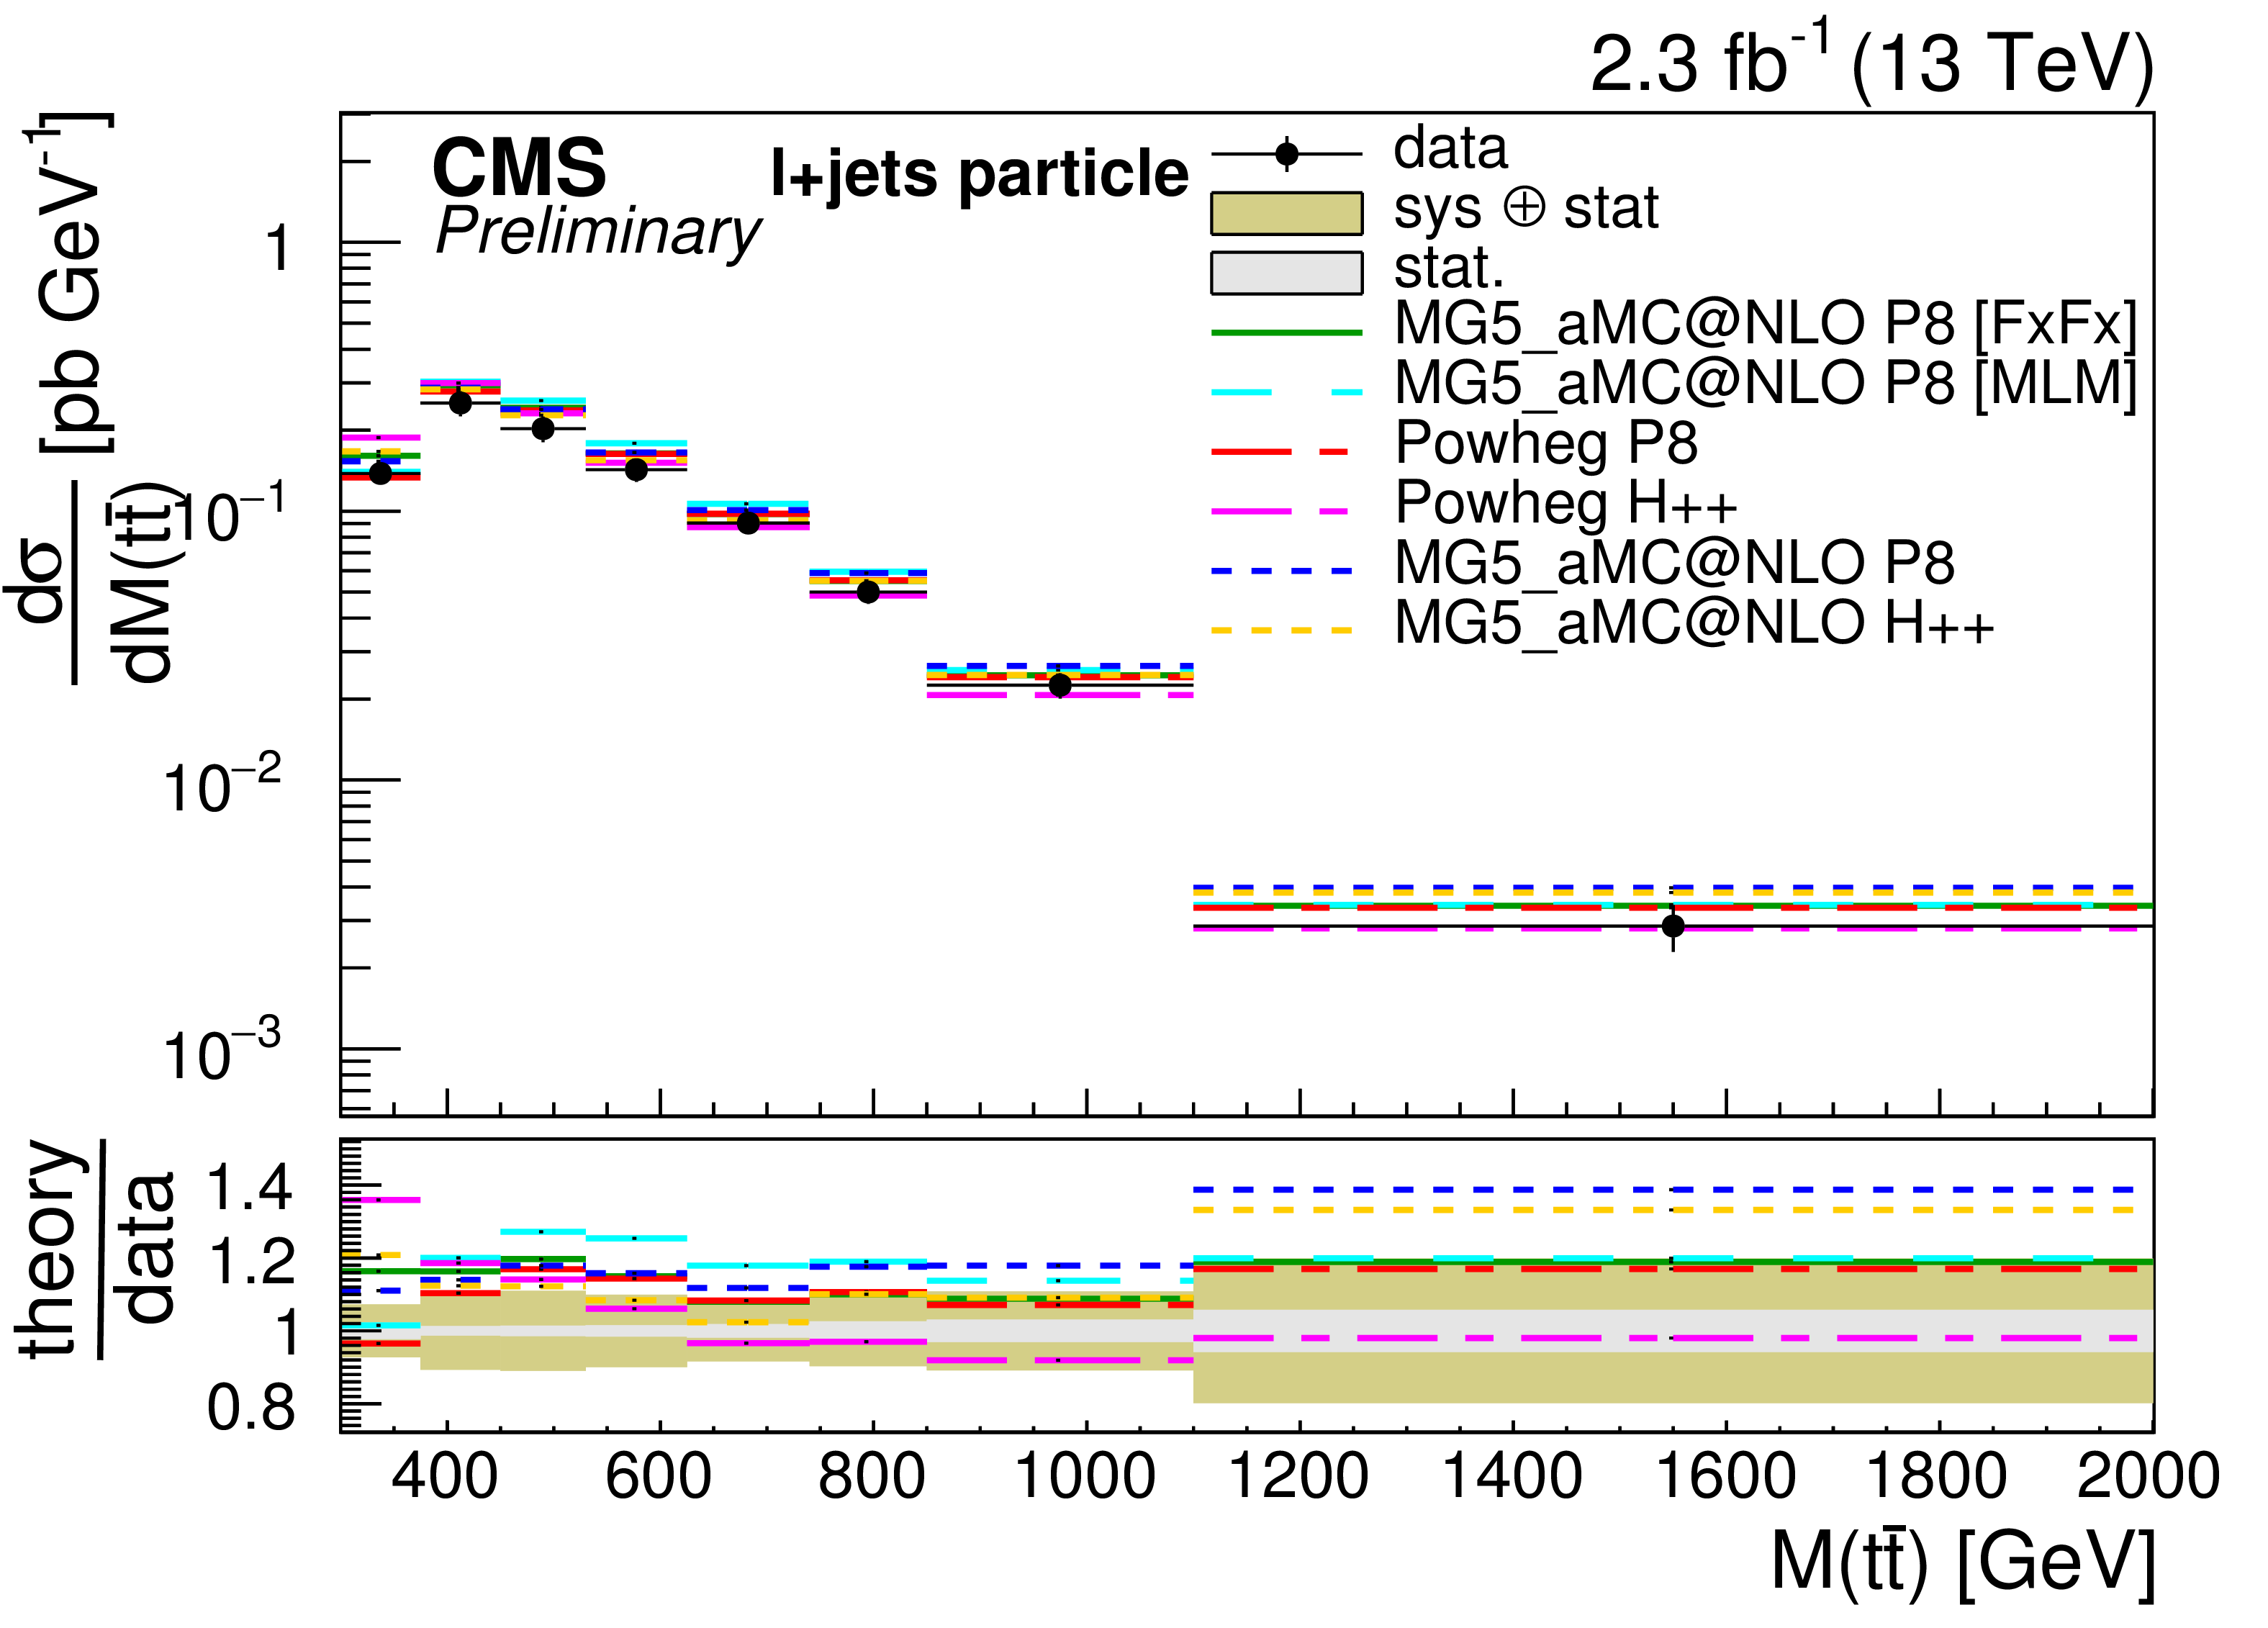
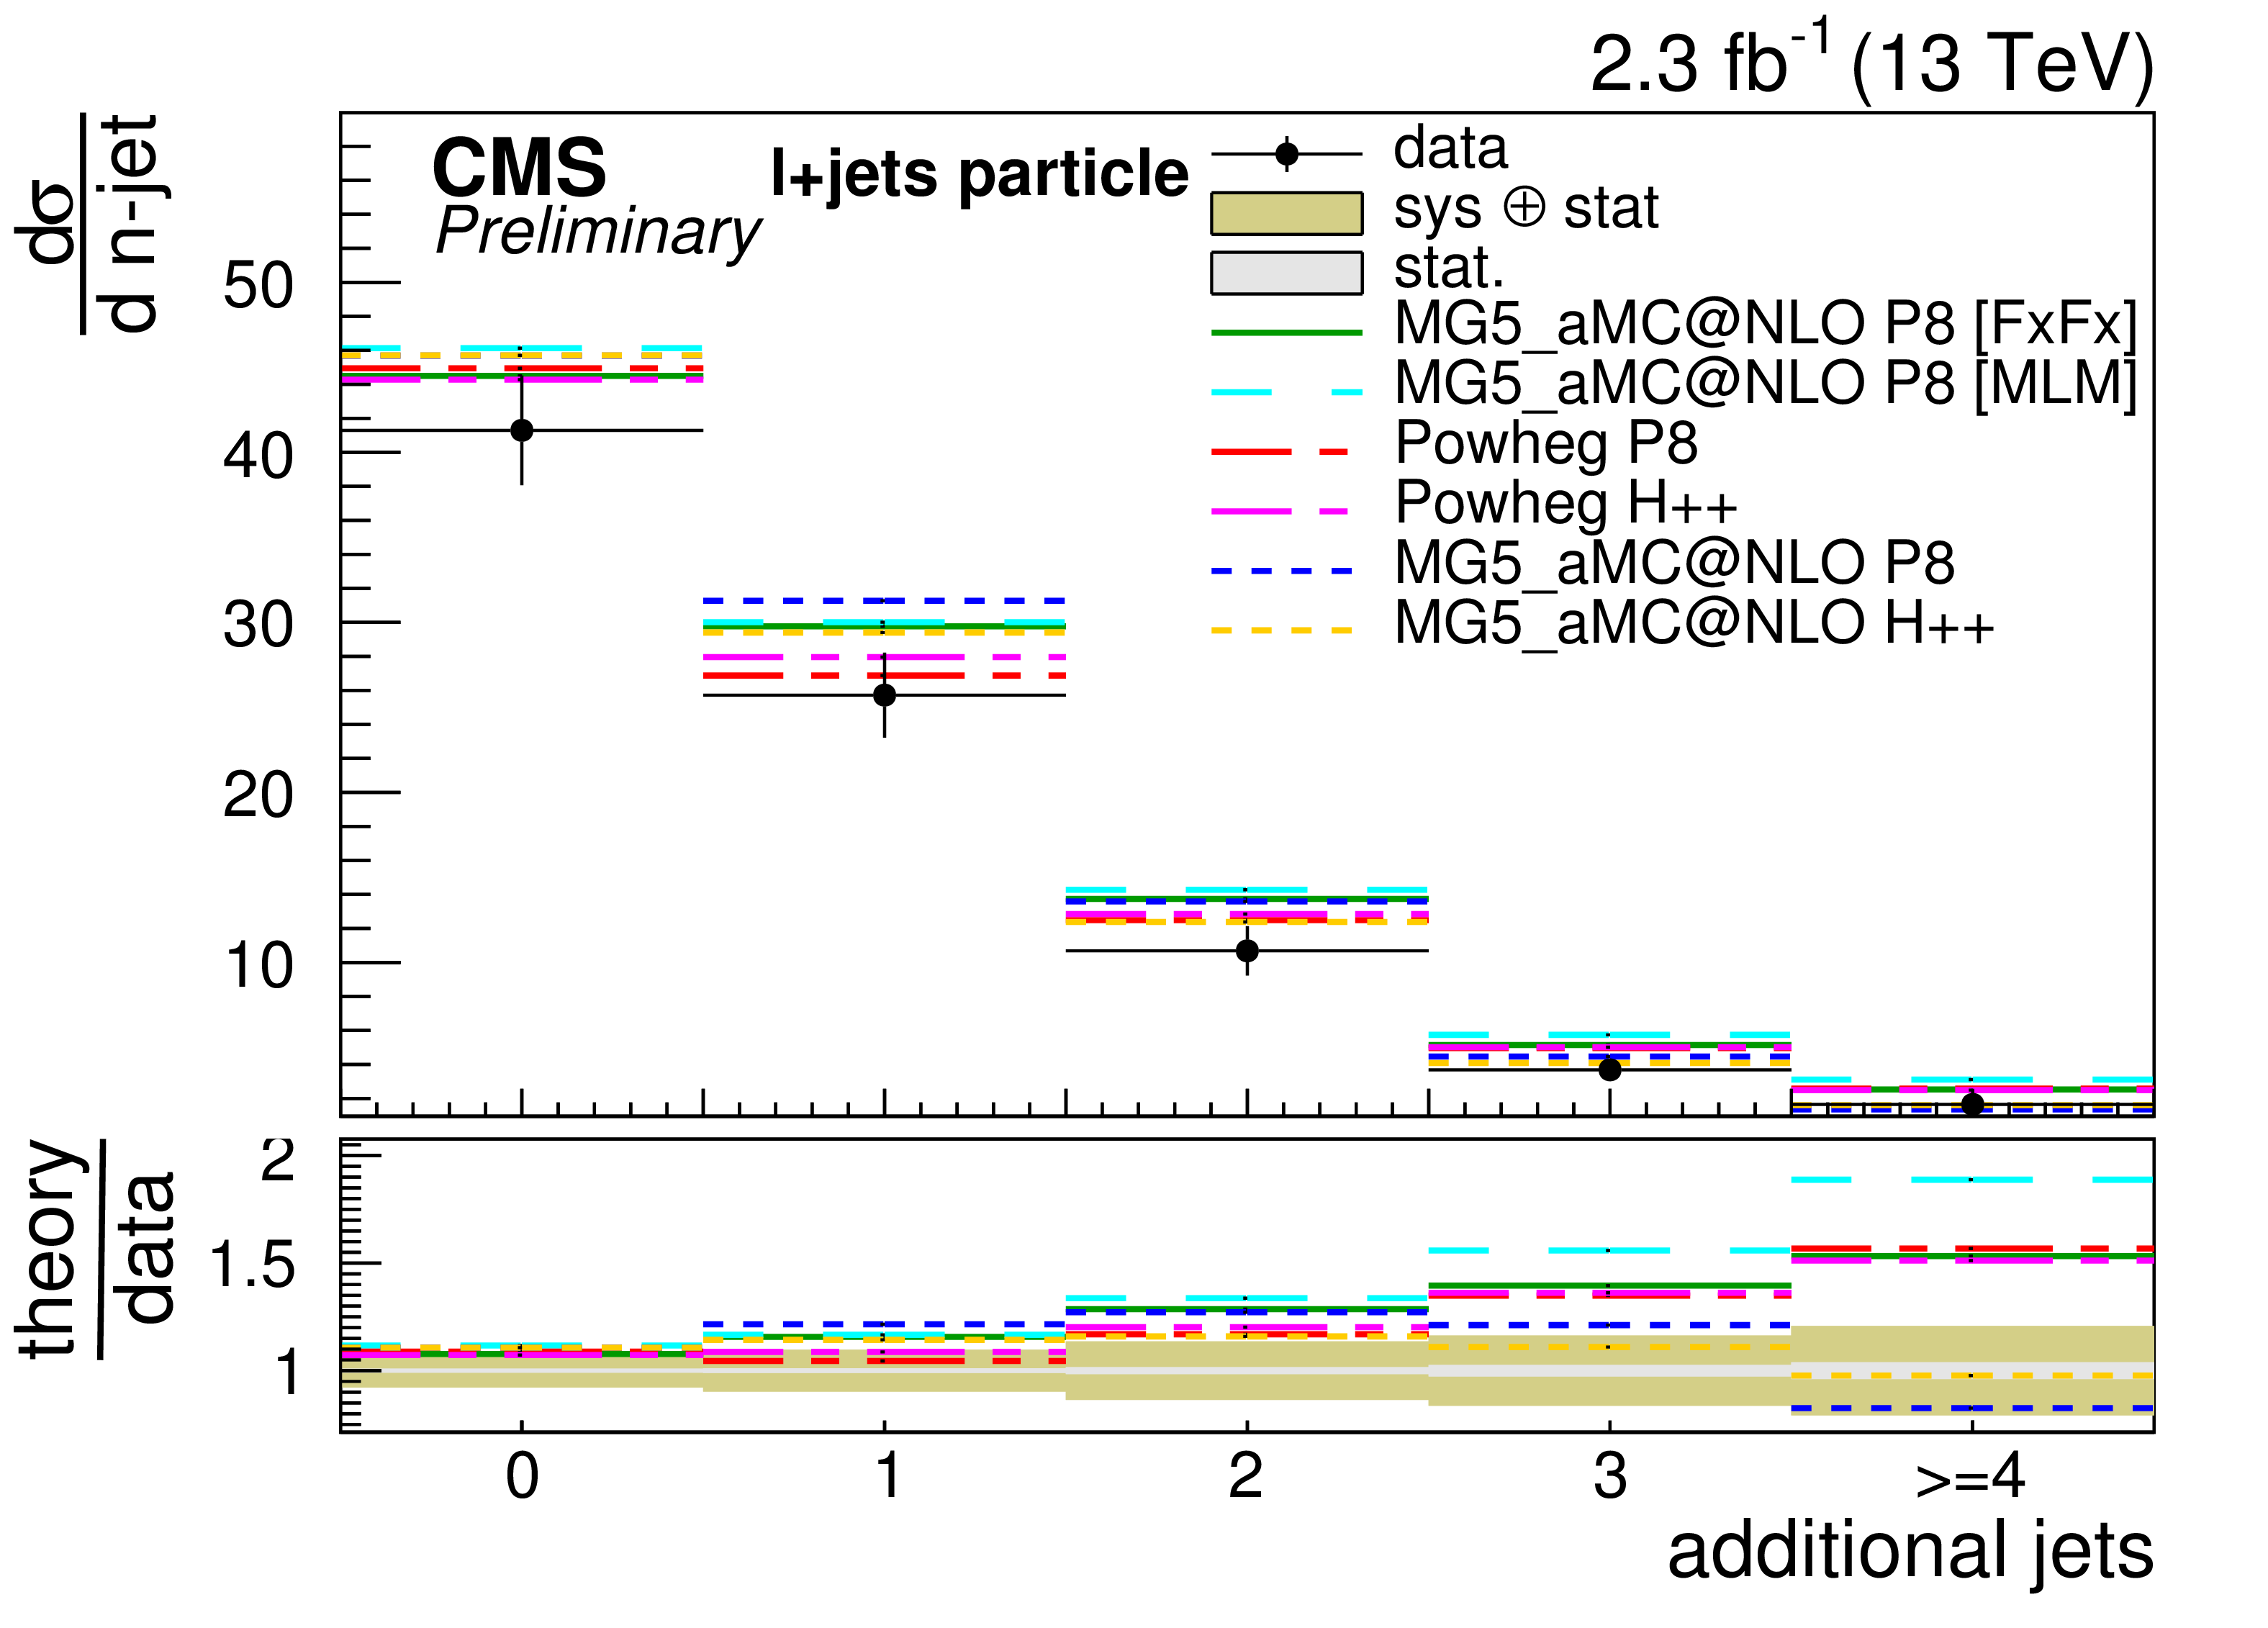
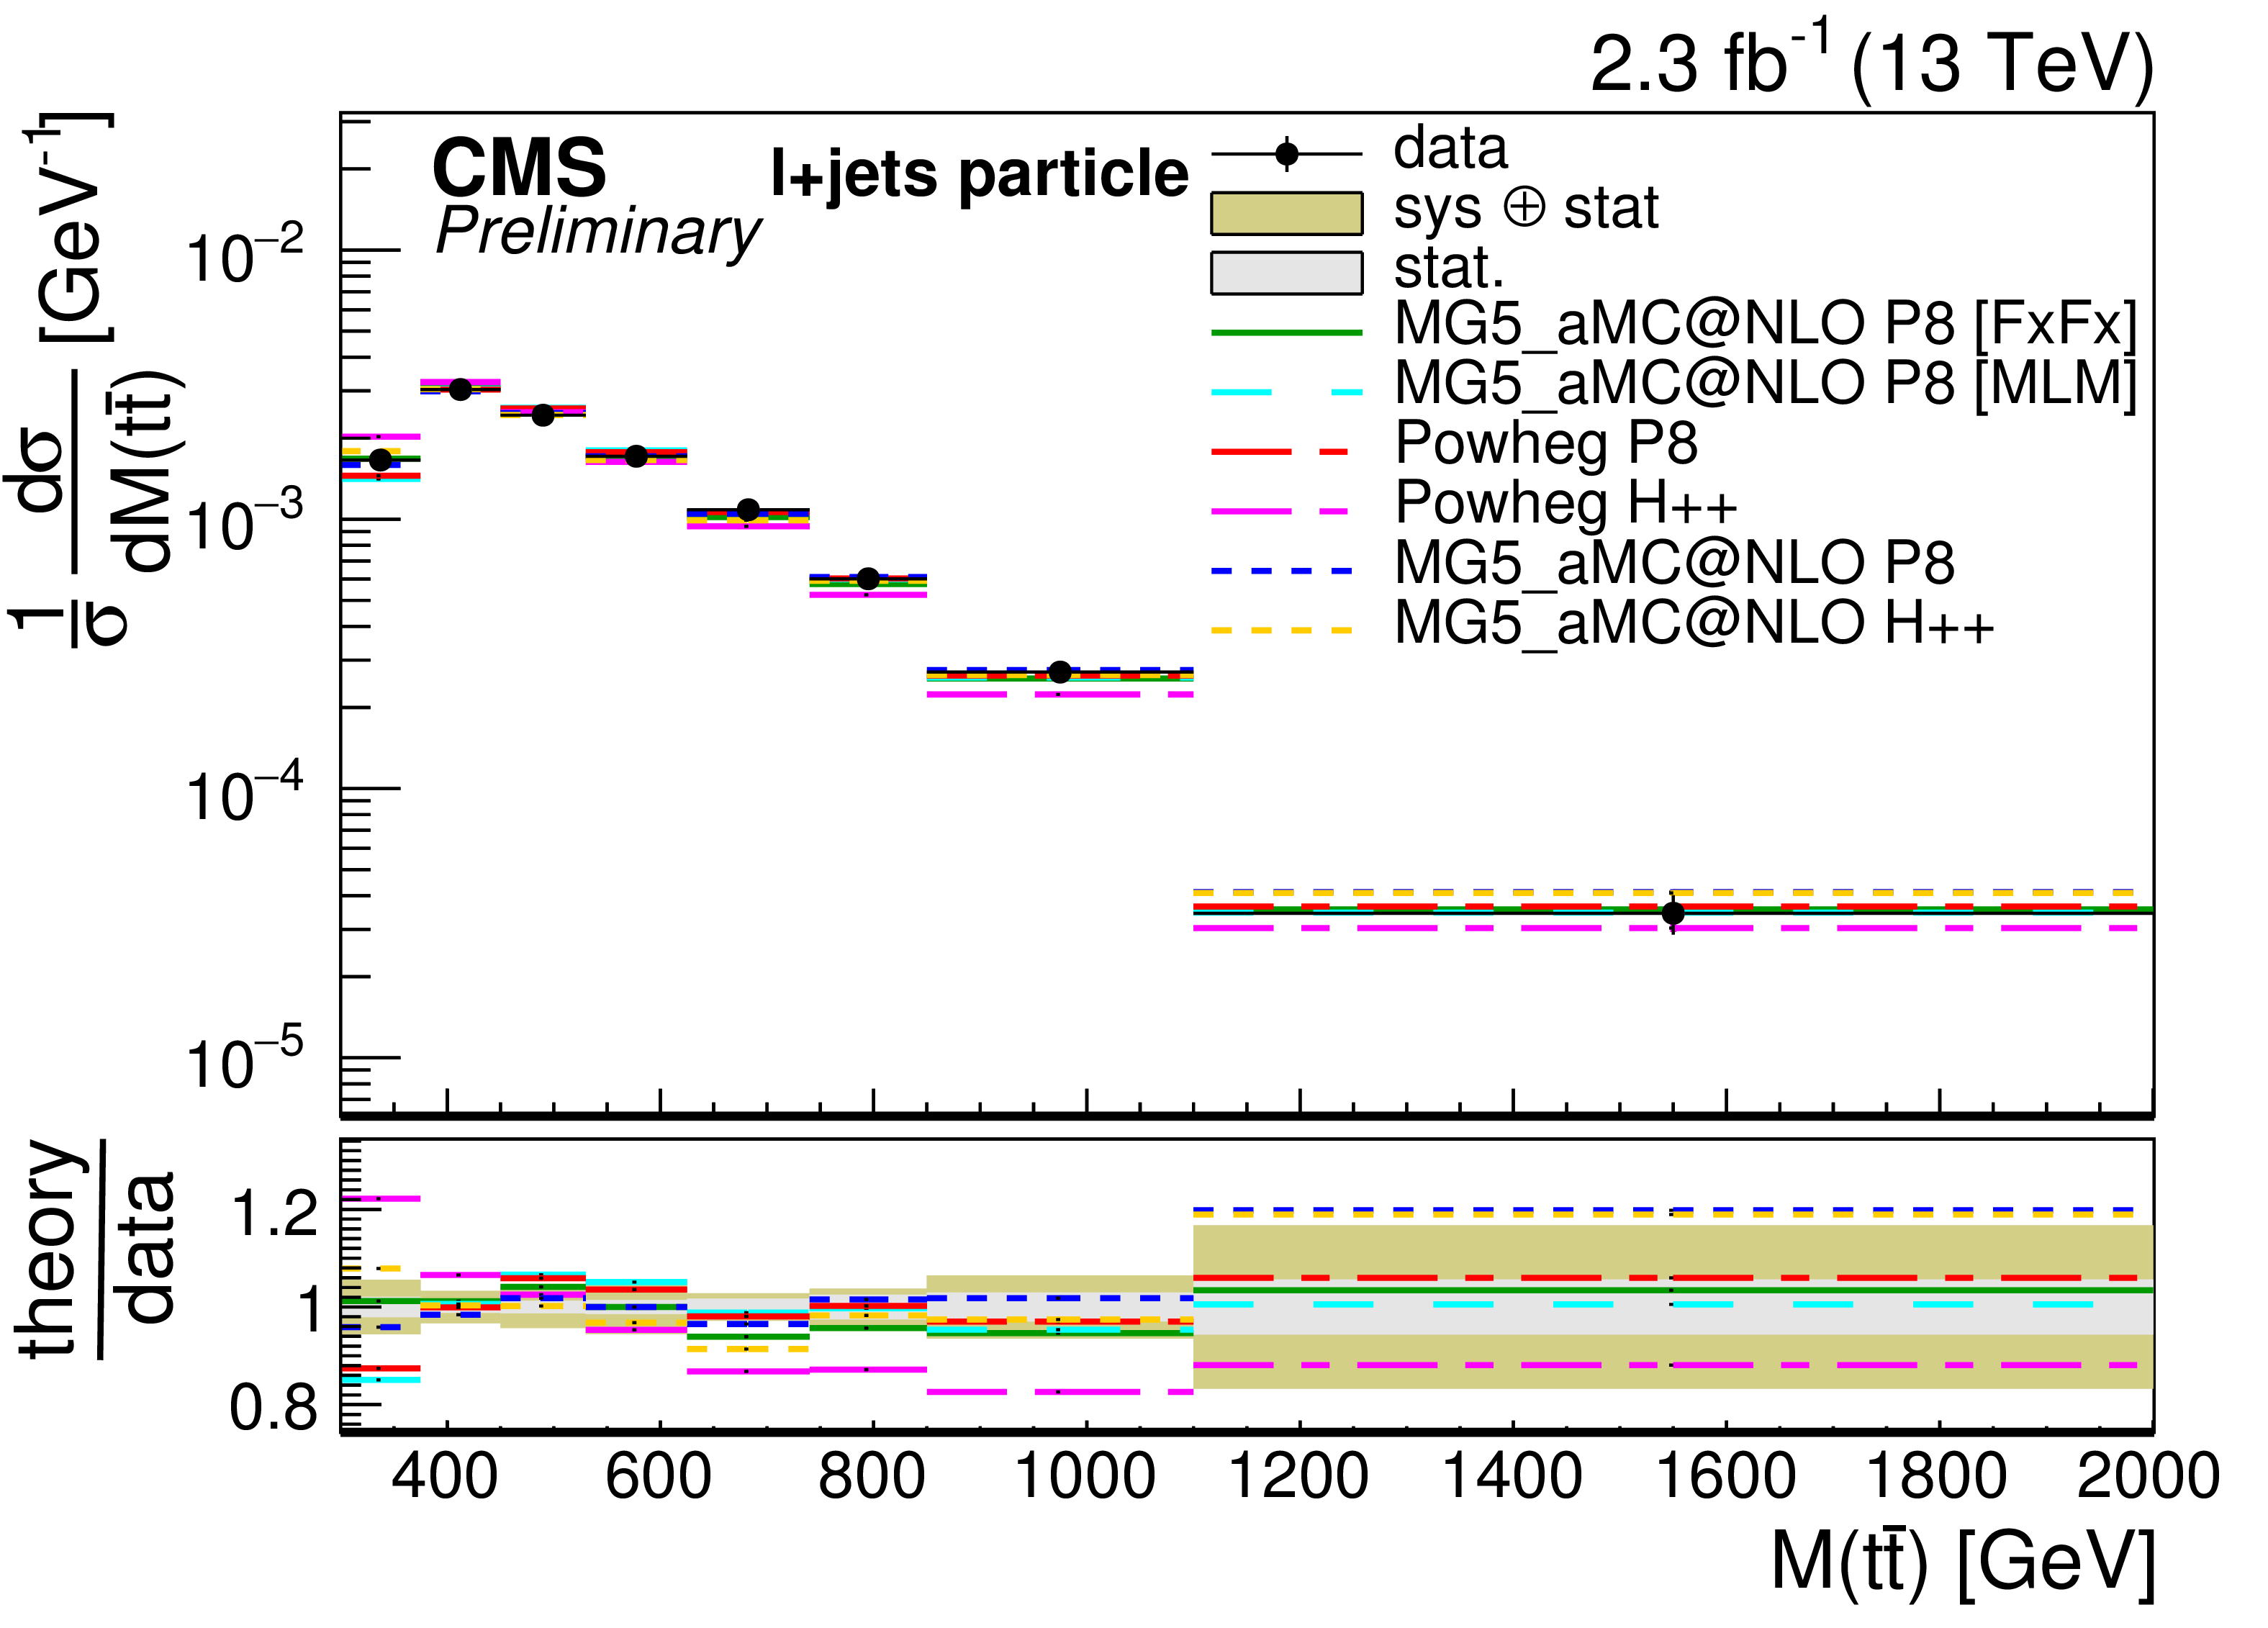
Figure 11-a:
Differential cross sections at particle level as a function of $ {p_{\mathrm {T}}} ( \mathrm{ t \bar{t} } )$, $|y( \mathrm{ t \bar{t} } )|$, $M( \mathrm{ t \bar{t} } )$, and the number of additional jets compared to the predictions of POWHEG and MG5-aMC@NLO plus PYTHIA-8 (P8) or HERWIG++ (H++) and the multijet simulations MG5-aMC@NLO (MLM) and MG5-aMC@NLO (FxFx). |
png pdf |
Figure 11-b:
Differential cross sections at particle level as a function of $ {p_{\mathrm {T}}} ( \mathrm{ t \bar{t} } )$, $|y( \mathrm{ t \bar{t} } )|$, $M( \mathrm{ t \bar{t} } )$, and the number of additional jets compared to the predictions of POWHEG and MG5-aMC@NLO plus PYTHIA-8 (P8) or HERWIG++ (H++) and the multijet simulations MG5-aMC@NLO (MLM) and MG5-aMC@NLO (FxFx). |
png pdf |
Figure 11-c:
Differential cross sections at particle level as a function of $ {p_{\mathrm {T}}} ( \mathrm{ t \bar{t} } )$, $|y( \mathrm{ t \bar{t} } )|$, $M( \mathrm{ t \bar{t} } )$, and the number of additional jets compared to the predictions of POWHEG and MG5-aMC@NLO plus PYTHIA-8 (P8) or HERWIG++ (H++) and the multijet simulations MG5-aMC@NLO (MLM) and MG5-aMC@NLO (FxFx). |
png pdf |
Figure 11-d:
Differential cross sections at particle level as a function of $ {p_{\mathrm {T}}} ( \mathrm{ t \bar{t} } )$, $|y( \mathrm{ t \bar{t} } )|$, $M( \mathrm{ t \bar{t} } )$, and the number of additional jets compared to the predictions of POWHEG and MG5-aMC@NLO plus PYTHIA-8 (P8) or HERWIG++ (H++) and the multijet simulations MG5-aMC@NLO (MLM) and MG5-aMC@NLO (FxFx). |
| Tables | |
png pdf |
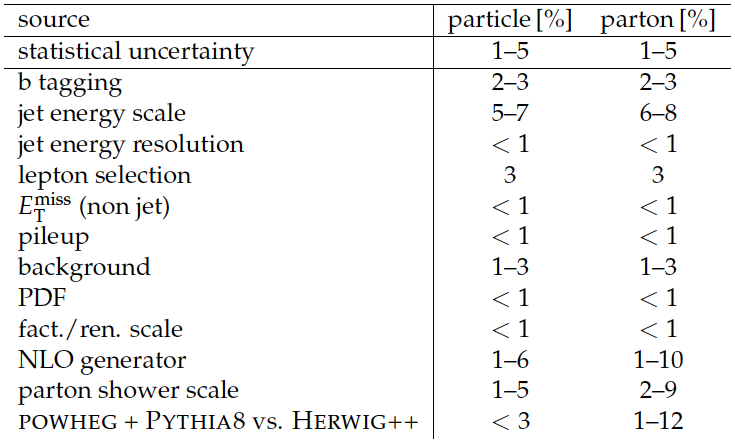
Table 1:
Overview on uncertainties in the differential cross section measurement. Typical ranges of uncertainties in the bins are shown. |
| Additional Figures | |
png pdf |
Additional Figure 1-a:
Normalized differential cross sections at parton level as a function of $ {p_{\mathrm {T}}} ( {\mathrm {t} })$ and $|y( {\mathrm {t} })|$ compared to the predictions of POWHEG and MG5-aMC@NLO plus PYTHIA-8 (P8) or HERWIG++ (H++) and the multijet simulations MG5-aMC@NLO (MLM) and MG5-aMC@NLO (FxFx). |

png pdf |
Additional Figure 1-b:
Normalized differential cross sections at parton level as a function of $ {p_{\mathrm {T}}} ( {\mathrm {t} })$ and $|y( {\mathrm {t} })|$ compared to the predictions of POWHEG and MG5-aMC@NLO plus PYTHIA-8 (P8) or HERWIG++ (H++) and the multijet simulations MG5-aMC@NLO (MLM) and MG5-aMC@NLO (FxFx). |
png pdf |
Additional Figure 1-c:
Normalized differential cross sections at parton level as a function of $ {p_{\mathrm {T}}} ( {\mathrm {t} })$ and $|y( {\mathrm {t} })|$ compared to the predictions of POWHEG and MG5-aMC@NLO plus PYTHIA-8 (P8) or HERWIG++ (H++) and the multijet simulations MG5-aMC@NLO (MLM) and MG5-aMC@NLO (FxFx). |
png pdf |
Additional Figure 1-d:
Normalized differential cross sections at parton level as a function of $ {p_{\mathrm {T}}} ( {\mathrm {t} })$ and $|y( {\mathrm {t} })|$ compared to the predictions of POWHEG and MG5-aMC@NLO plus PYTHIA-8 (P8) or HERWIG++ (H++) and the multijet simulations MG5-aMC@NLO (MLM) and MG5-aMC@NLO (FxFx). |
png pdf |
Additional Figure 2-a:
Normalized Differential cross sections at parton level as a function of $ {p_{\mathrm {T}}} ( {\mathrm {t} })$, $|y( {\mathrm {t} })|$, and $M( \mathrm{ t \bar{t} } )$ compared to the predictions of an approximate NNNLO calculation [ANNNLO,ANNNLOdiff] and a NLO+NNLL' calculation [NLONNLL]. |

png pdf |
Additional Figure 2-b:
Normalized Differential cross sections at parton level as a function of $ {p_{\mathrm {T}}} ( {\mathrm {t} })$, $|y( {\mathrm {t} })|$, and $M( \mathrm{ t \bar{t} } )$ compared to the predictions of an approximate NNNLO calculation [ANNNLO,ANNNLOdiff] and a NLO+NNLL' calculation [NLONNLL]. |
png pdf |
Additional Figure 2-c:
Normalized Differential cross sections at parton level as a function of $ {p_{\mathrm {T}}} ( {\mathrm {t} })$, $|y( {\mathrm {t} })|$, and $M( \mathrm{ t \bar{t} } )$ compared to the predictions of an approximate NNNLO calculation [ANNNLO,ANNNLOdiff] and a NLO+NNLL' calculation [NLONNLL]. |

png pdf |
Additional Figure 3-a:
Normalized differential cross sections at particle level as a function of $ {p_{\mathrm {T}}} ( {\mathrm {t} })$ and $|y( {\mathrm {t} })|$ compared to the predictions of POWHEG and MG5-aMC@NLO plus PYTHIA-8 (P8) or HERWIG++ (H++) and the multijet simulations MG5-aMC@NLO (MLM) and MG5-aMC@NLO (FxFx). |
png pdf |
Additional Figure 3-b:
Normalized differential cross sections at particle level as a function of $ {p_{\mathrm {T}}} ( {\mathrm {t} })$ and $|y( {\mathrm {t} })|$ compared to the predictions of POWHEG and MG5-aMC@NLO plus PYTHIA-8 (P8) or HERWIG++ (H++) and the multijet simulations MG5-aMC@NLO (MLM) and MG5-aMC@NLO (FxFx). |
png pdf |
Additional Figure 3-c:
Normalized differential cross sections at particle level as a function of $ {p_{\mathrm {T}}} ( {\mathrm {t} })$ and $|y( {\mathrm {t} })|$ compared to the predictions of POWHEG and MG5-aMC@NLO plus PYTHIA-8 (P8) or HERWIG++ (H++) and the multijet simulations MG5-aMC@NLO (MLM) and MG5-aMC@NLO (FxFx). |
png pdf |
Additional Figure 3-d:
Normalized differential cross sections at particle level as a function of $ {p_{\mathrm {T}}} ( {\mathrm {t} })$ and $|y( {\mathrm {t} })|$ compared to the predictions of POWHEG and MG5-aMC@NLO plus PYTHIA-8 (P8) or HERWIG++ (H++) and the multijet simulations MG5-aMC@NLO (MLM) and MG5-aMC@NLO (FxFx). |
png pdf |
Additional Figure 4-a:
Normalized differential cross sections as a function of $ {p_{\mathrm {T}}} ( \mathrm{ t \bar{t} } )$, $|y( \mathrm{ t \bar{t} } )|$, $M( \mathrm{ t \bar{t} } )$, and the number of additional jets compared to the predictions of POWHEG and MG5-aMC@NLO plus PYTHIA-8 (P8) or HERWIG++ (H++) and the multijet simulations MG5-aMC@NLO (MLM) and MG5-aMC@NLO (FxFx). |
png pdf |
Additional Figure 4-b:
Normalized differential cross sections as a function of $ {p_{\mathrm {T}}} ( \mathrm{ t \bar{t} } )$, $|y( \mathrm{ t \bar{t} } )|$, $M( \mathrm{ t \bar{t} } )$, and the number of additional jets compared to the predictions of POWHEG and MG5-aMC@NLO plus PYTHIA-8 (P8) or HERWIG++ (H++) and the multijet simulations MG5-aMC@NLO (MLM) and MG5-aMC@NLO (FxFx). |

png pdf |
Additional Figure 4-c:
Normalized differential cross sections as a function of $ {p_{\mathrm {T}}} ( \mathrm{ t \bar{t} } )$, $|y( \mathrm{ t \bar{t} } )|$, $M( \mathrm{ t \bar{t} } )$, and the number of additional jets compared to the predictions of POWHEG and MG5-aMC@NLO plus PYTHIA-8 (P8) or HERWIG++ (H++) and the multijet simulations MG5-aMC@NLO (MLM) and MG5-aMC@NLO (FxFx). |

png pdf |
Additional Figure 4-d:
Normalized differential cross sections as a function of $ {p_{\mathrm {T}}} ( \mathrm{ t \bar{t} } )$, $|y( \mathrm{ t \bar{t} } )|$, $M( \mathrm{ t \bar{t} } )$, and the number of additional jets compared to the predictions of POWHEG and MG5-aMC@NLO plus PYTHIA-8 (P8) or HERWIG++ (H++) and the multijet simulations MG5-aMC@NLO (MLM) and MG5-aMC@NLO (FxFx). |

png pdf |
Additional Figure 5-a:
Normalized differential cross sections at particle level as a function of $ {p_{\mathrm {T}}} ( \mathrm{ t \bar{t} } )$, $|y( \mathrm{ t \bar{t} } )|$, $M( \mathrm{ t \bar{t} } )$, and the number of additional jets compared to the predictions of POWHEG and MG5-aMC@NLO plus PYTHIA-8 (P8) or HERWIG++ (H++) and the multijet simulations MG5-aMC@NLO (MLM) and MG5-aMC@NLO (FxFx). |

png pdf |
Additional Figure 5-b:
Normalized differential cross sections at particle level as a function of $ {p_{\mathrm {T}}} ( \mathrm{ t \bar{t} } )$, $|y( \mathrm{ t \bar{t} } )|$, $M( \mathrm{ t \bar{t} } )$, and the number of additional jets compared to the predictions of POWHEG and MG5-aMC@NLO plus PYTHIA-8 (P8) or HERWIG++ (H++) and the multijet simulations MG5-aMC@NLO (MLM) and MG5-aMC@NLO (FxFx). |
png pdf |
Additional Figure 5-c:
Normalized differential cross sections at particle level as a function of $ {p_{\mathrm {T}}} ( \mathrm{ t \bar{t} } )$, $|y( \mathrm{ t \bar{t} } )|$, $M( \mathrm{ t \bar{t} } )$, and the number of additional jets compared to the predictions of POWHEG and MG5-aMC@NLO plus PYTHIA-8 (P8) or HERWIG++ (H++) and the multijet simulations MG5-aMC@NLO (MLM) and MG5-aMC@NLO (FxFx). |
png pdf |
Additional Figure 5-d:
Normalized differential cross sections at particle level as a function of $ {p_{\mathrm {T}}} ( \mathrm{ t \bar{t} } )$, $|y( \mathrm{ t \bar{t} } )|$, $M( \mathrm{ t \bar{t} } )$, and the number of additional jets compared to the predictions of POWHEG and MG5-aMC@NLO plus PYTHIA-8 (P8) or HERWIG++ (H++) and the multijet simulations MG5-aMC@NLO (MLM) and MG5-aMC@NLO (FxFx). |

png pdf |
Additional Figure 6-a:
Differential cross sections at parton level as a function of $ {p_{\mathrm {T}}} ( {\mathrm {t} })$, $|y( {\mathrm {t} })|$, $M( \mathrm{ t \bar{t} } )$, and $ {p_{\mathrm {T}}} ( \mathrm{ t \bar{t} } )$ compared to the predictions of an approximate NNNLO calculation [ANNNLO,ANNNLOdiff], a NLO+NNLL' calculation [NLONNLL], and a full NNLO [NNLO]. |
png pdf |
Additional Figure 6-b:
Differential cross sections at parton level as a function of $ {p_{\mathrm {T}}} ( {\mathrm {t} })$, $|y( {\mathrm {t} })|$, $M( \mathrm{ t \bar{t} } )$, and $ {p_{\mathrm {T}}} ( \mathrm{ t \bar{t} } )$ compared to the predictions of an approximate NNNLO calculation [ANNNLO,ANNNLOdiff], a NLO+NNLL' calculation [NLONNLL], and a full NNLO [NNLO]. |
png pdf |
Additional Figure 6-c:
Differential cross sections at parton level as a function of $ {p_{\mathrm {T}}} ( {\mathrm {t} })$, $|y( {\mathrm {t} })|$, $M( \mathrm{ t \bar{t} } )$, and $ {p_{\mathrm {T}}} ( \mathrm{ t \bar{t} } )$ compared to the predictions of an approximate NNNLO calculation [ANNNLO,ANNNLOdiff], a NLO+NNLL' calculation [NLONNLL], and a full NNLO [NNLO]. |

png pdf |
Additional Figure 6-d:
Differential cross sections at parton level as a function of $ {p_{\mathrm {T}}} ( {\mathrm {t} })$, $|y( {\mathrm {t} })|$, $M( \mathrm{ t \bar{t} } )$, and $ {p_{\mathrm {T}}} ( \mathrm{ t \bar{t} } )$ compared to the predictions of an approximate NNNLO calculation [ANNNLO,ANNNLOdiff], a NLO+NNLL' calculation [NLONNLL], and a full NNLO [NNLO]. |
|
|
Compact Muon Solenoid LHC, CERN |
|

|

|

|

|

|