

Compact Muon Solenoid
LHC, CERN
| CMS-PAS-SUS-17-005 | ||
| Search for top squarks decaying via four-body or chargino-mediated modes in the single-lepton final state at $\sqrt{s} = $ 13 TeV | ||
| CMS Collaboration | ||
| March 2018 | ||
| Abstract: A search for top squark pair production in a compressed scenario, where the mass difference between the top squark and the lightest supersymmetric particle (LSP) is smaller than the mass of the W boson, is presented. The dataset is comprised of proton-proton collisions, recorded by the CMS experiment at a centre-of-mass energy of 13 TeV and corresponding to an integrated luminosity of 35.9 fb$^{-1}$. In this search two decay modes of the top squark are considered: a four-body decay into a b quark, two additional fermions, and an LSP, and a decay via an intermediate chargino. Events are selected using the presence of a high-momentum jet, significant missing transverse energy and a low transverse momentum electron or muon. Two analysis techniques are used: a sequential selection based on the most discriminating observables, and a multivariate technique targeting the four-body decays. No evidence for the production of top squarks is found and mass limits at 95% confidence level are set that reach up to 560 GeV, depending on the m($\tilde{t}_1$)-m($\tilde{\chi}^0_1$) mass difference and the decay mode. | ||
|
Links:
CDS record (PDF) ;
inSPIRE record ;
CADI line (restricted) ;
These preliminary results are superseded in this paper, JHEP 09 (2018) 065. The superseded preliminary plots can be found here. |
||
| Figures | |

png pdf |
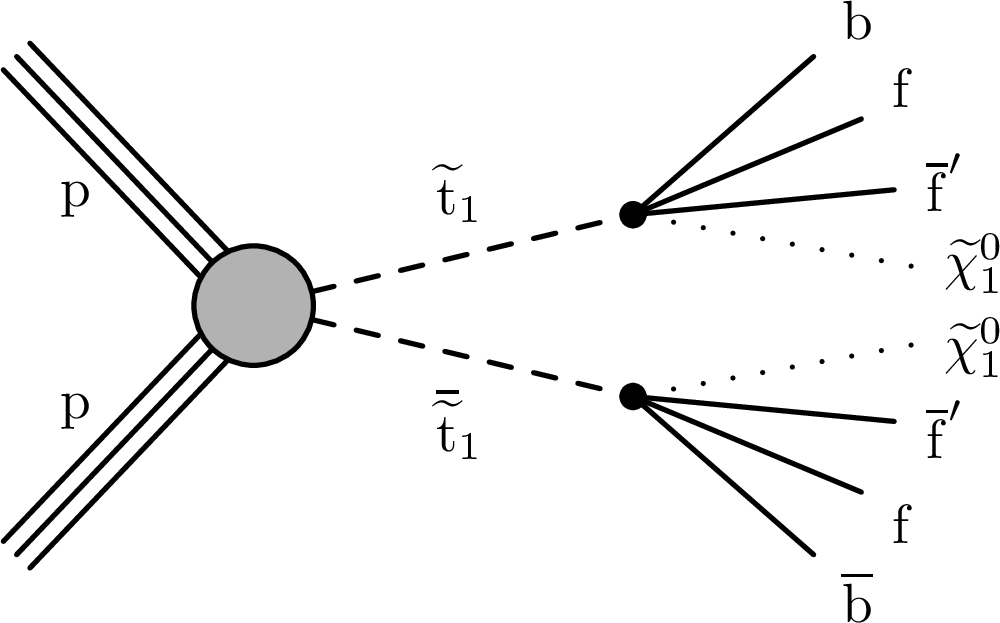
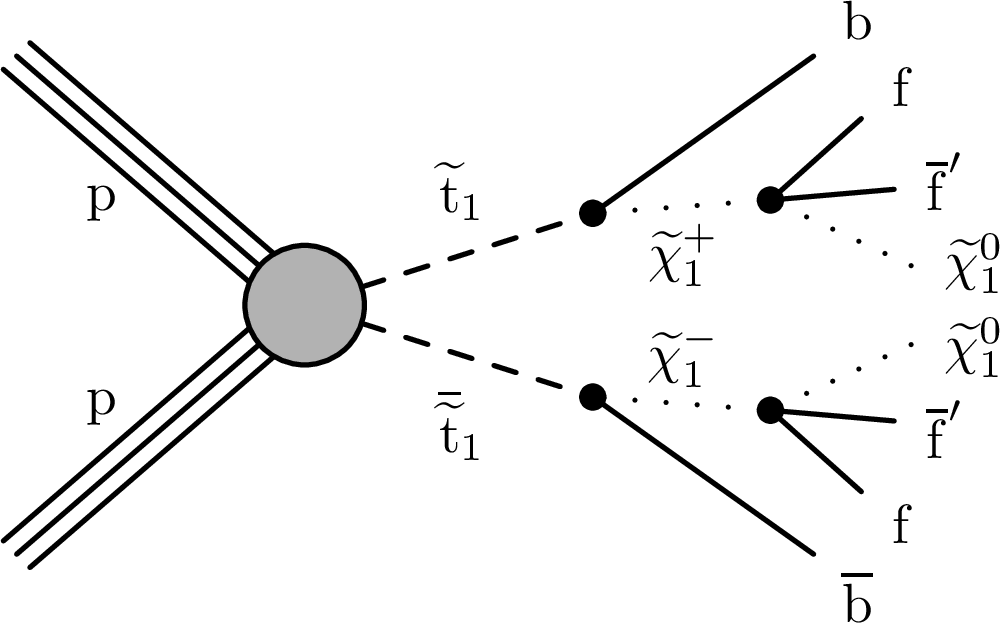
Figure 1:
Top squark pair production at the LHC with four-body (left) or chargino-mediated (right) decays. |
png pdf |
Figure 1-a:
Top squark pair production at the LHC with four-body (left) or chargino-mediated (right) decays. |
png pdf |
Figure 1-b:
Top squark pair production at the LHC with four-body (left) or chargino-mediated (right) decays. |
png pdf |
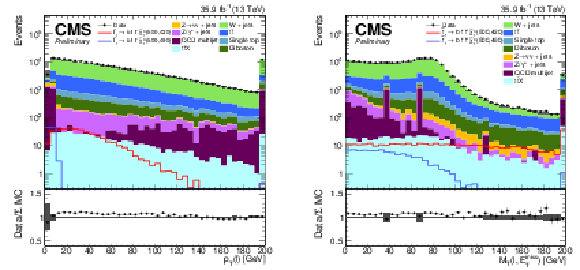
Figure 2:
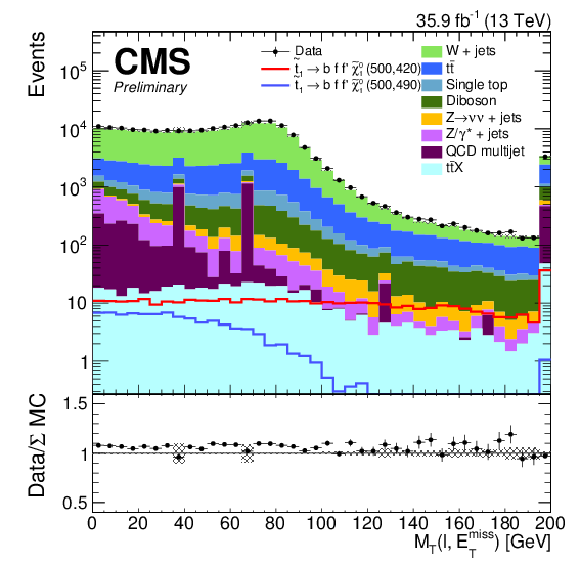
Data and MC distributions of different variables for L=35.9 fb$^{-1}$ at the preselection: Distributions of lepton ${p_{\mathrm {T}}}$ (left) and ${M_{\mathrm {T}}}$ (right). The lower panels show the ratio of data to the sum of the SM backgrounds where the dark shaded bands indicate the statistical uncertainties. Two signal points of the four-body decay are also represented while not being added to the background: (m($\tilde{\mathrm {t}}_{1}$),m($\tilde{\chi}^{0}_{1}$))= (500,490) and (500,420) GeV. |
png pdf |
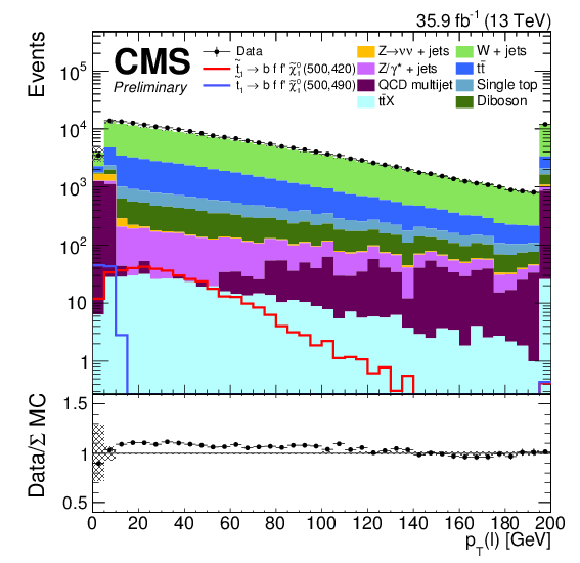
Figure 2-a:
Data and MC distributions of different variables for L=35.9 fb$^{-1}$ at the preselection: Distributions of lepton ${p_{\mathrm {T}}}$ (left) and ${M_{\mathrm {T}}}$ (right). The lower panels show the ratio of data to the sum of the SM backgrounds where the dark shaded bands indicate the statistical uncertainties. Two signal points of the four-body decay are also represented while not being added to the background: (m($\tilde{\mathrm {t}}_{1}$),m($\tilde{\chi}^{0}_{1}$))= (500,490) and (500,420) GeV. |
png pdf |
Figure 2-b:
Data and MC distributions of different variables for L=35.9 fb$^{-1}$ at the preselection: Distributions of lepton ${p_{\mathrm {T}}}$ (left) and ${M_{\mathrm {T}}}$ (right). The lower panels show the ratio of data to the sum of the SM backgrounds where the dark shaded bands indicate the statistical uncertainties. Two signal points of the four-body decay are also represented while not being added to the background: (m($\tilde{\mathrm {t}}_{1}$),m($\tilde{\chi}^{0}_{1}$))= (500,490) and (500,420) GeV. |
png pdf |
Figure 3:
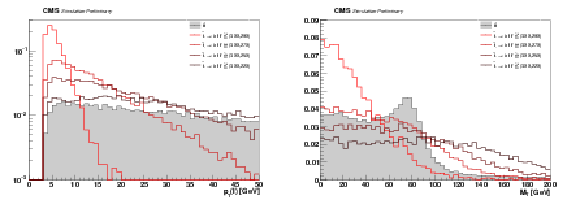
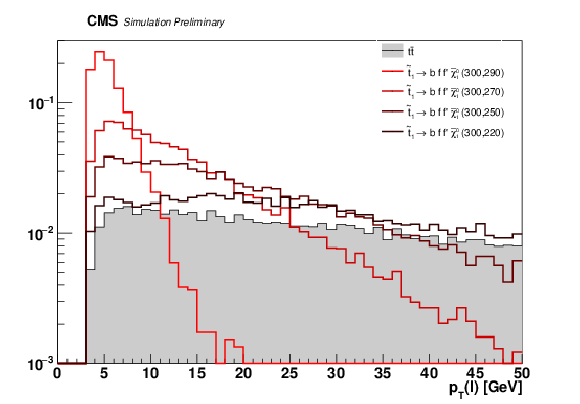
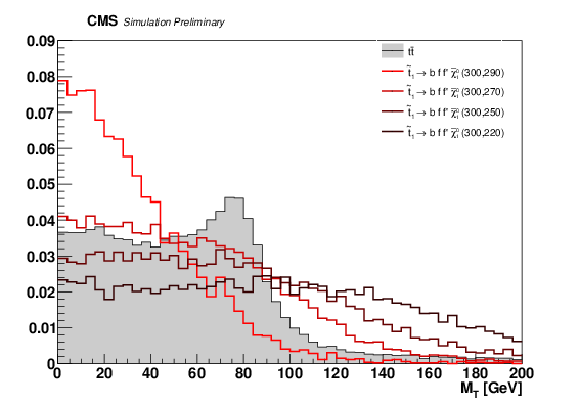
Normalized MC distribution of various input variables for signal with different $ {\Delta m} $ and for ${{\mathrm {t}\overline {\mathrm {t}}}}$ at preselection: ${{p_{\mathrm {T}}} (\ell)} $ and ${M_{\mathrm {T}}} $. |
png pdf |
Figure 3-a:
Normalized MC distribution of various input variables for signal with different $ {\Delta m} $ and for ${{\mathrm {t}\overline {\mathrm {t}}}}$ at preselection: ${{p_{\mathrm {T}}} (\ell)} $ and ${M_{\mathrm {T}}} $. |
png pdf |
Figure 3-b:
Normalized MC distribution of various input variables for signal with different $ {\Delta m} $ and for ${{\mathrm {t}\overline {\mathrm {t}}}}$ at preselection: ${{p_{\mathrm {T}}} (\ell)} $ and ${M_{\mathrm {T}}} $. |
png pdf |
Figure 4:
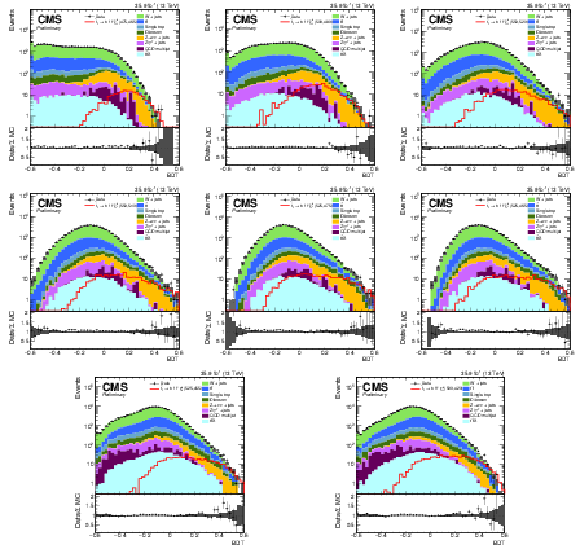
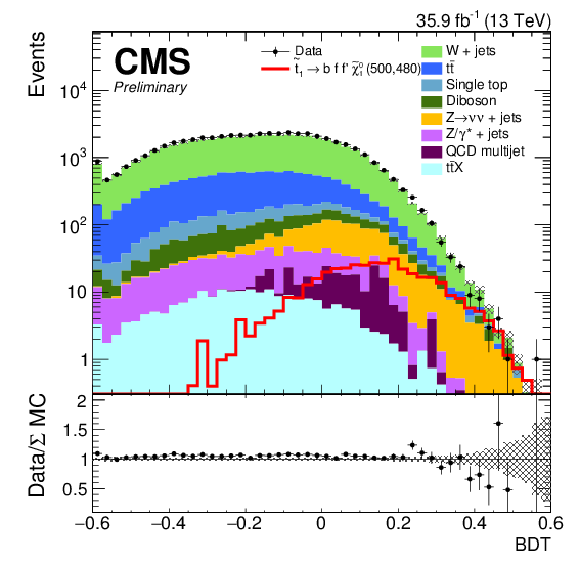
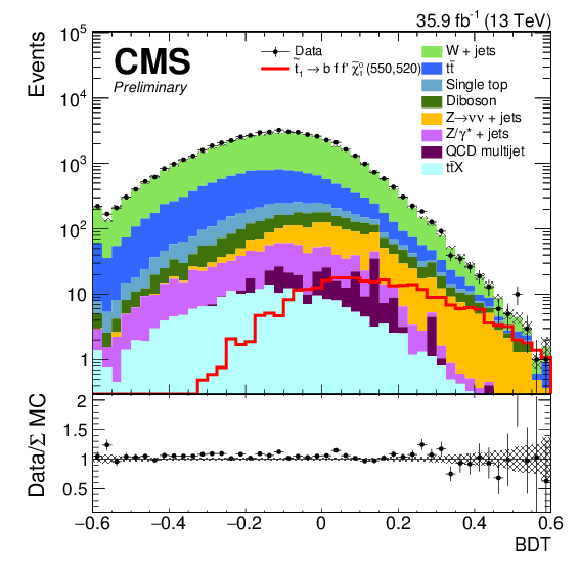
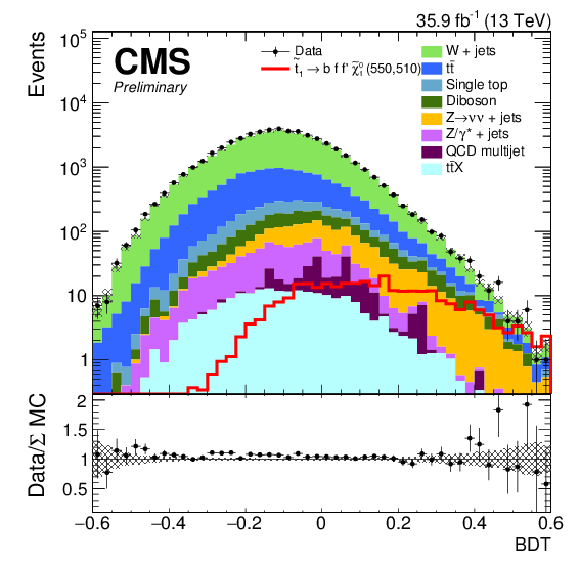
Data and expected MC distributions for the BDT output for L=35.9 fb$^{-1}$ at the preselection level. Starting from top-left to bottom-right: ${\Delta m} = $ 10 to 80 GeV. For each case, a representative (m($\tilde{t}_1$),m($\tilde{\chi}^0_1$)) signal point has also been reported while not added to the SM background. The shaded area on the Data/MC ratio represents the statistical uncertainty of the simulated background. |

png pdf |
Figure 4-a:
Data and expected MC distributions for the BDT output for L=35.9 fb$^{-1}$ at the preselection level. Starting from top-left to bottom-right: ${\Delta m} = $ 10 to 80 GeV. For each case, a representative (m($\tilde{t}_1$),m($\tilde{\chi}^0_1$)) signal point has also been reported while not added to the SM background. The shaded area on the Data/MC ratio represents the statistical uncertainty of the simulated background. |
png pdf |
Figure 4-b:
Data and expected MC distributions for the BDT output for L=35.9 fb$^{-1}$ at the preselection level. Starting from top-left to bottom-right: ${\Delta m} = $ 10 to 80 GeV. For each case, a representative (m($\tilde{t}_1$),m($\tilde{\chi}^0_1$)) signal point has also been reported while not added to the SM background. The shaded area on the Data/MC ratio represents the statistical uncertainty of the simulated background. |
png pdf |
Figure 4-c:
Data and expected MC distributions for the BDT output for L=35.9 fb$^{-1}$ at the preselection level. Starting from top-left to bottom-right: ${\Delta m} = $ 10 to 80 GeV. For each case, a representative (m($\tilde{t}_1$),m($\tilde{\chi}^0_1$)) signal point has also been reported while not added to the SM background. The shaded area on the Data/MC ratio represents the statistical uncertainty of the simulated background. |
png pdf |
Figure 4-d:
Data and expected MC distributions for the BDT output for L=35.9 fb$^{-1}$ at the preselection level. Starting from top-left to bottom-right: ${\Delta m} = $ 10 to 80 GeV. For each case, a representative (m($\tilde{t}_1$),m($\tilde{\chi}^0_1$)) signal point has also been reported while not added to the SM background. The shaded area on the Data/MC ratio represents the statistical uncertainty of the simulated background. |

png pdf |
Figure 4-e:
Data and expected MC distributions for the BDT output for L=35.9 fb$^{-1}$ at the preselection level. Starting from top-left to bottom-right: ${\Delta m} = $ 10 to 80 GeV. For each case, a representative (m($\tilde{t}_1$),m($\tilde{\chi}^0_1$)) signal point has also been reported while not added to the SM background. The shaded area on the Data/MC ratio represents the statistical uncertainty of the simulated background. |
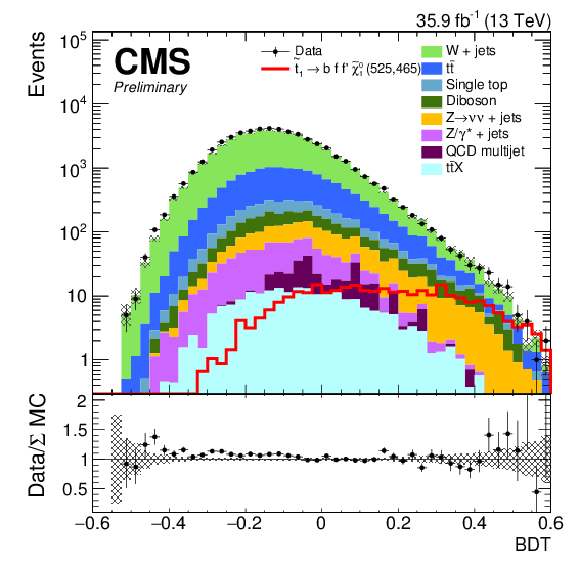
png pdf |
Figure 4-f:
Data and expected MC distributions for the BDT output for L=35.9 fb$^{-1}$ at the preselection level. Starting from top-left to bottom-right: ${\Delta m} = $ 10 to 80 GeV. For each case, a representative (m($\tilde{t}_1$),m($\tilde{\chi}^0_1$)) signal point has also been reported while not added to the SM background. The shaded area on the Data/MC ratio represents the statistical uncertainty of the simulated background. |
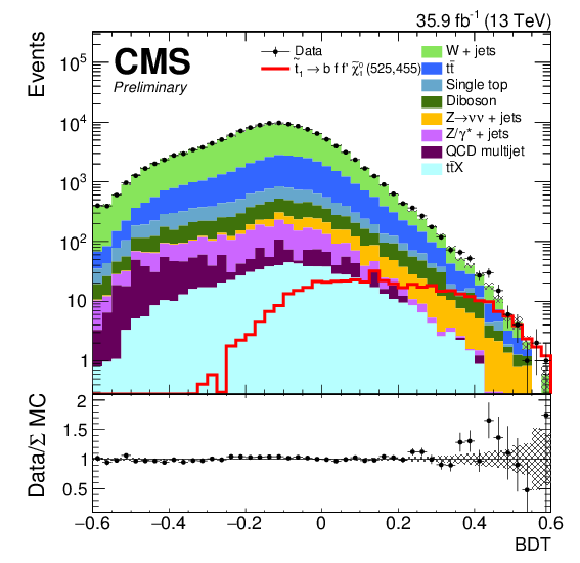
png pdf |
Figure 4-g:
Data and expected MC distributions for the BDT output for L=35.9 fb$^{-1}$ at the preselection level. Starting from top-left to bottom-right: ${\Delta m} = $ 10 to 80 GeV. For each case, a representative (m($\tilde{t}_1$),m($\tilde{\chi}^0_1$)) signal point has also been reported while not added to the SM background. The shaded area on the Data/MC ratio represents the statistical uncertainty of the simulated background. |
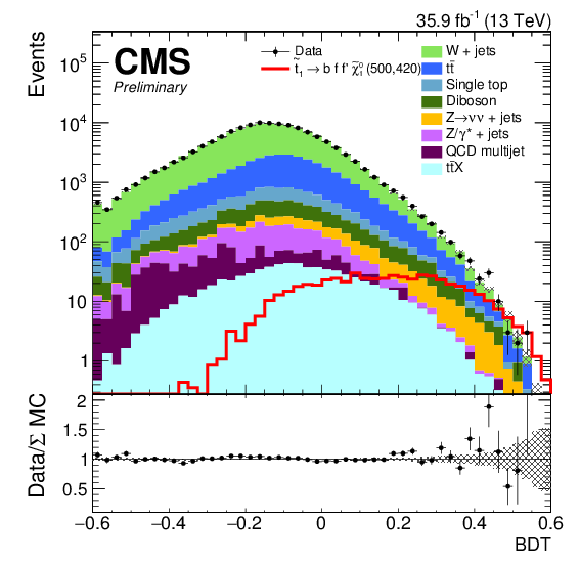
png pdf |
Figure 4-h:
Data and expected MC distributions for the BDT output for L=35.9 fb$^{-1}$ at the preselection level. Starting from top-left to bottom-right: ${\Delta m} = $ 10 to 80 GeV. For each case, a representative (m($\tilde{t}_1$),m($\tilde{\chi}^0_1$)) signal point has also been reported while not added to the SM background. The shaded area on the Data/MC ratio represents the statistical uncertainty of the simulated background. |
png pdf |
Figure 5:
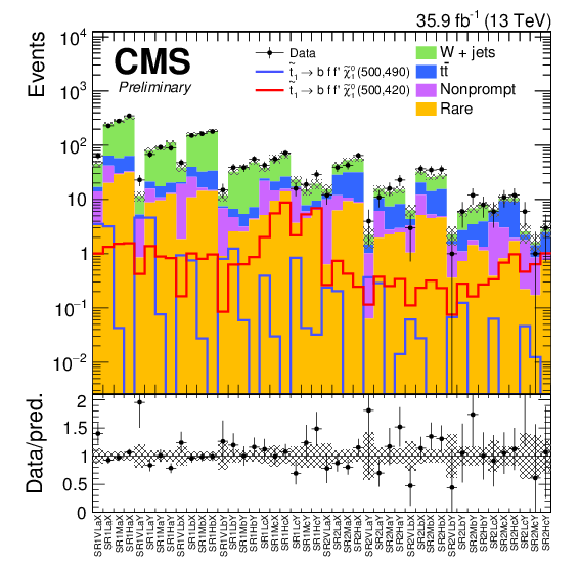
CC search: Summary of observed and expected background yields in all signal regions. The vertical bars and the shaded areas represent the statistical uncertainty of the data and the total uncertainty in the prediction, respectively. The lower panel shows the ratio of data to prediction. |
png pdf |
Figure 6:
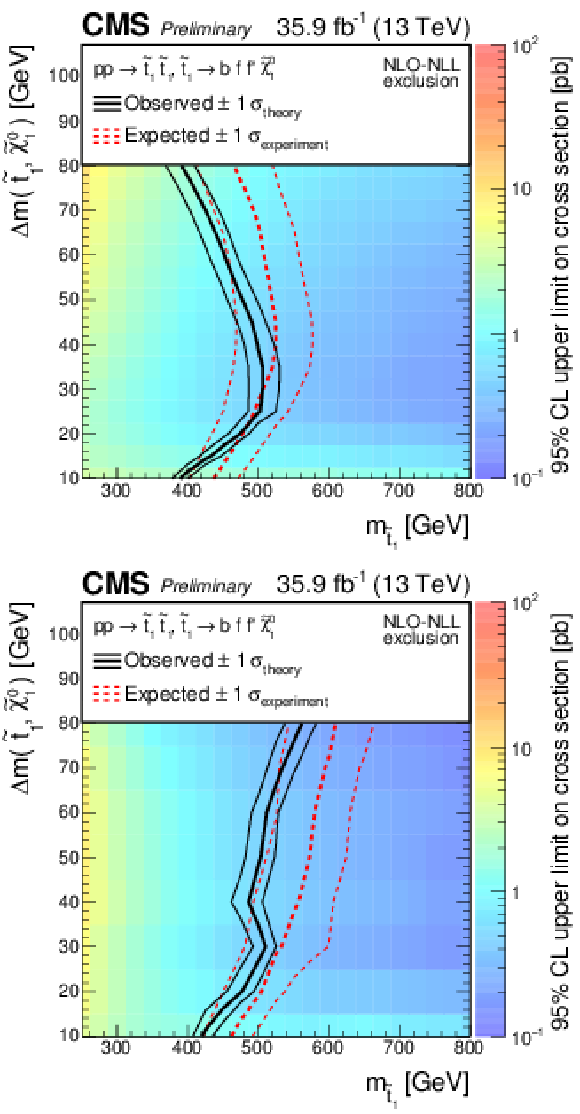
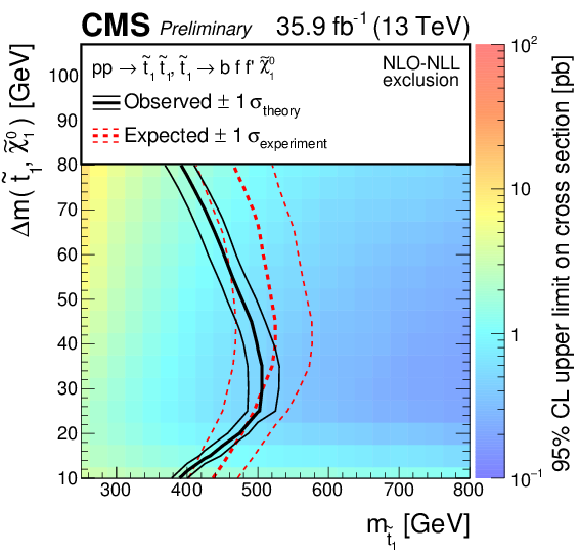
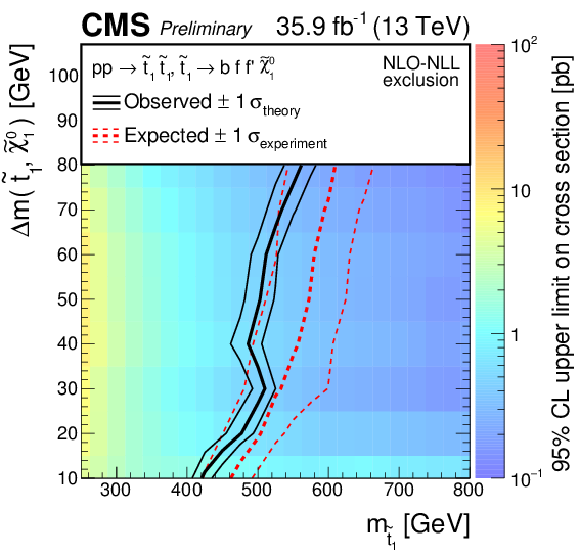
Exclusion limit at 95% CL for the four-body decay of the top squark as a function of m($\tilde{t}_1$) and $ {\Delta m} $ for the CC (top) and MVA (bottom) search. The colour shading corresponds to the observed limit on the cross section. The black (red) lines represent the observed (expected) limits, derived using the expected top squark pair production cross section. The thick lines represent the central values and the thin lines the variations due to the theoretical (experimental) uncertainties. |
png pdf |
Figure 6-a:
Exclusion limit at 95% CL for the four-body decay of the top squark as a function of m($\tilde{t}_1$) and $ {\Delta m} $ for the CC (top) and MVA (bottom) search. The colour shading corresponds to the observed limit on the cross section. The black (red) lines represent the observed (expected) limits, derived using the expected top squark pair production cross section. The thick lines represent the central values and the thin lines the variations due to the theoretical (experimental) uncertainties. |
png pdf |
Figure 6-b:
Exclusion limit at 95% CL for the four-body decay of the top squark as a function of m($\tilde{t}_1$) and $ {\Delta m} $ for the CC (top) and MVA (bottom) search. The colour shading corresponds to the observed limit on the cross section. The black (red) lines represent the observed (expected) limits, derived using the expected top squark pair production cross section. The thick lines represent the central values and the thin lines the variations due to the theoretical (experimental) uncertainties. |
png pdf |
Figure 7:
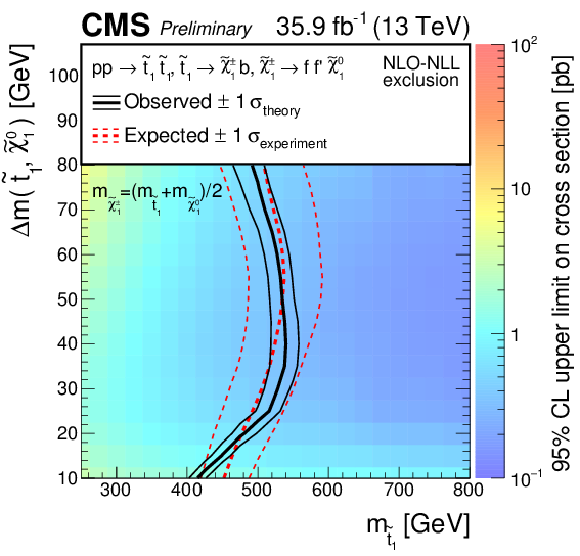
Exclusion limit at 95% CL for the chargino-mediated decay of the top squark as a function of m($\tilde{t}_1$) and $ {\Delta m} $ for the CC search. The colour shading corresponds to the observed limit on the cross section. The black (red) lines represent the observed (expected) limits, derived using the expected top squark pair production cross section. The thick lines represent the central values and the thin lines the variations due to the theoretical (experimental) uncertainties. |
png pdf |
Figure 8:
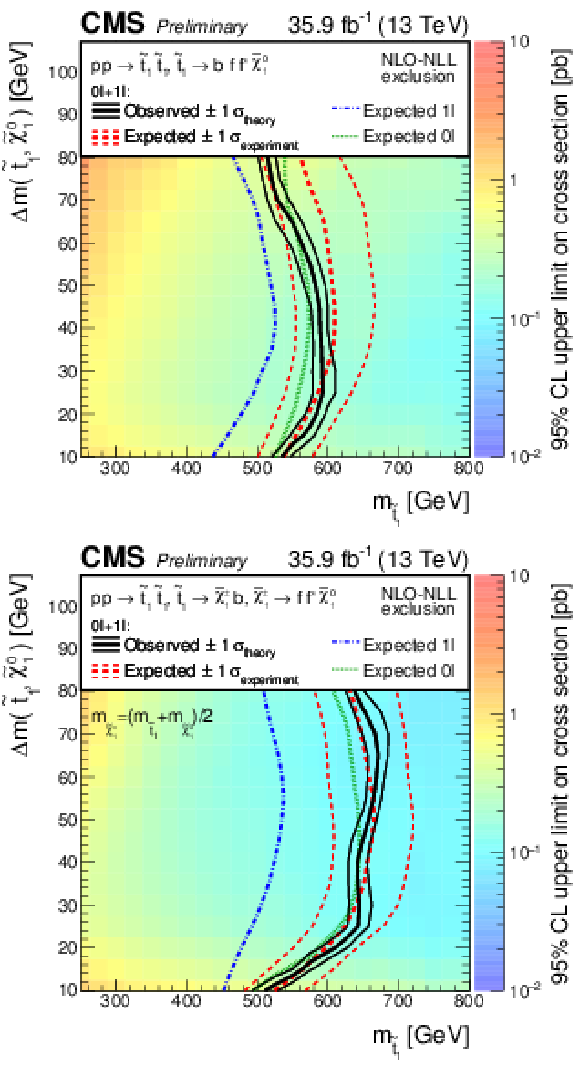
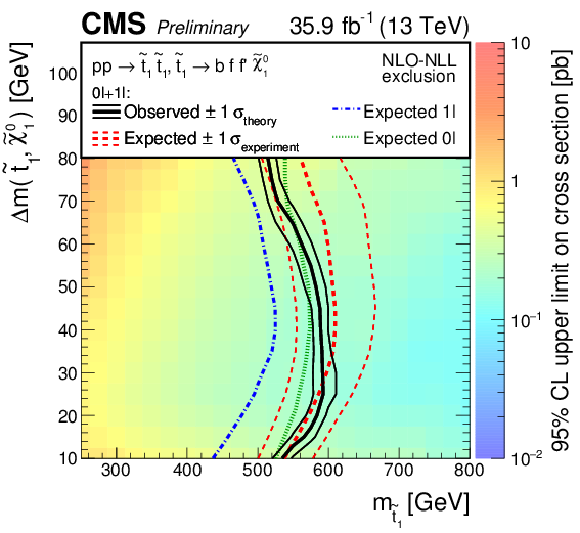
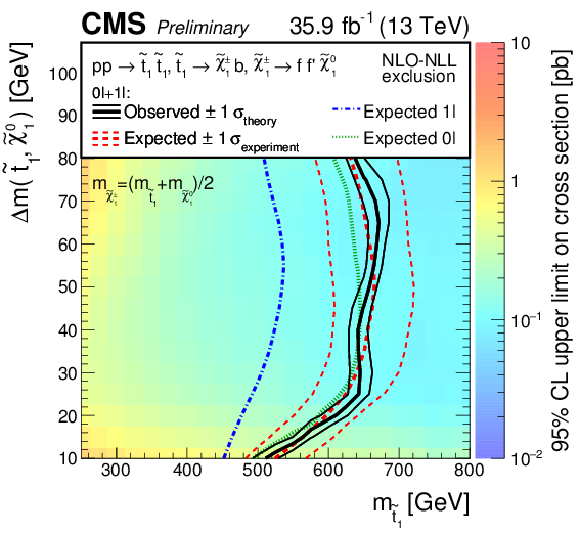
Combined limits at 95% CL between the single-lepton ($1 \ell $) and all-hadronic ($0 \ell $) searches for the four-body decay (top) and the chargino-mediated decay (bottom) of the top squark in the m($\tilde{t}_1$)-$\Delta$m($\tilde{t}_1$, $\tilde{\chi}^0_1$) plane. The correlations between the two searches have been taken into account. The colour shading corresponds to the observed limit on the cross section. The solid black (dashed red) lines show the observed (expected) mass limits, derived using the expected top squark pair production cross section. The thick lines represent the central values and the thin lines the variations due to the theoretical (experimental) uncertainties. The blue and green dashed lines show the individual expected mass limits for the $1 \ell $ and $0 \ell $ searches, respectively. |
png pdf |
Figure 8-a:
Combined limits at 95% CL between the single-lepton ($1 \ell $) and all-hadronic ($0 \ell $) searches for the four-body decay (top) and the chargino-mediated decay (bottom) of the top squark in the m($\tilde{t}_1$)-$\Delta$m($\tilde{t}_1$, $\tilde{\chi}^0_1$) plane. The correlations between the two searches have been taken into account. The colour shading corresponds to the observed limit on the cross section. The solid black (dashed red) lines show the observed (expected) mass limits, derived using the expected top squark pair production cross section. The thick lines represent the central values and the thin lines the variations due to the theoretical (experimental) uncertainties. The blue and green dashed lines show the individual expected mass limits for the $1 \ell $ and $0 \ell $ searches, respectively. |
png pdf |
Figure 8-b:
Combined limits at 95% CL between the single-lepton ($1 \ell $) and all-hadronic ($0 \ell $) searches for the four-body decay (top) and the chargino-mediated decay (bottom) of the top squark in the m($\tilde{t}_1$)-$\Delta$m($\tilde{t}_1$, $\tilde{\chi}^0_1$) plane. The correlations between the two searches have been taken into account. The colour shading corresponds to the observed limit on the cross section. The solid black (dashed red) lines show the observed (expected) mass limits, derived using the expected top squark pair production cross section. The thick lines represent the central values and the thin lines the variations due to the theoretical (experimental) uncertainties. The blue and green dashed lines show the individual expected mass limits for the $1 \ell $ and $0 \ell $ searches, respectively. |
| Tables | |
png pdf |
Table 1:
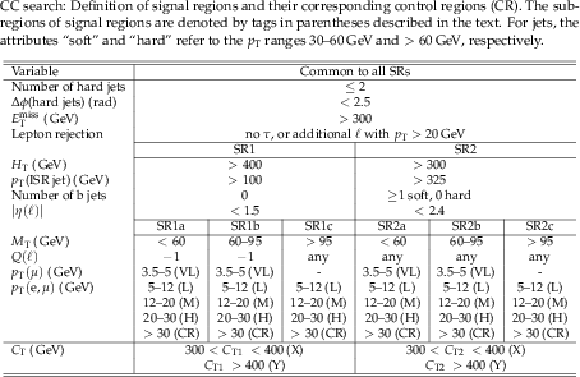
CC search: Definition of signal regions and their corresponding control regions (CR). The subregions of signal regions are denoted by tags in parentheses described in the text. For jets, the attributes "soft'' and "hard'' refer to the ${p_{\mathrm {T}}}$ ranges 30-60 GeV and $ > $ 60 GeV, respectively. |
png pdf |
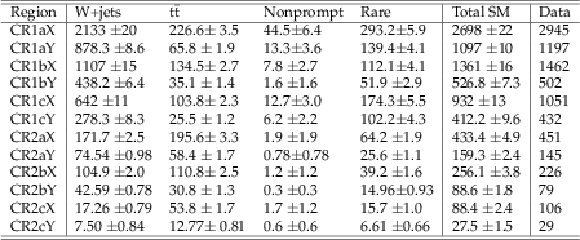
Table 2:
CC search: Simulated background contributions to control regions normalized to a luminosity of 35.9 fb$^{-1}$. The nonprompt contributions are estimated from data. Only statistical uncertainties are reported. |
png pdf |
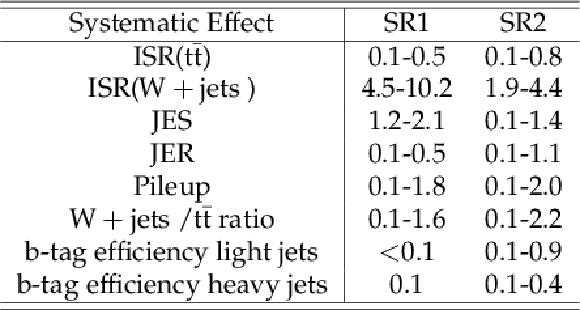
Table 3:
CC search: Typical ranges for relative systematic uncertainties in % on the total background prediction in the main signal regions |
png pdf |
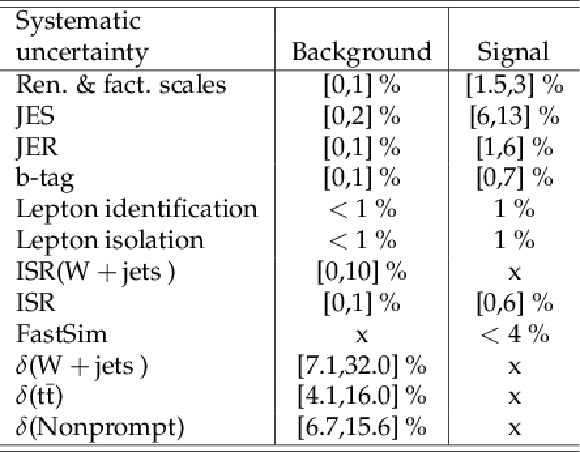
Table 4:
MVA search: Relative systematic uncertainties on the total background and signal prediction. "x'' means non-applicable. Square brackets indicate ranges of the systematic uncertainty, depending on different selections being applied for different $ {\Delta m} $ regions. |

png pdf |
Table 5:
MVA search: Prediction of the ${{\mathrm {W}}+\mathrm {jets}} $, ${{\mathrm {t}\overline {\mathrm {t}}}}$, nonprompt lepton and other backgrounds in the eight signal regions defined by the minimal threshold on the BDT output per $ {\Delta m} $ reported in the second column. The prediction of the first three processes is based on data while the one of $N^{CR}_{MC}$, i.e. rare backgrounds, is based on simulation. The uncertainties are based on the statistical uncertainty quadratically added to the uncertainties of Tab. 4: $\delta $ for the data driven background, and cross section for the background predicted from simulation. The number of total expected background ($N^{SR}(B)$) and observed data ($N^{SR}(D)$) events in each signal region is also reported. |
| Summary |
|
A search for direct top squark pair production is performed in a compressed scenario where the mass difference ($ {\Delta m} $ ) to the lightest sparticle does not exceed the W mass. Two decay modes of the top squark are targeted: The four-body decay mode to $\mathrm{b} \mathrm{ f f' } \tilde{\chi}^0_1$, and the chargino-mediated decay to $\mathrm{b} \tilde{\chi}^{+}_{1}$ with a subsequent decay $\tilde{\chi}^{+}_{1} \to \mathrm{ f f' } \tilde{\chi}^0_1$. Results are based on pp collision data at $\sqrt{s} = $ 13 TeV, recorded with the CMS detector in 2016 and corresponding to an integrated luminosity of 35.9 fb$^{-1}$. Selected events are required to have a single lepton (electron or muon), and significant ${{E_\mathrm{T}}^{\mathrm{miss}}} $. Because of the small mass difference between the top squark and the LSP, the decay products of the top squark are expected to have low $ {p_{\mathrm{T}}} $. Events where the presence of a jet from initial-state radiation leads to a boost of the top squark pair and sizeable $ {{E_\mathrm{T}}^{\mathrm{miss}}} $ are selected. Two search strategies are pursued. In the "cut-and-count'' approach signal regions are defined based on the most discriminating variables, in particular the transverse mass of the lepton-$ {{E_\mathrm{T}}^{\mathrm{miss}}} $ system, and the lepton momentum. In another approach, a multivariate technique is employed that uses both kinematic and topological variables and is specifically trained for different kinematic regions of the four-body decay mode. In both approaches, the dominating contributions to the signal regions from standard model processes (${\mathrm{W}+\mathrm{jets}} $, $\mathrm{t\bar{t}}$, and events with misidentified leptons) are estimated from control regions in data. Data are found to be compatible with the predicted standard model backgrounds, and the results are used to set limits at 95% CL on the production cross section as a function of the ${\tilde{\mathrm{t}}_{1}} $ and the $\tilde{\chi}^0_1$ mass. Assuming 100% branching fraction in the decay channel under consideration and a nominal top squark pair-production cross section, these limits are converted into mass limits. For the four-body decay, the limits on the top squark mass obtained in the multivariate search are comparable with the "cut-and-count'' approach for ${\Delta m} = $ 30 GeV but clearly exceed the latter at the lowest (${\Delta m} = $ 10 GeV) and highest (${\Delta m} = $ 80 GeV) values considered in this search, reaching 420 GeV and 560 GeV, respectively. For the case of chargino-mediated decays, where the chargino mass is chosen to be halfway between the top squark and the neutralino mass, the "cut-and-count'' approach probes ${\tilde{\mathrm{t}}_{1}} $ masses up to 540 GeV with a maximum sensitivity at ${\Delta m} = $ 40 GeV. The results of the "cut-and-count'' approach have also been combined with a search for top squark pair production in the fully hadronic channel [15]. The combined mass limits reach up to 590 GeV and 670 GeV for four-body and chargino-mediated decays, respectively. The results shown in this note represent the most stringent limits at this date for top squark pair production with mass differences below the W mass and decays in either the four-body or the chargino-mediated mode. |
| References | ||||
| 1 | J. Martin | A supersymmetry primer | 9709356 | |
| 2 | J. Wess and B. Zumino | Supergauge transformations in four dimensions | NPB 70 (1974) 39 | |
| 3 | H. P. Nilles | Supersymmetry, supergravity and particle physics | Phys. Reports 110 (1984) 1 | |
| 4 | H. E. Haber and G. L. Kane | The search for supersymmetry: Probing physics beyond the standard model | Phys. Reports 117 (1985) 75 | |
| 5 | R. Barbieri, S. Ferrara, and C. A. Savoy | Gauge models with spontaneously broken local supersymmetry | PLB 119 (1982) 343 | |
| 6 | S. Dawson, E. Eichten, and C. Quigg | Search for supersymmetric particles in hadron-hadron collisions | PRD 31 (1985) 1581 | |
| 7 | G. R. Farrar and P. Fayet | Phenomenology of the production, decay, and detection of new hadronic states associated with supersymmetry | PLB 76 (1978) 575 | |
| 8 | E. Witten | Dynamical breaking of supersymmetry | NPB 188 (1981) 513 | |
| 9 | S. Dimopoulos and H. Georgi | Softly broken supersymmetry and SU(5) | NPB 193 (1981) 150 | |
| 10 | CMS Collaboration | Observation of a new boson at a mass of 125 GeV with the CMS experiment at the LHC | PLB 716 (2012) 30 | CMS-HIG-12-028 1207.7235 |
| 11 | ATLAS Collaboration | Observation of a new particle in the search for the standard model higgs boson with the ATLAS detector at the LHC | PLB 716 (2012) 1 | 1207.7214 |
| 12 | C. Bal\'azs et al. | Dark matter, light stops and electroweak baryogenesis | PRD 70 (2004) 015007 | 0403224 |
| 13 | Cohen et al. | SUSY Simplified Models at 14, 33, and 100 TeV Proton Colliders | JHEP 04 (2014) 117 | 1311.6480 |
| 14 | CMS Collaboration | Search for supersymmetry in events with soft leptons, low jet multiplicity, and missing transverse energy in proton proton collisions at $ \sqrt{s} = $ 8 TeV | PLB 759 (2016) 9 | CMS-SUS-14-021 1512.08002 |
| 15 | CMS Collaboration | Search for direct production of supersymmetric partners of the top quark in the all-jets final state in proton-proton collisions at $ \sqrt{s}= $ 13 TeV | JHEP 10 (2017) 005 | CMS-SUS-16-049 1707.03316 |
| 16 | ATLAS Collaboration | Search for top squark pair production in final states with one isolated lepton, jets, and missing transverse momentum in $ \sqrt{s} = 8 TeV {\mathrm{p}}{\mathrm{p}} $ collisions with the ATLAS detector | JHEP 11 (2014) 118 | 1407.0583 |
| 17 | ATLAS Collaboration | Search for direct top squark pair production in final states with two leptons in $ \sqrt{s} = 13 TeV pp $ collisions with the ATLAS detector | Submitted to EPJC | 1708.03247 |
| 18 | CMS Collaboration | The CMS experiment at the CERN LHC | JINST 3 (2008) S08004 | CMS-00-001 |
| 19 | CMS Collaboration | Particle-flow reconstruction and global event description with the cms detector | JINST 12 (2017) P10003 | CMS-PRF-14-001 1706.04965 |
| 20 | M. Cacciari, G. P. Salam, and G. Soyez | The anti-$ k_t $ jet clustering algorithm | JHEP 04 (2008) 063 | 0802.1189 |
| 21 | M. Cacciari, G. P. Salam, and G. Soyez | FastJet user manual | EPJC 72 (2012) 1896 | 1111.6097 |
| 22 | CMS Collaboration | Reconstruction and identification of $ \tau $ lepton decays to hadrons and $ \nu_{\tau} $ at CMS | JINST 11 (2016), no. 01, P01019 | CMS-TAU-14-001 1510.07488 |
| 23 | CMS Collaboration | Identification of $ \Pqb-quark $ jets with the CMS experiment | JINST 8 (2013) P04013 | CMS-BTV-12-001 1211.4462 |
| 24 | CMS Collaboration | Identification of $ \Pqb\ $ quark jets at the CMS Experiment in the LHC Run 2 | CMS-PAS-BTV-15-001 | CMS-PAS-BTV-15-001 |
| 25 | J. Alwall et al. | The automated computation of tree-level and next-to-leading order differential cross sections, and their matching to parton shower simulations | JHEP 07 (2014) 079 | 1405.0301 |
| 26 | S. Alioli, P. Nason, C. Oleari, and E. Re | NLO single-top production matched with shower in POWHEG: s- and t-channel contributions | JHEP 09 (2009) 111 | 0907.4076 |
| 27 | E. Re | Single-top Wt-channel production matched with parton showers using the POWHEG method | EPJC 71 (2011) 1547 | 1009.2450 |
| 28 | NNPDF Collaboration | Parton distributions for the LHC Run II | JHEP 04 (2015) 040 | 1410.8849 |
| 29 | T. Sjostrand, S. Mrenna, and P. Skands | PYTHIA 6.4 physics and manual | JHEP 05 (2006) 026 | hep-ph/0603175 |
| 30 | T. Sjostrand, S. Mrenna, and P. Z. Skands | A Brief Introduction to PYTHIA 8.1 | CPC 178 (2008) 852 | 0710.3820 |
| 31 | CMS Collaboration | Event generator tunes obtained from underlying event and multiparton scattering measurements | EPJC 76 (2016) 155 | CMS-GEN-14-001 1512.00815 |
| 32 | GEANT4 Collaboration | GEANT4---a simulation toolkit | NIMA 506 (2003) 250 | |
| 33 | W. Beenakker, R. Hopker, and M. Spira | PROSPINO: A program for the production of supersymmetric particles in next-to-leading order QCD | hep-ph/9611232 | |
| 34 | W. Beenakker, R. Hopker, M. Spira, and P. M. Zerwas | Squark and gluino production at hadron colliders | NPB 492 (1997) 51 | hep-ph/9610490 |
| 35 | A. Kulesza and L. Motyka | Threshold resummation for squark-antisquark and gluino-pair production at the lhc | PRL 102 (2009) 111802 | hep-ph/0807.2405 |
| 36 | A. Kulesza and L. Motyka | Soft gluon resummation for the production of gluino-gluino and squark-antisquark pairs at the lhc | PRD 80 (2009) 095004 | hep-ph/0905.4749 |
| 37 | W. Beenakker et al. | Soft-gluon resummation for squark and gluino hadroproduction | JHEP 12 (2009) 41 | hep-ph/0909.4418 |
| 38 | W. Beenakker et al. | Squark and gluino production | Int. J. Mod. Phys. A 26 (2011) 2637 | hep-ph/1105.1110 |
| 39 | CMS Collaboration | The fast simulation of the CMS Detector at LHC | J. Phys. Conf. Ser. 331 (2011) 032049 | |
| 40 | CMS Collaboration | Search for direct pair production of scalar top quarks in the single- and dilepton channels in proton-proton collisions at $ \sqrt{s} = $ 8 TeV | JHEP 07 (2016) 027 | CMS-SUS-14-015 1602.03169 |
| 41 | CMS Collaboration | CMS Luminosity Measurements for the 2016 Data Taking Period | CMS-PAS-LUM-17-001 | CMS-PAS-LUM-17-001 |
| 42 | L. Rokach and O. Maimon | World Scientific Pub Co Inc., 2008 ISBN 978-981-277-171-1 | ||
| 43 | G. Cowan, K. Cranmer, E. Gross, and O. Vitells | Asymptotic formulae for likelihood-based tests of new physics | Eur. Phys. J C71 (2011) 1554 | 1007.1727 |
| 44 | T. Junk | Confidence level computation for combining searches with small statistics | NIMA 434 (1999) 435 | hep-ex/9902006 |
| 45 | A. L. Read | Presentation of search results: the $ CL_s $ technique | JPG 28 (2002) 2693 | |
| 46 | ATLAS and CMS Collaborations, LHC Higgs Combination Group | Procedure for the LHC higgs boson search combination in summer 2011 | ATL-PHYS-PUB/2011-11, CMS NOTE 2011/005 | |

|
Compact Muon Solenoid LHC, CERN |

|

|

|

|

|

|