

Compact Muon Solenoid
LHC, CERN
| CMS-PAS-SUS-16-032 | ||
| Search for direct production of bottom and top squark pairs in proton-proton collisions at $\sqrt{s}= $ 13 TeV | ||
| CMS Collaboration | ||
| March 2017 | ||
| Abstract: This note presents a search for direct production of bottom or top squark pairs in proton-proton collisions at a center-of-mass energy of $\sqrt{s}= $ 13 TeV collected by the CMS experiment at the LHC in 2016. The data used correspond to an integrated luminosity of 36 fb$^{-1}$. This search is performed in a final state of two, three, or four jets accompanied by a significant imbalance in the transverse momentum. No statistically significant excess of events is found beyond the expected contribution from standard model processes. Exclusion limits are set in the context of simplified models of bottom- or top-squark pair production. Bottom squarks with masses below 1225 GeV are excluded at 95%CL for small values of the neutralino mass. Top squarks with masses below 525 GeV are excluded if the mass difference to the lightest neutralino is close to 10 GeV. | ||
|
Links:
CDS record (PDF) ;
inSPIRE record ;
CADI line (restricted) ;
These preliminary results are superseded in this paper, PLB 778 (2018) 263. The superseded preliminary plots can be found here. |
||
| Figures & Tables | Summary | Additional Figures & Tables | References | CMS Publications |
|---|
| Additional information on efficiencies needed for reinterpretation of these results are available here. |
| Figures | |
png pdf |
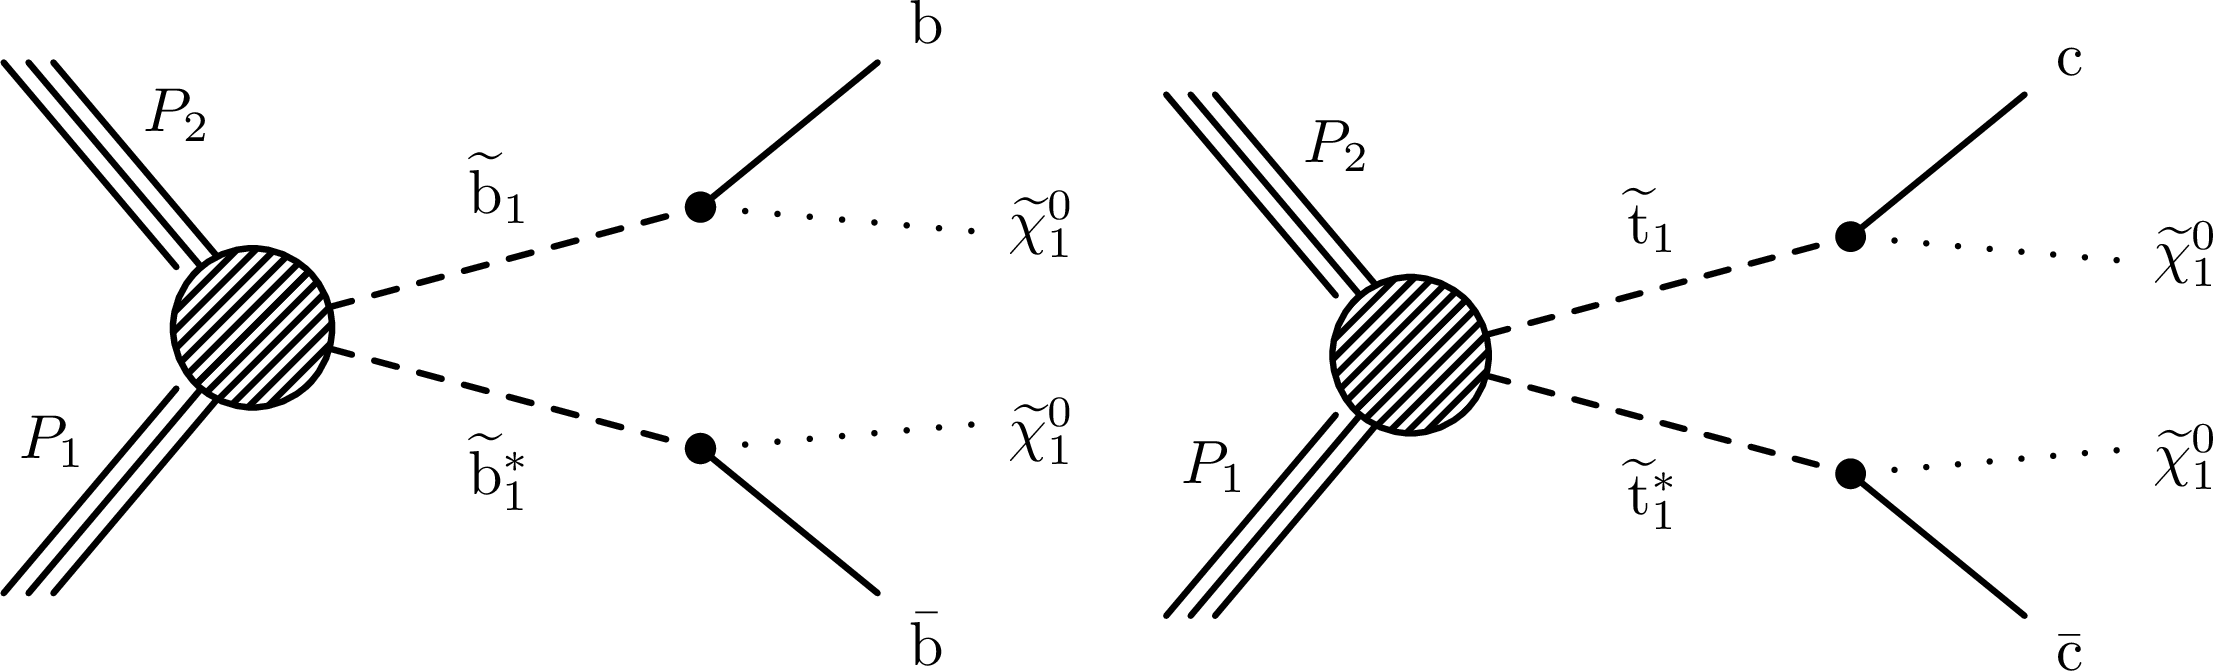
Figure 1:
Diagrams showing the pair production of top or bottom squarks followed by their decays according to $\tilde{ \mathrm{ b } } \rightarrow \mathrm{ b } \tilde{\chi}^{0} _1$ (left) and $\tilde{ \mathrm{ t } } \rightarrow \tilde{\mathrm{c}} \tilde{\chi}^{0} _1$ (right). |
png pdf |
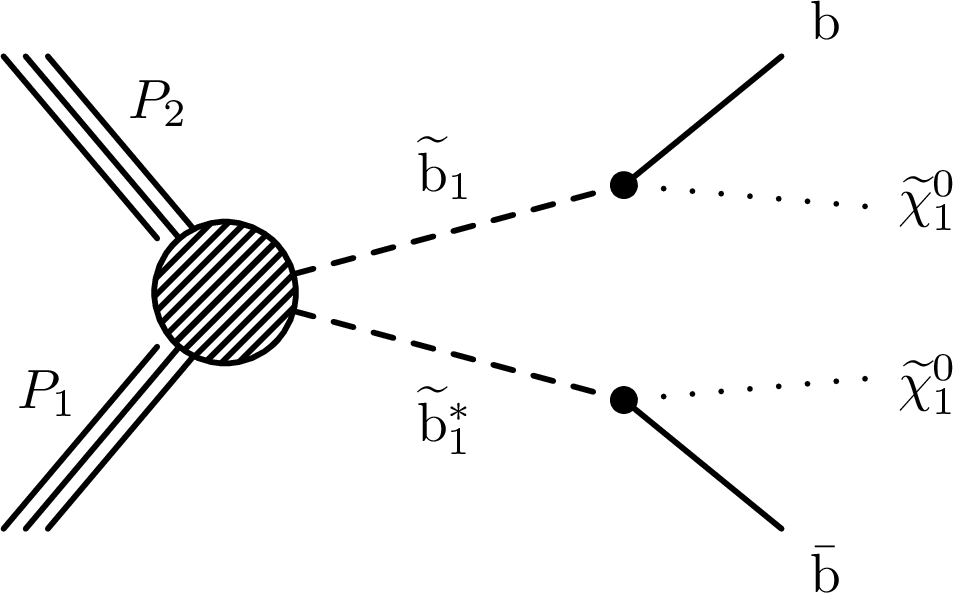
Figure 1-a:
Diagram showing the pair production of bottom squarks followed by their decays according to $\tilde{ \mathrm{ b } } \rightarrow \mathrm{ b } \tilde{\chi}^{0} _1$. |
png pdf |
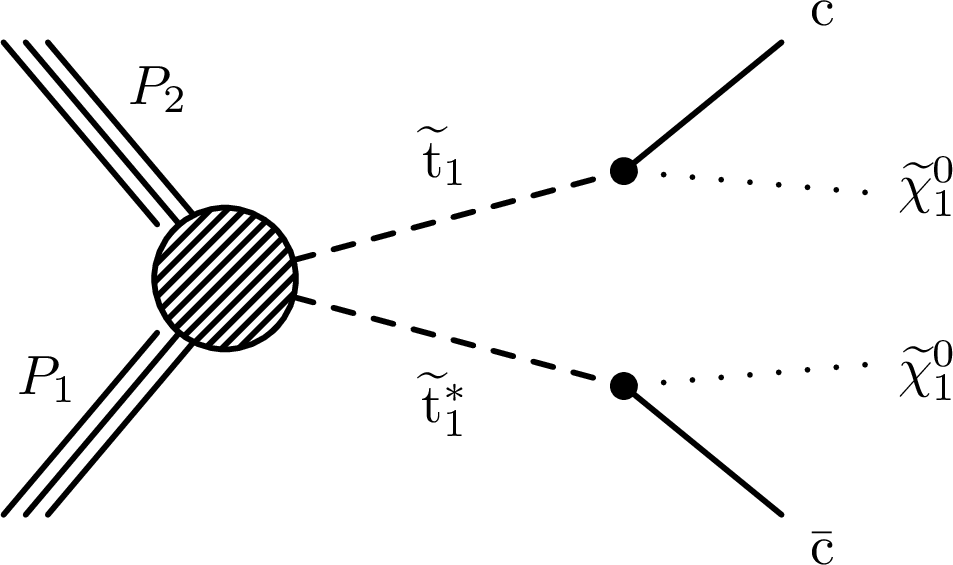
Figure 1-b:
Diagram showing the pair production of top squarks followed by their decays according to $\tilde{ \mathrm{ t } } \rightarrow \tilde{\mathrm{c}} \tilde{\chi}^{0} _1$. |
png pdf |
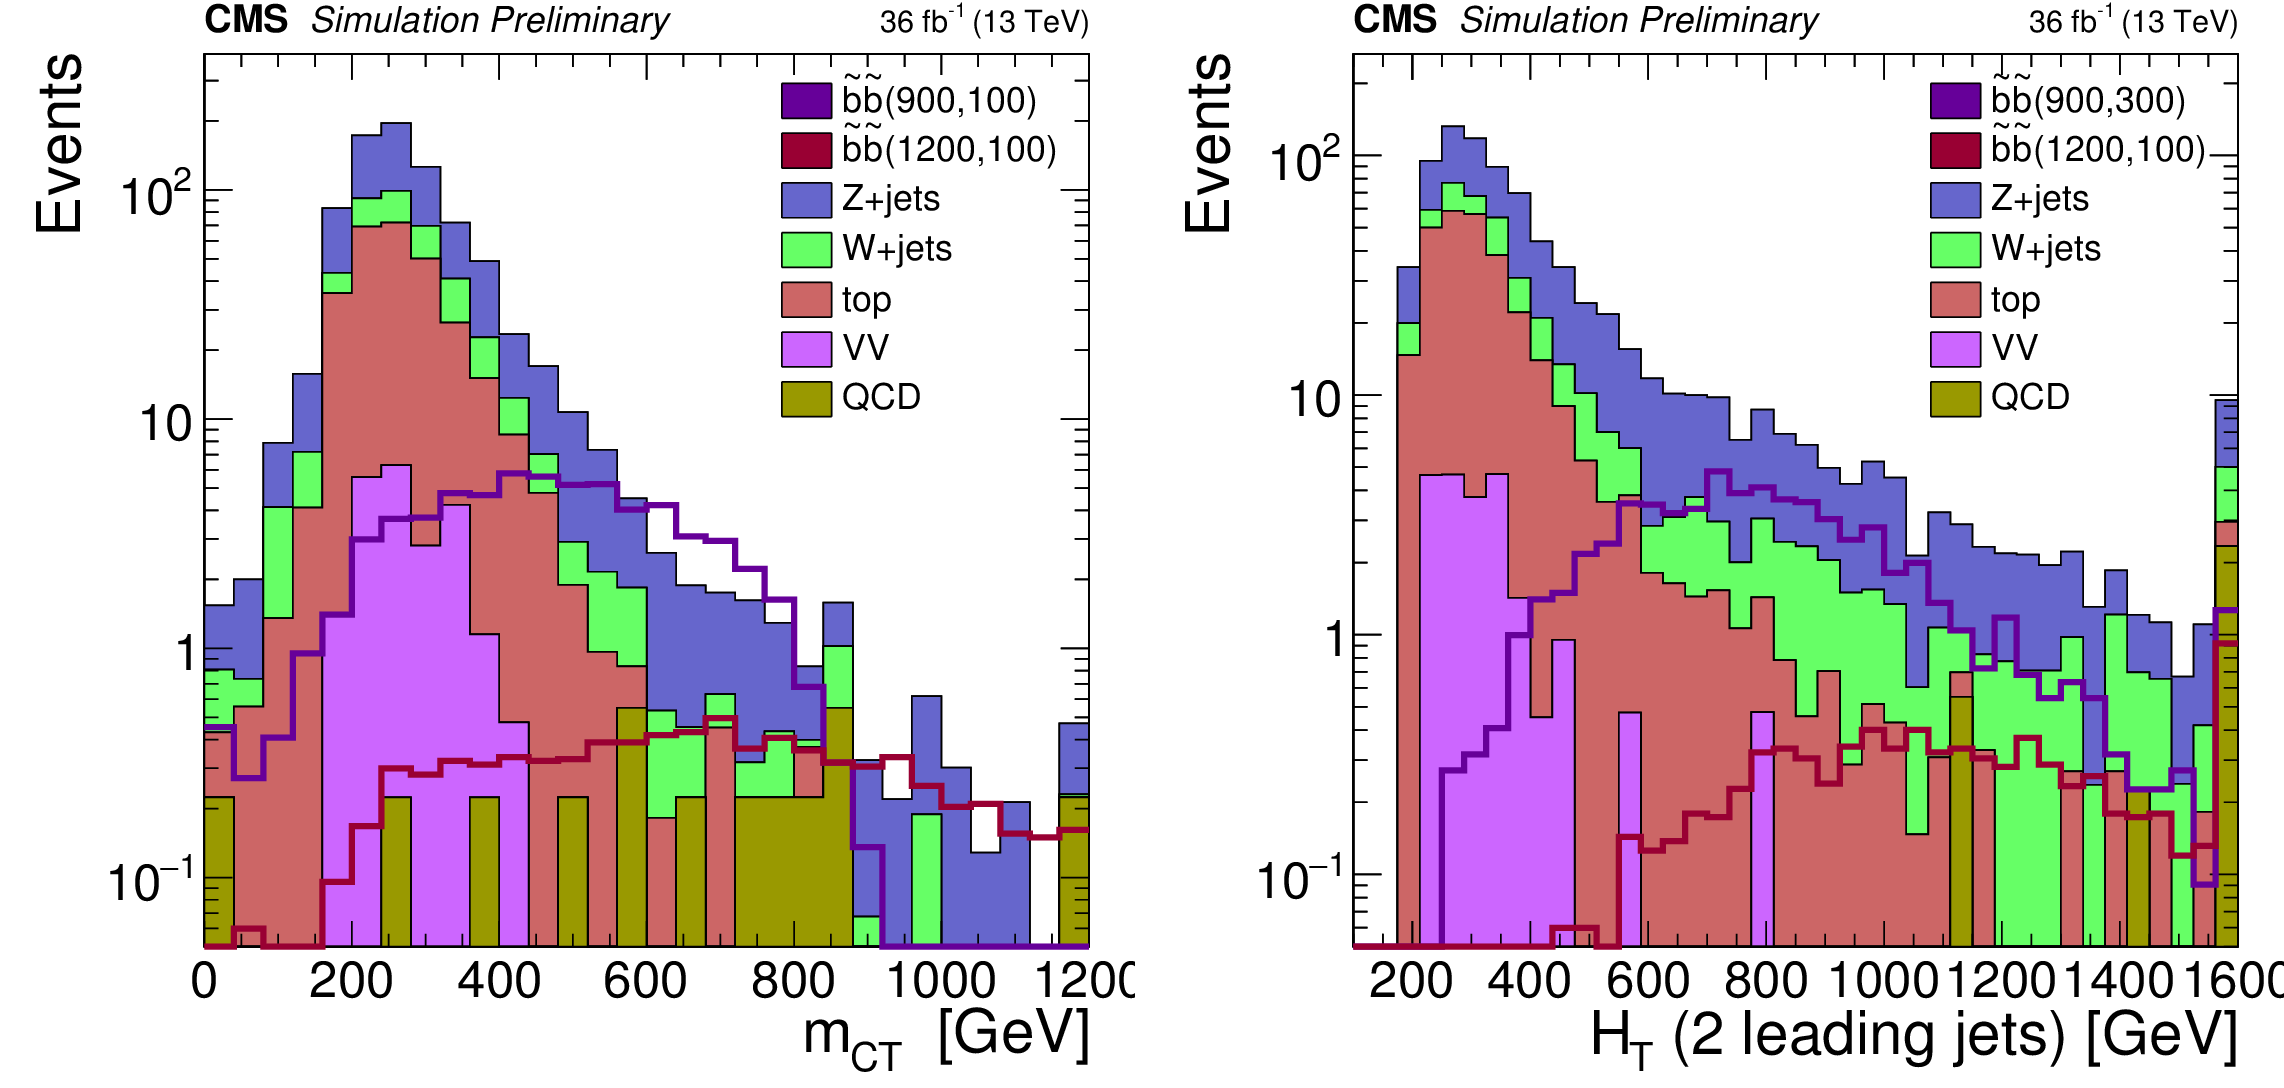
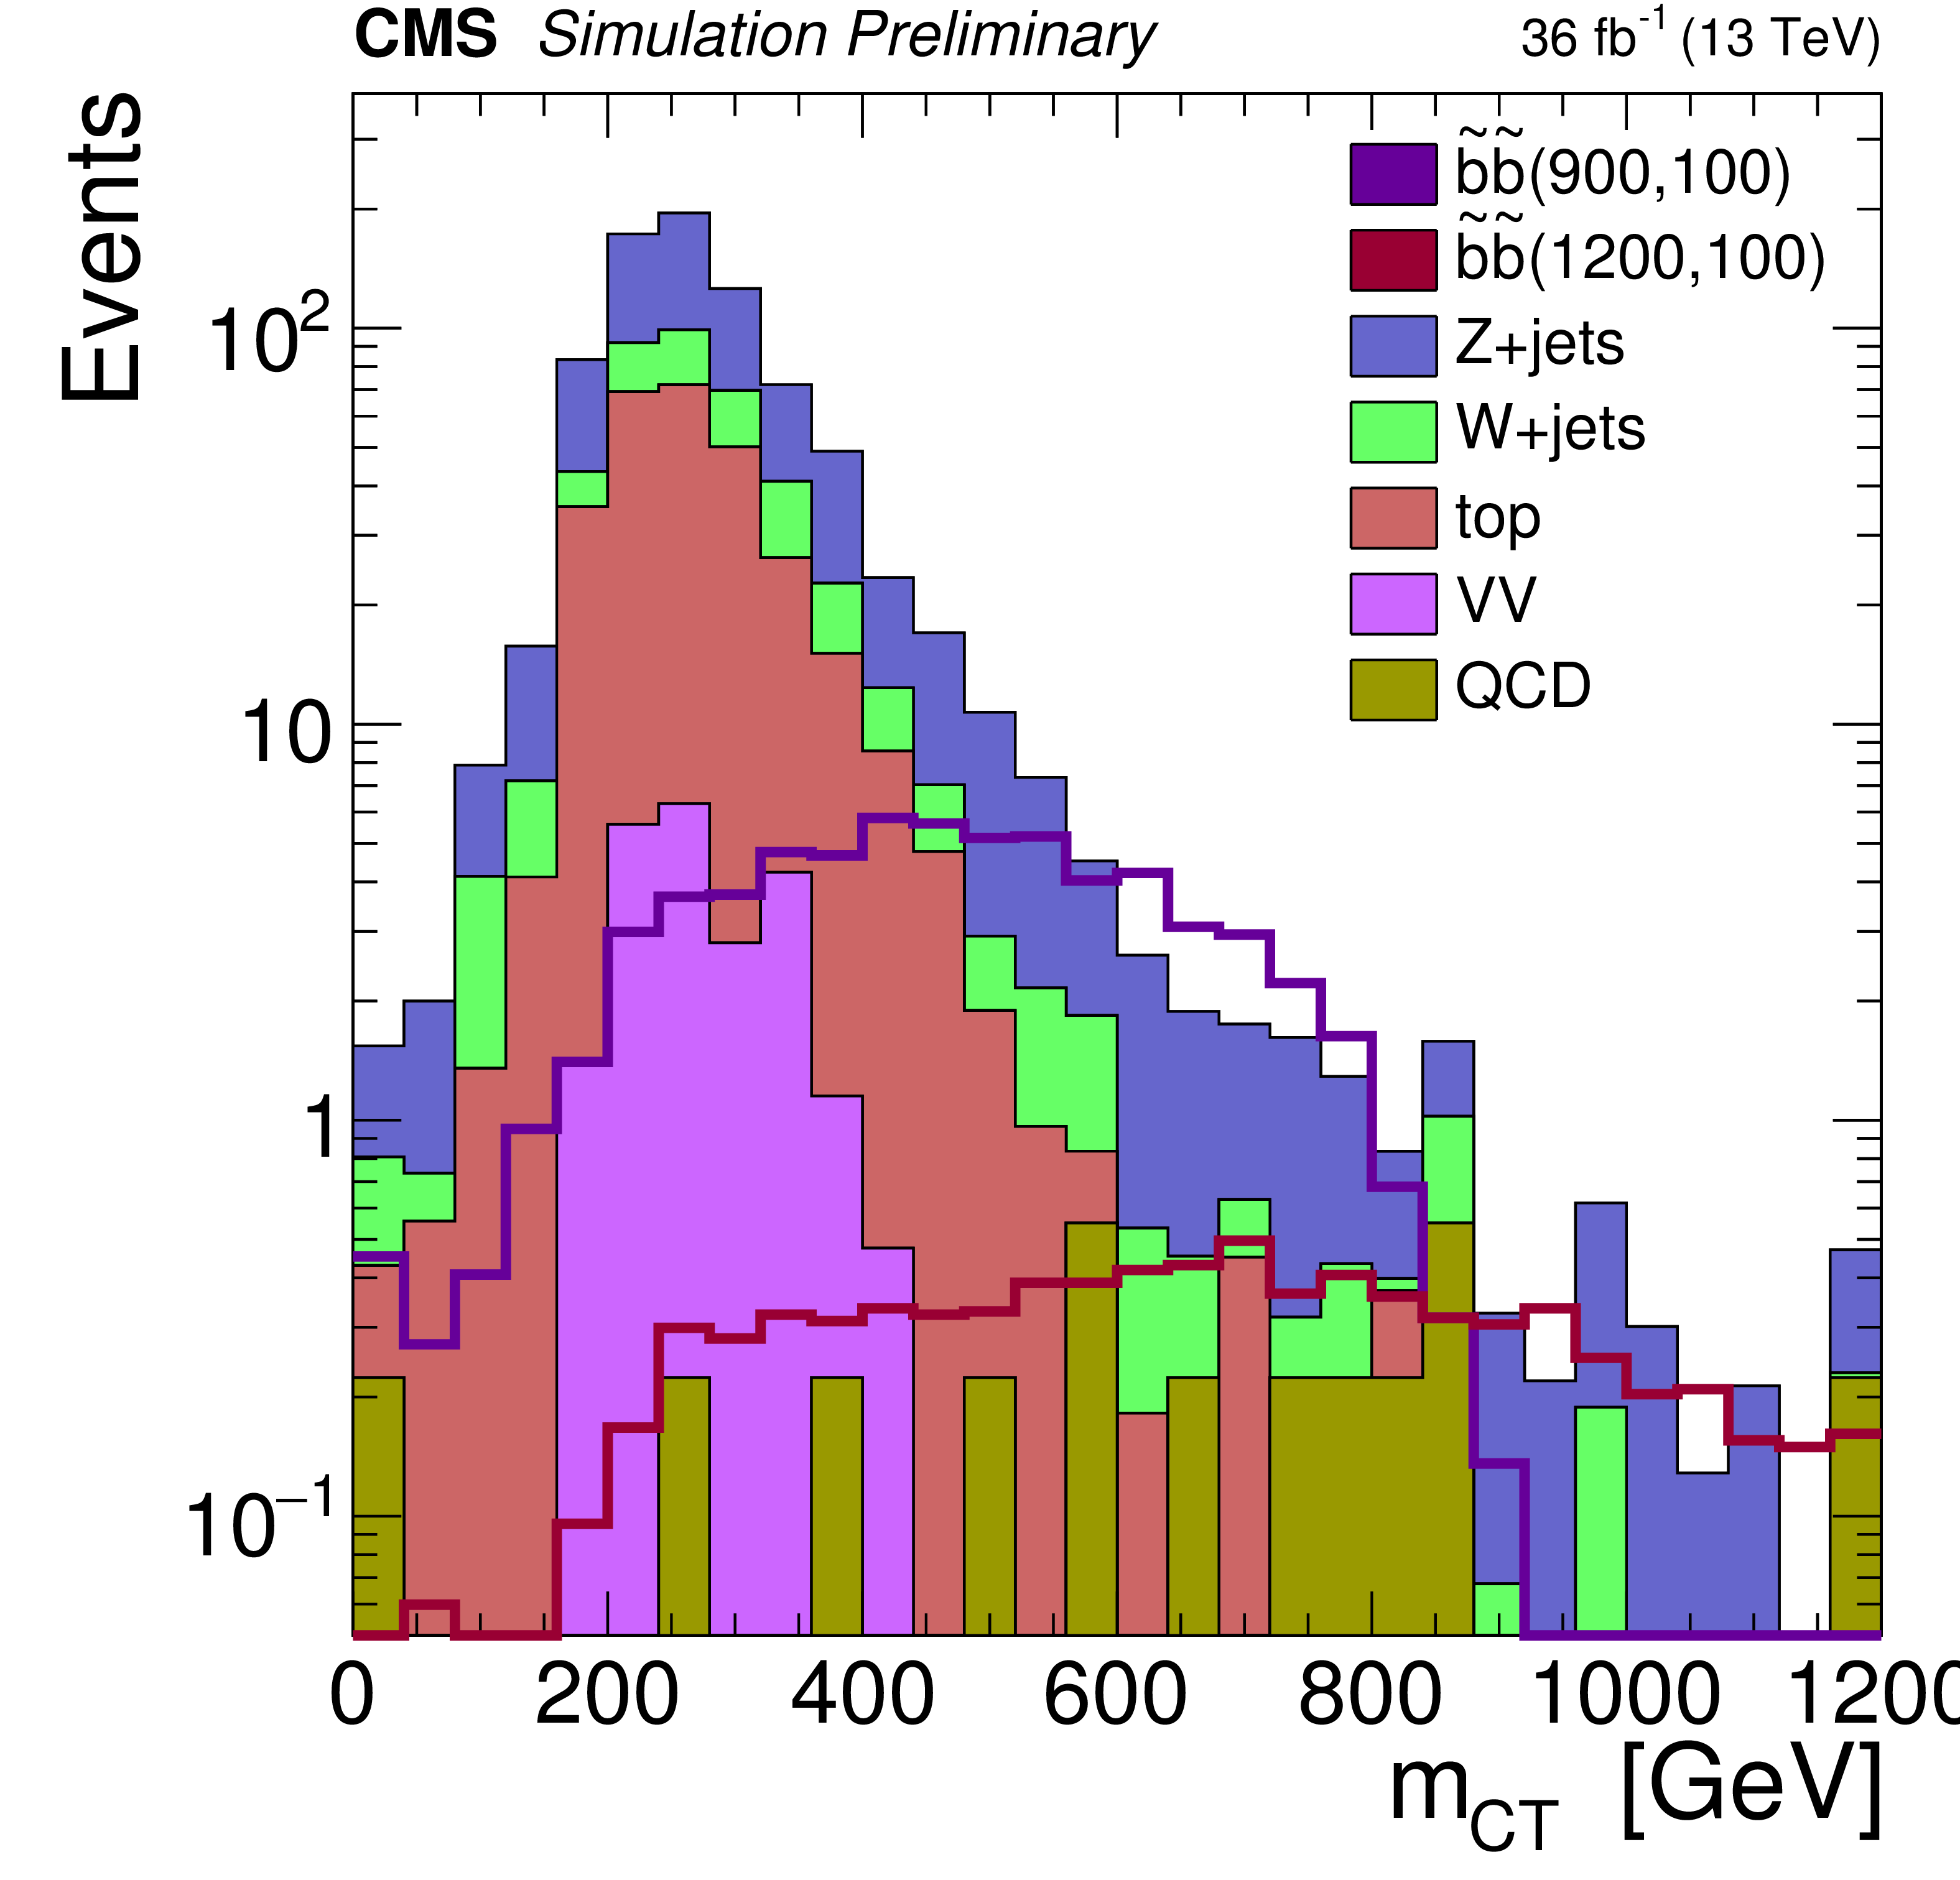
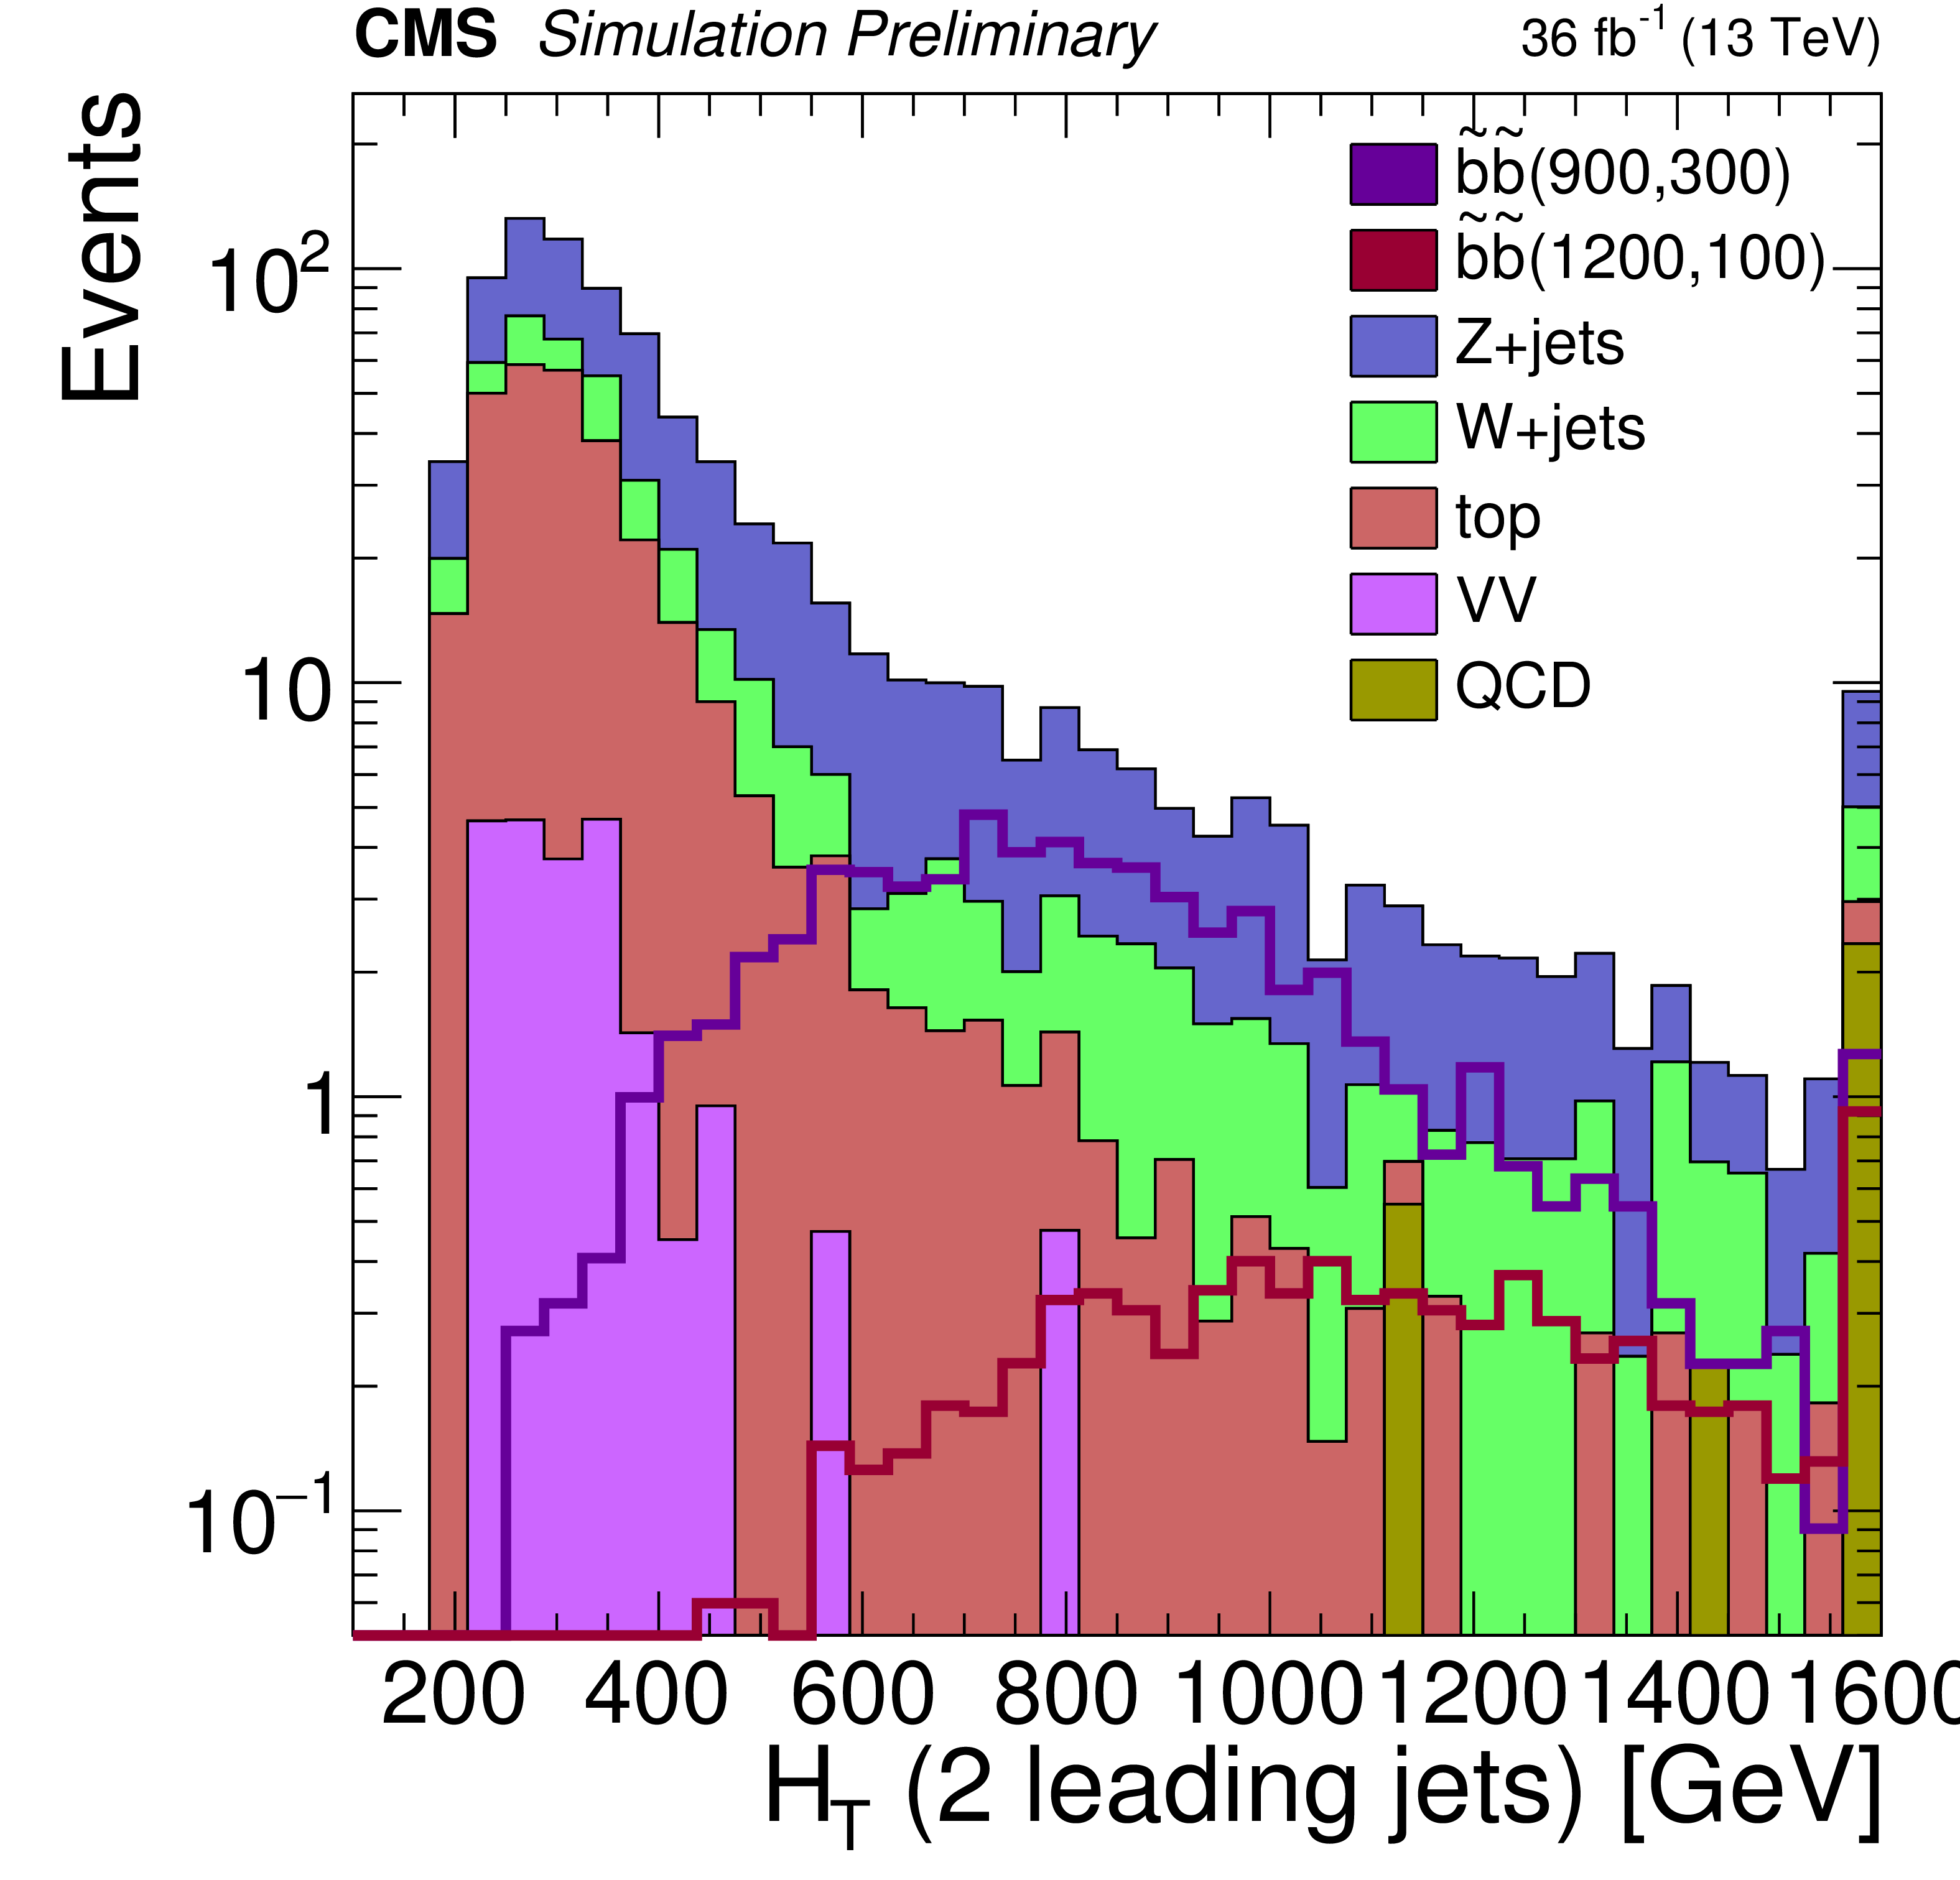
Figure 2:
Distribution of ${m_{\mathrm {CT}}}$ (left) and ${H_{\mathrm {T}}}$ (right) for the search in the non-compressed region as obtained from simulation. The stacked, filled histograms represent different background components while the lines show three different model points for bottom squark production. |
png pdf |
Figure 2-a:
Distribution of ${m_{\mathrm {CT}}}$ for the search in the non-compressed region as obtained from simulation. The stacked, filled histograms represent different background components while the lines show three different model points for bottom squark production. |
png pdf |
Figure 2-b:
Distribution of ${H_{\mathrm {T}}}$ for the search in the non-compressed region as obtained from simulation. The stacked, filled histograms represent different background components while the lines show three different model points for bottom squark production. |
png pdf |
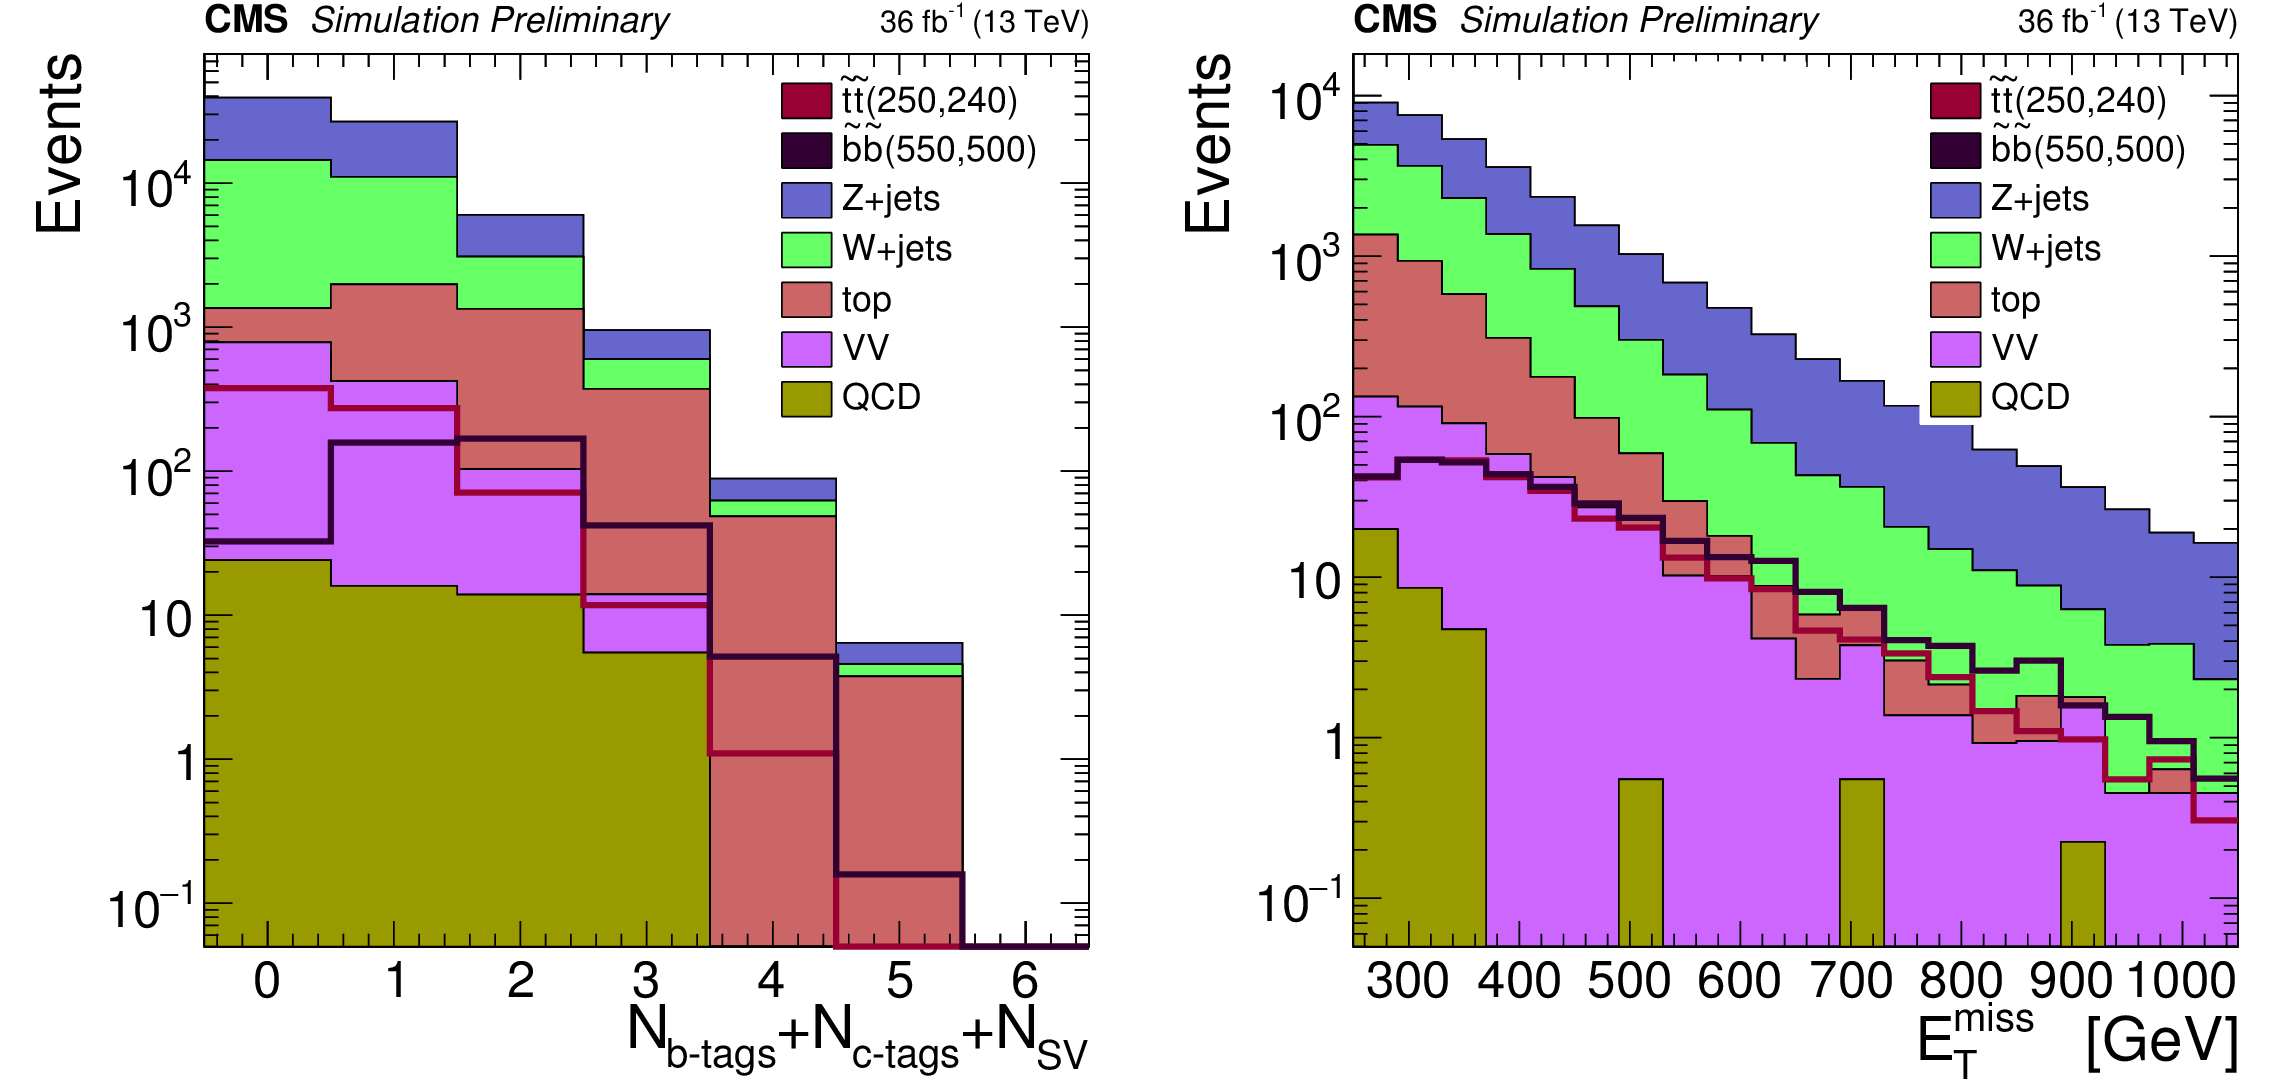
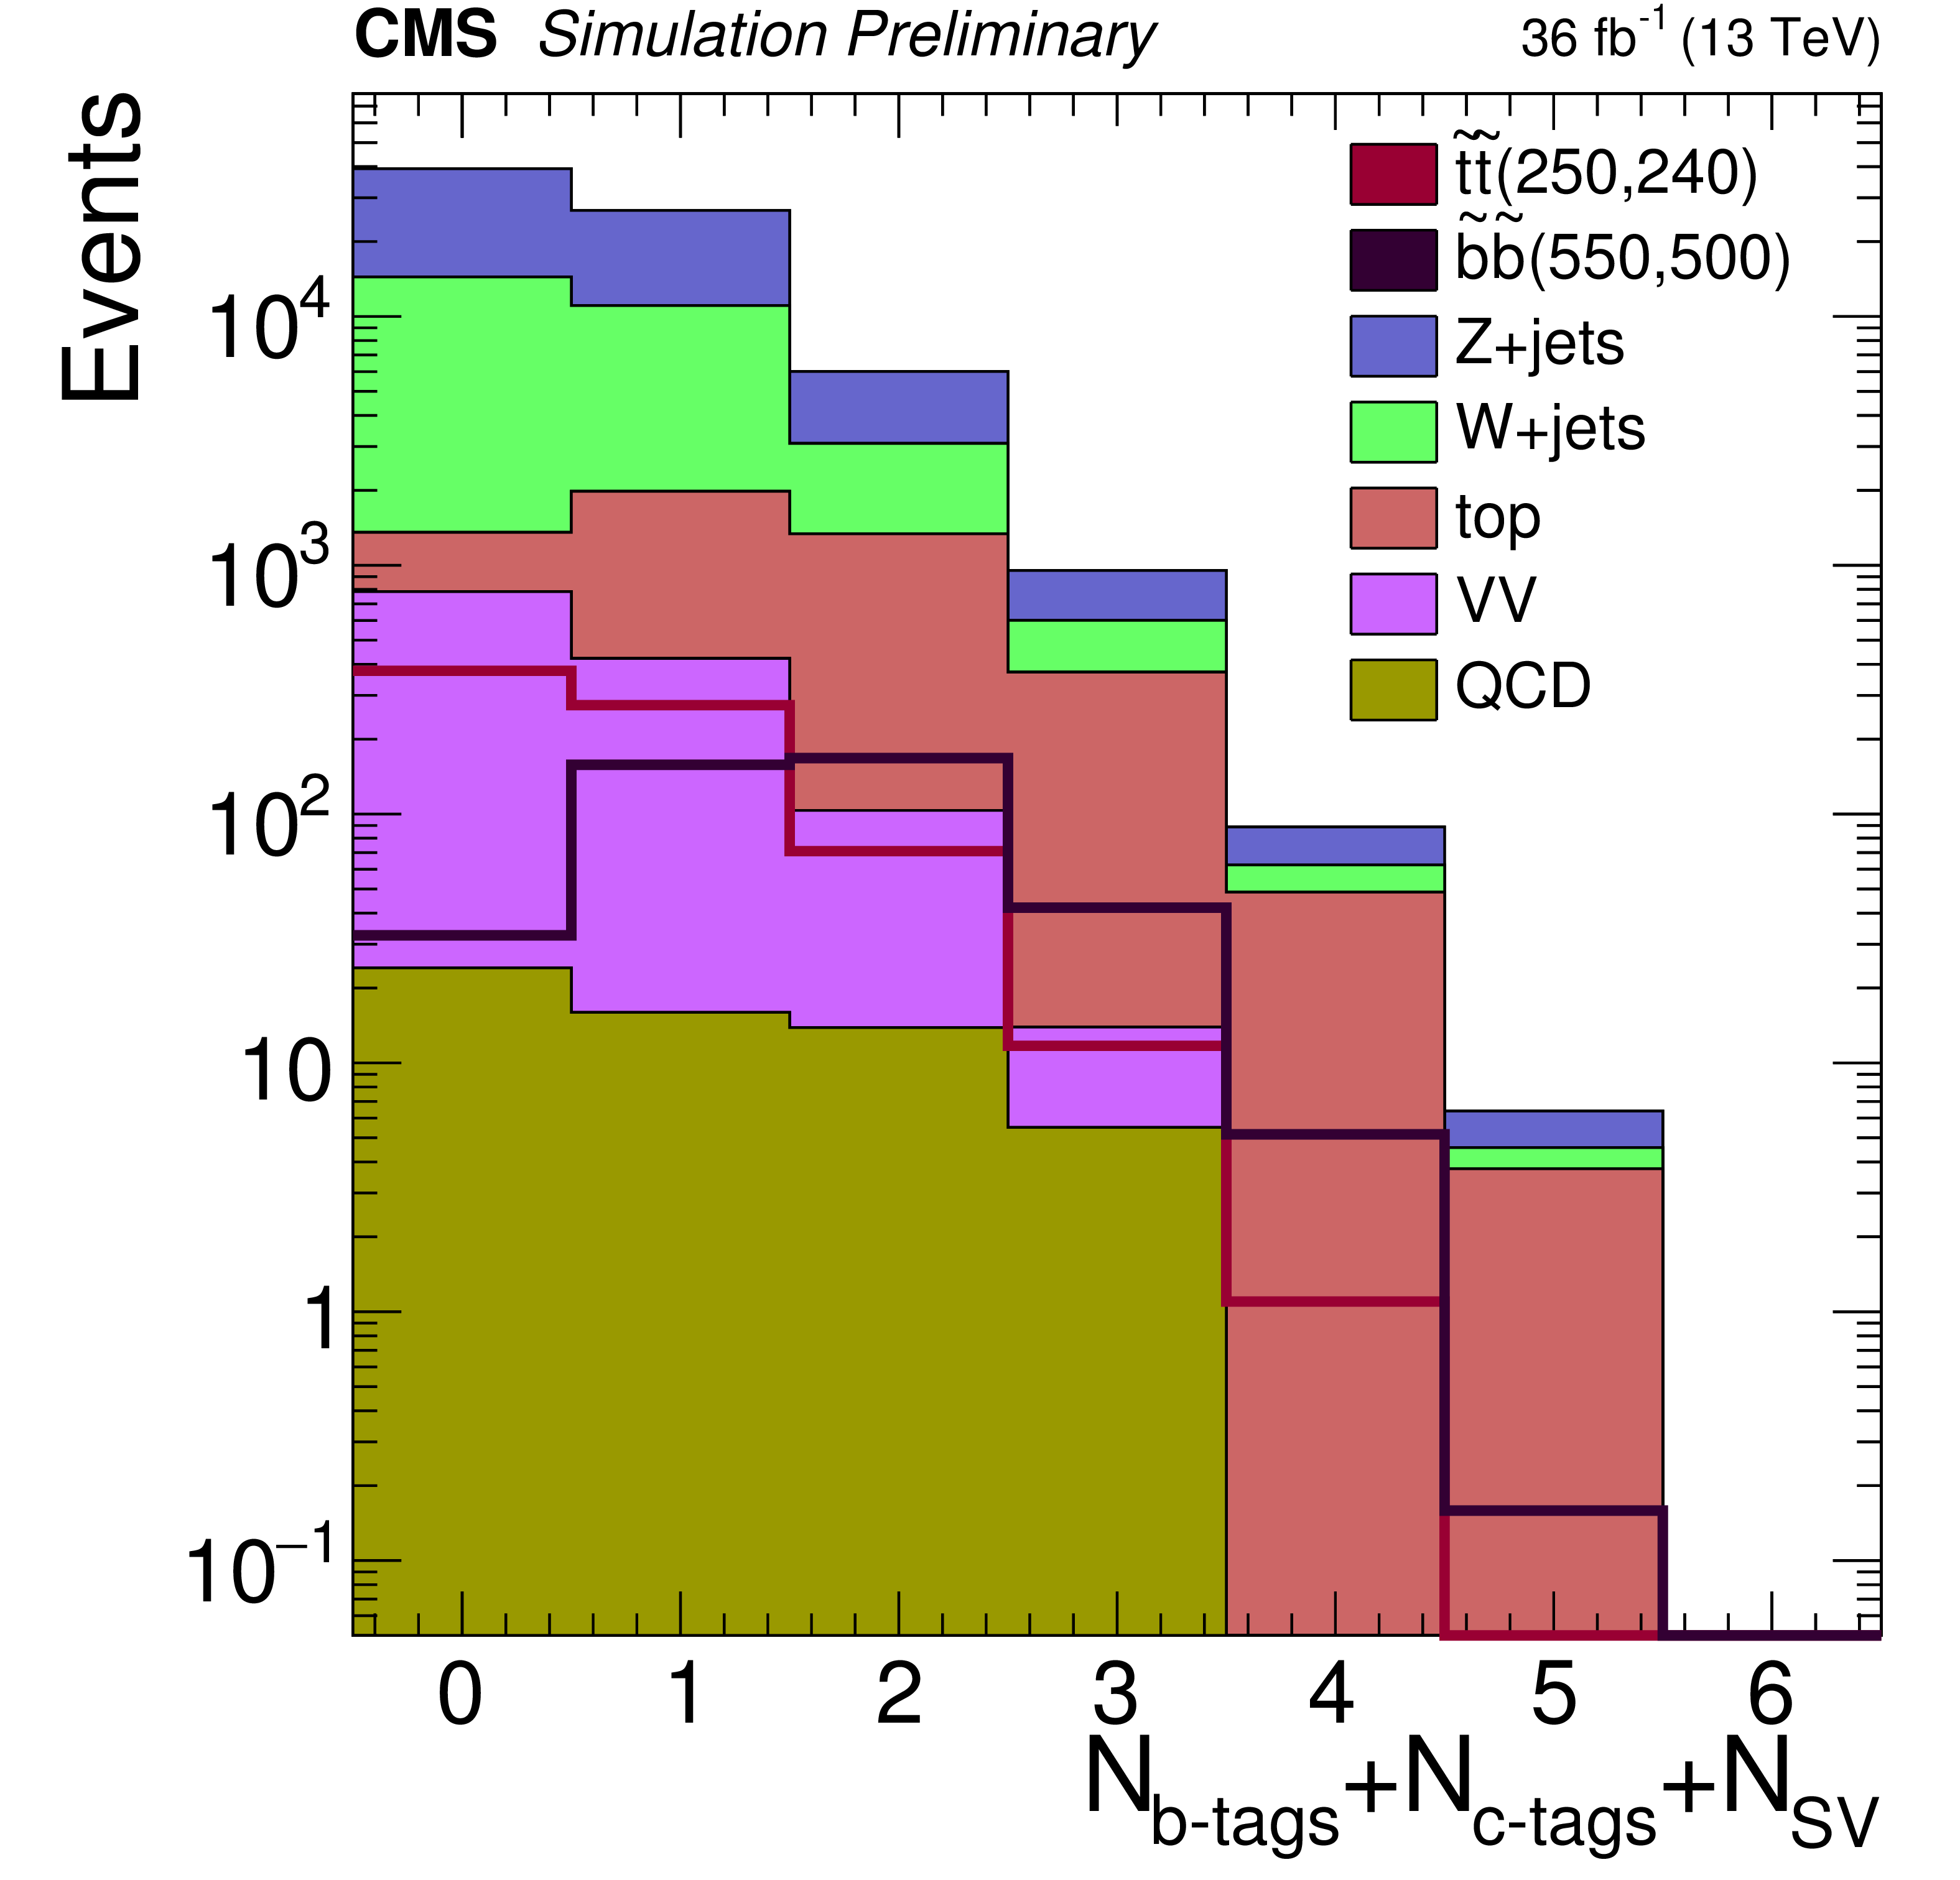
Figure 3:
Distributions of the combined b-, c-tagged jet, and SV multiplicity (left), and ${E_{ \mathrm {T}}^{ \mathrm {miss}}}$ for events with at least one b- or c-tagged jet (right) after the baseline selection for the compressed region as obtained from simulation. The stacked, filled histograms represent different background components while the lines show three different model points for bottom squark production. |
png pdf |
Figure 3-a:
Distributions of the combined b-, c-tagged jet, and SV multiplicity after the baseline selection for the compressed region as obtained from simulation. The stacked, filled histograms represent different background components while the lines show three different model points for bottom squark production. |
png pdf |
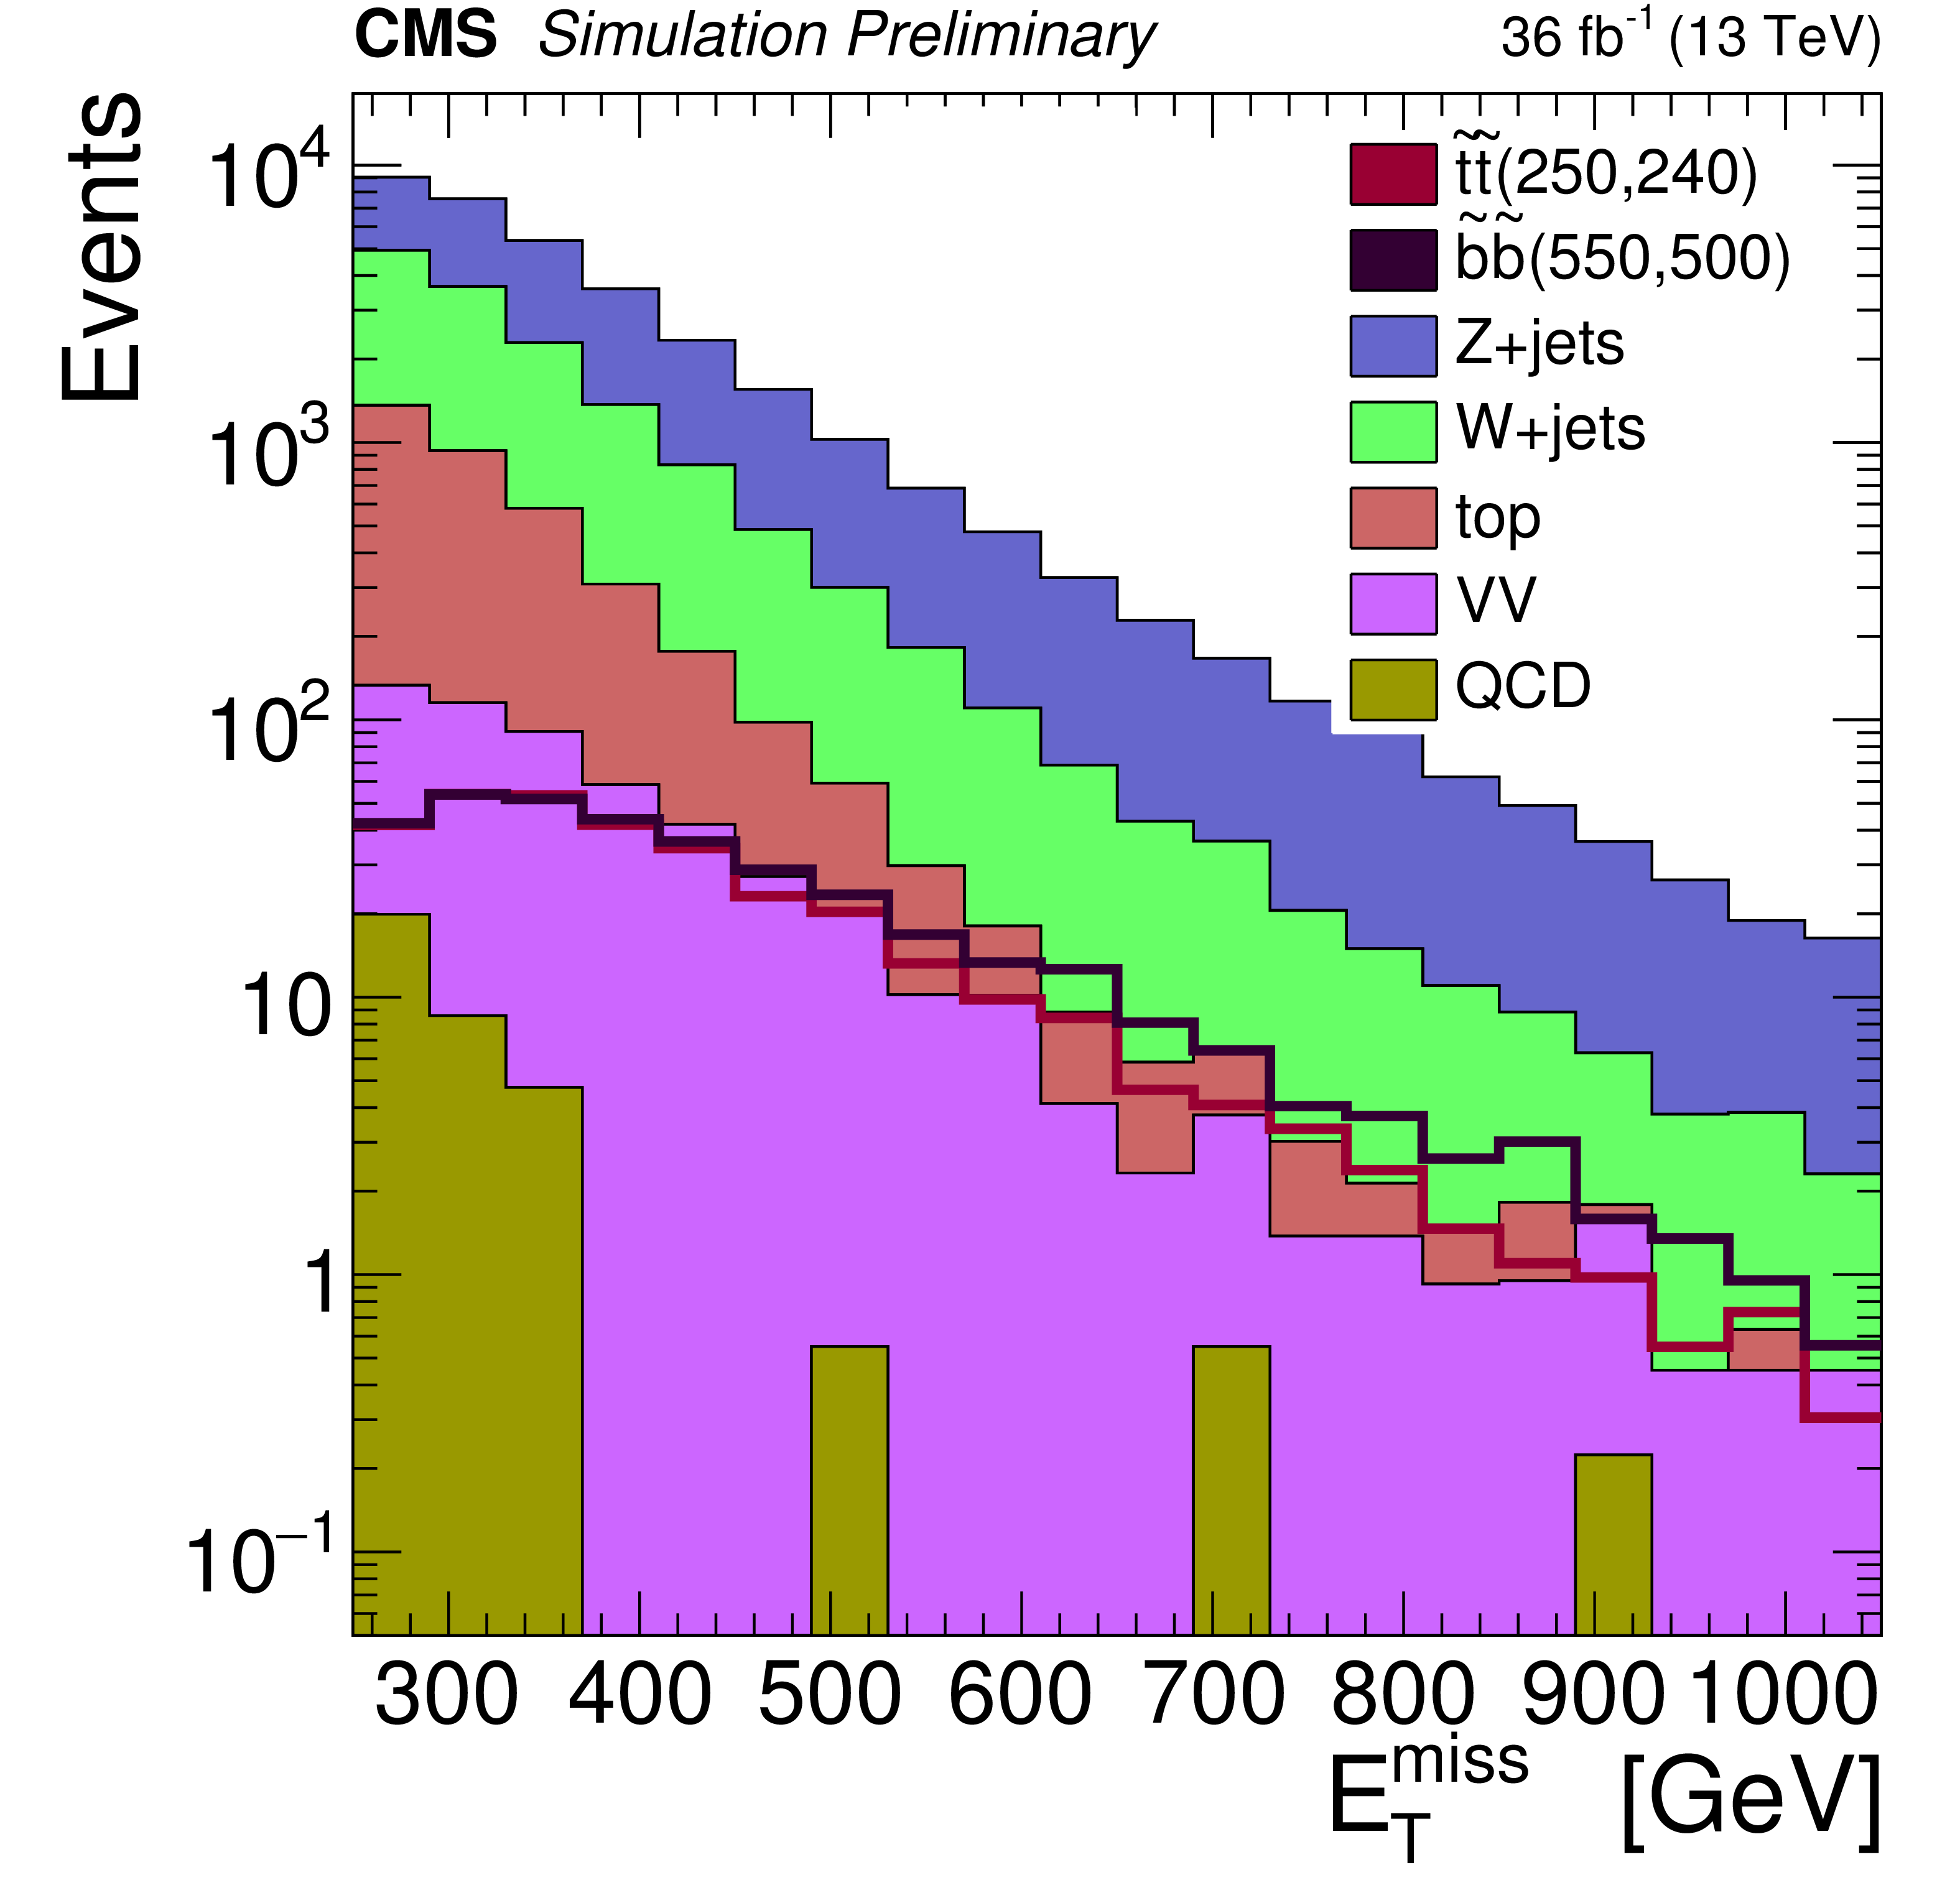
Figure 3-b:
Distributions of ${E_{ \mathrm {T}}^{ \mathrm {miss}}}$ for events with at least one b- or c-tagged jet after the baseline selection for the compressed region as obtained from simulation. The stacked, filled histograms represent different background components while the lines show three different model points for bottom squark production. |
png pdf |
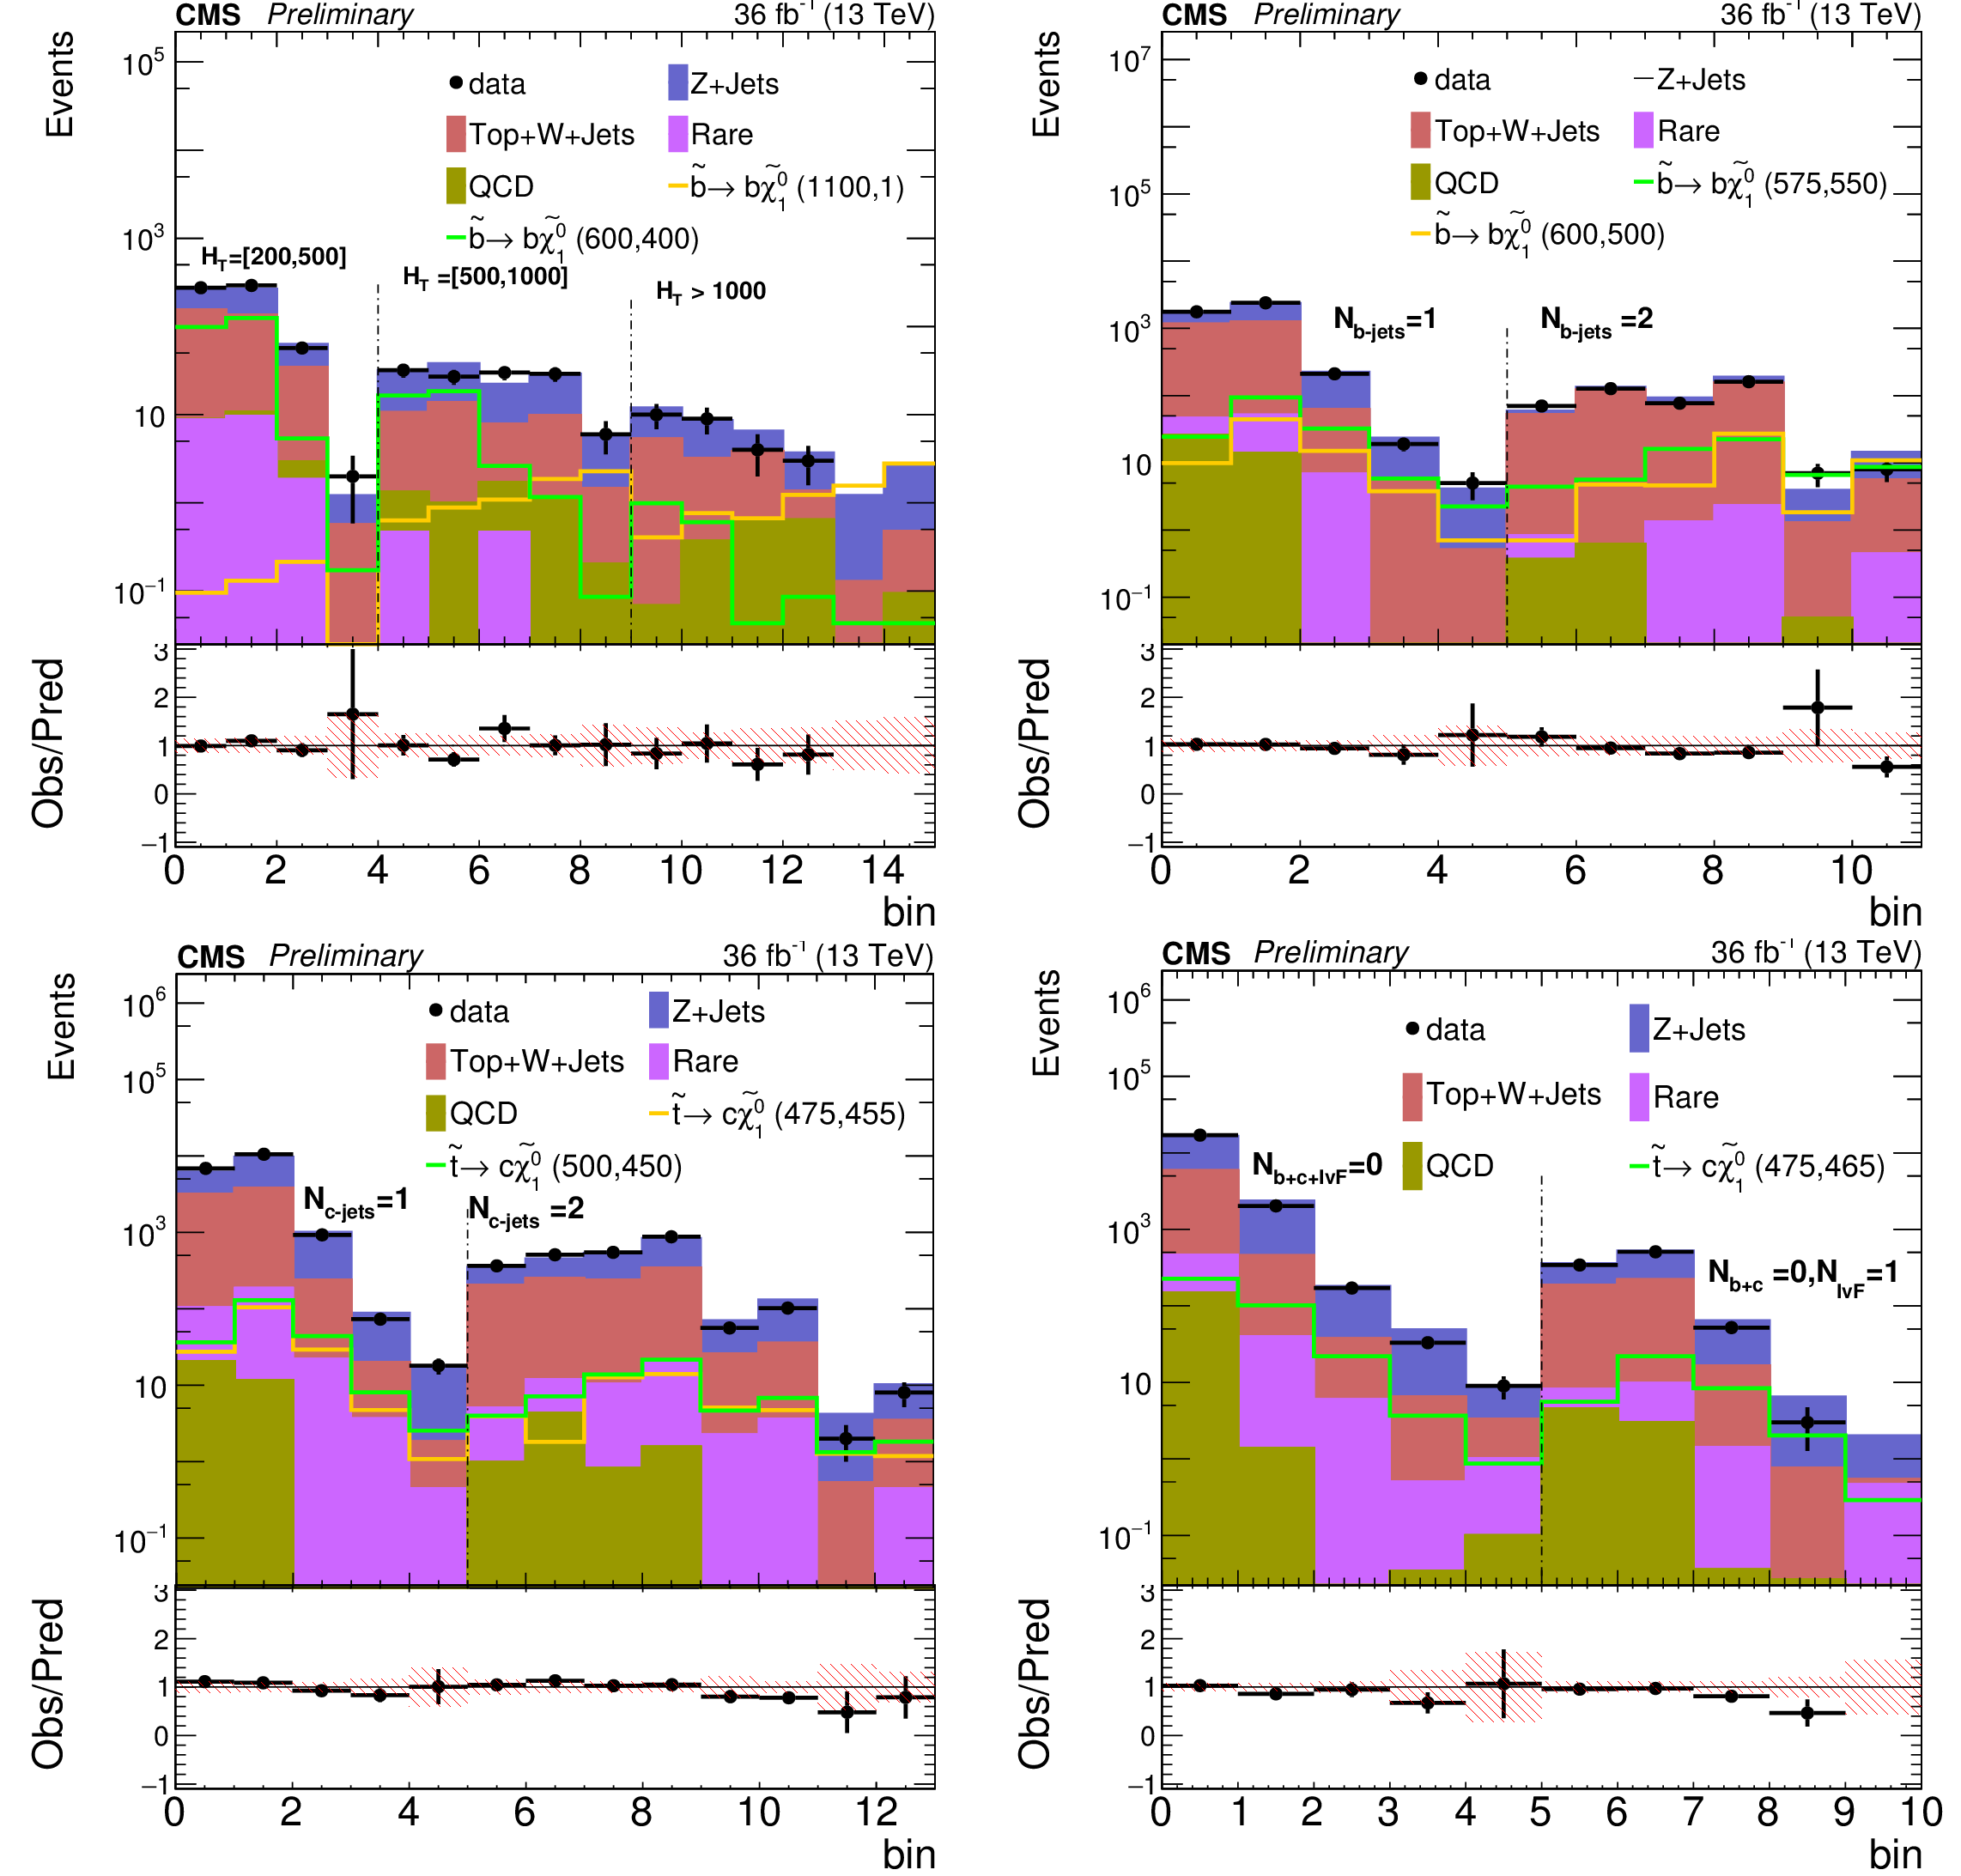
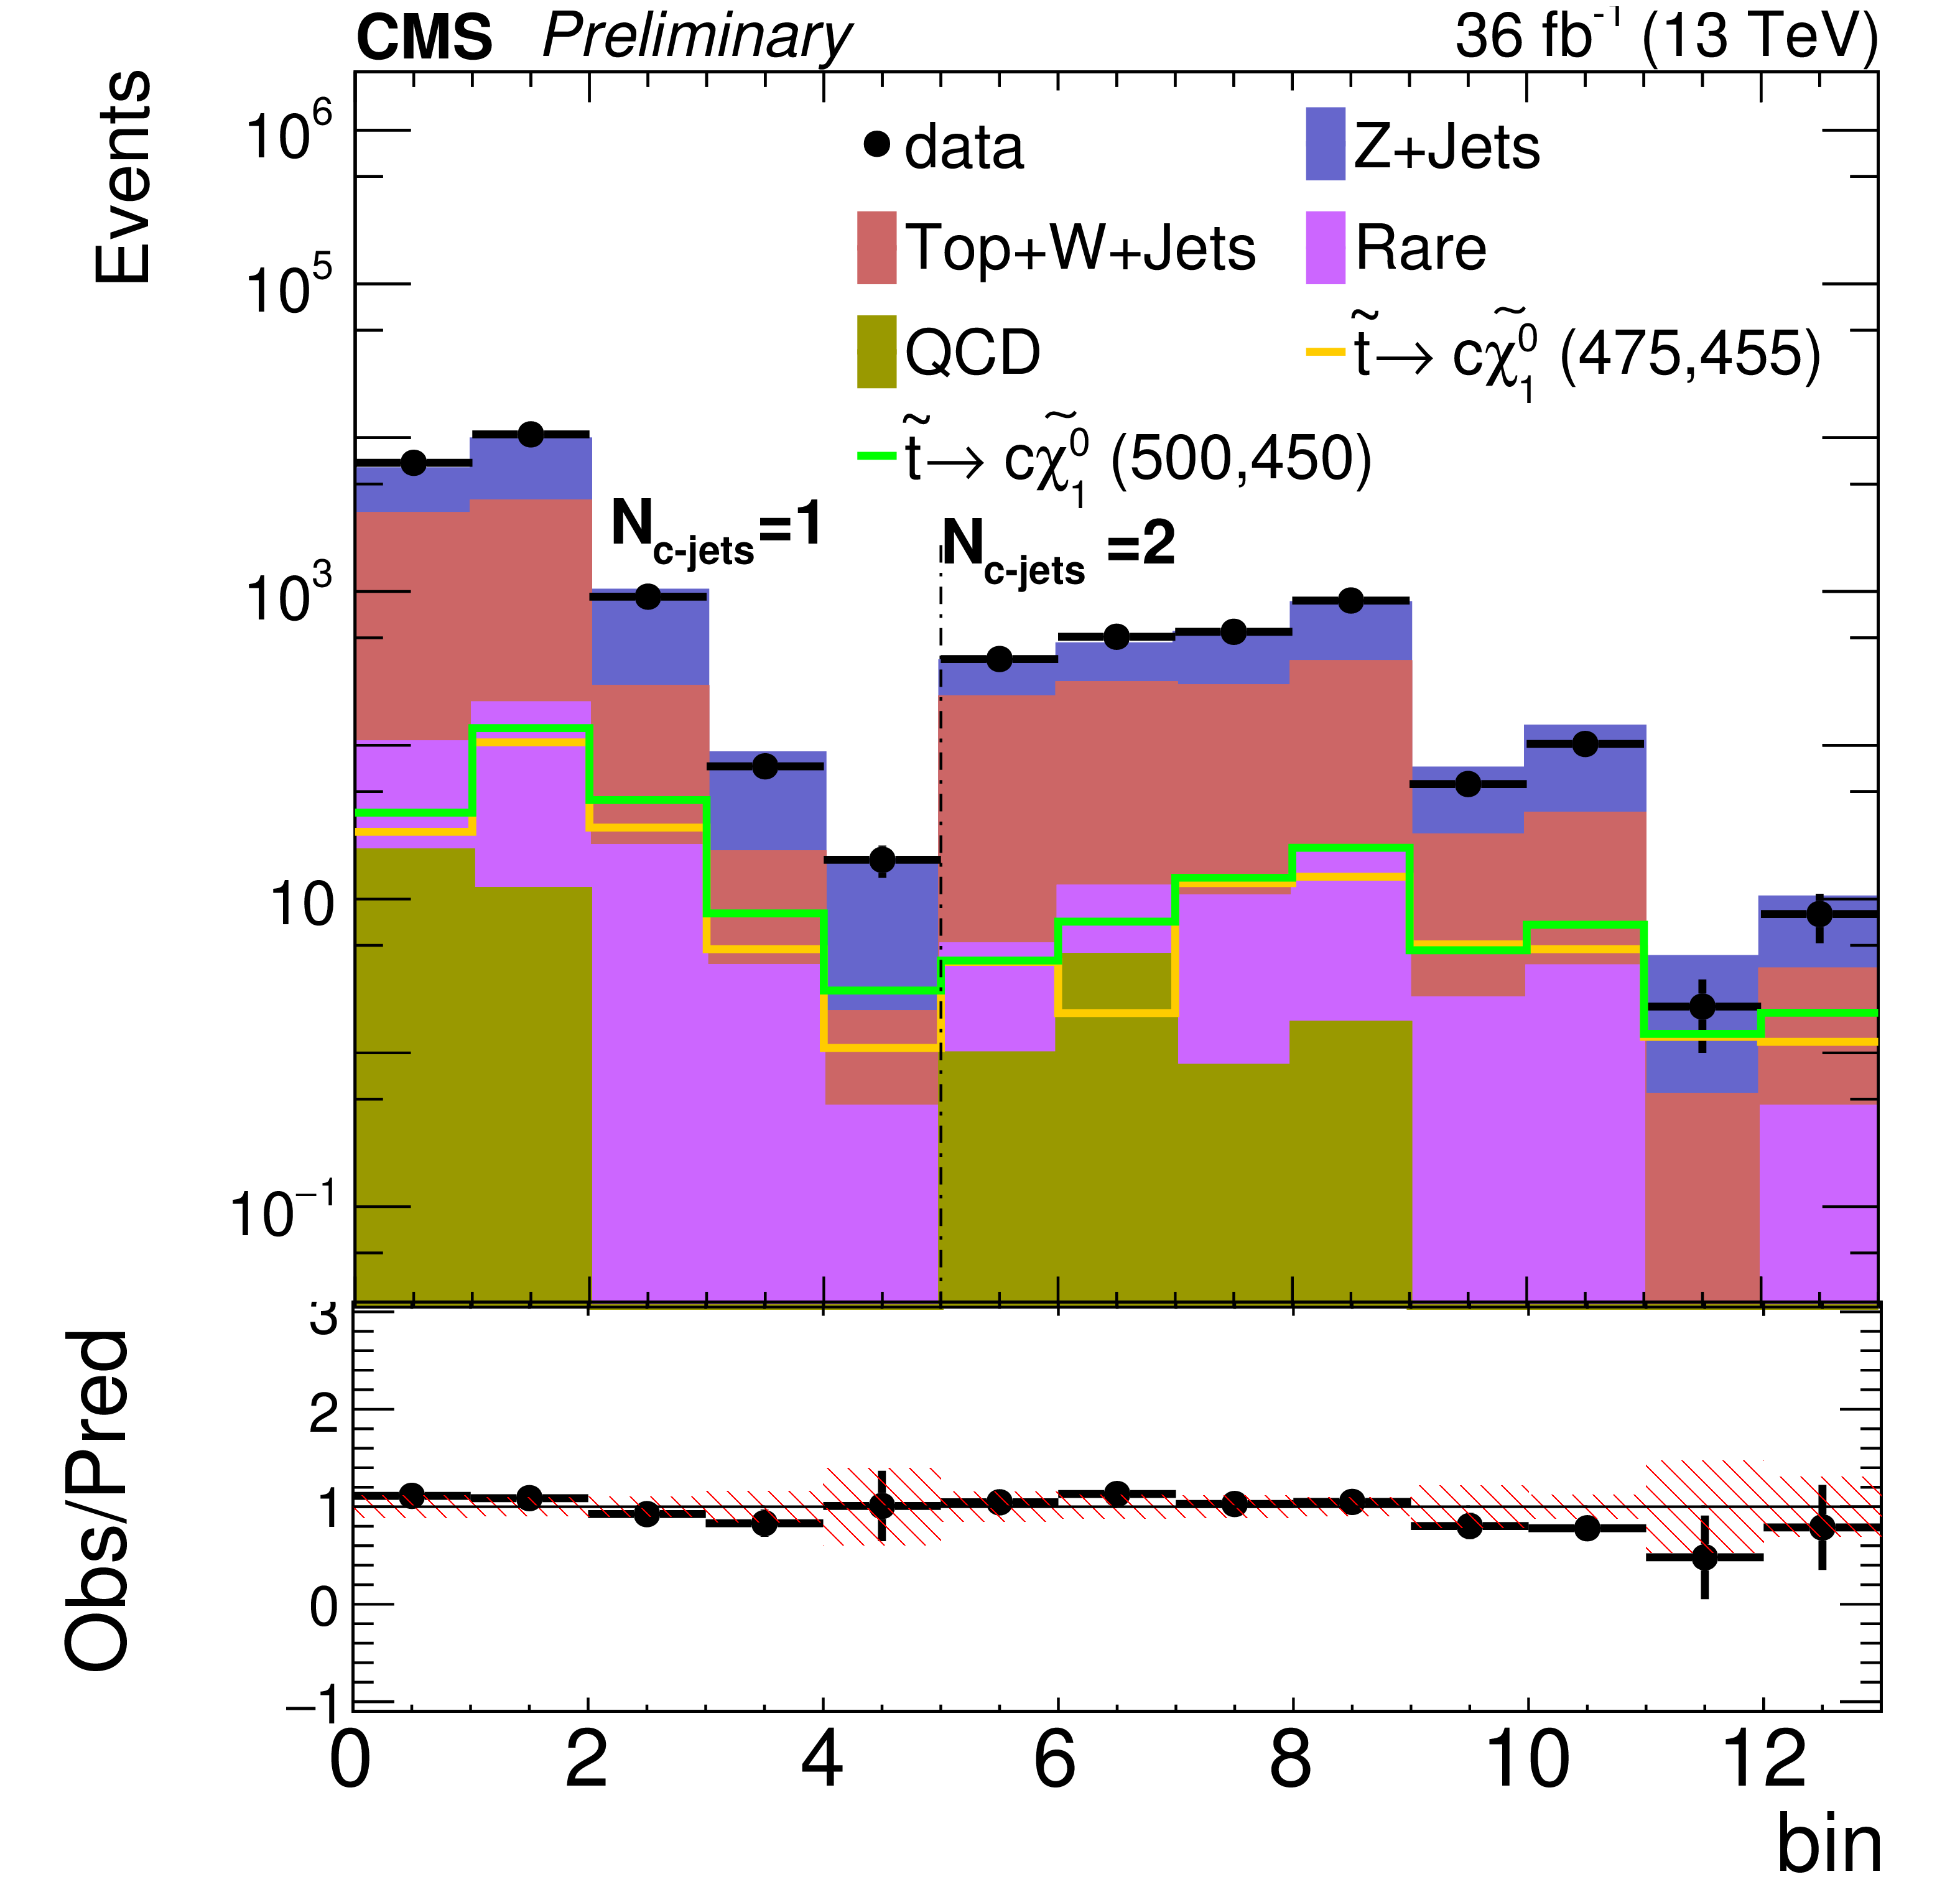
Figure 4:
Yields in the signal regions targeting the non-compressed (top left) and compressed (top right: ${N_{\mathrm {b-tags}}} =$ 1, 2, bottom left: ${N_{\mathrm {c-tags}}} = $ 1, 2, bottom right: ${N_{\mathrm {b-tags}}} + {N_{\mathrm {c-tags}}} =$ 0) scenarios. Data are shown as black points. The background predictions are represented by the stacked, filled histograms. The expected yields for two signal models are also shown. The lower panels show the ratio of data over total background prediction in each signal region. |
png pdf |
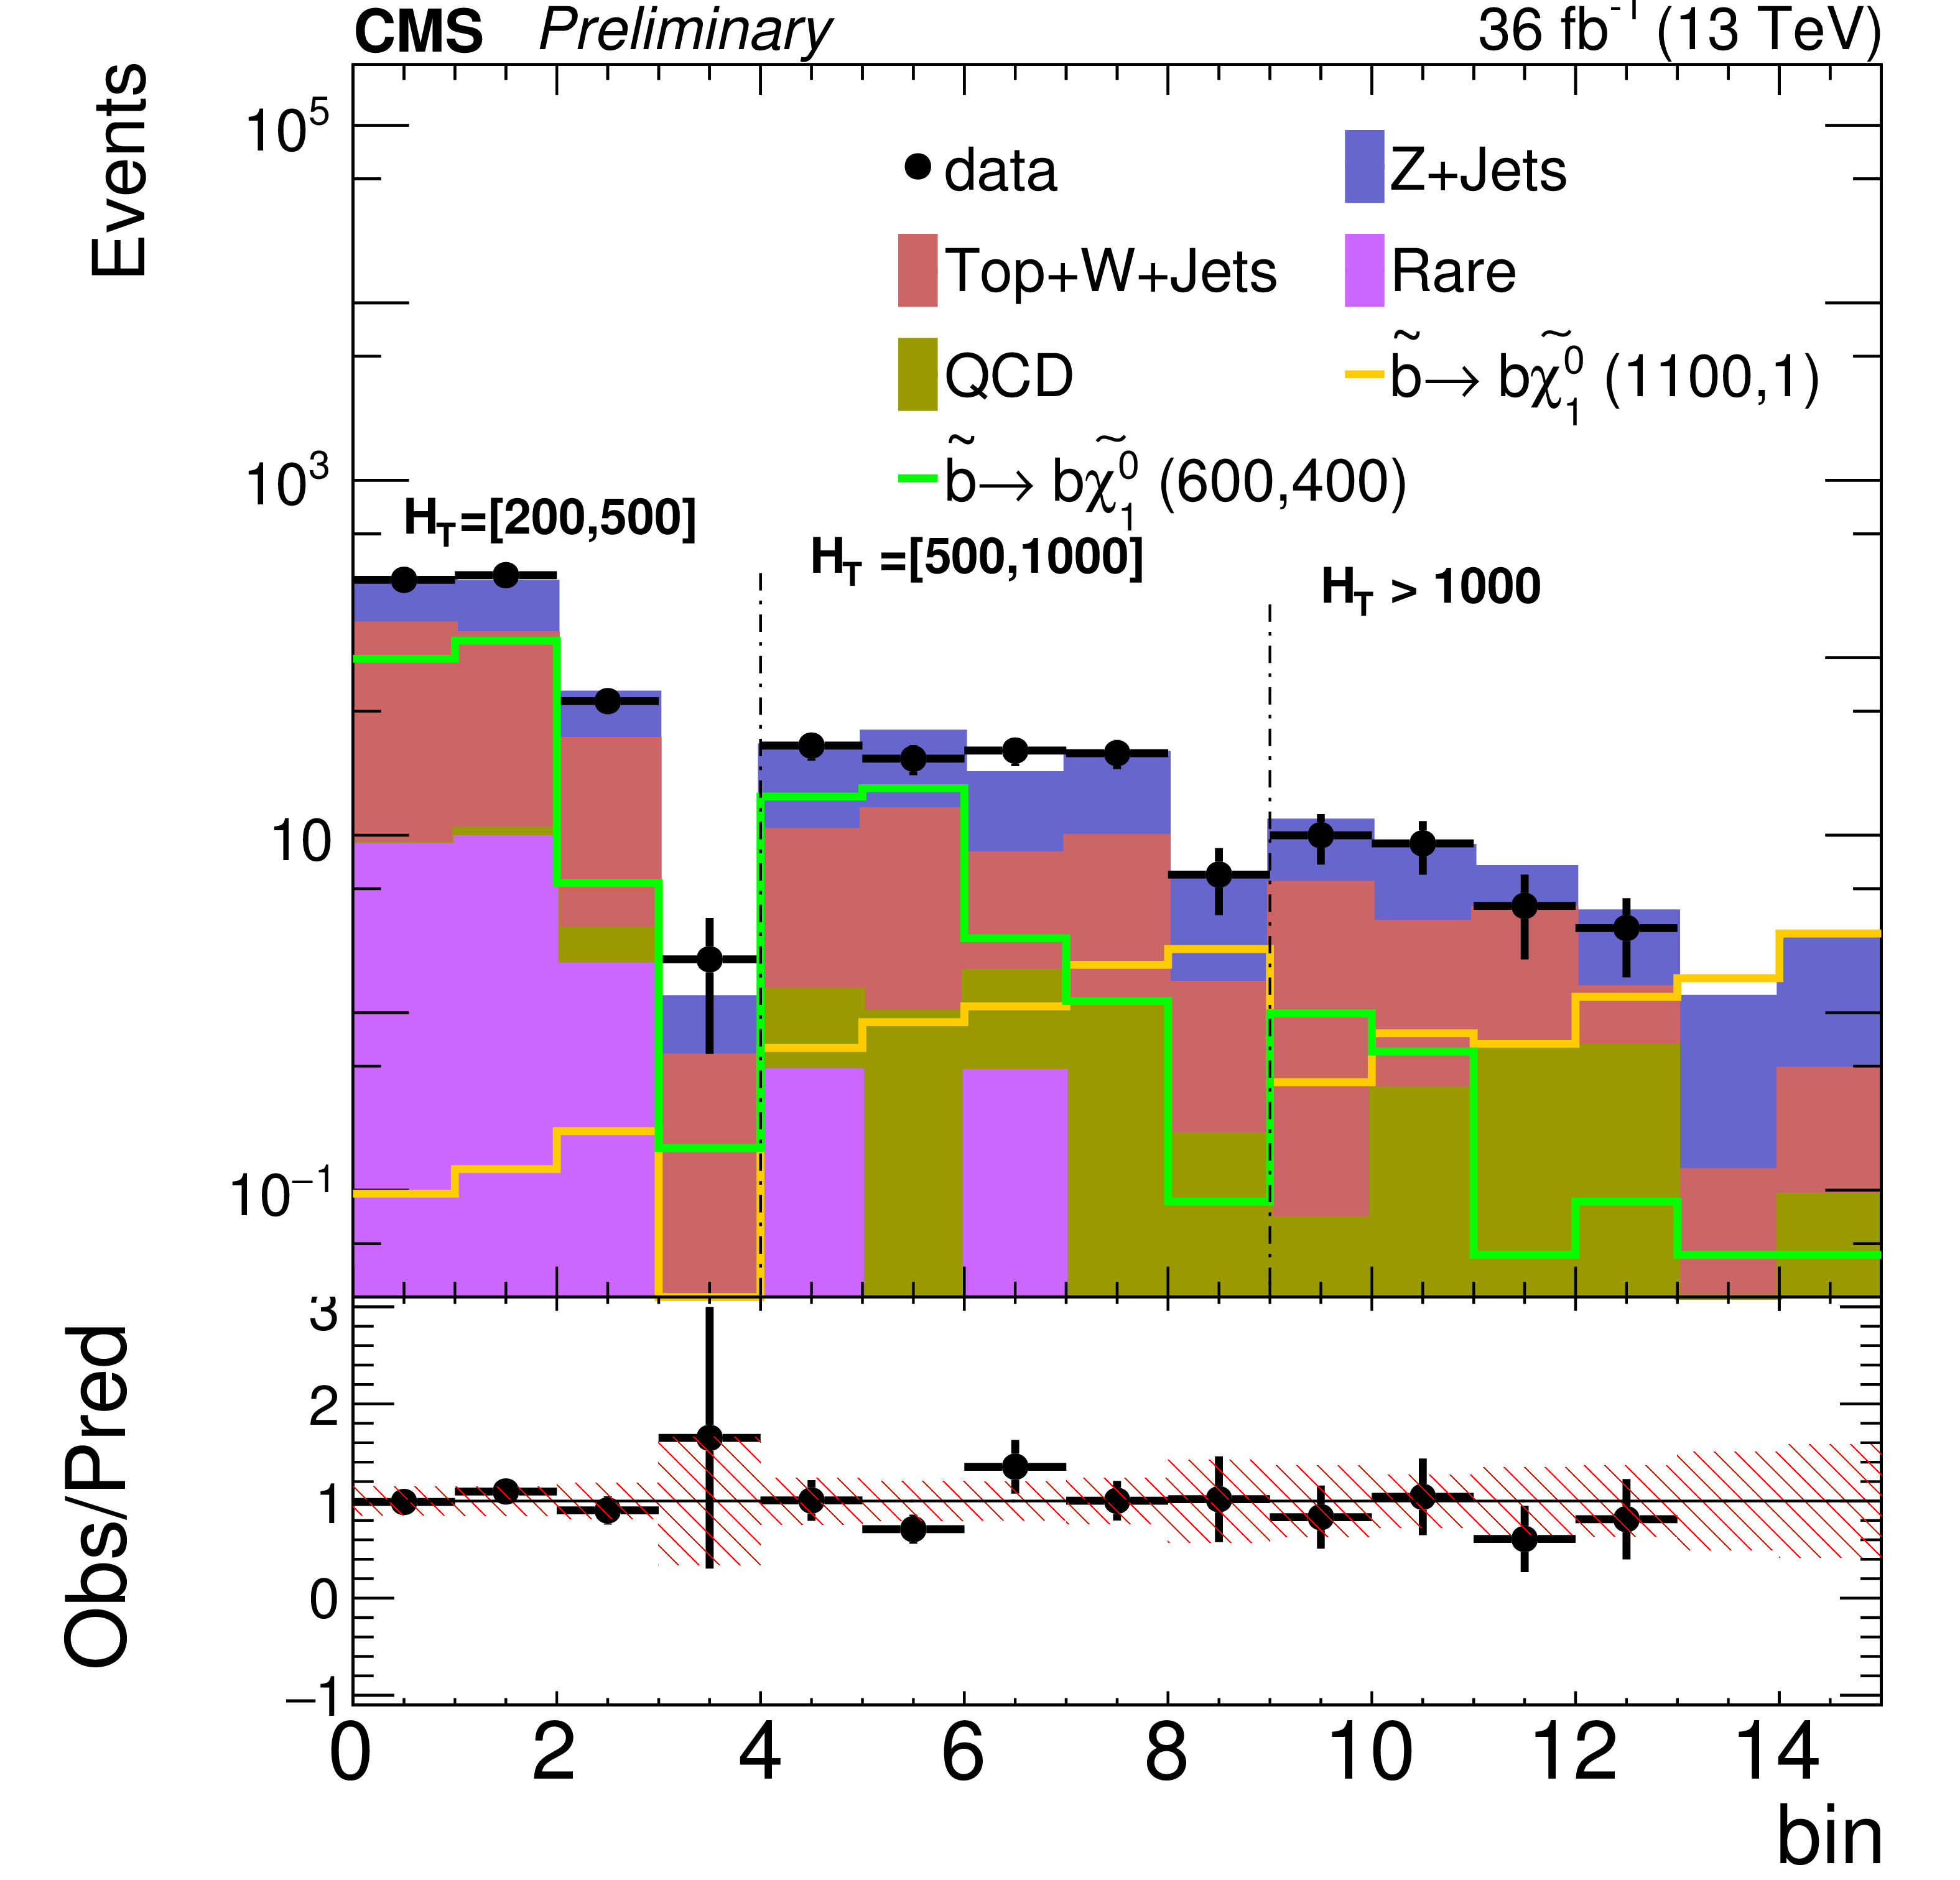
Figure 4-a:
Yields in the signal region targeting the non-compressed scenario. Data are shown as black points. The background predictions are represented by the stacked, filled histograms. The expected yields for two signal models are also shown. The lower panel shows the ratio of data over total background prediction. |
png pdf |
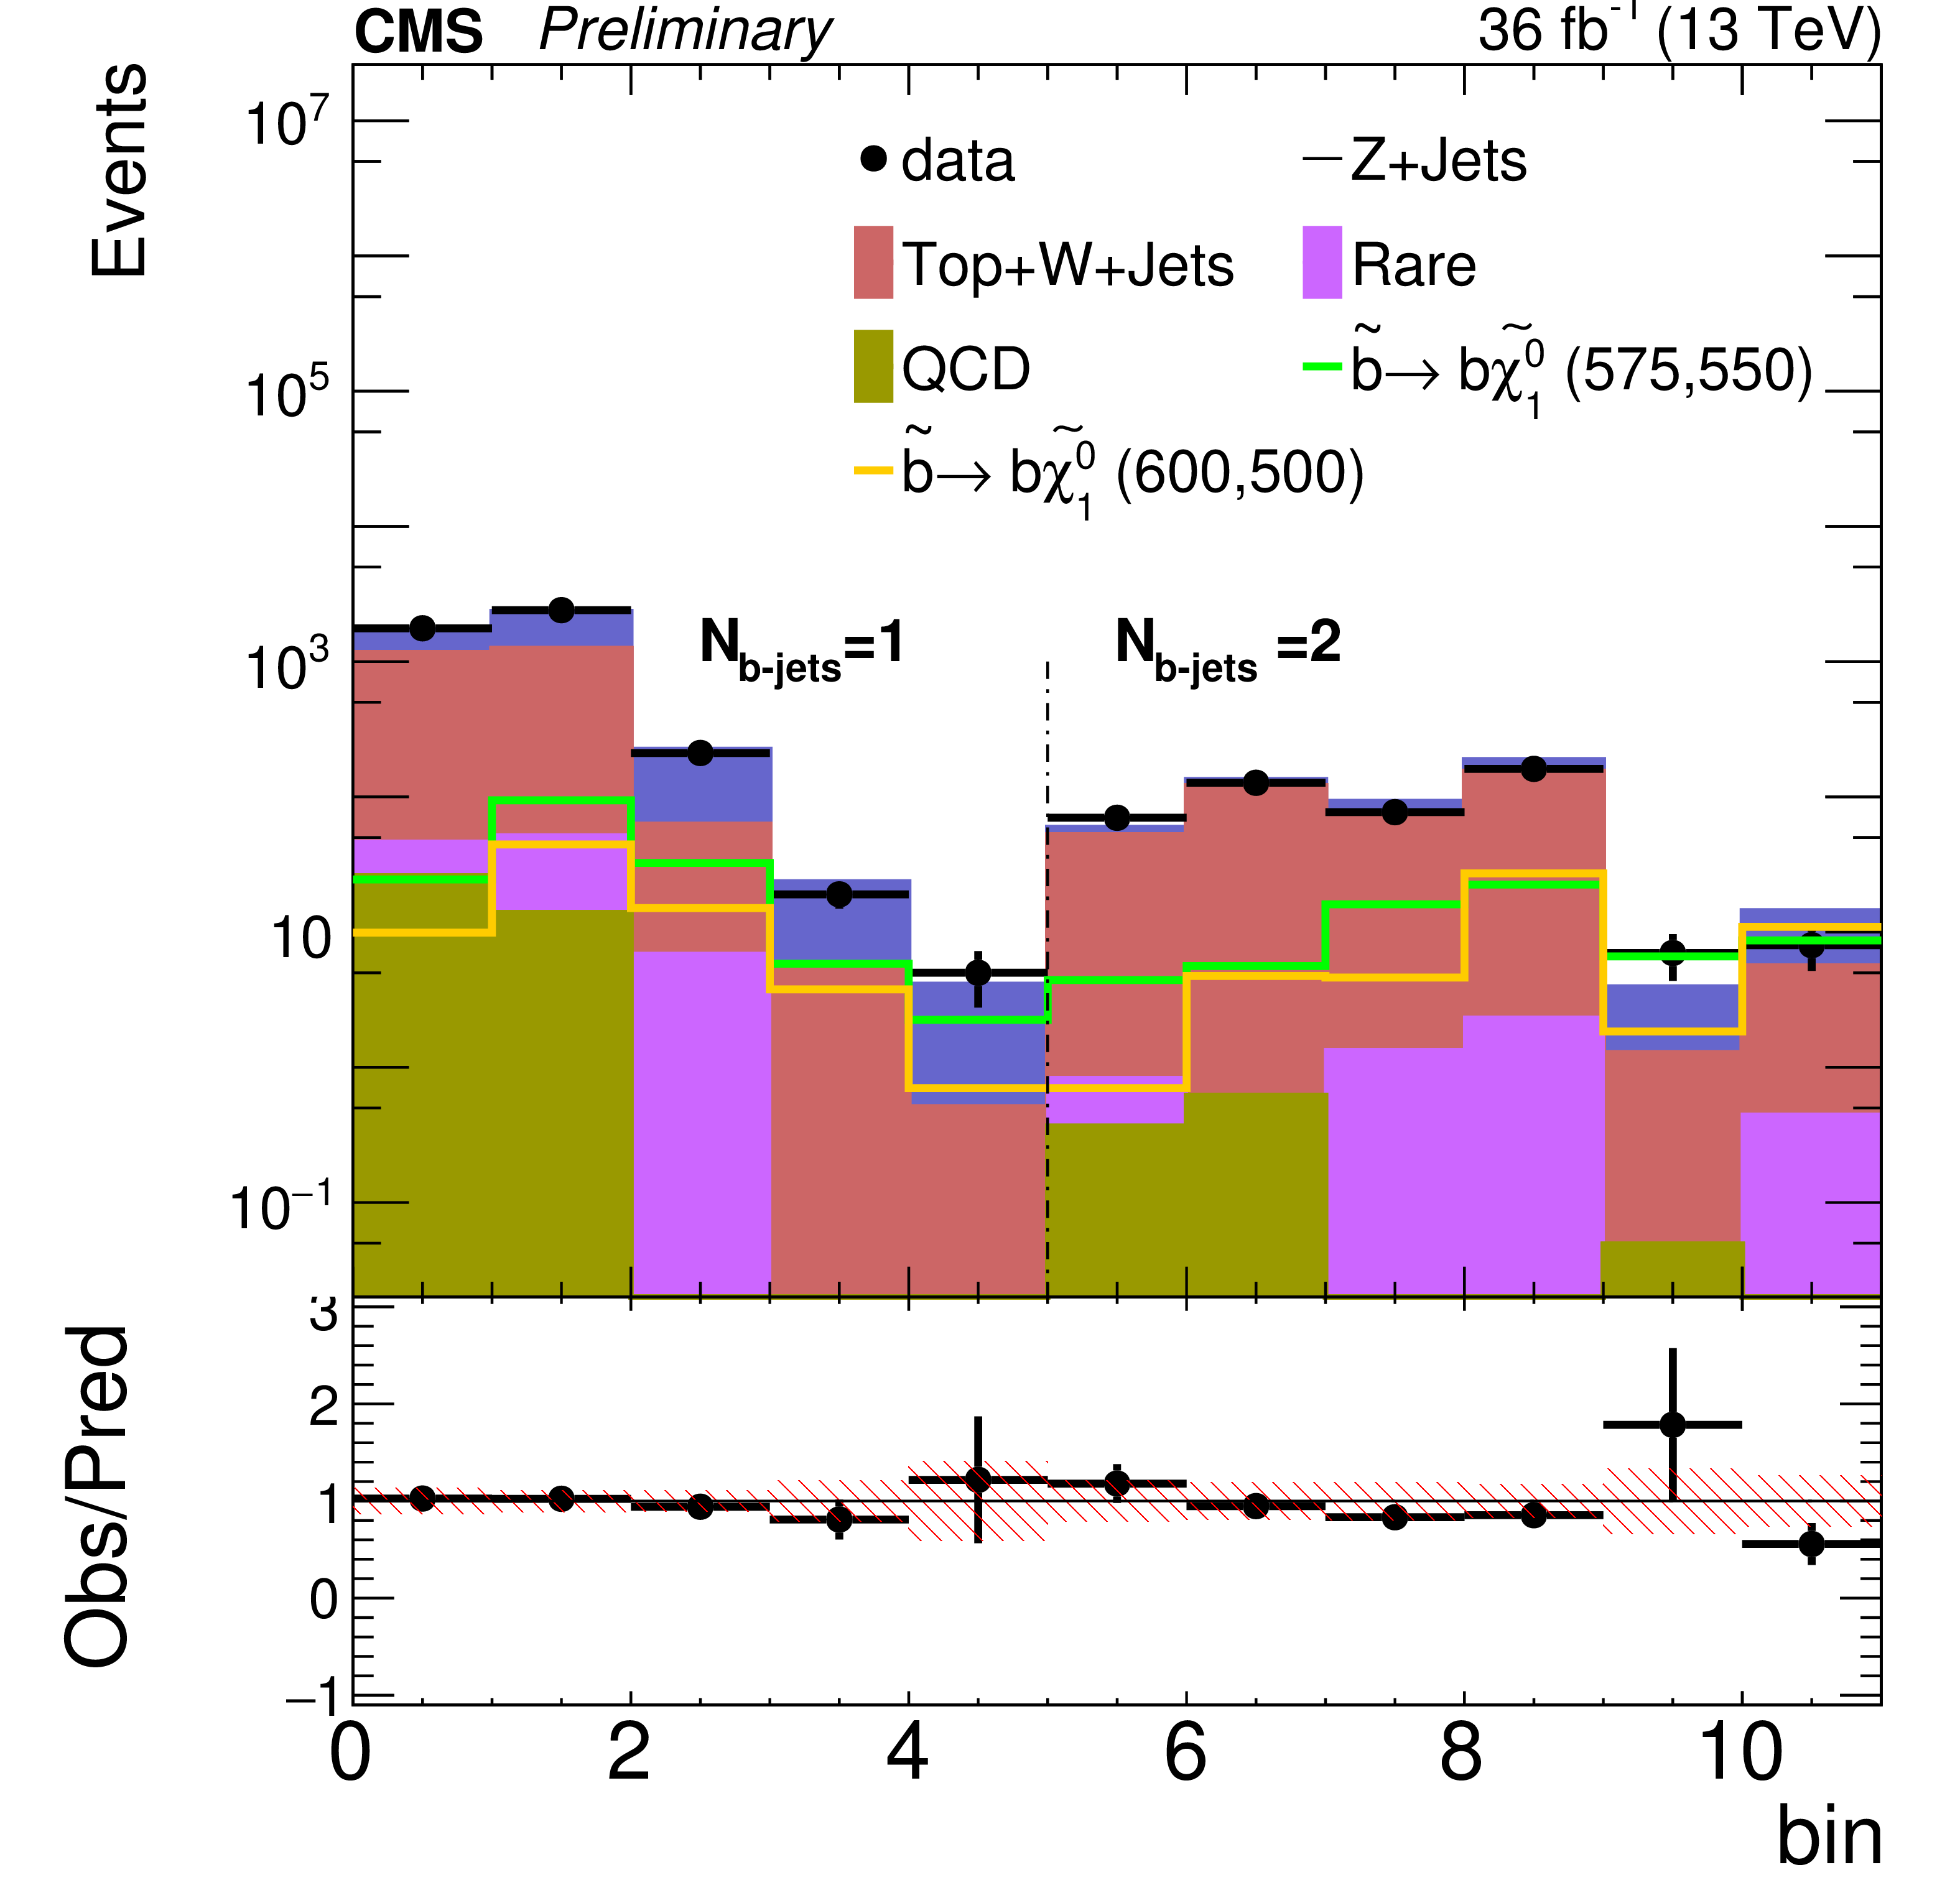
Figure 4-b:
Yields in the signal region targeting the compressed with ${N_{\mathrm {b-tags}}} =$ 1, 2 scenario. Data are shown as black points. The background predictions are represented by the stacked, filled histograms. The expected yields for two signal models are also shown. The lower panel shows the ratio of data over total background prediction. |
png pdf |
Figure 4-c:
Yields in the signal region targeting the non-compressed compressed with ${N_{\mathrm {c-tags}}} = $ 1, 2 scenario. Data are shown as black points. The background predictions are represented by the stacked, filled histograms. The expected yields for two signal models are also shown. The lower panel shows the ratio of data over total background prediction. |
png pdf |
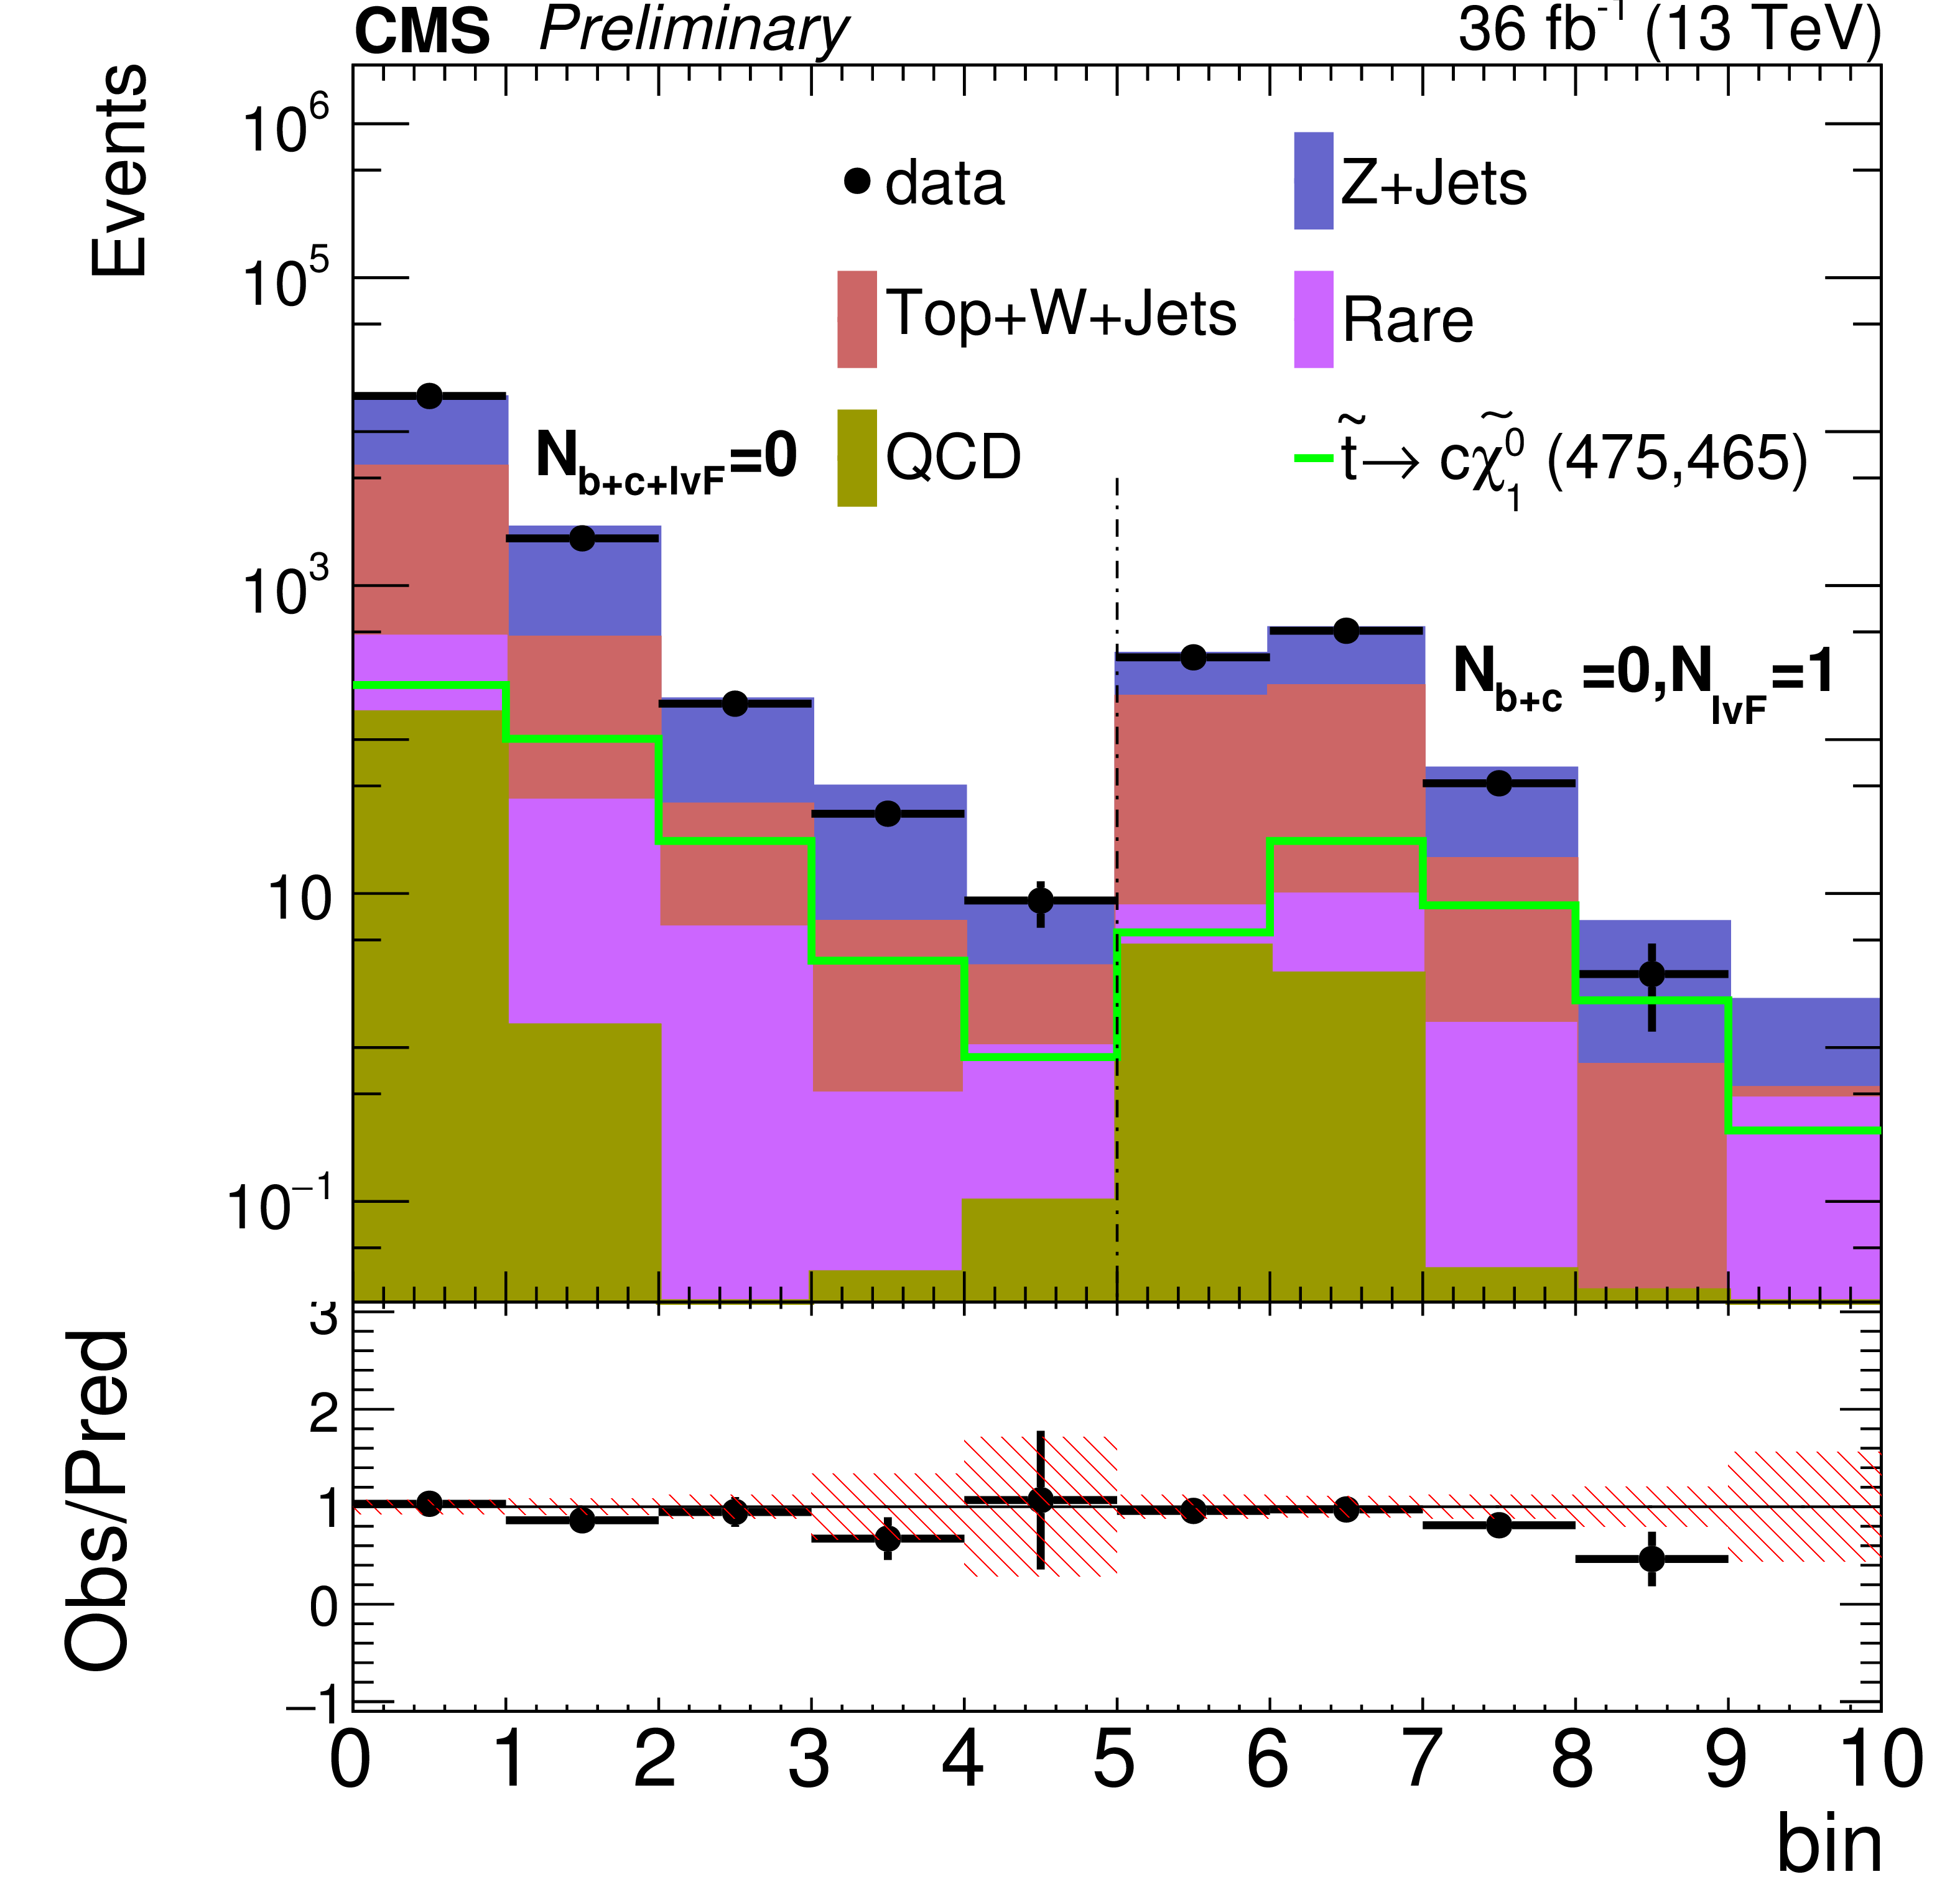
Figure 4-d:
Yields in the signal region targeting the compressed with ${N_{\mathrm {b-tags}}} + {N_{\mathrm {c-tags}}} =$ 0) scenario. Data are shown as black points. The background predictions are represented by the stacked, filled histograms. The expected yields for two signal models are also shown. The lower panel shows the ratio of data over total background prediction. |
png pdf |
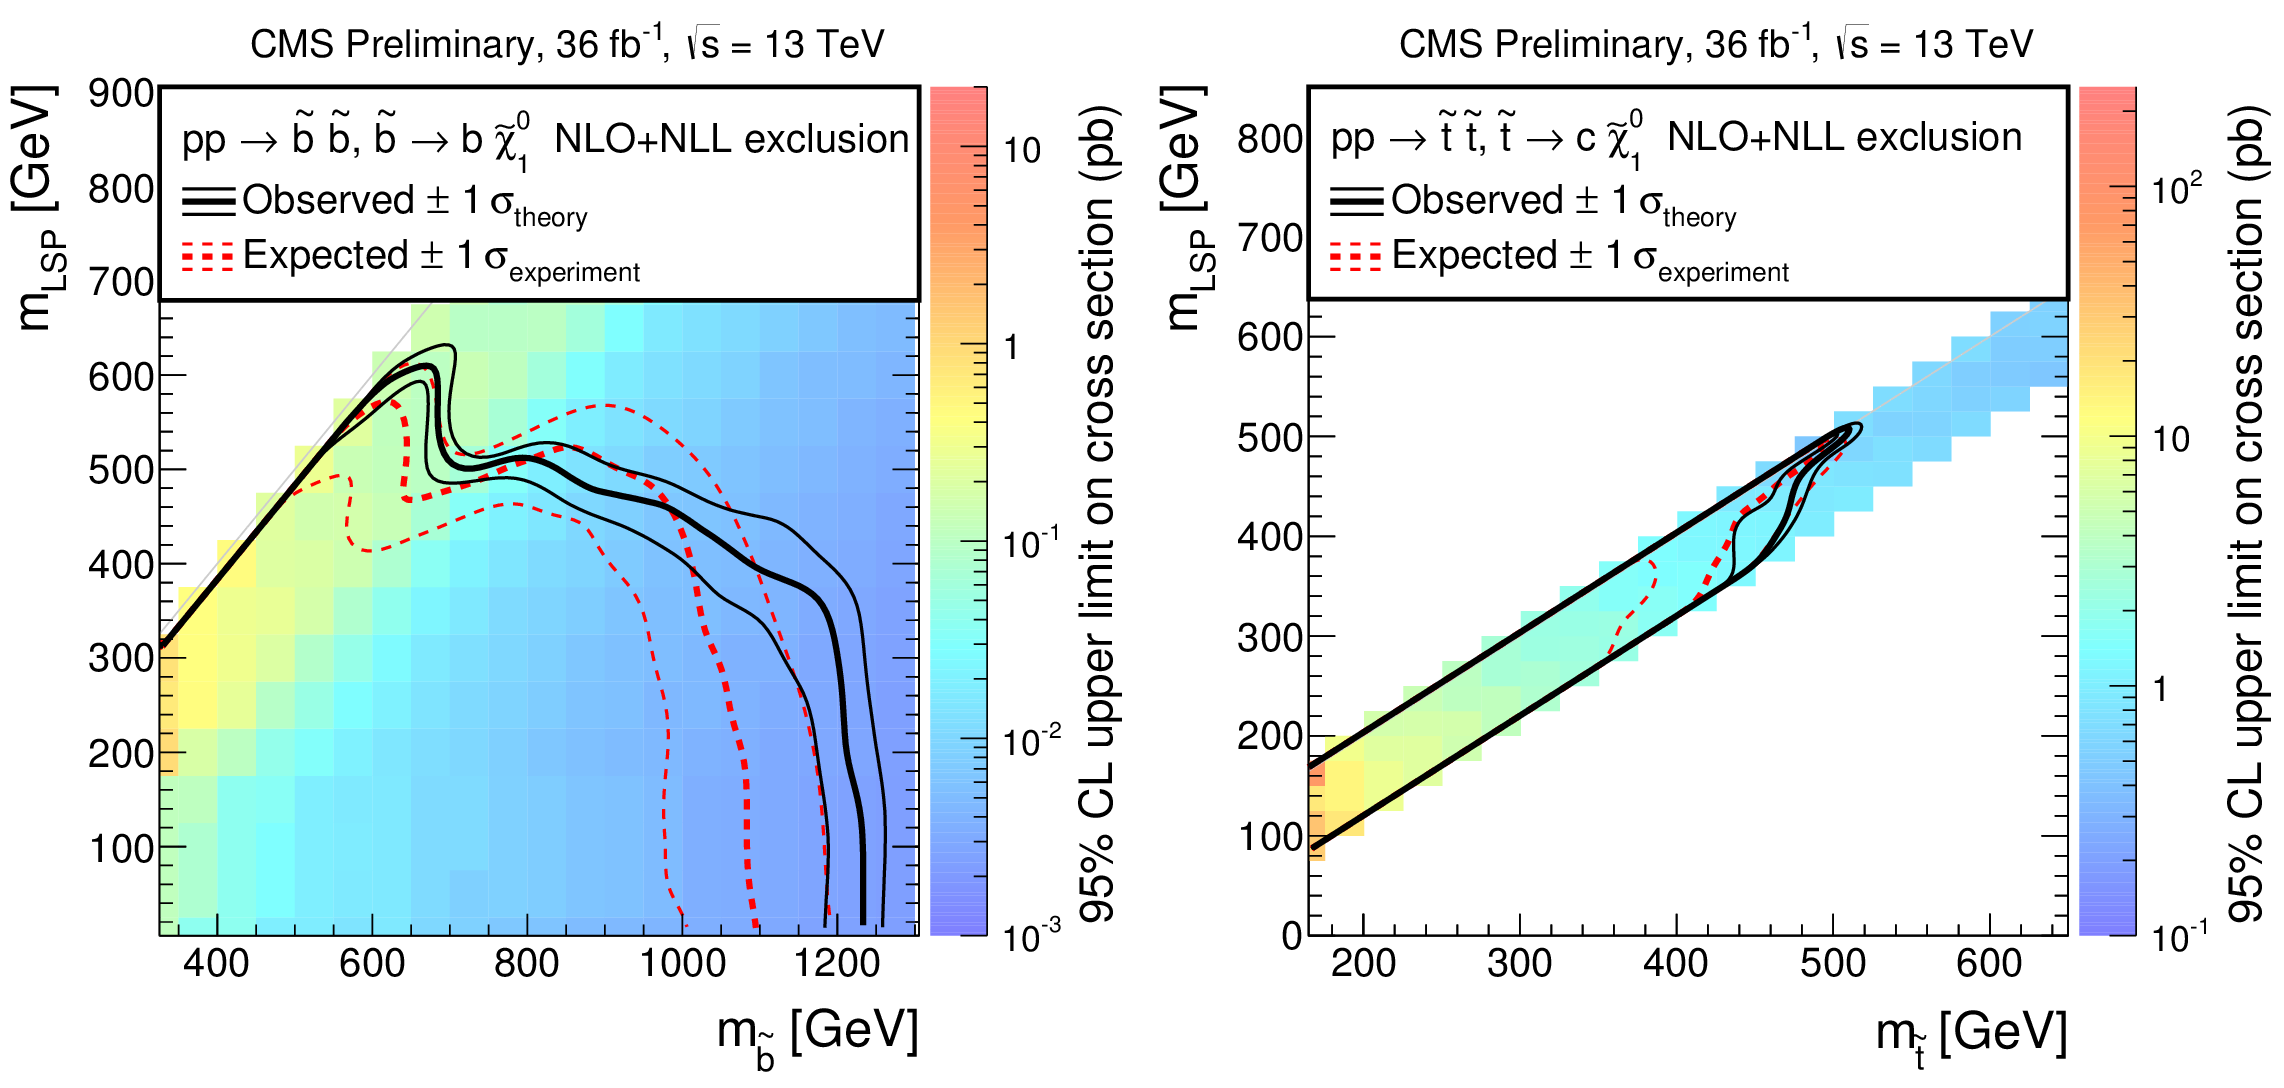
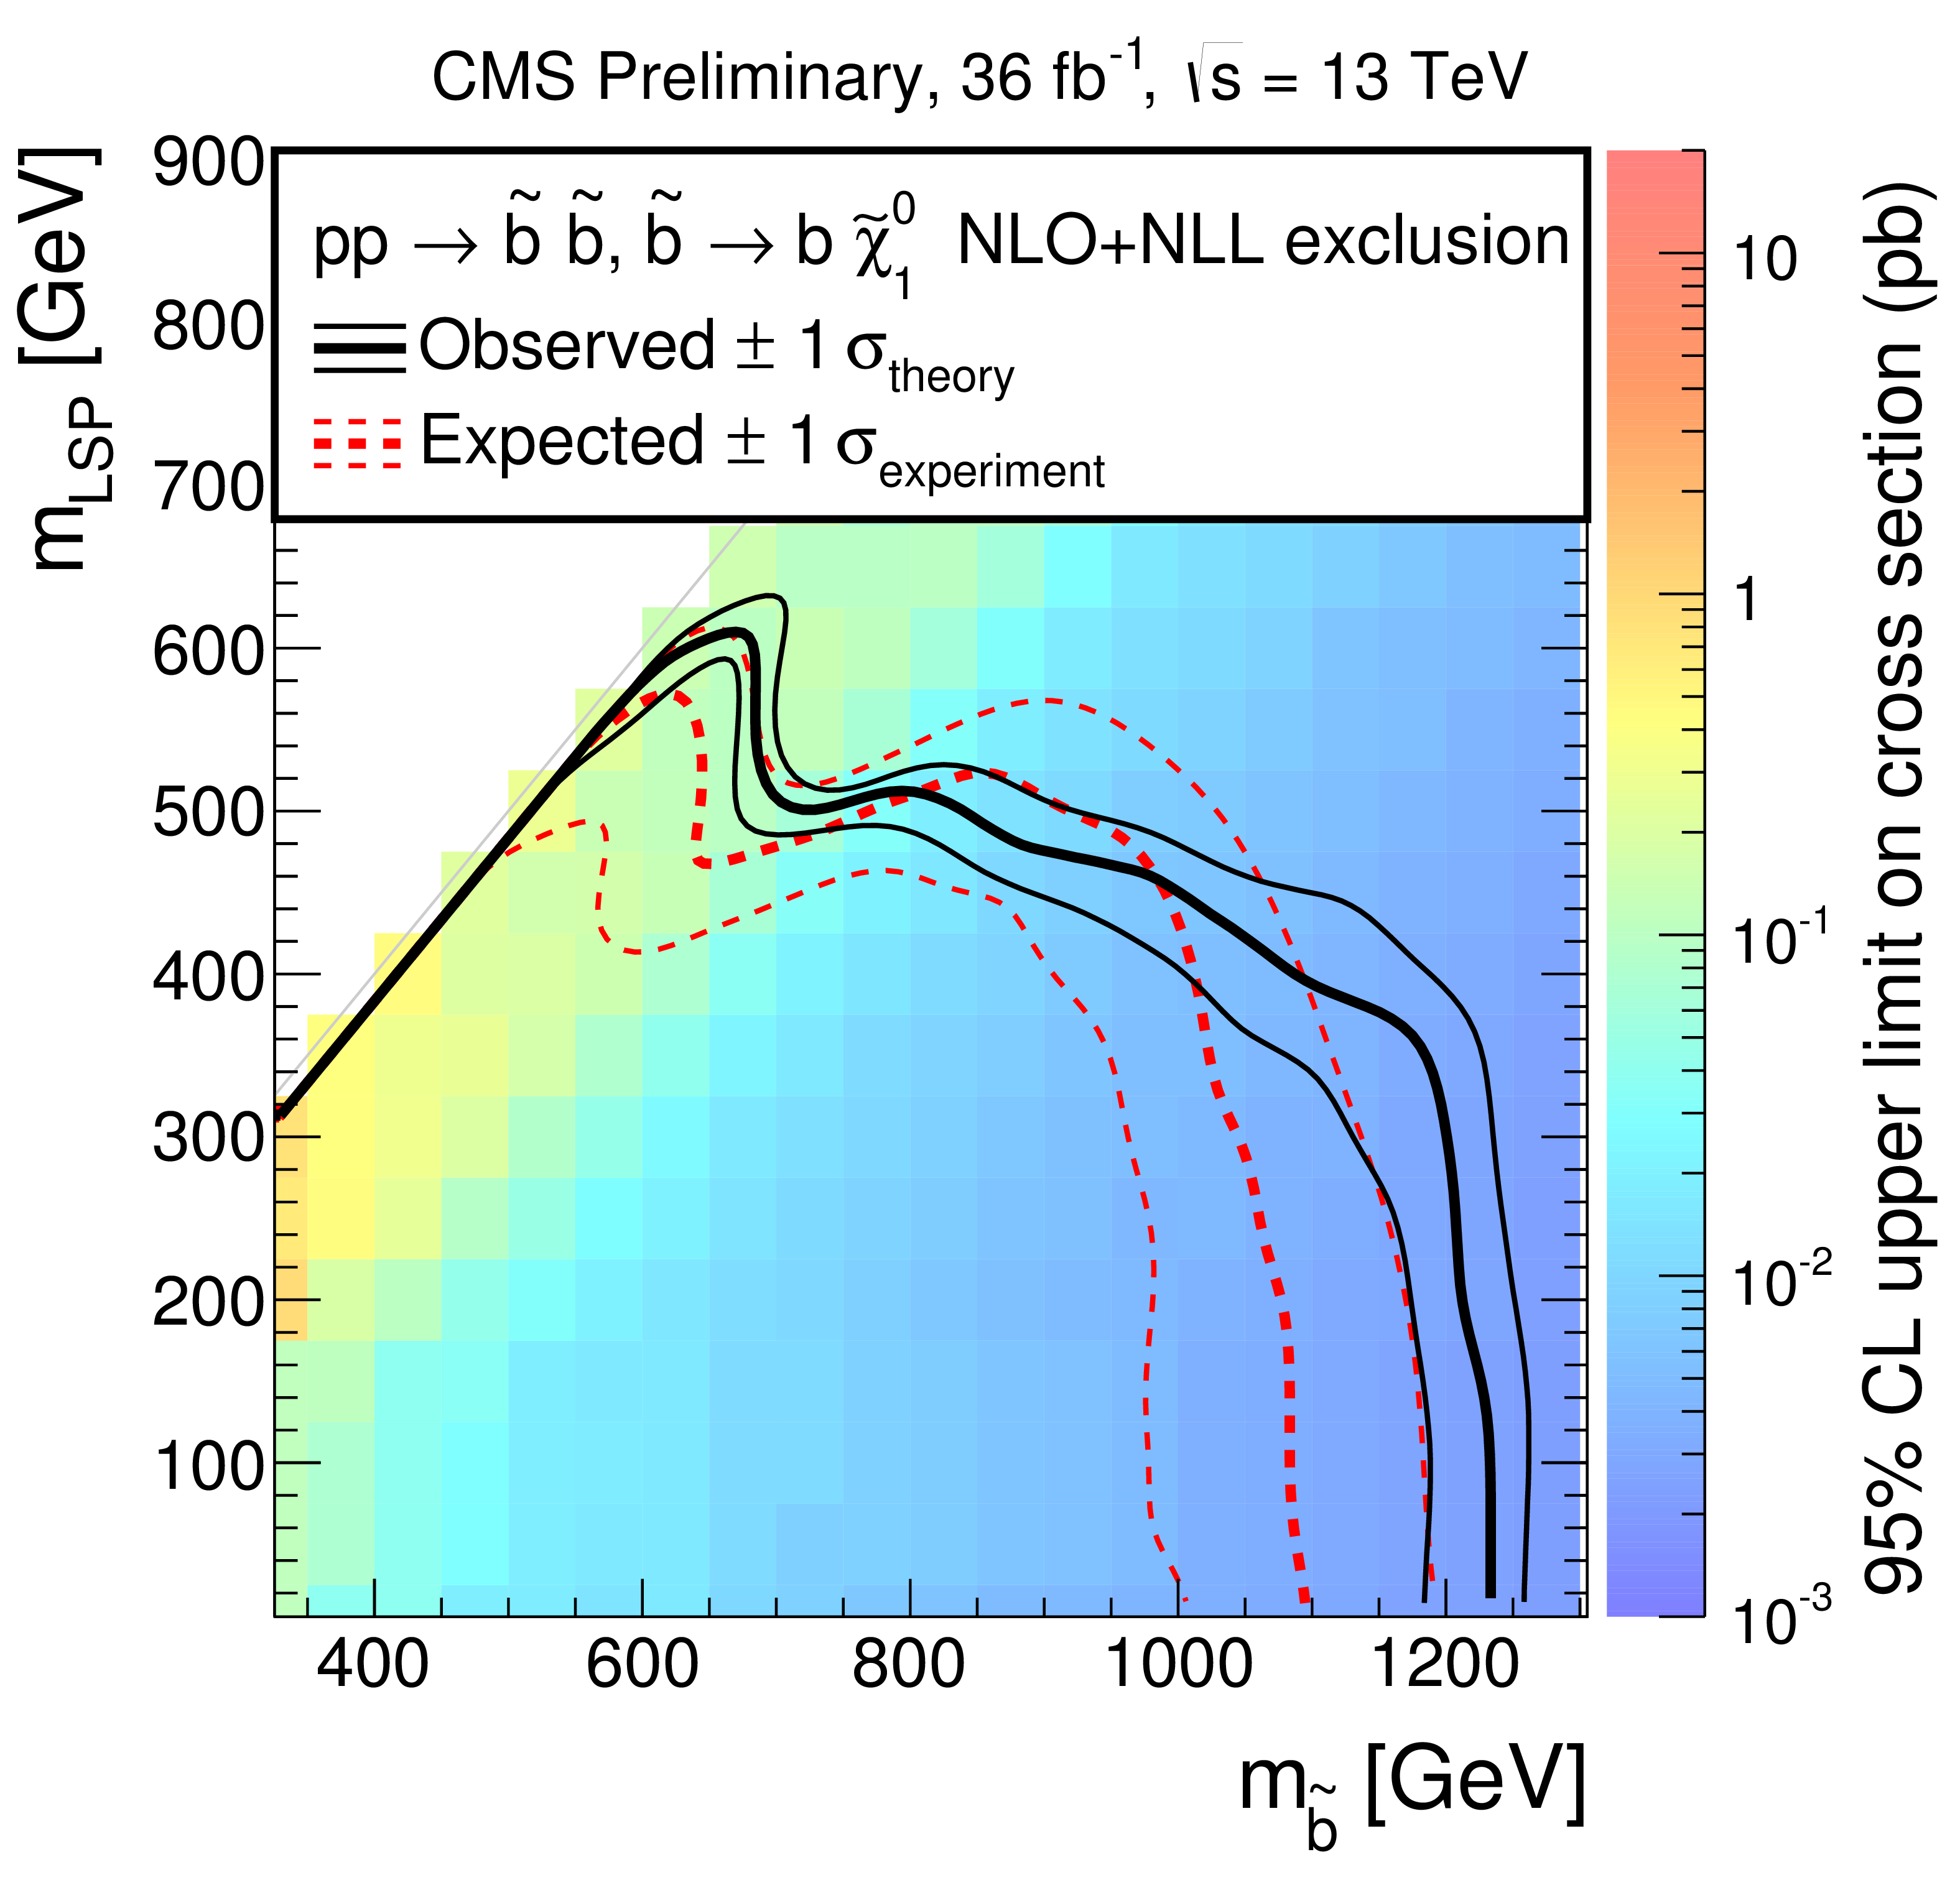
Figure 5:
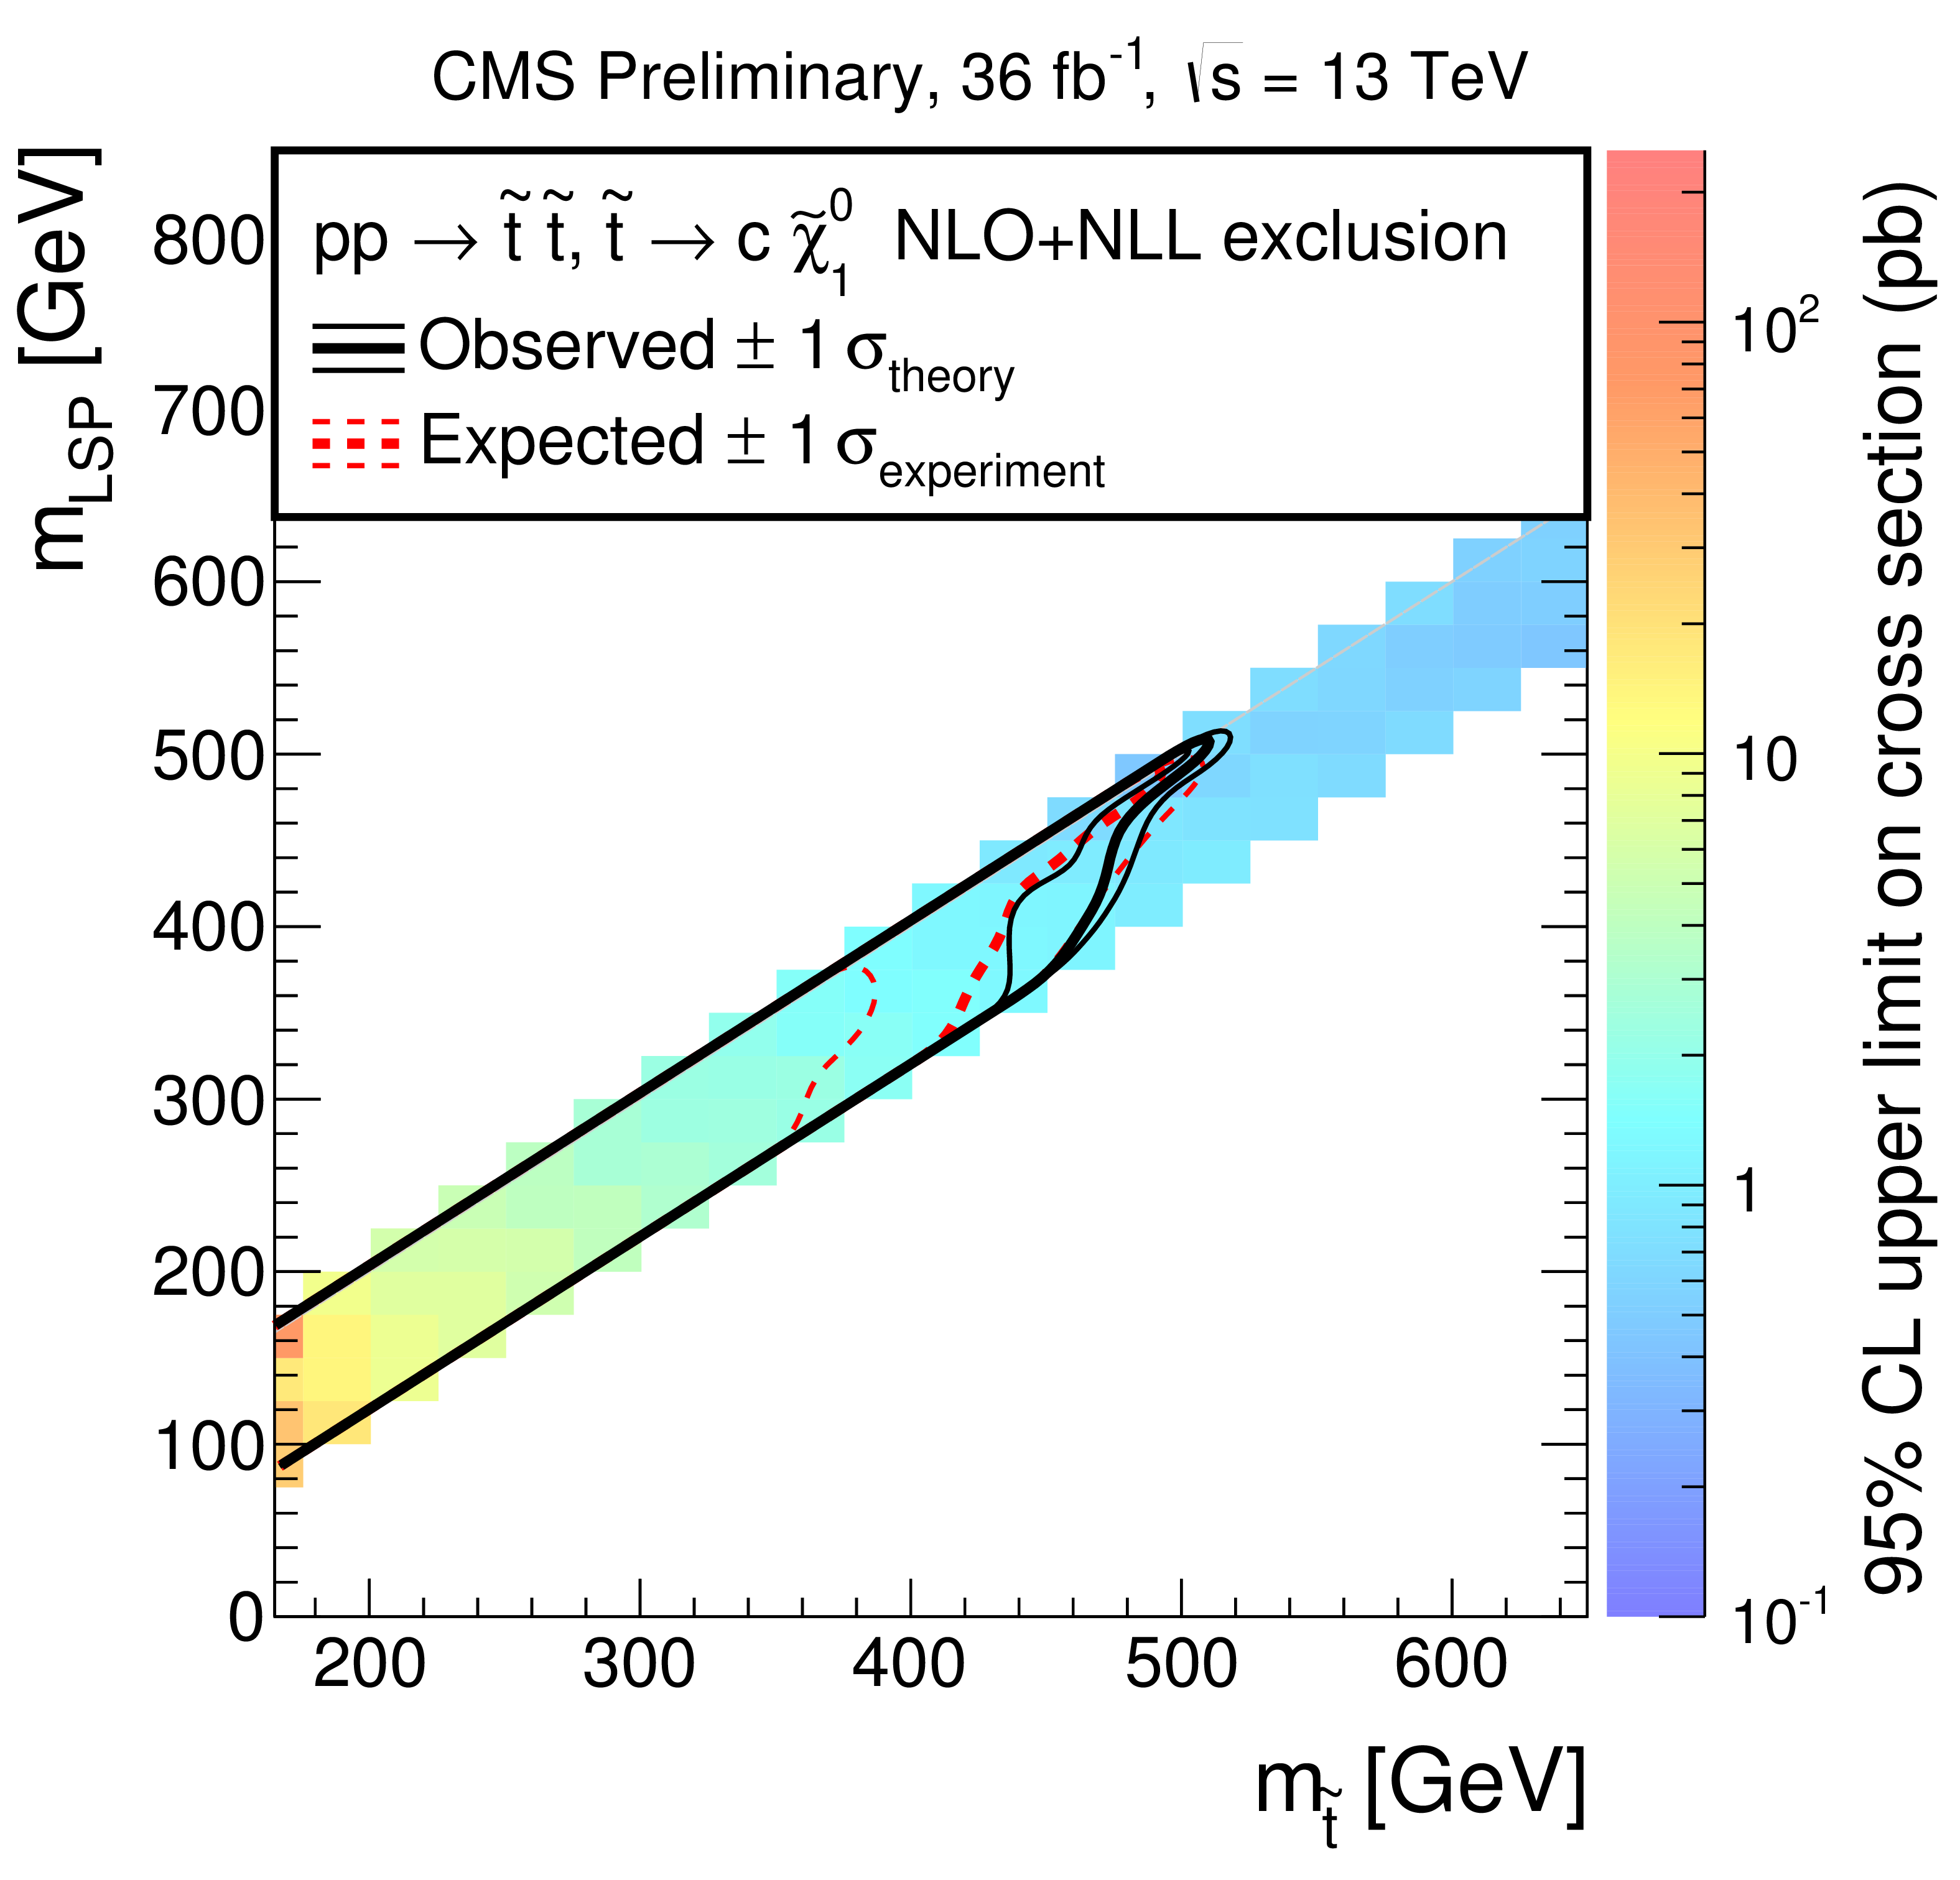
The 95% CL limits on the cross section, assuming 100% BR for the decay of the top squark shown in the legend (left). The combined 95% CL exclusion limits for top squark pair production assuming 100% branching fraction to the decay $\tilde{ \mathrm{ t } } \rightarrow \tilde{\mathrm{c}} \tilde{\chi}^{0} _1$ (right). The mass limits are shown as a black line for the observed limit and as a red line for the expected limit. |
png pdf root |
Figure 5-a:
The 95% CL limits on the cross section, assuming 100% BR for the decay of the top squark shown in the legend. The mass limits are shown as a black line for the observed limit and as a red line for the expected limit. |
png pdf root |
Figure 5-b:
The combined 95% CL exclusion limits for top squark pair production assuming 100% branching fraction to the decay $\tilde{ \mathrm{ t } } \rightarrow \tilde{\mathrm{c}} \tilde{\chi}^{0} _1$. The mass limits are shown as a black line for the observed limit and as a red line for the expected limit. |
png pdf |
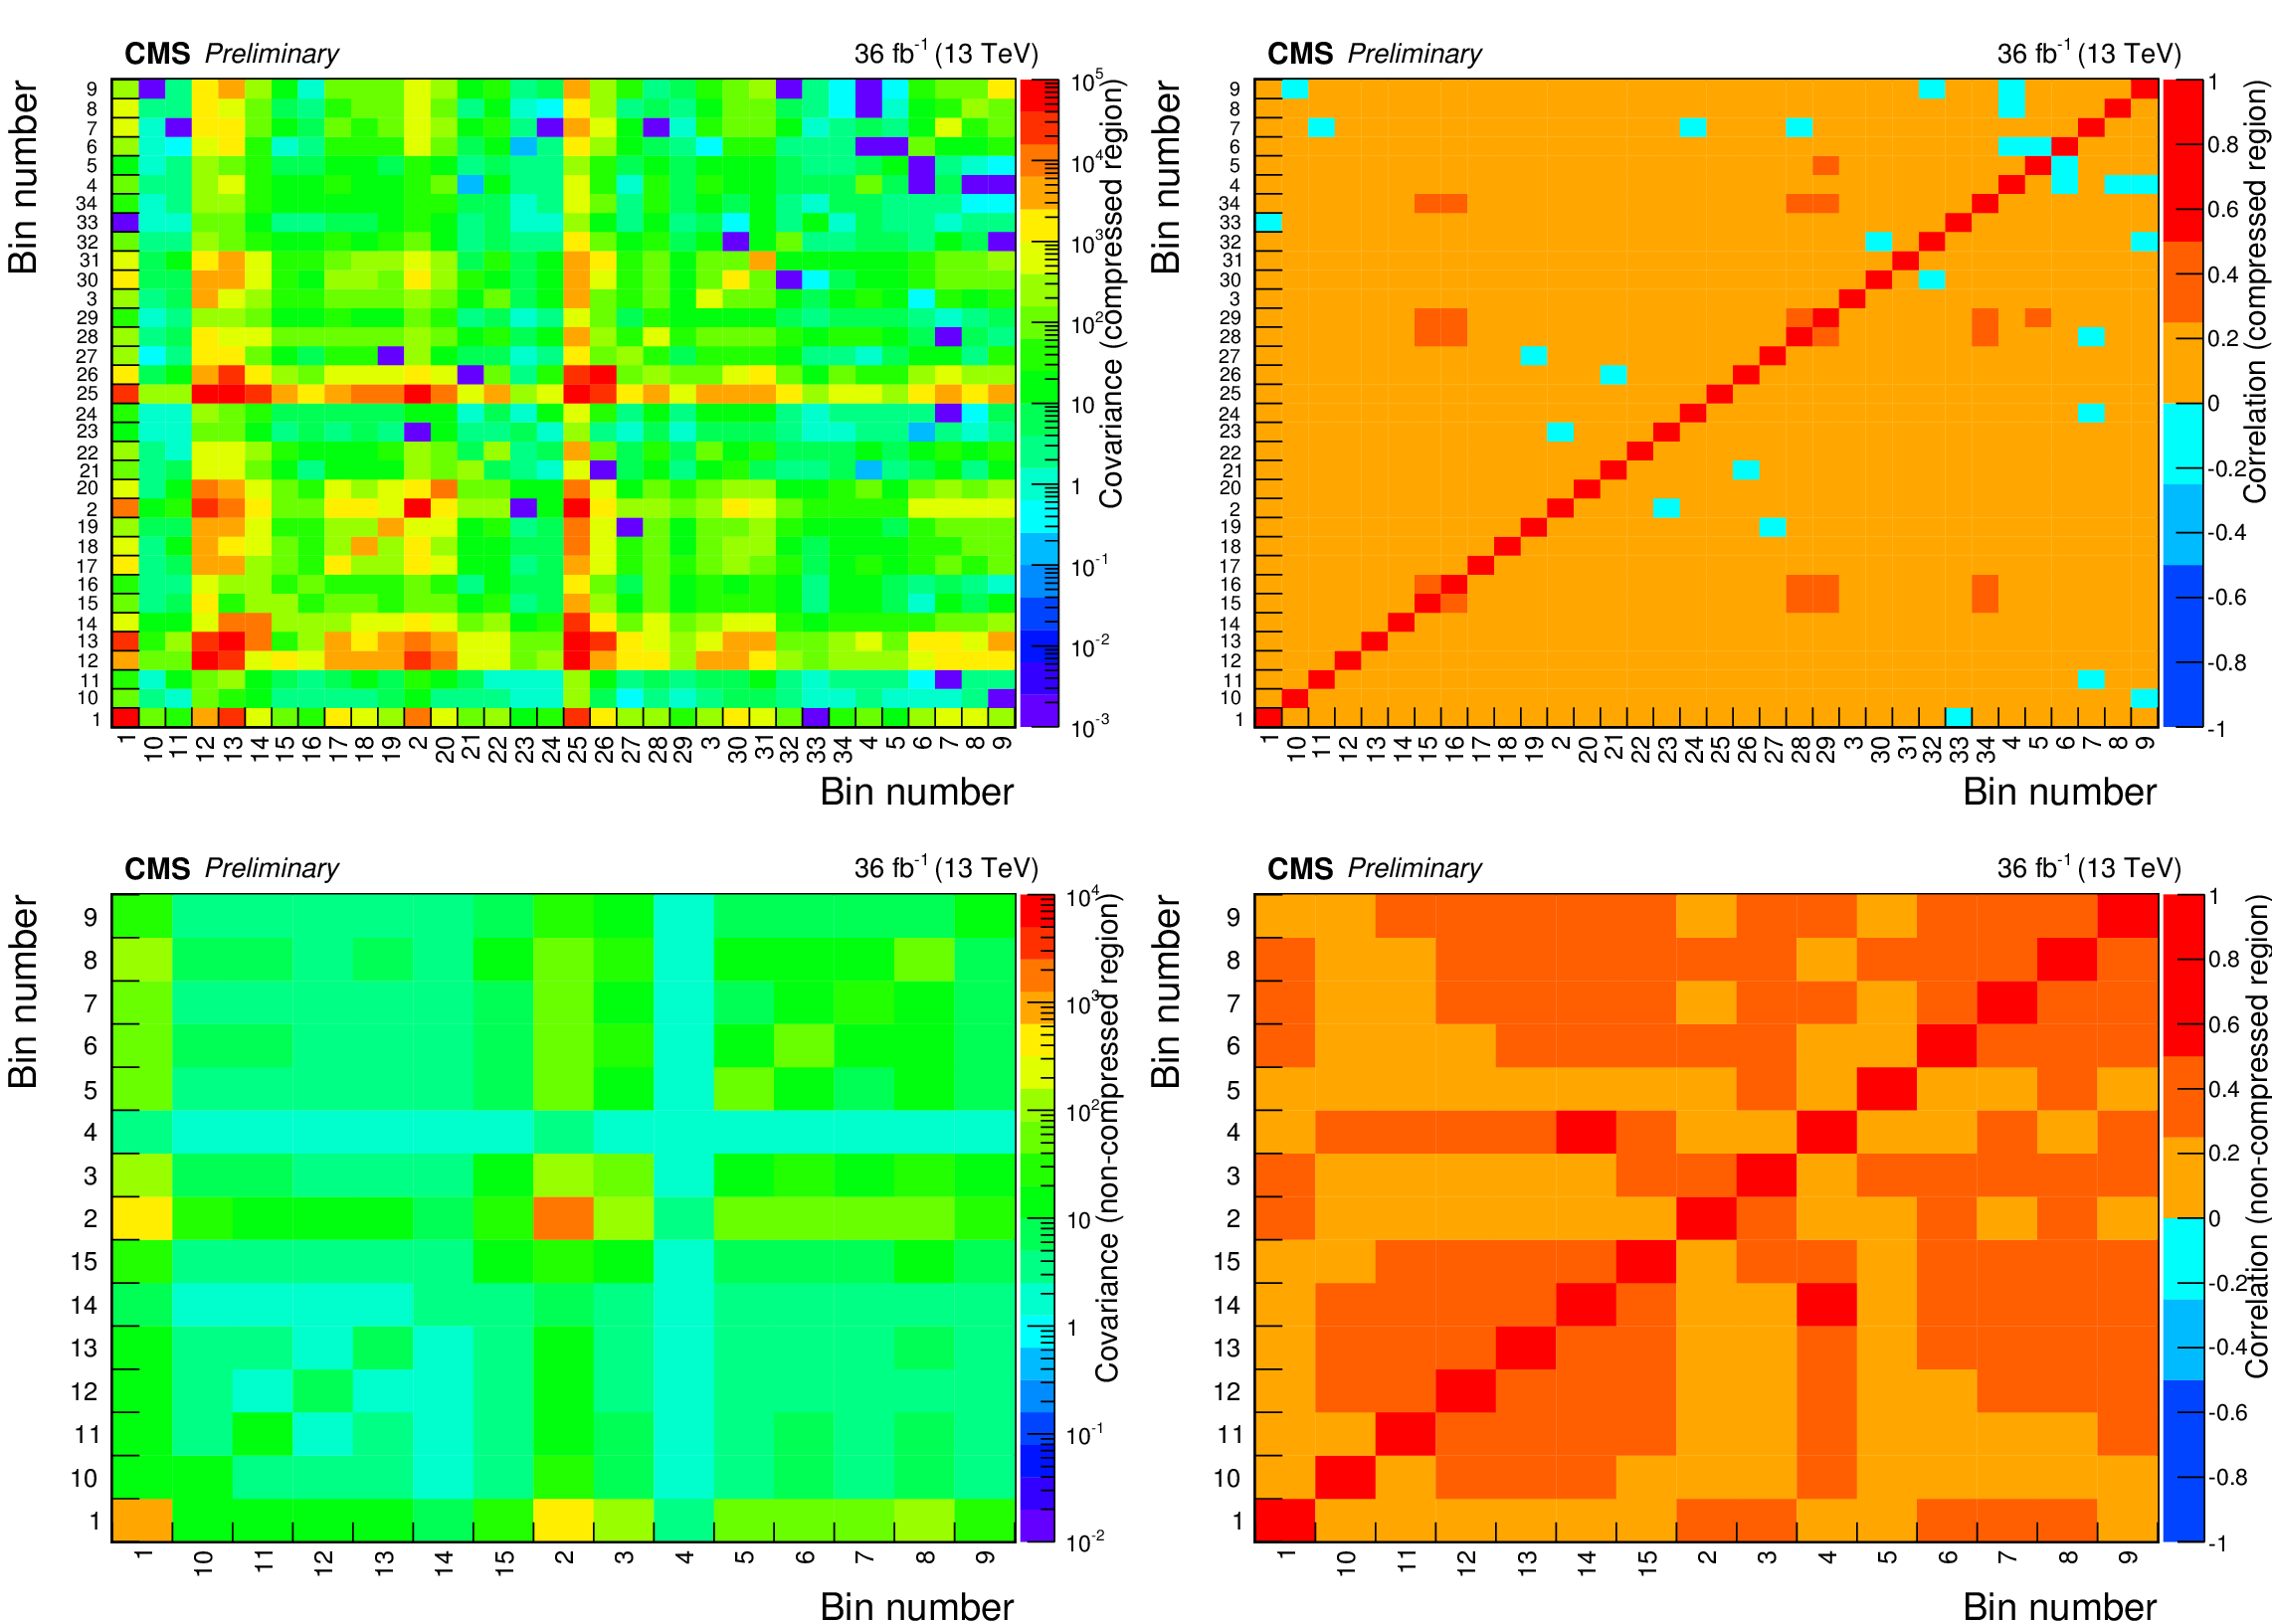
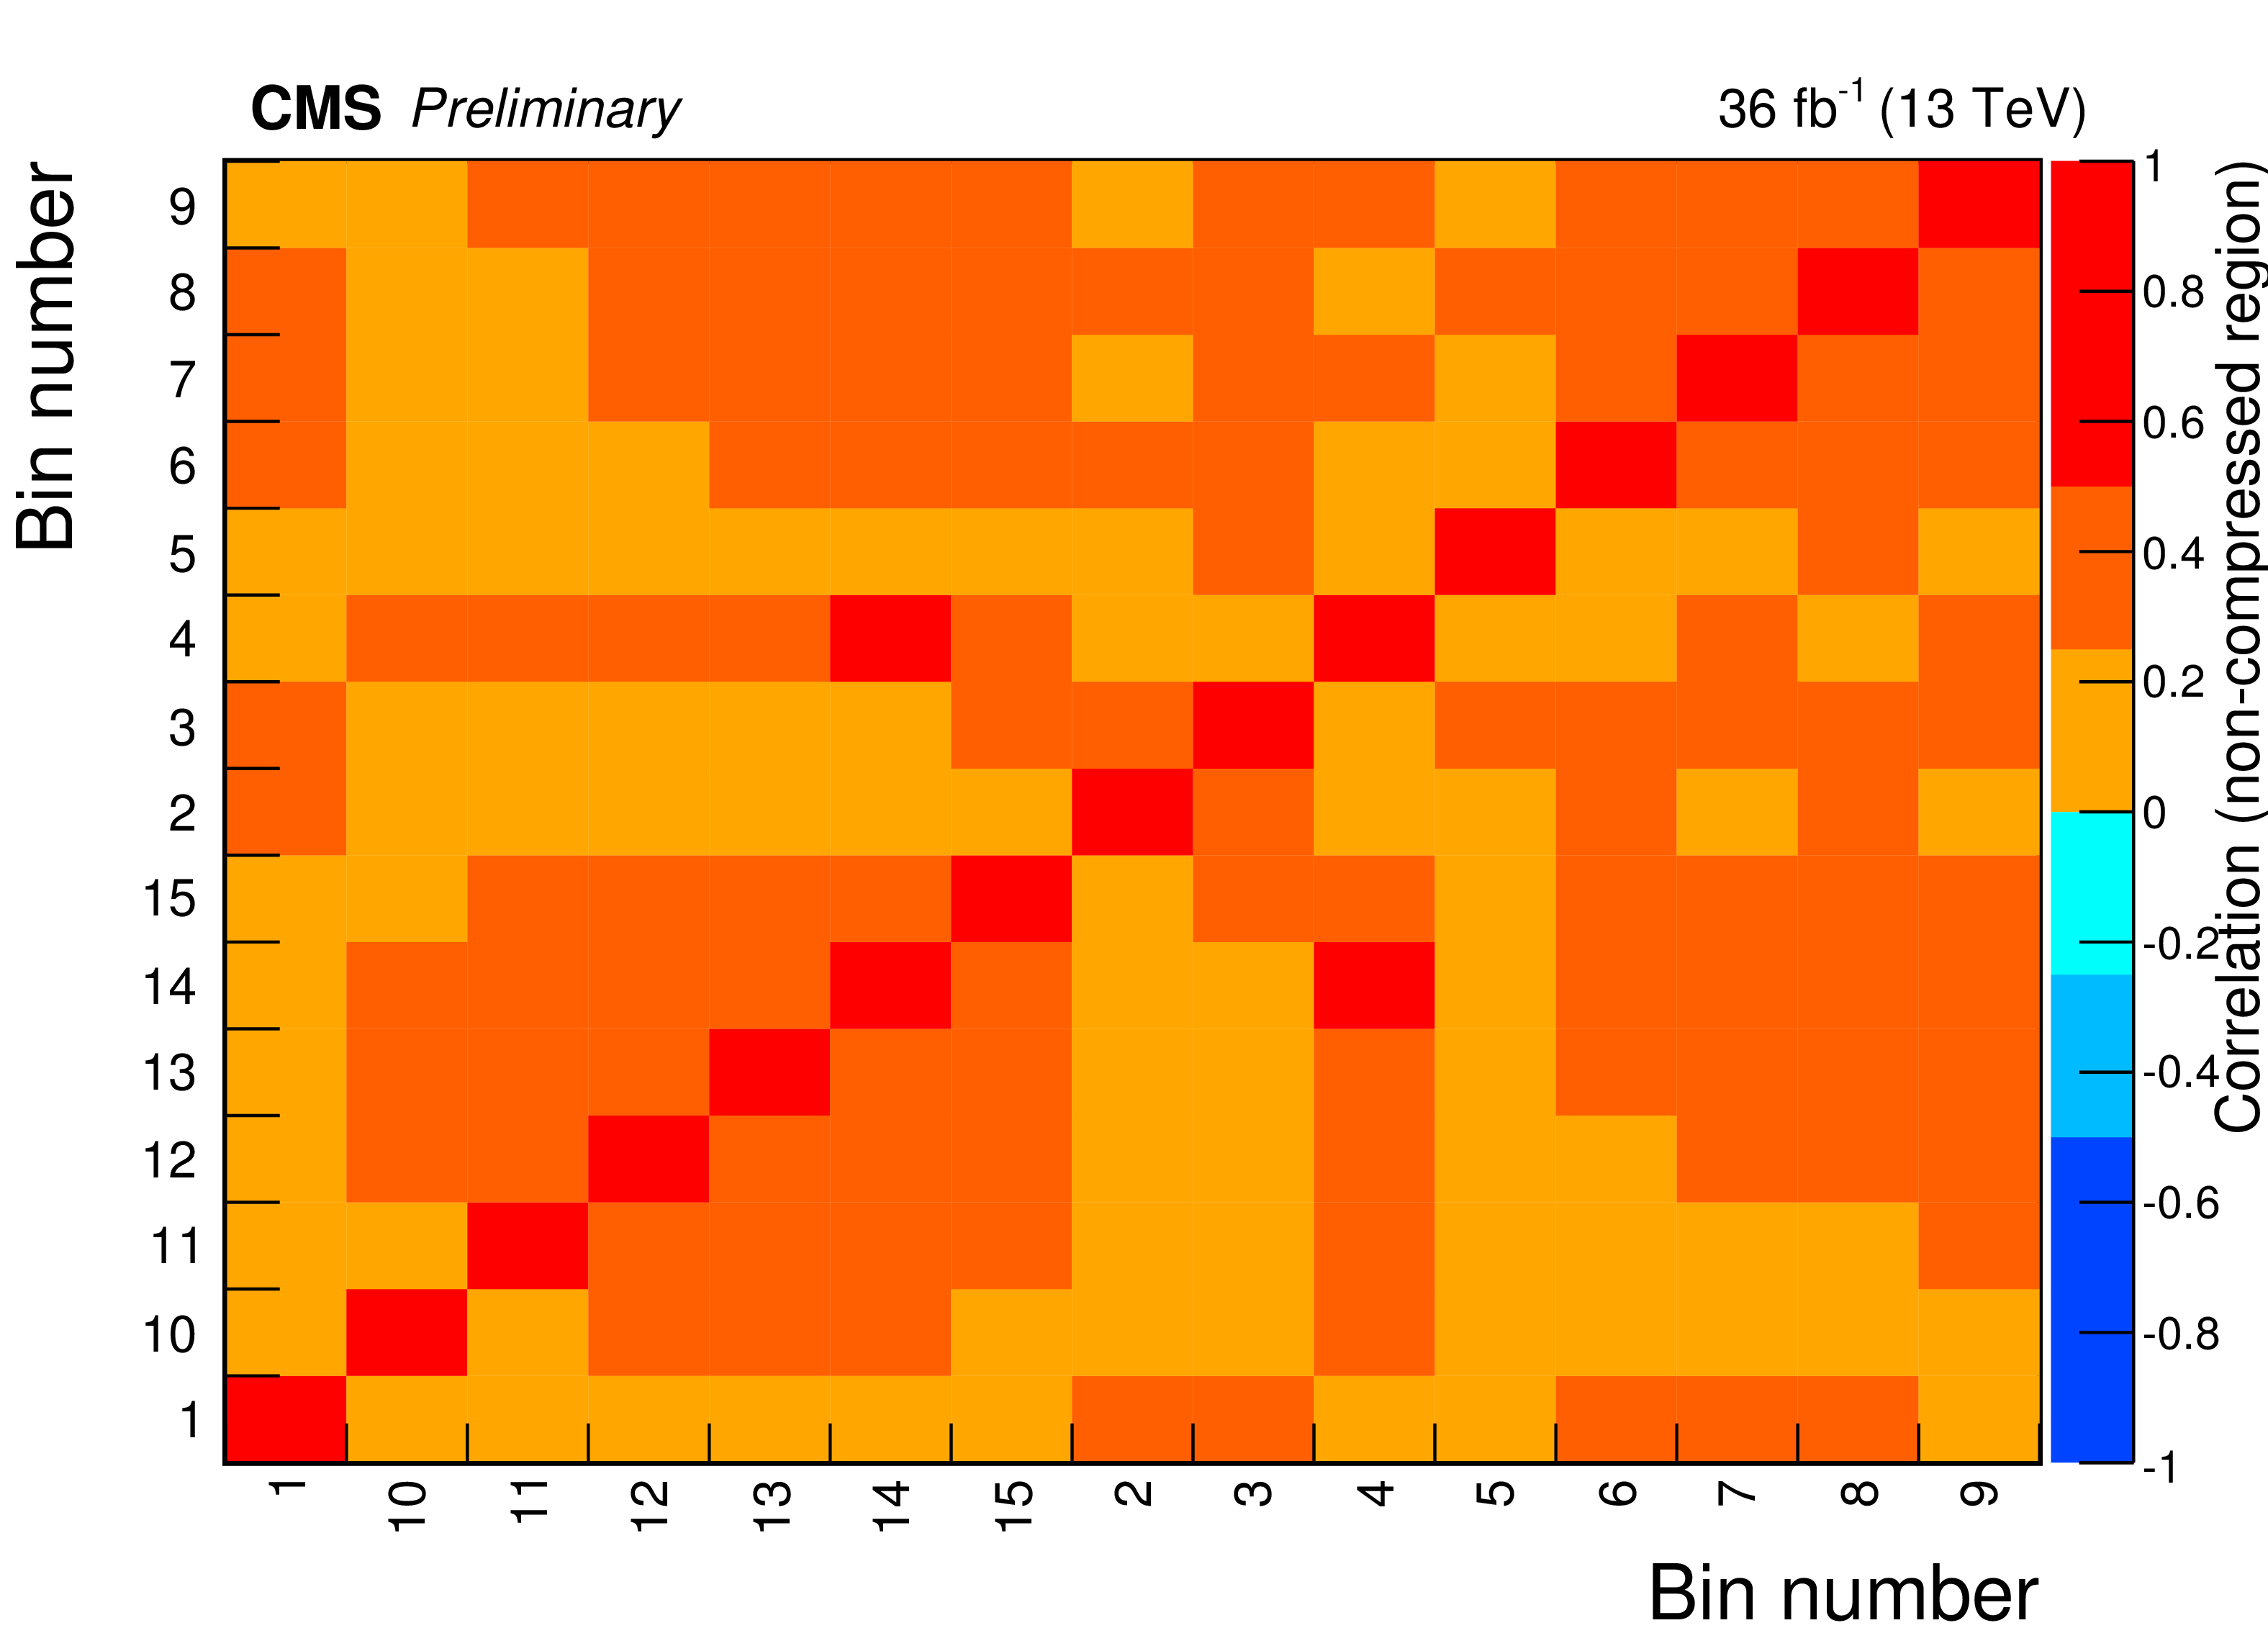
Figure 6:
The covariance and correlation matrices for the estimated backgrounds in the compressed and non-compressed search regions. |
png pdf root |
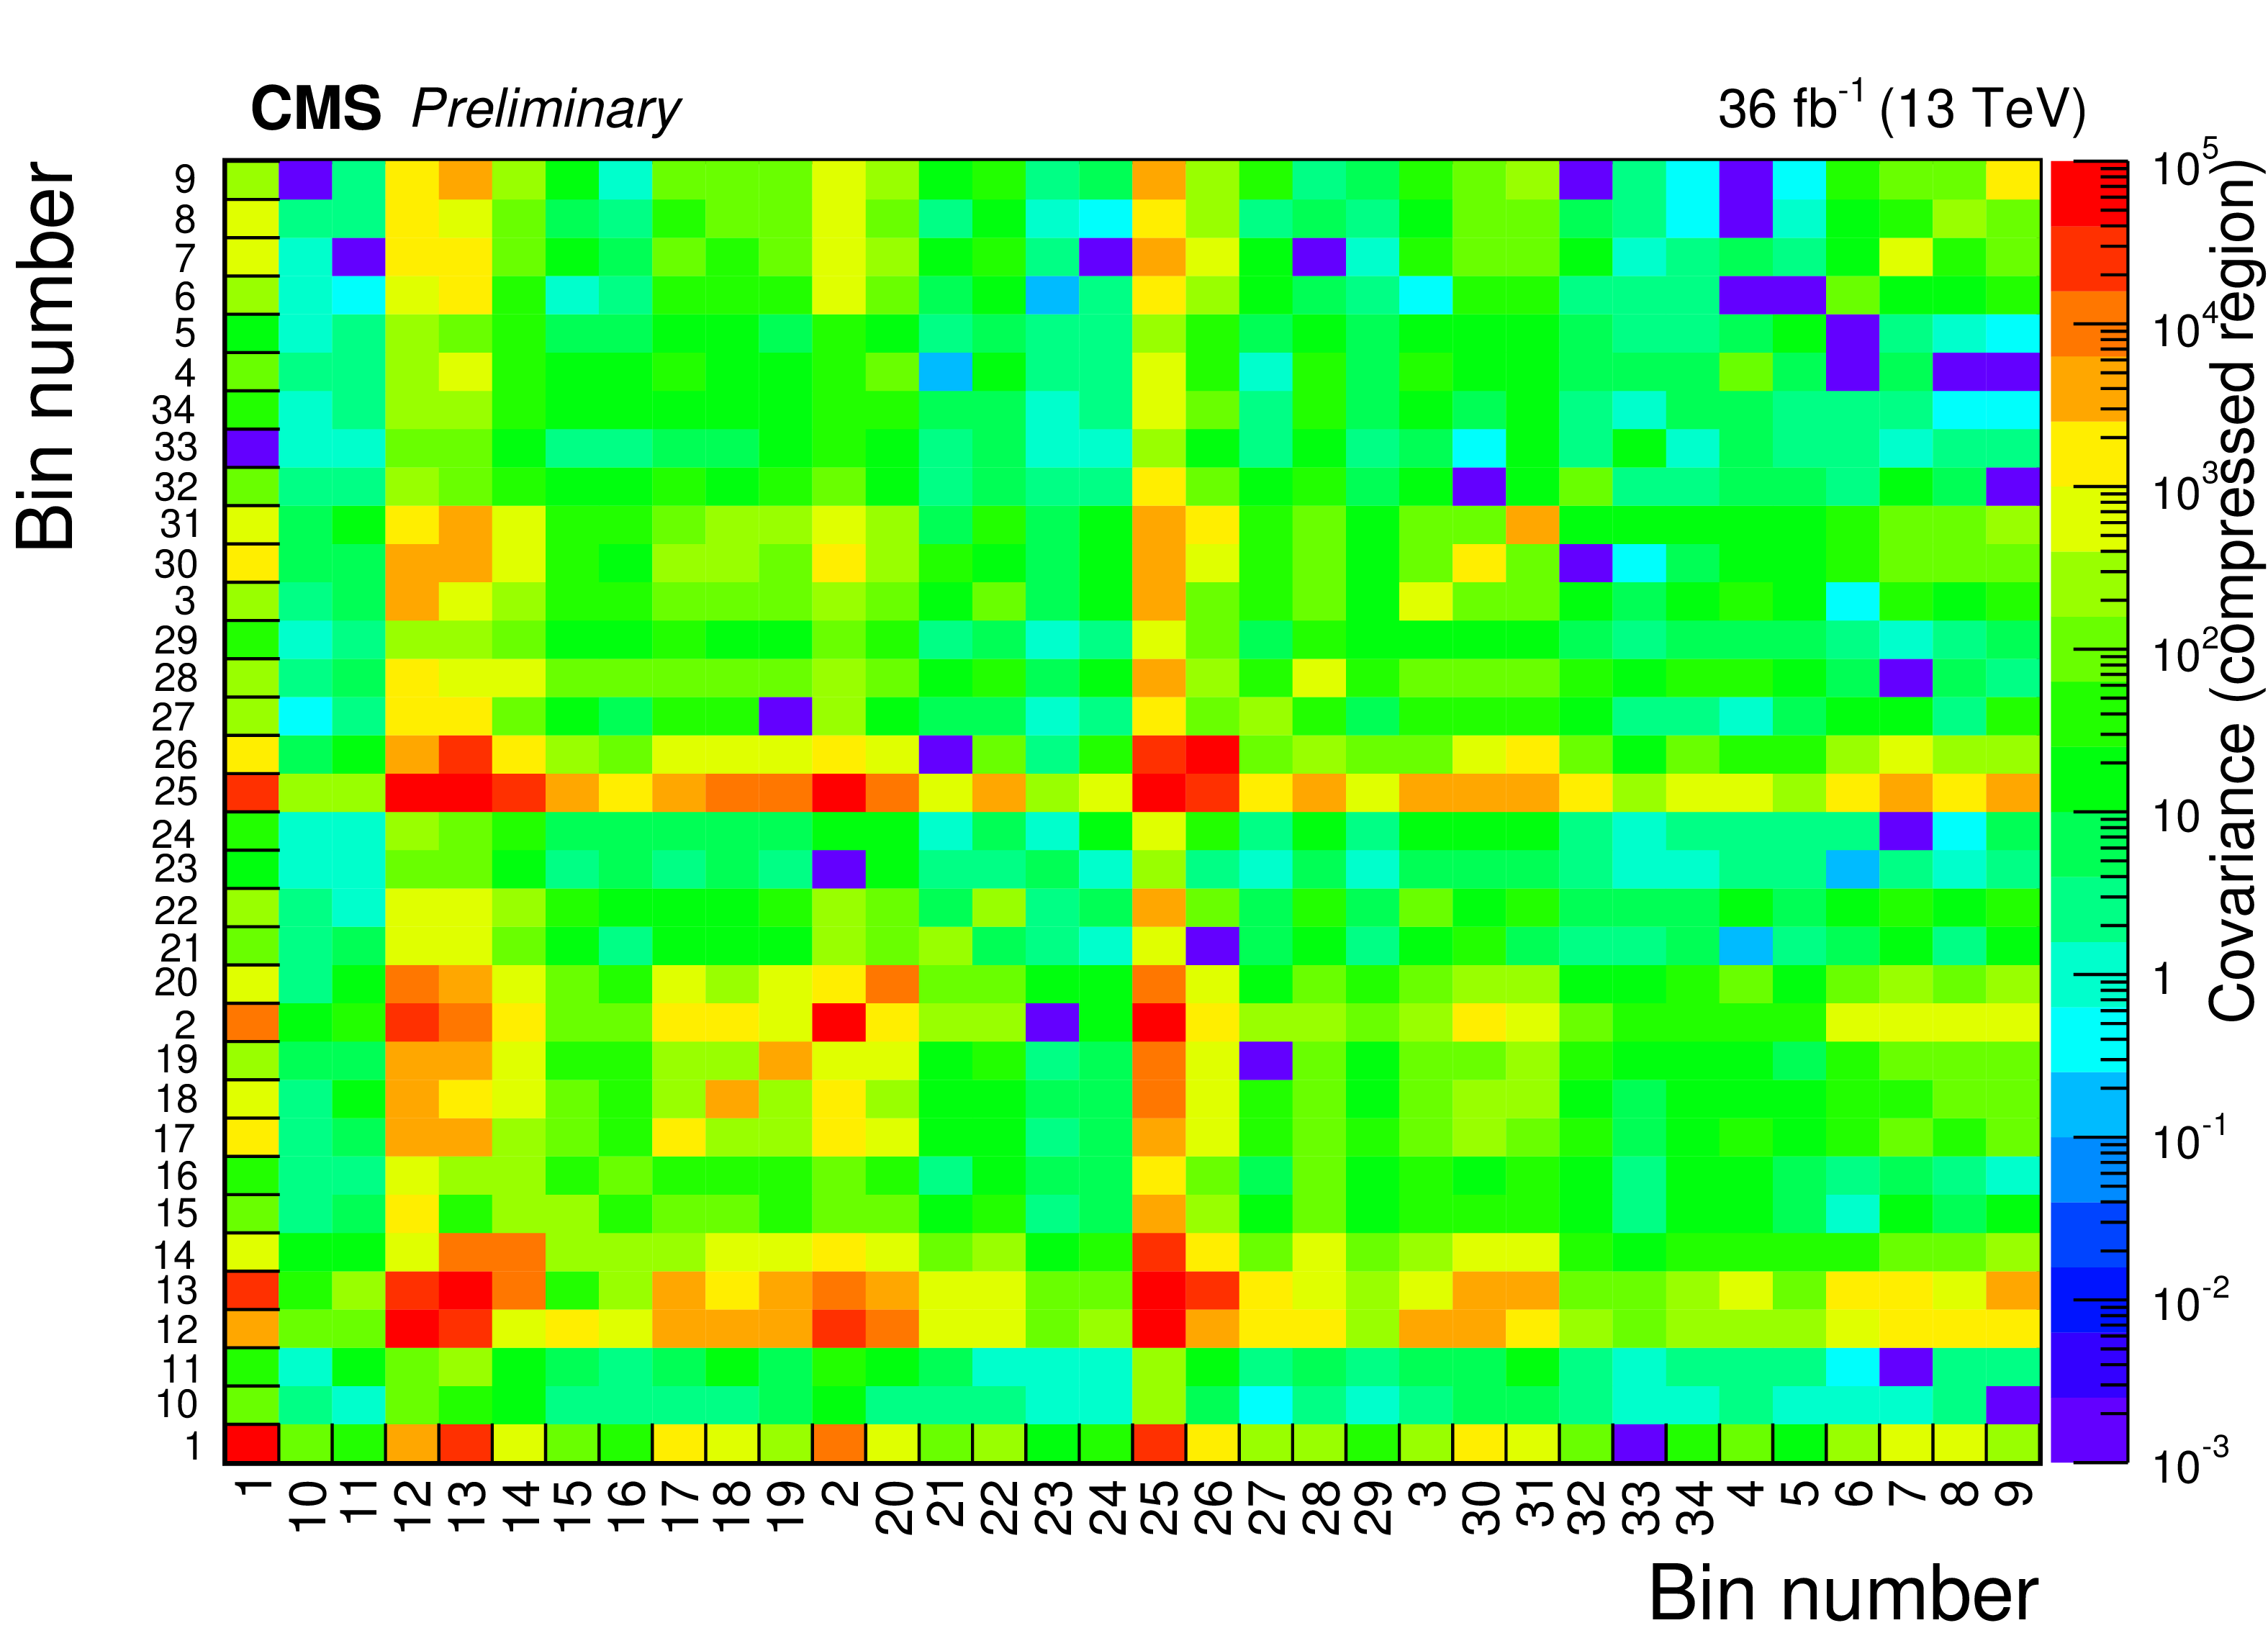
Figure 6-a:
The covariance matrix for the estimated backgrounds in the compressed search region. |
png pdf root |
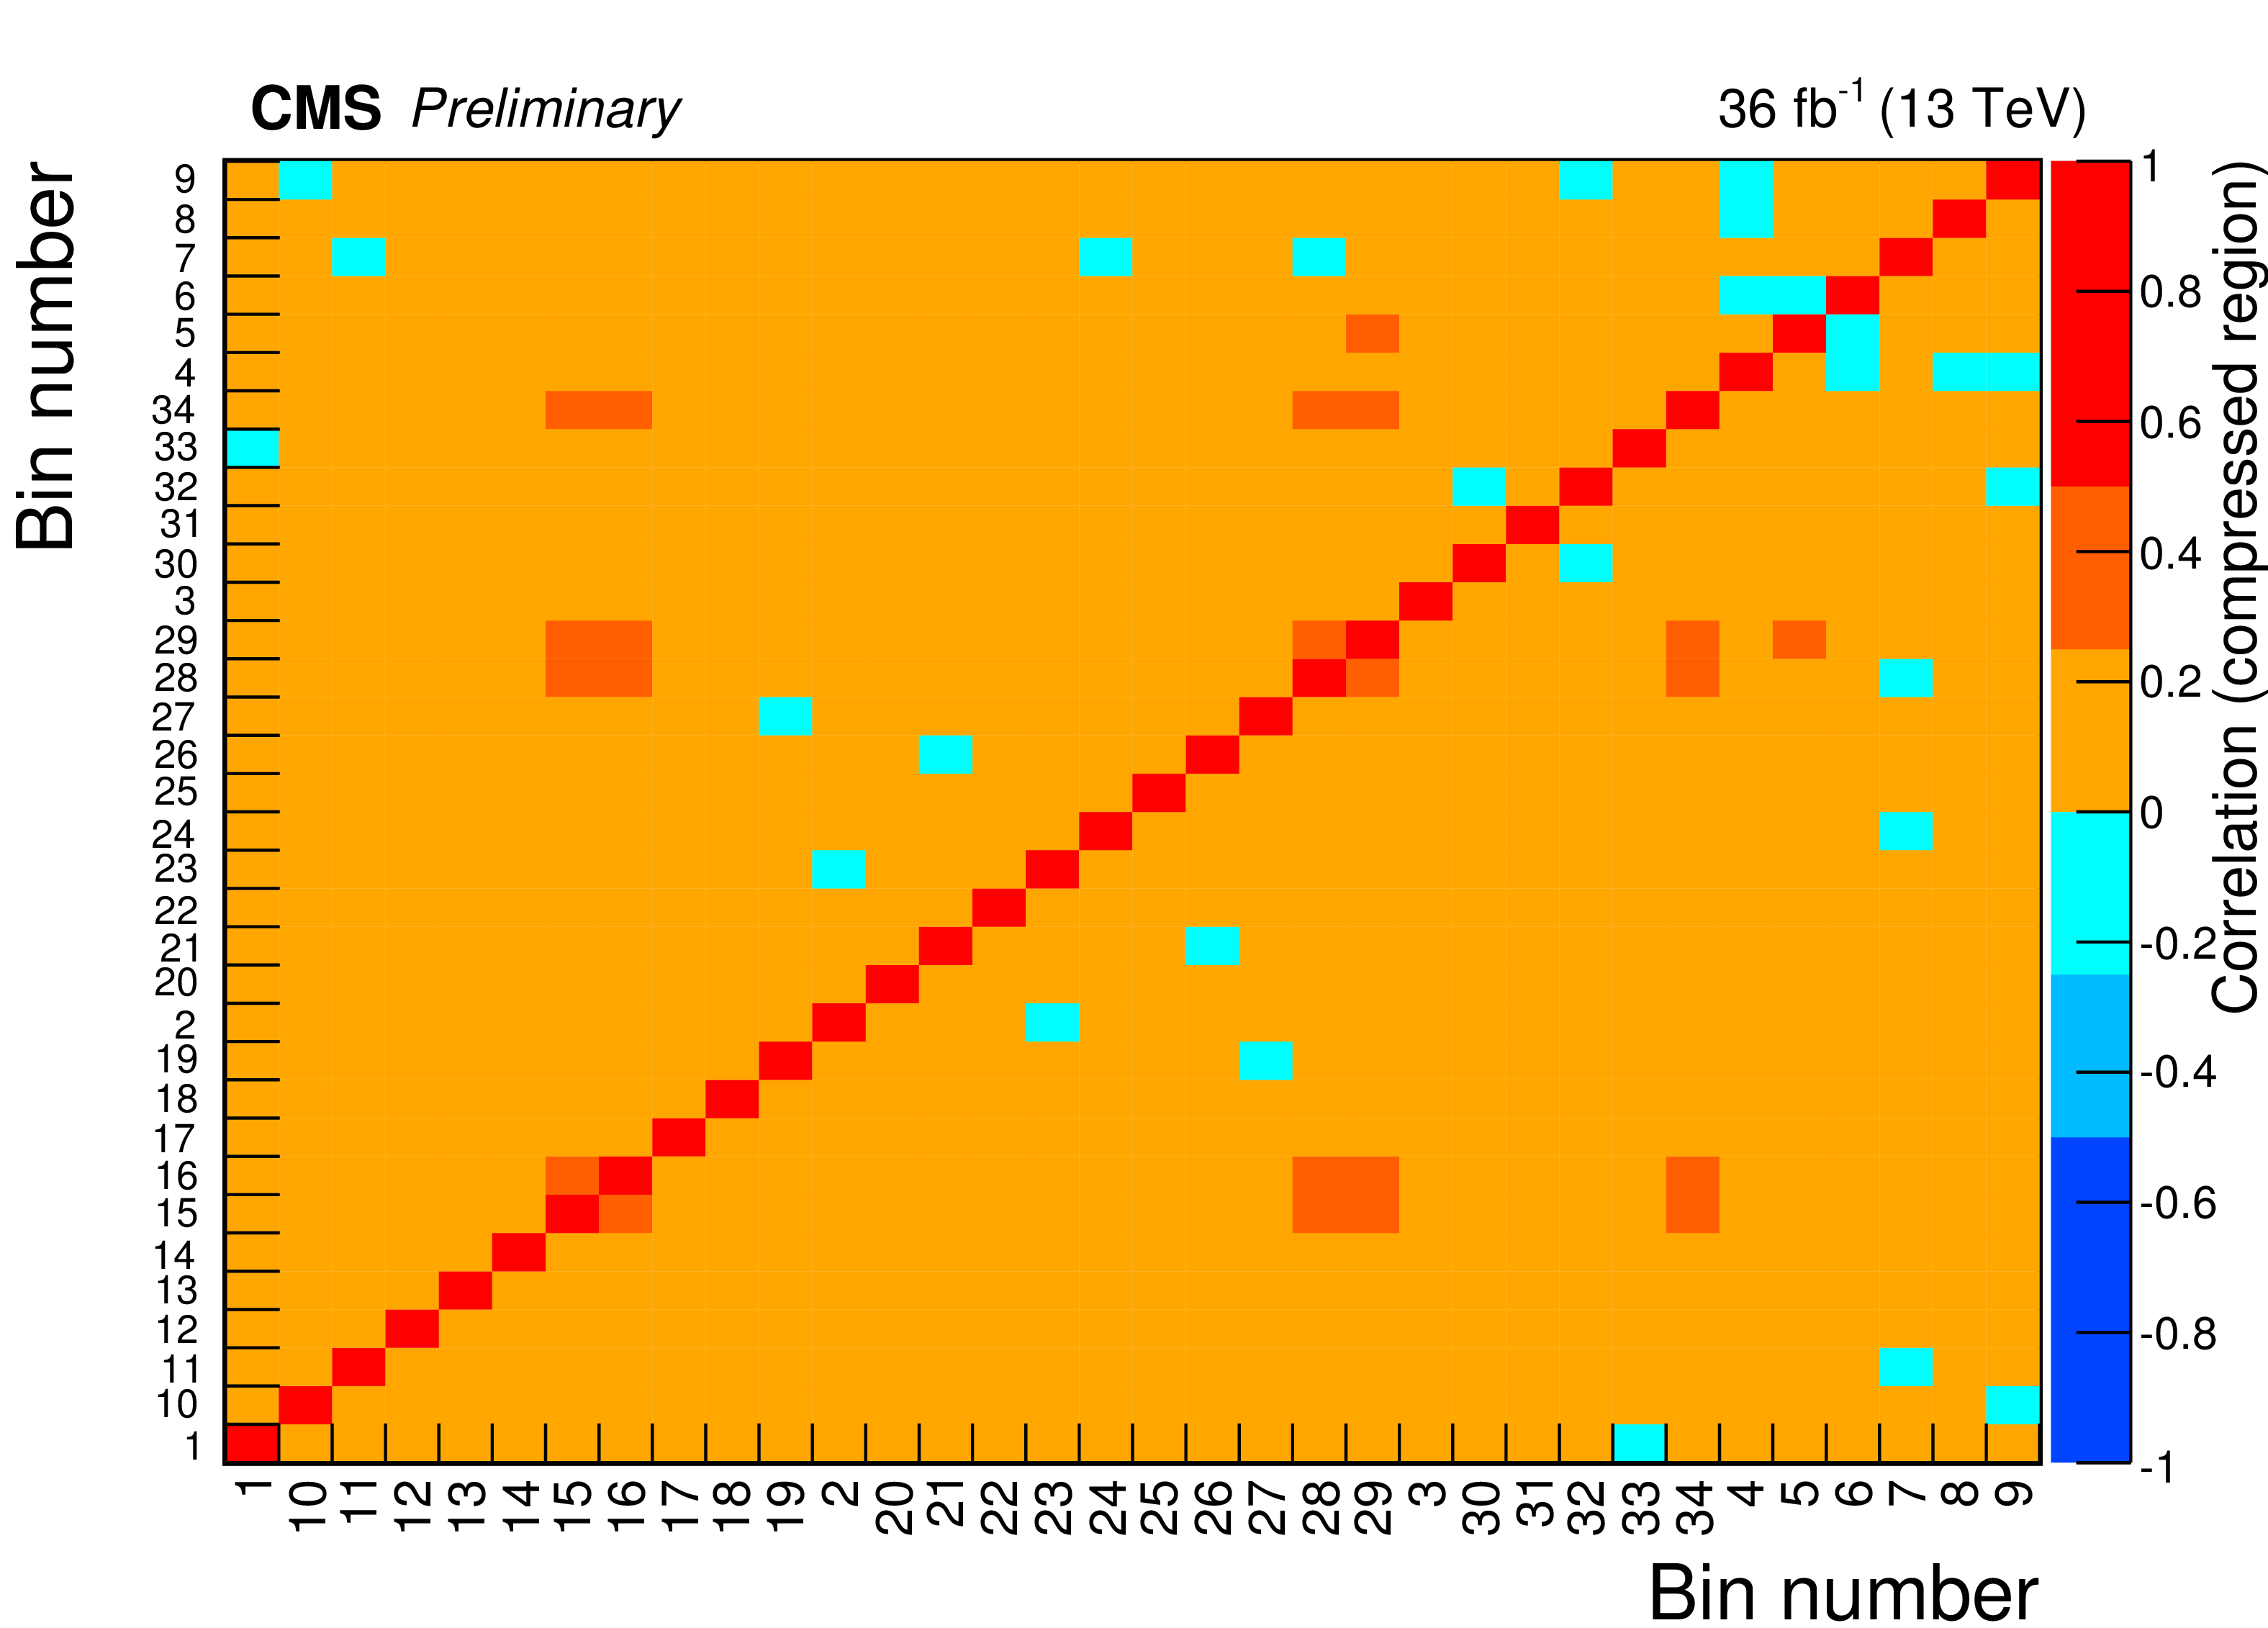
Figure 6-b:
The correlation matrix for the estimated backgrounds in the compressed search region. |
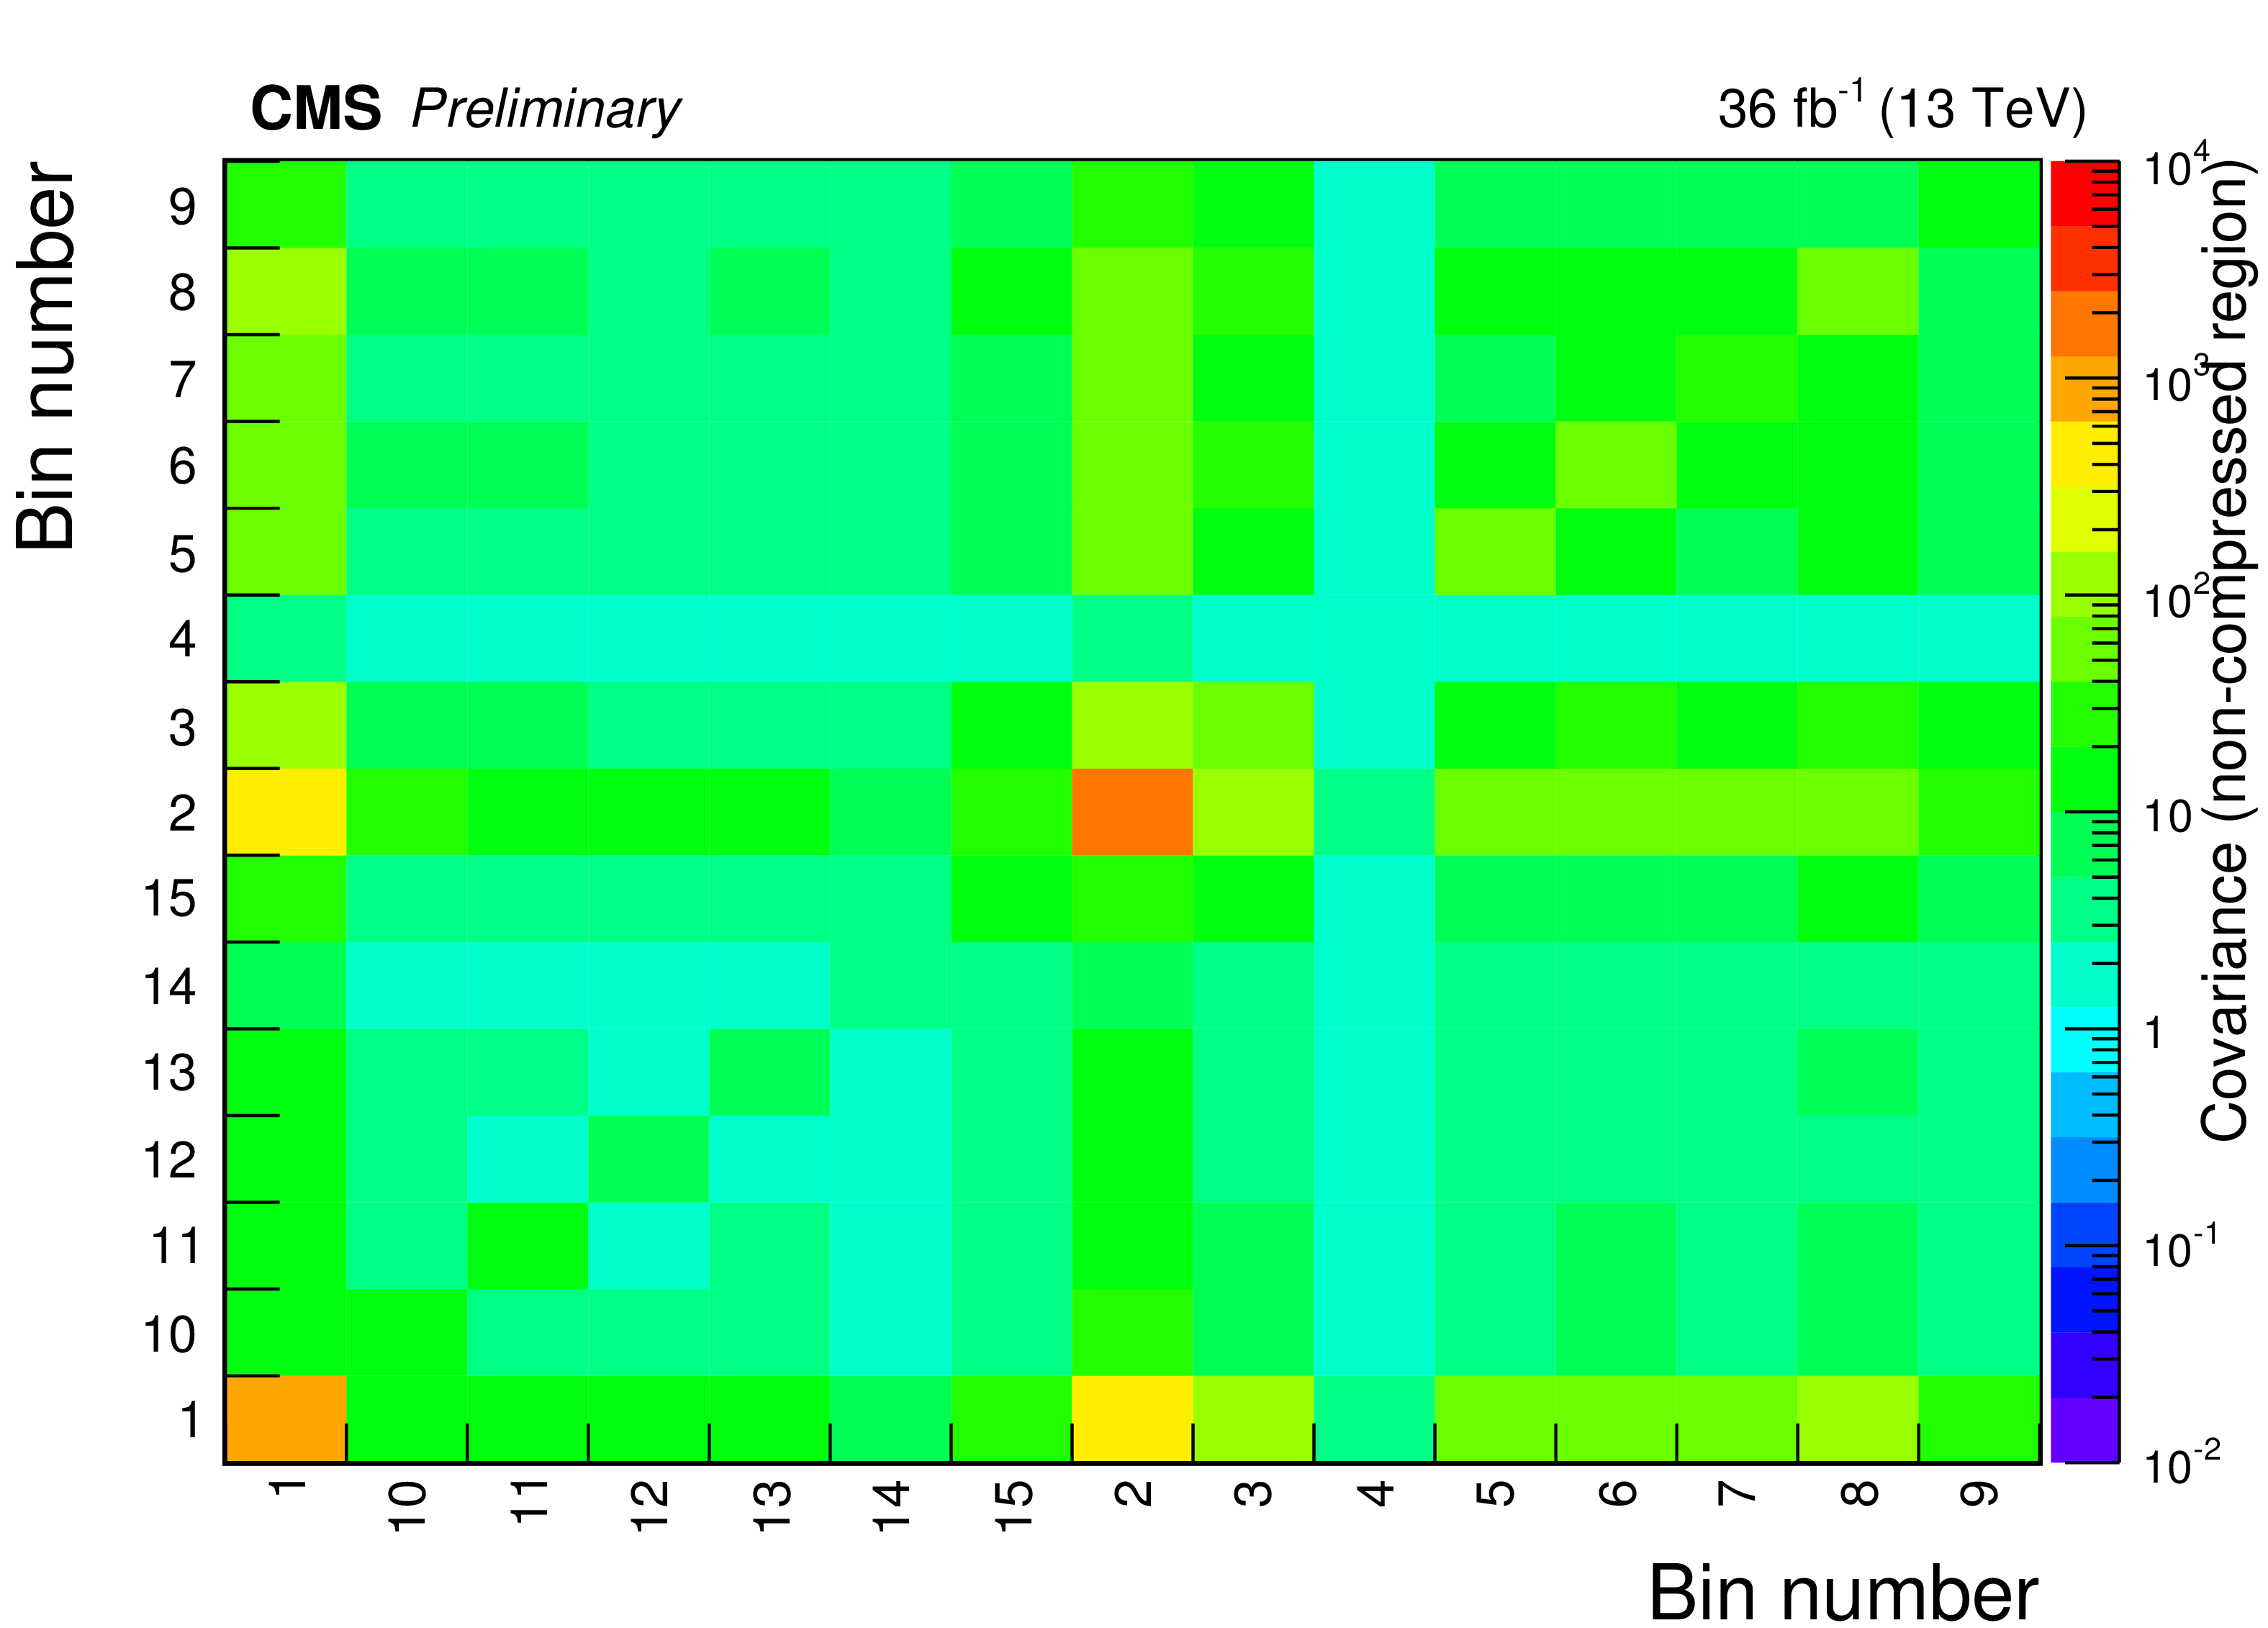
png pdf root |
Figure 6-c:
The covariance matrix for the estimated backgrounds in the non-compressed search region. |
png pdf root |
Figure 6-d:
The correlation matrix for the estimated backgrounds in the non-compressed search region. |
| Tables | |
png pdf |
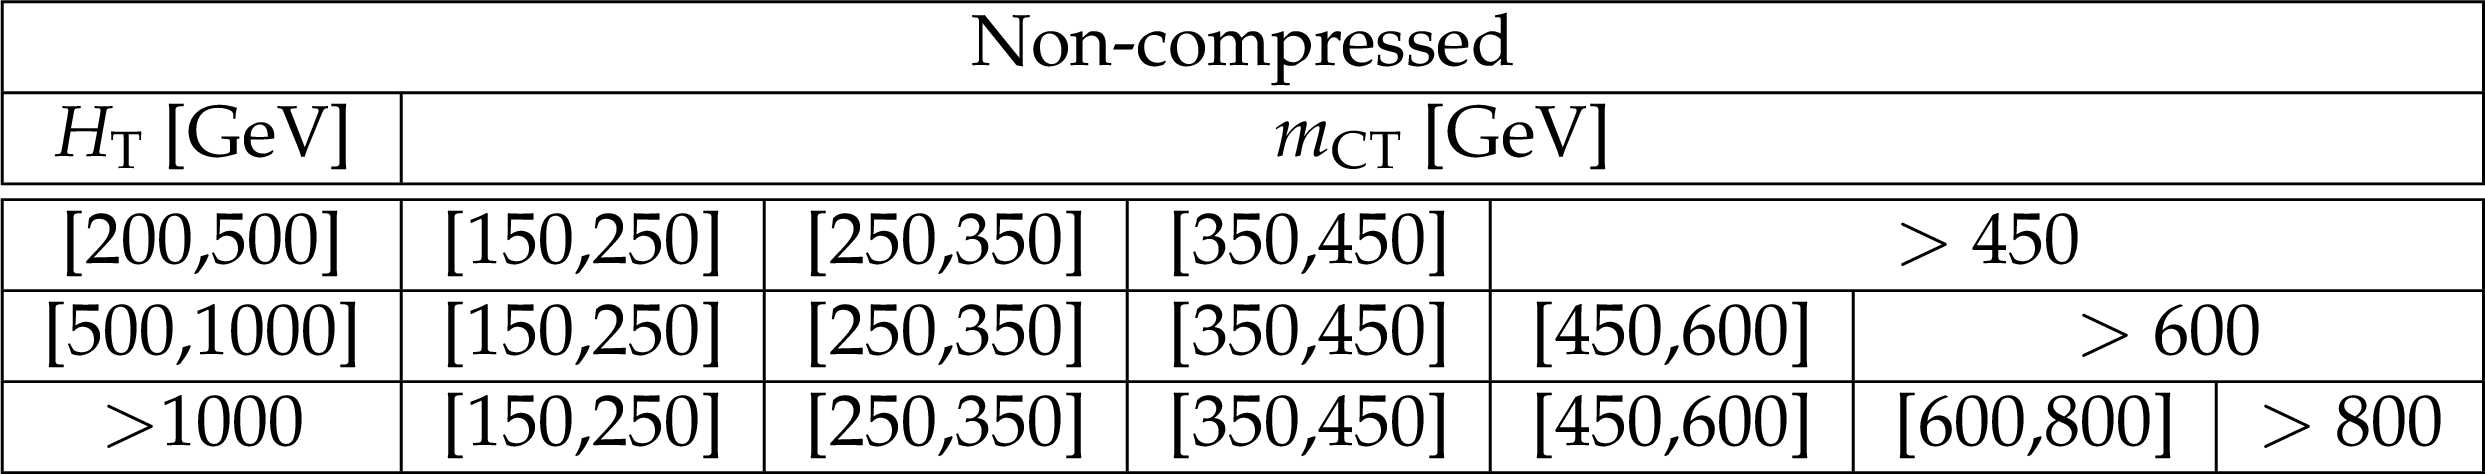
Table 1:
The ${m_{\mathrm {CT}}}$ and ${H_{\mathrm {T}}}$ signal bins in the non-compressed search region. |
png pdf |
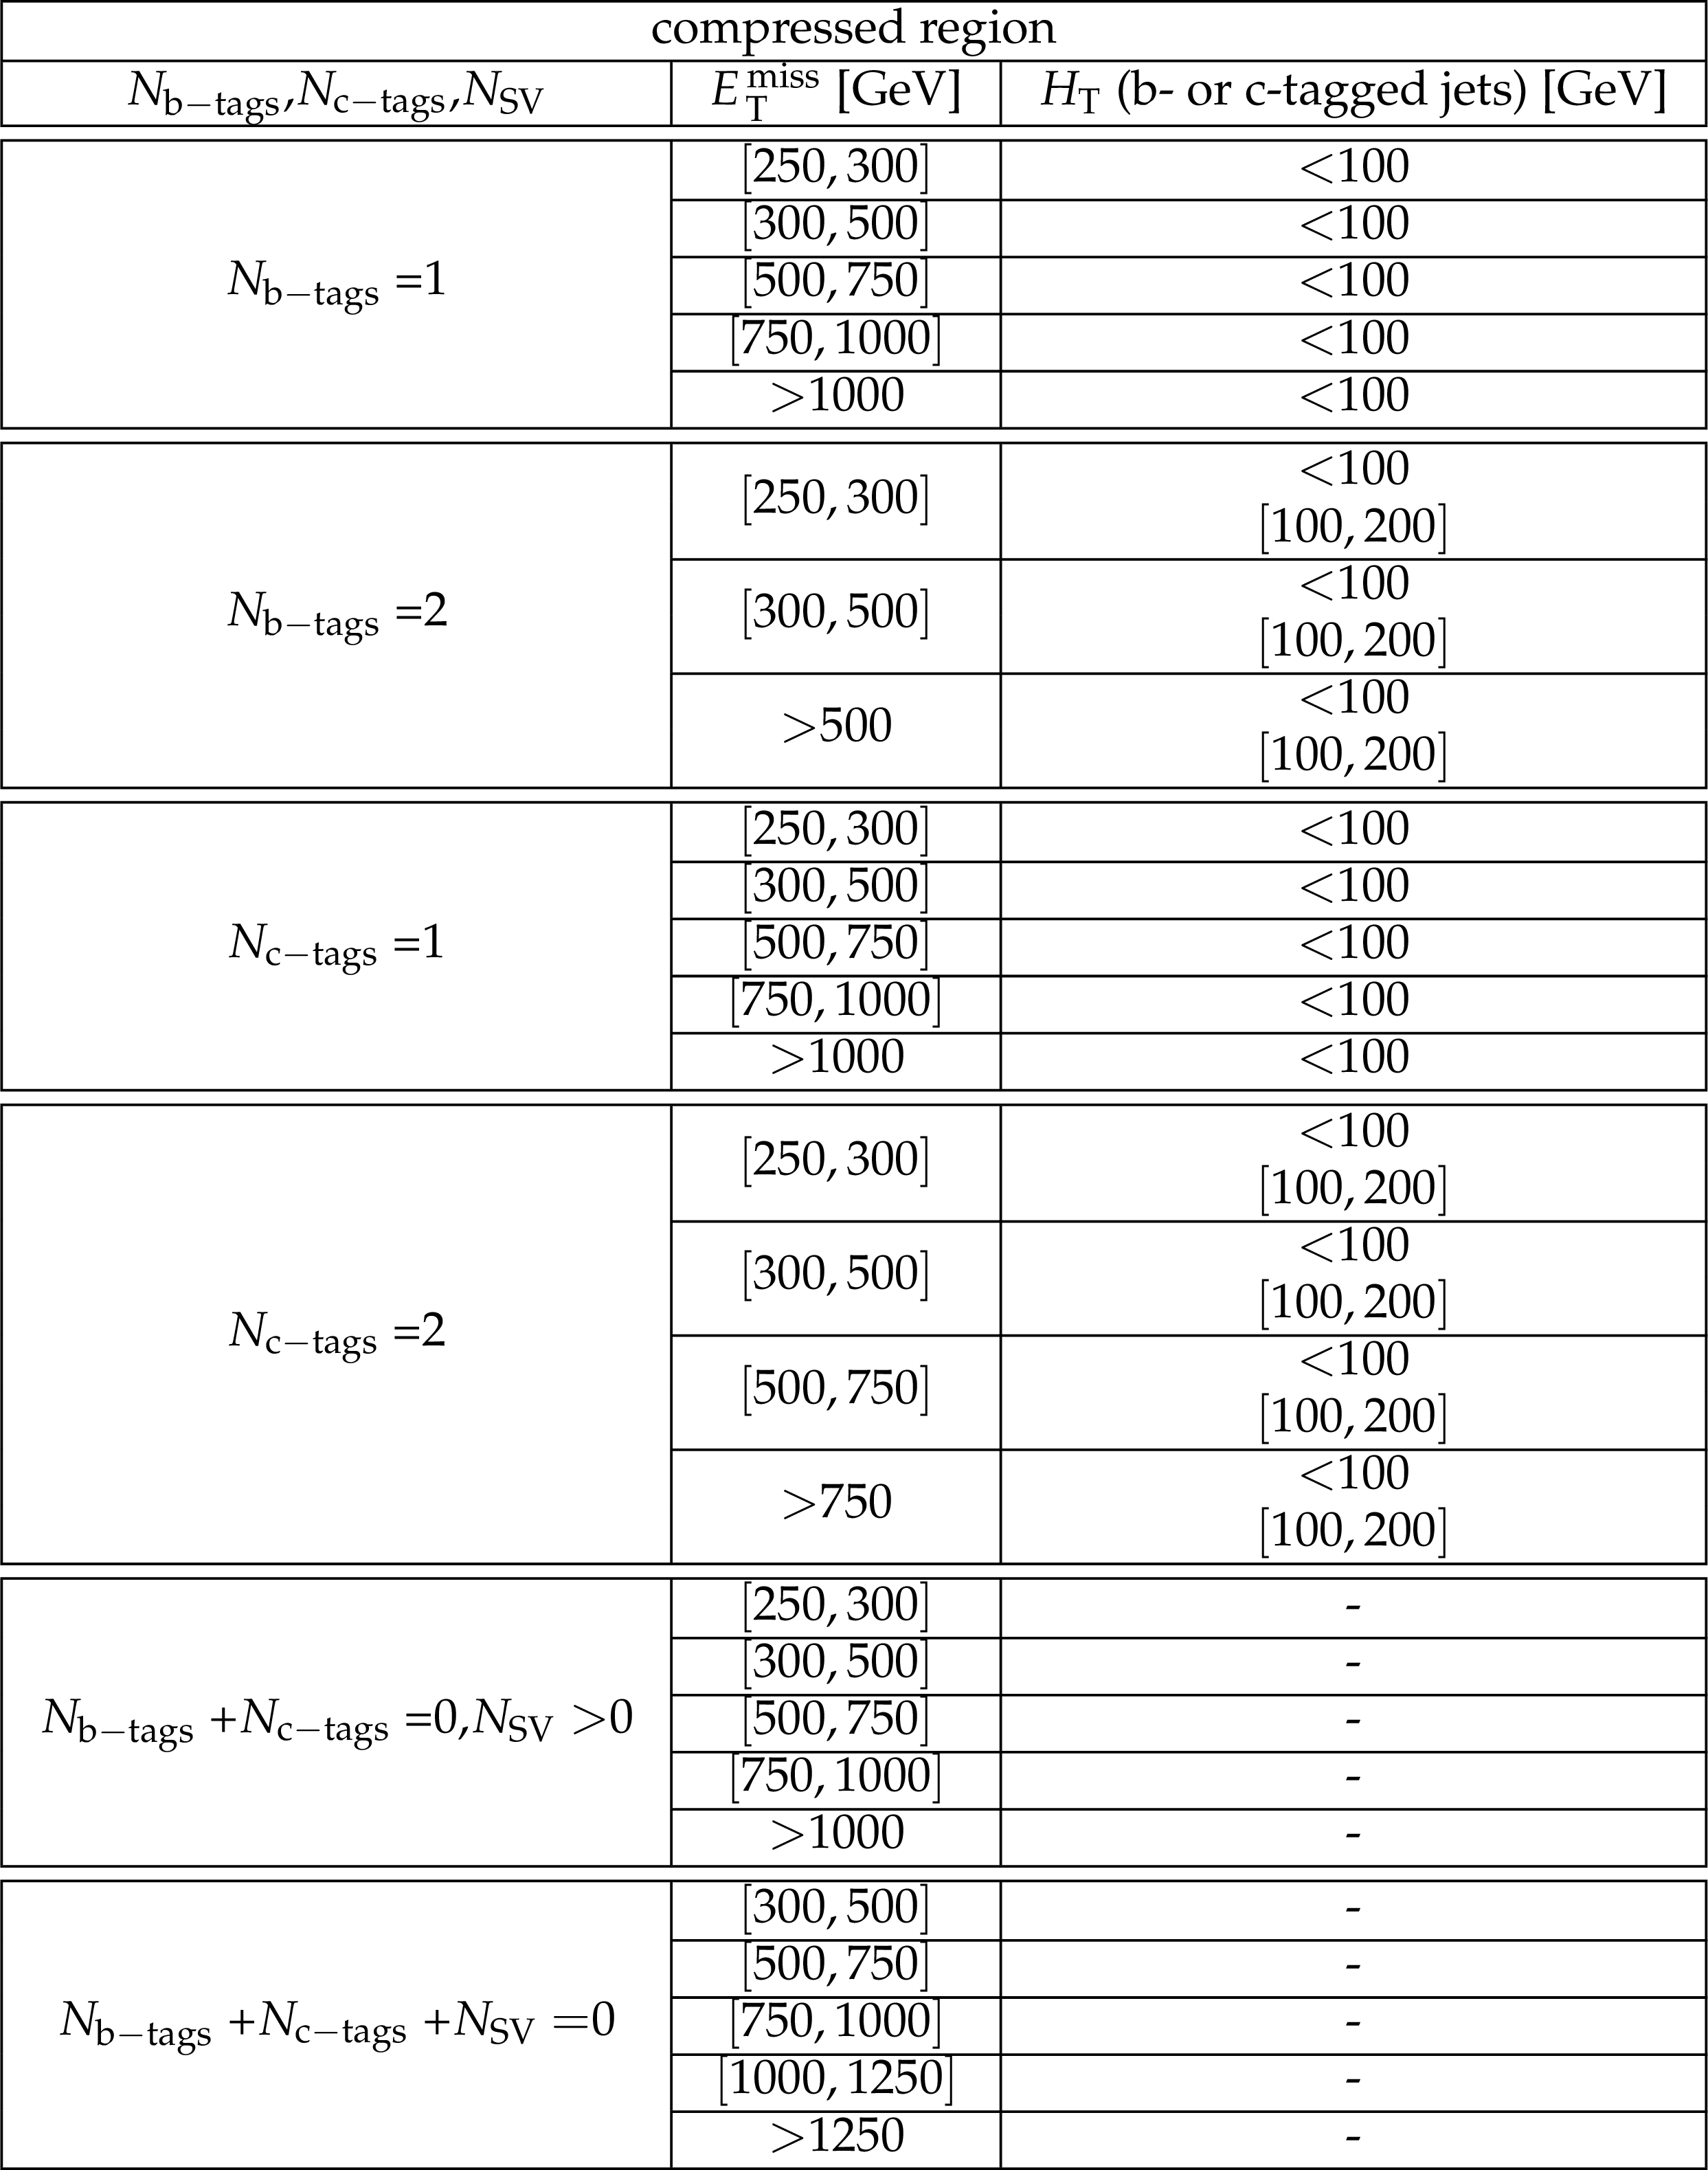
Table 2:
The signal bin definitions in the compressed search region. |
png pdf |
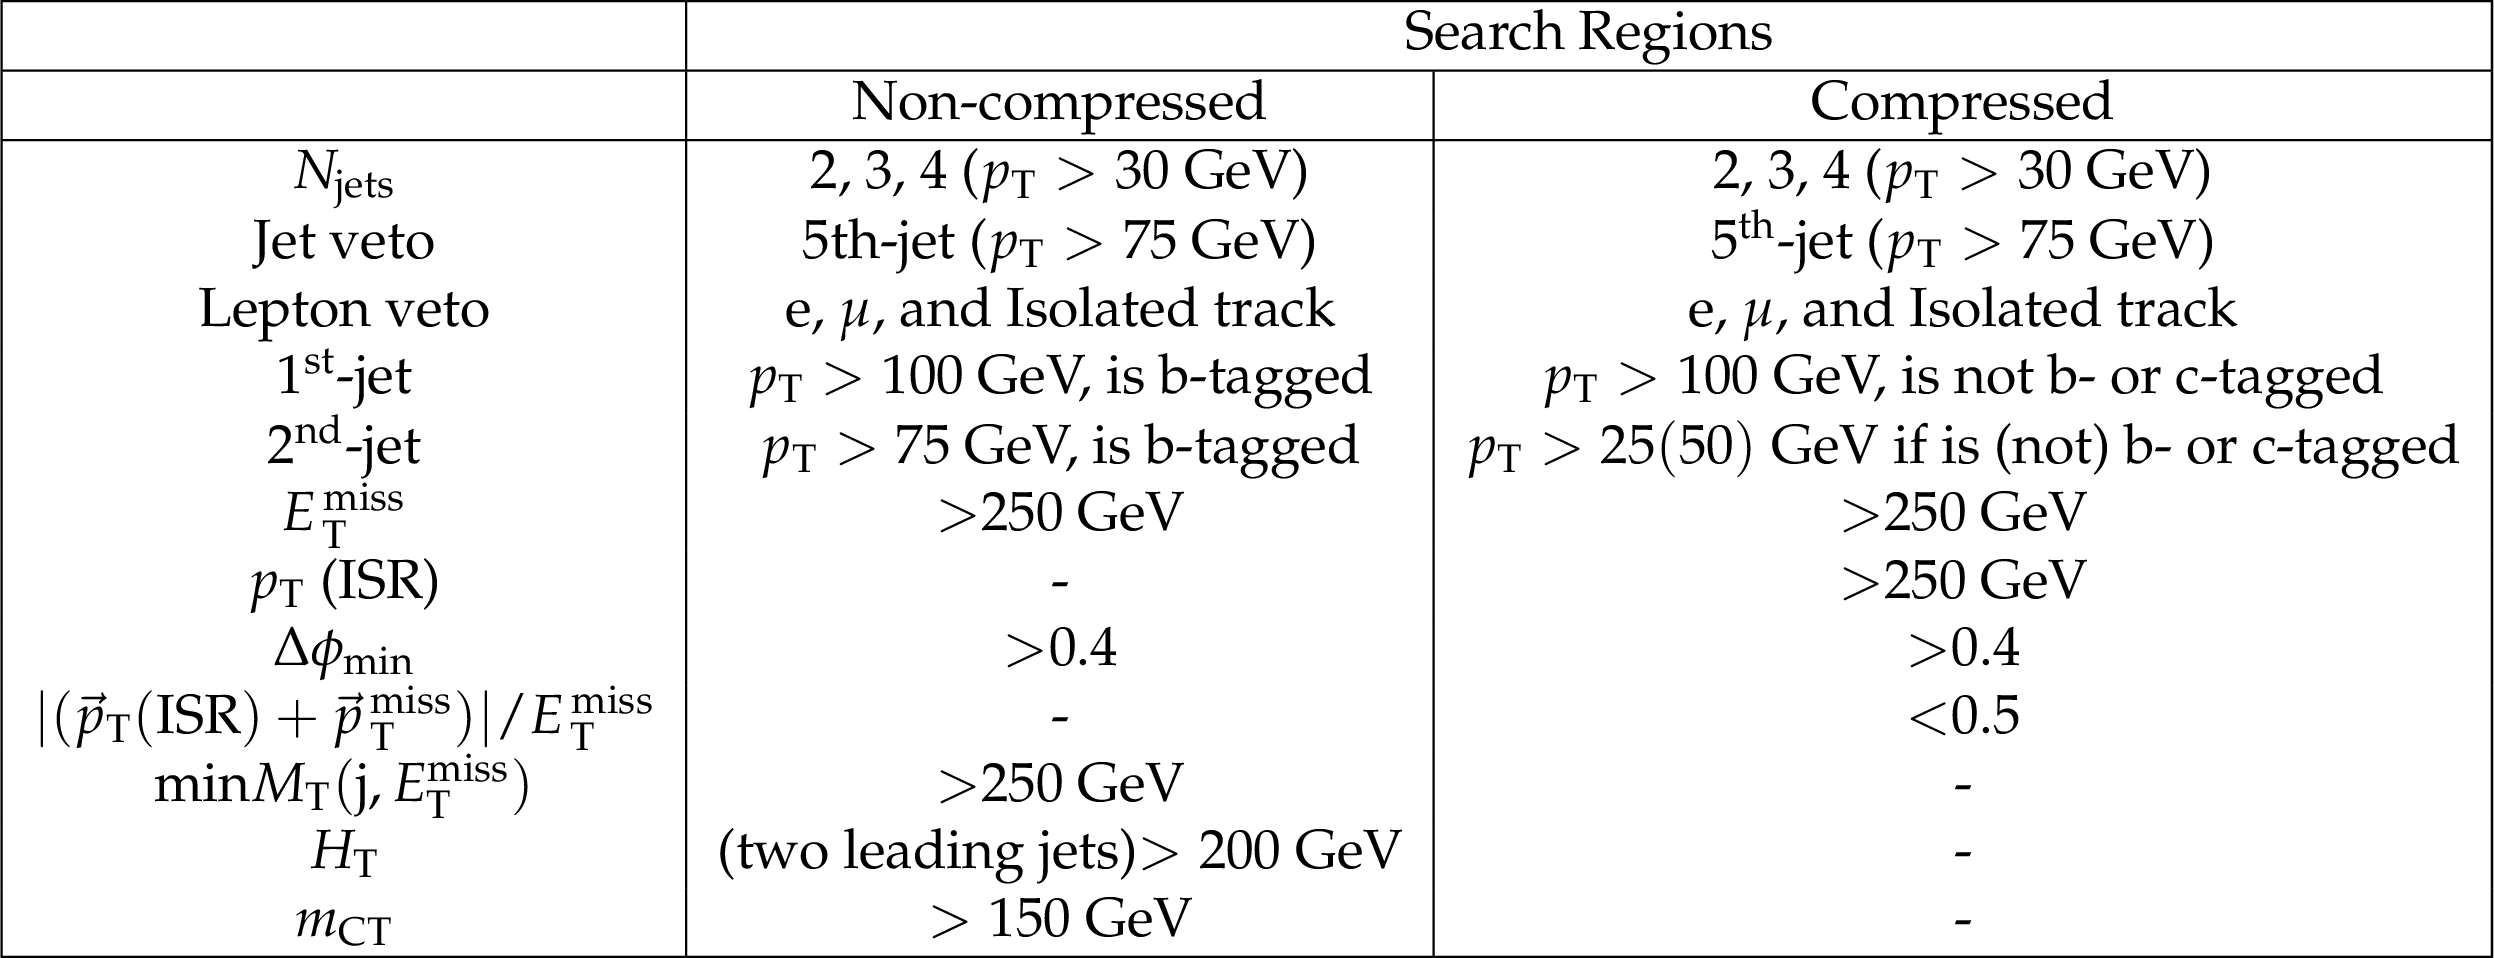
Table 3:
Baseline selections in both the non-compressed and compressed regions. |
png pdf |
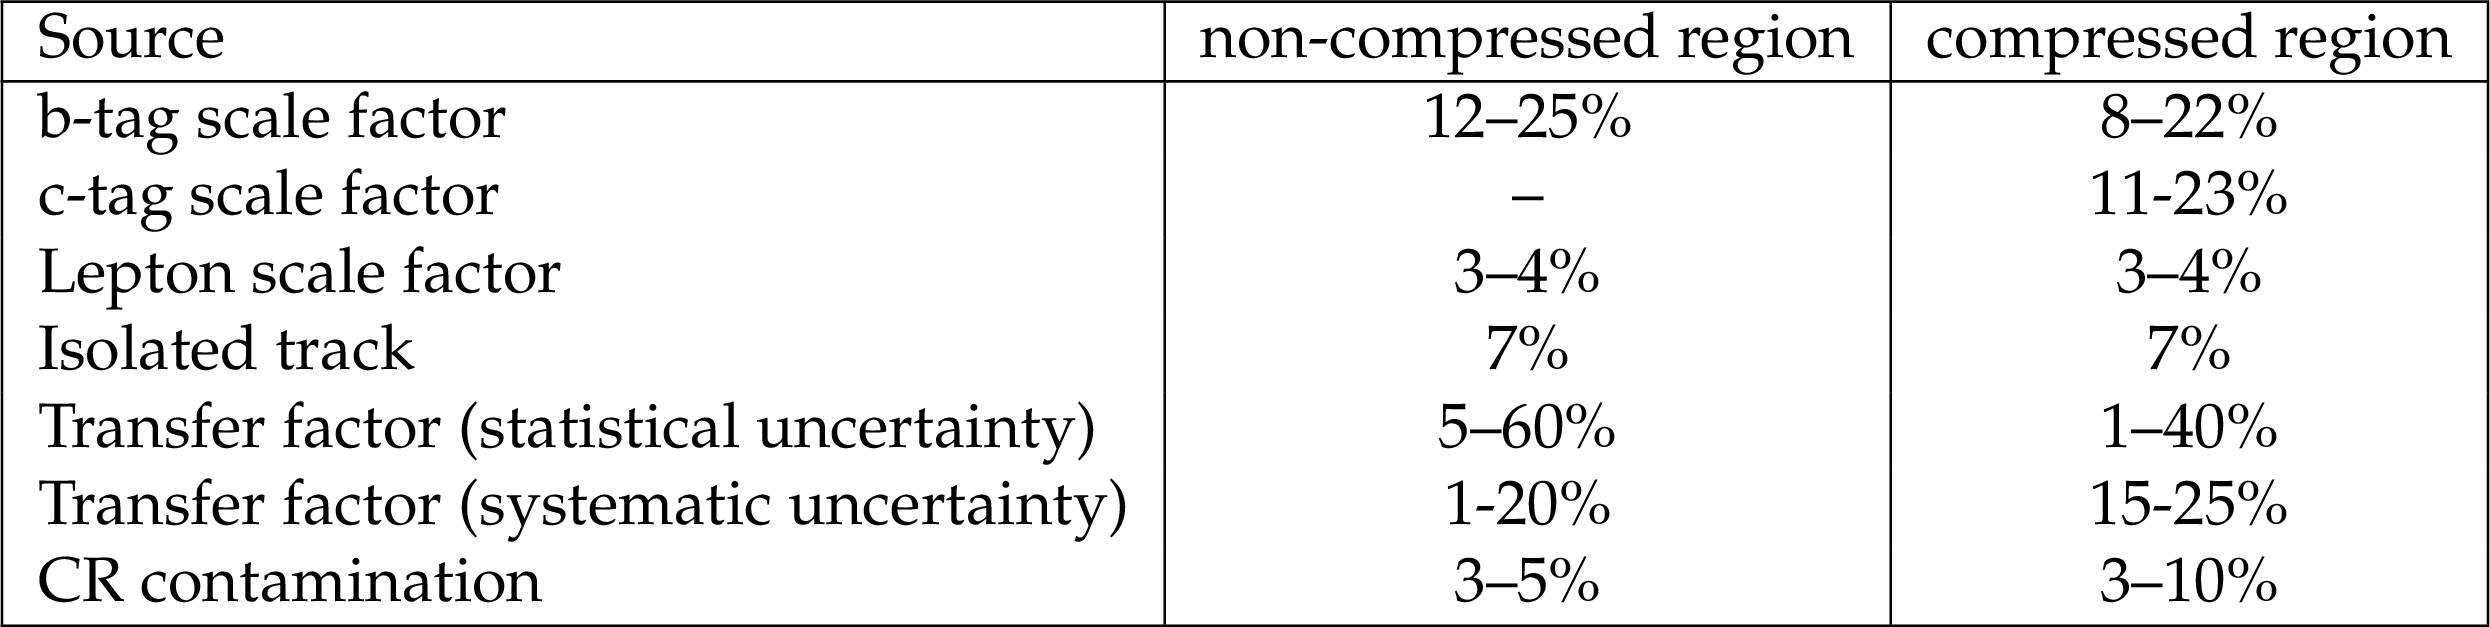
Table 4:
Typical ranges for the different systematic uncertainties on the lost lepton background estimate. |
png pdf |
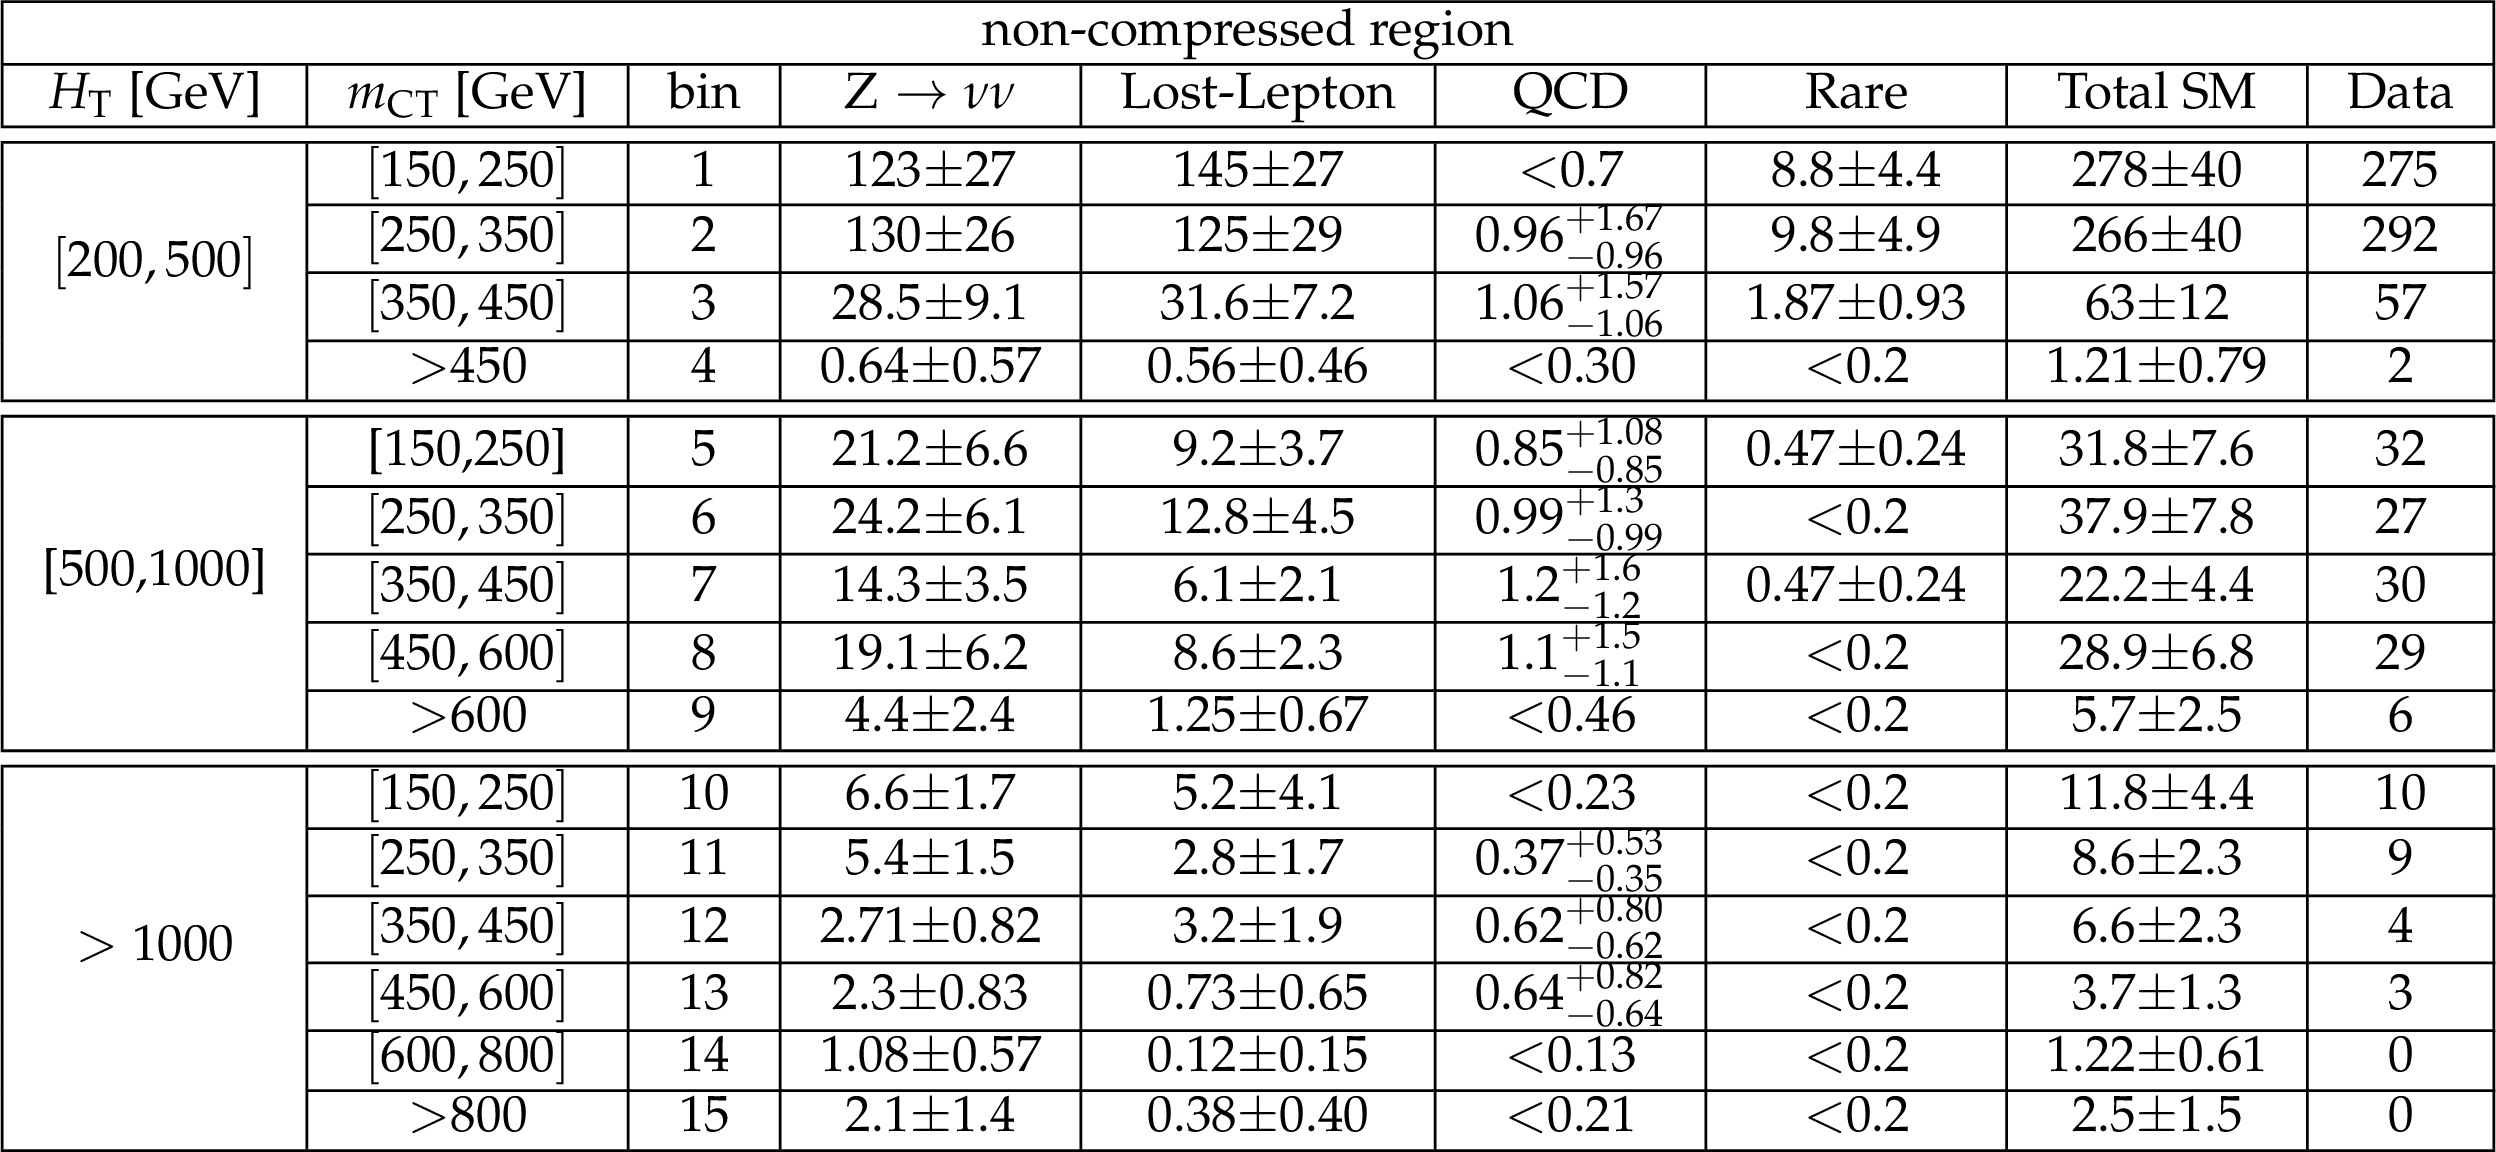
Table 5:
Observed number of events and background prediction (individual, total) in the non-compressed region. The uncertainties shown combine the statistical and systematic components. |
png pdf |
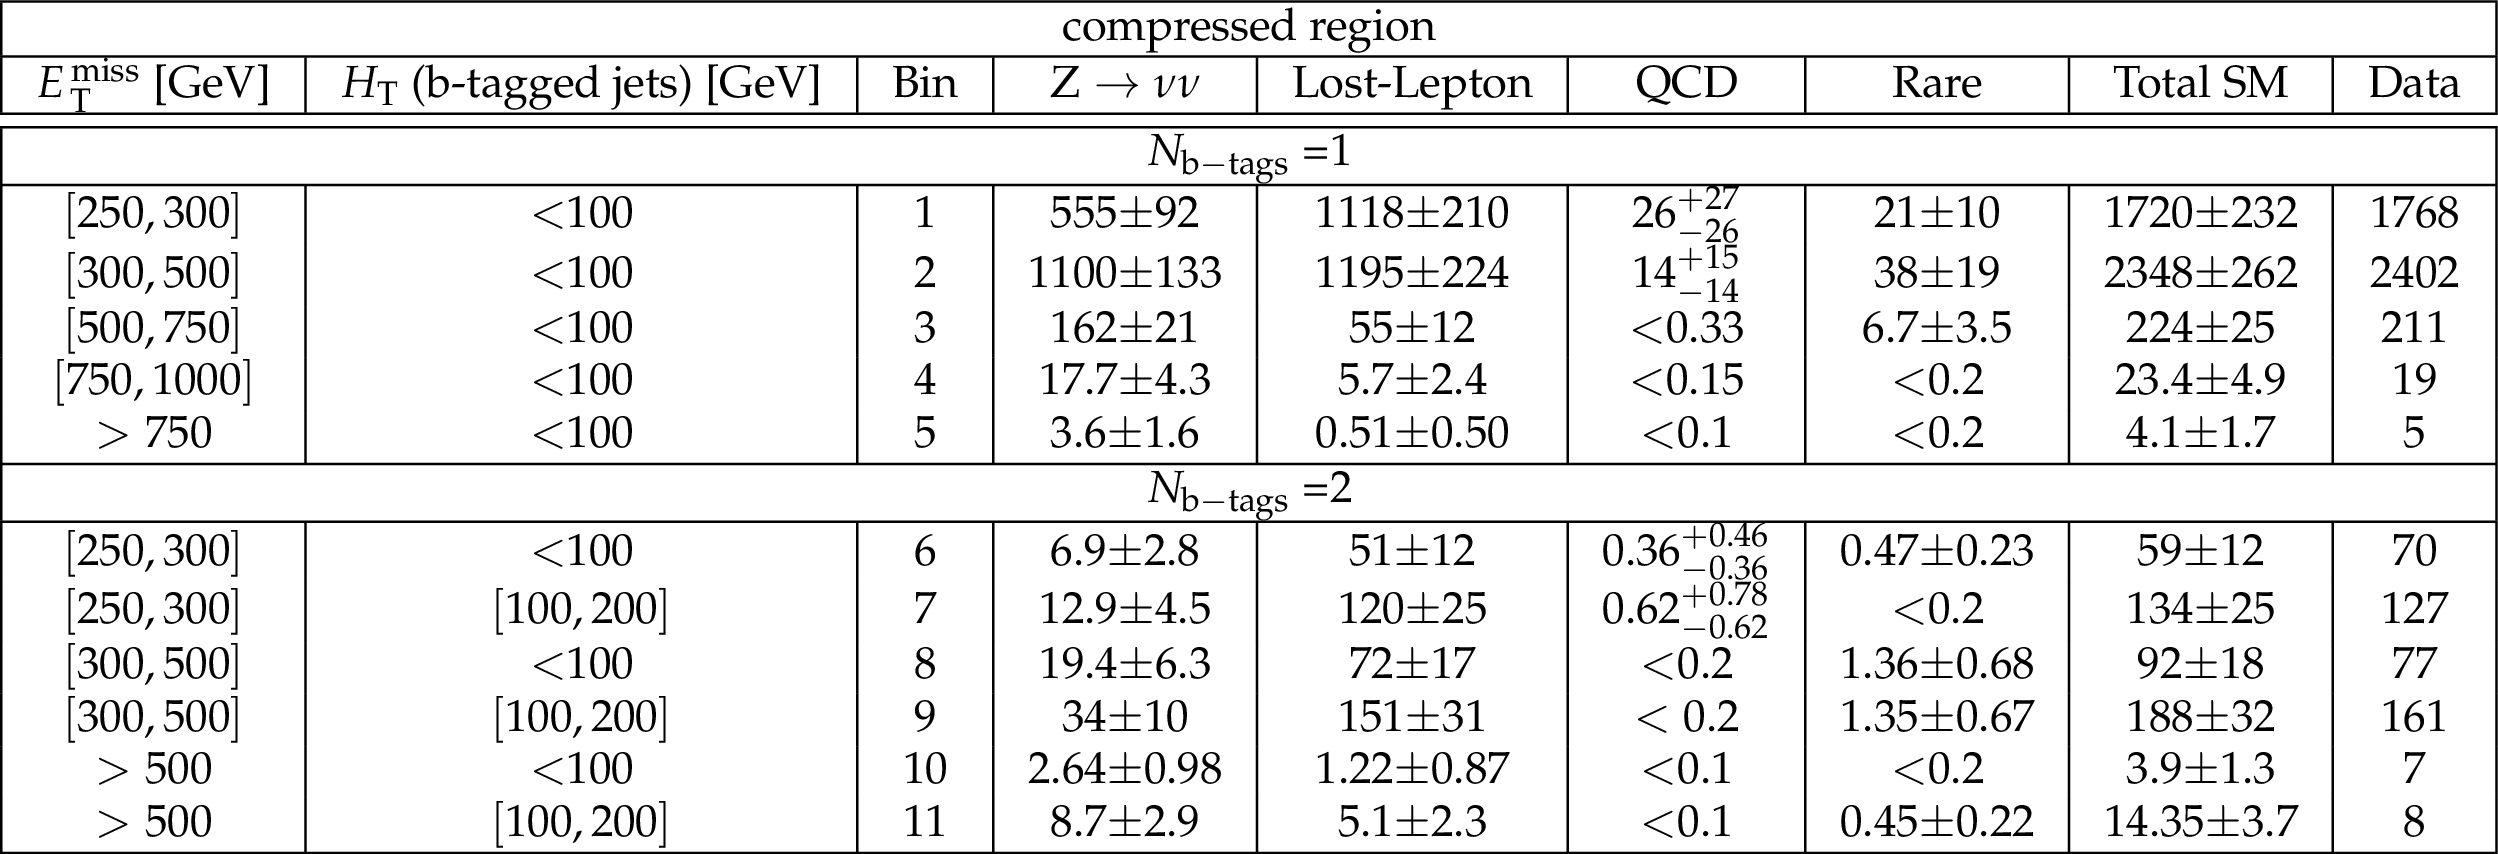
Table 6:
Observed number of events and background prediction (individual and total) in the compressed region with ${N_{\mathrm {b-tags}}} = $ 1, 2. the uncertainties shown combine the statistical and systematic components. |
png pdf |
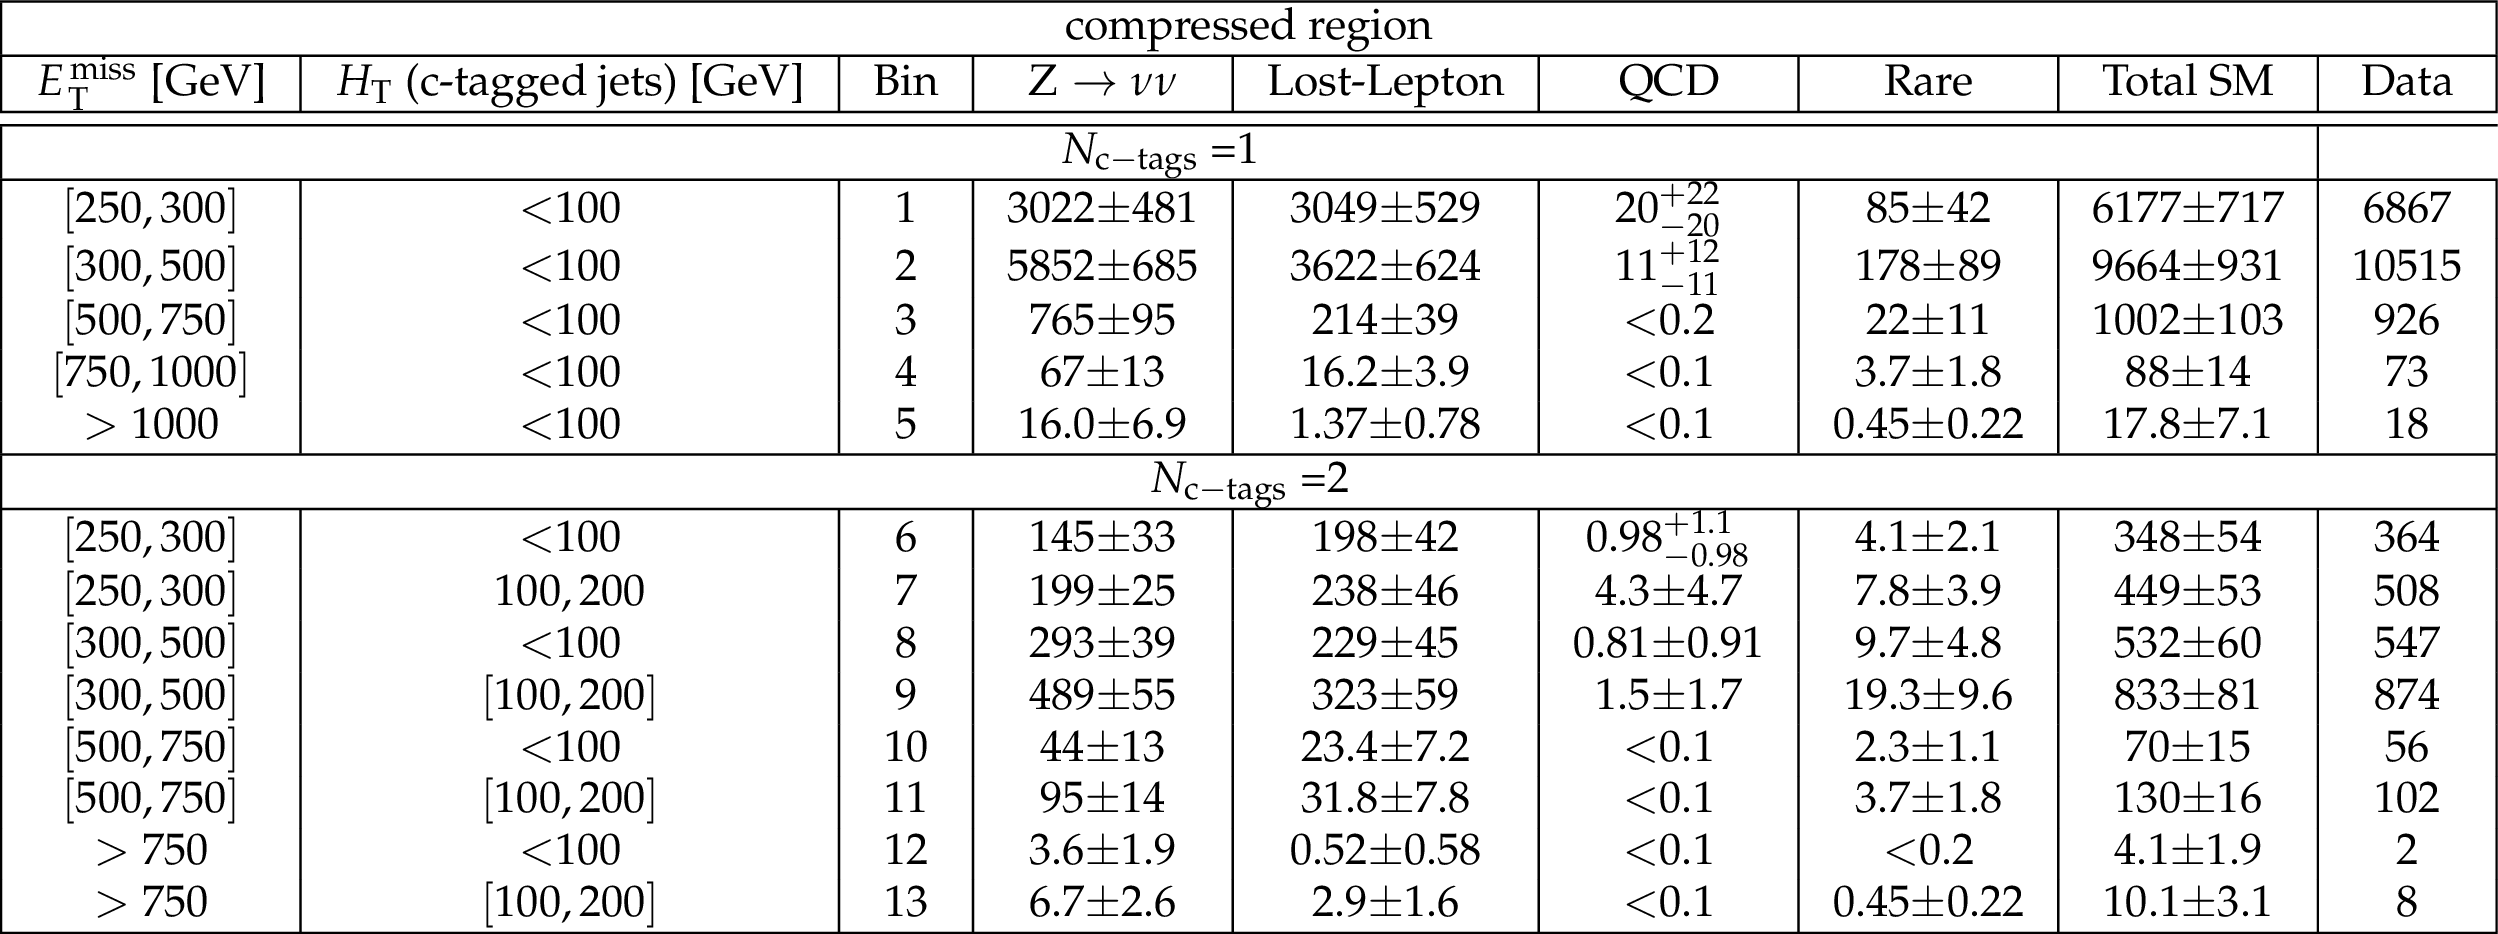
Table 7:
Observed number of events and background prediction (individual and total) in the compressed region with ${N_{\mathrm {c-tags}}} =$ 1, 2. The uncertainties shown combine the statistical and systematic components. |
png pdf |
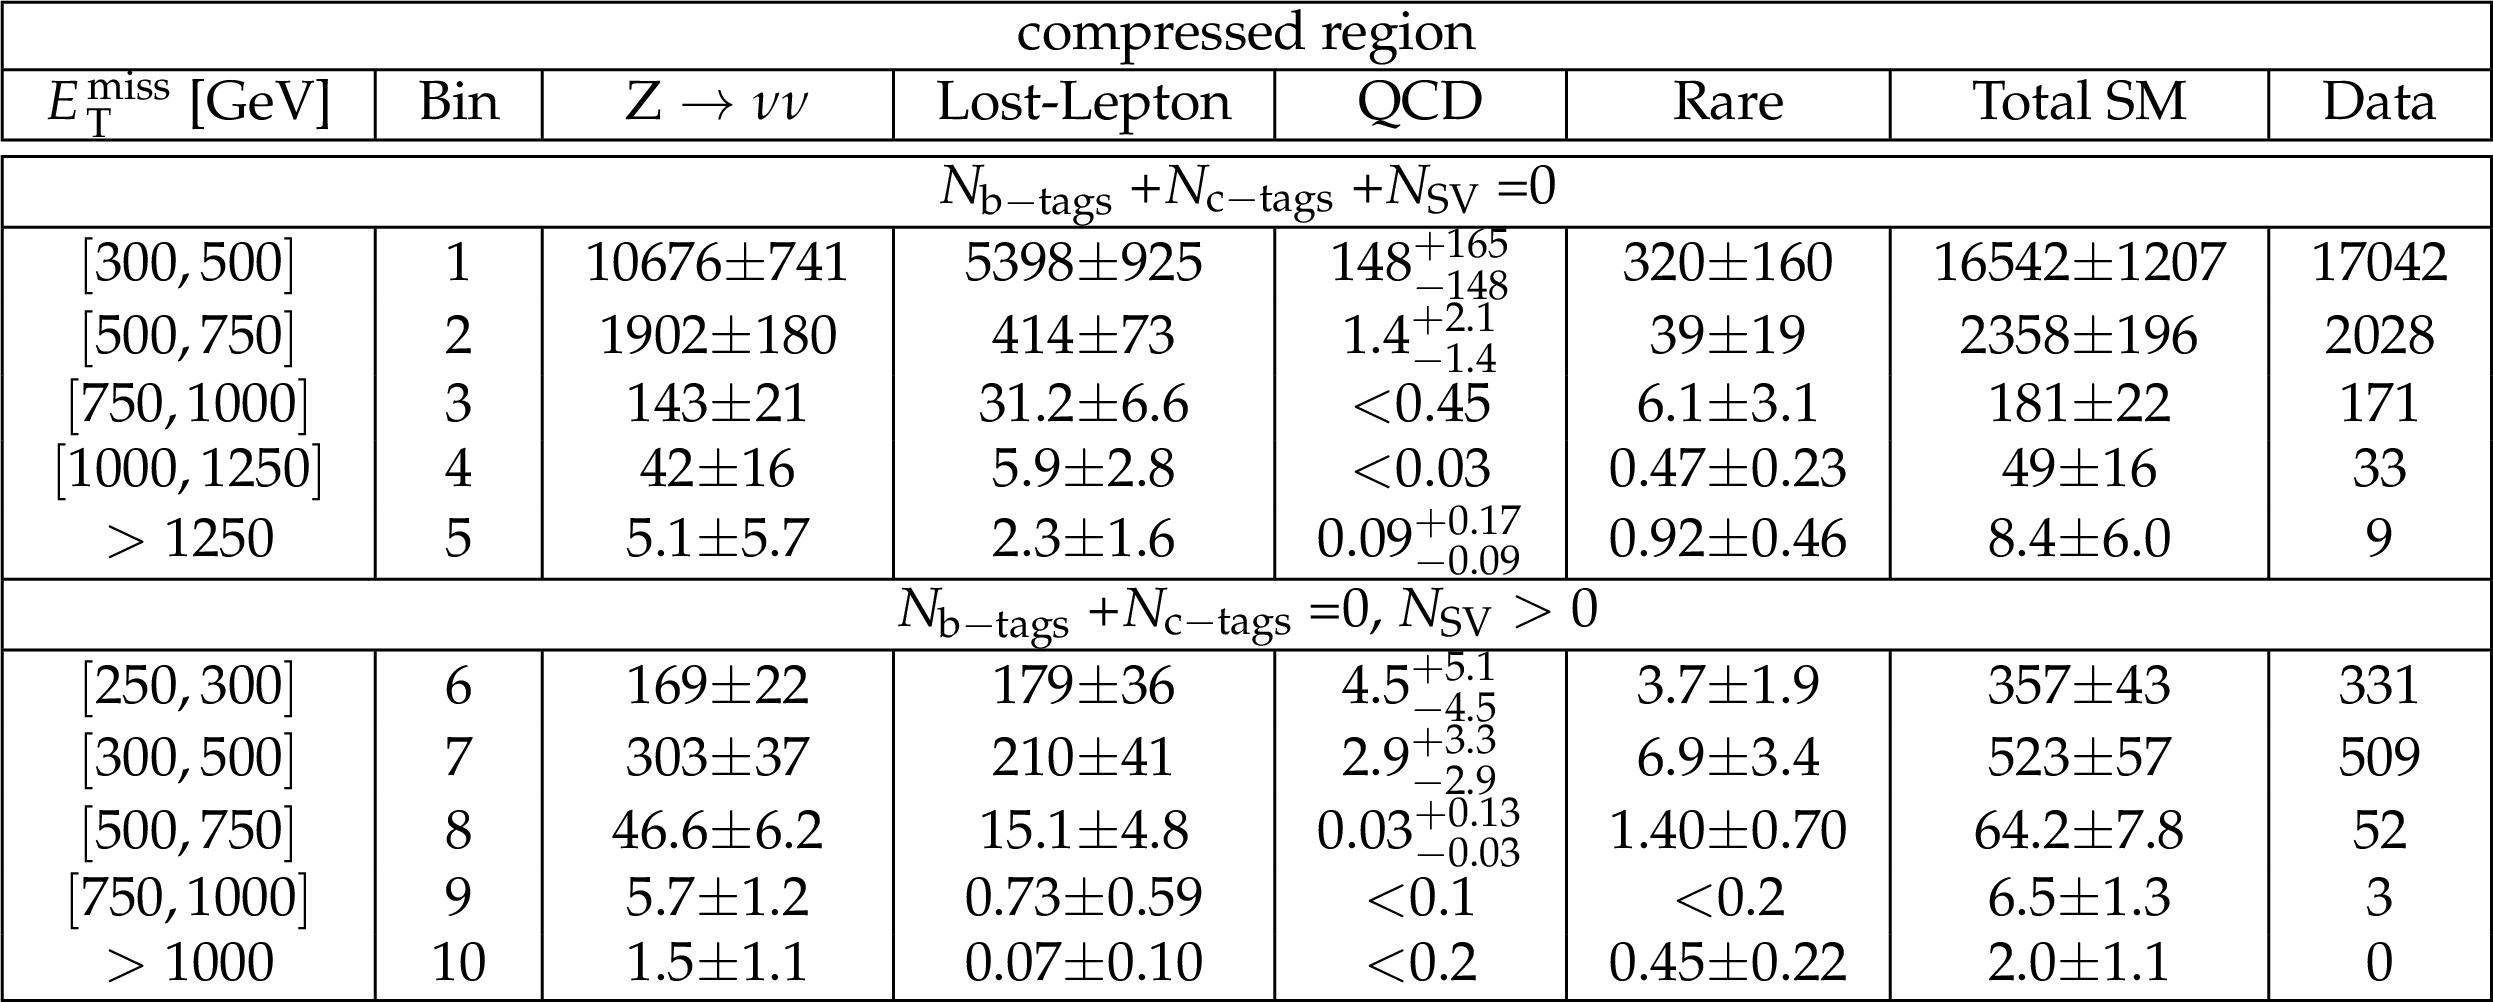
Table 8:
Observed number of events and background prediction (individual and total) in the compressed region with ${N_{\mathrm {b-tags}}} + {N_{\mathrm {c-tags}}} =$ 0. The uncertainties shown combine the statistical and systematic components. |
png pdf |
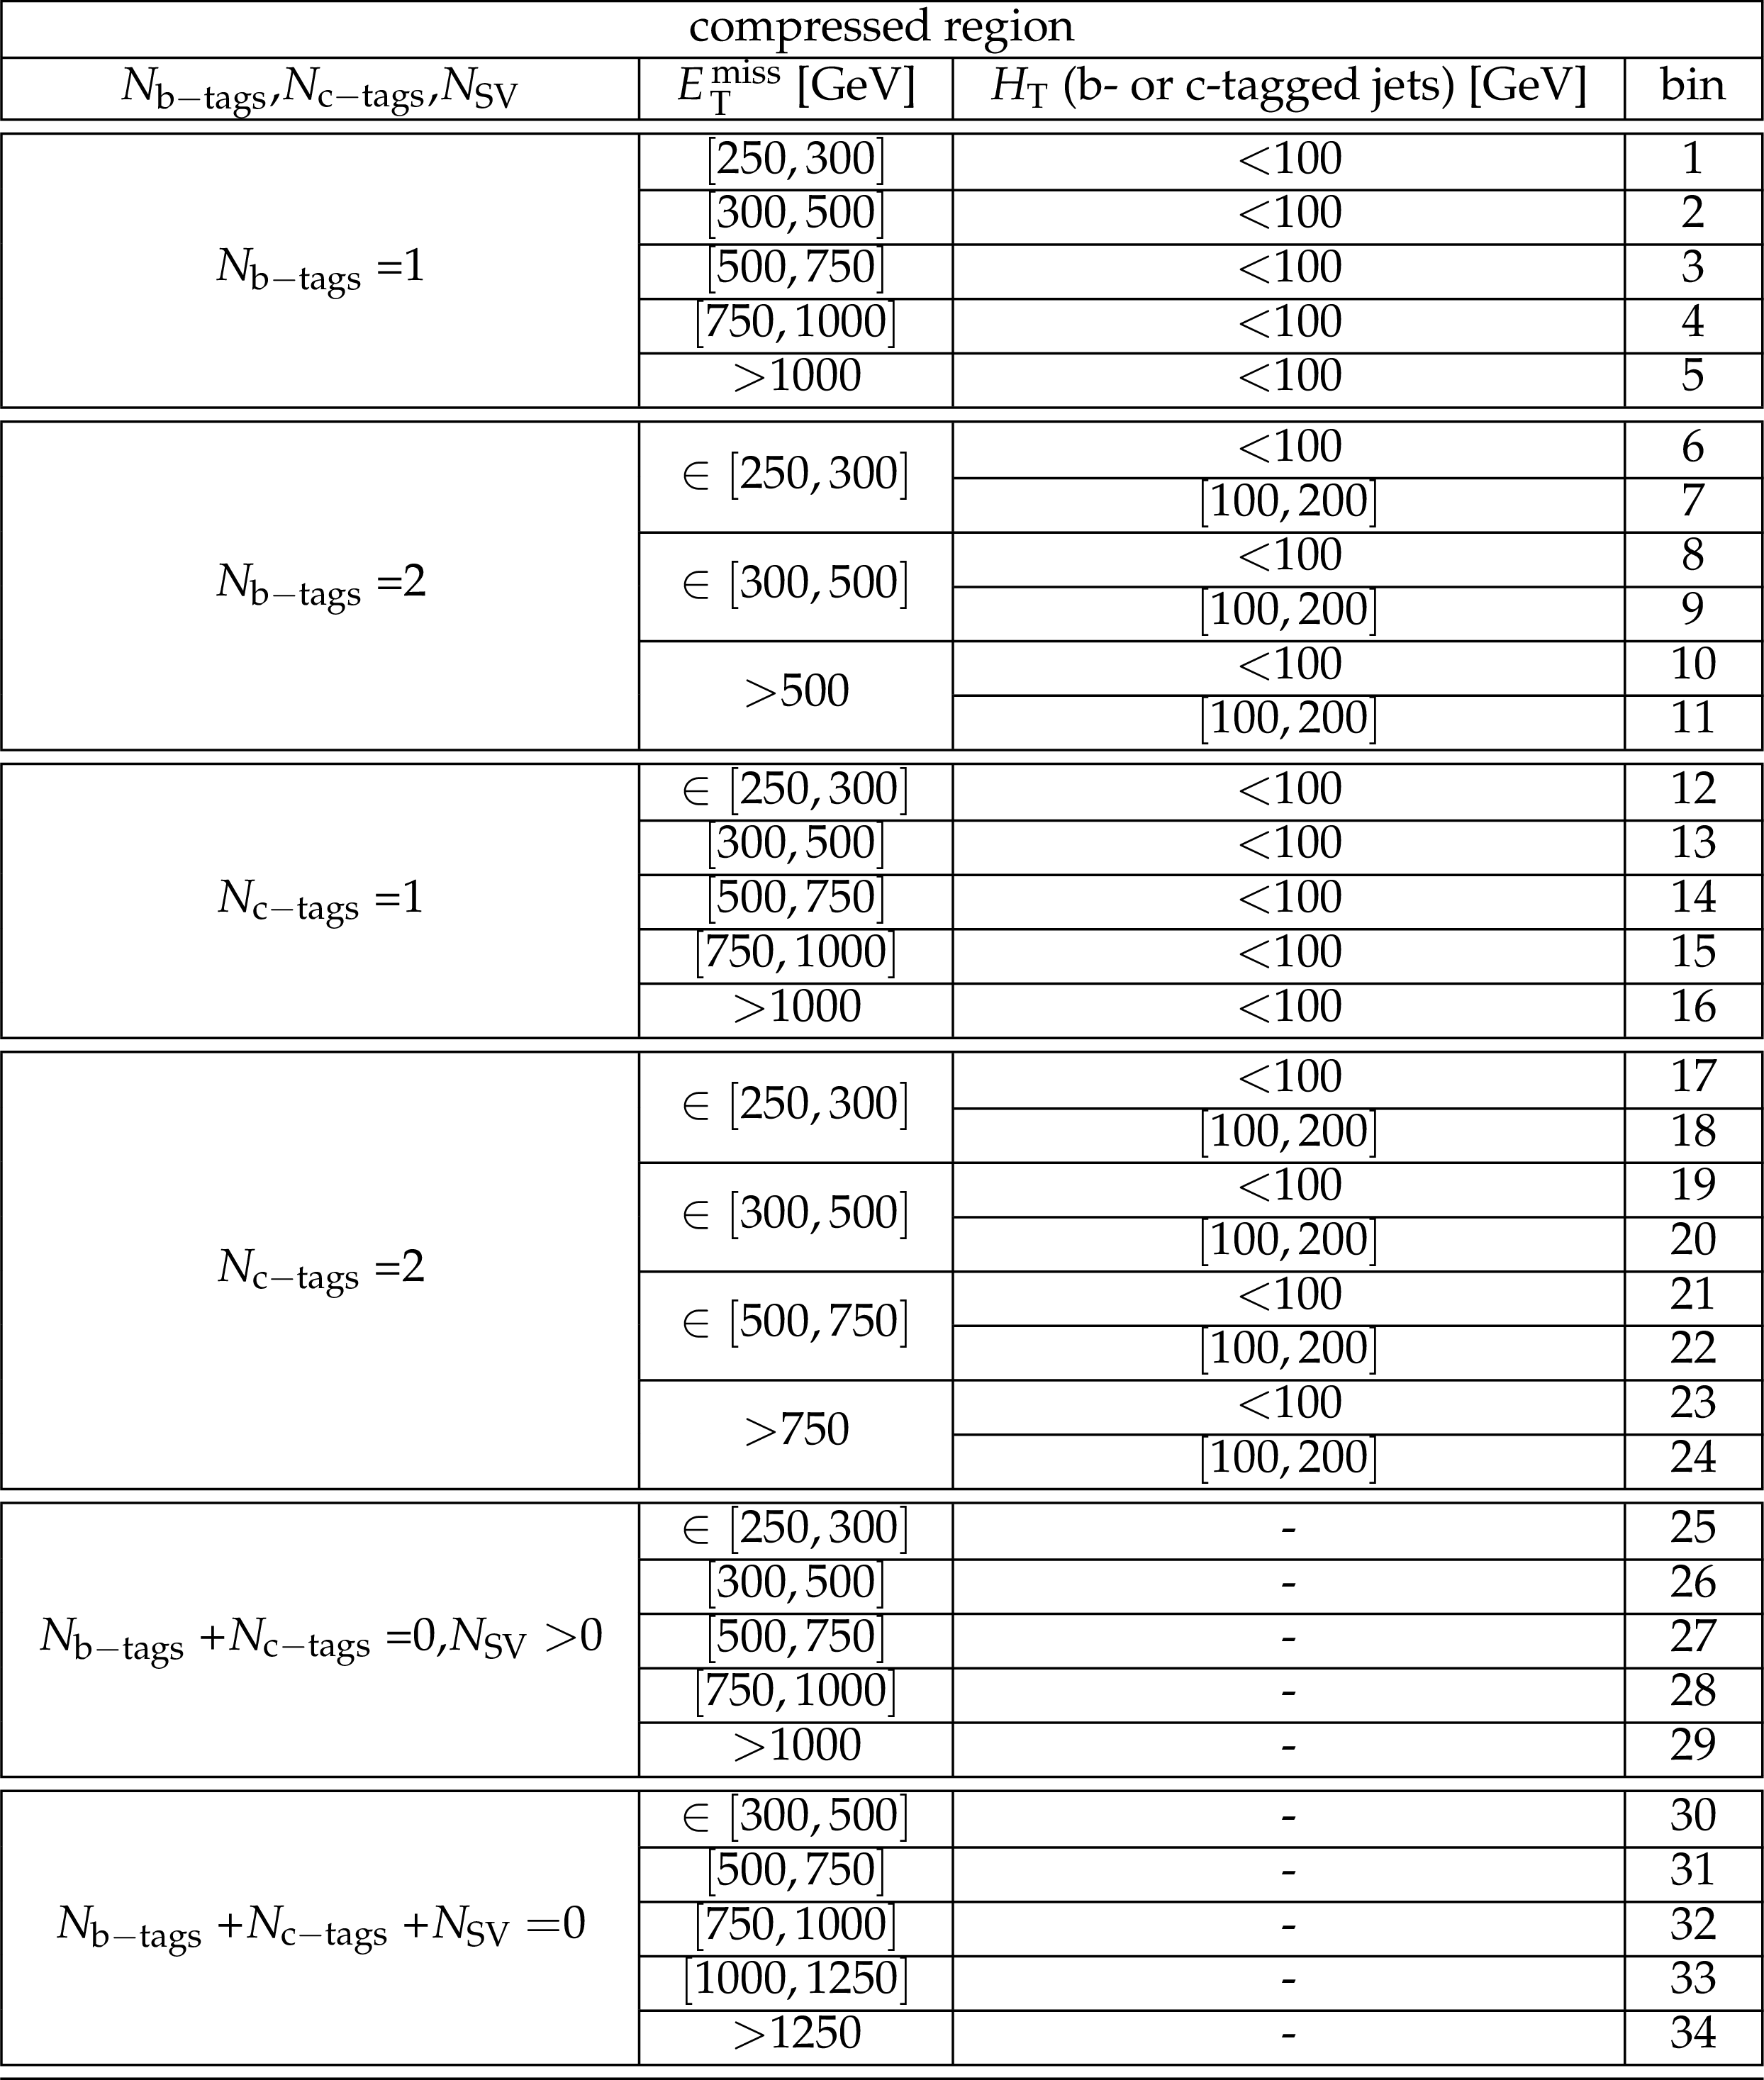
Table 9:
The bin number and definition in the compressed search region. |
| Summary |
| A search for pair production of bottom and top squarks is reported, based on a data sample of pp collisions collected with the CMS detector at $\sqrt{s} = $ 13 TeV in 2016, corresponding to an integrated luminosity of 36 fb$^{-1}$. Final states with two, three, and four jets, two of which originate from b or c quarks, and significant ${E_{\, \mathrm{T}}^{\, \mathrm{miss}}} $ have been analyzed. The search has been performed in exclusive binned signal regions defined by the number of jets identified as originating from a b or c quark, missing energy, scalar sum of the jets $p_{\mathrm{T}}$, and the contransverse mass. The standard model backgrounds per bin have been estimated from data control samples. We observe no excess above the SM predictions. Exclusion limits are set at the 95% CL on the simplified model production of a pair of bottom (top) squarks, with each bottom (top) squark decaying to a bottom (charm) quark and the lightest neutralino. The production of bottom squarks with masses up to 1225 GeV is excluded at 95% confidence level for neutralino masses less than 100 GeV. Top squarks with masses below 525 GeV are excluded if mass splitting between a top squark and an LSP is close to 10 GeV. |
| Additional Figures | |
png pdf |
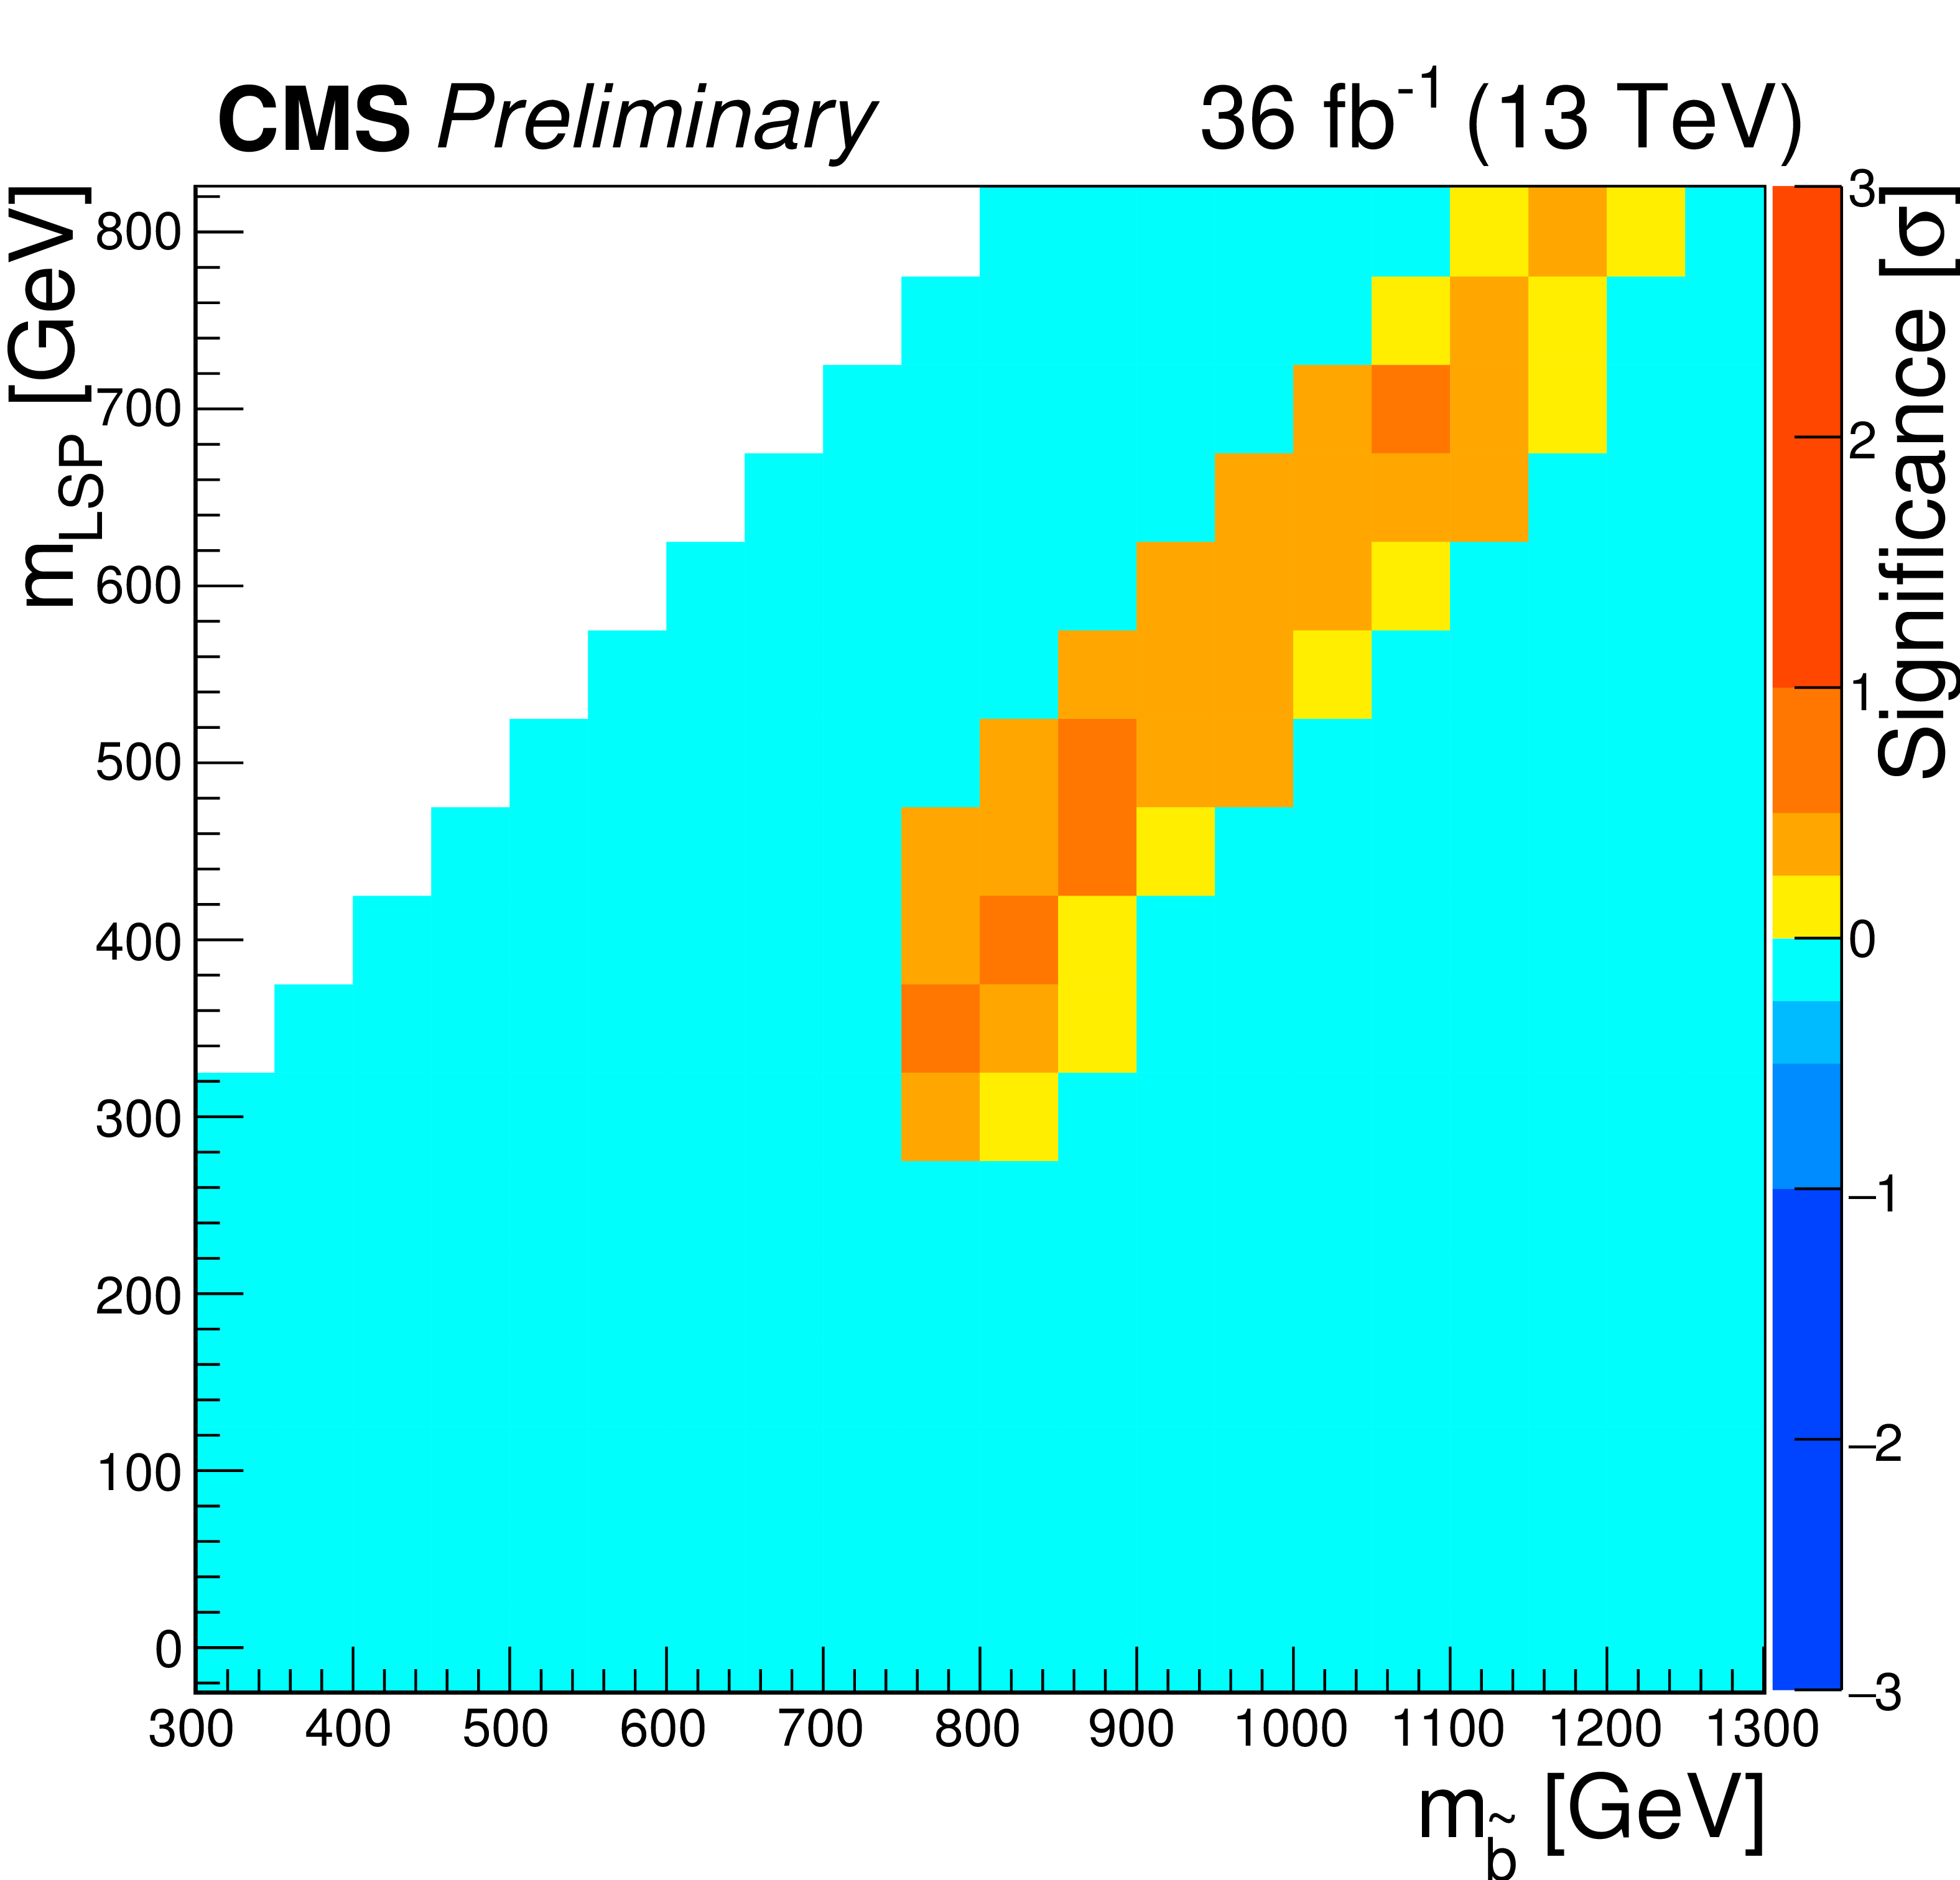
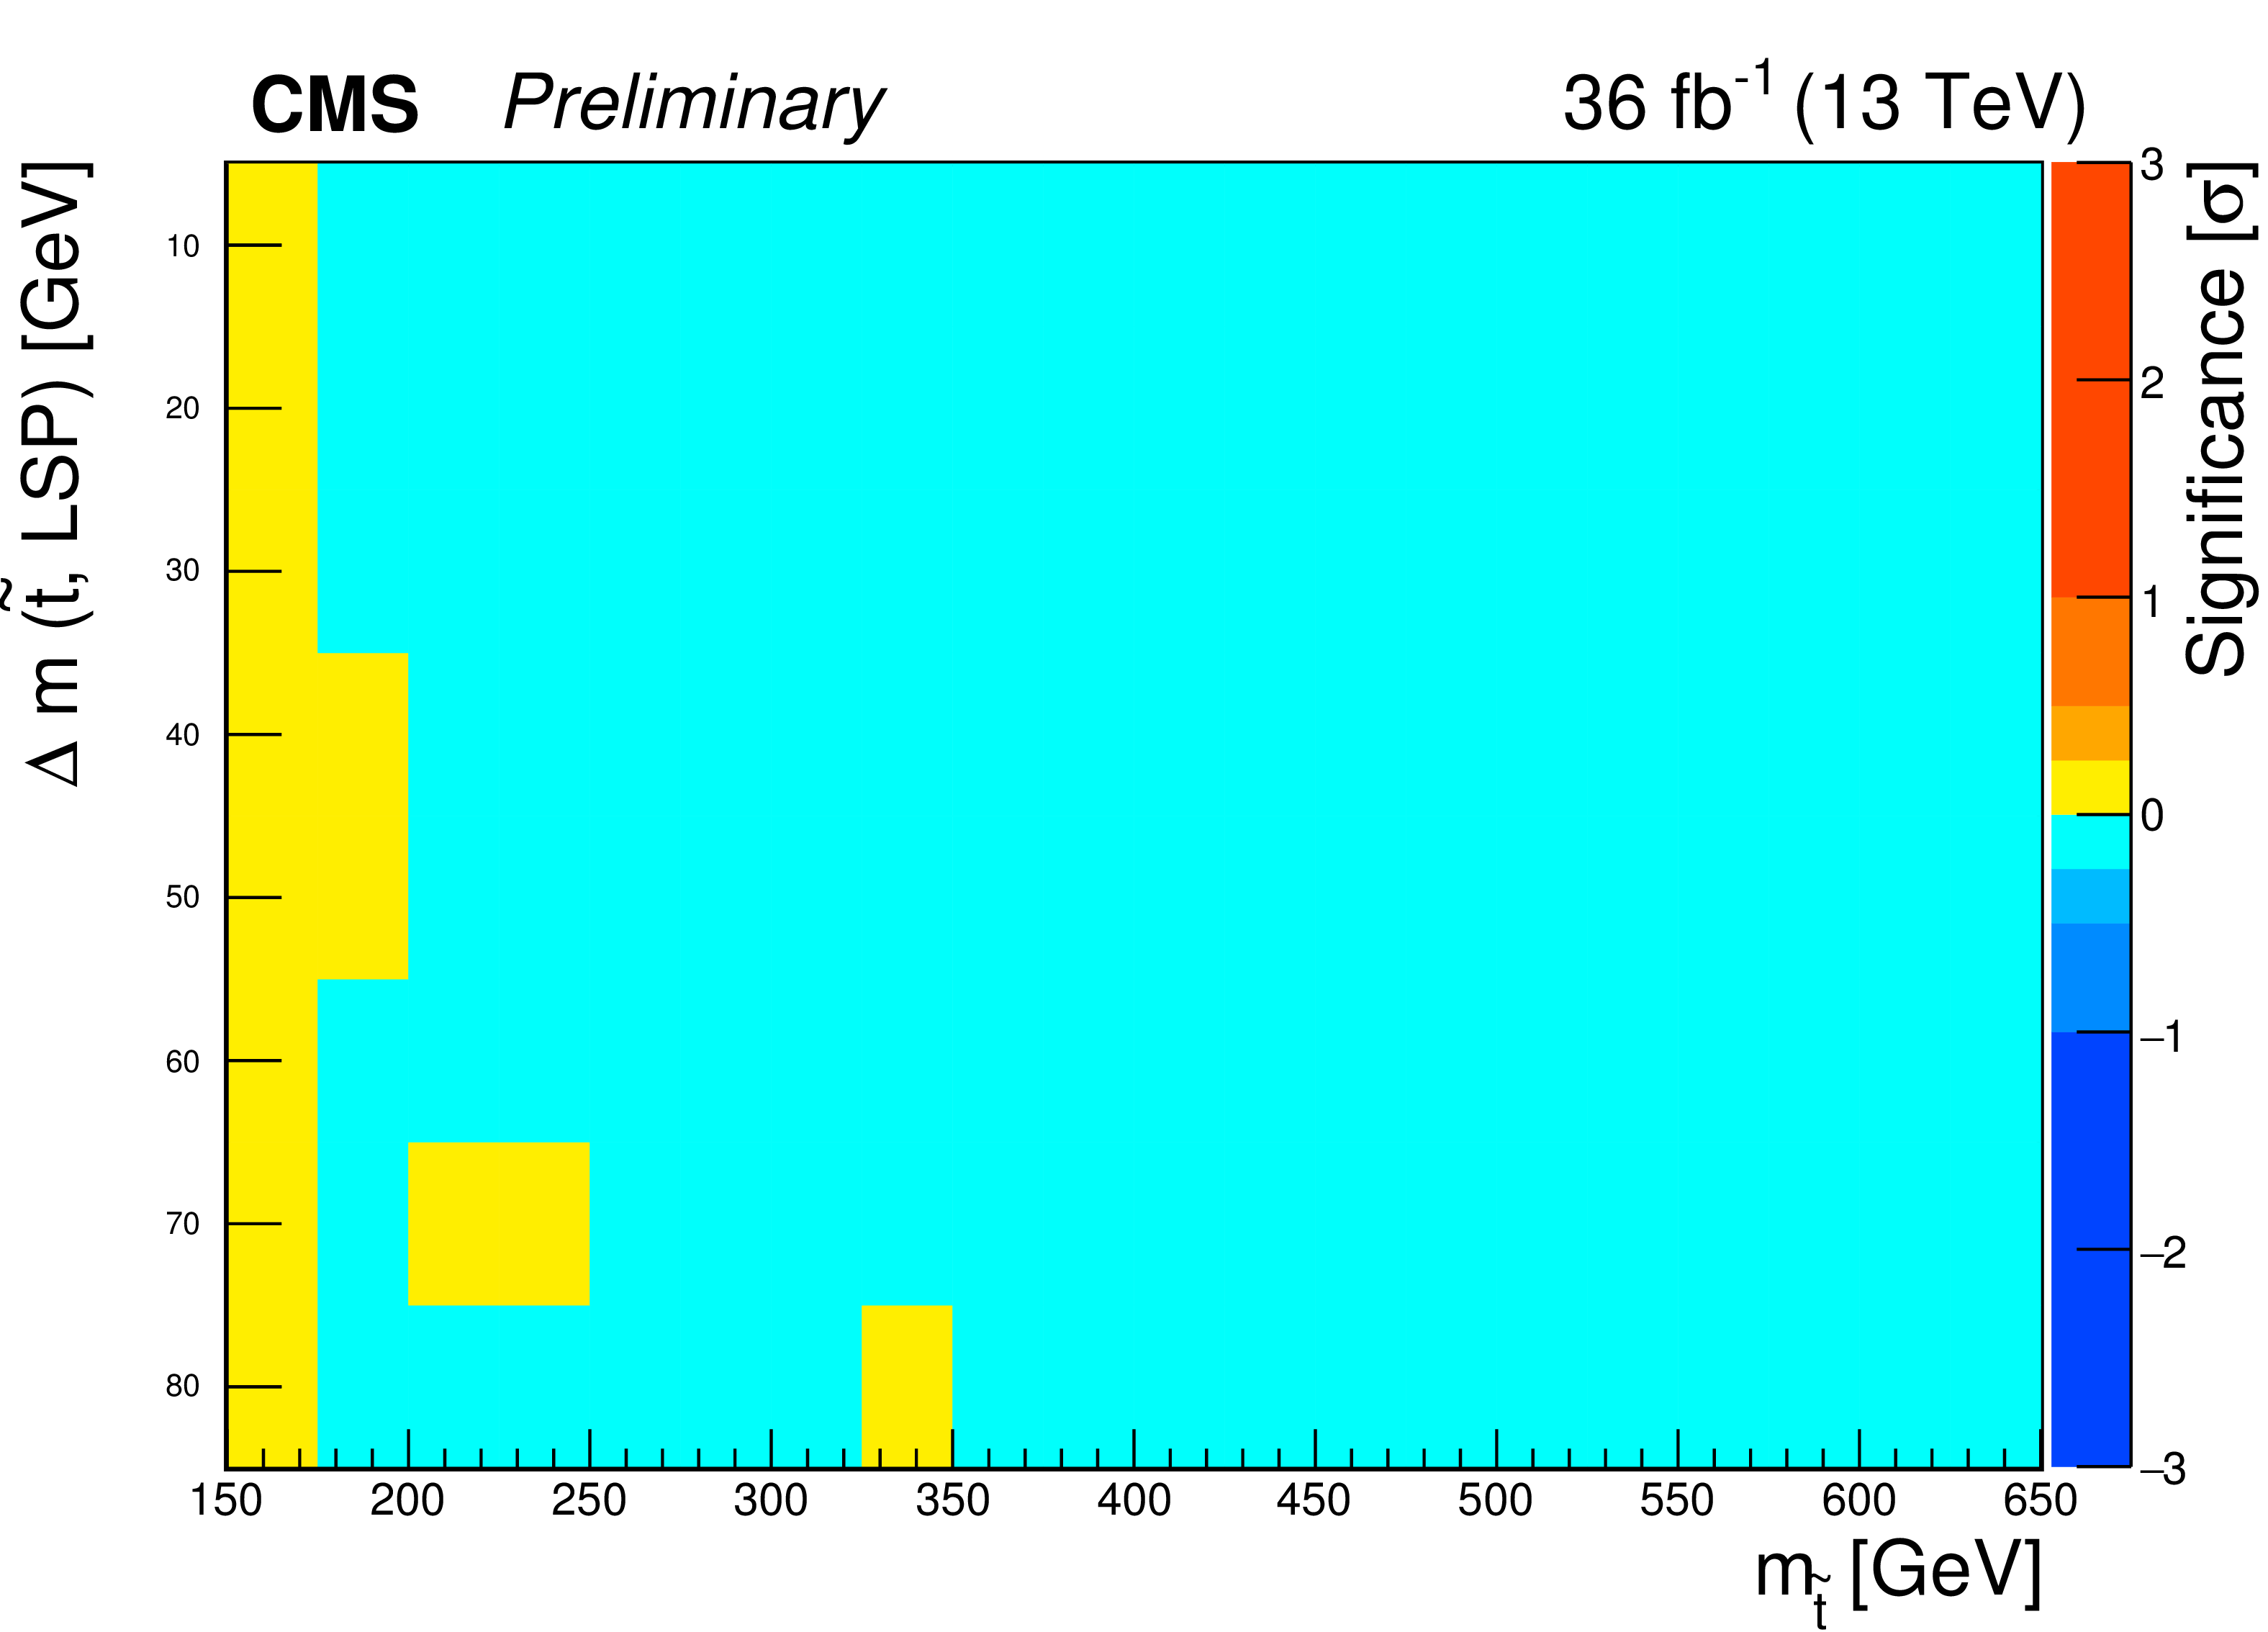
Additional Figure 1:
Observed significances for simplified models of top squark pair production in the $\tilde{ \mathrm{ b } } \rightarrow \mathrm{ b } \tilde{\chi}^{0} _1$ ("T2bb") decay scenario. |
png pdf |
Additional Figure 2:
Observed significances for simplified models of top squark pair production in the $\tilde{ \mathrm{ t } } \rightarrow \tilde{\mathrm{c}} \tilde{\chi}^{0} _1$ ("T2cc") decay scenario. |
| Additional Tables | |
png pdf |
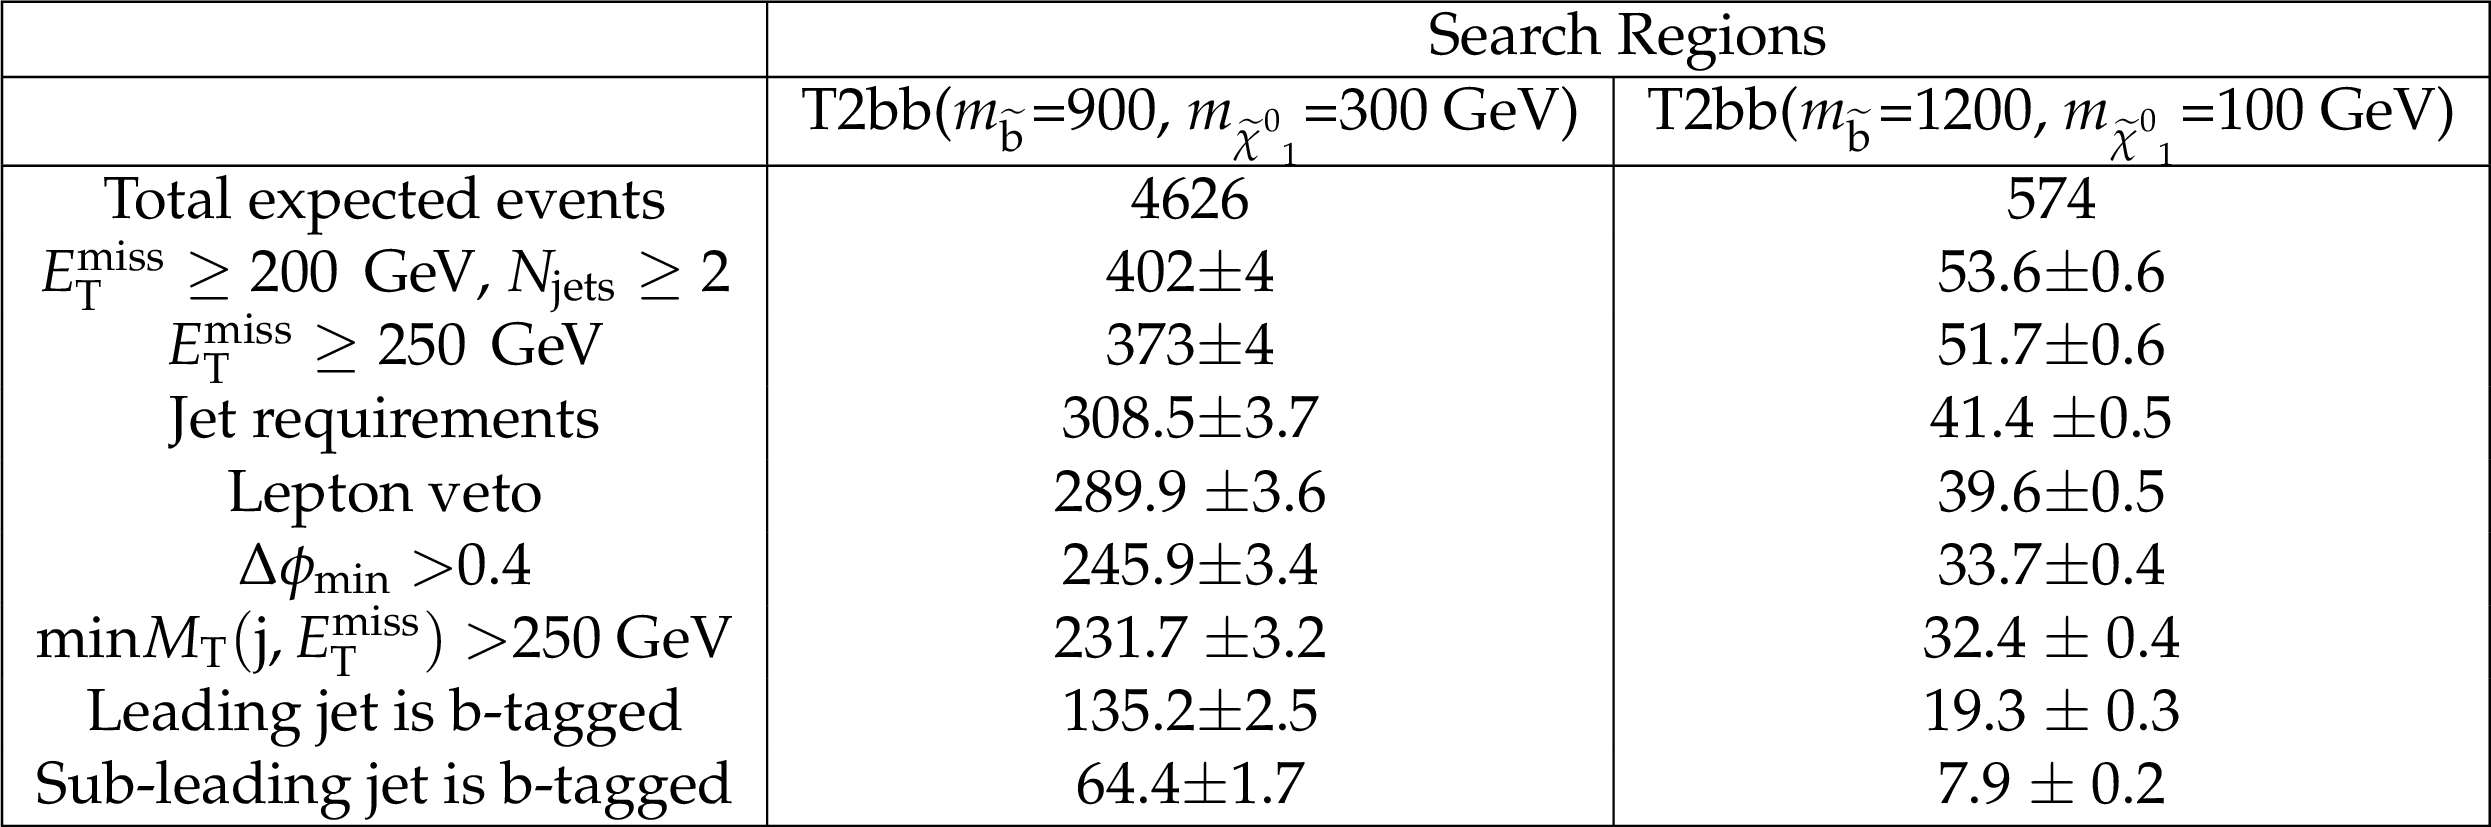
Additional Table 1:
Event yields from simulation for two signal points ($m_{\tilde{ \mathrm{ b } } } = $ 900 GeV and $m_{\tilde{\chi}^{0} _1} =$ 300 GeV) and ($m_{\tilde{ \mathrm{ b } } } =$ 1200 GeV and $m_{\tilde{\chi}^{0} _1} =$ 100 GeV) after applying each requirement in the non-compressed search region. The numbers are normalized to an integrated luminosity of 36 fb$^{-1}$ and the uncertainties correspond to statistical uncertainty from the MC samples. |
png pdf |
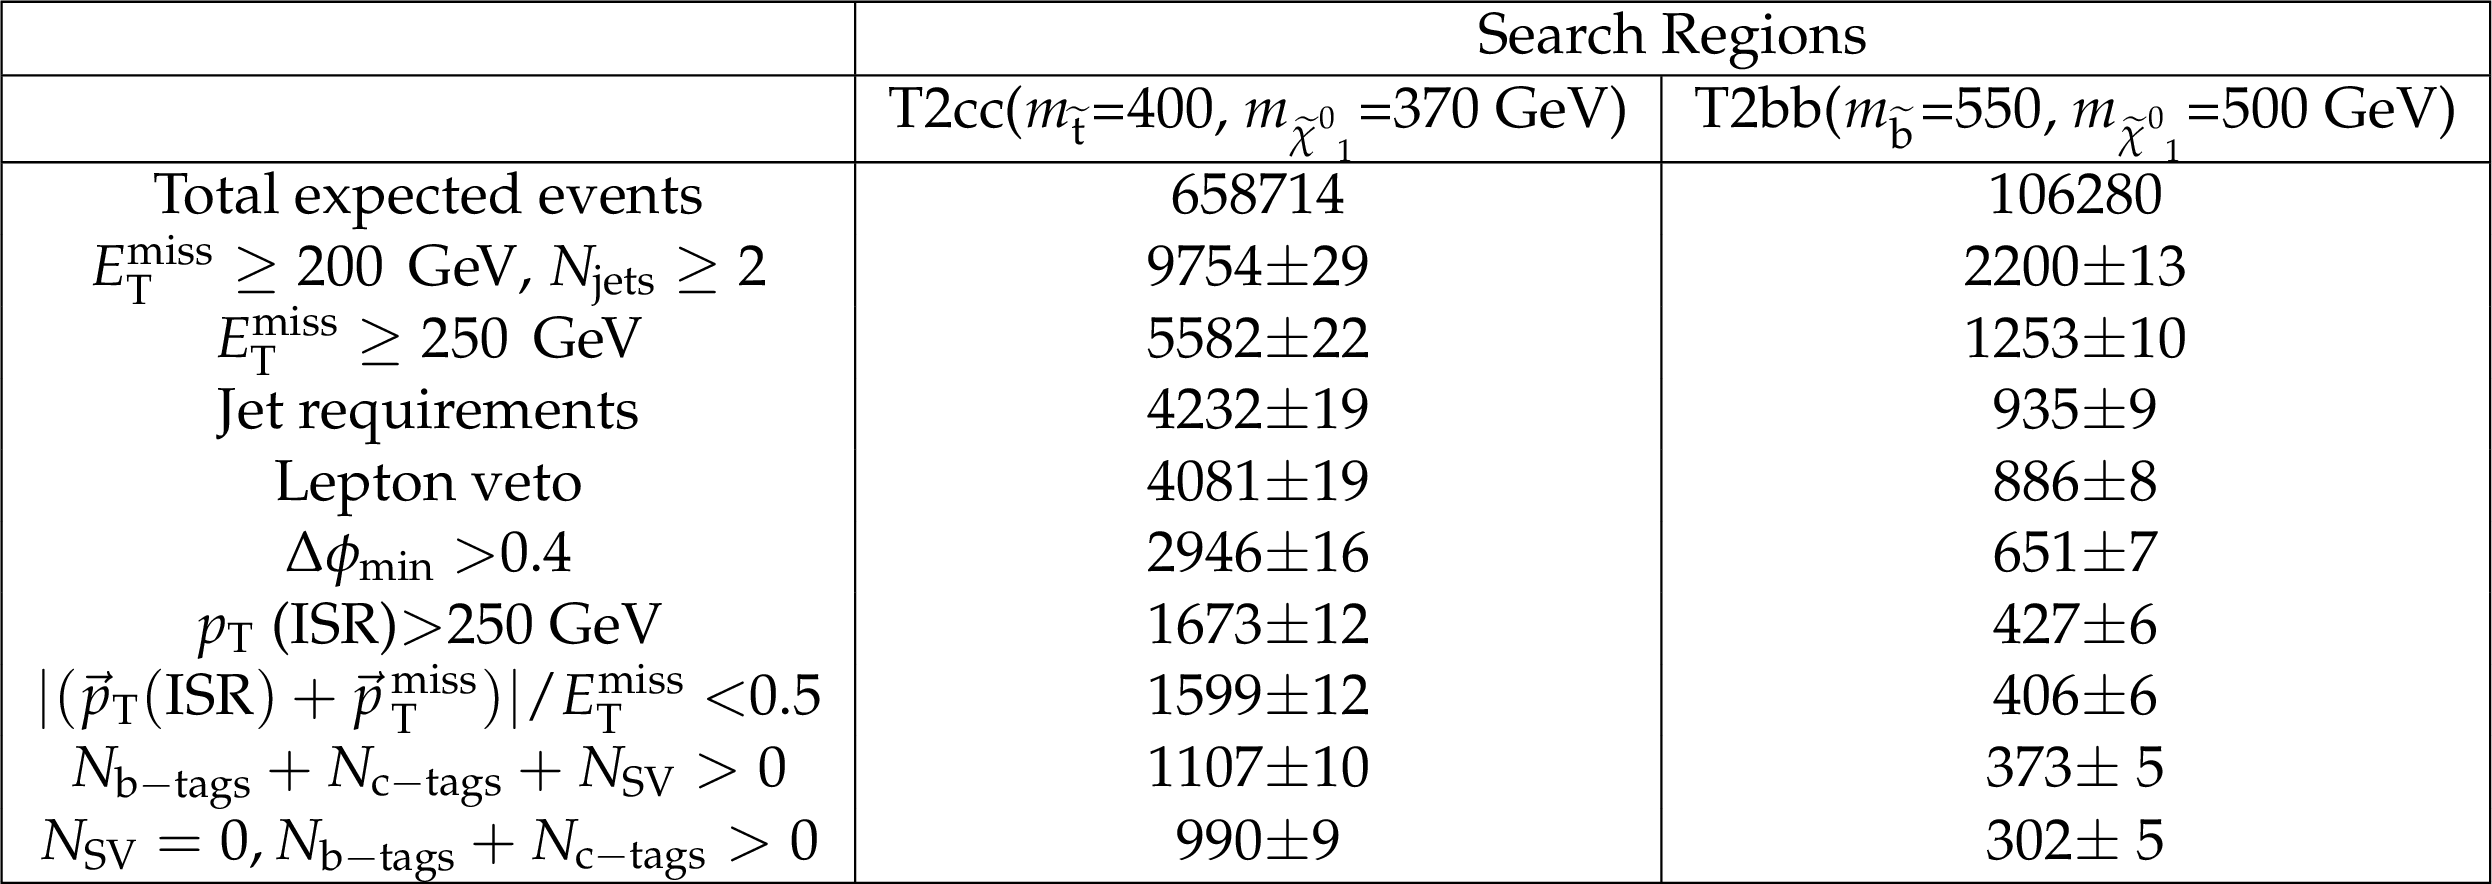
Additional Table 2:
Event yields from simulation for two signal points ($m_{\tilde{ \mathrm{ b } } } =$ 550 GeV and $m_{\tilde{\chi}^{0} _1} =$ 500 GeV) and ($m_{\tilde{ \mathrm{ t } } } =$ 400 GeV and $m_{\tilde{\chi}^{0} _1} =$ 370 GeV) after applying each requirement in the compressed search region. The numbers are normalized to an integrated luminosity of 36 fb$^{-1}$ and the uncertainties correspond to statistical uncertainty from the MC samples. |
| References | ||||
| 1 | G. 't Hooft | Naturalness, chiral symmetry, and spontaneous chiral symmetry breaking | NATO Sci. Ser. B 59 (1980)135 | |
| 2 | E. Witten | Dynamical breaking of supersymmetry | Nucl. Phys. B 188 (1981) 513 | |
| 3 | M. Dine, W. Fischler, and M. Srednicki | Supersymmetric technicolor | Nucl. Phys. B 189 (1981) 575 | |
| 4 | S. Dimopoulos and S. Raby | Supercolor | Nucl. Phys. B 192 (1981) 353 | |
| 5 | S. Dimopoulos and H. Georgi | Softly broken supersymmetry and SU(5) | Nucl. Phys. B 193 (1981) 150 | |
| 6 | R. K. Kaul and P. Majumdar | Cancellation of quadratically divergent mass corrections in globally supersymmetric spontaneously broken gauge theories | Nucl. Phys. B 199 (1982) 36 | |
| 7 | J. Wess and B. Zumino | Supergauge transformations in four-dimensions | Nucl. Phys. B 70 (1974) 39 | |
| 8 | G. R. Farrar and P. Fayet | Phenomenology of the Production, Decay, and Detection of New Hadronic States Associated with Supersymmetry | PLB 76 (1978) 575 | |
| 9 | C. Boehm, A. Djouadi, and M. Drees | Light scalar top quarks and supersymmetric dark matter | PRD 62 (2000) 035012 | hep-ph/9911496 |
| 10 | C. Balazs, M. Carena, and C. E. M. Wagner | Dark matter, light stops and electroweak baryogenesis | PRD 70 (2004) 015007 | hep-ph/403224 |
| 11 | G. Jungman, M. Kamionkowski, and K. Griest | Supersymmetric dark matter | PR 267 (1996) 195 | hep-ph/9506380 |
| 12 | CMS Collaboration | The CMS experiment at the CERN LHC | JINST 3 (2008) S08004 | CMS-00-001 |
| 13 | A. Delgado et al. | The light stop window | EPJC73 (2013), no. 3 | 1212.6847 |
| 14 | ATLAS Collaboration | Search for a supersymmetric partner to the top quark in final states with jets and missing transverse momentum at $ \sqrt{s}=$ 7 TeV with the ATLAS detector | PRL 109 (2012) 211802 | 1208.1447 |
| 15 | ATLAS Collaboration | Search for direct top squark pair production in final states with one isolated lepton, jets, and missing transverse momentum in $ \sqrt{s}=$ 7 TeV $ pp $ collisions using 4.7 fb$ ^{-1} $ of ATLAS data | PRL 109 (2012) 211803 | 1208.2590 |
| 16 | ATLAS Collaboration | Search for a heavy top-quark partner in final states with two leptons with the ATLAS detector at the LHC | JHEP 11 (2012) 094 | 1209.4186 |
| 17 | ATLAS Collaboration | Search for direct top-squark pair production in final states with two leptons in pp collisions at $ \sqrt{s}= $ 8 TeV with the ATLAS detector | JHEP 06 (2014) 124 | 1403.4853 |
| 18 | ATLAS Collaboration | Search for direct third-generation squark pair production in final states with missing transverse momentum and two b-jets in $ \sqrt{s} = $ 8 TeV $ pp $ collisions with the ATLAS detector | JHEP 10 (2013) 189 | 1308.2631 |
| 19 | ATLAS Collaboration | Measurement of Spin Correlation in Top-Antitop Quark Events and Search for Top Squark Pair Production in pp Collisions at $ \sqrt{s}=$ 8 TeV Using the ATLAS Detector | PRL 114 (2015) 142001 | 1412.4742 |
| 20 | ATLAS Collaboration | Search for pair-produced third-generation squarks decaying via charm quarks or in compressed supersymmetric scenarios in $ pp $ collisions at $ \sqrt{s}=$ 8 TeV with the ATLAS detector | PRD 90 (2014) 052008 | 1407.0608 |
| 21 | ATLAS Collaboration | ATLAS Run 1 searches for direct pair production of third-generation squarks at the Large Hadron Collider | EPJC 75 (2015) 510 | 1506.08616 |
| 22 | CMS Collaboration | Search for top-squark pair production in the single-lepton final state in pp collisions at $ \sqrt{s}=$ 8 TeV | EPJC 73 (2013) 2677 | CMS-SUS-13-011 1308.1586 |
| 23 | CMS Collaboration | Search for supersymmetry in hadronic final states with missing transverse energy using the variables $ \alpha_\mathrm{T} $ and b-quark multiplicity in pp collisions at $ \sqrt{s} = $ 8 TeV | EPJC 73 (2013) 2568 | CMS-SUS-12-028 1303.2985 |
| 24 | CMS Collaboration | Search for supersymmetry using razor variables in events with $ b $-tagged jets in $ pp $ collisions at $ \sqrt{s} = $ 8 TeV | PRD 91 (2015) 052018 | CMS-SUS-13-004 1502.00300 |
| 25 | CMS Collaboration | Searches for third-generation squark production in fully hadronic final states in proton-proton collisions at $ \sqrt{s}=$ 8 TeV | JHEP 06 (2015) 116 | CMS-SUS-14-001 1503.08037 |
| 26 | CMS Collaboration | Search for direct pair production of supersymmetric top quarks decaying to all-hadronic final states in pp collisions at $ \sqrt{s}=$ 8 TeV | EPJC 76 (2016) 460 | CMS-SUS-13-023 1603.00765 |
| 27 | CMS Collaboration | Particle Flow Event Reconstruction in CMS and Performance for Jets, Taus and MET | ||
| 28 | CMS Collaboration | Commissioning of the Particle-Flow Reconstruction in Minimum-Bias and Jet Events from pp Collisions at 7 TeV | ||
| 29 | CMS Collaboration | Commissioning of the particle-flow event reconstruction with leptons from J/Psi and W decays at 7 TeV | ||
| 30 | M. Cacciari, P. Salam, and G. Soyez | The anti-kt jet clustering algorithm | JHEP 08 (2008) 063 | |
| 31 | M. Cacciari, M. Salam, P. Gavin, and G. Soyez | Pileup subtraction using jet areas | PLB 659 (2007) 119 | 0707.1378 |
| 32 | CMS Collaboration | Performance of the CMS missing transverse momentum reconstruction in pp data at $ \sqrt{s}=$ 8 TeV | JINST 10 (2015) P02006 | CMS-JME-13-003 1411.0511 |
| 33 | CMS Collaboration | Performance of CMS muon reconstruction in pp collision events at $ \sqrt{s}=$ 7 TeV | JINST 7 (2012) P10002 | CMS-MUO-10-004 1206.4071 |
| 34 | CMS Collaboration | Identification of b-quark jets with the CMS experiment | JINST 8 (2013) P04013 | CMS-BTV-12-001 1211.4462 |
| 35 | CMS Collaboration | Identification of c-quark jets at the CMS experiment | CMS-PAS-BTV-16-001 | CMS-PAS-BTV-16-001 |
| 36 | J. Alwall et al. | MadGraph 5 : Going Beyond | JHEP 06 (2011) 128 | 1106.0522 |
| 37 | J. Alwall et al. | The automated computation of tree-level and next-to-leading order differential cross sections, and their matching to parton shower simulations | JHEP 07 (2014) 079 | 1405.0301 |
| 38 | S. M. T. Sjostrand and P. Z. Skands | A Brief Introduction to PYTHIA 8.1 | CPC 178 (2008) 852--867 | |
| 39 | GEANT4 Collaboration | GEANT4 --- simulation toolkit | NIMA 506 (2003) 250 | |
| 40 | CMS Collaboration | Fast simulation of the CMS detector | J. Phys. Conf. Ser. 219 (2010) | |
| 41 | CMS Collaboration | Pileup subtraction using jet areas | PLB 659 (2008) 119--126 | 0707.1378 |
| 42 | D. Tovey | Supersymmetric particle mass measurement with boost-corrected constransverse mass | JHEP 03 (2010) | |
| 43 | G. Polesello and D. Tovey | On measuring the masses of pair-produced semi-invisibly decaying particles at hadron colliders | JHEP 04 (2008) | |
| 44 | CMS Collaboration Collaboration | Identification of double-b quark jets in boosted event topologies | Technical Report CMS-PAS-BTV-15-002, CERN, Geneva | |
| 45 | Particle Data Group Collaboration | Review of Particle Physics | CPC 38 (2014) 090001 | |
| 46 | CMS Collaboration | Interpretation of Searches for Supersymmetry with simplified Models | PRD 88 (2013), no. 5, 052017 | CMS-SUS-11-016 1301.2175 |
| 47 | J. Alwall, P. Schuster, and N. Toro | Simplified Models for a First Characterization of New Physics at the LHC | PRD 79 (2009) | |
| 48 | J. Alwall, M.-P. Le, M. Lisanti, and et al | Model-Independent Jets plus Missing Energy Searches | PRD 79 (2009) | |
| 49 | LHC New Physics Working Group Collaboration | Simplified Models for LHC New Physics Searches | JPG 39 (2012) 105005 | 1105.2838 |
| 50 | A. L. Read | Presentation of search results: the CL s technique | JPG 28 (2002) 2693 | |
| 51 | T. Junk | Confidence level computation for combining searches with small statistics | Nucl. Instr. and Meth. A 434 (1999) 435 | |
| 52 | ATLAS and CMS Collaborations | Procedure for the LHC Higgs boson search combination in Summer 2011 | ||
| 53 | G. Cowan, K. Cranmer, E. Gross, and O. Vitells | Asymptotic formulae for likelihood-based tests of new physics | EPJC71 (2011) 1554 | 1007.1727 |
| 54 | A. Kulesza and L. Motyka | Threshold resummation for squark-antisquark and 645 gluino-pair production at the LHC | PRL 102 (2009) 111802 | |
| 55 | A. Kulesza and L. Motyka | Soft gluon resummation for the production of gluino-gluino and squark-antisquark pairs at the LHC | PRL 80 (2009) 095004 | |
| 56 | W. Beenakker and et al. | Soft-gluon resummation for squark and gluino hadroproduction | JHEP 12 (2009) 041 | |
| 57 | W. Beenakker and et al. | Squark and gluino hadroproduction | Int. J. Mod. Phys. A 26 (2011) 2637 | |
| 58 | M. Kramer and et al. | Supersymmetry production cross sections in pp collisions at $ \sqrt{s}=$ 7 TeV | 1206.2892 | |
|
|
Compact Muon Solenoid LHC, CERN |
|

|

|

|

|

|