

Compact Muon Solenoid
LHC, CERN
| CMS-PAS-BTV-16-001 | ||
| Identification of c-quark jets at the CMS experiment | ||
| CMS Collaboration | ||
| August 2016 | ||
| Abstract: An accurate identification of jets originating from b quarks is of primary importance in many measurements and searches at the LHC. The development of a charm tagger, identifying jets initiated by charm jets, would be of similar importance. In this note a technique where an MVA-based discriminator is used in order to select charm jets is presented, together with its expected performance on simulations, and its calibration on W+c and top quark pairs. The datasets used for the calibration of the algorithm are from proton-proton collisions at 13 TeV, recorded by the CMS experiment during the first year of the LHC Run II. | ||
| Links: CDS record (PDF) ; inSPIRE record ; CADI line (restricted) ; | ||
| Figures | |
png pdf |
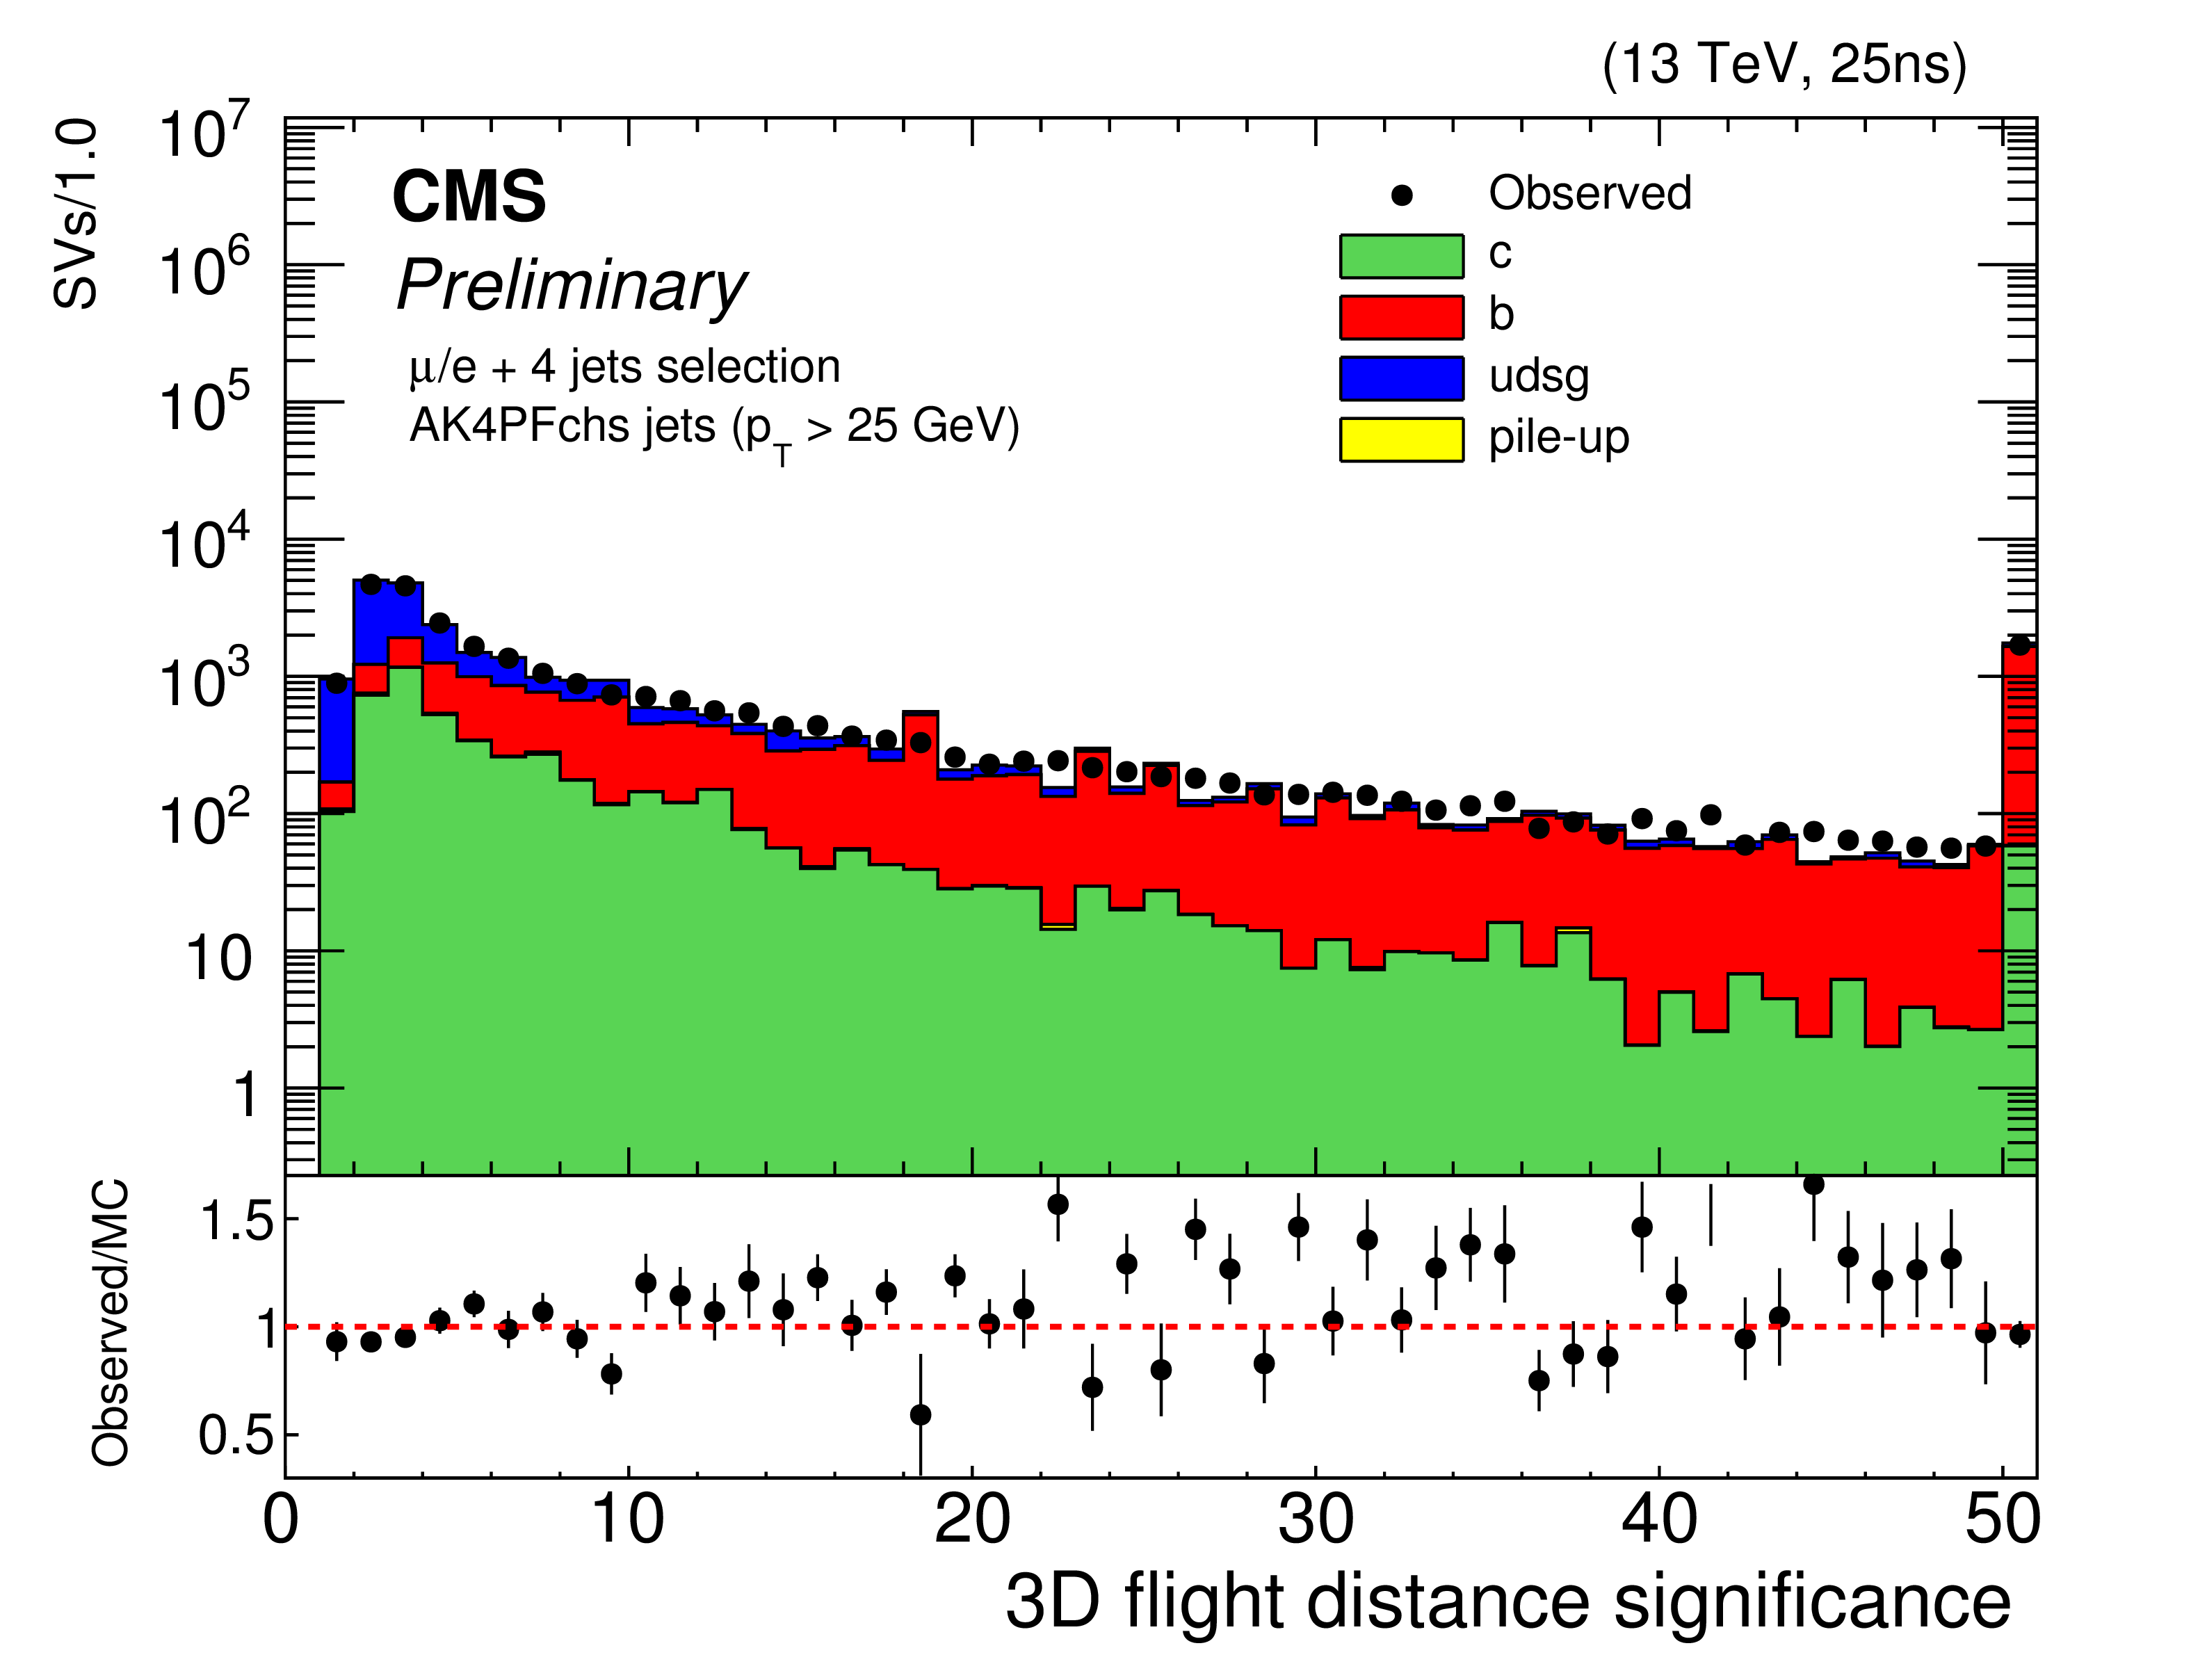
Figure 1-a:
Agreement between data and simulated samples for some of the input variables: 3D flight distance significance of the secondary vertex (a), the number of secondary vertices associated to the jet (b), the secondary vertex mass (c) and a variable called ``massVertexEnergyFraction'' which is defined as the product of the vertex mass and the fraction of the vertex energy with respect to the jet energy (d). |
png pdf |
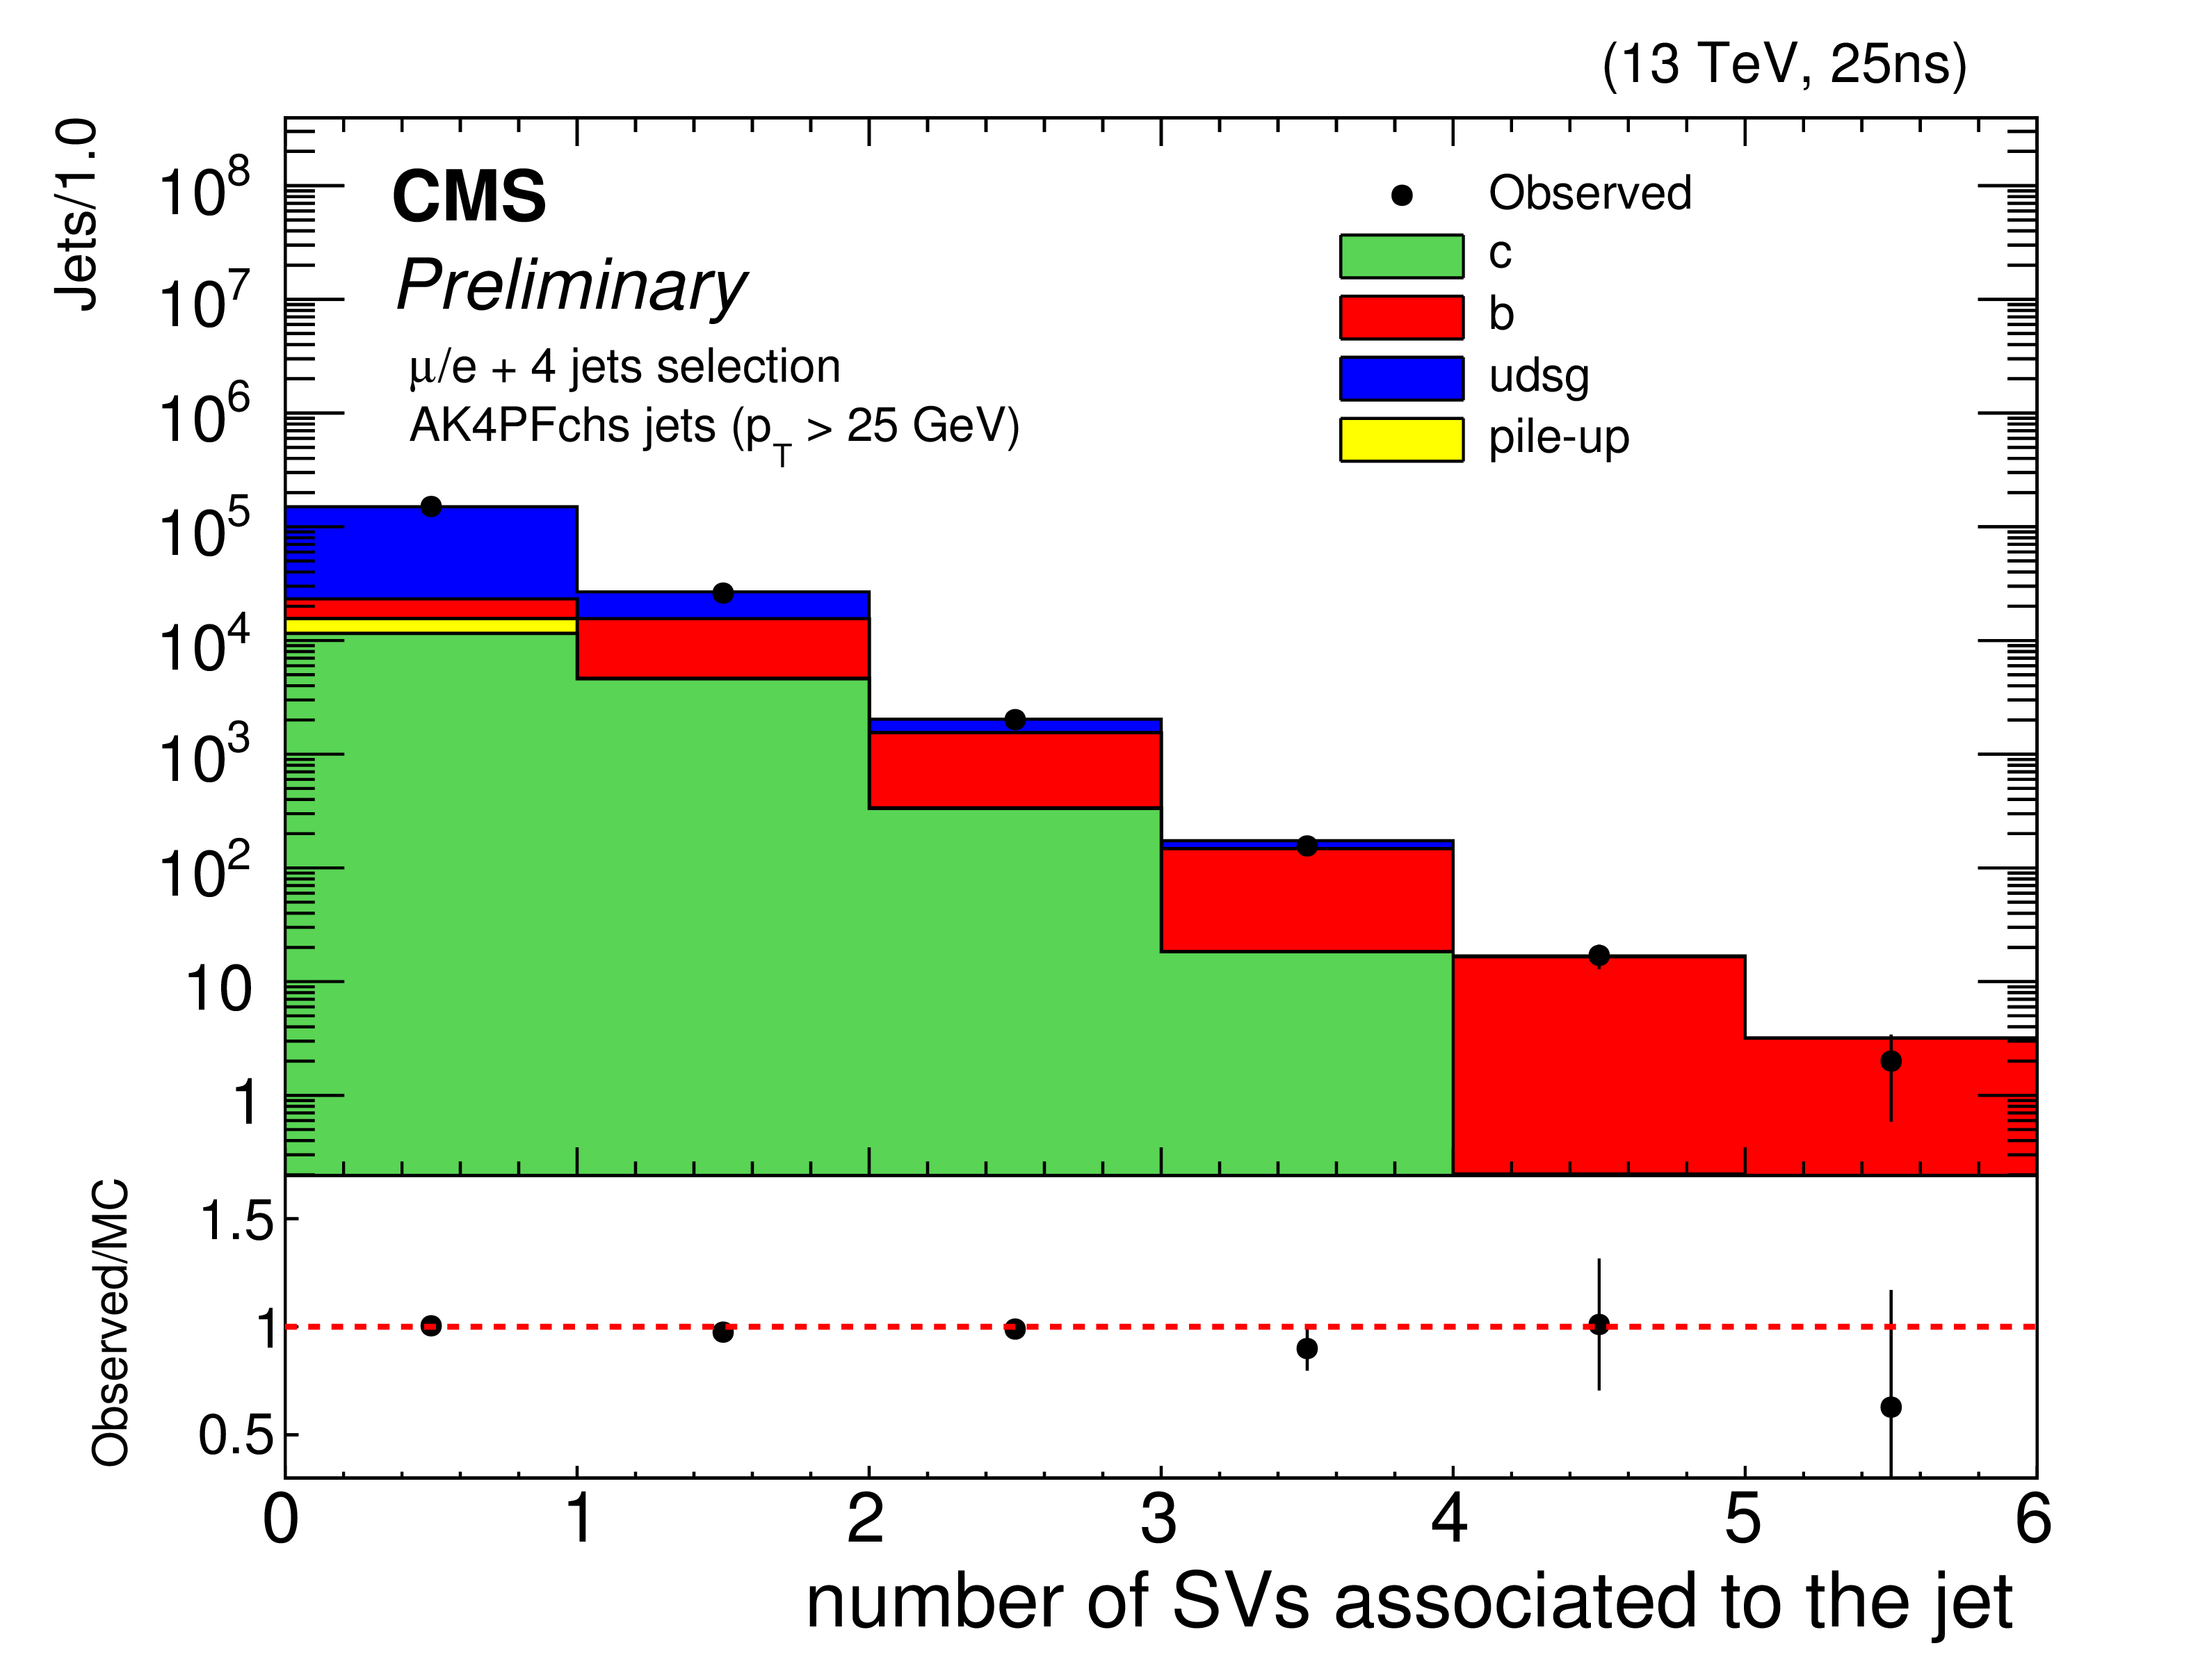
Figure 1-b:
Agreement between data and simulated samples for some of the input variables: 3D flight distance significance of the secondary vertex (a), the number of secondary vertices associated to the jet (b), the secondary vertex mass (c) and a variable called ``massVertexEnergyFraction'' which is defined as the product of the vertex mass and the fraction of the vertex energy with respect to the jet energy (d). |
png pdf |
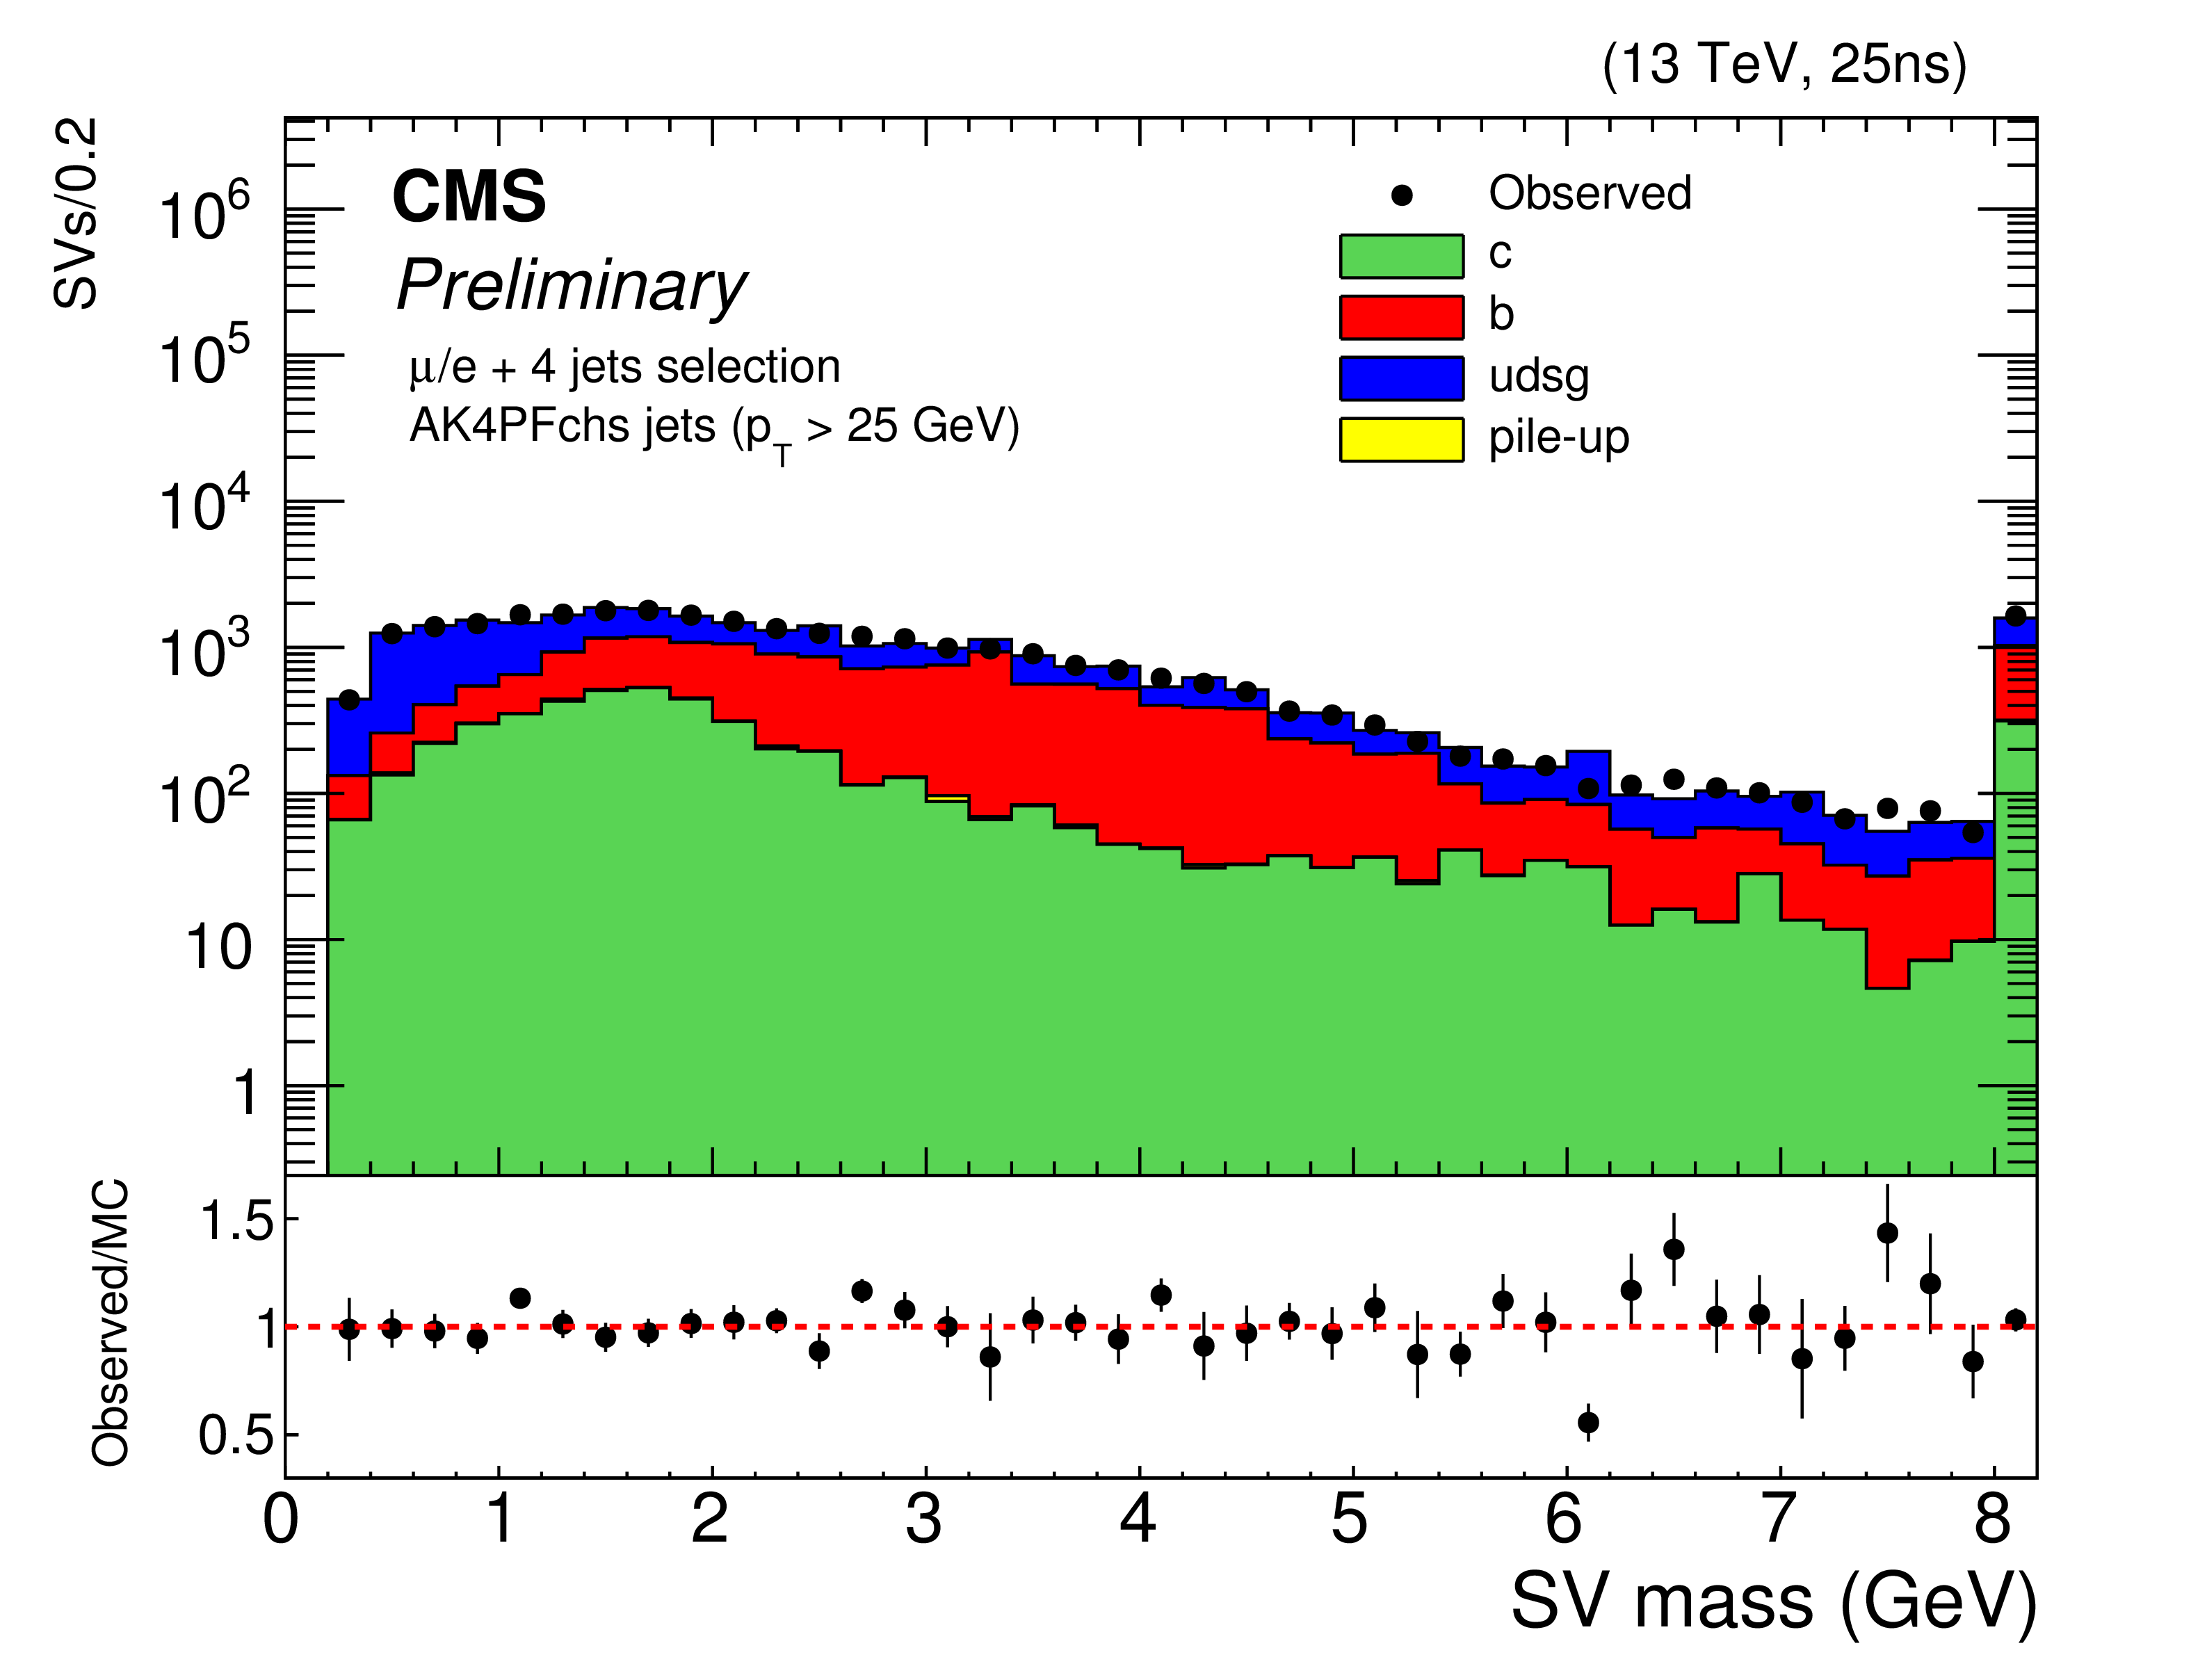
Figure 1-c:
Agreement between data and simulated samples for some of the input variables: 3D flight distance significance of the secondary vertex (a), the number of secondary vertices associated to the jet (b), the secondary vertex mass (c) and a variable called ``massVertexEnergyFraction'' which is defined as the product of the vertex mass and the fraction of the vertex energy with respect to the jet energy (d). |
png pdf |
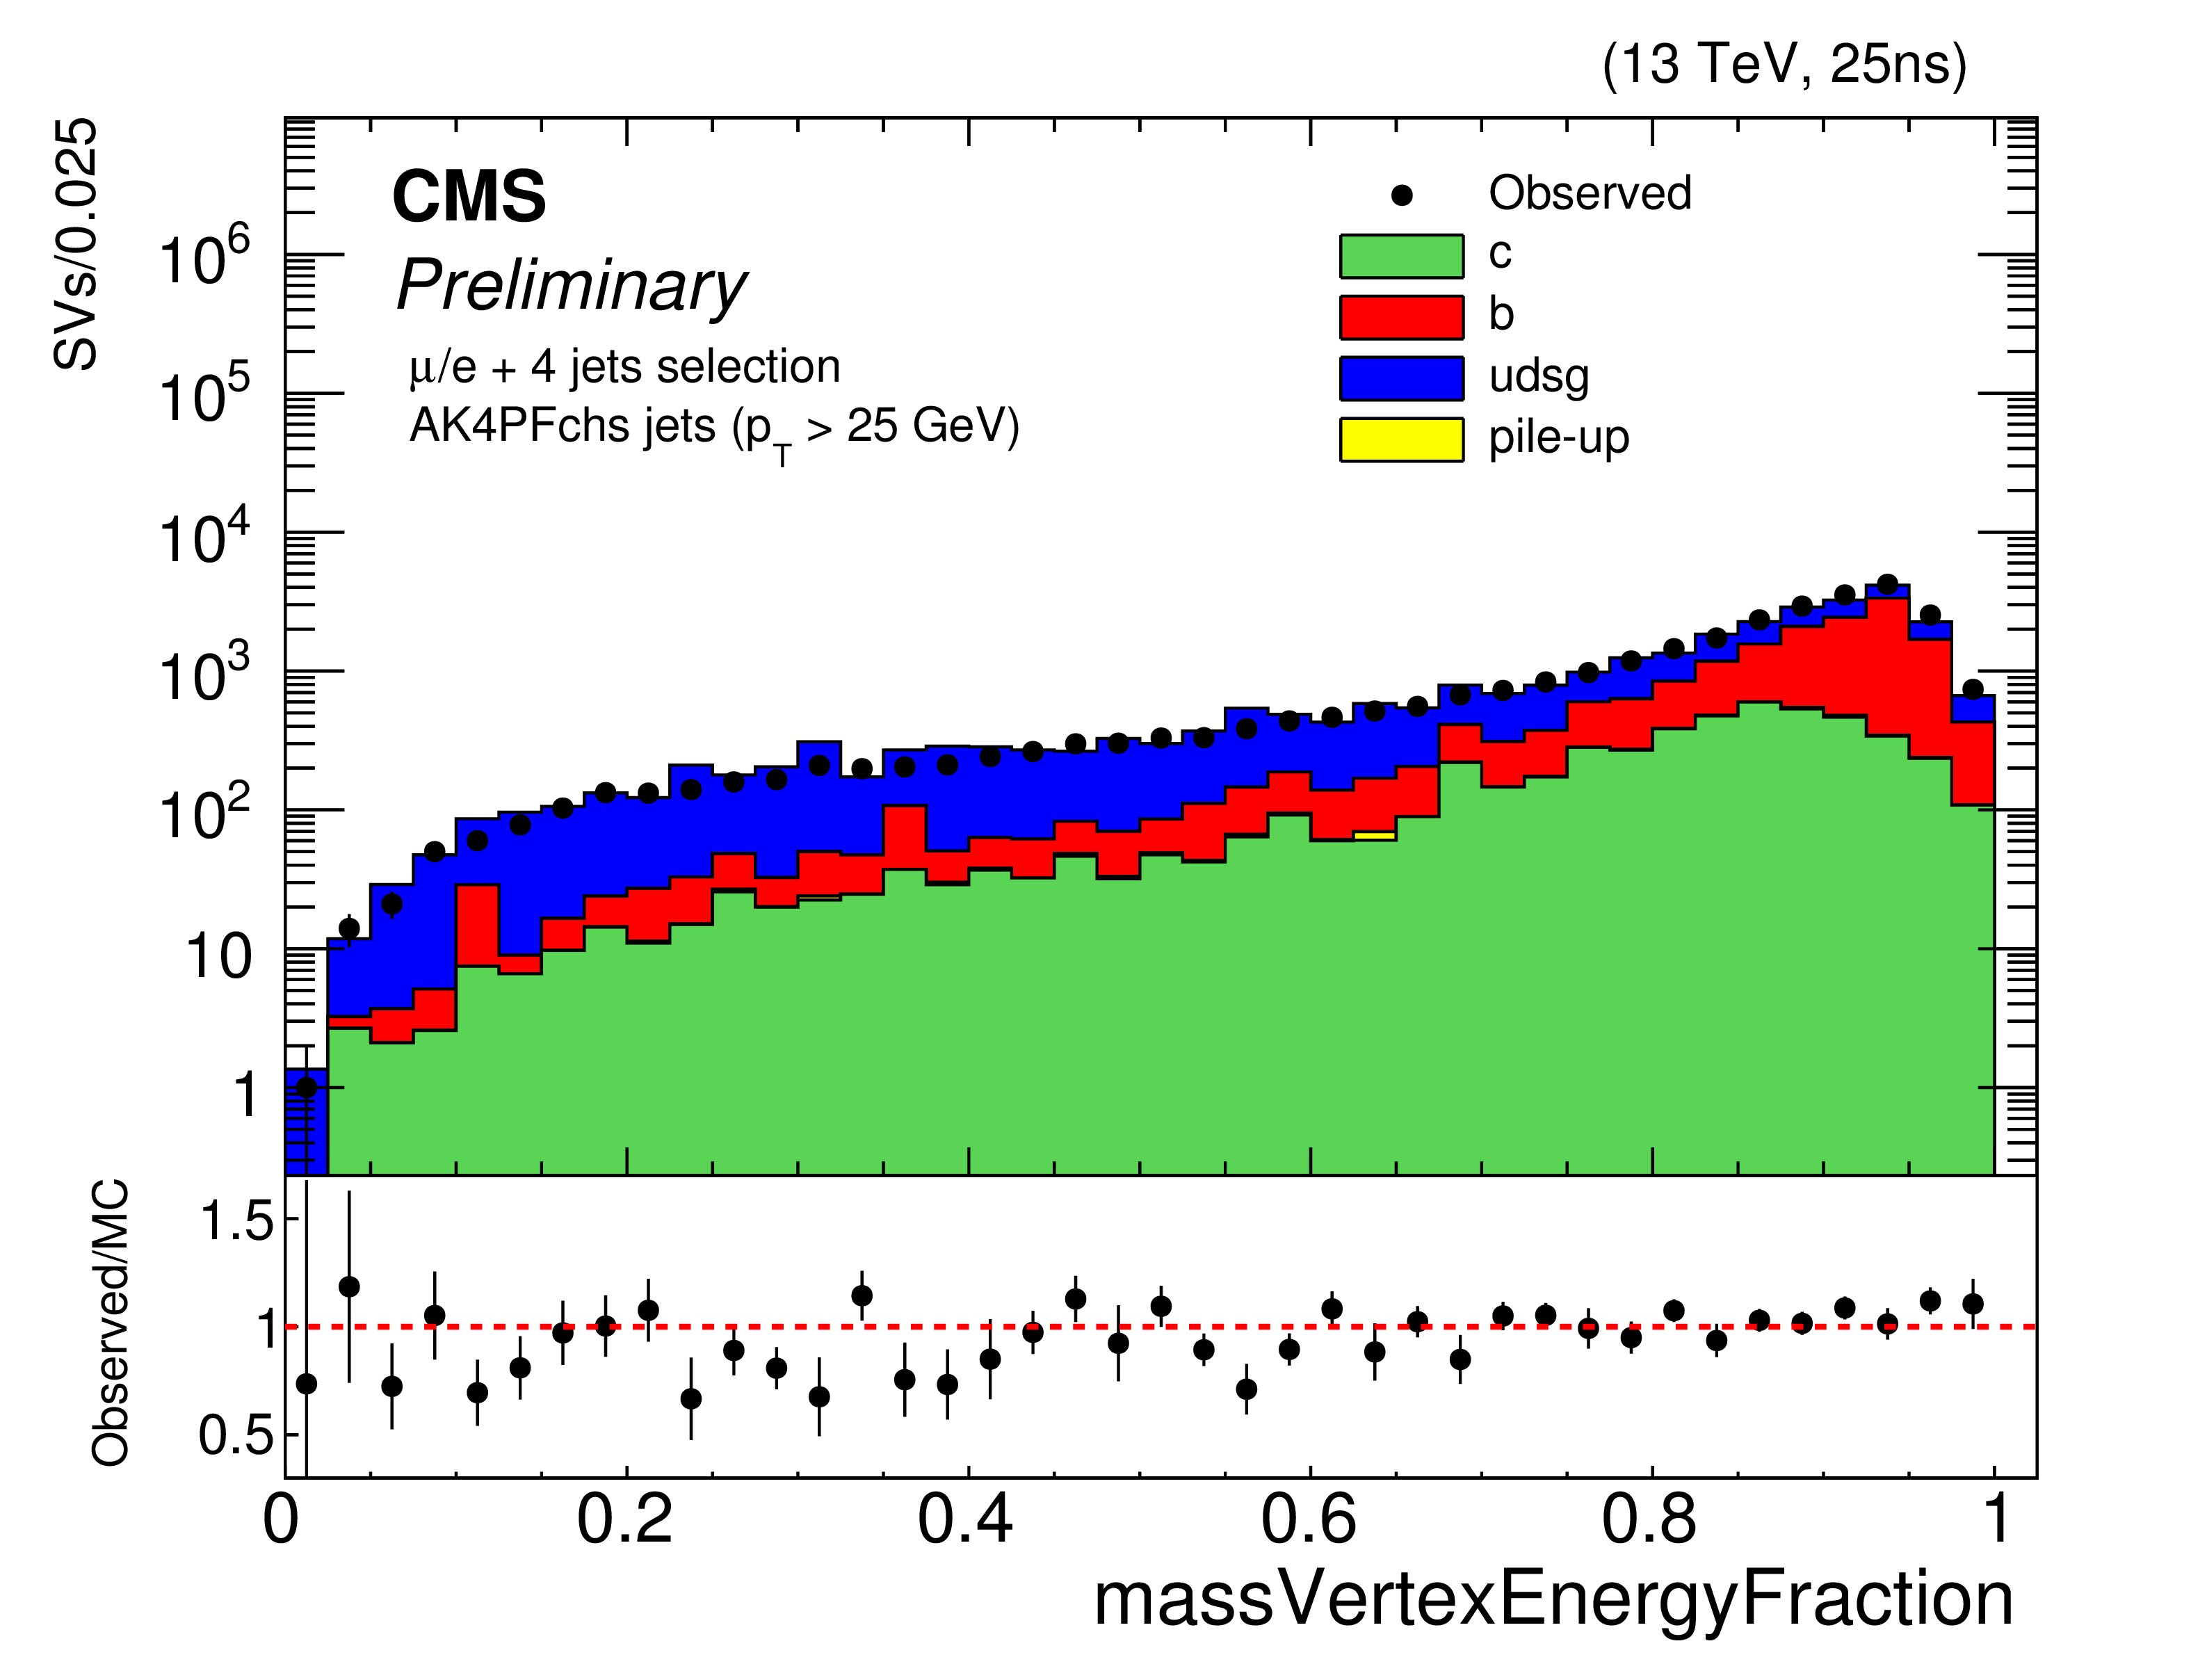
Figure 1-d:
Agreement between data and simulated samples for some of the input variables: 3D flight distance significance of the secondary vertex (a), the number of secondary vertices associated to the jet (b), the secondary vertex mass (c) and a variable called ``massVertexEnergyFraction'' which is defined as the product of the vertex mass and the fraction of the vertex energy with respect to the jet energy (d). |
png pdf |
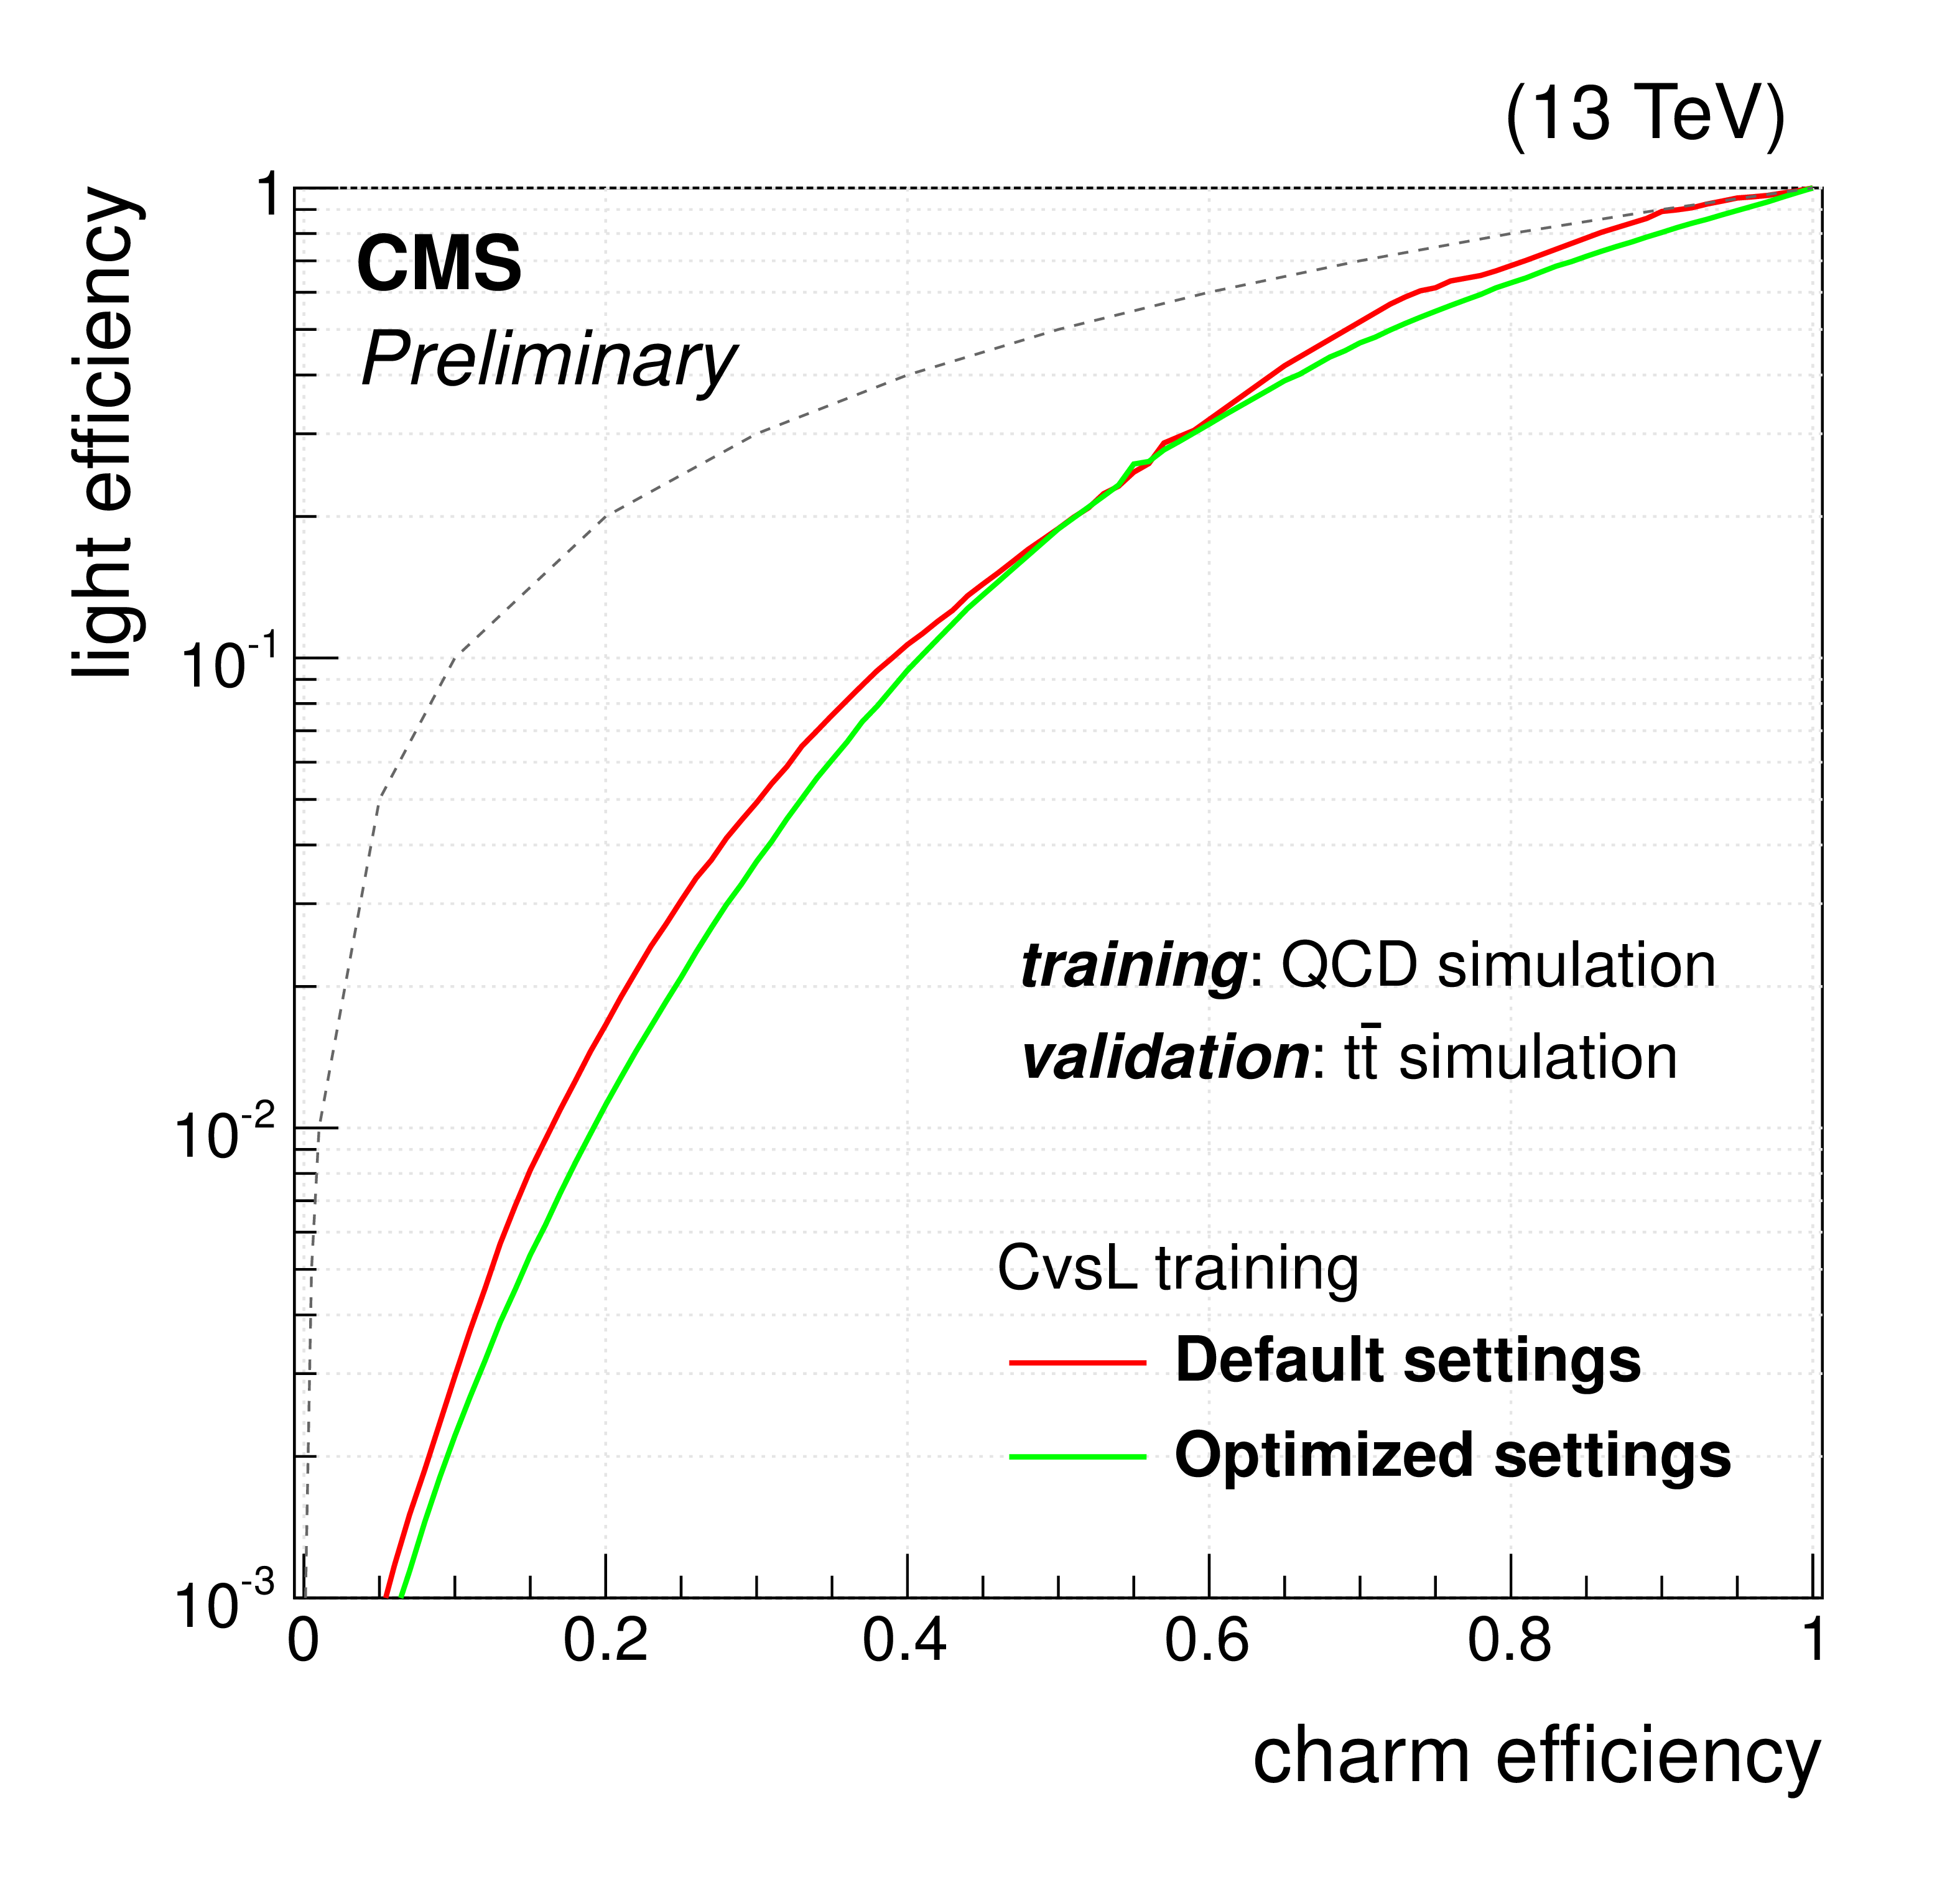
Figure 2:
Performance of the CvsL tagger compared between the default BDT options (in red) and the optimized BDT options (in green). The dashed grey line (the diagonal in this plane) represents a tagger with a random choice. |
png pdf |
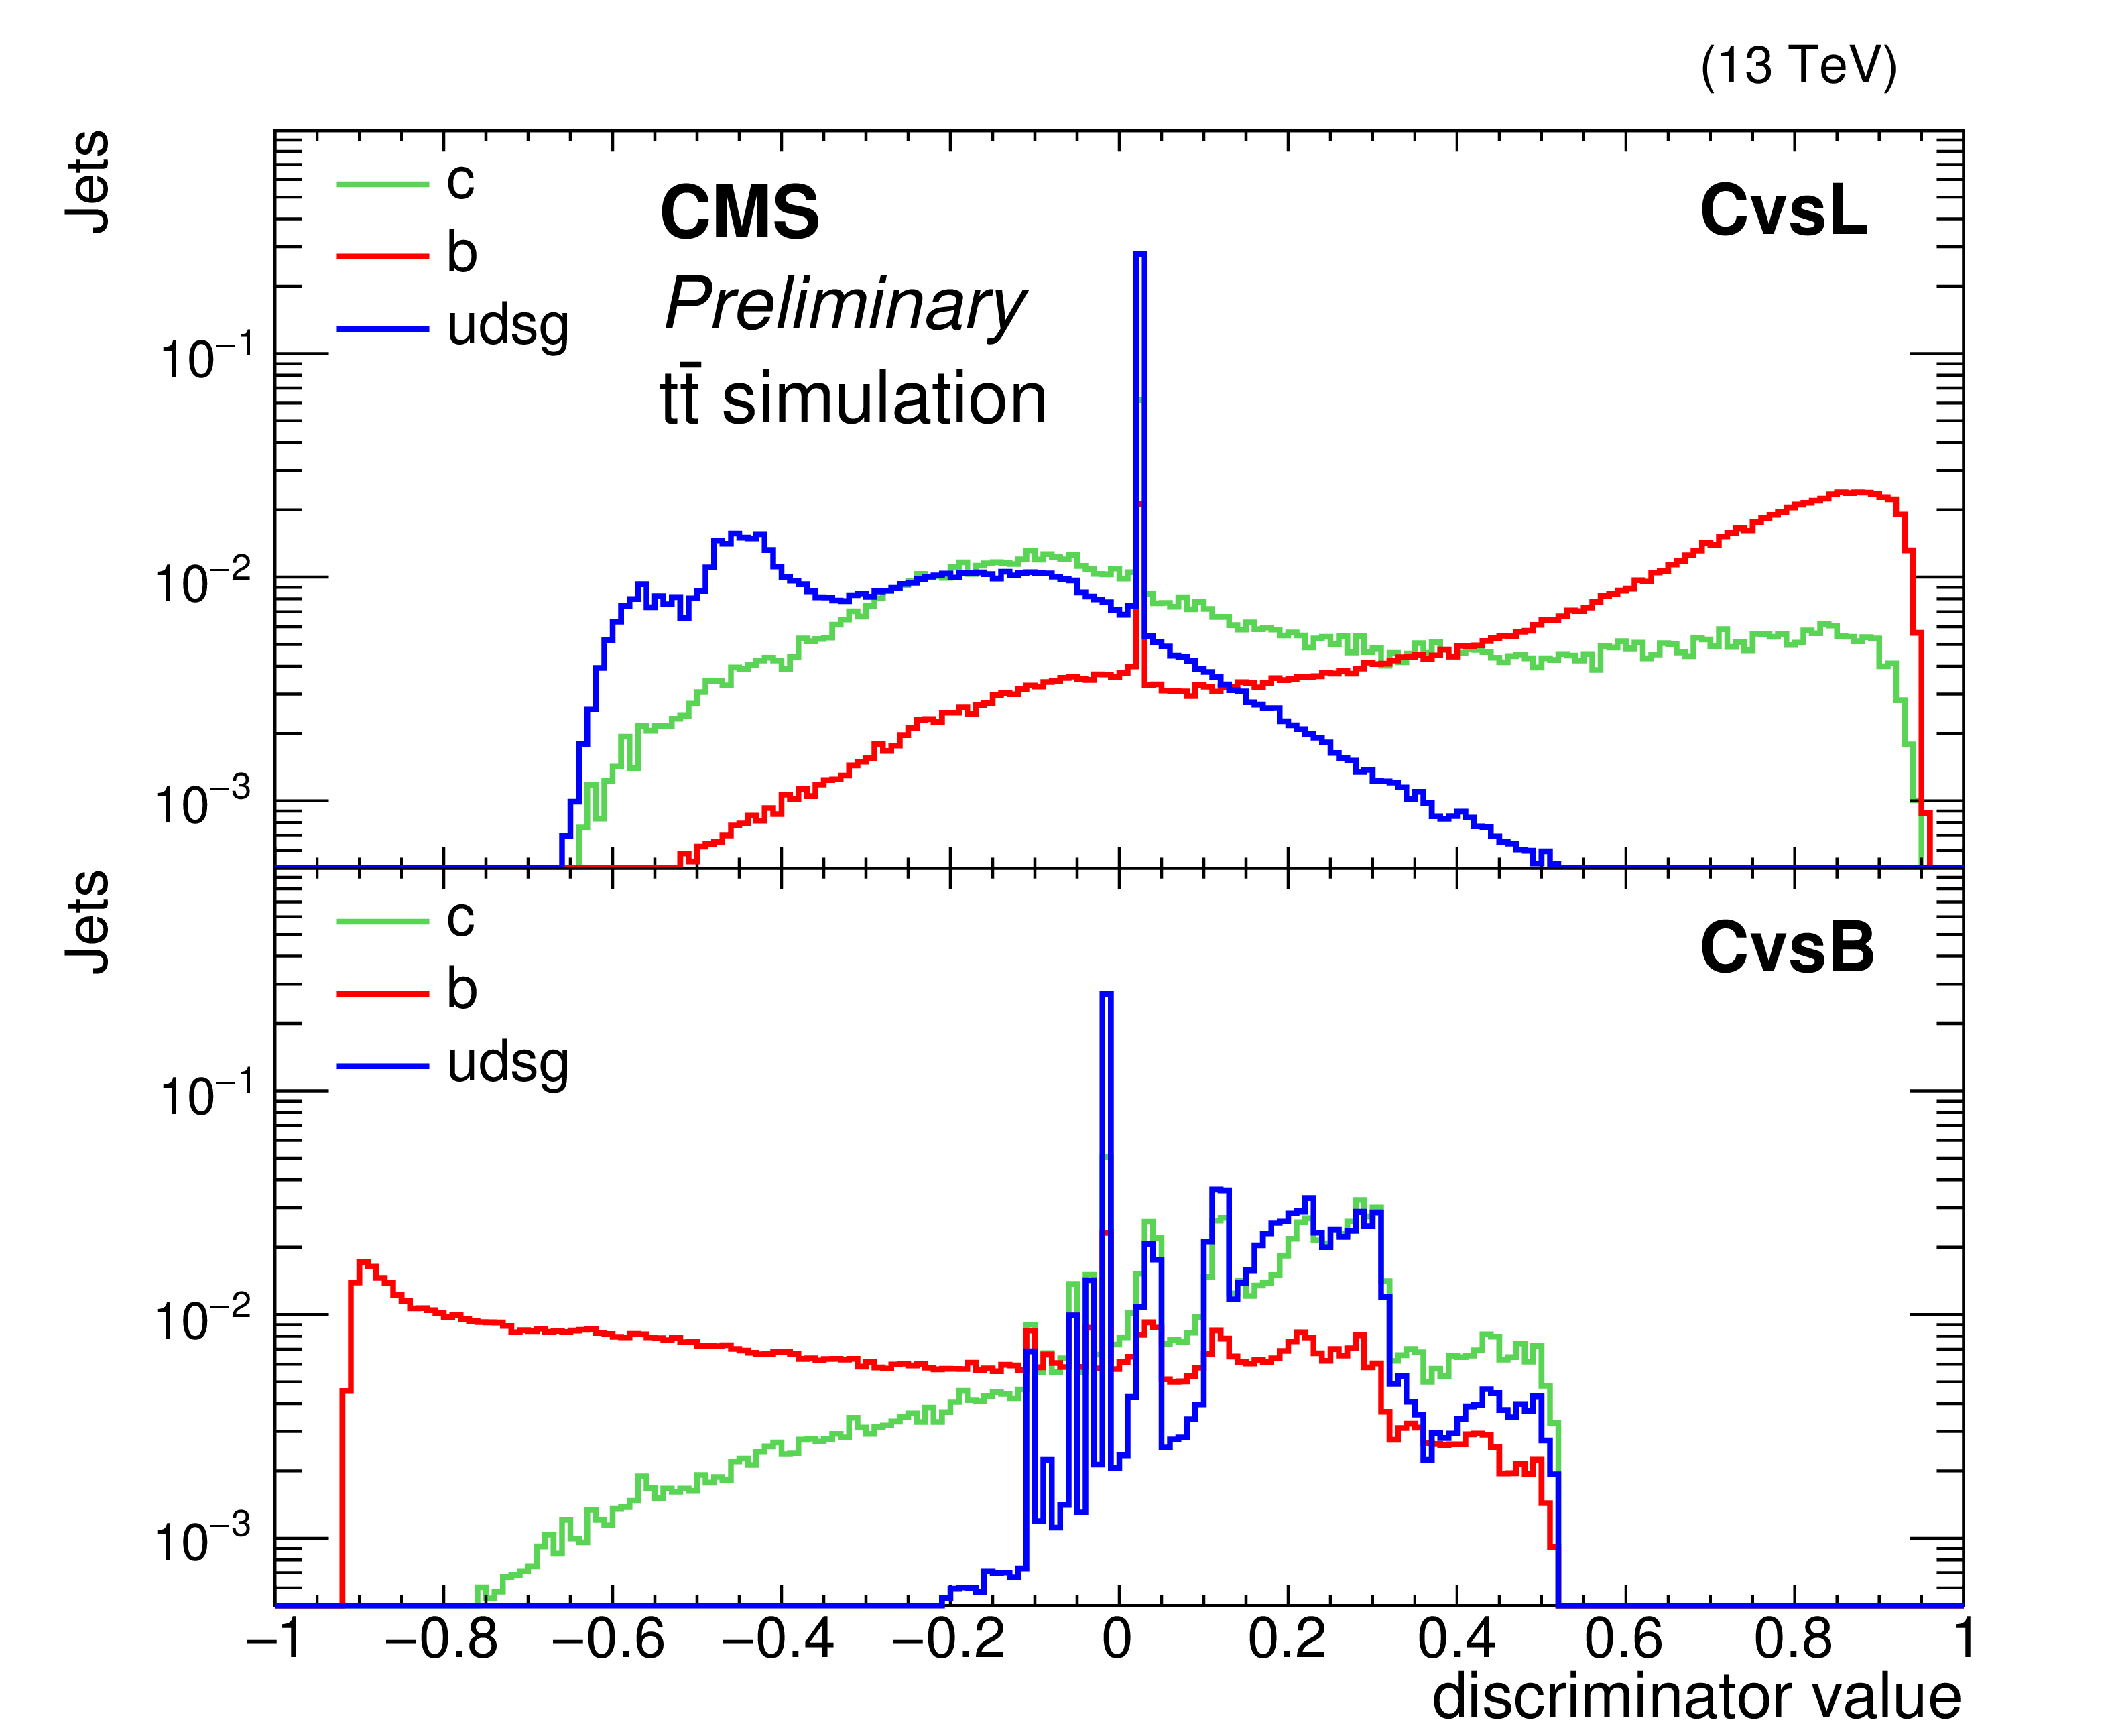
Figure 3-a:
a: Overlay of the BDT discriminator output for the different flavours for the CvsL (top) and for the CvsB (bottom) discriminators (normalized for each flavour). b: ROC curves showing the final performance of the CvsL (blue full line and axis) and CvsB (red full line and axis) trainings, validated on the ${\mathrm {t}\overline {\mathrm {t}}}$ sample. For comparison the performance of the CSVv2 and cMVAv2 [1] algorithms (used for b tagging) is also shown by the dotted lines. |
png pdf |
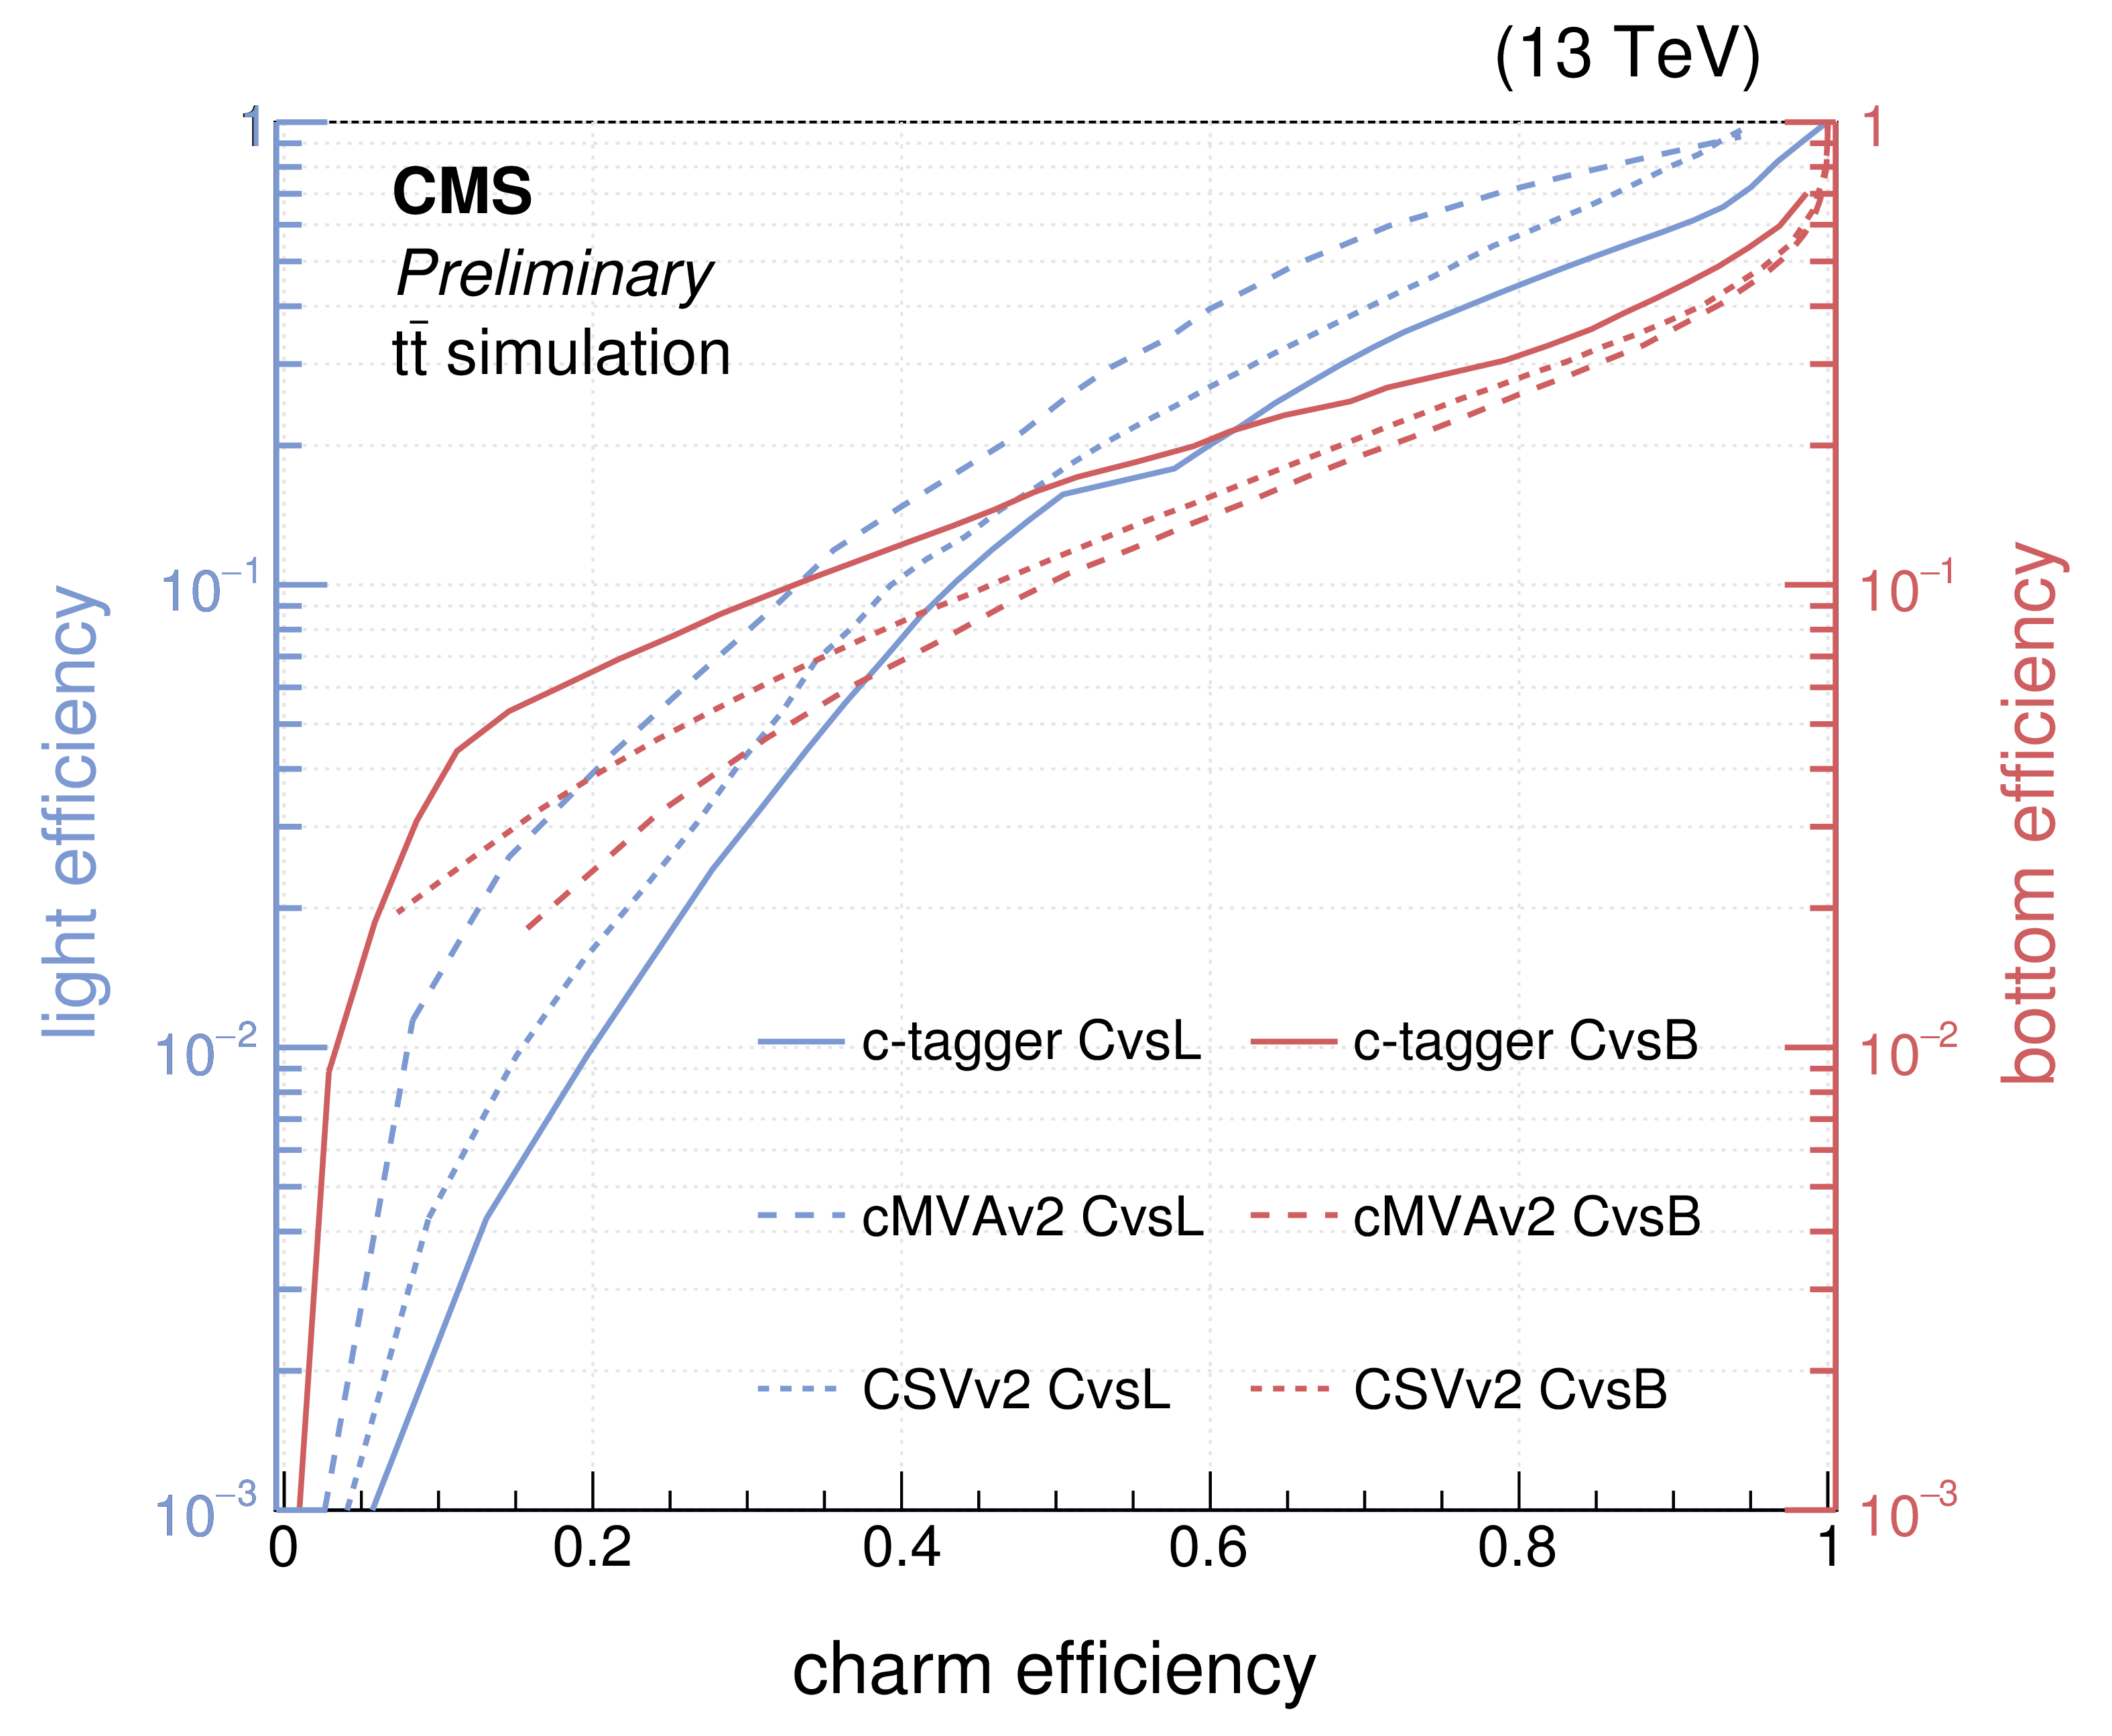
Figure 3-b:
a: Overlay of the BDT discriminator output for the different flavours for the CvsL (top) and for the CvsB (bottom) discriminators (normalized for each flavour). b: ROC curves showing the final performance of the CvsL (blue full line and axis) and CvsB (red full line and axis) trainings, validated on the ${\mathrm {t}\overline {\mathrm {t}}}$ sample. For comparison the performance of the CSVv2 and cMVAv2 [1] algorithms (used for b tagging) is also shown by the dotted lines. |
png pdf |
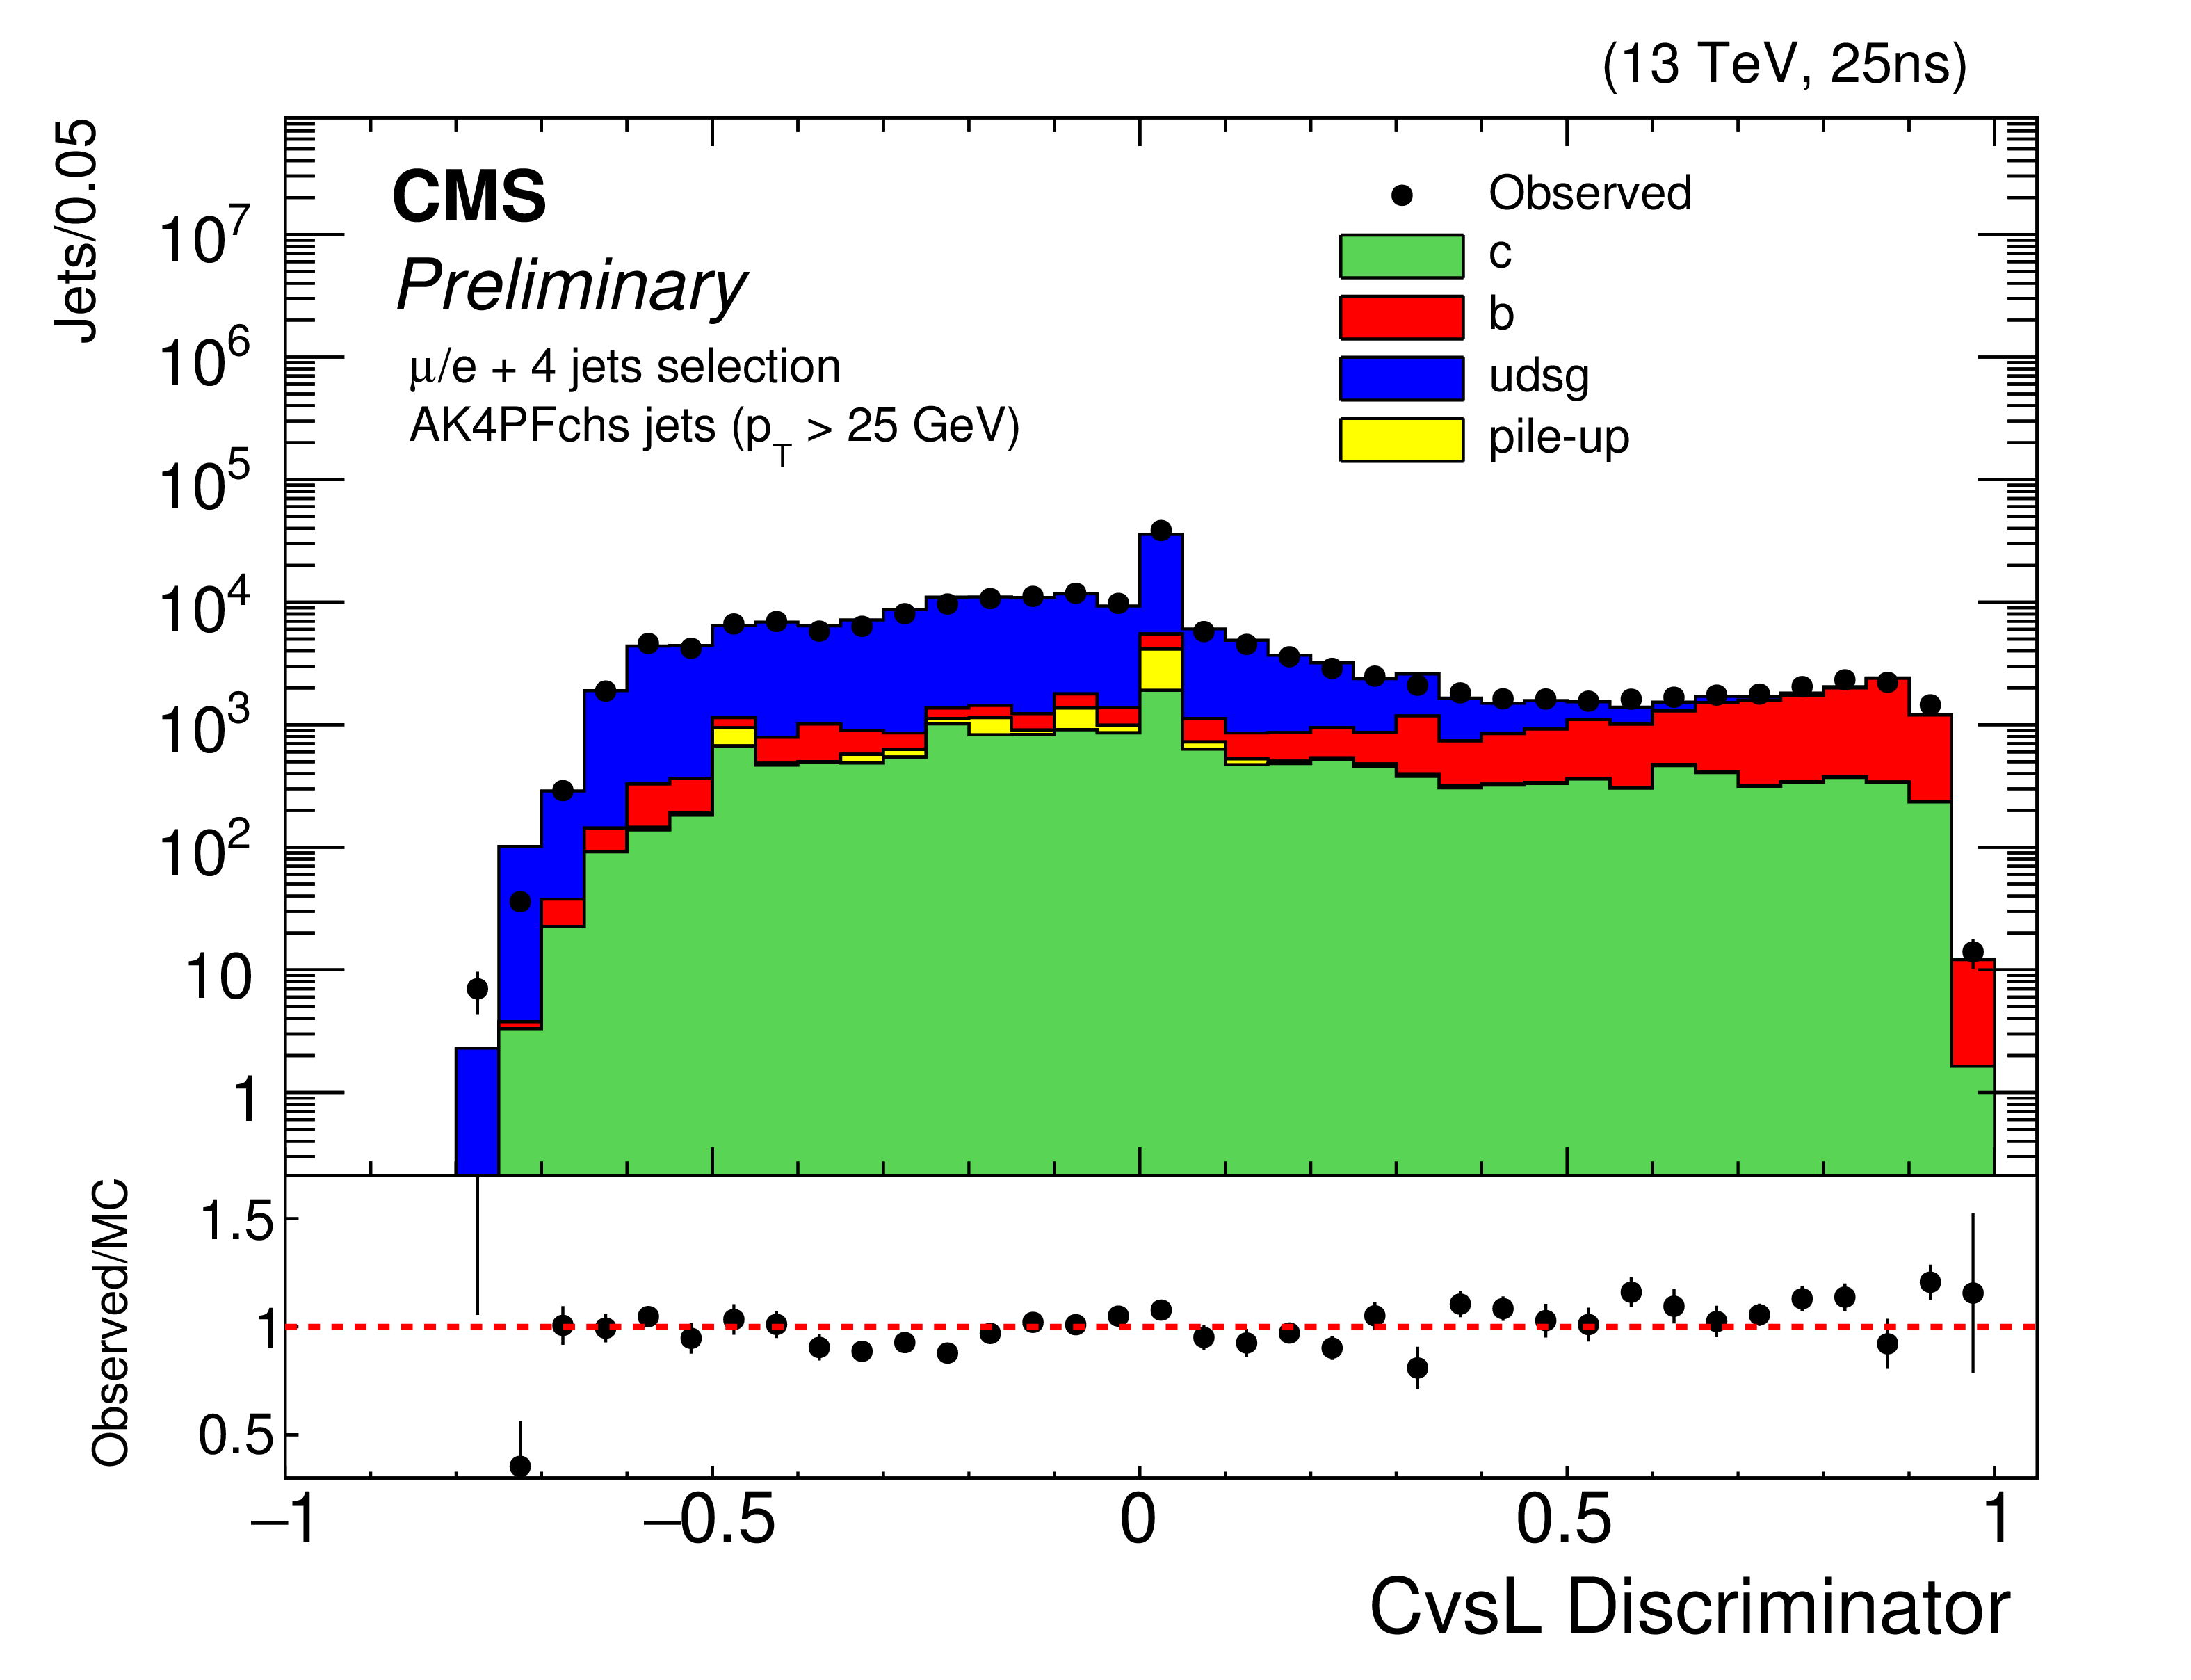
Figure 4-a:
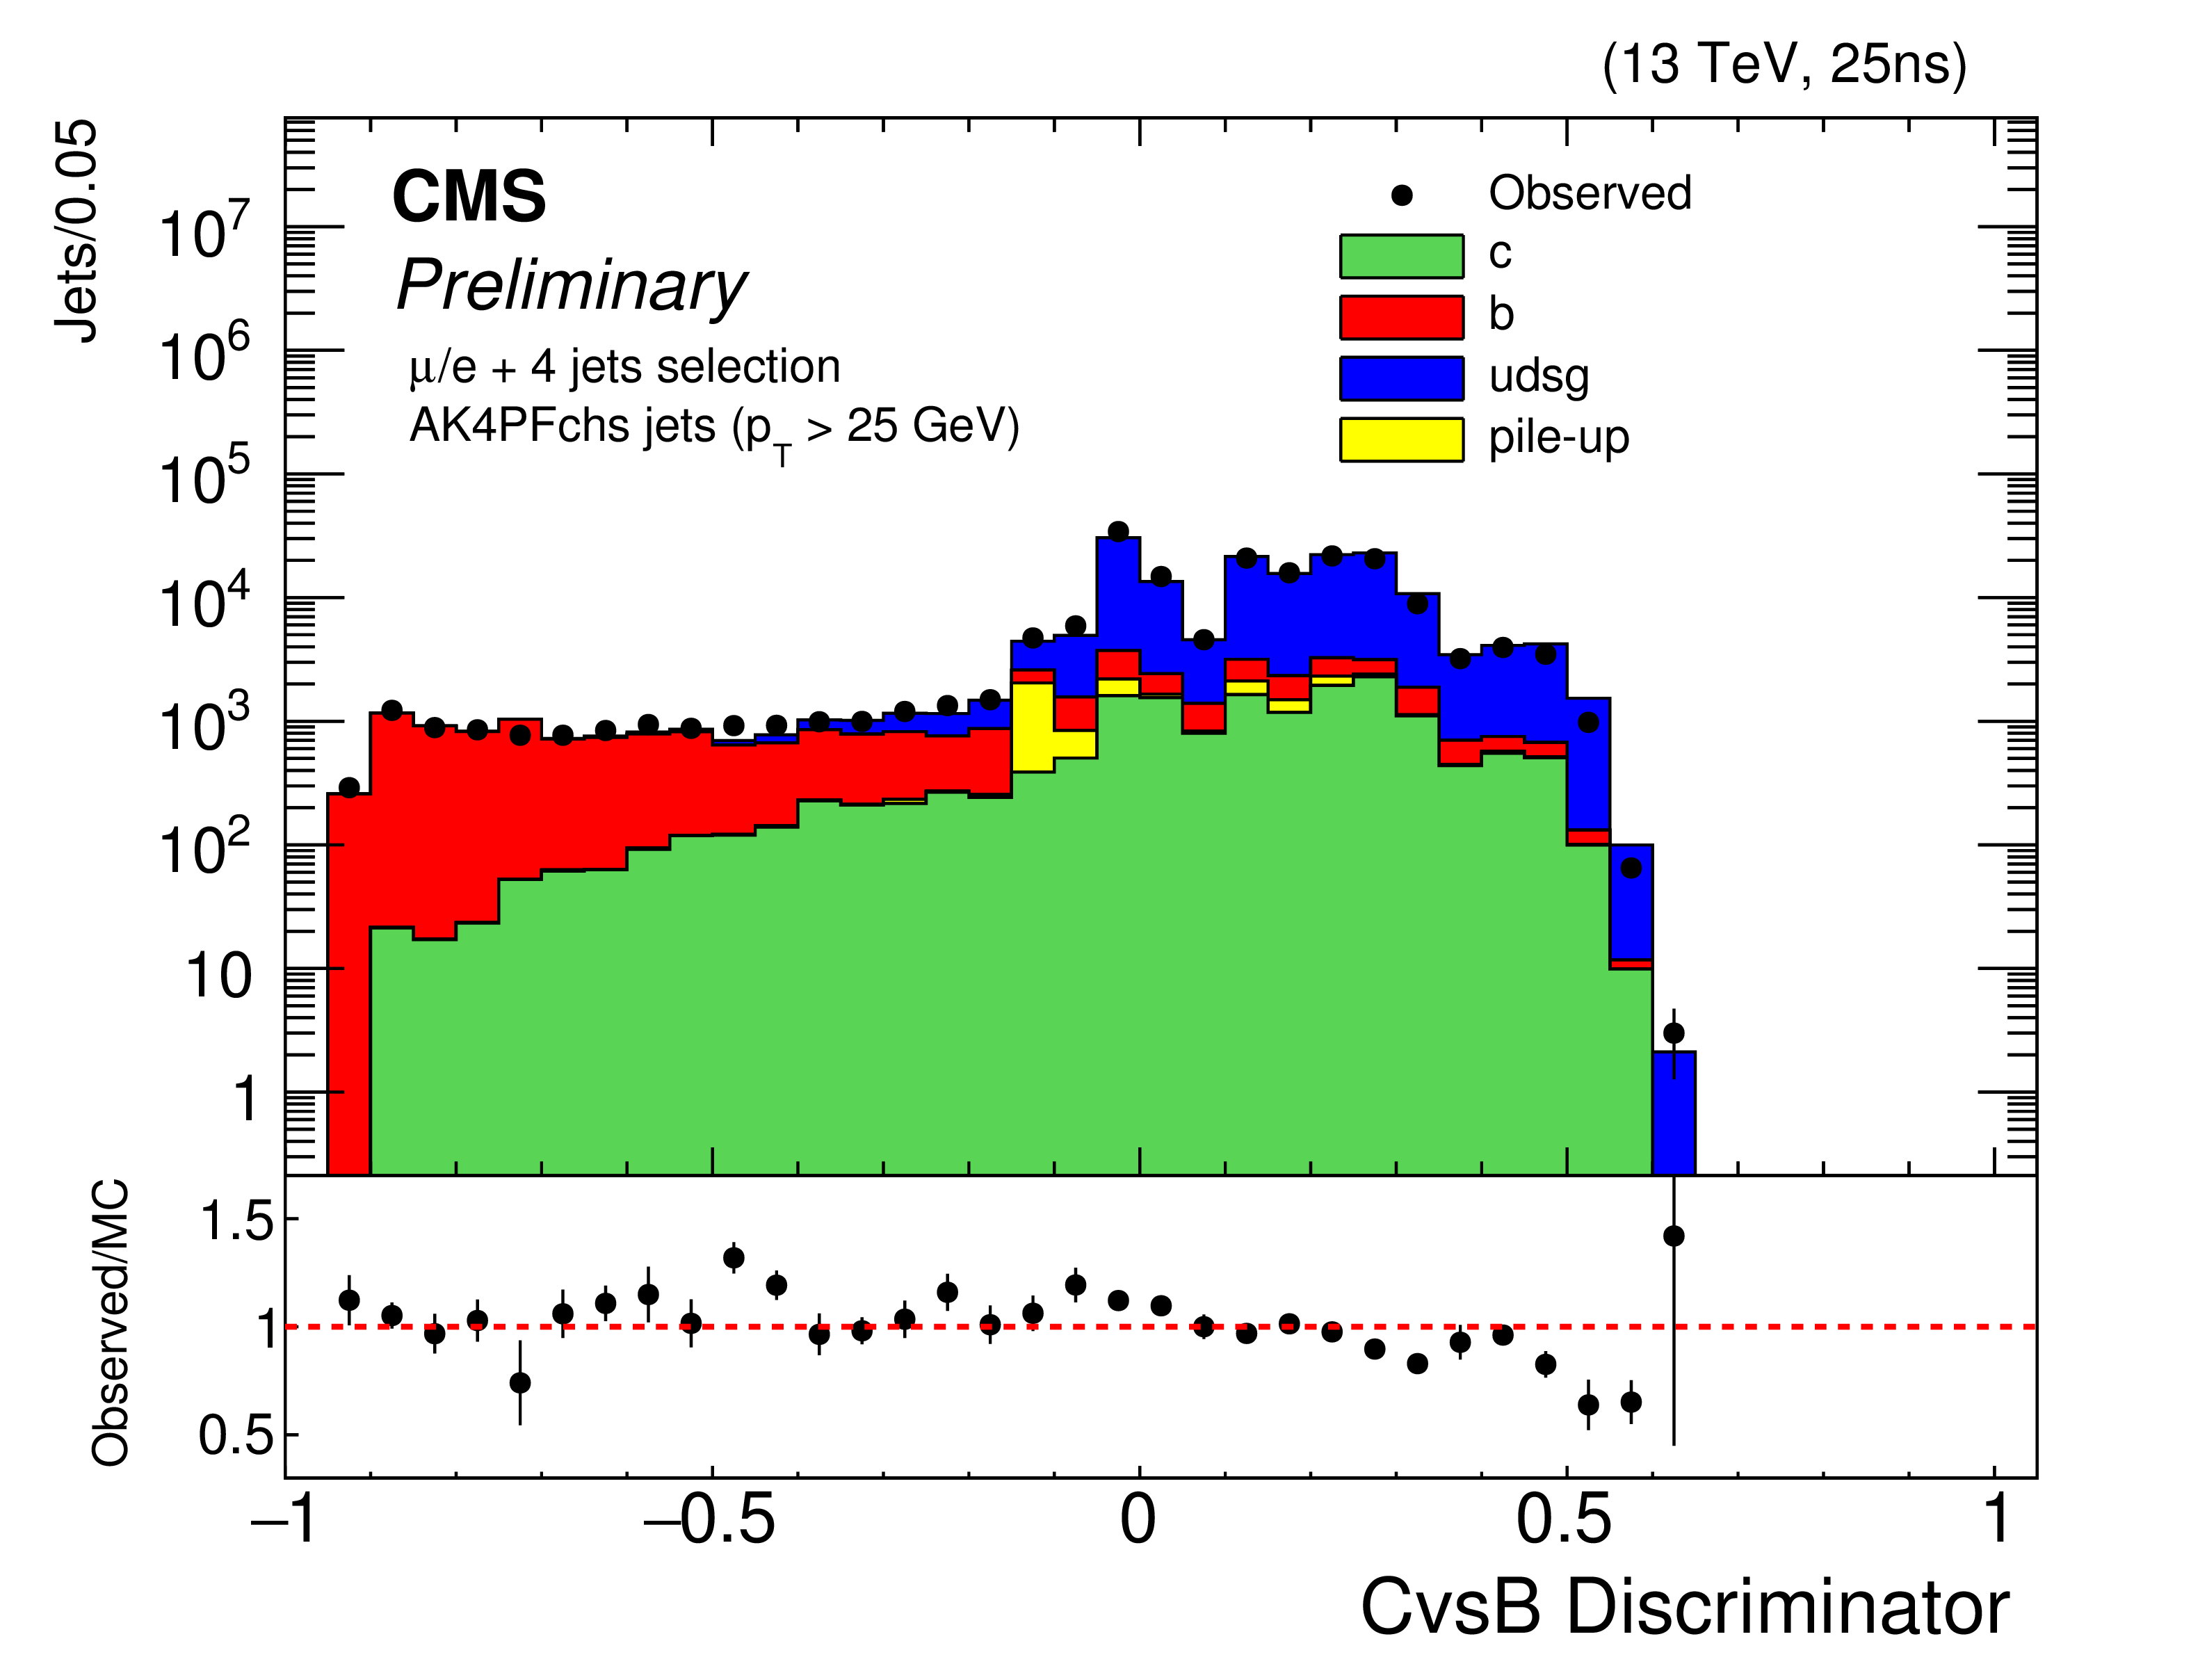
Agreement between data and simulated samples for the CvsL and CvsB discriminator distributions. |
png pdf |
Figure 4-b:
Agreement between data and simulated samples for the CvsL and CvsB discriminator distributions. |
png pdf |
Figure 5-a:
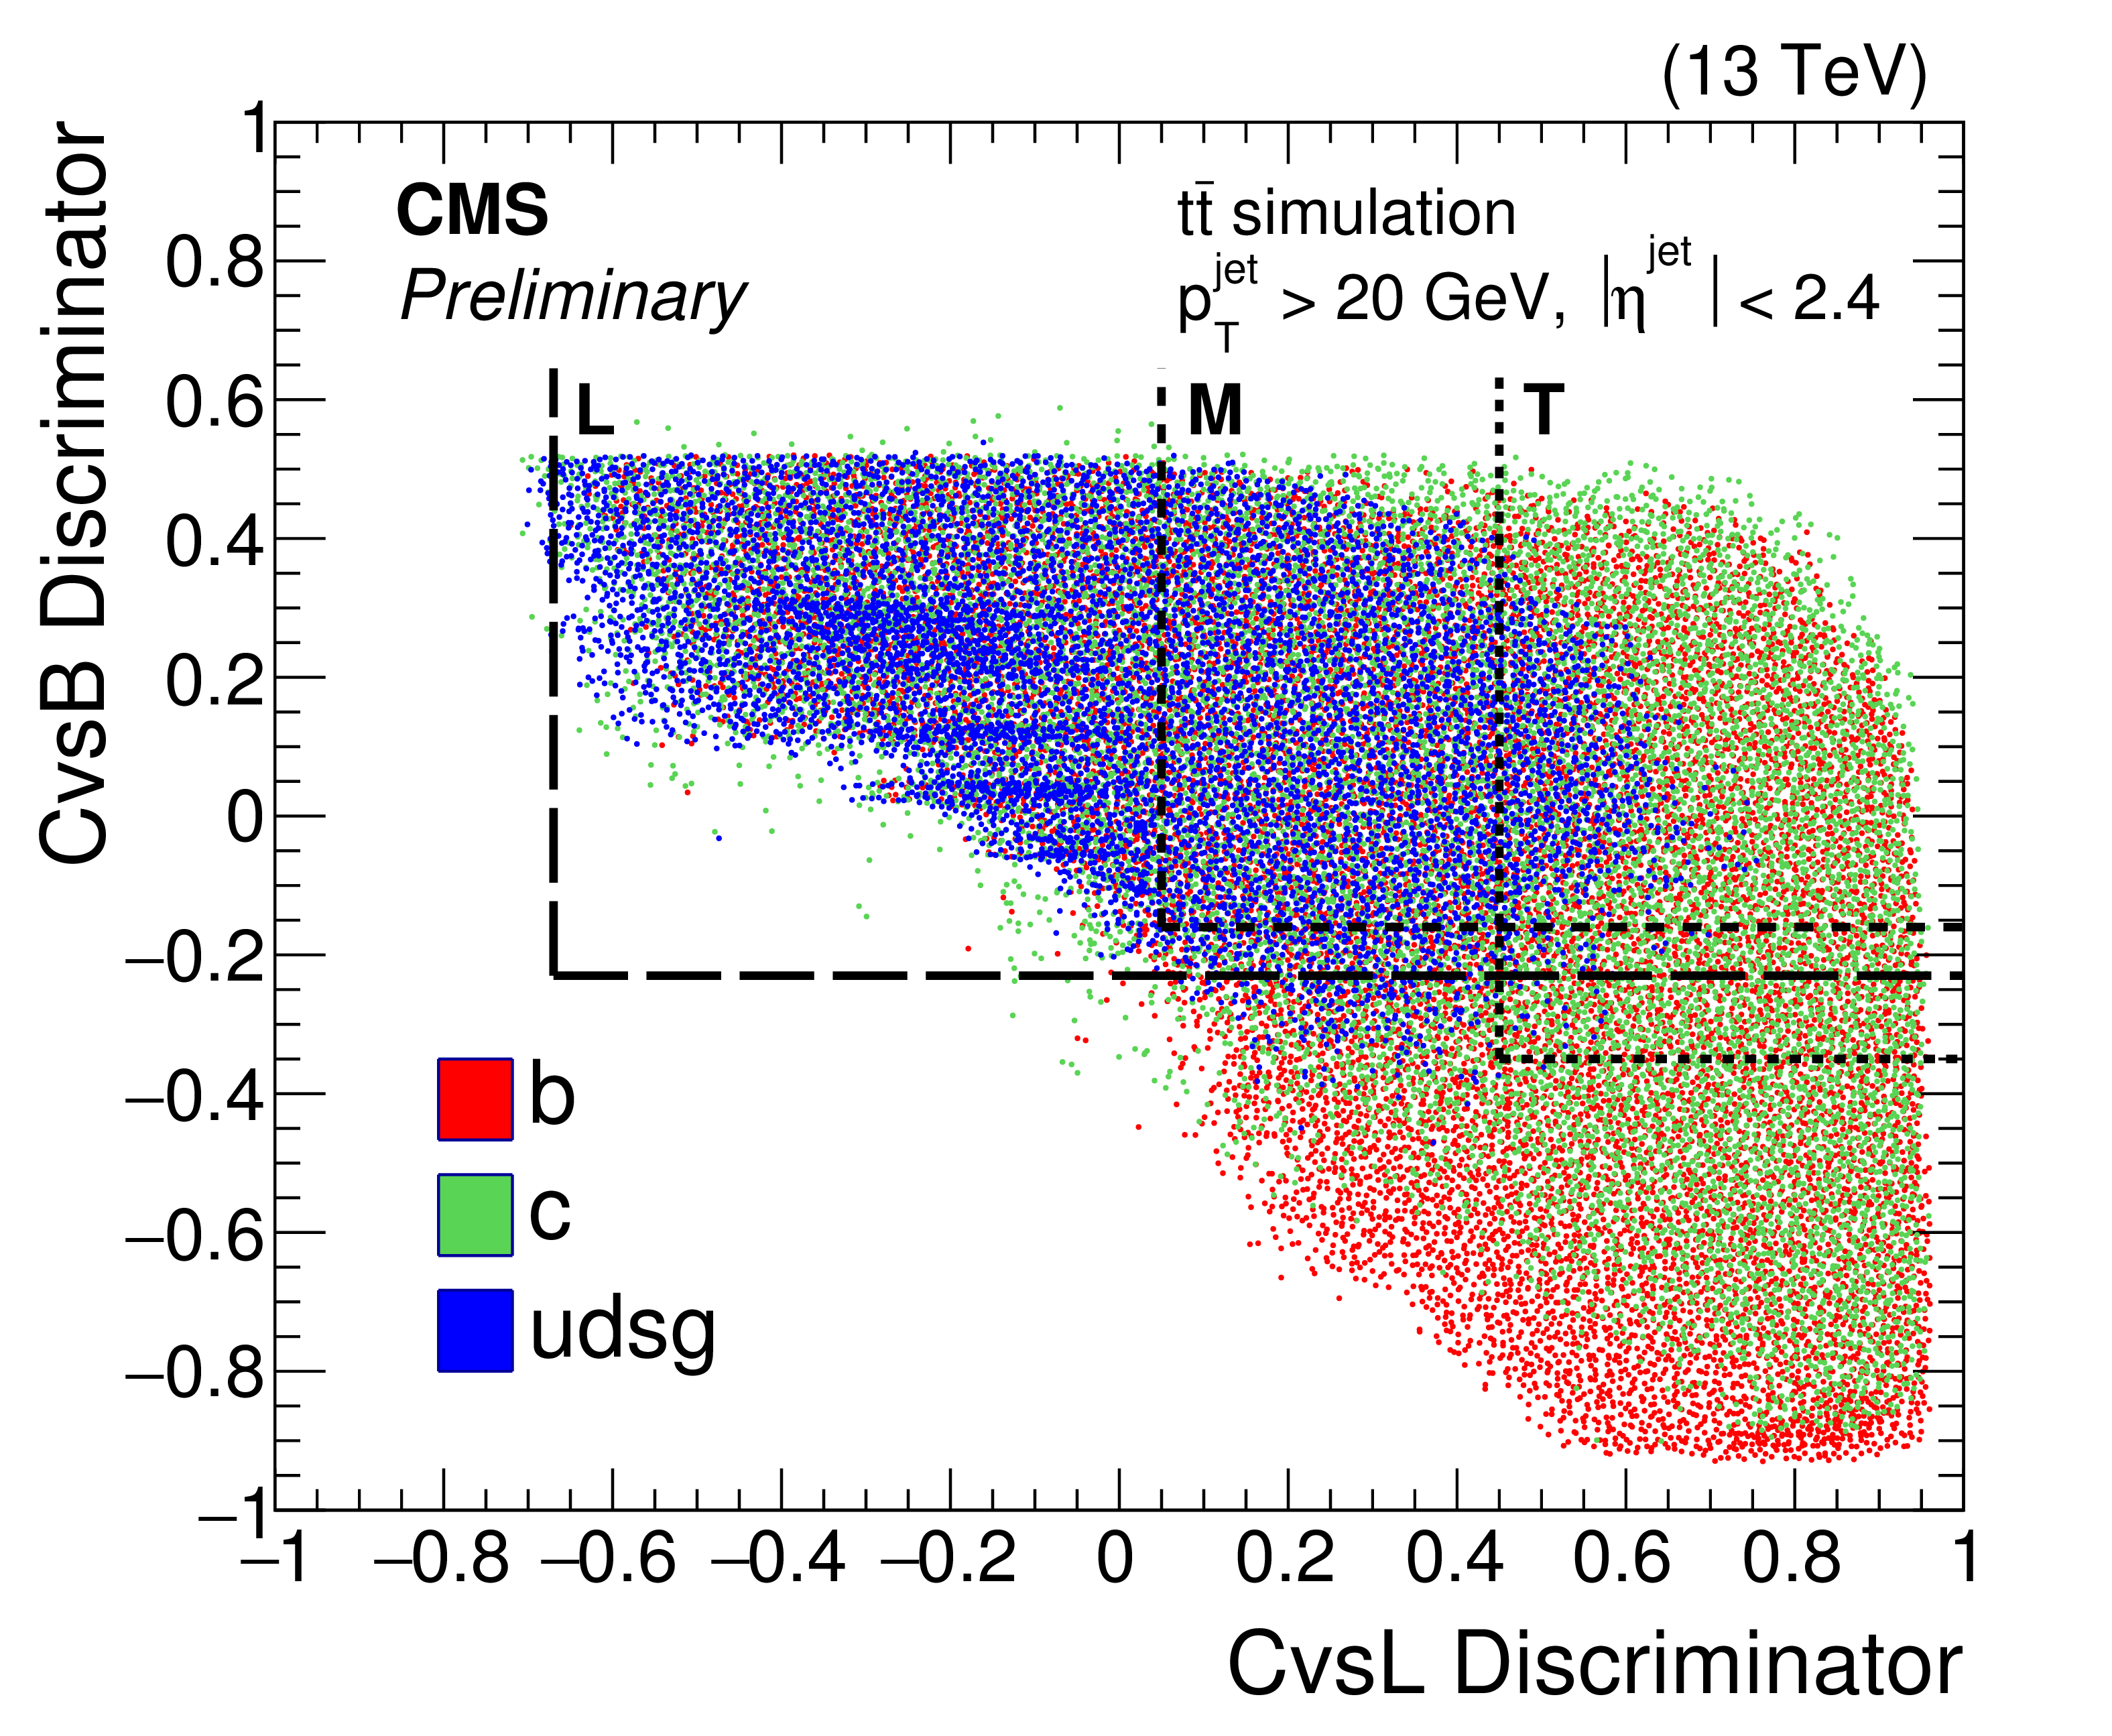
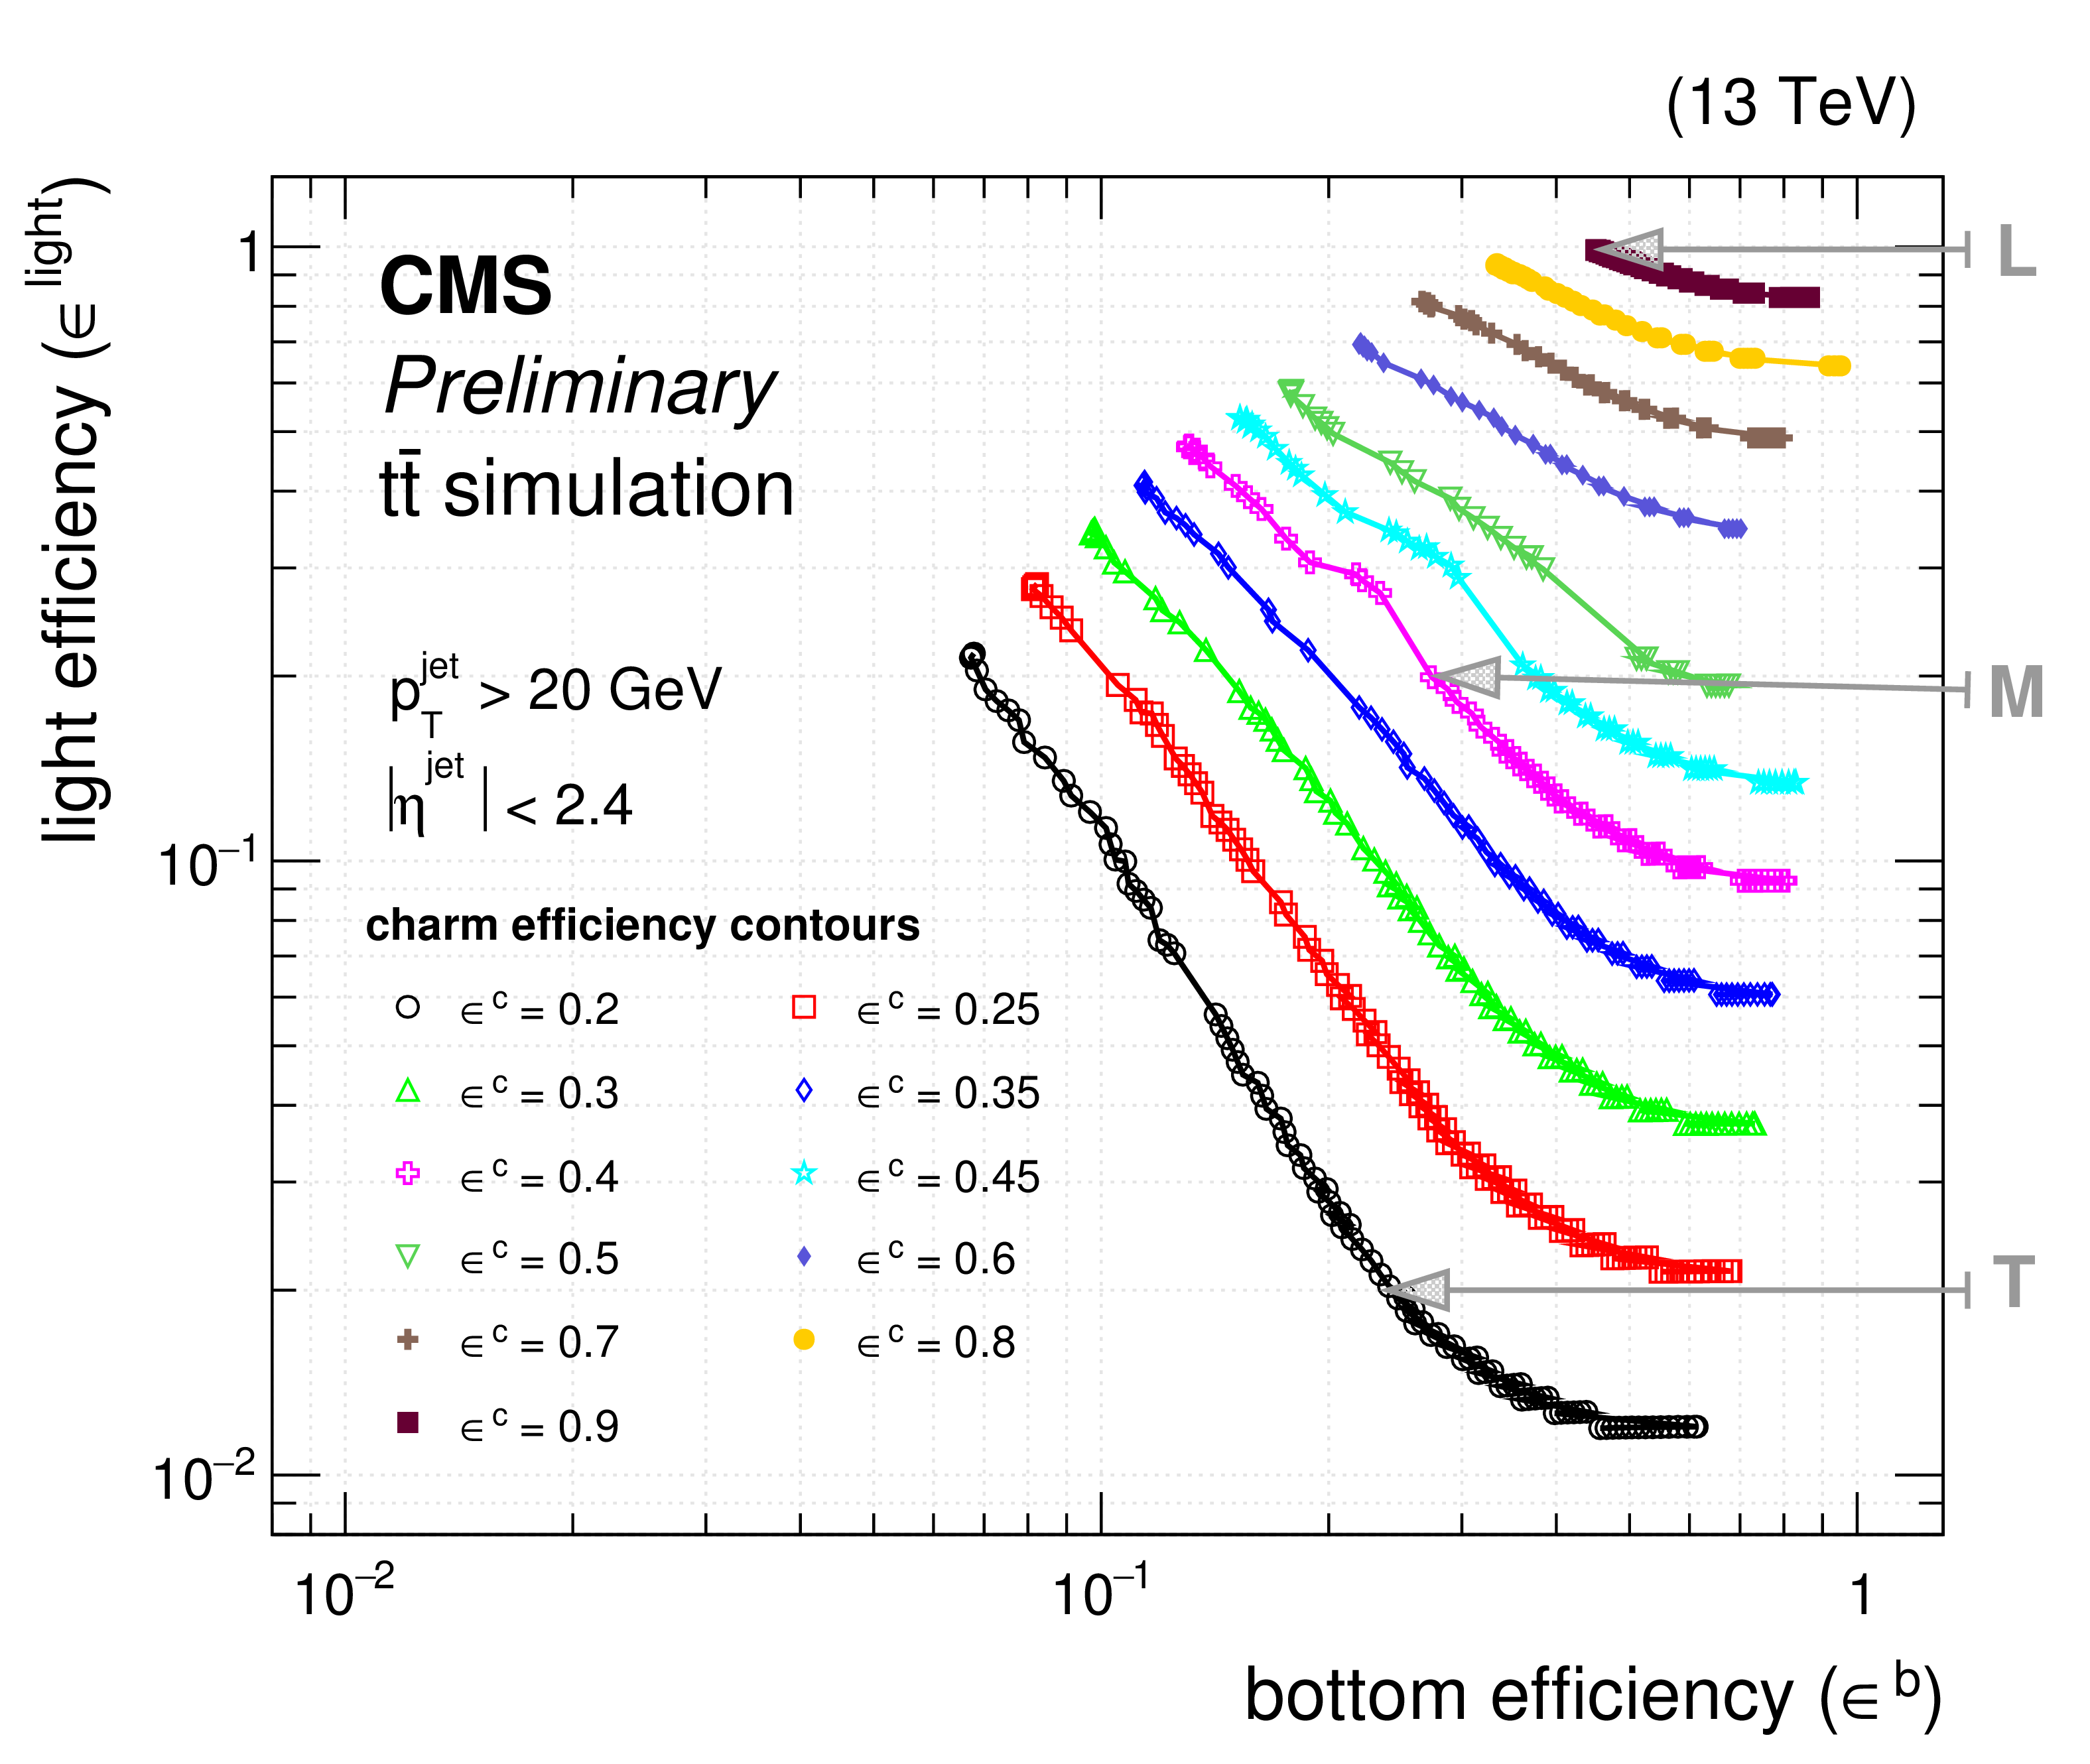
a: two dimensional scatter overlay of the BDT discriminators for b (red), c (green), and light jets (blue). The CvsL discriminator is shown on the x-axis and the CvsB discriminator is shown on the y-axis. b: relation between bottom and light mistag efficiency for different values of a constant charm efficiency. |
png pdf |
Figure 5-b:
a: two dimensional scatter overlay of the BDT discriminators for b (red), c (green), and light jets (blue). The CvsL discriminator is shown on the x-axis and the CvsB discriminator is shown on the y-axis. b: relation between bottom and light mistag efficiency for different values of a constant charm efficiency. |
png pdf |
Figure 6-a:
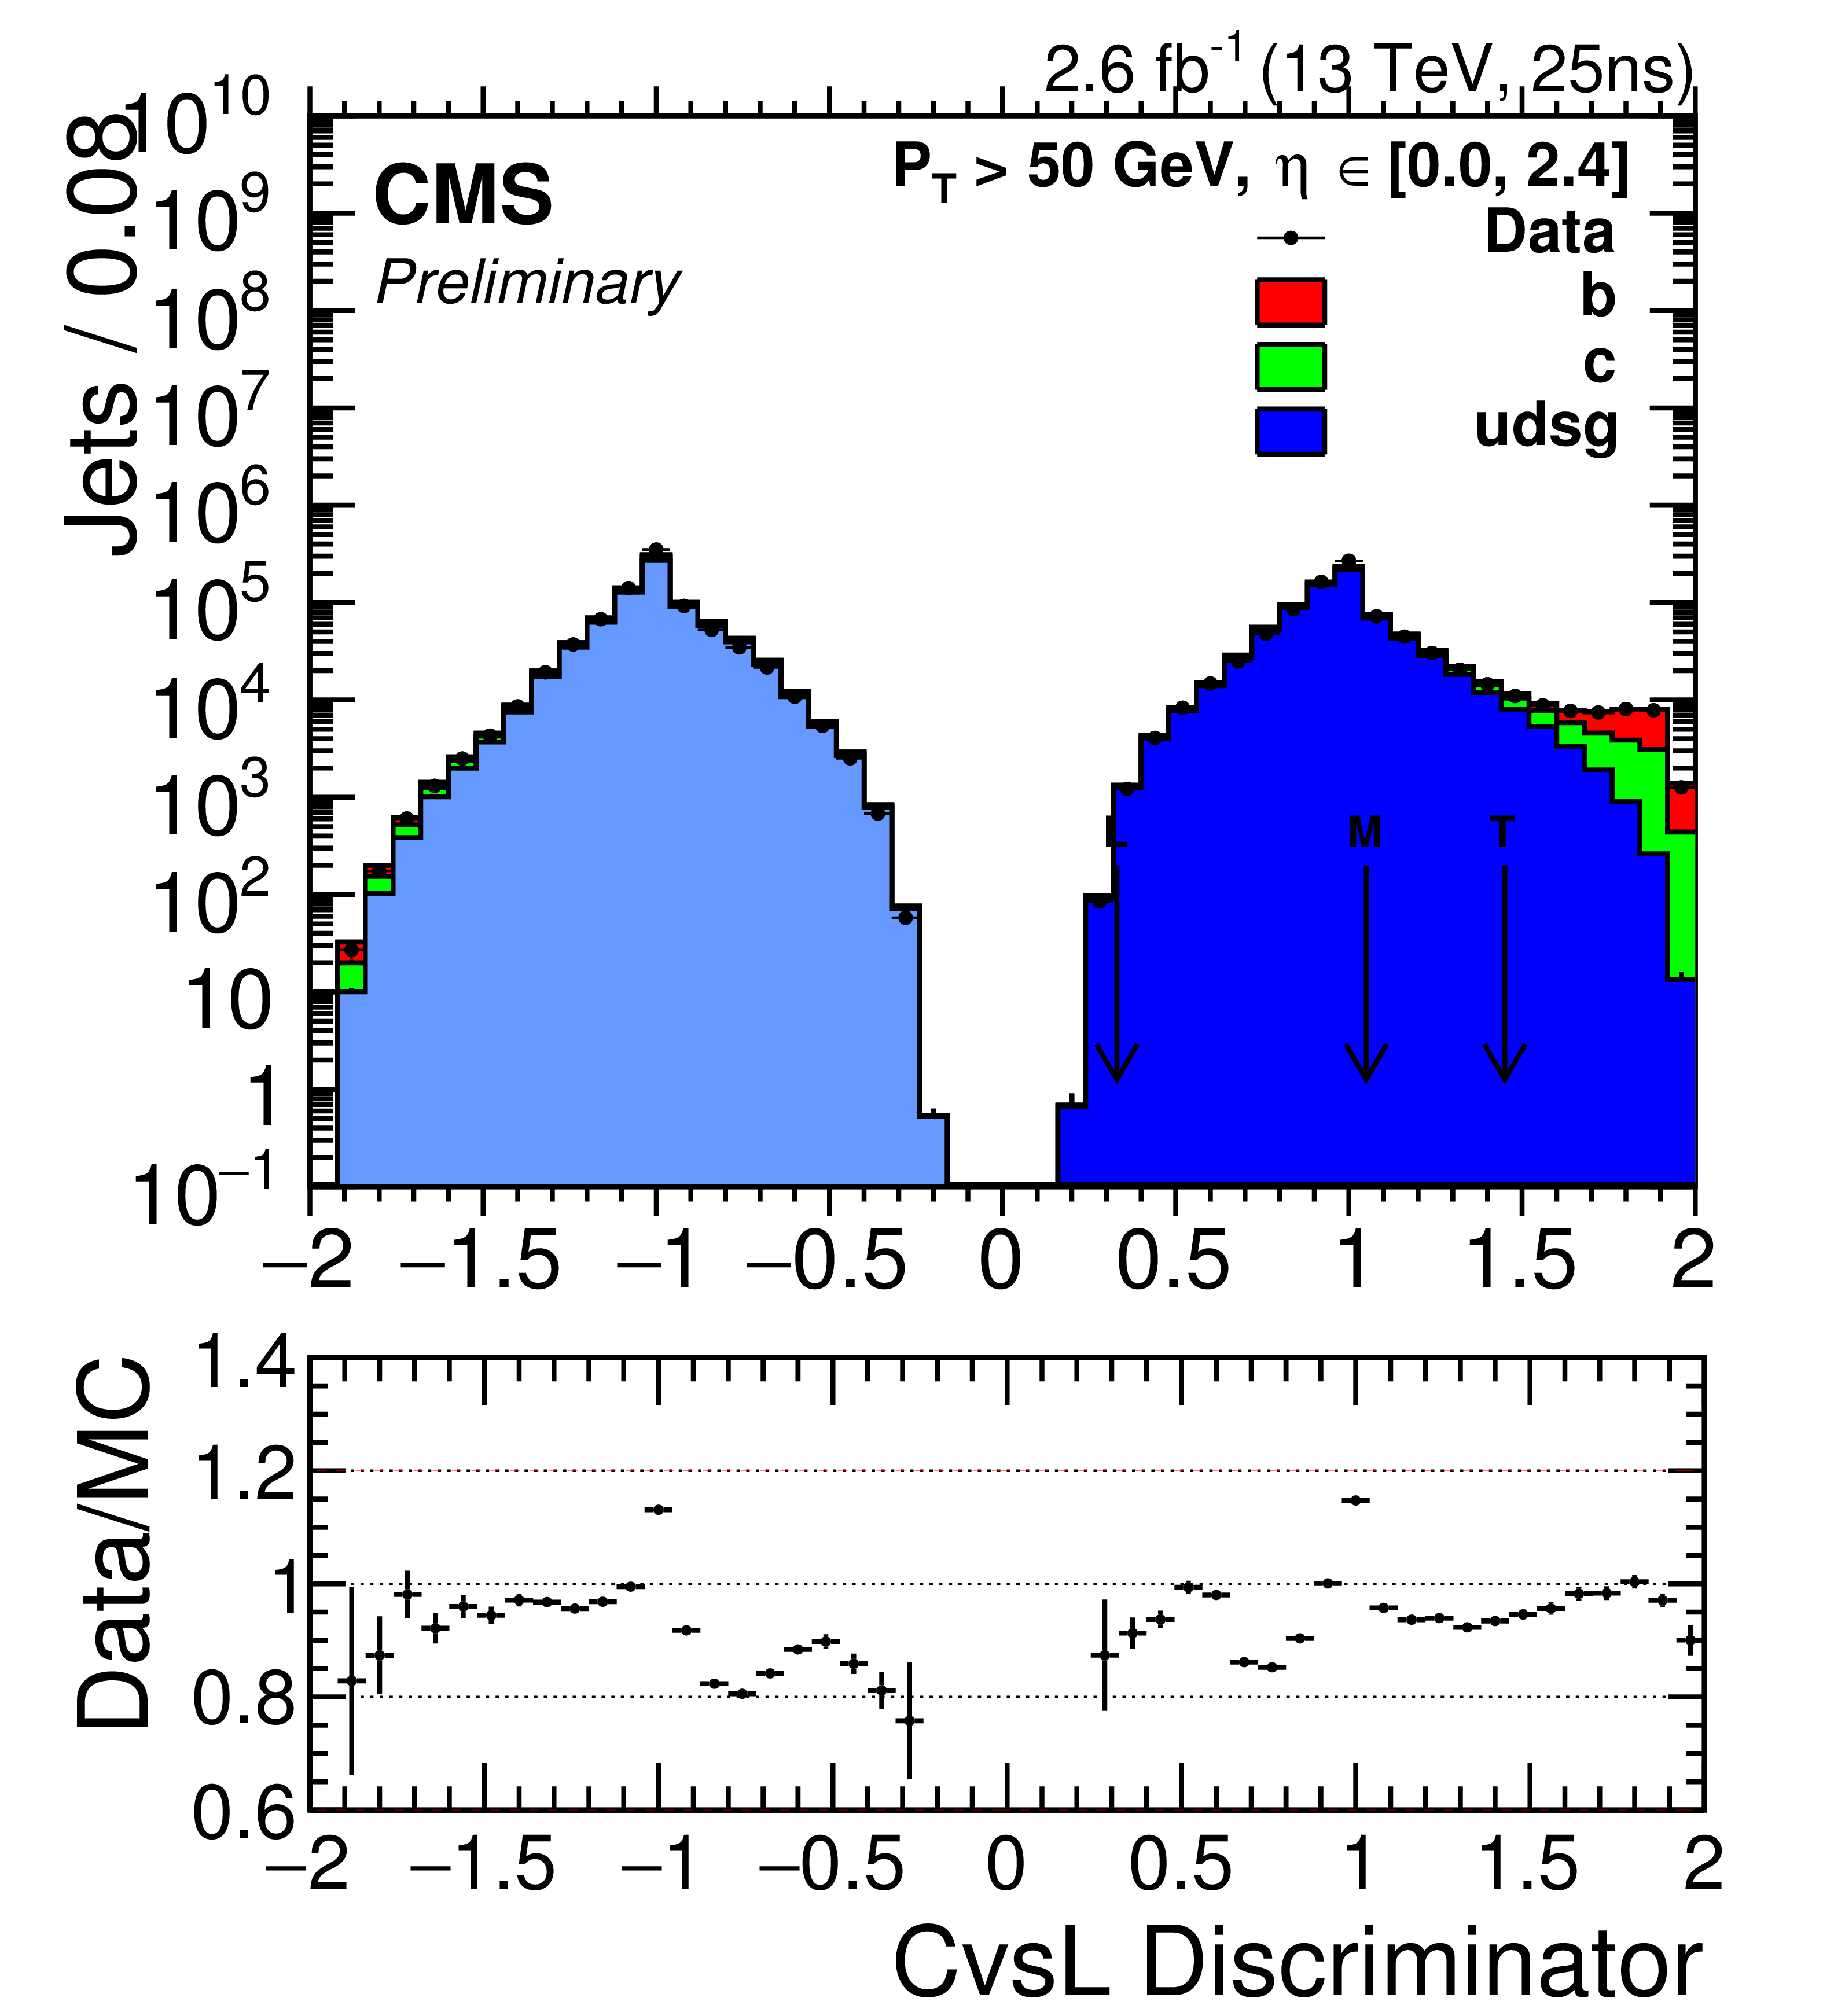
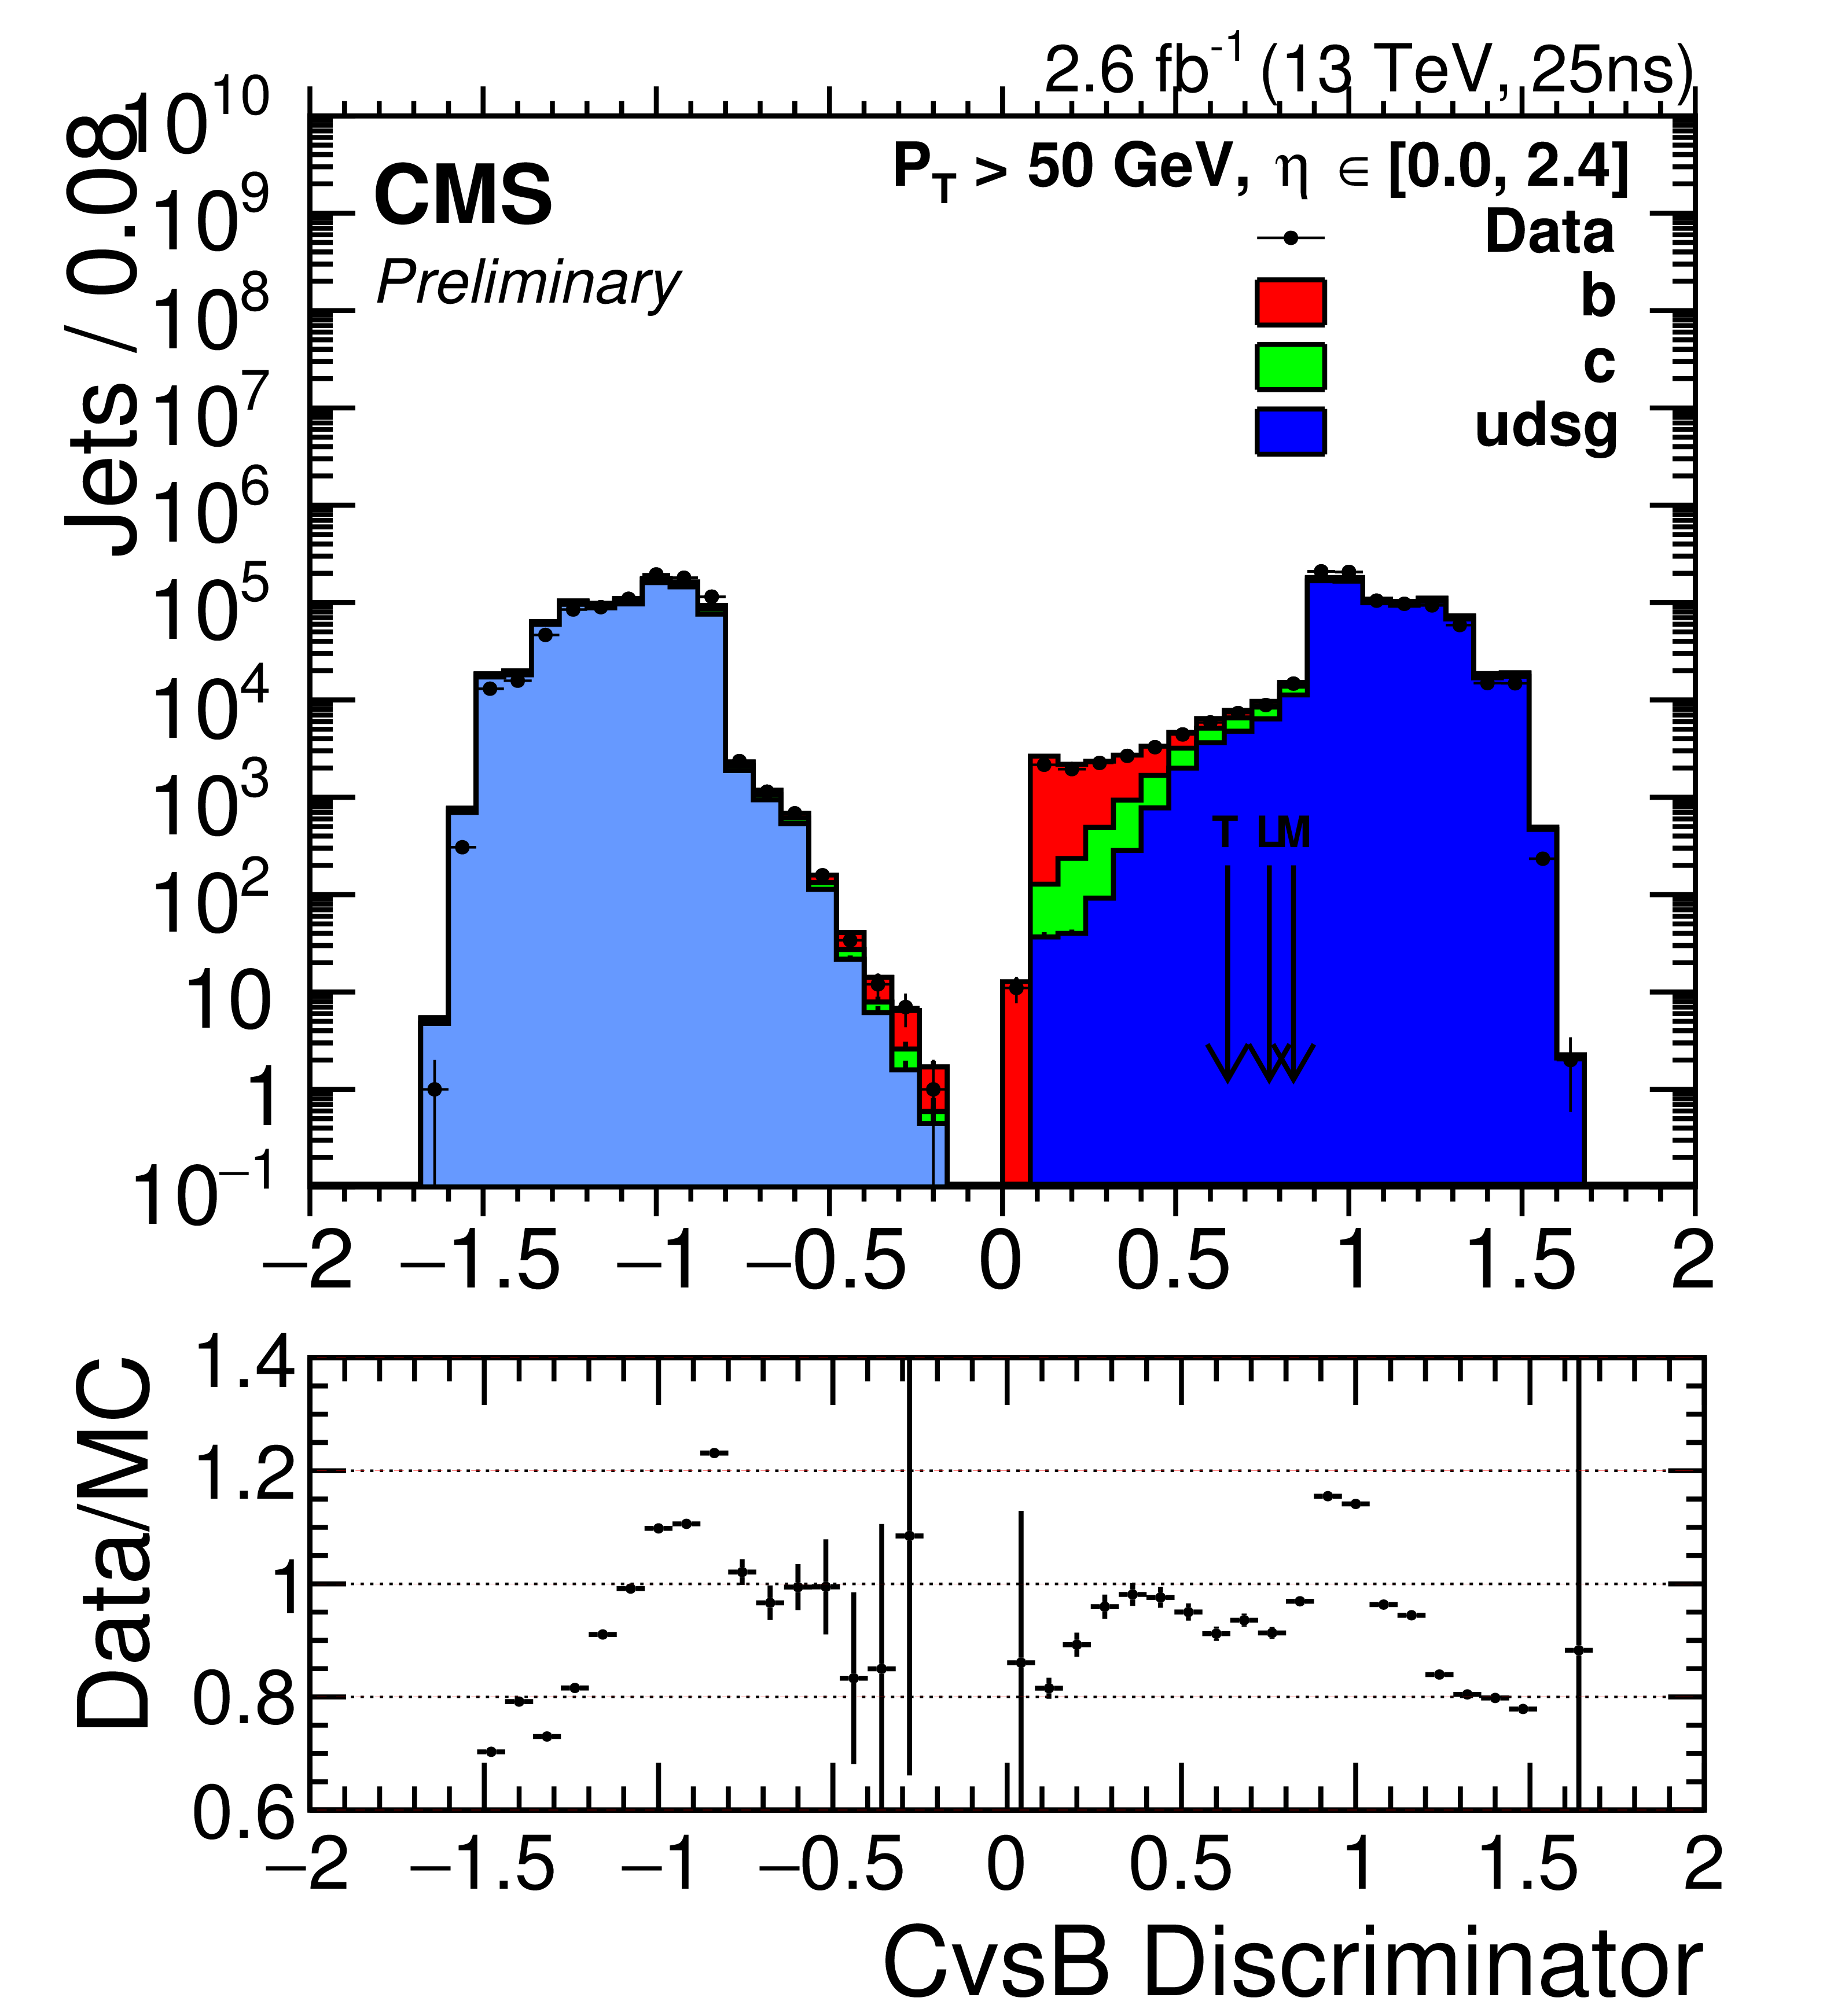
Data (dots) to Monte Carlo (stacked solid histogram, divided by jet flavour) comparison of the discriminator distributions for negative (negative side of the distribution) and positive taggers (positive side) for the CvsL and CvsB discriminators (a and b plot, respectively). A jet-trigger ${p_{\mathrm {T}}}$ threshold of 40 GeV is required for both data and simulation. The simulation is normalised to the number of entries in the data. |
png pdf |
Figure 6-b:
Data (dots) to Monte Carlo (stacked solid histogram, divided by jet flavour) comparison of the discriminator distributions for negative (negative side of the distribution) and positive taggers (positive side) for the CvsL and CvsB discriminators (a and b plot, respectively). A jet-trigger ${p_{\mathrm {T}}}$ threshold of 40 GeV is required for both data and simulation. The simulation is normalised to the number of entries in the data. |
png pdf |
Figure 7-a:
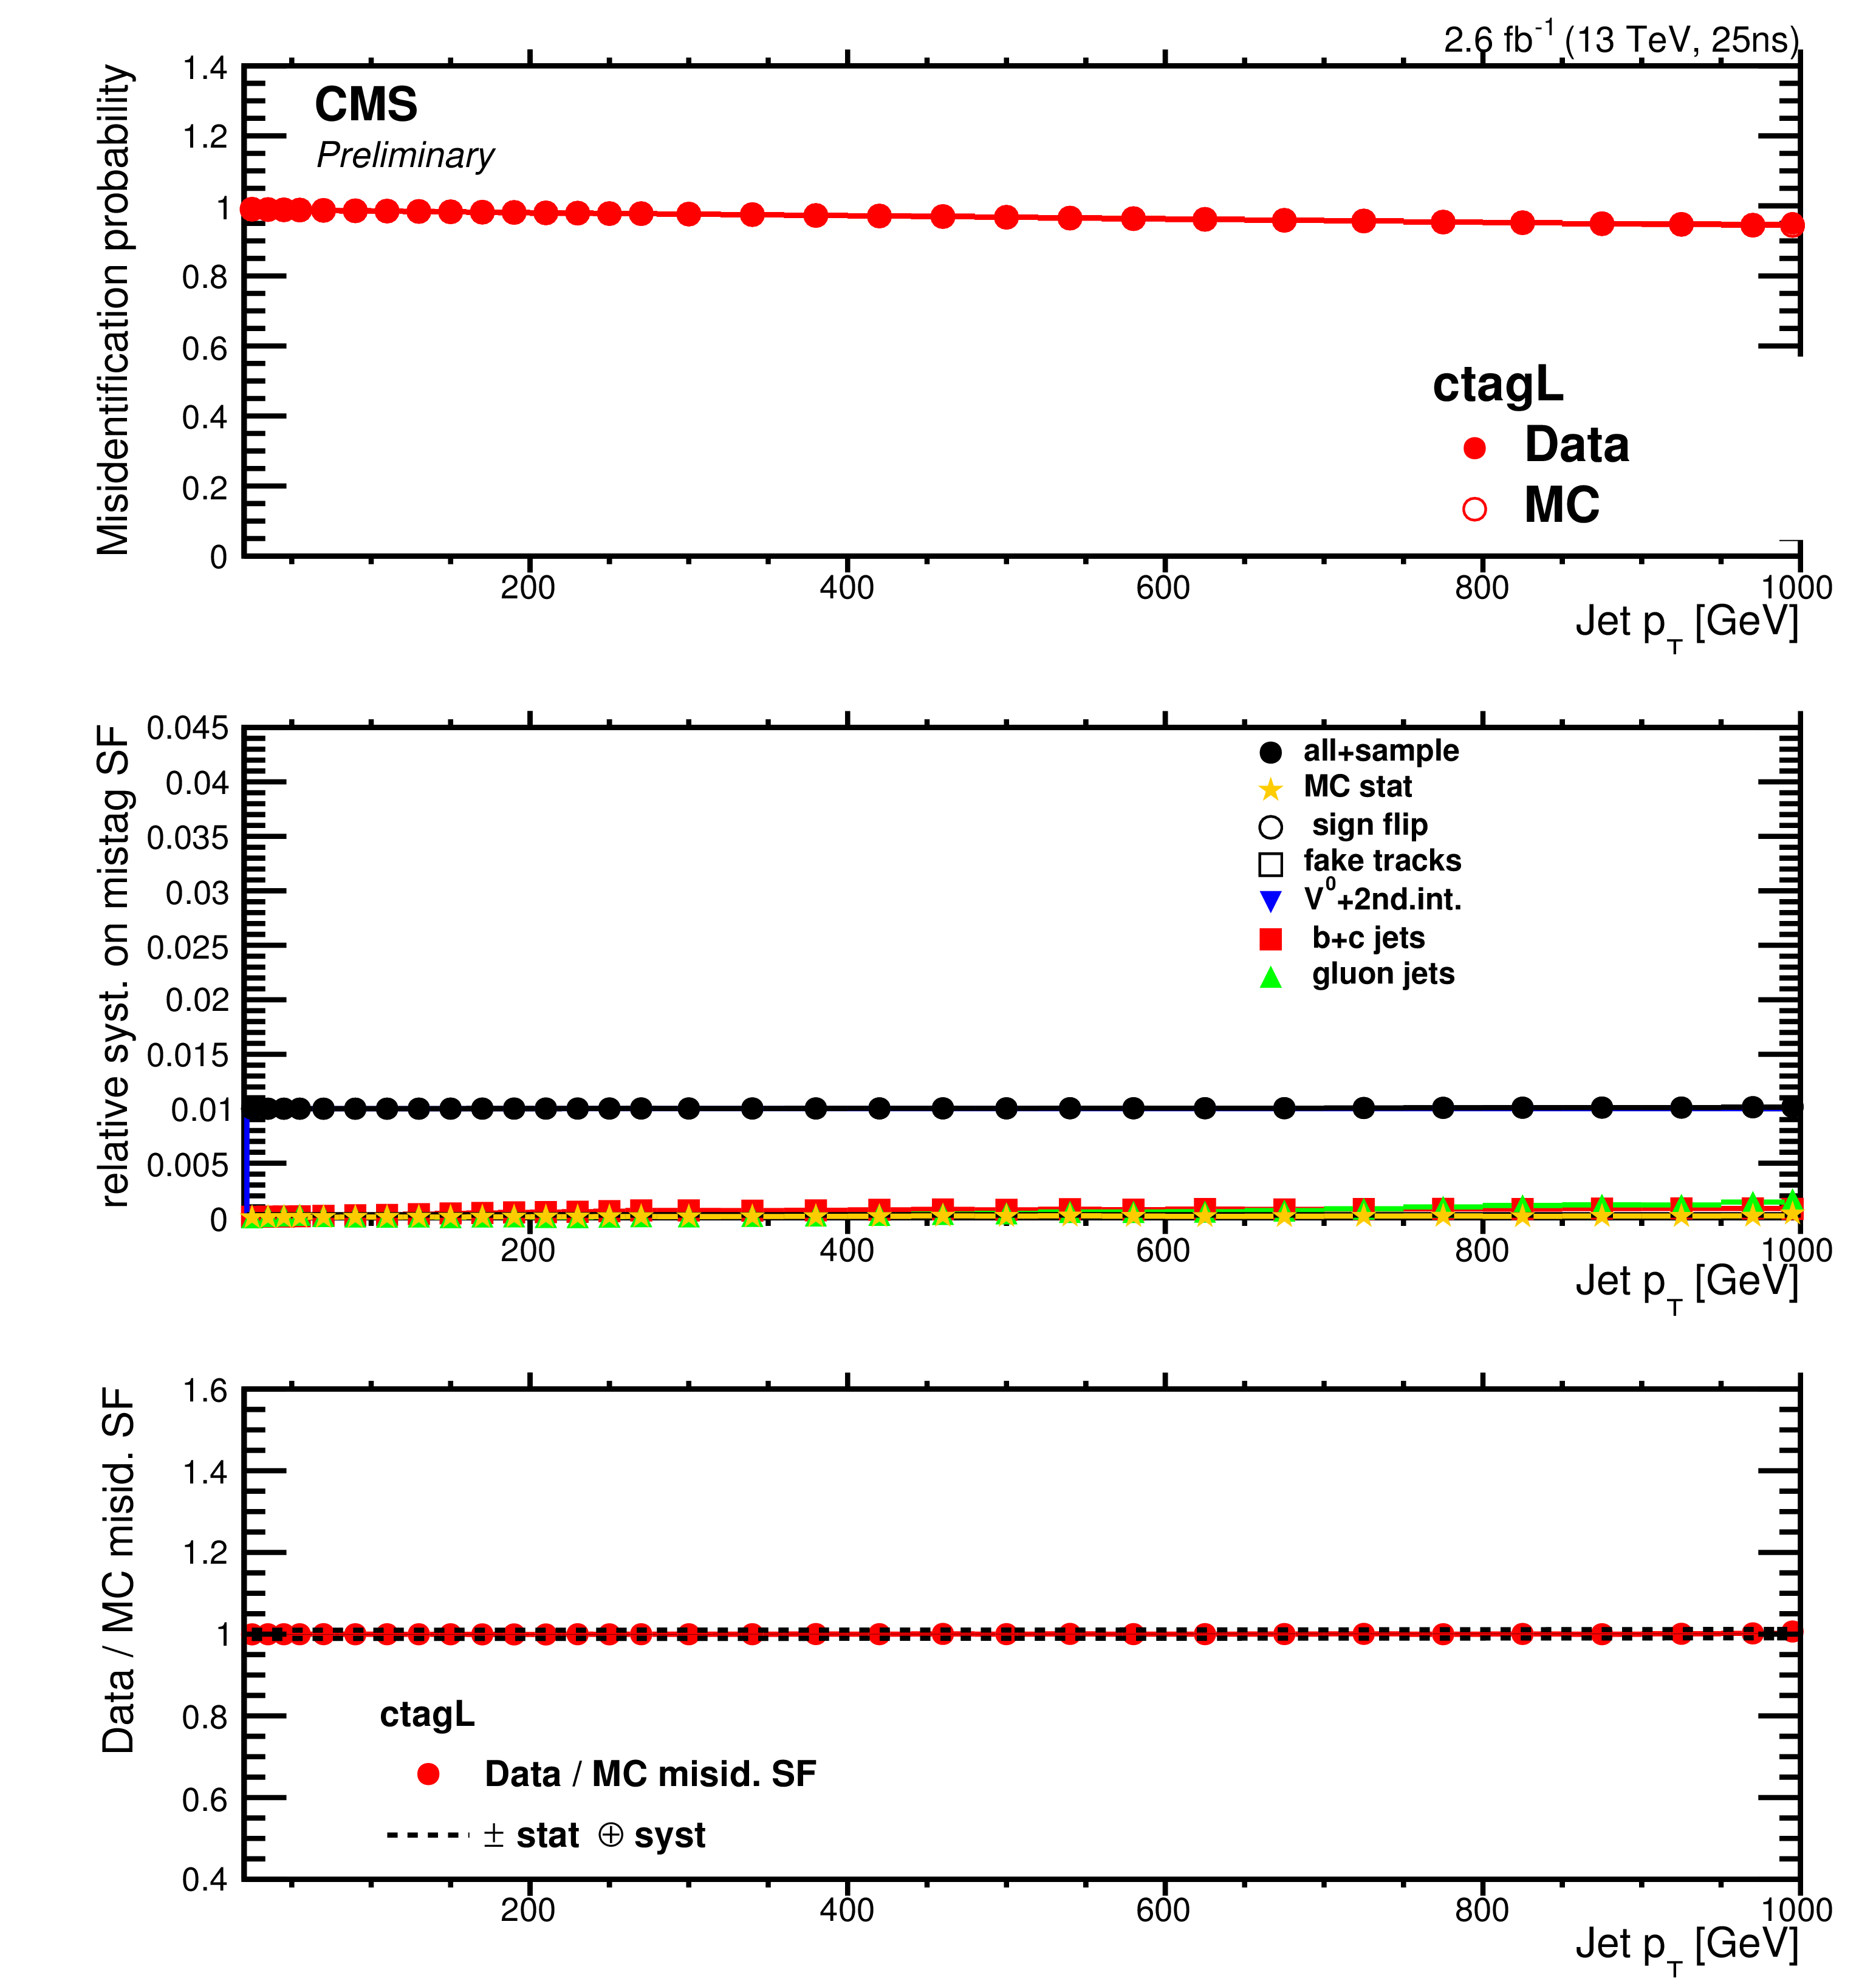
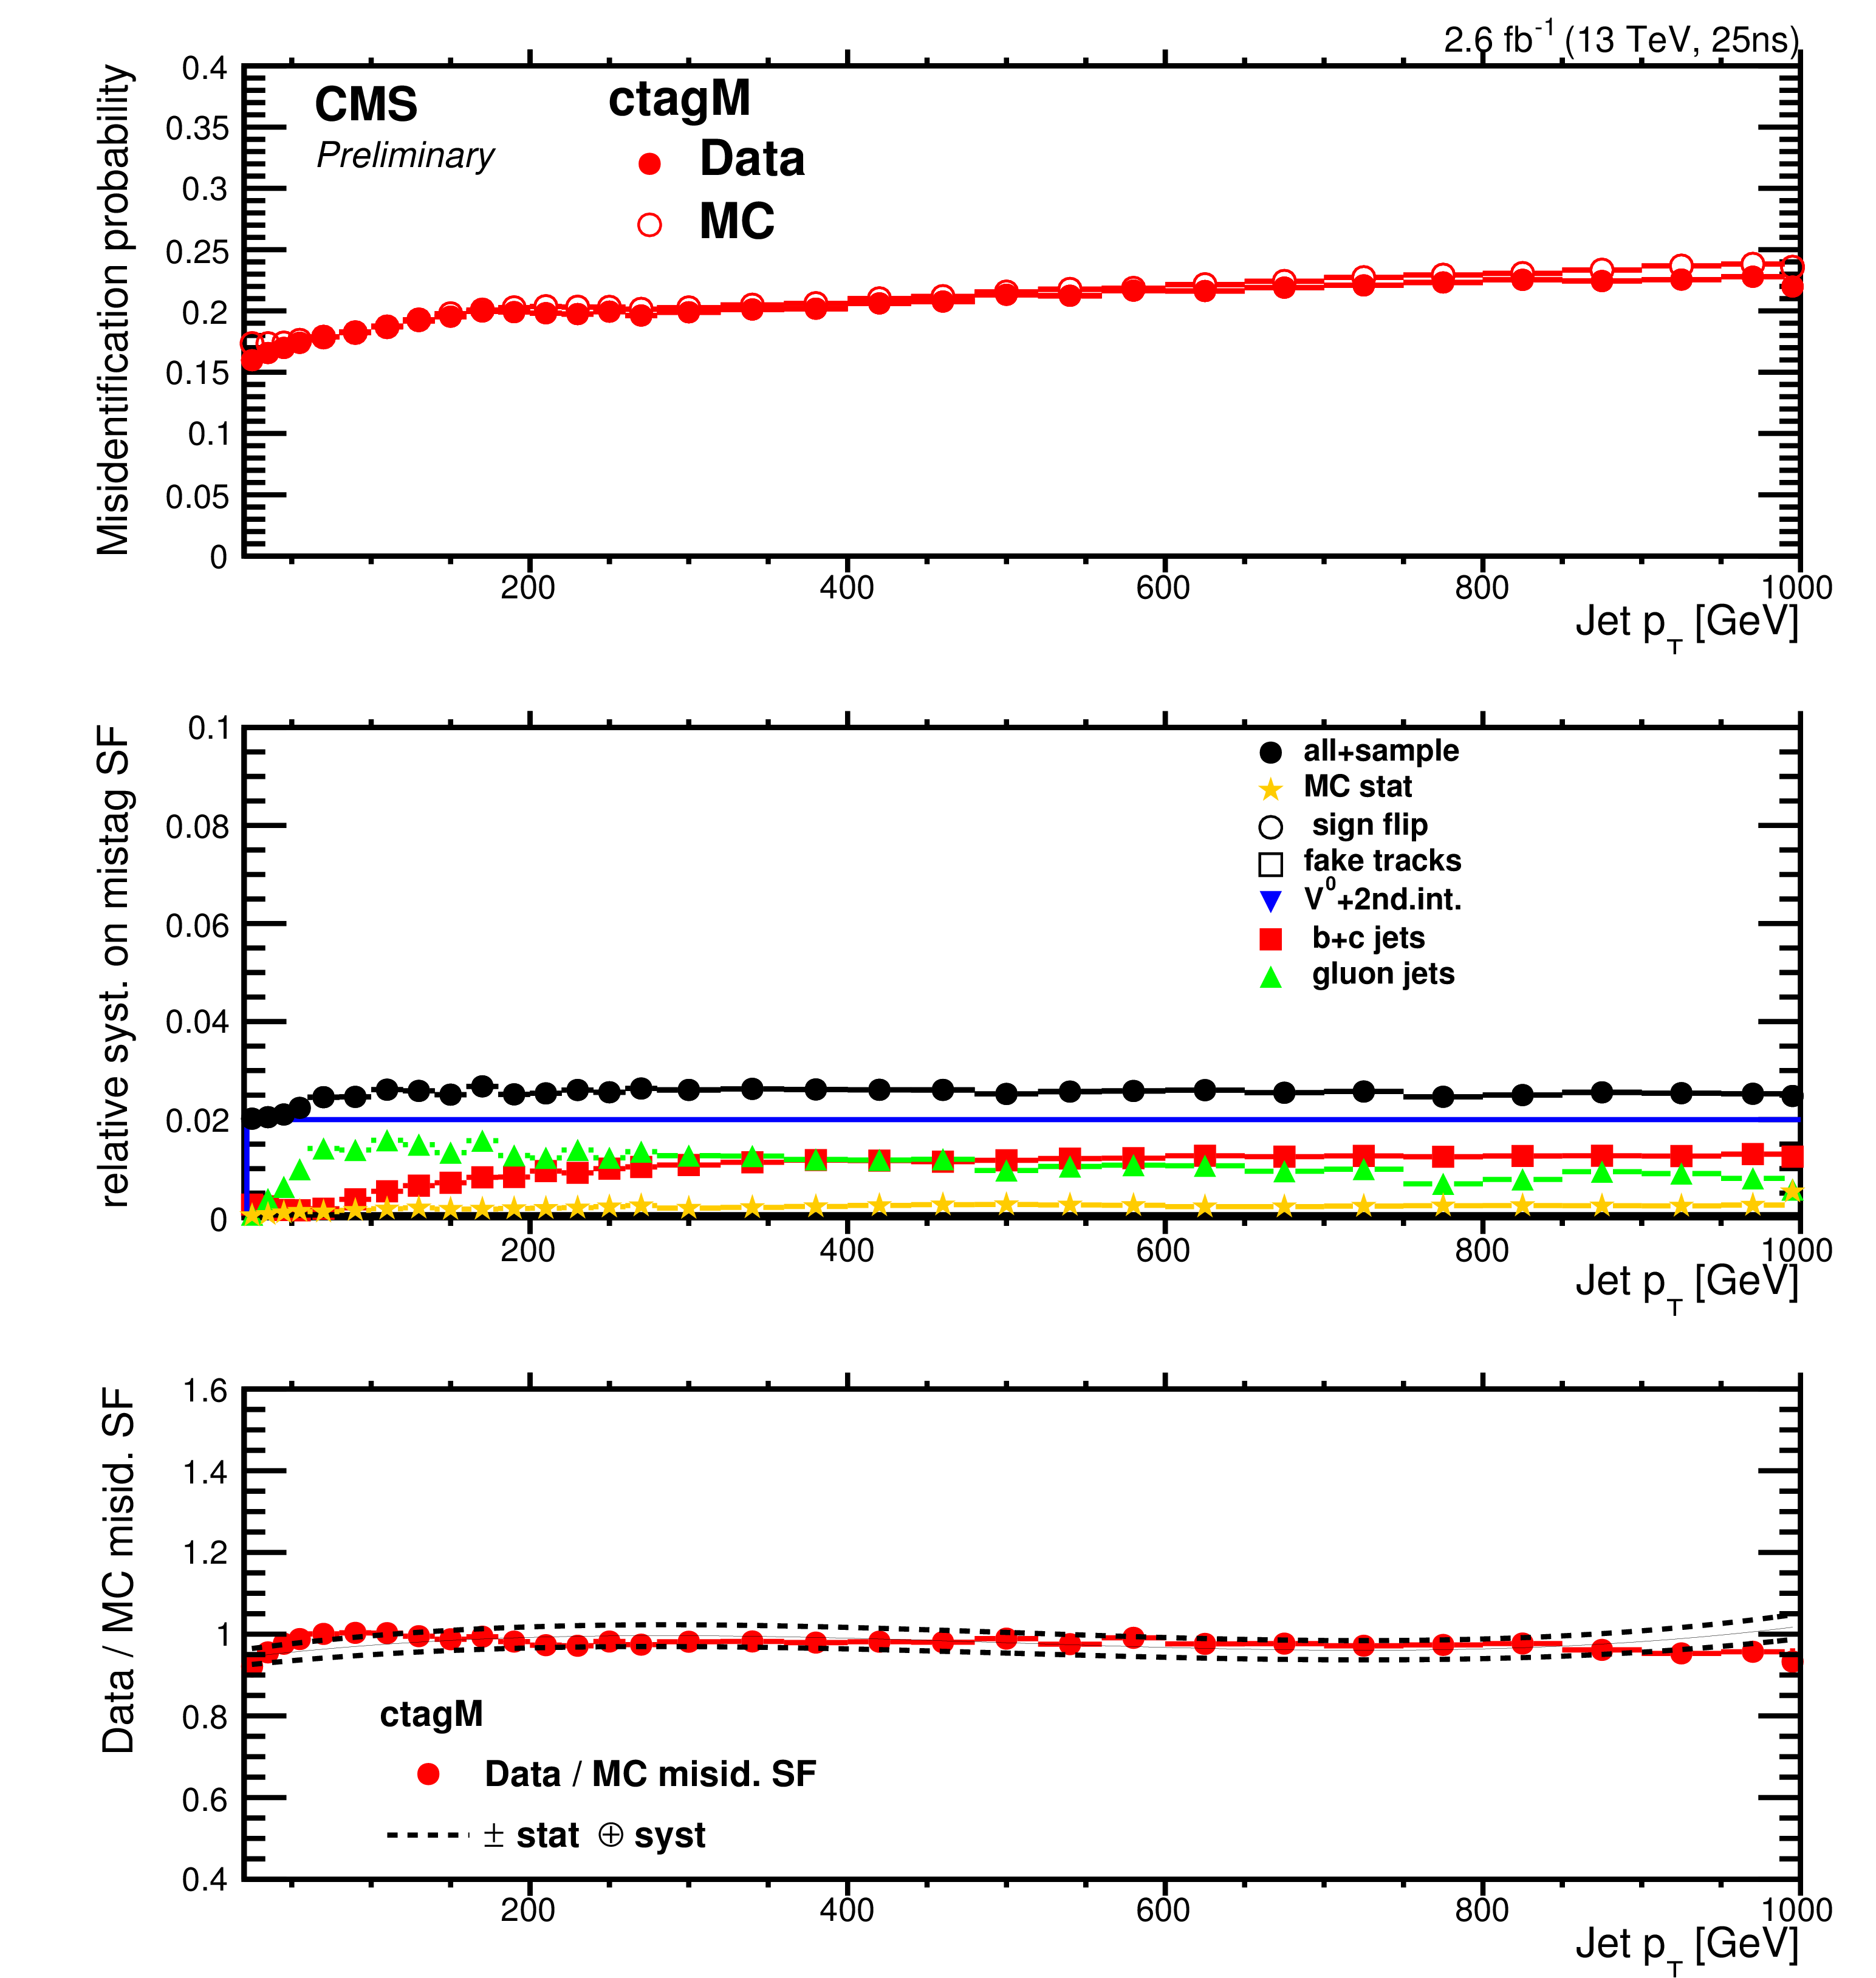
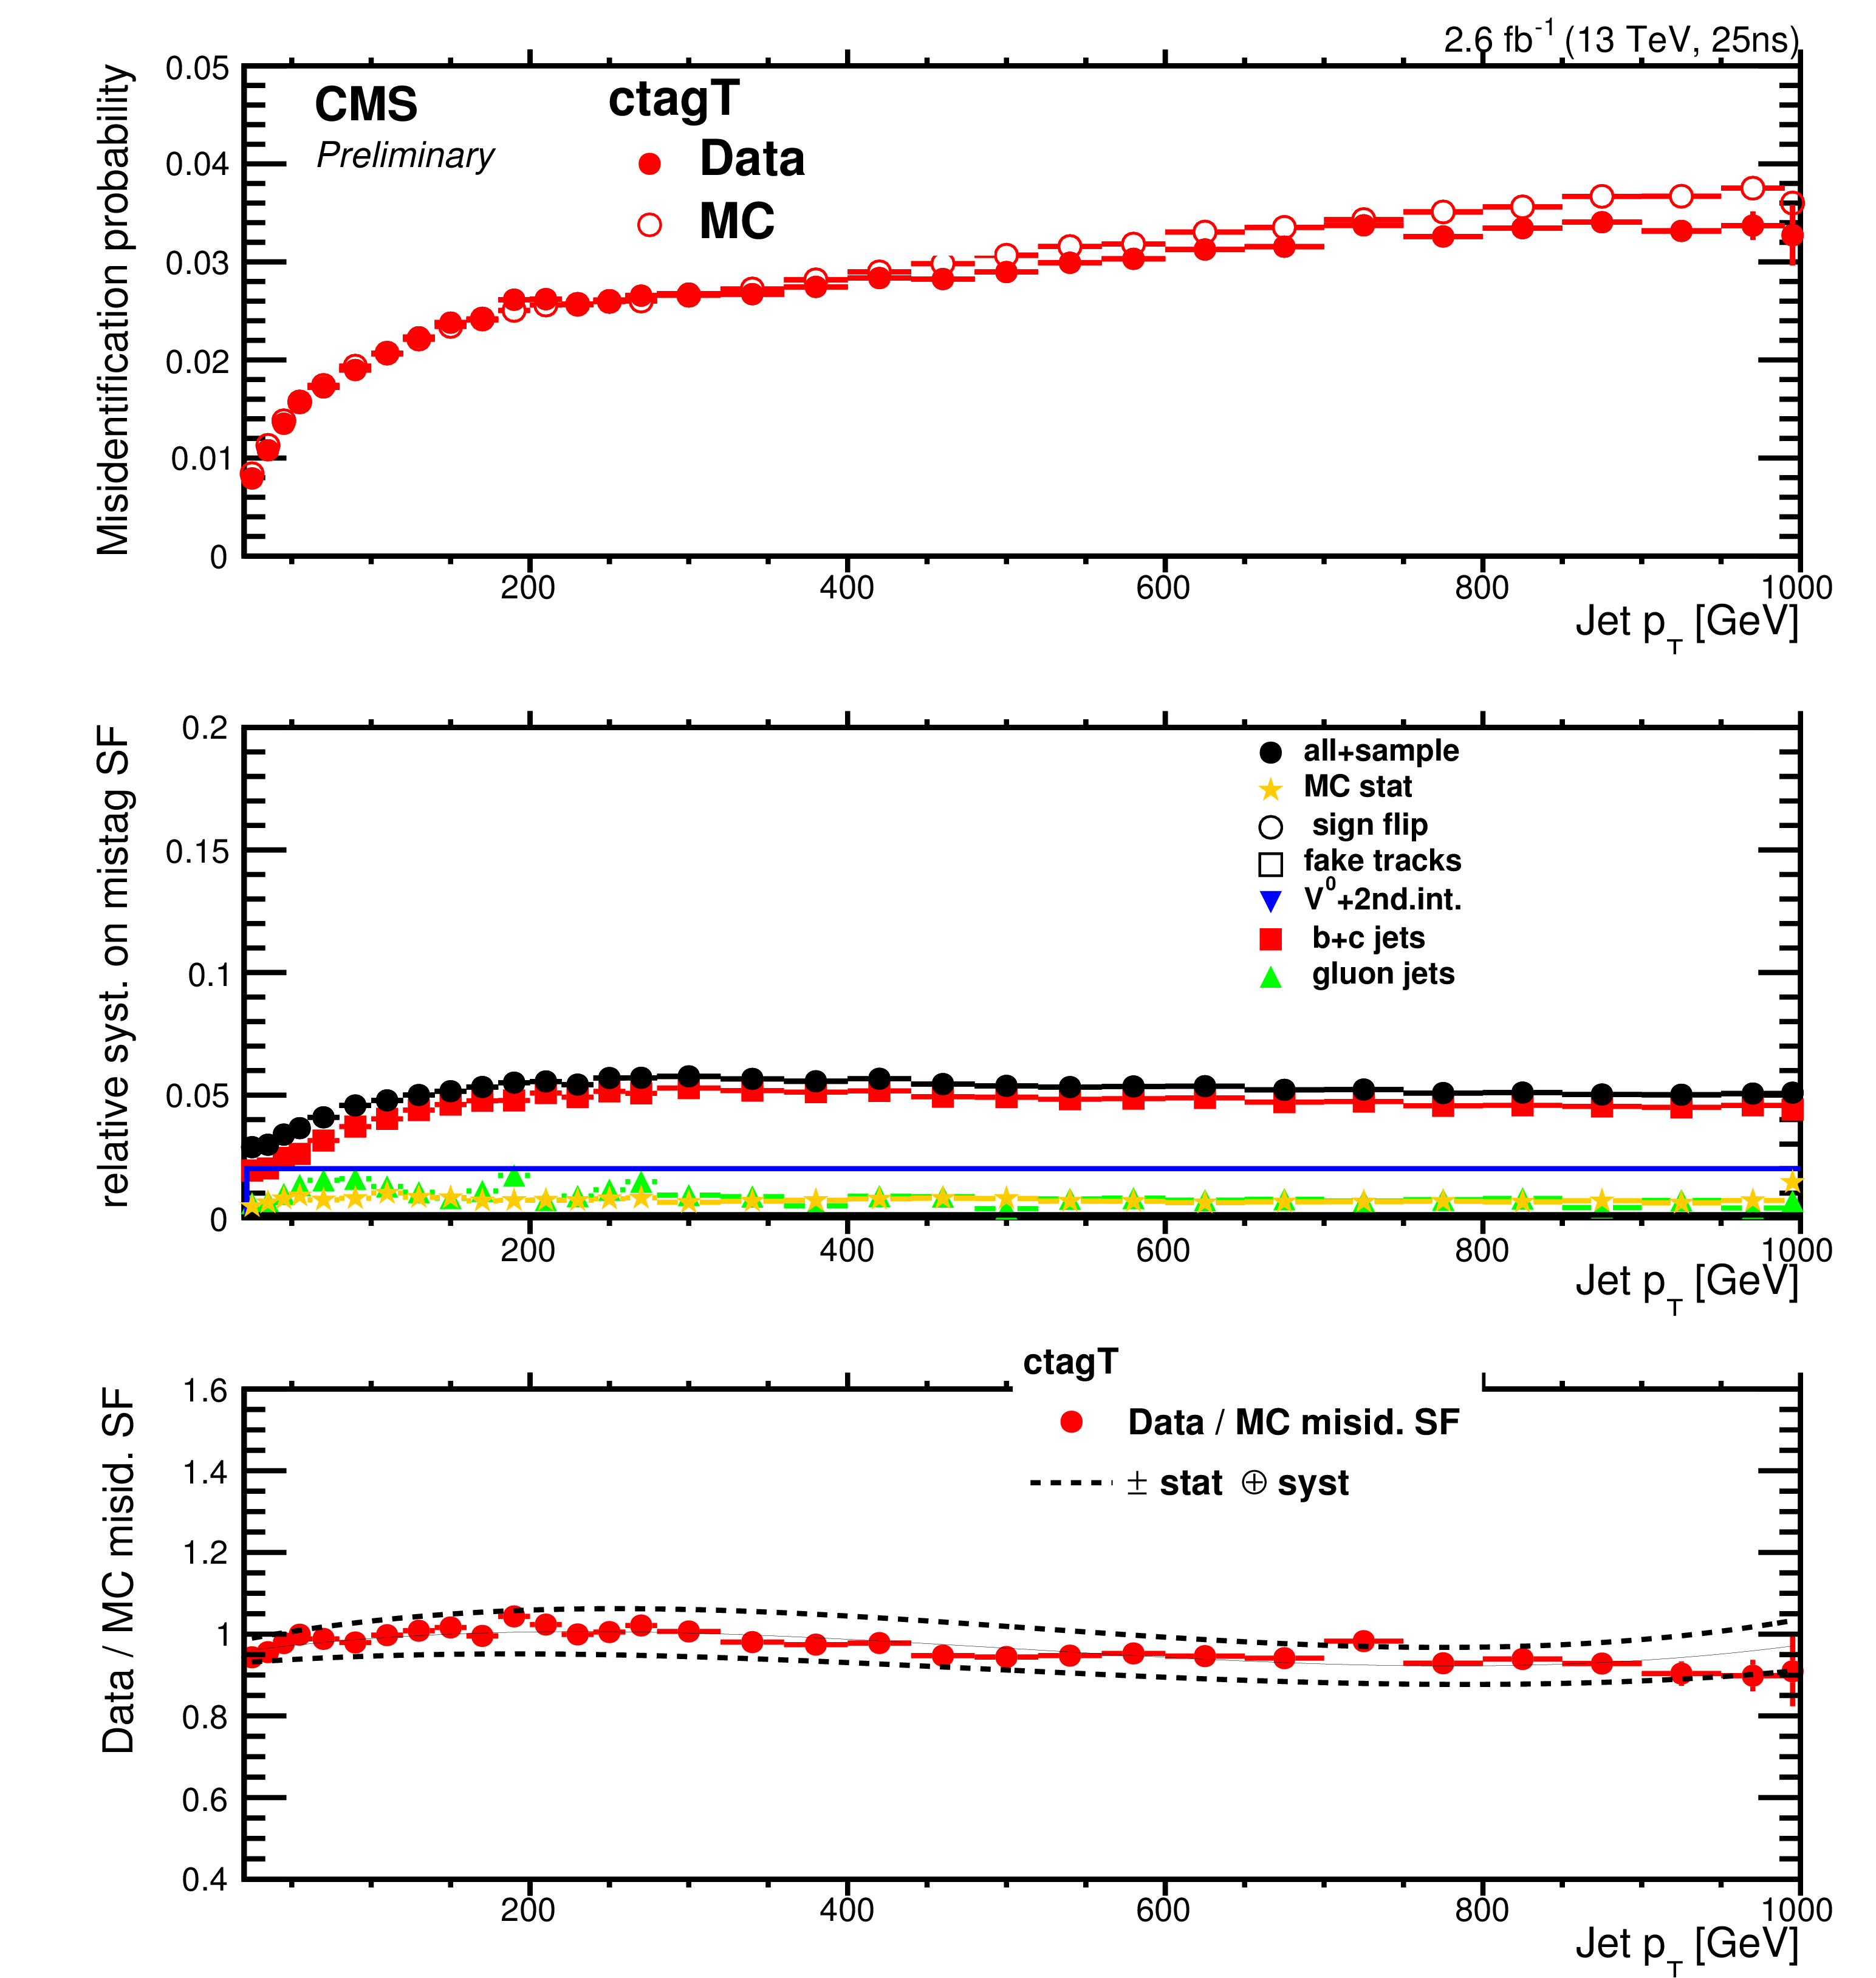
Misidentification probability in data and simulation (top), breakdown of systematic uncertainties contributions (middle), data-to-simulation scale factor of the light mis-idenfication probability (bottom) for the loose (a), medium (b) and tight (c) working points. The solid curve in the bottom plots represents a fit to the observed data, while the dashed curves show the combined statistical and systematic uncertainties on the measurements. |
png pdf |
Figure 7-b:
Misidentification probability in data and simulation (top), breakdown of systematic uncertainties contributions (middle), data-to-simulation scale factor of the light mis-idenfication probability (bottom) for the loose (a), medium (b) and tight (c) working points. The solid curve in the bottom plots represents a fit to the observed data, while the dashed curves show the combined statistical and systematic uncertainties on the measurements. |
png pdf |
Figure 7-c:
Misidentification probability in data and simulation (top), breakdown of systematic uncertainties contributions (middle), data-to-simulation scale factor of the light mis-idenfication probability (bottom) for the loose (a), medium (b) and tight (c) working points. The solid curve in the bottom plots represents a fit to the observed data, while the dashed curves show the combined statistical and systematic uncertainties on the measurements. |
png pdf |
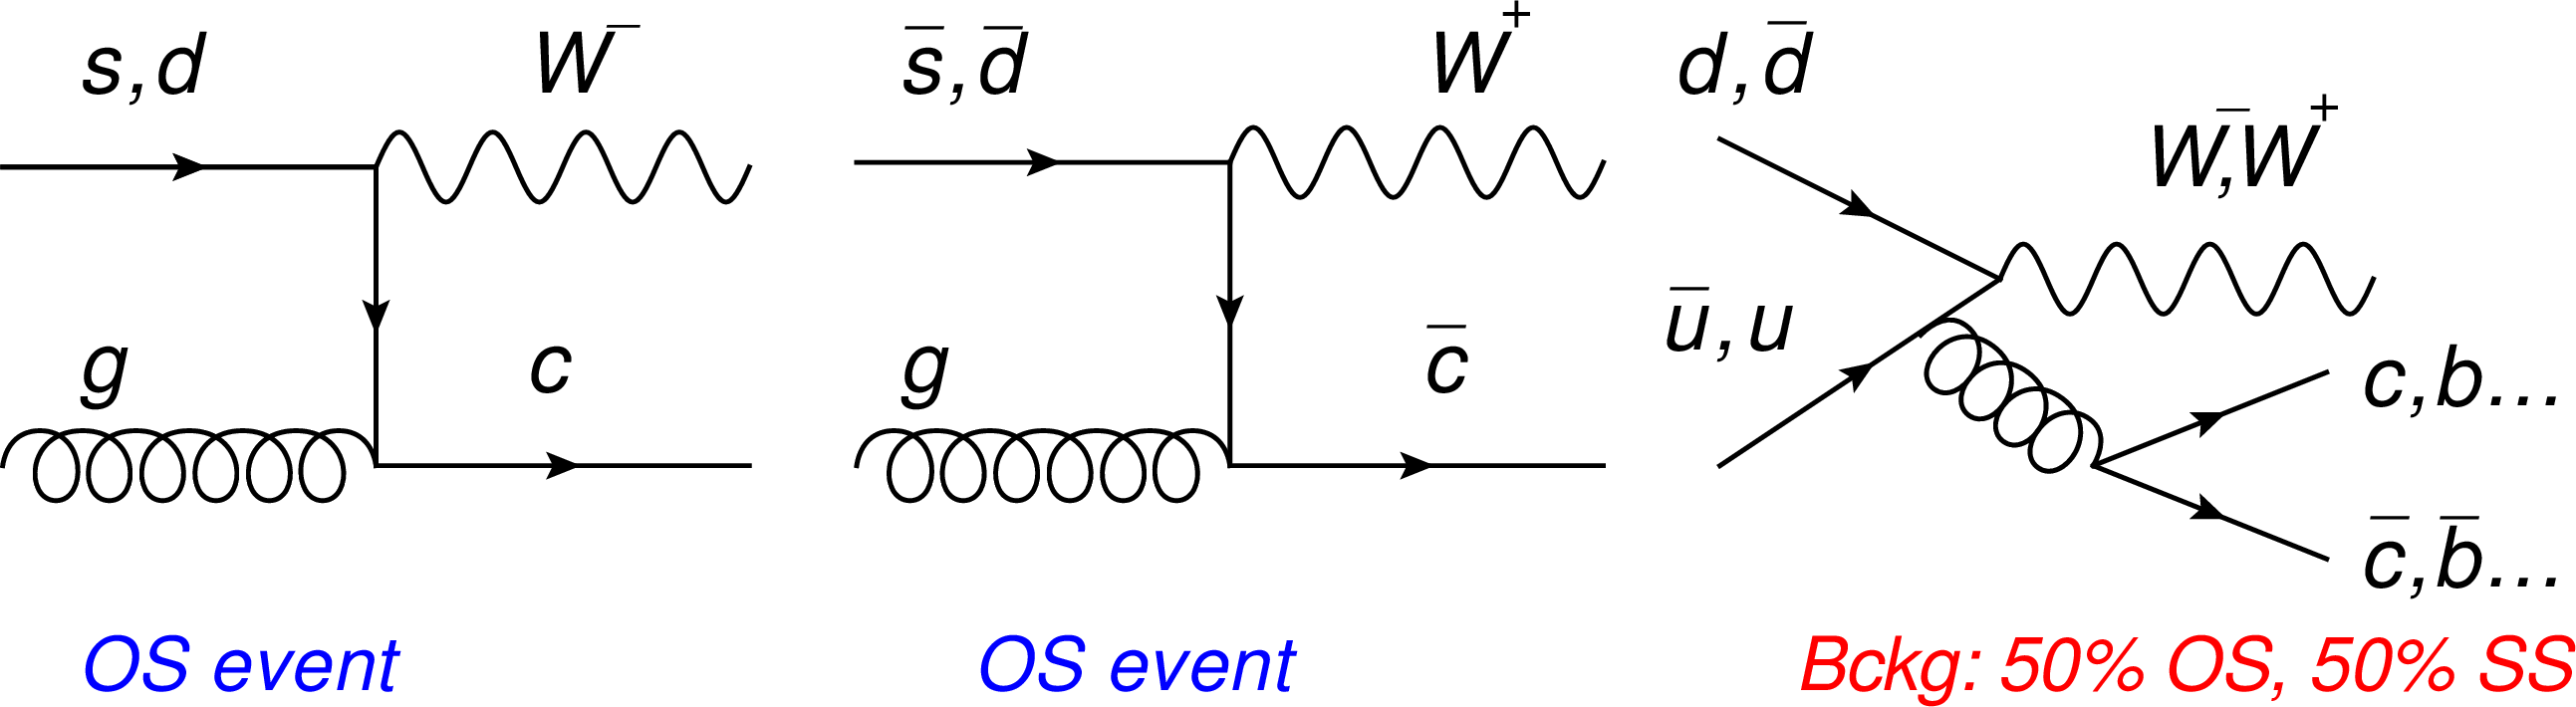
Figure 8:
Left and middle: leading order production of W+c signal with opposite sign charges (OS). Right: production of W+charm final state through gluon splitting process. In gluon splitting there is an additional charm quark with the same sign as the W boson (SS). |
png pdf |
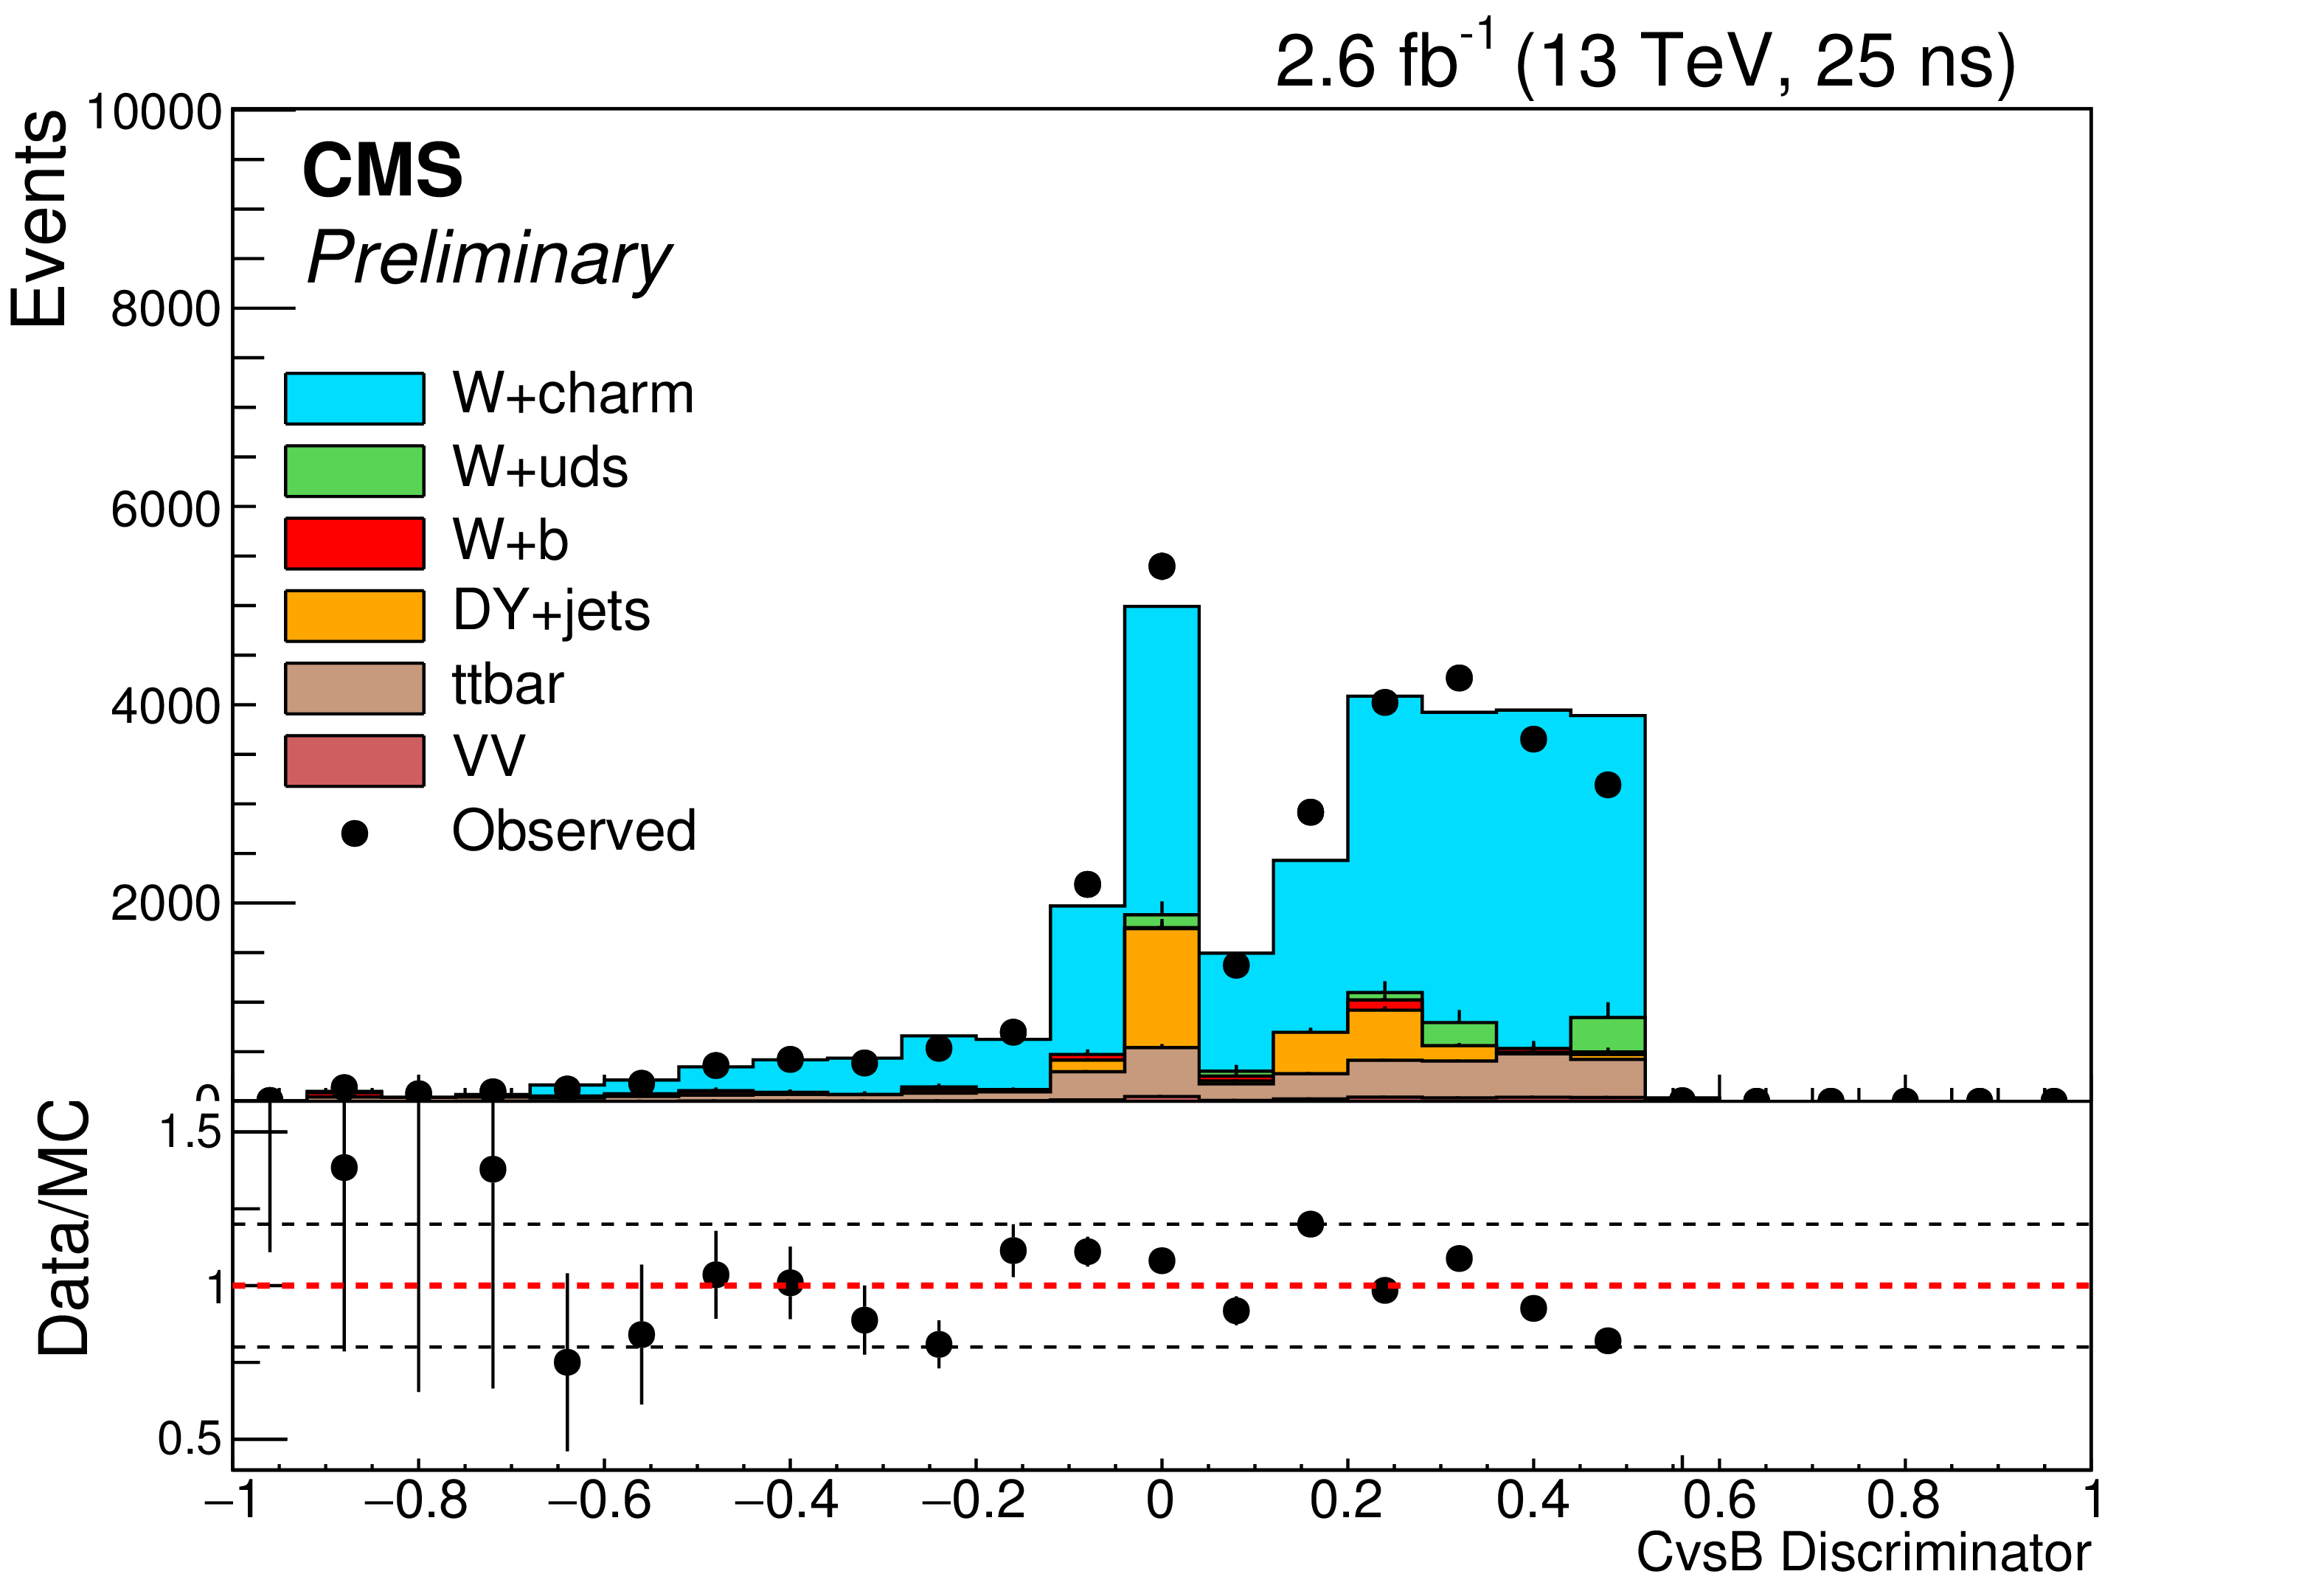
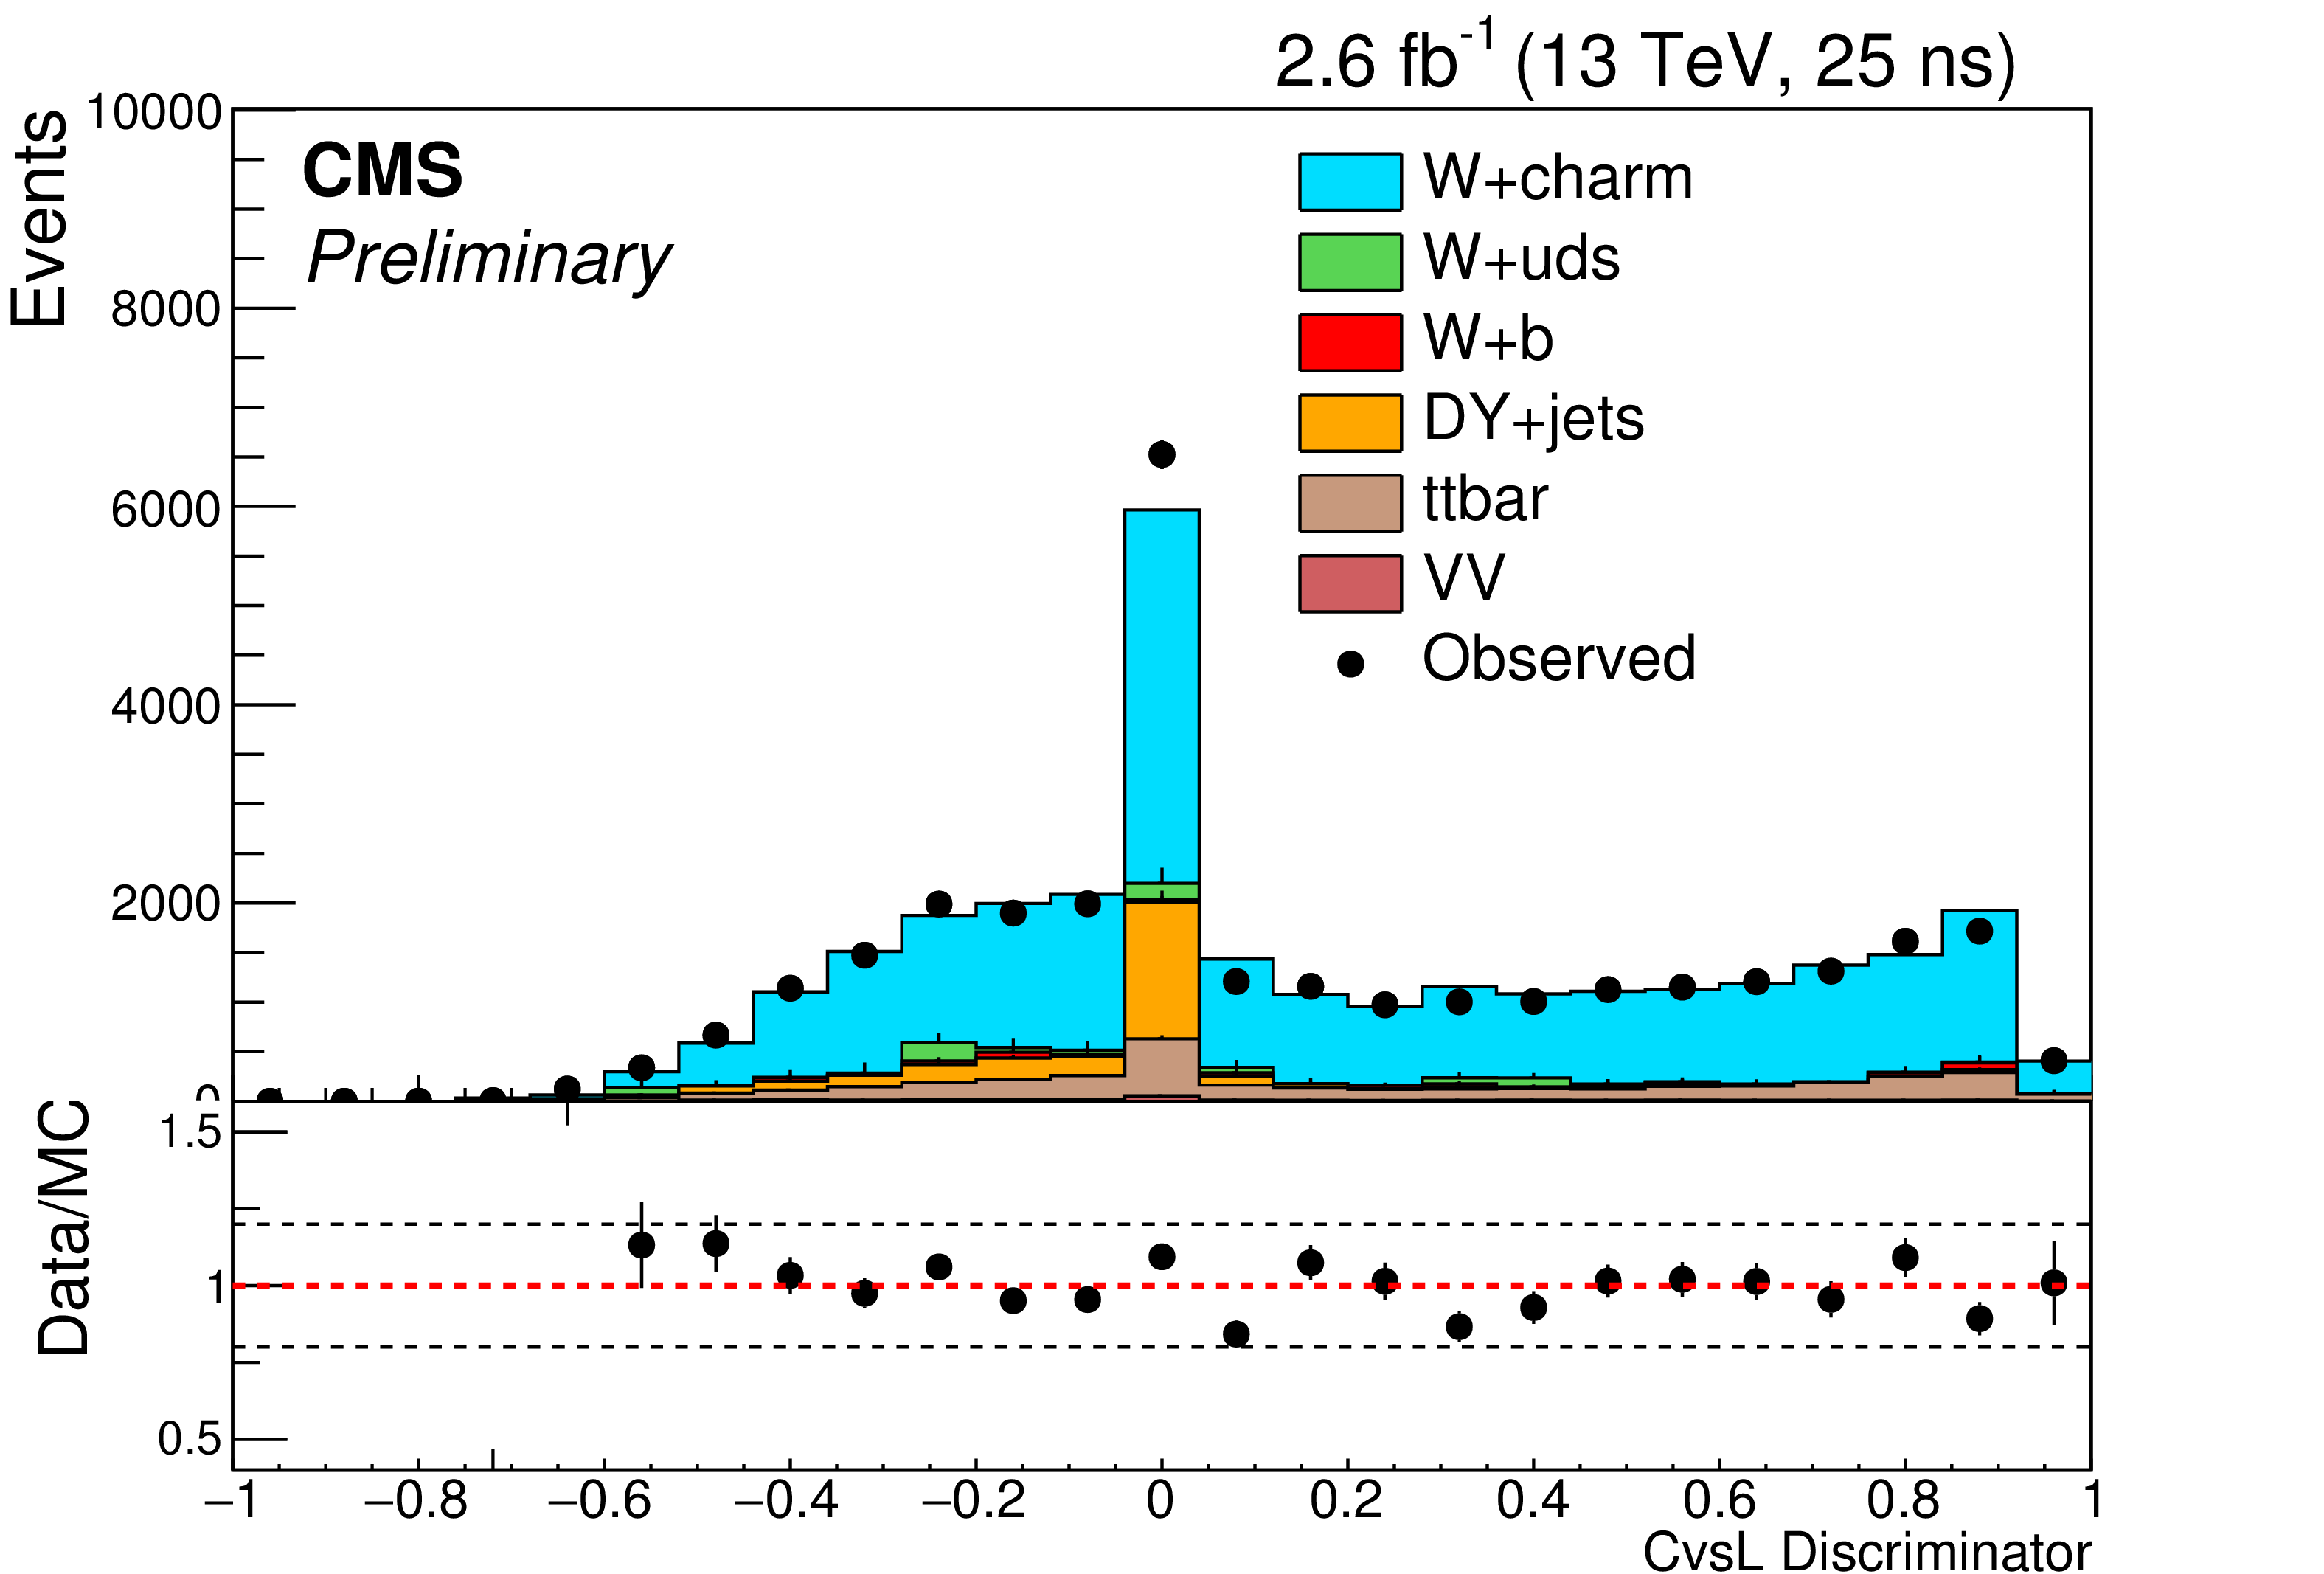
Figure 9-a:
Distribution of the c tagger discriminators (CvsB and CvsL) after applying W+charm selection and OS-SS subtraction. The plots corresponds to the sum of both electron and muon decays of the W. |
png pdf |
Figure 9-b:
Distribution of the c tagger discriminators (CvsB and CvsL) after applying W+charm selection and OS-SS subtraction. The plots corresponds to the sum of both electron and muon decays of the W. |
png pdf |
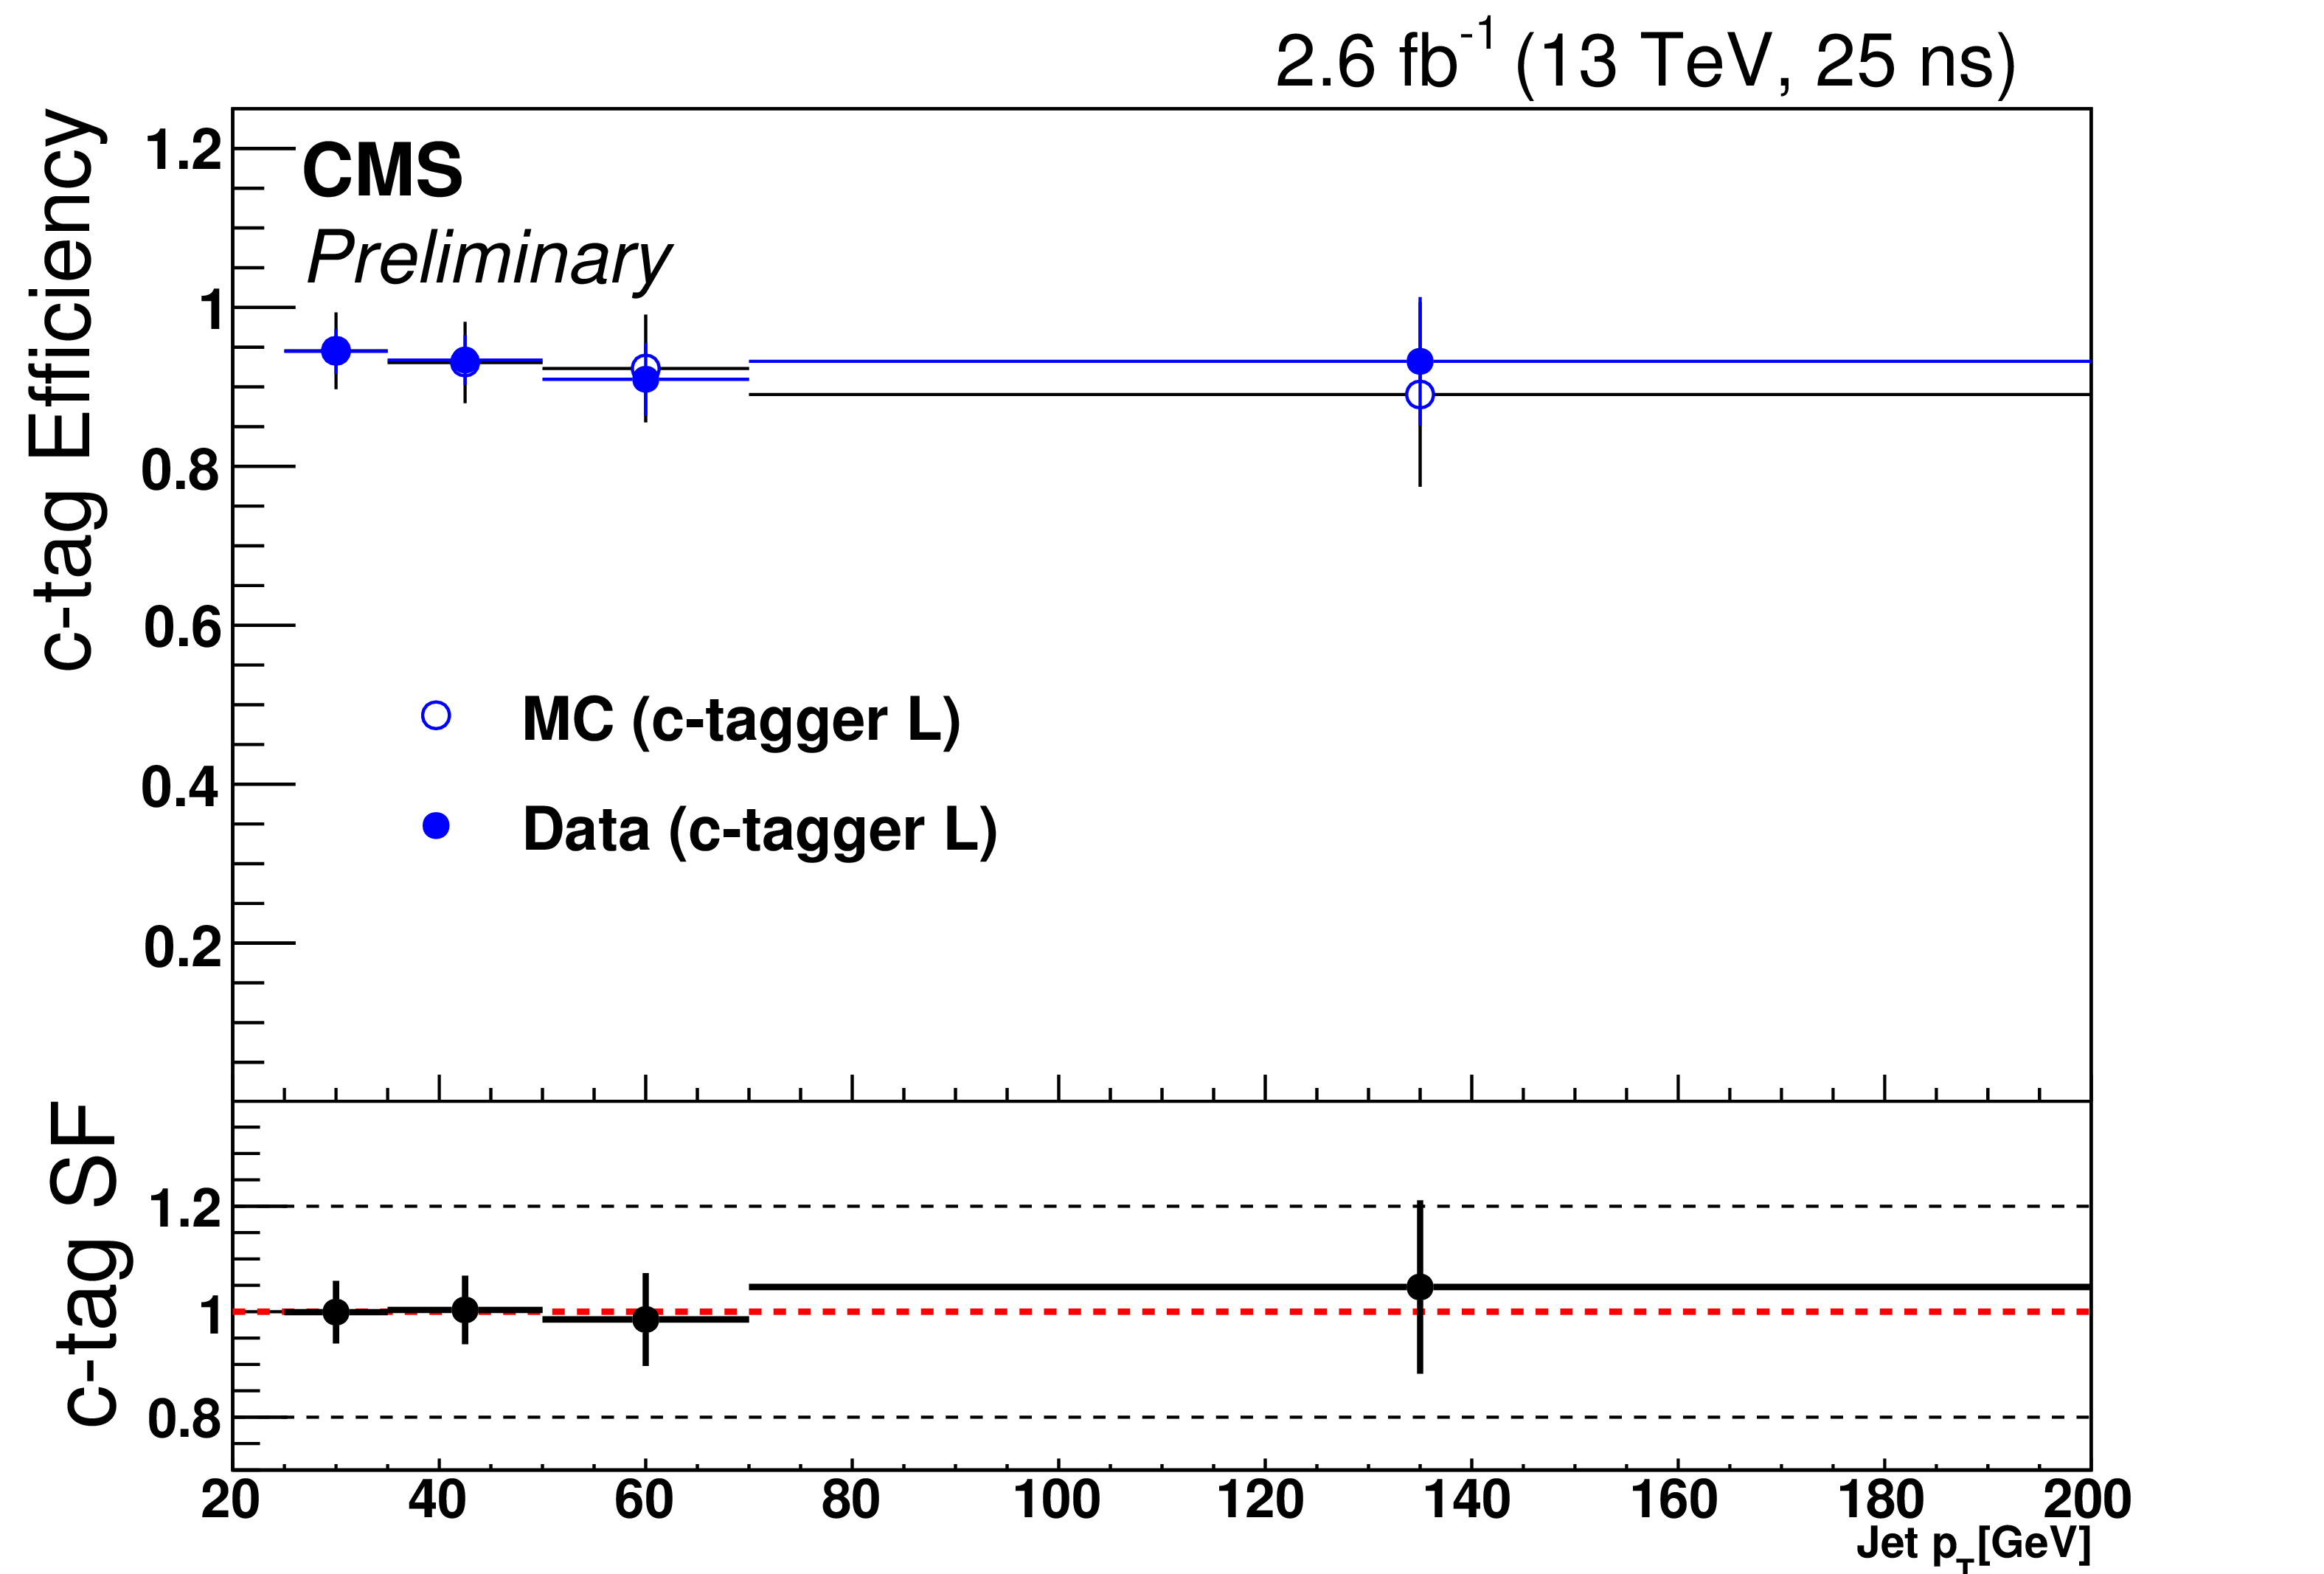
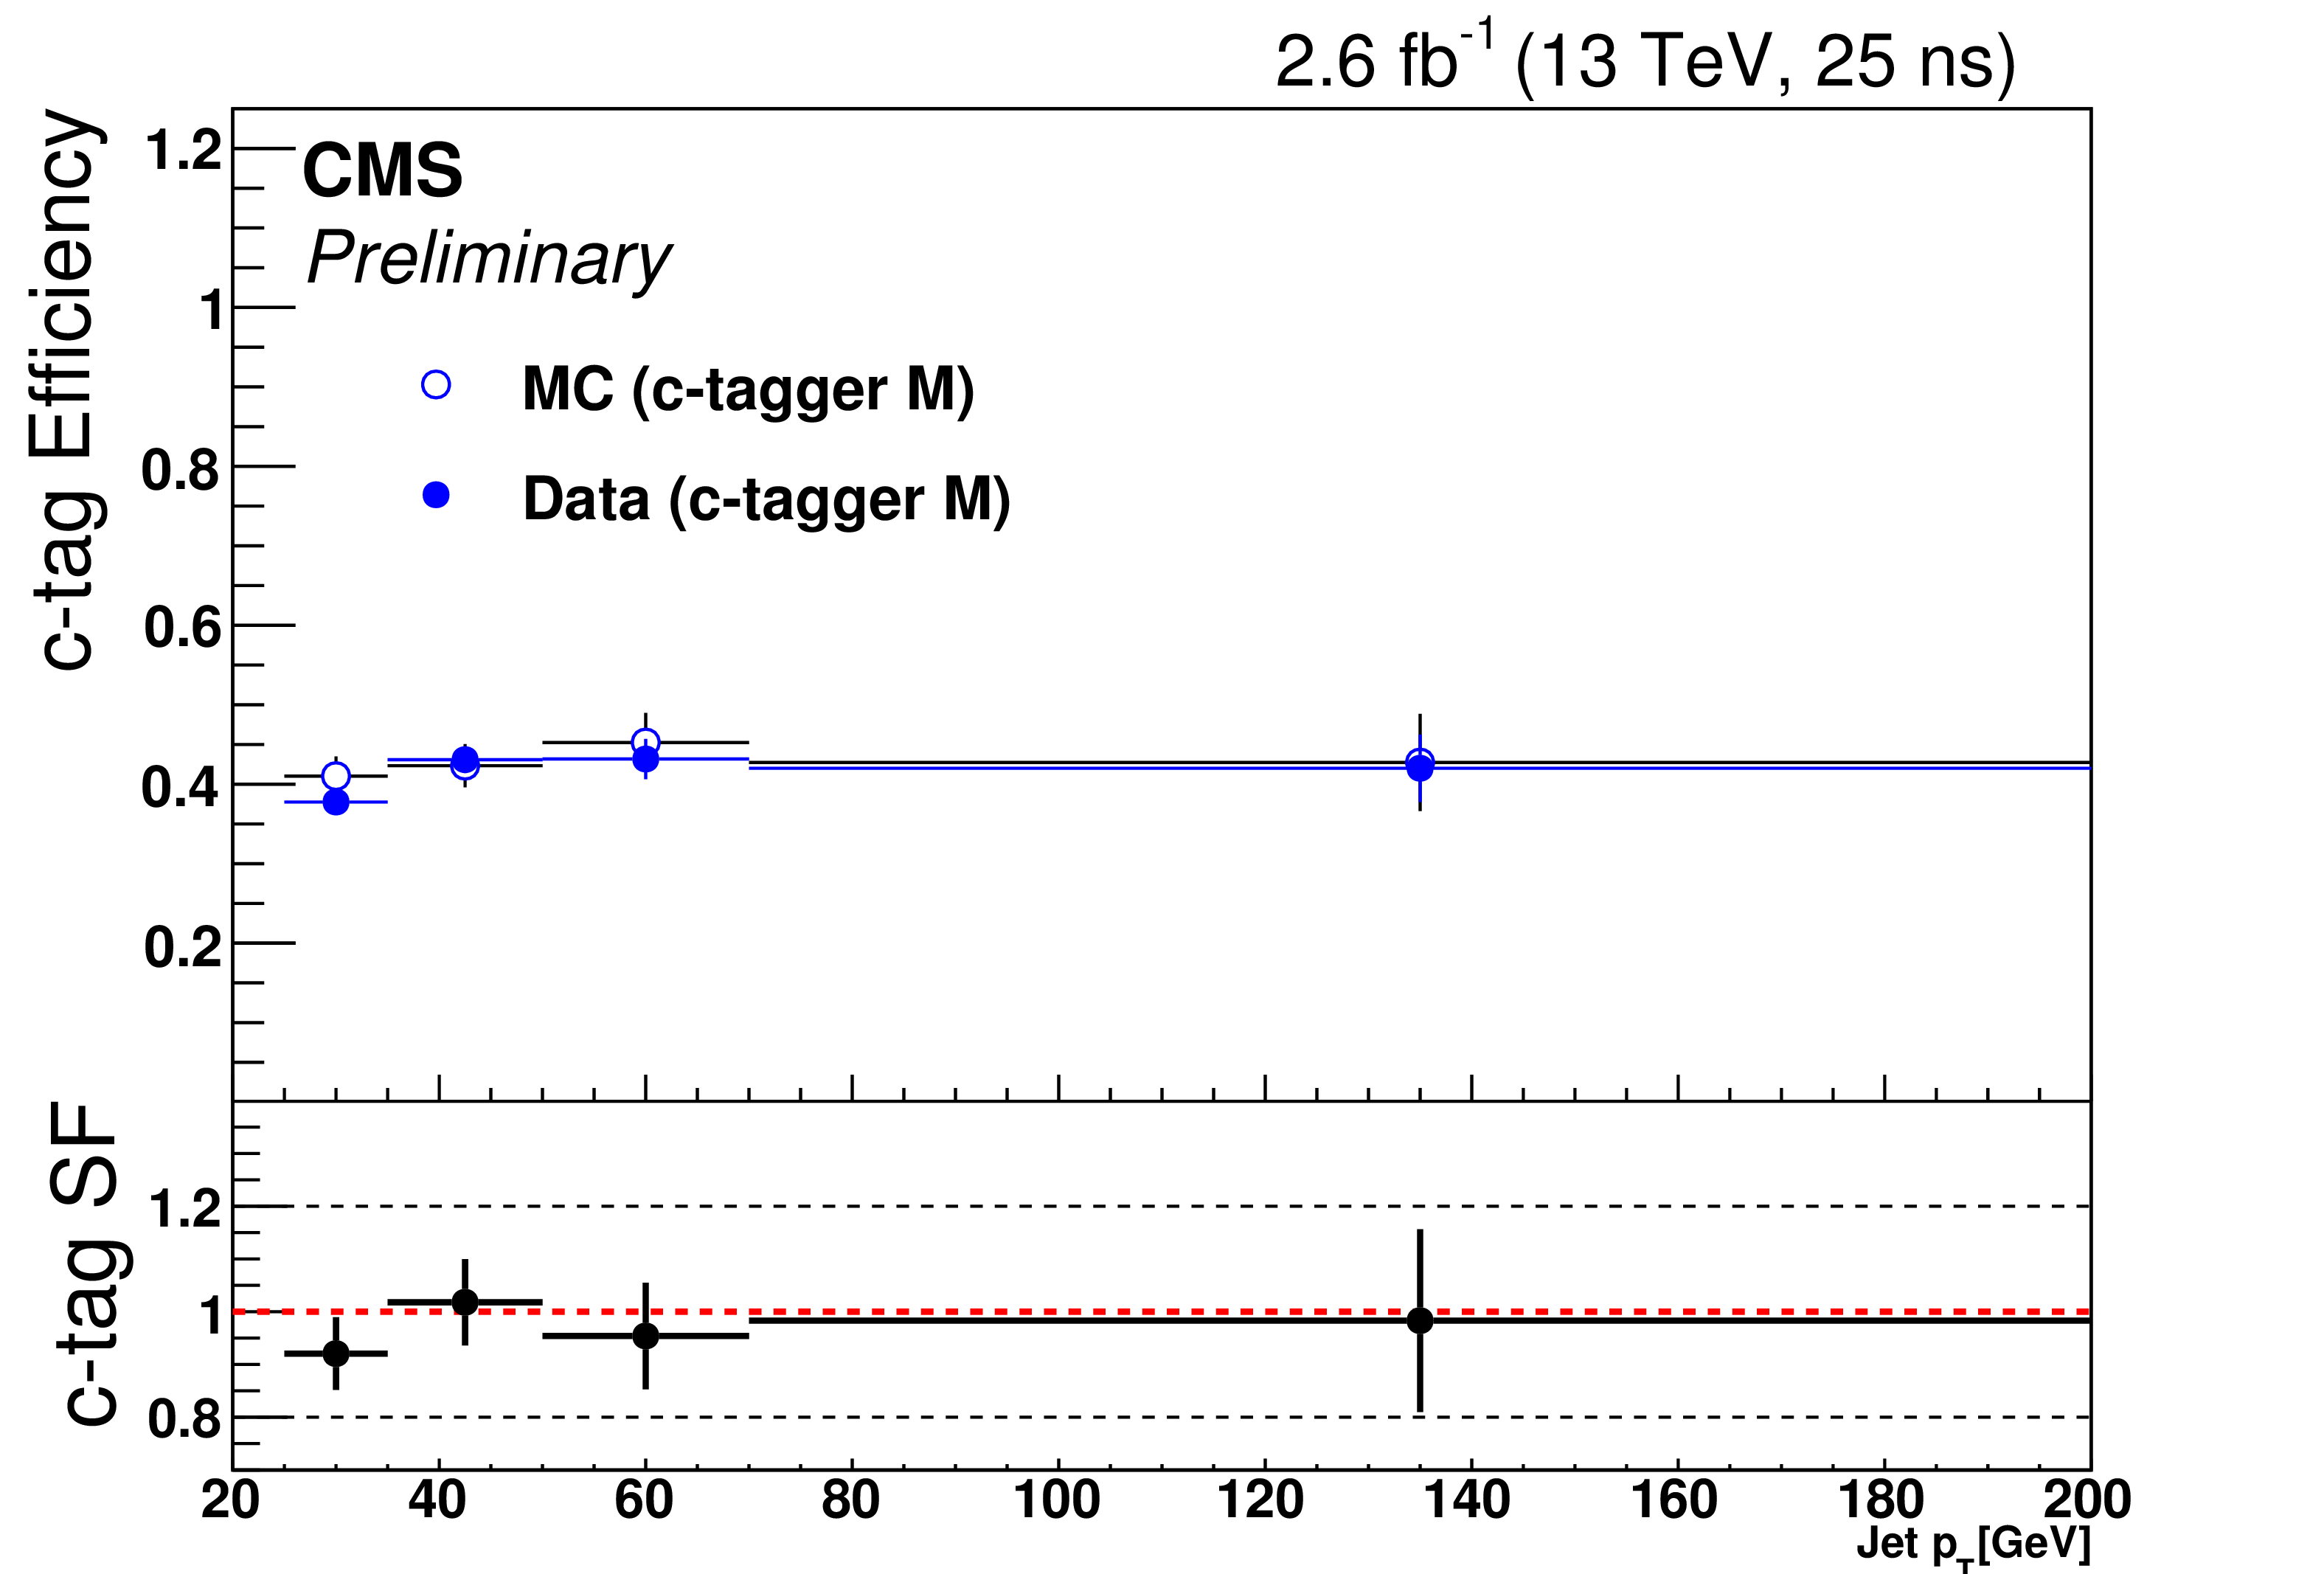
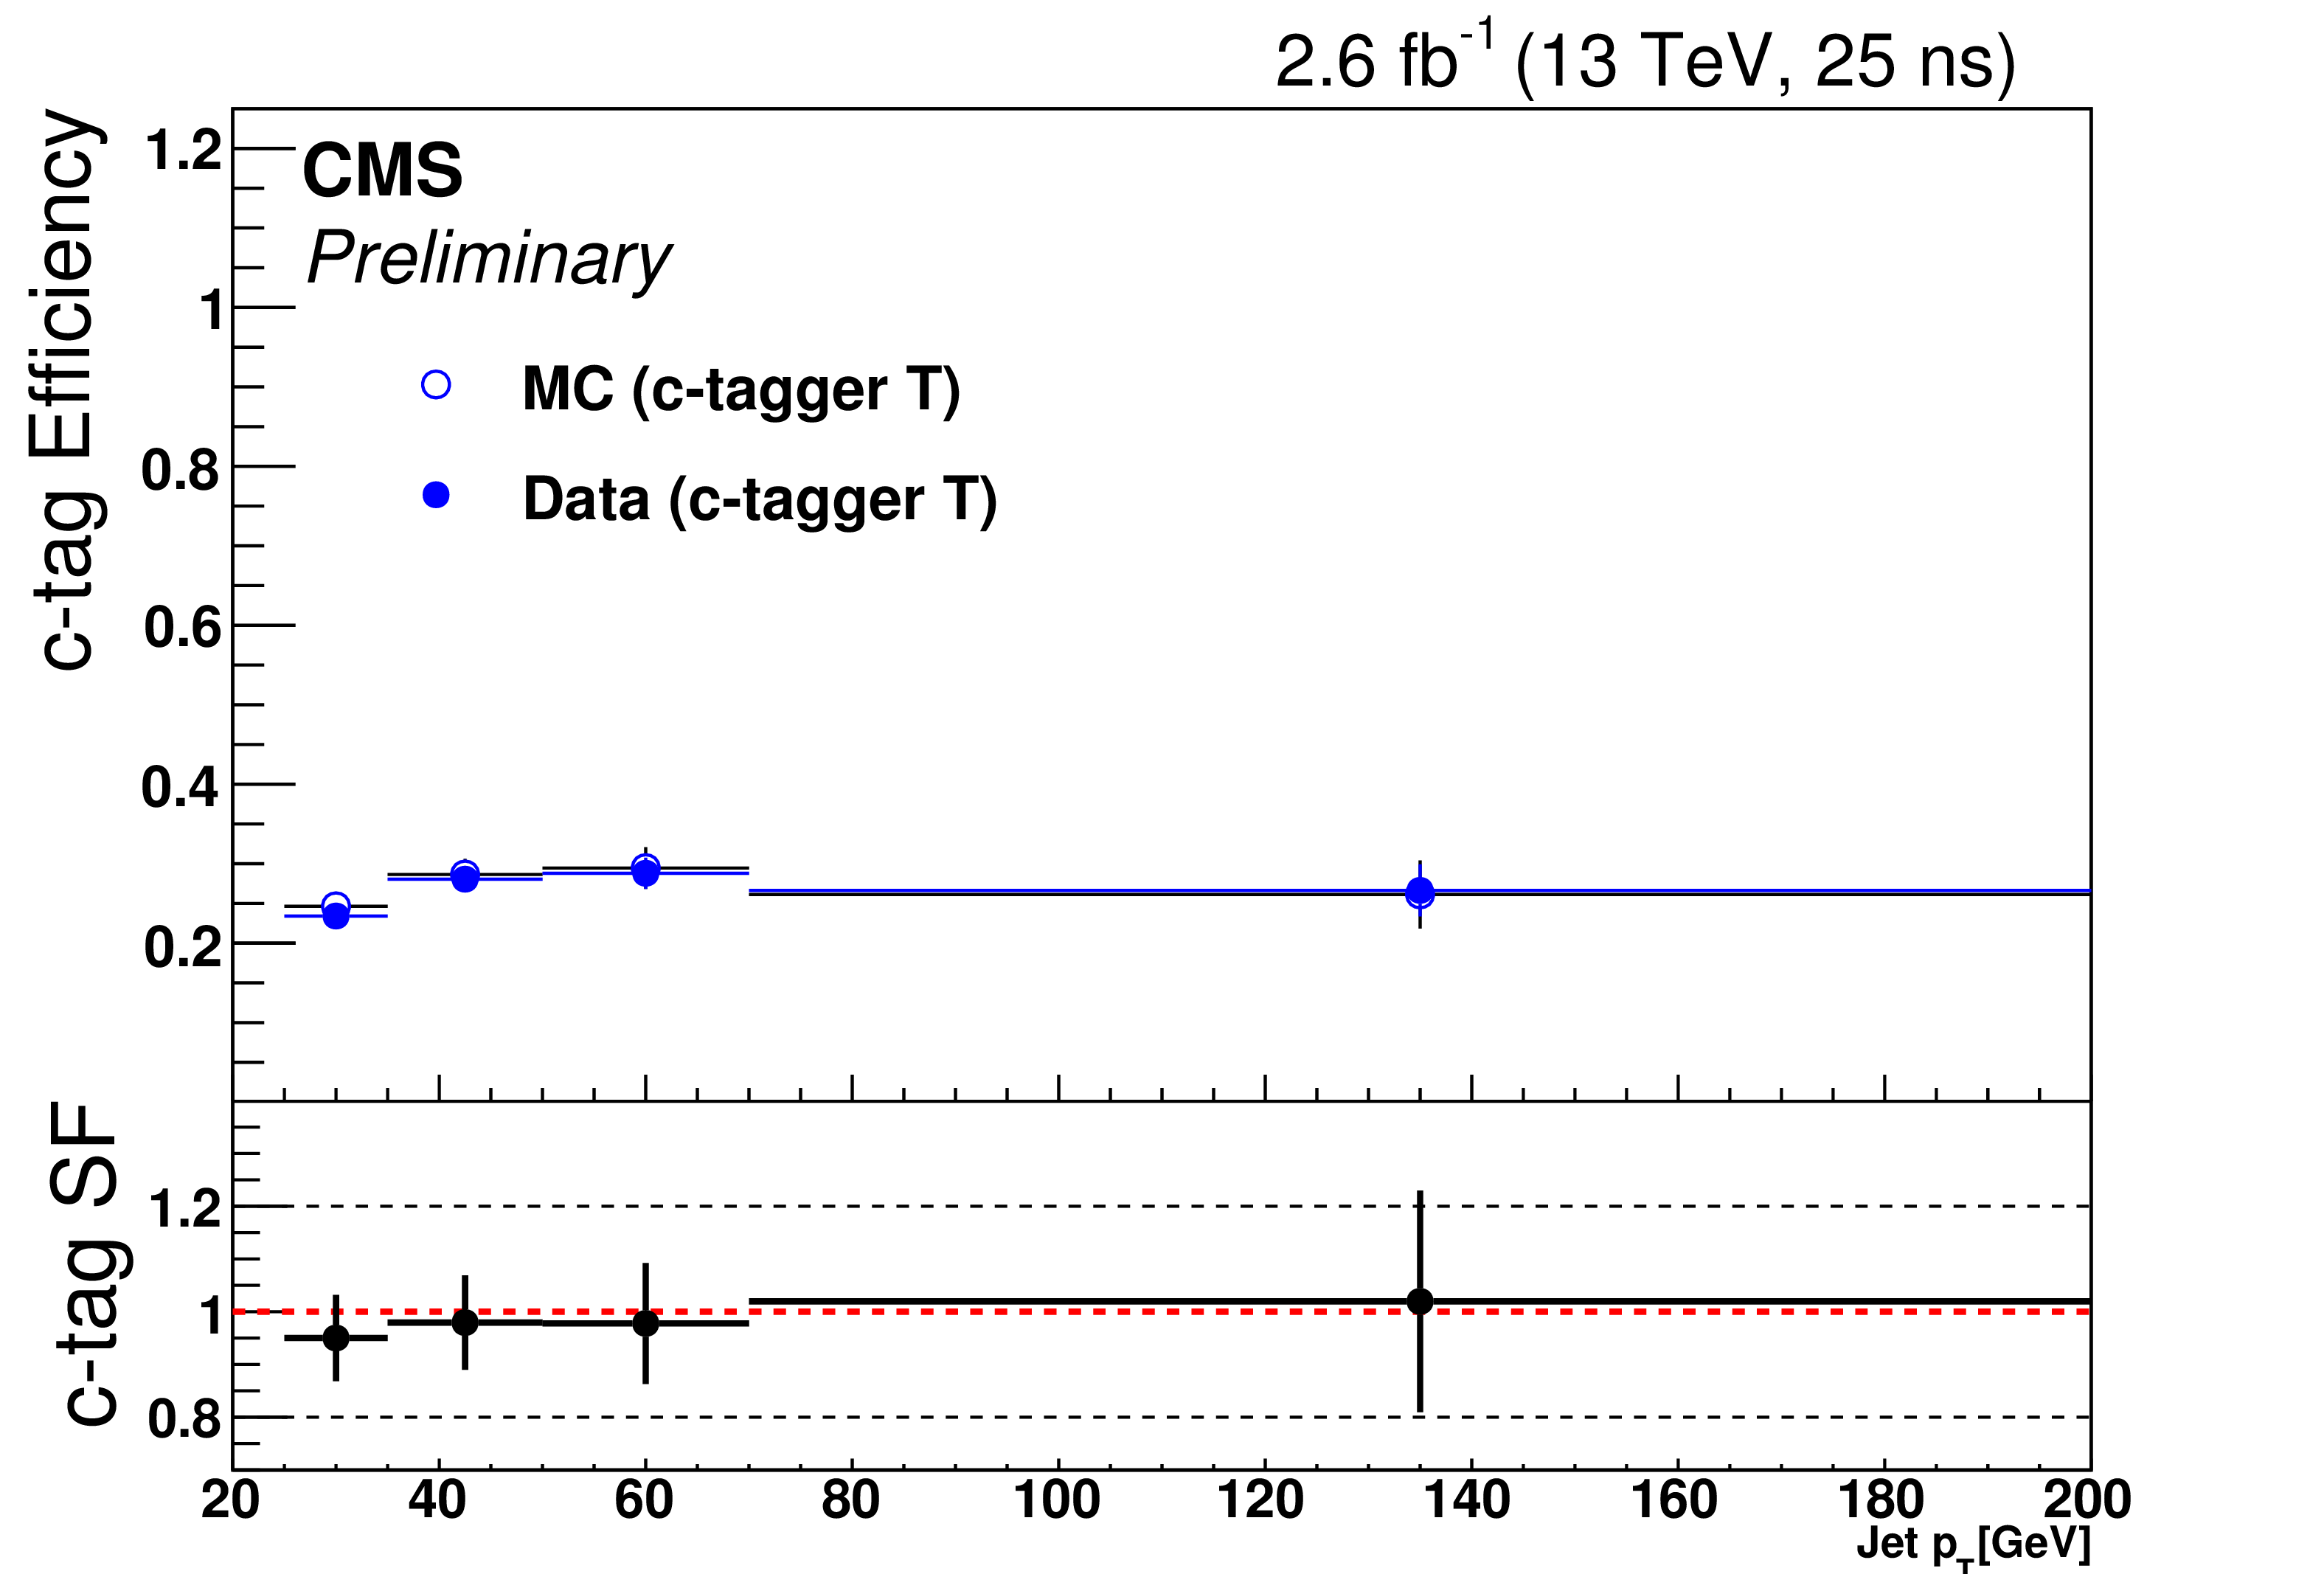
Figure 10-a:
c tagging efficiencies ($\epsilon _{ {\mathrm {\mathrm{c}}}}$) and scale factors ($SF_{ {\mathrm {\mathrm{c}}}}$) as a function of $ {p_{\mathrm {T}}} ^\text {jet}$ for the loose, medium, and tight c tagger working points (from a to c, respectively) using W+c events. |
png pdf |
Figure 10-b:
c tagging efficiencies ($\epsilon _{ {\mathrm {\mathrm{c}}}}$) and scale factors ($SF_{ {\mathrm {\mathrm{c}}}}$) as a function of $ {p_{\mathrm {T}}} ^\text {jet}$ for the loose, medium, and tight c tagger working points (from a to c, respectively) using W+c events. |
png pdf |
Figure 10-c:
c tagging efficiencies ($\epsilon _{ {\mathrm {\mathrm{c}}}}$) and scale factors ($SF_{ {\mathrm {\mathrm{c}}}}$) as a function of $ {p_{\mathrm {T}}} ^\text {jet}$ for the loose, medium, and tight c tagger working points (from a to c, respectively) using W+c events. |
png pdf |
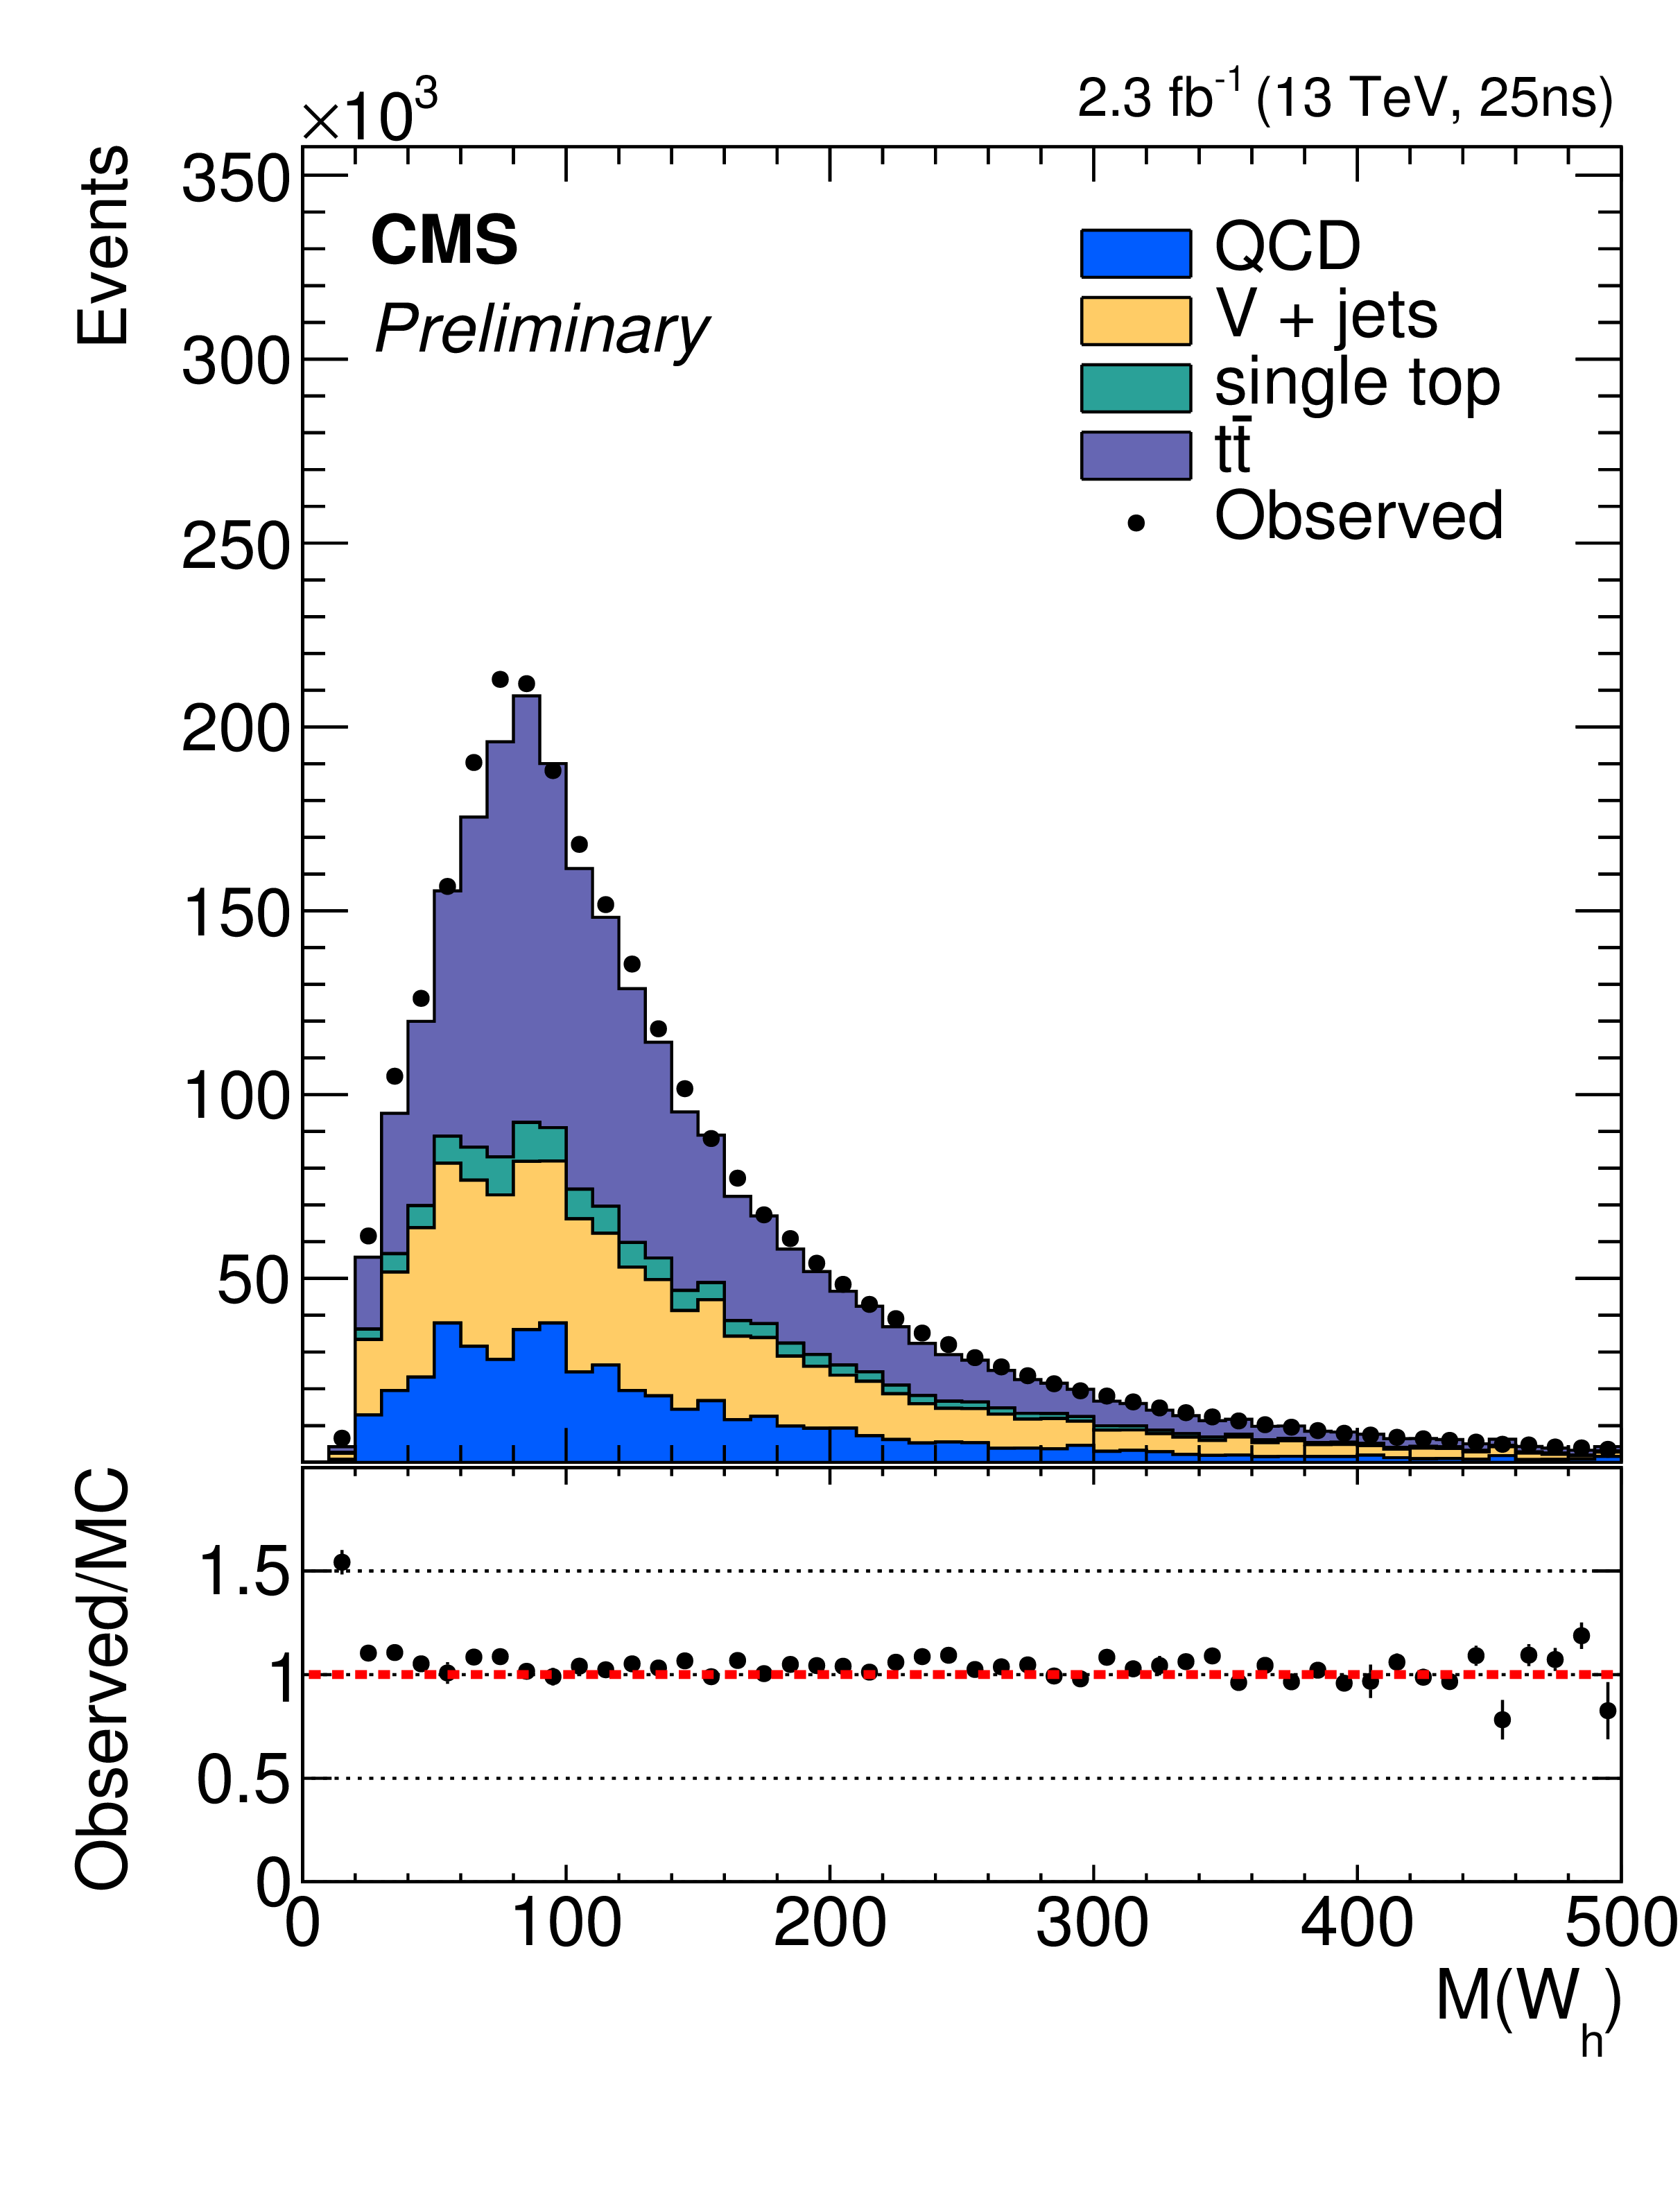
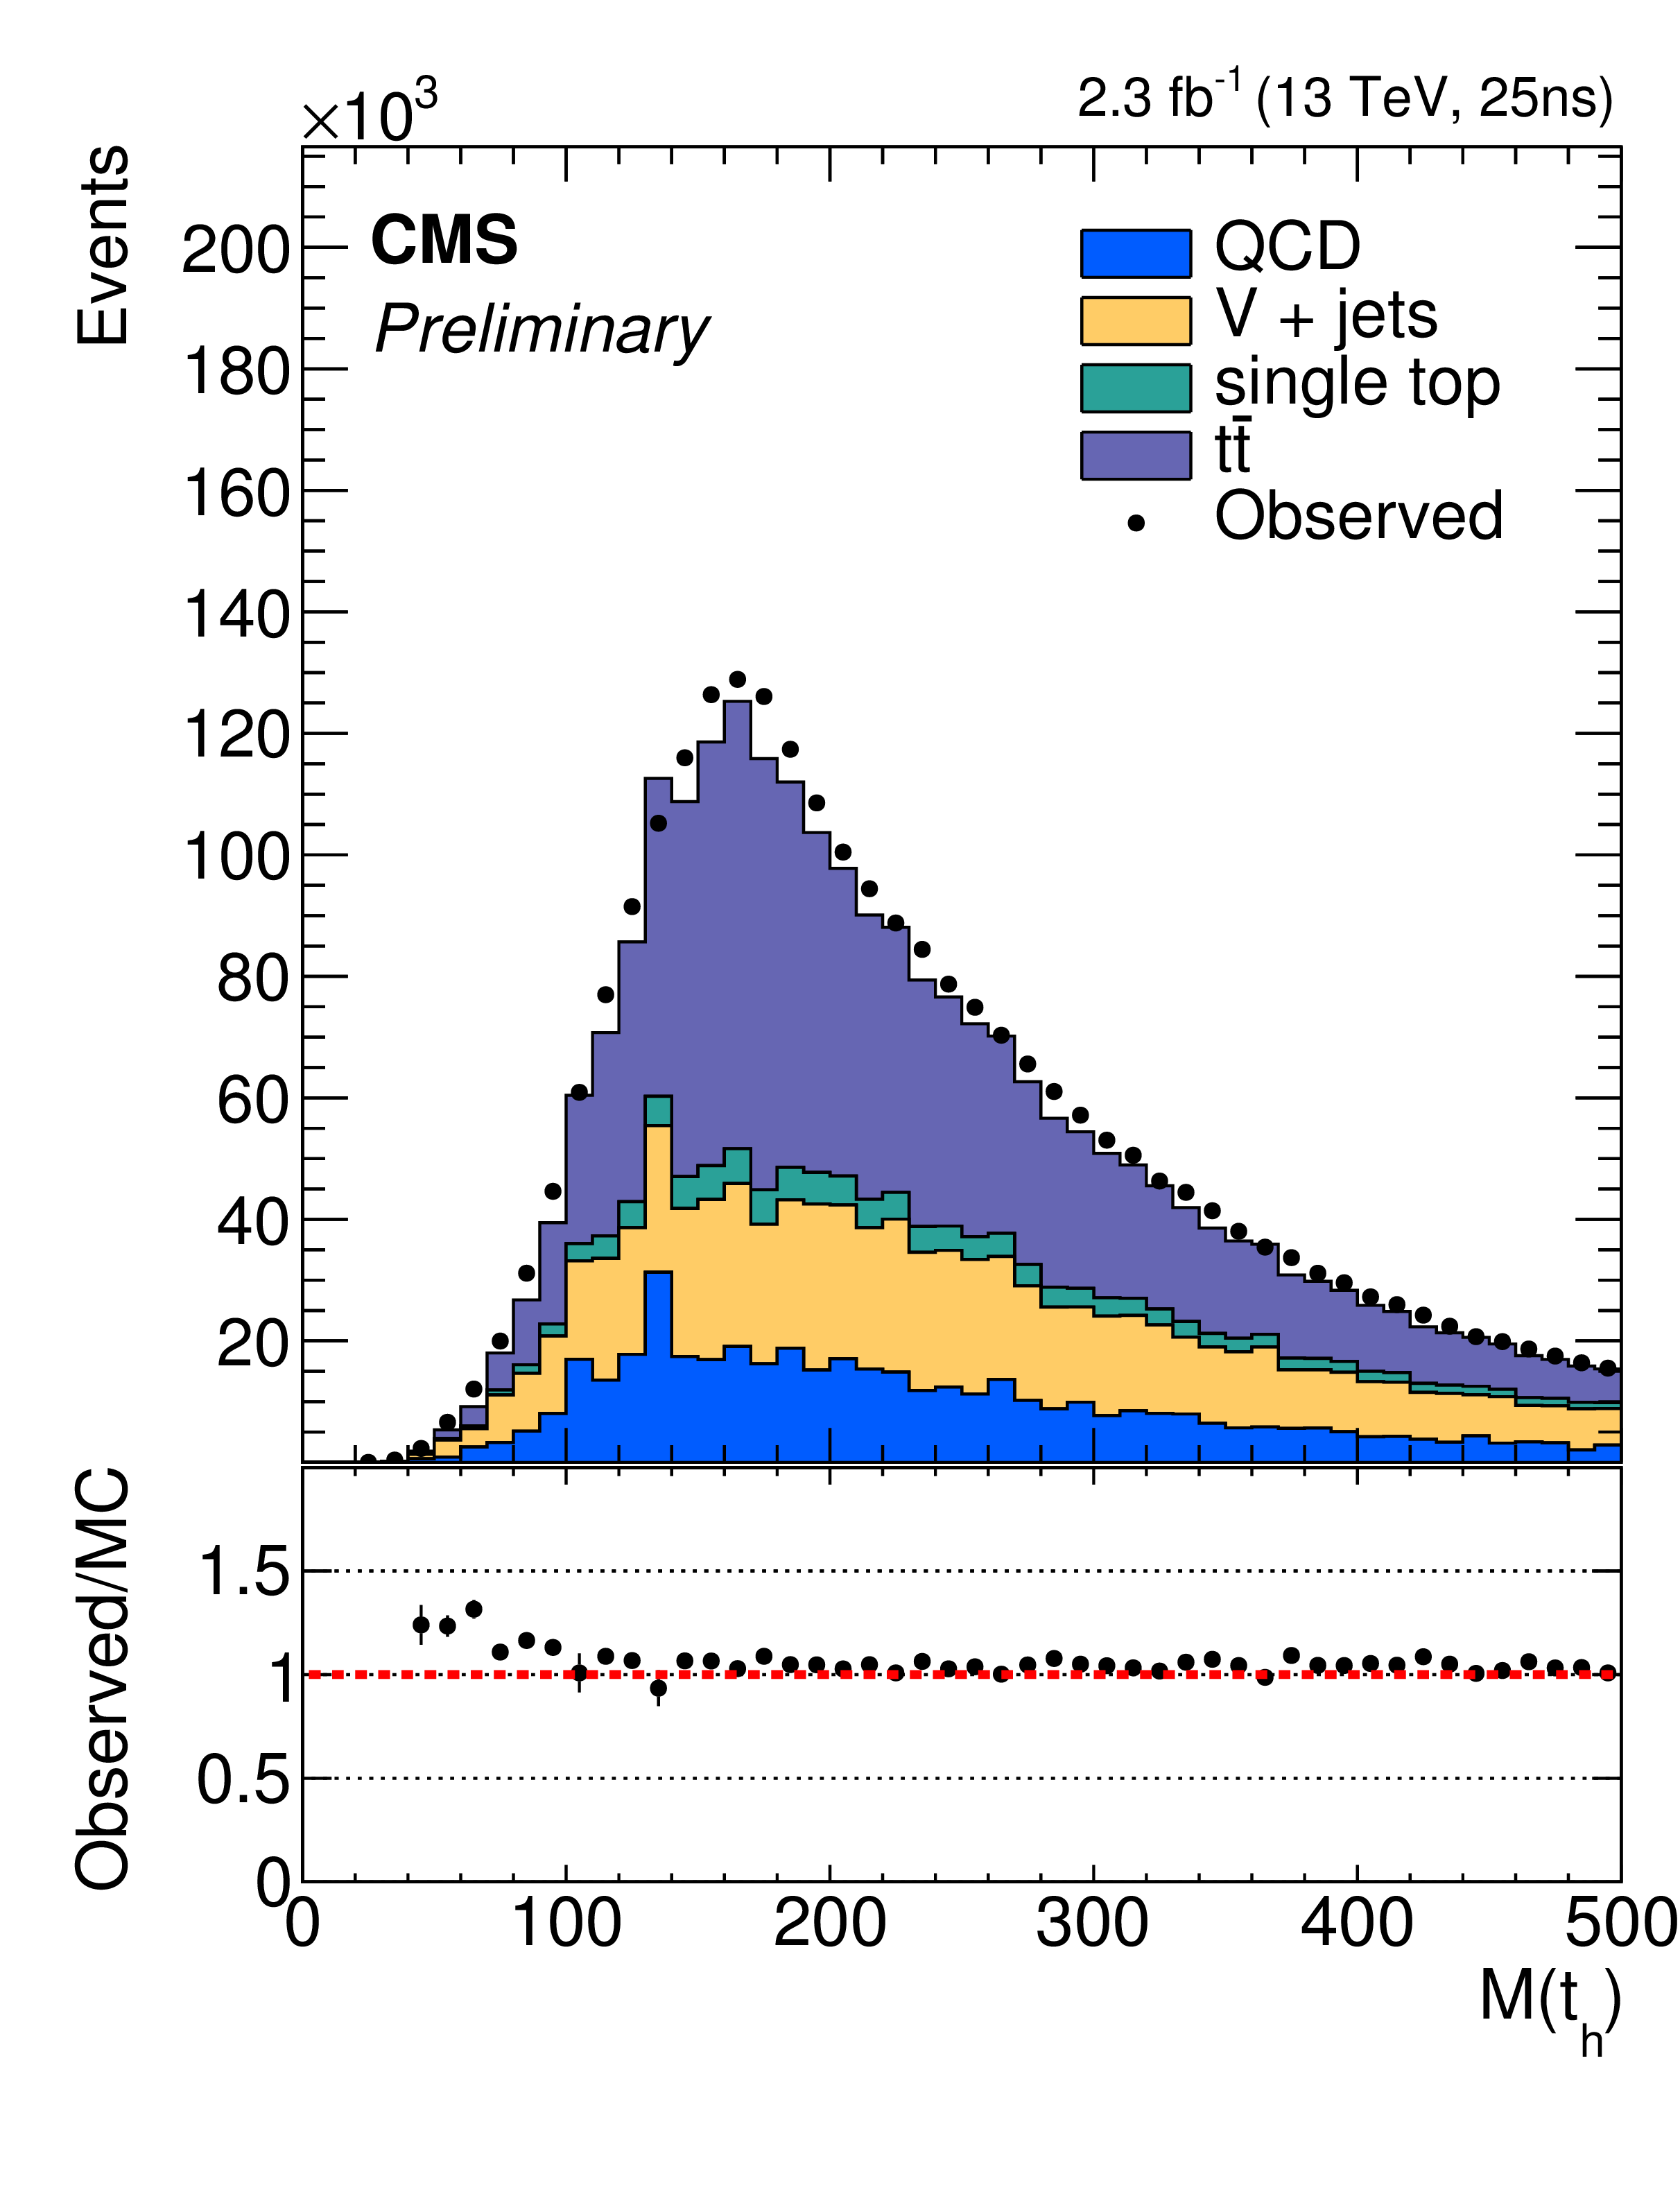
Figure 11-a:
Data and MC distributions of the invariant mass of the hadronically-decaying W (a), top quark (b), and of combined discriminant ${\lambda _{M}}$ (c) for every permutation in pre-selected events (i.e. those passing trigger and objects selection). The lower panels show the distribution of the MC over data ratio. These distributions were obtained processing 2.3 fb$^{-1}$ of 2015 data. |
png pdf |
Figure 11-b:
Data and MC distributions of the invariant mass of the hadronically-decaying W (a), top quark (b), and of combined discriminant ${\lambda _{M}}$ (c) for every permutation in pre-selected events (i.e. those passing trigger and objects selection). The lower panels show the distribution of the MC over data ratio. These distributions were obtained processing 2.3 fb$^{-1}$ of 2015 data. |
png pdf |
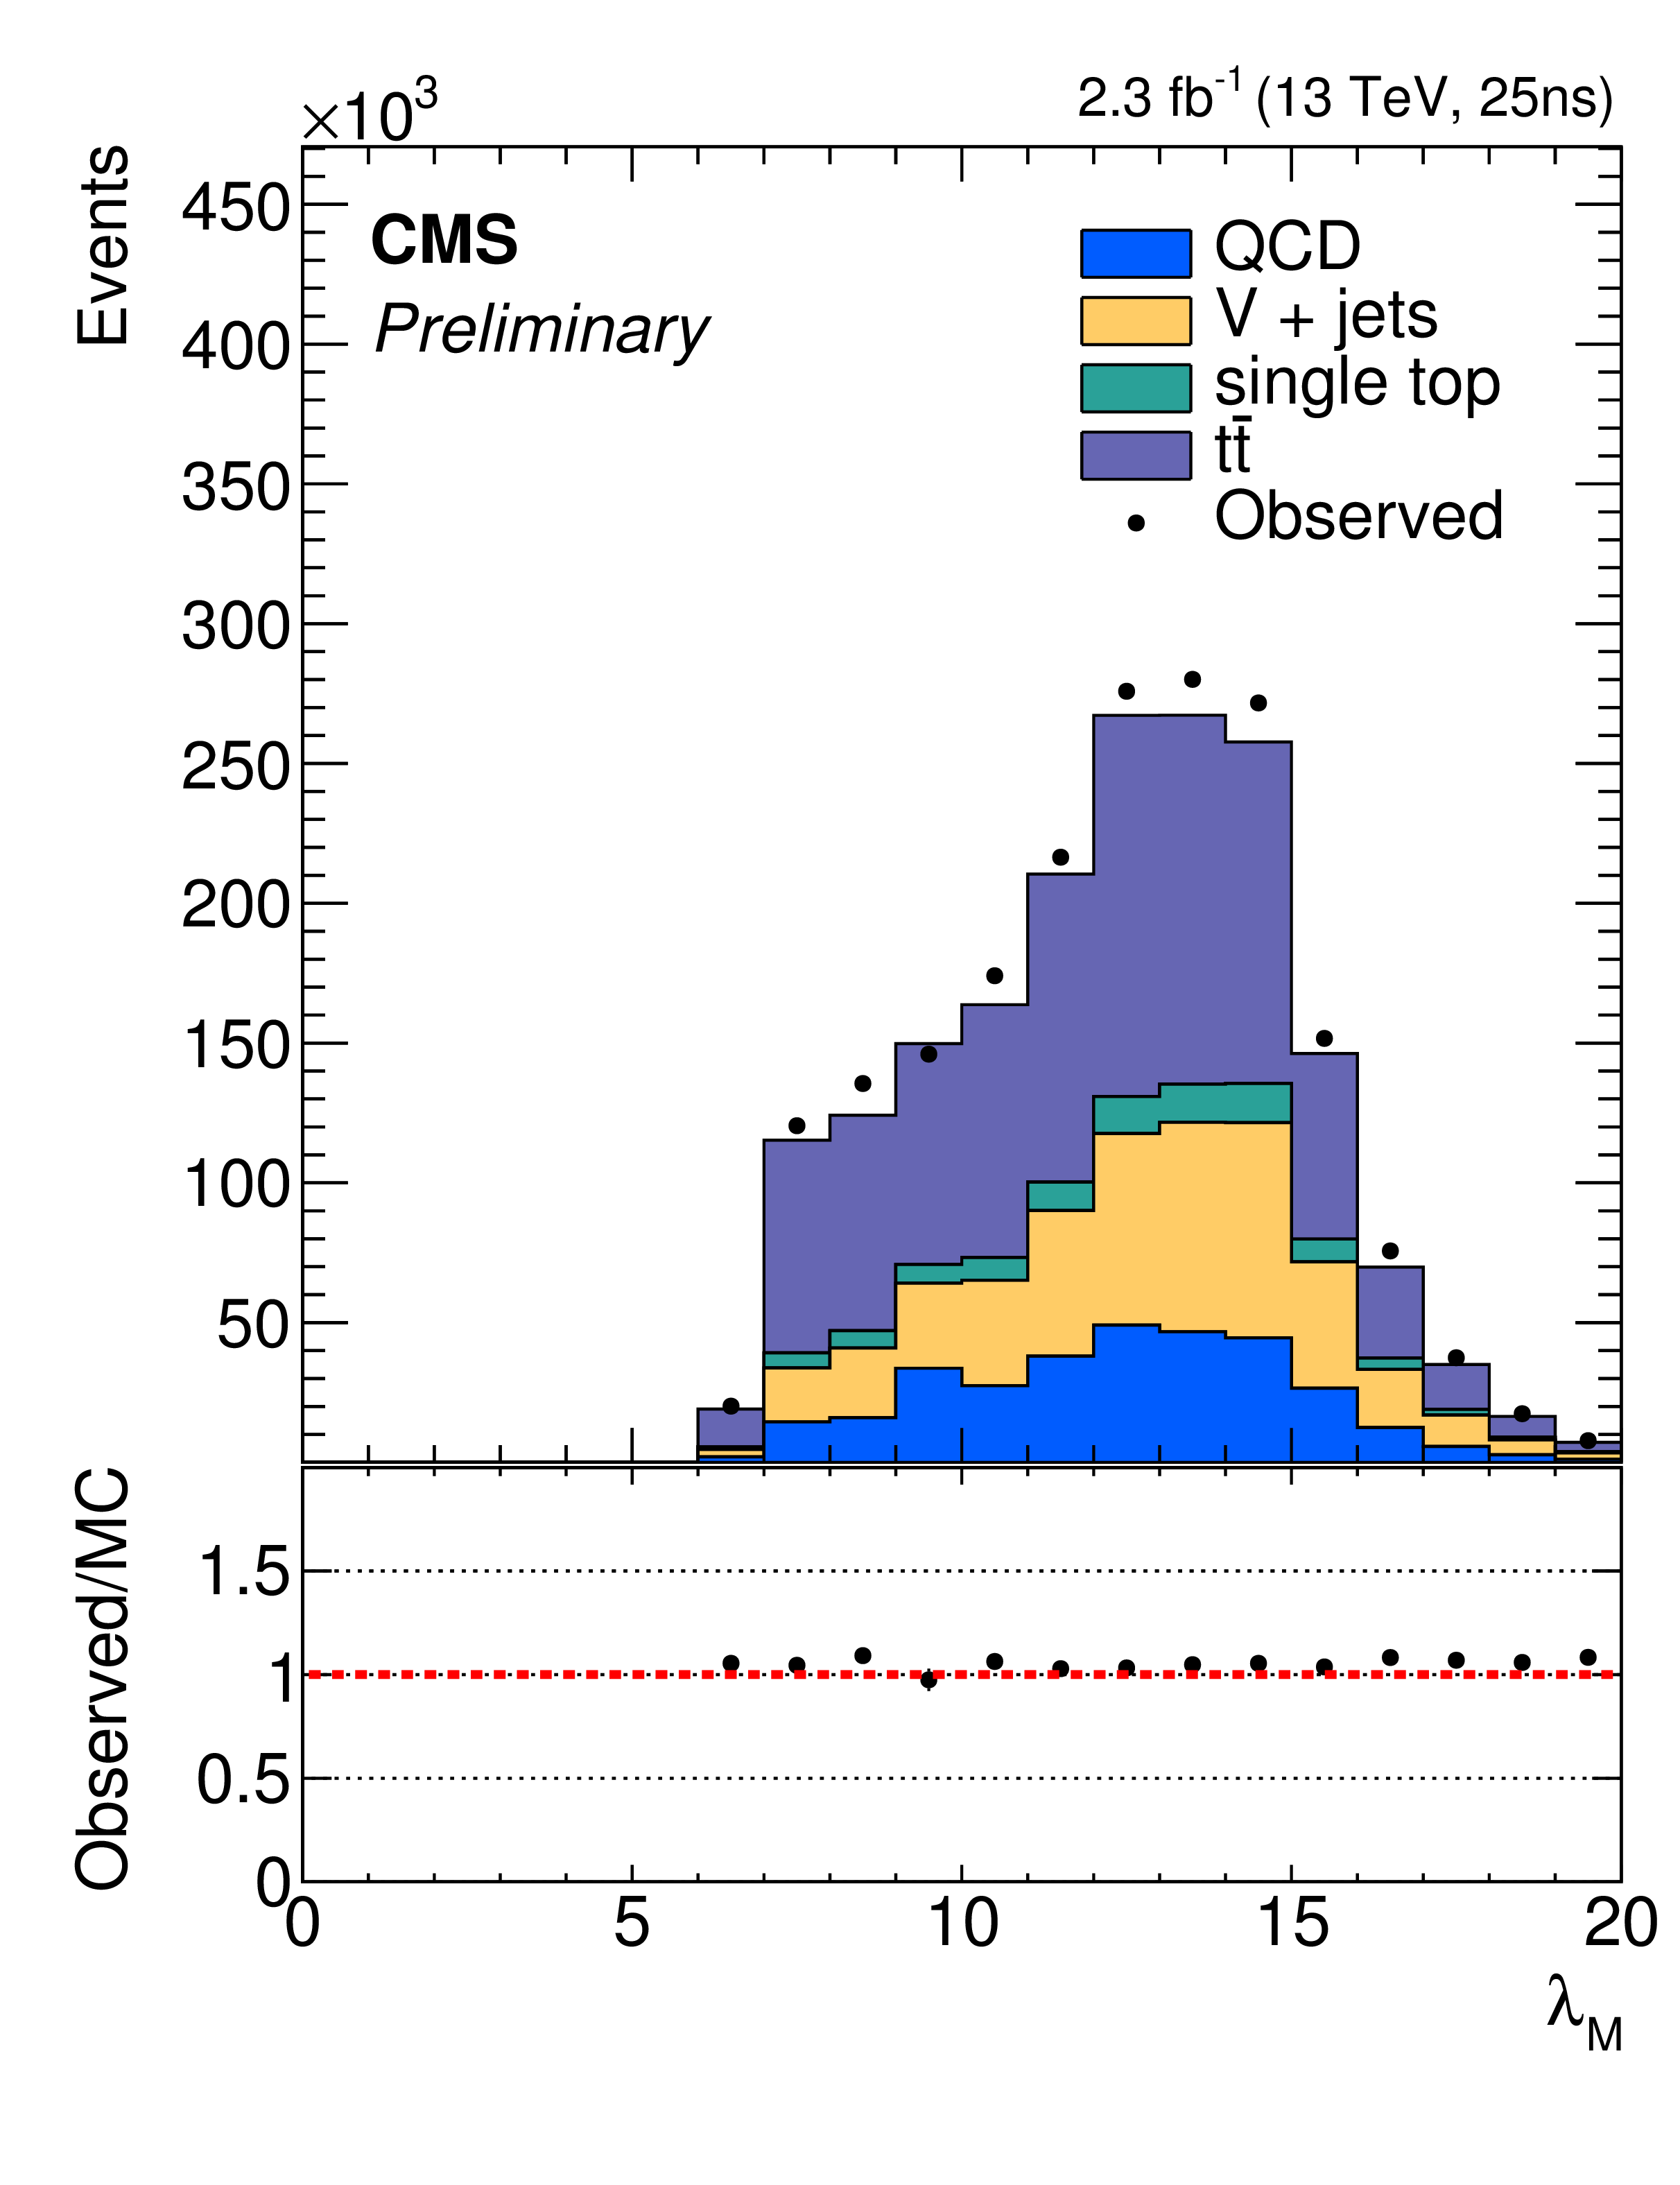
Figure 11-c:
Data and MC distributions of the invariant mass of the hadronically-decaying W (a), top quark (b), and of combined discriminant ${\lambda _{M}}$ (c) for every permutation in pre-selected events (i.e. those passing trigger and objects selection). The lower panels show the distribution of the MC over data ratio. These distributions were obtained processing 2.3 fb$^{-1}$ of 2015 data. |
png pdf |
Figure 12:
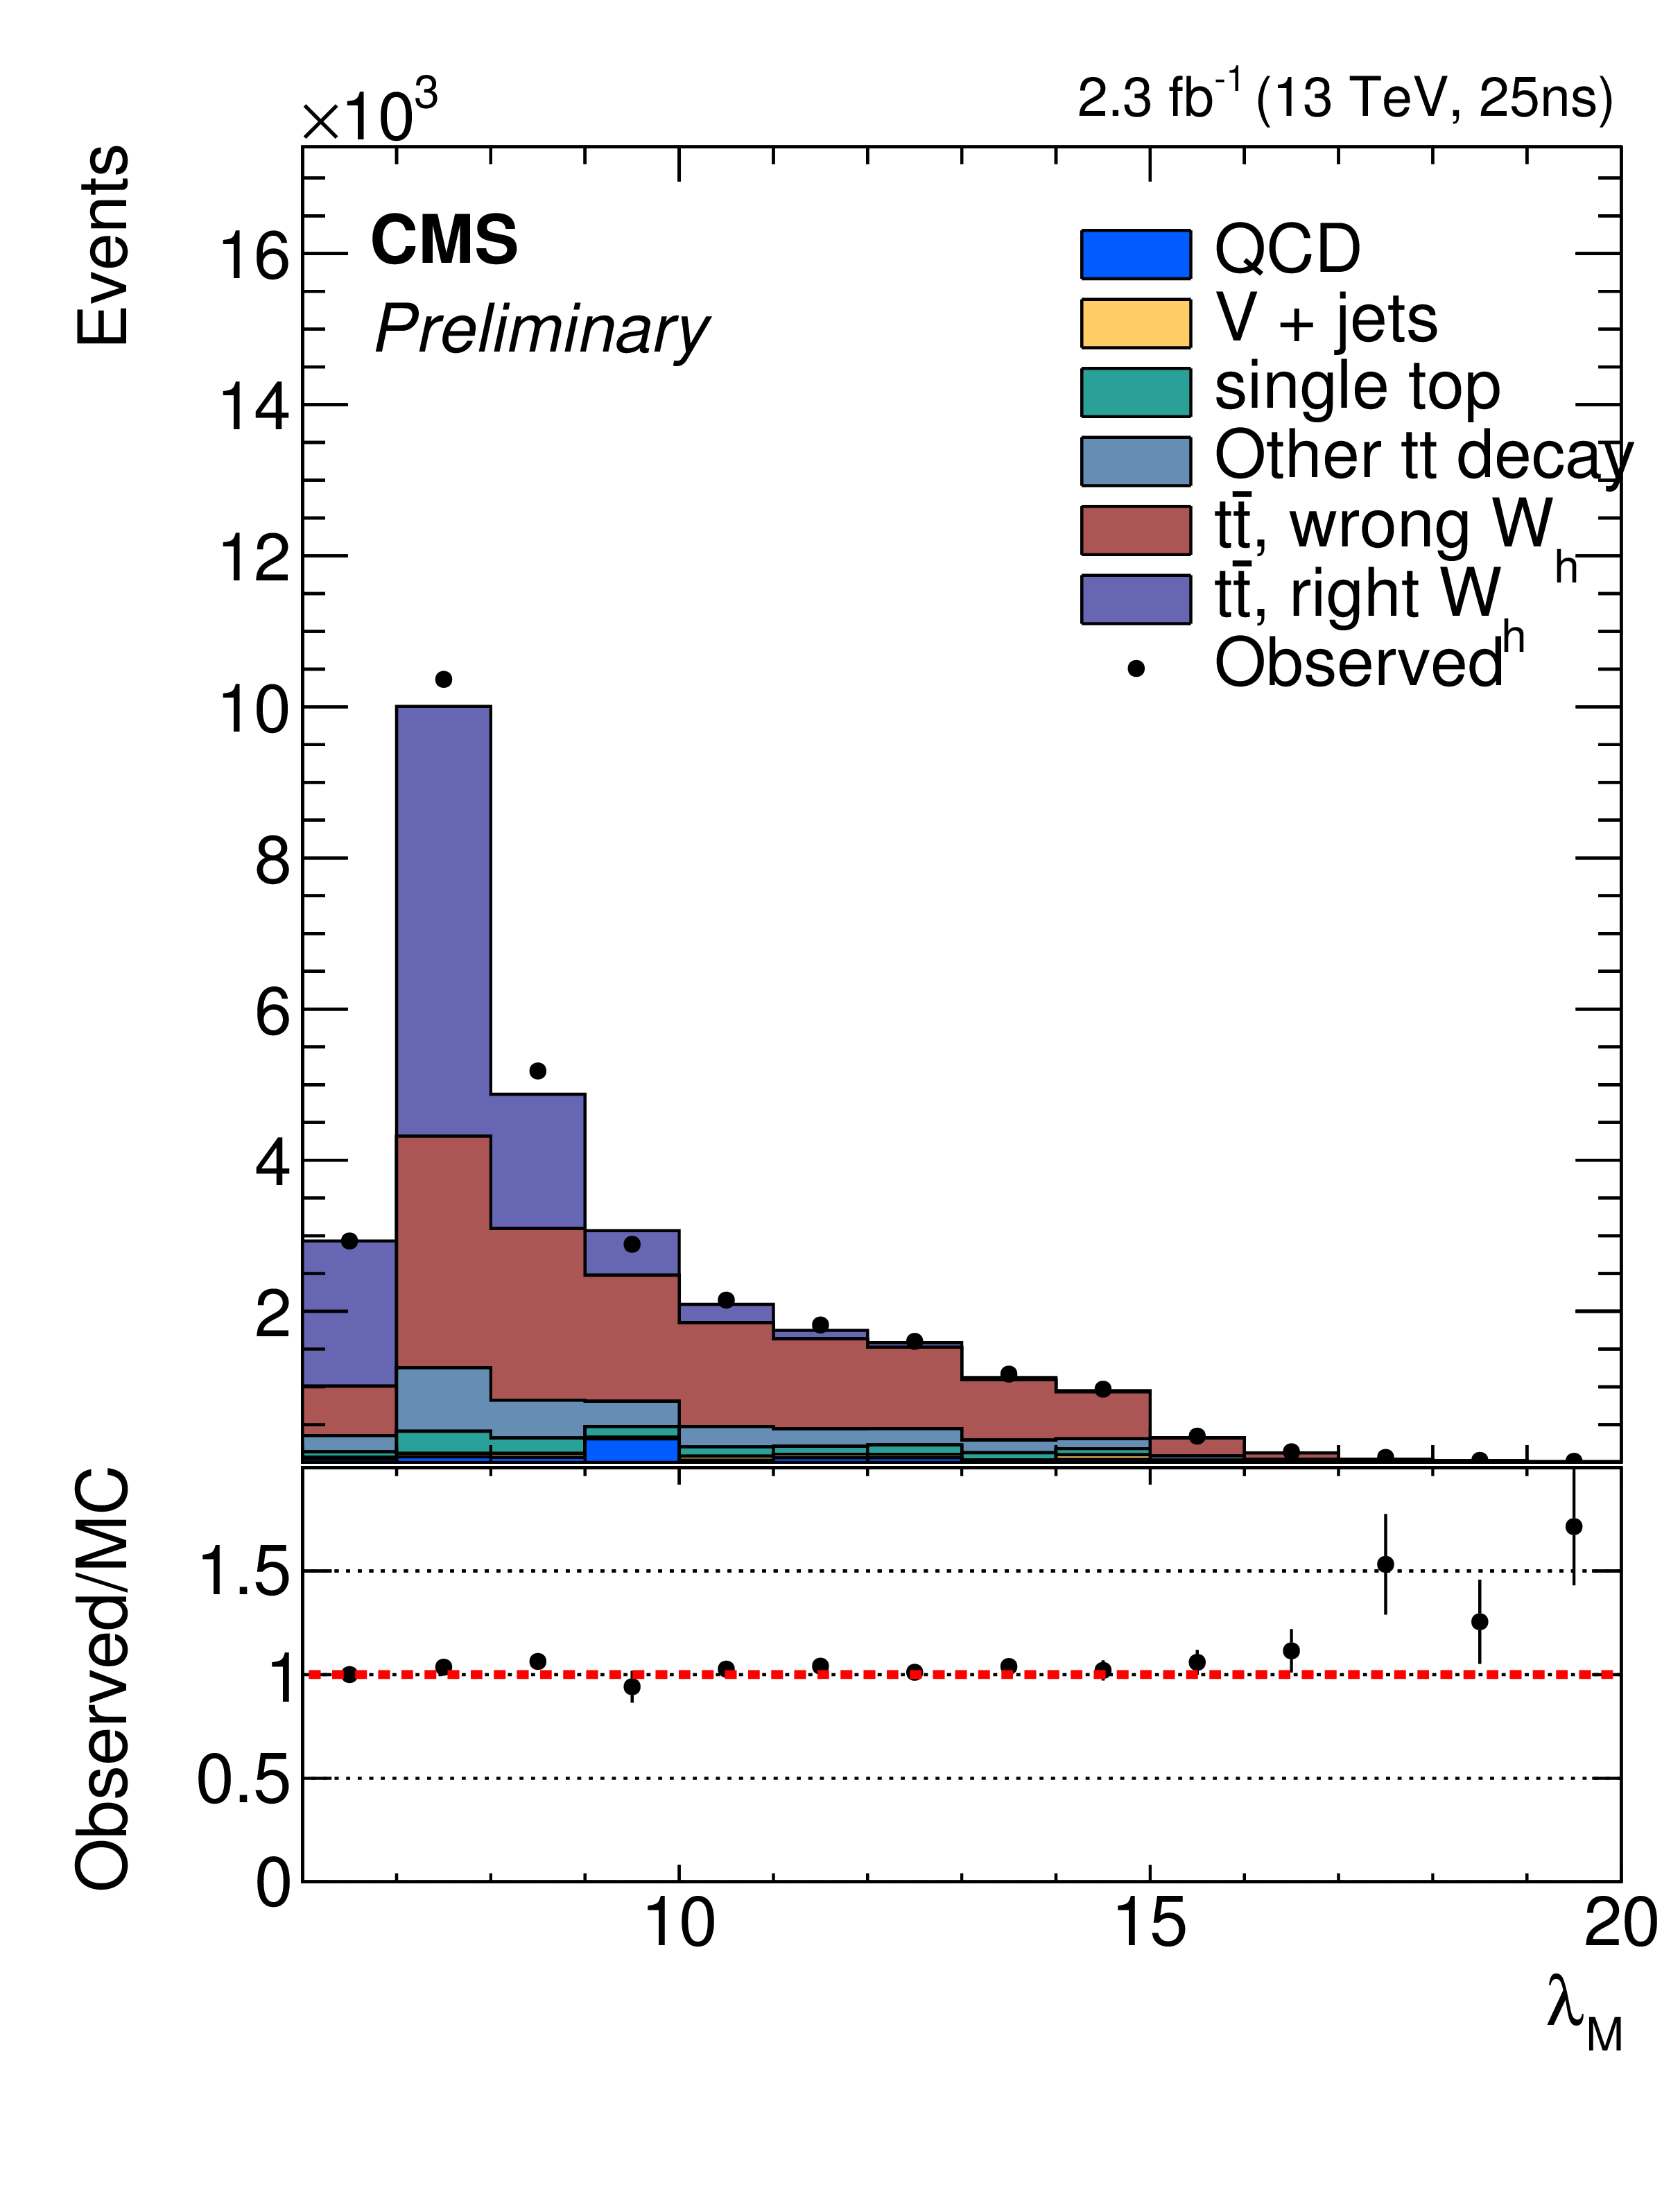
Data and MC distributions of ${\lambda _{M}}$ after full selection, including the selection of the best permutation and the b tagging identification of two of the jet of the permutation. The different simulated processes contributing are shown with different colours. The major contributions are semi-leptonic top quark pair decays with the hadronic W properly matched to the generator particles (violet), wrongly matched semi-leptonic top quark decays (red), and non semi-leptonic top quark decays (azure). Minor contributions are also present due to single top events (green), vector-boson plus jets (labeled as ``V+jets'', in yellow), and multi-jet production (``QCD'', in blue). |
png pdf |
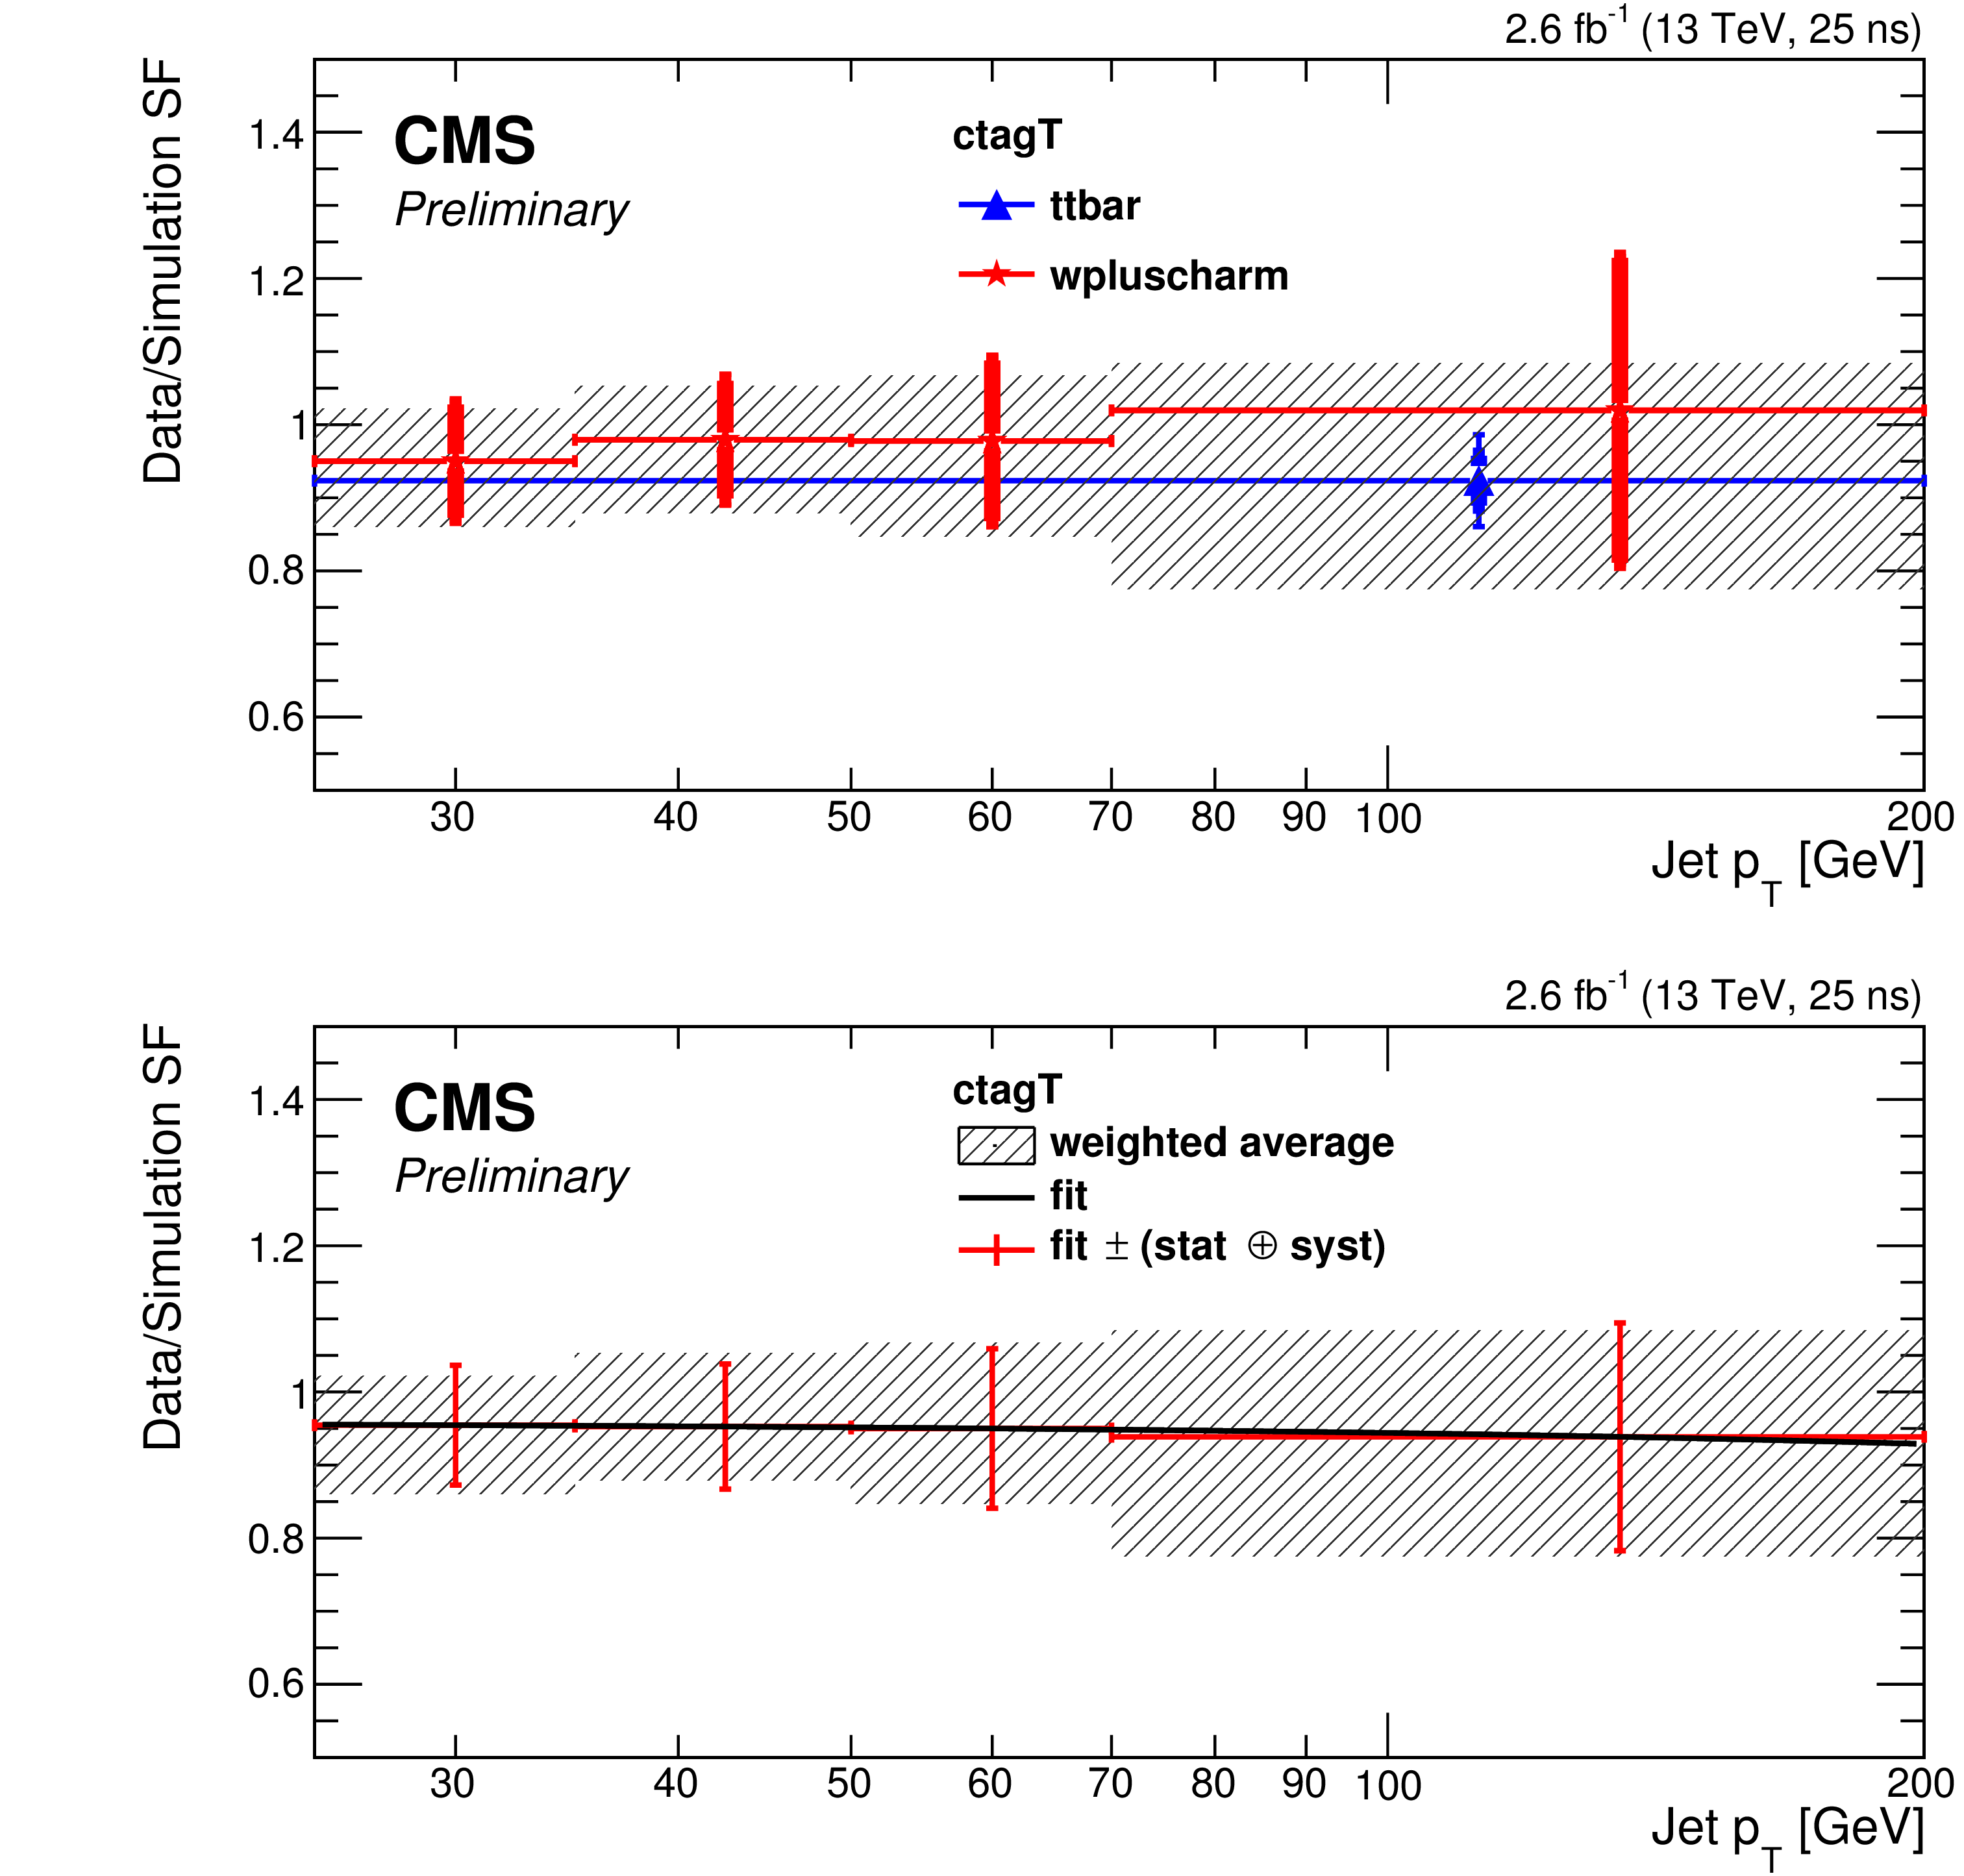
Figure 13-a:
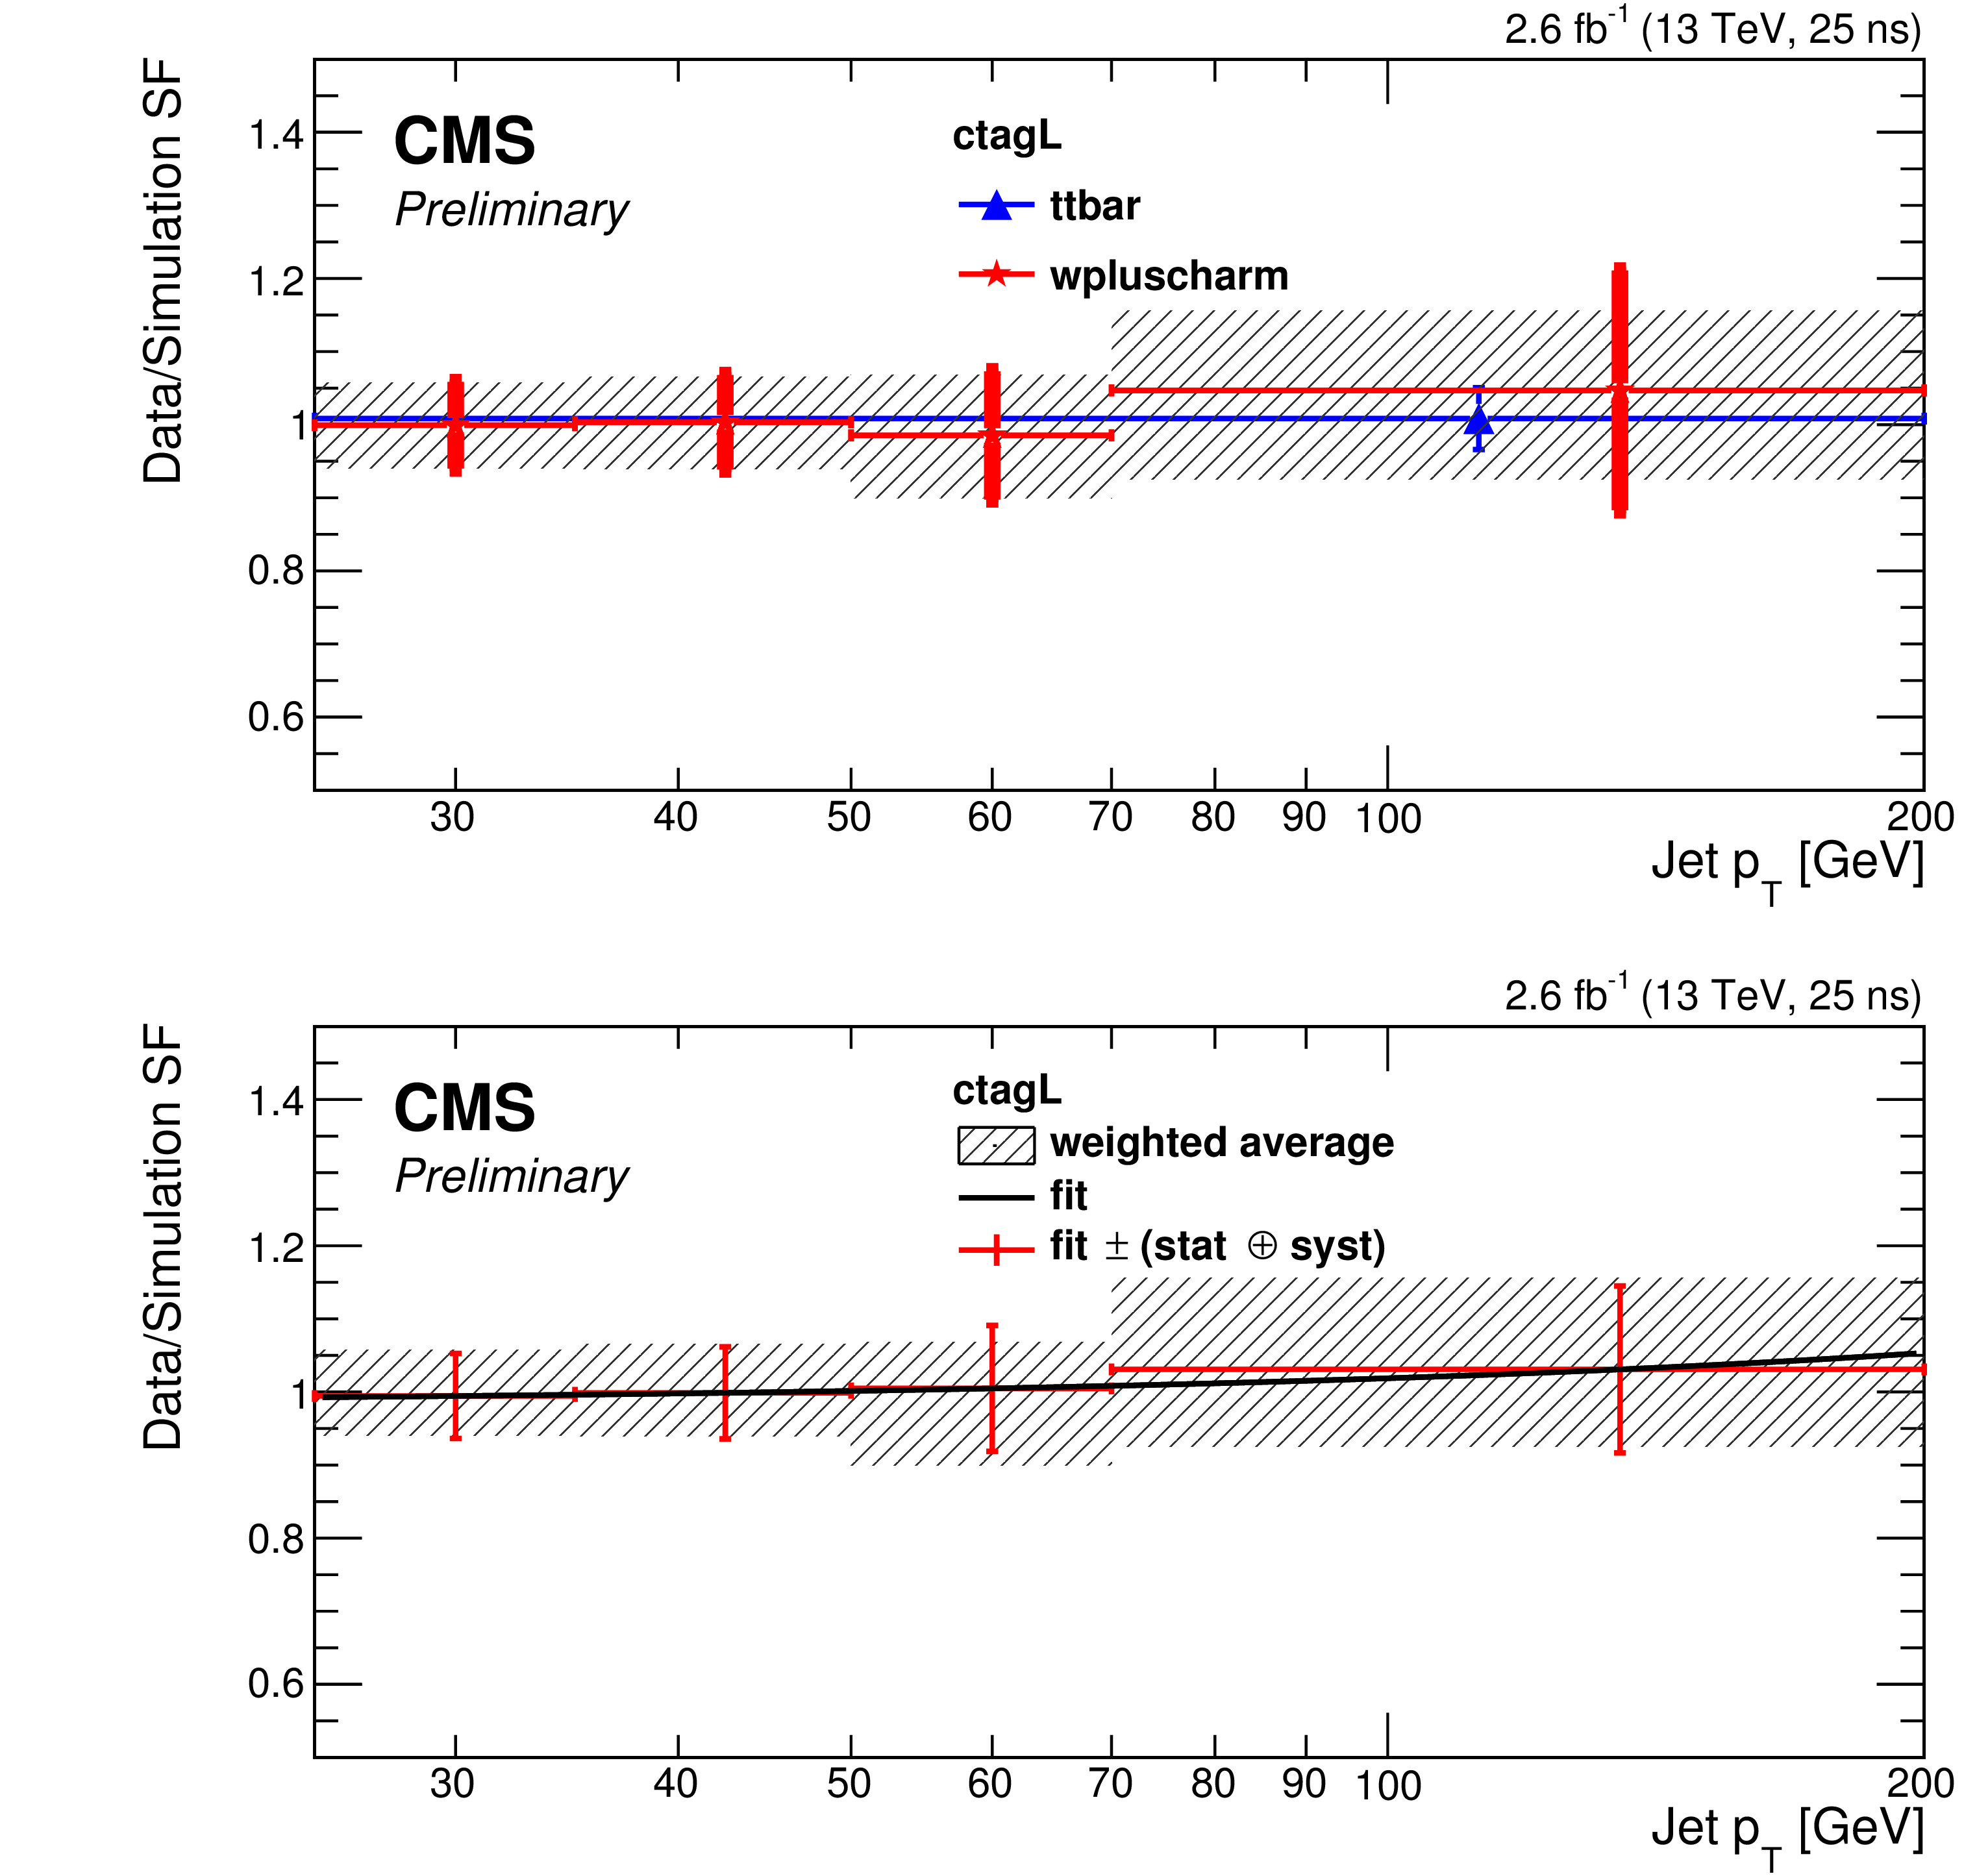
(upper panels) Data-to-simulation scale factor of the charm tagging efficiency for the c-tagging WP (loose on a, medium on b, tight on c) as measured with the two methods, with (thick error bar) statistical error and (narrow error bar) combined statistical and systematic uncertainties. The combined SF value with its overall uncertainty is displayed as a hatched area. (lower panels) Same combined SF value with the result of a linear fit function superimposed (solid curve). The combined statistical and systematic uncertainty is centred around the fit result (points with error bars). The last bin includes the overflow. |
png pdf |
Figure 13-b:
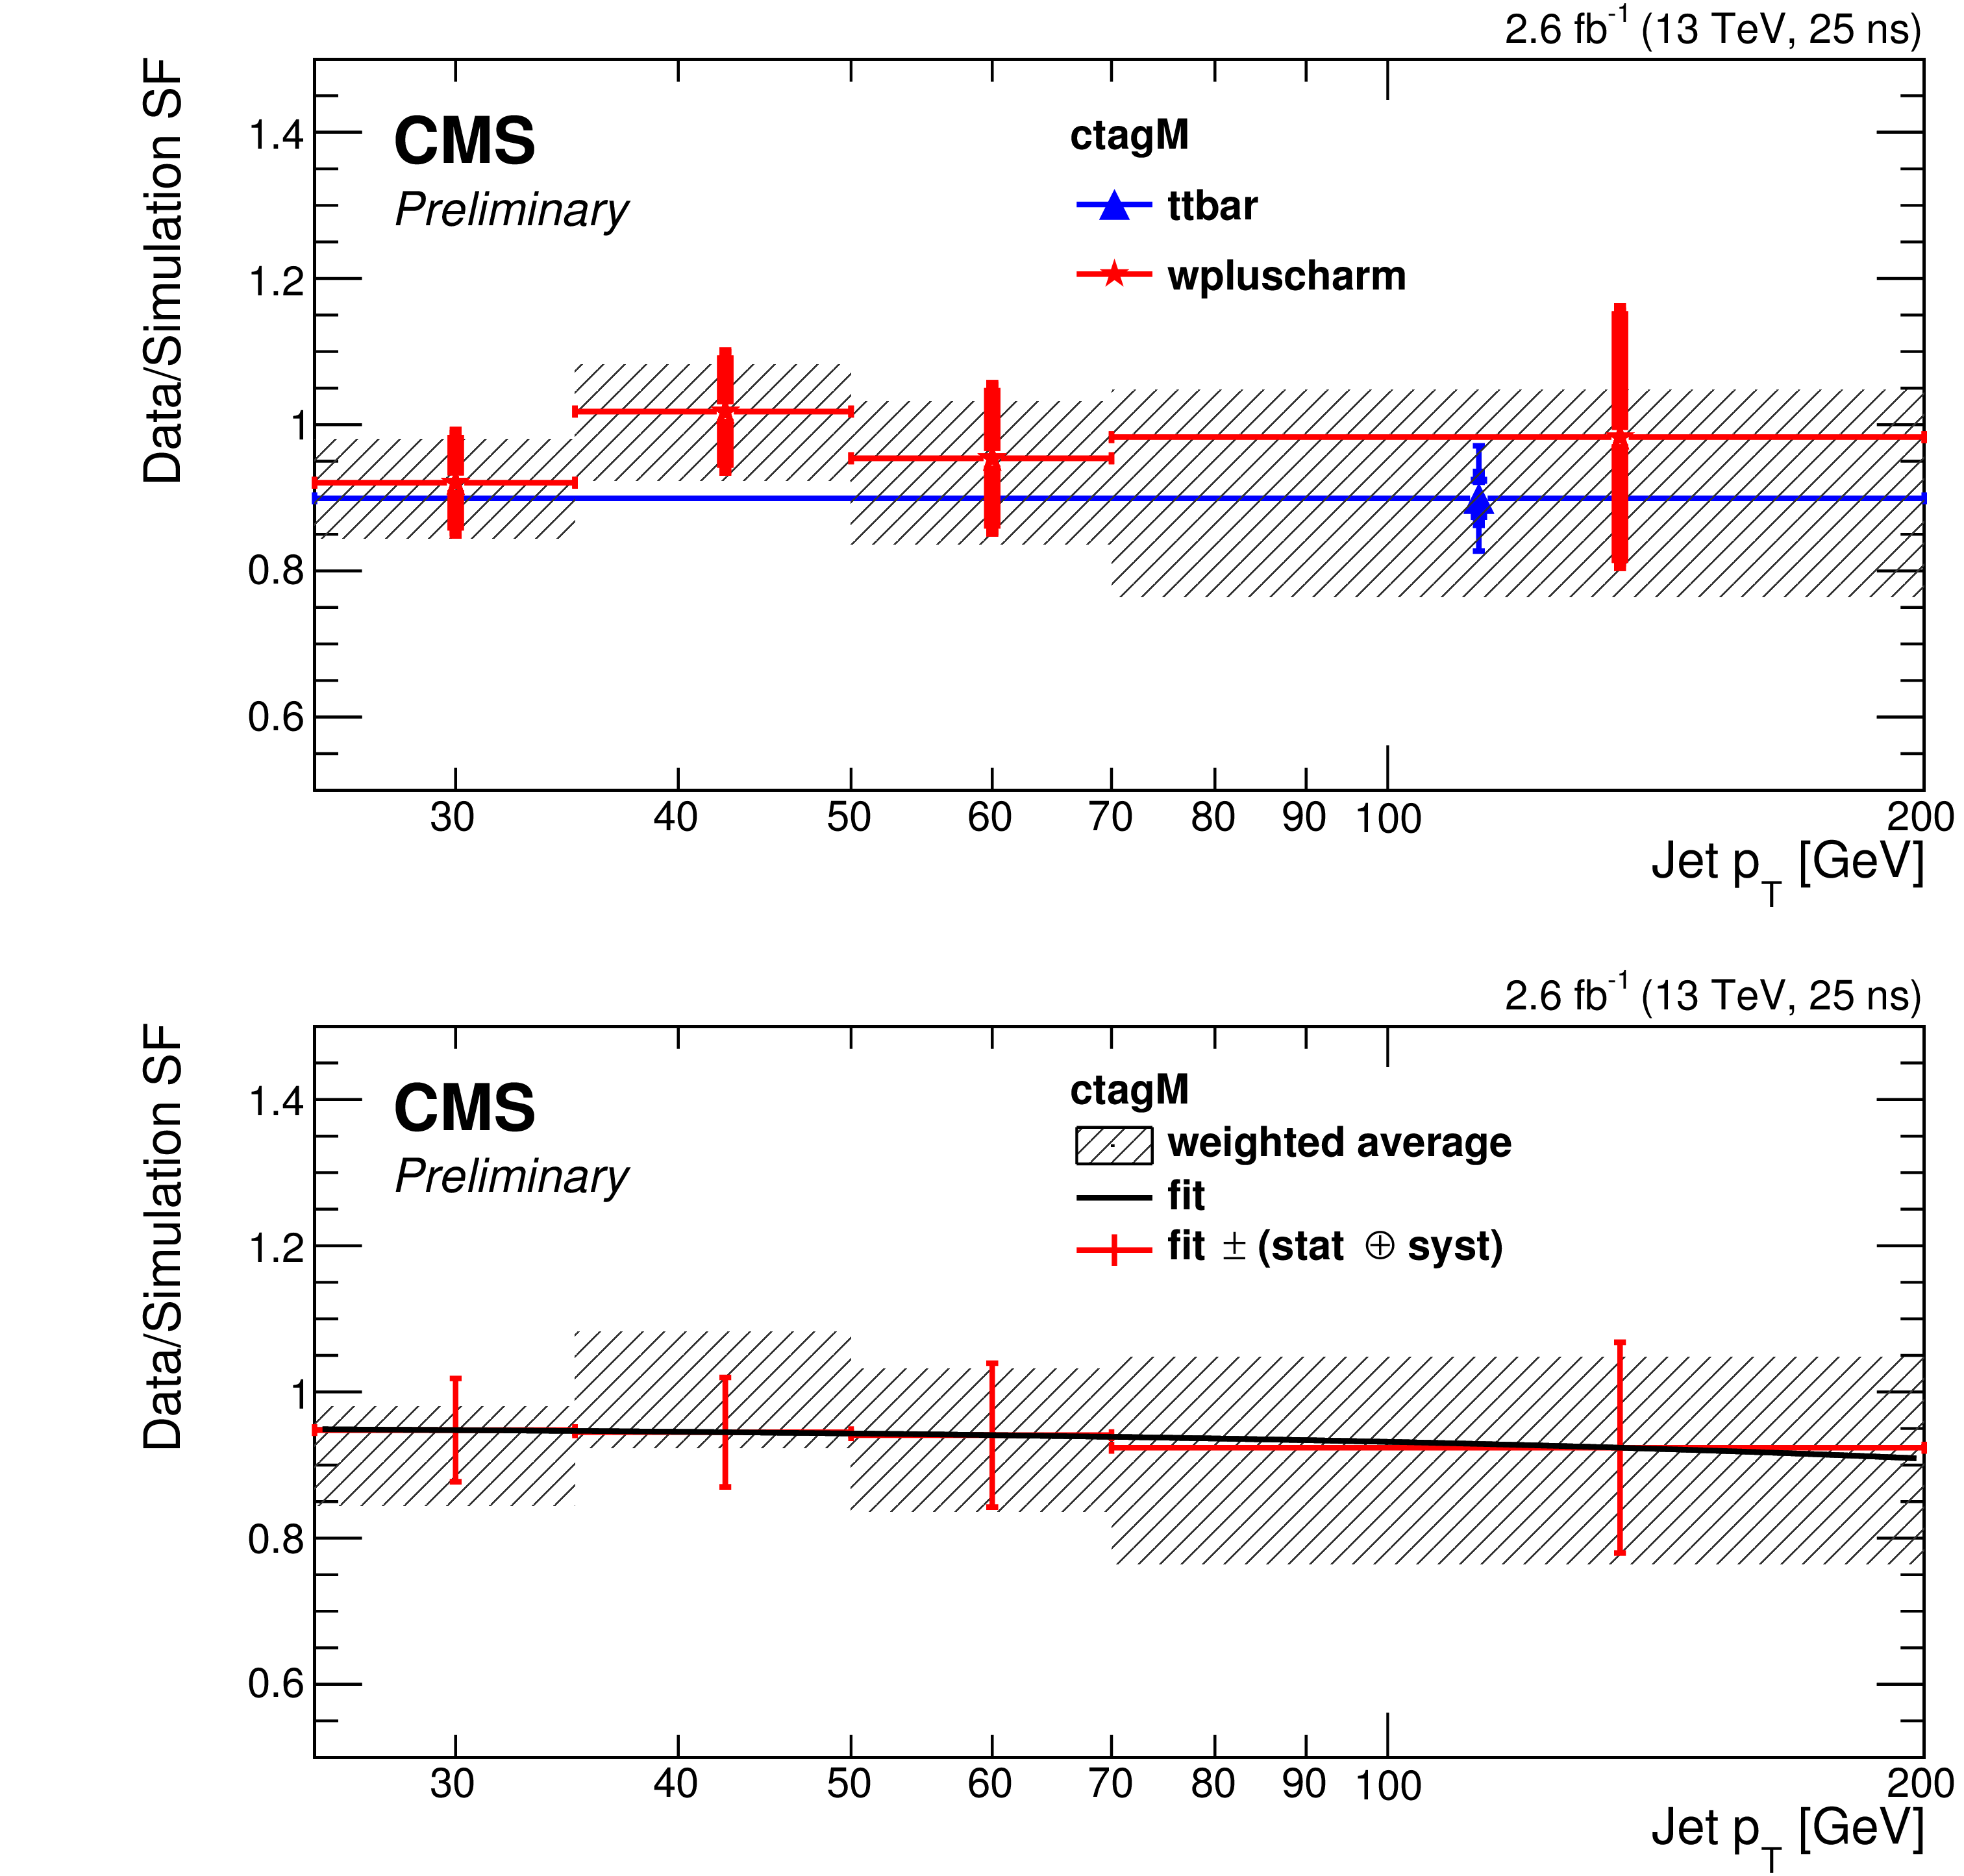
(upper panels) Data-to-simulation scale factor of the charm tagging efficiency for the c-tagging WP (loose on a, medium on b, tight on c) as measured with the two methods, with (thick error bar) statistical error and (narrow error bar) combined statistical and systematic uncertainties. The combined SF value with its overall uncertainty is displayed as a hatched area. (lower panels) Same combined SF value with the result of a linear fit function superimposed (solid curve). The combined statistical and systematic uncertainty is centred around the fit result (points with error bars). The last bin includes the overflow. |
png pdf |
Figure 13-c:
(upper panels) Data-to-simulation scale factor of the charm tagging efficiency for the c-tagging WP (loose on a, medium on b, tight on c) as measured with the two methods, with (thick error bar) statistical error and (narrow error bar) combined statistical and systematic uncertainties. The combined SF value with its overall uncertainty is displayed as a hatched area. (lower panels) Same combined SF value with the result of a linear fit function superimposed (solid curve). The combined statistical and systematic uncertainty is centred around the fit result (points with error bars). The last bin includes the overflow. |
| Tables | |
png pdf |
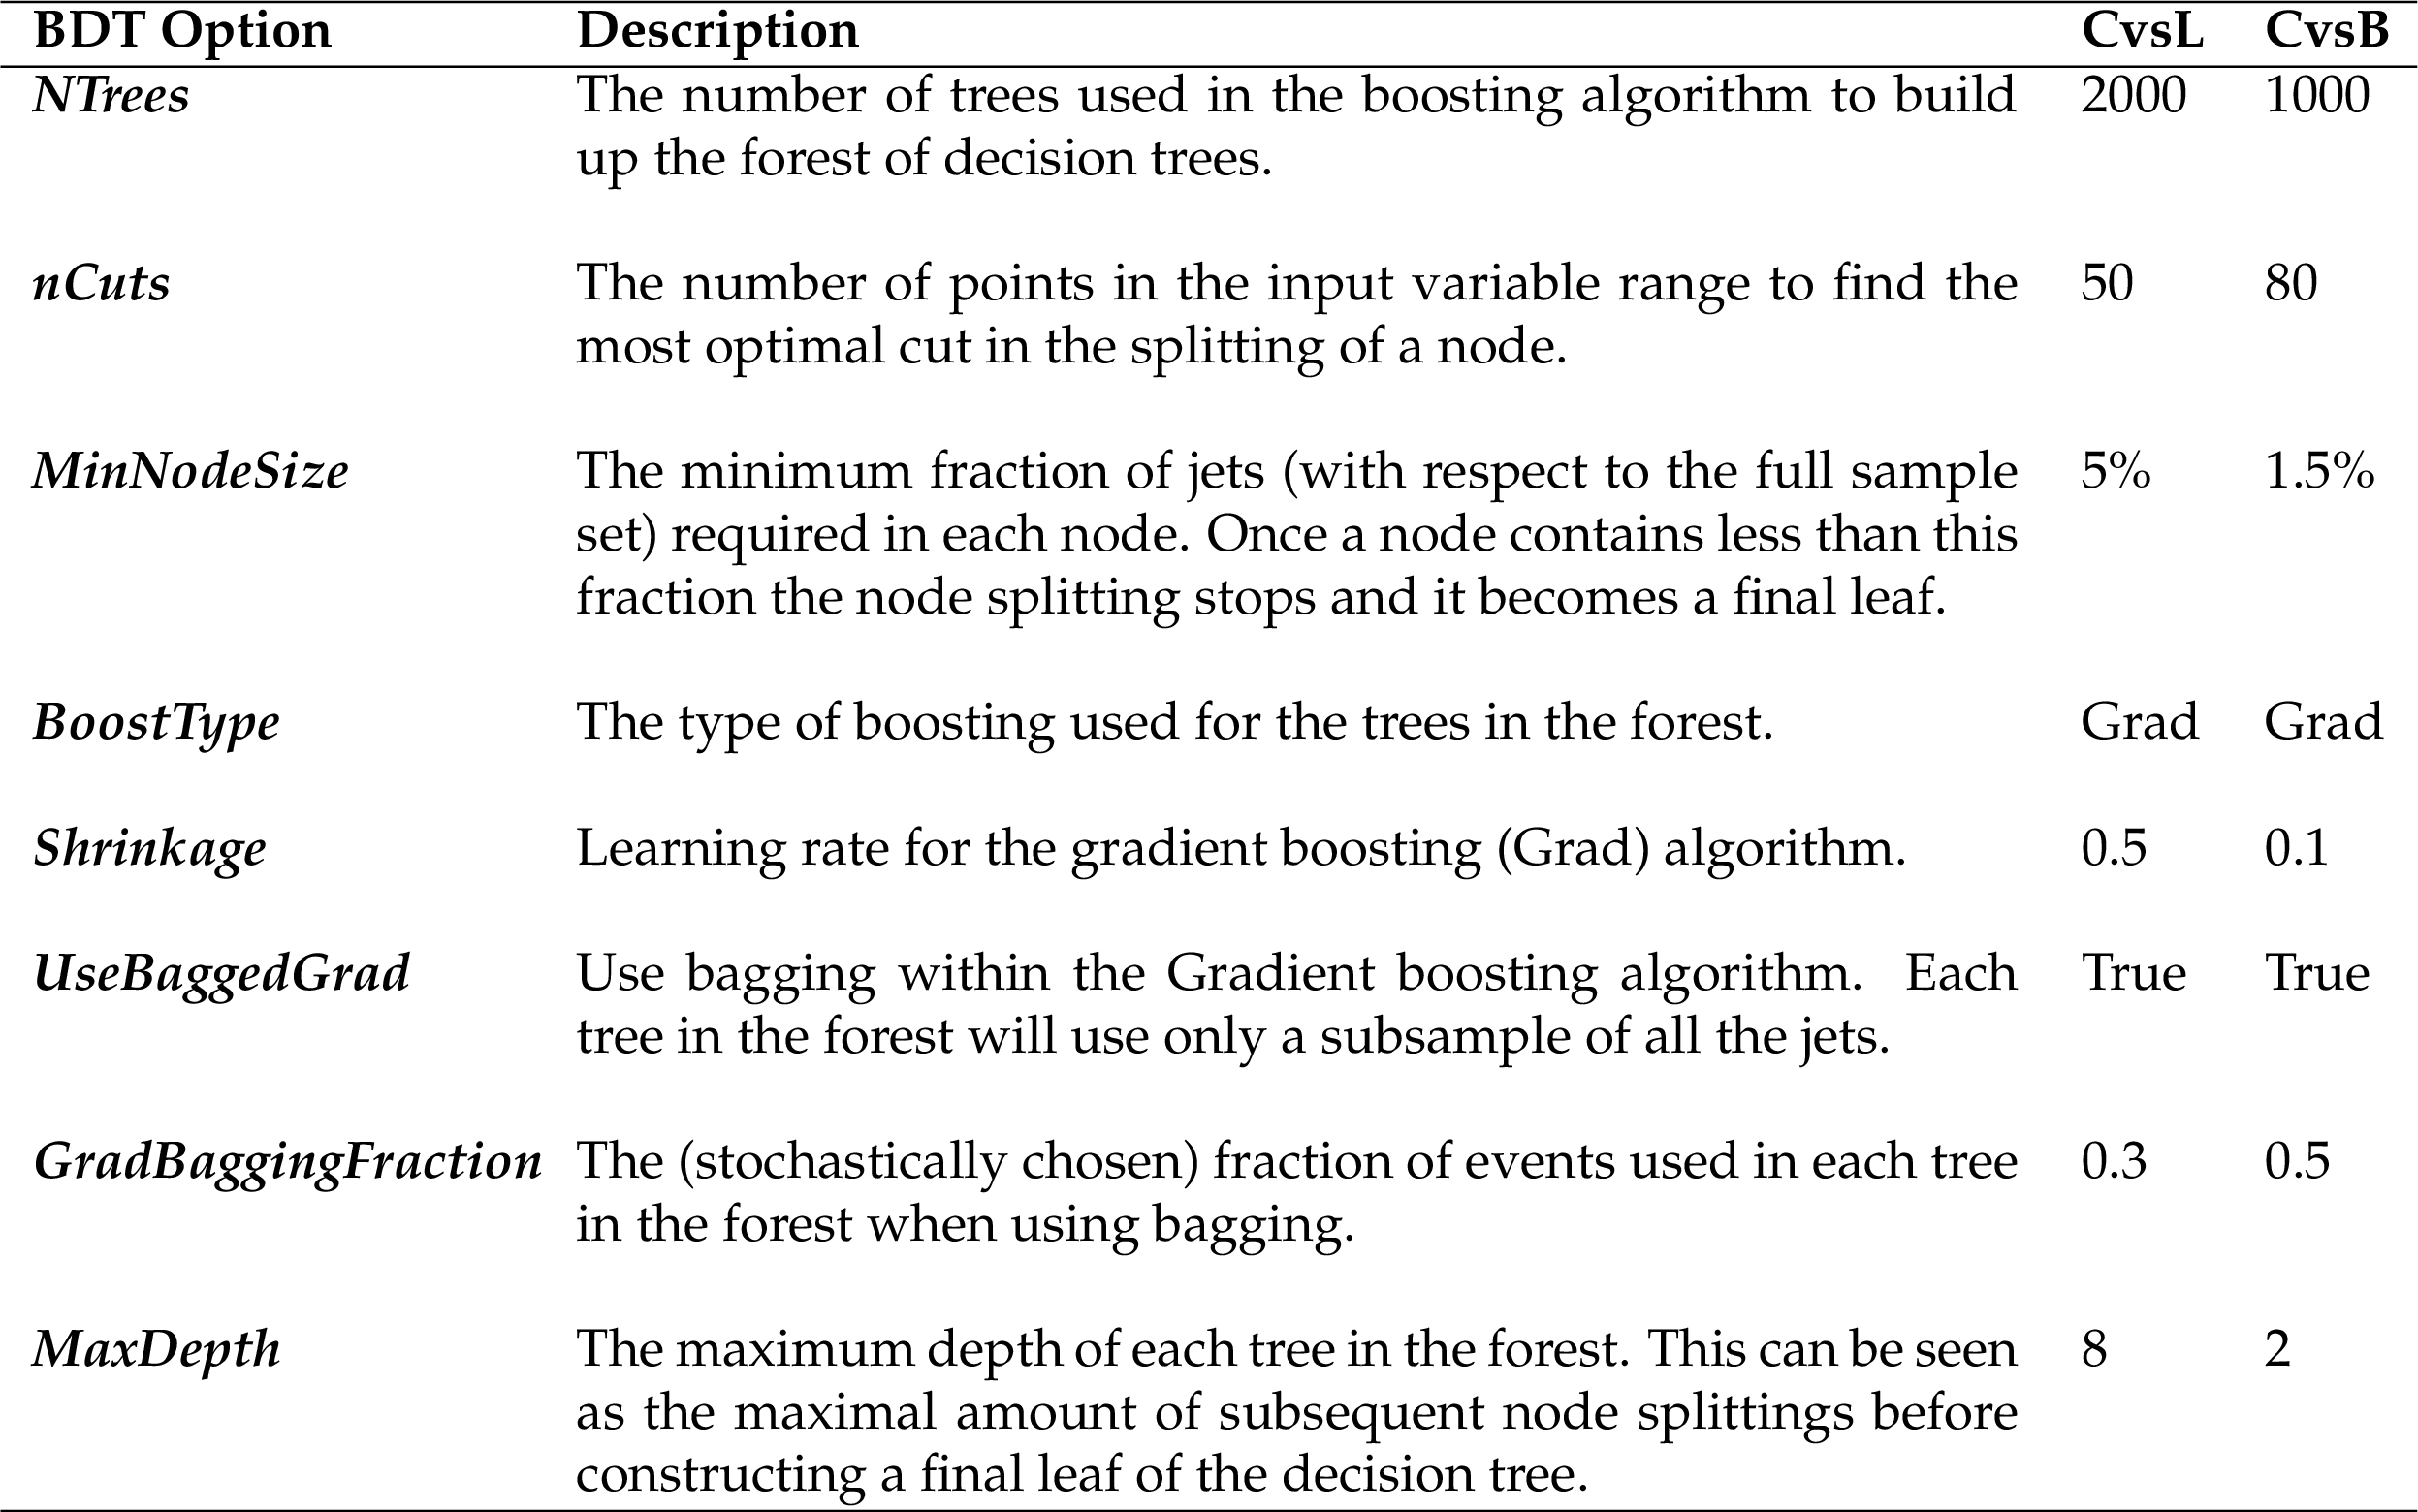
Table 1:
Explanation of the BDT options that are explicitly set during the c tagger training and their used values. To ease the reproducibility, the setting names used by TMVA are listed under the BDT Option column. |
png pdf |
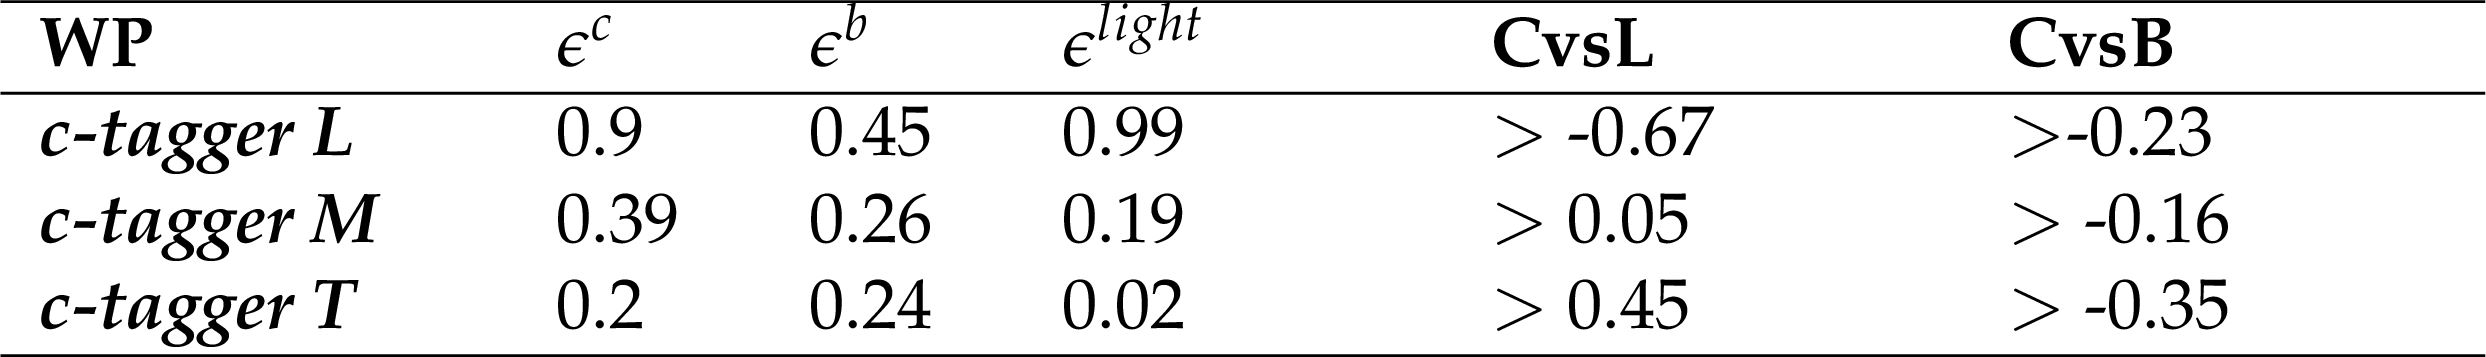
Table 2:
Definitions of the three working points with the corresponding cuts on the discriminator values and the global efficiencies, obtained from simulated ${\mathrm {t}\overline {\mathrm {t}}}$ samples, for each flavour. |
png pdf |
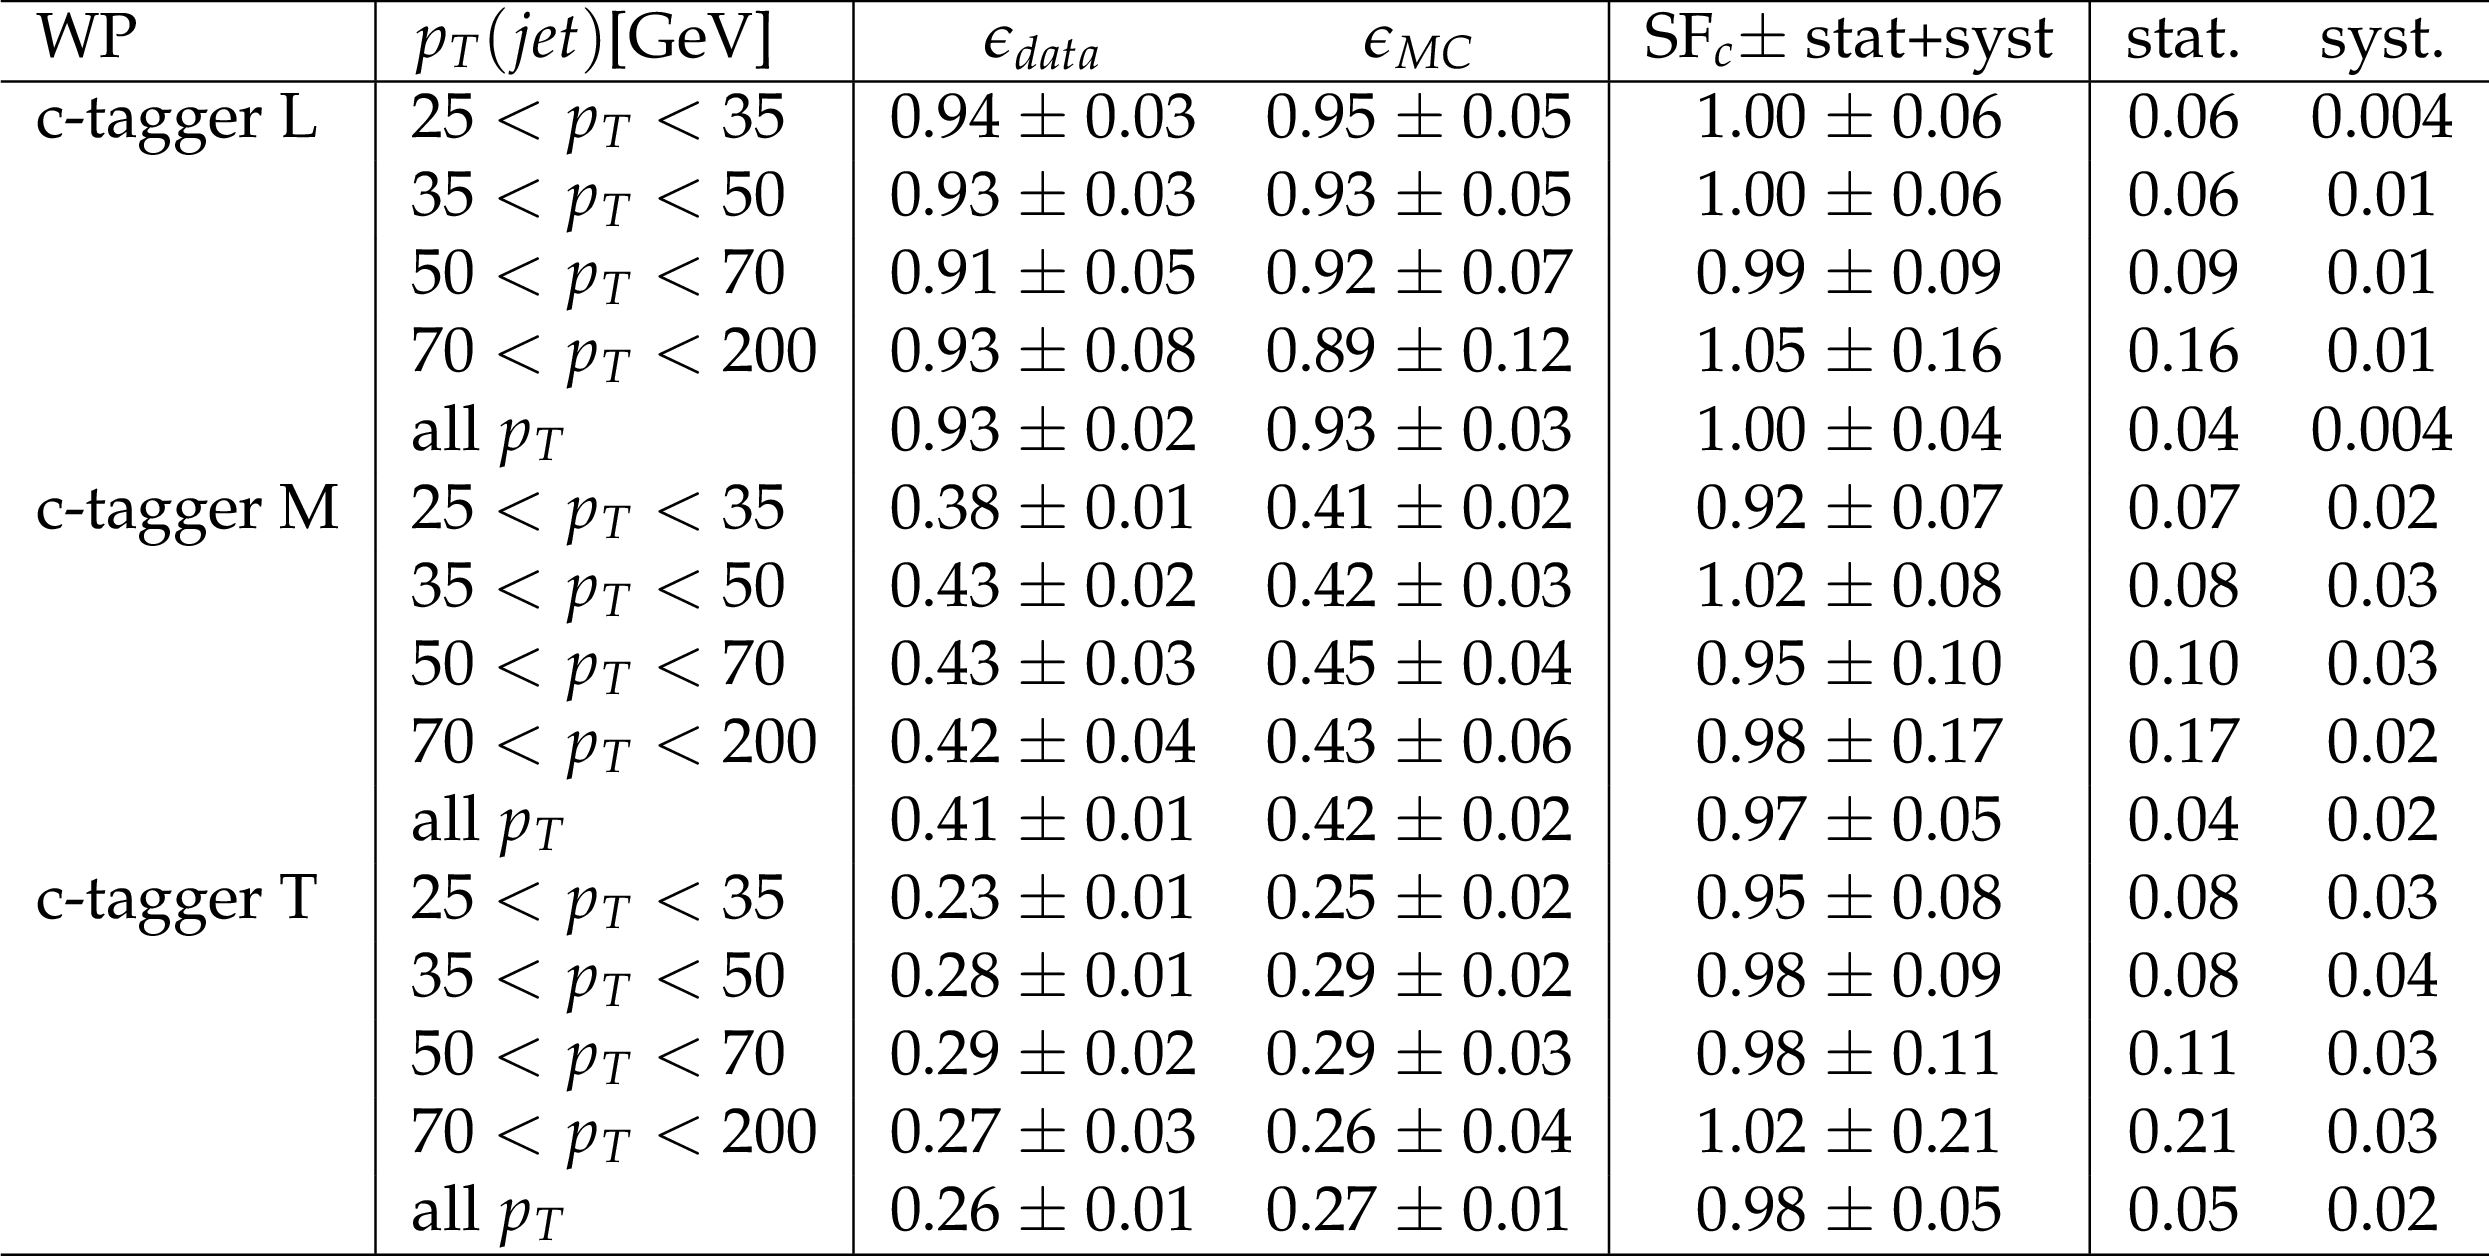
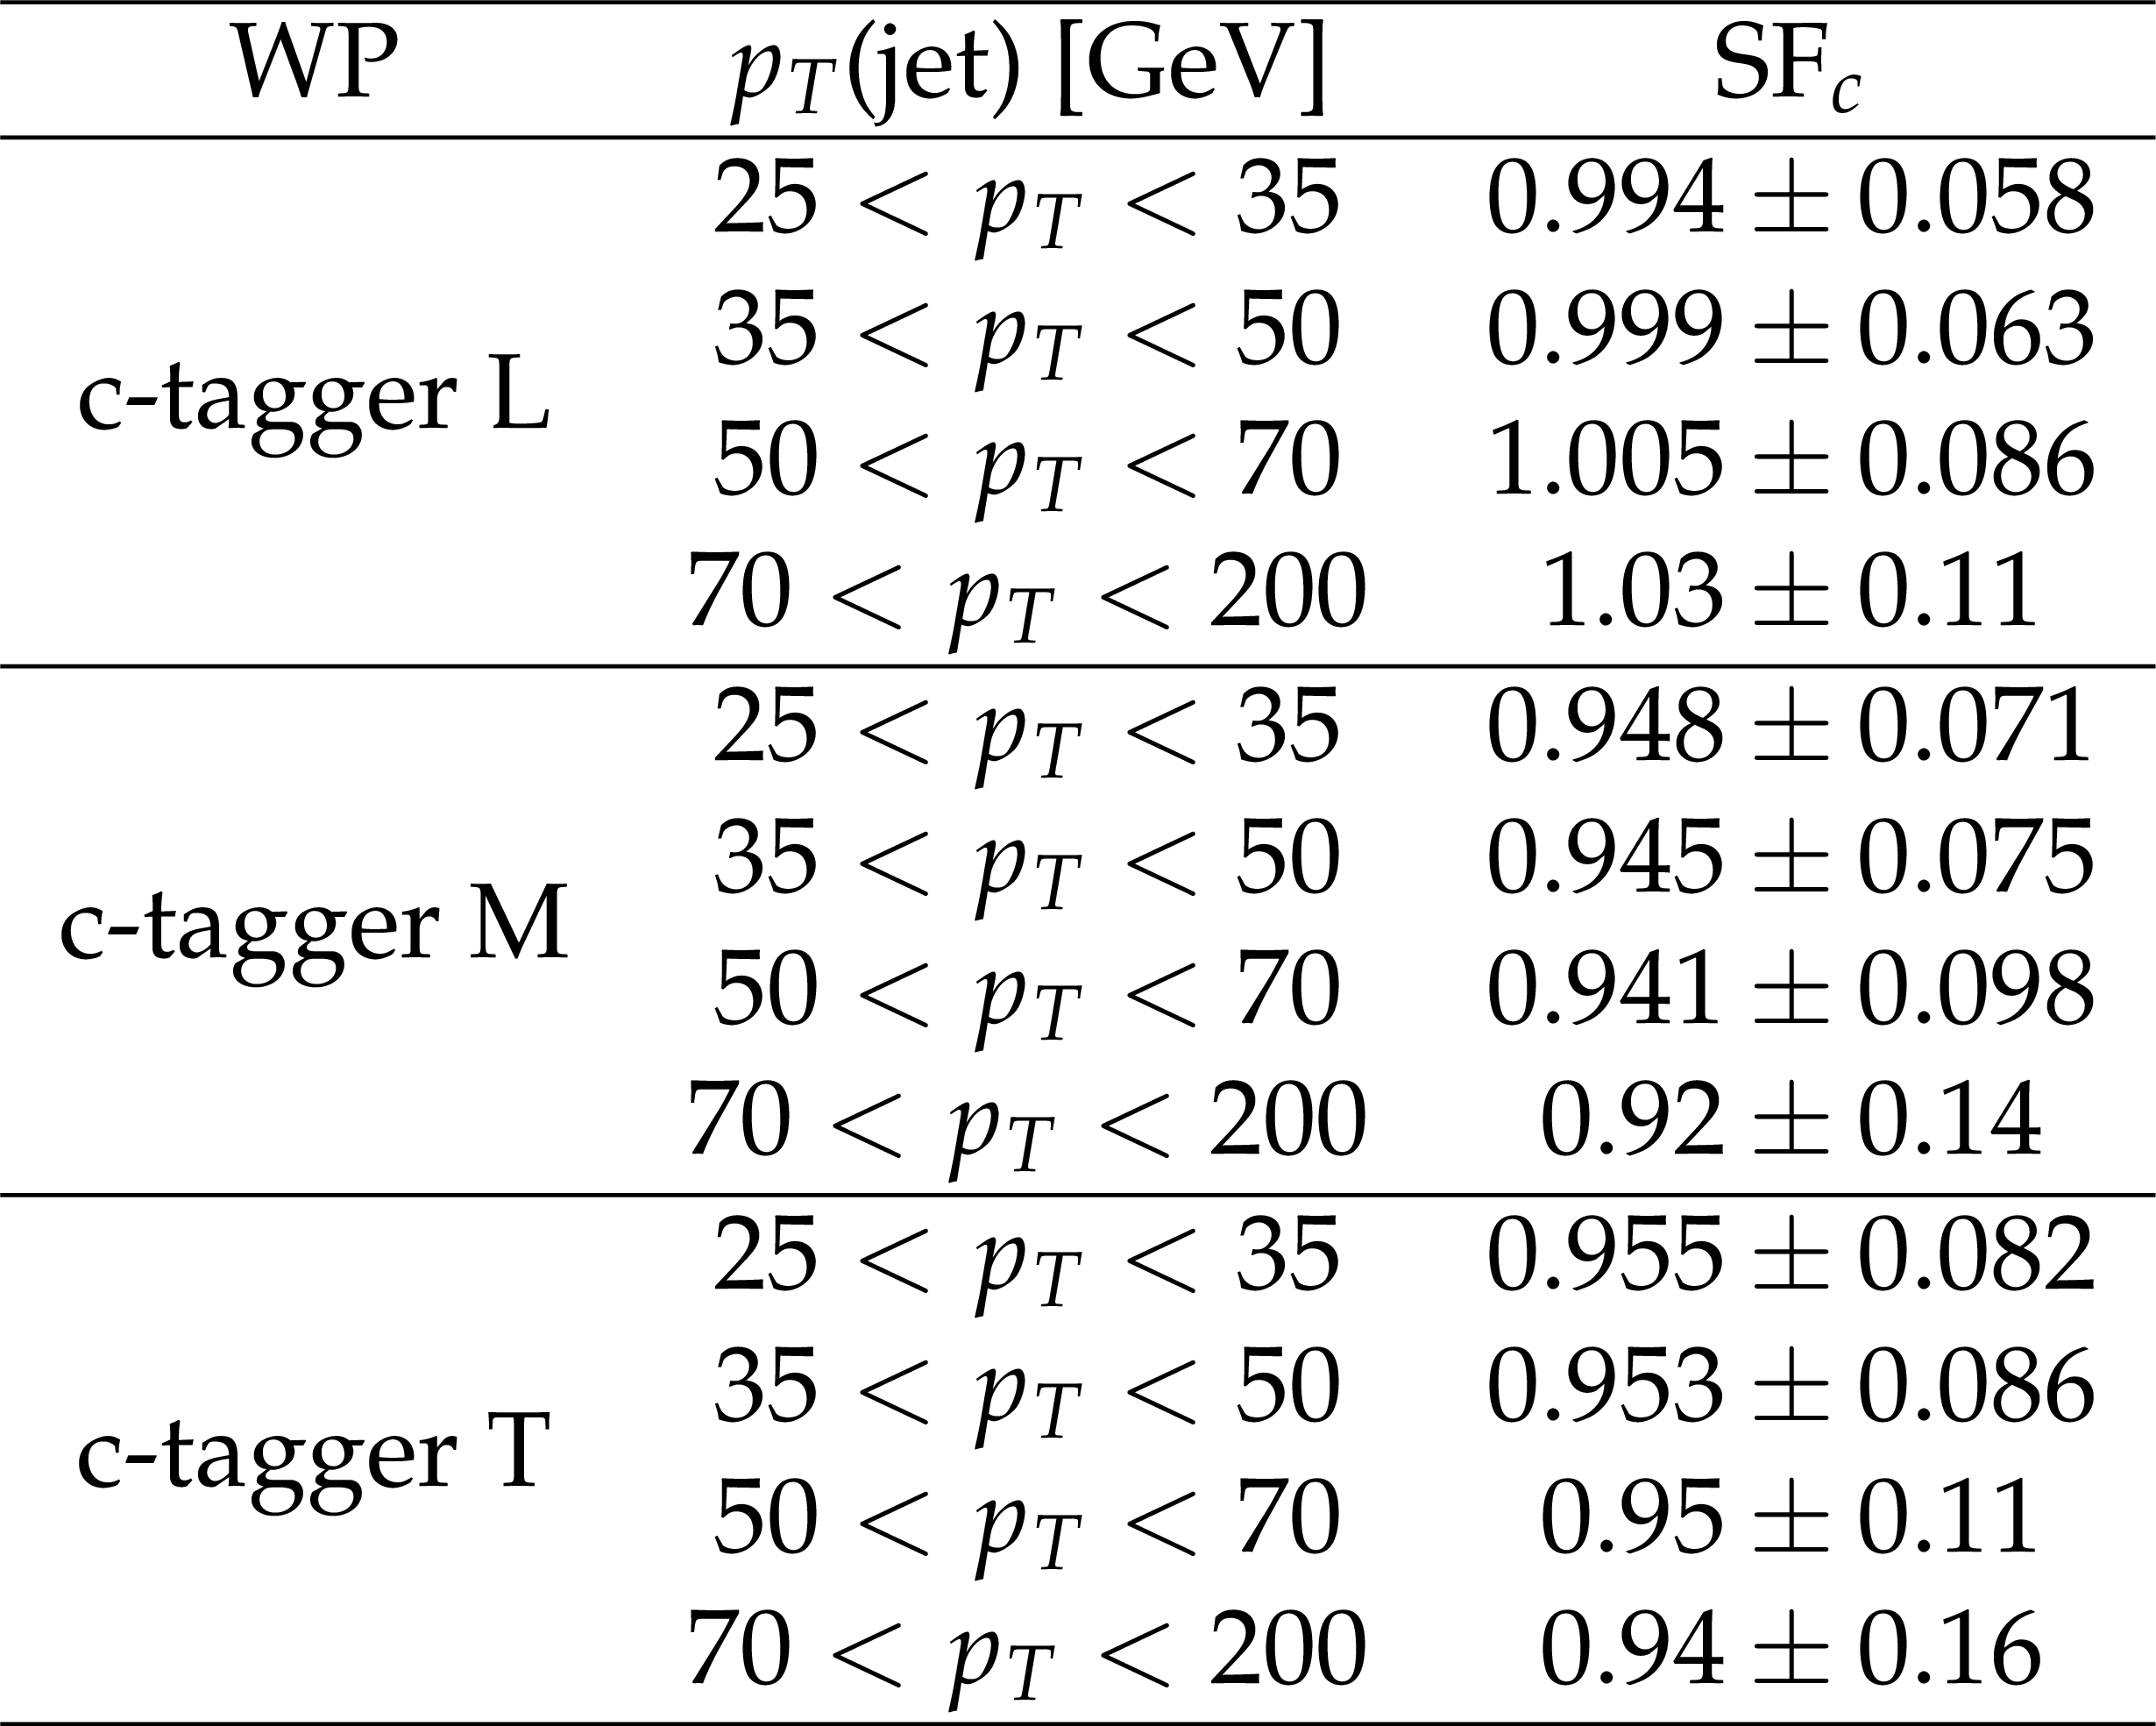
Table 3:
Efficiencies and $SF_{\mathrm{c}}$ for the c-tagger algorithm using W+c events. $SF_{\mathrm{c}}$ and the sum in quadrature of statistical and systematical uncertainties are shown in the third column. |
png pdf |
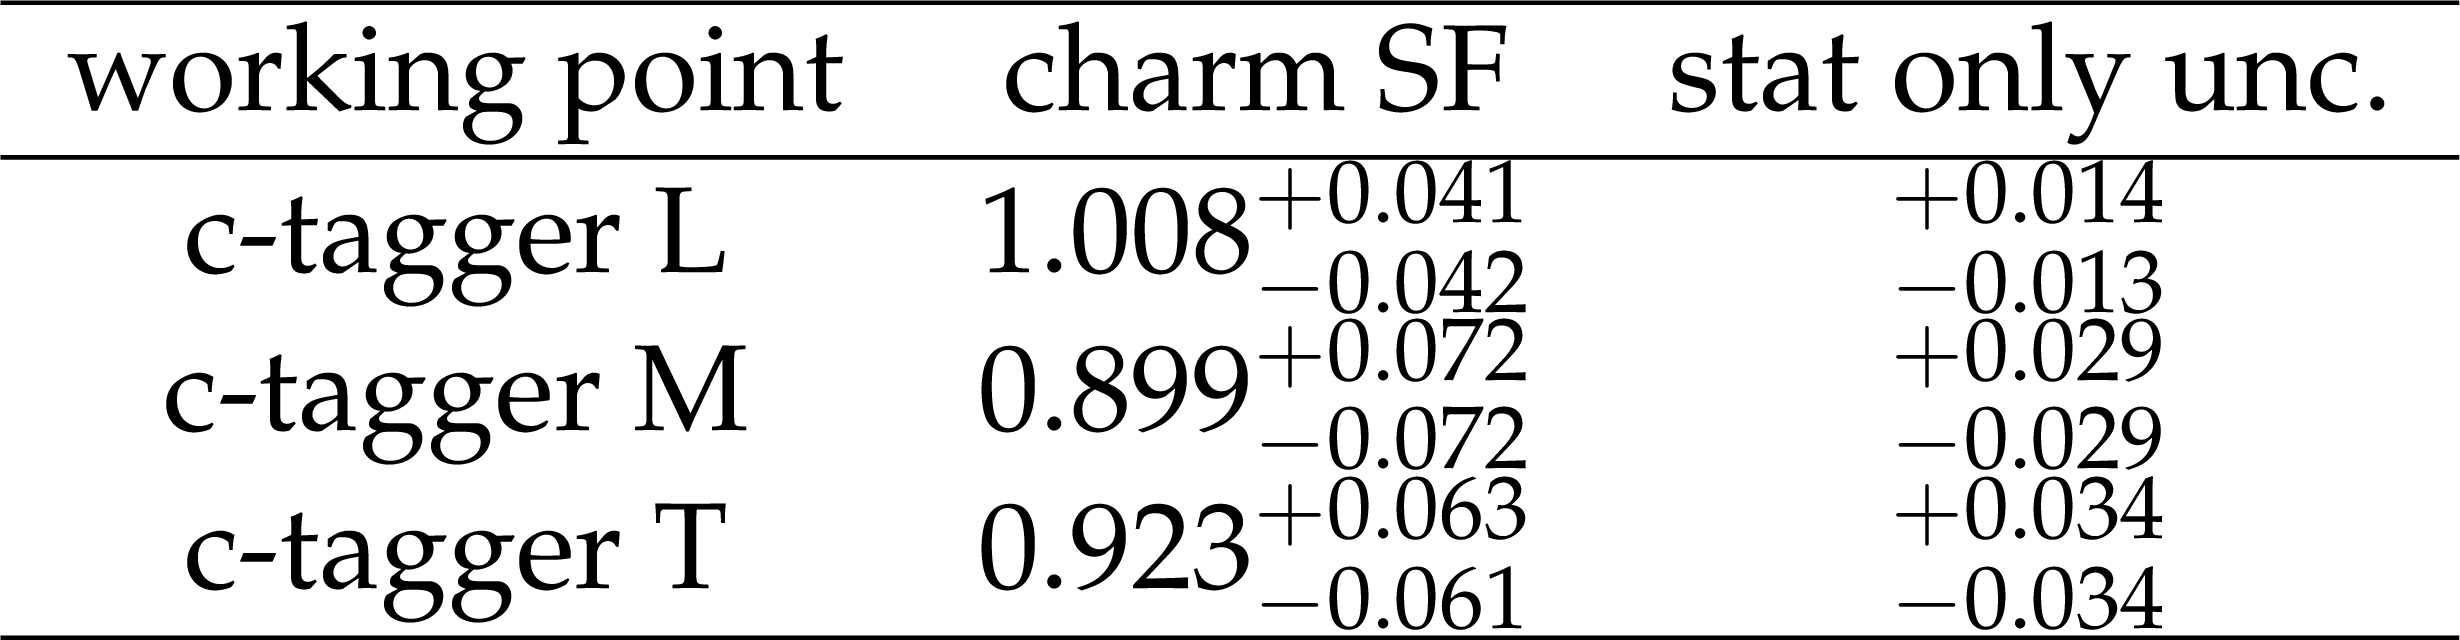
Table 4:
Measured scale factors for the efficiency of tagging charm jets in semi-leptonic $\mathrm{t\bar{t}}$ events. The quoted uncertainty includes both statistical and systematic uncertainty. The last column shows the statistical-only uncertainty. |
png pdf |
Table 5:
Combined $SF_{\mathrm{c}}$ values |
| Summary |
| A new tool for identifying charm jets is presented. The tagger has been developed using two boosted decision trees, trained and tested on simulated input datasets. The light-to-charm mistagging rate has been measured in multi-jet events. The performance of the tagger has been measured on W+c and semi-leptonic top quark pairs events, deriving scale factors for the charm identification. The precision achieved with the first method ranges between 6% and 21%, while the second provides a more precise evaluation of the scale factor, in the order of 5%, but without jet $p_{\mathrm{T}}$ dependence. The W+c jet population is strongly skewed towards low-$p_{\mathrm{T}}$ jets. The datasets for the efficiency calibrations have been extracted from proton-proton collisions collected by the CMS experiment in 2015. |
| References | ||||
| 1 | CMS Collaboration Collaboration | Identification of b quark jets at the CMS Experiment in the LHC Run 2 | Technical Report CMS-PAS-BTV-15-001, CERN, Geneva | |
| 2 | L. Breiman, J. Friedman, R. Olshen, and C. Stone | Classification and Regression Trees | Wadsworth and Brooks, Monterey, CA | |
| 3 | CMS Collaboration | The CMS experiment at the CERN LHC | JINST 3 (2008) S08004 | CMS-00-001 |
| 4 | P. Nason | A New method for combining NLO QCD with shower Monte Carlo algorithms | JHEP 11 (2004) 040 | hep-ph/0409146 |
| 5 | S. Frixione, P. Nason, and C. Oleari | Matching NLO QCD computations with Parton Shower simulations: the POWHEG method | JHEP 11 (2007) 070 | 0709.2092 |
| 6 | S. Alioli, P. Nason, C. Oleari, and E. Re | A general framework for implementing NLO calculations in shower Monte Carlo programs: the POWHEG BOX | JHEP 06 (2010) 043 | 1002.2581 |
| 7 | J. M. Campbell, R. K. Ellis, P. Nason, and E. Re | Top-pair production and decay at NLO matched with parton showers | JHEP 04 (2015) 114 | 1412.1828 |
| 8 | E. Re | Single-top Wt-channel production matched with parton showers using the POWHEG method | EPJC71 (2011) 1547 | 1009.2450 |
| 9 | J. Alwall et al. | The automated computation of tree-level and next-to-leading order differential cross sections, and their matching to parton shower simulations | JHEP 07 (2014) 079 | 1405.0301 |
| 10 | T. Sjostrand, S. Mrenna, and P. Z. Skands | A Brief Introduction to PYTHIA 8.1 | CPC 178 (2008) 852--867 | 0710.3820 |
| 11 | CMS Collaboration | Event generator tunes obtained from underlying event and multiparton scattering measurements | CMS-GEN-14-001 1512.00815 |
|
| 12 | CMS Collaboration Collaboration | Particle-Flow Event Reconstruction in CMS and Performance for Jets, Taus, and MET | Technical Report CMS-PAS-PFT-09-001, CERN, 2009. Geneva, Apr | |
| 13 | CMS Collaboration Collaboration | Commissioning of the Particle-Flow reconstruction in Minimum-Bias and Jet Events from pp Collisions at 7 TeV | Technical Report CMS-PAS-PFT-10-002, CERN, Geneva | |
| 14 | CMS Collaboration, F. Beaudette | The CMS Particle Flow Algorithm | in Proceedings, International Conference on Calorimetry for the High Energy Frontier (CHEF 2013), pp. 295--304 2013 | 1401.8155 |
| 15 | M. Cacciari, G. P. Salam, and G. Soyez | The anti-$ k_t $ jet clustering algorithm | JHEP 04 (2008) 063 | 0802.1189 |
| 16 | The CMS collaboration | Determination of jet energy calibration and transverse momentum resolution in CMS | Journal of Instrumentation 6 (2011), no. 11, P11002 | |
| 17 | CMS Collaboration | Measurement of $ B\bar{B} $ Angular Correlations based on Secondary Vertex Reconstruction at $ \sqrt{s}=7 $ TeV | JHEP 03 (2011) 136 | CMS-BPH-10-010 1102.3194 |
| 18 | R. Fruhwirth, W. Waltenberger, and P. Vanlaer | Adaptive Vertex Fitting | CMS-NOTE-2007-008 | |
| 19 | CMS Collaboration | Performance of b tagging at sqrt(s)=8 TeV in multijet, ttbar and boosted topology events | CMS-PAS-BTV-13-001 | CMS-PAS-BTV-13-001 |
| 20 | A. Hoecker et al. | TMVA: Toolkit for Multivariate Data Analysis | PoS ACAT (2007) 040 | physics/0703039 |
| 21 | R. Brun and F. Rademakers | ROOT: An object oriented data analysis framework | NIMA389 (1997) 81--86 | |
| 22 | CMS Collaboration | Measurement of associated W + charm production in pp collisions at $ \sqrt{s} $ = 7 TeV | JHEP 02 (2014) 013 | CMS-SMP-12-002 1310.1138 |
| 23 | CMS Collaboration Collaboration | Measurement of the inclusive and differential tt production cross sections in lepton + jets final states at 13 TeV | Technical Report CMS-PAS-TOP-16-008, CERN, Geneva | |
| 24 | L. Lyons, D. Gibaut, and P. Clifford | How to combine correlated estimates of a single physical quantity | NIMA 270 (1988) 110 | |
|
|
Compact Muon Solenoid LHC, CERN |
|

|

|

|

|

|