

Compact Muon Solenoid
LHC, CERN
| CMS-PAS-SUS-16-016 | ||
| An inclusive search for new phenomena in final states with one or more jets and missing transverse momentum at $ \sqrt{s} = $ 13 TeV with the ${\alpha_{\text{T}}} $ variable | ||
| CMS Collaboration | ||
| August 2016 | ||
| Abstract: A search for new-physics phenomena is performed in final states containing one or more jets and an imbalance in transverse momentum in pp collisions at a centre-of-mass energy of 13 TeV. The analysed data sample, recorded with the CMS detector in 2016 at the CERN Large Hadron Collider, corresponds to an integrated luminosity of 12.9 fb$^{-1}$. Several kinematic variables are employed to strongly suppress the dominant background, multijet production from quantum chromodynamics, as well as discriminate effectively between other standard model and new-physics processes. The search provides sensitivity to a broad range of new-physics models that yield a stable weakly interacting massive particle. The observed candidate events are found to agree with the expected contributions from standard model processes. The result is interpreted in the mass parameter space of simplified supersymmetric models that assume the gluino-mediated and direct production of pairs of third-generation squarks. The gluino mass, and bottom and top squark masses, are excluded up to 1775, 1025, and 875 GeV, respectively. | ||
| Links: CDS record (PDF) ; CADI line (restricted) ; | ||
| Figures & Tables | Summary | Additional Figures & Tables | References | CMS Publications |
|---|
|
Additional information on efficiencies needed for reinterpretation of these results are available here.
An implementation of the calculation of the alphaT variable in C++ is available at this link: code. |
| Figures | |

png pdf |
Figure 1:
(Top panel) Event yields observed in data (solid circles) and SM expectations with their associated uncertainties (black histogram with shaded band) from a CR-only fit as a function of ${n_{\text {b}}}$ and ${H_{\mathrm {T}}}$ for the monojet topology (${n_{\text {jet}}} = $ 1) in the signal region. (Bottom panel). The significance of deviations (pulls) observed in data with respect to the SM expectations from the CR-only (red circles) and full fit (blue circles). The pulls are indicative only and cannot be considered independently. |

png pdf |
Figure 2:
(Top panel) Event yields observed in data (solid circles) and SM expectations with their associated uncertainties (black histogram with shaded band) from a CR-only fit, integrated over ${H_{\mathrm {T}}^{\text {miss}}}$ , as a function of ${n_{\text {jet}}}$ , ${n_{\text {b}}}$ , and ${H_{\mathrm {T}}}$ for the asymmetric topology in the signal region. (Bottom panel). The significance of deviations (pulls) observed in data with respect to the SM expectations from the CR-only (red circles) and full fit (blue circles). The pulls are indicative only and cannot be considered independently. |
png pdf |
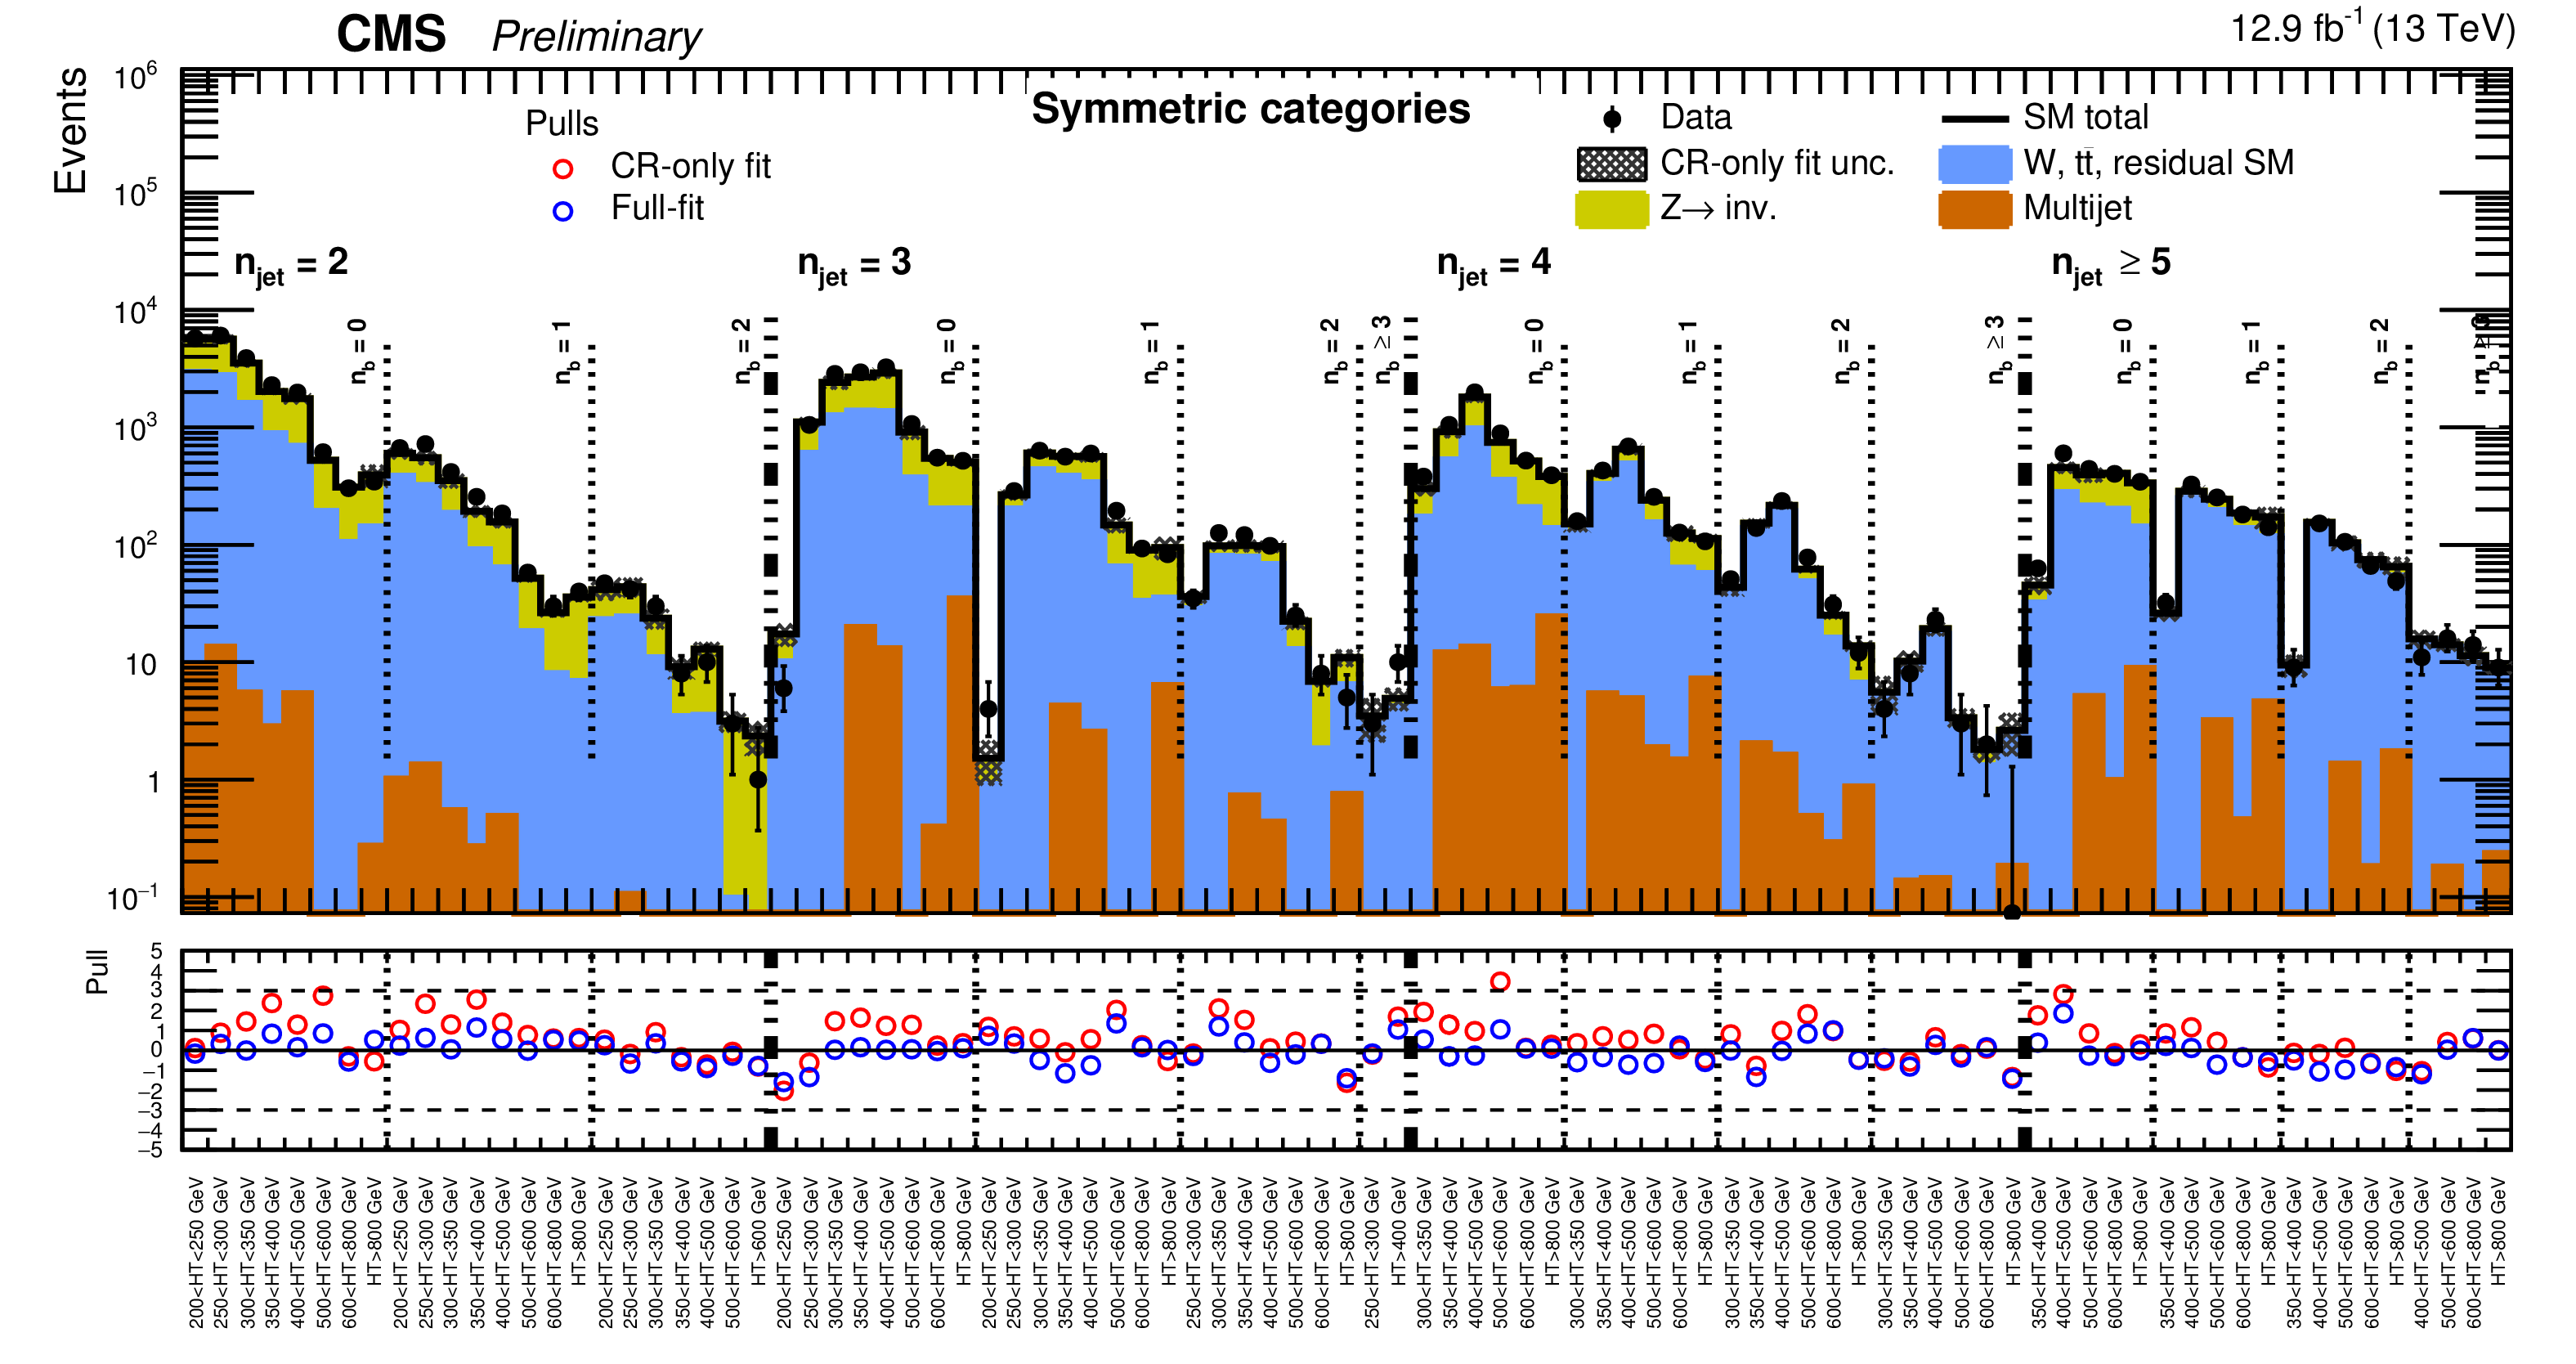
Figure 3:
(Top panel) Event yields observed in data (solid circles) and SM expectations with their associated uncertainties (black histogram with shaded band) from a CR-only fit, integrated over ${H_{\mathrm {T}}^{\text {miss}}}$ , as a function of ${n_{\text {jet}}}$ , ${n_{\text {b}}}$ , and ${H_{\mathrm {T}}}$ for the symmetric topology in the signal region. (Bottom panel). The significance of deviations (pulls) observed in data with respect to the SM expectations from the CR-only (red circles) and full fit (blue circles). The pulls are indicative only and cannot be considered independently. |
png pdf |
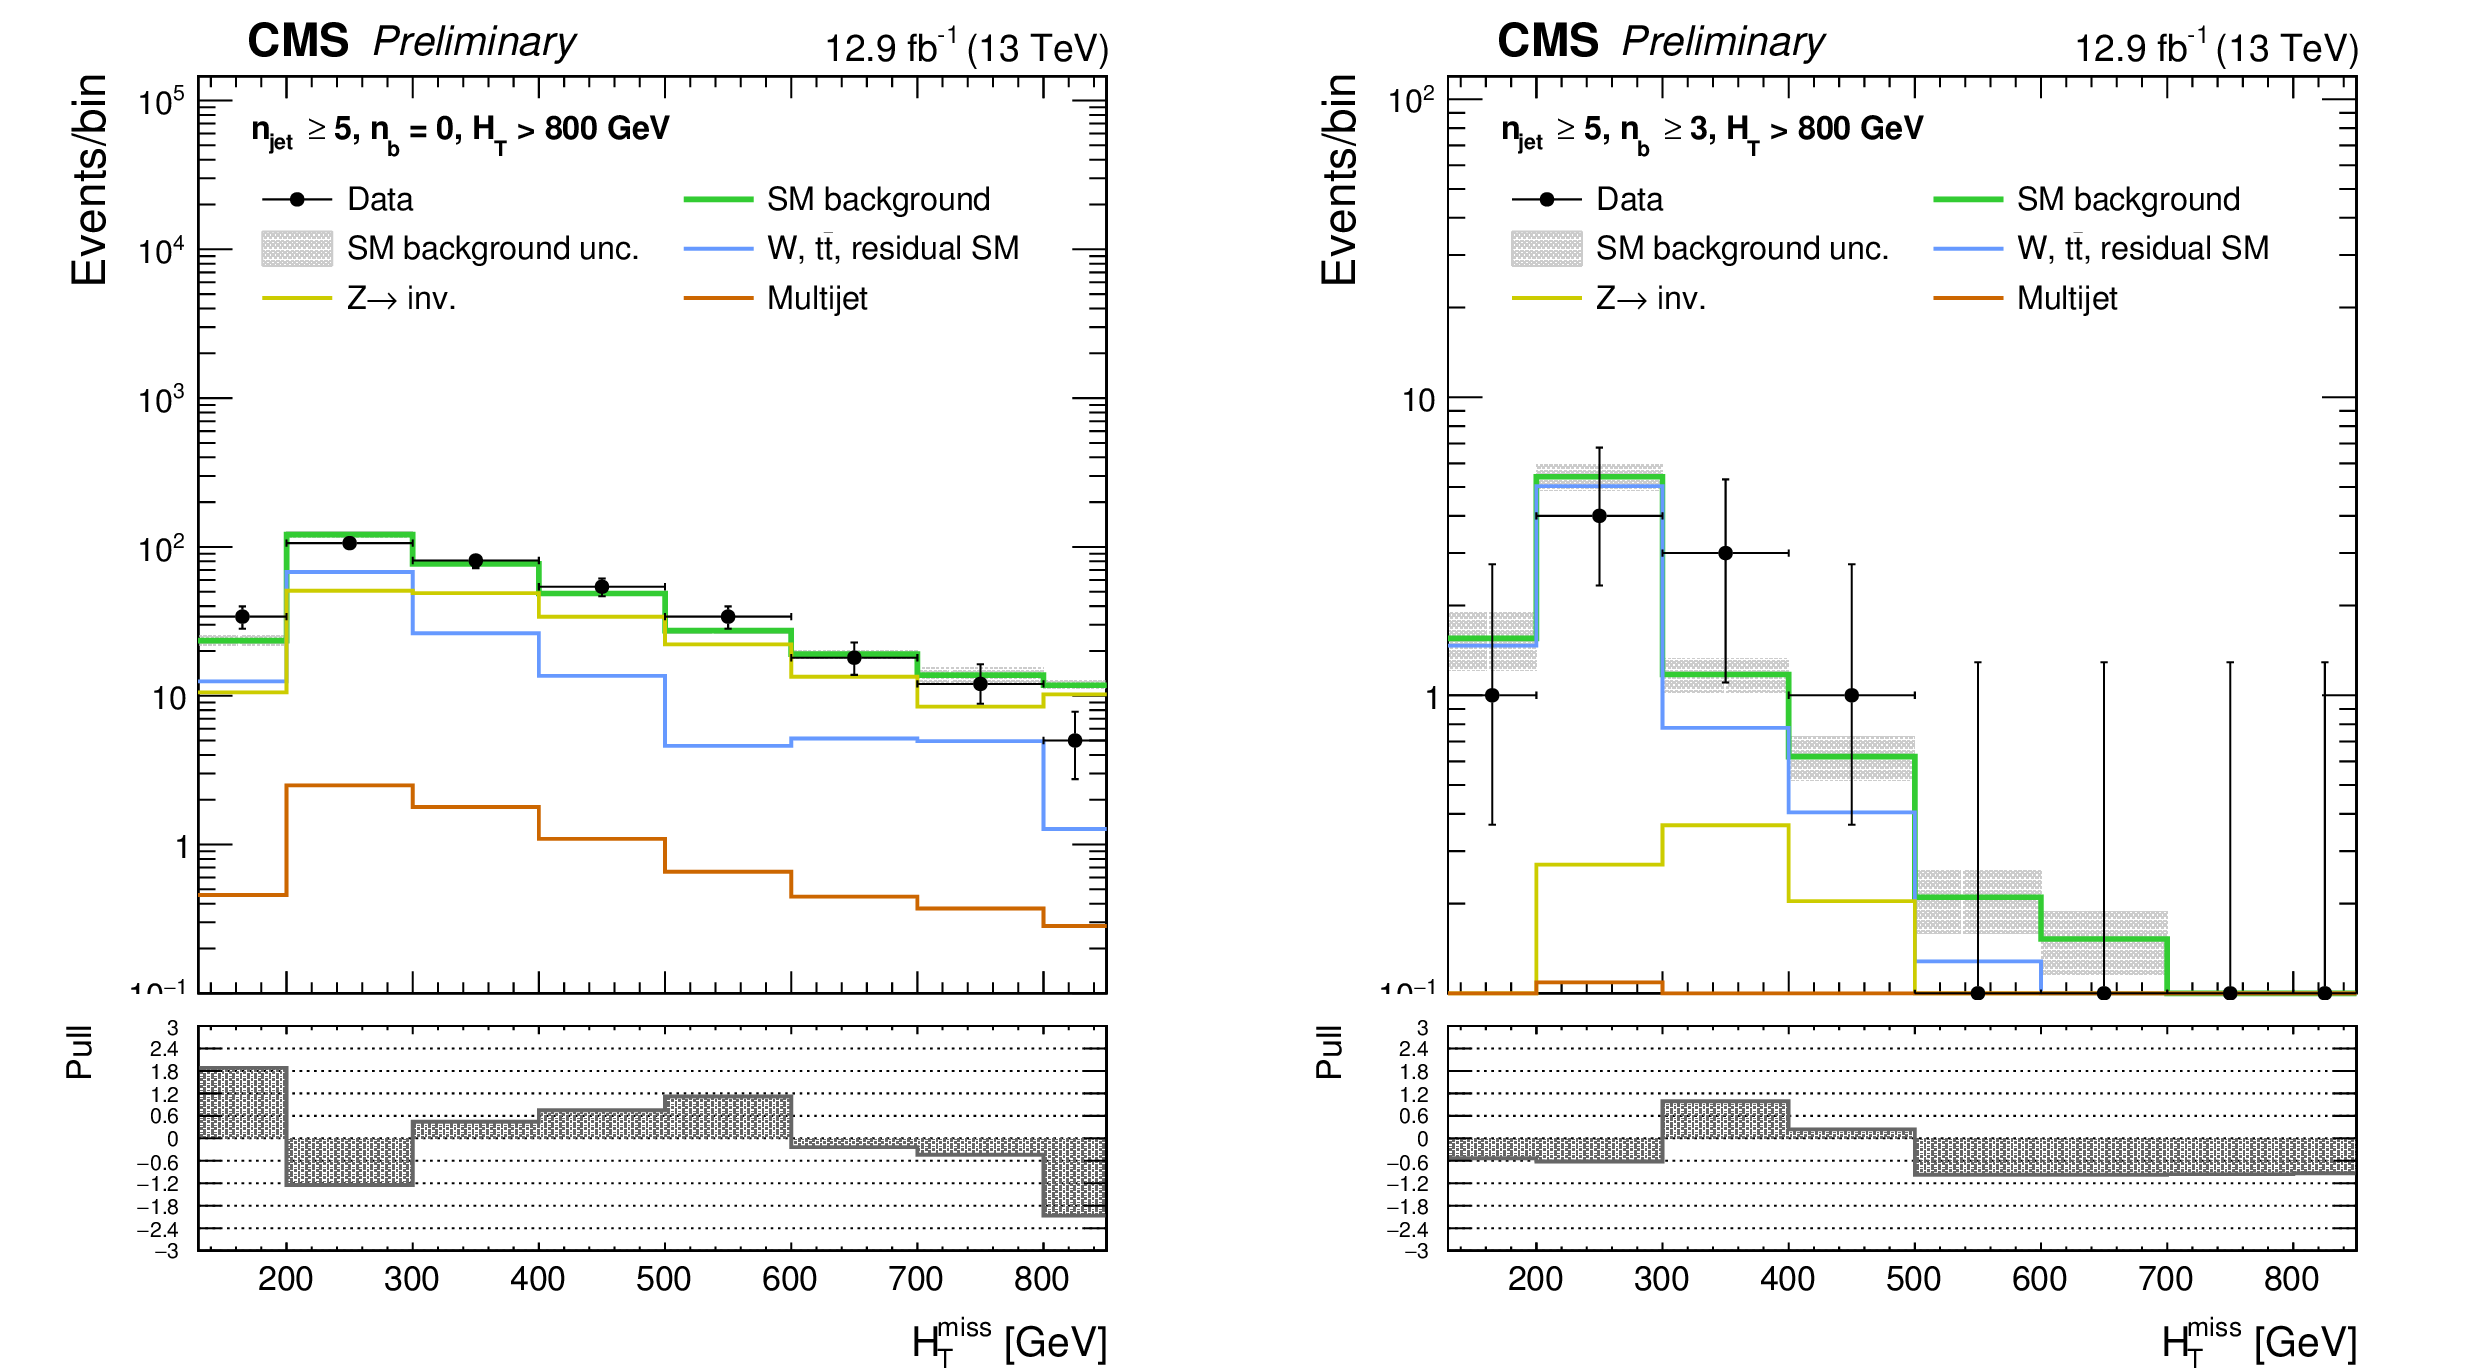
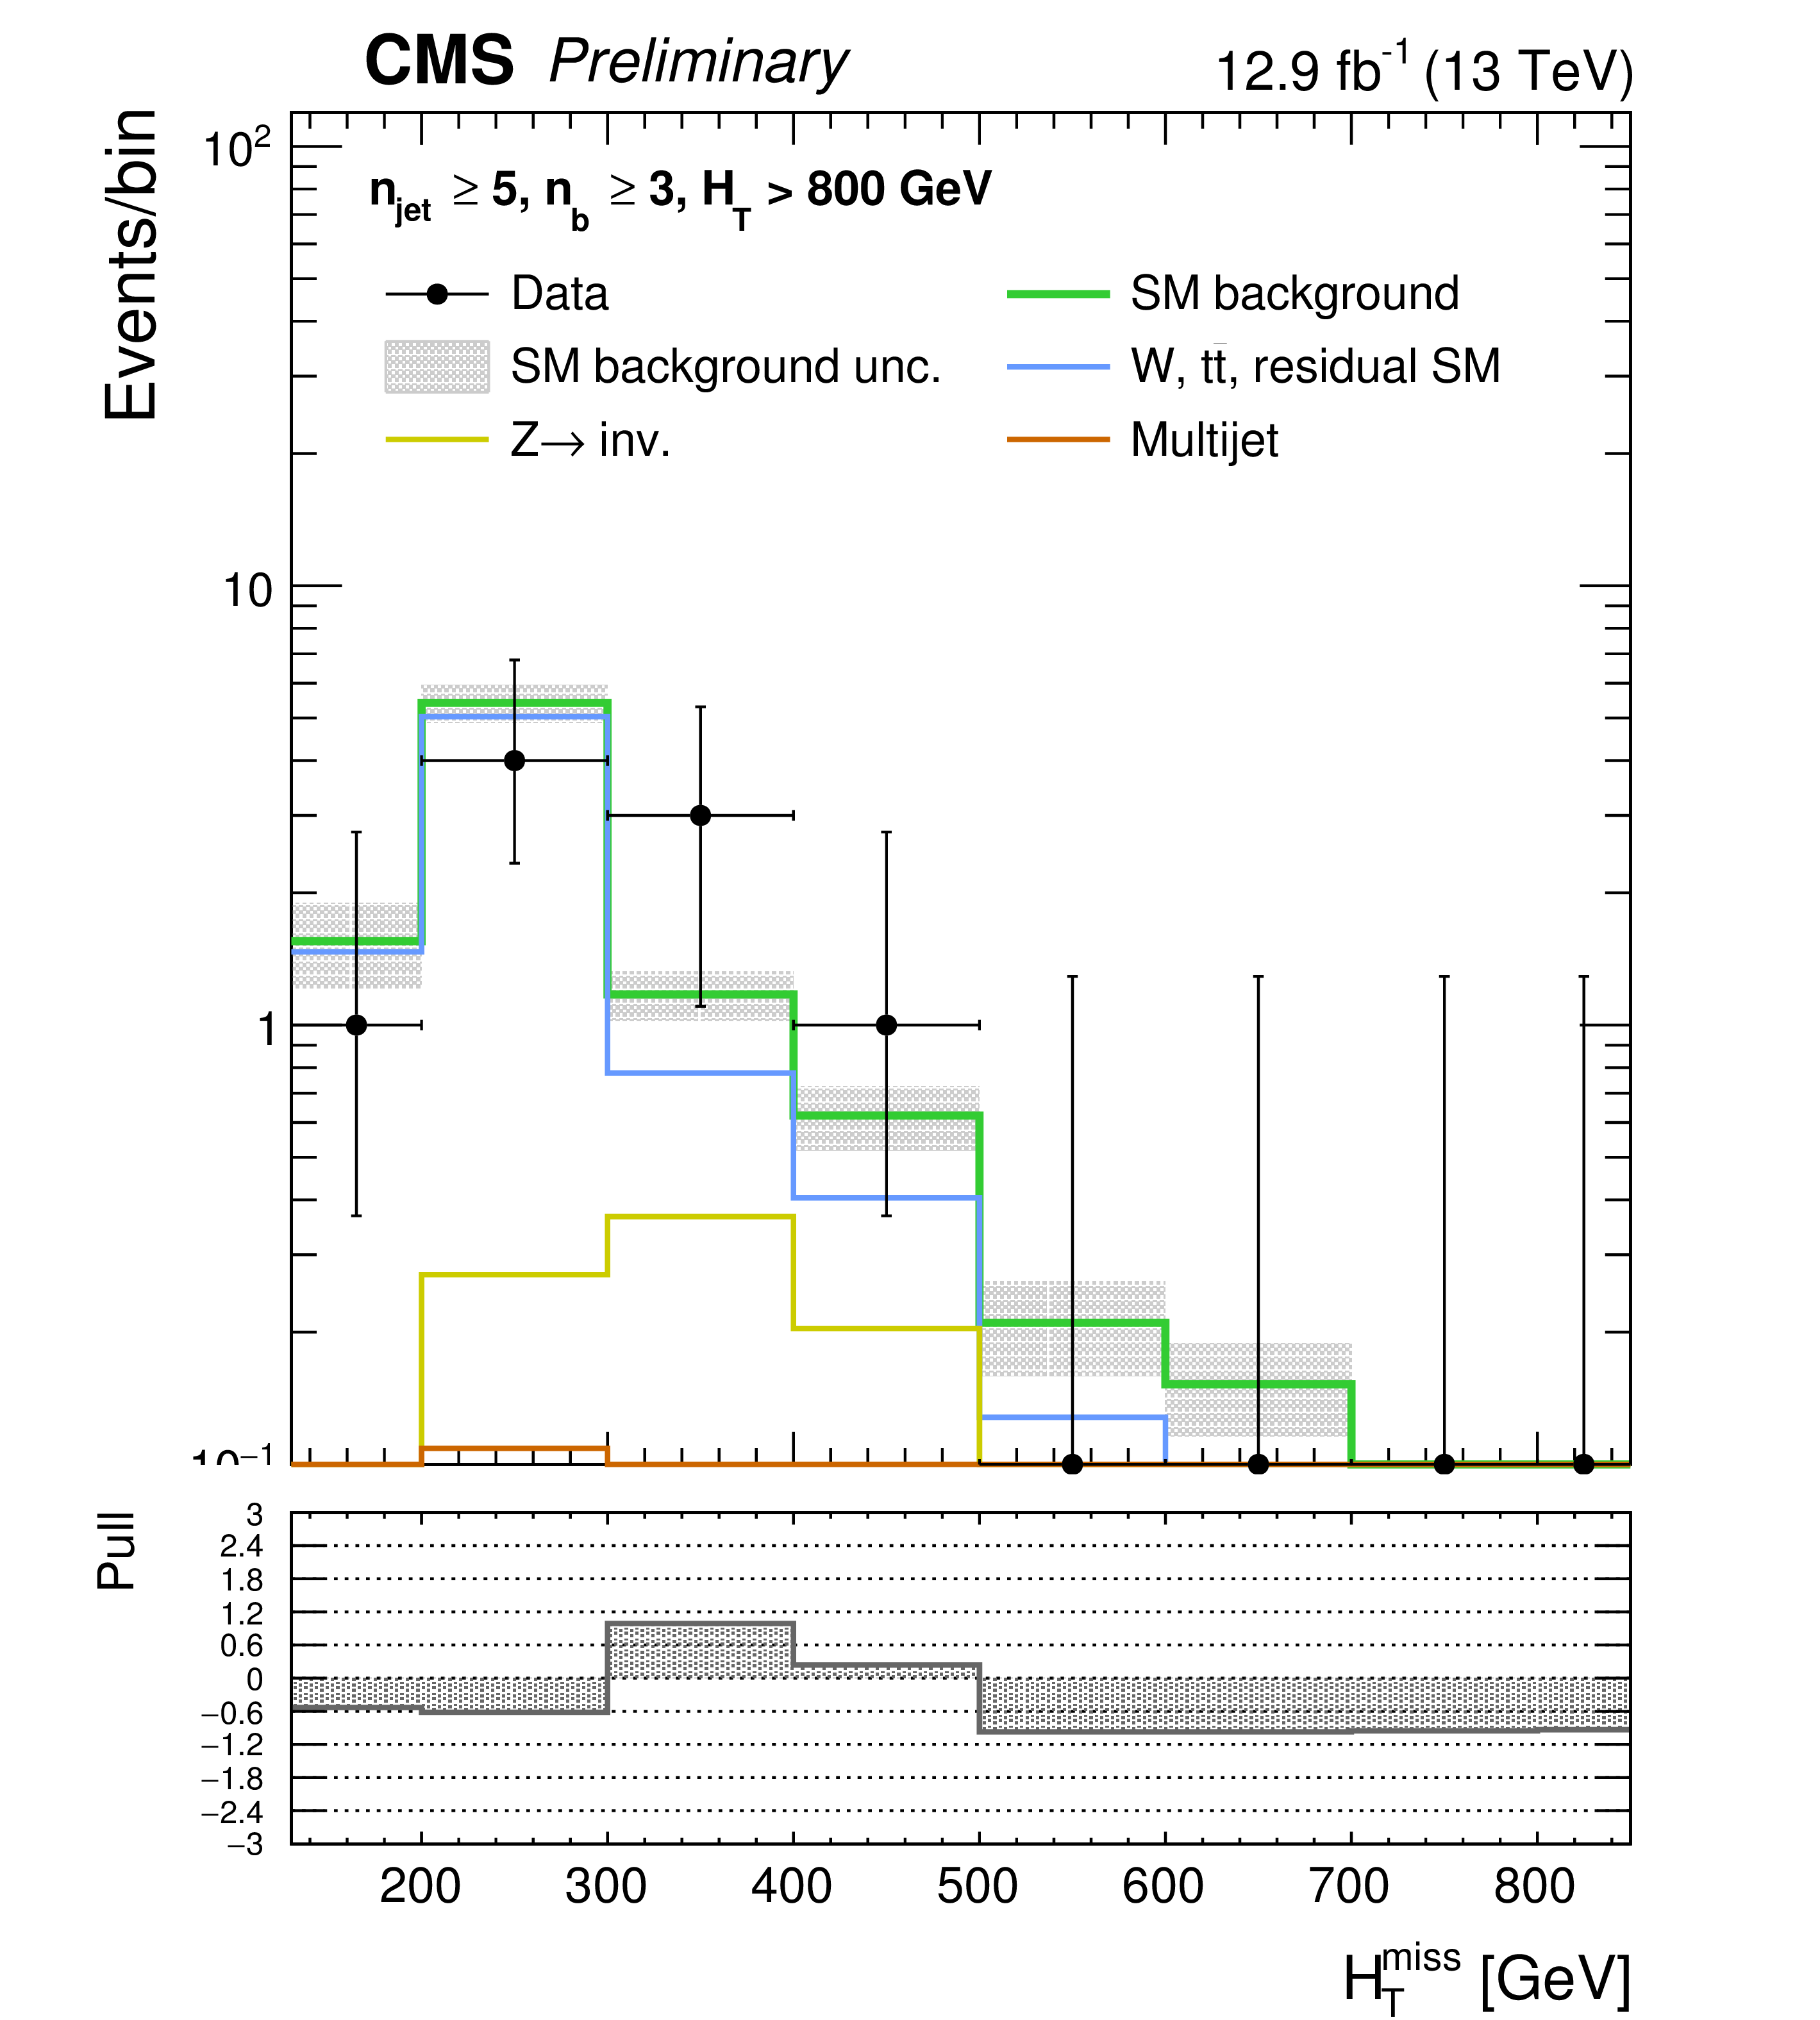
Figure 4:
Event yields observed in data (solid circles) and SM expectations from the CR-only fit with their associated uncertainties (green histogram with shaded band) as a function of ${H_{\mathrm {T}}^{\text {miss}}}$ for events in the signal region that satisfy ${n_{\text {jet}}} \geq$ 5, $ {H_{\mathrm {T}}} >$ 800 GeV , and (Left) $ {n_{\text {b}}} =$ 0 or (Right) $ {n_{\text {b}}} \geq $ 3. The final bin is the overflow bin. The bottom panels indicate the significance of the deviations (pulls) observed in data with respect to the SM expectations, expressed in terms of the total uncertainty in the SM expectations. The pulls are indicative only and cannot be considered independently. |

png pdf |
Figure 4-a:
Event yields observed in data (solid circles) and SM expectations from the CR-only fit with their associated uncertainties (green histogram with shaded band) as a function of ${H_{\mathrm {T}}^{\text {miss}}}$ for events in the signal region that satisfy ${n_{\text {jet}}} \geq$ 5, $ {H_{\mathrm {T}}} >$ 800 GeV , and $ {n_{\text {b}}} =$ 0. The final bin is the overflow bin. The bottom panels indicate the significance of the deviations (pulls) observed in data with respect to the SM expectations, expressed in terms of the total uncertainty in the SM expectations. The pulls are indicative only and cannot be considered independently. |
png pdf |
Figure 4-b:
Event yields observed in data (solid circles) and SM expectations from the CR-only fit with their associated uncertainties (green histogram with shaded band) as a function of ${H_{\mathrm {T}}^{\text {miss}}}$ for events in the signal region that satisfy ${n_{\text {jet}}} \geq$ 5, $ {H_{\mathrm {T}}} >$ 800 GeV , and $ {n_{\text {b}}} \geq $ 3. The final bin is the overflow bin. The bottom panels indicate the significance of the deviations (pulls) observed in data with respect to the SM expectations, expressed in terms of the total uncertainty in the SM expectations. The pulls are indicative only and cannot be considered independently. |
png pdf |
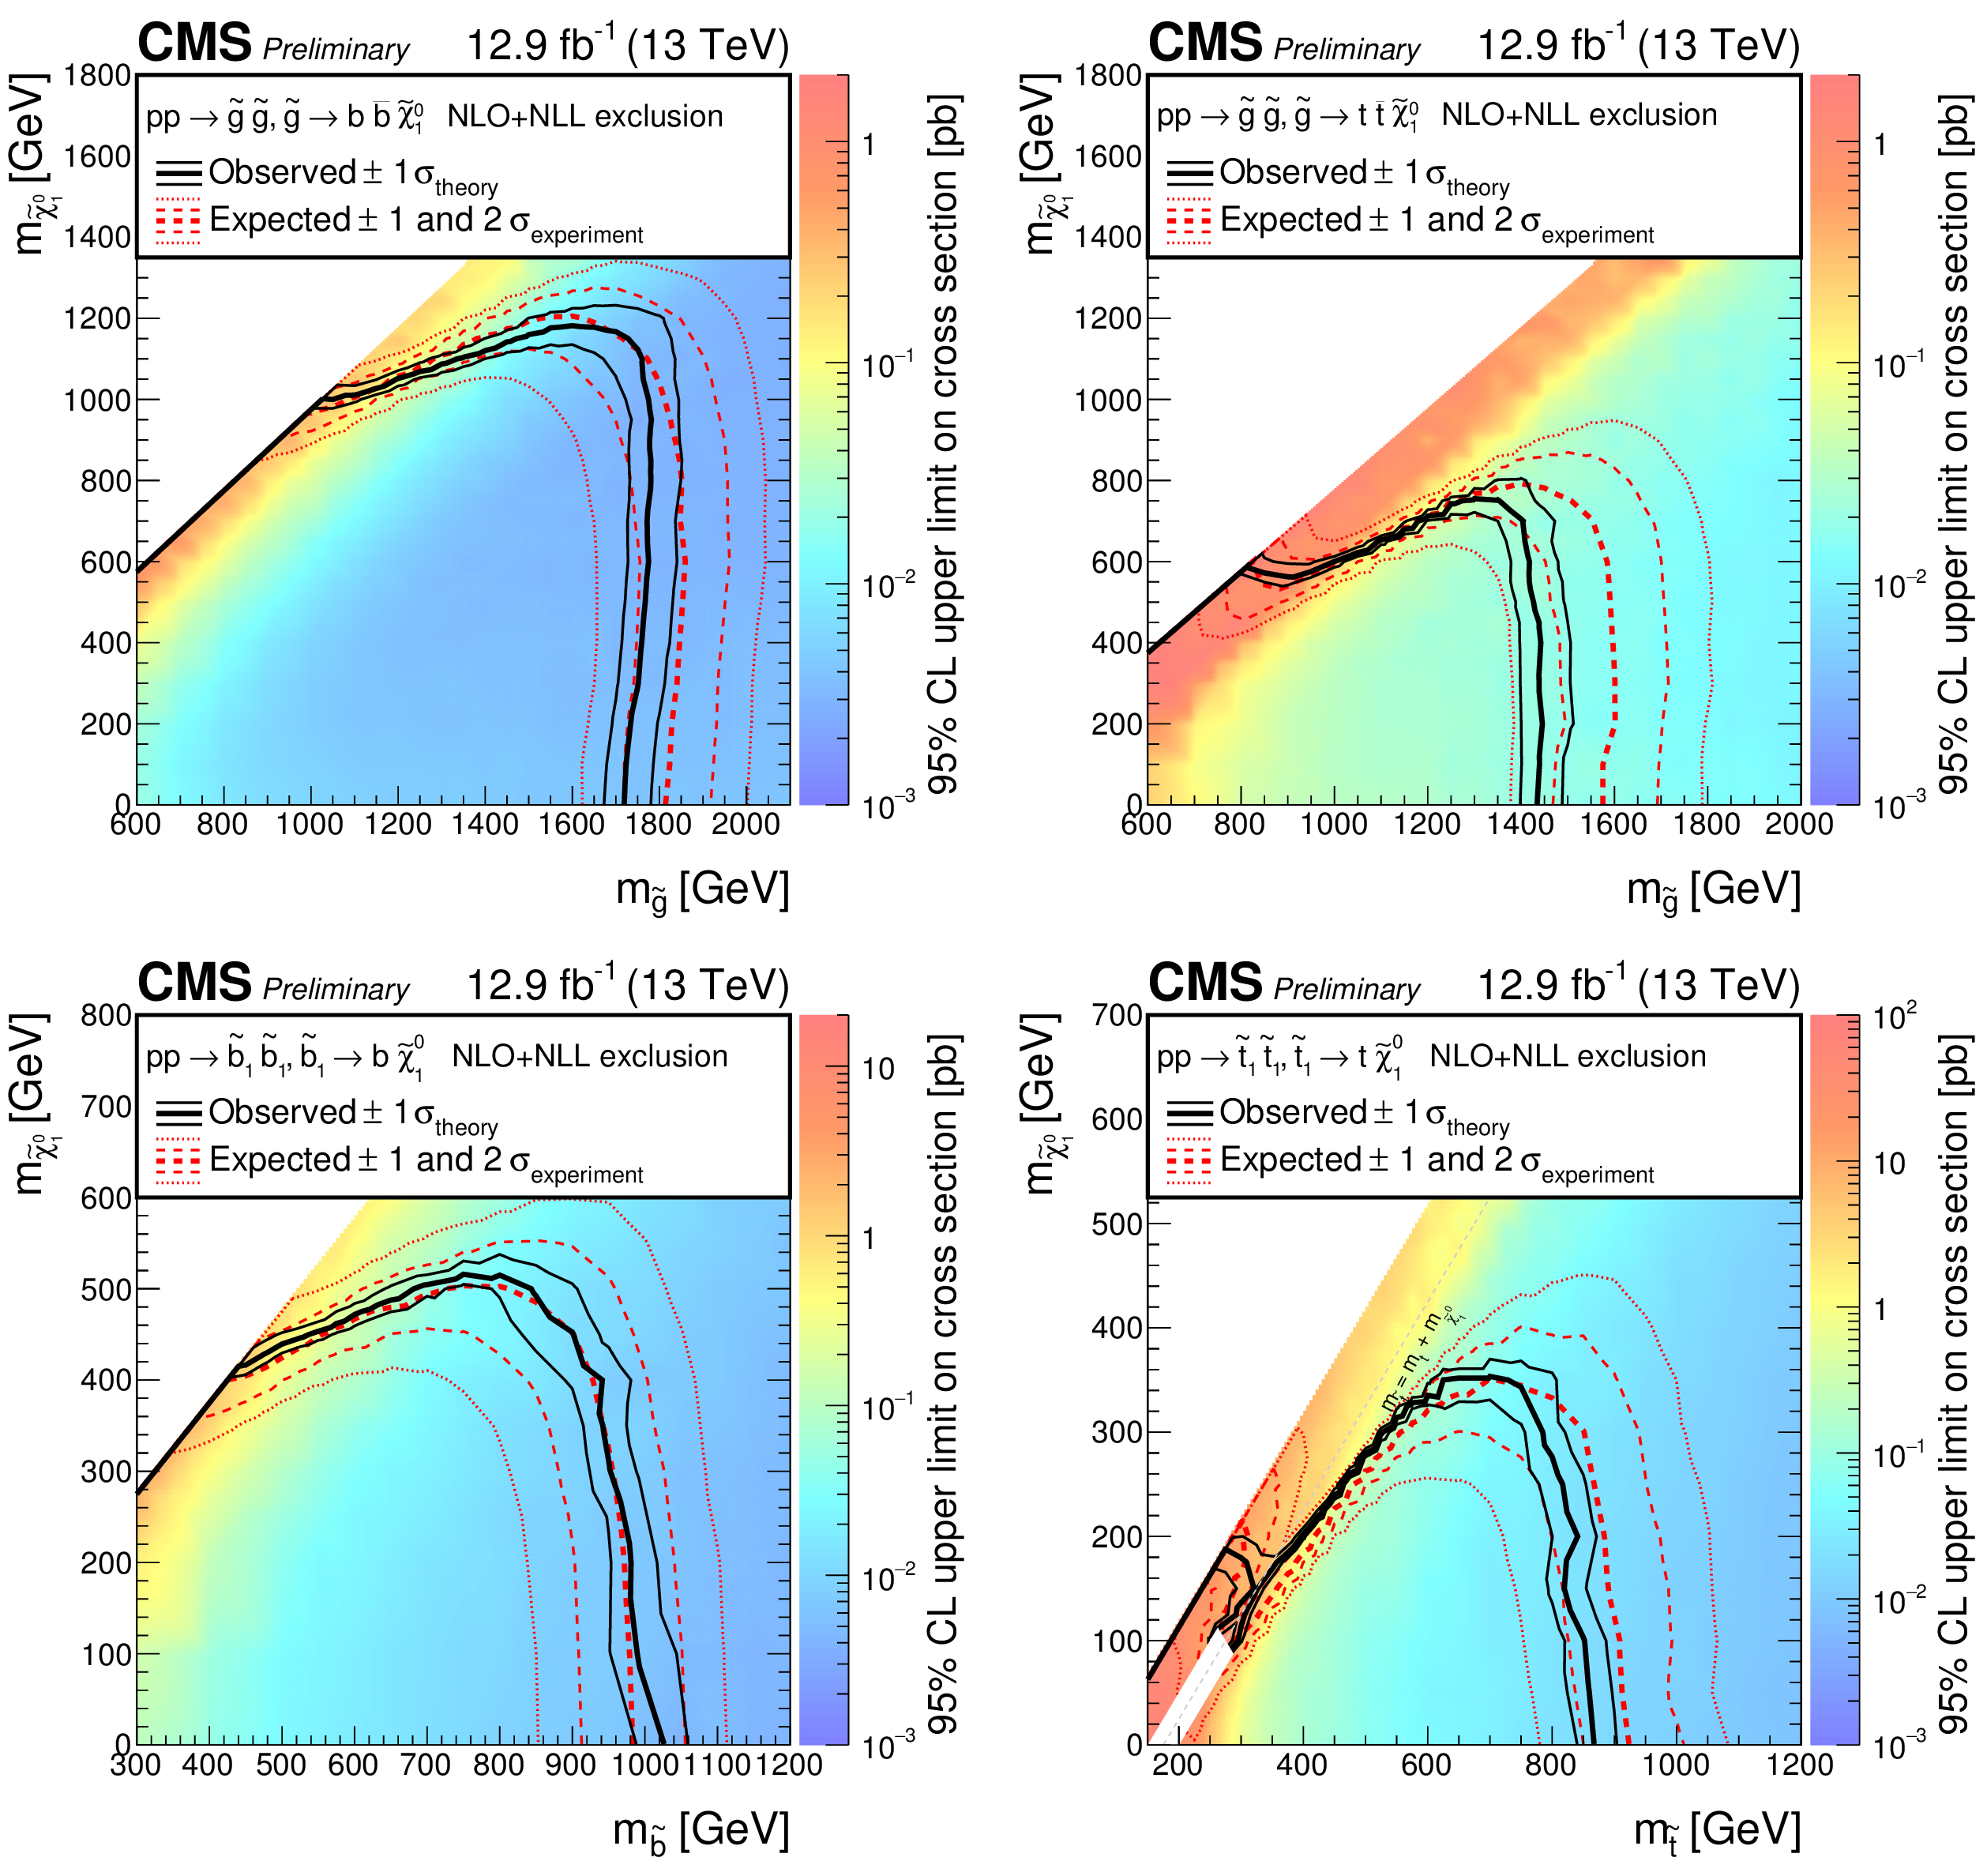
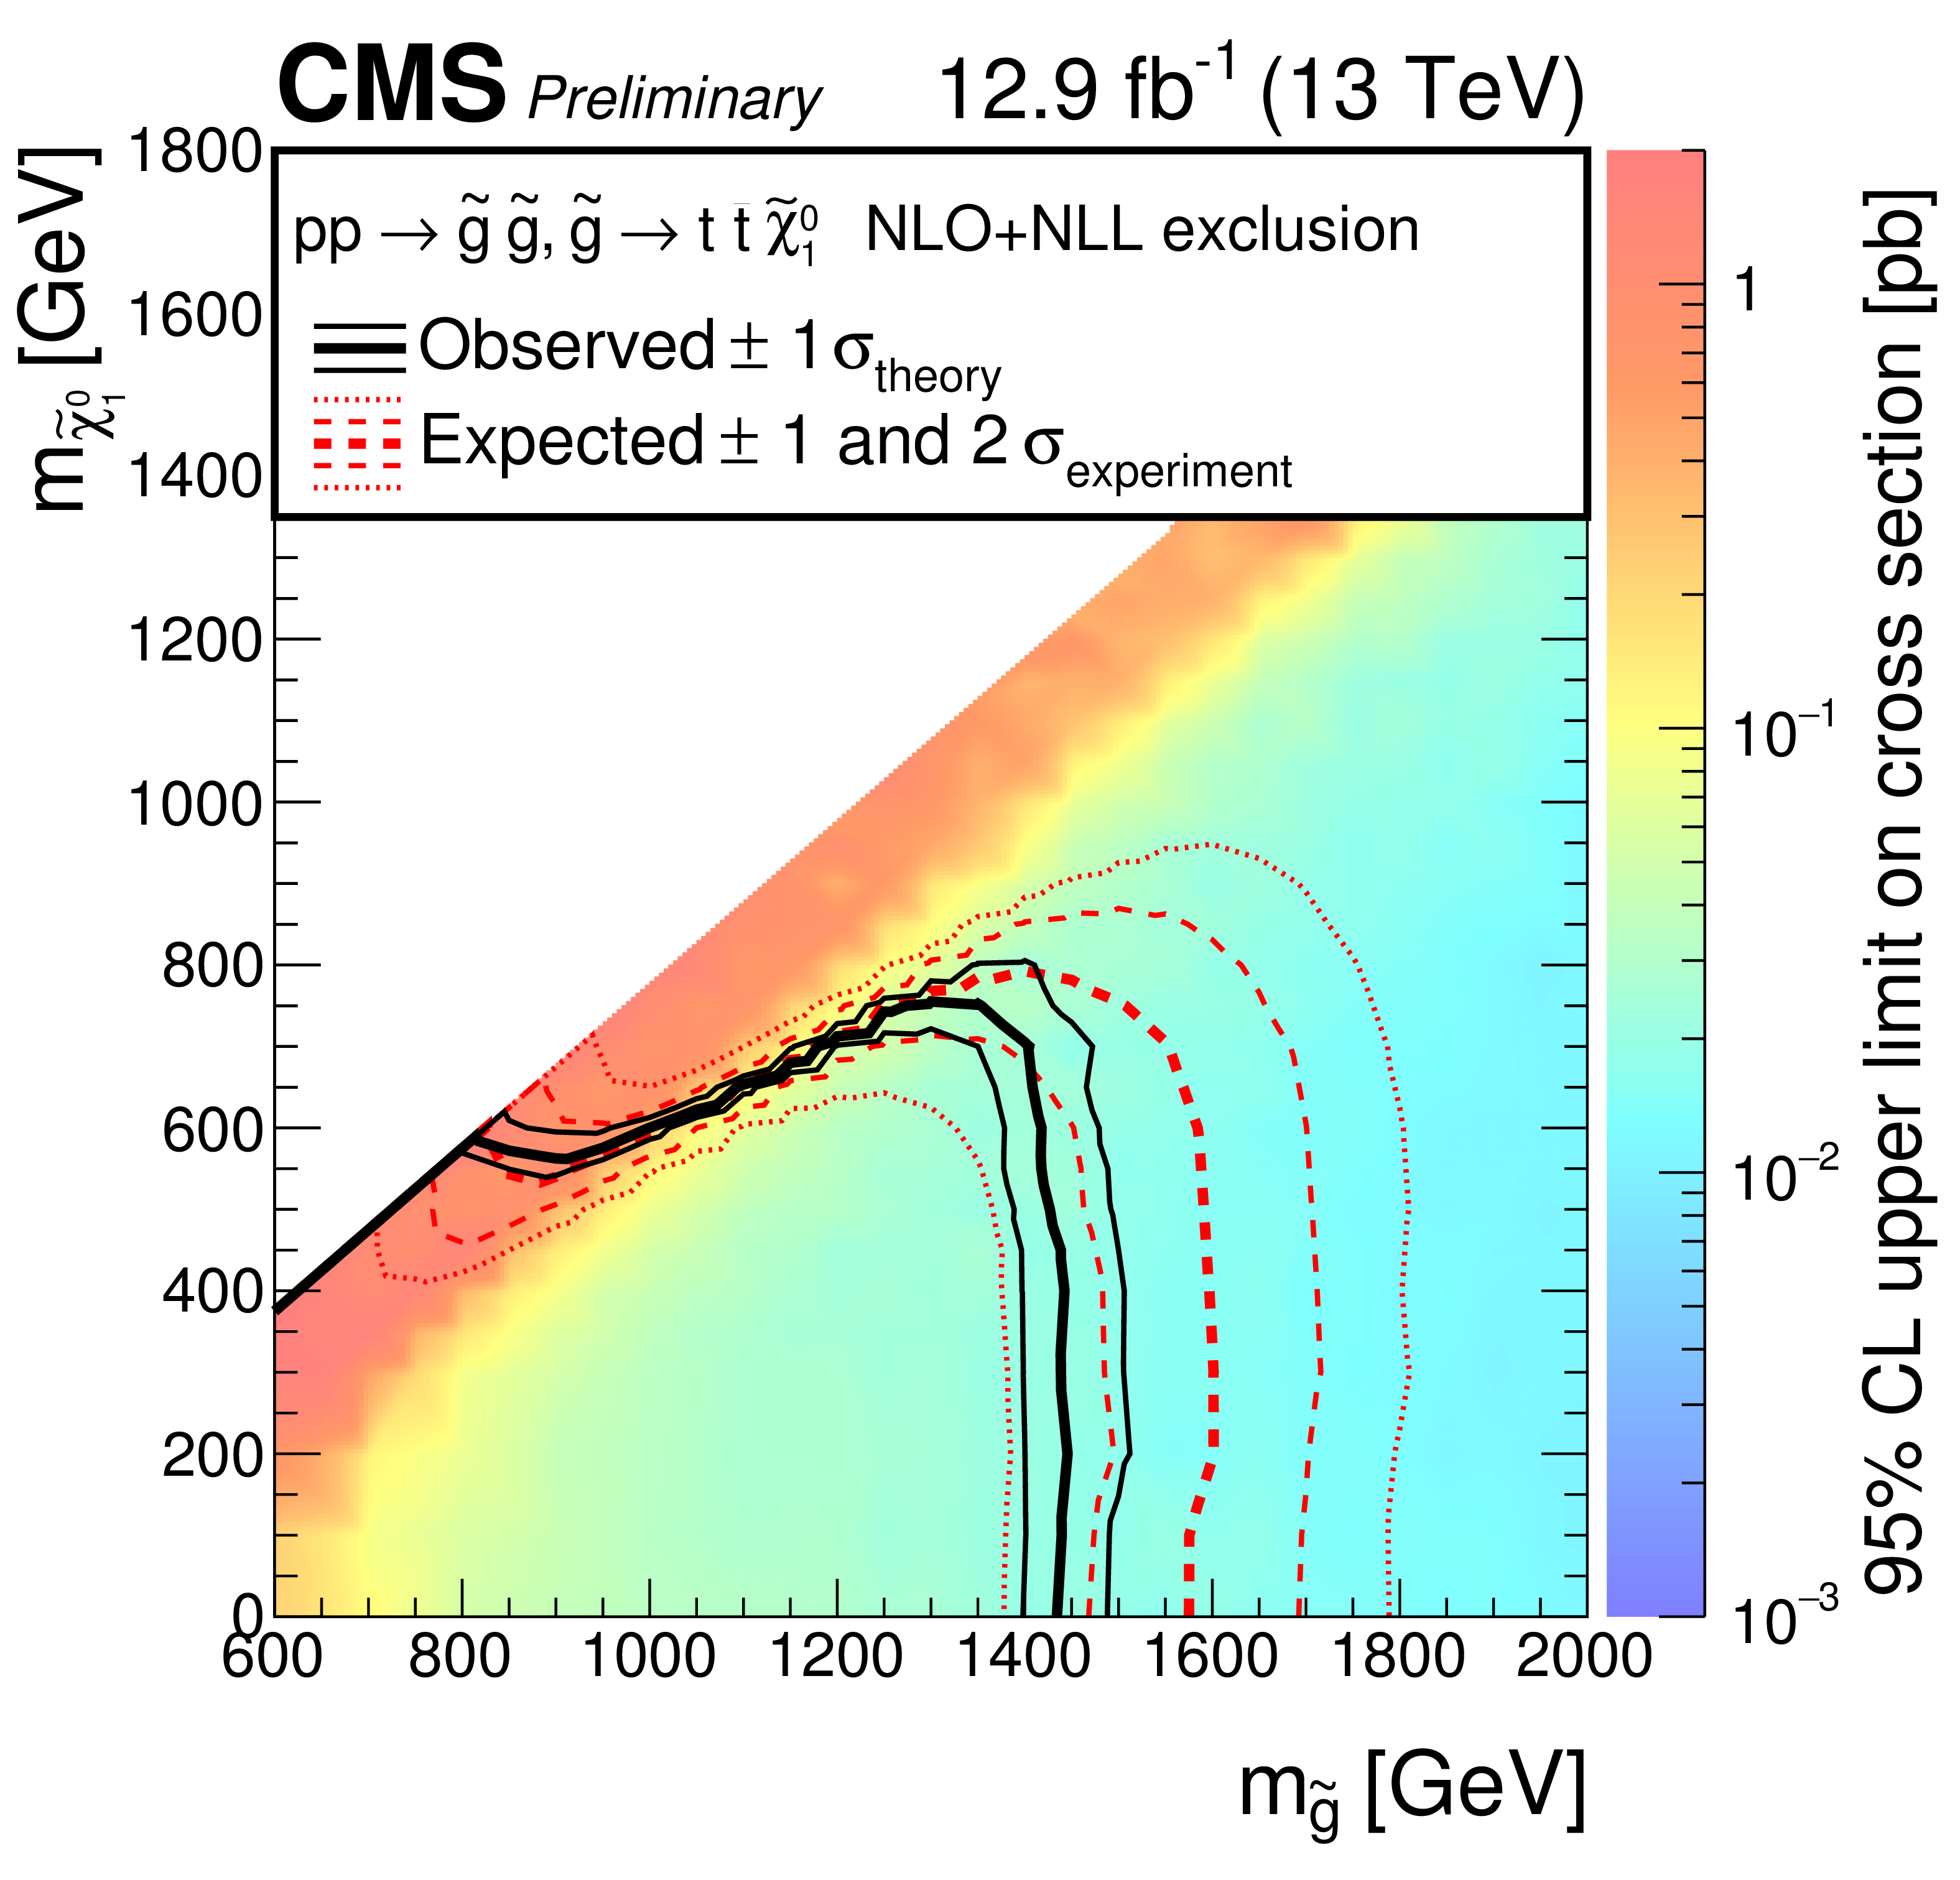
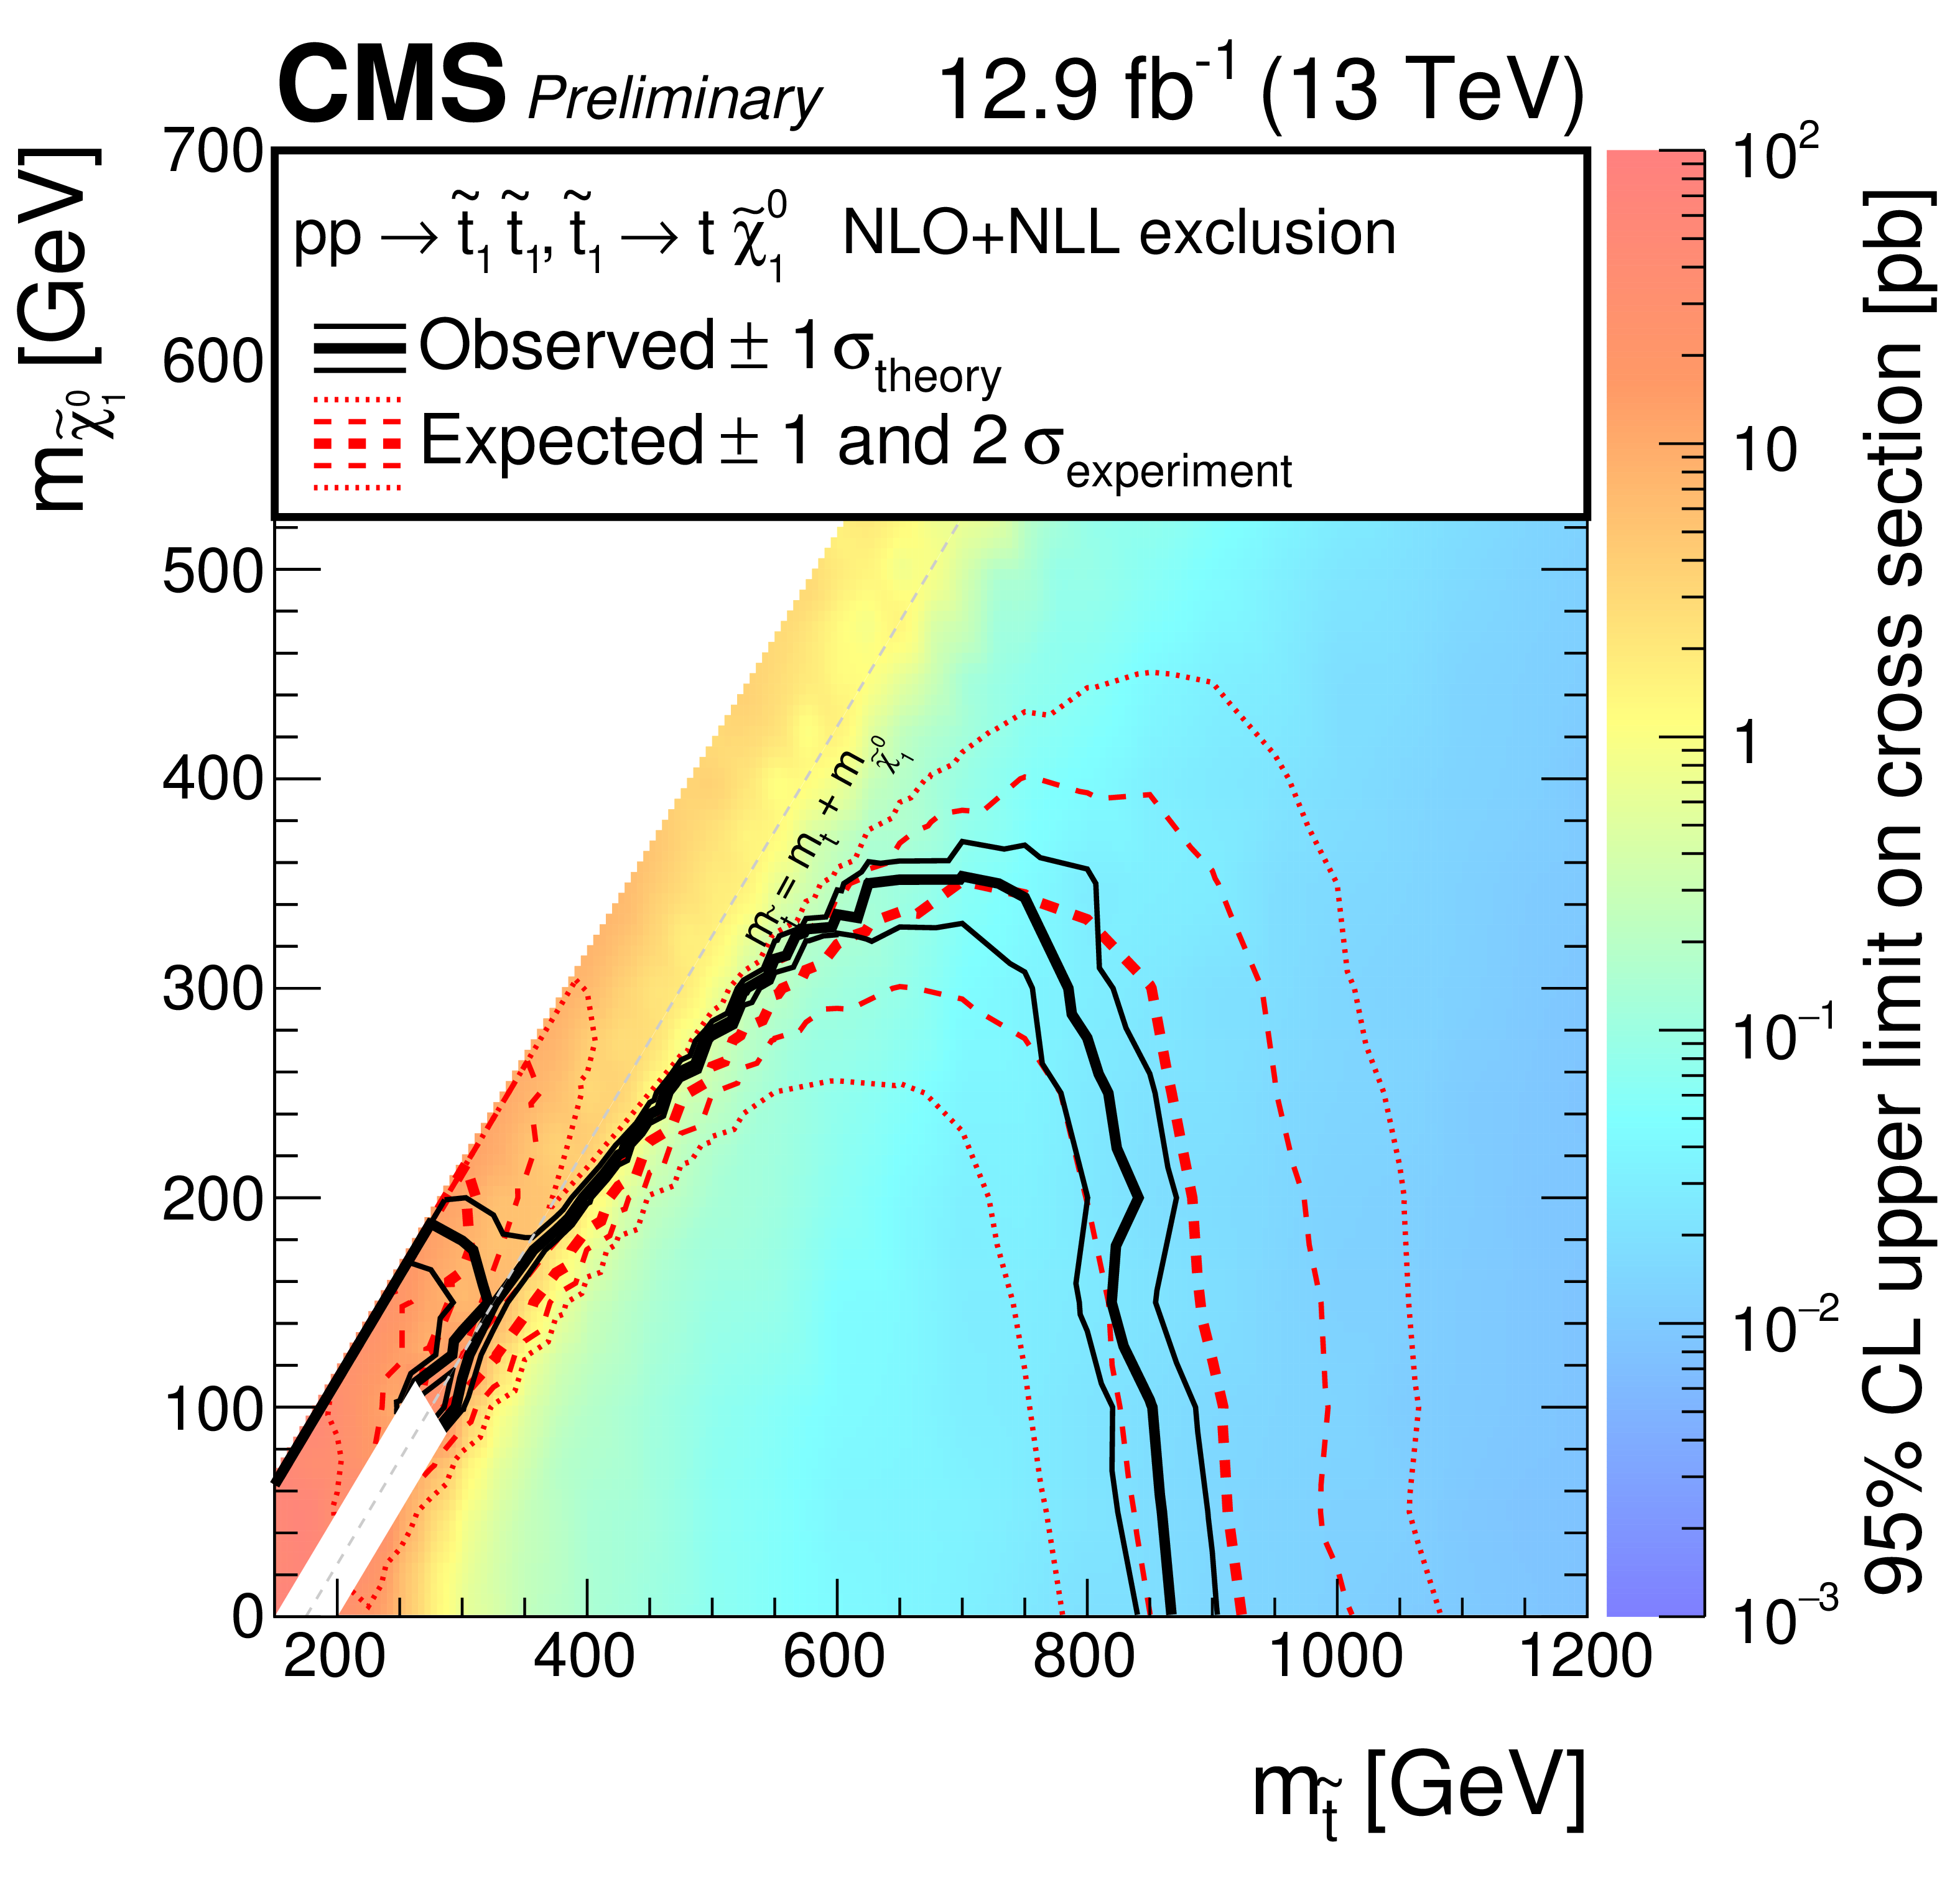
Figure 5:
Observed upper limit in cross section at 95% confidence level (indicated by the colour scale) for simplified models that assume the (Top) gluino-mediated or (Bottom) direct production of (Left) bottom or (Right) top squark pairs, as a function of the gluino or squark mass and the $ {\tilde{\chi}^{0}} _{1}$ mass. The black solid thick (thin) line indicates the observed mass exclusion regions assuming the nominal (${\pm }1 \sigma $ theory uncertainty) production cross section. The red dashed thick (thin) line indicates the median (${\pm }1 \sigma $ experimental uncertainty) expected mass exclusion regions. |

png pdf root |
Figure 5-a:
Observed upper limit in cross section at 95% confidence level (indicated by the colour scale) for simplified models that assume the gluino-mediated of bottom squark pairs, as a function of the gluino or squark mass and the $ {\tilde{\chi}^{0}} _{1}$ mass. The black solid thick (thin) line indicates the observed mass exclusion regions assuming the nominal (${\pm }1 \sigma $ theory uncertainty) production cross section. The red dashed thick (thin) line indicates the median (${\pm }1 \sigma $ experimental uncertainty) expected mass exclusion regions. |
png pdf root |
Figure 5-b:
Observed upper limit in cross section at 95% confidence level (indicated by the colour scale) for simplified models that assume the gluino-mediated of top squark pairs, as a function of the gluino or squark mass and the $ {\tilde{\chi}^{0}} _{1}$ mass. The black solid thick (thin) line indicates the observed mass exclusion regions assuming the nominal (${\pm }1 \sigma $ theory uncertainty) production cross section. The red dashed thick (thin) line indicates the median (${\pm }1 \sigma $ experimental uncertainty) expected mass exclusion regions. |

png pdf root |
Figure 5-c:
Observed upper limit in cross section at 95% confidence level (indicated by the colour scale) for simplified models that assume the direct production of bottom squark pairs, as a function of the gluino or squark mass and the $ {\tilde{\chi}^{0}} _{1}$ mass. The black solid thick (thin) line indicates the observed mass exclusion regions assuming the nominal (${\pm }1 \sigma $ theory uncertainty) production cross section. The red dashed thick (thin) line indicates the median (${\pm }1 \sigma $ experimental uncertainty) expected mass exclusion regions. |
png pdf root |
Figure 5-d:
Observed upper limit in cross section at 95% confidence level (indicated by the colour scale) for simplified models that assume the direct production of top squark pairs, as a function of the gluino or squark mass and the $ {\tilde{\chi}^{0}} _{1}$ mass. The black solid thick (thin) line indicates the observed mass exclusion regions assuming the nominal (${\pm }1 \sigma $ theory uncertainty) production cross section. The red dashed thick (thin) line indicates the median (${\pm }1 \sigma $ experimental uncertainty) expected mass exclusion regions. |
| Tables | |

png pdf |
Table 1:
Summary of the event selection requirements and categorisations used to define the signal region and control samples. |
png pdf |
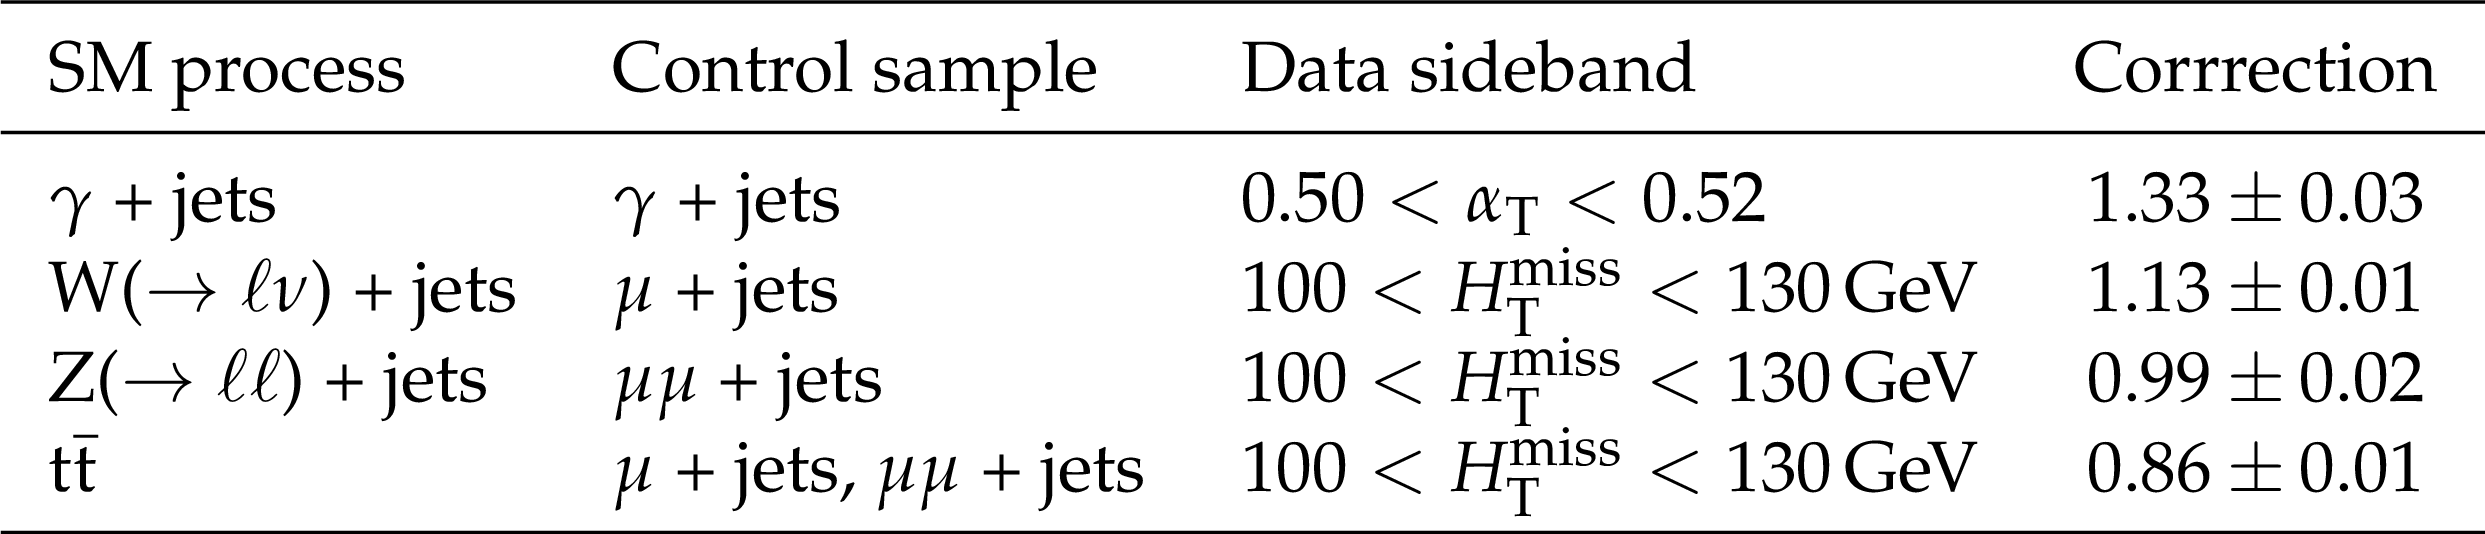
Table 2:
Cross section corrections for SM processes determined from data sidebands. |
png pdf |
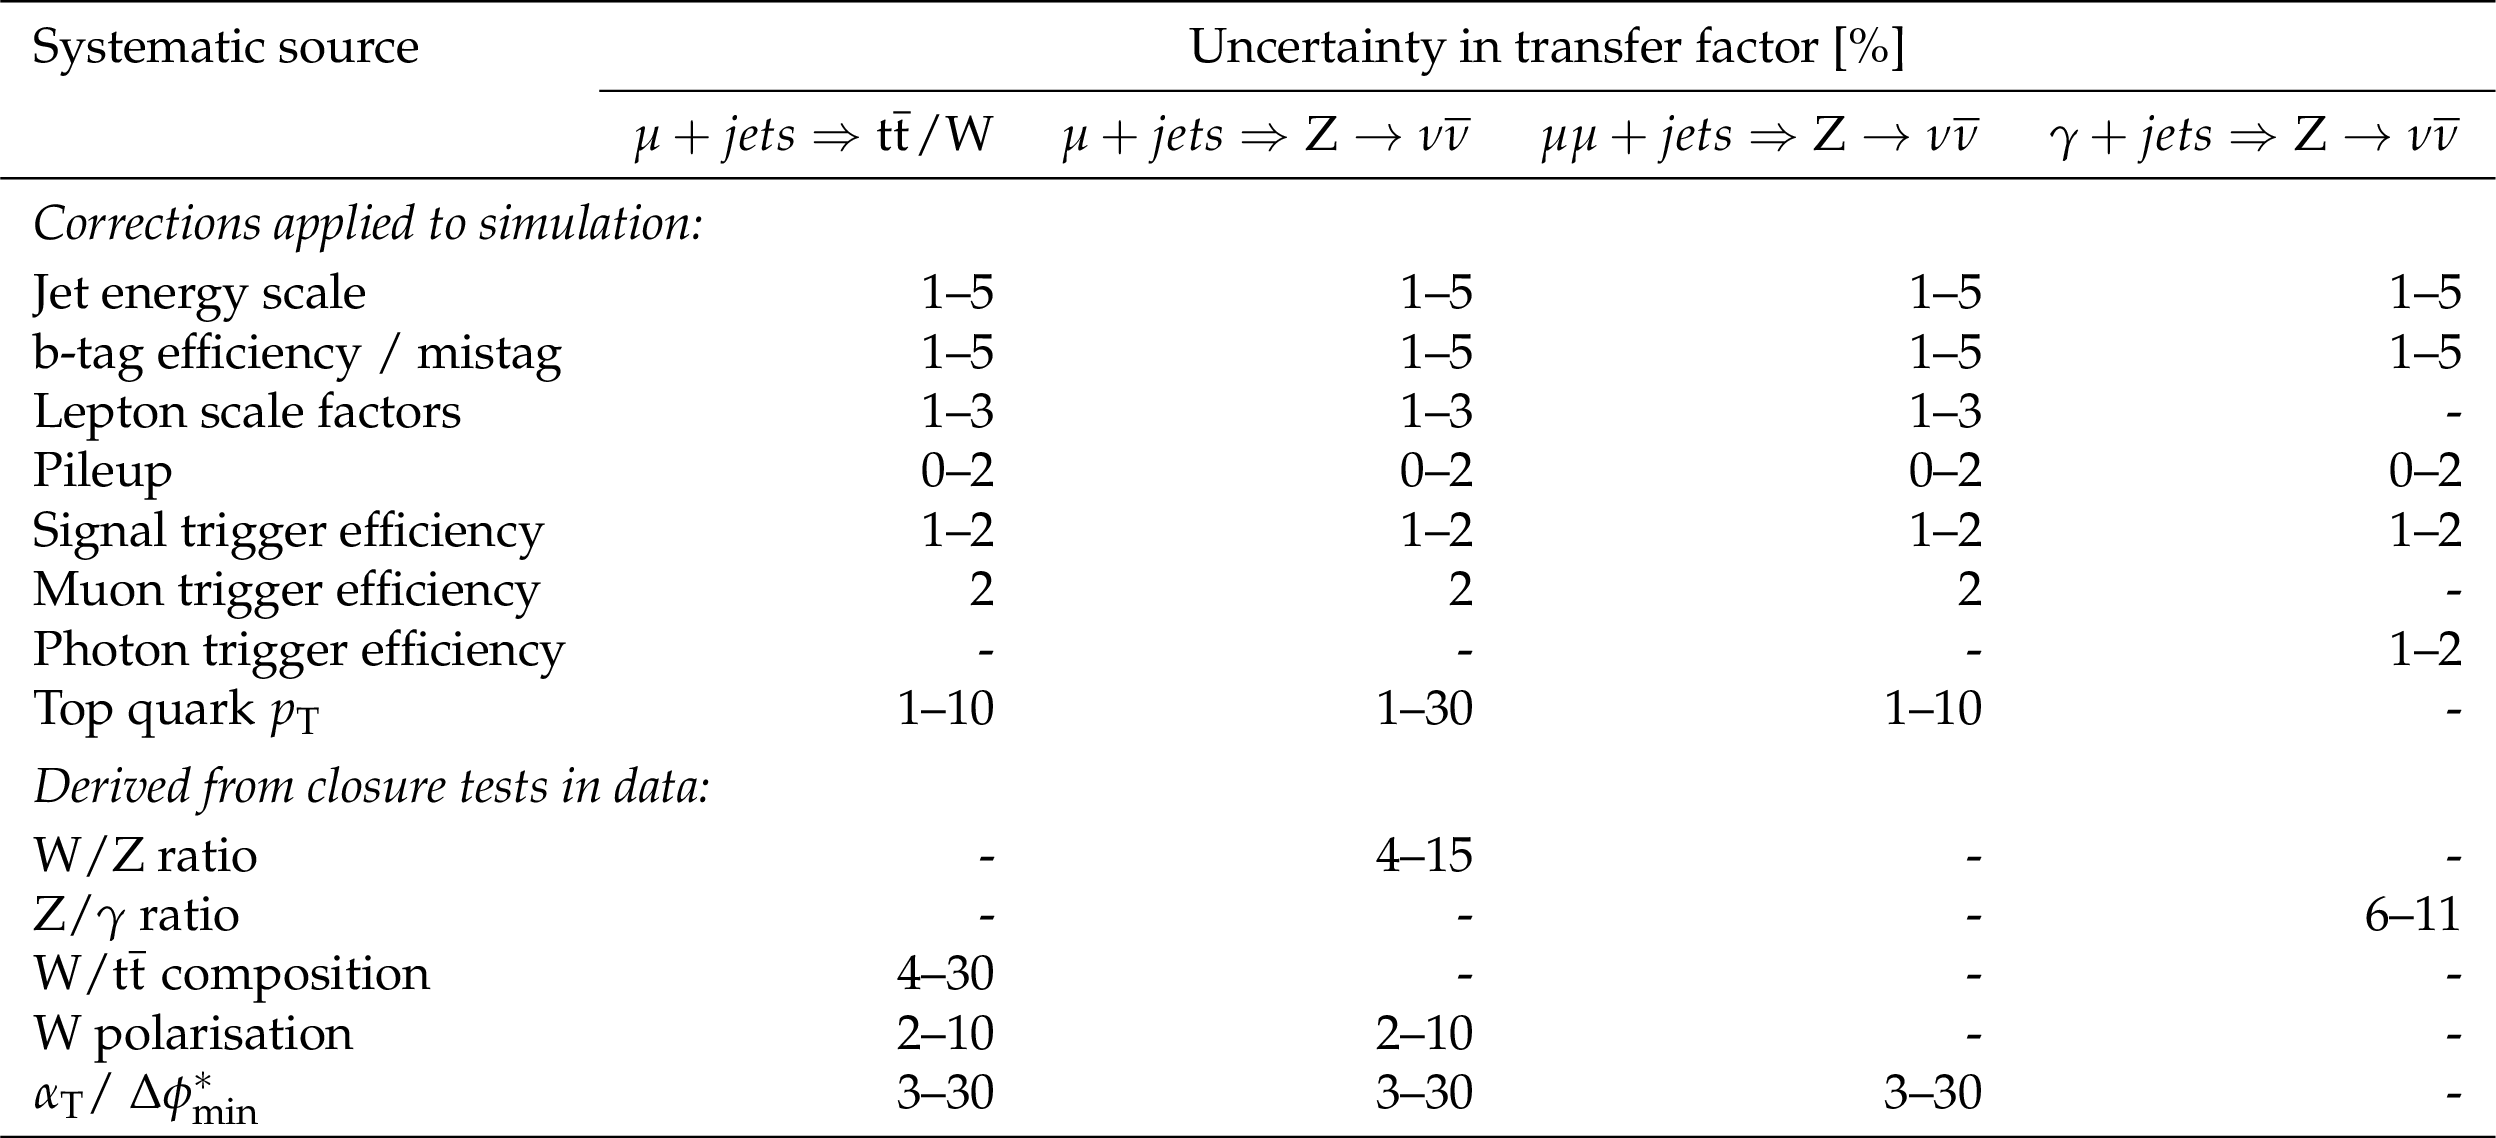
Table 3:
Systematic uncertainties in the transfer factors used in the method to estimate the SM backgrounds with genuine $\vec{p}_{\mathrm{T}}^{\text{miss}}$ in the signal region. The quoted ranges provide the minimum and maximum values used across all bins in ${n_{\text {jet}}}$ and ${H_{\mathrm {T}}}$. |
png pdf |
Table 4:
Representative magnitudes of systematic uncertainties in the experimental acceptance for simplified models that assume the pair production of bottom squarks and their decay to a b quark and a ${\tilde{\chi}^{0}} $. |

png pdf |
Table 5:
Summary of the mass limits obtained for the four classes of simplified models. The limits indicate the strongest observed (expected) mass exclusions for the gluino or squarks, and $ {\tilde{\chi}^{0}} _1$, and the quoted values have uncertainties of $\pm $25 GeV. |
| Summary |
| An inclusive search for supersymmetry with the CMS experiment is reported, based on a data sample of pp collisions collected in 2016 at $ \sqrt{s} = $ 13 TeV, corresponding to an integrated luminosity of 12.9 $\pm$ 0.8 fb$^{-1}$. Final states with jets and significant $\vec{p}_{\mathrm{T}}^{\text{miss}}$, as expected from the production and decay of massive gluinos and squarks, have been analysed. Candidate signal events are categorised according to the number of reconstructed jets, the number of jets identified to originate from bottom quarks, and the scalar and vector sums of the transverse momentum of jets. The sum of standard model backgrounds per bin has been estimated from a simultaneous binned likelihood fit to event yields in the signal region and control samples. The observed yields in the signal region are found to be in agreement with the expected contributions from standard model processes. Limits are determined in the mass parameter space of simplified models involving the gluino-mediated and direct production of third-generation squark pairs. The excluded mass parameter space extends significantly beyond that set by previous searches, with observed exclusions in gluino mass, and bottom and top squark masses, as high as 1775, 1025, and 875 GeV, respectively. |
| Additional Figures | |

png pdf |
Additional Figure 1:
The $\alpha _{\mathrm {T}}$ distribution in data for events satisfying the pre-selection criteria $H_{\mathrm {T}} > 300$ GeV and $p_{T}^{\mathrm {j2}} > 100$ GeV for $\alpha _{\mathrm {T}} < 0.55$ and the full selection for $\alpha _{\mathrm {T}} > 0.55$. |
png pdf |
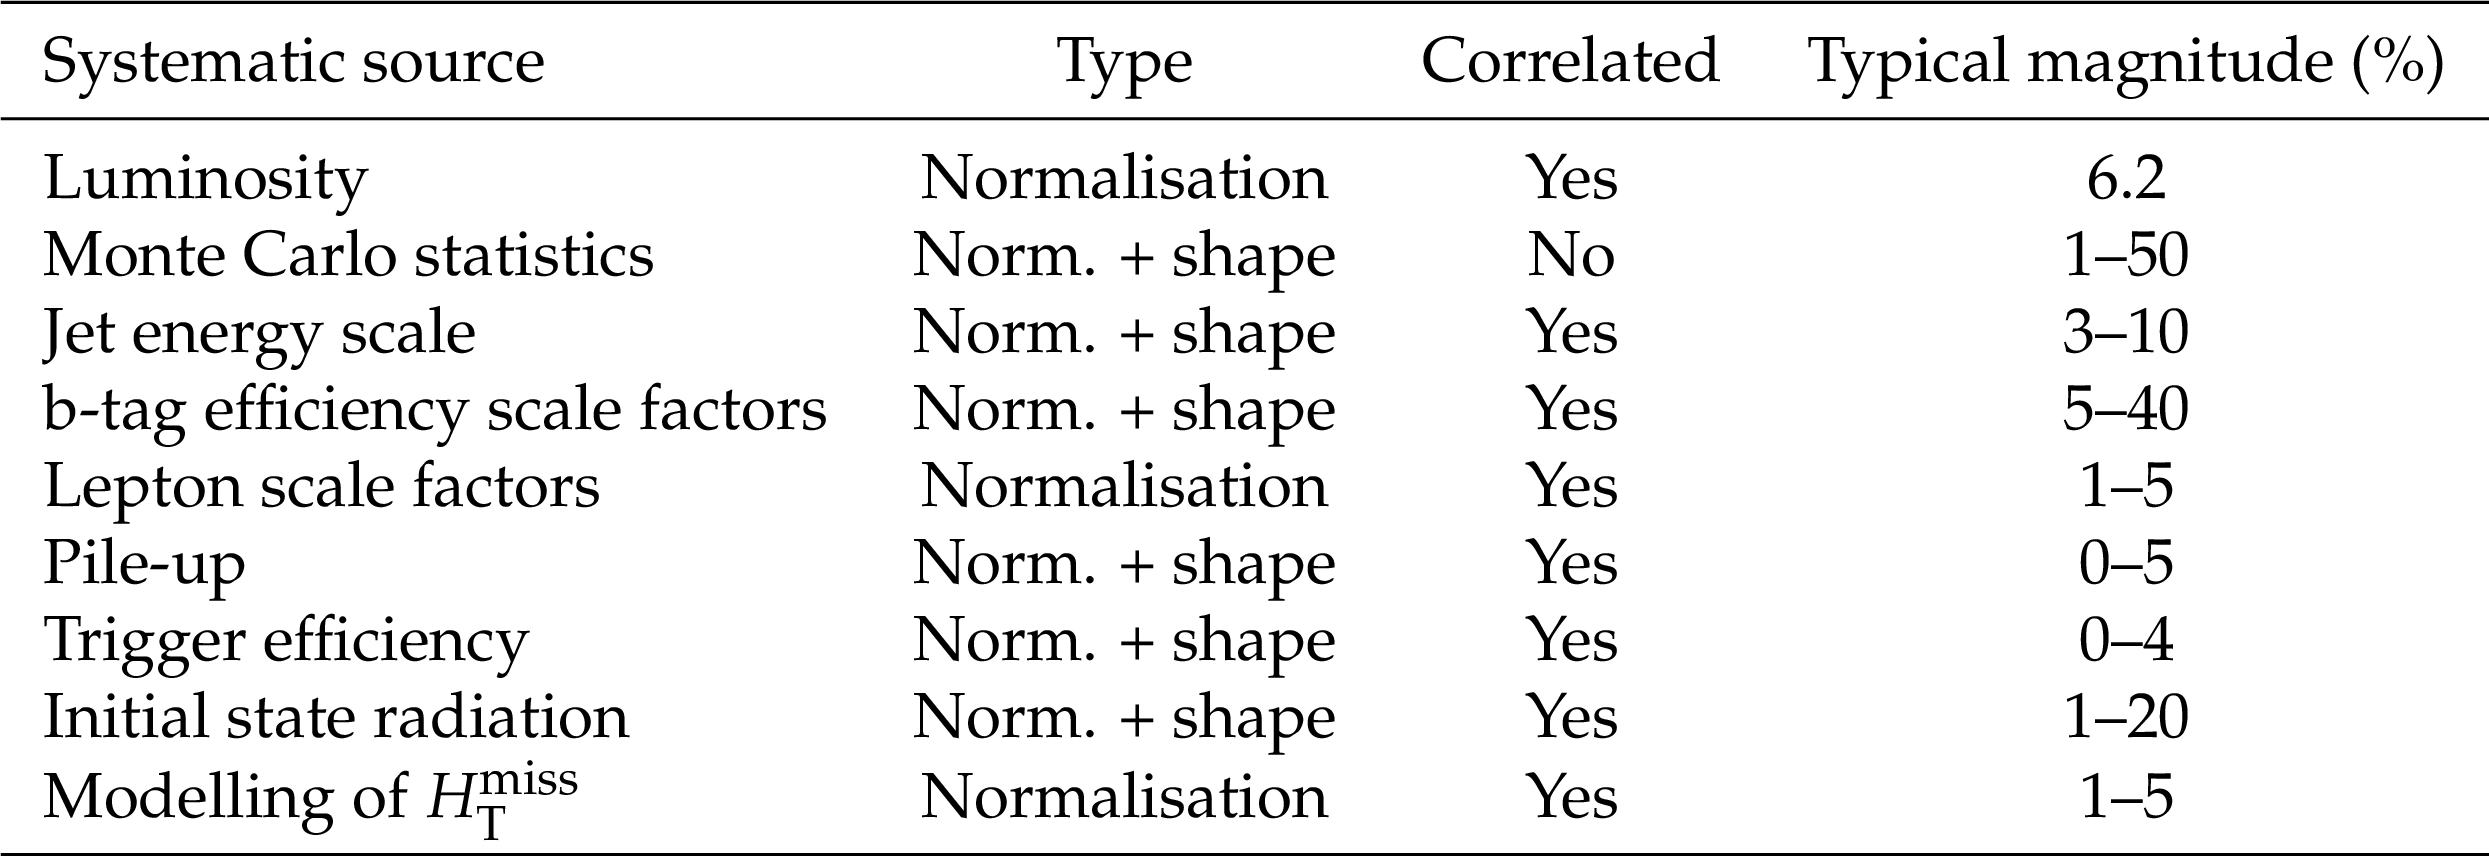
Additional Figure 2:
The $\Delta \phi ^{*}_{\mathrm {min}}$ distribution in data for events satisfying the pre-selection criteria, $H_{\mathrm {T}} > 800$ GeV and $p_{T}^{\mathrm {j2}} > 100$ GeV. |
png pdf root |
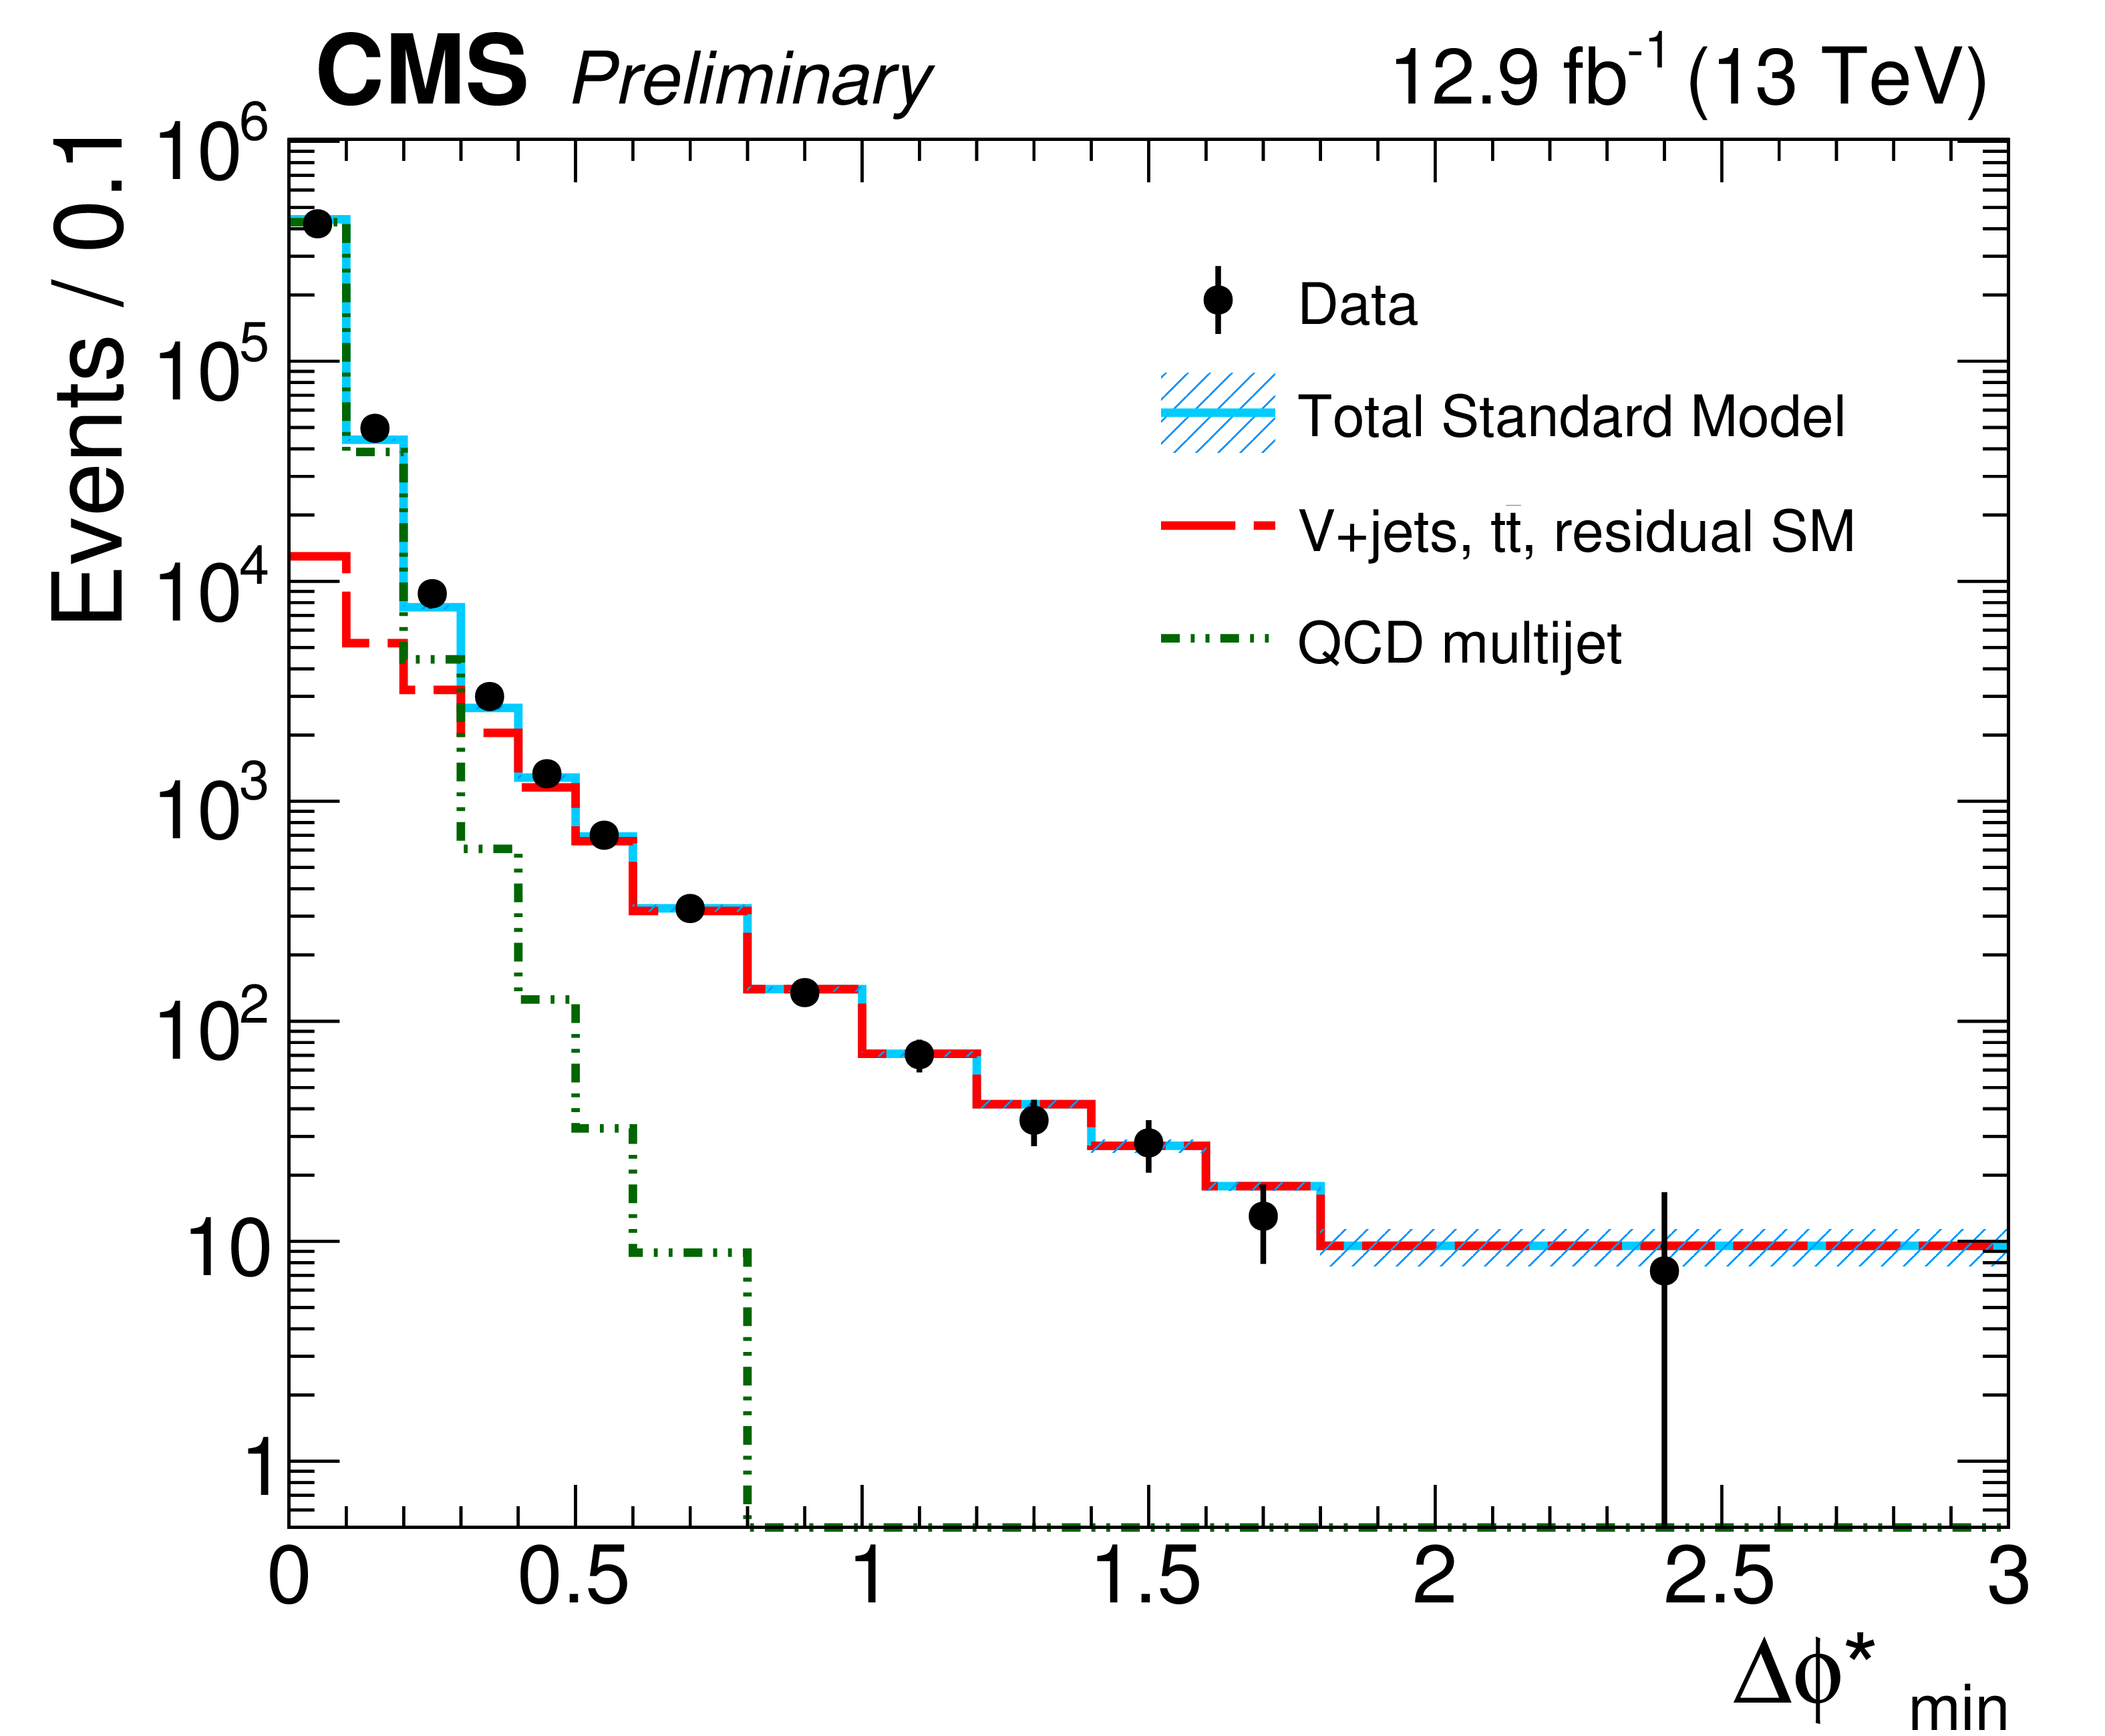
Additional Figure 3:
The pre-fit $H_{\mathrm {T}}^{\mathrm {miss}}$ distribution in the category $n_{b}=0, 1 \leq n_{jet} \leq 2$, for the predicted background, an example of a signal model and the observation. |
png pdf root |
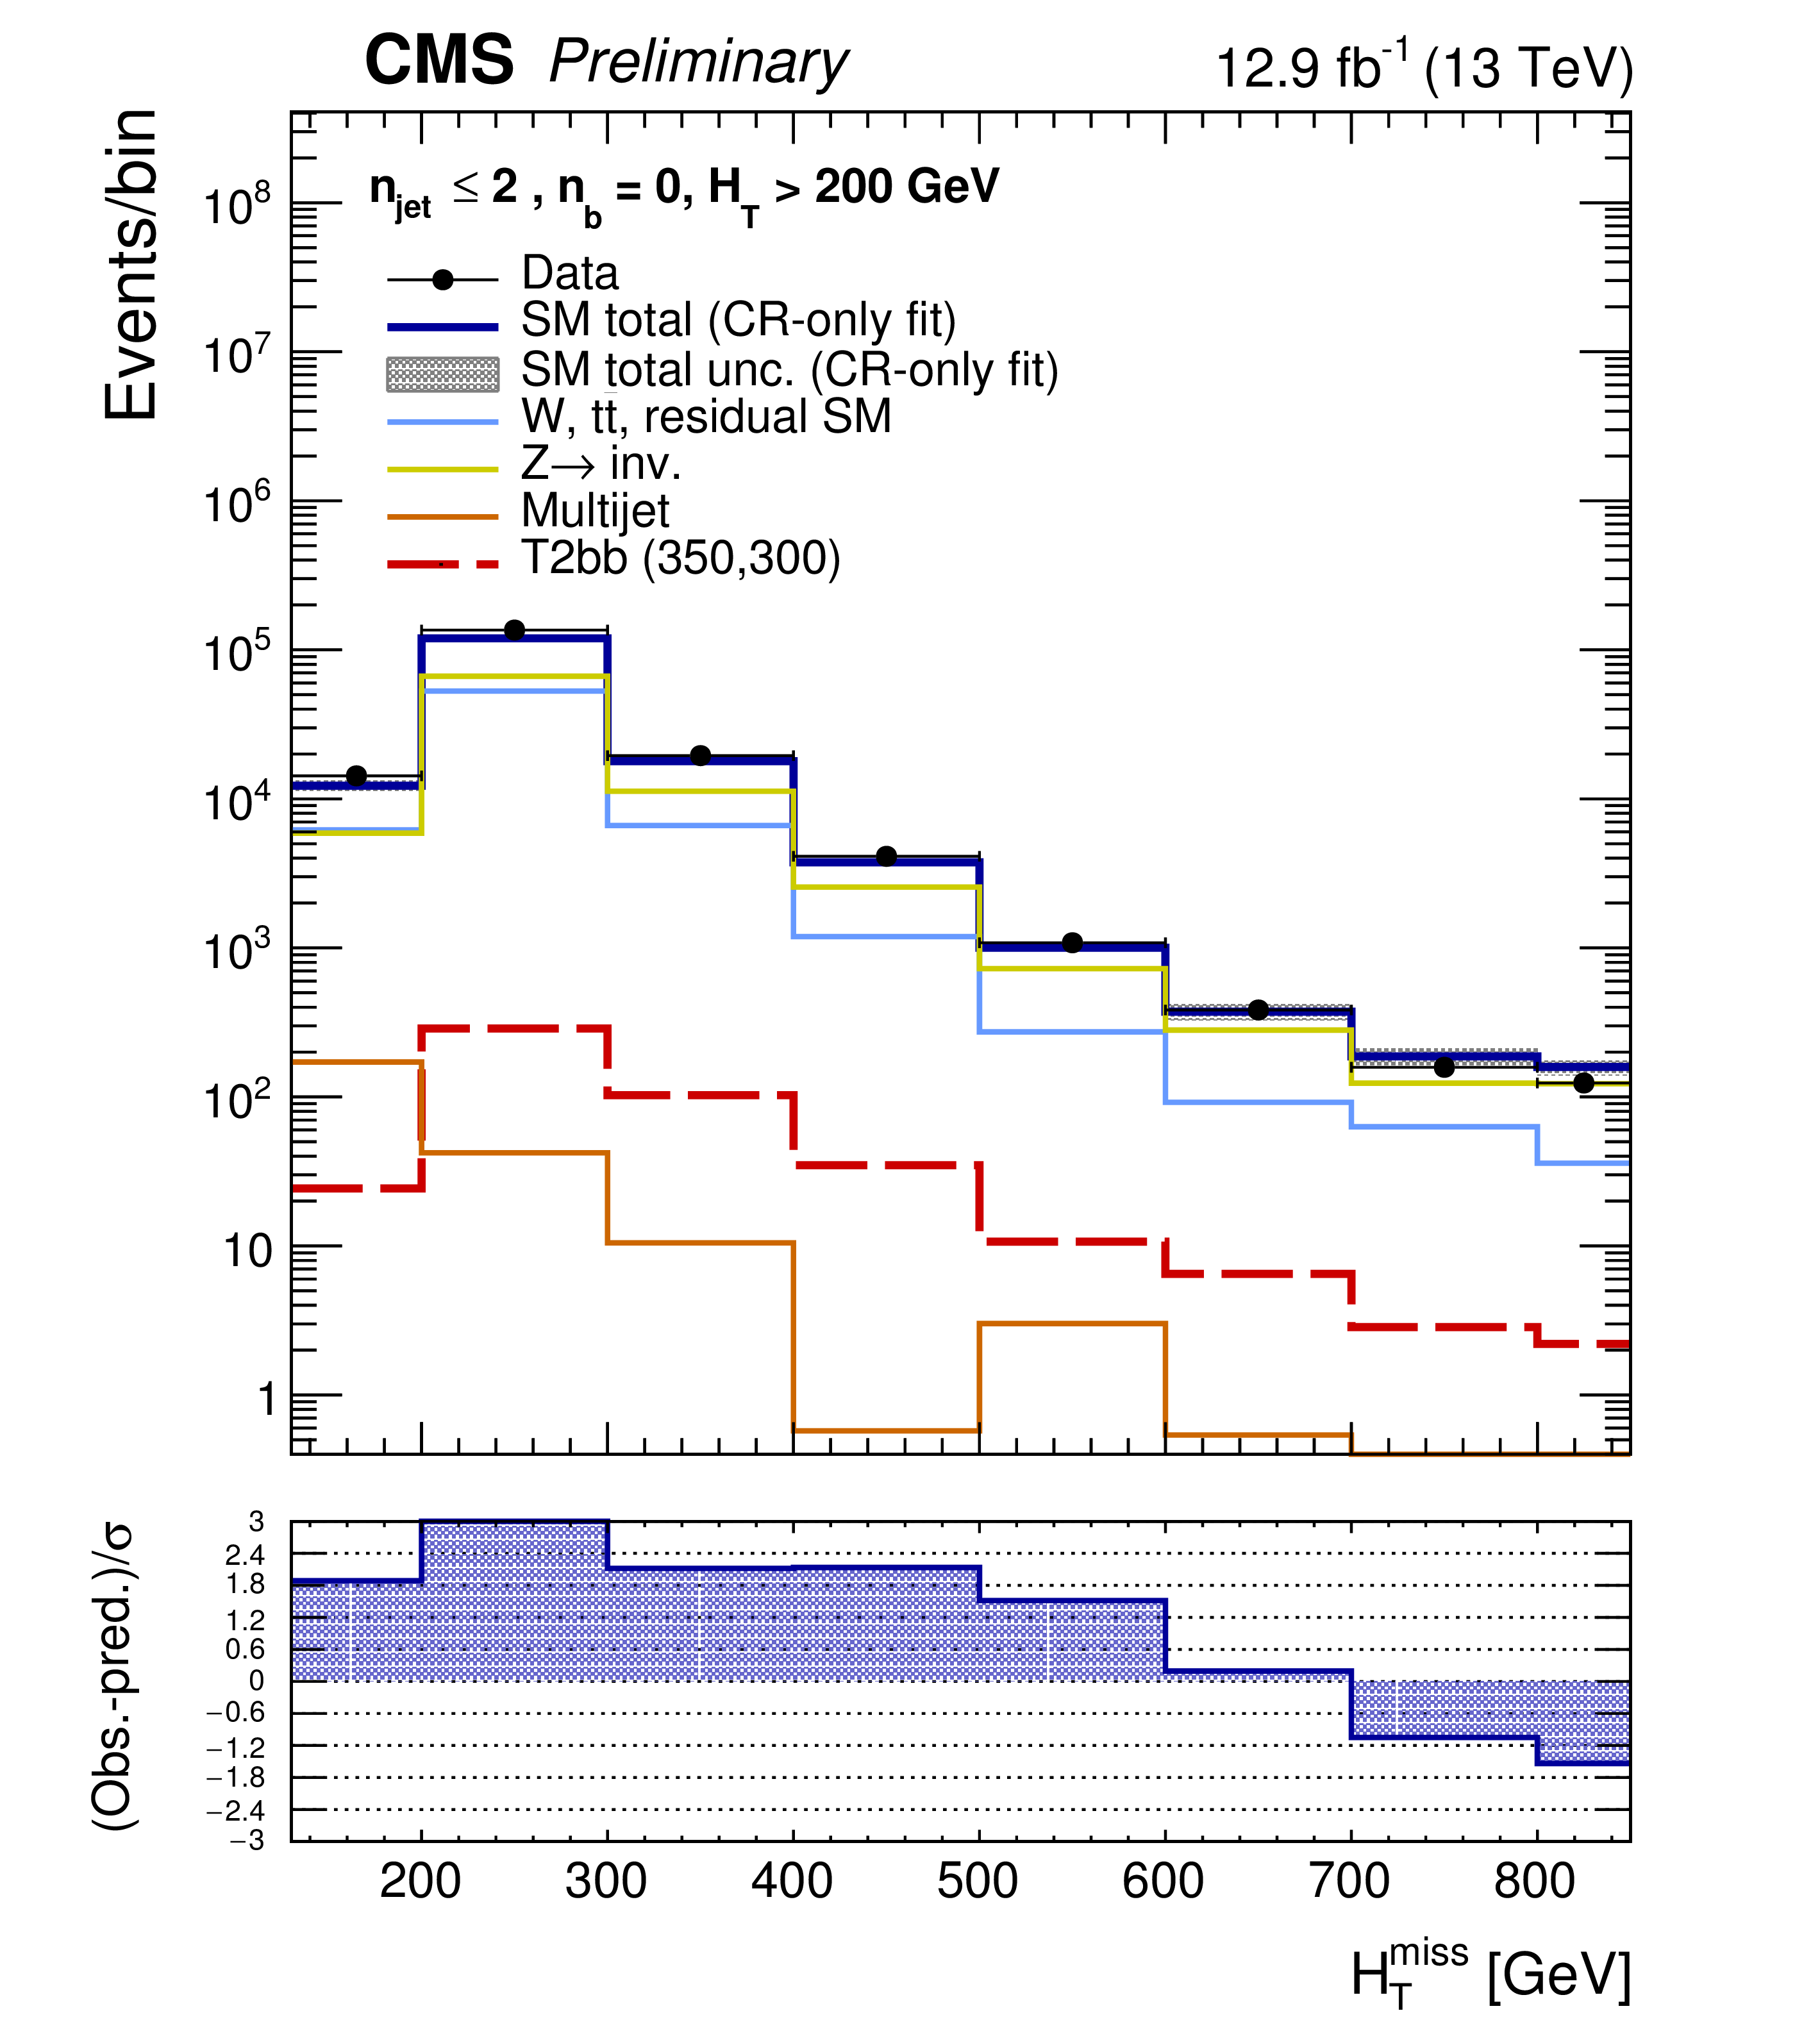
Additional Figure 4:
The post-fit (background-only fit) $H_{\mathrm {T}}^{\mathrm {miss}}$ distribution in the category $n_{b}=0, 1 \leq n_{jet} \leq 2$, for the predicted background, an example of a signal model and the observation. |

png pdf root |
Additional Figure 5:
The pre-fit $H_{\mathrm {T}}^{\mathrm {miss}}$ distribution in the category $n_{b}\geq 1, 1 \leq n_{jet} \leq 2$, for the predicted background, an example of a signal model and the observation. |

png pdf root |
Additional Figure 6:
The post-fit (background-only fit) $H_{\mathrm {T}}^{\mathrm {miss}}$ distribution in the category $n_{b}\geq 1, 1 \leq n_{jet} \leq 2$, for the predicted background, an example of a signal model and the observation. |
png pdf root |
Additional Figure 7:
The pre-fit $H_{\mathrm {T}}^{\mathrm {miss}}$ distribution in the category $n_{b}\leq 1, 3 \leq n_{jet}^{asym} \leq 4$, for the predicted background, an example of a signal model and the observation. |

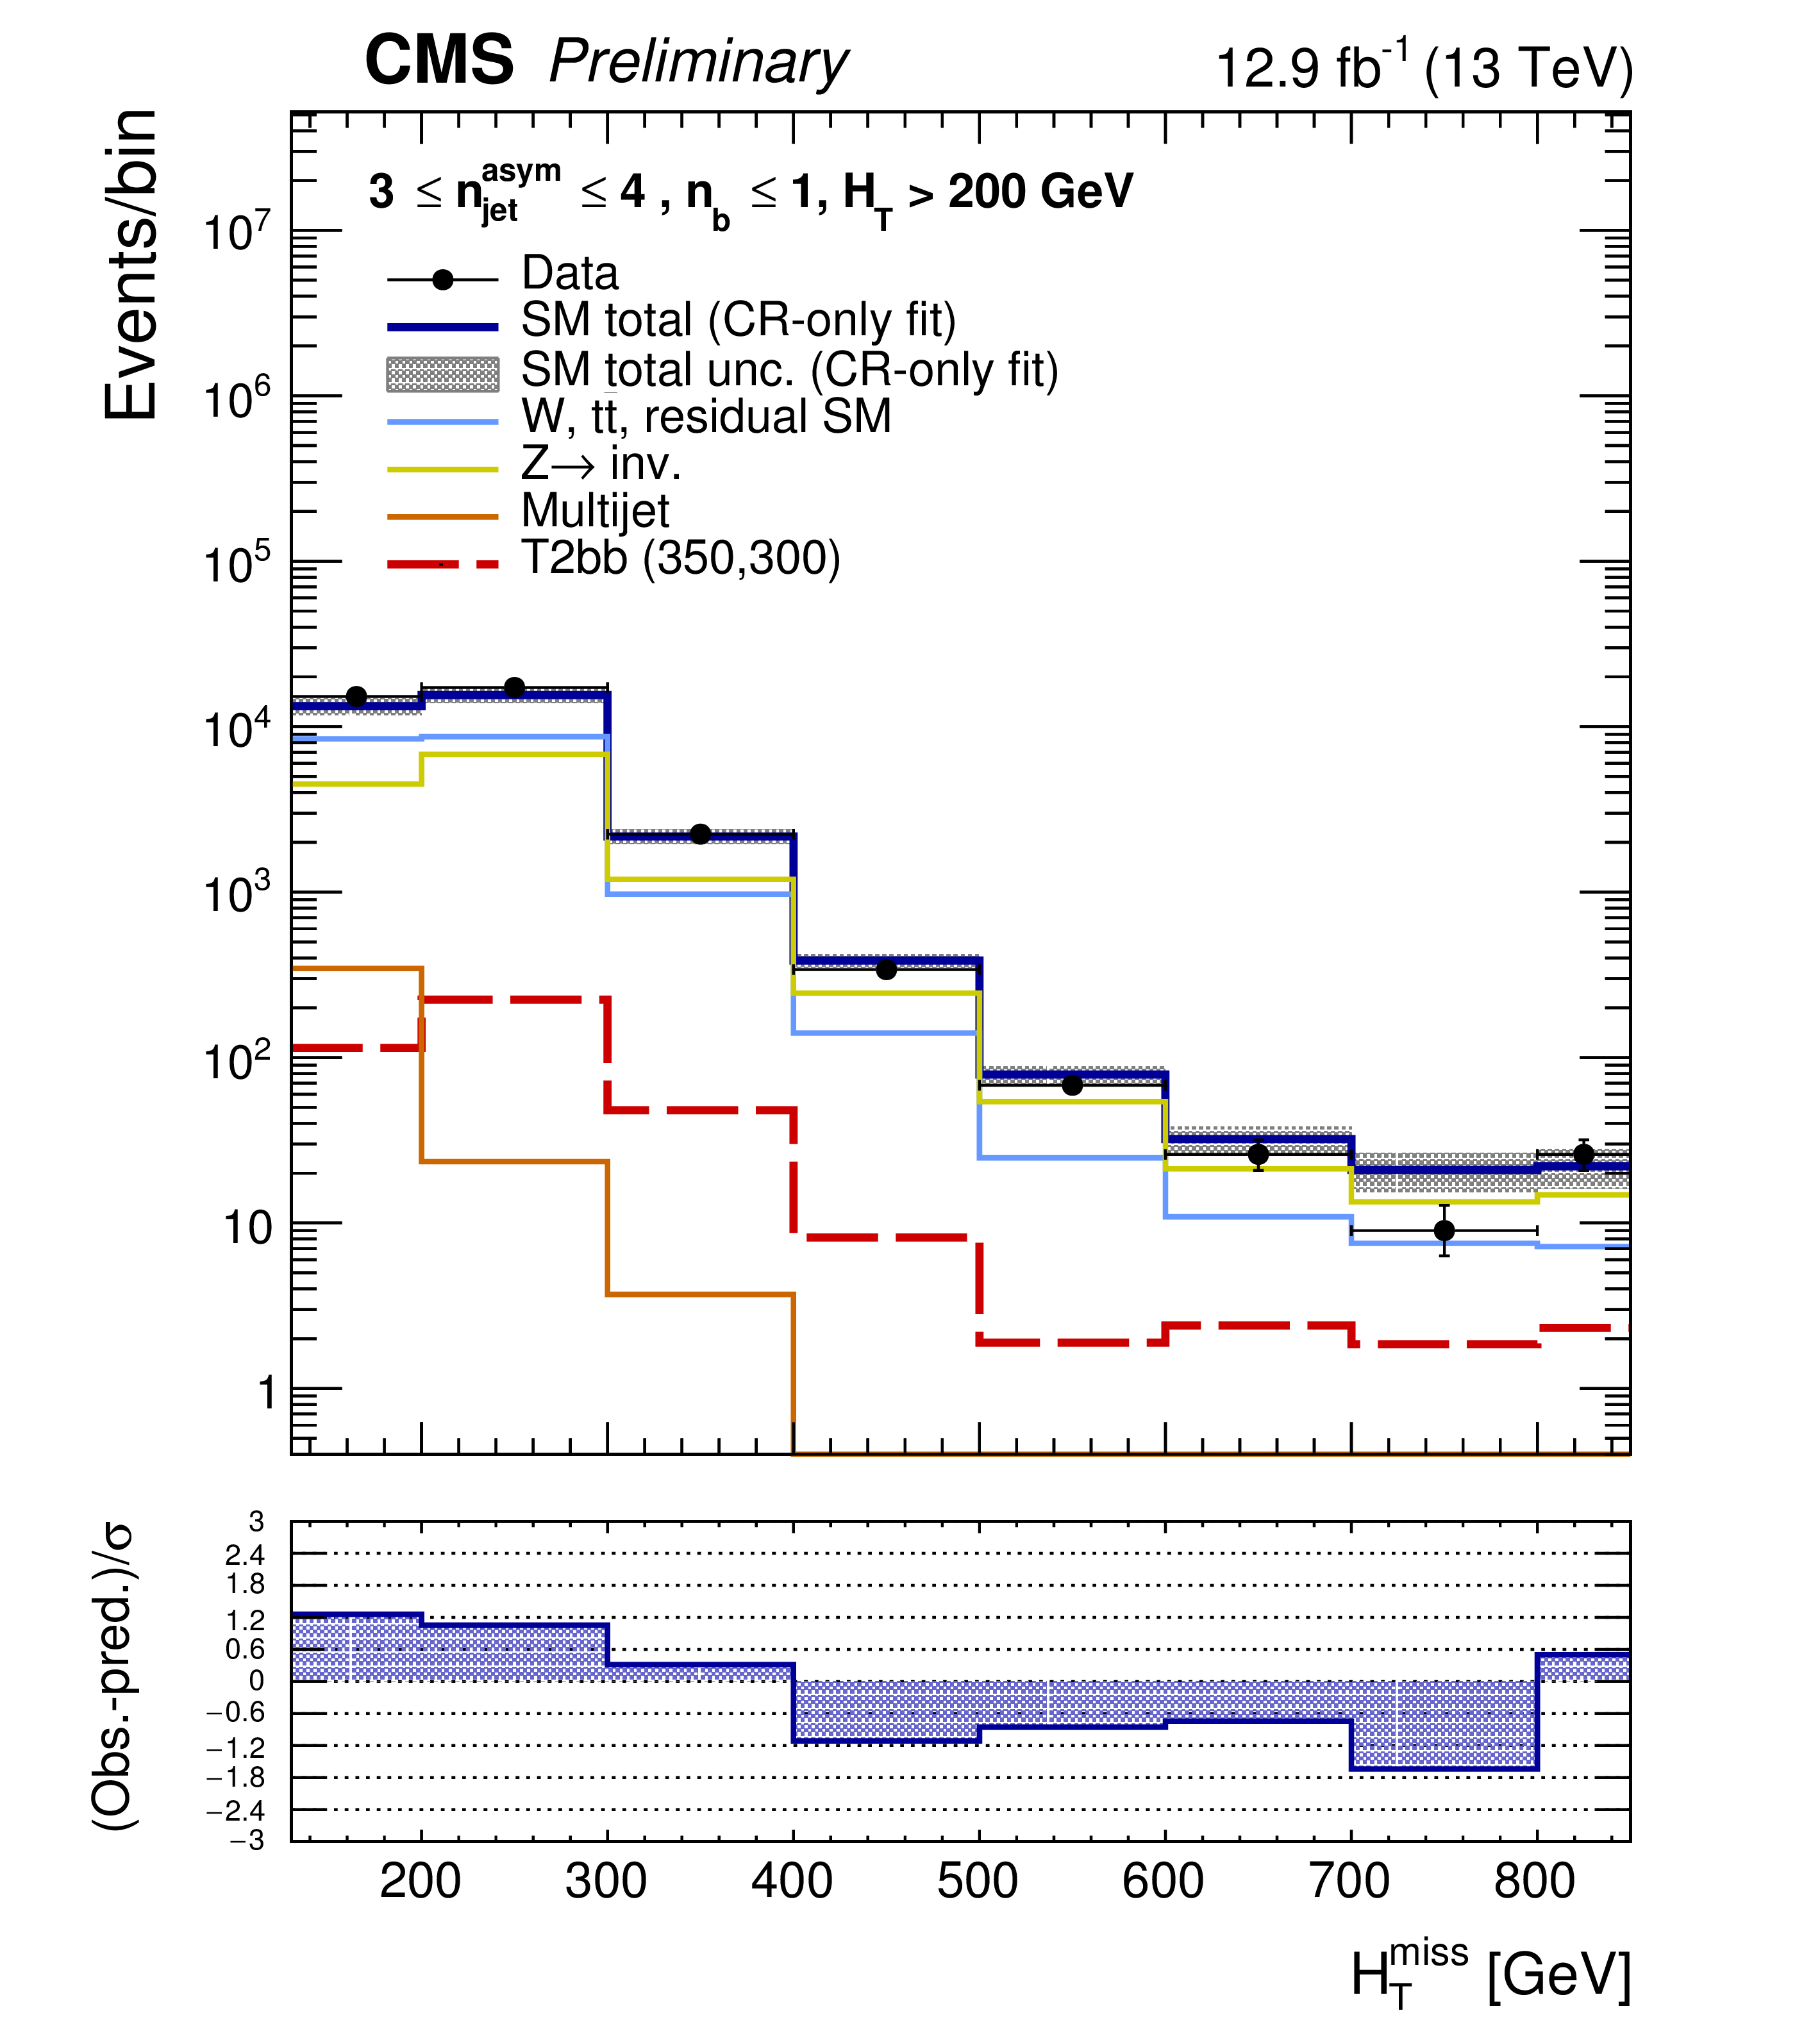
png pdf root |
Additional Figure 8:
The post-fit (background-only fit) $H_{\mathrm {T}}^{\mathrm {miss}}$ distribution in the category $n_{b}\leq 1, 3 \leq n_{jet}^{asym} \leq 4$, for the predicted background, an example of a signal model and the observation. |

png pdf root |
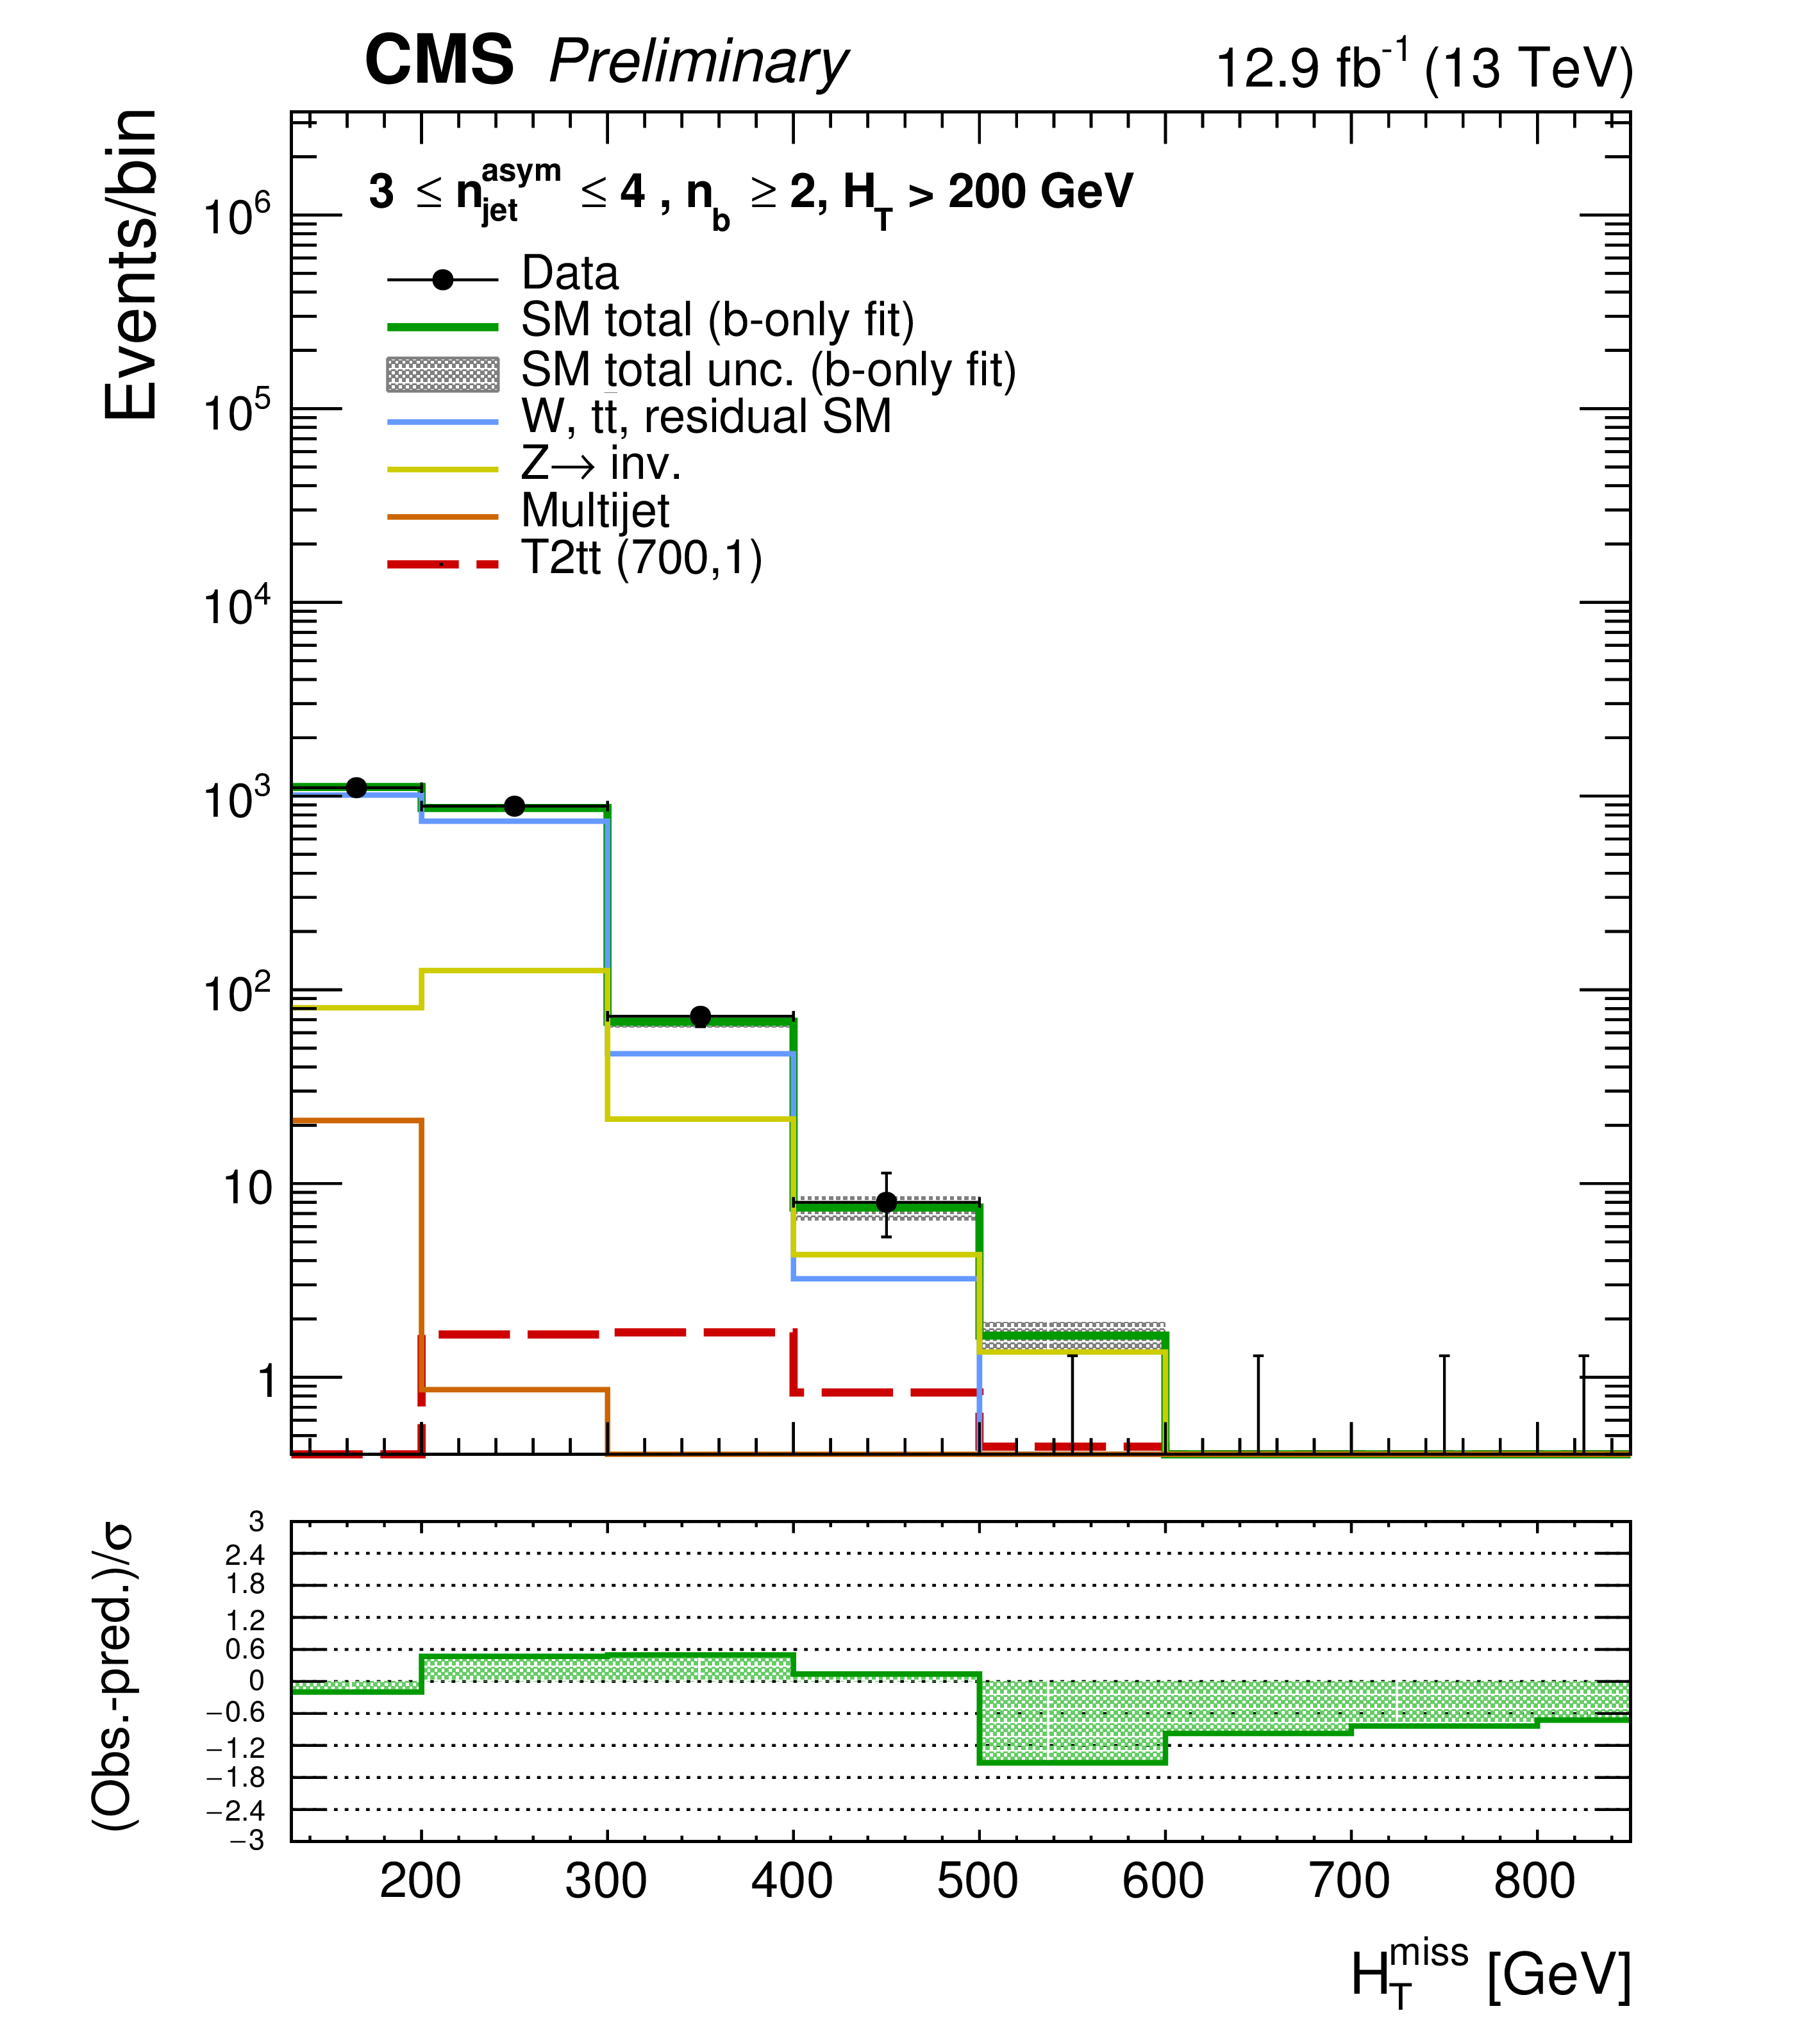
Additional Figure 9:
The pre-fit $H_{\mathrm {T}}^{\mathrm {miss}}$ distribution in the category $n_{b}\geq 2, 3 \leq n_{jet}^{asym} \leq 4$, for the predicted background, an example of a signal model and the observation. |
png pdf root |
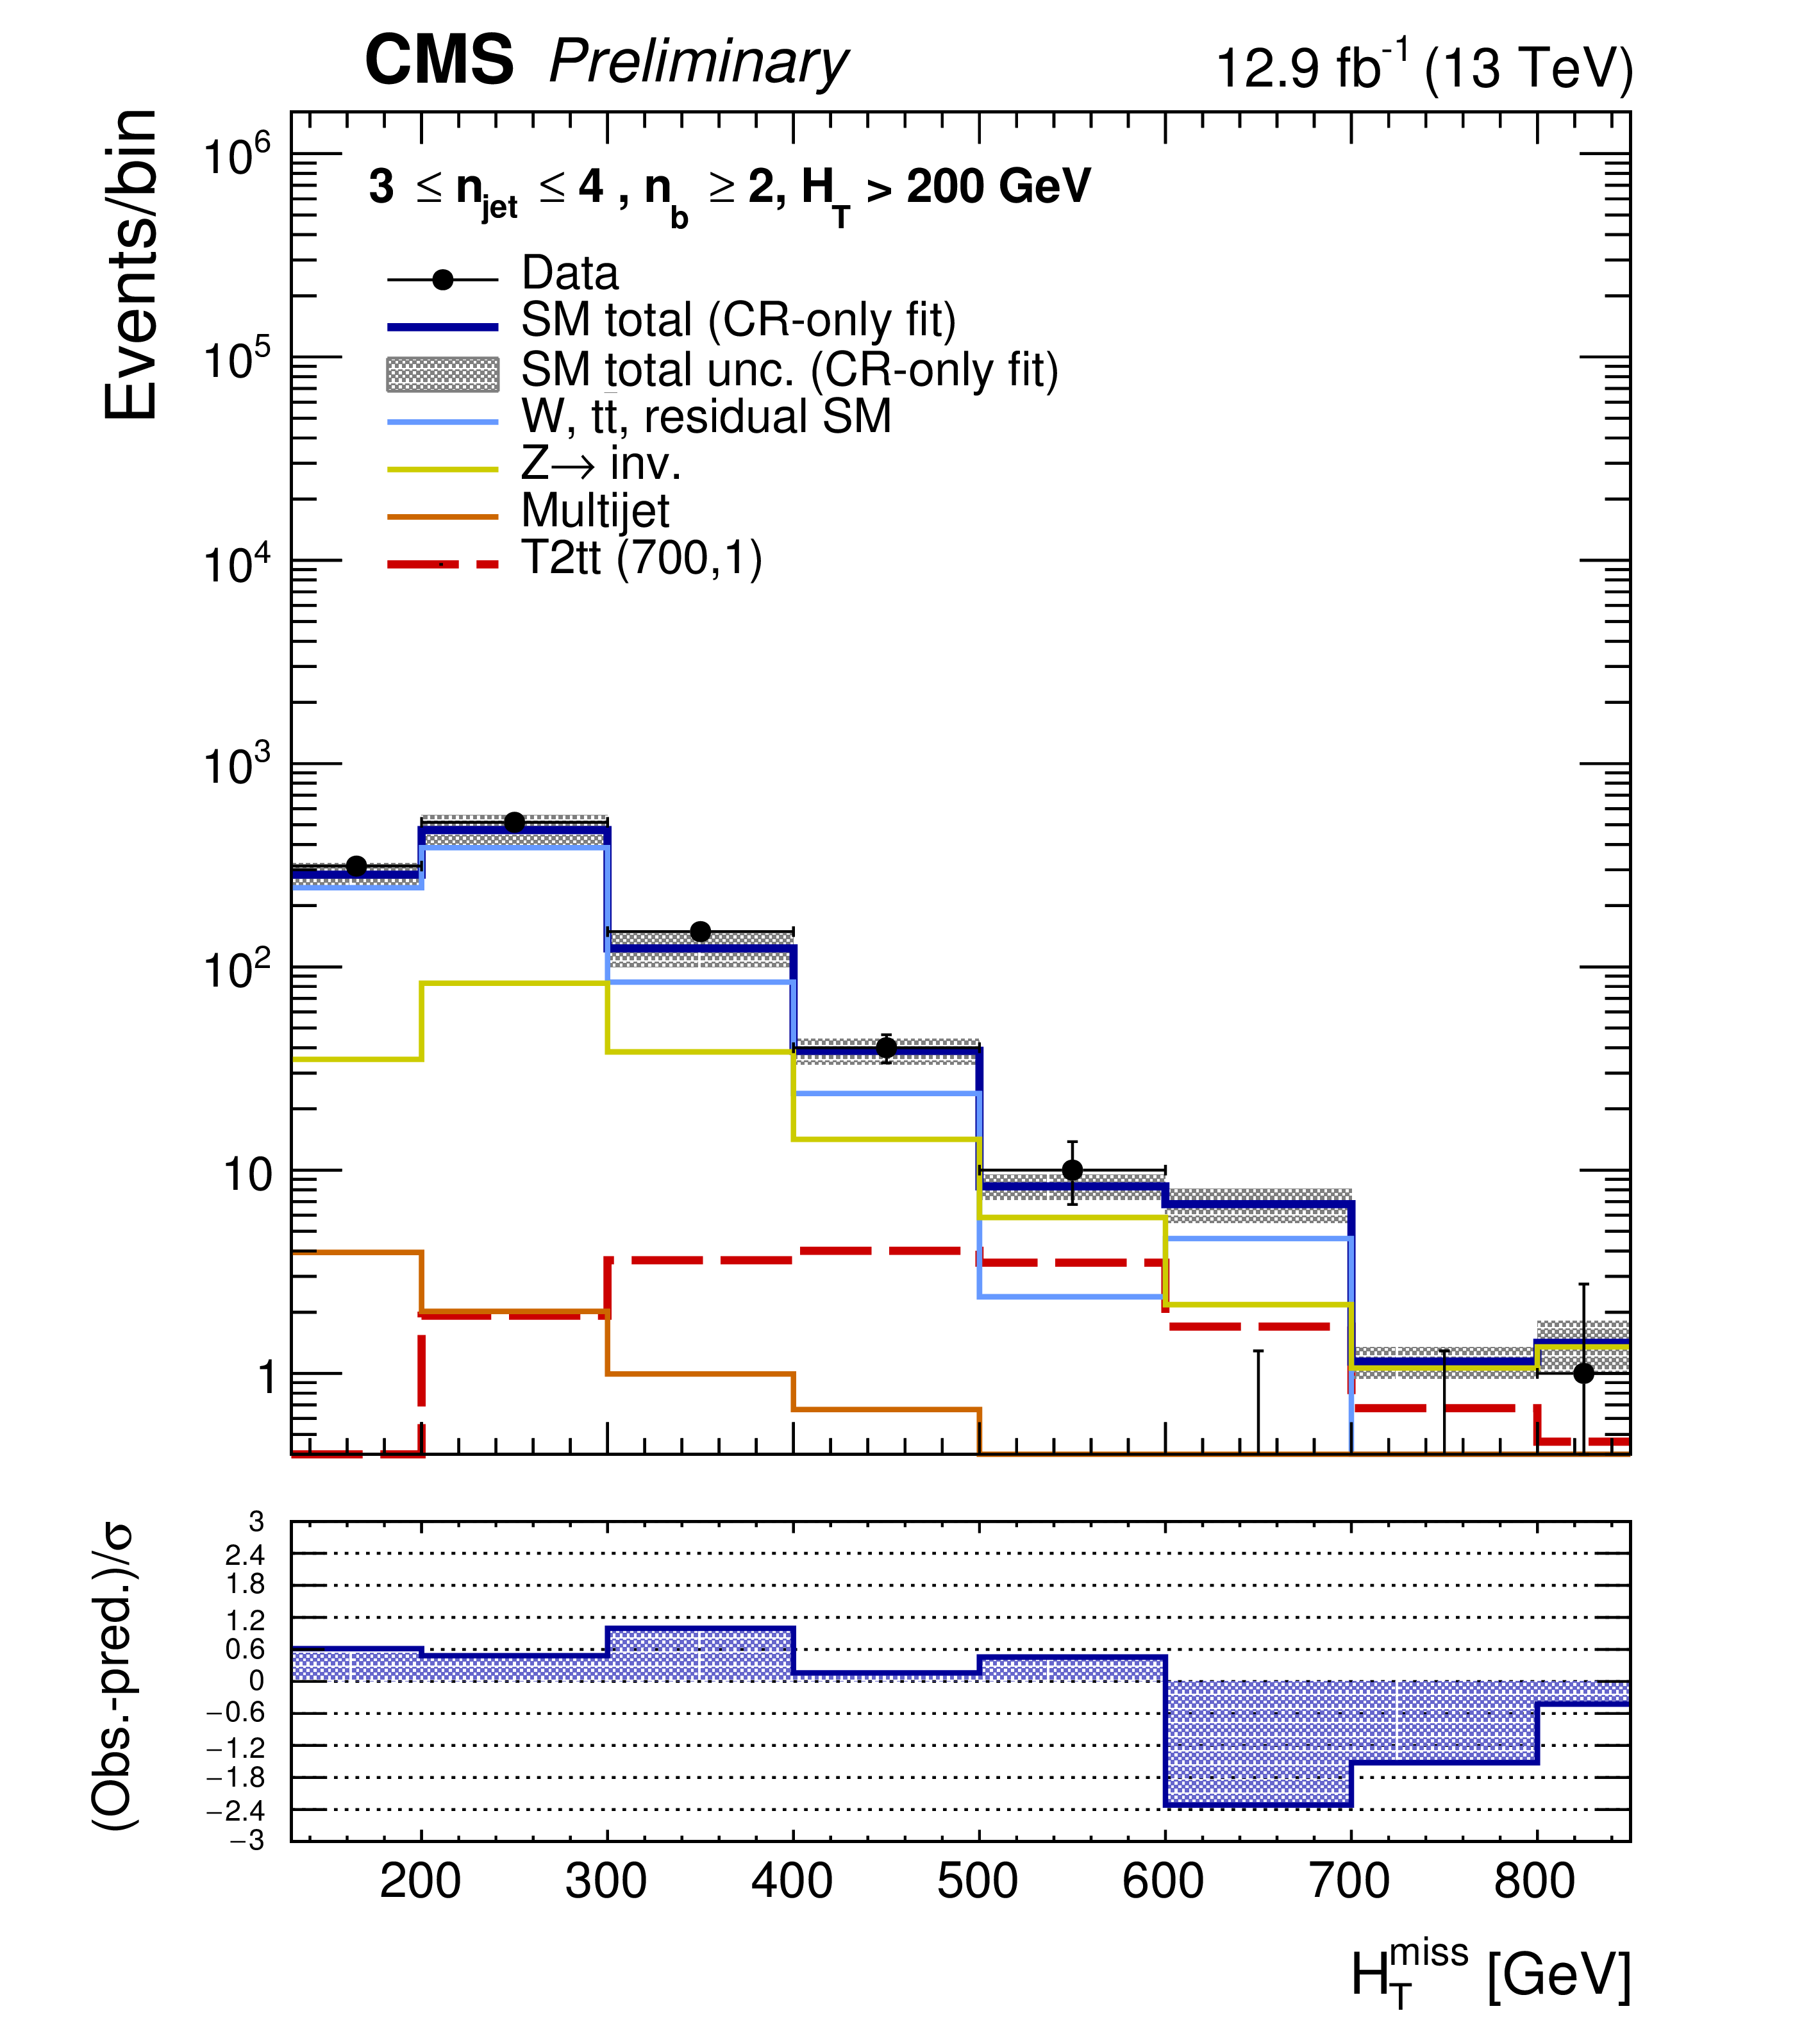
Additional Figure 10:
The post-fit (background-only fit) $H_{\mathrm {T}}^{\mathrm {miss}}$ distribution in the category $n_{b}\geq 2, 3 \leq n_{jet}^{asym} \leq 4$, for the predicted background, an example of a signal model and the observation. |

png pdf root |
Additional Figure 11:
The pre-fit $H_{\mathrm {T}}^{\mathrm {miss}}$ distribution in the category $n_{b}\leq 1, 3 \leq n_{jet} \leq 4$, for the predicted background, an example of a signal model and the observation. |

png pdf root |
Additional Figure 12:
The post-fit (background-only fit) $H_{\mathrm {T}}^{\mathrm {miss}}$ distribution in the category $n_{b}\leq 1, 3 \leq n_{jet} \leq 4$, for the predicted background, an example of a signal model and the observation. |
png pdf root |
Additional Figure 13:
The pre-fit $H_{\mathrm {T}}^{\mathrm {miss}}$ distribution in the category $n_{b}\geq 2, 3 \leq n_{jet} \leq 4$, for the predicted background, an example of a signal model and the observation. |

png pdf root |
Additional Figure 14:
The post-fit (background-only fit) $H_{\mathrm {T}}^{\mathrm {miss}}$ distribution in the category $n_{b}\geq 2, 3 \leq n_{jet} \leq 4$, for the predicted background, an example of a signal model and the observation. |
png pdf root |
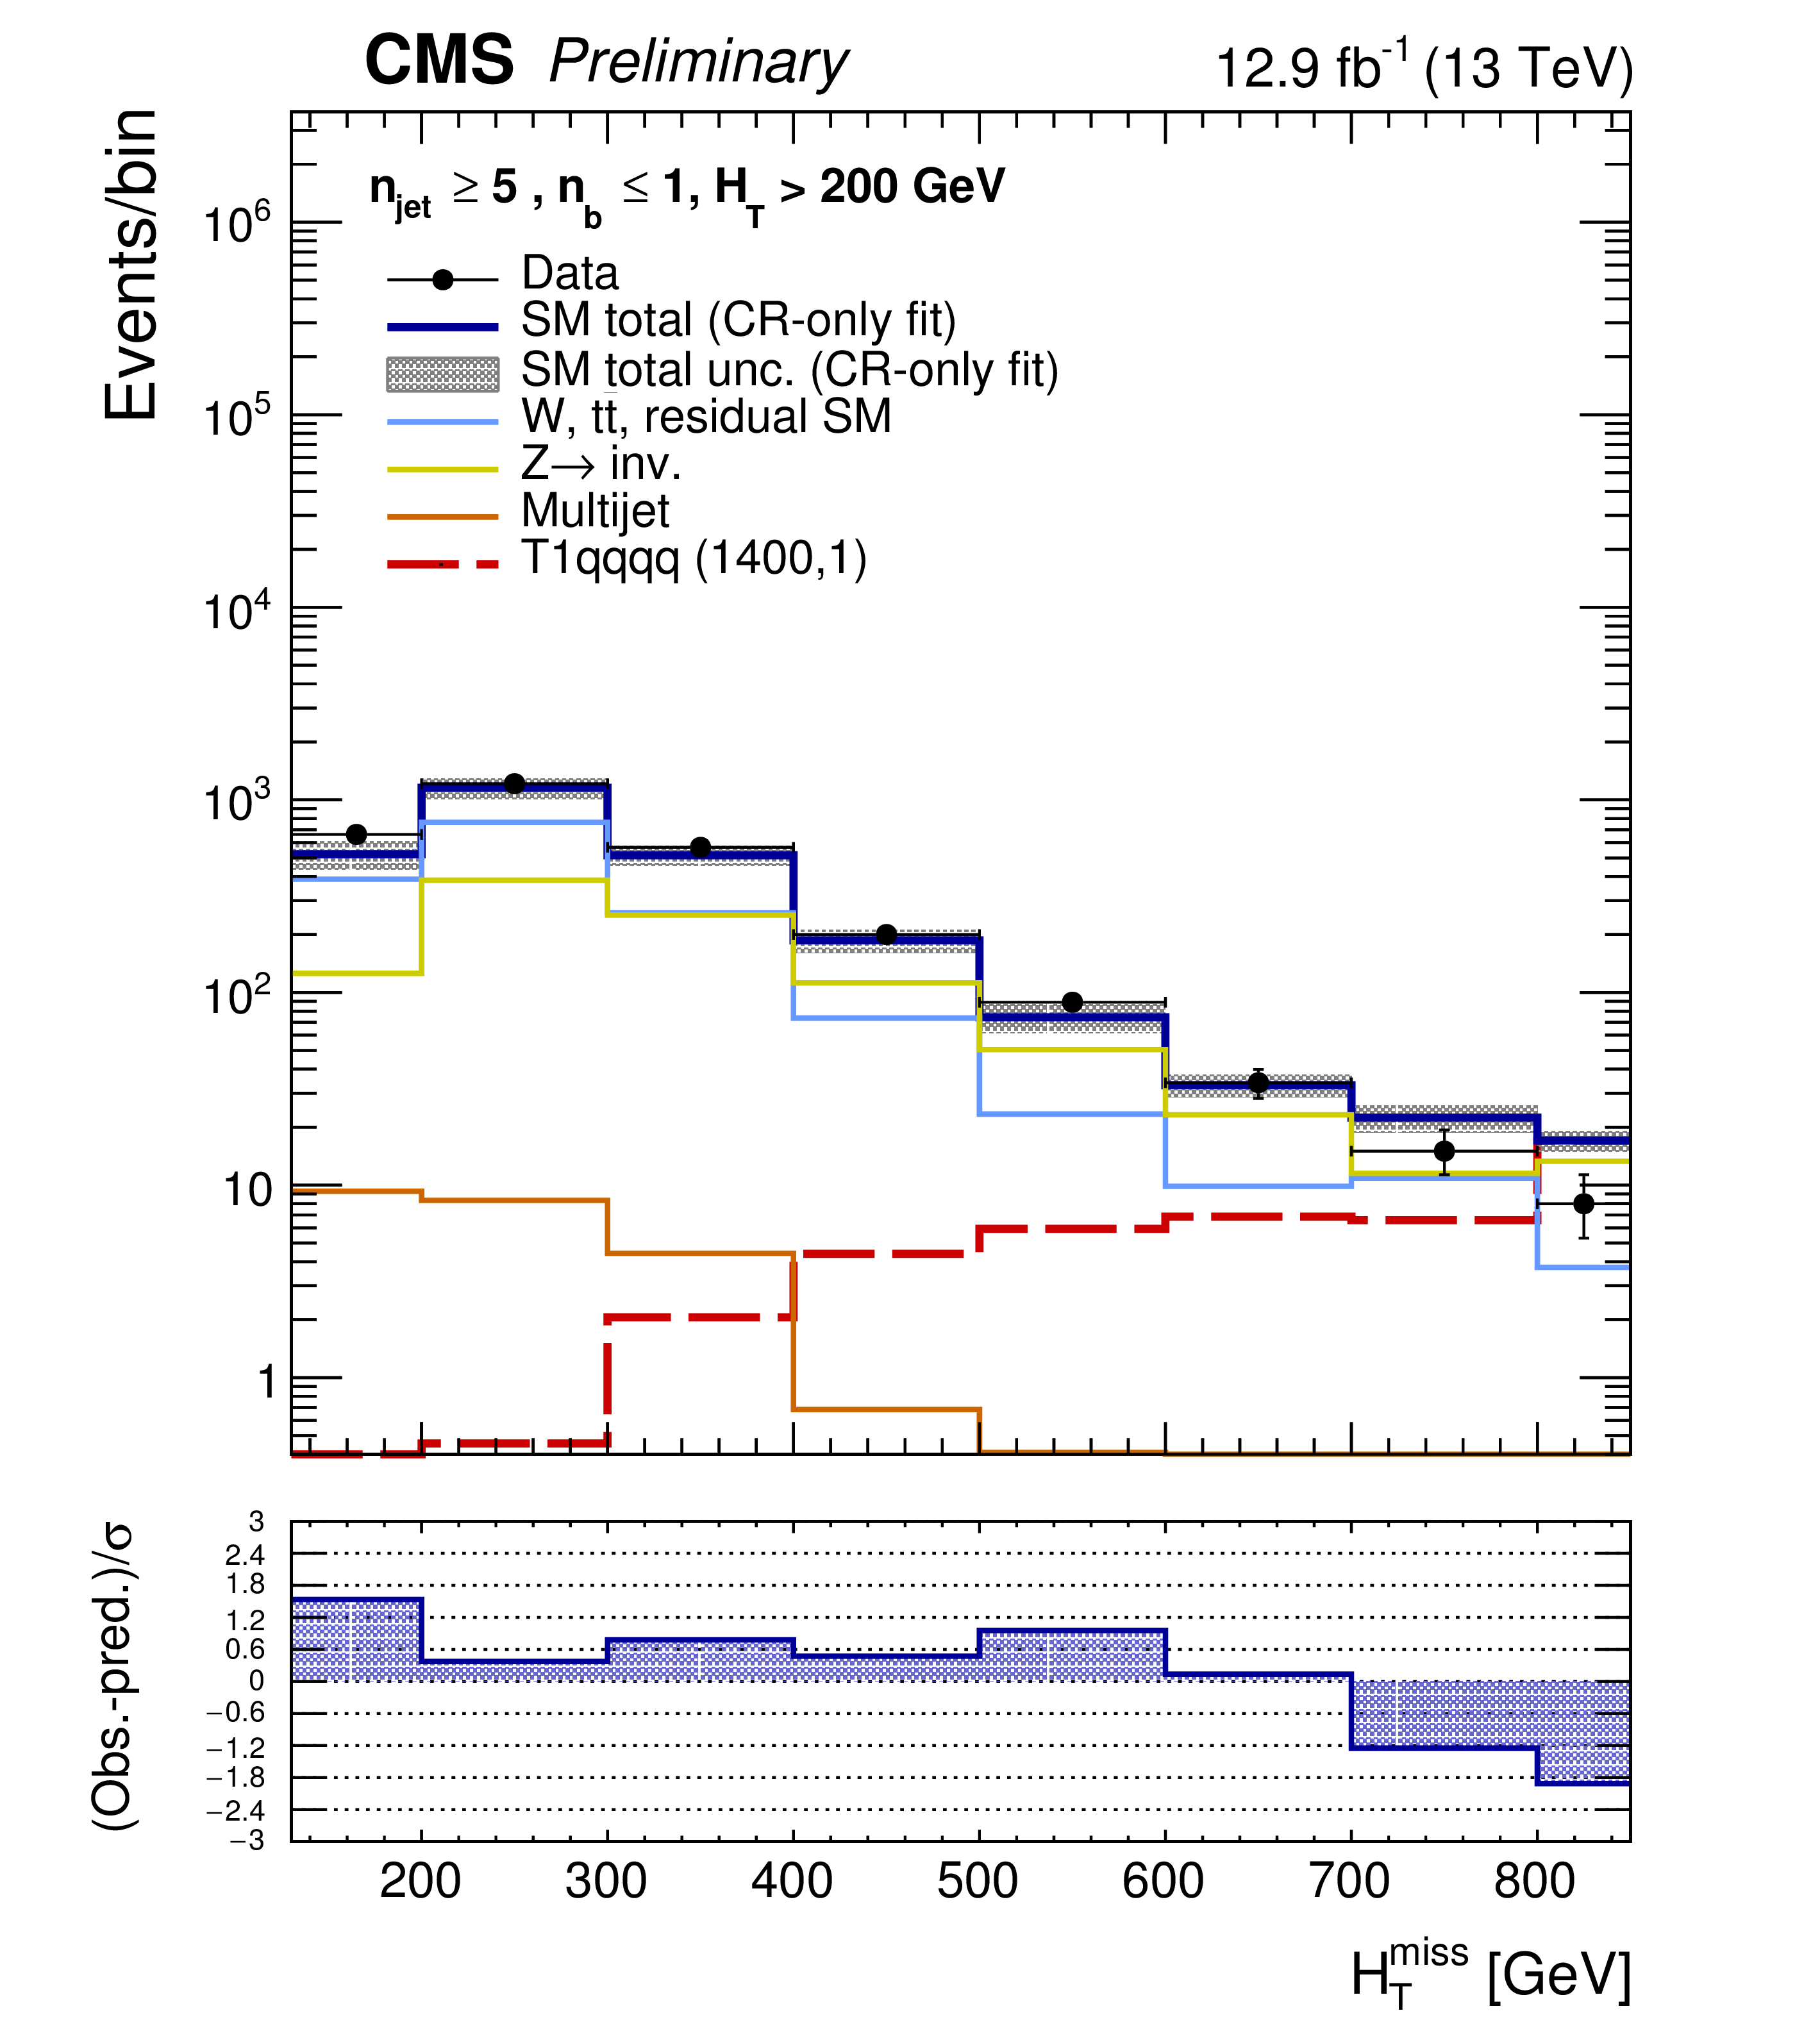
Additional Figure 15:
The pre-fit $H_{\mathrm {T}}^{\mathrm {miss}}$ distribution in the category $n_{b}\leq 1, n_{jet} \geq 5$, for the predicted background, an example of a signal model and the observation. |

png pdf root |
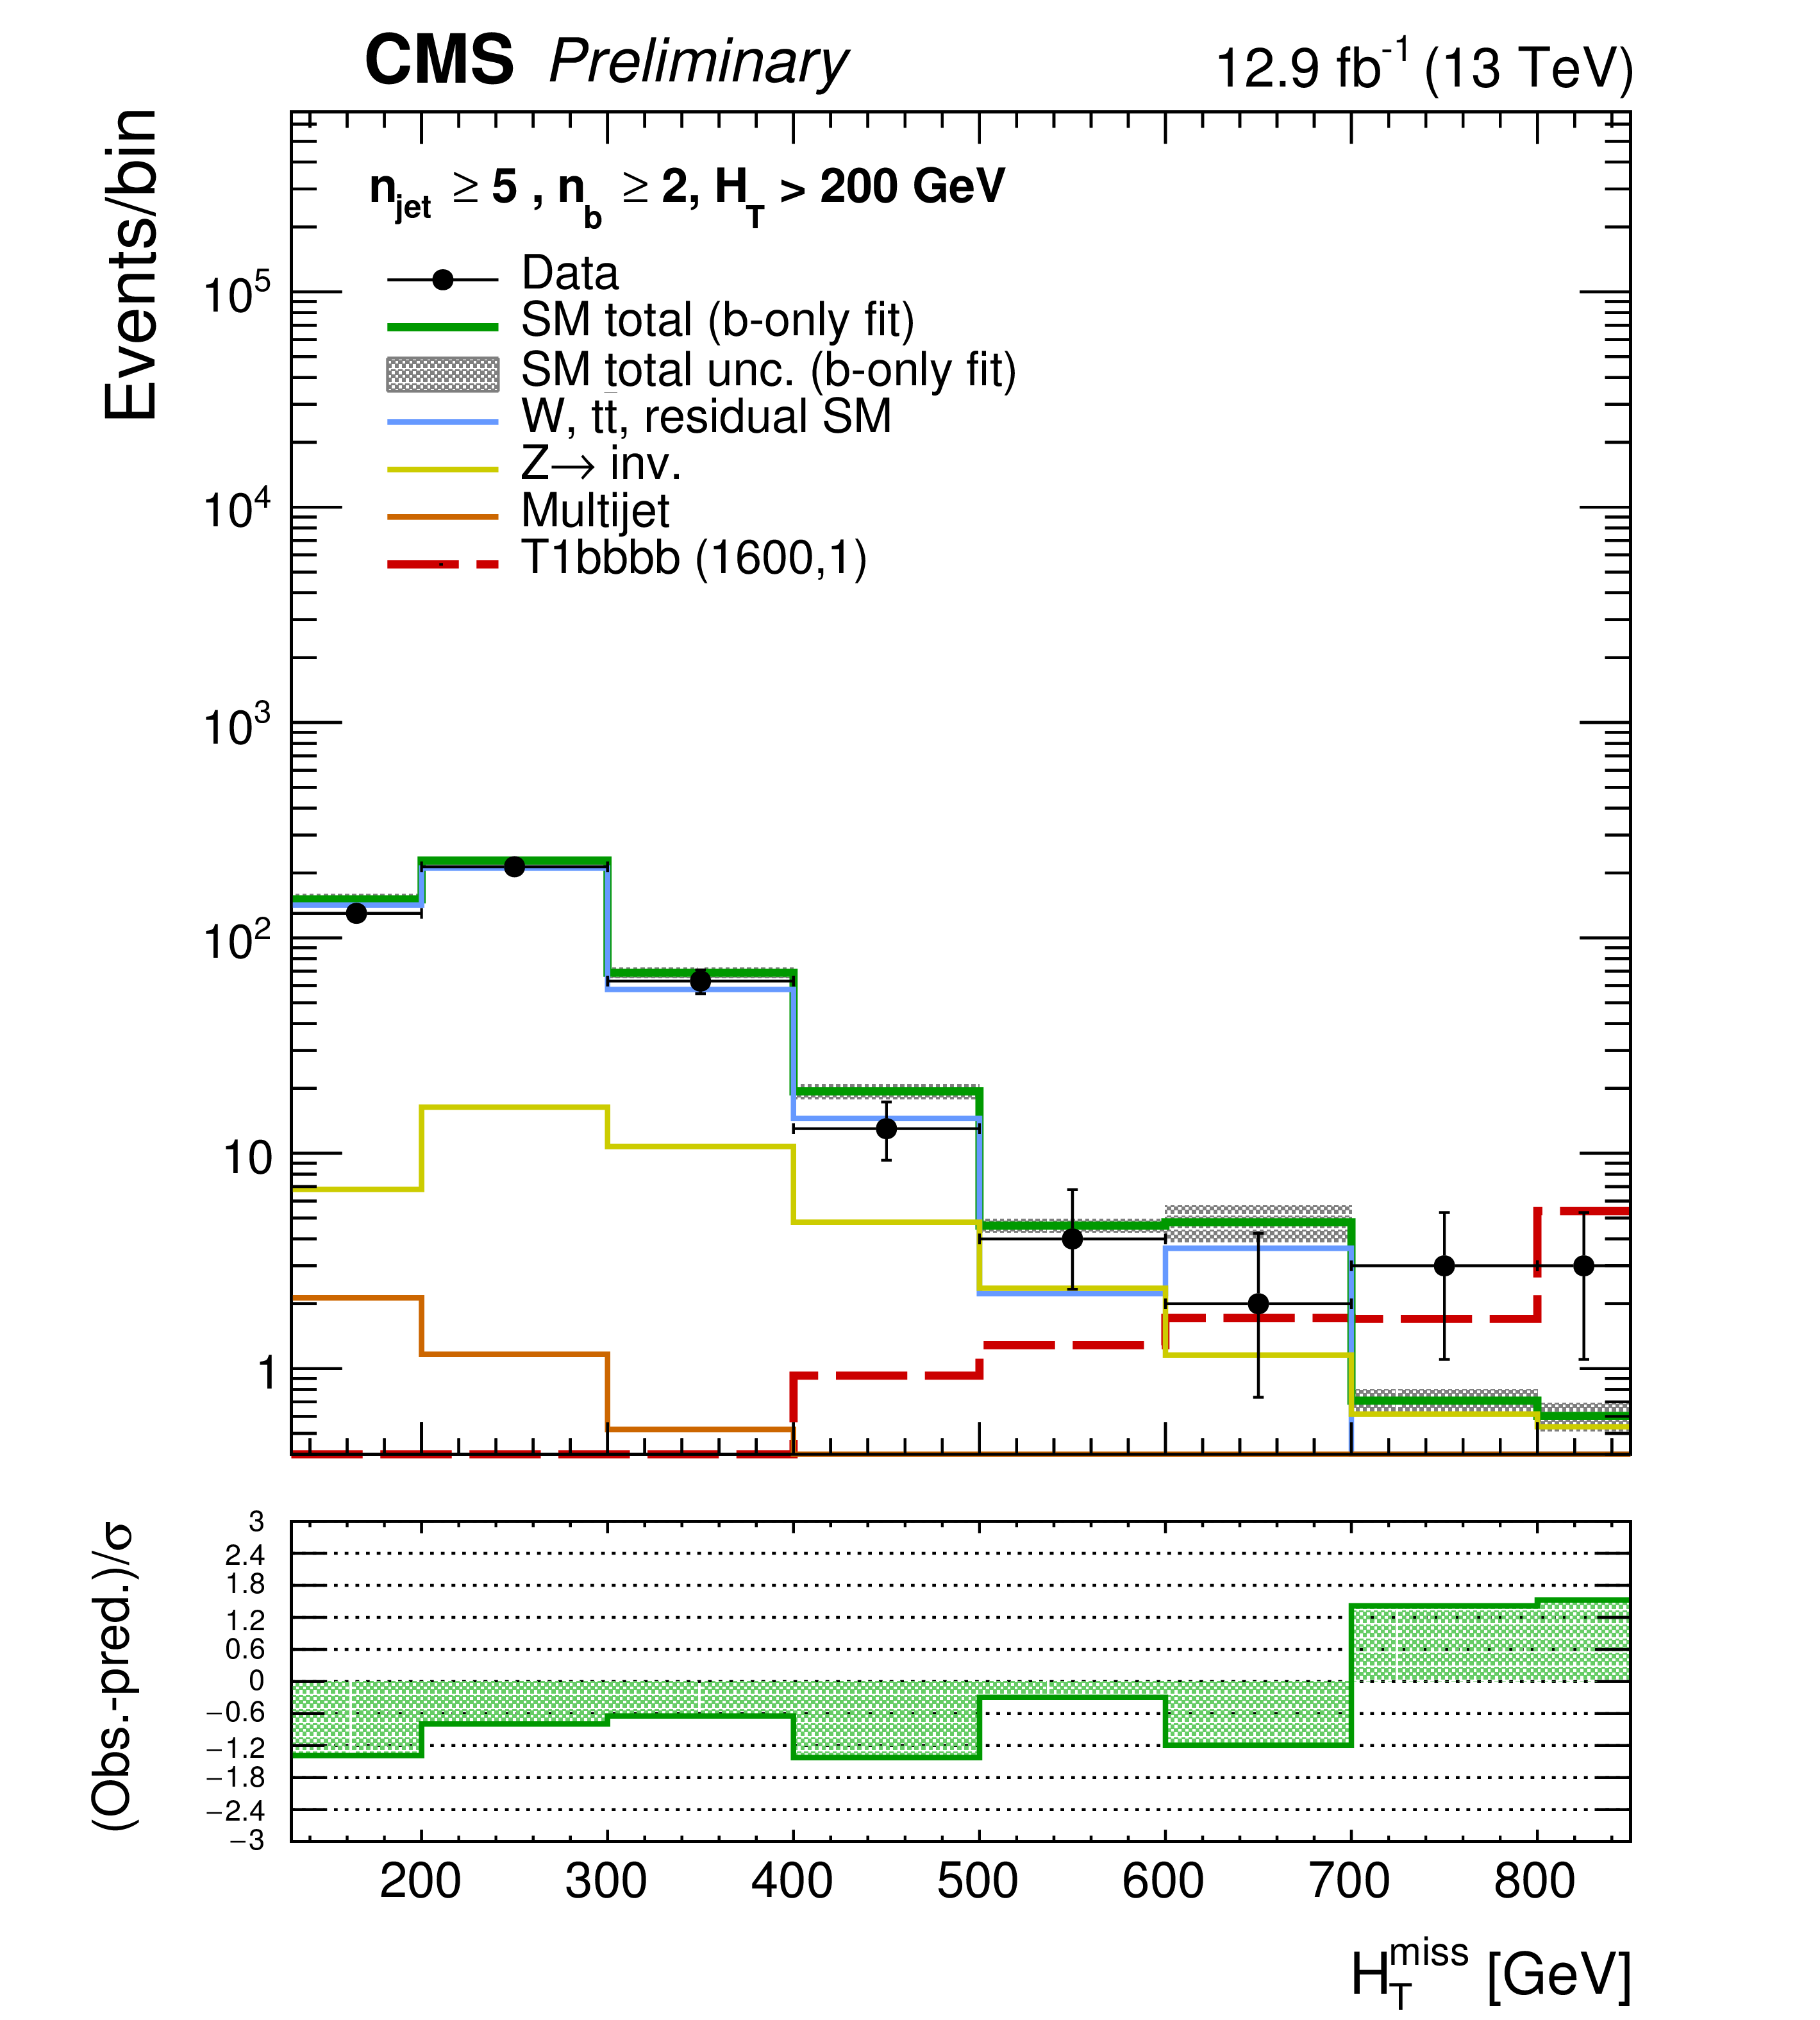
Additional Figure 16:
The post-fit (background-only fit) $H_{\mathrm {T}}^{\mathrm {miss}}$ distribution in the category $n_{b}\leq 1, n_{jet} \geq 5$, for the predicted background, an example of a signal model and the observation. |

png pdf root |
Additional Figure 17:
The pre-fit $H_{\mathrm {T}}^{\mathrm {miss}}$ distribution in the category $n_{b}\geq 2, n_{jet} \geq 5$, for the predicted background, an example of a signal model and the observation. |
png pdf root |
Additional Figure 18:
The post-fit (background-only fit) $H_{\mathrm {T}}^{\mathrm {miss}}$ distribution in the category $n_{b}\geq 2, n_{jet} \geq 5$, for the predicted background, an example of a signal model and the observation. |
| Additional Tables | |

png pdf |
Additional Table 1:
The overall efficiency and the efficiency for each selection for a benchmark model of gluino pair production with decay to 4 b-quarks (T1bbbb), corresponding to $m_{\text{Gluino}} = $ 1000 GeV, $m_{\text{LSP}} = $ 900 GeV. The details of the selection can be found in the main document. |

png pdf |
Additional Table 2:
The overall efficiency and the efficiency for each selection for a benchmark model of gluino pair production with decay to 4 b-quarks (T1bbbb), corresponding to $m_{\text{Gluino}} = $ 1800 GeV, $m_{\text{LSP}} = $ 1 GeV. The details of the selection can be found in the main document. |

png pdf |
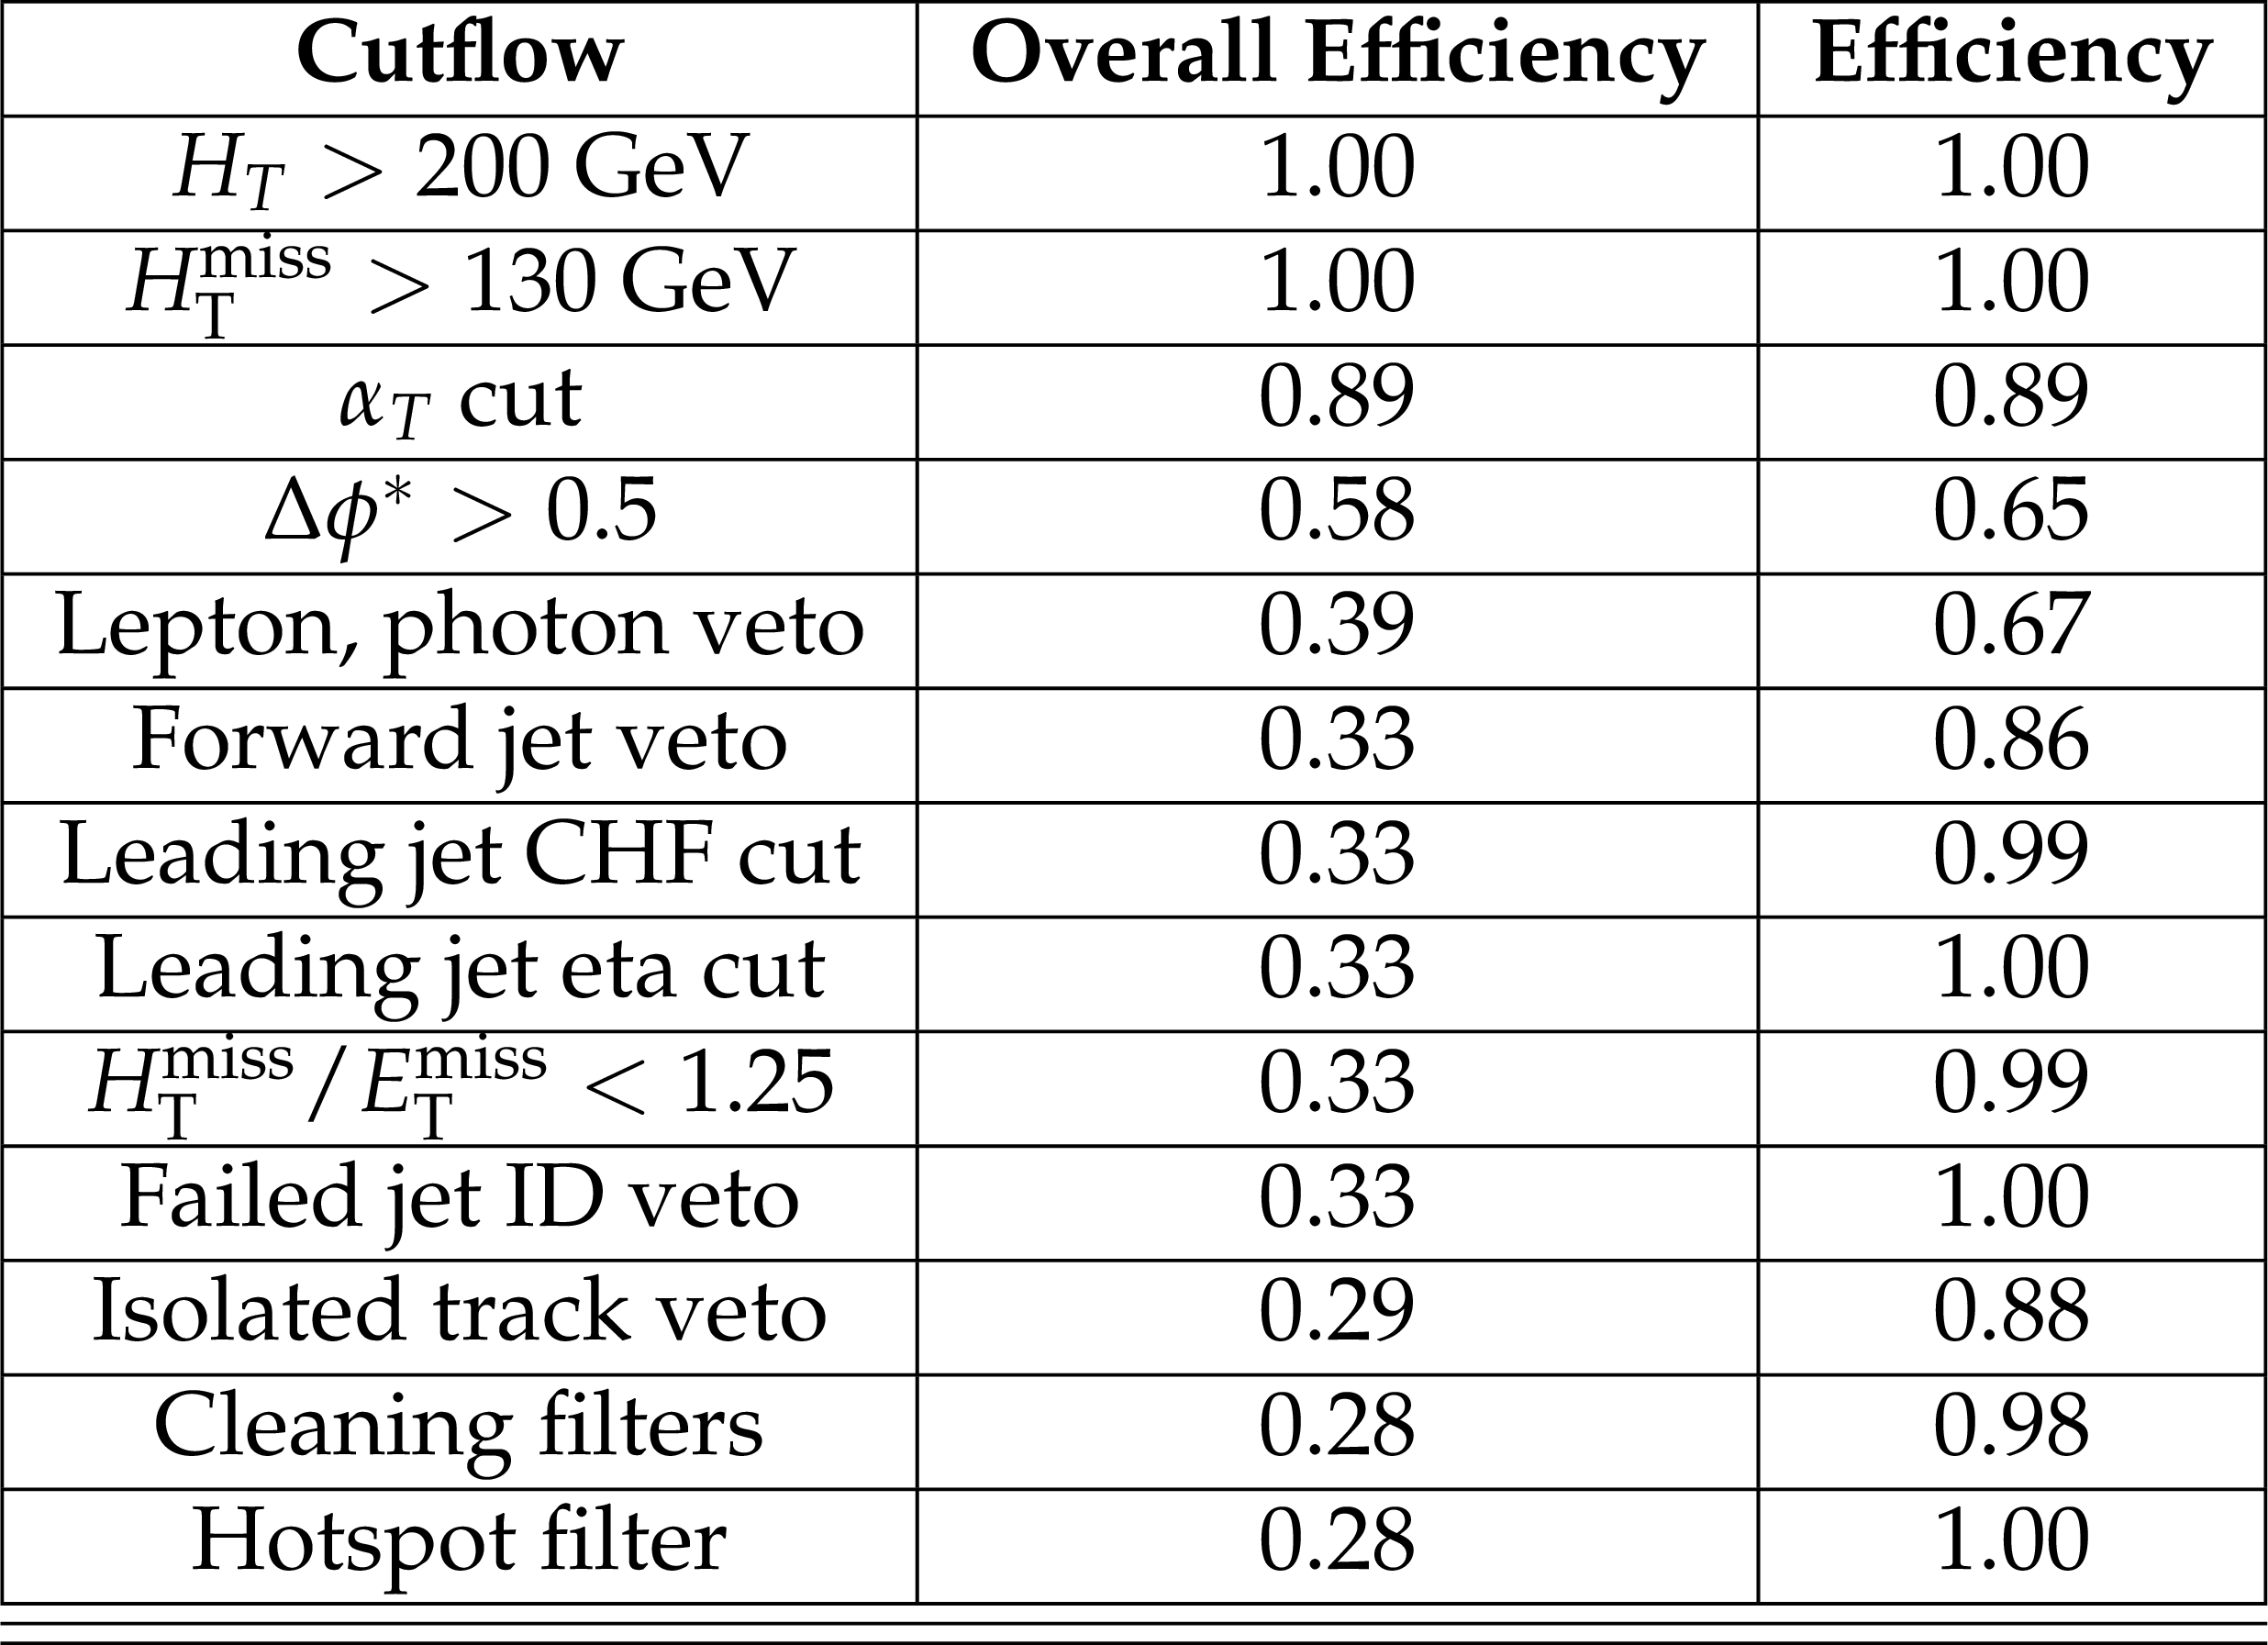
Additional Table 3:
The overall efficiency and the efficiency for each selection for a benchmark model of gluino pair production with decay to 4 top quarks (T1tttt), corresponding to $m_{\text{Gluino}} = $ 1600 GeV, $m_{\text{LSP}} = $ 1 GeV. The details of the selection can be found in the main document. |

png pdf |
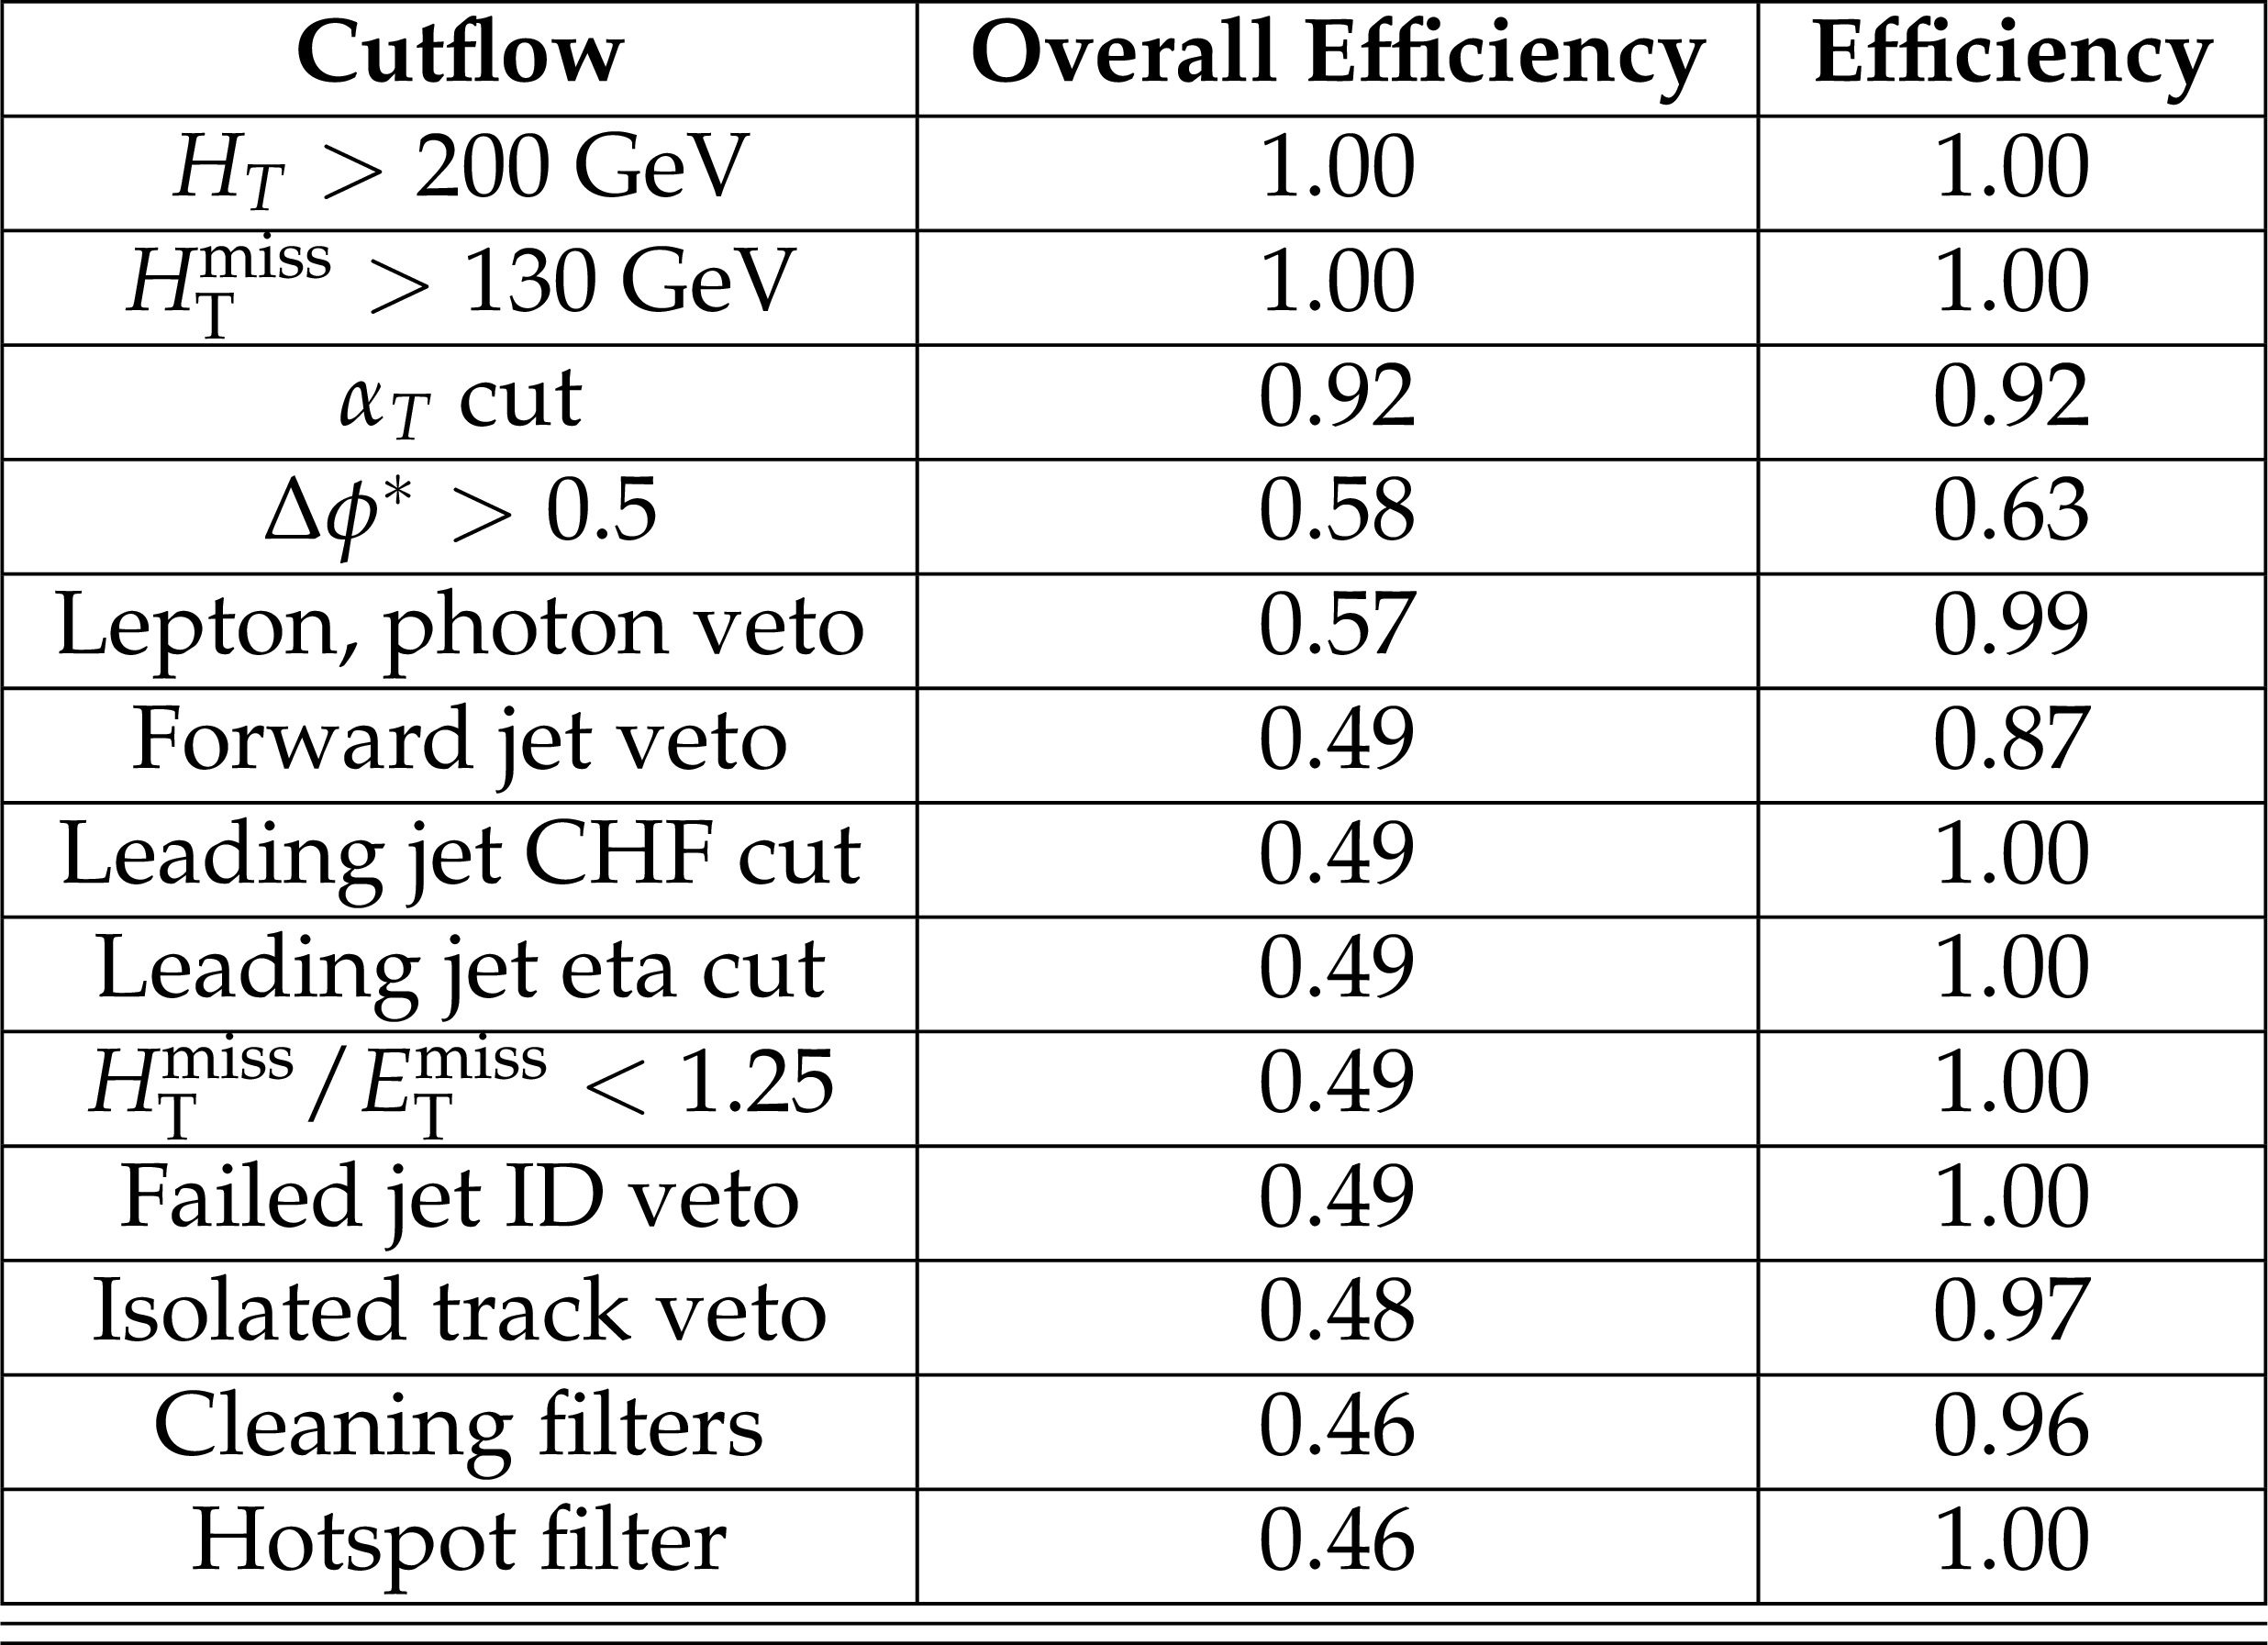
Additional Table 4:
The overall efficiency and the efficiency for each selection for a benchmark model of gluino pair production with decay to 4 top quarks (T1tttt), corresponding to $m_{\text{Gluino}} = $ 800 GeV, $m_{\text{LSP}} = $ 575 GeV. The details of the selection can be found in the main document. |

png pdf |
Additional Table 5:
The overall efficiency and the efficiency for each selection for a benchmark model of stop pair production with decay to 2 top quarks (T2tt), corresponding to $m_{\text{Stop}} = $ 300 GeV, $m_{\text{LSP}} = $ 200 GeV. The details of the selection can be found in the main document. |
png pdf |
Additional Table 6:
The overall efficiency and the efficiency for each selection for a benchmark model of stop pair production with decay to 2 top quarks (T2tt), corresponding to $m_{\text{Stop}} = $ 900 GeV, $m_{\text{LSP}} = $ 1 GeV. The details of the selection can be found in the main document. |
png pdf |
Additional Table 7:
The overall efficiency and the efficiency for each selection for a benchmark model of sbottom pair production with decay to 2 b-quarks (T2bb), corresponding to $m_{\text{Sbottom}} = $ 1000 GeV, $m_{\text{LSP}} = $ 1 GeV. The details of the selection can be found in the main document. |

png pdf |
Additional Table 8:
The overall efficiency and the efficiency for each selection for a benchmark model of sbottom pair production with decay to 2 b-quarks (T2bb), corresponding to $m_{\text{Sbottom}} = $ 450 GeV, $m_{\text{LSP}} = $ 400 GeV. The details of the selection can be found in the main document. |
| References | ||||
| 1 | Y. A. Gol'fand and E. P. Likhtman | Extension of the Algebra of Poincare Group Generators and Violation of p Invariance | JEPTL 13 (1971) 323 | |
| 2 | J. Wess and B. Zumino | Supergauge transformations in four dimensions | Nucl. Phys. B 70 (1974) 39 | |
| 3 | H. P. Nilles | Supersymmetry, Supergravity and Particle Physics | Phys. Reports 110 (1984) 1 | |
| 4 | H. Haber and G. Kane | The Search for Supersymmetry: Probing Physics Beyond the Standard Model | Phys. Reports 117 (1987) 75 | |
| 5 | R. Barbieri, S. Ferrara, and C. A. Savoy | Gauge Models with Spontaneously Broken Local Supersymmetry | PLB 119 (1982) 343 | |
| 6 | S. Dawson, E. Eichten, and C. Quigg | Search for Supersymmetric Particles in Hadron - Hadron Collisions | PRD 31 (1985) 1581 | |
| 7 | E. Witten | Dynamical Breaking of Supersymmetry | Nucl. Phys. B 188 (1981) 513 | |
| 8 | S. Dimopoulos and H. Georgi | Softly Broken Supersymmetry and SU(5) | Nucl. Phys. B 193 (1981) 150 | |
| 9 | ATLAS Collaboration | Observation of a new particle in the search for the Standard Model Higgs boson with the ATLAS detector at the LHC | PLB 716 (2012) 1 | |
| 10 | CMS Collaboration | Observation of a new boson at a mass of 125 GeV with the CMS experiment at the LHC | PLB 716 (2012) 30 | |
| 11 | G. R. Farrar and P. Fayet | Phenomenology of the Production, Decay, and Detection of New Hadronic States Associated with Supersymmetry | PLB 76 (1978) 575 | |
| 12 | ATLAS Collaboration | Search for new phenomena in final states with large jet multiplicities and missing transverse momentum with ATLAS using $ \sqrt{s} = $ 13 TeV proton--proton collisions | Accepted by \it PLB | 1602.09058 |
| 13 | ATLAS Collaboration | Search for new phenomena in final states with an energetic jet and large missing transverse momentum in pp collisions at $ \sqrt{s} = $ 13 TeV using the ATLAS detector | Submitted to \it PRD | 1604.07773 |
| 14 | CMS Collaboration | Search for supersymmetry in the multijet and missing transverse momentum final state in pp collisions at 13 TeV | Accepted by \it PLB | CMS-SUS-15-002 1602.06581 |
| 15 | CMS Collaboration | Search for new physics with the M$ _{T2} $ variable in all-jets final states produced in pp collisions at $ \sqrt{s} = $ 13 TeV | Submitted to \it JHEP | CMS-SUS-15-003 1603.04053 |
| 16 | CMS Collaboration | CMS Luminosity Based on Pixel Cluster Counting - Summer 2012 Update | CDS | |
| 17 | CMS Collaboration | The CMS experiment at the CERN LHC | JINST 03 (2008) S08004 | CMS-00-001 |
| 18 | CMS Collaboration | Search for Supersymmetry in pp Collisions at 7 TeV in Events with Jets and Missing Transverse Energy | PLB 698 (2011) 196 | |
| 19 | CMS Collaboration | Search for Supersymmetry at the LHC in Events with Jets and Missing Transverse Energy | PRL 107 (2011) 221804 | |
| 20 | CMS Collaboration | Search for supersymmetery in final states with missing transverse energy and 0, 1, 2, or $ \ge $3 b-quark jets in 7 TeV pp collisions using the $ \alpha_{\mathrm{T}} $ variable | JHEP 01 (2013) 077 | |
| 21 | CMS Collaboration | Search for supersymmetry in hadronic final states with missing transverse energy using the variables $ \alpha_{\mathrm{T}} $ and b-quark multiplicity in pp collisions at $ \sqrt{s} = $ 8 TeV | EPJC 01 (2013) 077 | |
| 22 | CMS Collaboration | Search for top squark pair production in compressed scenarios in proton-proton collisions at $ \sqrt{s} = $ 8 TeV using the $ \alpha_{\mathrm{T}} $ variable | Submitted to \it PLB | CMS-SUS-14-006 1605.08993 |
| 23 | CMS Collaboration | Search for new physics in final states with jets and missing transverse momentum in $ \sqrt{s} = 13 $~TeV pp collisions with the $ \alpha_T $ variable | CMS-PAS-SUS-15-005 | CMS-PAS-SUS-15-005 |
| 24 | L. Randall and D. Tucker-Smith | Dijet Searches for Supersymmetry at the Large Hadron Collider | PRL 101 (2008) 221803 | |
| 25 | J. Alwall, P. Schuster, and N. Toro | Simplified Models for a First Characterization of New Physics at the LHC | PRD 79 (2009) 075020 | |
| 26 | J. Alwall, M.-P. Le, M. Lisanti, and J. G. Wacker | Model-independent jets plus missing energy searches | PRD 79 (2009) 015005 | |
| 27 | D. Alves et al. | Simplified models for LHC new physics searches | JPG 39 (2012) 105005 | |
| 28 | J. Alwall et al. | The automated computation of tree-level and next-to-leading order differential cross sections, and their matching to parton shower simulations | Journal of High Energy Physics 07 (2014) 079 | 1405.0301 |
| 29 | S. Alioli, P. Nason, C. Oleari, and E. Re | A general framework for implementing NLO calculations in shower Monte Carlo programs: the POWHEG BOX | JHEP 06 (2010) 043 | 1002.2581 |
| 30 | E. Re | Single-top Wt-channel production matched with parton showers using the POWHEG method | EPJC 71 (2011) 1547 | 1009.2450 |
| 31 | T. Sj\"ostrand et al. | An Introduction to PYTHIA 8.2 | CPC 191 (2015) 159 | 1410.3012 |
| 32 | R. Gavin, Y. Li, F. Petriello, and S. Quackenbush | W Physics at the LHC with FEWZ 2.1 | CPC 184 (2013) 208 | 1201.5896 |
| 33 | R. Gavin, Y. Li, F. Petriello, and S. Quackenbush | FEWZ 2.0: A code for hadronic Z production at next-to-next-to-leading order | CPC 182 (2011) 2388 | 1011.3540 |
| 34 | T. Melia, P. Nason, R. Rontsch, and G. Zanderighi | W$ ^+ $W$ ^- $, WZ and ZZ production in the POWHEG BOX | JHEP 11 (2011) 078 | 1107.5051 |
| 35 | C. M. and A. Mitov | Top++: A program for the calculation of the top-pair cross-section at hadron colliders | CPC 185 (2014) 2930 | 1112.5675 |
| 36 | S. Alioli, P. Nason, C. Oleari, and E. Re | NLO single-top production matched with shower in POWHEG: s- and t-channel contributions | JHEP 09 (2009) 111 | 0907.4076 |
| 37 | S. Agostinelli et al. | GEANT4 --- a simulation toolkit | Nucl. Instr. and Meth. A 506 (2003) 250 | |
| 38 | W. Beenakker, R. H\"opker, M. Spira, and P. M. Zerwas | Squark and gluino production at hadron colliders | Nucl. Phys. B 492 (1997) 51 | |
| 39 | A. Kulesza and L. Motyka | Threshold Resummation for Squark-Antisquark and Gluino-Pair Production at the LHC | PRL 102 (2009) 111802 | |
| 40 | A. Kulesza and L. Motyka | Soft gluon resummation for the production of gluino-gluino and squark-antisquark pairs at the LHC | PRD 80 (2009) 095004 | |
| 41 | W. Beenakker et al. | Soft-gluon resummation for squark and gluino hadroproduction | JHEP 09 (2009) 041 | |
| 42 | W. Beenakker et al. | Squark and gluino hadroproduction | Int. J. Mod. Phys. A 26 (2011) 2637 | |
| 43 | C. Borschensky et al. | Squark and gluino production cross sections in pp collisions at $ \sqrt{s} = 13 $, 14, 33 and 100$ TeV $ | EPJC 74 (2014) 3174 | 1407.5066 |
| 44 | CMS Collaboration | The fast simulation of the CMS detector at LHC | J. Phys. Conf. Ser. 331 (2011) 032049 | |
| 45 | NNPDF Collaboration | Parton distributions for the LHC Run II | JHEP 04 (2015) 040 | 1410.8849 |
| 46 | CMS Collaboration | Particle--Flow Event Reconstruction in CMS and Performance for Jets, Taus, and $ E_{\mathrm{T}}^{\text{miss}} $ | CDS | |
| 47 | CMS Collaboration | Commissioning of the particle-flow event reconstruction with the first LHC collisions recorded in the CMS detector | CDS | |
| 48 | CMS Collaboration | Electron reconstruction and identification at $ \sqrt{s} $ = 7 TeV | CDS | |
| 49 | CMS Collaboration | Performance of CMS muon reconstruction in pp collision events at $ \sqrt{s} = $ 7 TeV | JINST 7 (2012) P10002 | |
| 50 | CMS Collaboration | Isolated Photon Reconstruction and Identification at $ \sqrt{s} $ = 7 TeV | CDS | |
| 51 | M. Cacciari, G. P. Salam, and G. Soyez | The anti-$ k_{\rm T} $ jet clustering algorithm | JHEP 04 (2008) 063 | |
| 52 | CMS Collaboration | Jet energy scale and resolution in the CMS experiment in pp collisions at 8 TeV | Submitted to \it JINST | CMS-JME-13-004 1607.03663 |
| 53 | CMS Collaboration | Performance of the CMS missing transverse momentum reconstruction in pp data at $ \sqrt{s} $ = 8 TeV | JINST 10 (2015) P02006 | CMS-JME-13-003 1411.0511 |
| 54 | Z. Bern et al. | Driving Missing Data at Next-to-Leading Order | 1106.1423 | |
| 55 | T. Junk | Confidence level computation for combining searches with small statistics | Nucl. Instr. and Meth. A 434 (1999) 435 | |
| 56 | A. L. Read | Presentation of search results: the $ CL_s $ technique | JPG 28 (2002) 2693 | |
| 57 | G. Cowan, K. Cranmer, E. Gross, and O. Vitells | Asymptotic formulae for likelihood-based tests of new physics | EPJC 71 (2011) 1554 | |
|
|
Compact Muon Solenoid LHC, CERN |
|

|

|

|

|

|