

Compact Muon Solenoid
LHC, CERN
| CMS-PAS-SMP-16-019 | ||
| Measurements of differential cross sections and search for the electroweak production of two Z bosons in association with jets | ||
| CMS Collaboration | ||
| May 2017 | ||
| Abstract: This analysis reports measurements of differential cross sections for the production of two Z bosons in association with jets in pp collisions and a search for the electroweak production of two Z bosons in association with two jets at $\sqrt{s}= $ 13 TeV. The analysis is based on a data sample collected with the CMS detector corresponding to an integrated luminosity of 35.9 fb$^{-1}$. The measurements are performed in the leptonic decay modes $\mathrm{ZZ}\to\ell\ell\ell'\ell'$, where $\ell,\ell' = e, \mu$. The differential cross section as a function of the jet multiplicity, the transverse momentum and pseudorapidity of the leading and subleading jets, as well as the invariant mass of the two leading jets and their pseudorapidity separation are presented. The measured differential cross sections are compared to theoretical predictions. The electroweak production (EW) of two Z bosons in association with two jets is measured with an observed (expected) significance of 2.7 (1.6) standard deviations. A fiducial cross section for the electroweak production is measured to be $\sigma_{\textrm{EW}} = $ 0.40$^{+0.21}_{-0.16}$ (stat) $^{+0.13}_{-0.09}$ (syst) fb, in agreement with the standard model prediction. Limits on anomalous quartic gauge couplings are derived in terms of the effective field theory operators T0, T1, T2, T8 and T9. | ||
| Links: CDS record (PDF) ; inSPIRE record ; CADI line (restricted) ; | ||
| Figures & Tables | Summary | Additional Figures & Tables | References | CMS Publications |
|---|
| Figures | |
png pdf |
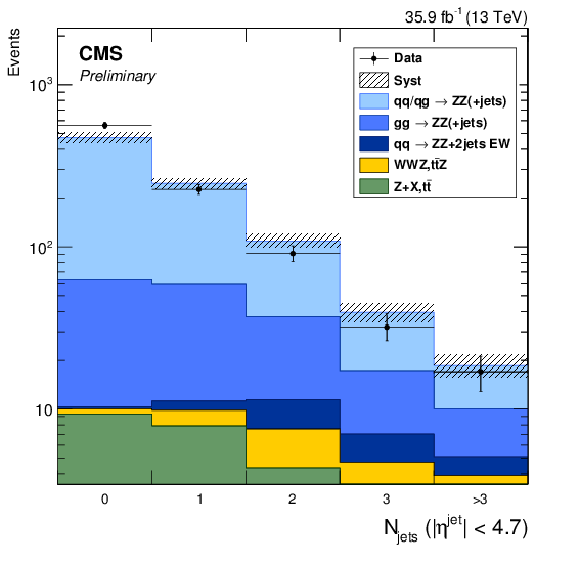
Figure 1:
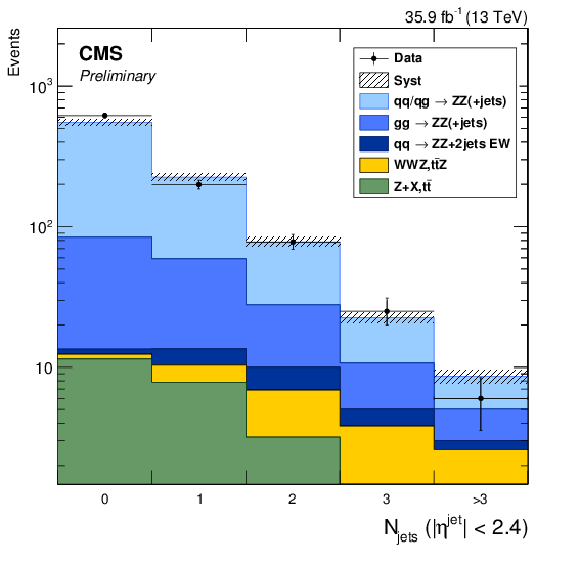
Distribution of reconstructed jet multiplicity. Points represent data, shaded histograms represent Monte Carlo predictions and background estimate while the hatched band on them represent systematic uncertainty on the prediction. Reducible background is obtained with data driven method. |
png pdf |
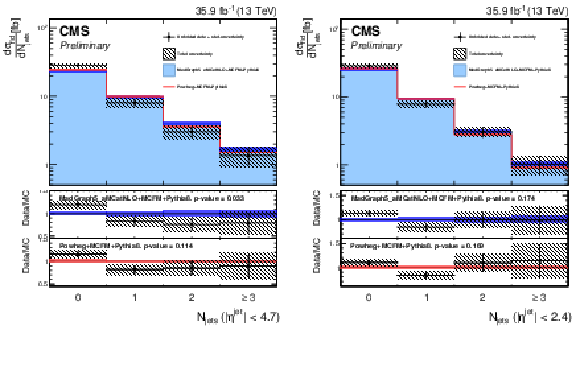
Figure 2:
Differential cross sections of $ \mathrm{pp} \to {\mathrm{ Z } } {\mathrm{ Z } } \to 4\ell $ processes as a function of the multiplicity of jets with $|\eta ^{\mathrm {jet}}|< $ 4.7 (left) and $|\eta ^{\mathrm {jet}}|< $ 2.4 (right). The cross sections are compared to the predictions from the MadGraph5_aMC@NLO and powheg sets of samples. All generators are interfaced to PYTHIA 8. The total experimental uncertainties are shown with hatched regions, while colored bands display the effect of varying the renormalization and factorization scales, PDFs and $\alpha _s$ on Monte Carlo (matrix element only) event description. |
png pdf |
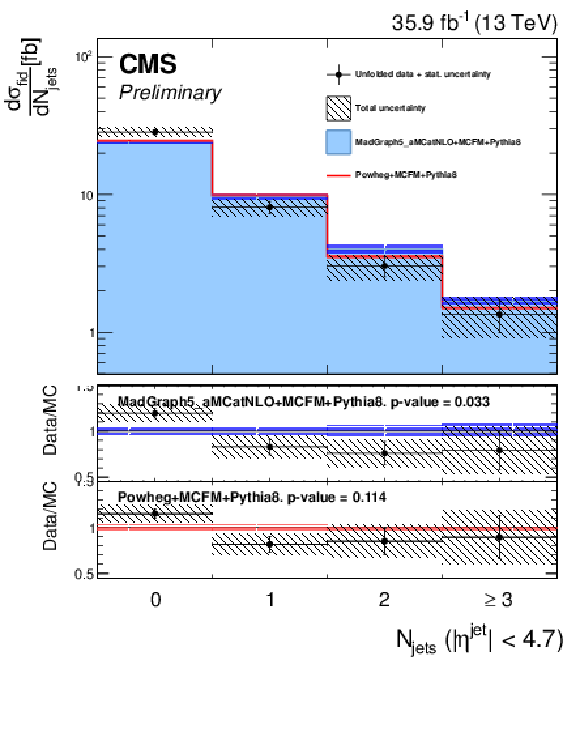
Figure 2-a:
Differential cross sections of $ \mathrm{pp} \to {\mathrm{ Z } } {\mathrm{ Z } } \to 4\ell $ processes as a function of the multiplicity of jets with $|\eta ^{\mathrm {jet}}|< $ 4.7. The cross sections are compared to the predictions from the MadGraph5_aMC@NLO and powheg sets of samples. All generators are interfaced to PYTHIA 8. The total experimental uncertainties are shown with hatched regions, while colored bands display the effect of varying the renormalization and factorization scales, PDFs and $\alpha _s$ on Monte Carlo (matrix element only) event description. |
png pdf |
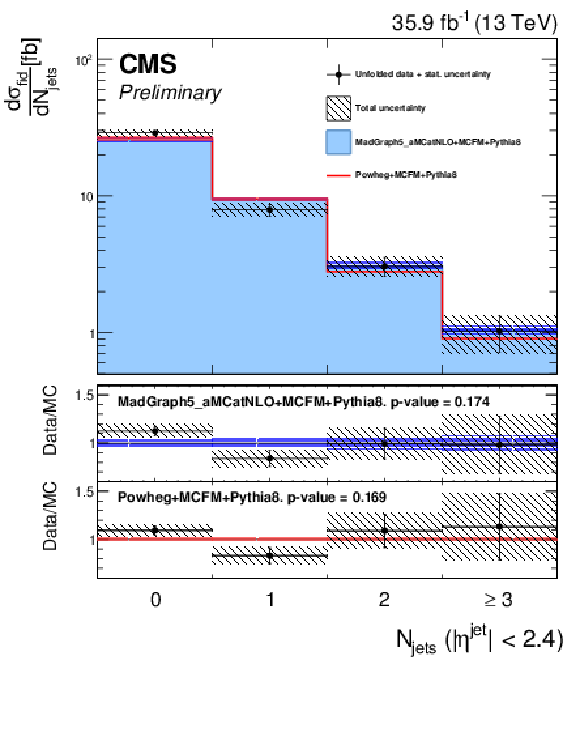
Figure 2-b:
Differential cross sections of $ \mathrm{pp} \to {\mathrm{ Z } } {\mathrm{ Z } } \to 4\ell $ processes as a function of the multiplicity of jets with $|\eta ^{\mathrm {jet}}|< $ 2.4. The cross sections are compared to the predictions from the MadGraph5_aMC@NLO and powheg sets of samples. All generators are interfaced to PYTHIA 8. The total experimental uncertainties are shown with hatched regions, while colored bands display the effect of varying the renormalization and factorization scales, PDFs and $\alpha _s$ on Monte Carlo (matrix element only) event description. |
png pdf |
Figure 3:
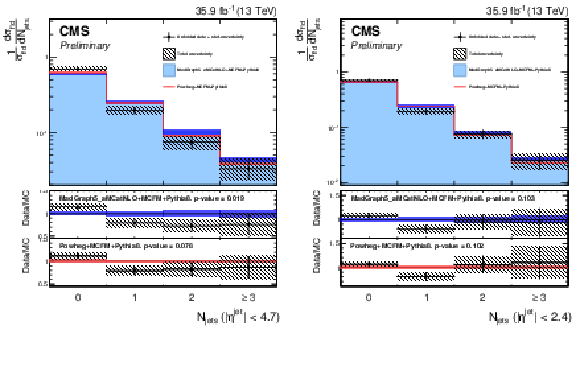
Normalized differential cross sections of $ \mathrm{pp} \to {\mathrm{ Z } } {\mathrm{ Z } } \to 4\ell $ processes as a function of the multiplicity of jets with $|\eta ^{\mathrm {jet}}|< $ 4.7 (left) and $|\eta ^{\mathrm {jet}}|< $ 2.4 (right). The cross sections are compared to the predictions from the MadGraph5_aMC@NLO and powheg sets of samples. All generators are interfaced to PYTHIA 8. The total experimental uncertainties are shown with hatched regions, while colored bands display the effect of varying the renormalization and factorization scales, PDFs and $\alpha _s$ on Monte Carlo (matrix element only) event description. The $\sigma _{\mathrm {fid}}$ on $y$ axis refers to the integral of the $\frac {d \sigma }{d \mathrm {N_{jets}}}$ distribution. |
png pdf |
Figure 3-a:
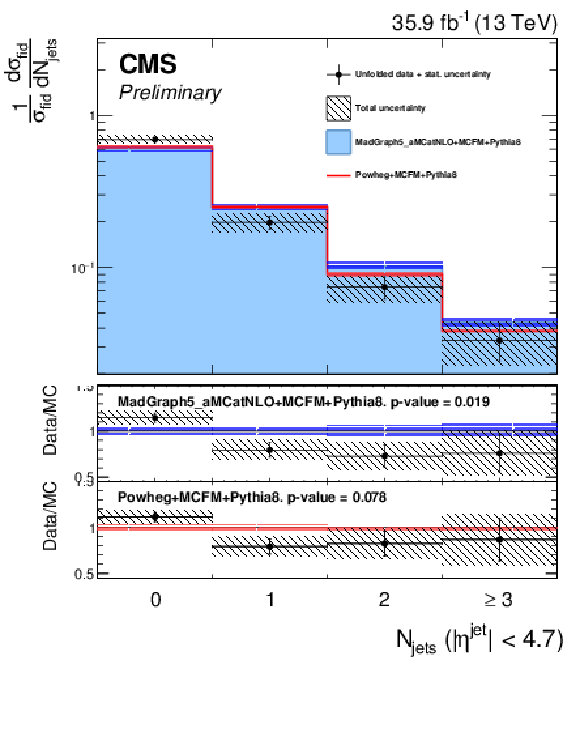
Normalized differential cross sections of $ \mathrm{pp} \to {\mathrm{ Z } } {\mathrm{ Z } } \to 4\ell $ processes as a function of the multiplicity of jets with $|\eta ^{\mathrm {jet}}|< $ 4.7. The cross sections are compared to the predictions from the MadGraph5_aMC@NLO and powheg sets of samples. All generators are interfaced to PYTHIA 8. The total experimental uncertainties are shown with hatched regions, while colored bands display the effect of varying the renormalization and factorization scales, PDFs and $\alpha _s$ on Monte Carlo (matrix element only) event description. The $\sigma _{\mathrm {fid}}$ on $y$ axis refers to the integral of the $\frac {d \sigma }{d \mathrm {N_{jets}}}$ distribution. |
png pdf |
Figure 3-b:
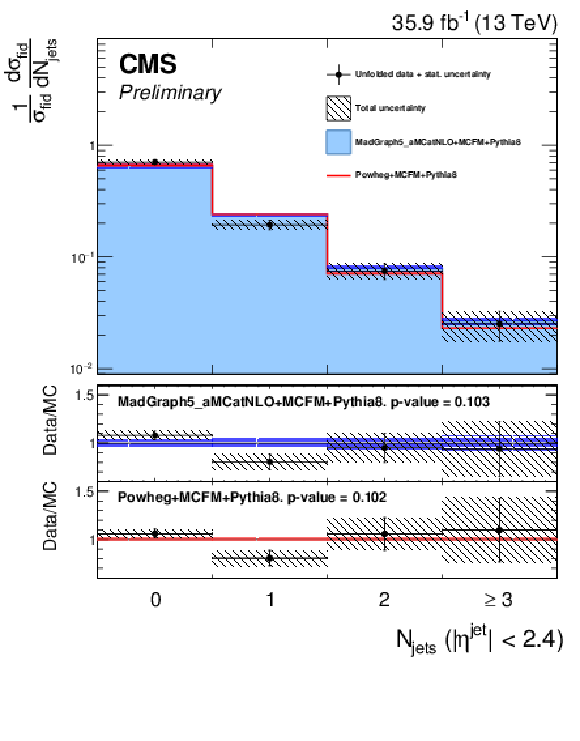
Normalized differential cross sections of $ \mathrm{pp} \to {\mathrm{ Z } } {\mathrm{ Z } } \to 4\ell $ processes as a function of the multiplicity of jets with $|\eta ^{\mathrm {jet}}|< $ 2.4. The cross sections are compared to the predictions from the MadGraph5_aMC@NLO and powheg sets of samples. All generators are interfaced to PYTHIA 8. The total experimental uncertainties are shown with hatched regions, while colored bands display the effect of varying the renormalization and factorization scales, PDFs and $\alpha _s$ on Monte Carlo (matrix element only) event description. The $\sigma _{\mathrm {fid}}$ on $y$ axis refers to the integral of the $\frac {d \sigma }{d \mathrm {N_{jets}}}$ distribution. |
png pdf |
Figure 4:
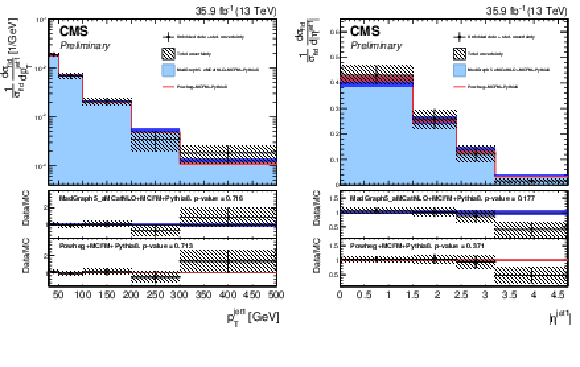
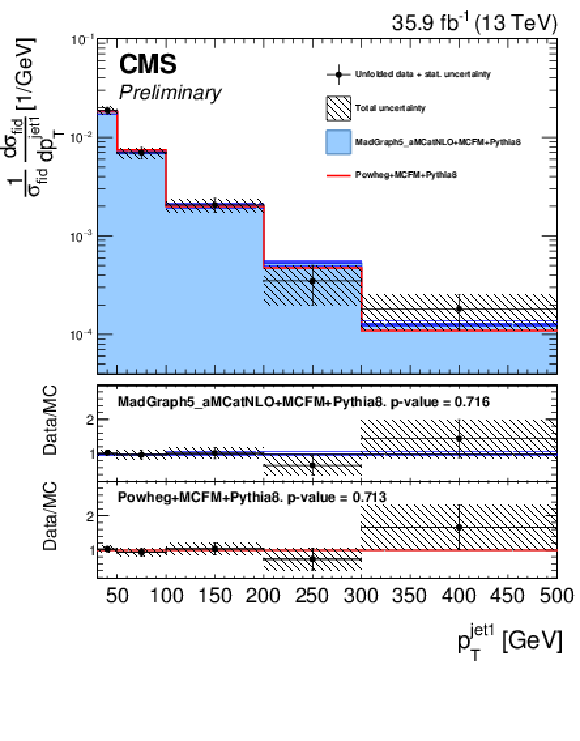
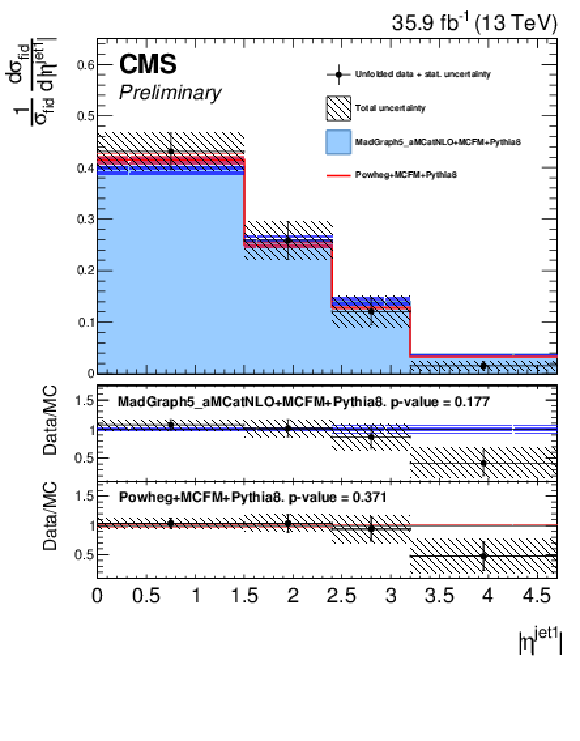
Normalized differential cross sections of $ \mathrm{pp} \to {\mathrm{ Z } } {\mathrm{ Z } } \to 4\ell $ processes with $N_{\mathrm {jets}}\ge $ 1 as a function of the ${p_{\mathrm {T}}} $-leading jet transverse momentum (left) and absolute value of pseudorapidity (right). Each bin of the distribution is divided by its width. The cross sections are compared to the predictions from the MadGraph5_aMC@NLO and powheg sets of samples. All generators are interfaced to PYTHIA 8. The total experimental uncertainties are shown with hatched regions, while colored bands display the effect of varying the renormalization and factorization scales, PDFs and $\alpha _s$ on Monte Carlo (matrix element only) event description. The $\sigma _{\mathrm {fid}}$ on $y$ axis refers to the integral of the $\frac {d \sigma }{ d p_T^{\mathrm {jet1}}}$ and $\frac {d \sigma }{d |\eta ^{\mathrm {jet1}}|}$ distributions, for the ${p_{\mathrm {T}}} $-leading jet transverse momentum and pseudorapidity respectively. |
png pdf |
Figure 4-a:
Normalized differential cross sections of $ \mathrm{pp} \to {\mathrm{ Z } } {\mathrm{ Z } } \to 4\ell $ processes with $N_{\mathrm {jets}}\ge $ 1 as a function of the ${p_{\mathrm {T}}} $-leading jet transverse momentum. Each bin of the distribution is divided by its width. The cross sections are compared to the predictions from the MadGraph5_aMC@NLO and powheg sets of samples. All generators are interfaced to PYTHIA 8. The total experimental uncertainties are shown with hatched regions, while colored bands display the effect of varying the renormalization and factorization scales, PDFs and $\alpha _s$ on Monte Carlo (matrix element only) event description. The $\sigma _{\mathrm {fid}}$ on $y$ axis refers to the integral of the $\frac {d \sigma }{ d p_T^{\mathrm {jet1}}}$ and $\frac {d \sigma }{d |\eta ^{\mathrm {jet1}}|}$ distributions, for the ${p_{\mathrm {T}}} $-leading jet transverse momentum and pseudorapidity respectively. |
png pdf |
Figure 4-b:
Normalized differential cross sections of $ \mathrm{pp} \to {\mathrm{ Z } } {\mathrm{ Z } } \to 4\ell $ processes with $N_{\mathrm {jets}}\ge $ 1 as a function of the absolute value of pseudorapidity. Each bin of the distribution is divided by its width. The cross sections are compared to the predictions from the MadGraph5_aMC@NLO and powheg sets of samples. All generators are interfaced to PYTHIA 8. The total experimental uncertainties are shown with hatched regions, while colored bands display the effect of varying the renormalization and factorization scales, PDFs and $\alpha _s$ on Monte Carlo (matrix element only) event description. The $\sigma _{\mathrm {fid}}$ on $y$ axis refers to the integral of the $\frac {d \sigma }{ d p_T^{\mathrm {jet1}}}$ and $\frac {d \sigma }{d |\eta ^{\mathrm {jet1}}|}$ distributions, for the ${p_{\mathrm {T}}} $-leading jet transverse momentum and pseudorapidity respectively. |
png pdf |
Figure 5:
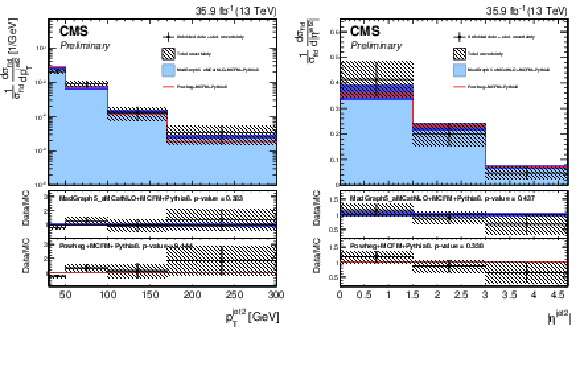
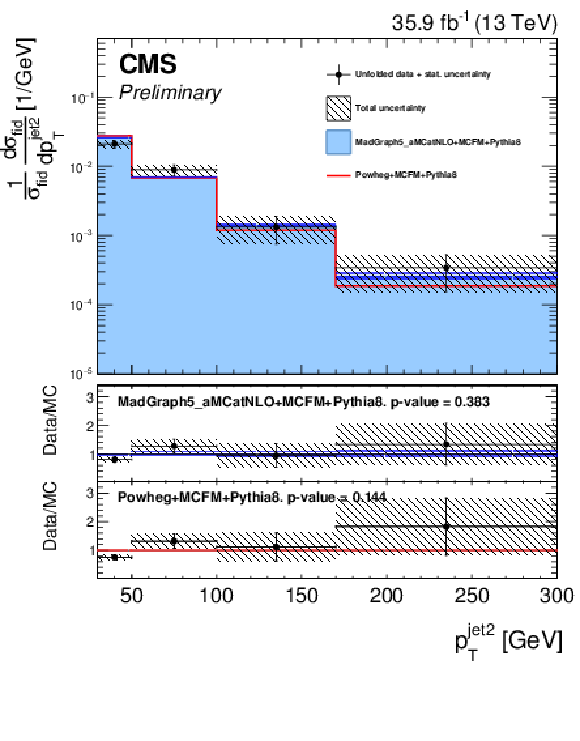
Normalized differential cross sections of $ \mathrm{pp} \to {\mathrm{ Z } } {\mathrm{ Z } } \to 4\ell $ processes with $N_{\mathrm {jets}}\ge $ 2 as a function of the ${p_{\mathrm {T}}} $-subleading jet transverse momentum (left) and absolute value of pseudorapidity (right). Each bin of the distribution is divided by its width. The cross sections are compared to the predictions from the MadGraph5_aMC@NLO and powheg sets of samples. All generators are interfaced to PYTHIA 8. The total experimental uncertainties are shown with hatched regions, while colored bands display the effect of varying the renormalization and factorization scales, PDFs and $\alpha _s$ on Monte Carlo (matrix element only) event description. The $\sigma _{\mathrm {fid}}$ on $y$ axis refers to the integral of the $\frac {d \sigma }{d p_T^{\mathrm {jet2}}}$ and $\frac {d \sigma }{d |\eta ^{\mathrm {jet2}}|}$ distributions, for the ${p_{\mathrm {T}}} $-subleading jet transverse momentum and pseudorapidity respectively. |
png pdf |
Figure 5-a:
Normalized differential cross sections of $ \mathrm{pp} \to {\mathrm{ Z } } {\mathrm{ Z } } \to 4\ell $ processes with $N_{\mathrm {jets}}\ge $ 2 as a function of the ${p_{\mathrm {T}}} $-subleading jet transverse momentum. Each bin of the distribution is divided by its width. The cross sections are compared to the predictions from the MadGraph5_aMC@NLO and powheg sets of samples. All generators are interfaced to PYTHIA 8. The total experimental uncertainties are shown with hatched regions, while colored bands display the effect of varying the renormalization and factorization scales, PDFs and $\alpha _s$ on Monte Carlo (matrix element only) event description. The $\sigma _{\mathrm {fid}}$ on $y$ axis refers to the integral of the $\frac {d \sigma }{d p_T^{\mathrm {jet2}}}$ and $\frac {d \sigma }{d |\eta ^{\mathrm {jet2}}|}$ distributions, for the ${p_{\mathrm {T}}} $-subleading jet transverse momentum and pseudorapidity respectively. |
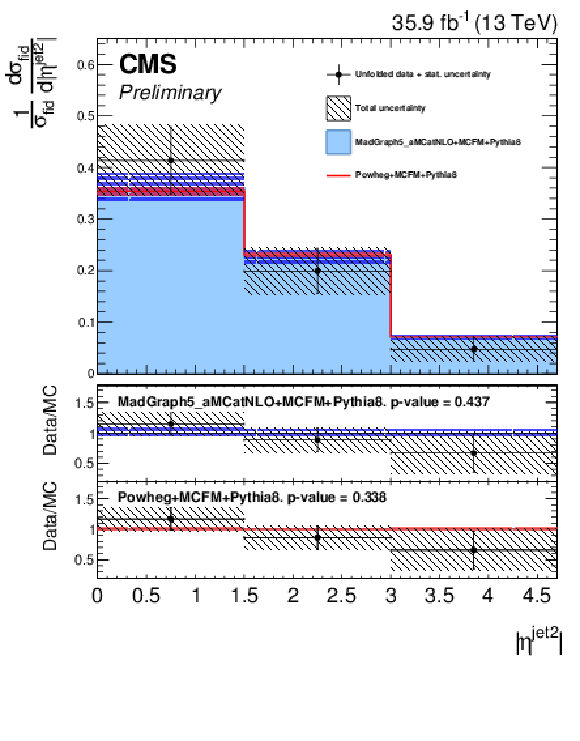
png pdf |
Figure 5-b:
Normalized differential cross sections of $ \mathrm{pp} \to {\mathrm{ Z } } {\mathrm{ Z } } \to 4\ell $ processes with $N_{\mathrm {jets}}\ge $ 2 as a function of the absolute value of pseudorapidity. Each bin of the distribution is divided by its width. The cross sections are compared to the predictions from the MadGraph5_aMC@NLO and powheg sets of samples. All generators are interfaced to PYTHIA 8. The total experimental uncertainties are shown with hatched regions, while colored bands display the effect of varying the renormalization and factorization scales, PDFs and $\alpha _s$ on Monte Carlo (matrix element only) event description. The $\sigma _{\mathrm {fid}}$ on $y$ axis refers to the integral of the $\frac {d \sigma }{d p_T^{\mathrm {jet2}}}$ and $\frac {d \sigma }{d |\eta ^{\mathrm {jet2}}|}$ distributions, for the ${p_{\mathrm {T}}} $-subleading jet transverse momentum and pseudorapidity respectively. |
png pdf |
Figure 6:
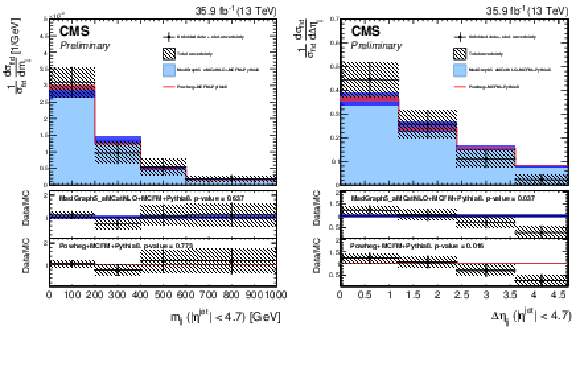
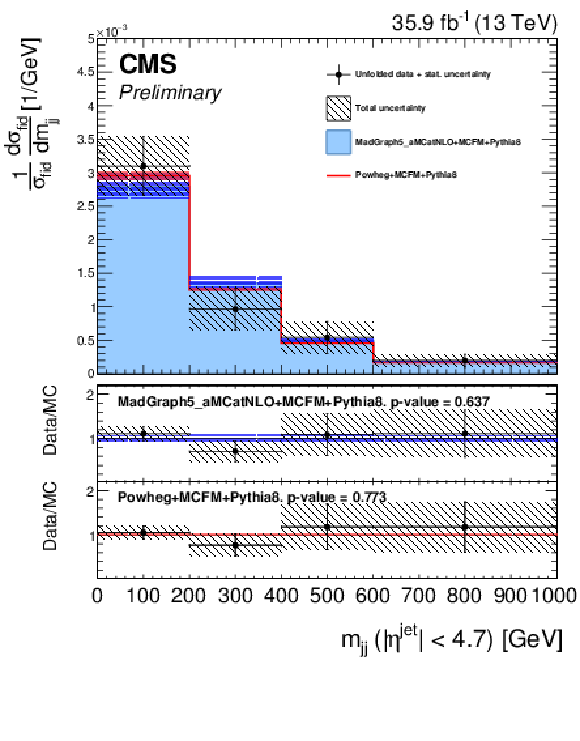
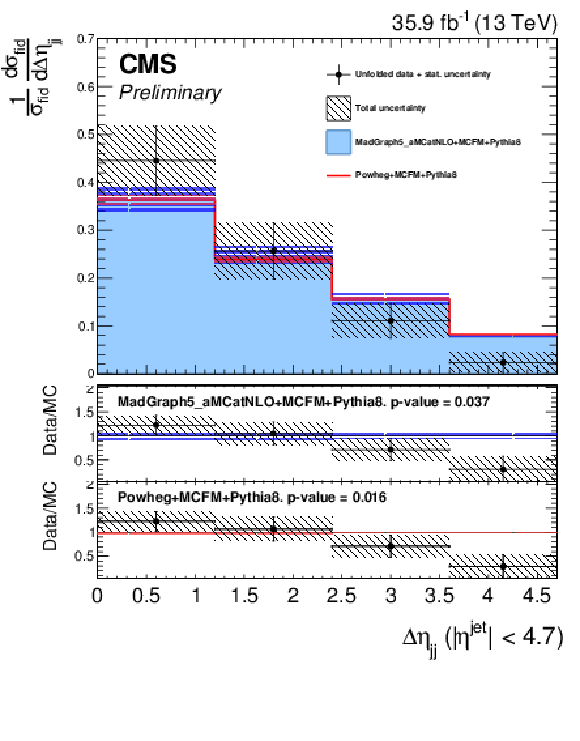
Differential cross sections of $ \mathrm{pp} \to {\mathrm{ Z } } {\mathrm{ Z } } \to 4\ell $ processes with $\mathrm {N_{jets}}\ge $ 2 as a function of the invariant mass of the two $ {p_{\mathrm {T}}} $-leading jets (left) and their pseudorapidity separation (right). Each bin of the distribution is divided by its width. The cross sections are compared to the predictions from the MadGraph5_aMC@NLO and powheg sets of samples. All generators are interfaced to PYTHIA 8. The total experimental uncertainties are shown with hatched regions, while colored bands display the effect of varying the renormalization and factorization scales, PDFs and $\alpha _s$ on Monte Carlo (matrix element only) event description. The $\sigma _{\mathrm {fid}}$ on $y$ axis refers to the integral of the $\frac {d \sigma }{d m_{jj}}$ and $\frac {d \sigma }{d \Delta \eta _{jj}}$ distributions, for the invariant mass of the two $ {p_{\mathrm {T}}} $-leading jets and their pseudorapidity separation respectively. |
png pdf |
Figure 6-a:
Differential cross sections of $ \mathrm{pp} \to {\mathrm{ Z } } {\mathrm{ Z } } \to 4\ell $ processes with $\mathrm {N_{jets}}\ge $ 2 as a function of the invariant mass of the two $ {p_{\mathrm {T}}} $-leading jets. Each bin of the distribution is divided by its width. The cross sections are compared to the predictions from the MadGraph5_aMC@NLO and powheg sets of samples. All generators are interfaced to PYTHIA 8. The total experimental uncertainties are shown with hatched regions, while colored bands display the effect of varying the renormalization and factorization scales, PDFs and $\alpha _s$ on Monte Carlo (matrix element only) event description. The $\sigma _{\mathrm {fid}}$ on $y$ axis refers to the integral of the $\frac {d \sigma }{d m_{jj}}$ and $\frac {d \sigma }{d \Delta \eta _{jj}}$ distributions, for the invariant mass of the two $ {p_{\mathrm {T}}} $-leading jets and their pseudorapidity separation respectively. |
png pdf |
Figure 6-b:
Differential cross sections of $ \mathrm{pp} \to {\mathrm{ Z } } {\mathrm{ Z } } \to 4\ell $ processes with $\mathrm {N_{jets}}\ge $ 2 as a function of the pseudorapidity separation of the two $ {p_{\mathrm {T}}} $-leading jets. Each bin of the distribution is divided by its width. The cross sections are compared to the predictions from the MadGraph5_aMC@NLO and powheg sets of samples. All generators are interfaced to PYTHIA 8. The total experimental uncertainties are shown with hatched regions, while colored bands display the effect of varying the renormalization and factorization scales, PDFs and $\alpha _s$ on Monte Carlo (matrix element only) event description. The $\sigma _{\mathrm {fid}}$ on $y$ axis refers to the integral of the $\frac {d \sigma }{d m_{jj}}$ and $\frac {d \sigma }{d \Delta \eta _{jj}}$ distributions, for the invariant mass of the two $ {p_{\mathrm {T}}} $-leading jets and their pseudorapidity separation respectively. |
png pdf |
Figure 7:
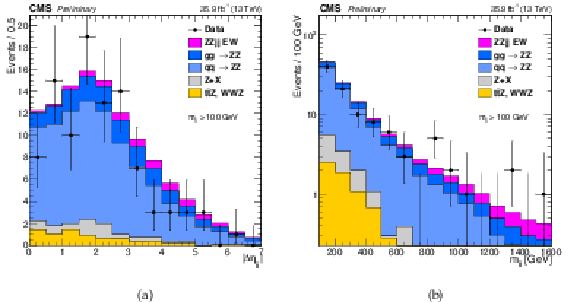
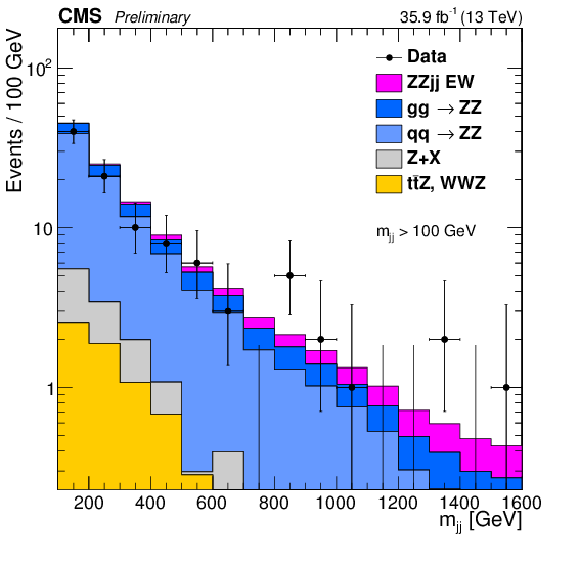
Distribution of the dijet pseudorapidity separation (left) and dijet invariant mass (right) for events passing the ZZjj selection, which requires $m_{jj} > $ 100 GeV. Points represent the data, filled histograms the expected signal and background contributions. |

png pdf |
Figure 7-a:
Distribution of the dijet pseudorapidity separation for events passing the ZZjj selection, which requires $m_{jj} > $ 100 GeV. Points represent the data, filled histograms the expected signal and background contributions. |
png pdf |
Figure 7-b:
Distribution of the dijet invariant mass for events passing the ZZjj selection, which requires $m_{jj} > $ 100 GeV. Points represent the data, filled histograms the expected signal and background contributions. |
png pdf |
Figure 8:
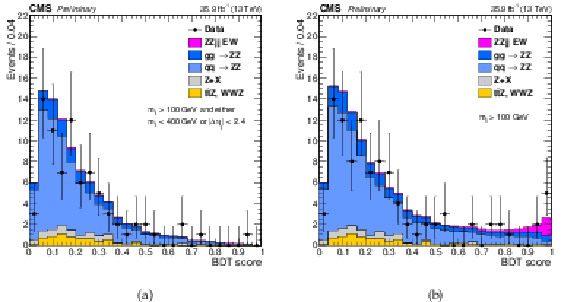
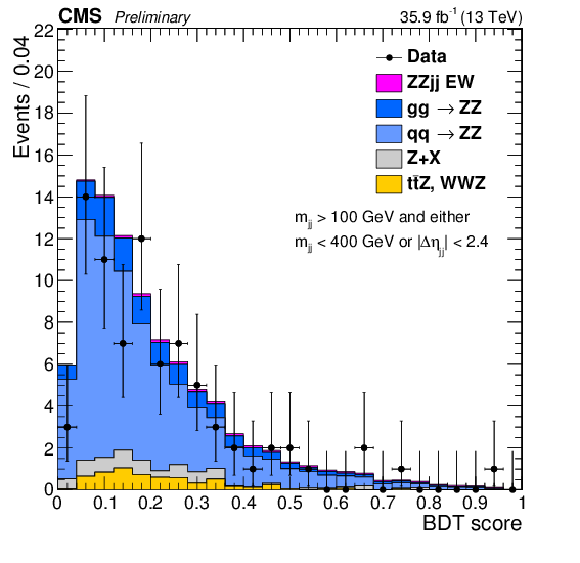
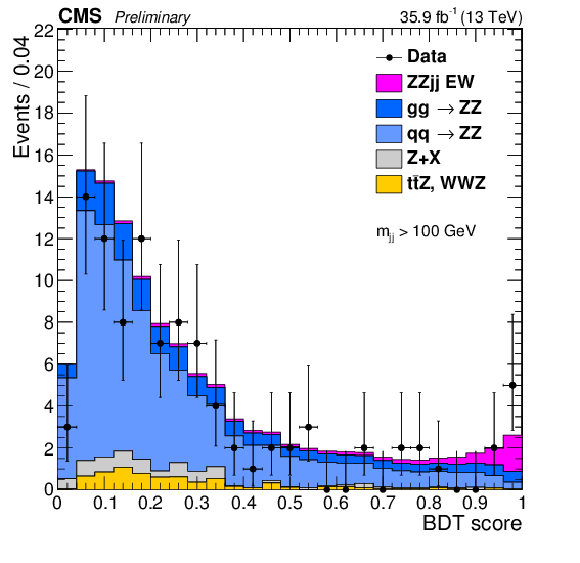
Distribution of the BDT score in the control region obtained by selecting ZZjj events with $m_{jj}< $ 400 GeV or $|\Delta \eta _{jj}|< $ 2.4 (left) and for the full ZZjj selection (right). Points represent the data, filled histograms the expected signal and background contributions. |
png pdf |
Figure 8-a:
Distribution of the BDT score in the control region obtained by selecting ZZjj events with $m_{jj}< $ 400 GeV or $|\Delta \eta _{jj}|< $ 2.4. Points represent the data, filled histograms the expected signal and background contributions. |
png pdf |
Figure 8-b:
Distribution of the BDT score for the full ZZjj selection. Points represent the data, filled histograms the expected signal and background contributions. |
png pdf |
Figure 9:
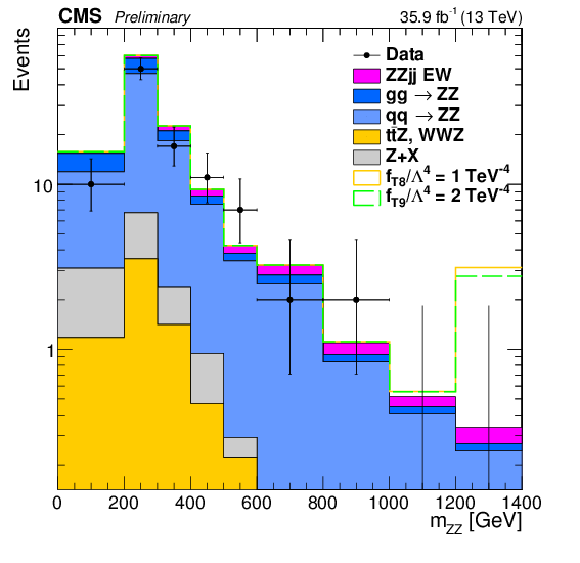
The $m_{ZZ}$ distribution in the ZZjj selection together with the SM prediction and two hypotheses for the aQGC coupling strengths. Points represent the data, filled histograms the expected signal and background contributions. |
| Tables | |
png pdf |
Table 1:
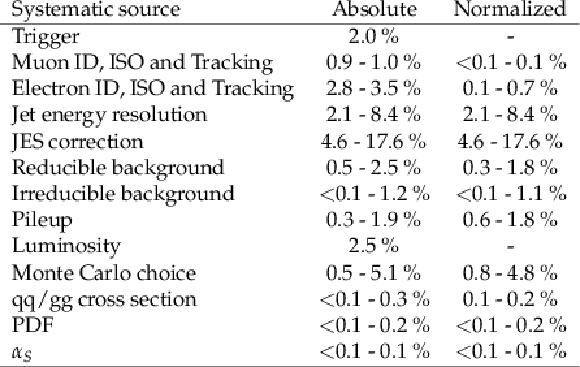
The contributions of each source of signal source of systematic uncertainty in the differential cross section measurements and in the normalized cross section measurement. Uncertainties that depend on jet multiplicity are listed as a range. |

png pdf |
Table 2:
Fiducial phase space definition. |

png pdf |
Table 3:
The $\mathrm{pp} \to {\mathrm{ Z } } {\mathrm{ Z } } \to \ell \ell \ell '\ell '$ production cross section as a function of the jet multiplicity. Luminosity uncertainty for number of jets $\ge $ 3 is smaller than 0.1 pb and is not quoted. The cross sections are compared to the theoretical predictions (last column) from the MadGraph5_aMC@NLO sets of samples. Theoretical uncertainty are obtained varying the renormalization and factorization scales, PDFs and $\alpha _s$ on Monte Carlo (matrix element only) event description. |

png pdf |
Table 4:
Signal and background yields for the ZZjj selection and for a VBS signal-enriched selection that requires $m_{jj}> $ 400 GeV and $|\Delta \eta _{jj}|> $ 2.4. |

png pdf |
Table 5:
Observed and expected lower and upper 95% CL limits on the couplings of the quartic operators T0, T1, and T2, as well as the neutral current operators T8 and T9. The unitarity bounds are also listed. All coupling parameter limits are in TeV$^{-4}$, the unitarity bounds in TeV. |
| Summary |
|
We presented results for a study of ZZ production in the four-lepton final state in association with jets in proton-proton collisions at 13 TeV. The data correspond to an integrated luminosity of 35.9 fb$^{-1}$ collected with the CMS detector at the LHC. Cross sections for the production of a pair of Z bosons in association with jets as a function of the number of jets, the transverse momentum and pseudorapidity of the leading and subleading jets, as well distributions of the invariant mass of the two leading jets and of the pseudorapidity separation between the two leading jets are reported. The results are corrected for detector effects by means of an iterative unfolding technique, and compared with particle-level predictions. A good agreement is observed overall with theoretical predictions. The more recent Monte Carlo ME calculations and parton-shower models predictions adopted in this analysis show a better agreement up to higher jet multiplicities with respect to the results at 8 TeV. The electroweak production of a pair of Z bosons in association with two jets is measured with an observed (expected) significance of 2.7 (1.6) standard deviations. The fiducial cross section is measured to be $\sigma_{\textrm{fid}} = $ 0.40$^{+0.21}_{-0.16}$ (stat) $^{+0.13}_{-0.09}$ (syst) fb, which is consistent with the SM prediction. Limits on anomalous quartic gauge couplings are set at 95% confidence level in terms of effective field theory operators, with units in TeV$^{-4}$: $-0.61 < f_{T_{1}}/\Lambda^4 <0.61$, $-1.2 < f_{T_{2}}/\Lambda^4 < 1.2$, $-0.84 < f_{T_{8}}/\Lambda^4 <0.84$, $-1.8 < f_{T_{9}}/\Lambda^4 <1.8$. |
| Additional Figures | |
png pdf |
Additional Figure 1:
Distribution of reconstructed multiplicity of jets with $|\eta ^{\mathrm {jet}}| < $ 2.4. Points represent data, shaded histograms represent Monte Carlo predictions and background estimate while the hatched band on them represent systematic uncertainty on the prediction. The reducible background is obtained with a data driven method. |
png pdf |
Additional Figure 2:
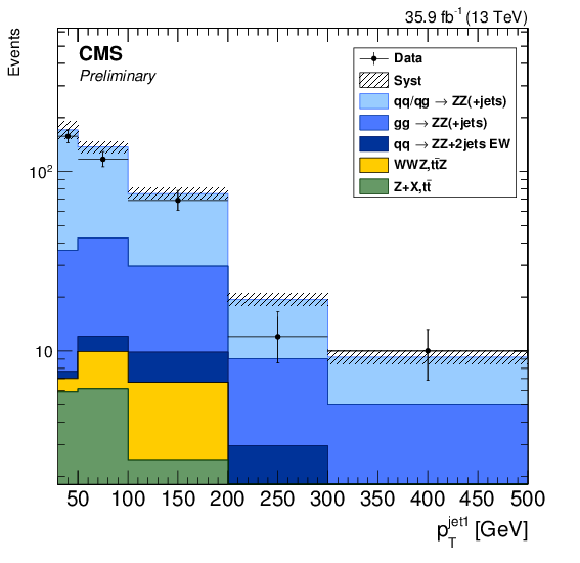
Distribution of reconstructed $p_{\mathrm{T}}$-leading jet transverse momentum. Points represent data, shaded histograms represent Monte Carlo predictions and background estimate while the hatched band on them represent systematic uncertainty on the prediction. The reducible background is obtained with a data driven method. |
png pdf |
Additional Figure 3:
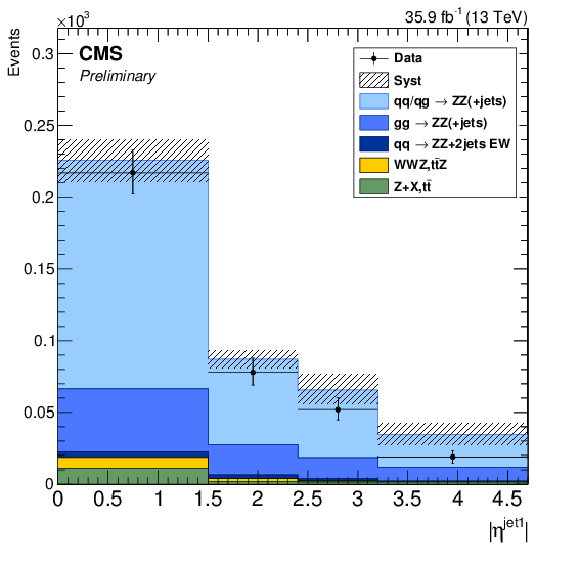
Distribution of reconstructed $p_{\mathrm{T}}$-leading jet pseudorapidity. Points represent data, shaded histograms represent Monte Carlo predictions and background estimate while the hatched band on them represent systematic uncertainty on the prediction. The reducible background is obtained with a data driven method. |
png pdf |
Additional Figure 4:
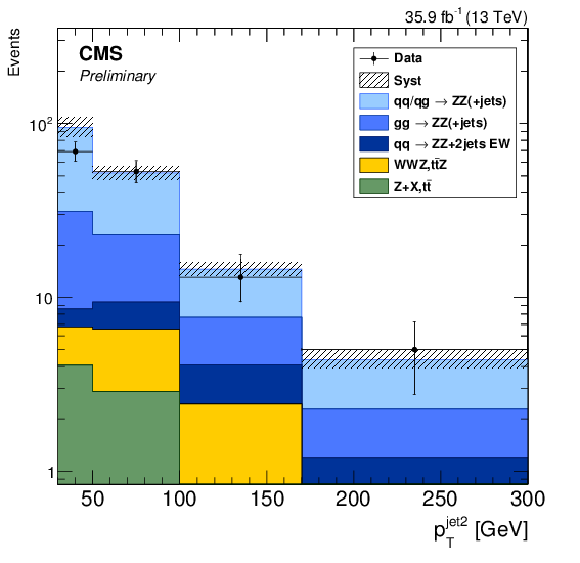
Distribution of reconstructed $p_{\mathrm{T}}$-subleading jet transverse momentum. Points represent data, shaded histograms represent Monte Carlo predictions and background estimate while the hatched band on them represent systematic uncertainty on the prediction. The reducible background is obtained with a data driven method. |
png pdf |
Additional Figure 5:
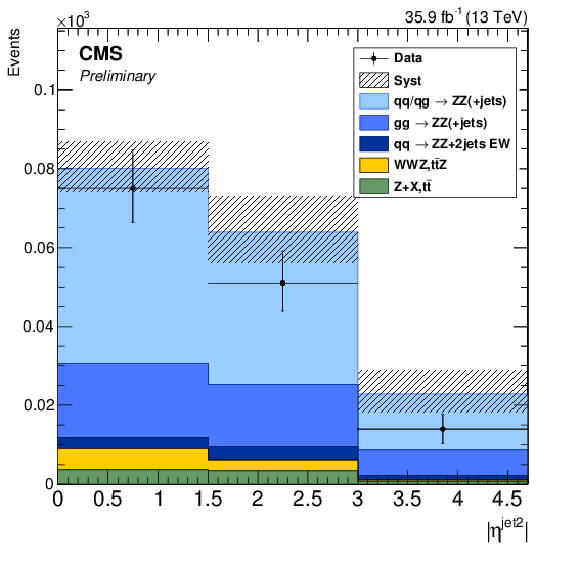
Distribution of reconstructed $p_{\mathrm{T}}$-subleading jet pseudorapidity. Points represent data, shaded histograms represent Monte Carlo predictions and background estimate while the hatched band on them represent systematic uncertainty on the prediction. The reducible background is obtained with a data driven method. |
png pdf |
Additional Figure 6:
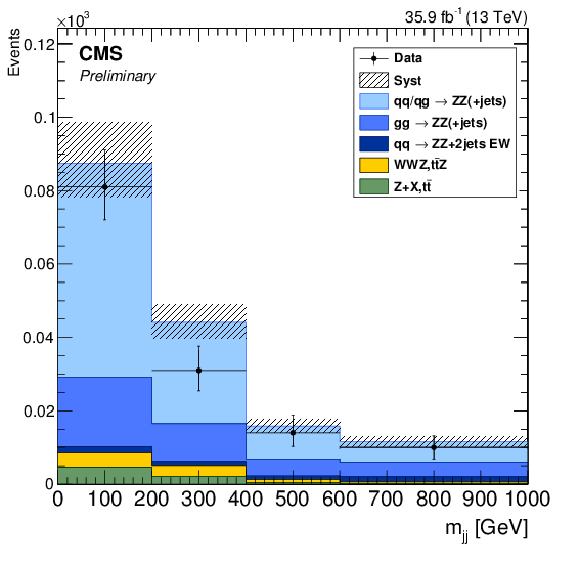
Distribution of reconstructed invariant mass of the two $p_{\mathrm{T}}$-leading jets. Points represent data, shaded histograms represent Monte Carlo predictions and background estimate while the hatched band on them represent systematic uncertainty on the prediction. The reducible background is obtained with a data driven method. |
png pdf |
Additional Figure 7:
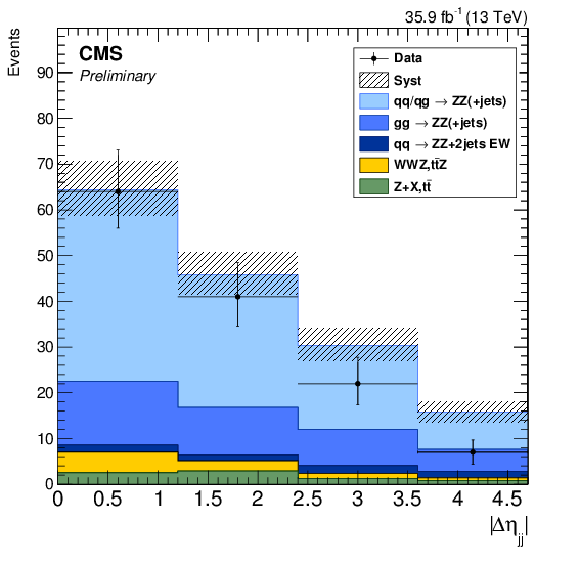
Distribution of reconstructed pseudorapidity separation between the two $p_{\mathrm{T}}$-leading jets. Points represent data, shaded histograms represent Monte Carlo predictions and background estimate while the hatched band on them represent systematic uncertainty on the prediction. The reducible background is obtained with a data driven method. |
png pdf |
Additional Figure 8:
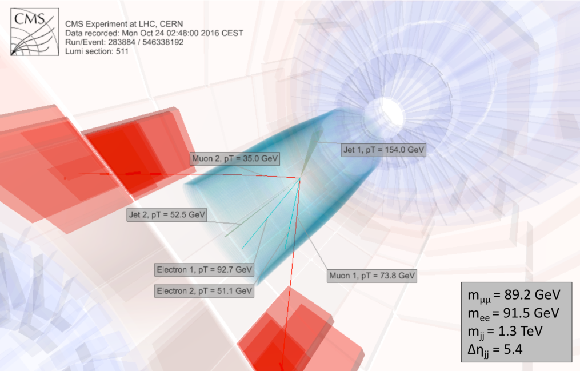
The following figure displays a real proton-proton collision event at 13 TeV in the CMS detector in which two high-energy electrons (light blue lines), two high-energy muons (red lines), and two high-energy hadronic jets (dark green cones) are observed. The presence of two opposite-sign same-flavour lepton pairs with mass close to the Z mass, of two hadronic jets in opposite hemispheres of the detector with a large pseudorapidity separation, as well as the absence of hadronic activity in the central region of the detector, are indicative of the electroweak production of two Z bosons and two jets. |
png pdf |
Additional Figure 9:
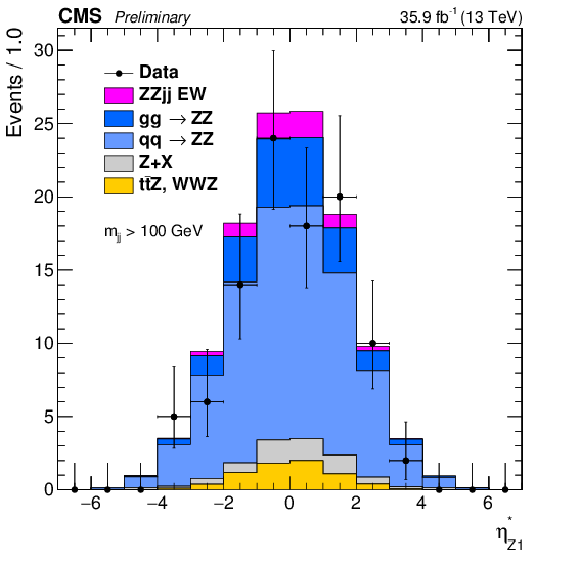
Distribution of the Zeppenfeld variable of the leading Z boson, $\eta ^*_{Z_{1}}=\eta _{Z_{1}} - (\eta _{jet 1} + \eta _{jet 2})/2$, for events passing the ZZjj selection, which requires $m_{jj} > $ 100 GeV. Points represent the data, filled histograms the expected signal and background contributions. |
png pdf |
Additional Figure 10:
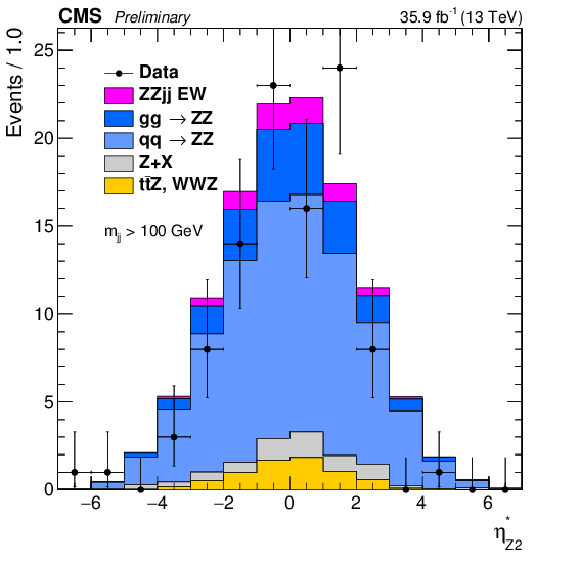
Distribution of the Zeppenfeld variable of the subleading Z boson, $\eta ^*_{Z_{2}}=\eta _{Z_{2}} - (\eta _{jet 1} + \eta _{jet 2})/2$, for events passing the ZZjj selection, which requires $m_{jj} > $ 100 GeV. Points represent the data, filled histograms the expected signal and background contributions. |
png pdf |
Additional Figure 11:
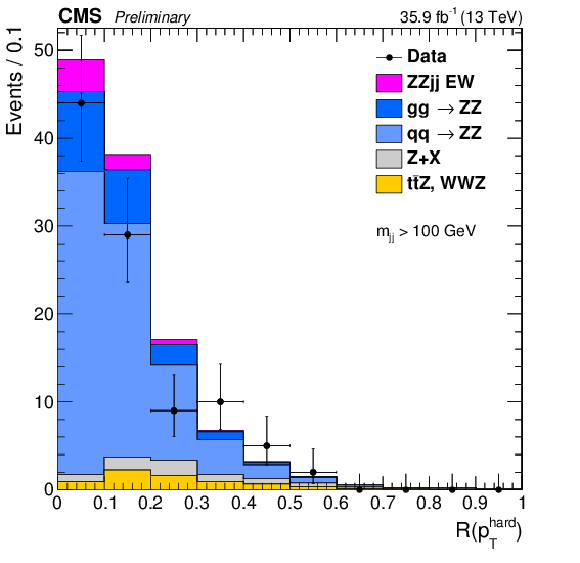
Distribution of the event balance observable for events passing the ZZjj selection, which requires $m_{jj}> 100 GeV $. Points represent the data, filled histograms the expected signal and background contributions. |
png pdf |
Additional Figure 12:
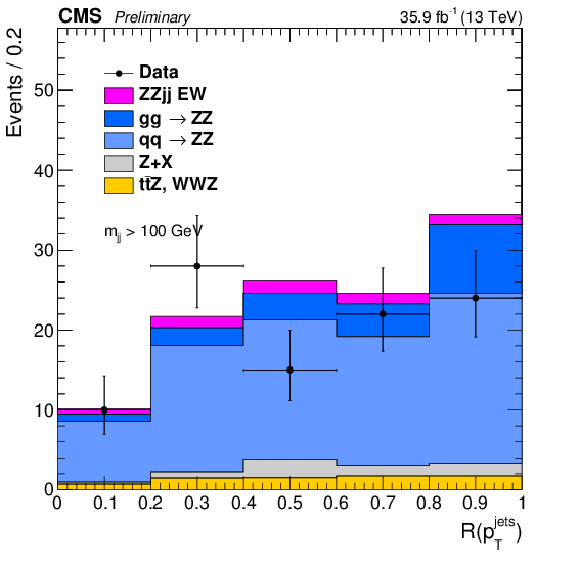
Distribution of the ratio between the $ {p_{\mathrm {T}}} $ of the dijet system and the scalar sum of the tagging jets' $ {p_{\mathrm {T}}} $ for events passing the ZZjj selection, which requires $m_{jj} > $ 100 GeV. Points represent the data, filled histograms the expected signal and background contributions. |
png pdf |
Additional Figure 13:
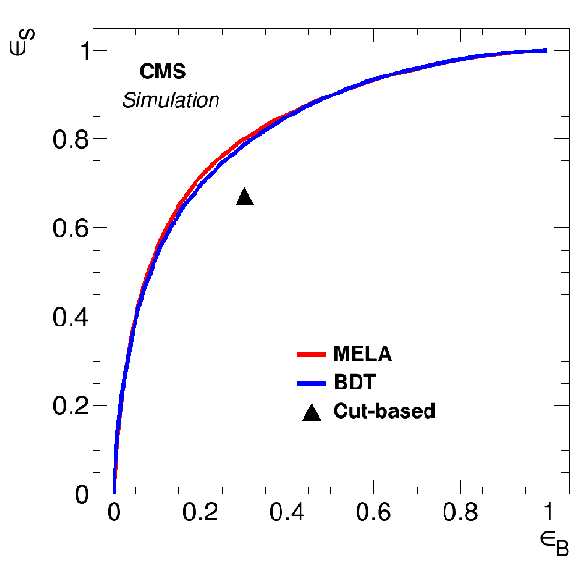
Signal versus background efficiency curves of the boosted decision tree (BDT) and matrix element likelihood (MELA) classifiers for separating the electroweak from the QCD-induced production of the $\ell \ell \ell '\ell 'jj$ final state. The efficiency of a cut-based selection on the dijet mass and dijet pseudorapidity separation is also shown. |
| Additional Tables | |

png pdf |
Additional Table 1:
Selected kinematic properties of signal-like events with BDT score $>$ 0.9 observed in the data |
| References | ||||
| 1 | M. Lemoine and M. J. G. Veltman | Radiative Corrections to $ e^{+} e^{-} \to W^{+} W^{-} $ in the Weinberg Model | Nucl. Phys. B 164 (1980) 445 | |
| 2 | B. W. Lee, C. Quigg, and H. B. Thacker | The Strength of Weak Interactions at Very High-Energies and the Higgs Boson Mass | PRL 38 (1977) 883 | |
| 3 | B. W. Lee, C. Quigg, and H. B. Thacker | Weak Interactions at Very High-Energies: The Role of the Higgs Boson Mass | PRD 16 (1977) 1519 | |
| 4 | ATLAS Collaboration | Observation of a new particle in the search for the Standard Model Higgs boson with the ATLAS detector at the LHC | PLB 716 (2012) 1 | 1207.7214 |
| 5 | CMS Collaboration | Observation of a new boson at a mass of 125 GeV with the CMS experiment at the LHC | PLB 716 (2012) 30 | CMS-HIG-12-028 1207.7235 |
| 6 | ATLAS and CMS collaborations | Measurements of the Higgs boson production and decay rates and constraints on its couplings from a combined ATLAS and CMS analysis of the LHC pp collision data at $ \sqrt{s}= $ 7 and 8 TeV | JHEP 08 (2016) 045 | 1606.02266 |
| 7 | D. L. Rainwater, R. Szalapski, and D. Zeppenfeld | Probing color singlet exchange in Z + two jet events at the CERN LHC | PRD54 (1996) 6680 | hep-ph/9605444 |
| 8 | V. A. Khoze, M. G. Ryskin, W. J. Stirling, and P. H. Williams | A Z monitor to calibrate Higgs production via vector boson fusion with rapidity gaps at the LHC | EPJC26 (2003) 429 | hep-ph/0207365 |
| 9 | CMS Collaboration | Measurement of the $ ZZ $ production cross section and search for anomalous couplings in 2 l2l ' final states in pp collisions at $ \sqrt{s}= $ 7 TeV | JHEP 01 (2013) 063 | CMS-SMP-12-007 1211.4890 |
| 10 | CMS Collaboration | Measurement of the $ pp \to ZZ $ production cross section and constraints on anomalous triple gauge couplings in four-lepton final states at $ \sqrt{s}= $ 8 TeV | PLB 740 (2015) 250, , [Corrigendum: Phys. Lett.B757,569(2016)] | CMS-SMP-13-005 1406.0113 |
| 11 | CMS Collaboration | Measurement of the ZZ production cross section and Z $ \to \ell^+\ell^-\ell'^+\ell'^- $ branching fraction in pp collisions at $ \sqrt{s}= $ 13 TeV | PLB 763 (2016) 280 | CMS-SMP-16-001 1607.08834 |
| 12 | CMS Collaboration | Measurement of the pp$ \rightarrow $ZZ production cross section, $ \mathrm{Z} \to 4\ell $ branching fraction and constraints on anomalous triple gauge couplings at $ \sqrt{s} = $ 13 TeV | CMS-PAS-SMP-16-017 | CMS-PAS-SMP-16-017 |
| 13 | ATLAS Collaboration | Measurement of $ ZZ $ production in pp collisions at $ \sqrt{s}= $ 7 TeV and limits on anomalous $ ZZZ $ and $ ZZ\gamma $ couplings with the ATLAS detector | JHEP 03 (2013) 128 | 1211.6096 |
| 14 | ATLAS Collaboration | Measurement of the $ ZZ $ Production Cross Section in pp Collisions at $ \sqrt{s}= $ 13 TeV with the ATLAS Detector | Acta Phys. Polon. B47 (2016) 1713 | |
| 15 | ATLAS Collaboration | Evidence for Electroweak Production of $ W^{\pm}W^{\pm}jj $ in pp Collisions at $ \sqrt{s}= $ 8 TeV with the ATLAS Detector | PRL 113 (2014) 141803 | 1405.6241 |
| 16 | CMS Collaboration | Study of vector boson scattering and search for new physics in events with two same-sign leptons and two jets | PRL 114 (2015) 051801 | CMS-SMP-13-015 1410.6315 |
| 17 | CMS Collaboration | Measurement of the differential cross sections for pairs of Z bosons produced in association with jets in pp collisions at $ \sqrt{s} = $ 8 TeV | CMS-PAS-SMP-15-012 | CMS-PAS-SMP-15-012 |
| 18 | O. J. P. Eboli, M. C. Gonzalez-Garcia, and J. K. Mizukoshi | $ \mathrm{p p} \to j j\, \mathrm{ e }^{\pm} \mu^{\mp} \nu \nu $ and $ j j\, \mathrm{ e }^{\pm} \mu^{\pm} \nu \nu $ at $ O(\alpha_{em}^{6}) $ and $ O(\alpha_{em}^4 \alpha_{s}^2) $ for the study of the quartic electroweak gauge boson vertex at CERN LHC | PRD 74 (2006) 073005 | hep-ph/0606118 |
| 19 | CMS Collaboration | Description and performance of track and primary-vertex reconstruction with the CMS tracker | JINST 9 (2014) P10009 | CMS-TRK-11-001 1405.6569 |
| 20 | CMS Collaboration | Performance of electron reconstruction and selection with the CMS detector in proton-proton collisions at $ \sqrt{s}= $ 8 TeV | JINST 10 (2015) P06005 | CMS-EGM-13-001 1502.02701 |
| 21 | CMS Collaboration | Performance of CMS muon reconstruction in pp collision events at $ \sqrt{s}= $ 7 TeV | JINST 7 (2012) P10002 | CMS-MUO-10-004 1206.4071 |
| 22 | CMS Collaboration | The CMS experiment at the CERN LHC | JINST 3 (2008) S08004 | CMS-00-001 |
| 23 | J. Alwall et al. | The automated computation of tree-level and next-to-leading order differential cross sections, and their matching to parton shower simulations | JHEP 07 (2014) 079 | 1405.0301 |
| 24 | R. Frederix and S. Frixione | Merging meets matching in MC@NLO | JHEP 12 (2012) 061 | 1209.6215 |
| 25 | P. Nason | A new method for combining NLO QCD with shower Monte Carlo algorithms | JHEP 11 (2004) 040 | hep-ph/0409146 |
| 26 | T. Melia, P. Nason, R. Rontsch, and G. Zanderighi | $ W^+ W^- $ , $ W Z $ and $ Z Z $ production in the POWHEG BOX | JHEP 11 (2011) 078 | 1107.5051 |
| 27 | F. Cascioli et al. | ZZ production at hadron colliders in NNLO QCD | PLB 735 (2014) 311 | 1405.2219 |
| 28 | J. M. Campbell and R. K. Ellis | MCFM for the Tevatron and the LHC | NPPS 205-206 (2010) 10 | 1007.3492 |
| 29 | F. Caola, K. Melnikov, R. R\"ontsch, and L. Tancredi | QCD corrections to ZZ production in gluon fusion at the LHC | PRD 92 (2015) 094028 | 1509.06734 |
| 30 | A. Ballestrero et al. | PHANTOM: A Monte Carlo event generator for six parton final states at high energy colliders | CPC 180 (2009) 401 | 0801.3359 |
| 31 | P. Artoisenet, R. Frederix, O. Mattelaer, and R. Rietkerk | Automatic spin-entangled decays of heavy resonances in Monte Carlo simulations | JHEP 03 (2013) 015 | 1212.3460 |
| 32 | T. Sj\"ostrand, S. Mrenna, and P. Skands | PYTHIA 6.4 physics and manual | JHEP 05 (2006) 026 | |
| 33 | T. Sj\"ostrand et al. | An introduction to PYTHIA 8.2 | CPC 191 (2015) 159 | 1410.3012 |
| 34 | CMS Collaboration | Event generator tunes obtained from underlying event and multiparton scattering measurements | EPJC 76 (2016) 155 | CMS-GEN-14-001 1512.00815 |
| 35 | NNPDF Collaboration | Parton distributions for the LHC Run II | JHEP 04 (2015) 040 | 1410.8849 |
| 36 | GEANT4 Collaboration | GEANT4---a simulation toolkit | NIMA 506 (2003) 250 | |
| 37 | J. Allison | Geant4 developments and applications | IEEE Trans. Nucl. Sci. 53 (2006) 270 | |
| 38 | M. Cacciari and G. P. Salam | Pileup subtraction using jet areas | PLB 659 (2008) 119 | 0707.1378 |
| 39 | CMS Collaboration | Measurement of the properties of a Higgs boson in the four-lepton final state | PRD 89 (2014) 092007 | CMS-HIG-13-002 1312.5353 |
| 40 | CMS Collaboration | Measurements of properties of the Higgs boson decaying into four leptons in pp collisions at $ \sqrt{s}= $ 13 TeV | CMS-PAS-HIG-16-041 | CMS-PAS-HIG-16-041 |
| 41 | CMS Collaboration | Particle-flow event reconstruction in CMS and performance for jets, taus, and $ E_{\mathrm{T}}^{\text{miss}} $ | CDS | |
| 42 | CMS Collaboration | Commissioning of the particle-flow event reconstruction with the first LHC collisions recorded in the CMS detector | CDS | |
| 43 | M. Cacciari, G. P. Salam, and G. Soyez | The anti-$ k_t $ jet clustering algorithm | JHEP 04 (2008) 063 | 0802.1189 |
| 44 | M. Cacciari, G. P. Salam, and G. Soyez | FastJet user manual | EPJC 72 (2012) 1896 | 1111.6097 |
| 45 | CMS Collaboration | Jet algorithms performance in 13 TeV data | CMS-PAS-JME-16-003 | CMS-PAS-JME-16-003 |
| 46 | CMS Collaboration | Jet energy scale and resolution performances with 13 TeV data | CDS | |
| 47 | CMS Collaboration | Jet energy scale and resolution in the CMS experiment in pp collisions at 8 TeV | CDS | |
| 48 | CMS Collaboration | CMS Luminosity Measurements for the 2016 Data Taking Period | CMS-PAS-LUM-17-001 | CMS-PAS-LUM-17-001 |
| 49 | G. D'Agostini | A Multidimensional unfolding method based on Bayes' theorem | NIMA362 (1995) 487 | |
| 50 | T. Adye | Unfolding algorithms and tests using RooUnfold | Proceedings, PHYSTAT 2011 Workshop on Statistical Issues Related to Discovery Claims in Search Experiments and Unfolding, CERN 2011 | 1105.1160 |
| 51 | F. Pedregosa et al. | Scikit-learn: Machine Learning in Python | J. Machine Learning Res. 12 (2011) 2825 | 1201.0490 |
| 52 | D. L. Rainwater, R. Szalapski, and D. Zeppenfeld | Probing color singlet exchange in Z + two jet events at the CERN LHC | PRD 54 (1996) 6680 | hep-ph/9605444 |
| 53 | CMS Collaboration | Measurement of electroweak production of two jets in association with a Z boson in proton-proton collisions at $ \sqrt{s}= $ 8 TeV | EPJC75 (2015) 66 | CMS-FSQ-12-035 1410.3153 |
| 54 | Y. Gao et al. | Spin determination of single-produced resonances at hadron colliders | PRD 81 (2010) 075022 | 1001.3396 |
| 55 | S. Bolognesi et al. | On the spin and parity of a single-produced resonance at the LHC | PRD 86 (2012) 095031 | 1208.4018 |
| 56 | I. Anderson et al. | Constraining anomalous $ HVV $ interactions at proton and lepton colliders | PRD 89 (2014) 035007 | 1309.4819 |
| 57 | ATLAS and CMS Collaborations, LHC Higgs Combination Group | Procedure for the LHC Higgs boson search combination in Summer 2011 | CMS-NOTE-2011-005 | |
| 58 | G. Cowan, K. Cranmer, E. Gross, and O. Vitells | Asymptotic formulae for likelihood-based tests of new physics | EPJC71 (2011) 1554 | 1007.1727 |
| 59 | K. Arnold et al. | VBFNLO: A Parton level Monte Carlo for processes with electroweak bosons | CPC 180 (2009) 1661 | 0811.4559 |

|
Compact Muon Solenoid LHC, CERN |

|

|

|

|

|

|