

Compact Muon Solenoid
LHC, CERN
| CMS-PAS-SMP-16-017 | ||
| Measurement of the $ \mathrm{ pp \rightarrow ZZ } $ production cross section, $\mathrm{ Z } \to {4\ell} $ branching fraction and constraints on anomalous triple gauge couplings at $ \sqrt{s} = $ 13 TeV | ||
| CMS Collaboration | ||
| March 2017 | ||
| Abstract: Four-lepton production in proton-proton collisions, ${\mathrm{ p }\mathrm{ p }} \to(\mathrm{ Z } / \gamma^*)(\mathrm{ Z }/ \gamma^*) \to {4\ell} $, where $\ell, \ell' = \mathrm{ e }$ or $\mu$, is studied at a center-of-mass energy of 13 TeV with the CMS detector at the LHC. The data sample corresponds to an integrated luminosity of 35.9 fb$^{-1}$. The ZZ production cross section, $\sigma(\mathrm{ p }\mathrm{ p } \to \mathrm{ Z }\mathrm{ Z }) =$ 17.8 $\pm$ 0.6 (stat)$ _{-0.6}^{+0.7}$ (syst) $\pm$ 0.4 (theory) $\pm$ 0.5 (lumi) pb, measured for events with two opposite-sign, same-flavor lepton pairs produced in the mass region 60 $ < m_{\ell^+\ell^-}, m_{\ell^{\prime +}\ell^{\prime -}} < $ 120 GeV is consistent with standard model predictions. Differential cross sections are measured and well described by the theoretical predictions. The Z boson branching fraction to four leptons is measured to be $\mathcal{B}(\mathrm{ Z } \to {4\ell}) =$ 4.74 $\pm$ 0.16 (stat)$ _{-0.17}^{+0.18}$ (syst) $\pm$ 0.08 (theory) $\pm$ 0.12 (lumi) $\times 10^{-6}$ the four-lepton invariant mass in the range 80 $ < m_{{4\ell} } < $ 100 GeV and dilepton mass $m_{{\ell^+\ell^-} } > $ 4 GeV for all opposite-sign, same-flavor lepton pairs. The invariant mass distribution of the four-lepton system is used to set limits on anomalous $\mathrm{ Z }\mathrm{ Z }\mathrm{ Z }$ and $\mathrm{ Z }\mathrm{ Z }\gamma$ couplings at the 95% confidence level: $ - 0.00117 < f_4^\mathrm{ Z } < 0.00110 $, $ - 0.00100 < f_5^\mathrm{ Z } < 0.00125 $, $ -0.00133 < f_4^{\gamma} < 0.00132 $, and $ -0.00123 < f_5^{\gamma} < 0.00130 $. The results agree with standard model predictions. | ||
|
Links:
CDS record (PDF) ;
inSPIRE record ;
CADI line (restricted) ;
These preliminary results are superseded in this paper, EPJC 78 (2018) 165. The superseded preliminary plots can be found here. |
||
| Figures & Tables | Summary | Additional Figures | References | CMS Publications |
|---|
| Figures | |

png pdf |
Figure 1:
Distributions of (left) the four-lepton invariant mass $m_{ {4\ell } }$ and (right) the invariant mass of the dilepton candidates in all selected four-lepton events, including both $\mathrm{ Z } _1$ and $\mathrm{ Z } _2$ in each event. Points represent the data, while shaded histograms represent the SM prediction and background estimate. |

png |
Figure 1-a:
Distribution of the four-lepton invariant mass $m_{ {4\ell } }$. Points represent the data, while shaded histograms represent the SM prediction and background estimate. |

png |
Figure 1-b:
Distribution of the invariant mass of the dilepton candidates in all selected four-lepton events, including both $\mathrm{ Z } _1$ and $\mathrm{ Z } _2$ in each event. Points represent the data, while shaded histograms represent the SM prediction and background estimate. |

png pdf |
Figure 2:
At (left) the distribution of the reconstructed mass of the $\mathrm{ Z } _1$ candidate. Points represent the data, while shaded histograms represent the SM prediction and background estimate. At (right) the reconstructed $m_{\mathrm{ Z } _2}$ plotted against the reconstructed $m_{\mathrm{ Z } _1}$ in data events, with distinctive markers for each final state. |
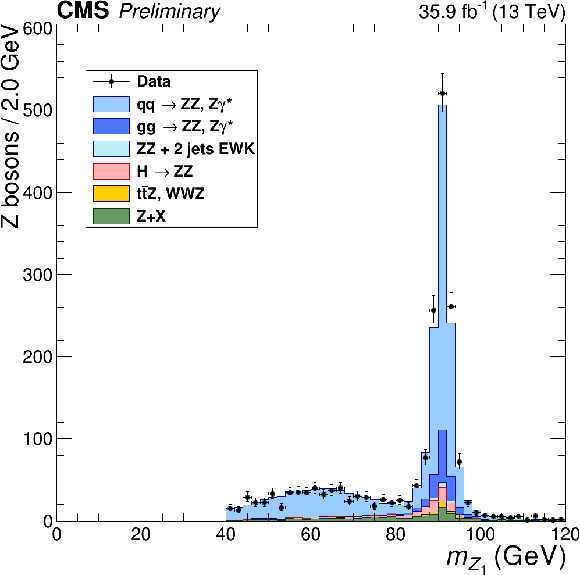
png |
Figure 2-a:
The distribution of the reconstructed mass of the $\mathrm{ Z } _1$ candidate. Points represent the data, while shaded histograms represent the SM prediction and background estimate. |
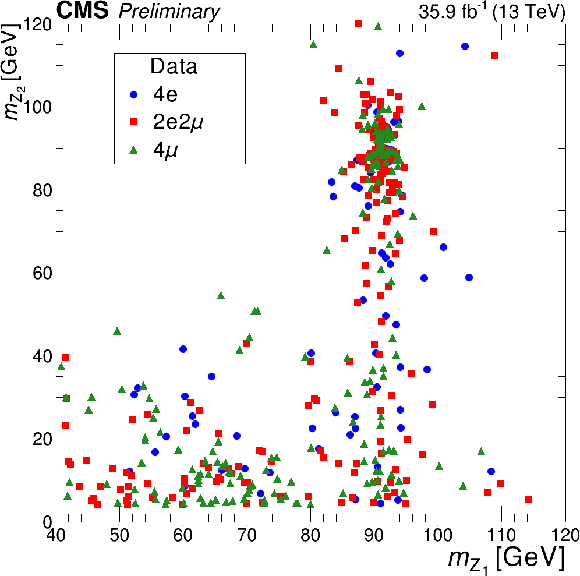
png |
Figure 2-b:
The reconstructed $m_{\mathrm{ Z } _2}$ plotted against the reconstructed $m_{\mathrm{ Z } _1}$ in data events, with distinctive markers for each final state. |

png pdf |
Figure 3:
At (left), the distribution of the reconstructed four-lepton mass $m_{ {4\ell } }$ for events selected with $m_{ {4\ell } } < $ 100 GeV. Points represent the data, while shaded histograms represent the SM prediction and background estimate. At (right) the reconstructed $m_{\mathrm{ Z } _2}$ plotted against the reconstructed $m_{\mathrm{ Z } _1}$ in data events selected with $m_{ {4\ell } }$ between 80 and 100 GeV, with distinctive markers for each final state. |
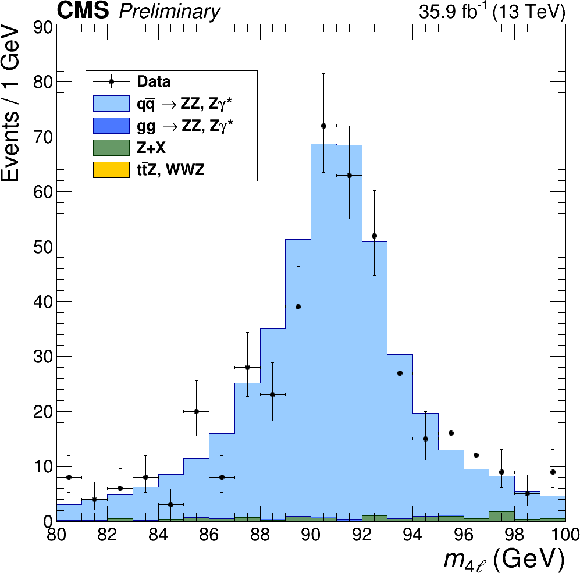
png |
Figure 3-a:
The distribution of the reconstructed four-lepton mass $m_{ {4\ell } }$ for events selected with $m_{ {4\ell } } < $ 100 GeV. Points represent the data, while shaded histograms represent the SM prediction and background estimate. |
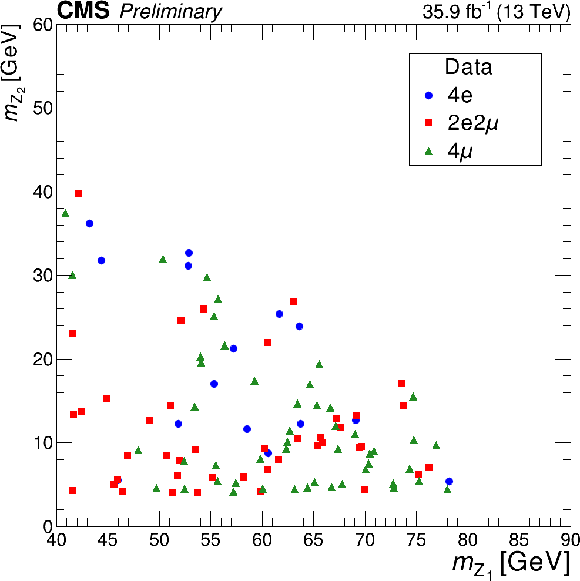
png |
Figure 3-b:
The reconstructed $m_{\mathrm{ Z } _2}$ plotted against the reconstructed $m_{\mathrm{ Z } _1}$ in data events selected with $m_{ {4\ell } }$ between 80 and 100 GeV, with distinctive markers for each final state. |

png pdf |
Figure 4:
Distributions of (left) the four-lepton invariant mass $m_{ {4\ell } }$ and (right) dilepton candidate mass for four-lepton events selected with both Z bosons on-shell. Points represent the data, while shaded histograms represent the SM prediction and background estimate. |

png |
Figure 4-a:
Distribution of the four-lepton invariant mass $m_{ {4\ell } }$. Points represent the data, while shaded histograms represent the SM prediction and background estimate. |

png |
Figure 4-b:
Distribution of the dilepton candidate mass for four-lepton events selected with both Z bosons on-shell. Points represent the data, while shaded histograms represent the SM prediction and background estimate. |
png pdf |
Figure 5:
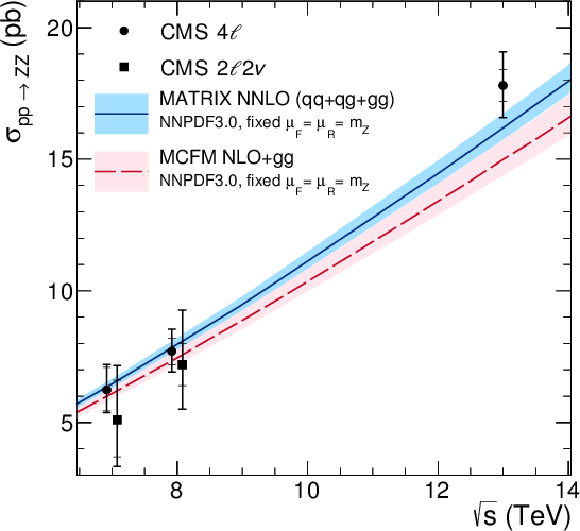
The total $ {\mathrm{ Z } \mathrm{ Z } } $ cross section as a function of the proton-proton center-of-mass energy. Results from the CMS experiment are compared to predictions from matrix and mcfm with NNPDF3.0 PDF sets and fixed scales $\mu _F = \mu _R = m_\mathrm{ Z } $. Details of the calculations and uncertainties are given in the text. Measurements at the same center-of-mass energy are shifted slightly along the horizontal axis for clarity. |
png pdf |
Figure 6:
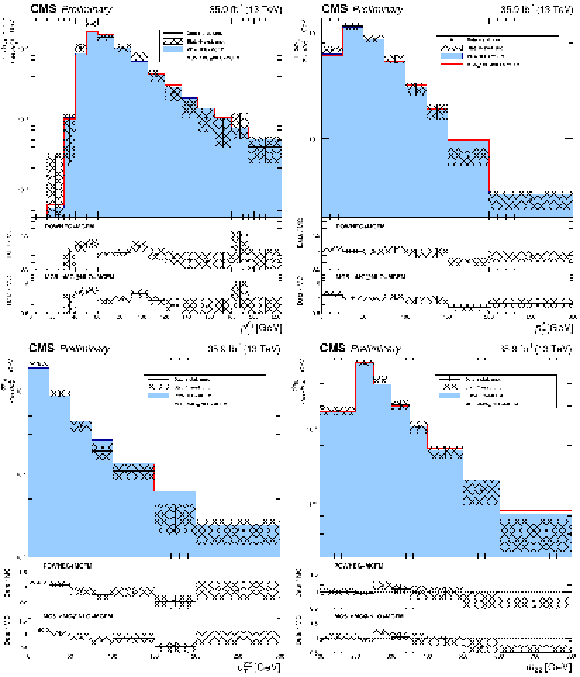
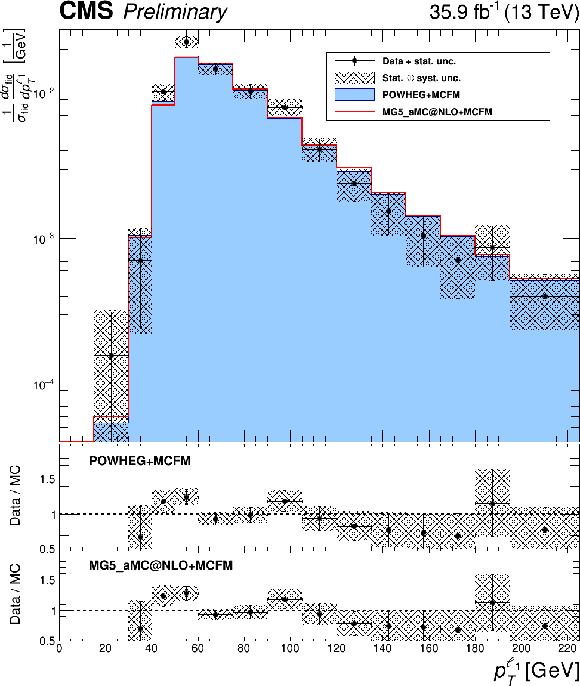
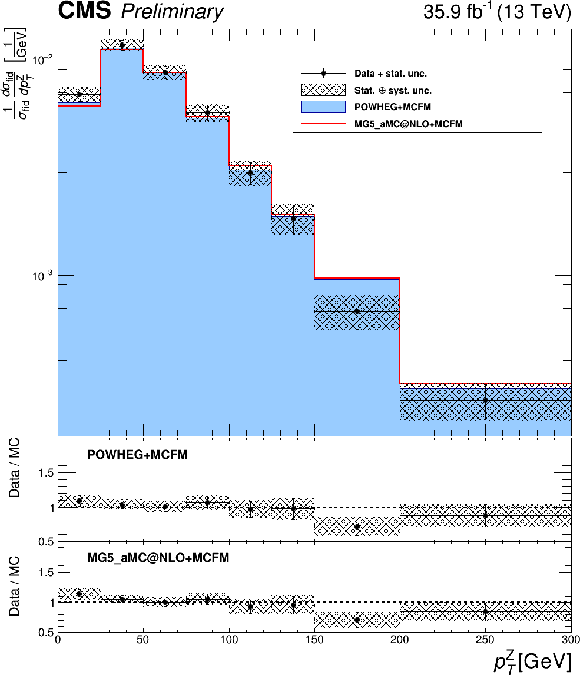
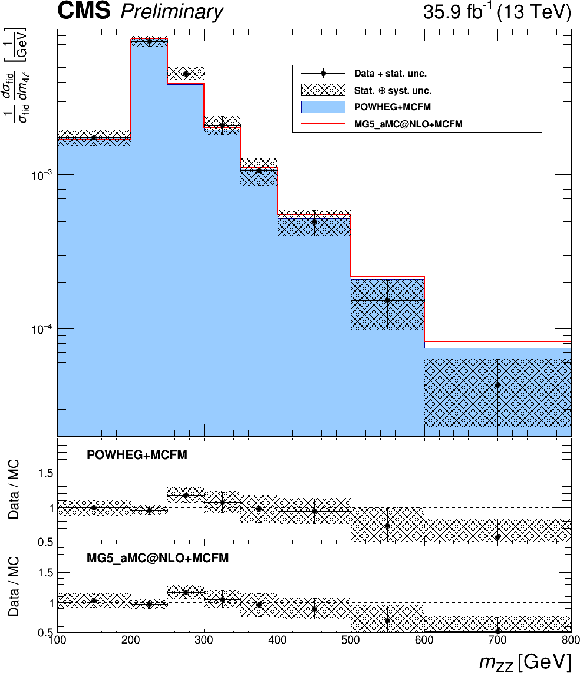
Differential cross sections normalized to the fiducial cross section for the combined 4e, 4$\mu $, and 2e2$\mu $ decay channels as a function of $ {p_{\mathrm {T}}} $ for (upper left) the highest ${p_{\mathrm {T}}}$ lepton in the event, (upper right) all Z bosons in $ {\mathrm{ Z } \mathrm{ Z } } $ events, and (lower left) the ZZ system. Figure (lower right) shows the normalized $ {\mathrm {d}}\sigma / {\mathrm {d}}{m_{\mathrm{ Z } \mathrm{ Z } }}$ distribution. Points represent the unfolded data, and the shaded histogram represent the POWHEG+MCFM predictions for ZZ signal, and the solid curves correspond to the results of the MadGraph5-aMC@NLO+MCFM calculations. The two lower plots in each subfigure represent the ratio of the measured cross section to the expected distributions from POWHEG+MCFM (middle plot) and MadGraph5-aMC@NLO+MCFM (bottom plot). The hatched areas on all the plots represent the full uncertainties calculated as the quadrature sum of the statistical and systematic uncertainties, while the crosses represent the statistical uncertainties only. |
png |
Figure 6-a:
Differential cross section normalized to the fiducial cross section for the combined 4e, 4$\mu $, and 2e2$\mu $ decay channels as a function of the $ {p_{\mathrm {T}}} $ of the highest-${p_{\mathrm {T}}}$ lepton in the event. Points represent the unfolded data, and the shaded histogram represent the POWHEG+MCFM predictions for ZZ signal, and the solid curves correspond to the results of the MadGraph5-aMC@NLO+MCFM calculations. The two lower plots represent the ratio of the measured cross section to the expected distributions from POWHEG+MCFM (middle plot) and MadGraph5-aMC@NLO+MCFM (bottom plot). The hatched areas on all the plots represent the full uncertainties calculated as the quadrature sum of the statistical and systematic uncertainties, while the crosses represent the statistical uncertainties only. |
png |
Figure 6-b:
Differential cross section normalized to the fiducial cross section for the combined 4e, 4$\mu $, and 2e2$\mu $ decay channels as a function of |

png |
Figure 6-c:
Differential cross section normalized to the fiducial cross section for the combined 4e, 4$\mu $, and 2e2$\mu $ decay channels as a function of |
png |
Figure 6-d:
Normalized $ {\mathrm {d}}\sigma / {\mathrm {d}}{m_{\mathrm{ Z } \mathrm{ Z } }}$ distribution. Points represent the unfolded data, and the shaded histogram represent the POWHEG+MCFM predictions for ZZ signal, and the solid curves correspond to the results of the MadGraph5-aMC@NLO+MCFM calculations. The two lower plots represent the ratio of the measured cross section to the expected distributions from POWHEG+MCFM (middle plot) and MadGraph5-aMC@NLO+MCFM (bottom plot). The hatched areas on all the plots represent the full uncertainties calculated as the quadrature sum of the statistical and systematic uncertainties, while the crosses represent the statistical uncertainties only. |

png pdf |
Figure 7:
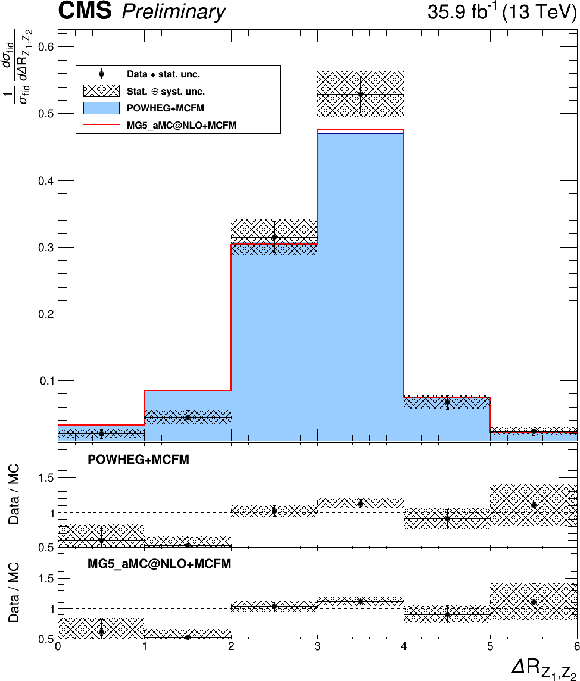
Differential cross sections normalized to the fiducial cross section for the combined 4e, 4$\mu $, and 2e2$\mu $ decay channels as a function of (left) azimuthal separation of the two Z bosons and (right) $\Delta R$ between the Z-bosons. Points represent the unfolded data, and the shaded histogram represent the POWHEG+MCFM predictions for ZZ signal, and the solid curves correspond to the results of the MadGraph5-aMC@NLO+MCFM calculations. The two lower plots in each subfigure represent the ratio of the measured cross section to the expected distributions from POWHEG+MCFM (middle plot) and MadGraph5-aMC@NLO+MCFM (bottom plot). The hatched areas on all the plots represent the full uncertainties calculated as the quadrature sum of the statistical and systematic uncertainties, while the crosses represent the statistical uncertainties only. |

png |
Figure 7-a:
Differential cross sections normalized to the fiducial cross section for the combined 4e, 4$\mu $, and 2e2$\mu $ decay channels as a function of the azimuthal separation of the two Z bosons. Points represent the unfolded data, and the shaded histogram represent the POWHEG+MCFM predictions for ZZ signal, and the solid curves correspond to the results of the MadGraph5-aMC@NLO+MCFM calculations. The two lower plots represent the ratio of the measured cross section to the expected distributions from POWHEG+MCFM (middle plot) and MadGraph5-aMC@NLO+MCFM (bottom plot). The hatched areas on all the plots represent the full uncertainties calculated as the quadrature sum of the statistical and systematic uncertainties, while the crosses represent the statistical uncertainties only. |
png |
Figure 7-b:
Differential cross sections normalized to the fiducial cross section for the combined 4e, 4$\mu $, and 2e2$\mu $ decay channels as a function of the $\Delta R$ between the Z-bosons. Points represent the unfolded data, and the shaded histogram represent the POWHEG+MCFM predictions for ZZ signal, and the solid curves correspond to the results of the MadGraph5-aMC@NLO+MCFM calculations. The two lower plots represent the ratio of the measured cross section to the expected distributions from POWHEG+MCFM (middle plot) and MadGraph5-aMC@NLO+MCFM (bottom plot). The hatched areas on all the plots represent the full uncertainties calculated as the quadrature sum of the statistical and systematic uncertainties, while the crosses represent the statistical uncertainties only. |

png pdf |
Figure 8:
Differential cross sections normalized to the fiducial cross section for the combined 4e, 4$\mu $, and 2e2$\mu $ decay channels as a function of the four-lepton mass for events subject only to the common requirements of Table 4. SM $\gamma \gamma \to \mathrm{ H } \to \mathrm{ Z } \mathrm{ Z } ^* $ production is included, simulated with POWHEG. Points represent the unfolded data, and the shaded histogram represent the POWHEG+MCFM predictions for ZZ signal, and the solid curves correspond to the results of the MadGraph5-aMC@NLO+MCFM+POWHEG calculations. The two lower plots represent the ratio of the measured cross section to the expected distributions from POWHEG+MCFM. The hatched areas on all the plots represent the full uncertainties calculated as the quadrature sum of the statistical and systematic uncertainties, while the crosses represent the statistical uncertainties only. |

png pdf |
Figure 9:
Distribution of the four-lepton reconstructed mass for the combined 4e, 4$\mu $, and 2e2$\mu$ channels. Points represent the data, the shaded histograms represent the SM prediction including signal and irreducible background Monte Carlo and the data-driven background estimate. Dashed histograms represent example aTGC signals (colors), and the SHERPA SM prediction (black), included to illustrate the expected shape differences between the SHERPA and POWHEG samples. The SHERPA distributions are normalized such that the SM sample has the same total yield as the POWHEG sample predicts. The last bin includes the "overflow'' contribution from events at masses above 1.2 TeV. |

png pdf |
Figure 10:
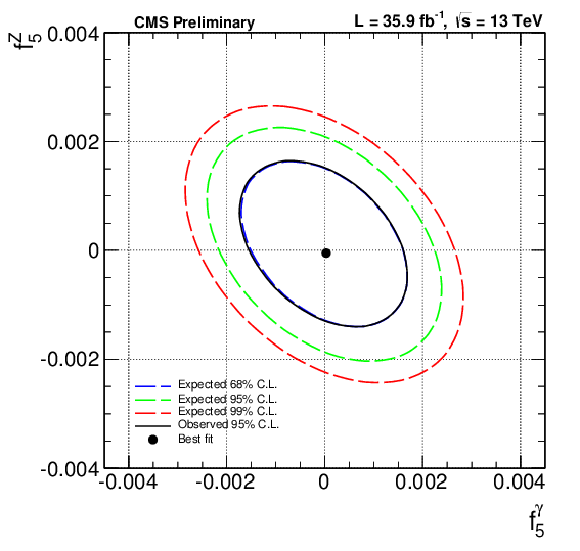
Two-dimensional exclusion limits at 68% (dashed contour) and 95% (solid contour) CL on the $\mathrm{ Z } \mathrm{ Z } \mathrm{ Z } $ and $\mathrm{ Z } \mathrm{ Z } \gamma $ aTGCs. The left (right) plot shows the exclusion contour in the $(f_{4(5)}^\mathrm{ Z }, f_{4(5)}^\gamma)$ parameter planes. The values of couplings outside of contours are excluded at the corresponding confidence level. The solid dot is the point at which the likelihood is at its maximum. No form factor is used. |

png pdf |
Figure 10-a:
Two-dimensional exclusion limits at 68% (dashed contour) and 95% (solid contour) CL on the $\mathrm{ Z } \mathrm{ Z } \mathrm{ Z } $ and $\mathrm{ Z } \mathrm{ Z } \gamma $ aTGCs. The plot shows the exclusion contour in the $(f_{4}^\mathrm{ Z }, f_{4}^\gamma)$ parameter planes. The values of couplings outside of contours are excluded at the corresponding confidence level. The solid dot is the point at which the likelihood is at its maximum. No form factor is used. |
png pdf |
Figure 10-b:
Two-dimensional exclusion limits at 68% (dashed contour) and 95% (solid contour) CL on the $\mathrm{ Z } \mathrm{ Z } \mathrm{ Z } $ and $\mathrm{ Z } \mathrm{ Z } \gamma $ aTGCs. The plot shows the exclusion contour in the $(f_{5}^\mathrm{ Z }, f_{5}^\gamma)$ parameter planes. The values of couplings outside of contours are excluded at the corresponding confidence level. The solid dot is the point at which the likelihood is at its maximum. No form factor is used. |
| Tables | |

png pdf |
Table 1:
The contributions of each source of signal systematic uncertainty in the cross section measurements. The integrated luminosity uncertainty and the PDF and scale uncertainties are considered separately. All other uncertainties are added in quadrature into a single systematic uncertainty. Uncertainties that vary by decay channel are listed as a range. |

png pdf |
Table 2:
The observed and expected yields of four-lepton events in the mass region 80 $ < m_{ {4\ell } } < $ 100 GeV and estimated yields of background events evaluated from data, shown for each final state and summed in the total expected yield. The first uncertainty is statistical, the second one is systematic. The systematic uncertainties do not include the uncertainty on the integrated luminosity. |

png pdf |
Table 3:
The observed and expected yields of ZZ events, and estimated yields of background events evaluated from data, shown for each final state and summed in the total expected yield. The first uncertainty is statistical, the second one is systematic. The systematic uncertainties do not include the uncertainty on the integrated luminosity. |

png pdf |
Table 4:
Fiducial definitions for the reported cross sections. The common requirements are applied for both measurements. |
| Summary |
| Results have been presented for a study of four-lepton final states in proton-proton collisions at $ \sqrt{s} = $ 13 TeV with the CMS detector at the LHC. The $\mathrm{ pp \to ZZ }$ cross section has been measured to be $\sigma(\mathrm{ p }\mathrm{ p } \to \mathrm{ Z }\mathrm{ Z }) = $ 17.8 $\pm$ 0.6 (stat)$ _{-0.6}^{+0.7}$ (syst) $\pm$ 0.4 (theory) $\pm$ 0.5 (lumi) pb measured for Z boson masses in the range 60 $ < m_{\mathrm{ Z }} < $ 120 GeV. The branching fraction for Z boson decays to four leptons has been measured to be $\mathcal{B}(\mathrm{ Z } \to {4\ell}) = $ 4.74 $\pm$ 0.16 (stat)$ _{-0.17}^{+0.18}$ (syst) $\pm$ 0.08 (theory) $\pm$ 0.12 (lumi) $\times 10^{-6}$ for four-lepton mass in the range 80 $ < m_{{4\ell} } < $ 100 GeV and dilepton mass $m_{{\ell^+\ell^-} } > $ 4 GeV for all oppositely charged same-flavor lepton pairs. The results are consistent with SM predictions. The normalized differential cross sections have also been measured and agree well with the SM predictions. Improved limits on anomalous $\mathrm{ Z } \mathrm{ Z } \mathrm{ Z }$ and $\mathrm{ Z } \mathrm{ Z } \gamma$ triple gauge couplings are established, significantly restricting their allowed ranges. |
| Additional Figures | |

png pdf |
Additional Figure 1:
The total ZZ cross section as a function of the proton-proton center-of-mass energy. Results from the CMS and ATLAS experiments are compared to predictions from matrix at NNLO in QCD, and MCFM at NLO in QCD. The MCFM prediction further includes gluon-gluon initiated production at LO in QCD. Both predictions use NNPDF3.0 PDF sets and fixed scales $\mu _F = \mu _R = m_{\mathrm{Z}} $. Details of the calculations and uncertainties are given in the text of SMP-16-017. ATLAS measurements were performed with a Z mass window of 66-116 GeV, and are corrected for the resulting 1.6%difference. Measurements at the same center-of-mass energy are shifted slightly along the horizontal axis for clarity. |
| References | ||||
| 1 | K. Hagiwara, R. D. Peccei, and D. Zeppenfeld | Probing the weak boson sector in $ \mathrm{ e }^{+}\mathrm{ e }^{-} \to \mathrm{ W^{+} }\mathrm{ W^{-} } $ | Nucl. Phys. B 282 (1987) 253 | |
| 2 | G. J. Gounaris, J. Layssac, and F. M. Renard | New and standard physics contributions to anomalous Z and gamma self-couplings | PRD 62 (2000) 073013 | hep-ph/0003143 |
| 3 | CMS Collaboration | Measurement of the ZZ production cross section and search for anomalous couplings in $ 2\ell 2\ell' $ final states in pp collisions at $ \sqrt{s}=$ 7 TeV | JHEP 01 (2013) 063 | CMS-SMP-12-007 1211.4890 |
| 4 | CMS Collaboration | Measurement of the $ \text{pp} \to \rm{ZZ} $ production cross section and constraints on anomalous triple gauge couplings in four-lepton final states at $ \sqrt{s}=$ 8 TeV | PLB 740 (2015) 250 | CMS-SMP-13-005 1406.0113 |
| 5 | CMS Collaboration | Measurements of the ZZ production cross sections in the $ 2\ell 2\nu $ channel in proton-proton collisions at $ \sqrt{s}=$ 7 and 8 TeV and combined constraints on triple gauge couplings | EPJC 75 (2015) 511 | CMS-SMP-12-016 1503.05467 |
| 6 | CMS Collaboration | Measurement of the ZZ production cross section and Z $ \to \ell^+\ell^-\ell'^+\ell'^- $ branching fraction in pp collisions at $ \sqrt s $=13 TeV | PLB 763 (2016) 280 | CMS-SMP-16-001 1607.08834 |
| 7 | ATLAS Collaboration | Measurement of ZZ production in pp collisions at $ \sqrt{s}=$ 7 TeV and limits on anomalous ZZZ and ZZ$ \gamma $ couplings with the ATLAS detector | JHEP 03 (2013) 128 | 1211.6096 |
| 8 | ATLAS Collaboration | Measurements of four-lepton production in pp collisions at $ \sqrt{s}=$ 8 TeV with the ATLAS detector | PLB 753 (2016) 552 | 1509.07844 |
| 9 | ATLAS Collaboration | Measurement of the ZZ Production Cross Section in pp Collisions at $ \sqrt{s}=$ 13 TeV with the ATLAS Detector | PRL 116 (2016) 101801 | 1512.05314 |
| 10 | F. Cascioli et al. | ZZ production at hadron colliders in NNLO QCD | PLB 735 (2014) 311 | 1405.2219 |
| 11 | ATLAS Collaboration | Measurement of the $ ZZ $ production cross section in proton-proton collisions at $ \sqrt{s}=$ 8 TeV using the $ ZZ\to\ell^{-}\ell^{+}\ell^{\prime -}\ell^{\prime +} $ and $ ZZ\to\ell^{-}\ell^{+}\nu\bar{\nu} $ channels with the ATLAS detector | JHEP 01 (2017) 099 | 1610.07585 |
| 12 | ALEPH Collaboration | Study of the four fermion final state at the Z resonance | Z. Phys. C 66 (1995) 3 | |
| 13 | CMS Collaboration | Observation of Z decays to four leptons with the CMS detector at the LHC | JHEP 12 (2012) 034 | CMS-SMP-12-009 1210.3844 |
| 14 | ATLAS Collaboration | Measurements of Four-Lepton Production at the Z Resonance in pp Collisions at $ \sqrt{s}=$ 7 and 8 TeV with ATLAS | PRL 112 (2014) 231806 | 1403.5657 |
| 15 | CMS Collaboration | The CMS experiment at the CERN LHC | JINST 3 (2008) S08004 | CMS-00-001 |
| 16 | CMS Collaboration | Performance of electron reconstruction and selection with the CMS detector in proton-proton collisions at $ \sqrt{s}=$ 8 TeV | JINST 10 (2015) P06005 | CMS-EGM-13-001 1502.02701 |
| 17 | CMS Collaboration | Performance of CMS muon reconstruction in pp collision events at $ \sqrt{s}=$ 7 TeV | JINST 7 (2012) P10002 | CMS-MUO-10-004 1206.4071 |
| 18 | S. Alioli, P. Nason, C. Oleari, and E. Re | NLO vector-boson production matched with shower in POWHEG | JHEP 07 (2008) 060 | 0805.4802 |
| 19 | P. Nason | A new method for combining NLO QCD with shower Monte Carlo algorithms | JHEP 11 (2004) 040 | hep-ph/0409146 |
| 20 | S. Frixione, P. Nason, and C. Oleari | Matching NLO QCD computations with parton shower simulations: the POWHEG method | JHEP 11 (2007) 070 | 0709.2092 |
| 21 | J. M. Campbell and R. K. Ellis | MCFM for the Tevatron and the LHC | NPPS 205--206 (2010) 10 | 1007.3492 |
| 22 | F. Caola, K. Melnikov, R. Rontsch, and L. Tancredi | QCD corrections to ZZ production in gluon fusion at the LHC | PRD 92 (2015) 094028 | 1509.06734 |
| 23 | A. Ballestrero et al. | PHANTOM: A Monte Carlo event generator for six parton final states at high energy colliders | CPC 180 (2009) 401--417 | 0801.3359 |
| 24 | Y. Gao et al. | Spin determination of single-produced resonances at hadron colliders | PRD 81 (2010) 075022 | 1001.3396 |
| 25 | S. Bolognesi et al. | On the spin and parity of a single-produced resonance at the LHC | PRD 86 (2012) 095031 | 1208.4018 |
| 26 | I. Anderson et al. | Constraining anomalous HVV interactions at proton and lepton colliders | PRD 89 (2014) 035007 | 1309.4819 |
| 27 | J. Alwall et al. | The automated computation of tree-level and next-to-leading order differential cross sections, and their matching to parton shower simulations | JHEP 07 (2014) 079 | 1405.0301 |
| 28 | T. Gleisberg et al. | Event generation with SHERPA 1.1 | JHEP 02 (2009) 007 | 0811.4622 |
| 29 | T. Sjostrand, S. Mrenna, and P. Skands | PYTHIA 6.4 physics and manual | JHEP 05 (2006) 026 | hep-ph/0603175 |
| 30 | T. Sjostrand et al. | An introduction to PYTHIA 8.2 | CPC 191 (2015) 159 | 1410.3012 |
| 31 | S. Alioli, P. Nason, C. Oleari, and E. Re | A general framework for implementing NLO calculations in shower Monte Carlo programs: the POWHEG BOX | JHEP 06 (2010) 043 | 1002.2581 |
| 32 | CMS Collaboration | Event generator tunes obtained from underlying event and multiparton scattering measurements | EPJC 76 (2016) 155 | CMS-GEN-14-001 1512.00815 |
| 33 | NNPDF Collaboration | Parton distributions for the LHC Run II | JHEP 04 (2015) 040 | 1410.8849 |
| 34 | GEANT4 Collaboration | GEANT4---a simulation toolkit | NIMA 506 (2003) 250 | |
| 35 | CMS Collaboration | Particle--Flow Event Reconstruction in CMS and Performance for Jets, Taus, and $ E_{\mathrm{T}}^{\text{miss}} $ | CDS | |
| 36 | CMS Collaboration | Commissioning of the Particle-flow Event Reconstruction with the first LHC collisions recorded in the CMS detector | CDS | |
| 37 | M. Cacciari and G. P. Salam | Pileup subtraction using jet areas | PLB 659 (2008) 119 | 0707.1378 |
| 38 | CMS Collaboration | Measurement of the Inclusive W and Z Production Cross Sections in pp Collisions at $ \sqrt{s}=$ 7 TeV | JHEP 10 (2011) 132 | CMS-EWK-10-005 1107.4789 |
| 39 | CMS Collaboration | Measurement of the properties of a Higgs boson in the four-lepton final state | PRD 89 (2014), no. 9, 092007 | CMS-HIG-13-002 1312.5353 |
| 40 | J. Butterworth et al. | PDF4LHC recommendations for LHC Run II | J. Phys. G 43 (2016) 023001 | 1510.03865 |
| 41 | CMS Collaboration | CMS Luminosity Measurement for the 2015 Data Taking Period | CMS-PAS-LUM-15-001 | CMS-PAS-LUM-15-001 |
| 42 | ATLAS and CMS Collaborations | Combined Measurement of the Higgs Boson Mass in pp Collisions at $ \sqrt{s}=$ 7 and 8 TeV with the ATLAS and CMS Experiments | PRL 114 (2015) 191803 | 1503.07589 |
| 43 | R. Gavin, Y. Li, F. Petriello, and S. Quackenbush | FEWZ~2.0: A code for hadronic Z production at next-to-next-to-leading order | CPC 182 (2011) 2388 | 1011.3540 |
| 44 | Particle Data Group, K. A. Olive et al. | Review of particle physics | CPC 38 (2014) 090001 | |
| 45 | M. Grazzini, S. Kallweit, and D. Rathlev | ZZ production at the LHC: fiducial cross sections and distributions in NNLO QCD | PLB 750 (2015) 407 | 1507.06257 |
| 46 | G. D'Agostini | Improved iterative Bayesian unfolding | 1010.0632 | |

|
Compact Muon Solenoid LHC, CERN |

|

|

|

|

|

|