

Compact Muon Solenoid
LHC, CERN
| CMS-PAS-SMP-16-007 | ||
| Measurement of the weak mixing angle with the forward-backward asymmetry of Drell-Yan events at 8 TeV | ||
| CMS Collaboration | ||
| July 2017 | ||
| Abstract: We present a measurement of the effective weak mixing angle using the forward-backward asymmetry of Drell-Yan (ee and $\mu\mu$) events in pp collisions at $\sqrt{s}= $ 8 TeV at CMS. The data sample corresponds to an integrated luminosity of 18.8 fb$^{-1}$ and 19.6 fb$^{-1}$ for muon and electron channels, respectively. The sample consists of 8.2 million dimuon and 4.9 million dielectron events. With new analysis techniques and a larger dataset, the statistical and systematic uncertainties are significantly reduced compared to our previous measurement. The extracted value of the effective weak mixing angle from the combined ee and $\mu\mu$ data samples is $ \sin^2\theta^{\text{lept}}_{\text{eff}}= $ 0.23101 $\pm$ 0.00036 (stat) $\pm$ 0.00018 (syst) $\pm$ 0.00016 (theory) $\pm$ 0.00030 (pdf) or $ \sin^2\theta^{\text{lept}}_{\text{eff}}= $ 0.23101 $\pm$ 0.00052. | ||
|
Links:
CDS record (PDF) ;
inSPIRE record ;
CADI line (restricted) ;
These preliminary results are superseded in this paper, EPJC 78 (2018) 701. The superseded preliminary plots can be found here. |
||
| Figures | |

png pdf |
Figure 1:
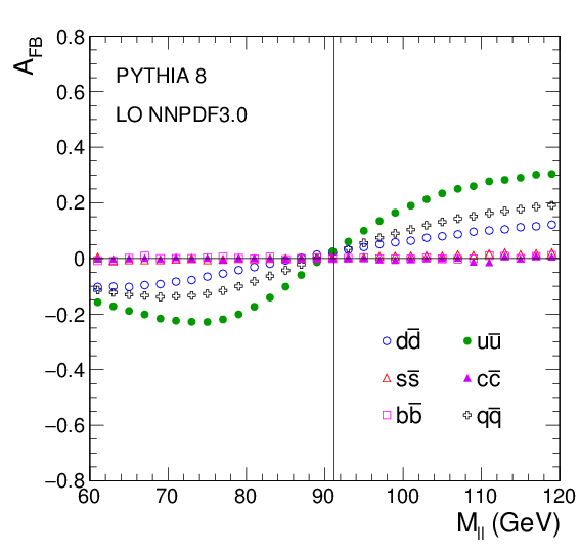
$ {A_\text {FB}} (M_{ {\ell \ell }})$ distributions for dimuon events generated with PYTHIA 8 using the leading-order NNPDF3.0. The dimuon rapidity is restricted to $|Y_{ {\ell \ell }}|< $ 2.4. (Left) $ {A_\text {FB}} ^\mathrm {true}(M_{ {\ell \ell }})$ in different $\mathrm{q\bar{q}}$ production channels. The curves are made using Eq. 5. Here, the definition of $ {A_\text {FB}} ^\mathrm {true}(M_{ {\ell \ell }})$ uses the known quark direction instead of the dilepton boost direction. (Middle) The observable (diluted) $ {A_\text {FB}} $ for different $\mathrm{q\bar{q}}$ production channels. (Right) The total observable (diluted) $ {A_\text {FB}} $ for different $|Y_{ {\ell \ell }}|$ bins. |

png pdf |
Figure 1-a:
$ {A_\text {FB}} (M_{ {\ell \ell }})$ distributions for dimuon events generated with PYTHIA 8 using the leading-order NNPDF3.0. The dimuon rapidity is restricted to $|Y_{ {\ell \ell }}|< $ 2.4. $ {A_\text {FB}} ^\mathrm {true}(M_{ {\ell \ell }})$ in different $\mathrm{q\bar{q}}$ production channels. The curves are made using Eq. 5. Here, the definition of $ {A_\text {FB}} ^\mathrm {true}(M_{ {\ell \ell }})$ uses the known quark direction instead of the dilepton boost direction. |
png pdf |
Figure 1-b:
$ {A_\text {FB}} (M_{ {\ell \ell }})$ distributions for dimuon events generated with PYTHIA 8 using the leading-order NNPDF3.0. The dimuon rapidity is restricted to $|Y_{ {\ell \ell }}|< $ 2.4. The observable (diluted) $ {A_\text {FB}} $ for different $\mathrm{q\bar{q}}$ production channels. |

png pdf |
Figure 1-c:
$ {A_\text {FB}} (M_{ {\ell \ell }})$ distributions for dimuon events generated with PYTHIA 8 using the leading-order NNPDF3.0. The dimuon rapidity is restricted to $|Y_{ {\ell \ell }}|< $ 2.4. The total observable (diluted) $ {A_\text {FB}} $ for different $|Y_{ {\ell \ell }}|$ bins. |
png pdf |
Figure 2:
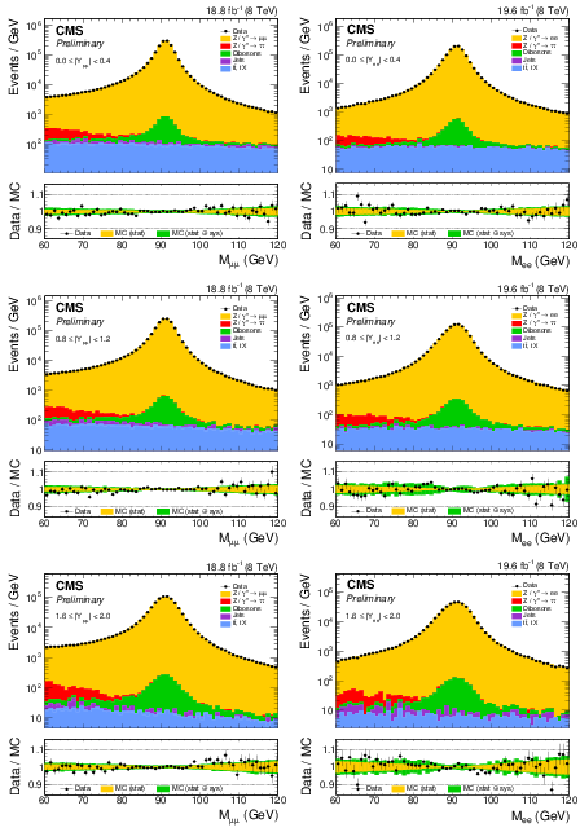
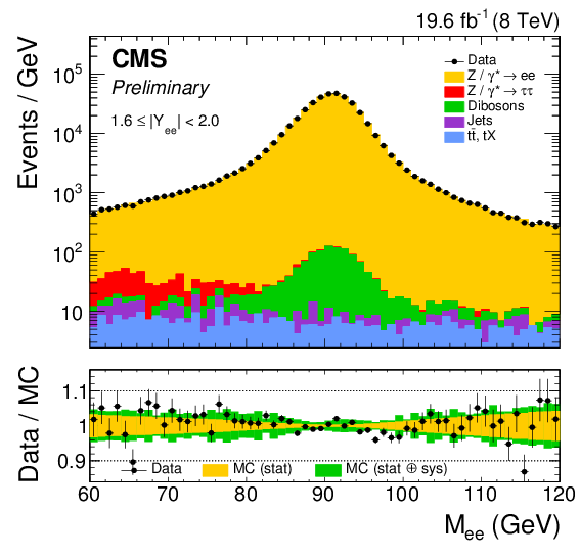
Dimuon (left) and dielectron (right) mass distributions in three representative rapidity bins: $|Y_{ {\ell \ell }}|< $ 0.4 (top), 0.8 $ < |Y_{ {\ell \ell }}| < $ 1.2 (center), and 1.6 $ < |Y_{ {\ell \ell }}| < $ 2.0 (bottom). |
png pdf |
Figure 2-a:
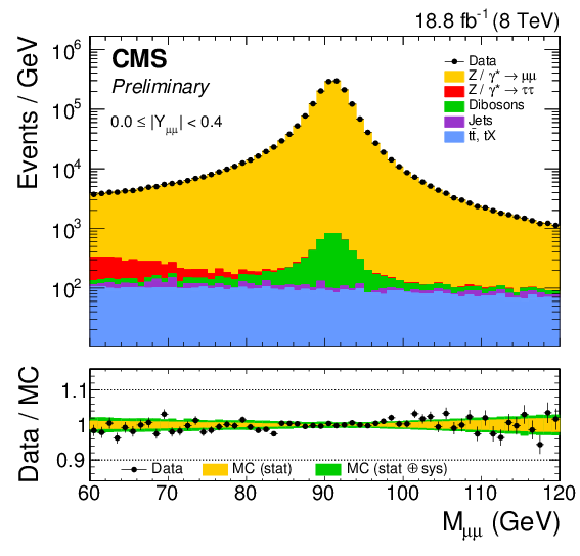
Dimuon mass distribution in representative rapidity bin $|Y_{ {\ell \ell }}|< $ 0.4. |

png pdf |
Figure 2-b:
Dielectron mass distribution in representative rapidity bin $|Y_{ {\ell \ell }}|< $ 0.4. |

png pdf |
Figure 2-c:
Dimuon mass distribution in representative rapidity bin 0.8 $ < |Y_{ {\ell \ell }}|< $ 1.2. |

png pdf |
Figure 2-d:
Dielectron mass distribution in representative rapidity bin 0.8 $ < |Y_{ {\ell \ell }}|< $ 1.2. |
png pdf |
Figure 2-e:
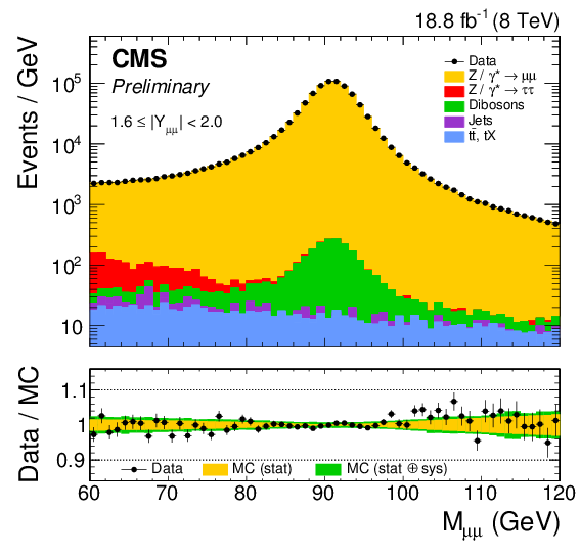
Dimuon mass distribution in representative rapidity bin 1.6 $ < |Y_{ {\ell \ell }}| < $ 2.0. |
png pdf |
Figure 2-f:
Dielectron mass distribution in representative rapidity bin 1.6 $ < |Y_{ {\ell \ell }}| < $ 2.0. |
png pdf |
Figure 3:
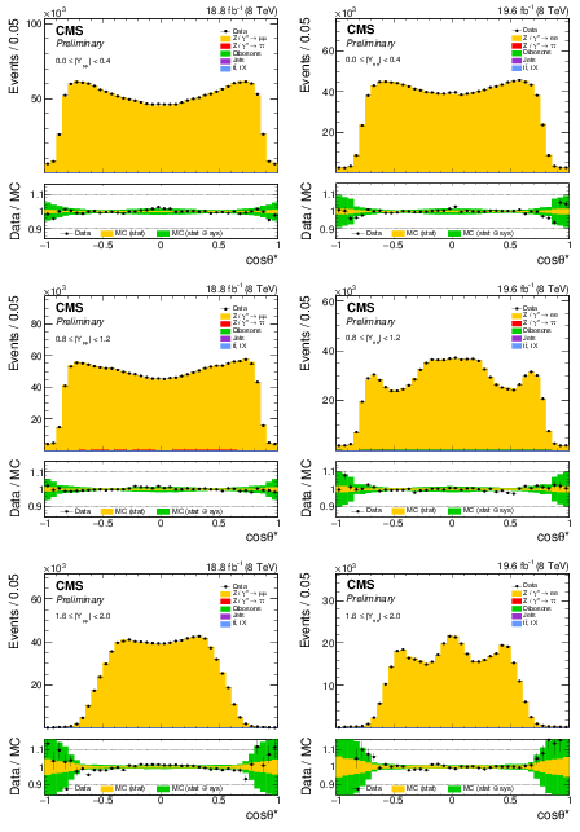
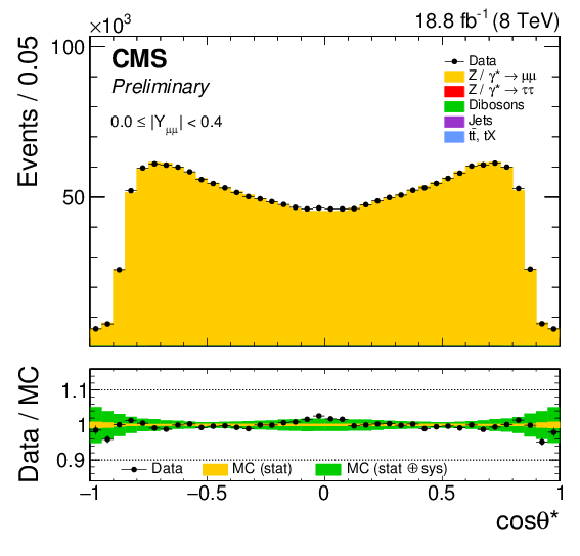
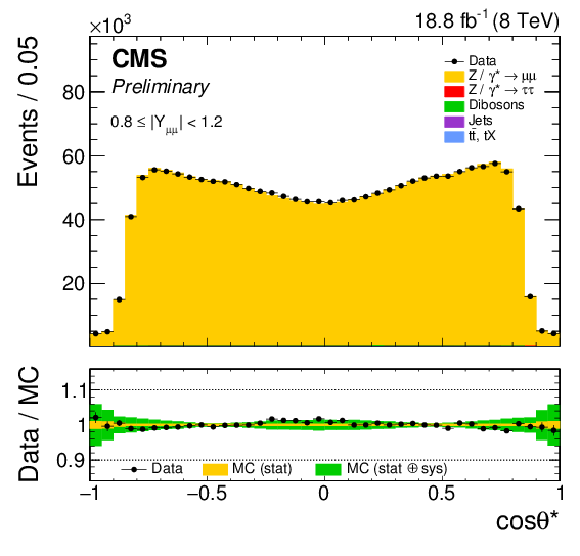
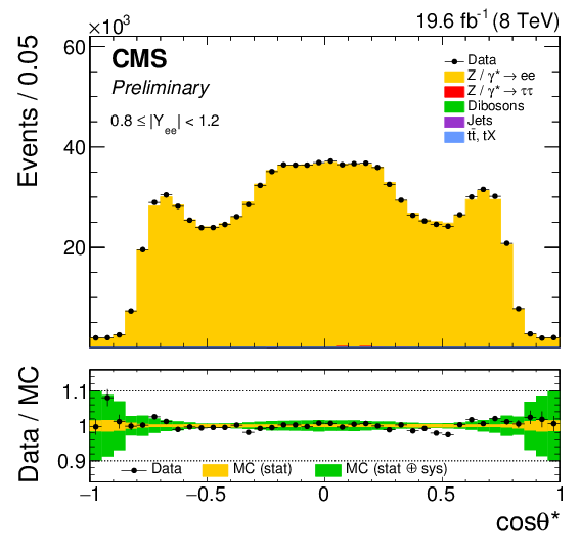
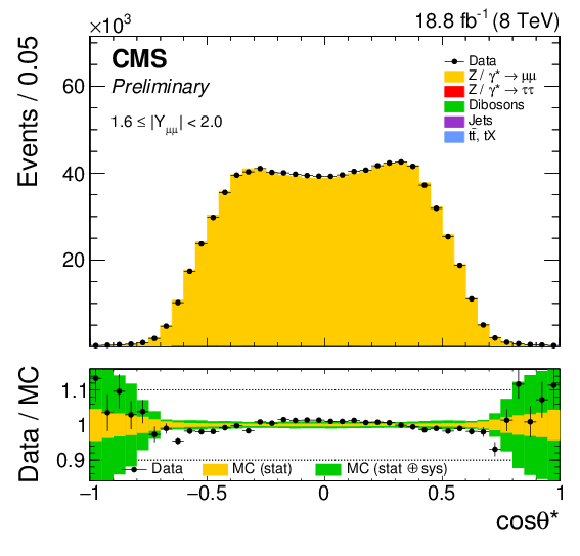
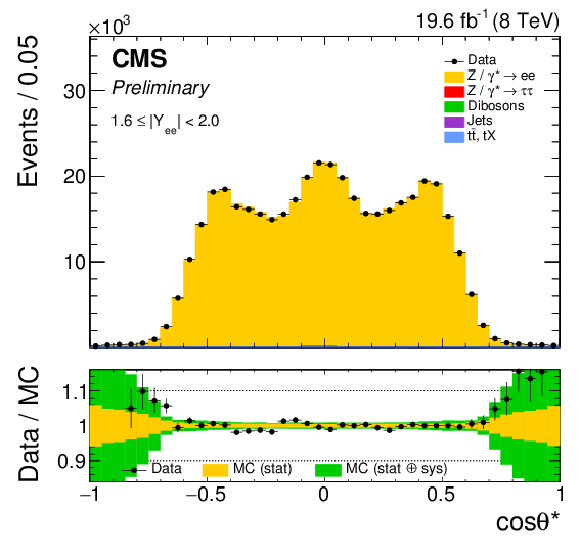
The muon (left) and electron (right) $ {\cos\theta ^{*}} $ distributions in three representative rapidity bins: $|Y_{ {\ell \ell }}| < $ 0.4 (top), 0.8 $ < |Y_{ {\ell \ell }}| < $ 1.2 (center), and 1.6 $ < |Y_{ {\ell \ell }}| < $ 2.0 (bottom). |
png pdf |
Figure 3-a:
The muon $ {\cos\theta ^{*}} $ distribution in representative rapidity bin $|Y_{ {\ell \ell }}| < $ 0.4. |

png pdf |
Figure 3-b:
The electron $ {\cos\theta ^{*}} $ distribution in representative rapidity bin $|Y_{ {\ell \ell }}| < $ 0.4. |
png pdf |
Figure 3-c:
The muon $ {\cos\theta ^{*}} $ distribution in representative rapidity bin 0.8 $ < |Y_{ {\ell \ell }}| < $ 1.2. |
png pdf |
Figure 3-d:
The electron $ {\cos\theta ^{*}} $ distribution in representative rapidity bin 0.8 $ < |Y_{ {\ell \ell }}| < $ 1.2. |
png pdf |
Figure 3-e:
The muon $ {\cos\theta ^{*}} $ distribution in representative rapidity bin 1.6 $ < |Y_{ {\ell \ell }}| < $ 2.0. |
png pdf |
Figure 3-f:
The electron $ {\cos\theta ^{*}} $ distribution in representative rapidity bin 1.6 $ < |Y_{ {\ell \ell }}| < $ 2.0. |
png pdf |
Figure 4:
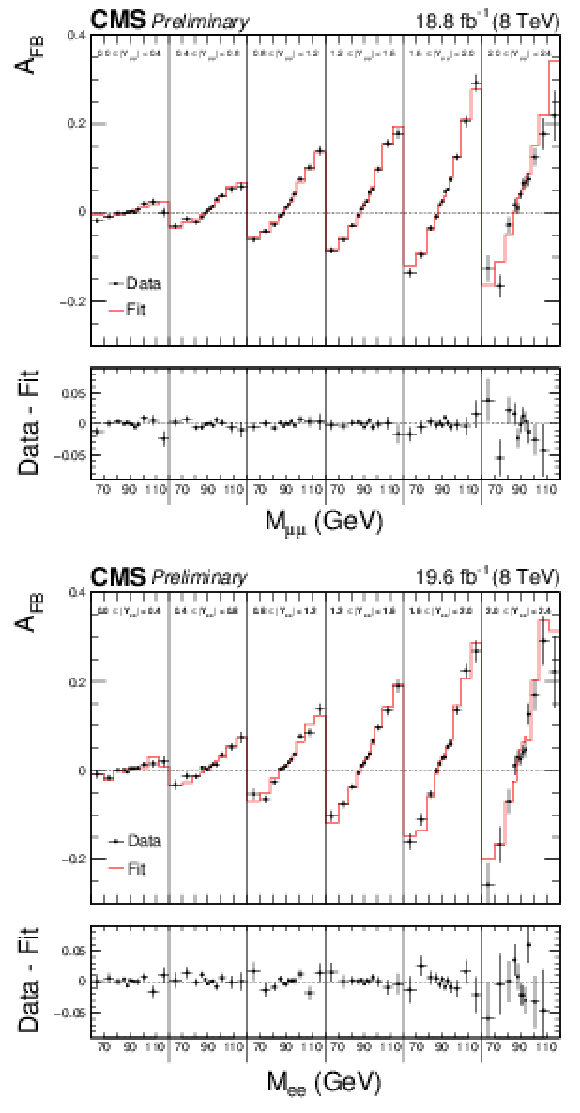
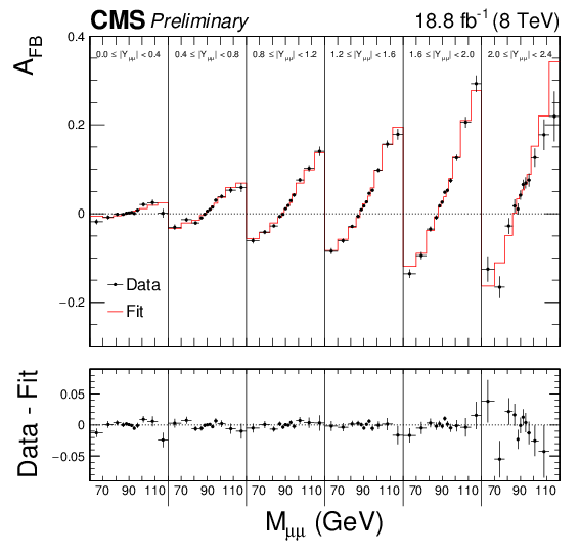
Comparison between data and best-fit $ {A_\text {FB}} $ distributions in the dimuon (top) and dielectron (bottom) channels. The best-fit $ {A_\text {FB}} $ value in each bin is obtained by linear interpolation between the two neighboring templates. The templates are based on the central PDF of the NLO NNPDF3.0 set. |
png pdf |
Figure 4-a:
Comparison between data and best-fit $ {A_\text {FB}} $ distributions in the dimuon channel. The best-fit $ {A_\text {FB}} $ value in each bin is obtained by linear interpolation between the two neighboring templates. The templates are based on the central PDF of the NLO NNPDF3.0 set. |

png pdf |
Figure 4-b:
Comparison between data and best-fit $ {A_\text {FB}} $ distributions in the dielectron channel. The best-fit $ {A_\text {FB}} $ value in each bin is obtained by linear interpolation between the two neighboring templates. The templates are based on the central PDF of the NLO NNPDF3.0 set. |
png pdf |
Figure 5:
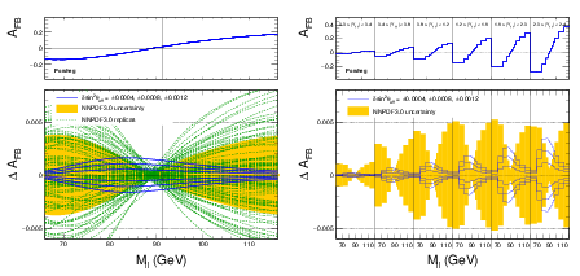
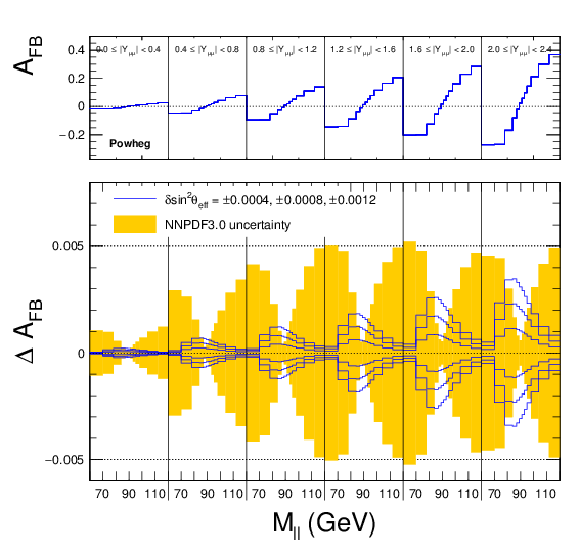
Distribution of $ {A_\text {FB}} $ as a function of mass integrated over rapidity (left) and in six rapidity bins (right) for $ {\sin^2\theta ^{\text {lept}}_{\text {eff}}} = $ 0.23120. The solid lines in the bottom panel correspond to six variations of $ {\sin^2\theta ^{\text {lept}}_{\text {eff}}} $ around the central value: $\pm$ 0.00040, $\pm$ 0.00080 and $\pm$ 0.00120. The dashed lines correspond to $ {A_\text {FB}} $ predictions for 100 NNPDF3.0 replicas. The shaded band illustrates the standard deviation over the NNPDF3.0 replicas. |

png pdf |
Figure 5-a:
Distribution of $ {A_\text {FB}} $ as a function of mass integrated over rapidity for $ {\sin^2\theta ^{\text {lept}}_{\text {eff}}} = $ 0.23120. The solid lines in the bottom panel correspond to six variations of $ {\sin^2\theta ^{\text {lept}}_{\text {eff}}} $ around the central value: $\pm$ 0.00040, $\pm$ 0.00080 and $\pm$ 0.00120. The dashed lines correspond to $ {A_\text {FB}} $ predictions for 100 NNPDF3.0 replicas. The shaded band illustrates the standard deviation over the NNPDF3.0 replicas. |
png pdf |
Figure 5-b:
Distribution of $ {A_\text {FB}} $ as a function of mass in six rapidity bins for $ {\sin^2\theta ^{\text {lept}}_{\text {eff}}} = $ 0.23120. The solid lines in the bottom panel correspond to six variations of $ {\sin^2\theta ^{\text {lept}}_{\text {eff}}} $ around the central value: $\pm$ 0.00040, $\pm$ 0.00080 and $\pm$ 0.00120. The dashed lines correspond to $ {A_\text {FB}} $ predictions for 100 NNPDF3.0 replicas. The shaded band illustrates the standard deviation over the NNPDF3.0 replicas. |
png pdf |
Figure 6:
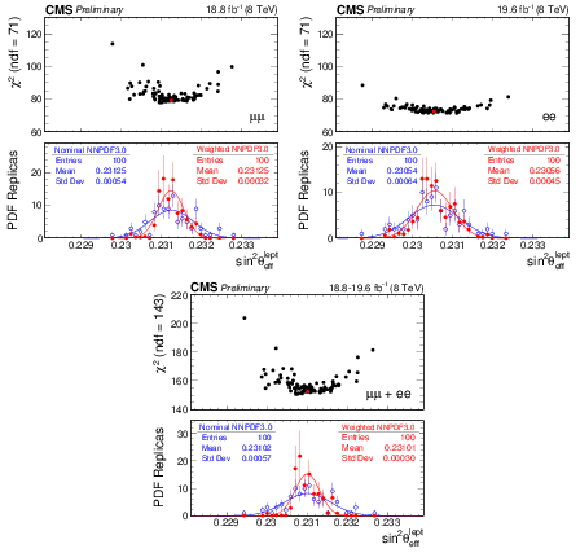
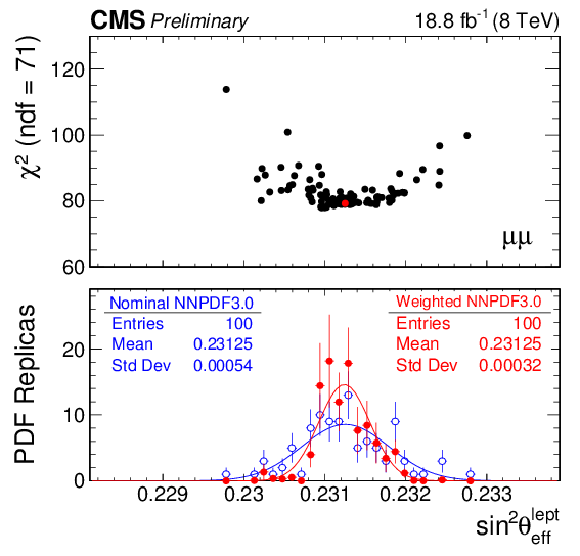
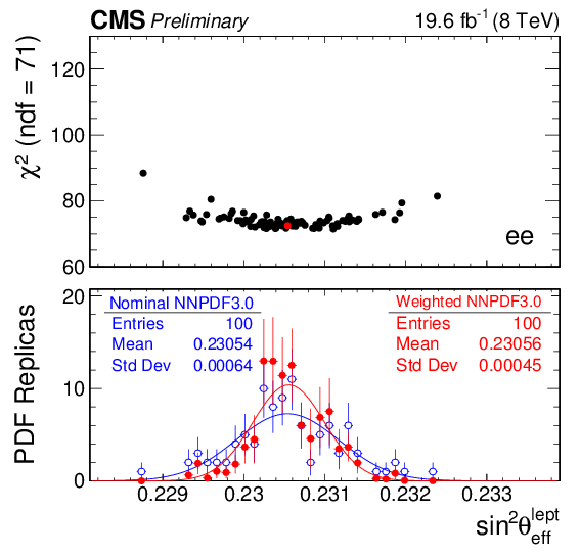
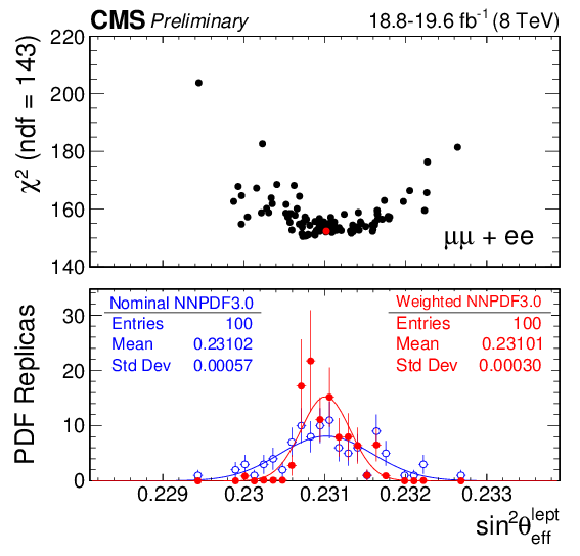
The top panel of each figure shows the $\chi ^2_{\mathrm {min}}$ vs best-fit ${\sin^2\theta ^{\text {lept}}_{\text {eff}}} $ distribution for 100 NNPDF replicas in muon channel (top left), electron channel (top right), and their combination (bottom). The corresponding bottom panels show the best-fit ${\sin^2\theta ^{\text {lept}}_{\text {eff}}}$ distribution over the nominal (blue) and weighted (red) PDF replicas. |
png pdf |
Figure 6-a:
The top panel of the figure shows the $\chi ^2_{\mathrm {min}}$ vs best-fit ${\sin^2\theta ^{\text {lept}}_{\text {eff}}} $ distribution for 100 NNPDF replicas in muon channel. The bottom panel shows the best-fit ${\sin^2\theta ^{\text {lept}}_{\text {eff}}}$ distribution over the nominal (blue) and weighted (red) PDF replicas. |
png pdf |
Figure 6-b:
The top panel of the figure shows the $\chi ^2_{\mathrm {min}}$ vs best-fit ${\sin^2\theta ^{\text {lept}}_{\text {eff}}} $ distribution for 100 NNPDF replicas in electron channel.The bottom panel shows the best-fit ${\sin^2\theta ^{\text {lept}}_{\text {eff}}}$ distribution over the nominal (blue) and weighted (red) PDF replicas. |
png pdf |
Figure 6-c:
The top panel of the figure shows the $\chi ^2_{\mathrm {min}}$ vs best-fit ${\sin^2\theta ^{\text {lept}}_{\text {eff}}} $ distribution for 100 NNPDF replicas in the combination of muon and electron channels. The bottom panel shows the best-fit ${\sin^2\theta ^{\text {lept}}_{\text {eff}}}$ distribution over the nominal (blue) and weighted (red) PDF replicas. |

png pdf |
Figure 7:
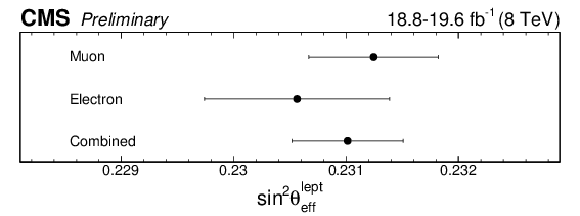
The extracted values of ${\sin^2\theta ^{\text {lept}}_{\text {eff}}}$ in the muon and electron channels and their combination. The error bars include the statistical, experimental, and PDF uncertainties. The PDF uncertainties are derived without (left) and with using the Bayesian $\chi ^2$ weighting method (right). |
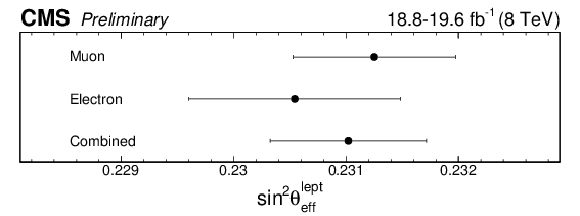
png pdf |
Figure 7-a:
The extracted values of ${\sin^2\theta ^{\text {lept}}_{\text {eff}}}$ in the muon and electron channels and their combination. The error bars include the statistical, experimental, and PDF uncertainties. The PDF uncertainties are derived without using the Bayesian $\chi ^2$ weighting method. |
png pdf |
Figure 7-b:
The extracted values of ${\sin^2\theta ^{\text {lept}}_{\text {eff}}}$ in the muon and electron channels and their combination. The error bars include the statistical, experimental, and PDF uncertainties. The PDF uncertainties are derived with using the Bayesian $\chi ^2$ weighting method. |

png pdf |
Figure 8:
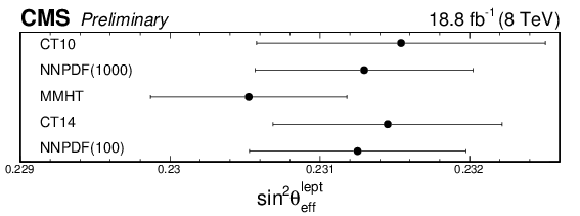
Extracted values of ${\sin^2\theta ^{\text {lept}}_{\text {eff}}}$ from the dimuon data for different PDF sets with nominal (left) and $\chi ^2$ reweighted (right) PDF replicas. The error bars include the statistical, experimental and the PDF uncertainties. |
png pdf |
Figure 8-a:
Extracted values of ${\sin^2\theta ^{\text {lept}}_{\text {eff}}}$ from the dimuon data for different PDF sets with nominal PDF replicas. The error bars include the statistical, experimental and the PDF uncertainties. |

png pdf |
Figure 8-b:
Extracted values of ${\sin^2\theta ^{\text {lept}}_{\text {eff}}}$ from the dimuon data for different PDF sets with $\chi ^2$ reweighted PDF replicas. The error bars include the statistical, experimental and the PDF uncertainties. |
png pdf |
Figure 9:
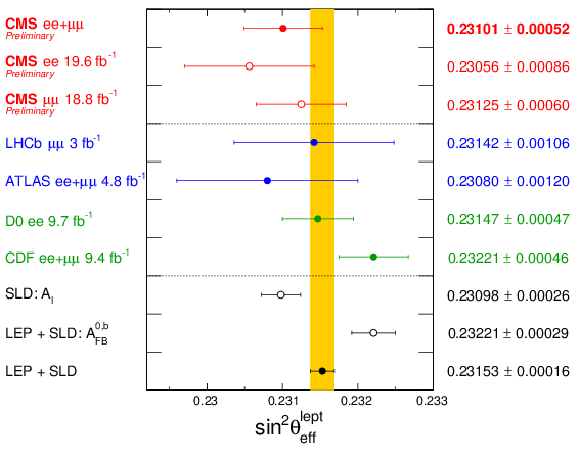
Comparison of the measured ${\sin^2\theta ^{\text {lept}}_{\text {eff}}}$ in the muon and electron channels and their combination with the previous LEP, SLC, Tevatron and LHC measurements. The shaded band corresponds to the combination of the LEP and SLC measurements. |
| Tables | |

png pdf |
Table 1:
Summary of the statistical uncertainties. The statistical uncertainties in the lepton selection efficiency and calibration coefficients in data are included. |

png pdf |
Table 2:
Summary of experimental systematic uncertainties. |
png pdf |
Table 3:
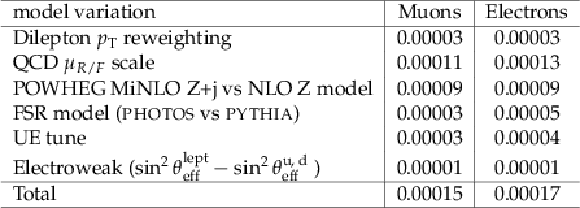
Theory systematic uncertainties in the dimuon (left) and dielectron (right) channels. Detailed descriptions of each systematics are given in the text. |

png pdf |
Table 4:
Central value and PDF uncertainty of the measured ${\sin^2\theta ^{\text {lept}}_{\text {eff}}}$ in the muon and electron channels and their combination with and without constraining PDFs using Bayesian $\chi ^2$ reweighting. |
| Summary |
| We extract ${\sin^2\theta^{\text{lept}}_{\text{eff}}} $ from the measurements of the mass and rapidity dependence of $ {A_\text {FB}} $ in Drell-Yan ee and $\mu\mu$ events. With larger datasets and new analysis techniques, including precise lepton momentum calibration, angular event weighting, and additional PDF constraints, the statistical and systematic uncertainties are significantly reduced compared to our previous measurement. The combined result from the dielectron and dimuon channels is $ \sin^2\theta^{\text{lept}}_{\text{eff}}= $ 0.23101 $\pm$ 0.00036 (stat) $\pm$ 0.00018 (syst) $\pm$ 0.00016 (theory) $\pm$ 0.00030 (pdf) or $ \sin^2\theta^{\text{lept}}_{\text{eff}}= $ 0.23101 $\pm$ 0.00052. The results are consistent with the most precise LEP and SLD measurements. |
| References | ||||
| 1 | J. C. Collins and D. E. Soper | Angular Distribution of Dileptons in High-Energy Hadron Collisions | PRD 16 (1977) 2219 | |
| 2 | SLD Electroweak Group, DELPHI, ALEPH, SLD, SLD Heavy Flavour Group, OPAL, LEP Electroweak Working Group, L3 Collaboration | Precision electroweak measurements on the $ Z $ resonance | PR 427 (2006) 257 | hep-ex/0509008 |
| 3 | CMS Collaboration | Measurement of the weak mixing angle with the Drell-Yan process in proton-proton collisions at the LHC | PRD 84 (2011) 112002 | CMS-EWK-11-003 1110.2682 |
| 4 | ATLAS Collaboration | Measurement of the forward-backward asymmetry of electron and muon pair-production in $ pp $ collisions at $ \sqrt{s} = $ 7 TeV with the ATLAS detector | JHEP 09 (2015) 049 | 1503.03709 |
| 5 | LHCb Collaboration | Measurement of the forward-backward asymmetry in $ Z/\gamma^{\ast} \rightarrow \mu^{+}\mu^{-} $ decays and determination of the effective weak mixing angle | JHEP 11 (2015) 190 | 1509.07645 |
| 6 | CDF Collaboration | Indirect measurement of $ \sin^2 \theta_W $ (or $ M_W $) using $ \mu^+\mu^- $ pairs from $ \gamma^*/Z $ bosons produced in $ p\bar{p} $ collisions at a center-of-momentum energy of 1.96 TeV | PRD 89 (2014) 072005 | 1402.2239 |
| 7 | CDF Collaboration | Measurement of $ \sin^2\theta^{\rm lept}_{\rm eff} $ using $ e^+e^- $ pairs from $ \gamma^*/Z $ bosons produced in $ p\bar{p} $ collisions at a center-of-momentum energy of 1.96 TeV | PRD 93 (2016) 112016 | 1605.02719 |
| 8 | D0 Collaboration | Measurement of the effective weak mixing angle in $ p\bar{p}\rightarrow Z/\gamma^{*}\rightarrow e^{+}e^{-} $ events | PRL 115 (2015) 041801 | 1408.5016 |
| 9 | S. Alioli, P. Nason, C. Oleari, and E. Re | NLO vector-boson production matched with shower in POWHEG | JHEP 07 (2008) 060 | 0805.4802 |
| 10 | P. Nason | A new method for combining NLO QCD with shower Monte Carlo algorithms | JHEP 11 (2004) 040 | hep-ph/0409146 |
| 11 | S. Frixione, P. Nason, and C. Oleari | Matching NLO QCD computations with parton shower simulations: the POWHEG method | JHEP 11 (2007) 070 | 0709.2092 |
| 12 | S. Alioli, P. Nason, C. Oleari, and E. Re | A general framework for implementing NLO calculations in shower Monte Carlo programs: the POWHEG BOX | JHEP 06 (2010) 043 | 1002.2581 |
| 13 | H.-L. Lai et al. | New parton distributions for collider physics | PRD 82 (2010) 074024 | 1007.2241 |
| 14 | T. Sjostrand, S. Mrenna, and P. Skands | PYTHIA 6.4 physics and manual | JHEP 05 (2006) 026 | hep-ph/0603175 |
| 15 | CMS Collaboration | Measurement of the Underlying Event Activity at the LHC with $ \sqrt{s}= $ 7 TeV and Comparison with $ \sqrt{s} = $ 0.9 TeV | JHEP 09 (2011) 109 | CMS-QCD-10-010 1107.0330 |
| 16 | N. Davidson et al. | Universal Interface of TAUOLA Technical and Physics Documentation | CPC 183 (2012) 821 | 1002.0543 |
| 17 | J. Pumplin et al. | New generation of parton distributions with uncertainties from global QCD analysis | JHEP 07 (2002) 012 | hep-ph/0201195 |
| 18 | GEANT4 Collaboration | GEANT4---a simulation toolkit | NIMA 506 (2003) 250 | |
| 19 | CMS Collaboration | Measurements of inclusive $ \mathrm{ W } $ and $ \mathrm{ Z } $ cross sections in $ \mathrm{ p }\mathrm{ p } $ collisions at $ \sqrt{s} = $ 7 TeV with the CMS experiment | JHEP 10 (2011) 132 | CMS-EWK-10-005 1107.4789 |
| 20 | CMS Collaboration | Performance of CMS muon reconstruction in $ \mathrm{ p }\mathrm{ p } $ collision events at $ \sqrt{s} = $ 7 TeV | JINST 7 (2012) P10002 | CMS-MUO-10-004 1206.4071 |
| 21 | CMS Collaboration | Measurement of the differential cross section and charge asymmetry for inclusive $ \mathrm {p}\mathrm {p}\rightarrow \mathrm {W}^{\pm }+X $ production at $ {\sqrt{s}} = $ 8 TeV | EPJC 76 (2016) 469 | CMS-SMP-14-022 1603.01803 |
| 22 | A. Bodek et al. | Extracting Muon Momentum Scale Corrections for Hadron Collider Experiments | EPJC 72 (2012) 2194 | 1208.3710 |
| 23 | E. Mirkes and J. Ohnemus | $ W $ and $ Z $ polarization effects in hadronic collisions | PRD 50 (1994) 5692 | hep-ph/9406381 |
| 24 | A. Bodek | A simple event weighting technique for optimizing the measurement of the forward-backward asymmetry of Drell-Yan dilepton pairs at hadron colliders | EPJC 67 (2010) 321 | 0911.2850 |
| 25 | T. Sjostrand, S. Mrenna, and P. Z. Skands | A Brief Introduction to PYTHIA 8.1 | CPC 178 (2008) 852 | 0710.3820 |
| 26 | CMS Collaboration | Event generator tunes obtained from underlying event and multiparton scattering measurements | EPJC 76 (2016) 155 | CMS-GEN-14-001 1512.00815 |
| 27 | B. Efron | Bootstrap methods: Another look at the jackknife | Ann. Statist. 7 (1979) 1 | |
| 28 | U. Baur et al. | Electroweak radiative corrections to neutral current Drell-Yan processes at hadron colliders | PRD 65 (2002) 033007 | hep-ph/0108274 |
| 29 | K. Hamilton, P. Nason, and G. Zanderighi | MINLO: Multi-Scale Improved NLO | JHEP 10 (2012) 155 | 1206.3572 |
| 30 | CMS Collaboration | Angular coefficients of Z bosons produced in pp collisions at $ \sqrt{s} = $ 8 TeV and decaying to $ \mu^+ \mu^- $ as a function of transverse momentum and rapidity | PLB 750 (2015) 154 | CMS-SMP-13-010 1504.03512 |
| 31 | D. \relax Yu. Bardin et al. | ZFITTER v.6.21: A Semianalytical program for fermion pair production in e+ e- annihilation | CPC 133 (2001) 229 | hep-ph/9908433 |
| 32 | W. T. Giele and S. Keller | Implications of hadron collider observables on parton distribution function uncertainties | PRD 58 (1998) 094023 | hep-ph/9803393 |
| 33 | N. Sato, J. F. Owens, and H. Prosper | Bayesian Reweighting for Global Fits | PRD 89 (2014) 114020 | 1310.1089 |
| 34 | A. Bodek, J. Han, A. Khukhunaishvili, and W. Sakumoto | Using Drell-Yan forward-backward asymmetry to reduce PDF uncertainties in the measurement of electroweak parameters | EPJC 76 (2016) 115 | 1507.02470 |

|
Compact Muon Solenoid LHC, CERN |

|

|

|

|

|

|