

Compact Muon Solenoid
LHC, CERN
| CMS-PAS-SMP-14-008 | ||
| Prospects for the study of vector boson scattering in same sign WW and WZ interactions at the HL-LHC with the upgraded CMS detector | ||
| CMS Collaboration | ||
| September 2016 | ||
| Abstract: Studies of the $ \mathrm{ pp \rightarrow W^{\pm}Z jj }$ and $ \mathrm{ pp \rightarrow W^{\pm} W^{\pm} jj } $ vector boson scattering processes in 14 TeV pp collisions using the planned upgrades of the CMS detector are presented. These studies include assessments on the expected precision in measuring the electroweak cross sections, the discovery potential for observing longitudinal vector boson scattering and limits on partial unitarization scenarios between vector boson scattering and the Higgs boson. Beyond the standard model sensitivity is probed in the framework of the effective field theory by extracting expected limits on quartic gauge couplings for $\mathrm{ {W}^{\pm} {W}^{\pm} }$ scattering. All results are presented with a luminosity of 3 ab$^{-1}$ and comparisons with the non upgraded CMS detector including its aging due to radiation are performed. | ||
| Links: CDS record (PDF) ; inSPIRE record ; CADI line (restricted) ; | ||
| Figures | |
png pdf |
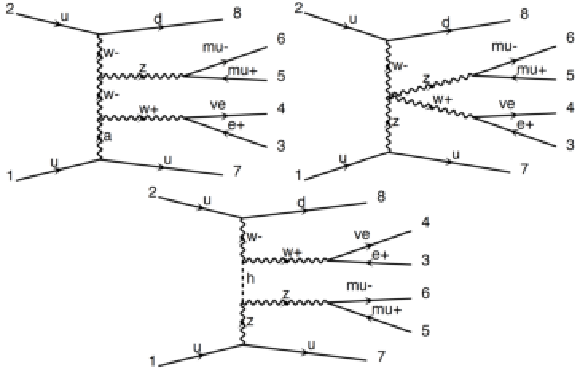
Figure 1:
Representative tree level Feynman diagrams for EWK WZ scattering interactions. |
png pdf |
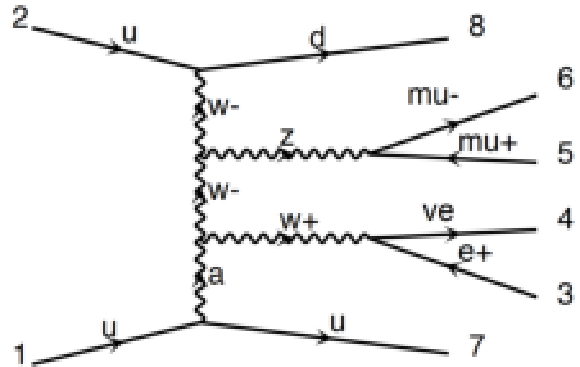
Figure 1-a:
Representative tree level Feynman diagram for EWK WZ scattering interactions. |
png pdf |
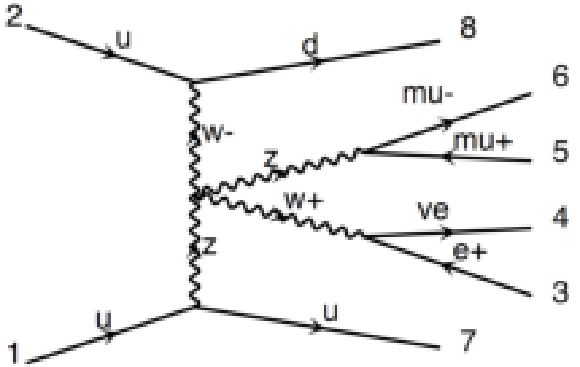
Figure 1-b:
Representative tree level Feynman diagram for EWK WZ scattering interactions. |
png pdf |
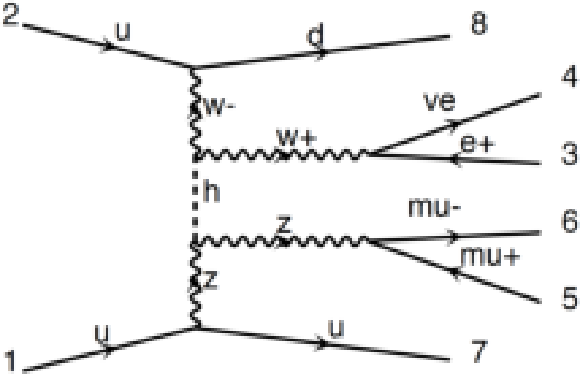
Figure 1-c:
Representative tree level Feynman diagram for EWK WZ scattering interactions. |
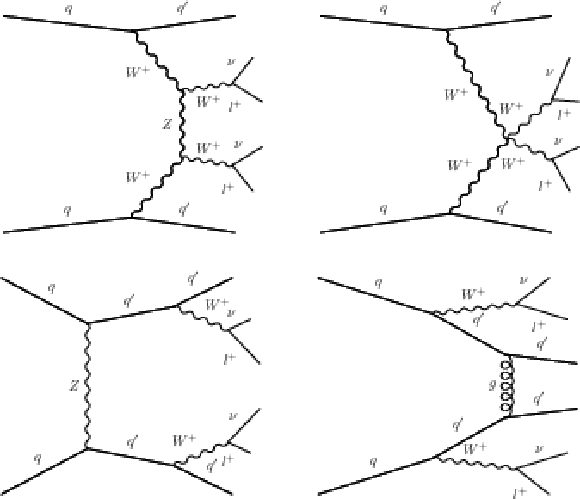
png pdf |
Figure 2:
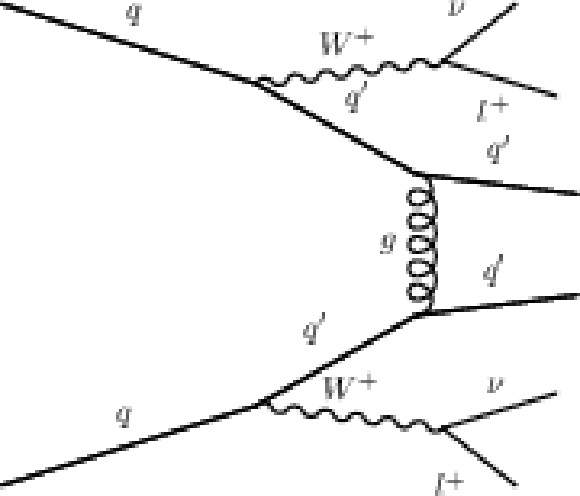
Example Feynman diagrams for EW or QCD $\mathrm{ W^{+}W^{+} } $ production. |
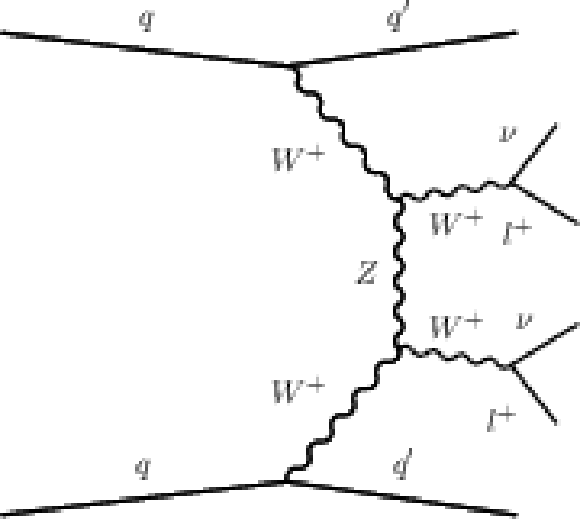
png pdf |
Figure 2-a:
Example Feynman diagram for EW $\mathrm{ W^{+}W^{+} } $ production. |
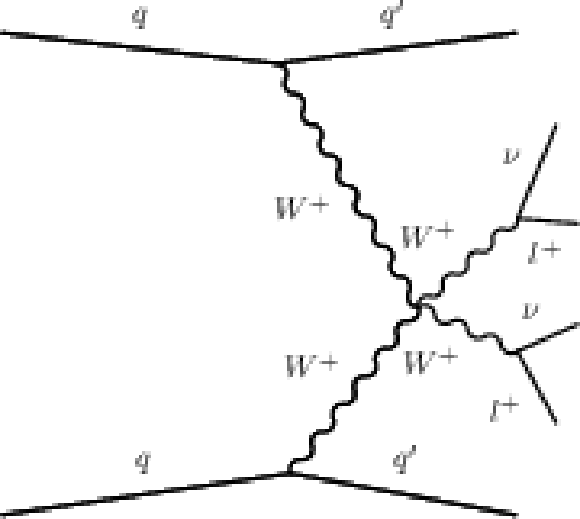
png pdf |
Figure 2-b:
Example Feynman diagram for EW $\mathrm{ W^{+}W^{+} } $ production. |
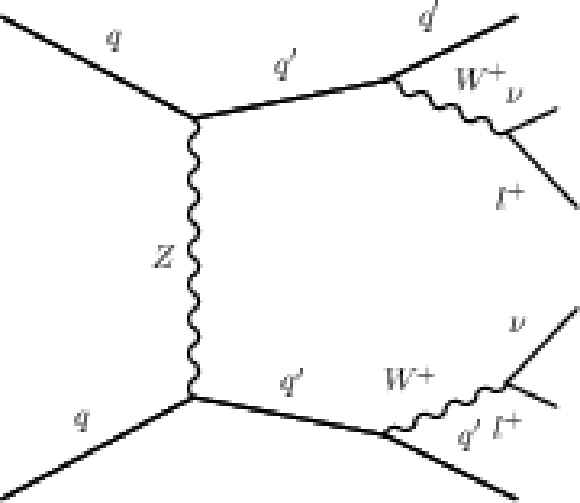
png pdf |
Figure 2-c:
Example Feynman diagram for EW $\mathrm{ W^{+}W^{+} } $ production. |
png pdf |
Figure 2-d:
Example Feynman diagram for QCD $\mathrm{ W^{+}W^{+} } $ production. |
png pdf |
Figure 3:
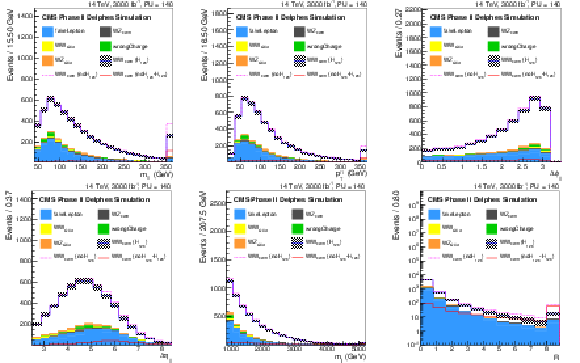
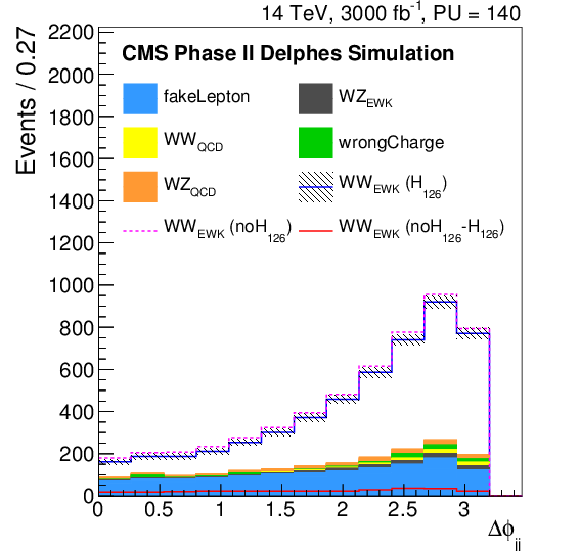
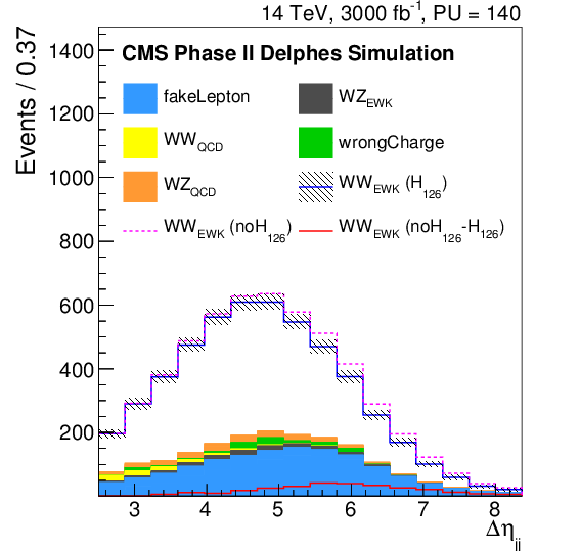
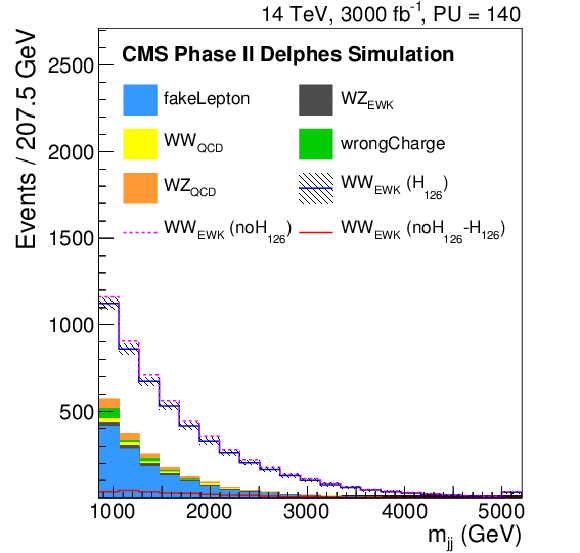
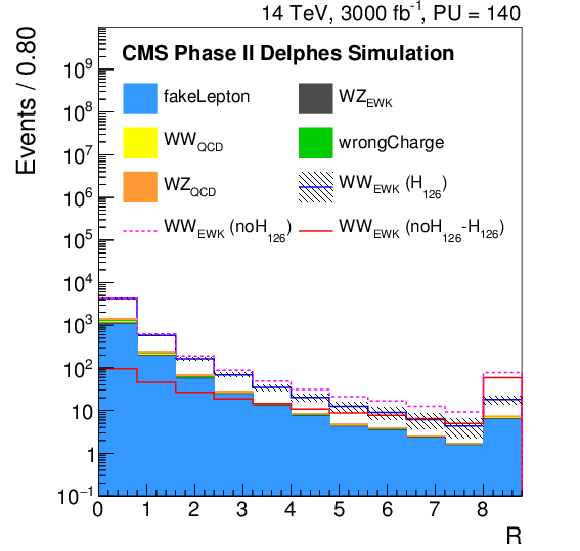
Distributions of the di-lepton invariant mass ($m_{\ell \ell }$), the ${p_{\mathrm {T}}}$ of the leading lepton ($ {p_{\mathrm {T}}} ^{l1}$), the difference in $\phi $ angle between the tag jets ($\Delta \phi _{jj}$), the difference in pseudorapidity between the tag jets ($\Delta \eta _{jj}$), the tag jets invariant mass ($m_{jj}$) and the variable $R = { {p_{\mathrm {T}}} ^{\ell _1}\cdot {p_{\mathrm {T}}} ^{\ell _2}}/({ {p_{\mathrm {T}}} ^{j_1}\cdot {p_{\mathrm {T}}} ^{j_2}})$, where $ {p_{\mathrm {T}}} ^{\ell _1}$ and $ {p_{\mathrm {T}}} ^{\ell _2}$ ($ {p_{\mathrm {T}}} ^{j_1}$ and $ {p_{\mathrm {T}}} ^{j_2}$) are the ${p_{\mathrm {T}}}$ of the two leptons (tag jets), for the Phase II detector, after the same-sign W$^{\pm }$W$^{\pm }$ selection. The signal and the backgrounds are reported, normalized to the integrated luminosity of 3 ab$^{-1}$. In particular, the blue continuous line corresponds to the EWK di-boson scattering in the Standard Model, the dashed pink one corresponds to the EWK di-boson scattering in absence of the Higgs boson, while the continuous red line corresponds to the difference between the two. |
png pdf |
Figure 3-a:
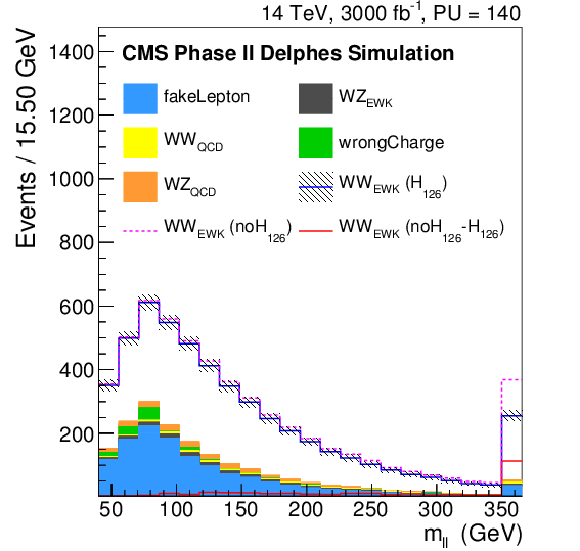
Distribution of the di-lepton invariant mass ($m_{\ell \ell }$) for the Phase II detector, after the same-sign W$^{\pm }$W$^{\pm }$ selection. The signal and the backgrounds are reported, normalized to the integrated luminosity of 3 ab$^{-1}$. In particular, the blue continuous line corresponds to the EWK di-boson scattering in the Standard Model, the dashed pink one corresponds to the EWK di-boson scattering in absence of the Higgs boson, while the continuous red line corresponds to the difference between the two. |
png pdf |
Figure 3-b:
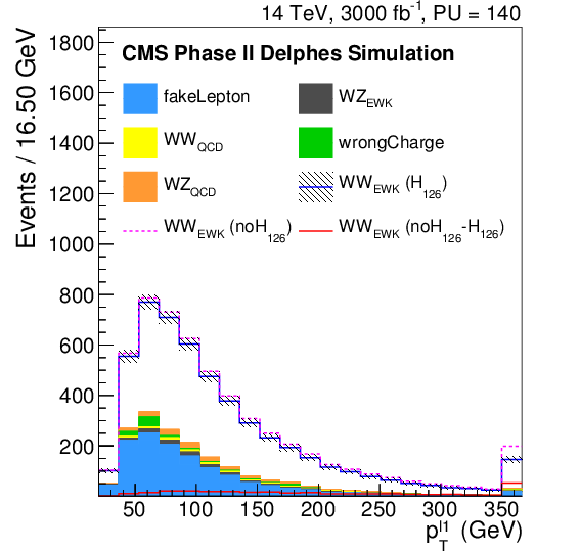
Distribution of the ${p_{\mathrm {T}}}$ of the leading lepton ($ {p_{\mathrm {T}}} ^{l1}$) for the Phase II detector, after the same-sign W$^{\pm }$W$^{\pm }$ selection. The signal and the backgrounds are reported, normalized to the integrated luminosity of 3 ab$^{-1}$. In particular, the blue continuous line corresponds to the EWK di-boson scattering in the Standard Model, the dashed pink one corresponds to the EWK di-boson scattering in absence of the Higgs boson, while the continuous red line corresponds to the difference between the two. |
png pdf |
Figure 3-c:
Distribution of the difference in $\phi $ angle between the tag jets ($\Delta \phi _{jj}$) for the Phase II detector, after the same-sign W$^{\pm }$W$^{\pm }$ selection. The signal and the backgrounds are reported, normalized to the integrated luminosity of 3 ab$^{-1}$. In particular, the blue continuous line corresponds to the EWK di-boson scattering in the Standard Model, the dashed pink one corresponds to the EWK di-boson scattering in absence of the Higgs boson, while the continuous red line corresponds to the difference between the two. |
png pdf |
Figure 3-d:
Distribution of the difference in pseudorapidity between the tag jets ($\Delta \eta _{jj}$) for the Phase II detector, after the same-sign W$^{\pm }$W$^{\pm }$ selection. The signal and the backgrounds are reported, normalized to the integrated luminosity of 3 ab$^{-1}$. In particular, the blue continuous line corresponds to the EWK di-boson scattering in the Standard Model, the dashed pink one corresponds to the EWK di-boson scattering in absence of the Higgs boson, while the continuous red line corresponds to the difference between the two. |
png pdf |
Figure 3-e:
Distribution or the tag jets invariant mass ($m_{jj}$) for the Phase II detector, after the same-sign W$^{\pm }$W$^{\pm }$ selection. The signal and the backgrounds are reported, normalized to the integrated luminosity of 3 ab$^{-1}$. In particular, the blue continuous line corresponds to the EWK di-boson scattering in the Standard Model, the dashed pink one corresponds to the EWK di-boson scattering in absence of the Higgs boson, while the continuous red line corresponds to the difference between the two. |
png pdf |
Figure 3-f:
Distribution of the variable $R = { {p_{\mathrm {T}}} ^{\ell _1}\cdot {p_{\mathrm {T}}} ^{\ell _2}}/({ {p_{\mathrm {T}}} ^{j_1}\cdot {p_{\mathrm {T}}} ^{j_2}})$, where $ {p_{\mathrm {T}}} ^{\ell _1}$ and $ {p_{\mathrm {T}}} ^{\ell _2}$ ($ {p_{\mathrm {T}}} ^{j_1}$ and $ {p_{\mathrm {T}}} ^{j_2}$) are the ${p_{\mathrm {T}}}$ of the two leptons (tag jets), for the Phase II detector, after the same-sign W$^{\pm }$W$^{\pm }$ selection. The signal and the backgrounds are reported, normalized to the integrated luminosity of 3 ab$^{-1}$. In particular, the blue continuous line corresponds to the EWK di-boson scattering in the Standard Model, the dashed pink one corresponds to the EWK di-boson scattering in absence of the Higgs boson, while the continuous red line corresponds to the difference between the two. |
png pdf |
Figure 4:
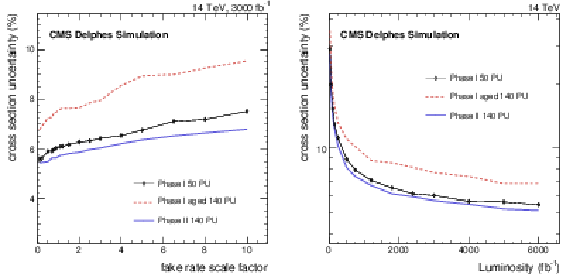
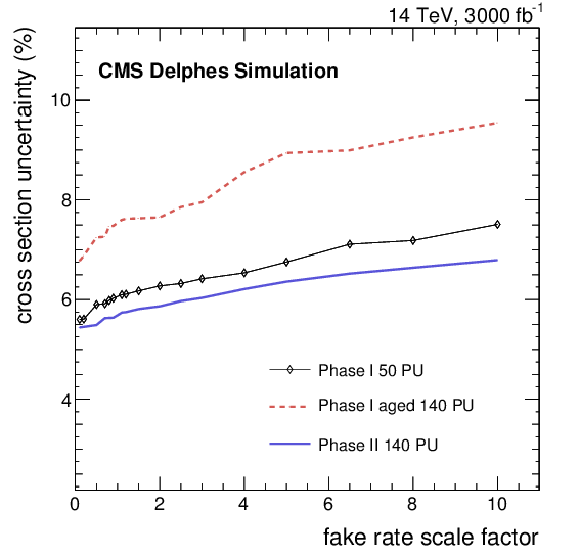
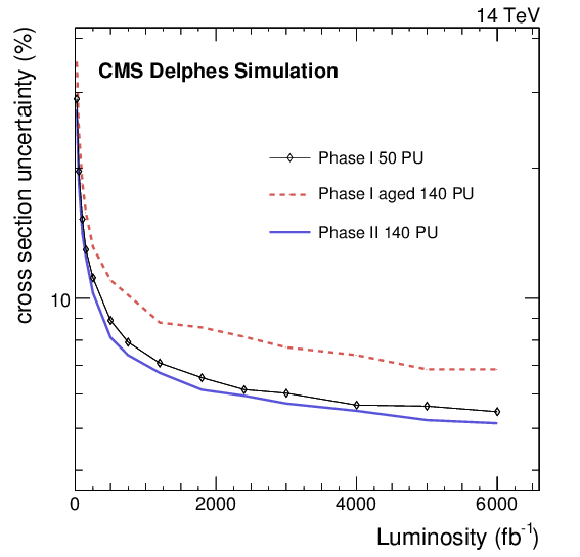
On the left, the expected total uncertainty for the various scenarios with several possible scale factors to the fake rate, for the same-sign EWK WW cross section measurement after 3 ab$^{-1}$ of collected data. On the right, the evolution of the analysis uncertainty, for the unity scale factor of the fake rate, as a function of the collected luminosity. |
png pdf |
Figure 4-a:
The expected total uncertainty for the various scenarios with several possible scale factors to the fake rate, for the same-sign EWK WW cross section measurement after 3 ab$^{-1}$ of collected data. |
png pdf |
Figure 4-b:
The evolution of the analysis uncertainty, for the unity scale factor of the fake rate, as a function of the collected luminosity. |
png pdf |
Figure 5:
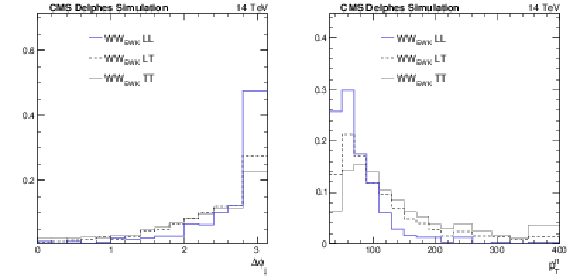
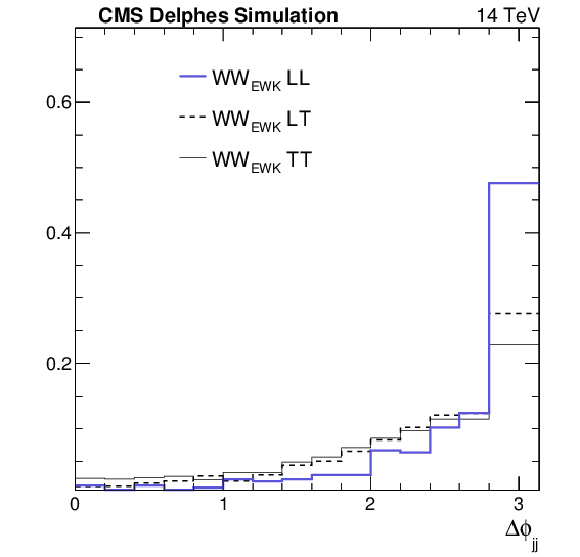
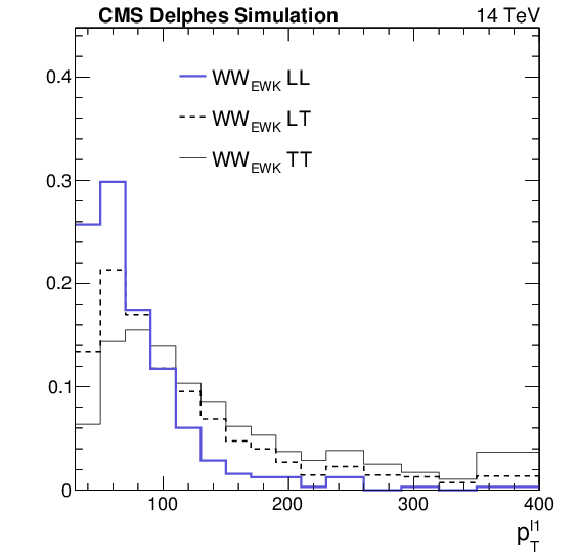
Distributions of the difference in $\phi $ angle between the tag jets ($\Delta \phi _{jj}$) and the $ {p_{\mathrm {T}}} $ of the leading lepton ($ {p_{\mathrm {T}}} ^{l1}$), for LL, TL, and TT components of the EWK W$^{\pm }$W$^{\pm }$ after the same-sign W$^{\pm }$W$^{\pm }$ selection and for the Phase II detector. The distributions for the three components are normalized to unity. |
png pdf |
Figure 5-a:
Distribution of the difference in $\phi $ angle between the tag jets ($\Delta \phi _{jj}$), for LL, TL, and TT components of the EWK W$^{\pm }$W$^{\pm }$ after the same-sign W$^{\pm }$W$^{\pm }$ selection and for the Phase II detector. The distributions for the three components are normalized to unity. |
png pdf |
Figure 5-b:
Distribution of the $ {p_{\mathrm {T}}} $ of the leading lepton ($ {p_{\mathrm {T}}} ^{l1}$), for LL, TL, and TT components of the EWK W$^{\pm }$W$^{\pm }$ after the same-sign W$^{\pm }$W$^{\pm }$ selection and for the Phase II detector. The distributions for the three components are normalized to unity. |
png pdf |
Figure 6:
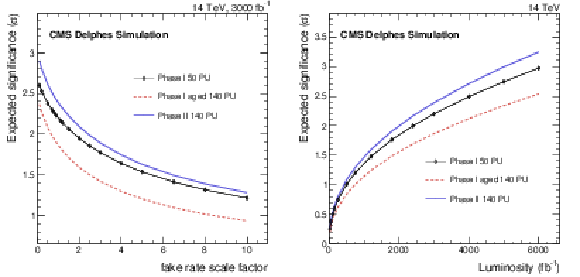
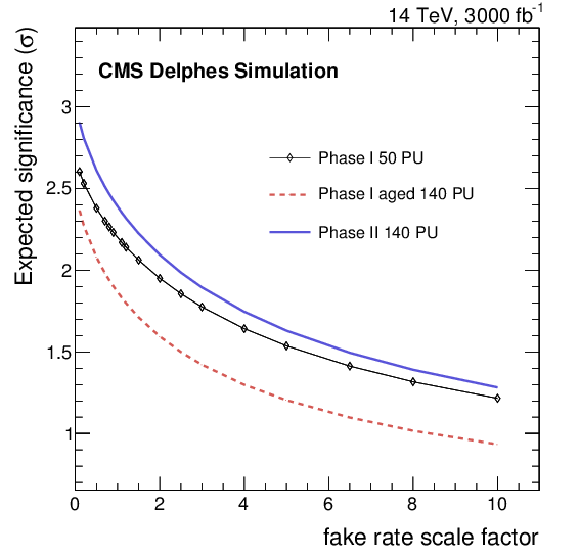
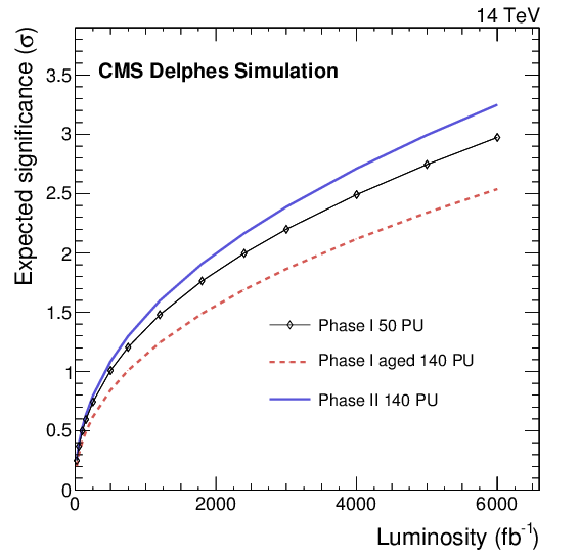
On the left, the expected discovery significance for the longitudinal vector boson scattering for the various detector scenarios with several possible scale factors to the fake rate after 3 ab$^{-1}$ of data, for the same-sign WW analysis. On the right, the evolution of the discovery sensitivity, for the unity scale factor of the fake rate, as a function of the collected luminosity. |
png pdf |
Figure 6-a:
The expected discovery significance for the longitudinal vector boson scattering for the various detector scenarios with several possible scale factors to the fake rate after 3 ab$^{-1}$ of data, for the same-sign WW analysis. |
png pdf |
Figure 6-b:
The evolution of the discovery sensitivity, for the unity scale factor of the fake rate, as a function of the collected luminosity. |
png pdf |
Figure 7:
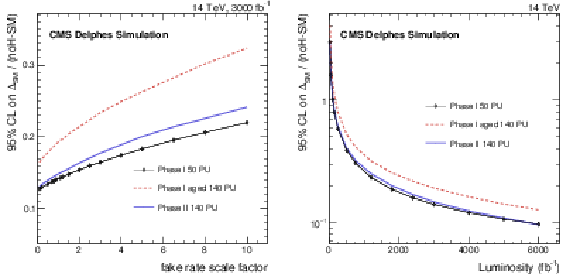
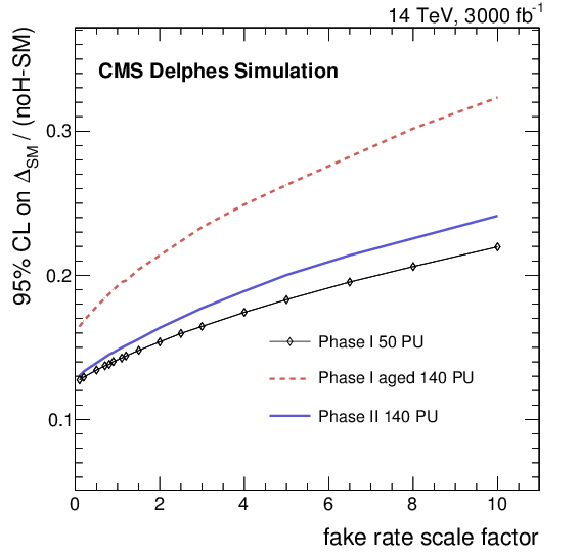
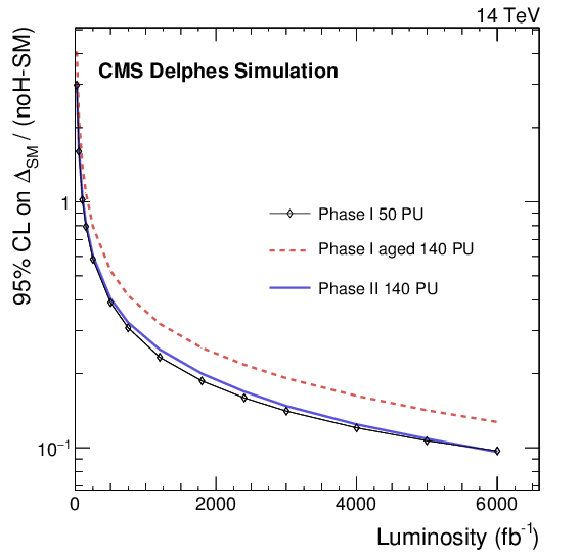
The expected 95% CL exclusion power for the no-Higgs scenario after 3 ab$^{-1}$ of integrated luminosity and as a function of the data/MC fake lepton scale factor (left), and as a function of the integrated luminosity when the fake lepton scale factor is set to one (right). The limit is expressed as deviation from the Standard Model divided by the difference of the no-Higgs case from the Standard Model itself. |
png pdf |
Figure 7-a:
The expected 95% CL exclusion power for the no-Higgs scenario after 3 ab$^{-1}$ of integrated luminosity as a function of the data/MC fake lepton scale factor. The limit is expressed as deviation from the Standard Model divided by the difference of the no-Higgs case from the Standard Model itself. |
png pdf |
Figure 7-b:
The expected 95% CL exclusion power for the no-Higgs scenario after 3 ab$^{-1}$ of integrated luminosity as a function of the integrated luminosity when the fake lepton scale factor is set to one. The limit is expressed as deviation from the Standard Model divided by the difference of the no-Higgs case from the Standard Model itself. |
png pdf |
Figure 8:
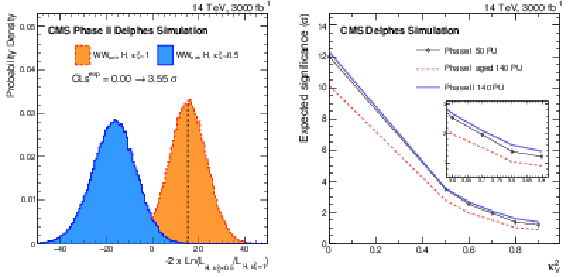
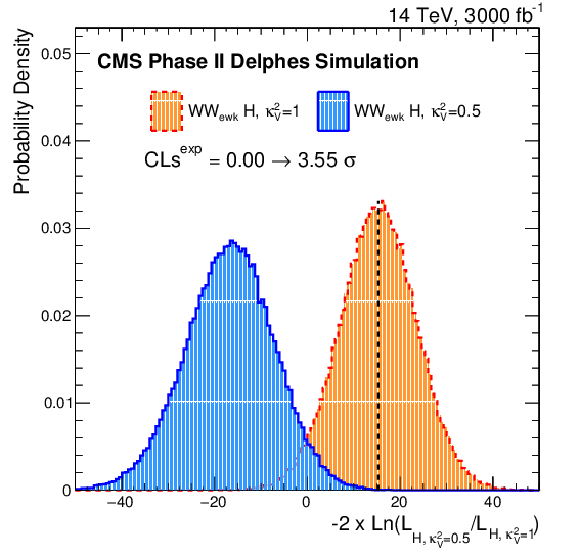
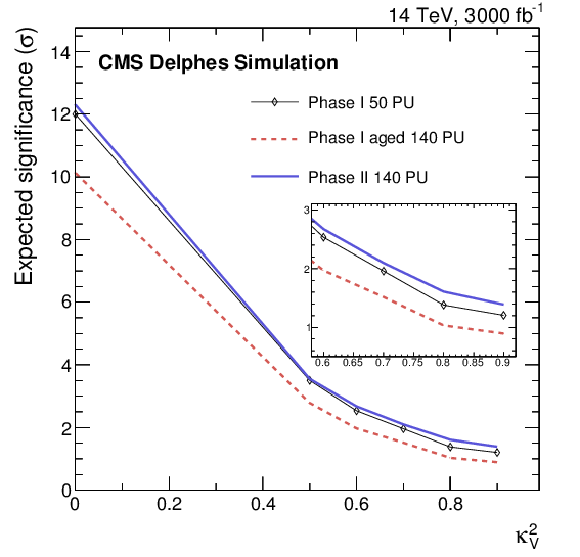
Test statistic between the hypothesis of the partial unitarization in the case of $\kappa _V^2=$ 0.5 and the SM ($\kappa _V^2= $ 1) after 3 ab$^{-1}$ of integrated luminosity and unity scale factor of the fake lepton rate for the Phase II detector (left), and the expected separation between the SM and partial unitarization scenarios as a function of $\kappa _V^2$ for the same luminosity and lepton fake rate for the three detector scenarios (right). |
png pdf |
Figure 8-a:
Test statistic between the hypothesis of the partial unitarization in the case of $\kappa _V^2=$ 0.5 and the SM ($\kappa _V^2= $ 1) after 3 ab$^{-1}$ of integrated luminosity and unity scale factor of the fake lepton rate for the Phase II detector. |
png pdf |
Figure 8-b:
The expected separation between the SM and partial unitarization scenarios as a function of $\kappa _V^2$ after 3 ab$^{-1}$ of integrated luminosity and unity scale factor of the fake lepton rate for the Phase II detector. |
png pdf |
Figure 9:
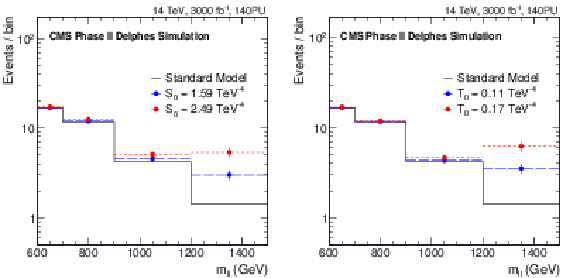
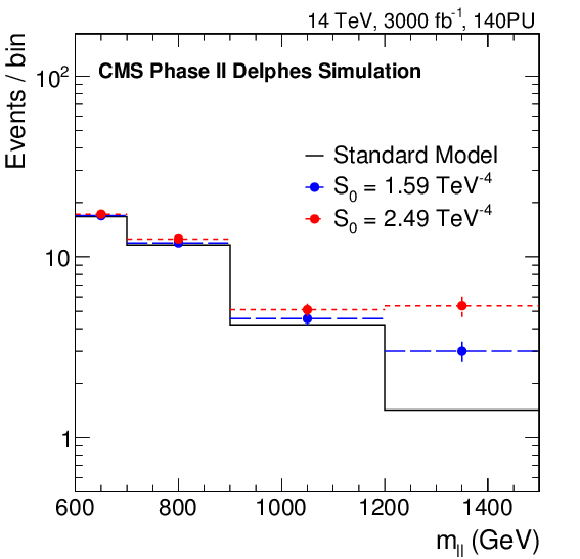
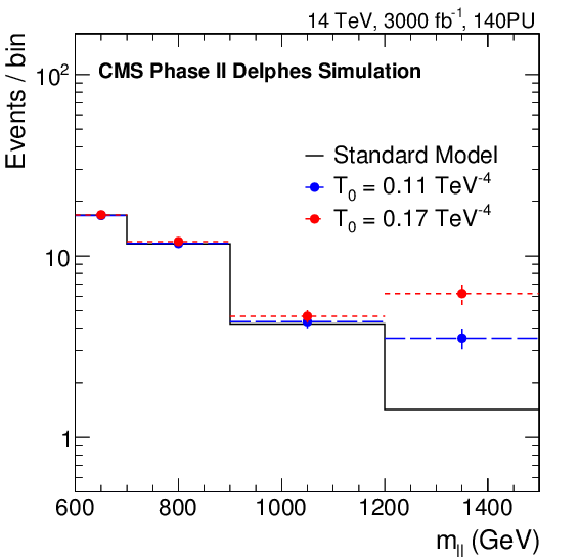
Distributions of the di-lepton invariant mass ($m_{\ell \ell }$) for $m_{\ell \ell }> $ 600 GeV for the SM signal and its modifications for two values of the coefficient associated with the $S_0$ (left) and $T_0$ (right) operators. |
png pdf |
Figure 9-a:
Distribution of the di-lepton invariant mass ($m_{\ell \ell }$) for $m_{\ell \ell }> $ 600 GeV for the SM signal and its modifications for two values of the coefficient associated with the $S_0$ operator. |
png pdf |
Figure 9-b:
Distribution of the di-lepton invariant mass ($m_{\ell \ell }$) for $m_{\ell \ell }> $ 600 GeV for the SM signal and its modifications for two values of the coefficient associated with the $T_0$ operator. |
png pdf |
Figure 10:
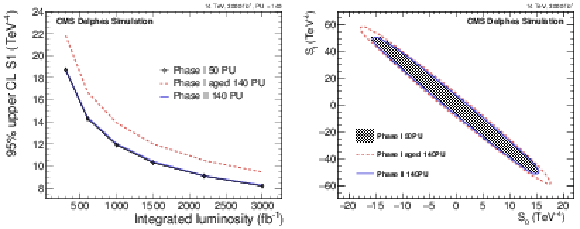
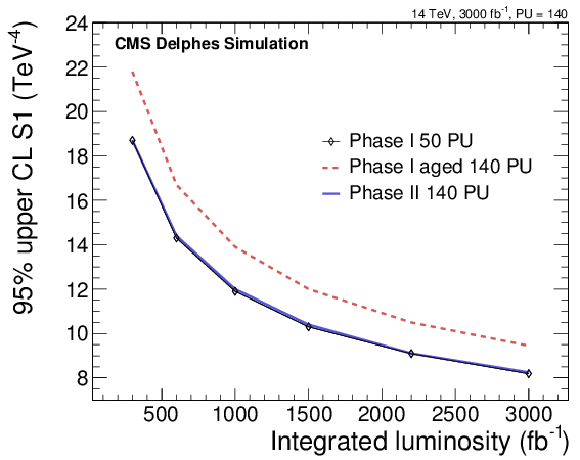
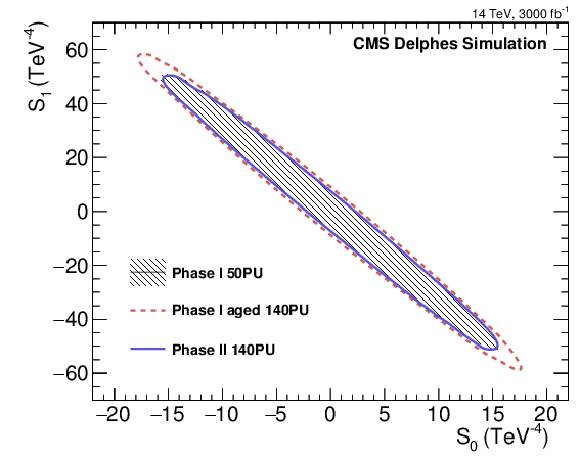
Expected 95% CL limits on the coefficient associated to the S${_1}$ operator for the unity scale factor of the fake lepton rate and the three detector scenarios as a function of the collected luminosity (left) and 2D contour 95% CL limits on the coefficients associated to the S${_0}$ and S${_1}$ operators for 3 ab$^{-1}$ of data and the unity scale factor of the fake lepton rate for the three detector scenarios (right). |
png pdf |
Figure 10-a:
Expected 95% CL limits on the coefficient associated to the S${_1}$ operator for the unity scale factor of the fake lepton rate and the three detector scenarios as a function of the collected luminosity. |
png pdf |
Figure 10-b:
2D contour 95% CL limits on the coefficients associated to the S${_0}$ and S${_1}$ operators for 3 ab$^{-1}$ of data and the unity scale factor of the fake lepton rate for the three detector scenarios. |
png pdf |
Figure 11:
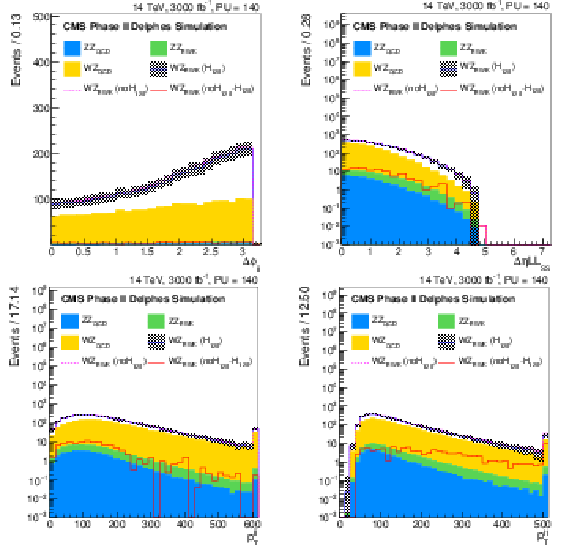
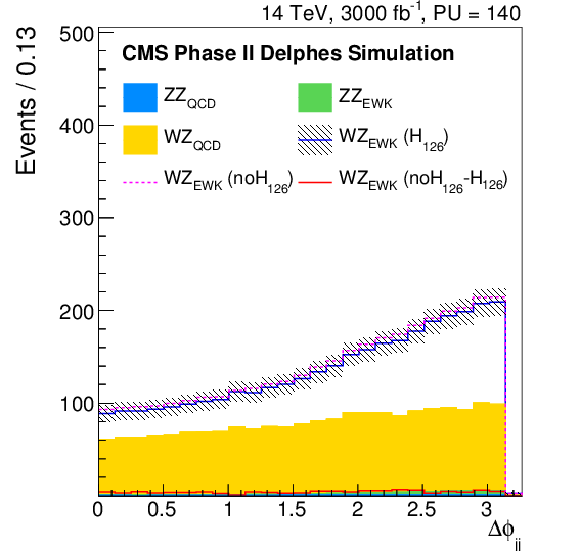
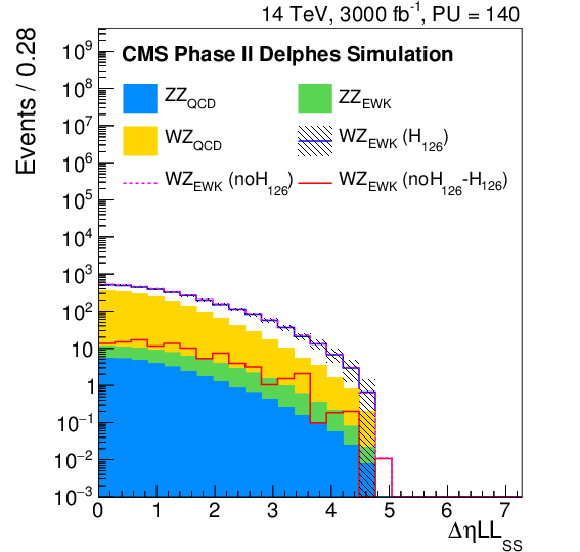
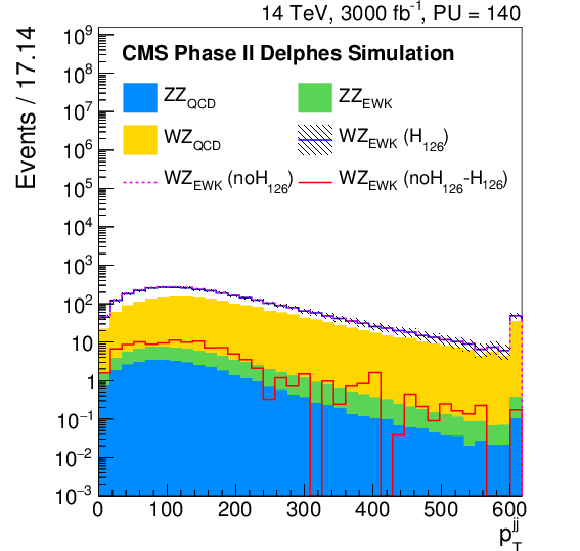
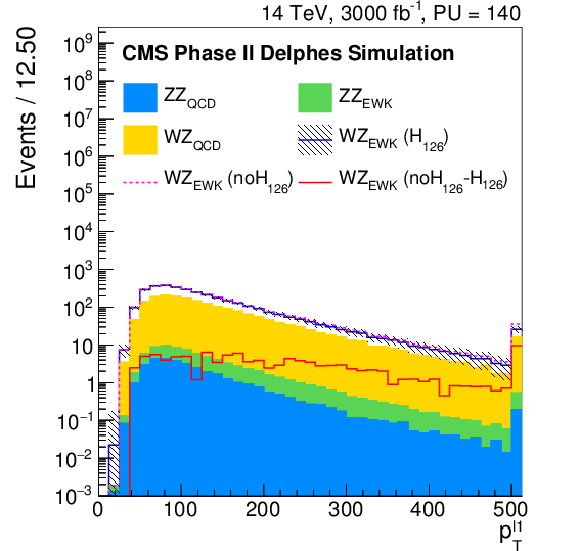
Distributions of the difference in azimuthal angle between the tag jets ($\Delta \varphi _{jj}$), the difference in pseudorapidity between the same sign leptons ($\Delta \eta _{ll}^{\rm SS}$), the $ {p_{\mathrm {T}}} $ of di-jet pair ($ {p_{\mathrm {T}}} ^{jj}$) and the $ {p_{\mathrm {T}}} $ of the leading lepton ($ {p_{\mathrm {T}}} ^{l1}$) for the Phase II detector, after the WZ selection. The signal and the backgrounds are reported, normalised to the integrated luminosity of 3 ab$^{-1}$. In particular, the blue continuous line corresponds to the EWK di-boson scattering in the Standard Model, the dashed pink one corresponds to the EWK di-boson scattering in absence of the Higgs boson, while the continuous red line corresponds to the difference between the two. |
png pdf |
Figure 11-a:
Distributions of the difference in azimuthal angle between the tag jets ($\Delta \varphi _{jj}$) for the Phase II detector, after the WZ selection. The signal and the backgrounds are reported, normalised to the integrated luminosity of 3 ab$^{-1}$. In particular, the blue continuous line corresponds to the EWK di-boson scattering in the Standard Model, the dashed pink one corresponds to the EWK di-boson scattering in absence of the Higgs boson, while the continuous red line corresponds to the difference between the two. |
png pdf |
Figure 11-b:
Distribution of the difference in pseudorapidity between the same sign leptons ($\Delta \eta _{ll}^{\rm SS}$) for the Phase II detector, after the WZ selection. The signal and the backgrounds are reported, normalised to the integrated luminosity of 3 ab$^{-1}$. In particular, the blue continuous line corresponds to the EWK di-boson scattering in the Standard Model, the dashed pink one corresponds to the EWK di-boson scattering in absence of the Higgs boson, while the continuous red line corresponds to the difference between the two. |
png pdf |
Figure 11-c:
Distribution of the $ {p_{\mathrm {T}}} $ of di-jet pair ($ {p_{\mathrm {T}}} ^{jj}$) for the Phase II detector, after the WZ selection. The signal and the backgrounds are reported, normalised to the integrated luminosity of 3 ab$^{-1}$. In particular, the blue continuous line corresponds to the EWK di-boson scattering in the Standard Model, the dashed pink one corresponds to the EWK di-boson scattering in absence of the Higgs boson, while the continuous red line corresponds to the difference between the two. |
png pdf |
Figure 11-d:
Distribution of the $ {p_{\mathrm {T}}} $ of the leading lepton ($ {p_{\mathrm {T}}} ^{l1}$) for the Phase II detector, after the WZ selection. The signal and the backgrounds are reported, normalised to the integrated luminosity of 3 ab$^{-1}$. In particular, the blue continuous line corresponds to the EWK di-boson scattering in the Standard Model, the dashed pink one corresponds to the EWK di-boson scattering in absence of the Higgs boson, while the continuous red line corresponds to the difference between the two. |
png pdf |
Figure 12:
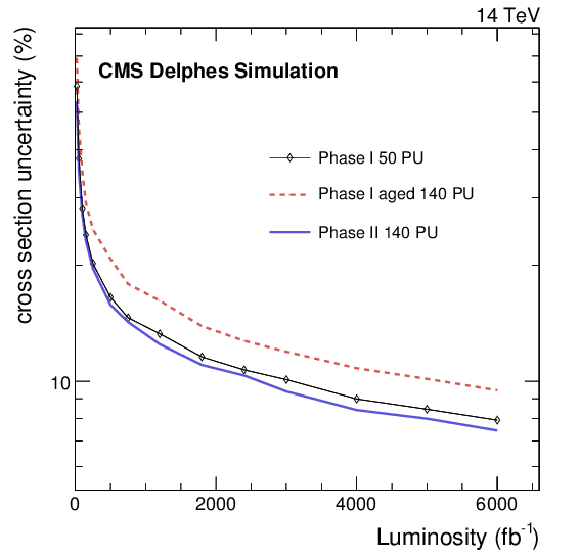
The expected total uncertainty for the various detector scenarios for the EWK WZ cross section measurement as a function of the collected luminosity. |
png pdf |
Figure 13:
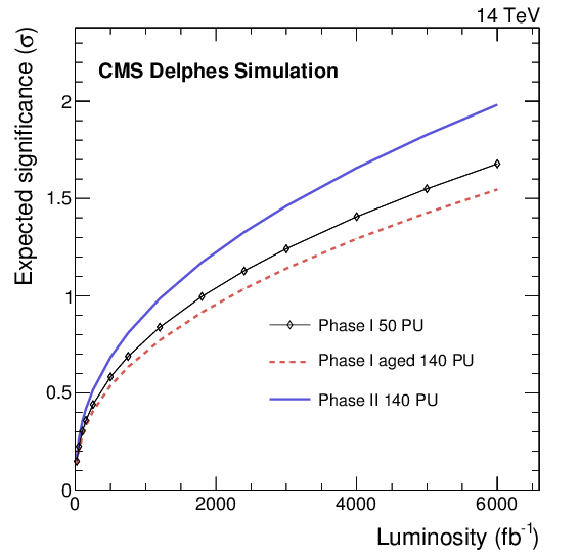
The expected discovery significance for the longitudinal vector boson scattering for the various detector scenarios as a function of the collected luminosity for the WZ analysis. |
png pdf |
Figure 14:
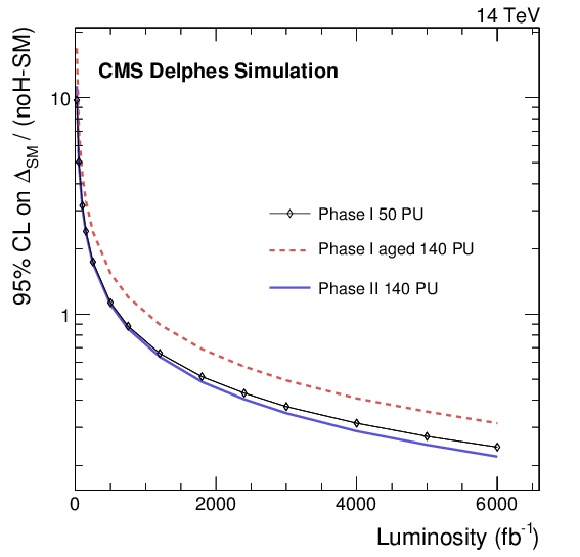
The expected 95% CL exclusion power for the no-Higgs scenario as a function of the integrated luminosity for the WZ analysis The limit is expressed as deviation from the Standard Model divided by the difference of the no-Higgs case from the Standard Model itself. |
png pdf |
Figure 15:
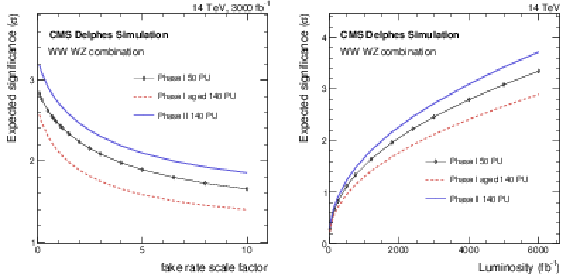
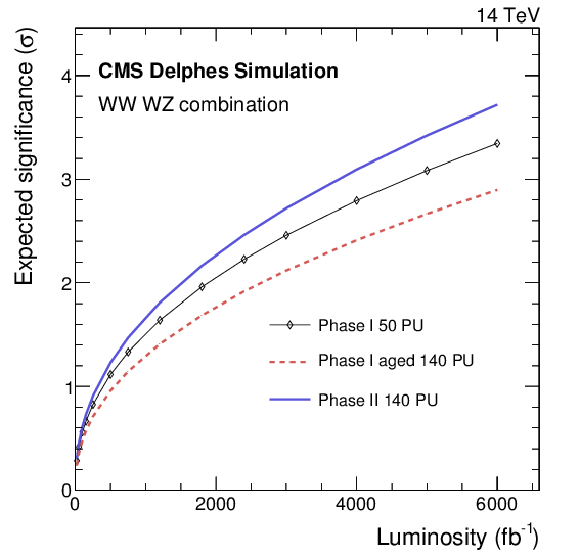
On the left, the expected discovery significance for the longitudinal vector boson scattering for the various detector scenarios with several possible scale factors to the fake rate after 3 ab$^{-1}$ of data, for the combination of same-sign WW and WZ analyses. On the right, the evolution of the discovery sensitivity, for the unity scale factor of the fake rate, as a function of the collected luminosity. |

png pdf |
Figure 15-a:
The expected discovery significance for the longitudinal vector boson scattering for the various detector scenarios with several possible scale factors to the fake rate after 3 ab$^{-1}$ of data, for the combination of same-sign WW and WZ analyses. |
png pdf |
Figure 15-b:
The evolution of the discovery sensitivity, for the unity scale factor of the fake rate, as a function of the collected luminosity. |
png pdf |
Figure 16:
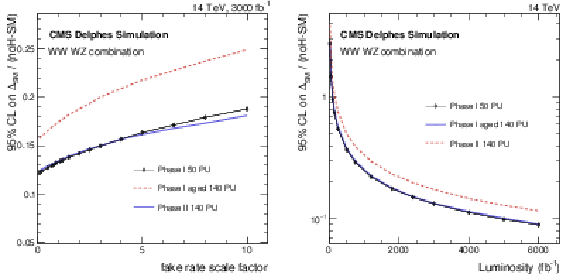
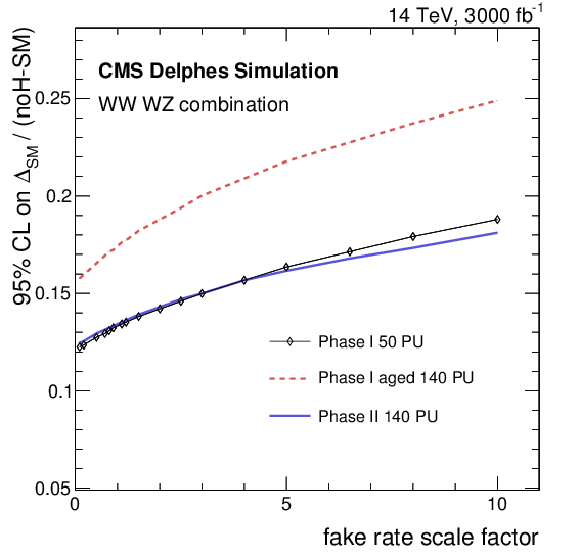
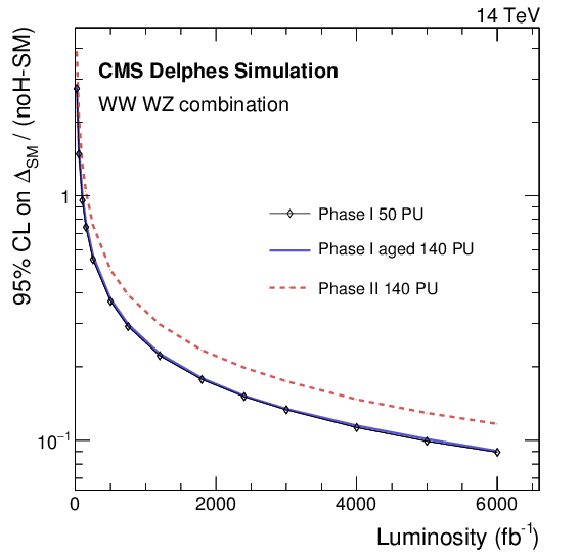
The expected 95% CL exclusion power for the no-Higgs scenario after 3 ab$^{-1}$ of integrated luminosity and as a function of the data/MC fake lepton scale factor (left), and as a function of the integrated luminosity when the fake lepton scale factor is set to one (right) for the combination of same-sign WW and WZ analyses. The limit is expressed as deviation from the Standard Model divided by the difference of the no-Higgs case from the Standard Model itself. |
png pdf |
Figure 16-a:
The expected 95% CL exclusion power for the no-Higgs scenario after 3 ab$^{-1}$ of integrated luminosity as a function of the data/MC fake lepton scale factor for the combination of same-sign WW and WZ analyses. The limit is expressed as deviation from the Standard Model divided by the difference of the no-Higgs case from the Standard Model itself. |
png pdf |
Figure 16-b:
The expected 95% CL exclusion power for the no-Higgs scenario after 3 ab$^{-1}$ of integrated luminosity as a function of the integrated luminosity when the fake lepton scale factor is set to one for the combination of same-sign WW and WZ analyses. The limit is expressed as deviation from the Standard Model divided by the difference of the no-Higgs case from the Standard Model itself. |
| Tables | |
png pdf |
Table 1:
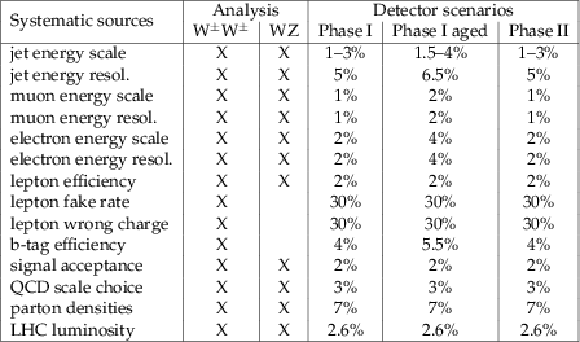
The systematics used for the $\mathrm{ W^{\pm } W^{\pm } } $ and WZ scattering analyses for each of the detector scenarios considered. The second and third columns indicate which systematics are used by the two analyses. |
png pdf |
Table 2:
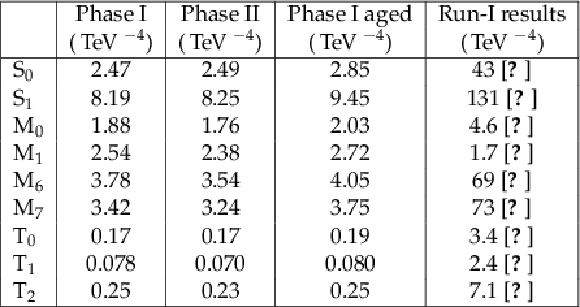
Expected 95% CL limits on the coefficients for BSM higher order (dimension-eight) operators in the EFT Lagrangian for 3 ab$^{-1}$ of data and the unity scale factor of the fake lepton rate for the three detector scenarios. The last column is summarizing the LHC Run-I observed upper limits obtained so far by CMS [12,39,38]. |

png pdf |
Table 3:
Results of the combination of WW and WZ analyses, assuming a scale factor of 1 for the lepton fake rate, for the expected significance of the longitudinal scattering observation and expected 95% CL limit on deviations from the Standard Model due to partial unitarization schemes. |
| Summary |
| This work presents a feasibility study for the measurement of vector boson scattering properties with the CMS detector at the high-luminosity LHC. Two promising fully leptonic final states have been investigated: the same sign W bosons and WZ boson pairs. An attempt is made to include all expected sources of backgrounds, including the reducible ones, as the ones due to jets faking leptons. Given the large uncertainty on the detailed detector simulation, results are expressed as a function of a data/MC scale factor for the lepton fake rate. The precision in the measurement of the EWK component cross-section has been determined to be 10% or better after the total integrated luminosity that will be collected by the CMS experiment, namely 3 ab$^{-1}$. With this level of accuracy it has been possible to study the sensitivity of the analysis to scenarios beyond the Standard Model. On the one hand, the performance in detecting the presence of additional dimension eight operators in the effective field theory framework has been shown to improve significantly with respect to the current limits on quartic anomalous gauge couplings. On the other hand, the study of these final states proves to be able to separate cases where the standard model is only partially unitarized in the vector boson scattering. The sensitivity to the very small longitudinal component of the vector boson scattering has been studied. In this case, the full statistics available allows for some discrimination of a signal, approaching the 3$\sigma$ level. Results have been presented for three scenarios, characterized by different conditions of the CMS detector during the LHC high luminosity data taking. The current detector design, aged by the long irradiation, has been compared to a model with tracker system, muon system and forward calorimetry upgraded to stand the harsh environment of the high luminosity LHC. Also the non-aged current CMS detector has been tested, in order to provide a benchmark of the physics performance of the present CMS detector. The comparison of the results for these three detector scenarios, clearly shows that the detector upgrade will recover the performance lost due to the aging of the current CMS hardware. Further improvements in background rejection are expected, when the b-veto capability of the tracker extension in Phase II will be considered as well. |
| References | ||||
| 1 | ATLAS Collaboration | Observation of a new particle in the search for the Standard Model Higgs boson with the ATLAS detector at the LHC | Phys.Lett. B716 (2012) 1--29 | 1207.7214 |
| 2 | CMS Collaboration | Observation of a new boson at a mass of 125 GeV with the CMS experiment at the LHC | Phys.Lett. B716 (2012) 30--61 | CMS-HIG-12-028 1207.7235 |
| 3 | CMS Collaboration | Precise determination of the mass of the Higgs boson and tests of compatibility of its couplings with the standard model predictions using proton collisions at 7 and 8 $ \,\text {TeV} $ | EPJC75 (2015) 212 | CMS-HIG-14-009 1412.8662 |
| 4 | CMS Collaboration | Constraints on the spin-parity and anomalous HVV couplings of the Higgs boson in proton collisions at 7 and 8 TeV | PRD92 (2015) 012004 | CMS-HIG-14-018 1411.3441 |
| 5 | ATLAS Collaboration | Measurements of the Higgs boson production and decay rates and coupling strengths using pp collision data at $ \sqrt{s}=7 $ and 8 TeV in the ATLAS experiment | EPJC76 (2016) 6 | 1507.04548 |
| 6 | ATLAS Collaboration | Study of the spin and parity of the Higgs boson in diboson decays with the ATLAS detector | EPJC75 (2015) 476, , [Erratum: Eur. Phys. J.C76,no.3,152(2016)] | 1506.05669 |
| 7 | B. Jager, C. Oleari, and D. Zeppenfeld | Next-to-leading order QCD corrections to W+ W+ jj and W- W- jj production via weak-boson fusion | Phys.Rev. D80 (2009) 034022 | 0907.0580 |
| 8 | G. Bozzi, B. Jager, C. Oleari, and D. Zeppenfeld | Next-to-leading order QCD corrections to W+ Z and W- Z production via vector-boson fusion | Phys.Rev. D75 (2007) 073004 | hep-ph/0701105 |
| 9 | F. Campanario, M. Kerner, L. D. Ninh, and D. Zeppenfeld | Next-to-leading order QCD corrections to $ W^+W^+ $ and $ W^-W^- $ production in association with two jets | PRD89 (2014) 054009 | 1311.6738 |
| 10 | A. Ballestrero, G. Bevilacqua, and E. Maina | A Complete parton level analysis of boson-boson scattering and ElectroWeak Symmetry Breaking in lv + four jets production at the LHC | JHEP 05 (2009) 015 | 0812.5084 |
| 11 | CMS Collaboration | Vector Boson Scattering and Quartic Gauge Coupling Studies in WZ Production at 14 TeV | CDS | |
| 12 | CMS Collaboration | Study of vector boson scattering and search for new physics in events with two same-sign leptons and two jets | PRL 114 (2015) 051801 | CMS-SMP-13-015 1410.6315 |
| 13 | ATLAS Collaboration | Evidence for Electroweak Production of $ W^{\pm}W^{\pm}jj $ in $ pp $ Collisions at $ \sqrt{s}=8 $ TeV with the ATLAS Detector | PRL 113 (2014) 141803 | 1405.6241 |
| 14 | A. L. Read | Modified frequentist analysis of search results (the $ CL_{s} $ method) | Technical Report CERN-OPEN-2000-205 | |
| 15 | A. Ballestrero et al. | PHANTOM: A Monte Carlo event generator for six parton final states at high energy colliders | Comput.Phys.Commun. 180 (2009) 401--417 | 0801.3359 |
| 16 | J. Alwall et al. | The automated computation of tree-level and next-to-leading order differential cross sections, and their matching to parton shower simulations | JHEP 07 (2014) 079 | 1405.0301 |
| 17 | J. Pumplin et al. | New generation of parton distributions with uncertainties from global QCD analysis | JHEP 07 (2002) 012 | hep-ph/0201195 |
| 18 | J. Butler et al. | Technical Proposal for the Phase-II Upgrade of the CMS Detector | Technical Report CERN-LHCC-2015-010. LHCC-P-008, CERN, Geneva. Geneva, June | |
| 19 | C. Degrande et al. | Effective Field Theory: A Modern Approach to Anomalous Couplings | Annals Phys. 335 (2013) 21--32 | 1205.4231 |
| 20 | S. Frixione, P. Nason, and C. Oleari | Matching NLO QCD computations with Parton Shower simulations: the POWHEG method | JHEP 11 (2007) 070 | 0709.2092 |
| 21 | J. Gao et al. | CT10 next-to-next-to-leading order global analysis of QCD | PRD89 (2014) 033009 | 1302.6246 |
| 22 | T. Sjostrand, S. Mrenna, and P. Z. Skands | PYTHIA 6.4 Physics and Manual | JHEP 05 (2006) 026 | hep-ph/0603175 |
| 23 | T. Sjostrand, S. Mrenna, and P. Z. Skands | A Brief Introduction to PYTHIA 8.1 | CPC 178 (2008) 852--867 | 0710.3820 |
| 24 | CMS Collaboration | Underlying Event Tunes and Double Parton Scattering | CDS | |
| 25 | CMS Collaboration | The CMS experiment at the CERN LHC | JINST 3 (2008) S08004 | CMS-00-001 |
| 26 | CMS Collaboration | Technical proposal for the upgrade of the CMS detector through 2020 | CDS | |
| 27 | GEANT4 Collaboration | GEANT4: A Simulation toolkit | NIMA506 (2003) 250 | |
| 28 | DELPHES 3 Collaboration | DELPHES 3, A modular framework for fast simulation of a generic collider experiment | JHEP 1402 (2014) 057 | 1307.6346 |
| 29 | CMS Collaboration | Particle-Flow Event Reconstruction in CMS and Performance for Jets, Taus, and MET | CDS | |
| 30 | M. Cacciari and G. P. Salam | Pileup subtraction using jet areas | PLB659 (2008) 119--126 | 0707.1378 |
| 31 | M. Cacciari, G. P. Salam, and G. Soyez | The Anti-k(t) jet clustering algorithm | JHEP 04 (2008) 063 | 0802.1189 |
| 32 | CMS Collaboration | Identification of b-quark jets with the CMS experiment | JINST 8 (2013) P04013 | CMS-BTV-12-001 1211.4462 |
| 33 | CMS Collaboration | Search for the associated production of the Higgs boson with a top-quark pair | JHEP 09 (2014) 087, , [Erratum: JHEP10,106(2014)] | CMS-HIG-13-029 1408.1682 |
| 34 | ATLAS and CMS Collaborations, LHC Higgs Combination Group | Procedure for the LHC Higgs boson search combination in Summer 2011 | CMS Note ATL-PHYS-PUB 2011-11, CMS-NOTE 2011-005 | |
| 35 | CMS Collaboration | Combined results of searches for the standard model Higgs boson in $ pp $ collisions at $ \sqrt{s}=7 $ TeV | PLB710 (2012) 26--48 | CMS-HIG-11-032 1202.1488 |
| 36 | LHC Higgs Cross Section Working Group Collaboration | Handbook of LHC Higgs Cross Sections: 3. Higgs Properties | Technical Report CERN-2013-004, FERMILAB-CONF-13-667-T | 1307.1347 |
| 37 | O. Eboli, M. Gonzalez-Garcia, and J. Mizukoshi | $ p p \rightarrow j j e^{\pm} \mu^{\pm} \nu \nu $ and $ j j e^{\pm} \mu^{\mp} \nu \nu $ at~O($ \alpha_{em}^6 $) and O($ \alpha_{em}^4 \alpha_s^2 $) for the study of the quartic electroweak gauge boson vertex at CERN LHC | Phys.Rev. D74 (2006) 073005 | hep-ph/0606118 |
| 38 | CMS Collaboration | Evidence for exclusive gamma-gamma to W+ W- production and constraints on Anomalous Quartic Gauge Couplings at $ \sqrt{s}=8 $ TeV | CMS-PAS-FSQ-13-008 | CMS-PAS-FSQ-13-008 |
| 39 | CMS Collaboration | Evidence for the electroweak Z gamma production in association with two jets and a search for anomalous quartic gauge couplings in pp collisions at $ \sqrt{s} $ = 8 $ TeV $ | CMS-PAS-SMP-14-018 | CMS-PAS-SMP-14-018 |

|
Compact Muon Solenoid LHC, CERN |

|

|

|

|

|

|