

Compact Muon Solenoid
LHC, CERN
| CMS-PAS-HIN-24-015 | ||
| Exploring the origin of $ \mathrm{D^0} $ meson elliptic flow in PbPb collisions at $ \sqrt{\smash[b]{s_{_{\mathrm{NN}}}}}= $ 5.02 TeV using event shape engineering | ||
| CMS Collaboration | ||
| 15 May 2025 | ||
| Abstract: The effect of the initial collision geometry on the elliptic flow ($ v_2 $) in events with prompt $ \mathrm{D^0} $ mesons produced in PbPb collisions at $ \sqrt{\smash[b]{s_{_{\mathrm{NN}}}}}= $ 5.02 TeV is studied using data from the CMS experiment. Using an event-shape engineering technique, initial-state eccentricities within a given centrality range are systematically varied. The $ v_2 $ of $ \mathrm{D^0} $ mesons is measured in five centrality classes, 0-10, 10-20, 20-30, 30-40 and 40-50$ % $ and further categorized into ten event-shape classes based on the reduced flow vector ($ q_2 $) within each centrality range. The measurement is performed within the kinematic region of $ \mathrm{D^0} $ rapidity, $ \lvert y \rvert < $ 1 and transverse momentum ($ p_{\mathrm{T}} $) of 2-30 GeV/$c$. A clear positive correlation is observed between the $ q_2 $ and the $ \mathrm{D^0} v_2 $, indicating that the initial-state geometry significantly influences the development of charm-hadron flow in heavy-ion collisions. Furthermore, a comparison between the $ v_2 $ of $ \mathrm{D^0} $ mesons and that of low-$ p_{\mathrm{T}} $ (1-3 GeV/$c$) charged particles reveals a linear correlation, strongly suggesting that initial-geometry eccentricity is the primary origin of the charm-hadron elliptic flow, and hints of nonlinearity are observed at $ \mathrm{D^0} p_{\mathrm{T}} > $ 10 GeV/$c$. | ||
| Links: CDS record (PDF) ; CADI line (restricted) ; | ||
| Figures | |
png pdf |
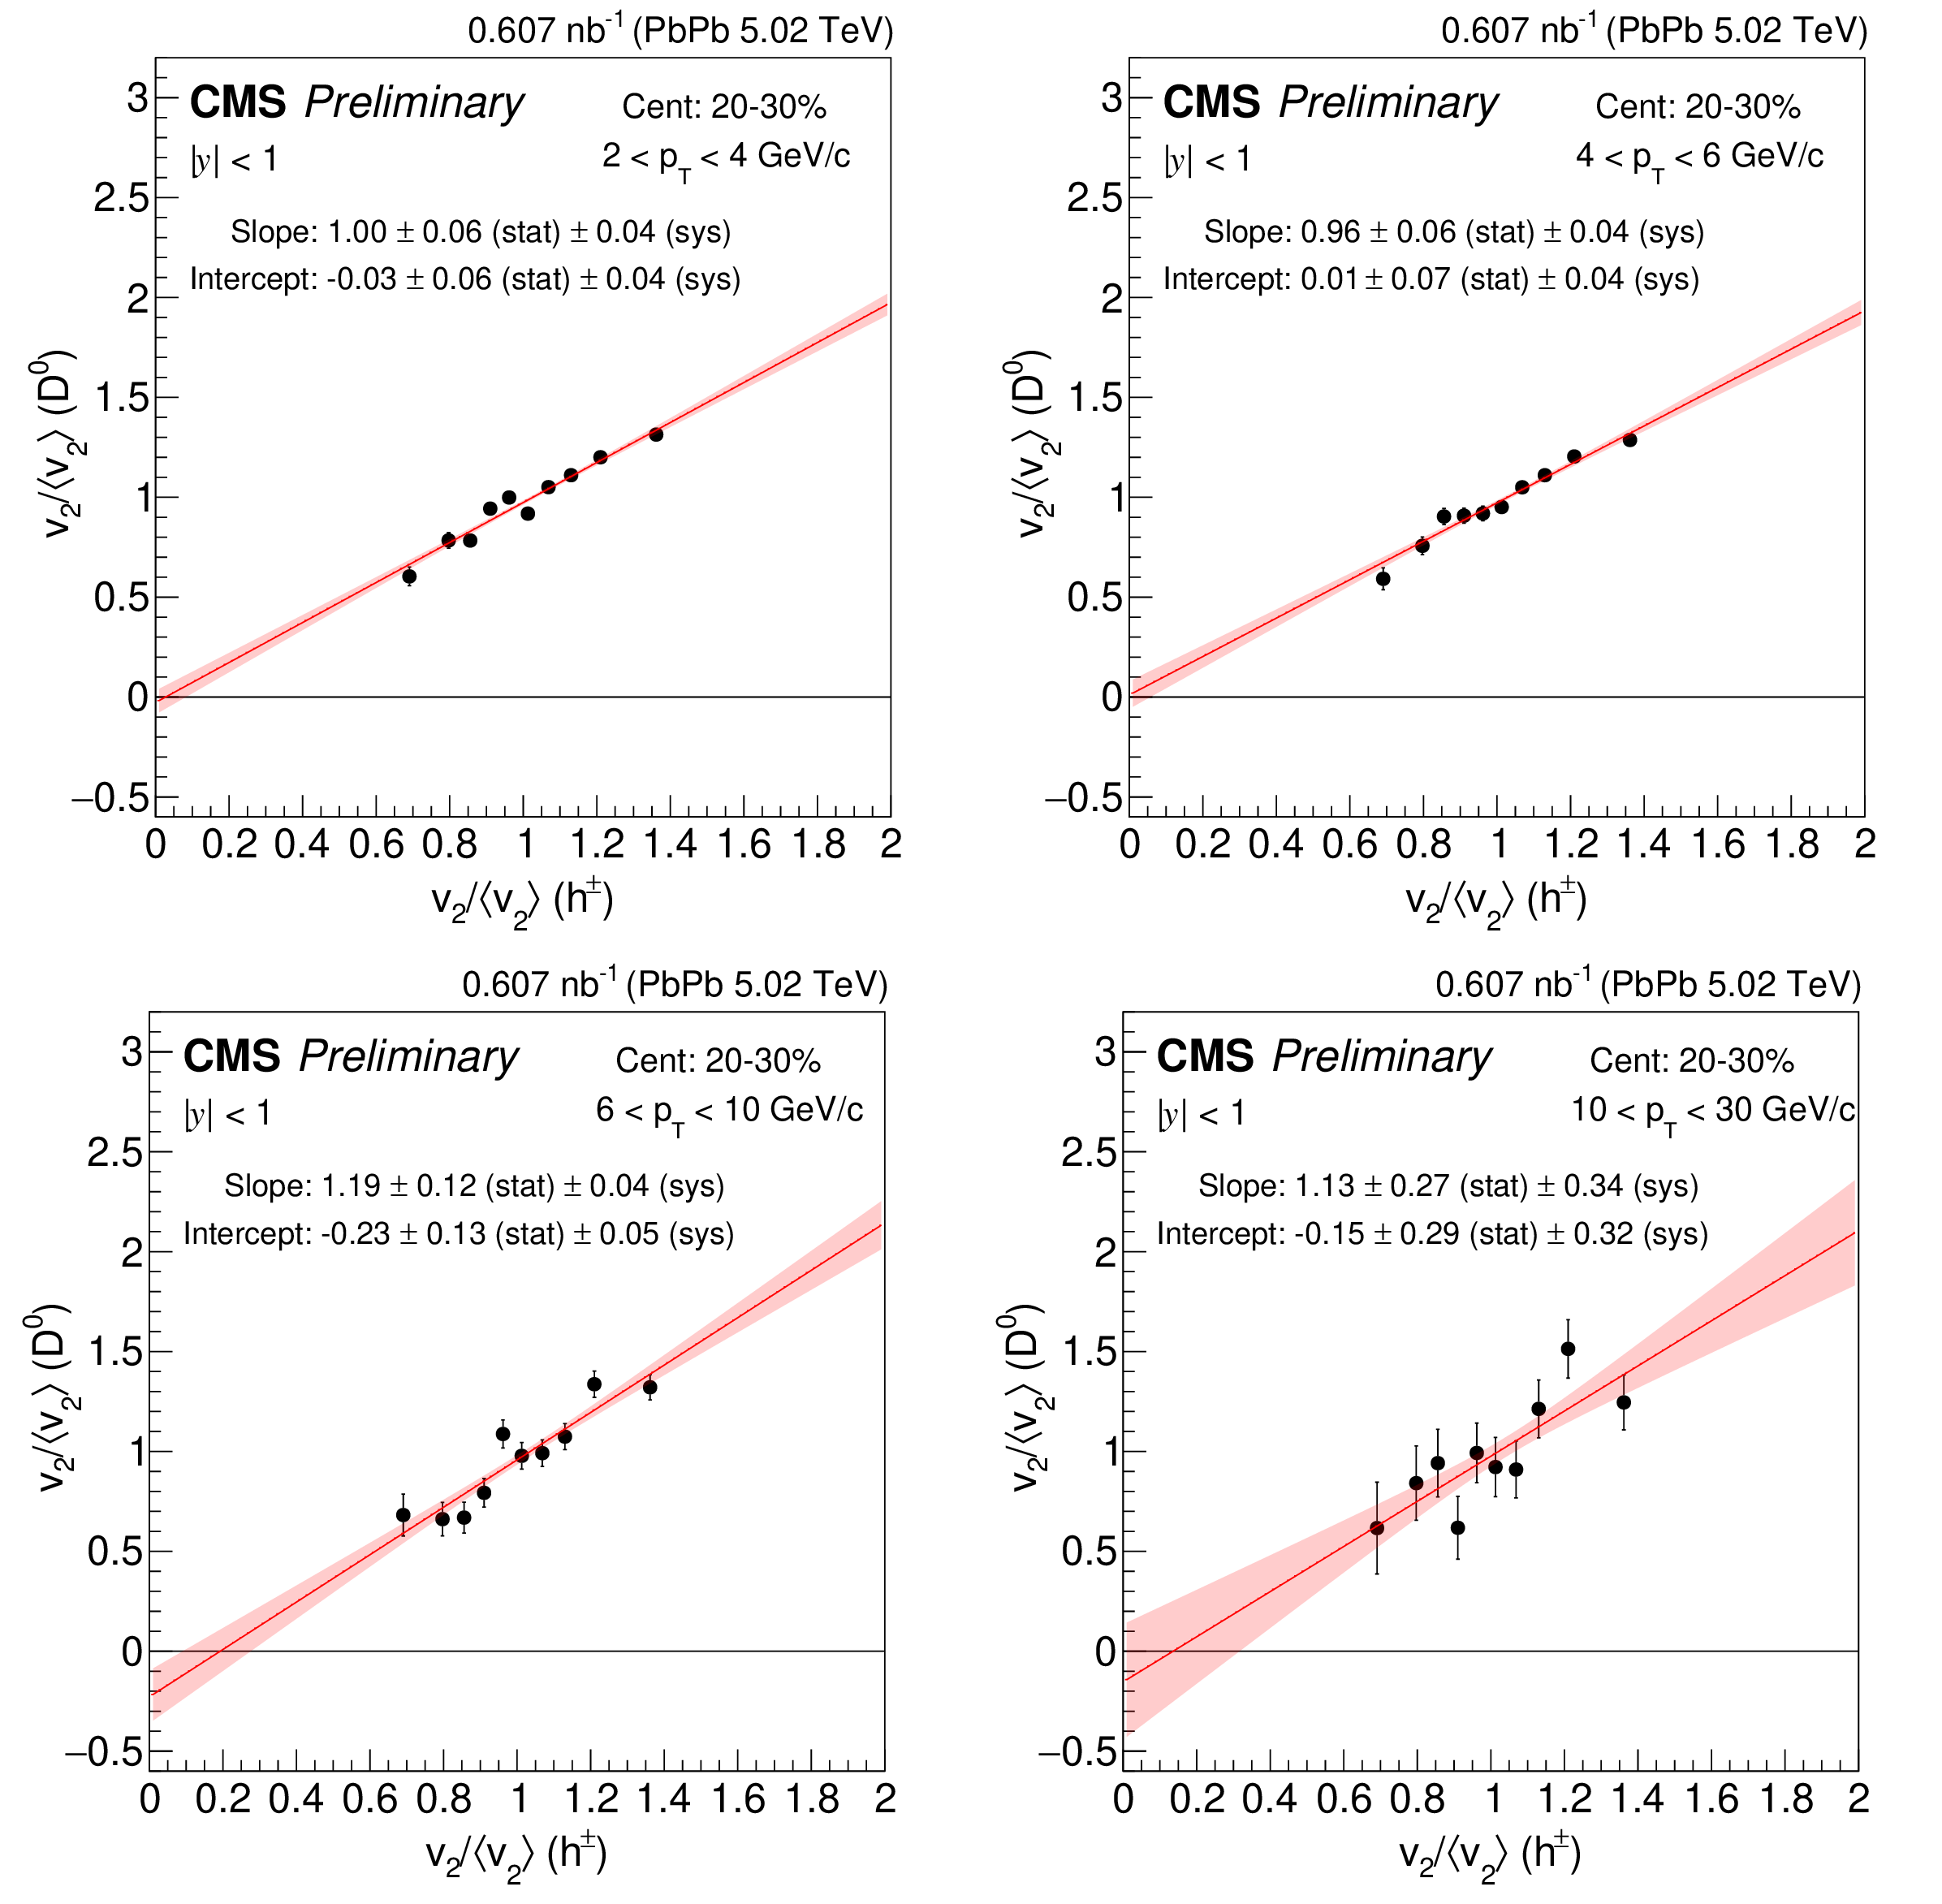
Figure 1:
Correlation between the normalized $ \mathrm{D^0} v_2 $ and the charged-particle $ v_2 $. The $ v_2 $ value in each $ q_2 $ bin is scaled by the $ q_2 $-inclusive $ v_2 $. The charged-particle $ v_2 $ is measured in the $ p_{\mathrm{T}} $ region 1-3 GeV/$c$. The correlation plots for $ \mathrm{D^0} p_{\mathrm{T}} $ 2-4 (upper left), 4-6 (upper right), 6-10 (lower left) and 10-30 GeV/$c$ (lower right) in the centrality class 20-30%. The red band corresponds to the uncertainty of one standard deviation. |
png pdf |
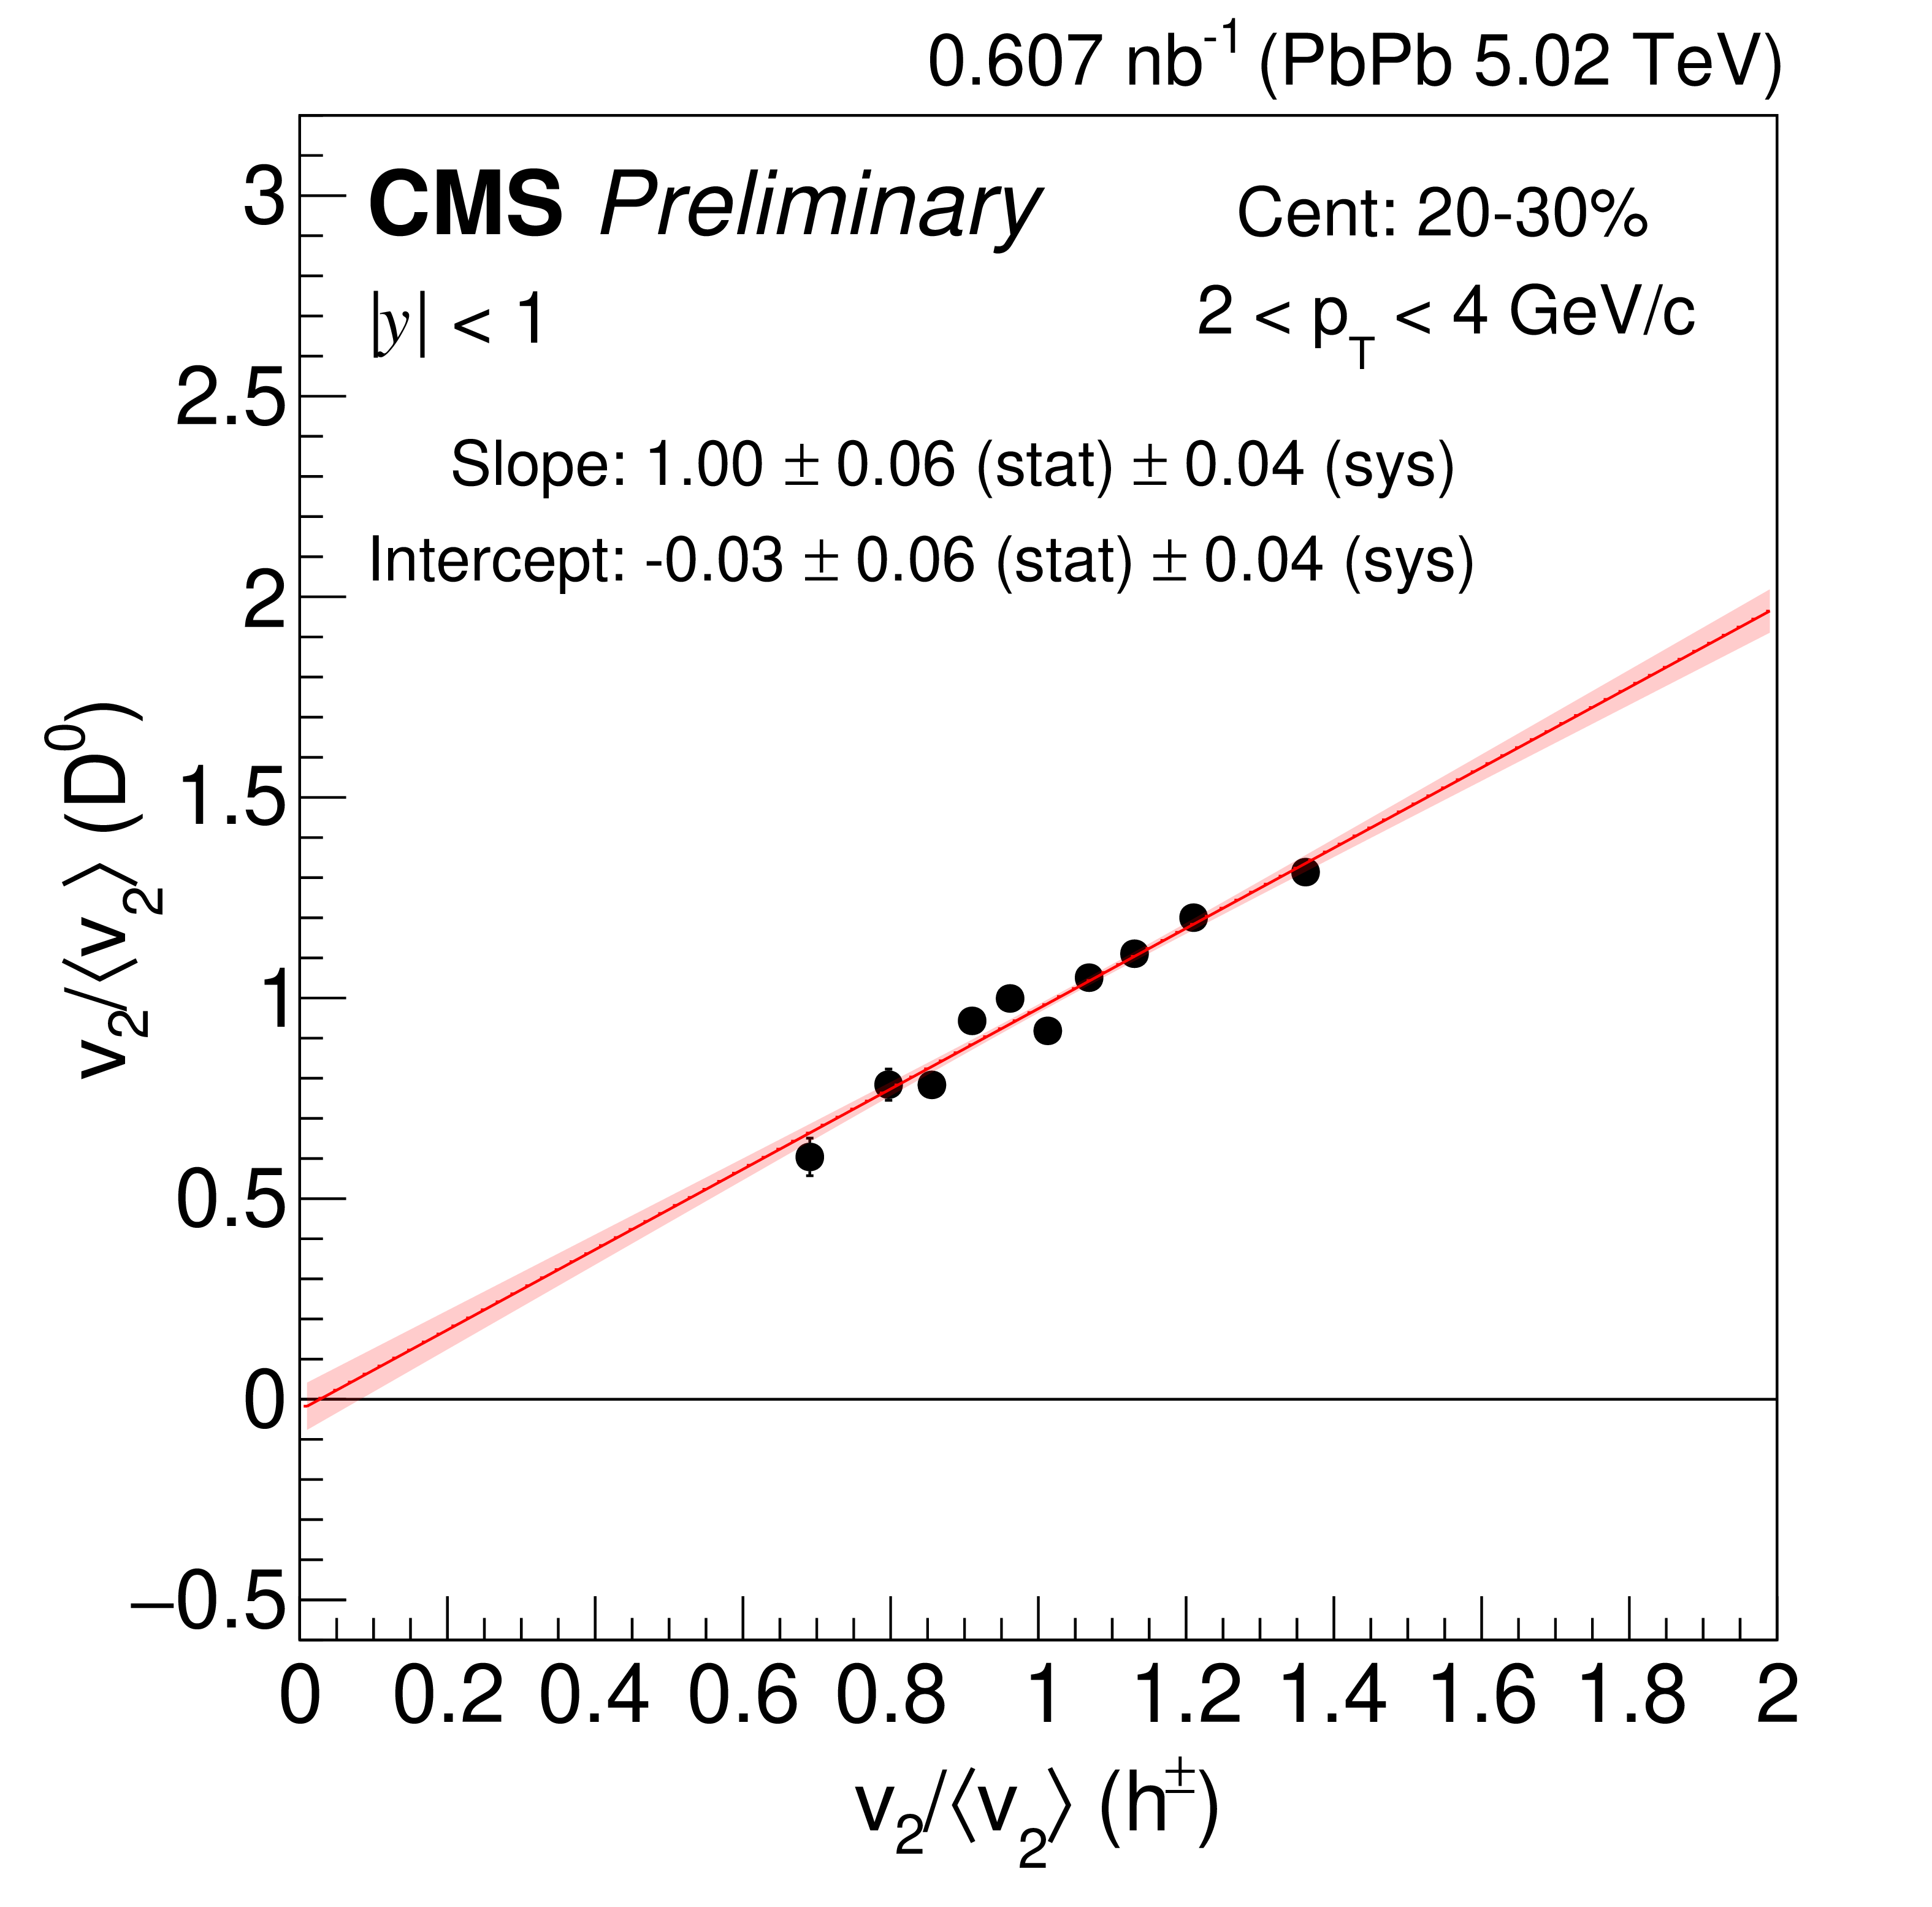
Figure 1-a:
Correlation between the normalized $ \mathrm{D^0} v_2 $ and the charged-particle $ v_2 $. The $ v_2 $ value in each $ q_2 $ bin is scaled by the $ q_2 $-inclusive $ v_2 $. The charged-particle $ v_2 $ is measured in the $ p_{\mathrm{T}} $ region 1-3 GeV/$c$. The correlation plots for $ \mathrm{D^0} p_{\mathrm{T}} $ 2-4 (upper left), 4-6 (upper right), 6-10 (lower left) and 10-30 GeV/$c$ (lower right) in the centrality class 20-30%. The red band corresponds to the uncertainty of one standard deviation. |

png pdf |
Figure 1-b:
Correlation between the normalized $ \mathrm{D^0} v_2 $ and the charged-particle $ v_2 $. The $ v_2 $ value in each $ q_2 $ bin is scaled by the $ q_2 $-inclusive $ v_2 $. The charged-particle $ v_2 $ is measured in the $ p_{\mathrm{T}} $ region 1-3 GeV/$c$. The correlation plots for $ \mathrm{D^0} p_{\mathrm{T}} $ 2-4 (upper left), 4-6 (upper right), 6-10 (lower left) and 10-30 GeV/$c$ (lower right) in the centrality class 20-30%. The red band corresponds to the uncertainty of one standard deviation. |
png pdf |
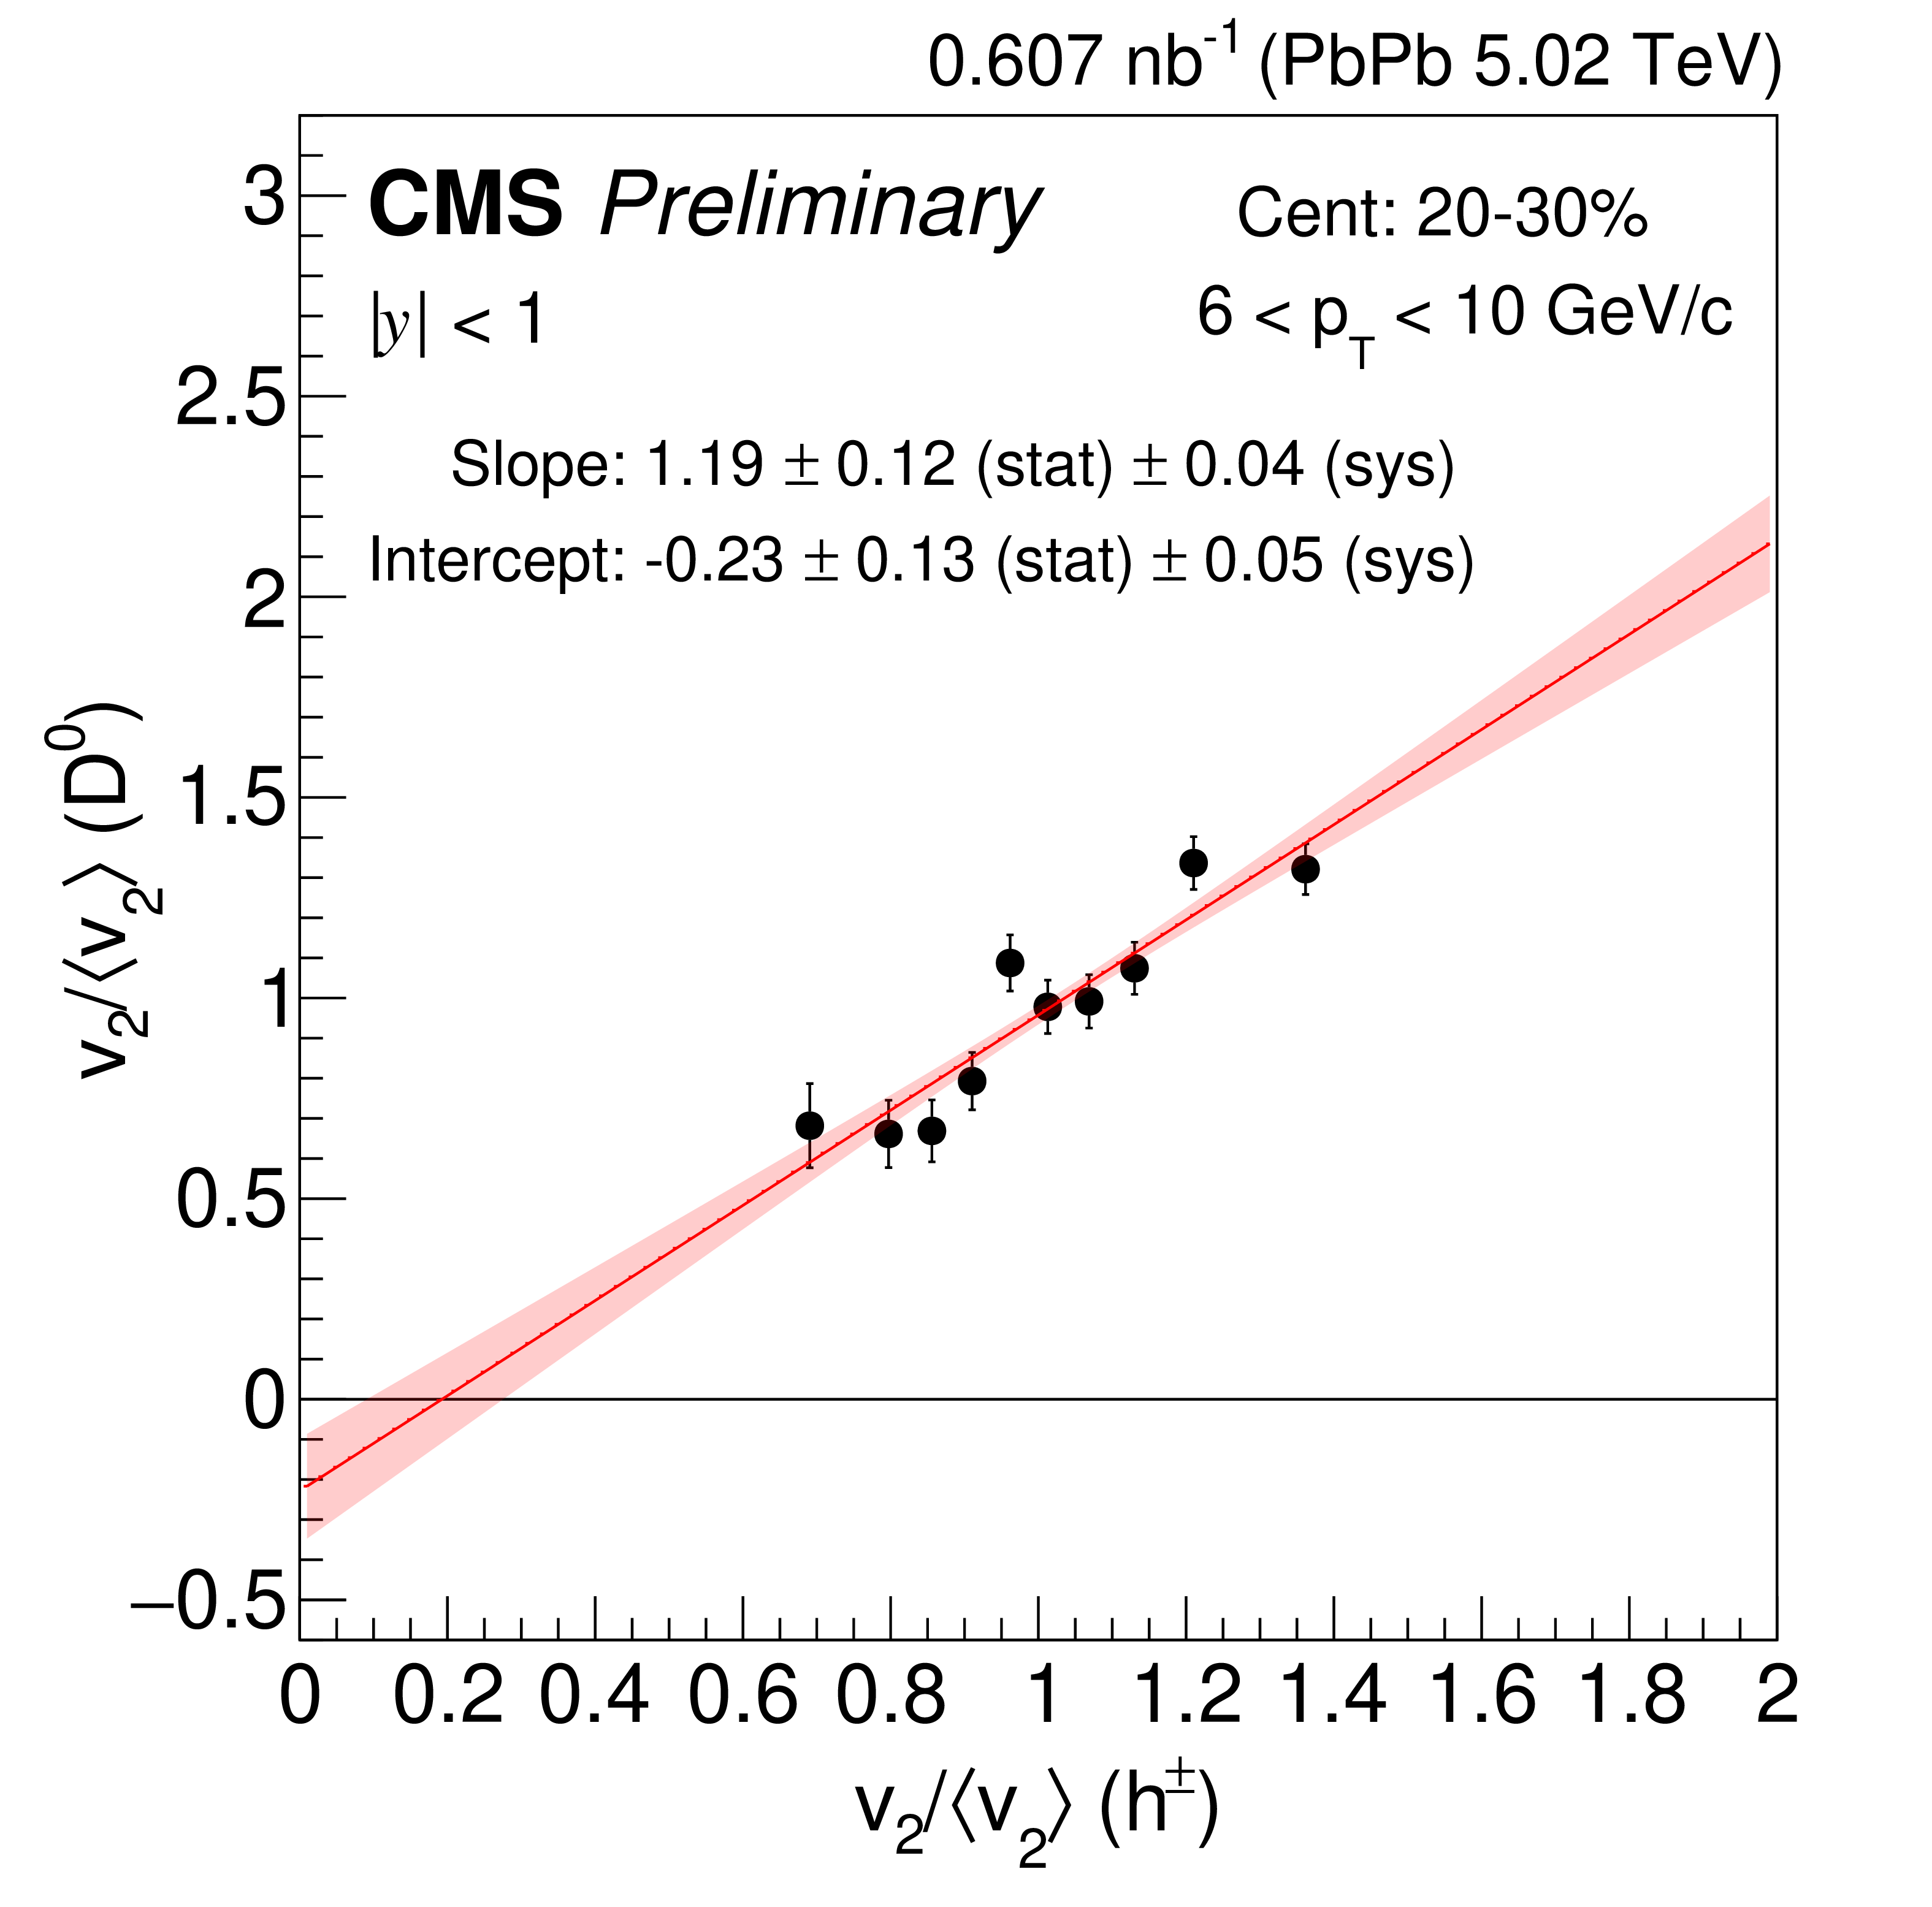
Figure 1-c:
Correlation between the normalized $ \mathrm{D^0} v_2 $ and the charged-particle $ v_2 $. The $ v_2 $ value in each $ q_2 $ bin is scaled by the $ q_2 $-inclusive $ v_2 $. The charged-particle $ v_2 $ is measured in the $ p_{\mathrm{T}} $ region 1-3 GeV/$c$. The correlation plots for $ \mathrm{D^0} p_{\mathrm{T}} $ 2-4 (upper left), 4-6 (upper right), 6-10 (lower left) and 10-30 GeV/$c$ (lower right) in the centrality class 20-30%. The red band corresponds to the uncertainty of one standard deviation. |
png pdf |
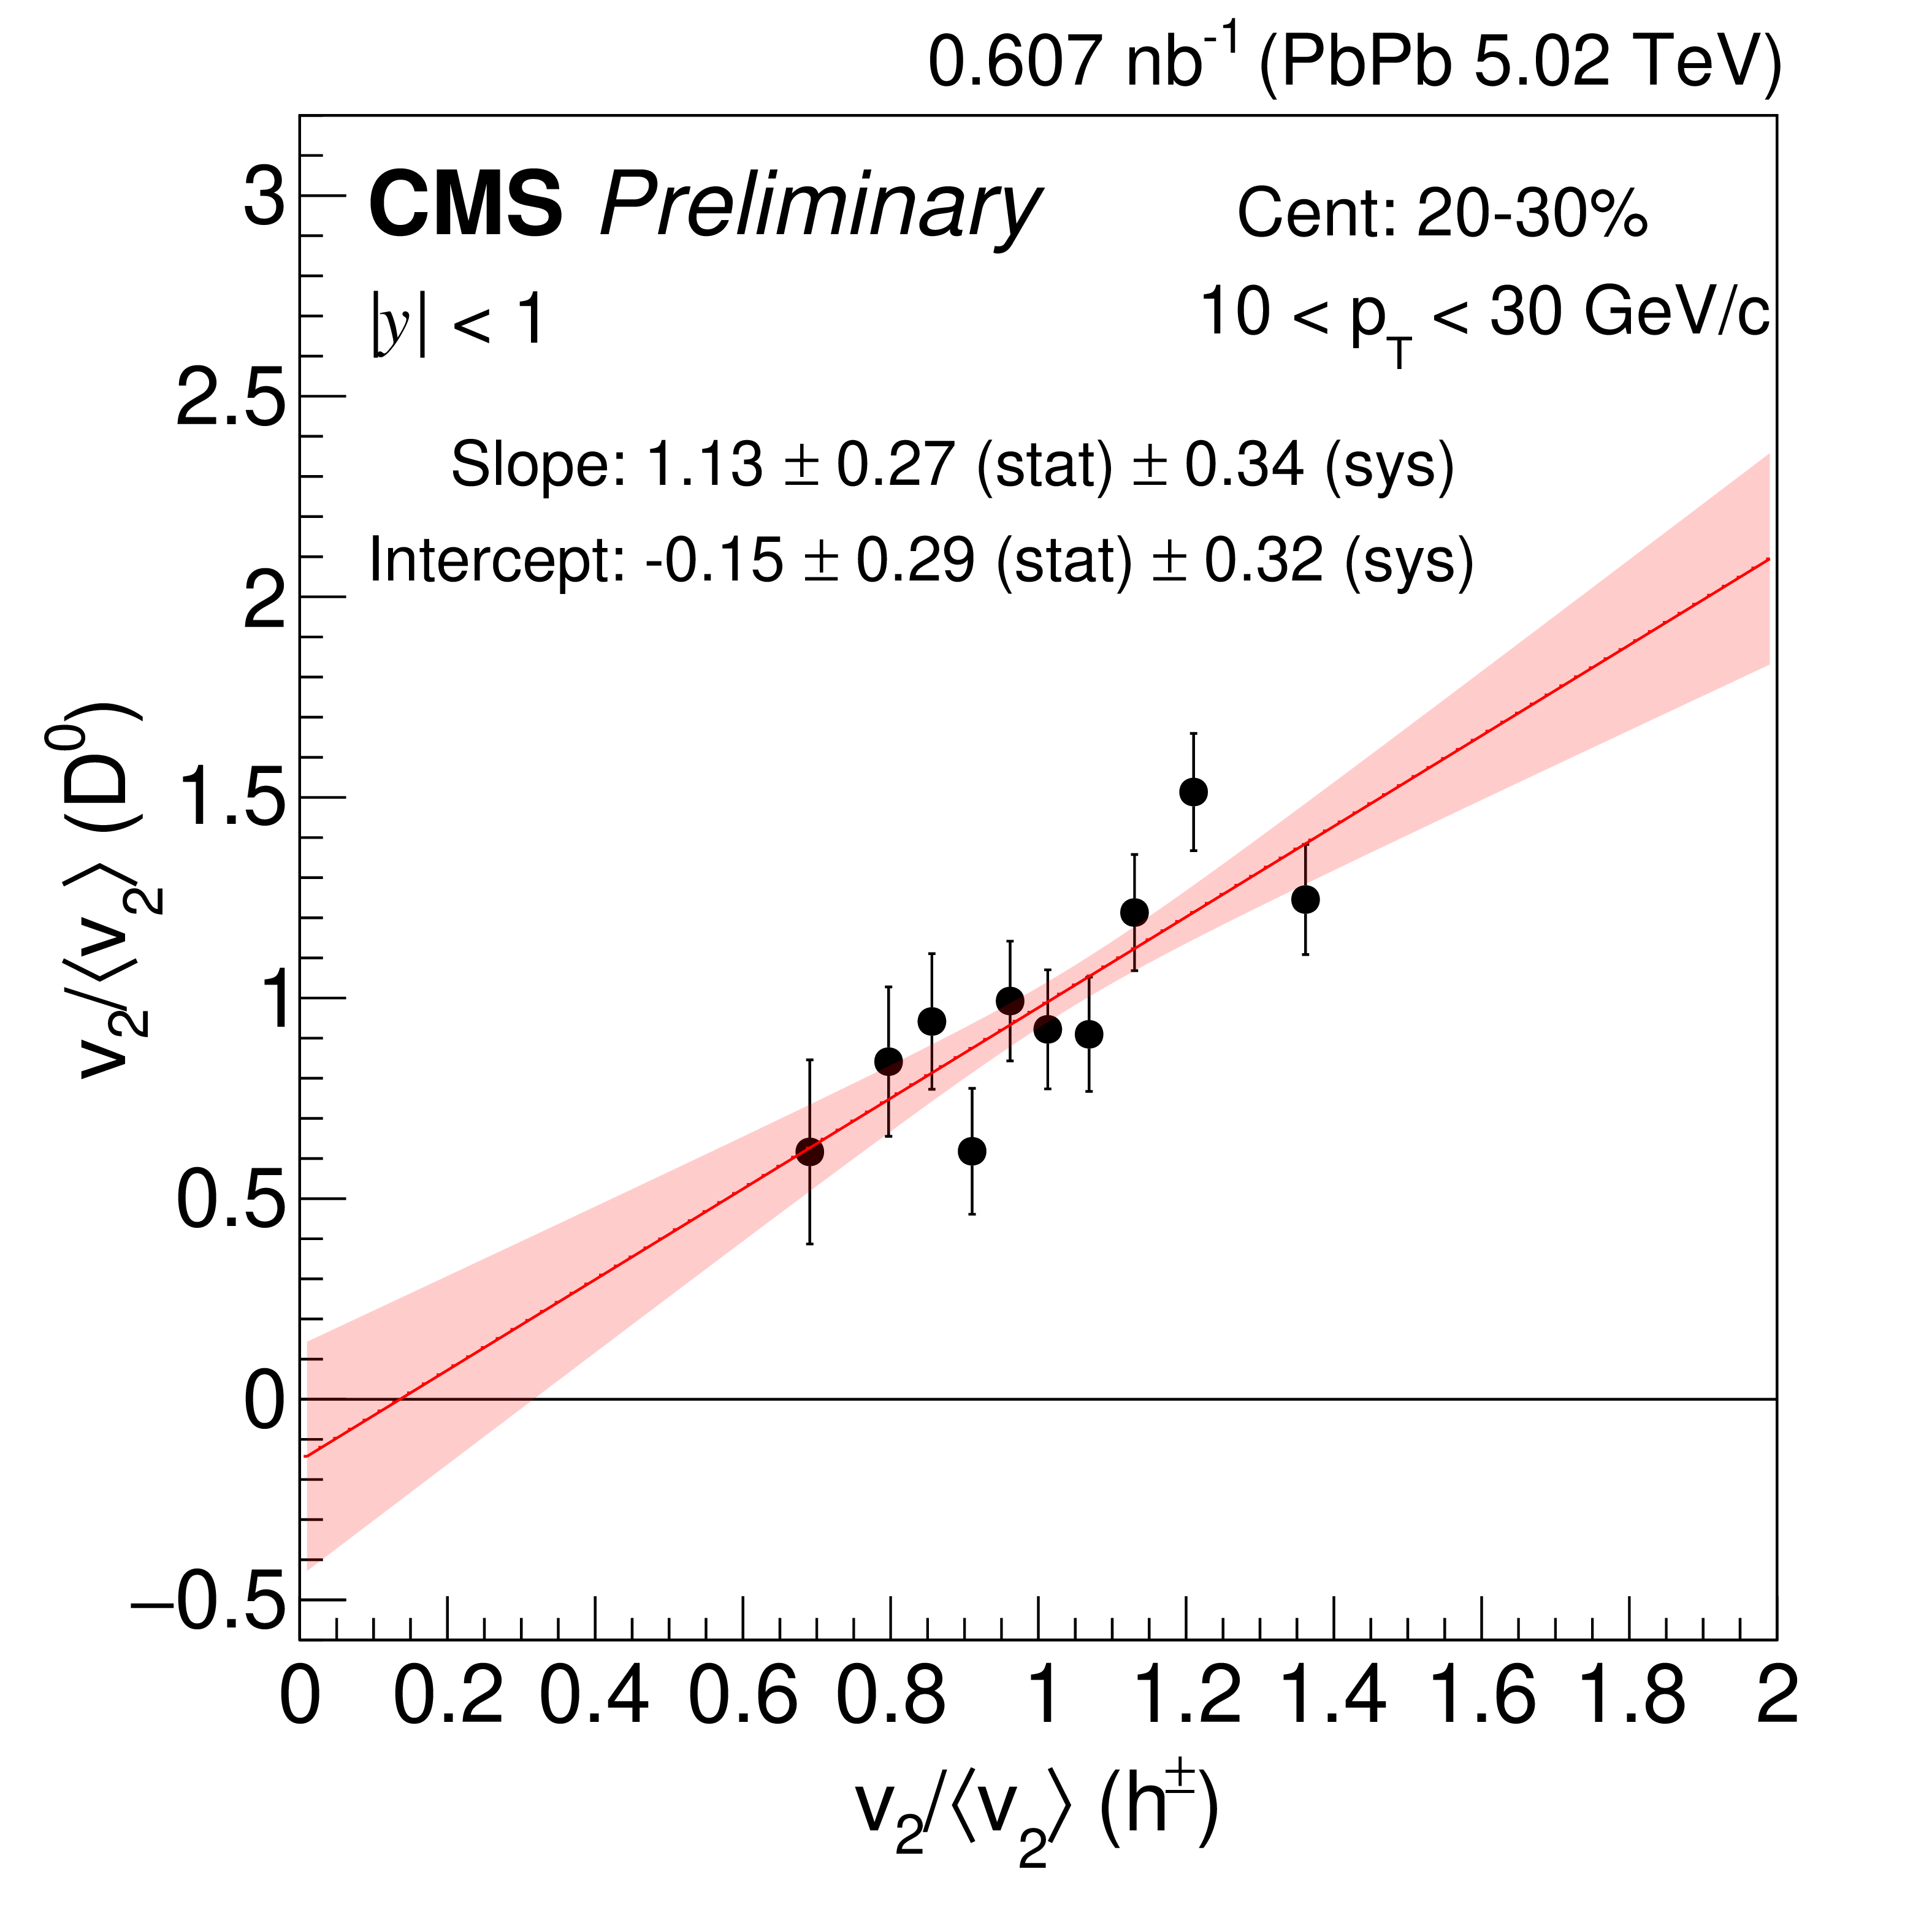
Figure 1-d:
Correlation between the normalized $ \mathrm{D^0} v_2 $ and the charged-particle $ v_2 $. The $ v_2 $ value in each $ q_2 $ bin is scaled by the $ q_2 $-inclusive $ v_2 $. The charged-particle $ v_2 $ is measured in the $ p_{\mathrm{T}} $ region 1-3 GeV/$c$. The correlation plots for $ \mathrm{D^0} p_{\mathrm{T}} $ 2-4 (upper left), 4-6 (upper right), 6-10 (lower left) and 10-30 GeV/$c$ (lower right) in the centrality class 20-30%. The red band corresponds to the uncertainty of one standard deviation. |
png pdf |
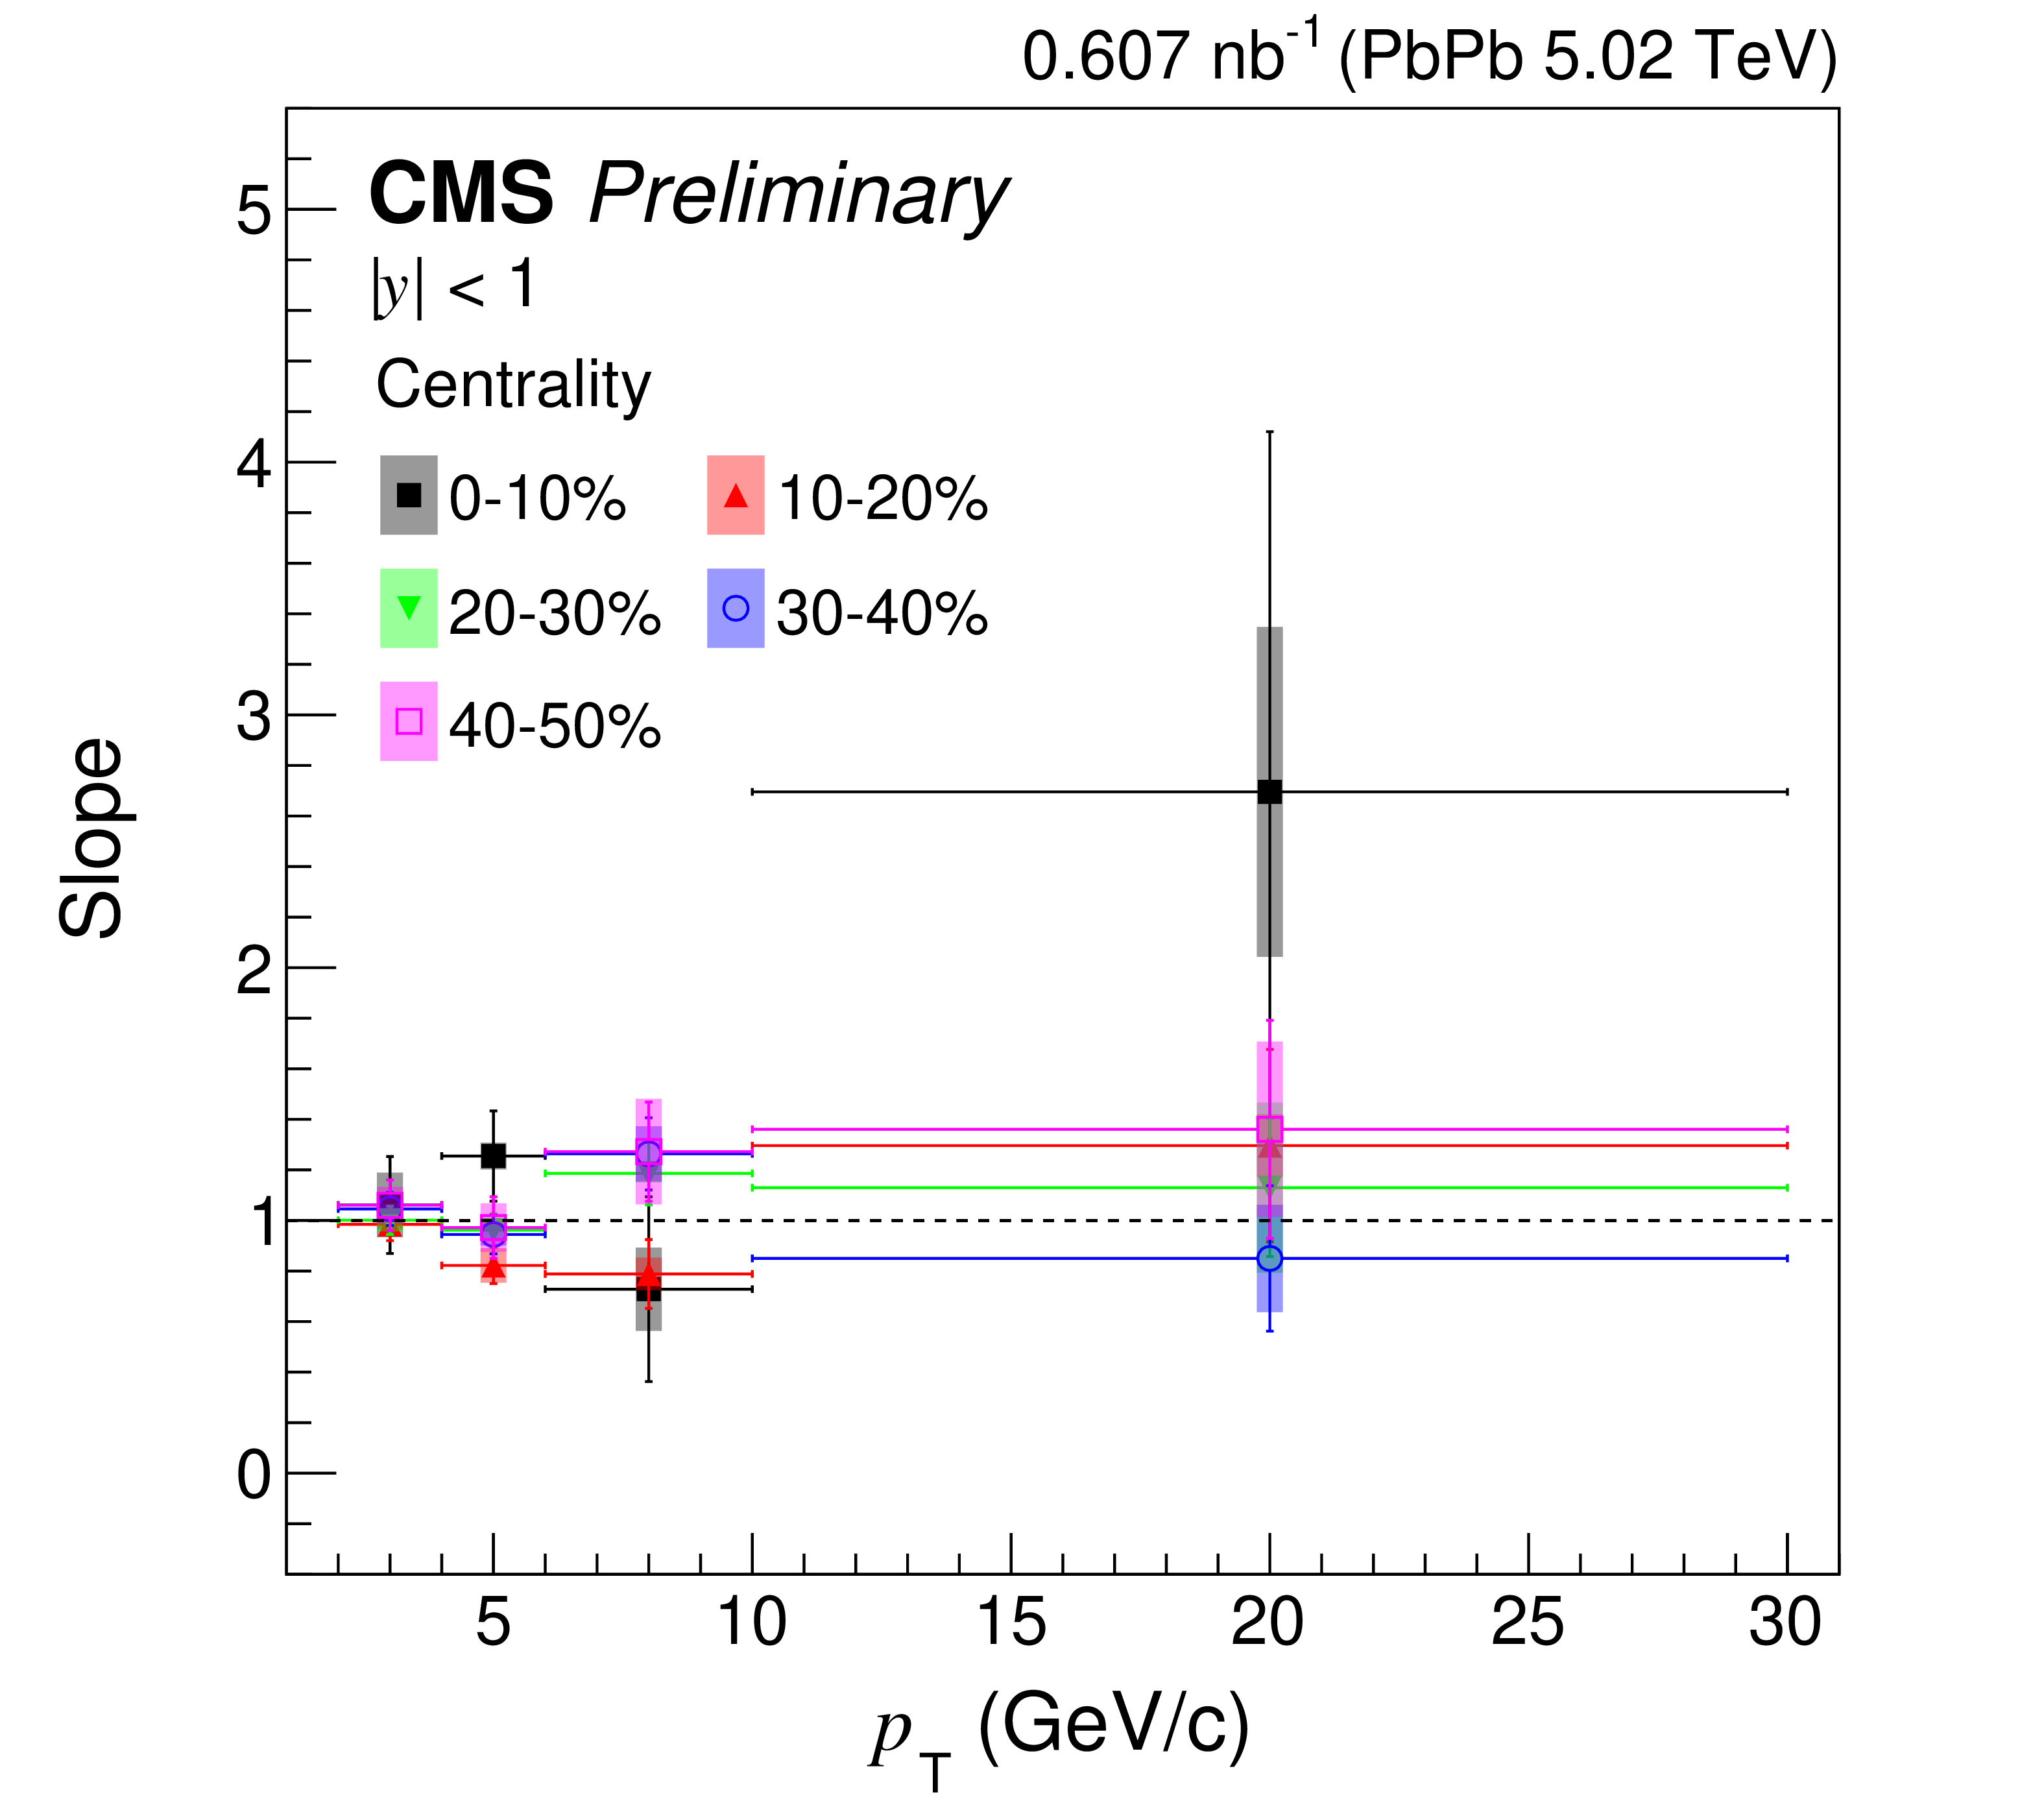
Figure 2:
Slopes obtained from the correlation plots of the prompt $ \mathrm{D^0} v_2 $ vs the charged-particle $ v_2 $ for each $ p_{\mathrm{T}} $ and centrality class of $ \mathrm{D^0} $. For the correlation plots, the $ v_2 $ in each $ q_2 $ bin is normalized by the $ q_2 $-inclusive $ v_2 $. The vertical lines correspond to the statistical uncertainties and the vertical bands correspond to the systematic uncertainties added in quadrature. The slopes calculated are consistent with unity. |
png pdf |
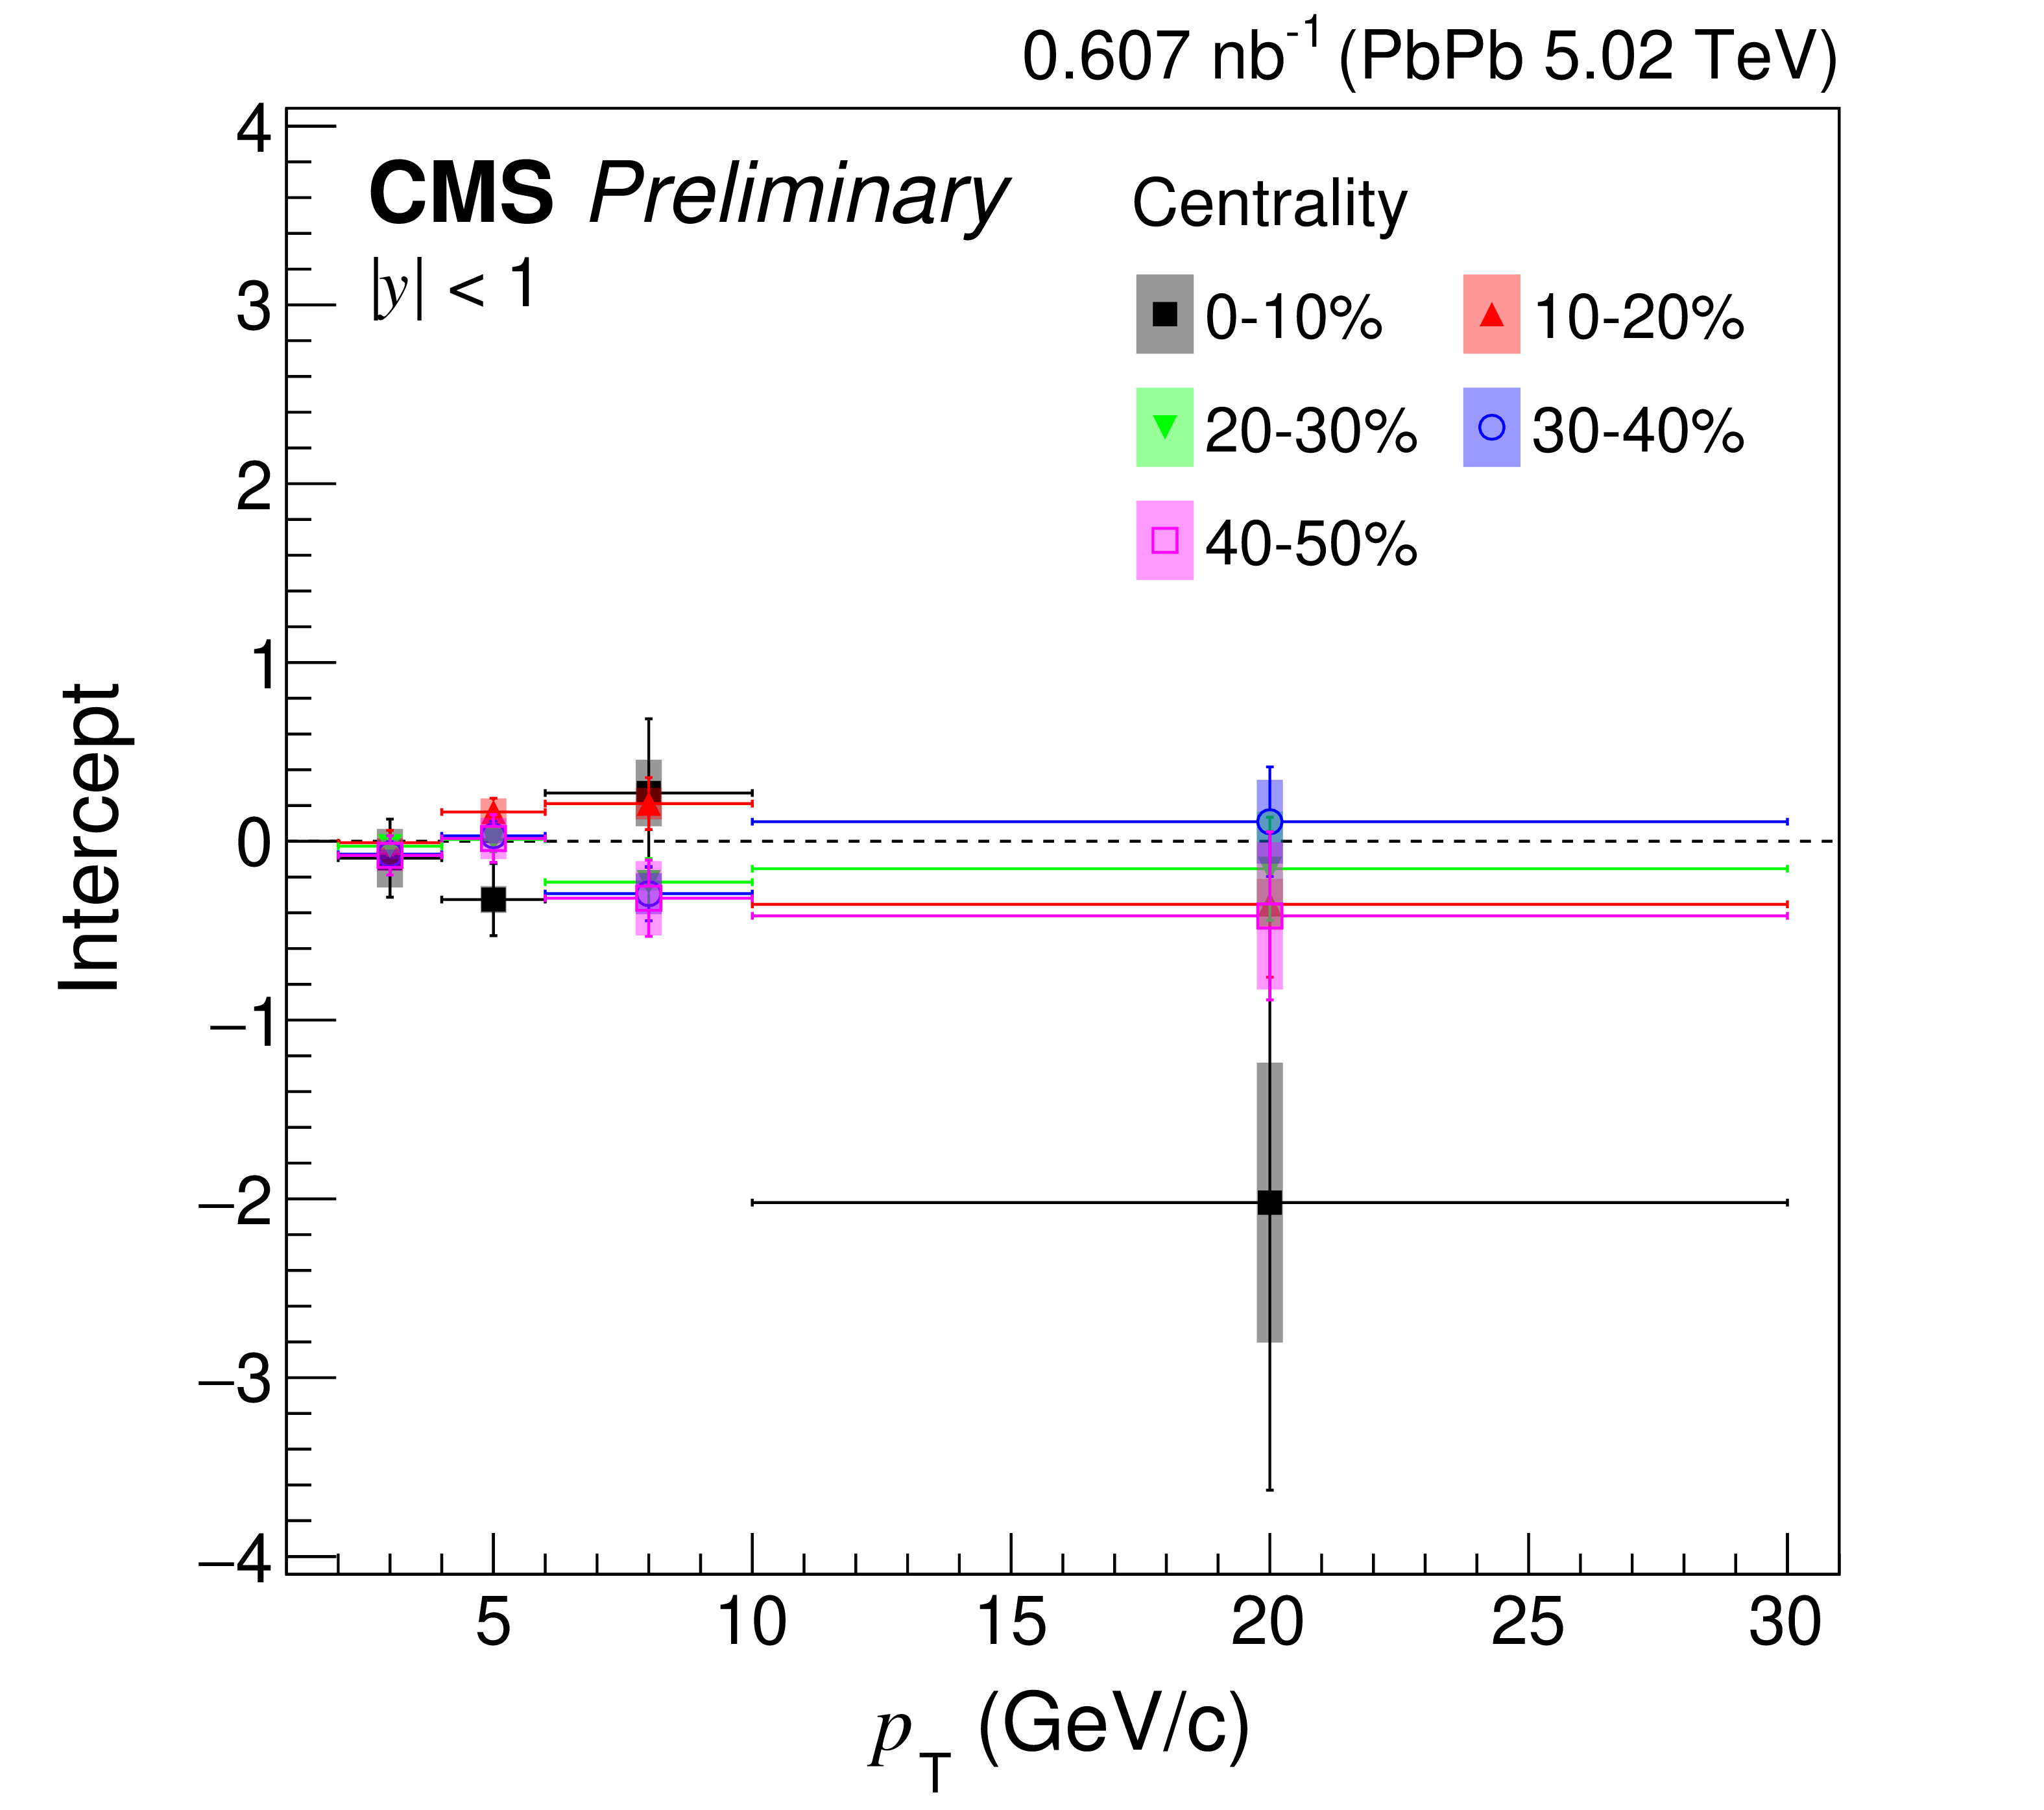
Figure 3:
Intercepts obtained from the correlation plots of the prompt $ \mathrm{D^0} v_2 $ vs the charged-particle $ v_2 $ for each $ p_{\mathrm{T}} $ and centrality class of $ \mathrm{D^0} $. For the correlation plots, the $ v_2 $ in each $ q_2 $ bin is normalized by the $ q_2 $-inclusive $ v_2 $. The vertical lines correspond to the statistical uncertainties and the vertical bands correspond to the systematic uncertainties added in quadrature. The intercepts calculated are consistent with zero. |
png pdf |
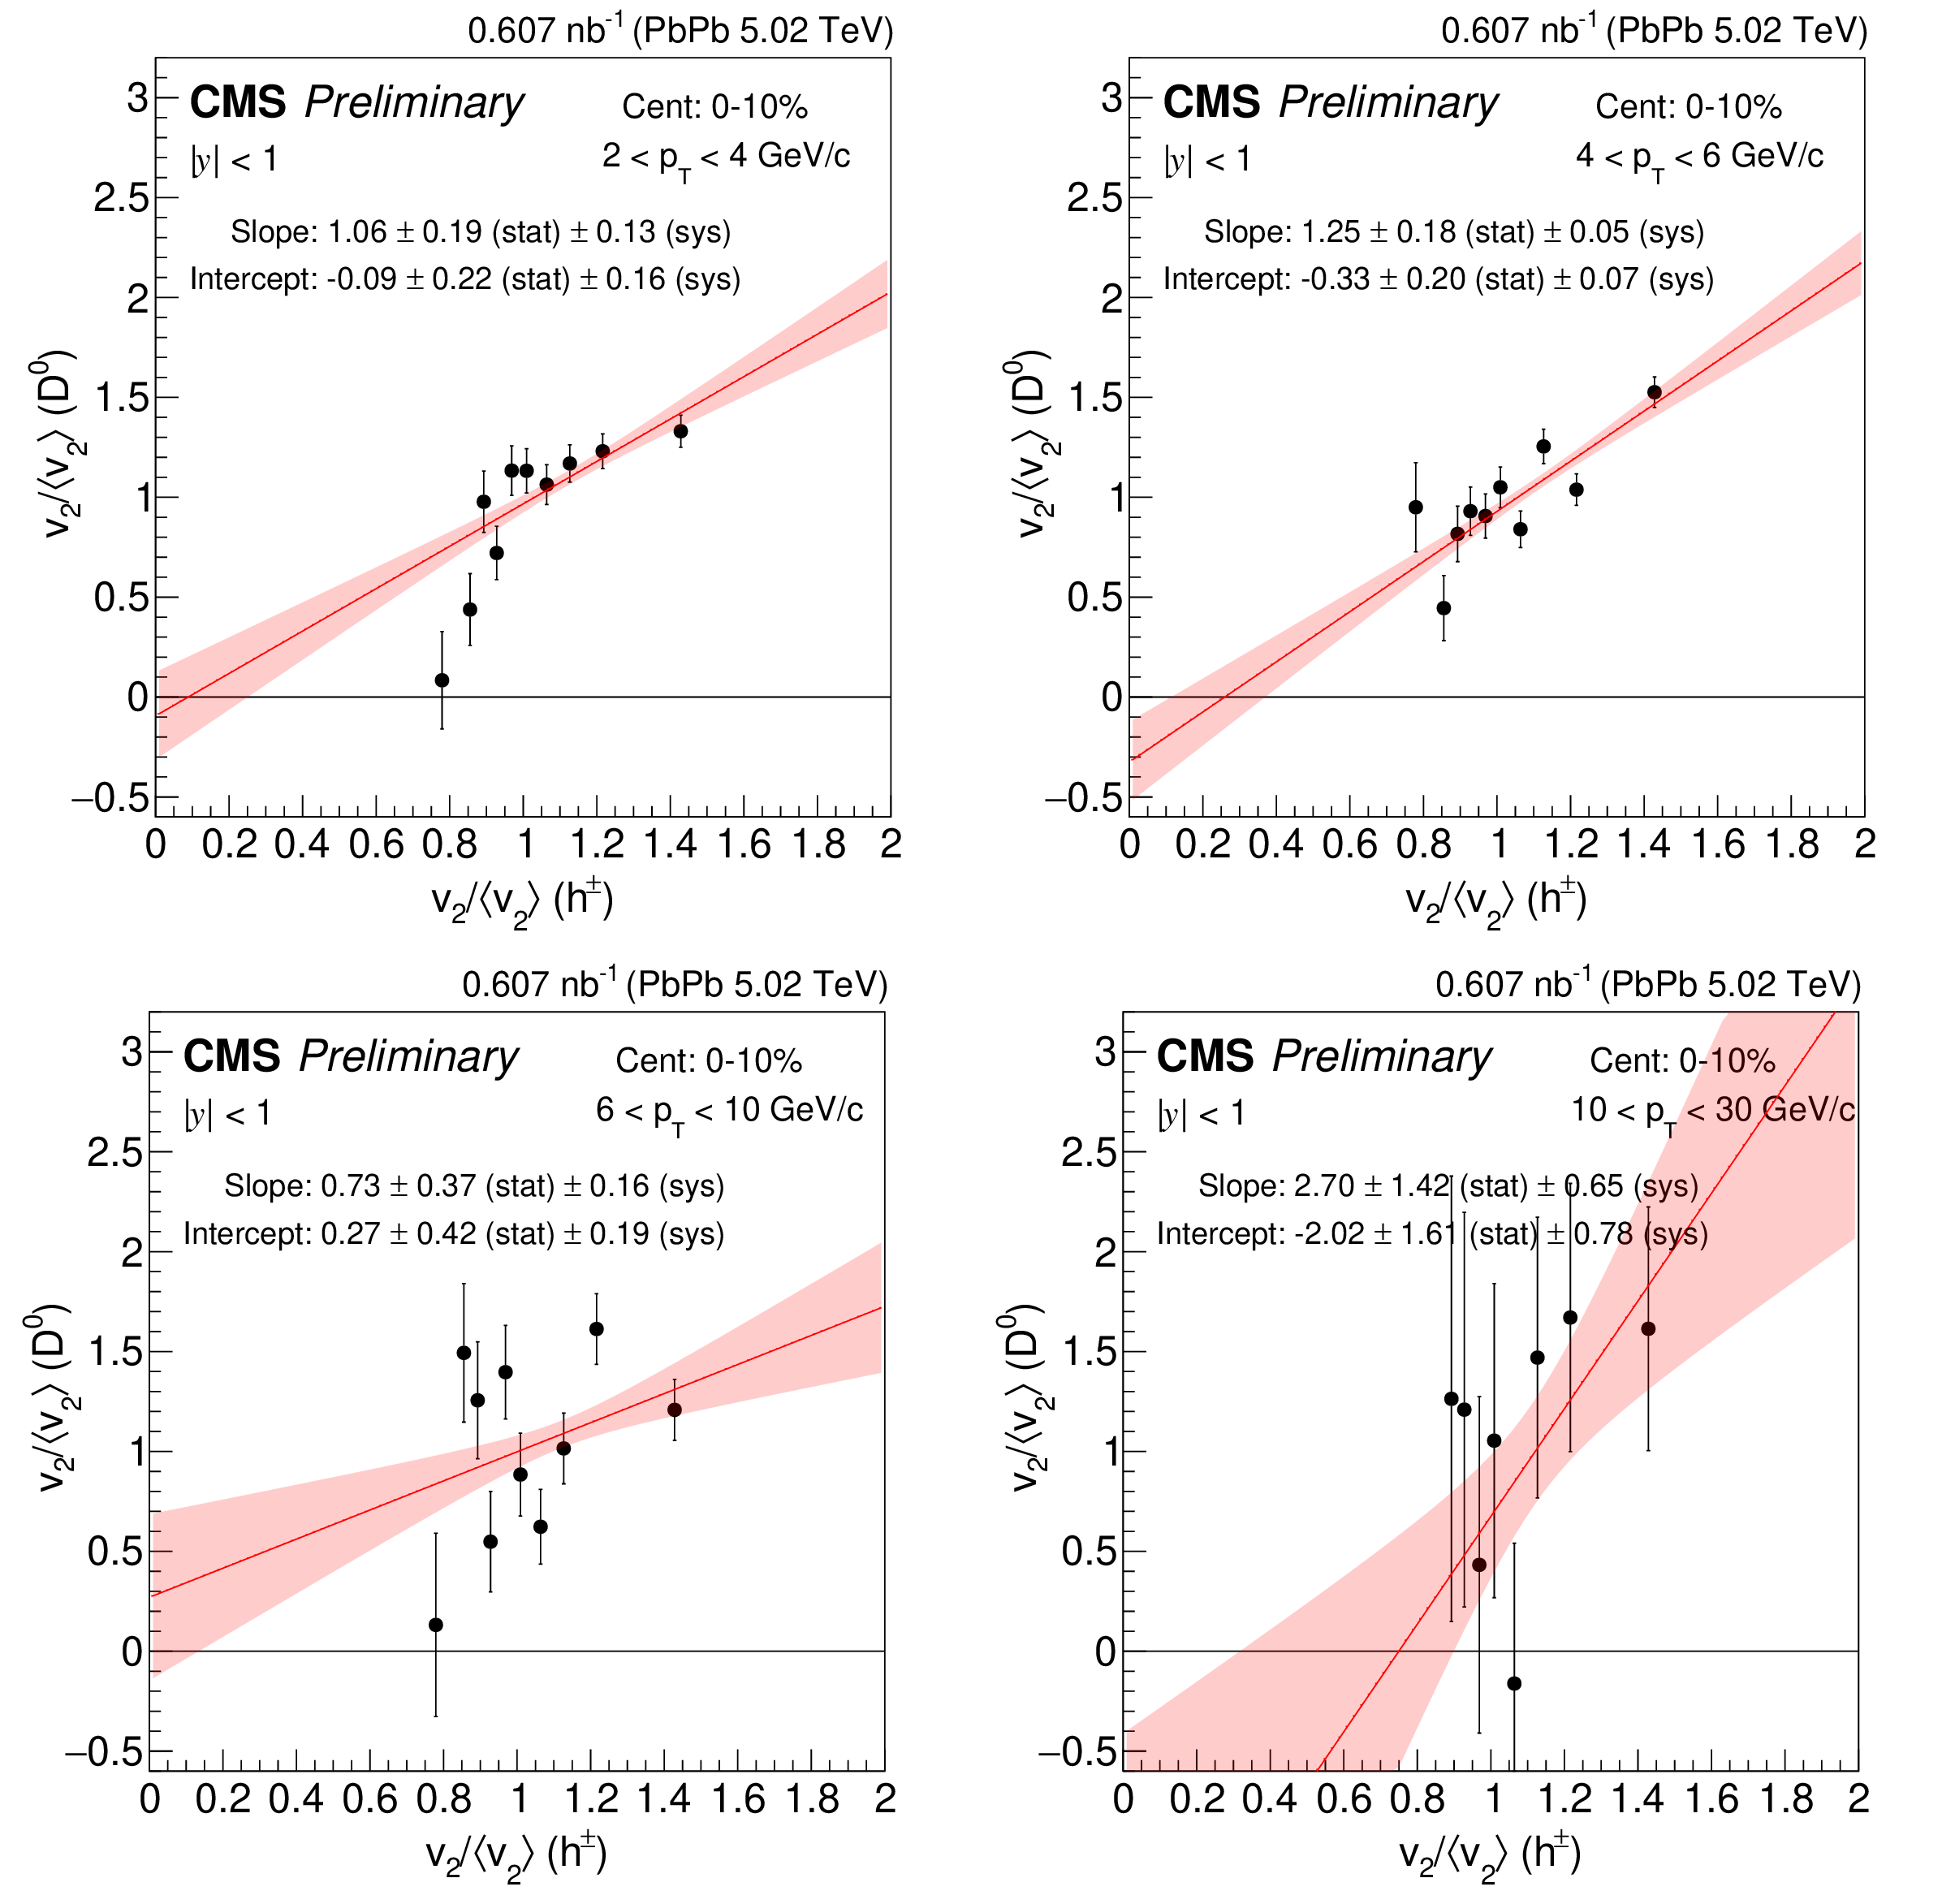
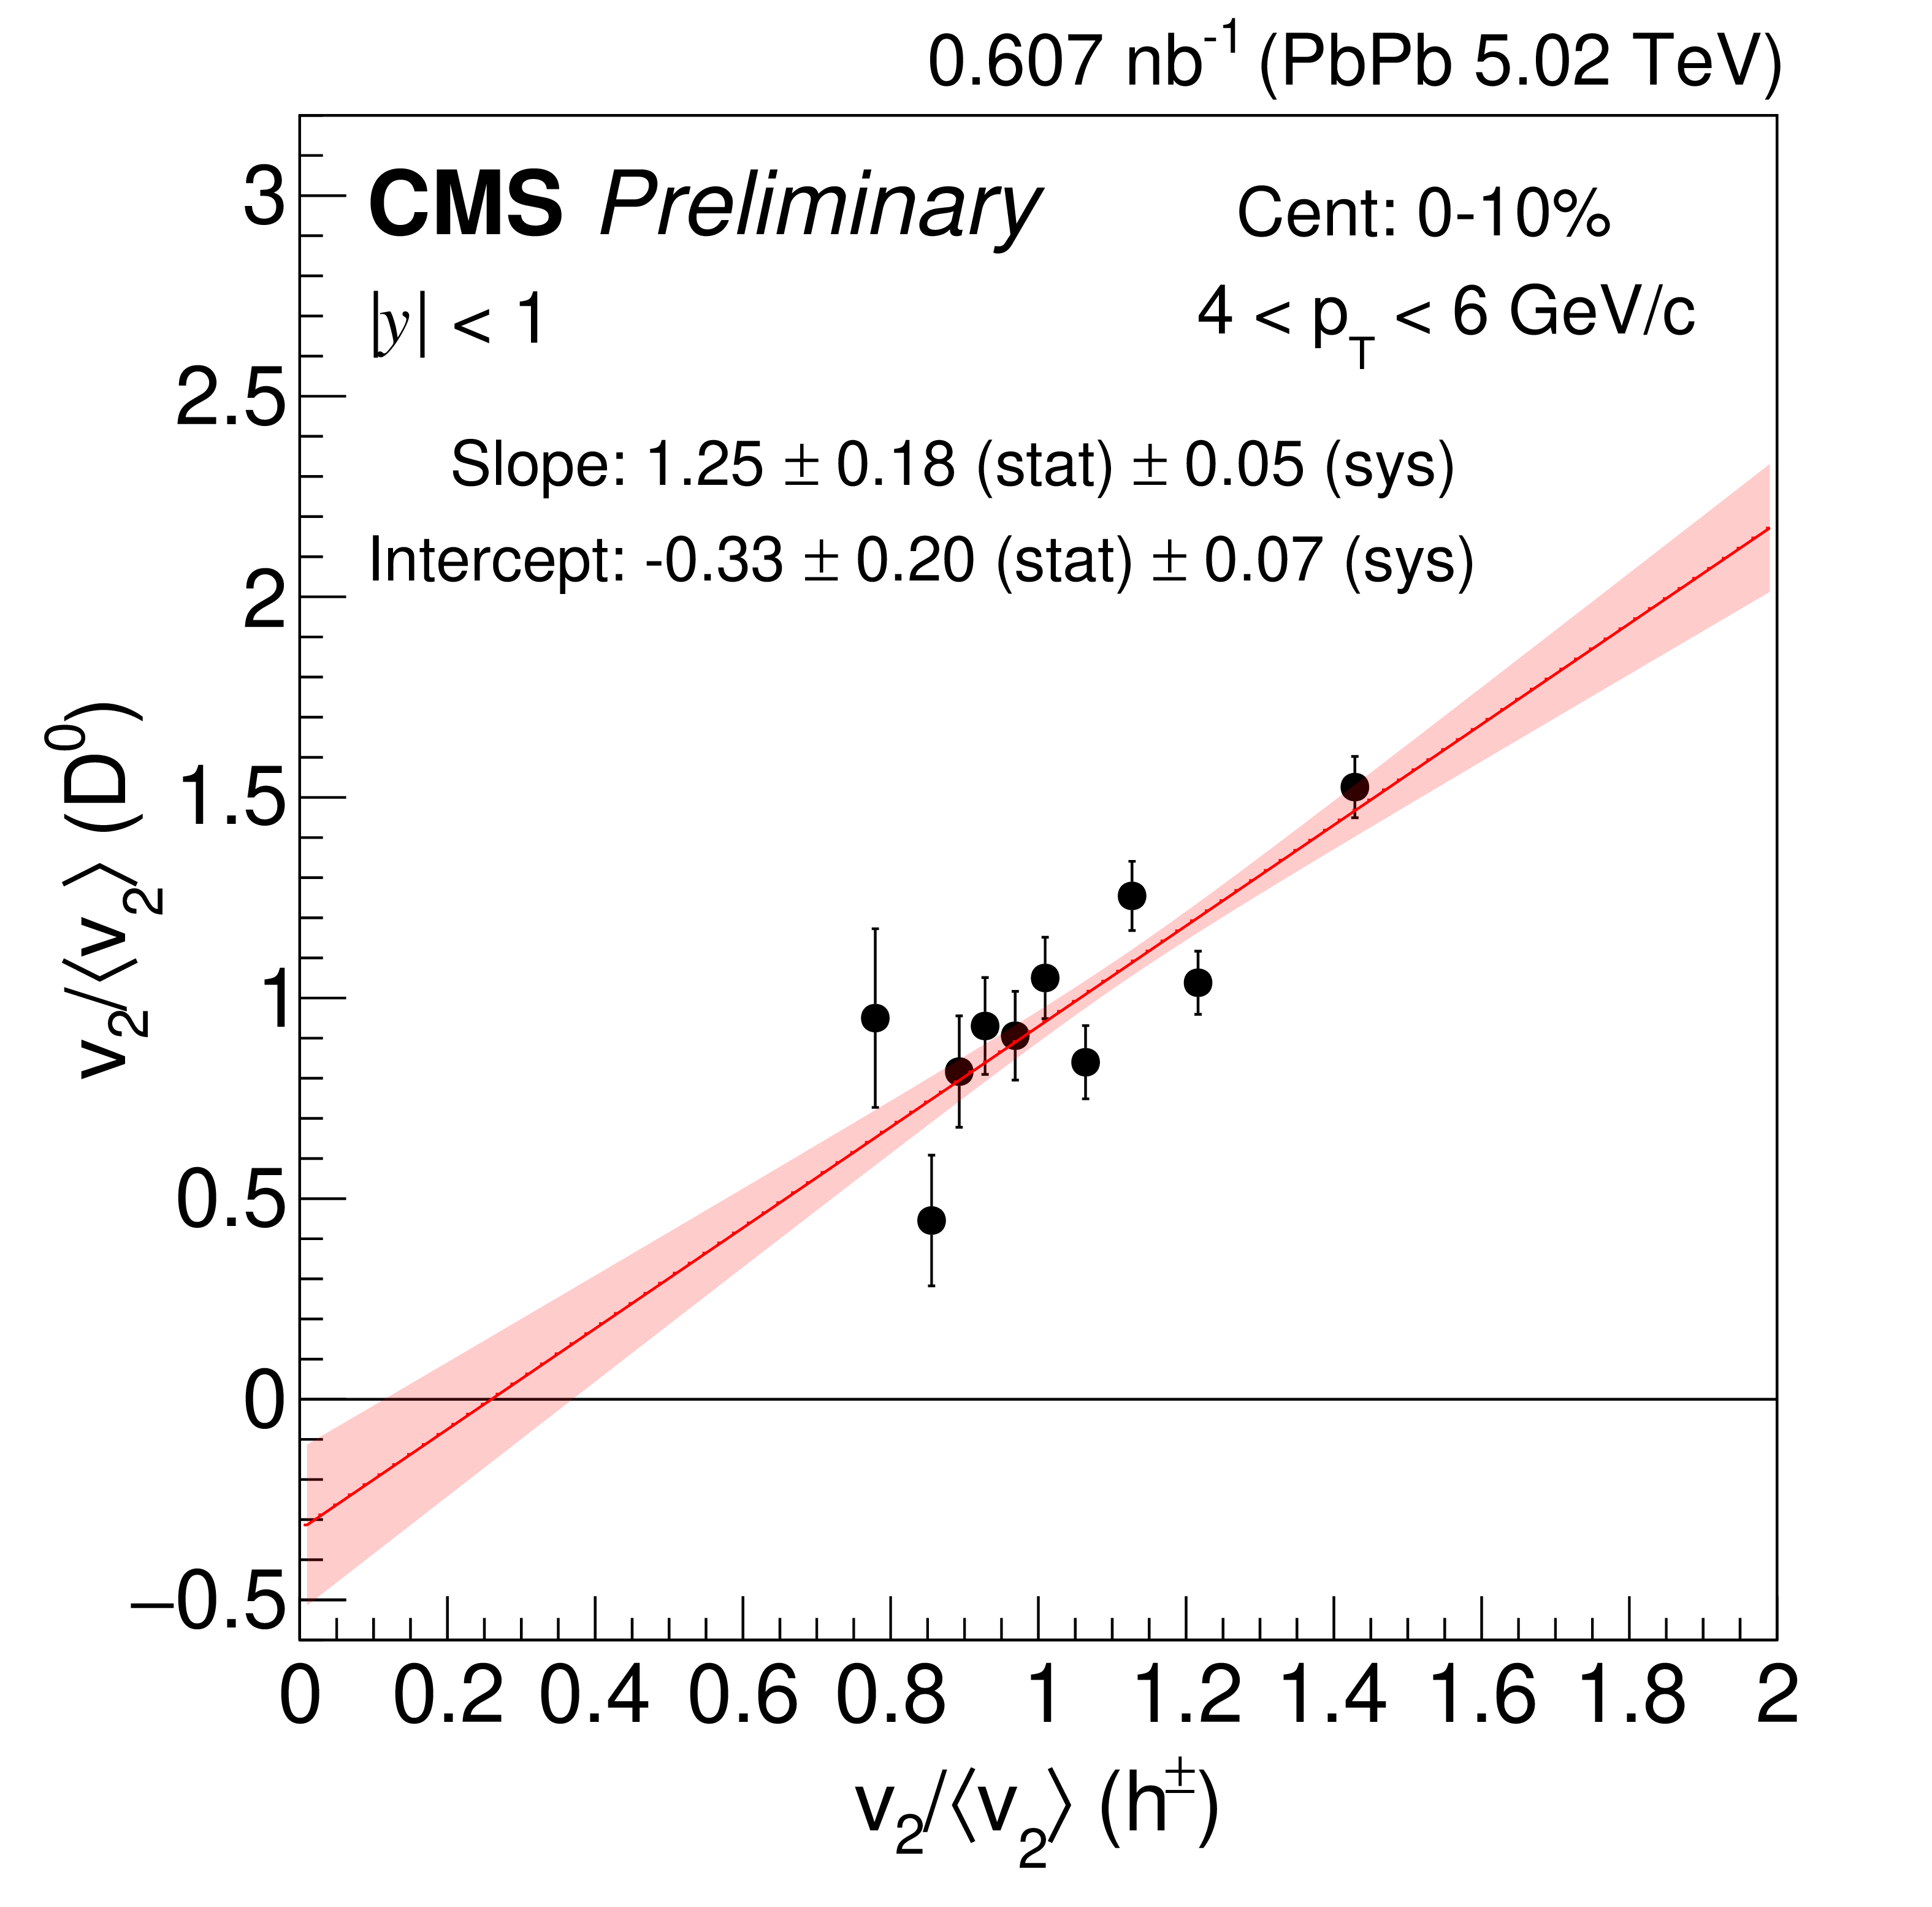
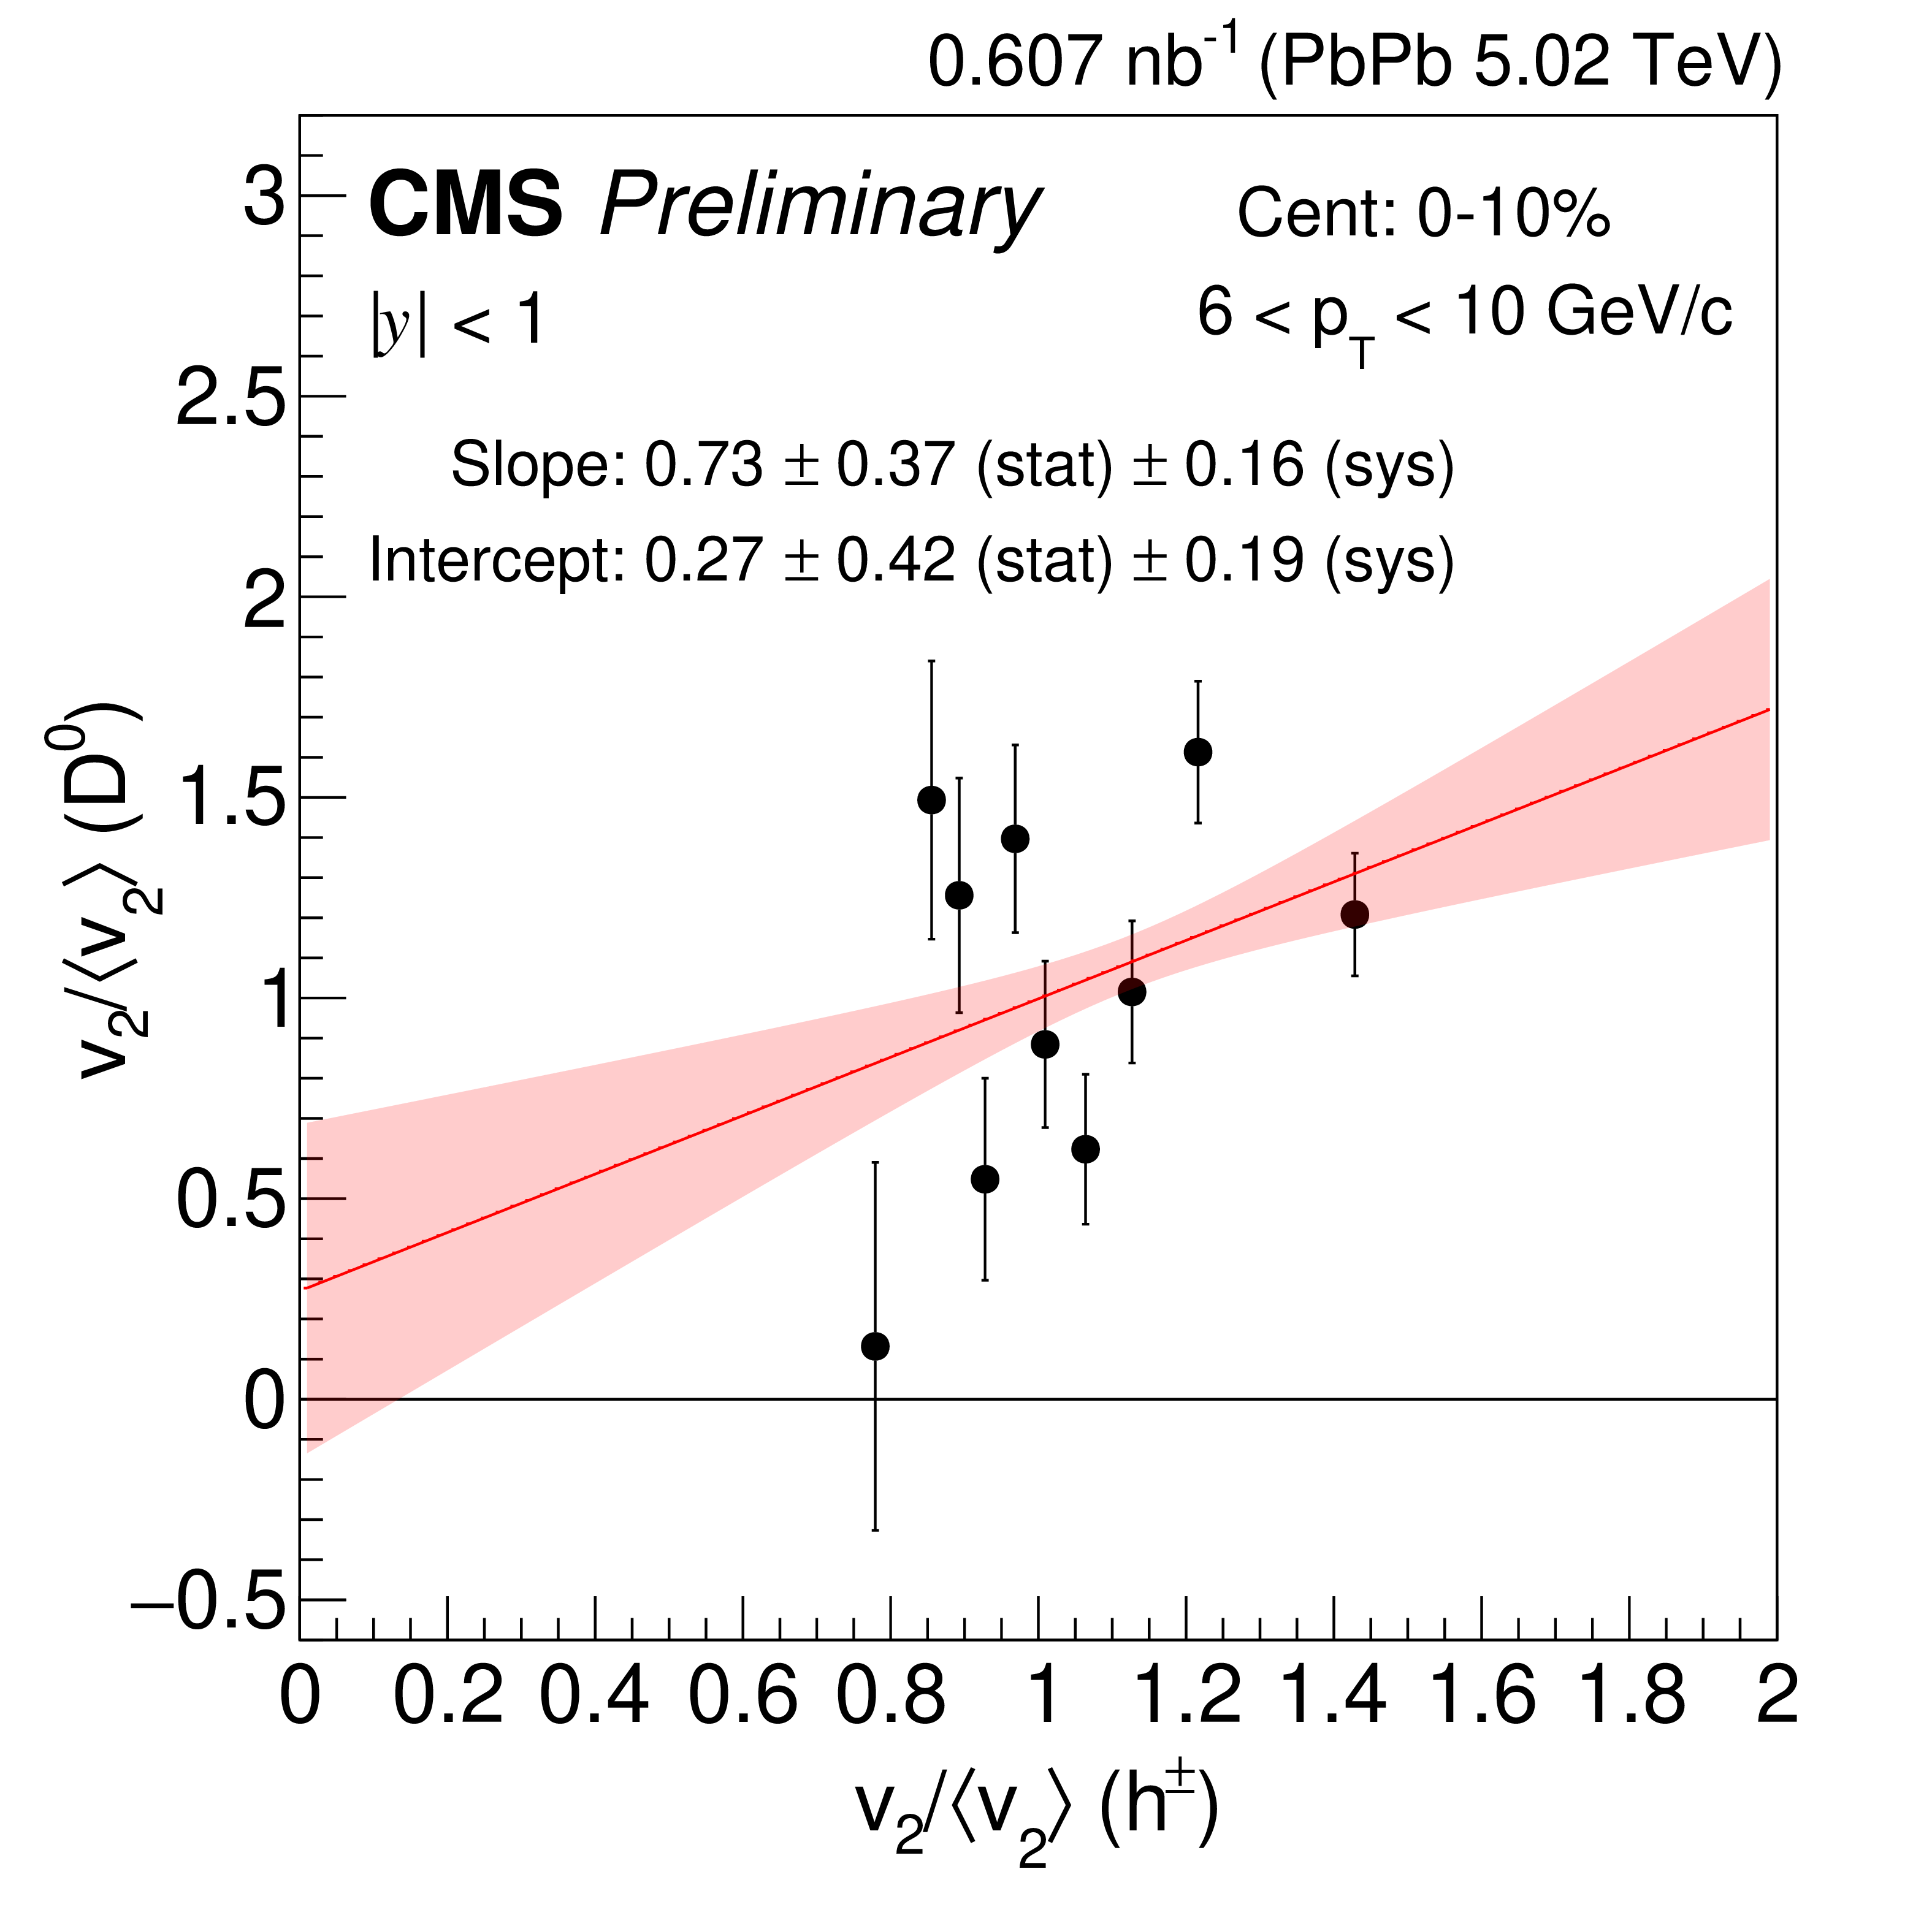
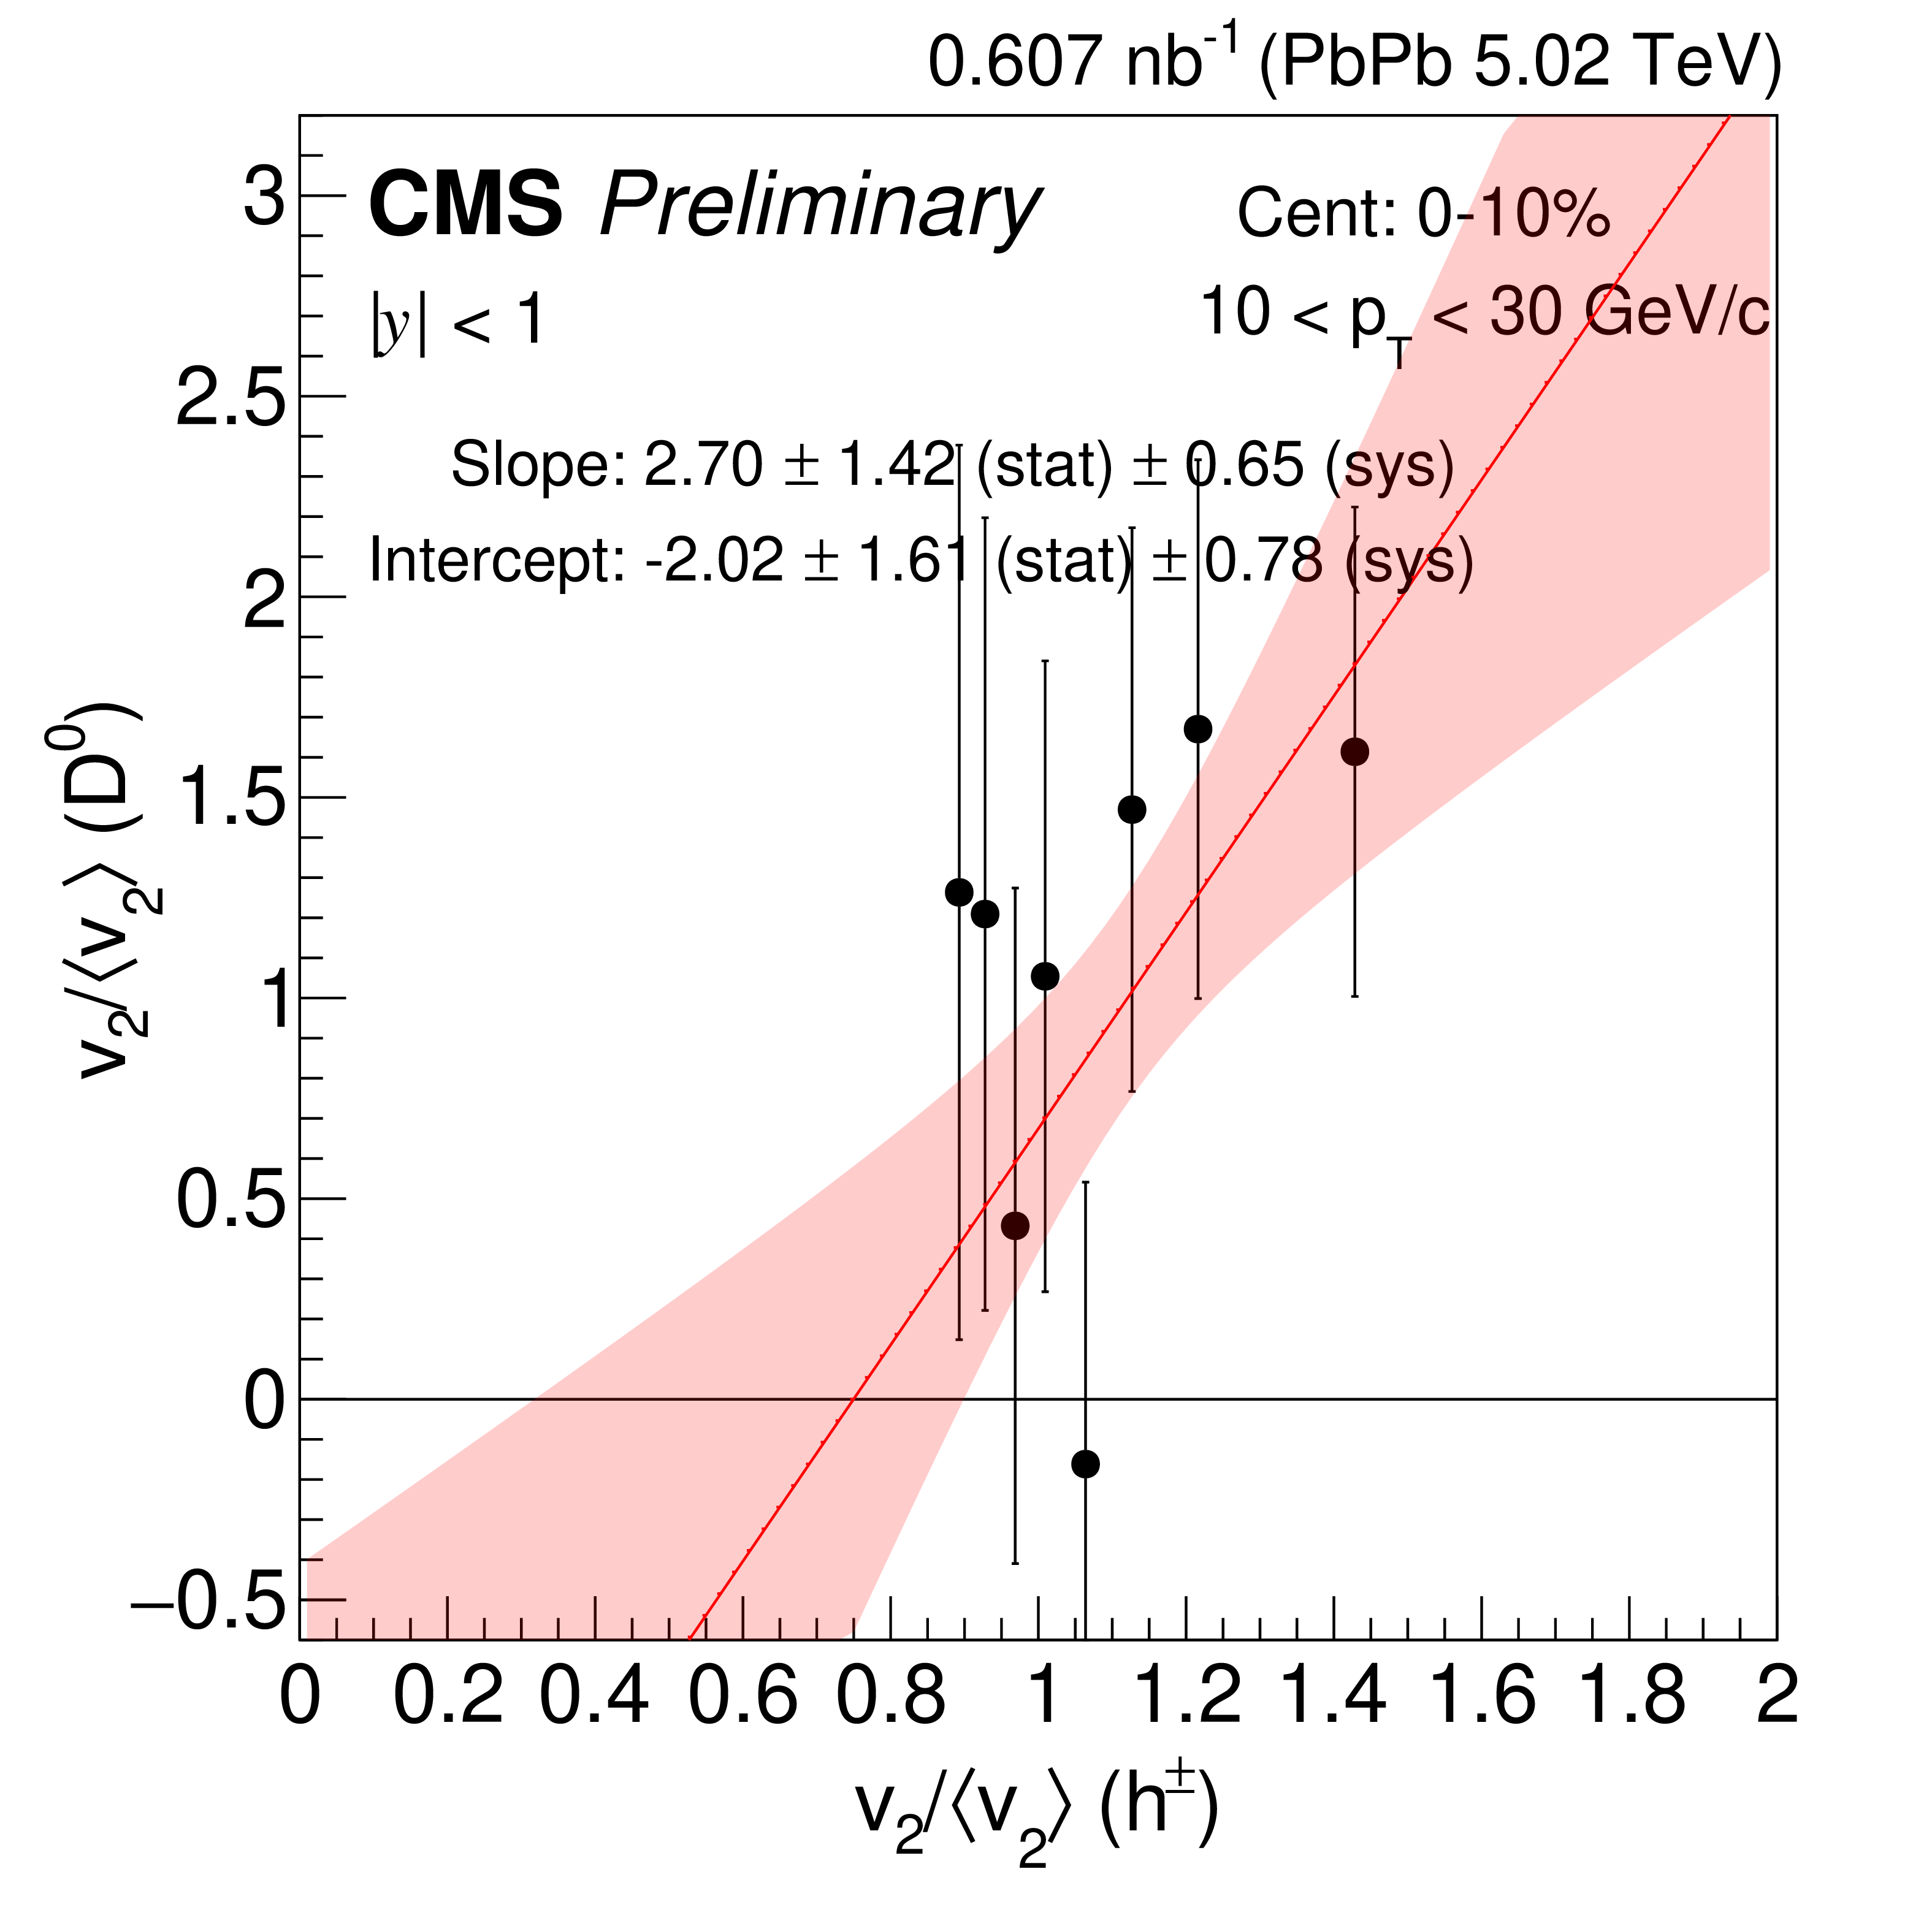
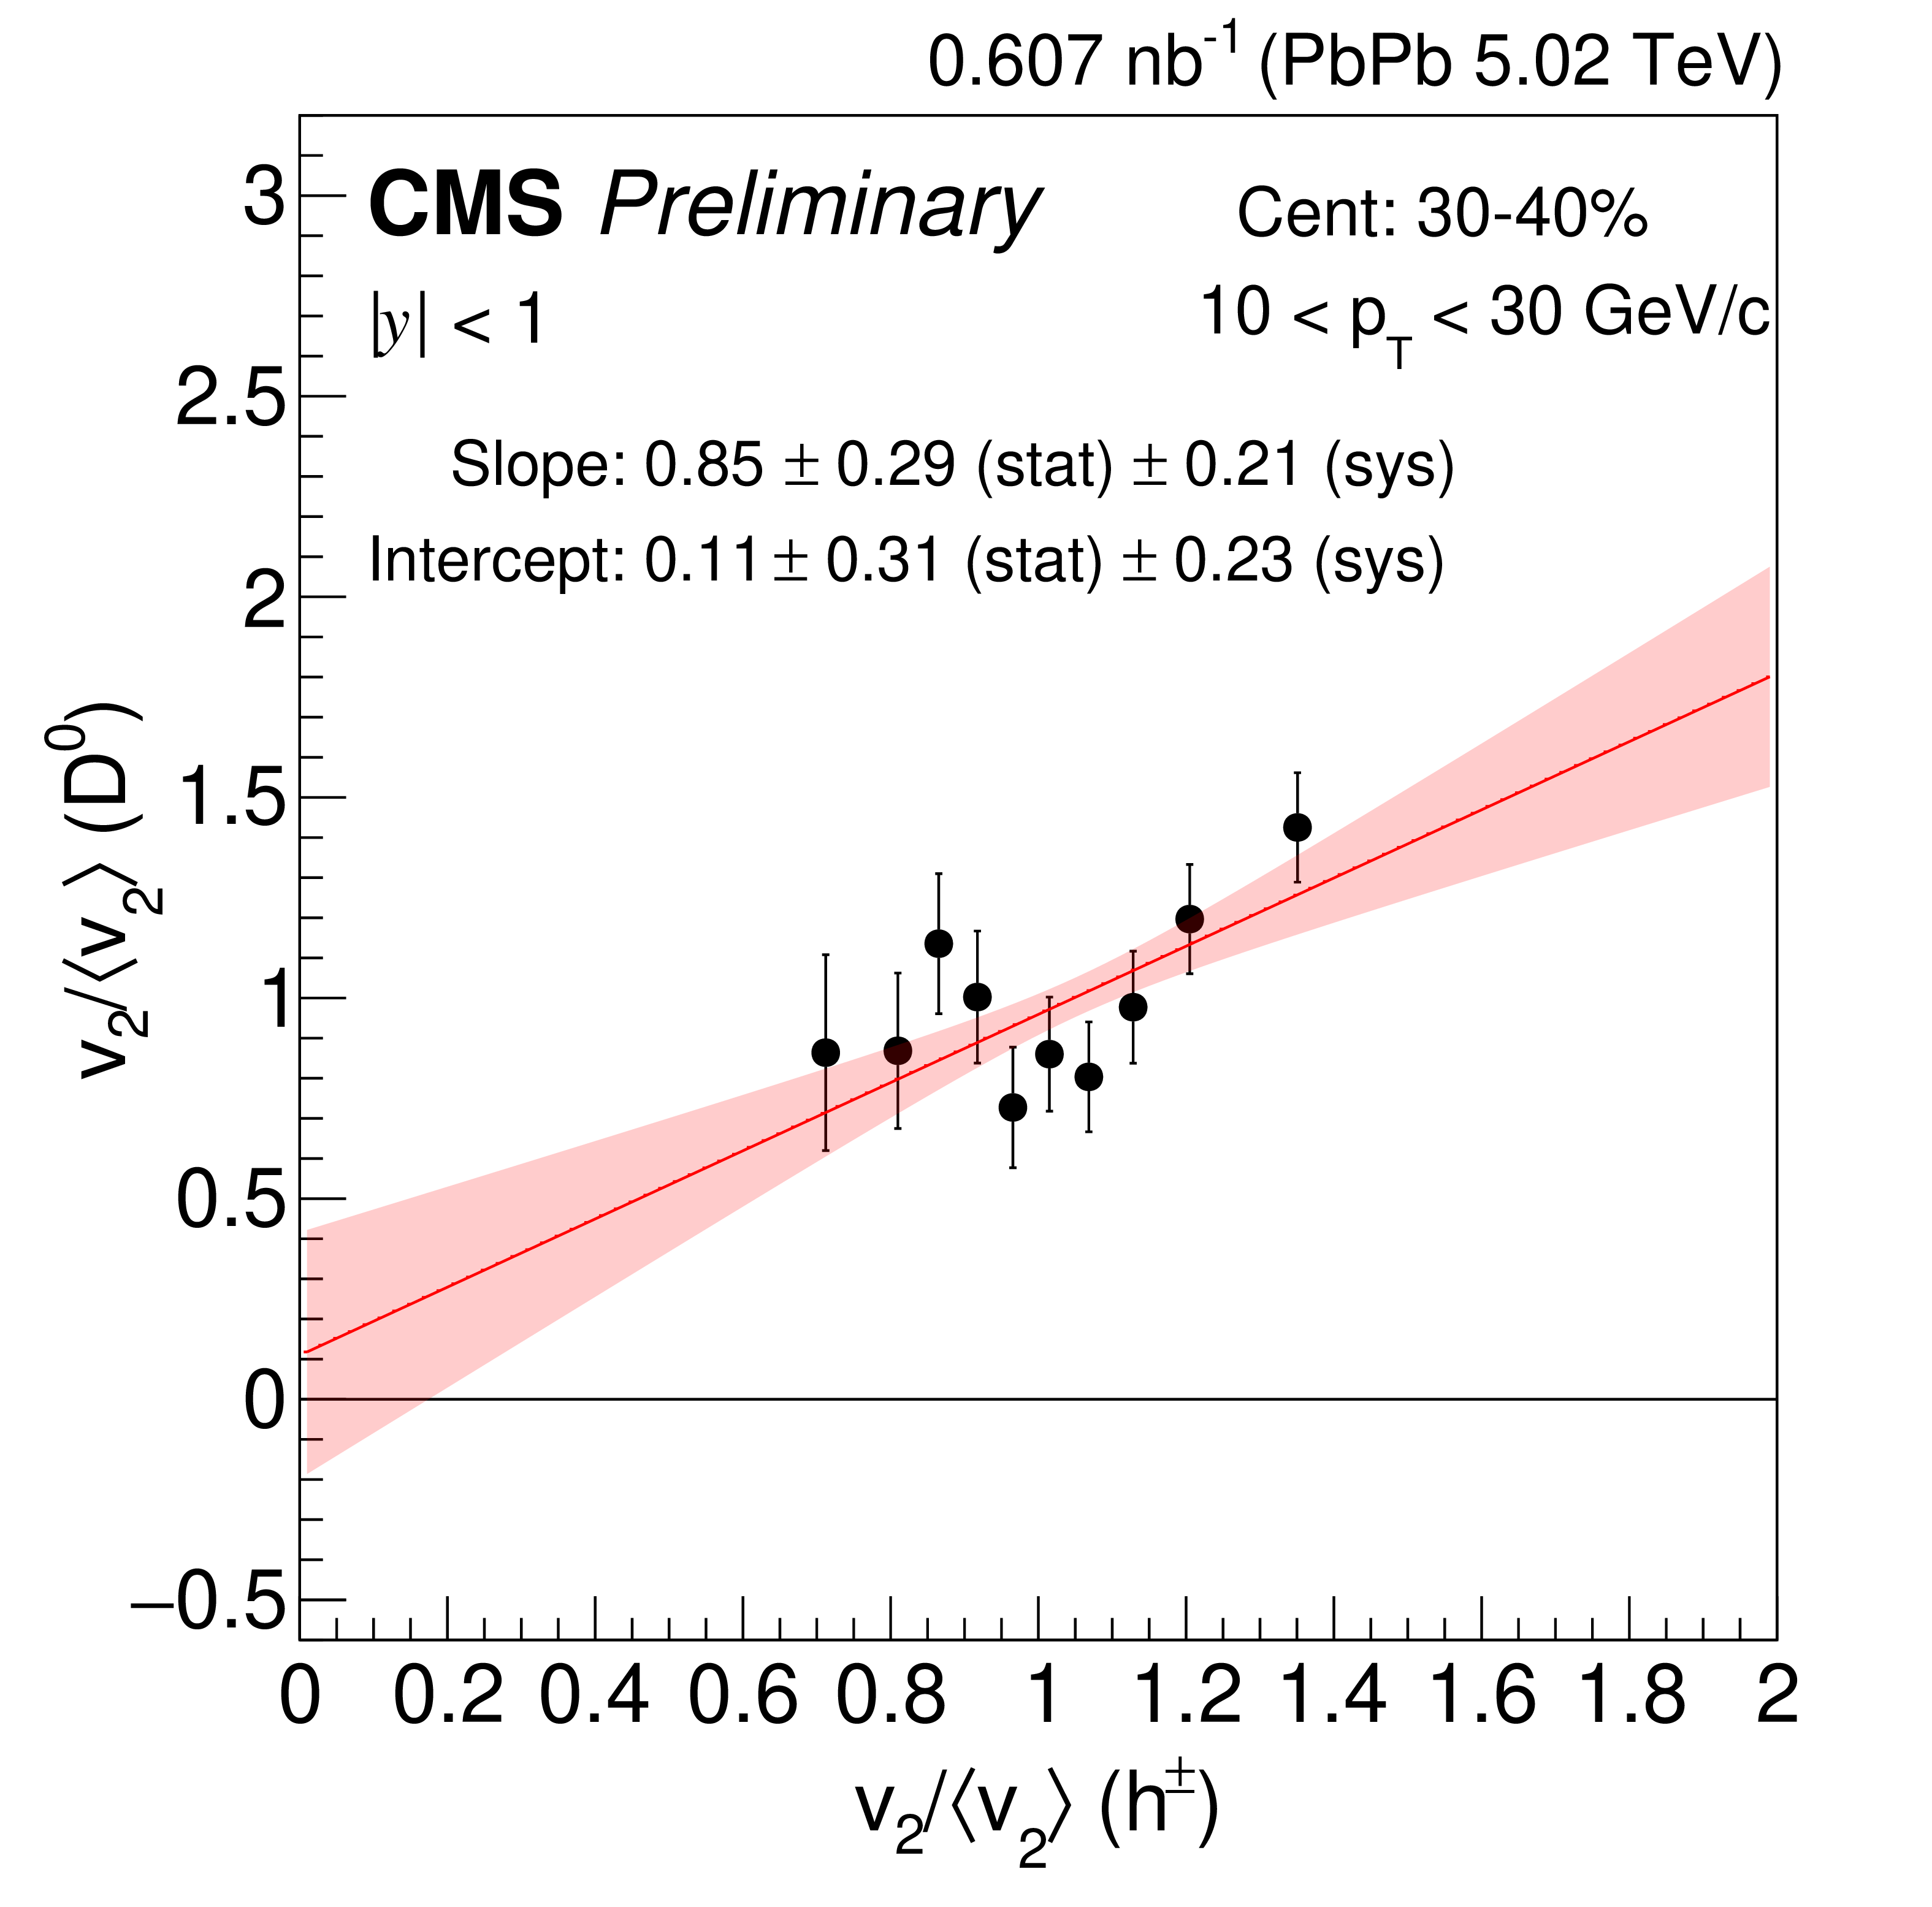
Figure 4:
Correlation between the normalized $ \mathrm{D^0} v_2 $ and the charged-particle $ v_2 $. The $ v_2 $ value in each $ q_2 $ bin is scaled by the $ q_2 $-inclusive $ v_2 $. The charged-particle $ v_2 $ is measured in the $ p_{\mathrm{T}} $ region 1-3 GeV/$c$. The correlation plots for $ \mathrm{D^0} p_{\mathrm{T}} $ 2-4 (upper left), 4-6 (upper right), 6-10 (lower left) and 10-30 GeV/$c$ (lower right) in the centrality class 0-10%. The red band corresponds to the uncertainty of one standard deviation. |
png pdf |
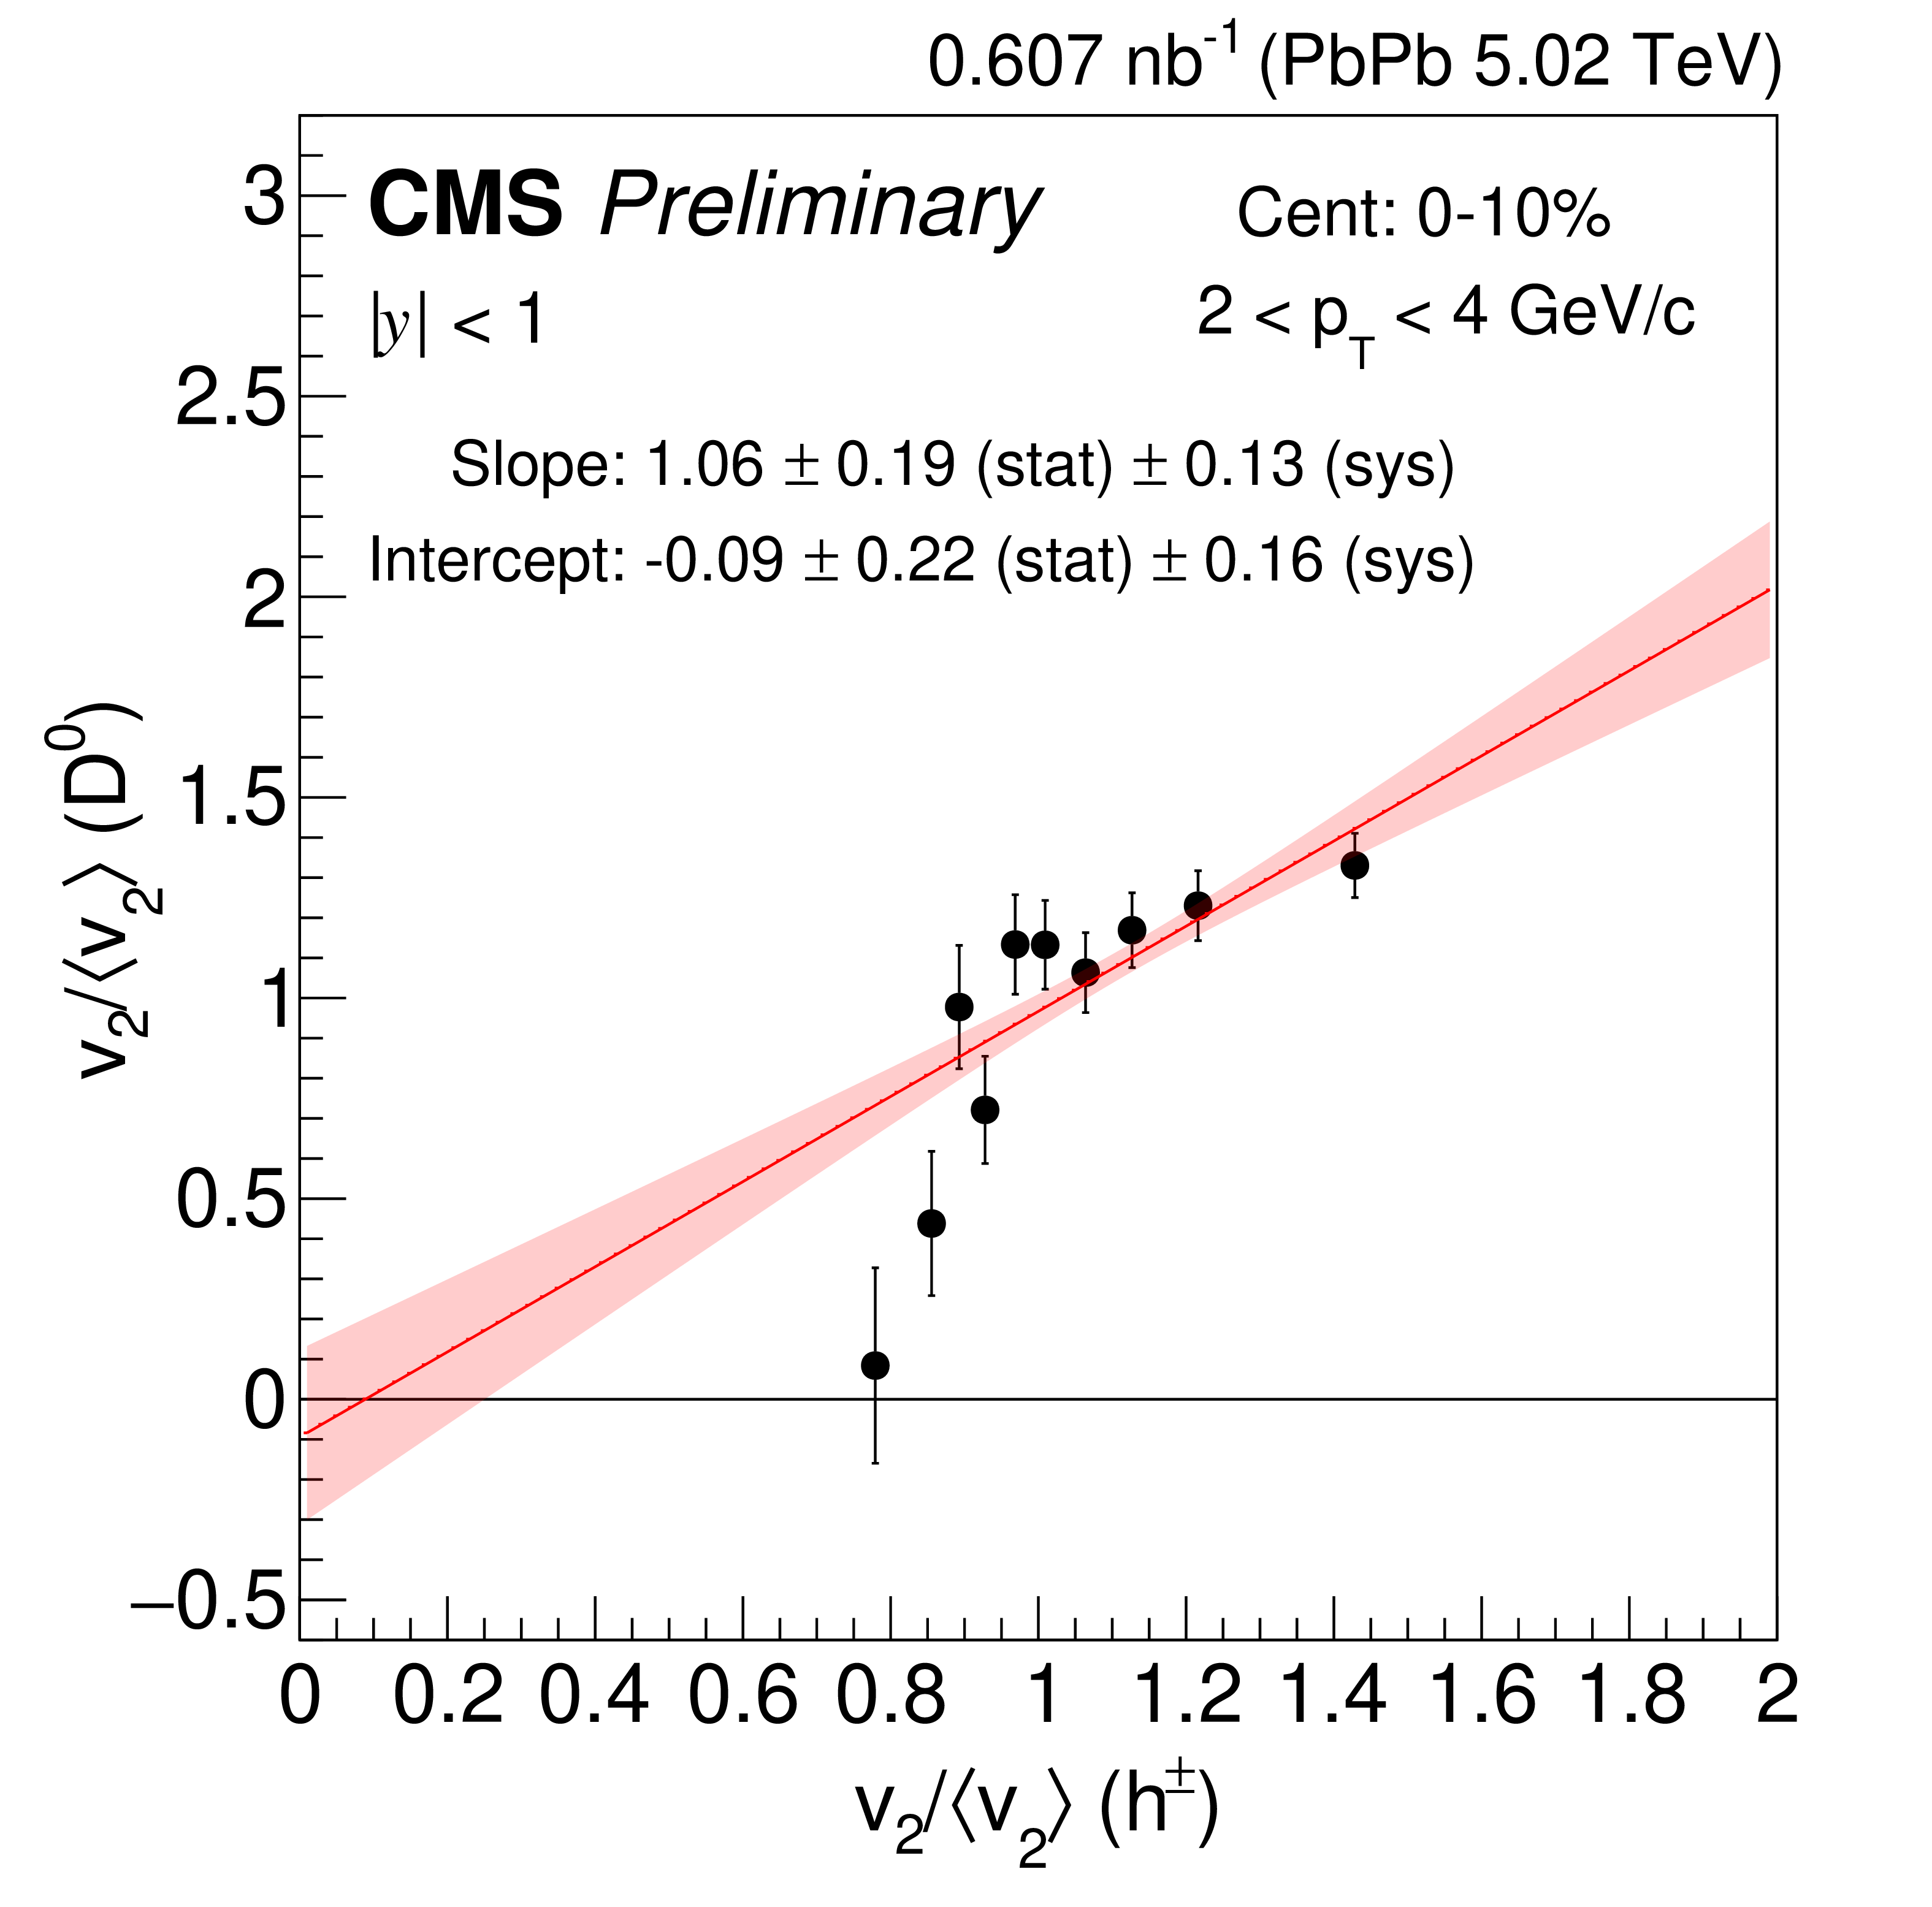
Figure 4-a:
Correlation between the normalized $ \mathrm{D^0} v_2 $ and the charged-particle $ v_2 $. The $ v_2 $ value in each $ q_2 $ bin is scaled by the $ q_2 $-inclusive $ v_2 $. The charged-particle $ v_2 $ is measured in the $ p_{\mathrm{T}} $ region 1-3 GeV/$c$. The correlation plots for $ \mathrm{D^0} p_{\mathrm{T}} $ 2-4 (upper left), 4-6 (upper right), 6-10 (lower left) and 10-30 GeV/$c$ (lower right) in the centrality class 0-10%. The red band corresponds to the uncertainty of one standard deviation. |
png pdf |
Figure 4-b:
Correlation between the normalized $ \mathrm{D^0} v_2 $ and the charged-particle $ v_2 $. The $ v_2 $ value in each $ q_2 $ bin is scaled by the $ q_2 $-inclusive $ v_2 $. The charged-particle $ v_2 $ is measured in the $ p_{\mathrm{T}} $ region 1-3 GeV/$c$. The correlation plots for $ \mathrm{D^0} p_{\mathrm{T}} $ 2-4 (upper left), 4-6 (upper right), 6-10 (lower left) and 10-30 GeV/$c$ (lower right) in the centrality class 0-10%. The red band corresponds to the uncertainty of one standard deviation. |
png pdf |
Figure 4-c:
Correlation between the normalized $ \mathrm{D^0} v_2 $ and the charged-particle $ v_2 $. The $ v_2 $ value in each $ q_2 $ bin is scaled by the $ q_2 $-inclusive $ v_2 $. The charged-particle $ v_2 $ is measured in the $ p_{\mathrm{T}} $ region 1-3 GeV/$c$. The correlation plots for $ \mathrm{D^0} p_{\mathrm{T}} $ 2-4 (upper left), 4-6 (upper right), 6-10 (lower left) and 10-30 GeV/$c$ (lower right) in the centrality class 0-10%. The red band corresponds to the uncertainty of one standard deviation. |
png pdf |
Figure 4-d:
Correlation between the normalized $ \mathrm{D^0} v_2 $ and the charged-particle $ v_2 $. The $ v_2 $ value in each $ q_2 $ bin is scaled by the $ q_2 $-inclusive $ v_2 $. The charged-particle $ v_2 $ is measured in the $ p_{\mathrm{T}} $ region 1-3 GeV/$c$. The correlation plots for $ \mathrm{D^0} p_{\mathrm{T}} $ 2-4 (upper left), 4-6 (upper right), 6-10 (lower left) and 10-30 GeV/$c$ (lower right) in the centrality class 0-10%. The red band corresponds to the uncertainty of one standard deviation. |
png pdf |
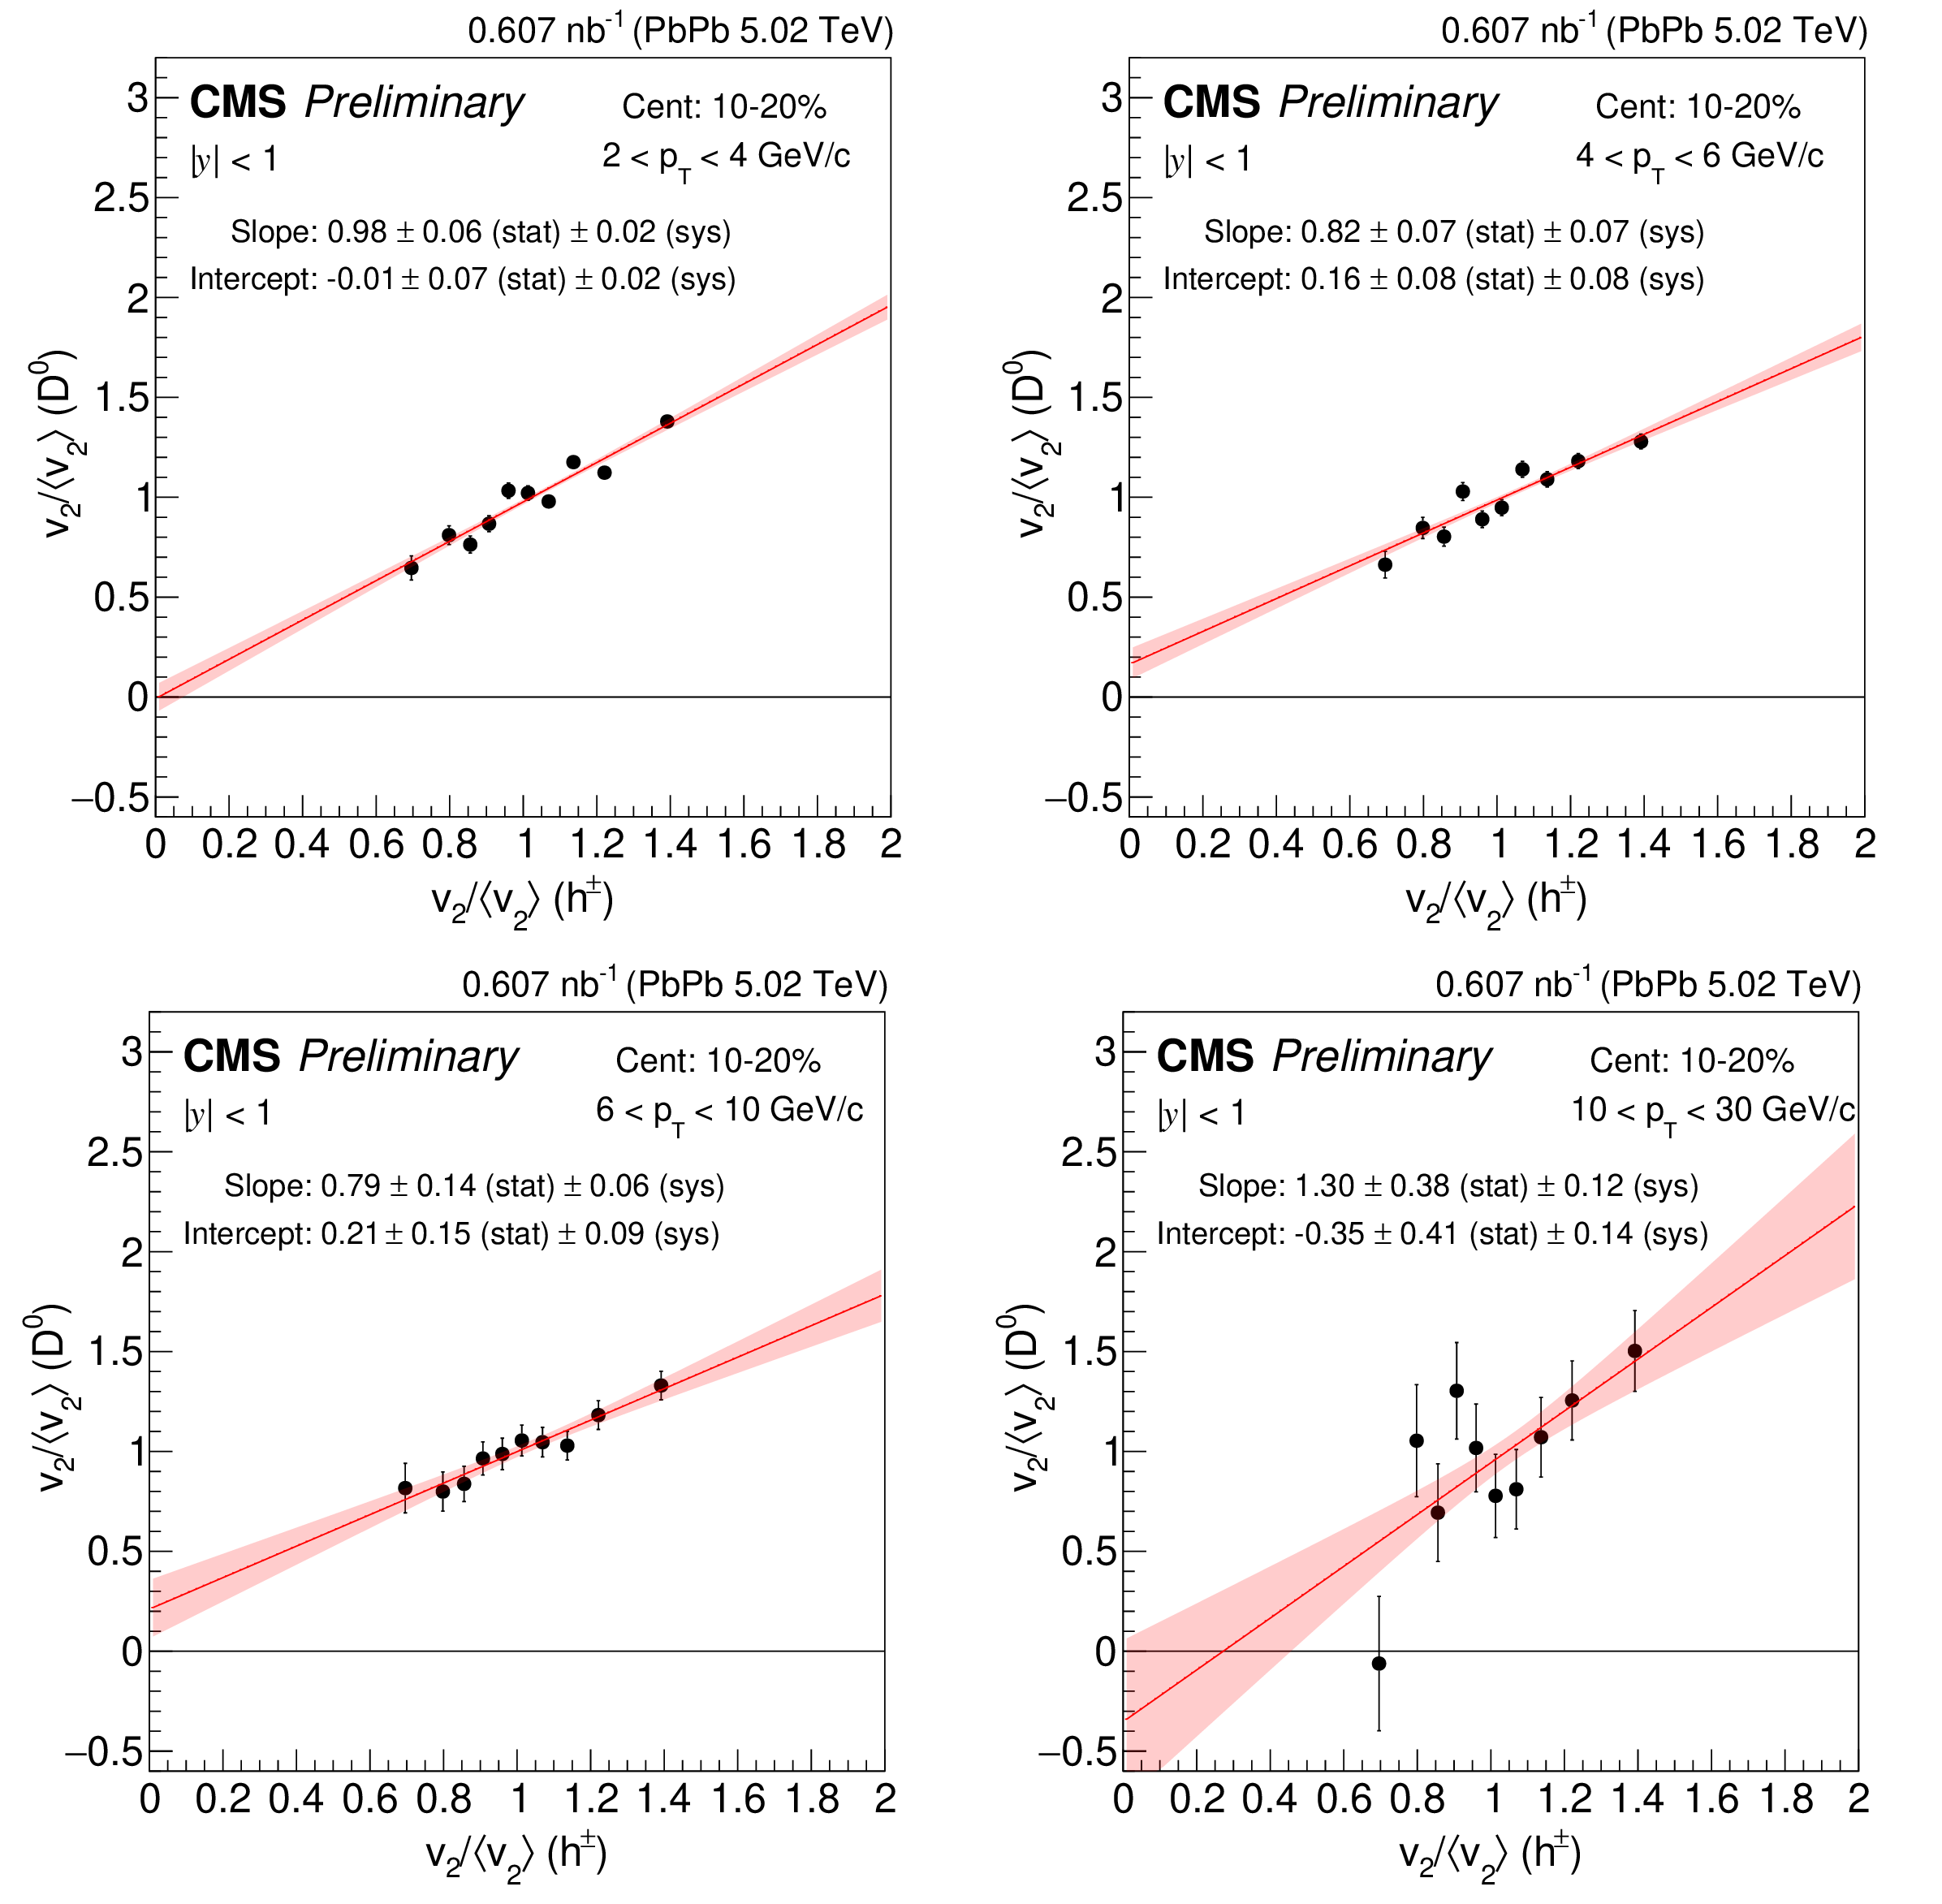
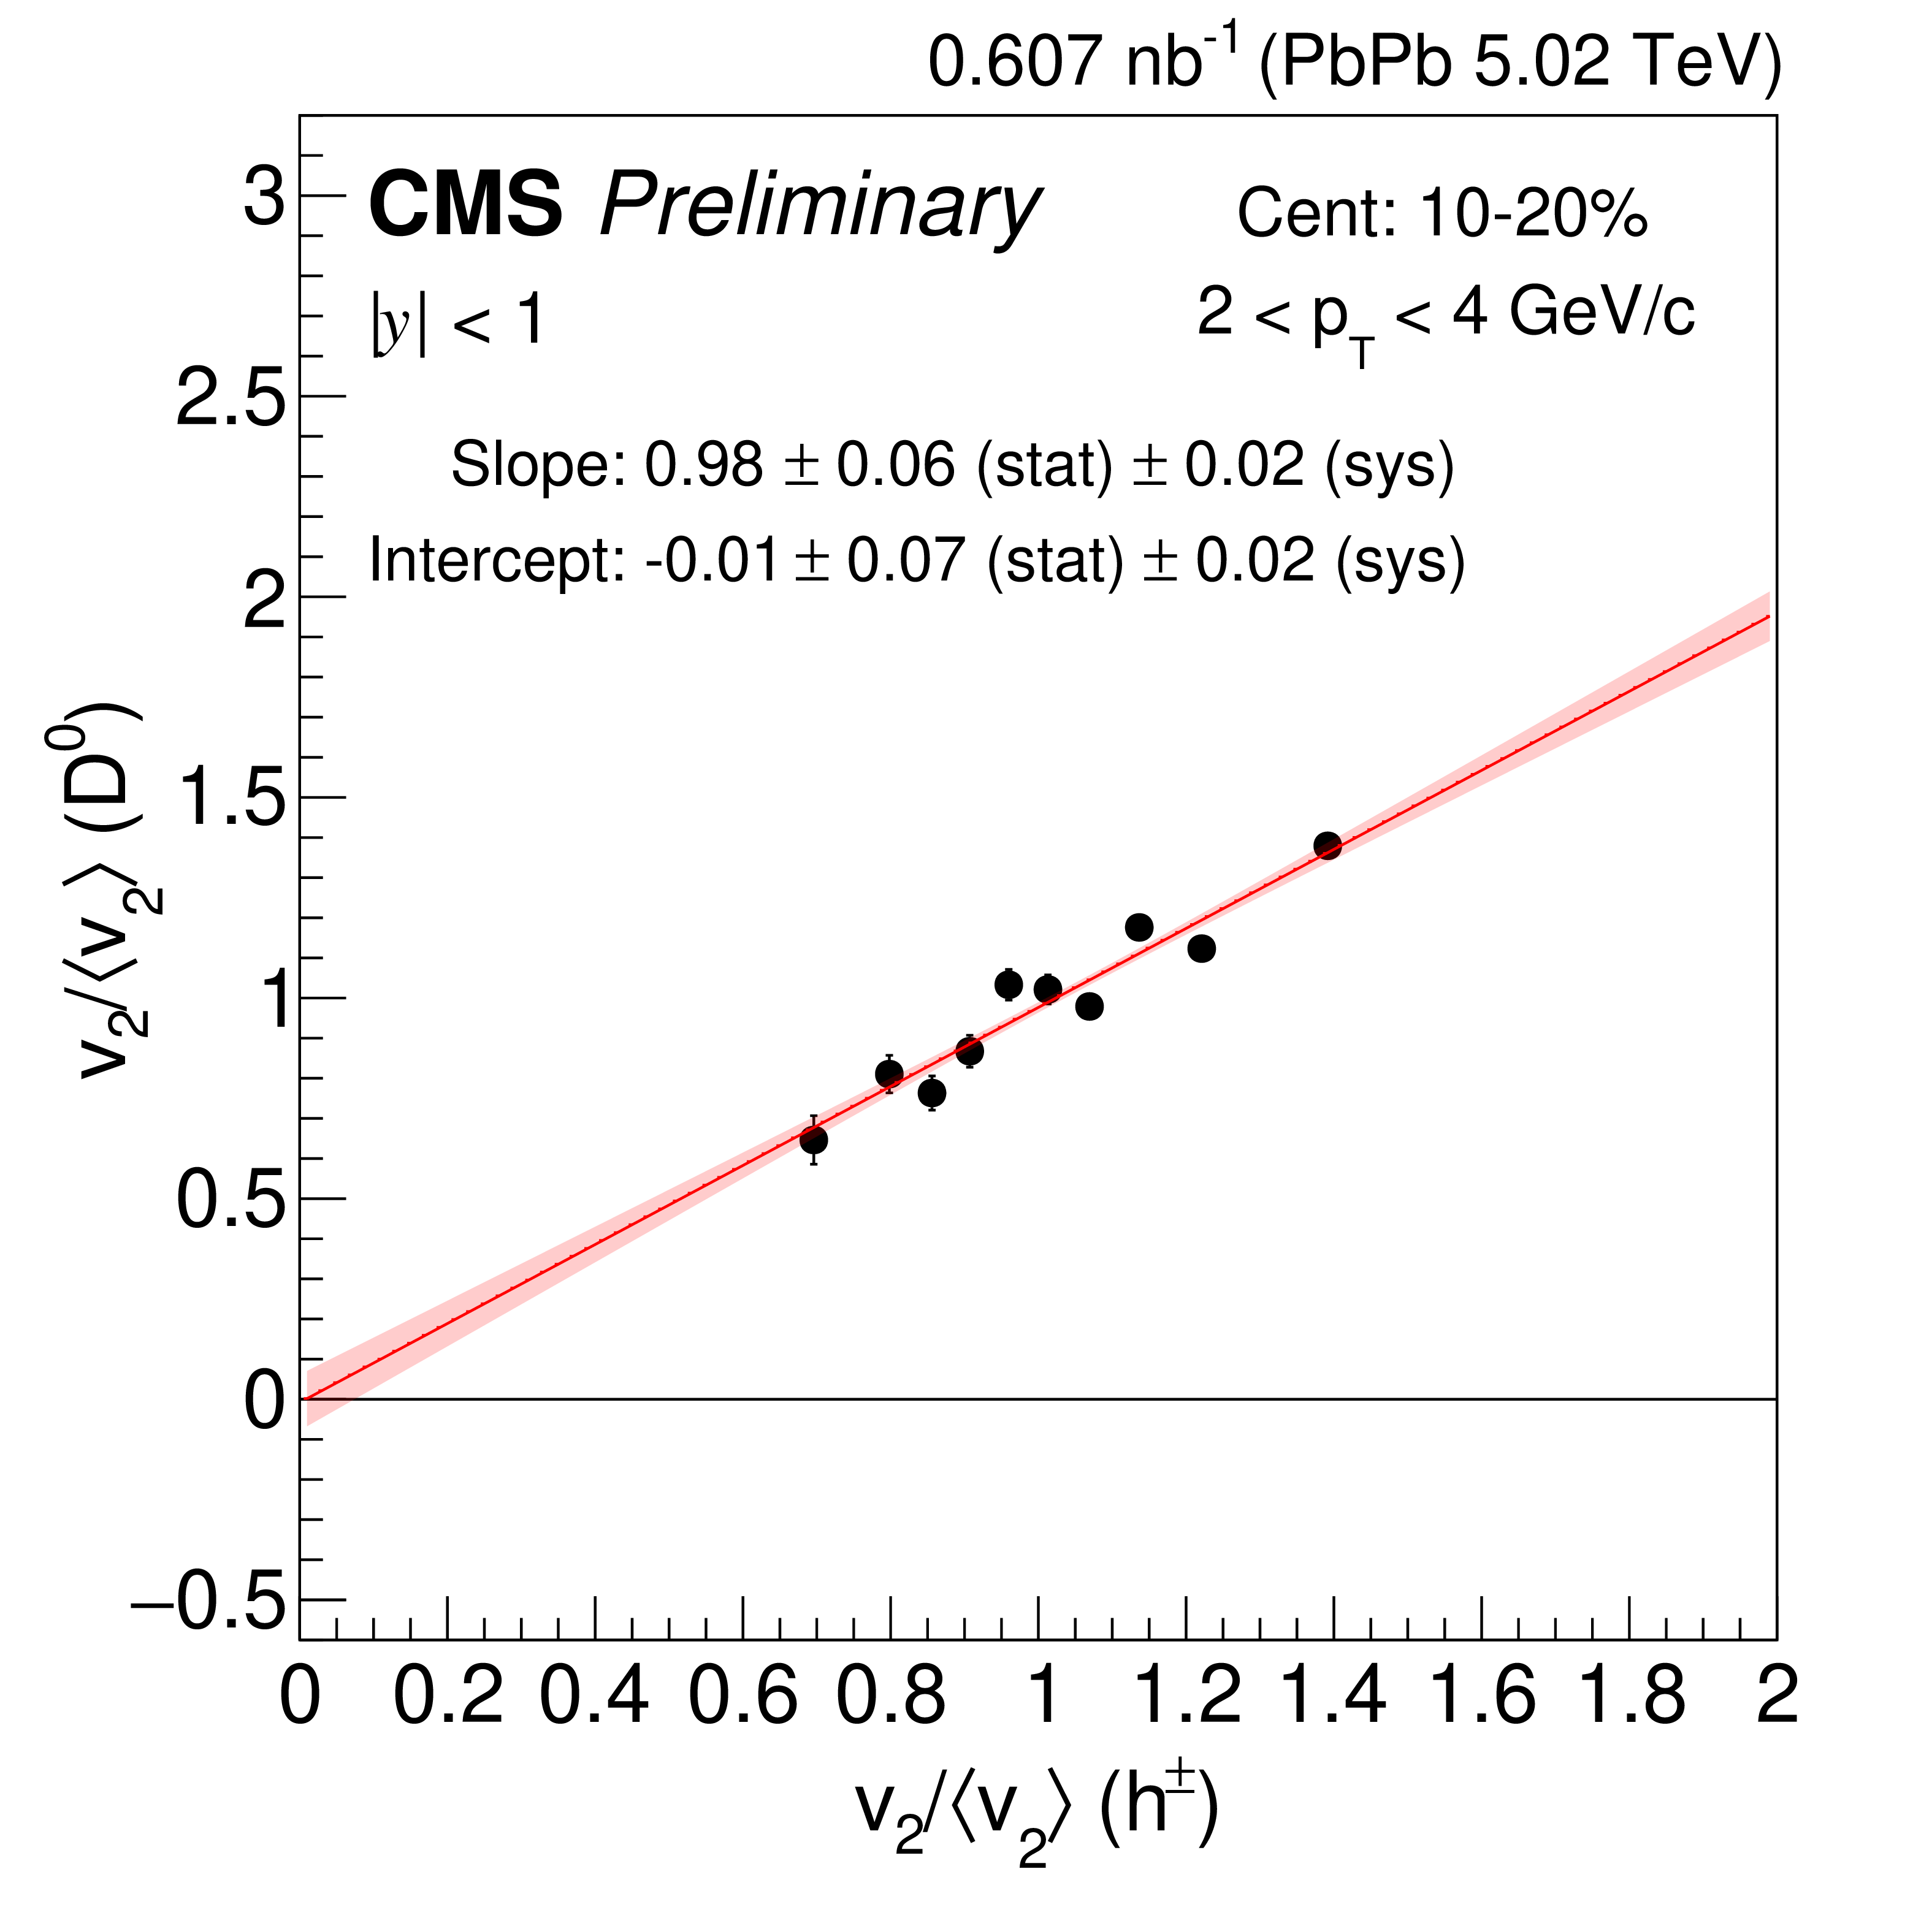
Figure 5:
Correlation between the normalized $ \mathrm{D^0} v_2 $ and the charged-particle $ v_2 $. The $ v_2 $ value in each $ q_2 $ bin is scaled by the $ q_2 $-inclusive $ v_2 $. The charged-particle $ v_2 $ is measured in the $ p_{\mathrm{T}} $ region 1-3 GeV/$c$. The correlation plots for $ \mathrm{D^0} p_{\mathrm{T}} $ 2-4 (upper left), 4-6 (upper right), 6-10 (lower left) and 10-30 GeV/$c$ (lower right) in the centrality class 10-20%. The red band corresponds to the uncertainty of one standard deviation. |
png pdf |
Figure 5-a:
Correlation between the normalized $ \mathrm{D^0} v_2 $ and the charged-particle $ v_2 $. The $ v_2 $ value in each $ q_2 $ bin is scaled by the $ q_2 $-inclusive $ v_2 $. The charged-particle $ v_2 $ is measured in the $ p_{\mathrm{T}} $ region 1-3 GeV/$c$. The correlation plots for $ \mathrm{D^0} p_{\mathrm{T}} $ 2-4 (upper left), 4-6 (upper right), 6-10 (lower left) and 10-30 GeV/$c$ (lower right) in the centrality class 10-20%. The red band corresponds to the uncertainty of one standard deviation. |
png pdf |
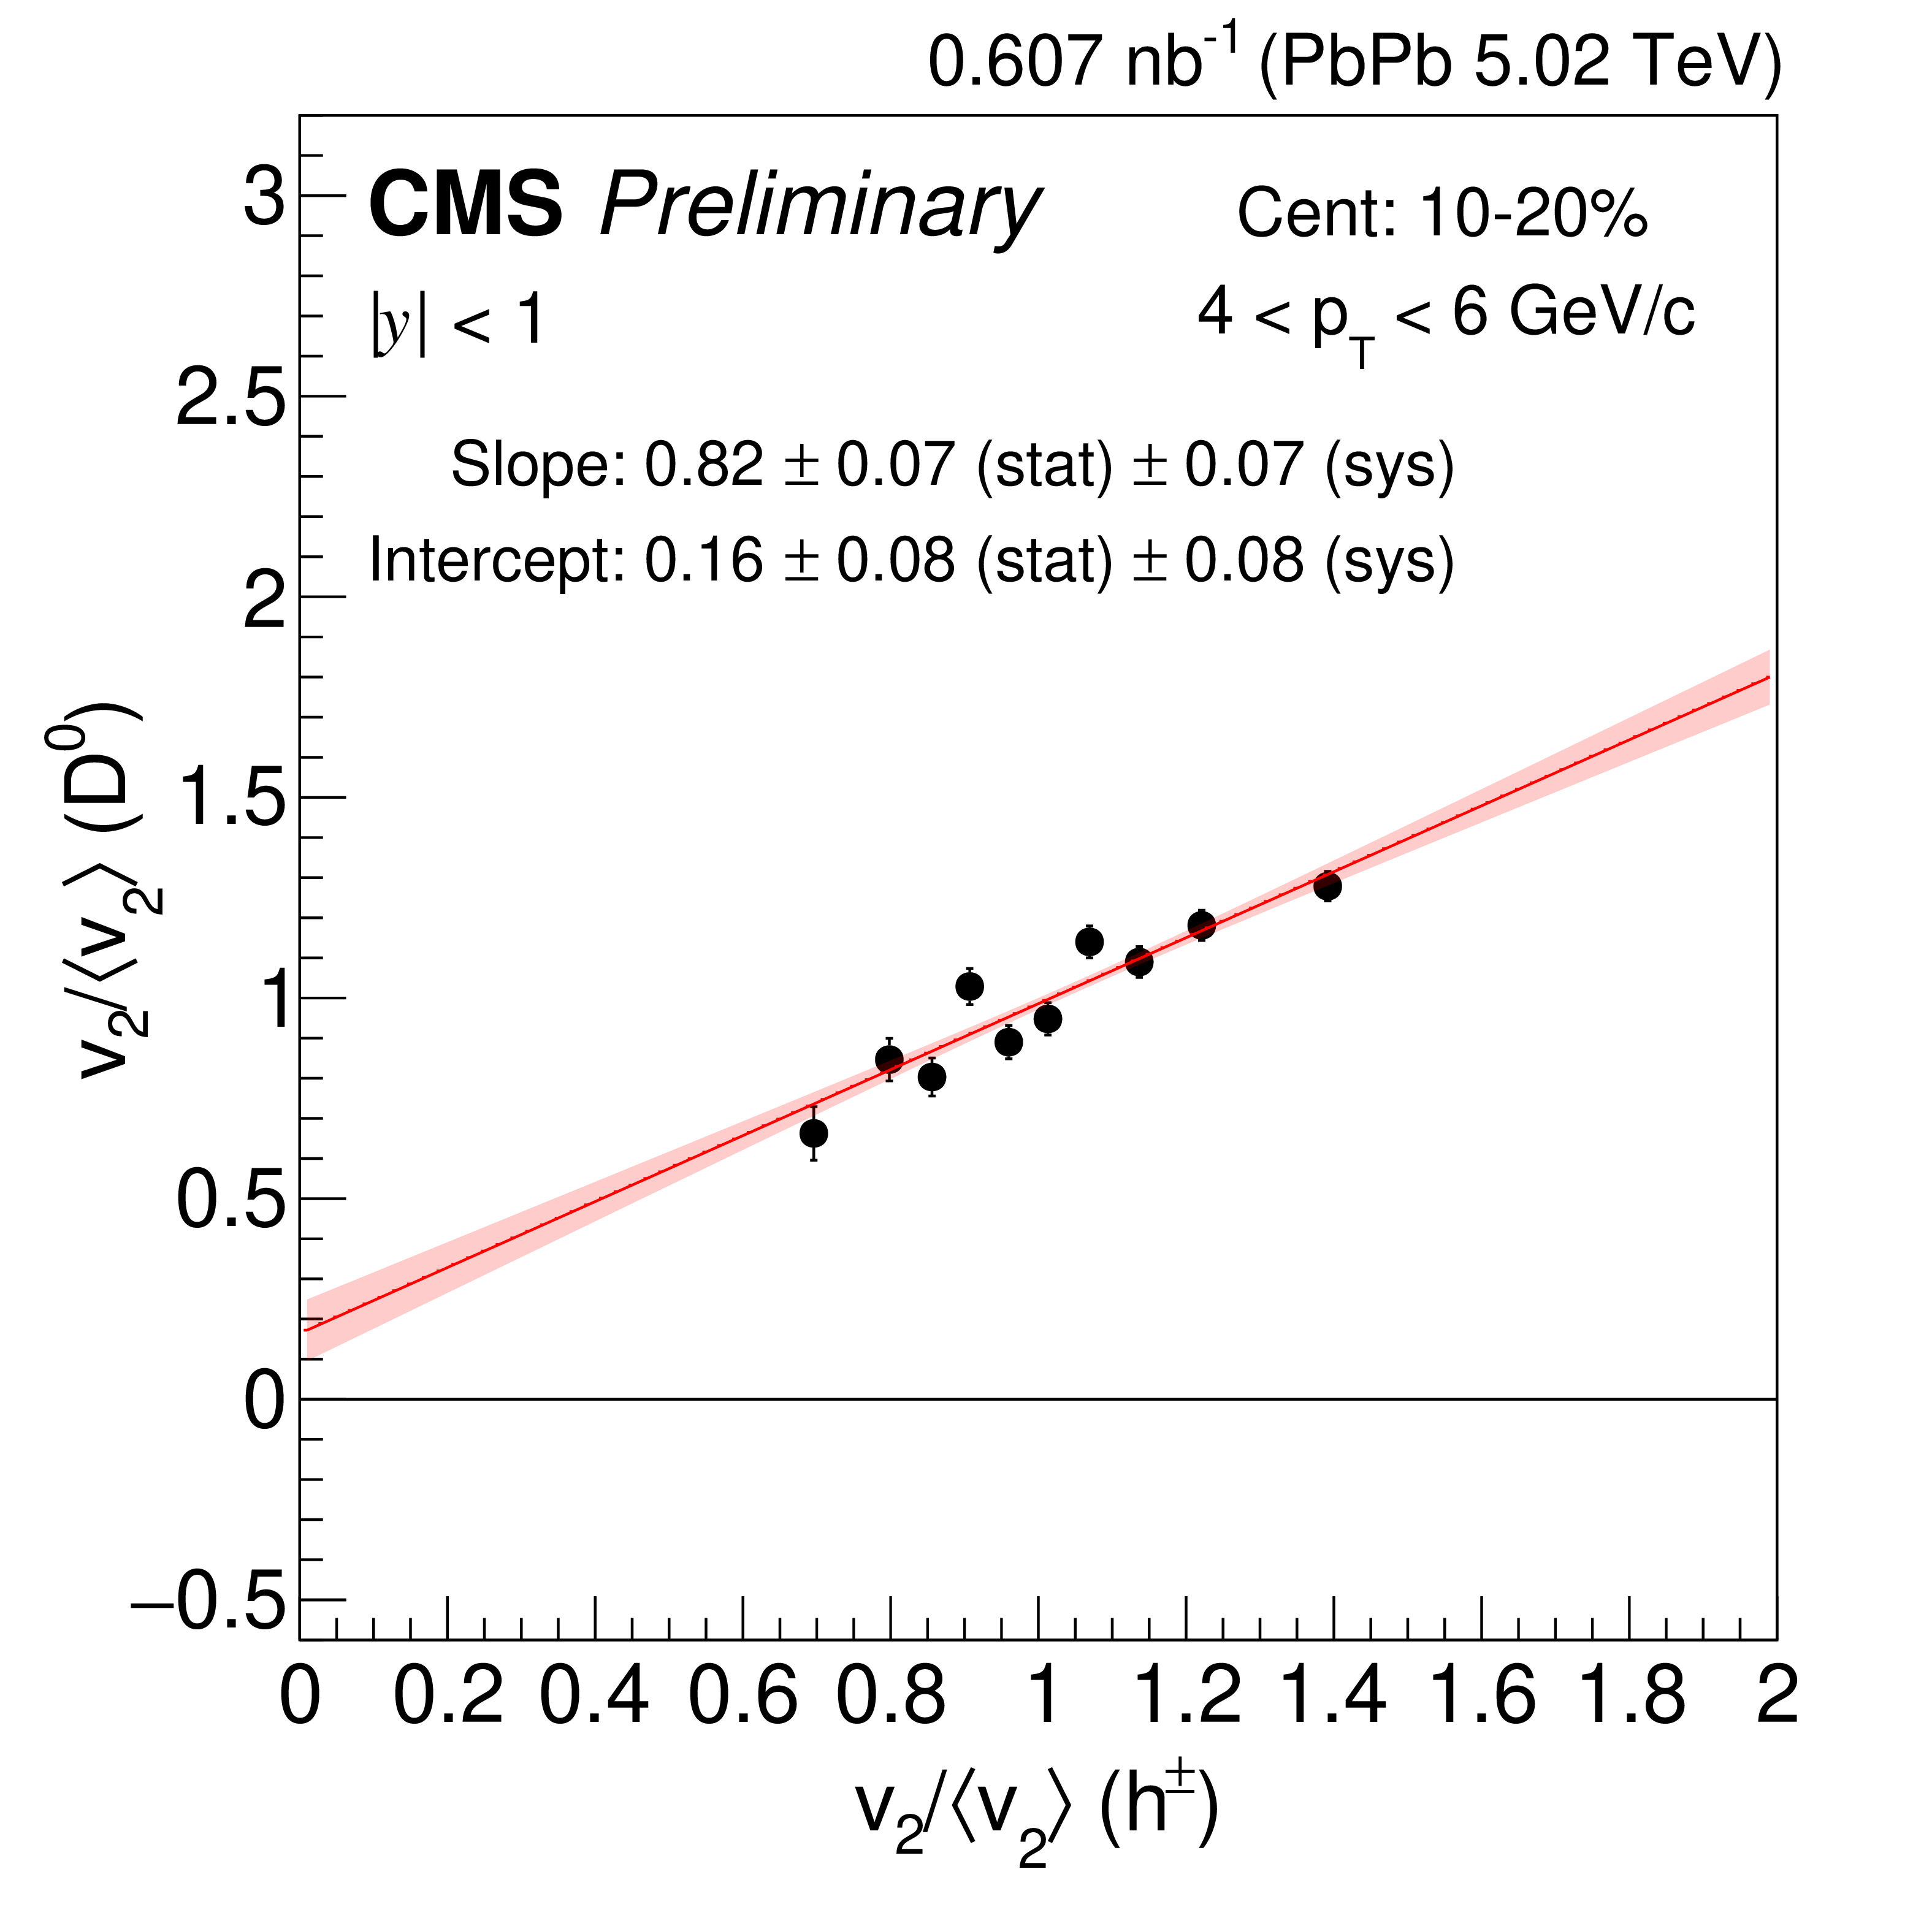
Figure 5-b:
Correlation between the normalized $ \mathrm{D^0} v_2 $ and the charged-particle $ v_2 $. The $ v_2 $ value in each $ q_2 $ bin is scaled by the $ q_2 $-inclusive $ v_2 $. The charged-particle $ v_2 $ is measured in the $ p_{\mathrm{T}} $ region 1-3 GeV/$c$. The correlation plots for $ \mathrm{D^0} p_{\mathrm{T}} $ 2-4 (upper left), 4-6 (upper right), 6-10 (lower left) and 10-30 GeV/$c$ (lower right) in the centrality class 10-20%. The red band corresponds to the uncertainty of one standard deviation. |
png pdf |
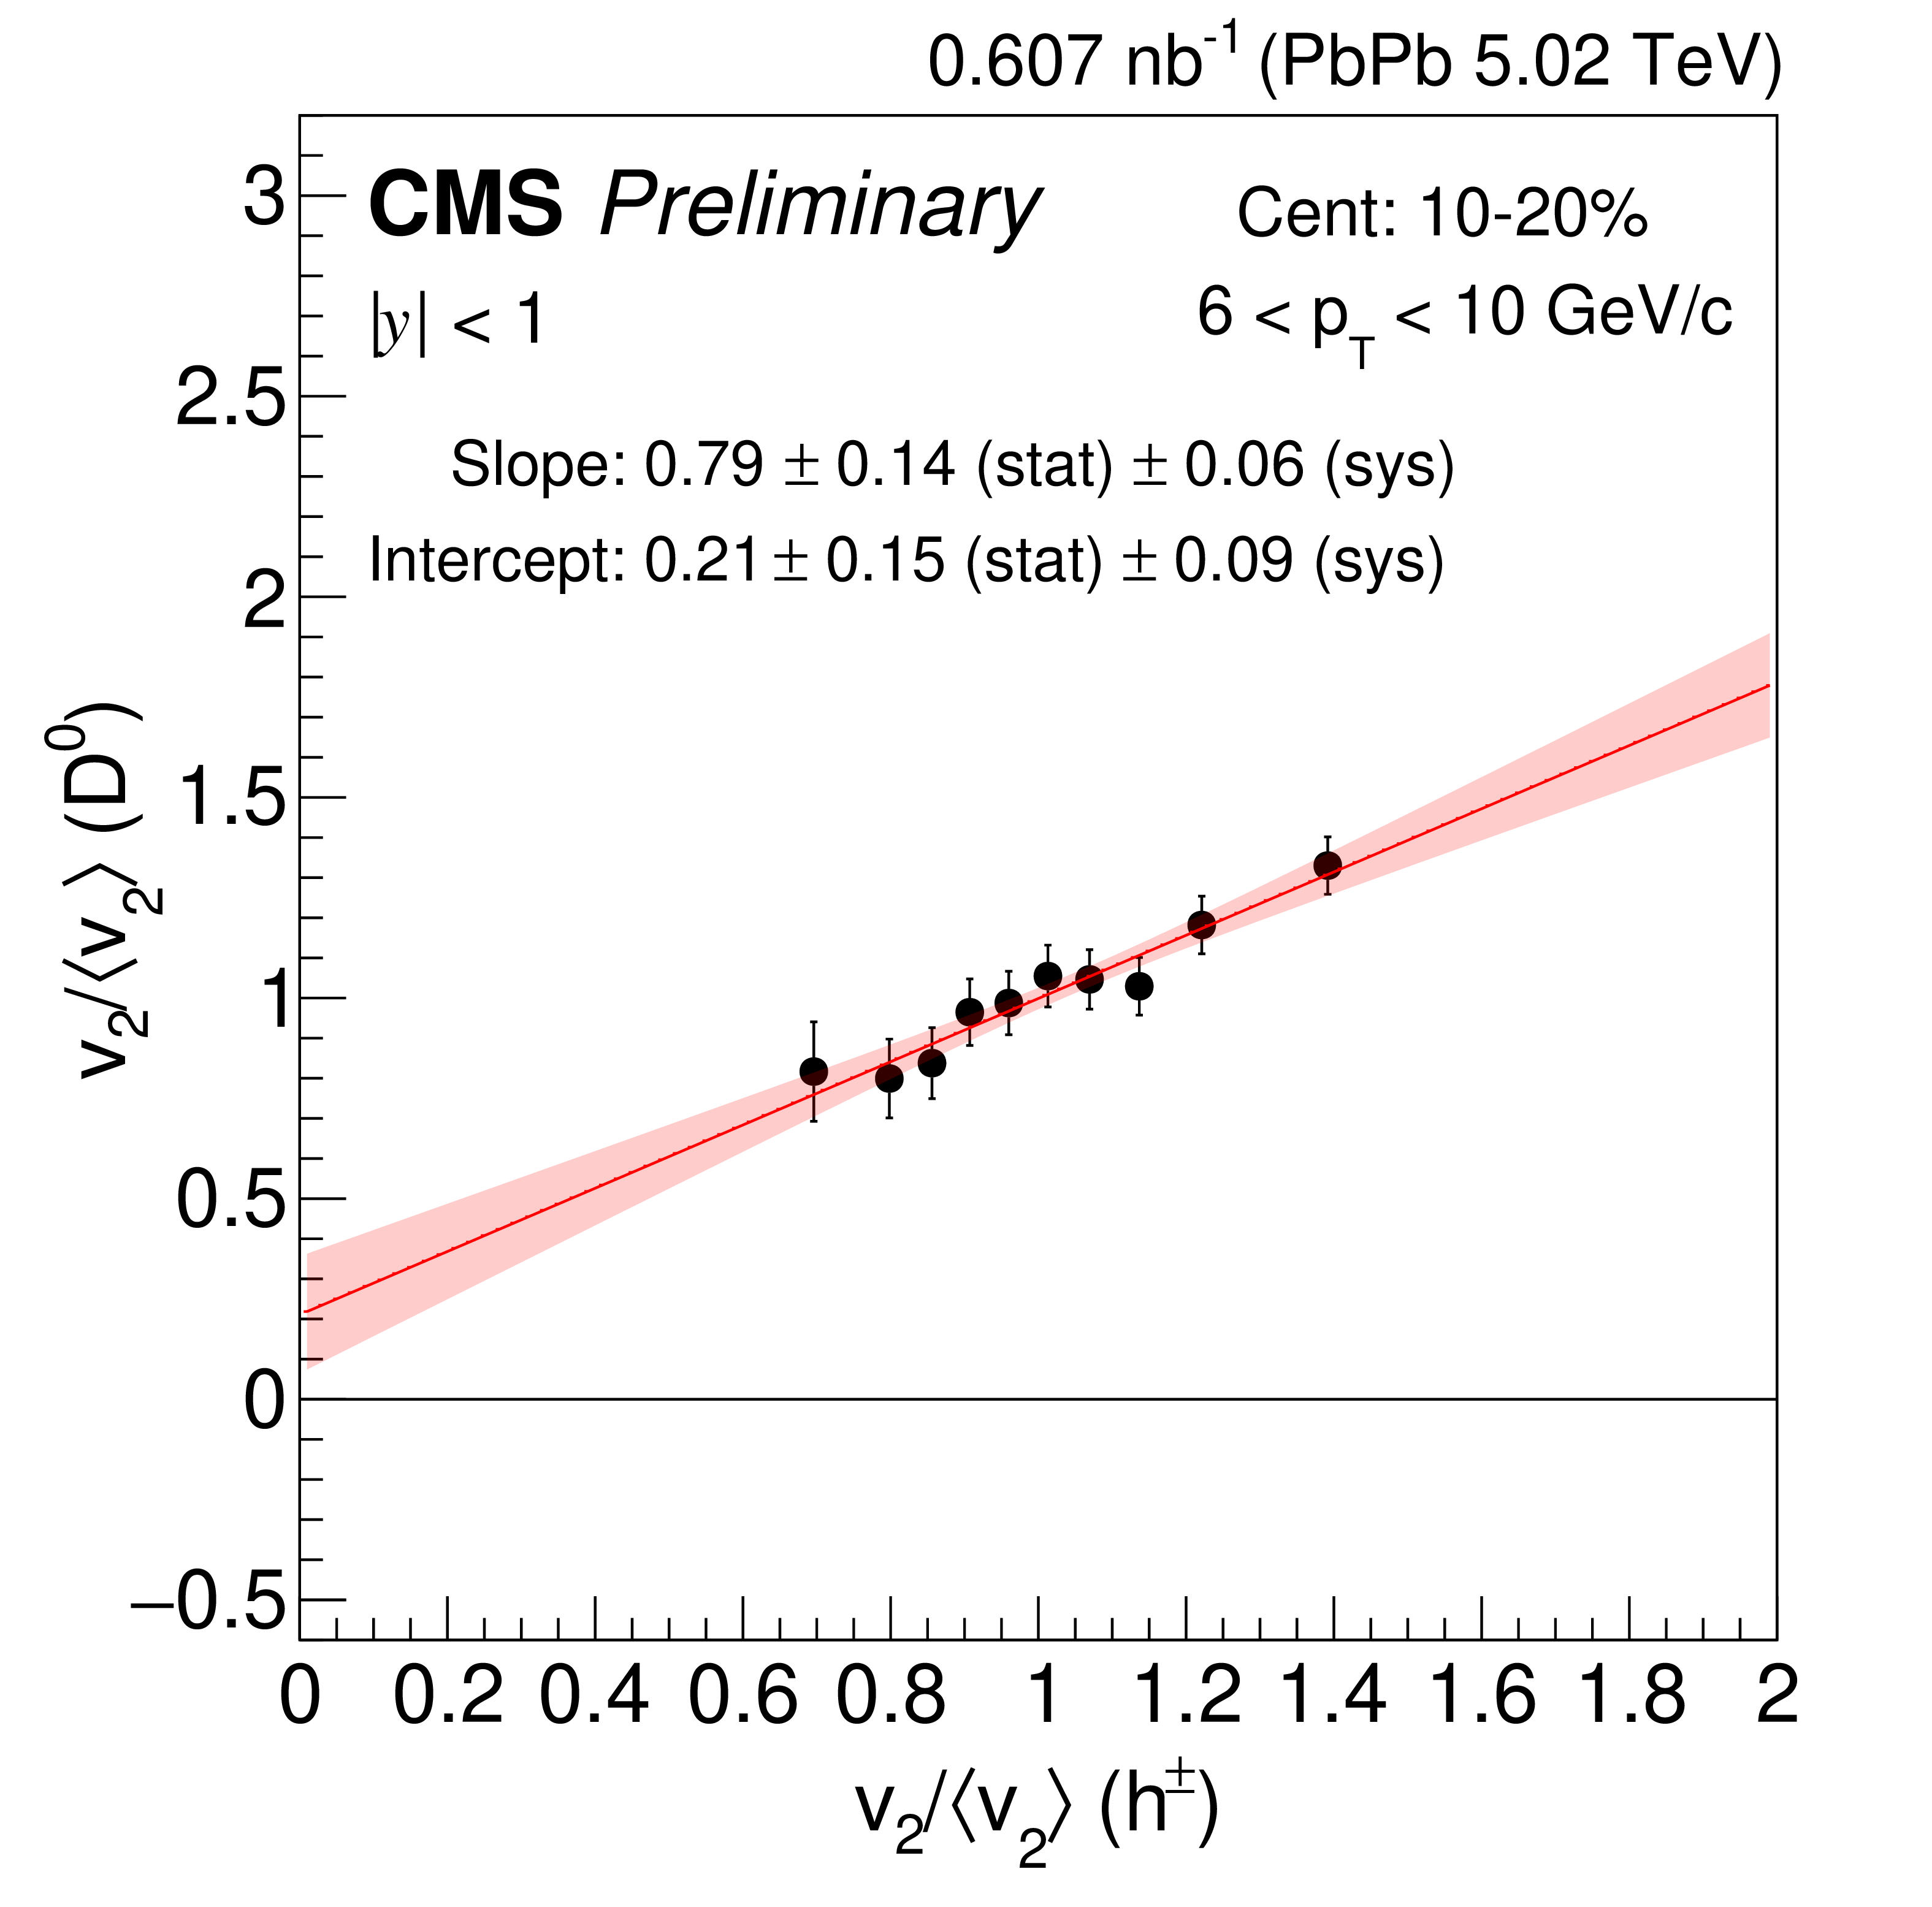
Figure 5-c:
Correlation between the normalized $ \mathrm{D^0} v_2 $ and the charged-particle $ v_2 $. The $ v_2 $ value in each $ q_2 $ bin is scaled by the $ q_2 $-inclusive $ v_2 $. The charged-particle $ v_2 $ is measured in the $ p_{\mathrm{T}} $ region 1-3 GeV/$c$. The correlation plots for $ \mathrm{D^0} p_{\mathrm{T}} $ 2-4 (upper left), 4-6 (upper right), 6-10 (lower left) and 10-30 GeV/$c$ (lower right) in the centrality class 10-20%. The red band corresponds to the uncertainty of one standard deviation. |
png pdf |
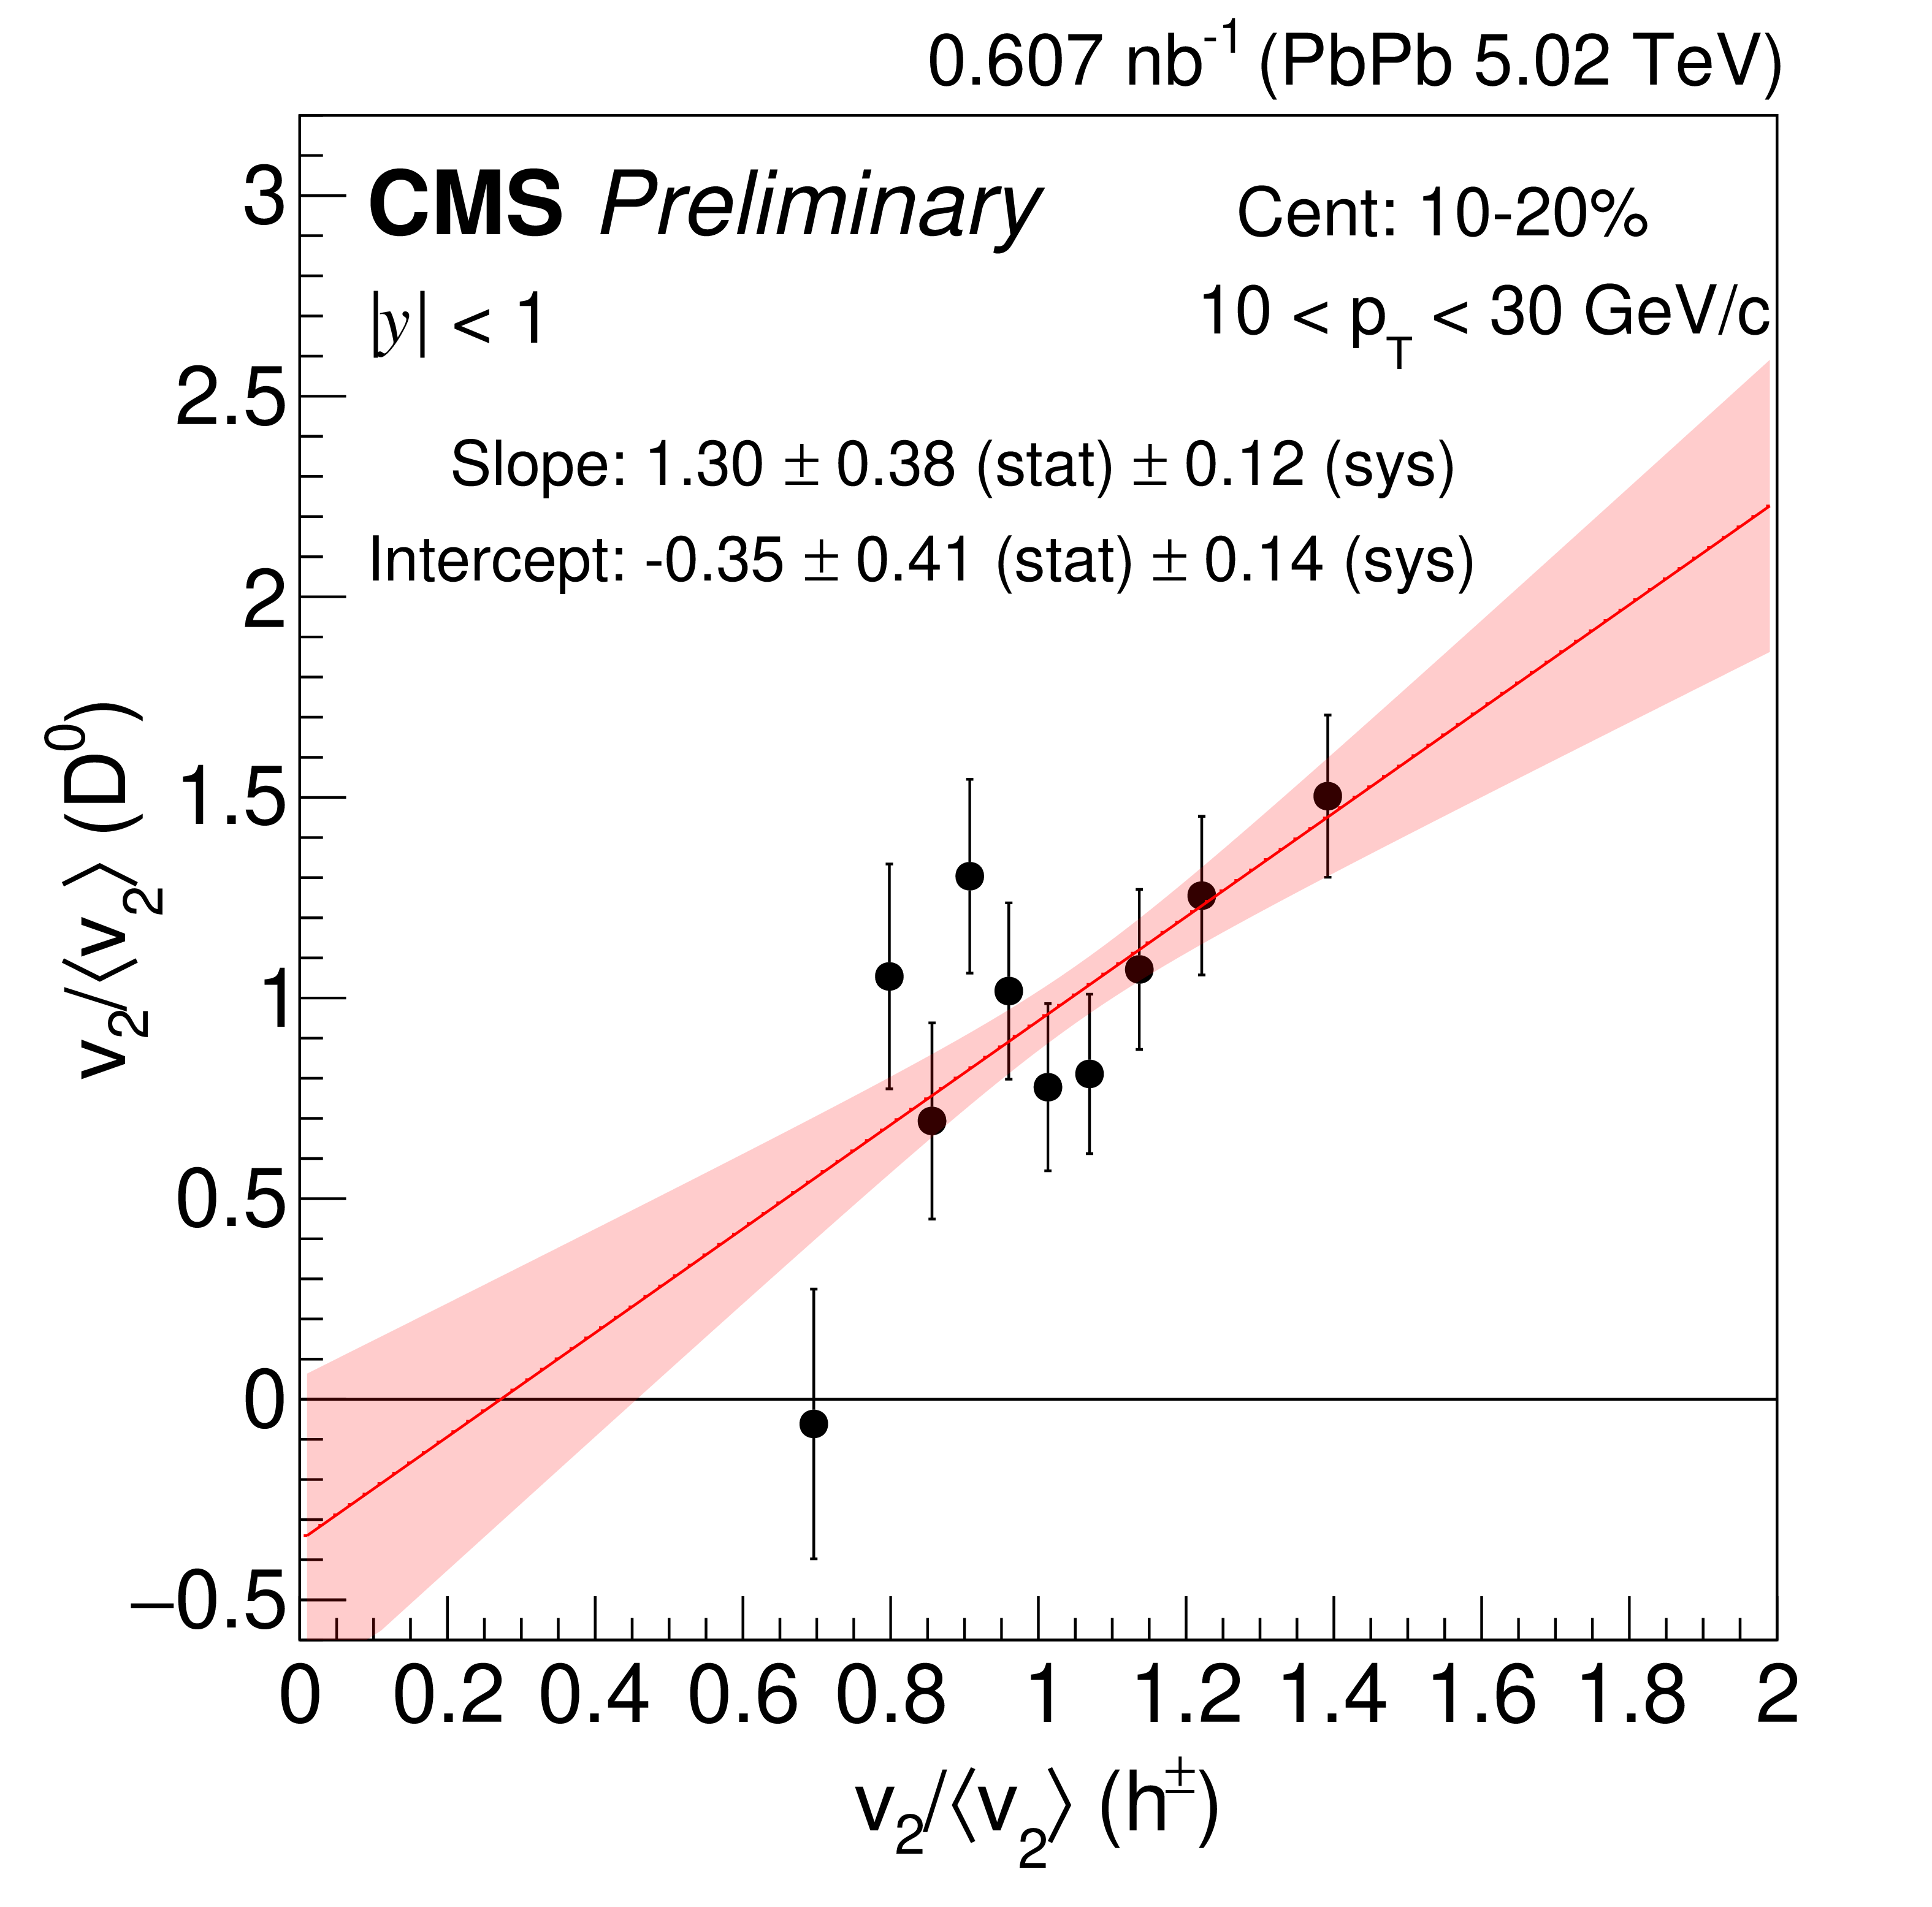
Figure 5-d:
Correlation between the normalized $ \mathrm{D^0} v_2 $ and the charged-particle $ v_2 $. The $ v_2 $ value in each $ q_2 $ bin is scaled by the $ q_2 $-inclusive $ v_2 $. The charged-particle $ v_2 $ is measured in the $ p_{\mathrm{T}} $ region 1-3 GeV/$c$. The correlation plots for $ \mathrm{D^0} p_{\mathrm{T}} $ 2-4 (upper left), 4-6 (upper right), 6-10 (lower left) and 10-30 GeV/$c$ (lower right) in the centrality class 10-20%. The red band corresponds to the uncertainty of one standard deviation. |
png pdf |
Figure 6:
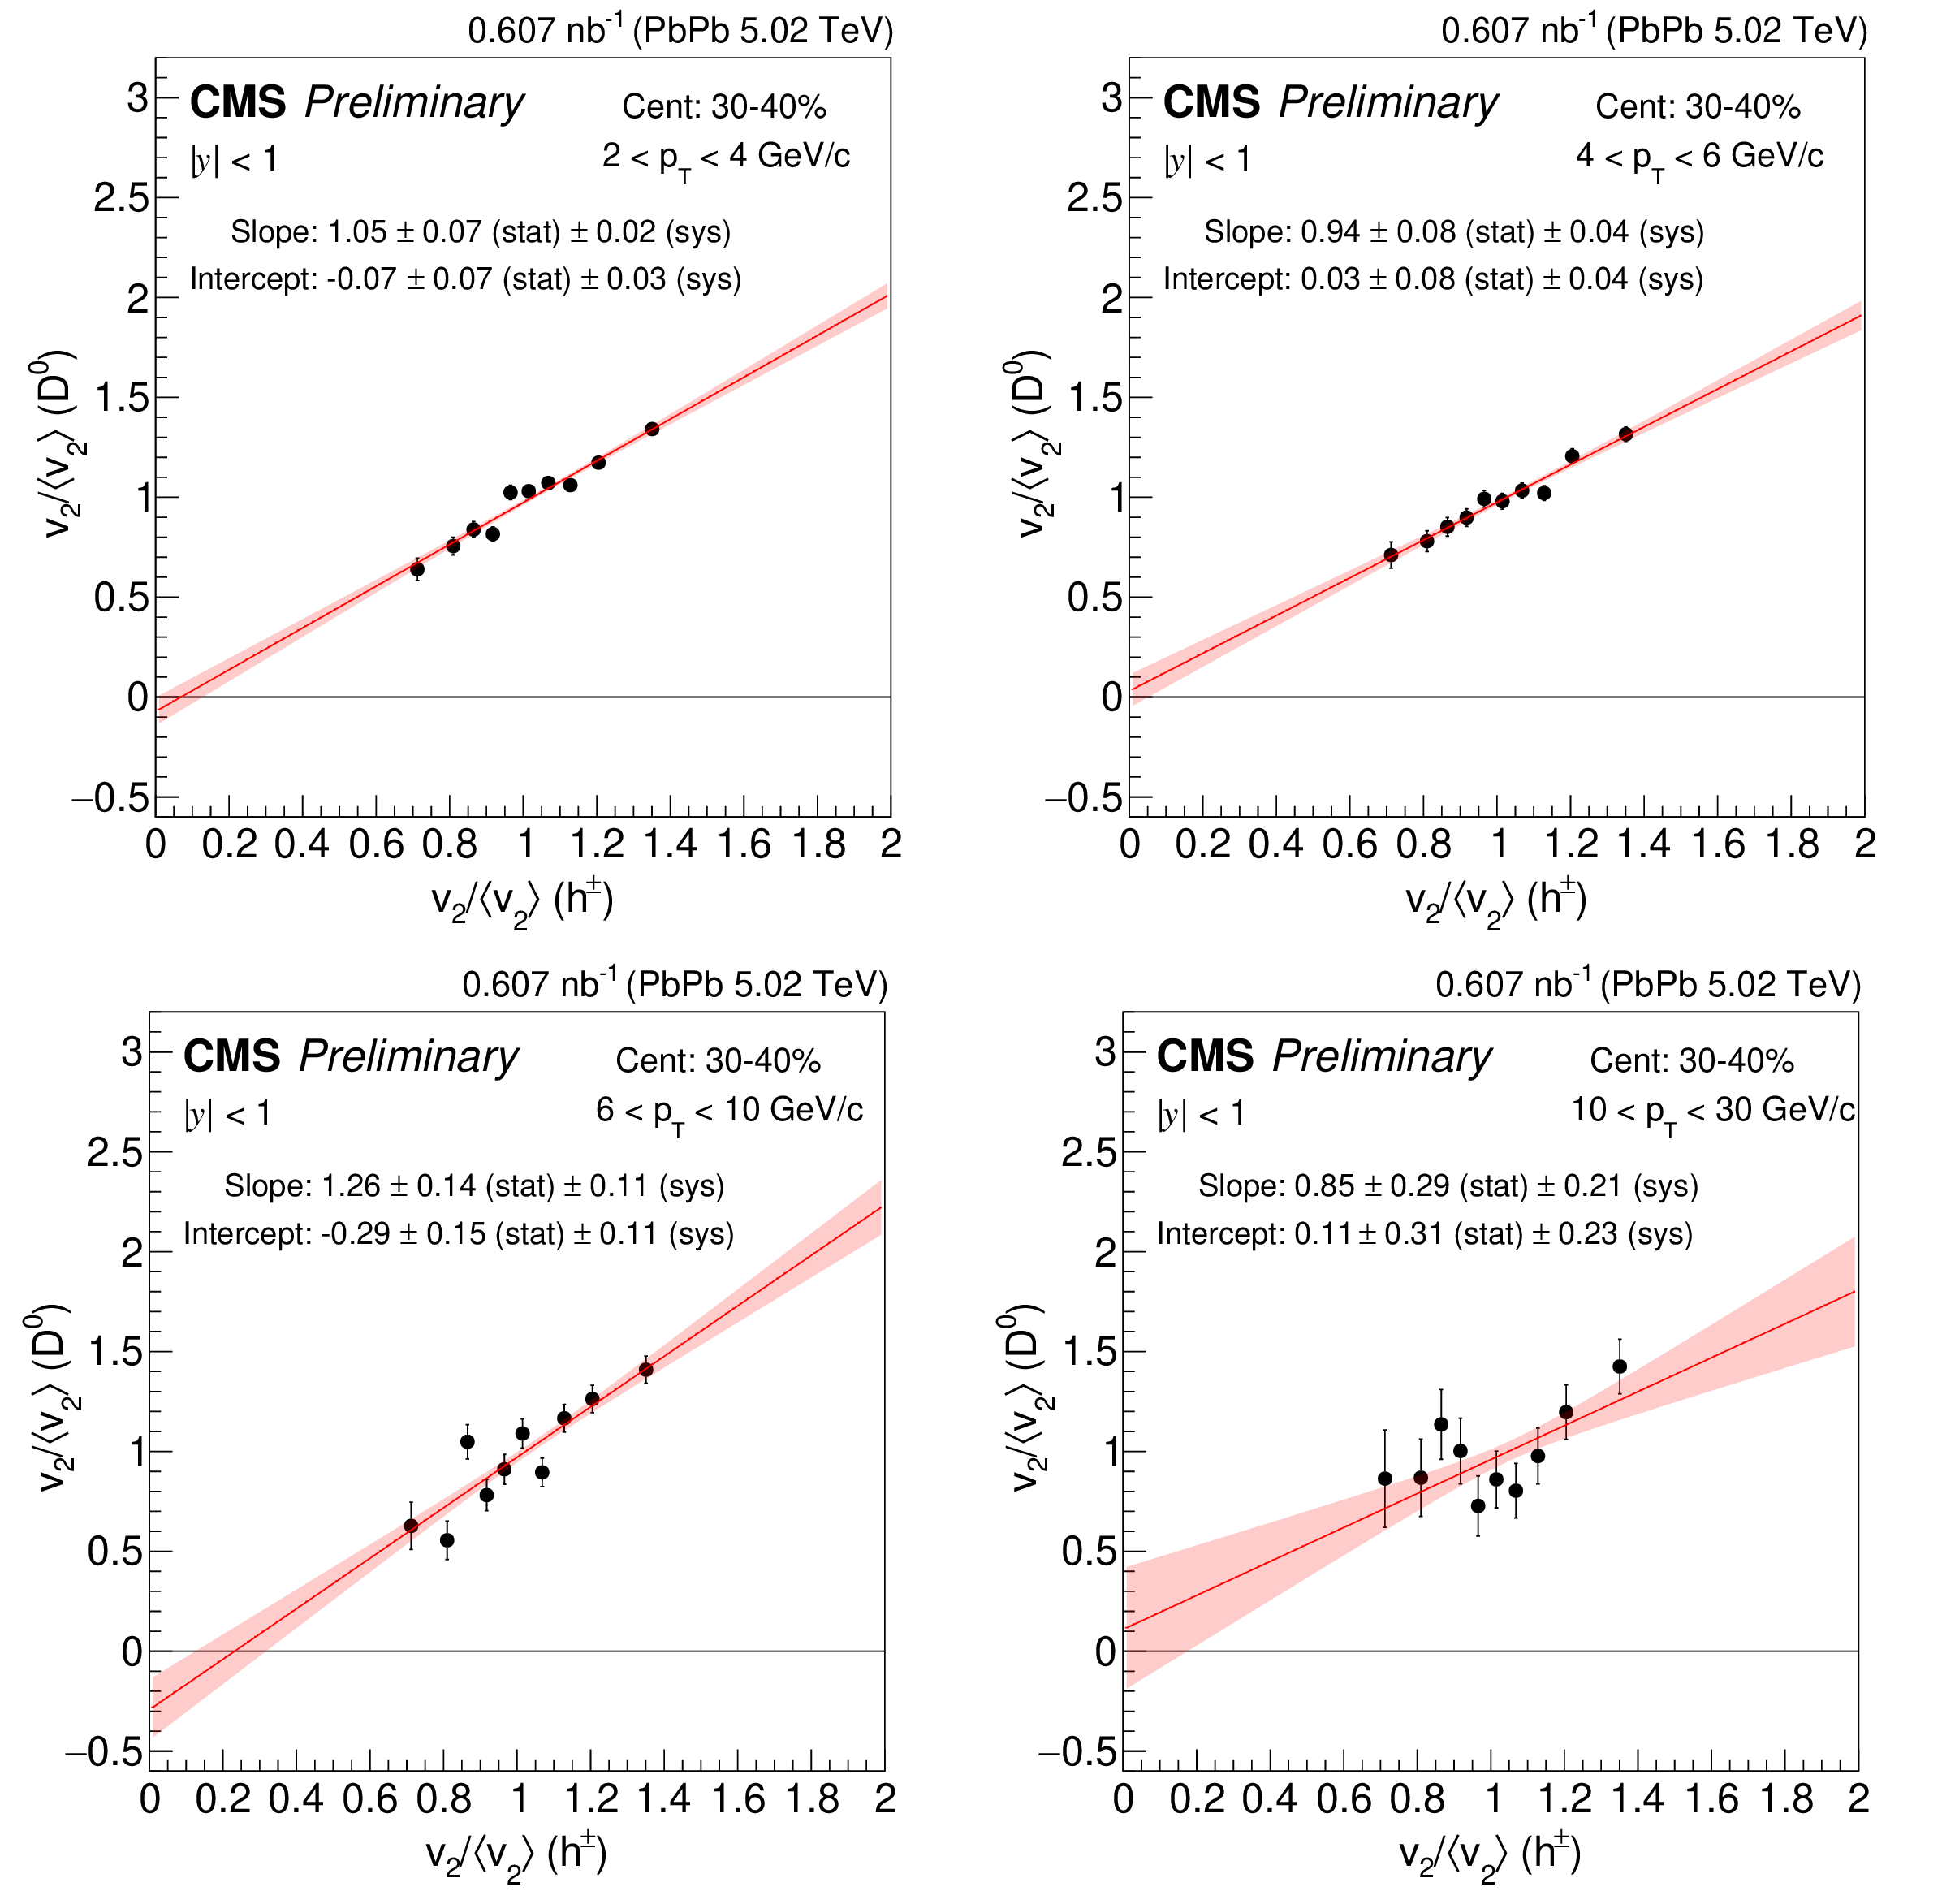
Correlation between the normalized $ \mathrm{D^0} v_2 $ and the charged-particle $ v_2 $. The $ v_2 $ value in each $ q_2 $ bin is scaled by the $ q_2 $-inclusive $ v_2 $. The charged-particle $ v_2 $ is measured in the $ p_{\mathrm{T}} $ region 1-3 GeV/$c$. The correlation plots for $ \mathrm{D^0} p_{\mathrm{T}} $ 2-4 (upper left), 4-6 (upper right), 6-10 (lower left) and 10-30 GeV/$c$ (lower right) in the centrality class 30-40%. The red band corresponds to the uncertainty of one standard deviation. |
png pdf |
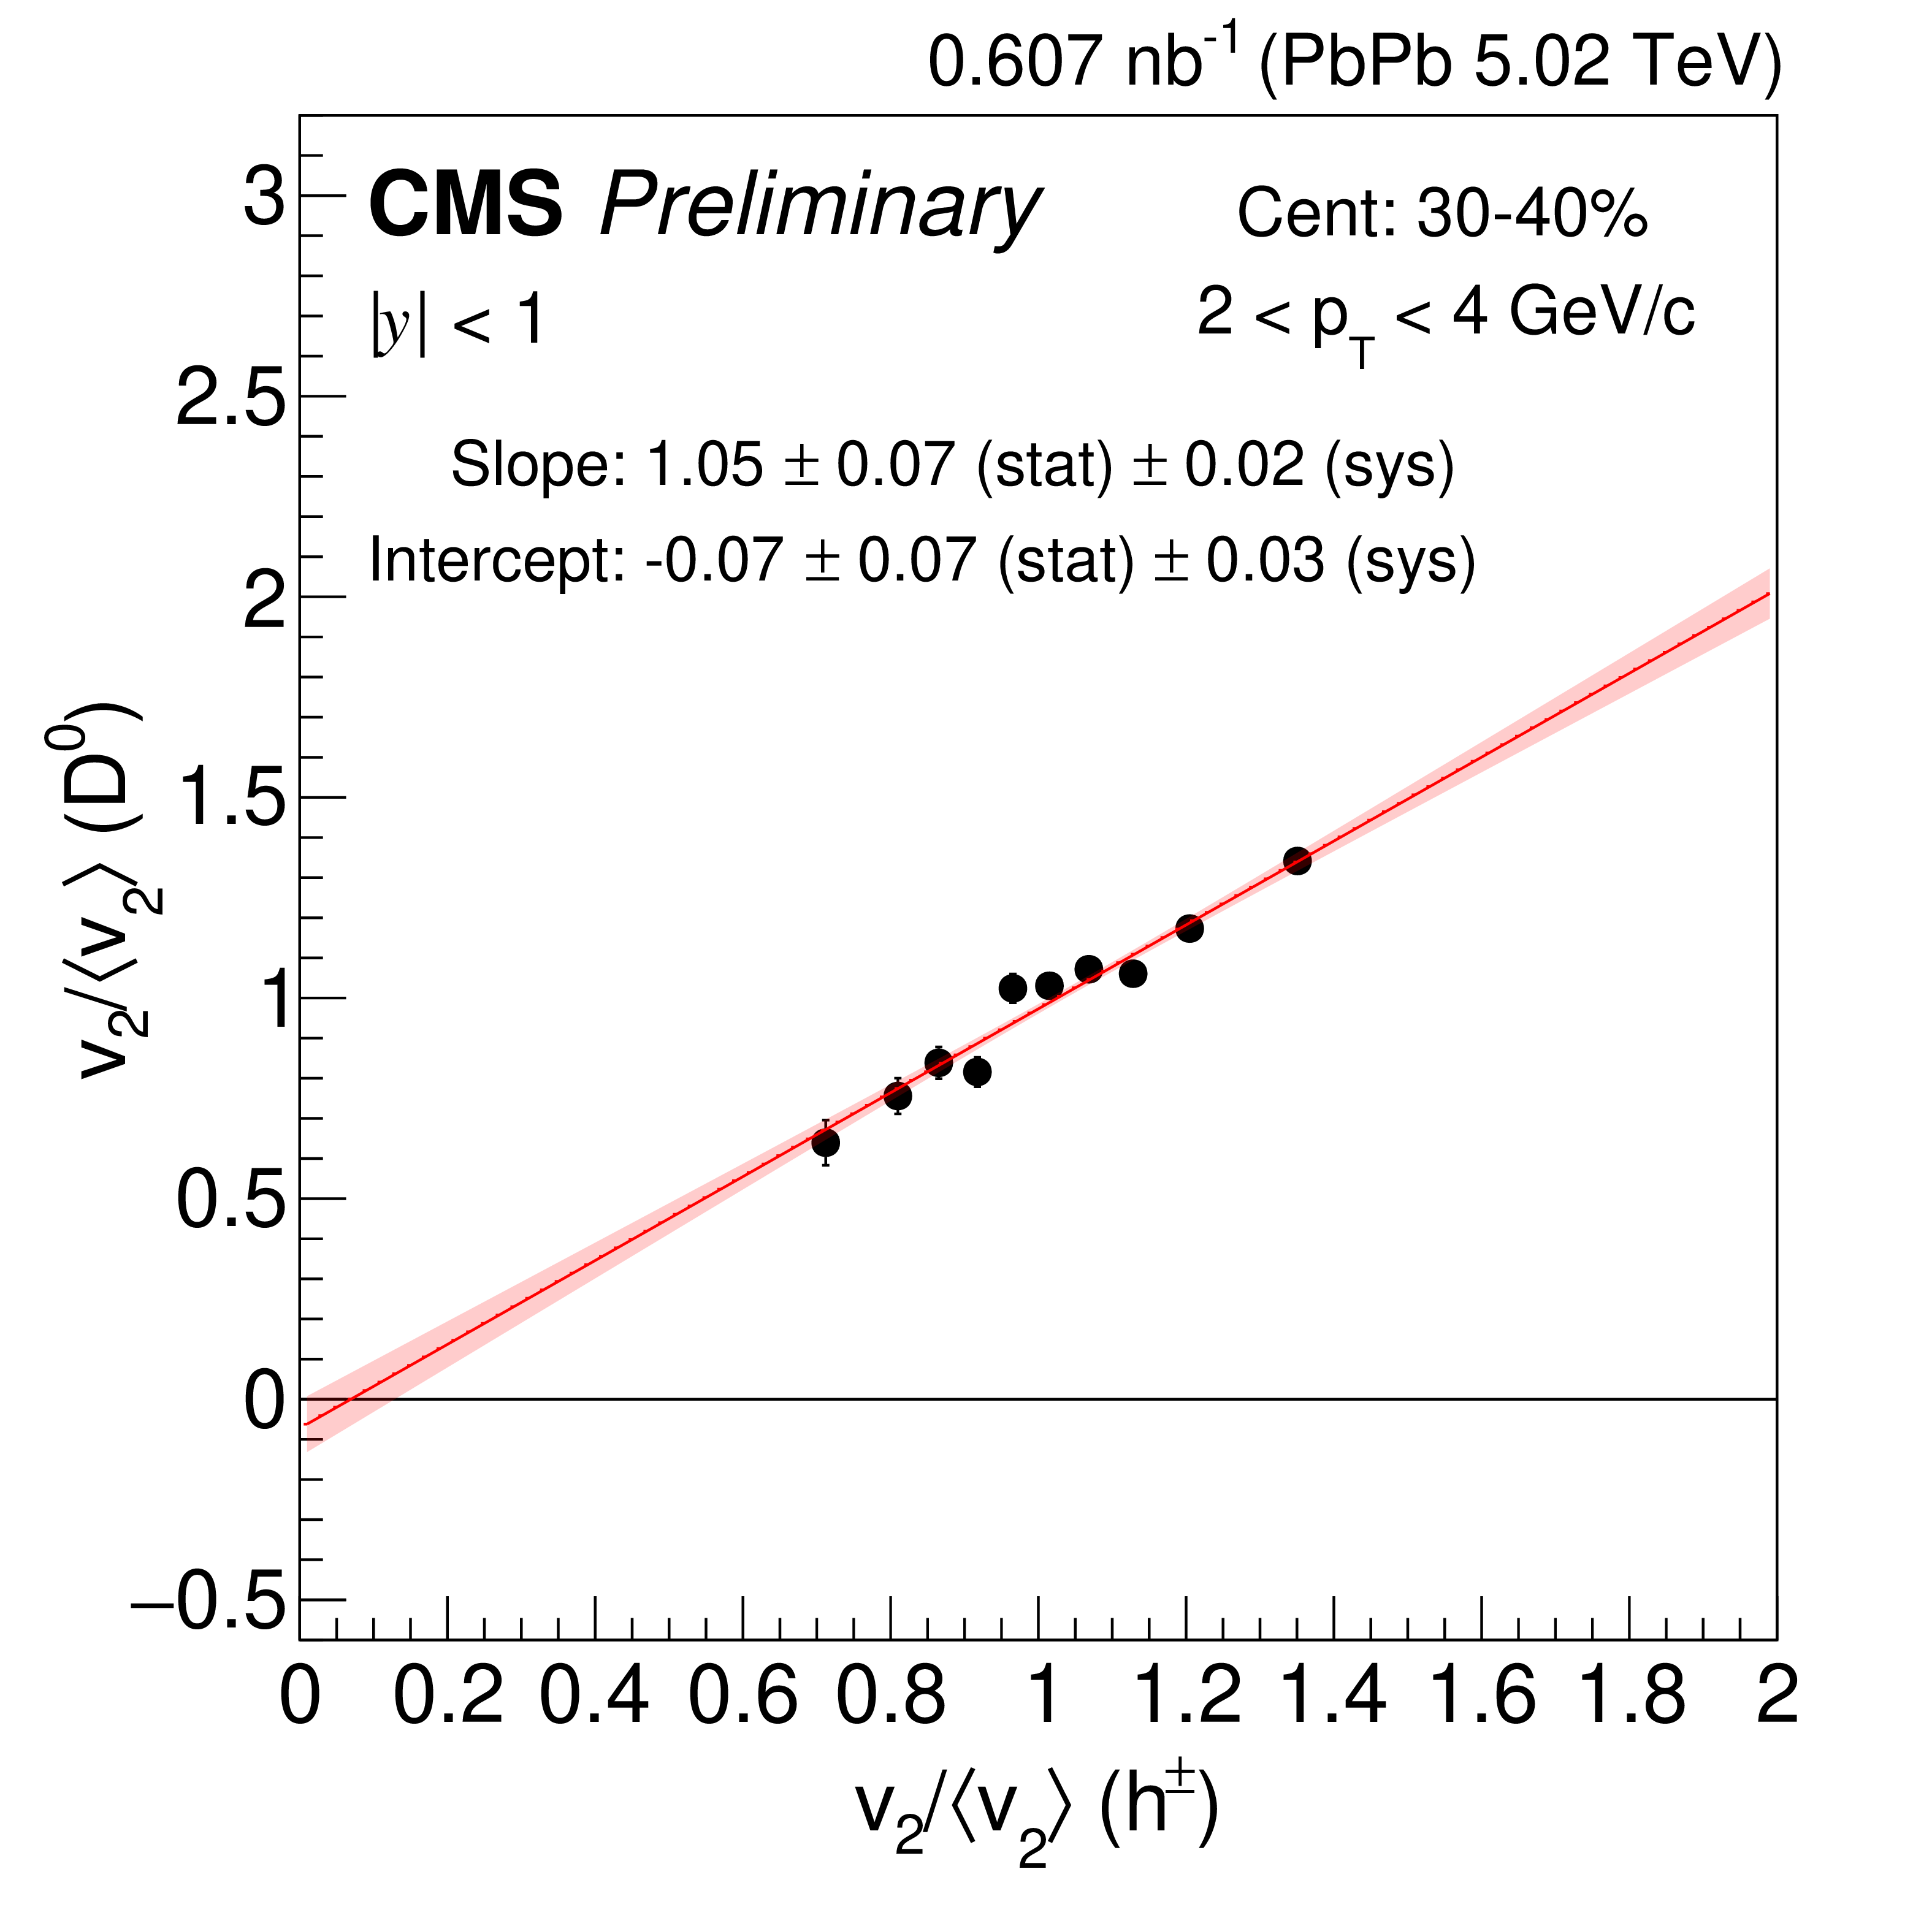
Figure 6-a:
Correlation between the normalized $ \mathrm{D^0} v_2 $ and the charged-particle $ v_2 $. The $ v_2 $ value in each $ q_2 $ bin is scaled by the $ q_2 $-inclusive $ v_2 $. The charged-particle $ v_2 $ is measured in the $ p_{\mathrm{T}} $ region 1-3 GeV/$c$. The correlation plots for $ \mathrm{D^0} p_{\mathrm{T}} $ 2-4 (upper left), 4-6 (upper right), 6-10 (lower left) and 10-30 GeV/$c$ (lower right) in the centrality class 30-40%. The red band corresponds to the uncertainty of one standard deviation. |
png pdf |
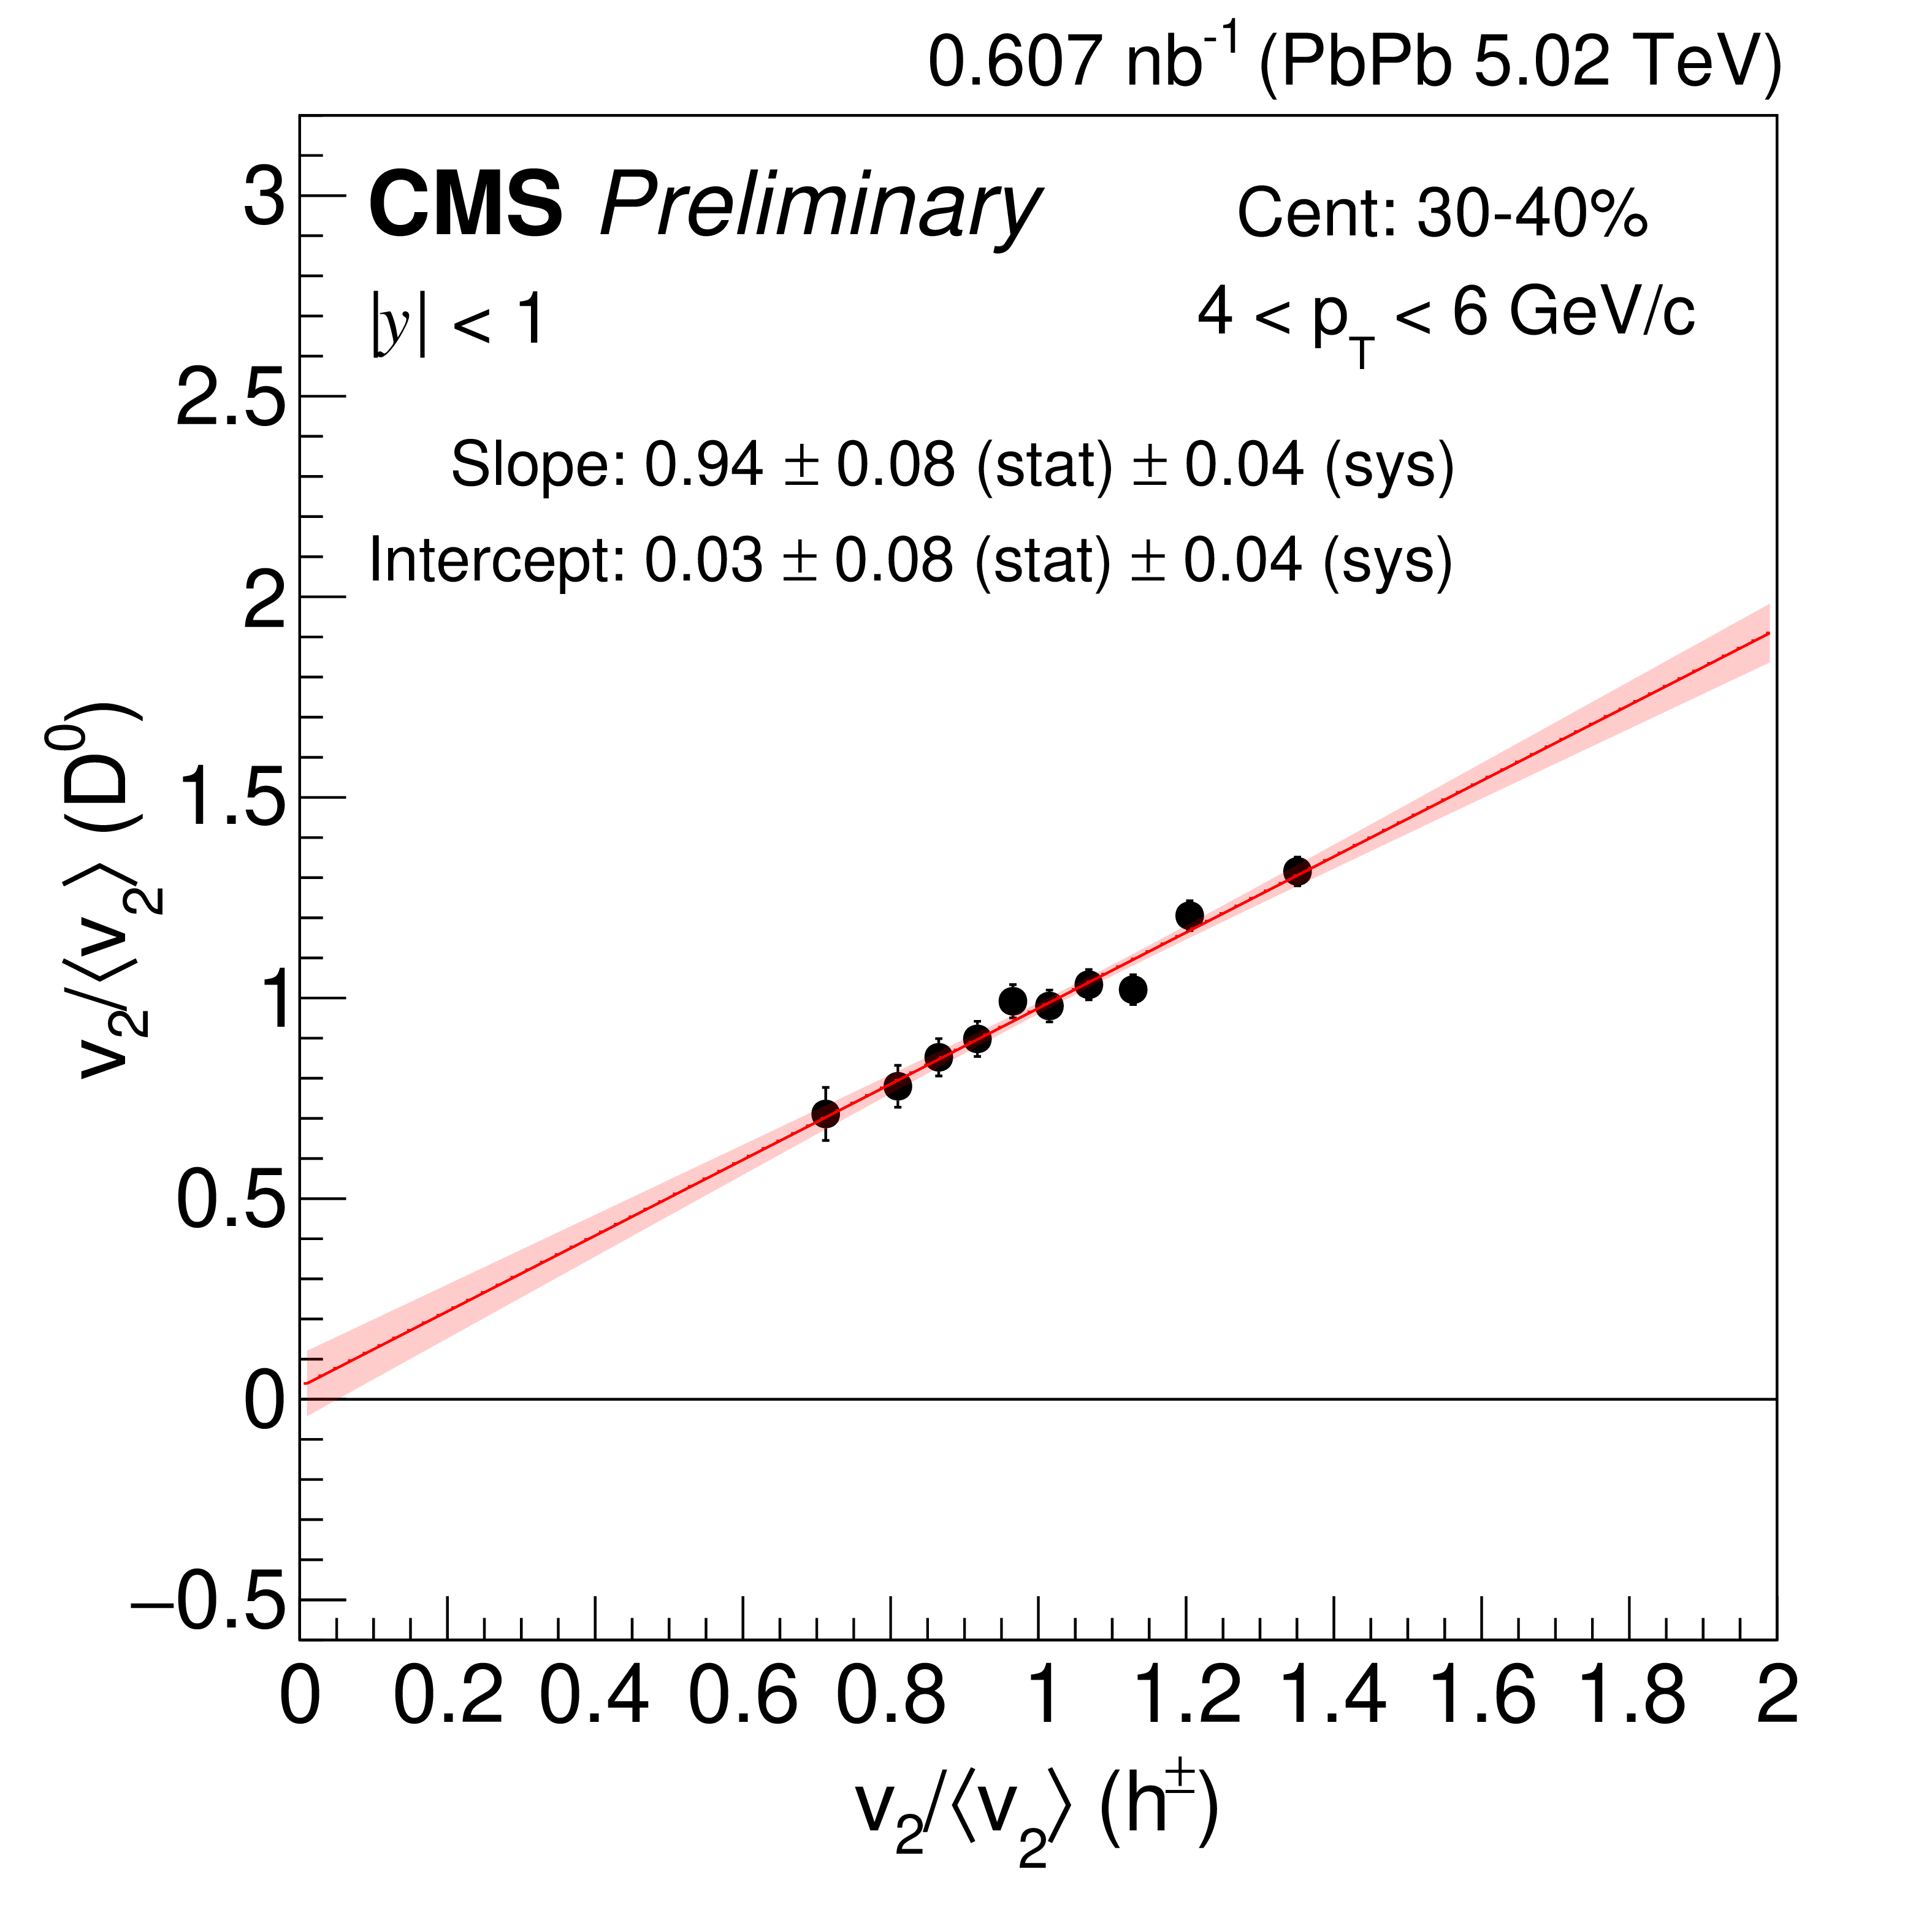
Figure 6-b:
Correlation between the normalized $ \mathrm{D^0} v_2 $ and the charged-particle $ v_2 $. The $ v_2 $ value in each $ q_2 $ bin is scaled by the $ q_2 $-inclusive $ v_2 $. The charged-particle $ v_2 $ is measured in the $ p_{\mathrm{T}} $ region 1-3 GeV/$c$. The correlation plots for $ \mathrm{D^0} p_{\mathrm{T}} $ 2-4 (upper left), 4-6 (upper right), 6-10 (lower left) and 10-30 GeV/$c$ (lower right) in the centrality class 30-40%. The red band corresponds to the uncertainty of one standard deviation. |
png pdf |
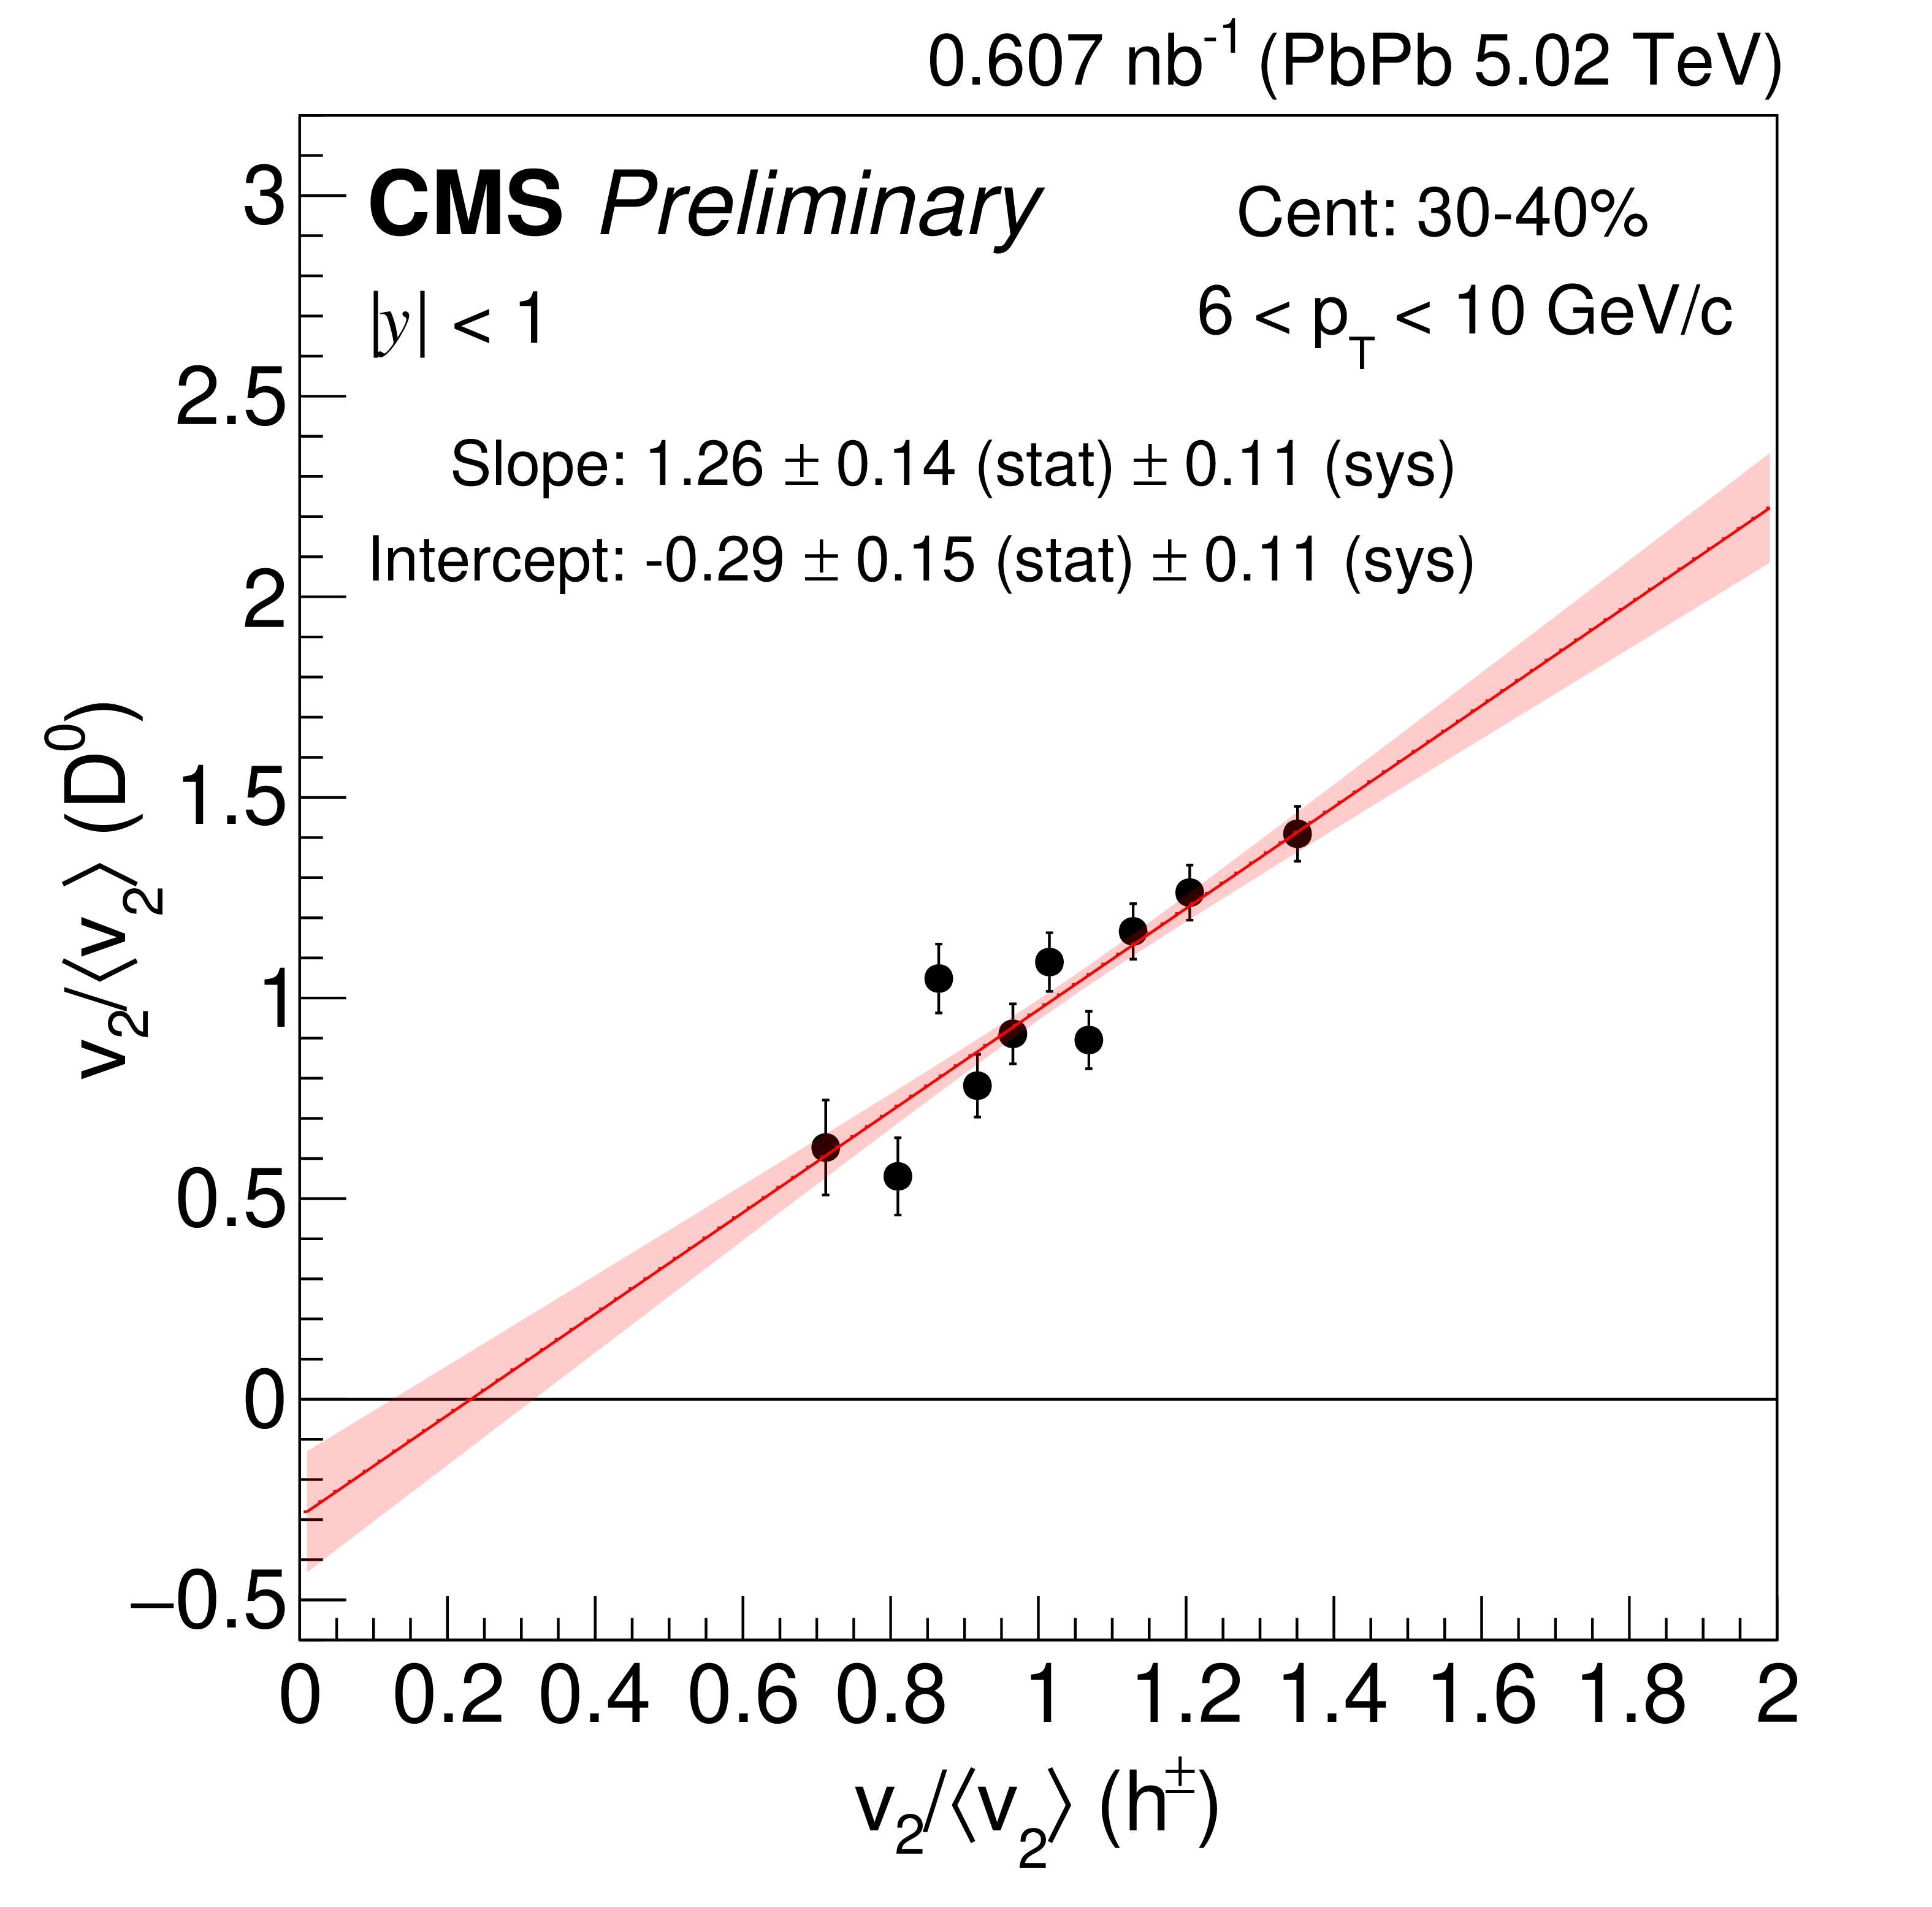
Figure 6-c:
Correlation between the normalized $ \mathrm{D^0} v_2 $ and the charged-particle $ v_2 $. The $ v_2 $ value in each $ q_2 $ bin is scaled by the $ q_2 $-inclusive $ v_2 $. The charged-particle $ v_2 $ is measured in the $ p_{\mathrm{T}} $ region 1-3 GeV/$c$. The correlation plots for $ \mathrm{D^0} p_{\mathrm{T}} $ 2-4 (upper left), 4-6 (upper right), 6-10 (lower left) and 10-30 GeV/$c$ (lower right) in the centrality class 30-40%. The red band corresponds to the uncertainty of one standard deviation. |
png pdf |
Figure 6-d:
Correlation between the normalized $ \mathrm{D^0} v_2 $ and the charged-particle $ v_2 $. The $ v_2 $ value in each $ q_2 $ bin is scaled by the $ q_2 $-inclusive $ v_2 $. The charged-particle $ v_2 $ is measured in the $ p_{\mathrm{T}} $ region 1-3 GeV/$c$. The correlation plots for $ \mathrm{D^0} p_{\mathrm{T}} $ 2-4 (upper left), 4-6 (upper right), 6-10 (lower left) and 10-30 GeV/$c$ (lower right) in the centrality class 30-40%. The red band corresponds to the uncertainty of one standard deviation. |
png pdf |
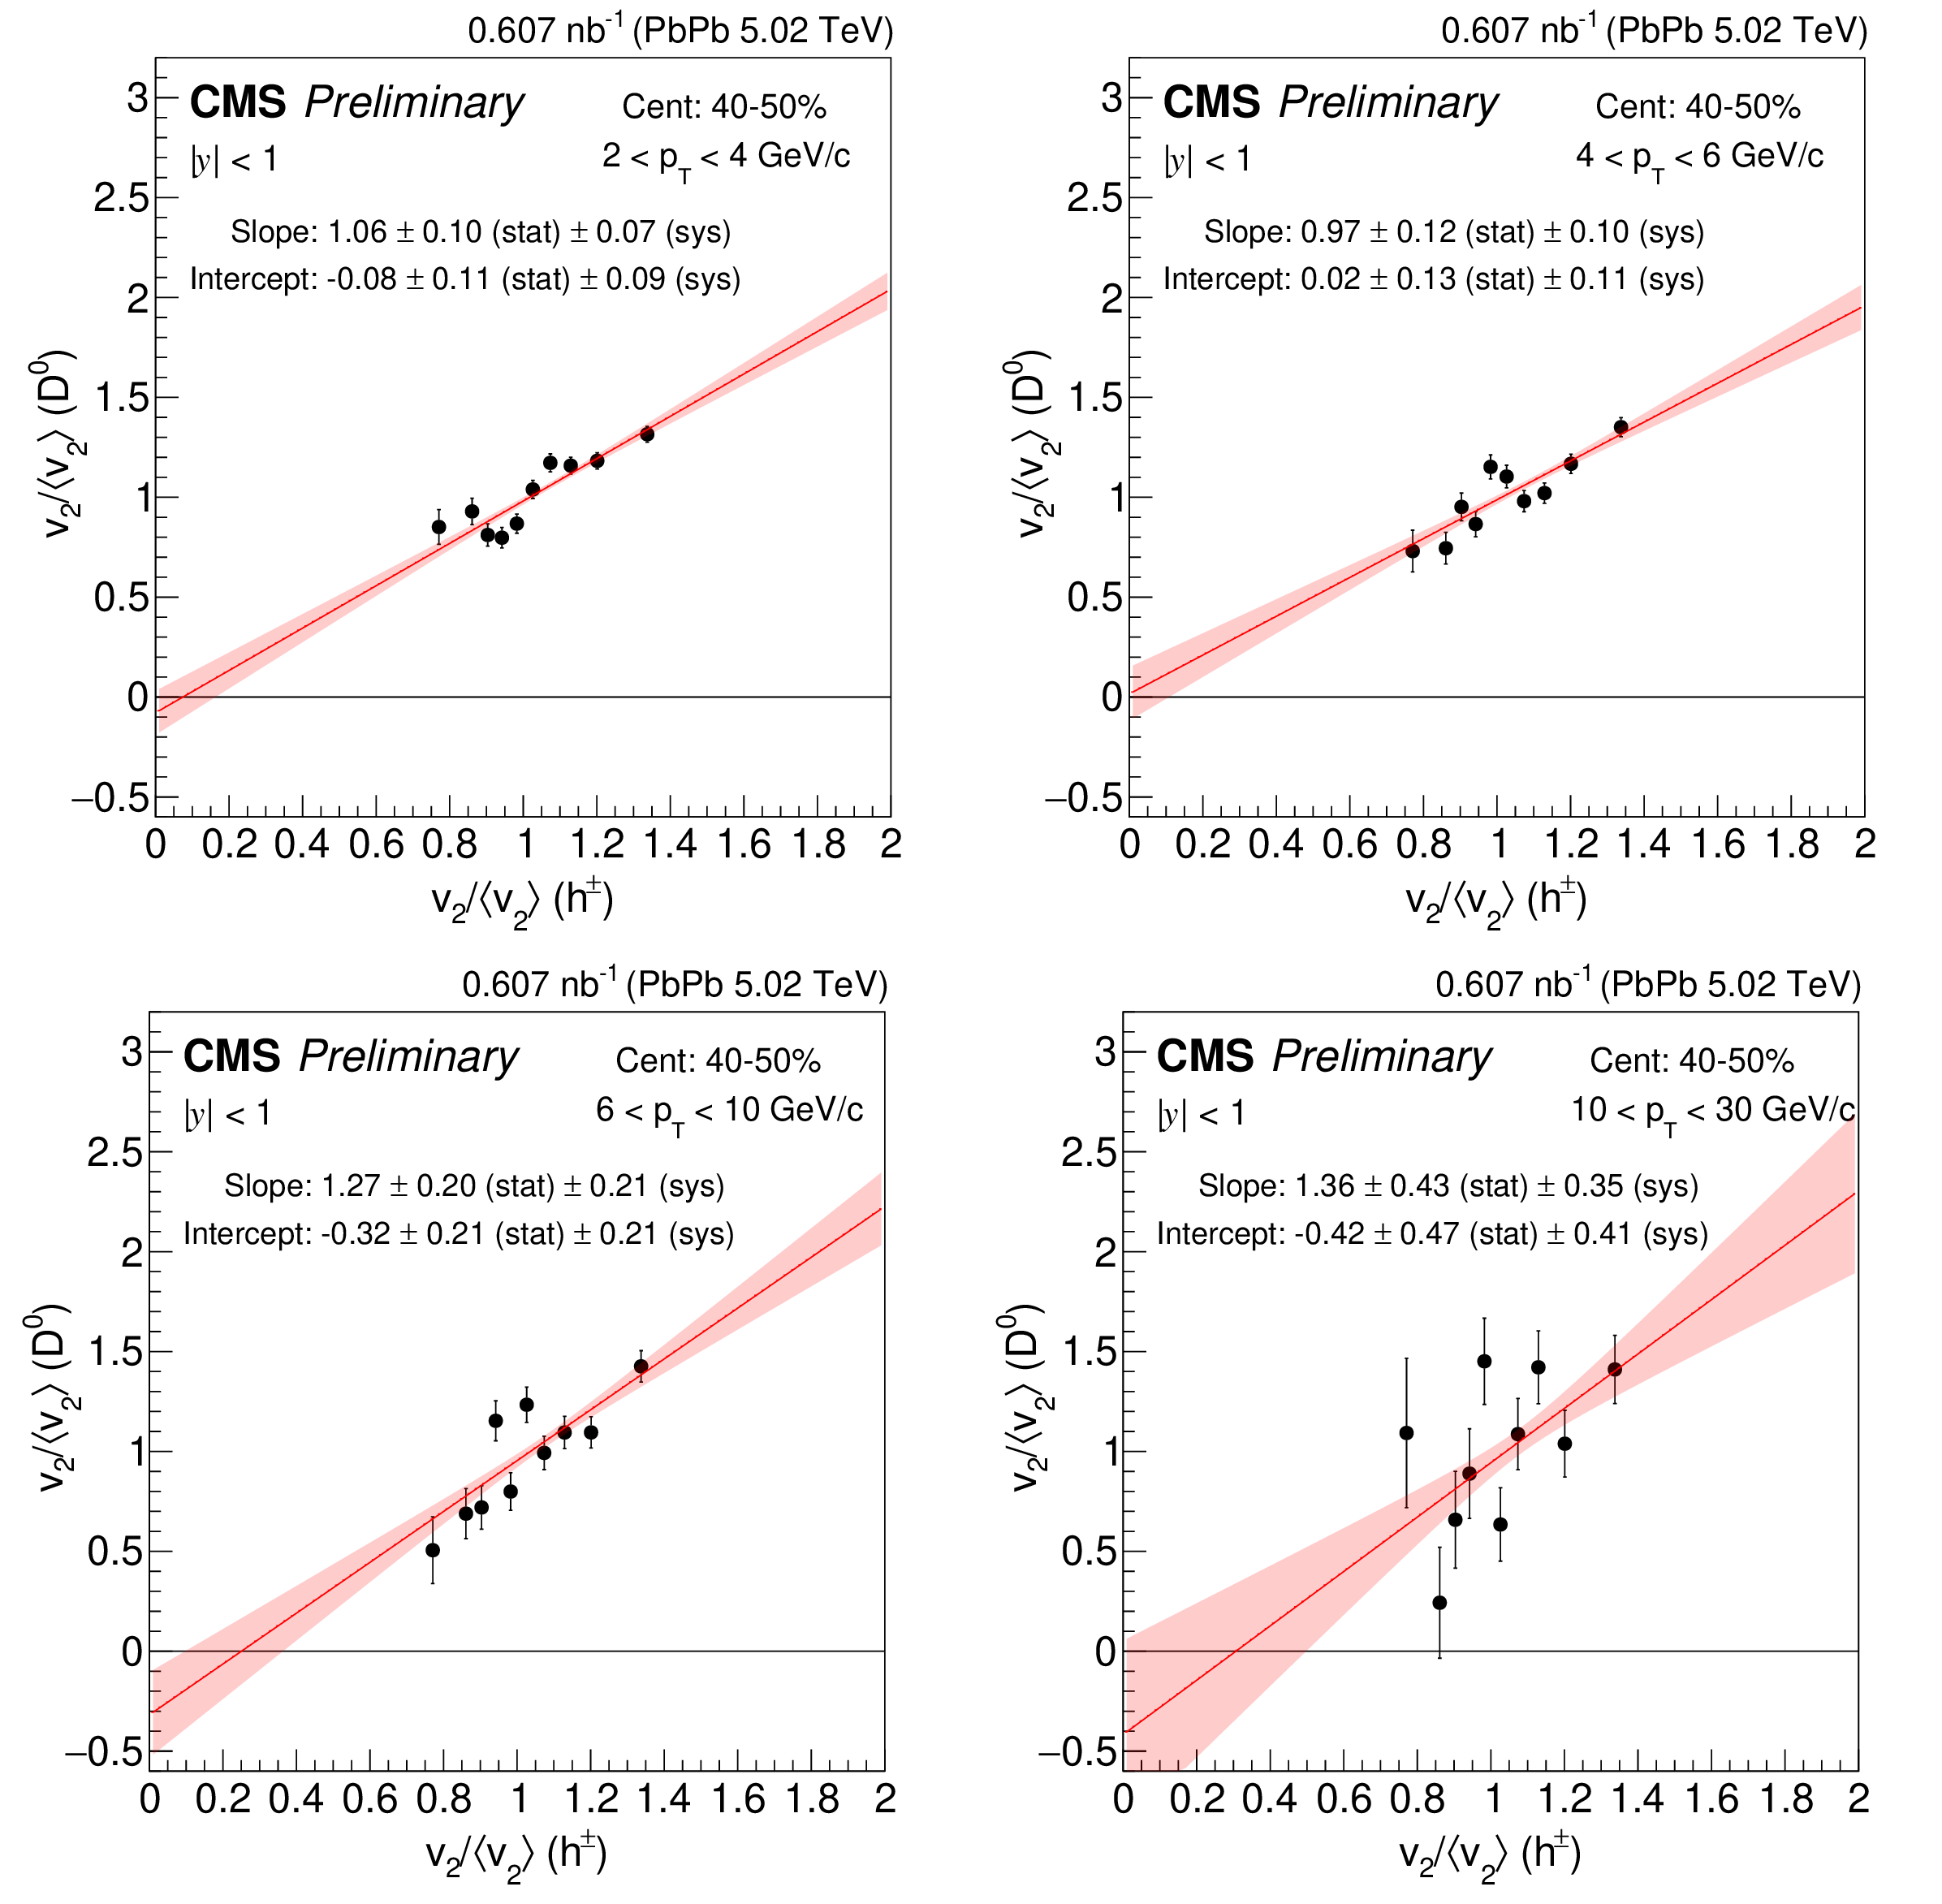
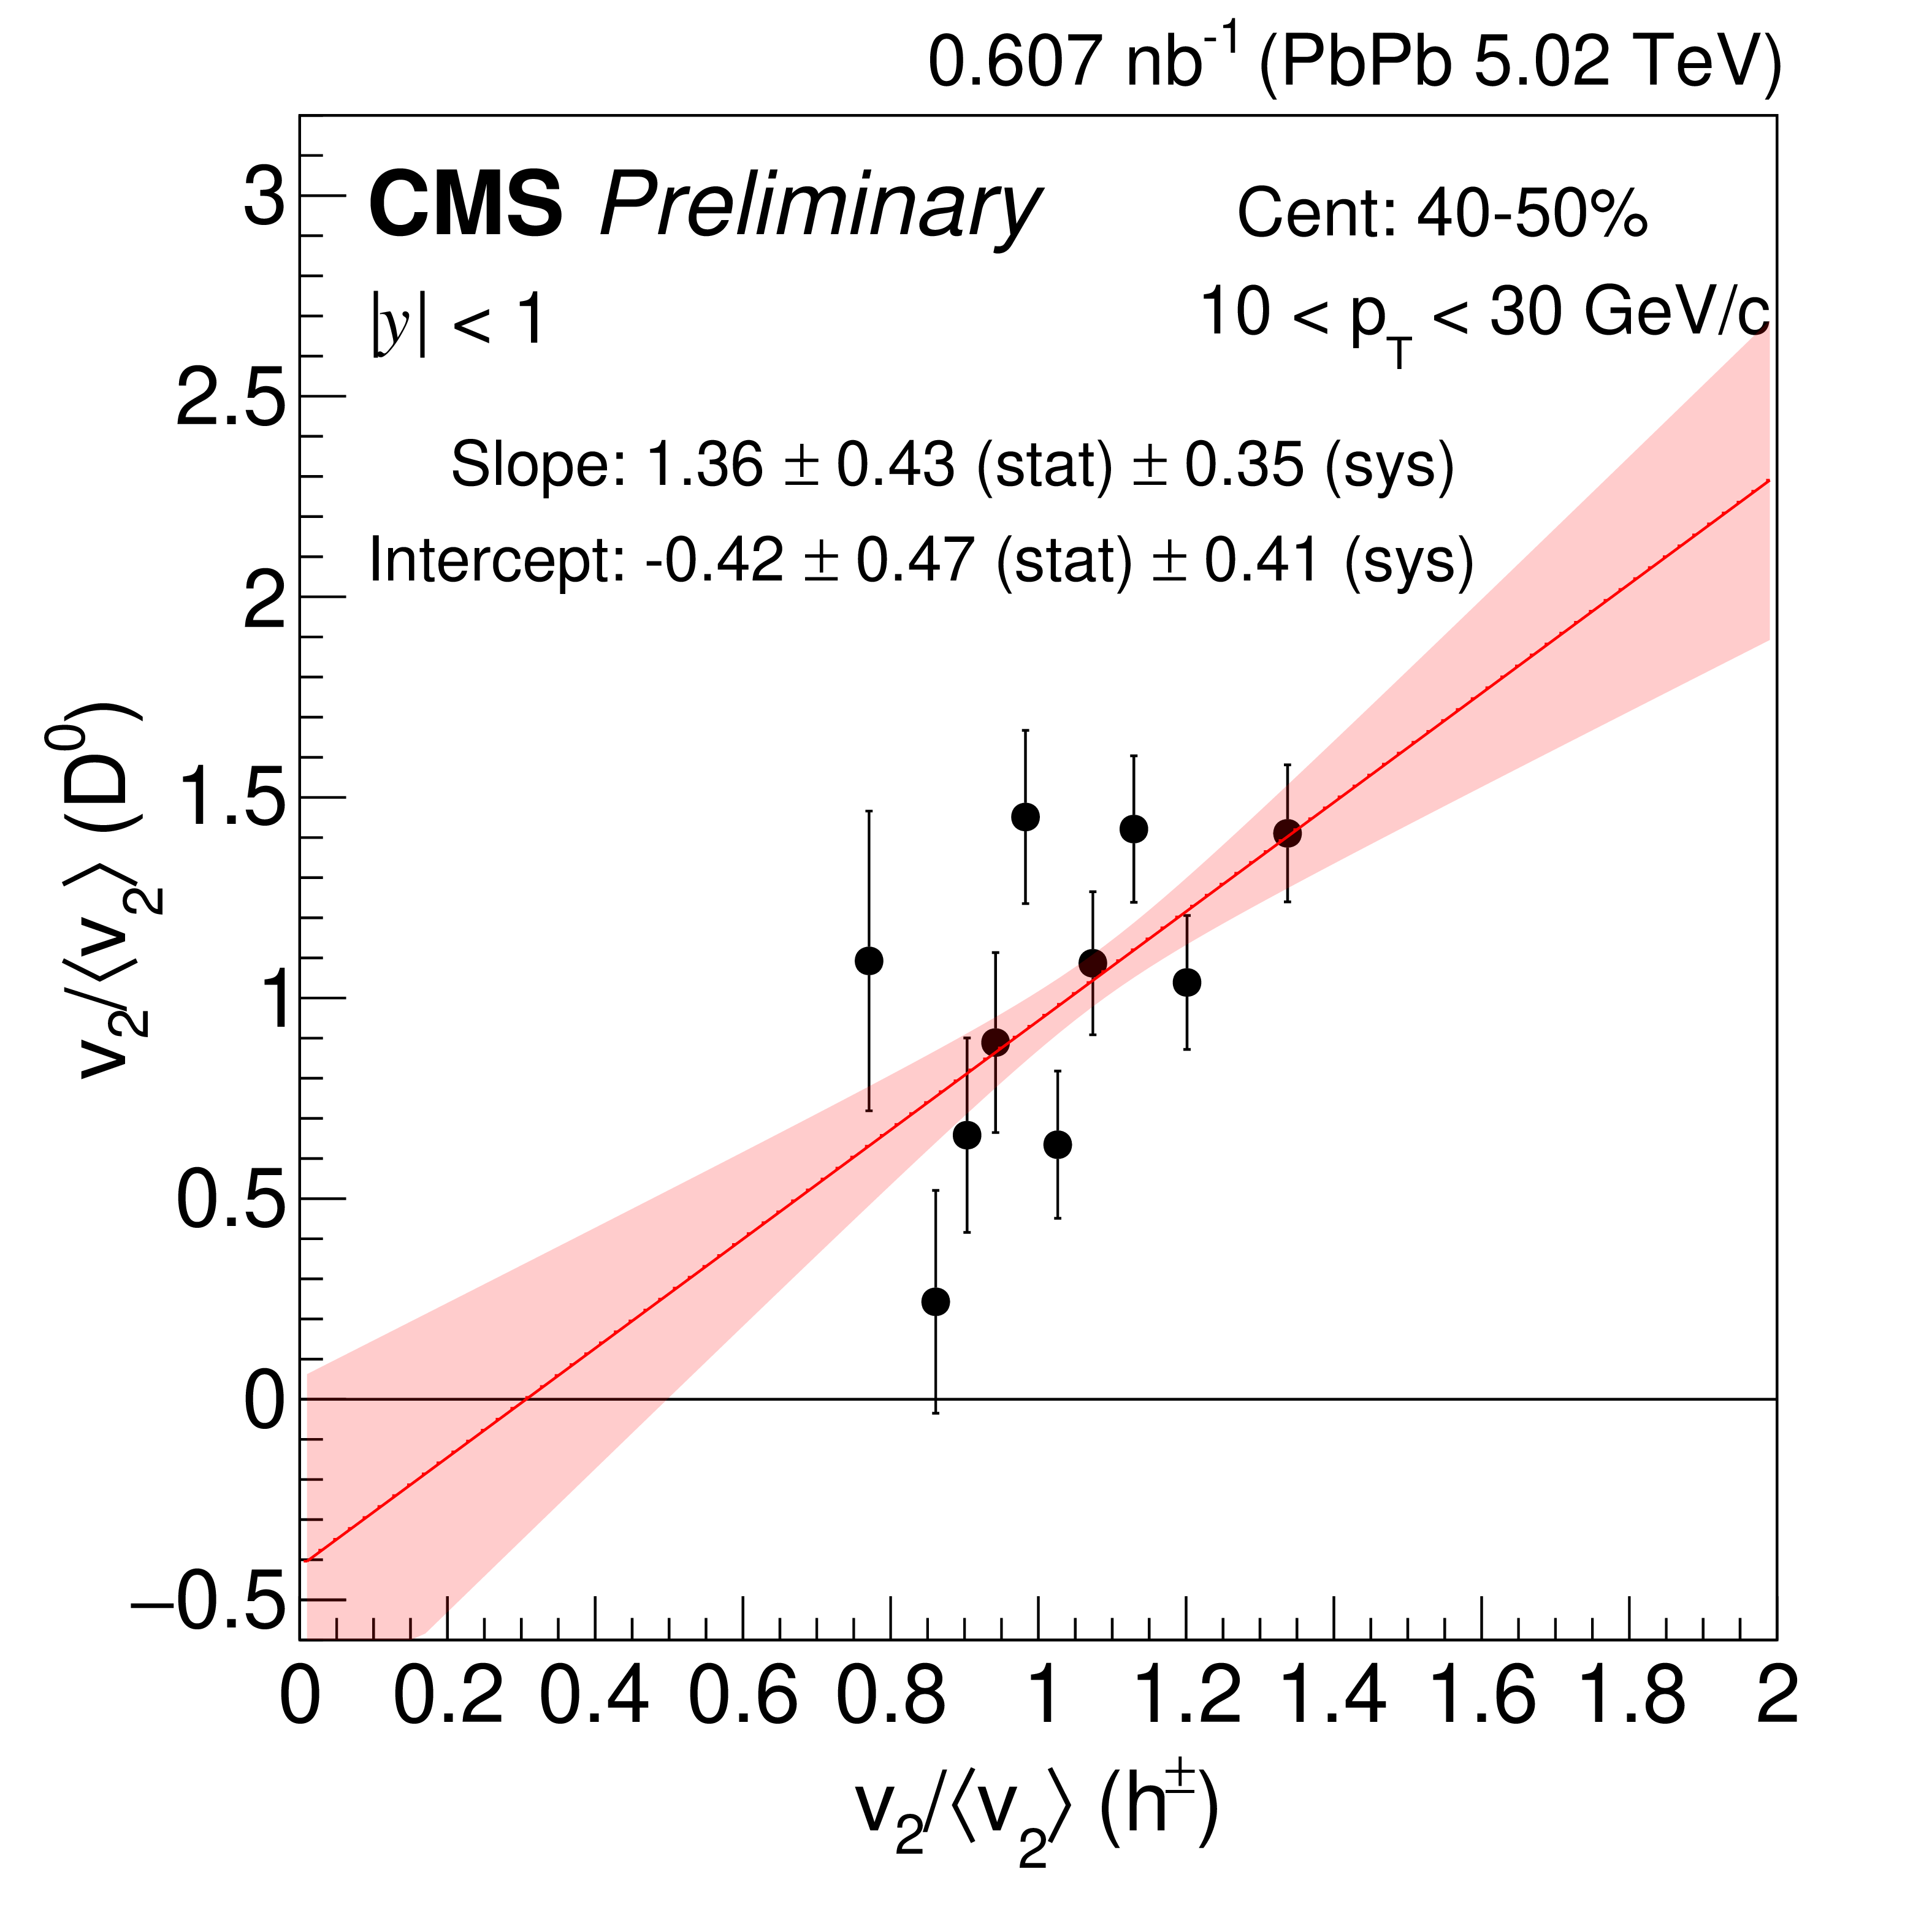
Figure 7:
Correlation between the normalized $ \mathrm{D^0} v_2 $ and the charged-particle $ v_2 $. The $ v_2 $ value in each $ q_2 $ bin is scaled by the $ q_2 $-inclusive $ v_2 $. The charged-particle $ v_2 $ is measured in the $ p_{\mathrm{T}} $ region 1-3 GeV/$c$. The correlation plots for $ \mathrm{D^0} p_{\mathrm{T}} $ 2-4 (upper left), 4-6 (upper right), 6-10 (lower left) and 10-30 GeV/$c$ (lower right) in the centrality class 40-50%. The red band corresponds to the uncertainty of one standard deviation. |
png pdf |
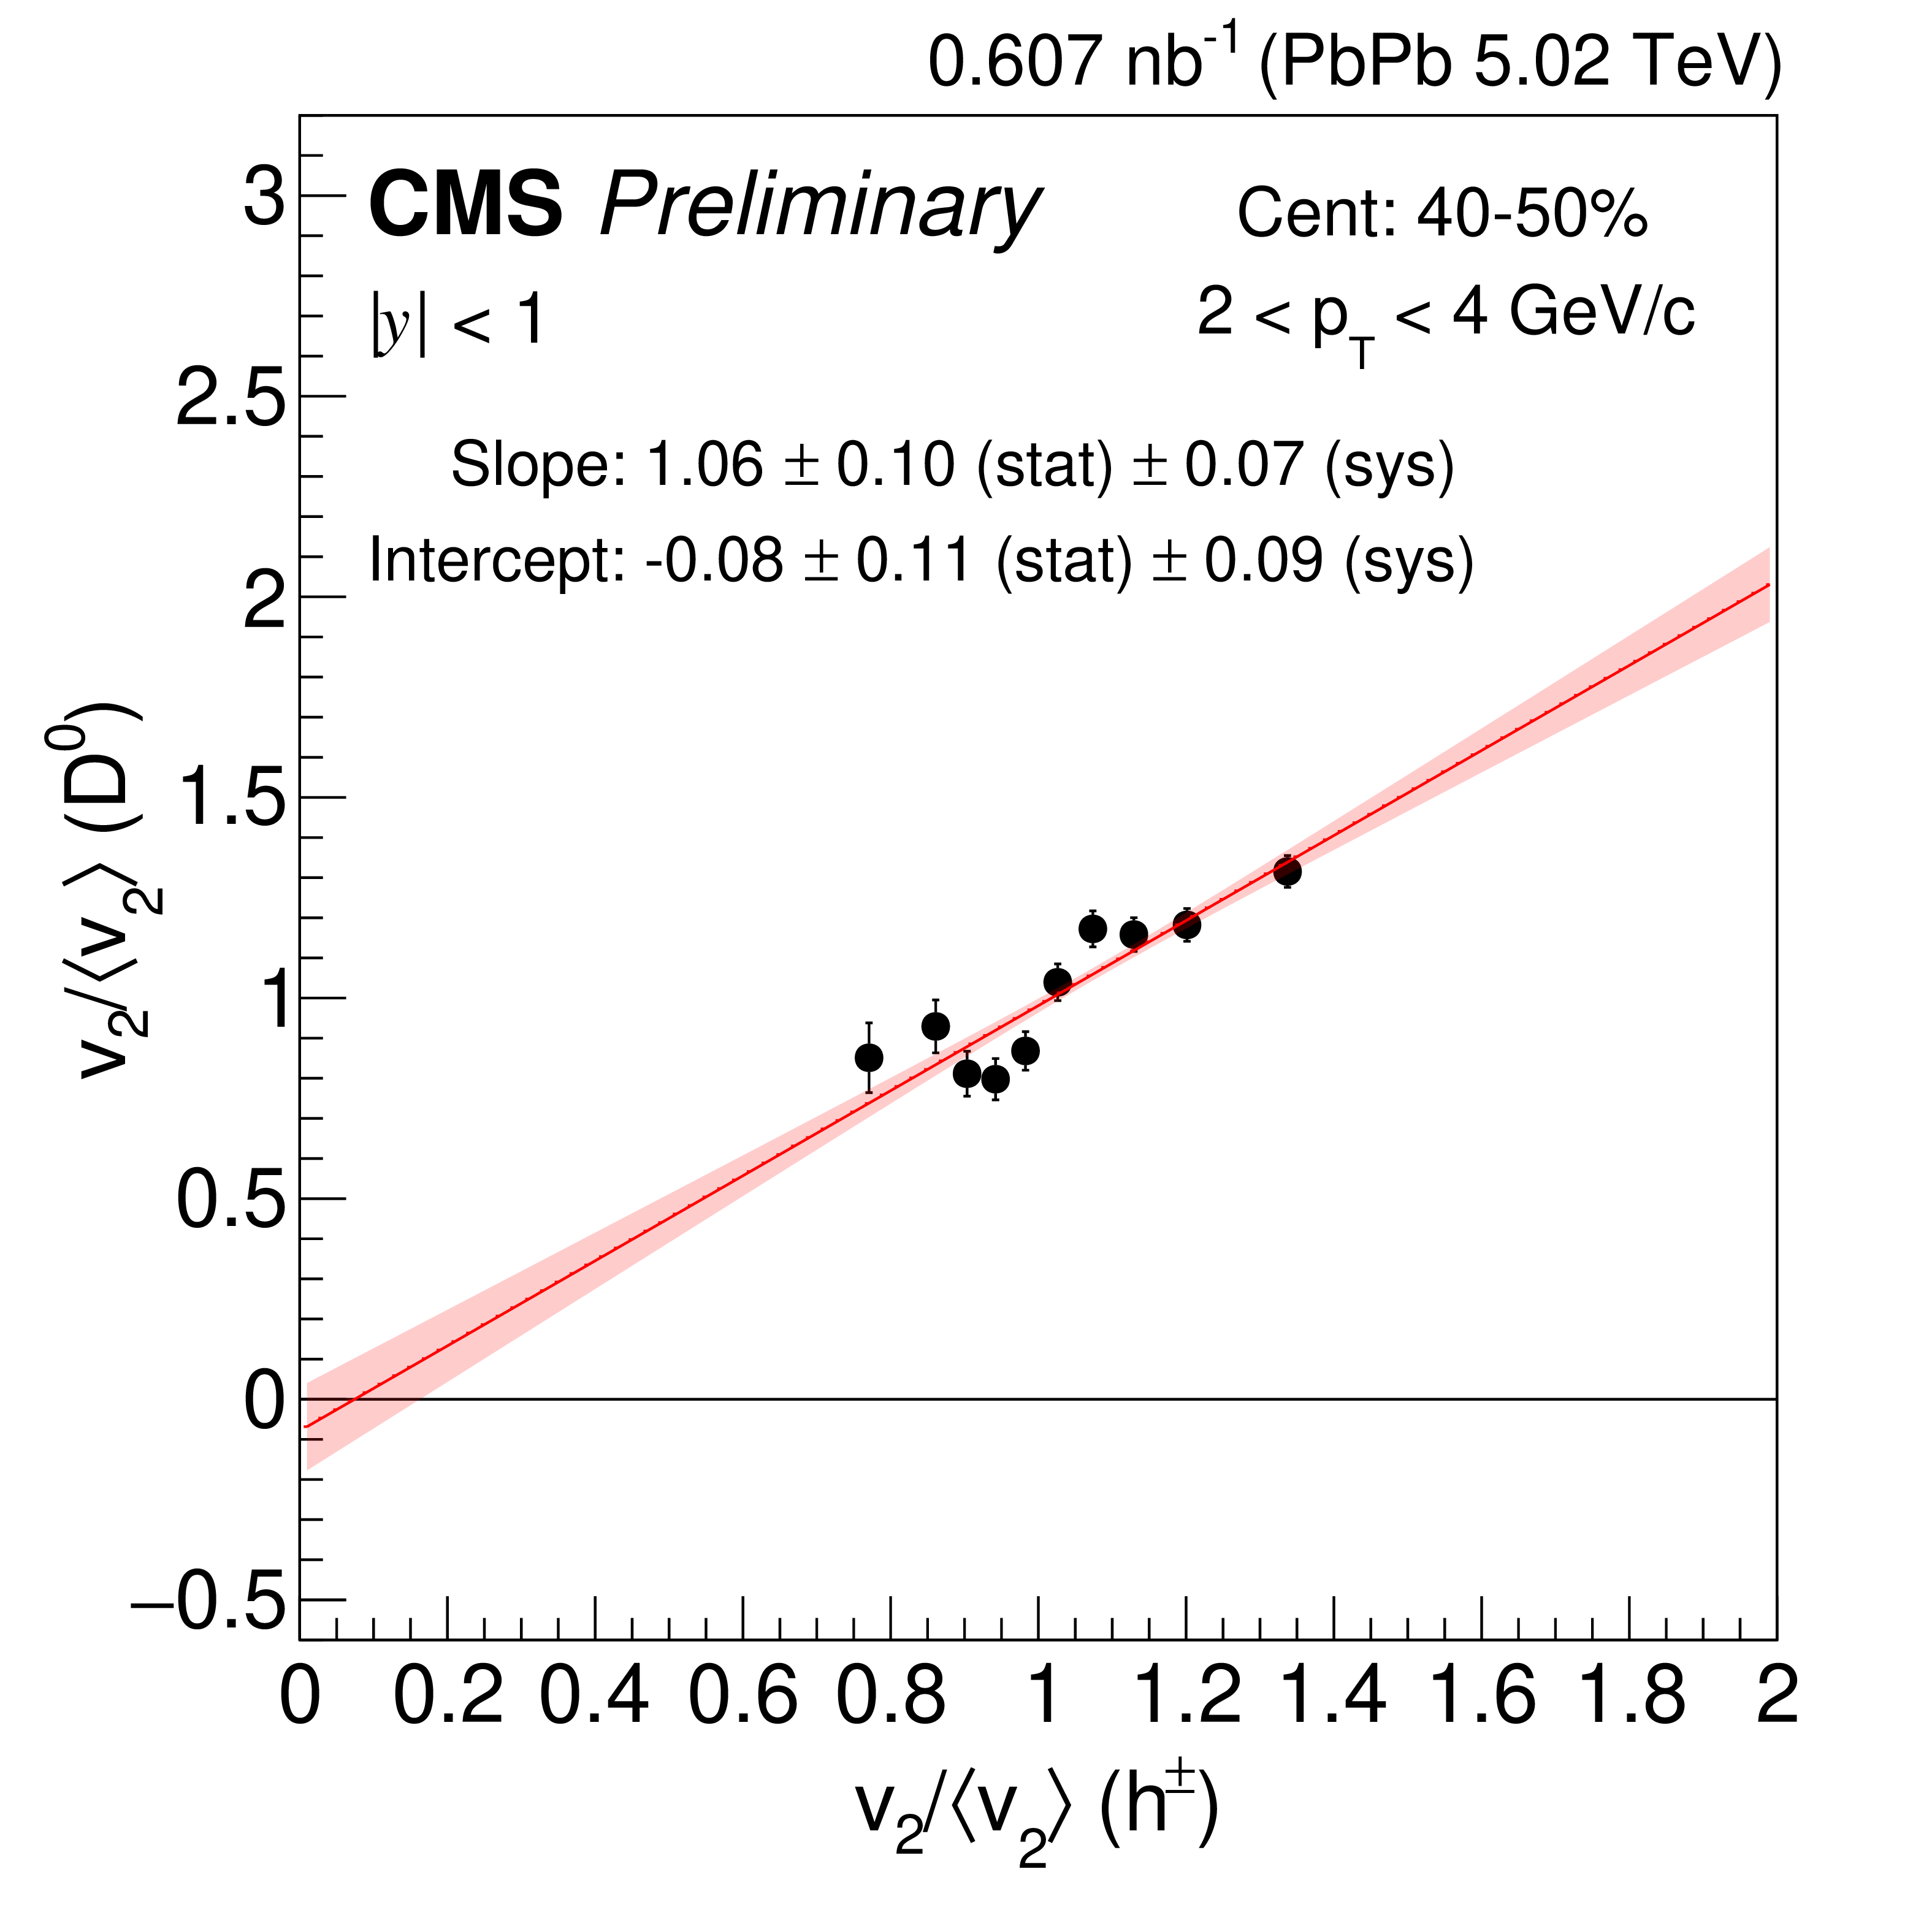
Figure 7-a:
Correlation between the normalized $ \mathrm{D^0} v_2 $ and the charged-particle $ v_2 $. The $ v_2 $ value in each $ q_2 $ bin is scaled by the $ q_2 $-inclusive $ v_2 $. The charged-particle $ v_2 $ is measured in the $ p_{\mathrm{T}} $ region 1-3 GeV/$c$. The correlation plots for $ \mathrm{D^0} p_{\mathrm{T}} $ 2-4 (upper left), 4-6 (upper right), 6-10 (lower left) and 10-30 GeV/$c$ (lower right) in the centrality class 40-50%. The red band corresponds to the uncertainty of one standard deviation. |
png pdf |
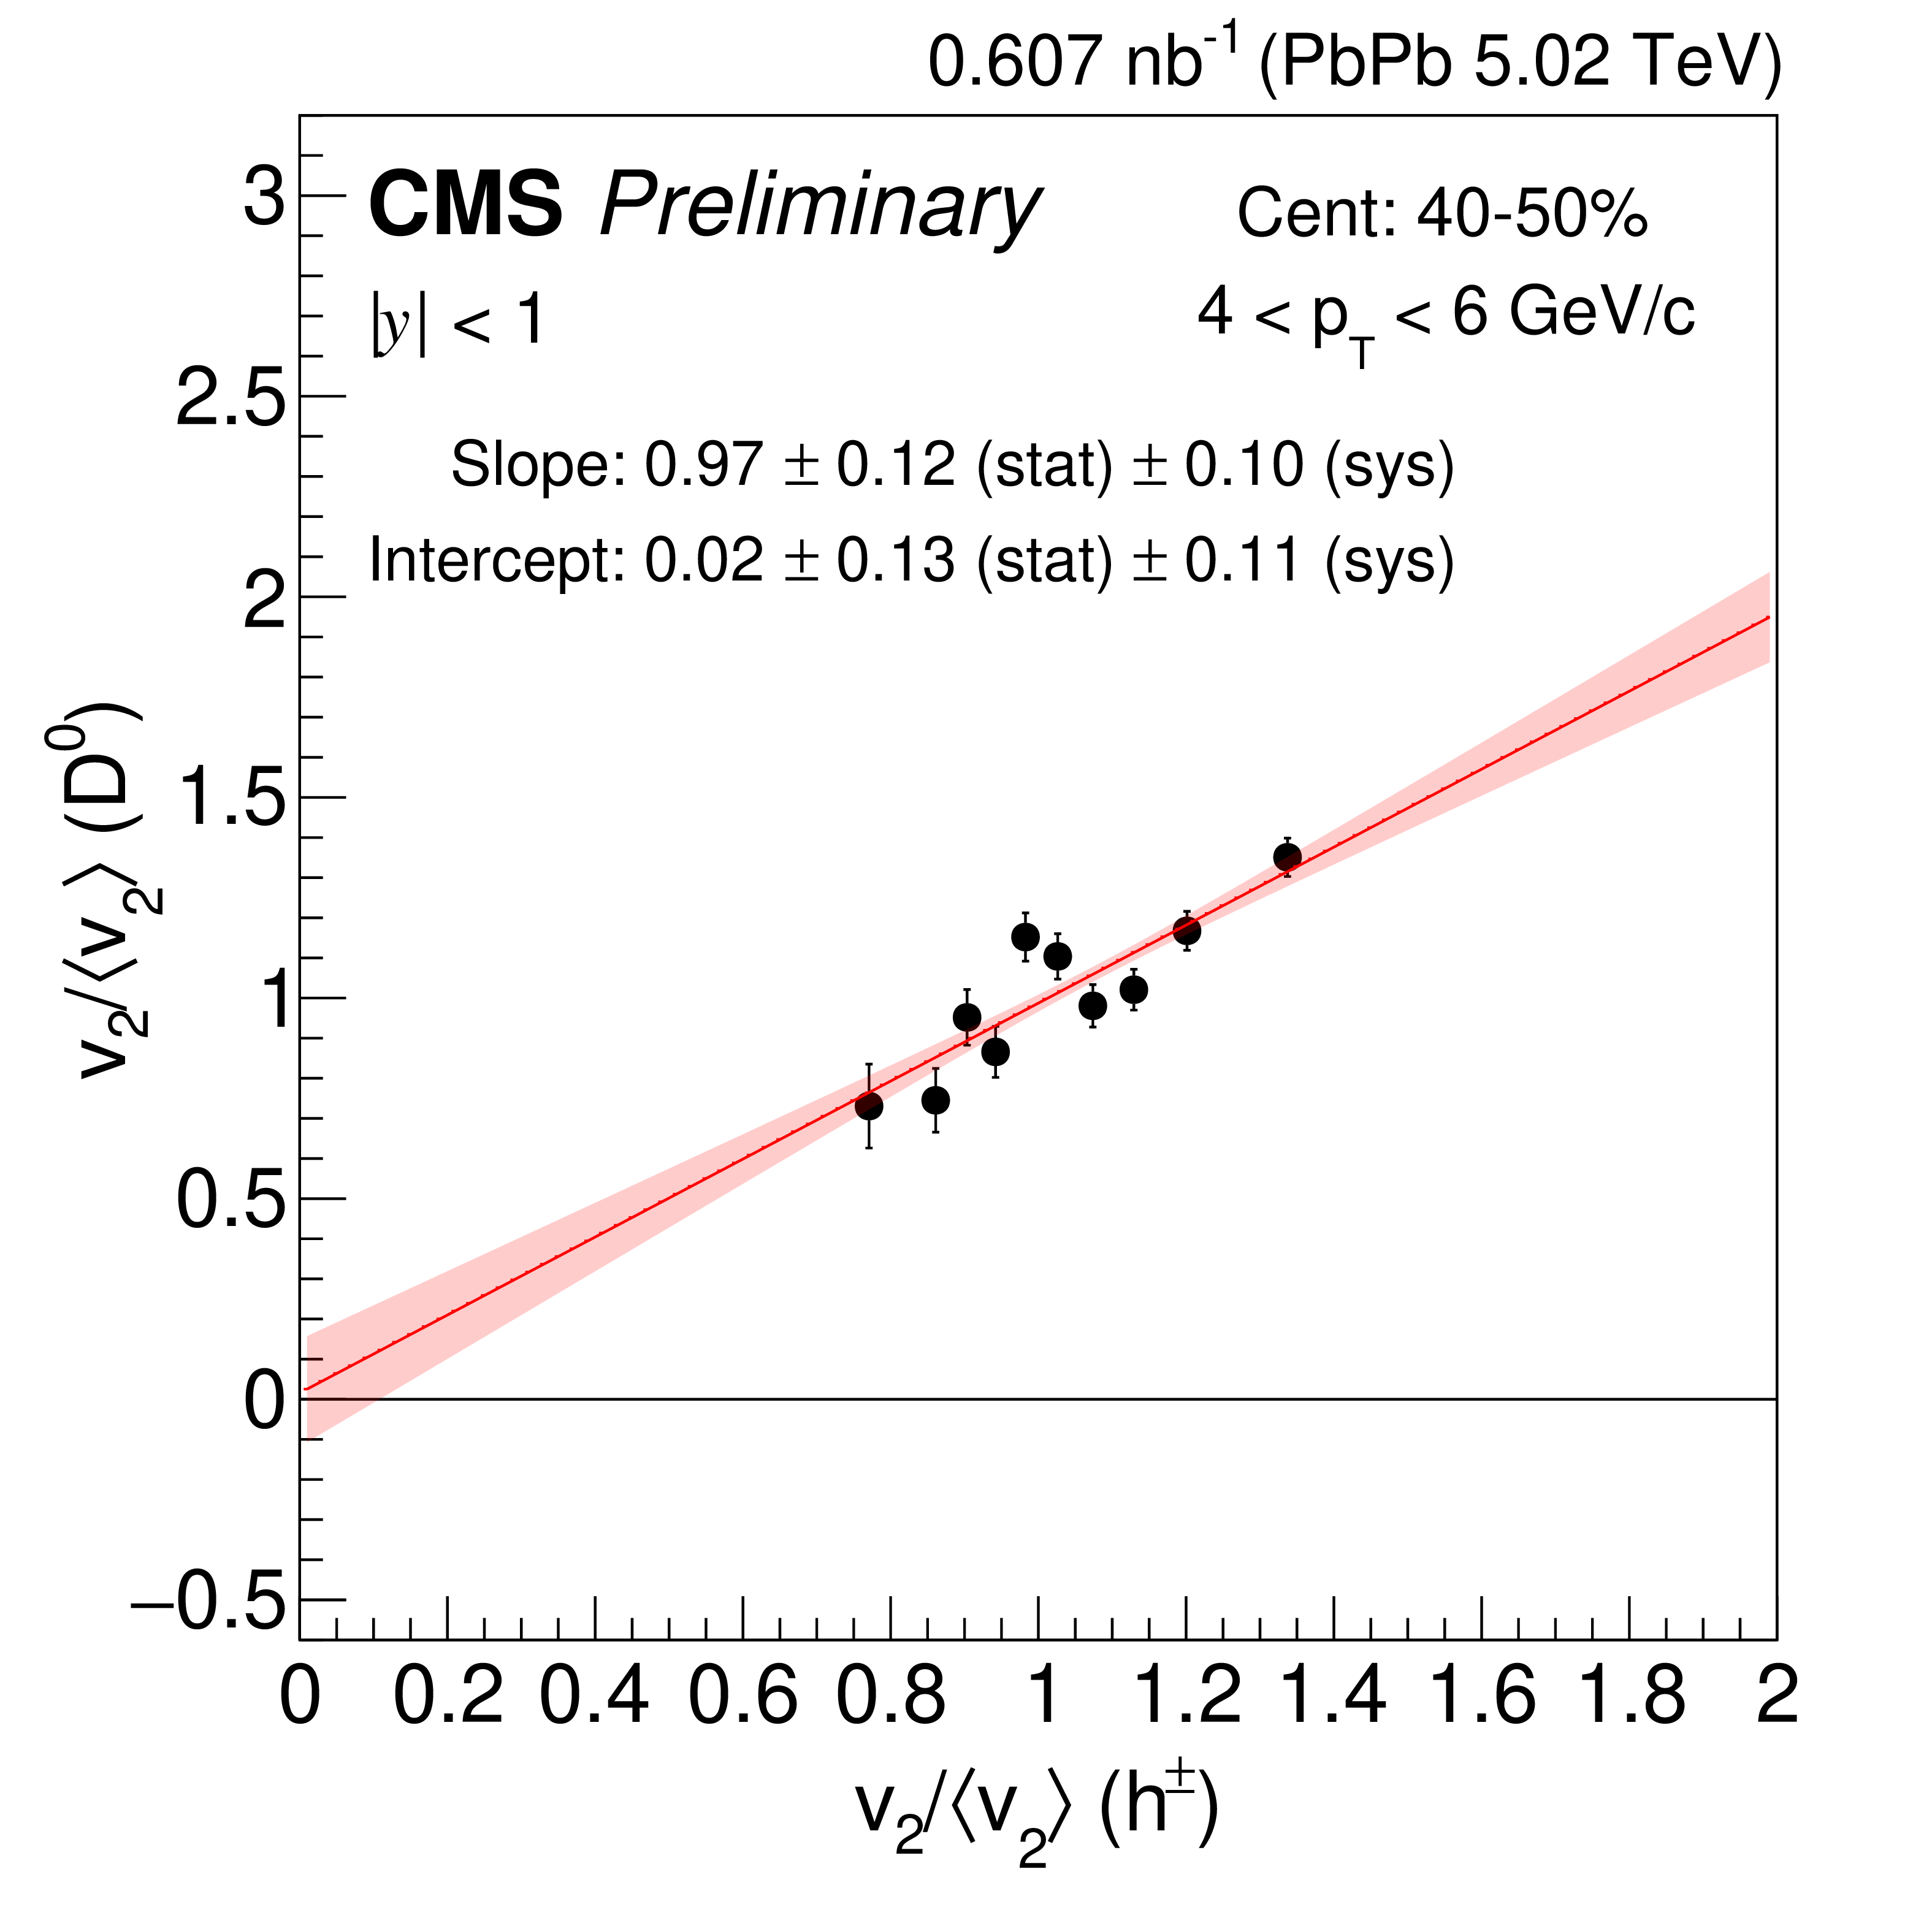
Figure 7-b:
Correlation between the normalized $ \mathrm{D^0} v_2 $ and the charged-particle $ v_2 $. The $ v_2 $ value in each $ q_2 $ bin is scaled by the $ q_2 $-inclusive $ v_2 $. The charged-particle $ v_2 $ is measured in the $ p_{\mathrm{T}} $ region 1-3 GeV/$c$. The correlation plots for $ \mathrm{D^0} p_{\mathrm{T}} $ 2-4 (upper left), 4-6 (upper right), 6-10 (lower left) and 10-30 GeV/$c$ (lower right) in the centrality class 40-50%. The red band corresponds to the uncertainty of one standard deviation. |

png pdf |
Figure 7-c:
Correlation between the normalized $ \mathrm{D^0} v_2 $ and the charged-particle $ v_2 $. The $ v_2 $ value in each $ q_2 $ bin is scaled by the $ q_2 $-inclusive $ v_2 $. The charged-particle $ v_2 $ is measured in the $ p_{\mathrm{T}} $ region 1-3 GeV/$c$. The correlation plots for $ \mathrm{D^0} p_{\mathrm{T}} $ 2-4 (upper left), 4-6 (upper right), 6-10 (lower left) and 10-30 GeV/$c$ (lower right) in the centrality class 40-50%. The red band corresponds to the uncertainty of one standard deviation. |
png pdf |
Figure 7-d:
Correlation between the normalized $ \mathrm{D^0} v_2 $ and the charged-particle $ v_2 $. The $ v_2 $ value in each $ q_2 $ bin is scaled by the $ q_2 $-inclusive $ v_2 $. The charged-particle $ v_2 $ is measured in the $ p_{\mathrm{T}} $ region 1-3 GeV/$c$. The correlation plots for $ \mathrm{D^0} p_{\mathrm{T}} $ 2-4 (upper left), 4-6 (upper right), 6-10 (lower left) and 10-30 GeV/$c$ (lower right) in the centrality class 40-50%. The red band corresponds to the uncertainty of one standard deviation. |
| Tables | |
png pdf |
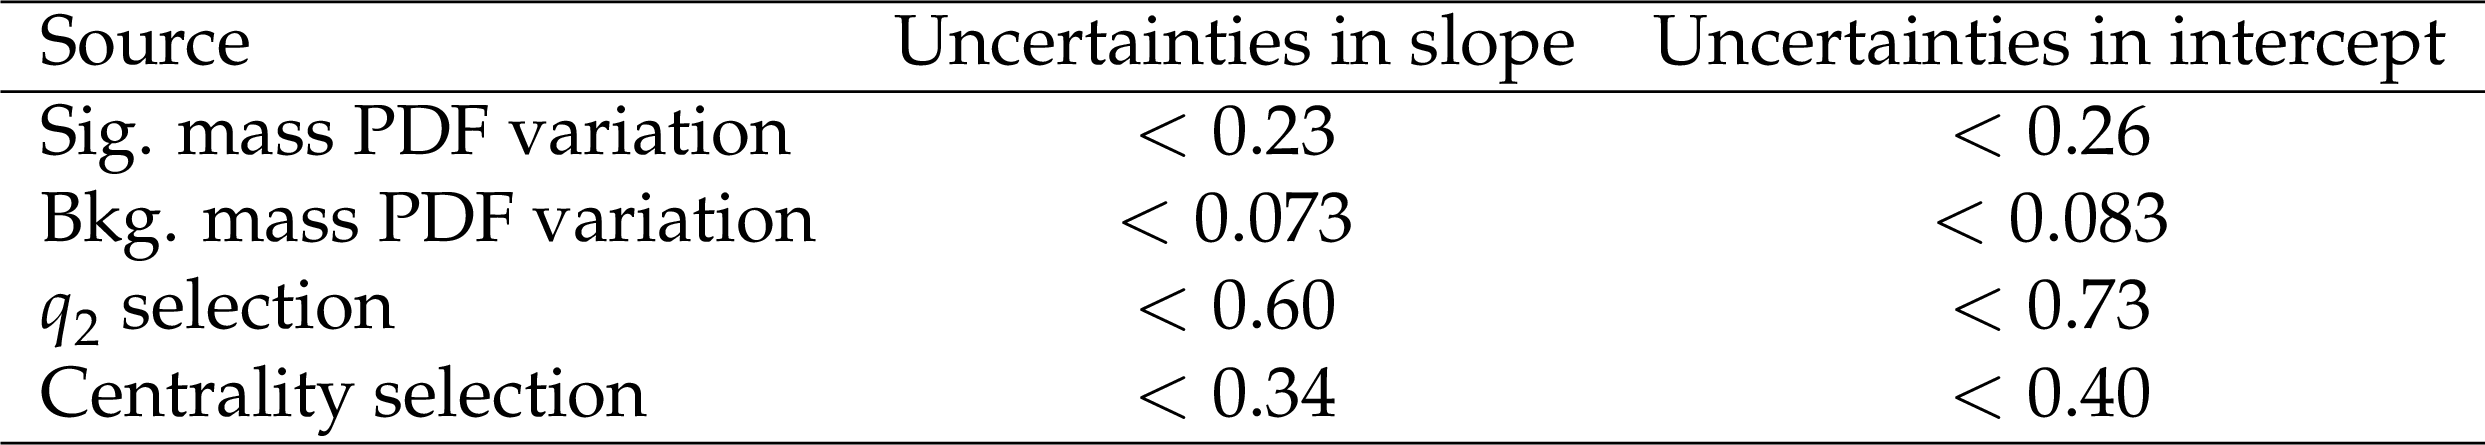
Table 1:
Summary of systematic uncertainties in the absolute differences between the nominal and the alternative analyses for the slope and intercept of the correlation plots. |
| Summary |
| In this study, a clear correlation between the initial collision geometry is demonstrated, characterized by the reduced flow vector, and the elliptic flow of prompt $ \mathrm{D^0} $ mesons in PbPb collisions at $ \sqrt{\smash[b]{s_{_{\mathrm{NN}}}}}= $ 5.02 TeV. By employing event-shape engineering to systematically vary initial-state eccentricities, we have shown that the $ \mathrm{D^0} $ meson $ v_2 $ is strongly correlated to the eccentricity ($ \epsilon_2 $) of the initial geometry. This observation, coupled with the observed correlation between $ \mathrm{D^0} v_2 $ and charged-particle $ v_2 $ within the $ p_{\mathrm{T}} $ range 1-3 GeV/$c$, reinforces the conclusion that the initial geometry eccentricity is the dominant source of charm-hadron elliptic flow. This correlation is approximately linear and exists in the centrality region of 0-50% (10% classes) and for both low (2-10 GeV/$c$) and high-$ p_{\mathrm{T}} $ (10-30 GeV/$c$) of $ \mathrm{D^0} $-meson. A nonlinear correlation, specifically for high $ \mathrm{D^0} p_{\mathrm{T}} $ may be an indication of the path-length dependent energy-loss of charm quark in the QGP medium. These findings provide compelling evidence for the significant role of initial-state geometry in shaping the collective flow of heavy quarks within the quark-gluon plasma created in heavy-ion collisions. |
| References | ||||
| 1 | E. V. Shuryak | Theory of Hadronic Plasma | Sov. Phys. JETP 47 (1978) 212 | |
| 2 | U. Heinz and R. Snellings | Collective flow and viscosity in relativistic heavy-ion collisions | Ann. Rev. Nucl. Part. Sci. 63 (2013) 123 | 1301.2826 |
| 3 | S. Voloshin and Y. Zhang | Flow study in relativistic nuclear collisions by fourier expansion of azimuthal particle distributions | Z. Phys. C 70 (1996) 665 | hep-ph/9407282 |
| 4 | W. Busza, K. Rajagopal, and W. van der Schee | Heavy ion collisions: The big picture, and the big questions | Ann. Rev. Nucl. Part. Sci. 68 (2018) 339 | 1802.04801 |
| 5 | J. Takahashi et al. | Topology studies of hydrodynamics using two particle correlation analysis | PRL 103 (2009) 242301 | 0902.4870 |
| 6 | B. Alver and G. Roland | Collision geometry fluctuations and triangular flow in heavy-ion collisions | [Erratum: Phys.Rev.C 82, 039903] PRC 81 (2010) 054905 |
1003.0194 |
| 7 | F. G. Gardim, F. Grassi, M. Luzum, and J.-Y. Ollitrault | Mapping the hydrodynamic response to the initial geometry in heavy-ion collisions | PRC 85 (2012) 024908 | 1111.6538 |
| 8 | H. Niemi, G. S. Denicol, H. Holopainen, and P. Huovinen | Event-by-event distributions of azimuthal asymmetries in ultrarelativistic heavy-ion collisions | PRC 87 (2013) 054901 | 1212.1008 |
| 9 | F. G. Gardim, J. Noronha-Hostler, M. Luzum, and F. Grassi | Effects of viscosity on the mapping of initial to final state in heavy ion collisions | PRC 91 (2015) 034902 | 1411.2574 |
| 10 | PHENIX Collaboration | Heavy quark production in $ p+p $ and energy loss and flow of heavy quarks in Au+Au collisions at $ \sqrt {\smash [b]{s_{_{\mathrm {NN}}}}}= $ 200 GeV | PRC 84 (2011) 044905 | 1005.1627 |
| 11 | STAR Collaboration | Elliptic flow of electrons from heavy-flavor hadron decays in Au+Au collisions at $ \sqrt {\smash [b]{s_{_{\mathrm {NN}}}}} = $ 200, 62.4, and 39 GeV | PRC 95 (2017) 034907 | 1405.6348 |
| 12 | STAR Collaboration | Measurement of $ D^0 $ azimuthal anisotropy at midrapidity in Au+Au collisions at $ \sqrt {\smash [b]{s_{_{\mathrm {NN}}}}}= $ 200 GeV | PRL 118 (2017) 212301 | 1701.06060 |
| 13 | ALICE Collaboration | Azimuthal anisotropy of $ D $-meson production in Pb-Pb collisions at $ \sqrt {\smash [b]{s_{_{\mathrm {NN}}}}}= $ 2.76 TeV | PRC 90 (2014) 034904 | 1405.2001 |
| 14 | ALICE Collaboration | $ D $-meson azimuthal anisotropy in midcentral Pb-Pb collisions at $ \sqrt{s_{\rm NN}}= $ 5.02 TeV | PRL 120 (2018) 102301 | 1707.01005 |
| 15 | CMS Collaboration | Probing charm quark dynamics via multiparticle correlations in Pb-Pb collisions at $ \sqrt {\smash [b]{s_{_{\mathrm {NN}}}}} $ = 5.02 TeV | PRL 129 (2022) 022001 | CMS-HIN-20-001 2112.12236 |
| 16 | CMS Collaboration | Measurement of prompt $ D^0 $ meson azimuthal anisotropy in Pb-Pb collisions at $ \sqrt {\smash [b]{s_{_{\mathrm {NN}}}}} $ = 5.02 TeV | PRL 120 (2018) 202301 | CMS-HIN-16-007 1708.03497 |
| 17 | CMS Collaboration | Measurement of prompt $ \mathrm{D^0} $ and $ \mathrm{\overline{D}}^{0} $ meson azimuthal anisotropy and search for strong electric fields in PbPb collisions at $ \sqrt {\smash [b]{s_{_{\mathrm {NN}}}}} = $ 5.02 TeV | PLB 816 (2021) 136253 | CMS-HIN-19-008 2009.12628 |
| 18 | ALICE Collaboration | Event-shape engineering for the D-meson elliptic flow in mid-central Pb-Pb collisions at $ \sqrt{s_{\rm NN}} = $ 5.02 TeV | JHEP 02 (2019) 150 | 1809.09371 |
| 19 | ALICE Collaboration | Transverse-momentum and event-shape dependence of D-meson flow harmonics in Pb-Pb collisions at $ \sqrt{s_{\rm NN}} $ = 5.02 TeV | PLB 813 (2021) 136054 | 2005.11131 |
| 20 | J. Schukraft, A. Timmins, and S. A. Voloshin | Ultra-relativistic nuclear collisions: Event shape engineering | PLB 719 (2013) 394 | 1208.4563 |
| 21 | CMS Collaboration | Constraints on the chiral magnetic effect using charge-dependent azimuthal correlations in $ p\mathrm{Pb} $ and PbPb collisions at the CERN Large Hadron Collider | PRC 97 (2018) 044912 | CMS-HIN-17-001 1708.01602 |
| 22 | CMS Collaboration | Description and performance of track and primary-vertex reconstruction with the CMS tracker | JINST 9 (2014) P10009 | CMS-TRK-11-001 1405.6569 |
| 23 | CMS Collaboration | The CMS experiment at the CERN LHC | JINST 3 (2008) S08004 | |
| 24 | CMS Collaboration | Precision luminosity measurement in proton-proton collisions at $ \sqrt{s}= $ 13 TeV in 2015 and 2016 at CMS | EPJC 81 (2021) 800 | CMS-LUM-17-003 2104.01927 |
| 25 | CMS Collaboration | CMS luminosity measurement using nucleus-nucleus collisions at $ \sqrt{{s}_{\mathrm{NN}}}=5.02\text{ }\text{ }\mathrm{TeV} $ in 2018 | CMS Physics Analysis Summary, 2022 CMS-PAS-LUM-18-001 |
CMS-PAS-LUM-18-001 |
| 26 | CMS Collaboration | The CMS trigger system | JINST 12 (2017) P01020 | CMS-TRG-12-001 1609.02366 |
| 27 | CMS Collaboration | Charged-particle nuclear modification factors in PbPb and pPb collisions at $ \sqrt{s_{\mathrm{NN}}}= $ 5.02 TeV | JHEP 04 (2017) 039 | CMS-HIN-15-015 1611.01664 |
| 28 | T. Sjöstrand et al. | An introduction to PYTHIA 8.2 | Comput. Phys. Commun. 191 (2015) 159 | 1410.3012 |
| 29 | CMS Collaboration | Event generator tunes obtained from underlying event and multiparton scattering measurements | EPJC 76 (2016) 155 | CMS-GEN-14-001 1512.00815 |
| 30 | D. J. Lange | The EvtGen particle decay simulation package | NIM A 462 (2001) 152 | |
| 31 | GEANT4 Collaboration | GEANT 4---a simulation toolkit | NIM A 506 (2003) 250 | |
| 32 | Particle Data Group Collaboration | Review of particle physics | PRD 110 (2024) 030001 | |
| 33 | A. Hoecker et al. | TMVA, the Toolkit for Multivariate Data Analysis with ROOT | PoS ACAT 04 (2009) 0 | physics/0703039 |
| 34 | STAR Collaboration | Elliptic flow from two- and four-particle correlations in Au+Au collisions at $ \sqrt{s_{\mathrm{NN}}}= $ 130 GeV | PRC 66 (2002) 034904 | nucl-ex/0206001 |
| 35 | M. Luzum and J.-Y. Ollitrault | Eliminating experimental bias in anisotropic-flow measurements of high-energy nuclear collisions | PRC 87 (2013) 044907 | 1209.2323 |
| 36 | A. M. Poskanzer and S. A. Voloshin | Methods for analyzing anisotropic flow in relativistic nuclear collisions | PRC 58 (1998) 1671 | nucl-ex/9805001 |
| 37 | NA49 Collaboration | Directed and elliptic flow of charged pions and protons in $ \mathrm{Pb}+\mathrm{Pb} $ collisions at 40 $ A $ and 158 $ A\mathrm{GeV} $ | PRC 68 (2003) 034903 | nucl-ex/0303001 |
| 38 | CMS Collaboration | Measurements of azimuthal anisotropy of nonprompt $ D^0 $ mesons in PbPb collisions at $ \sqrt{{s}_{\mathrm{NN}}}= $ 5.02 TeV | Physics Letters B 850 (2024) 138389 | CMS-HIN-21-003 2212.01636 |
|
|
Compact Muon Solenoid LHC, CERN |
|

|

|

|

|

|