

Compact Muon Solenoid
LHC, CERN
| CMS-PAS-HIG-17-005 | ||
| Search for production of a Higgs boson and a single top quark in multilepton final states in proton collisions at $\sqrt{s}= $ 13 TeV | ||
| CMS Collaboration | ||
| May 2017 | ||
| Abstract: A search for the production of a Higgs boson in association with a single top quark is presented, focusing on leptonic signatures provided by the $\mathrm{H}\rightarrow\mathrm{W}\mathrm{W}$, $\mathrm{H}\rightarrow\tau\tau$, and $\mathrm{H}\rightarrow\mathrm{Z}\mathrm{Z}$ decay modes. Due to strong interference of the two main leading-order diagrams, the production cross section of this process is highly sensitive to the relative sign of the top-Higgs coupling modifier, $\kappa_{\mathrm{t}}$, and the coupling modifier of vector bosons to the Higgs, $\kappa_{\mathrm{V}}$. The analysis exploits signatures with two same-sign leptons or three leptons in the final state, and uses the 2016 data sample collected with the CMS detector at the LHC at a center of mass energy of 13 TeV, which corresponds to an integrated luminosity of 35.9 fb$^{-1}$. Multivariate techniques are used to discriminate the signal from the dominant backgrounds. The analysis yields a 95% confidence level (C.L.) upper limit on the combined $\mathrm{tH}+\mathrm{t\overline{t}H}$ production cross section times branching ratio of 0.64 pb, with an expected limit of 0.32 pb, for a scenario with $\kappa_\mathrm{t}=-1.0$ and $\kappa_\mathrm{V}= 1.0$. Values of $\kappa_\mathrm{t}$ outside the range of $-1.25$ to $+1.60$ are excluded at 95% C.L., assuming $\kappa_\mathrm{V}=1.0$. | ||
| Links: CDS record (PDF) ; inSPIRE record ; CADI line (restricted) ; | ||
| Figures & Tables | Summary | Additional Figures | References | CMS Publications |
|---|
| Figures | |
png pdf |
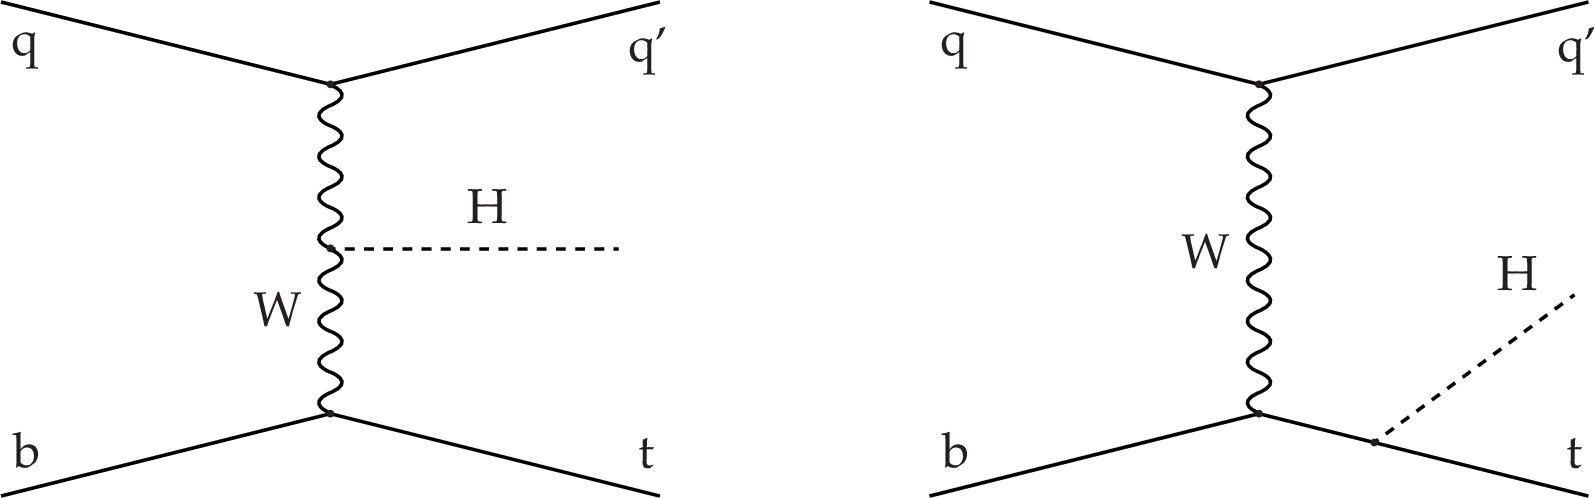
Figure 1:
Dominant leading order Feynman diagrams for the production of ${\mathrm{ t } \mathrm{ H } \mathrm {q}} $ events. The Higgs boson is either radiated from the W boson (left) or the top quark (right). |
png pdf |
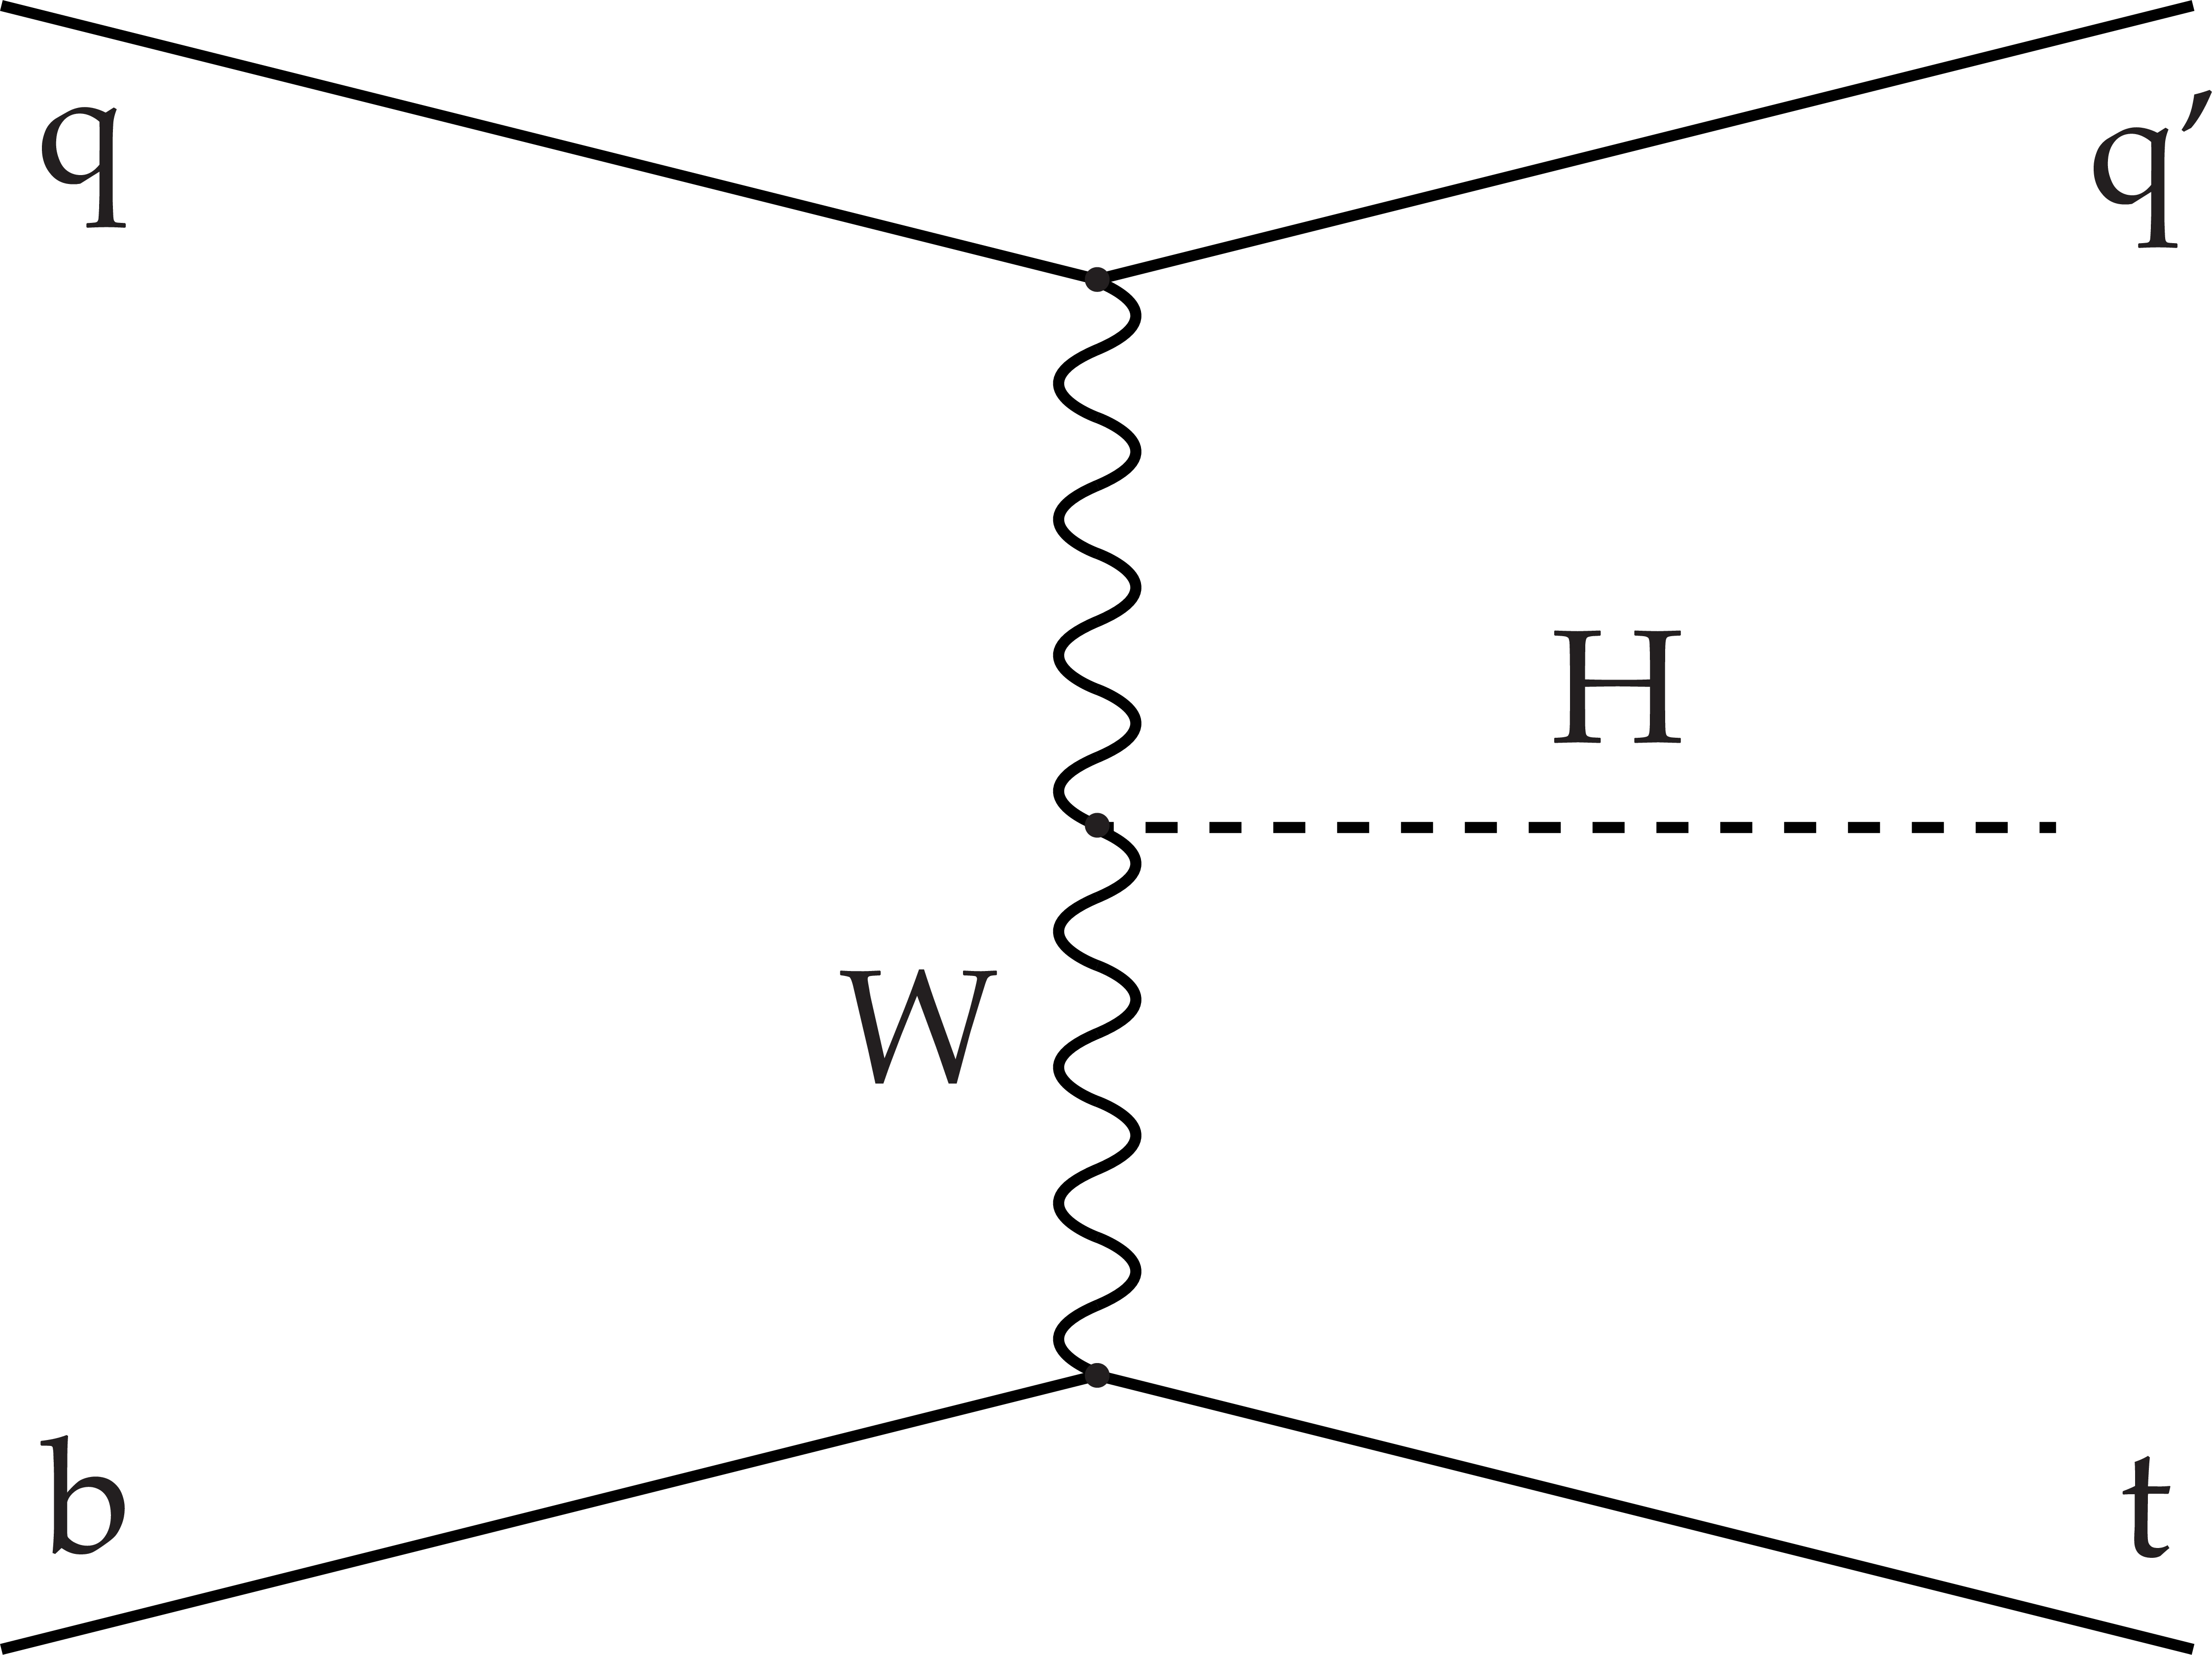
Figure 1-a:
Dominant leading order Feynman diagram for the production of ${\mathrm{ t } \mathrm{ H } \mathrm {q}} $ events. The Higgs boson is radiated from the W boson. |
png pdf |
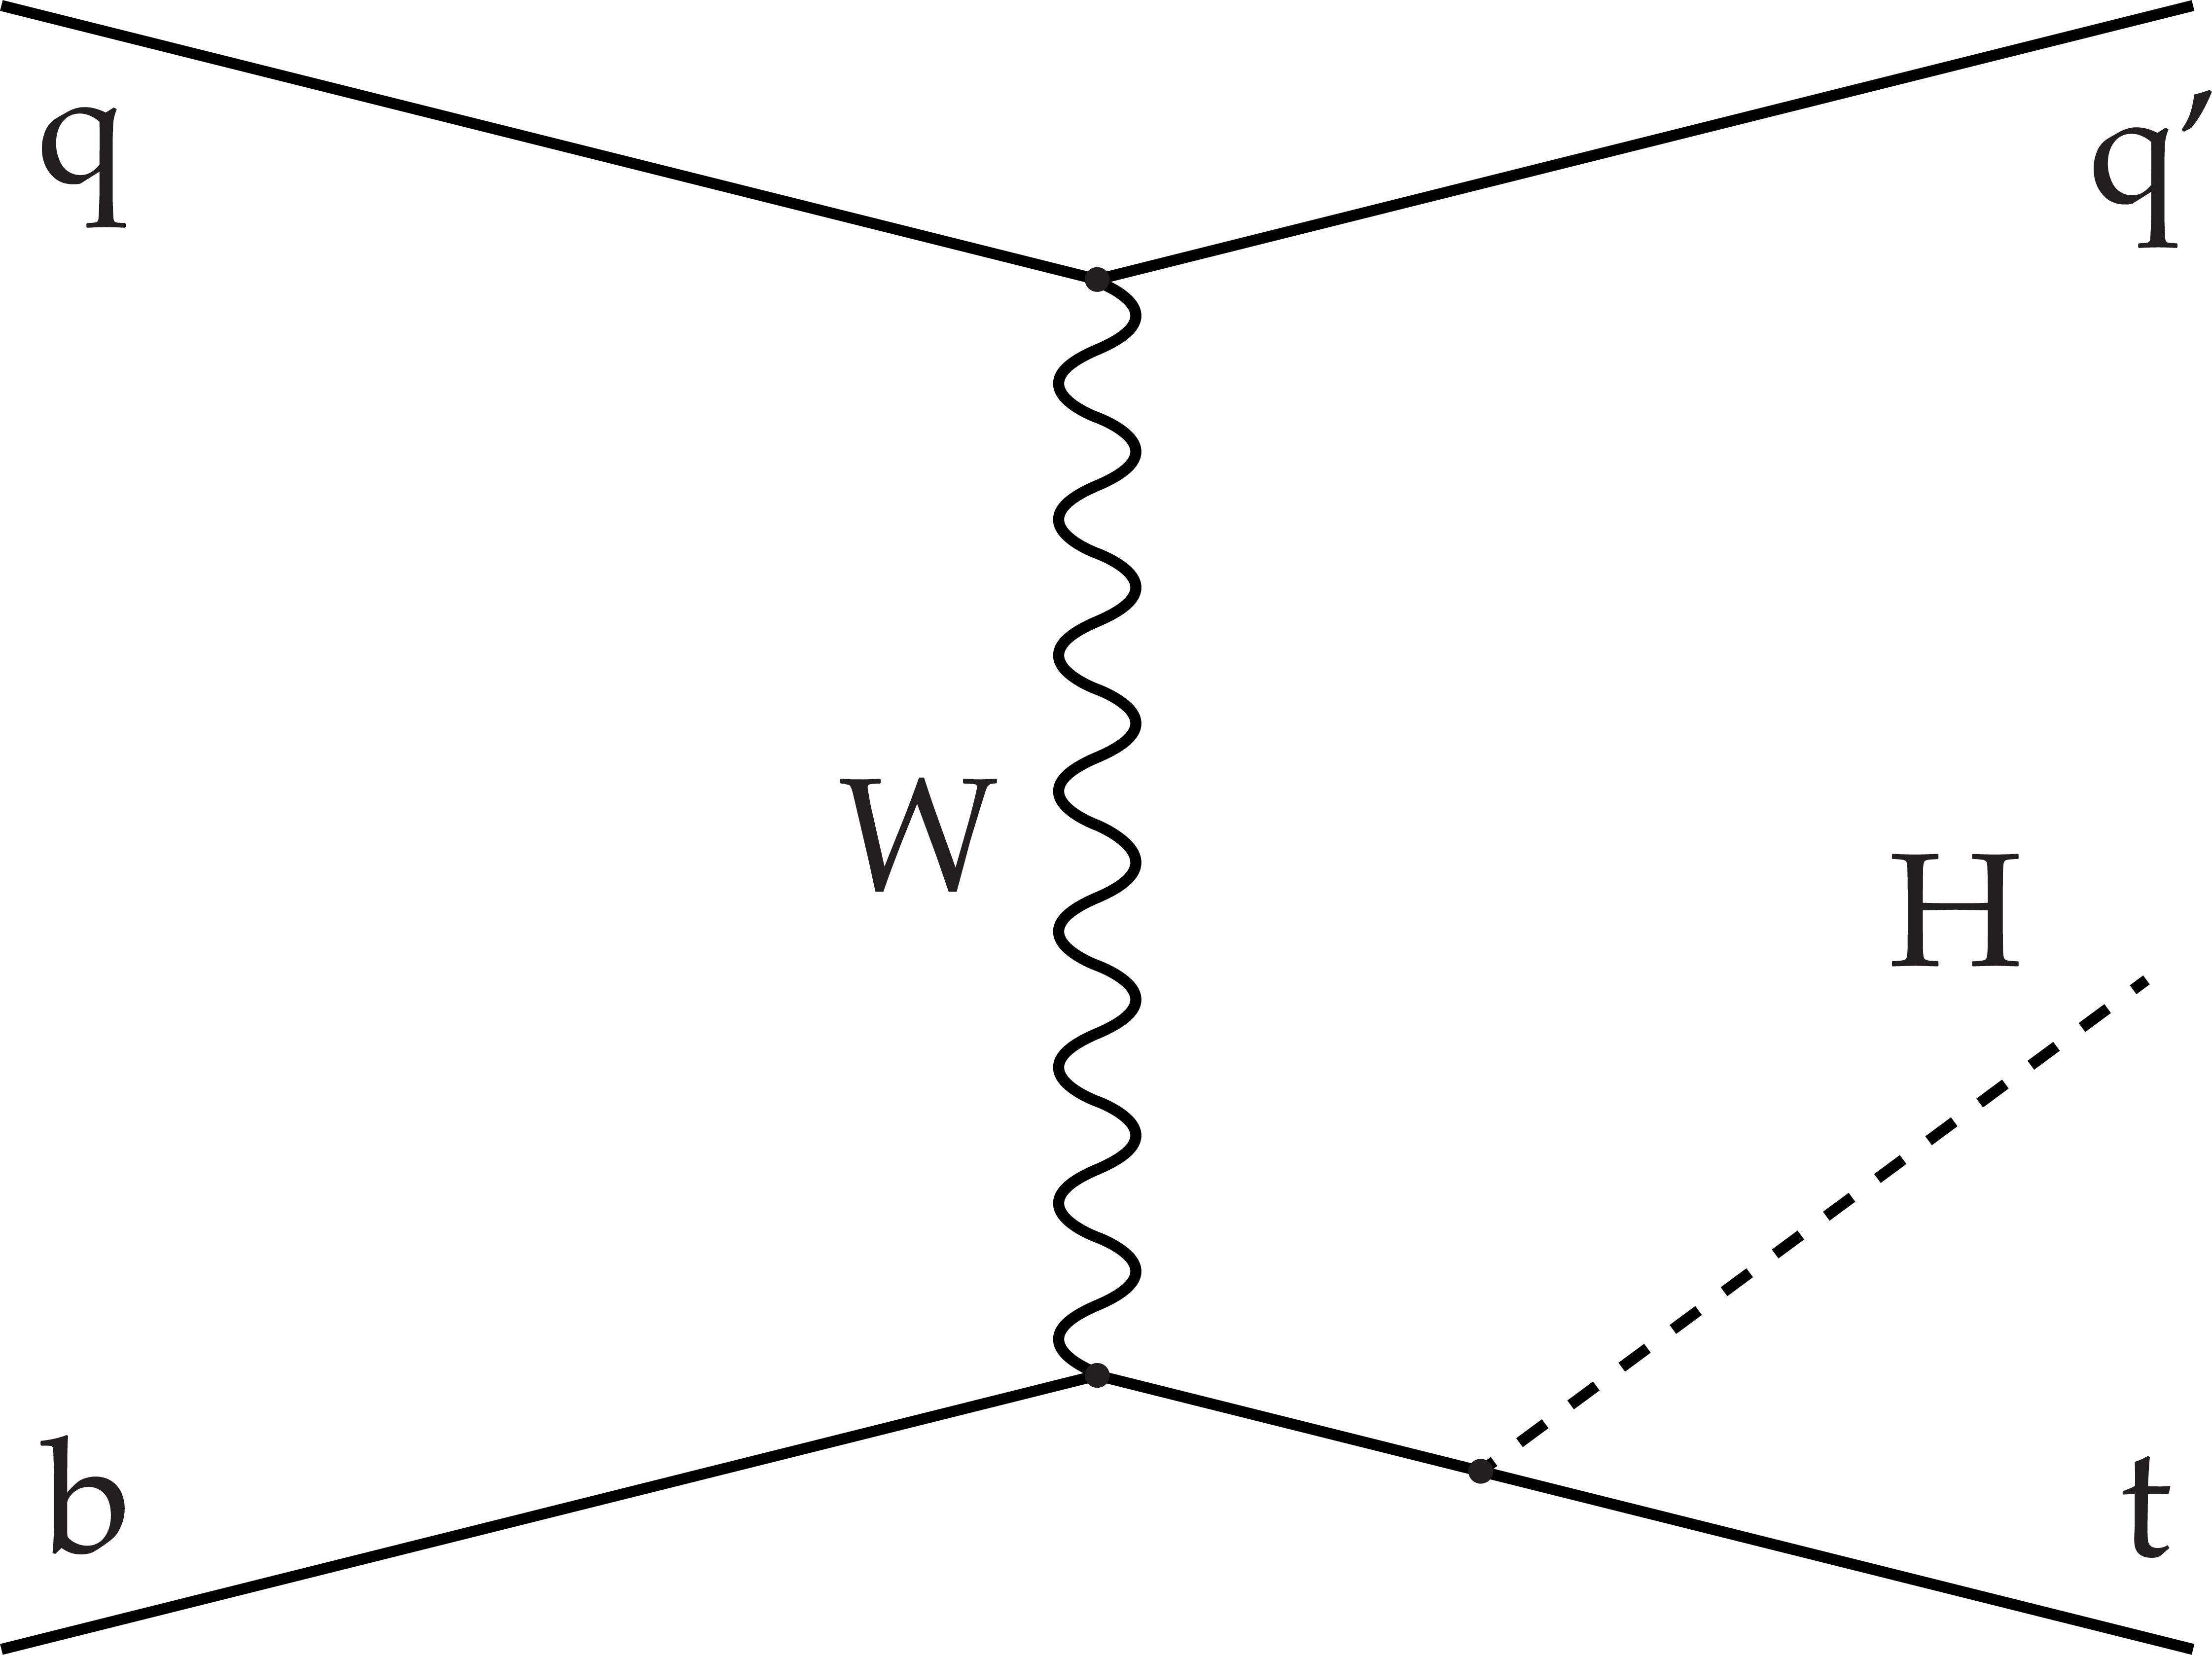
Figure 1-b:
Dominant leading order Feynman diagram for the production of ${\mathrm{ t } \mathrm{ H } \mathrm {q}} $ events. The Higgs boson is radiated from the top quark. |
png pdf |
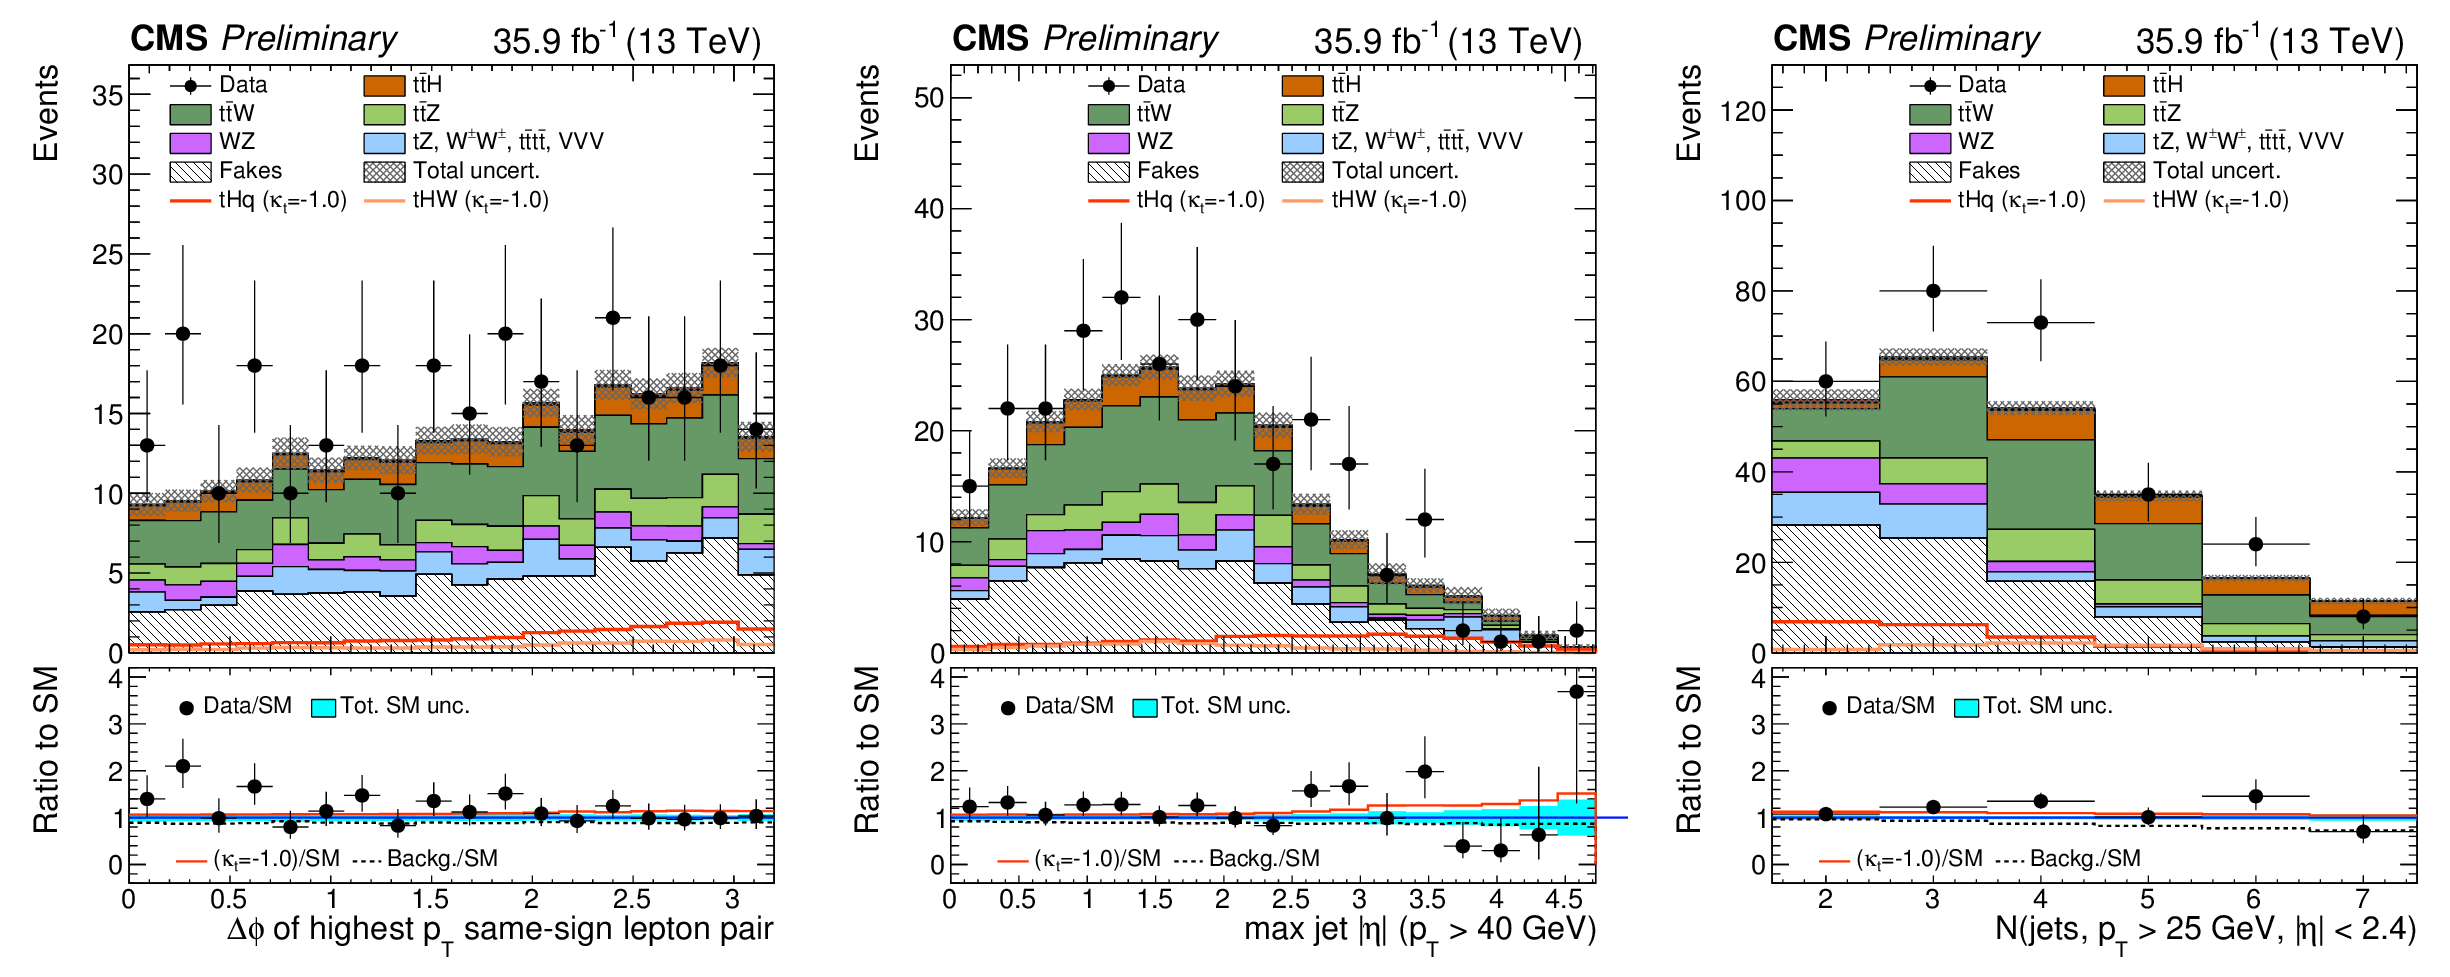
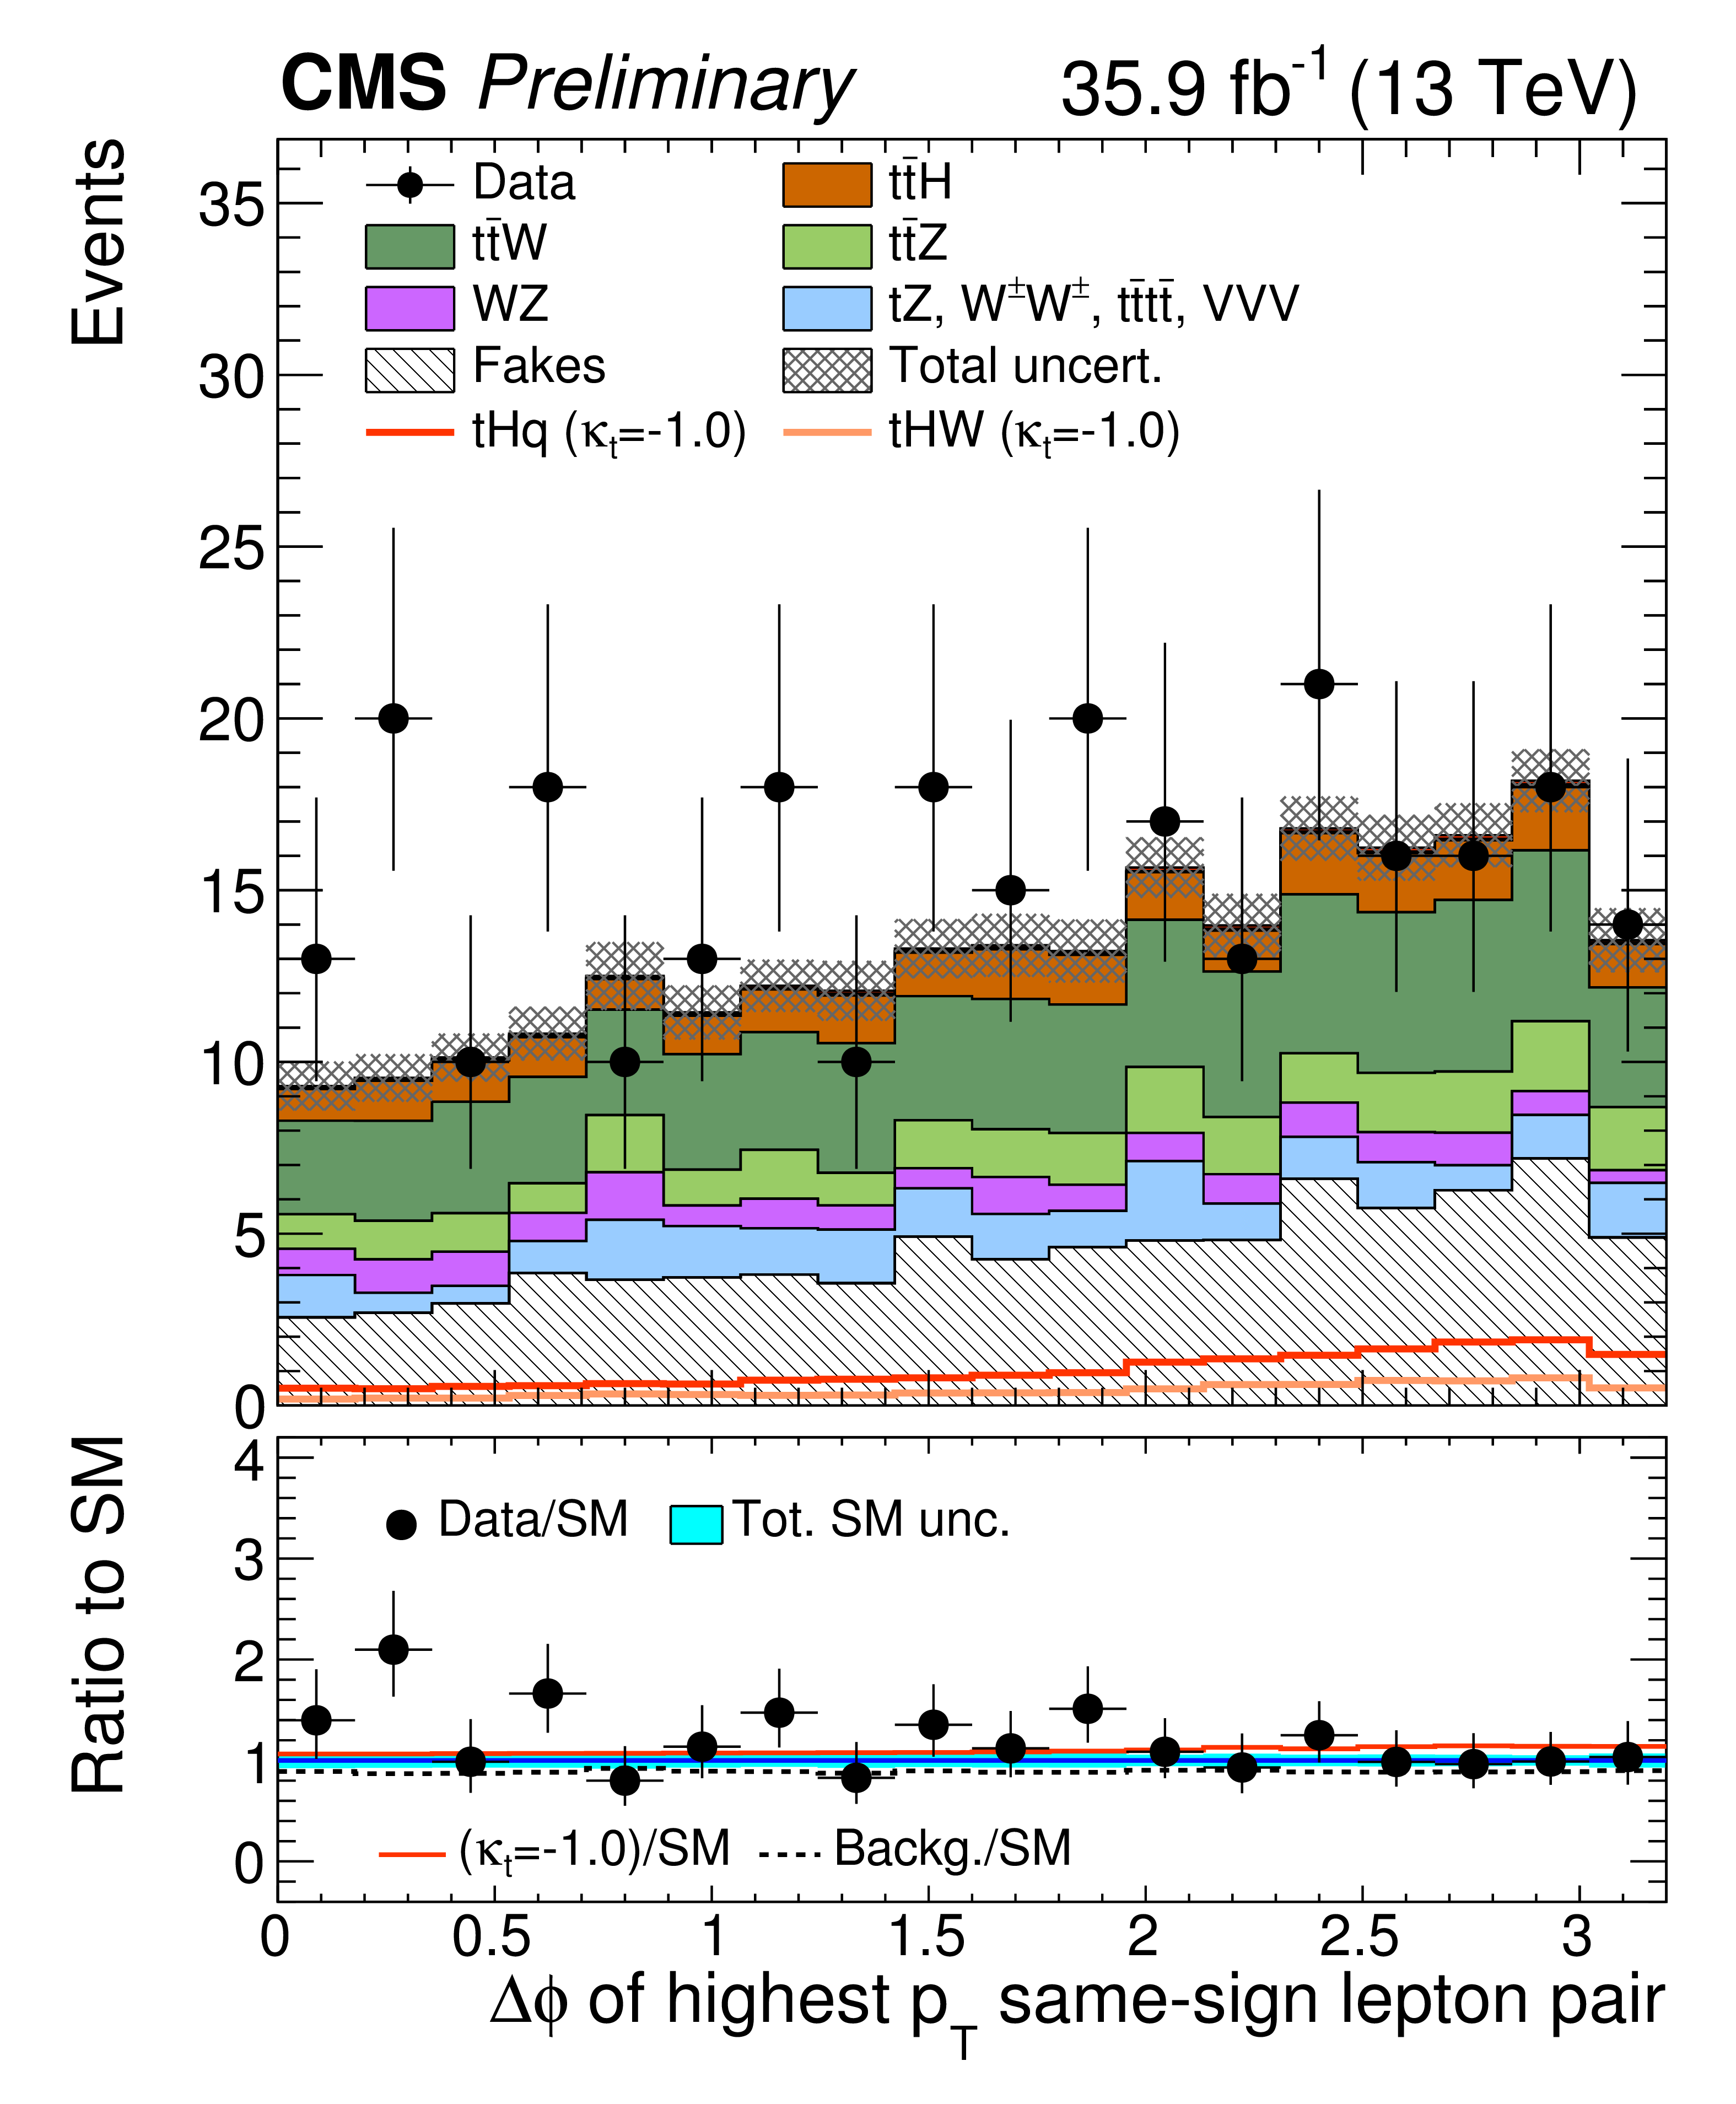
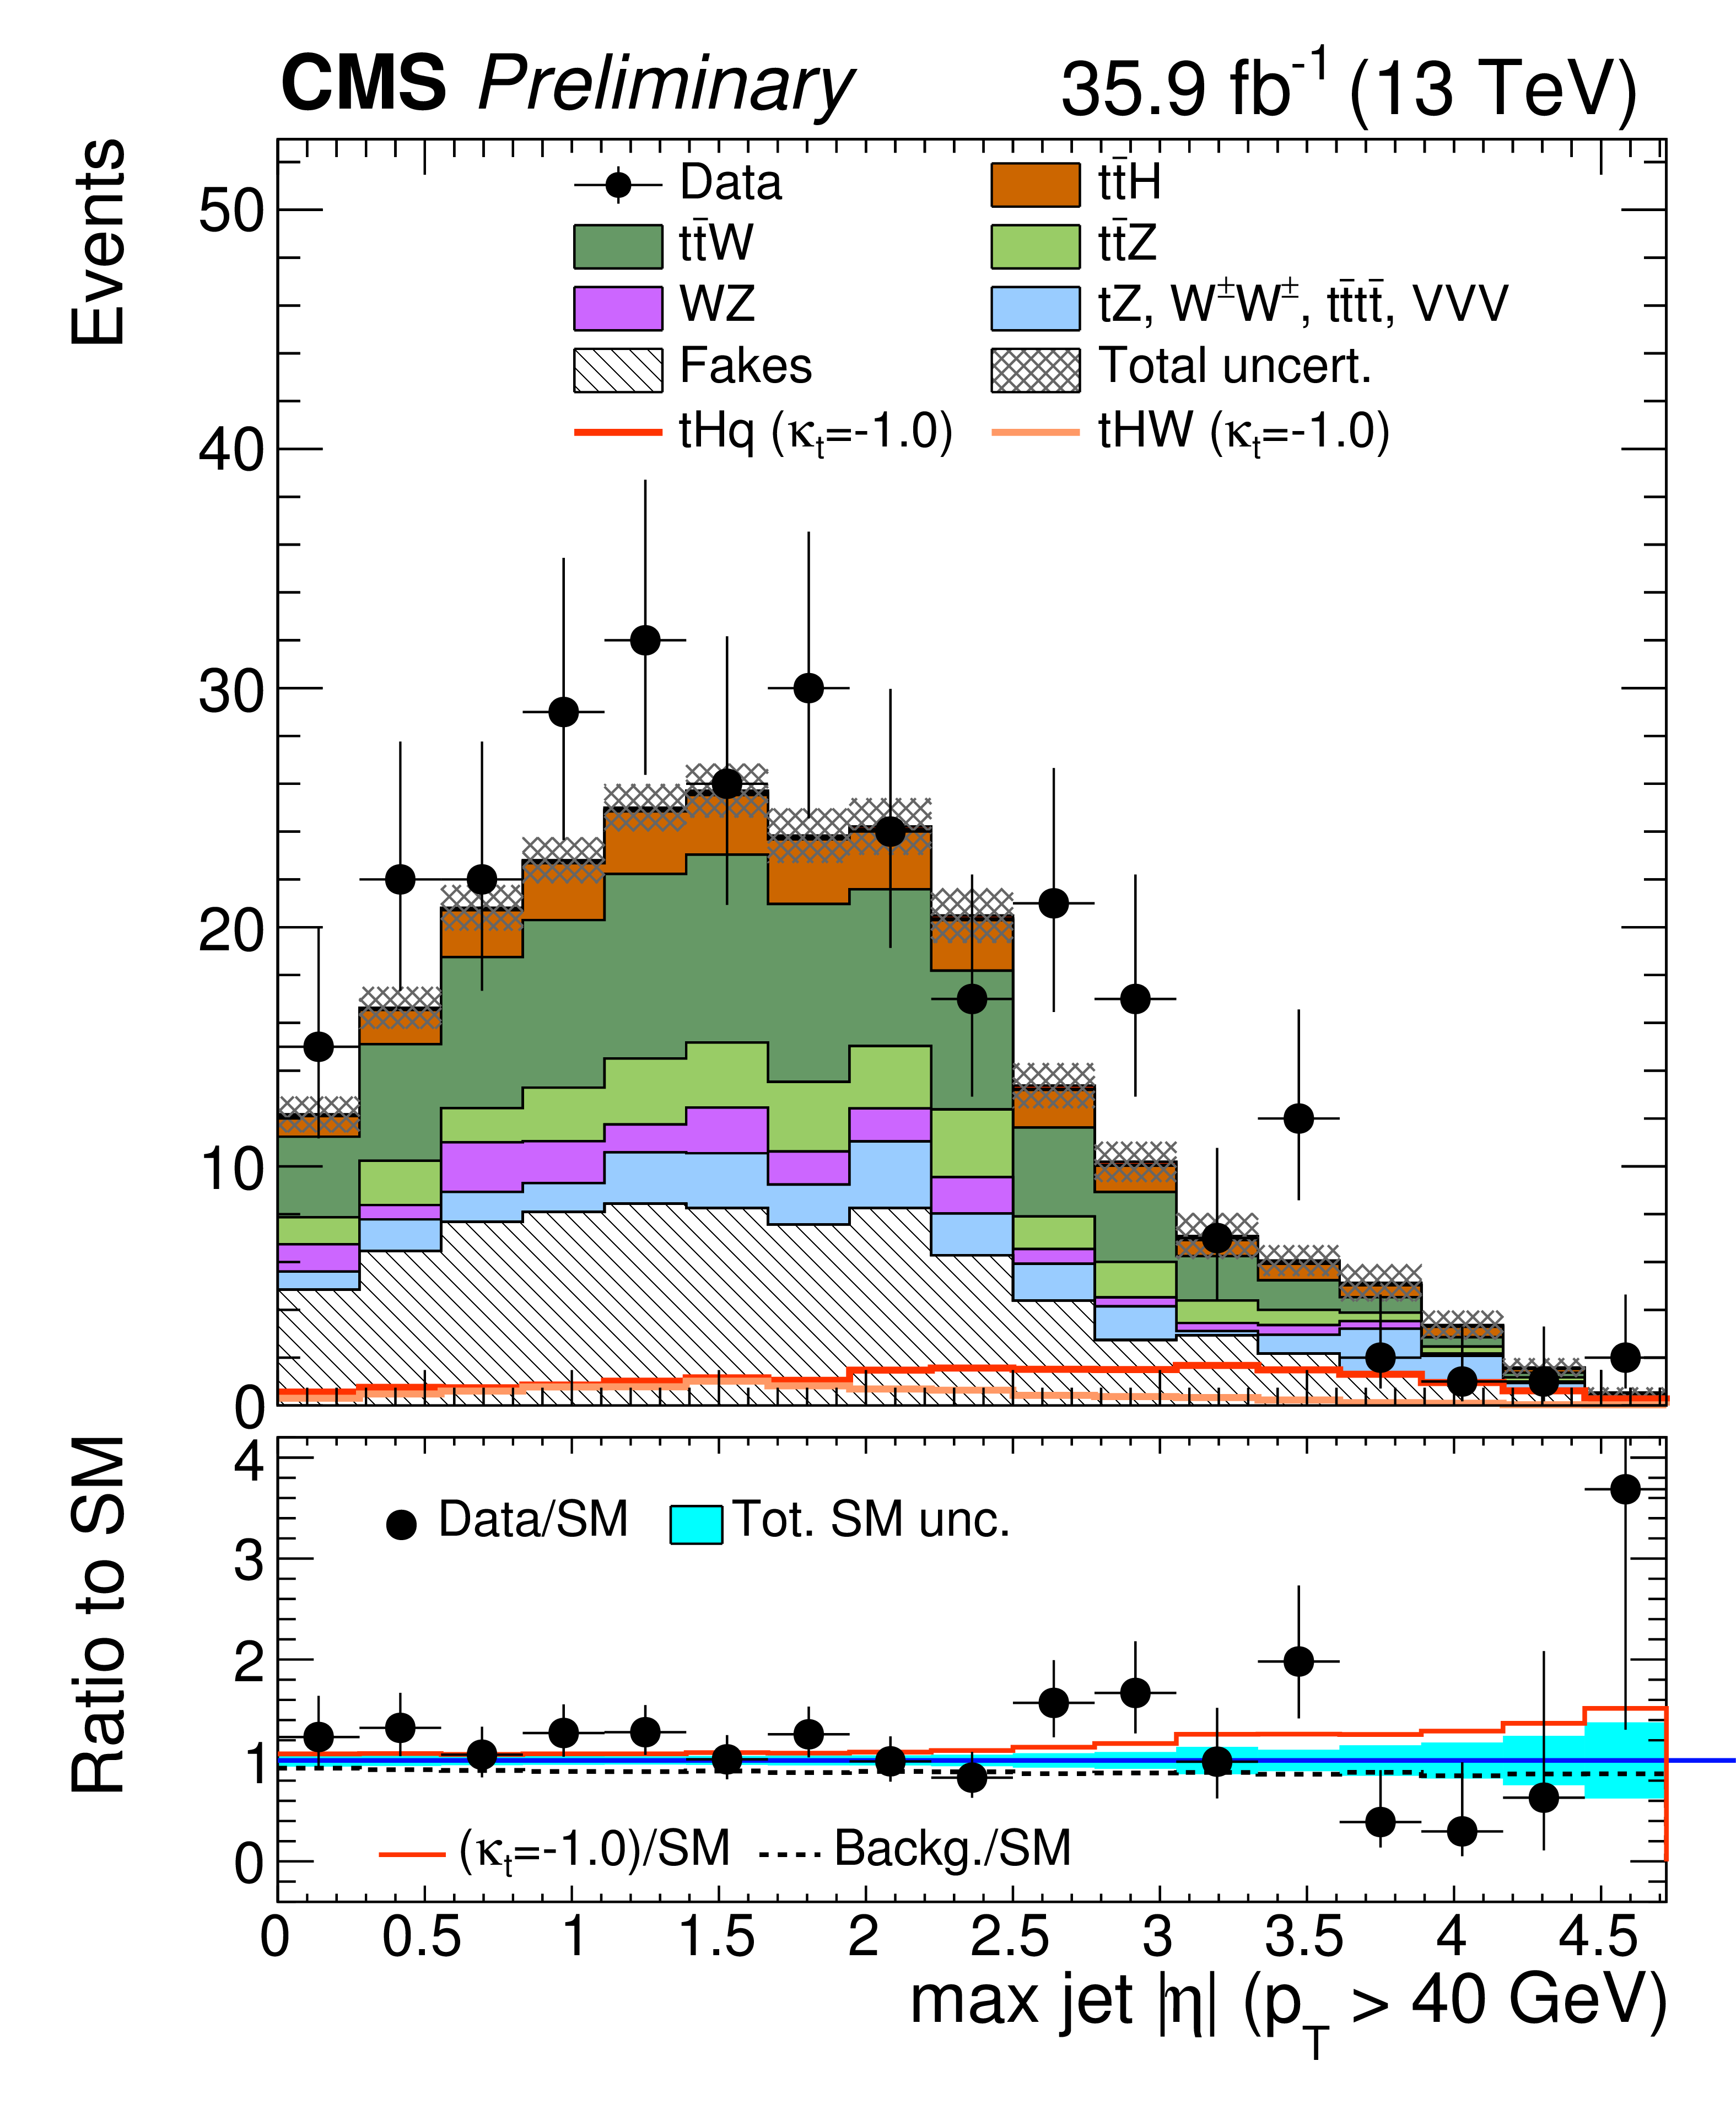
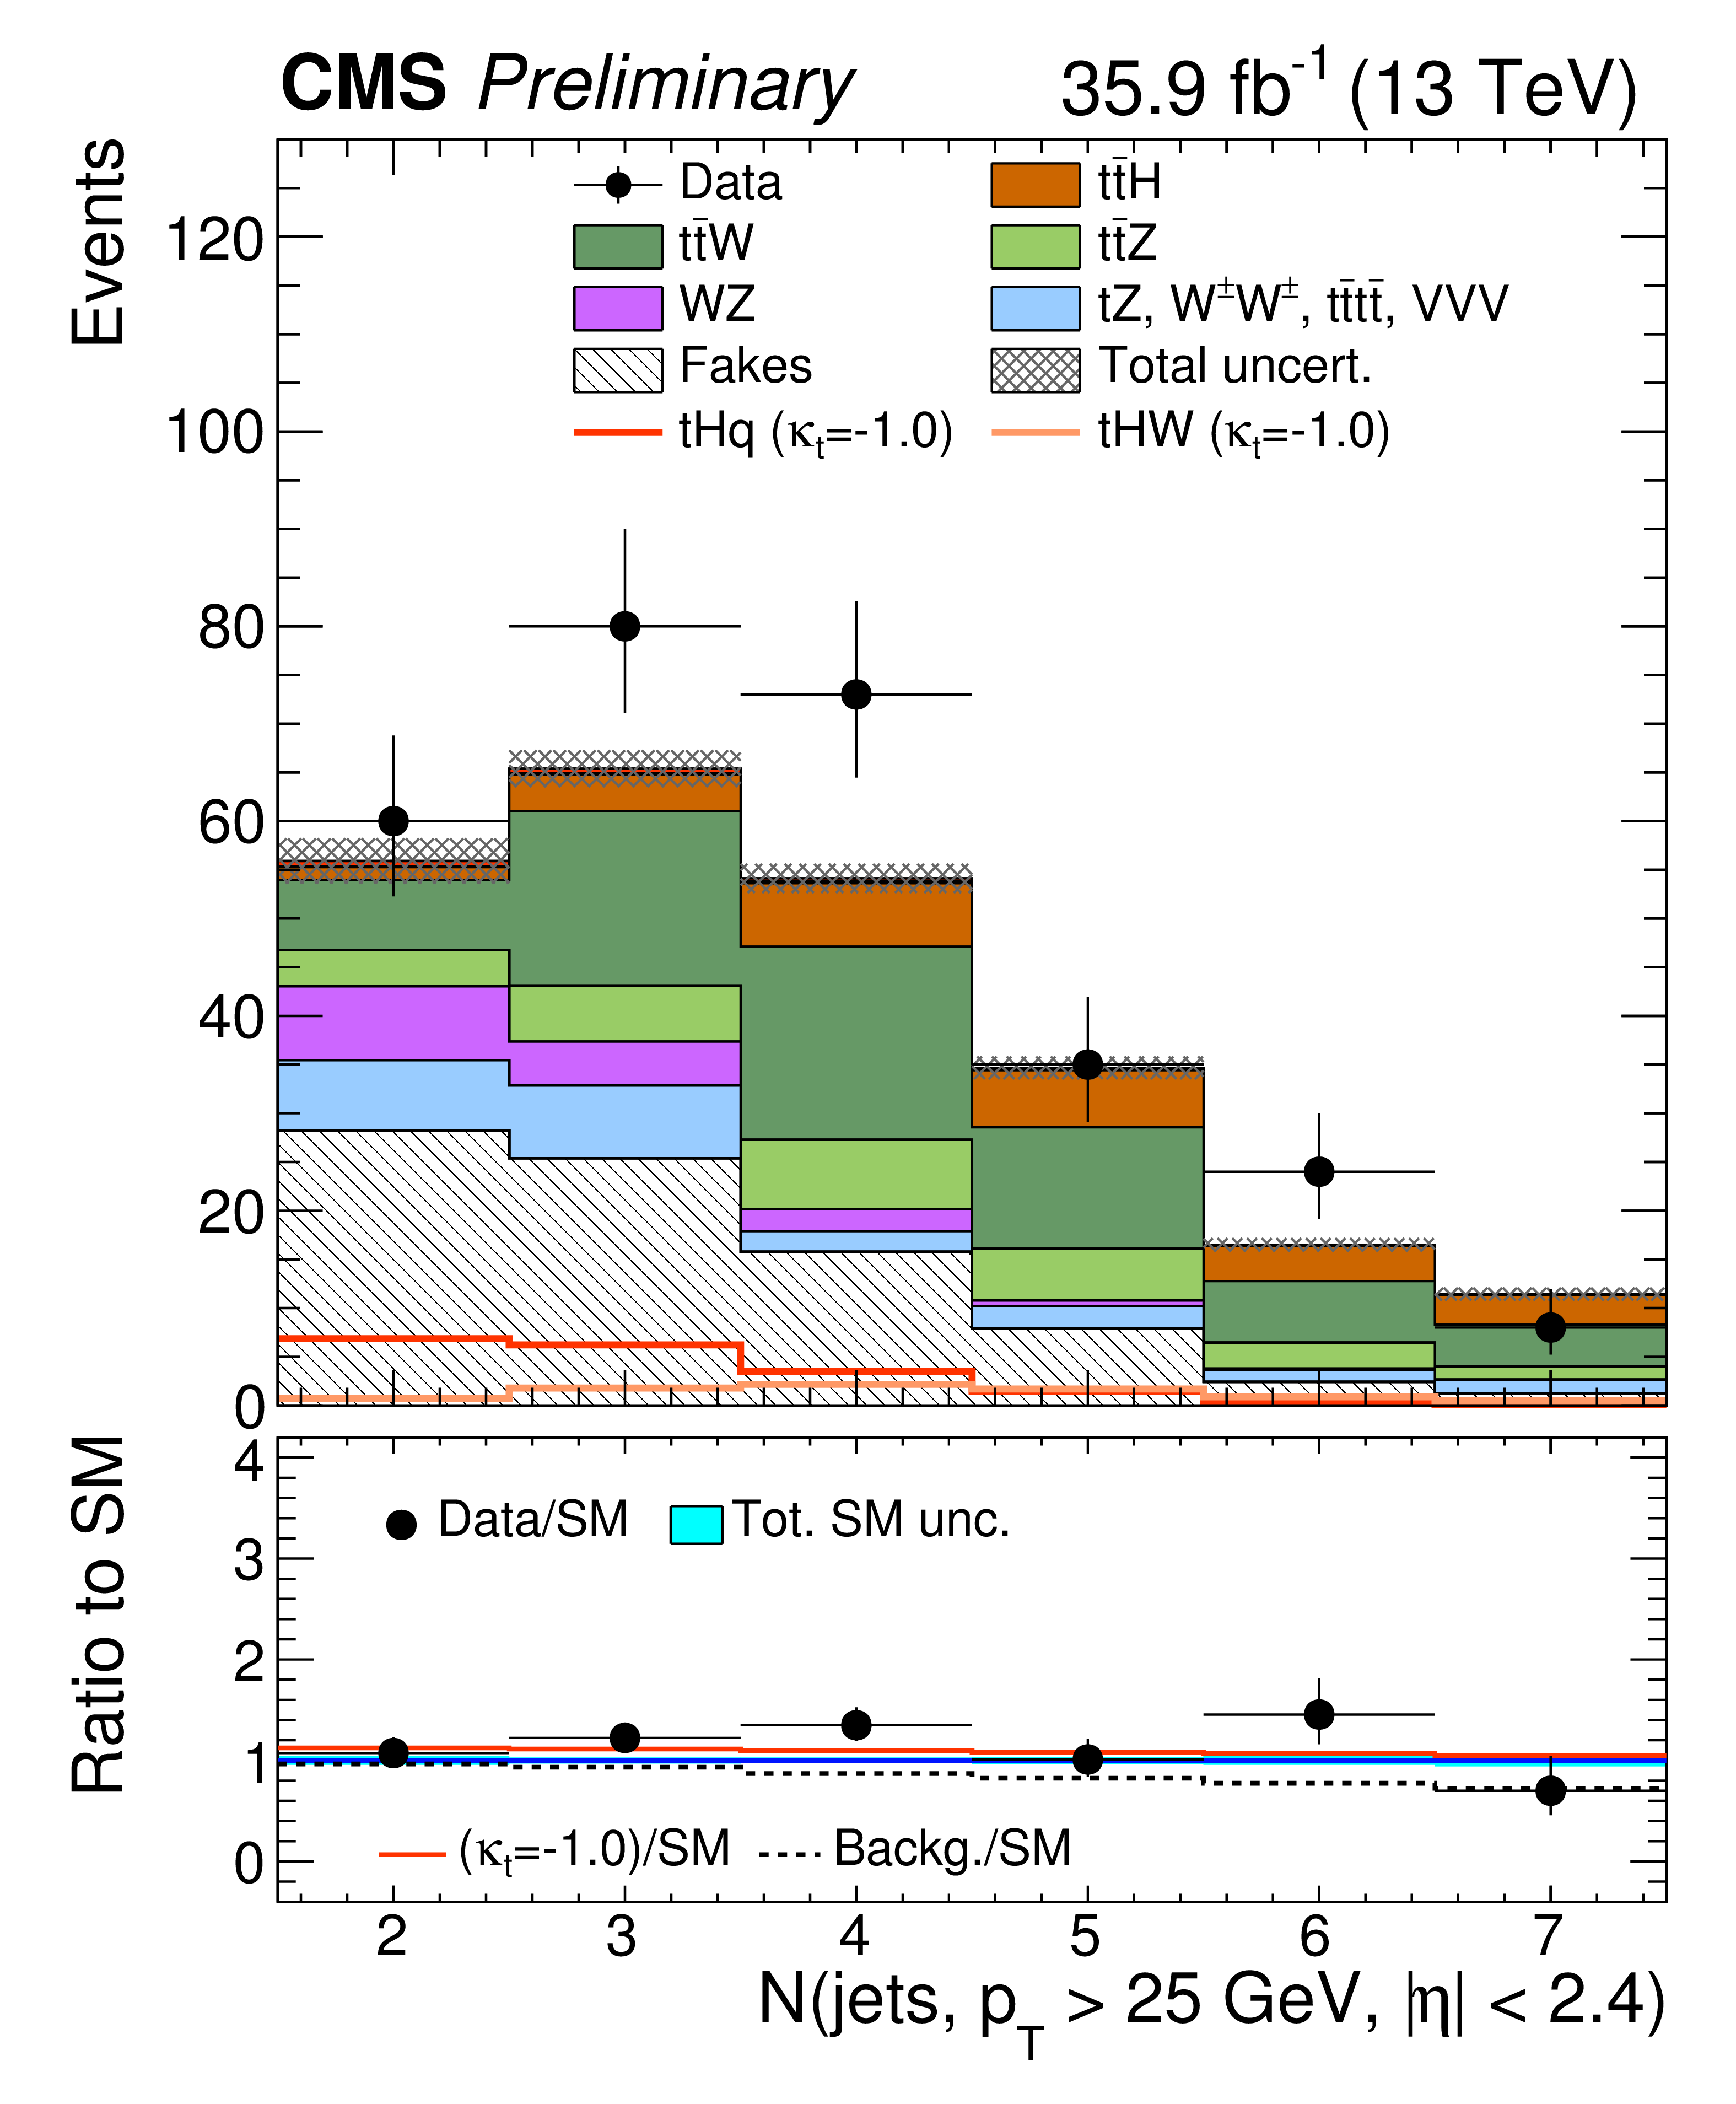
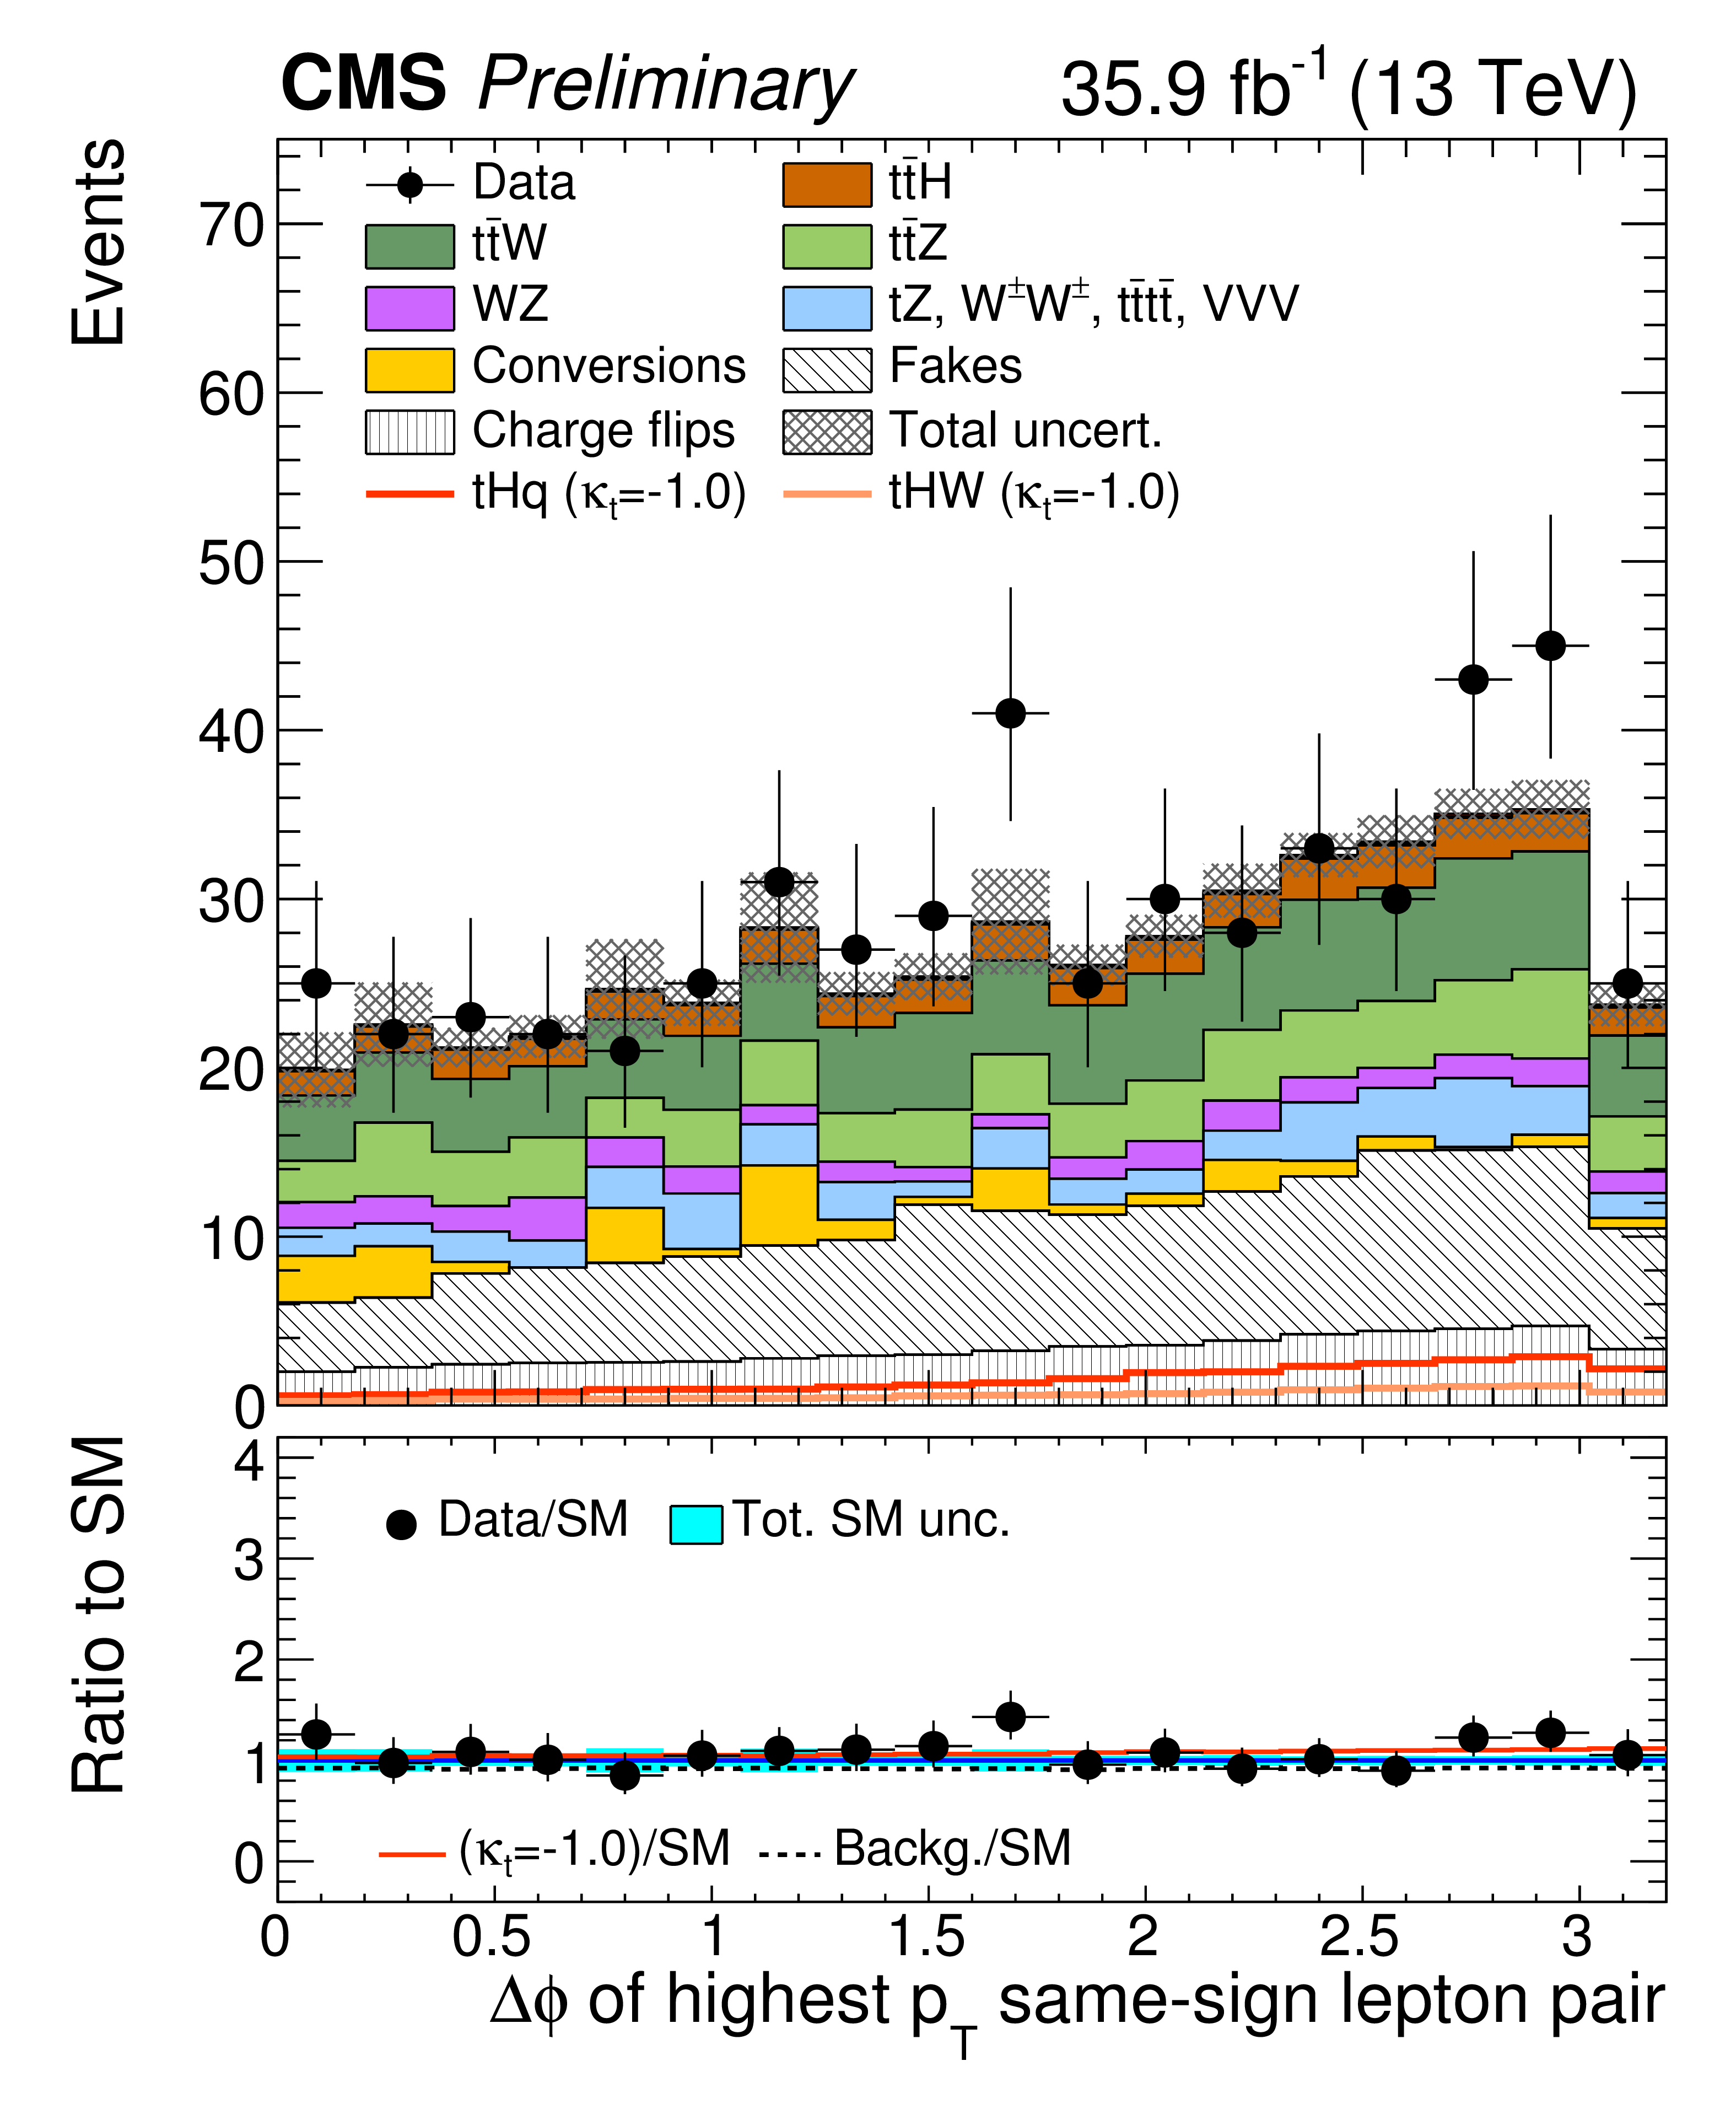
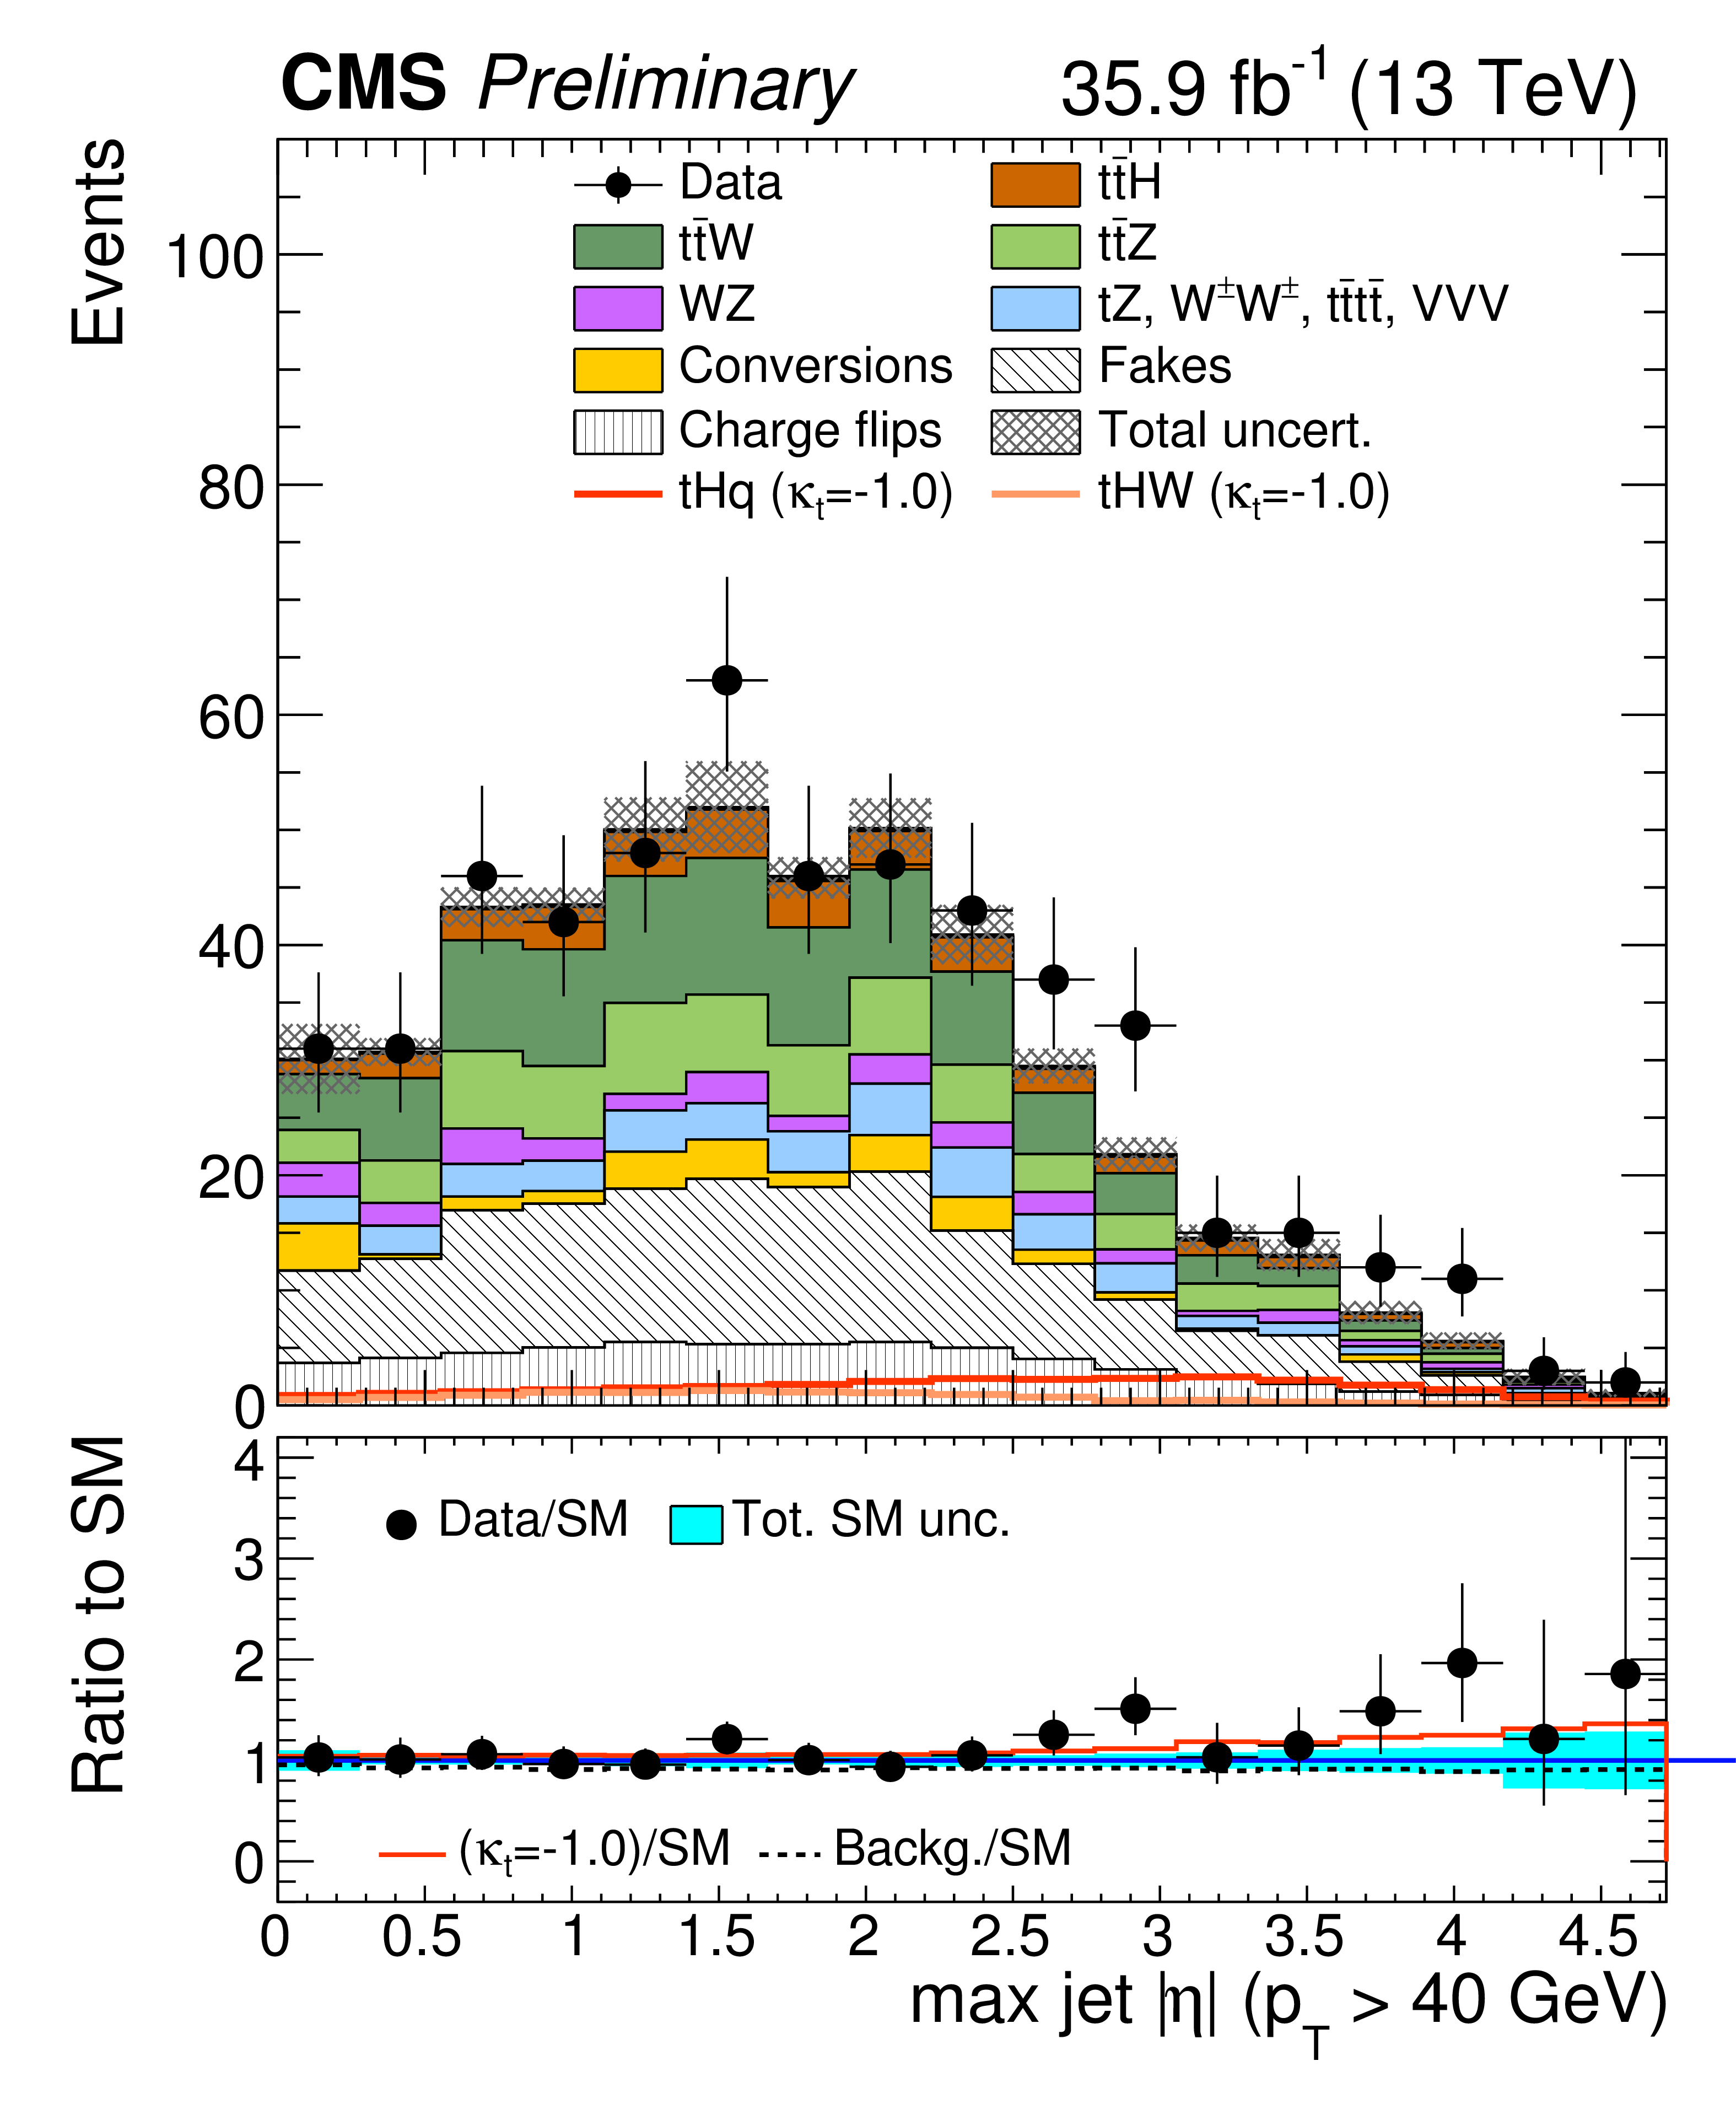
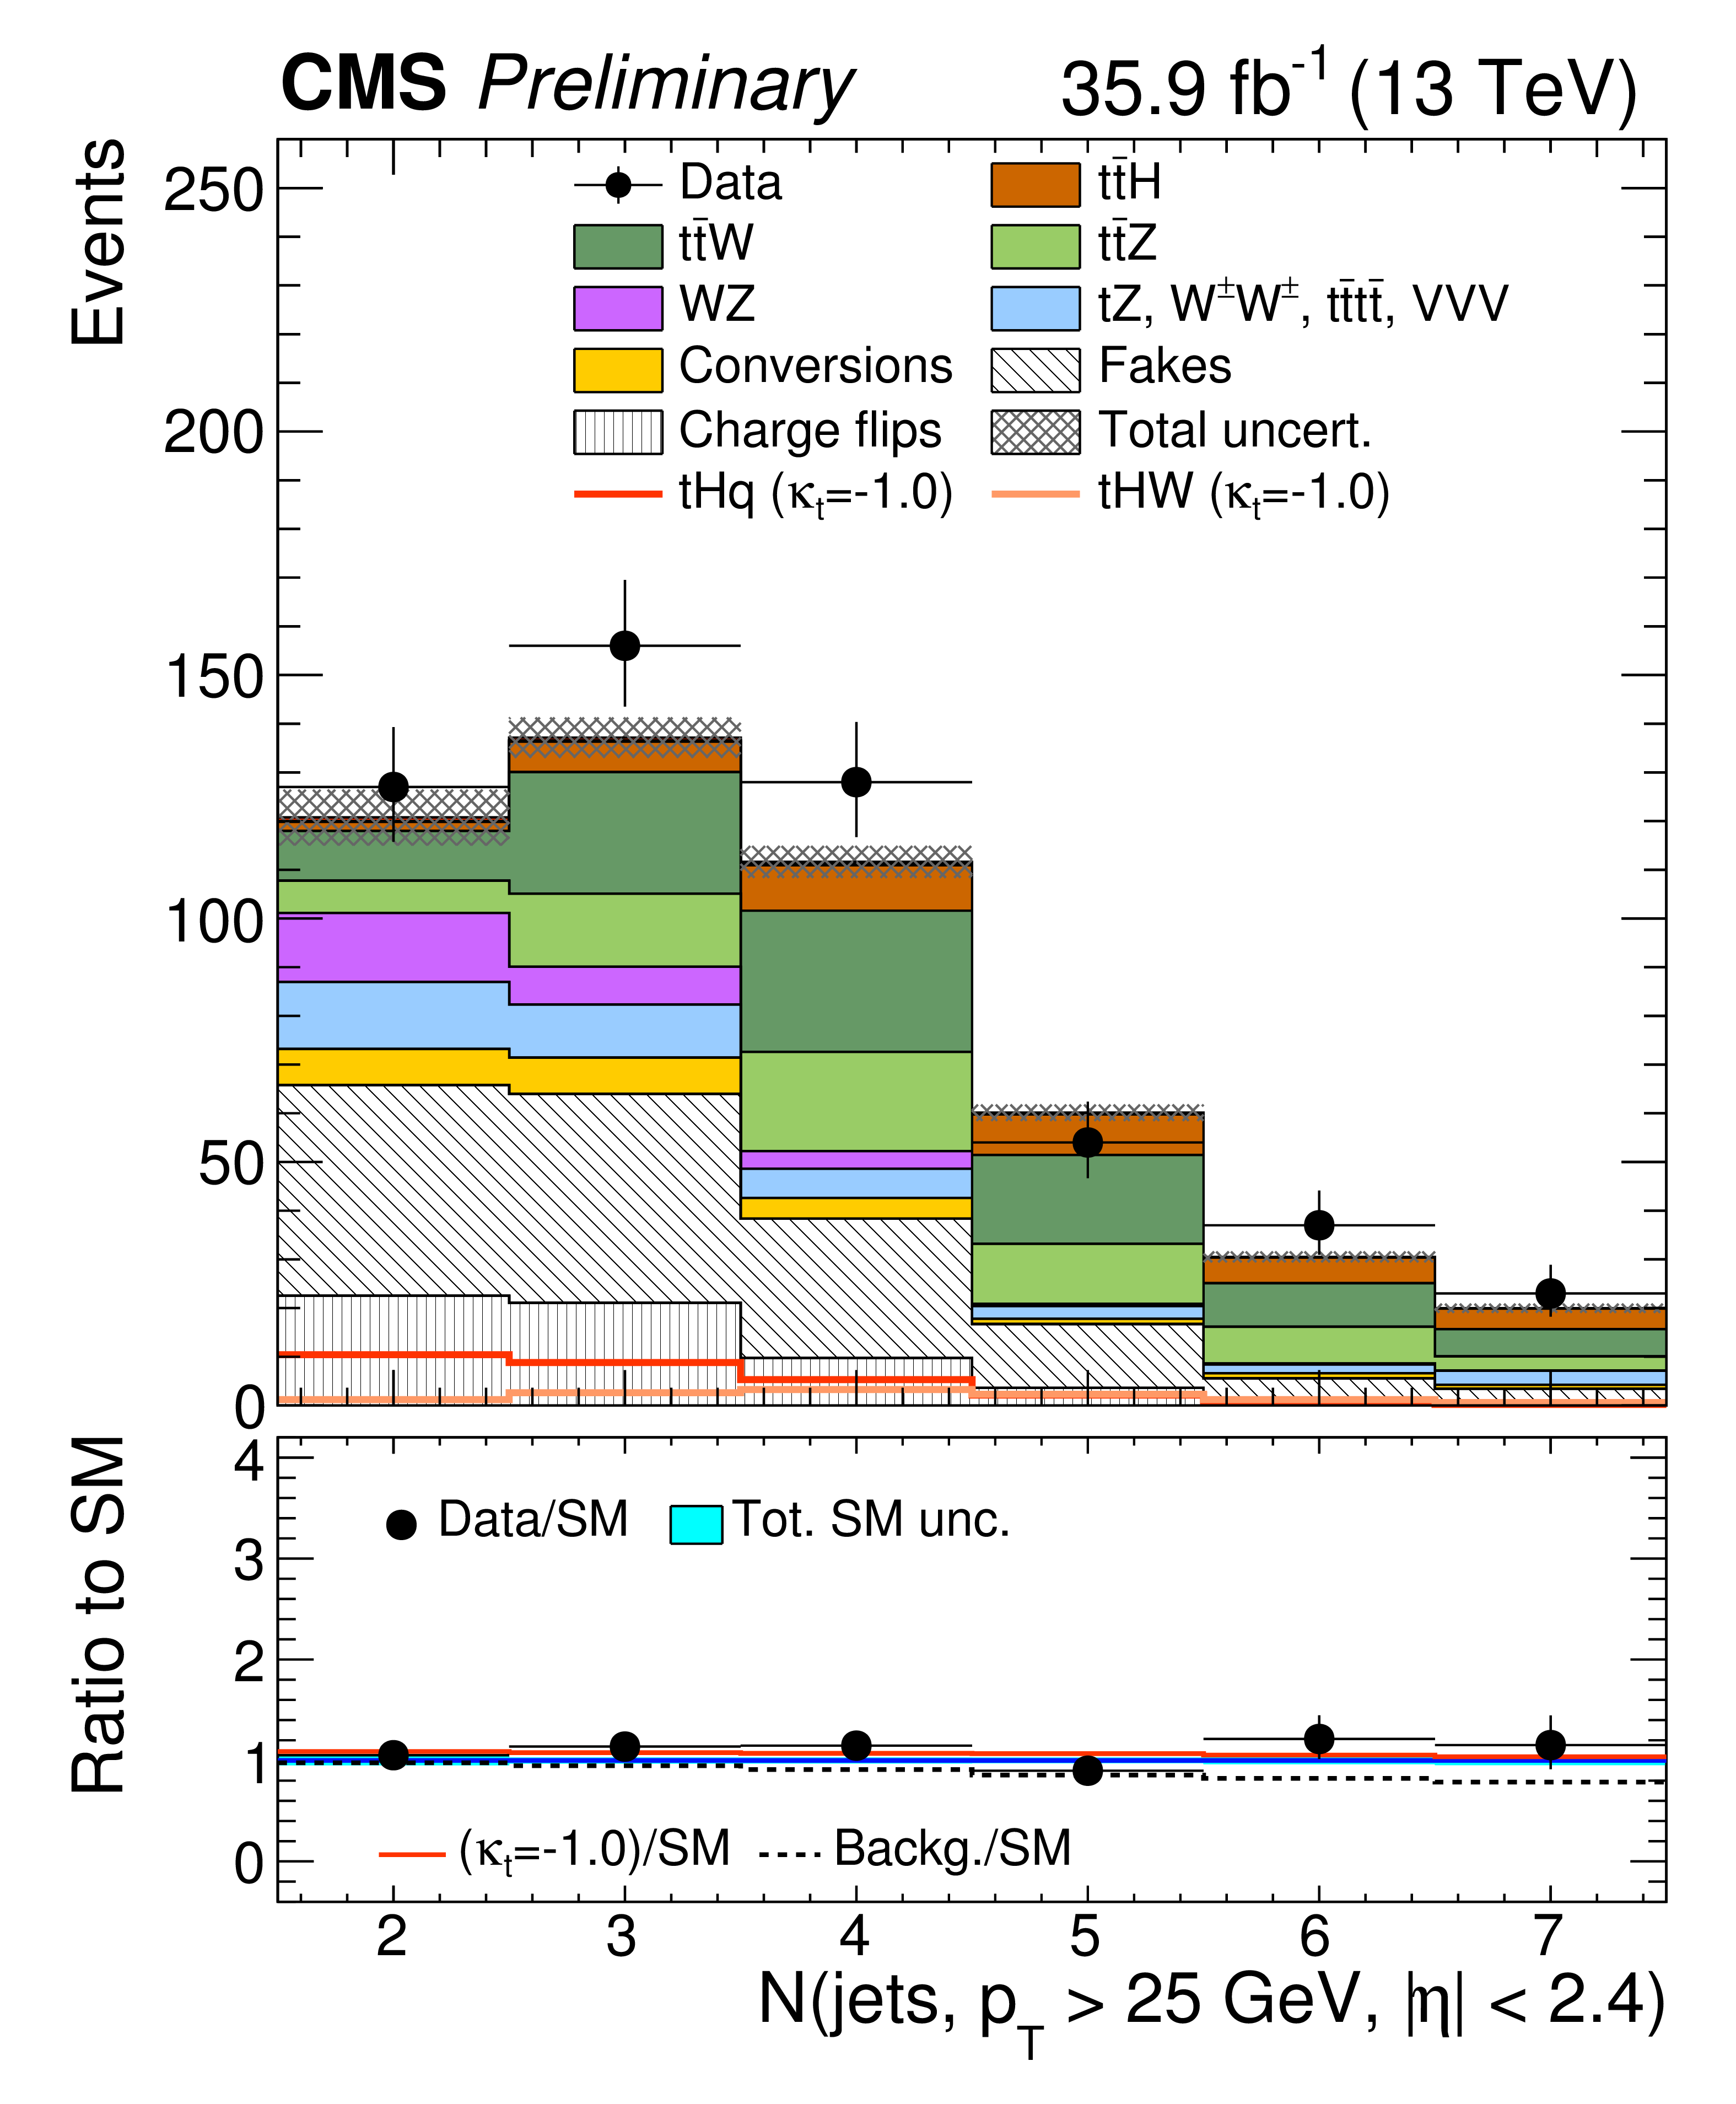
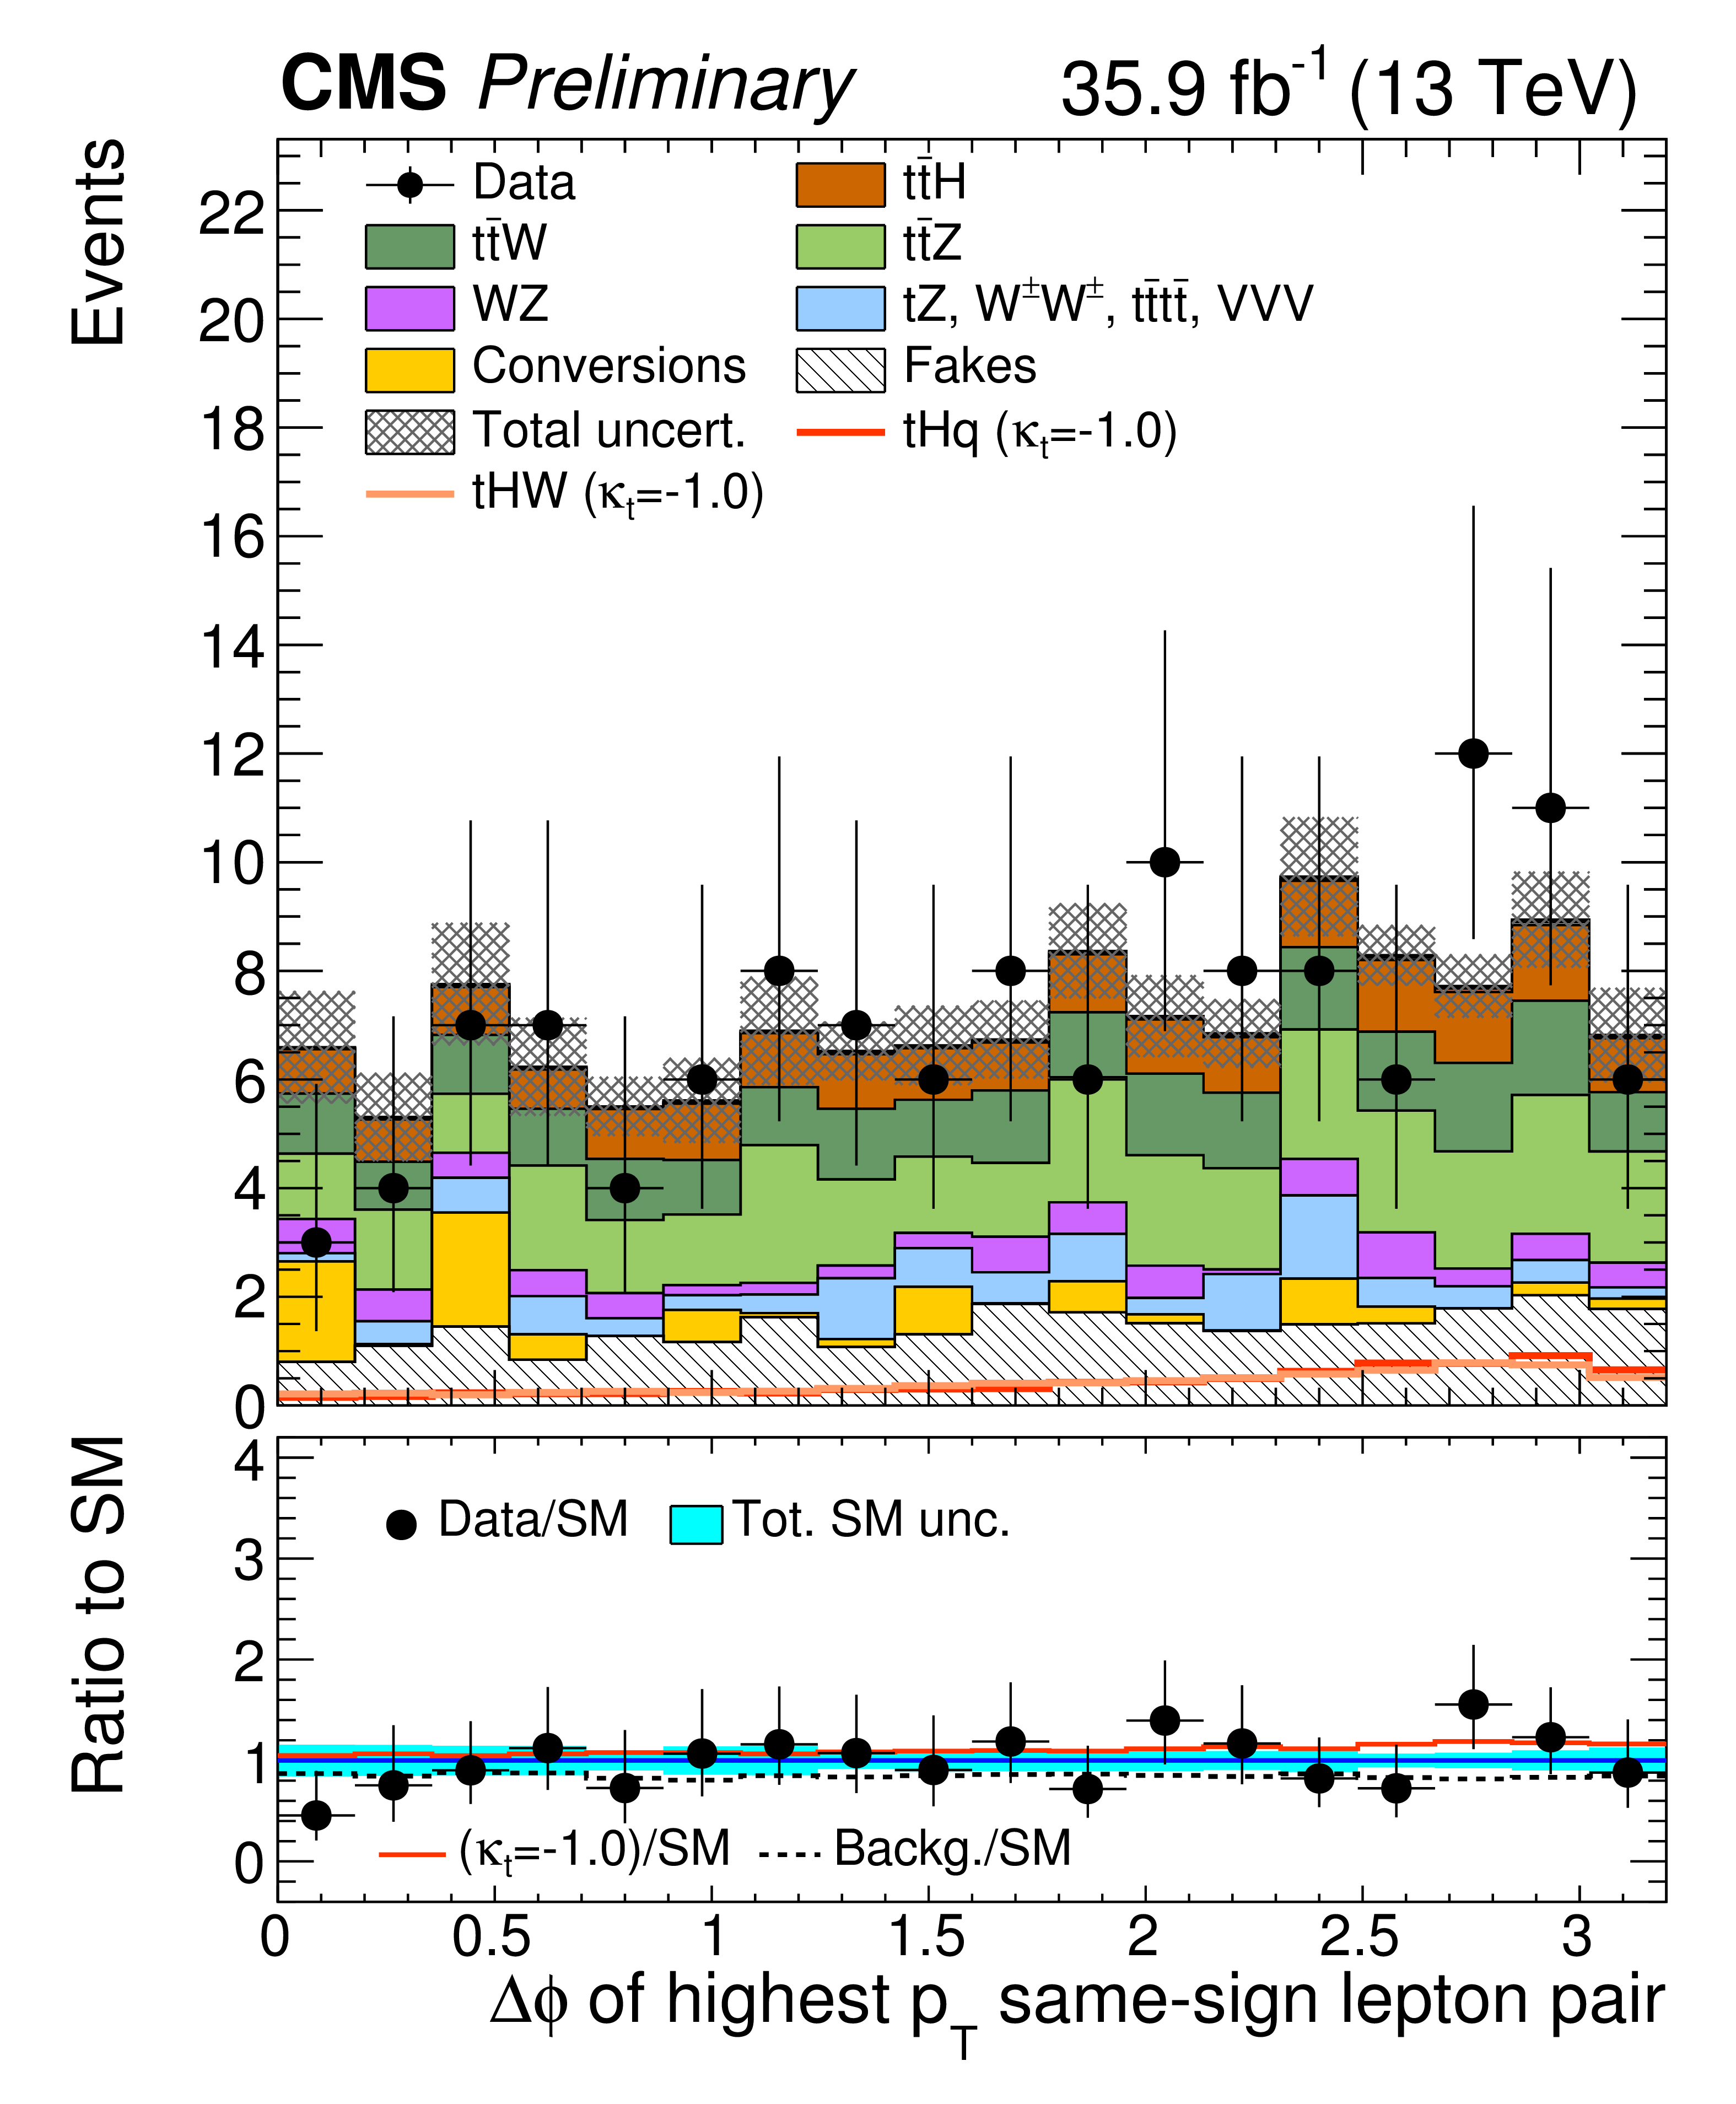
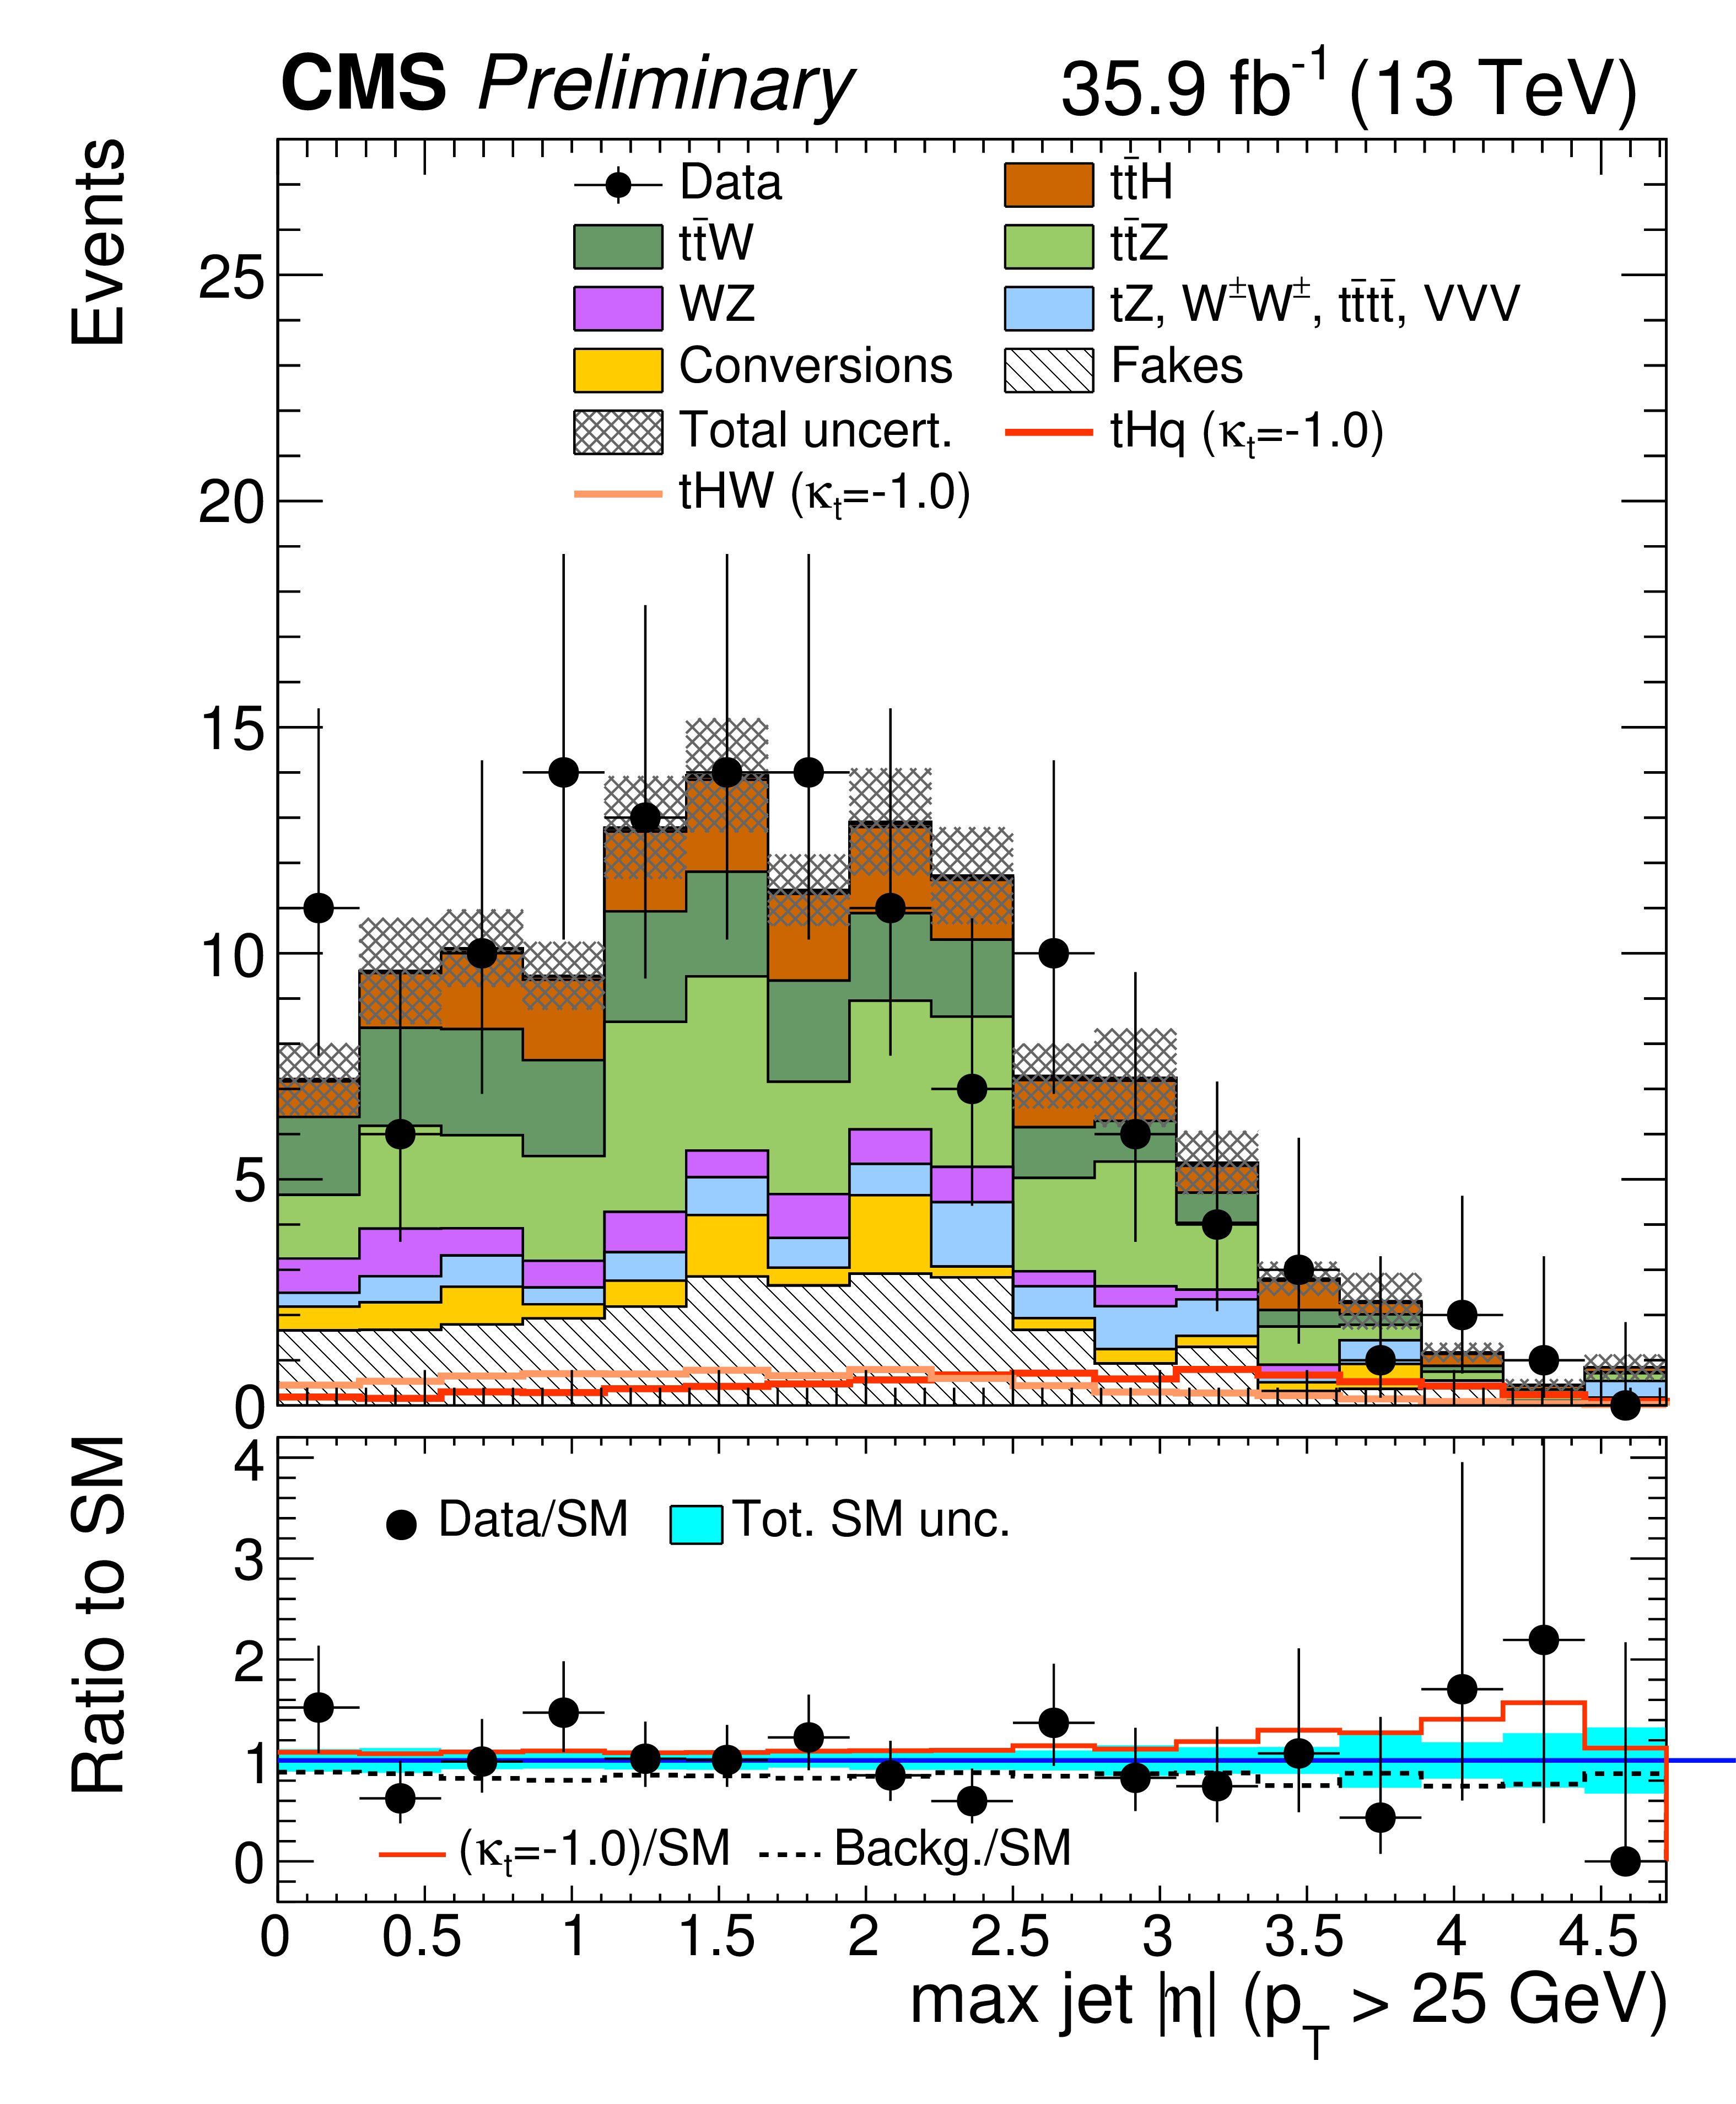
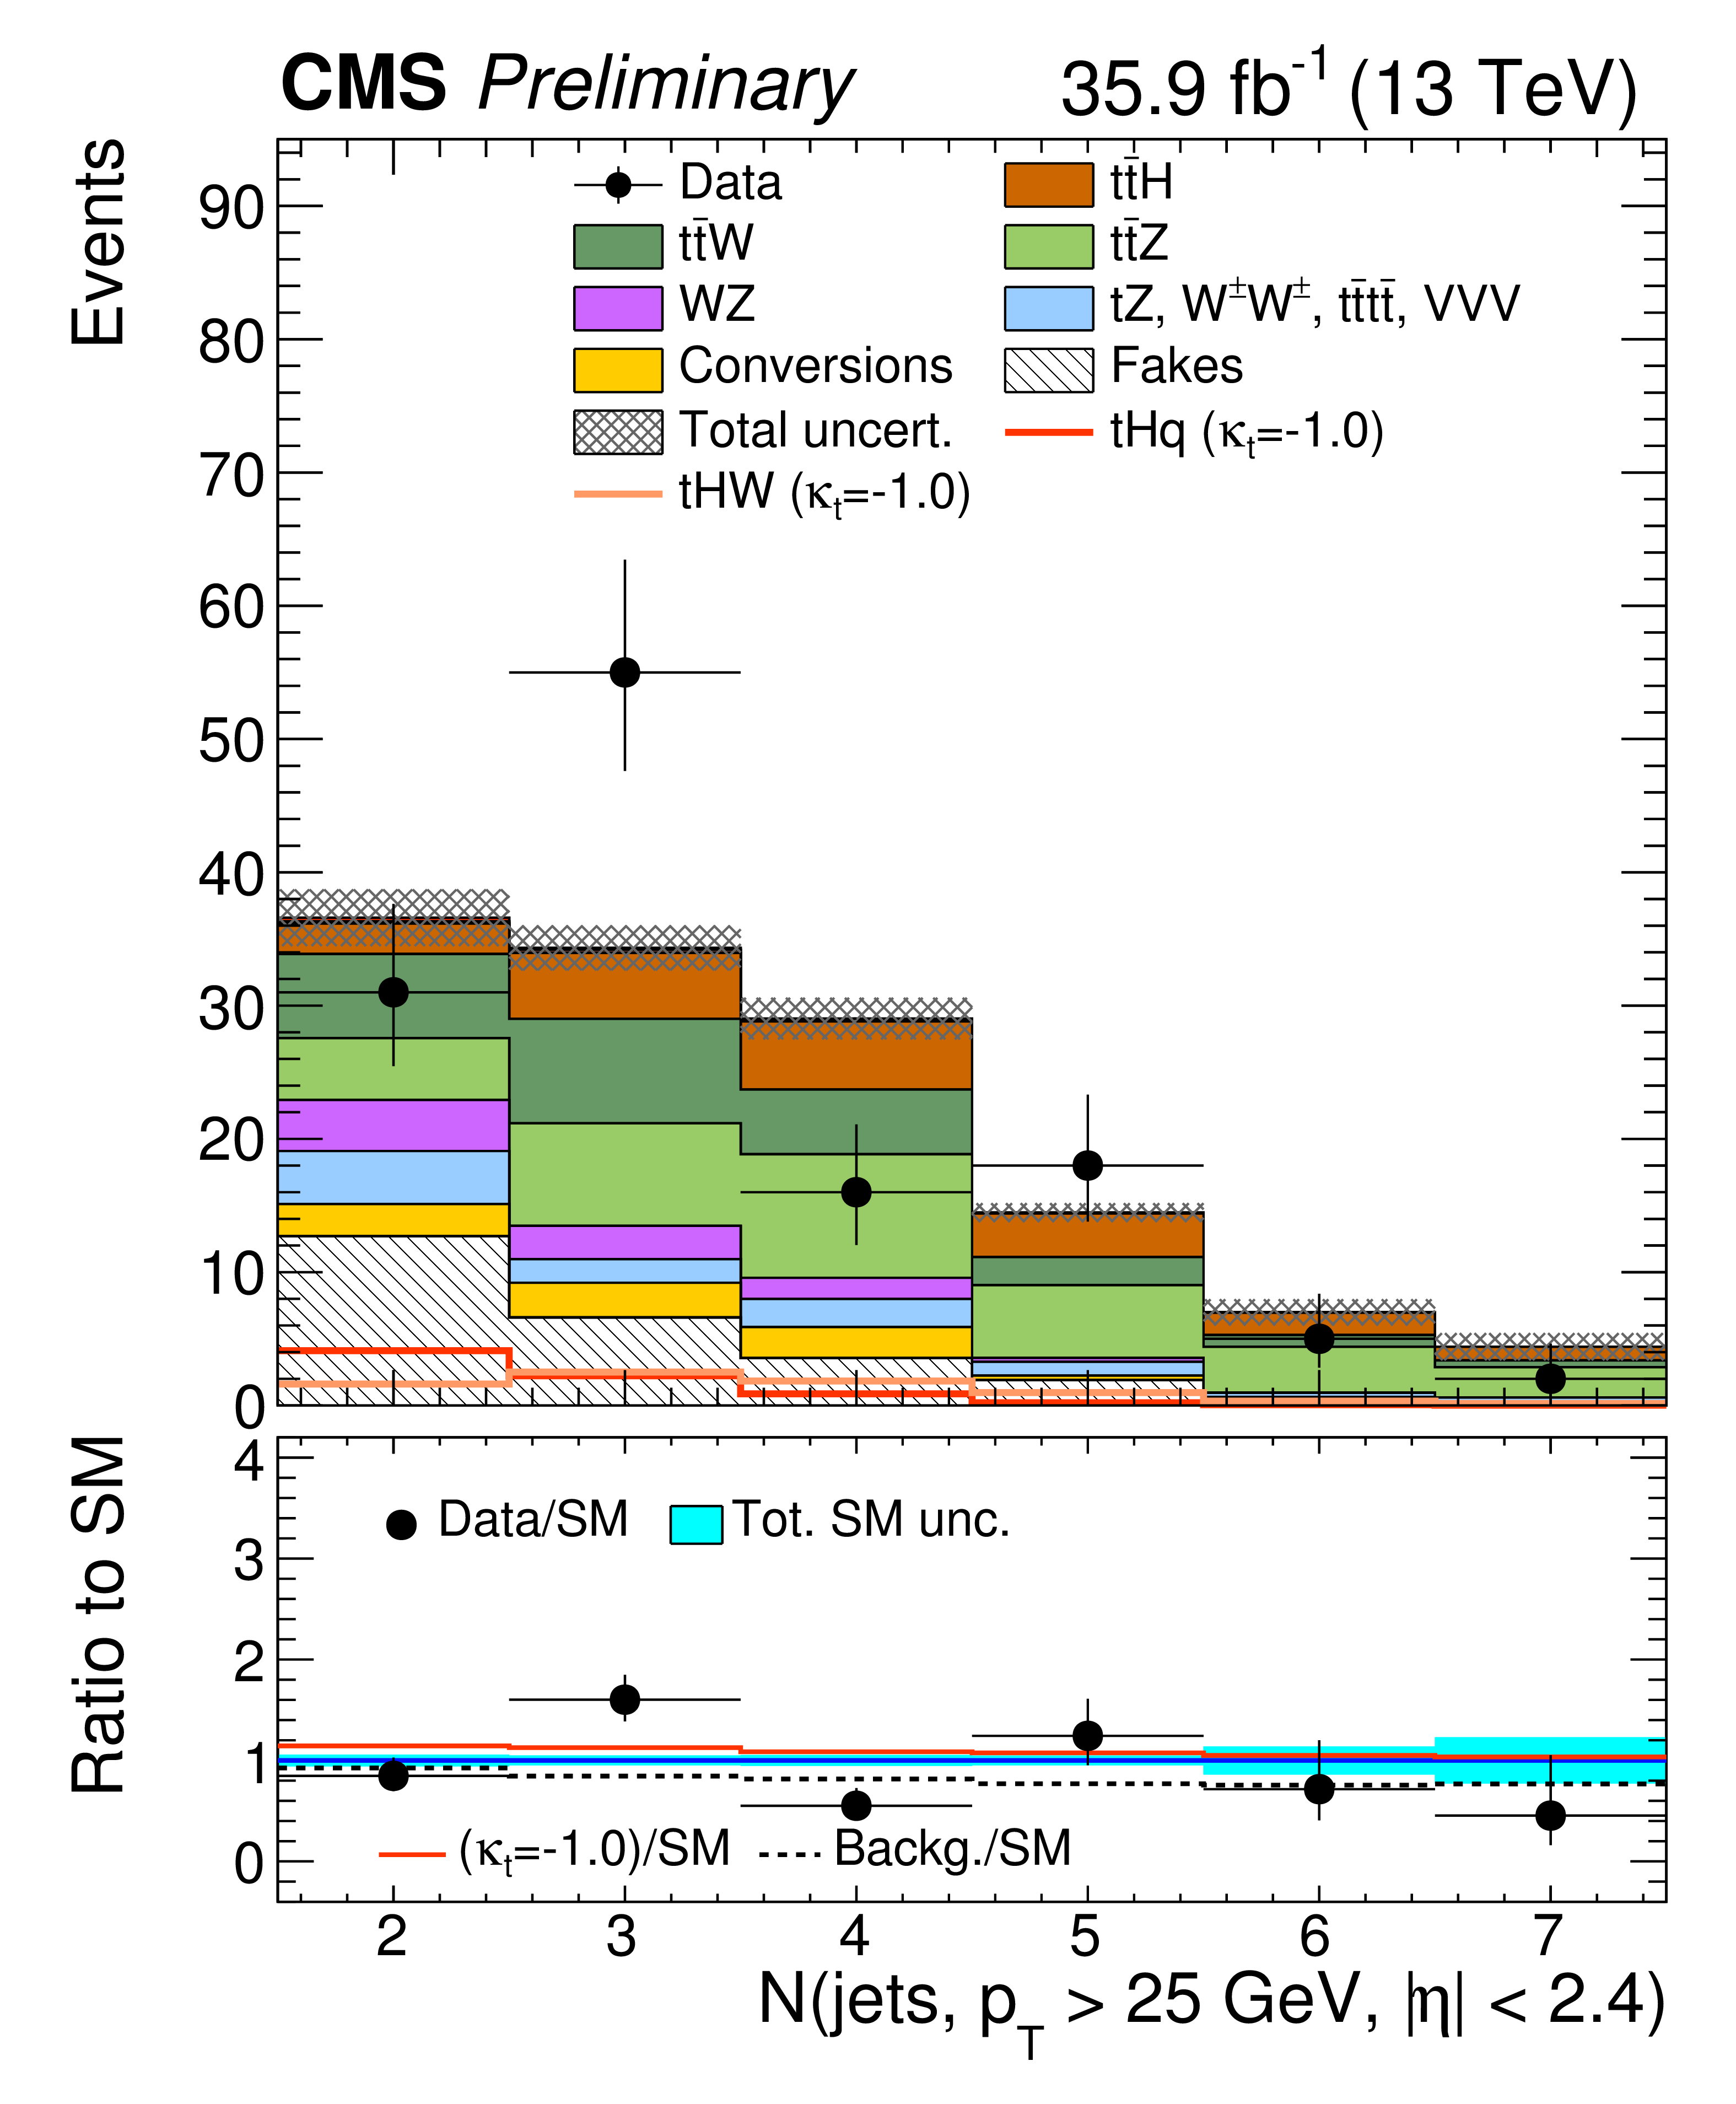
Figure 2:
Distributions of discriminating variables for the event pre-selection for the same-sign ${\mu \mu } $ channel, normalized to 35.9 fb$^{-1}$, before fitting the signal discriminant to the observed data. Uncertainties are statistical and unconstrained (pre-fit) normalization systematics. The shape of the two ${\mathrm{ t } \mathrm{ H } } $ signals for $ {\kappa _\mathrm{ t } } =-1.0$ is shown, normalized to their respective cross sections for $ {\kappa _\mathrm{ t } } =-1.0, {\kappa _\text {V}} =1.0$. |
png pdf |
Figure 2-a:
Distribution for the event pre-selection for the same-sign ${\mu \mu } $ channel, normalized to 35.9 fb$^{-1}$, before fitting the signal discriminant to the observed data. Uncertainties are statistical and unconstrained (pre-fit) normalization systematics. The shape of the two ${\mathrm{ t } \mathrm{ H } } $ signals for $ {\kappa _\mathrm{ t } } =-1.0$ is shown, normalized to their respective cross sections for $ {\kappa _\mathrm{ t } } =-1.0, {\kappa _\text {V}} =1.0$. |
png pdf |
Figure 2-b:
Distribution for the event pre-selection for the same-sign ${\mu \mu } $ channel, normalized to 35.9 fb$^{-1}$, before fitting the signal discriminant to the observed data. Uncertainties are statistical and unconstrained (pre-fit) normalization systematics. The shape of the two ${\mathrm{ t } \mathrm{ H } } $ signals for $ {\kappa _\mathrm{ t } } =-1.0$ is shown, normalized to their respective cross sections for $ {\kappa _\mathrm{ t } } =-1.0, {\kappa _\text {V}} =1.0$. |
png pdf |
Figure 2-c:
Distribution for the event pre-selection for the same-sign ${\mu \mu } $ channel, normalized to 35.9 fb$^{-1}$, before fitting the signal discriminant to the observed data. Uncertainties are statistical and unconstrained (pre-fit) normalization systematics. The shape of the two ${\mathrm{ t } \mathrm{ H } } $ signals for $ {\kappa _\mathrm{ t } } =-1.0$ is shown, normalized to their respective cross sections for $ {\kappa _\mathrm{ t } } =-1.0, {\kappa _\text {V}} =1.0$. |
png pdf |
Figure 3:
Distributions of discriminating variables for the event pre-selection for the same-sign${\mathrm{ e } \mu } $ channel, normalized to 35.9 fb$^{-1}$, before fitting the signal discriminant to the observed data. Uncertainties are statistical and unconstrained (pre-fit) normalization systematics. The shape of the two ${\mathrm{ t } \mathrm{ H } } $ signals for $ {\kappa _\mathrm{ t } } =-1.0$ is shown, normalized to their respective cross sections for $ {\kappa _\mathrm{ t } } =-1.0, {\kappa _\text {V}} =1.0$. |
png pdf |
Figure 3-a:
Distribution for the event pre-selection for the same-sign${\mathrm{ e } \mu } $ channel, normalized to 35.9 fb$^{-1}$, before fitting the signal discriminant to the observed data. Uncertainties are statistical and unconstrained (pre-fit) normalization systematics. The shape of the two ${\mathrm{ t } \mathrm{ H } } $ signals for $ {\kappa _\mathrm{ t } } =-1.0$ is shown, normalized to their respective cross sections for $ {\kappa _\mathrm{ t } } =-1.0, {\kappa _\text {V}} =1.0$. |
png pdf |
Figure 3-b:
Distribution for the event pre-selection for the same-sign${\mathrm{ e } \mu } $ channel, normalized to 35.9 fb$^{-1}$, before fitting the signal discriminant to the observed data. Uncertainties are statistical and unconstrained (pre-fit) normalization systematics. The shape of the two ${\mathrm{ t } \mathrm{ H } } $ signals for $ {\kappa _\mathrm{ t } } =-1.0$ is shown, normalized to their respective cross sections for $ {\kappa _\mathrm{ t } } =-1.0, {\kappa _\text {V}} =1.0$. |
png pdf |
Figure 3-c:
Distribution for the event pre-selection for the same-sign${\mathrm{ e } \mu } $ channel, normalized to 35.9 fb$^{-1}$, before fitting the signal discriminant to the observed data. Uncertainties are statistical and unconstrained (pre-fit) normalization systematics. The shape of the two ${\mathrm{ t } \mathrm{ H } } $ signals for $ {\kappa _\mathrm{ t } } =-1.0$ is shown, normalized to their respective cross sections for $ {\kappa _\mathrm{ t } } =-1.0, {\kappa _\text {V}} =1.0$. |
png pdf |
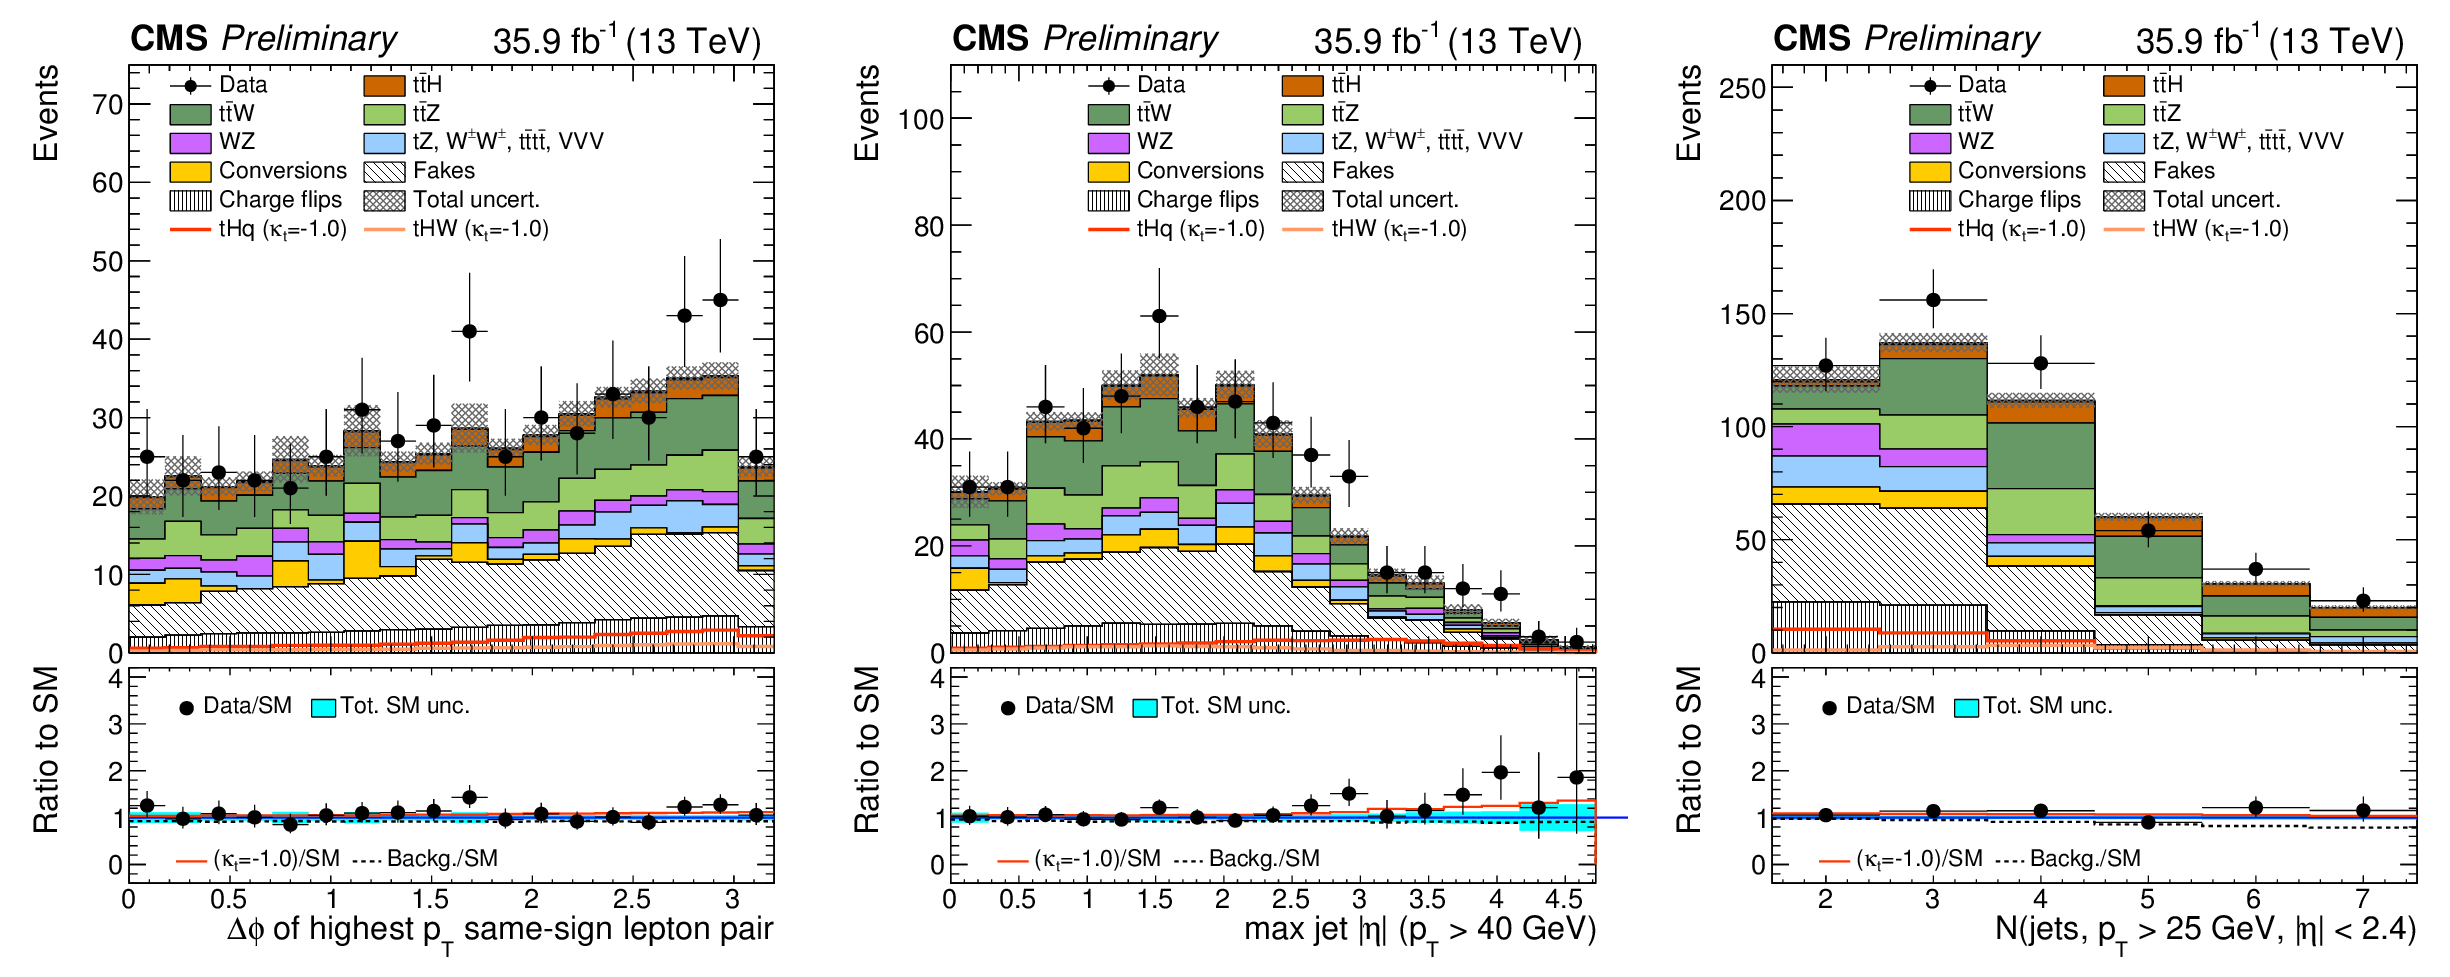
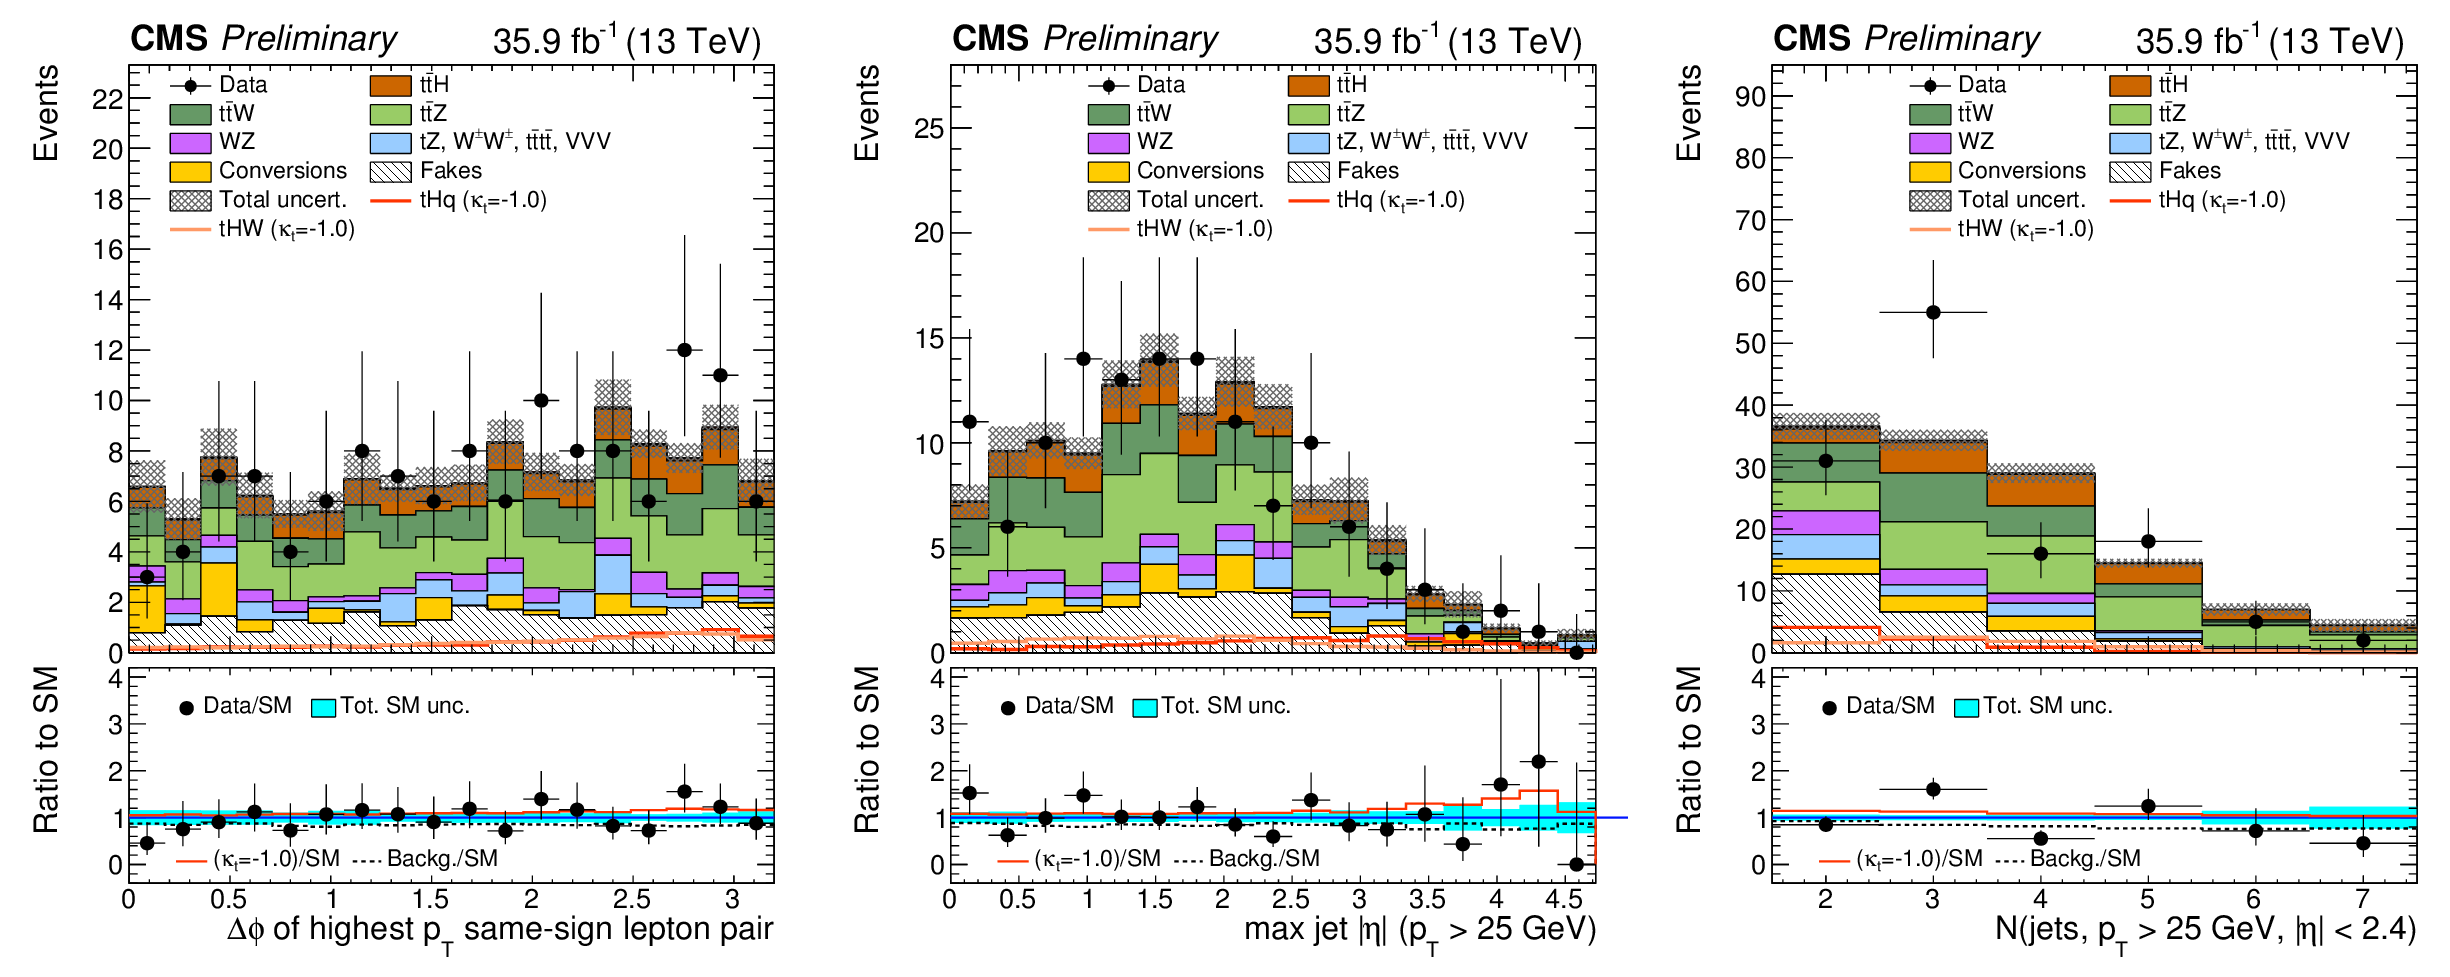
Figure 4:
Distributions of discriminating variables for the event pre-selection for the three lepton channel, normalized to 35.9 fb$^{-1}$, before fitting the signal discriminant to the observed data. Uncertainties are statistical and unconstrained (pre-fit) normalization systematics. The shape of the two ${\mathrm{ t } \mathrm{ H } } $ signals for $ {\kappa _\mathrm{ t } } =-1.0$ is shown, normalized to their respective cross sections for $ {\kappa _\mathrm{ t } } =-1.0, {\kappa _\text {V}} =1.0$. |
png pdf |
Figure 4-a:
Distribution for the event pre-selection for the three lepton channel, normalized to 35.9 fb$^{-1}$, before fitting the signal discriminant to the observed data. Uncertainties are statistical and unconstrained (pre-fit) normalization systematics. The shape of the two ${\mathrm{ t } \mathrm{ H } } $ signals for $ {\kappa _\mathrm{ t } } =-1.0$ is shown, normalized to their respective cross sections for $ {\kappa _\mathrm{ t } } =-1.0, {\kappa _\text {V}} =1.0$. |
png pdf |
Figure 4-b:
Distribution for the event pre-selection for the three lepton channel, normalized to 35.9 fb$^{-1}$, before fitting the signal discriminant to the observed data. Uncertainties are statistical and unconstrained (pre-fit) normalization systematics. The shape of the two ${\mathrm{ t } \mathrm{ H } } $ signals for $ {\kappa _\mathrm{ t } } =-1.0$ is shown, normalized to their respective cross sections for $ {\kappa _\mathrm{ t } } =-1.0, {\kappa _\text {V}} =1.0$. |
png pdf |
Figure 4-c:
Distribution for the event pre-selection for the three lepton channel, normalized to 35.9 fb$^{-1}$, before fitting the signal discriminant to the observed data. Uncertainties are statistical and unconstrained (pre-fit) normalization systematics. The shape of the two ${\mathrm{ t } \mathrm{ H } } $ signals for $ {\kappa _\mathrm{ t } } =-1.0$ is shown, normalized to their respective cross sections for $ {\kappa _\mathrm{ t } } =-1.0, {\kappa _\text {V}} =1.0$. |
png pdf |
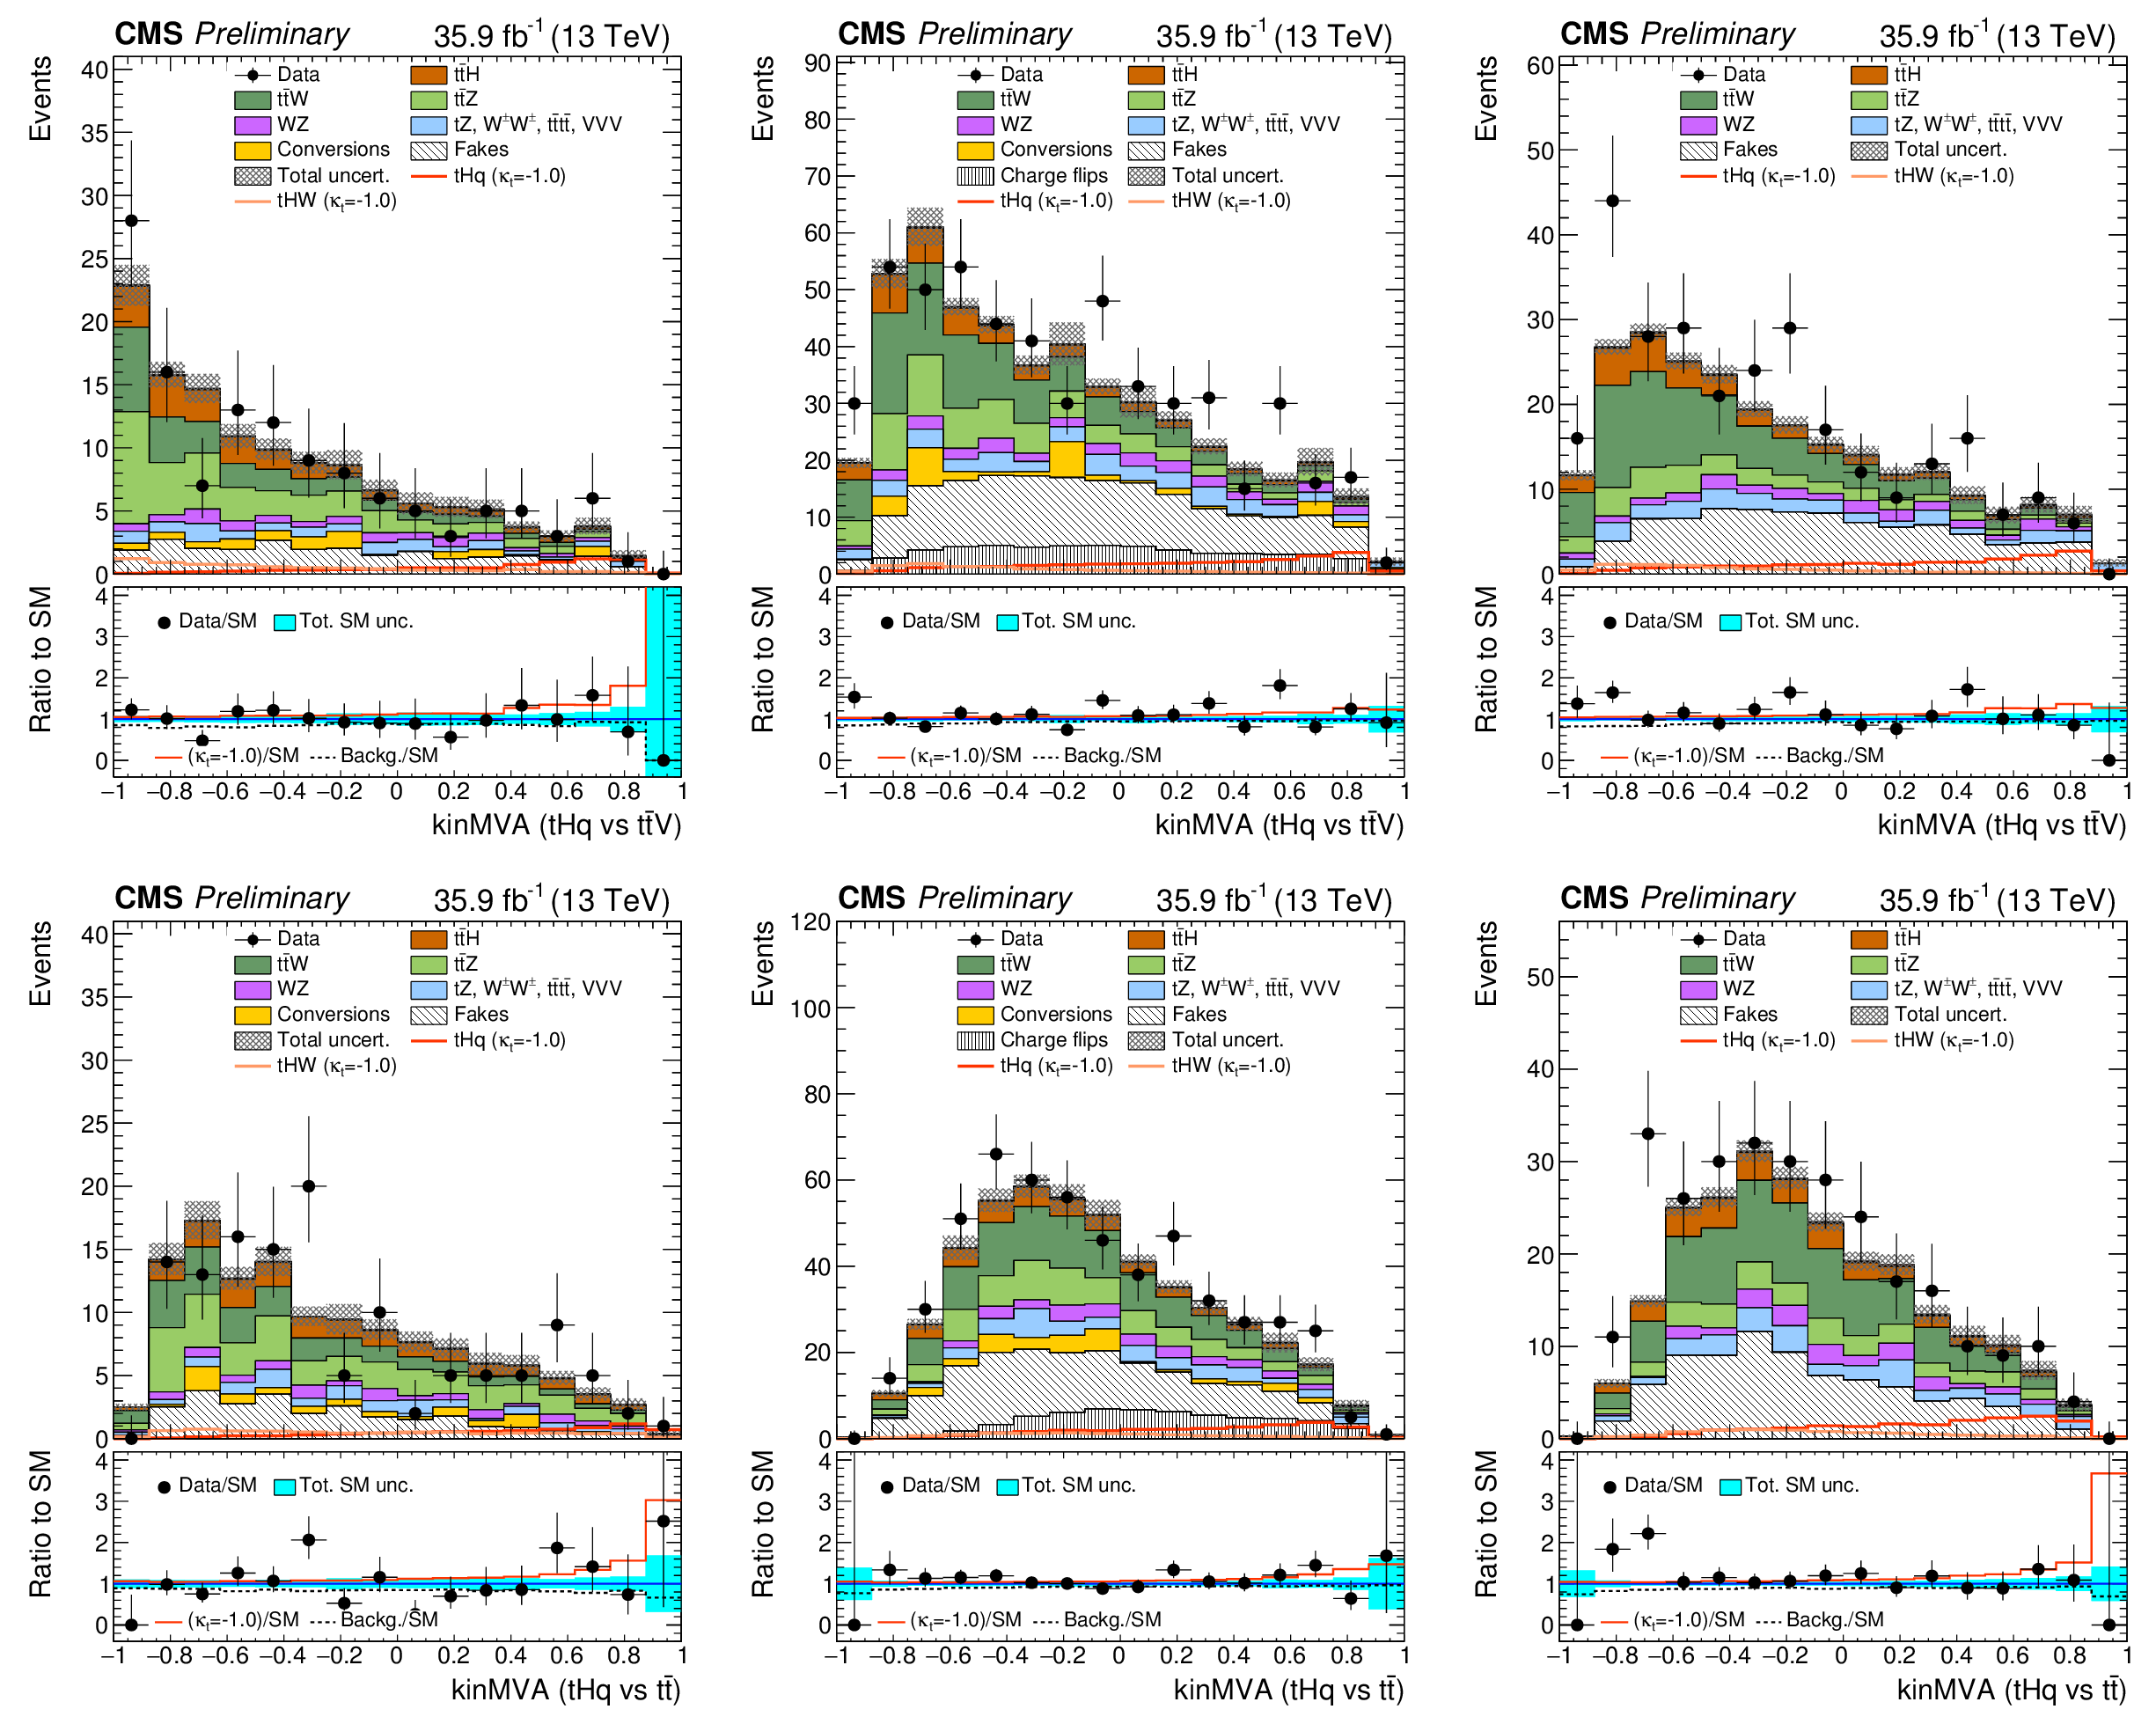
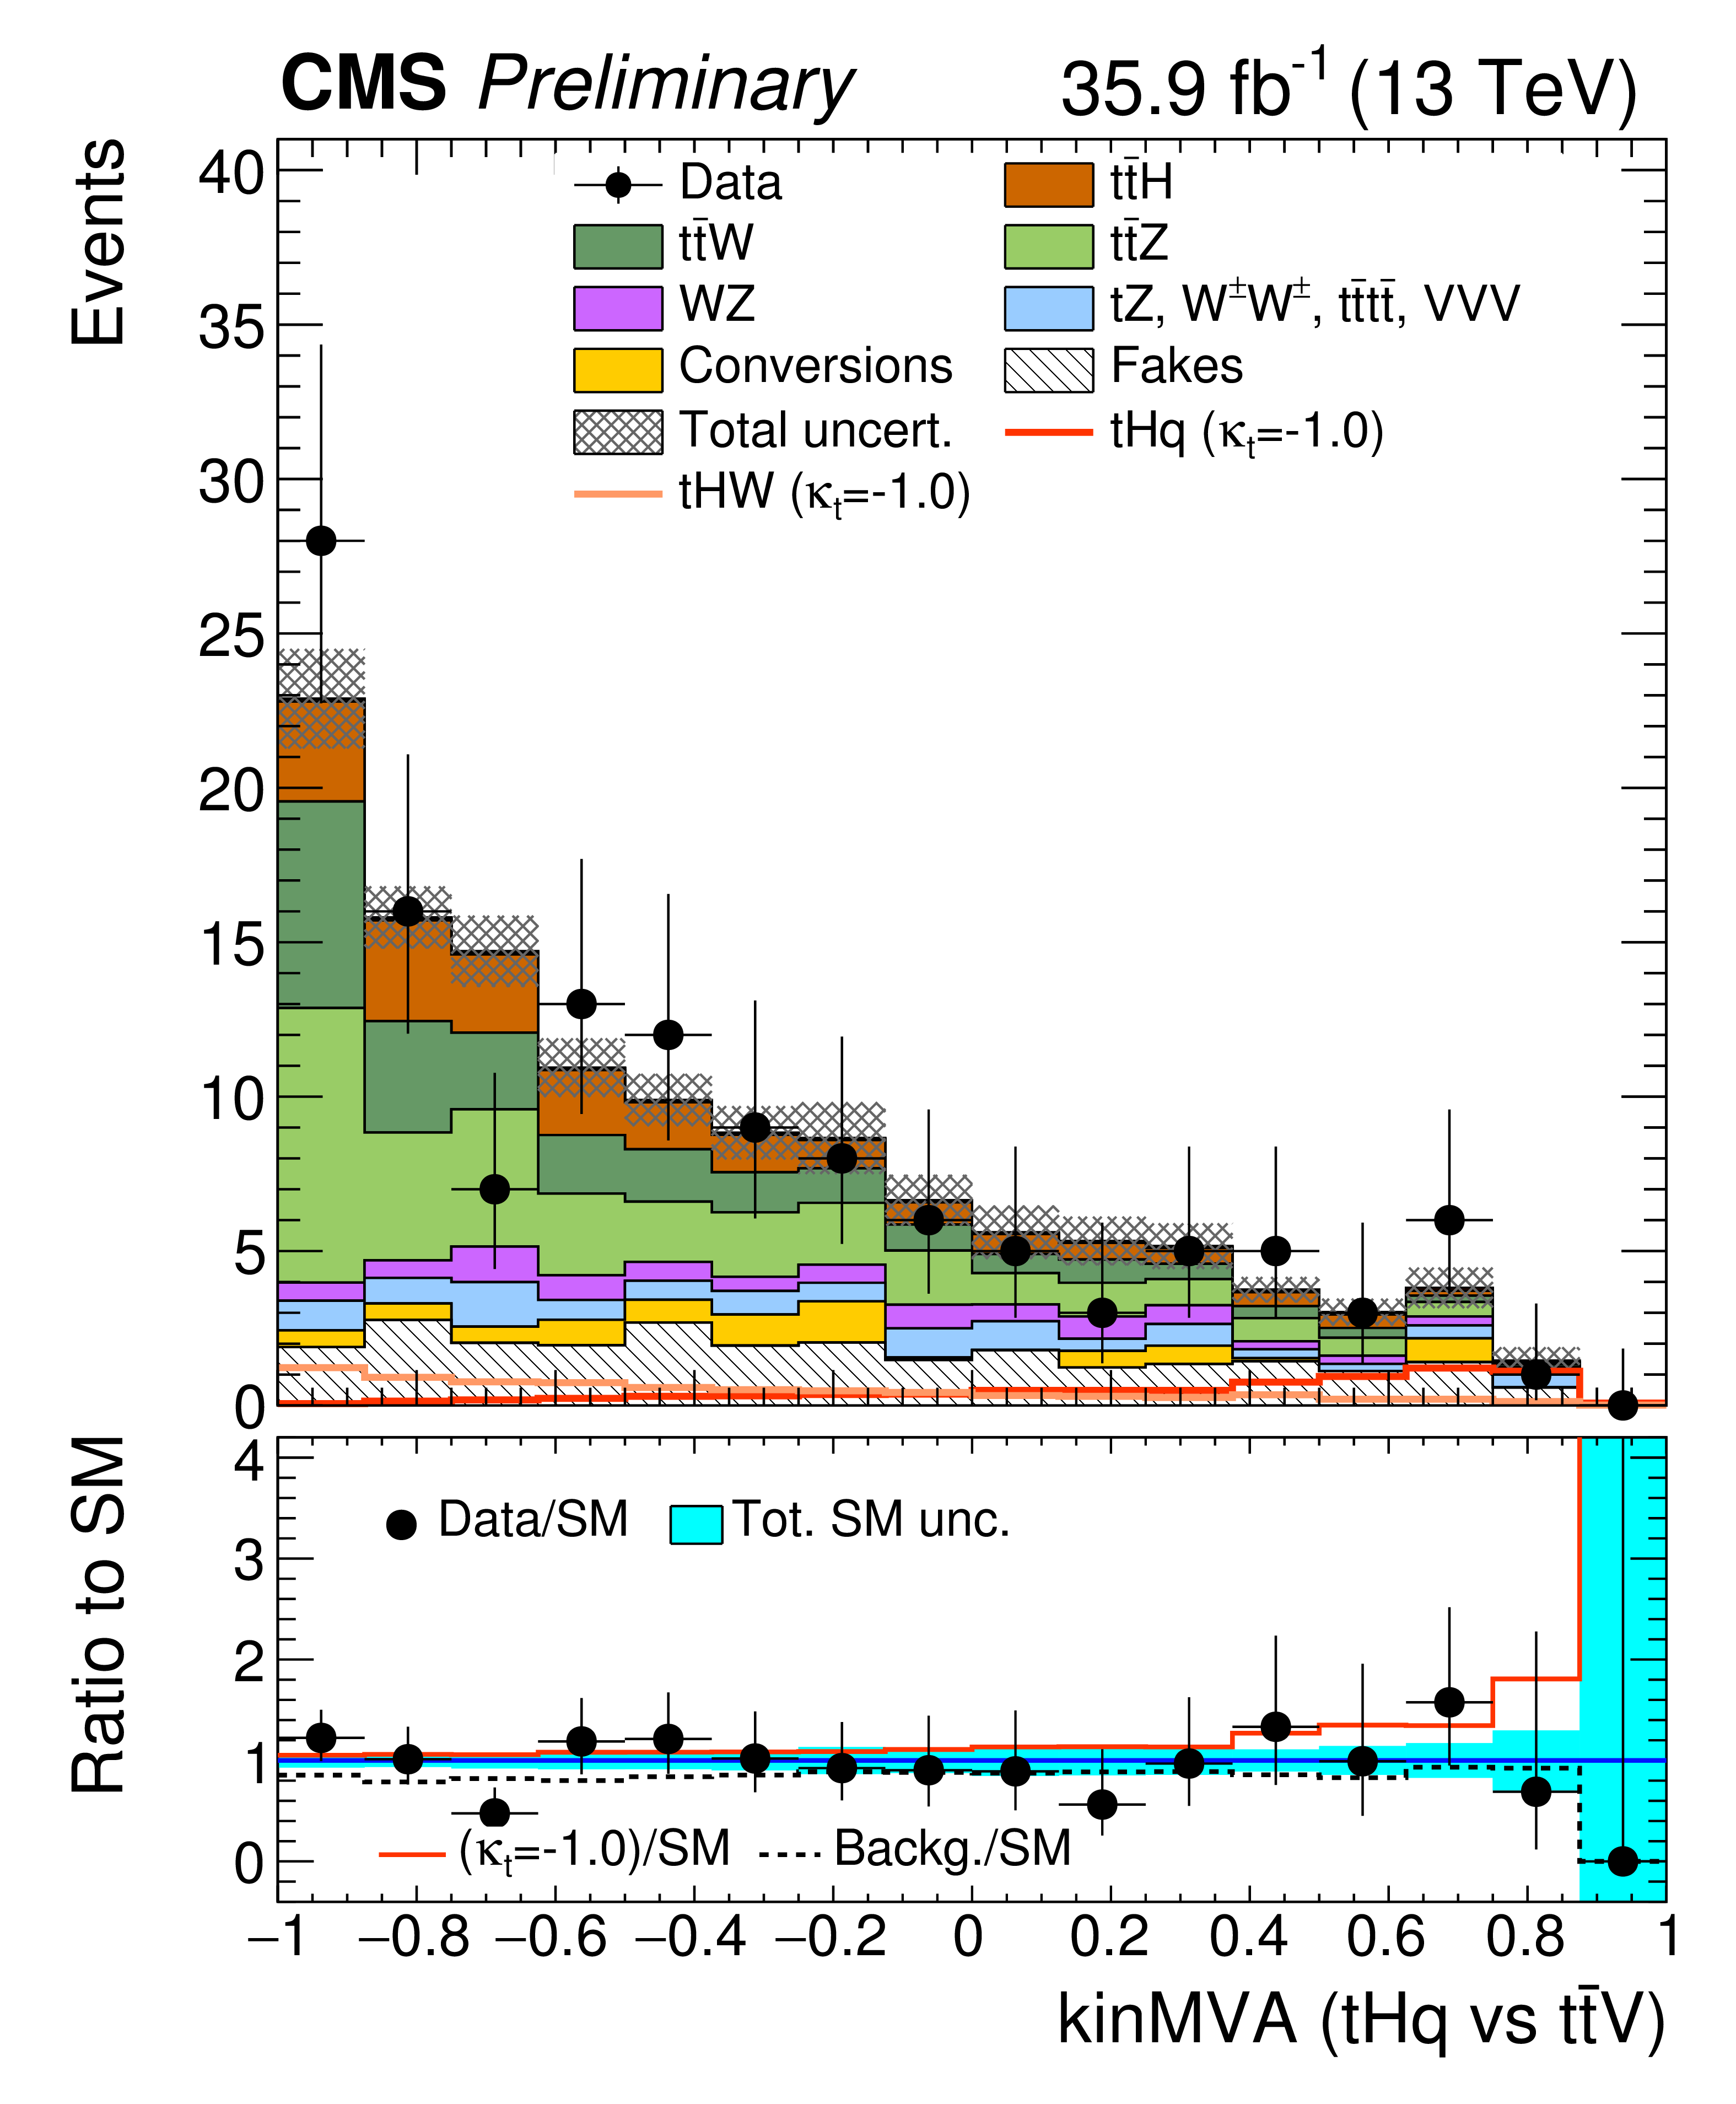
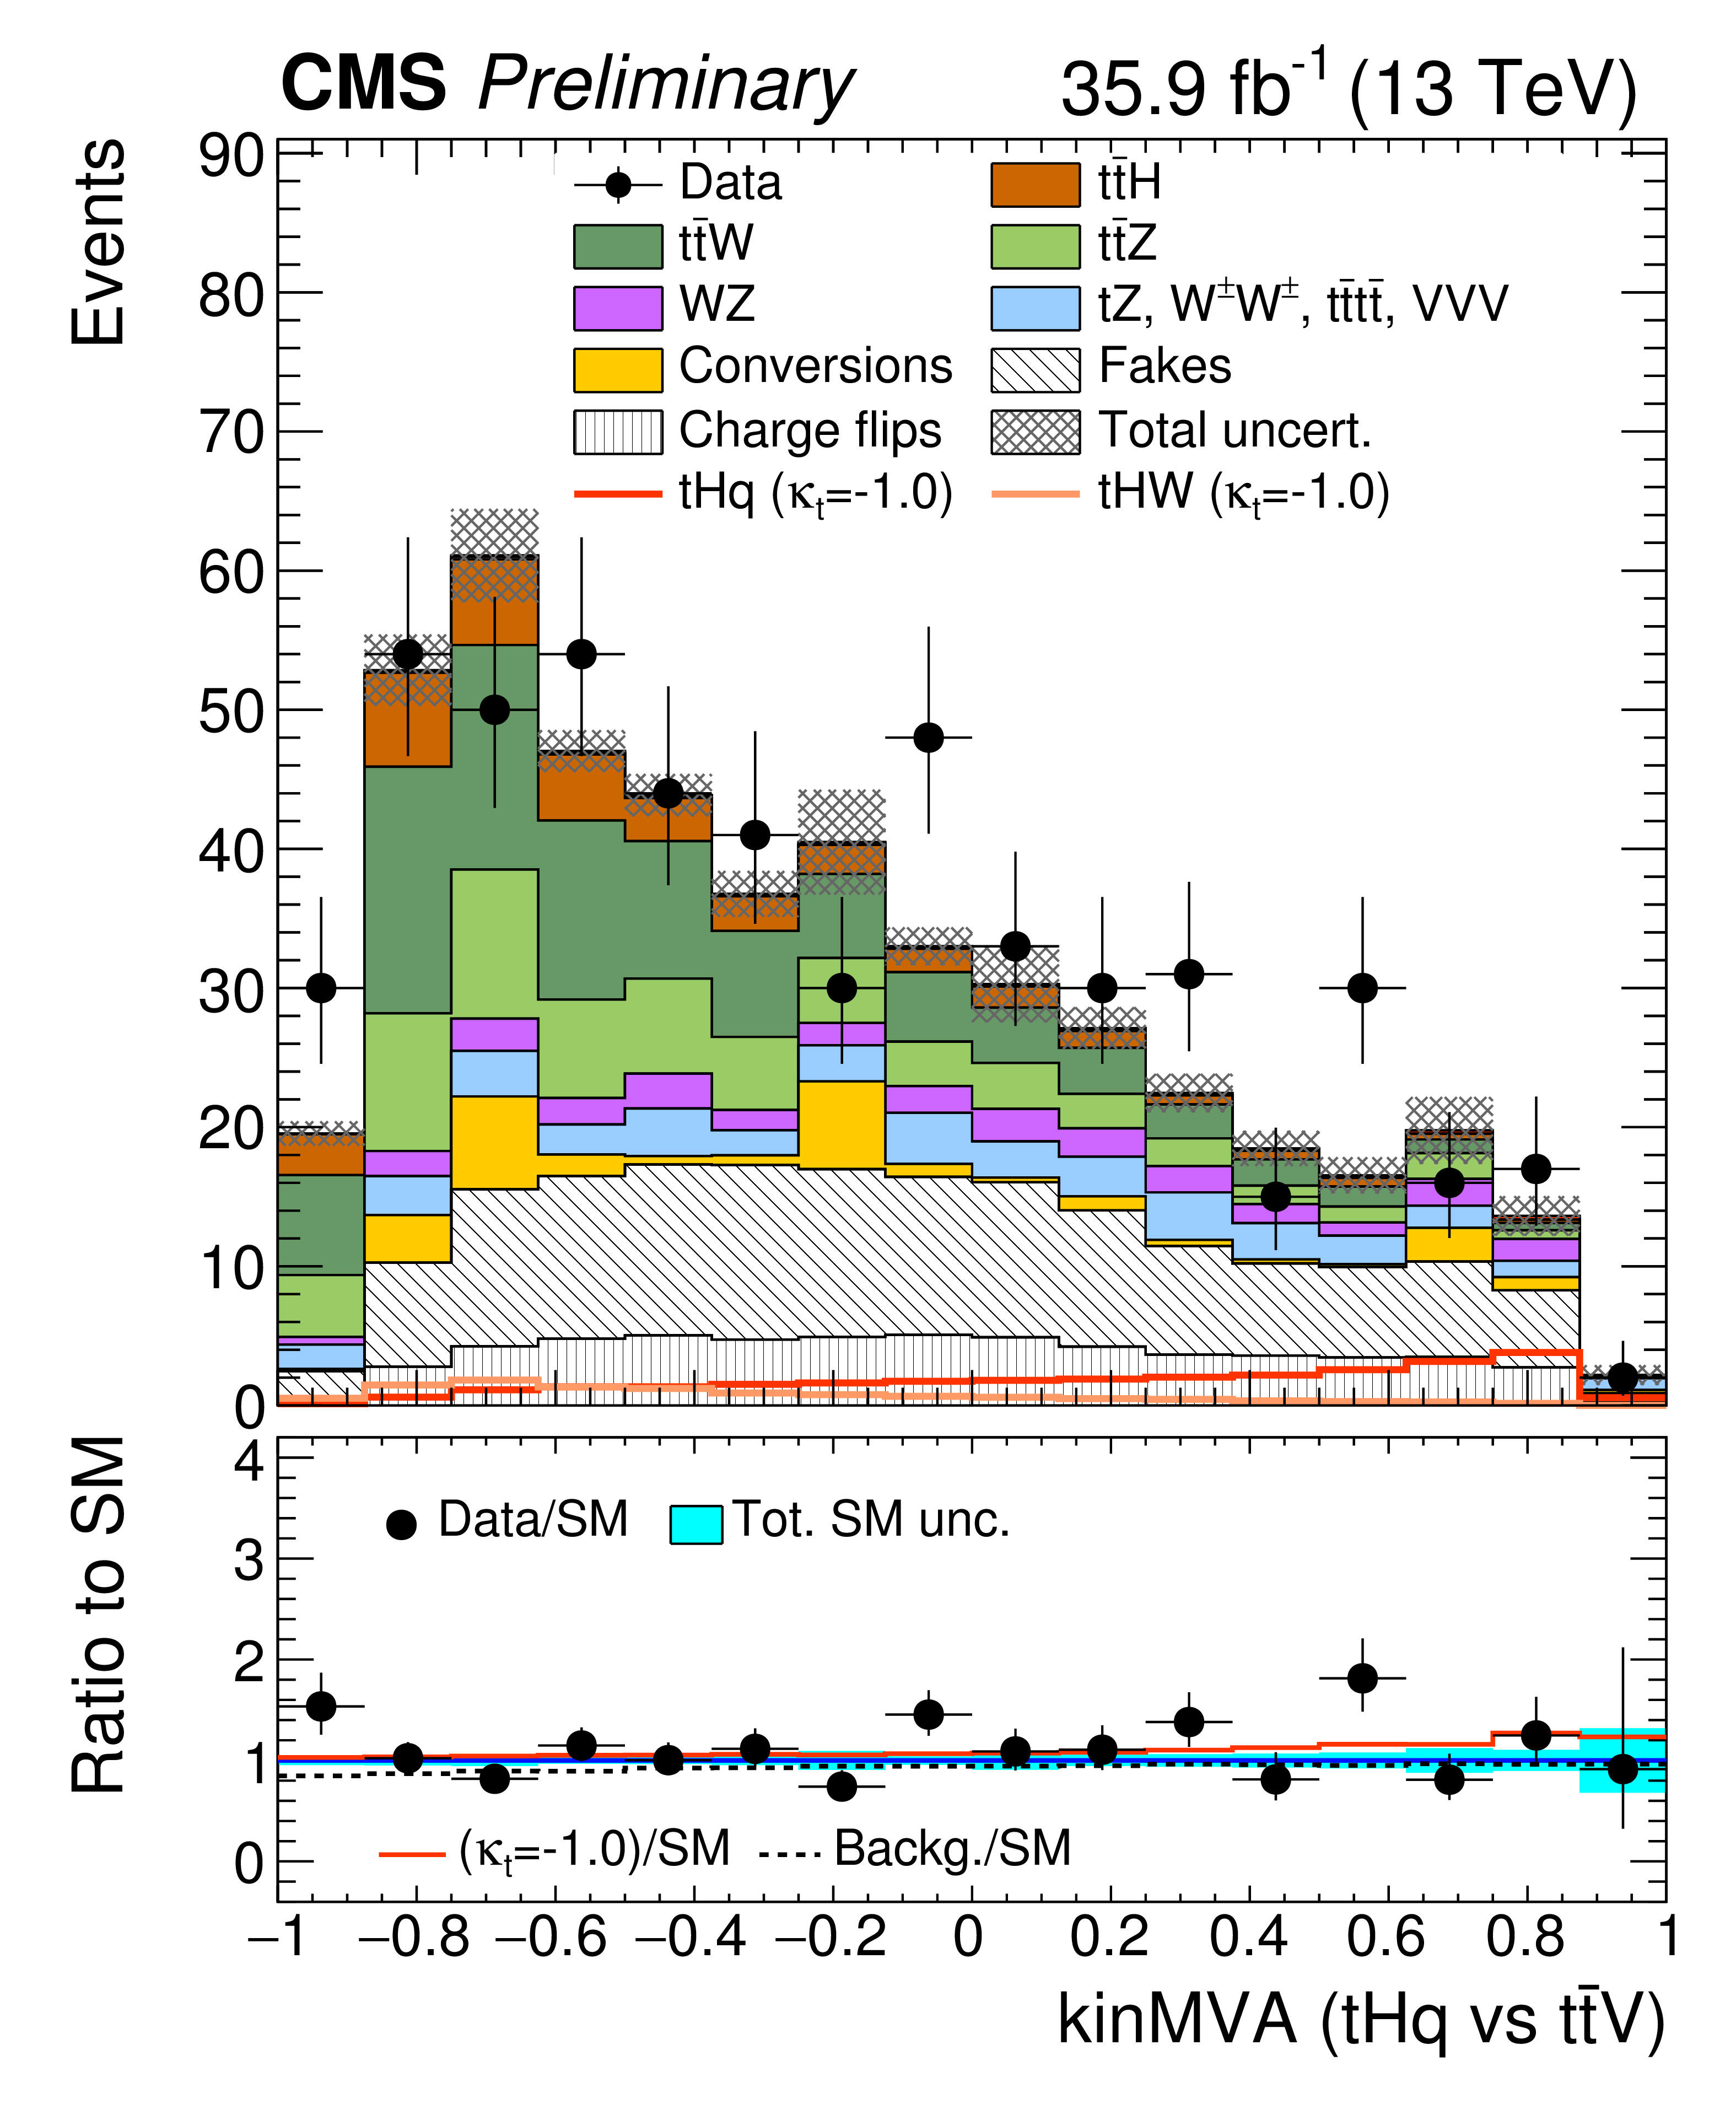
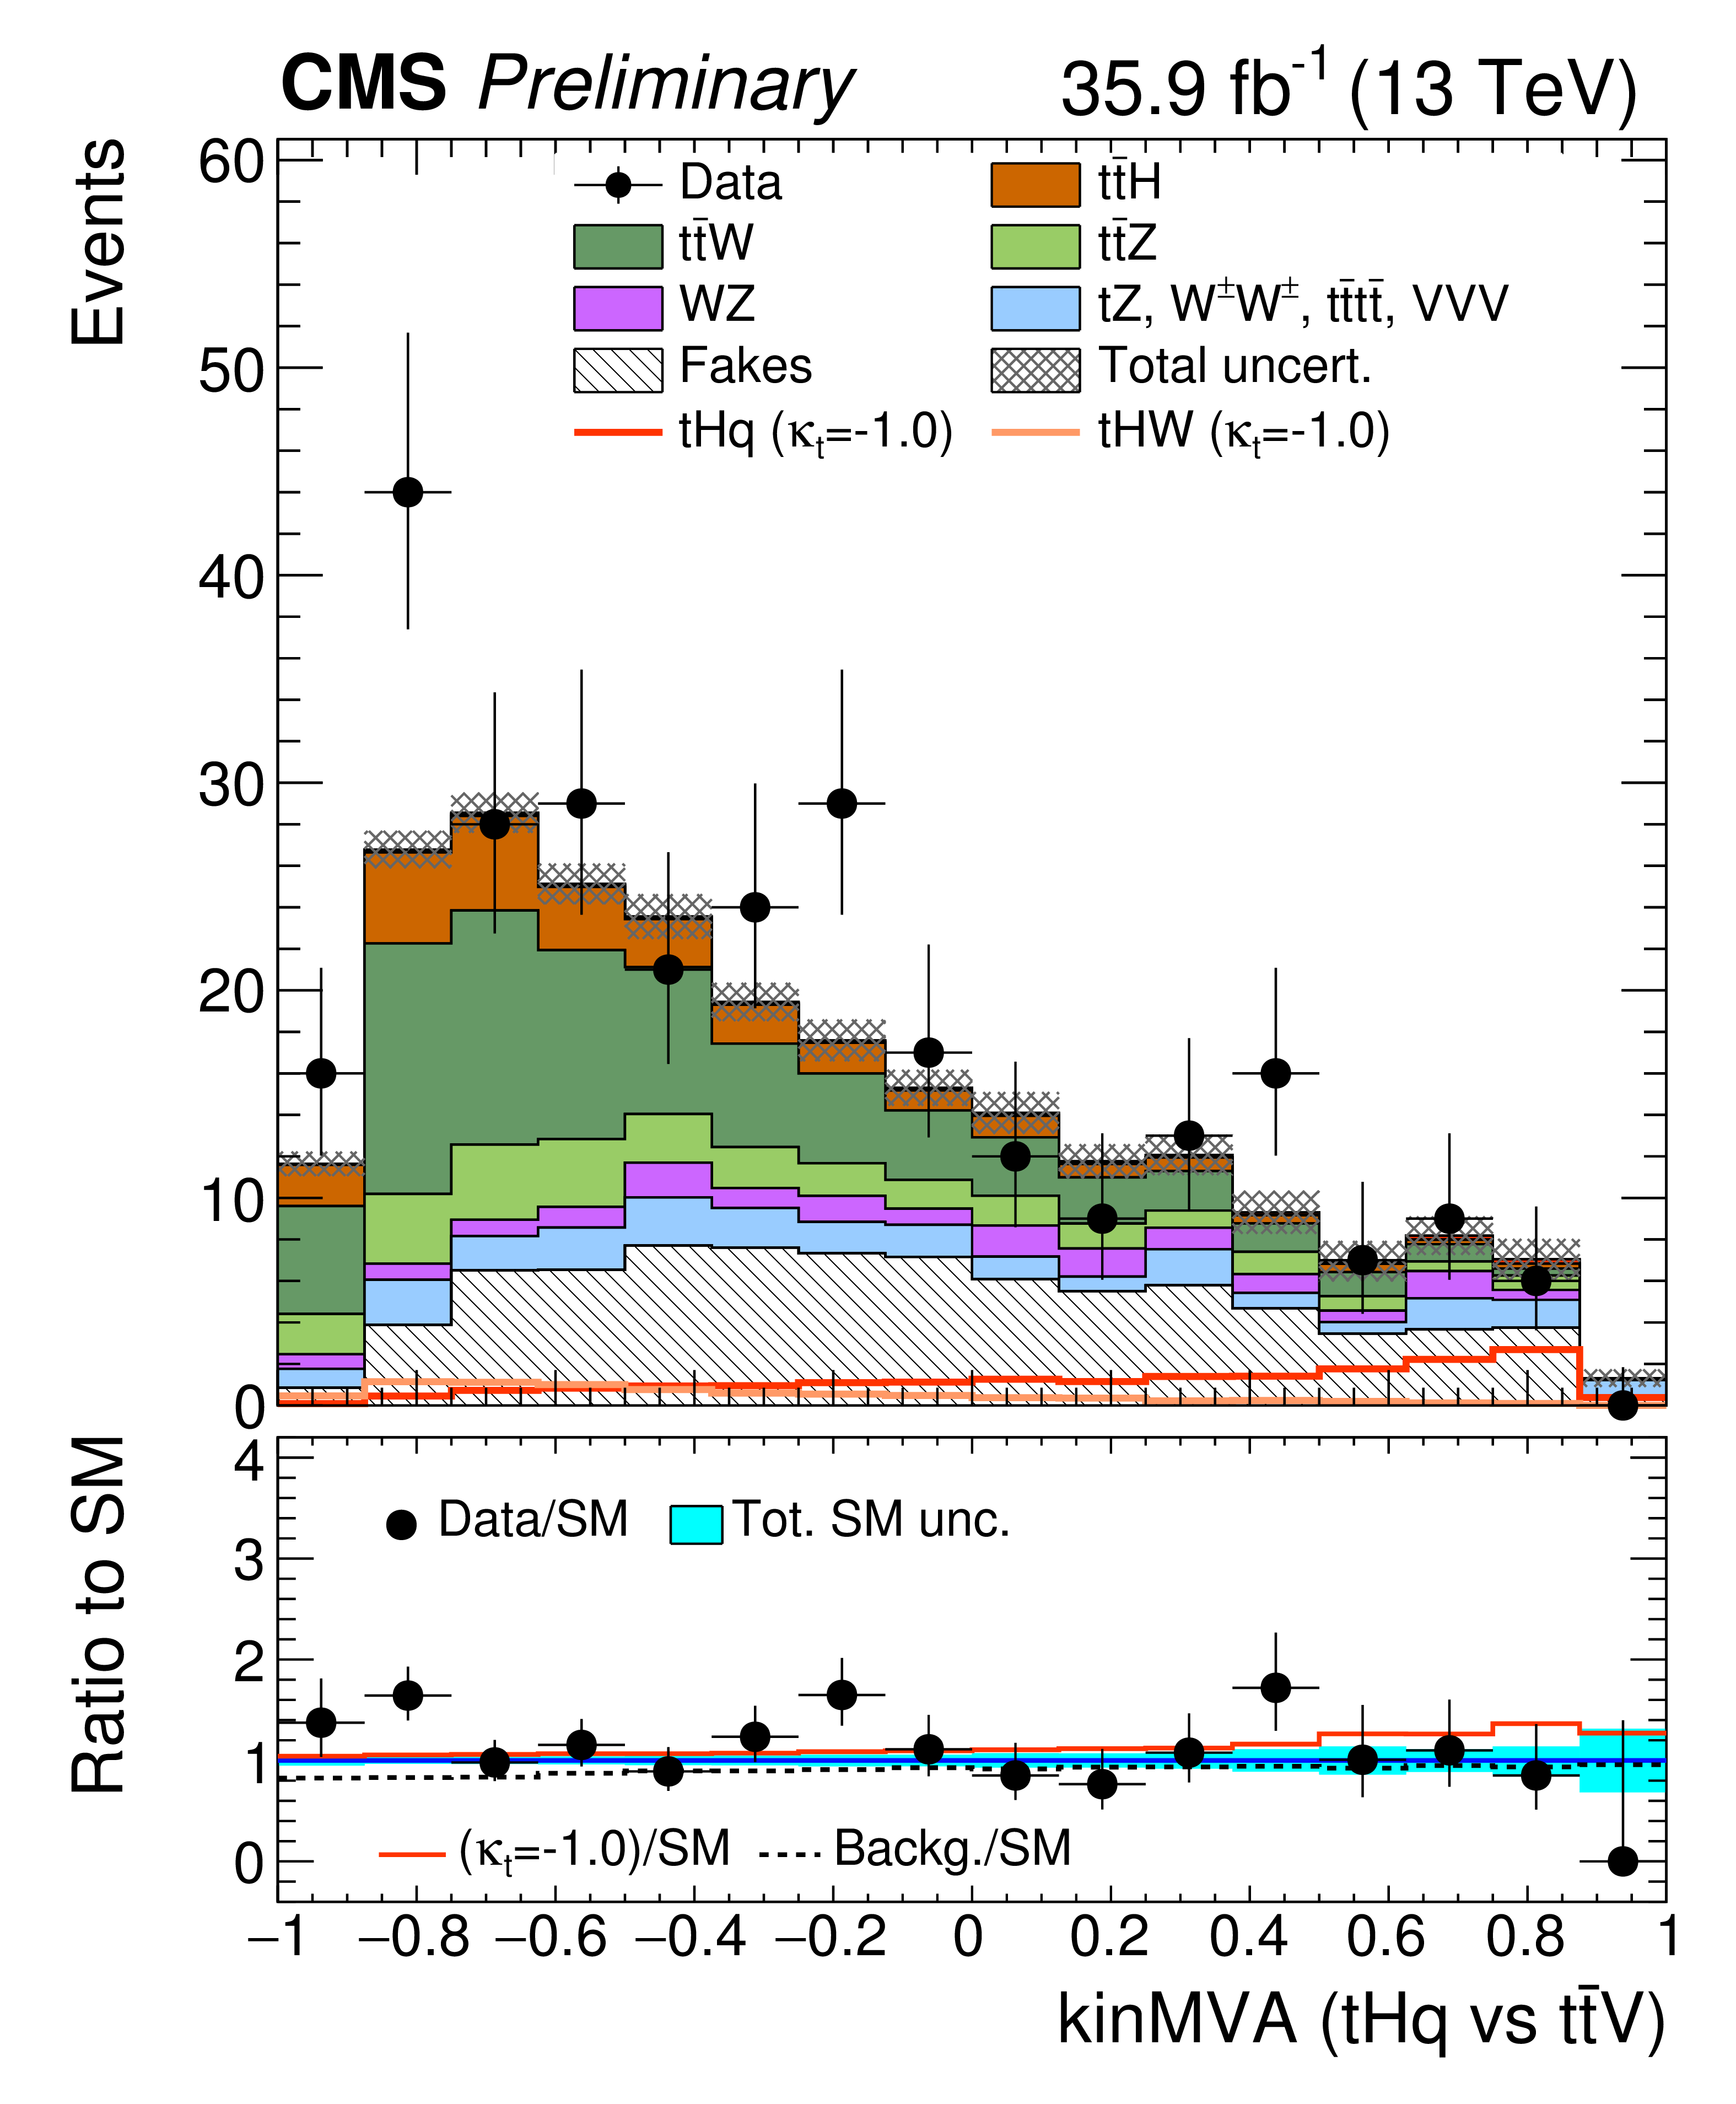
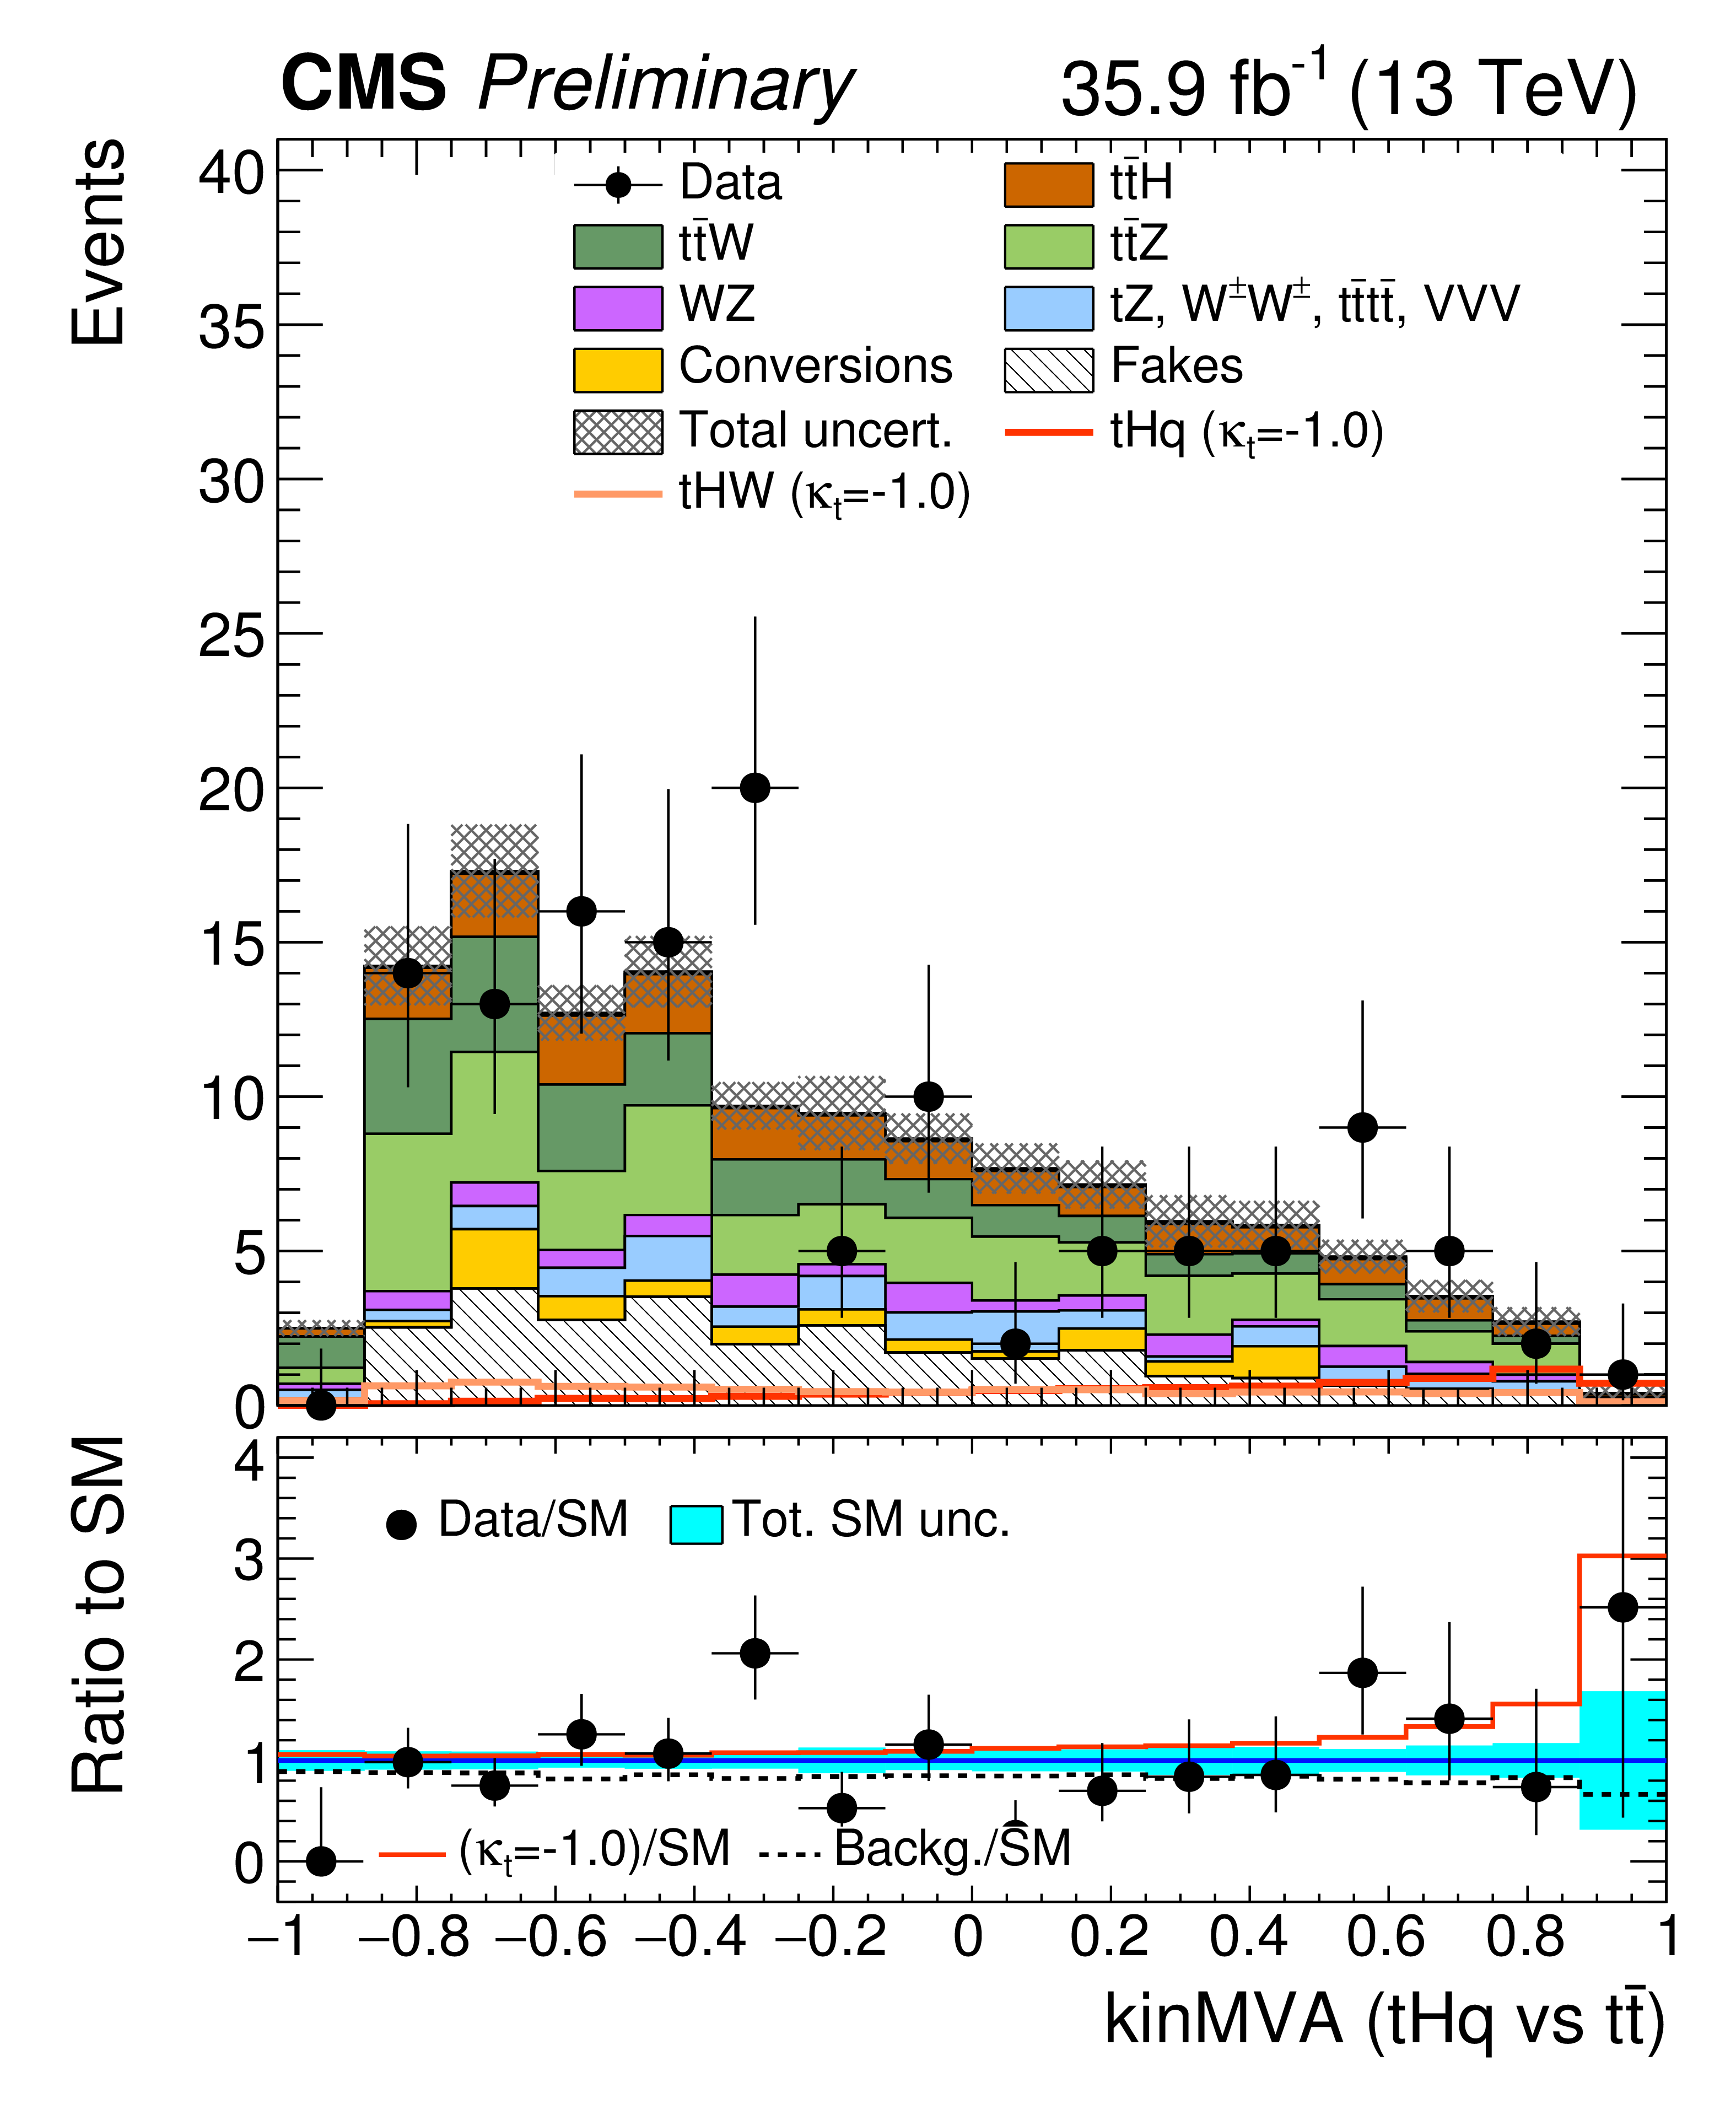
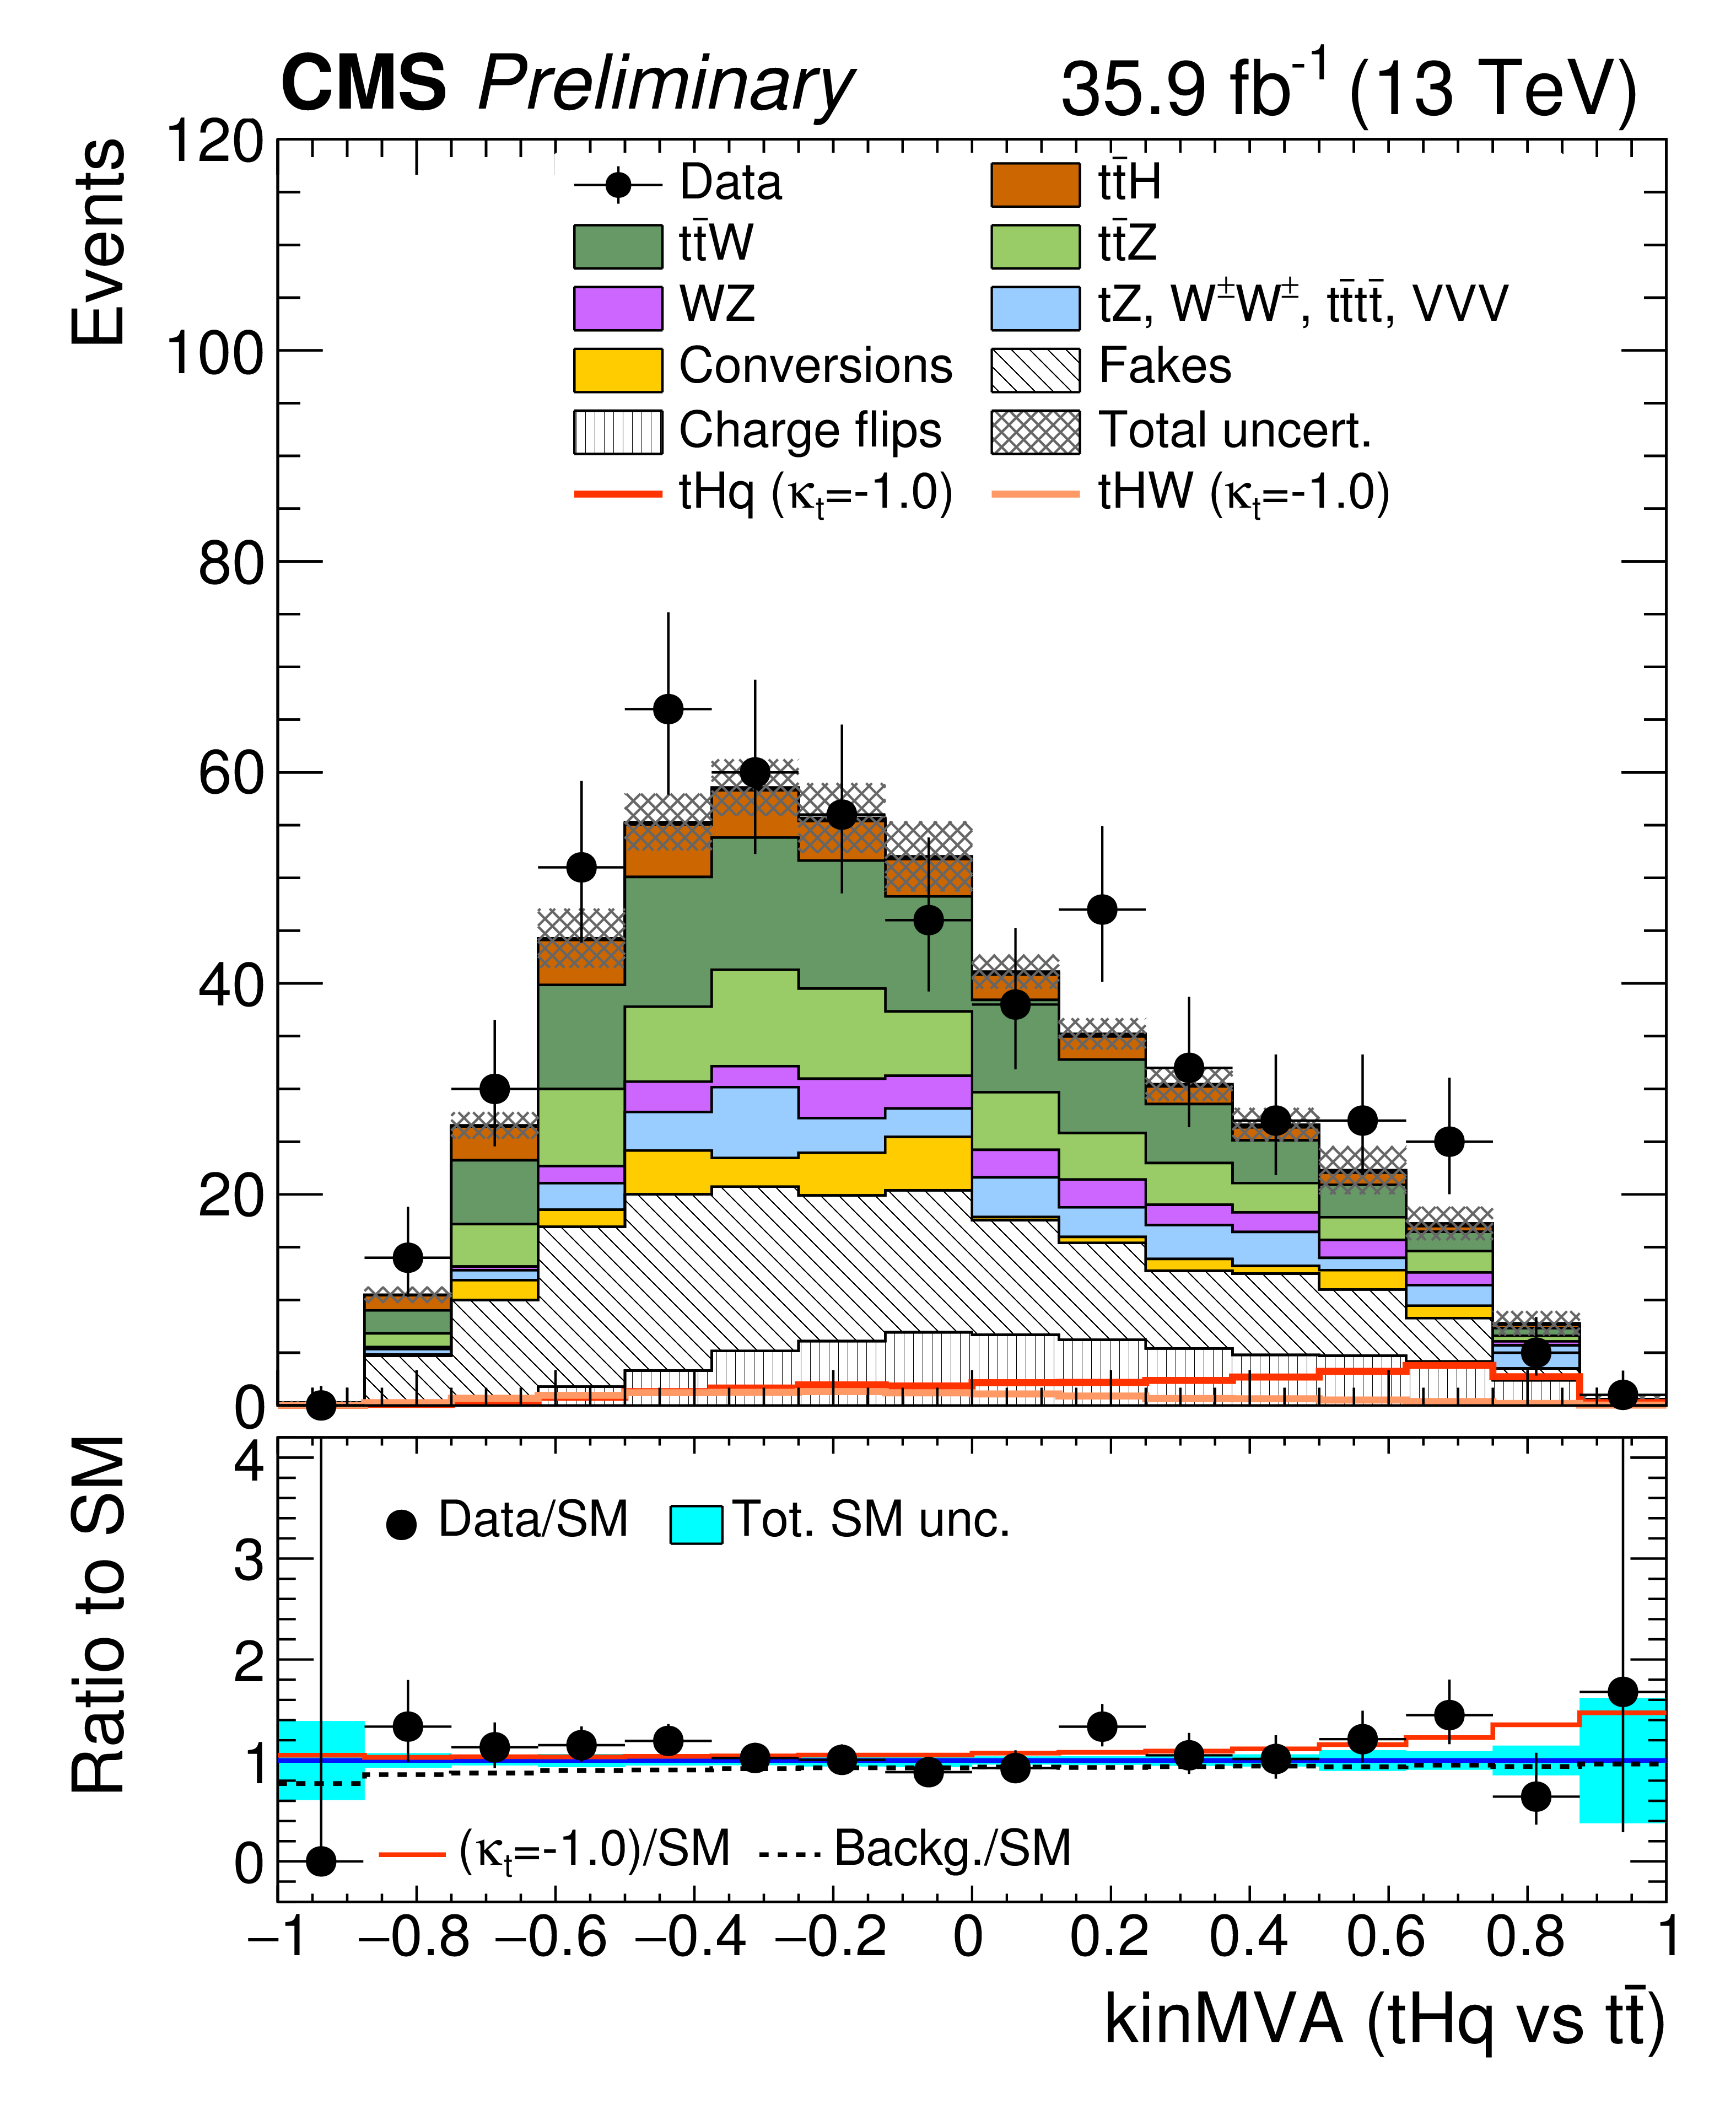
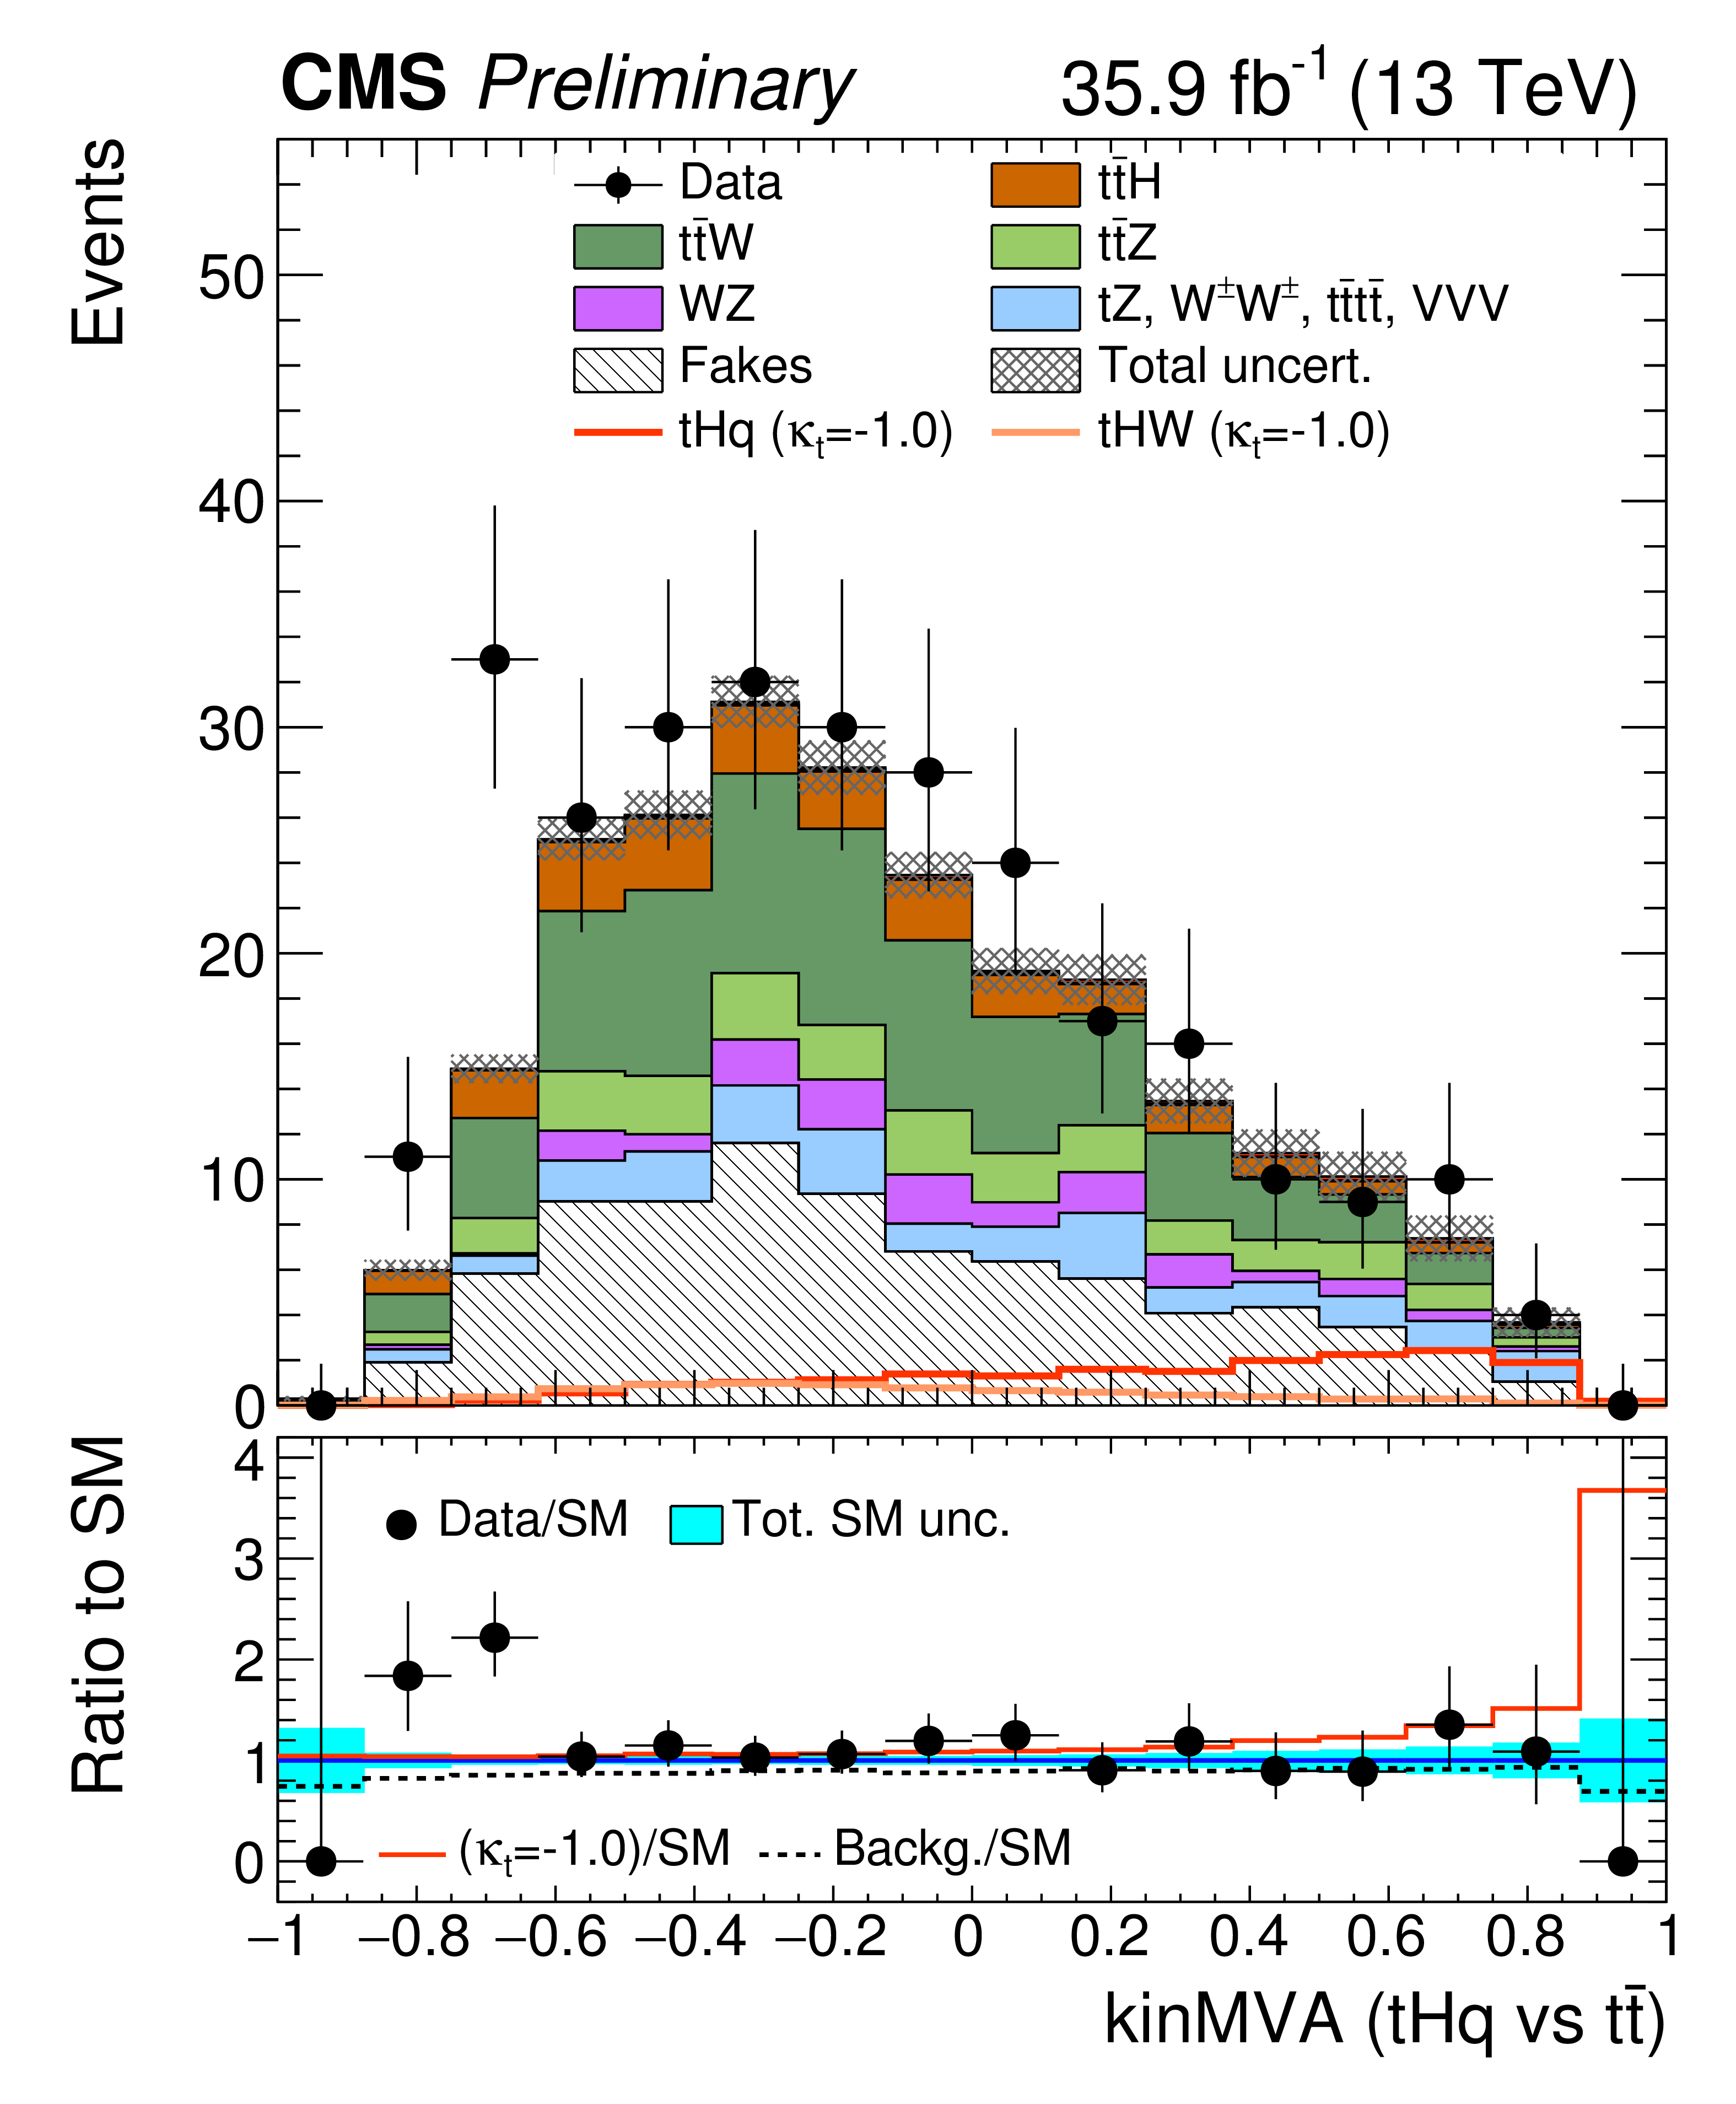
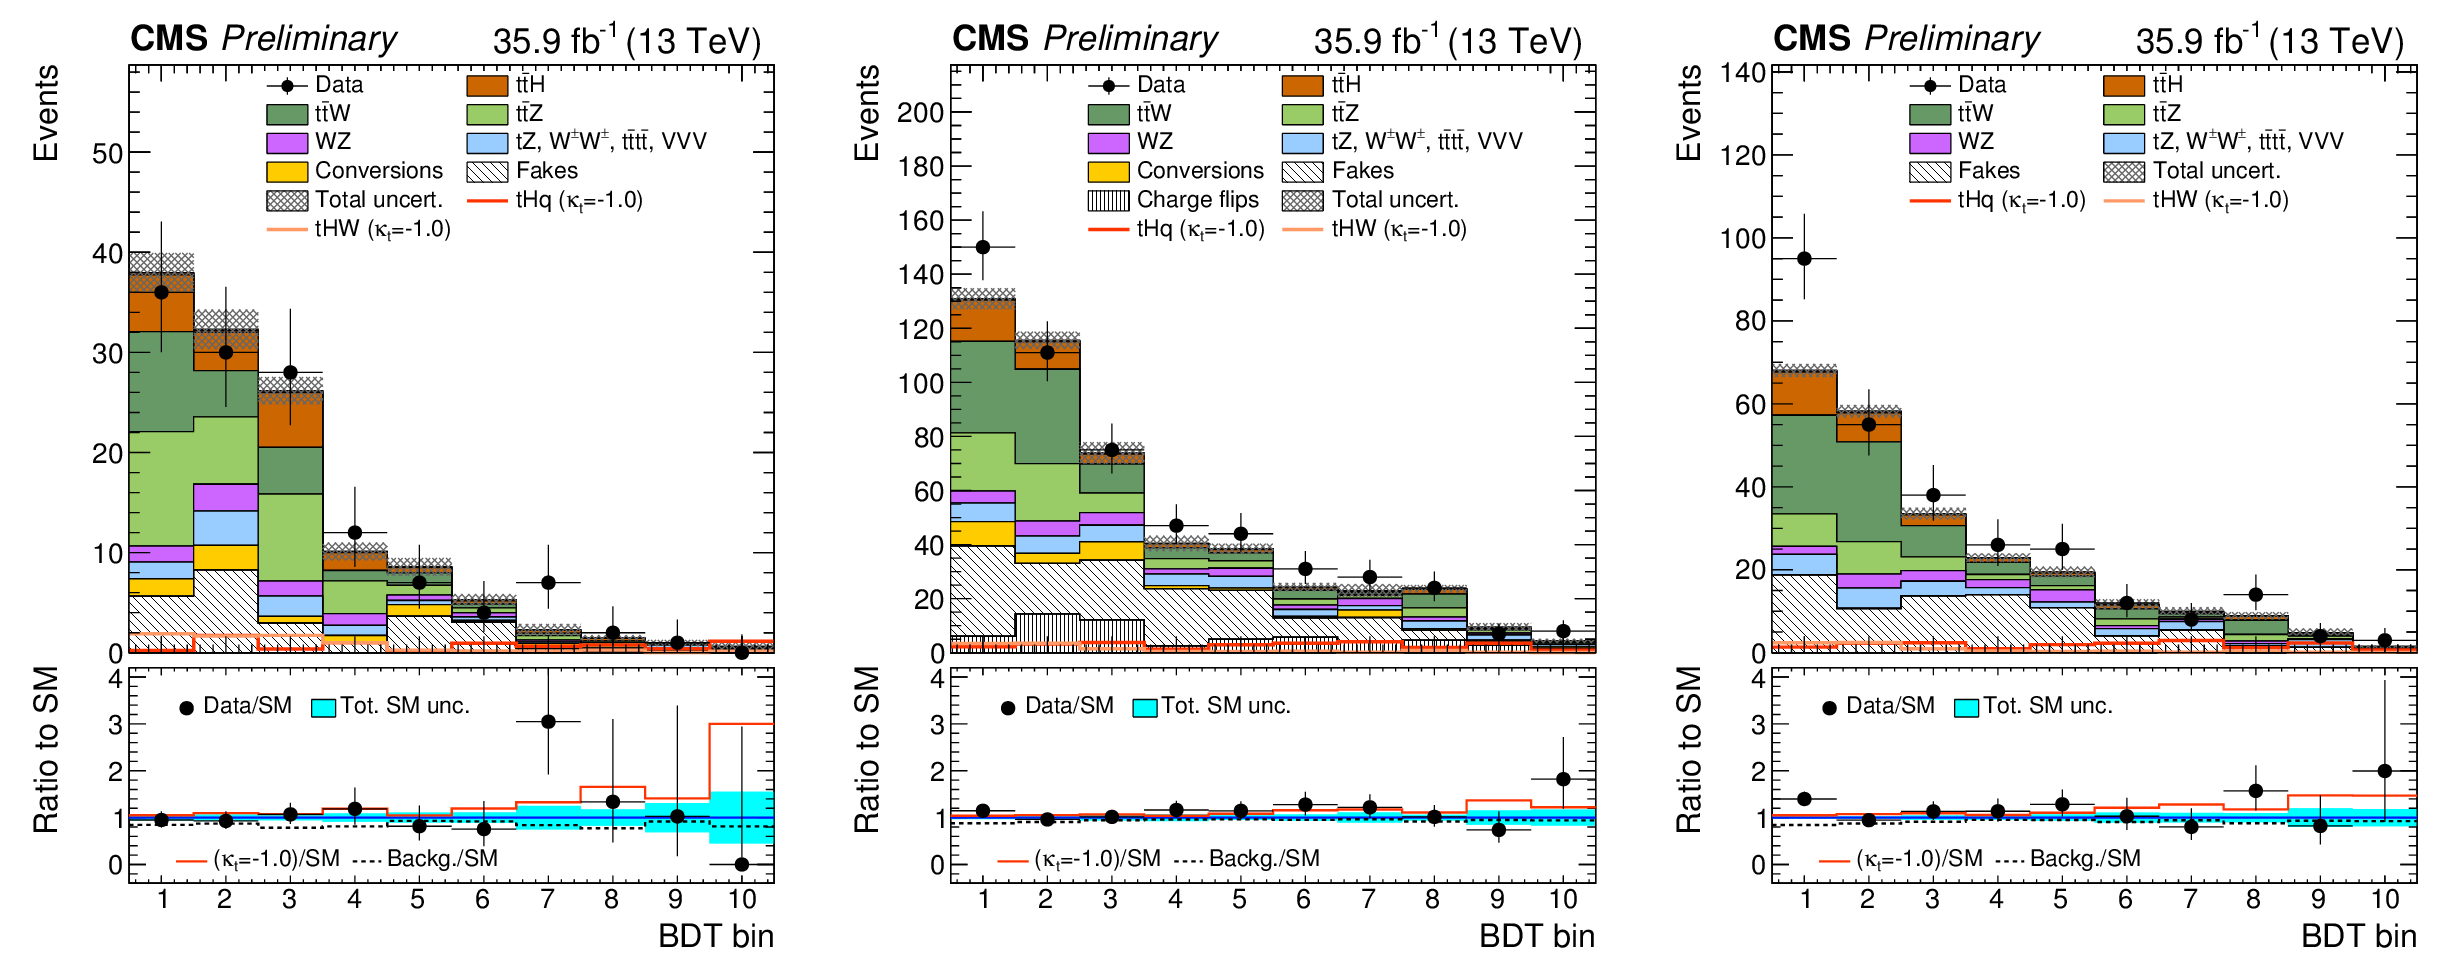
Figure 5:
Pre-fit BDT classifier outputs, for the three-lepton channel (left), ${\mathrm{ e } \mu } $ (center), and ${\mu \mu } $ (right), for 35.9 fb$^{-1}$, for training against ${{\mathrm{ t } \mathrm{ \bar{t} } } \mathrm {V}} $ (top row) and against ${\mathrm{ t } \mathrm{ \bar{t} } } $ (bottom row). In the box below each distribution, the ratio of the observed and predicted event yields is shown. The shape of the two ${\mathrm{ t } \mathrm{ H } } $ signals for $ {\kappa _\mathrm{ t } } =-1.0$ is shown, normalized to their respective cross sections for $ {\kappa _\mathrm{ t } } =-1.0, {\kappa _\text {V}} =1.0$. The grey band represents the unconstrained (pre-fit) statistical and systematical uncertainties. |
png pdf |
Figure 5-a:
Pre-fit BDT classifier output, for the three-lepton channel , for 35.9 fb$^{-1}$, for training against ${{\mathrm{ t } \mathrm{ \bar{t} } } \mathrm {V}} $. In the box below the distribution, the ratio of the observed and predicted event yields is shown. The shape of the two ${\mathrm{ t } \mathrm{ H } } $ signals for $ {\kappa _\mathrm{ t } } =-1.0$ is shown, normalized to their respective cross sections for $ {\kappa _\mathrm{ t } } =-1.0, {\kappa _\text {V}} =1.0$. The grey band represents the unconstrained (pre-fit) statistical and systematical uncertainties. |
png pdf |
Figure 5-b:
Pre-fit BDT classifier output, for ${\mathrm{ e } \mu } $, for 35.9 fb$^{-1}$, for training against ${{\mathrm{ t } \mathrm{ \bar{t} } } \mathrm {V}} $. In the box below the distribution, the ratio of the observed and predicted event yields is shown. The shape of the two ${\mathrm{ t } \mathrm{ H } } $ signals for $ {\kappa _\mathrm{ t } } =-1.0$ is shown, normalized to their respective cross sections for $ {\kappa _\mathrm{ t } } =-1.0, {\kappa _\text {V}} =1.0$. The grey band represents the unconstrained (pre-fit) statistical and systematical uncertainties. |
png pdf |
Figure 5-c:
Pre-fit BDT classifier output, for ${\mu \mu } $, for 35.9 fb$^{-1}$, for training against ${{\mathrm{ t } \mathrm{ \bar{t} } } \mathrm {V}} $. In the box below the distribution, the ratio of the observed and predicted event yields is shown. The shape of the two ${\mathrm{ t } \mathrm{ H } } $ signals for $ {\kappa _\mathrm{ t } } =-1.0$ is shown, normalized to their respective cross sections for $ {\kappa _\mathrm{ t } } =-1.0, {\kappa _\text {V}} =1.0$. The grey band represents the unconstrained (pre-fit) statistical and systematical uncertainties. |
png pdf |
Figure 5-d:
Pre-fit BDT classifier output, for the three-lepton channel, for 35.9 fb$^{-1}$, for training against ${\mathrm{ t } \mathrm{ \bar{t} } } $. In the box below the distribution, the ratio of the observed and predicted event yields is shown. The shape of the two ${\mathrm{ t } \mathrm{ H } } $ signals for $ {\kappa _\mathrm{ t } } =-1.0$ is shown, normalized to their respective cross sections for $ {\kappa _\mathrm{ t } } =-1.0, {\kappa _\text {V}} =1.0$. The grey band represents the unconstrained (pre-fit) statistical and systematical uncertainties. |
png pdf |
Figure 5-e:
Pre-fit BDT classifier output, for ${\mathrm{ e } \mu } $, for 35.9 fb$^{-1}$, for training against ${\mathrm{ t } \mathrm{ \bar{t} } } $. In the box below the distribution, the ratio of the observed and predicted event yields is shown. The shape of the two ${\mathrm{ t } \mathrm{ H } } $ signals for $ {\kappa _\mathrm{ t } } =-1.0$ is shown, normalized to their respective cross sections for $ {\kappa _\mathrm{ t } } =-1.0, {\kappa _\text {V}} =1.0$. The grey band represents the unconstrained (pre-fit) statistical and systematical uncertainties. |
png pdf |
Figure 5-f:
Pre-fit BDT classifier output, for ${\mu \mu } $, for 35.9 fb$^{-1}$, for training against ${\mathrm{ t } \mathrm{ \bar{t} } } $. In the box below the distribution, the ratio of the observed and predicted event yields is shown. The shape of the two ${\mathrm{ t } \mathrm{ H } } $ signals for $ {\kappa _\mathrm{ t } } =-1.0$ is shown, normalized to their respective cross sections for $ {\kappa _\mathrm{ t } } =-1.0, {\kappa _\text {V}} =1.0$. The grey band represents the unconstrained (pre-fit) statistical and systematical uncertainties. |
png pdf |
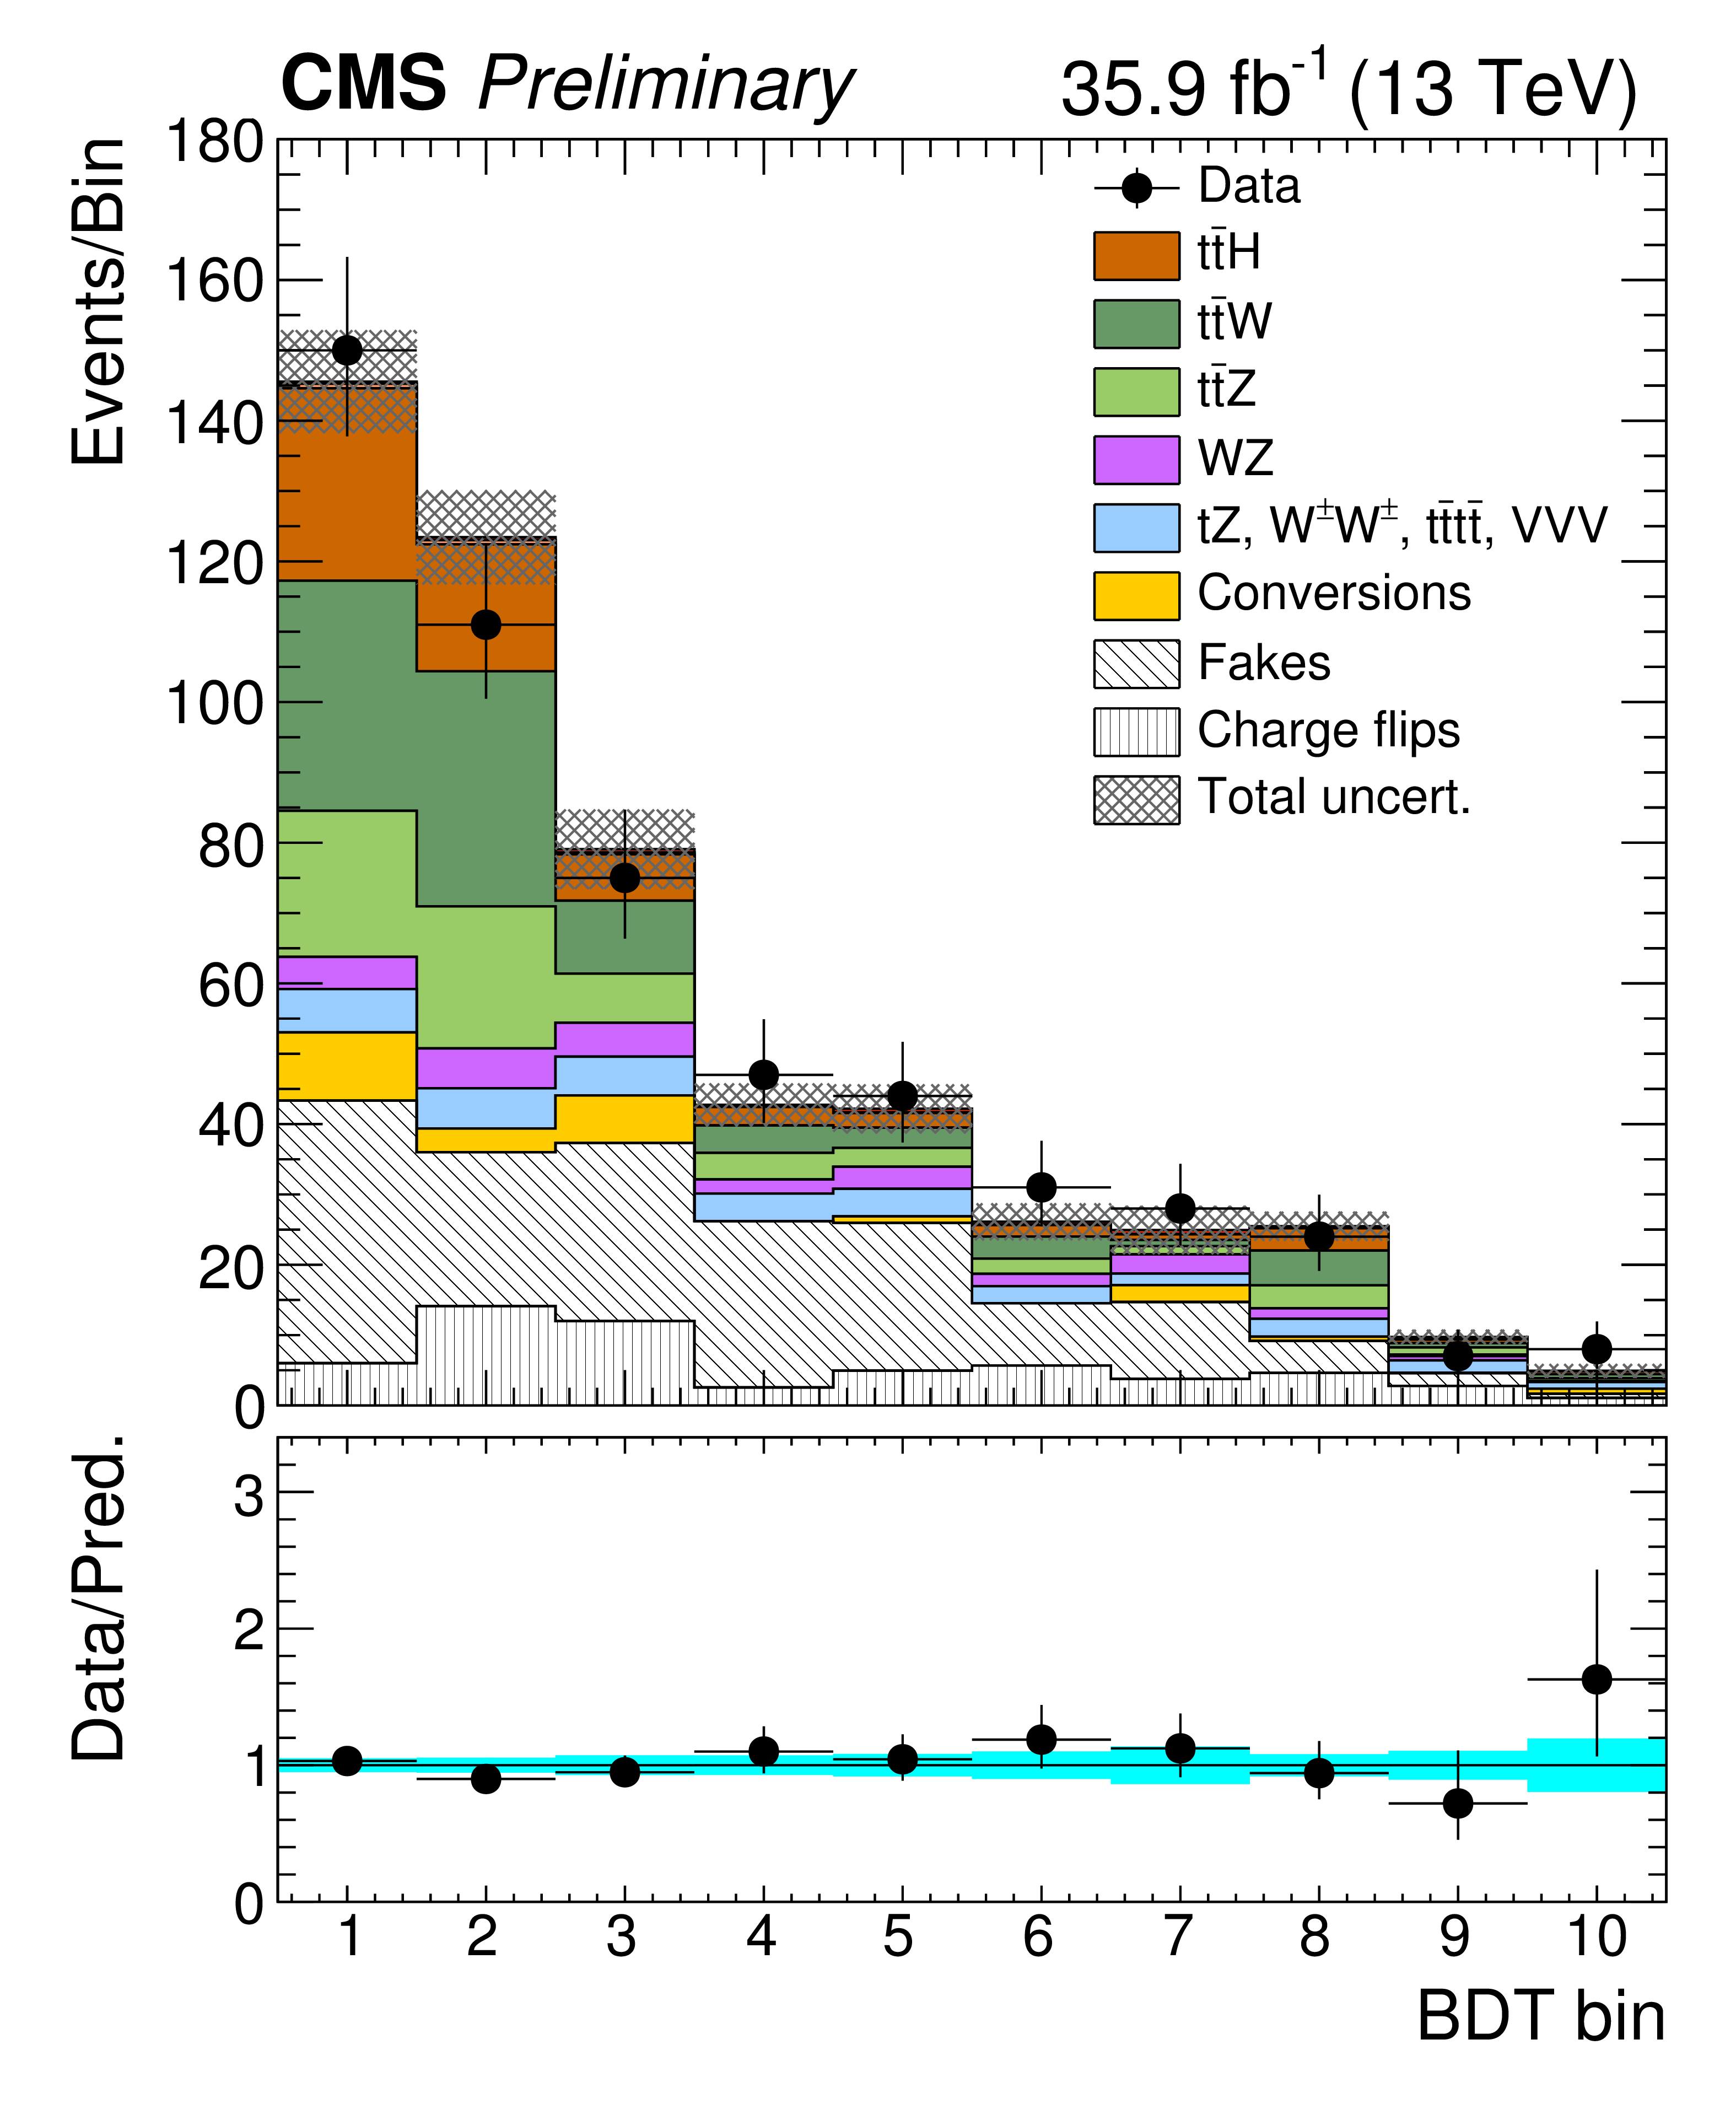
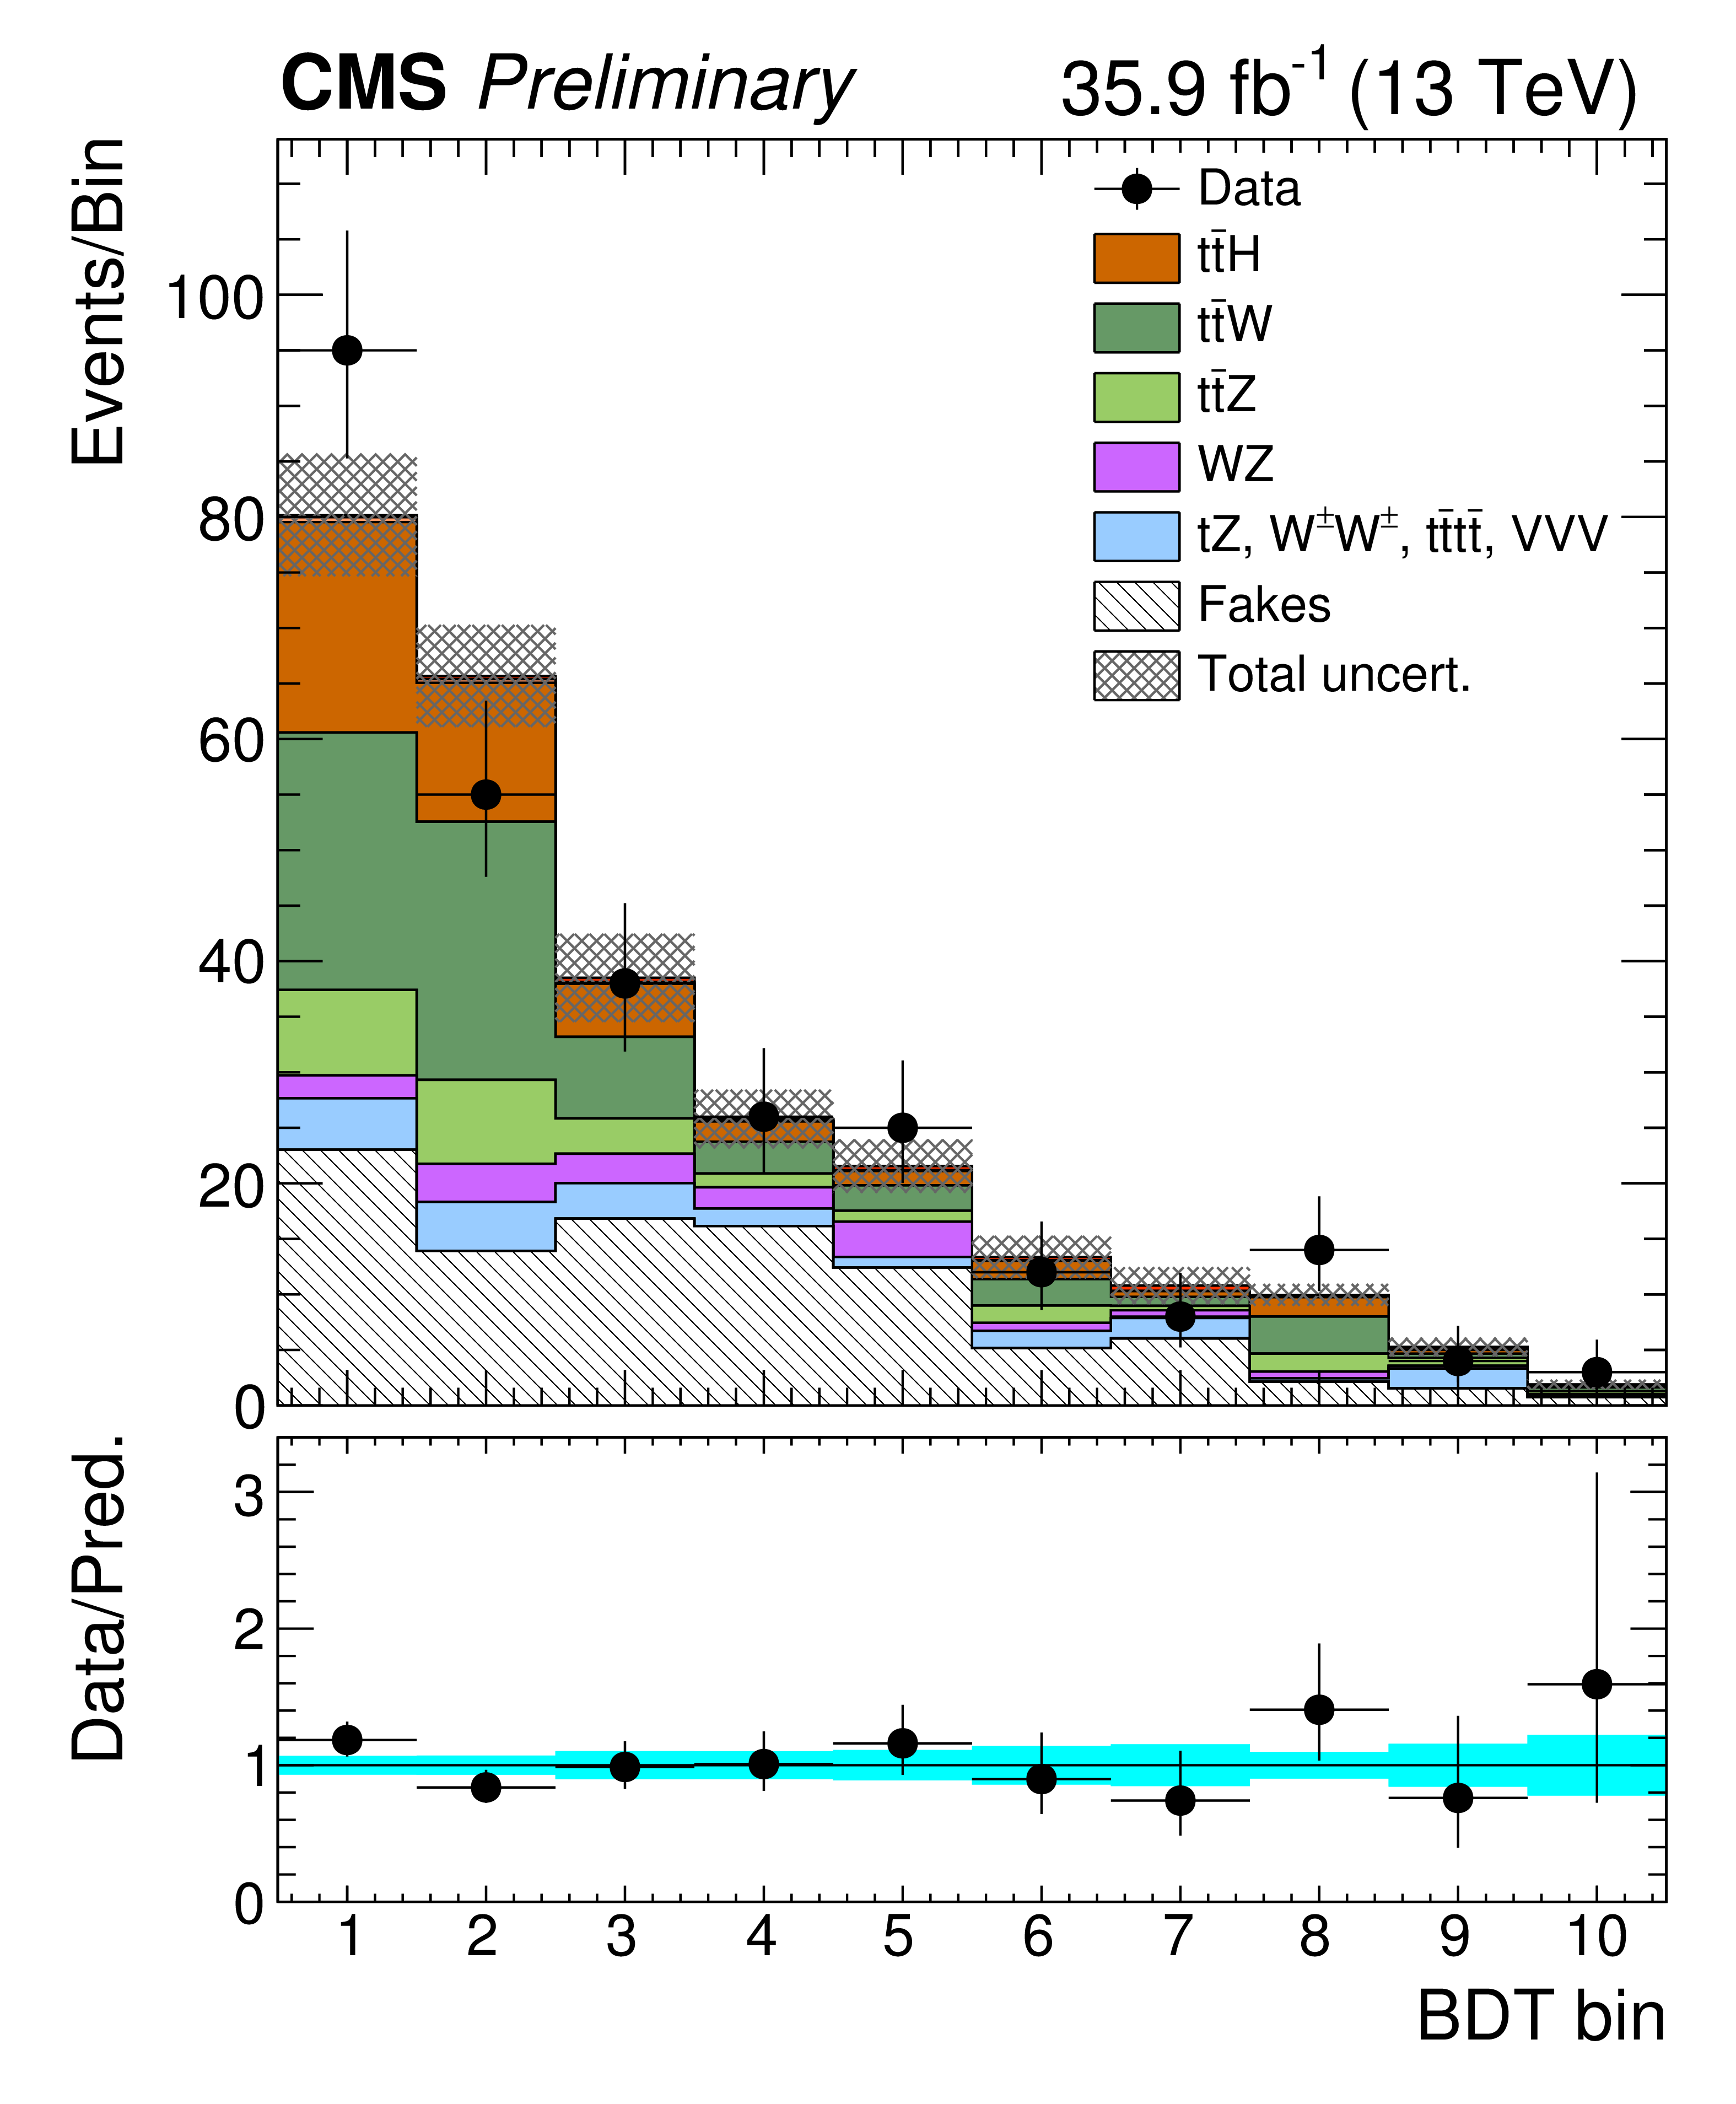
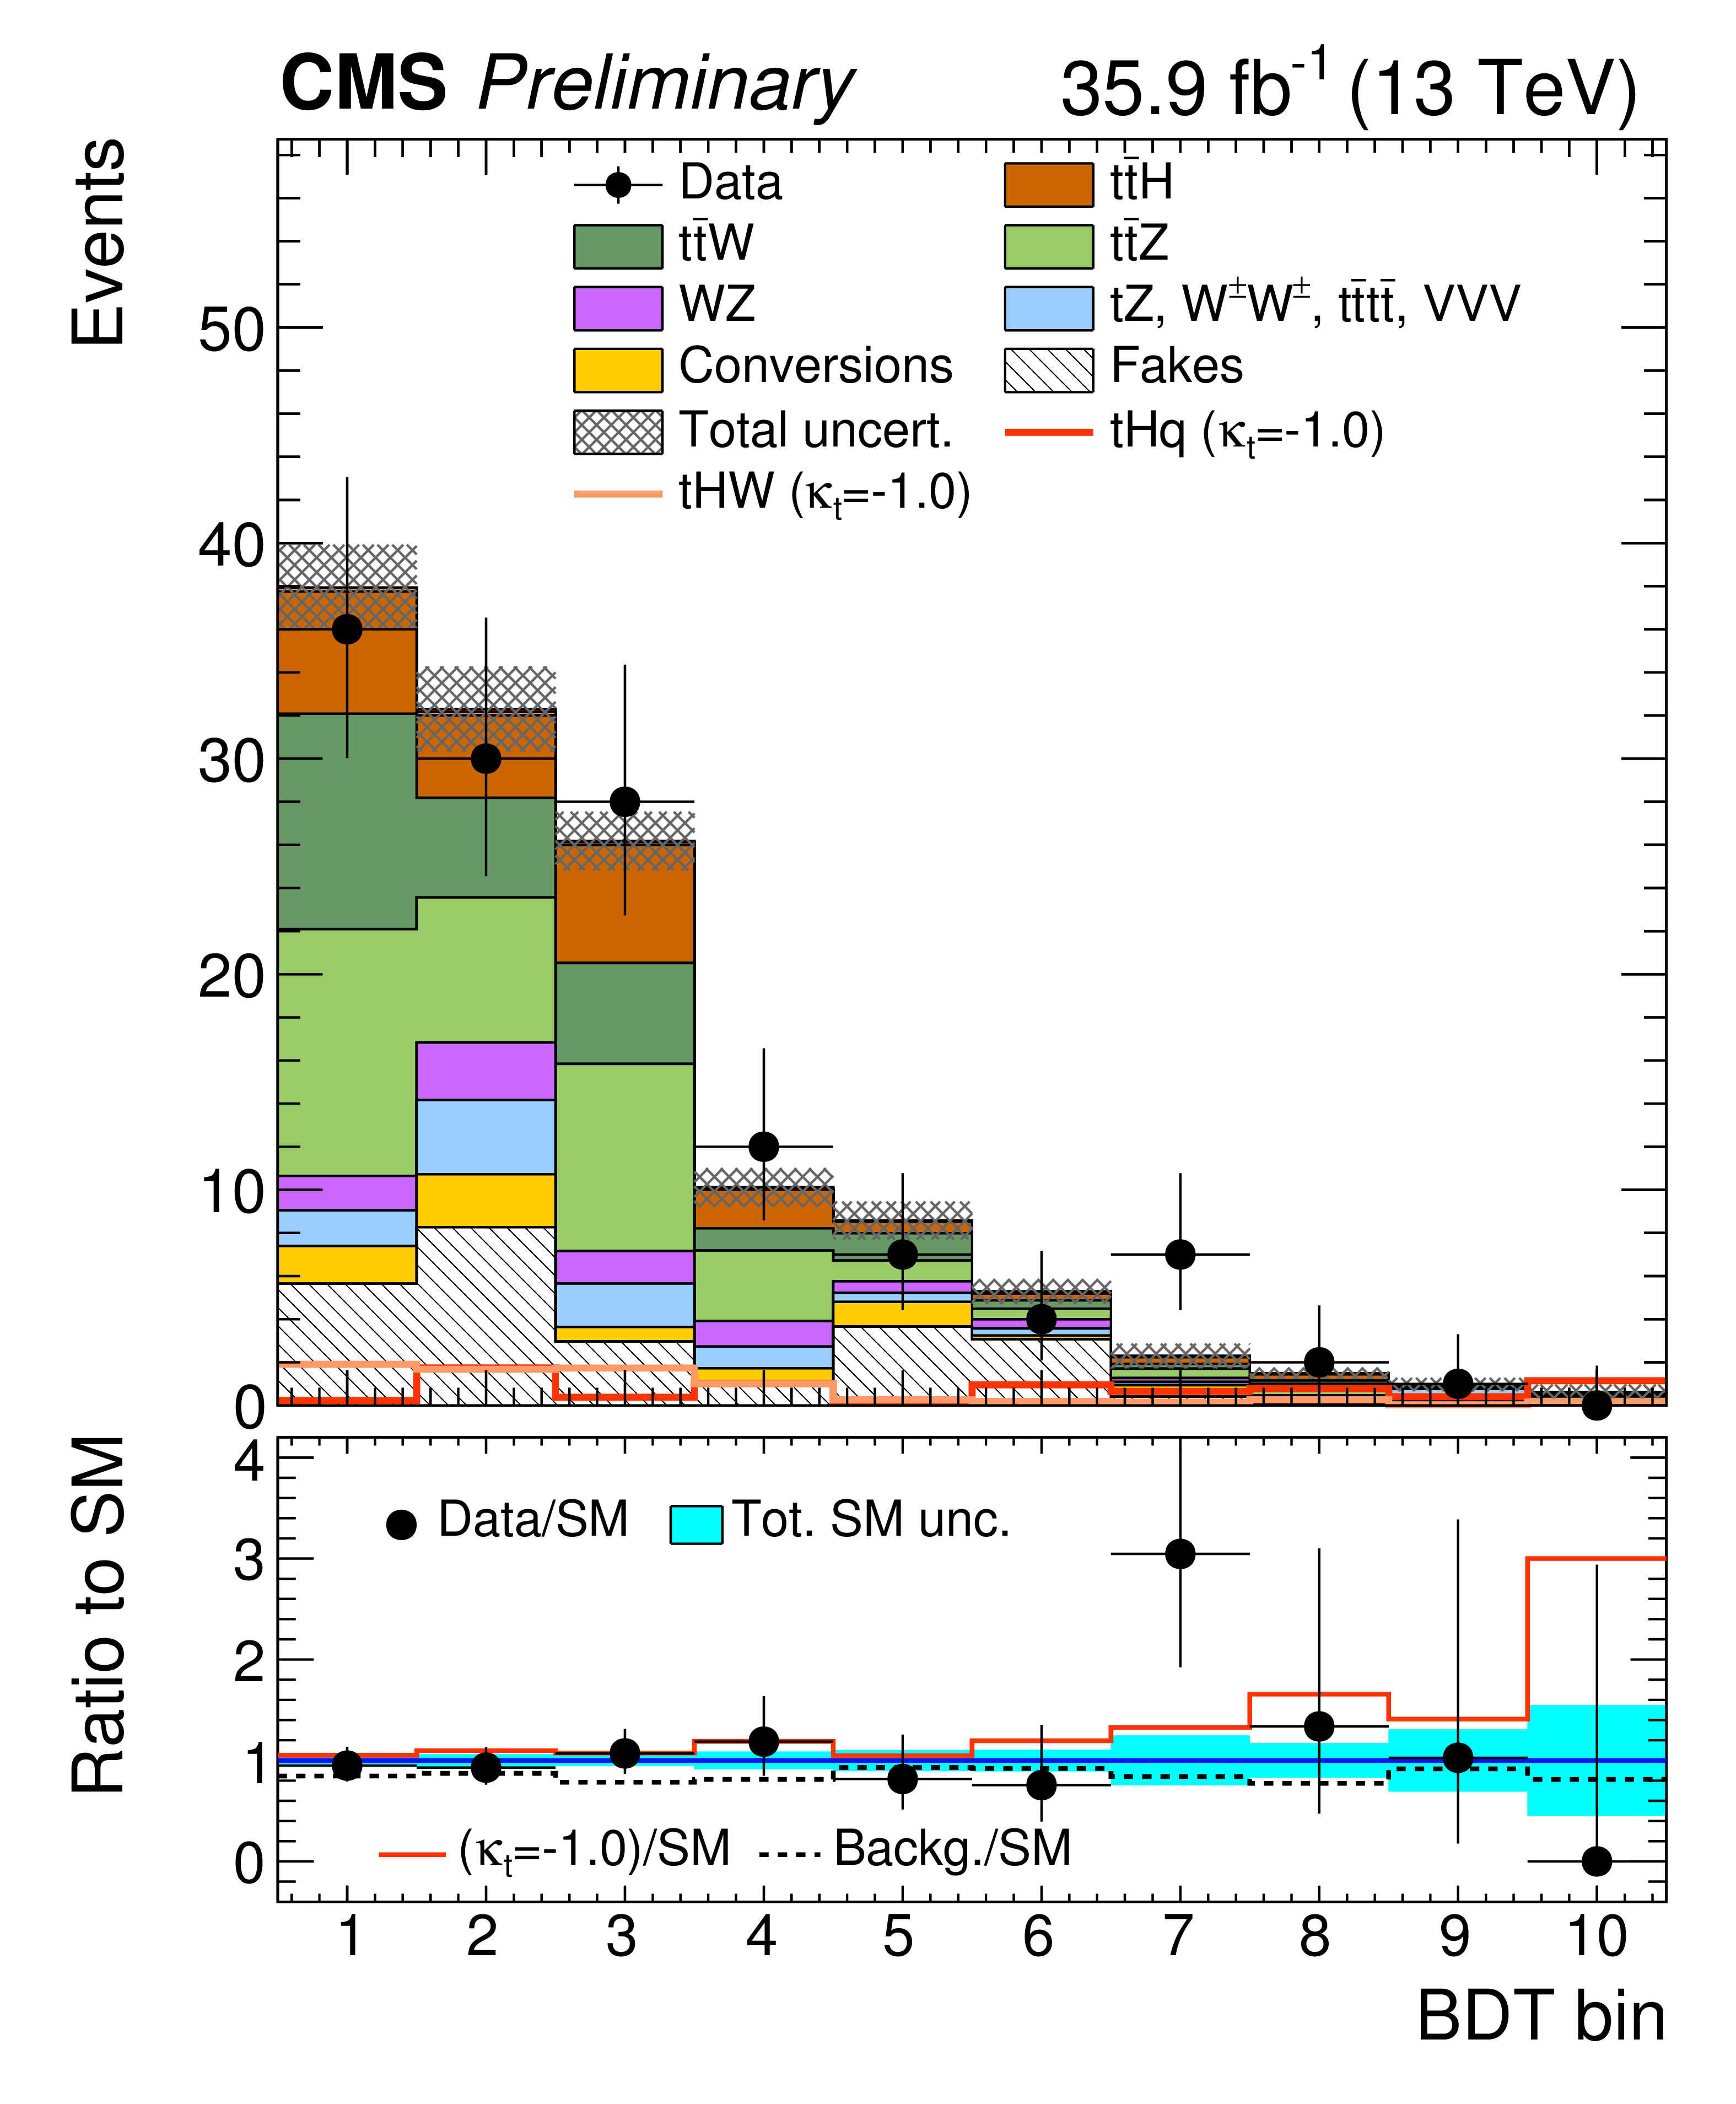
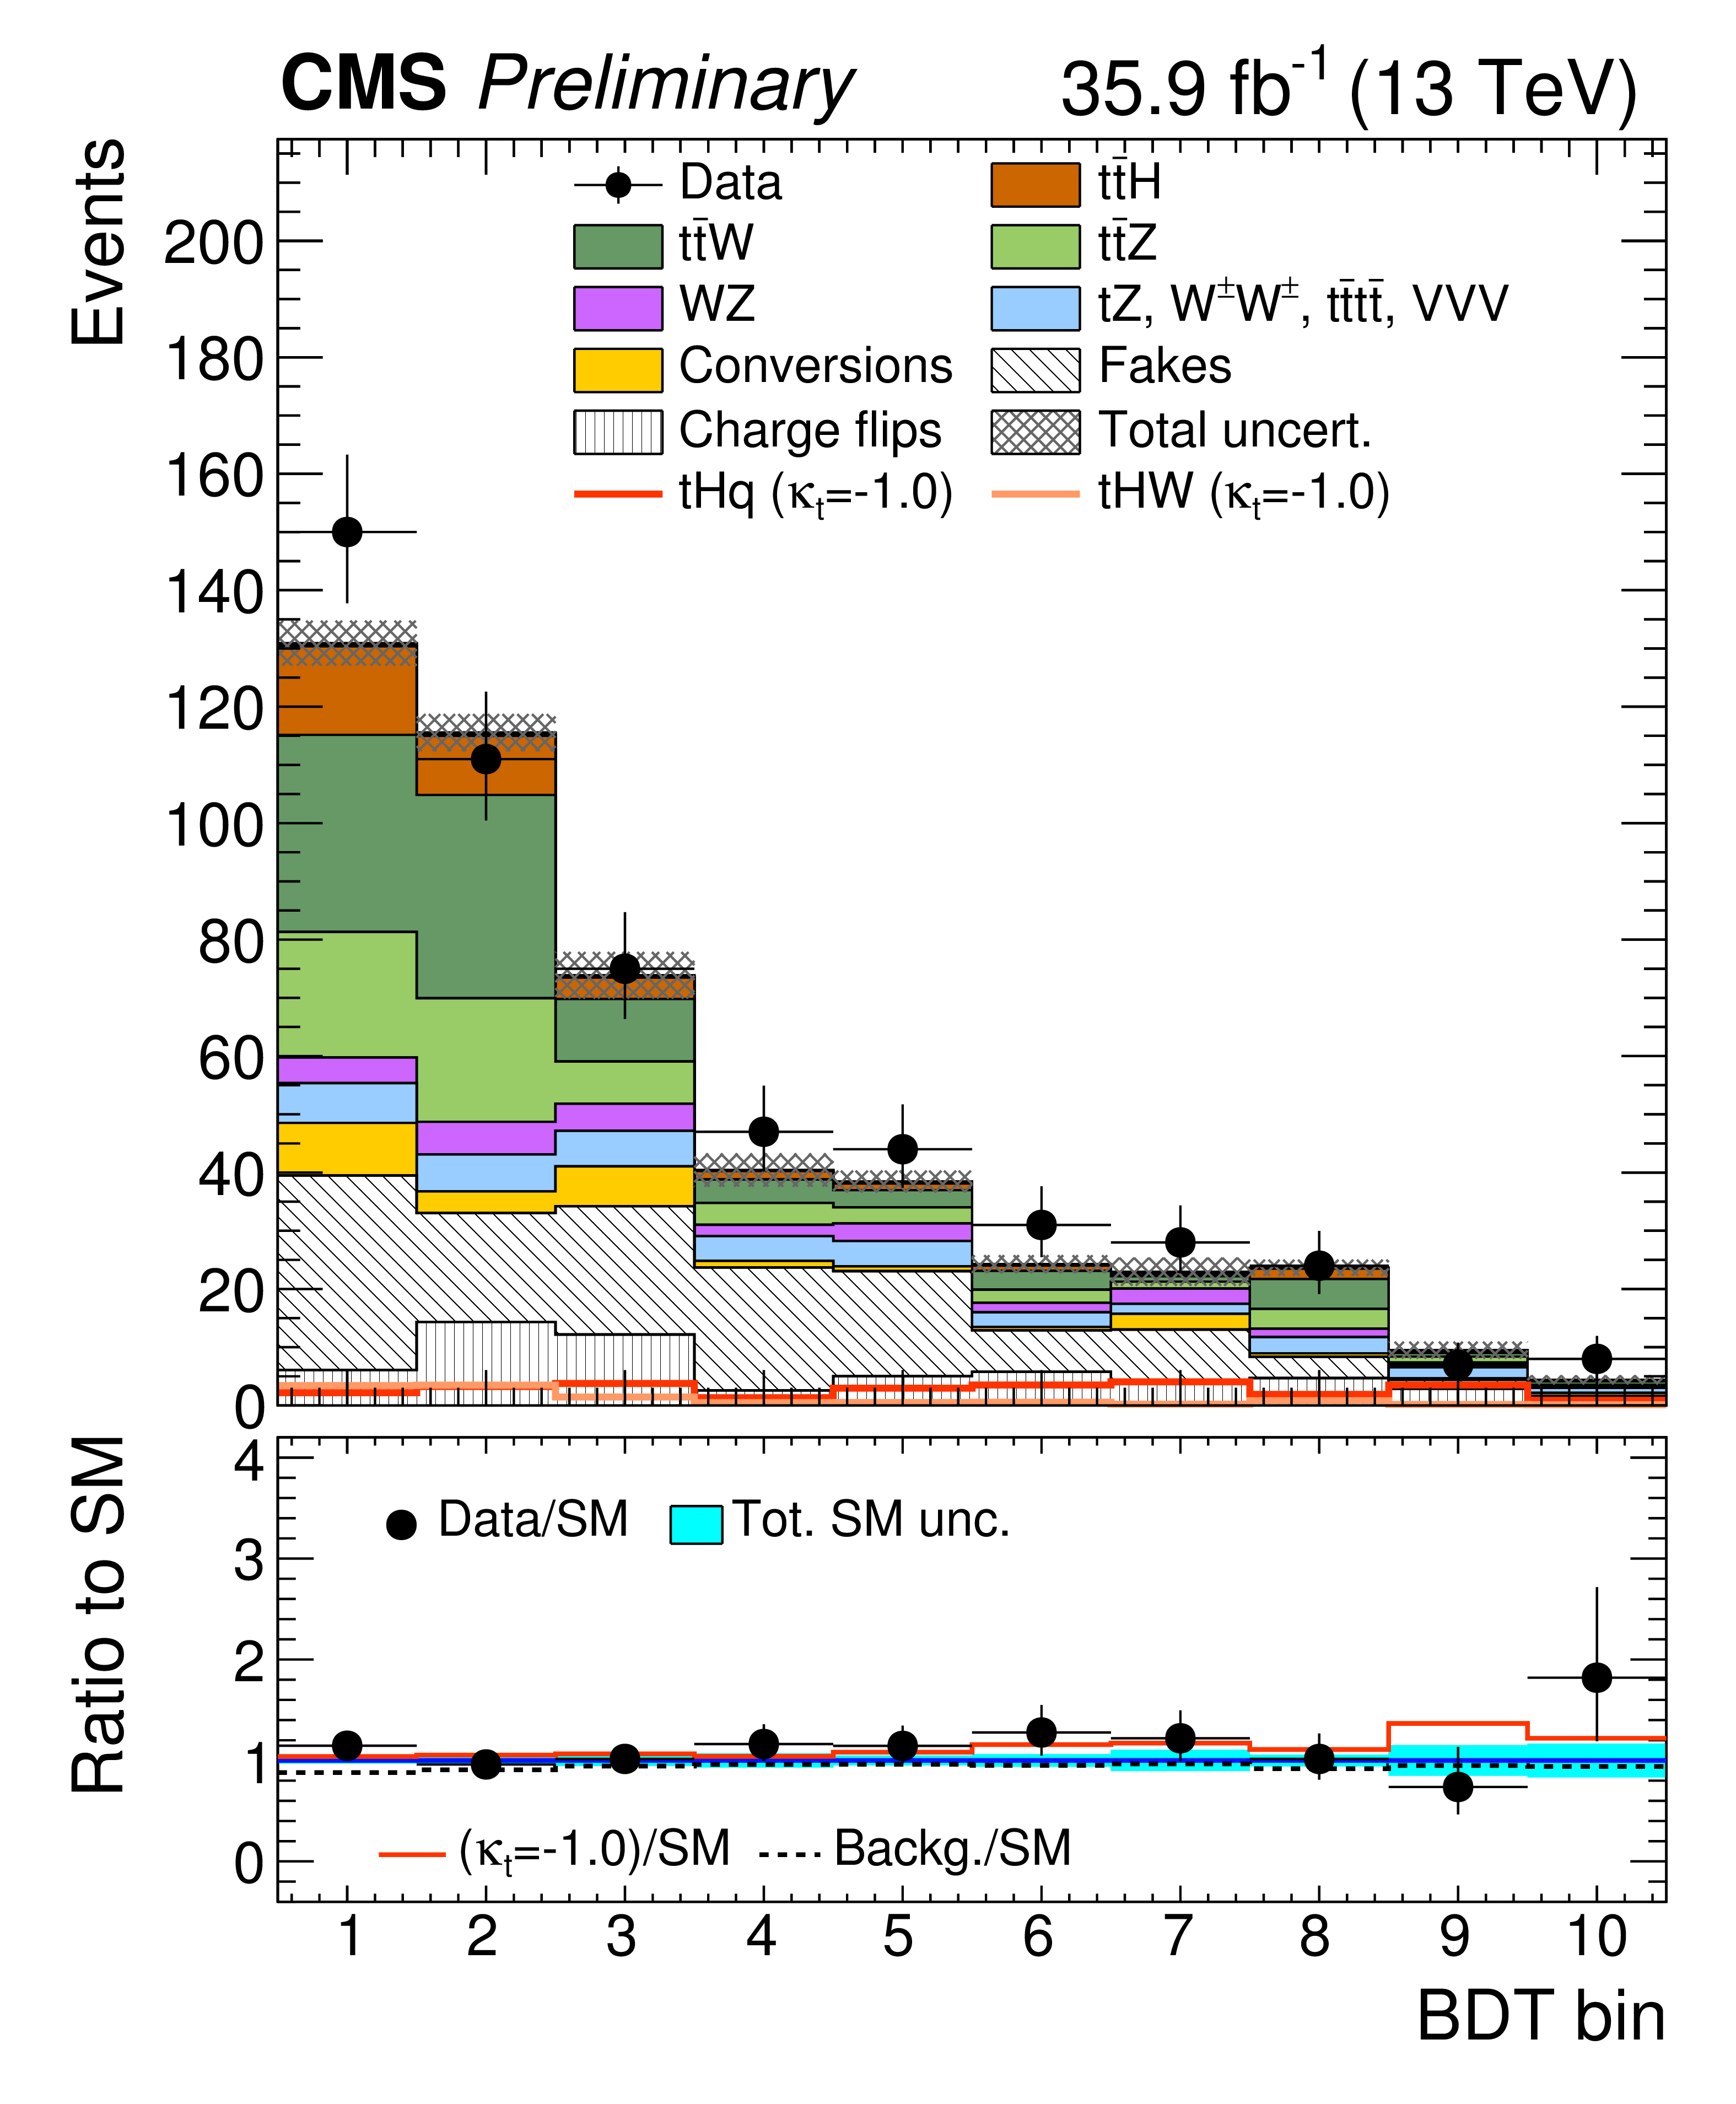
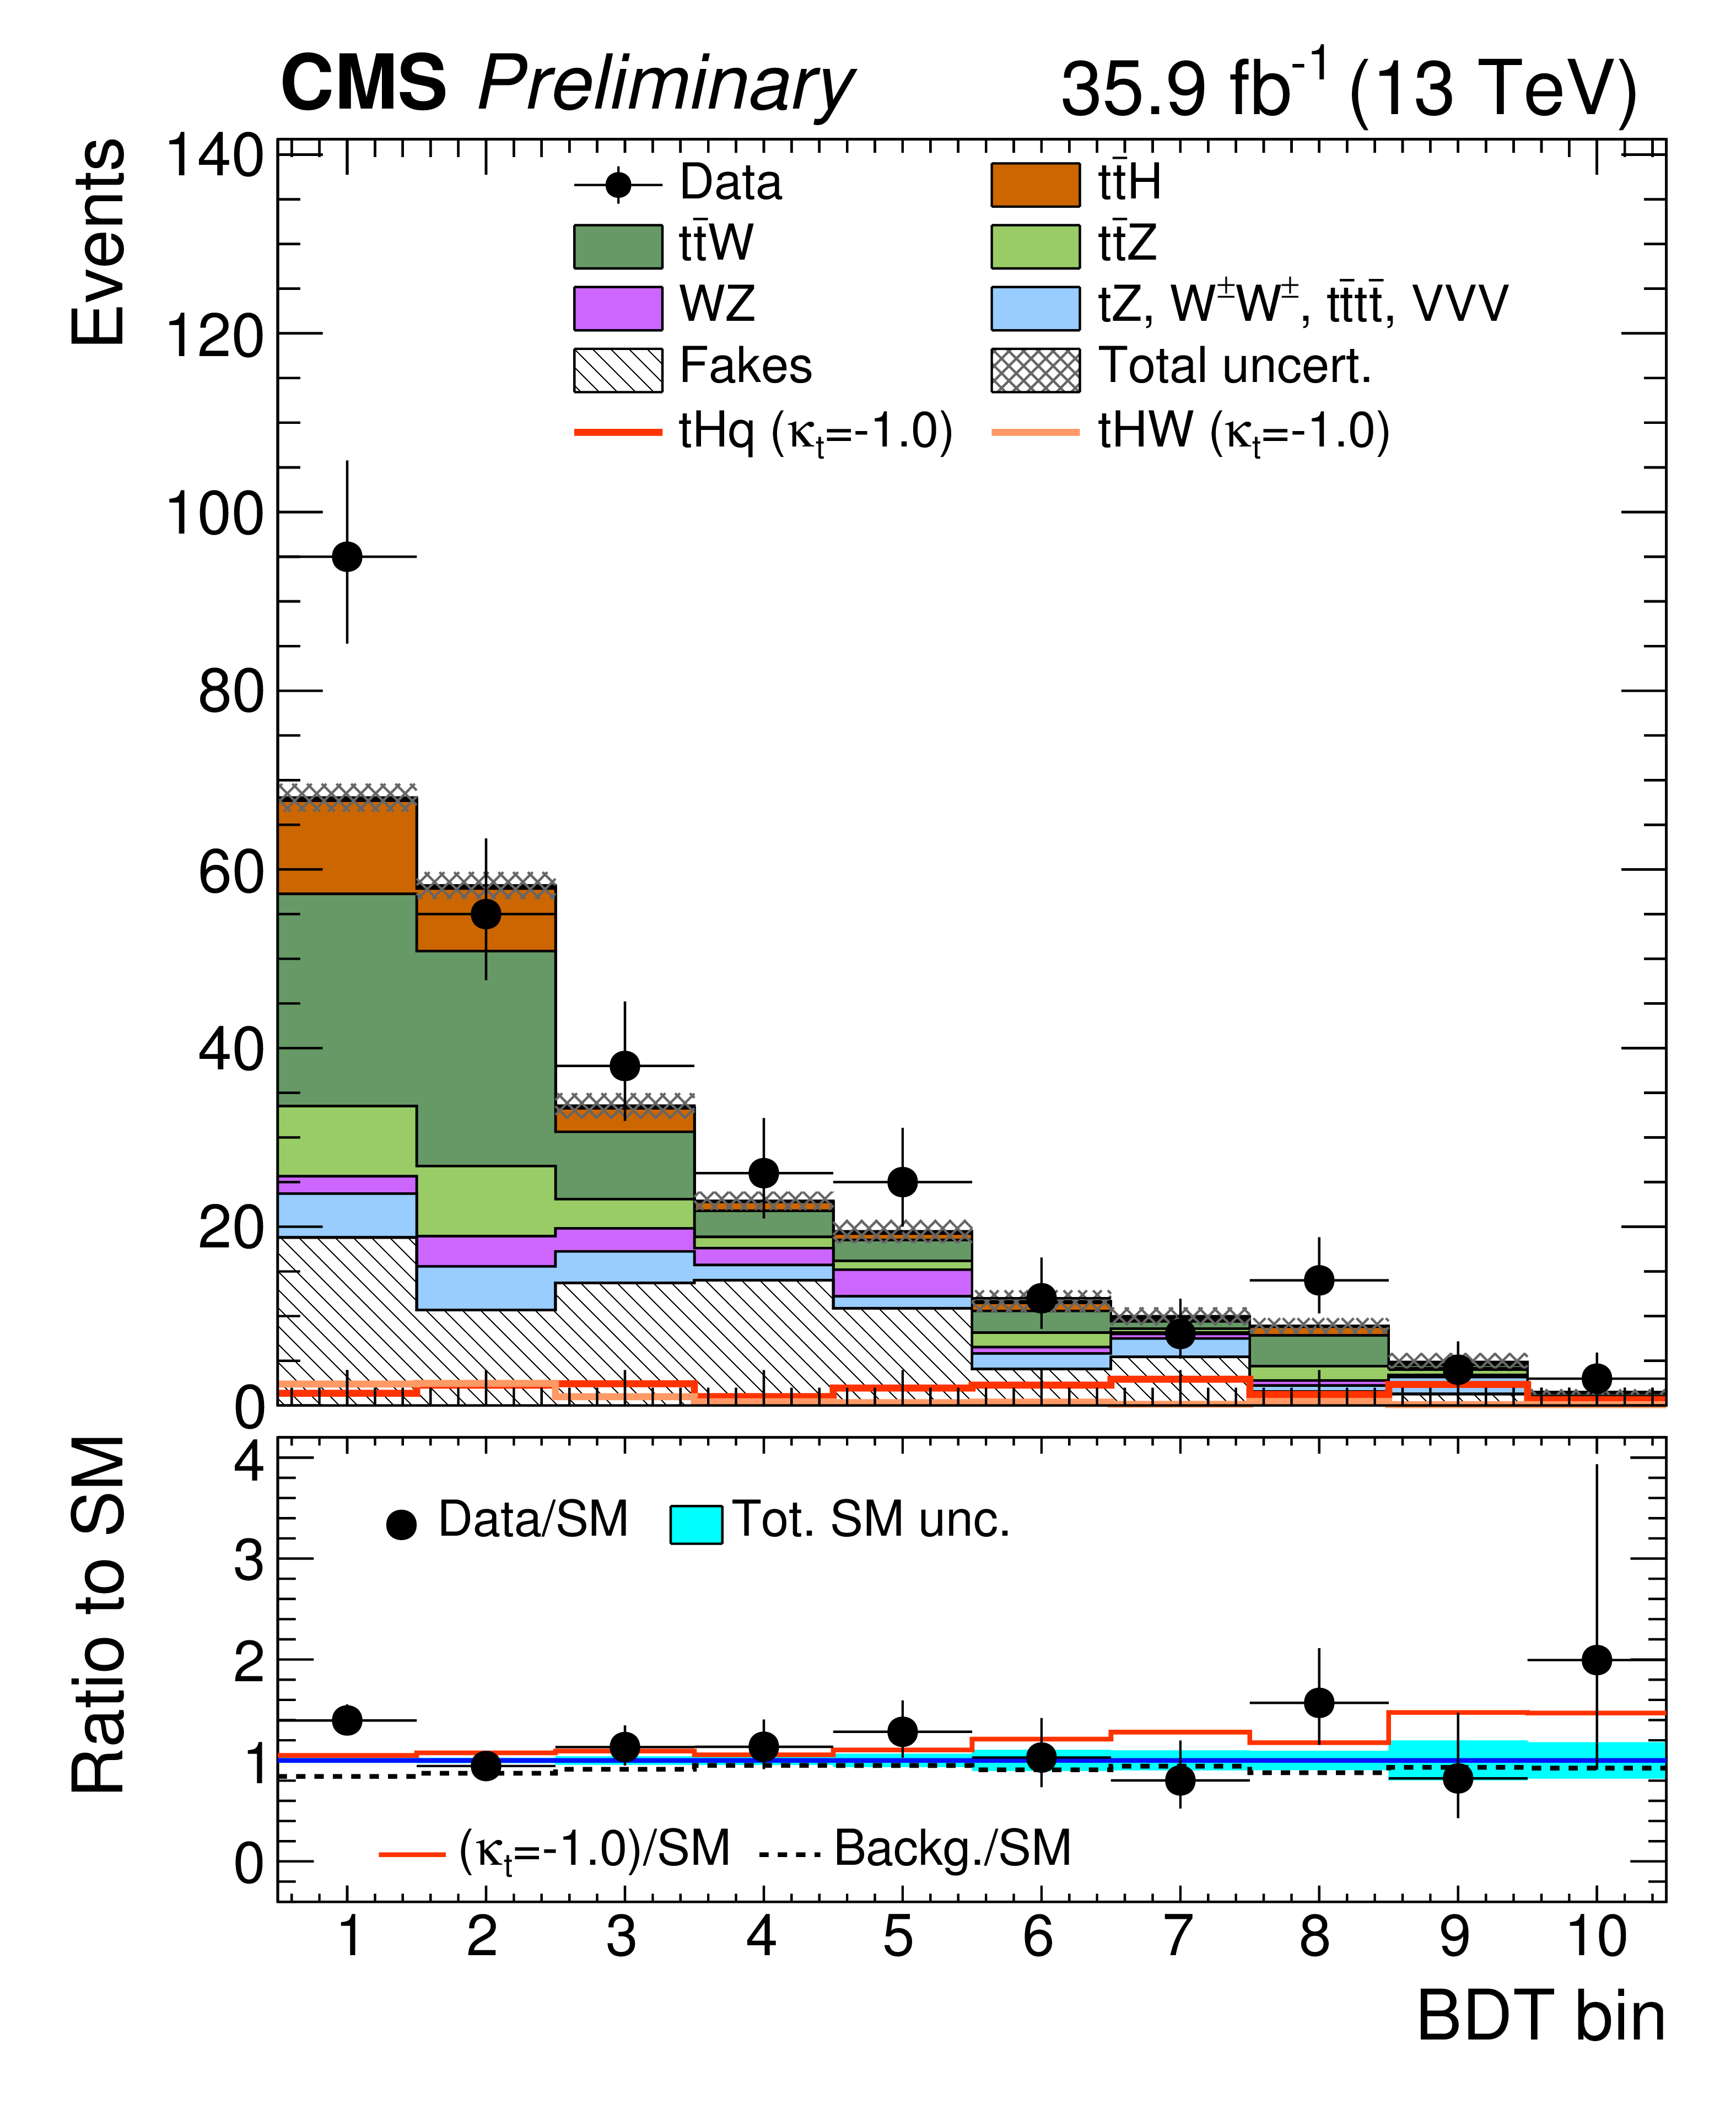
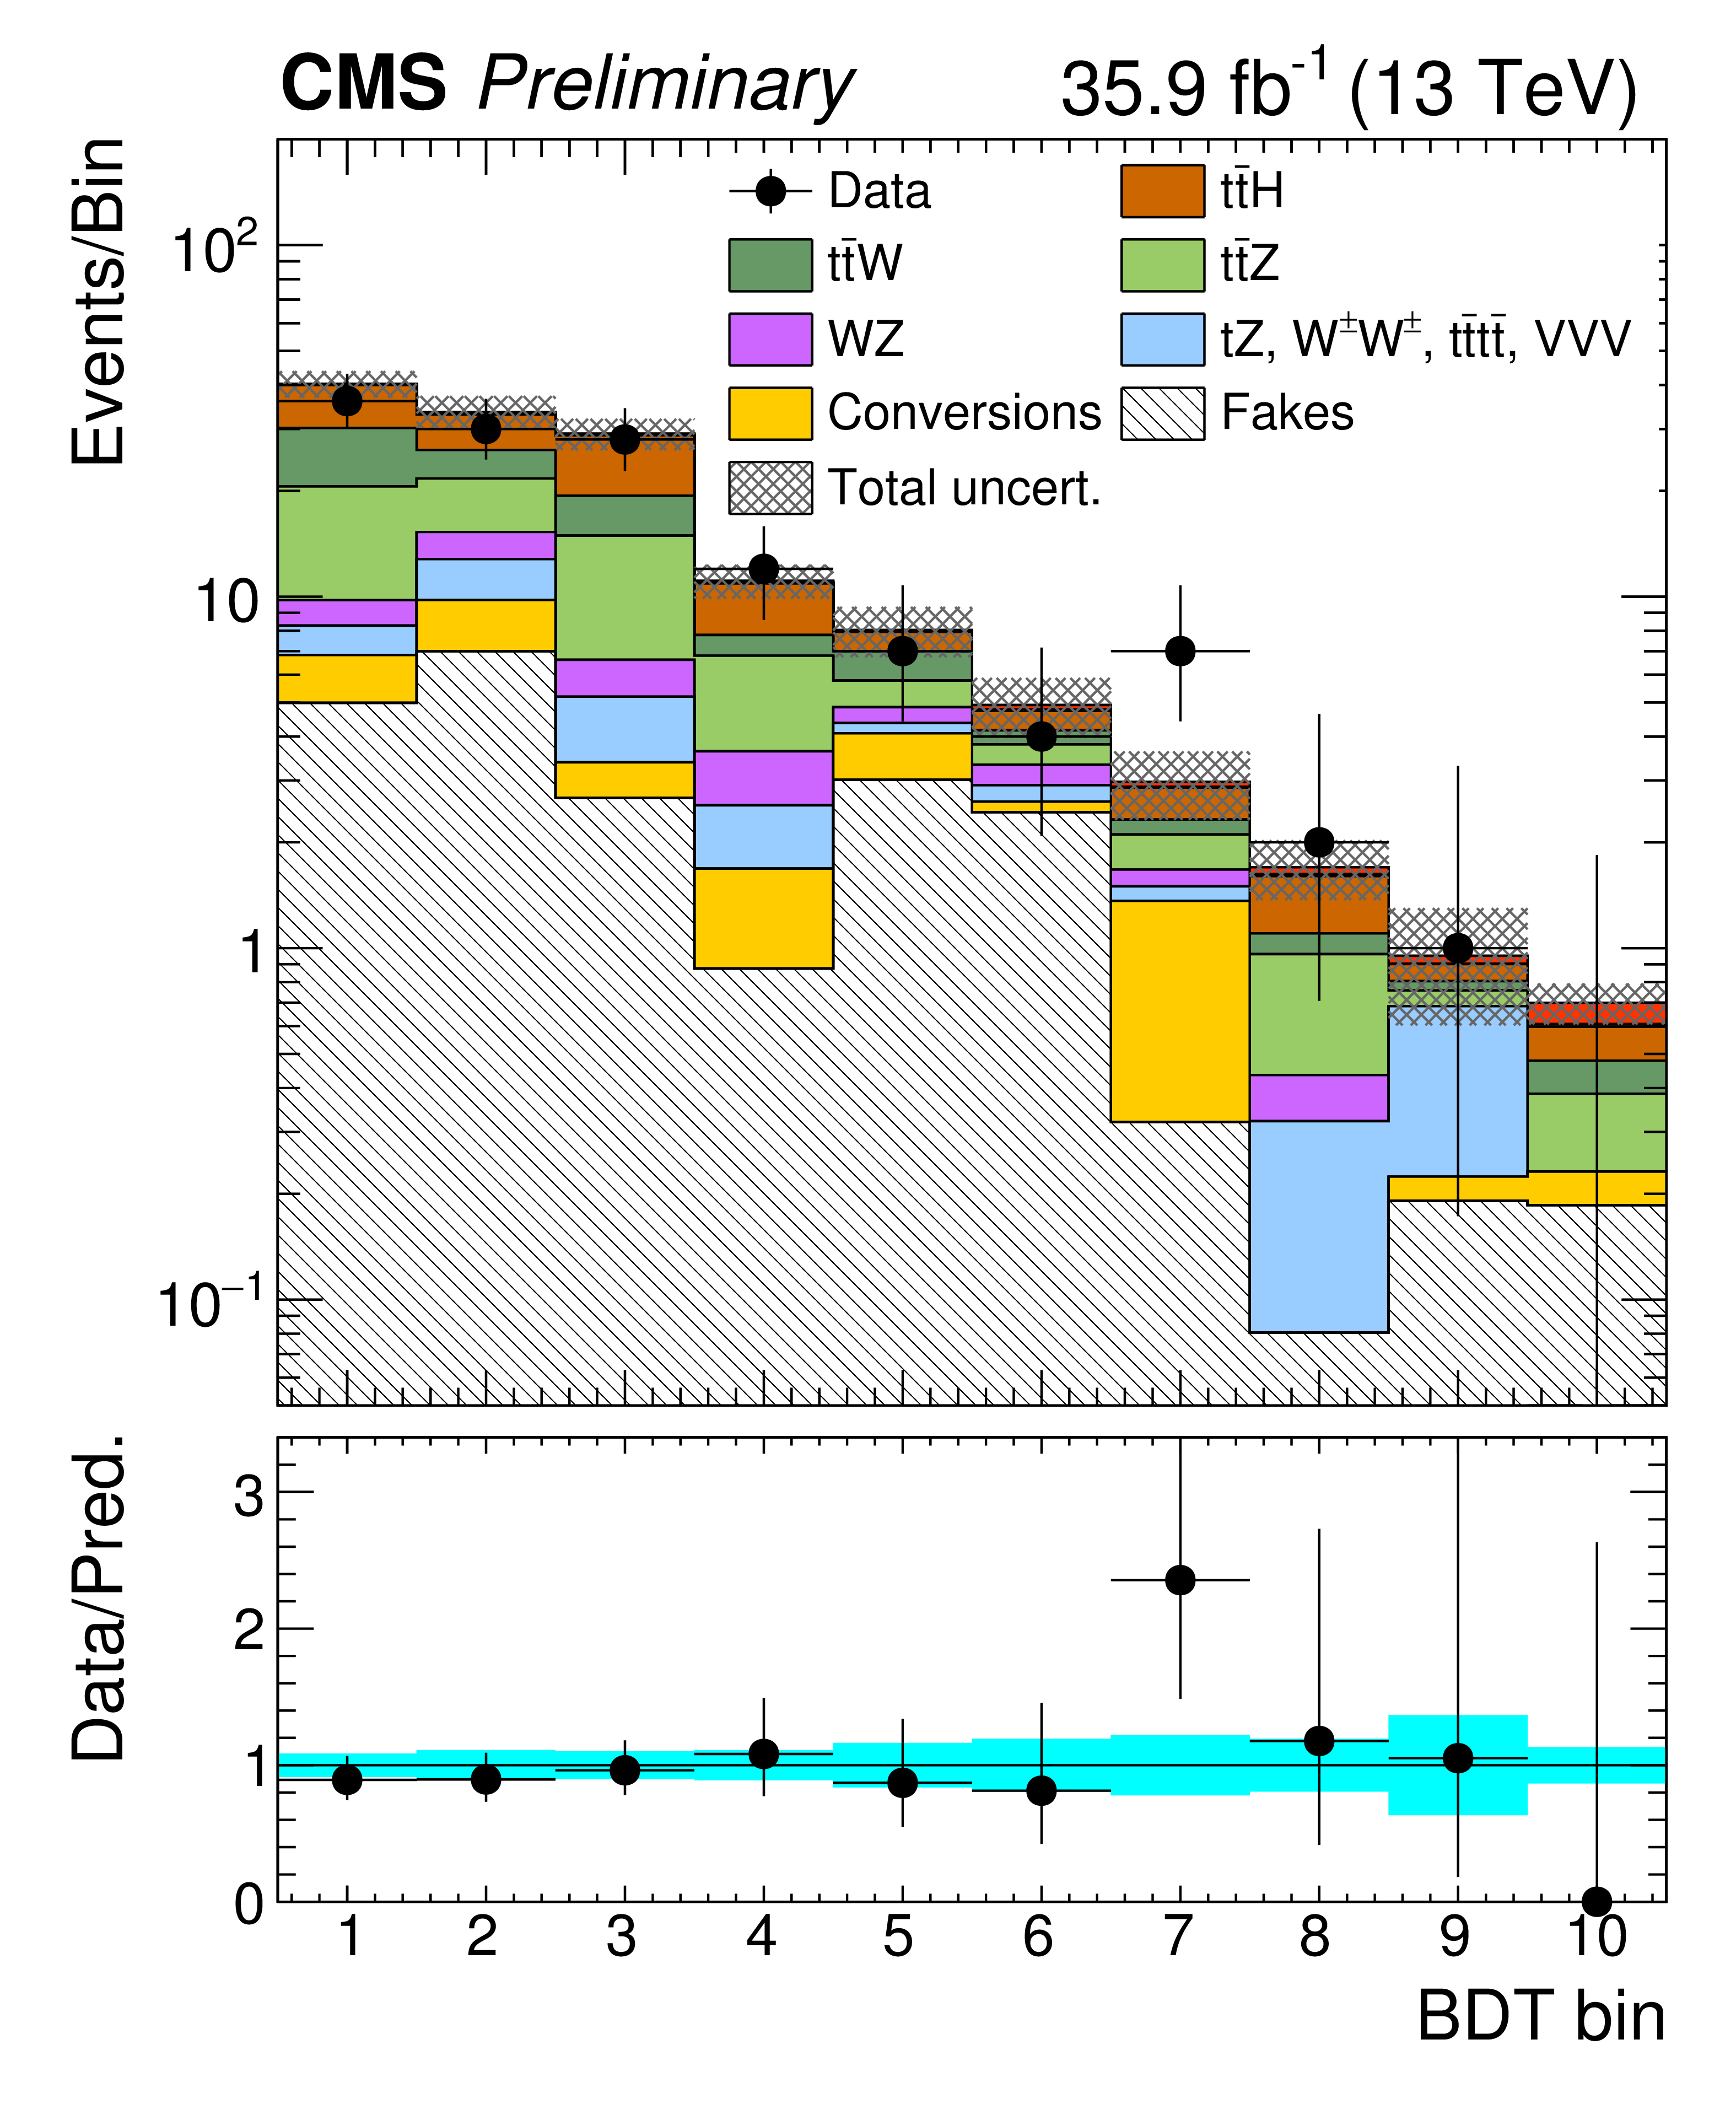
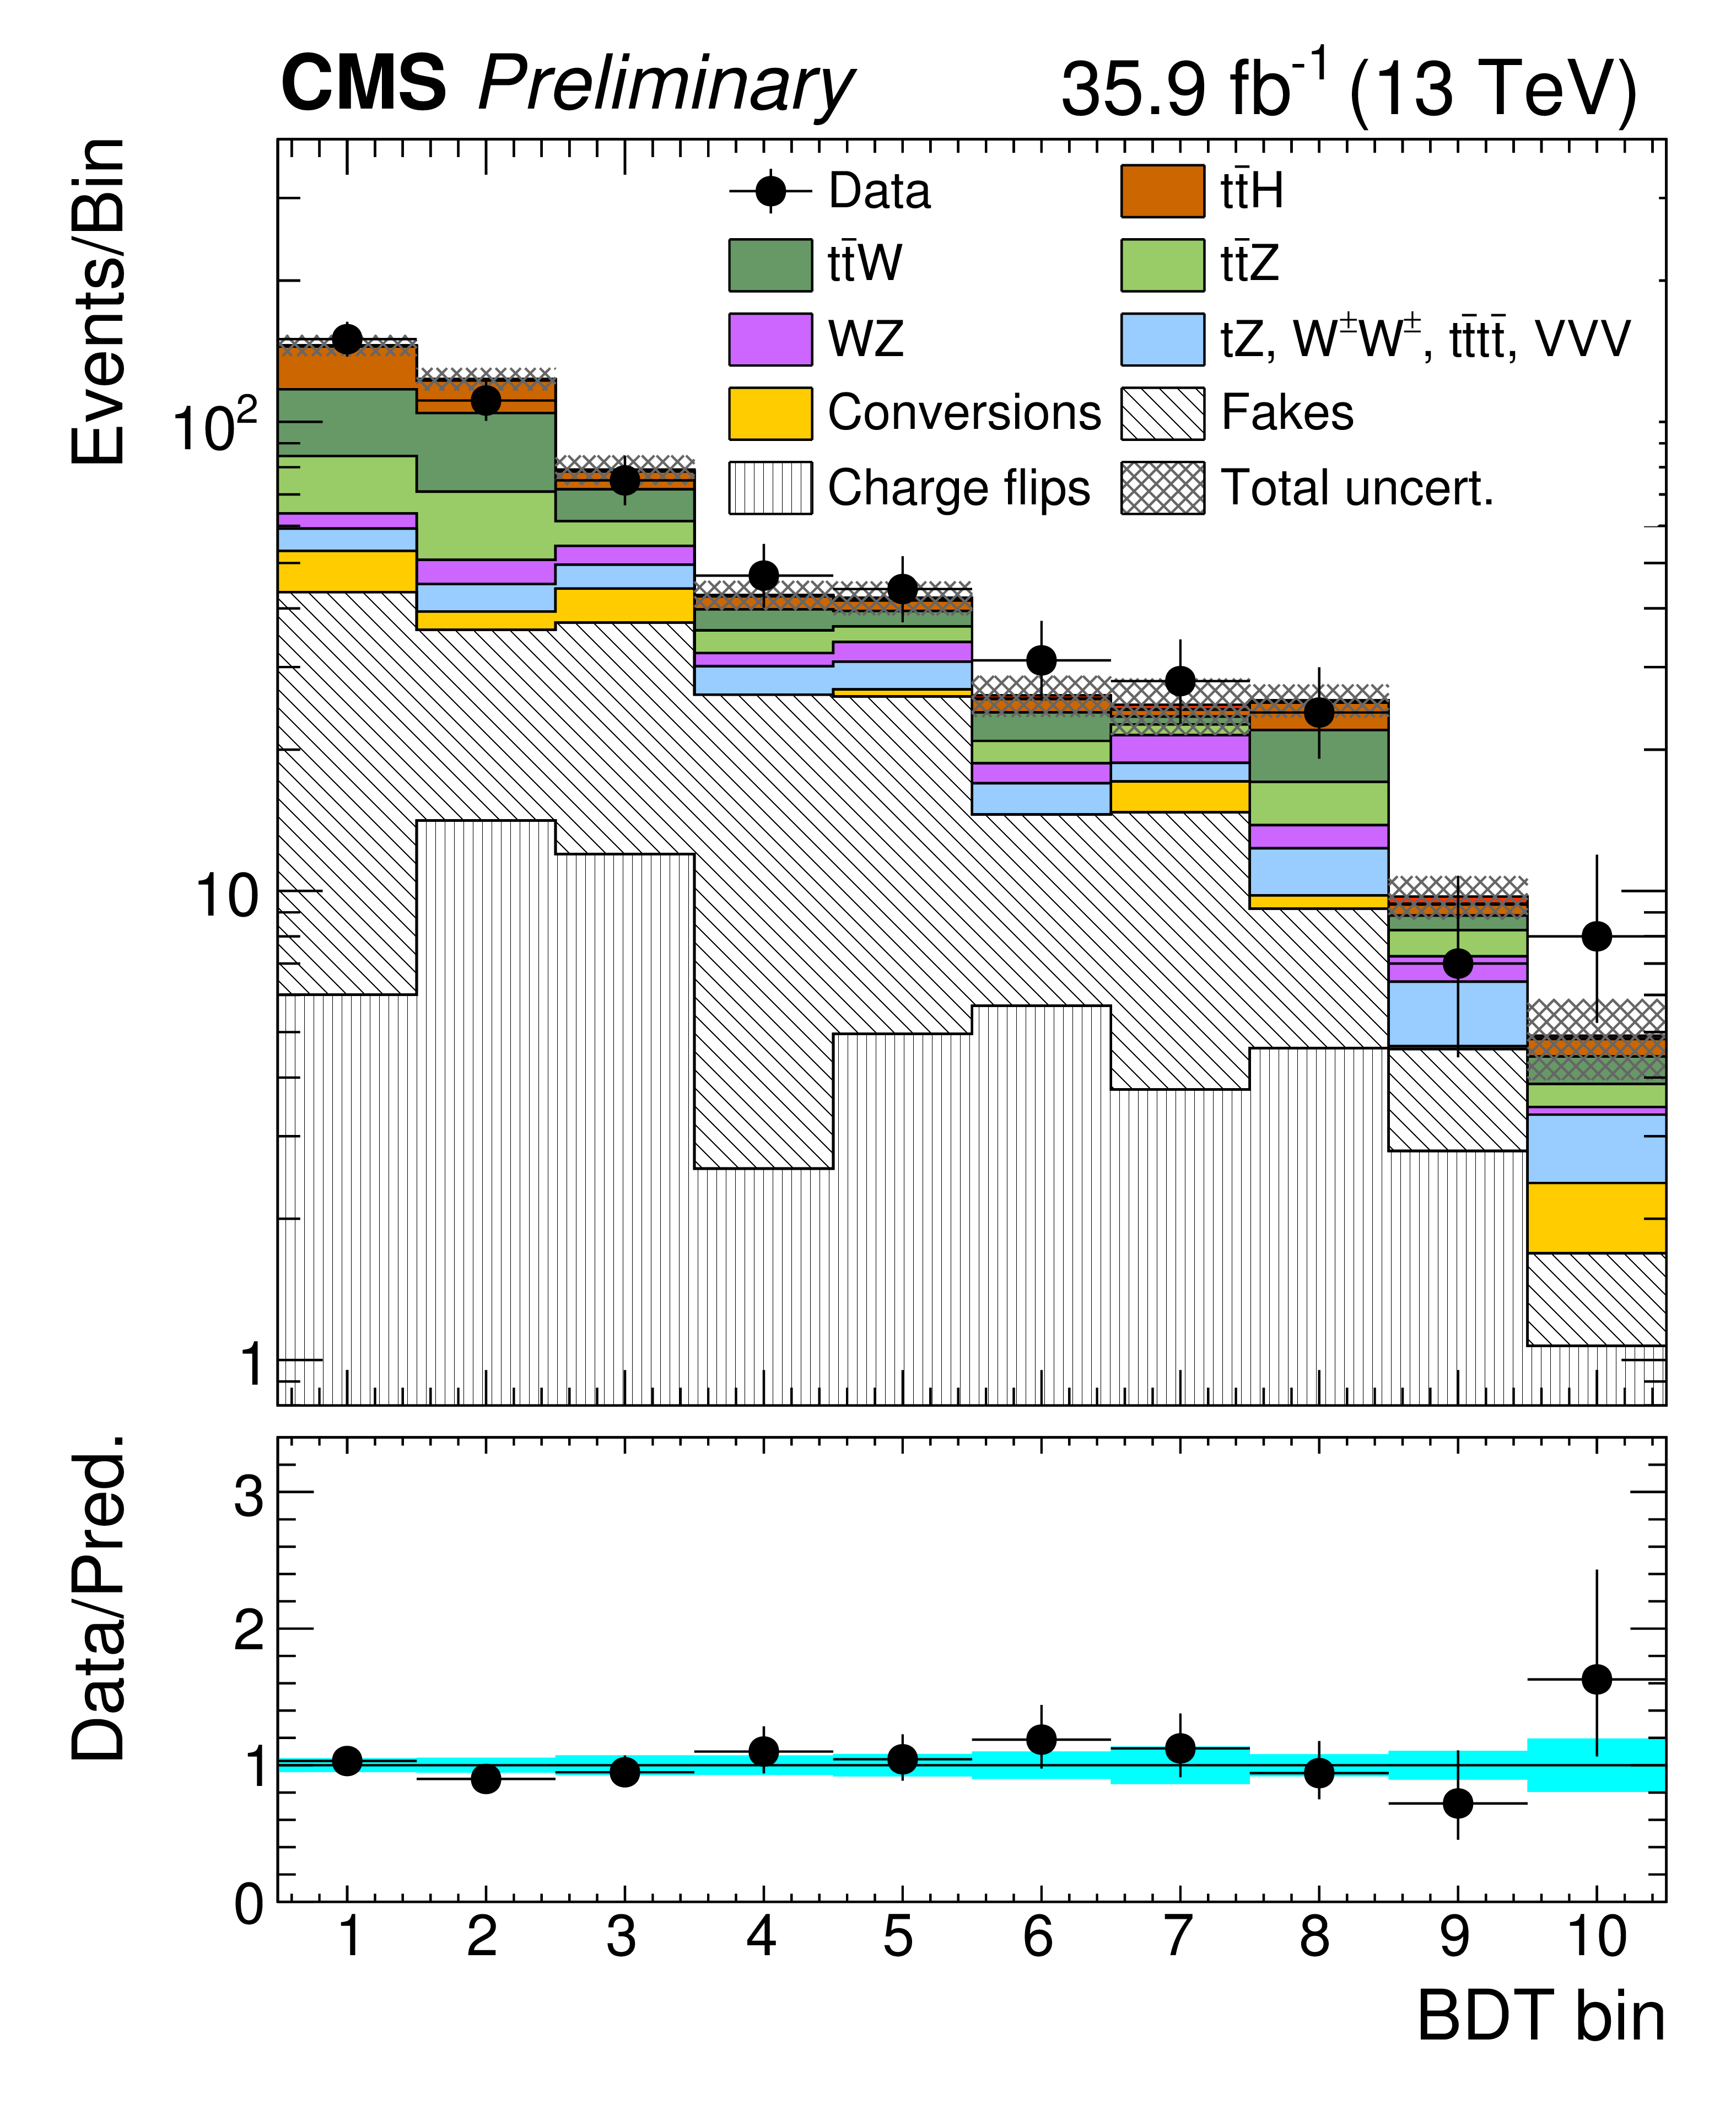
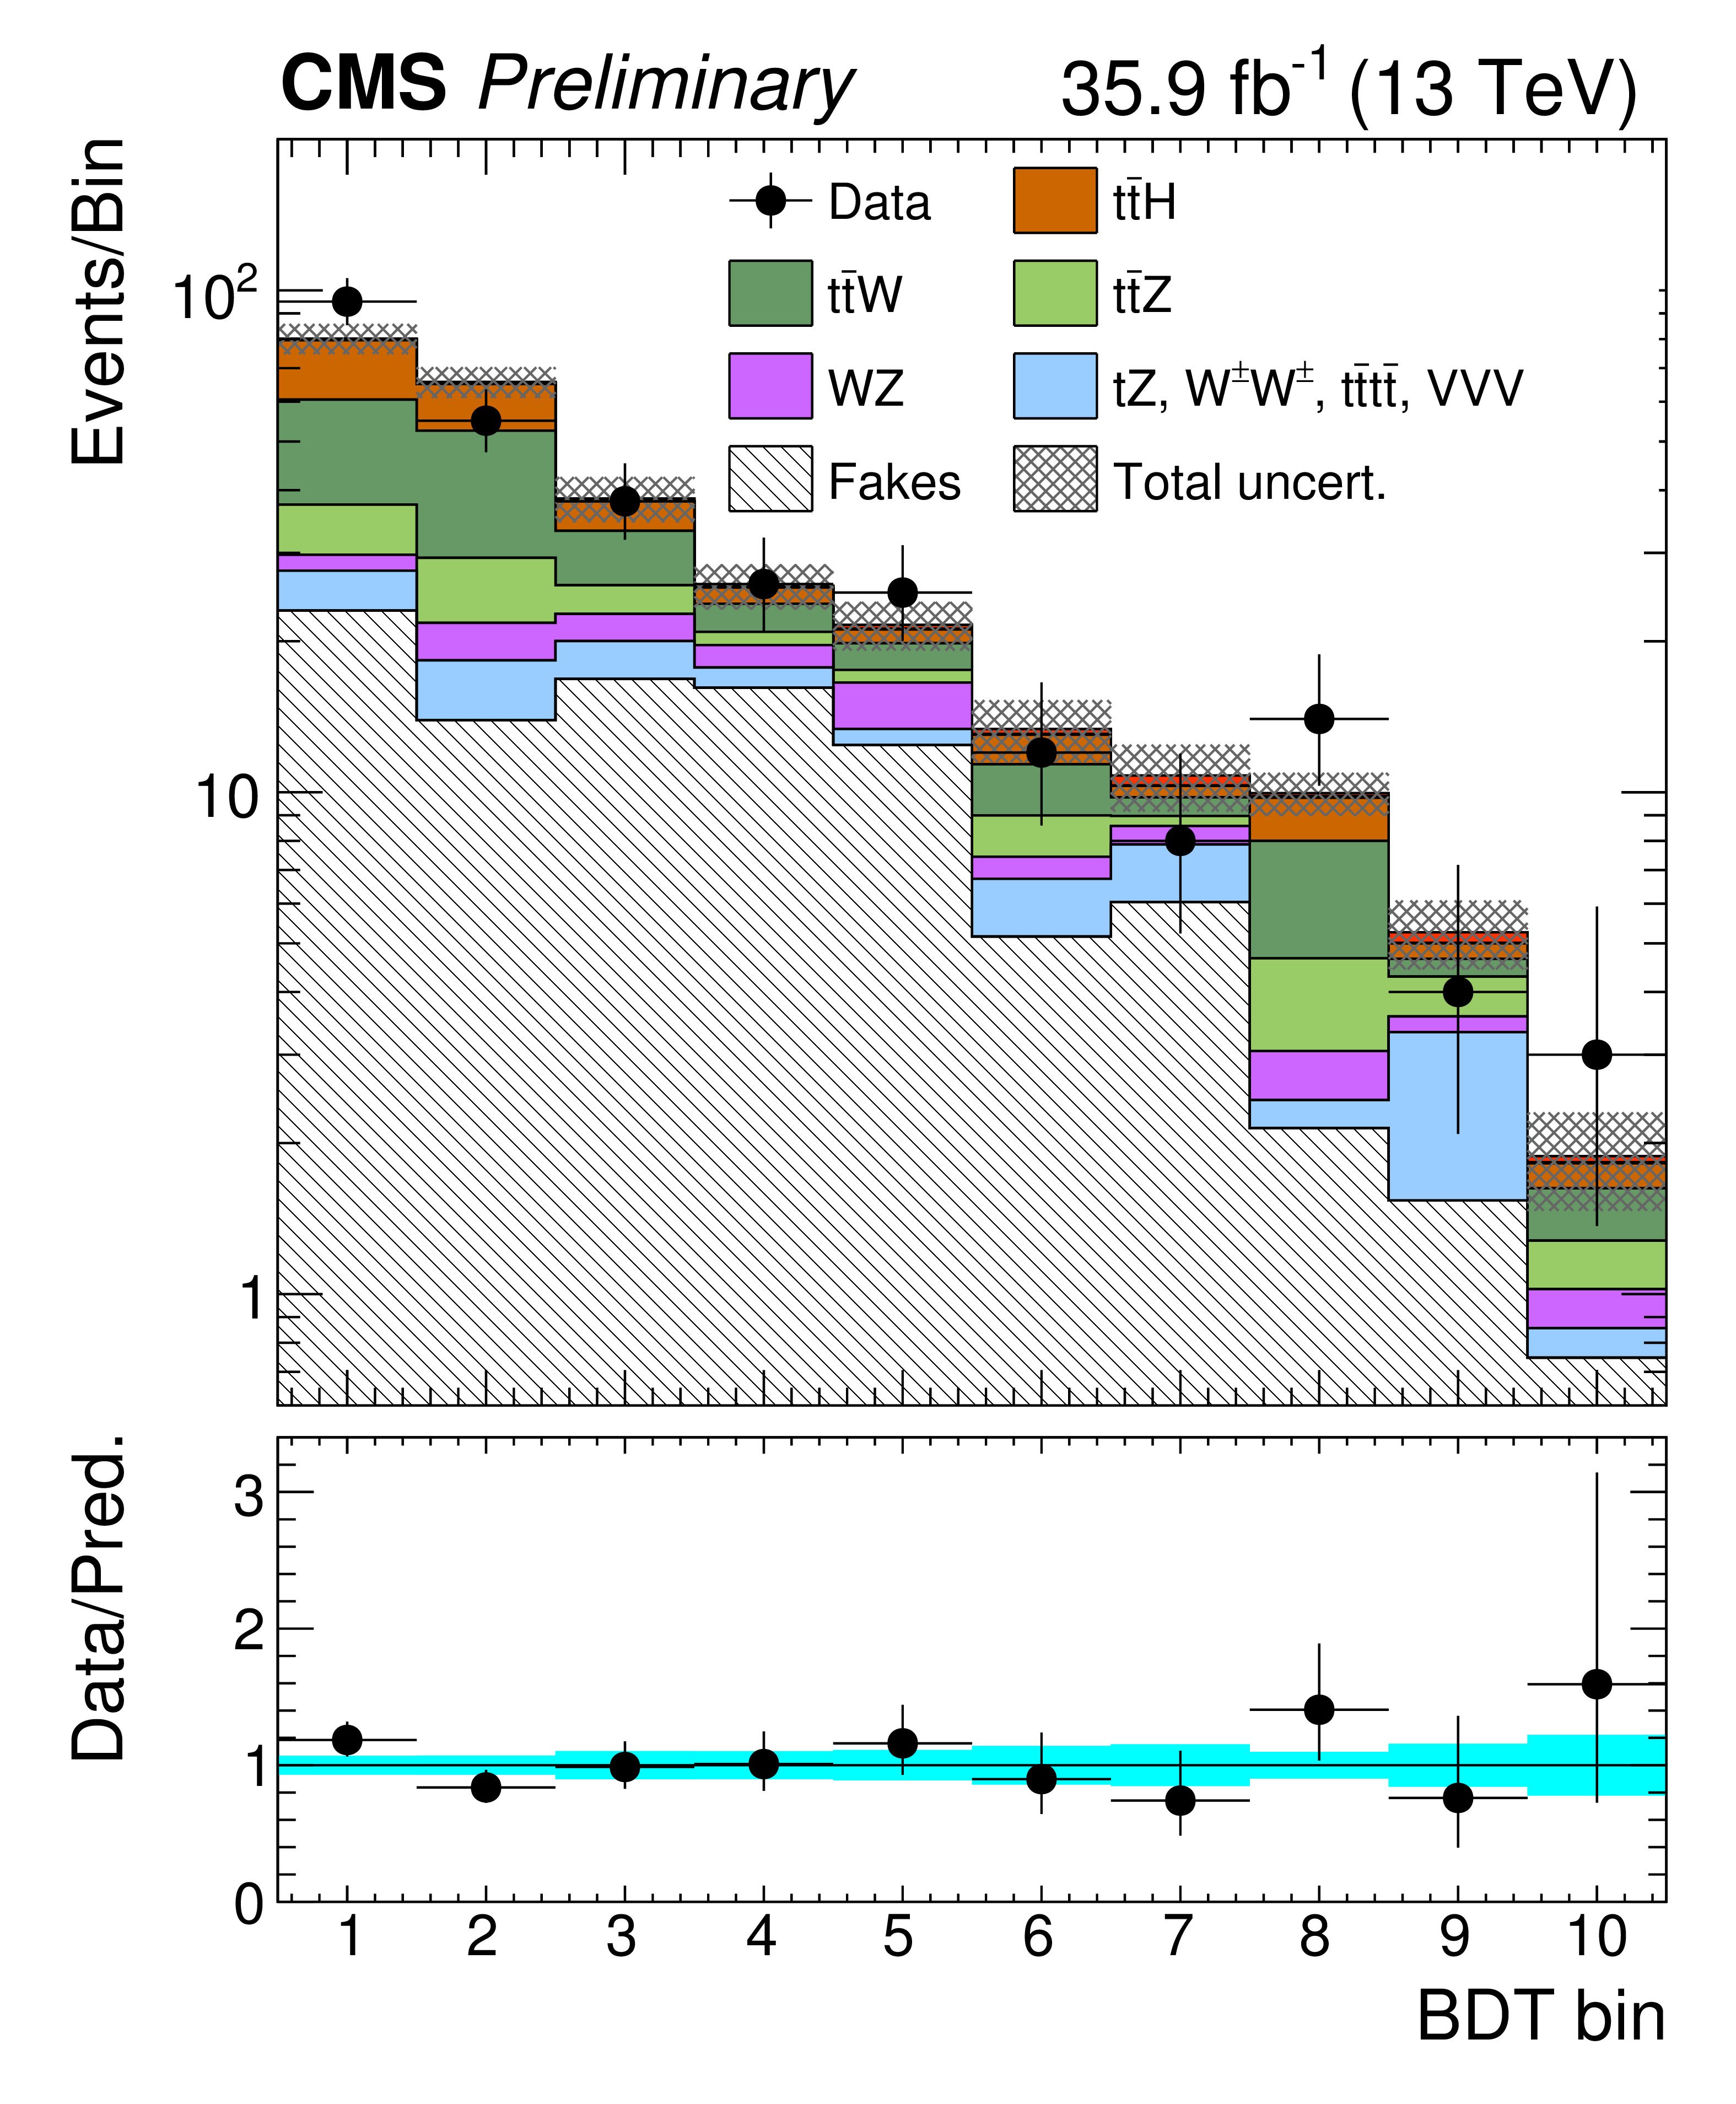
Figure 6:
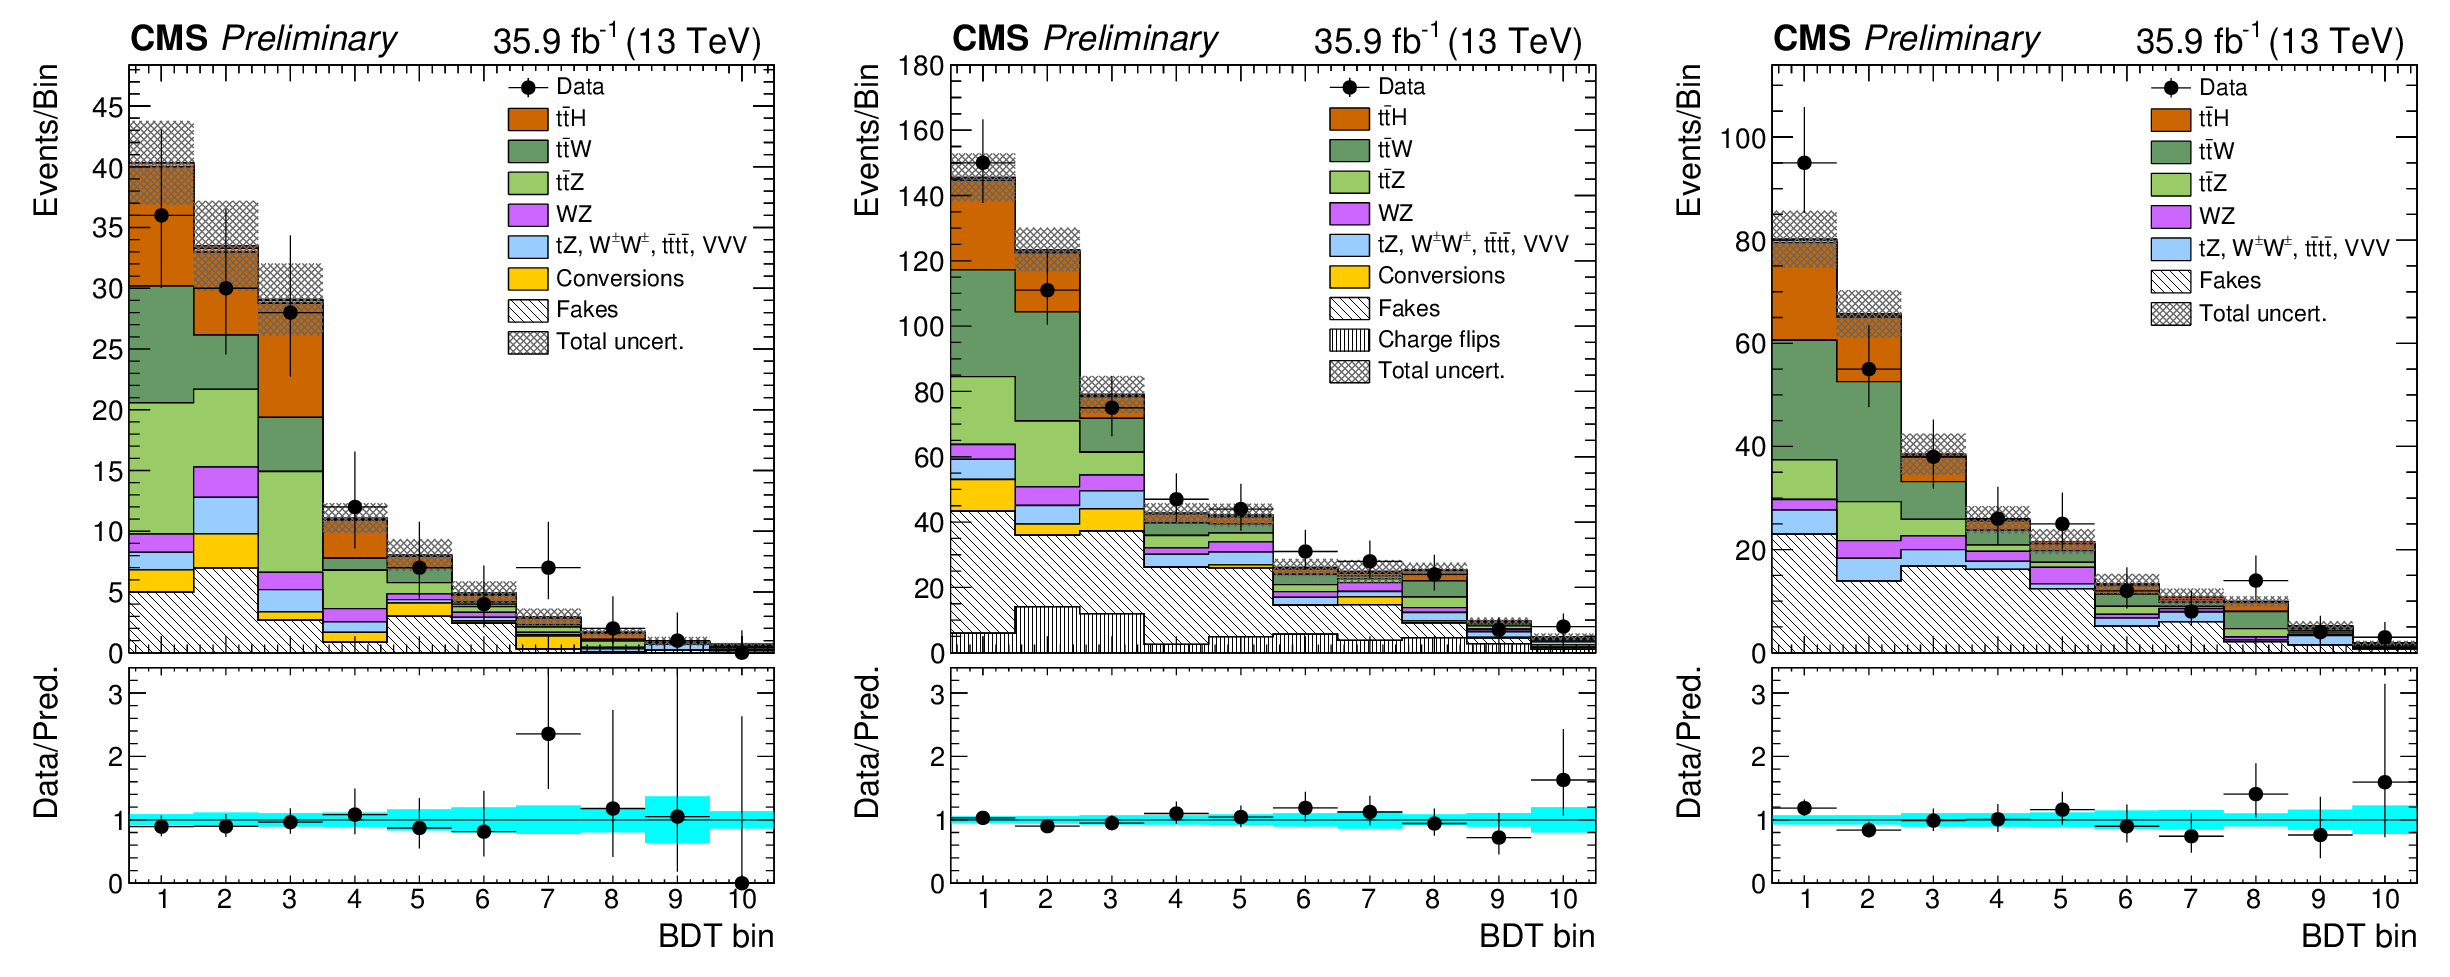
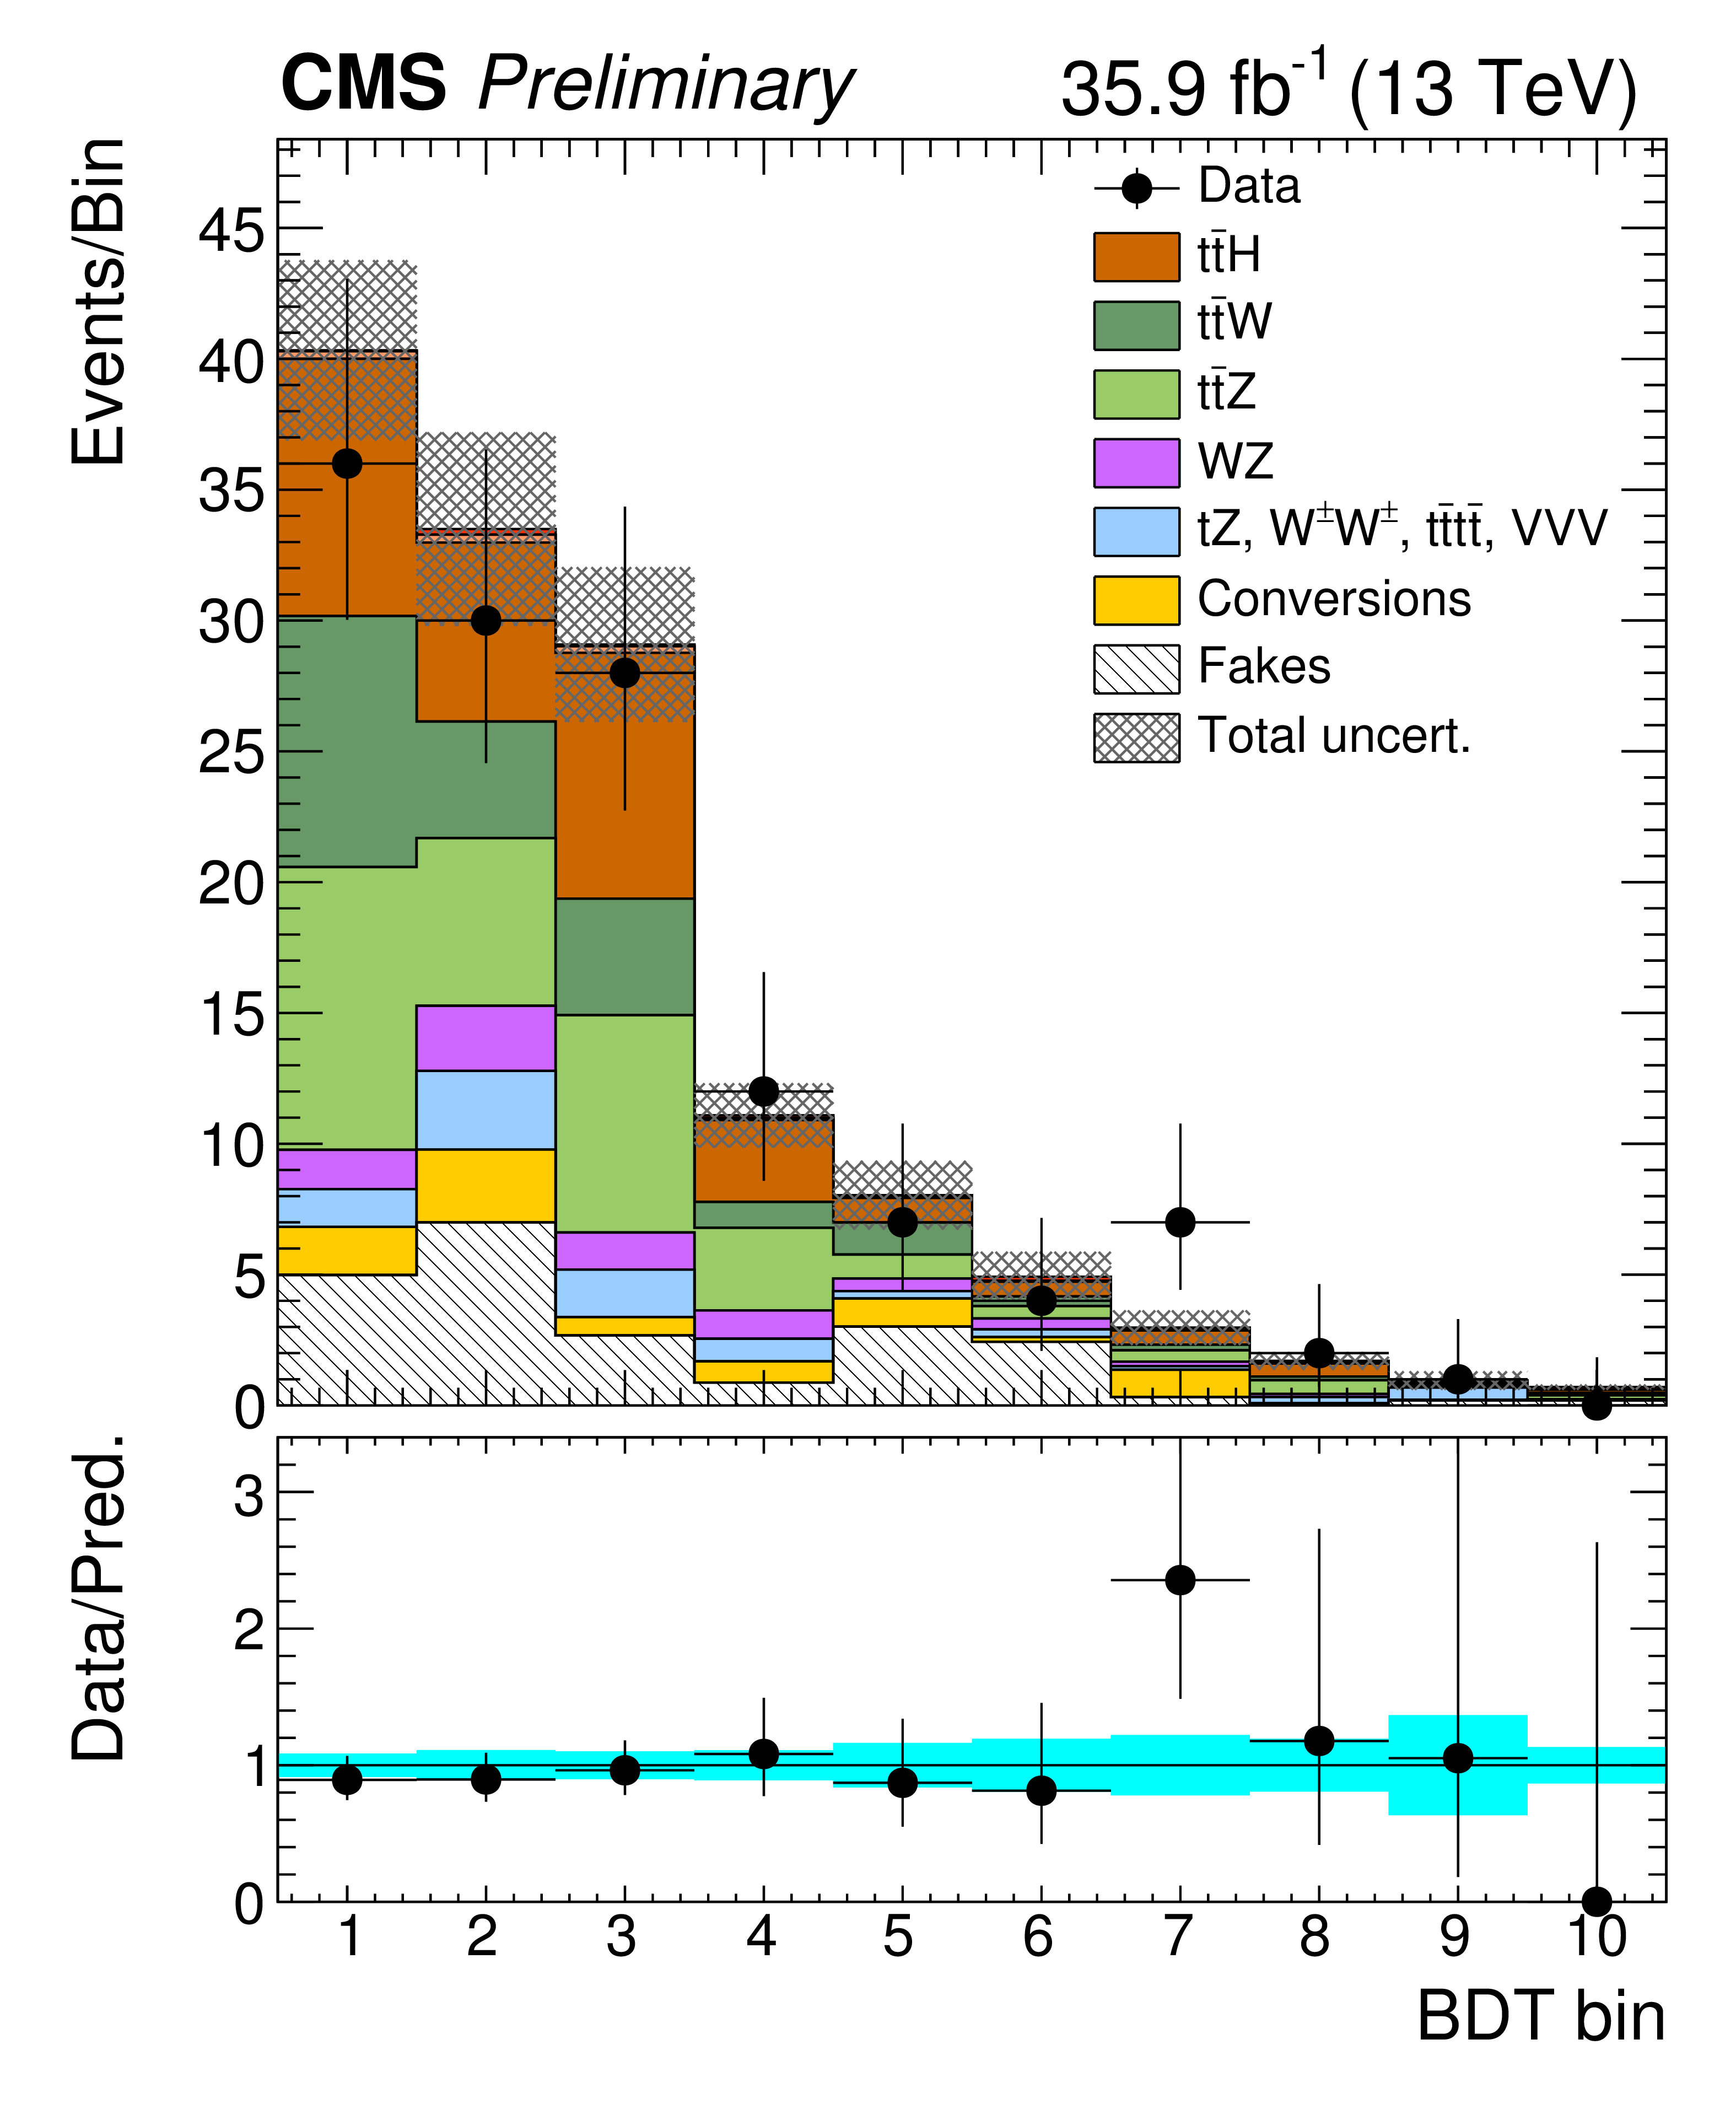
Post-fit categorized BDT classifier outputs as used in the maximum likelihood fit for the three-lepton channel (left), ${\mathrm{ e } \mu } $ (center), and ${\mu \mu } $ (right), for 35.9 fb$^{-1}$. In the box below each distribution, the ratio of the observed and predicted event yields is shown. |
png pdf |
Figure 6-a:
Post-fit categorized BDT classifier outputs as used in the maximum likelihood fit for the three-lepton channel, for 35.9 fb$^{-1}$. In the box below the distribution, the ratio of the observed and predicted event yields is shown. |
png pdf |
Figure 6-b:
Post-fit categorized BDT classifier outputs as used in the maximum likelihood fit for ${\mathrm{ e } \mu } $, for 35.9 fb$^{-1}$. In the box below the distribution, the ratio of the observed and predicted event yields is shown. |
png pdf |
Figure 6-c:
Post-fit categorized BDT classifier outputs as used in the maximum likelihood fit for ${\mu \mu } $, for 35.9 fb$^{-1}$. In the box below the distribution, the ratio of the observed and predicted event yields is shown. |
png pdf |
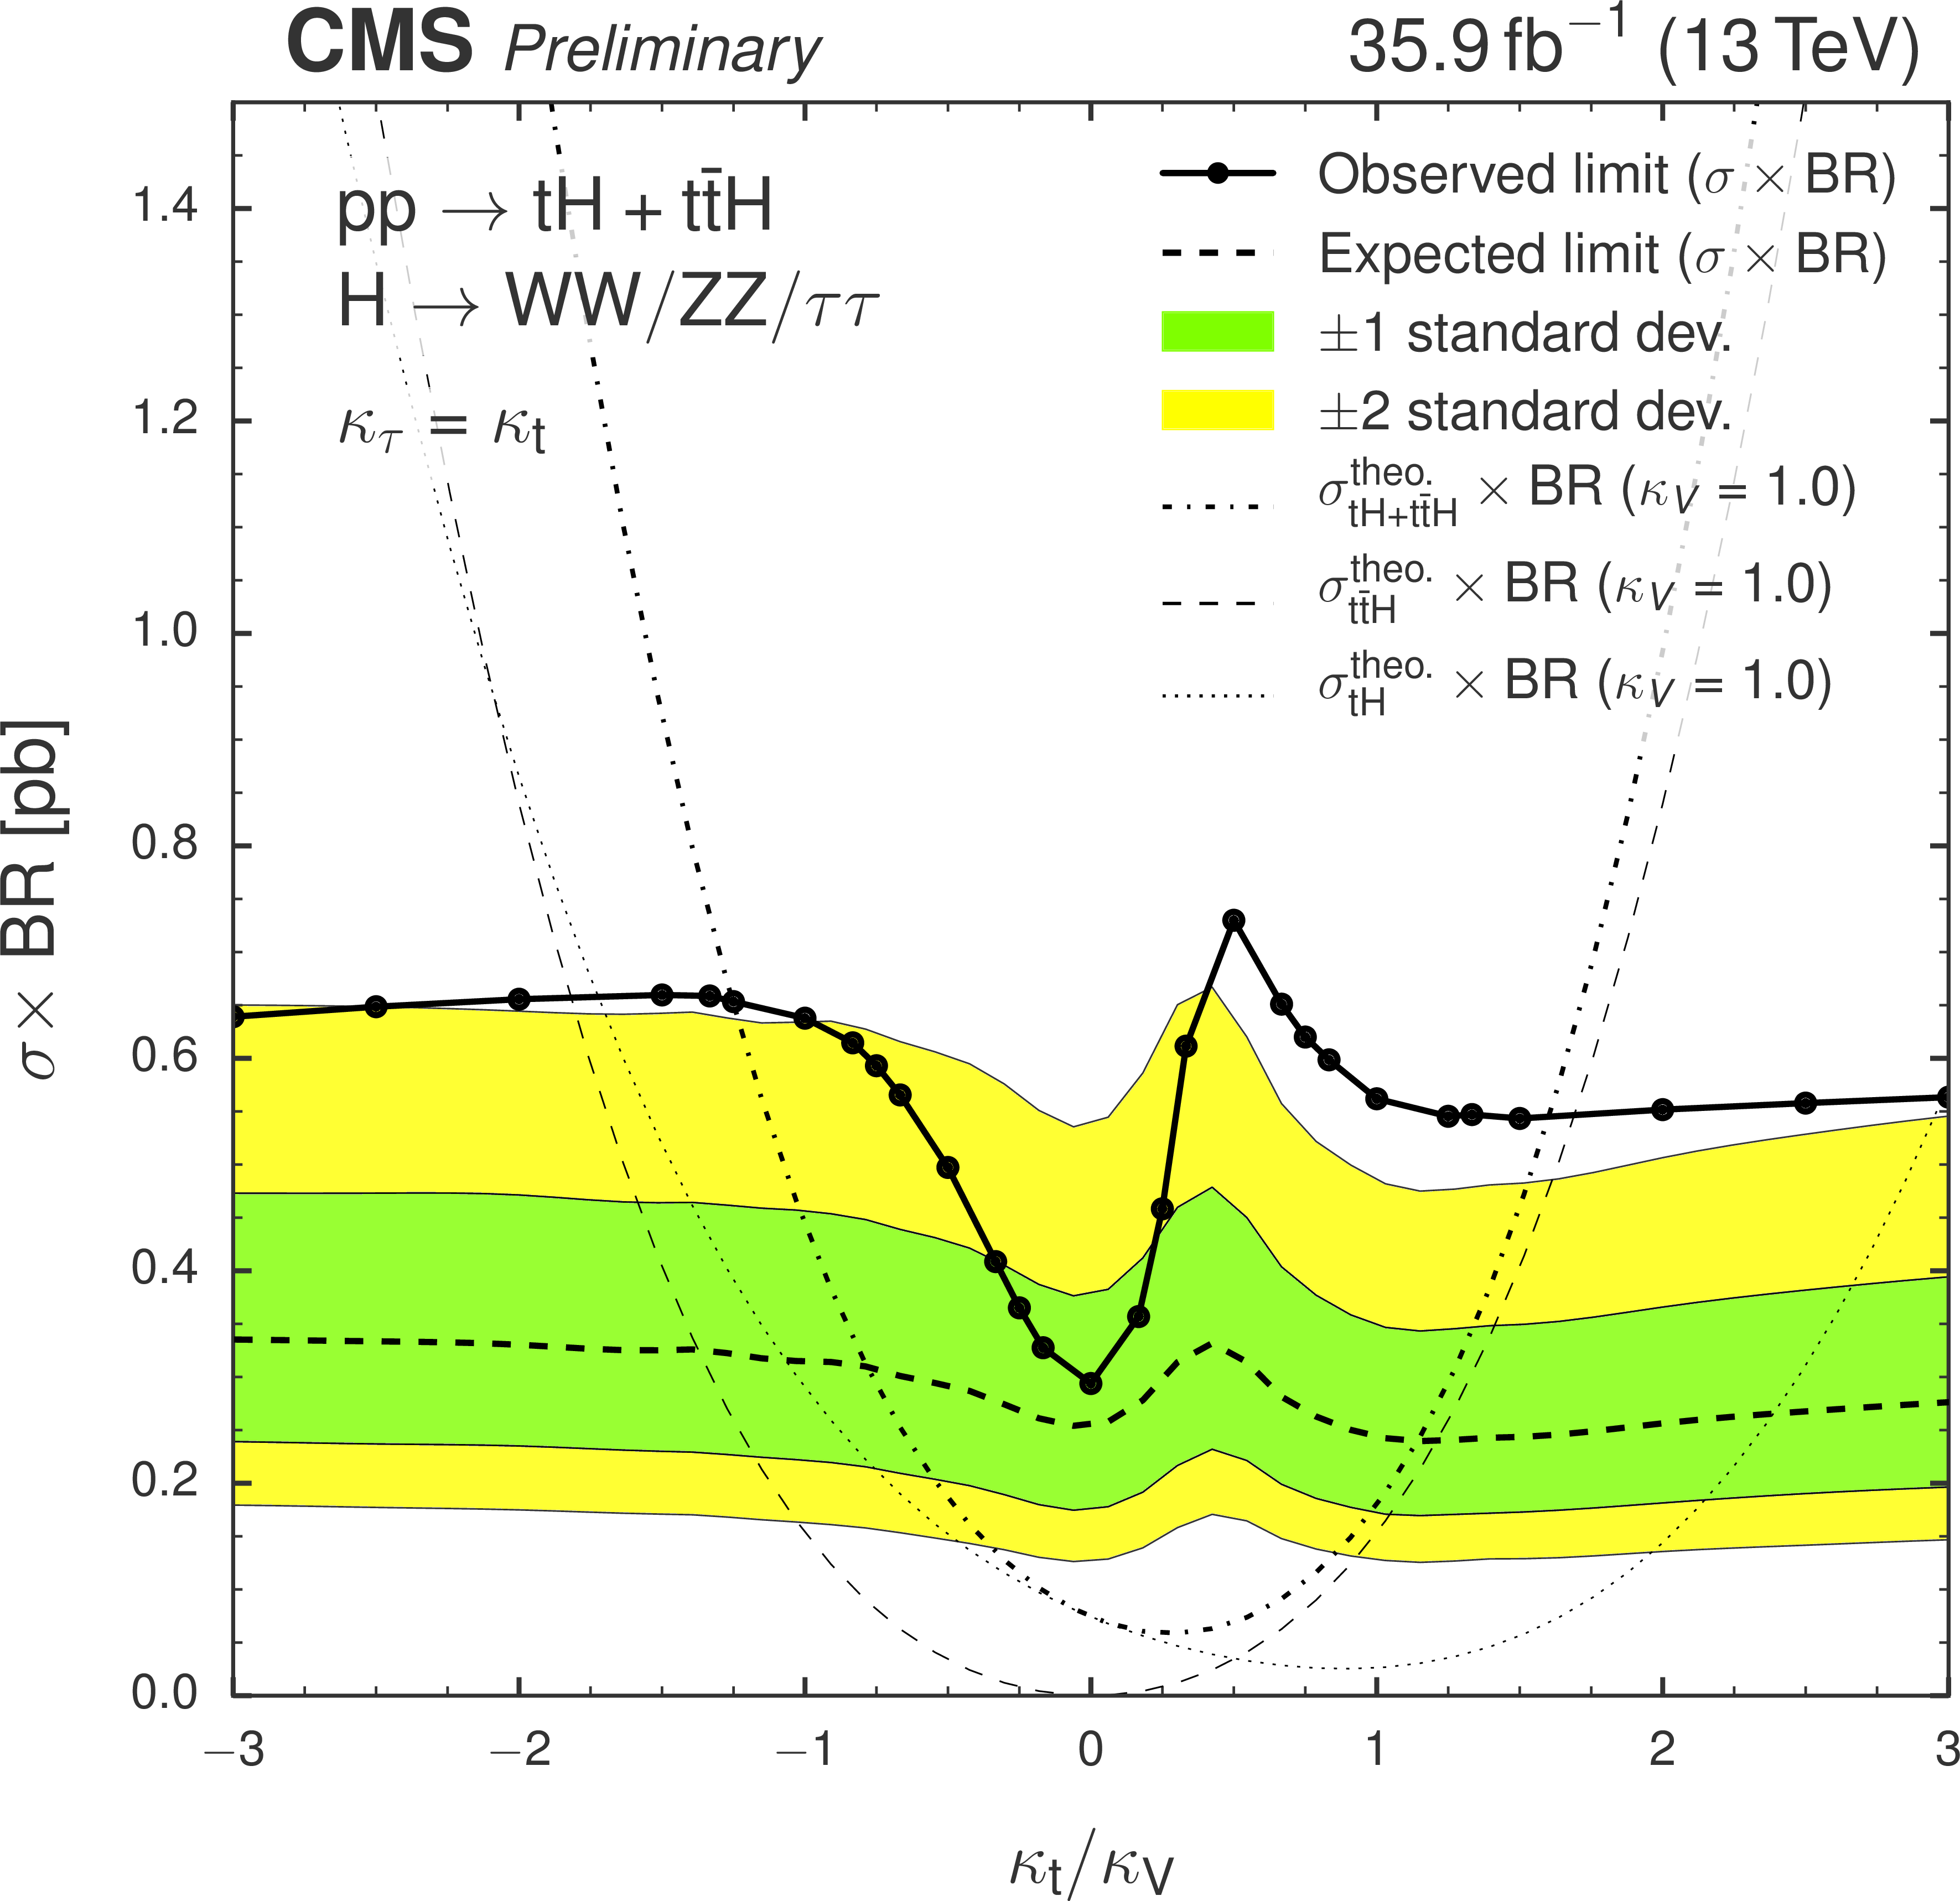
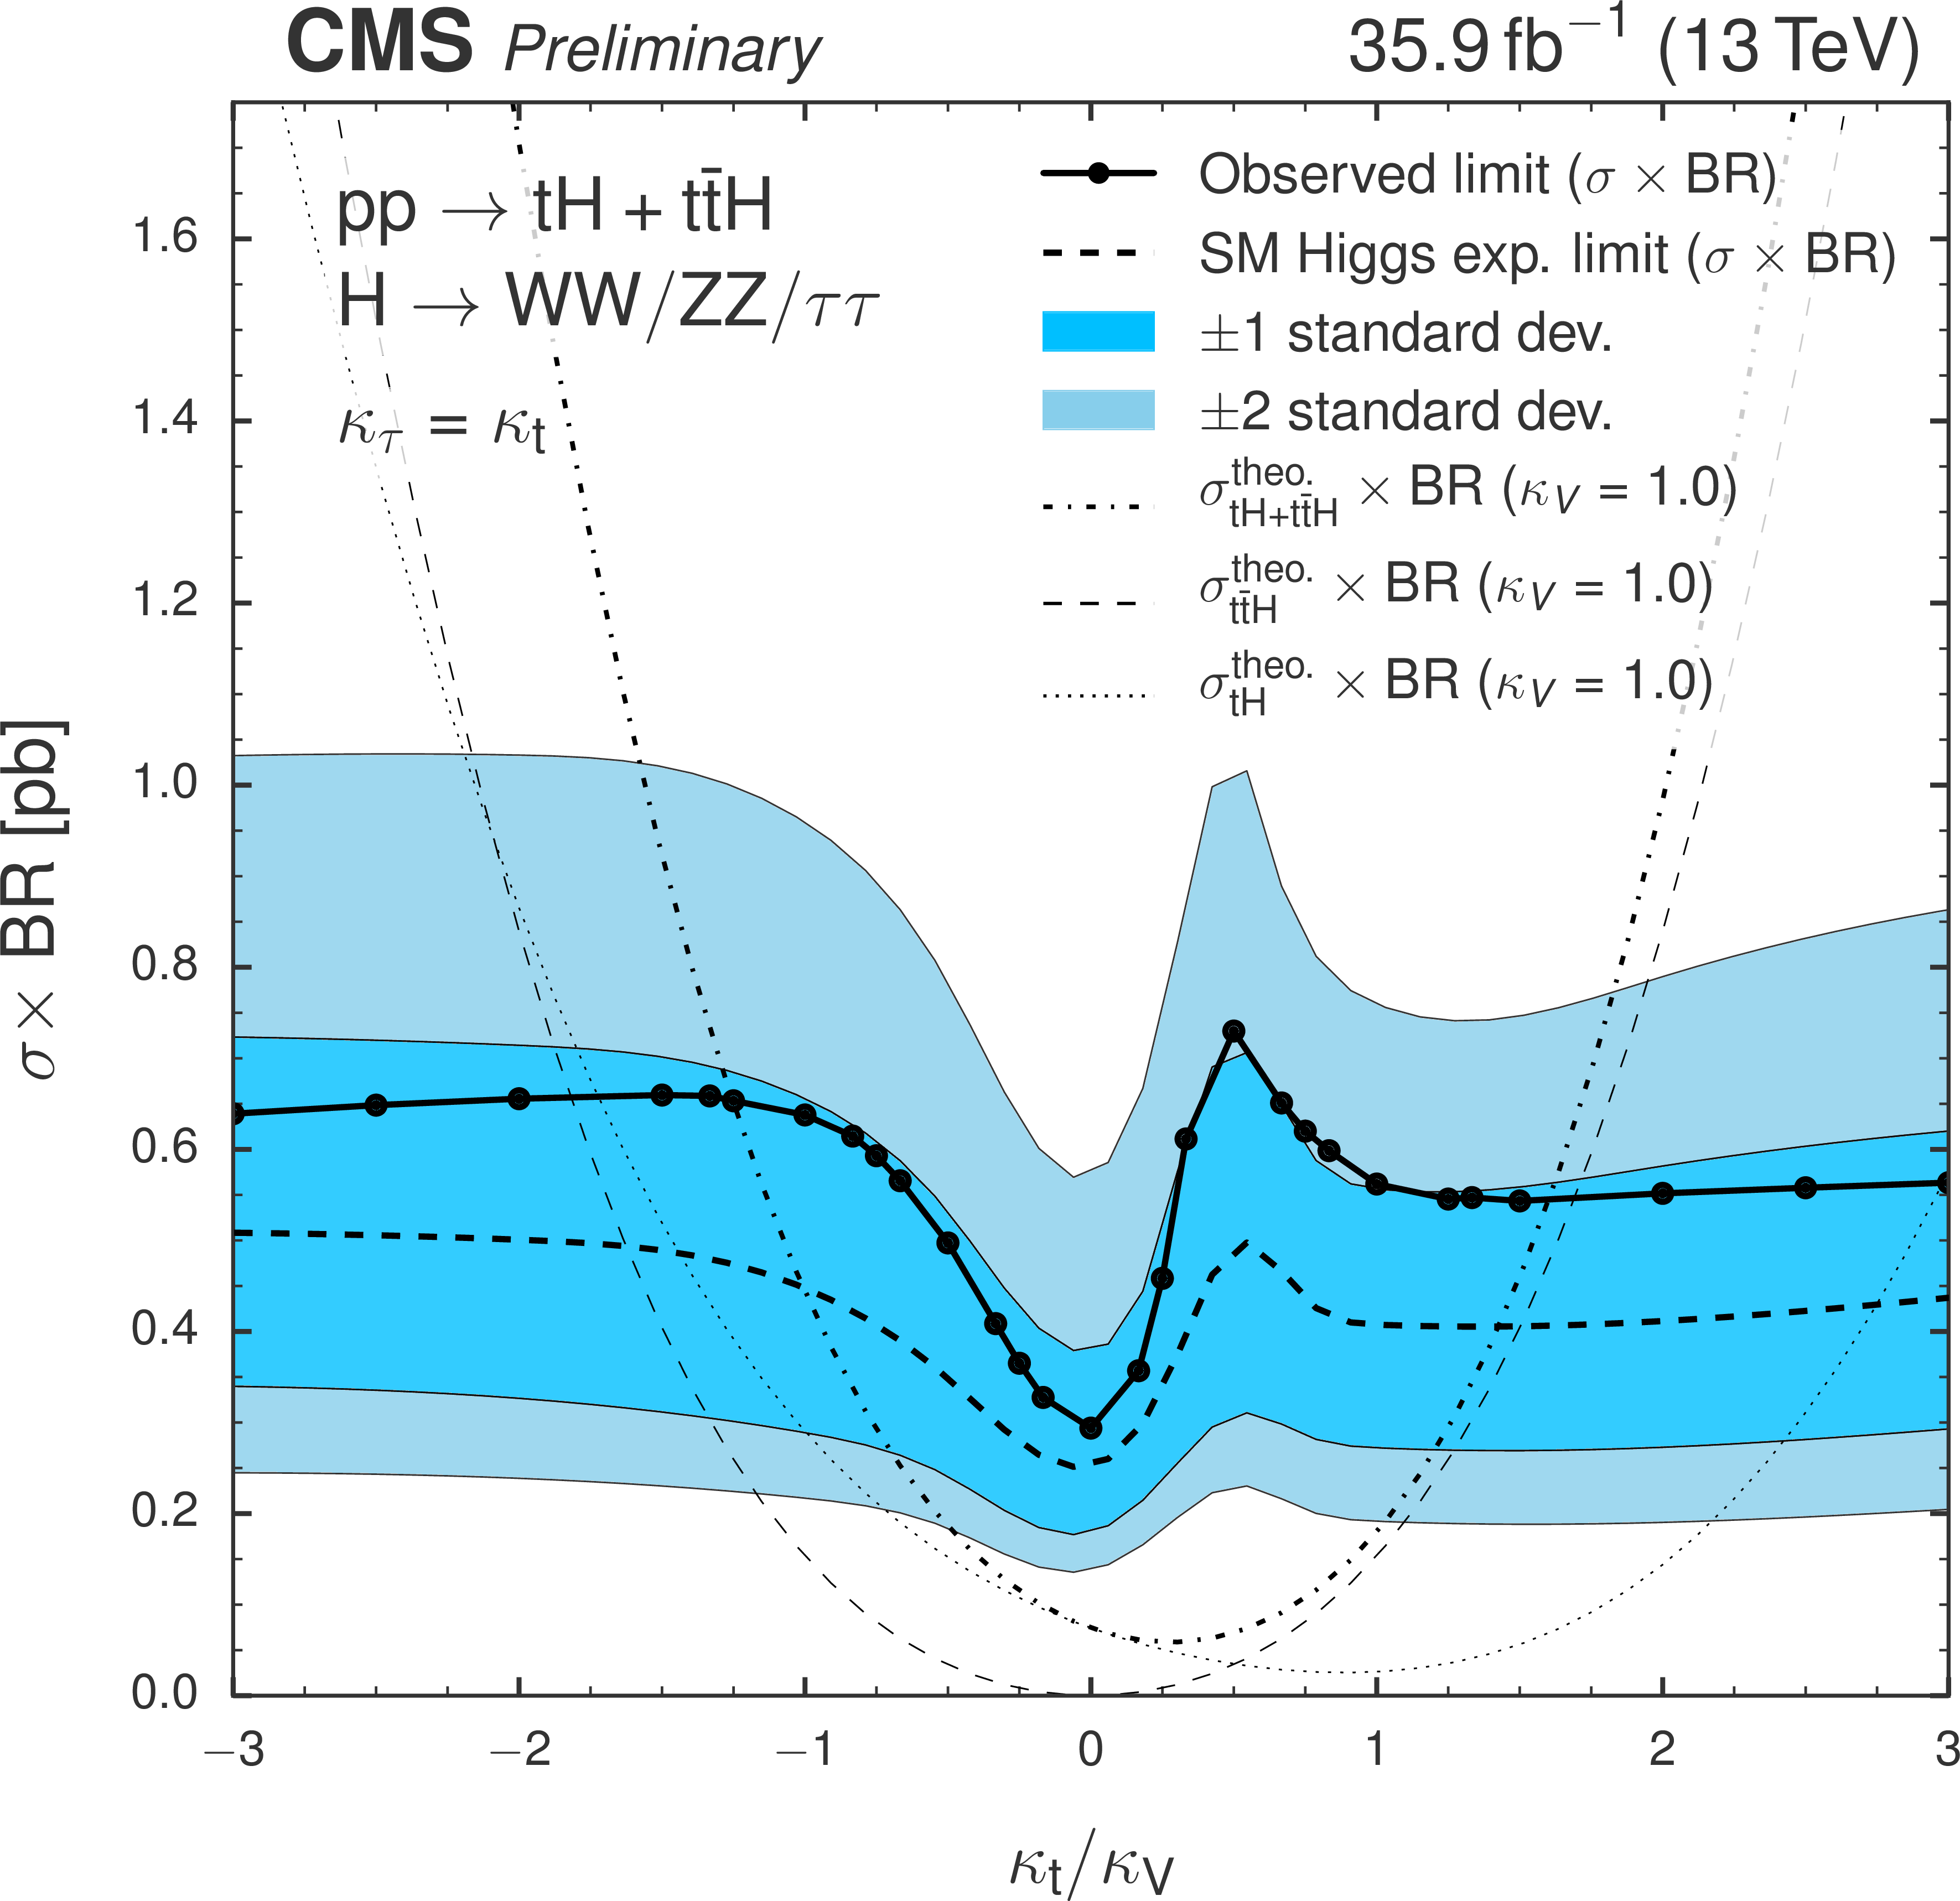
Figure 7:
Observed and expected 95% C.L. upper limit on the $ {\mathrm{ t } \mathrm{ H } } + {{\mathrm{ t } \mathrm{ \bar{t} } } \mathrm {H}} $ cross section times $\mathrm{ H } \to {\mathrm {W}} {\mathrm {W}} ^*+ {\tau \tau } +{\mathrm{ Z } } {\mathrm{ Z } } ^*$ branching fraction for different values of the coupling ratio ${\kappa _\mathrm{ t } } / {\kappa _\text {V}} $. The expected limit is derived from a background-only MC dataset. |
| Tables | |
png pdf |
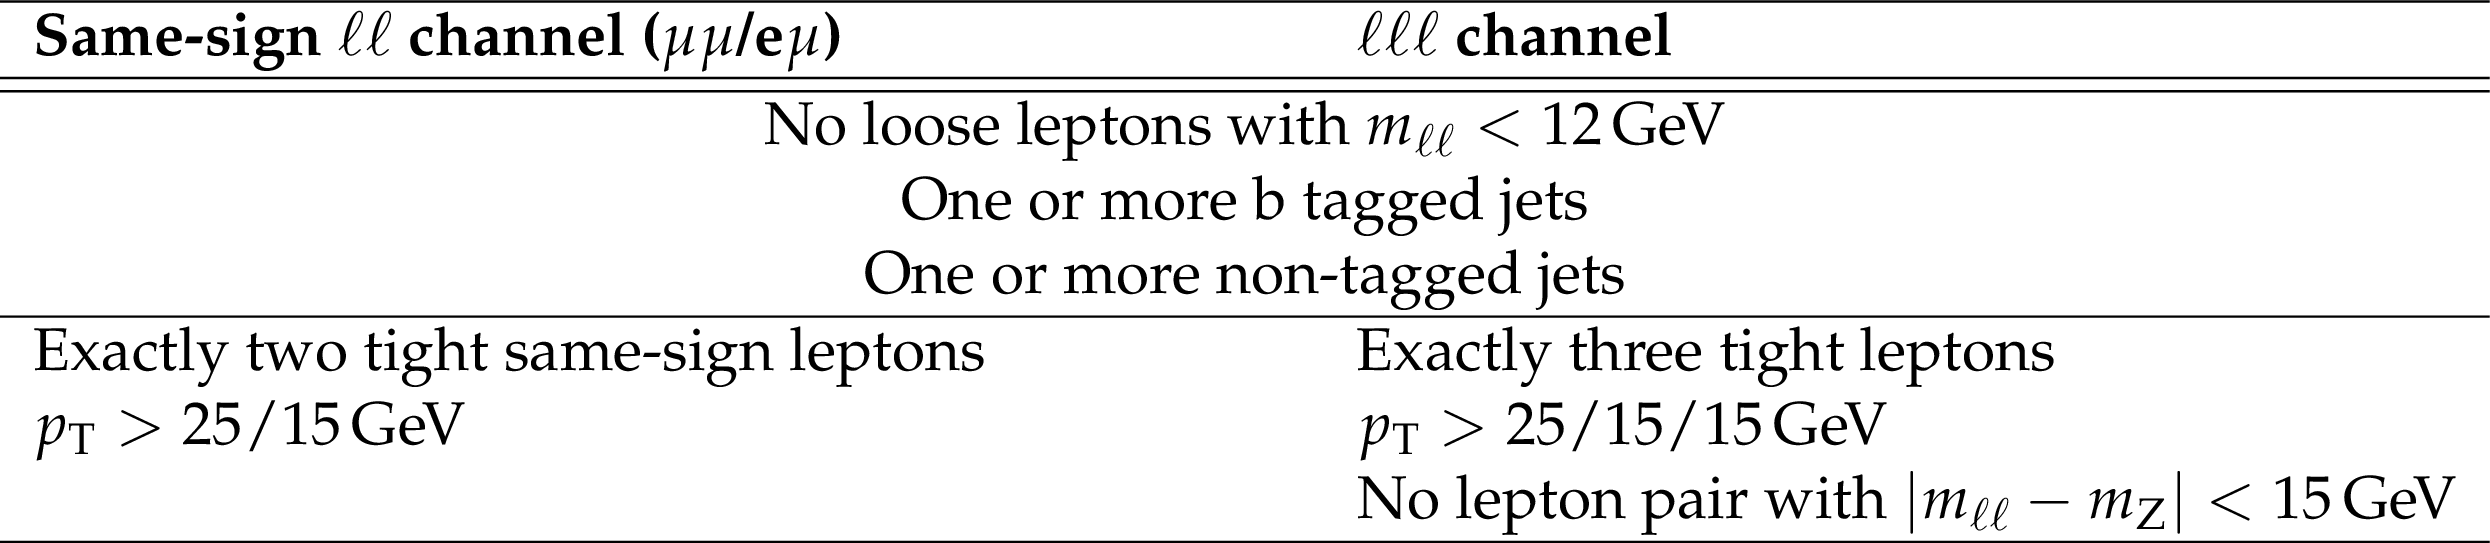
Table 1:
Summary of event selection. |
png pdf |
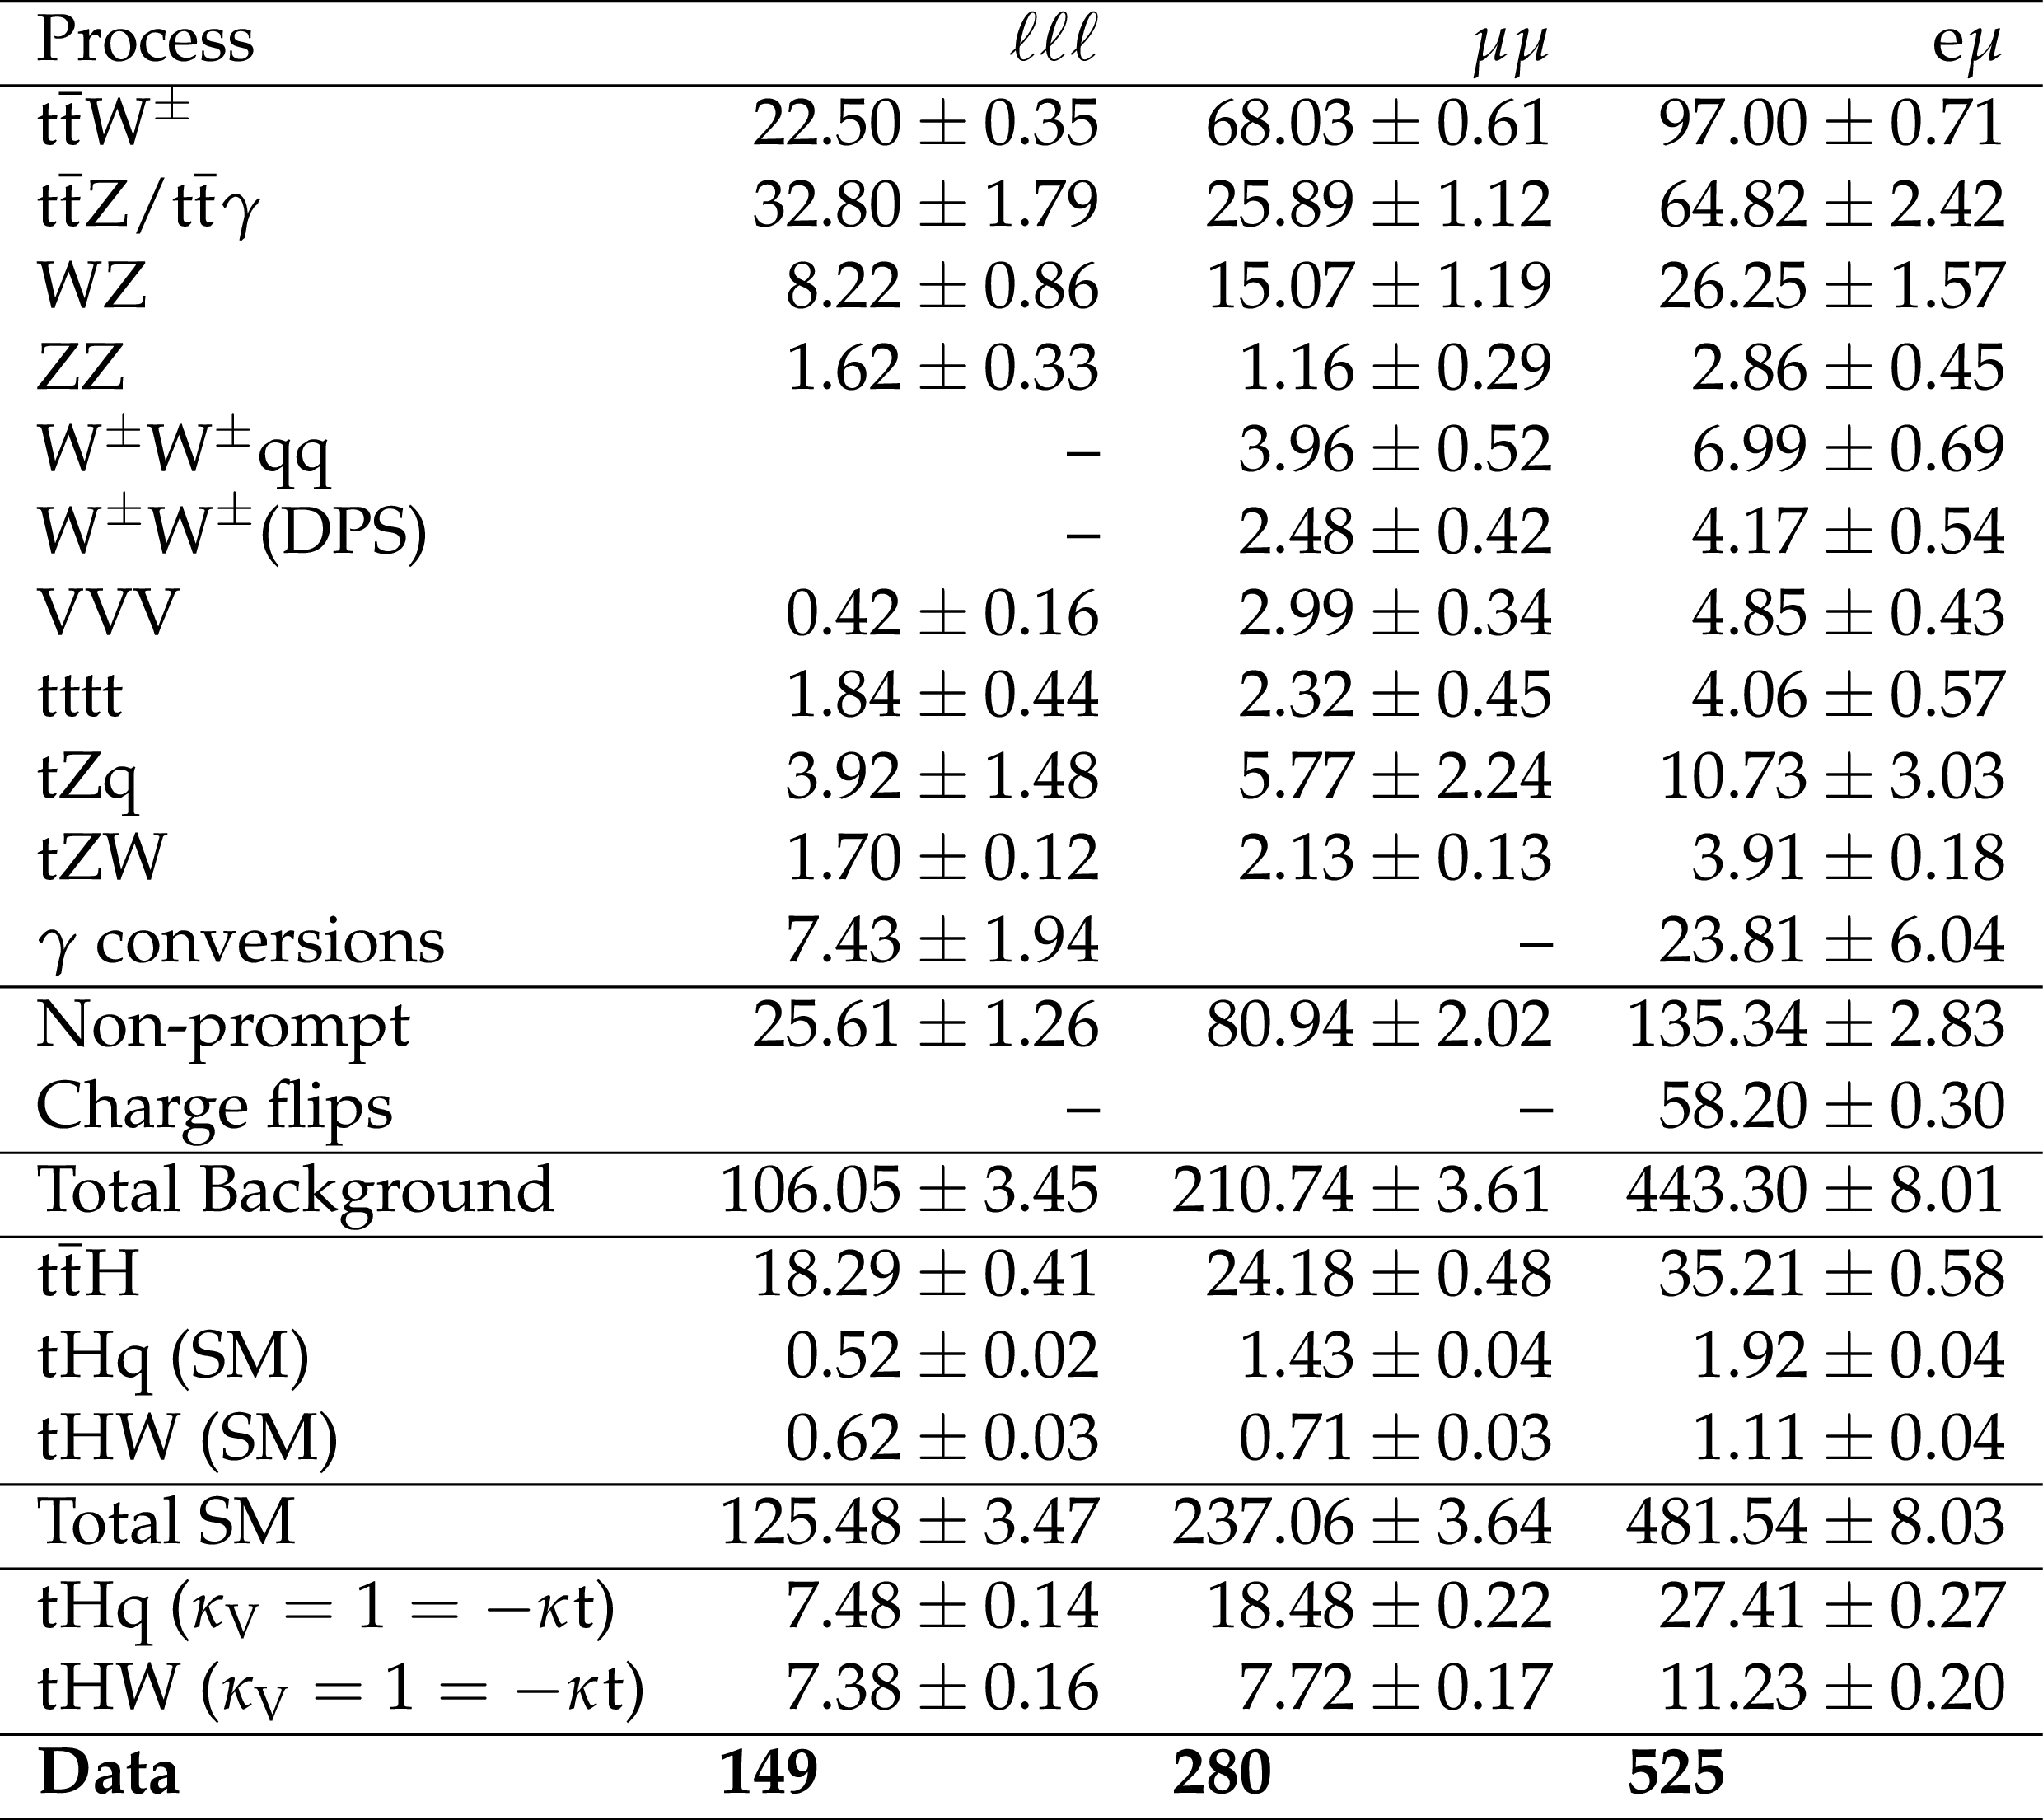
Table 2:
Data yields and expected backgrounds after the event pre-selection for the three channels in 35.9 fb$^{-1}$ of integrated luminosity. Uncertainties are statistical only. |
png pdf |
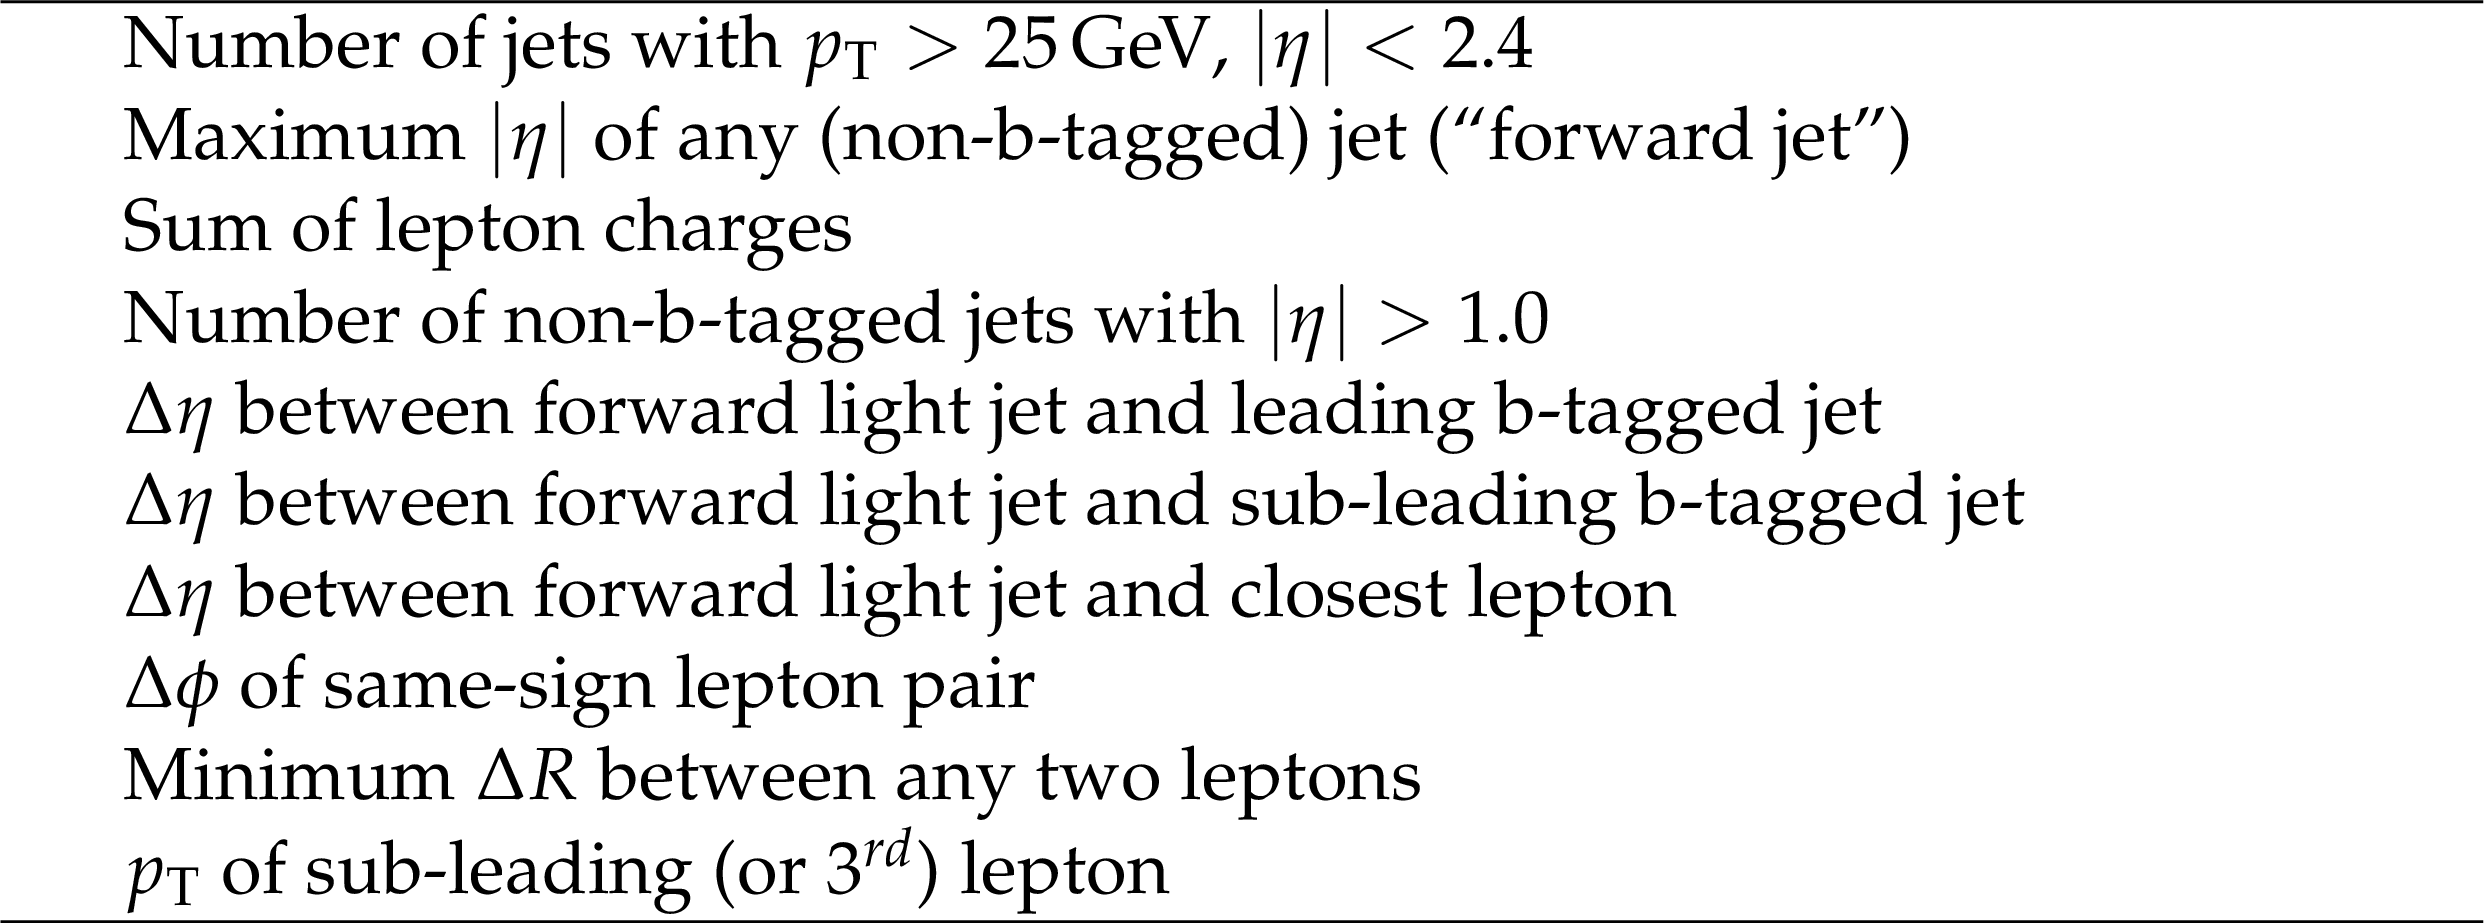
Table 3:
Input variables to the signal discrimination classifier. |
png pdf |
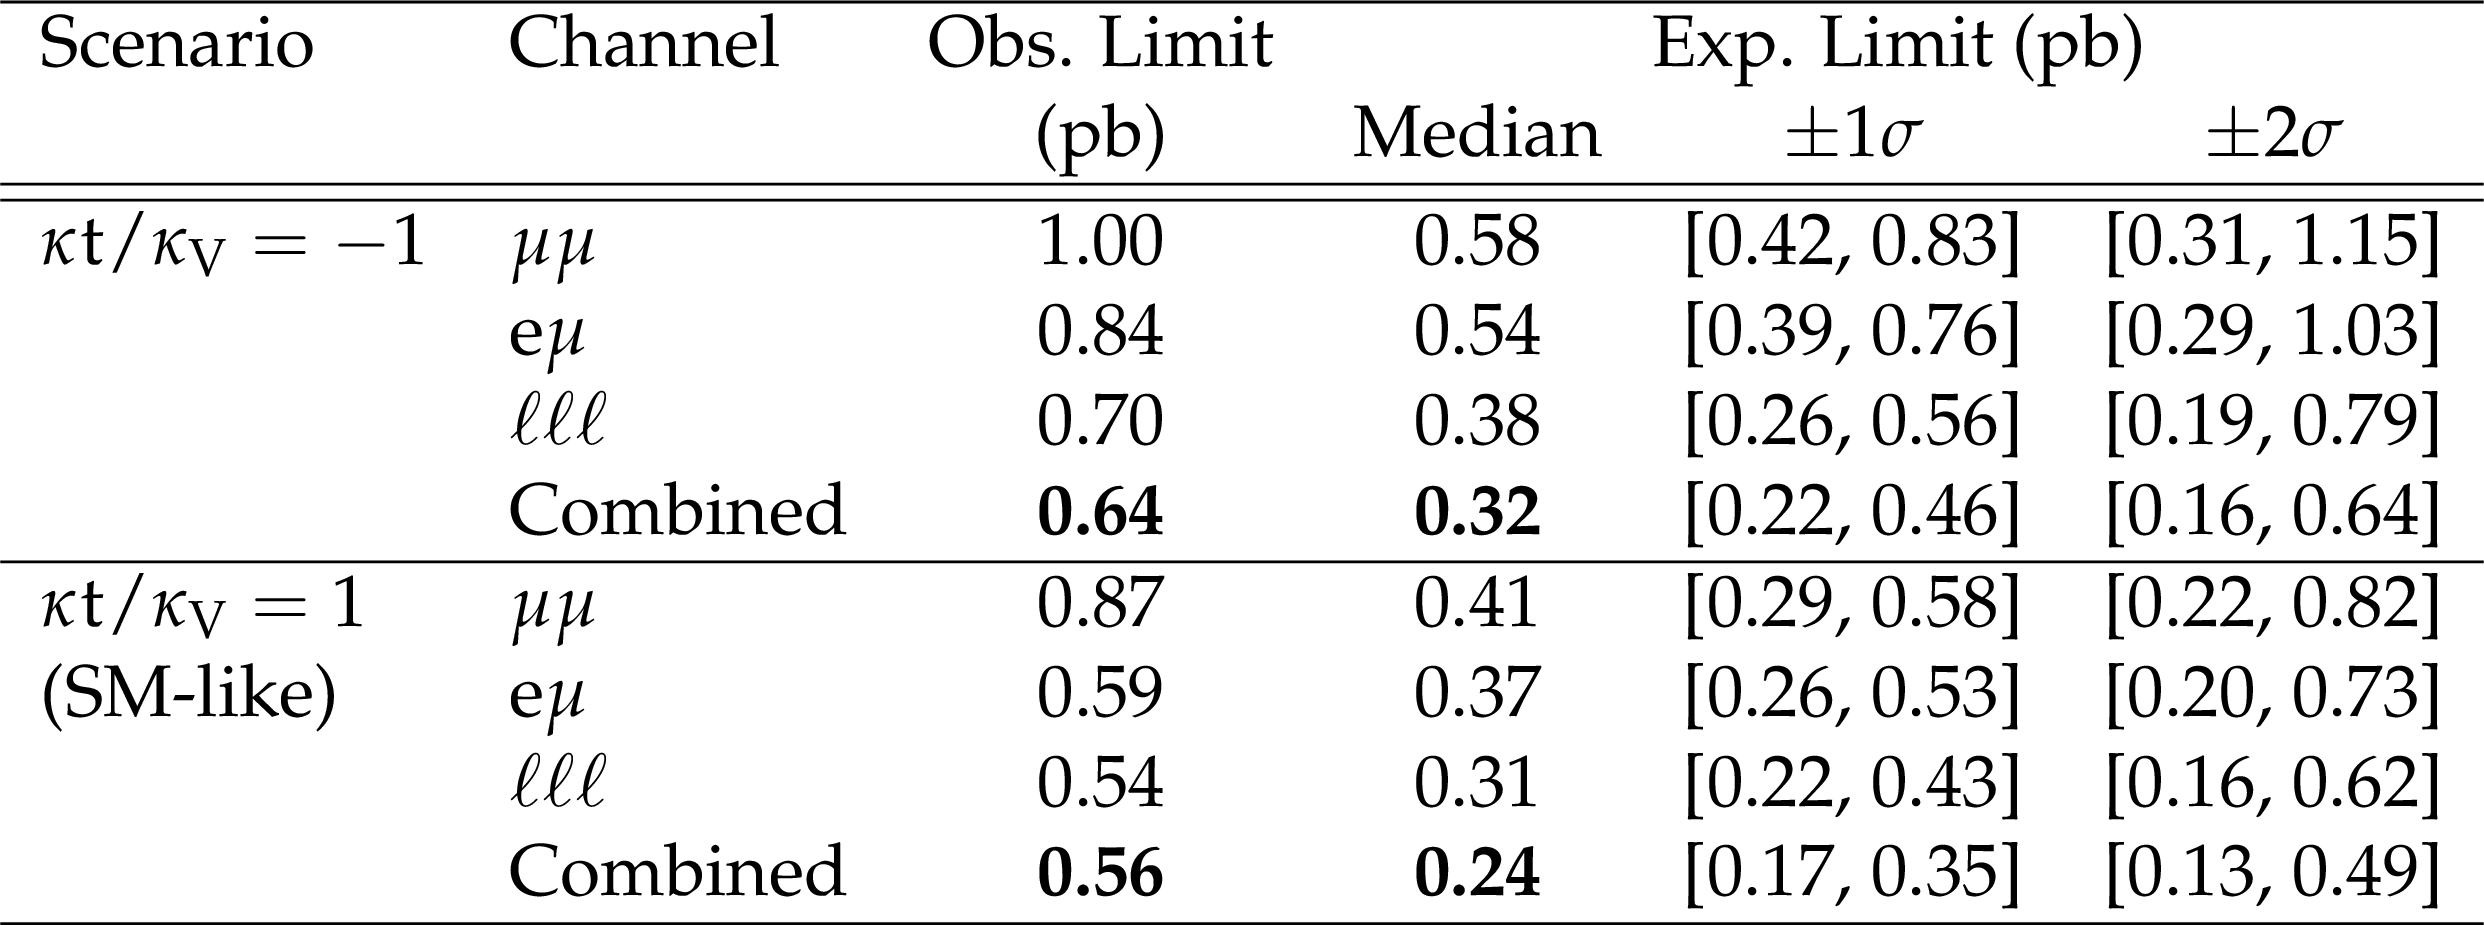
Table 4:
Expected and observed 95% C.L. upper limits on the $ {\mathrm{ t } \mathrm{ H } } + {{\mathrm{ t } \mathrm{ \bar{t} } } \mathrm {H}} $ production cross section times $\mathrm{ H } \to {\mathrm {W}} {\mathrm {W}} ^*+ {\tau \tau } +{\mathrm{ Z } } {\mathrm{ Z } } ^*$ branching ratio for a scenario of inverted couplings ($ {\kappa _\mathrm{ t } } / {\kappa _\text {V}} =-1.0$, top rows) and for a standard-model-like signal ($ {\kappa _\mathrm{ t } } / {\kappa _\text {V}} =1.0$, bottom rows), in pb. The expected limit is calculated on a background-only MC dataset. |
| Summary |
|
A search for the production of a Higgs boson in association with a single top quark has been presented, using the CMS detector and the full 2016 data sample of pp collisions at 13 TeV, corresponding to an integrated luminosity of 35.9 fb$^{-1}$. Three channels have been analyzed, targeting the Higgs boson decaying to a pair of W or Z bosons, or two $\tau$ leptons and the leptonic decay of the top: two same-sign leptons (${\mu\mu} $, ${\mathrm{ e }\mu} $) and three leptons. This process can benefit from a greatly enhanced production cross section in the case of anomalous top-Higgs couplings, and the results are used to constrain these couplings. Combining the results from all three channels yields a 95% confidence level (C.L.) upper limit on the production cross section times branching ratio of events containing a SM Higgs boson of 0.56 pb, with an expected limit of 0.24 pb. Values of the ratio of Higgs-top coupling modifier ${\kappa_\mathrm{t }} $ and Higgs-vector boson coupling modifier ${\kappa_\text{V}} $ are outside the range $-1.25$ to $+1.60$ are excluded at 95% C.L. |
| Additional Figures | |
png pdf |
Additional Figure 1:
Pre-fit categorized BDT classifier outputs, for the three-lepton channel (left), $ {\mathrm{ e } \mu } $ (center), and $ {\mu \mu } $ (right), for 35.9 fb$^{-1}$. In the box below each distribution, the ratio of the observed and predicted event yields is shown. The shape of the two $ {\mathrm{ t } \mathrm{ H } } $ signals for $ {\kappa _\mathrm{ t } } =-1.0$ is shown, normalized to their respective cross sections for $ {\kappa _\mathrm{ t } } =-1.0$, ${\kappa _\text {V}} =1.0$. The grey band represents the unconstrained (pre-fit) statistical and systematical uncertainties. |
png pdf |
Additional Figure 1-a:
Pre-fit categorized BDT classifier outputs, for the three-lepton channel, for 35.9 fb$^{-1}$. In the box below each distribution, the ratio of the observed and predicted event yields is shown. The shape of the two $ {\mathrm{ t } \mathrm{ H } } $ signals for $ {\kappa _\mathrm{ t } } =-1.0$ is shown, normalized to their respective cross sections for $ {\kappa _\mathrm{ t } } =-1.0$, ${\kappa _\text {V}} =1.0$. The grey band represents the unconstrained (pre-fit) statistical and systematical uncertainties. |
png pdf |
Additional Figure 1-b:
Pre-fit categorized BDT classifier outputs, for $ {\mathrm{ e } \mu } $, for 35.9 fb$^{-1}$. In the box below each distribution, the ratio of the observed and predicted event yields is shown. The shape of the two $ {\mathrm{ t } \mathrm{ H } } $ signals for $ {\kappa _\mathrm{ t } } =-1.0$ is shown, normalized to their respective cross sections for $ {\kappa _\mathrm{ t } } =-1.0$, ${\kappa _\text {V}} =1.0$. The grey band represents the unconstrained (pre-fit) statistical and systematical uncertainties. |
png pdf |
Additional Figure 1-c:
Pre-fit categorized BDT classifier outputs, for $ {\mu \mu } $, for 35.9 fb$^{-1}$. In the box below each distribution, the ratio of the observed and predicted event yields is shown. The shape of the two $ {\mathrm{ t } \mathrm{ H } } $ signals for $ {\kappa _\mathrm{ t } } =-1.0$ is shown, normalized to their respective cross sections for $ {\kappa _\mathrm{ t } } =-1.0$, ${\kappa _\text {V}} =1.0$. The grey band represents the unconstrained (pre-fit) statistical and systematical uncertainties. |
png pdf |
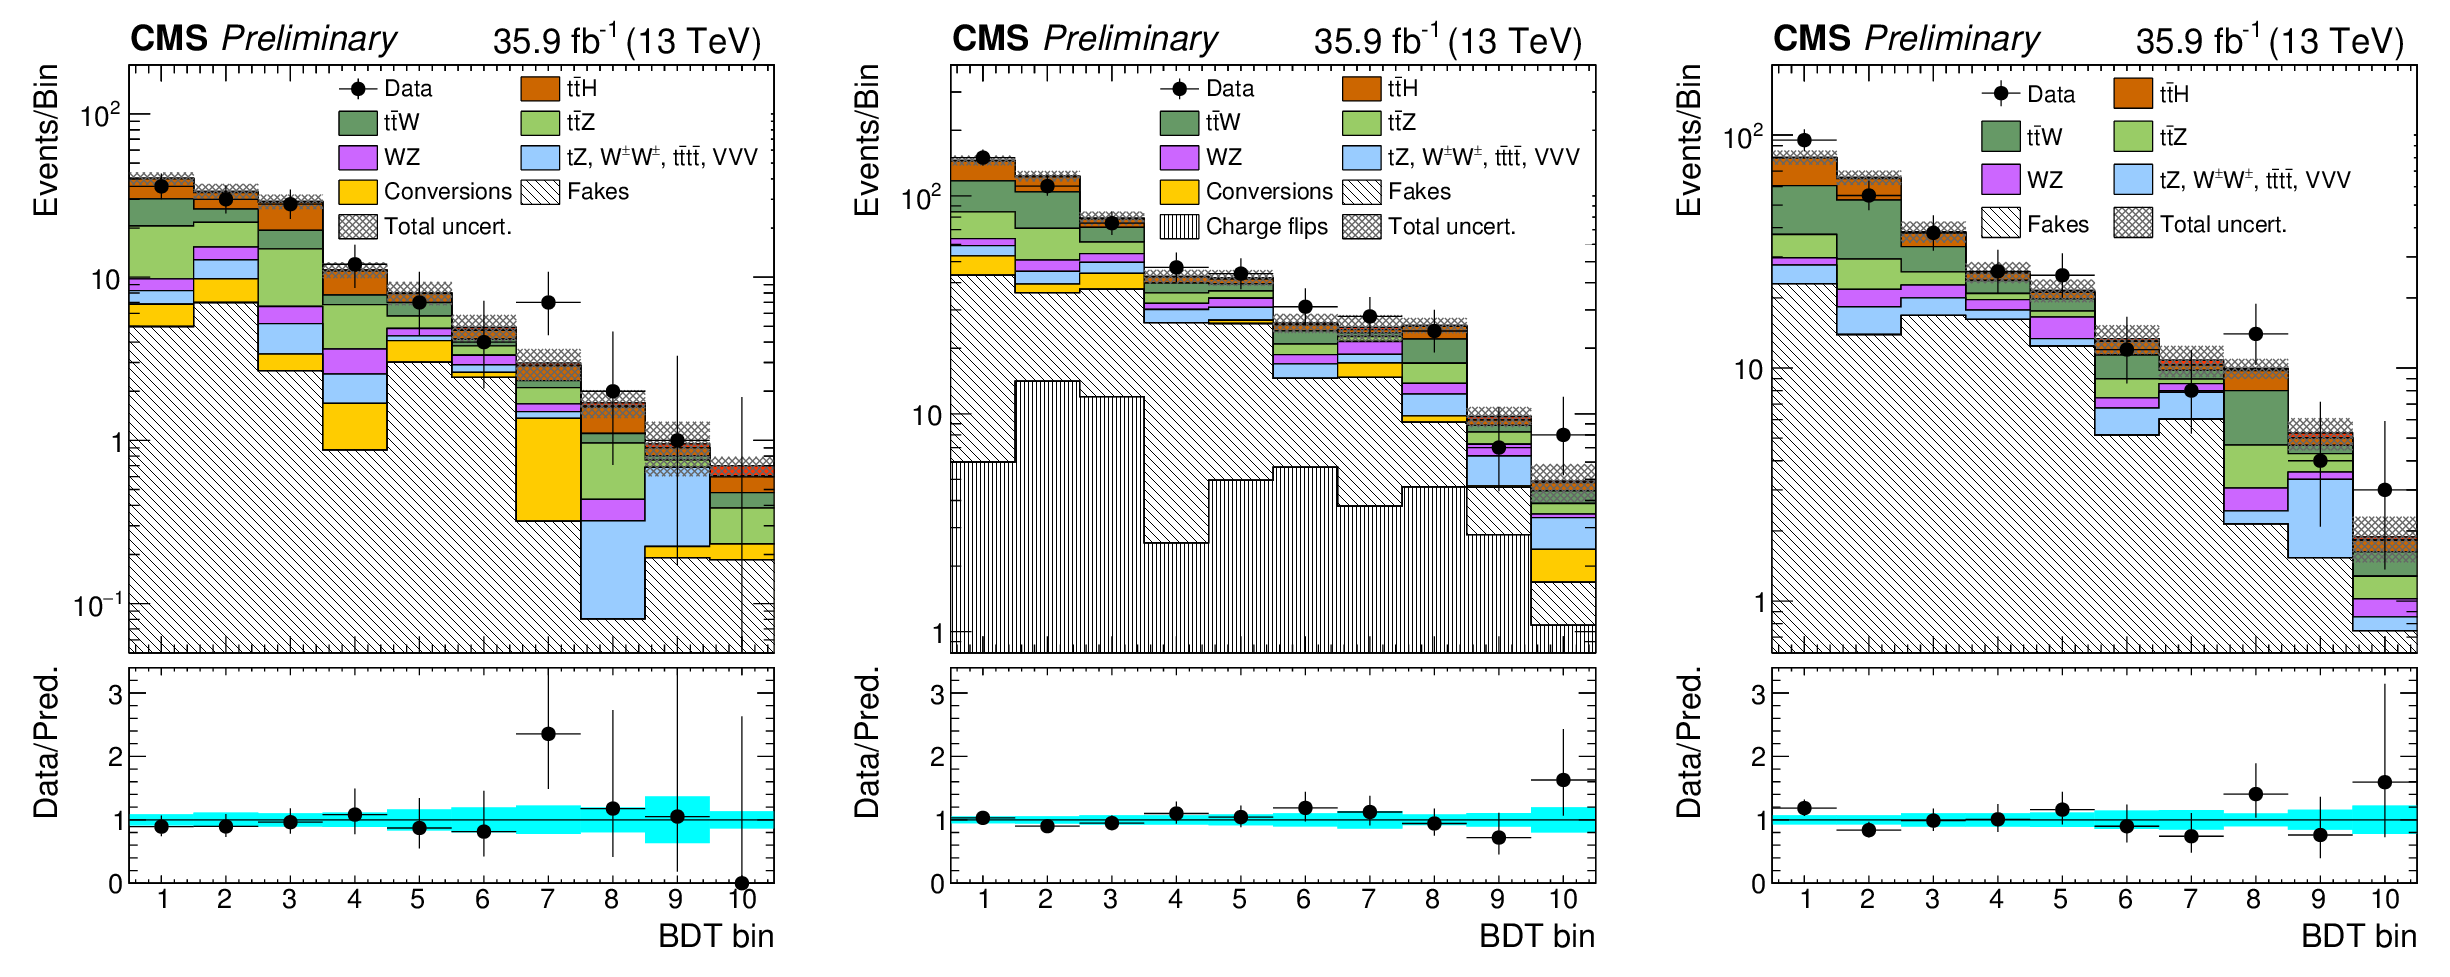
Additional Figure 2:
Post-fit categorized BDT classifier outputs (on logarithmic scale) as used in the maximum likelihood fit for the three-lepton channel (left), $ {\mathrm{ e } \mu } $ (center), and $ {\mu \mu } $ (right), for 35.9 fb$^{-1}$. In the box below each distribution, the ratio of the observed and predicted event yields is shown. |
png pdf |
Additional Figure 2-a:
Post-fit categorized BDT classifier outputs (on logarithmic scale) as used in the maximum likelihood fit for the three-lepton channel, for 35.9 fb$^{-1}$. In the box below each distribution, the ratio of the observed and predicted event yields is shown. |
png pdf |
Additional Figure 2-b:
Post-fit categorized BDT classifier outputs (on logarithmic scale) as used in the maximum likelihood fit for $ {\mathrm{ e } \mu } $, for 35.9 fb$^{-1}$. In the box below each distribution, the ratio of the observed and predicted event yields is shown. |
png pdf |
Additional Figure 2-c:
Post-fit categorized BDT classifier outputs (on logarithmic scale) as used in the maximum likelihood fit for $ {\mu \mu } $, for 35.9 fb$^{-1}$. In the box below each distribution, the ratio of the observed and predicted event yields is shown. |
png pdf |
Additional Figure 3:
Observed and expected 95% C.L. upper limit on the $ {\mathrm{ t } \mathrm{ H } } + {{\mathrm{ t } {}\mathrm{ \bar{t} } } \mathrm {H}} $ cross section times $\mathrm{ H } \to {\mathrm {W}} {\mathrm {W}} ^*+ {\tau \tau } +{\mathrm{ Z } } {\mathrm{ Z } } ^*$ branching fraction for different values of the coupling ratio ${\kappa _\mathrm{ t } } / {\kappa _\text {V}}$. The expected limit is derived from a MC dataset of SM processes including the contributions from ${{\mathrm{ t } {}\mathrm{ \bar{t} } } \mathrm {H}} $ and $ {\mathrm{ t } \mathrm{ H } } $ expected in the SM. |
| References | ||||
| 1 | CMS Collaboration | Observation of a new boson at a mass of 125 GeV with the CMS experiment at the LHC | Phys.Lett. B716 (2012) 30--61 | CMS-HIG-12-028 1207.7235 |
| 2 | ATLAS Collaboration | Observation of a new particle in the search for the Standard Model Higgs boson with the ATLAS detector at the LHC | Phys.Lett. B716 (2012) 1--29 | 1207.7214 |
| 3 | CMS Collaboration | Measurement of the top quark mass using proton-proton data at $ {\sqrt{s}} = $ 7 and 8 TeV | PRD93 (2016), no. 7, 072004 | CMS-TOP-14-022 1509.04044 |
| 4 | S. Biswas, E. Gabrielli, F. Margaroli, and B. Mele | Direct constraints on the top-Higgs coupling from the 8 TeV LHC data | JHEP 07 (2013) 73 | |
| 5 | B. Hespel, F. Maltoni, and E. Vryonidou | Higgs and Z boson associated production via gluon fusion in the SM and the 2HDM | JHEP 06 (2015) 065 | 1503.01656 |
| 6 | ATLAS Collaboration | Measurements of Higgs boson production and couplings in diboson final states with the ATLAS detector at the LHC | PLB726 (2013) 88--119 | 1307.1427 |
| 7 | CMS Collaboration | Precise determination of the mass of the Higgs boson and tests of compatibility of its couplings with the standard model predictions using proton collisions at 7 and 8 TeV | EPJC75 (2015) 212 | CMS-HIG-14-009 1412.8662 |
| 8 | ATLAS, CMS Collaboration | Measurements of the Higgs boson production and decay rates and constraints on its couplings from a combined ATLAS and CMS analysis of the LHC pp collision data at $ \sqrt{s}= $ 7 and 8 TeV | Submitted to JHEP | 1606.02266 |
| 9 | J. Ellis and T. You | Updated Global Analysis of Higgs Couplings | JHEP 06 (2013) 103 | 1303.3879 |
| 10 | G. Bordes and B. van Eijk | On the associate production of a neutral intermediate mass Higgs boson with a single top quark at the LHC and SSC | PLB 299 (1993) 315 | |
| 11 | T. M. P. Tait and C. P. Yuan | Single top quark production as a window to physics beyond the standard model | PRD 63 (2000) 014018 | hep-ph/0007298 |
| 12 | M. Farina et al. | Lifting degeneracies in Higgs couplings using single top production in association with a Higgs boson | JHEP 1305 (2013) 022 | 1211.3736 |
| 13 | F. Demartin, F. Maltoni, K. Mawatari, and M. Zaro | Higgs production in association with a single top quark at the LHC | EPJC 75 (2015), no. 6, 267 | |
| 14 | F. Demartin et al. | tWH associated production at the LHC | EPJC77 (2017) 34 | 1607.05862 |
| 15 | CMS Collaboration | Search for the associated production of a Higgs boson with a single top quark in proton-proton collisions at $ \sqrt{s}= $ 8 TeV | JHEP 06 (2016) 177 | CMS-HIG-14-027 1509.08159 |
| 16 | CMS Collaboration | Search for $ \mathrm{ H }\to\mathrm{b }\mathrm{ \bar{b} } $ in association with a single top quark as a test of Higgs boson couplings at $ \sqrt{s} = $ 13 TeV | CMS-PAS-HIG-16-019 | CMS-PAS-HIG-16-019 |
| 17 | CMS Collaboration | Search for Higgs boson production in association with top quarks in multilepton final states at $ \sqrt{s} = $ 13 TeV | ||
| 18 | CMS Collaboration | The CMS experiment at the CERN LHC | JINST 3 (2008) S08004 | CMS-00-001 |
| 19 | CMS Collaboration | Particle-Flow Event Reconstruction in CMS and Performance for Jets, Taus, and $ E_{T}^{miss} $ | CDS | |
| 20 | M. Cacciari, G. P. Salam, and G. Soyez | FastJet User Manual | EPJC72 (2012) 1896 | 1111.6097 |
| 21 | M. Cacciari and G. P. Salam | Dispelling the $ N^{3} $ myth for the $ k_T $ jet-finder | PLB641 (2006) 57--61 | hep-ph/0512210 |
| 22 | CMS Collaboration | Determination of Jet Energy Calibration and Transverse Momentum Resolution in CMS | JINST 6 (2011) P11002 | CMS-JME-10-011 1107.4277 |
| 23 | CMS Collaboration | Identification of b-quark jets with the CMS experiment | JINST 8 (2013) P04013 | CMS-BTV-12-001 1211.4462 |
| 24 | CMS Collaboration | Identification of b quark jets at the CMS Experiment in the LHC Run 2 | CMS-PAS-BTV-15-001 | CMS-PAS-BTV-15-001 |
| 25 | CMS Collaboration | Performance of CMS muon reconstruction in pp collision events at $ \sqrt{s} = $ 7 TeV | JINST 7 (2012) P10002 | CMS-MUO-10-004 1206.4071 |
| 26 | CMS Collaboration | Performance of Electron Reconstruction and Selection with the CMS Detector in Proton-Proton Collisions at $ \sqrt{s} = $ 8 TeV | JINST 10 (2015), no. 06, P06005 | CMS-EGM-13-001 1502.02701 |
| 27 | K. Rehermann and B. Tweedie | Efficient Identification of Boosted Semileptonic Top Quarks at the LHC | JHEP 03 (2011) 059 | 1007.2221 |
| 28 | CMS Collaboration | Search for SUSY in same-sign dilepton events at $ \sqrt{s}= $ 13 TeV | EPJC76 (2016) 439 | CMS-SUS-15-008 1605.03171 |
| 29 | J. Alwall et al. | The automated computation of tree-level and next-to-leading order differential cross sections, and their matching to parton shower simulations | JHEP 07 (2014) 079 | 1405.0301 |
| 30 | J. Alwall et al. | Comparative study of various algorithms for the merging of parton showers and matrix elements in hadronic collisions | EPJC53 (2008) 473--500 | 0706.2569 |
| 31 | NNPDF Collaboration | Parton distributions for the LHC Run II | JHEP 04 (2015) 040 | 1410.8849 |
| 32 | R. Frederix and S. Frixione | Merging meets matching in MC@NLO | JHEP 12 (2012) 061 | 1209.6215 |
| 33 | P. Nason | A New method for combining NLO QCD with shower Monte Carlo algorithms | JHEP 0411 (2004) 040 | hep-ph/0409146 |
| 34 | S. Frixione, P. Nason, and C. Oleari | Matching NLO QCD computations with parton shower simulations: the POWHEG method | JHEP 11 (2007) 070 | 0709.2092 |
| 35 | S. Alioli, P. Nason, C. Oleari, and E. Re | A general framework for implementing NLO calculations in shower Monte Carlo programs: the POWHEG BOX | JHEP 06 (2010) 043 | 1002.2581 |
| 36 | E. Re | Single-top Wt-channel production matched with parton showers using the POWHEG method | EPJC71 (2011) 1547 | 1009.2450 |
| 37 | S. Alioli, P. Nason, C. Oleari, and E. Re | NLO single-top production matched with shower in POWHEG: s- and t-channel contributions | JHEP 0909 (2009) 111 | 0907.4076 |
| 38 | T. Melia, P. Nason, R. Rontsch, and G. Zanderighi | $ \text{W}^{+}\text{W}^{-} $, WZ and ZZ production in the POWHEG BOX | JHEP 1111 (2011) 078 | 1107.5051 |
| 39 | T. Sjostrand et al. | An Introduction to PYTHIA 8.2 | CPC 191 (2015) 159--177 | 1410.3012 |
| 40 | J. Allison et al. | GEANT4 developments and applications | IEEE Trans. Nucl. Sci. 53 (2006) 270 | |
| 41 | LHC Higgs Cross Section Working Group | Handbook of LHC Higgs Cross Sections: 4. Deciphering the Nature of the Higgs Sector | 1610.07922 | |
|
|
Compact Muon Solenoid LHC, CERN |
|

|

|

|

|

|