

Compact Muon Solenoid
LHC, CERN
| CMS-PAS-HIG-17-004 | ||
| Search for Higgs boson production in association with top quarks in multilepton final states at $\sqrt{s}= $ 13 TeV | ||
| CMS Collaboration | ||
| March 2017 | ||
| Abstract: A search for the production for a standard model Higgs boson in association with a top quark pair ($\mathrm{t}\overline{\mathrm{t}}\mathrm{H}$) is presented. The analysis is based on pp collision data collected by the CMS experiment at a center of mass energy of $\sqrt{s}= $ 13 TeV in 2016, and corresponding to an integrated luminosity of 35.9 fb$^{-1}$. We target final states where the Higgs boson decays to $\mathrm{WW}^{*}$, $\mathrm{ZZ}^{*}$ or $\tau\tau$, and at least one of the top quarks decays leptonically, by selecting events with two leptons of the same charge, three leptons or at least four leptons, and b-jets. We obtain a best fit $\mathrm{t}\overline{\mathrm{t}}\mathrm{H}$ yield of 1.5 $\pm$ 0.5 times the standard model prediction, with an observed (expected) significance of 3.3$\sigma$ (2.5$\sigma$), by the combination of these results with those obtained from the 2015 dataset. | ||
| Links: CDS record (PDF) ; inSPIRE record ; CADI line (restricted) ; | ||
| Figures & Tables | Summary | Additional Figures | References | CMS Publications |
|---|
| Figures | |
png pdf |
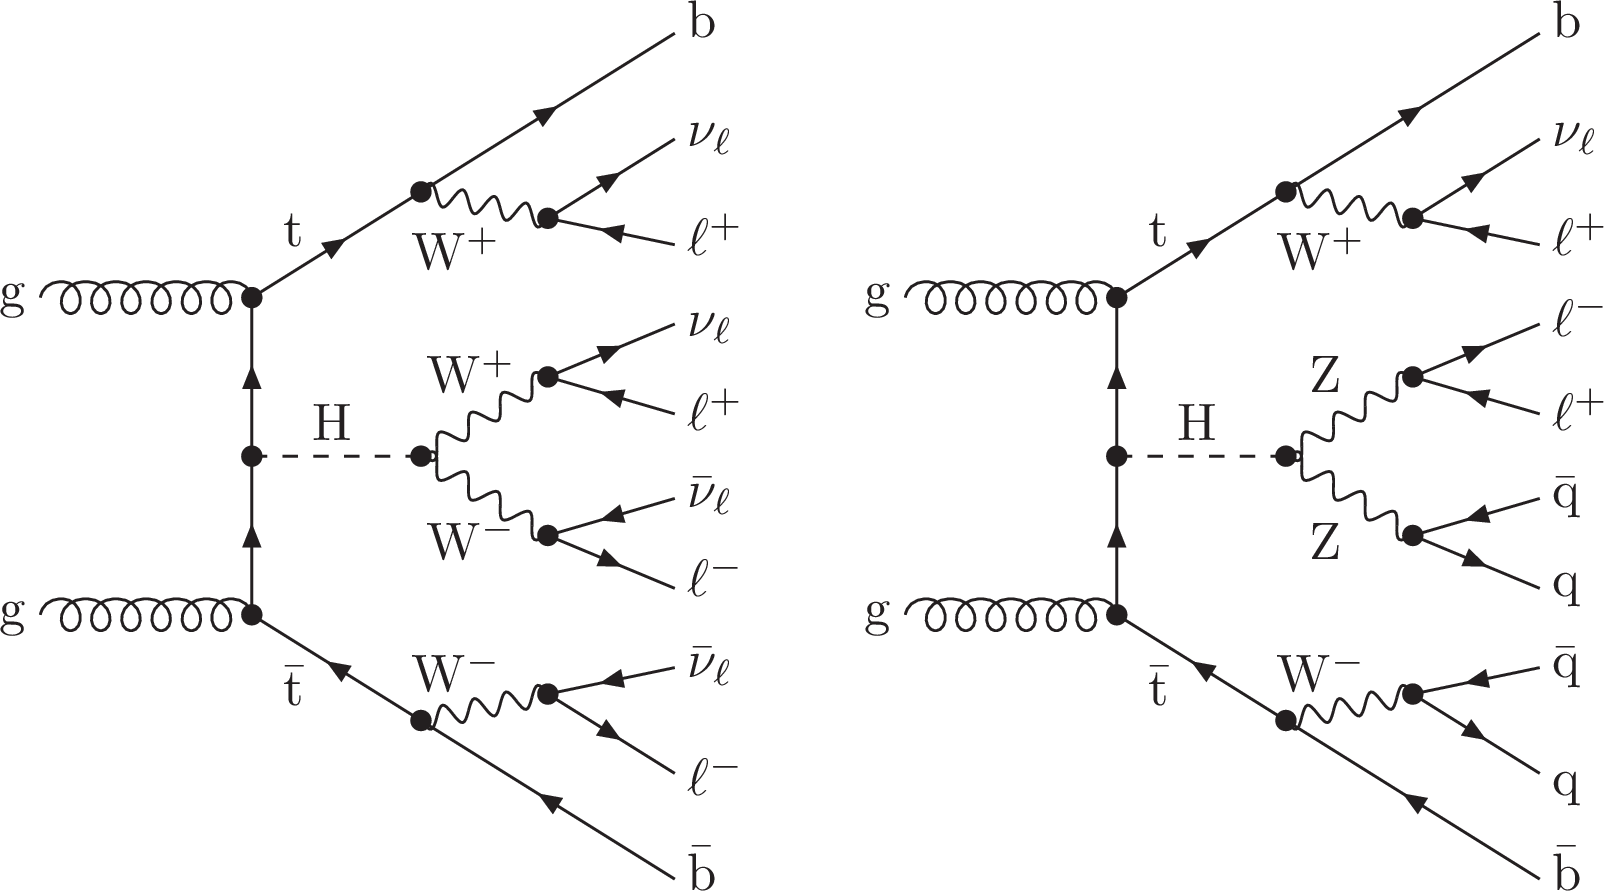
Figure 1:
Possible Feynman diagrams for $ {{\mathrm{ t } {}\mathrm{ \bar{t} } } \mathrm{ H } } $ production at the LHC, where the Higgs boson decays to $W\mathrm{ W } ^{*}$ (left) or ${\mathrm{ Z } } {\mathrm{ Z } } ^{*}$ (right). Subsequent W and Z decays are shown by representing examples of leptonic final states. |
png pdf |
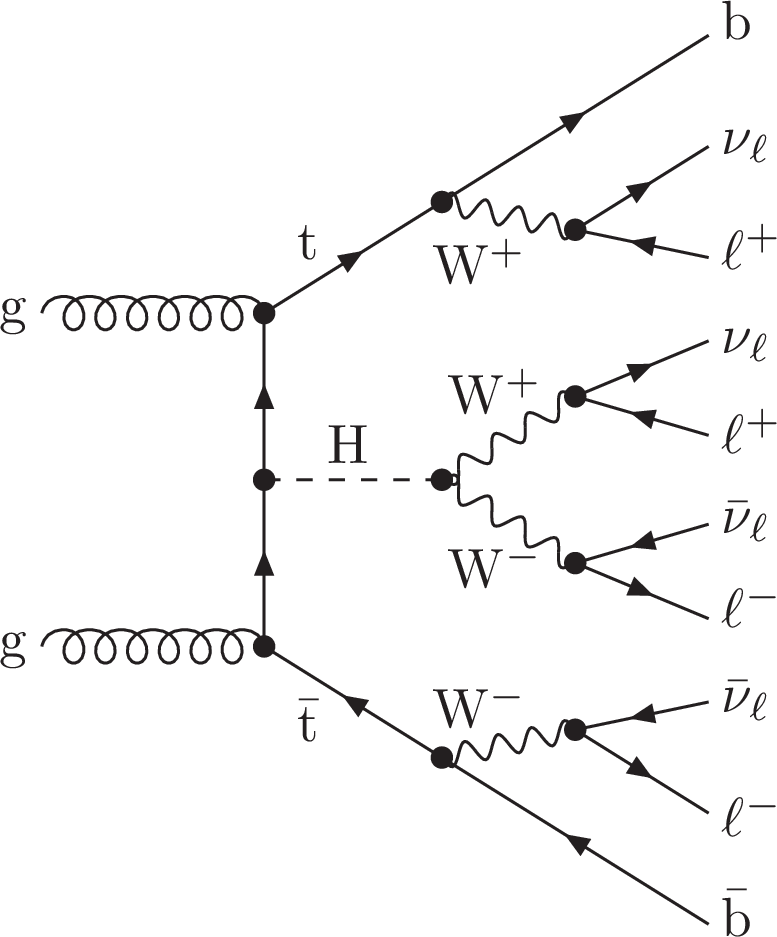
Figure 1-a:
Feynman diagram for $ {{\mathrm{ t } {}\mathrm{ \bar{t} } } \mathrm{ H } } $ production at the LHC, where the Higgs boson decays to $W\mathrm{ W } ^{*}$. Subsequent W and Z decays are shown by representing examples of leptonic final states. |
png pdf |
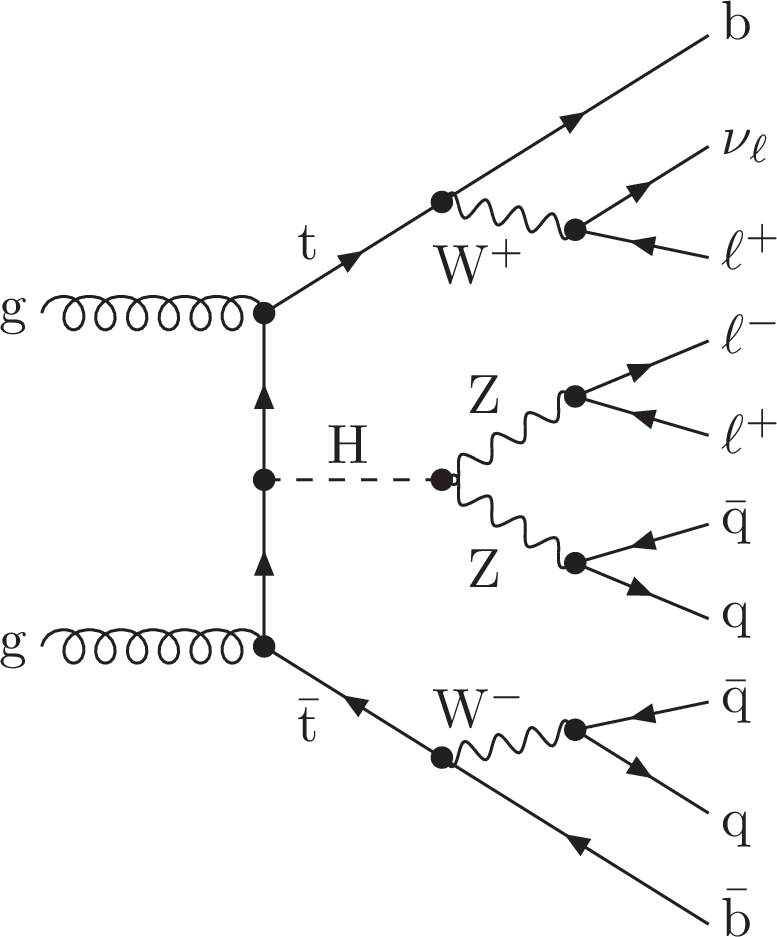
Figure 1-b:
Feynman diagram for $ {{\mathrm{ t } {}\mathrm{ \bar{t} } } \mathrm{ H } } $ production at the LHC, where the Higgs boson decays to ${\mathrm{ Z } } {\mathrm{ Z } } ^{*}$. Subsequent W and Z decays are shown by representing examples of leptonic final states. |
png pdf |
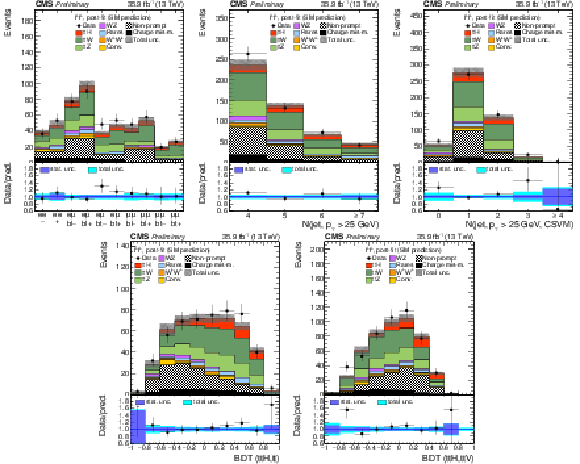
Figure 2:
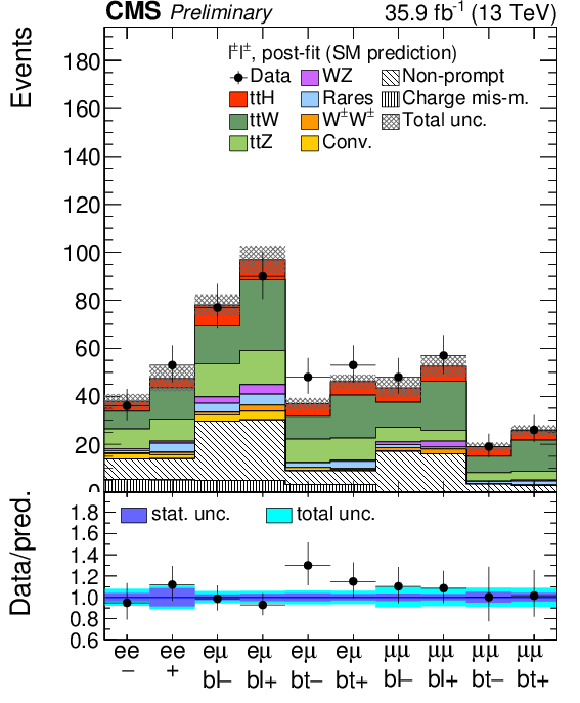
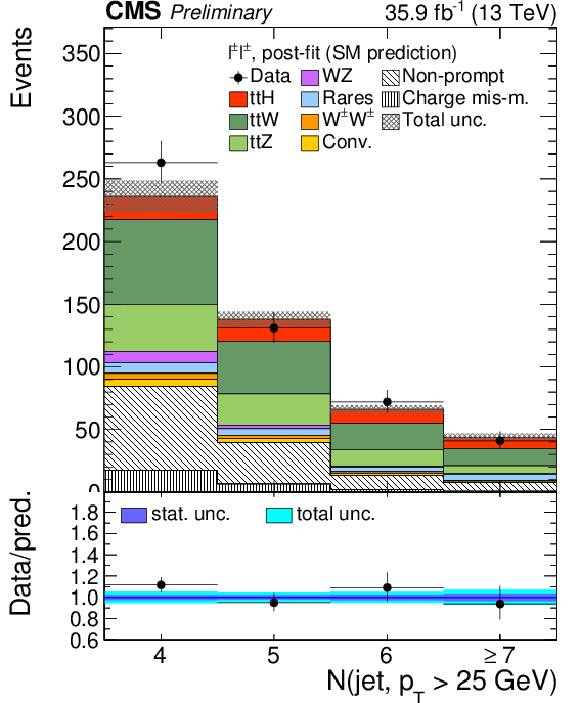
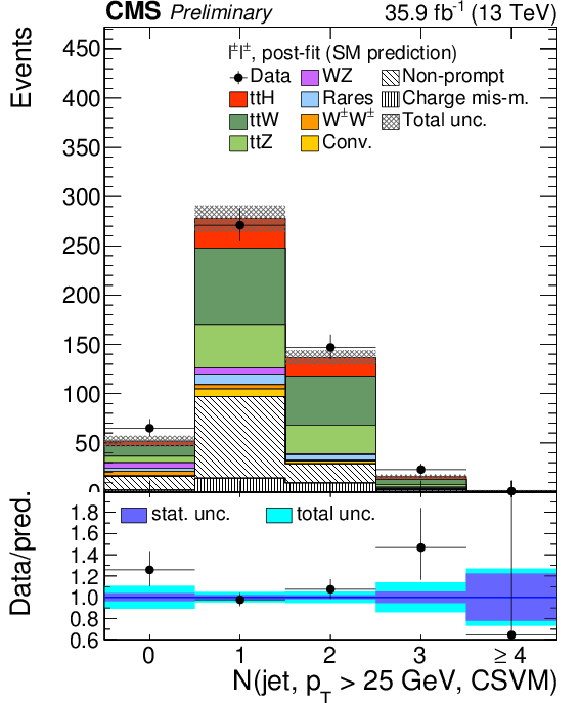
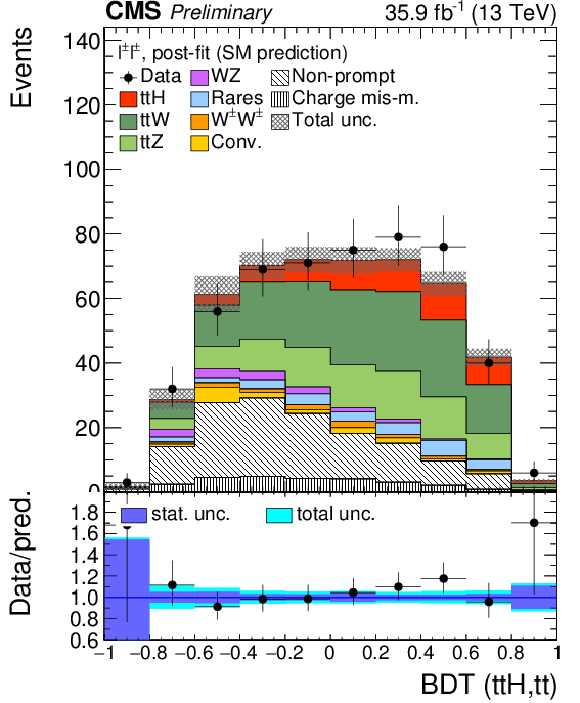
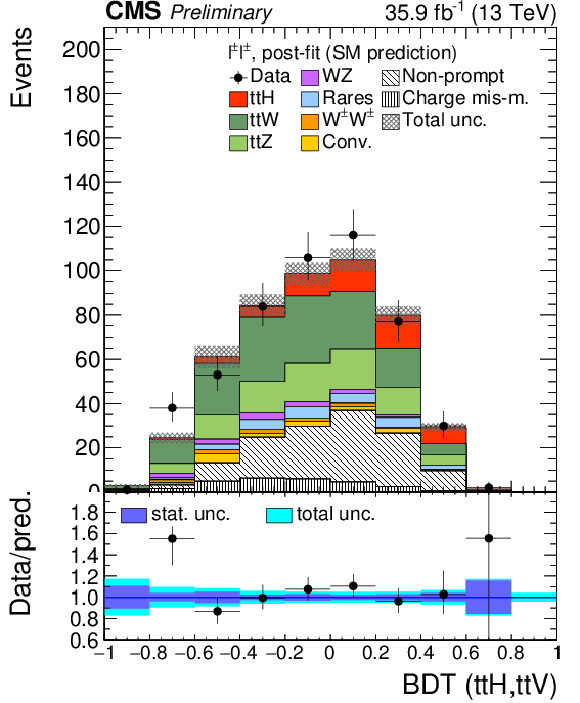
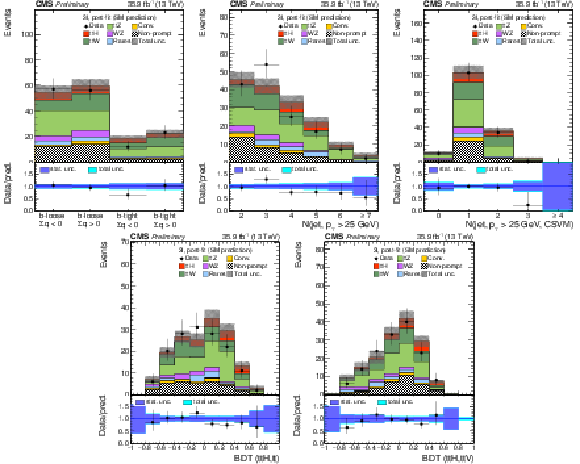
Same-sign dilepton channel; top row: distribution in the categories used for the fit, number of jets, number of jets passing the medium working point of the CSV tagger; bottom row: distributions of the BDT classifier outputs. The distributions are shown after the fit to the data, with all processes constrained to the SM expectation. |
png pdf |
Figure 2-a:
Same-sign dilepton channel; distribution in the categories used for the fit. The distributions are shown after the fit to the data, with all processes constrained to the SM expectation. |
png pdf |
Figure 2-b:
Same-sign dilepton channel; distribution in the number of jets. The distributions are shown after the fit to the data, with all processes constrained to the SM expectation. |
png pdf |
Figure 2-c:
Same-sign dilepton channel; distribution in the number of jets passing the medium working point of the CSV tagger. The distributions are shown after the fit to the data, with all processes constrained to the SM expectation. |
png pdf |
Figure 2-d:
Same-sign dilepton channel; distribution of the BDT (ttH,tt) classifier output. The distributions are shown after the fit to the data, with all processes constrained to the SM expectation. |
png pdf |
Figure 2-e:
Same-sign dilepton channel; distribution of the BDT (ttH,ttV) classifier output. The distributions are shown after the fit to the data, with all processes constrained to the SM expectation. |
png pdf |
Figure 3:
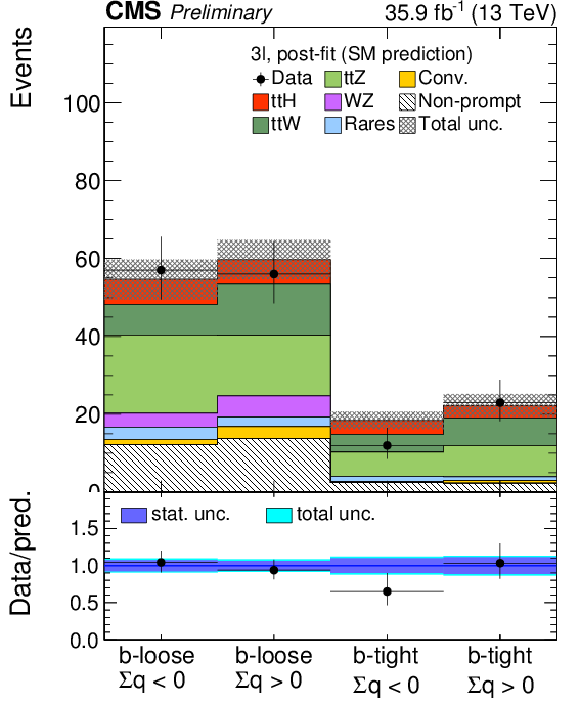
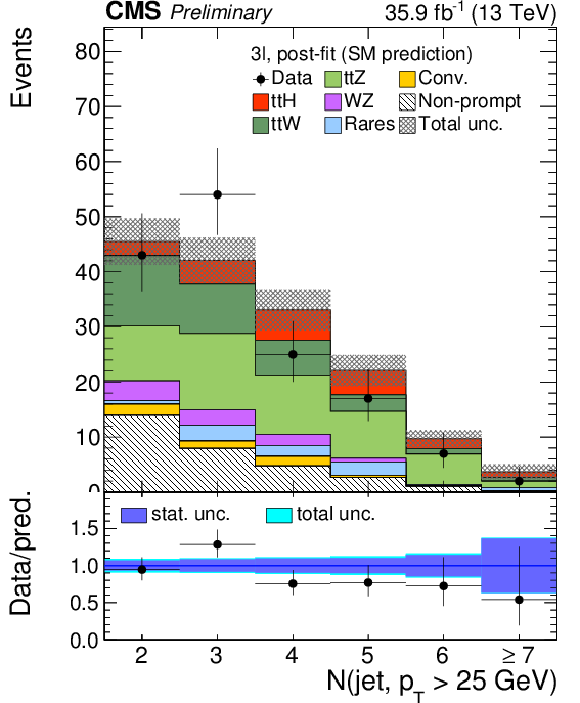
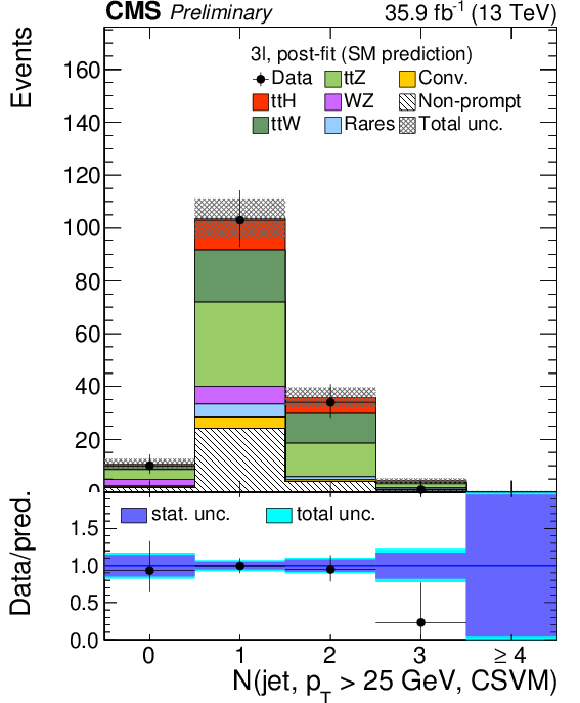
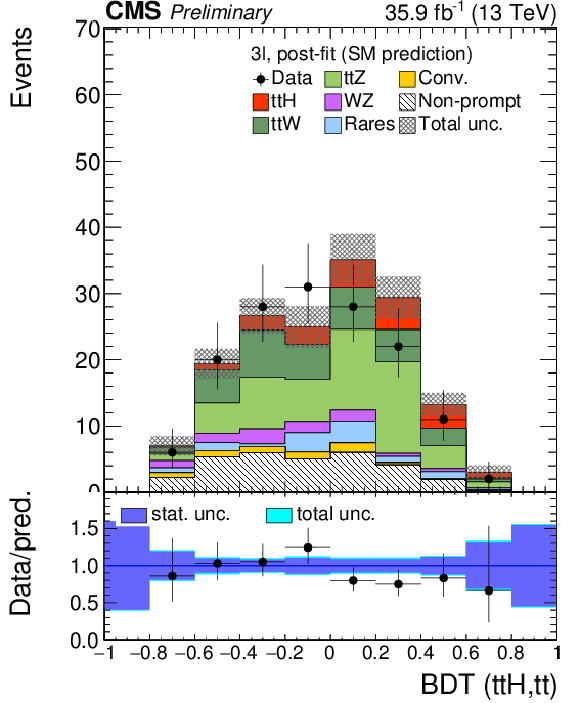
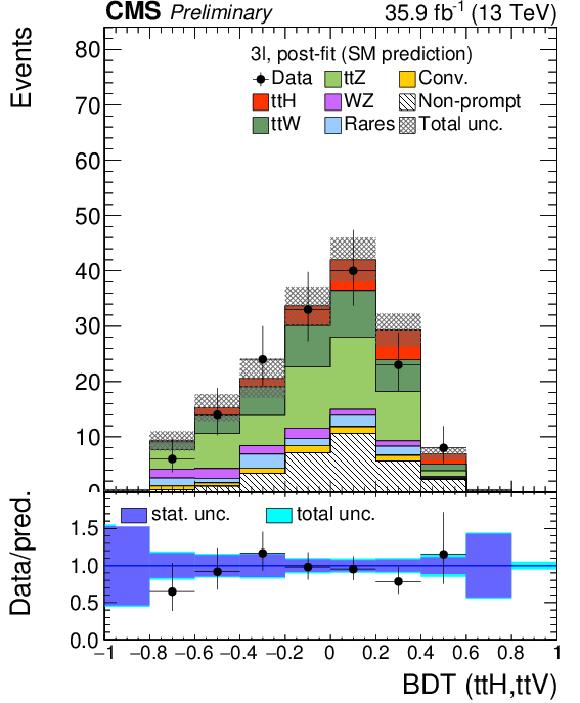
Three lepton channel; top row: distribution in the categories used for the fit, number of jets, number of jets passing the medium working point of the CSV tagger; bottom row: distributions of the BDT classifier outputs. The distributions are shown after the fit to the data, with all processes constrained to the SM expectation. |
png pdf |
Figure 3-a:
Three lepton channel; distribution in the categories used for the fit. The distributions are shown after the fit to the data, with all processes constrained to the SM expectation. |
png pdf |
Figure 3-b:
Three lepton channel; distribution in the number of jets. The distributions are shown after the fit to the data, with all processes constrained to the SM expectation. |
png pdf |
Figure 3-c:
Three lepton channel; distribution in the number of jets passing the medium working point of the CSV tagger. The distributions are shown after the fit to the data, with all processes constrained to the SM expectation. |
png pdf |
Figure 3-d:
Three lepton channel; distribution of the BDT (ttH,tt) classifier output. The distributions are shown after the fit to the data, with all processes constrained to the SM expectation. |
png pdf |
Figure 3-e:
Three lepton channel; distribution of the BDT (ttH,ttV) classifier output. The distributions are shown after the fit to the data, with all processes constrained to the SM expectation. |
png pdf |
Figure 4:
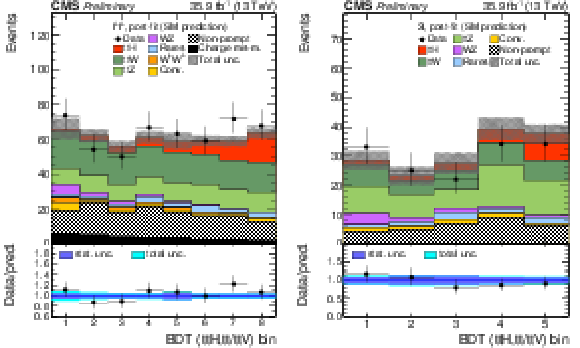
Combination of the BDT classifier outputs in the bins used for signal extraction, for the same-sign dilepton (left) and three-lepton (right) channels. The distributions are shown after the fit to the data, with all processes constrained to the SM expectation. |
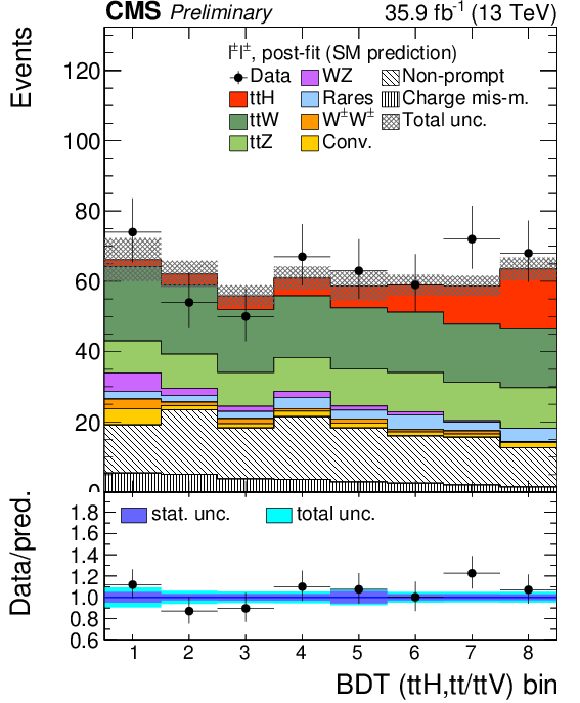
png pdf |
Figure 4-a:
Combination of the BDT classifier outputs in the bins used for signal extraction, for the same-sign dilepton channel. The distributions are shown after the fit to the data, with all processes constrained to the SM expectation. |
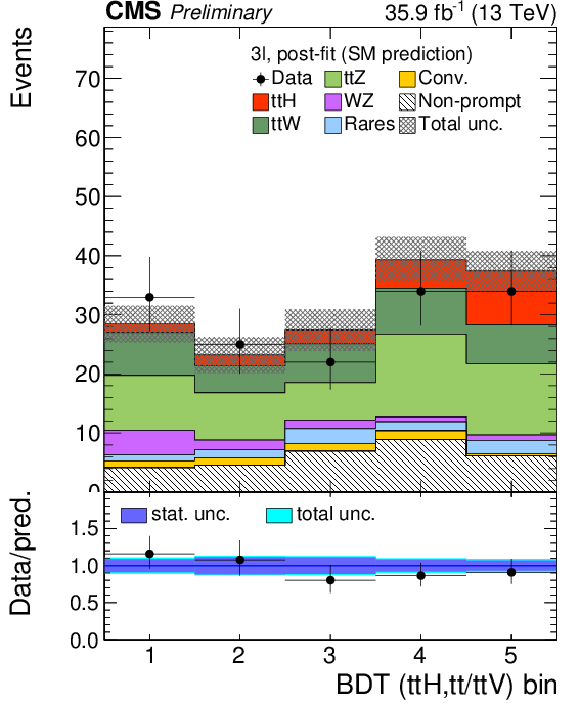
png pdf |
Figure 4-b:
Combination of the BDT classifier outputs in the bins used for signal extraction, for the three-lepton channel. The distributions are shown after the fit to the data, with all processes constrained to the SM expectation. |
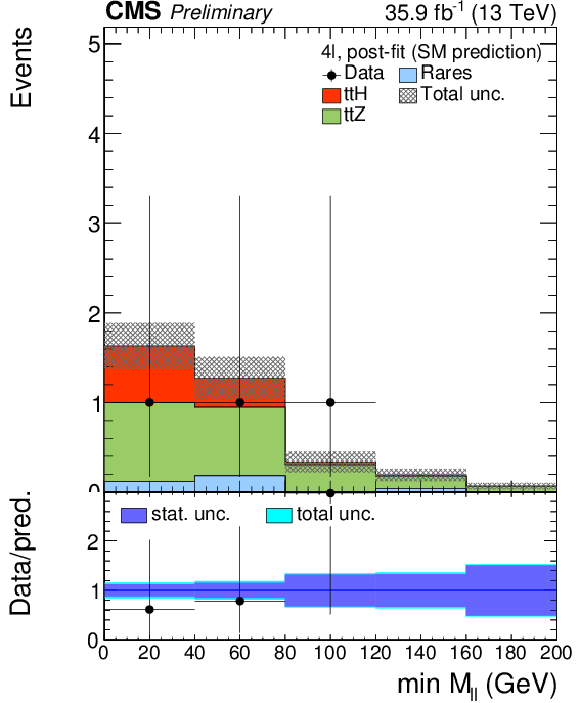
png pdf |
Figure 5:
Minimum mass of opposite-sign (OS) lepton pairs in the 4L category, without any selection on lepton flavor (all-flavor, AF). The distribution is shown after the fit to the data, with all processes constrained to the SM expectation. |
| Tables | |
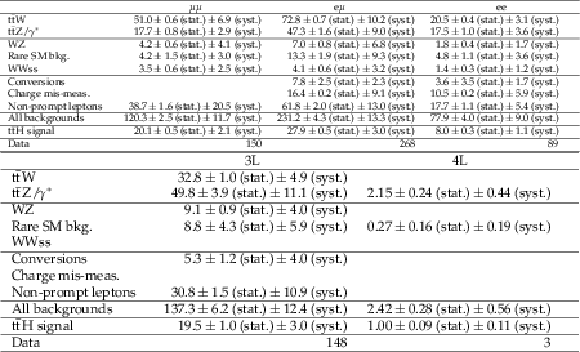
png pdf |
Table 1:
Yields for expected signal and background processes, and observed yields in data, for the 2LSS (top), 3L and 4l (bottom) channels. The predictions for the non-prompt lepton and charge mis-measurement contributions are extracted from data. Yields are shown after a fit to data, with all processes constrained to the SM expectation. |

png pdf |
Table 2:
Asymptotic 95% CL upper limits on $\mu $ under the background-only hypothesis. |

png pdf |
Table 3:
Best fit of the signal strength parameter. |
| Summary |
| A search for the production of a SM Higgs boson in association with a top anti-top quark pair has been presented. The analysis is based on pp collision data collected by the CMS experiment in 2016, and corresponding to an integrated luminosity of 35.9 fb$^{-1}$. We target events where the Higgs boson decays to $\mathrm{WW}^{*}$, $\mathrm{ZZ}^{*}$ or $\tau\tau$ by requiring with two same-sign leptons or at least three leptons in the final state. Results are combined with those obtained from the 2015 dataset. The observed (expected) best fit ${\mathrm{ t \bar{t} }\mathrm{ H }} $ yield is 1.5$_{-0.5}^{+0.5}$ (1.0$_{-0.4}^{+0.5}$) times the SM prediction, corresponding to a significance of 3.3$\sigma$ (2.5$\sigma$). |
| Additional Figures | |
png pdf |
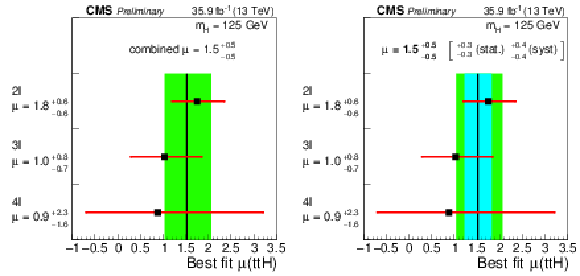
Additional Figure 1:
Best fit signal strength for the 2016 analysis alone in different analysis channels (a) and with statistical and systematic uncertainties separately displayed (b). |
png pdf |
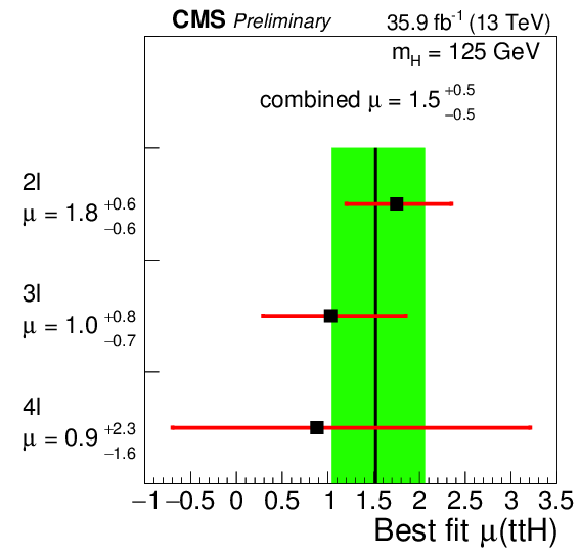
Additional Figure 1-a:
Best fit signal strength for the 2016 analysis alone in different analysis channels. |
png pdf |
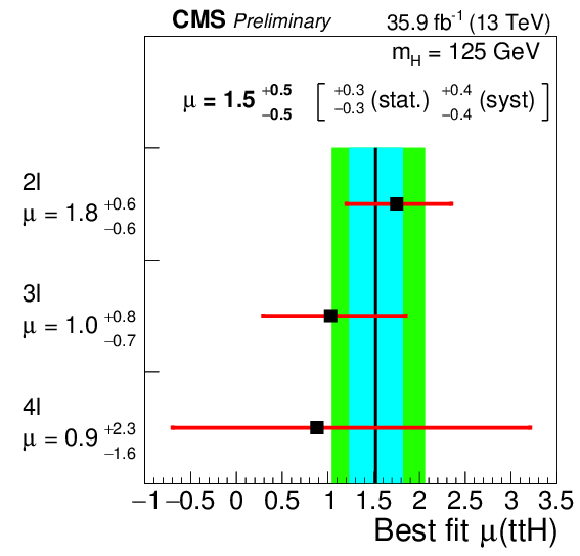
Additional Figure 1-b:
Best fit signal strength for the 2016 analysis alone in different analysis channels, with statistical and systematic uncertainties separately displayed. |
png pdf |
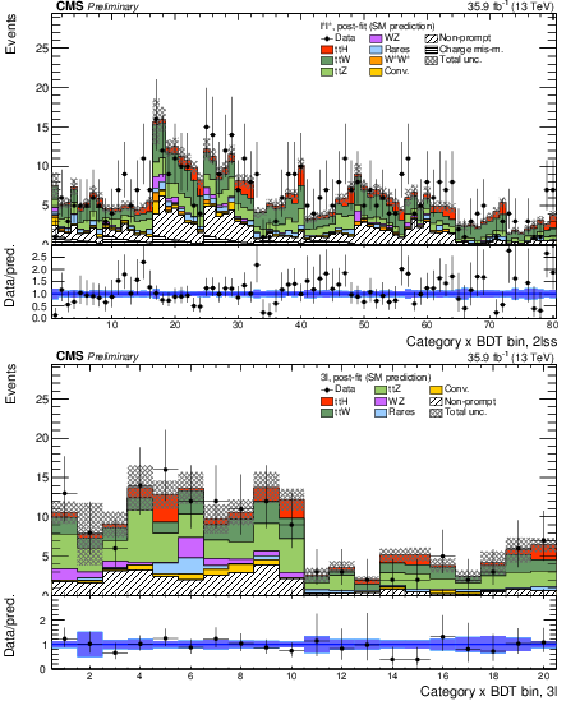
Additional Figure 2:
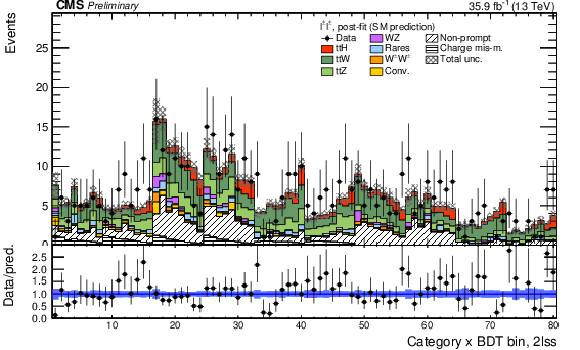
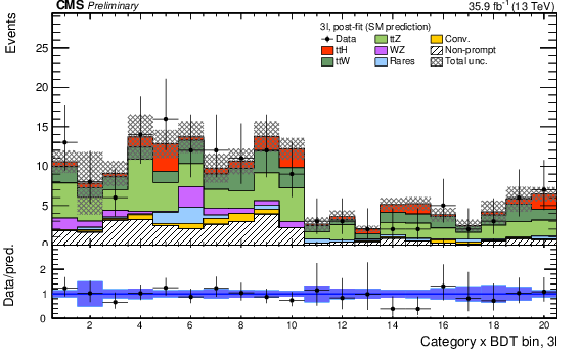
Event yields in the bins used for the signal extraction fit in the 2LSS and 3L channels. Each block of 8 bins in 2LSS, 5 bins in 3L corresponds to an analysis category, with the same ordering as in the figures presented in the PAS. The distributions are shown after the fit to the data, with all processes constrained to the SM expectation. |
png pdf |
Additional Figure 2-a:
Event yields in the bins used for the signal extraction fit in the 2LSS channel. Each block of 8 bins corresponds to an analysis category, with the same ordering as in the figures presented in the PAS. The distributions are shown after the fit to the data, with all processes constrained to the SM expectation. |
png pdf |
Additional Figure 2-b:
Event yields in the bins used for the signal extraction fit in the 3L channel. Each block of 5 bins corresponds to an analysis category, with the same ordering as in the figures presented in the PAS. The distributions are shown after the fit to the data, with all processes constrained to the SM expectation. |
png pdf |
Additional Figure 3:
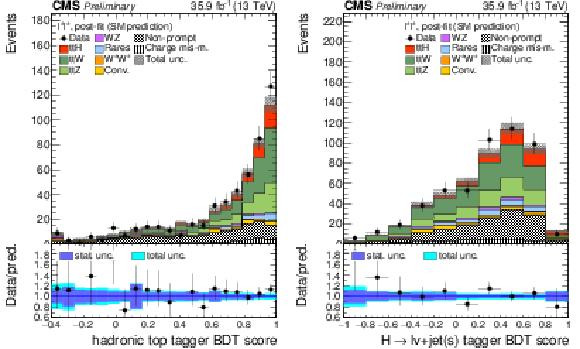
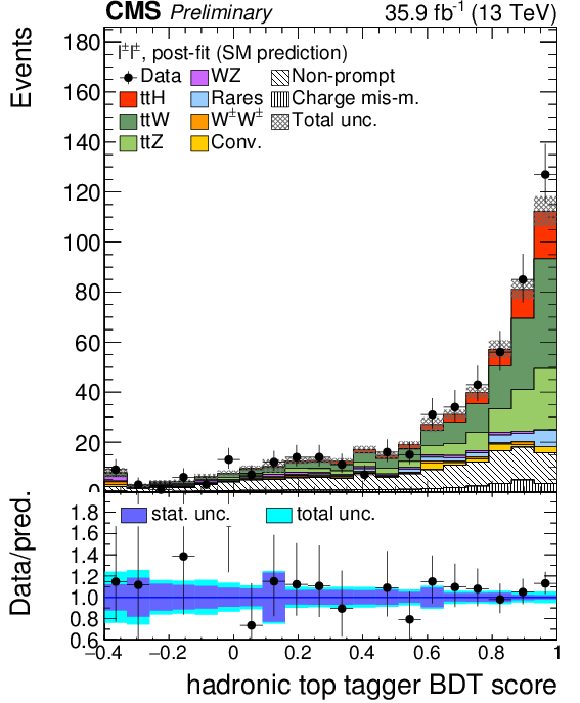
Distribution of the hadronic top and Higgs jet tagger BDT scores in the 2LSS channel. The distributions are shown after the fit to the data, with all processes constrained to the SM expectation. |
png pdf |
Additional Figure 3-a:
Distribution of the hadronic top tagger BDT score in the 2LSS channel. The distribution is shown after the fit to the data, with all processes constrained to the SM expectation. |

png pdf |
Additional Figure 3-b:
Distribution of the Higgs jet tagger BDT score in the 2LSS channel. The distribution is shown after the fit to the data, with all processes constrained to the SM expectation. |
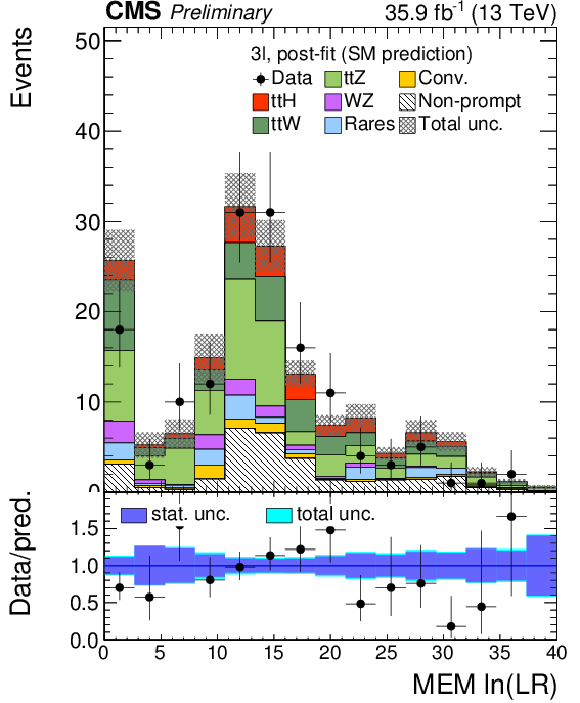
png pdf |
Additional Figure 4:
Distribution of the likelihood ratio of matrix element weights in the 3L channel. The distributions are shown after the fit to the data, with all processes constrained to the SM expectation. |
| References | ||||
| 1 | CMS Collaboration | Observation of a new boson at a mass of 125 GeV with the CMS experiment at the LHC | PLB716 (2012) 30--61 | CMS-HIG-12-028 1207.7235 |
| 2 | ATLAS Collaboration | Observation of a new particle in the search for the Standard Model Higgs boson with the ATLAS detector at the LHC | PLB716 (2012) 1--29 | 1207.7214 |
| 3 | ATLAS and CMS Collaborations | Combined Measurement of the Higgs Boson Mass in $ pp $ Collisions at $ \sqrt{s}= $ 7 and 8 TeV with the ATLAS and CMS Experiments | PRL 114 (2015) 191803 | 1503.07589 |
| 4 | ATLAS Collaboration | Measurements of the Higgs boson production and decay rates and coupling strengths using pp collision data at $ \sqrt{s}= $ 7 and 8 TeV in the ATLAS experiment | EPJC76 (2016), no. 1, 6 | 1507.04548 |
| 5 | CMS Collaboration | Precise determination of the mass of the Higgs boson and tests of compatibility of its couplings with the standard model predictions using proton collisions at 7 and 8 TeV | EPJC75 (2015), no. 5, 212 | CMS-HIG-14-009 1412.8662 |
| 6 | ATLAS and CMS Collaborations | Measurements of the Higgs boson production and decay rates and constraints on its couplings from a combined ATLAS and CMS analysis of the LHC pp collision data at $ \sqrt{s} $ = 7 and 8 TeV | ATLAS-CONF-2015-044, CMS-PAS-HIG-15-002 | |
| 7 | CMS Collaboration | Search for the associated production of the Higgs boson with a top-quark pair | JHEP 09 (2014) 087, , [Erratum: JHEP10,106(2014)] | CMS-HIG-13-029 1408.1682 |
| 8 | ATLAS Collaboration | Search for $ \text{H} \to \gamma\gamma $ produced in association with top quarks and constraints on the Yukawa coupling between the top quark and the Higgs boson using data taken at 7 TeV and 8 TeV with the ATLAS detector | PLB740 (2015) 222--242 | 1409.3122 |
| 9 | ATLAS Collaboration | Search for the Standard Model Higgs boson produced in association with top quarks and decaying into $ b\bar{b} $ in pp collisions at $ \sqrt{s} $ = 8 TeV with the ATLAS detector | EPJC75 (2015), no. 7, 349 | 1503.05066 |
| 10 | ATLAS Collaboration | Search for the associated production of the Higgs boson with a top quark pair in multilepton final states with the ATLAS detector | PLB749 (2015) 519--541 | 1506.05988 |
| 11 | CMS Collaboration | Search for associated production of Higgs bosons and top quarks in multilepton final states at $ \sqrt{s} = $ 13 TeV | CMS-PAS-HIG-16-022 | CMS-PAS-HIG-16-022 |
| 12 | CMS Collaboration | Particle-Flow Event Reconstruction in CMS and Performance for Jets, Taus, and MET | CDS | |
| 13 | CMS Collaboration | Commissioning of the Particle--Flow reconstruction in Minimum--Bias and Jet Events from $ pp $ Collisions at 7 TeV | CDS | |
| 14 | M. Cacciari, G. P. Salam, and G. Soyez | FastJet User Manual | EPJC72 (2012) 1896 | 1111.6097 |
| 15 | M. Cacciari and G. P. Salam | Dispelling the $ N^{3} $ myth for the $ k_t $ jet-finder | PLB641 (2006) 57--61 | hep-ph/0512210 |
| 16 | CMS Collaboration | Determination of Jet Energy Calibration and Transverse Momentum Resolution in CMS | JINST 6 (2011) P11002 | CMS-JME-10-011 1107.4277 |
| 17 | CMS Collaboration | Identification of b-quark jets with the CMS experiment | JINST 8 (2013) P04013 | CMS-BTV-12-001 1211.4462 |
| 18 | CMS Collaboration | Identification of b quark jets at the CMS Experiment in the LHC Run 2 | CMS-PAS-BTV-15-001 | CMS-PAS-BTV-15-001 |
| 19 | CMS Collaboration | Performance of CMS muon reconstruction in pp collision events at $ \sqrt{s} $ = 7 TeV | JINST 7 (2012) P10002 | CMS-MUO-10-004 1206.4071 |
| 20 | CMS Collaboration | Performance of Electron Reconstruction and Selection with the CMS Detector in Proton-Proton Collisions at $ \sqrt{s} $ = 8 TeV | JINST 10 (2015), no. 06, P06005 | CMS-EGM-13-001 1502.02701 |
| 21 | CMS Collaboration | Reconstruction and identification of $ \tau $ lepton decays to hadrons and $ \nu_\tau $ at CMS | JINST 11 (2016), no. 01, P01019 | CMS-TAU-14-001 1510.07488 |
| 22 | B. P. Roe et al. | Boosted decision trees as an alternative to artificial neural networks for particle identification | NIMA 543 (2005) 577 | 0408124 |
| 23 | K. Rehermann and B. Tweedie | Efficient Identification of Boosted Semileptonic Top Quarks at the LHC | JHEP 03 (2011) 059 | 1007.2221 |
| 24 | CMS Collaboration | Search for new physics in same-sign dilepton events in proton-proton collisions at $ \sqrt{s} = $ 13 TeV | EPJC76 (2016), no. 8, 439 | CMS-SUS-15-008 1605.03171 |
| 25 | A. Hoecker et al. | TMVA - Toolkit for Multivariate Data Analysis | PoS ACAT 040 (2007) | physics/0703039 |
| 26 | NNPDF Collaboration | Parton distributions for the LHC Run II | JHEP 04 (2015) 040 | 1410.8849 |
| 27 | J. Alwall et al. | The automated computation of tree-level and next-to-leading order differential cross sections, and their matching to parton shower simulations | JHEP 07 (2014) 079 | 1405.0301 |
| 28 | J. MacQueen | Some methods for classification and analysis of multivariate observations | in Proceedings of the Fifth Berkeley Symposium on Mathematical Statistics and Probability, Volume 1: Statistics, Berkeley | |
| 29 | P. Nason | A New method for combining NLO QCD with shower Monte Carlo algorithms | JHEP 11 (2004) 040 | hep-ph/0409146 |
| 30 | S. Frixione, P. Nason, and C. Oleari | Matching NLO QCD computations with Parton Shower simulations: the POWHEG method | JHEP 11 (2007) 070 | 0709.2092 |
| 31 | S. Alioli, P. Nason, C. Oleari, and E. Re | A general framework for implementing NLO calculations in shower Monte Carlo programs: the POWHEG BOX | JHEP 06 (2010) 043 | 1002.2581 |
| 32 | E. Re | Single-top Wt-channel production matched with parton showers using the POWHEG method | EPJC71 (2011) 1547 | 1009.2450 |
| 33 | S. Alioli, P. Nason, C. Oleari, and E. Re | NLO single-top production matched with shower in POWHEG: s- and t-channel contributions | JHEP 09 (2009) 111 | 0907.4076 |
| 34 | T. Melia, P. Nason, R. Rontsch, and G. Zanderighi | $ \text{W}^{+}\text{W}^{-} $, WZ and ZZ production in the POWHEG BOX | JHEP 11 (2011) 078 | 1107.5051 |
| 35 | T. Sjöstrand et al. | An Introduction to PYTHIA 8.2 | CPC 191 (2015) 159--177 | 1410.3012 |
| 36 | J. Allison et al. | Geant4 developments and applications | IEEE Trans. Nucl. Sci. 53 (2006) 270 | |
| 37 | LHC Higgs Cross Section Working Group Collaboration | Handbook of LHC Higgs Cross Sections: 4. Deciphering the Nature of the Higgs Sector | 1610.07922 | |
| 38 | A. L. Read | Presentation of search results: The CL(s) technique | JPG28 (2002) 2693--2704 | |
| 39 | T. Junk | Confidence level computation for combining searches with small statistics | NIMA434 (1999) 435--443 | hep-ex/9902006 |
| 40 | G. Cowan, K. Cranmer, E. Gross, and O. Vitells | Asymptotic formulae for likelihood-based tests of new physics | EPJC71 (2011) 1554, , [Erratum: Eur. Phys. J.C73,2501(2013)] | 1007.1727 |
| 41 | ATLAS and CMS Collaborations, LHC Higgs Combination Group | Procedure for the LHC Higgs boson search combination in summer 2011 | CMS-NOTE-2011-005 | |
| 42 | CMS Collaboration | Search for ttH production in multilepton final states at $ \sqrt{s} = $ 13 TeV | CMS-PAS-HIG-15-008 | CMS-PAS-HIG-15-008 |

|
Compact Muon Solenoid LHC, CERN |

|

|

|

|

|

|