

Compact Muon Solenoid
LHC, CERN
| CMS-PAS-EXO-14-017 | ||
| Enhanced scope of a Phase 2 CMS detector for the study of exotic physics signatures at the HL-LHC | ||
| CMS Collaboration | ||
| August 2016 | ||
| Abstract: The high luminosity LHC (HL-LHC) run, which is due to start in 2025, is expected to collect an integrated luminosity of approximately 3000 fb$^{-1}$ at $\sqrt{s}= $ 14 TeV. The discovery and study of physics beyond the standard model will remain one of the major goals of the CMS collaboration during this period. Such physics can yield exotic signatures, whose observation places unusual demands on the performance and capabilities of the detector. For a few selected exotic physics models, we present studies of what can be achieved using CMS data during the HL-LHC run. We look at how this potential is influenced by the design of the upgraded CMS detector, as documented in the phase 2 technical proposal. This document provides supplementary material for a deeper level of understanding of these studies. In the case of a high mass resonance decaying to leptons, we explore the hypothesis that this is discovered prior to 2025, and examine what would be learned about the resonance's properties using the HL-LHC data. In the case of searches for long-lived exotic particles, we show that the discovery potential is influenced by the availability of dE/dx measurements from the tracker, the precision of time of flight measurements from the electromagnetic calorimeter, and the ability to trigger on displaced leptons. | ||
| Links: CDS record (PDF) ; inSPIRE record ; CADI line (restricted) ; | ||
| Figures | |
png pdf |
Figure 1:
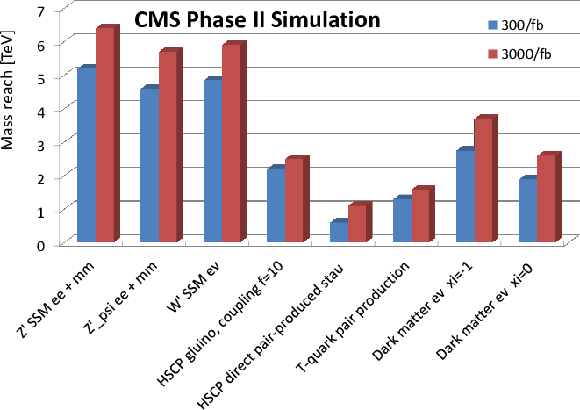
Projected performance of selected BSM searches with an upgraded CMS detector at the LHC (300 fb$^{-1}$) and HL-LHC (3000 fb$^{-1}$) [2]. The 5 sigma discovery reach in terms of particle mass is shown. Selected models include new resonances Z' and W' , heavy stable charged particles (HSCP) such as gluino or stau, and pair-produced T-quarks. The chosen dark matter monolepton channel allows to study potentially different couplings to up- and down-type quarks parametrized by $\xi $ (labelled xi in the plot). Shown is the reach in mediator mass. This plot is contained in the TP [1]. |
png pdf |
Figure 2-a:
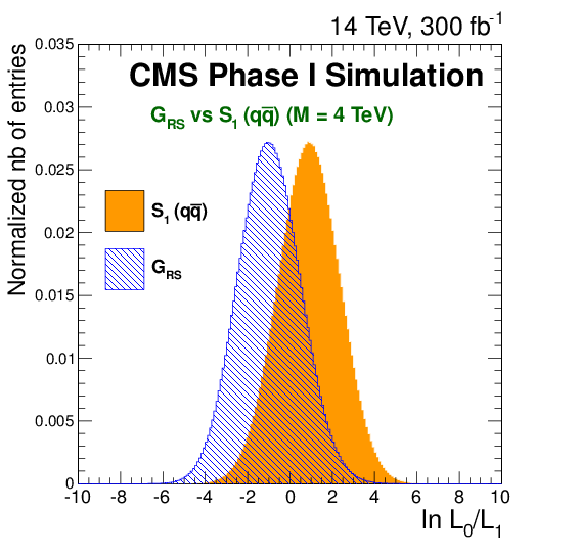
Likelihood ratio between two hypotheses (RS Graviton, $G_{RS}$, and a spin1, $S_1$, resonance) for a signal corresponding to a $G_{RS}$ at M = 4 TeV and for an integrated luminosity of 300 fb$^{-1}$ (a) and 3000 fb$^{-1}$ (b) collected at $\sqrt {s} =$ 14 TeV. The results use a 1D likelihood based on the dielectron angular distribution ($|\cos\theta _{CS_{meas}}|$) with 100 bins. These plots are contained in the TP [1]. |
png pdf |
Figure 2-b:
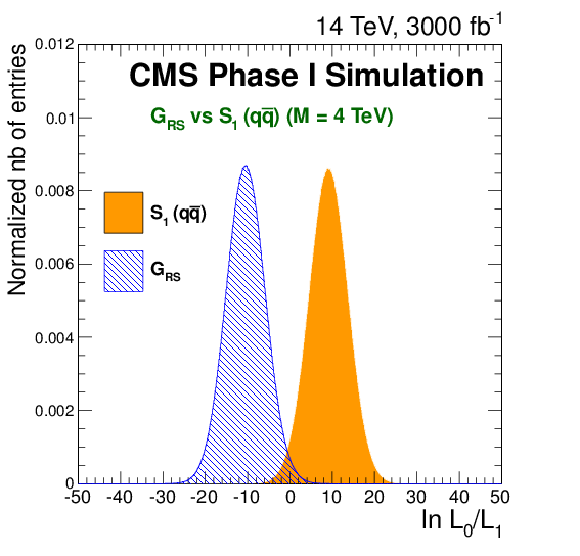
Likelihood ratio between two hypotheses (RS Graviton, $G_{RS}$, and a spin1, $S_1$, resonance) for a signal corresponding to a $G_{RS}$ at M = 4 TeV and for an integrated luminosity of 300 fb$^{-1}$ (a) and 3000 fb$^{-1}$ (b) collected at $\sqrt {s} =$ 14 TeV. The results use a 1D likelihood based on the dielectron angular distribution ($|\cos\theta _{CS_{meas}}|$) with 100 bins. These plots are contained in the TP [1]. |
png pdf |
Figure 3-a:
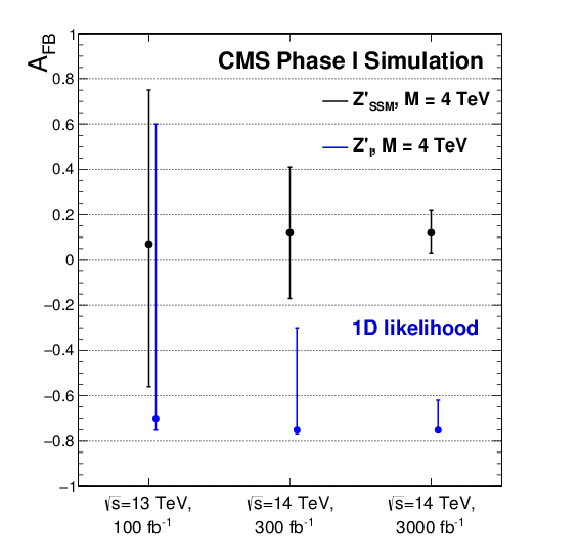
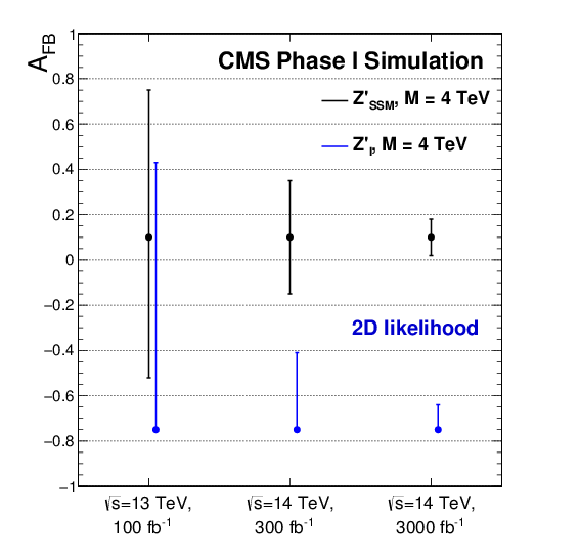
Expected measured value of the forward-backward asymmetry for a $\mathrm{Z}' _{SSM}$ spin1 resonance of M = 4 TeV in comparison to a $\mathrm{Z}' _I$ and their 68% confidence level interval for the center-of-mass energy and luminosity foreseen for the next data taking phases of the LHC. The dots indicate the most likely values obtained from the likelihood maximization. The results use a 1D likelihood based on the dielectron angular distribution ($\cos\theta $ distribution using 100 bins) (a) and a 2D likelihood ratio based on the dielectron angular distribution and dielectron pair rapidity ($\cos\theta $ distribution and $|y_{ee}|$ distribution using 20 x 5 bins) (b). |
png pdf |
Figure 3-b:
Expected measured value of the forward-backward asymmetry for a $\mathrm{Z}' _{SSM}$ spin1 resonance of M = 4 TeV in comparison to a $\mathrm{Z}' _I$ and their 68% confidence level interval for the center-of-mass energy and luminosity foreseen for the next data taking phases of the LHC. The dots indicate the most likely values obtained from the likelihood maximization. The results use a 1D likelihood based on the dielectron angular distribution ($\cos\theta $ distribution using 100 bins) (a) and a 2D likelihood ratio based on the dielectron angular distribution and dielectron pair rapidity ($\cos\theta $ distribution and $|y_{ee}|$ distribution using 20 x 5 bins) (b). |
png pdf |
Figure 4-a:
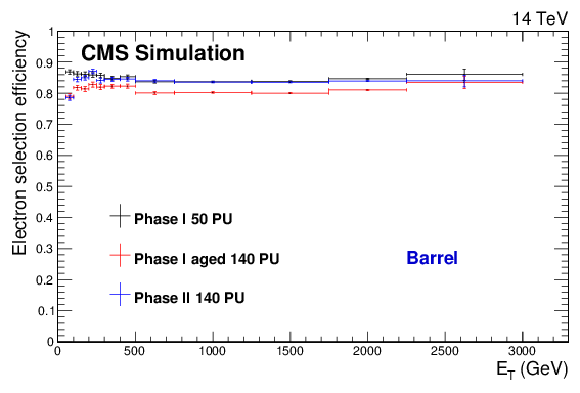
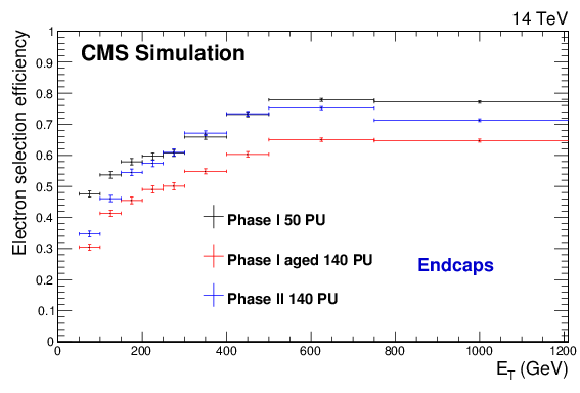
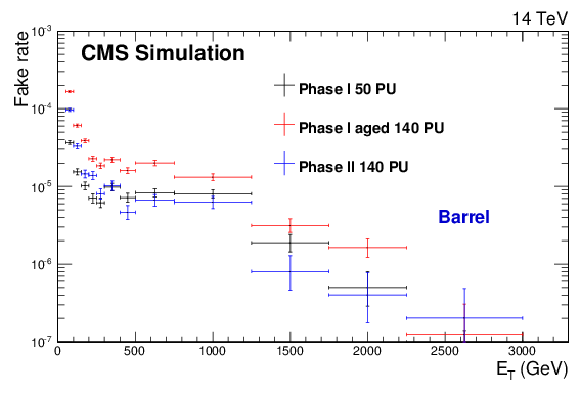
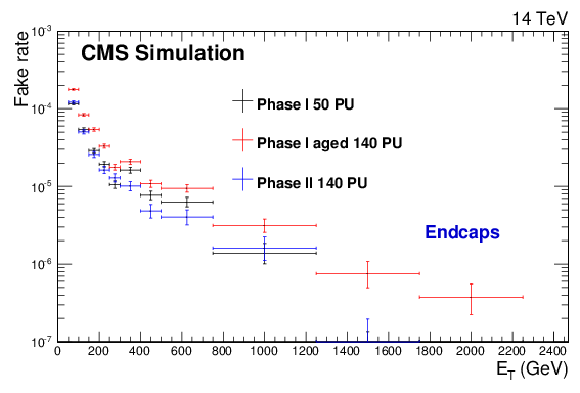
Total electron reconstruction and selection efficiencies from a $Z'_{SSM}\rightarrow \mathrm{ee} $ simulated sample (M = 4 TeV) (a,b) and fake rates from a QCD simulated sample (c,d) for the three detector scenarios described in the text. The results are shown separately for barrel (a,c) and endcaps (b,d) candidates. |
png pdf |
Figure 4-b:
Total electron reconstruction and selection efficiencies from a $Z'_{SSM}\rightarrow \mathrm{ee} $ simulated sample (M = 4 TeV) (a,b) and fake rates from a QCD simulated sample (c,d) for the three detector scenarios described in the text. The results are shown separately for barrel (a,c) and endcaps (b,d) candidates. |
png pdf |
Figure 4-c:
Total electron reconstruction and selection efficiencies from a $Z'_{SSM}\rightarrow \mathrm{ee} $ simulated sample (M = 4 TeV) (a,b) and fake rates from a QCD simulated sample (c,d) for the three detector scenarios described in the text. The results are shown separately for barrel (a,c) and endcaps (b,d) candidates. |
png pdf |
Figure 4-d:
Total electron reconstruction and selection efficiencies from a $Z'_{SSM}\rightarrow \mathrm{ee} $ simulated sample (M = 4 TeV) (a,b) and fake rates from a QCD simulated sample (c,d) for the three detector scenarios described in the text. The results are shown separately for barrel (a,c) and endcaps (b,d) candidates. |
png pdf |
Figure 5-a:
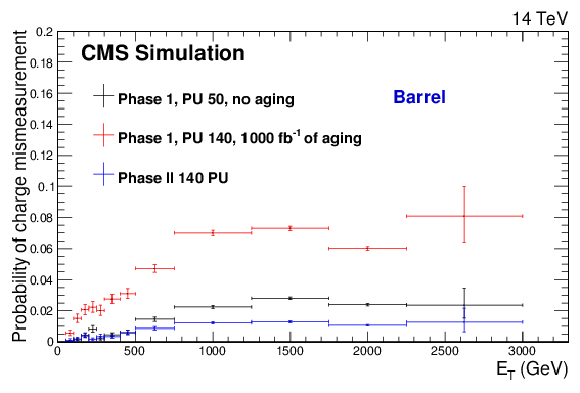
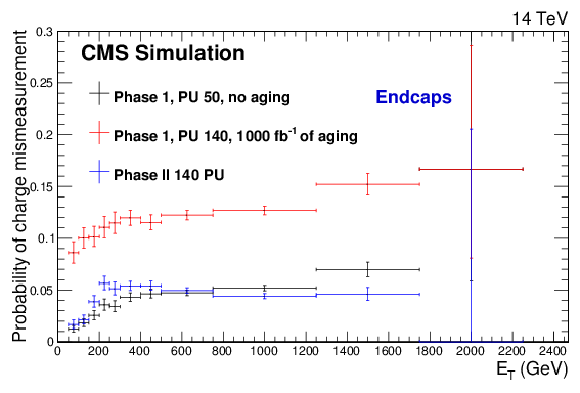
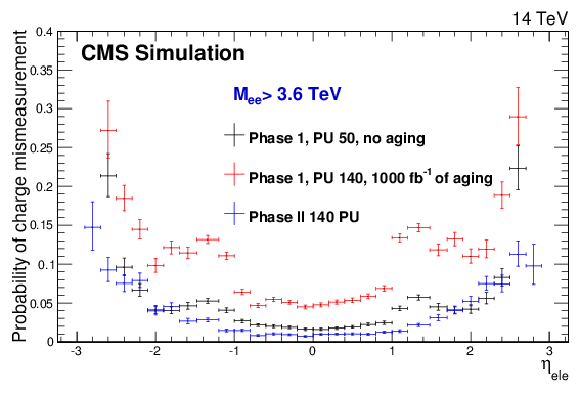
Electron charge mis-identification as a function of $E_{\mathrm{T}}$ in the barrel (a) and endcaps (b) and as a function of $\eta $ (c) for the three detector scenarios described in the text, from a $Z'_{SSM}\rightarrow \mathrm{ee}$ simulated sample (M=4 TeV). The bottom plot is contained in the TP [1]. |
png pdf |
Figure 5-b:
Electron charge mis-identification as a function of $E_{\mathrm{T}}$ in the barrel (a) and endcaps (b) and as a function of $\eta $ (c) for the three detector scenarios described in the text, from a $Z'_{SSM}\rightarrow \mathrm{ee}$ simulated sample (M=4 TeV). The bottom plot is contained in the TP [1]. |
png pdf |
Figure 5-c:
Electron charge mis-identification as a function of $E_{\mathrm{T}}$ in the barrel (a) and endcaps (b) and as a function of $\eta $ (c) for the three detector scenarios described in the text, from a $Z'_{SSM}\rightarrow \mathrm{ee}$ simulated sample (M=4 TeV). The bottom plot is contained in the TP [1]. |
png pdf |
Figure 6:
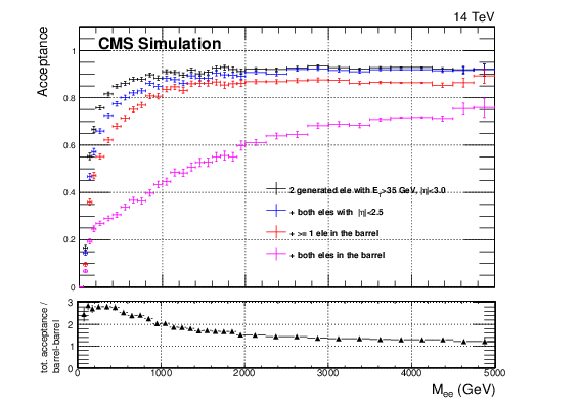
Acceptance (at generator level) for different detection scenarios as a function of the dielectron invariant mass. The run2 coverage is up to $|\eta |< $ 2.5 (blue points). With the upgraded detector, the tracker and calorimeter acceptance extends up to $|\eta |< $ 3.0 (black points). The worst case occurs if both electrons are required to be in the barrel region (purple points) which could become necessary if the forward calorimeters were not upgraded and hence become unusable during phase2 because of radiation damage. This plot is contained in the TP [1]. |
png pdf |
Figure 7-a:
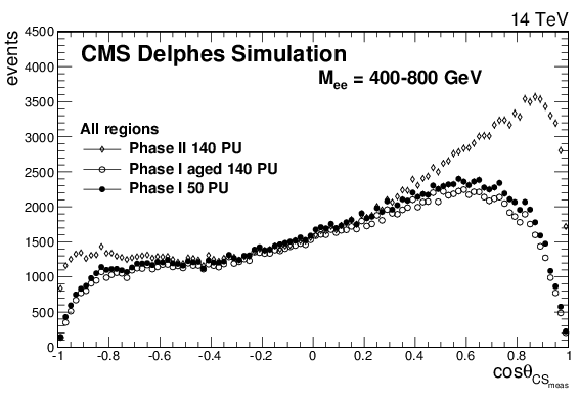
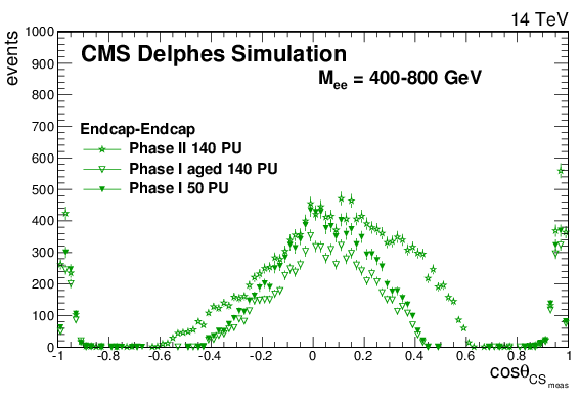
The $\cos\theta _{CS_{meas}}$ distributions for Drell-Yan events with a dielectron mass between 400 and 800 GeV for all events (top left), barrel-barrel events (top right), barrel-endcaps events (bottom left), and endcaps-endcaps events (bottom right). In this figure, the CMS detector is simulated using DELPHES. The upper left plot is contained in the TP [1]. |
png pdf |
Figure 7-b:
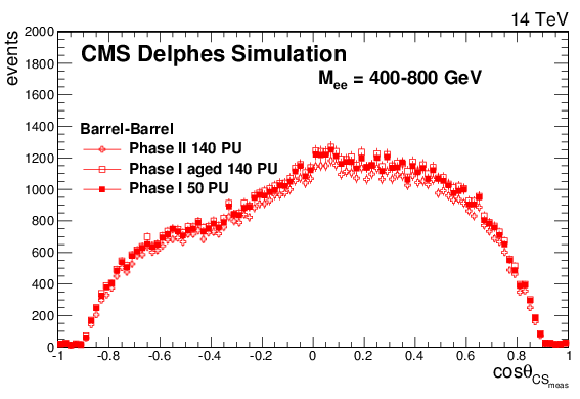
The $\cos\theta _{CS_{meas}}$ distributions for Drell-Yan events with a dielectron mass between 400 and 800 GeV for all events (top left), barrel-barrel events (top right), barrel-endcaps events (bottom left), and endcaps-endcaps events (bottom right). In this figure, the CMS detector is simulated using DELPHES. The upper left plot is contained in the TP [1]. |
png pdf |
Figure 7-c:
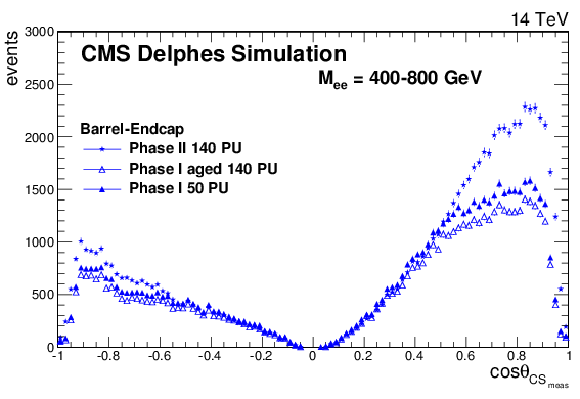
The $\cos\theta _{CS_{meas}}$ distributions for Drell-Yan events with a dielectron mass between 400 and 800 GeV for all events (top left), barrel-barrel events (top right), barrel-endcaps events (bottom left), and endcaps-endcaps events (bottom right). In this figure, the CMS detector is simulated using DELPHES. The upper left plot is contained in the TP [1]. |
png pdf |
Figure 7-d:
The $\cos\theta _{CS_{meas}}$ distributions for Drell-Yan events with a dielectron mass between 400 and 800 GeV for all events (top left), barrel-barrel events (top right), barrel-endcaps events (bottom left), and endcaps-endcaps events (bottom right). In this figure, the CMS detector is simulated using DELPHES. The upper left plot is contained in the TP [1]. |
png pdf |
Figure 8-a:
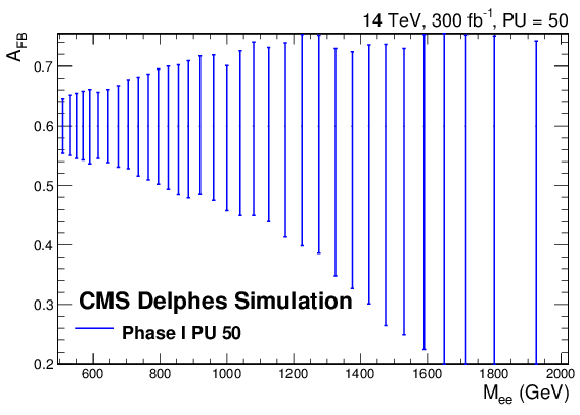
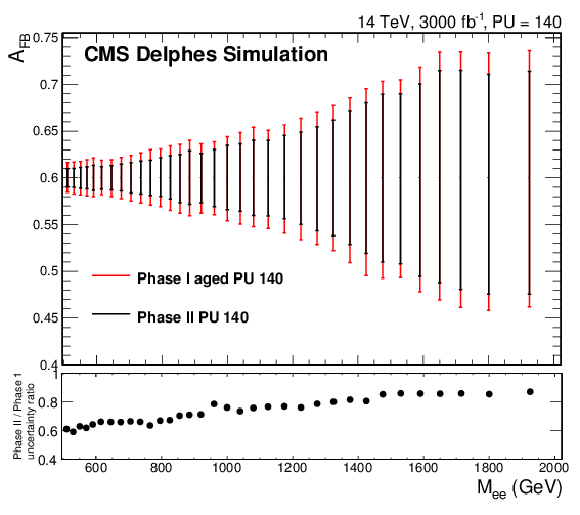
Precision of $A_{FB}$ measurement for Drell-Yan events as a function of the dielectron invariant mass for the phase 1 aged and the phase 2 scenarios. The right plot is contained in the TP [1]. |
png pdf |
Figure 8-b:
Precision of $A_{FB}$ measurement for Drell-Yan events as a function of the dielectron invariant mass for the phase 1 aged and the phase 2 scenarios. The right plot is contained in the TP [1]. |

png pdf |
Figure 9:
The Feynman diagrams for the production and decay of an SSM W' boson (left) and HNC-CI (right). |
png pdf |
Figure 10-a:
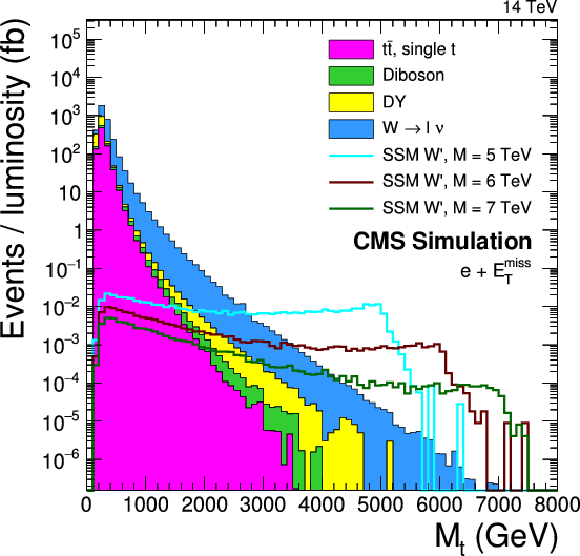
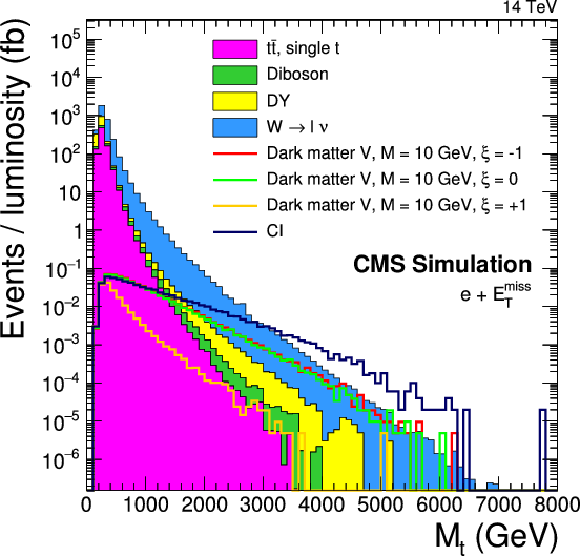
The transverse mass distribution ($M_{\mathrm{T}}$) at generator level for backgrounds and various W' signals (a), contact interaction and dark matter (b). Note the different shapes. Signals in the (a) graph are normalized to their theoretical cross sections at $\sqrt {s}=$ 14 TeV. For the signals in the (b) graph, the cross sections can scale with the model parameters while leaving the $M_{\mathrm{T}}$ shape unchanged. Therefore the signals are normalized to a fixed cross section of 1 fb. |
png pdf |
Figure 10-b:
The transverse mass distribution ($M_{\mathrm{T}}$) at generator level for backgrounds and various W' signals (a), contact interaction and dark matter (b). Note the different shapes. Signals in the (a) graph are normalized to their theoretical cross sections at $\sqrt {s}=$ 14 TeV. For the signals in the (b) graph, the cross sections can scale with the model parameters while leaving the $M_{\mathrm{T}}$ shape unchanged. Therefore the signals are normalized to a fixed cross section of 1 fb. |
png pdf |
Figure 11-a:
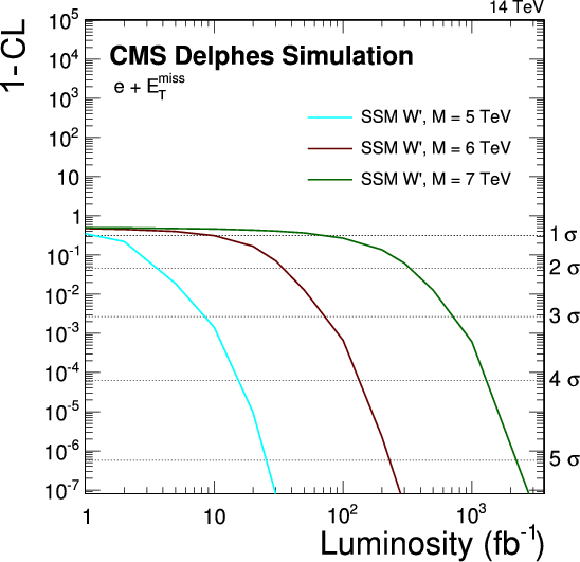
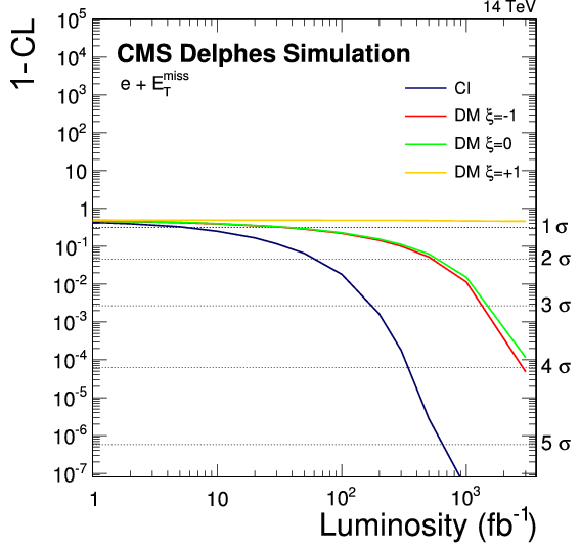
The discovery potential of different BSM models compared to the standard model as a function of the integrated luminosity. In the plot (a), three different W' signals are shown, which would exhibit a Jacobian peak which eases the discovery. The plot (b) summarizes signals with an unstructured excess, such as DM or CI. In both plots, the left-hand vertical axis measures the discovery potential in terms of confidence level (1-CL), while the right-hand axis measures it in standard deviations. |
png pdf |
Figure 11-b:
The discovery potential of different BSM models compared to the standard model as a function of the integrated luminosity. In the plot (a), three different W' signals are shown, which would exhibit a Jacobian peak which eases the discovery. The plot (b) summarizes signals with an unstructured excess, such as DM or CI. In both plots, the left-hand vertical axis measures the discovery potential in terms of confidence level (1-CL), while the right-hand axis measures it in standard deviations. |
png pdf |
Figure 12-a:
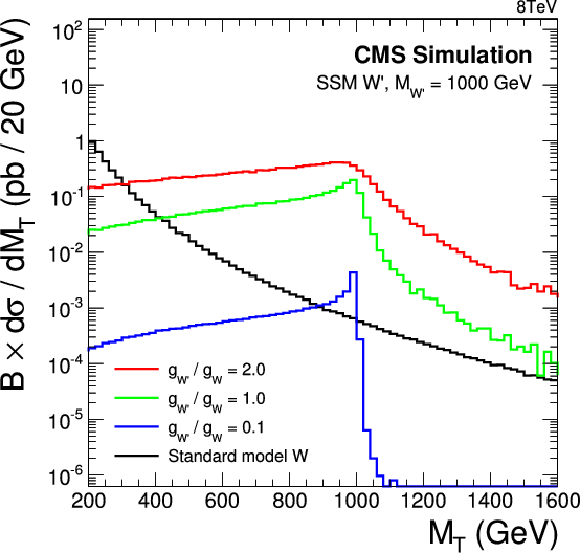
Transverse mass distributions for SSM W' with a mass of 1 TeV (a) and 6 TeV (b) for different coupling strengths. |
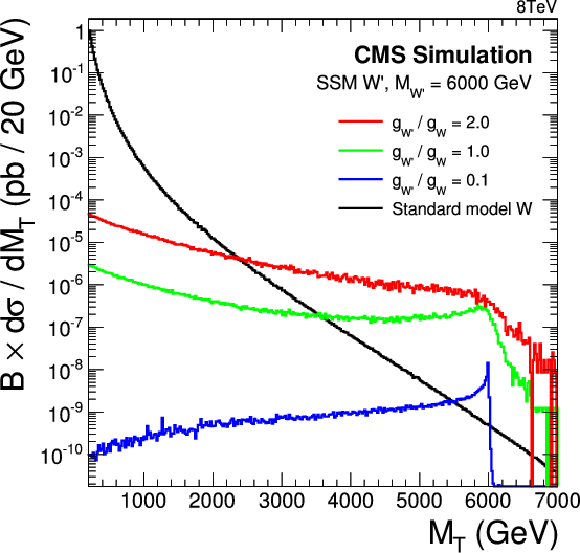
png pdf |
Figure 12-b:
Transverse mass distributions for SSM W' with a mass of 1 TeV (a) and 6 TeV (b) for different coupling strengths. |
png pdf |
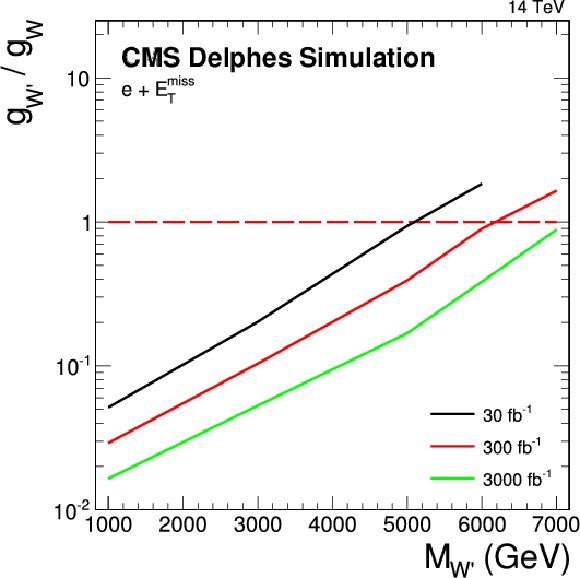
Figure 13:
Sensitivity reach for three benchmark integrated luminosities for a SSM W' with couplings $g_{\mathrm{W}' }/g_W < $ 1. The red dashed line corresponds to equal coupling strength where $g_{\mathrm{W}' } = g_W$. As a function of the resonance mass, high luminosities are necessary to reach low couplings of the order 0.1 to 0.01 for a five sigma discovery. |
png pdf |
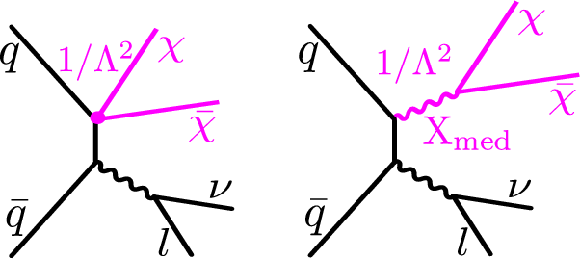
Figure 14:
Feynman diagrams for pair production of DM particles in association with a leptonically decaying W boson, as described by effective field theory (left) or through a simplified model describing the interaction with the exchange of a mediator $ {\text {X}_{\text {med}}} $ (right). |
png pdf |
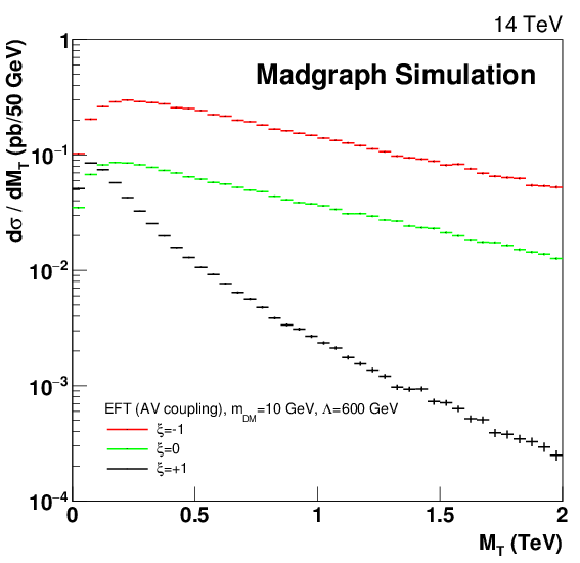
Figure 15:
$M_{\mathrm{T}}$ -dependent differential cross section for a DM signal with $ {m_{DM}} =$ 10 GeV (EFT) and different values of $\xi $. Constructive (destructive) interference yields highest (lowest) cross sections. |
png pdf |
Figure 16:
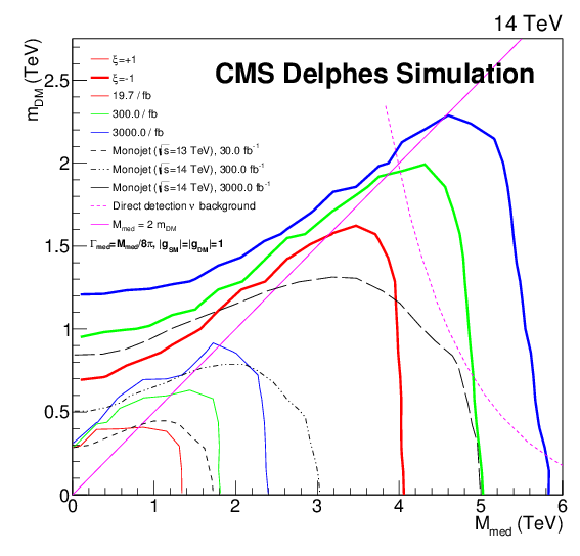
Production cross sections in the plane of ($ {M_{\text {med}}} , {m_{DM}} $) determined from a simplified model for axial-vector coupling for $\xi = \pm$ 1. The solid contours indicate projected 95% CL limits from mono-e analysis, compared to the projected 90% CL limits from mono-jet analysis results [20] marked as dotted contours. In both analyses the projected cross section limits have been calculated using a DELPHES simulation. Depicted in magenta are a line dividing on-shell and off-shell mediator production as well as the neutrino background also taken from [20], which is the irreducible background for direction-insensitive direct-detection experiments. |
png pdf |
Figure 17-a:
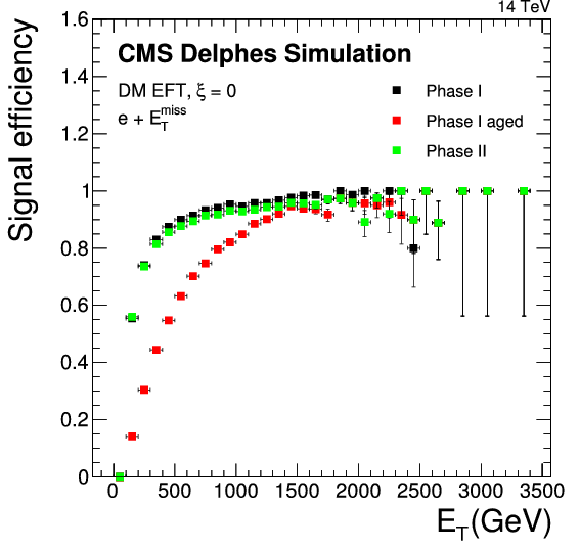
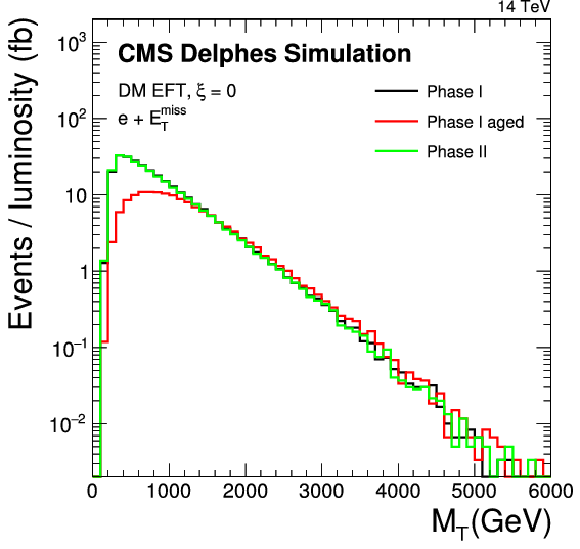
Detector performance for different scenarios including phase1 ``ageing'' effects imposed on the tracker and endcap calorimeters. a: Signal efficiency for a DM sample (EFT) with a mass of 10 GeV and no interference ($\xi =0$). b: $M_{\mathrm{T}}$ spectrum. These plots are contained in the Technical Proposal [1]. |
png pdf |
Figure 17-b:
Detector performance for different scenarios including phase1 ``ageing'' effects imposed on the tracker and endcap calorimeters. a: Signal efficiency for a DM sample (EFT) with a mass of 10 GeV and no interference ($\xi =0$). b: $M_{\mathrm{T}}$ spectrum. These plots are contained in the Technical Proposal [1]. |
png pdf |
Figure 18:
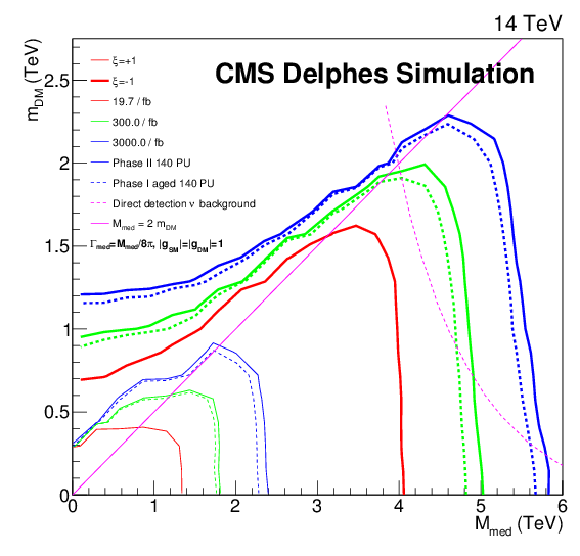
Production cross sections in the plane of $( {M_{\text {med}}} , {m_{DM}} )$ determined from a simplified model for axial-vector coupling for $\xi = \pm$ 1 . Contours indicate projected 95% CL limits from mono-e analysis, of which solid contours represent phase2 conditions and dashed contours indicate phase1 ``aged'' conditions. Depicted in magenta are a line dividing on-shell and off-shell mediator production as well as the neutrino background taken from [20], which is the irreducible background for direction-insensitive direct-detection experiments. An earlier version of the plot is contained in the Technical Proposal [1]. |
png pdf |
Figure 19-a:
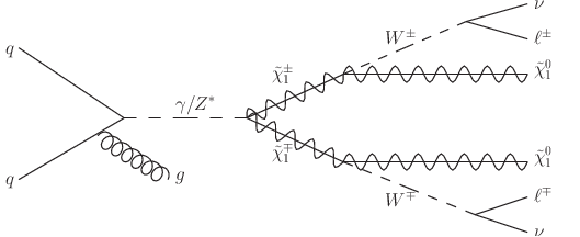
Higgsino signatures leading to $\geq $2 leptons (with $\ell = \mathrm{e}$, $\mu $) and ${E_{\mathrm {T}}^{\text {miss}}}$ (from neutrinos and neutralinos), sometimes accompanied by an ISR jet. |
png pdf |
Figure 19-b:
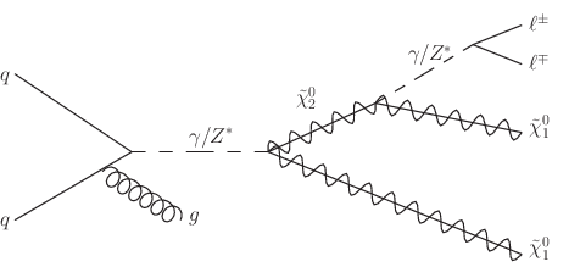
Higgsino signatures leading to $\geq $2 leptons (with $\ell = \mathrm{e}$, $\mu $) and ${E_{\mathrm {T}}^{\text {miss}}}$ (from neutrinos and neutralinos), sometimes accompanied by an ISR jet. |
png pdf |
Figure 19-c:
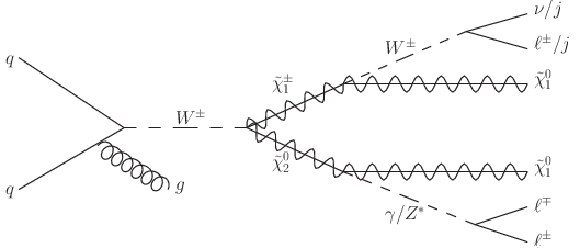
Higgsino signatures leading to $\geq $2 leptons (with $\ell = \mathrm{e}$, $\mu $) and ${E_{\mathrm {T}}^{\text {miss}}}$ (from neutrinos and neutralinos), sometimes accompanied by an ISR jet. |
png pdf |
Figure 20-a:
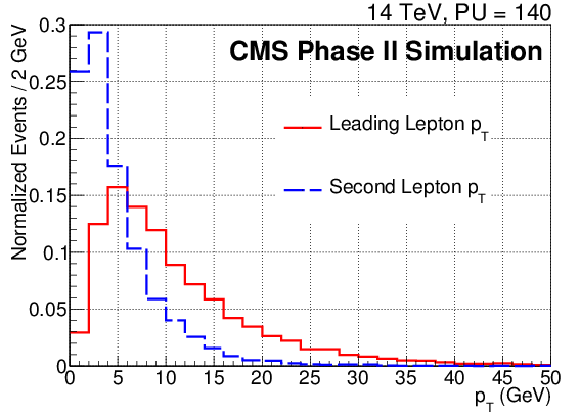
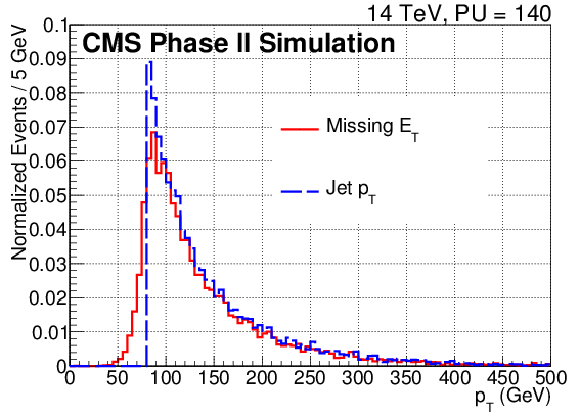
Transverse momentum spectrum at generator level for events generated with $M_{1} = M_{2} =$ 500 GeV and $\mu =$ 110 GeV. On the (a) plot are shown the spectra for the leading and next-to-leading lepton, on the (b) plot for ${E_{\mathrm {T}}^{\text {miss}}}$ and the leading jet. |
png pdf |
Figure 20-b:
Transverse momentum spectrum at generator level for events generated with $M_{1} = M_{2} =$ 500 GeV and $\mu =$ 110 GeV. On the (a) plot are shown the spectra for the leading and next-to-leading lepton, on the (b) plot for ${E_{\mathrm {T}}^{\text {miss}}}$ and the leading jet. |
png pdf |
Figure 21-a:
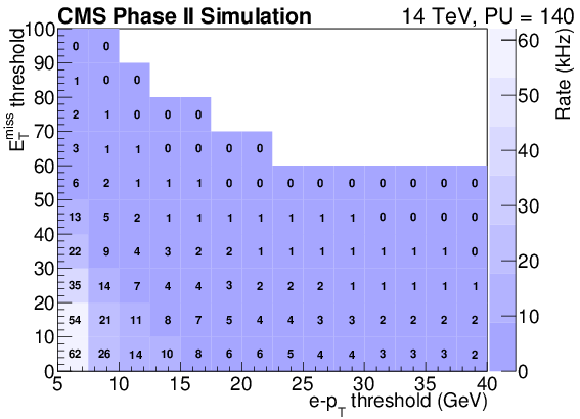
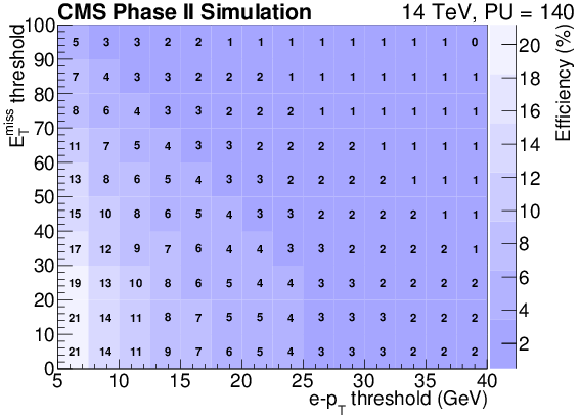
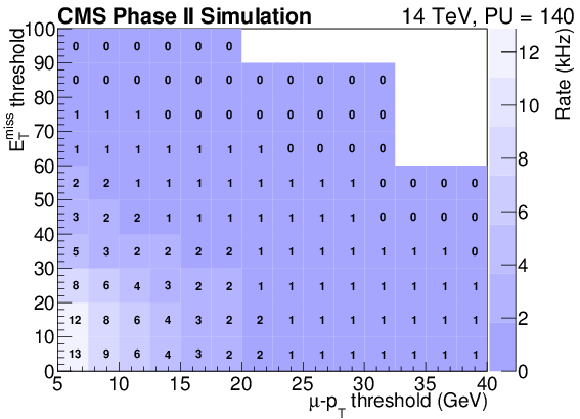
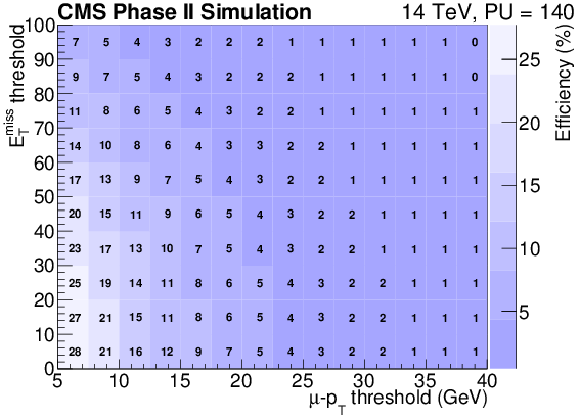
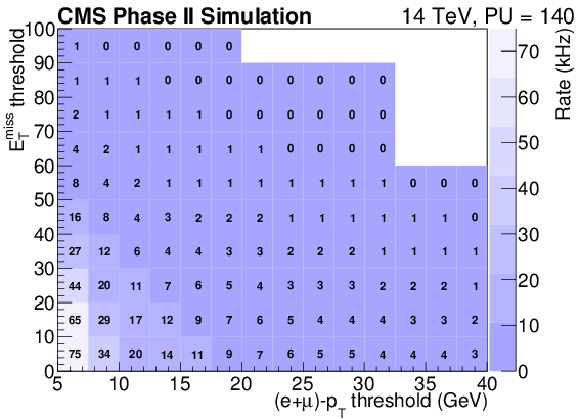
Trigger rate (a,c) and efficiency (b,d) as a function of the lepton ${p_{\mathrm {T}}}$ threshold and ${E_{\mathrm {T}}^{\text {miss}}}$ requirement for the electron (a,b) and muon (c,d) channels. |
png pdf |
Figure 21-b:
Trigger rate (a,c) and efficiency (b,d) as a function of the lepton ${p_{\mathrm {T}}}$ threshold and ${E_{\mathrm {T}}^{\text {miss}}}$ requirement for the electron (a,b) and muon (c,d) channels. |
png pdf |
Figure 21-c:
Trigger rate (a,c) and efficiency (b,d) as a function of the lepton ${p_{\mathrm {T}}}$ threshold and ${E_{\mathrm {T}}^{\text {miss}}}$ requirement for the electron (a,b) and muon (c,d) channels. |
png pdf |
Figure 21-d:
Trigger rate (a,c) and efficiency (b,d) as a function of the lepton ${p_{\mathrm {T}}}$ threshold and ${E_{\mathrm {T}}^{\text {miss}}}$ requirement for the electron (a,b) and muon (c,d) channels. |
png pdf |
Figure 22-a:
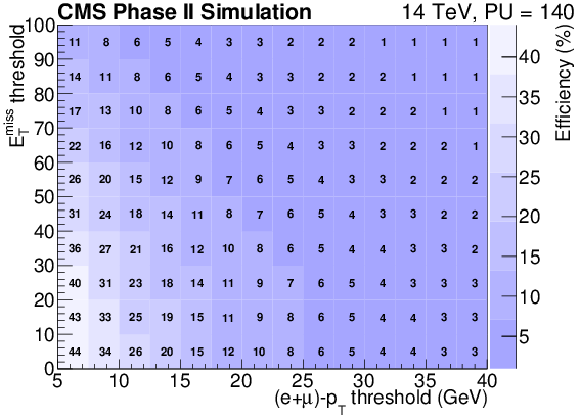
Trigger rate (a) and efficiency (b) as a function of the ${E_{\mathrm {T}}^{\text {miss}}}$ and lepton ${p_{\mathrm {T}}}$ threshold requirements, assuming identical trigger thresholds are imposed on the electron and muon channels. |
png pdf |
Figure 22-b:
Trigger rate (a) and efficiency (b) as a function of the ${E_{\mathrm {T}}^{\text {miss}}}$ and lepton ${p_{\mathrm {T}}}$ threshold requirements, assuming identical trigger thresholds are imposed on the electron and muon channels. |
png pdf |
Figure 23-a:
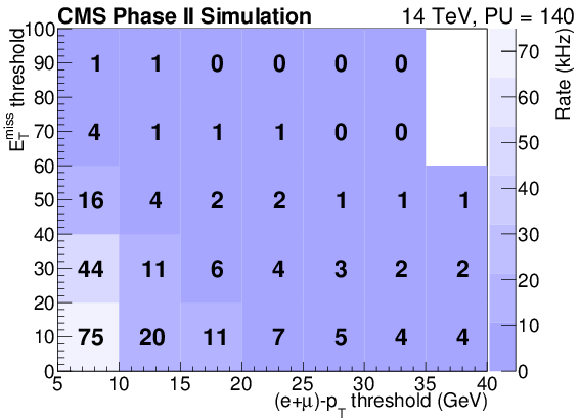
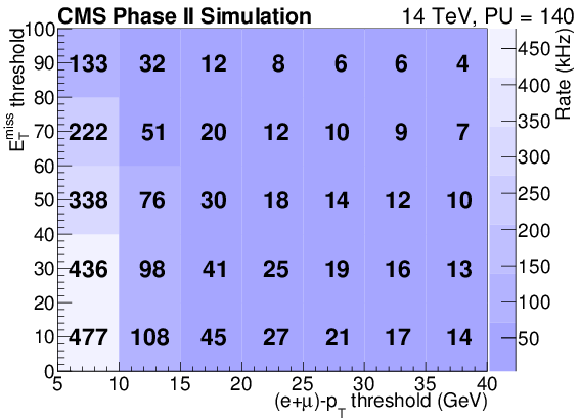
Trigger rates when using (a) or not using (b) the track-trigger, as a function of the ${E_{\mathrm {T}}^{\text {miss}}}$ and lepton ${p_{\mathrm {T}}}$ threshold requirements, assuming identical trigger thresholds are imposed on the electron and muon channels. These plots are contained in the TP [1]. |
png pdf |
Figure 23-b:
Trigger rates when using (a) or not using (b) the track-trigger, as a function of the ${E_{\mathrm {T}}^{\text {miss}}}$ and lepton ${p_{\mathrm {T}}}$ threshold requirements, assuming identical trigger thresholds are imposed on the electron and muon channels. These plots are contained in the TP [1]. |
png pdf |
Figure 24:
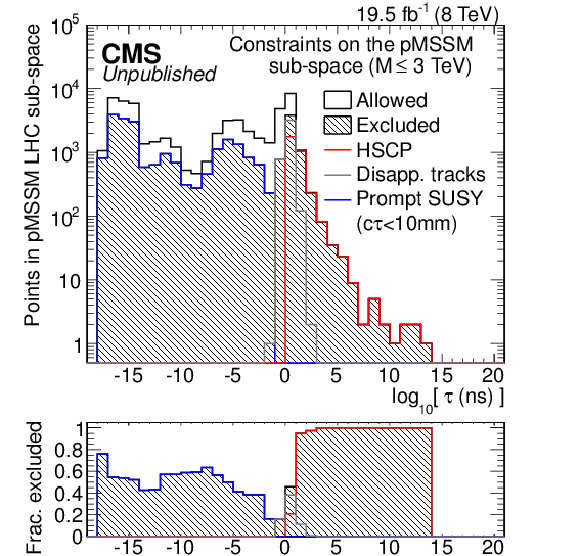
Coverage of SUSY searches with complementary detection techniques: short-lived particles are studied by dedicated SUSY searches (shown in blue) while HSCP signatures derive from long-lived particle searches (red). Figure adapted from ref. [29]. |
png pdf |
Figure 25-a:
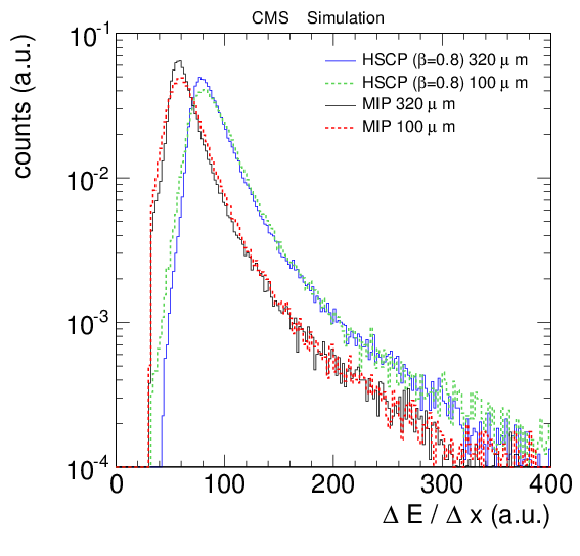
$ \rm{d} E / \rm{d} x $ for a MIP compared with that of an HSCP of $\beta =$ 0.8, shown for two different sensor thicknesses: 320 m for the present detector and 100 m as a possible scenario for upgraded sensors. Any value selected in between, (e.g. 200 m ), would not change the picture. |
png pdf |
Figure 25-b:
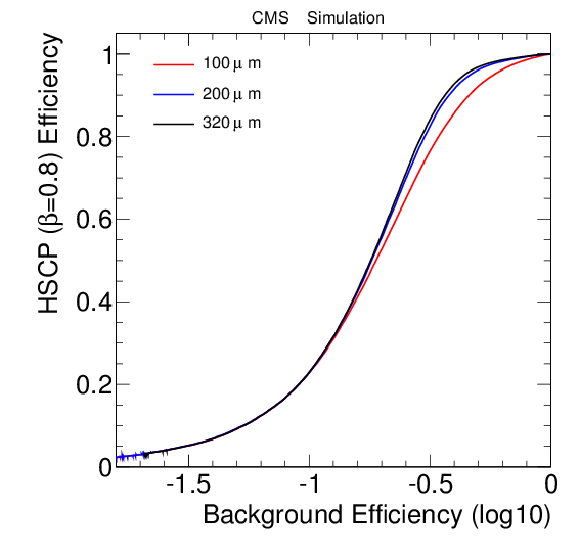
Graphics showing the selection efficiency for signal versus background for three sensor thicknesses of 100, 200 and 320 m . |
png pdf |
Figure 26-a:
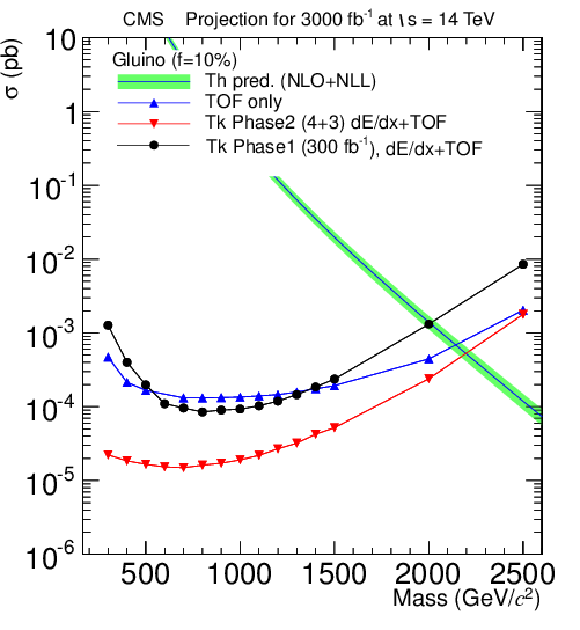
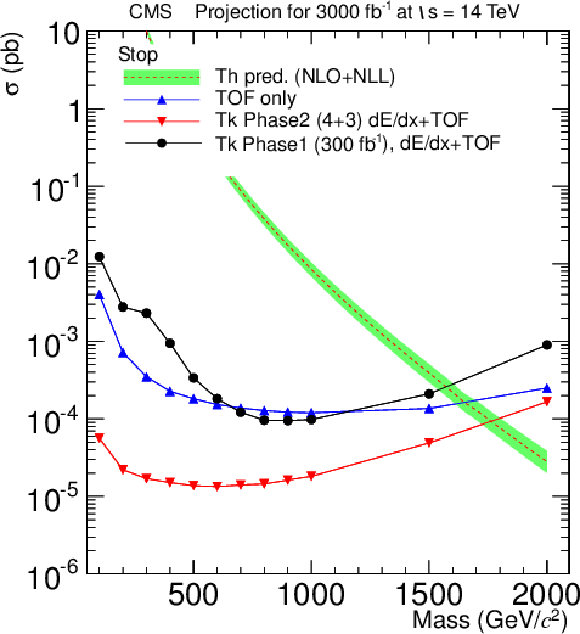
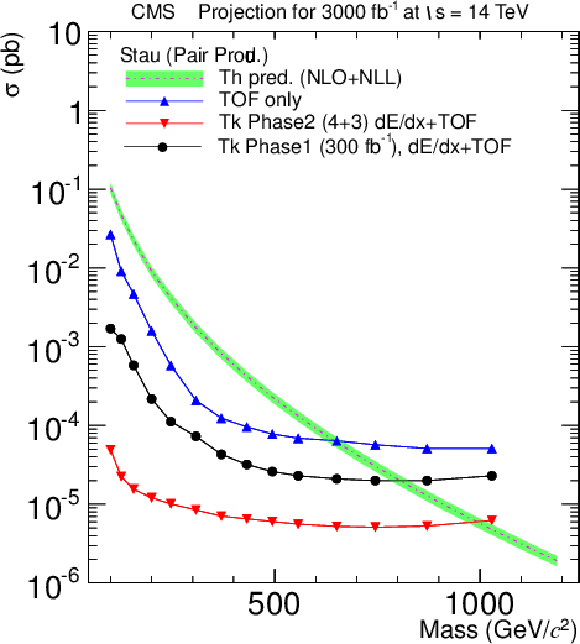
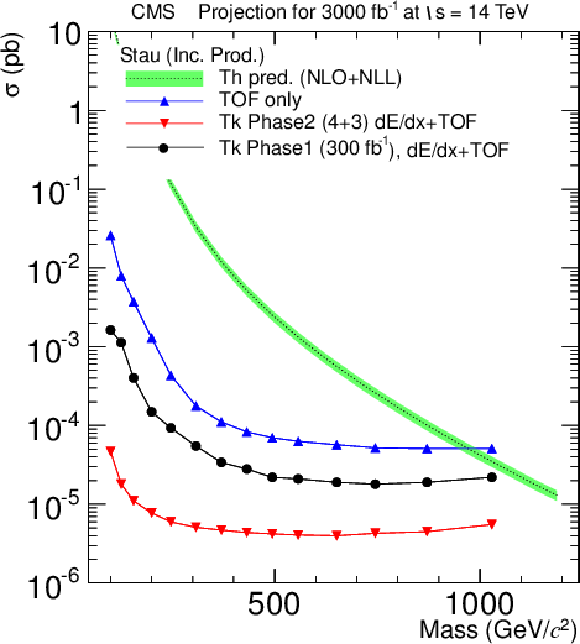
Projected cross section limits for 3000 fb$^{-1}$ for gluinos (a), stop (b), pair-produced stau (c) and gauge-mediated stau (d). All plots compare the sensitivity at the end of phase 1 (black) with the following two possible scenarios for the upgraded detector: having only time-of-flight information and no $ \rm{d} E / \rm{d} x $ (blue) and the one scenario where $ \rm{d} E / \rm{d} x $ HoT information is provided from 4+3 tracker layers along with the time-of-flight information (red). The scenario of 4+6 layers for $ \rm{d} E / \rm{d} x $ +TOF is not shown. The sensitivity plot for pair-produced stop is contained in the TP [1]. |
png pdf |
Figure 26-b:
Projected cross section limits for 3000 fb$^{-1}$ for gluinos (a), stop (b), pair-produced stau (c) and gauge-mediated stau (d). All plots compare the sensitivity at the end of phase 1 (black) with the following two possible scenarios for the upgraded detector: having only time-of-flight information and no $ \rm{d} E / \rm{d} x $ (blue) and the one scenario where $ \rm{d} E / \rm{d} x $ HoT information is provided from 4+3 tracker layers along with the time-of-flight information (red). The scenario of 4+6 layers for $ \rm{d} E / \rm{d} x $ +TOF is not shown. The sensitivity plot for pair-produced stop is contained in the TP [1]. |
png pdf |
Figure 26-c:
Projected cross section limits for 3000 fb$^{-1}$ for gluinos (a), stop (b), pair-produced stau (c) and gauge-mediated stau (d). All plots compare the sensitivity at the end of phase 1 (black) with the following two possible scenarios for the upgraded detector: having only time-of-flight information and no $ \rm{d} E / \rm{d} x $ (blue) and the one scenario where $ \rm{d} E / \rm{d} x $ HoT information is provided from 4+3 tracker layers along with the time-of-flight information (red). The scenario of 4+6 layers for $ \rm{d} E / \rm{d} x $ +TOF is not shown. The sensitivity plot for pair-produced stop is contained in the TP [1]. |
png pdf |
Figure 26-d:
Projected cross section limits for 3000 fb$^{-1}$ for gluinos (a), stop (b), pair-produced stau (c) and gauge-mediated stau (d). All plots compare the sensitivity at the end of phase 1 (black) with the following two possible scenarios for the upgraded detector: having only time-of-flight information and no $ \rm{d} E / \rm{d} x $ (blue) and the one scenario where $ \rm{d} E / \rm{d} x $ HoT information is provided from 4+3 tracker layers along with the time-of-flight information (red). The scenario of 4+6 layers for $ \rm{d} E / \rm{d} x $ +TOF is not shown. The sensitivity plot for pair-produced stop is contained in the TP [1]. |
png pdf |
Figure 27:
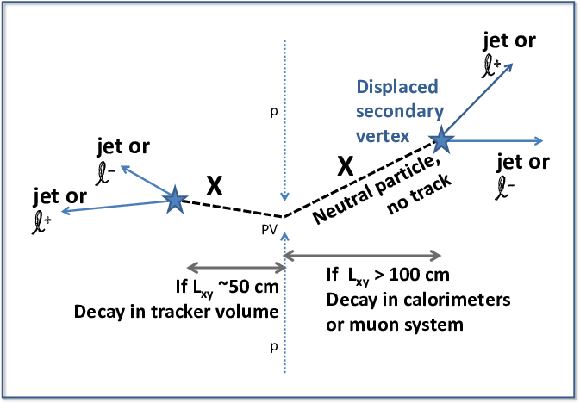
A possible long-lived signature: a (non-SM) Higgs boson decays to a pair of neutral, long-lived bosons X , which then each decay to a pair of oppositely charged leptons. |
png pdf |
Figure 28-a:
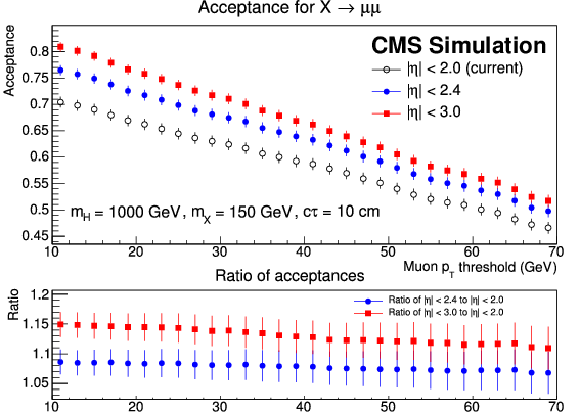
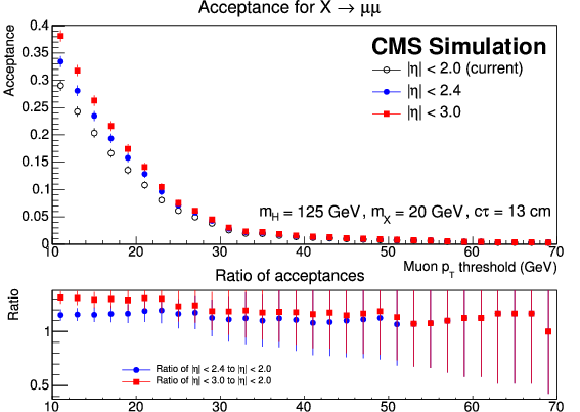
Acceptance for $\mathrm{X} \rightarrow {\ell ^+} {\ell ^-} $ as a function of the requirement on the minimum allowed lepton ${p_{\mathrm {T}}} $, for the $\mathrm{ H } \rightarrow {\mathrm{X}} {\mathrm{X}} $ model. The results are shown for three different requirements on the maximum permitted lepton rapidity; the bottom plot shows the relative increase in acceptance if the requirement on the lepton rapidity is loosened with respect to current requirement $|\eta | < $ 2, beyond which the present CMS tracker is inefficient at reconstructing displaced tracks [31]. The plots correspond to two different combinations of H and X boson masses. The left plot is contained in the TP [1]. |
png pdf |
Figure 28-b:
Acceptance for $\mathrm{X} \rightarrow {\ell ^+} {\ell ^-} $ as a function of the requirement on the minimum allowed lepton ${p_{\mathrm {T}}} $, for the $\mathrm{ H } \rightarrow {\mathrm{X}} {\mathrm{X}} $ model. The results are shown for three different requirements on the maximum permitted lepton rapidity; the bottom plot shows the relative increase in acceptance if the requirement on the lepton rapidity is loosened with respect to current requirement $|\eta | < $ 2, beyond which the present CMS tracker is inefficient at reconstructing displaced tracks [31]. The plots correspond to two different combinations of H and X boson masses. The left plot is contained in the TP [1]. |
png pdf |
Figure 29-a:
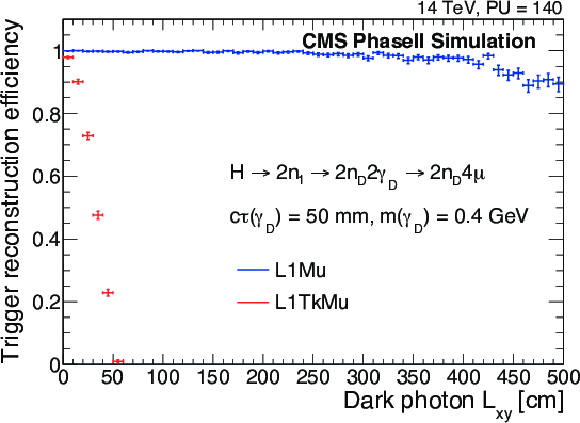
The probability of reconstructing at least one muon candidate produced in the decay of a light long-lived light particle decaying to a pair of muons $\gamma _d \to \mu \mu $ as a function of $L_{xy}$, the distance between the $\gamma _d$ decay vertex to the beam-line in the transverse plane. Standalone muon trigger L1Mu performance is compared to that of L1TrkMu, a trigger based on matching muon and track trigger candidates with the CMS phase2 detector simulation. Other parameters of the model are shown in the legend and are chosen to ensure that a typical muon transverse impact parameter $d_{xy}$ is small to minimize any sources of inefficiency not associated with $L_{xy}$. |
png pdf |
Figure 29-b:
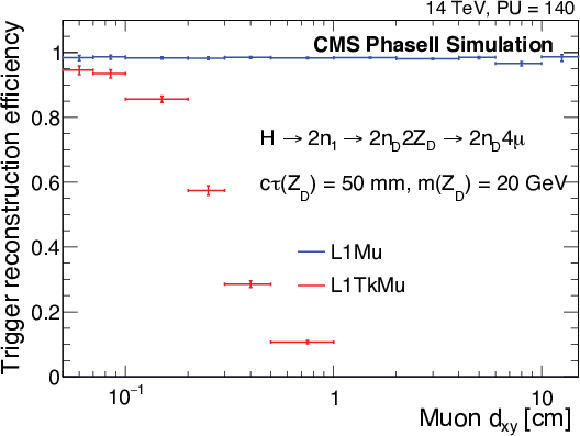
Probability to reconstruct a muon using L1Mu and L1TrkMu algorithms as a function of muon's true transverse impact parameter $d_{xy}$. The parameters of the model are chosen to provide a good coverage over the entire region of $d_{xy}$ shown. Only muons with small true $L_{xy}$ and $ {p_{\mathrm {T}}} >$ 8 GeV are used in the measurement to minimize sources of inefficiency not related to $d_{xy}$. (Fig. from GE1/1 TDR). |
| Tables | |
png pdf |
Table 1:
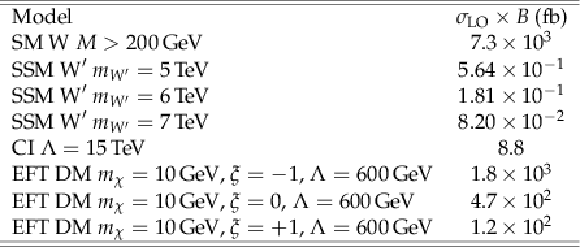
Signal production cross sections times inclusive branching fraction to one lepton. |
| Summary |
| This note presents a number of selected analyses in the context of the high-luminosity HL-LHC. It has been demonstrated how the BSM physics reach will increase with the added luminosity. This is certainly the case if hints of a new physics signal are seen at the end of run 3 and its properties need to be studied. Studies of the spin and production mode of a dielectron resonance were presented as an example for this scenario. Rare processes and weak couplings will also profit from high luminosity provided the present detector performance can be maintained during HL-LHC operation. For final states with high $ E_{\mathrm{T}} $ electrons, the performance degradation of an aged detector was studied and the impact on the sensitivity demonstrated. The proposed phase 2 detector mitigates this degradation. Dark matter searches are also expected to gain in physics reach. HL-LHC will probe beyond the irreducible neutrino background of direct-detection experiments. The required detector performance for DM signal efficiency will be preserved with the phase 2 upgrade. On the other hand, sensitivity to some exotic signatures requires specific detector properties. As an example, analyses searching for HSCP need a minimum of $ \rm{d} E / \rm{d} x $ information from the silicon pixel detector and the tracker to maintain sensitivity. Moreover, analyses searching for displaced signatures have particular demands on the trigger. Whereas signatures with tracks originating at (or pointing to) the primary vertex will profit from the sharp trigger turn-on and the low lepton $p_{\mathrm{T}}$ thresholds afforded by the the track trigger available in the phase 2 detector, for the case of a displaced tracks with a large impact parameter, the track trigger will become inefficient and needs to be complemented by stand-alone triggers as discussed in the example of the muon trigger. |
| References | ||||
| 1 | J. Butler et al. | Technical Proposal for the Phase-II Upgrade of the CMS Detector | Technical Report CERN-LHCC-2015-010. LHCC-P-008, CERN, Geneva. Geneva, June | |
| 2 | CMS Collaboration | Projected Performance of an Upgraded CMS Detector at the LHC and HL-LHC: Contribution to the Snowmass Process | 1307.7135 | |
| 3 | GEANT4 Collaboration | GEANT4: A simulation toolkit | NIMA506 (2003) 250--303 | |
| 4 | DELPHES 3 Collaboration | DELPHES 3, A modular framework for fast simulation of a generic collider experiment | JHEP 1402 (2014) 057 | 1307.6346 |
| 5 | P. Langacker | The Physics of Heavy $ Z^\prime $ Gauge Bosons | Rev.Mod.Phys. 81 (2009) 1199--1228 | 0801.1345 |
| 6 | L. Randall and R. Sundrum | A Large mass hierarchy from a small extra dimension | Phys.Rev.Lett. 83 (1999) 3370--3373 | hep-ph/9905221 |
| 7 | R. Cousins, J. Mumford, and V. Valuev | Forward-backward asymmetry of simulated and reconstructed $ Z'\rightarrow \mu^+\mu^- $ events in CMS | CMS-NOTE-2005-022 | |
| 8 | CMS Collaboration | Forward–backward asymmetry of Drell–Yan lepton pairs in pp collisions at $ \sqrt{s} = 8 $ $ \,\mathrm{TeV} $ | Technical Report 6 | CMS-SMP-14-004 1601.04768 |
| 9 | A. L. Read | Presentation of search results: The CL(s) technique | J.Phys. G28 (2002) 2693--2704 | |
| 10 | G. Cowan, K. Cranmer, E. Gross, and O. Vitells | Asymptotic formulae for likelihood-based tests of new physics | Eur.Phys.J. C71 (2011) 1554 | 1007.1727 |
| 11 | CMS Collaboration | Search for heavy narrow dilepton resonances in $ pp $ collisions at $ \sqrt{s}=7 $ TeV and $ \sqrt{s}=8 $ TeV | Phys.Lett. B720 (2013) 63--82 | CMS-EXO-12-015 1212.6175 |
| 12 | CMS Collaboration | Search for physics beyond the standard model in dilepton mass spectra in proton-proton collisions at $ \sqrt{s}=8 $ TeV | technical report | CMS-EXO-12-061 1412.6302 |
| 13 | M. Olschewski | Search for new physics in proton-proton collision events with a lepton and missing transverse energy | Technical Report , PhD thesis, urn:nbn:de:hbz:82-rwth-2016-027043, RWTH Aachen | |
| 14 | CMS Collaboration | Search for physics beyond the standard model in final states with a lepton and missing transverse energy in proton-proton collisions at sqrt(s) = 8 TeV | PRD91 (2015), no. 9, 092005 | CMS-EXO-12-060 1408.2745 |
| 15 | Y. Bai and T. M. Tait | Searches with Mono-Leptons | Phys.Lett. B723 (2013) 384--387 | 1208.4361 |
| 16 | U. Haisch, F. Kahlhoefer, and T. M. P. Tait | On Mono-W Signatures in Spin-1 Simplified Models | PLB760 (2016) 207--213 | 1603.01267 |
| 17 | V. G. Kutzner | Search for new physics in the mono-electron channel with the CMS experiment in pp collision data at $ \sqrt{s} $=13$ TeV $ | Technical Report , PhD thesis, RWTH Aachen | |
| 18 | N. F. Bell et al. | Dark matter at the LHC: Effective field theories and gauge invariance | PRD92 (2015), no. 5, 053008 | 1503.07874 |
| 19 | N. F. Bell, Y. Cai, and R. K. Leane | Mono-W Dark Matter Signals at the LHC: Simplified Model Analysis | JCAP 1601 (2016), no. 01, 051 | 1512.00476 |
| 20 | O. Buchmueller, M. J. Dolan, S. A. Malik, and C. McCabe | Characterising dark matter searches at colliders and direct detection experiments: Vector mediators | JHEP 1501 (2015) 037 | 1407.8257 |
| 21 | P. J. Fox, R. Harnik, J. Kopp, and Y. Tsai | Missing Energy Signatures of Dark Matter at the LHC | Phys.Rev. D85 (2012) 056011 | 1109.4398 |
| 22 | O. Buchmueller, M. J. Dolan, and C. McCabe | Beyond Effective Field Theory for Dark Matter Searches at the LHC | JHEP 1401 (2014) 025 | 1308.6799 |
| 23 | P. Harris, V. V. Khoze, M. Spannowsky, and C. Williams | Constraining Dark Sectors at Colliders: Beyond the Effective Theory Approach | 1411.0535 | |
| 24 | M. R. Buckley, D. Feld, and D. Goncalves | Scalar Simplified Models for Dark Matter | Phys.Rev. D91 (2015), no. 1, 015017 | 1410.6497 |
| 25 | ECFA and Snowmass working groups | Exotica ECFA and Snowmass projections | CMS-AN-13-221 | |
| 26 | CMS Collaboration | Cross section calculation for leptonicaly decaying W at NNLO QCD and NLO electroweak | CMS-AN-14-263 | |
| 27 | J. Billard, L. Strigari, and E. Figueroa-Feliciano | Implication of neutrino backgrounds on the reach of next generation dark matter direct detection experiments | Phys.Rev. D89 (2014), no. 2, 023524 | 1307.5458 |
| 28 | Z. Han, G. D. Kribs, A. Martin, and A. Menon | Hunting Quasi-Degenerate Higgsinos | Phys.Rev. D89 (2014) 075007 | 1401.1235 |
| 29 | CMS Collaboration | Constraints on the pMSSM, AMSB model and on other models from the search for long-lived charged particles in proton-proton collisions at $ \sqrt{s} $ = 8 TeV | CMS-EXO-13-006 1502.02522 |
|
| 30 | CMS Collaboration | Searches for long-lived charged particles in pp collisions at $ \sqrt{s} $=7 and 8 TeV | JHEP 1307 (2013) 122 | CMS-EXO-12-026 1305.0491 |
| 31 | CMS Collaboration | Search for long-lived particles that decay into final states containing two electrons or two muons in proton-proton collisions at sqrt(s) = 8 TeV | CMS-EXO-12-037 1411.6977 |
|
| 32 | CMS Collaboration | Search for "Displaced Supersymmetry" in events with an electron and a muon with large impact parameters | CMS-B2G-12-024 1409.4789 |
|
| 33 | CMS Collaboration | Use of tracking in the CMS L1 trigger for the phase-2 upgrade | CMS-DN-14-002 | |
| 34 | CMS Collaboration | CMS Technical Design Report for the Level-1 Trigger Upgrade | CERN-LHCC-2012-015 | |
| 35 | PAMELA Collaboration | An anomalous positron abundance in cosmic rays with energies 1.5-100 GeV | Nature 458 (2009) 607 | 0810.4995 |
| 36 | Fermi LAT Collaboration | Measurement of separate cosmic-ray electron and positron spectra with the Fermi Large Area Telescope | PRL 108 (2012) 011103 | 1109.0521 |

|
Compact Muon Solenoid LHC, CERN |

|

|

|

|

|

|