

Compact Muon Solenoid
LHC, CERN
 Visit us: CMS Public Website, CMS Physics ;
Contact us: CMS Publications Committee
Visit us: CMS Public Website, CMS Physics ;
Contact us: CMS Publications Committee
| CMS-PAS-BPH-25-005 | ||
| Search for the rare decay $ {\rm K}^0_\mathrm{S}\to\mu^+\mu^- $ in proton-proton collisions at $ \sqrt{s}= $ 13.6 TeV | ||
| CMS Collaboration | ||
| 2026-07-23 | ||
| Abstract: Rare kaon decays have long been a subject of significant interest, with most previous studies conducted using fixed-target experiments as well as B-factories. The implementation of a new trigger strategy during LHC Run 3 enables the CMS experiment to contribute to this area of research by exploiting the unprecedented luminosity of the LHC. This study reports on a search for the rare decay of $ {\rm K}^0_\mathrm{S} $ mesons into two muons using proton-proton collision data at $ \sqrt{s}= $ 13.6 TeV collected by the CMS experiment during the 2022 to 2025 operation of the CERN LHC, with an integrated luminosity of 287 fb$ ^{-1} $. No significant excess is observed. A limit on the branching fraction of $ \mathcal{B}({\rm K}^0_\mathrm{S}\to\mu^+\mu^-) < 4.6 (5.5)\times10^{-10} $ at 90% (95%) confidence level is set. | ||
| Links: CDS record (PDF) ; CADI line (restricted) ; | ||
| Figures & Tables | Summary | Additional Figures | References | CMS Publications |
|---|
| Figures | |
png pdf |
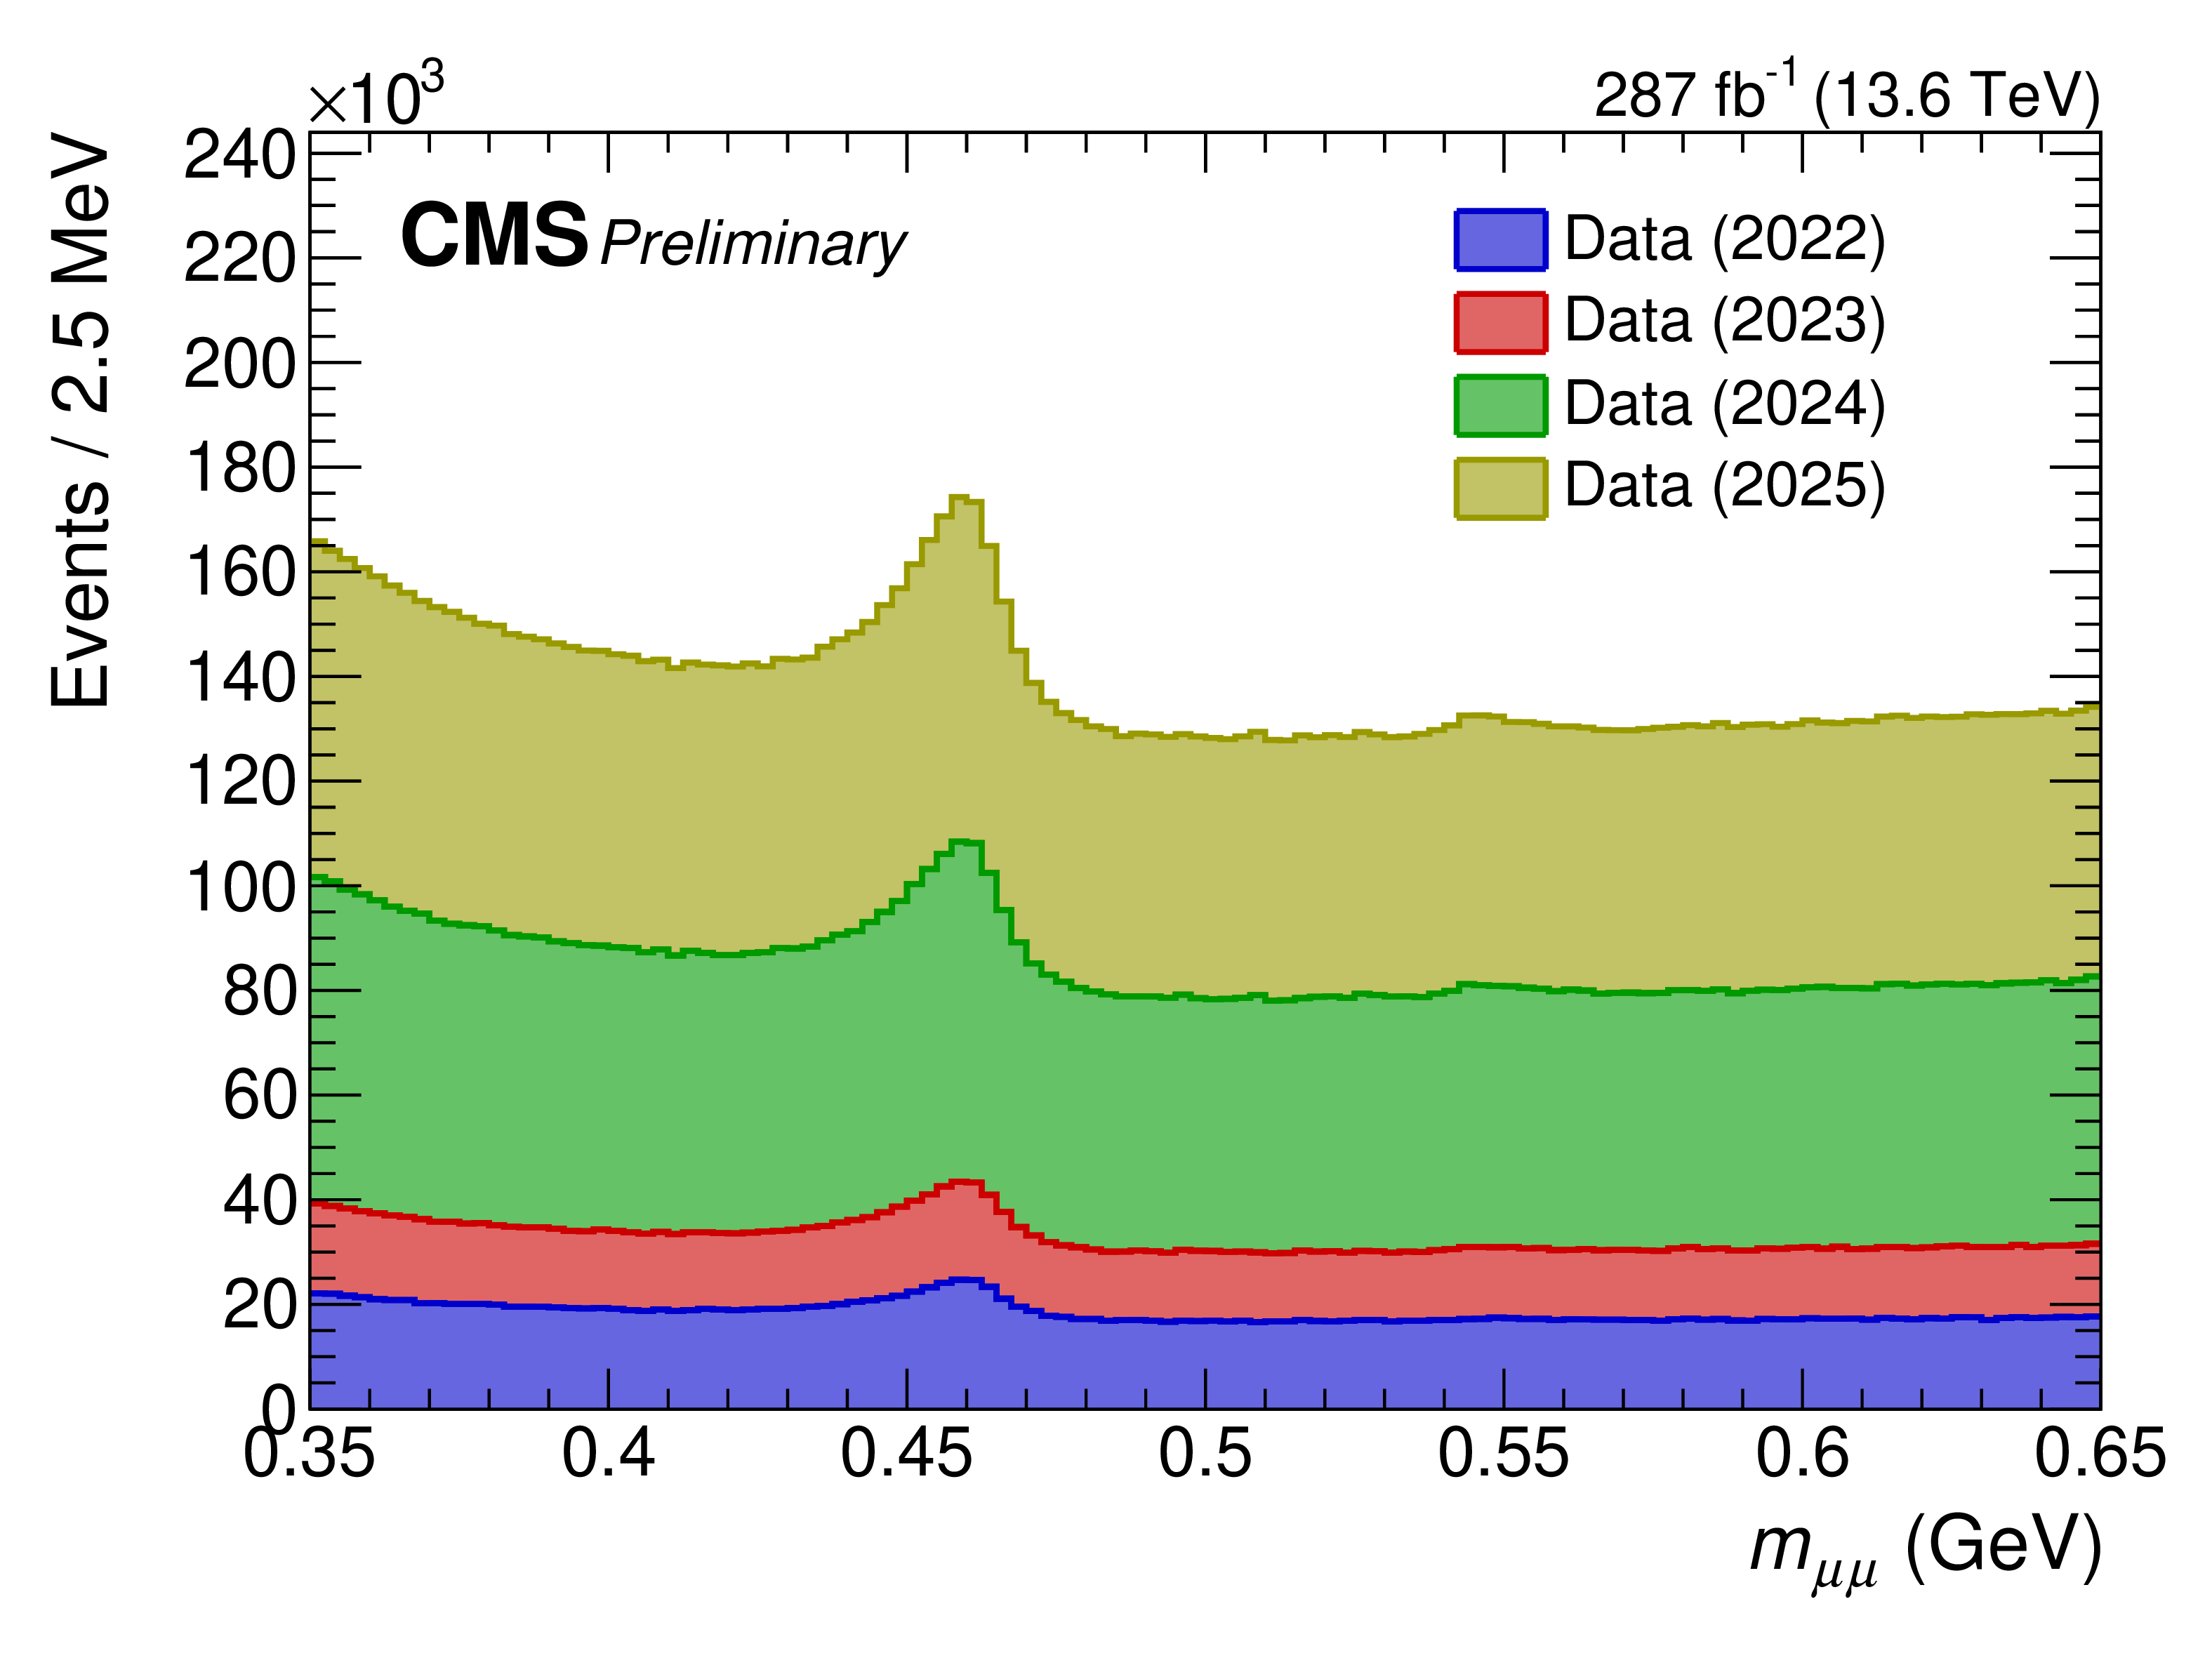
Figure 1:
The distributions of the dimuon mass $ m_{\mu\mu} $ for 2022--2025 data sample after the baseline selection. |
png pdf |
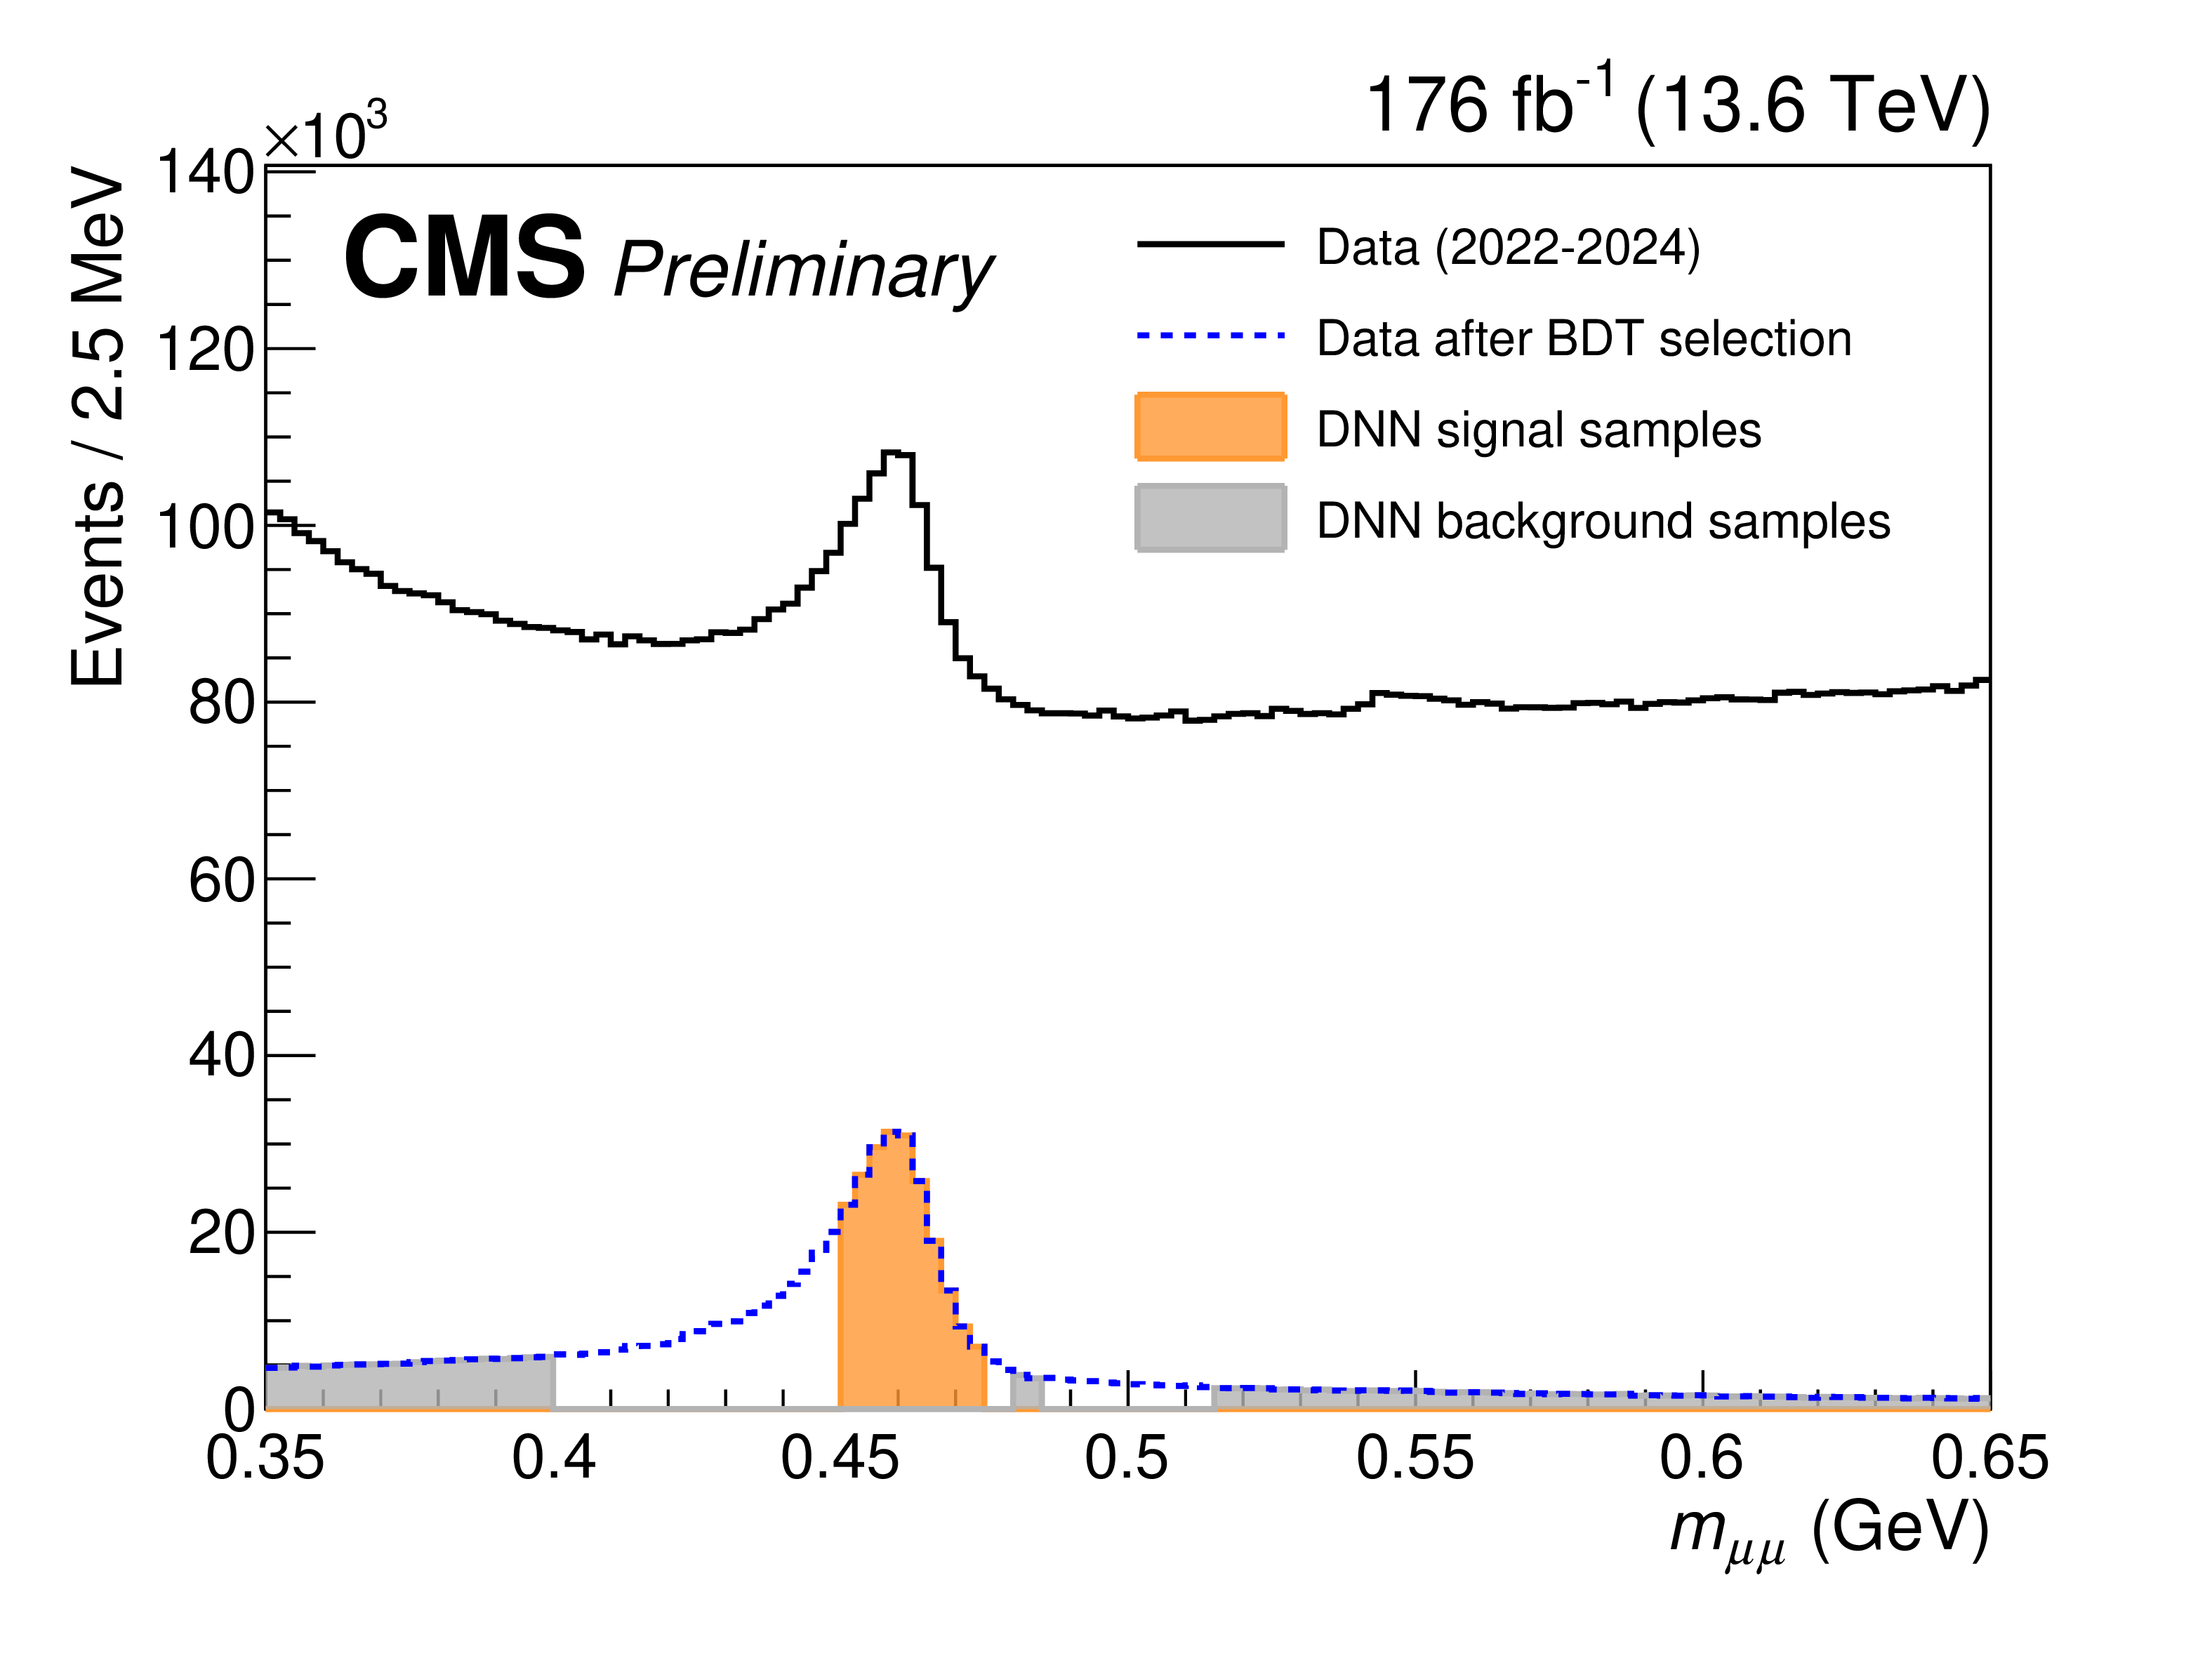
Figure 2:
The distributions of the dimuon mass $ m_{\mu\mu} $ for 2022--2024 data sample before and after BDT selection. The orange and grey shaded areas represent the signal and background samples used for DNN training, respectively. |
png pdf |
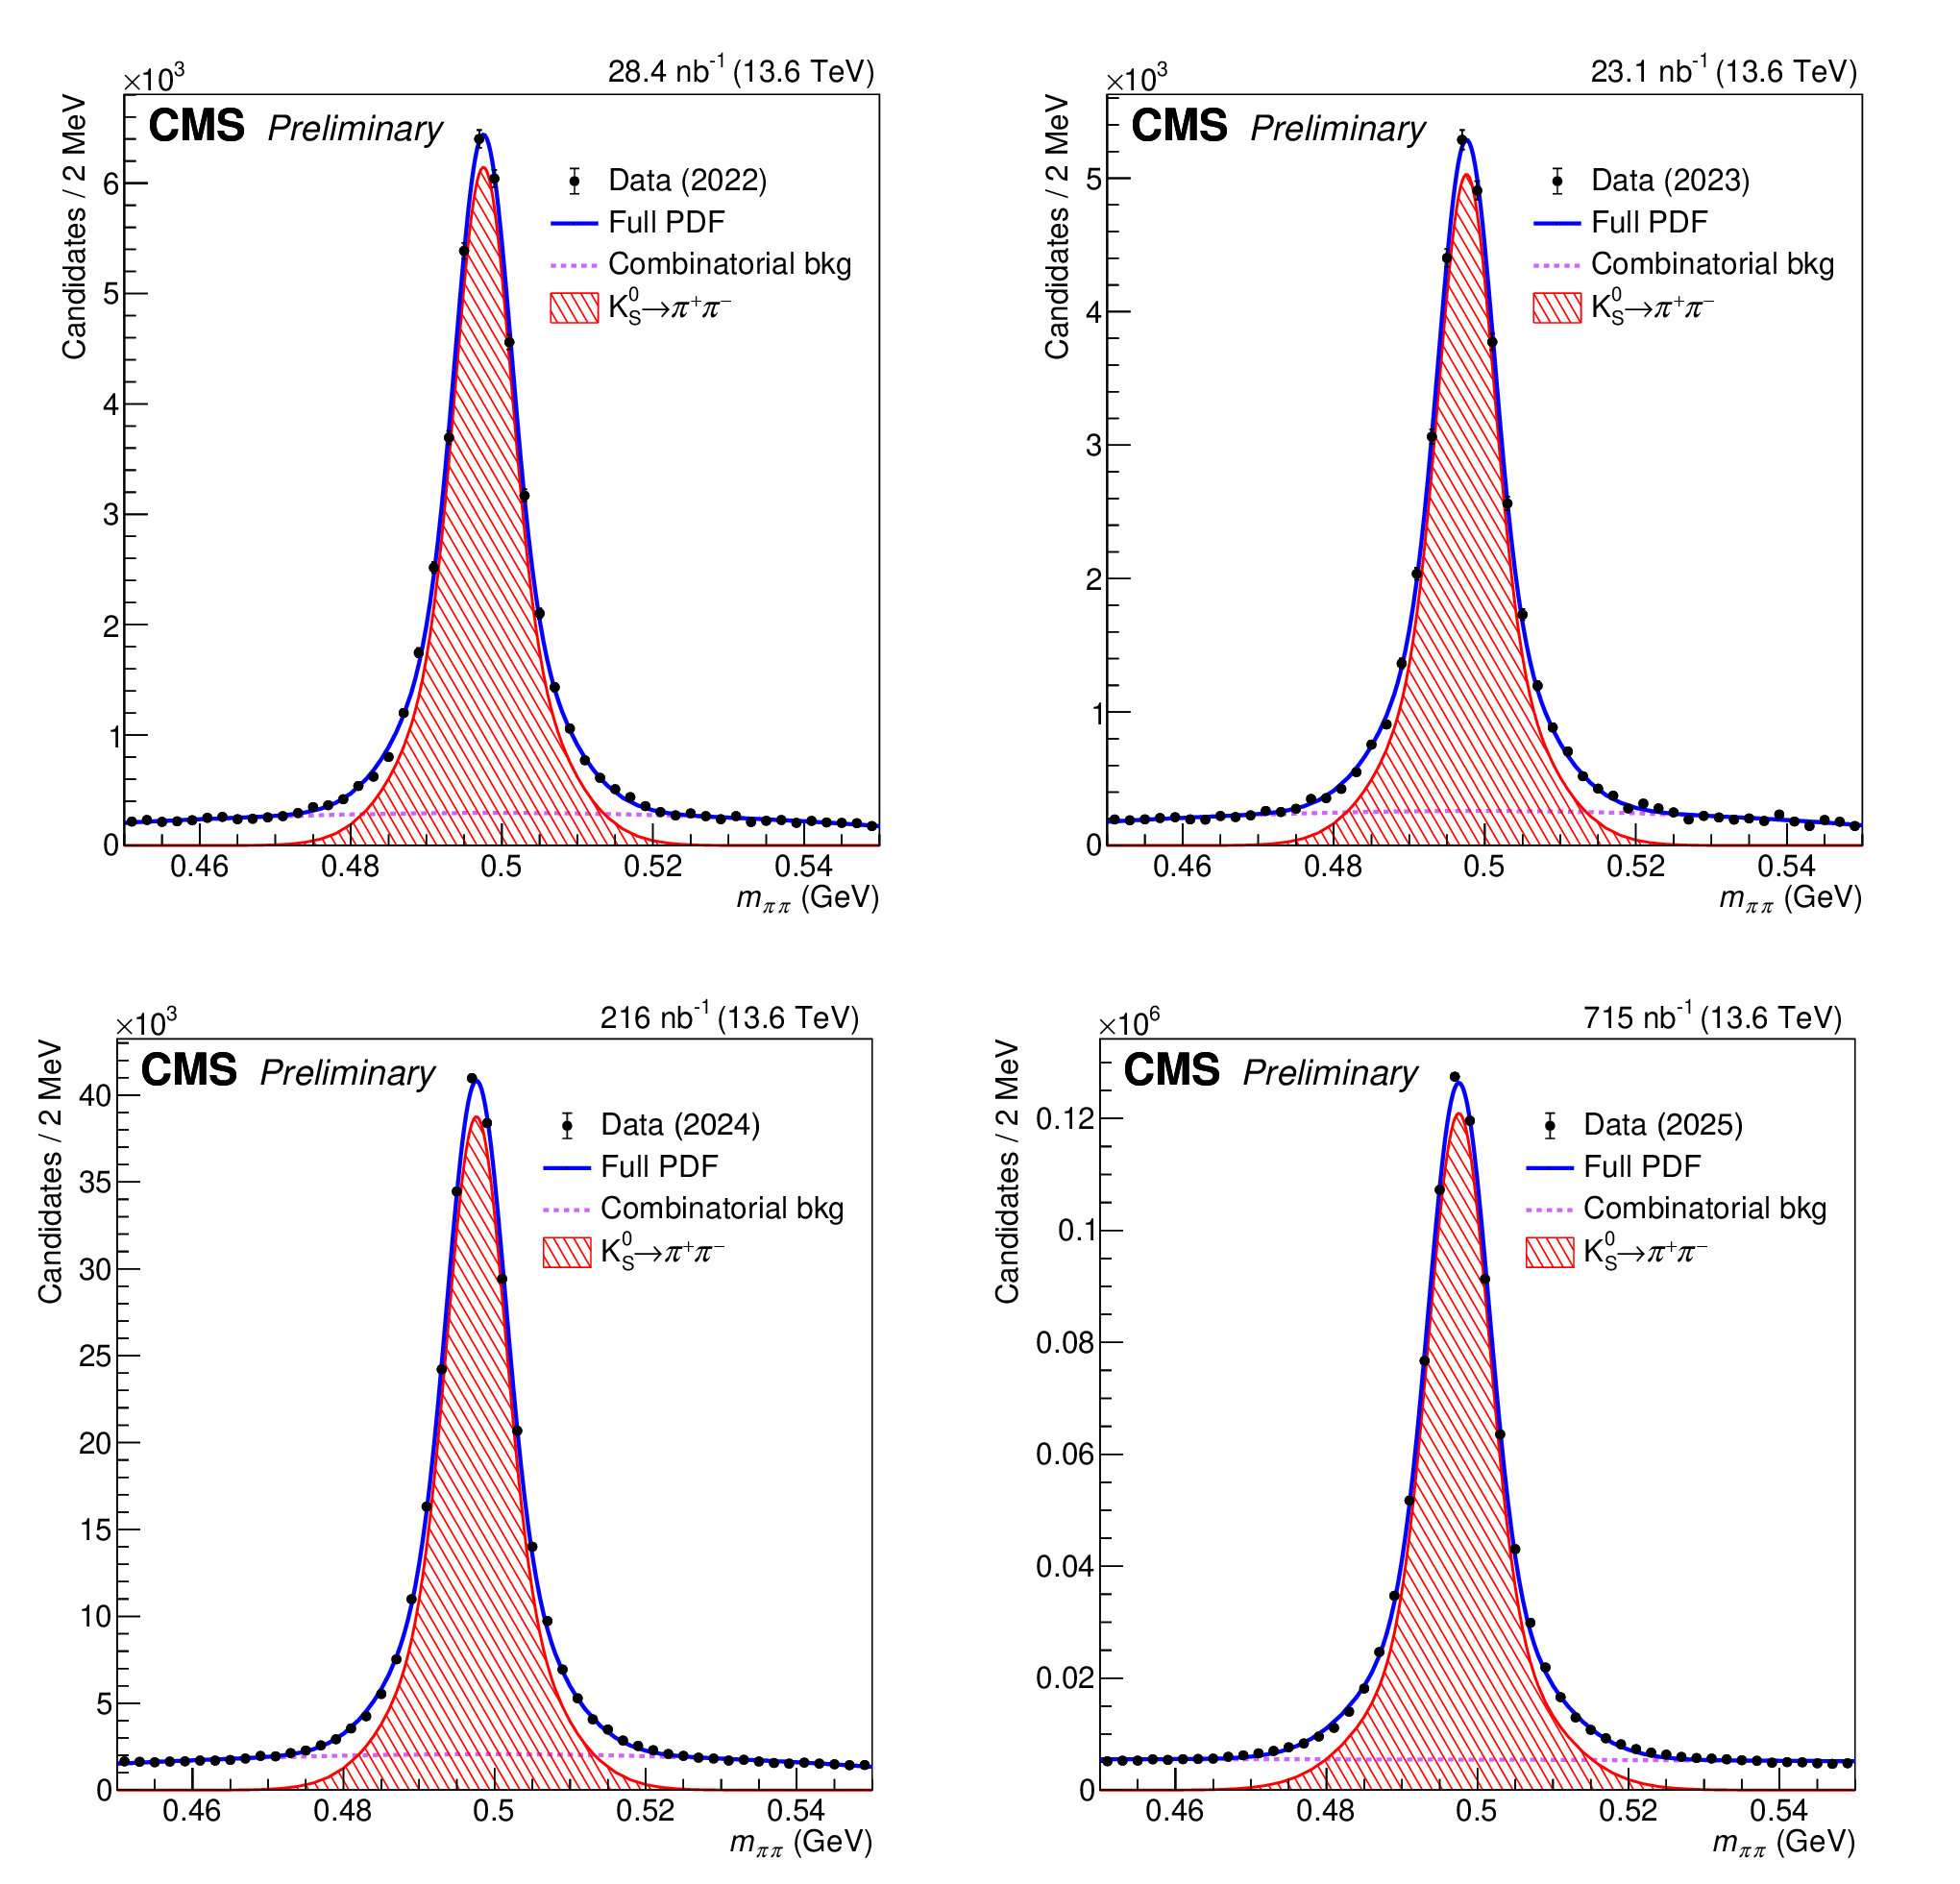
Figure 3:
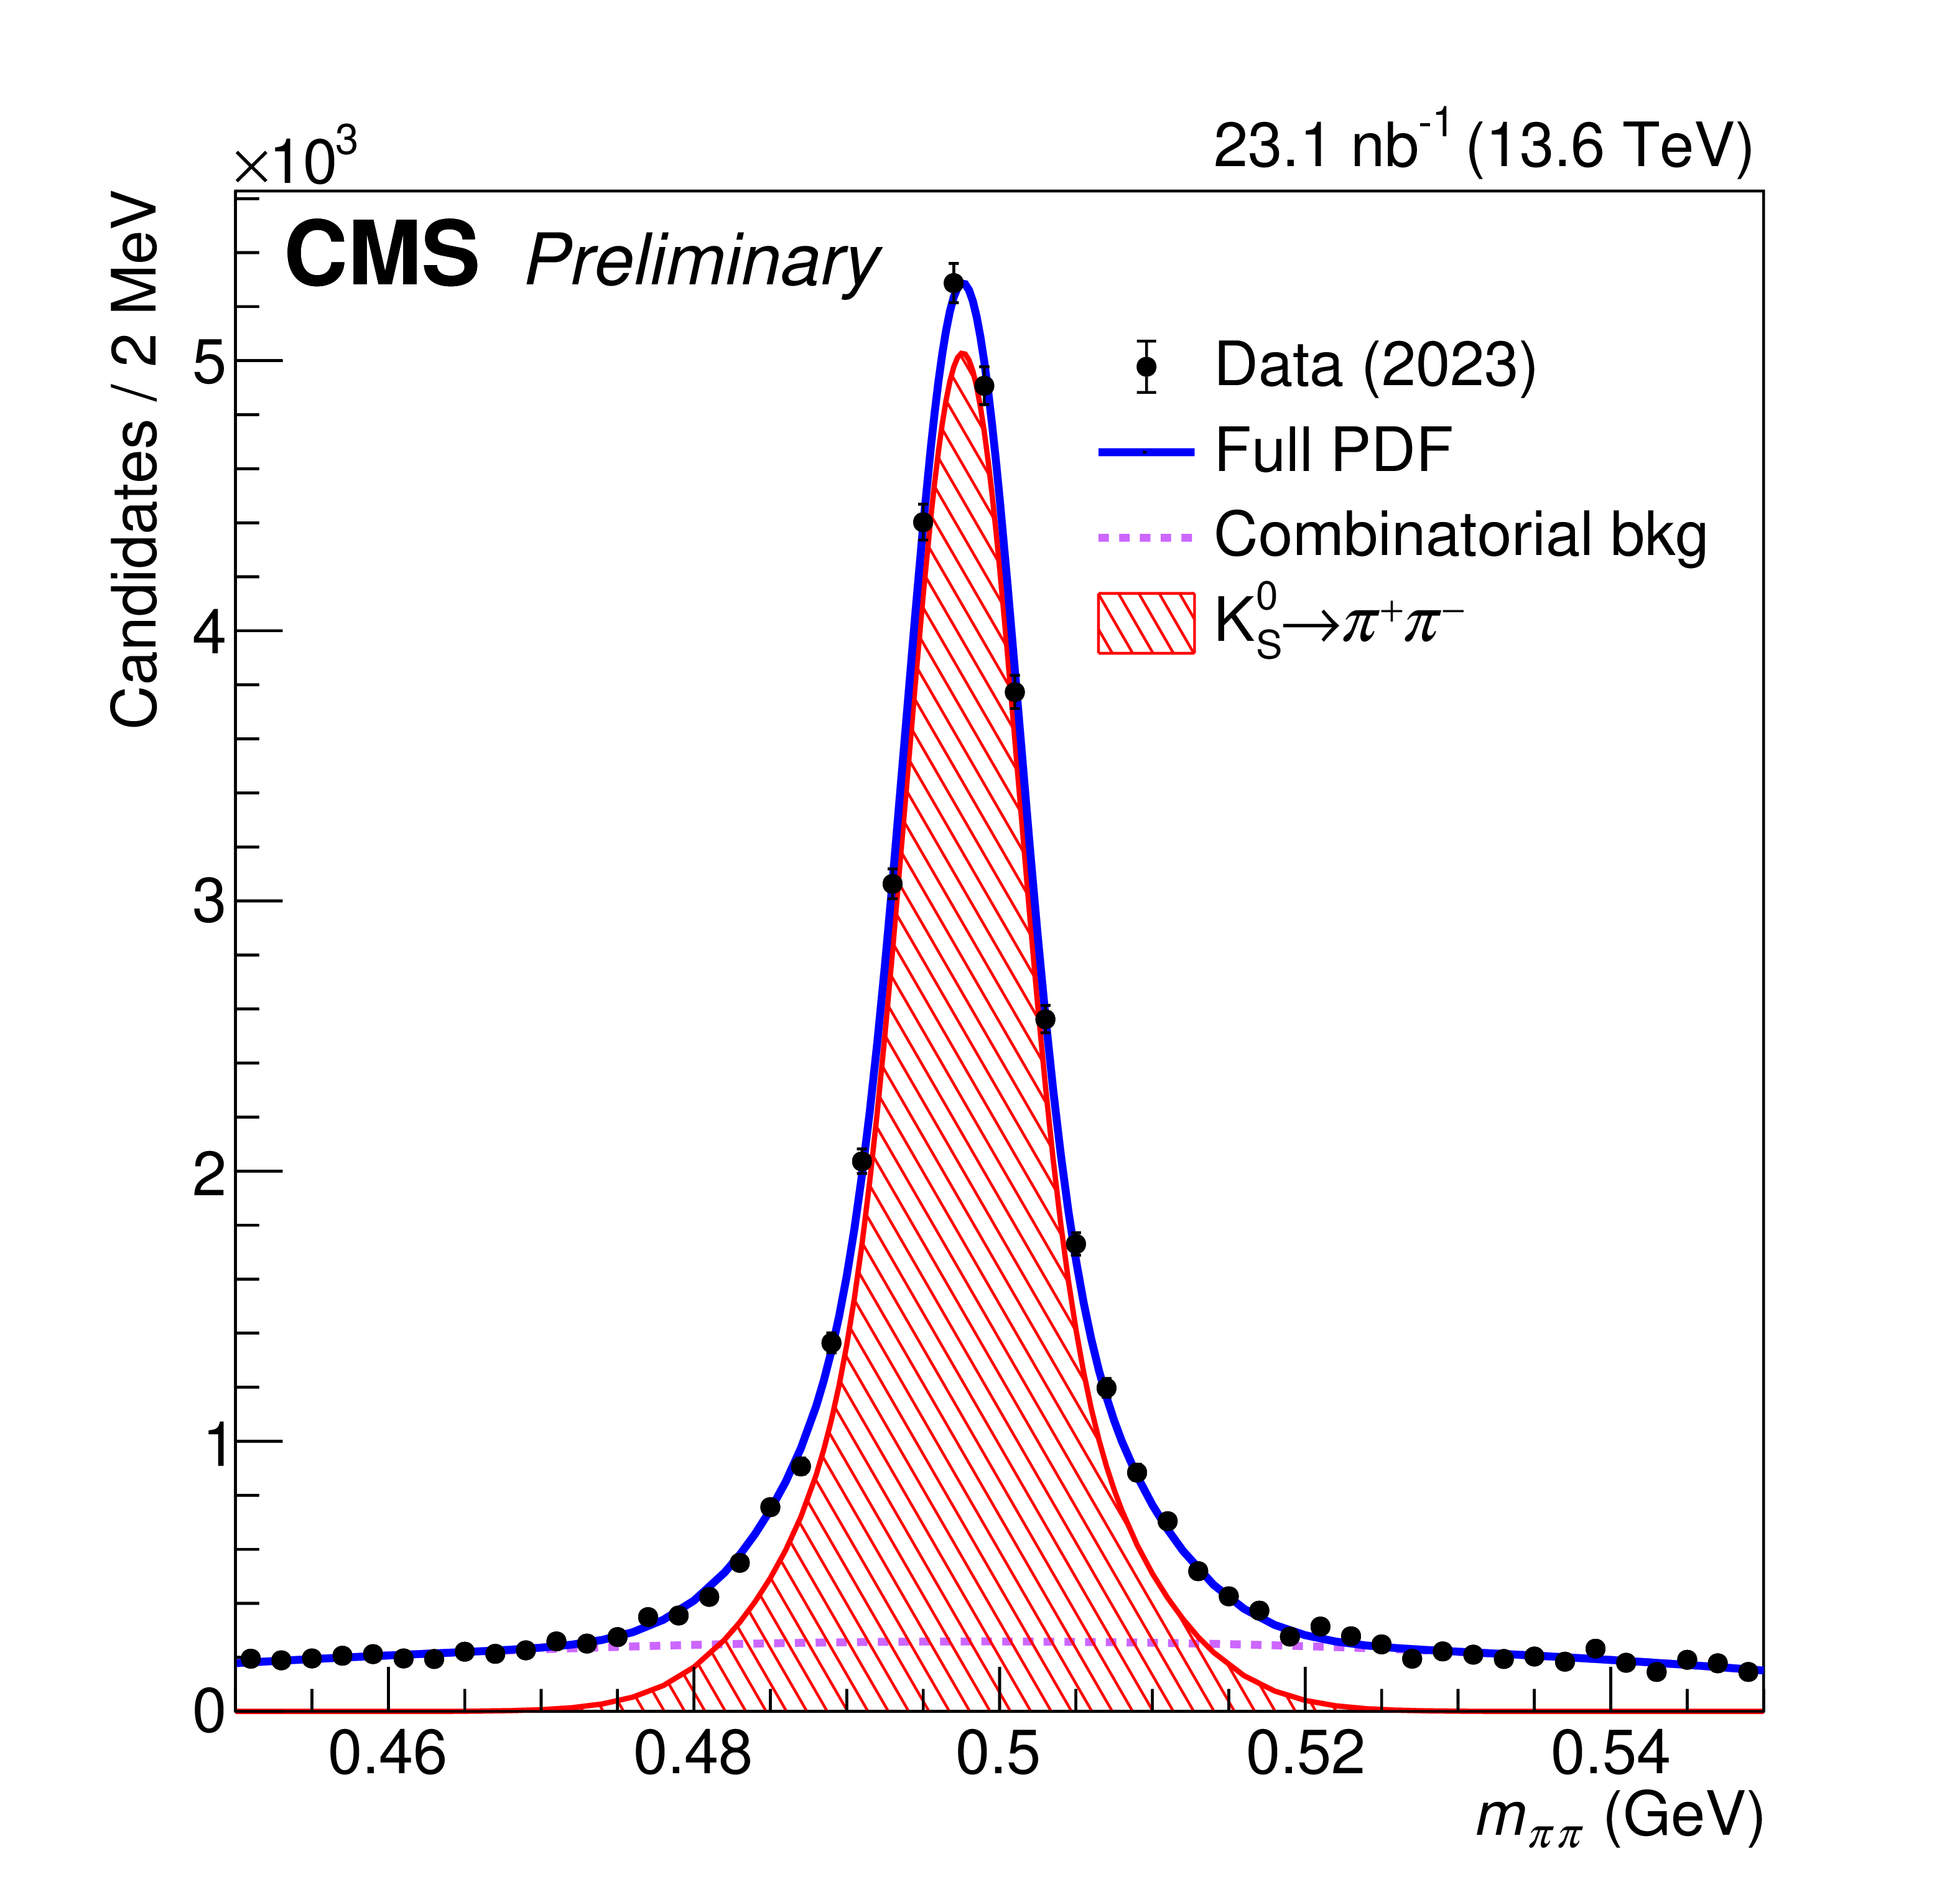
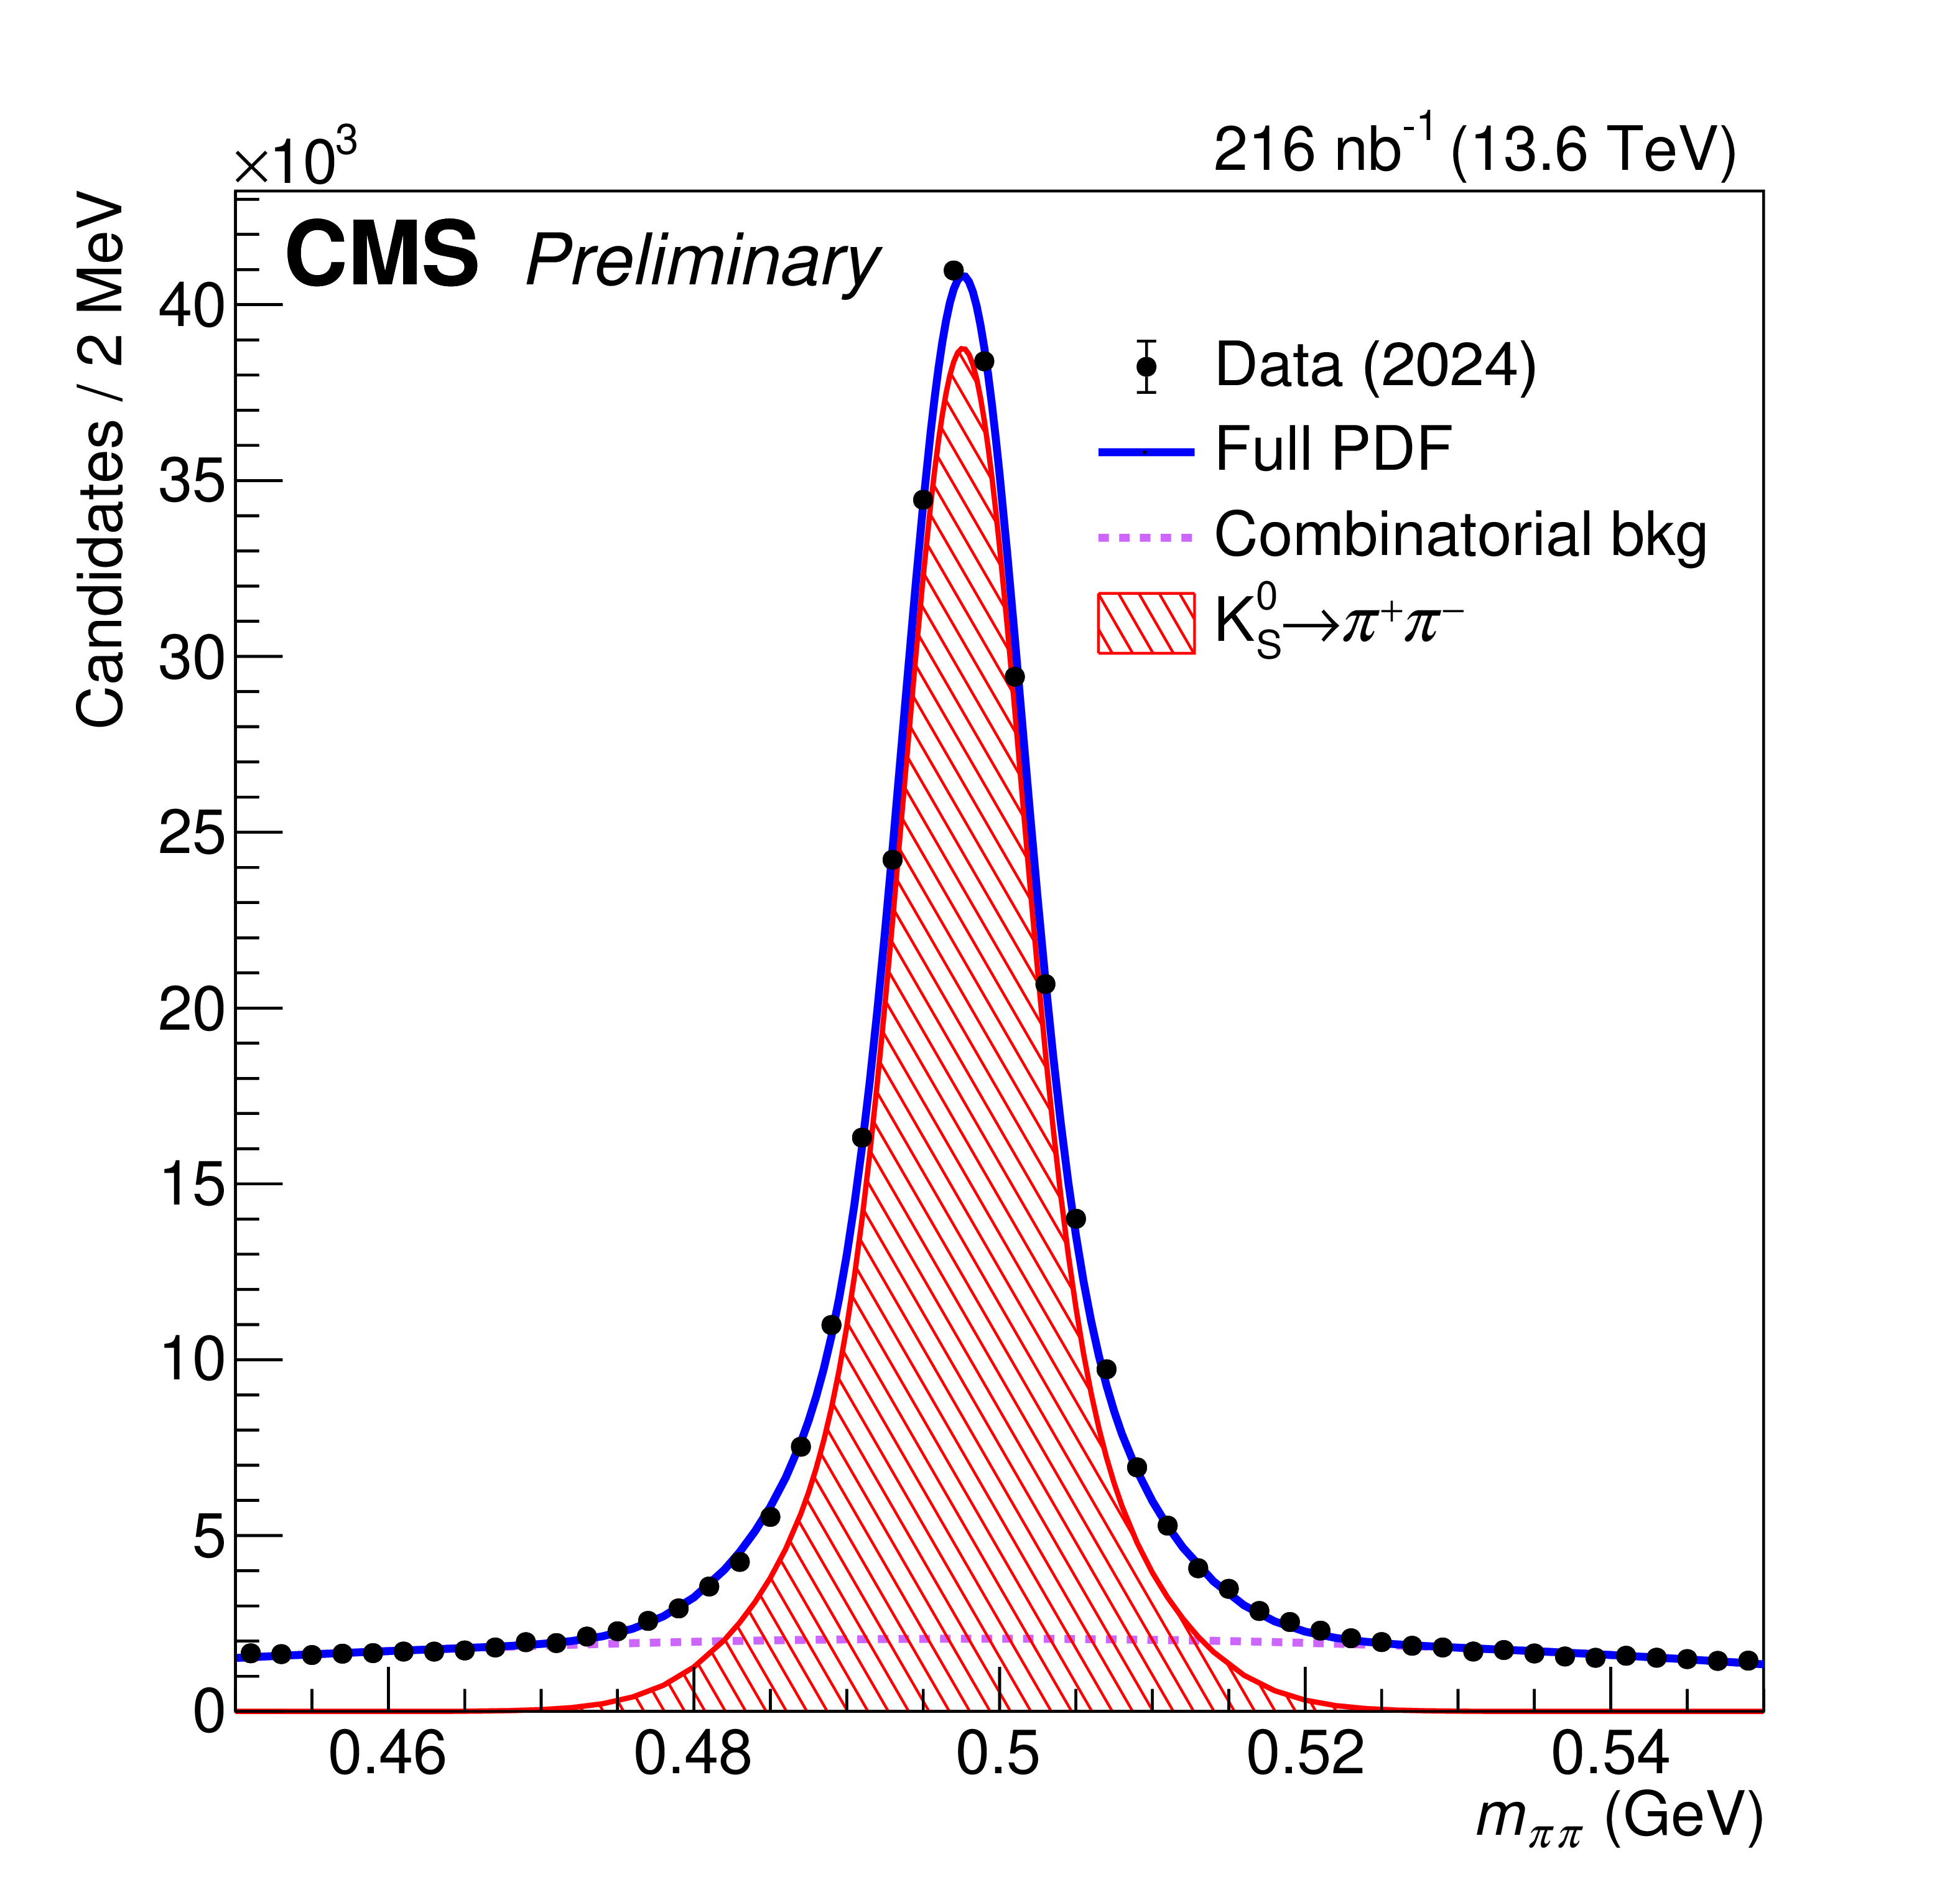
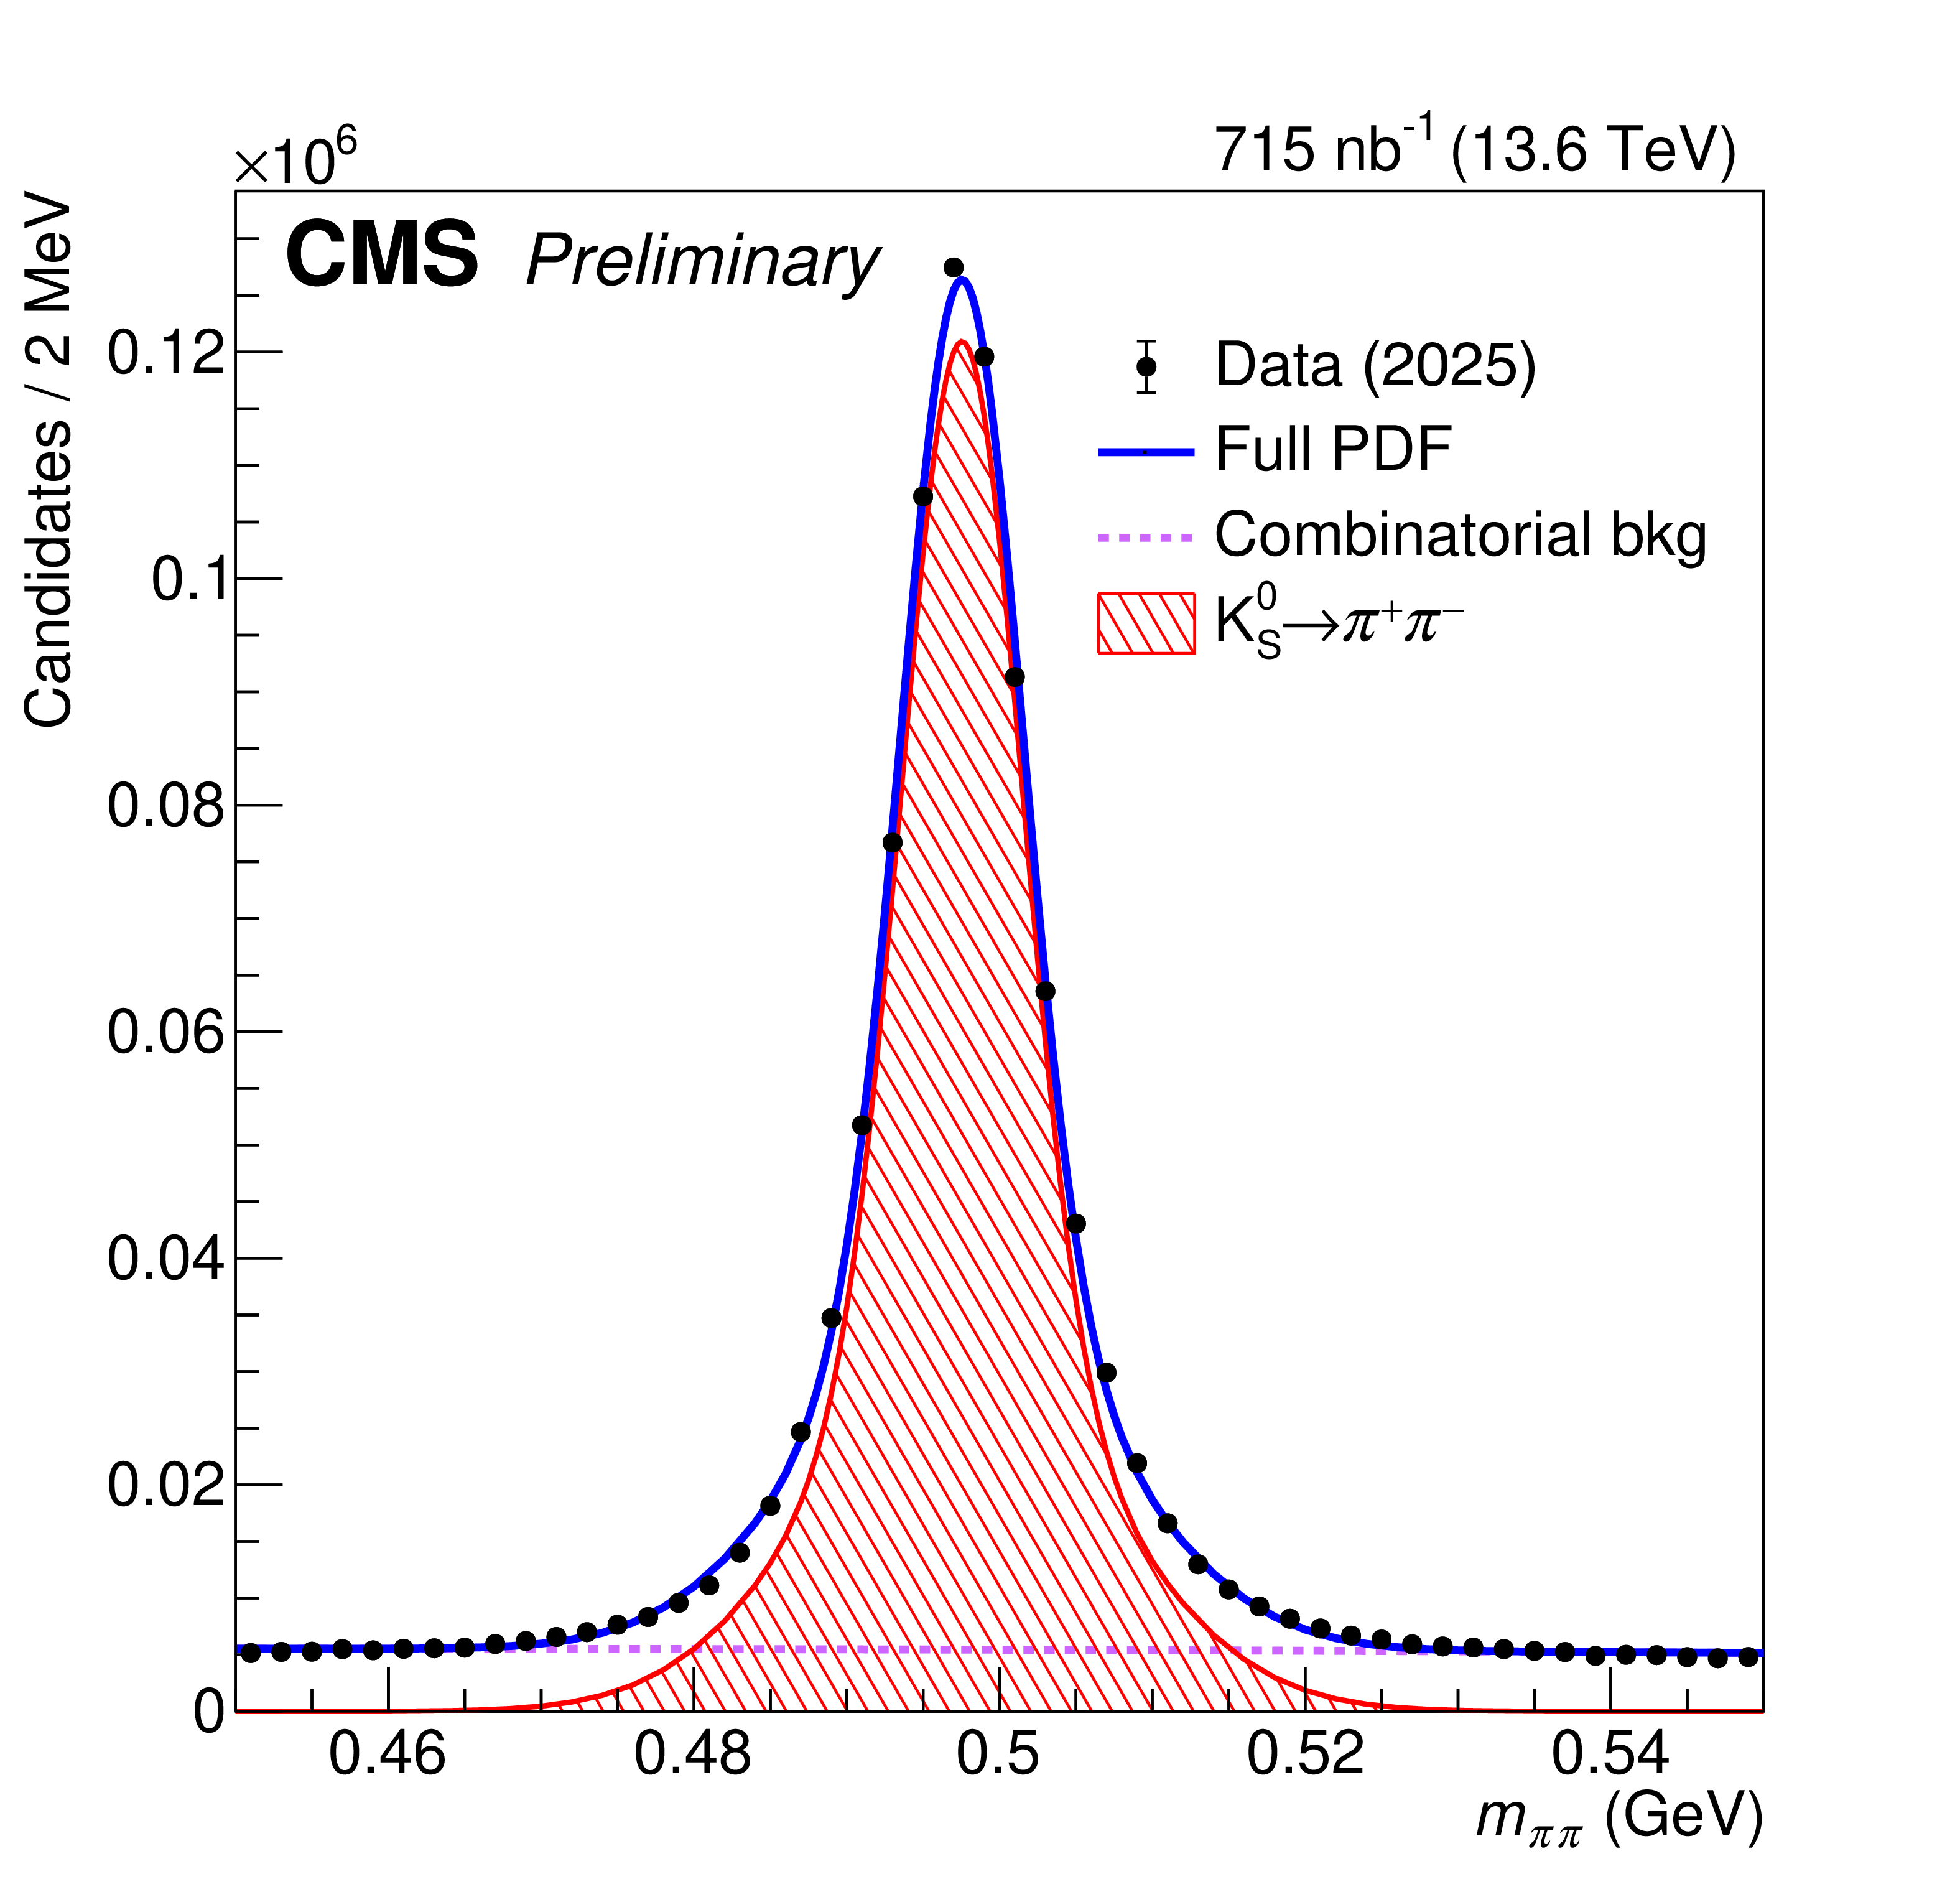
The distributions of the dipion mass $ m_{\pi\pi} $ for the $ \mathrm{K^0_S}\to\pi^+\pi^- $ normalization channel using data collected from 2022 to 2025, along with the total fit (solid curve), the $ \mathrm{K^0_S}\to\pi^+\pi^- $ contribution (hatched area), and the background contributions (dashed curve). |
png pdf |
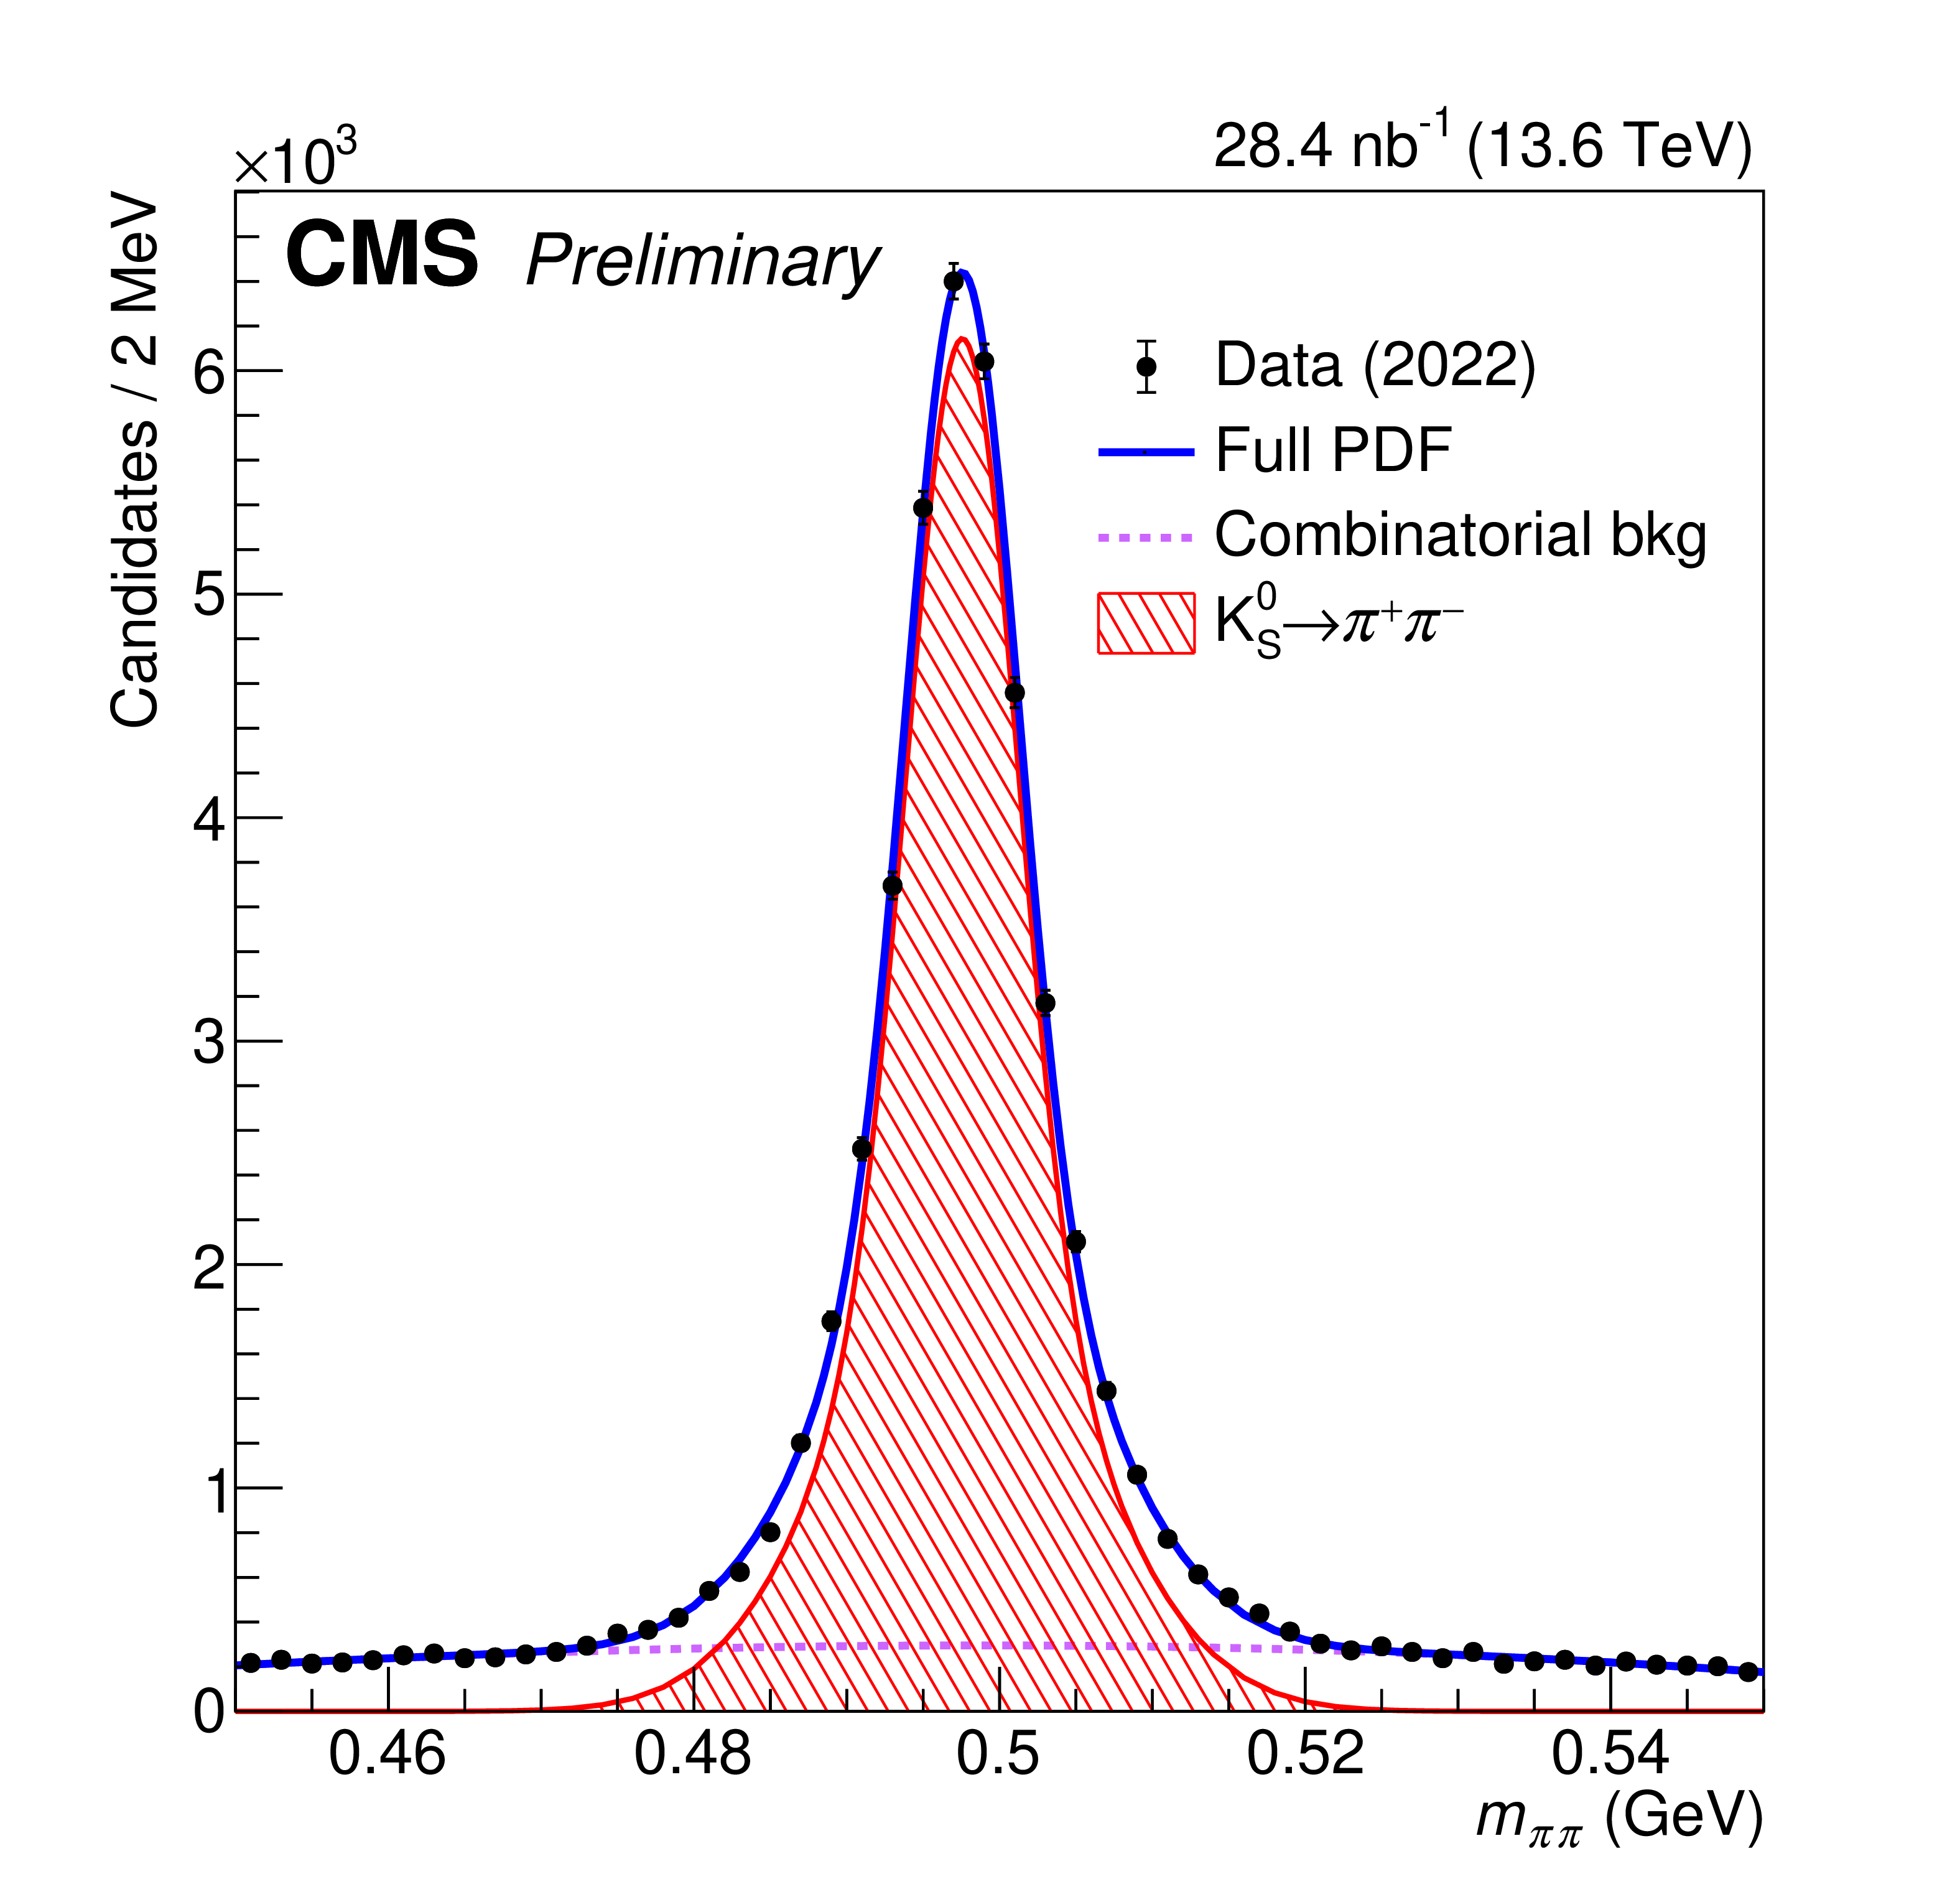
Figure 3-a:
The distributions of the dipion mass $ m_{\pi\pi} $ for the $ \mathrm{K^0_S}\to\pi^+\pi^- $ normalization channel using data collected from 2022 to 2025, along with the total fit (solid curve), the $ \mathrm{K^0_S}\to\pi^+\pi^- $ contribution (hatched area), and the background contributions (dashed curve). |
png pdf |
Figure 3-b:
The distributions of the dipion mass $ m_{\pi\pi} $ for the $ \mathrm{K^0_S}\to\pi^+\pi^- $ normalization channel using data collected from 2022 to 2025, along with the total fit (solid curve), the $ \mathrm{K^0_S}\to\pi^+\pi^- $ contribution (hatched area), and the background contributions (dashed curve). |
png pdf |
Figure 3-c:
The distributions of the dipion mass $ m_{\pi\pi} $ for the $ \mathrm{K^0_S}\to\pi^+\pi^- $ normalization channel using data collected from 2022 to 2025, along with the total fit (solid curve), the $ \mathrm{K^0_S}\to\pi^+\pi^- $ contribution (hatched area), and the background contributions (dashed curve). |
png pdf |
Figure 3-d:
The distributions of the dipion mass $ m_{\pi\pi} $ for the $ \mathrm{K^0_S}\to\pi^+\pi^- $ normalization channel using data collected from 2022 to 2025, along with the total fit (solid curve), the $ \mathrm{K^0_S}\to\pi^+\pi^- $ contribution (hatched area), and the background contributions (dashed curve). |
png pdf |
Figure 4:
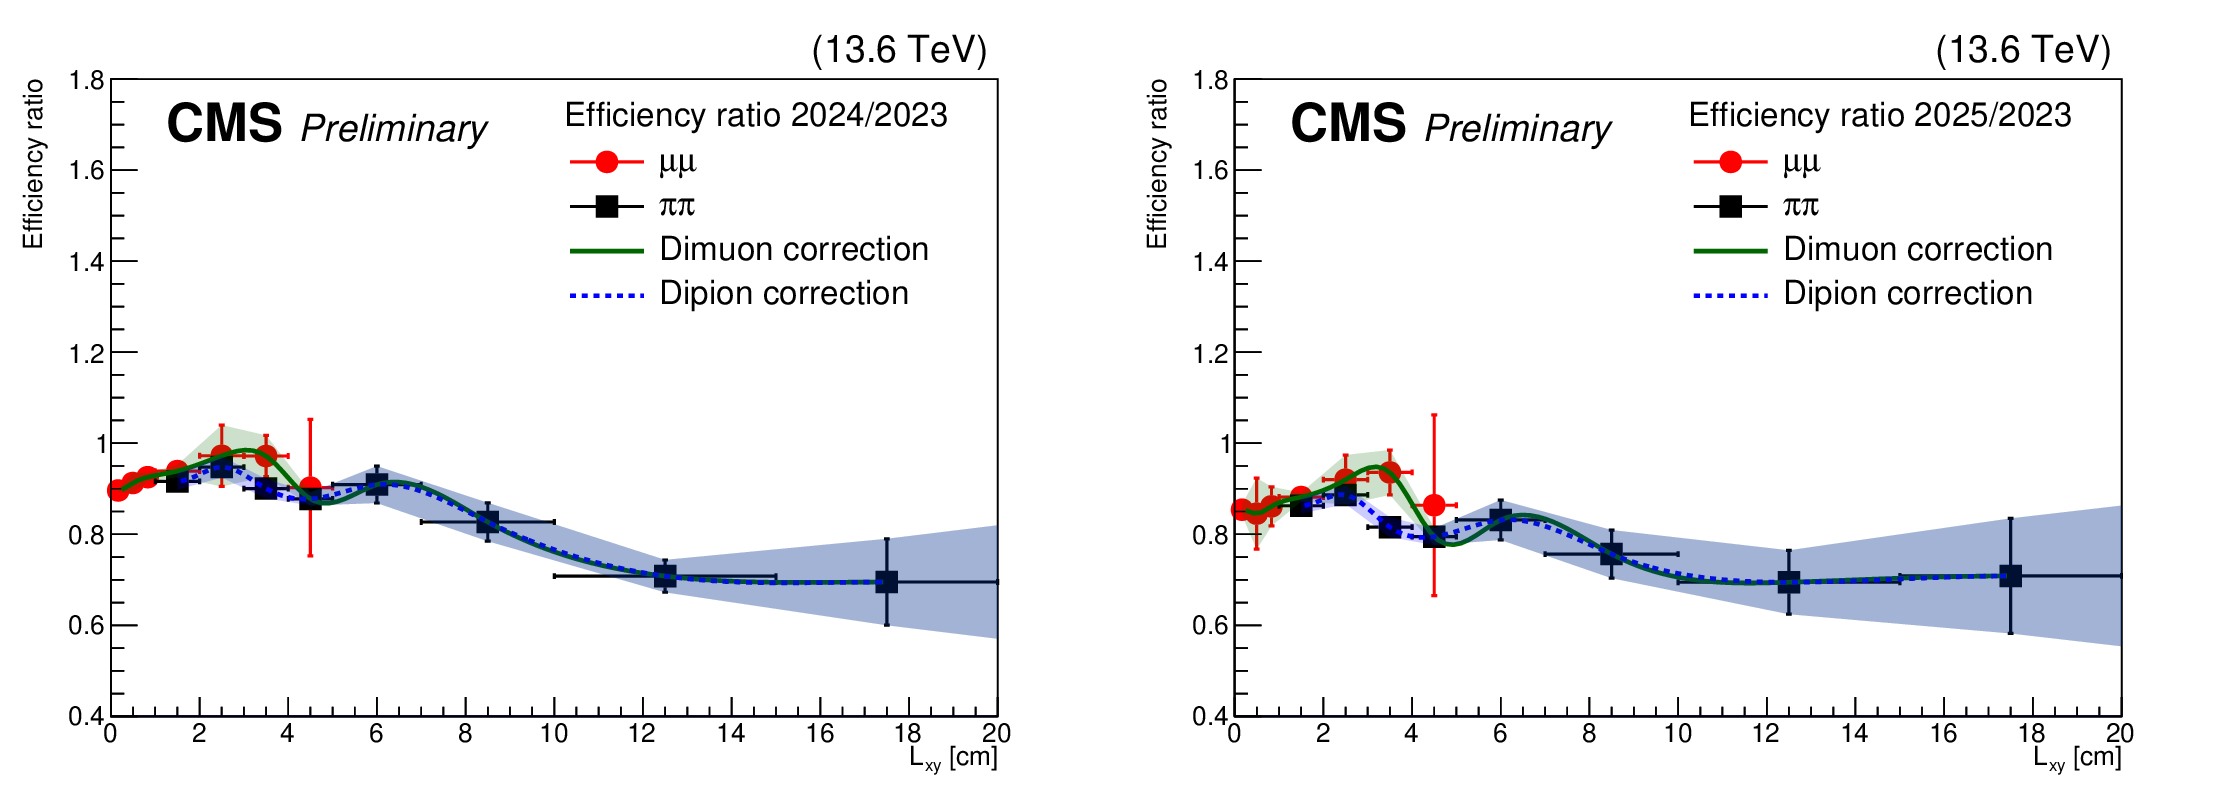
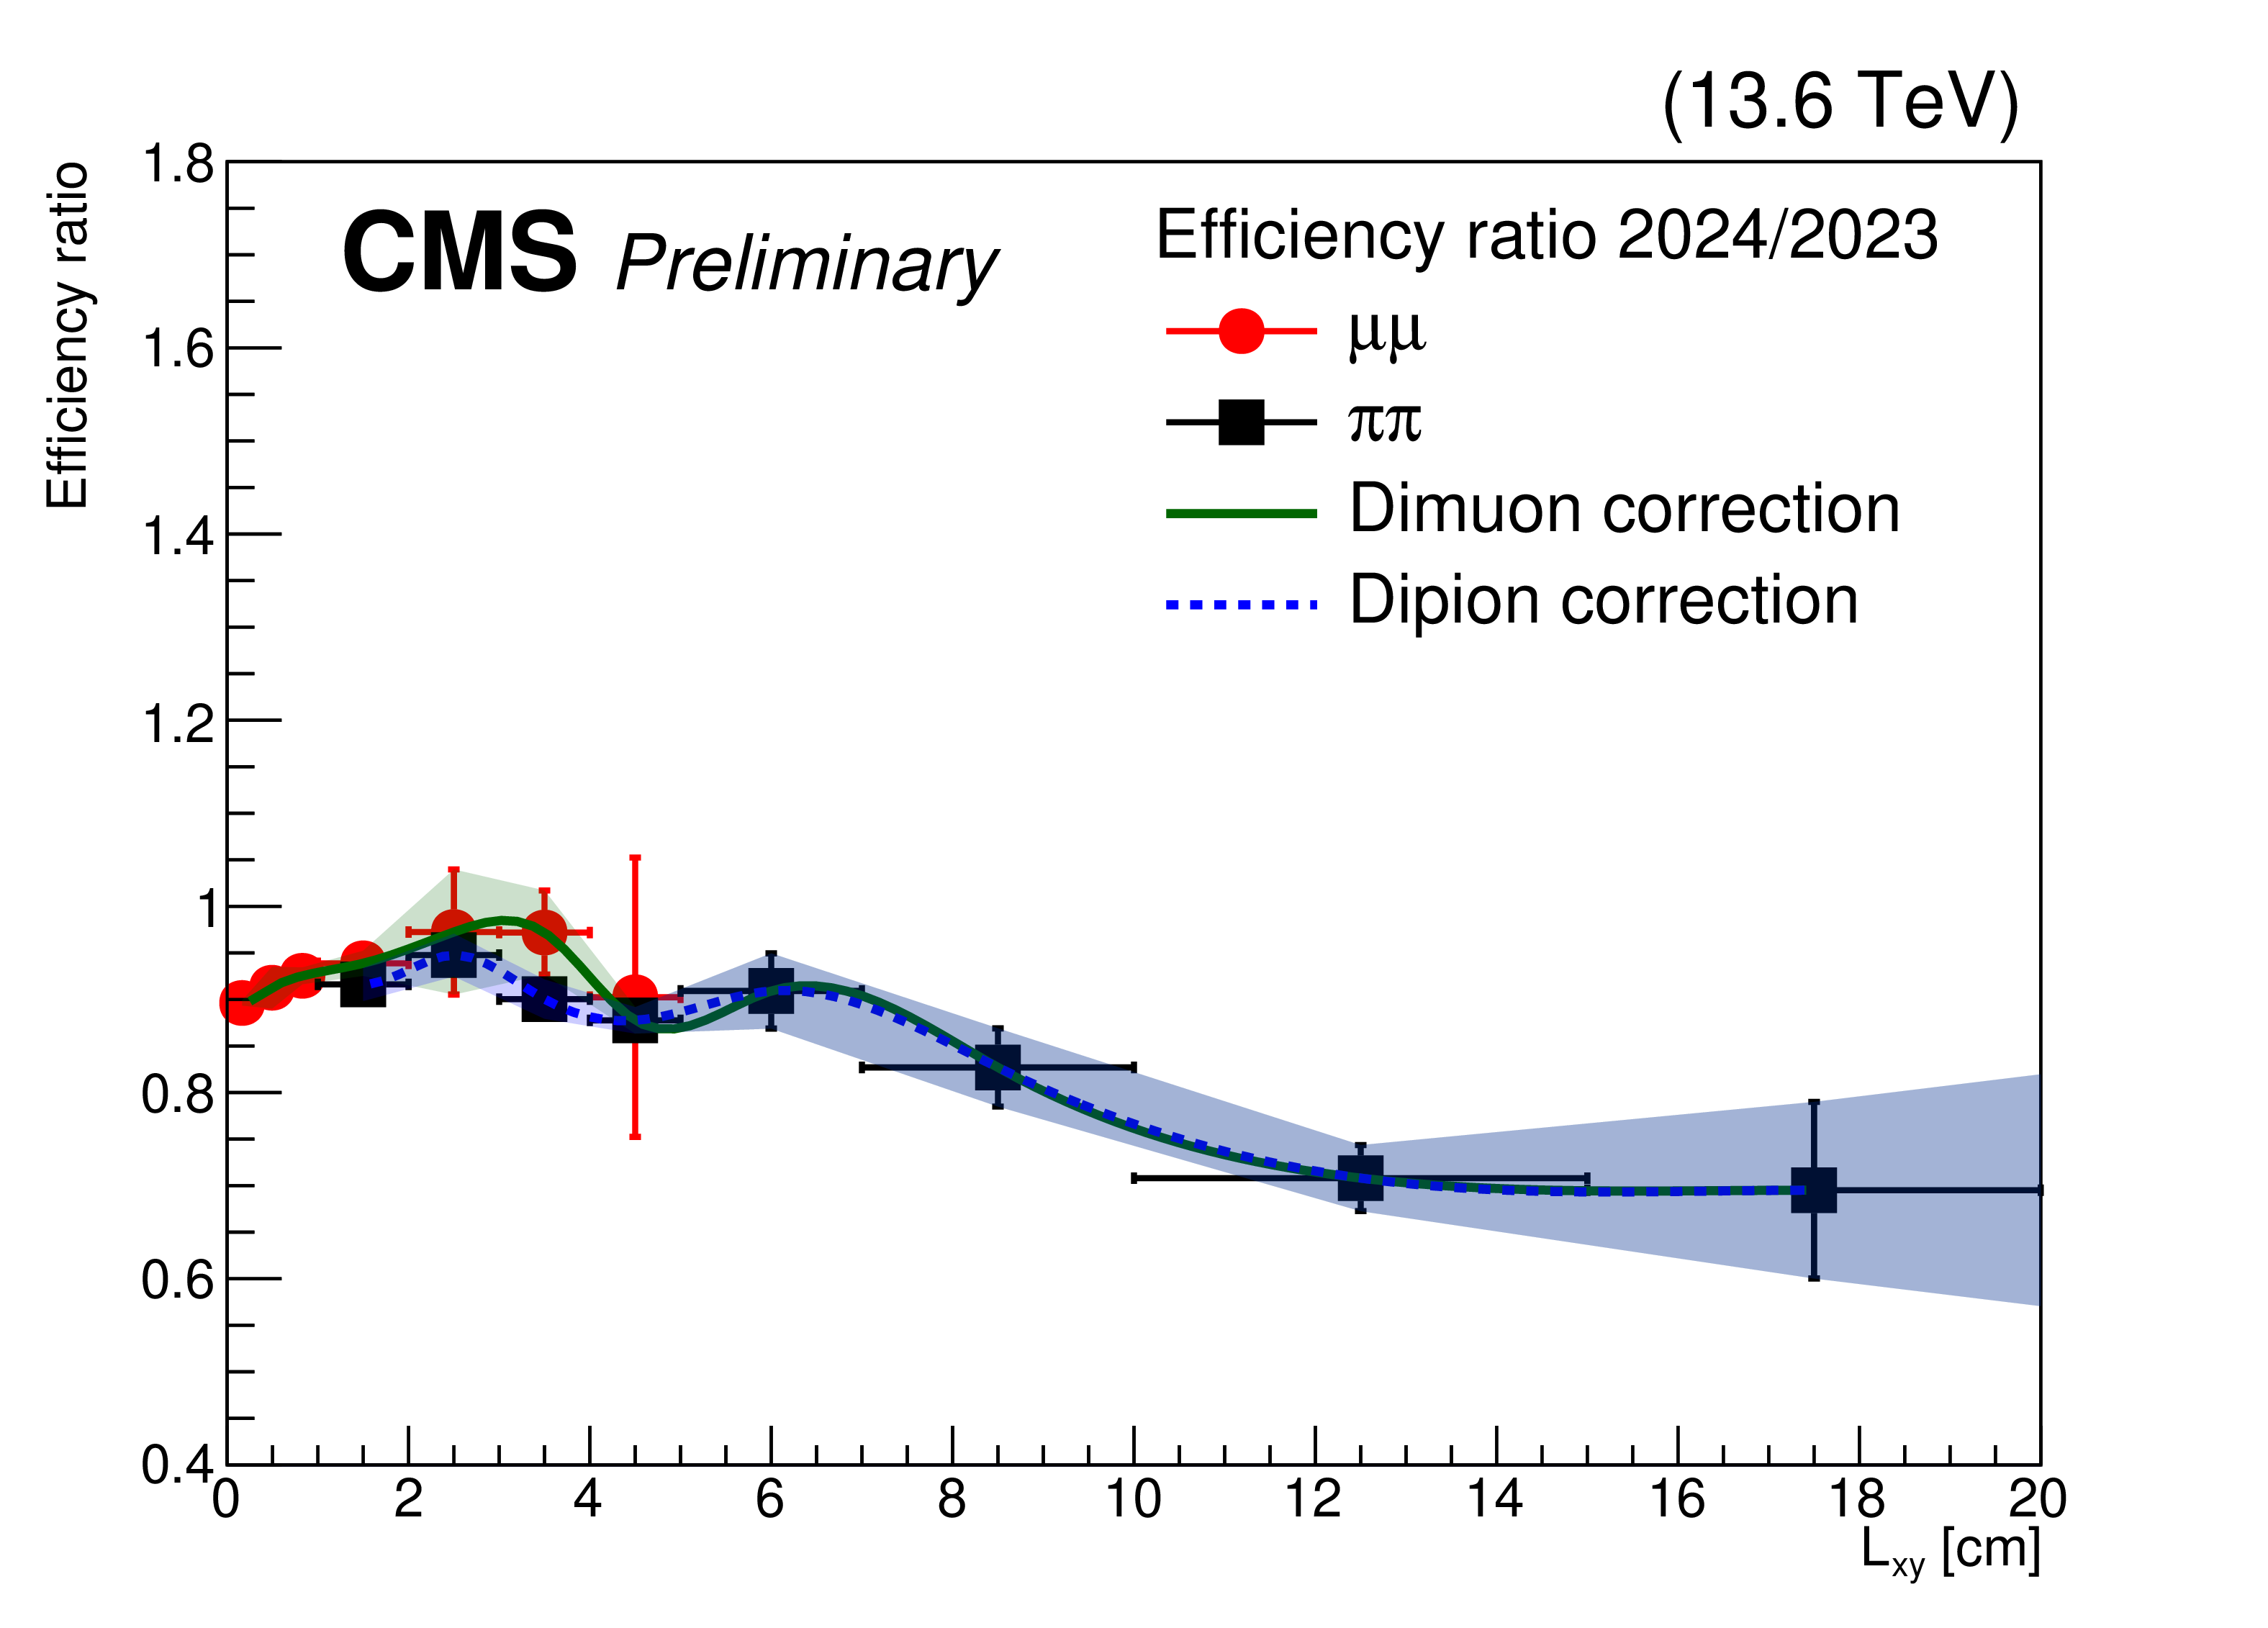
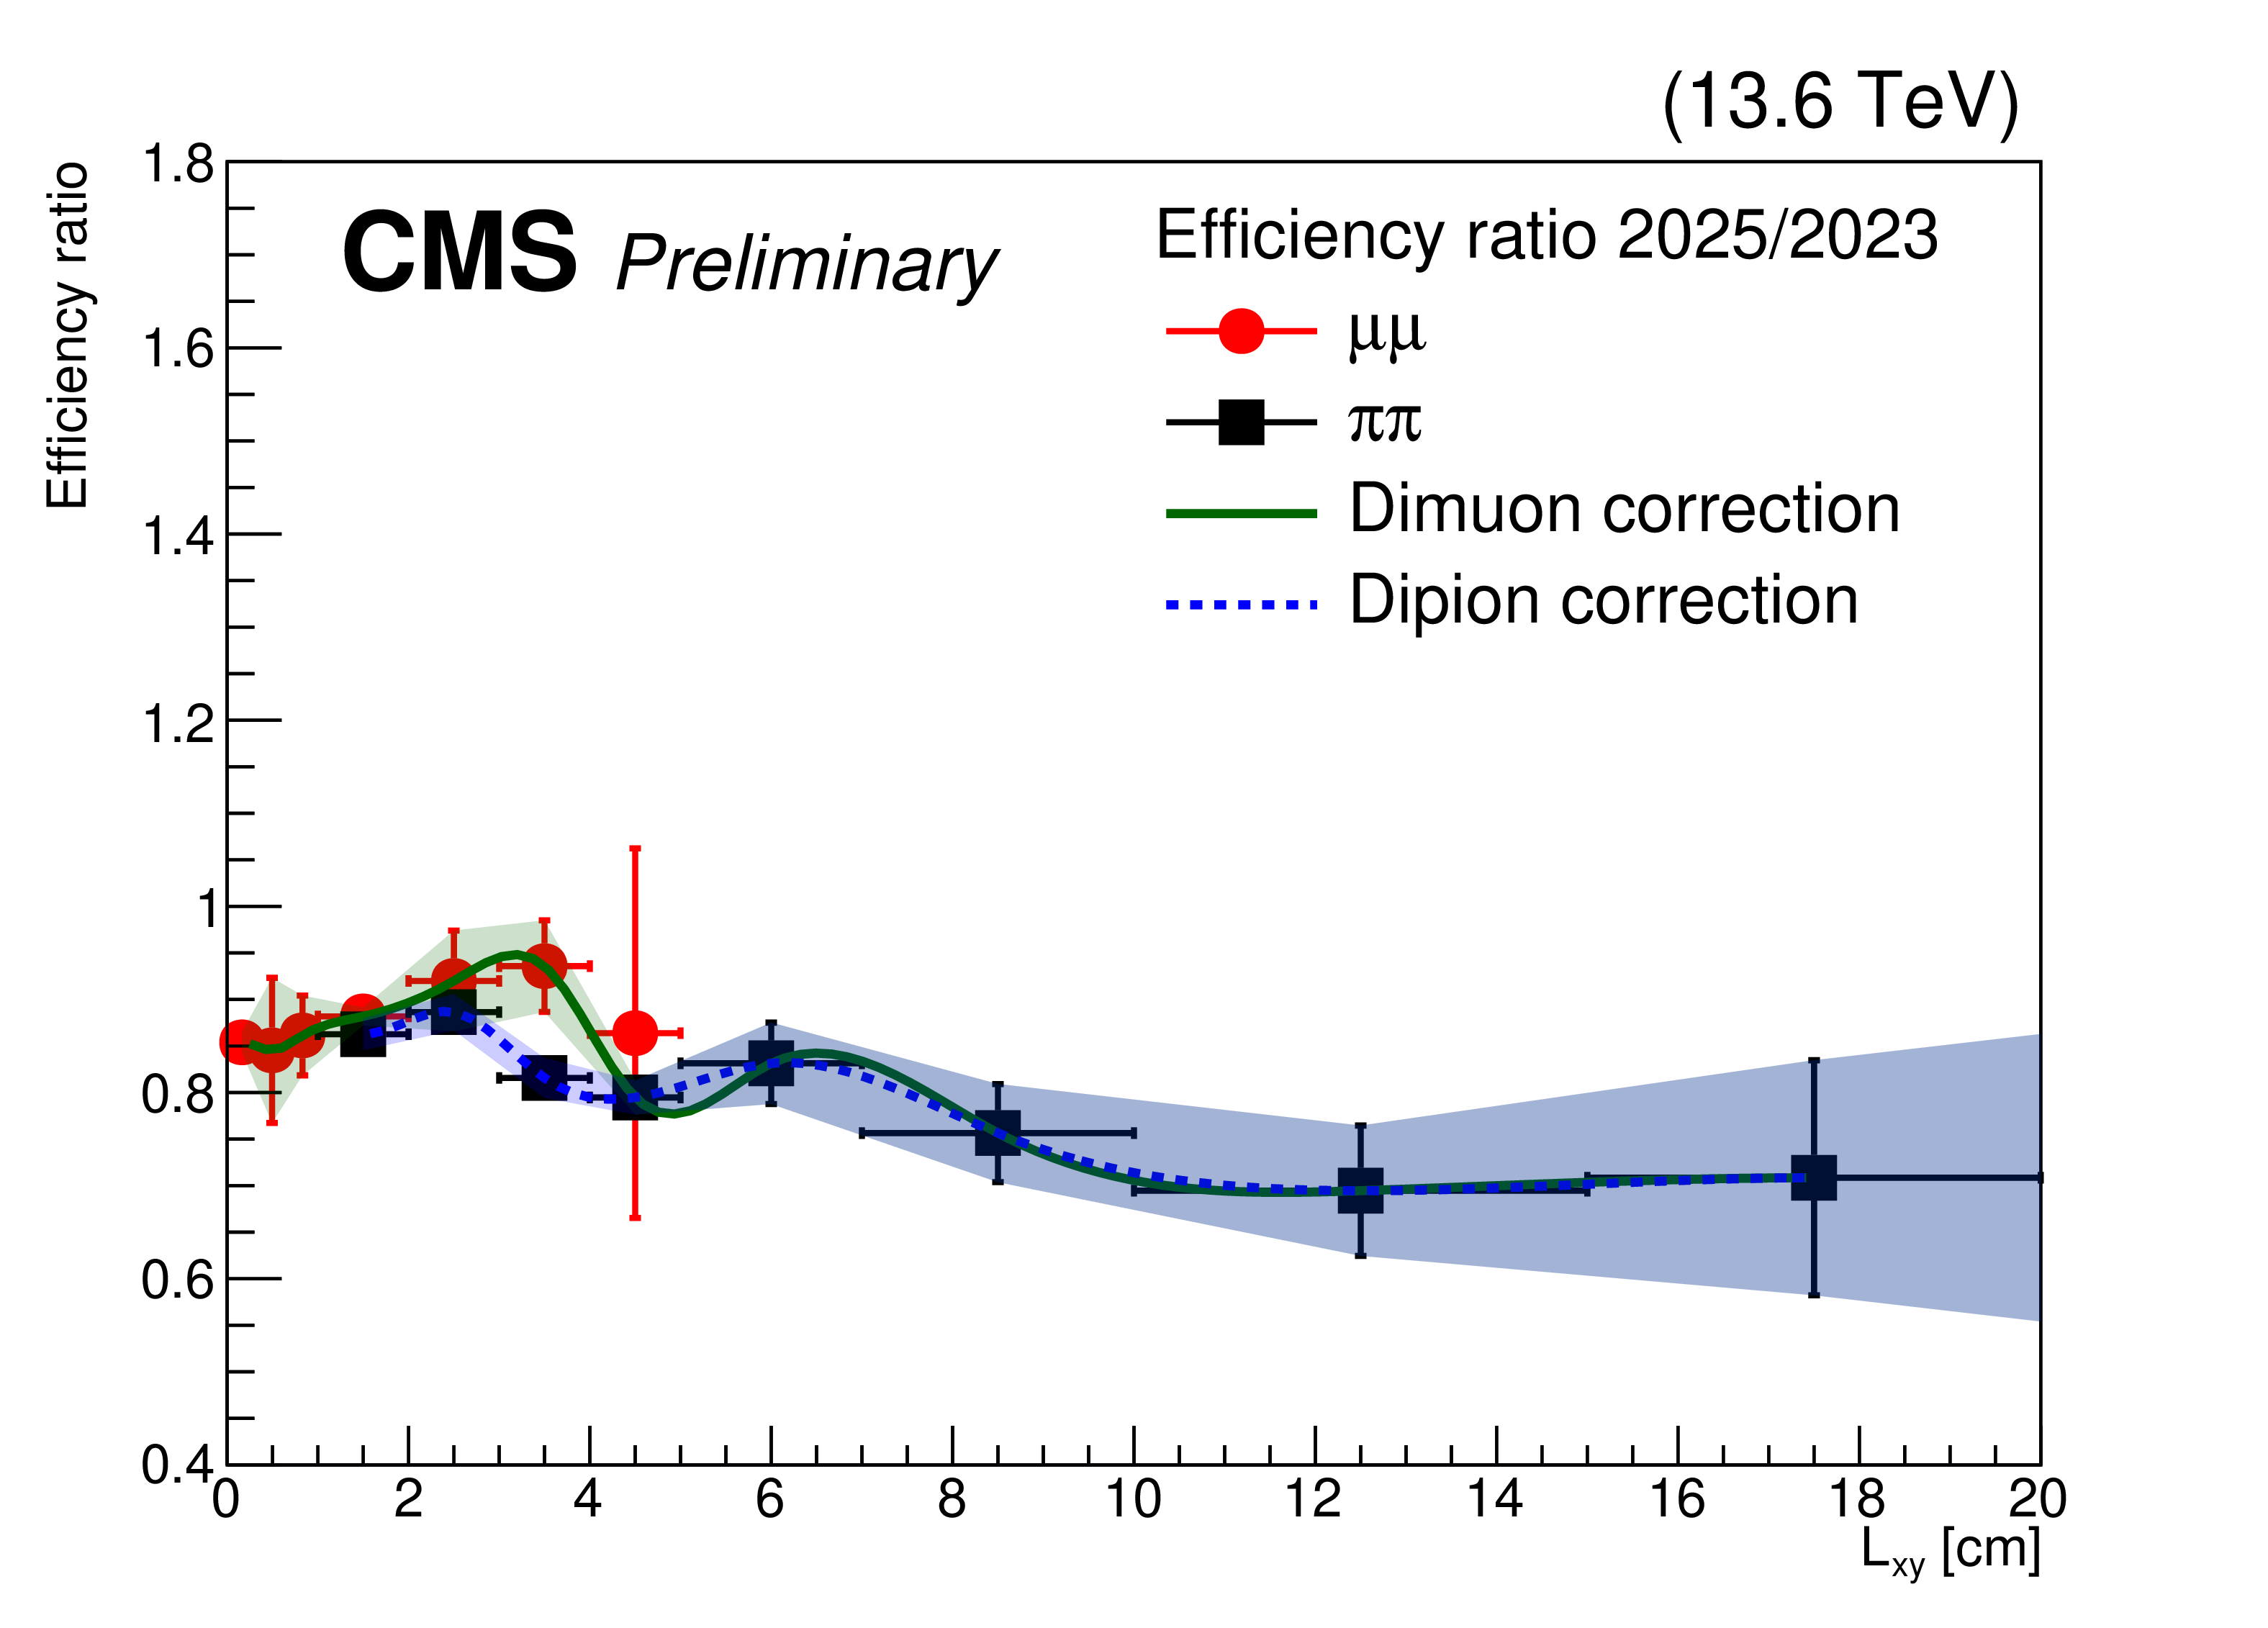
The efficiency comparison between 2024 (left) and 2025 (right) to 2023 for dimuon and dipion final states as a function of transverse displacement $ L_{\mathrm{xy}} $. Smooth functions, implemented via cubic splines, are used to extract the correction values continuously as a function of $ L_{\mathrm{xy}} $. |
png pdf |
Figure 4-a:
The efficiency comparison between 2024 (left) and 2025 (right) to 2023 for dimuon and dipion final states as a function of transverse displacement $ L_{\mathrm{xy}} $. Smooth functions, implemented via cubic splines, are used to extract the correction values continuously as a function of $ L_{\mathrm{xy}} $. |
png pdf |
Figure 4-b:
The efficiency comparison between 2024 (left) and 2025 (right) to 2023 for dimuon and dipion final states as a function of transverse displacement $ L_{\mathrm{xy}} $. Smooth functions, implemented via cubic splines, are used to extract the correction values continuously as a function of $ L_{\mathrm{xy}} $. |
png pdf |
Figure 5:
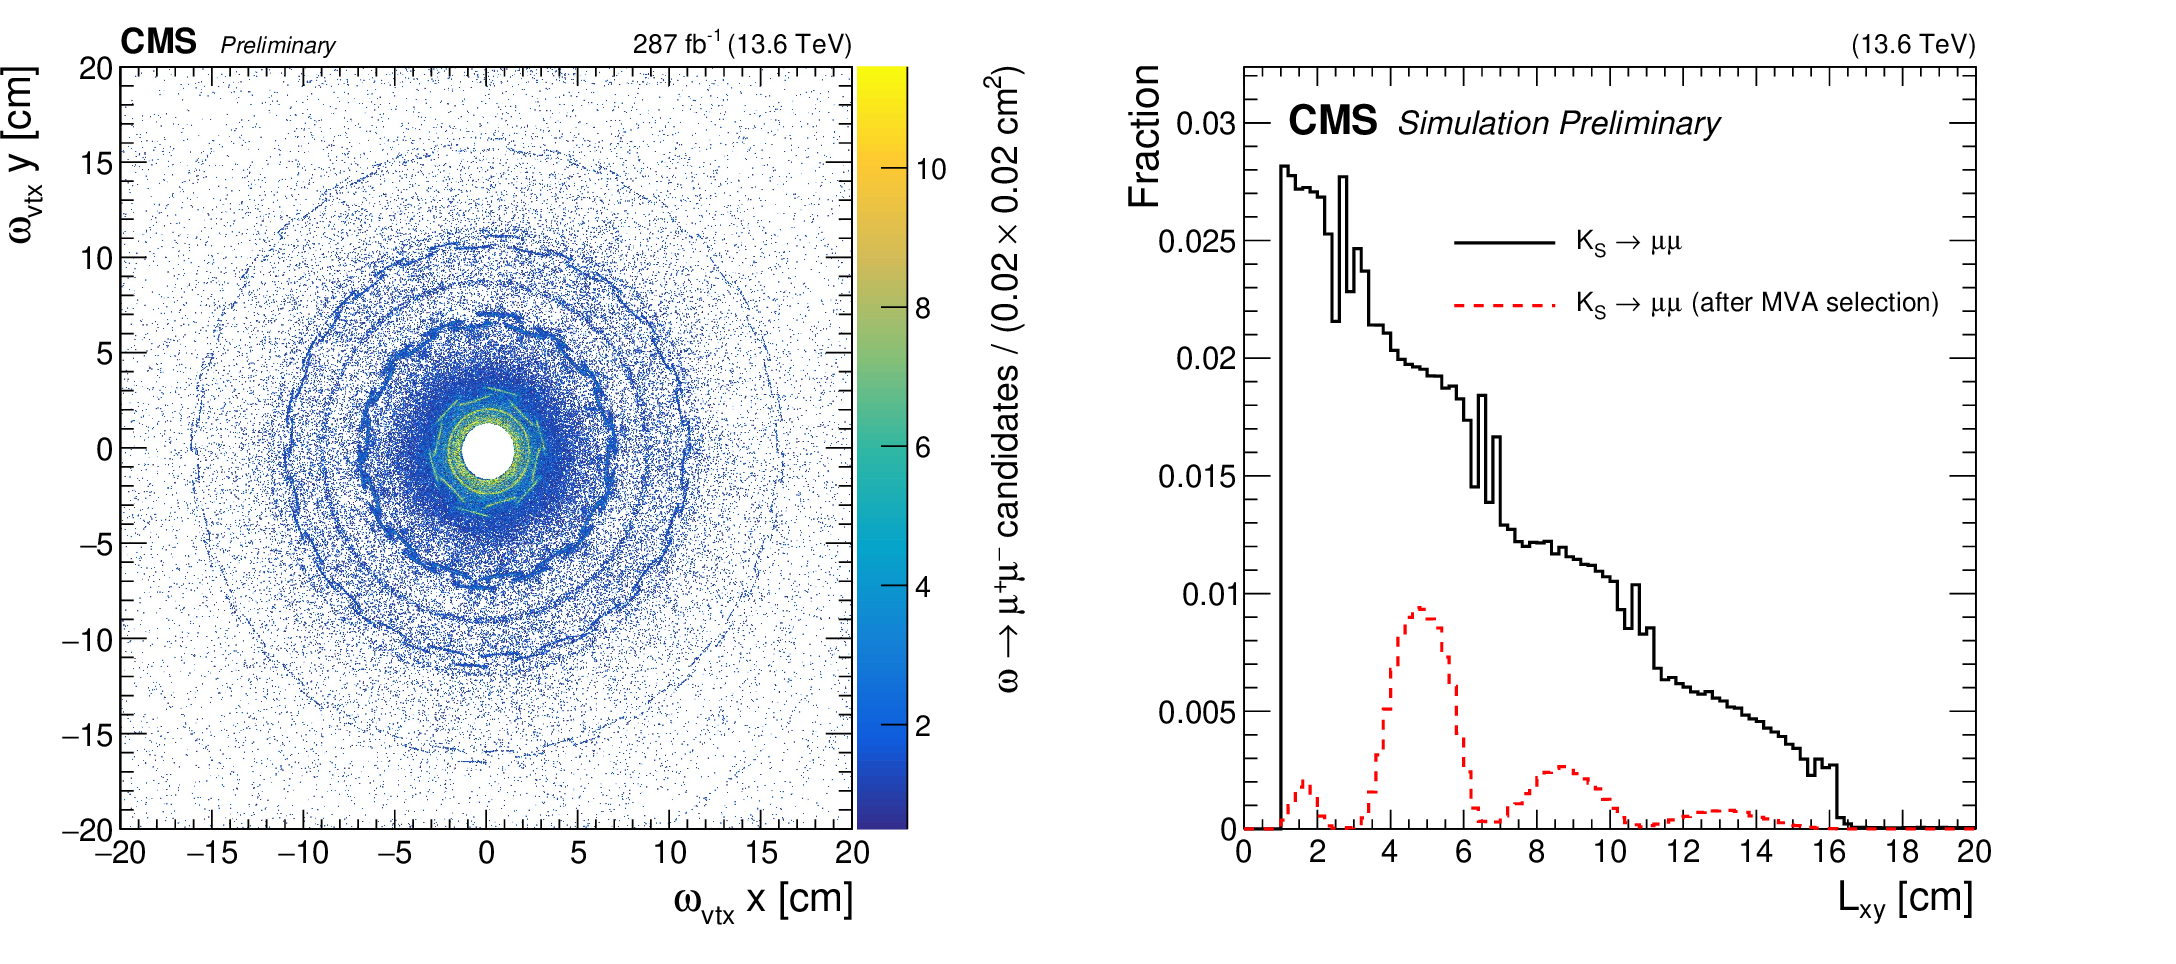
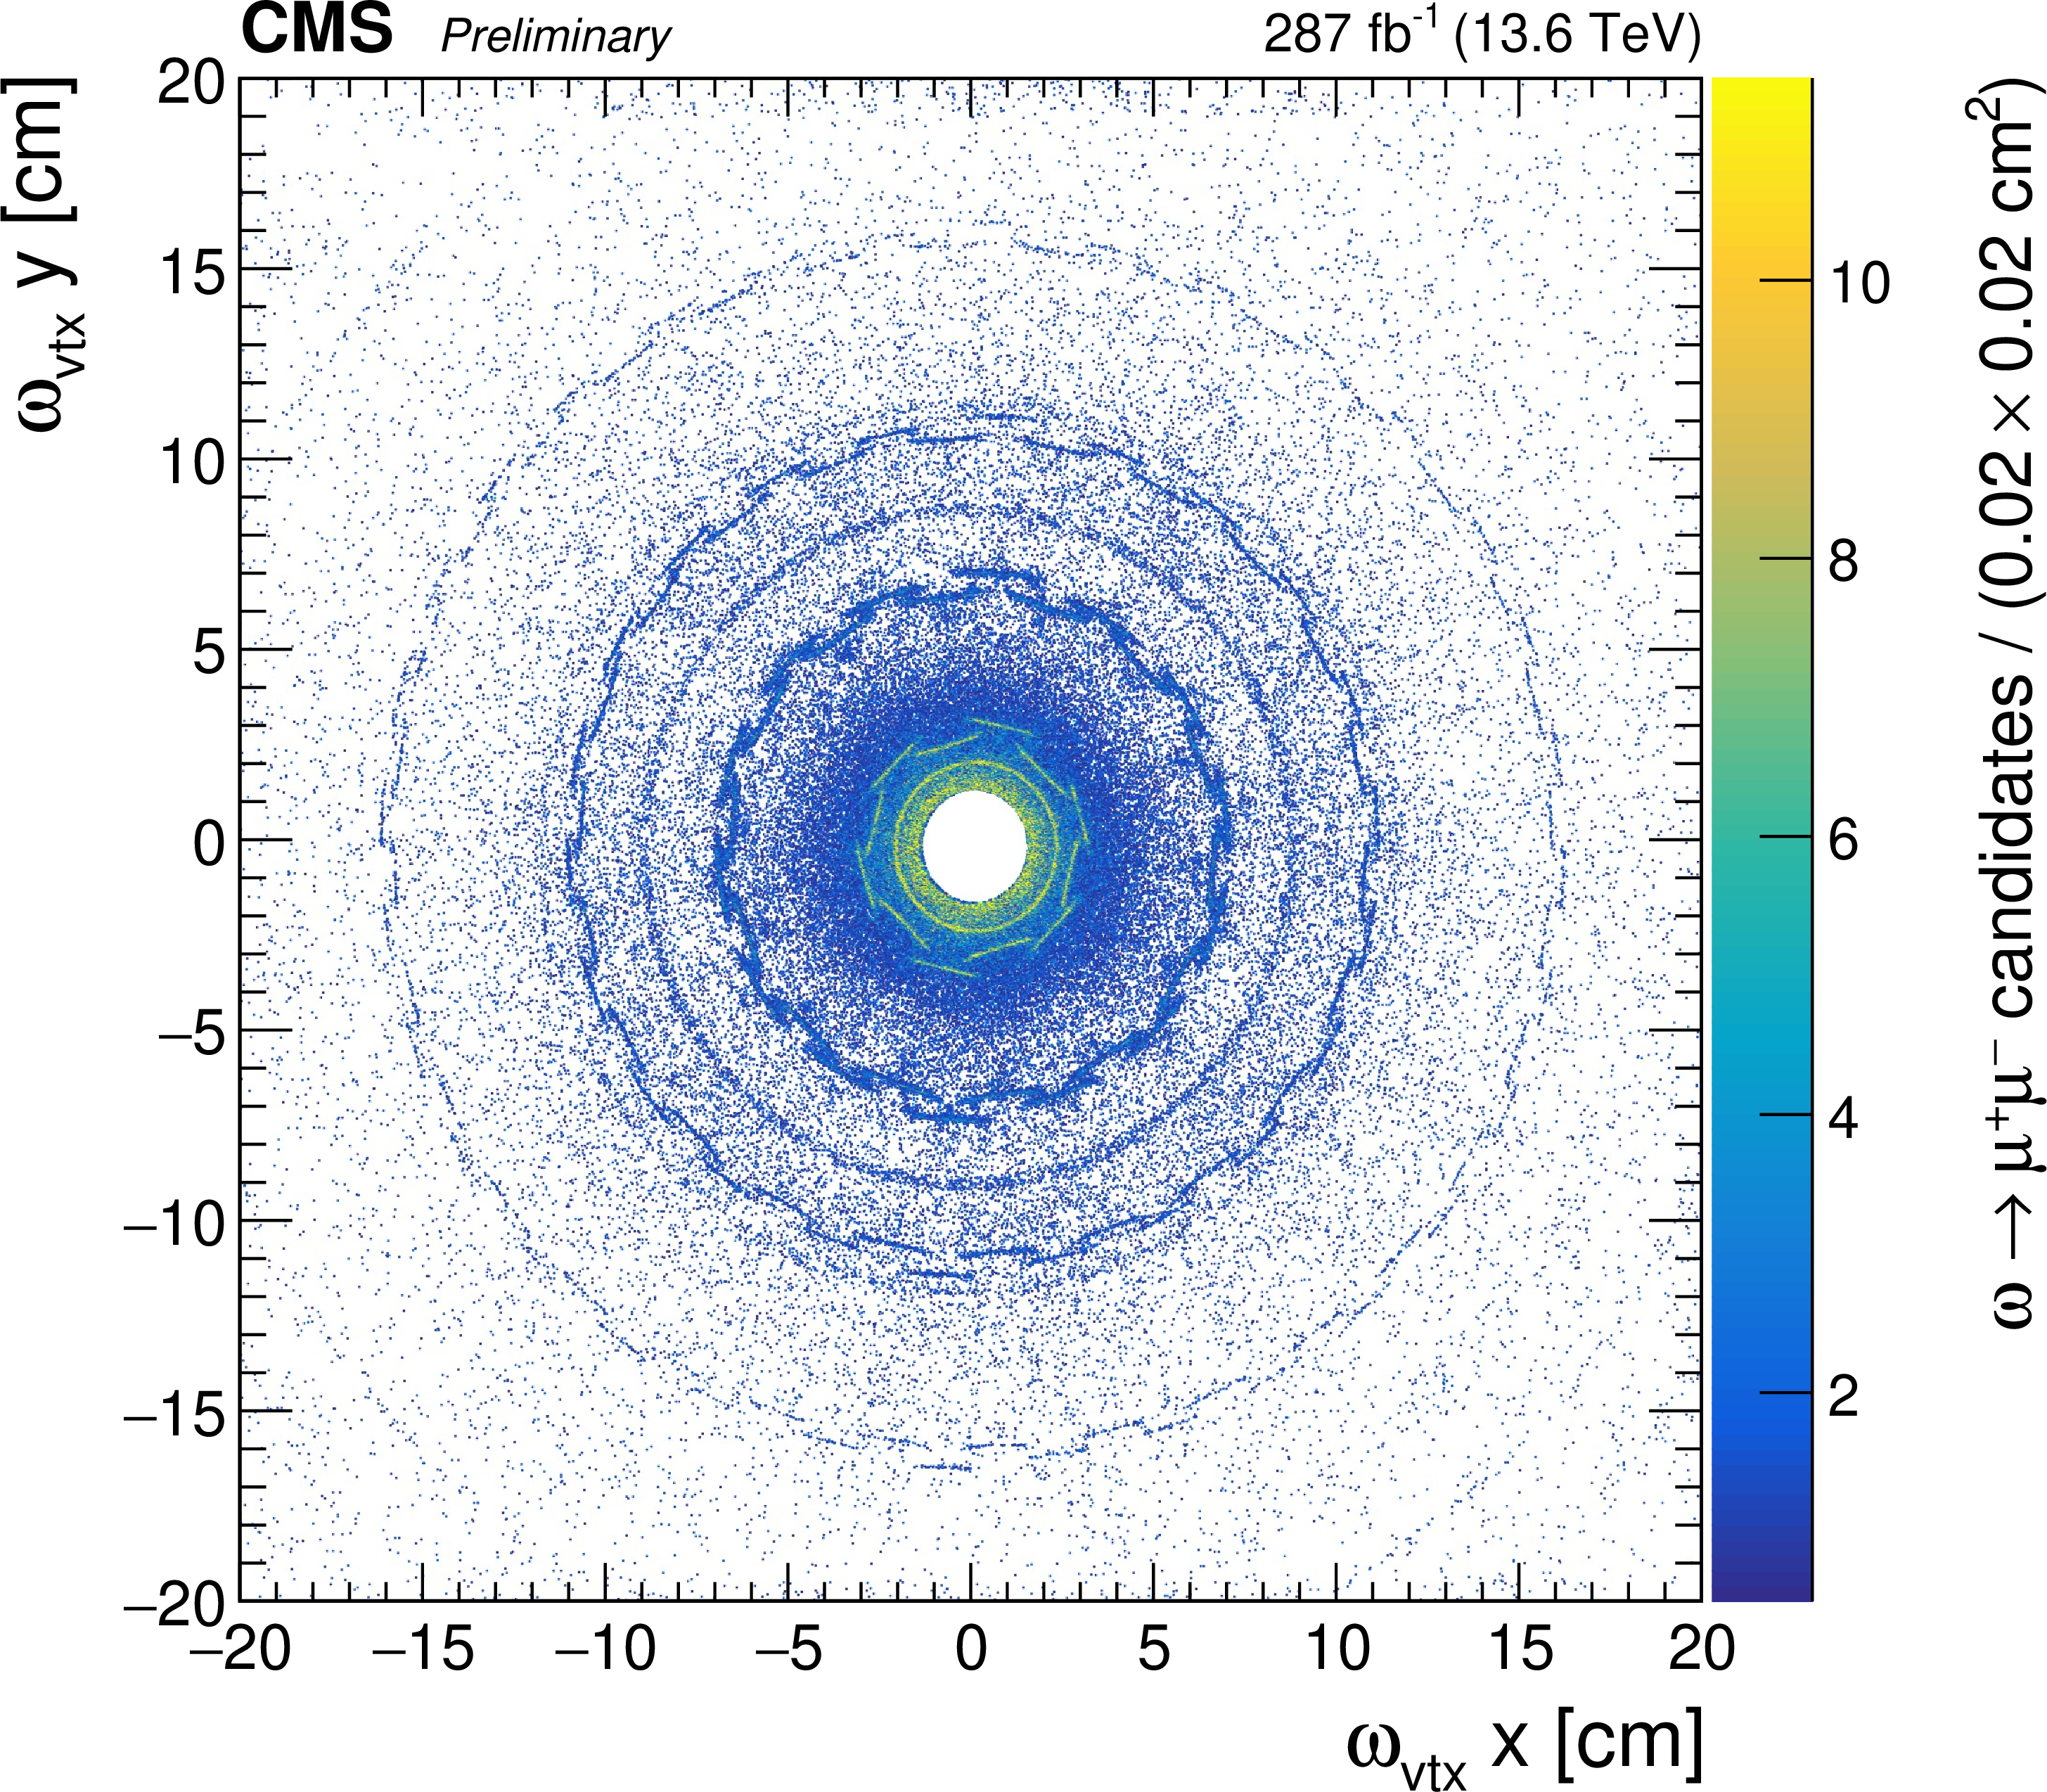
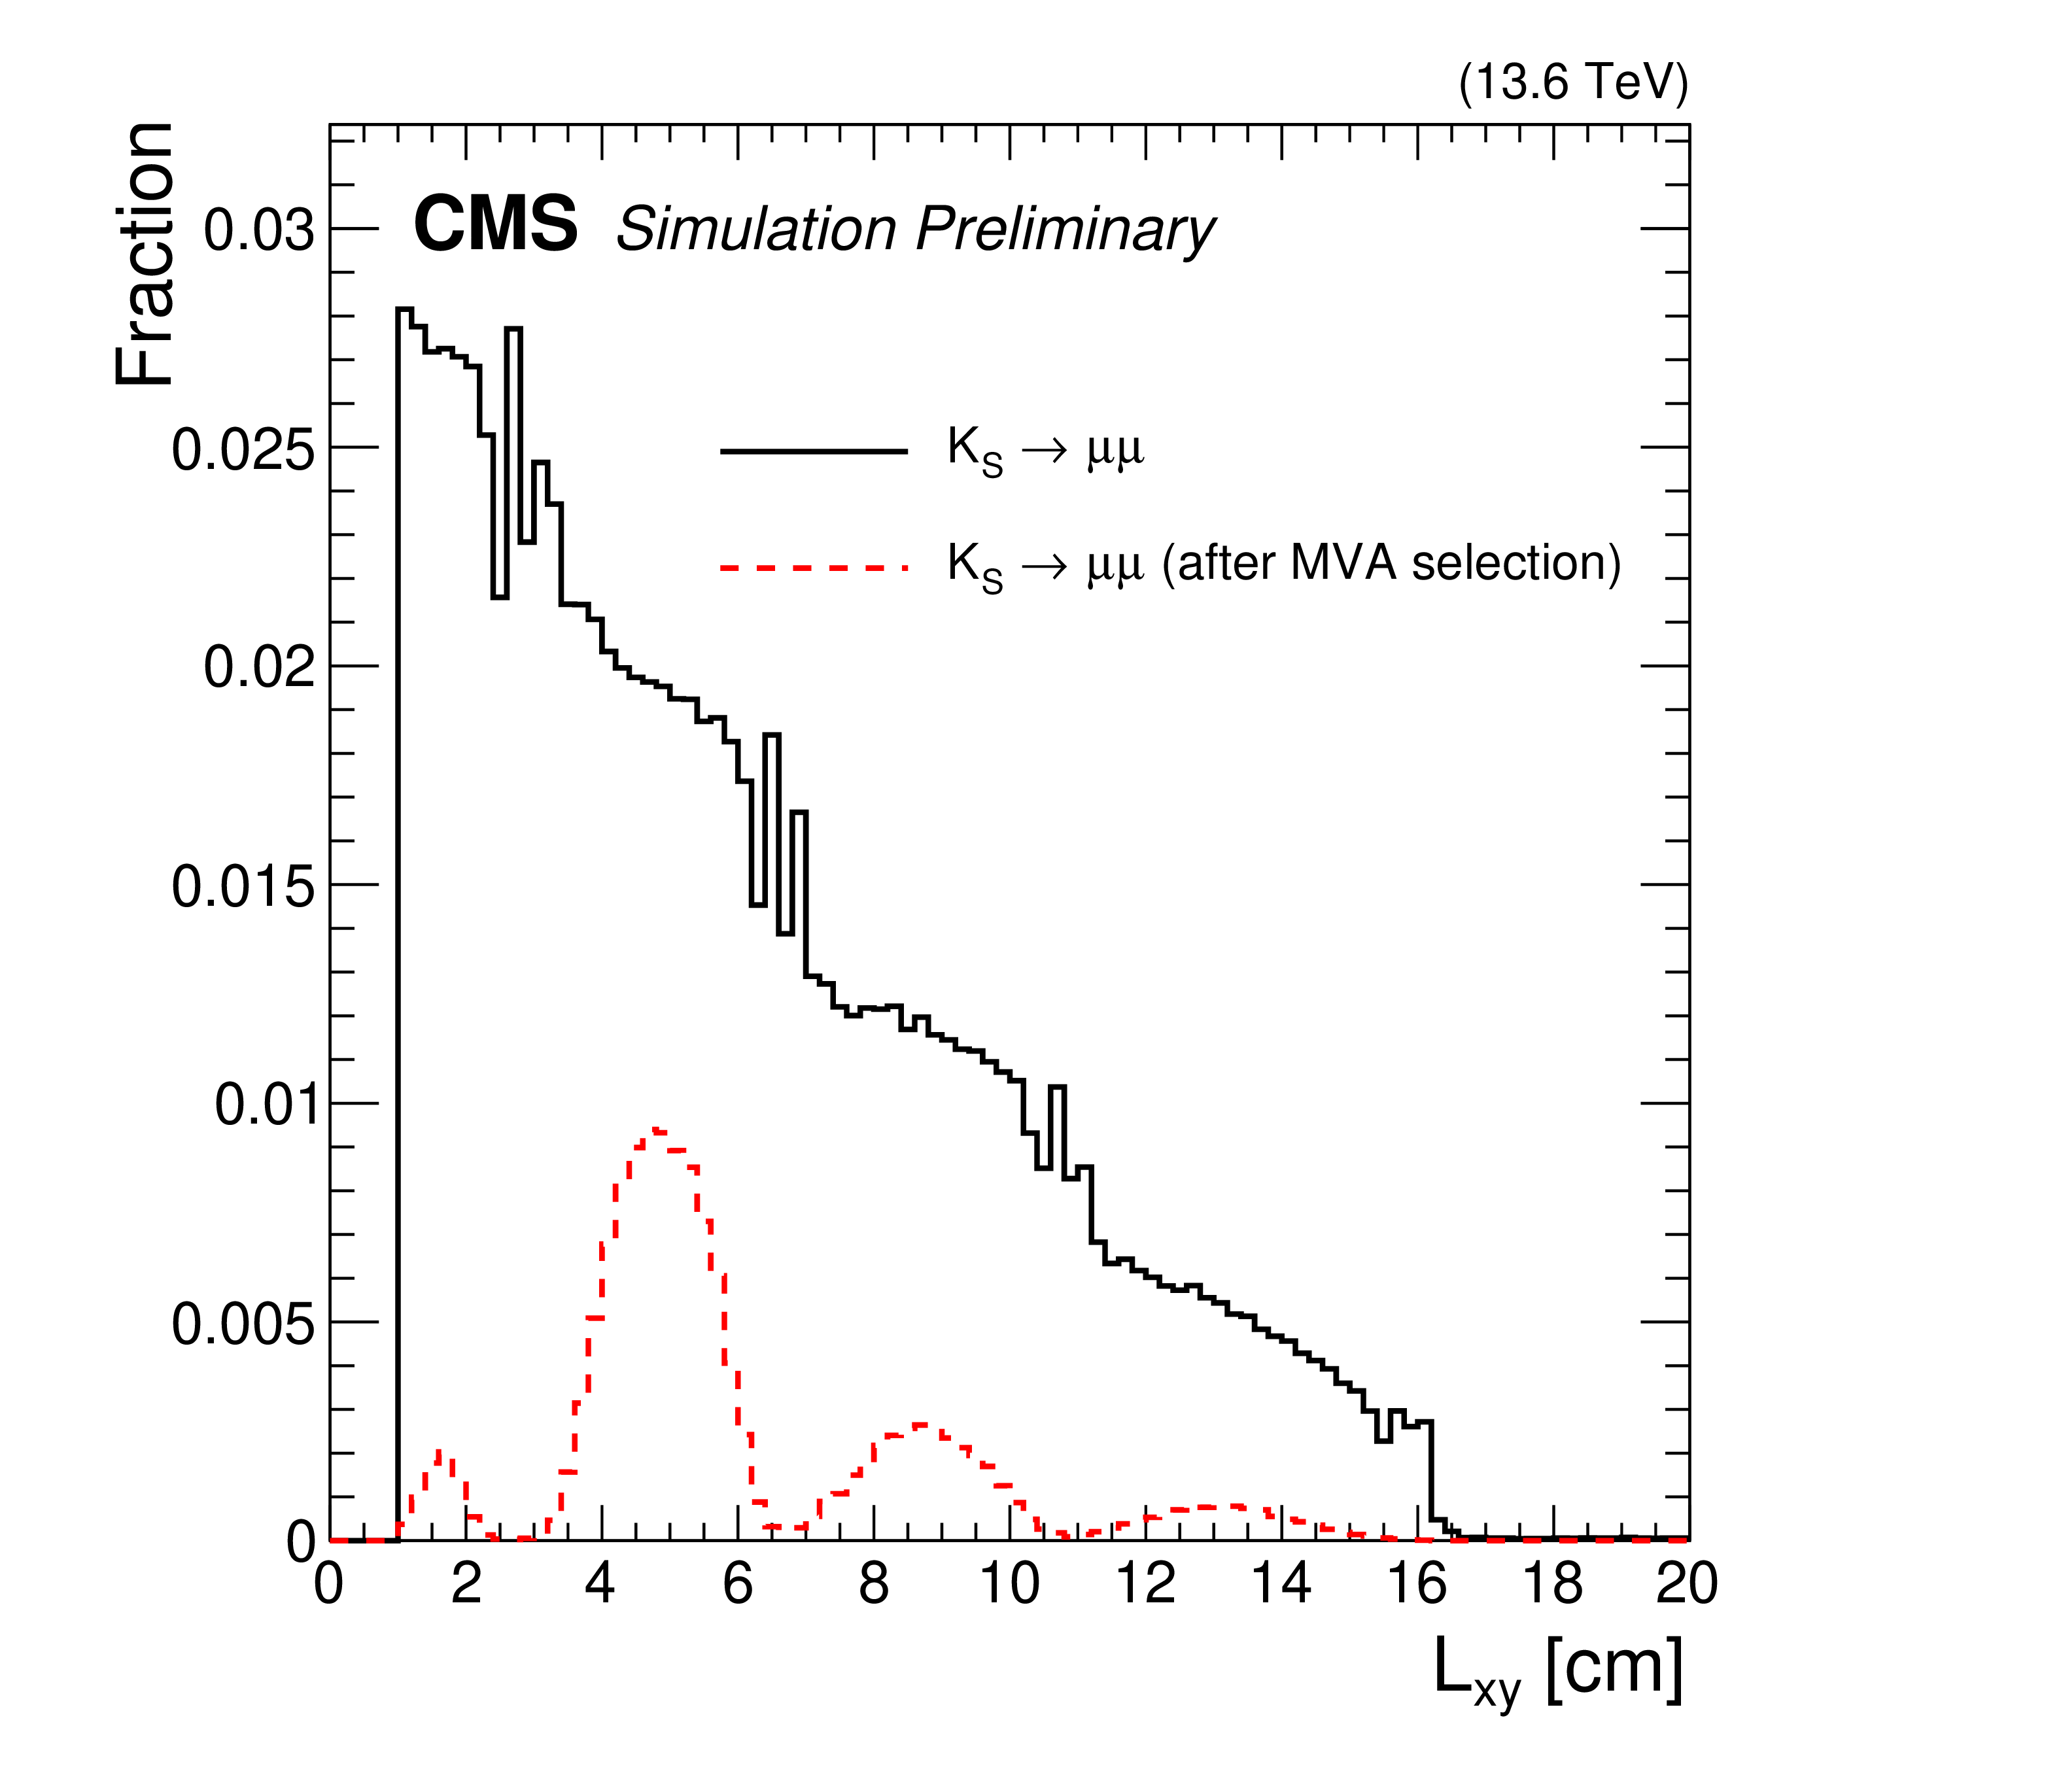
Left: the distribution of the vertices of $ \omega\to\mu^{+}\mu^{-} $ decays in the transverse plane on the beam pipe and CMS pixel layers from the data, using the $ _\mathrm{{s}}\mathcal{P}\mathrm{lot} $ technique [30]. Right: the $ L_{\mathrm{xy}} $ distributions for the $ \mathrm{K^0_S}\to\mu^{+}\mu^{-} $ simulation before and after the MVA selection, normalized to unity based on the preselection distribution. |
png pdf |
Figure 5-a:
Left: the distribution of the vertices of $ \omega\to\mu^{+}\mu^{-} $ decays in the transverse plane on the beam pipe and CMS pixel layers from the data, using the $ _\mathrm{{s}}\mathcal{P}\mathrm{lot} $ technique [30]. Right: the $ L_{\mathrm{xy}} $ distributions for the $ \mathrm{K^0_S}\to\mu^{+}\mu^{-} $ simulation before and after the MVA selection, normalized to unity based on the preselection distribution. |
png pdf |
Figure 5-b:
Left: the distribution of the vertices of $ \omega\to\mu^{+}\mu^{-} $ decays in the transverse plane on the beam pipe and CMS pixel layers from the data, using the $ _\mathrm{{s}}\mathcal{P}\mathrm{lot} $ technique [30]. Right: the $ L_{\mathrm{xy}} $ distributions for the $ \mathrm{K^0_S}\to\mu^{+}\mu^{-} $ simulation before and after the MVA selection, normalized to unity based on the preselection distribution. |
png pdf |
Figure 6:
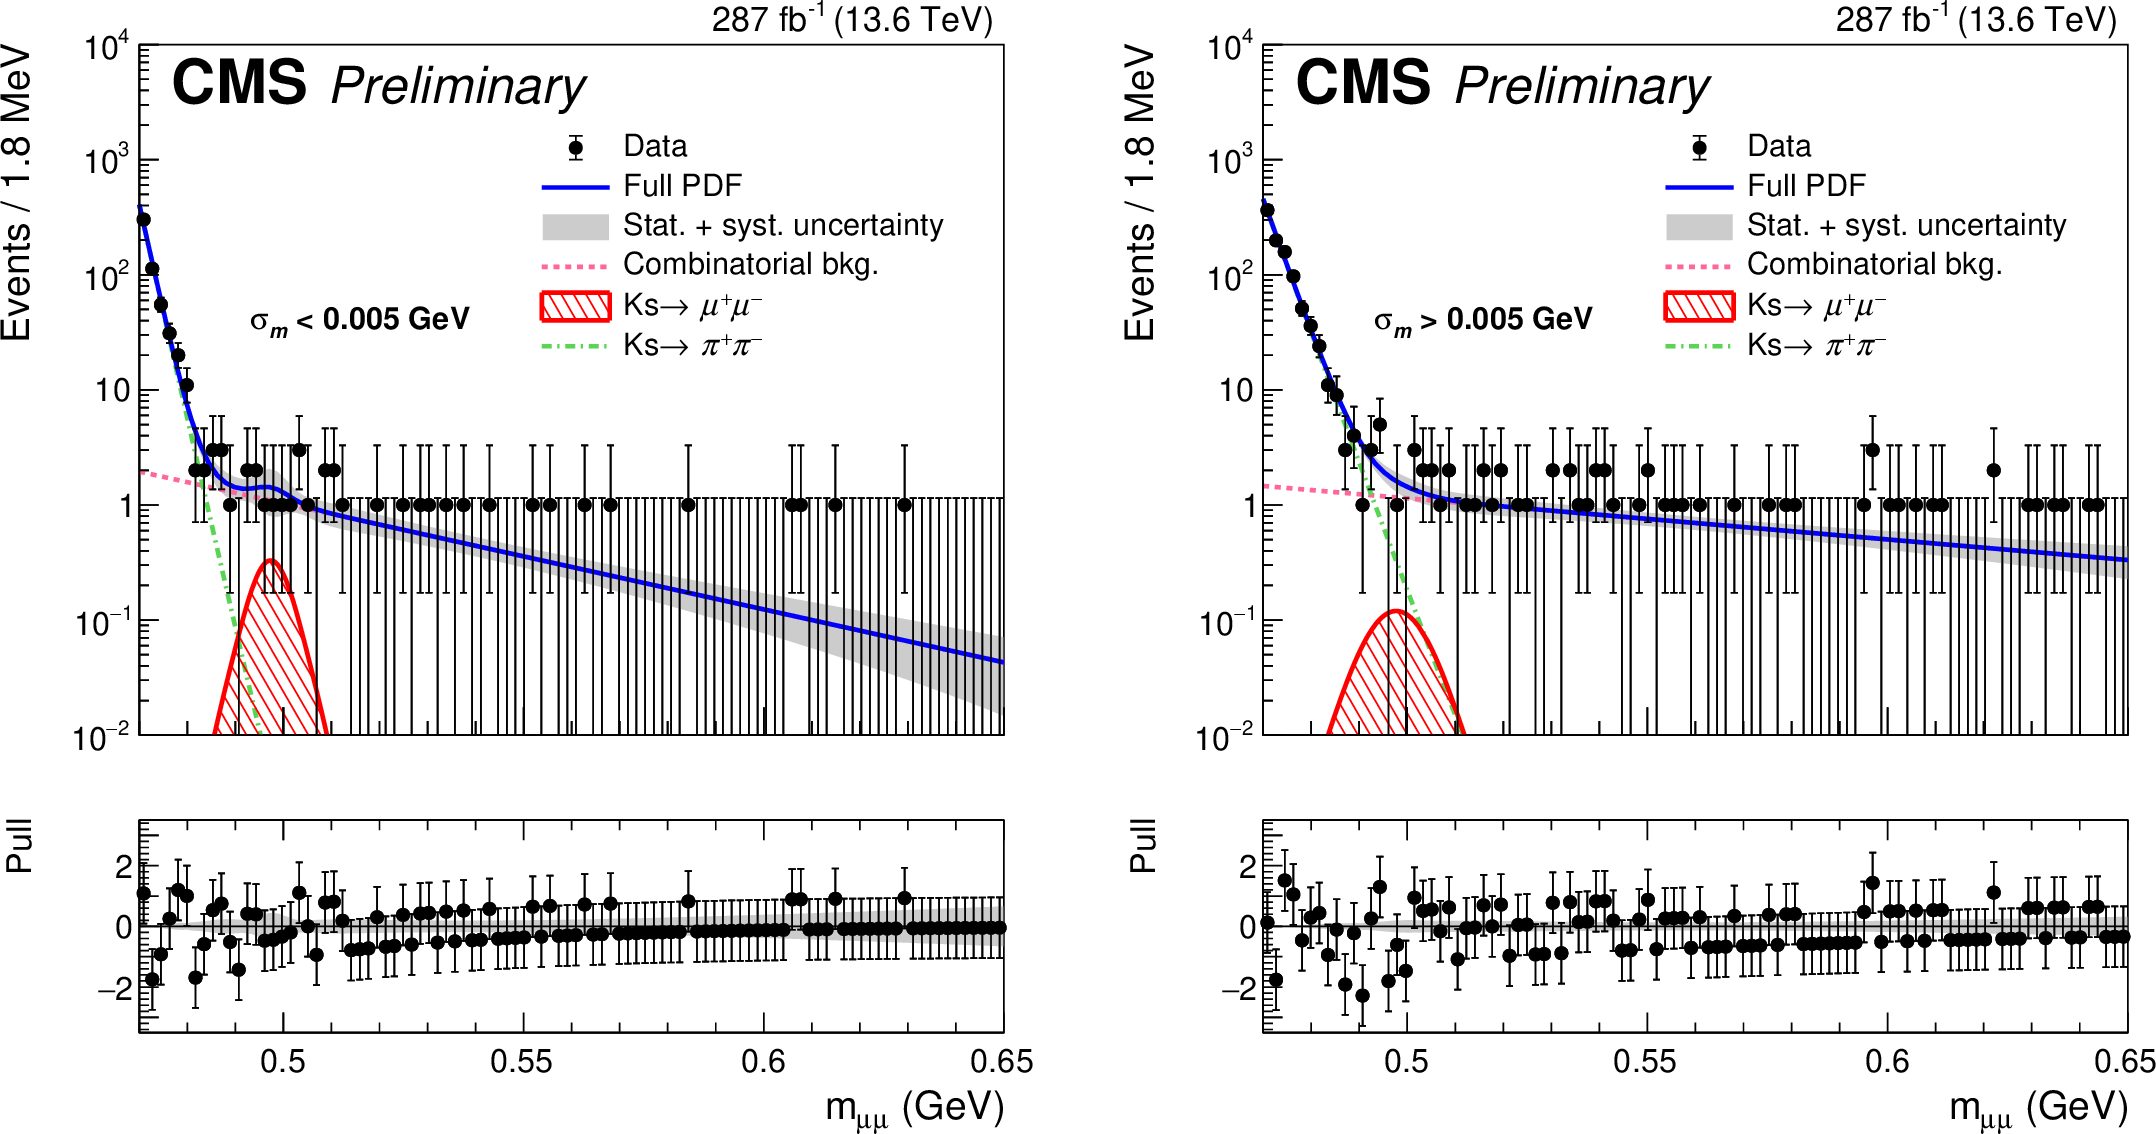
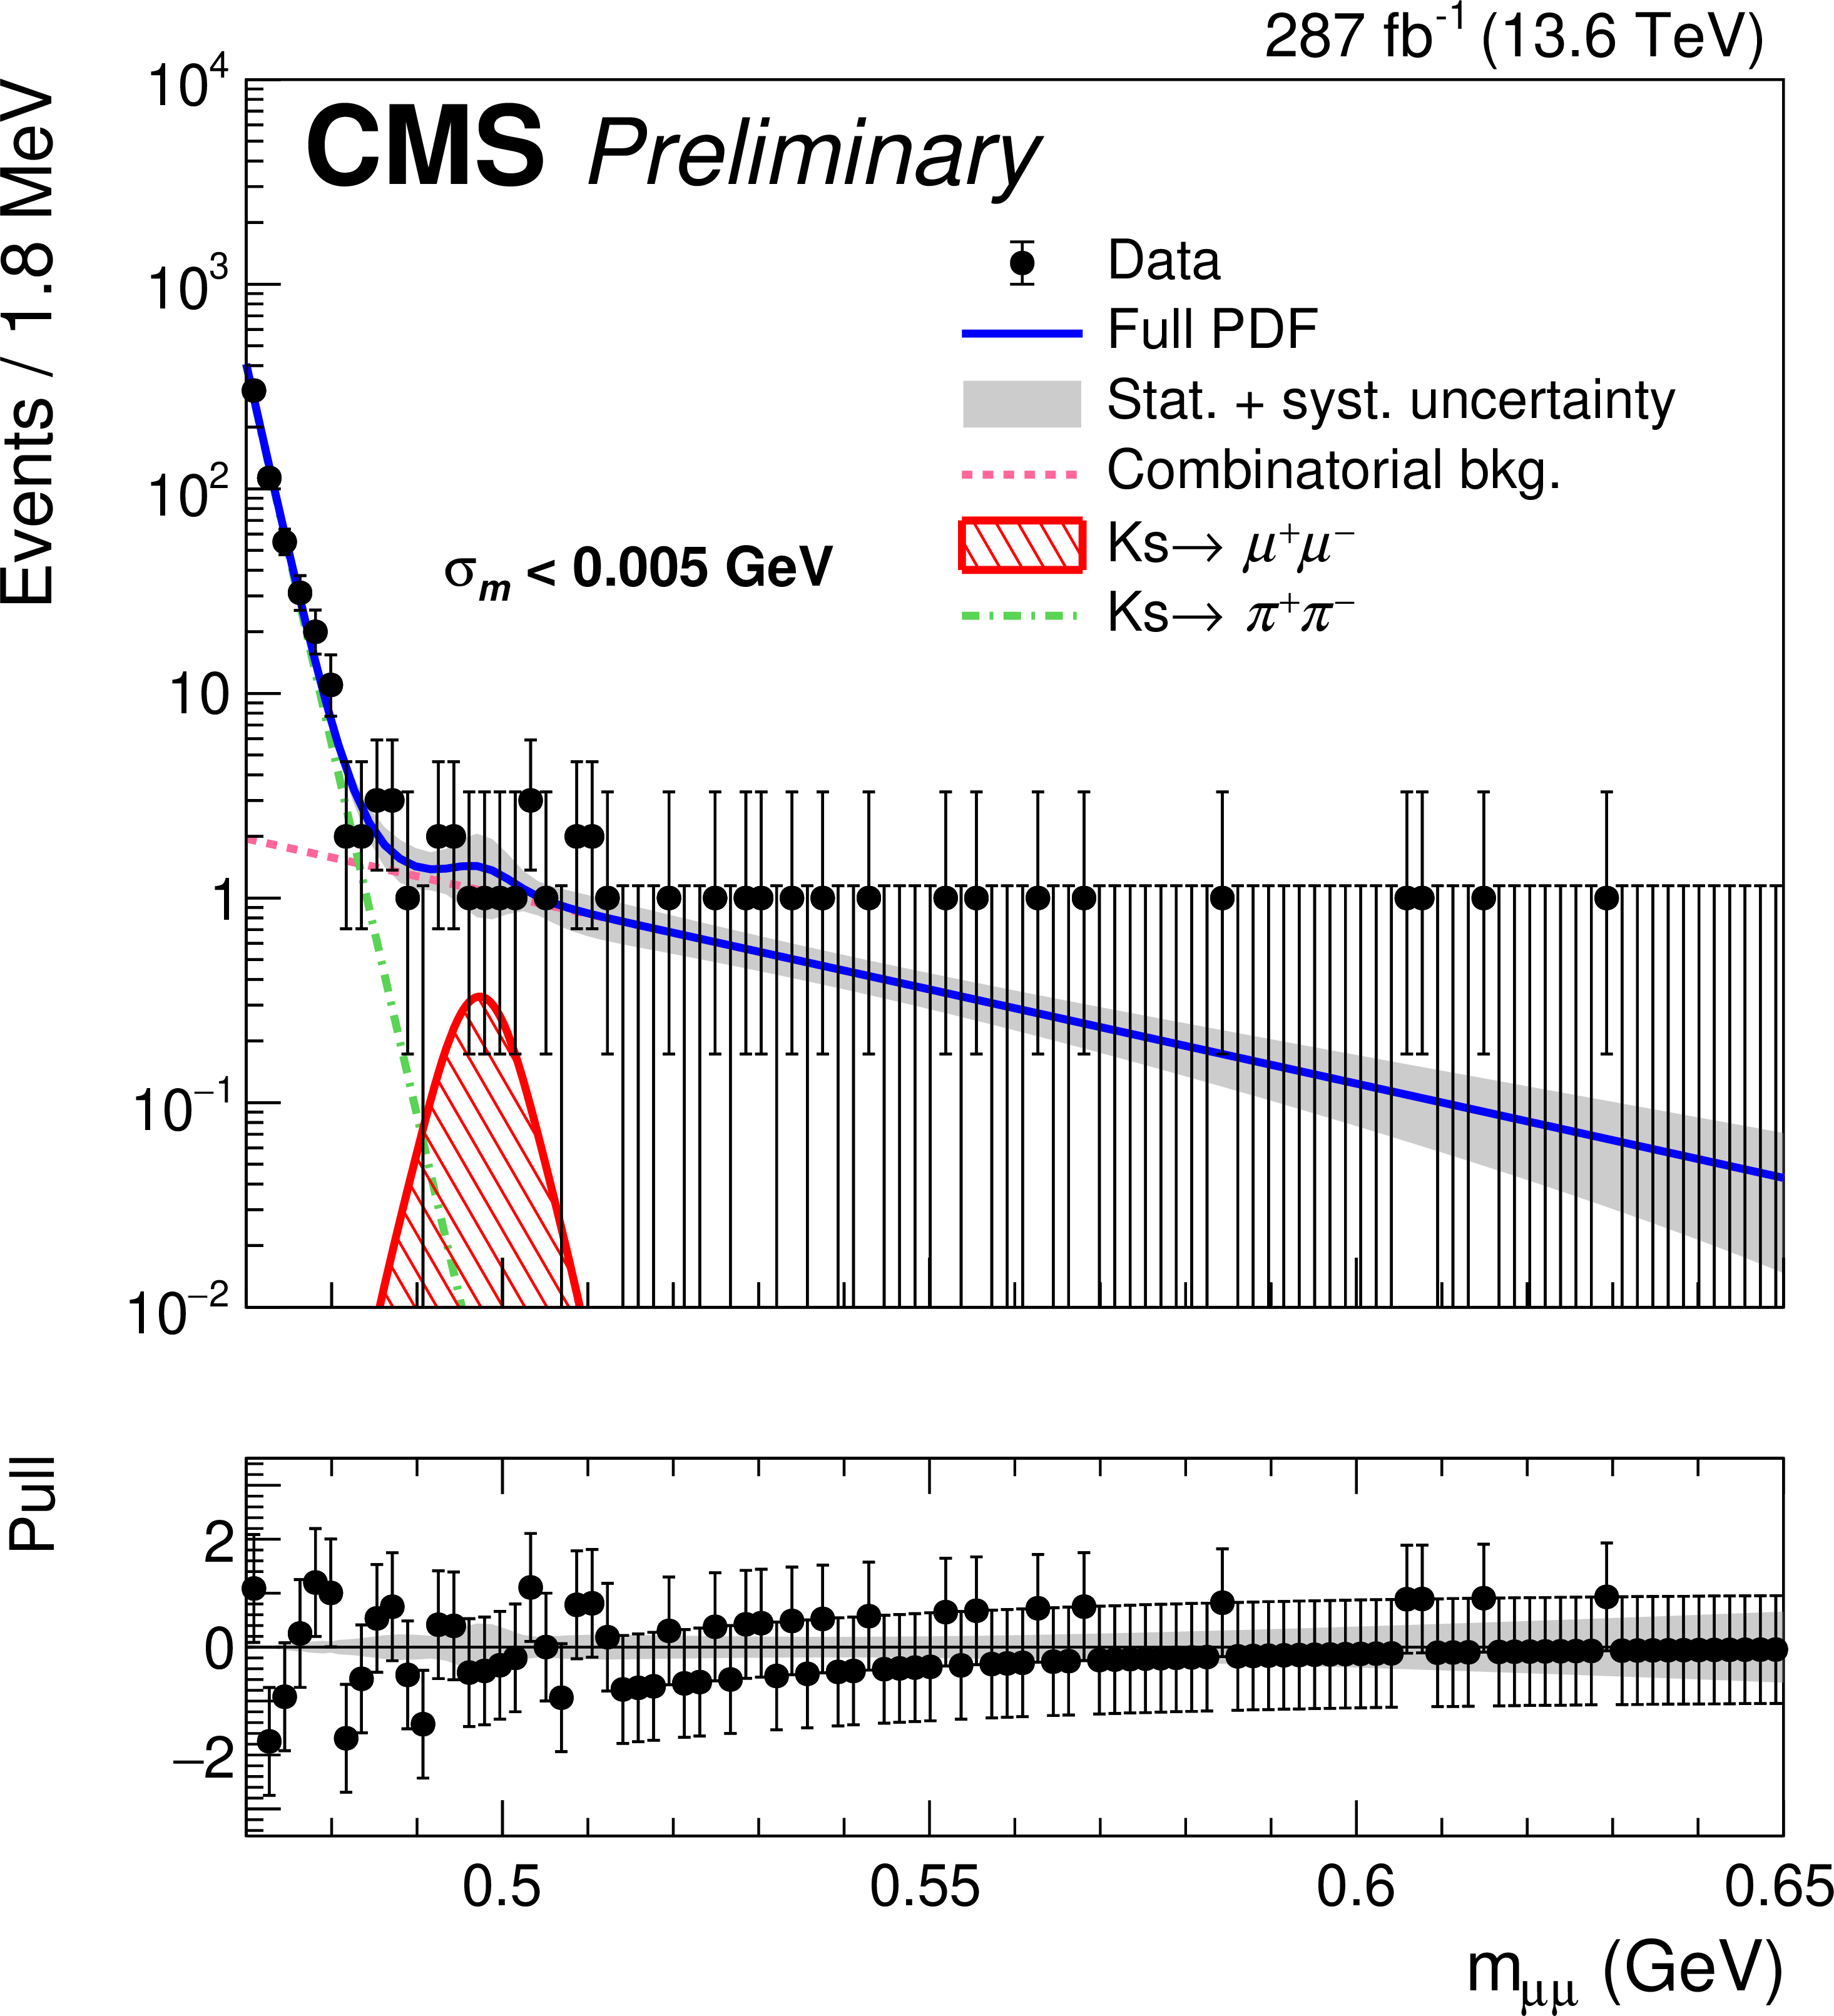
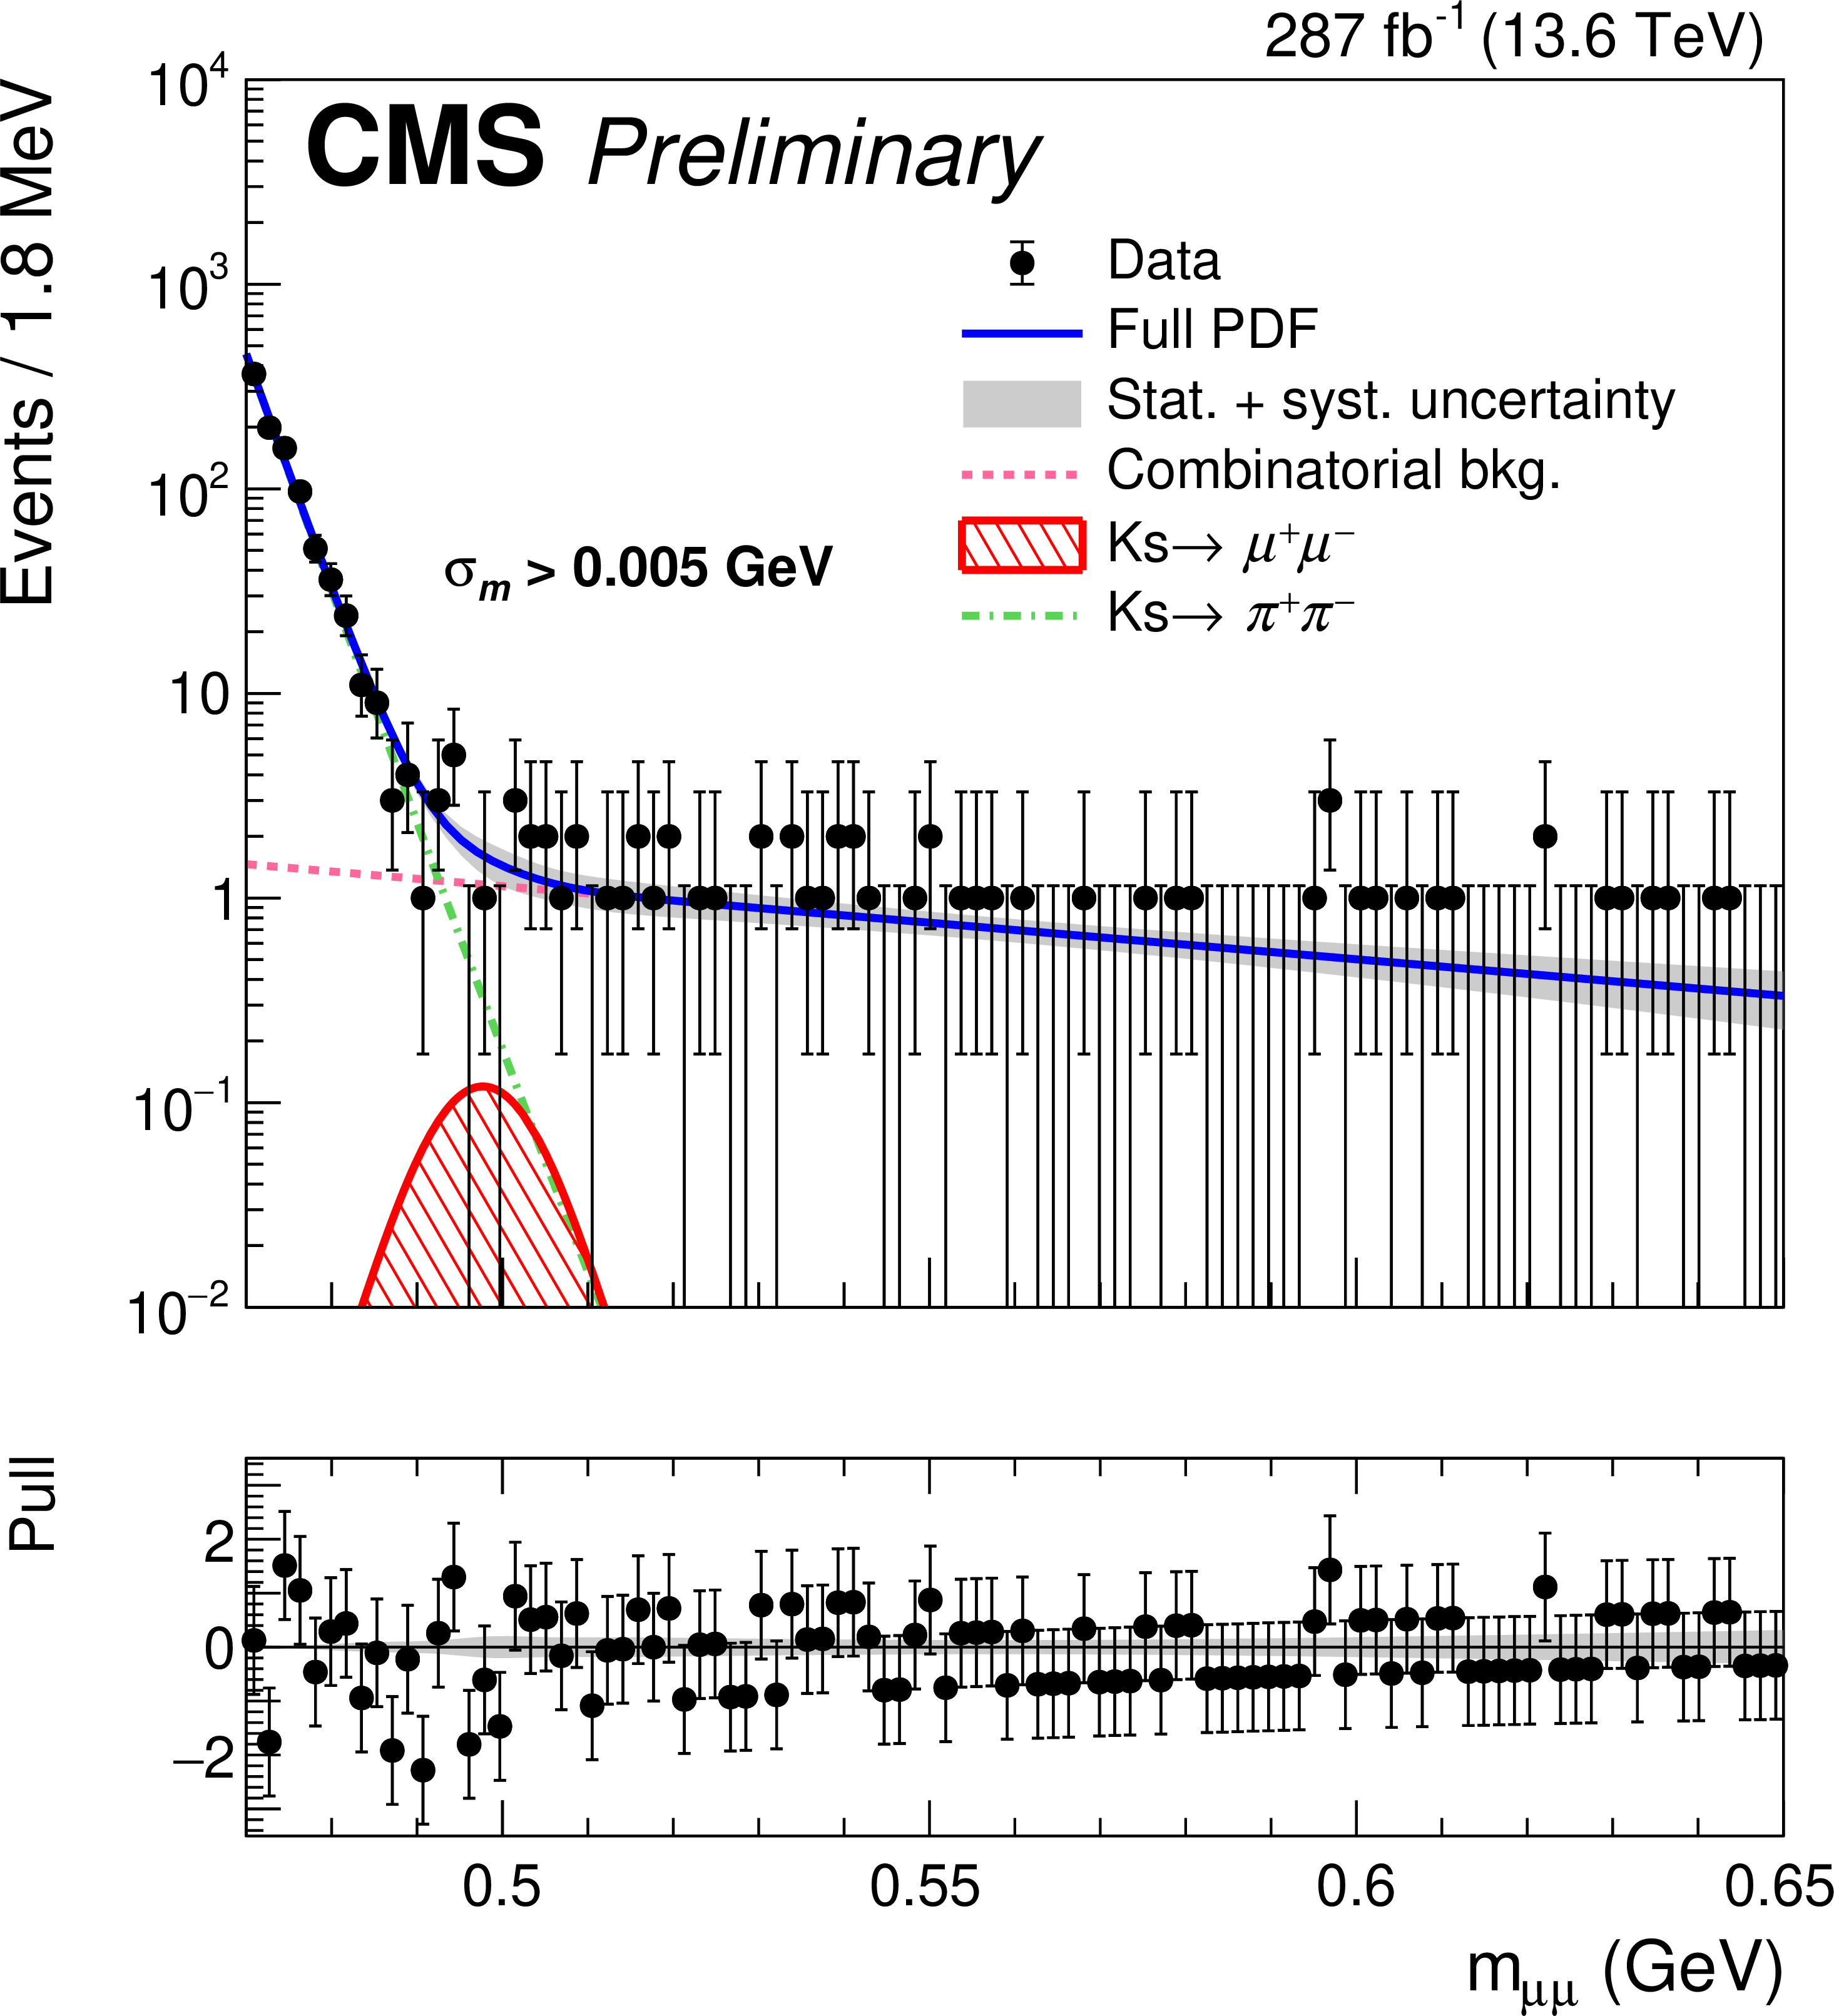
The distributions of the dimuon mass $ m_{\mu\mu} $ for the signal channel in categories of $ \sigma_m < $ 0.005 GeV (left) and $ \sigma_m > $ 0.005 GeV (right), along with the associated projections of the full fit (solid curve), signal contribution (hatched area), and background contributions (other curves). The pull is defined as the difference between the data and the fit, divided by the statistical uncertainty in the data. |
png pdf |
Figure 6-a:
The distributions of the dimuon mass $ m_{\mu\mu} $ for the signal channel in categories of $ \sigma_m < $ 0.005 GeV (left) and $ \sigma_m > $ 0.005 GeV (right), along with the associated projections of the full fit (solid curve), signal contribution (hatched area), and background contributions (other curves). The pull is defined as the difference between the data and the fit, divided by the statistical uncertainty in the data. |
png pdf |
Figure 6-b:
The distributions of the dimuon mass $ m_{\mu\mu} $ for the signal channel in categories of $ \sigma_m < $ 0.005 GeV (left) and $ \sigma_m > $ 0.005 GeV (right), along with the associated projections of the full fit (solid curve), signal contribution (hatched area), and background contributions (other curves). The pull is defined as the difference between the data and the fit, divided by the statistical uncertainty in the data. |
png pdf |
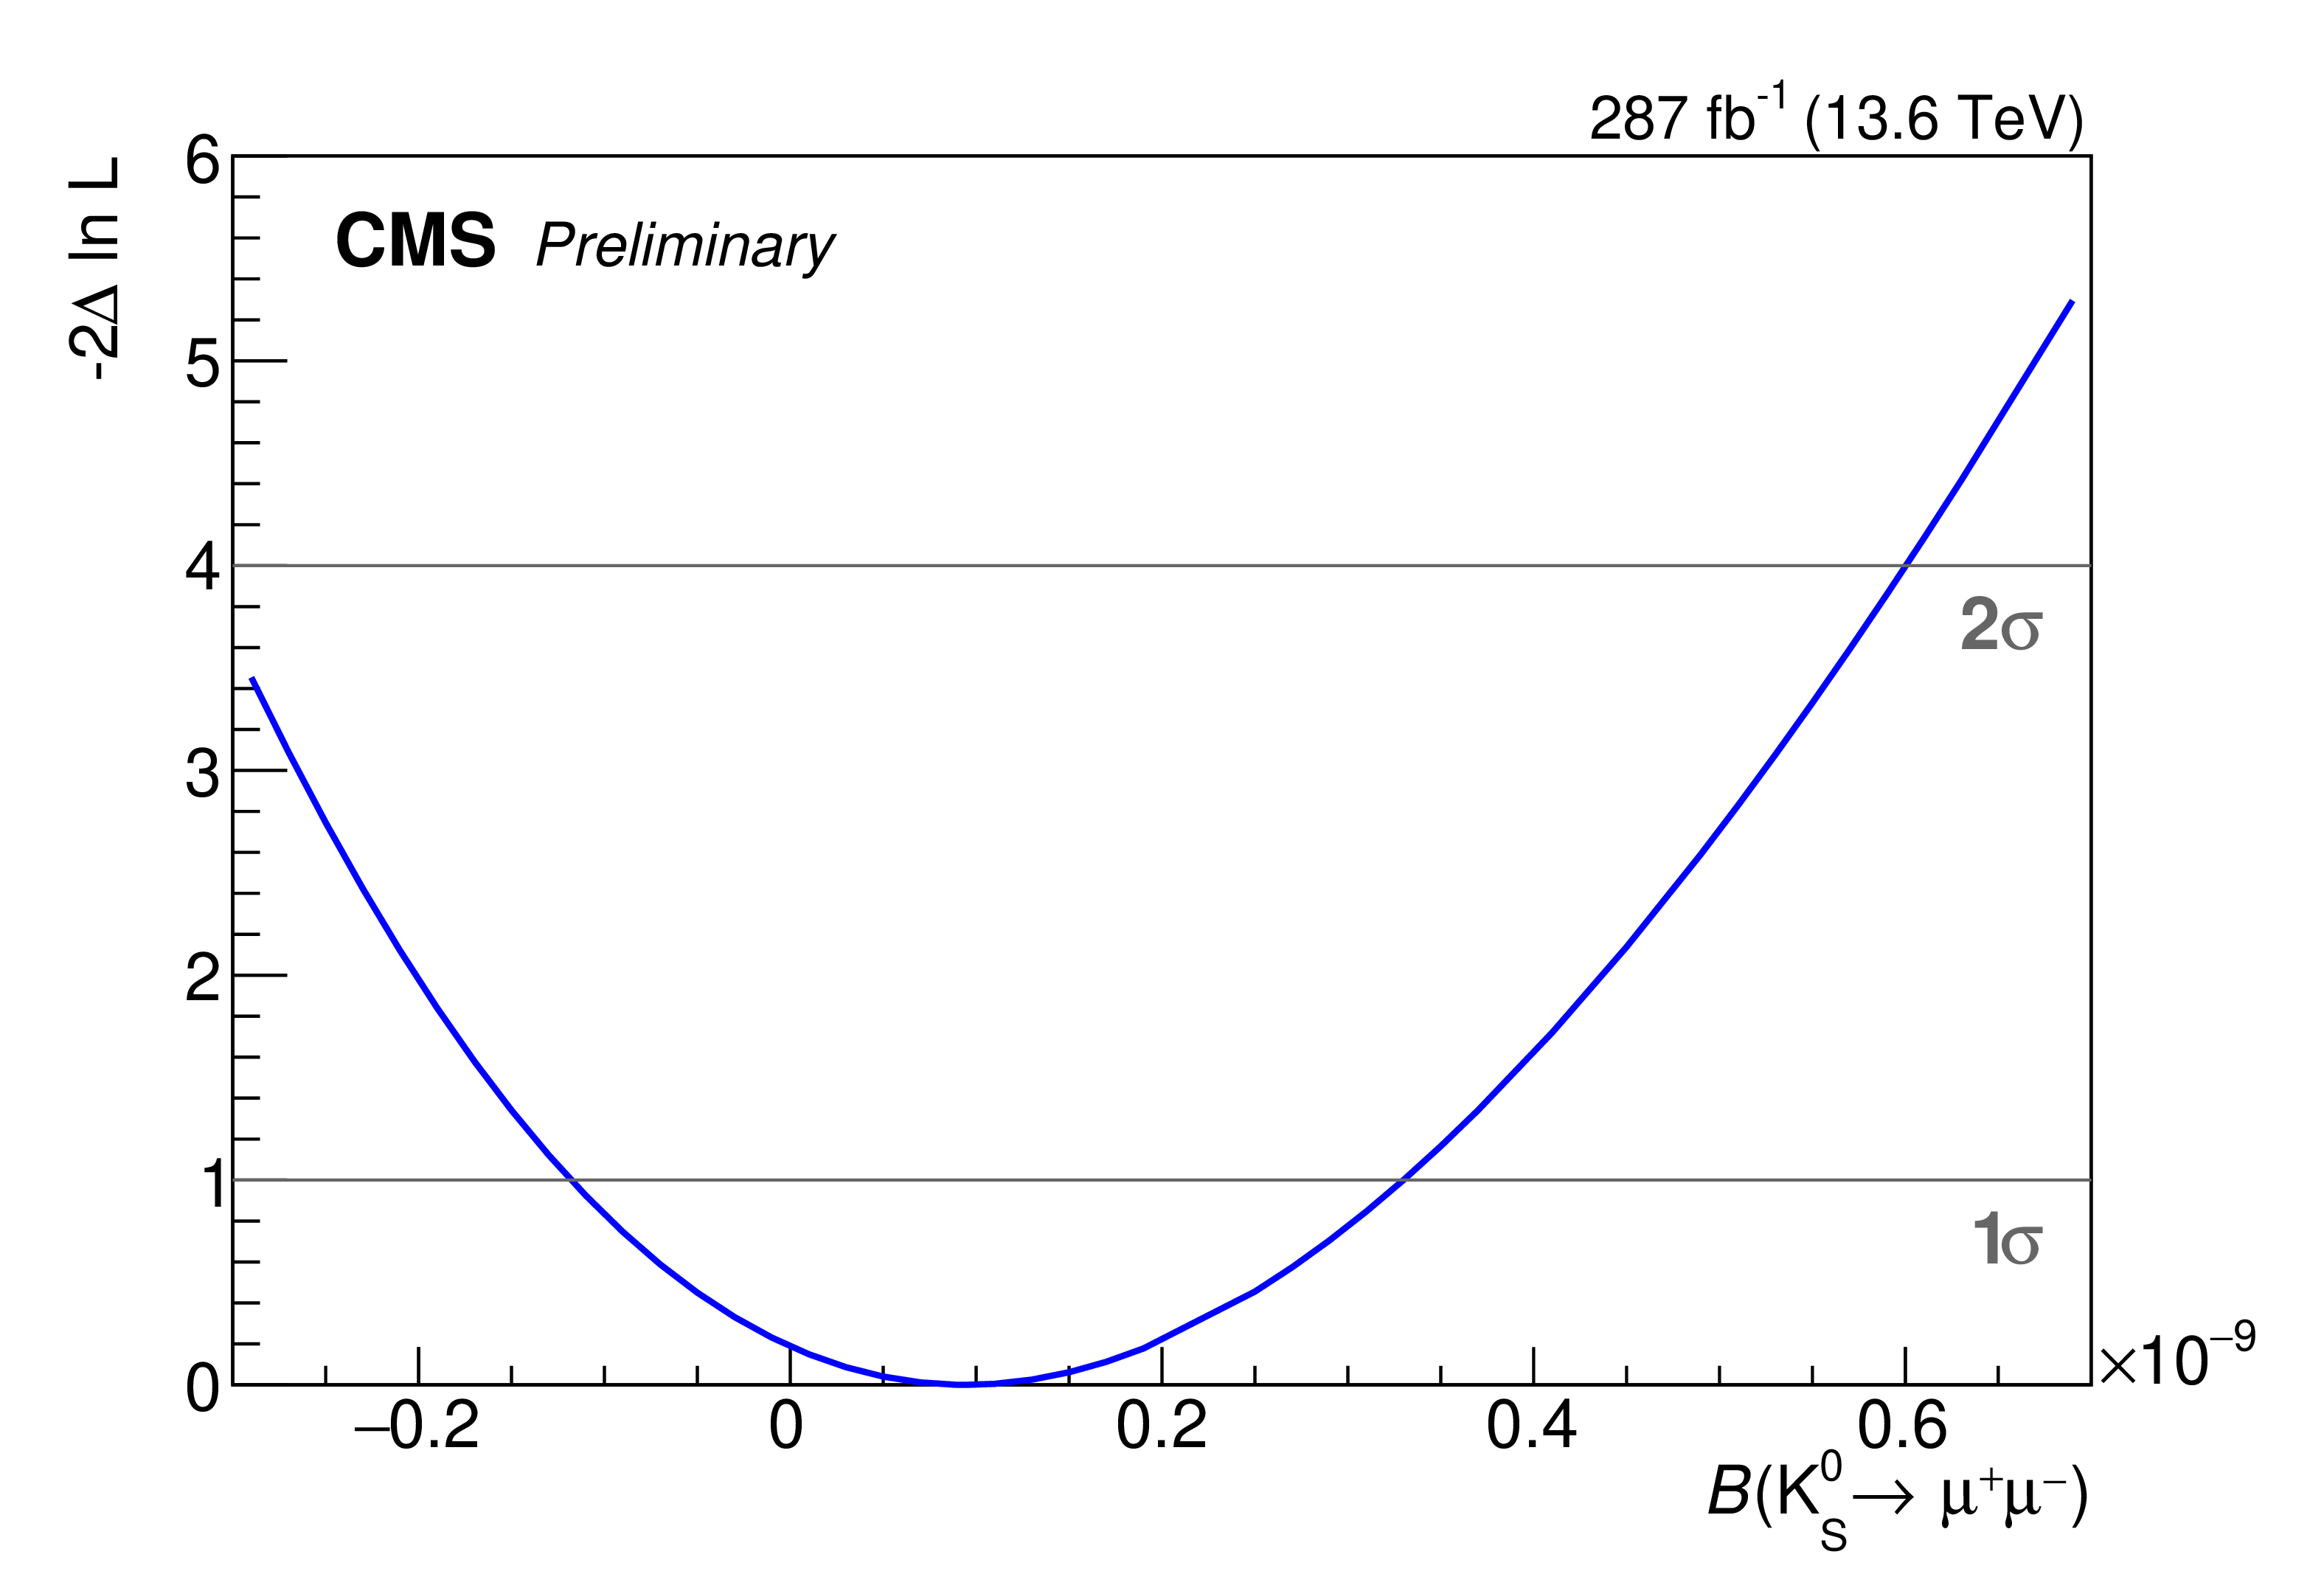
Figure 7:
The profile likelihood as a function of the $ \mathrm{K^0_S}\to\mu^{+}\mu^{-} $ branching fraction |
png pdf |
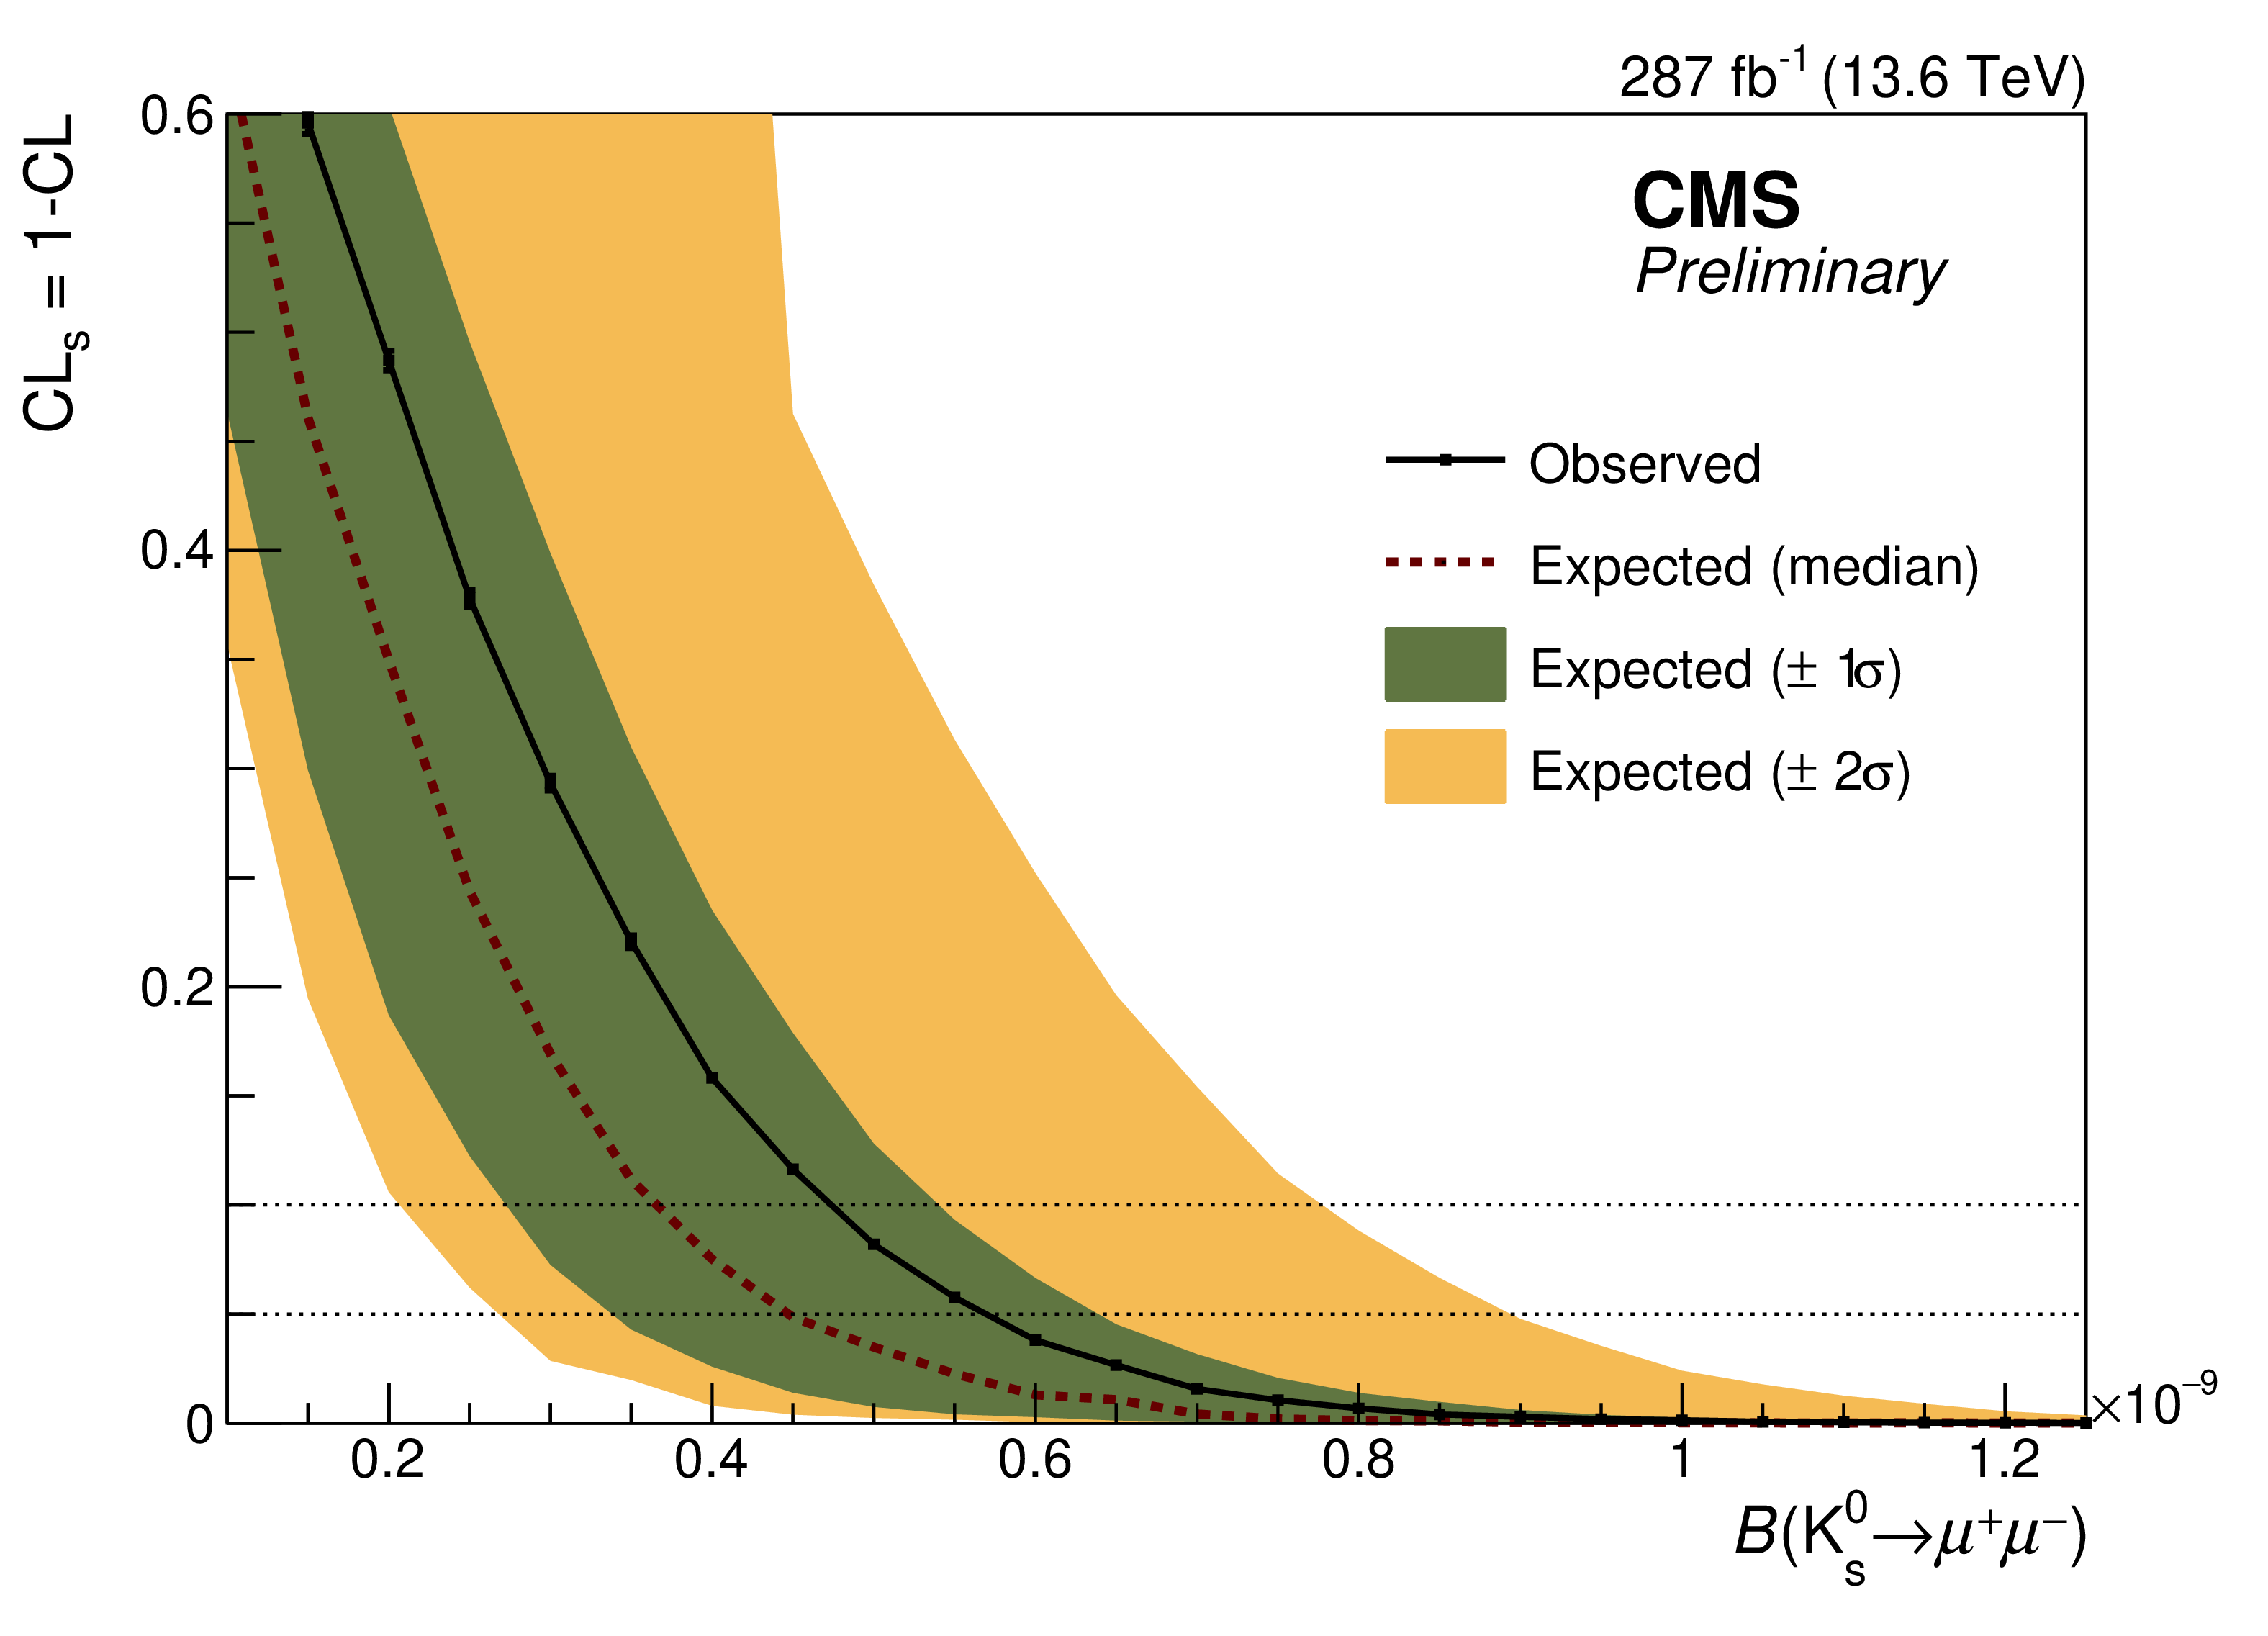
Figure 8:
The upper limits on the $ \mathrm{K^0_S}\to\mu^{+}\mu^{-} $ decay branching fraction using the $ \text{CL}_\text{s} $ method. The dashed line represents the expected median value of the quantity 1 $ -\text{CL} $ for the background-only hypothesis, while the solid line shows the observed value. |
| Tables | |

png pdf |
Table 1:
The fitted yields of $ \mathrm{K^0_S}\to\pi^+\pi^- $ in zero bias datasets after the final selection. The columns ``Comb'', ``Lumi'', and ``Prescale'' denote the combinatorial background, the integrated luminosity, and the trigger prescale factor, respectively. The observed numbers of events are given in the Data column. |
png pdf |
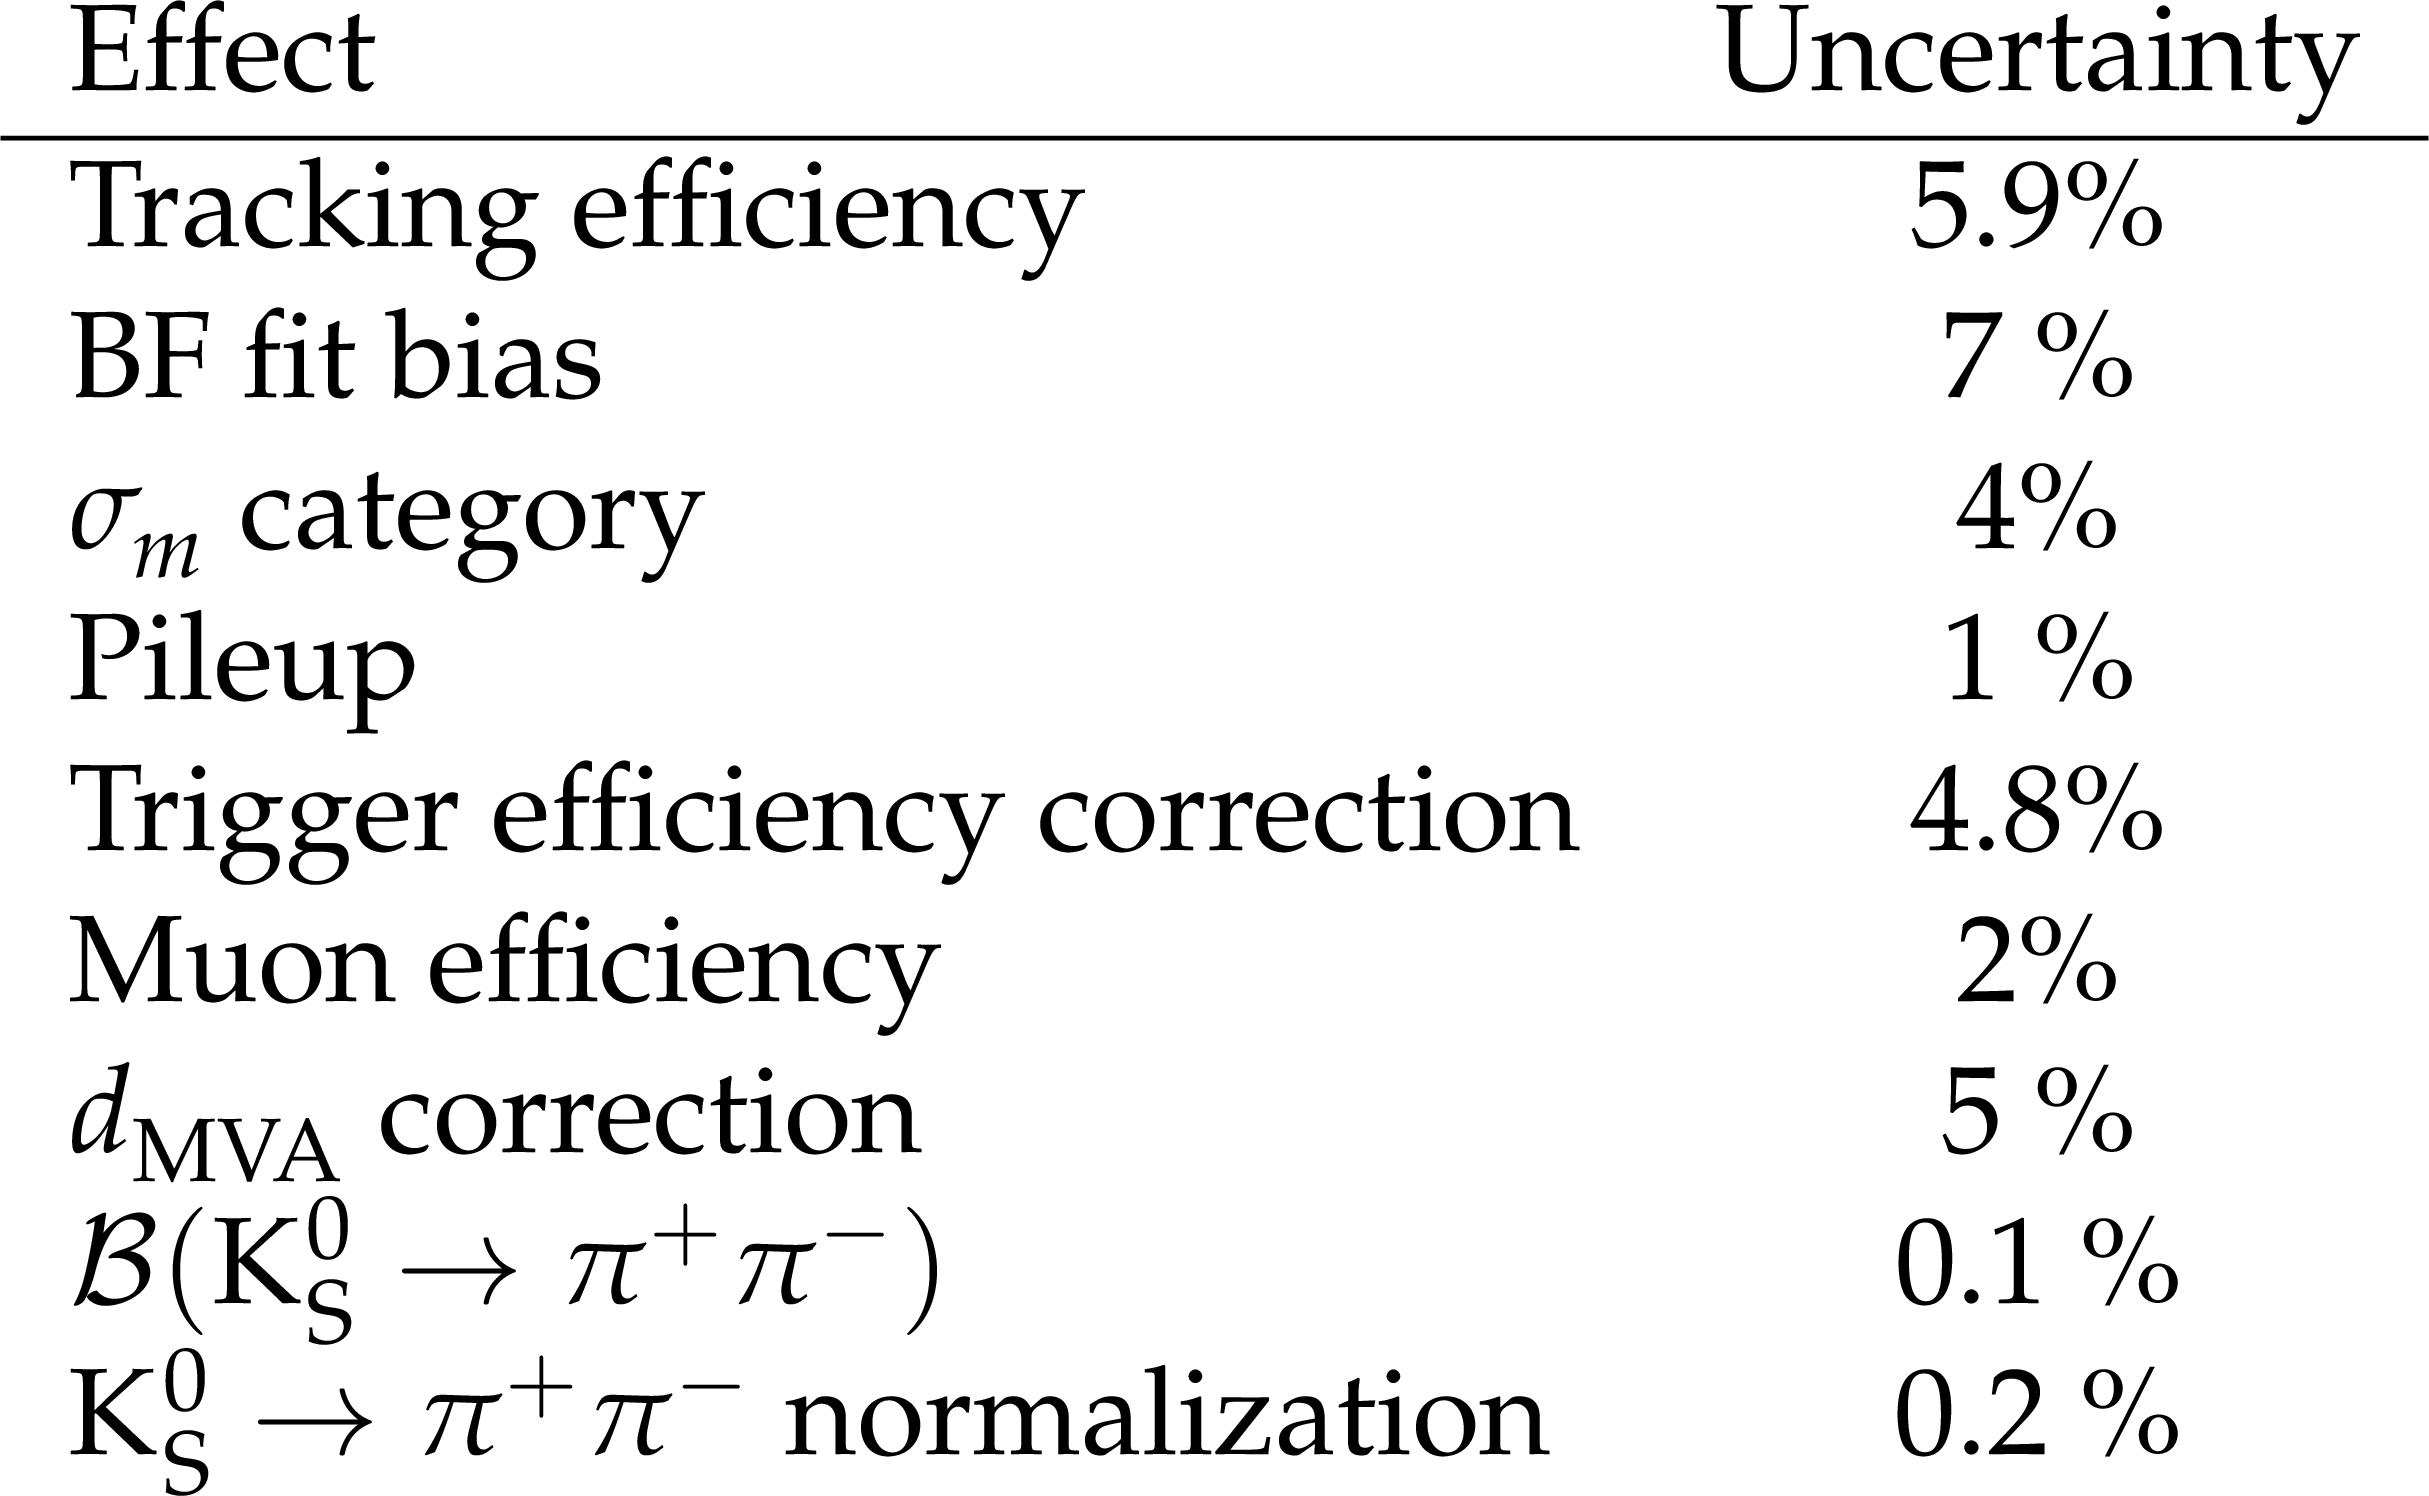
Table 2:
Summary of systematic uncertainties for the $ \mathrm{K^0_S}\to\mu^{+}\mu^{-} $ branching ratio measurement. |

png pdf |
Table 3:
The post-fit event yields for signal, the combinatorial background (``Comb''), and the $ \mathrm{K^0_S}\to\pi^+\pi^- $ background are summarized. The observed event yields are given in the Data column. |
| Summary |
| A search for $ \mathrm{K^0_S}\to\mu^{+}\mu^{-} $ decays by the CMS experiment, using proton-proton collision data at $ \sqrt{s} = $ 13.6 TeV corresponding to an integrated luminosity of 287 fb$ ^{-1} $, is presented. As one of the first CMS analyses to utilize the 2025 dataset, this work provides a deeper understanding of the Run 3 di-track reconstruction performance across both the 2024 and 2025 data-taking periods. A two-step multivariate analysis is performed, utilizing a boosted decision tree to preselect data samples that are then used to train a deep neural network to suppress the background by orders of magnitude. No significant excess above the fitted background is observed. An upper limit of $ {\mathcal B}(\mathrm{K^0_S}\to\mu^{+}\mu^{-}) < 4.6 (5.5) \times 10^{-10} $ is set at 90 (95)% confidence level. The resulting upper limit is about a factor of two higher than the world's most sensitive constraint established by the LHCb experiment [6], providing an independent probe of a highly suppressed flavor-changing neutral current process in the strange sector. |
| Additional Figures | |
png pdf |
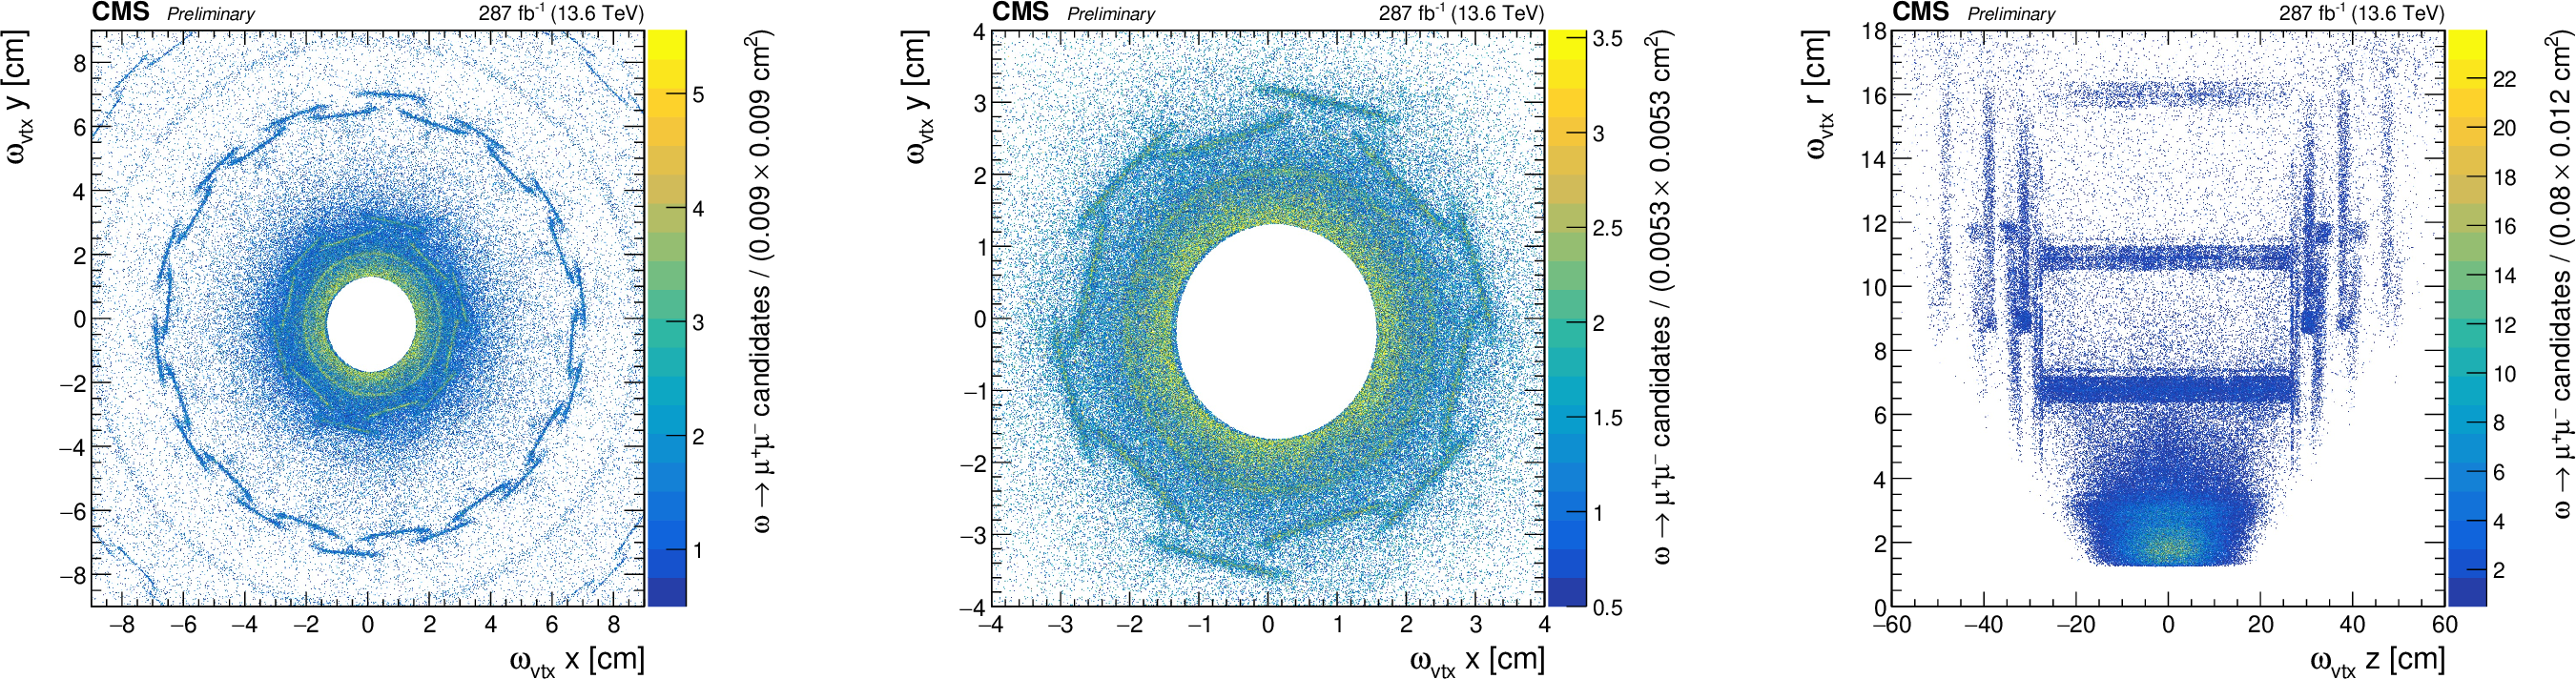
Additional Figure 1:
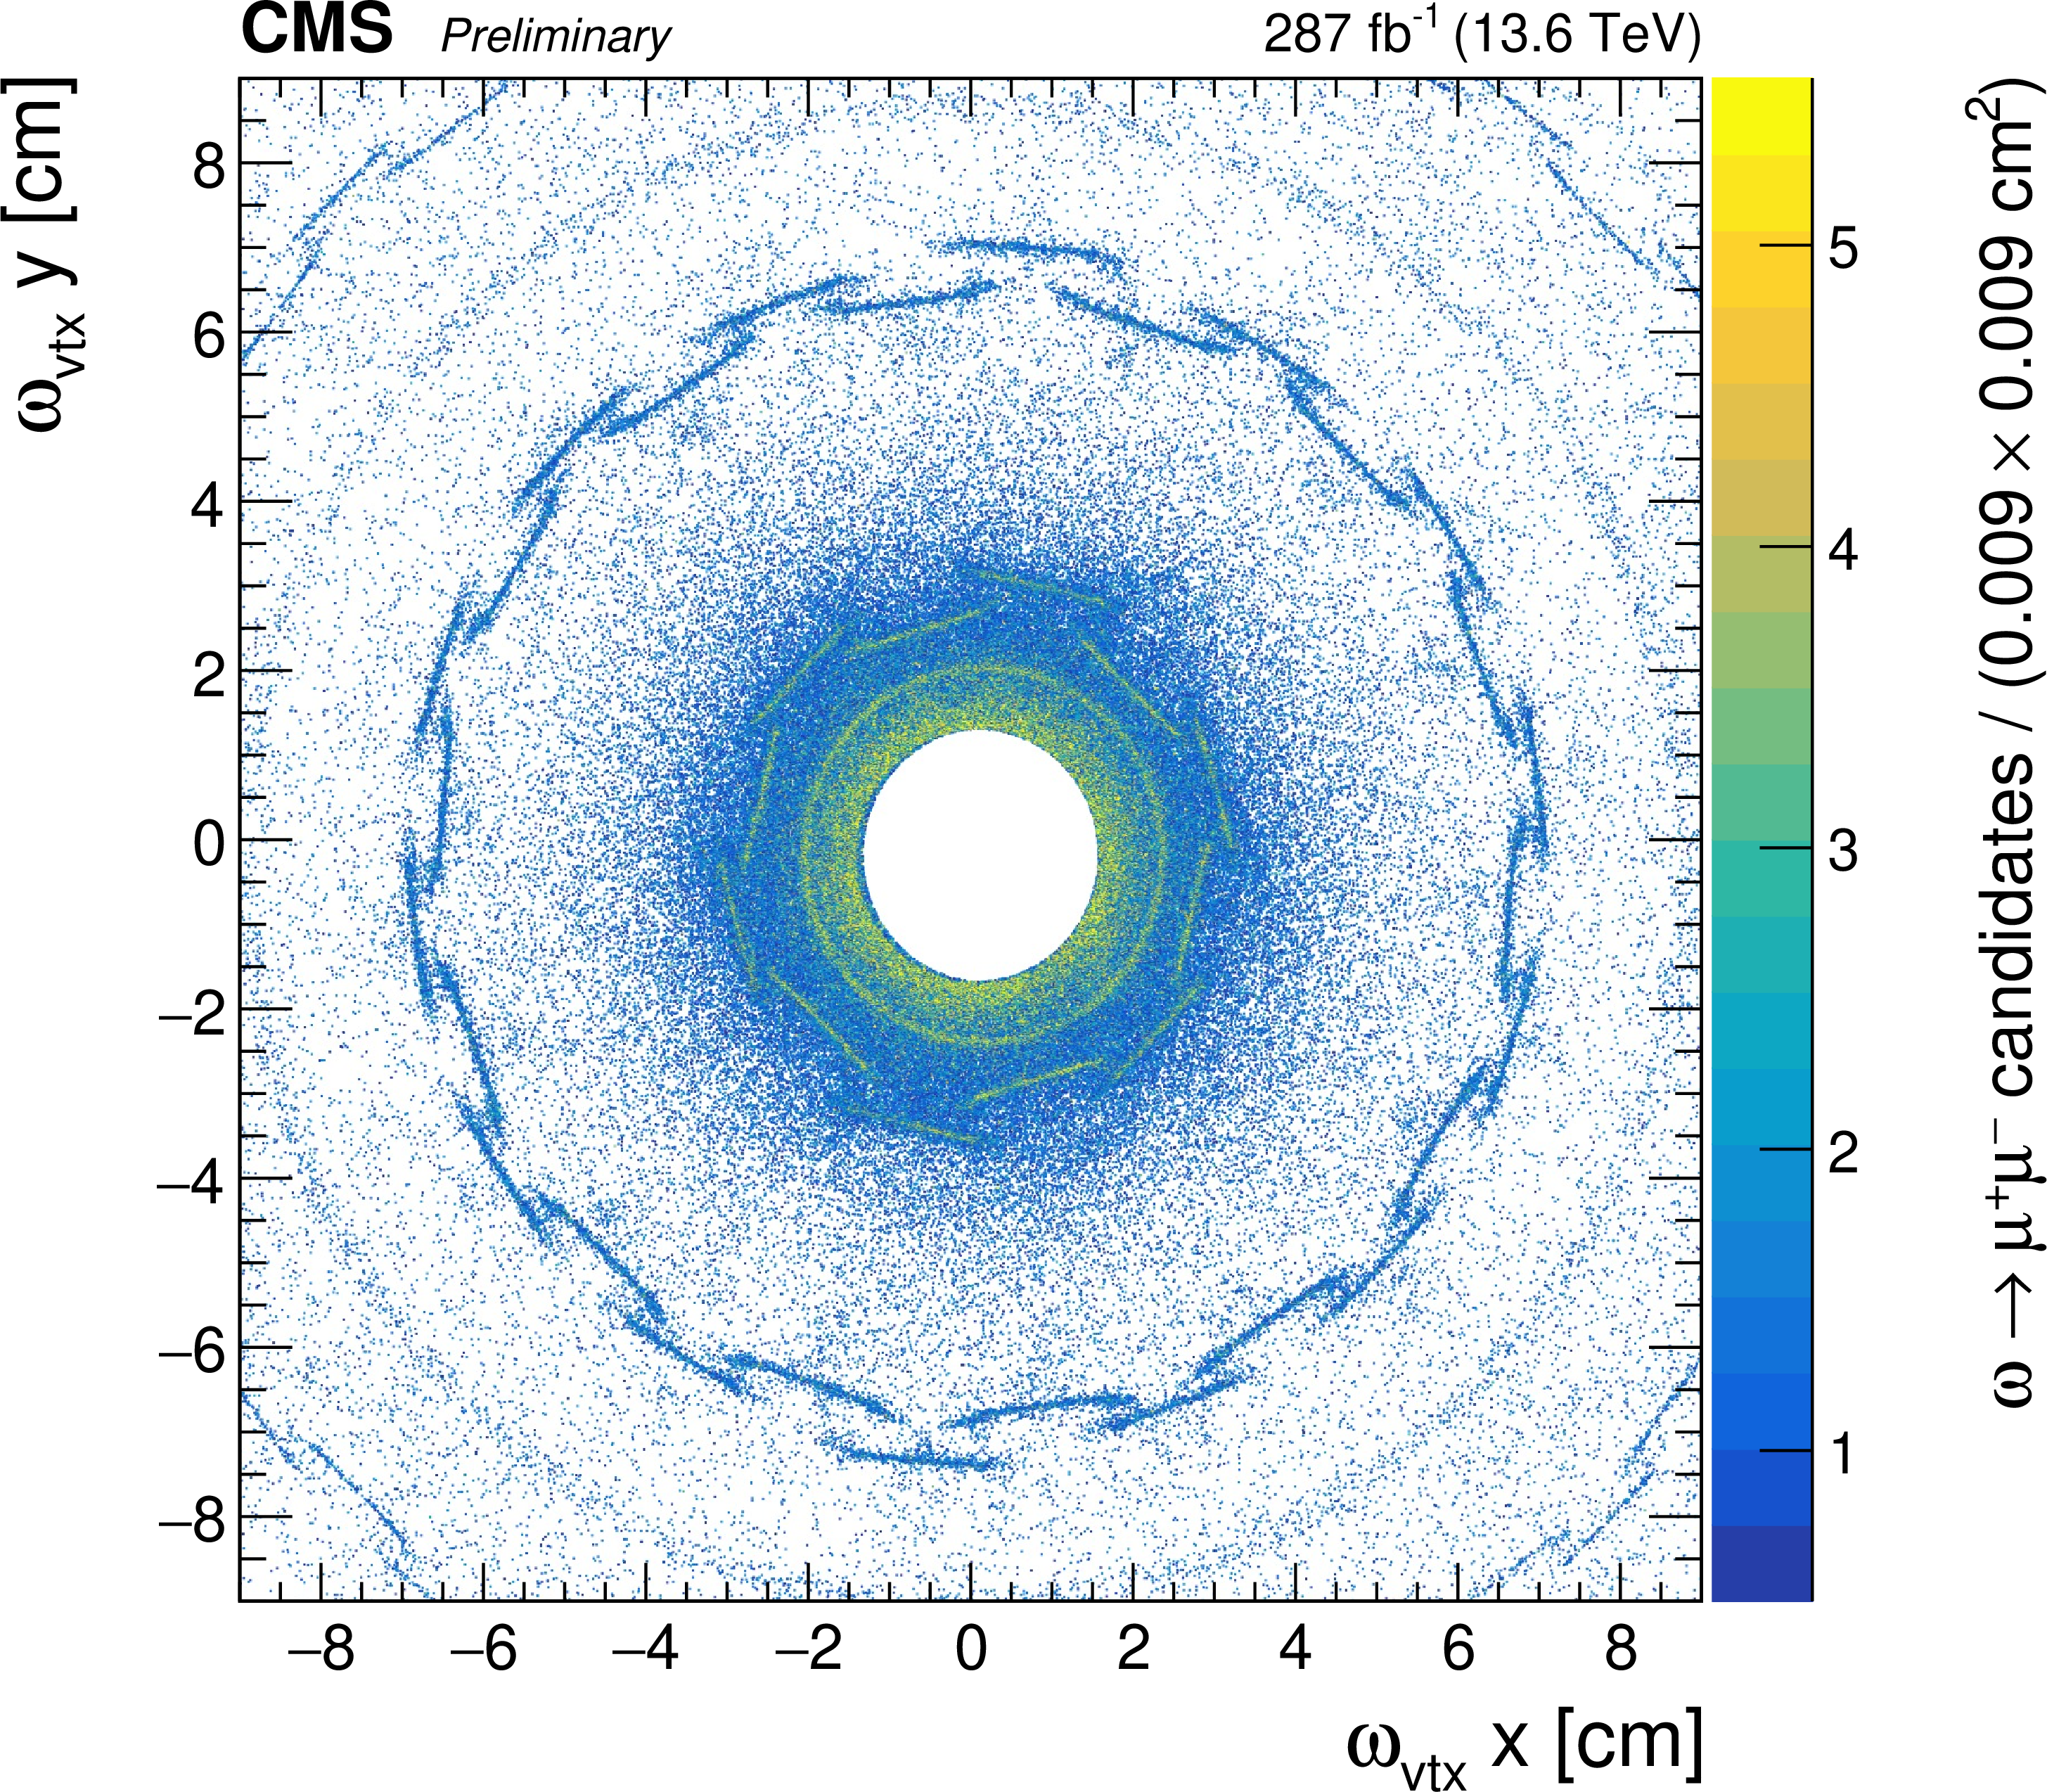
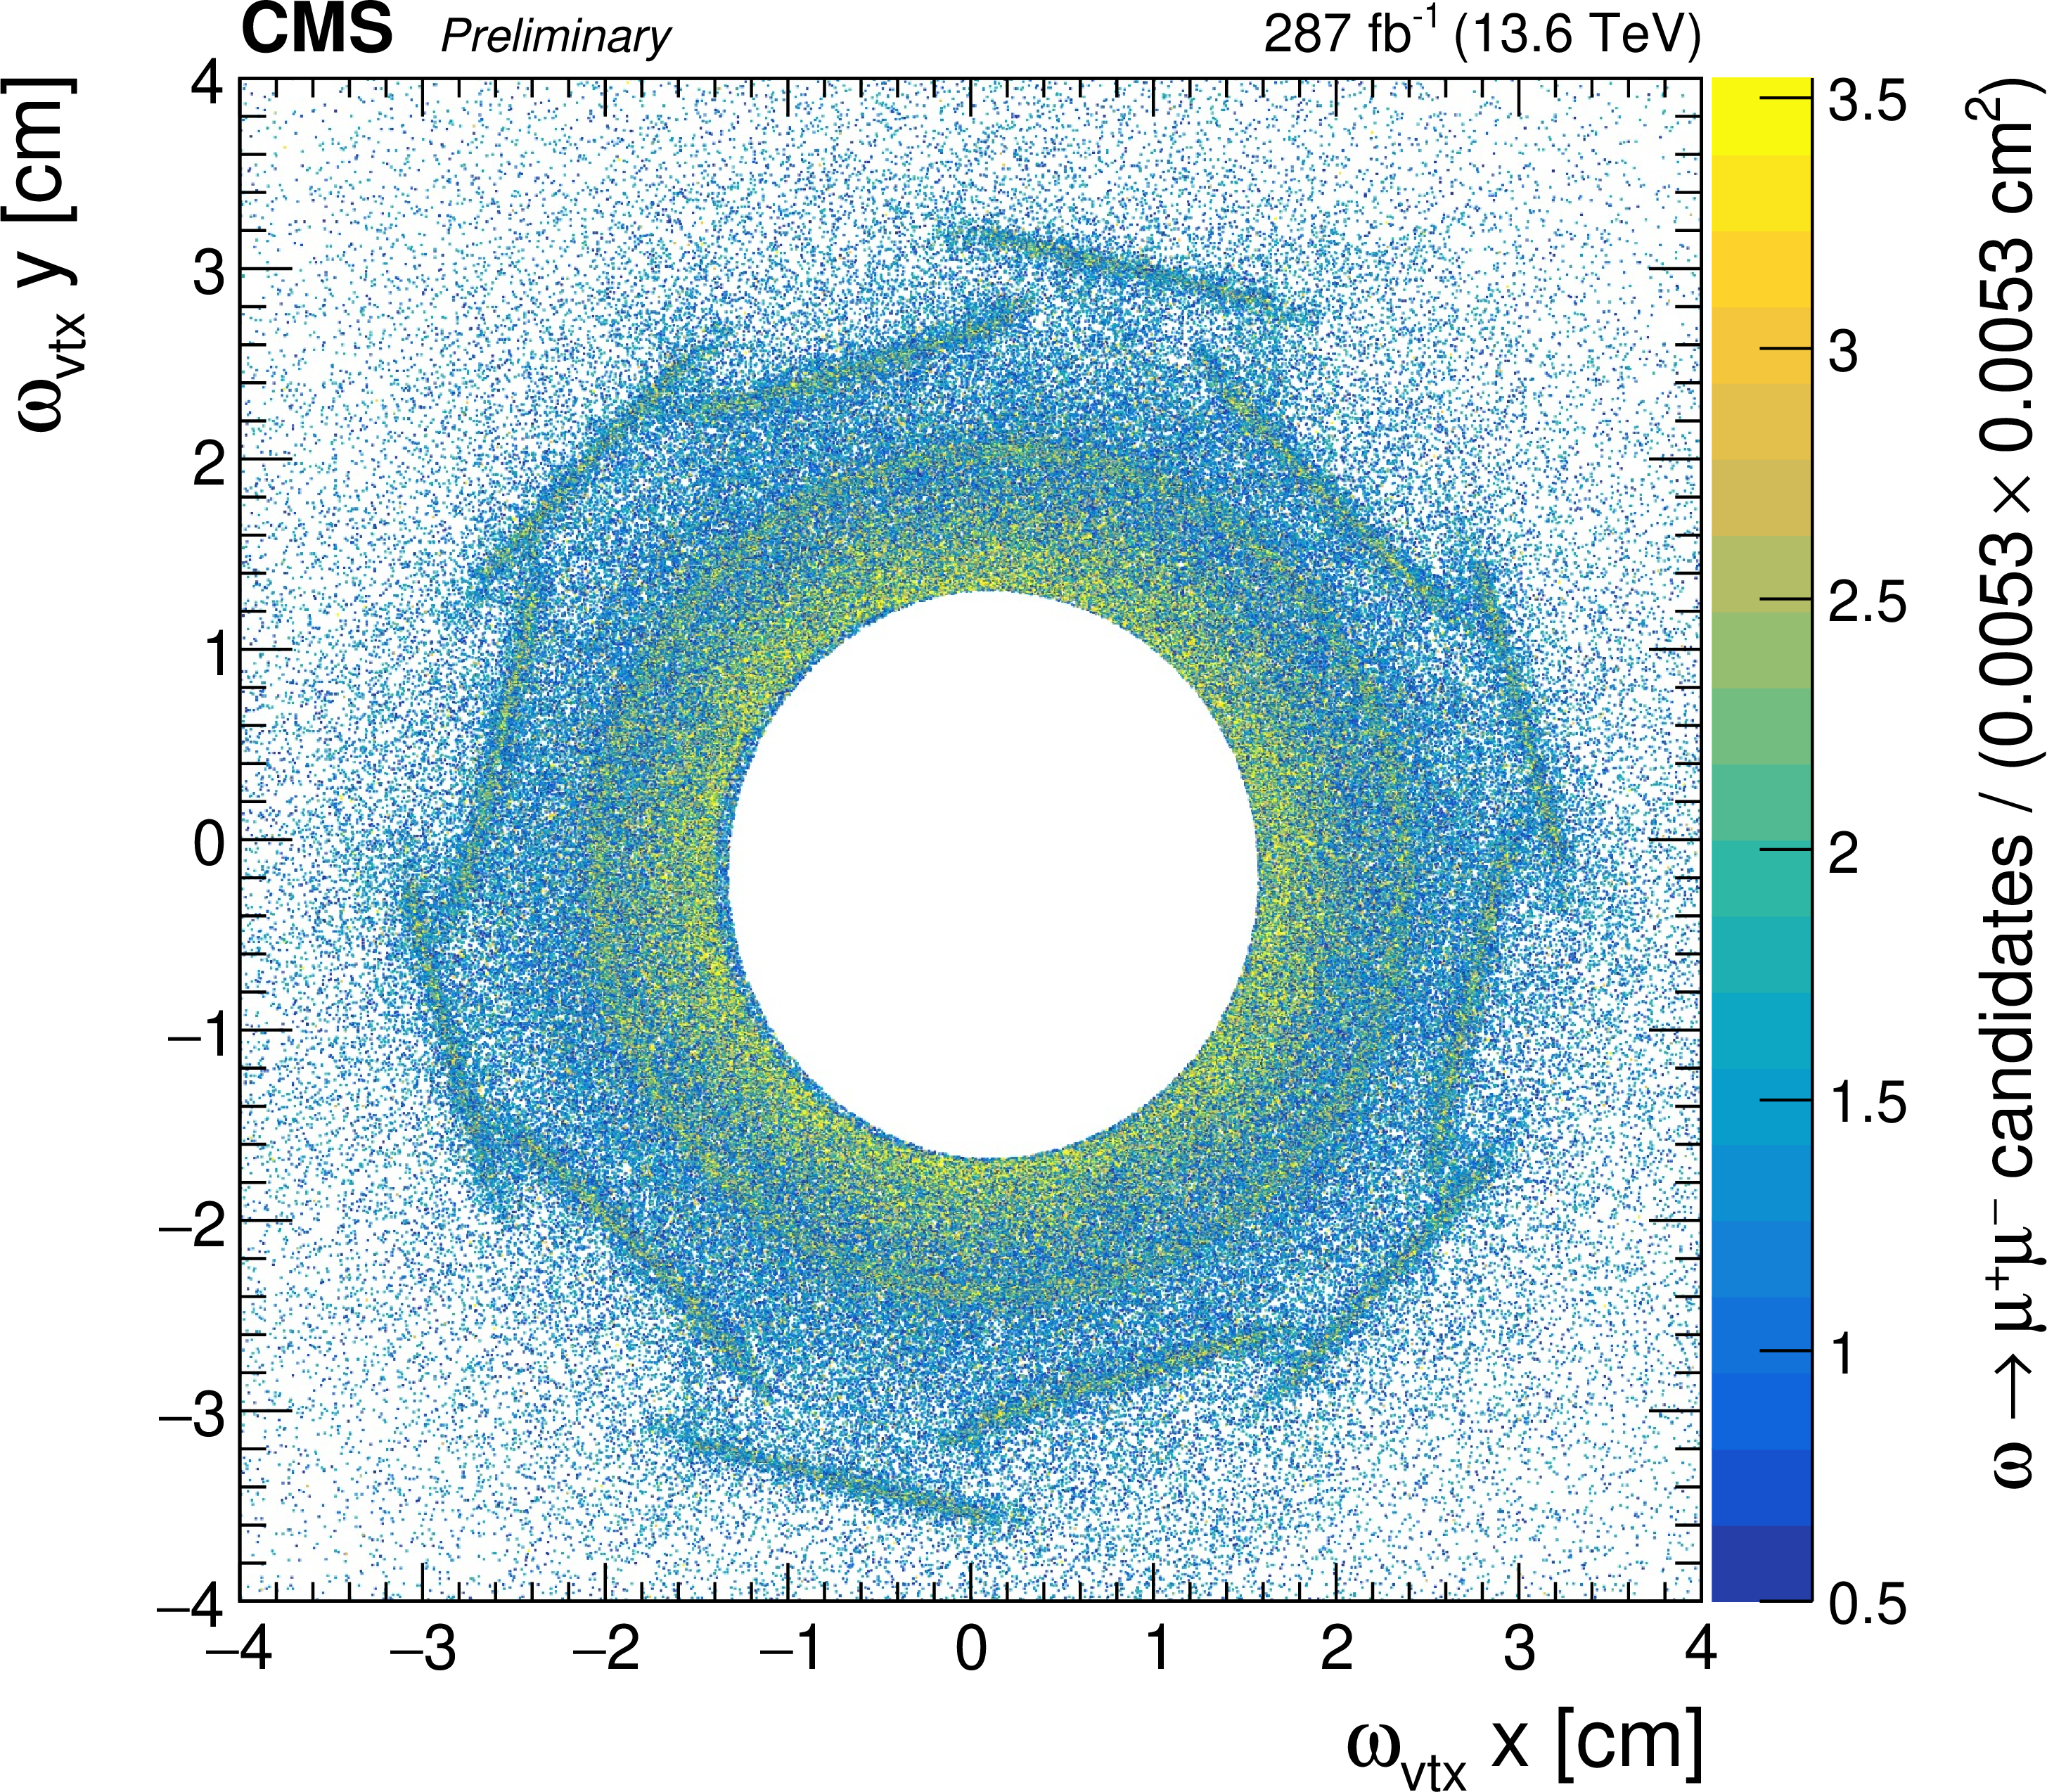
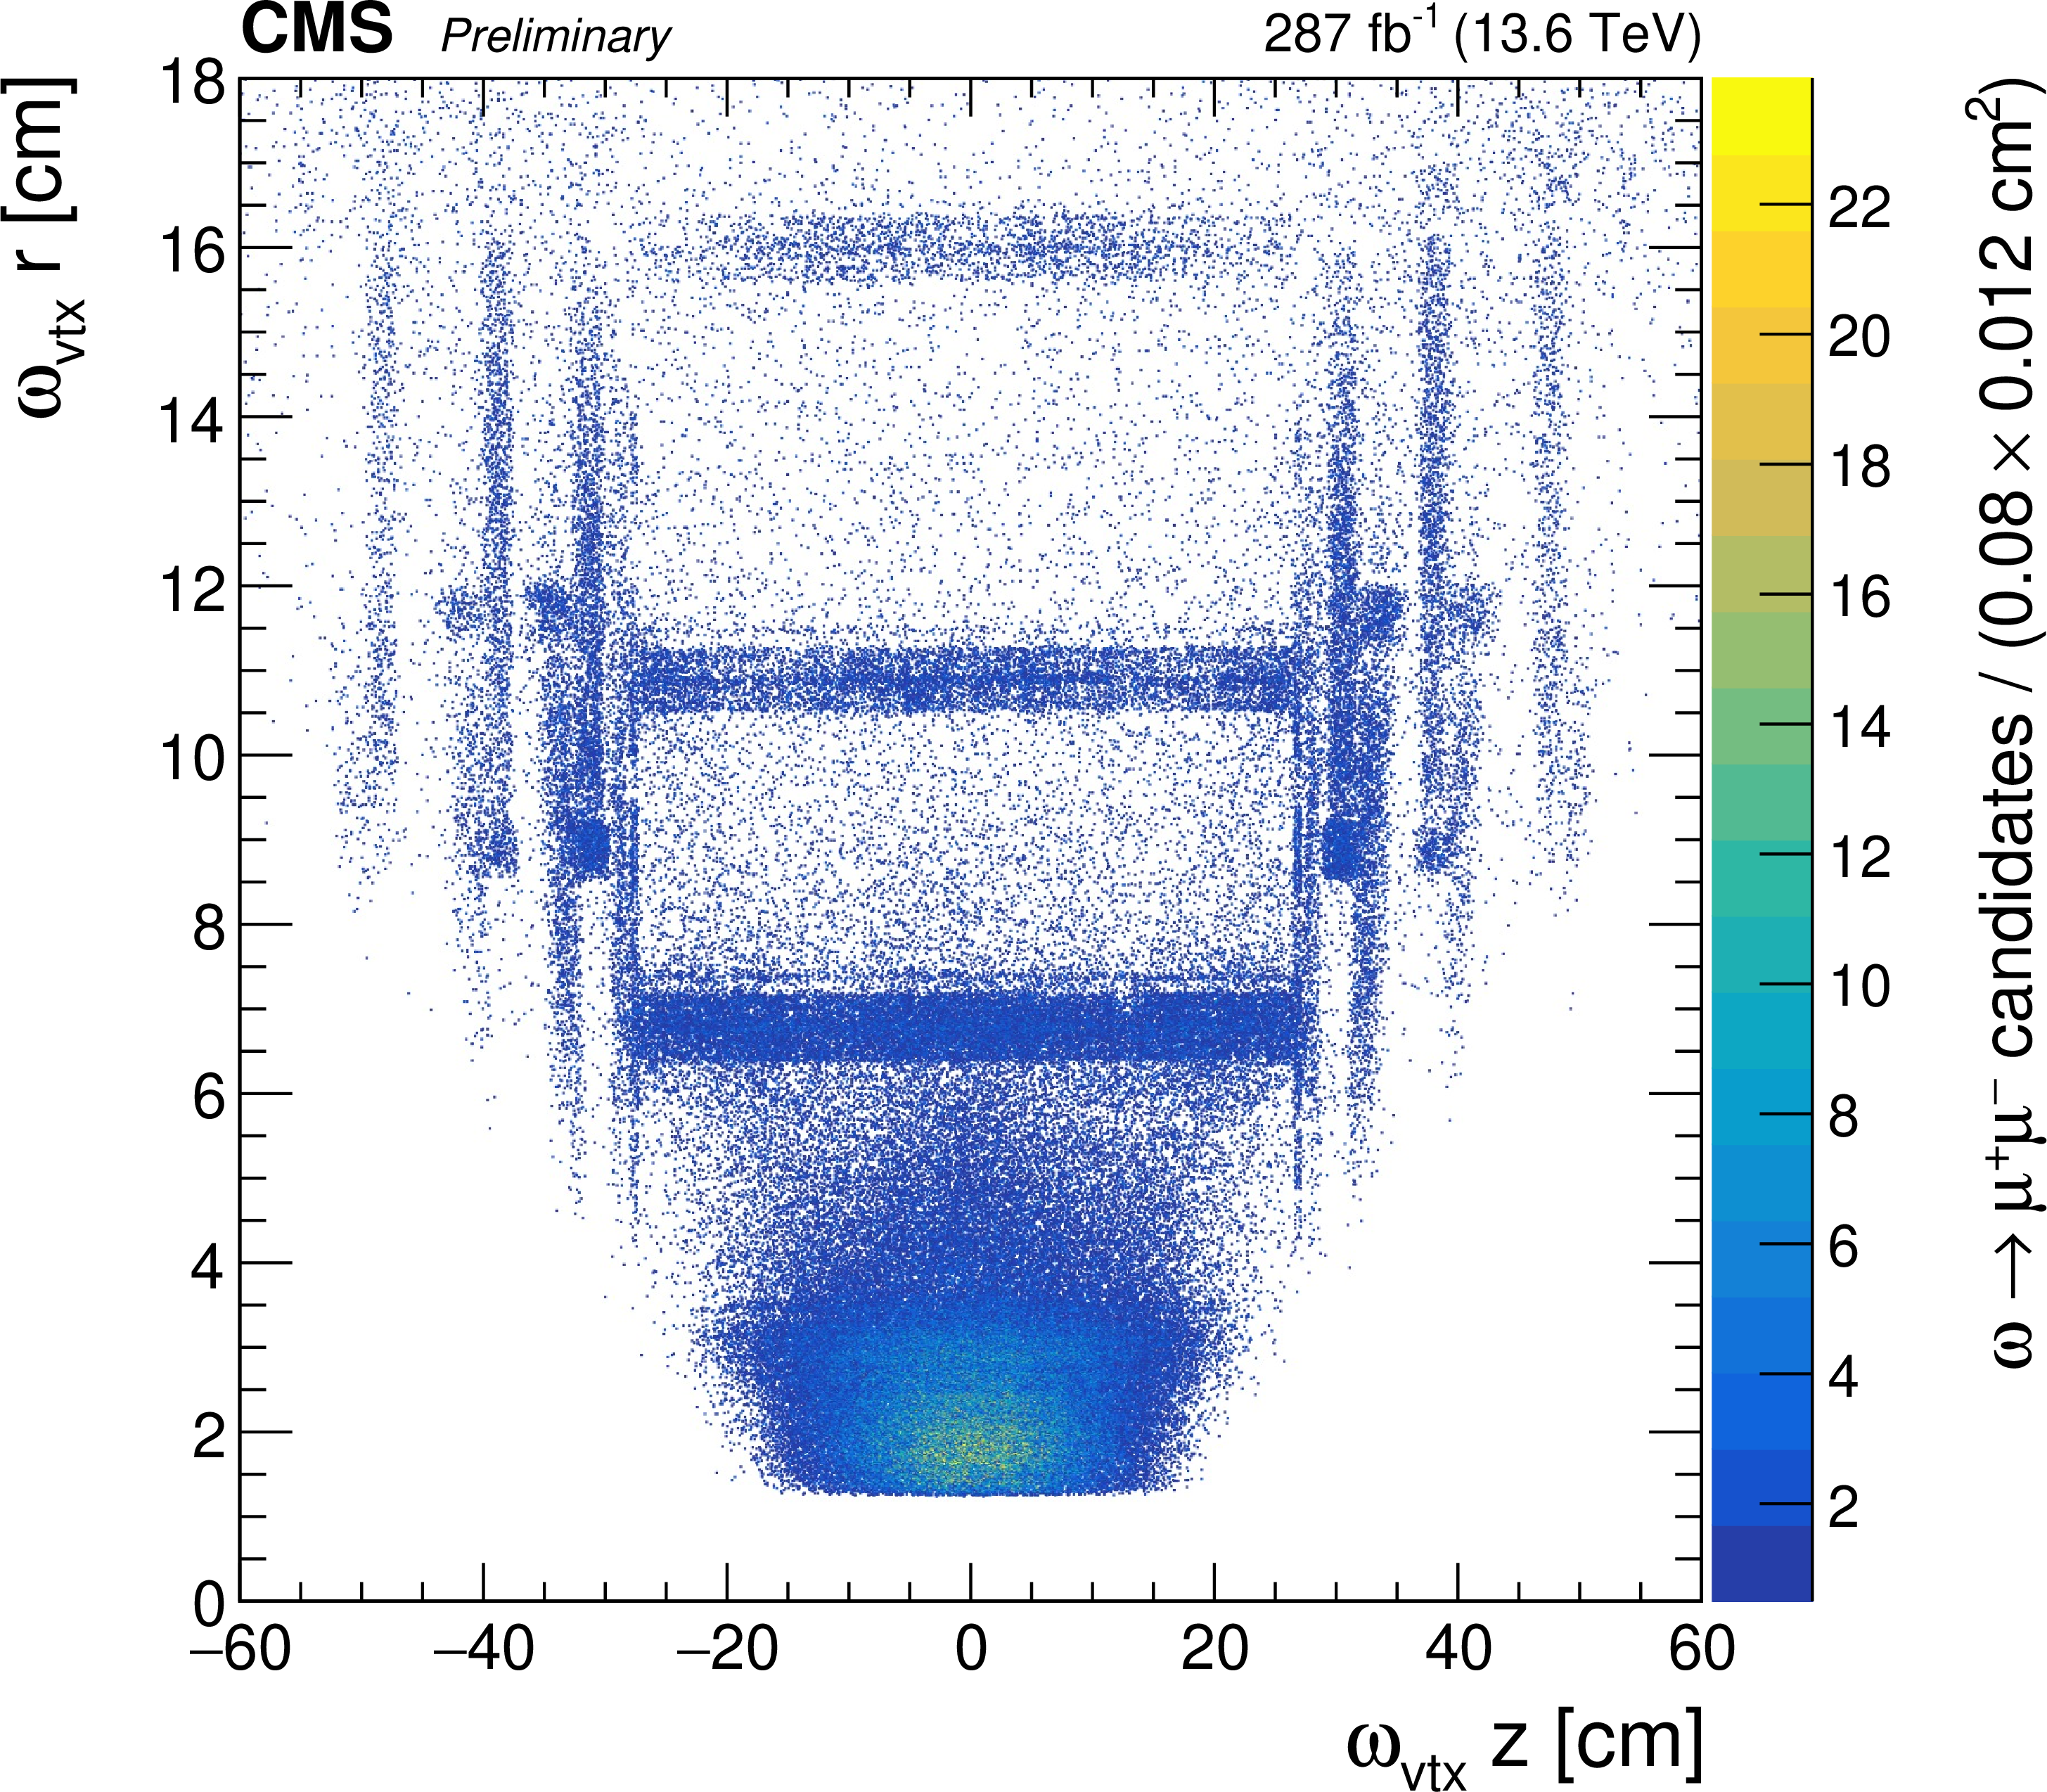
The distributions of the vertices of $\omega \to \mu^+\mu^-$ decays in data, obtained using the ${}_\mathrm{{s}}\mathcal{P}\mathrm{lot}$ technique. The full distribution in the transverse plane is shown in the upper left, an enlarged view of the beam pipe and inner pixel layer is shown in the upper right, and the distribution in the longitudinal $r$--$z$ plane is shown at the bottom, where $r$ denotes the radial coordinate. |
png pdf |
Additional Figure 1-a:
The distributions of the vertices of $\omega \to \mu^+\mu^-$ decays in data, obtained using the ${}_\mathrm{{s}}\mathcal{P}\mathrm{lot}$ technique. The full distribution in the transverse plane is shown in the upper left, an enlarged view of the beam pipe and inner pixel layer is shown in the upper right, and the distribution in the longitudinal $r$--$z$ plane is shown at the bottom, where $r$ denotes the radial coordinate. |
png pdf |
Additional Figure 1-b:
The distributions of the vertices of $\omega \to \mu^+\mu^-$ decays in data, obtained using the ${}_\mathrm{{s}}\mathcal{P}\mathrm{lot}$ technique. The full distribution in the transverse plane is shown in the upper left, an enlarged view of the beam pipe and inner pixel layer is shown in the upper right, and the distribution in the longitudinal $r$--$z$ plane is shown at the bottom, where $r$ denotes the radial coordinate. |
png pdf |
Additional Figure 1-c:
The distributions of the vertices of $\omega \to \mu^+\mu^-$ decays in data, obtained using the ${}_\mathrm{{s}}\mathcal{P}\mathrm{lot}$ technique. The full distribution in the transverse plane is shown in the upper left, an enlarged view of the beam pipe and inner pixel layer is shown in the upper right, and the distribution in the longitudinal $r$--$z$ plane is shown at the bottom, where $r$ denotes the radial coordinate. |
png pdf |
Additional Figure 2:
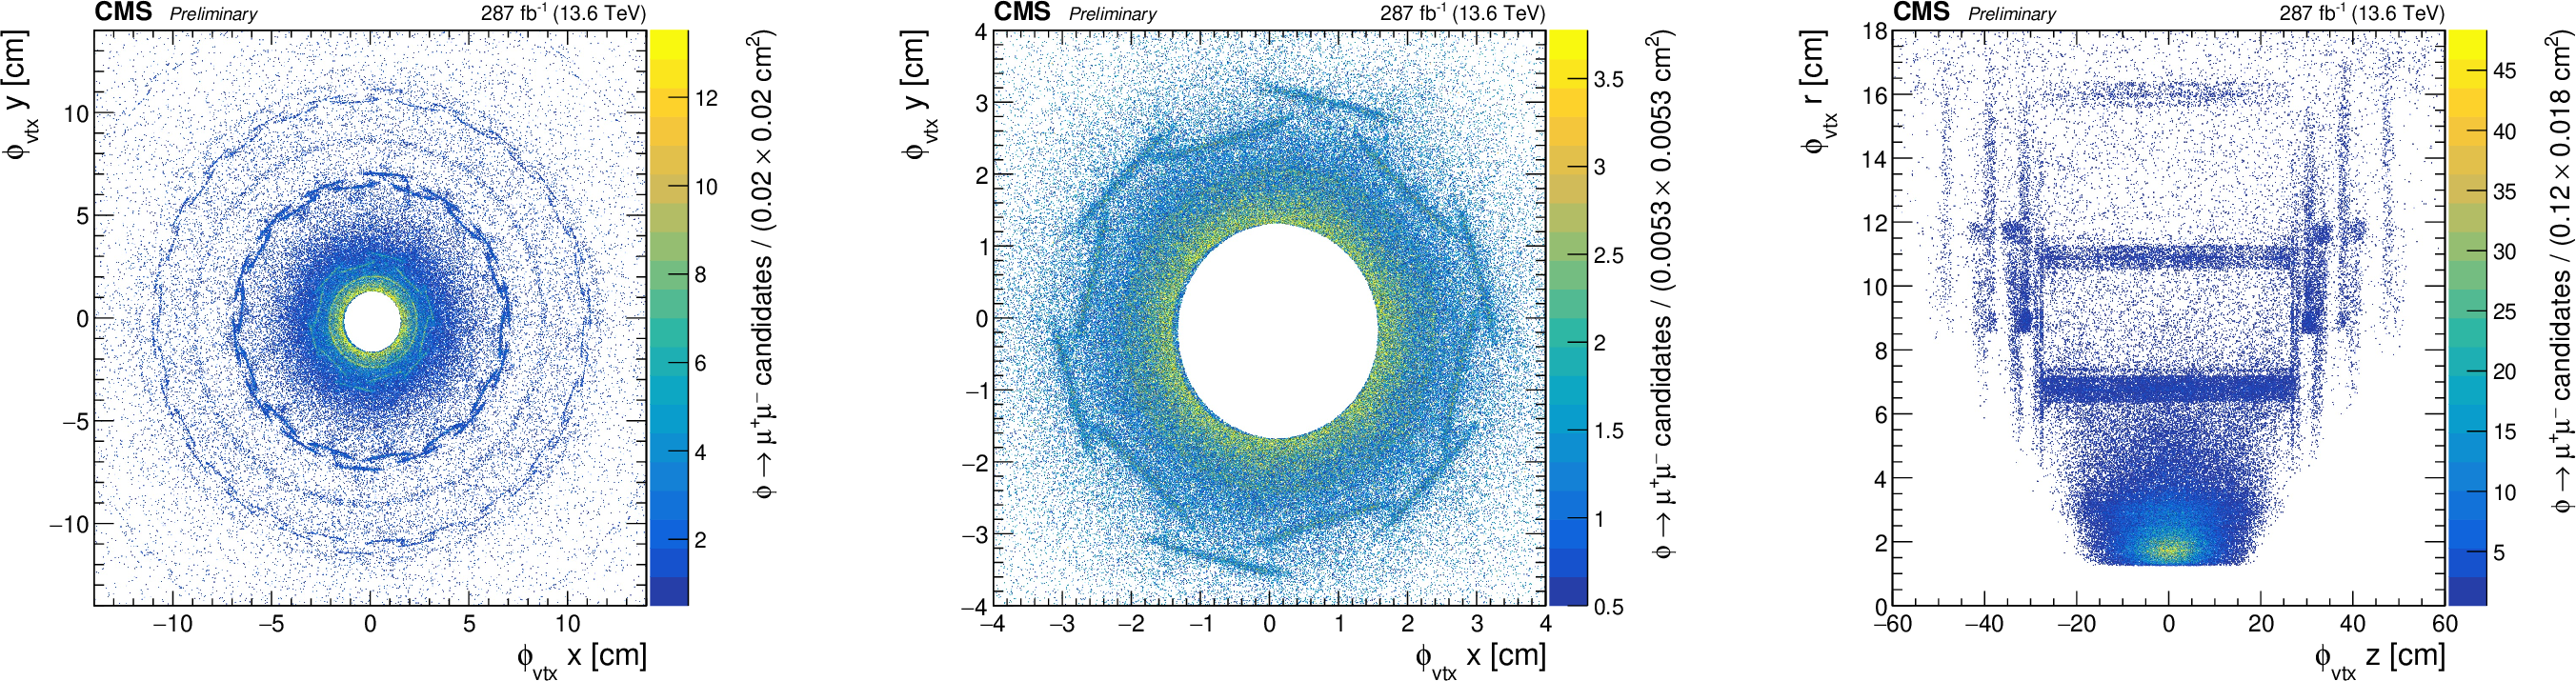
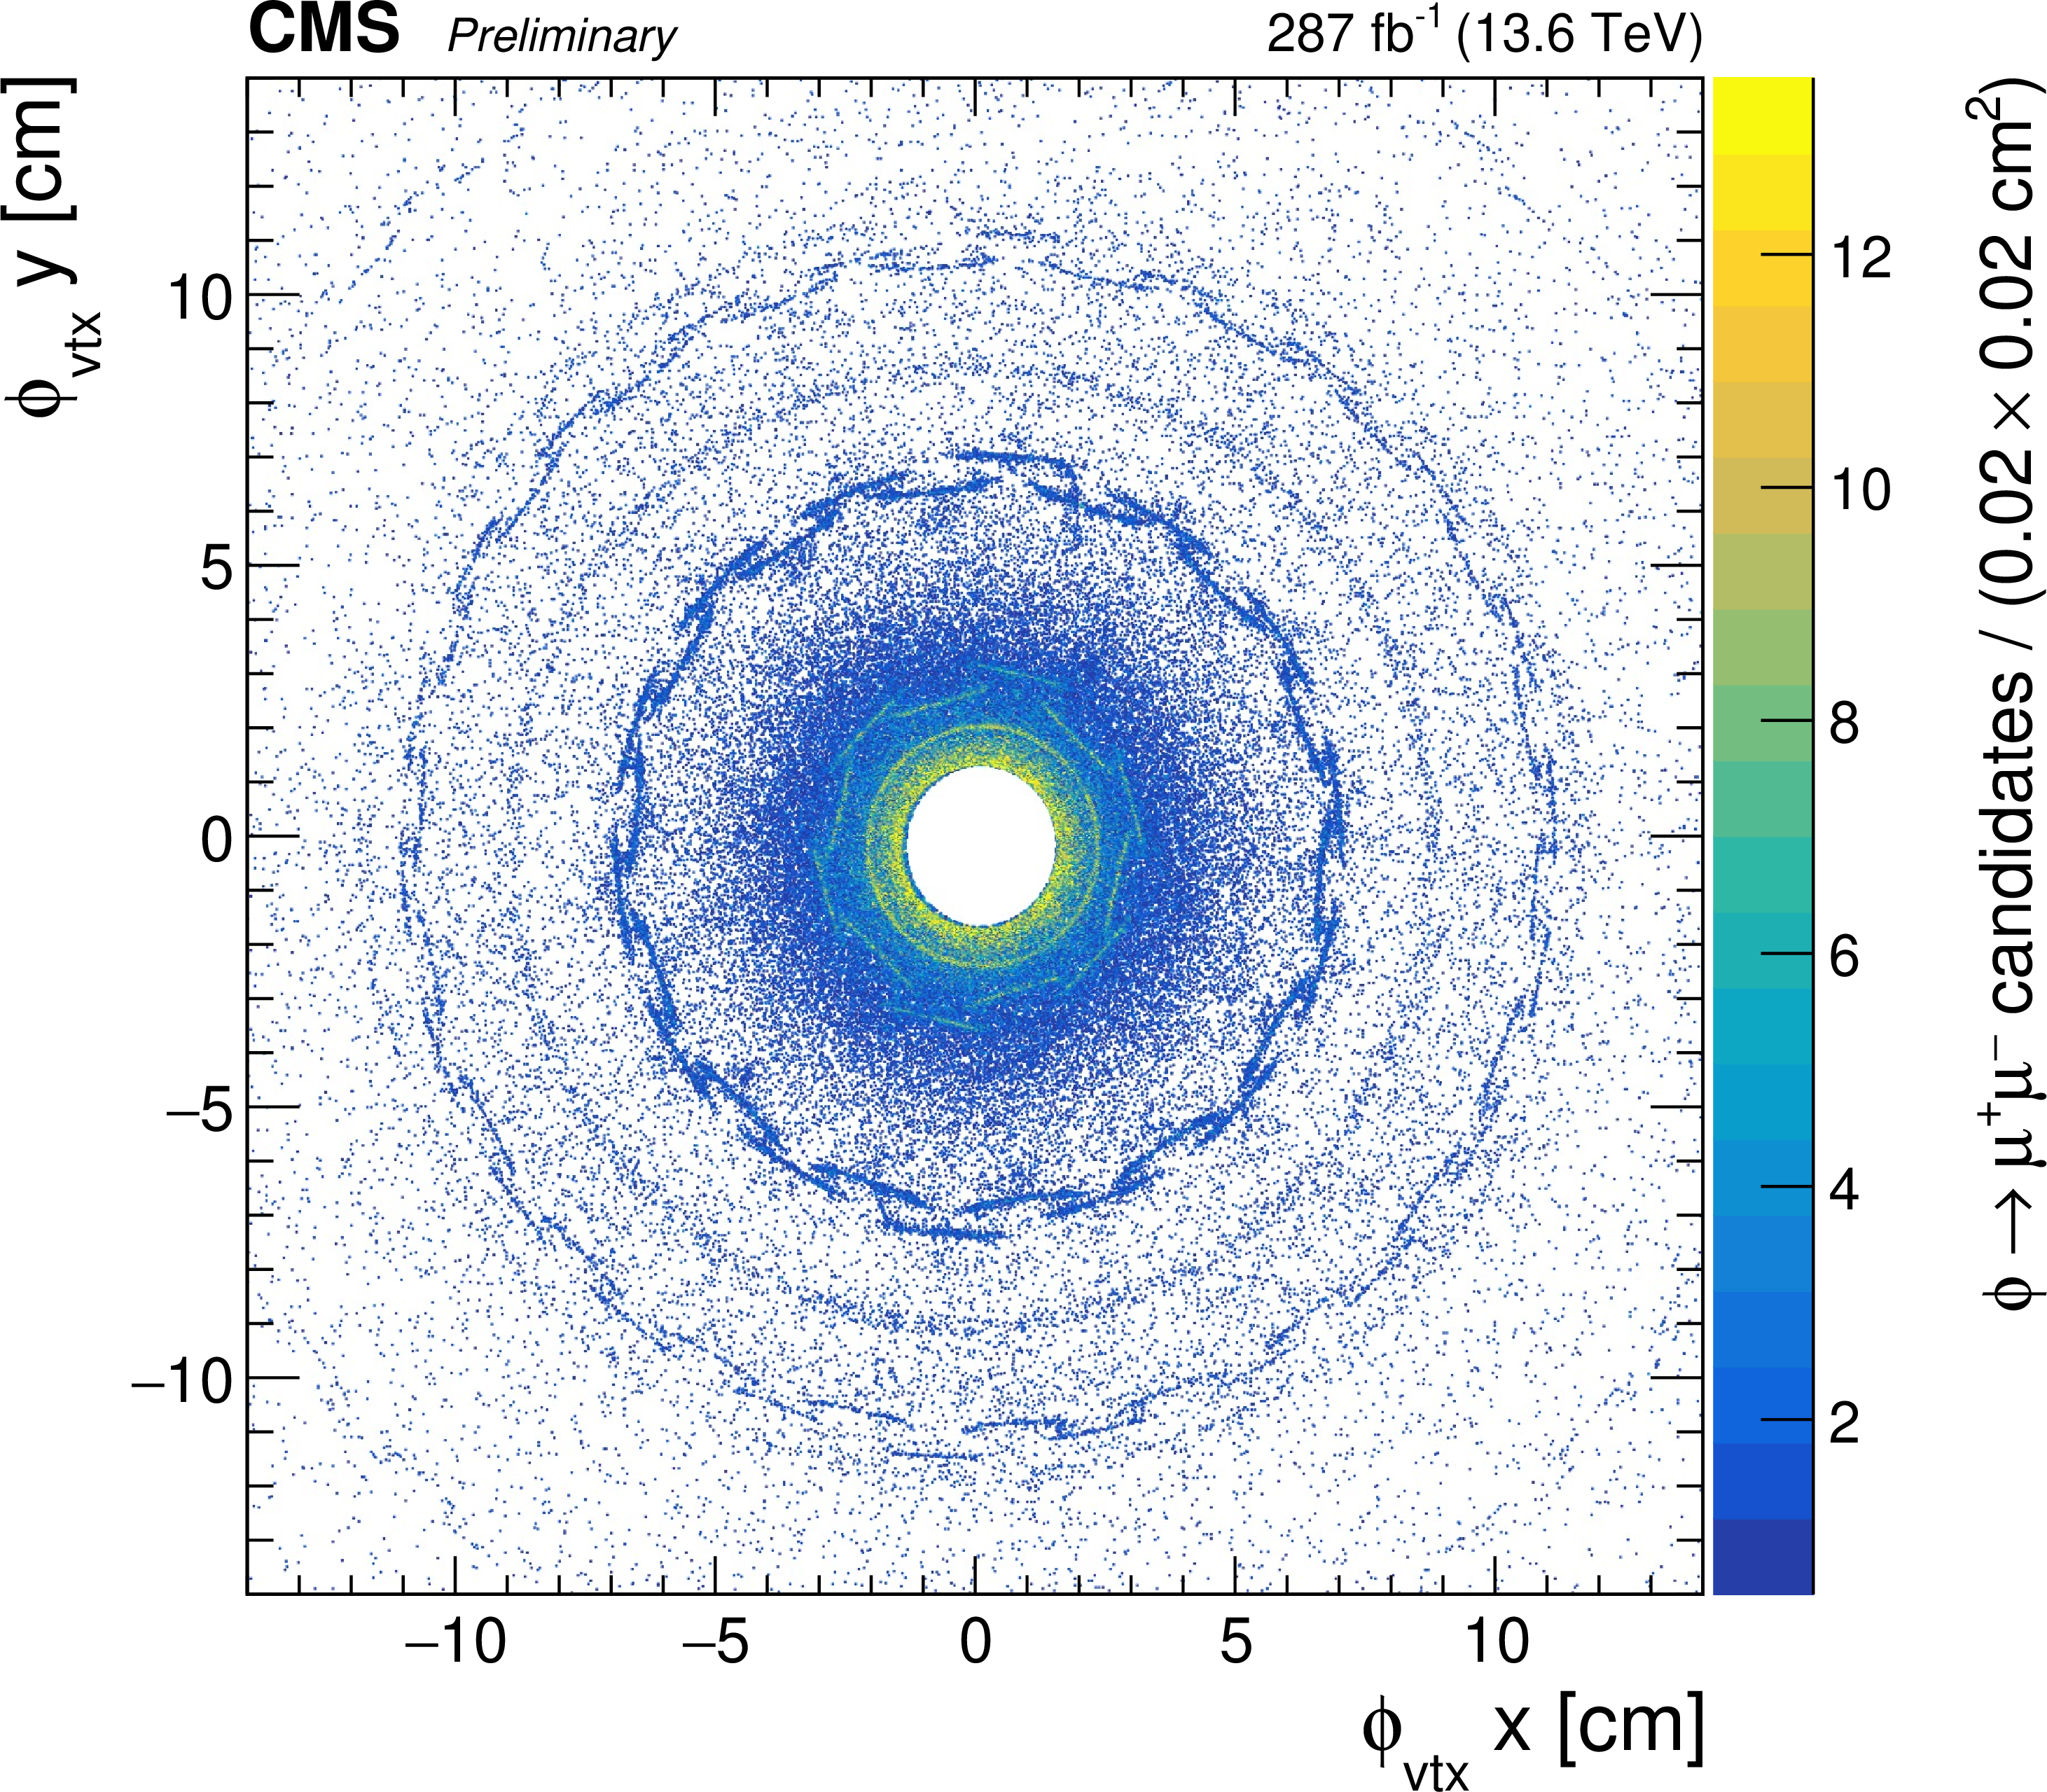
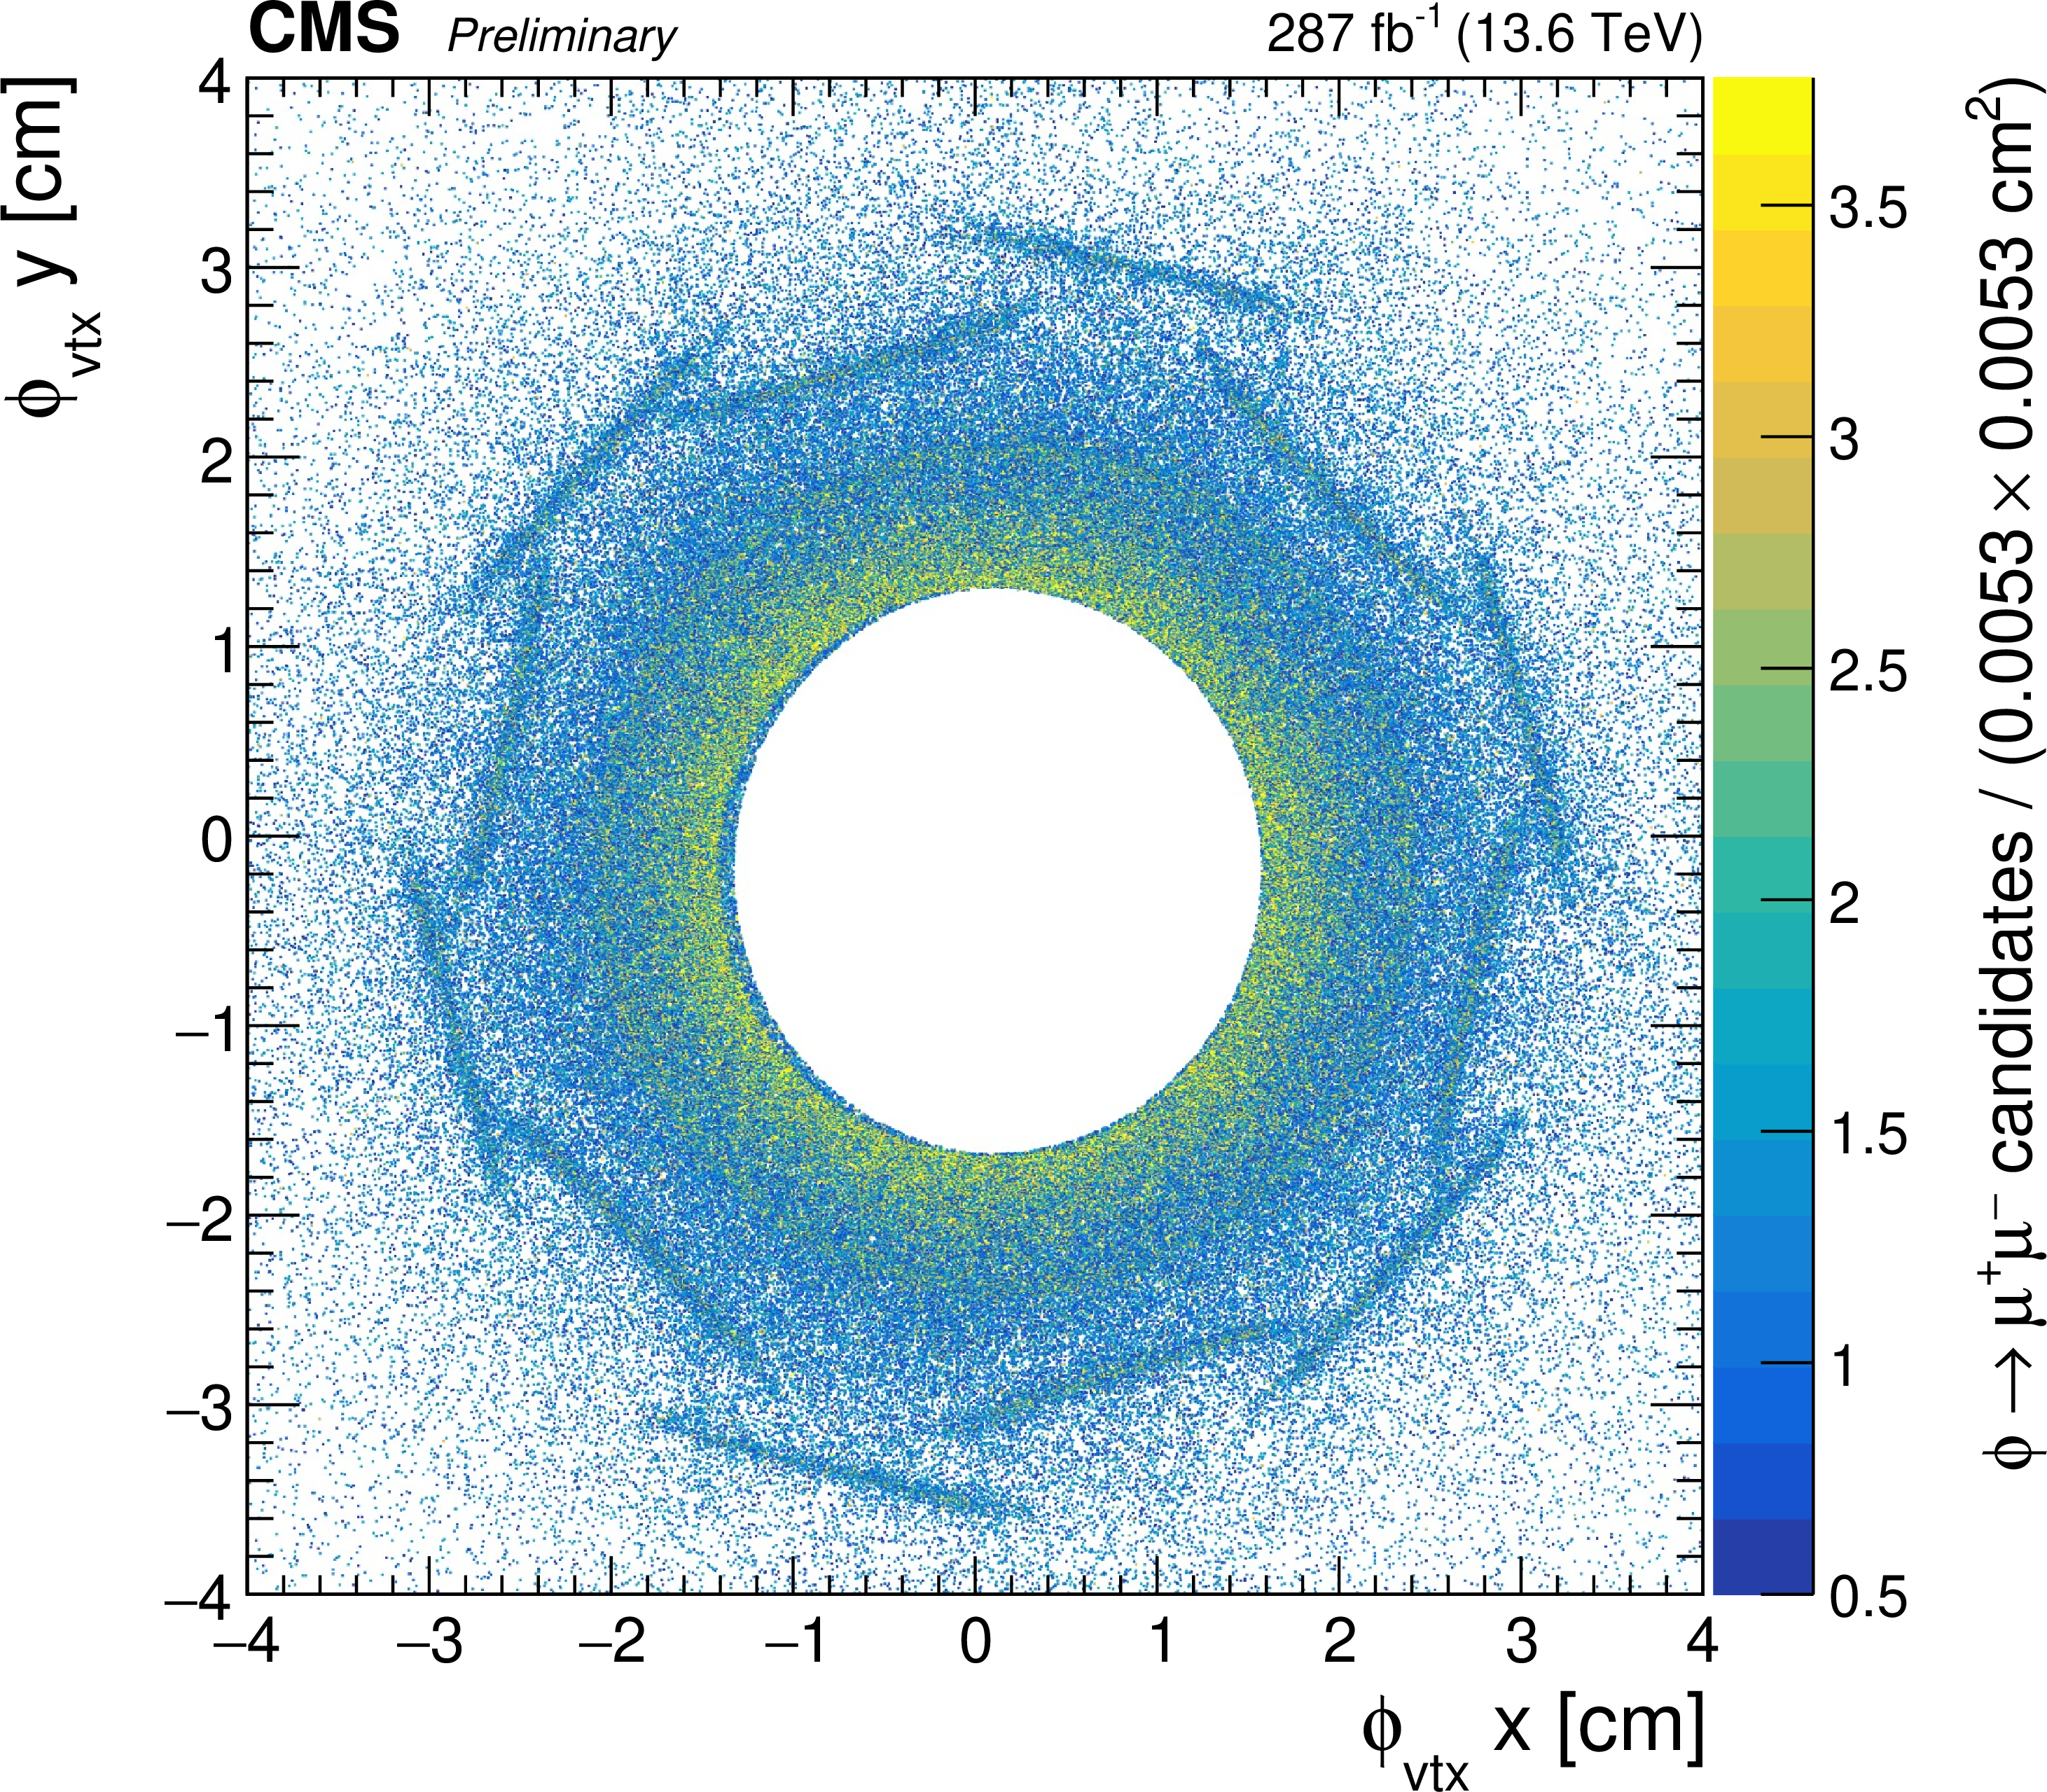
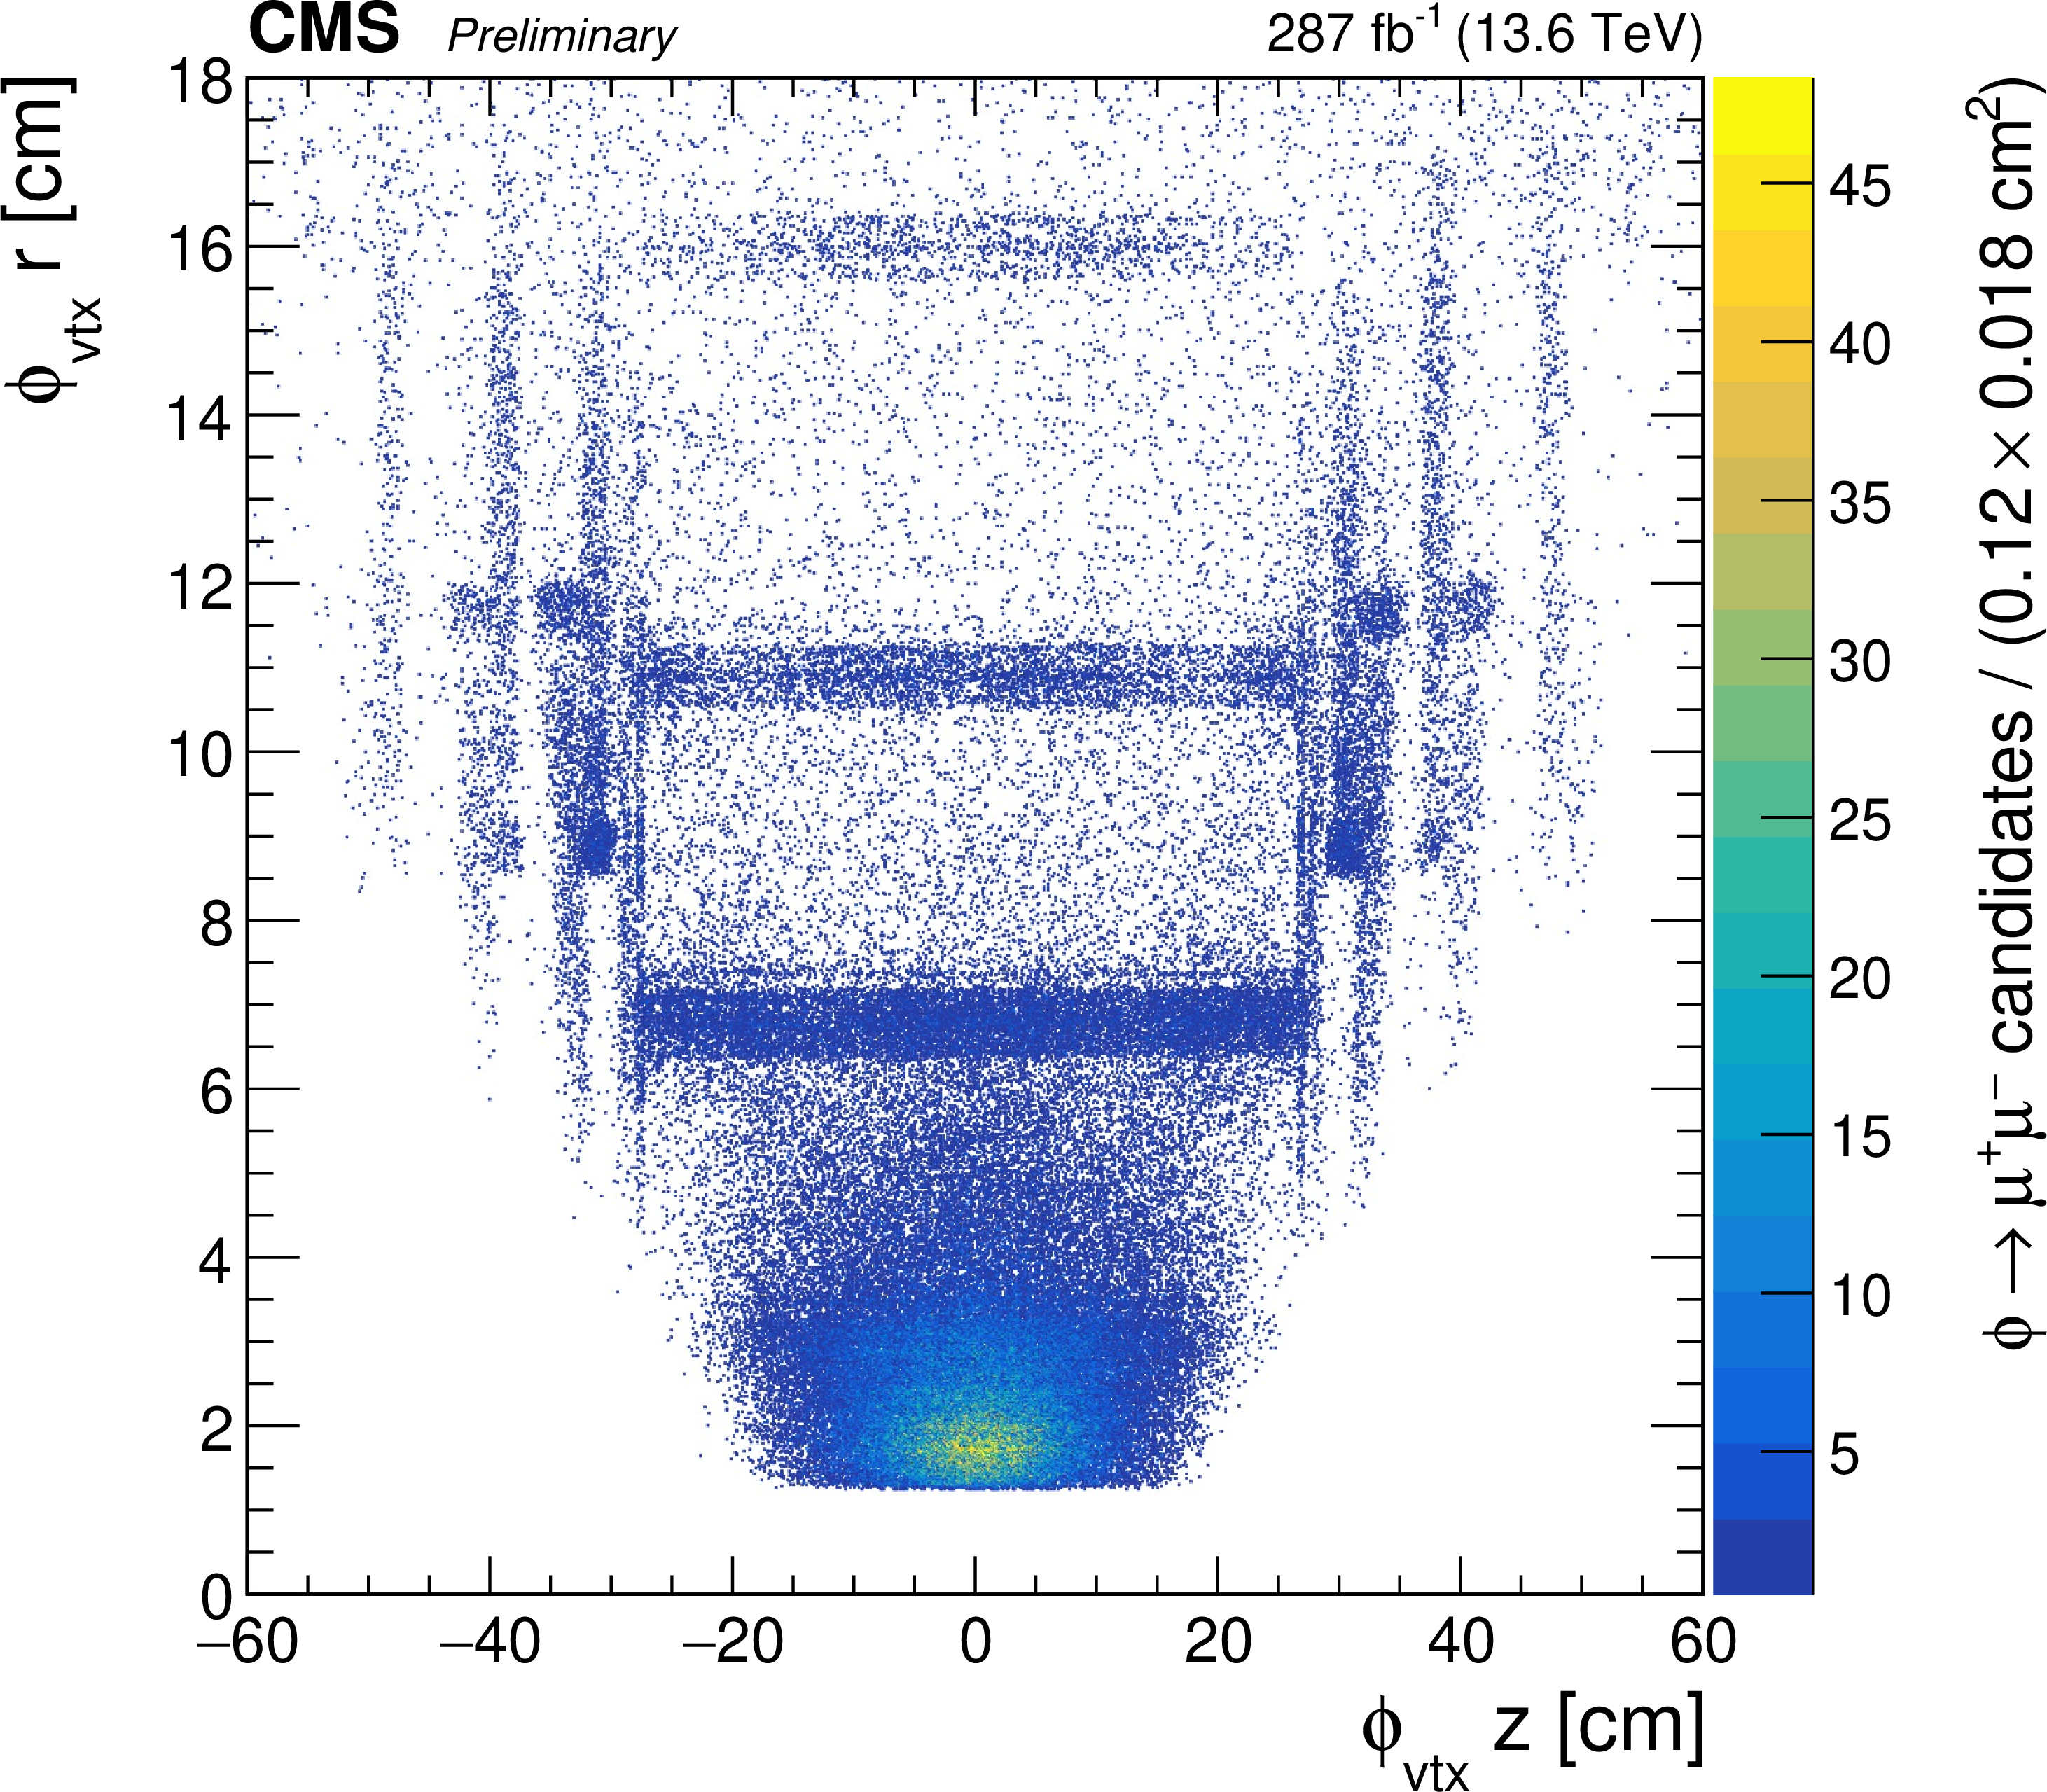
The distributions of the vertices of $\phi \to \mu^+\mu^-$ decays in data, obtained using the ${}_\mathrm{{s}}\mathcal{P}\mathrm{lot}$ technique. The full distribution in the transverse plane is shown in the upper left, an enlarged view of the beam pipe and inner pixel layer is shown in the upper right, and the distribution in the longitudinal $r$--$z$ plane is shown at the bottom, where $r$ denotes the radial coordinate. |
png pdf |
Additional Figure 2-a:
The distributions of the vertices of $\phi \to \mu^+\mu^-$ decays in data, obtained using the ${}_\mathrm{{s}}\mathcal{P}\mathrm{lot}$ technique. The full distribution in the transverse plane is shown in the upper left, an enlarged view of the beam pipe and inner pixel layer is shown in the upper right, and the distribution in the longitudinal $r$--$z$ plane is shown at the bottom, where $r$ denotes the radial coordinate. |
png pdf |
Additional Figure 2-b:
The distributions of the vertices of $\phi \to \mu^+\mu^-$ decays in data, obtained using the ${}_\mathrm{{s}}\mathcal{P}\mathrm{lot}$ technique. The full distribution in the transverse plane is shown in the upper left, an enlarged view of the beam pipe and inner pixel layer is shown in the upper right, and the distribution in the longitudinal $r$--$z$ plane is shown at the bottom, where $r$ denotes the radial coordinate. |
png pdf |
Additional Figure 2-c:
The distributions of the vertices of $\phi \to \mu^+\mu^-$ decays in data, obtained using the ${}_\mathrm{{s}}\mathcal{P}\mathrm{lot}$ technique. The full distribution in the transverse plane is shown in the upper left, an enlarged view of the beam pipe and inner pixel layer is shown in the upper right, and the distribution in the longitudinal $r$--$z$ plane is shown at the bottom, where $r$ denotes the radial coordinate. |
png pdf |
Additional Figure 3:
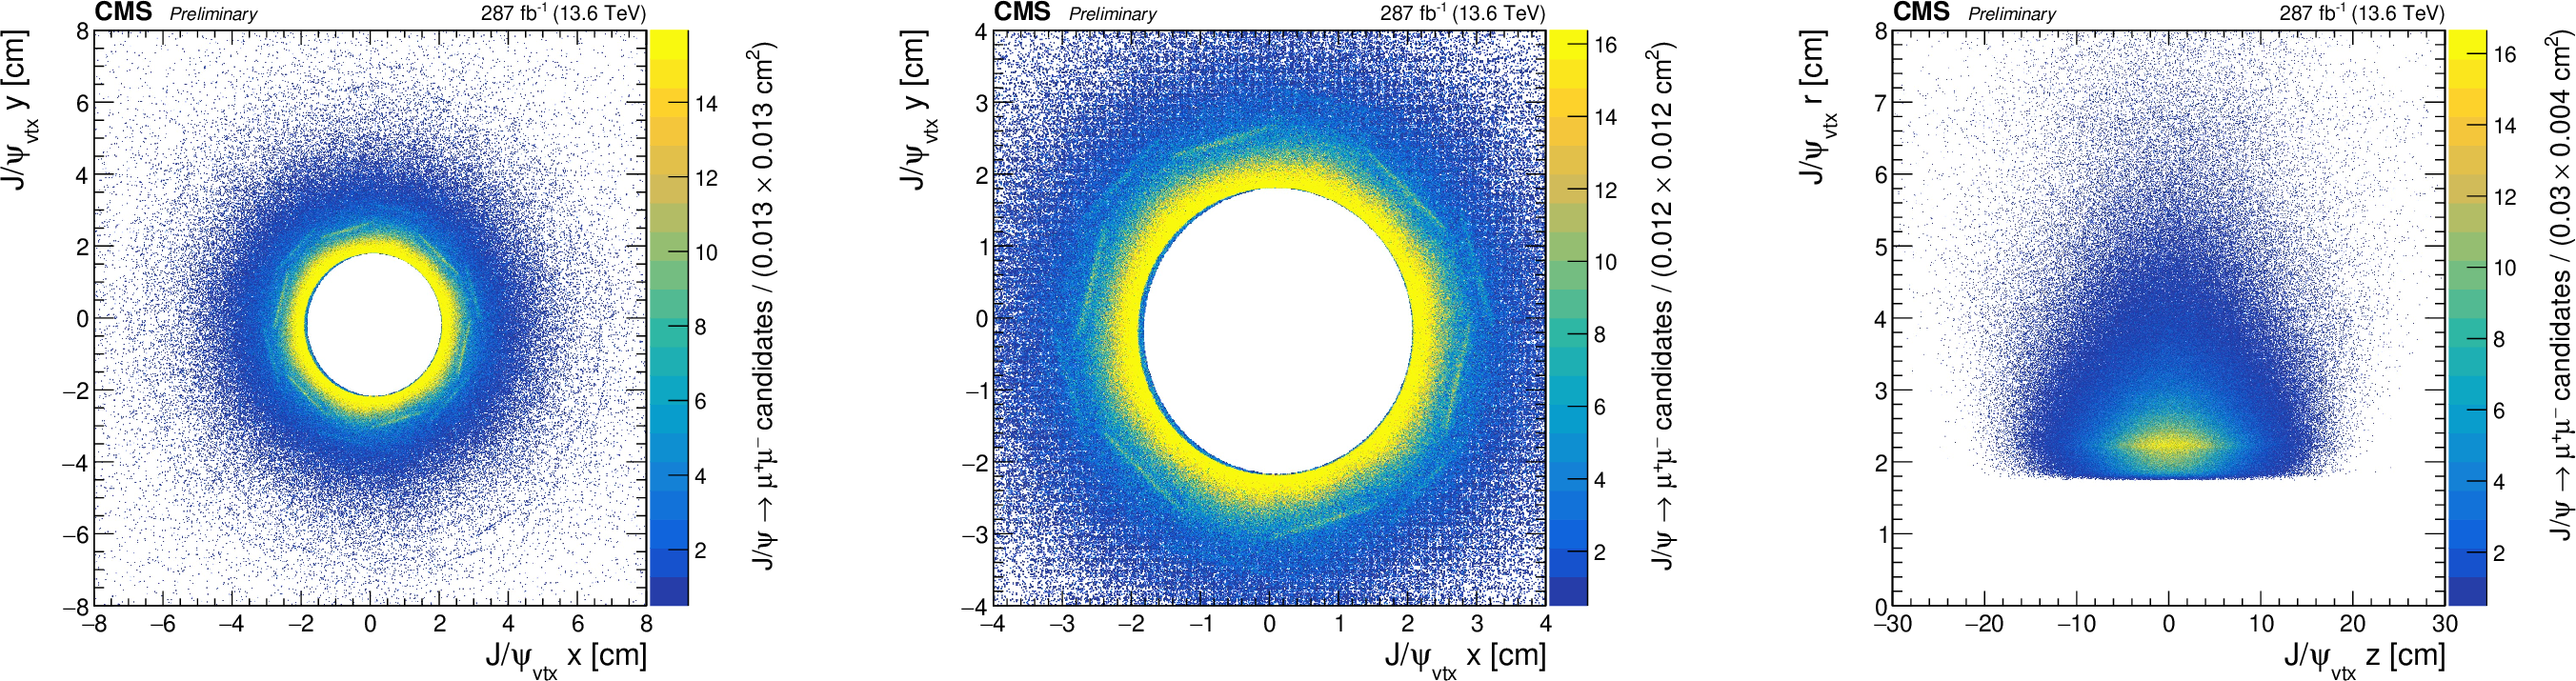
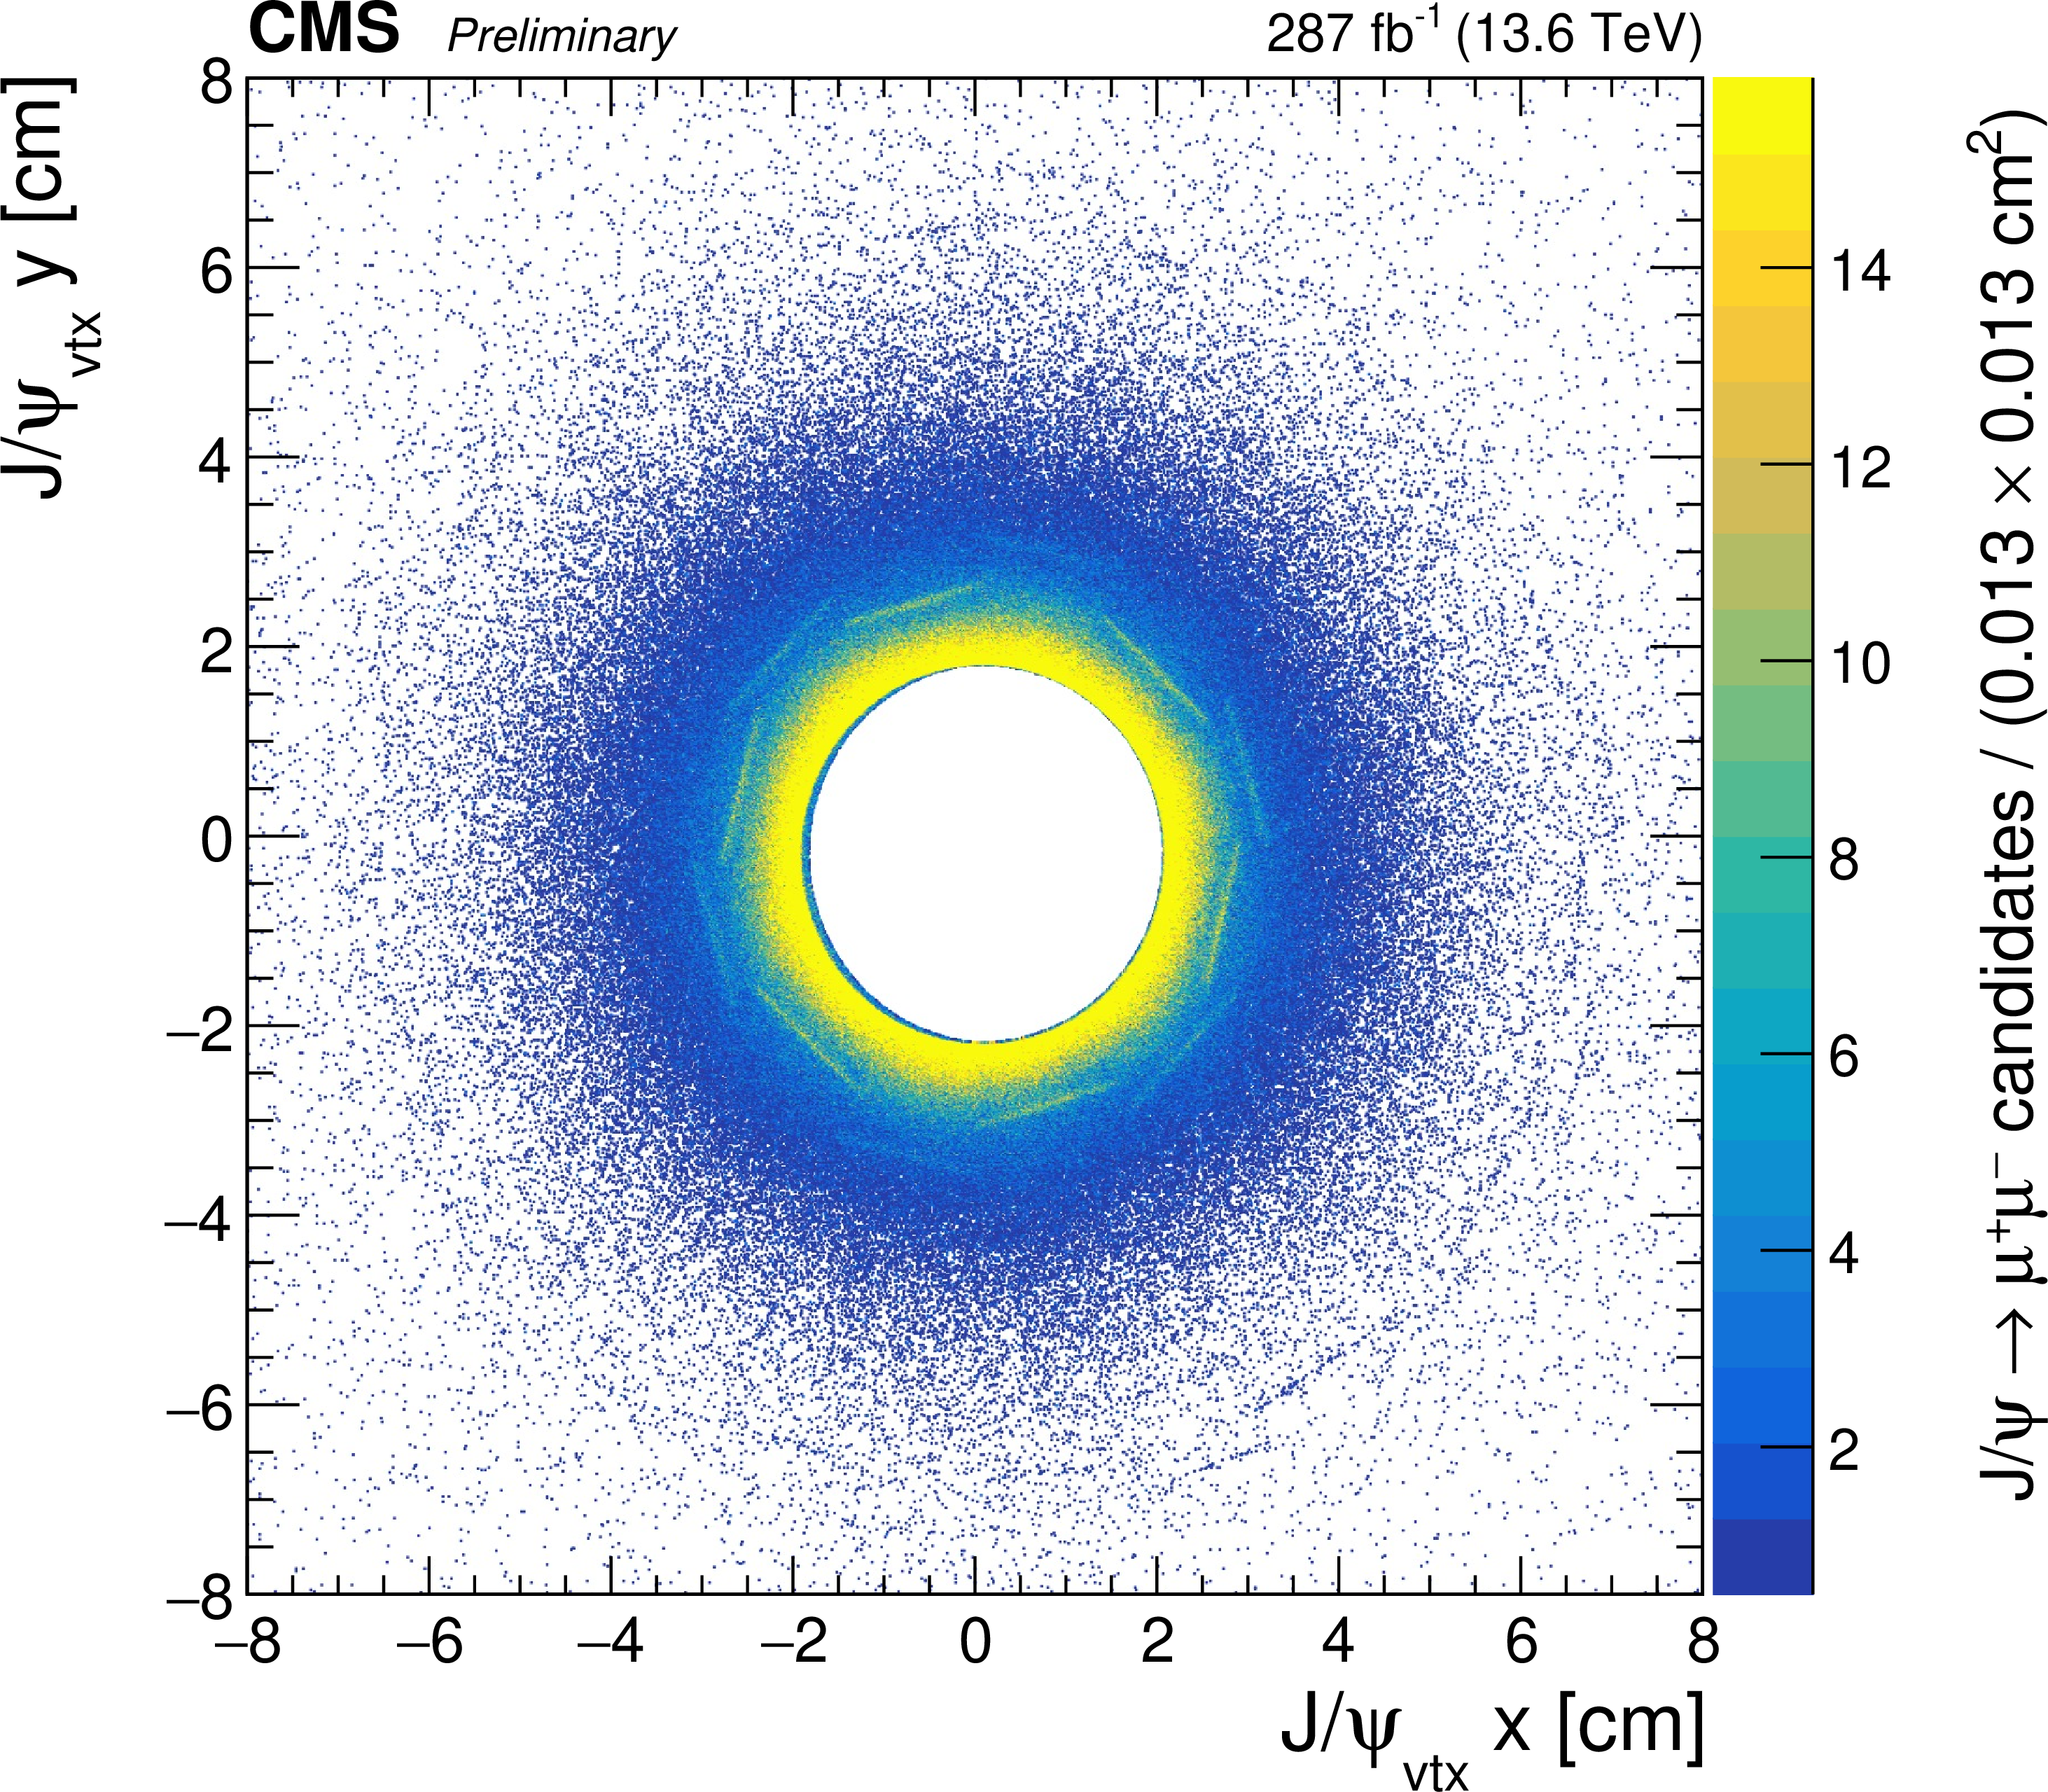
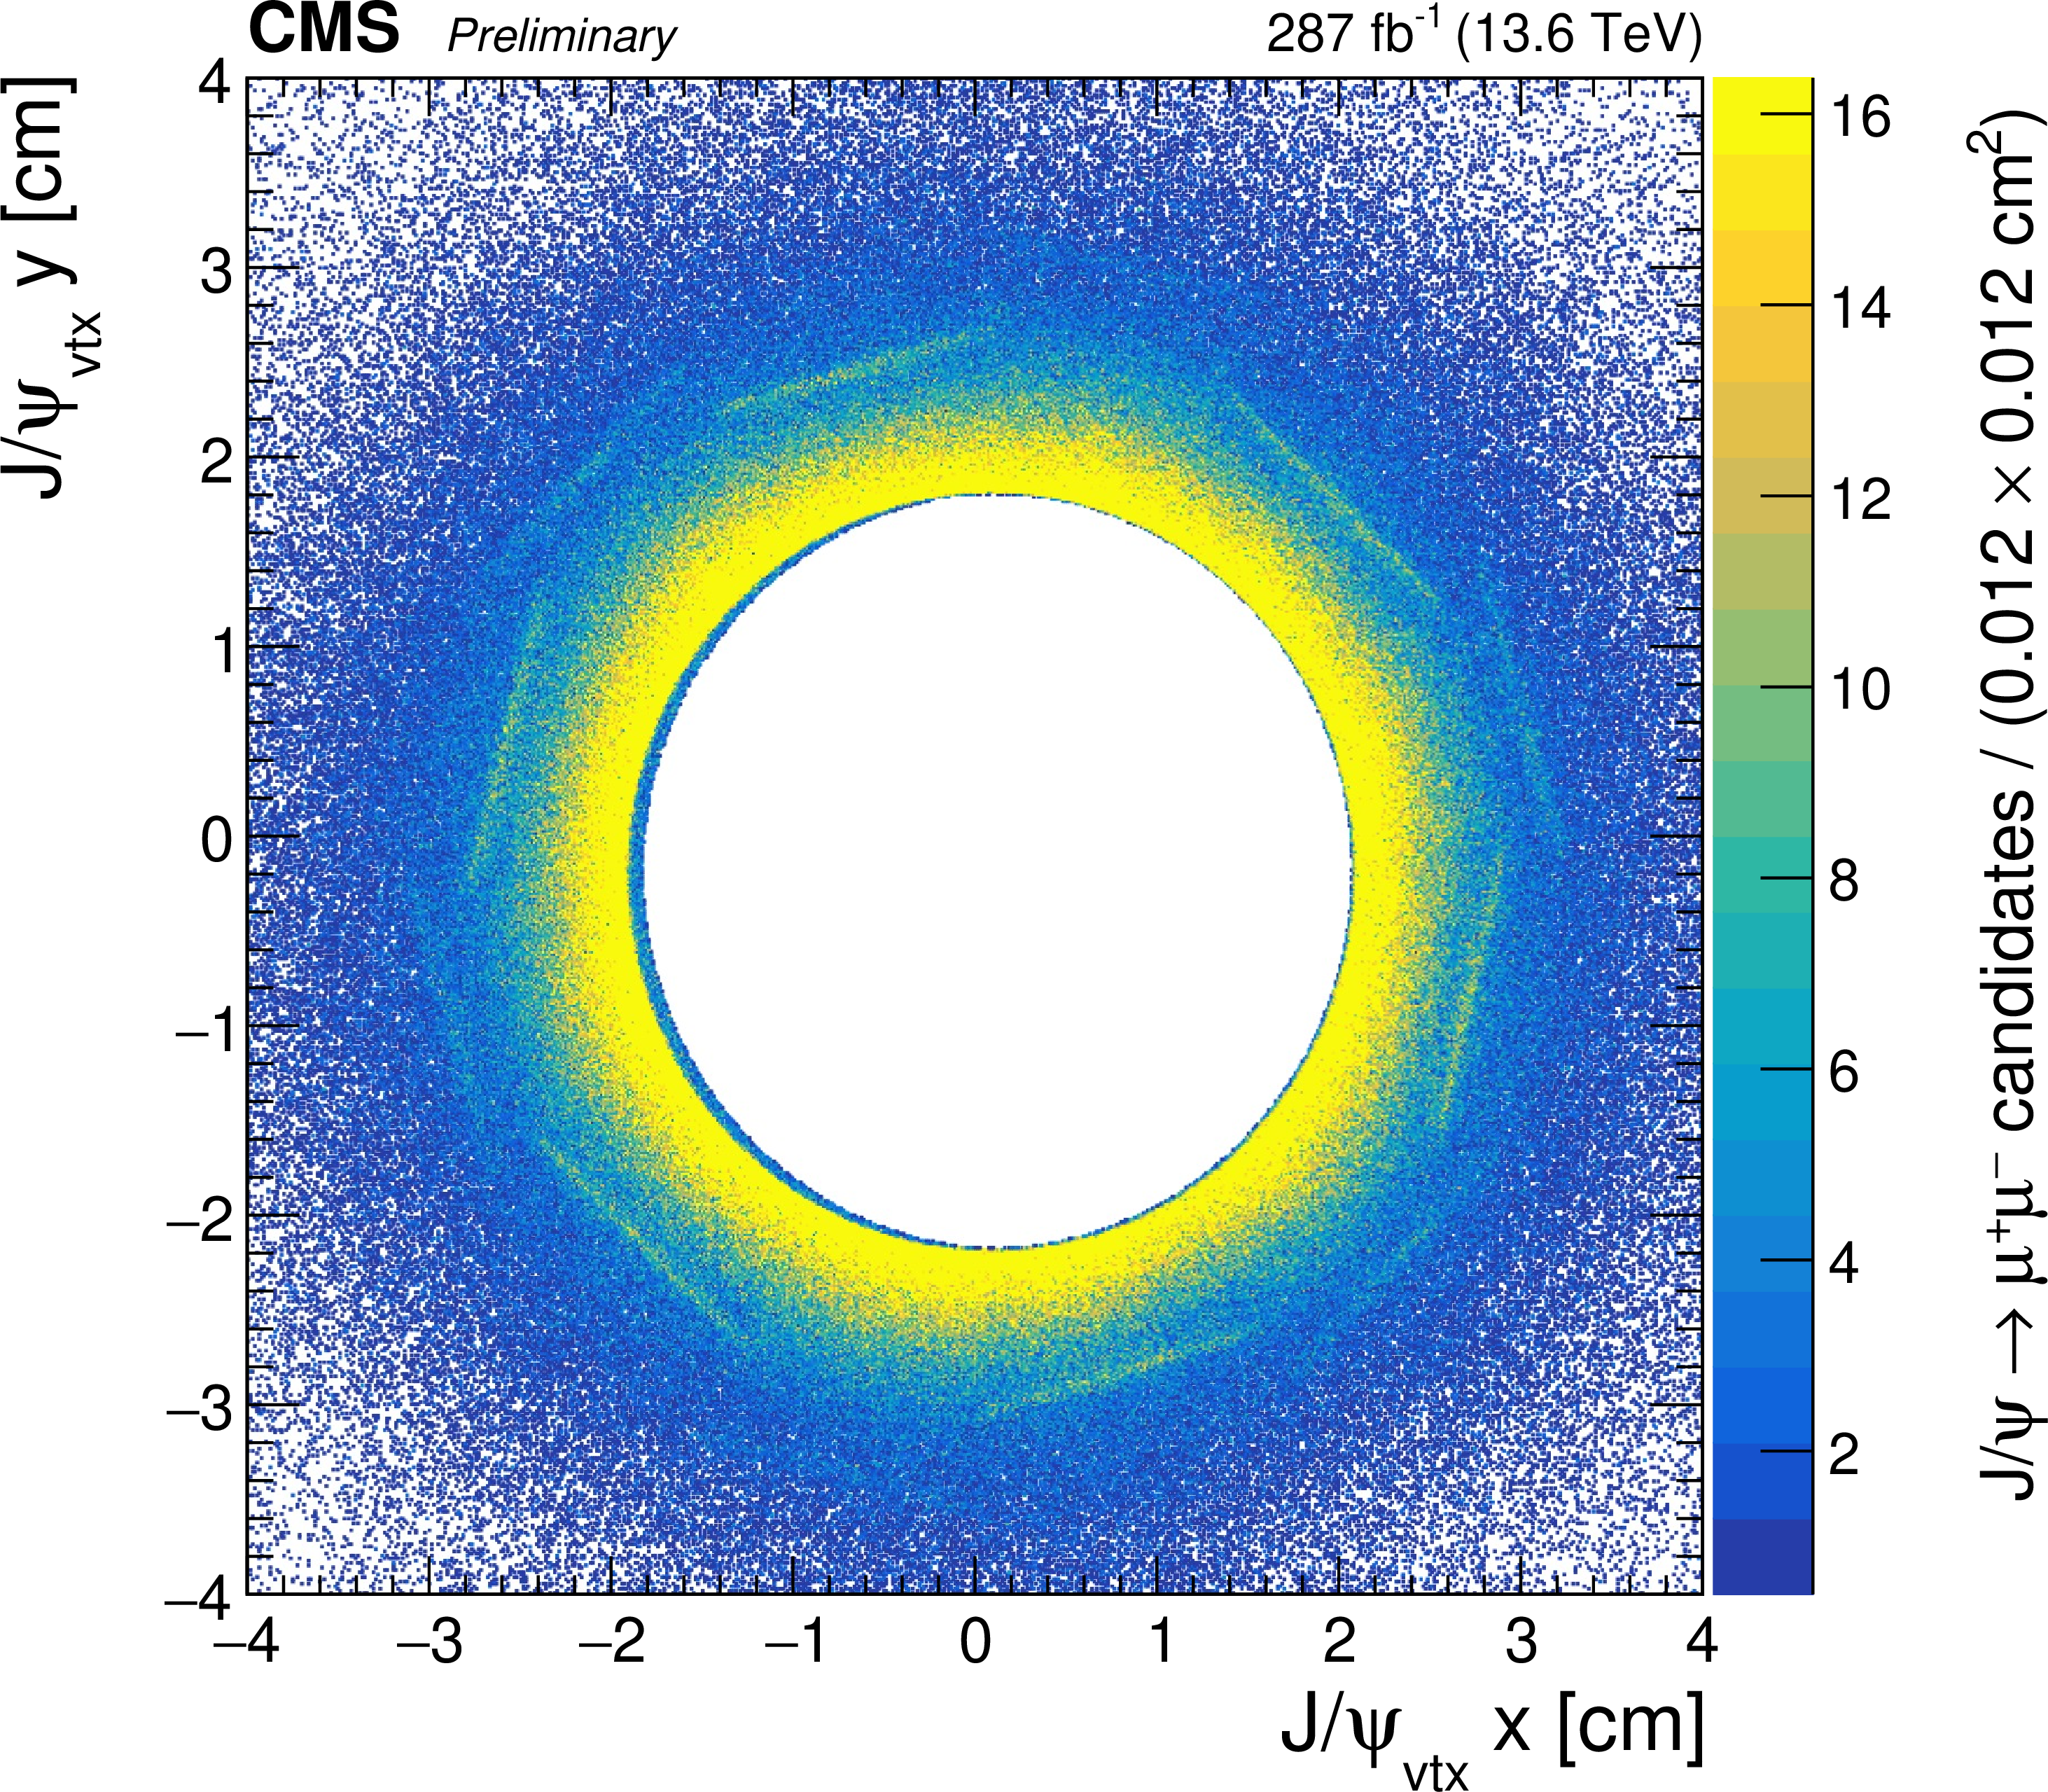
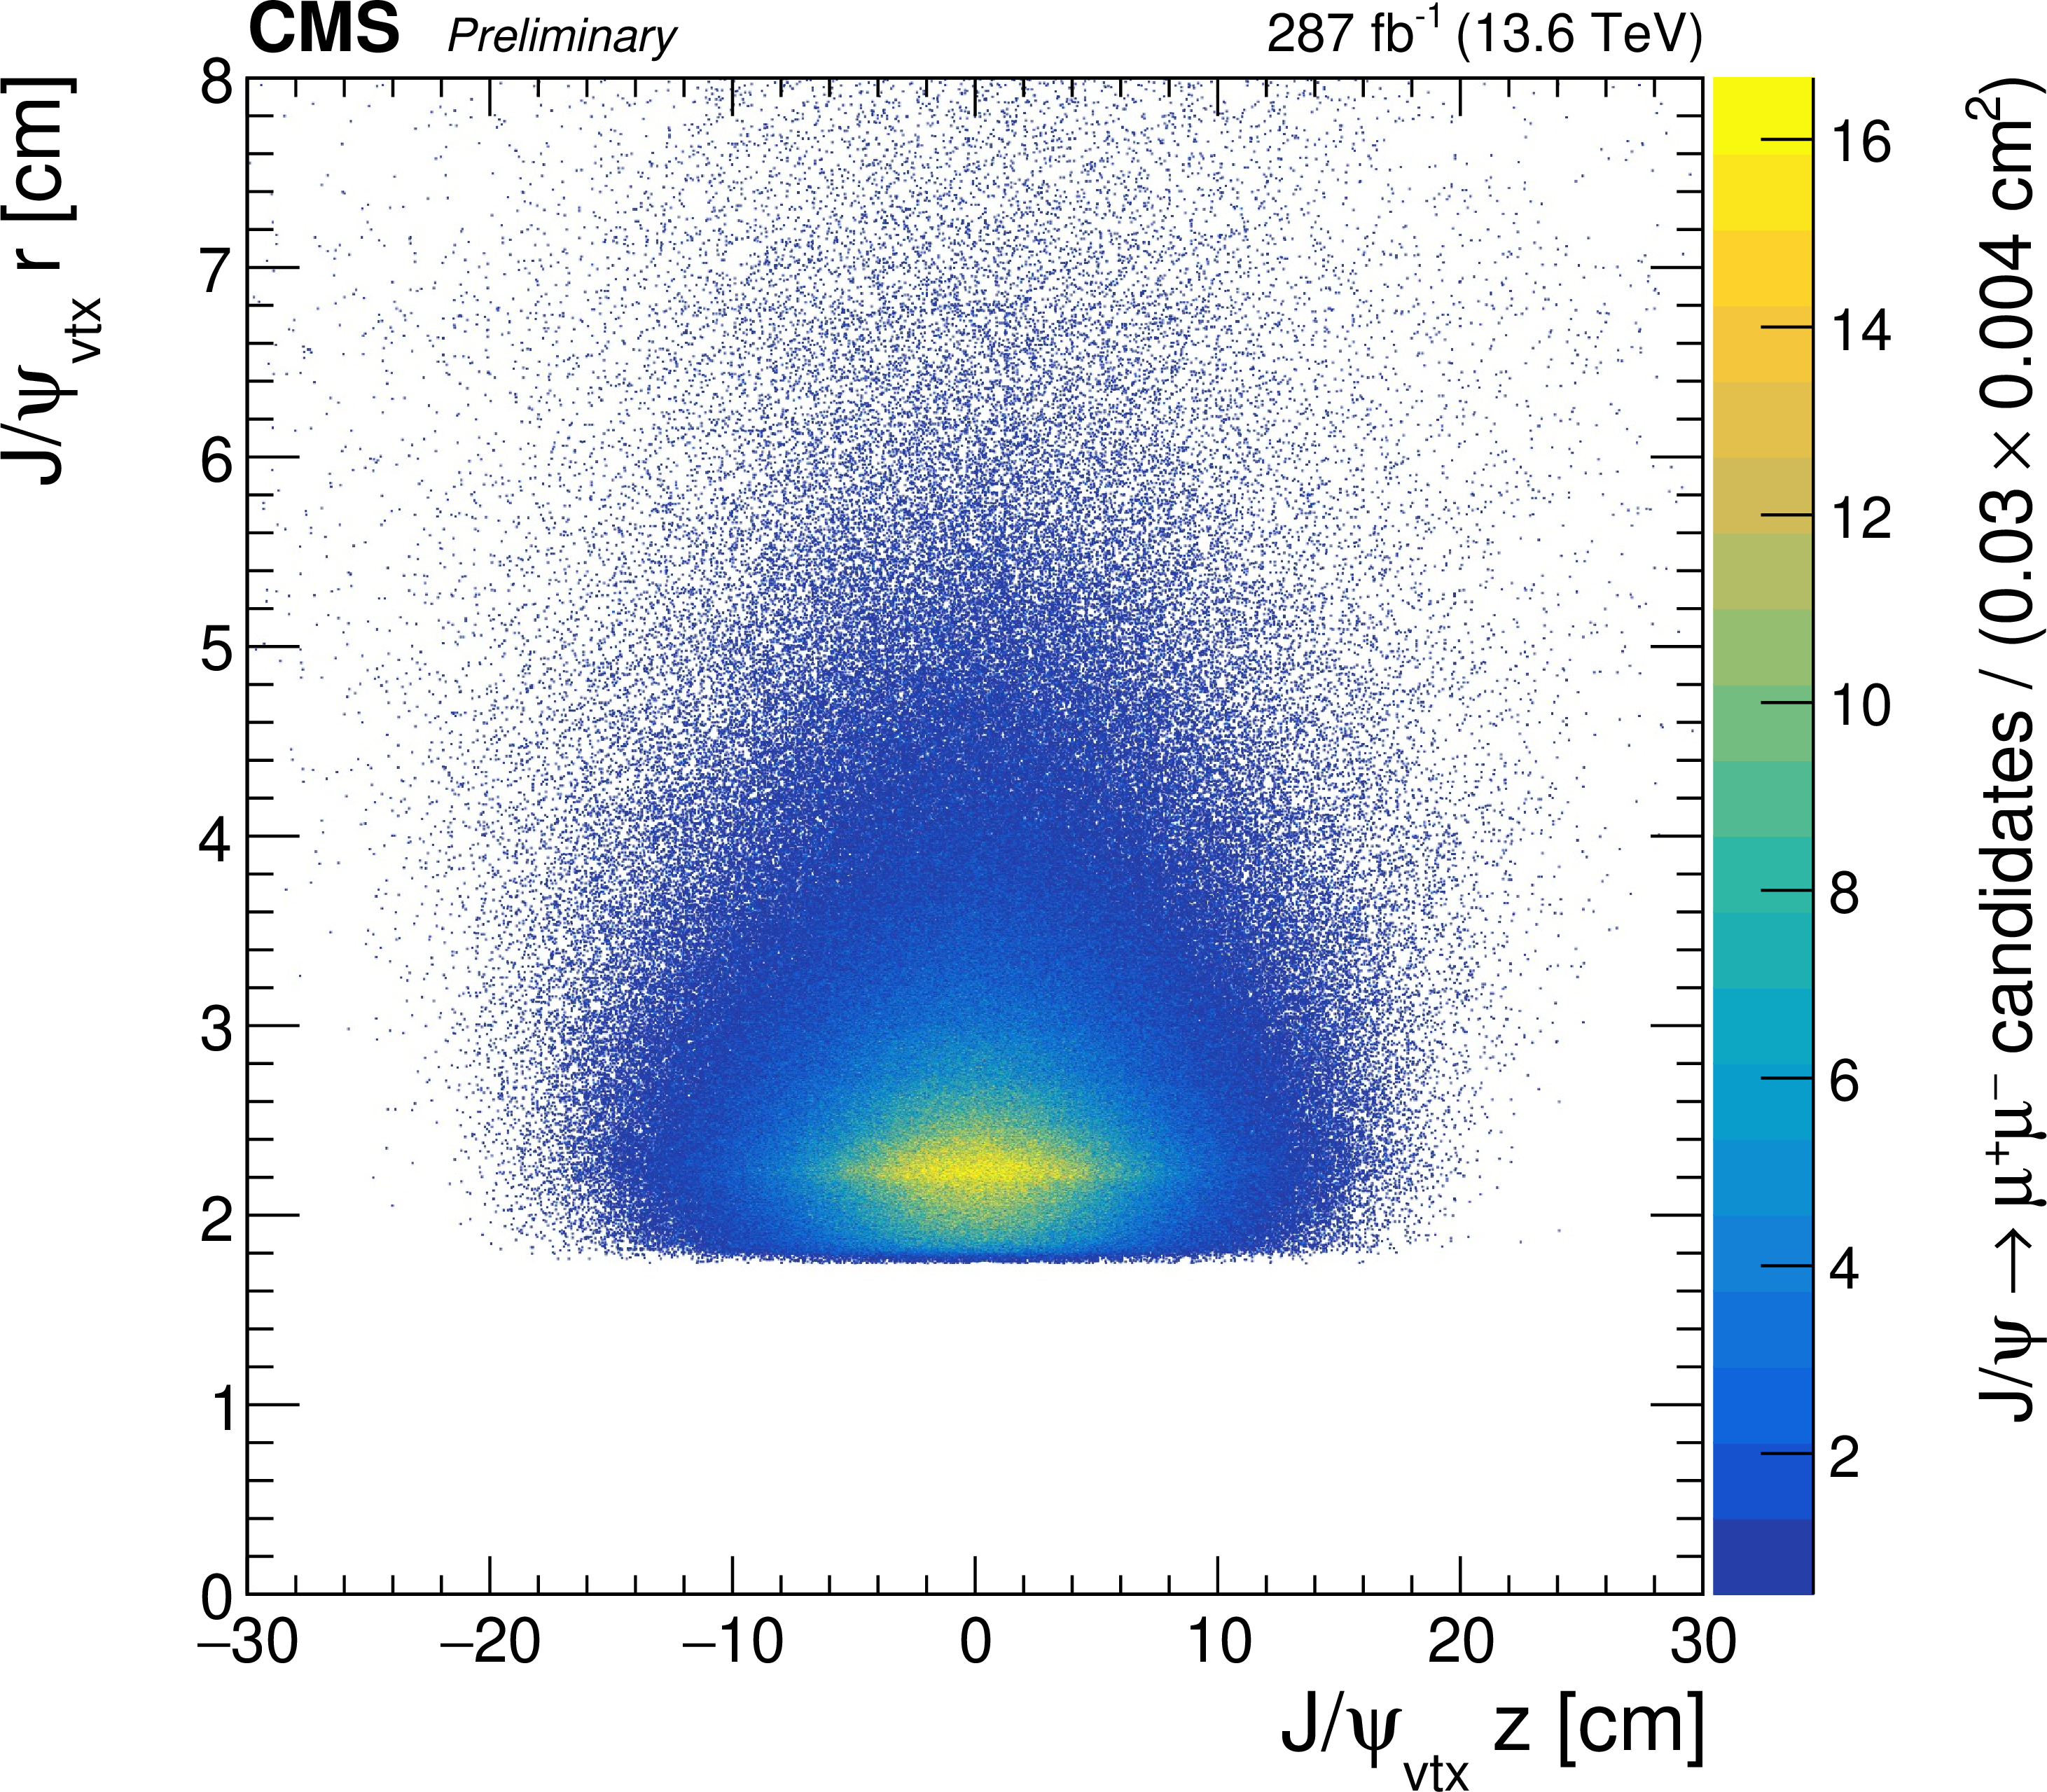
The distributions of the vertices of $J\Psi \to \mu^+\mu^-$ decays in data, obtained using the ${}_\mathrm{{s}}\mathcal{P}\mathrm{lot}$ technique. The full distribution in the transverse plane is shown in the upper left, an enlarged view of the beam pipe and inner pixel layer is shown in the upper right, and the distribution in the longitudinal $r$--$z$ plane is shown at the bottom, where $r$ denotes the radial coordinate. |
png pdf |
Additional Figure 3-a:
The distributions of the vertices of $J\Psi \to \mu^+\mu^-$ decays in data, obtained using the ${}_\mathrm{{s}}\mathcal{P}\mathrm{lot}$ technique. The full distribution in the transverse plane is shown in the upper left, an enlarged view of the beam pipe and inner pixel layer is shown in the upper right, and the distribution in the longitudinal $r$--$z$ plane is shown at the bottom, where $r$ denotes the radial coordinate. |
png pdf |
Additional Figure 3-b:
The distributions of the vertices of $J\Psi \to \mu^+\mu^-$ decays in data, obtained using the ${}_\mathrm{{s}}\mathcal{P}\mathrm{lot}$ technique. The full distribution in the transverse plane is shown in the upper left, an enlarged view of the beam pipe and inner pixel layer is shown in the upper right, and the distribution in the longitudinal $r$--$z$ plane is shown at the bottom, where $r$ denotes the radial coordinate. |
png pdf |
Additional Figure 3-c:
The distributions of the vertices of $J\Psi \to \mu^+\mu^-$ decays in data, obtained using the ${}_\mathrm{{s}}\mathcal{P}\mathrm{lot}$ technique. The full distribution in the transverse plane is shown in the upper left, an enlarged view of the beam pipe and inner pixel layer is shown in the upper right, and the distribution in the longitudinal $r$--$z$ plane is shown at the bottom, where $r$ denotes the radial coordinate. |
| References | ||||
| 1 | V. Chobanova et al. | Probing SUSY effects in $ k_s^0\rightarrow\mu^+\mu^- $ | JHEP 05 (2018) 024 | 1711.11030 |
| 2 | M. Endo et al. | Gluino-mediated electroweak penguin with flavor-violating trilinear couplings | JHEP 04 (2018) 019 | 1712.04959 |
| 3 | C. Bobeth and A. J. Buras | Leptoquarks meet $ \varepsilon'/\varepsilon $ and rare kaon processes | JHEP 02 (2018) 101 | 1712.01295 |
| 4 | G. D'Ambrosio and T. Kitahara | Direct $ cp $ violation in $ k \to \mu^+ \mu^- $ | PRL 119 (2017) 201802 | 1707.06999 |
| 5 | A. Dery, M. Ghosh, Y. Grossman, and S. Schacht | $ k\to\mu^{+}\mu^{-} $ as a clean probe of short-distance physics | JHEP 07 (2021) 103 | 2104.06427 |
| 6 | LHCb Collaboration | Constraints on the $ k^0_s \rightarrow \mu^+ \mu^- $ branching fraction | PRL 125 (2020) 231801 | 2001.10354 |
| 7 | Particle Data Group Collaboration | Review of particle physics | PRD 110 (2024) 030001 | |
| 8 | CMS Collaboration | The CMS experiment at the CERN LHC | JINST 3 (2008) S08004 | |
| 9 | CMS Collaboration | Development of the CMS detector for the CERN LHC Run 3 | JINST 19 (2024) P05064 | CMS-PRF-21-001 2309.05466 |
| 10 | CMS Collaboration | Performance of the CMS Level-1 trigger in proton-proton collisions at $ \sqrt{s} = $ 13 TeV | JINST 15 (2020) P10017 | CMS-TRG-17-001 2006.10165 |
| 11 | CMS Collaboration | The CMS trigger system | JINST 12 (2017) P01020 | CMS-TRG-12-001 1609.02366 |
| 12 | CMS Collaboration | Performance of the CMS high-level trigger during LHC Run 2 | JINST 19 (2024) P11021 | CMS-TRG-19-001 2410.17038 |
| 13 | CMS Collaboration | Electron and photon reconstruction and identification with the CMS experiment at the CERN LHC | JINST 16 (2021) P05014 | CMS-EGM-17-001 2012.06888 |
| 14 | CMS Collaboration | Performance of the CMS muon detector and muon reconstruction with proton-proton collisions at $ \sqrt{s} = $ 13 TeV | JINST 13 (2018) P06015 | CMS-MUO-16-001 1804.04528 |
| 15 | CMS Collaboration | Description and performance of track and primary-vertex reconstruction with the CMS tracker | JINST 9 (2014) P10009 | CMS-TRK-11-001 1405.6569 |
| 16 | CMS Tracker Group Collaboration | The CMS Phase-1 pixel detector upgrade | JINST 16 (2021) P02027 | 2012.14304 |
| 17 | CMS Collaboration | Track impact parameter resolution for the full pseudo rapidity coverage in the 2017 dataset with the CMS phase-1 pixel detector | CMS Detector Performance Summary CMS-DP-2020-049, 2020 CDS |
|
| 18 | CMS Collaboration | Pixel auto-masking, occupancy, and cluster size versus $ \eta $ in 2025 | CMS Detector Performance Summary CMS-DP-2026-016, 2026 CDS |
|
| 19 | T. Sjöstrand et al. | An introduction to PYTHIA 8.2 | Comput. Phys. Commun. 191 (2015) 159 | 1410.3012 |
| 20 | CMS Collaboration | Extraction and validation of a new set of CMS PYTHIA8 tunes from underlying-event measurements | EPJC 80 (2020) 4 | CMS-GEN-17-001 1903.12179 |
| 21 | GEANT4 Collaboration | GEANT 4---a simulation toolkit | NIM A 506 (2003) 250 | |
| 22 | D. J. Lange | The EvtGen particle decay simulation package | NIM A 462 (2001) 152 | |
| 23 | N. Davidson, T. Przedzinski, and Z. Was | PHOTOS interface in C++: technical and physics documentation | Comput. Phys. Commun. 199 (2016) 86 | 1011.0937 |
| 24 | CMS Collaboration | Enriching the physics program of the CMS experiment via data scouting and data parking | Phys. Rep. 1115 (2025) 678 | CMS-EXO-23-007 2403.16134 |
| 25 | K. Prokofiev and T. Speer | A kinematic fit and a decay chain reconstruction library | Computing in High Energy and Nuclear Physics 200 (2005) 411 | |
| 26 | A. Blum, A. Kalai, and J. Langford | Beating the hold-out: bounds for k-fold and progressive cross-validation | in the Ann. Conf. on Computational Learning Theory, COLT '99, 1999 Proc. 1 (1999) 203 |
|
| 27 | T. Chen and C. Guestrin | XGBoost: A scalable tree boosting system | in and ACM SIGKDD International Conference on Knowledge Discovery and Data Mining, KDD '16, ACM, New York, NY, USA, 2016 Proceedings of the 2 (2016) 785 |
|
| 28 | D. Mart \'\i nez Santos and F. Dupertuis | Mass distributions marginalized over per-event errors | NIM A 764 (2014) 150 | 1312.5000 |
| 29 | P. D. Dauncey, M. Kenzie, N. Wardle, and G. J. Davies | Handling uncertainties in background shapes: the discrete profiling method | JINST 10 (2015) P04015 | 1408.6865 |
| 30 | M. Pivk and F. R. Le Diberder | $ _\mathrm{{s}}\mathcal{P}\mathrm{lot} $: A statistical tool to unfold data distributions | NIM A 555 (2005) 356 | physics/0402083 |
| 31 | CMS Collaboration | Performance of CMS muon reconstruction in pp collision events at $ \sqrt{s} = $ 7 TeV | JINST 7 (2012) P10002 | CMS-MUO-10-004 1206.4071 |
| 32 | CMS Collaboration | Muon id and isolation efficiencies with muons in proton-proton collisions at $ \sqrt{s} = $ 13.6 TeV | CMS Detector Performance Summary CMS-DP-2024-067, 2024 CDS |
|
| 33 | CMS Collaboration | The CMS statistical analysis and combination tool: Combine | Comput. Softw. Big Sci. 8 (2024) 19 | CMS-CAT-23-001 2404.06614 |
| 34 | W. Verkerke and D. Kirkby | The RooFit toolkit for data modeling | in the International Conference on Computing in High Energy and Nuclear Physics (CHEP ): La Jolla CA, United States, March 24--28 Proc. 1 (2003) 3 |
physics/0306116 |
| 35 | L. Moneta et al. | The RooStats project | in the International Workshop on Advanced Computing and Analysis Techniques in Physics Research (ACAT ): Jaipur, India, February 22--27 Proc. 1 (2010) 3 |
1009.1003 |
| 36 | T. Junk | Confidence level computation for combining searches with small statistics | NIM A 434 (1999) 435 | hep-ex/9902006 |
| 37 | A. L. Read | Presentation of search results: The $ \text{CL}_\text{s} $ technique | JPG 28 (2002) 2693 | |
|
|
Compact Muon Solenoid LHC, CERN |

|

|

|

|

|

|