

Compact Muon Solenoid
LHC, CERN
| CMS-PAS-BPH-21-007 | ||
| Measurement of $ {\mathrm{B}} $ meson production fractions in proton-proton collisions at $ \sqrt{s} = $ 13 TeV using hadronic open-charm and charmonium decays | ||
| CMS Collaboration | ||
| 25 March 2025 | ||
| Abstract: Production fractions of B$ ^{\pm} $, B$ ^0 $, and B$ _s^0 $ mesons are measured in proton-proton collisions at $ \sqrt{s} = $ 13 TeV using a special data set recorded in 2018 with high-rate triggers designed to collect an unbiased sample of 10$ ^{10} $ b hadrons with the CMS experiment at the LHC. These data made hadronic open-charm decays of B mesons (B$ _{(s)} \to \pi $D$ _{(s)} $), where the D meson decays into fully hadronic final states, accessible for this measurement. Production fraction ratios as functions of the B meson transverse momentum ($ p_{\mathrm{T}} $) and rapidity ($ y $) are measured using the open-charm decays in the kinematic range of 8 $ < p_{\mathrm{T}} < $ 60 GeV and $ |y| < $ 2.25. In addition, the same data are used to measure the relative production fraction ratios in the charmonium decay channels (B$ _{(s)} \to $ X $ \mathrm{J}/\psi $, with X being K, K$ ^{\ast} $(892)$ ^{0} $, $ \phi $(1020) mesons), where the $ \mathrm{J}/\psi $ meson decays into a pair of muons. These measurements are normalized in situ to the measured yields in the open-charm channels, thus allowing, for the first time, the extraction of the production fractions in charmonium channels directly with an absolute normalization. These results also improve several world-average values of the ratios of branching fractions of B meson decays to charmonium and open-charm states. Finally, we test isospin invariance in B meson production in proton-proton collisions. | ||
| Links: CDS record (PDF) ; Physics Briefing ; CADI line (restricted) ; | ||
| Figures | |
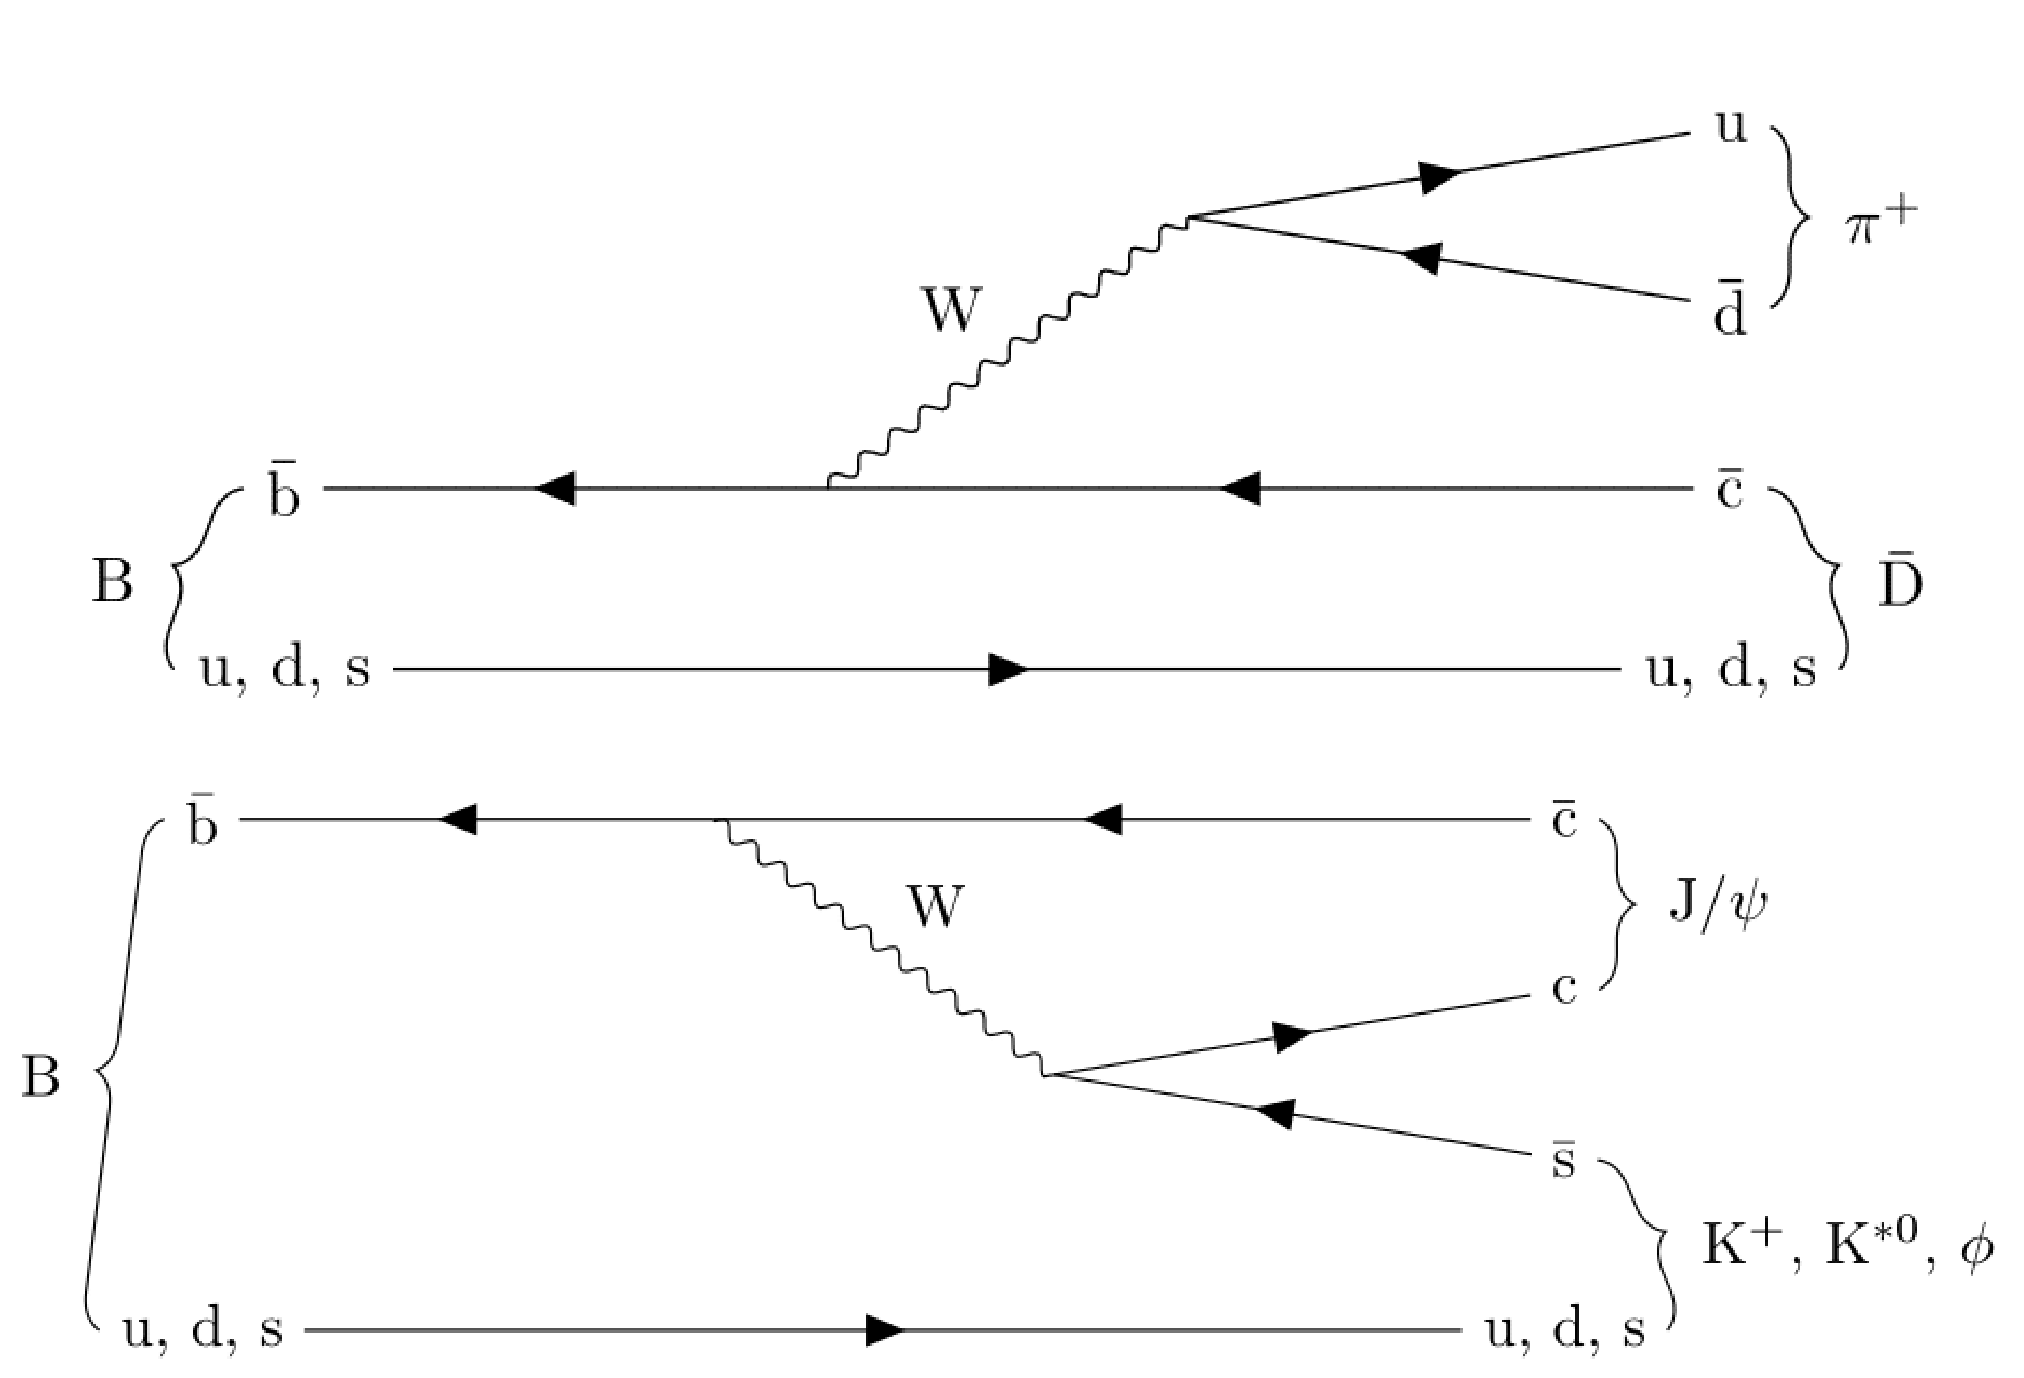
png pdf |
Figure 1:
Representative Feynman diagrams for the open-charm (upper) and charmonium (lower) decays of the $ {\mathrm{B}^{+}} $, $ {\mathrm{B}^0} $, and $ \mathrm{B}_{s}^{0} $ mesons. |
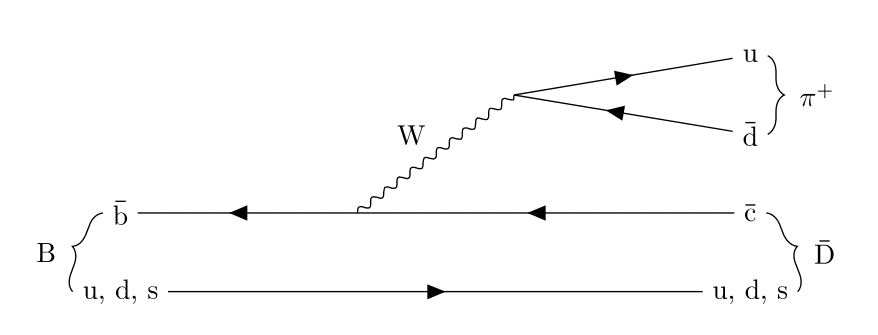
png |
Figure 1-a:
Representative Feynman diagrams for the open-charm (upper) and charmonium (lower) decays of the $ {\mathrm{B}^{+}} $, $ {\mathrm{B}^0} $, and $ \mathrm{B}_{s}^{0} $ mesons. |

png |
Figure 1-b:
Representative Feynman diagrams for the open-charm (upper) and charmonium (lower) decays of the $ {\mathrm{B}^{+}} $, $ {\mathrm{B}^0} $, and $ \mathrm{B}_{s}^{0} $ mesons. |
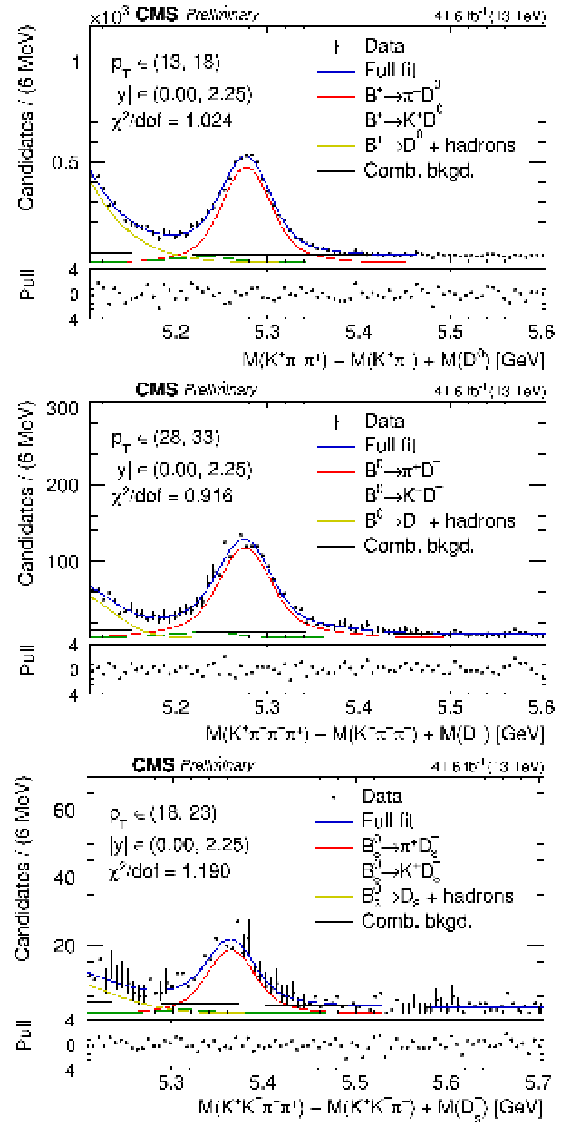
png pdf |
Figure 2:
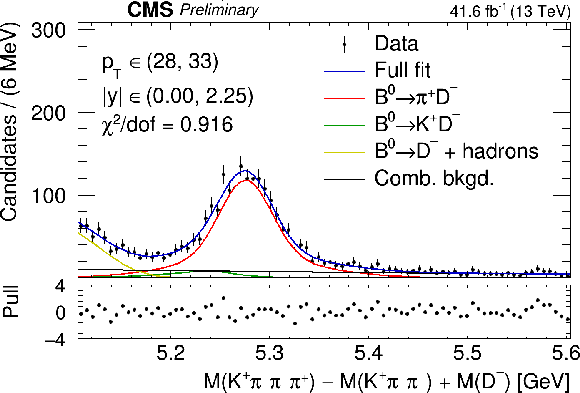
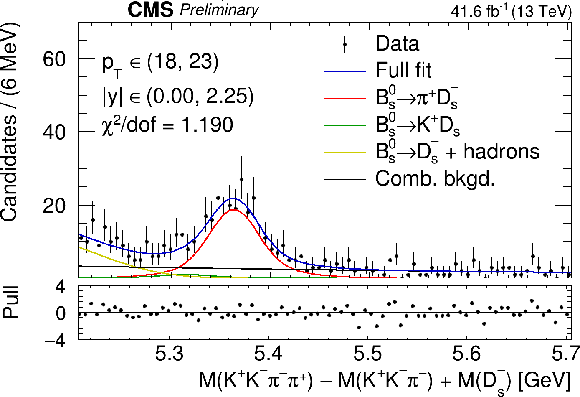
Examples of fits to the $ {\mathrm{B}} $ candidate mass distribution (corrected by the $ \mathrm{D} $ meson mass) used to extract the signal in the open-charm channels. The upper, middle, and lower rows correspond to the $ {\mathrm{B}^{+}} $, $ {\mathrm{B}^0} $, and $ \mathrm{B}_{s}^{0} $ decays, respectively. The values of $ \chi^2 $ per degree of freedom ($ \chi^2/\mathrm{dof} $) are presented in each plot. The lower panels illustrate the pull distribution, defined as the deviation of data from the fit function, normalized by the statistical uncertainty in each bin. |
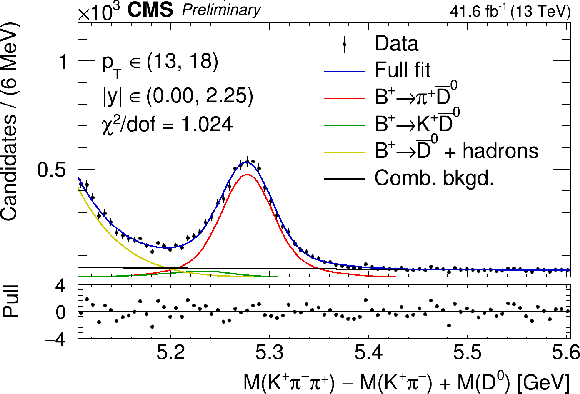
png |
Figure 2-a:
Examples of fits to the $ {\mathrm{B}} $ candidate mass distribution (corrected by the $ \mathrm{D} $ meson mass) used to extract the signal in the open-charm channels. The upper, middle, and lower rows correspond to the $ {\mathrm{B}^{+}} $, $ {\mathrm{B}^0} $, and $ \mathrm{B}_{s}^{0} $ decays, respectively. The values of $ \chi^2 $ per degree of freedom ($ \chi^2/\mathrm{dof} $) are presented in each plot. The lower panels illustrate the pull distribution, defined as the deviation of data from the fit function, normalized by the statistical uncertainty in each bin. |
png |
Figure 2-b:
Examples of fits to the $ {\mathrm{B}} $ candidate mass distribution (corrected by the $ \mathrm{D} $ meson mass) used to extract the signal in the open-charm channels. The upper, middle, and lower rows correspond to the $ {\mathrm{B}^{+}} $, $ {\mathrm{B}^0} $, and $ \mathrm{B}_{s}^{0} $ decays, respectively. The values of $ \chi^2 $ per degree of freedom ($ \chi^2/\mathrm{dof} $) are presented in each plot. The lower panels illustrate the pull distribution, defined as the deviation of data from the fit function, normalized by the statistical uncertainty in each bin. |
png |
Figure 2-c:
Examples of fits to the $ {\mathrm{B}} $ candidate mass distribution (corrected by the $ \mathrm{D} $ meson mass) used to extract the signal in the open-charm channels. The upper, middle, and lower rows correspond to the $ {\mathrm{B}^{+}} $, $ {\mathrm{B}^0} $, and $ \mathrm{B}_{s}^{0} $ decays, respectively. The values of $ \chi^2 $ per degree of freedom ($ \chi^2/\mathrm{dof} $) are presented in each plot. The lower panels illustrate the pull distribution, defined as the deviation of data from the fit function, normalized by the statistical uncertainty in each bin. |
png pdf |
Figure 3:
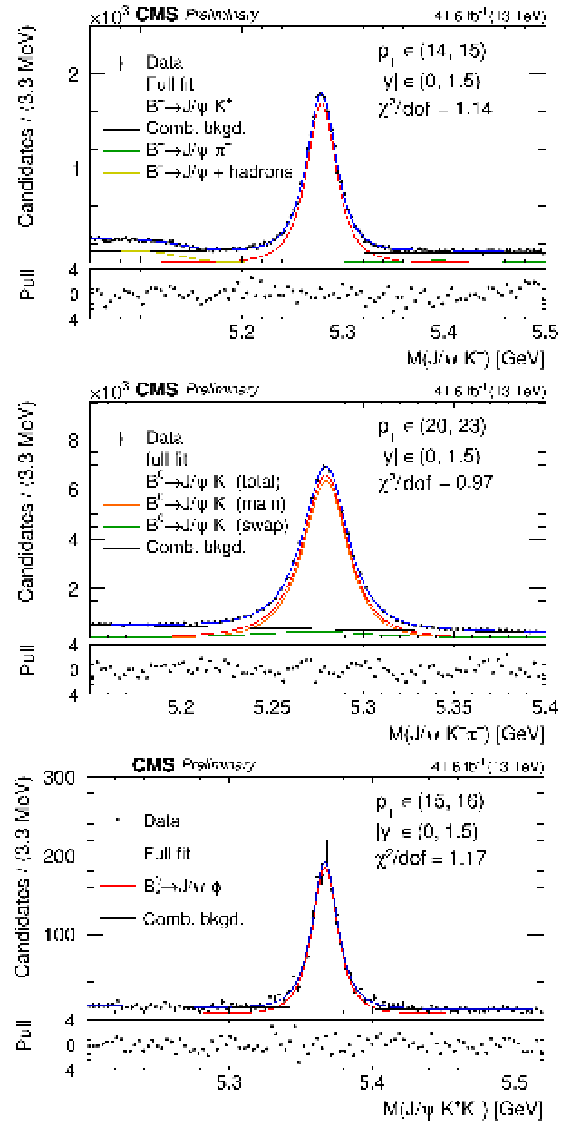
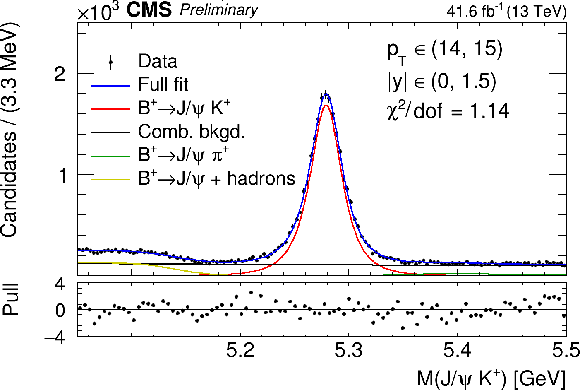
Examples of fits to the $ {\mathrm{B}} $ candidate mass distribution used to extract the signal in the charmonium channels in the tag-side analysis. The upper, middle, and lower rows correspond to the $ {\mathrm{B}^{+}} $, $ {\mathrm{B}^0} $, and $ \mathrm{B}_{s}^{0} $ decays, respectively. Notations are as in Fig. 2 |
png |
Figure 3-a:
Examples of fits to the $ {\mathrm{B}} $ candidate mass distribution used to extract the signal in the charmonium channels in the tag-side analysis. The upper, middle, and lower rows correspond to the $ {\mathrm{B}^{+}} $, $ {\mathrm{B}^0} $, and $ \mathrm{B}_{s}^{0} $ decays, respectively. Notations are as in Fig. 2 |
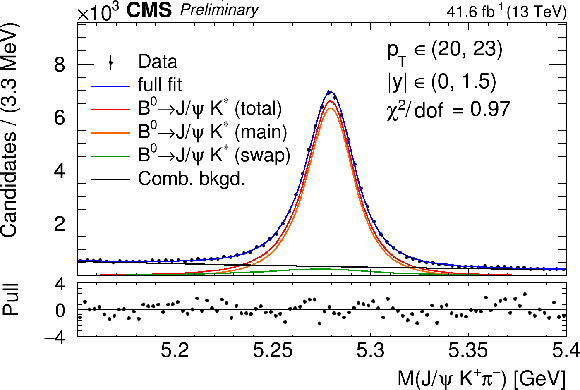
png |
Figure 3-b:
Examples of fits to the $ {\mathrm{B}} $ candidate mass distribution used to extract the signal in the charmonium channels in the tag-side analysis. The upper, middle, and lower rows correspond to the $ {\mathrm{B}^{+}} $, $ {\mathrm{B}^0} $, and $ \mathrm{B}_{s}^{0} $ decays, respectively. Notations are as in Fig. 2 |
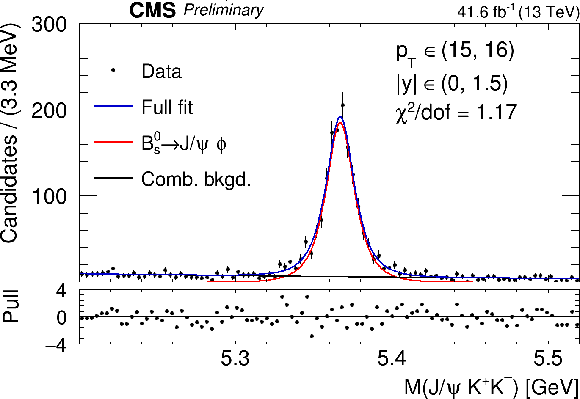
png |
Figure 3-c:
Examples of fits to the $ {\mathrm{B}} $ candidate mass distribution used to extract the signal in the charmonium channels in the tag-side analysis. The upper, middle, and lower rows correspond to the $ {\mathrm{B}^{+}} $, $ {\mathrm{B}^0} $, and $ \mathrm{B}_{s}^{0} $ decays, respectively. Notations are as in Fig. 2 |
png pdf |
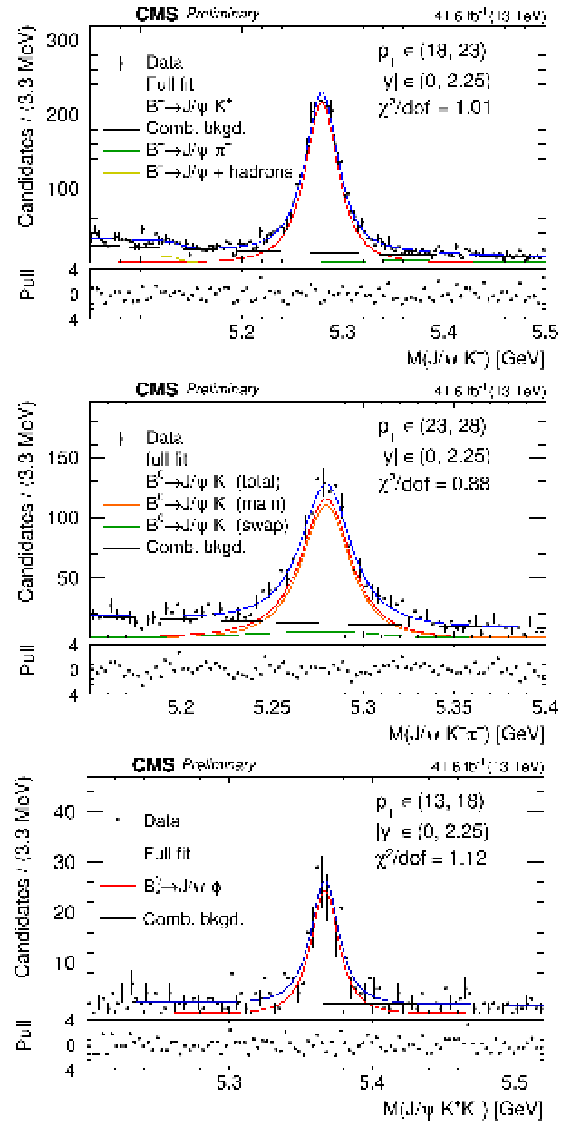
Figure 4:
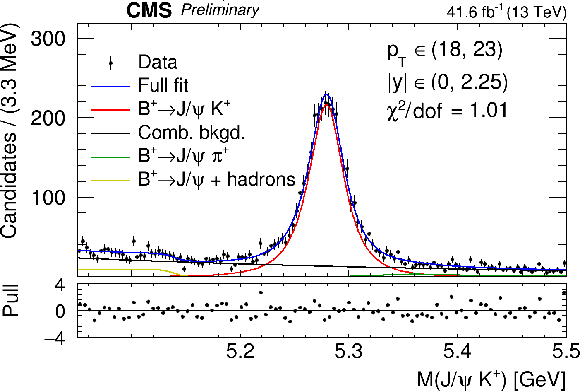
Examples of fits to the $ {\mathrm{B}} $ candidate mass distribution used to extract the signal in the charmonium channels in the probe-side analysis. The upper, middle, and lower rows correspond to the $ {\mathrm{B}^{+}} $, $ {\mathrm{B}^0} $, and $ \mathrm{B}_{s}^{0} $ decays, respectively. Notations are as in Fig. 2 |
png |
Figure 4-a:
Examples of fits to the $ {\mathrm{B}} $ candidate mass distribution used to extract the signal in the charmonium channels in the probe-side analysis. The upper, middle, and lower rows correspond to the $ {\mathrm{B}^{+}} $, $ {\mathrm{B}^0} $, and $ \mathrm{B}_{s}^{0} $ decays, respectively. Notations are as in Fig. 2 |
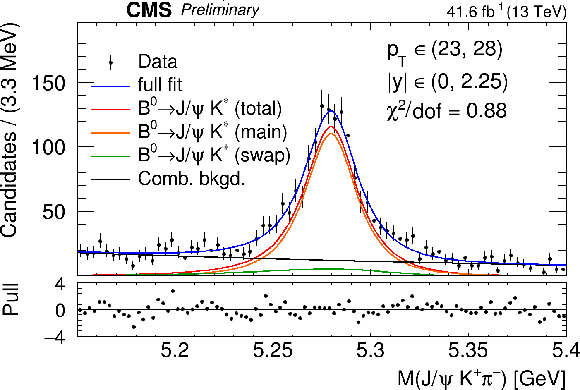
png |
Figure 4-b:
Examples of fits to the $ {\mathrm{B}} $ candidate mass distribution used to extract the signal in the charmonium channels in the probe-side analysis. The upper, middle, and lower rows correspond to the $ {\mathrm{B}^{+}} $, $ {\mathrm{B}^0} $, and $ \mathrm{B}_{s}^{0} $ decays, respectively. Notations are as in Fig. 2 |
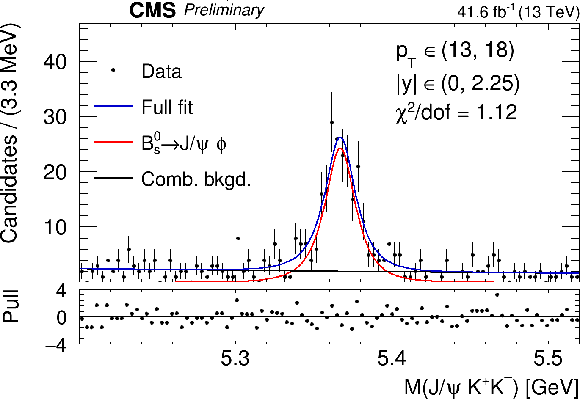
png |
Figure 4-c:
Examples of fits to the $ {\mathrm{B}} $ candidate mass distribution used to extract the signal in the charmonium channels in the probe-side analysis. The upper, middle, and lower rows correspond to the $ {\mathrm{B}^{+}} $, $ {\mathrm{B}^0} $, and $ \mathrm{B}_{s}^{0} $ decays, respectively. Notations are as in Fig. 2 |
png pdf |
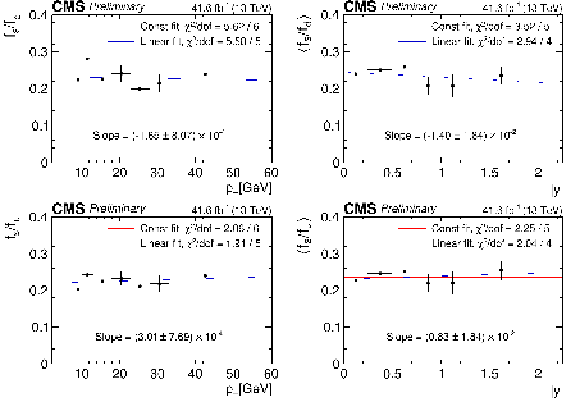
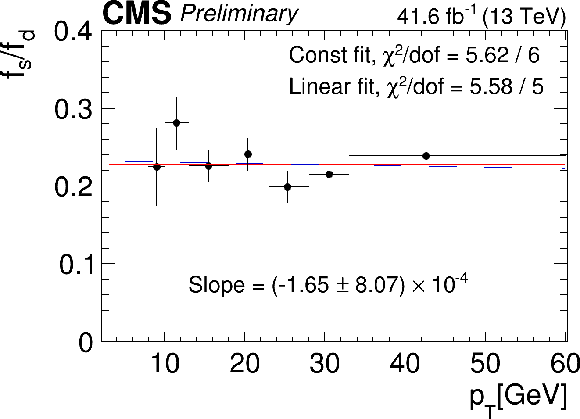
Figure 5:
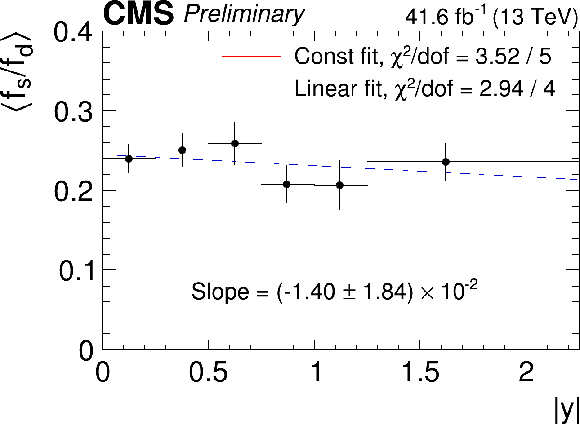
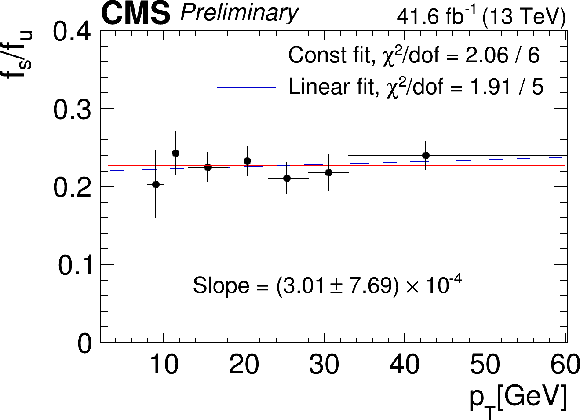
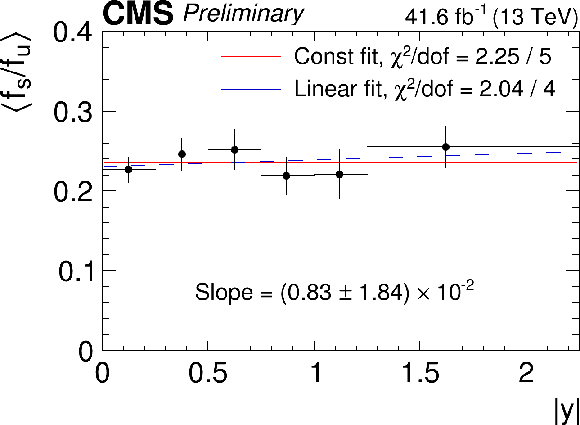
The production fraction ratios $ f_\mathrm{s}/f_\mathrm{u} $ and $ f_\mathrm{s}/f_\mathrm{d} $ as functions of $ p_{\mathrm{T}} $ and $ |y| $, measured using open-charm decays. Vertical error bars for each point represent the combined statistical and bin-to-bin-uncorrelated systematic uncertainty. The global uncertainties are not included in these plots for the test of the $ p_{\mathrm{T}} $ and $ |y| $ dependence of PFRs. The red dashed line is the average over the full reconstructed kinematic range, and the blue line is the linear fit result. Values enclosed in angle brackets represent $ p_{\mathrm{T}} $-averaged quantities, where the absolute normalization of PFR values may be affected by the $ p_{\mathrm{T}} $ dependence. |
png |
Figure 5-a:
The production fraction ratios $ f_\mathrm{s}/f_\mathrm{u} $ and $ f_\mathrm{s}/f_\mathrm{d} $ as functions of $ p_{\mathrm{T}} $ and $ |y| $, measured using open-charm decays. Vertical error bars for each point represent the combined statistical and bin-to-bin-uncorrelated systematic uncertainty. The global uncertainties are not included in these plots for the test of the $ p_{\mathrm{T}} $ and $ |y| $ dependence of PFRs. The red dashed line is the average over the full reconstructed kinematic range, and the blue line is the linear fit result. Values enclosed in angle brackets represent $ p_{\mathrm{T}} $-averaged quantities, where the absolute normalization of PFR values may be affected by the $ p_{\mathrm{T}} $ dependence. |
png |
Figure 5-b:
The production fraction ratios $ f_\mathrm{s}/f_\mathrm{u} $ and $ f_\mathrm{s}/f_\mathrm{d} $ as functions of $ p_{\mathrm{T}} $ and $ |y| $, measured using open-charm decays. Vertical error bars for each point represent the combined statistical and bin-to-bin-uncorrelated systematic uncertainty. The global uncertainties are not included in these plots for the test of the $ p_{\mathrm{T}} $ and $ |y| $ dependence of PFRs. The red dashed line is the average over the full reconstructed kinematic range, and the blue line is the linear fit result. Values enclosed in angle brackets represent $ p_{\mathrm{T}} $-averaged quantities, where the absolute normalization of PFR values may be affected by the $ p_{\mathrm{T}} $ dependence. |
png |
Figure 5-c:
The production fraction ratios $ f_\mathrm{s}/f_\mathrm{u} $ and $ f_\mathrm{s}/f_\mathrm{d} $ as functions of $ p_{\mathrm{T}} $ and $ |y| $, measured using open-charm decays. Vertical error bars for each point represent the combined statistical and bin-to-bin-uncorrelated systematic uncertainty. The global uncertainties are not included in these plots for the test of the $ p_{\mathrm{T}} $ and $ |y| $ dependence of PFRs. The red dashed line is the average over the full reconstructed kinematic range, and the blue line is the linear fit result. Values enclosed in angle brackets represent $ p_{\mathrm{T}} $-averaged quantities, where the absolute normalization of PFR values may be affected by the $ p_{\mathrm{T}} $ dependence. |
png |
Figure 5-d:
The production fraction ratios $ f_\mathrm{s}/f_\mathrm{u} $ and $ f_\mathrm{s}/f_\mathrm{d} $ as functions of $ p_{\mathrm{T}} $ and $ |y| $, measured using open-charm decays. Vertical error bars for each point represent the combined statistical and bin-to-bin-uncorrelated systematic uncertainty. The global uncertainties are not included in these plots for the test of the $ p_{\mathrm{T}} $ and $ |y| $ dependence of PFRs. The red dashed line is the average over the full reconstructed kinematic range, and the blue line is the linear fit result. Values enclosed in angle brackets represent $ p_{\mathrm{T}} $-averaged quantities, where the absolute normalization of PFR values may be affected by the $ p_{\mathrm{T}} $ dependence. |
png pdf |
Figure 6:
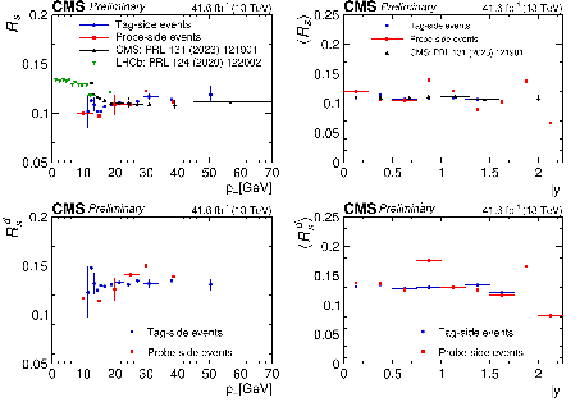
The relative production fraction ratios $ \mathcal{R}_\mathrm{s} $, $ \mathcal{R}_\mathrm{s}^\mathrm{d} $ as functions of $ p_{\mathrm{T}} $ and $ |y| $, measured using charmonium decays. Results for tag-side (upper row) and probe-side (lower row) events are shown. For comparison, the recent CMS measurement [7] is also presented. The error bars include both statistical and bin-to-bin uncorrelated systematic uncertainties, as well as the global uncertainty of 2.1% associated with the tracking efficiency, added quadratically in each bin. Values enclosed in angle brackets represent $ p_{\mathrm{T}} $-averaged quantities, where the absolute normalization of PFR values may be affected by the $ p_{\mathrm{T}} $ dependence. |
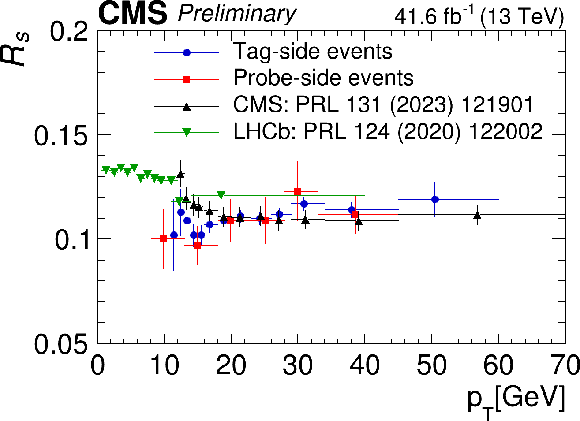
png |
Figure 6-a:
The relative production fraction ratios $ \mathcal{R}_\mathrm{s} $, $ \mathcal{R}_\mathrm{s}^\mathrm{d} $ as functions of $ p_{\mathrm{T}} $ and $ |y| $, measured using charmonium decays. Results for tag-side (upper row) and probe-side (lower row) events are shown. For comparison, the recent CMS measurement [7] is also presented. The error bars include both statistical and bin-to-bin uncorrelated systematic uncertainties, as well as the global uncertainty of 2.1% associated with the tracking efficiency, added quadratically in each bin. Values enclosed in angle brackets represent $ p_{\mathrm{T}} $-averaged quantities, where the absolute normalization of PFR values may be affected by the $ p_{\mathrm{T}} $ dependence. |
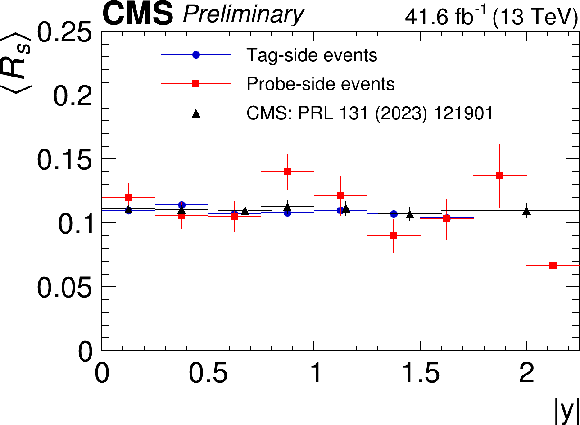
png |
Figure 6-b:
The relative production fraction ratios $ \mathcal{R}_\mathrm{s} $, $ \mathcal{R}_\mathrm{s}^\mathrm{d} $ as functions of $ p_{\mathrm{T}} $ and $ |y| $, measured using charmonium decays. Results for tag-side (upper row) and probe-side (lower row) events are shown. For comparison, the recent CMS measurement [7] is also presented. The error bars include both statistical and bin-to-bin uncorrelated systematic uncertainties, as well as the global uncertainty of 2.1% associated with the tracking efficiency, added quadratically in each bin. Values enclosed in angle brackets represent $ p_{\mathrm{T}} $-averaged quantities, where the absolute normalization of PFR values may be affected by the $ p_{\mathrm{T}} $ dependence. |
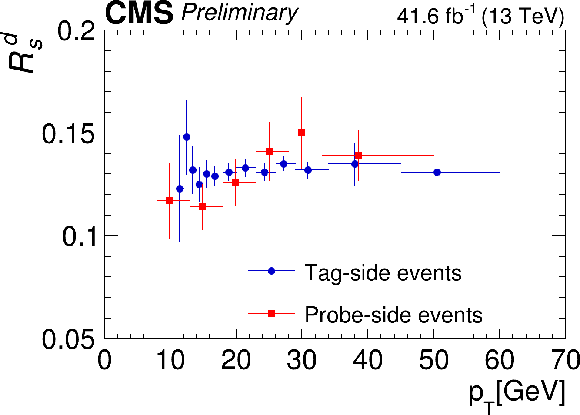
png |
Figure 6-c:
The relative production fraction ratios $ \mathcal{R}_\mathrm{s} $, $ \mathcal{R}_\mathrm{s}^\mathrm{d} $ as functions of $ p_{\mathrm{T}} $ and $ |y| $, measured using charmonium decays. Results for tag-side (upper row) and probe-side (lower row) events are shown. For comparison, the recent CMS measurement [7] is also presented. The error bars include both statistical and bin-to-bin uncorrelated systematic uncertainties, as well as the global uncertainty of 2.1% associated with the tracking efficiency, added quadratically in each bin. Values enclosed in angle brackets represent $ p_{\mathrm{T}} $-averaged quantities, where the absolute normalization of PFR values may be affected by the $ p_{\mathrm{T}} $ dependence. |
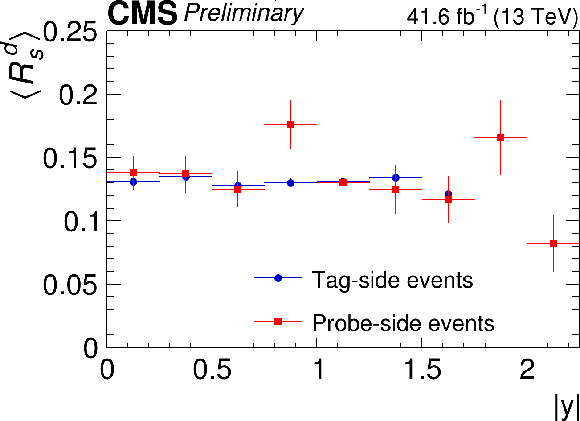
png |
Figure 6-d:
The relative production fraction ratios $ \mathcal{R}_\mathrm{s} $, $ \mathcal{R}_\mathrm{s}^\mathrm{d} $ as functions of $ p_{\mathrm{T}} $ and $ |y| $, measured using charmonium decays. Results for tag-side (upper row) and probe-side (lower row) events are shown. For comparison, the recent CMS measurement [7] is also presented. The error bars include both statistical and bin-to-bin uncorrelated systematic uncertainties, as well as the global uncertainty of 2.1% associated with the tracking efficiency, added quadratically in each bin. Values enclosed in angle brackets represent $ p_{\mathrm{T}} $-averaged quantities, where the absolute normalization of PFR values may be affected by the $ p_{\mathrm{T}} $ dependence. |
png pdf |
Figure 7:
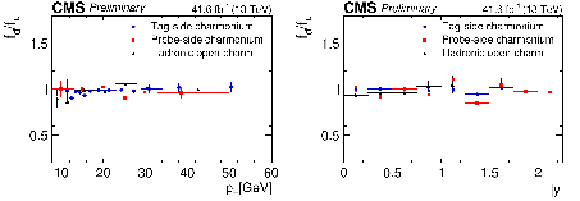
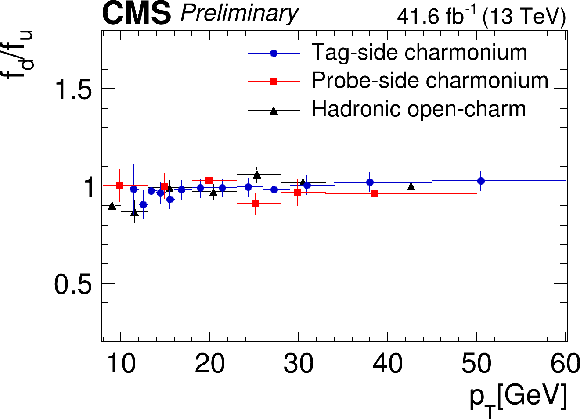
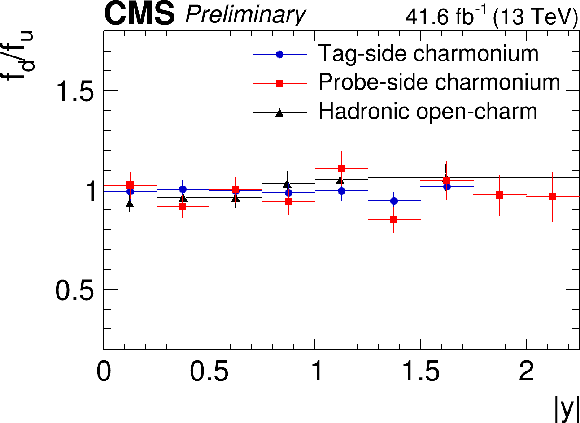
The production fraction ratios $ f_\mathrm{d}/f_\mathrm{u} $ as functions of $ p_{\mathrm{T}} $ and $ |y| $ measured using both the open-charm and chamonium decays, without assuming isospin invariance. The error bars include both statistical and bin-to-bin uncorrelated systematic uncertainties, as well as the global uncertainty associated with $ r^{+0} = $ 1.057 $ \pm $ 0.023 added quadratically in each bin. |
png |
Figure 7-a:
The production fraction ratios $ f_\mathrm{d}/f_\mathrm{u} $ as functions of $ p_{\mathrm{T}} $ and $ |y| $ measured using both the open-charm and chamonium decays, without assuming isospin invariance. The error bars include both statistical and bin-to-bin uncorrelated systematic uncertainties, as well as the global uncertainty associated with $ r^{+0} = $ 1.057 $ \pm $ 0.023 added quadratically in each bin. |
png |
Figure 7-b:
The production fraction ratios $ f_\mathrm{d}/f_\mathrm{u} $ as functions of $ p_{\mathrm{T}} $ and $ |y| $ measured using both the open-charm and chamonium decays, without assuming isospin invariance. The error bars include both statistical and bin-to-bin uncorrelated systematic uncertainties, as well as the global uncertainty associated with $ r^{+0} = $ 1.057 $ \pm $ 0.023 added quadratically in each bin. |
png pdf |
Figure 8:
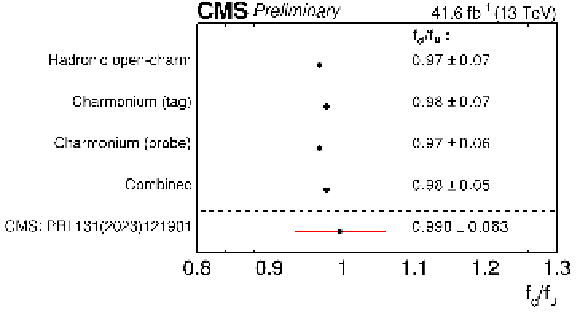
Comparison of the $ f_\mathrm{d}/f_\mathrm{u} $ measurements across different channels. The "Combined" value, shown above the black dashed line, is obtained from a combined $ \chi^{2} $ fit of the measurements from two statistically independent channels: the open-charm and tag-side charmonium. Additionally, the plot presents the previous CMS result [7] for comparison. The blue dashed line represents the unity value where the production fraction $ f_{\mathrm{d}} $ and $ f_{\mathrm{u}} $ are equal. |
png pdf |
Figure 9:
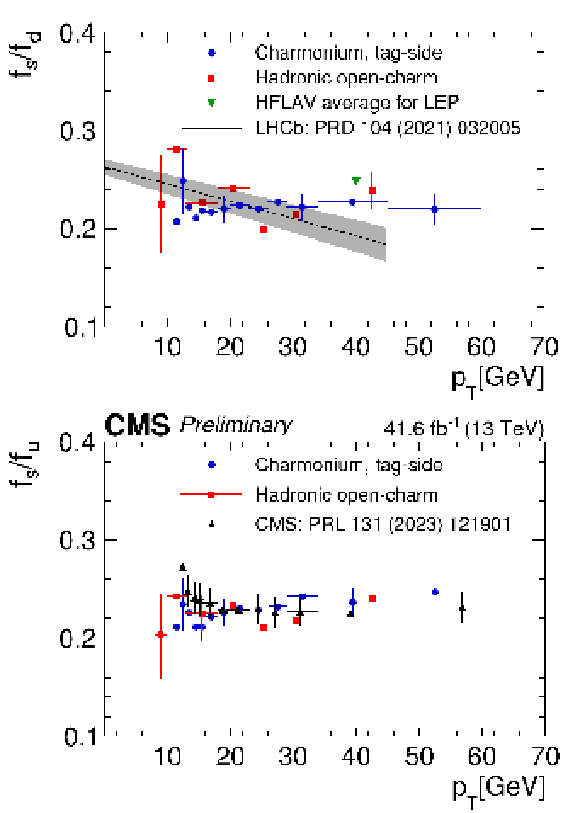
The $ \mathcal{R}_\mathrm{s} $ and $ \mathcal{R}_\mathrm{s}^\mathrm{d} $ values measured in the charmonium analysis are converted to $ f_\mathrm{s}/f_\mathrm{u} $ and $ f_\mathrm{s}/f_\mathrm{d} $ using the absolute normalization $ c_{\mathrm{s}\mathrm{u}} $ and $ c_{\mathrm{s}\mathrm{d}} $. For comparison, PFR measurements from the open-charm analysis, LEP [10] and CMS [7] (converted to $ f_\mathrm{s}/f_\mathrm{u} $ using the $ c_{\mathrm{s}\mathrm{u}} $) are overlaid, along with the latest trend of $ f_\mathrm{s}/f_\mathrm{d} $ observed by LHCb [5]. The error bars include both statistical and bin-to-bin uncorrelated systematic uncertainties, as well as the global uncertainty of 2.1% associated with the tracking efficiency, added quadratically in each bin. |
png |
Figure 9-a:
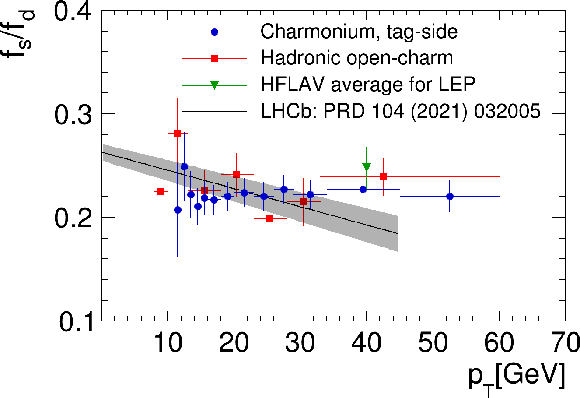
The $ \mathcal{R}_\mathrm{s} $ and $ \mathcal{R}_\mathrm{s}^\mathrm{d} $ values measured in the charmonium analysis are converted to $ f_\mathrm{s}/f_\mathrm{u} $ and $ f_\mathrm{s}/f_\mathrm{d} $ using the absolute normalization $ c_{\mathrm{s}\mathrm{u}} $ and $ c_{\mathrm{s}\mathrm{d}} $. For comparison, PFR measurements from the open-charm analysis, LEP [10] and CMS [7] (converted to $ f_\mathrm{s}/f_\mathrm{u} $ using the $ c_{\mathrm{s}\mathrm{u}} $) are overlaid, along with the latest trend of $ f_\mathrm{s}/f_\mathrm{d} $ observed by LHCb [5]. The error bars include both statistical and bin-to-bin uncorrelated systematic uncertainties, as well as the global uncertainty of 2.1% associated with the tracking efficiency, added quadratically in each bin. |
png |
Figure 9-b:
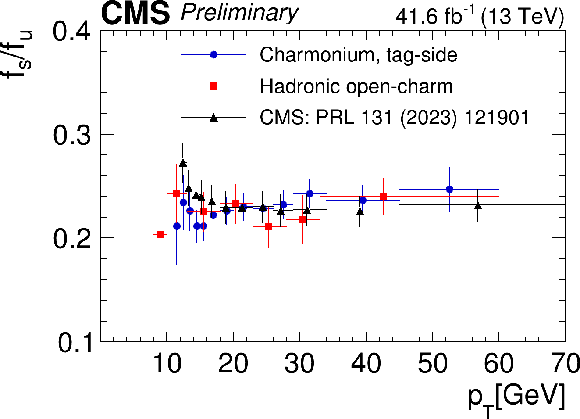
The $ \mathcal{R}_\mathrm{s} $ and $ \mathcal{R}_\mathrm{s}^\mathrm{d} $ values measured in the charmonium analysis are converted to $ f_\mathrm{s}/f_\mathrm{u} $ and $ f_\mathrm{s}/f_\mathrm{d} $ using the absolute normalization $ c_{\mathrm{s}\mathrm{u}} $ and $ c_{\mathrm{s}\mathrm{d}} $. For comparison, PFR measurements from the open-charm analysis, LEP [10] and CMS [7] (converted to $ f_\mathrm{s}/f_\mathrm{u} $ using the $ c_{\mathrm{s}\mathrm{u}} $) are overlaid, along with the latest trend of $ f_\mathrm{s}/f_\mathrm{d} $ observed by LHCb [5]. The error bars include both statistical and bin-to-bin uncorrelated systematic uncertainties, as well as the global uncertainty of 2.1% associated with the tracking efficiency, added quadratically in each bin. |
png pdf |
Figure 10:
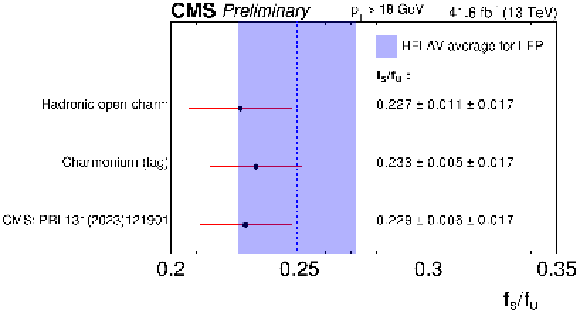
Comparison of $ f_\mathrm{s}/f_\mathrm{u} $ measurements in high $ p_{\mathrm{T}} $ ($ p_{\mathrm{T}} > $ 18 GeV) across different channels. The blue dashed line and shaded band represent the LEP measurement and its uncertainty [10], respectively, included for comparison. The $ \mathcal{R}_\mathrm{s} $ values obtained in the chamonium analysis with tag-side events and the previous CMS measurement [7] are converted to $ f_\mathrm{s}/f_\mathrm{u} $ using the absolute normalization factor $ c_{\mathrm{s}\mathrm{u}} $. |
| Tables | |

png pdf |
Table 1:
Summary of the single-muon $ {\mathrm{B}} $ parking triggers. |
png pdf |
Table 2:
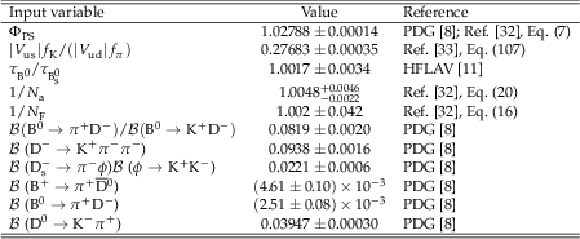
Inputs for the open-charm PFR measurements. |
png pdf |
Table 3:
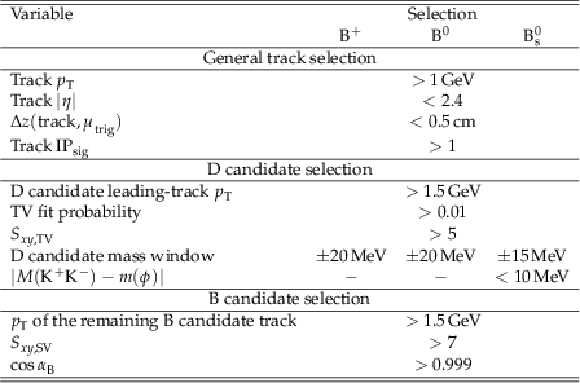
Summary of the preselection requirements for $ {\mathrm{B}} $ candidates in the open-charm analysis. The-sign means that the selection does not apply to this channel. |
png pdf |
Table 4:
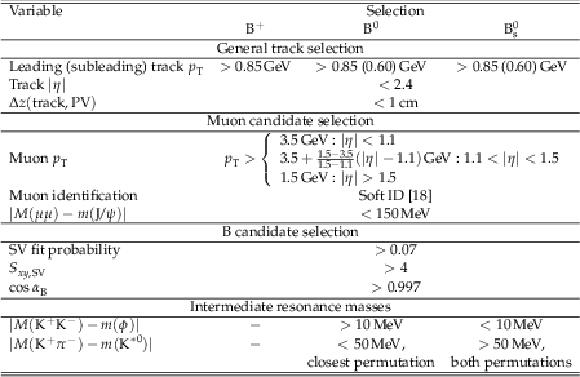
Summary of the selection requirements for $ {\mathrm{B}} $ candidates in the charmonium analysis. The-sign means that the selection is not applied in this channel. |

png pdf |
Table 5:
Fit functions used in the open-charm and charmonium analyses. The-sign means that the background does not apply to this channel. |

png pdf |
Table 6:
Summary of MC corrections for the open-charm and charmonium channels. |
png pdf |
Table 7:
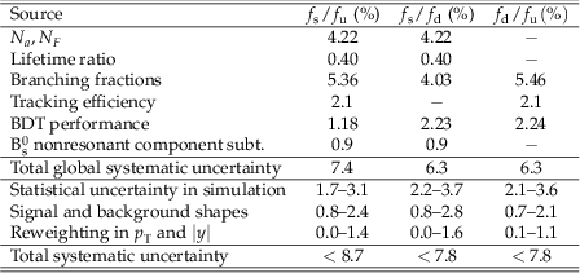
The sources and values of the systematic uncertainties affecting the measured PFRs in the open-charm analysis. The bin-to-bin-uncorrelated uncertainties are presented as ranges, which indicate the range of uncertainties across different $ p_{\mathrm{T}} $ and $ |y| $ bins. The-sign means that the uncertainty does not apply. The reported values are the relative systematic uncertainties in percent. |

png pdf |
Table 8:
Sources of systematic uncertainty affecting the measured $ \mathcal{R}_\mathrm{s} $, $ \mathcal{R}_\mathrm{s}^\mathrm{d} $, and $ f_\mathrm{d}/f_\mathrm{u} $ values for each tag-side and probe-side events in the charmonium analysis. The uncertainties are presented as ranges, which indicate the range of the uncertainties across different $ p_{\mathrm{T}} $ and $ |y| $ bins. The-sign means that the uncertainty does not apply. The reported values are the relative systematic uncertainty in percent. |

png pdf |
Table 9:
Summary of the channels employed in each measurement of $ f_\mathrm{s}/f_\mathrm{u} $, $ f_\mathrm{s}/f_\mathrm{d} $, $ \mathcal{R}_\mathrm{s} $, $ \mathcal{R}_\mathrm{s}^\mathrm{d} $, $ f_\mathrm{d}/f_\mathrm{u} $, and in determining the absolute normalizations for $ \mathcal{R}_\mathrm{s} $ and $ \mathcal{R}_\mathrm{s}^\mathrm{d} $. The-sign means that the channel is not included. |
| Summary |
| In summary, the relative production fractions of $ {\mathrm{B}^{+}} $, $ {\mathrm{B}^0} $, and $ \mathrm{B}_{s}^{0} $ mesons have been measured in proton-proton collisions at $ \sqrt{s} = $ 13 TeV using a special data set recorded in 2018 with the CMS experiment at the LHC, corresponding to an integrated luminosity of 41.6 fb$^{-1}$. This data set, collected with high-rate triggers, provided an unprecedented unbiased sample of $ 10^{10} \mathrm{b} $ hadrons. These data enabled the measurement of the hadronic open-charm decays of $ {\mathrm{B}} $ mesons ($ {\mathrm{B}}_{(\mathrm{s})} \to \pi\mathrm{D}_{(\mathrm{s})} $) for the first time in CMS. Production fraction ratios as functions of $ {\mathrm{B}} $ meson transverse momentum and absolute rapidity were measured using the open-charm decays in the range of 8 $ < p_{\mathrm{T}} < $ 60 GeV and $ |y| < $ 2.25. The same data set was also used to measure these ratios in the charmonium decay channels, with the $ {\mathrm{J}/\psi} $ meson decaying into a pair of muons, to determine the dependence of these ratios on $ {\mathrm{B}} $ meson kinematics. No statistically significant dependence on $ {\mathrm{B}} $ meson kinematics was observed within the uncertainties, although these results are also consistent with the low-$ p_{\mathrm{T}} $ trend observed in previous measurements by LHCb [5] and CMS [7]. Additionally, the $ f_\mathrm{d}/f_\mathrm{u} $ ratio was measured in both the charmonium and open-charm channels, providing a test of isospin invariance in B meson production. No significant deviation from isospin invariance was observed within the precision of the data. The absolute normalization from the charmonium to the open-charm decays has been measured independent of the possible low-$ p_{\mathrm{T}} $ trend of the PFRs. This measurement allows, for the first time, the extraction of production fraction ratios in the charmonium channels with an absolute normalization, rather than just as a shape measurement. The measurements are also used to extract $ {\mathrm{B}^{+}} \mathrm{B}_{s}^{0} $, and $ {\mathrm{B}^0} $ branching fraction ratios of open-charm decays to charmonium decays, improving upon the world-average value for the $ \mathrm{B}_{s}^{0} $ decays. |
| References | ||||
| 1 | LHCb Collaboration | Measurement of $ b $-hadron production fractions in 7 $ \rm{TeV} $ pp collisions | PRD 85 (2012) 032008 | 1111.2357 |
| 2 | LHCb Collaboration | Measurement of the fragmentation fraction ratio $ f_{s}/f_{d} $ and its dependence on $ B $ meson kinematics | JHEP 04 (2013) 001 | 1301.5286 |
| 3 | LHCb Collaboration | Measurement of $ b $ hadron fractions in 13 TeV $ pp $ collisions | PRD 100 (2019) 031102 | 1902.06794 |
| 4 | LHCb Collaboration | Measurement of $ f_s / f_u $ variation with proton-proton collision energy and $ B $-meson kinematics | PRL 124 (2020) 122002 | 1910.09934 |
| 5 | LHCb Collaboration | Precise measurement of the $ f_s/f_d $ ratio of fragmentation fractions and of $ B^0_s $ decay branching fractions | PRD 104 (2021) 032005 | 2103.06810 |
| 6 | ATLAS Collaboration | Determination of the ratio of $ b $-quark fragmentation fractions $ f_s/f_d $ in $ pp $ collisions at $ \sqrt{s}= $ 7 TeV with the ATLAS detector | PRL 115 (2015) 262001 | 1507.08925 |
| 7 | CMS Collaboration | Measurement of the dependence of the hadron production fraction ratio $ f_\mathrm{s} / f_\mathrm{u} $ and $ f_\mathrm{d} / f_ \mathrm{u} $ on B meson kinematic variables in proton-proton collisions at $ \sqrt{s} $ = 13 TeV | PRL 131 (2023) 121901 | CMS-BPH-21-001 2212.02309 |
| 8 | Particle Data Group Collaboration | Review of particle physics | PRD 110 (2024) 030001 | |
| 9 | CMS Collaboration | Measurement of the $ \mathrm{B}_{s}^{0} \to \mu^{+}\mu^{-} $ decay properties and search for the $ {\mathrm{B}^0} \to \mu^{+}\mu^{-} $ decay in proton-proton collisions at $ \sqrt{s}= $ 13 TeV | PLB 842 (2023) 137955 | CMS-BPH-21-006 2212.10311 |
| 10 | HFLAV Collaboration | Averages of b-hadron, c-hadron, and $ \tau $-lepton properties as of 2018 | EPJC 81 (2021) 226 | 1909.12524 |
| 11 | HFLAV Collaboration | Averages of $ b $-hadron, $ c $-hadron, and $ \tau $-lepton properties as of 2023 | 2411.18639 | |
| 12 | F. Bernlochner et al. | Novel approaches to determine $ B^\pm $ and $ B^0 $ meson production fractions | PRD 110 (2024) 014007 | 2306.04686 |
| 13 | CMS Collaboration | Enriching the Physics Program of the CMS Experiment via Data Scouting and Data Parking | Phys. Rep. TBA TBA, 2024 link |
CMS-EXO-23-007 2403.16134 |
| 14 | CMS Collaboration | CMS luminosity measurements for the 2018 data-taking period at $ \sqrt{s} = $ 13 TeV | CMS Physics Analysis Summary, 2018 CMS-PAS-LUM-18-001 |
CMS-PAS-LUM-18-001 |
| 15 | CMS Collaboration | Strategies and performance of the CMS silicon tracker alignment during LHC Run 2 | NIM A 1037 (2022) 166795 | CMS-TRK-20-001 2111.08757 |
| 16 | W. Adam et al. | The CMS Phase-1 pixel detector upgrade | JINST 16 (2021) P02027 | 2012.14304 |
| 17 | CMS Collaboration | Track impact parameter resolution for the full pseudo rapidity coverage in the 2017 dataset with the CMS Phase-1 Pixel detector | CMS Detector Performance Summary CMS-DP-2020-049, 2020 CDS |
|
| 18 | CMS Collaboration | Performance of the CMS muon detector and muon reconstruction with proton-proton collisions at $ \sqrt{s}= $ 13 TeV | JINST 13 (2018) P06015 | CMS-MUO-16-001 1804.04528 |
| 19 | CMS Collaboration | Performance of the CMS Level-1 trigger in proton-proton collisions at $ \sqrt{s} = $ 13\,TeV | JINST 15 (2020) P10017 | CMS-TRG-17-001 2006.10165 |
| 20 | CMS Collaboration | The CMS trigger system | JINST 12 (2017) P01020 | CMS-TRG-12-001 1609.02366 |
| 21 | CMS Collaboration | The CMS experiment at the CERN LHC | JINST 3 (2008) S08004 | 1003.4038 |
| 22 | CMS Collaboration | Development of the CMS detector for the CERN LHC Run 3 | JINST 19 (2024) P05064 | CMS-PRF-21-001 2309.05466 |
| 23 | T. Sj\"ostrand et al. | An introduction to PYTHIA 8.2 | Comput. Phys. Commun. 191 (2015) 159 | 1410.3012 |
| 24 | CMS Collaboration | Extraction and validation of a new set of CMS PYTHIA8 tunes from underlying-event measurements | EPJC 80 (2020) 4 | CMS-GEN-17-001 1903.12179 |
| 25 | NNPDF Collaboration | Parton distributions from high-precision collider data | EPJC 77 (2017) 663 | 1706.00428 |
| 26 | D. J. Lange | The EvtGen particle decay simulation package | NIM A 462 (2001) 152 | |
| 27 | E. Barberio and Z. Was | PHOTOS: A Universal Monte Carlo for QED radiative corrections. Version 2.0 | Comput. Phys. Commun. 79 (1994) 291 | |
| 28 | GEANT4 Collaboration | GEANT 4---a simulation toolkit | NIM A 506 (2003) 250 | |
| 29 | M. Beneke, G. Buchalla, M. Neubert, and C. T. Sachrajda | QCD factorization for exclusive, nonleptonic B meson decays: General arguments and the case of heavy light final states | NPB 591 (2000) 313 | hep-ph/0006124 |
| 30 | R. Fleischer, N. Serra, and N. Tuning | Tests of factorization and SU(3) relations in B decays into heavy-light final states | PRD 83 (2011) 014017 | 1012.2784 |
| 31 | T. Huber, S. Kränkl, and X.-Q. Li | Two-body non-leptonic heavy-to-heavy decays at NNLO in QCD factorization | JHEP 09 (2016) 112 | 1606.02888 |
| 32 | M. Bordone et al. | A puzzle in $ \bar{B}_{(s)}^0 \to D_{(s)}^{(*)+} \lbrace \pi^-, K^-\rbrace $ decays and extraction of the $ f_s/f_d $ fragmentation fraction | EPJC 80 (2020) 951 | 2007.10338 |
| 33 | M. Di Carlo et al. | Light-meson leptonic decay rates in lattice QCD+QED | PRD 100 (2019) 034514 | 1904.08731 |
| 34 | CMS Collaboration | CMS Tracking Performance Results from Early LHC Operation | EPJC 70 (2010) 1165 | CMS-TRK-10-001 1007.1988 |
| 35 | CMS Collaboration | Particle-flow reconstruction and global event description with the CMS detector | JINST 12 (2017) P10003 | CMS-PRF-14-001 1706.04965 |
| 36 | BaBar Collaboration | Dalitz plot analysis of $ D_s^+ \to K^+ K^- \pi^+ $ | PRD 83 (2011) 052001 | 1011.4190 |
| 37 | M. Pivk and F. R. Le Diberder | $ \mathit{_sPlot} $: A Statistical tool to unfold data distributions | NIM A 555 (2005) 356 | physics/0402083 |
| 38 | T. Chen and C. Guestrin | XGBoost: A Scalable Tree Boosting System | in nd ACM SIGKDD Int. Conf. on Knowledge Discovery and Data Mining, 2016 Proc. 2 (2016) 2 |
1603.02754 |
| 39 | F. Pedregosa et al. | Scikit-learn: Machine Learning in Python | J. Mach. Learn. Res. 12 (2011) 2825 | 1201.0490 |
| 40 | N. L. Johnson | Systems of frequency curves generated by methods of translation | Biometrika 36 (1949) 149 | |
| 41 | M. J. Oreglia | A study of the reactions $ \psi^\prime \to \gamma \gamma \psi $ | PhD thesis, Stanford University, . SLAC Report SLAC-R-236, 1980 link |
|
| 42 | CMS Collaboration | Measurements of Inclusive $ W $ and $ Z $ Cross Sections in $ pp $ Collisions at $ \sqrt{s}= $ 7 TeV | JHEP 01 (2011) 080 | CMS-EWK-10-002 1012.2466 |
| 43 | M. Cacciari, M. Greco, and P. Nason | The $ p_T $ spectrum in heavy-flavour hadroproduction. | JHEP 05 (1998) 007 | hep-ph/9803400 |
| 44 | CMS Collaboration | Tracking performances for charged pions with Run2 Legacy data | CMS Detector Performance Summary CMS-DP-2022-012, 2022 CDS |
|
| 45 | S. Jackman | Bayesian Analysis for the Social Sciences | John Wiley \& Sons, New Jersey, USA, 2009 link |
|
| 46 | Belle Collaboration | Measurement of the branching fraction and $ CP $ asymmetry for $ B\to\bar{D}^{0} \pi $ decays | PRD 105 (2022) 072007 | 2111.12337 |
| 47 | Belle Collaboration | Study of $ \overline{B}^0\rightarrow D^{+}h^{-} (h=K/\pi) $ decays at Belle | PRD 105 (2022) 012003 | 2111.04978 |
| 48 | Belle Collaboration | Test of lepton flavor universality and search for lepton flavor violation in $ B \rightarrow K\ell \ell $ decays | JHEP 03 (2021) 105 | 1908.01848 |

|
Compact Muon Solenoid LHC, CERN |

|

|

|

|

|

|