

Compact Muon Solenoid
LHC, CERN
| CMS-PAS-TOP-18-007 | ||
| Search for CP violating anomalous top quark couplings in proton-proton collisions at $\sqrt{s}= $ 13 TeV | ||
| CMS Collaboration | ||
| September 2020 | ||
| Abstract: Results of a search for CP violation in top quark pair production are presented, using proton-proton collision data at a center-of-mass energy of $\sqrt{s}= $ 13 TeV. The data set analyzed corresponds to an integrated luminosity of 35.9 fb$^{-1}$ collected by the CMS experiment. Final states with two charged leptons are considered. In this search two observables are probed, $\mathcal{O}_{1}$ and $\mathcal{O}_{3}$, which are the Levi-Civita tensors of the four-momenta of charged leptons, jets originating from $\text{b}$ quarks, and top quarks. Asymmetries in these observables are sensitive to CP violation, and their measurement is used to determine the chromoelectric dipole moment of the top quark. The chromoelectric dipole moments derived from the measured asymmetries in $\mathcal{O}_{1}$ and $\mathcal{O}_{3}$ are 0.58 $\pm$ 0.69 (stat) $\pm$ 0.70 (syst) $ \times $ 10$^{-18}$ $g_{\text{S}} \cdot $cm and $-0.01$ $\pm$ 0.72 (stat) $\pm$ 0.58 (syst) $ \times $ 10$^{-18}$ $g_{\text{S}} \cdot$cm, respectively, with $g_\text{S}$ the strong coupling. These results are consistent with the standard model prediction. | ||
|
Links:
CDS record (PDF) ;
inSPIRE record ;
CADI line (restricted) ;
These preliminary results are superseded in this paper, Submitted to JHEP. The superseded preliminary plots can be found here. |
||
| Figures | |

png pdf |
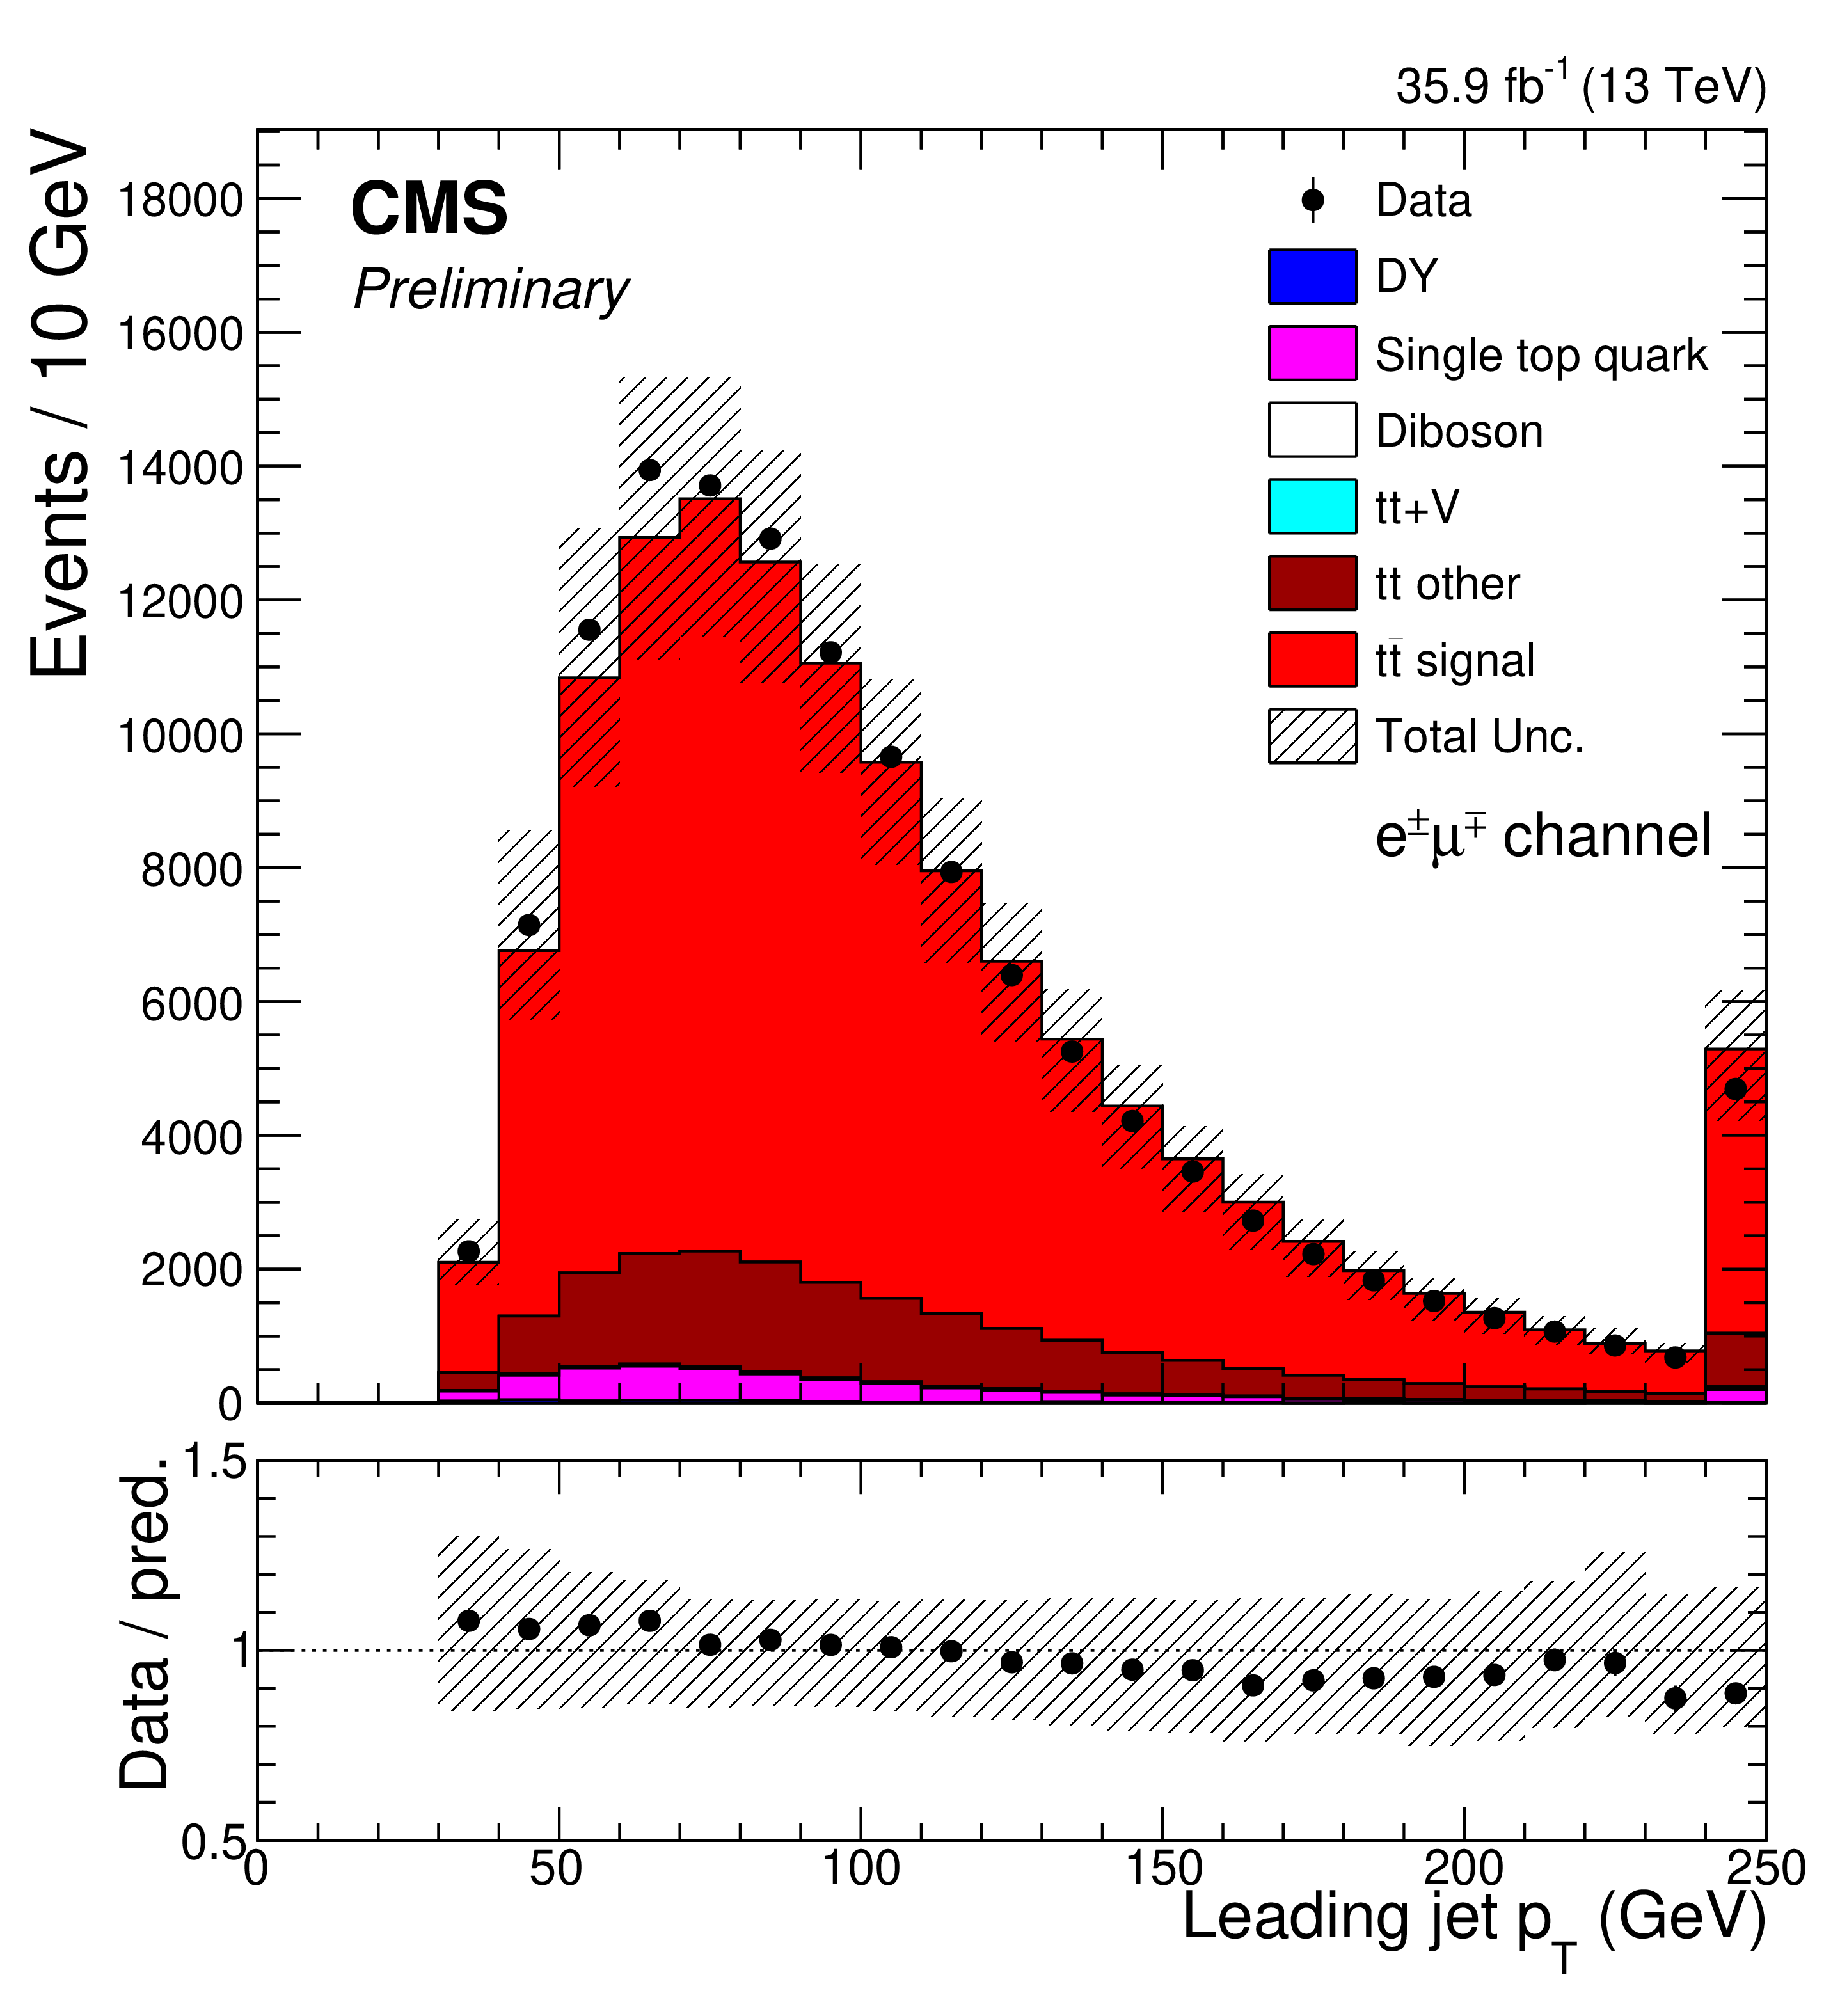
Figure 1:
The comparisons of predictions and observed data for the kinematic distributions of the ${p_{\mathrm {T}}}$ of the leading lepton (upper left), subleading lepton (upper right), leading jet (lower left) and subleading jet (lower right) in the $\mathrm{e^{\pm}} {\mu ^\mp} $ channel. The vertical bars on the markers of the observed data represent the statistical uncertainties. The shaded band in the predicted distributions includes statistical and systematic uncertainties. The ratios of the data to the predictions from simulation are presented in the lower panel of each figure. |

png pdf |
Figure 1-a:
The comparisons of predictions and observed data for the kinematic distributions of the ${p_{\mathrm {T}}}$ of the leading lepton, in the $\mathrm{e^{\pm}} {\mu ^\mp} $ channel. The vertical bars on the markers of the observed data represent the statistical uncertainties. The shaded band in the predicted distributions includes statistical and systematic uncertainties. The ratios of the data to the predictions from simulation are presented in the lower panel. |

png pdf |
Figure 1-b:
The comparisons of predictions and observed data for the kinematic distributions of the ${p_{\mathrm {T}}}$ of the subleading lepton, in the $\mathrm{e^{\pm}} {\mu ^\mp} $ channel. The vertical bars on the markers of the observed data represent the statistical uncertainties. The shaded band in the predicted distributions includes statistical and systematic uncertainties. The ratios of the data to the predictions from simulation are presented in the lower panel. |
png pdf |
Figure 1-c:
The comparisons of predictions and observed data for the kinematic distributions of the ${p_{\mathrm {T}}}$ of the leading jet, in the $\mathrm{e^{\pm}} {\mu ^\mp} $ channel. The vertical bars on the markers of the observed data represent the statistical uncertainties. The shaded band in the predicted distributions includes statistical and systematic uncertainties. The ratios of the data to the predictions from simulation are presented in the lower panel. |
png pdf |
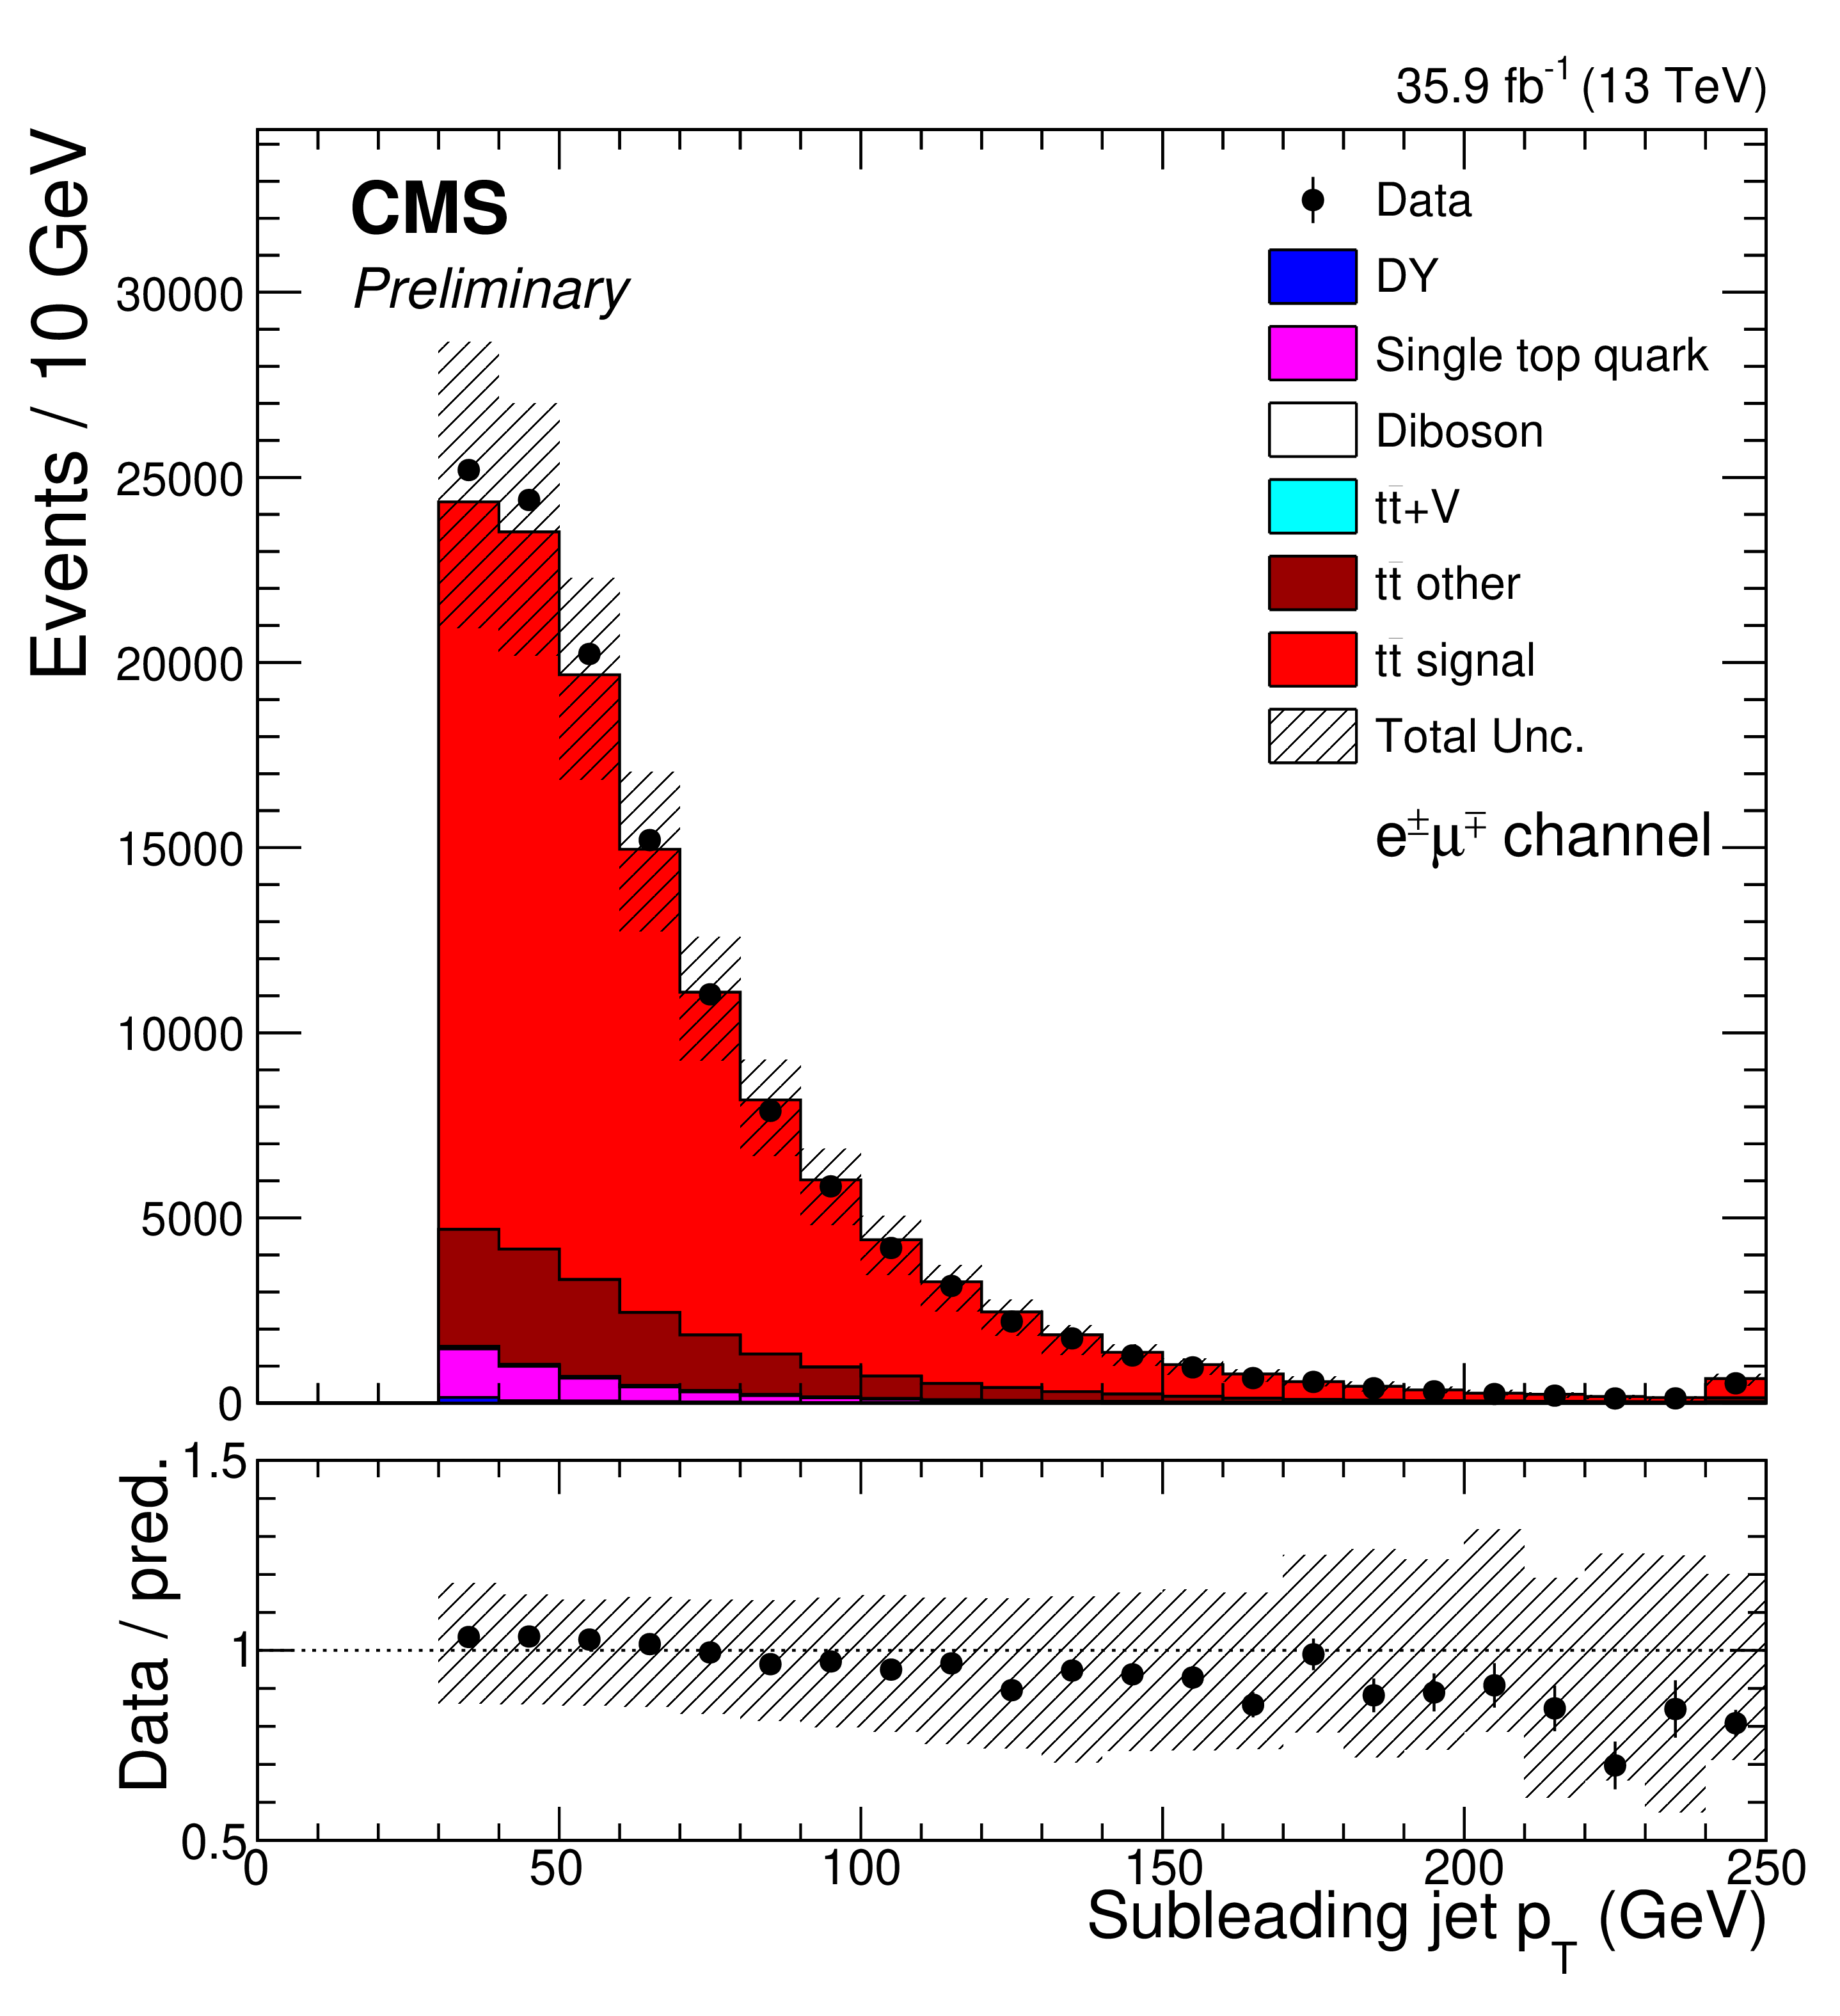
Figure 1-d:
The comparisons of predictions and observed data for the kinematic distributions of the ${p_{\mathrm {T}}}$ of the subleading jet, in the $\mathrm{e^{\pm}} {\mu ^\mp} $ channel. The vertical bars on the markers of the observed data represent the statistical uncertainties. The shaded band in the predicted distributions includes statistical and systematic uncertainties. The ratios of the data to the predictions from simulation are presented in the lower panel. |
png pdf |
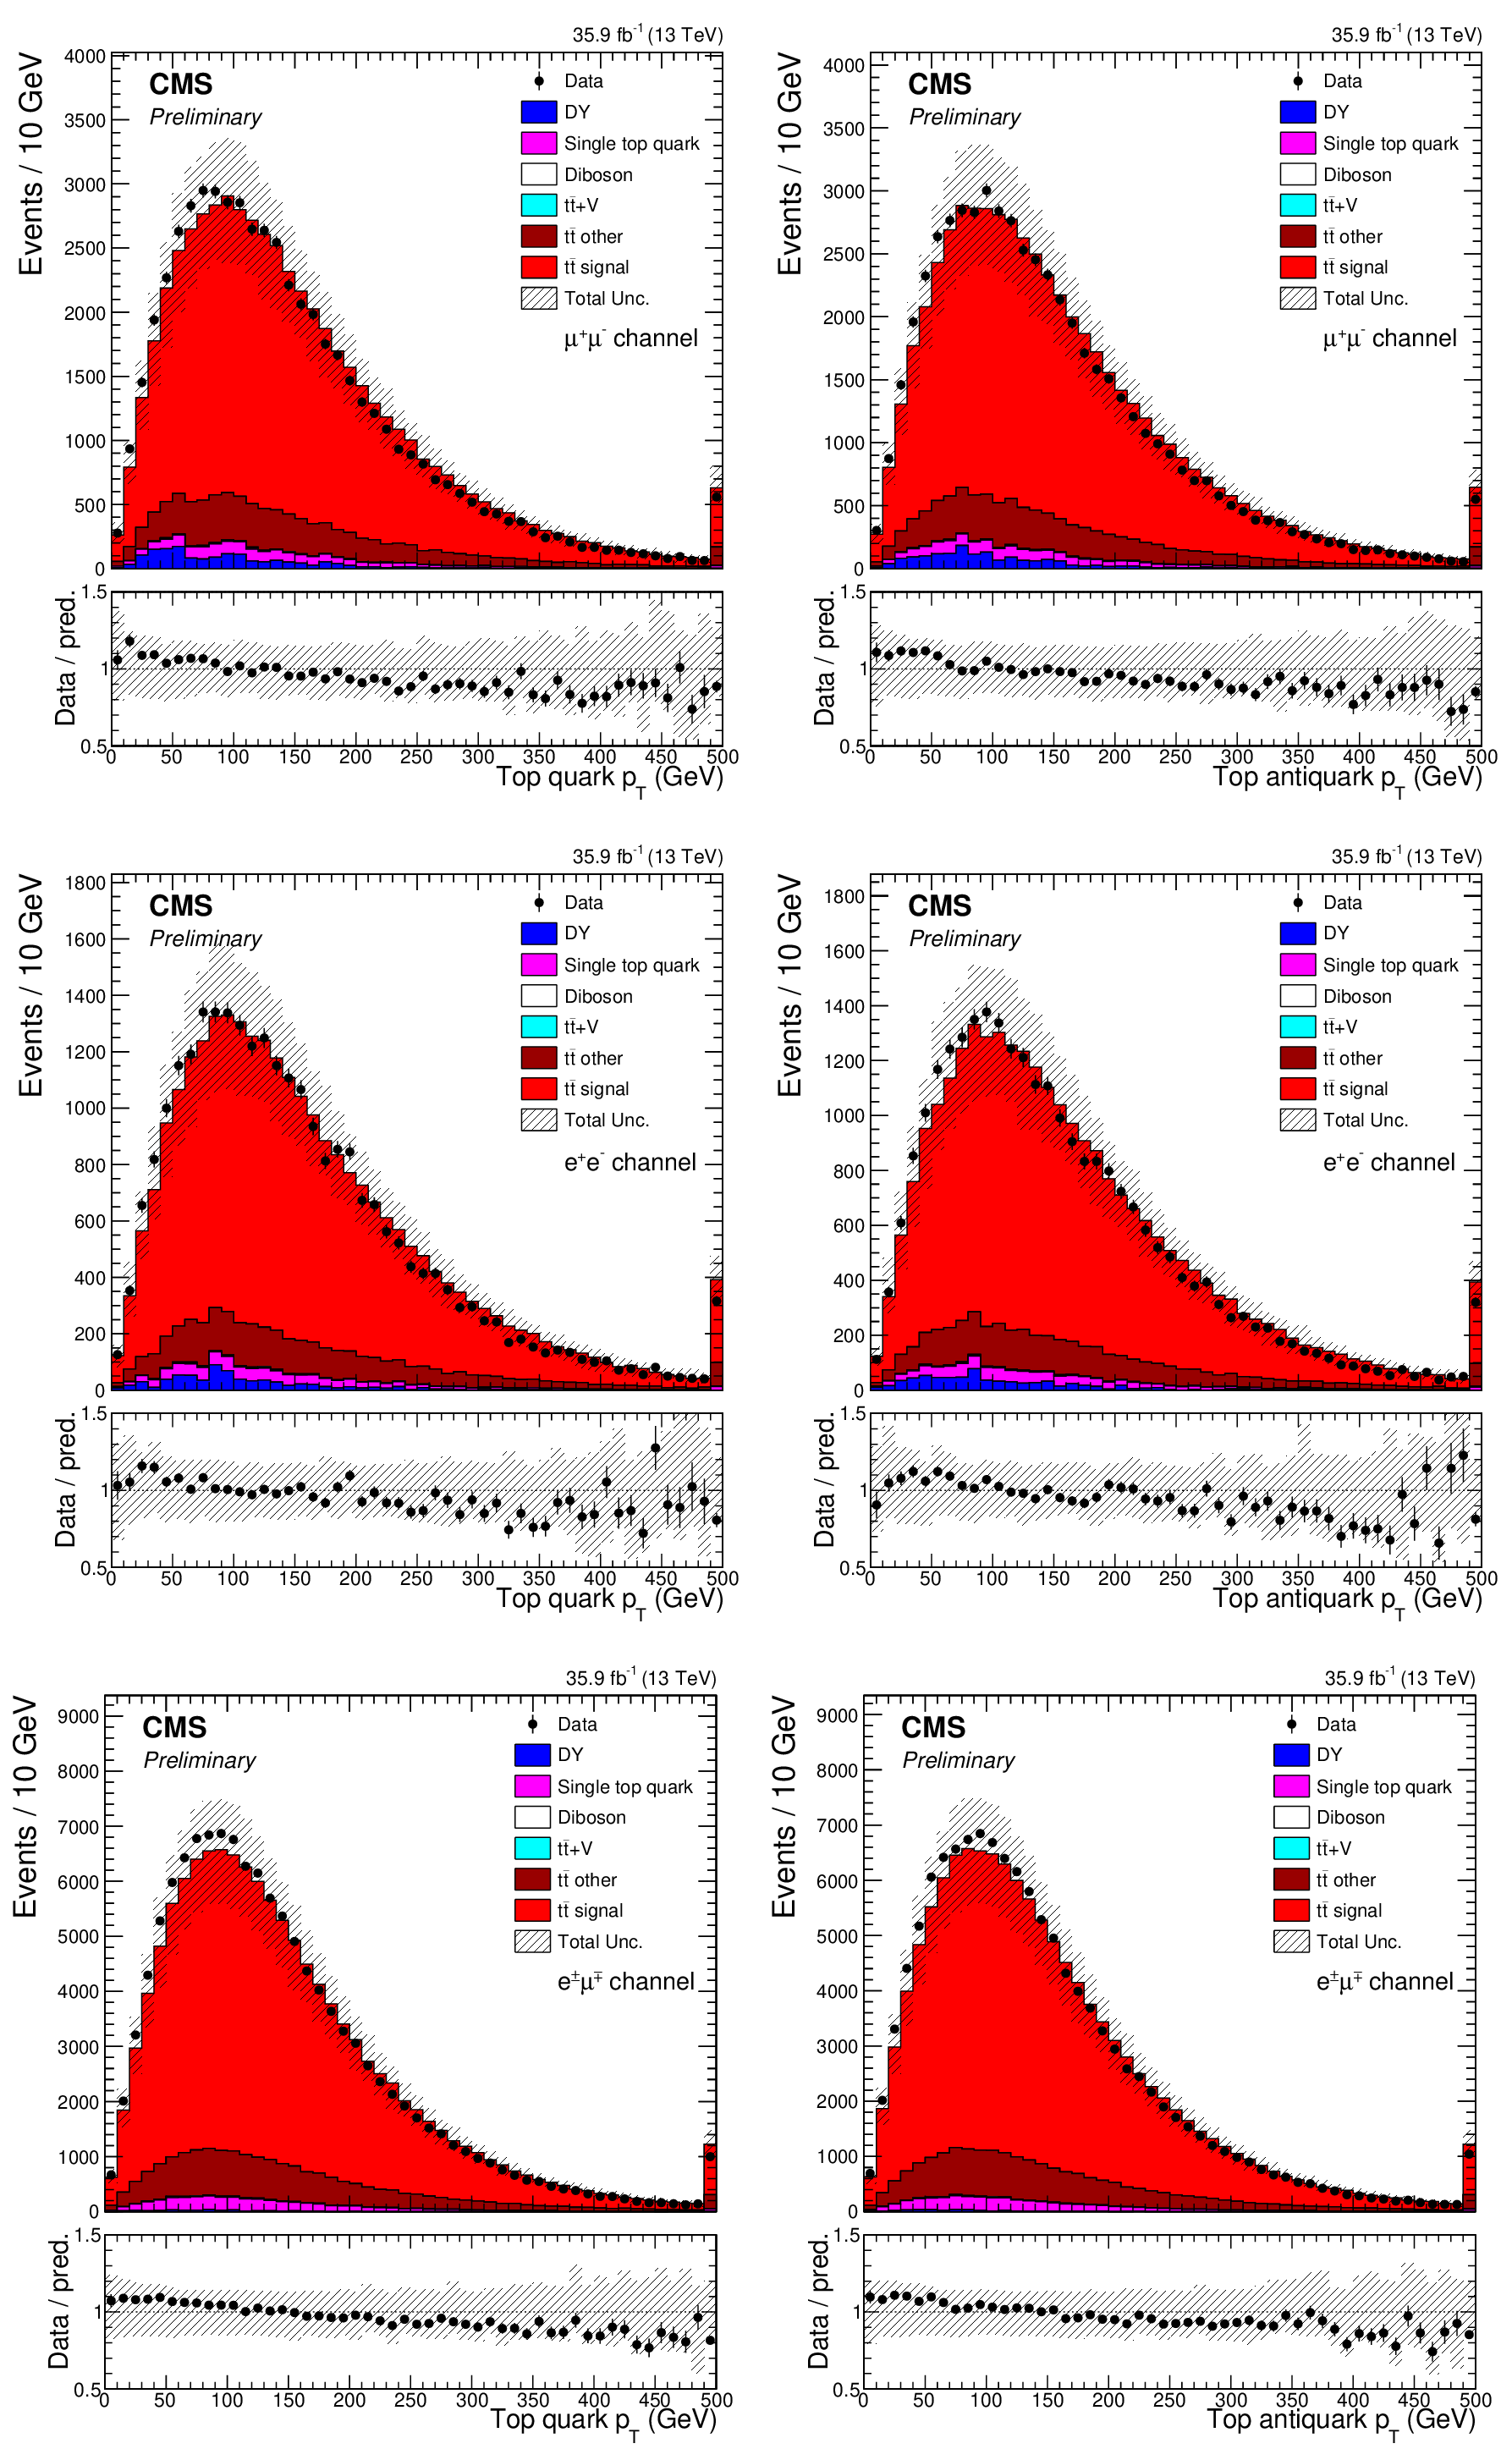
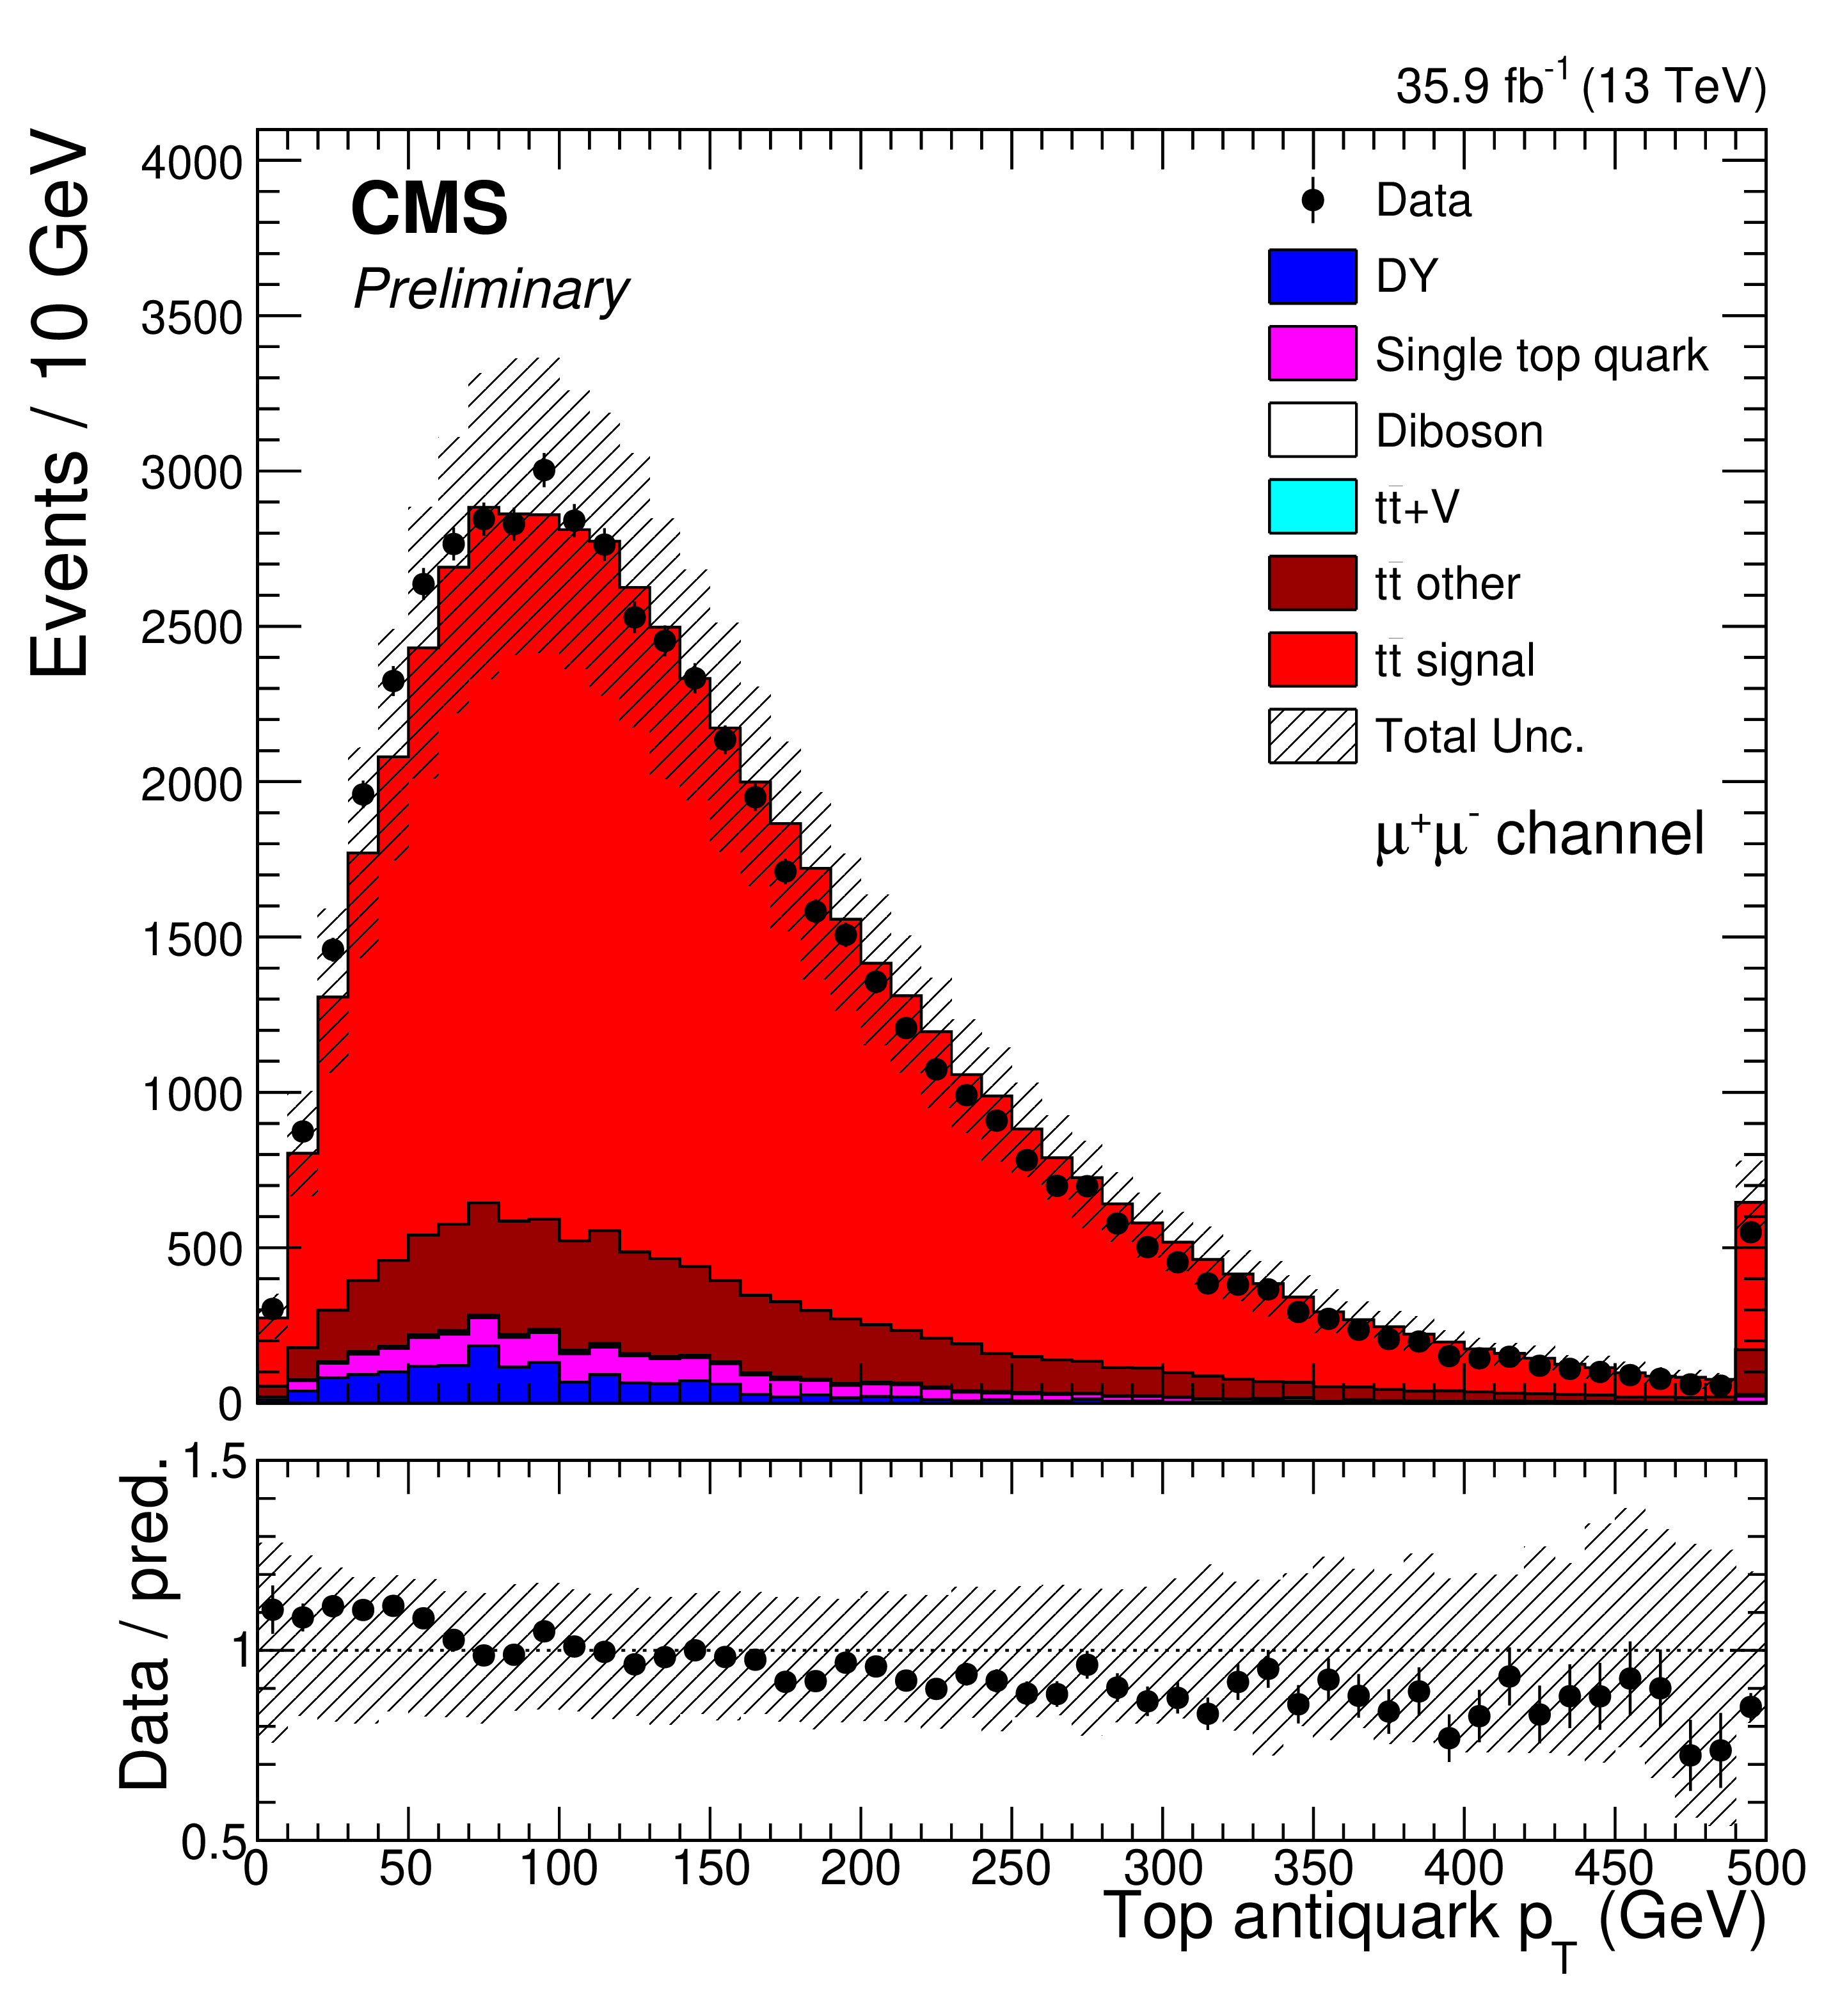
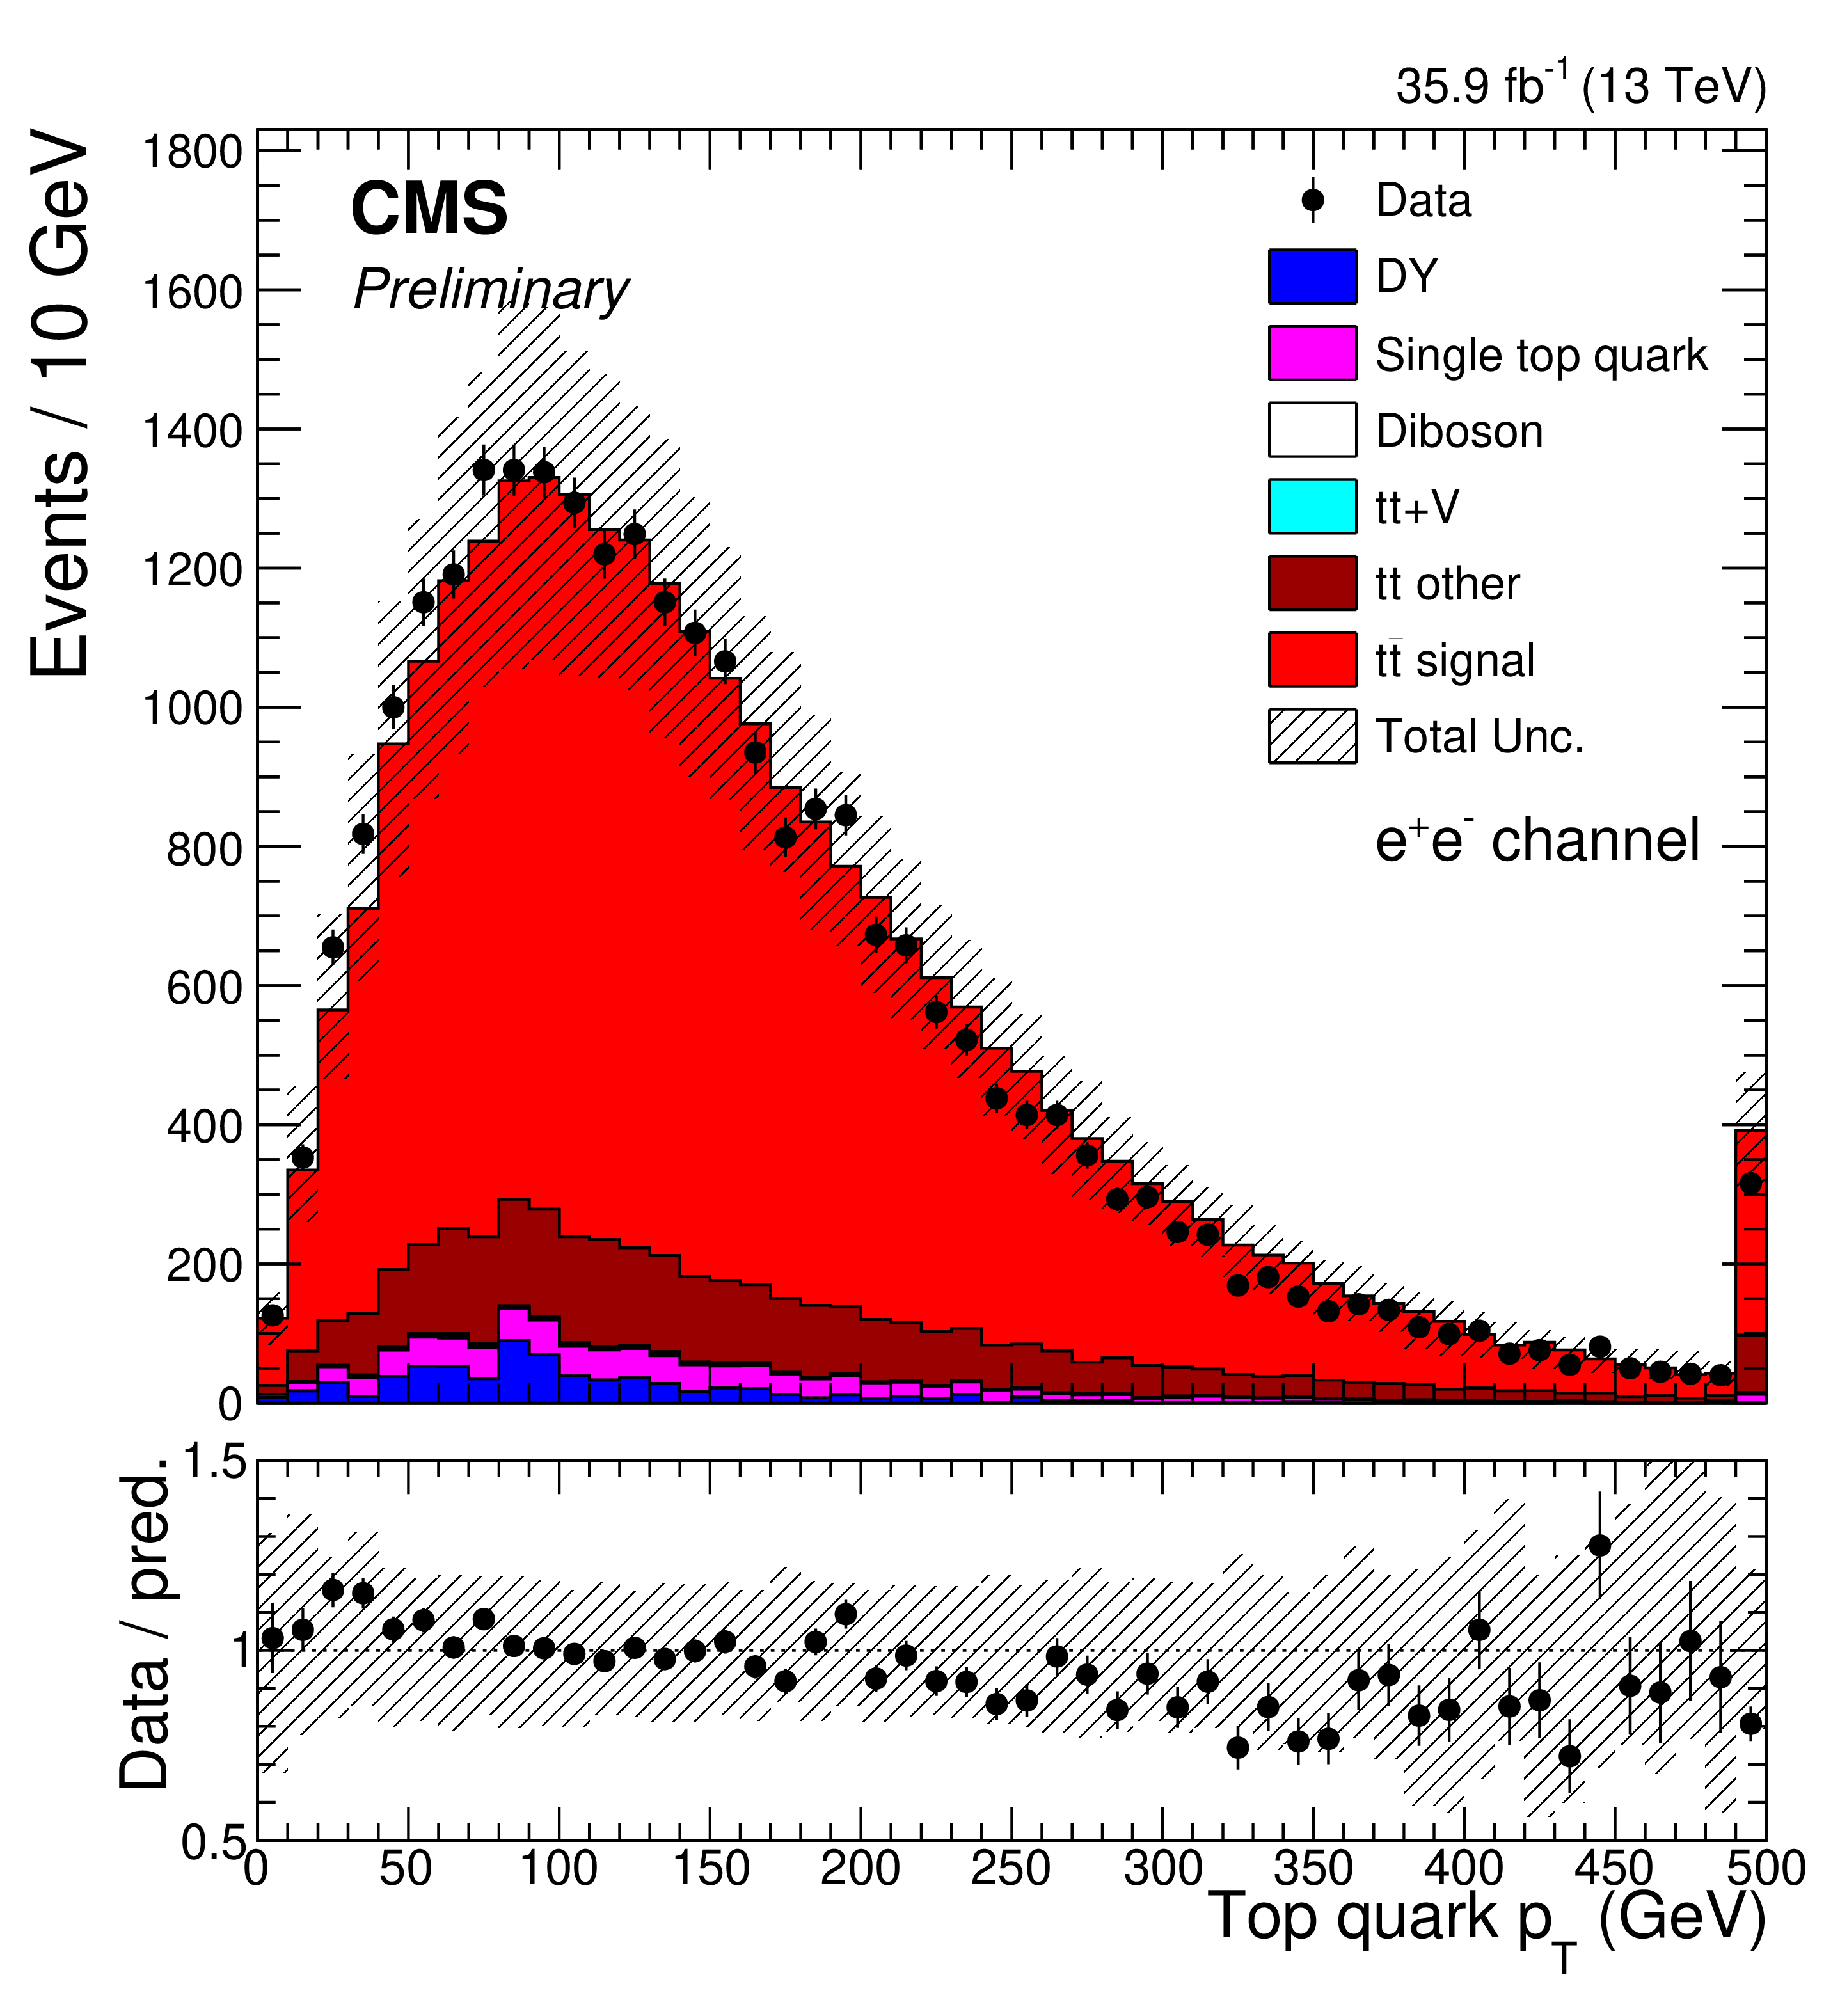
Figure 2:
The comparisons of predictions and observed data for the ${p_{\mathrm {T}}}$ distributions of the top quark (left) and antiquark (right) in the $\mu^{+} \mu^{-} $ (upper), $\mathrm{e^{+}} \mathrm{e^{-}} $ (middle) and $\mathrm{e^{\pm}} {\mu ^\mp} $ (lower) channel. The vertical bars on the markers of the observed data represent the statistical uncertainties. The shaded band in the predicted distributions includes statistical and systematic uncertainties. The ratios of the data to the predictions from simulation are presented in the lower panel of each figure. |
png pdf |
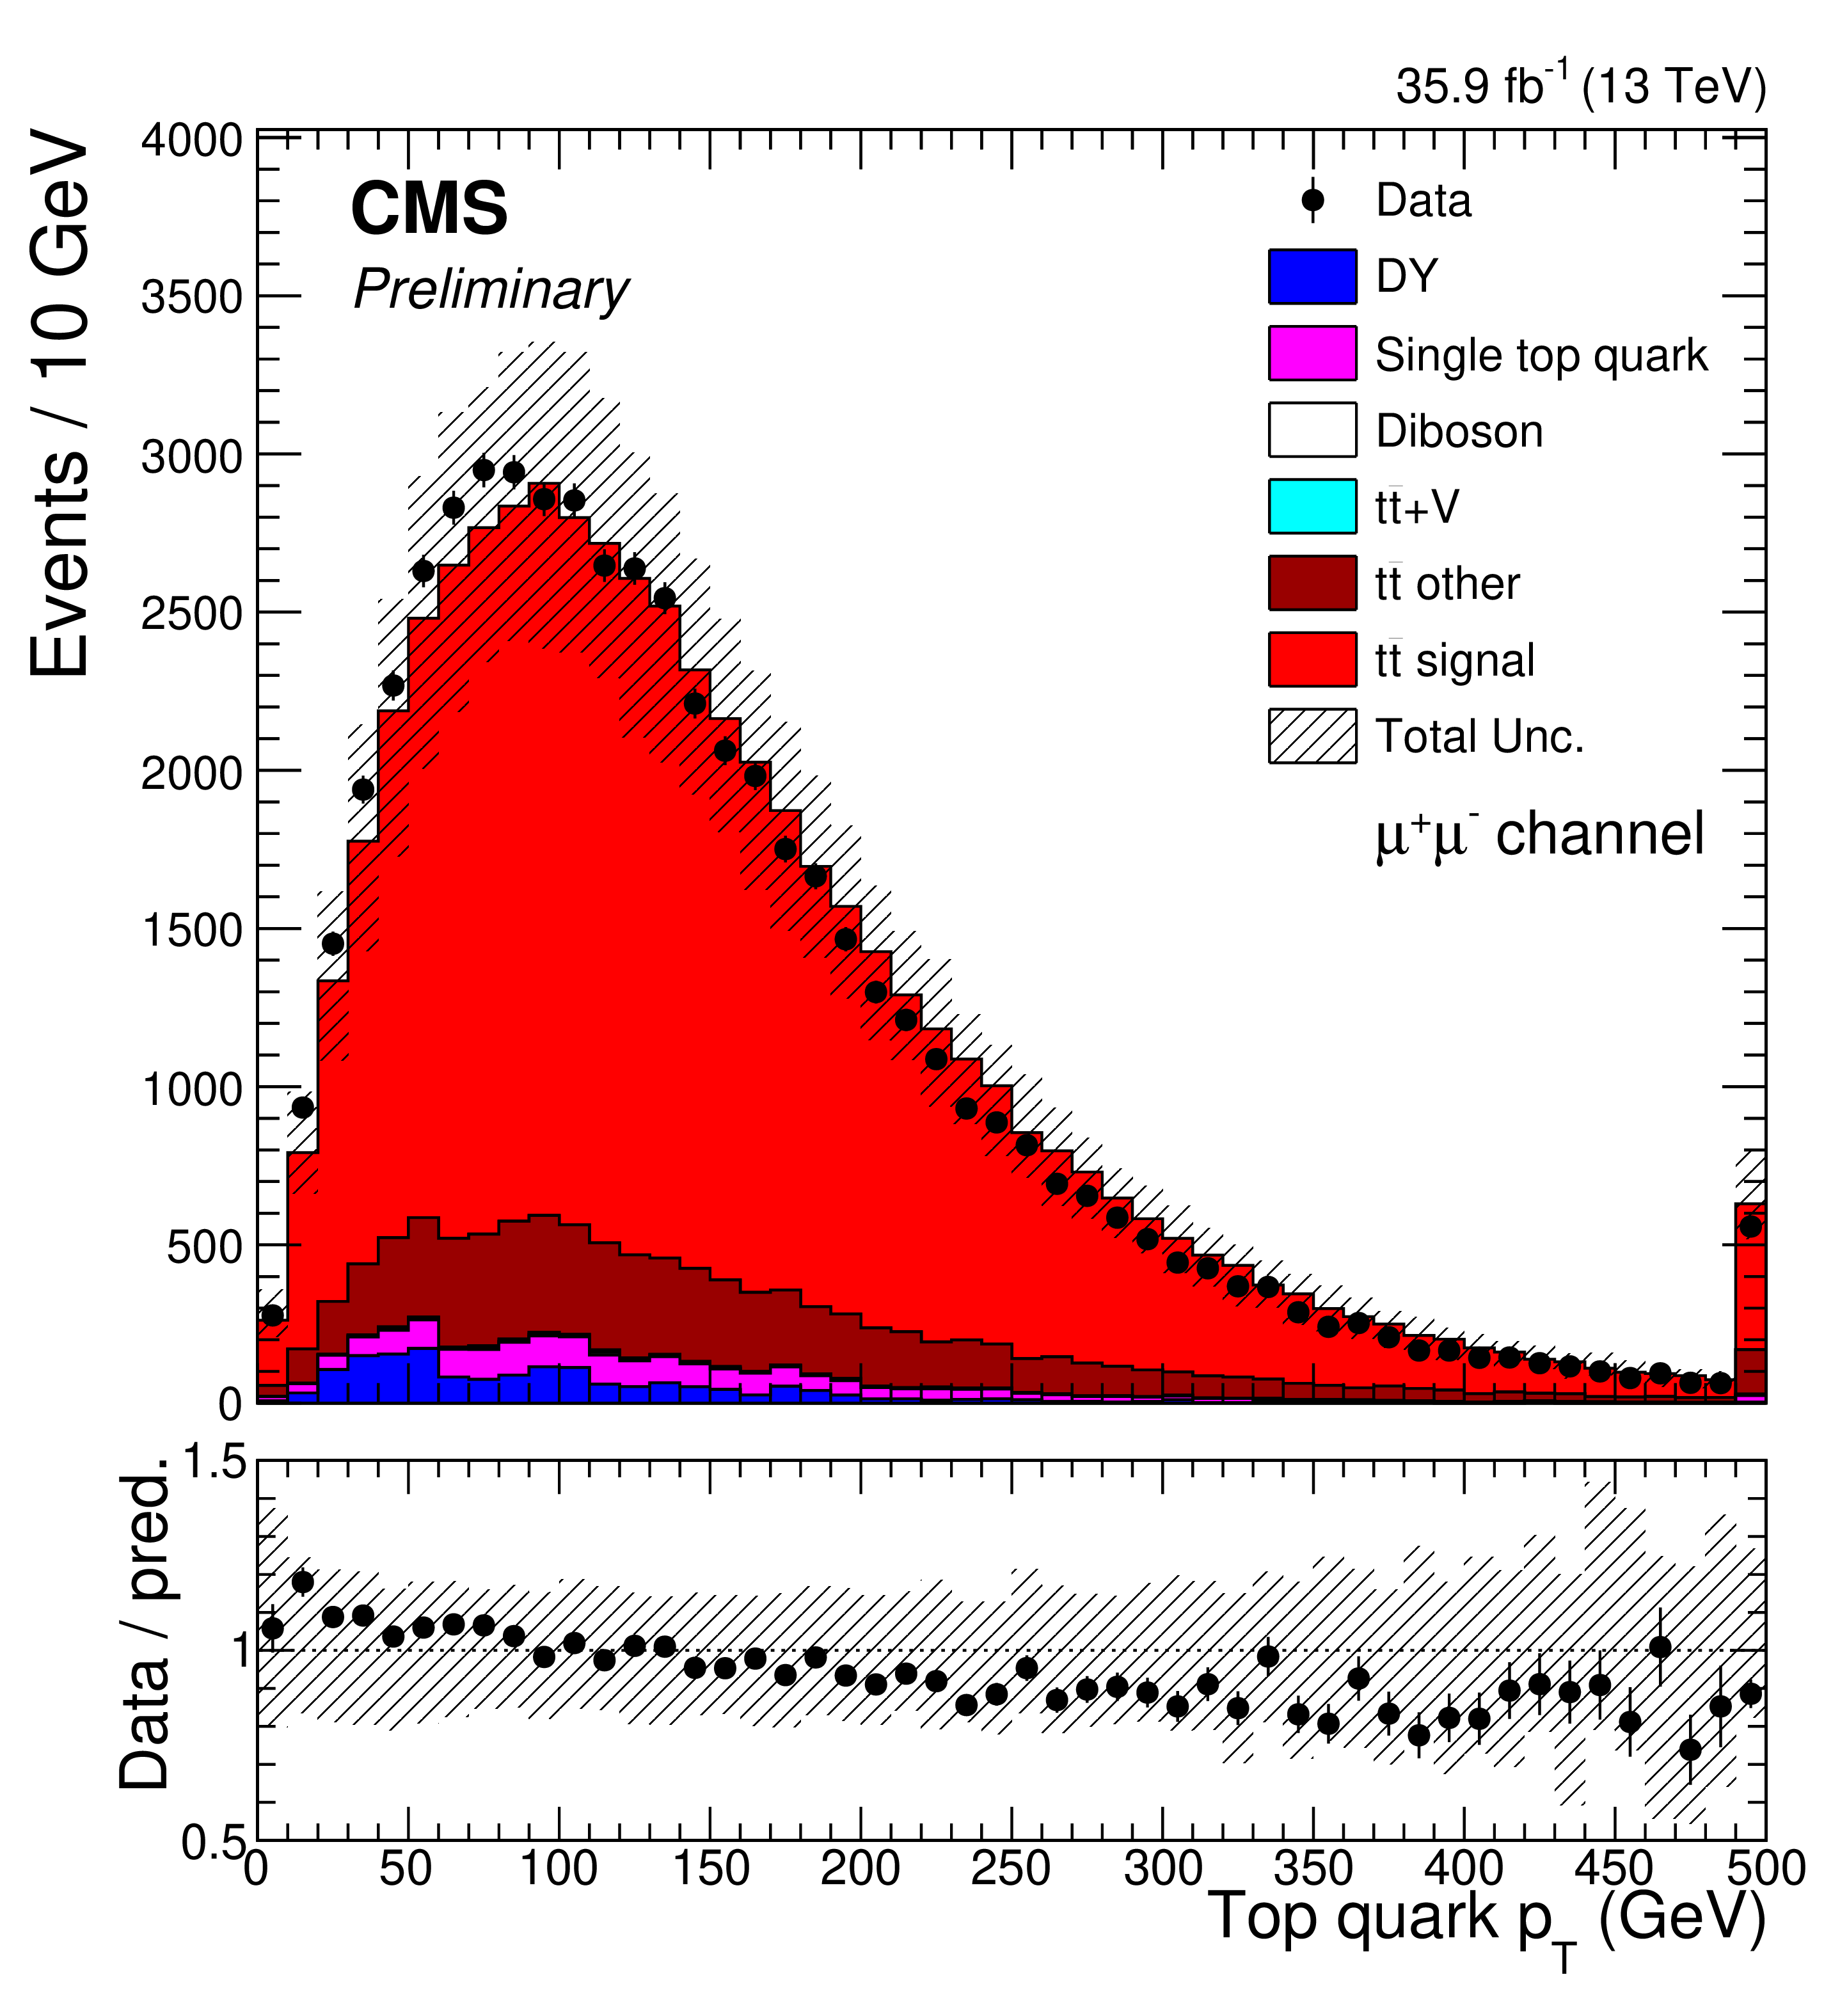
Figure 2-a:
The comparisons of predictions and observed data for the ${p_{\mathrm {T}}}$ distributions of the top quark (right) in the $\mu^{+} \mu^{-} $ channel. The vertical bars on the markers of the observed data represent the statistical uncertainties. The shaded band in the predicted distributions includes statistical and systematic uncertainties. The ratios of the data to the predictions from simulation are presented in the lower panel. |
png pdf |
Figure 2-b:
The comparisons of predictions and observed data for the ${p_{\mathrm {T}}}$ distributions of the top antiquark (right) in the $\mu^{+} \mu^{-} $ channel. The vertical bars on the markers of the observed data represent the statistical uncertainties. The shaded band in the predicted distributions includes statistical and systematic uncertainties. The ratios of the data to the predictions from simulation are presented in the lower panel. |
png pdf |
Figure 2-c:
The comparisons of predictions and observed data for the ${p_{\mathrm {T}}}$ distributions of the top quark (right) in the $\mathrm{e^{+}} \mathrm{e^{-}} $ channel. The vertical bars on the markers of the observed data represent the statistical uncertainties. The shaded band in the predicted distributions includes statistical and systematic uncertainties. The ratios of the data to the predictions from simulation are presented in the lower panel. |
png pdf |
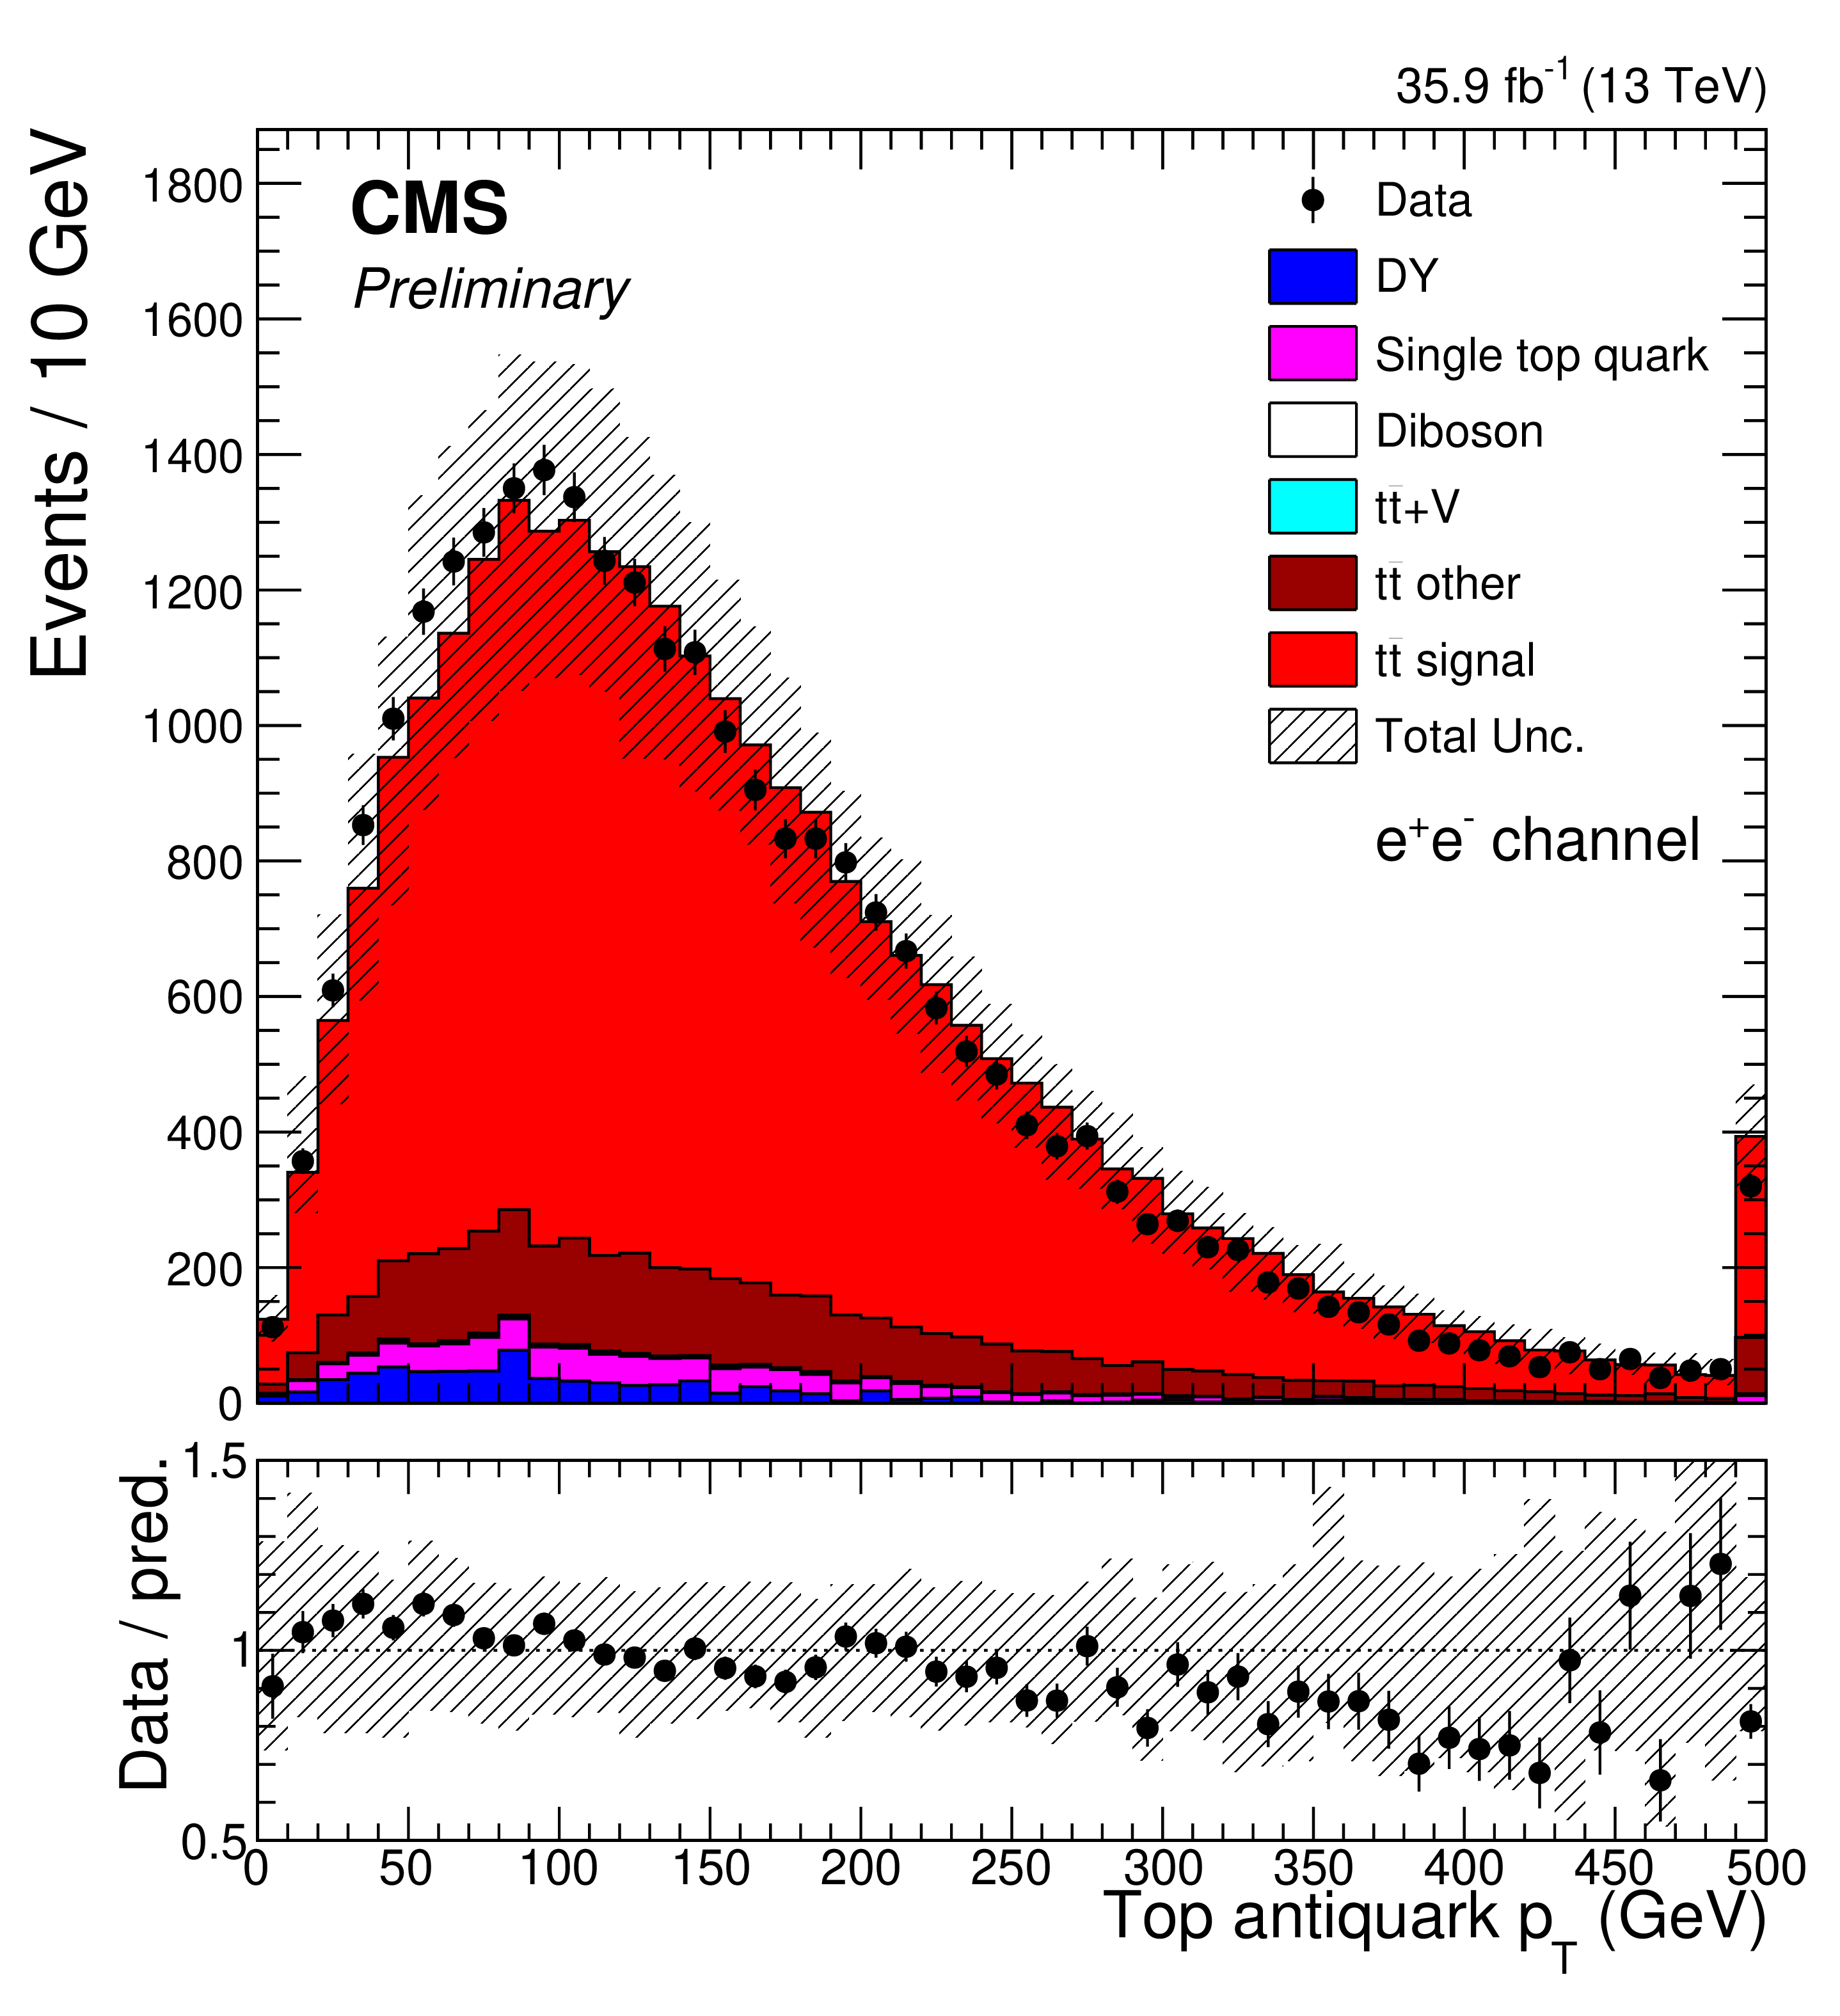
Figure 2-d:
The comparisons of predictions and observed data for the ${p_{\mathrm {T}}}$ distributions of the top antiquark (right) in the $\mathrm{e^{+}} \mathrm{e^{-}} $channel. The vertical bars on the markers of the observed data represent the statistical uncertainties. The shaded band in the predicted distributions includes statistical and systematic uncertainties. The ratios of the data to the predictions from simulation are presented in the lower panel. |

png pdf |
Figure 2-e:
The comparisons of predictions and observed data for the ${p_{\mathrm {T}}}$ distributions of the top quark (right) in the $\mathrm{e^{\pm}} {\mu ^\mp} $ channel. The vertical bars on the markers of the observed data represent the statistical uncertainties. The shaded band in the predicted distributions includes statistical and systematic uncertainties. The ratios of the data to the predictions from simulation are presented in the lower panel. |
png pdf |
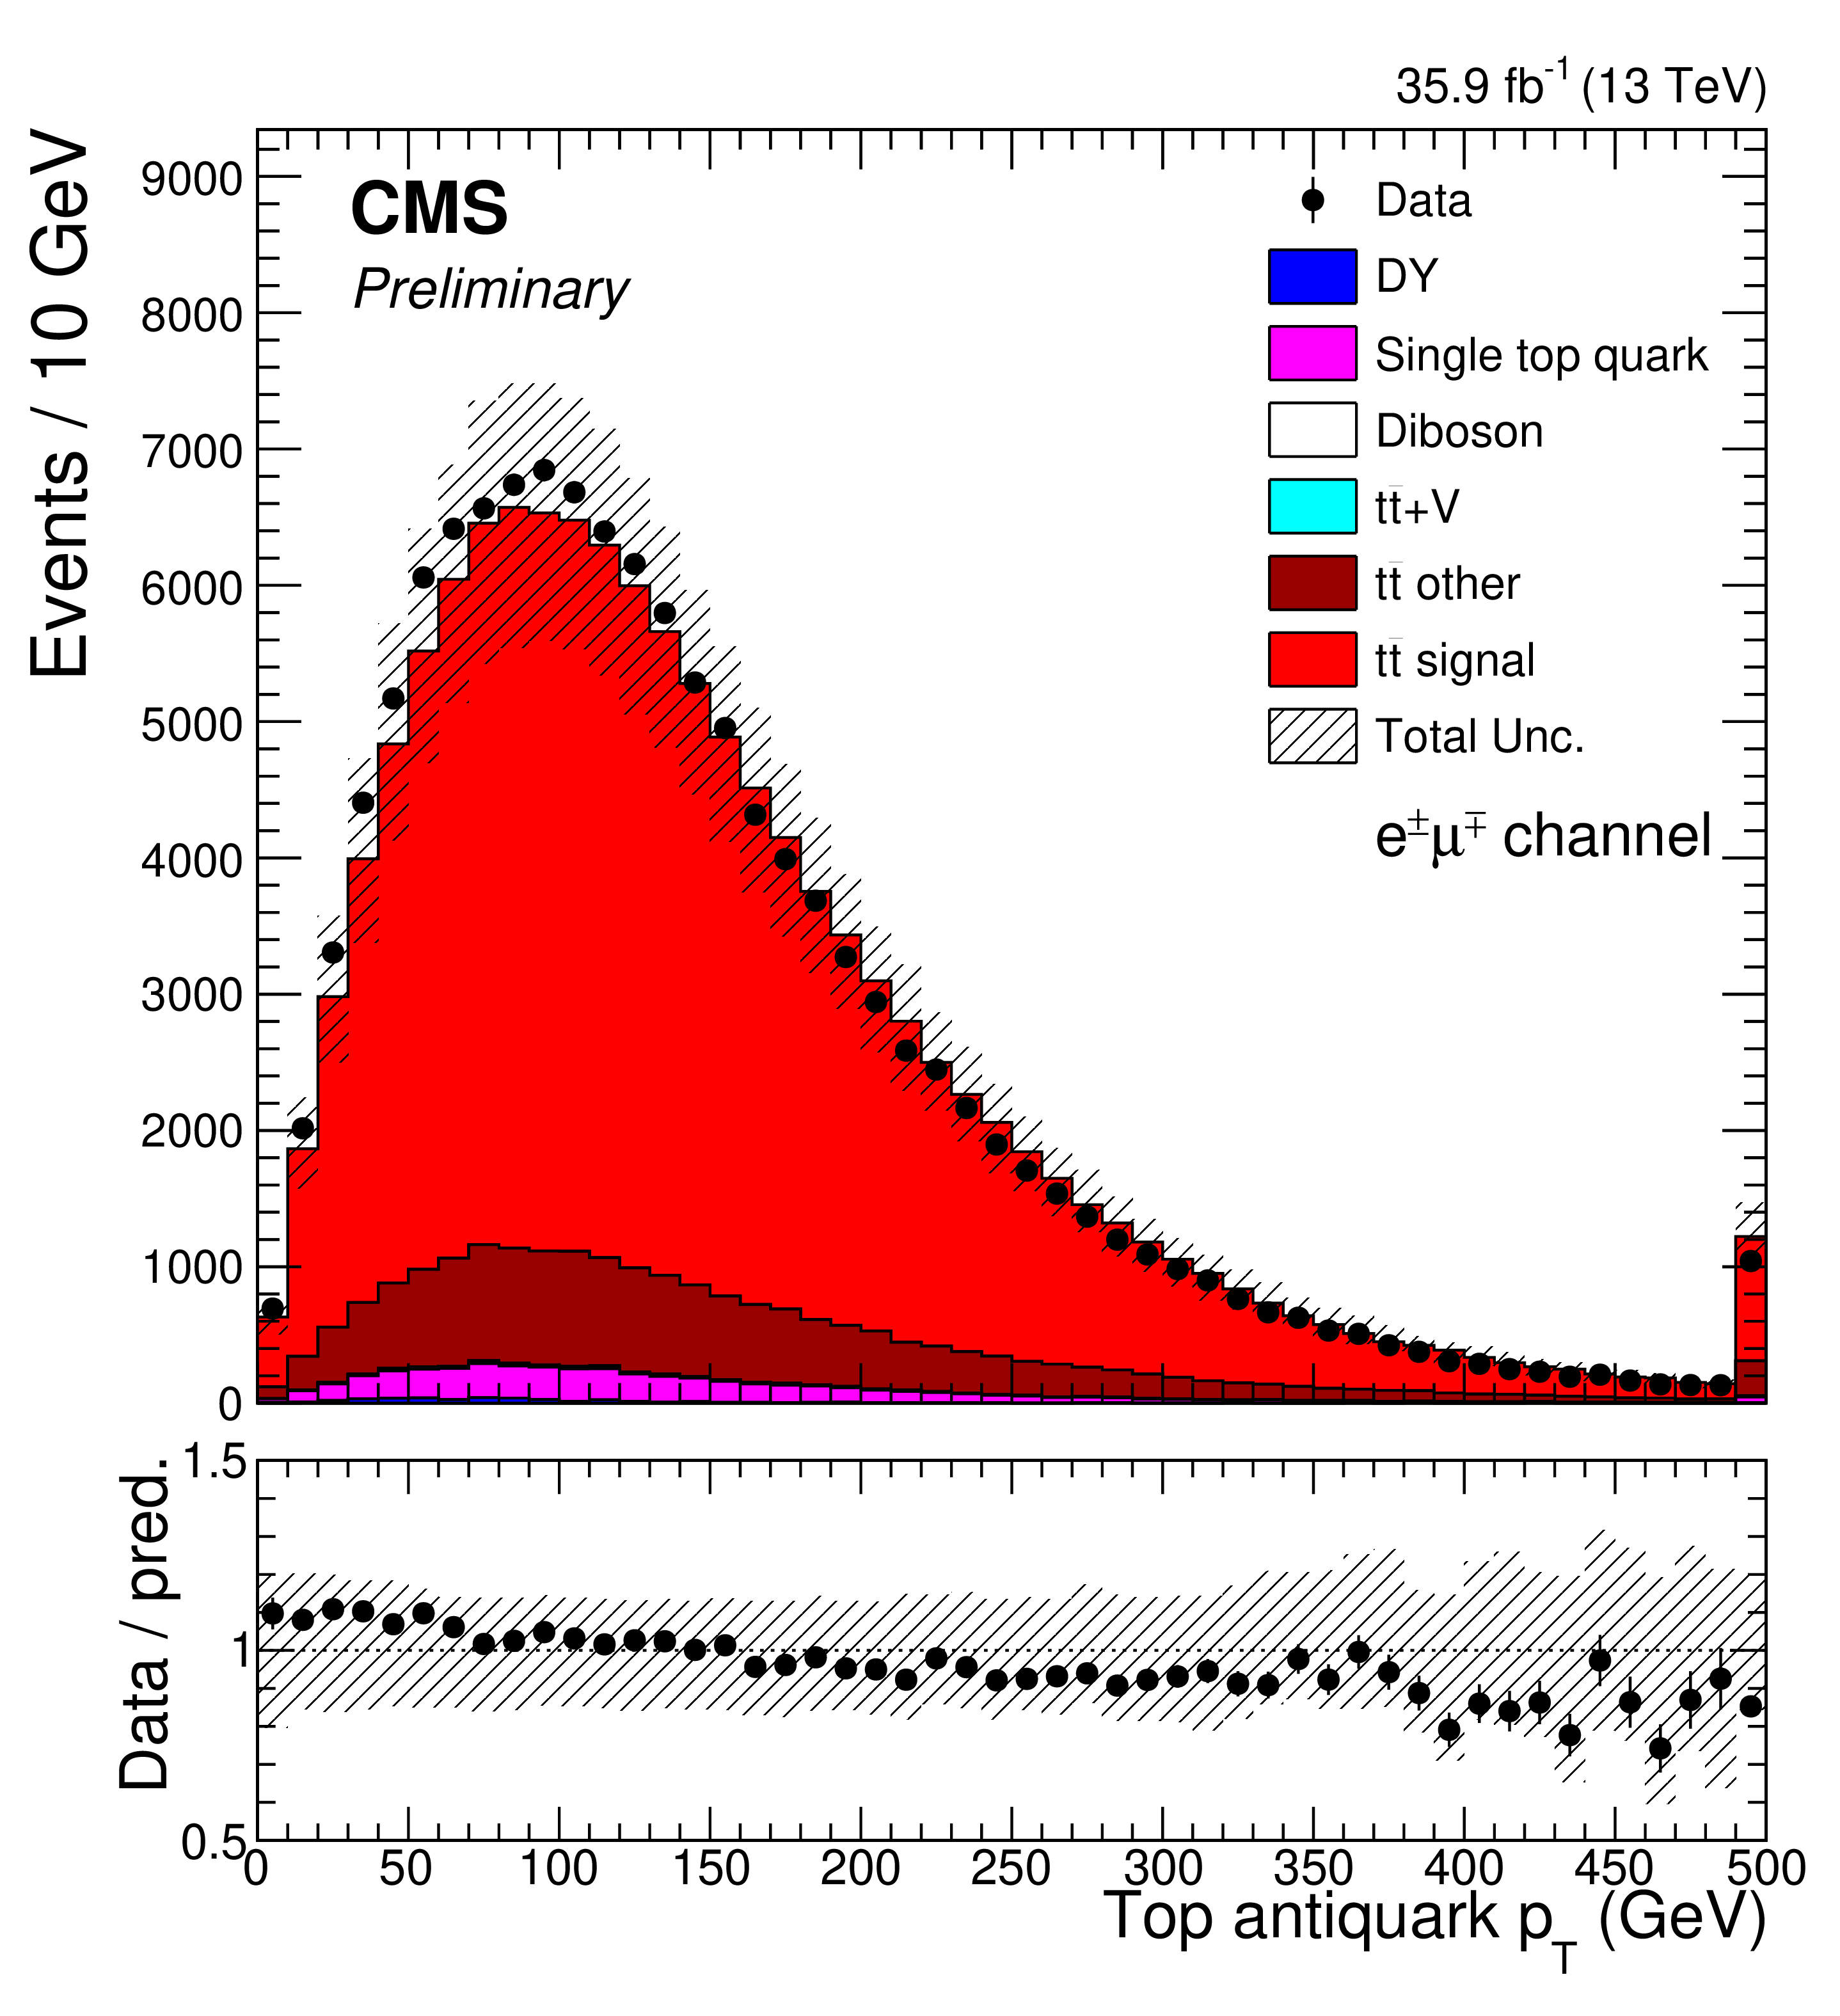
Figure 2-f:
The comparisons of predictions and observed data for the ${p_{\mathrm {T}}}$ distributions of the top antiquark (right) in the $\mathrm{e^{\pm}} {\mu ^\mp} $ channel. The vertical bars on the markers of the observed data represent the statistical uncertainties. The shaded band in the predicted distributions includes statistical and systematic uncertainties. The ratios of the data to the predictions from simulation are presented in the lower panel. |
png pdf |
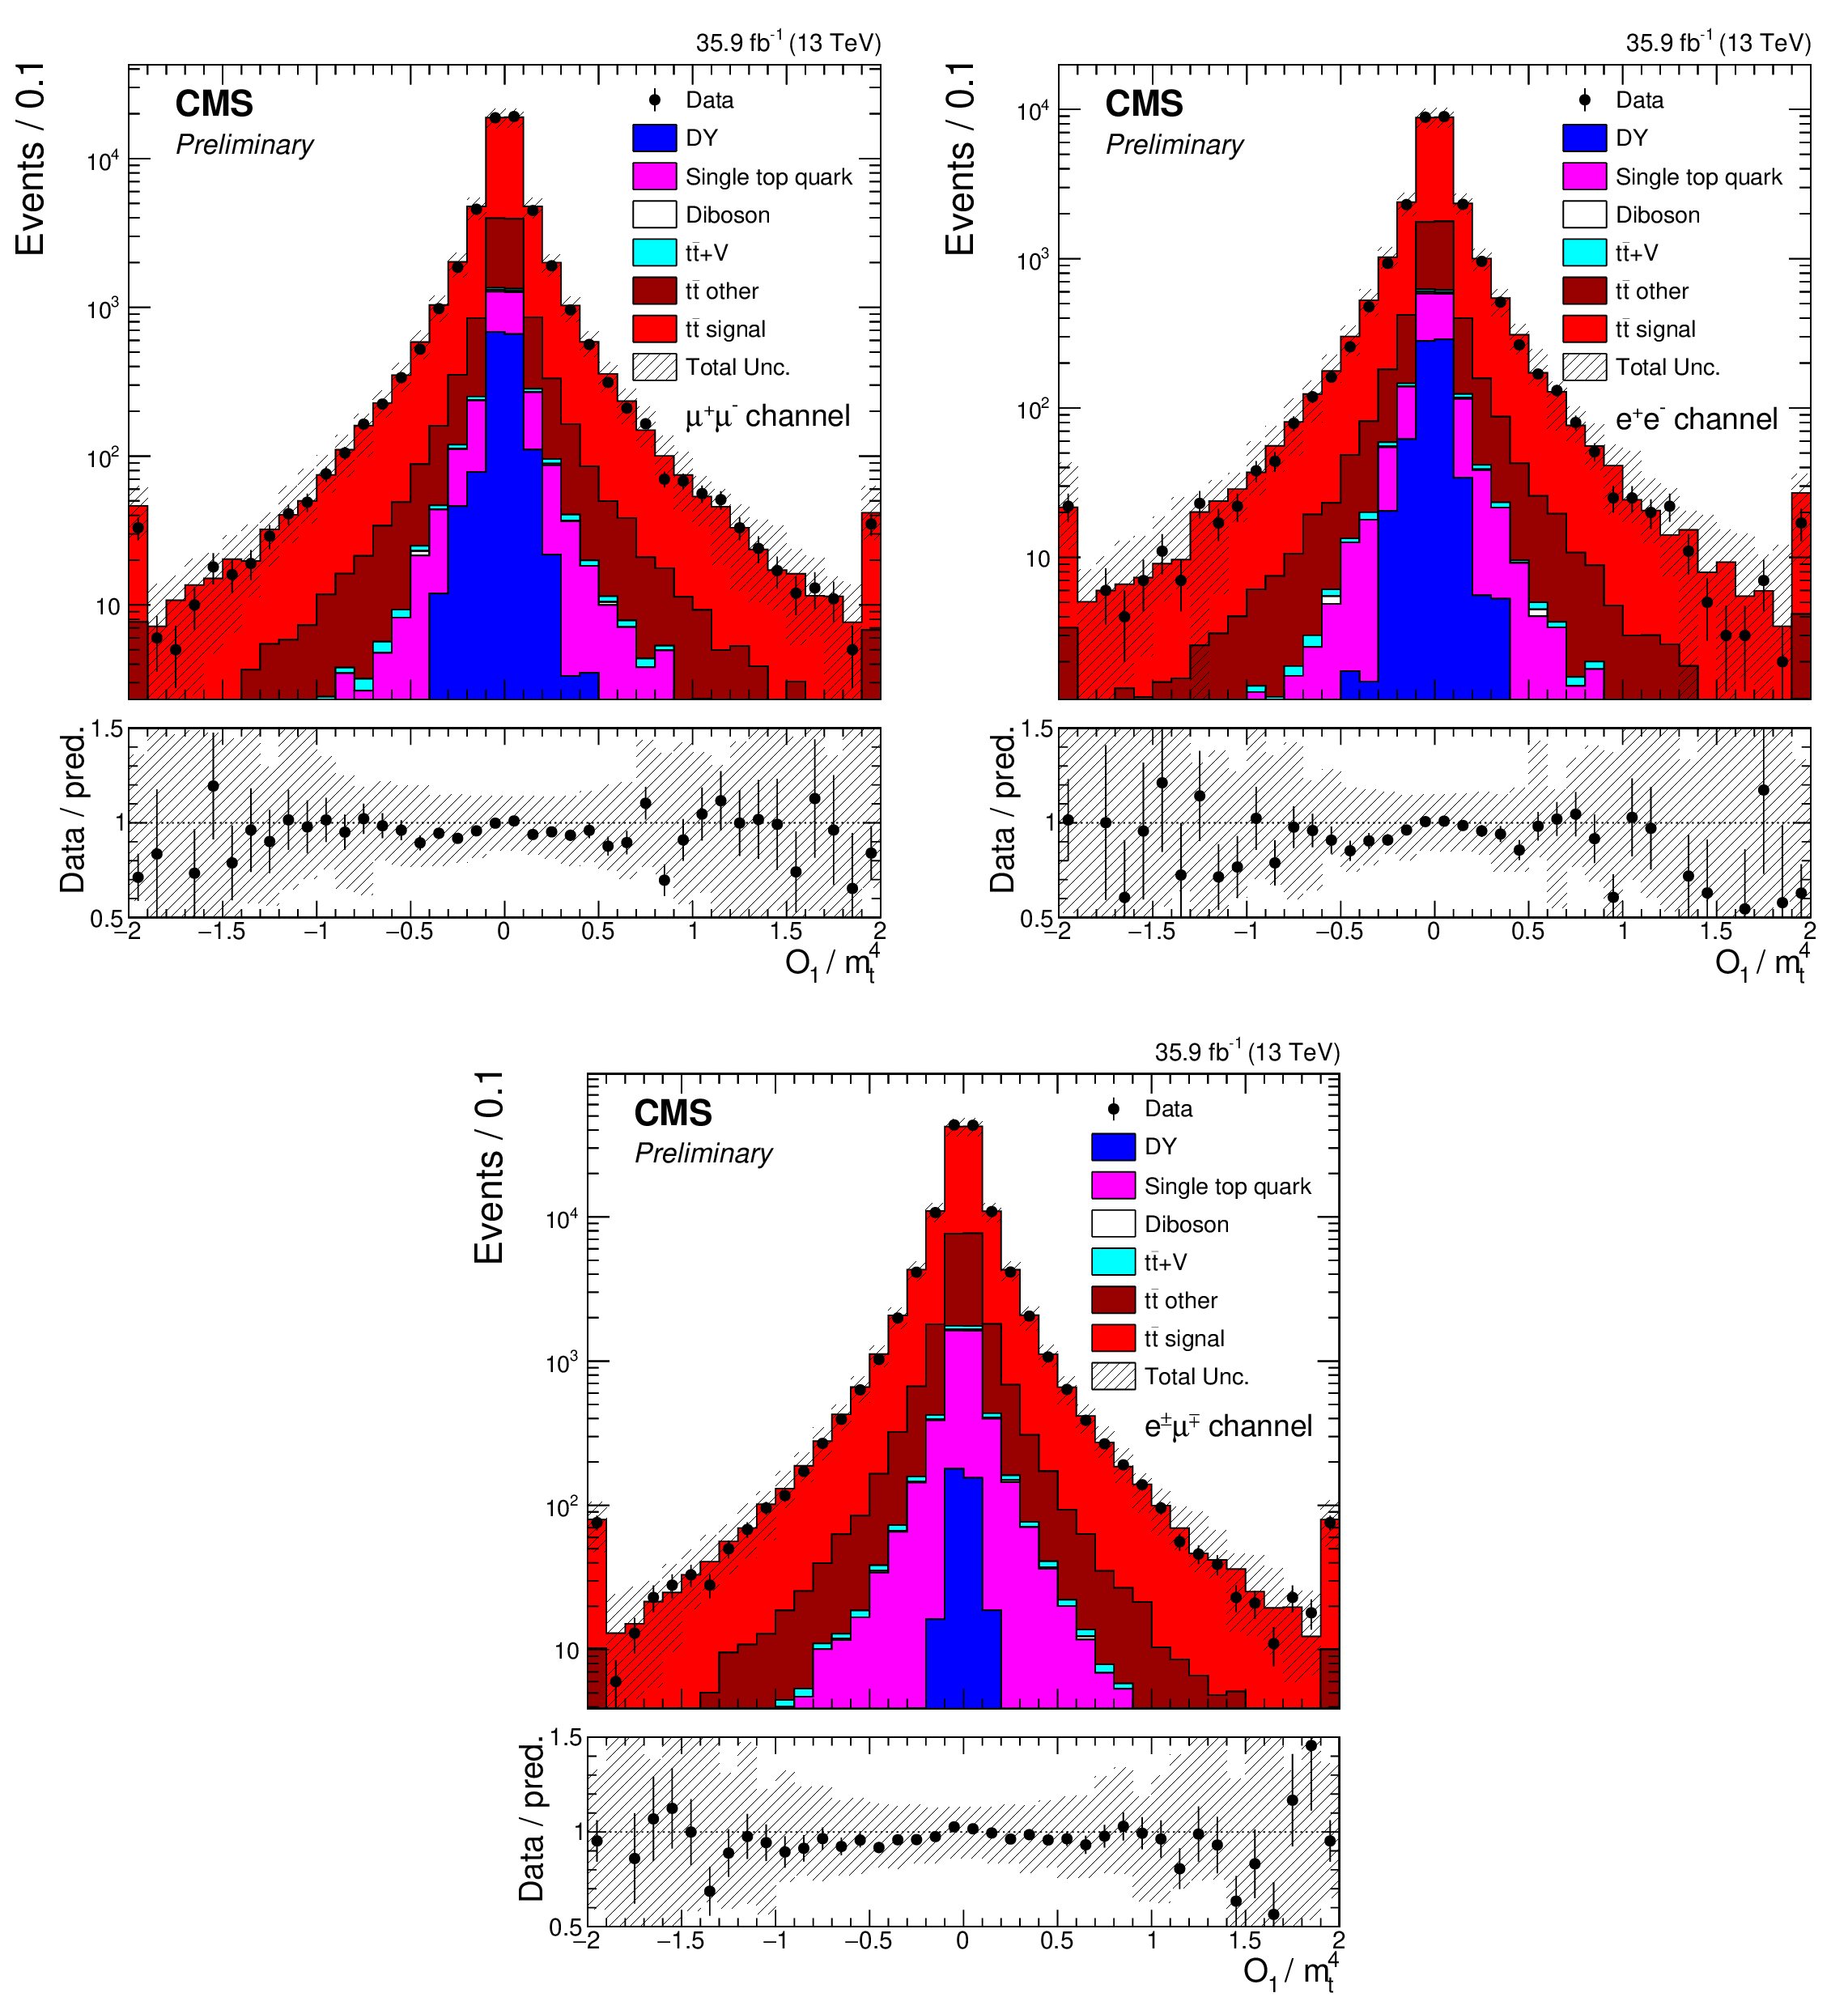
Figure 3:
The comparisons of predictions and observed data for $\mathcal {O}_{1}$ in the $\mu^{+} \mu^{-} $ (upper left), $\mathrm{e^{+}} \mathrm{e^{-}} $ (upper right), and $\mathrm{e^{\pm}} {\mu ^\mp} $ (lower) channel. The vertical bars on the markers of the observed data represent the statistical uncertainties. The shaded band in the predicted distributions includes statistical and systematic uncertainties. The ratios of the data to the predictions from simulation are presented in the lower panel of each figure. |
png pdf |
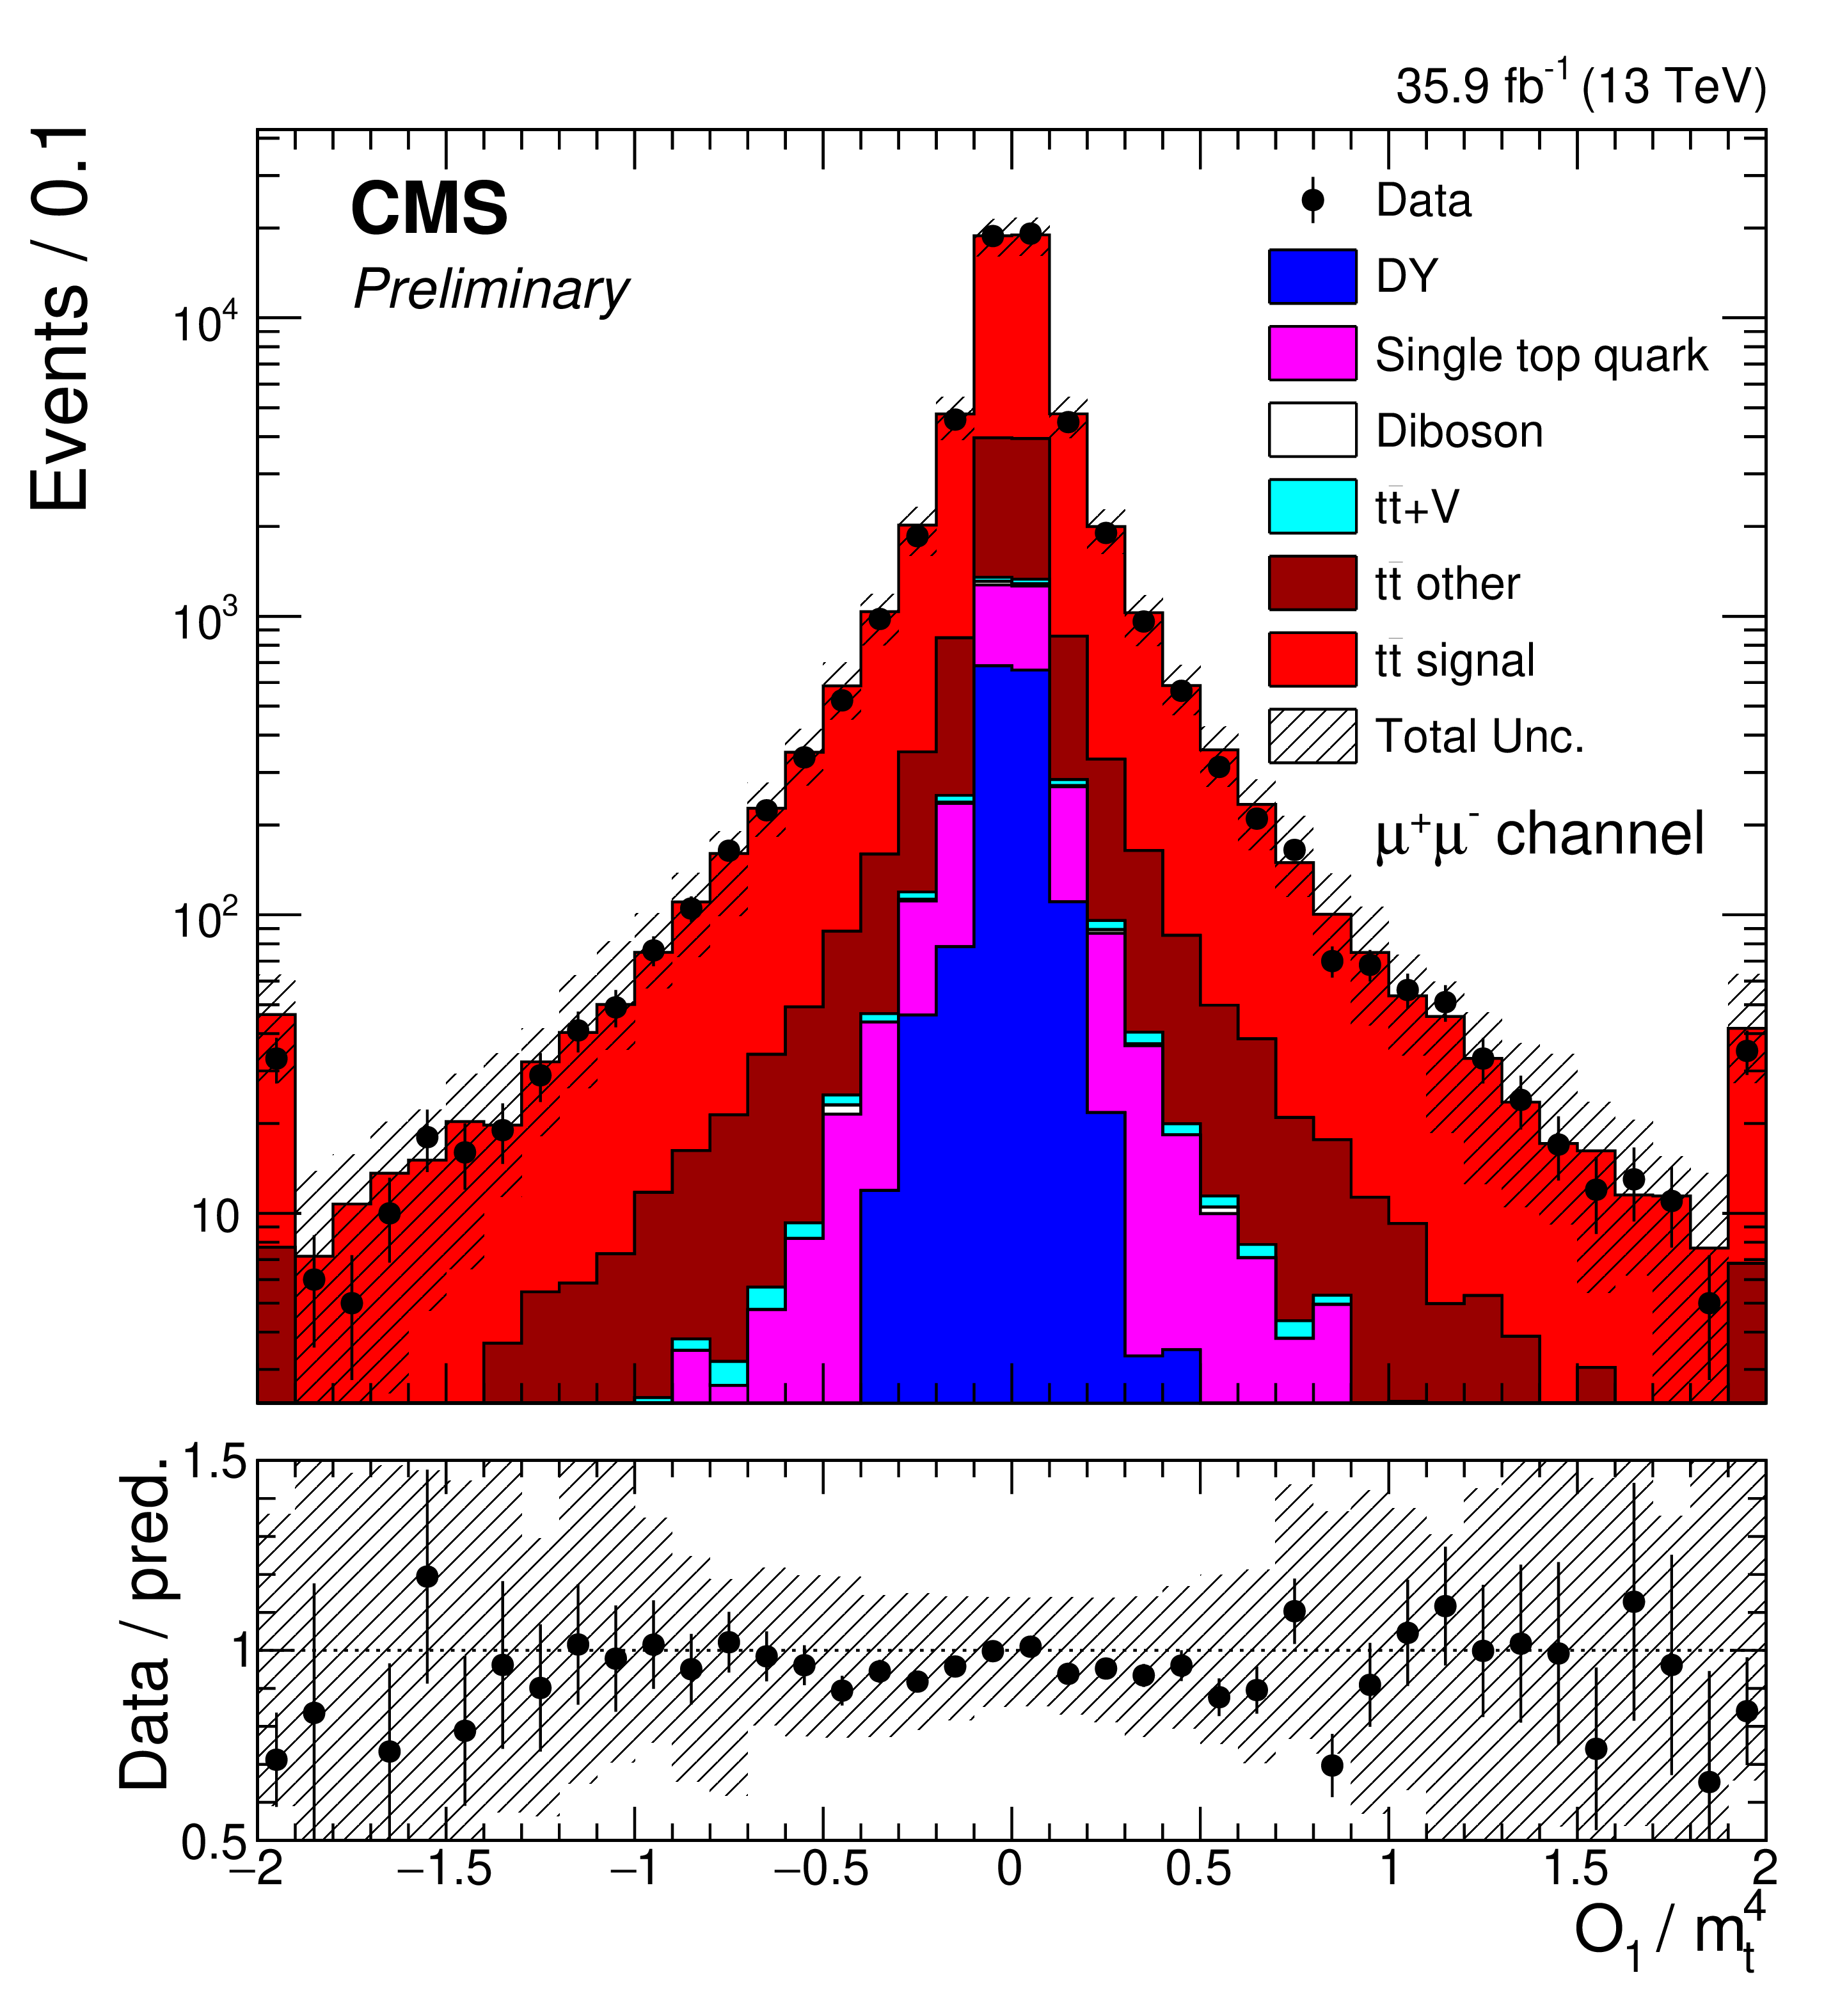
Figure 3-a:
The comparisons of predictions and observed data for $\mathcal {O}_{1}$ in the $\mu^{+} \mu^{-} $ channel. The vertical bars on the markers of the observed data represent the statistical uncertainties. The shaded band in the predicted distributions includes statistical and systematic uncertainties. The ratios of the data to the predictions from simulation are presented in the lower panel. |
png pdf |
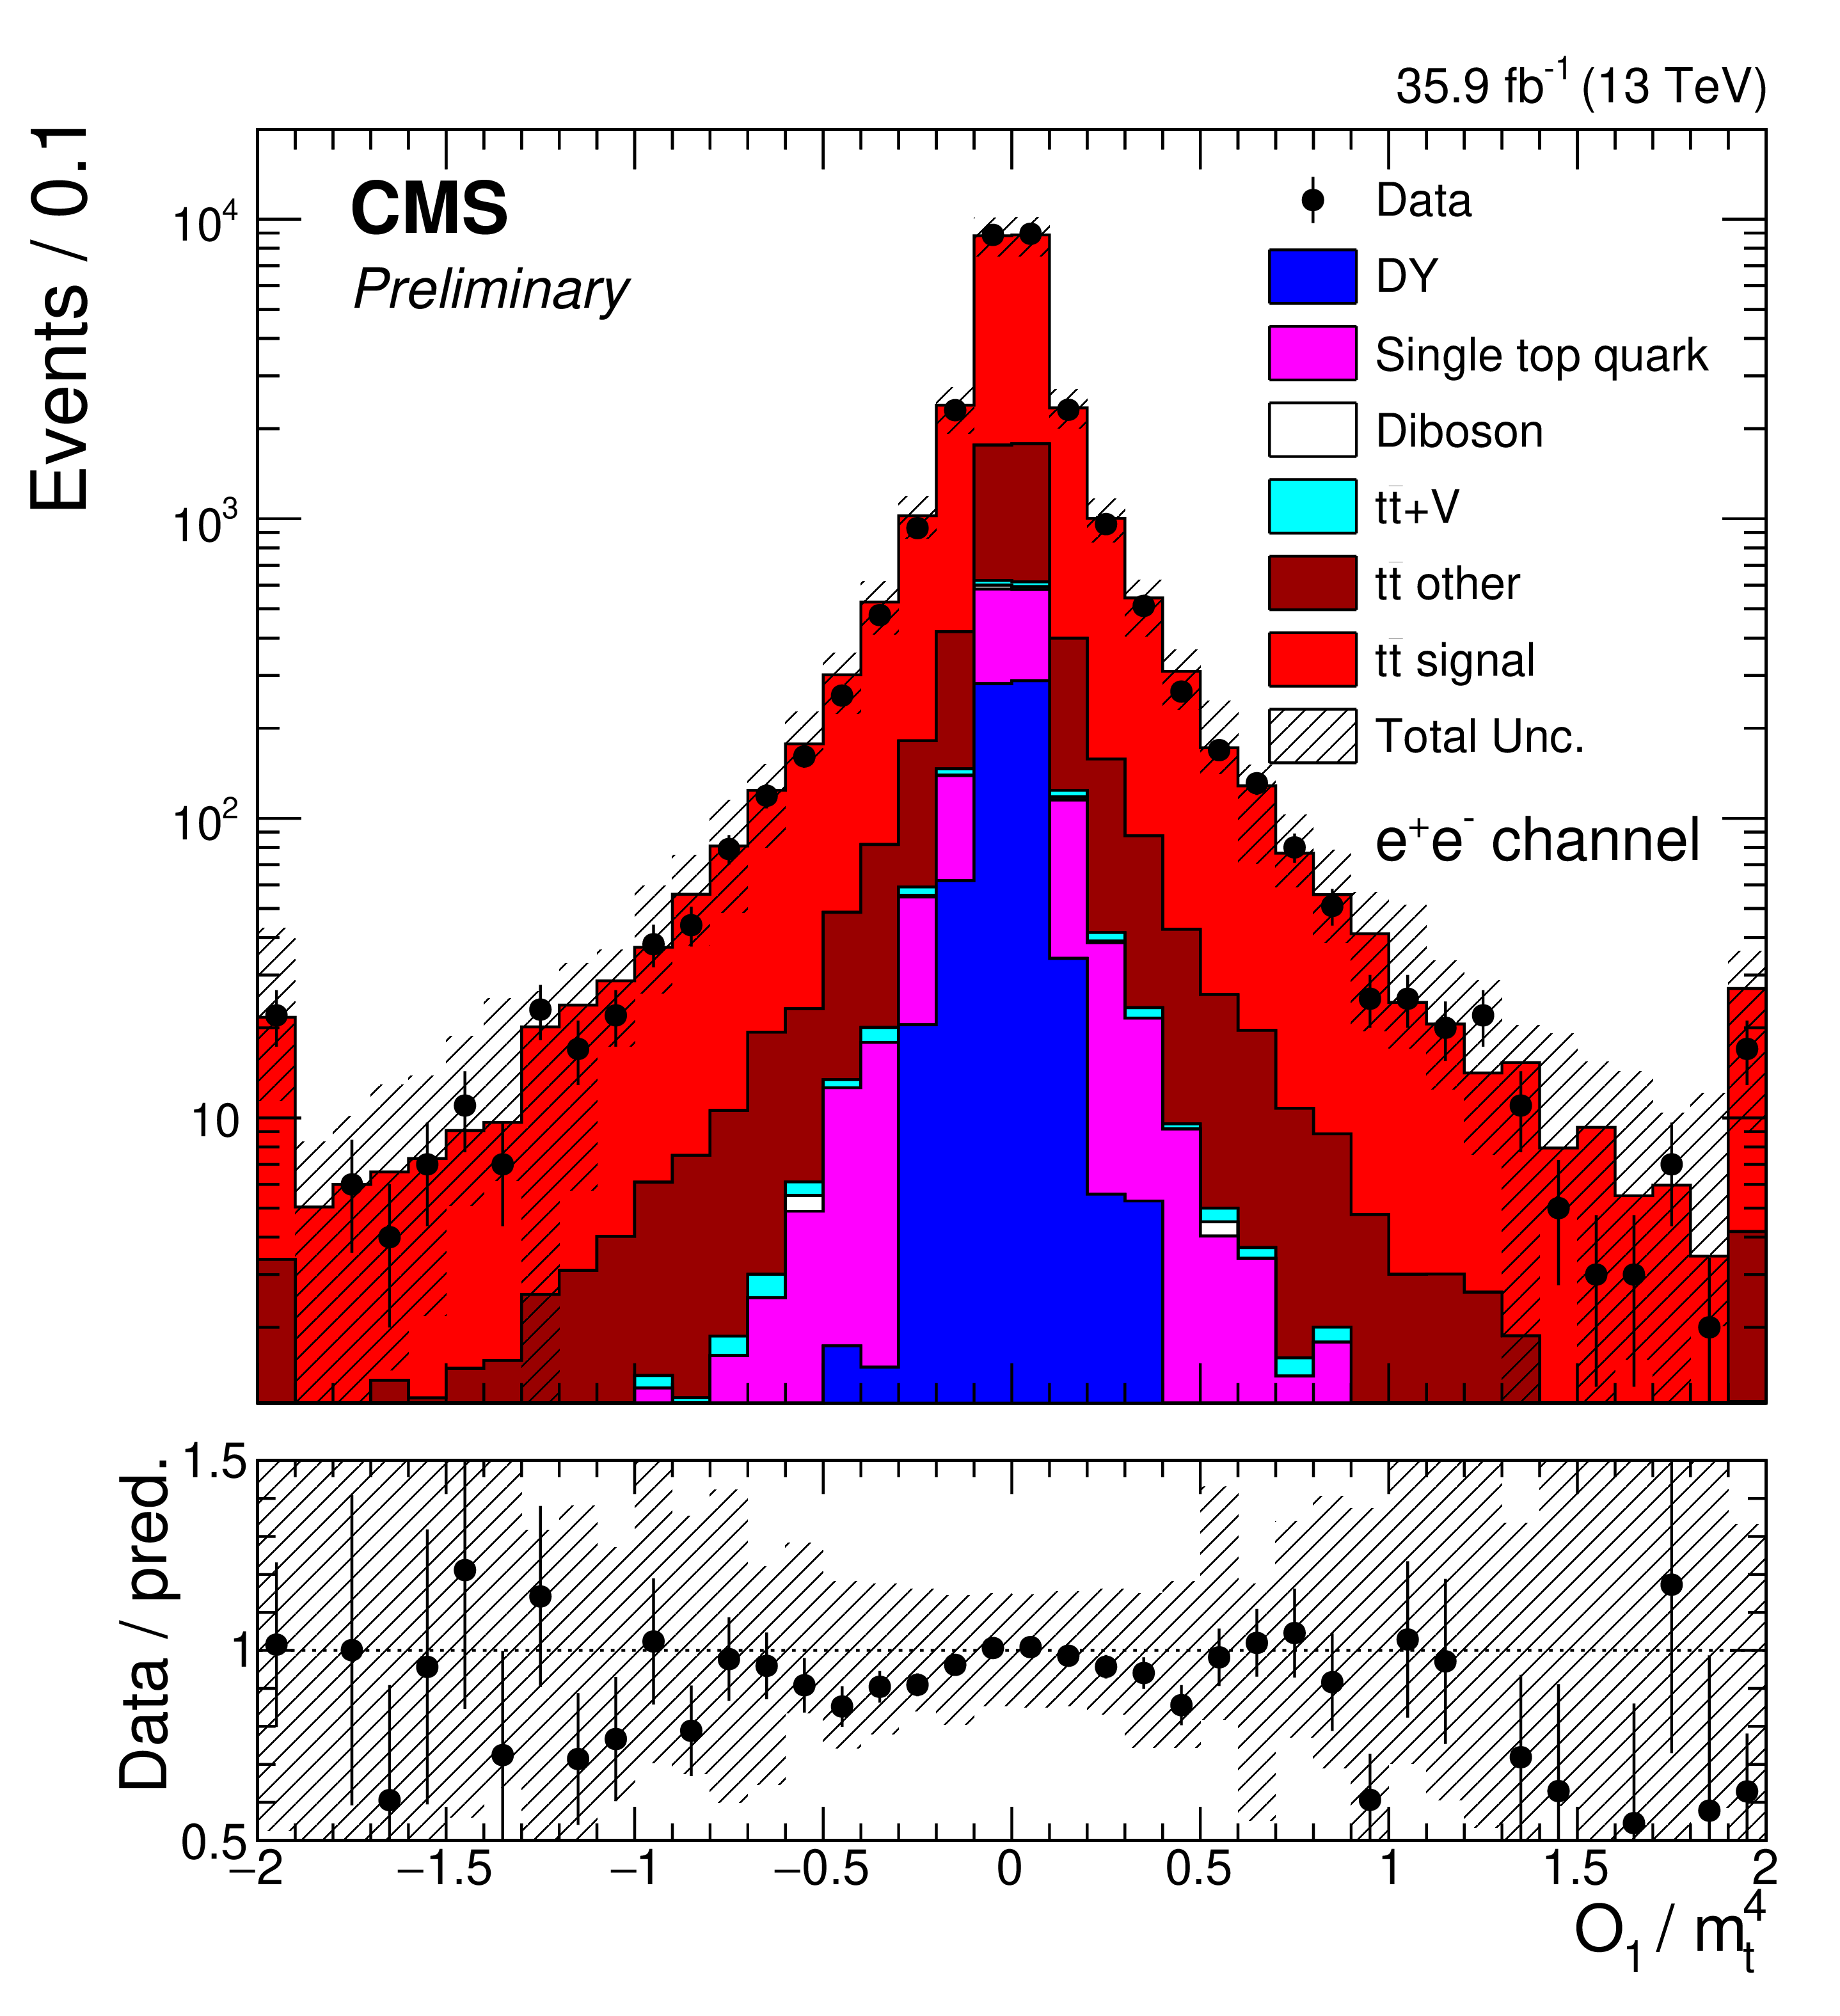
Figure 3-b:
The comparisons of predictions and observed data for $\mathcal {O}_{1}$ in the $\mathrm{e^{+}} \mathrm{e^{-}} $ channel. The vertical bars on the markers of the observed data represent the statistical uncertainties. The shaded band in the predicted distributions includes statistical and systematic uncertainties. The ratios of the data to the predictions from simulation are presented in the lower panel. |
png pdf |
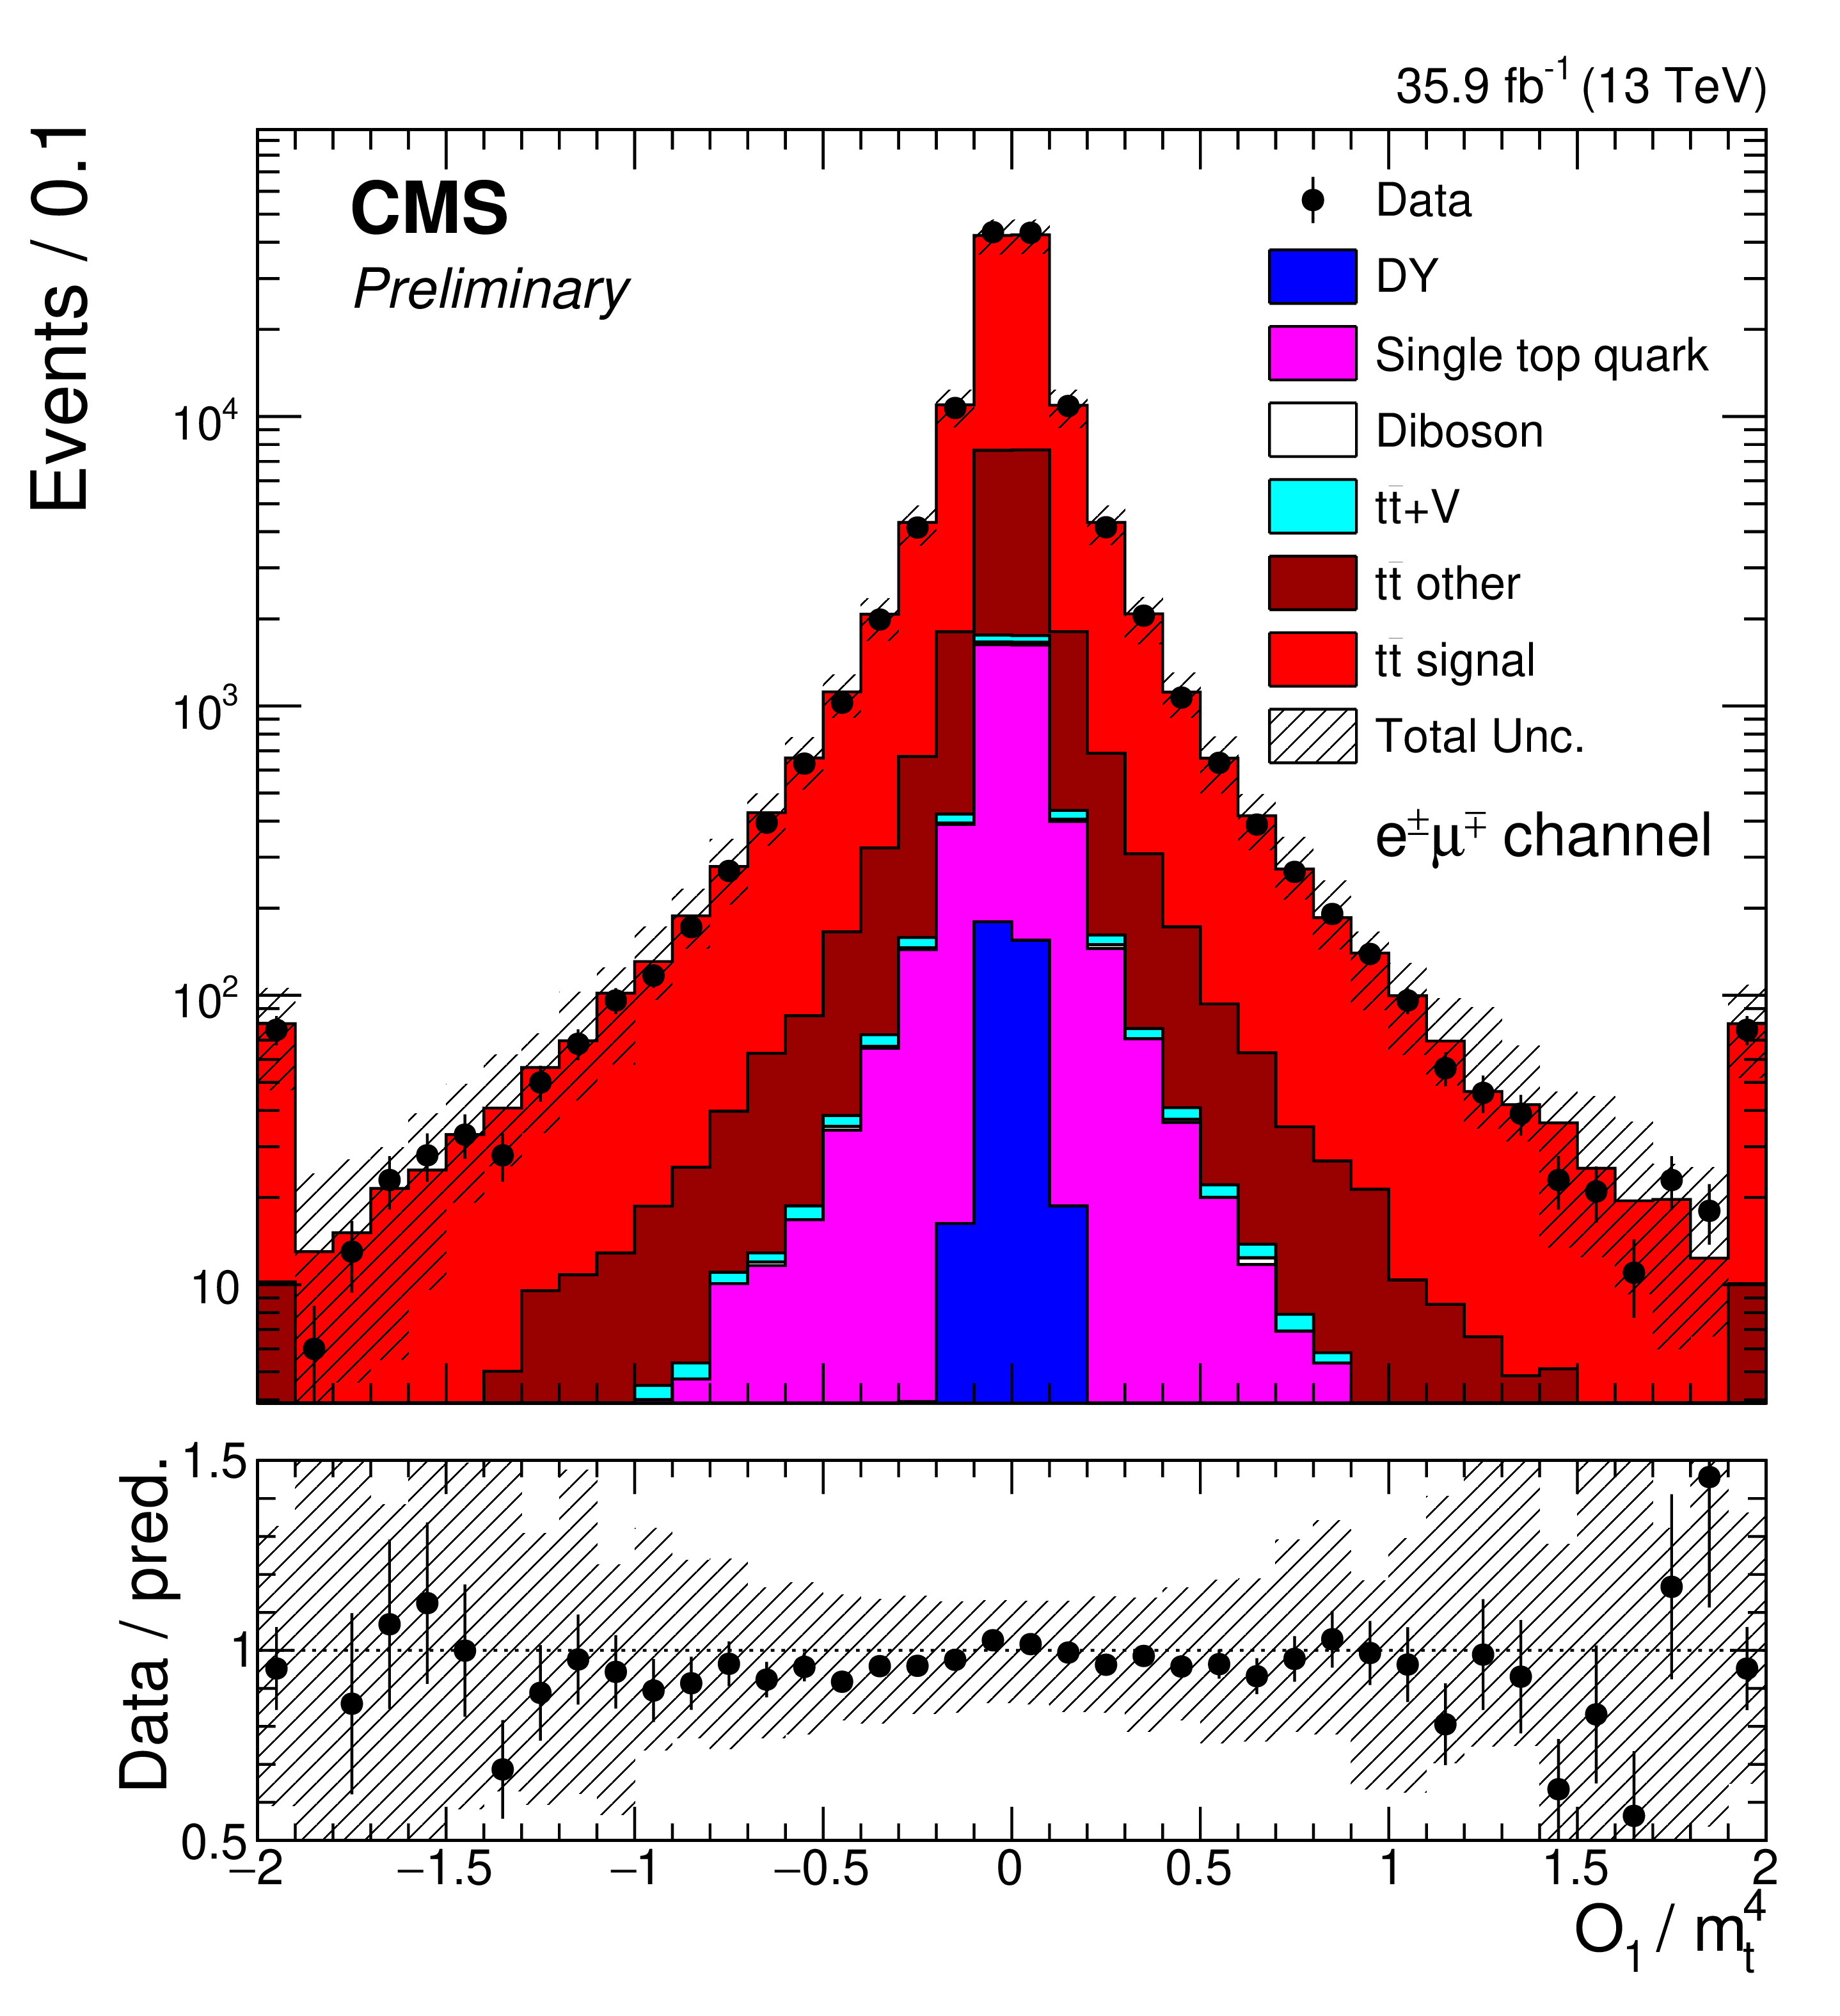
Figure 3-c:
The comparisons of predictions and observed data for $\mathcal {O}_{1}$ in the $\mathrm{e^{\pm}} {\mu ^\mp} $ channel. The vertical bars on the markers of the observed data represent the statistical uncertainties. The shaded band in the predicted distributions includes statistical and systematic uncertainties. The ratios of the data to the predictions from simulation are presented in the lower panel. |
png pdf |
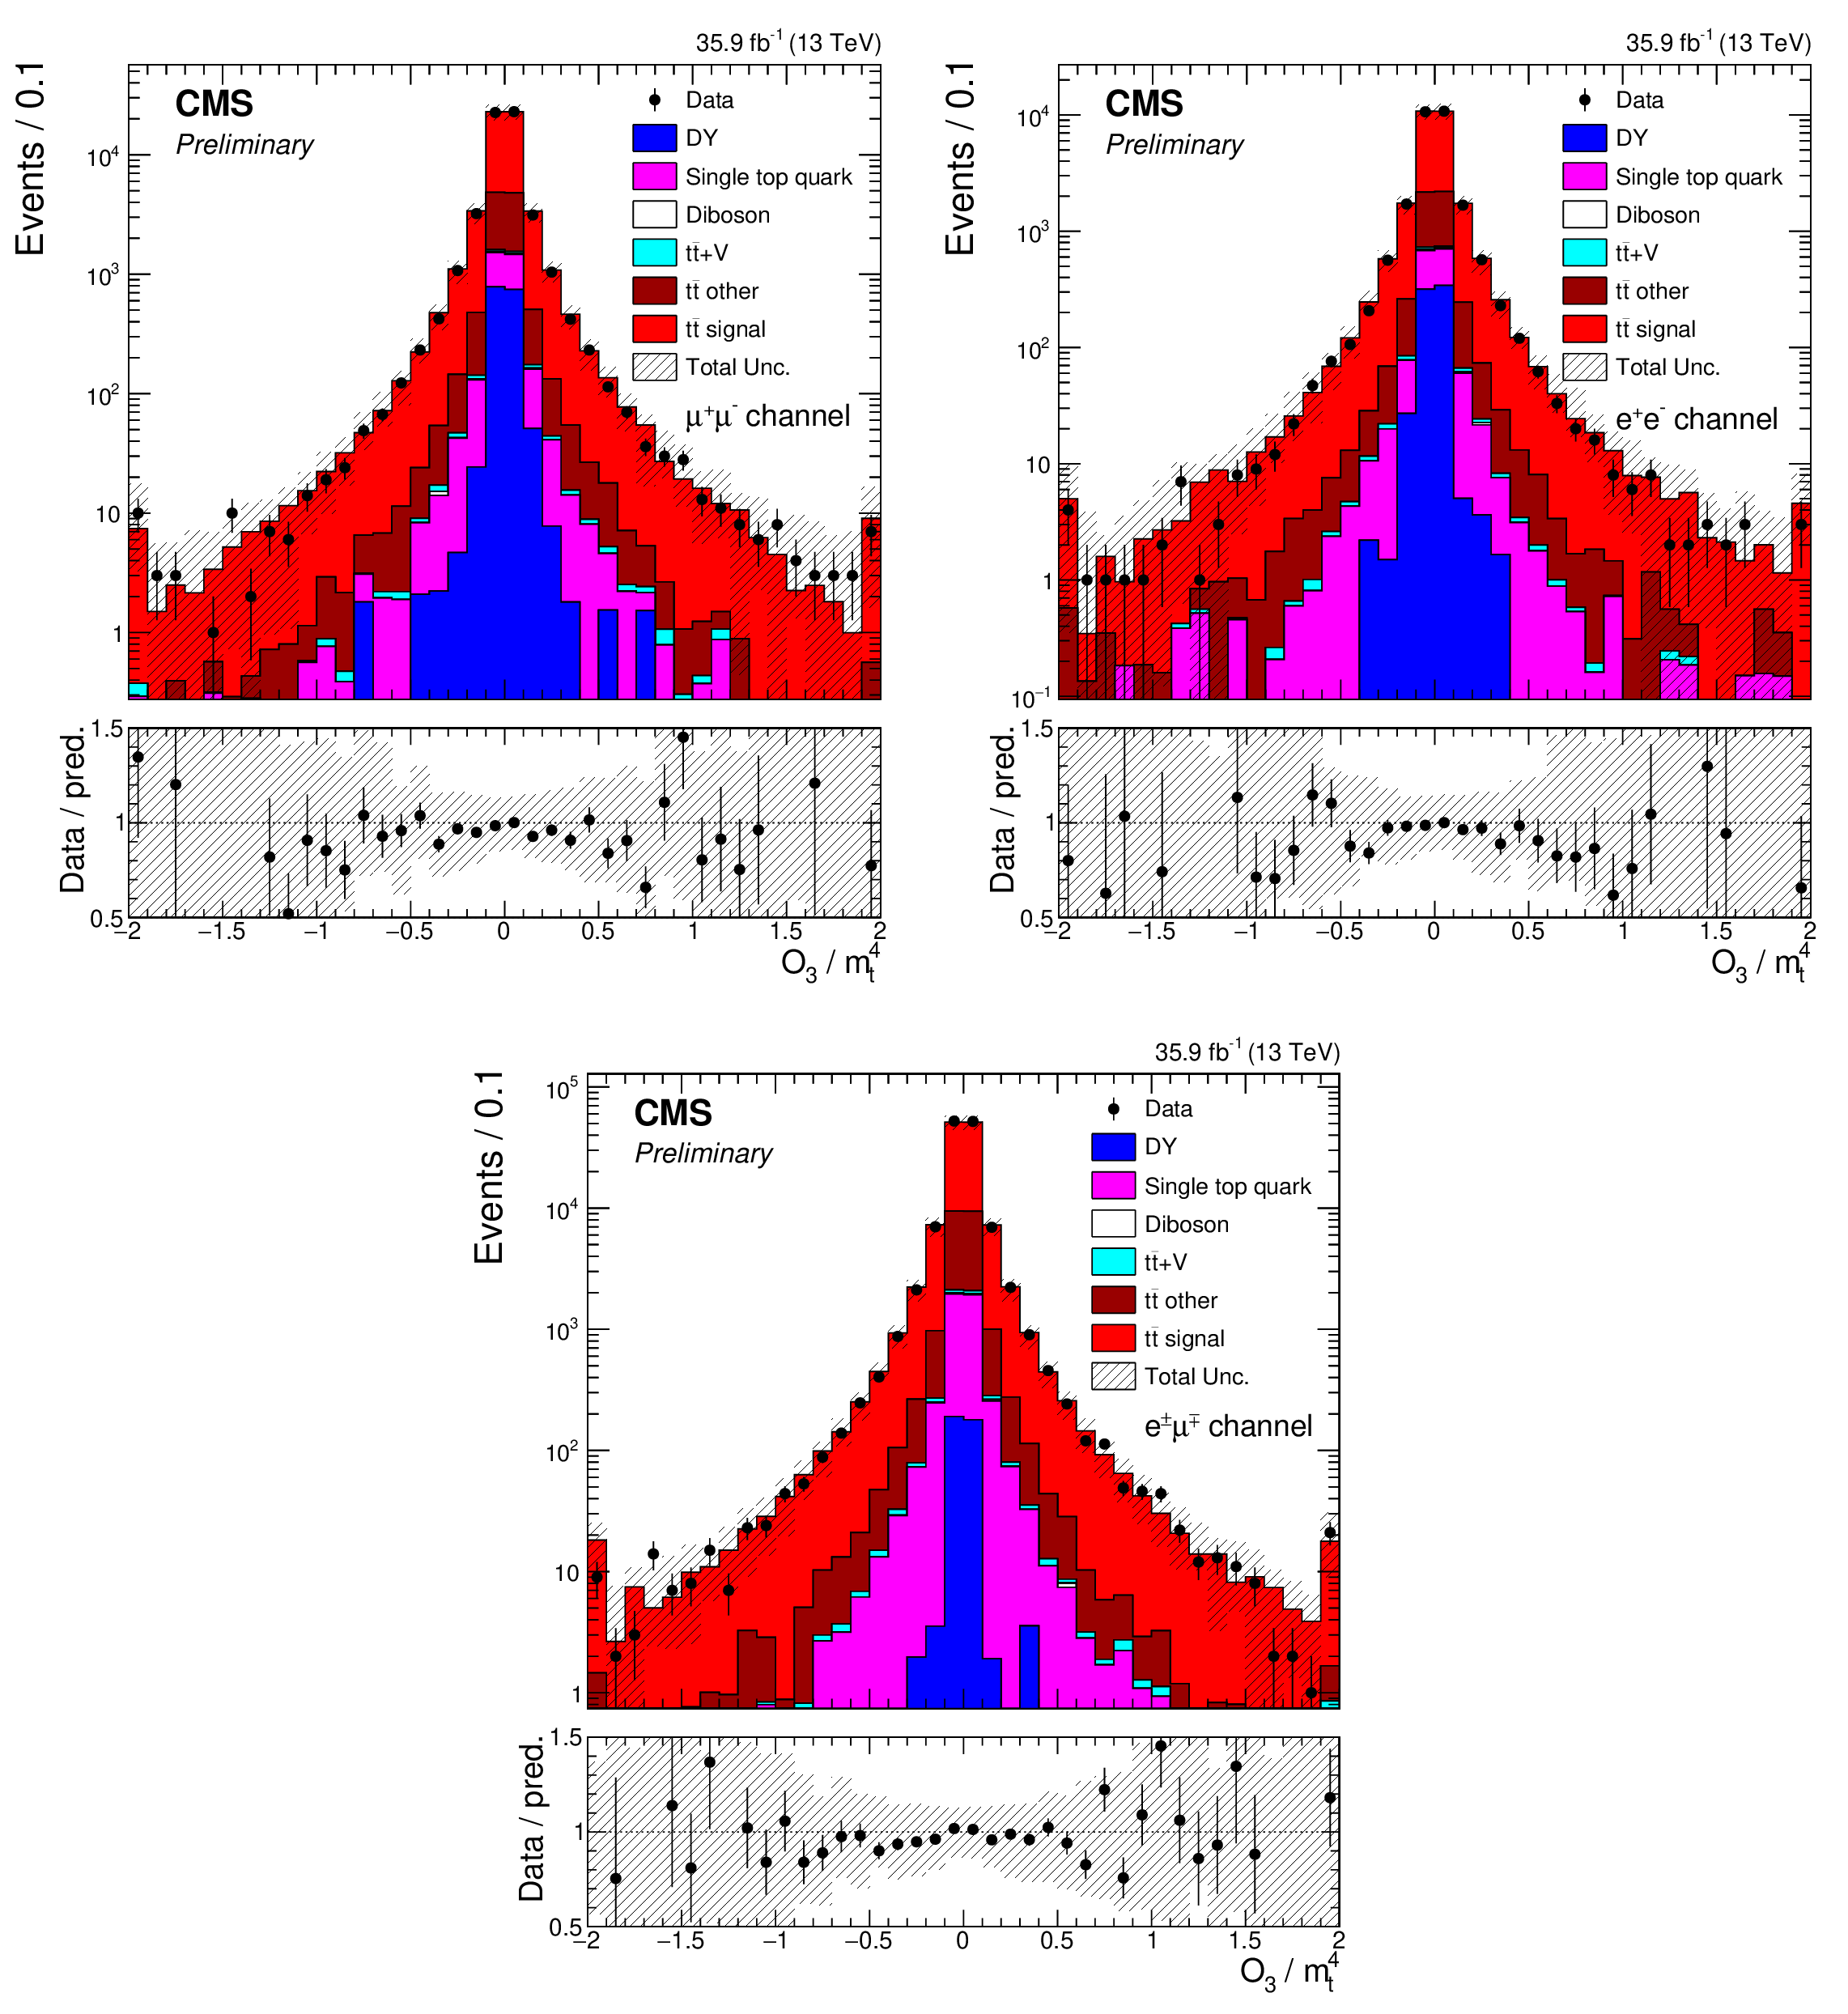
Figure 4:
The comparisons of predictions and observed data for $\mathcal {O}_{3}$ in the $\mu^{+} \mu^{-} $ (upper left), $\mathrm{e^{+}} \mathrm{e^{-}} $ (upper right), and $\mathrm{e^{\pm}} {\mu ^\mp} $ (lower) channel. The vertical bars on the markers of the observed data represent the statistical uncertainties. The shaded band in the predicted distributions includes statistical and systematic uncertainties. |
png pdf |
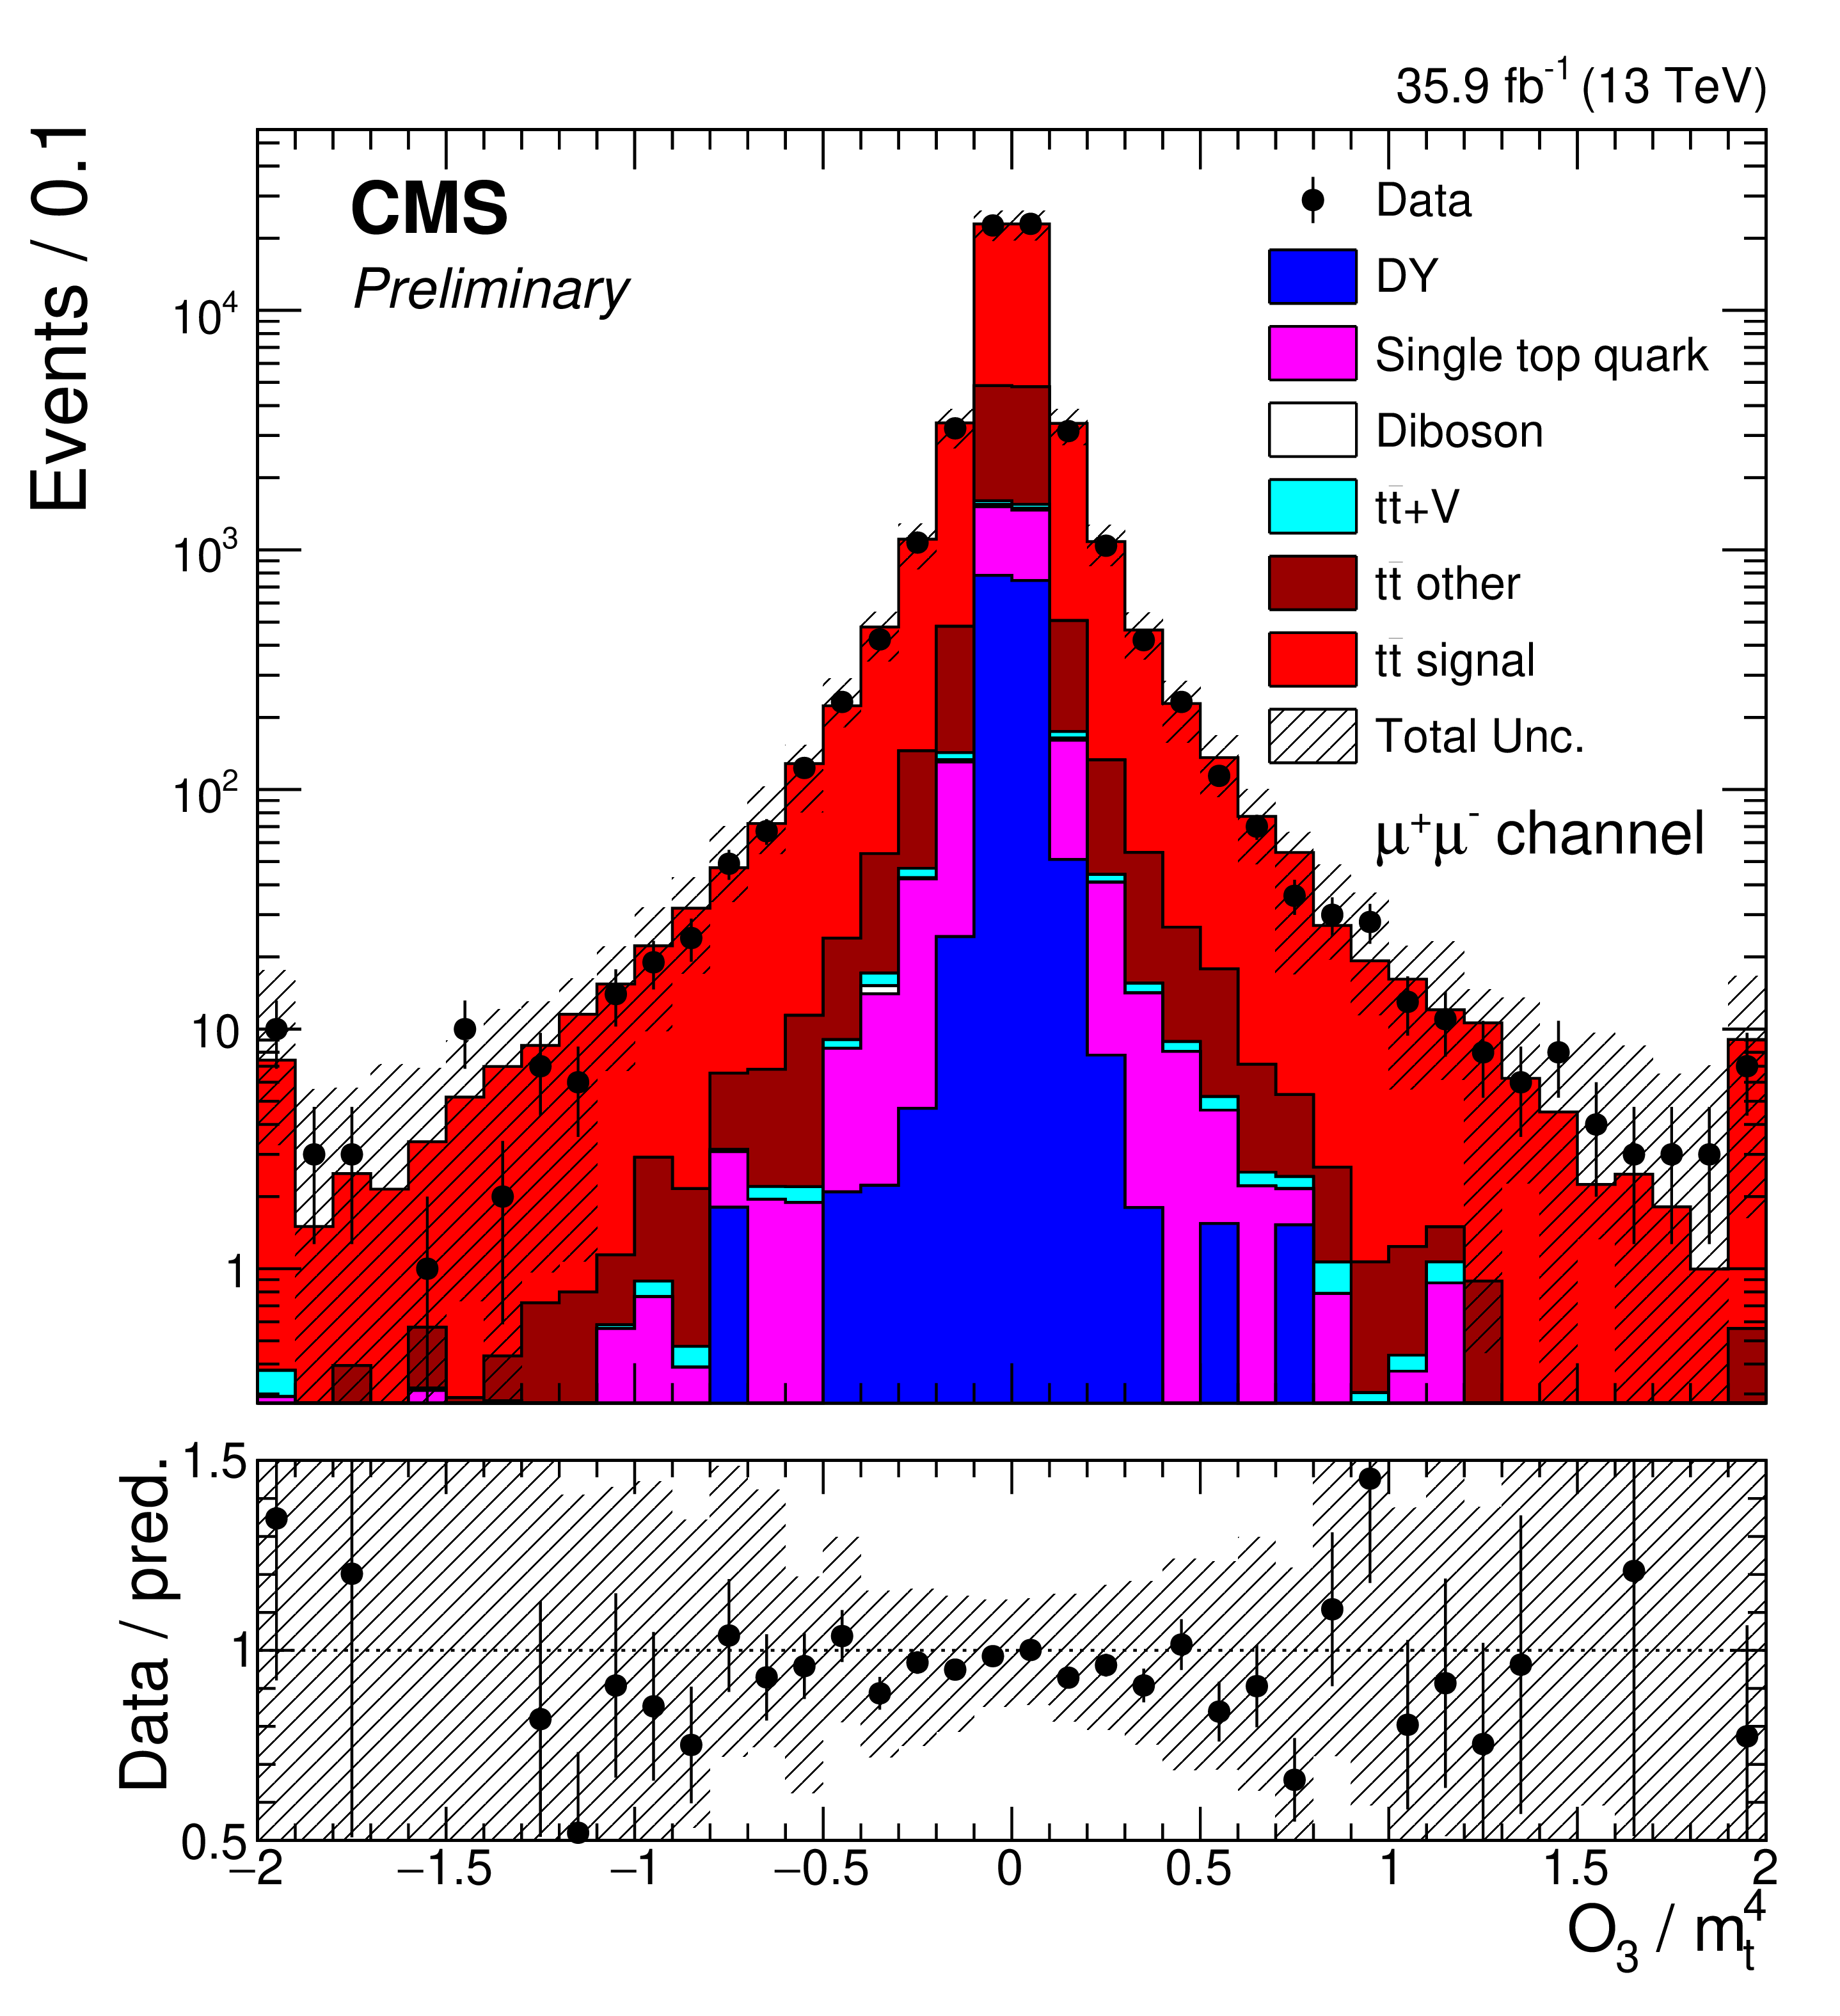
Figure 4-a:
The comparisons of predictions and observed data for $\mathcal {O}_{3}$ in the $\mu^{+} \mu^{-} $ channel. The vertical bars on the markers of the observed data represent the statistical uncertainties. The shaded band in the predicted distributions includes statistical and systematic uncertainties. |
png pdf |
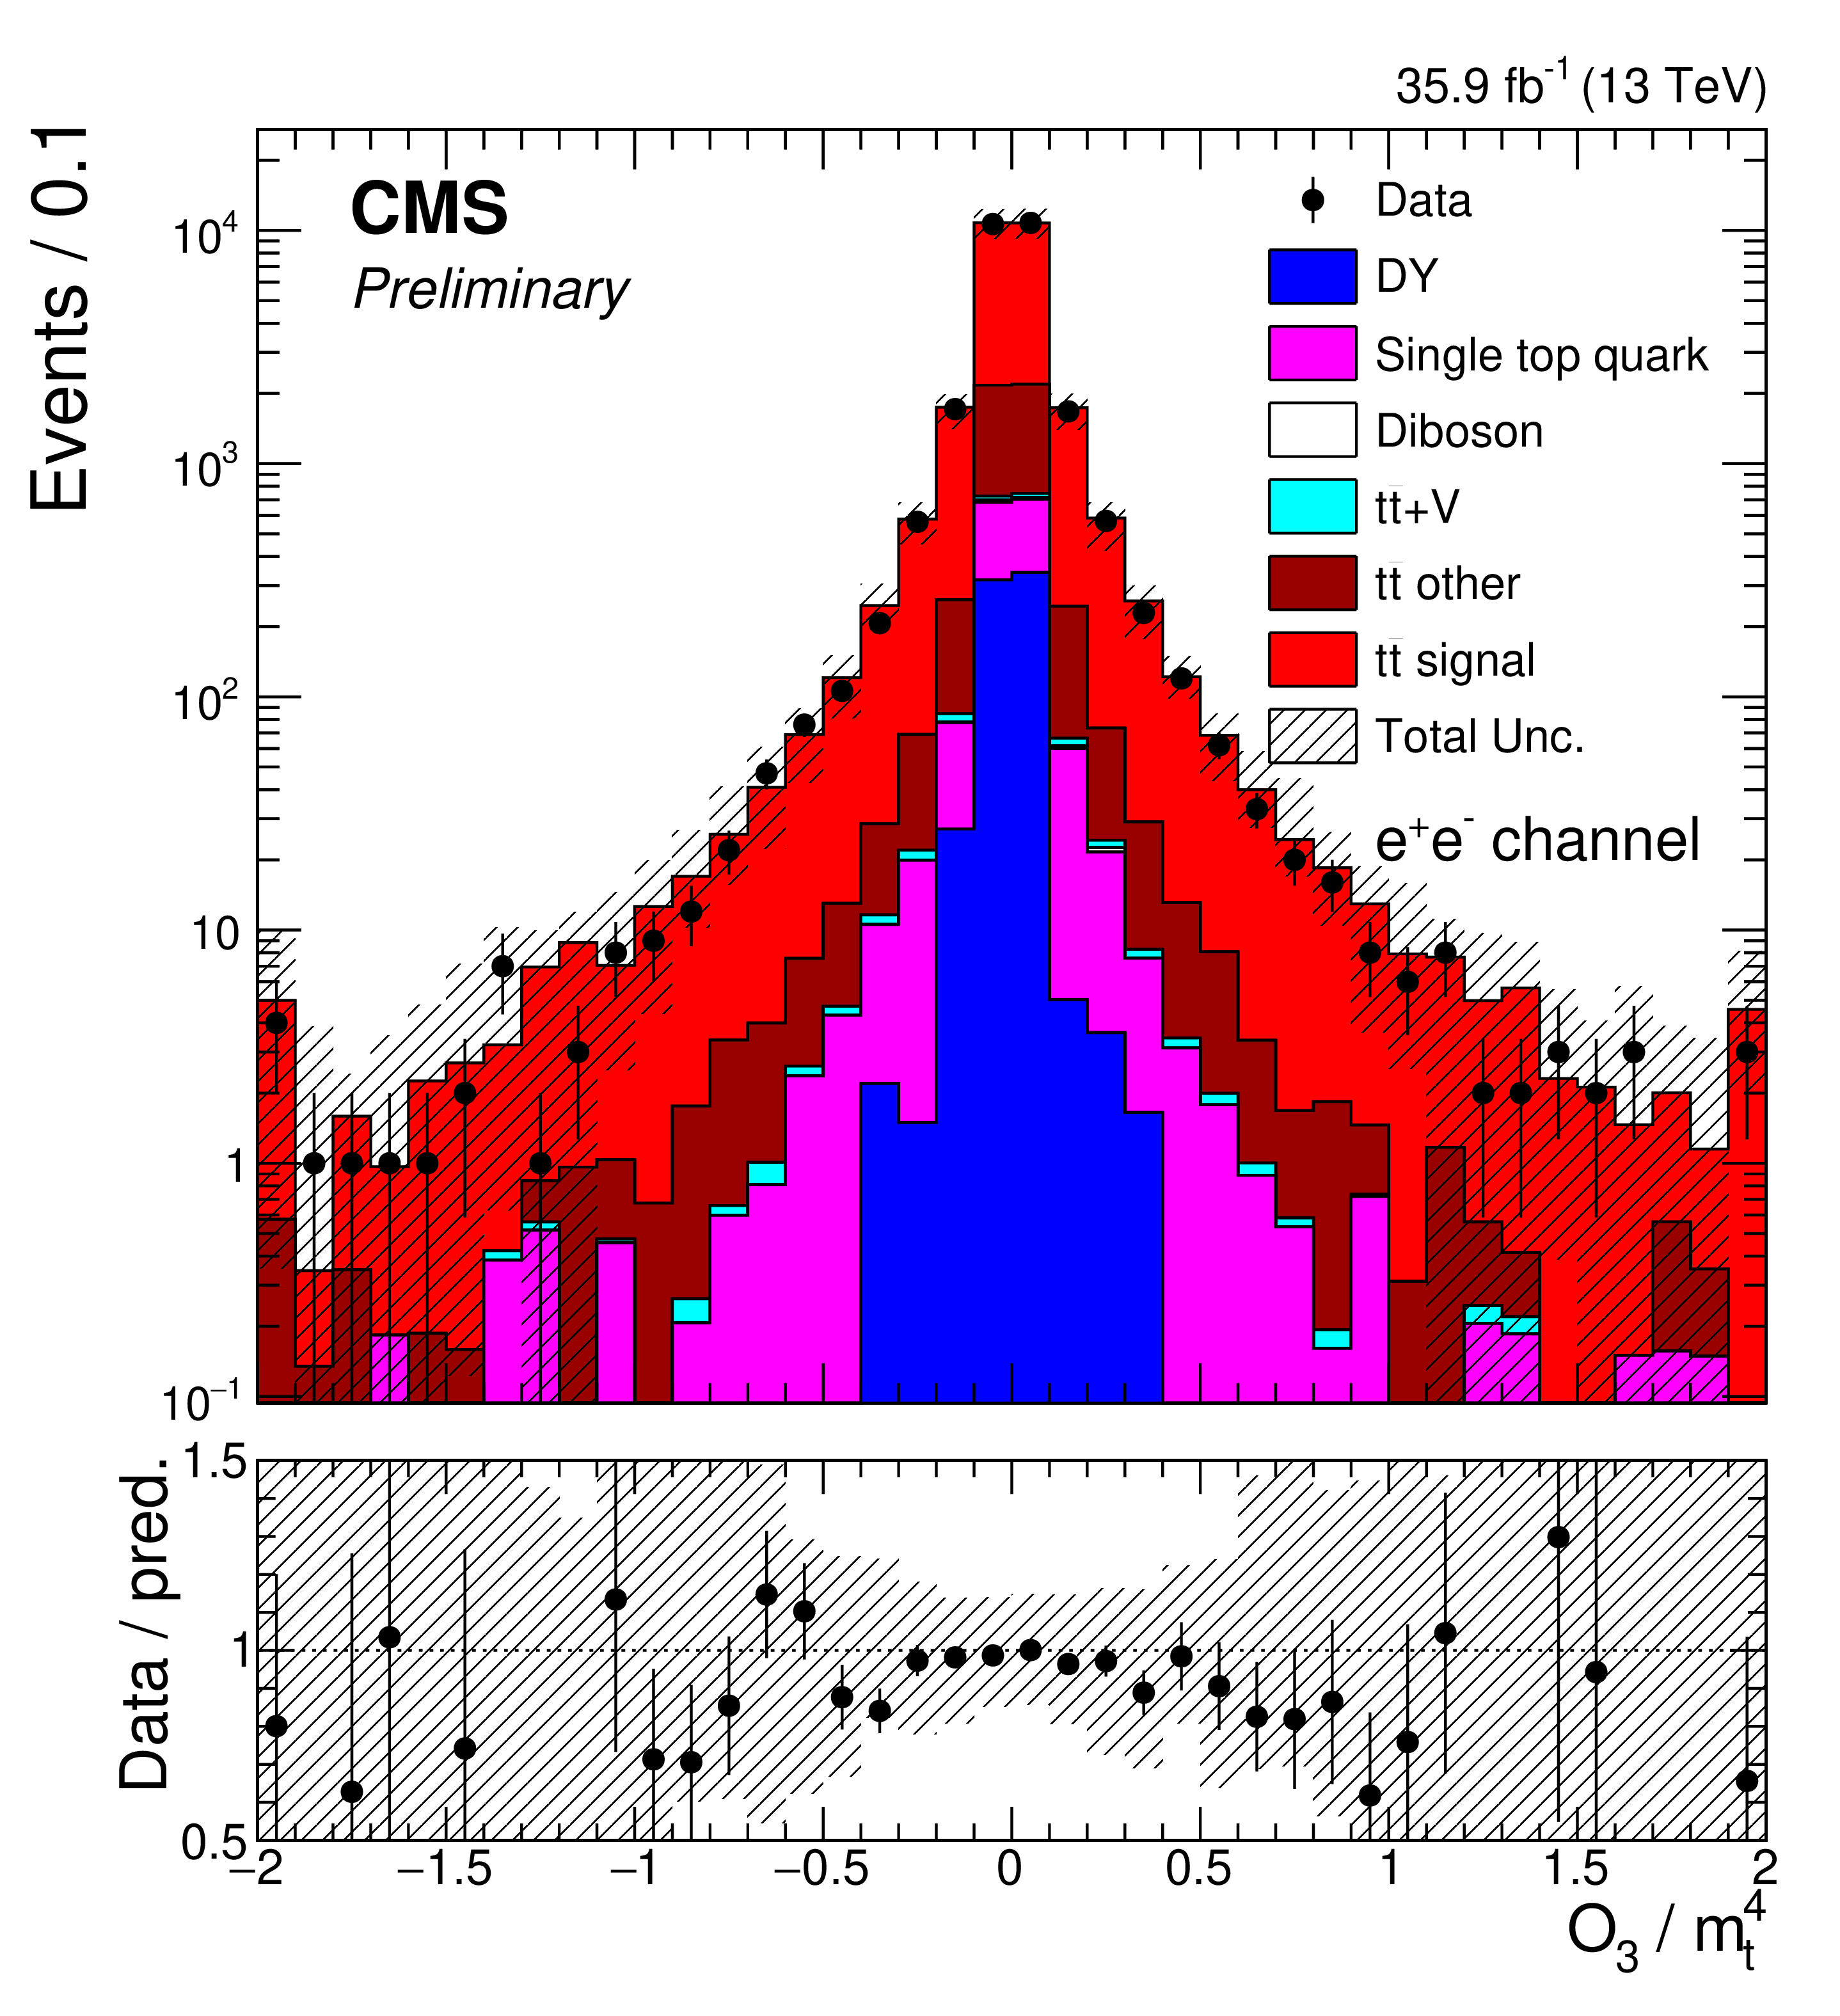
Figure 4-b:
The comparisons of predictions and observed data for $\mathcal {O}_{3}$ in the $\mathrm{e^{+}} \mathrm{e^{-}} $ channel. The vertical bars on the markers of the observed data represent the statistical uncertainties. The shaded band in the predicted distributions includes statistical and systematic uncertainties. |
png pdf |
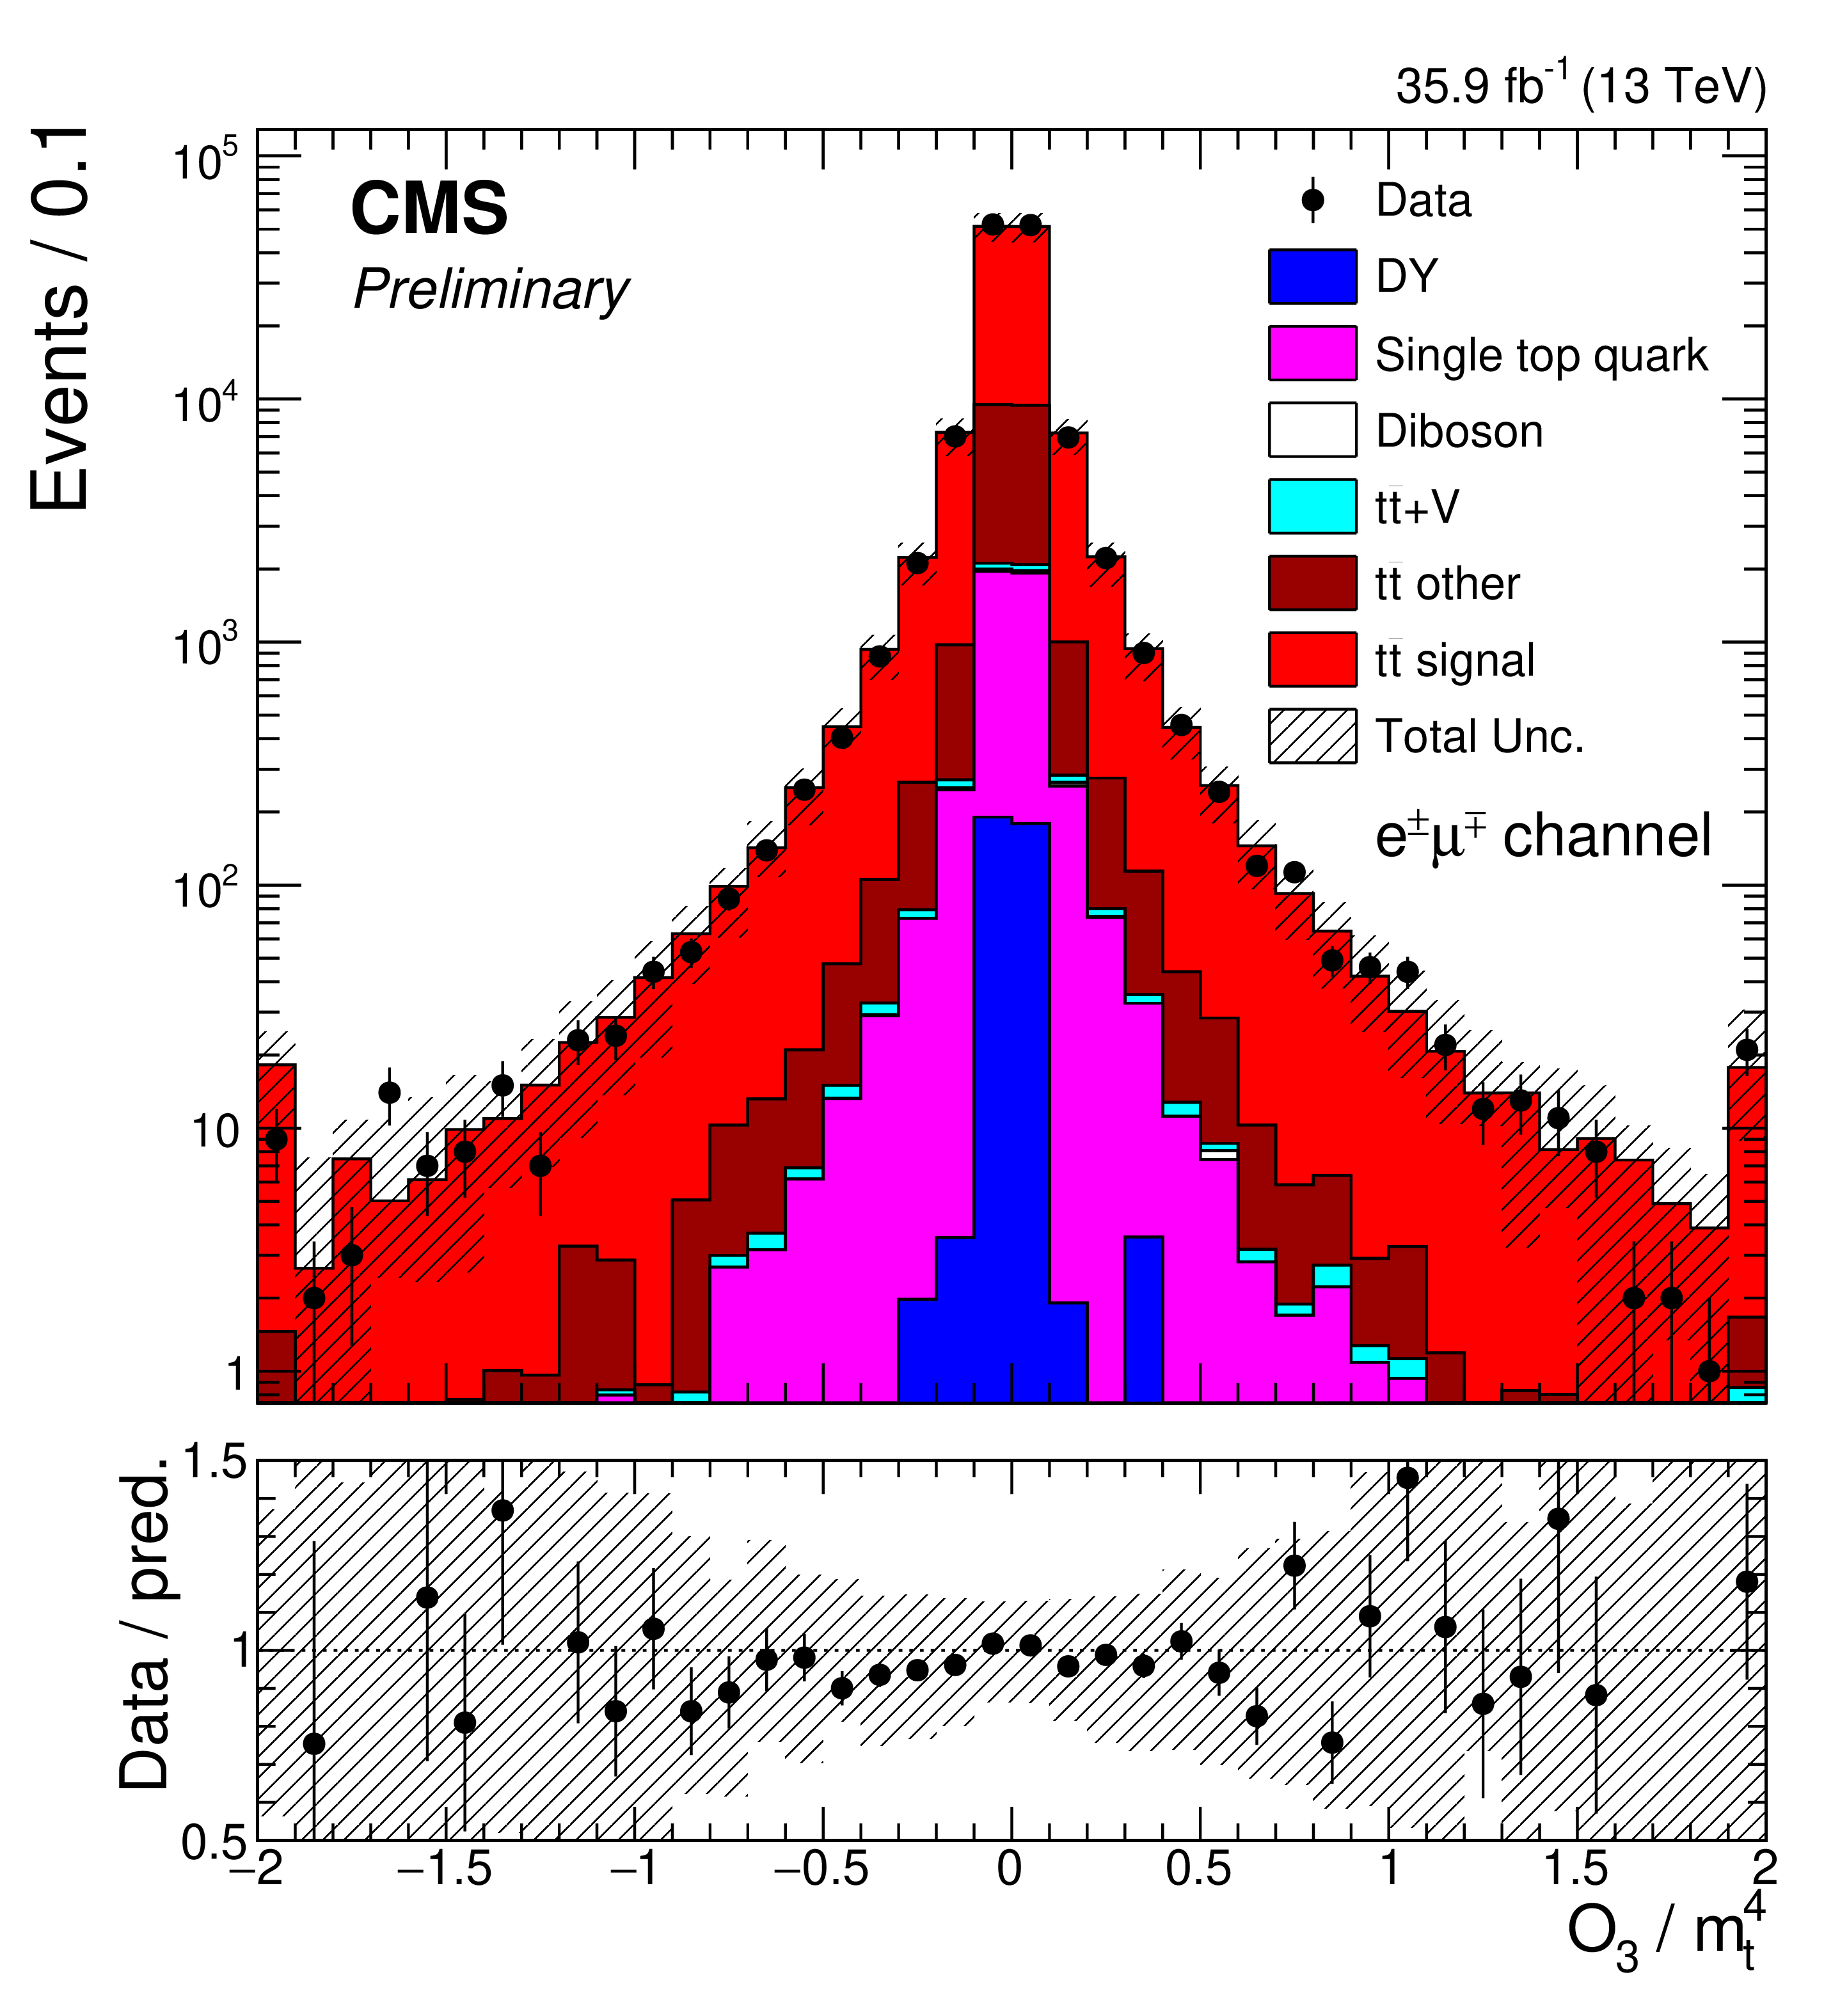
Figure 4-c:
The comparisons of predictions and observed data for $\mathcal {O}_{3}$ in the $\mathrm{e^{\pm}} {\mu ^\mp} $ channel. The vertical bars on the markers of the observed data represent the statistical uncertainties. The shaded band in the predicted distributions includes statistical and systematic uncertainties. |
png pdf |
Figure 5:
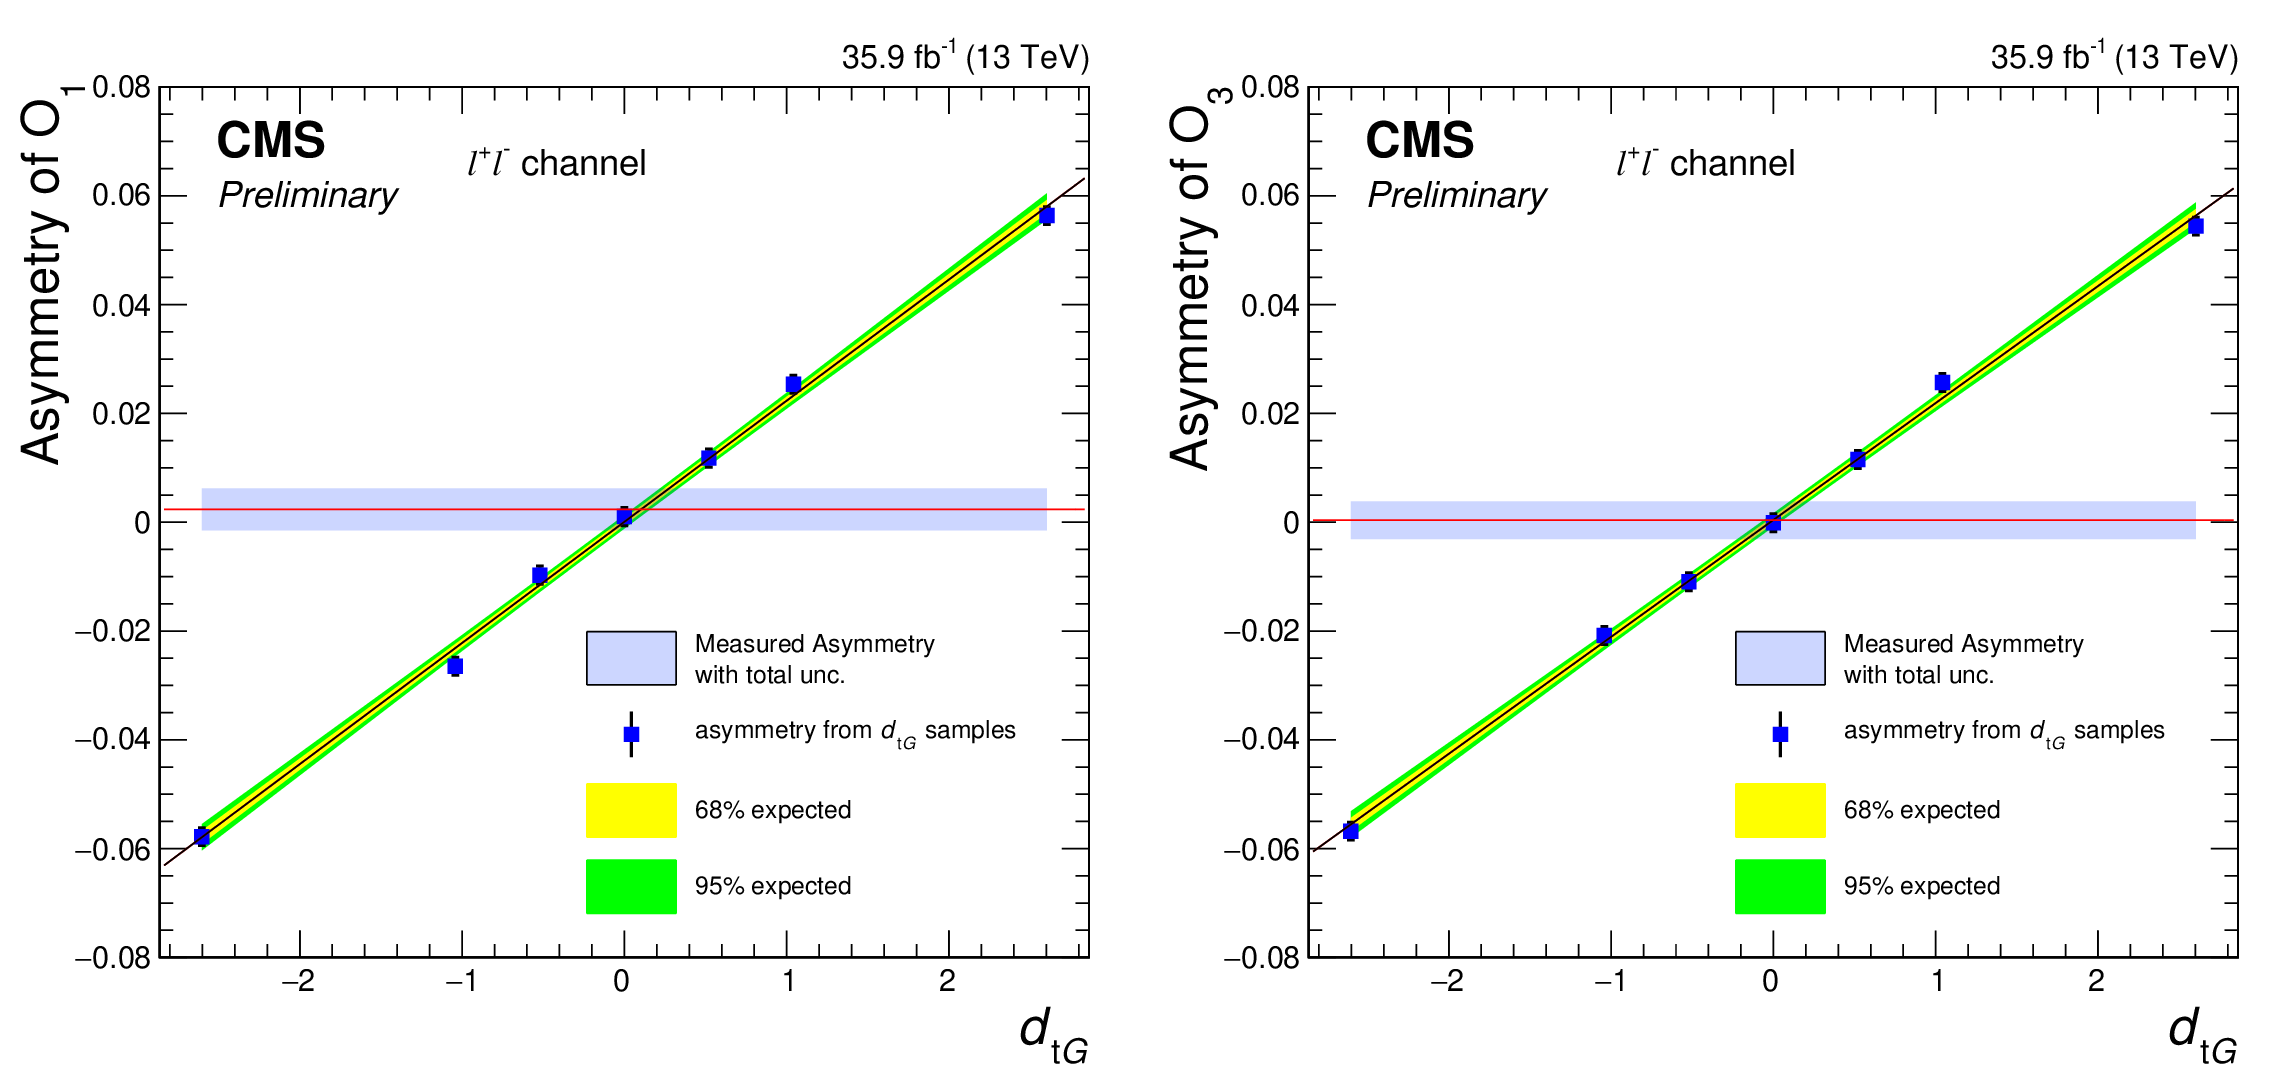
Asymmetries as a function of $d_{\mathrm{t} G}$ for $\mathcal {O}_{1}$ (left) and $\mathcal {O}_{3}$ (right). Those are the results for the combined dilepton channel. The inner and outer bands correspond to the uncertainties at the 68% and 95% confidence level, respectively, of the linear fit results. The square points are the asymmetries measured with the simulated samples corresponding to the different assumed $d_{\mathrm{t} G}$ values. The horizontal line indicates the measured asymmetry, and the shaded region around it the total statistical and systematic uncertainty. |
png pdf |
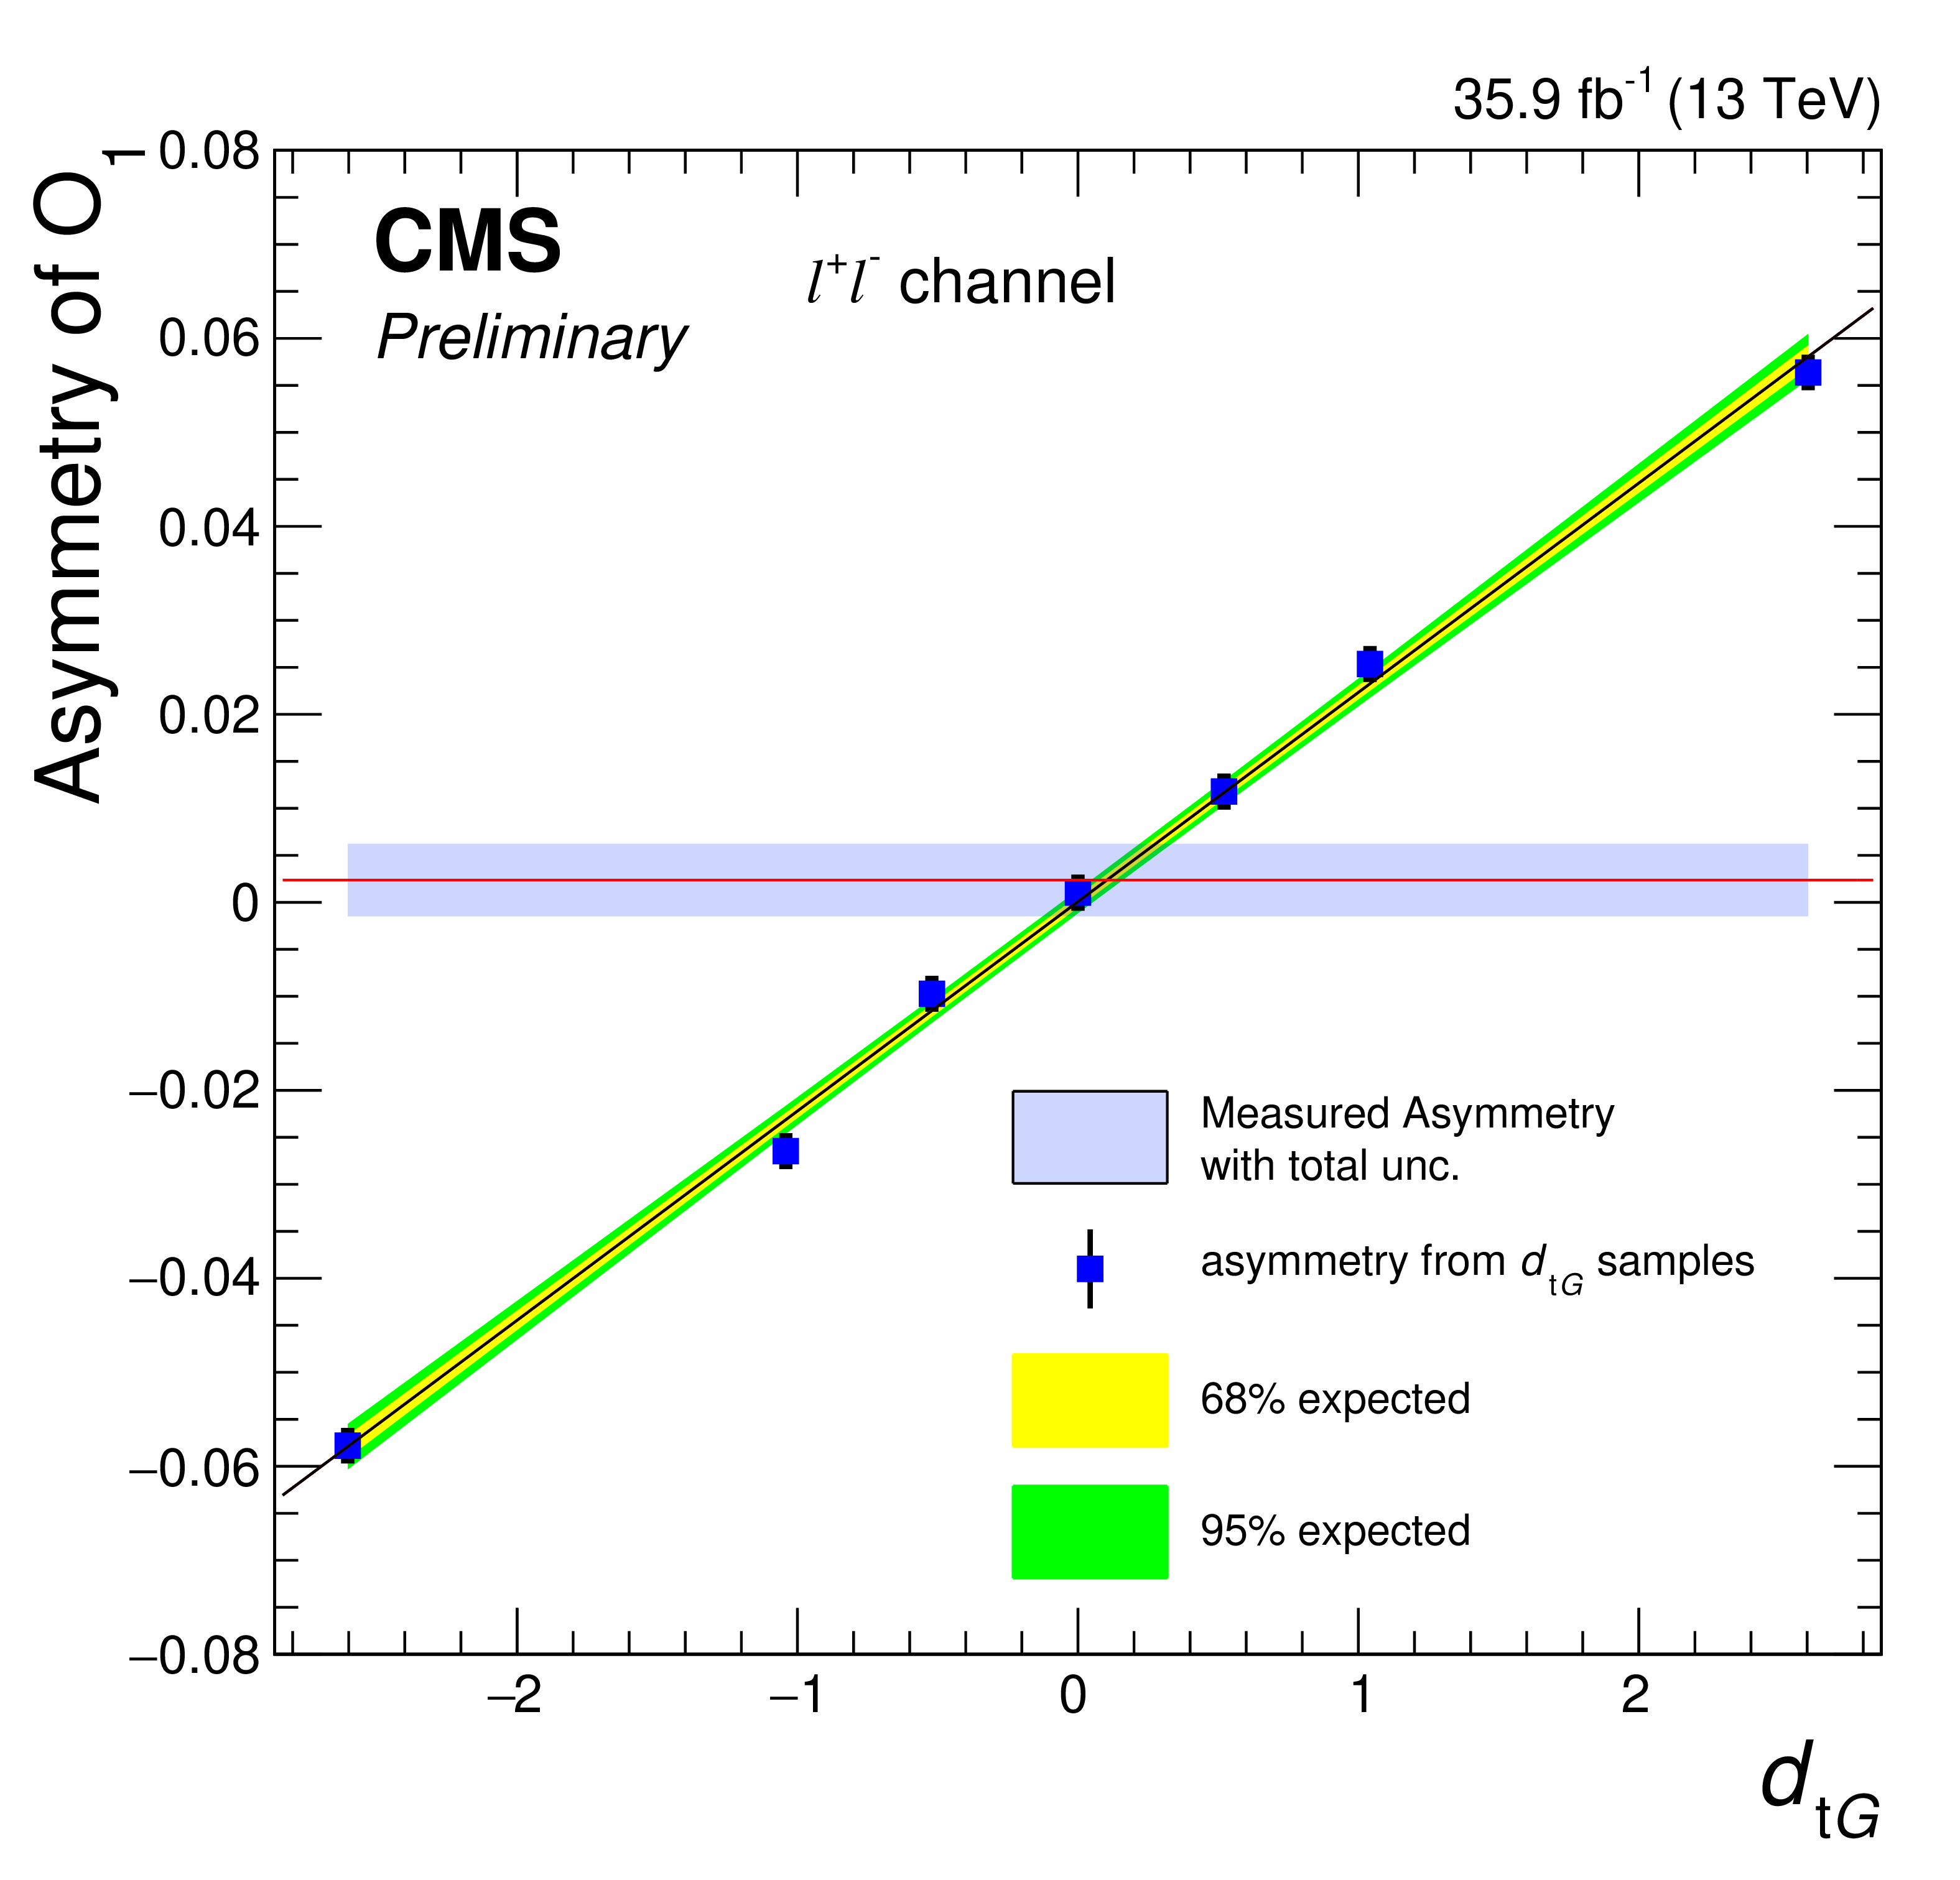
Figure 5-a:
Asymmetries as a function of $d_{\mathrm{t} G}$ for $\mathcal {O}_{1}$. Those are the results for the combined dilepton channel. The inner and outer bands correspond to the uncertainties at the 68% and 95% confidence level, respectively, of the linear fit results. The square points are the asymmetries measured with the simulated samples corresponding to the different assumed $d_{\mathrm{t} G}$ values. The horizontal line indicates the measured asymmetry, and the shaded region around it the total statistical and systematic uncertainty. |

png pdf |
Figure 5-b:
Asymmetries as a function of $d_{\mathrm{t} G}$ for $\mathcal {O}_{3}$. Those are the results for the combined dilepton channel. The inner and outer bands correspond to the uncertainties at the 68% and 95% confidence level, respectively, of the linear fit results. The square points are the asymmetries measured with the simulated samples corresponding to the different assumed $d_{\mathrm{t} G}$ values. The horizontal line indicates the measured asymmetry, and the shaded region around it the total statistical and systematic uncertainty. |
| Tables | |
png pdf |
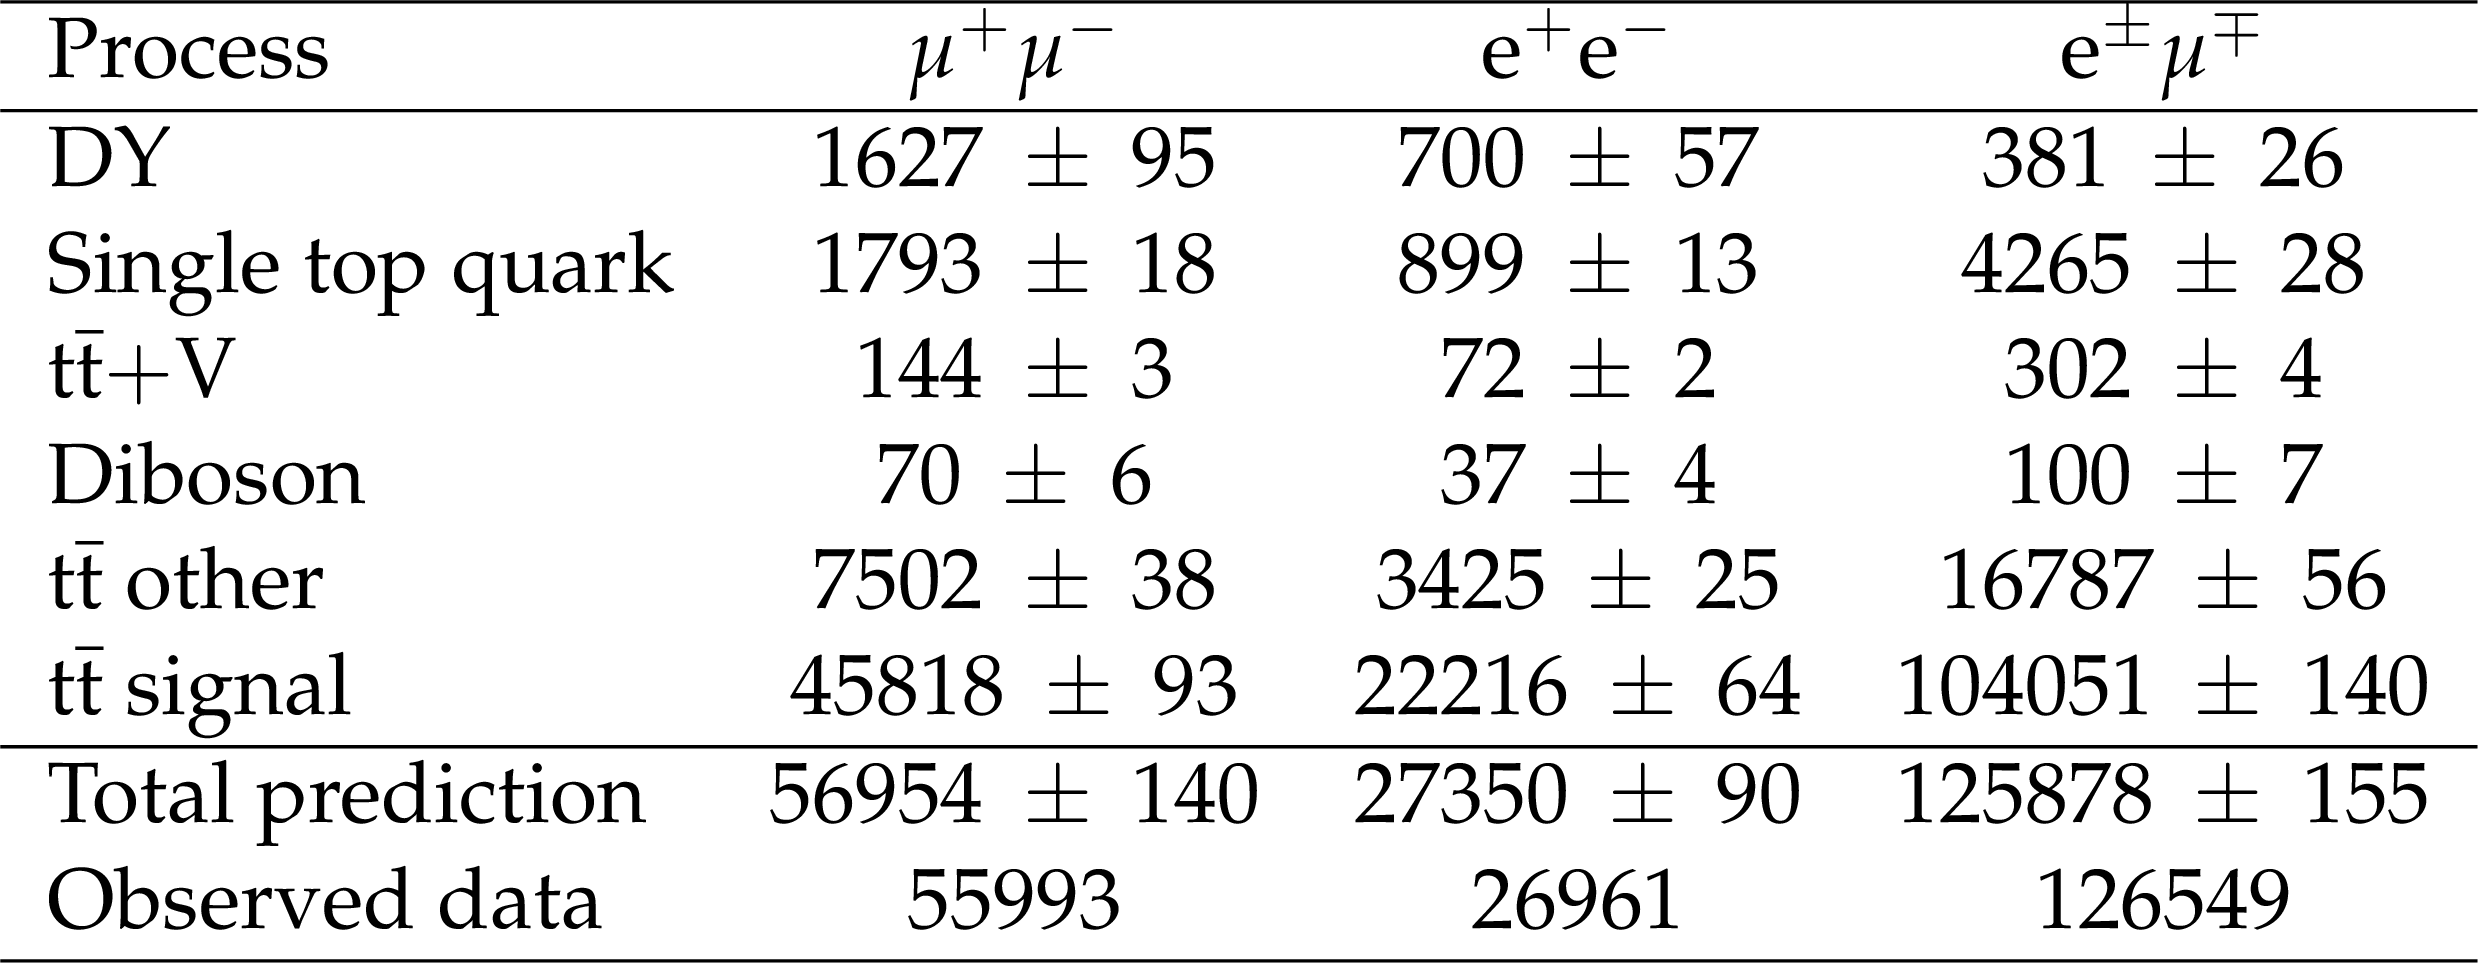
Table 1:
Simulated event yields with their statistical uncertainties for the three dilepton channels after applying the event selection criteria and normalization described in the text. |
png pdf |
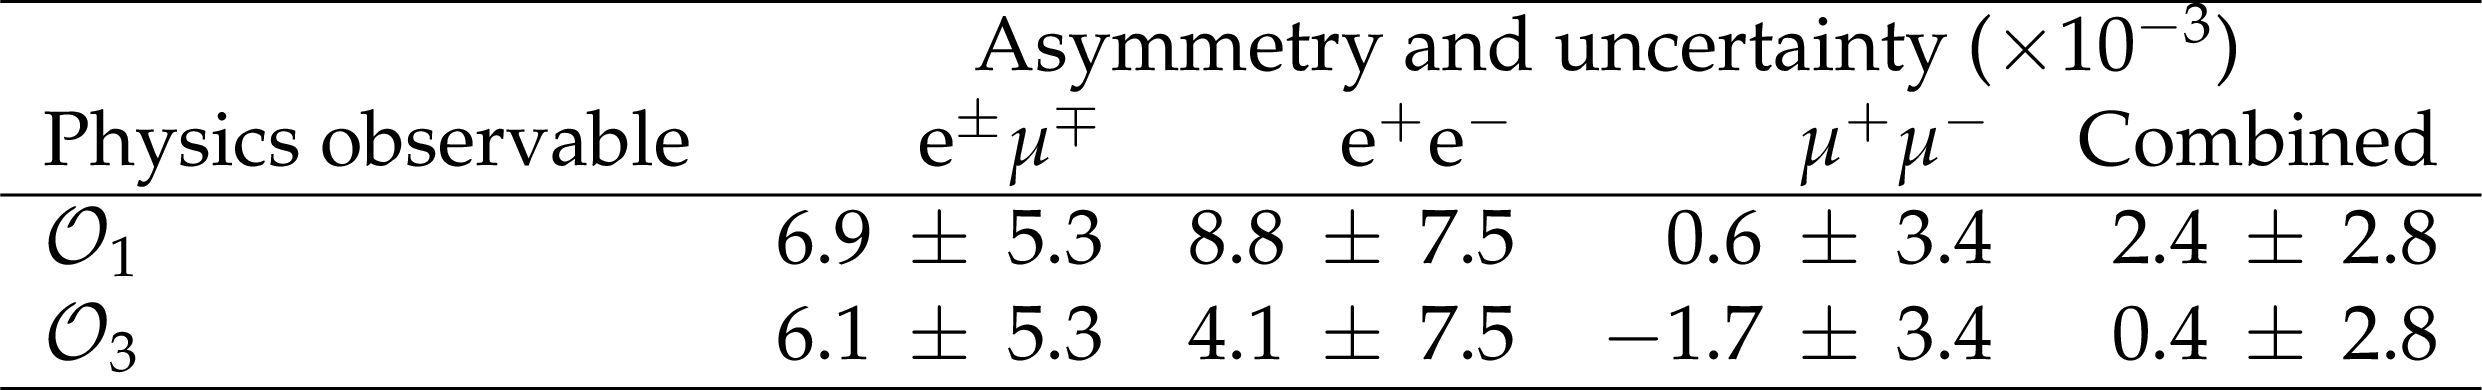
Table 2:
Measured asymmetries of $\mathcal {O}_{1}$ and $\mathcal {O}_{3}$ with statistical uncertainties. |
png pdf |
Table 3:
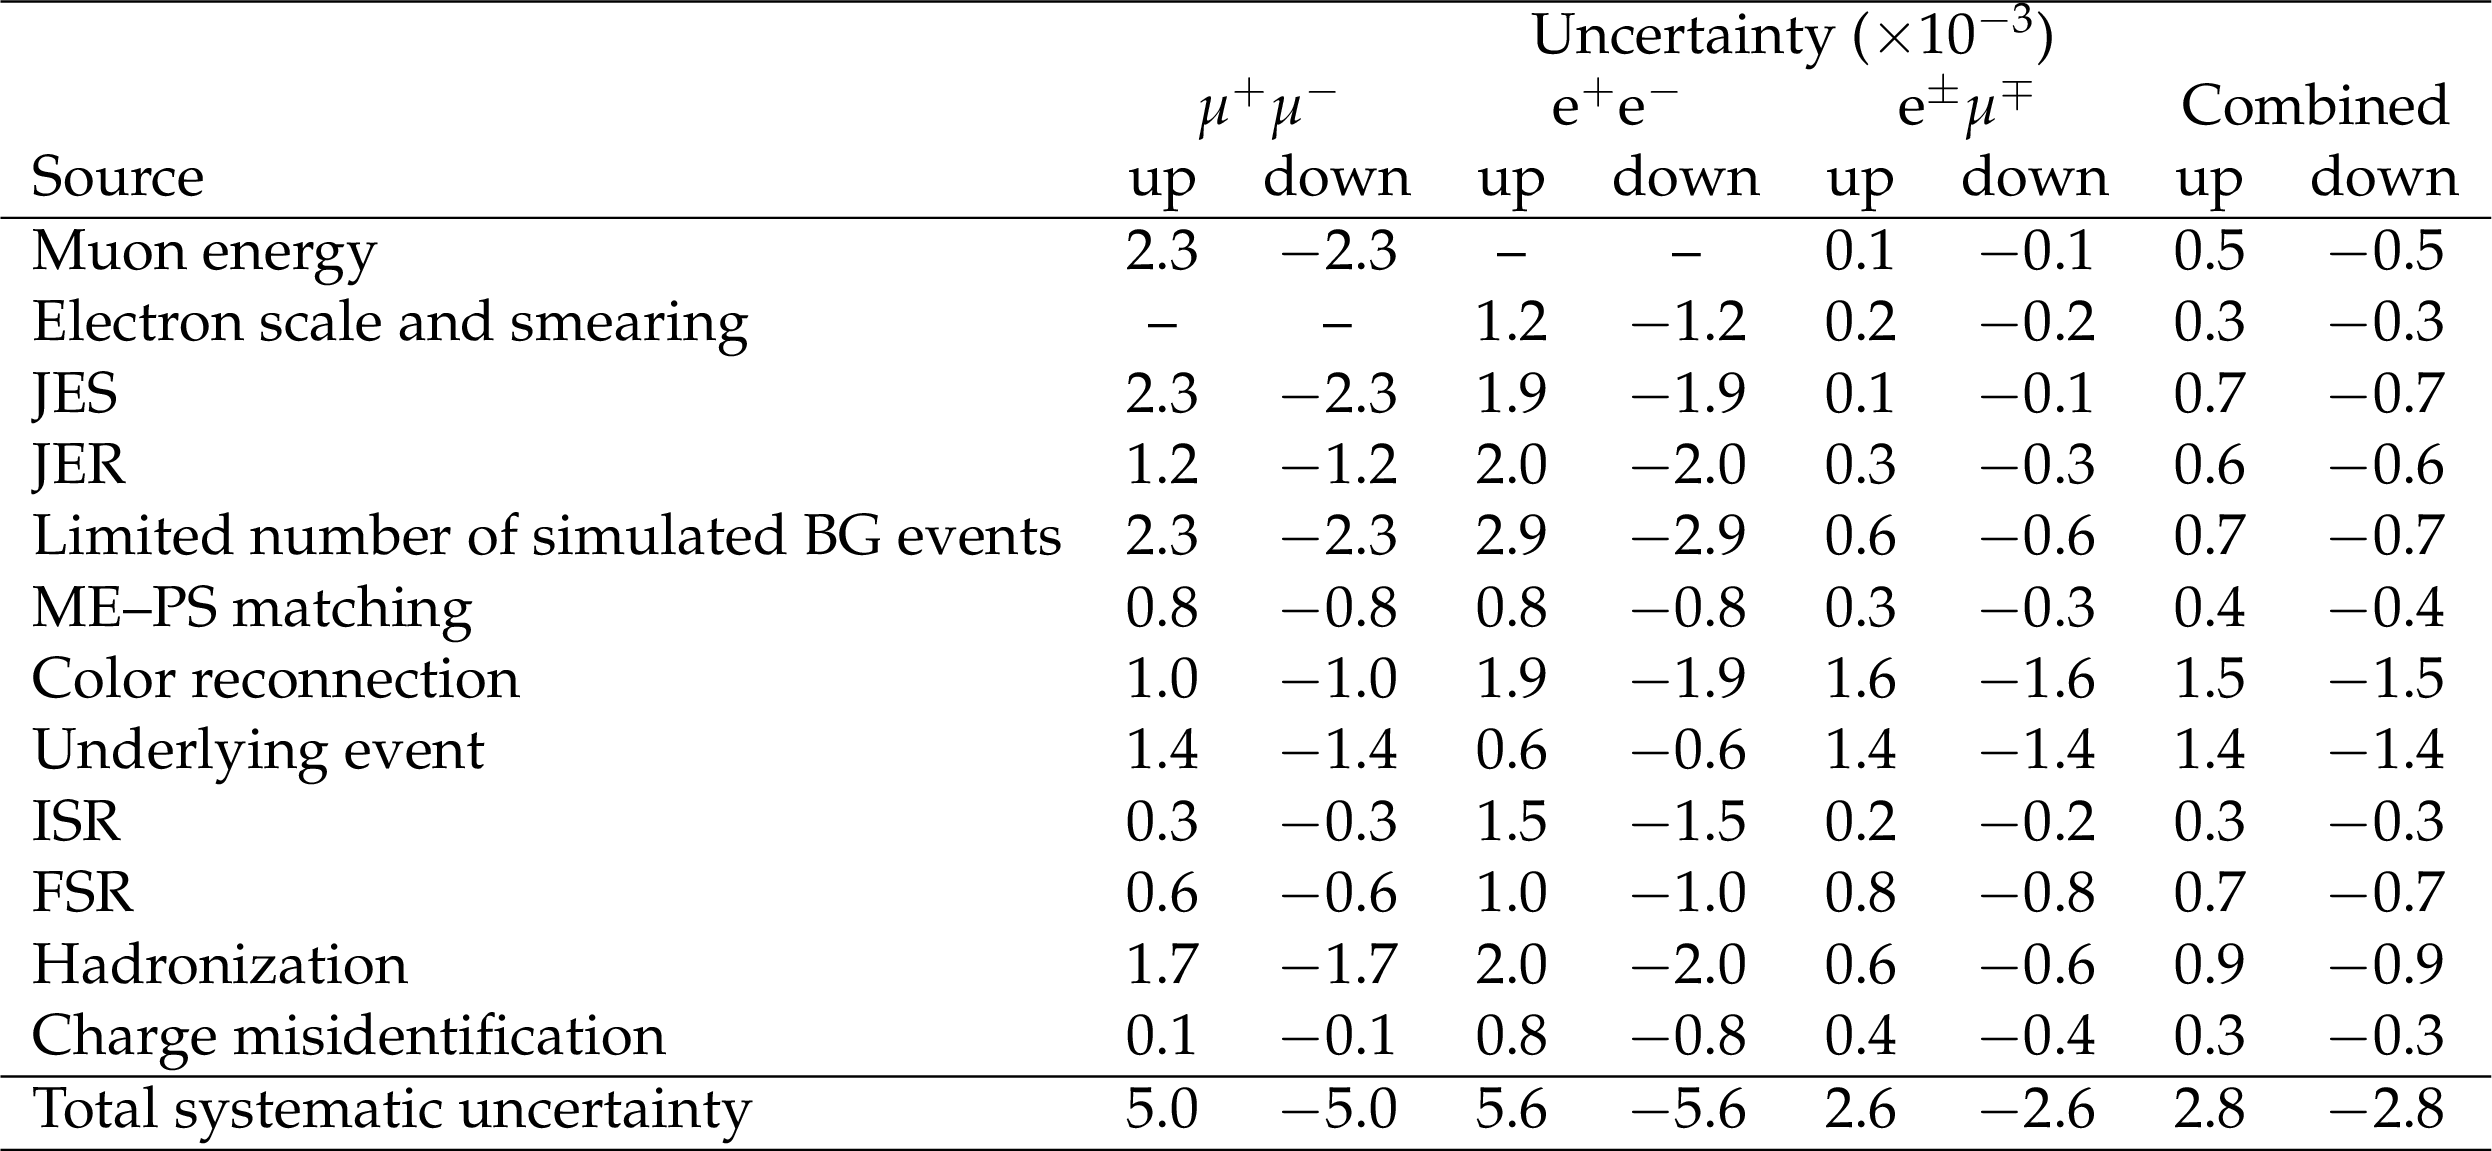
Systematic uncertainties of asymmetries of $\mathcal {O}_{1}$, as detailed in the text. |
png pdf |
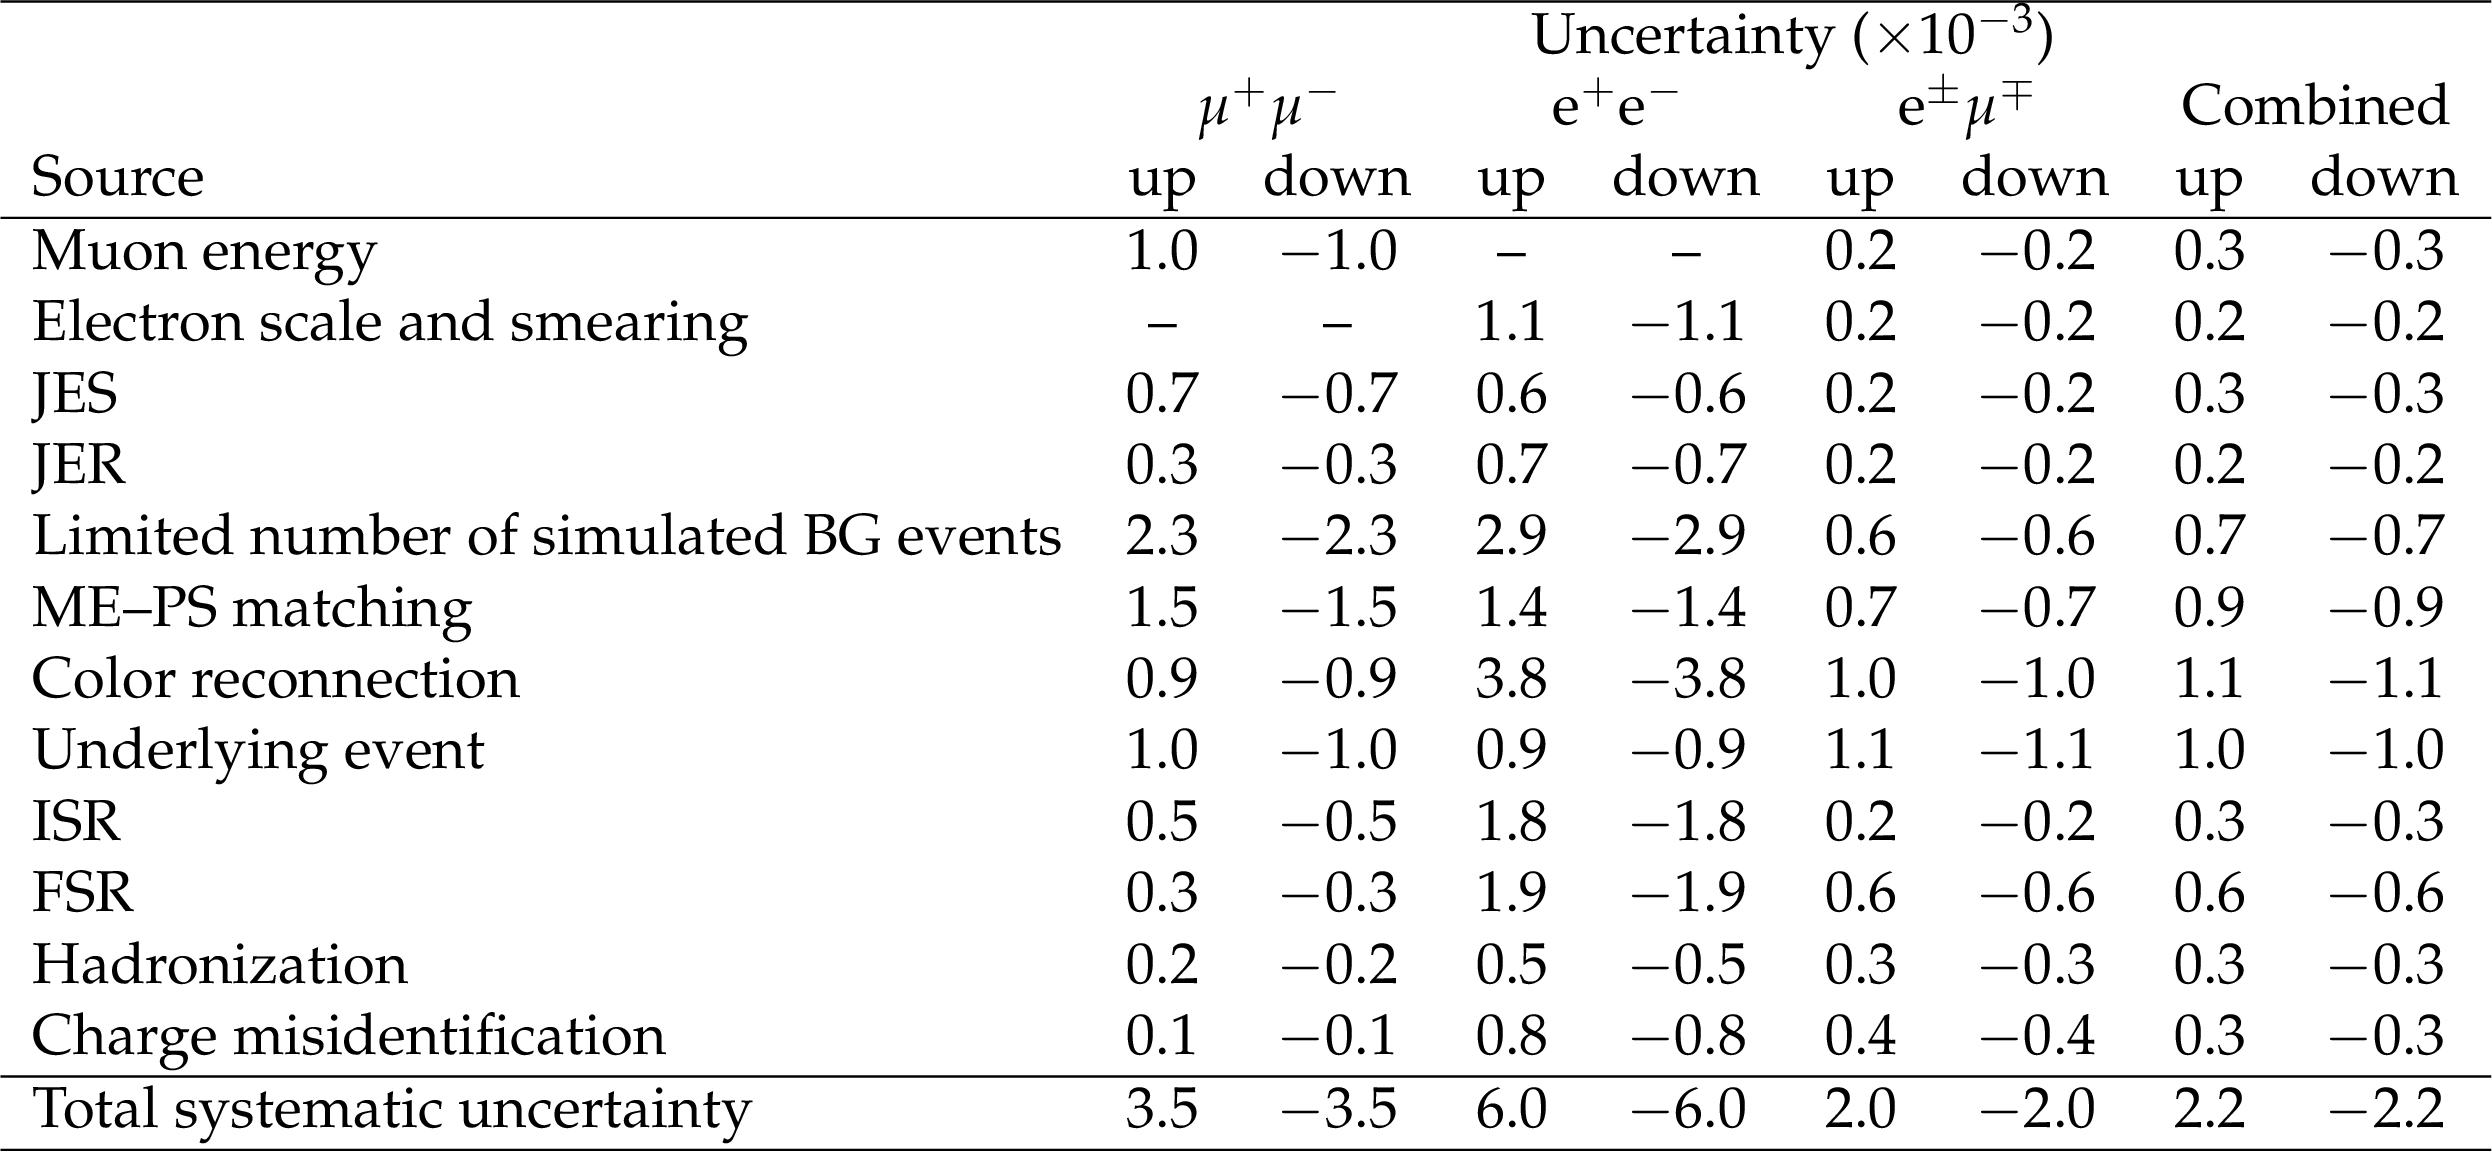
Table 4:
Systematic uncertainties of asymmetries of $\mathcal {O}_{3}$, as detailed in the text. |
png pdf |
Table 5:
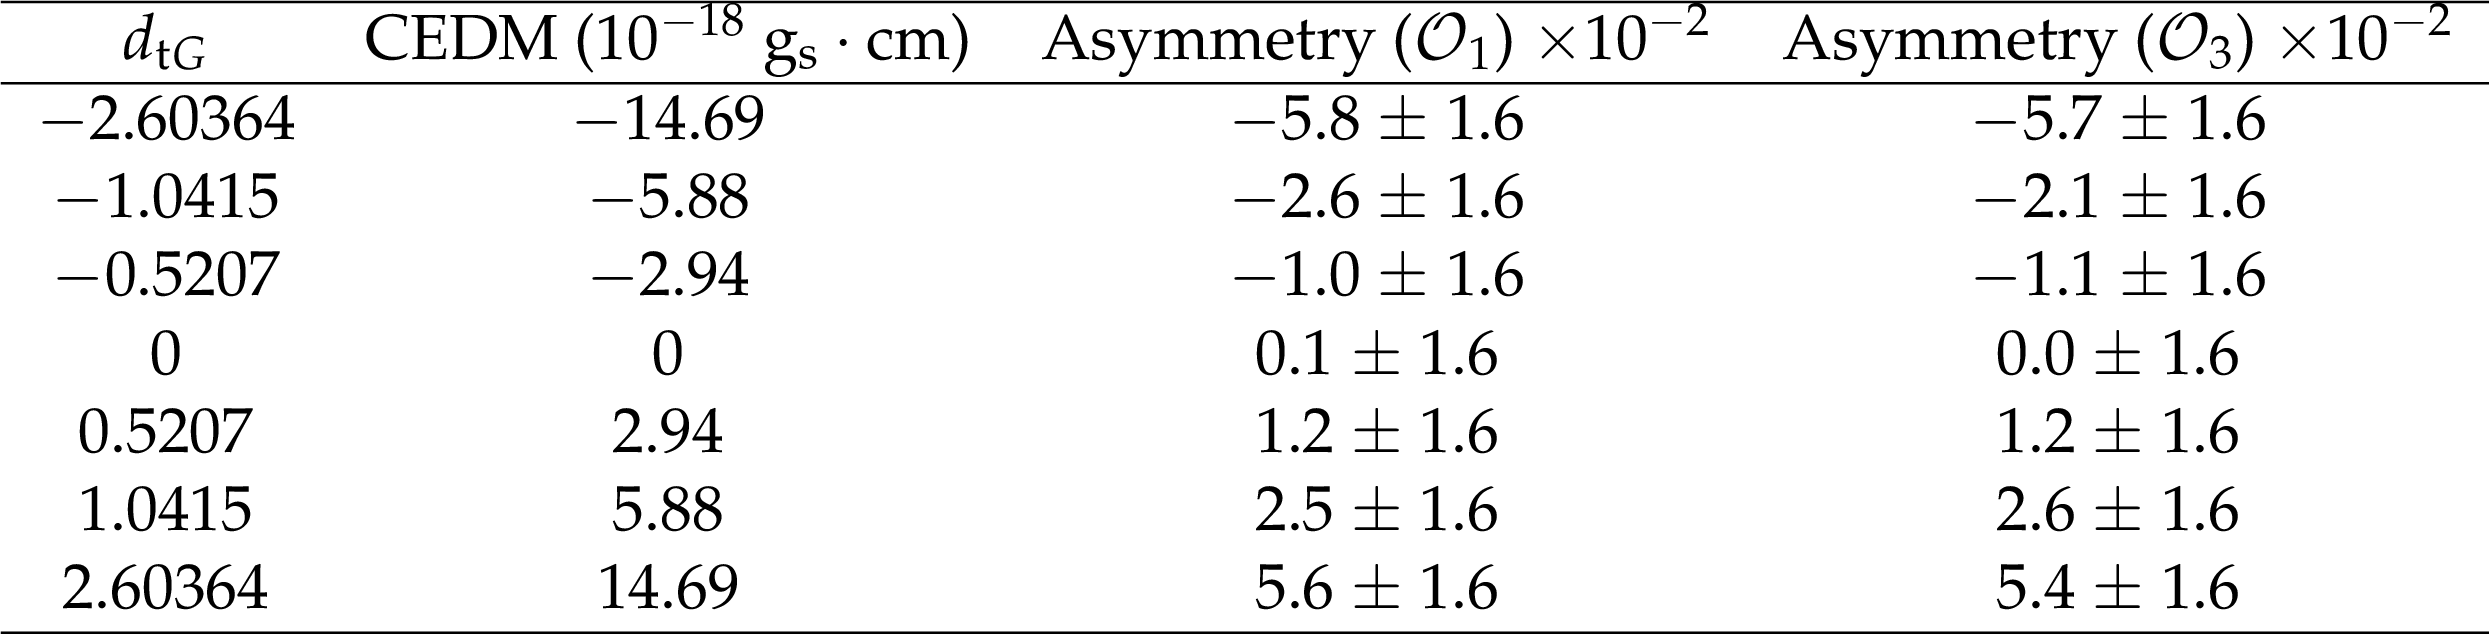
The assumed dimensionless CEDM $d_{\mathrm{t} G}$ in the dedicated CP violated ${\mathrm{t} {}\mathrm{\bar{t}}}$ event samples, with corresponding CEDM values in units of $\rm {g_{s}} \cdot $cm and expected asymmetries. The uncertainty in the asymmetries is statistical. |
png pdf |
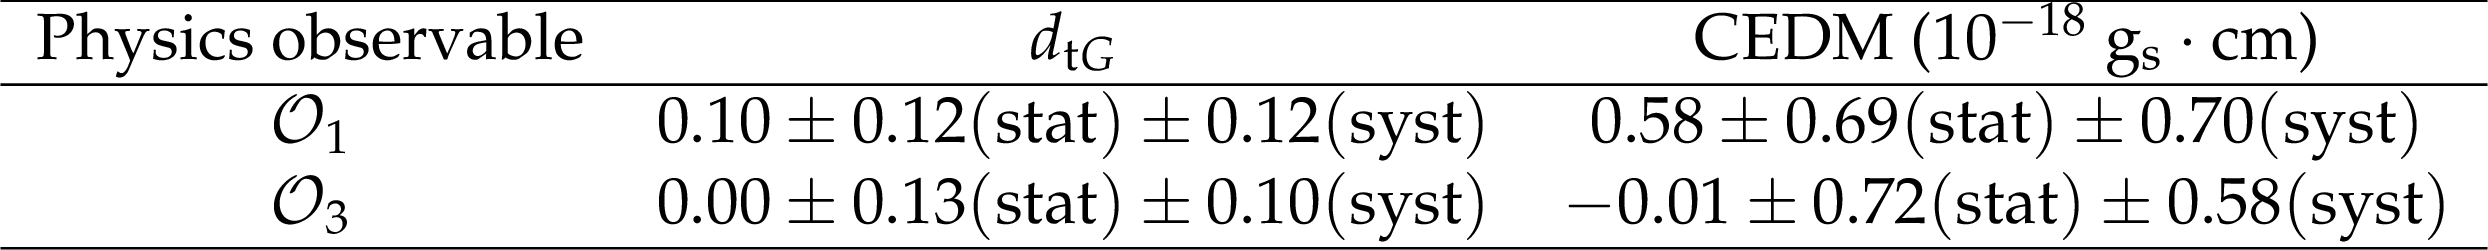
Table 6:
The measured $d_{\mathrm{t} G}$ and CEDM of $\mathcal {O}_{1}$ and $\mathcal {O}_{3}$ with their uncertainties. |
| Summary |
| CP violation is studied in top quark pair production in the dilepton final state. The analysis is based on proton-proton collision data at a center-of-mass energy of 13 TeV, collected by the CMS experiment and corresponding to an integrated luminosity of 35.9 fb$^{-1}$. In this analysis two physics observables are used, $\mathcal{O}_{1}$ and $\mathcal{O}_{3}$, which are the Levi-Civita tensors of the four-momenta of leptons, jets originating from b quarks, and top quarks. Asymmetries in these observables as well as the chromoelectric dipole moment of the top quark are measured. The measured chromoelectric dipole moments based on the $\mathcal{O}_{1}$ and $\mathcal{O}_{3}$ observables in the combined dilepton channel are 0.58 $\pm$ 0.69 (stat) $\pm$ 0.70 (syst) $ \times $ 10$^{-18}$ $g_{\text{S}} \cdot$cm, and $-$0.01 $\pm$ 0.72 (stat) $\pm$ 0.58 (syst) $ \times $ 10$^{-18}$ $g_{\text{S}} \cdot$cm, respectively. These results are consistent with the standard model prediction. |
| References | ||||
| 1 | J. H. Christenson, J. W. Cronin, V. L. Fitch, and R. Turlay | Evidence for the $ 2 {\pi} $ decay of the $ \mathrm{K}_{2}^{0} $ meson | PRL 13 (1964) 138 | |
| 2 | H. Wahl | First observation and precision measurement of direct CP violation: the experiments NA31 and NA48 | Physics Reports 403-404 (2004) 19 | |
| 3 | Particle Data Group | Review of particle physics | PRD 98 (2018) 030001 | |
| 4 | O. Antipin and G. Valencia | T-odd correlations from CP violating anomalous top-quark couplings revisited | PRD 79 (2009) 013013 | |
| 5 | A. Hayreter and G. Valencia | T-odd correlations from the top-quark chromoelectric dipole moment in lepton plus jets top-pair events | PRD 93 (2016) 014020 | |
| 6 | D. Atwood, S. Bar-Shalom, G. Eilam, and A. Soni | CP violation in top physics | Physics Reports 347 (2001), no. 1, 1 | |
| 7 | S. Alioli, P. Nason, C. Oleari, and E. Re | A general framework for implementing NLO calculations in shower Monte Carlo programs: the POWHEG BOX | JHEP 06 (2010) 043 | 1002.2581 |
| 8 | T. Sjostrand et al. | An introduction to PYTHIA 8.2 | CPC 191 (2015) 159 | 1410.3012 |
| 9 | P. Skands, S. Carrazza, and J. Rojo | Tuning PYTHIA 8.1: the Monash 2013 tune | EPJC 74 (2014) 3024 | 1404.5630 |
| 10 | J. Alwall et al. | Comparative study of various algorithms for the merging of parton showers and matrix elements in hadronic collisions | EPJC 53 (2008) 473 | 0706.2569 |
| 11 | GEANT4 Collaboration | GEANT4--a simulation toolkit | NIMA 506 (2003) 250 | |
| 12 | ATLAS Collaboration | Measurement of the inelastic proton-proton cross section at $ \sqrt{s} = $ 13 TeV with the ATLAS detector at the LHC | PRL 117 (2016) 182002 | 1606.02625 |
| 13 | K. Melnikov and F. Petriello | Electroweak gauge boson production at hadron colliders through $ \mathcal{O}({{\alpha}}_{s}^{2}) $ | PRD 74 (Dec, 2006) 114017 | |
| 14 | N. Kidonakis | NNLL threshold resummation for top-pair and single-top production | Physics of Particles and Nuclei 45 (Jul, 2014) 714--722 | |
| 15 | J. M. Campbell and R. Ellis | MCFM for the tevatron and the LHC | Nuclear Physics B - Proceedings Supplements 205-206 (2010) 10, . Loops and Legs in Quantum Field Theory | |
| 16 | J. M. Campbell, R. K. Ellis, and C. Williams | Vector boson pair production at the LHC | JHEP 07 (2011) 018 | 1105.0020 |
| 17 | F. Maltoni, D. Pagani, and I. Tsinikos | Associated production of a top-quark pair with vector bosons at NLO in QCD: impact on $ \mathrm{t}\overline{\mathrm{t}}\mathrm{H} $ searches at the LHC | JHEP 02 (2016) 113 | 1507.05640 |
| 18 | M. Czakon and A. Mitov | Top++: A program for the calculation of the top-pair cross-section at hadron colliders | Computer Physics Communications 185 (2014) 2930 | |
| 19 | CMS Collaboration | Particle-flow reconstruction and global event description with the CMS detector | JINST 12 (2017) P10003 | CMS-PRF-14-001 1706.04965 |
| 20 | CMS Collaboration | Performance of electron reconstruction and selection with the CMS detector in proton-proton collisions at $ \sqrt{s} = $ 8 TeV | JINST 10 (2015) P06005 | CMS-EGM-13-001 1502.02701 |
| 21 | CMS Collaboration | Performance of the CMS muon detector and muon reconstruction with proton-proton collisions at $ \sqrt{s}= $ 13 TeV | JINST 13 (2018) P06015 | CMS-MUO-16-001 1804.04528 |
| 22 | M. Cacciari, G. P. Salam, and G. Soyez | The anti-$ k_t $ jet clustering algorithm | JHEP 04 (2008) 063 | 0802.1189 |
| 23 | M. Cacciari, G. P. Salam, and G. Soyez | FastJet user manual | EPJC 72 (2012) 1896 | 1111.6097 |
| 24 | CMS Collaboration | Jet energy scale and resolution in the CMS experiment in pp collisions at 8 TeV | JINST 12 (2017) P02014 | CMS-JME-13-004 1607.03663 |
| 25 | CMS Collaboration | Identification of heavy-flavour jets with the CMS detector in pp collisions at 13 TeV | JINST 13 (2018) P05011 | CMS-BTV-16-002 1712.07158 |
| 26 | CMS Collaboration | Measurement of the differential cross section for top quark pair production in pp collisions at $ \sqrt{s} = $ 8 TeV | EPJC 75 (2015) 542 | CMS-TOP-12-028 1505.04480 |
| 27 | CMS Collaboration | Measurements of $ \mathrm{t\overline{t}} $ differential cross sections in proton-proton collisions at $ \sqrt{s}= $ 13 TeV using events containing two leptons | JHEP 02 (2019) 149 | CMS-TOP-17-014 1811.06625 |
| 28 | L. Lyons, D. Gibaut, and P. Clifford | How to combine correlated estimates of a single physical quantity | Nuclear Instruments and Methods in Physics Research Section A: Accelerators, Spectrometers, Detectors and Associated Equipment 270 (1988) 110 | |
| 29 | CMS Collaboration | CMS Luminosity Measurements for the 2016 Data Taking Period | CMS-PAS-LUM-17-001 | CMS-PAS-LUM-17-001 |
| 30 | ATLAS Collaboration | Measurement of the inelastic proton-proton cross section at $ \sqrt{s} = $ 13 TeV with the ATLAS detector at the LHC | PRL 117 (2016) 182002 | 1606.02625 |
| 31 | CMS Collaboration | Measurement of the $ \mathrm{t\overline{t}} $ production cross section, the top quark mass, and the strong coupling constant using dilepton events in pp collisions at $ \sqrt{s}= $ 13 TeV | EPJC 79 (2019) 368 | CMS-TOP-17-001 1812.10505 |
| 32 | CMS Collaboration | Measurement of the Drell--Yan cross sections in pp collisions at $ \sqrt{s} = $ 7 TeV with the CMS experiment | JHEP 10 (2011) 007 | CMS-EWK-10-007 1108.0566 |
| 33 | CMS Collaboration | Measurement of the top quark pair production cross section in proton-proton collisions at $ \sqrt{s} = $ 13 TeV with the CMS detector | PRL 116 (2016) 052002 | CMS-TOP-15-003 1510.05302 |
| 34 | J. Butterworth et al. | PDF4LHC recommendations for LHC Run II | JPG 43 (2016) 023001 | 1510.03865 |
| 35 | CMS Collaboration | Measurement of differential top-quark pair production cross sections in pp collisions at $ \sqrt{s} = $ 7 TeV | EPJC 73 (2013) 2339 | CMS-TOP-11-013 1211.2220 |
| 36 | CMS Collaboration | Measurement of the $ \mathrm{t}\overline{{\mathrm{t}}} $ production cross section in the all-jets final state in pp collisions at $ \sqrt{s}= $ 8 TeV | EPJC 76 (2016) 128 | CMS-TOP-14-018 1509.06076 |
| 37 | CMS Collaboration | Measurement of differential cross sections for top quark pair production using the lepton+jets final state in proton-proton collisions at 13 TeV | PRD 95 (2017) 092001 | CMS-TOP-16-008 1610.04191 |
| 38 | M. G. Bowler | $ \text{e}^{+}\text{e}^{-} $ production of heavy quarks in the string model | Z. Phys. C 11 (1981) 169 | |
| 39 | C. Peterson, D. Schlatter, I. Schmitt, and P. M. Zerwas | Scaling violations in inclusive $ \text{e}^{+}\text{e}^{{-}} $ annihilation spectra | PRD 27 (1983) 105 | |
| 40 | S. Argyropoulos and T. Sjostrand | Effects of color reconnection on $ \mathrm{t}\overline{\mathrm{t}} $ final states at the LHC | JHEP 11 (2014) 043 | 1407.6653 |
| 41 | J. R. Christiansen and P. Z. Skands | String formation beyond leading colour | JHEP 08 (2015) 003 | 1505.01681 |
| 42 | CMS Collaboration | Investigations of the impact of the parton shower tuning in Pythia 8 in the modelling of $ \mathrm{t\overline{t}} $ at $ \sqrt{s}= $ 8 and 13 TeV | CMS-PAS-TOP-16-021 | CMS-PAS-TOP-16-021 |
| 43 | D0 Collaboration | Direct measurement of the mass difference between top and antitop quarks | PRD 84 (2011) 052005 | |
| 44 | CMS Collaboration | Measurement of the top quark polarization and $ t\overline{t} $ spin correlations using dilepton final states in proton-proton collisions at $ \sqrt{s}= $ 13 TeV | PRD 100 (2019) 072002 | |
| 45 | W. Bernreuther, D. Heisler, and Z.-G. Si | A set of top quark spin correlation and polarization observables for the LHC: Standard model predictions and new physics contributions | JHEP 12 (2015) 026 | 1508.05271 |
|
|
Compact Muon Solenoid LHC, CERN |
|

|

|

|

|

|