

Compact Muon Solenoid
LHC, CERN
| CMS-PAS-SMP-21-003 | ||
| Azimuthal correlations in Z+jets events at 13 TeV | ||
| CMS Collaboration | ||
| July 2021 | ||
| Abstract: The production of Z bosons associated with jets is measured at $\sqrt{s}= $ 13 TeV with data recorded at the LHC corresponding to a luminosity of 36.3 fb$^{-1}$. The multiplicity of jets with $p_\mathrm{T}(\mathrm{Z}) > $ 30 GeV is measured for different regions of the Z transverse momentum, ranging from $p_\mathrm{T}(\mathrm{Z}) < $ 10 GeV to $p_\mathrm{T}(\mathrm{Z}) > $ 100 GeV. The azimuthal correlation $\Delta \phi$ between the Z boson and the leading jet as well as the correlation $\Delta\phi (j_1, j_2)$ between the two leading jets is measured for different $p_\mathrm{T}(\mathrm{Z})$. The measurements are compared with predictions with up to two additional partons merged at next-to-leading order supplemented with parton shower and hadronization, with predictions at NLO for up to two additional partons based on transverse momentum dependent parton distributions and the corresponding parton showers, and with resummed predictions of Z production at NNLO supplemented with conventional parton shower. Predictions based on matrix element calculations with up to two additional partons at NLO come close to the measurements. | ||
|
Links:
CDS record (PDF) ;
CADI line (restricted) ;
These preliminary results are superseded in this paper, Submitted to EPJC. The superseded preliminary plots can be found here. |
||
| Figures | |
png pdf |
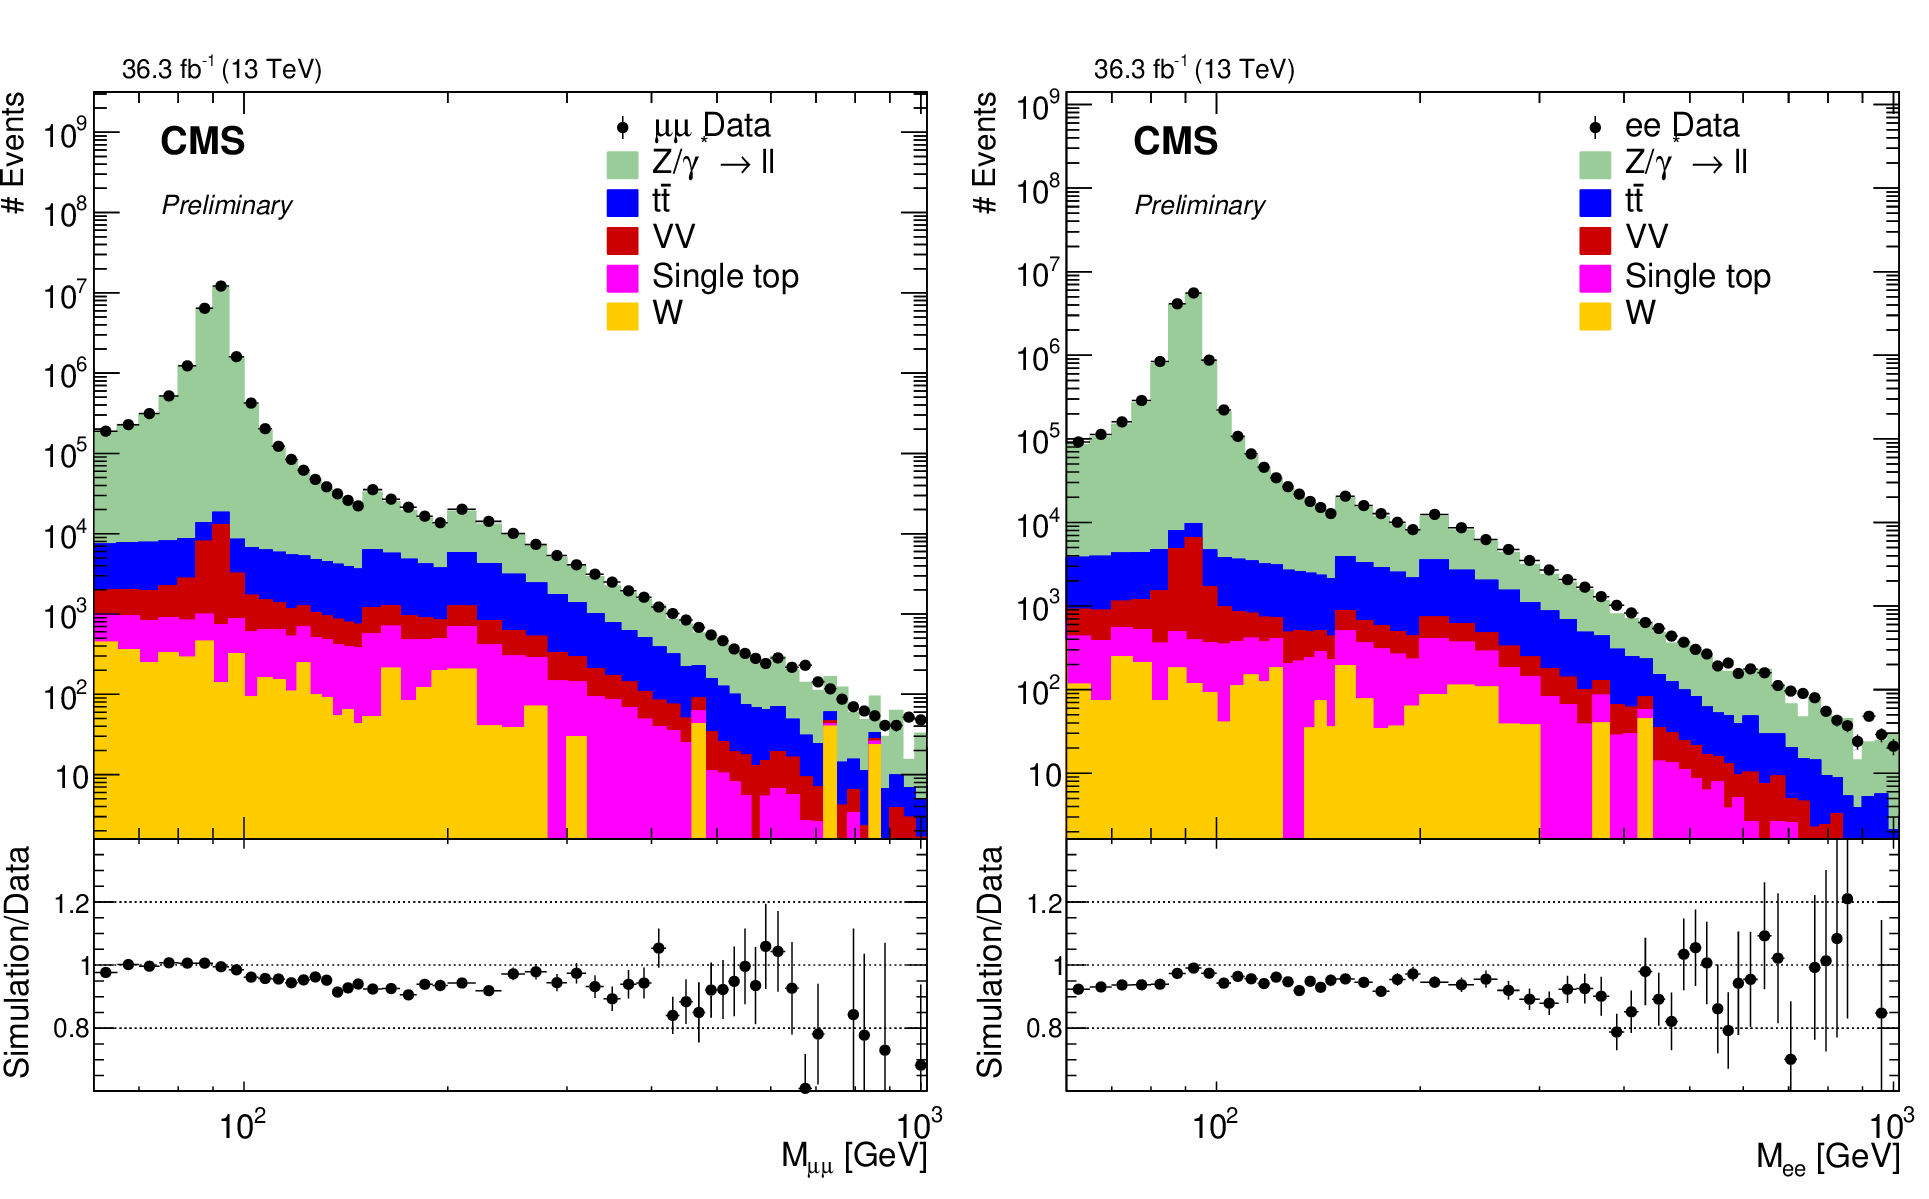
Figure 1:
Data to simulation comparison of the dilepton invariant mass for $\mu^{+} {}\mu^{-}$ channel (left) and $\mathrm{e^{+}} {}\mathrm{e^{-}}$ channel (right). |
png pdf |
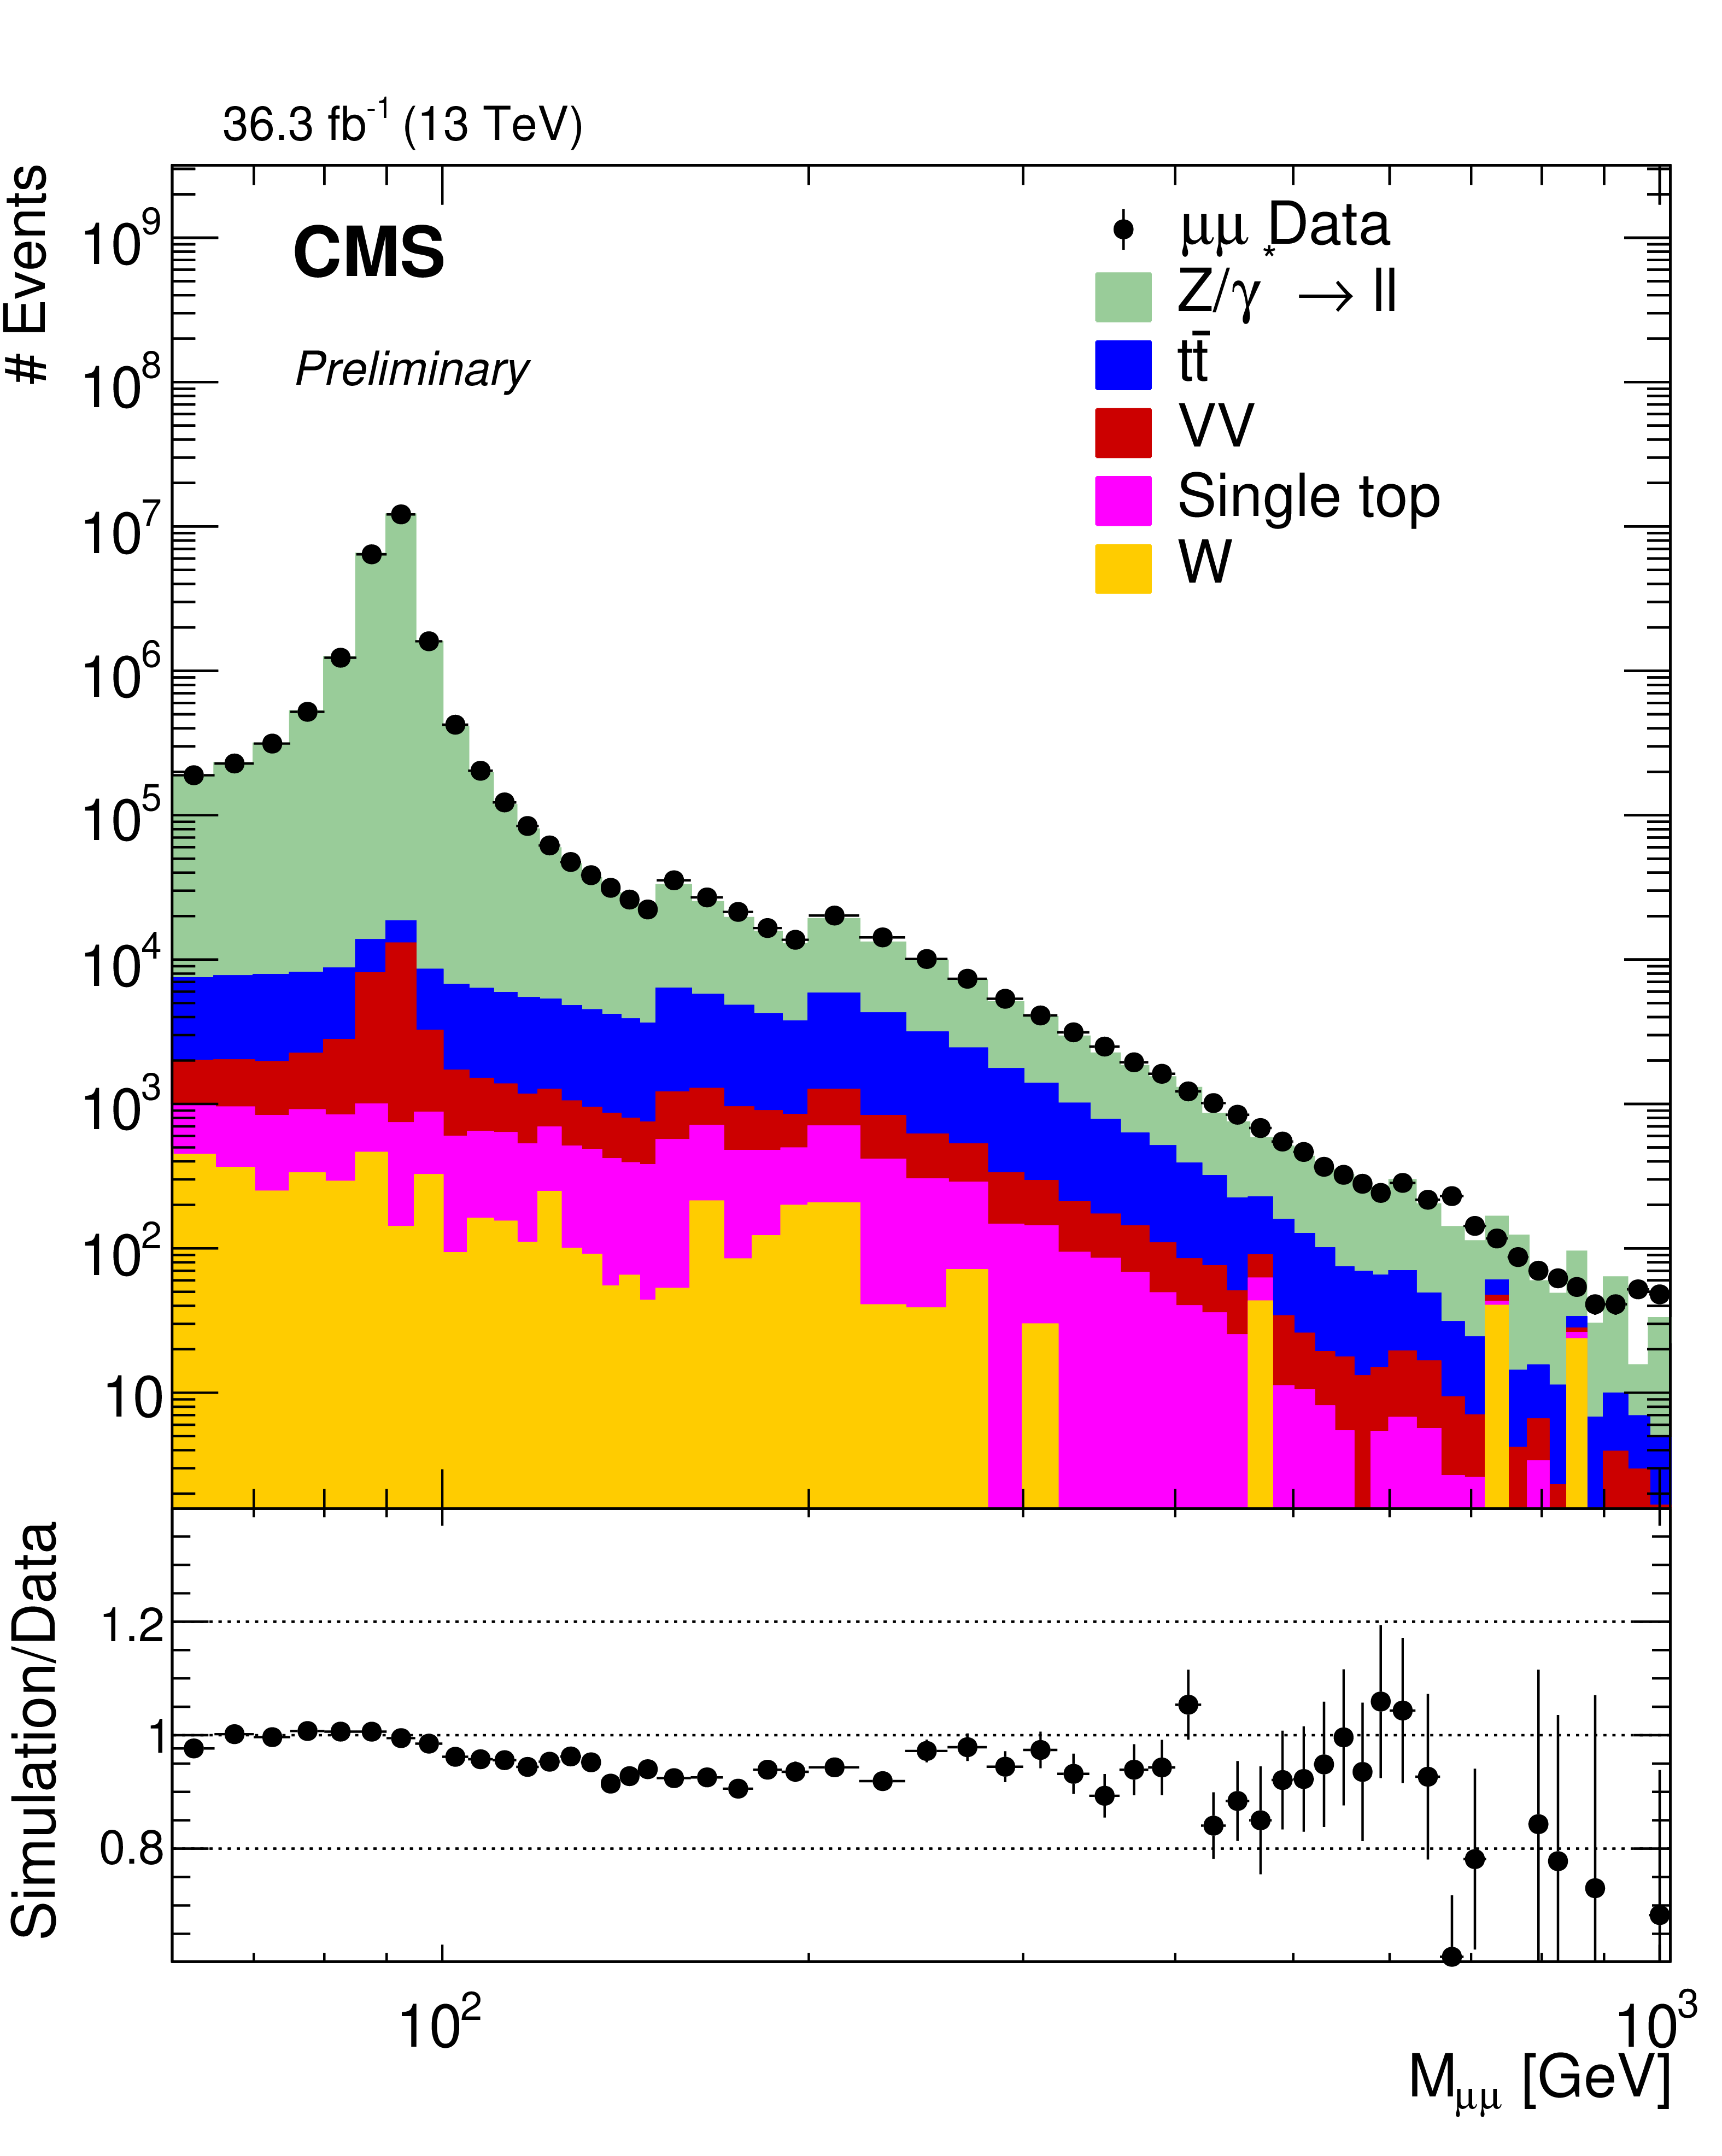
Figure 1-a:
Data to simulation comparison of the dilepton invariant mass for $\mu^{+} {}\mu^{-}$ channel (left) and $\mathrm{e^{+}} {}\mathrm{e^{-}}$ channel (right). |

png pdf |
Figure 1-b:
Data to simulation comparison of the dilepton invariant mass for $\mu^{+} {}\mu^{-}$ channel (left) and $\mathrm{e^{+}} {}\mathrm{e^{-}}$ channel (right). |
png pdf |
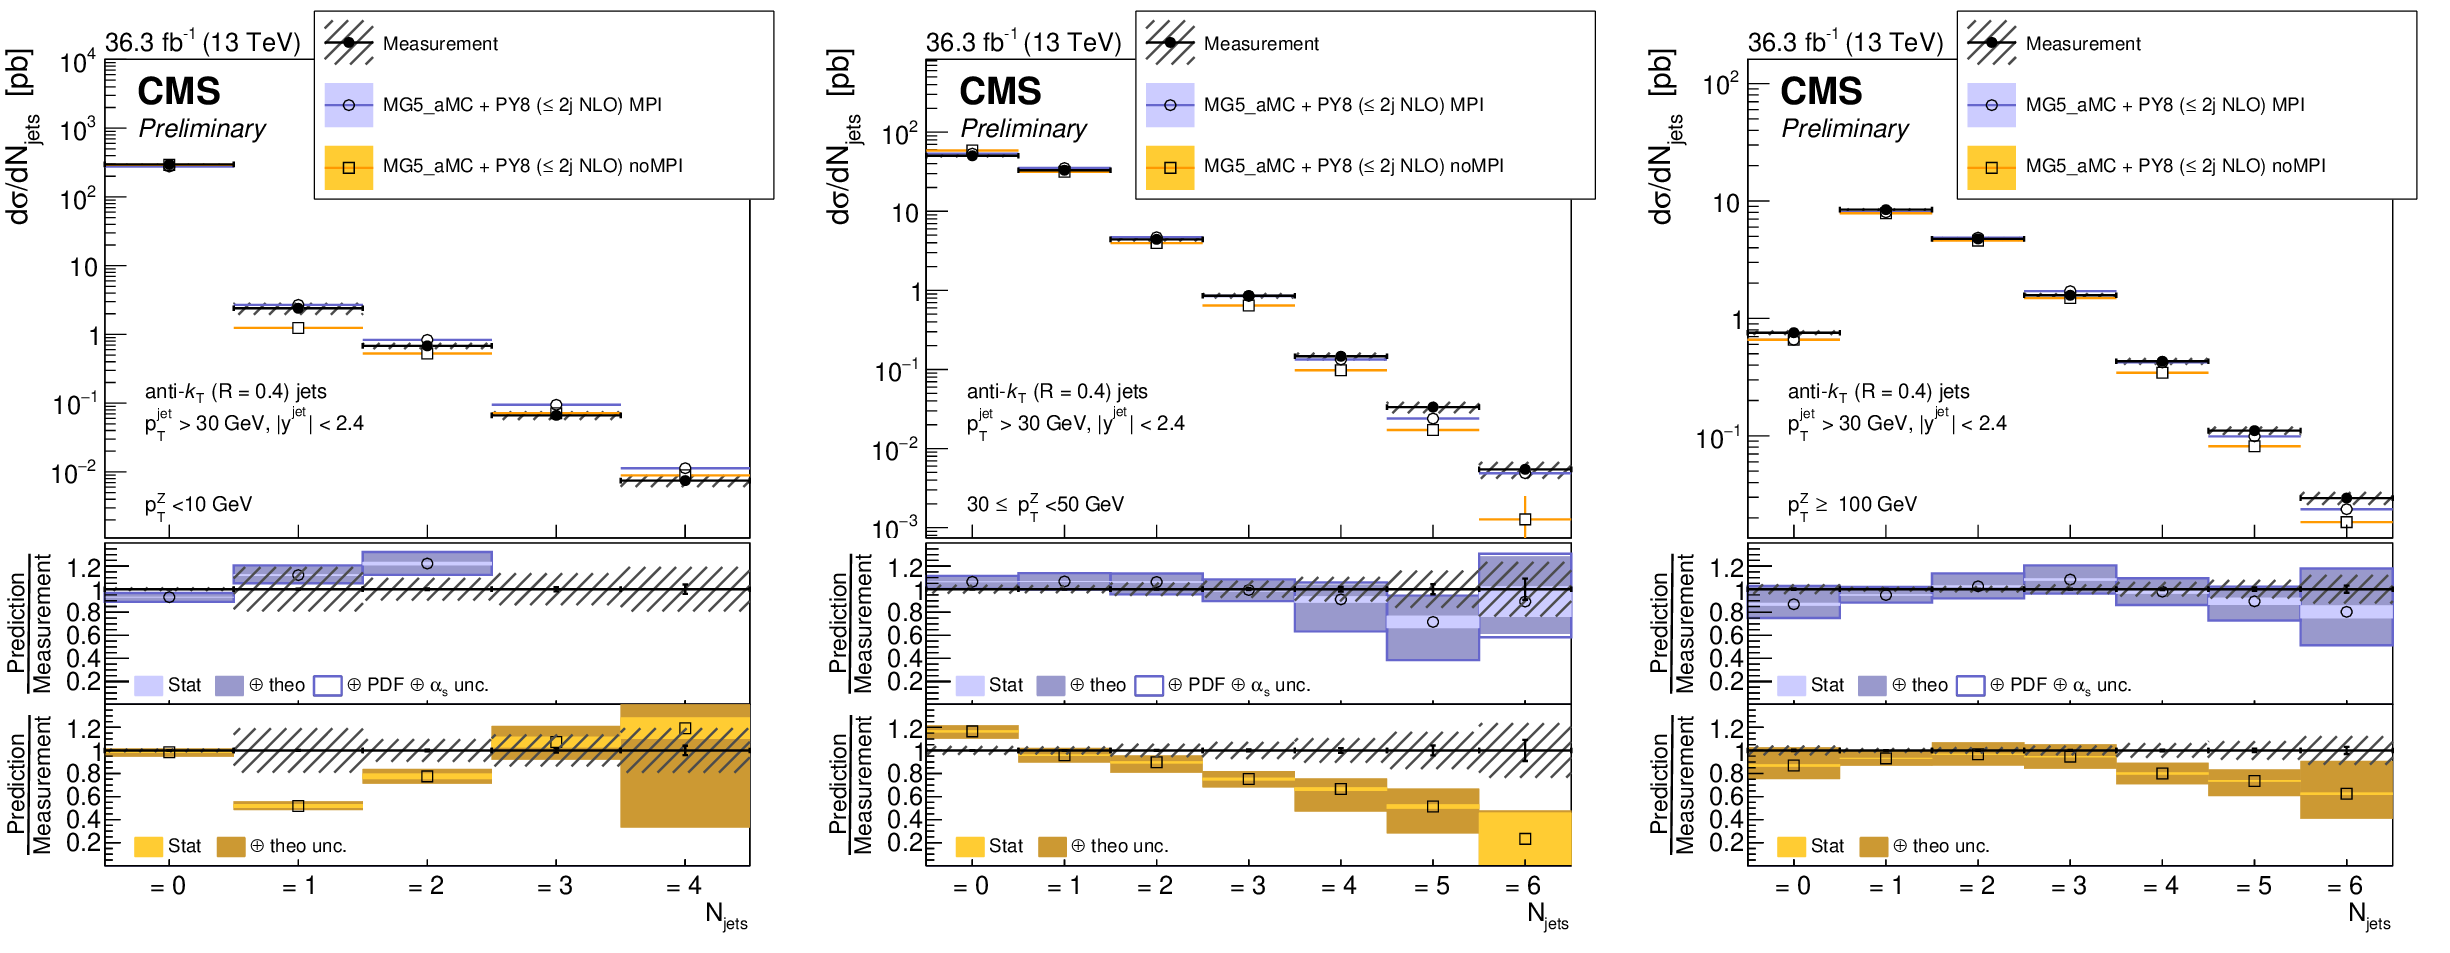
Figure 2:
Jet multiplicity in three different regions of ${p_{\mathrm{T}}}^{\mathrm{Z}}$ : $ {p_{\mathrm{T}}{(\mathrm{Z})}} \leq $ 10 GeV (left), 30 $\leq {p_{\mathrm{T}}{(\mathrm{Z})}} < $ 50 GeV (middle), 100 GeV $ \leq {p_{\mathrm{T}}{(\mathrm{Z})}} $ (right). The error bars on the data points represent the statistical uncertainty of the measurement, and the hatched band shows the total uncertainties of statistical and systematic sources added in quadrature. Predictions using MG5_aMC+Py8 ($\leq 2j $ NLO) with and without multi-parton interactions are shown. |

png pdf |
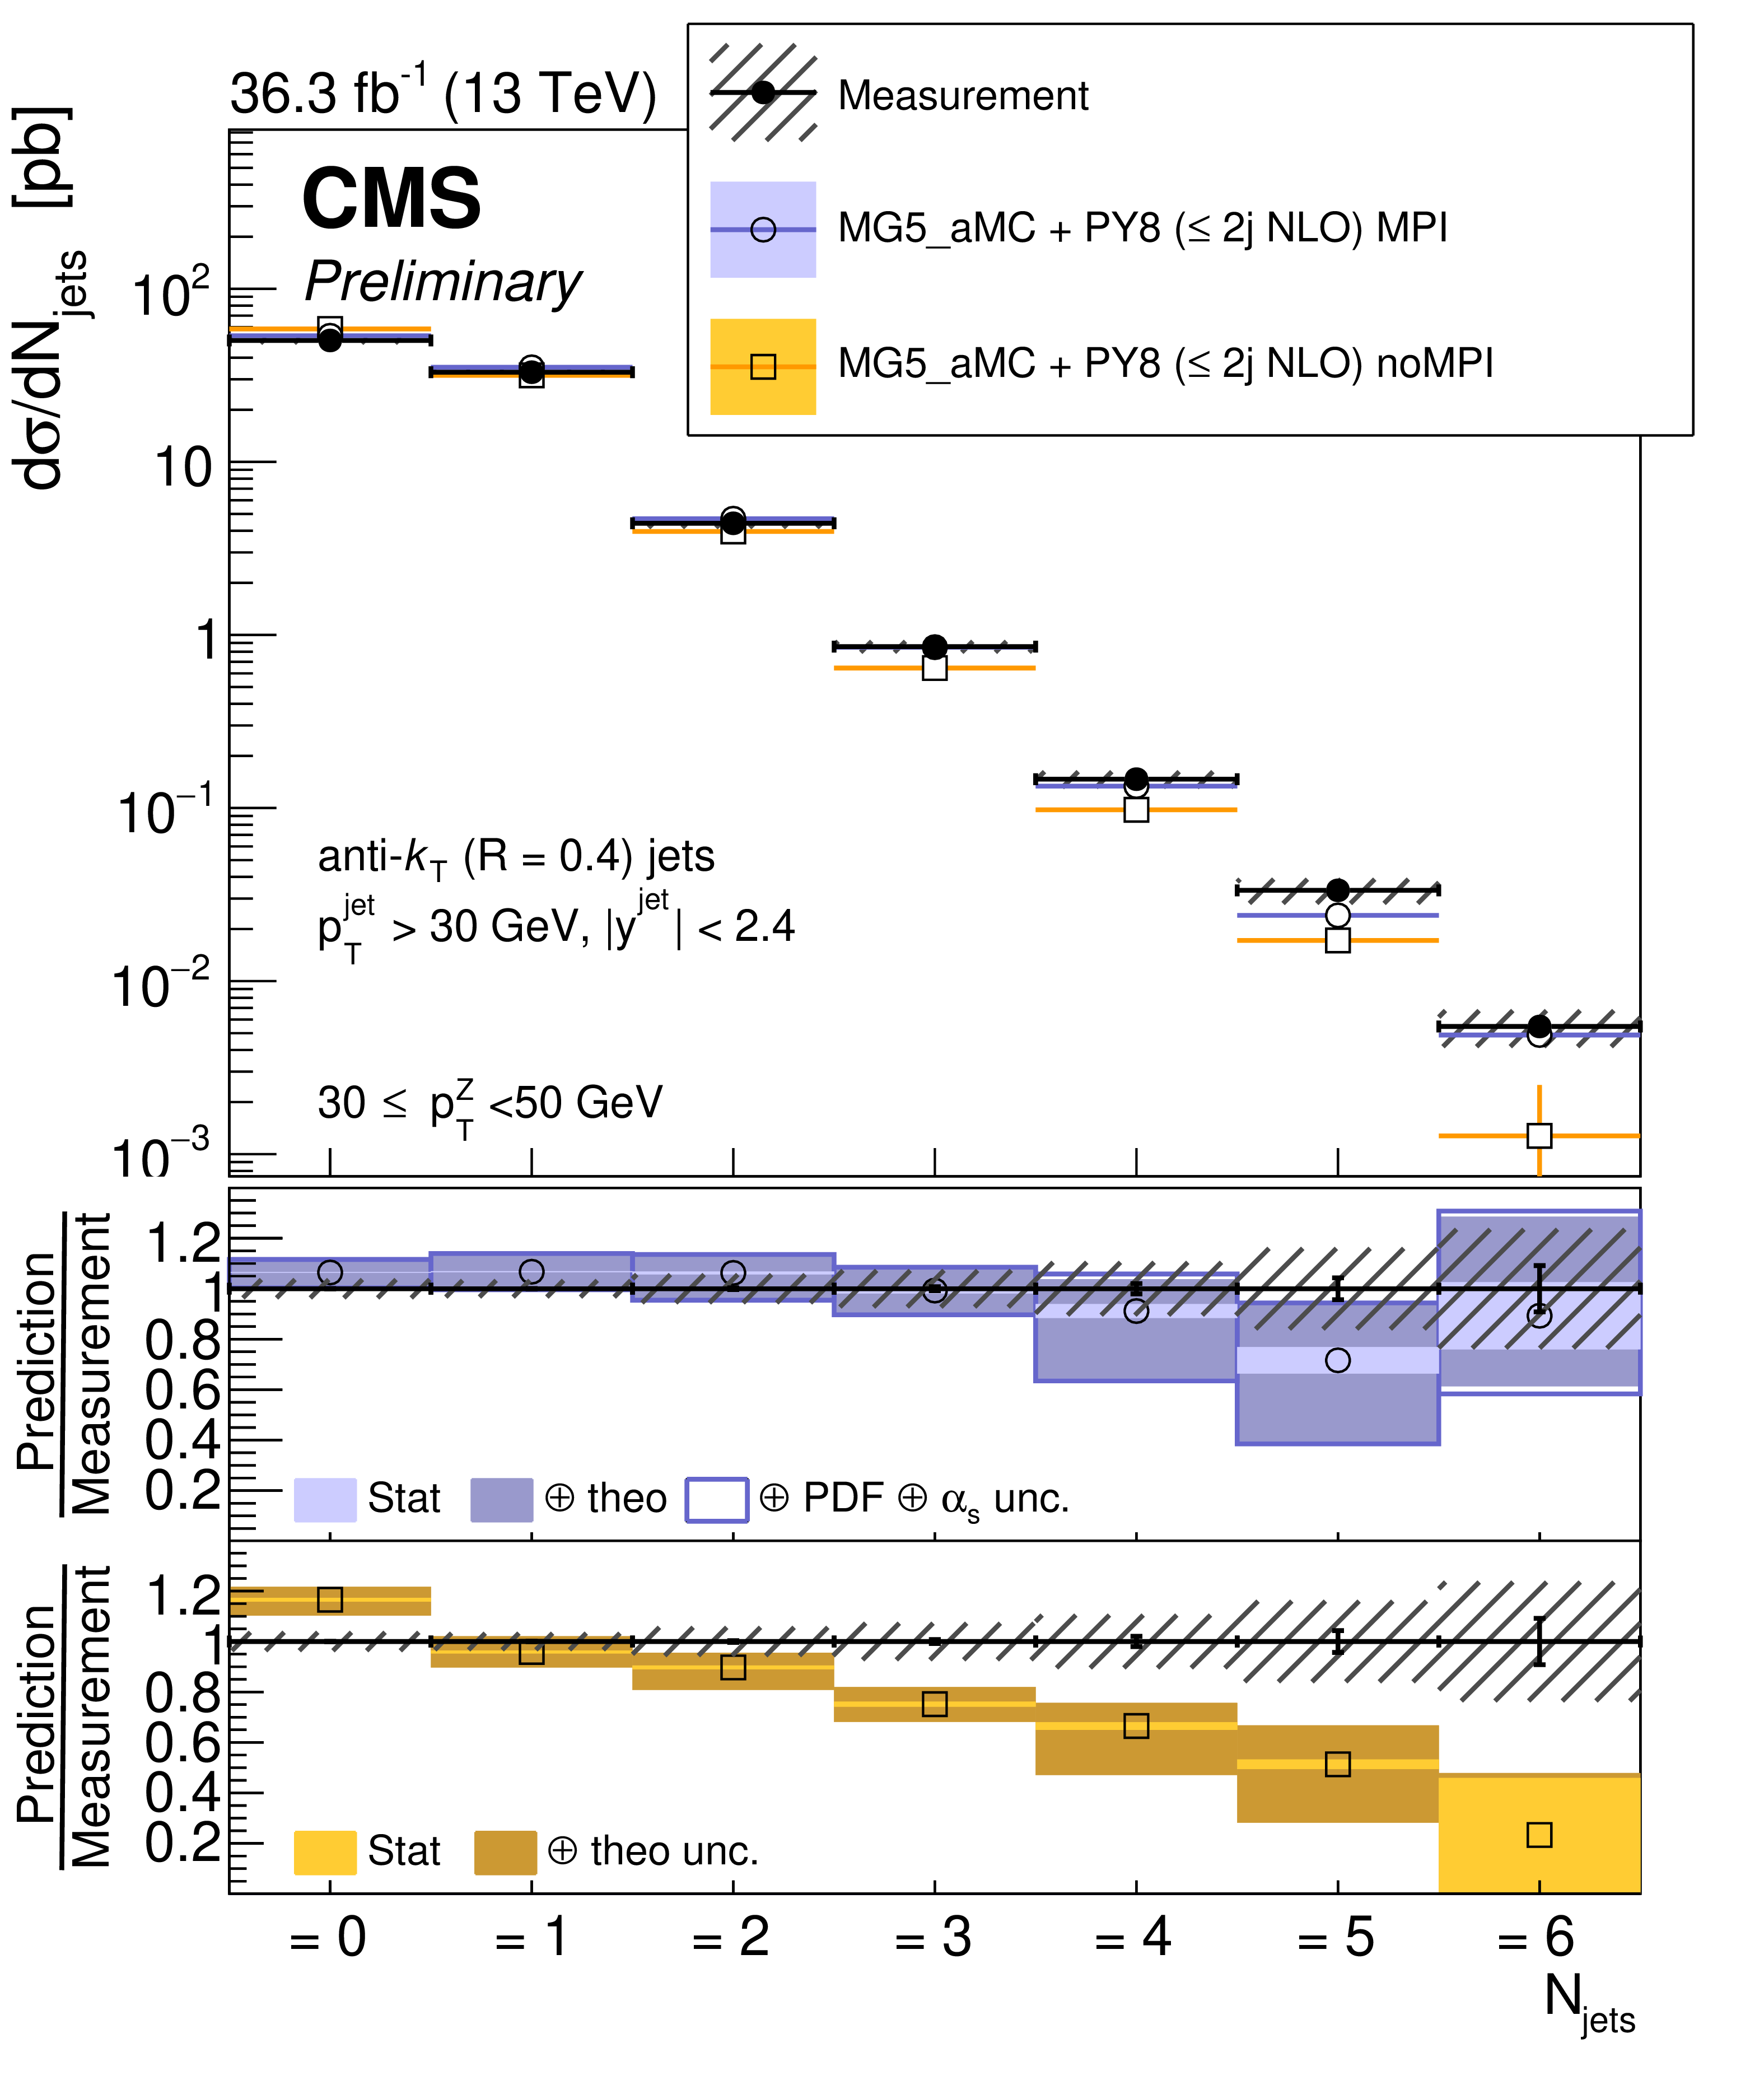
Figure 2-a:
Jet multiplicity in three different regions of ${p_{\mathrm{T}}}^{\mathrm{Z}}$ : $ {p_{\mathrm{T}}{(\mathrm{Z})}} \leq $ 10 GeV (left), 30 $\leq {p_{\mathrm{T}}{(\mathrm{Z})}} < $ 50 GeV (middle), 100 GeV $ \leq {p_{\mathrm{T}}{(\mathrm{Z})}} $ (right). The error bars on the data points represent the statistical uncertainty of the measurement, and the hatched band shows the total uncertainties of statistical and systematic sources added in quadrature. Predictions using MG5_aMC+Py8 ($\leq 2j $ NLO) with and without multi-parton interactions are shown. |
png pdf |
Figure 2-b:
Jet multiplicity in three different regions of ${p_{\mathrm{T}}}^{\mathrm{Z}}$ : $ {p_{\mathrm{T}}{(\mathrm{Z})}} \leq $ 10 GeV (left), 30 $\leq {p_{\mathrm{T}}{(\mathrm{Z})}} < $ 50 GeV (middle), 100 GeV $ \leq {p_{\mathrm{T}}{(\mathrm{Z})}} $ (right). The error bars on the data points represent the statistical uncertainty of the measurement, and the hatched band shows the total uncertainties of statistical and systematic sources added in quadrature. Predictions using MG5_aMC+Py8 ($\leq 2j $ NLO) with and without multi-parton interactions are shown. |
png pdf |
Figure 2-c:
Jet multiplicity in three different regions of ${p_{\mathrm{T}}}^{\mathrm{Z}}$ : $ {p_{\mathrm{T}}{(\mathrm{Z})}} \leq $ 10 GeV (left), 30 $\leq {p_{\mathrm{T}}{(\mathrm{Z})}} < $ 50 GeV (middle), 100 GeV $ \leq {p_{\mathrm{T}}{(\mathrm{Z})}} $ (right). The error bars on the data points represent the statistical uncertainty of the measurement, and the hatched band shows the total uncertainties of statistical and systematic sources added in quadrature. Predictions using MG5_aMC+Py8 ($\leq 2j $ NLO) with and without multi-parton interactions are shown. |

png pdf |
Figure 3:
Jet multiplicity in three different regions of ${p_{\mathrm{T}}}^{\mathrm{Z}}$ : $ {p_{\mathrm{T}}{(\mathrm{Z})}} \leq $ 10 GeV (left), 30 $\leq {p_{\mathrm{T}}{(\mathrm{Z})}} < $ 50 GeV (middle), 100 GeV $ \leq {p_{\mathrm{T}}{(\mathrm{Z})}} $ (right). Predictions from Geneva NNLO, MG5_aMC+CA3 (Z+1) NLO and MG5_aMC+CA3 (Z+2) NLO are shown. An overall normalization factor of 1.2 is applied to MG5_aMC+CA3 (Z+1) NLO and MG5_aMC+CA3 (Z+2) NLO. |
png pdf |
Figure 3-a:
Jet multiplicity in three different regions of ${p_{\mathrm{T}}}^{\mathrm{Z}}$ : $ {p_{\mathrm{T}}{(\mathrm{Z})}} \leq $ 10 GeV (left), 30 $\leq {p_{\mathrm{T}}{(\mathrm{Z})}} < $ 50 GeV (middle), 100 GeV $ \leq {p_{\mathrm{T}}{(\mathrm{Z})}} $ (right). Predictions from Geneva NNLO, MG5_aMC+CA3 (Z+1) NLO and MG5_aMC+CA3 (Z+2) NLO are shown. An overall normalization factor of 1.2 is applied to MG5_aMC+CA3 (Z+1) NLO and MG5_aMC+CA3 (Z+2) NLO. |

png pdf |
Figure 3-b:
Jet multiplicity in three different regions of ${p_{\mathrm{T}}}^{\mathrm{Z}}$ : $ {p_{\mathrm{T}}{(\mathrm{Z})}} \leq $ 10 GeV (left), 30 $\leq {p_{\mathrm{T}}{(\mathrm{Z})}} < $ 50 GeV (middle), 100 GeV $ \leq {p_{\mathrm{T}}{(\mathrm{Z})}} $ (right). Predictions from Geneva NNLO, MG5_aMC+CA3 (Z+1) NLO and MG5_aMC+CA3 (Z+2) NLO are shown. An overall normalization factor of 1.2 is applied to MG5_aMC+CA3 (Z+1) NLO and MG5_aMC+CA3 (Z+2) NLO. |
png pdf |
Figure 3-c:
Jet multiplicity in three different regions of ${p_{\mathrm{T}}}^{\mathrm{Z}}$ : $ {p_{\mathrm{T}}{(\mathrm{Z})}} \leq $ 10 GeV (left), 30 $\leq {p_{\mathrm{T}}{(\mathrm{Z})}} < $ 50 GeV (middle), 100 GeV $ \leq {p_{\mathrm{T}}{(\mathrm{Z})}} $ (right). Predictions from Geneva NNLO, MG5_aMC+CA3 (Z+1) NLO and MG5_aMC+CA3 (Z+2) NLO are shown. An overall normalization factor of 1.2 is applied to MG5_aMC+CA3 (Z+1) NLO and MG5_aMC+CA3 (Z+2) NLO. |
png pdf |
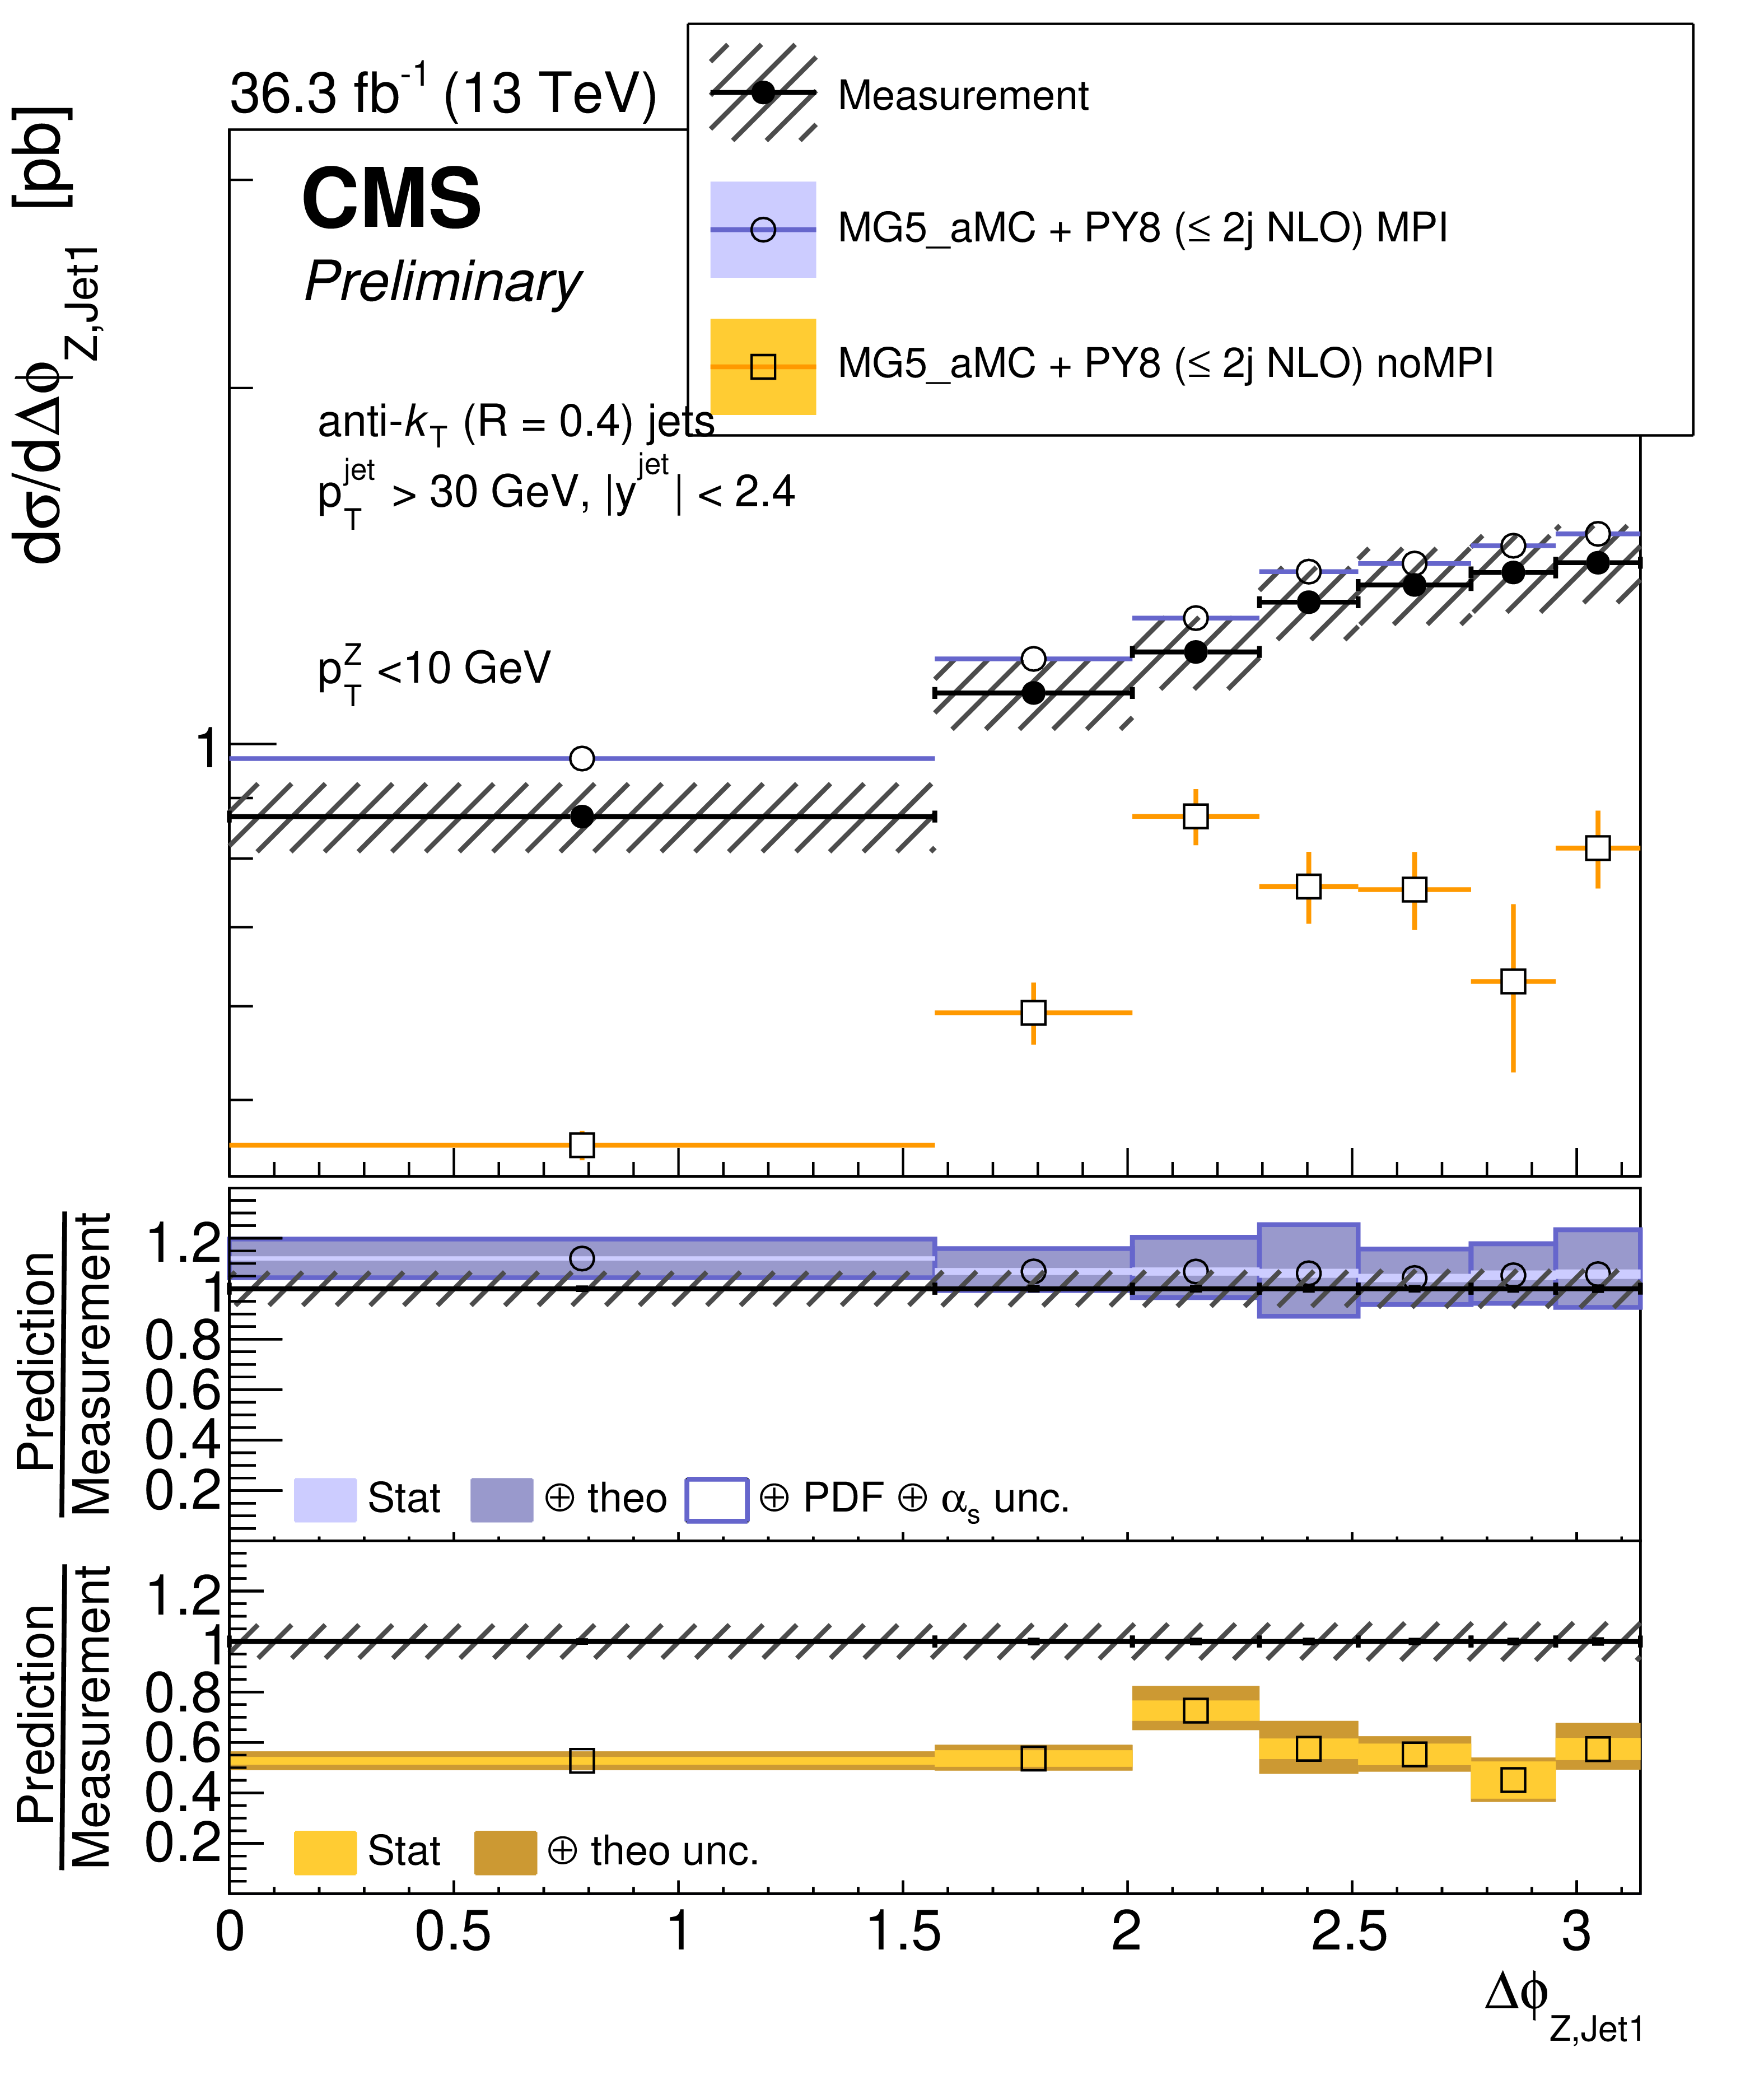
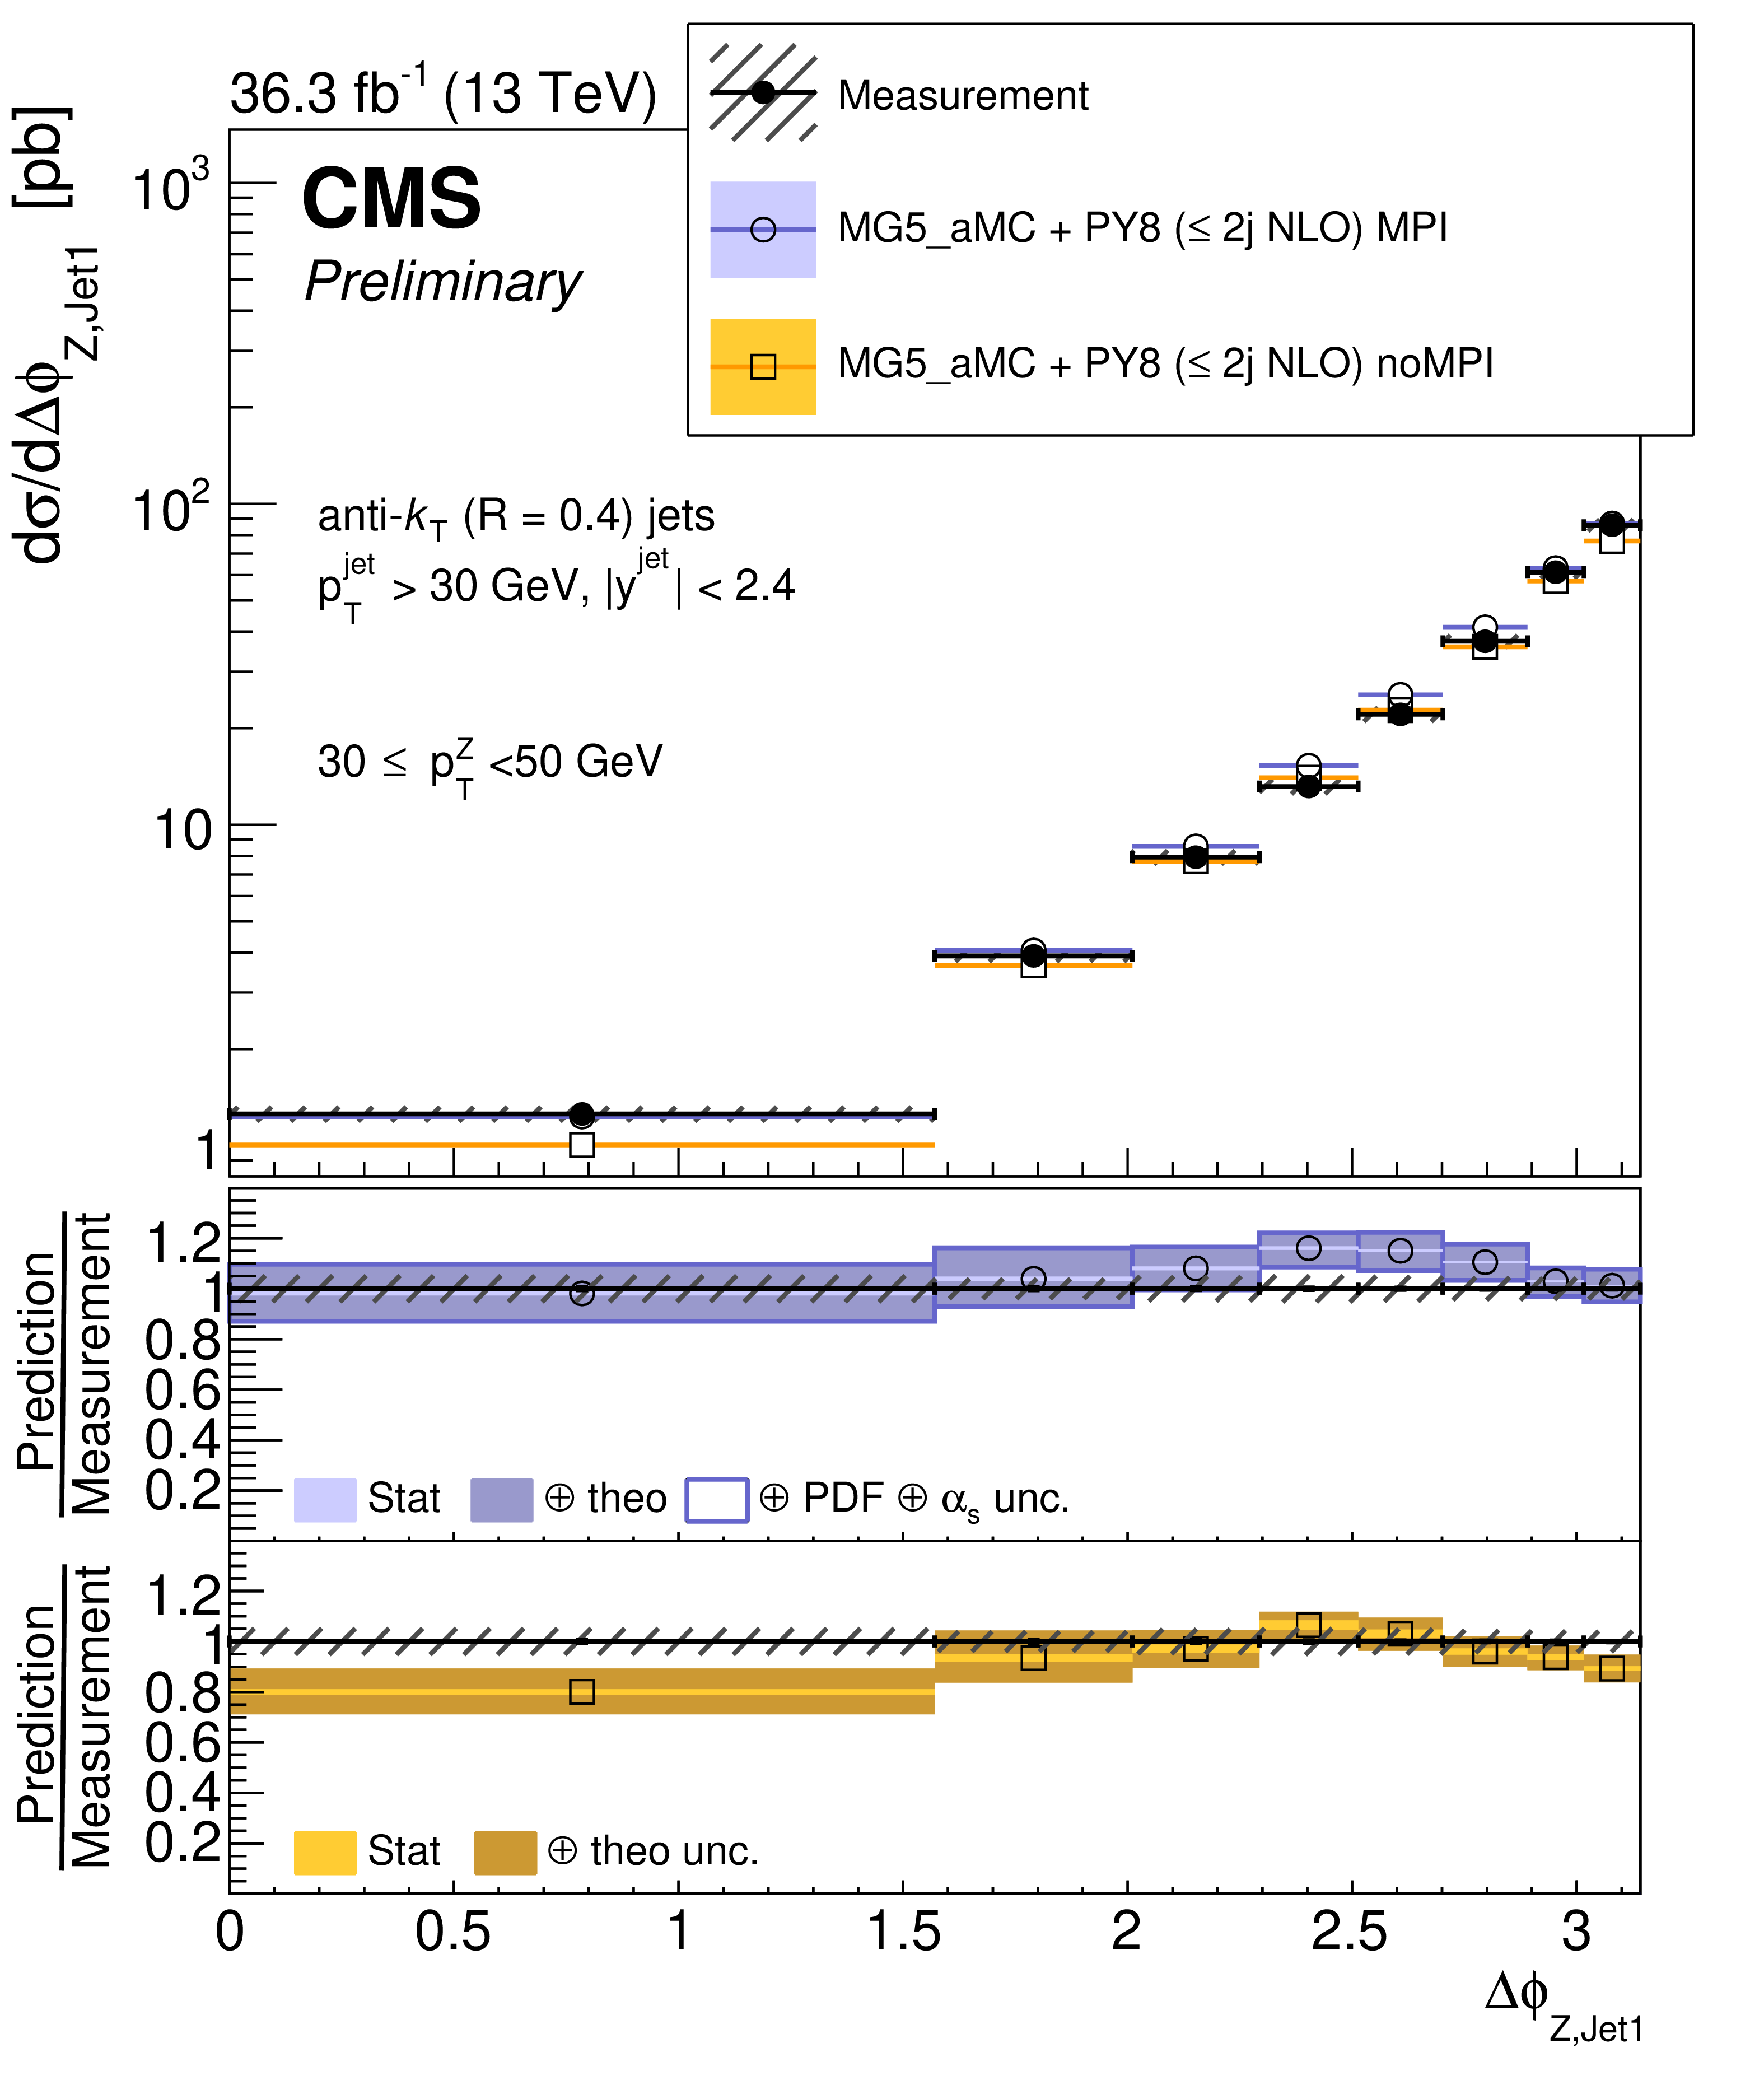
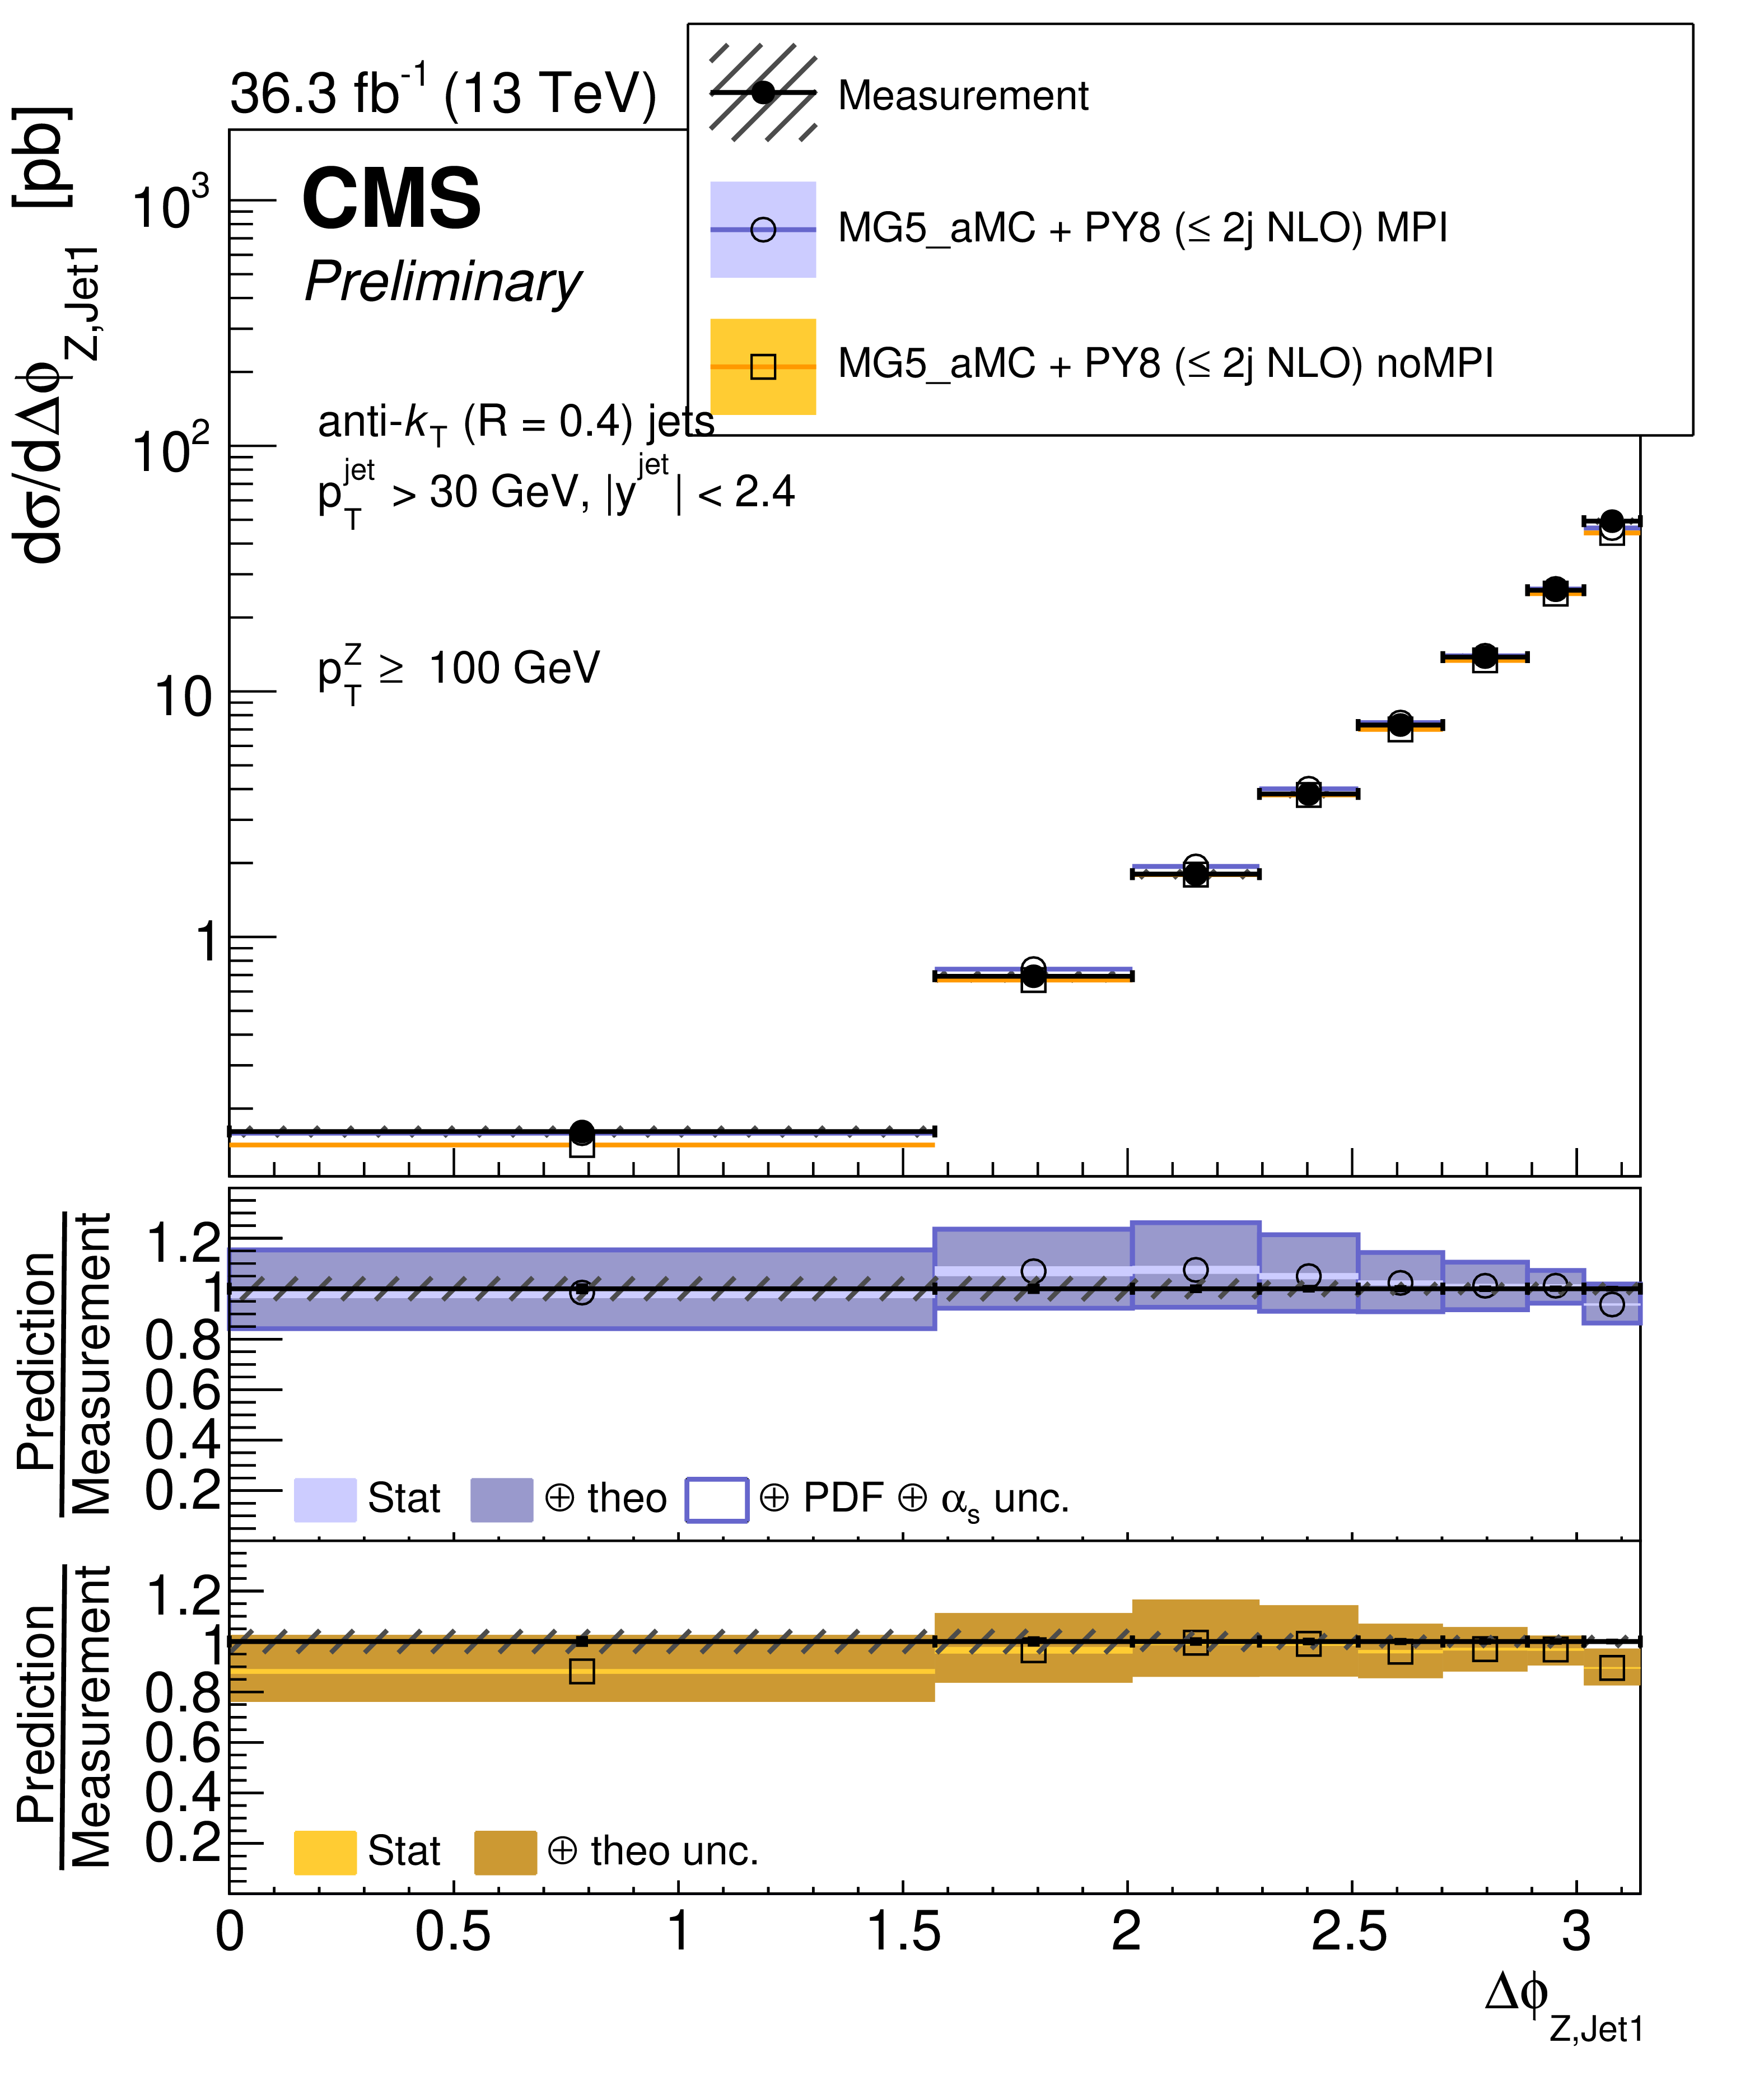
Figure 4:
Cross section as a function of ${\Delta \phi _{\mathrm{Z}, \text{Jet}1}}$ between the Z boson and the leading jet in different ${p_{\mathrm{T}}{(\mathrm{Z})}}$ bins: $ {p_{\mathrm{T}}{(\mathrm{Z})}} \leq $ 10 GeV (left), 30 $\leq {p_{\mathrm{T}}{(\mathrm{Z})}} < $ 50 GeV (middle), 100 GeV $ \leq {p_{\mathrm{T}}{(\mathrm{Z})}} $ (right). The error bars on the data points represent the statistical uncertainty of the measurement, and the hatched band shows the total uncertainties of statistical and systematic sources added in quadrature. Predictions using MG5_aMC+Py8 ($\leq 2j $ NLO) with and without multi-parton interactions are shown. |
png pdf |
Figure 4-a:
Cross section as a function of ${\Delta \phi _{\mathrm{Z}, \text{Jet}1}}$ between the Z boson and the leading jet in different ${p_{\mathrm{T}}{(\mathrm{Z})}}$ bins: $ {p_{\mathrm{T}}{(\mathrm{Z})}} \leq $ 10 GeV (left), 30 $\leq {p_{\mathrm{T}}{(\mathrm{Z})}} < $ 50 GeV (middle), 100 GeV $ \leq {p_{\mathrm{T}}{(\mathrm{Z})}} $ (right). The error bars on the data points represent the statistical uncertainty of the measurement, and the hatched band shows the total uncertainties of statistical and systematic sources added in quadrature. Predictions using MG5_aMC+Py8 ($\leq 2j $ NLO) with and without multi-parton interactions are shown. |
png pdf |
Figure 4-b:
Cross section as a function of ${\Delta \phi _{\mathrm{Z}, \text{Jet}1}}$ between the Z boson and the leading jet in different ${p_{\mathrm{T}}{(\mathrm{Z})}}$ bins: $ {p_{\mathrm{T}}{(\mathrm{Z})}} \leq $ 10 GeV (left), 30 $\leq {p_{\mathrm{T}}{(\mathrm{Z})}} < $ 50 GeV (middle), 100 GeV $ \leq {p_{\mathrm{T}}{(\mathrm{Z})}} $ (right). The error bars on the data points represent the statistical uncertainty of the measurement, and the hatched band shows the total uncertainties of statistical and systematic sources added in quadrature. Predictions using MG5_aMC+Py8 ($\leq 2j $ NLO) with and without multi-parton interactions are shown. |
png pdf |
Figure 4-c:
Cross section as a function of ${\Delta \phi _{\mathrm{Z}, \text{Jet}1}}$ between the Z boson and the leading jet in different ${p_{\mathrm{T}}{(\mathrm{Z})}}$ bins: $ {p_{\mathrm{T}}{(\mathrm{Z})}} \leq $ 10 GeV (left), 30 $\leq {p_{\mathrm{T}}{(\mathrm{Z})}} < $ 50 GeV (middle), 100 GeV $ \leq {p_{\mathrm{T}}{(\mathrm{Z})}} $ (right). The error bars on the data points represent the statistical uncertainty of the measurement, and the hatched band shows the total uncertainties of statistical and systematic sources added in quadrature. Predictions using MG5_aMC+Py8 ($\leq 2j $ NLO) with and without multi-parton interactions are shown. |

png pdf |
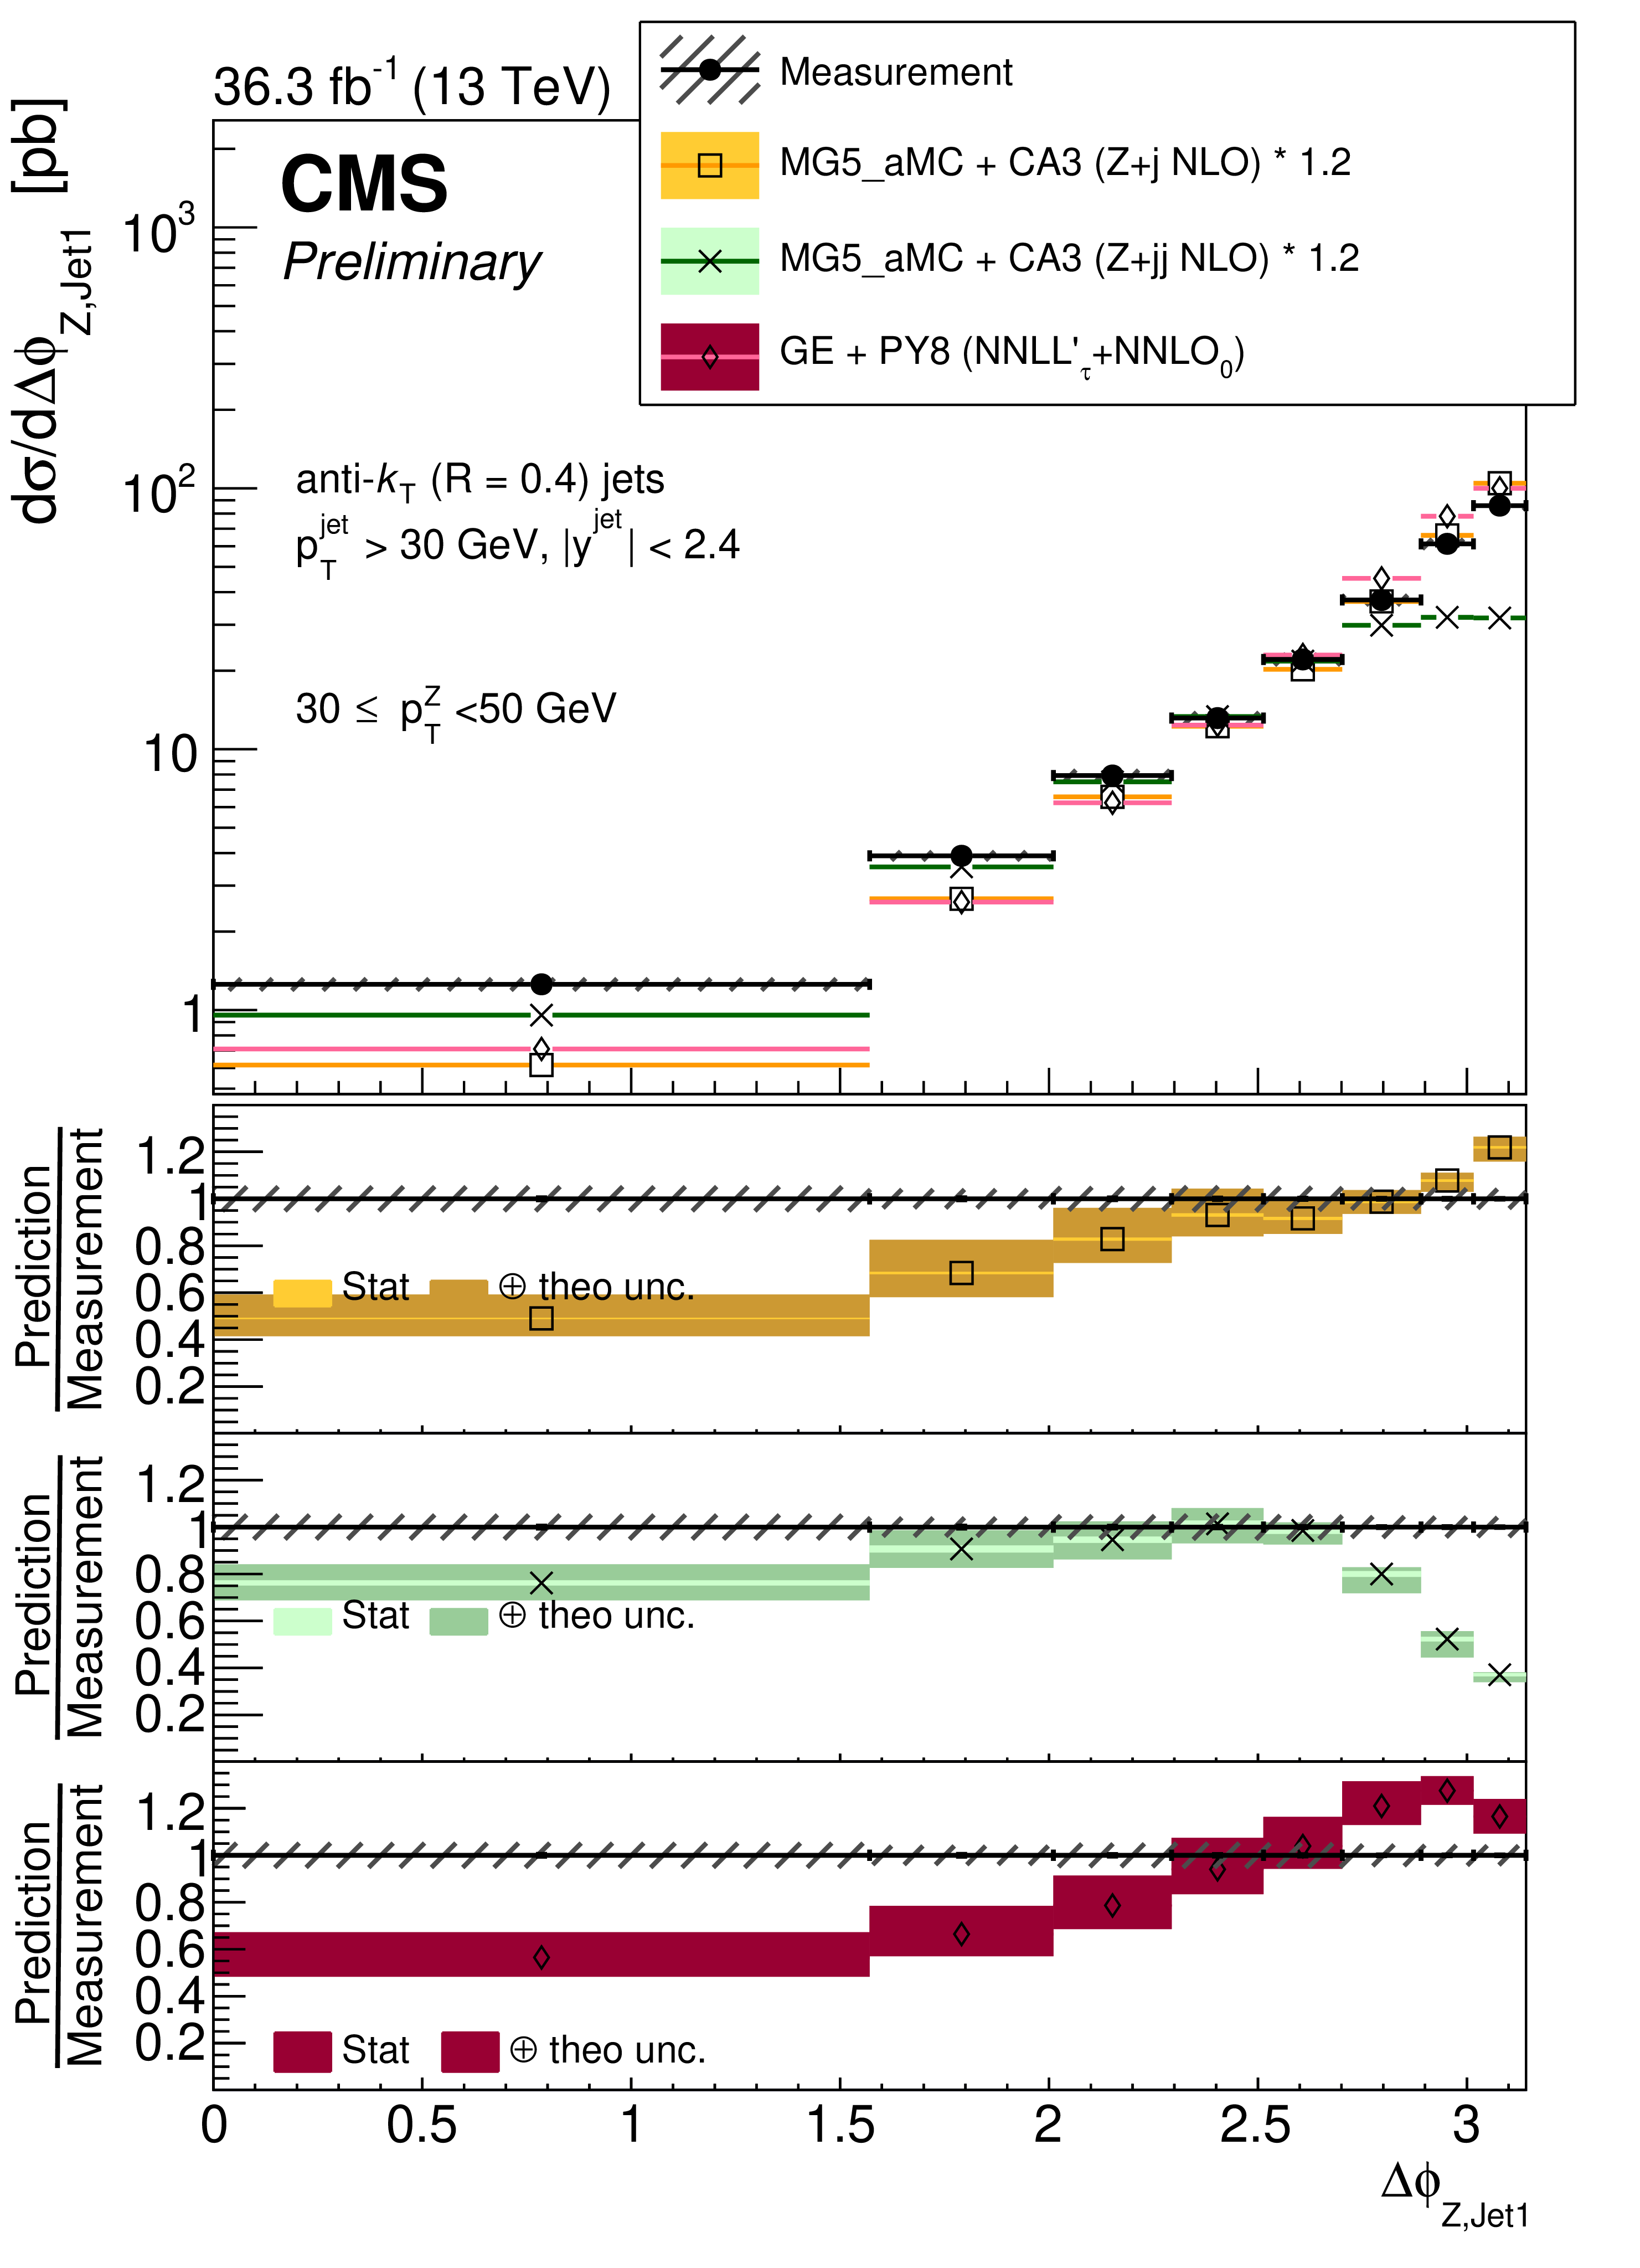
Figure 5:
Cross section as a function of ${\Delta \phi _{\mathrm{Z}, \text{Jet}1}}$ between the Z boson and the leading jet in different ${p_{\mathrm{T}}{(\mathrm{Z})}}$ bins: $ {p_{\mathrm{T}}{(\mathrm{Z})}} \leq $ 10 GeV (left), 30 $\leq {p_{\mathrm{T}}{(\mathrm{Z})}} < $ 50 GeV (middle), 100 GeV $ \leq {p_{\mathrm{T}}{(\mathrm{Z})}} $ (right). Predictions from Geneva NNLO, MG5_aMC+CA3 (Z+1) NLO and MG5_aMC+CA3 (Z+2) NLO are shown. An overall normalization factor of 1.2 is applied to MG5_aMC+CA3 (Z+1) NLO and MG5_aMC+CA3 (Z+2) NLO. |

png pdf |
Figure 5-a:
Cross section as a function of ${\Delta \phi _{\mathrm{Z}, \text{Jet}1}}$ between the Z boson and the leading jet in different ${p_{\mathrm{T}}{(\mathrm{Z})}}$ bins: $ {p_{\mathrm{T}}{(\mathrm{Z})}} \leq $ 10 GeV (left), 30 $\leq {p_{\mathrm{T}}{(\mathrm{Z})}} < $ 50 GeV (middle), 100 GeV $ \leq {p_{\mathrm{T}}{(\mathrm{Z})}} $ (right). Predictions from Geneva NNLO, MG5_aMC+CA3 (Z+1) NLO and MG5_aMC+CA3 (Z+2) NLO are shown. An overall normalization factor of 1.2 is applied to MG5_aMC+CA3 (Z+1) NLO and MG5_aMC+CA3 (Z+2) NLO. |
png pdf |
Figure 5-b:
Cross section as a function of ${\Delta \phi _{\mathrm{Z}, \text{Jet}1}}$ between the Z boson and the leading jet in different ${p_{\mathrm{T}}{(\mathrm{Z})}}$ bins: $ {p_{\mathrm{T}}{(\mathrm{Z})}} \leq $ 10 GeV (left), 30 $\leq {p_{\mathrm{T}}{(\mathrm{Z})}} < $ 50 GeV (middle), 100 GeV $ \leq {p_{\mathrm{T}}{(\mathrm{Z})}} $ (right). Predictions from Geneva NNLO, MG5_aMC+CA3 (Z+1) NLO and MG5_aMC+CA3 (Z+2) NLO are shown. An overall normalization factor of 1.2 is applied to MG5_aMC+CA3 (Z+1) NLO and MG5_aMC+CA3 (Z+2) NLO. |

png pdf |
Figure 5-c:
Cross section as a function of ${\Delta \phi _{\mathrm{Z}, \text{Jet}1}}$ between the Z boson and the leading jet in different ${p_{\mathrm{T}}{(\mathrm{Z})}}$ bins: $ {p_{\mathrm{T}}{(\mathrm{Z})}} \leq $ 10 GeV (left), 30 $\leq {p_{\mathrm{T}}{(\mathrm{Z})}} < $ 50 GeV (middle), 100 GeV $ \leq {p_{\mathrm{T}}{(\mathrm{Z})}} $ (right). Predictions from Geneva NNLO, MG5_aMC+CA3 (Z+1) NLO and MG5_aMC+CA3 (Z+2) NLO are shown. An overall normalization factor of 1.2 is applied to MG5_aMC+CA3 (Z+1) NLO and MG5_aMC+CA3 (Z+2) NLO. |

png pdf |
Figure 6:
Cross section as a function of ${\Delta \phi (j_1j_2)}$ between two leading jets in different ${p_{\mathrm{T}}{(\mathrm{Z})}}$ regions: $ {p_{\mathrm{T}}{(\mathrm{Z})}} \leq $ 10 GeV (left), 30 $\leq {p_{\mathrm{T}}{(\mathrm{Z})}} < $ 50 GeV (middle), 100 GeV $ \leq {p_{\mathrm{T}}{(\mathrm{Z})}} $ (right). The error bars on the data points represent the statistical uncertainty of the measurement, and the hatched band shows the total uncertainties of statistical and systematic sources added in quadrature. Predictions using MG5_aMC+Py8 ($\leq 2j $ NLO) with and without multi-parton interactions are shown. |

png pdf |
Figure 6-a:
Cross section as a function of ${\Delta \phi (j_1j_2)}$ between two leading jets in different ${p_{\mathrm{T}}{(\mathrm{Z})}}$ regions: $ {p_{\mathrm{T}}{(\mathrm{Z})}} \leq $ 10 GeV (left), 30 $\leq {p_{\mathrm{T}}{(\mathrm{Z})}} < $ 50 GeV (middle), 100 GeV $ \leq {p_{\mathrm{T}}{(\mathrm{Z})}} $ (right). The error bars on the data points represent the statistical uncertainty of the measurement, and the hatched band shows the total uncertainties of statistical and systematic sources added in quadrature. Predictions using MG5_aMC+Py8 ($\leq 2j $ NLO) with and without multi-parton interactions are shown. |

png pdf |
Figure 6-b:
Cross section as a function of ${\Delta \phi (j_1j_2)}$ between two leading jets in different ${p_{\mathrm{T}}{(\mathrm{Z})}}$ regions: $ {p_{\mathrm{T}}{(\mathrm{Z})}} \leq $ 10 GeV (left), 30 $\leq {p_{\mathrm{T}}{(\mathrm{Z})}} < $ 50 GeV (middle), 100 GeV $ \leq {p_{\mathrm{T}}{(\mathrm{Z})}} $ (right). The error bars on the data points represent the statistical uncertainty of the measurement, and the hatched band shows the total uncertainties of statistical and systematic sources added in quadrature. Predictions using MG5_aMC+Py8 ($\leq 2j $ NLO) with and without multi-parton interactions are shown. |

png pdf |
Figure 6-c:
Cross section as a function of ${\Delta \phi (j_1j_2)}$ between two leading jets in different ${p_{\mathrm{T}}{(\mathrm{Z})}}$ regions: $ {p_{\mathrm{T}}{(\mathrm{Z})}} \leq $ 10 GeV (left), 30 $\leq {p_{\mathrm{T}}{(\mathrm{Z})}} < $ 50 GeV (middle), 100 GeV $ \leq {p_{\mathrm{T}}{(\mathrm{Z})}} $ (right). The error bars on the data points represent the statistical uncertainty of the measurement, and the hatched band shows the total uncertainties of statistical and systematic sources added in quadrature. Predictions using MG5_aMC+Py8 ($\leq 2j $ NLO) with and without multi-parton interactions are shown. |

png pdf |
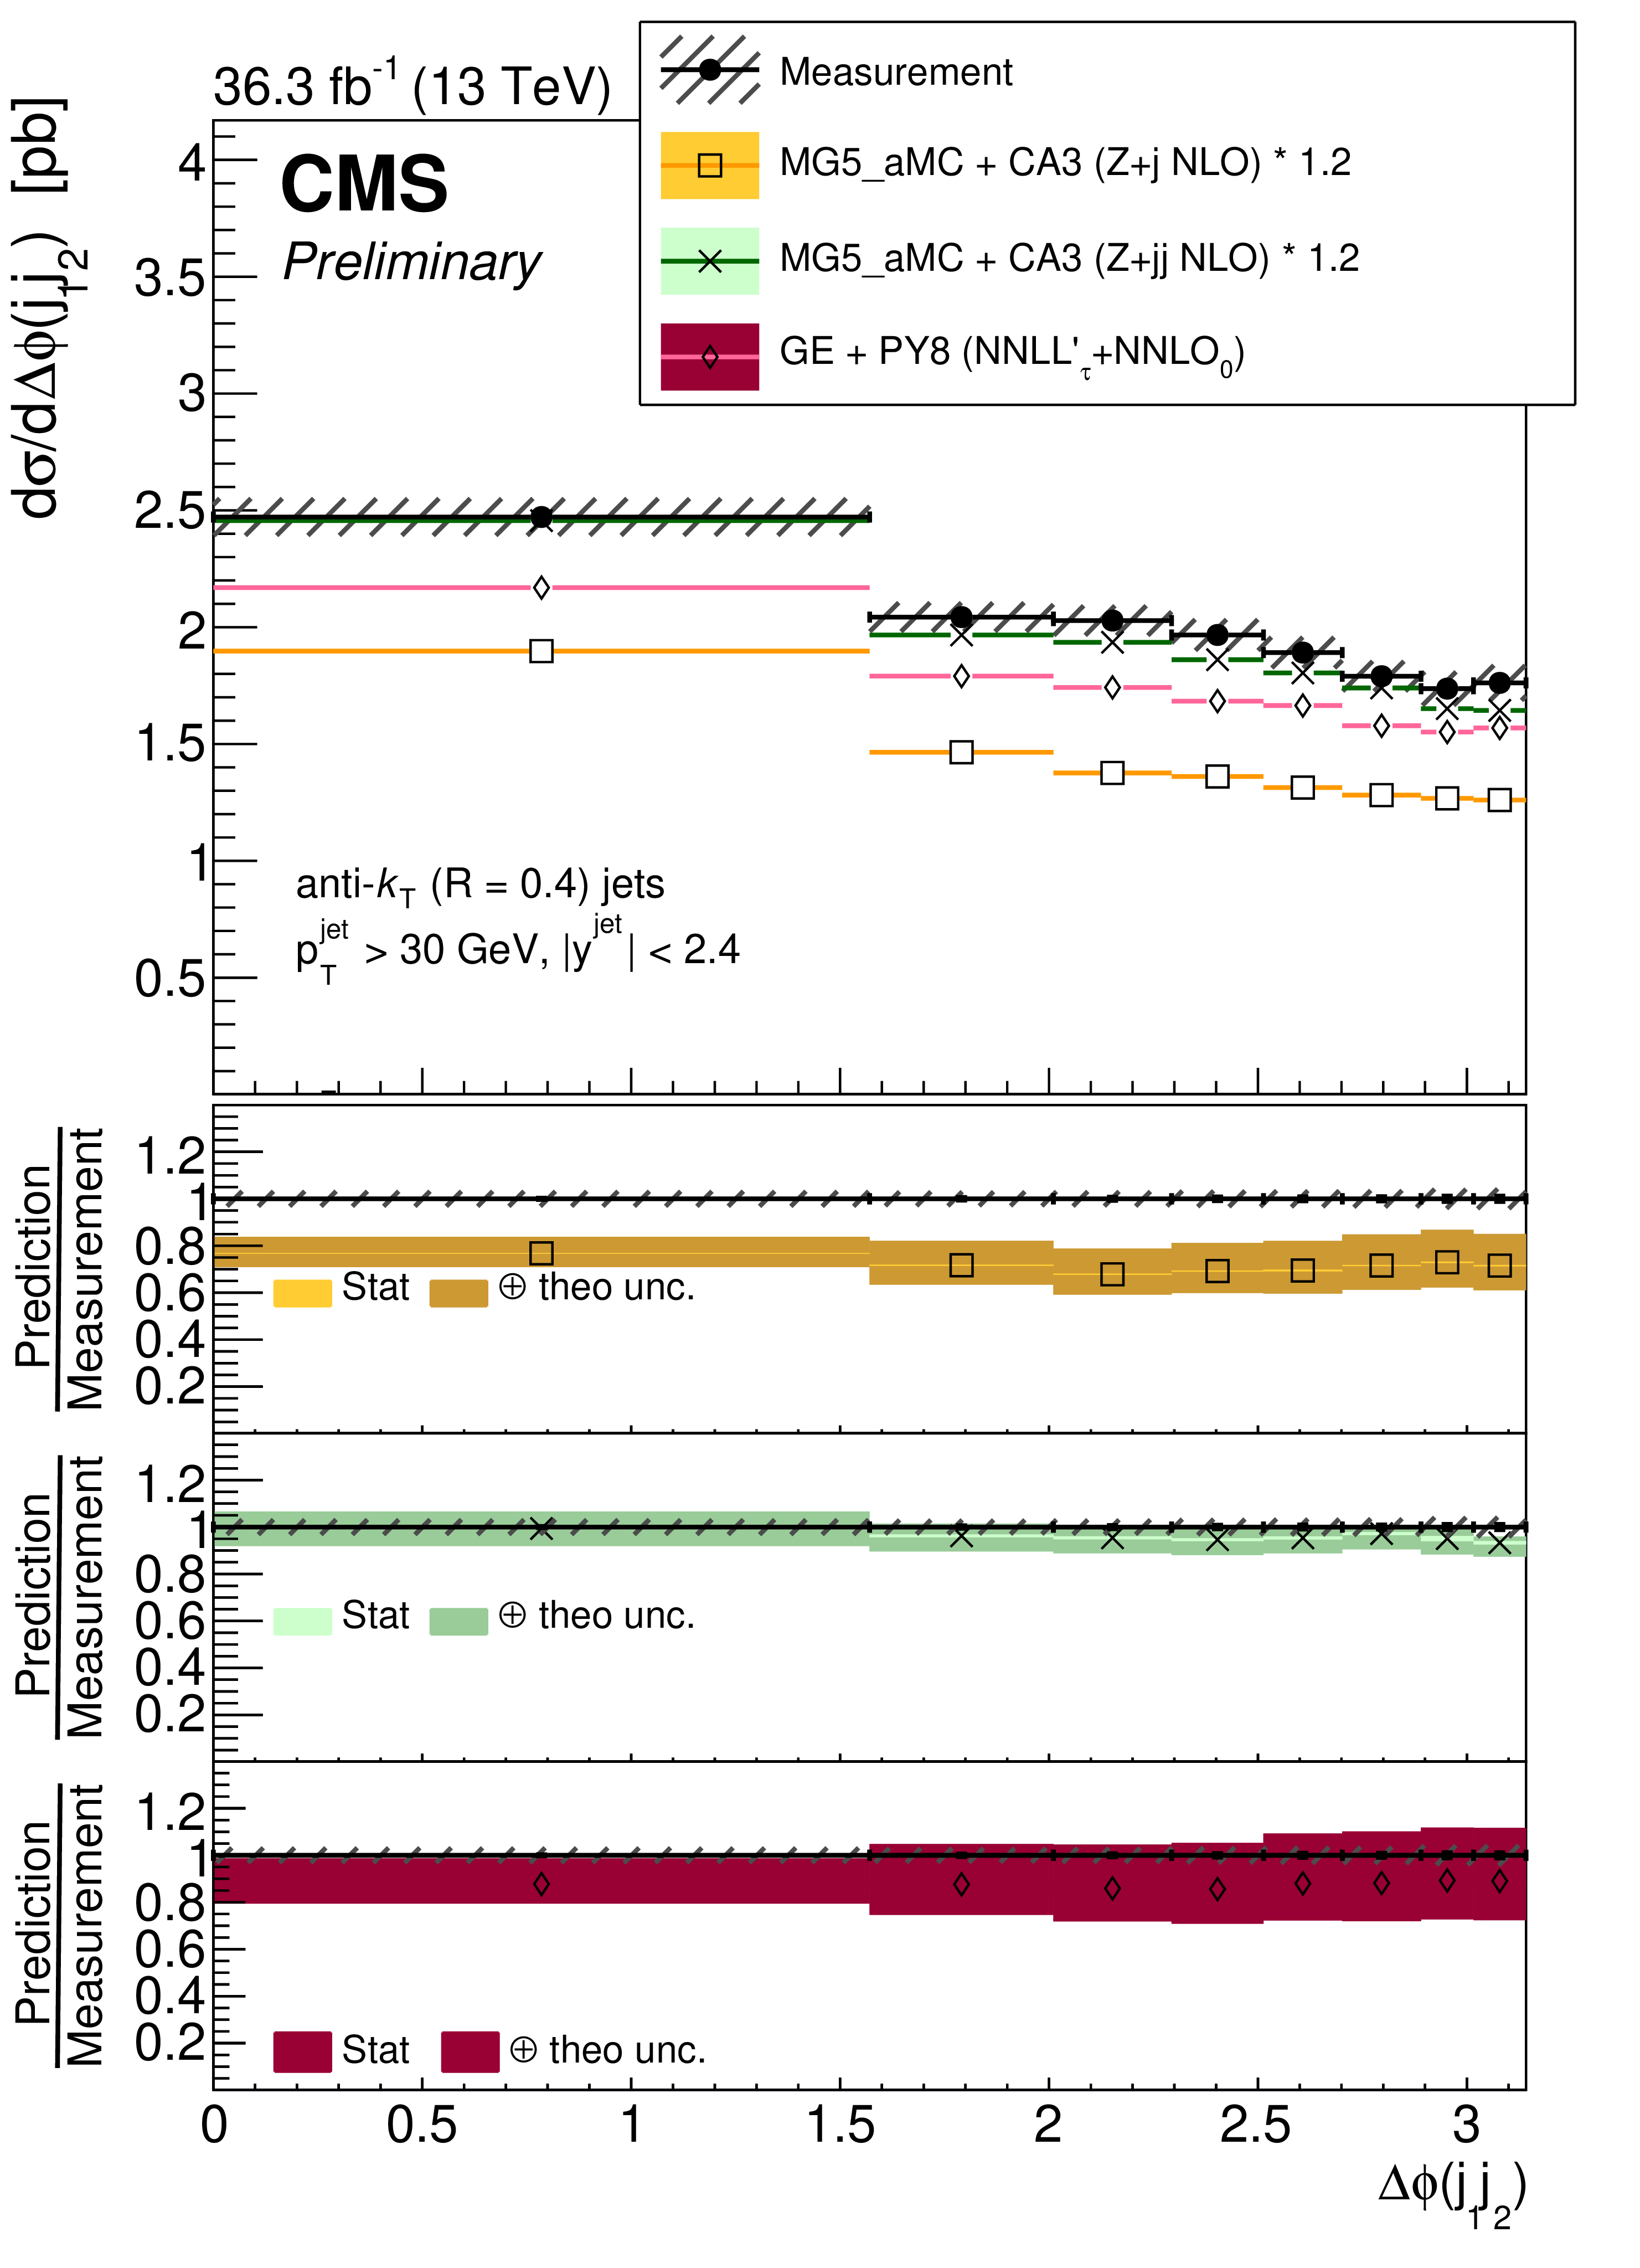
Figure 7:
Cross section as a function of ${\Delta \phi (j_1j_2)}$ between two leading jets in different ${p_{\mathrm{T}}{(\mathrm{Z})}}$ regions: $ {p_{\mathrm{T}}{(\mathrm{Z})}} \leq $ 10 GeV (left), 30 $\leq {p_{\mathrm{T}}{(\mathrm{Z})}} < $ 50 GeV (middle), 100 GeV $ \leq {p_{\mathrm{T}}{(\mathrm{Z})}} $(right). Predictions from Geneva NNLO, MG5_aMC+CA3 (Z+1) NLO and MG5_aMC+CA3 (Z+2) NLO are shown. An overall normalization factor of 1.2 is applied to MG5_aMC+CA3 (Z+1) NLO and MG5_aMC+CA3 (Z+2) NLO. |

png pdf |
Figure 7-a:
Cross section as a function of ${\Delta \phi (j_1j_2)}$ between two leading jets in different ${p_{\mathrm{T}}{(\mathrm{Z})}}$ regions: $ {p_{\mathrm{T}}{(\mathrm{Z})}} \leq $ 10 GeV (left), 30 $\leq {p_{\mathrm{T}}{(\mathrm{Z})}} < $ 50 GeV (middle), 100 GeV $ \leq {p_{\mathrm{T}}{(\mathrm{Z})}} $(right). Predictions from Geneva NNLO, MG5_aMC+CA3 (Z+1) NLO and MG5_aMC+CA3 (Z+2) NLO are shown. An overall normalization factor of 1.2 is applied to MG5_aMC+CA3 (Z+1) NLO and MG5_aMC+CA3 (Z+2) NLO. |

png pdf |
Figure 7-b:
Cross section as a function of ${\Delta \phi (j_1j_2)}$ between two leading jets in different ${p_{\mathrm{T}}{(\mathrm{Z})}}$ regions: $ {p_{\mathrm{T}}{(\mathrm{Z})}} \leq $ 10 GeV (left), 30 $\leq {p_{\mathrm{T}}{(\mathrm{Z})}} < $ 50 GeV (middle), 100 GeV $ \leq {p_{\mathrm{T}}{(\mathrm{Z})}} $(right). Predictions from Geneva NNLO, MG5_aMC+CA3 (Z+1) NLO and MG5_aMC+CA3 (Z+2) NLO are shown. An overall normalization factor of 1.2 is applied to MG5_aMC+CA3 (Z+1) NLO and MG5_aMC+CA3 (Z+2) NLO. |
png pdf |
Figure 7-c:
Cross section as a function of ${\Delta \phi (j_1j_2)}$ between two leading jets in different ${p_{\mathrm{T}}{(\mathrm{Z})}}$ regions: $ {p_{\mathrm{T}}{(\mathrm{Z})}} \leq $ 10 GeV (left), 30 $\leq {p_{\mathrm{T}}{(\mathrm{Z})}} < $ 50 GeV (middle), 100 GeV $ \leq {p_{\mathrm{T}}{(\mathrm{Z})}} $(right). Predictions from Geneva NNLO, MG5_aMC+CA3 (Z+1) NLO and MG5_aMC+CA3 (Z+2) NLO are shown. An overall normalization factor of 1.2 is applied to MG5_aMC+CA3 (Z+1) NLO and MG5_aMC+CA3 (Z+2) NLO. |
| Tables | |

png pdf |
Table 1:
Description of the simulated samples used in the analysis. |

png pdf |
Table 2:
Phase space of the measurement at particle level. |
| Summary |
|
We have measured Z+jet production in pp collisions at the LHC at a center-of-mass energy of 13 TeV. The associated jet multiplicity for different regions of the transverse momentum of the Z boson, ${p_{\mathrm{T}}}^{\mathrm{Z}}$, has been measured. At ${p_{\mathrm{T}}}^{\mathrm{Z}} \leq $ 10 GeV only about 1% of the event have jets with ${p_{\mathrm{T}}} > $ 30 GeV, with a non-negligible tail to high multiplicity. At 30 $ \leq {p_{\mathrm{T}}}^{\mathrm{Z}} \leq $ 50 GeV most of the events have at least one jet with a significant tail to higher jet multiplicities. The angular correlation, ${\Delta\phi_{\mathrm{Z}, \text{Jet}1}} $, between the Z boson and the leading jet as well as correlation between the two leading jets has been measured for different regions in ${p_{\mathrm{T}}}^{\mathrm{Z}}$. At low ${p_{\mathrm{T}}}^{\mathrm{Z}}$ the Z boson is only loosely correlated with the jets, while the two jets are strongly correlated. At large ${p_{\mathrm{T}}}^{\mathrm{Z}}$ the Z boson is highly correlated with the leading jet, while the two leading jets are not strongly correlated. The measurement shows a region at low ${p_{\mathrm{T}}}^{\mathrm{Z}}$, where the Z boson appears as an EW correction to high ${p_{\mathrm{T}}}$ jet production, while at large ${p_{\mathrm{T}}}^{\mathrm{Z}}$ the dominant process is Z+1 noncollinear hard parton production. The NLO prediction of MG5_aMC+Py8 ($\leq 2j $ NLO) with Z+0,1,2 noncollinear hard partons supplemented with parton shower and underlying events from PYTHIAE merged with the FxFx procedure describes the measurement well. The predictions of MG5_aMC+CA3 (Z+1) NLO and MG5_aMC+CA3 (Z+2) NLO using PB-TMDs with the corresponding parton showers are close to the measurments, keeping in mind that the parameters of the initial state parton shower are fixed by the PB-TMD and no MPI is simulated. The prediction from Geneva NNLO using matrix elements at NNLO for Z production supplemented with resummation, parton shower and MPI from PYTHIA 8 is in most regions close to the measurements. In summary, Z+jet measurements challenge theoretical predictions; a good agreement can be achieved including contributions of multiparton interactions, parton shower, parton densities as well as multijet matrix-element merging. The differential measurements provided here help to disentangle the different contributions, and illustrate where which contribution becomes important. |
| References | ||||
| 1 | R. K. Ellis, G. Martinelli, and R. Petronzio | Lepton Pair Production at Large Transverse Momentum in Second Order QCD | NPB 211 (1983) 106 | |
| 2 | J. C. Collins, D. E. Soper, and G. F. Sterman | Transverse Momentum Distribution in Drell-Yan Pair and W and Z Boson production | NPB 250 (1985) 199 | |
| 3 | W. Bizon et al. | The transverse momentum spectrum of weak gauge bosons at N $ {}^3 $ LL + NNLO | EPJC 79 (2019) 868 | 1905.05171 |
| 4 | A. Bermudez Martinez et al. | Production of Z-bosons in the parton branching method | PRD 100 (2019) 074027 | 1906.00919 |
| 5 | CMS Collaboration | Measurements of differential Z boson production cross sections in proton-proton collisions at $ \sqrt{s} = $ 13 TeV | JHEP 12 (2019) 061 | CMS-SMP-17-010 1909.04133 |
| 6 | CDF Collaboration | Measurement of inclusive jet cross-sections in $ Z/\gamma^* \to e^{+} e^{-} $ + jets production in $ p \bar{p} $ collisions at $ \sqrt{s} = $ 1.96-TeV | PRL 100 (2008) 102001 | 0711.3717 |
| 7 | ATLAS Collaboration | Measurement of the production cross section of jets in association with a Z boson in pp collisions at $ \sqrt{s} = $ 7 TeV with the ATLAS detector | JHEP 07 (2013) 032 | 1304.7098 |
| 8 | ATLAS Collaboration | Measurement of the production cross section for Z/gamma* in association with jets in $ pp $ collisions at $ \sqrt{s}= $ 7 TeV with the ATLAS detector | PRD 85 (2012) 032009 | 1111.2690 |
| 9 | CMS Collaboration | Measurements of jet multiplicity and differential production cross sections of $ Z + $ jets events in proton-proton collisions at $ \sqrt{s} = $ 7 TeV | PRD 91 (2015) 052008 | CMS-SMP-12-017 1408.3104 |
| 10 | CMS Collaboration | Jet Production Rates in Association with $ W $ and $ Z $ Bosons in $ pp $ Collisions at $ \sqrt{s}= $ 7 TeV | JHEP 01 (2012) 010 | CMS-EWK-10-012 1110.3226 |
| 11 | CMS Collaboration | Event Shapes and Azimuthal Correlations in $ Z $ + Jets Events in $ pp $ Collisions at $ \sqrt{s}= $ 7 TeV | PLB 722 (2013) 238 | CMS-EWK-11-021 1301.1646 |
| 12 | LHCb Collaboration | Study of forward Z + jet production in pp collisions at $ \sqrt{s} = $ 7 TeV | JHEP 01 (2014) 033 | 1310.8197 |
| 13 | CMS Collaboration | Measurements of differential production cross sections for a Z boson in association with jets in pp collisions at $ \sqrt{s}= $ 8 TeV | JHEP 04 (2017) 022 | CMS-SMP-14-013 1611.03844 |
| 14 | ATLAS Collaboration | Measurement of the inclusive cross-section for the production of jets in association with a Z boson in proton-proton collisions at 8 TeV using the ATLAS detector | EPJC 79 (2019) 847 | 1907.06728 |
| 15 | CMS Collaboration | Measurement of differential cross sections for Z boson production in association with jets in proton-proton collisions at $ \sqrt{s} = $ 13 TeV | EPJC 78 (2018) 965 | CMS-SMP-16-015 1804.05252 |
| 16 | ATLAS Collaboration | Measurements of the production cross section of a $ Z $ boson in association with jets in pp collisions at $ \sqrt{s} = $ 13 TeV with the ATLAS detector | EPJC 77 (2017) 361 | 1702.05725 |
| 17 | F. Hautmann et al. | Collinear and TMD quark and gluon densities from Parton Branching solution of QCD evolution equations | JHEP 01 (2018) 070 | 1708.03279 |
| 18 | F. Hautmann et al. | Soft-gluon resolution scale in QCD evolution equations | PLB 772 (2017) 446 | 1704.01757 |
| 19 | A. Bermudez Martinez et al. | Collinear and TMD parton densities from fits to precision DIS measurements in the parton branching method | PRD 99 (2019) 074008 | 1804.11152 |
| 20 | S. Baranov et al. | CASCADE3 A Monte Carlo event generator based on TMDs | EPJC 81 (2021) 425 | 2101.10221 |
| 21 | S. Alioli, C. W. Bauer, S. Guns, and F. J. Tackmann | Underlying event sensitive observables in Drell-Yan production using GENEVA | EPJC 76 (2016) 614 | 1605.07192 |
| 22 | S. Alioli et al. | Drell-Yan production at NNLL$ ' $+NNLO matched to parton showers | PRD 92 (2015) 094020 | 1508.01475 |
| 23 | S. Alioli et al. | Matching Fully Differential NNLO Calculations and Parton Showers | JHEP 06 (2014) 089 | 1311.0286 |
| 24 | S. Alioli et al. | Combining Higher-Order Resummation with Multiple NLO Calculations and Parton Showers in GENEVA | JHEP 09 (2013) 120 | 1211.7049 |
| 25 | CMS Collaboration | Performance of the CMS Level-1 trigger in proton-proton collisions at $ \sqrt{s} = $ 13 TeV | JINST 15 (2020) P10017 | CMS-TRG-17-001 2006.10165 |
| 26 | CMS Collaboration | The CMS trigger system | JINST 12 (2017) P01020 | CMS-TRG-12-001 1609.02366 |
| 27 | CMS Collaboration | Particle-flow reconstruction and global event description with the cms detector | JINST 12 (2017) P10003 | CMS-PRF-14-001 1706.04965 |
| 28 | M. Cacciari, G. P. Salam, and G. Soyez | The Anti-k(t) jet clustering algorithm | JHEP 04 (2008) 063 | 0802.1189 |
| 29 | CMS Collaboration | Jet energy scale and resolution in the CMS experiment in pp collisions at 8 TeV | JINST 12 (2017) P02014 | CMS-JME-13-004 1607.03663 |
| 30 | CMS Collaboration | Performance of electron reconstruction and selection with the CMS detector in proton-proton collisions at $ \sqrt{s} = $ 8 TeV | JINST 10 (2015) P06005 | CMS-EGM-13-001 1502.02701 |
| 31 | CMS Collaboration | Performance of the CMS muon detector and muon reconstruction with proton-proton collisions at $ \sqrt{s}= $ 13 TeV | JINST 13 (2018) P06015 | CMS-MUO-16-001 1804.04528 |
| 32 | CMS Collaboration | The CMS experiment at the CERN LHC | JINST 3 (2008) S08004 | CMS-00-001 |
| 33 | J. Alwall et al. | The automated computation of tree-level and next-to-leading order differential cross sections, and their matching to parton shower simulations | JHEP 07 (2014) 079 | 1405.0301 |
| 34 | T. Sjostrand et al. | An introduction to PYTHIA 8.2 | CPC 191 (2015) 159 | 1410.3012 |
| 35 | CMS Collaboration | Event generator tunes obtained from underlying event and multiparton scattering measurements | EPJC 76 (2016) 155 | CMS-GEN-14-001 1512.00815 |
| 36 | R. Frederix and S. Frixione | Merging meets matching in MC@NLO | JHEP 12 (2012) 061 | 1209.6215 |
| 37 | NNPDF Collaboration | Parton distributions for the LHC Run II | JHEP 04 (2015) 040 | 1410.8849 |
| 38 | T. Sjostrand, S. Mrenna, and P. Skands | PYTHIA 6.4 physics and manual | JHEP 05 (2006) 026 | hep-ph/0603175 |
| 39 | NNPDF Collaboration | Parton distributions from high-precision collider data | EPJC 77 (2017) 663 | 1706.00428 |
| 40 | GEANT4 Collaboration | GEANT4 -- a simulation toolkit | NIMA 506 (2003) 250 | |
| 41 | P. Nason | A New method for combining NLO QCD with shower Monte Carlo algorithms | JHEP 11 (2004) 040 | hep-ph/0409146 |
| 42 | S. Frixione, P. Nason, and C. Oleari | Matching NLO QCD computations with parton shower simulations: the POWHEG method | JHEP 11 (2007) 070 | 0709.2092 |
| 43 | S. Alioli, P. Nason, C. Oleari, and E. Re | A general framework for implementing NLO calculations in shower Monte Carlo programs: the POWHEG BOX | JHEP 06 (2010) 043 | 1002.2581 |
| 44 | E. Re | Single-top Wt-channel production matched with parton showers using the POWHEG method | EPJC 71 (2011) 1547 | 1009.2450 |
| 45 | S. Alioli, P. Nason, C. Oleari, and E. Re | NLO single-top production matched with shower in POWHEG:s- andt-channel contributions | JHEP 09 (2009) 111 | 0907.4076 |
| 46 | S. Frixione, P. Nason, and G. Ridolfi | A Positive-weight next-to-leading-order Monte Carlo for heavy flavour hadroproduction | JHEP 09 (2007) 126 | 0707.3088 |
| 47 | M. Czakon and A. Mitov | Top++: A Program for the Calculation of the Top-Pair Cross-Section at Hadron Colliders | CPC 185 (2014) 2930 | 1112.5675 |
| 48 | G. D'Agostini | A Multidimensional unfolding method based on Bayes' theorem | NIMA 362 (1995) 487 | |
| 49 | CMS Collaboration | Precision luminosity measurement in proton-proton collisions at $ \sqrt{s} = $ 13 TeV in 2015 and 2016 at CMS | CMS-LUM-17-003 2104.01927 |
|
| 50 | A. Valassi | Combining correlated measurements of several different physical quantities | NIM500 (2003) 391 | |
|
|
Compact Muon Solenoid LHC, CERN |
|

|

|

|

|

|