

Compact Muon Solenoid
LHC, CERN
| CMS-SMP-21-003 ; CERN-EP-2022-178 | ||
| Azimuthal correlations in Z+jets events in proton-proton collisions at $ \sqrt{s} = $ 13 TeV | ||
| CMS Collaboration | ||
| 28 October 2022 | ||
| Eur. Phys. J. C 83 (2023) 722 | ||
| Abstract: The production of Z bosons associated with jets is measured in pp collisions at $ \sqrt{s}= $ 13 TeV with data recorded with the CMS experiment at the LHC corresponding to an integrated luminosity of 36.3 fb$ ^{-1} $. The multiplicity of jets with transverse momentum $ p_{\mathrm{T}} > $ 30 GeV is measured for different regions of the Z boson's $ p_{\mathrm{T}}(\mathrm{Z}) $, from lower than 10 GeV to higher than 100 GeV. The azimuthal correlation $ \Delta \phi $ between the Z boson and the leading jet, as well as the correlations between the two leading jets are measured in three regions of $ p_{\mathrm{T}}(\mathrm{Z}) $. The measurements are compared with several predictions at leading and next-to-leading orders, interfaced with parton showers. Predictions based on transverse-momentum dependent parton distributions and corresponding parton showers give a good description of the measurement in the regions where multiple parton interactions and higher jet multiplicities are not important. The effects of multiple parton interactions are shown to be important to correctly describe the measured spectra in the low $ p_{\mathrm{T}}(\mathrm{Z}) $ regions. | ||
| Links: e-print arXiv:2210.16139 [hep-ex] (PDF) ; CDS record ; inSPIRE record ; HepData record ; CADI line (restricted) ; | ||
| Figures | |
png pdf |
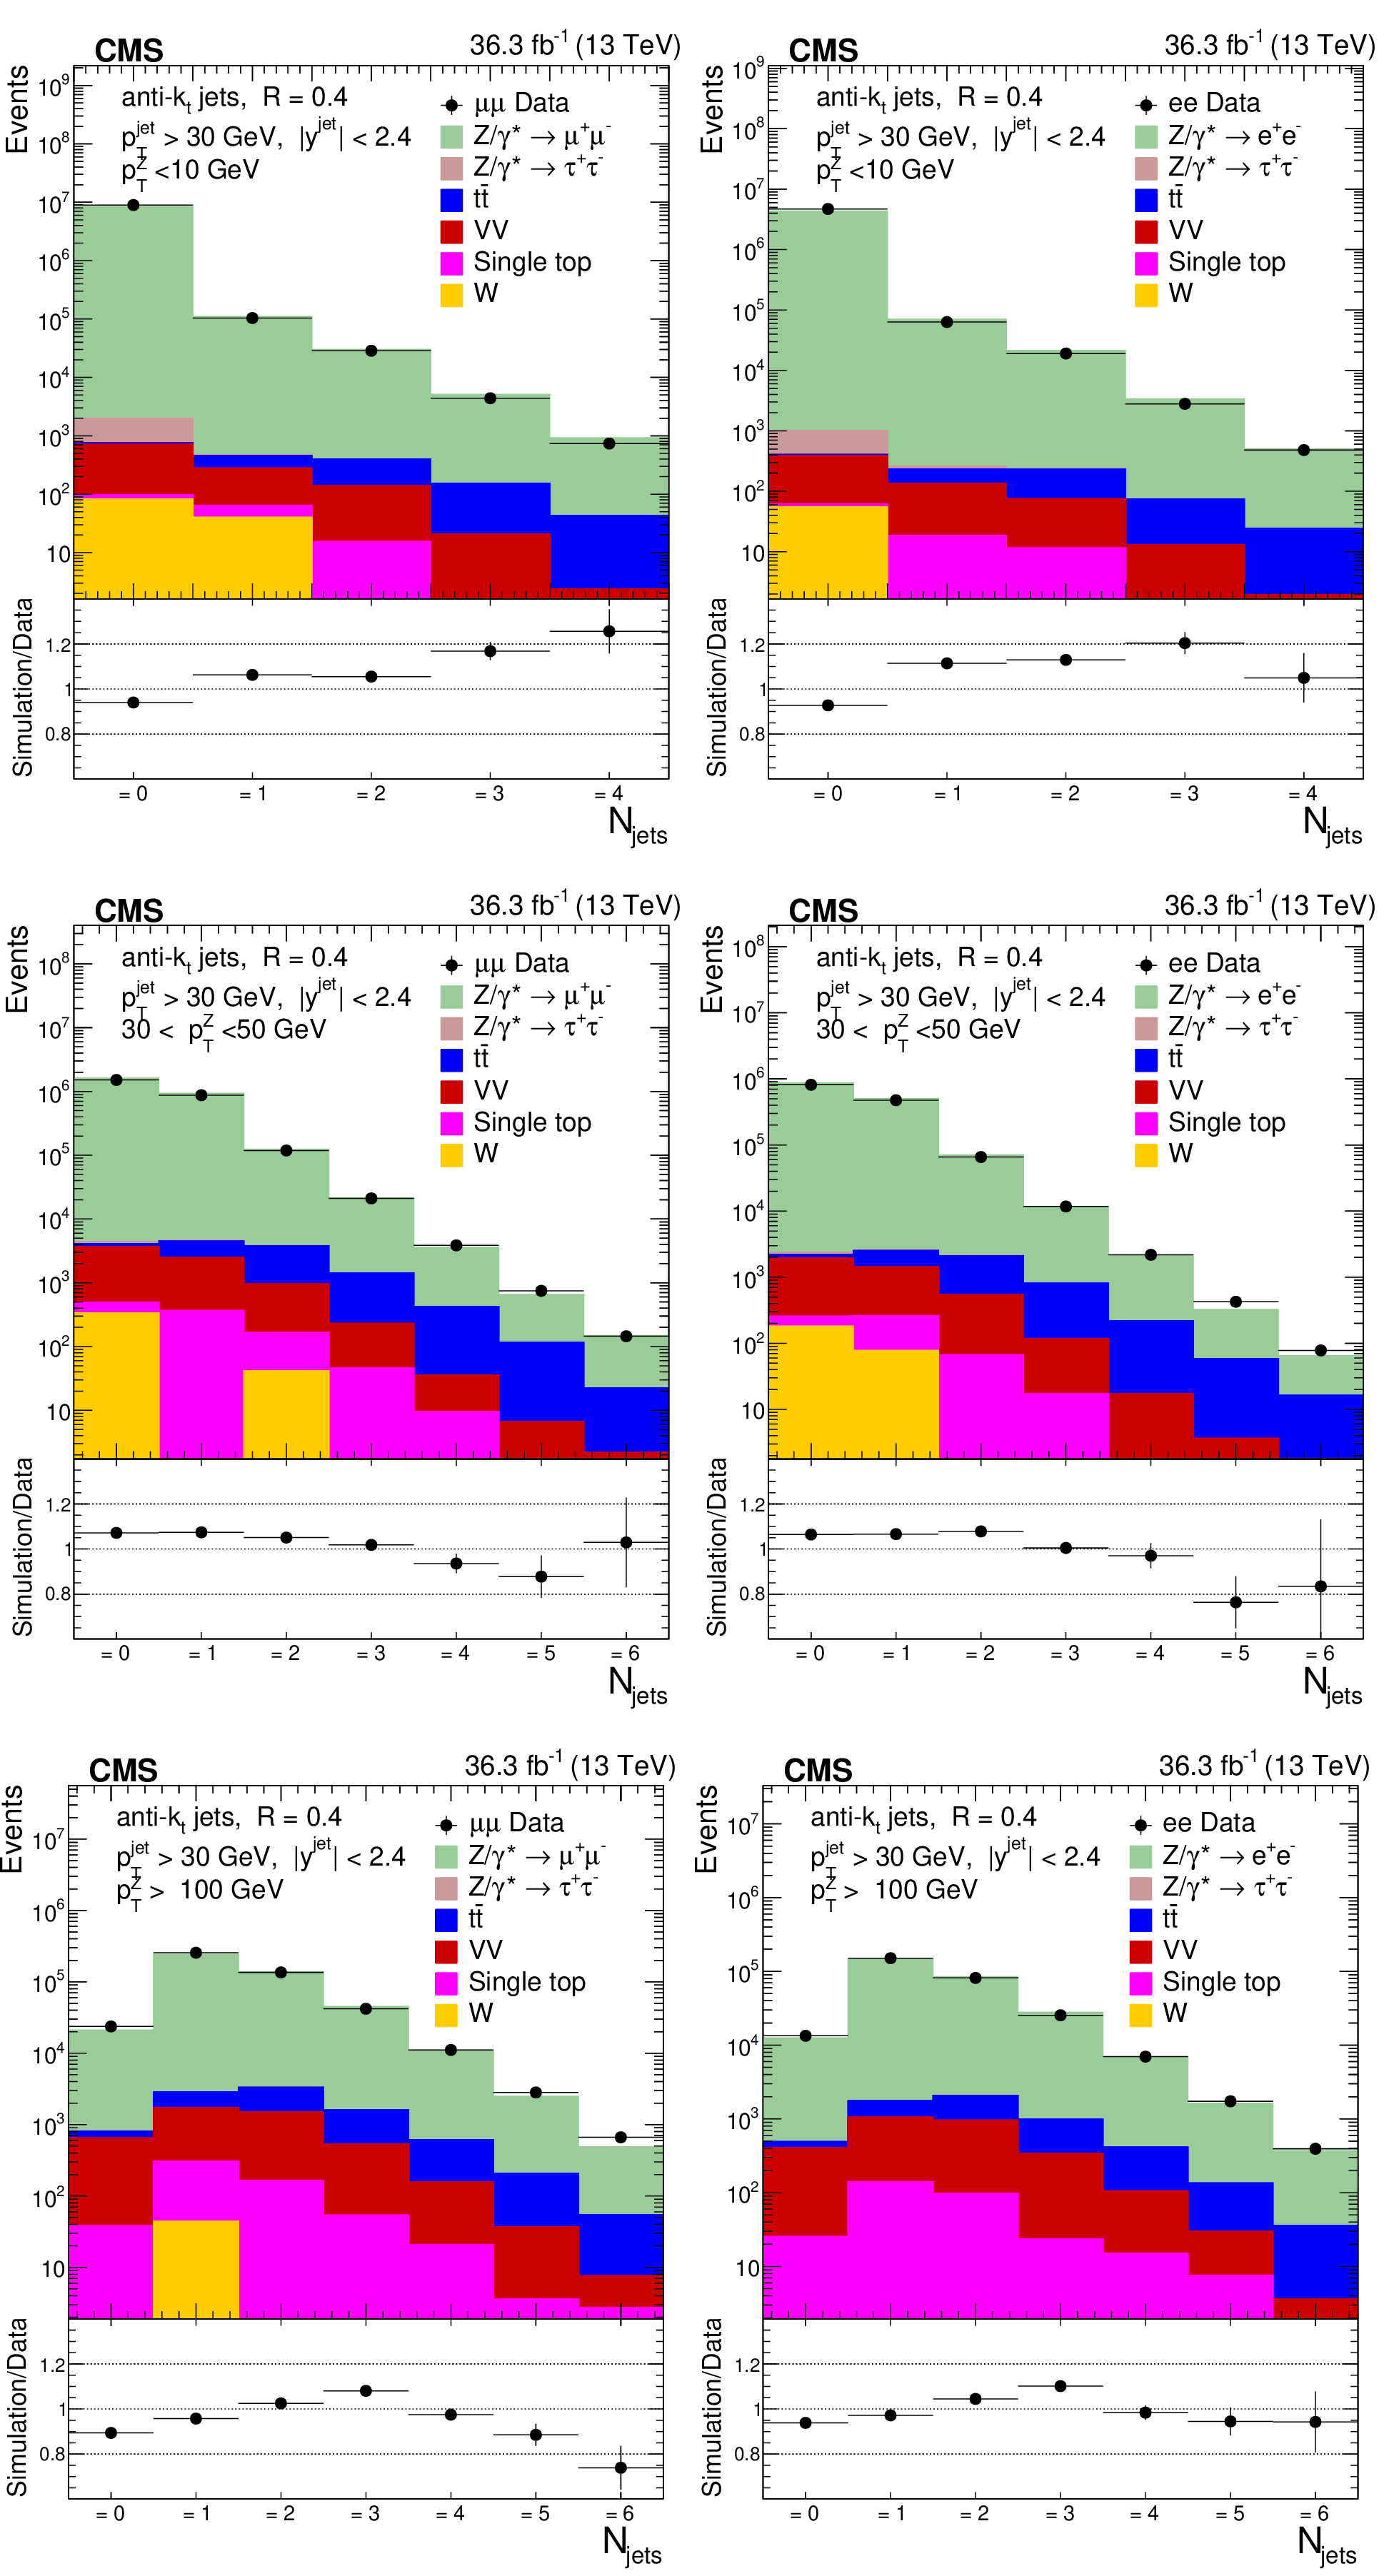
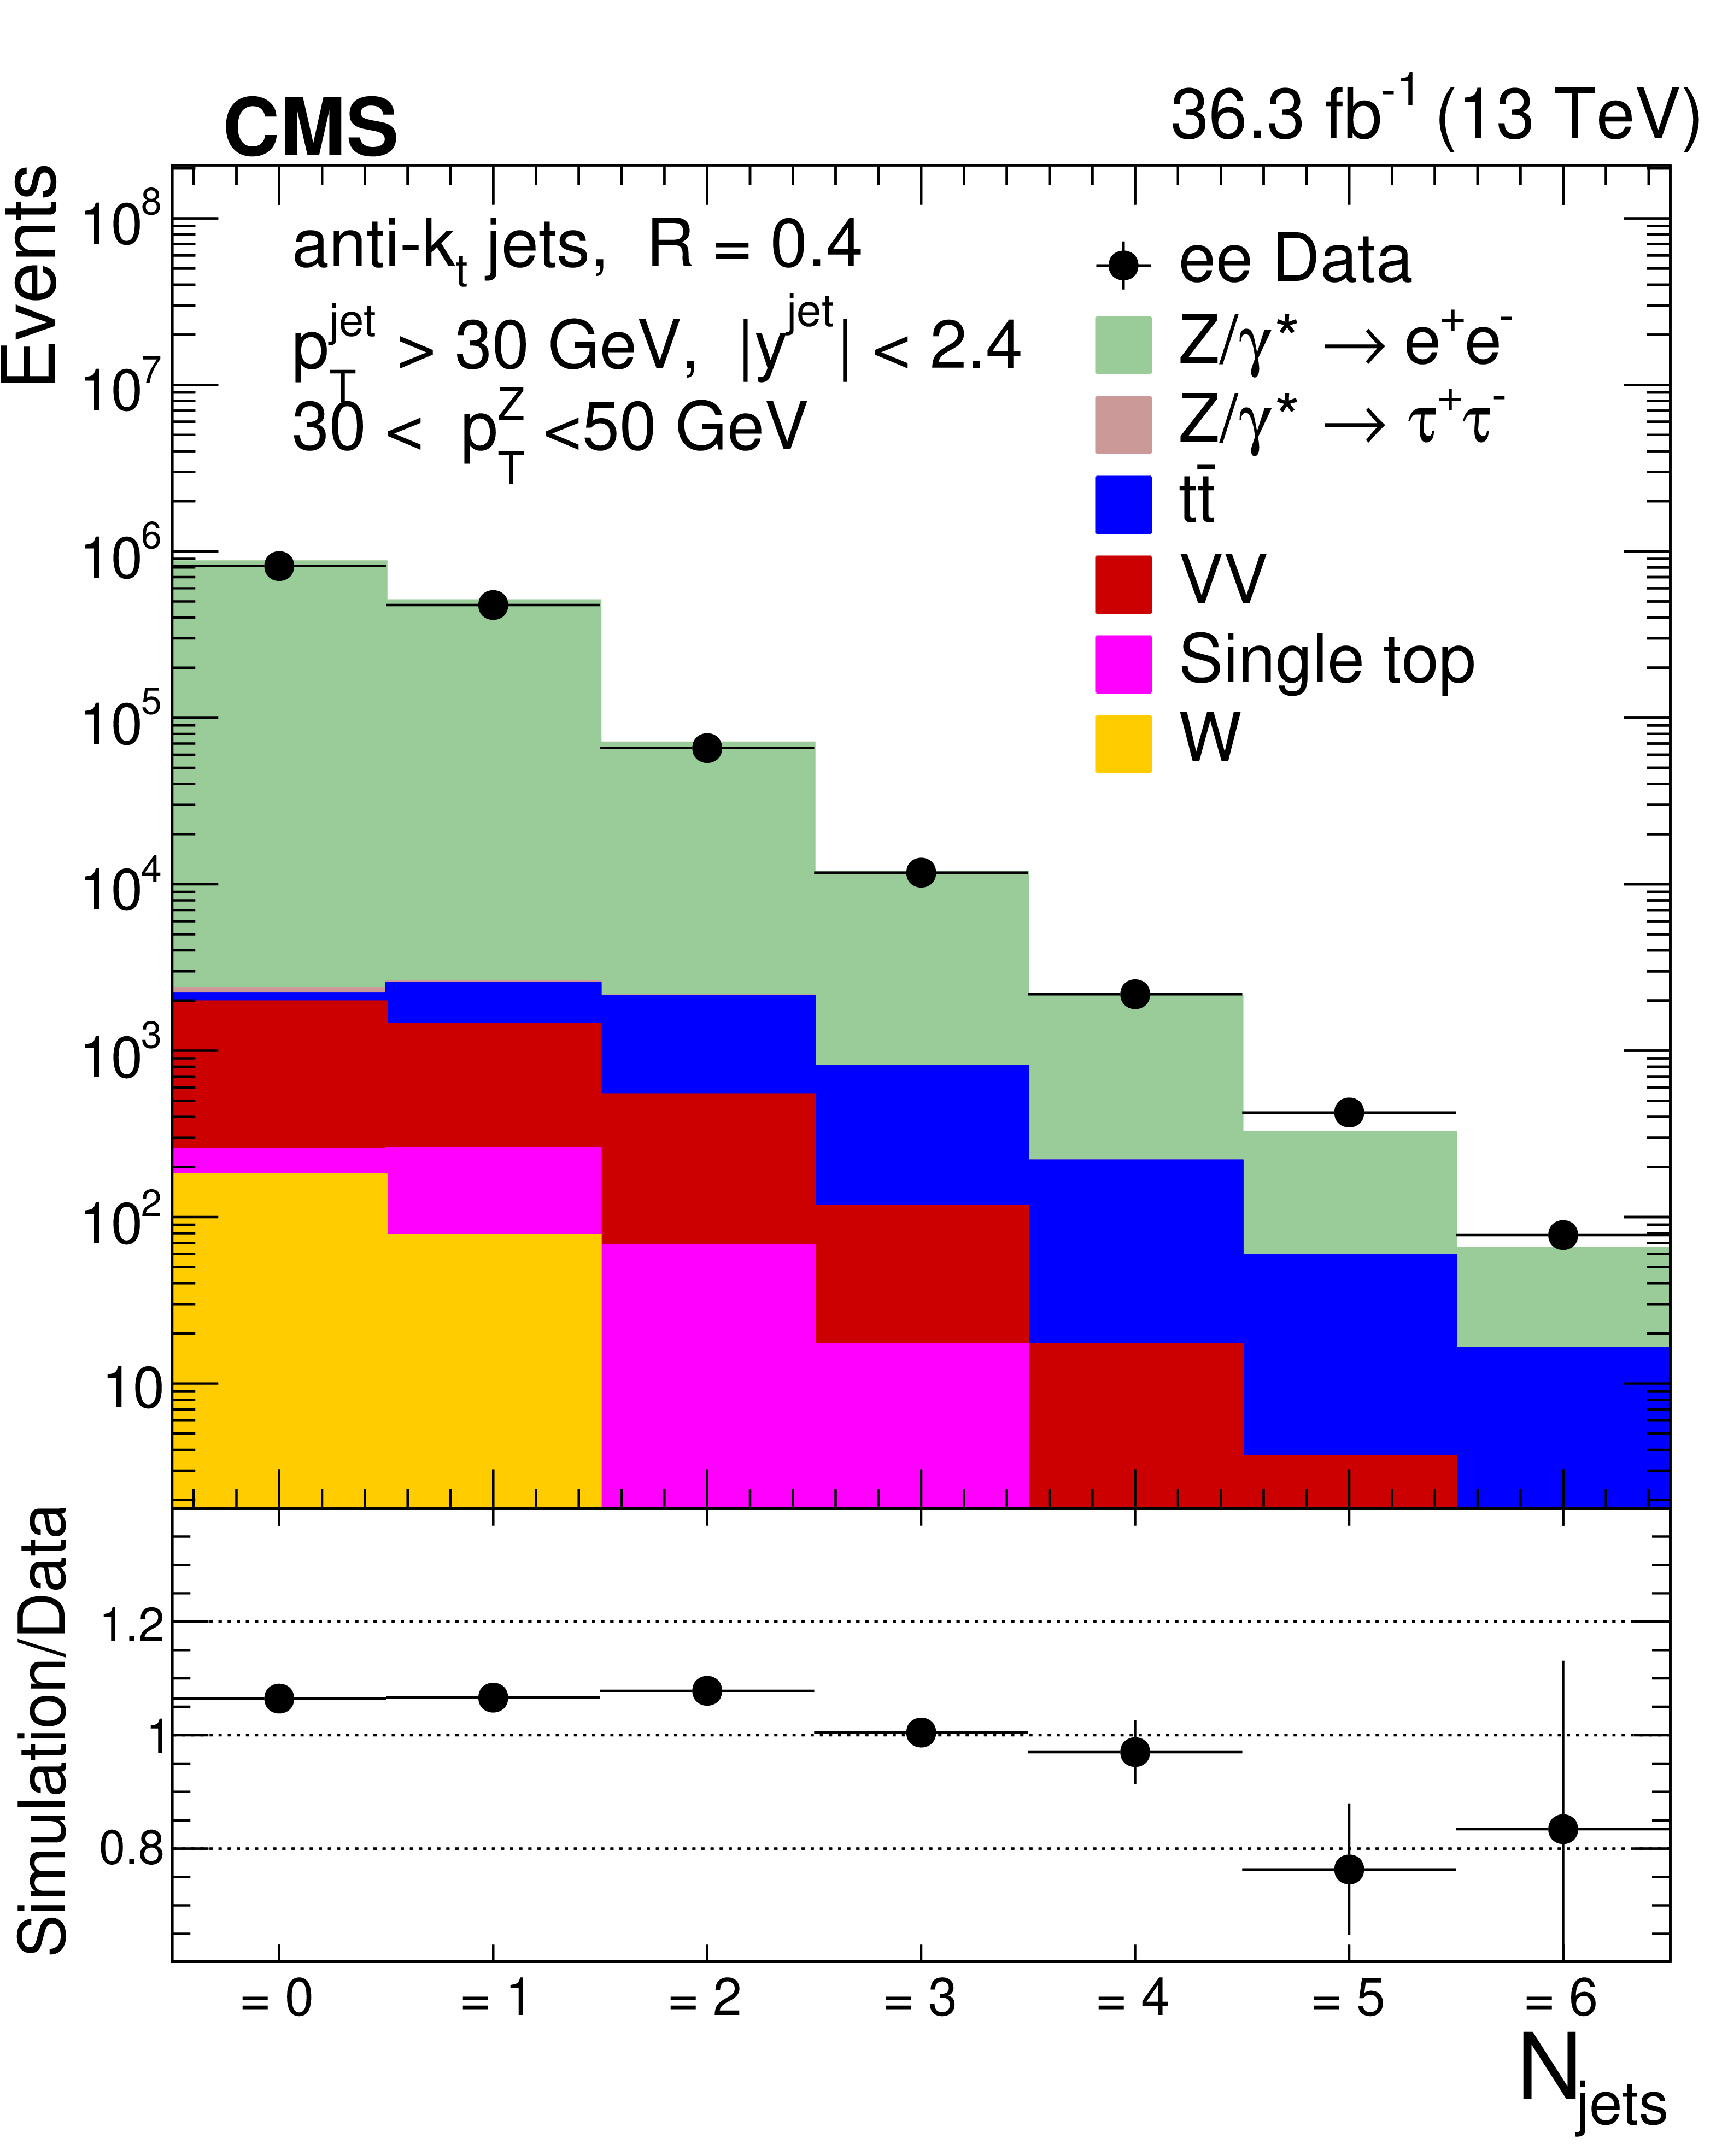
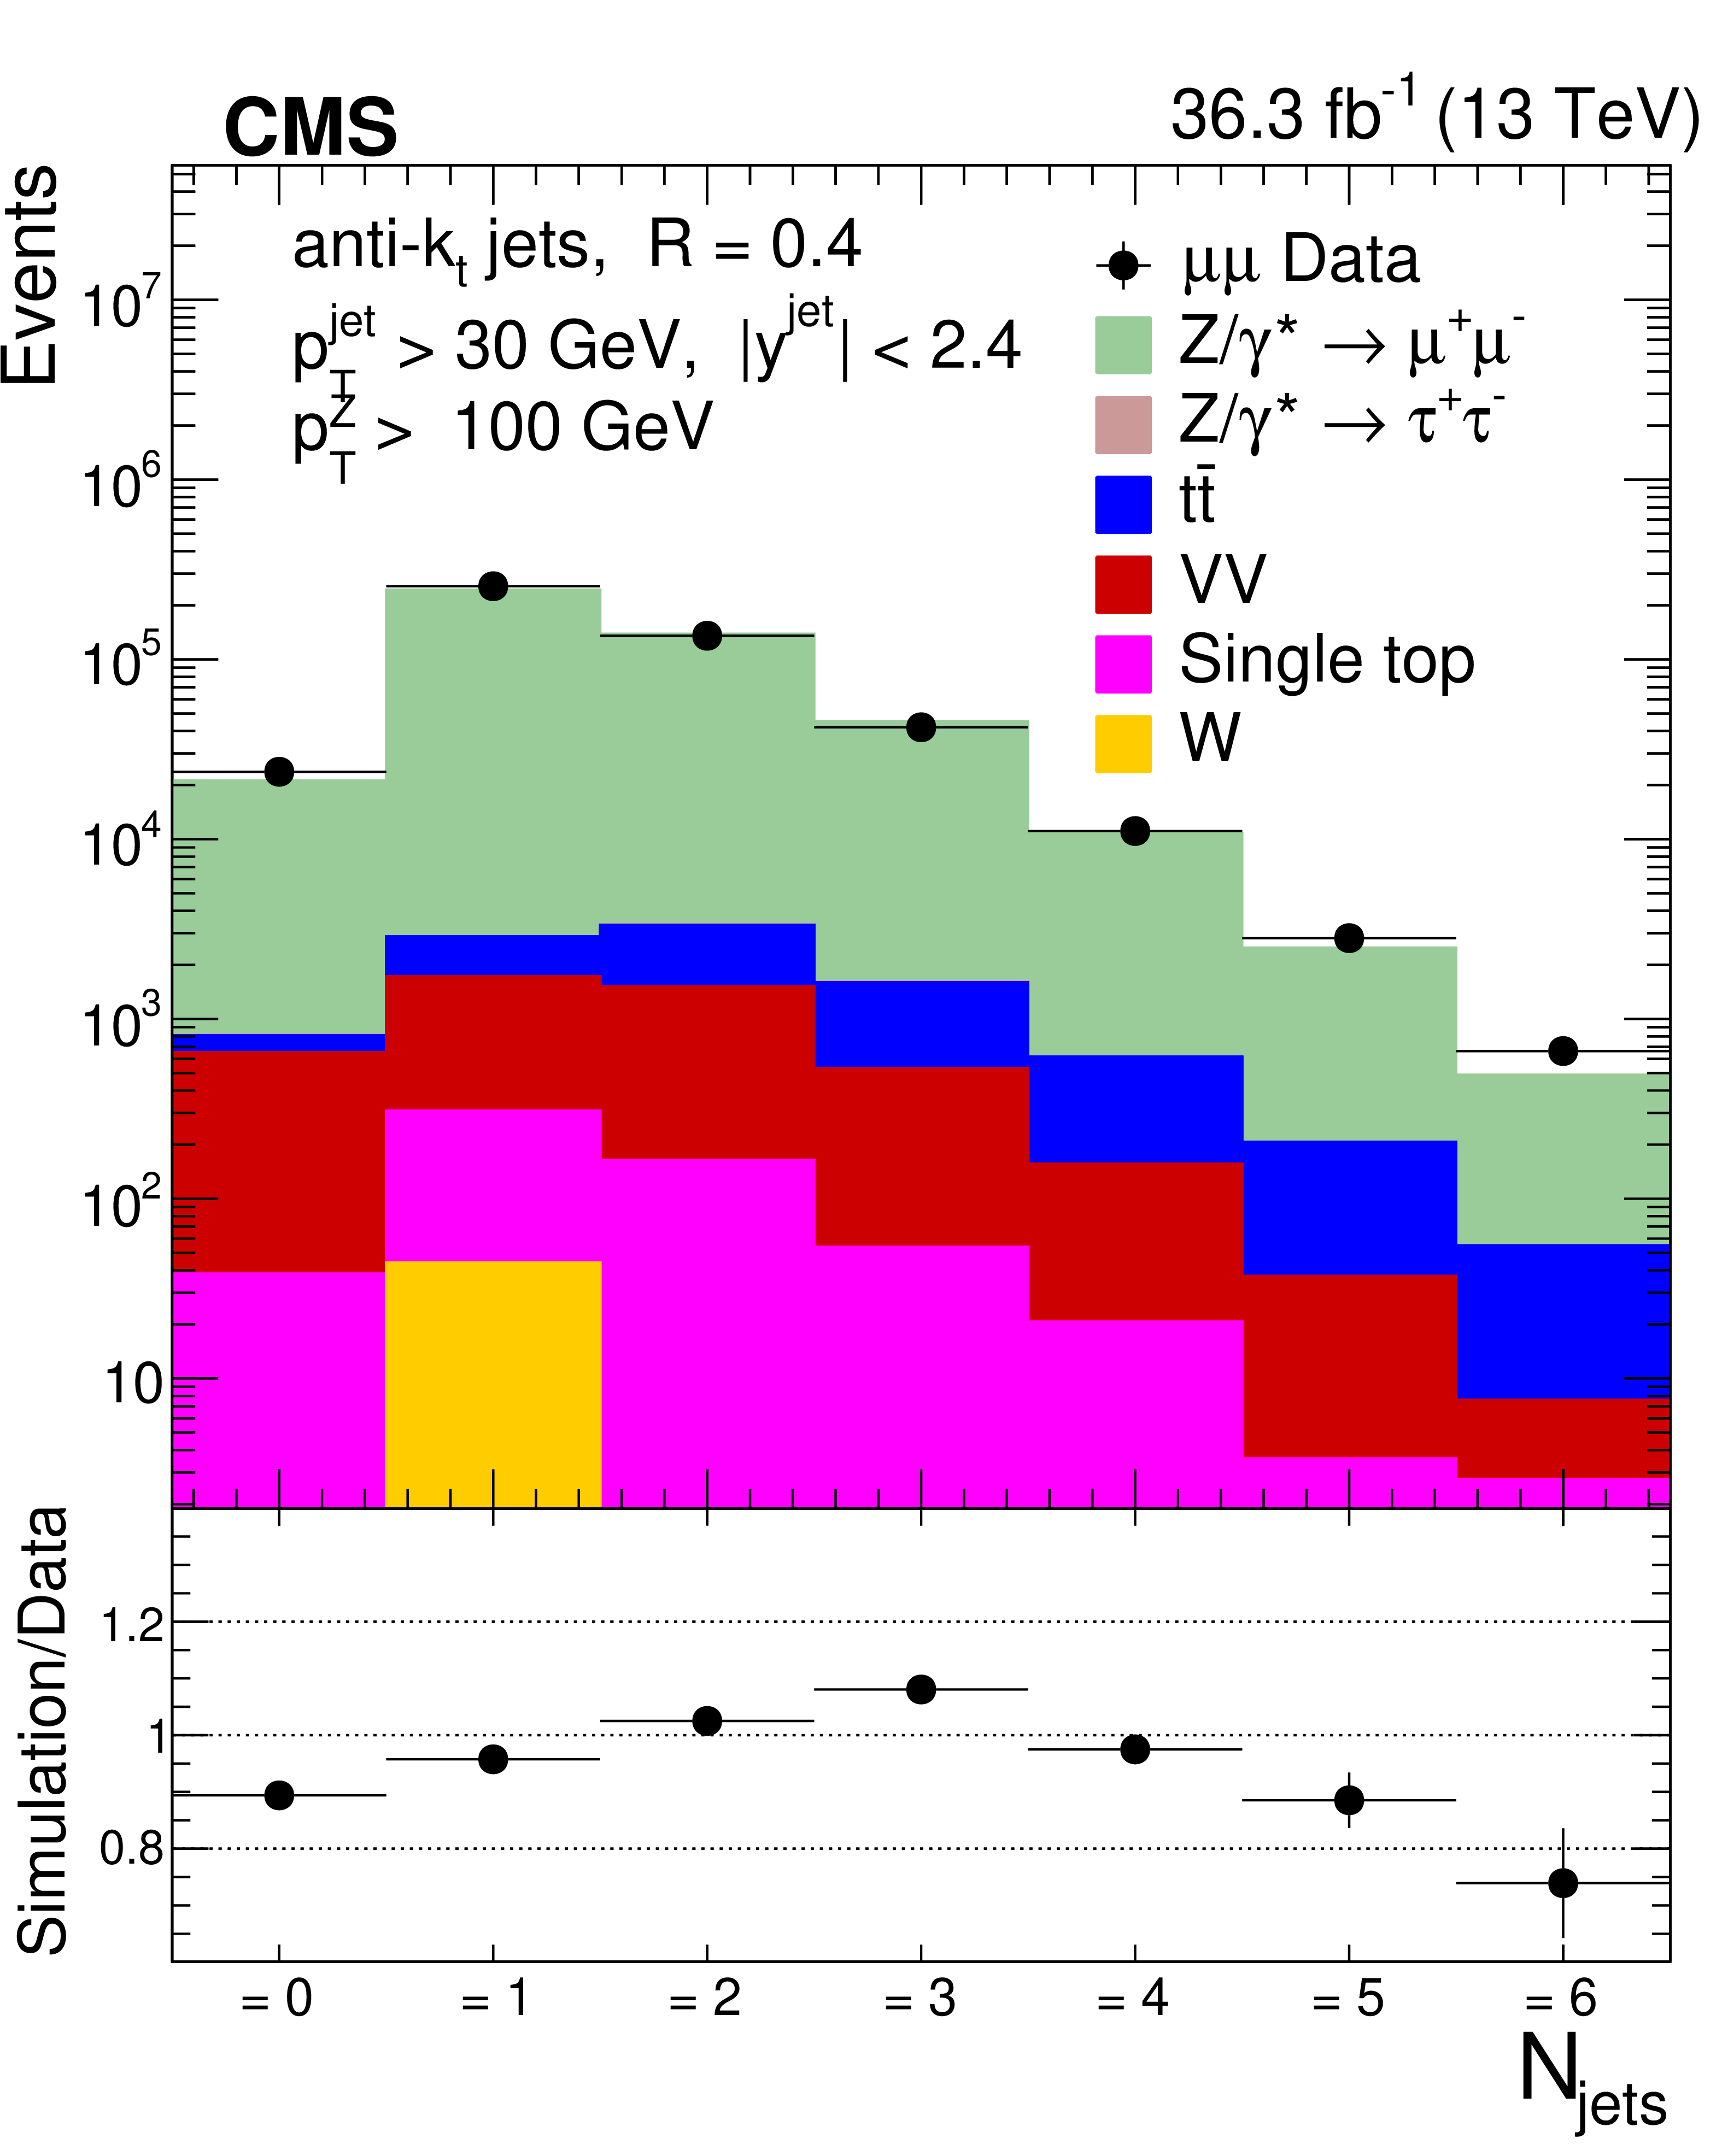
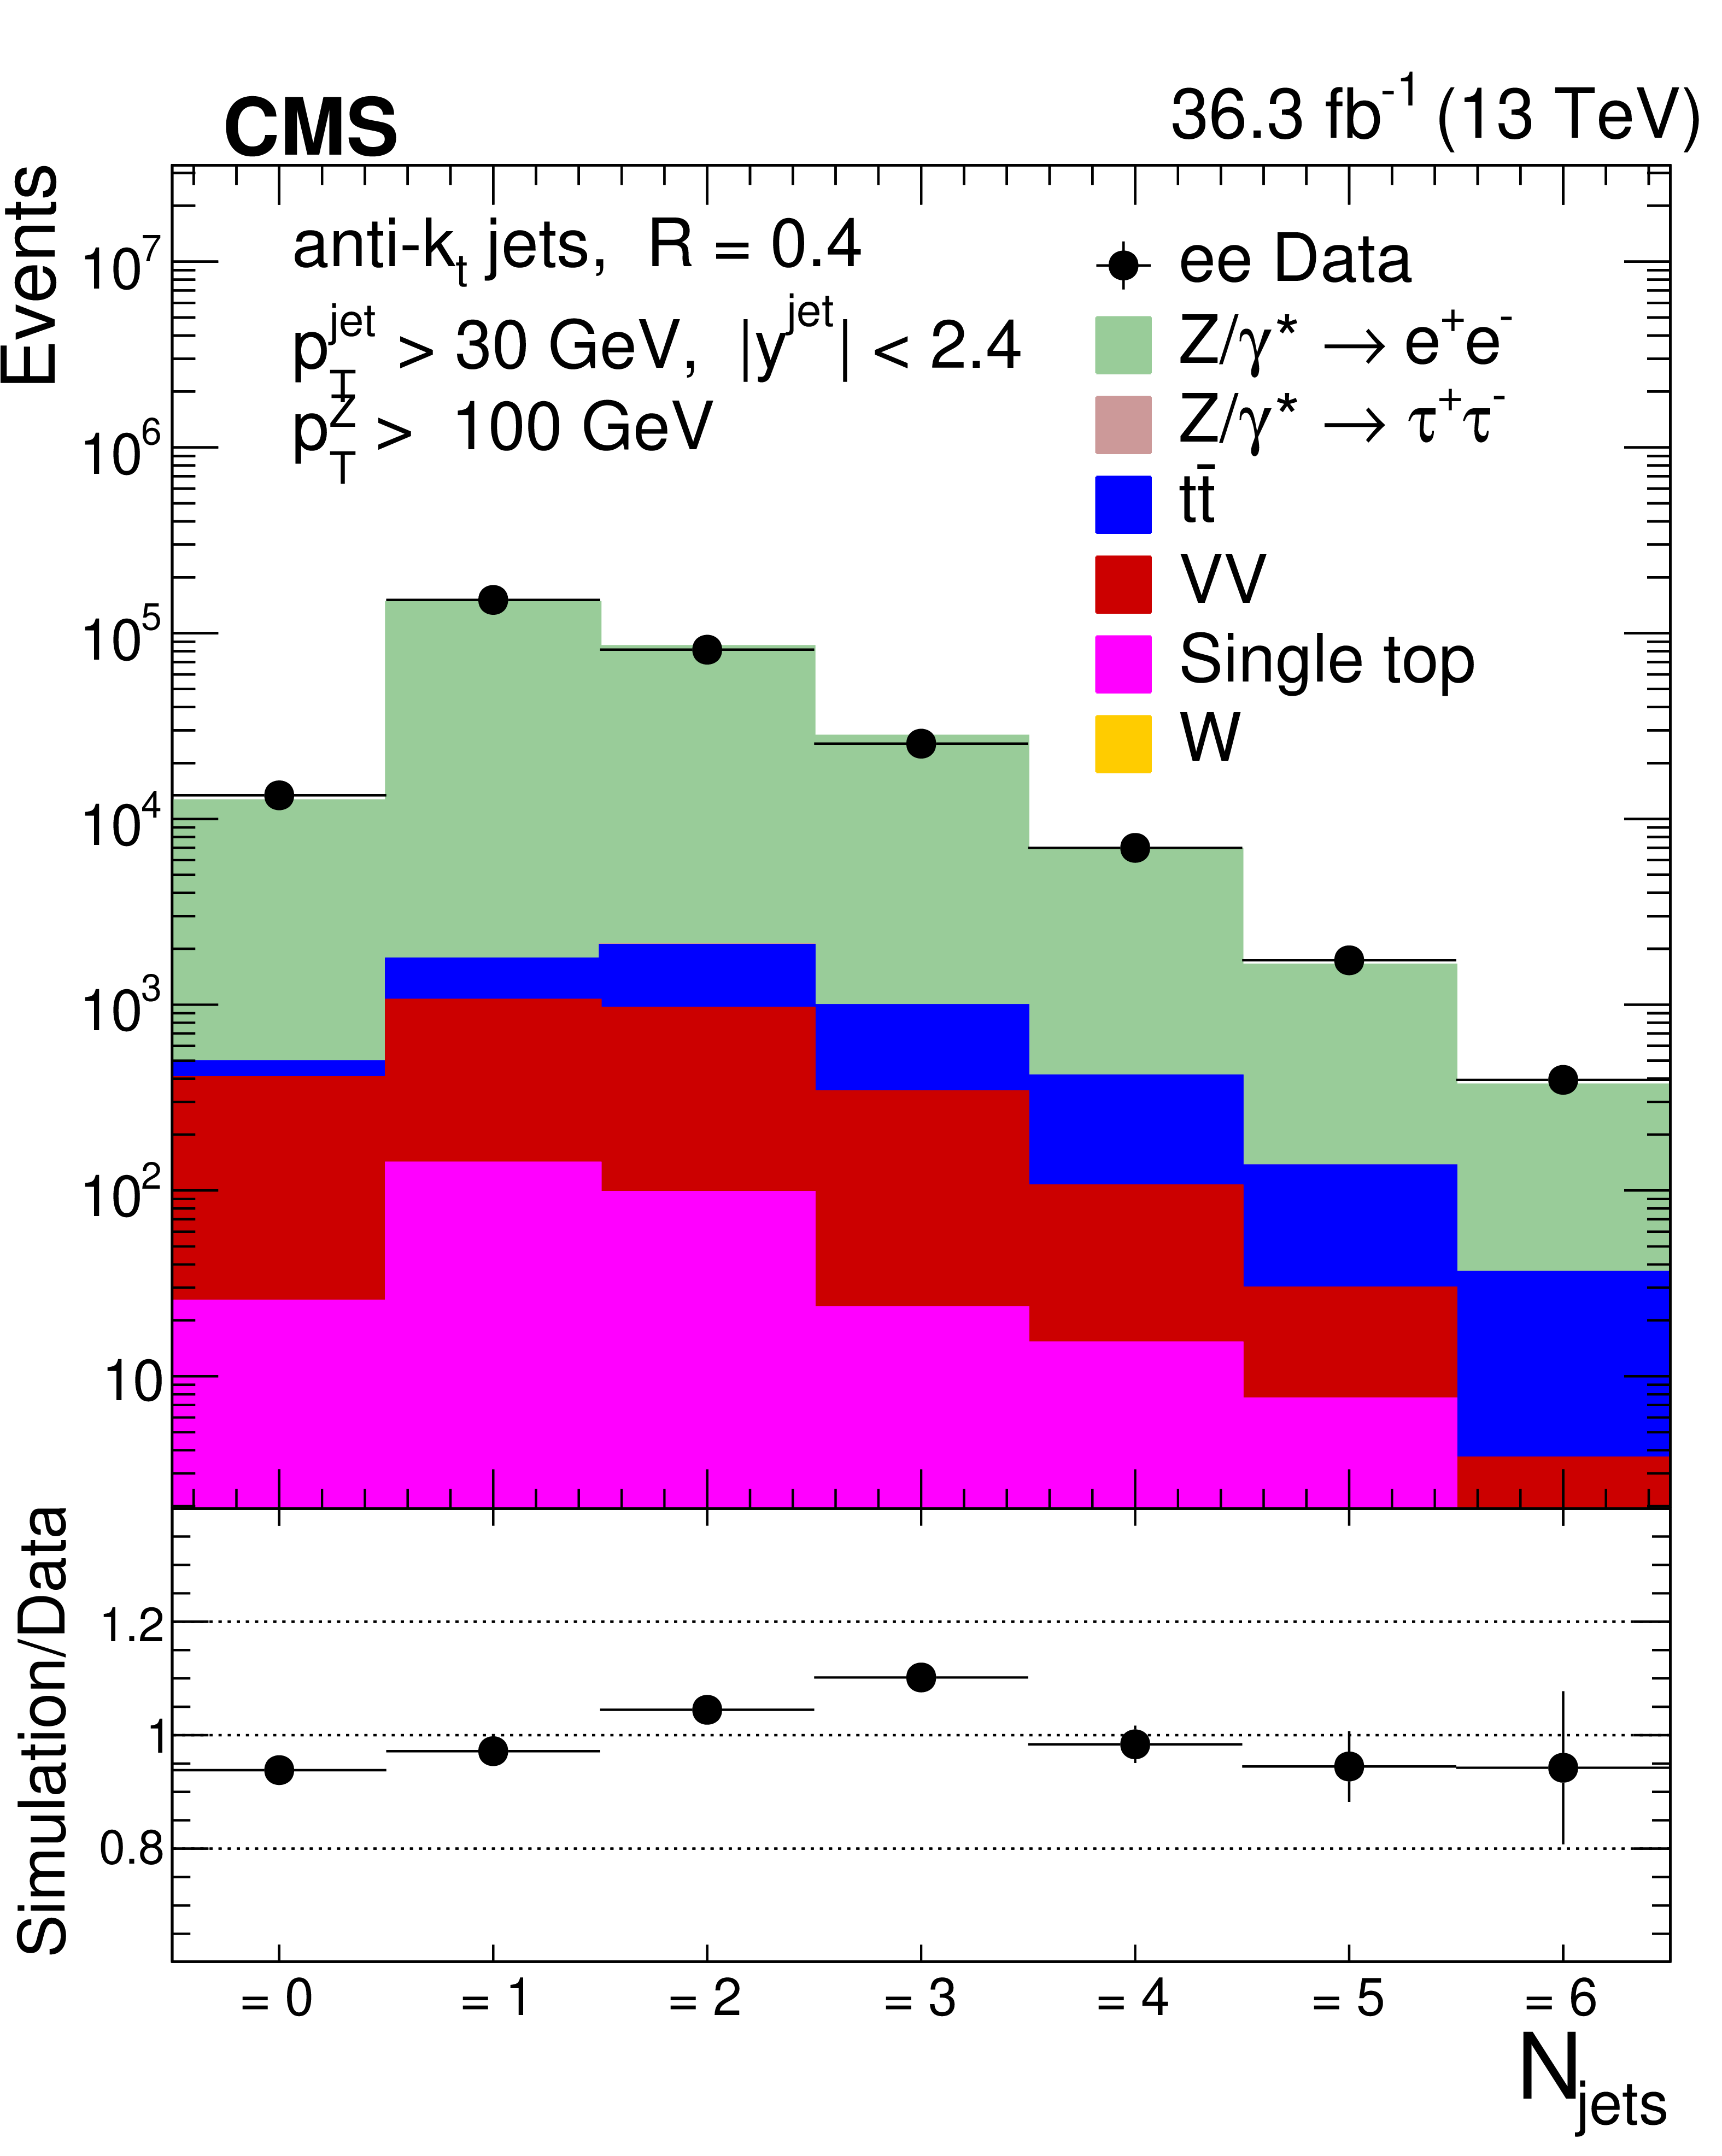
Figure 1:
The exclusive jet multiplicity distribution before unfolding in three different regions of $ p_{\mathrm{T}}(\mathrm{Z}) $: $ p_{\mathrm{T}}(\mathrm{Z}) < $ 10 GeV (upper), 30 $ < p_{\mathrm{T}}(\mathrm{Z}) < $ 50 GeV (middle), $ p_{\mathrm{T}}(\mathrm{Z}) > $ 100 GeV (lower) for the $ \mu^{+} \mu^{-} $ channel (left) and the $ \mathrm{e}^+ \mathrm{e}^- $ channel (right). The error bars around the data points represent the statistical uncertainties. |
png pdf |
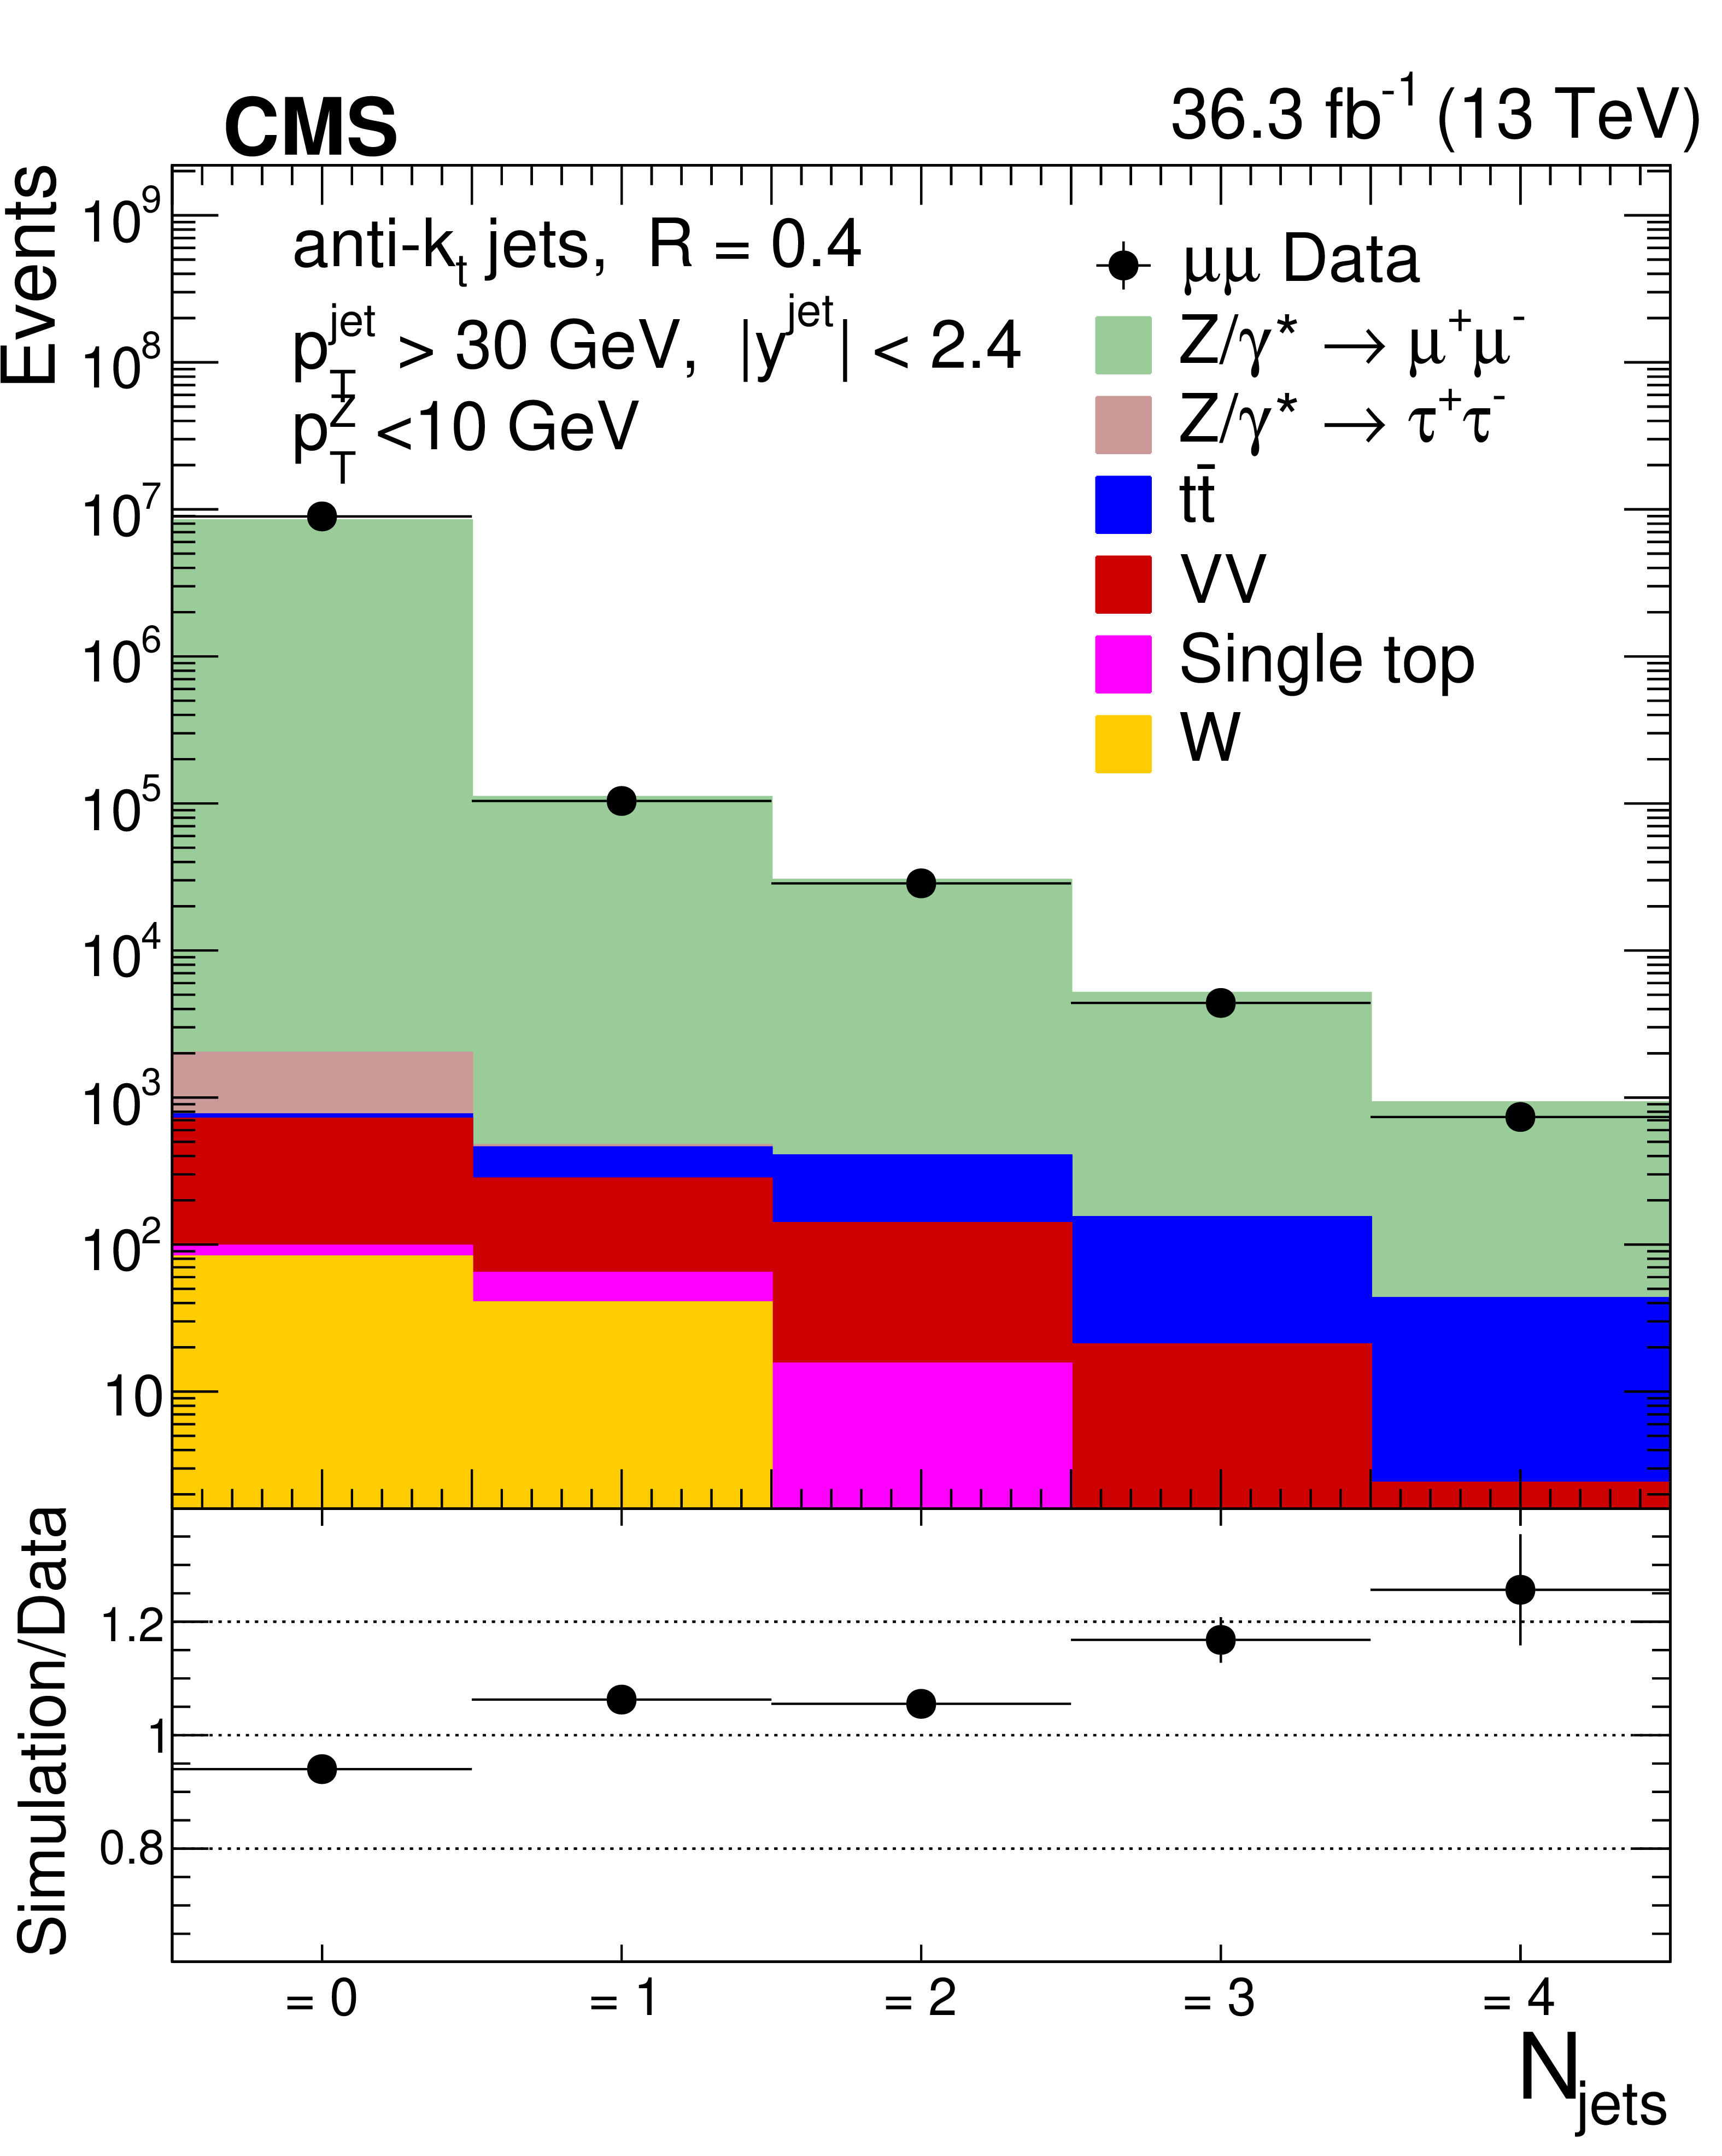
Figure 1-a:
The exclusive jet multiplicity distribution before unfolding for $ p_{\mathrm{T}}(\mathrm{Z}) $: $ p_{\mathrm{T}}(\mathrm{Z}) < $ 10 GeV for the $ \mu^{+} \mu^{-} $ channel. The error bars around the data points represent the statistical uncertainties. |
png pdf |
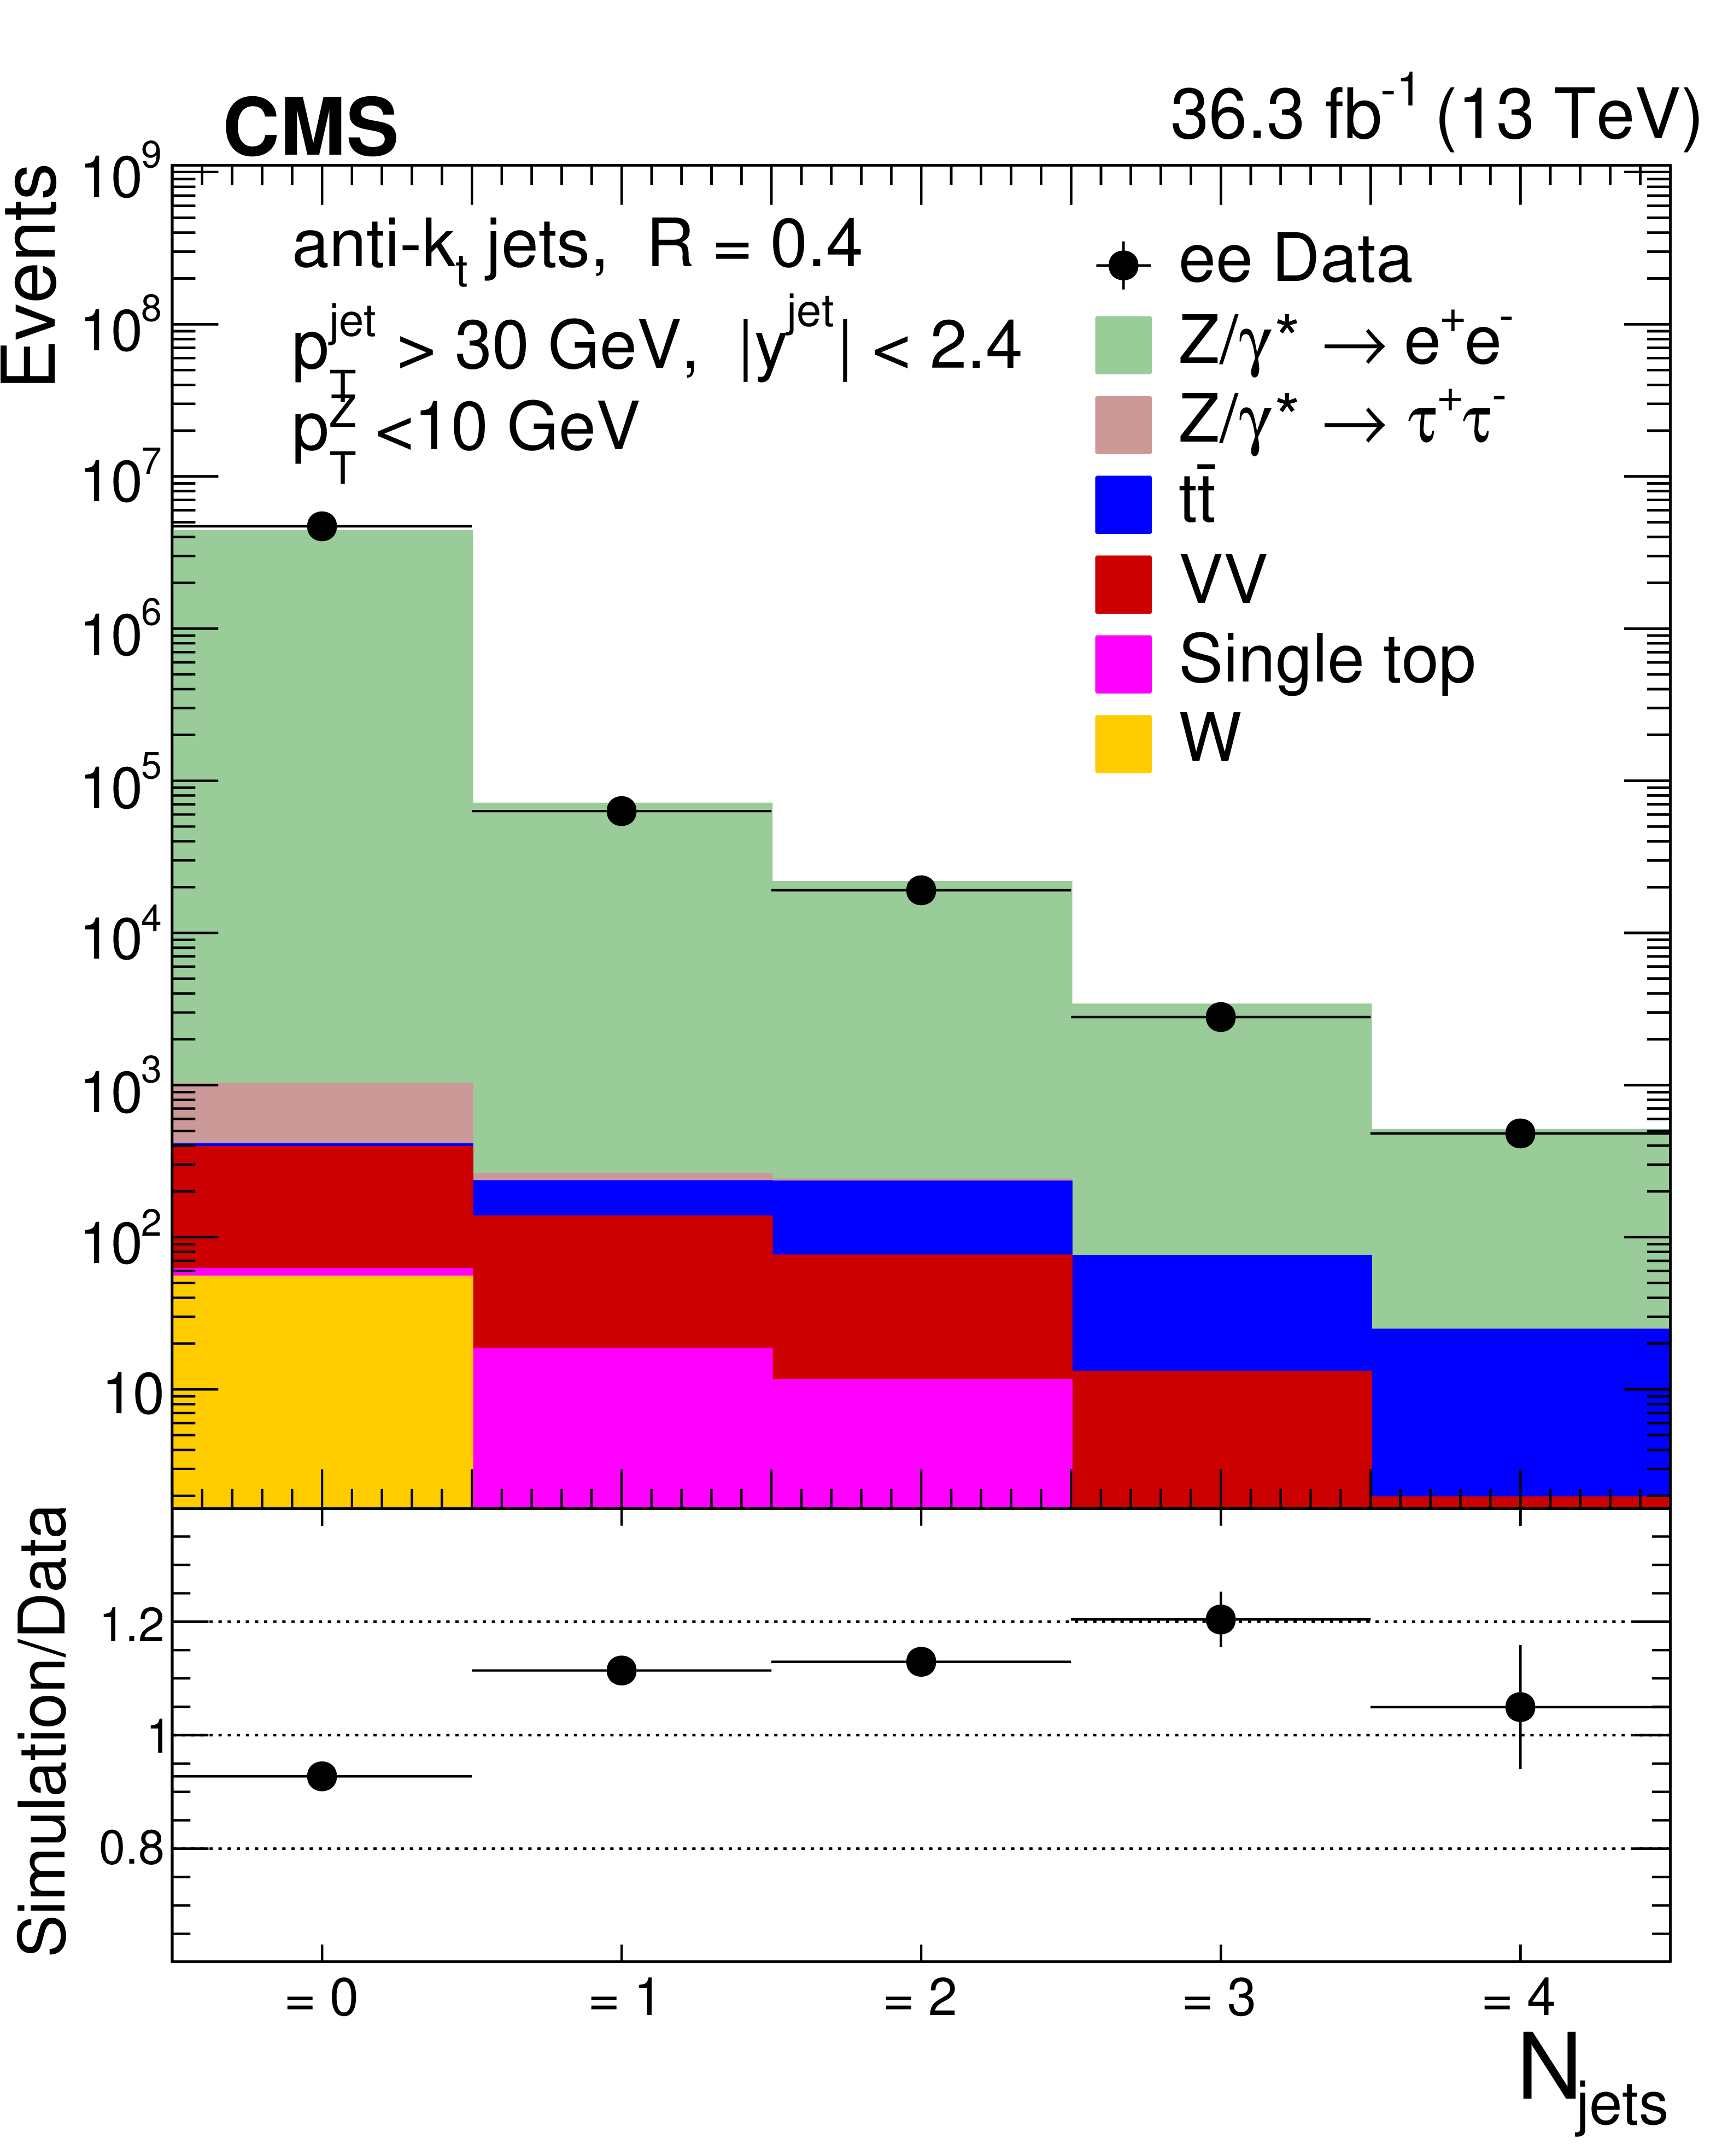
Figure 1-b:
The exclusive jet multiplicity distribution before unfolding for $ p_{\mathrm{T}}(\mathrm{Z}) $: $ p_{\mathrm{T}}(\mathrm{Z}) < $ 10 GeV for the $ \mathrm{e}^+ \mathrm{e}^- $ channel. The error bars around the data points represent the statistical uncertainties. |
png pdf |
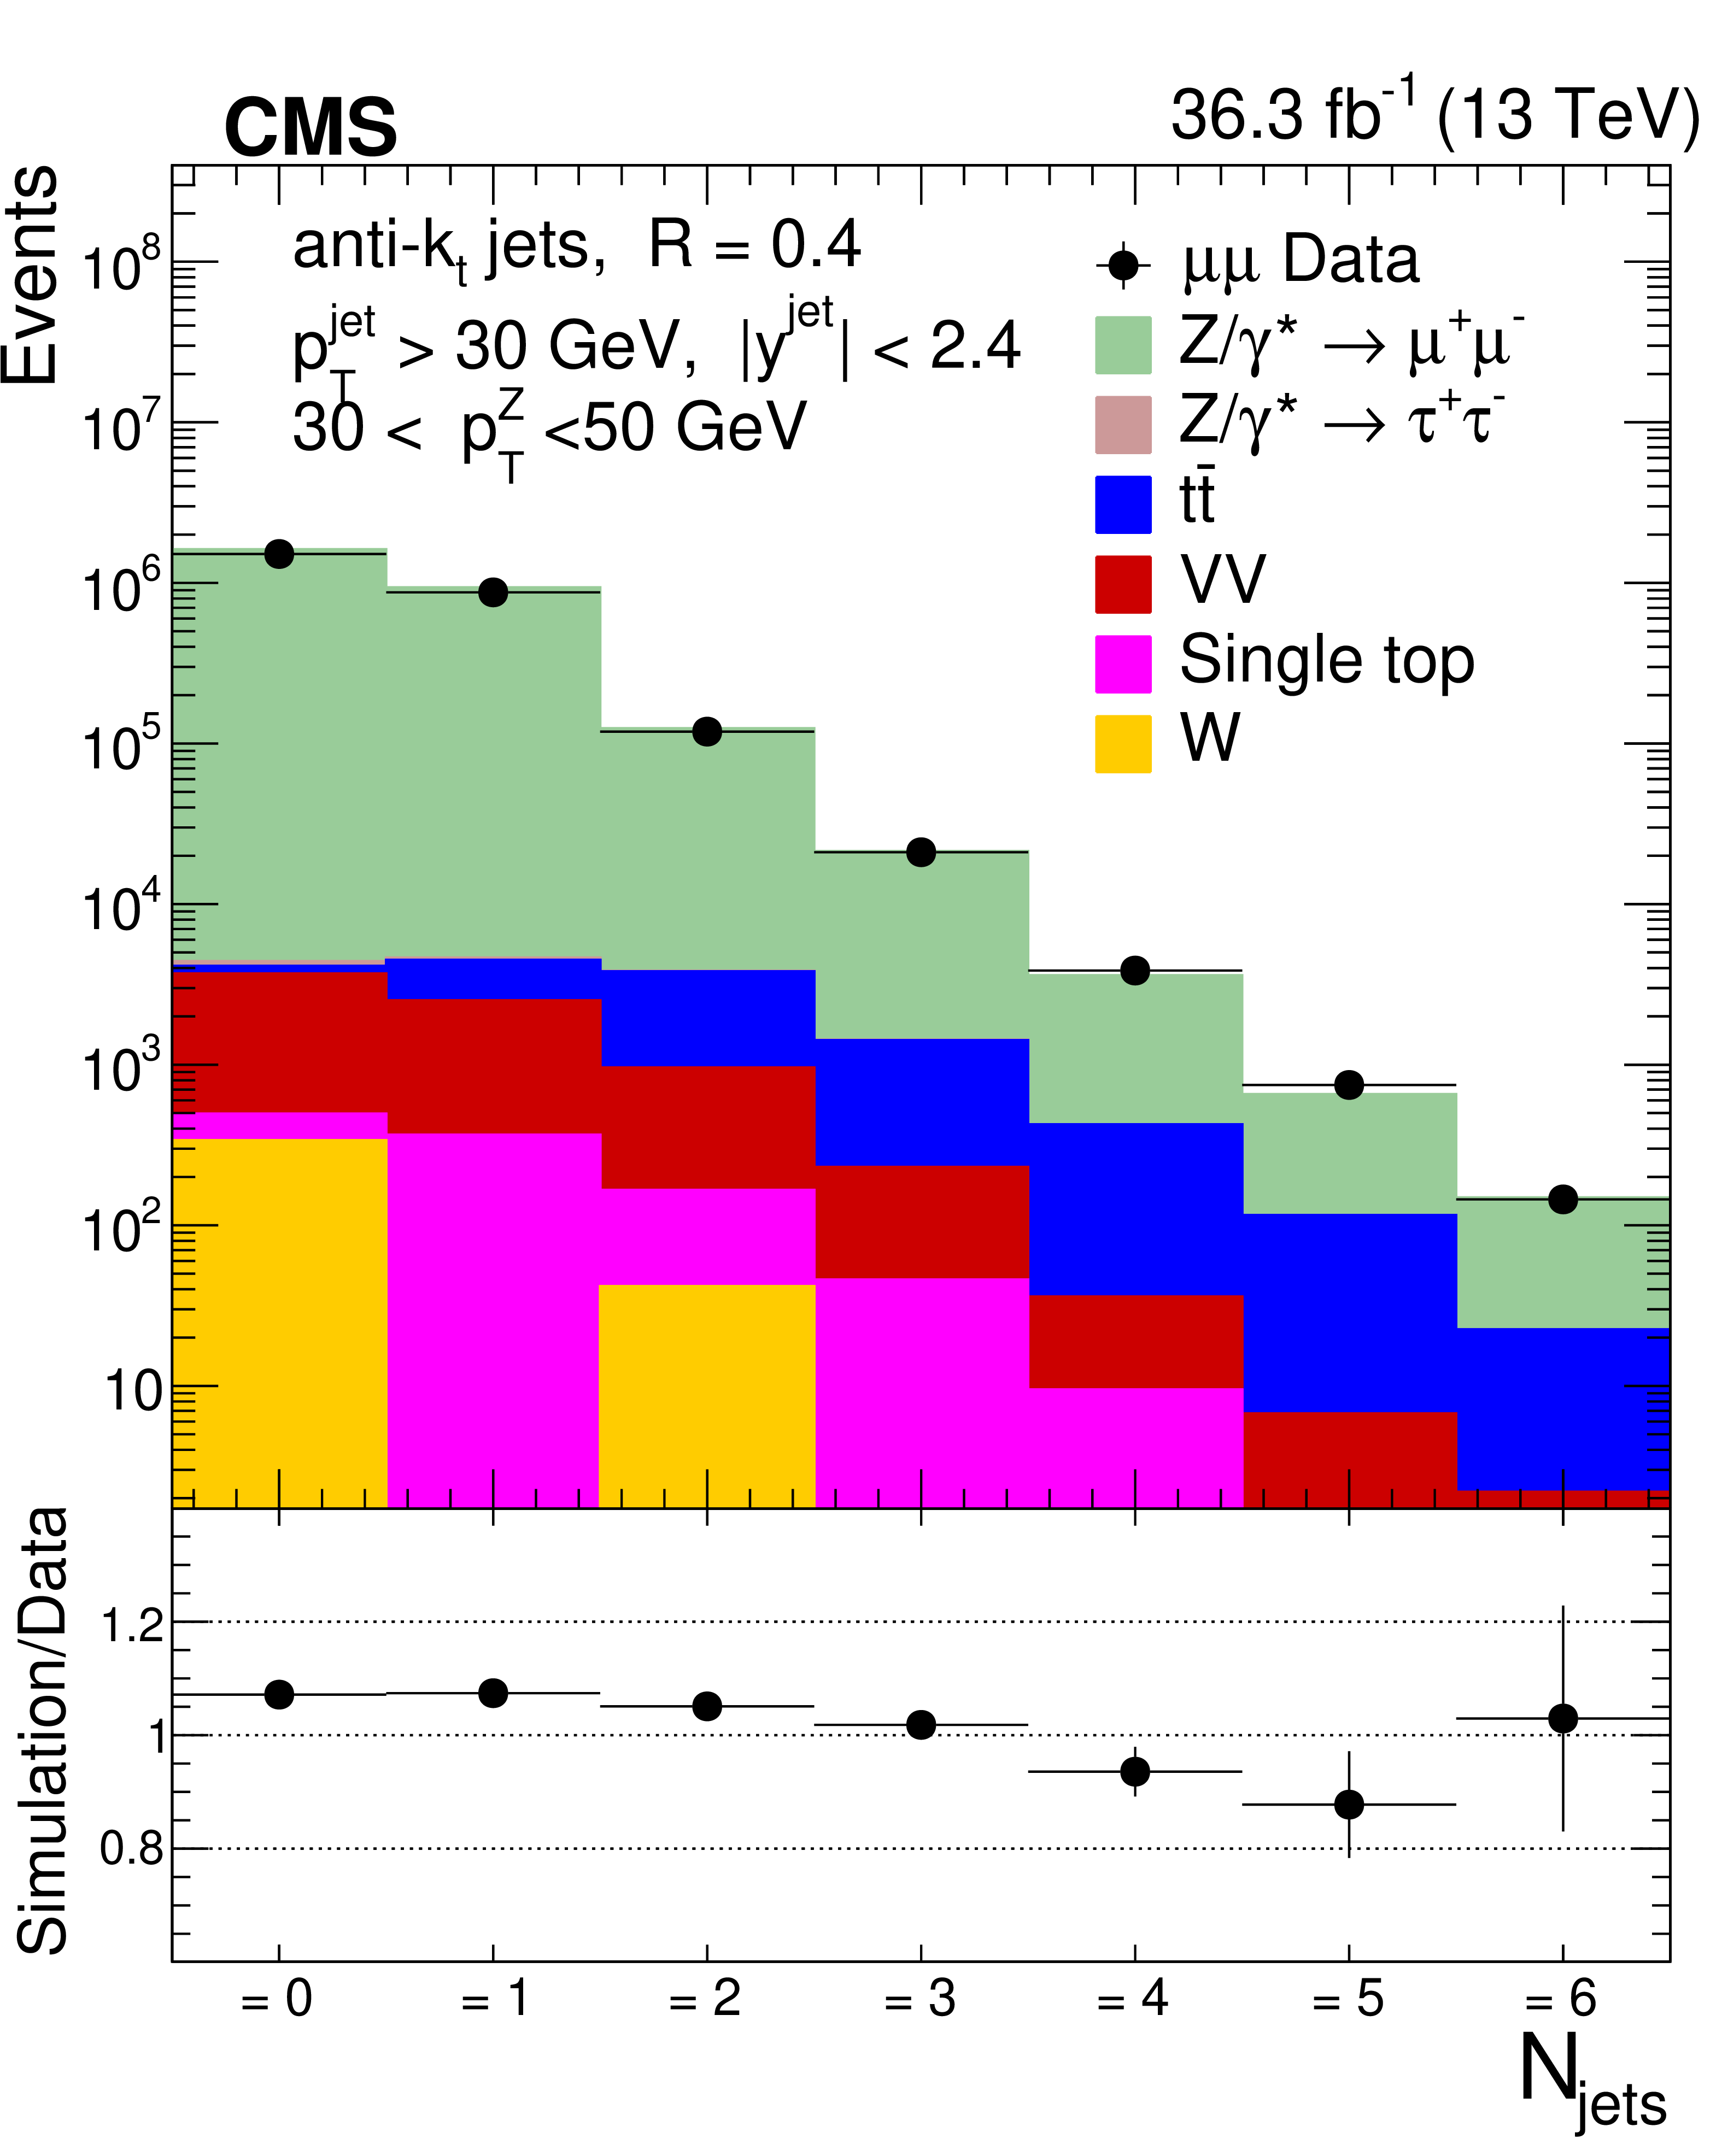
Figure 1-c:
The exclusive jet multiplicity distribution before unfolding for $ p_{\mathrm{T}}(\mathrm{Z}) $: 30 $ < p_{\mathrm{T}}(\mathrm{Z}) < $ 50 GeV for the $ \mu^{+} \mu^{-} $ channel. The error bars around the data points represent the statistical uncertainties. |
png pdf |
Figure 1-d:
The exclusive jet multiplicity distribution before unfolding for $ p_{\mathrm{T}}(\mathrm{Z}) $: 30 $ < p_{\mathrm{T}}(\mathrm{Z}) < $ 50 GeV for the $ \mathrm{e}^+ \mathrm{e}^- $ channel. The error bars around the data points represent the statistical uncertainties. |
png pdf |
Figure 1-e:
The exclusive jet multiplicity distribution before unfolding for $ p_{\mathrm{T}}(\mathrm{Z}) $: $ p_{\mathrm{T}}(\mathrm{Z}) > $ 100 GeV for the $ \mu^{+} \mu^{-} $ channel. The error bars around the data points represent the statistical uncertainties. |
png pdf |
Figure 1-f:
The exclusive jet multiplicity distribution before unfolding for $ p_{\mathrm{T}}(\mathrm{Z}) $: $ p_{\mathrm{T}}(\mathrm{Z}) > $ 100 GeV for the $ \mathrm{e}^+ \mathrm{e}^- $ channel. The error bars around the data points represent the statistical uncertainties. |
png pdf |
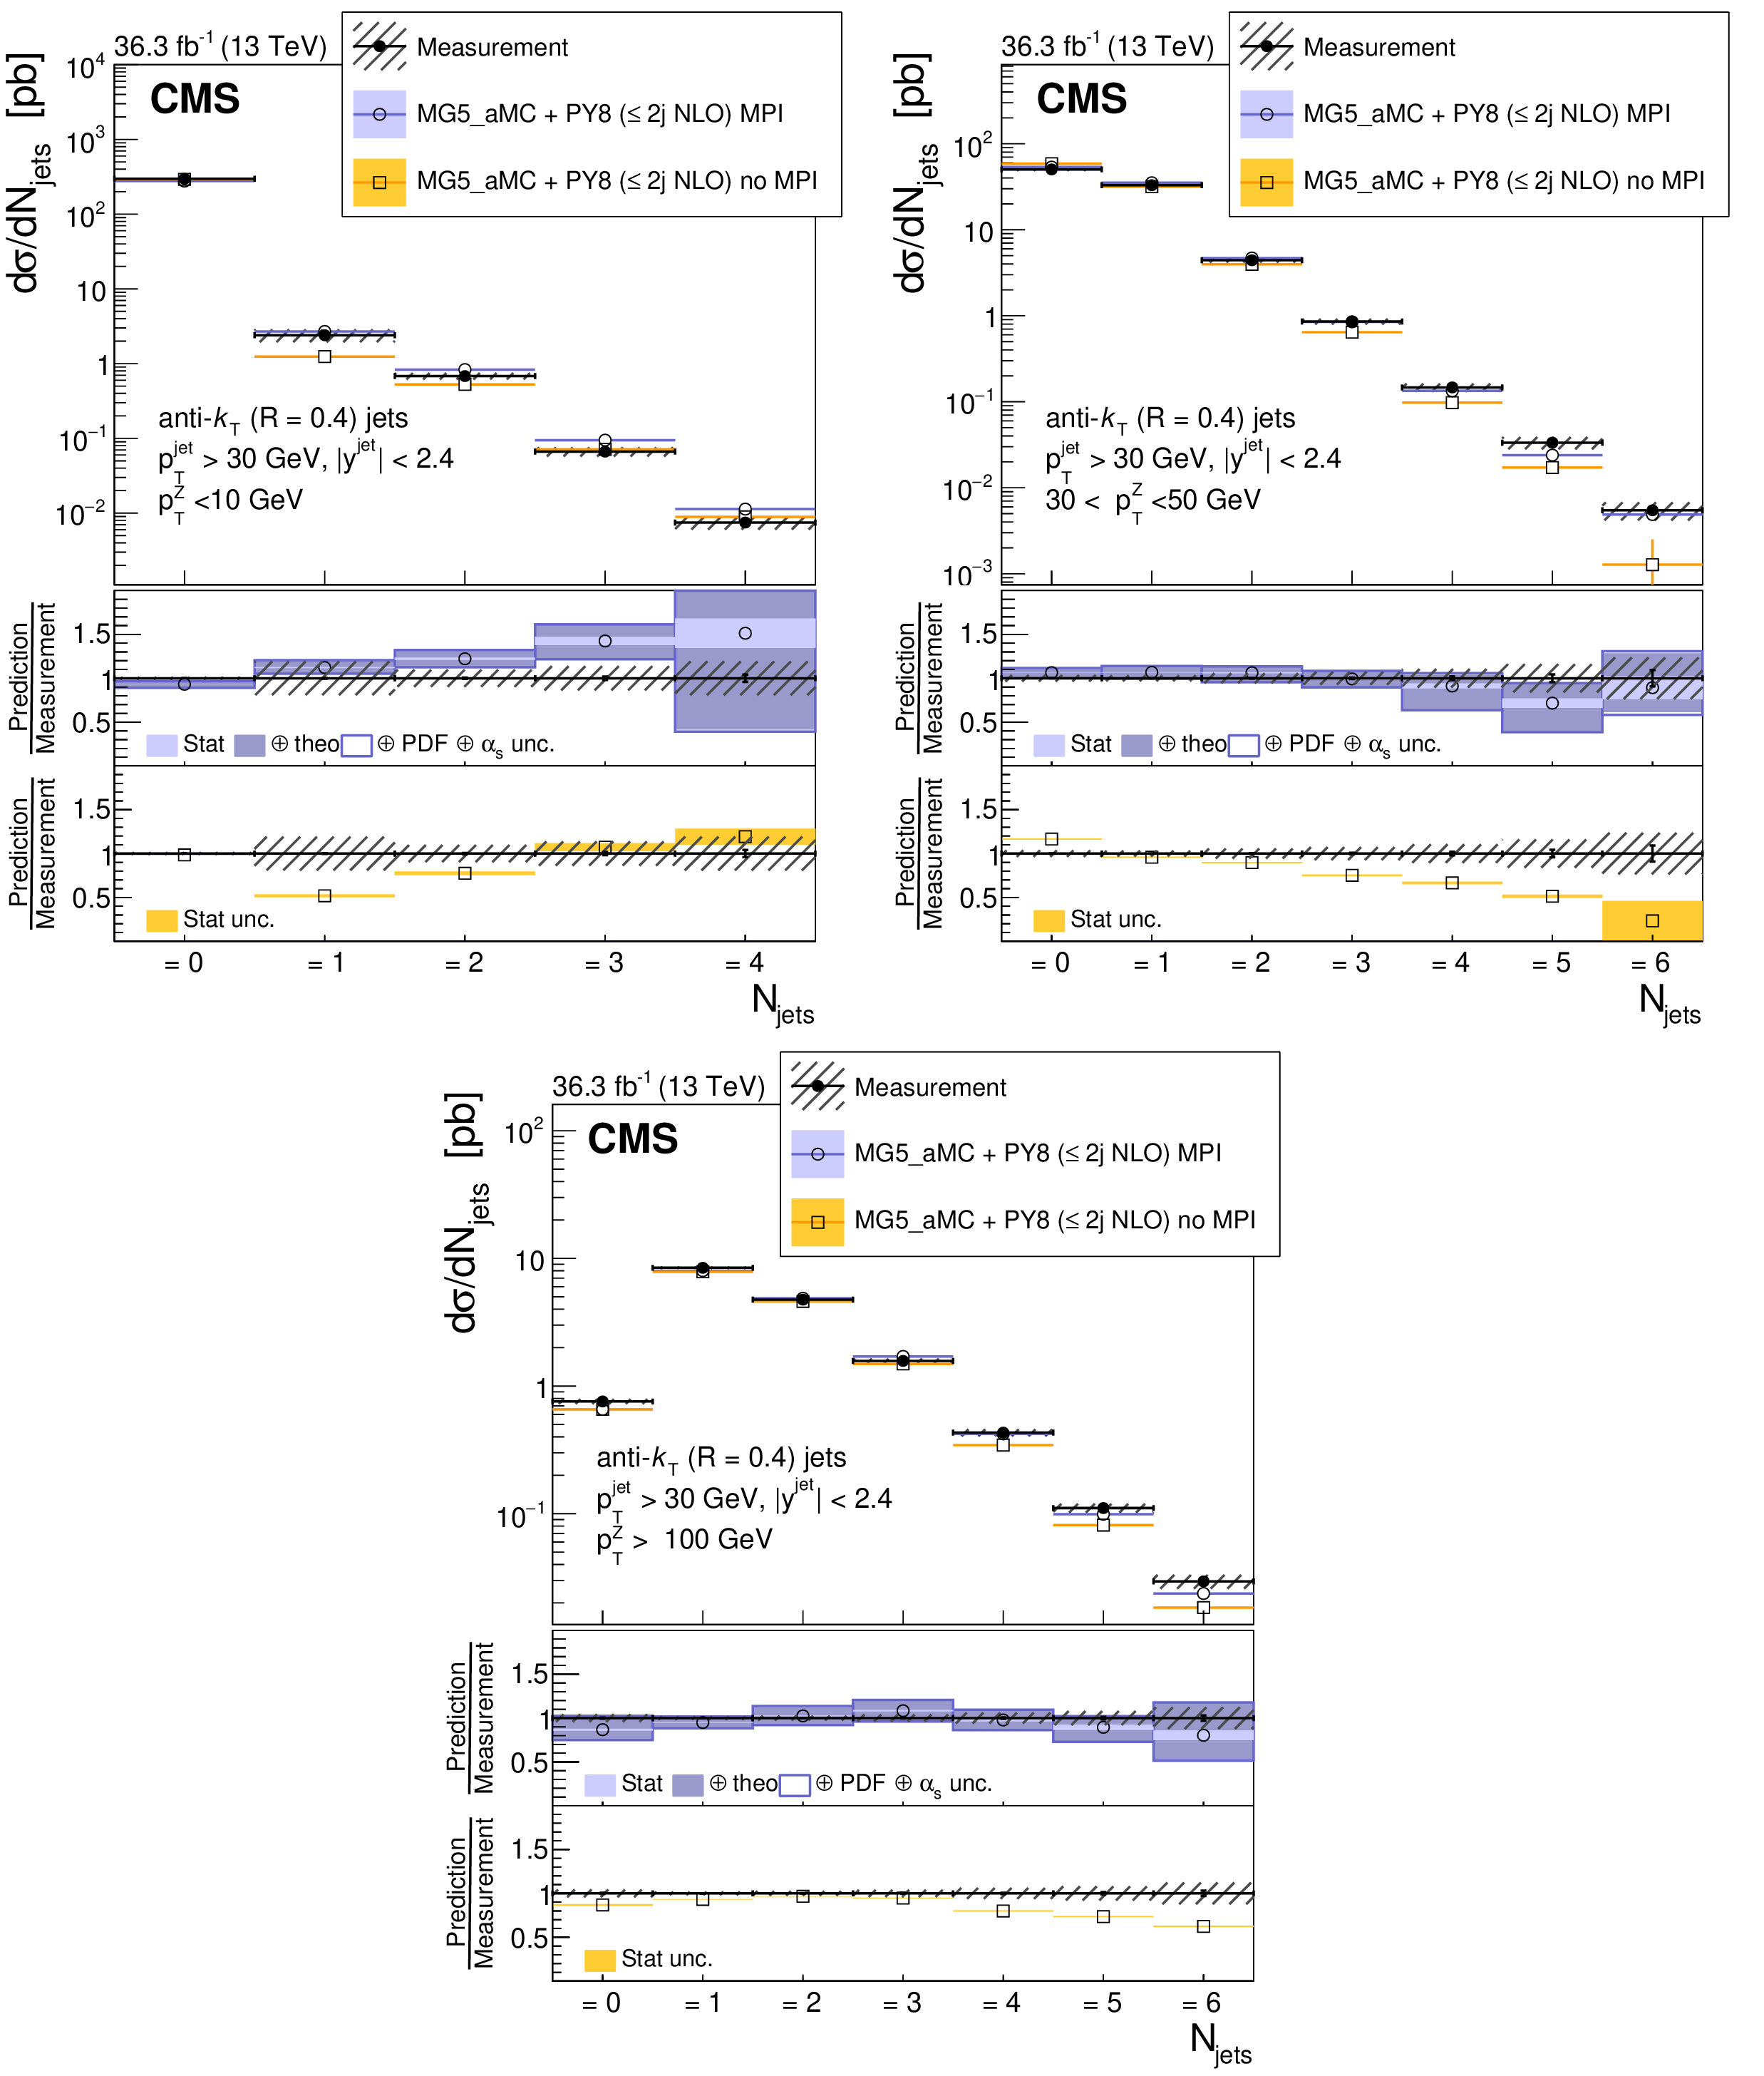
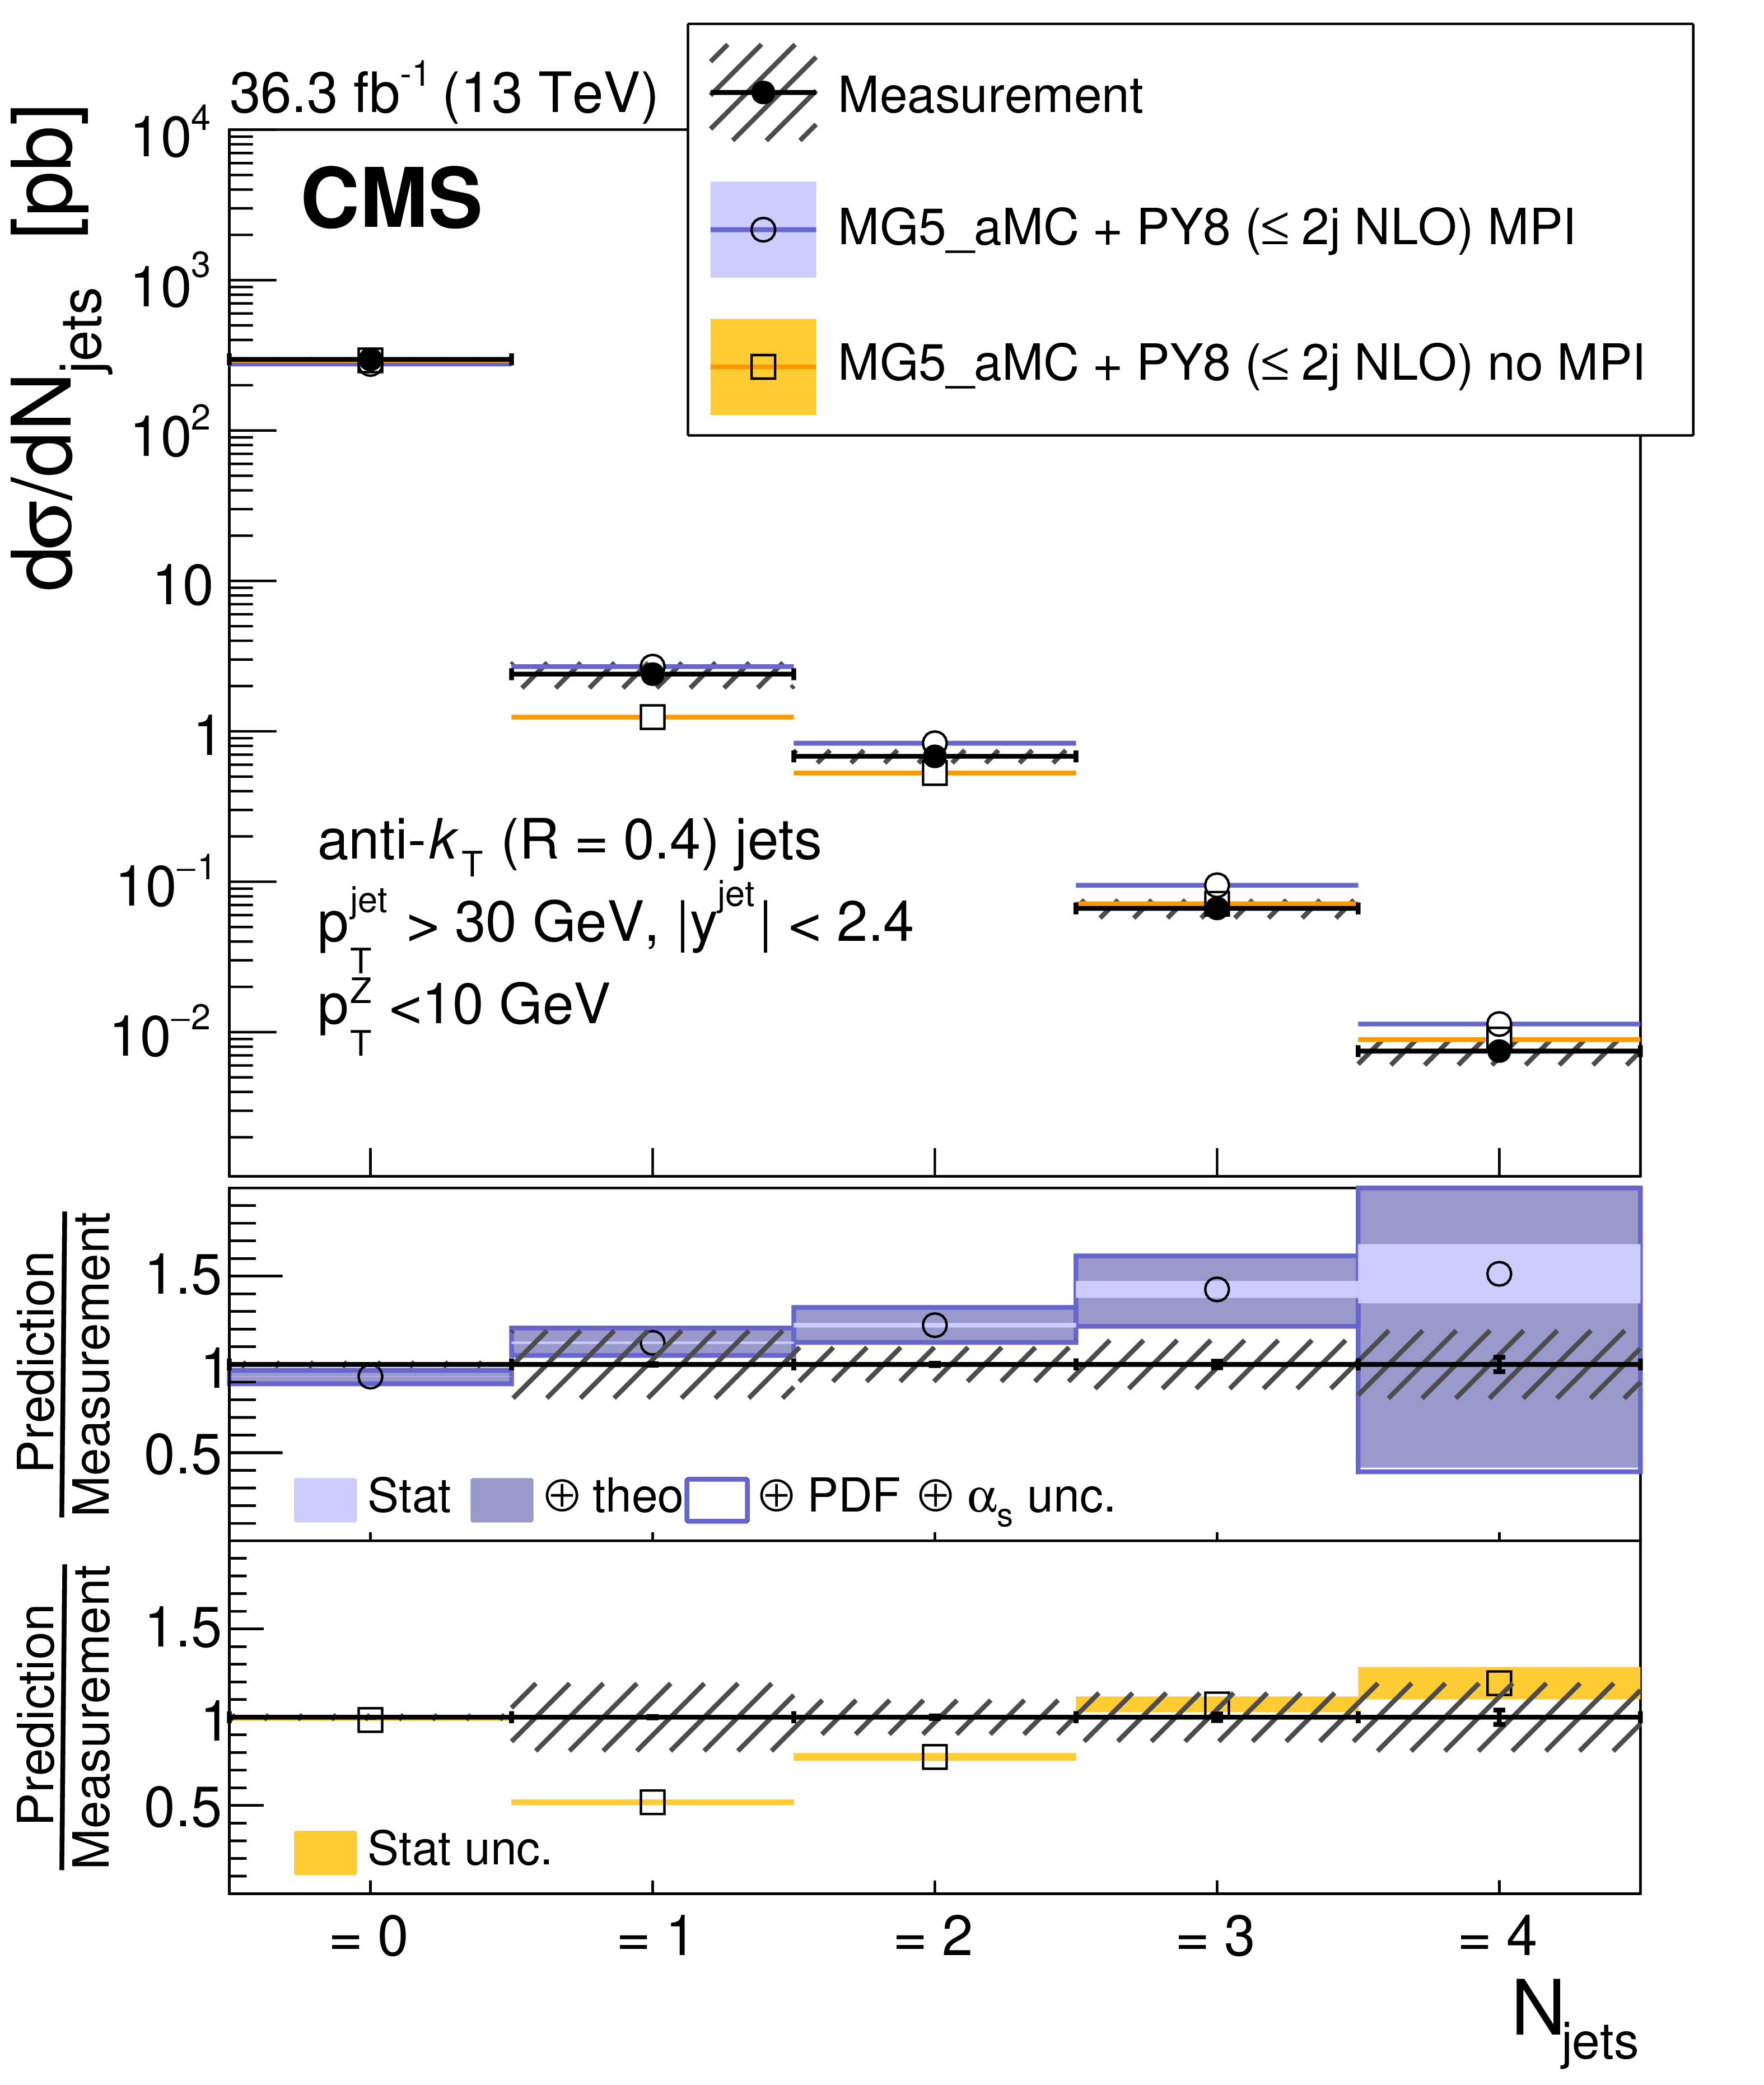
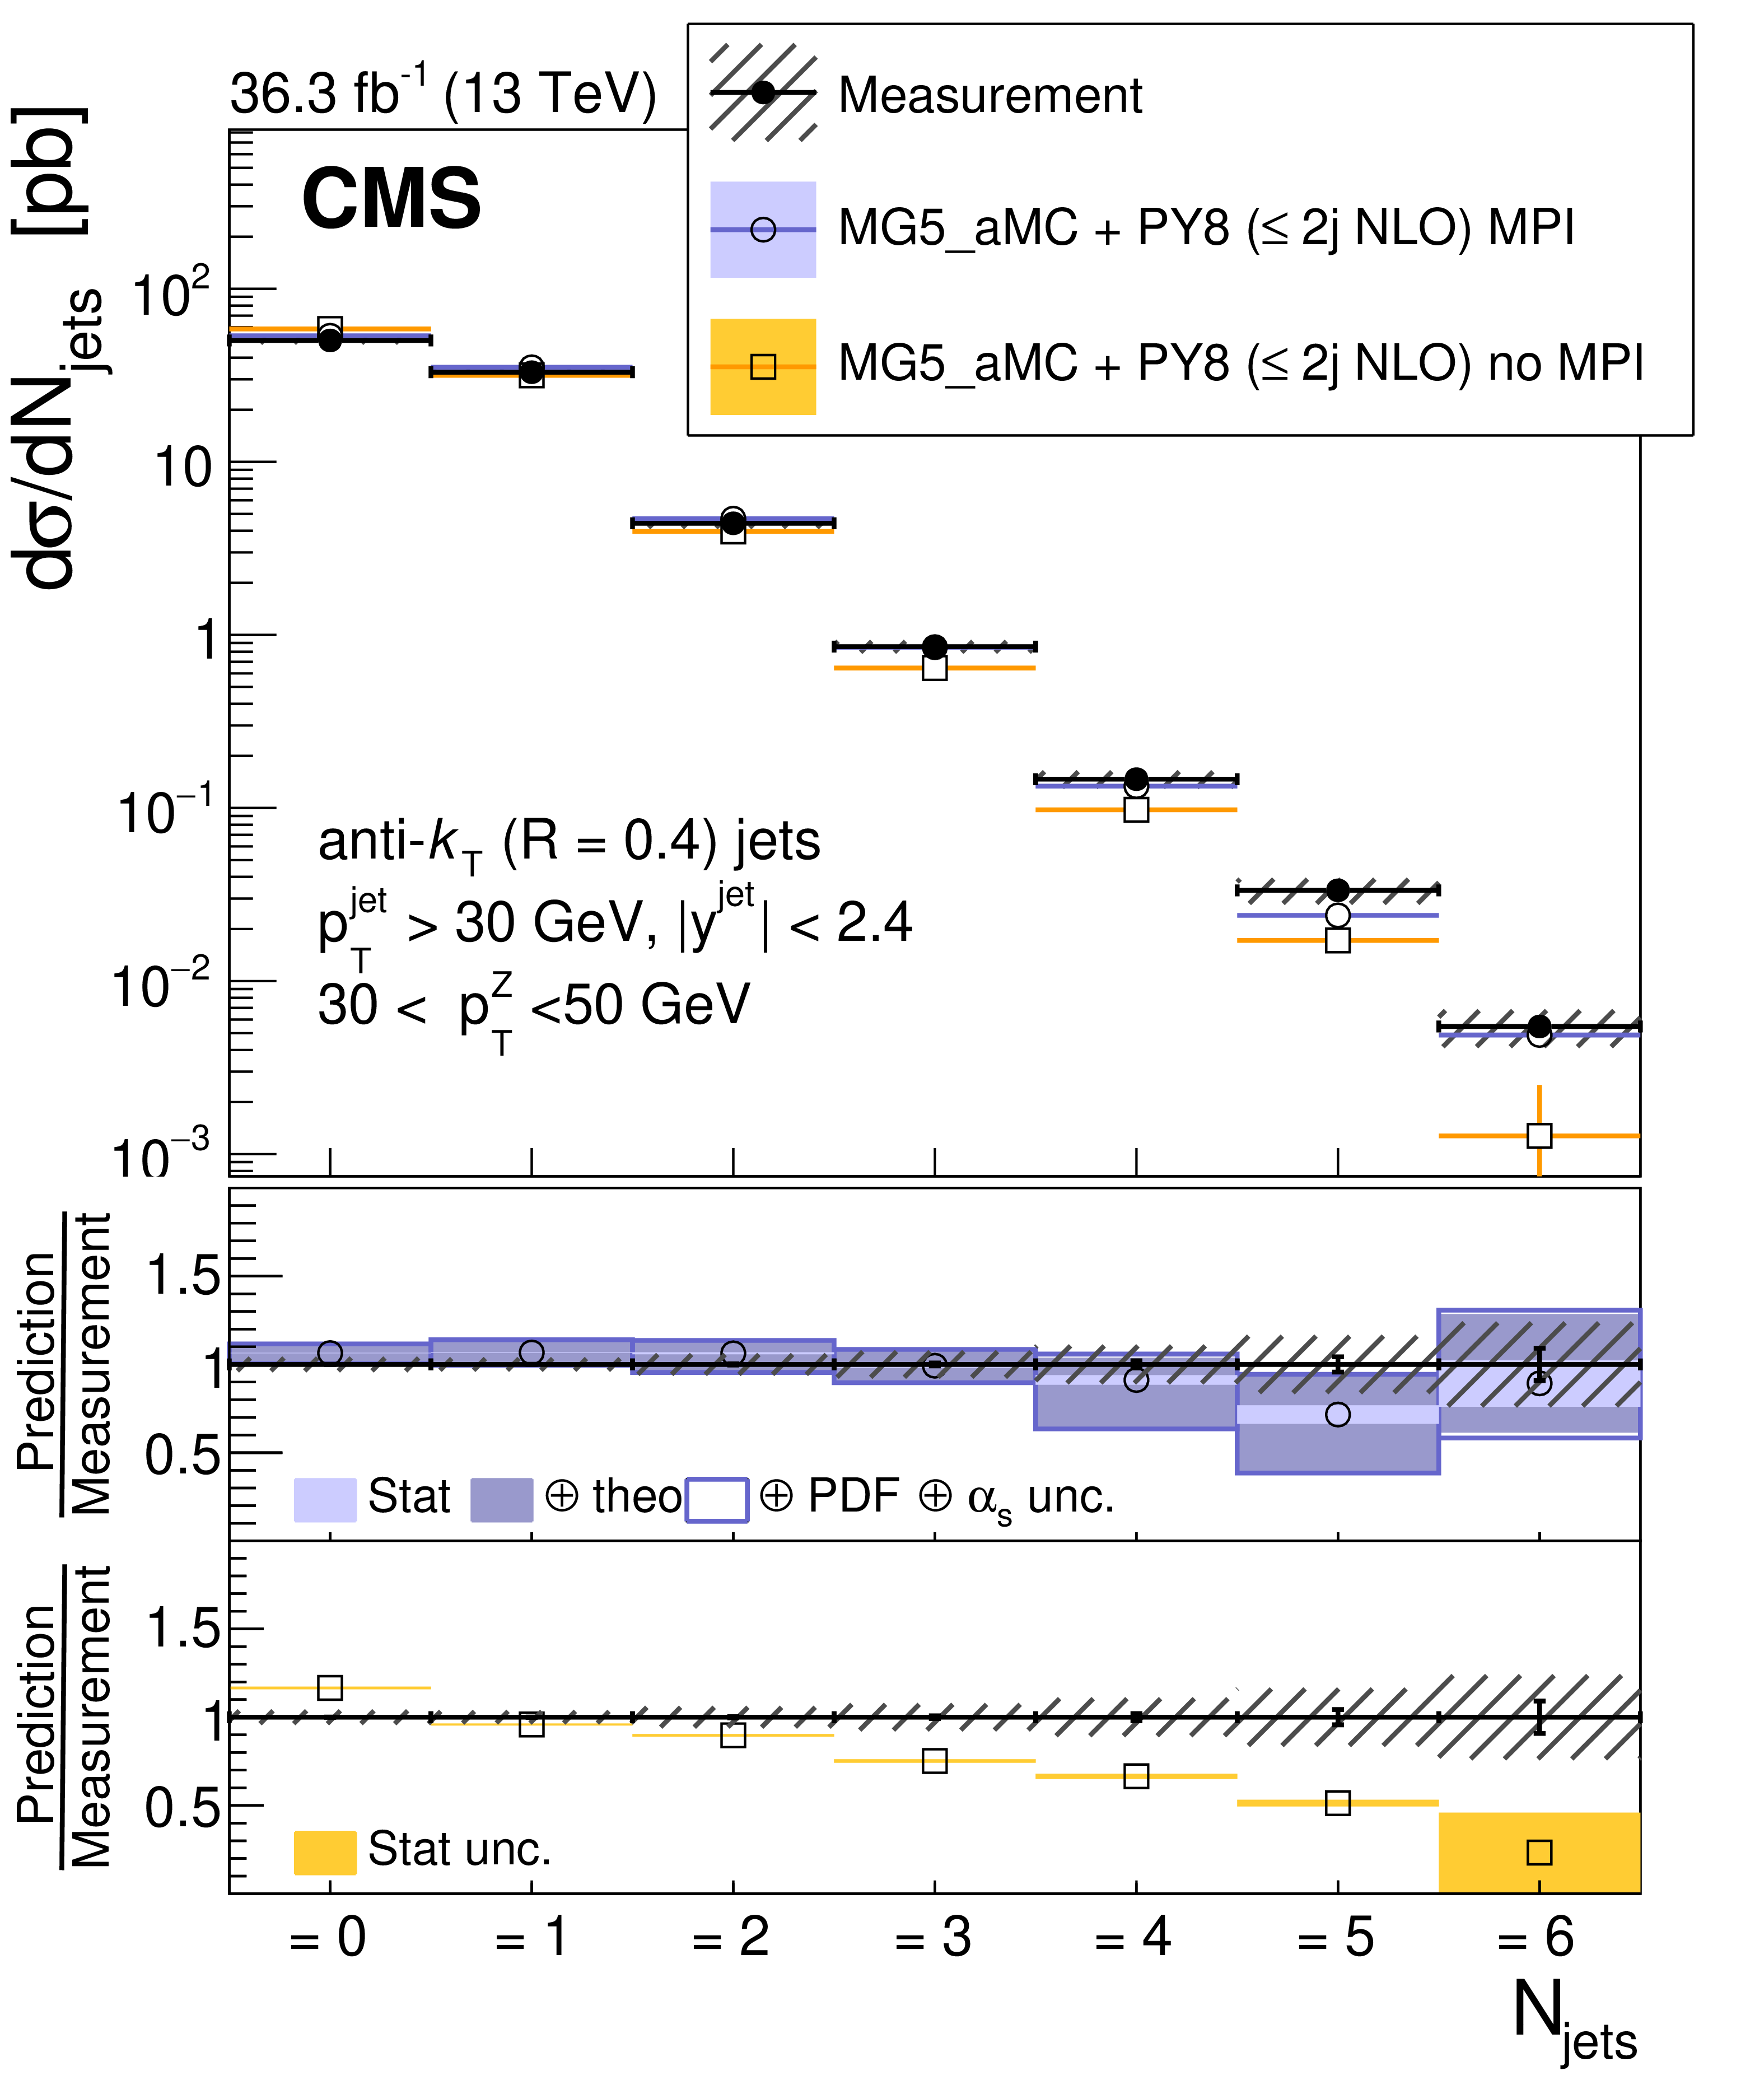
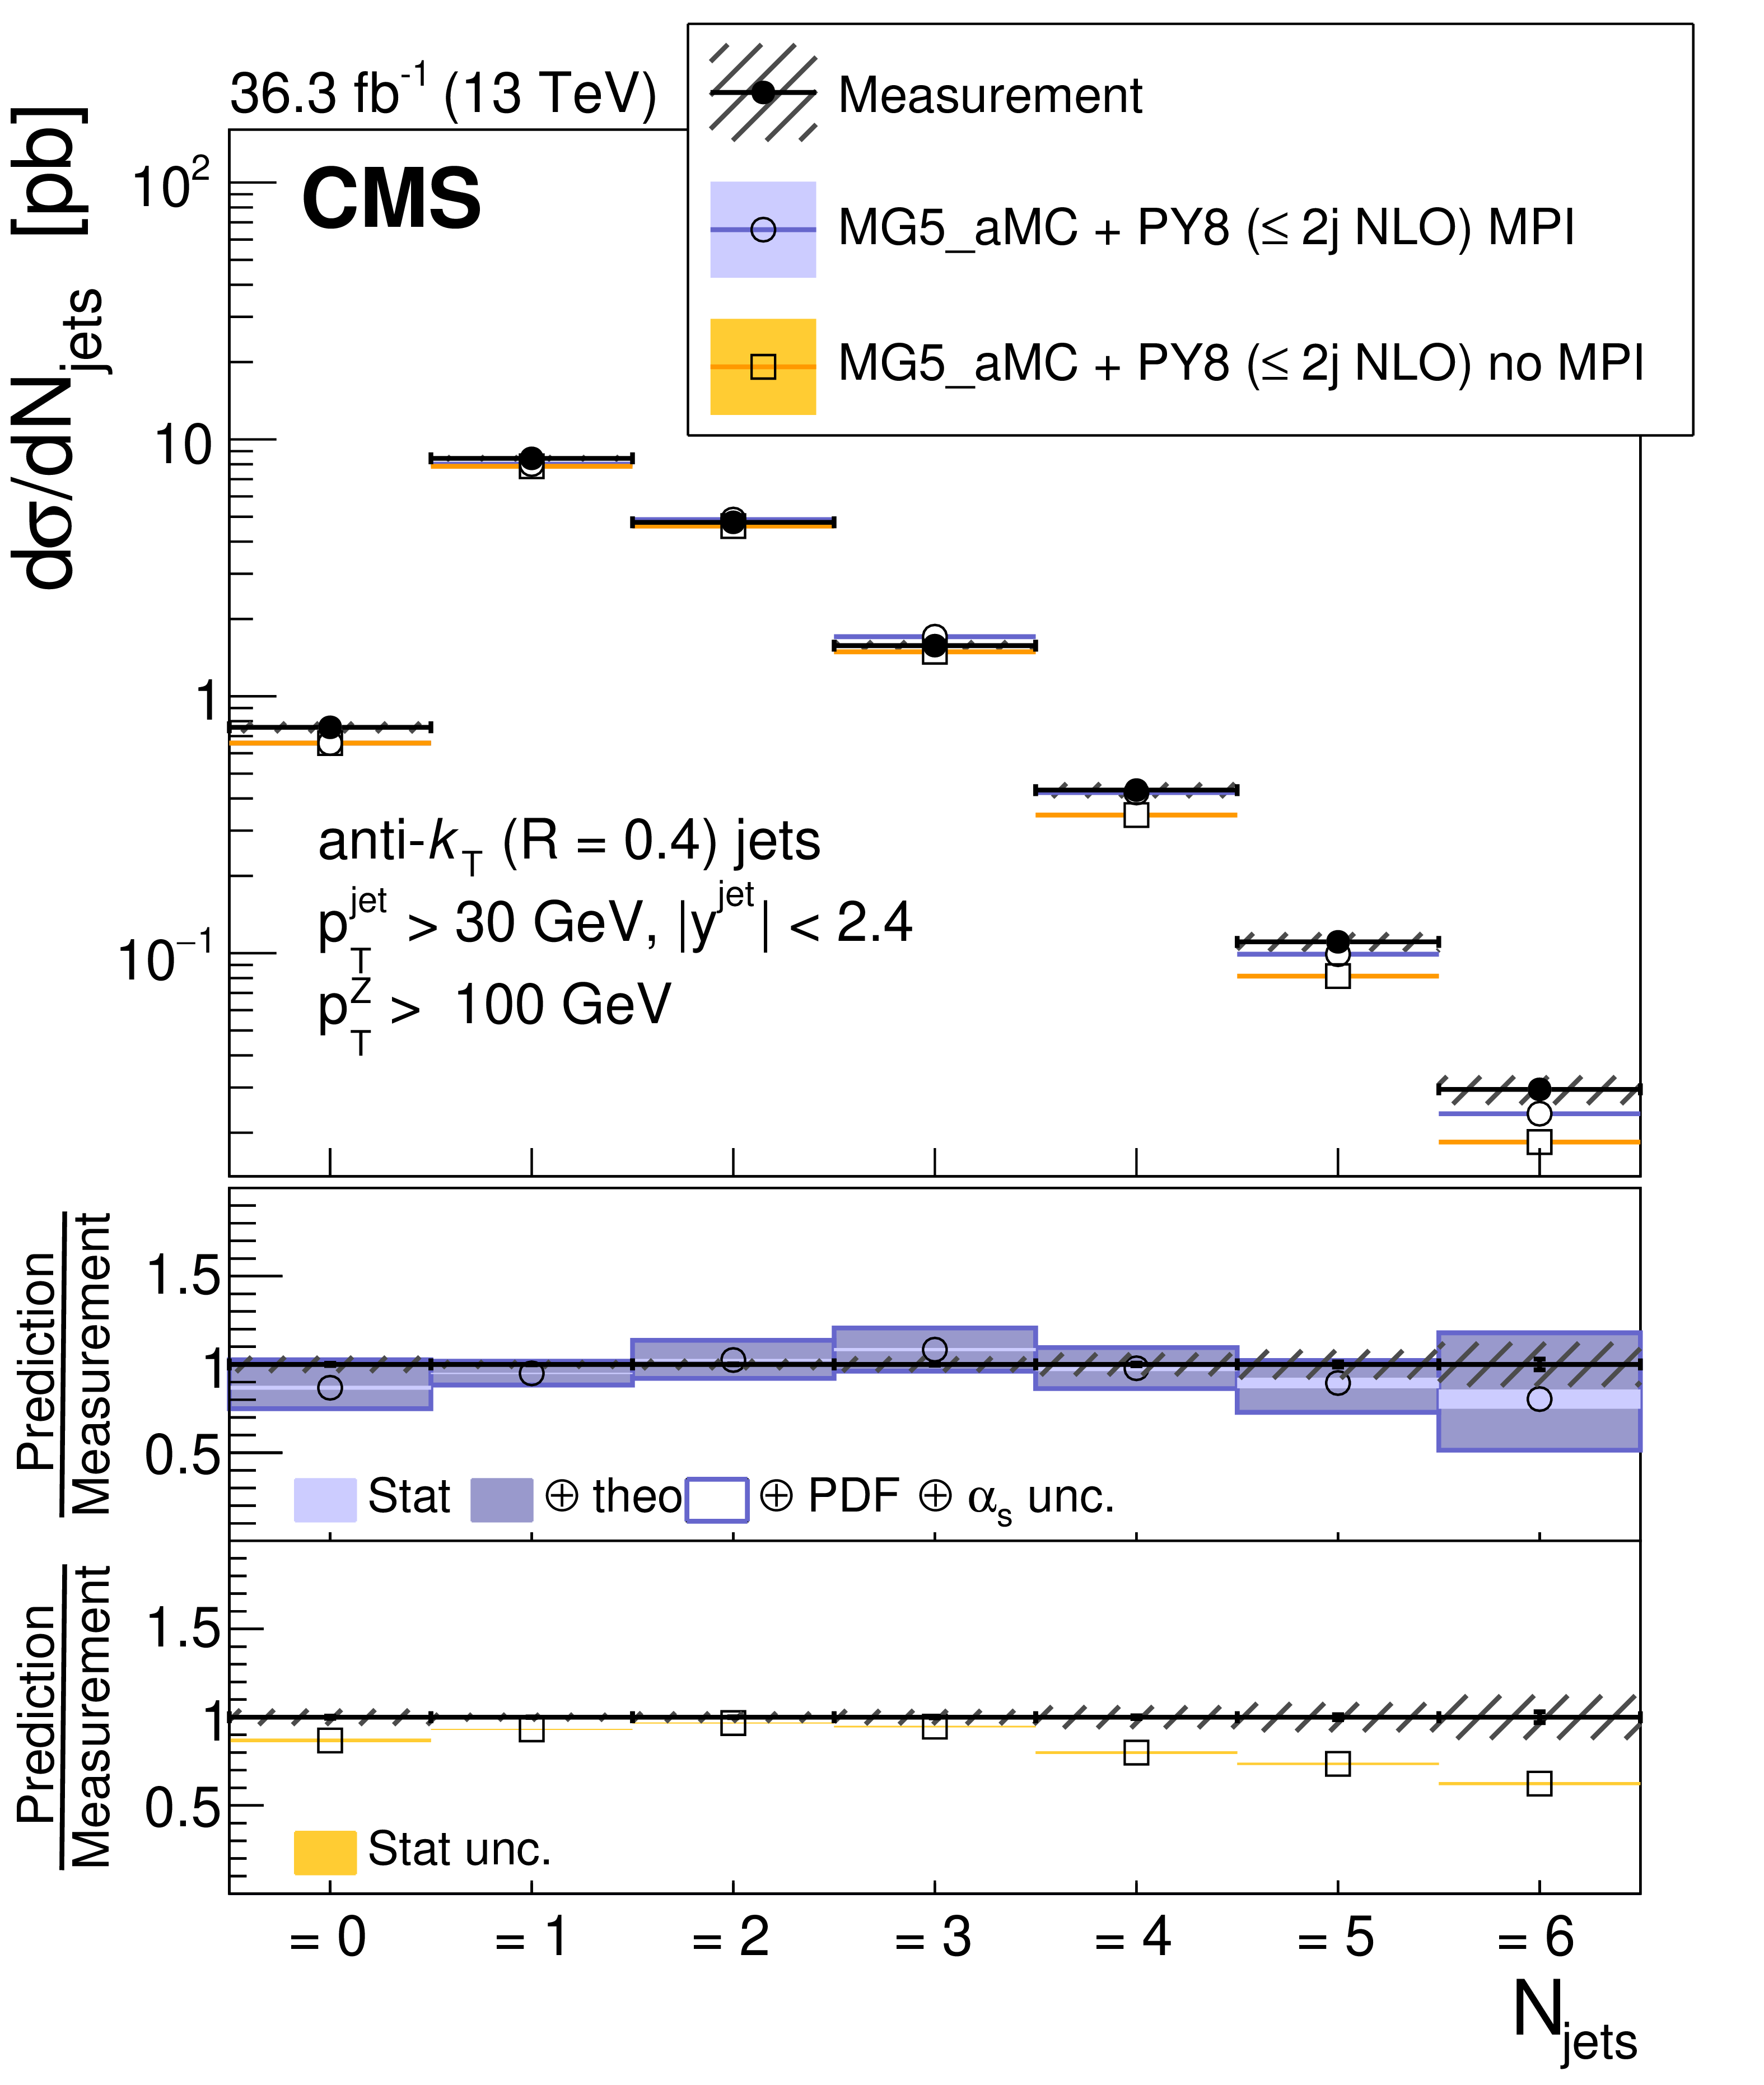
Figure 2:
Jet multiplicity in three different regions of $ p_{\mathrm{T}}(\mathrm{Z}) $: $ p_{\mathrm{T}}(\mathrm{Z}) < $ 10 GeV (upper left), 30 $ < p_{\mathrm{T}}(\mathrm{Z}) < $ 50 GeV (upper right), $ p_{\mathrm{T}}(\mathrm{Z}) > $ 100 GeV (lower). The error bars on the data points represent the statistical uncertainty of the measurement, and the hatched band shows the total statistical and systematic uncertainties added in quadrature. Predictions using MG5_AMC+PY8 ($ \leq $ 2j NLO) with and without MPI are shown. |
png pdf |
Figure 2-a:
Jet multiplicity for $ p_{\mathrm{T}}(\mathrm{Z}) < $ 10 GeV. The error bars on the data points represent the statistical uncertainty of the measurement, and the hatched band shows the total statistical and systematic uncertainties added in quadrature. Predictions using MG5_AMC+PY8 ($ \leq $ 2j NLO) with and without MPI are shown. |
png pdf |
Figure 2-b:
Jet multiplicity for 30 $ < p_{\mathrm{T}}(\mathrm{Z}) < $ 50 GeV. The error bars on the data points represent the statistical uncertainty of the measurement, and the hatched band shows the total statistical and systematic uncertainties added in quadrature. Predictions using MG5_AMC+PY8 ($ \leq $ 2j NLO) with and without MPI are shown. |
png pdf |
Figure 2-c:
Jet multiplicity for $ p_{\mathrm{T}}(\mathrm{Z}) > $ 100 GeV. The error bars on the data points represent the statistical uncertainty of the measurement, and the hatched band shows the total statistical and systematic uncertainties added in quadrature. Predictions using MG5_AMC+PY8 ($ \leq $ 2j NLO) with and without MPI are shown. |
png pdf |
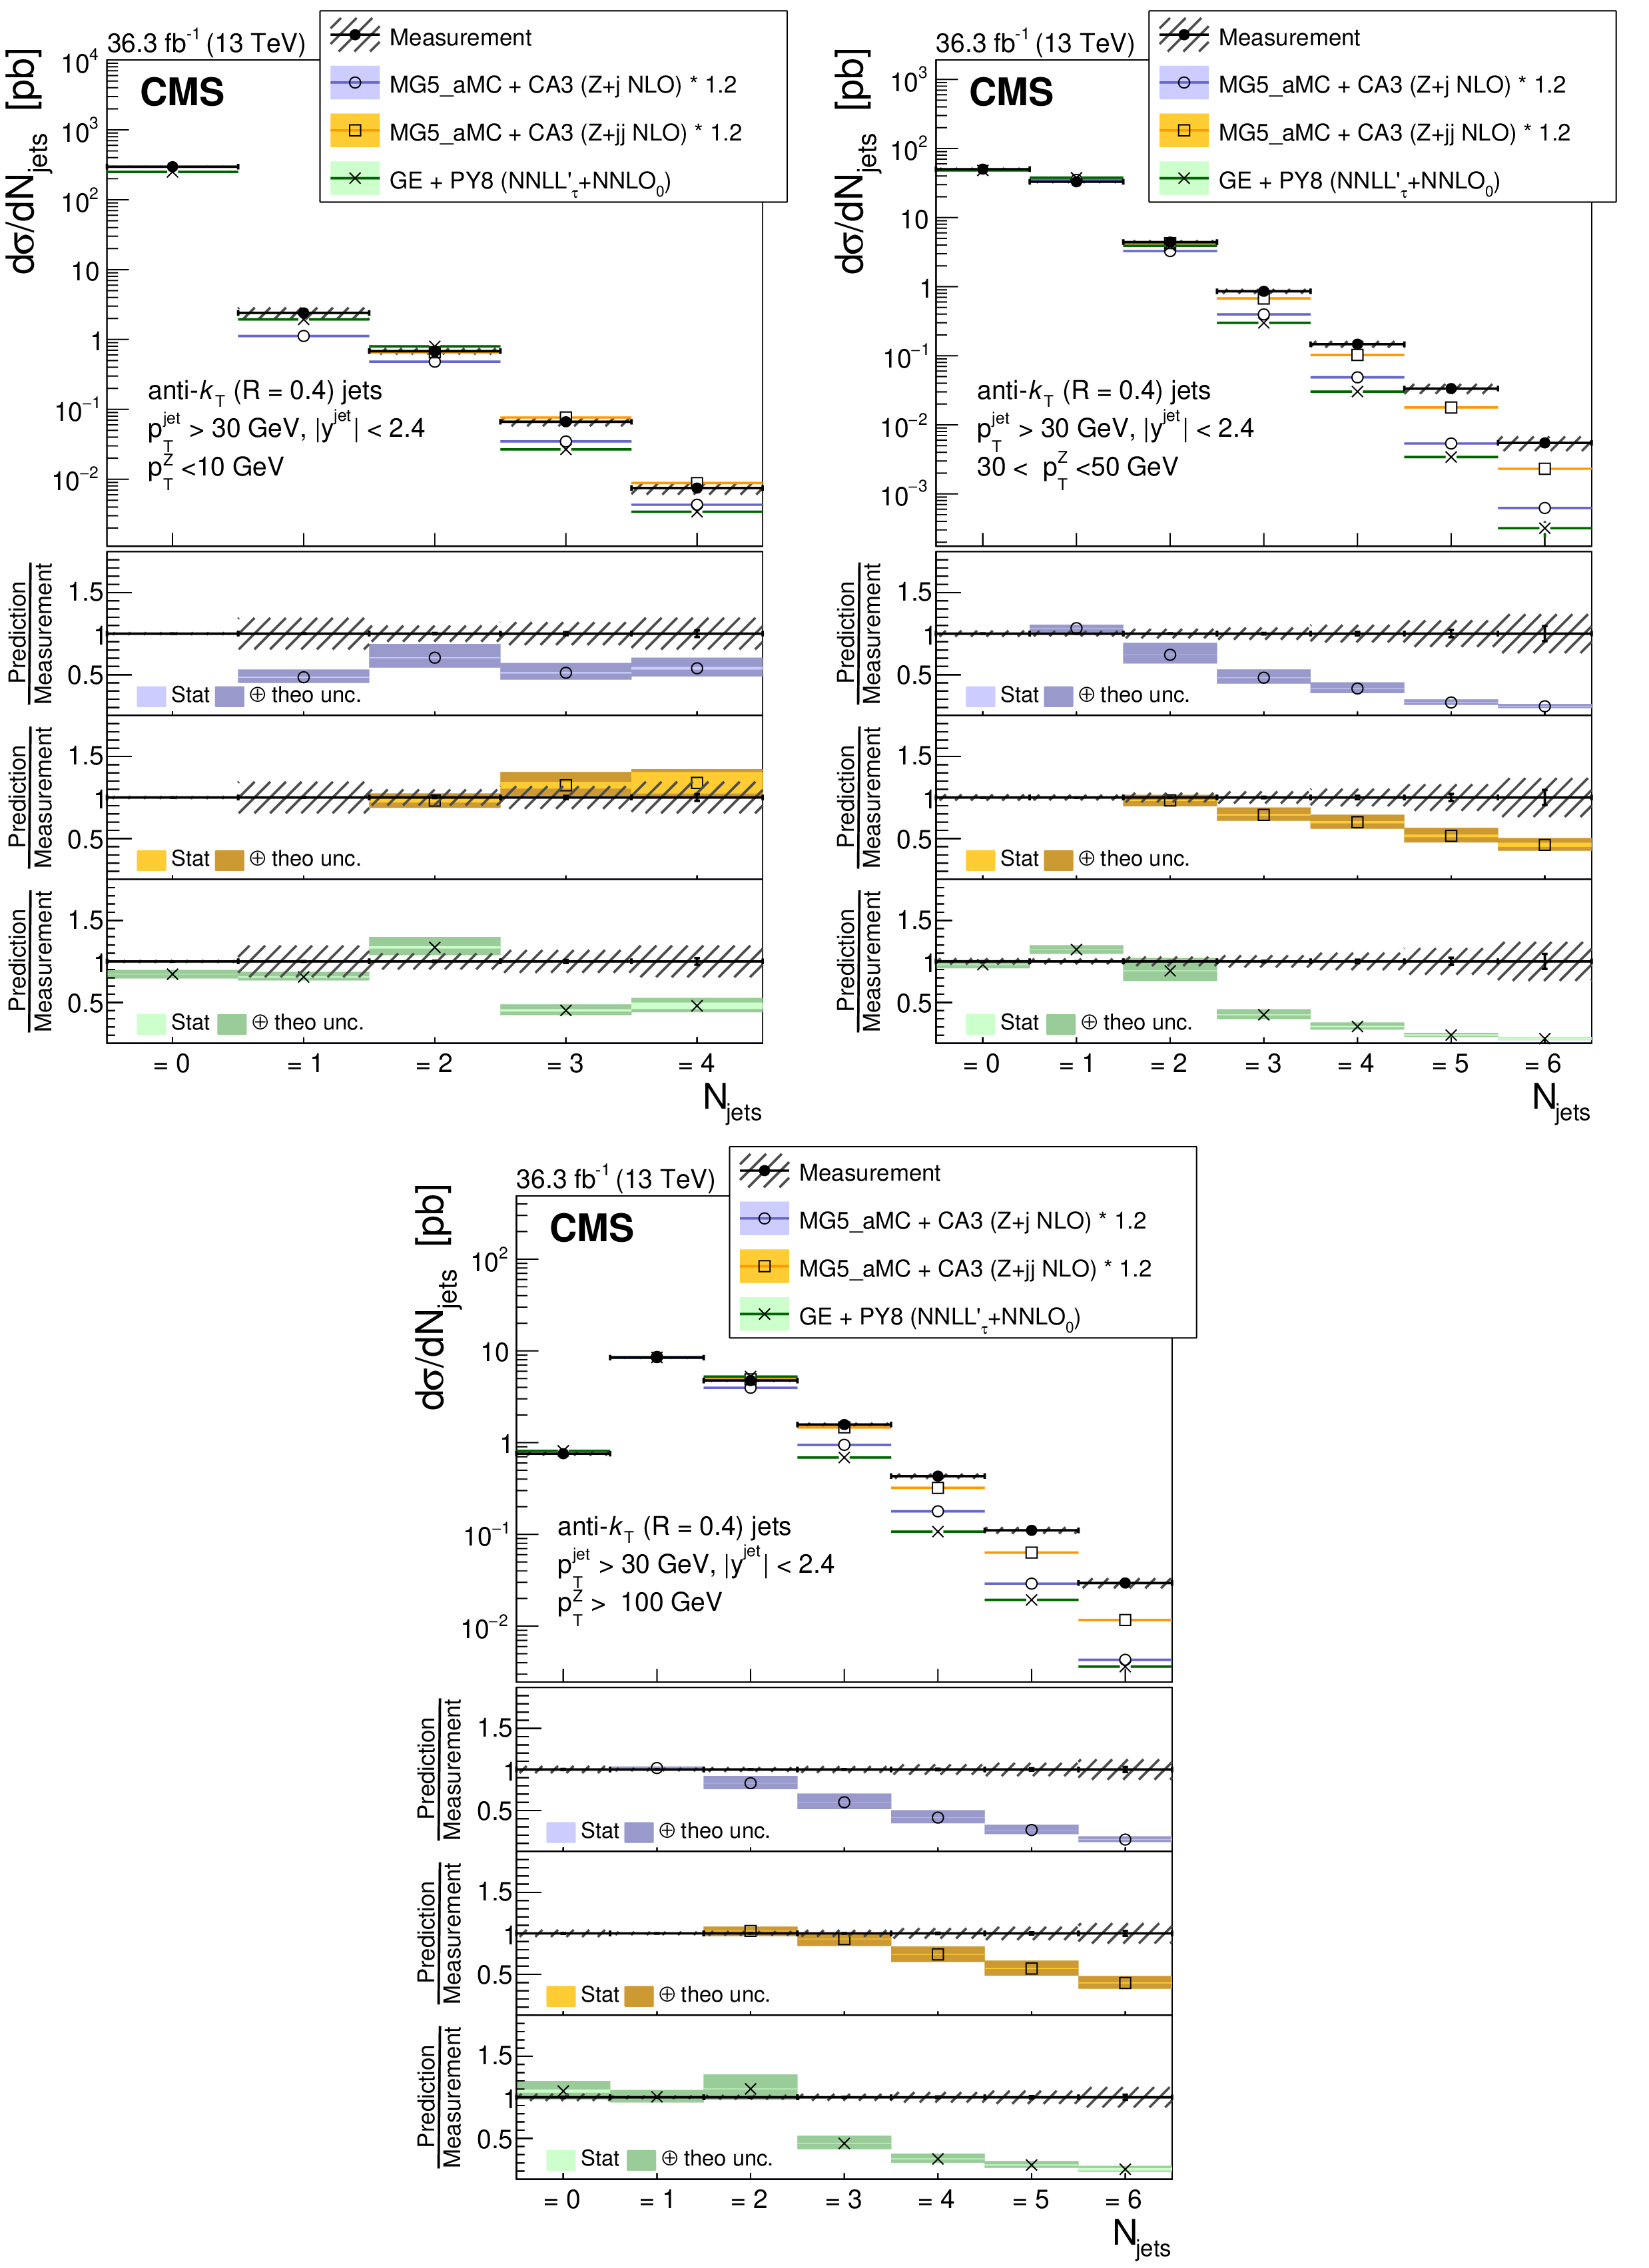
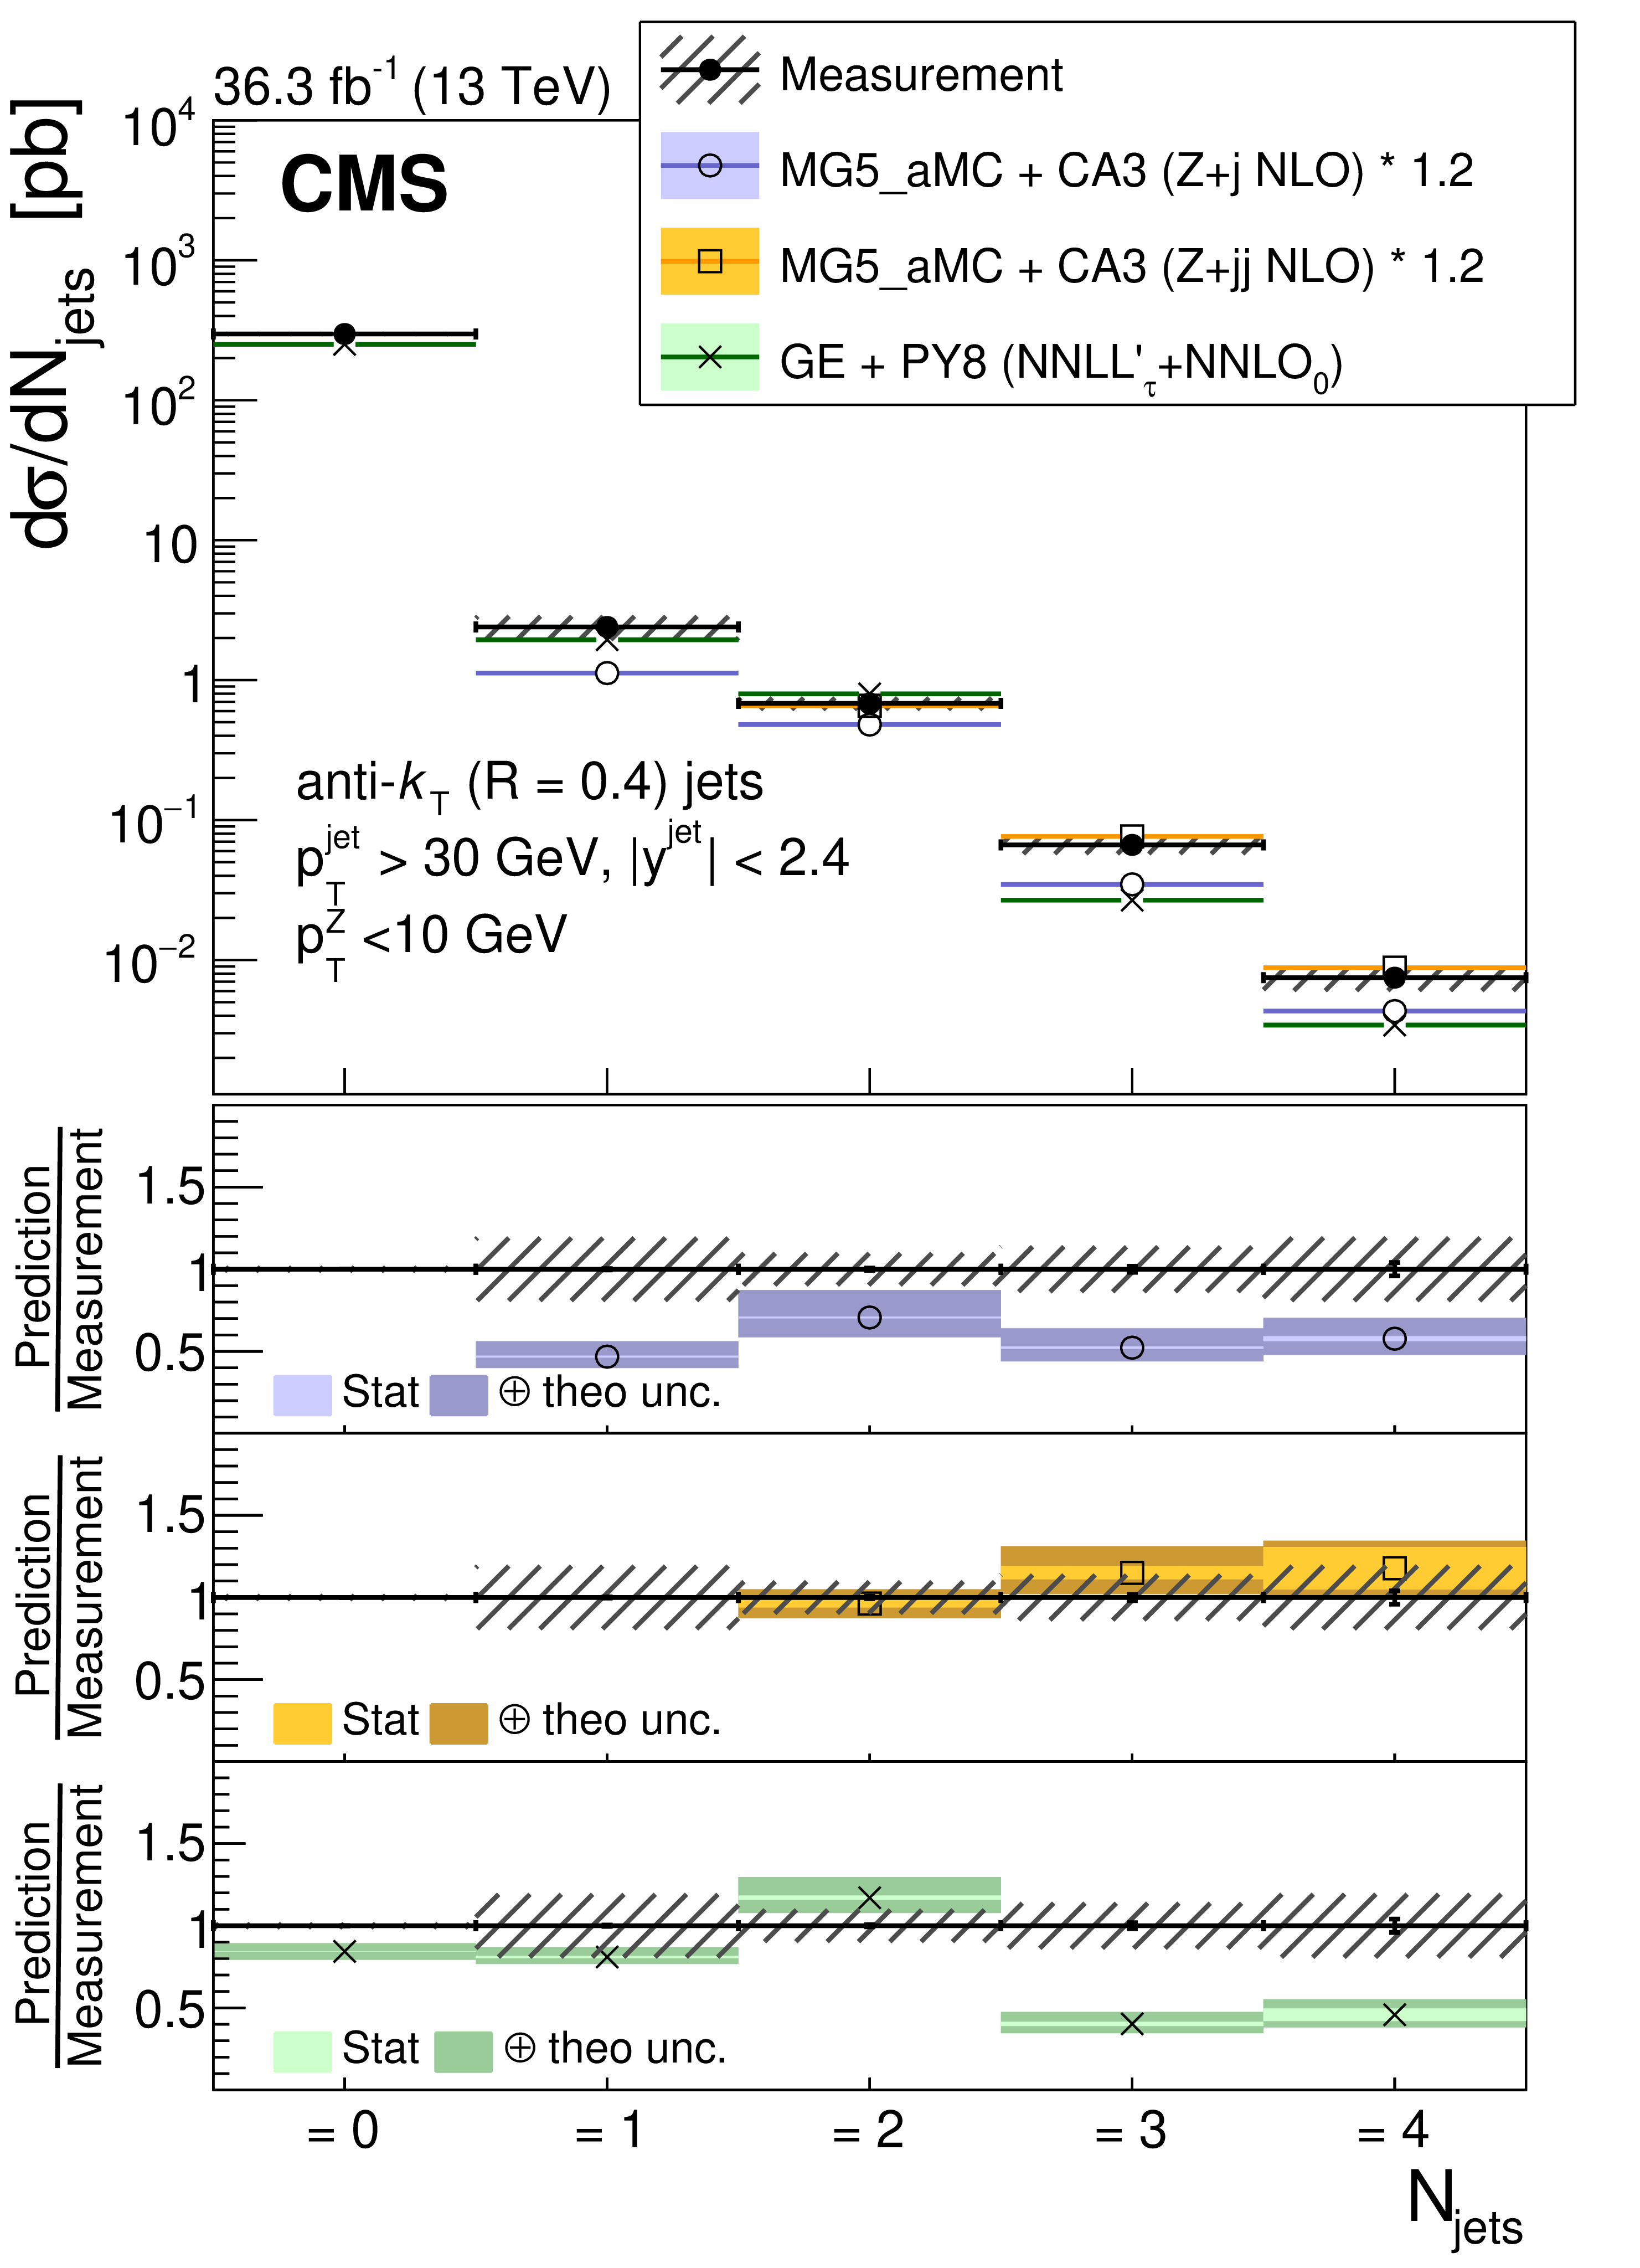
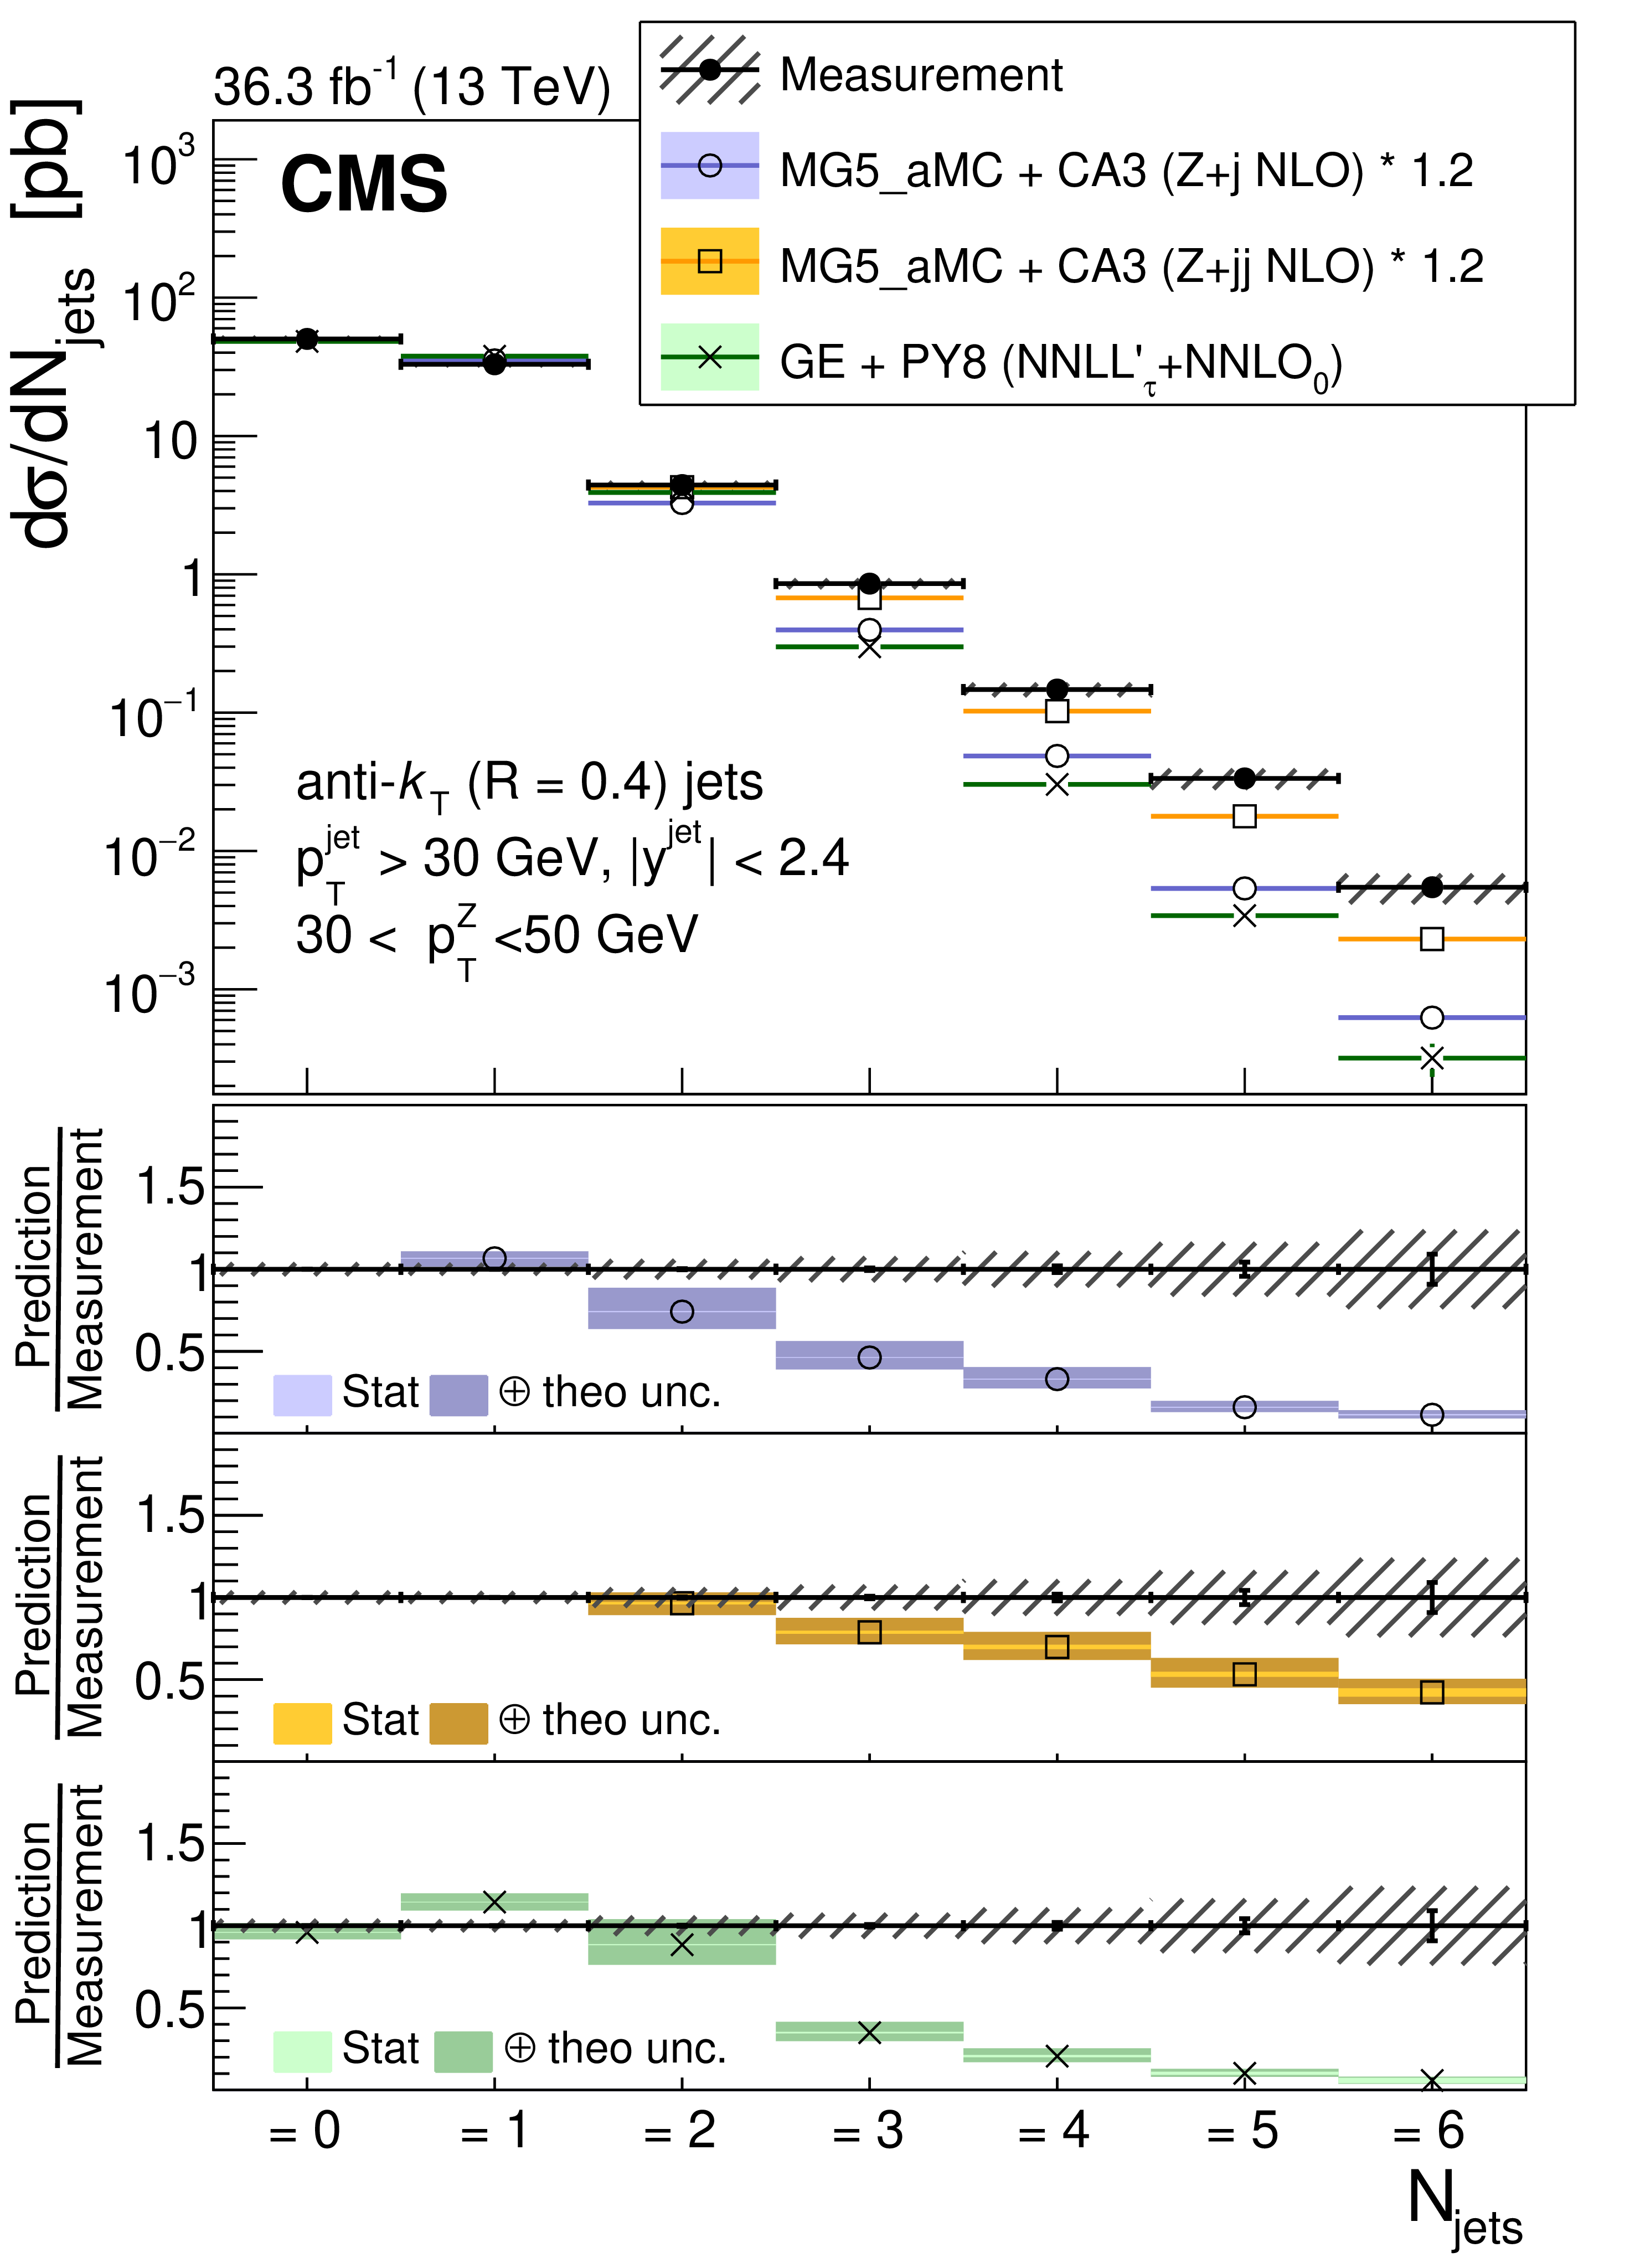
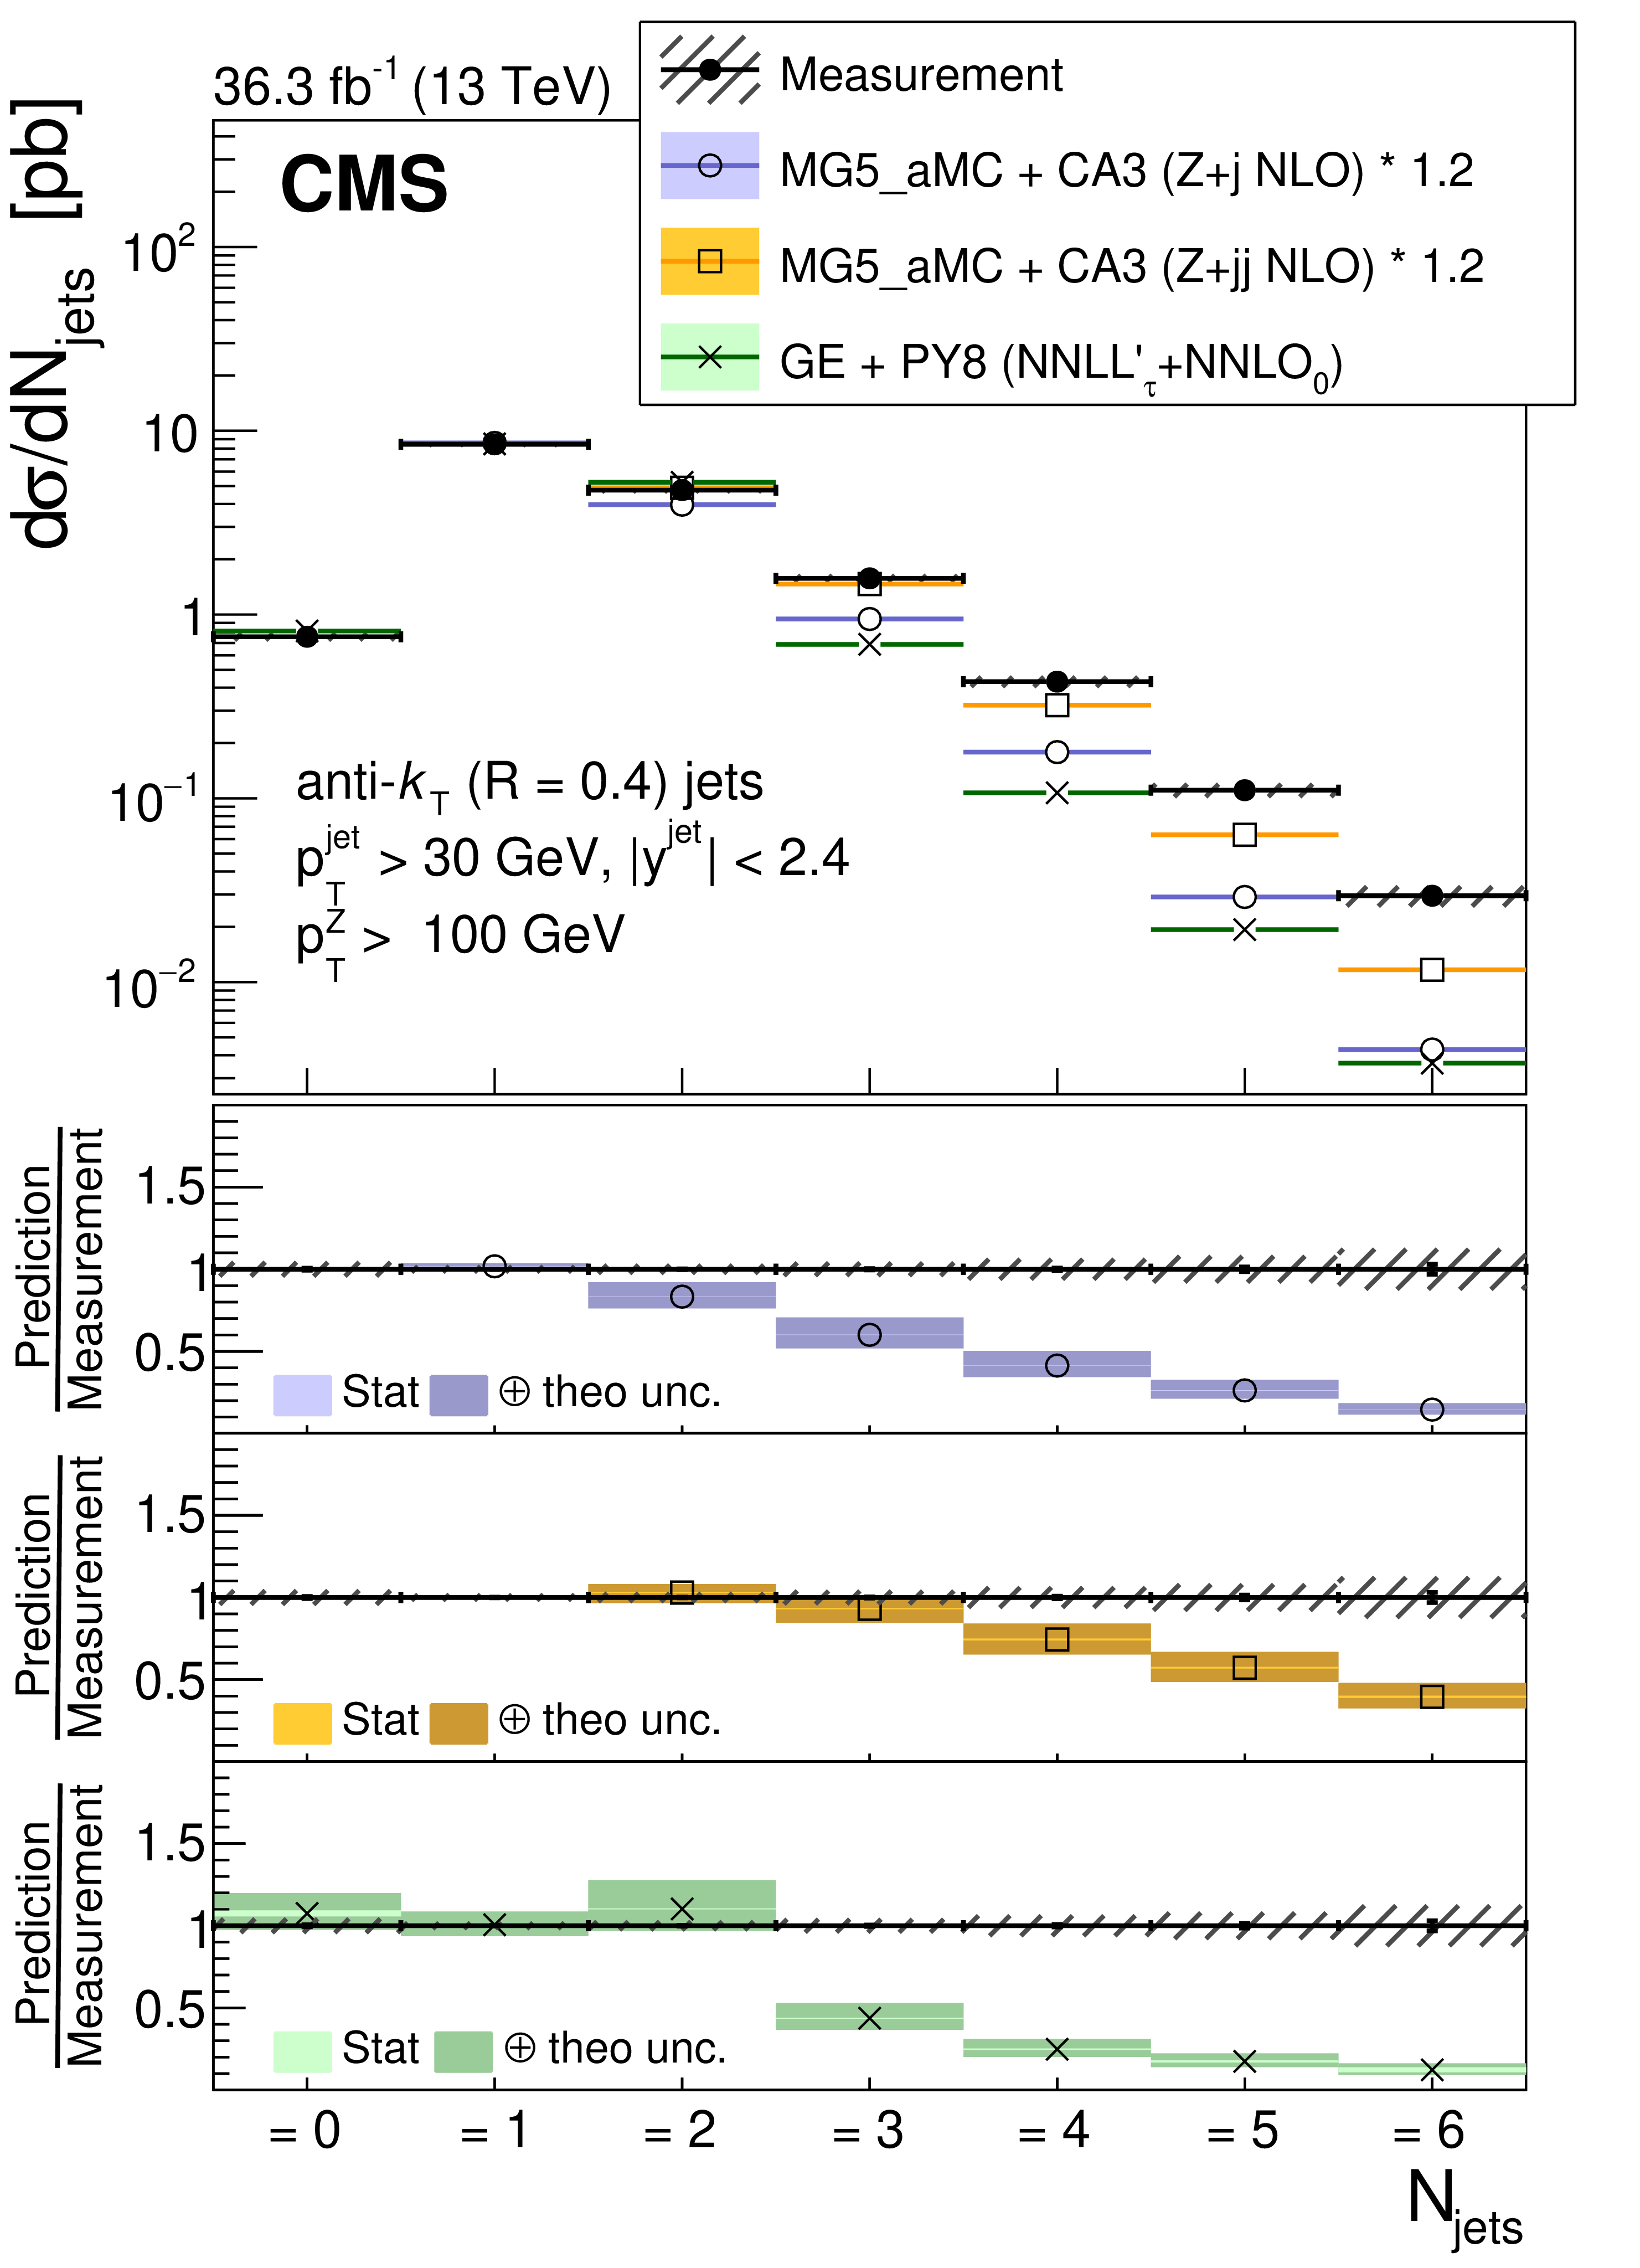
Figure 3:
Jet multiplicity in three different regions of $ p_{\mathrm{T}}(\mathrm{Z}) $: $ p_{\mathrm{T}}(\mathrm{Z}) < $ 10 GeV (upper left), 30 $ < p_{\mathrm{T}}(\mathrm{Z}) < $ 50 GeV (upper right), $ p_{\mathrm{T}}(\mathrm{Z}) > $ 100 GeV (lower). The error bars on the data points represent the statistical uncertainty of the measurement, and the hatched band shows the total statistical and systematic uncertainties added in quadrature. Predictions from MG5_AMC+CA3 (Z+1 NLO), MG5_AMC+CA3 (Z+2 NLO) and GENEVA (Z+0 NNLO) are shown. An overall normalization factor of 1.2 is applied to MG5_AMC+CA3 (Z+1 NLO) and MG5_AMC+CA3 (Z+2 NLO). |
png pdf |
Figure 3-a:
Jet multiplicity for $ p_{\mathrm{T}}(\mathrm{Z}) < $ 10 GeV. The error bars on the data points represent the statistical uncertainty of the measurement, and the hatched band shows the total statistical and systematic uncertainties added in quadrature. Predictions from MG5_AMC+CA3 (Z+1 NLO), MG5_AMC+CA3 (Z+2 NLO) and GENEVA (Z+0 NNLO) are shown. An overall normalization factor of 1.2 is applied to MG5_AMC+CA3 (Z+1 NLO) and MG5_AMC+CA3 (Z+2 NLO). |
png pdf |
Figure 3-b:
Jet multiplicity for 30 $ < p_{\mathrm{T}}(\mathrm{Z}) < $ 50 GeV. The error bars on the data points represent the statistical uncertainty of the measurement, and the hatched band shows the total statistical and systematic uncertainties added in quadrature. Predictions from MG5_AMC+CA3 (Z+1 NLO), MG5_AMC+CA3 (Z+2 NLO) and GENEVA (Z+0 NNLO) are shown. An overall normalization factor of 1.2 is applied to MG5_AMC+CA3 (Z+1 NLO) and MG5_AMC+CA3 (Z+2 NLO). |
png pdf |
Figure 3-c:
Jet multiplicity for $ p_{\mathrm{T}}(\mathrm{Z}) > $ 100 GeV. The error bars on the data points represent the statistical uncertainty of the measurement, and the hatched band shows the total statistical and systematic uncertainties added in quadrature. Predictions from MG5_AMC+CA3 (Z+1 NLO), MG5_AMC+CA3 (Z+2 NLO) and GENEVA (Z+0 NNLO) are shown. An overall normalization factor of 1.2 is applied to MG5_AMC+CA3 (Z+1 NLO) and MG5_AMC+CA3 (Z+2 NLO). |
png pdf |
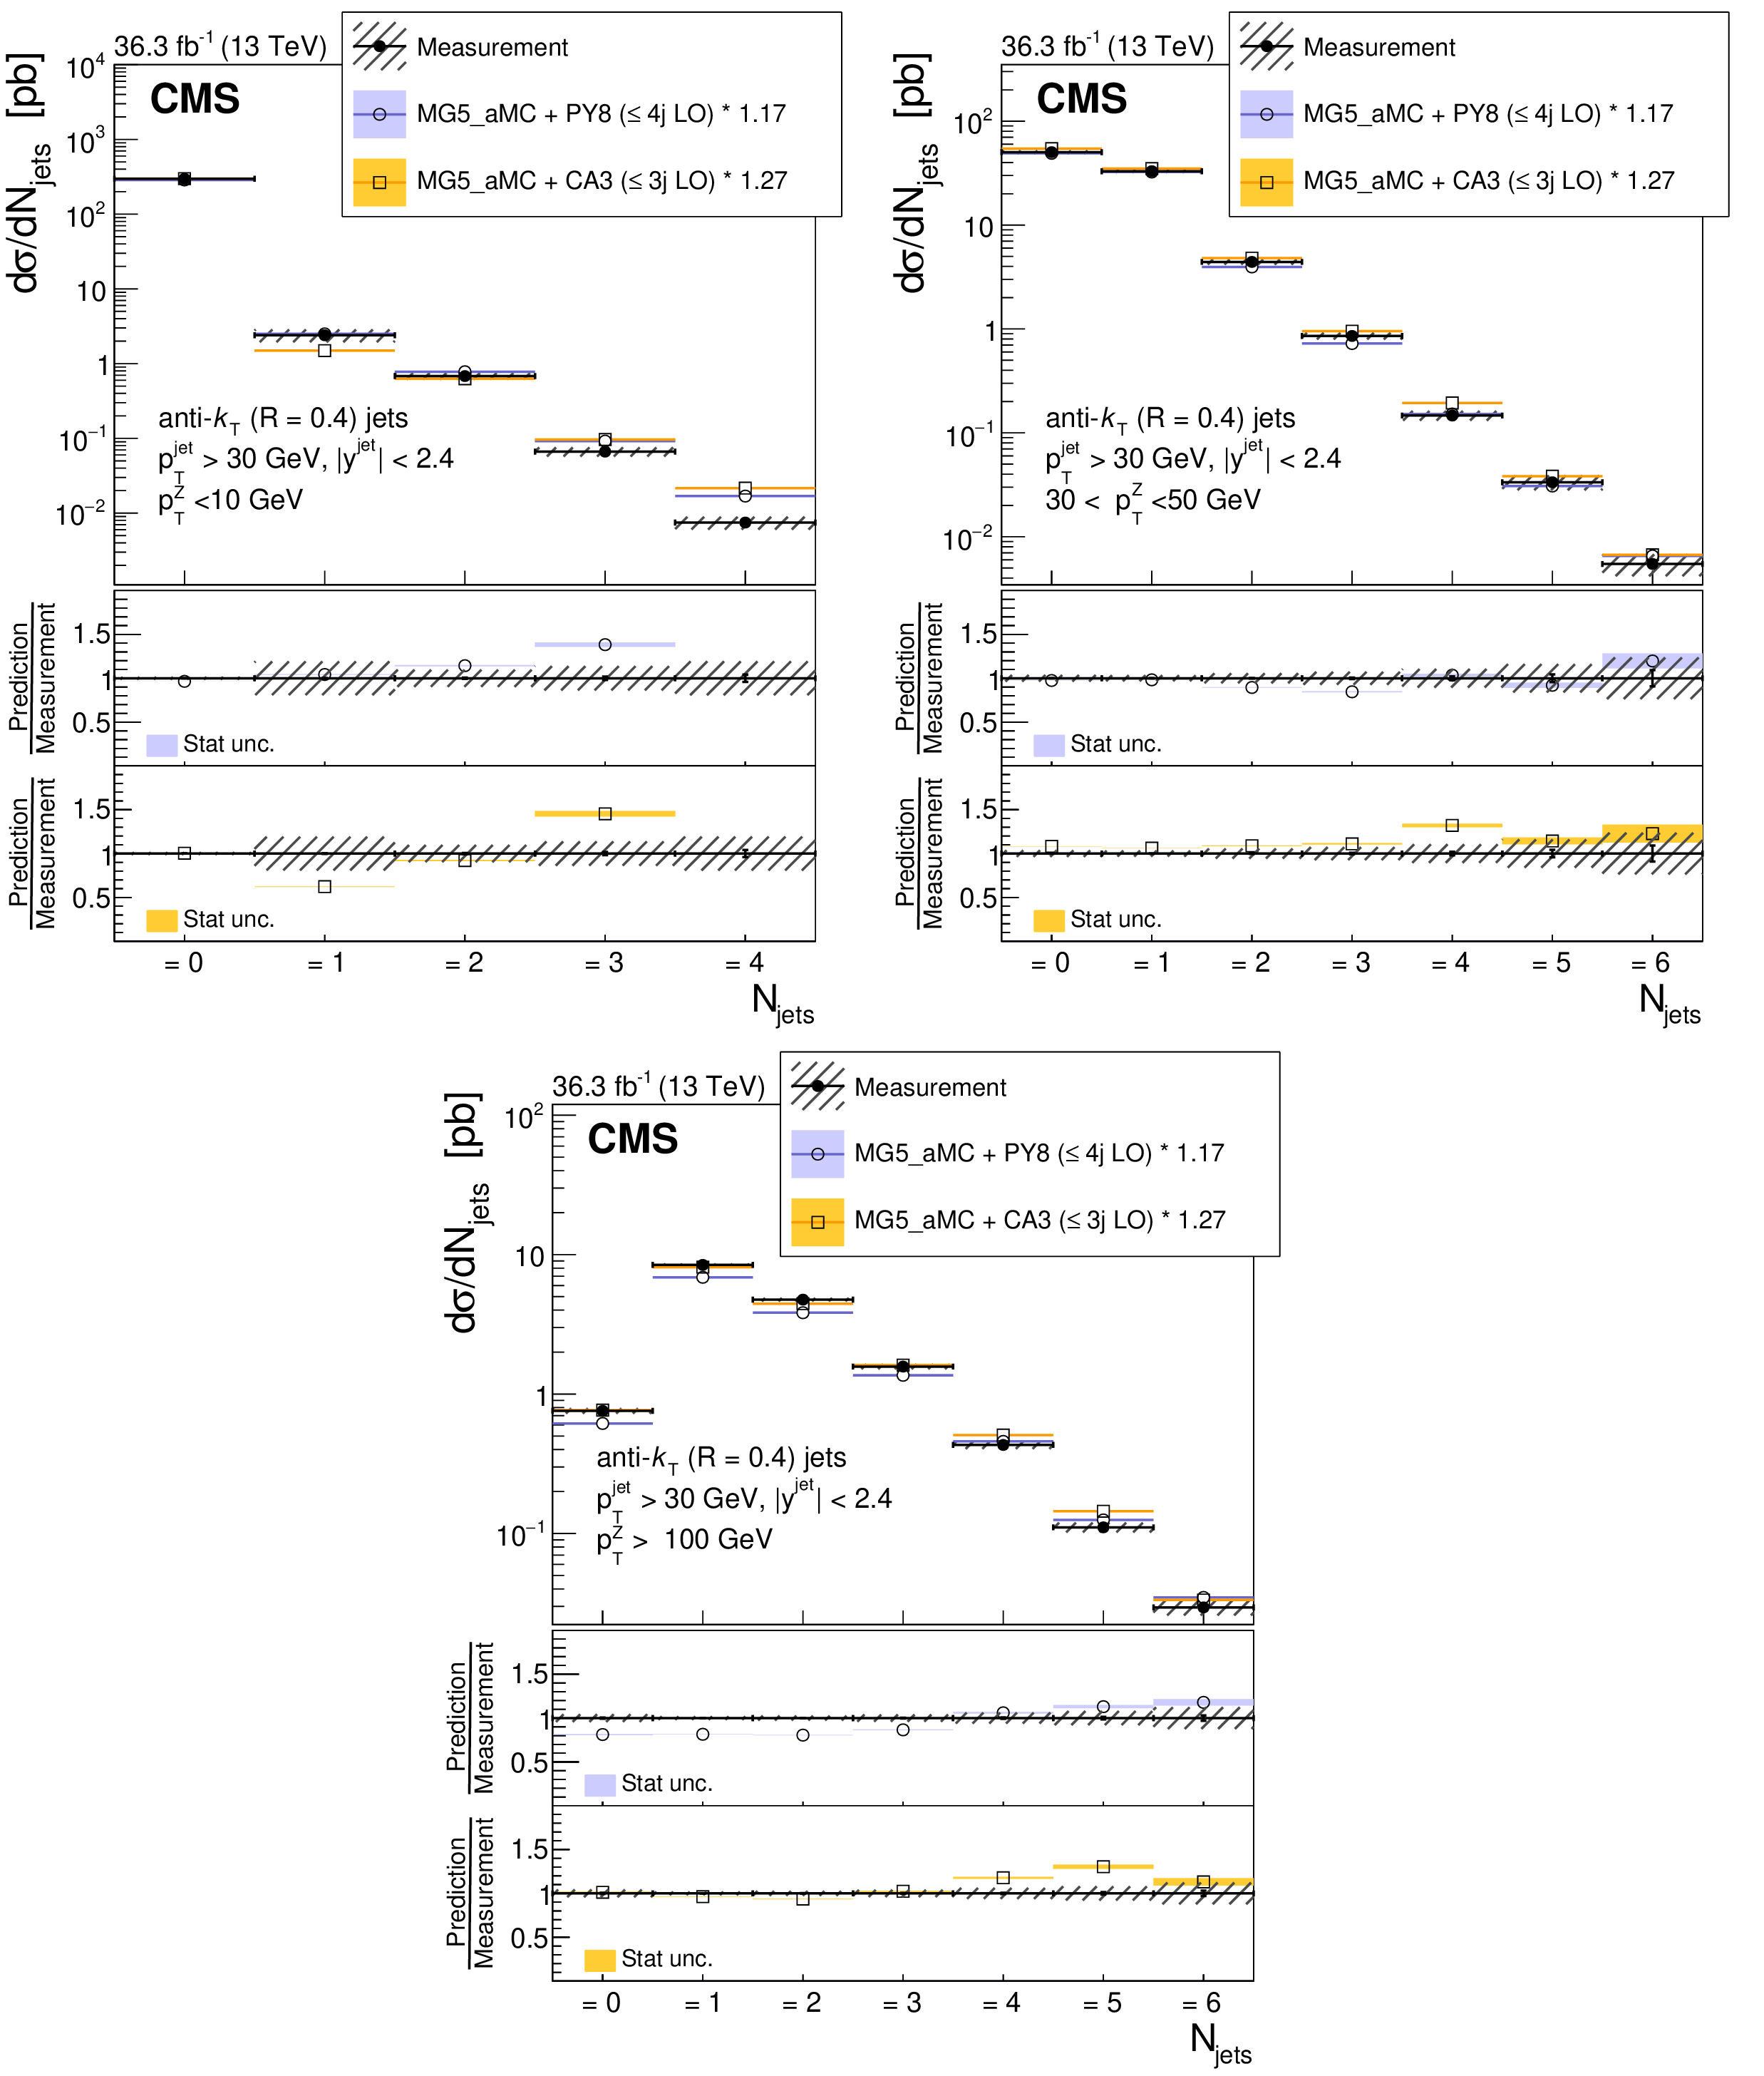
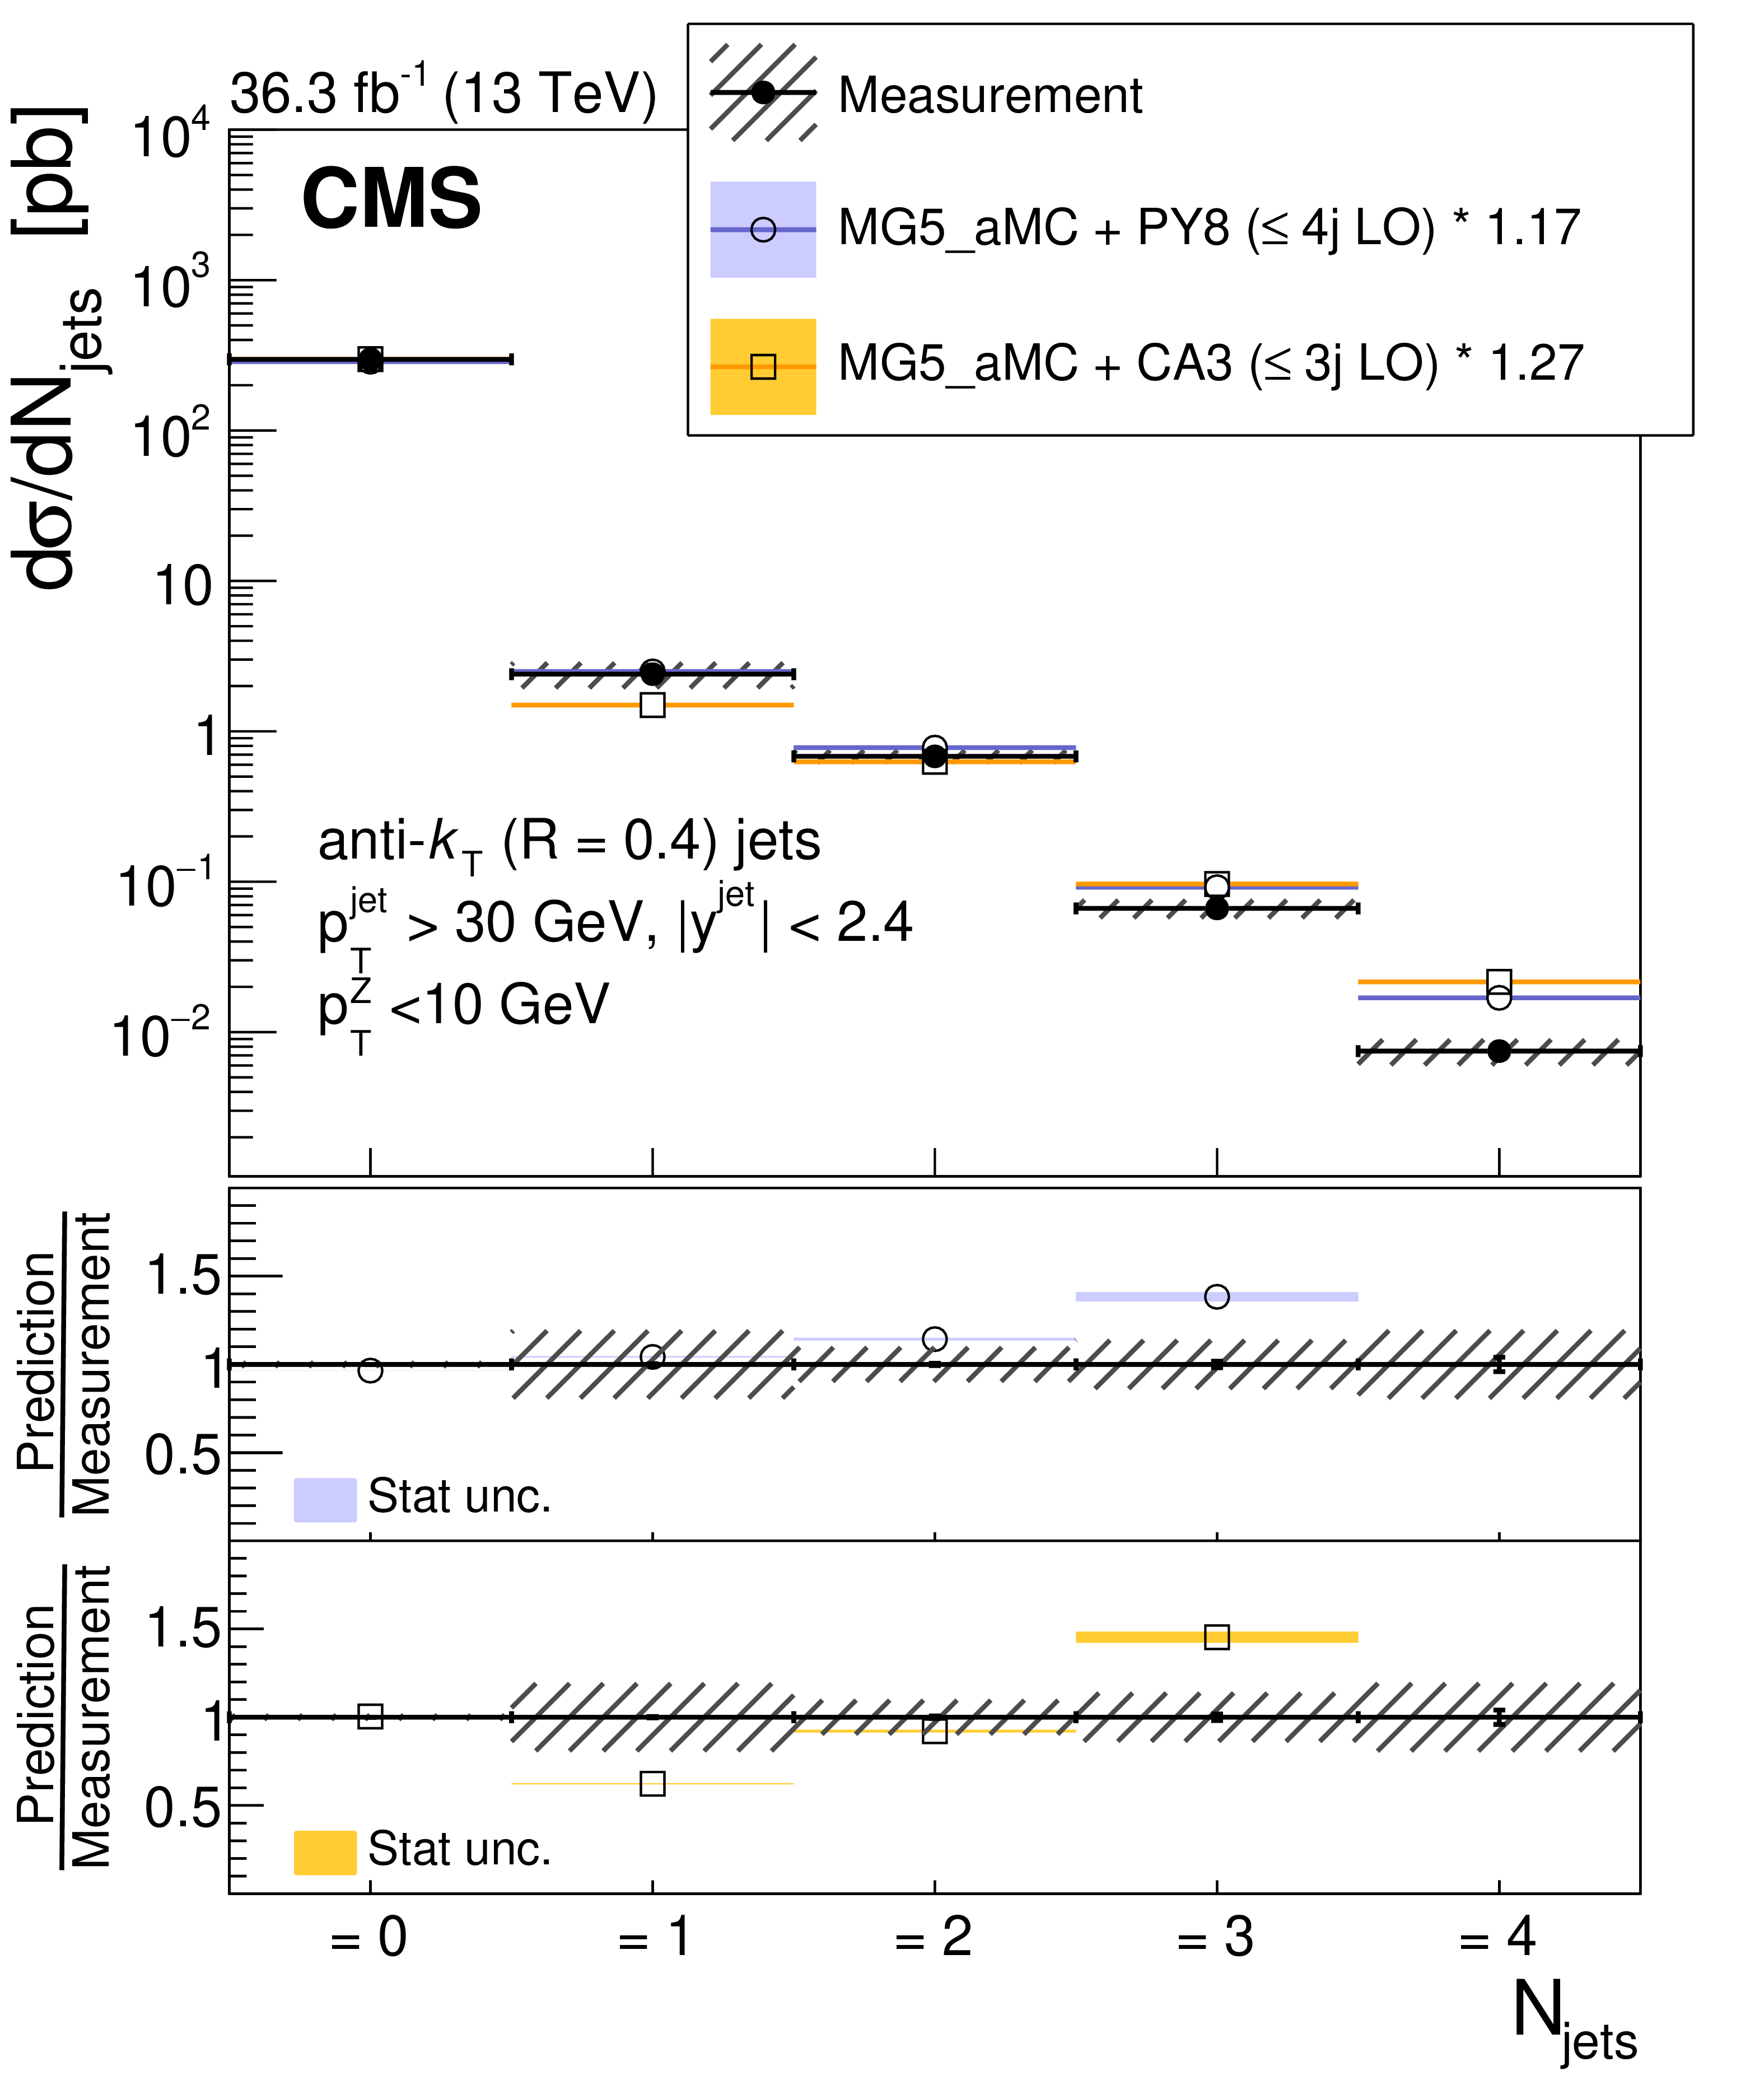
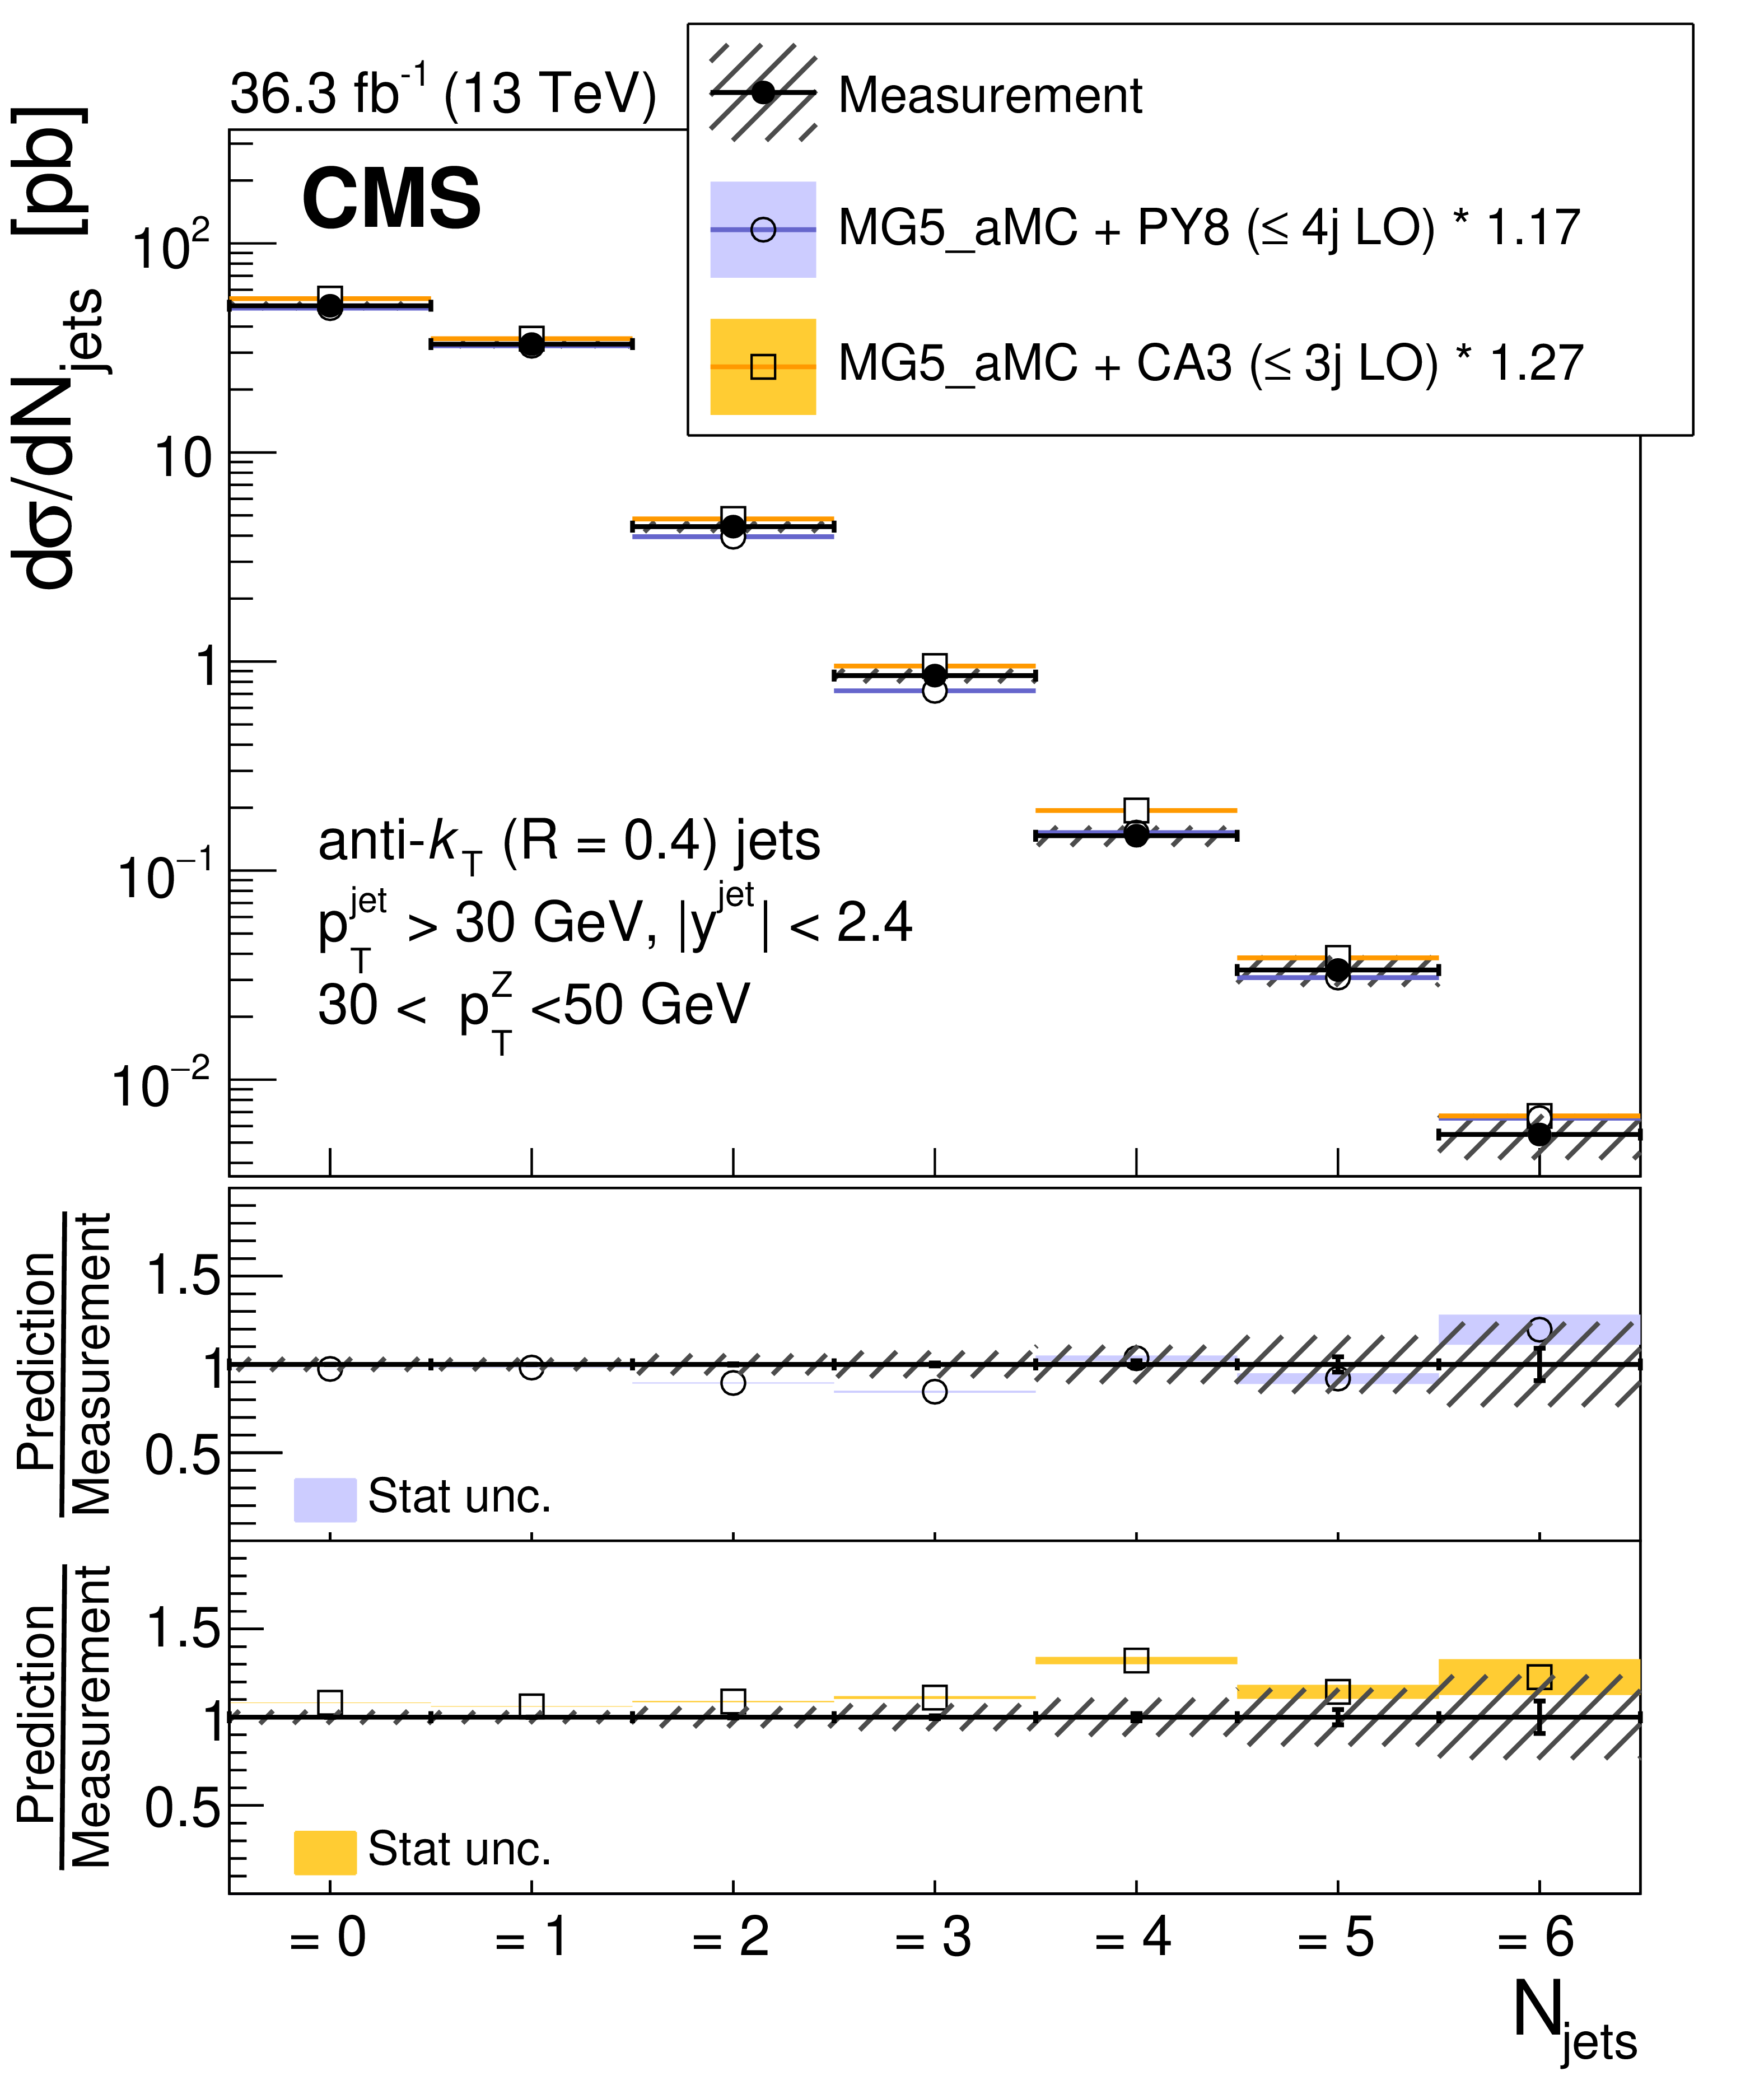
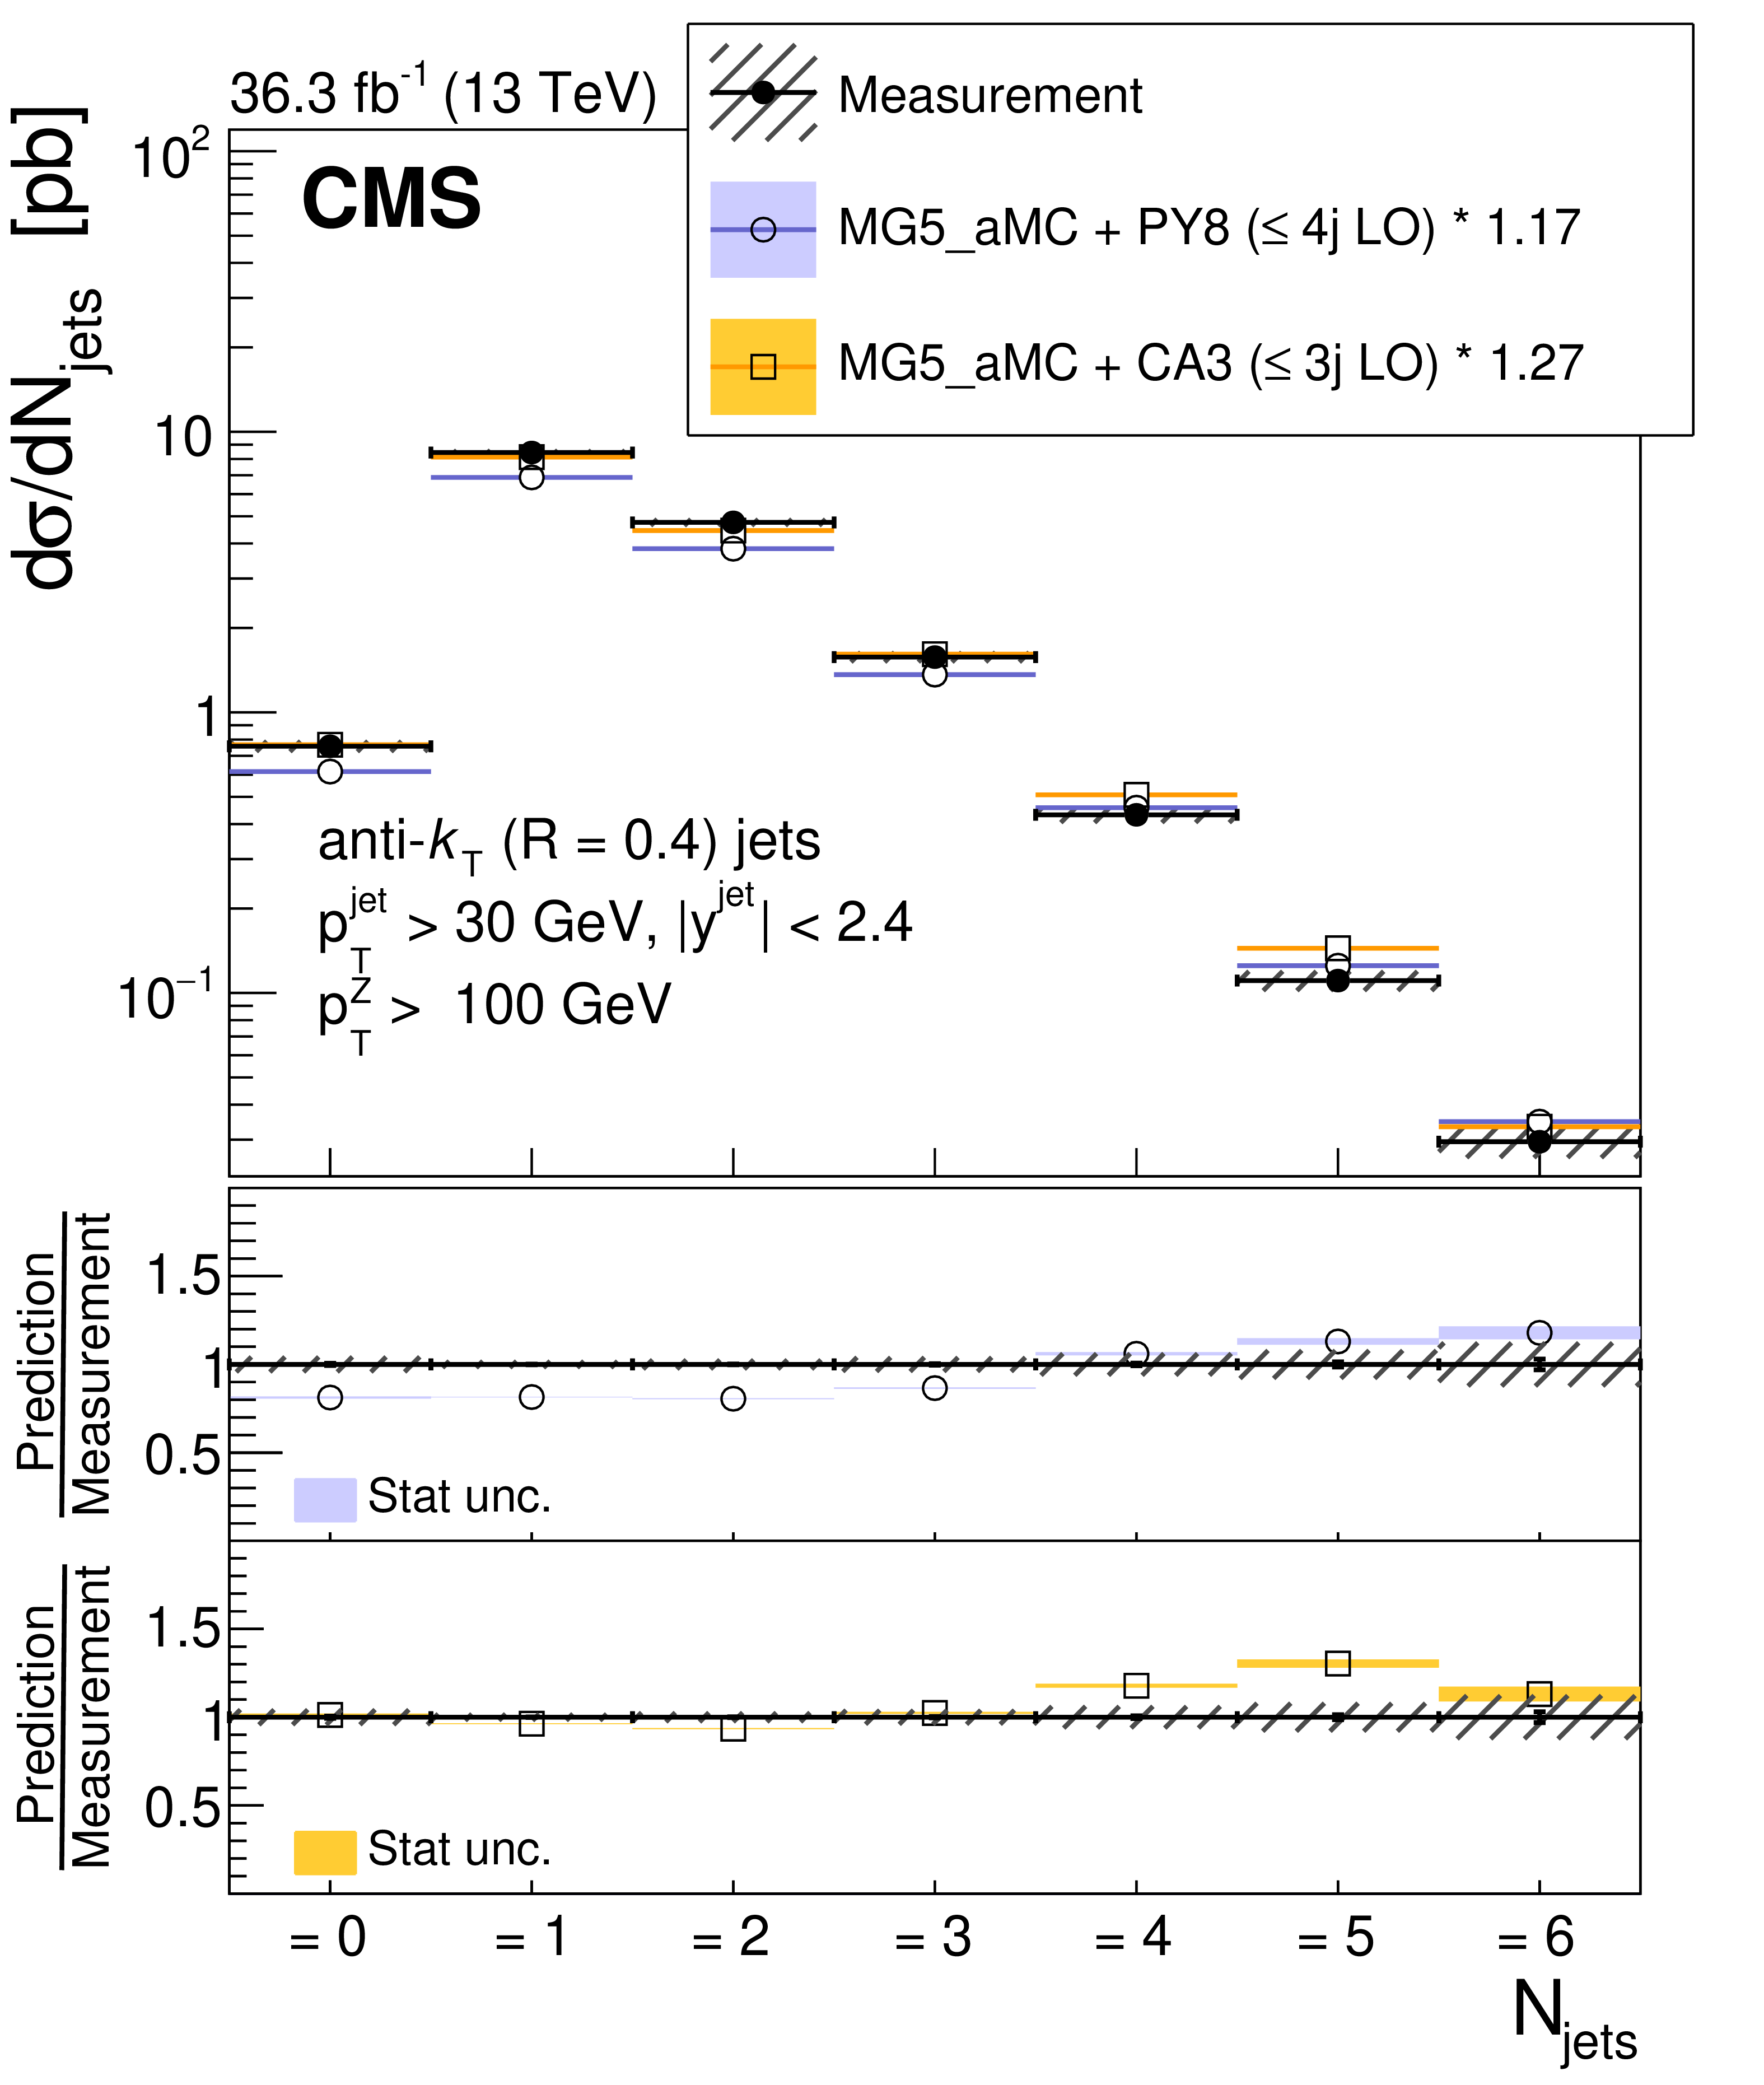
Figure 4:
Jet multiplicity in three different regions of $ p_{\mathrm{T}}(\mathrm{Z}) $: $ p_{\mathrm{T}}(\mathrm{Z}) < $ 10 GeV (upper left), 30 $ < p_{\mathrm{T}}(\mathrm{Z}) < $ 50 GeV (upper right), $ p_{\mathrm{T}}(\mathrm{Z}) > $ 100 GeV (lower). The error bars on the data points represent the statistical uncertainty of the measurement, and the hatched band shows the total statistical and systematic uncertainties added in quadrature. Predictions from MG5_AMC+PY8 ($ \leq $ 4j LO) and MG5_AMC+CA3 (Z $ \leq $ 3j LO) are shown. Different normalization factors are applied, as described in the text. |
png pdf |
Figure 4-a:
Jet multiplicity in three different regions for $ p_{\mathrm{T}}(\mathrm{Z}) < $ 10 GeV. The error bars on the data points represent the statistical uncertainty of the measurement, and the hatched band shows the total statistical and systematic uncertainties added in quadrature. Predictions from MG5_AMC+PY8 ($ \leq $ 4j LO) and MG5_AMC+CA3 (Z $ \leq $ 3j LO) are shown. Different normalization factors are applied, as described in the text. |
png pdf |
Figure 4-b:
Jet multiplicity in three different regions for $ p_{\mathrm{T}}(\mathrm{Z}) < $ 10 GeV. The error bars on the data points represent the statistical uncertainty of the measurement, and the hatched band shows the total statistical and systematic uncertainties added in quadrature. Predictions from MG5_AMC+PY8 ($ \leq $ 4j LO) and MG5_AMC+CA3 (Z $ \leq $ 3j LO) are shown. Different normalization factors are applied, as described in the text. |
png pdf |
Figure 4-c:
Jet multiplicity in three different regions for $ p_{\mathrm{T}}(\mathrm{Z}) > $ 100 GeV. The error bars on the data points represent the statistical uncertainty of the measurement, and the hatched band shows the total statistical and systematic uncertainties added in quadrature. Predictions from MG5_AMC+PY8 ($ \leq $ 4j LO) and MG5_AMC+CA3 (Z $ \leq $ 3j LO) are shown. Different normalization factors are applied, as described in the text. |
png pdf |
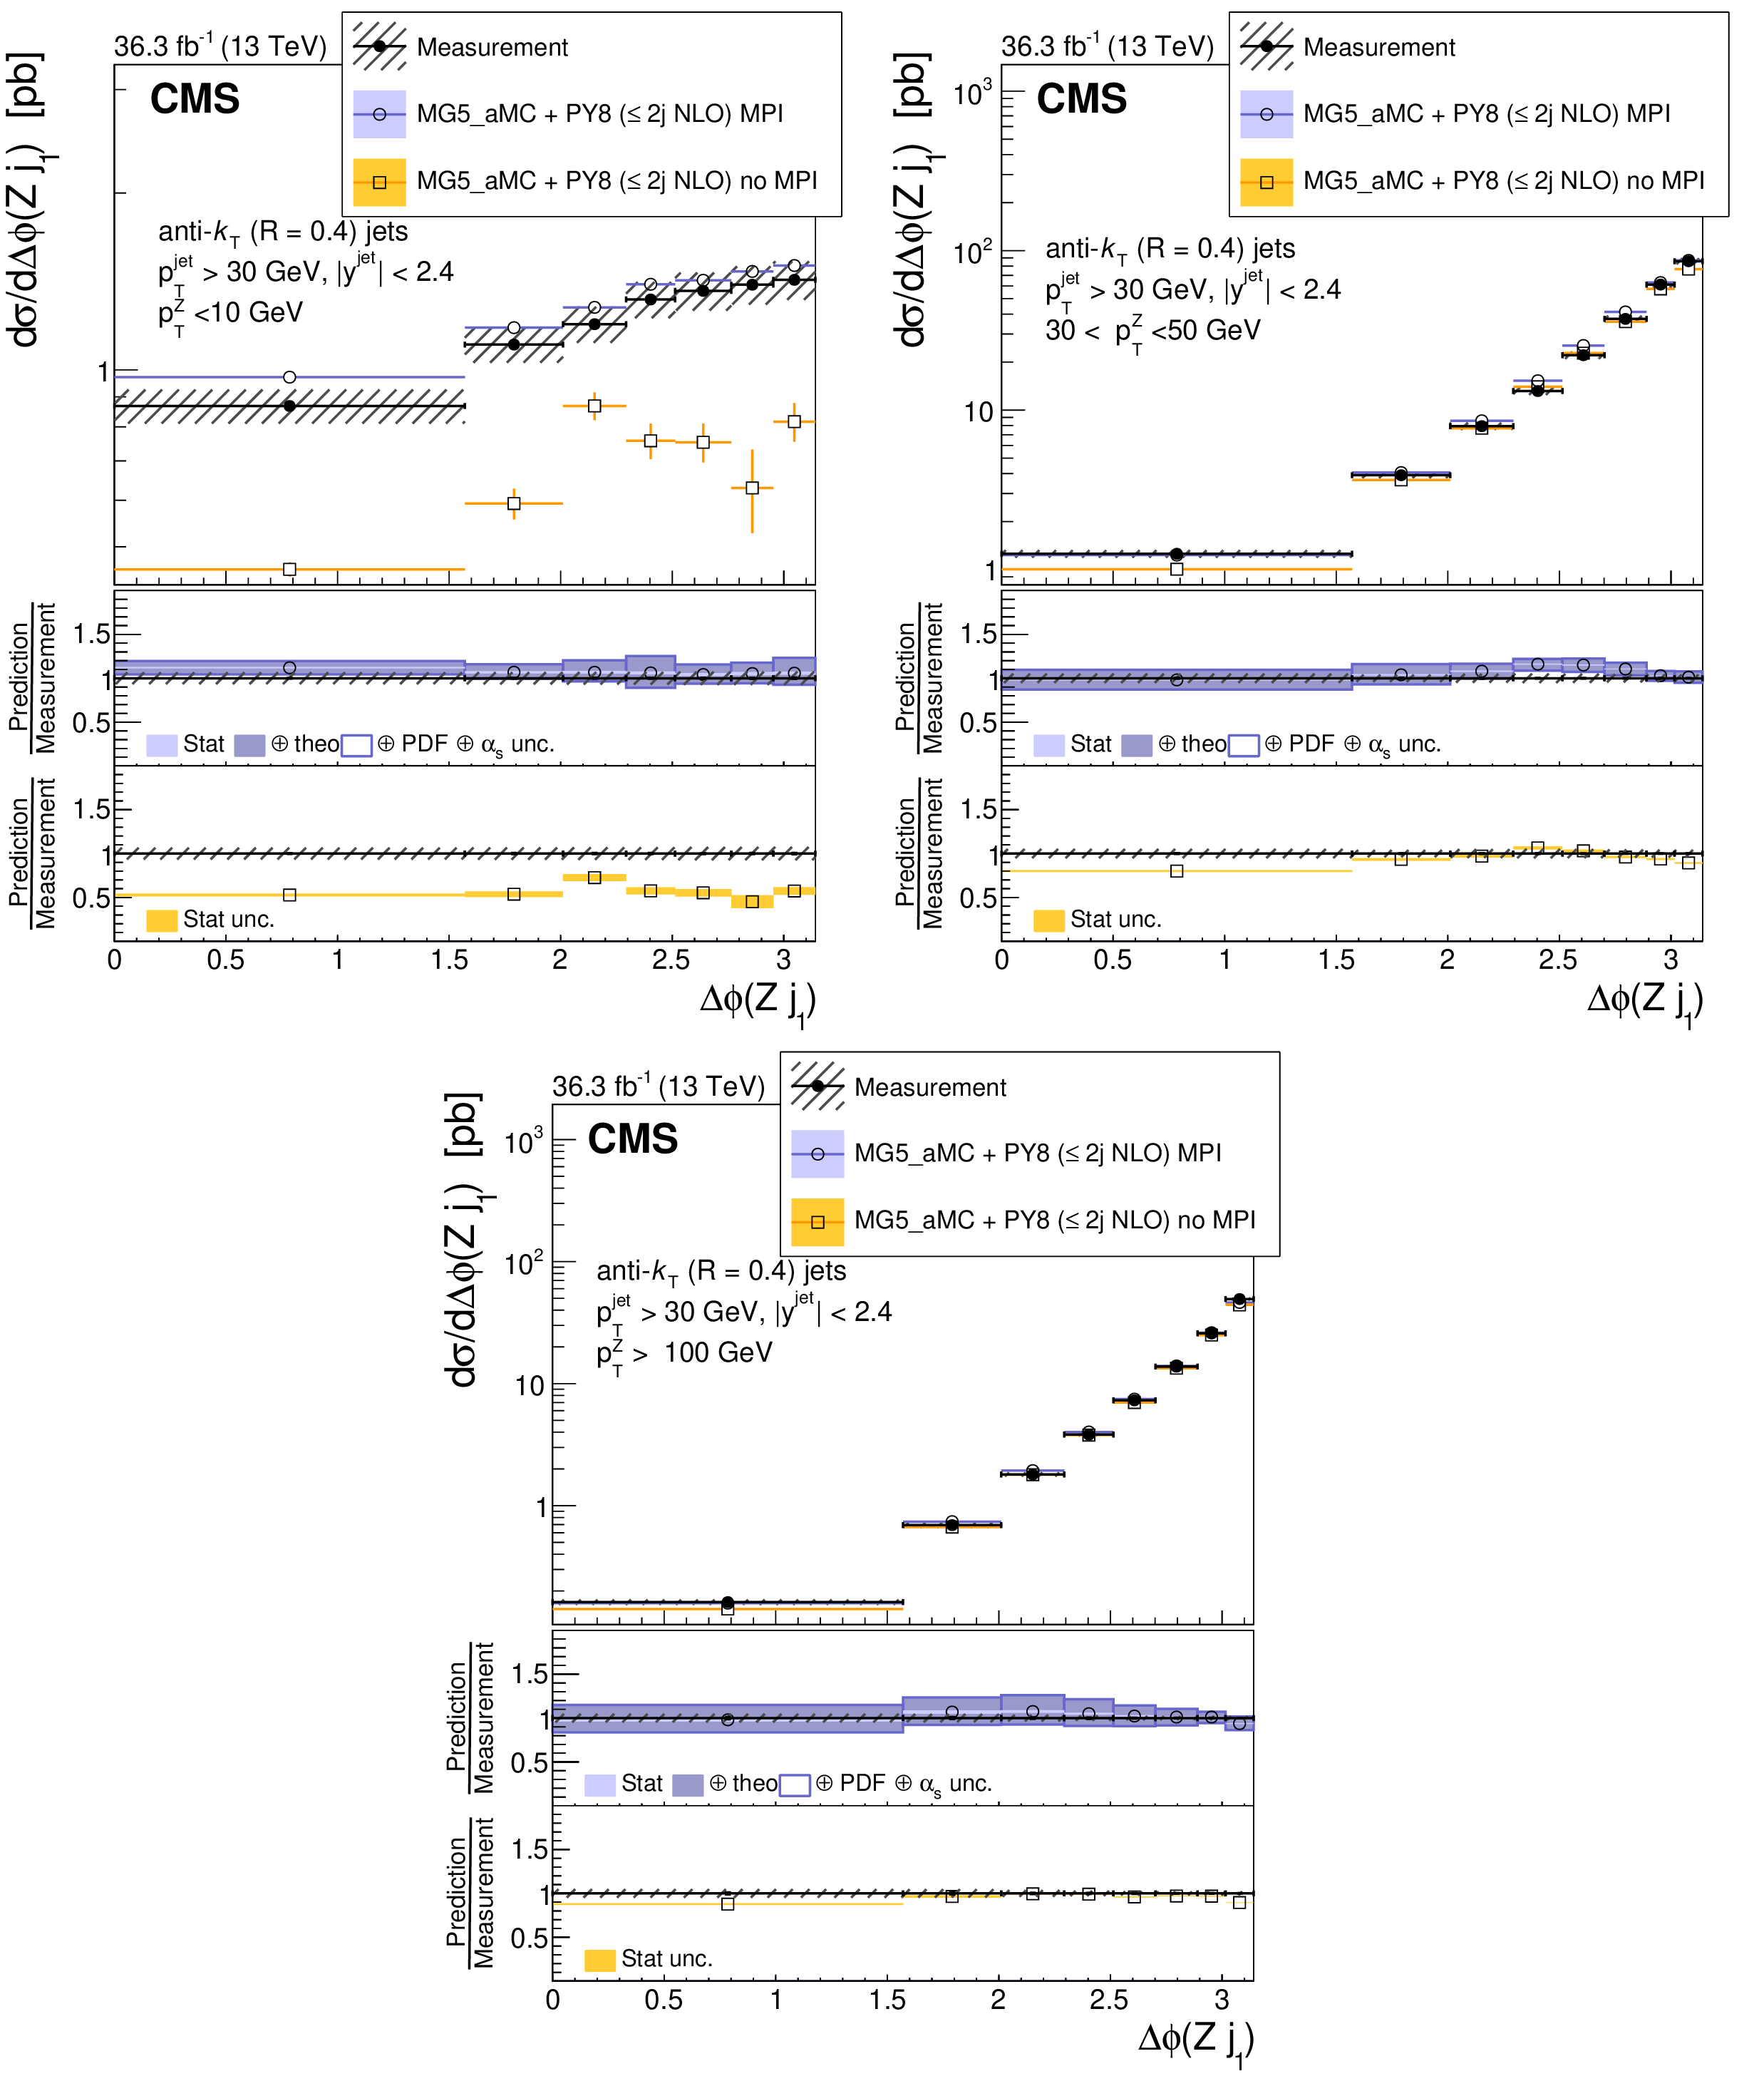
Figure 5:
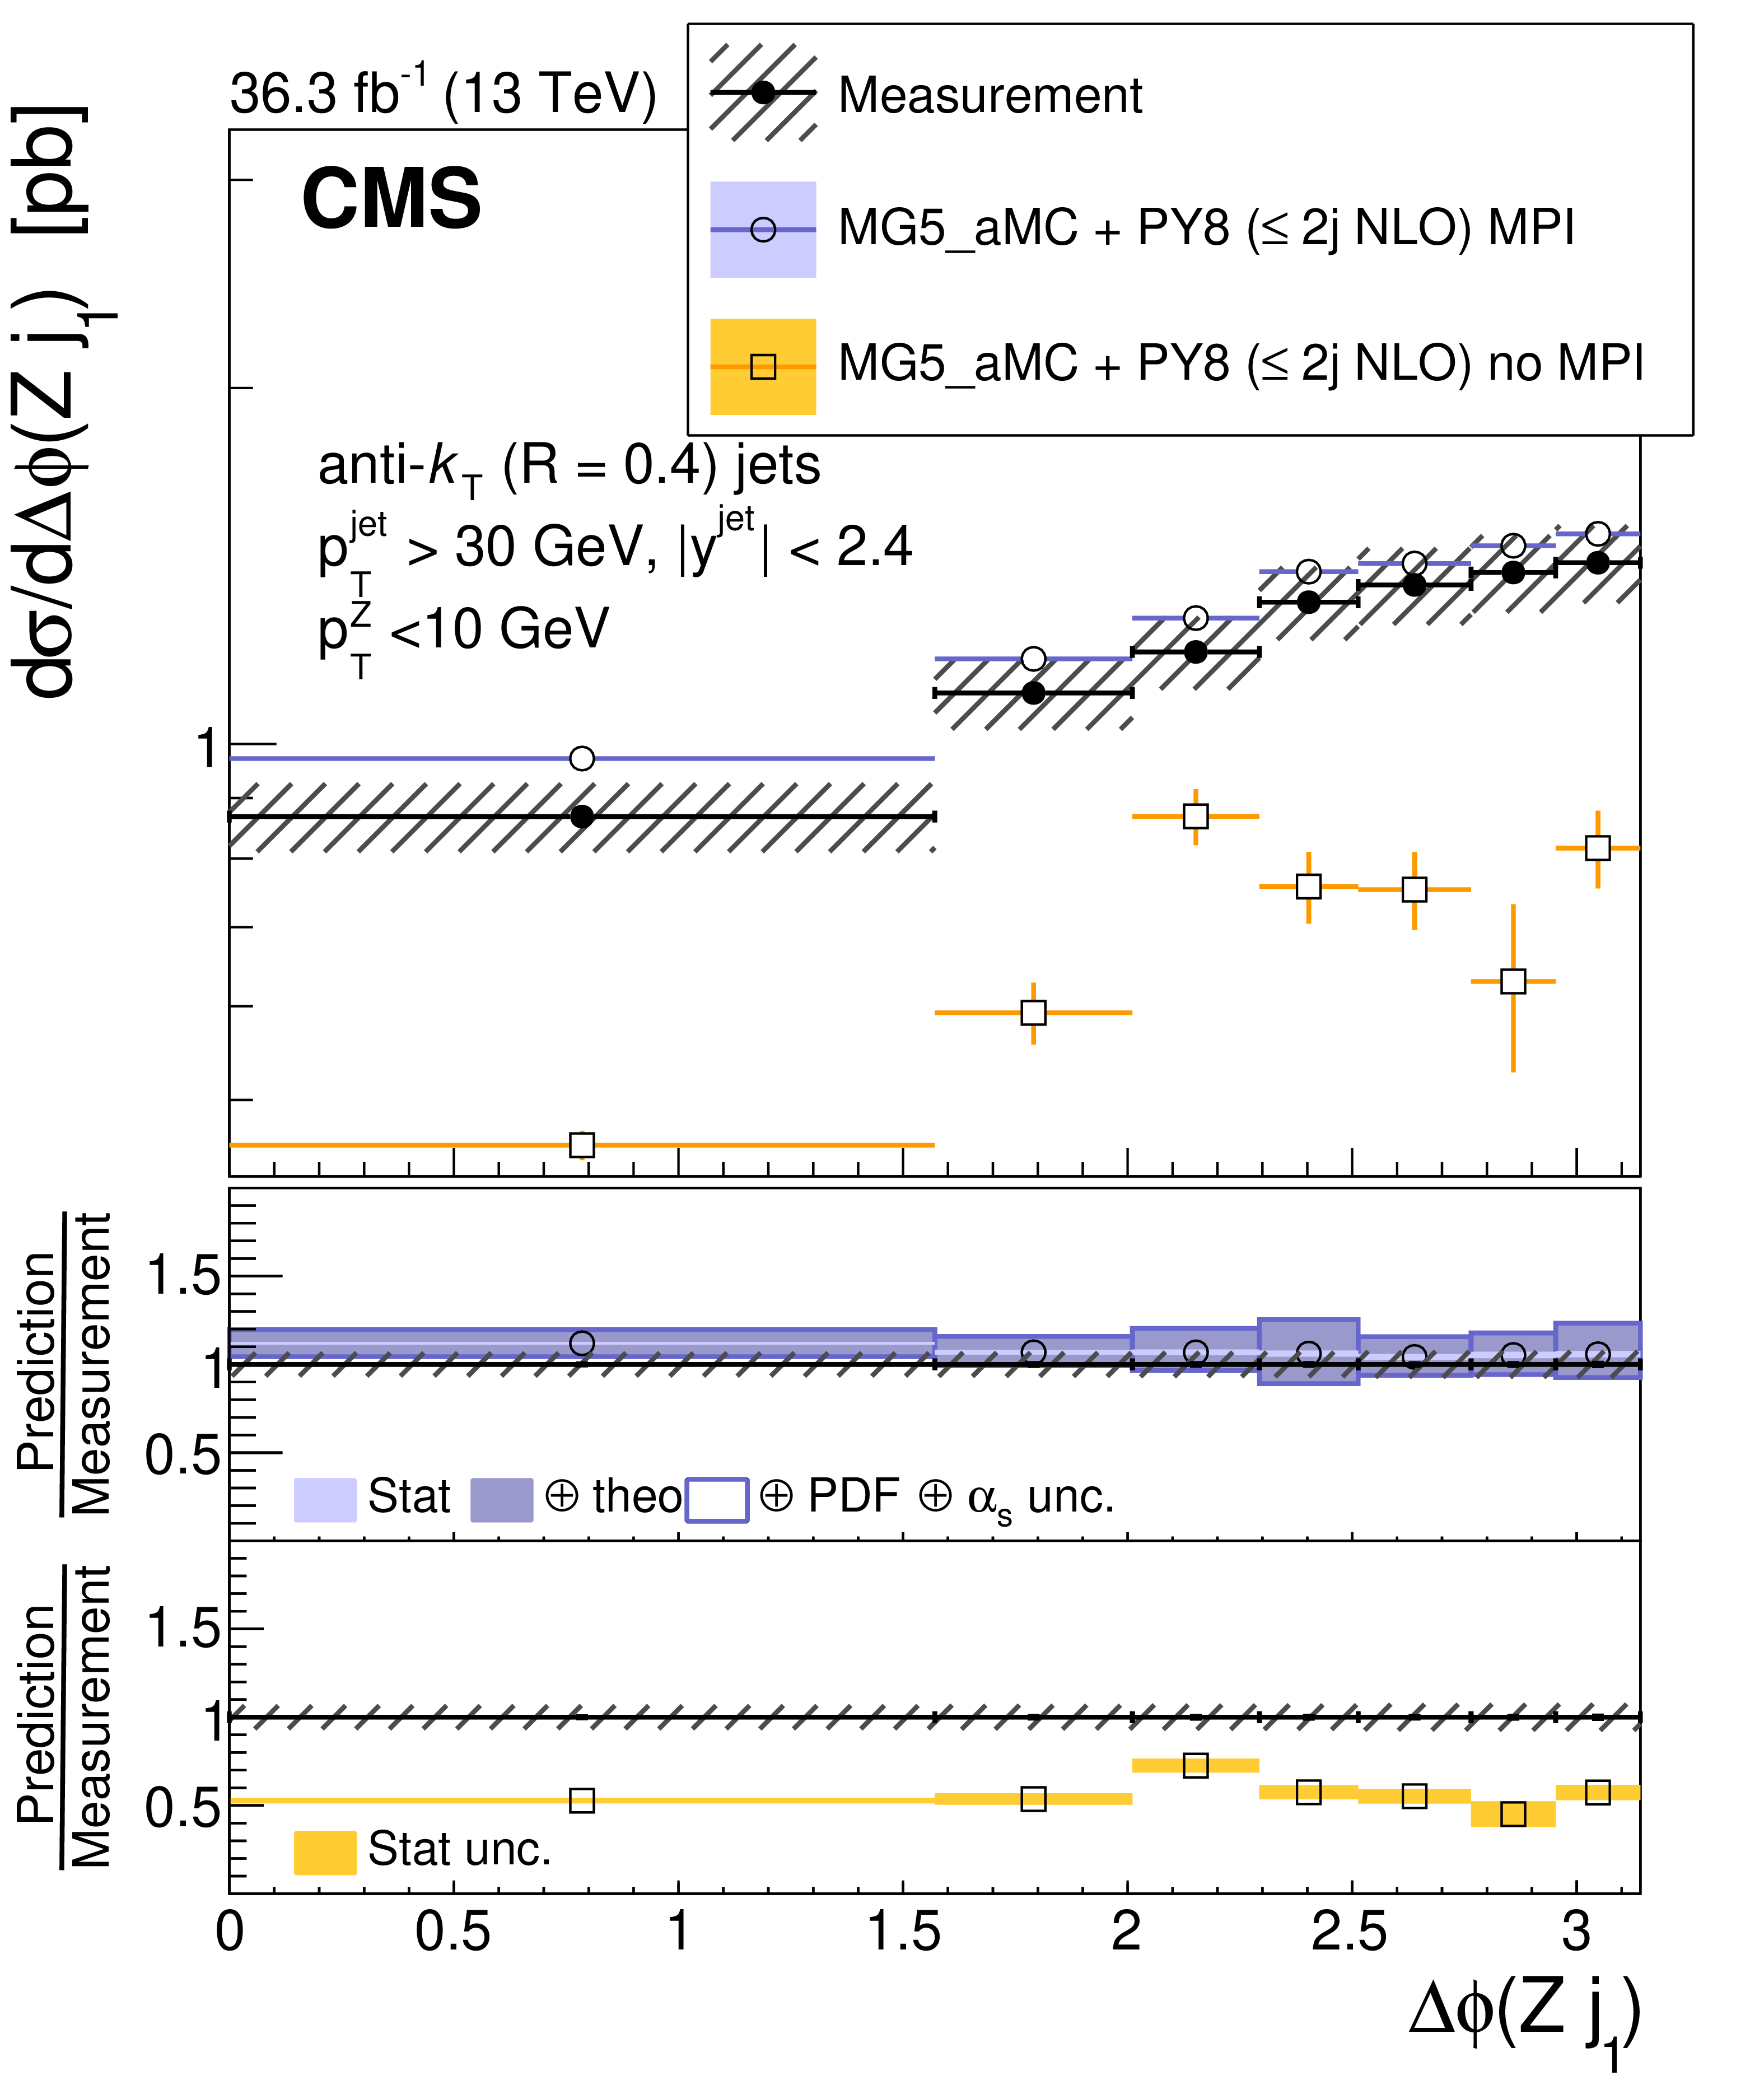
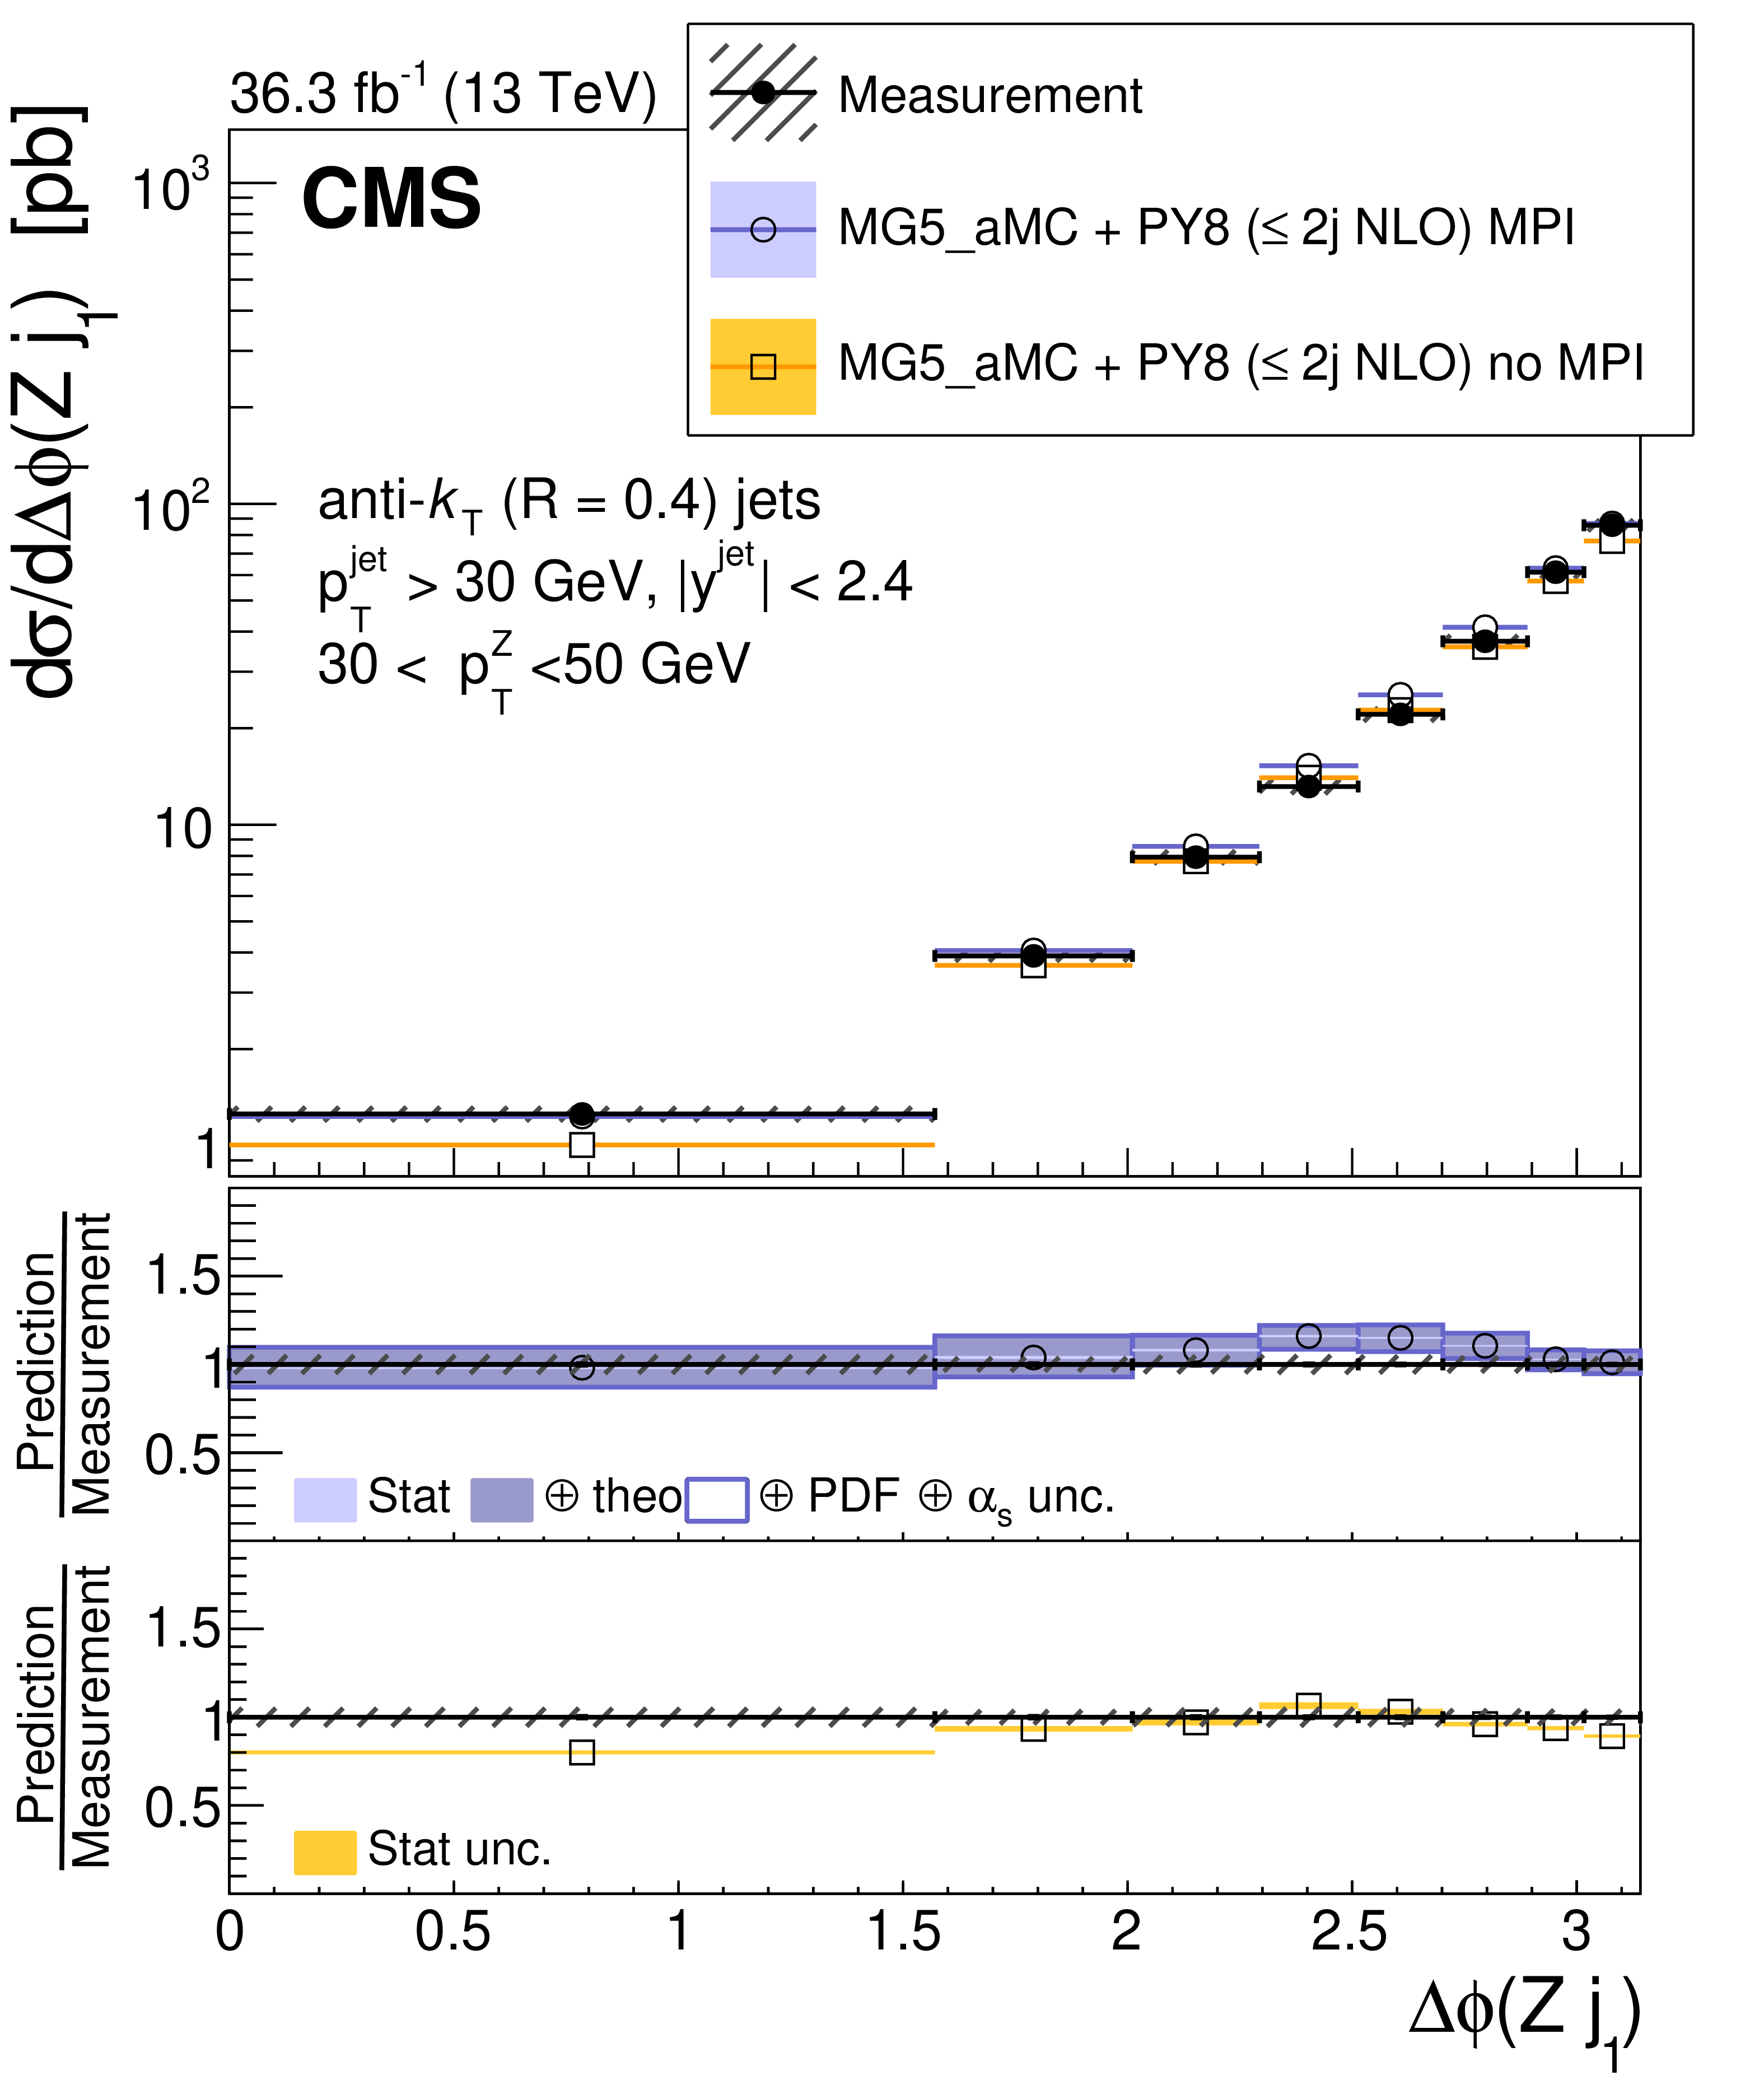
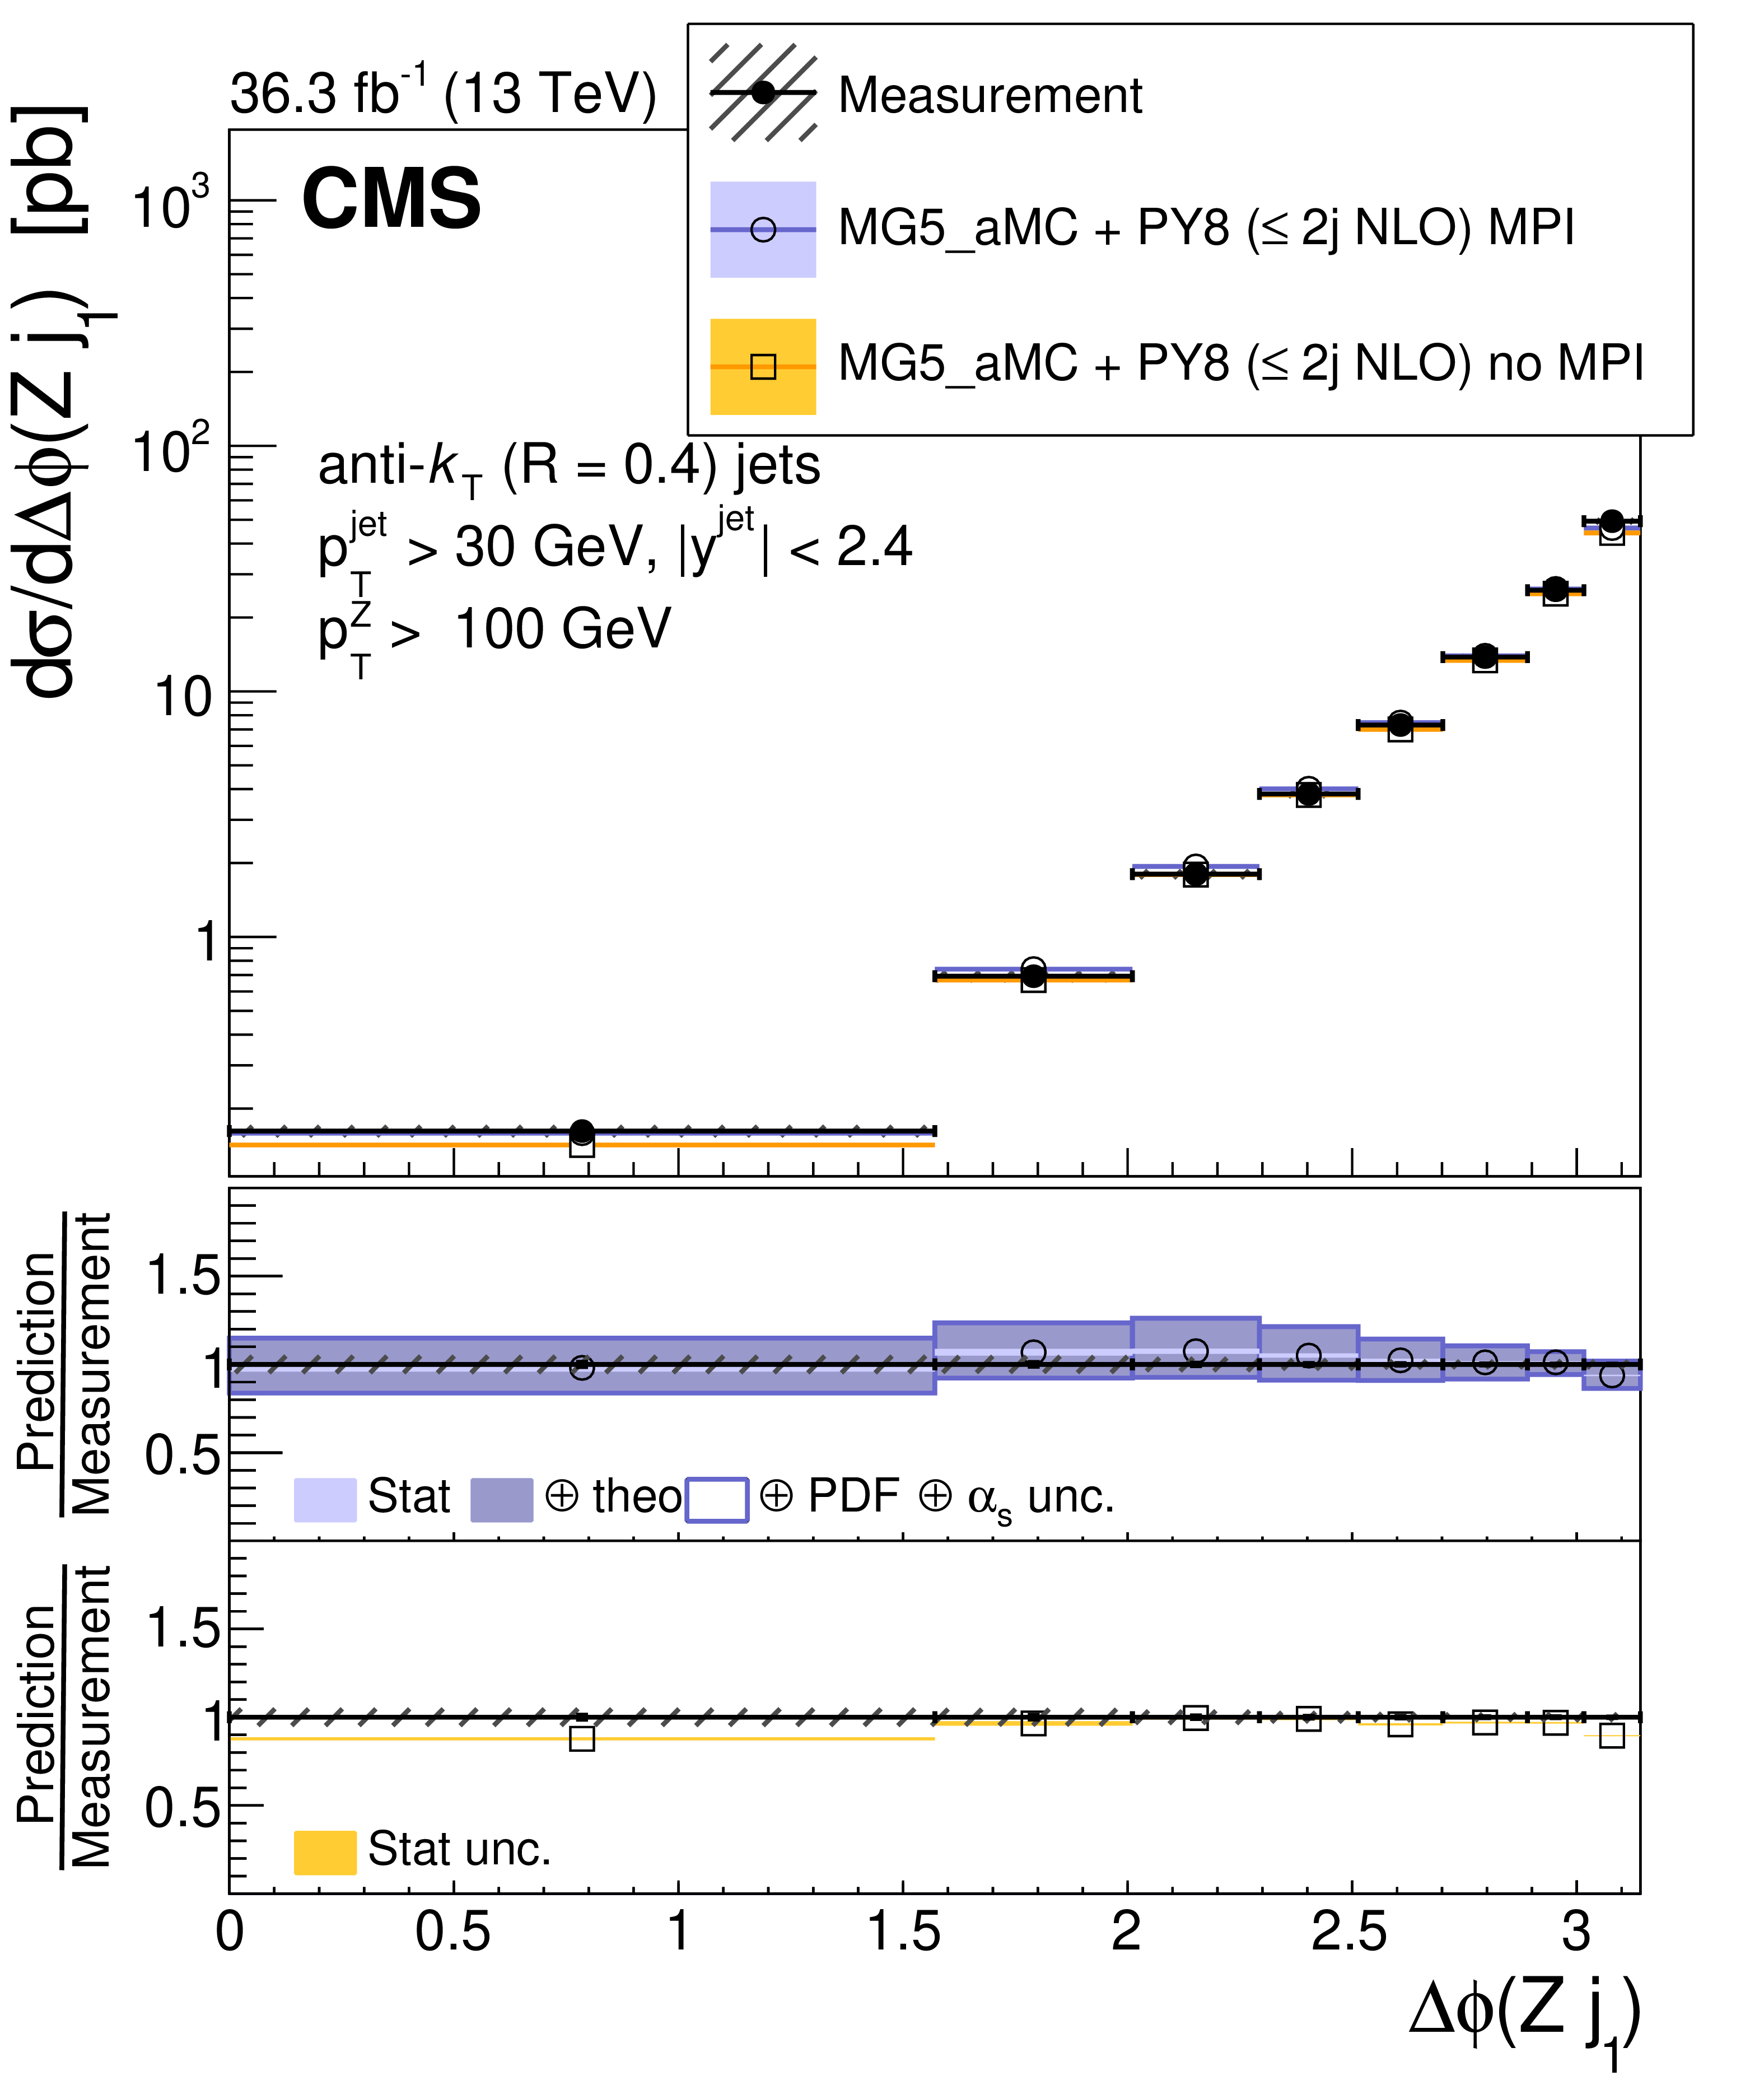
Cross section as a function of $ \Delta\phi (\mathrm{Z} j_1) $ between the Z boson and the leading jet in the three $ p_{\mathrm{T}}(\mathrm{Z}) $ bins: $ p_{\mathrm{T}}(\mathrm{Z}) < $ 10 GeV (upper left), 30 $ < p_{\mathrm{T}}(\mathrm{Z}) < $ 50 GeV (upper right), $ p_{\mathrm{T}}(\mathrm{Z}) > $ 100 GeV (lower). The error bars on the data points represent the statistical uncertainty of the measurement, and the hatched band shows the total statistical and systematic uncertainties added in quadrature. Predictions using MG5_AMC+PY8 ($ \leq $ 2j NLO) with and without multi-parton interactions are shown. |
png pdf |
Figure 5-a:
Cross section as a function of $ \Delta\phi (\mathrm{Z} j_1) $ between the Z boson and the leading jet for $ p_{\mathrm{T}}(\mathrm{Z}) < $ 10 GeV. The error bars on the data points represent the statistical uncertainty of the measurement, and the hatched band shows the total statistical and systematic uncertainties added in quadrature. Predictions using MG5_AMC+PY8 ($ \leq $ 2j NLO) with and without multi-parton interactions are shown. |
png pdf |
Figure 5-b:
Cross section as a function of $ \Delta\phi (\mathrm{Z} j_1) $ between the Z boson and the leading jet for 30 $ < p_{\mathrm{T}}(\mathrm{Z}) < $ 50 GeV. The error bars on the data points represent the statistical uncertainty of the measurement, and the hatched band shows the total statistical and systematic uncertainties added in quadrature. Predictions using MG5_AMC+PY8 ($ \leq $ 2j NLO) with and without multi-parton interactions are shown. |
png pdf |
Figure 5-c:
Cross section as a function of $ \Delta\phi (\mathrm{Z} j_1) $ between the Z boson and the leading jet for $ p_{\mathrm{T}}(\mathrm{Z}) > $ 100 GeV. The error bars on the data points represent the statistical uncertainty of the measurement, and the hatched band shows the total statistical and systematic uncertainties added in quadrature. Predictions using MG5_AMC+PY8 ($ \leq $ 2j NLO) with and without multi-parton interactions are shown. |
png pdf |
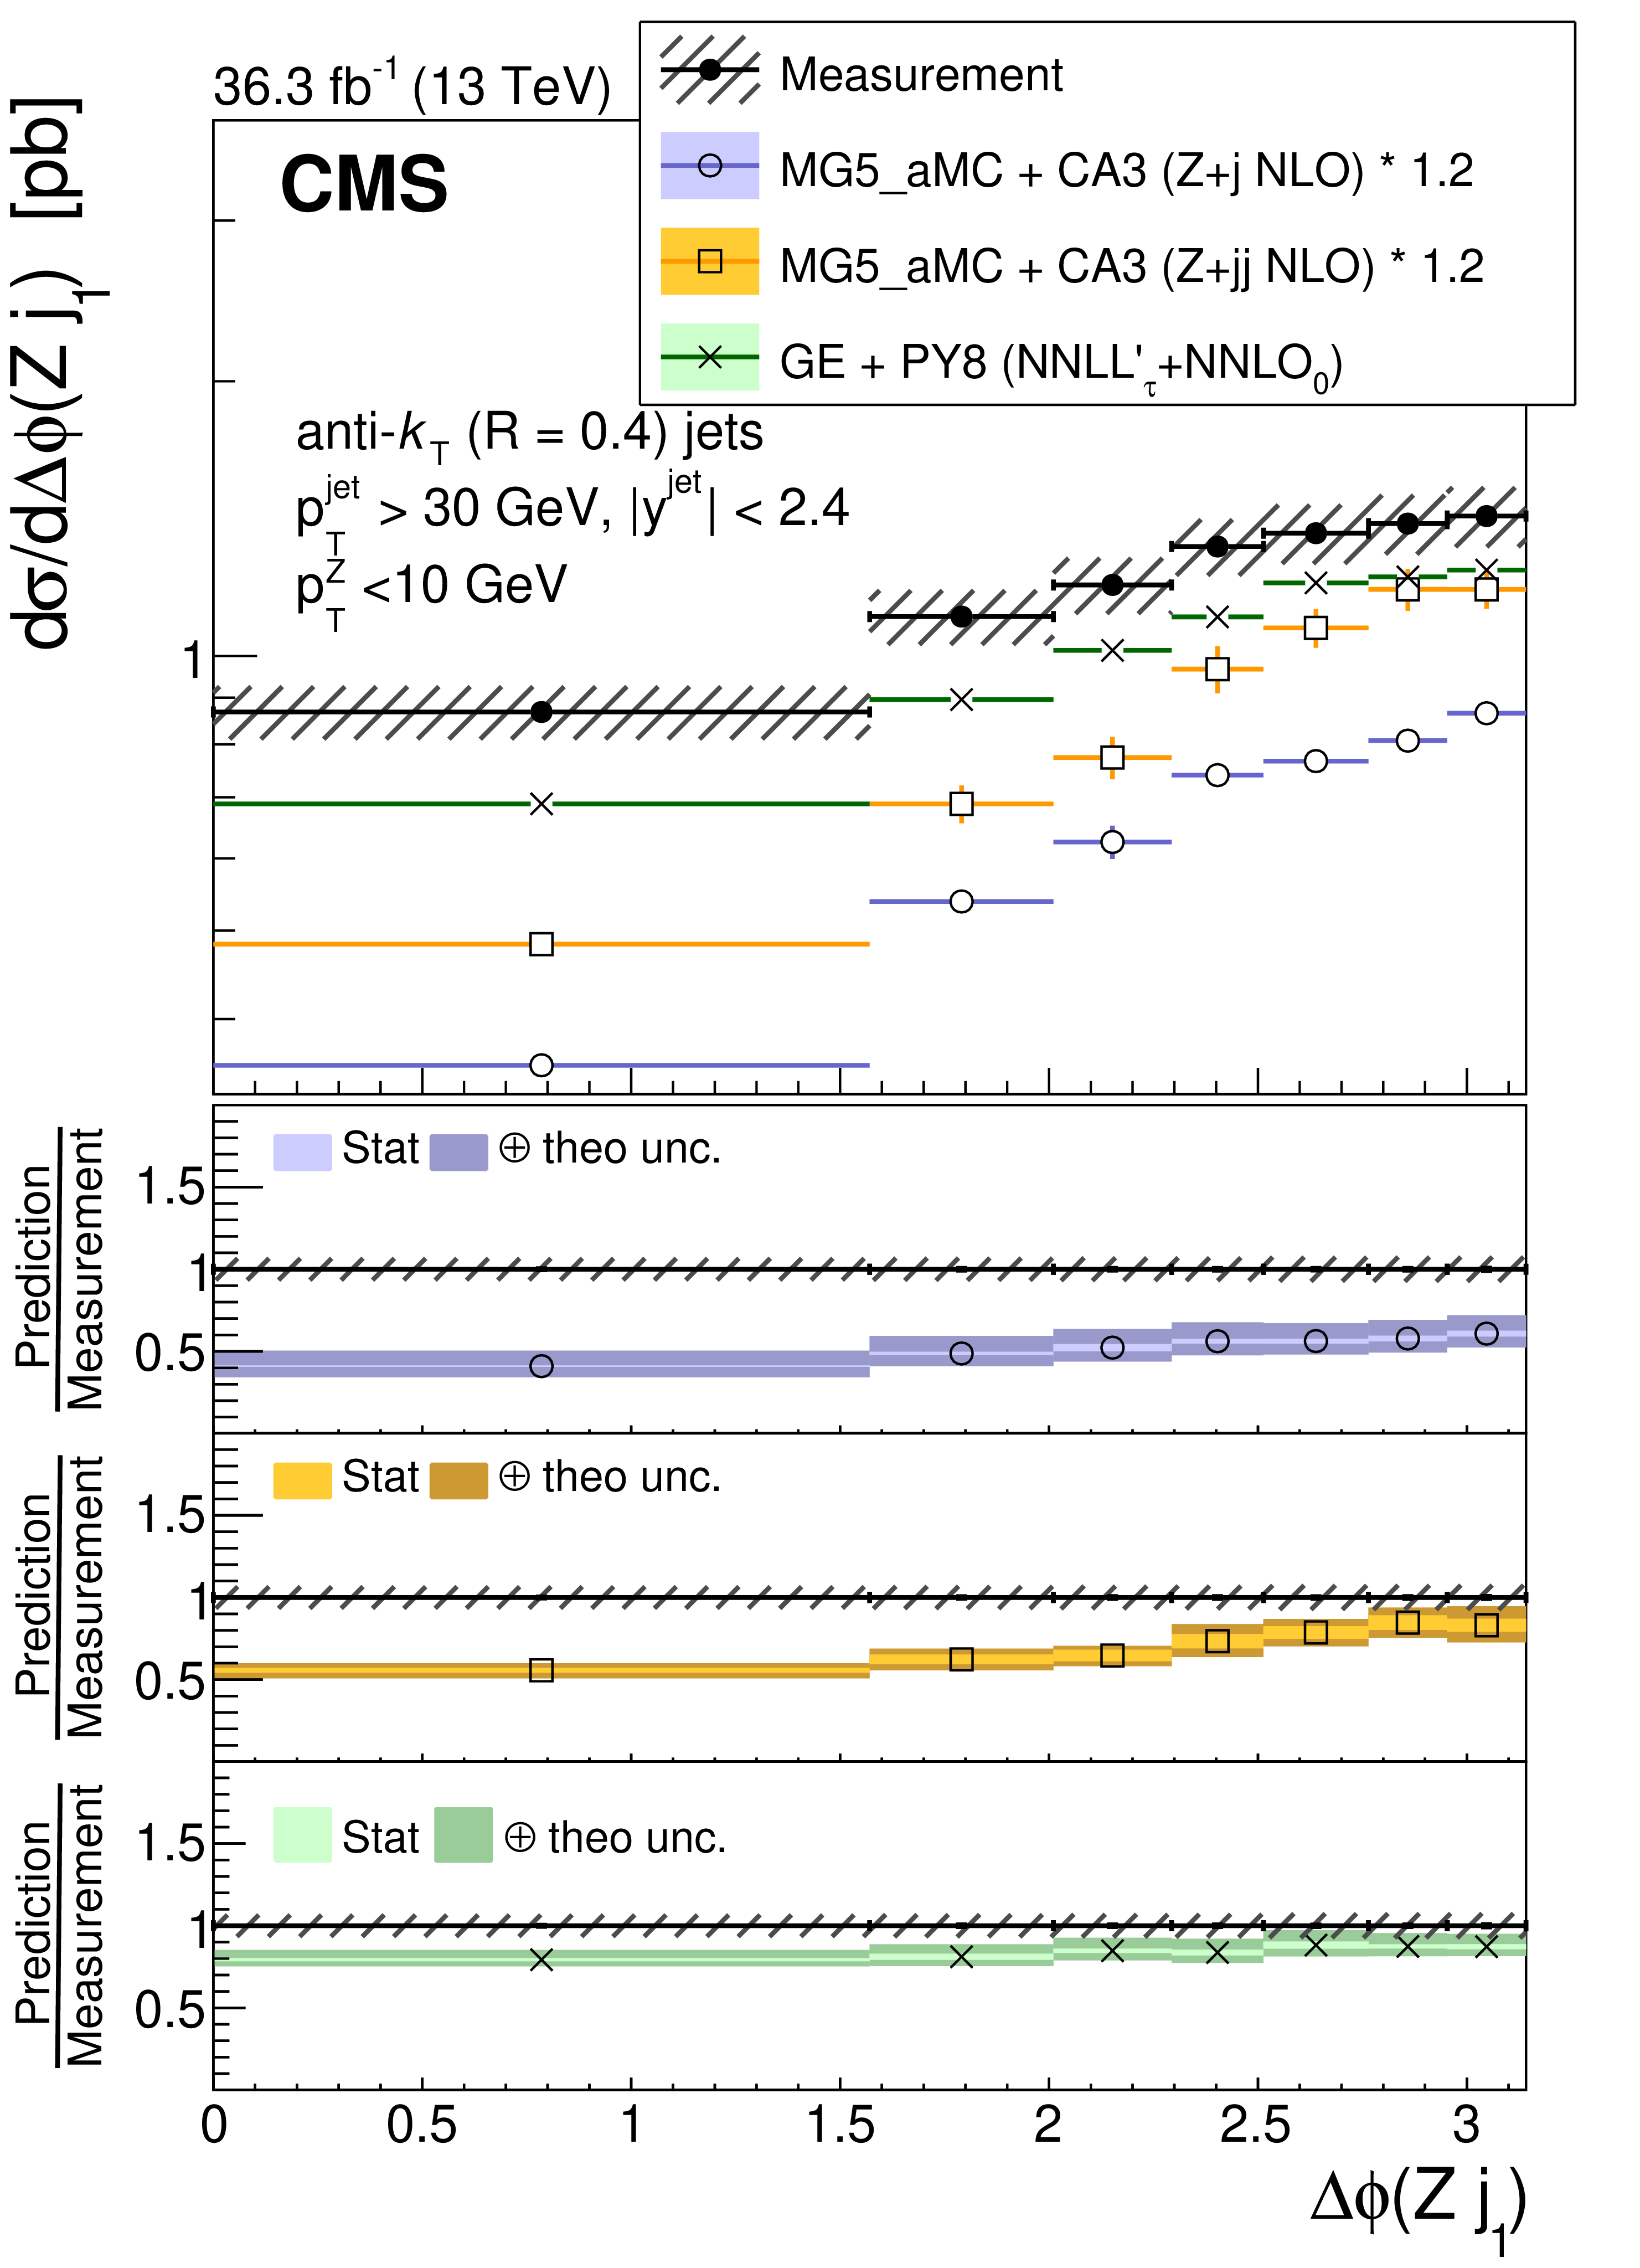
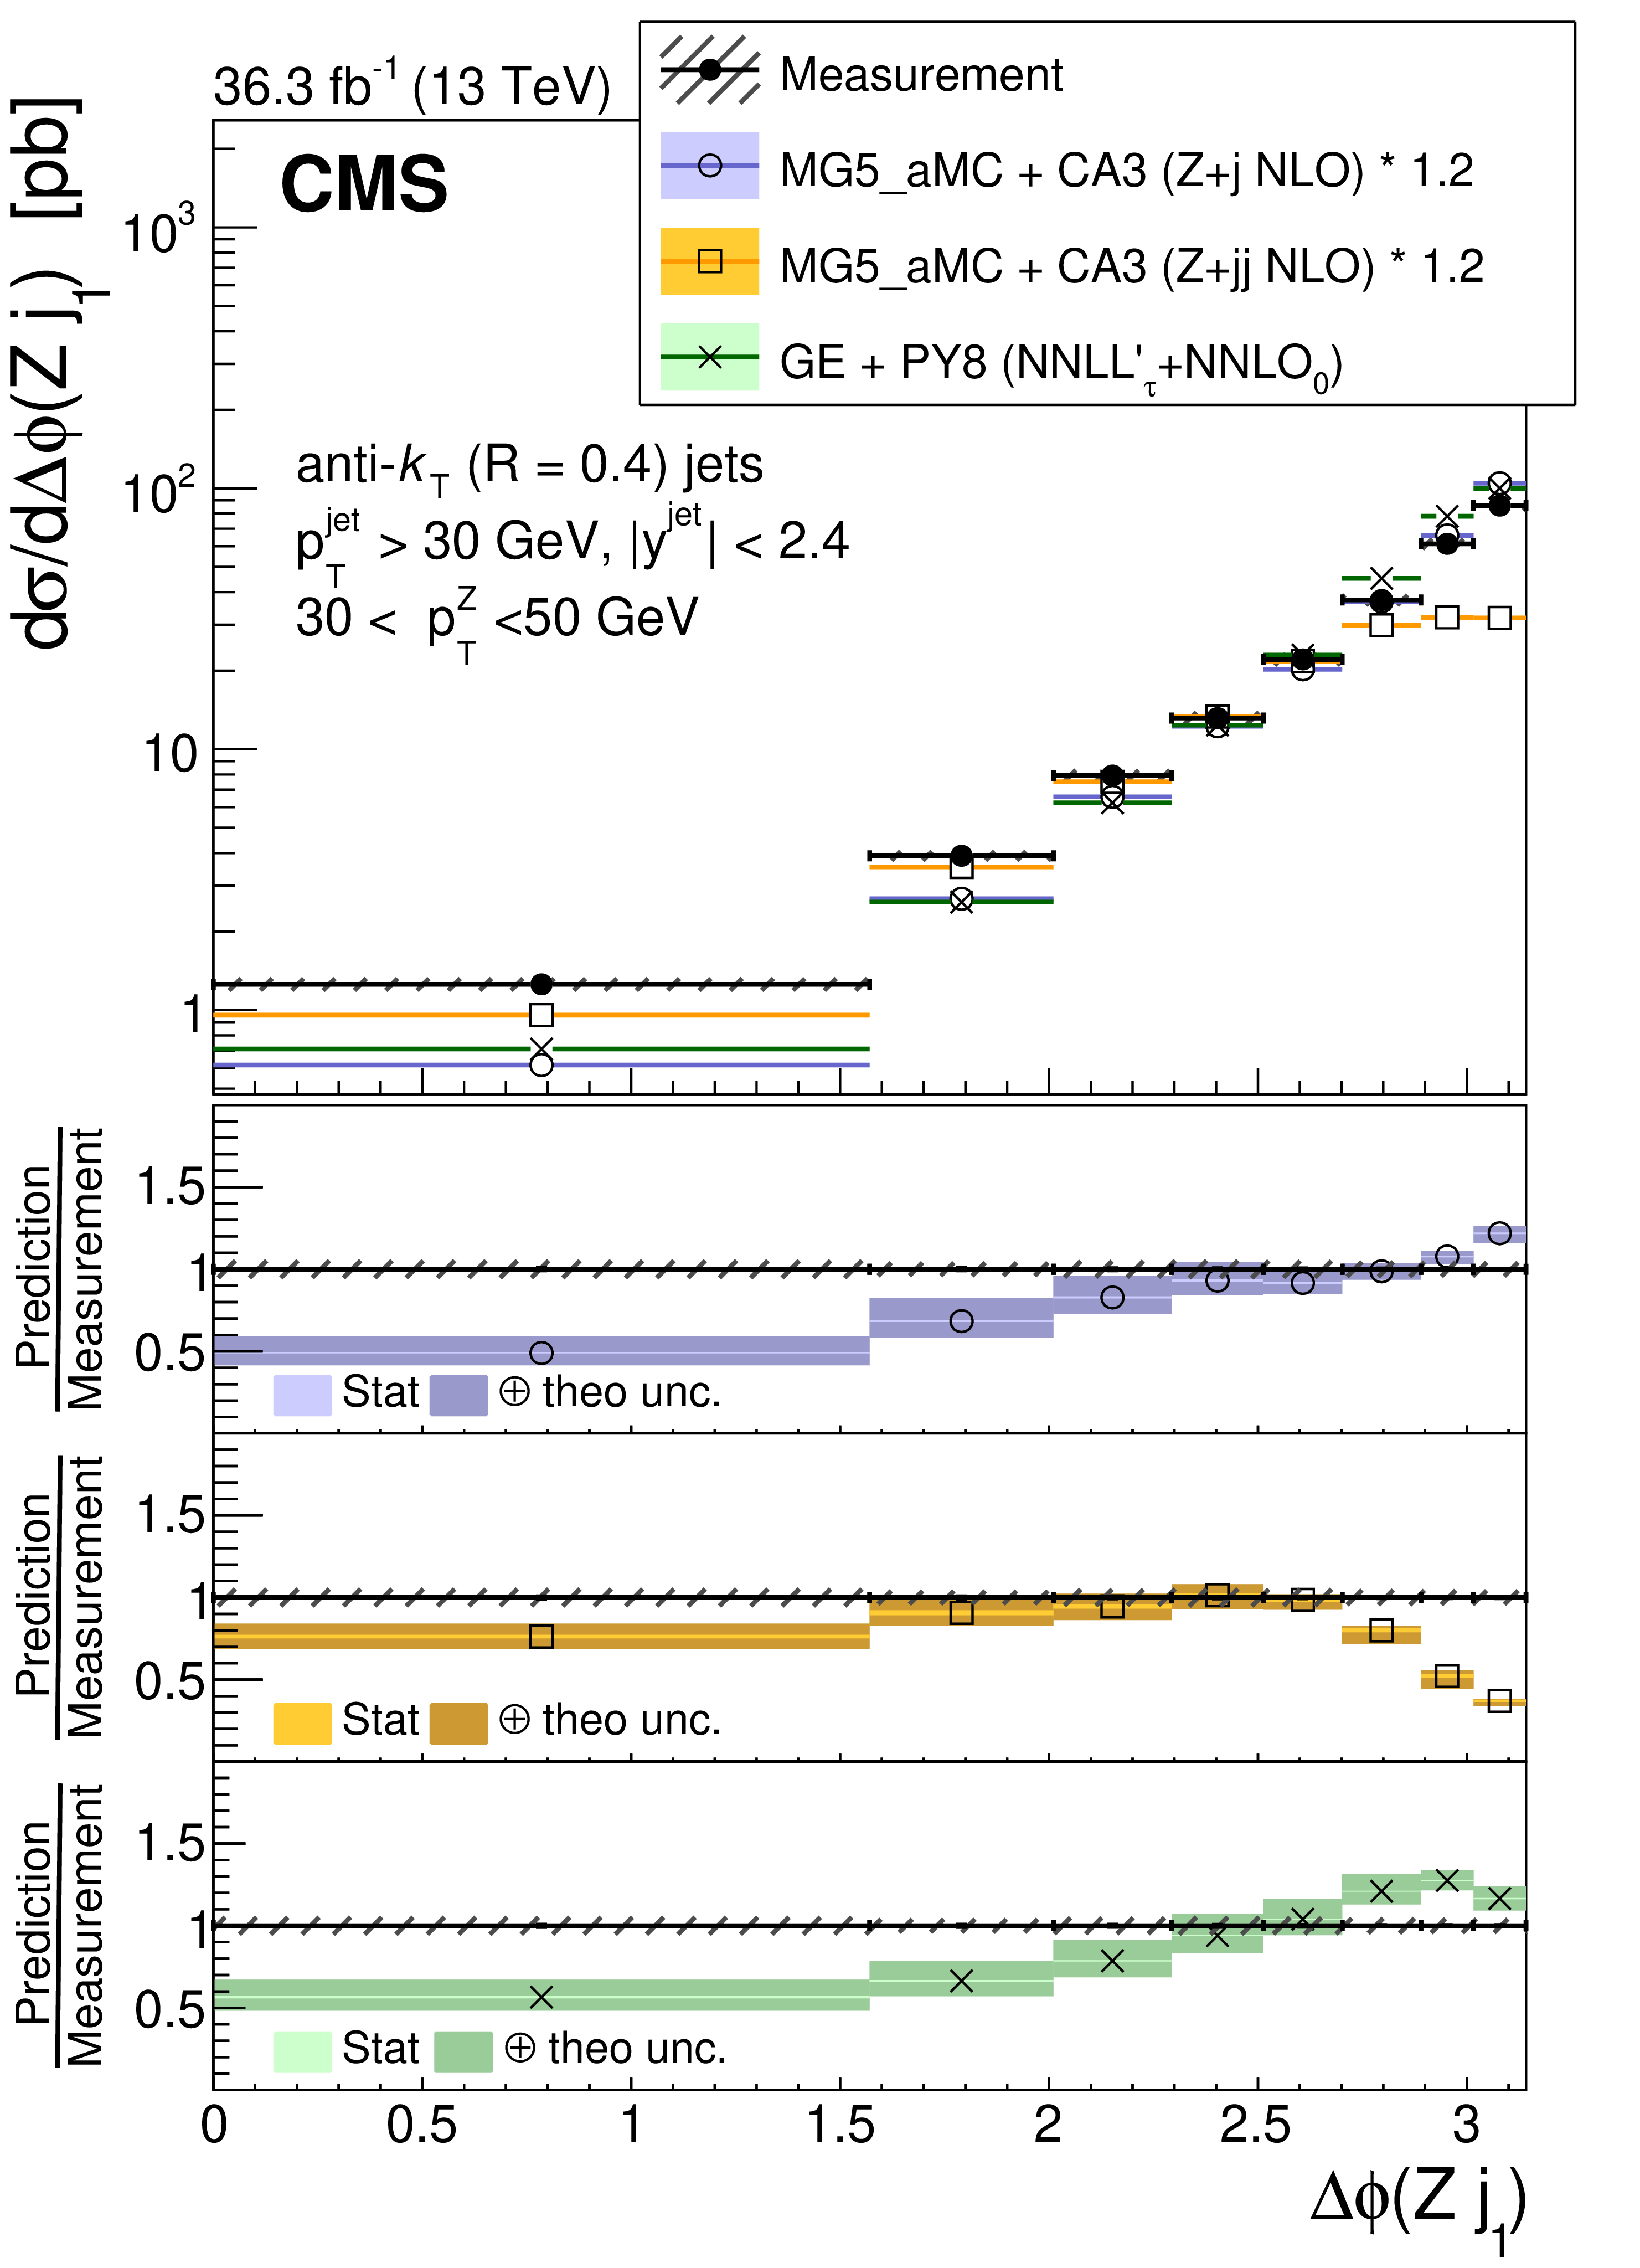
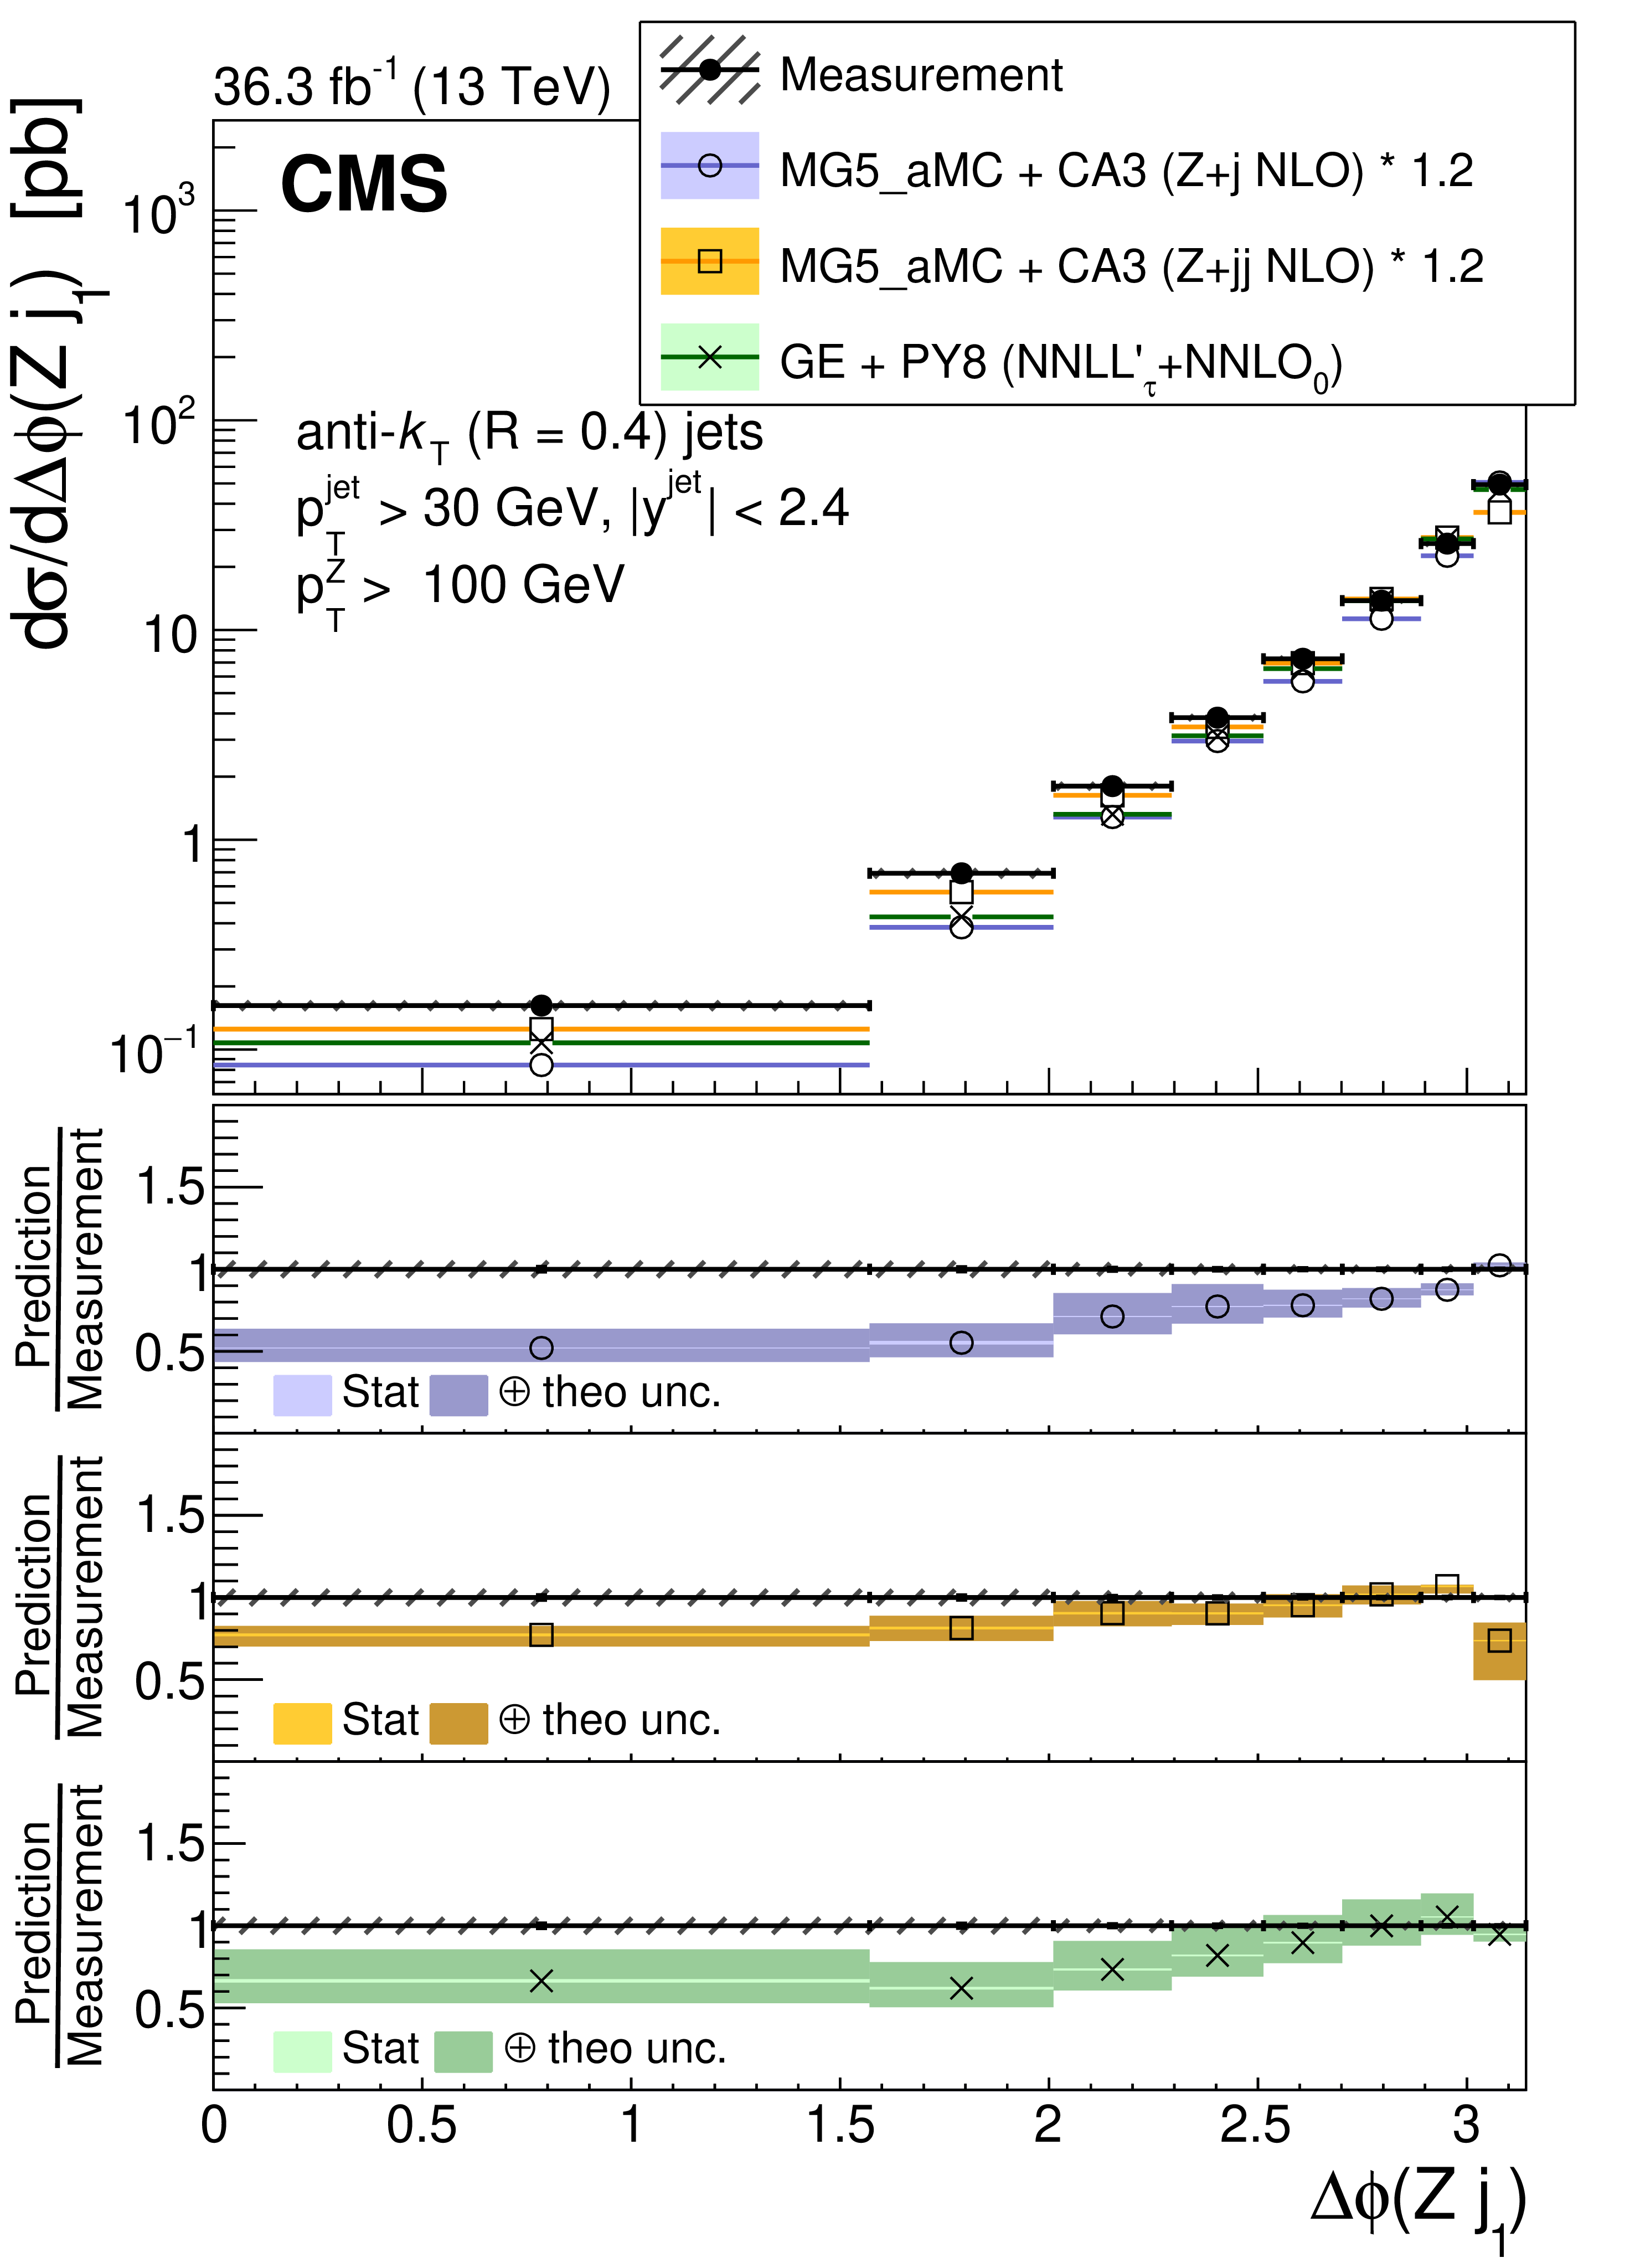
Figure 6:
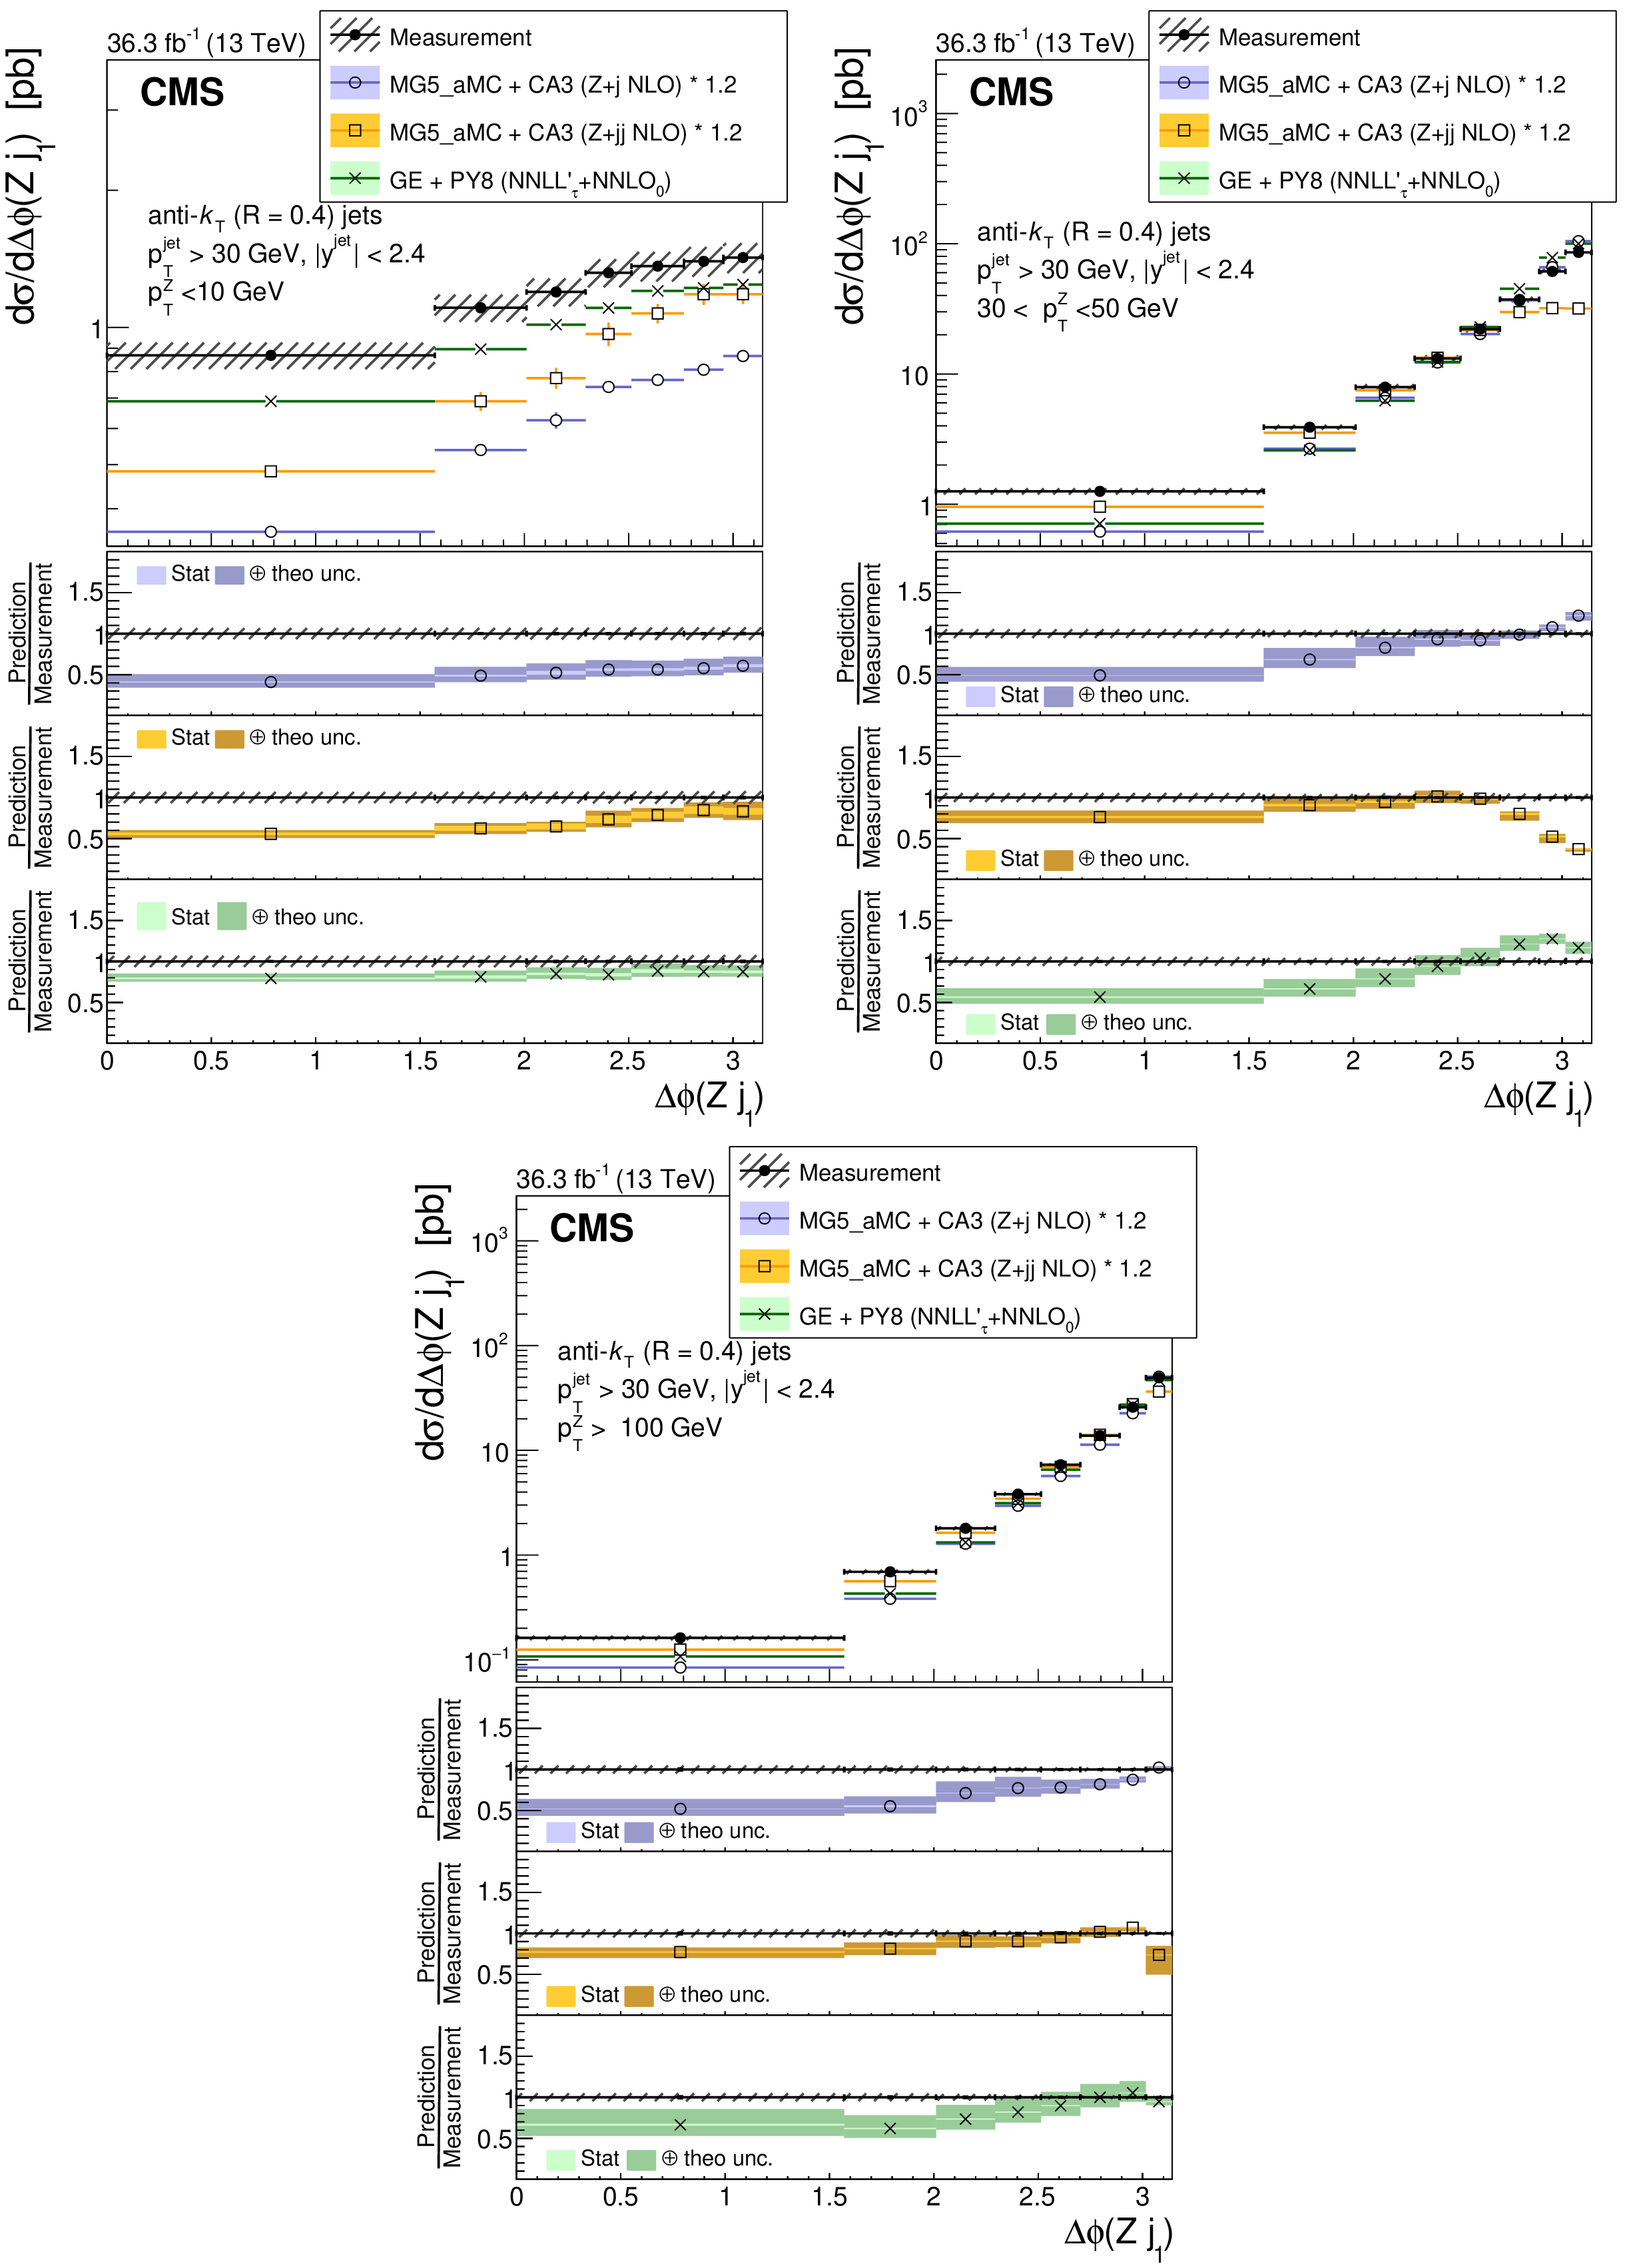
Cross section as a function of $ \Delta\phi (\mathrm{Z} j_1) $ between the Z boson and the leading jet in the three $ p_{\mathrm{T}}(\mathrm{Z}) $ bins: $ p_{\mathrm{T}}(\mathrm{Z}) < $ 10 GeV (upper left), 30 $ < p_{\mathrm{T}}(\mathrm{Z}) < $ 50 GeV (upper right), $ p_{\mathrm{T}}(\mathrm{Z}) > $ 100 GeV (lower). The error bars on the data points represent the statistical uncertainty of the measurement, and the hatched band shows the total statistical and systematic uncertainties added in quadrature. Predictions from GENEVA (Z+0 NNLO), MG5_AMC+CA3 (Z+1 NLO) and MG5_AMC+CA3 (Z+2 NLO) are shown. An overall normalization factor of 1.2 is applied to MG5_AMC+CA3 (Z+1 NLO) and MG5_AMC+CA3 (Z+2 NLO). |
png pdf |
Figure 6-a:
Cross section as a function of $ \Delta\phi (\mathrm{Z} j_1) $ between the Z boson and the leading jet for $ p_{\mathrm{T}}(\mathrm{Z}) < $ 10 GeV. The error bars on the data points represent the statistical uncertainty of the measurement, and the hatched band shows the total statistical and systematic uncertainties added in quadrature. Predictions from GENEVA (Z+0 NNLO), MG5_AMC+CA3 (Z+1 NLO) and MG5_AMC+CA3 (Z+2 NLO) are shown. An overall normalization factor of 1.2 is applied to MG5_AMC+CA3 (Z+1 NLO) and MG5_AMC+CA3 (Z+2 NLO). |
png pdf |
Figure 6-b:
Cross section as a function of $ \Delta\phi (\mathrm{Z} j_1) $ between the Z boson and the leading jet for 30 $ < p_{\mathrm{T}}(\mathrm{Z}) < $ 50 GeV. The error bars on the data points represent the statistical uncertainty of the measurement, and the hatched band shows the total statistical and systematic uncertainties added in quadrature. Predictions from GENEVA (Z+0 NNLO), MG5_AMC+CA3 (Z+1 NLO) and MG5_AMC+CA3 (Z+2 NLO) are shown. An overall normalization factor of 1.2 is applied to MG5_AMC+CA3 (Z+1 NLO) and MG5_AMC+CA3 (Z+2 NLO). |
png pdf |
Figure 6-c:
Cross section as a function of $ \Delta\phi (\mathrm{Z} j_1) $ between the Z boson and the leading jet for $ p_{\mathrm{T}}(\mathrm{Z}) > $ 100 GeV. The error bars on the data points represent the statistical uncertainty of the measurement, and the hatched band shows the total statistical and systematic uncertainties added in quadrature. Predictions from GENEVA (Z+0 NNLO), MG5_AMC+CA3 (Z+1 NLO) and MG5_AMC+CA3 (Z+2 NLO) are shown. An overall normalization factor of 1.2 is applied to MG5_AMC+CA3 (Z+1 NLO) and MG5_AMC+CA3 (Z+2 NLO). |
png pdf |
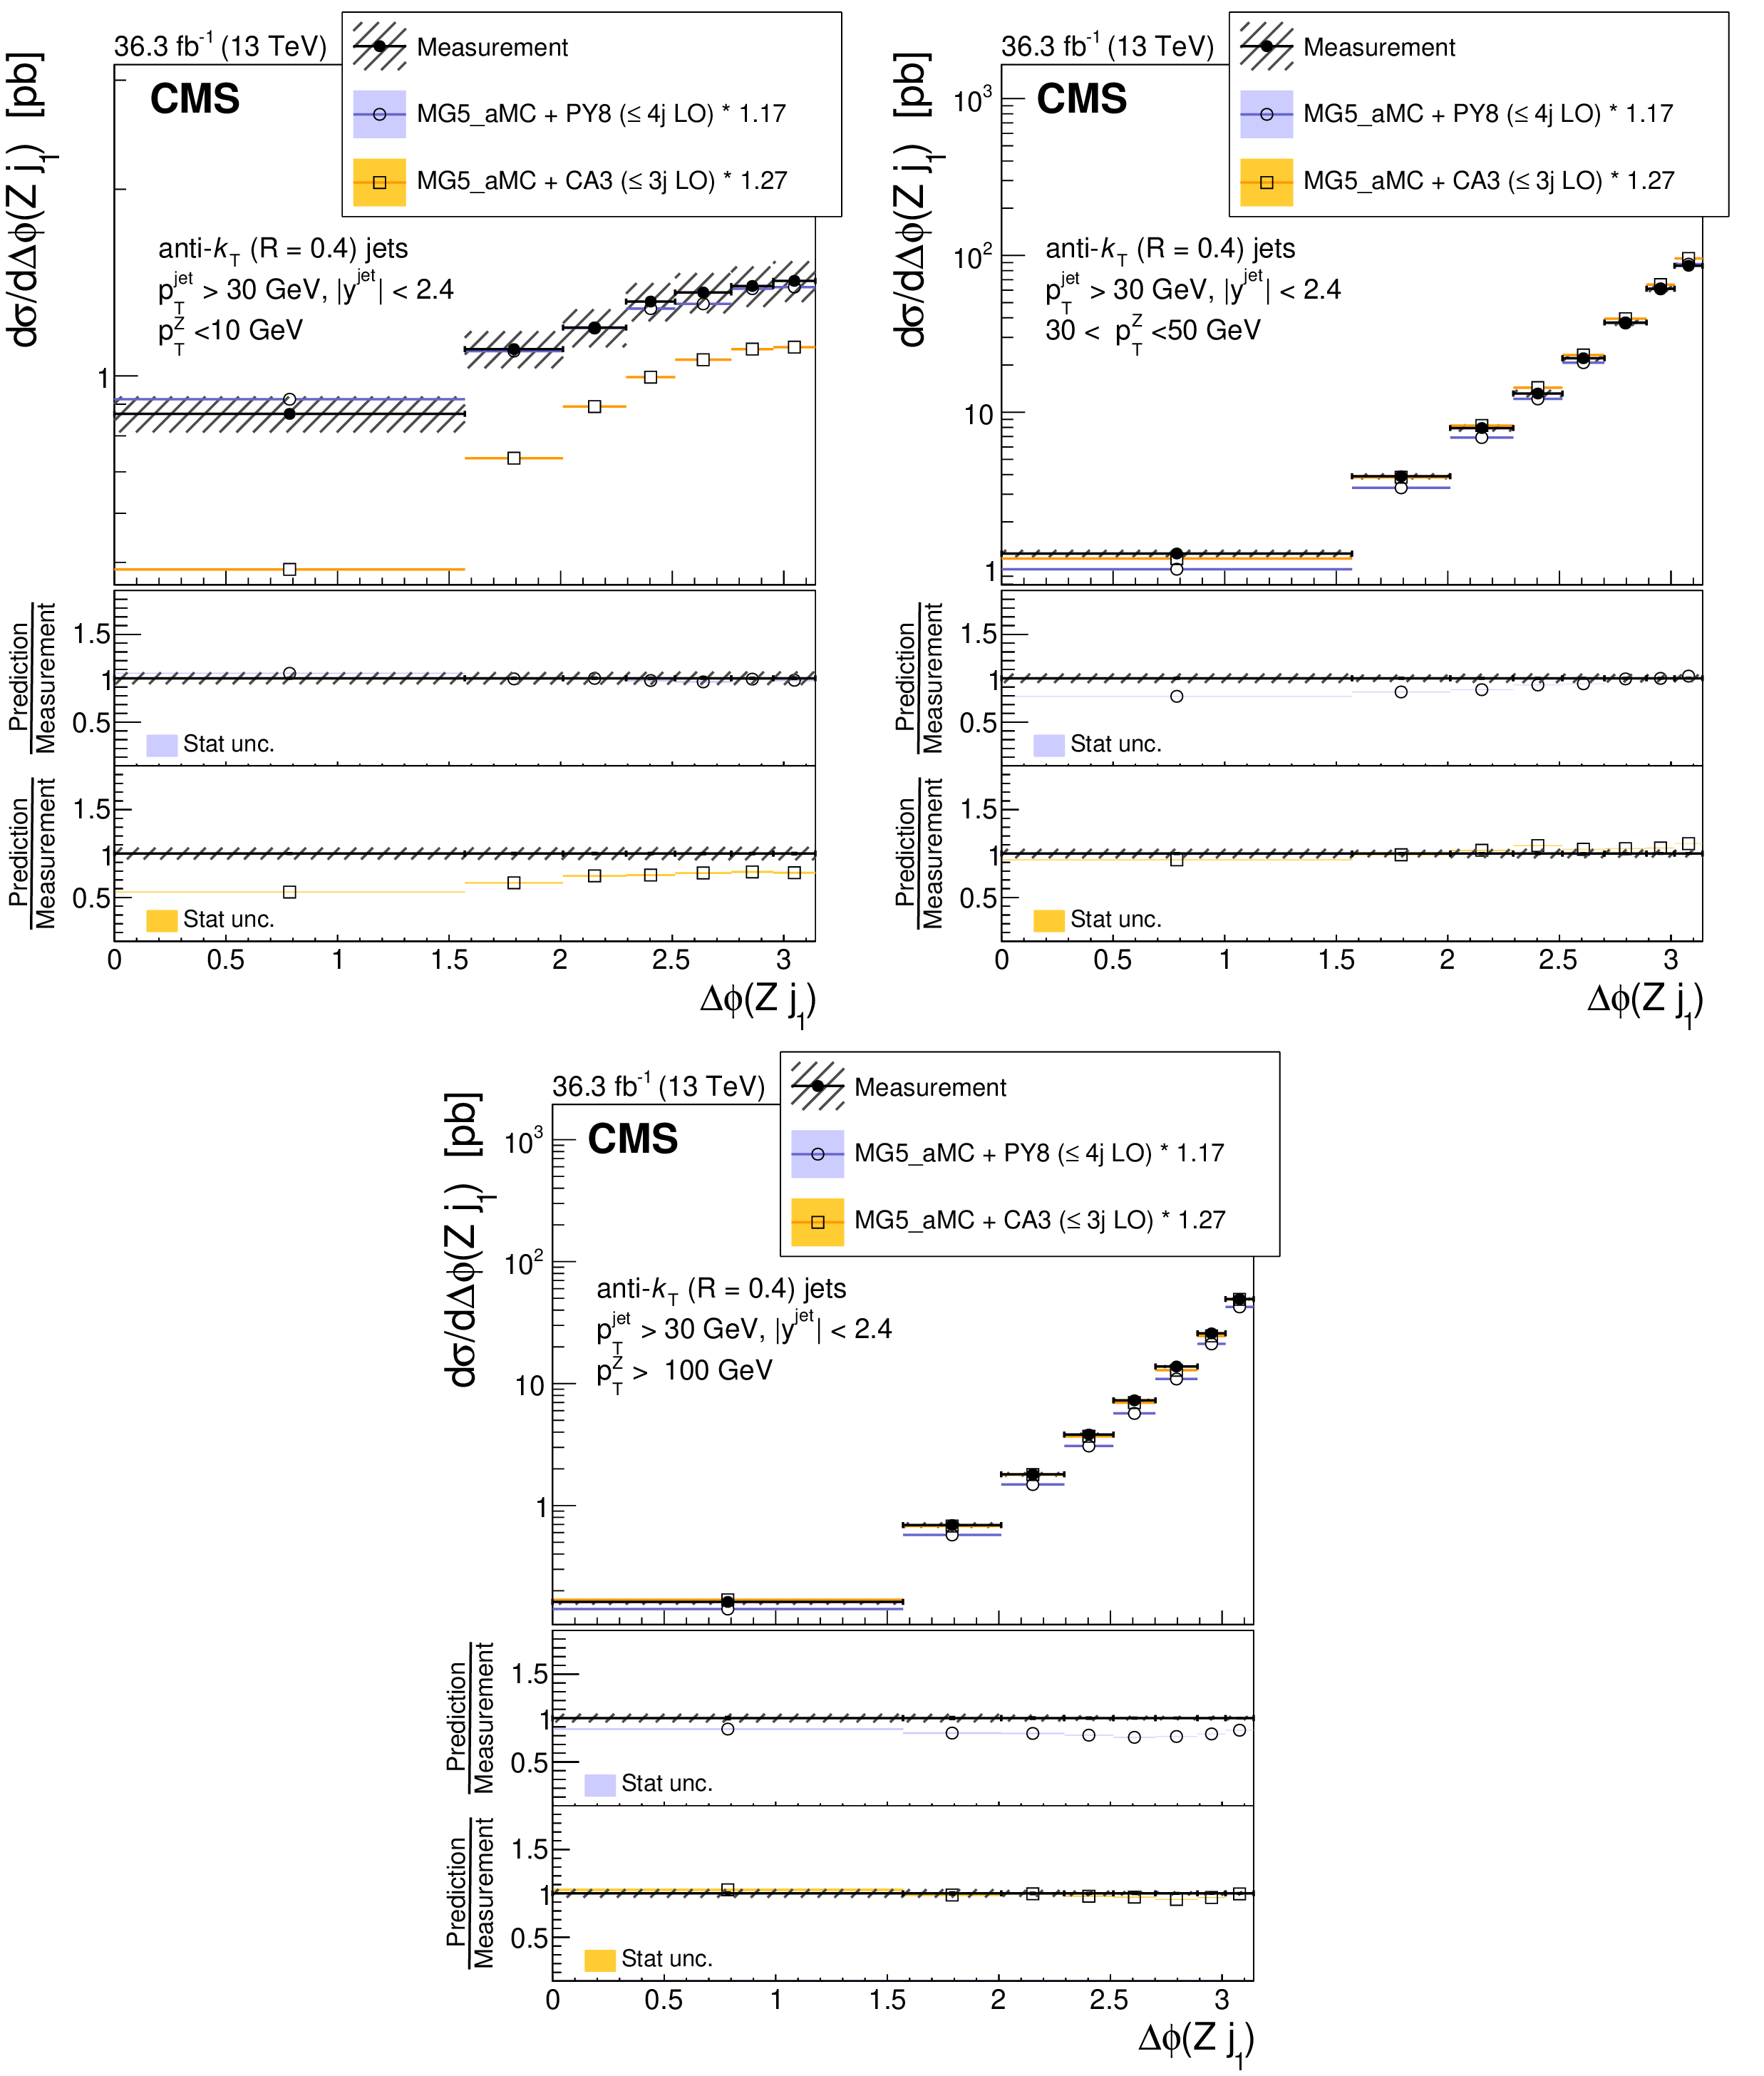
Figure 7:
Cross section as a function of $ \Delta\phi (\mathrm{Z} j_1) $ between the Z boson and the leading jet in three $ p_{\mathrm{T}}(\mathrm{Z}) $ bins: $ p_{\mathrm{T}}(\mathrm{Z}) < $ 10 GeV (upper left), 30 $ < p_{\mathrm{T}}(\mathrm{Z}) < $ 50 GeV (upper right), $ p_{\mathrm{T}}(\mathrm{Z}) > $ 100 GeV (lower). The error bars on the data points represent the statistical uncertainty of the measurement, and the hatched band shows the total statistical and systematic uncertainties added in quadrature. Predictions from MG5_AMC+PY8 ($ \leq $ 4j LO) and MG5_AMC+CA3 (Z $ \leq $ 3j LO) are shown. Different normalization factors are applied, as described in the text. |
png pdf |
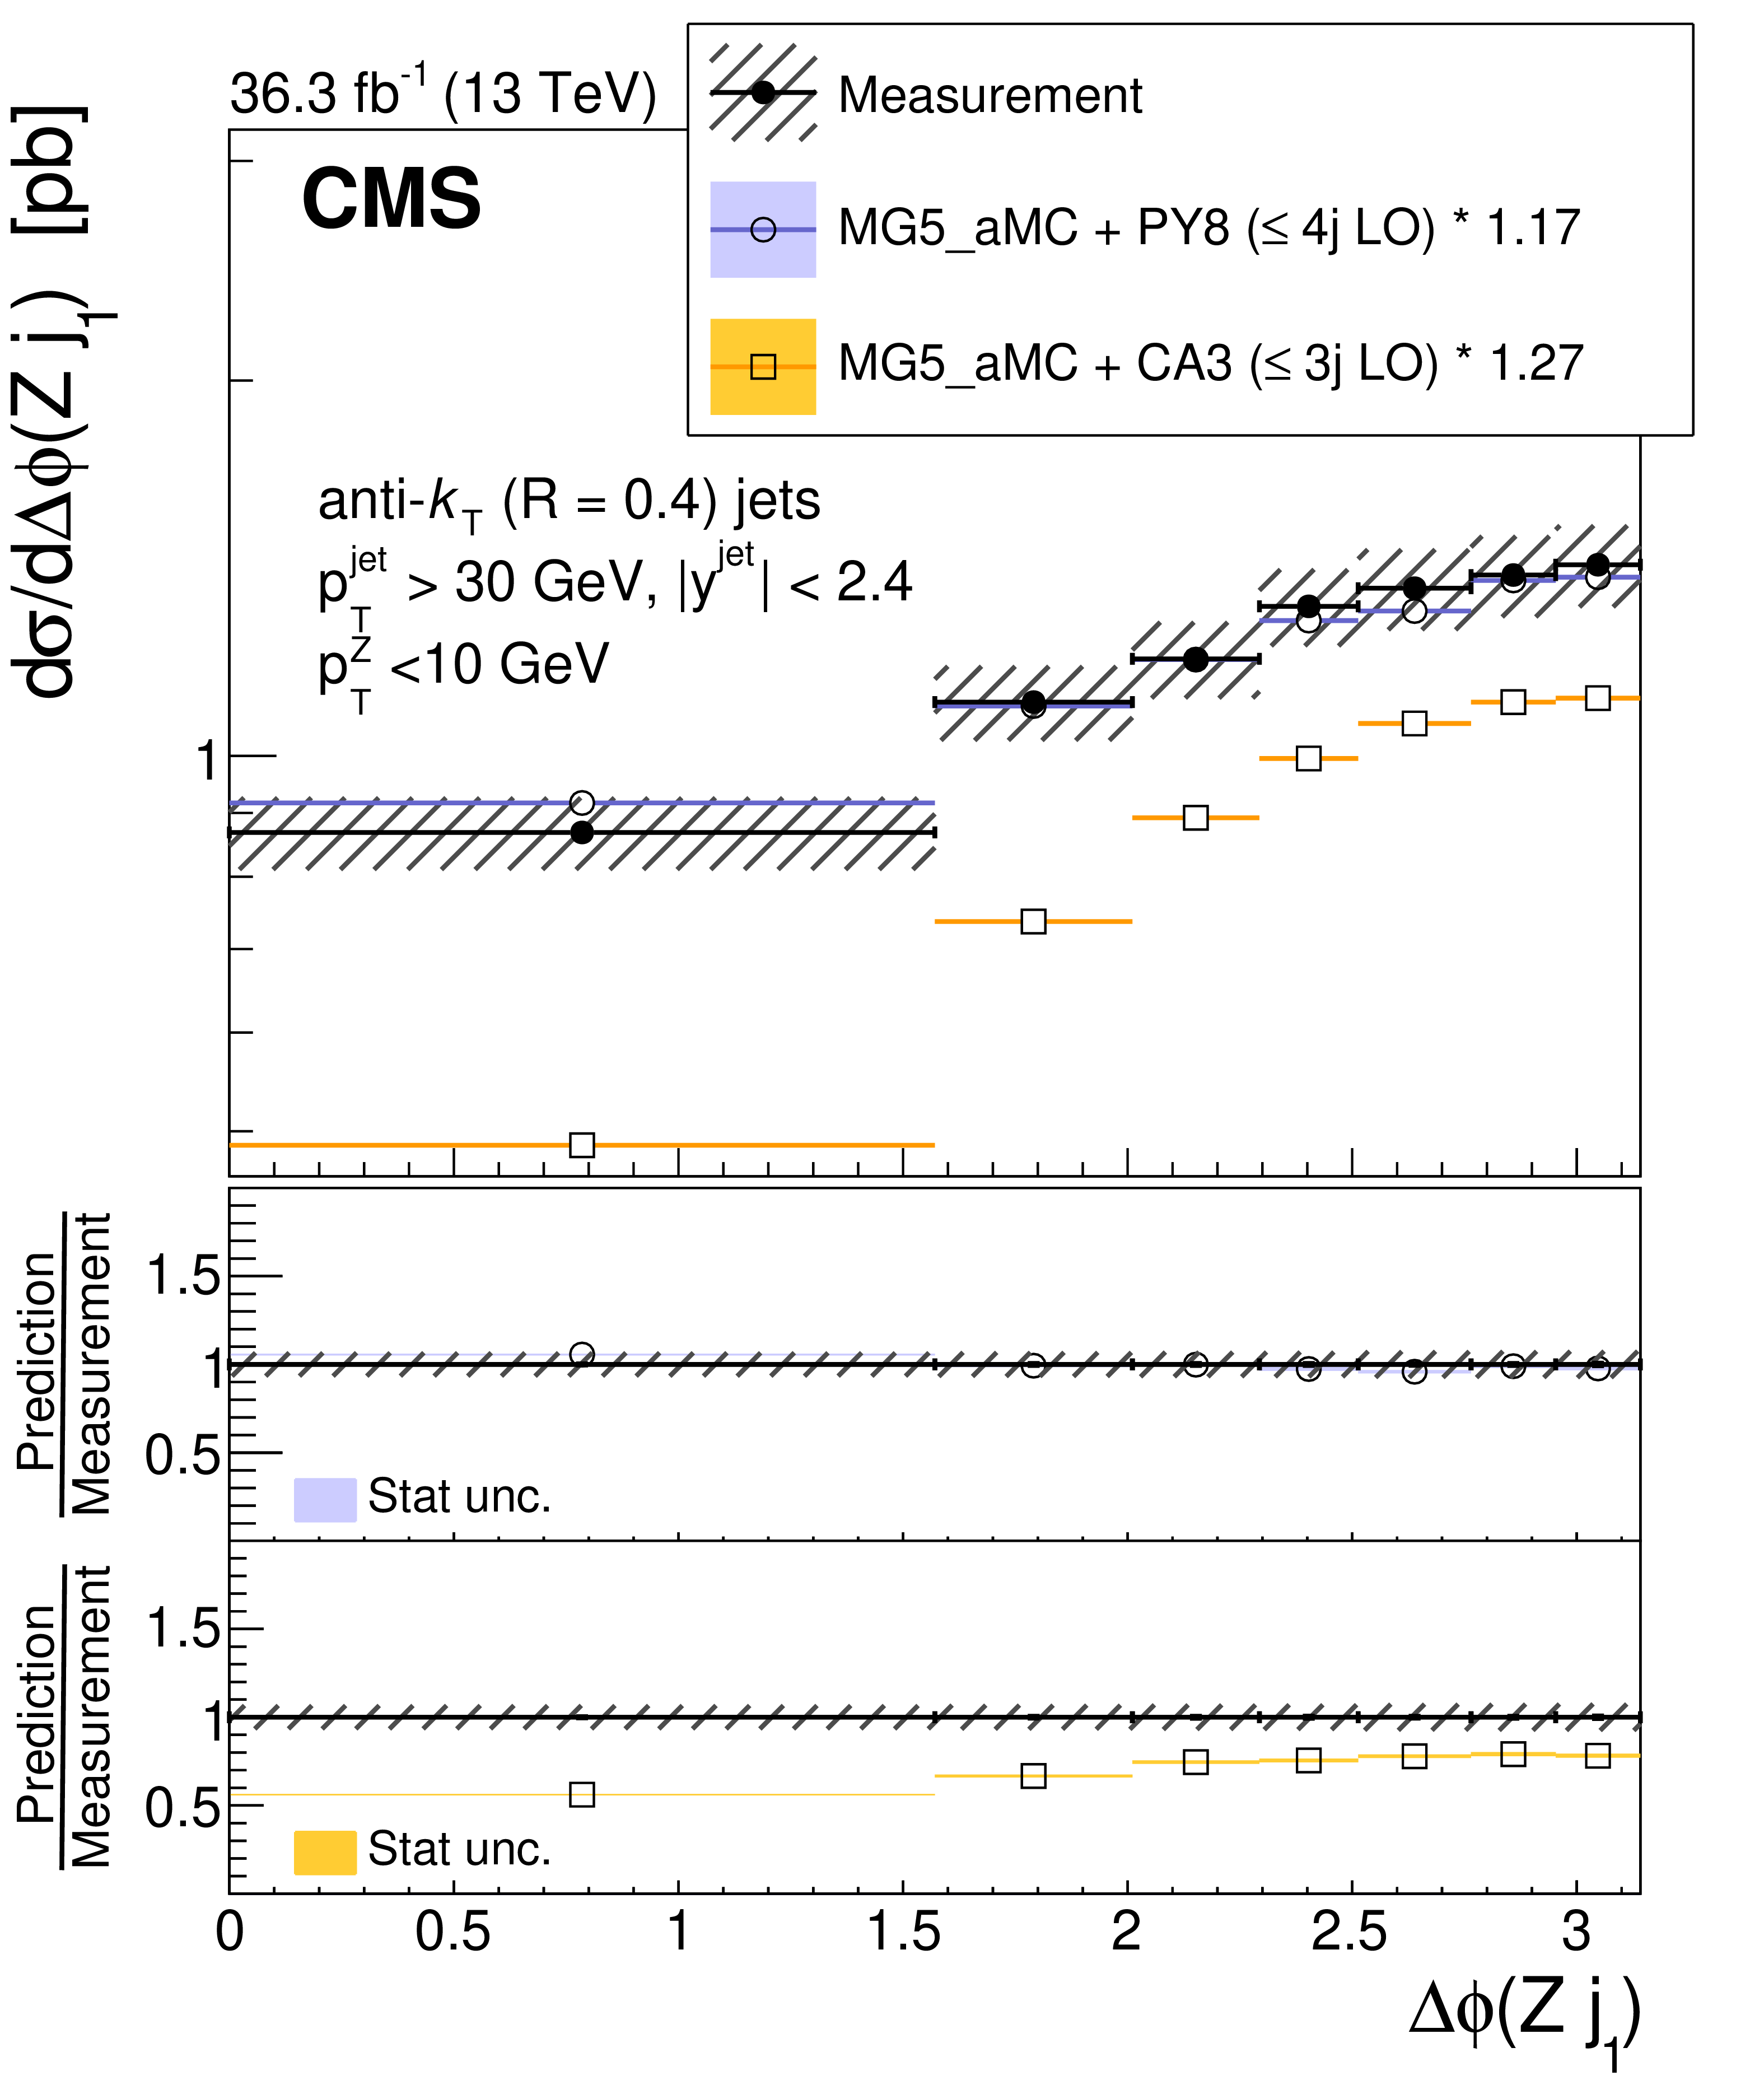
Figure 7-a:
Cross section as a function of $ \Delta\phi (\mathrm{Z} j_1) $ between the Z boson and the leading jet for $ p_{\mathrm{T}}(\mathrm{Z}) < $ 10 GeV. The error bars on the data points represent the statistical uncertainty of the measurement, and the hatched band shows the total statistical and systematic uncertainties added in quadrature. Predictions from MG5_AMC+PY8 ($ \leq $ 4j LO) and MG5_AMC+CA3 (Z $ \leq $ 3j LO) are shown. Different normalization factors are applied, as described in the text. |
png pdf |
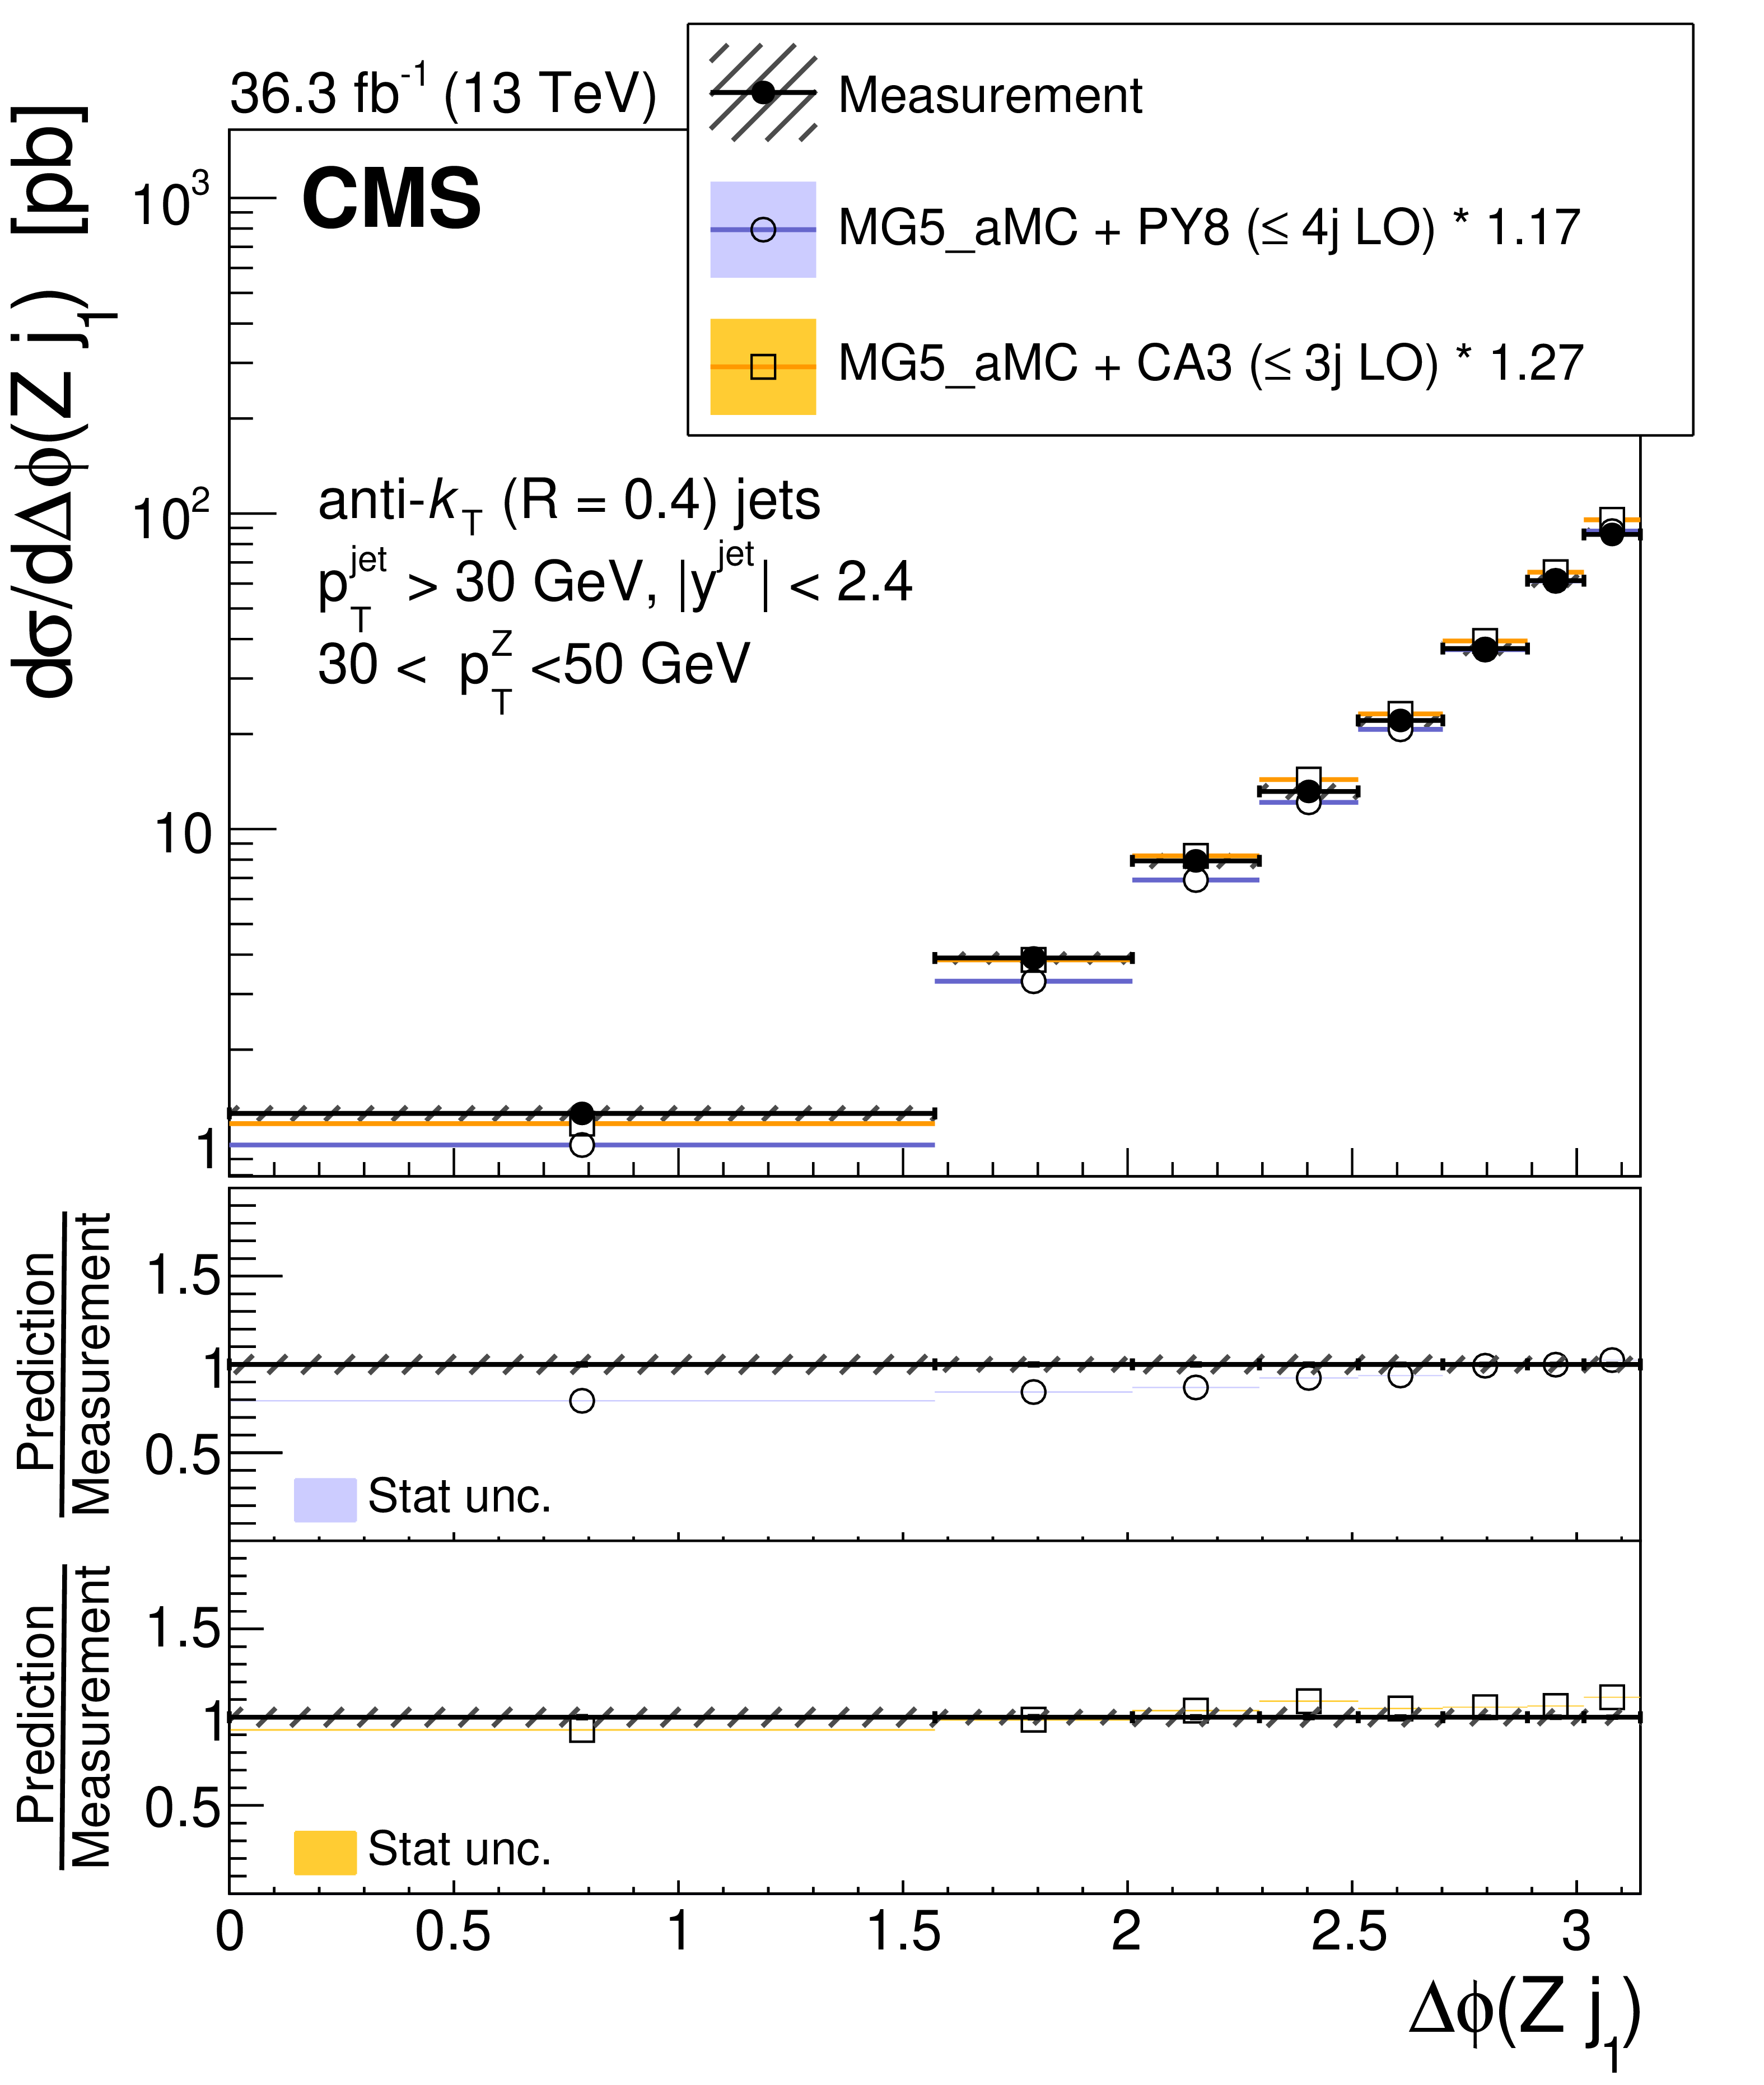
Figure 7-b:
Cross section as a function of $ \Delta\phi (\mathrm{Z} j_1) $ between the Z boson and the leading jet for 30 $ < p_{\mathrm{T}}(\mathrm{Z}) < $ 50 GeV. The error bars on the data points represent the statistical uncertainty of the measurement, and the hatched band shows the total statistical and systematic uncertainties added in quadrature. Predictions from MG5_AMC+PY8 ($ \leq $ 4j LO) and MG5_AMC+CA3 (Z $ \leq $ 3j LO) are shown. Different normalization factors are applied, as described in the text. |
png pdf |
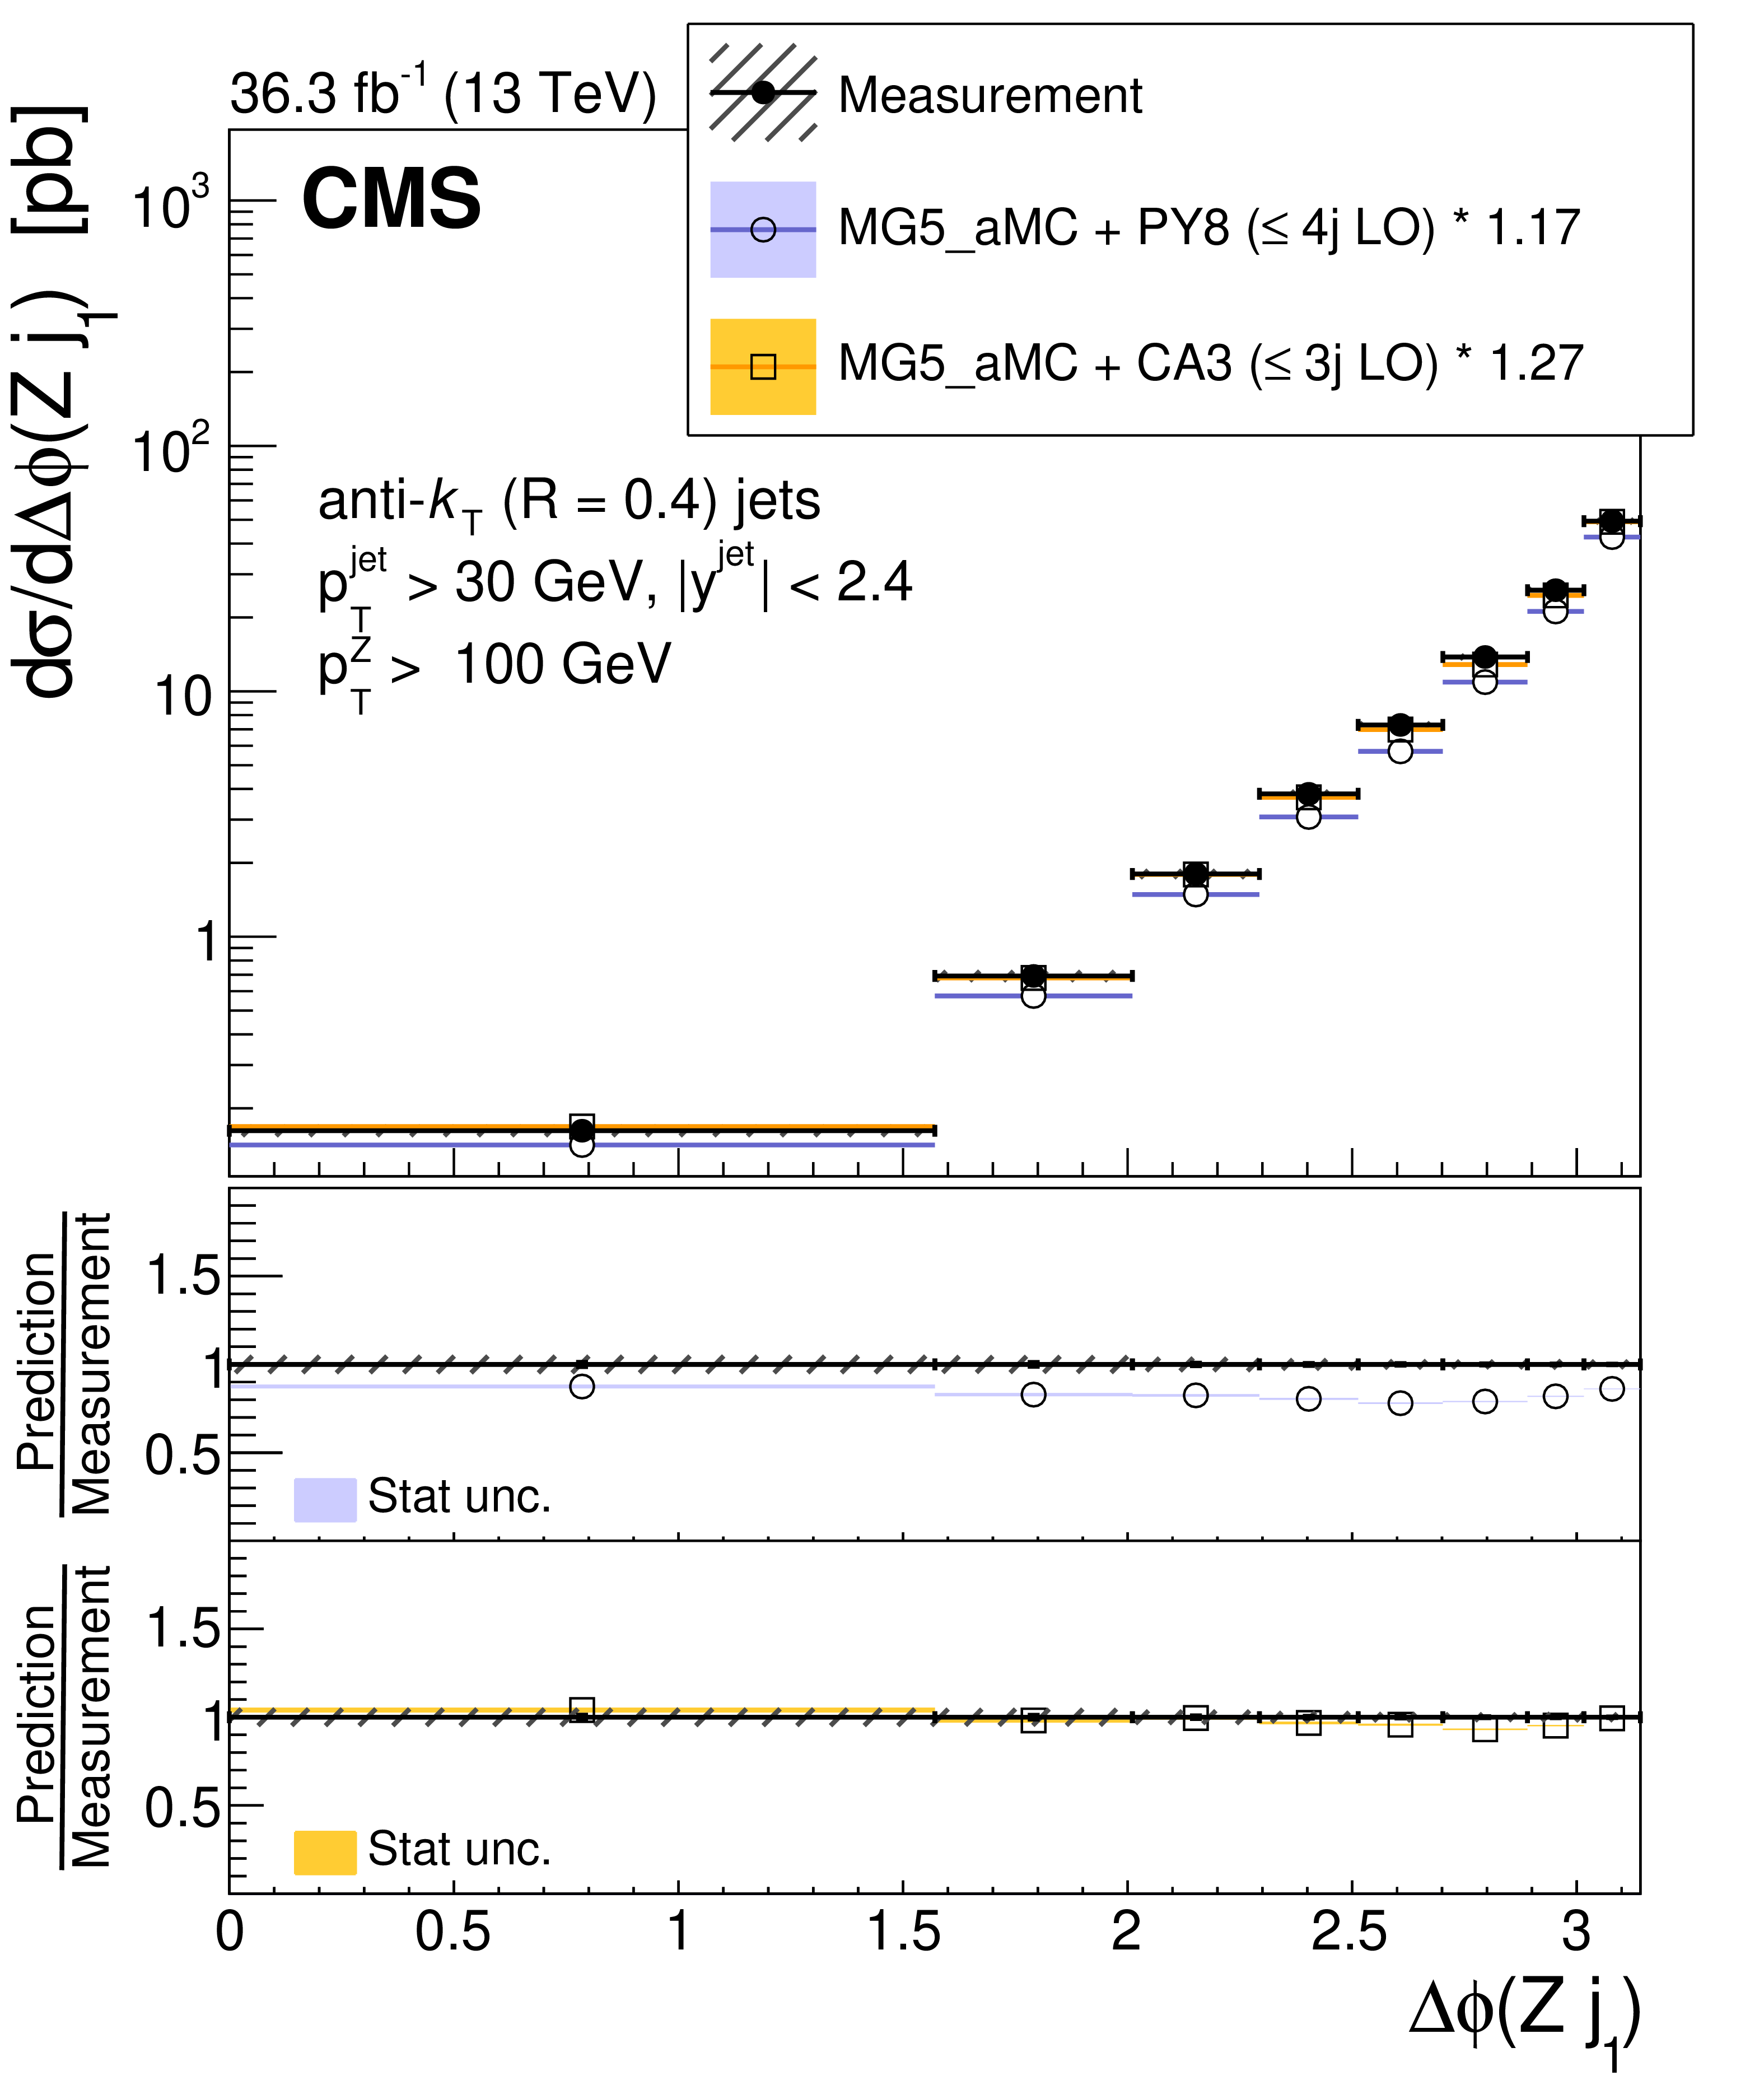
Figure 7-c:
Cross section as a function of $ \Delta\phi (\mathrm{Z} j_1) $ between the Z boson and the leading jet for $ p_{\mathrm{T}}(\mathrm{Z}) > $ 100 GeV. The error bars on the data points represent the statistical uncertainty of the measurement, and the hatched band shows the total statistical and systematic uncertainties added in quadrature. Predictions from MG5_AMC+PY8 ($ \leq $ 4j LO) and MG5_AMC+CA3 (Z $ \leq $ 3j LO) are shown. Different normalization factors are applied, as described in the text. |
png pdf |
Figure 8:
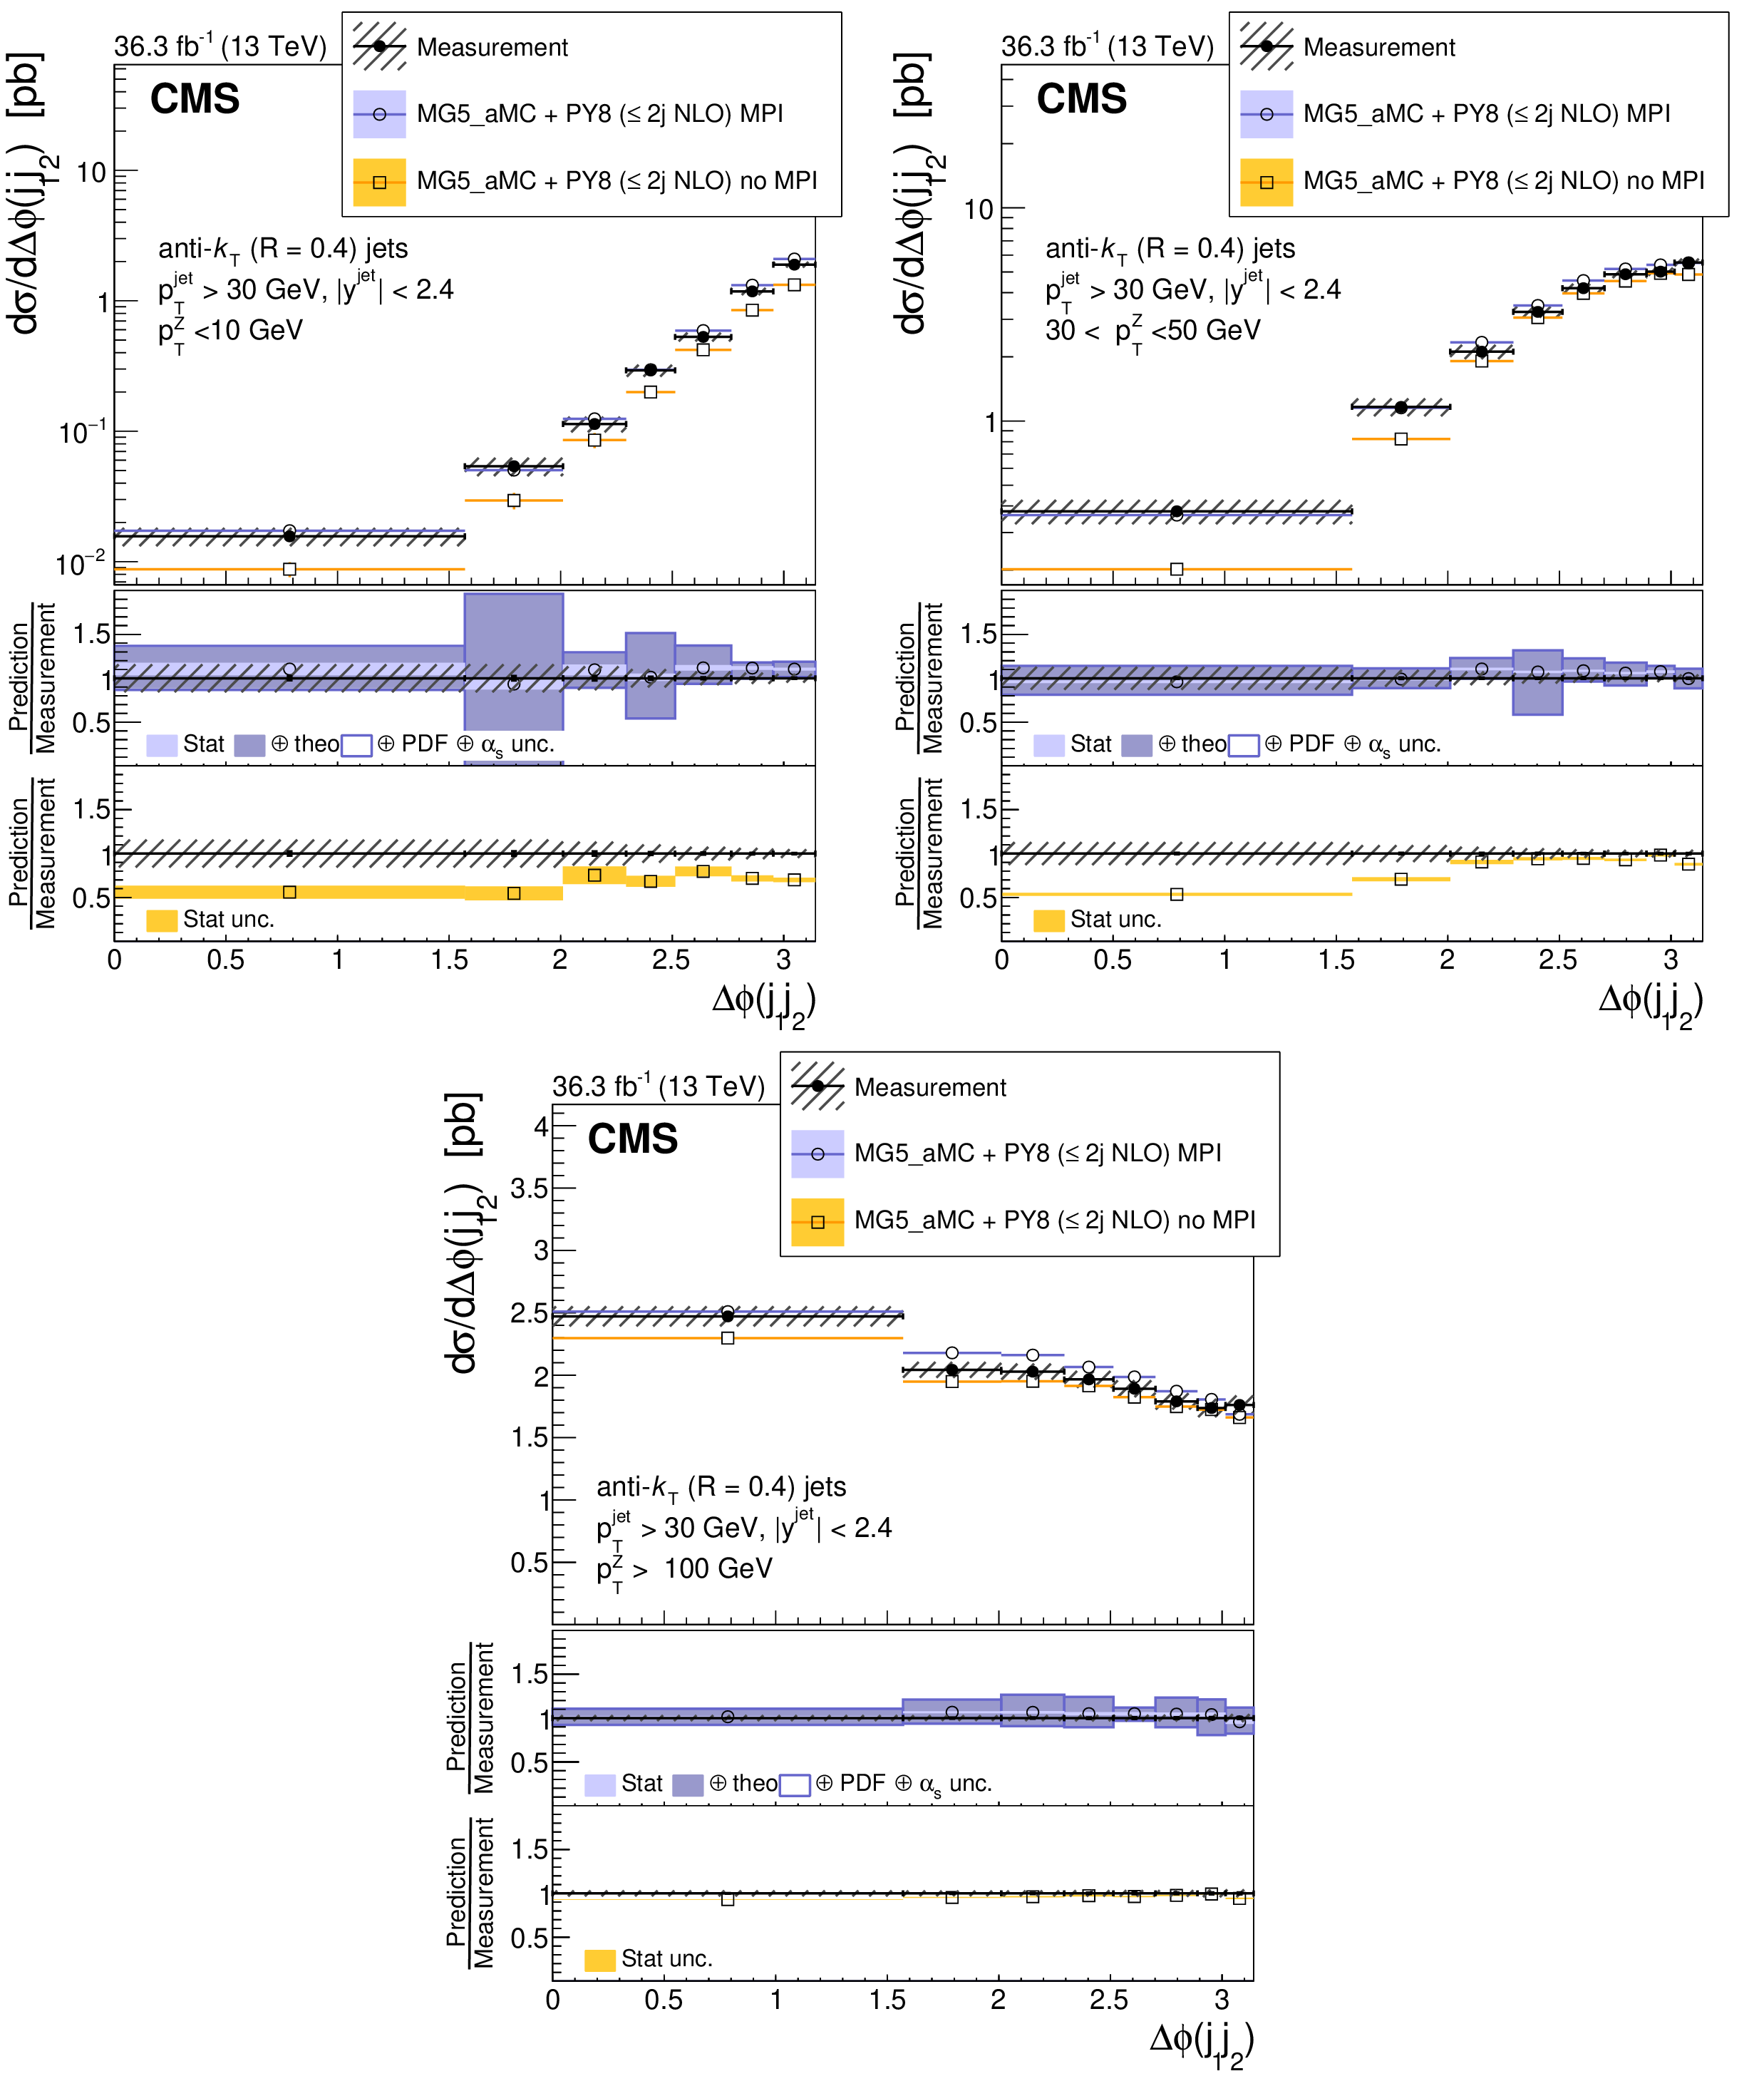
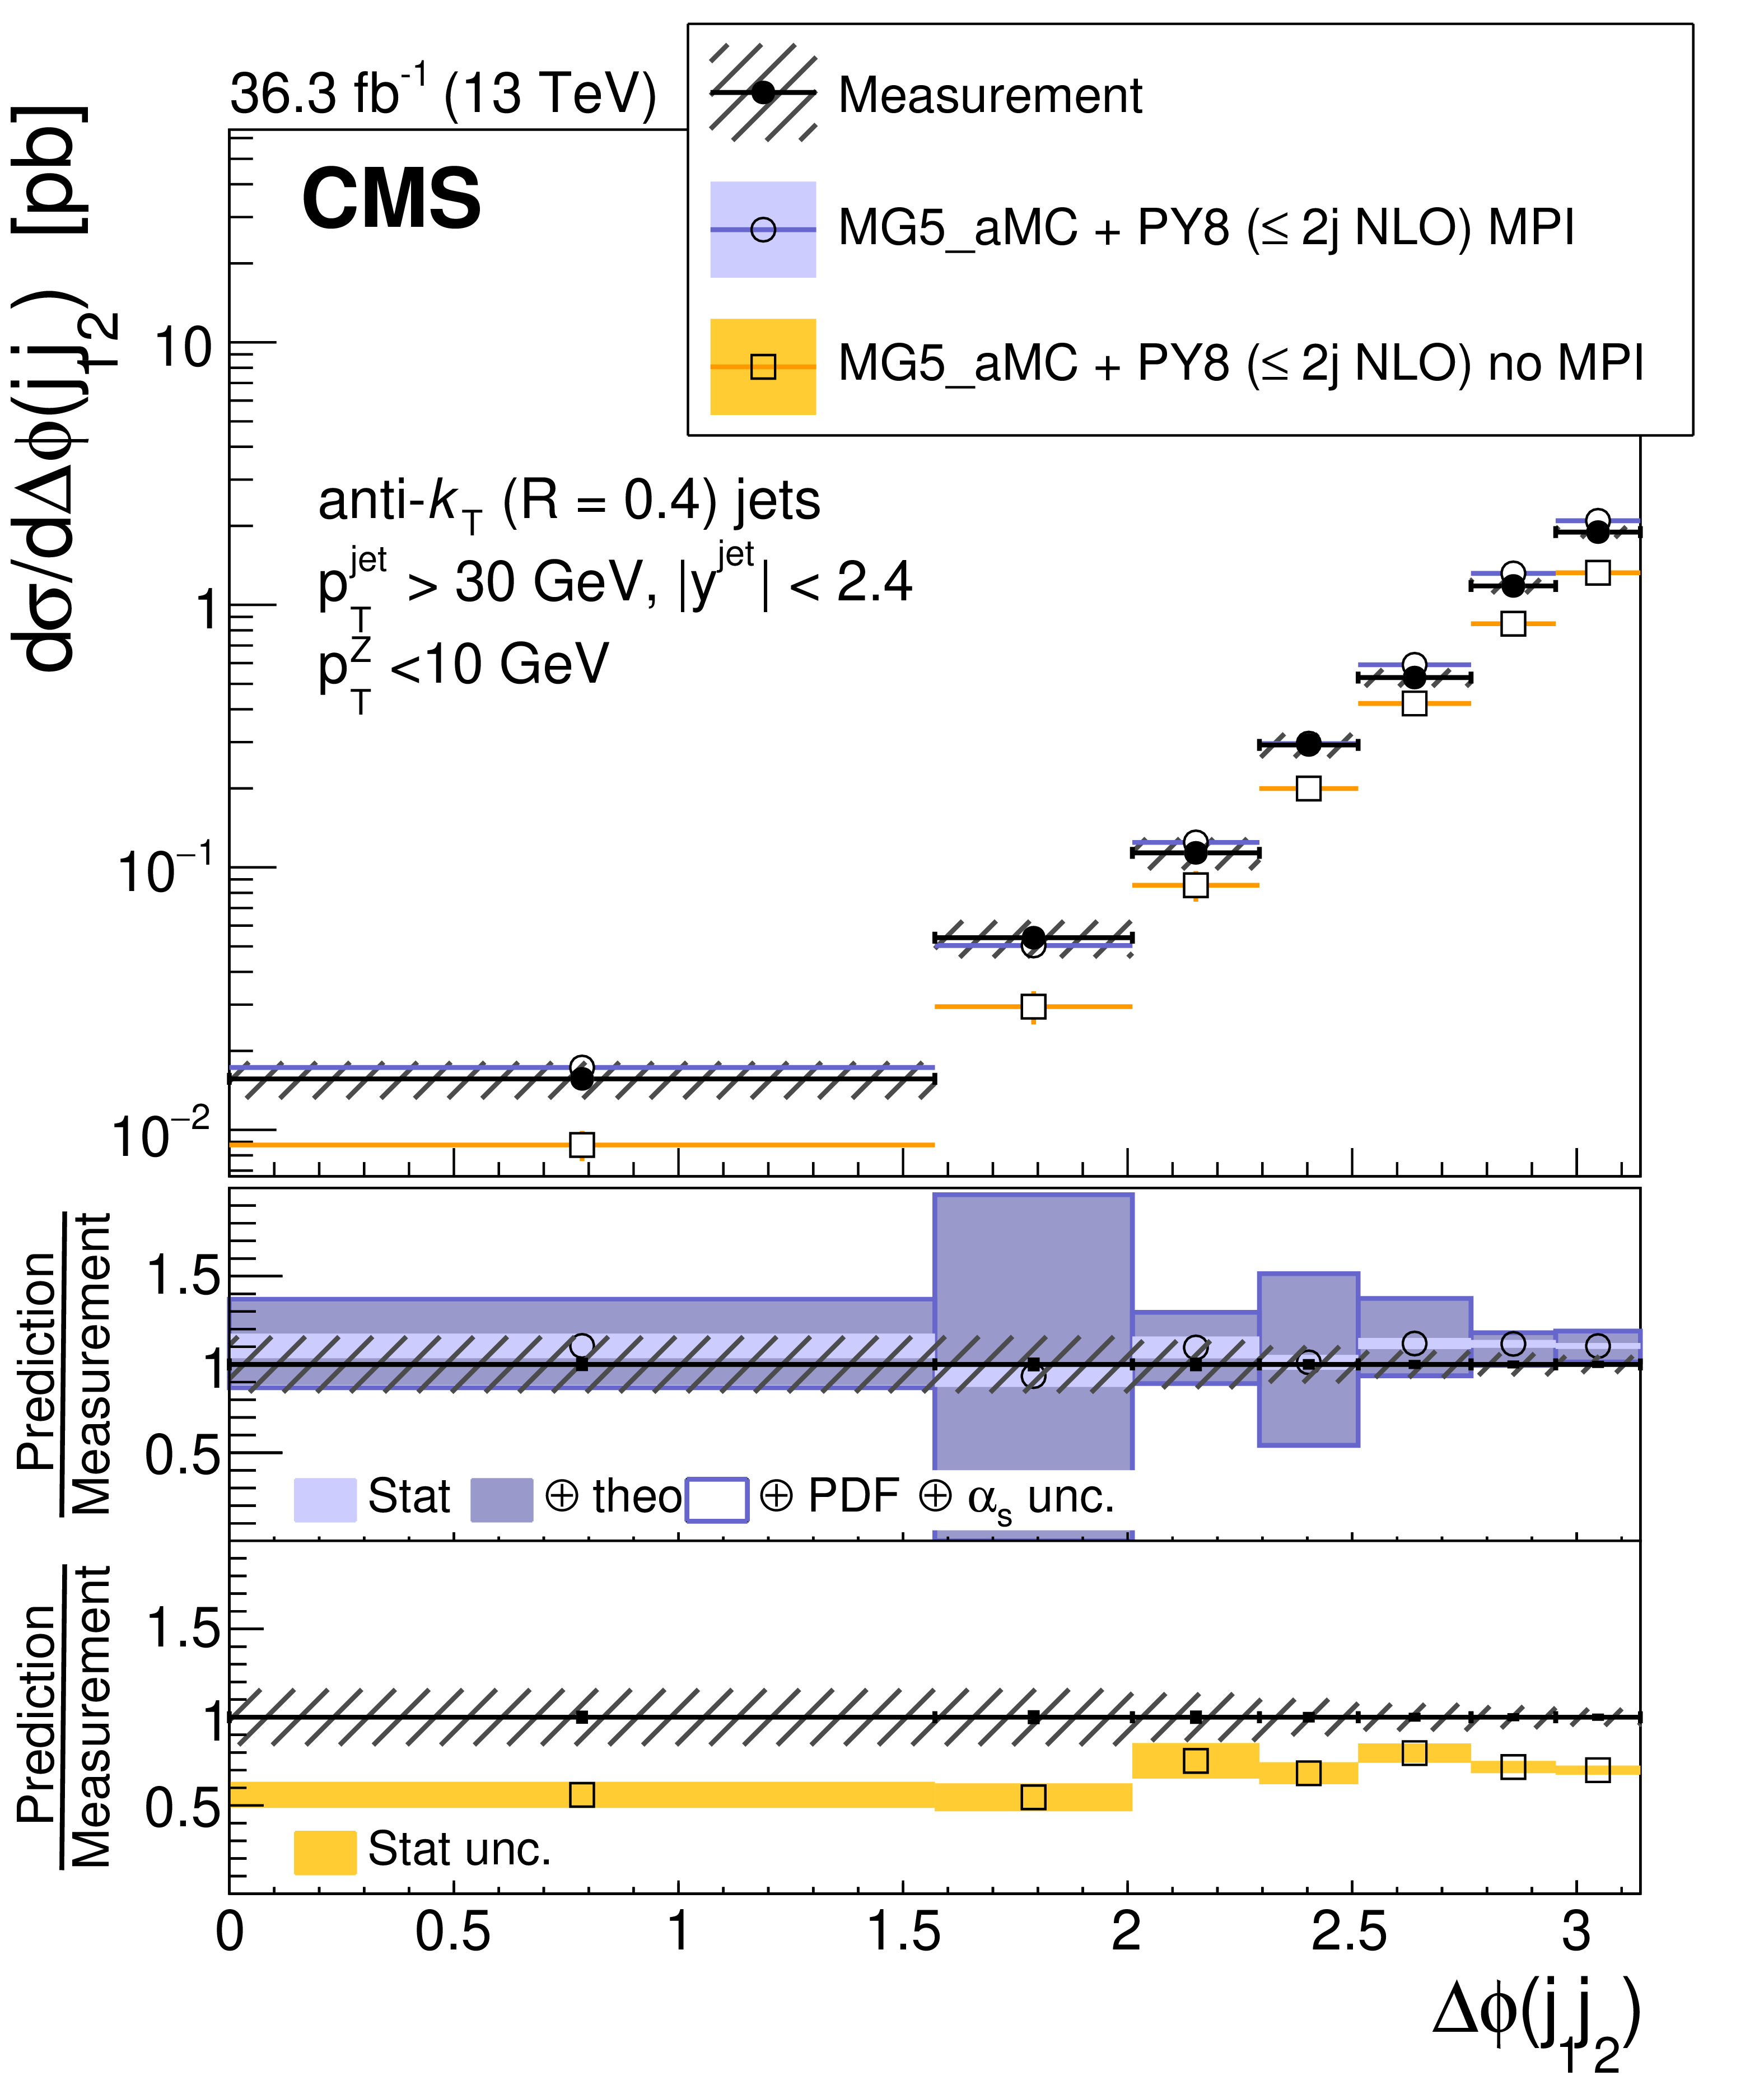
Cross section as a function of $ \Delta\phi (j_1j_2) $ between two leading jets in three $ p_{\mathrm{T}}(\mathrm{Z}) $ regions: $ p_{\mathrm{T}}(\mathrm{Z}) < $ 10 GeV (upper left), 30 $ < p_{\mathrm{T}}(\mathrm{Z}) < $ 50 GeV (upper right), $ p_{\mathrm{T}}(\mathrm{Z}) > $ 100 GeV (lower). The error bars on the data points represent the statistical uncertainty of the measurement, and the hatched band shows the total statistical and systematic uncertainties added in quadrature. Predictions using MG5_AMC+PY8 ($ \leq $ 2j NLO) with and without multiparton interactions are shown. |
png pdf |
Figure 8-a:
Cross section as a function of $ \Delta\phi (j_1j_2) $ between two leading jets for $ p_{\mathrm{T}}(\mathrm{Z}) < $ 10 GeV. The error bars on the data points represent the statistical uncertainty of the measurement, and the hatched band shows the total statistical and systematic uncertainties added in quadrature. Predictions using MG5_AMC+PY8 ($ \leq $ 2j NLO) with and without multiparton interactions are shown. |
png pdf |
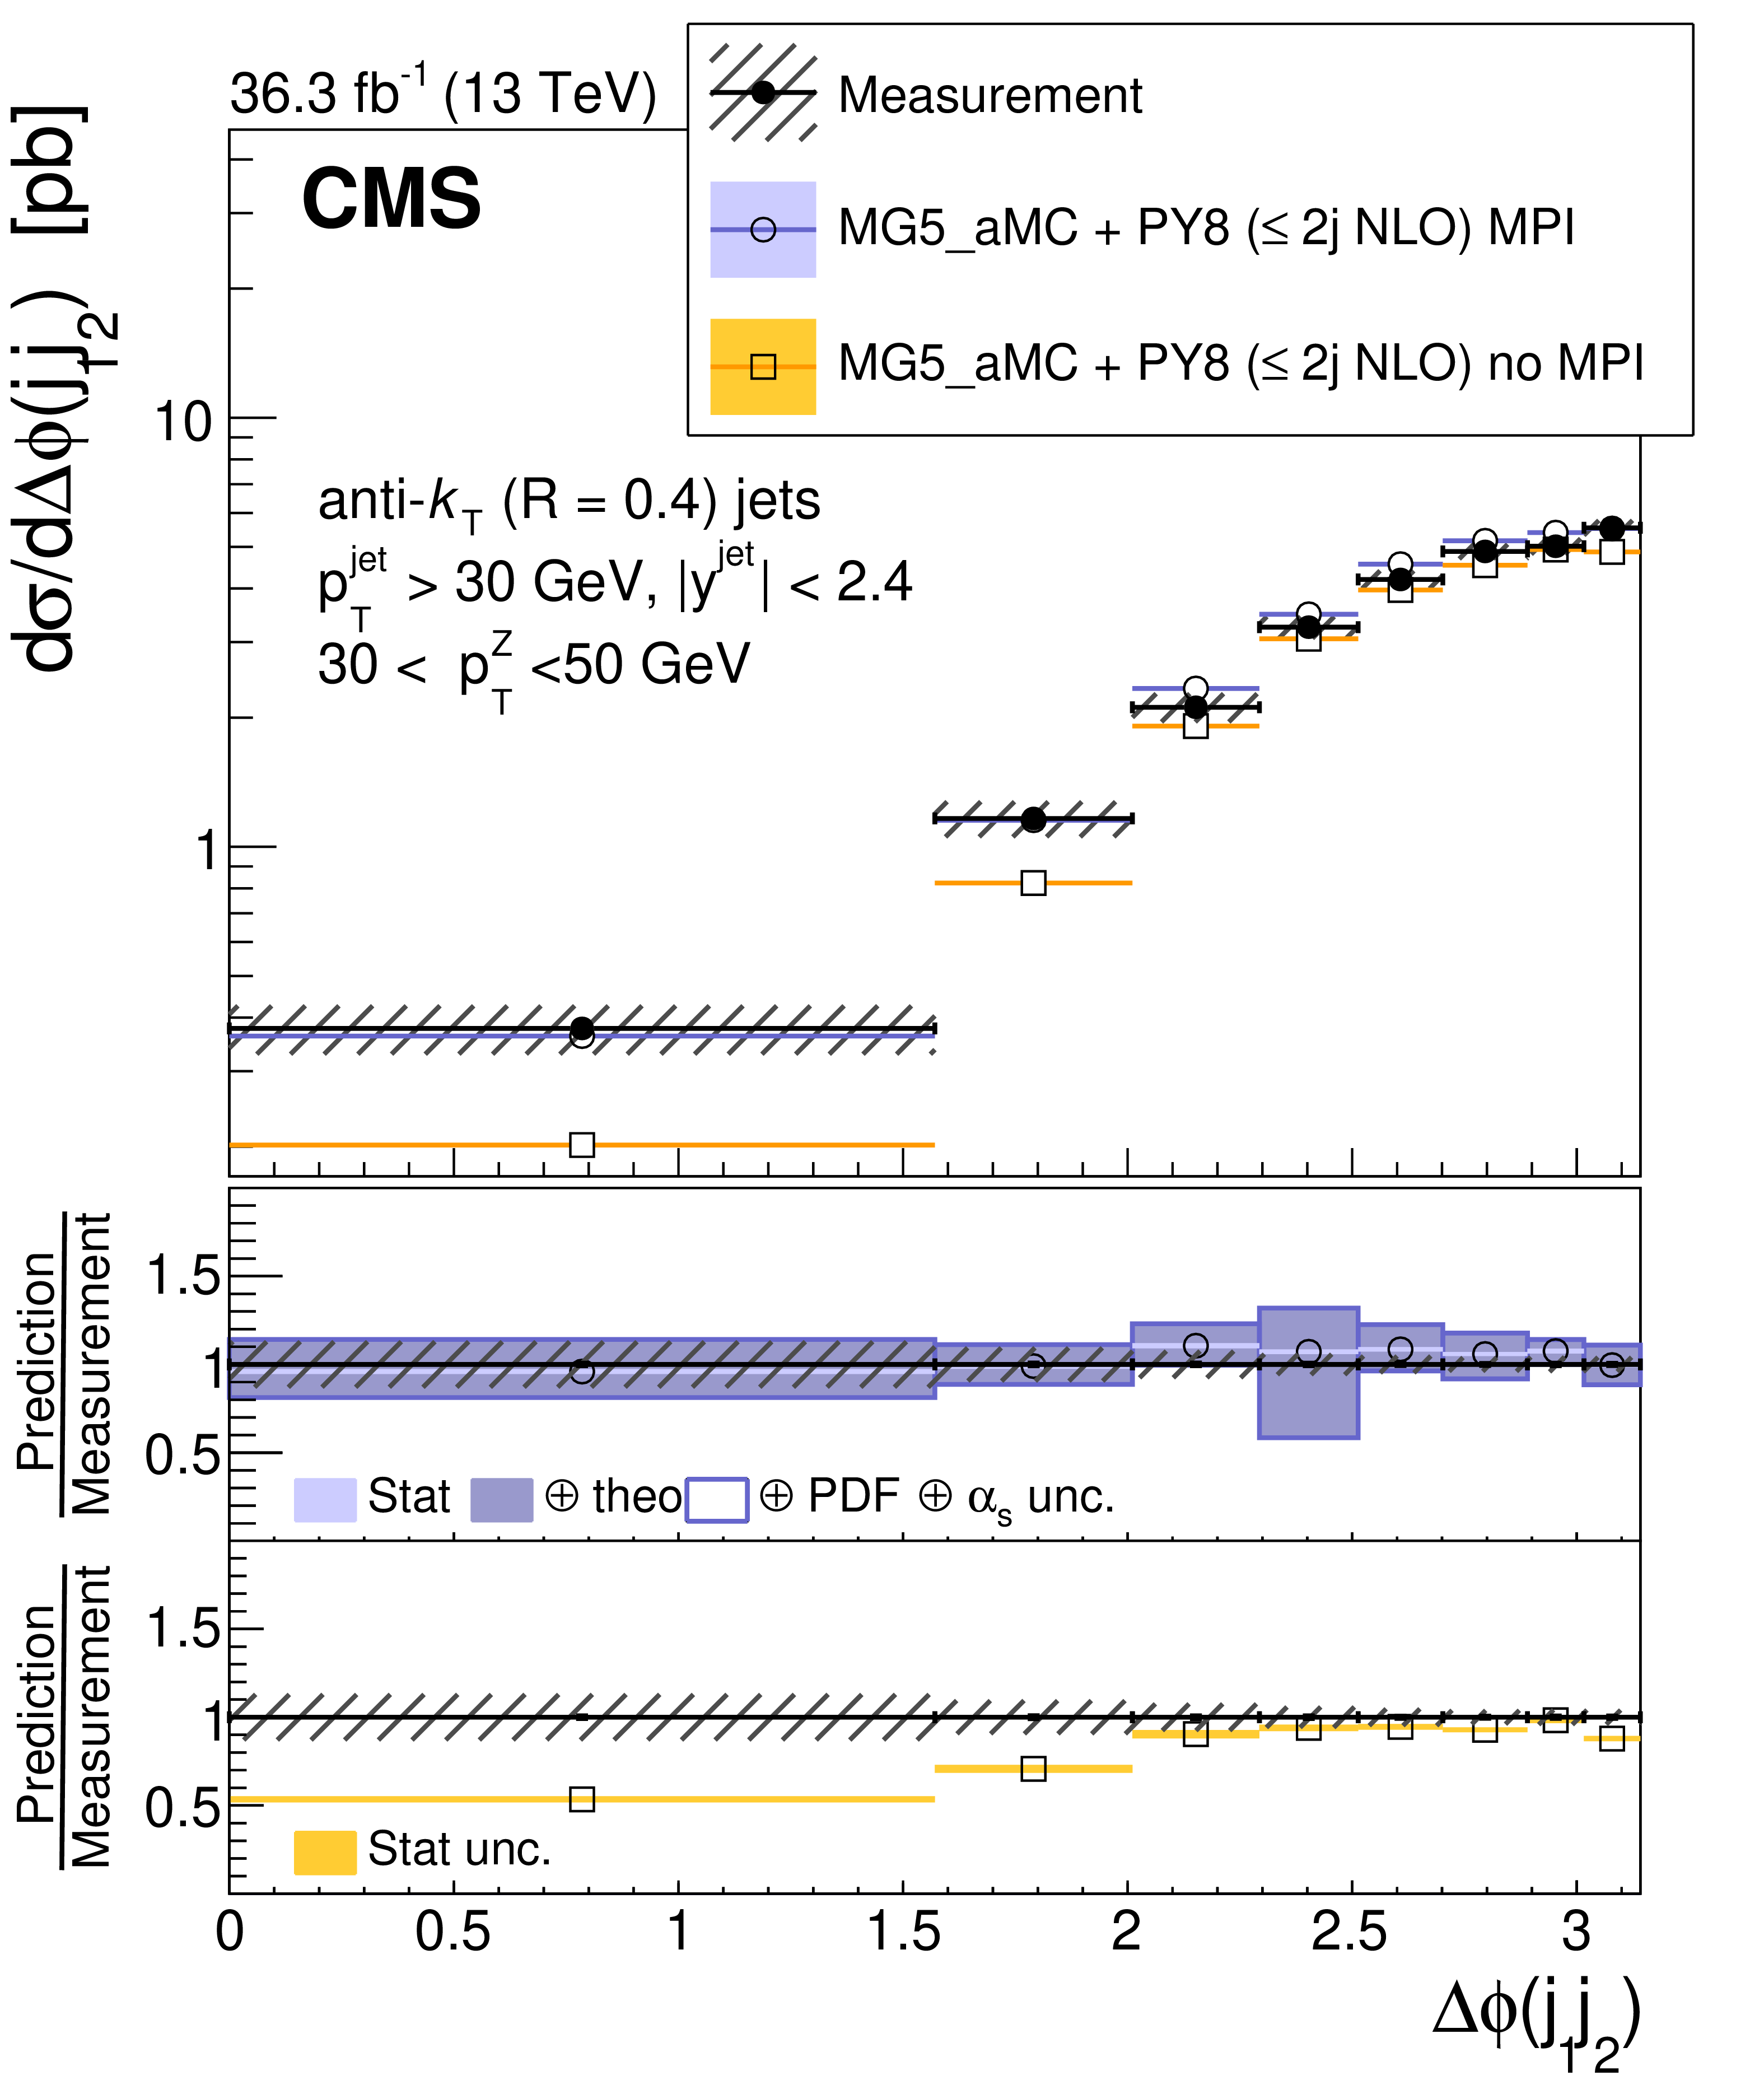
Figure 8-b:
Cross section as a function of $ \Delta\phi (j_1j_2) $ between two leading jets for 30 $ < p_{\mathrm{T}}(\mathrm{Z}) < $ 50 GeV. The error bars on the data points represent the statistical uncertainty of the measurement, and the hatched band shows the total statistical and systematic uncertainties added in quadrature. Predictions using MG5_AMC+PY8 ($ \leq $ 2j NLO) with and without multiparton interactions are shown. |
png pdf |
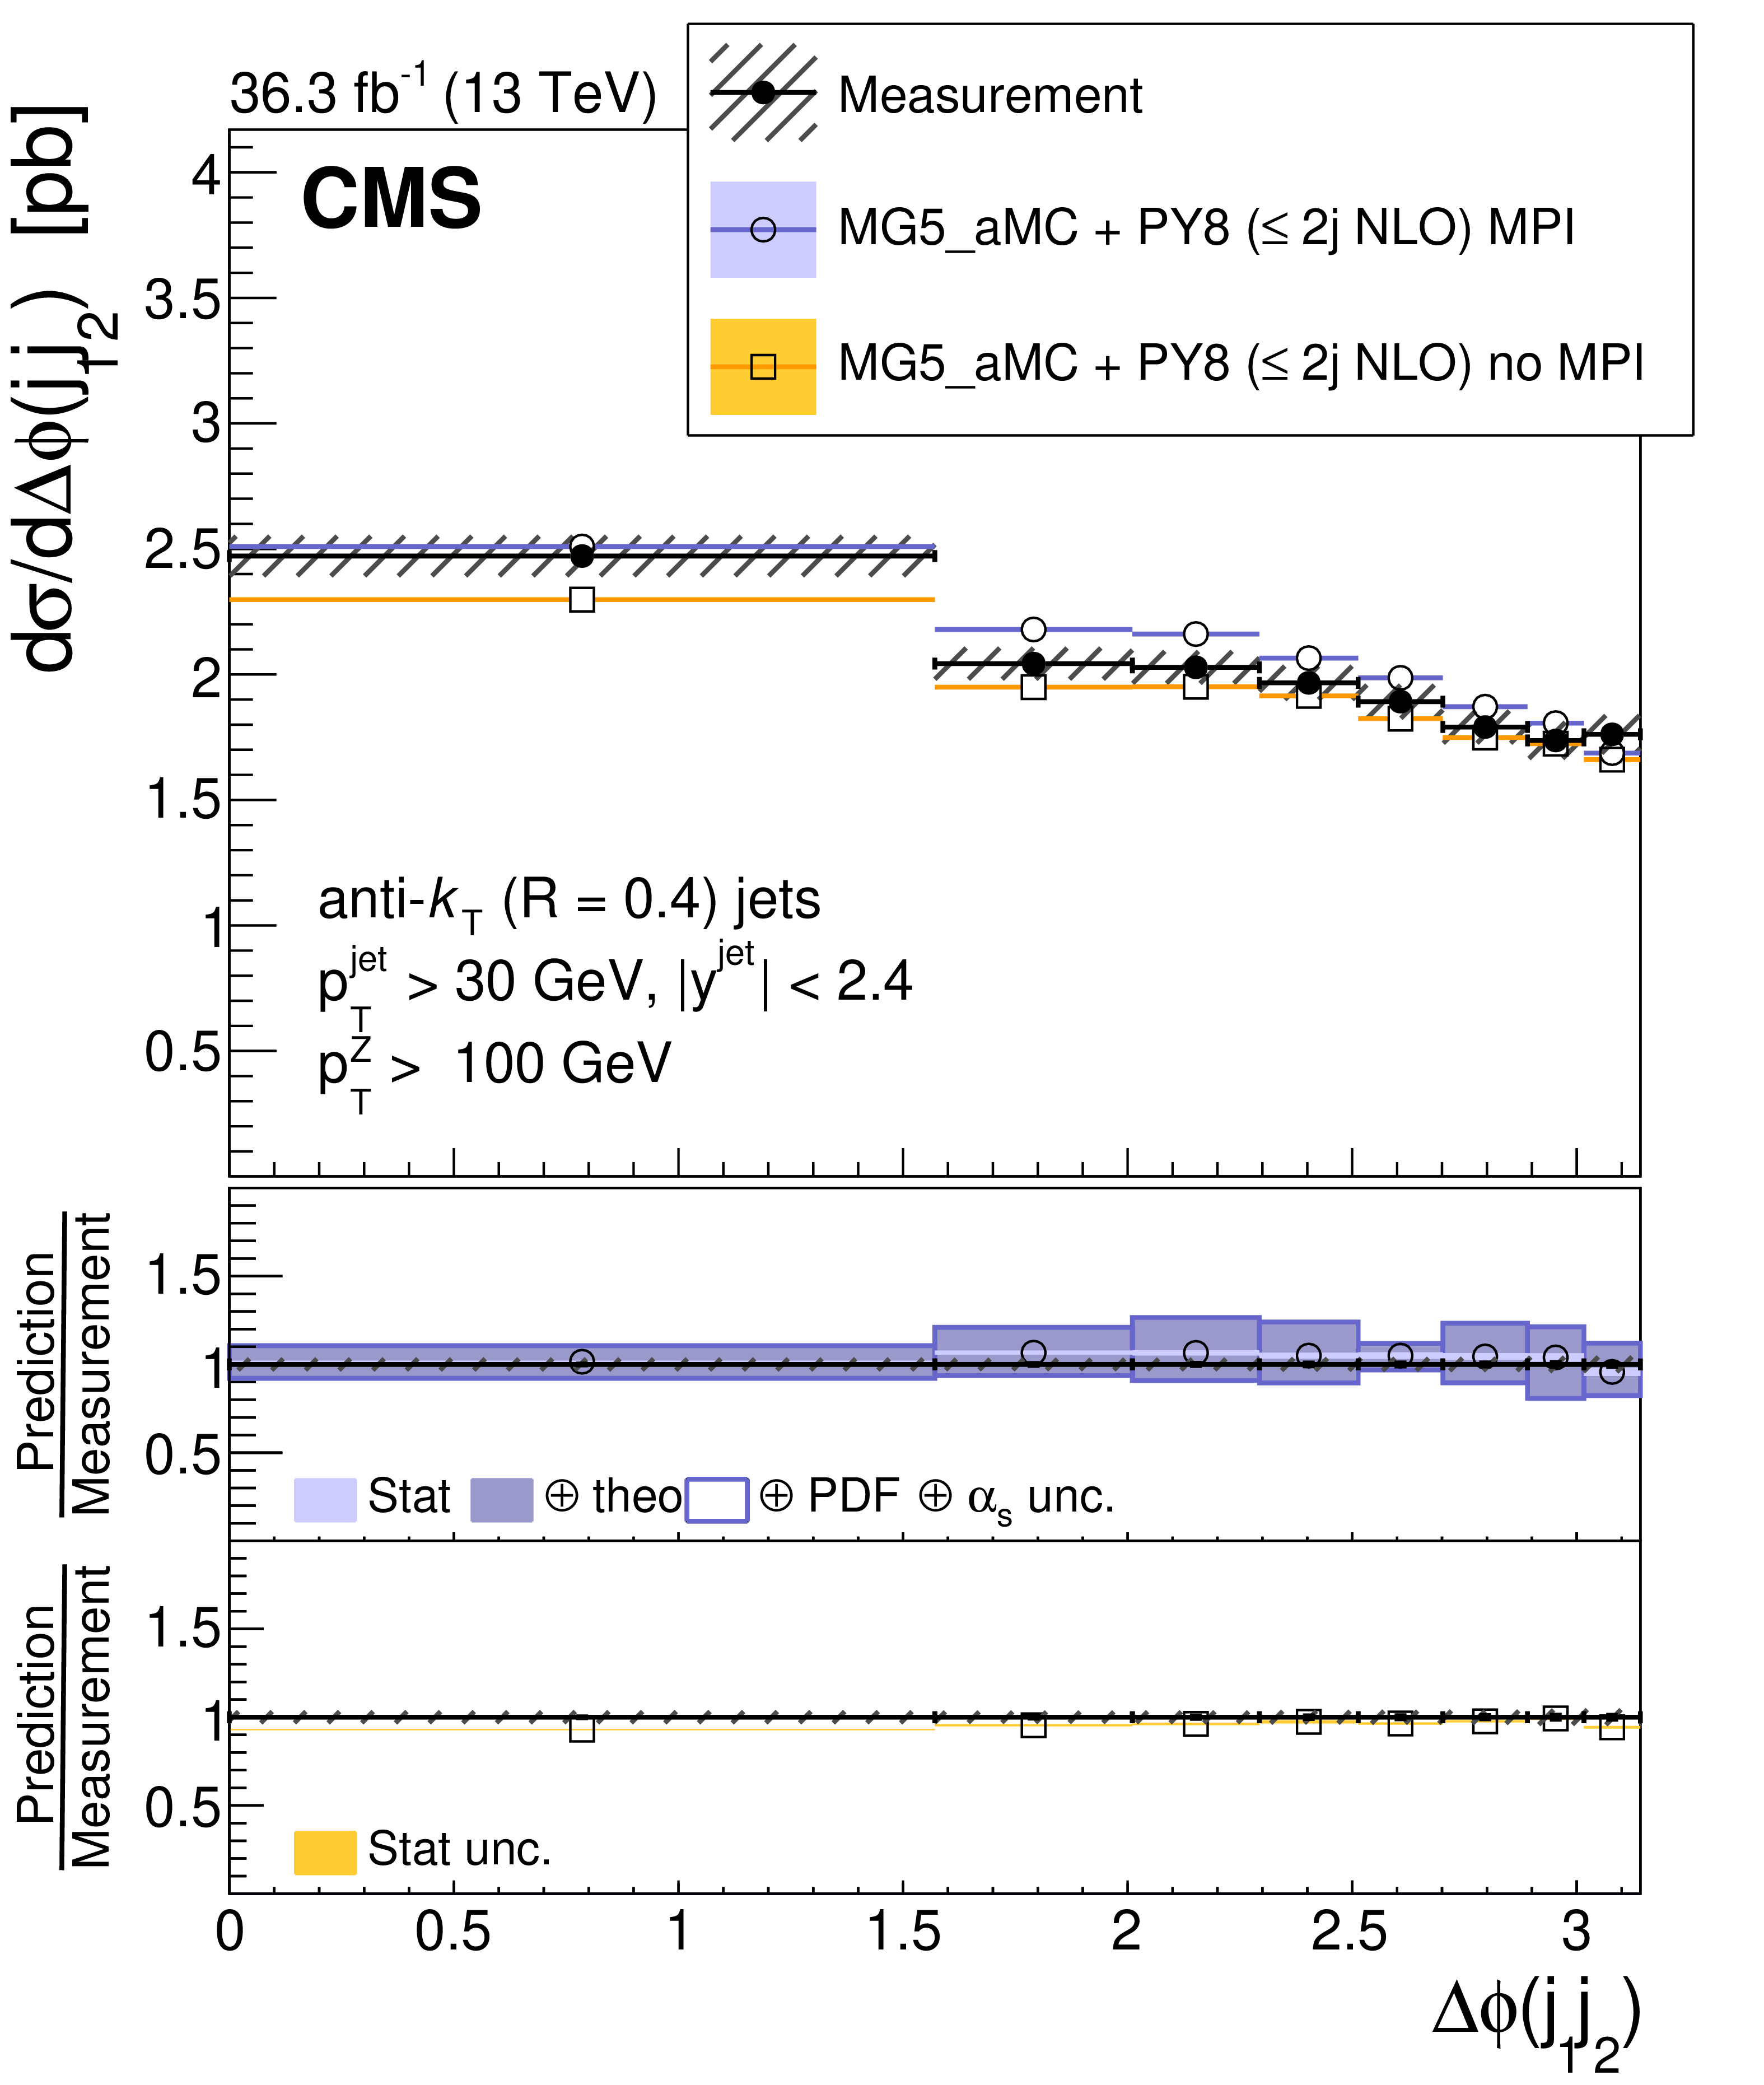
Figure 8-c:
Cross section as a function of $ \Delta\phi (j_1j_2) $ between two leading jets for $ p_{\mathrm{T}}(\mathrm{Z}) > $ 100 GeV. The error bars on the data points represent the statistical uncertainty of the measurement, and the hatched band shows the total statistical and systematic uncertainties added in quadrature. Predictions using MG5_AMC+PY8 ($ \leq $ 2j NLO) with and without multiparton interactions are shown. |
png pdf |
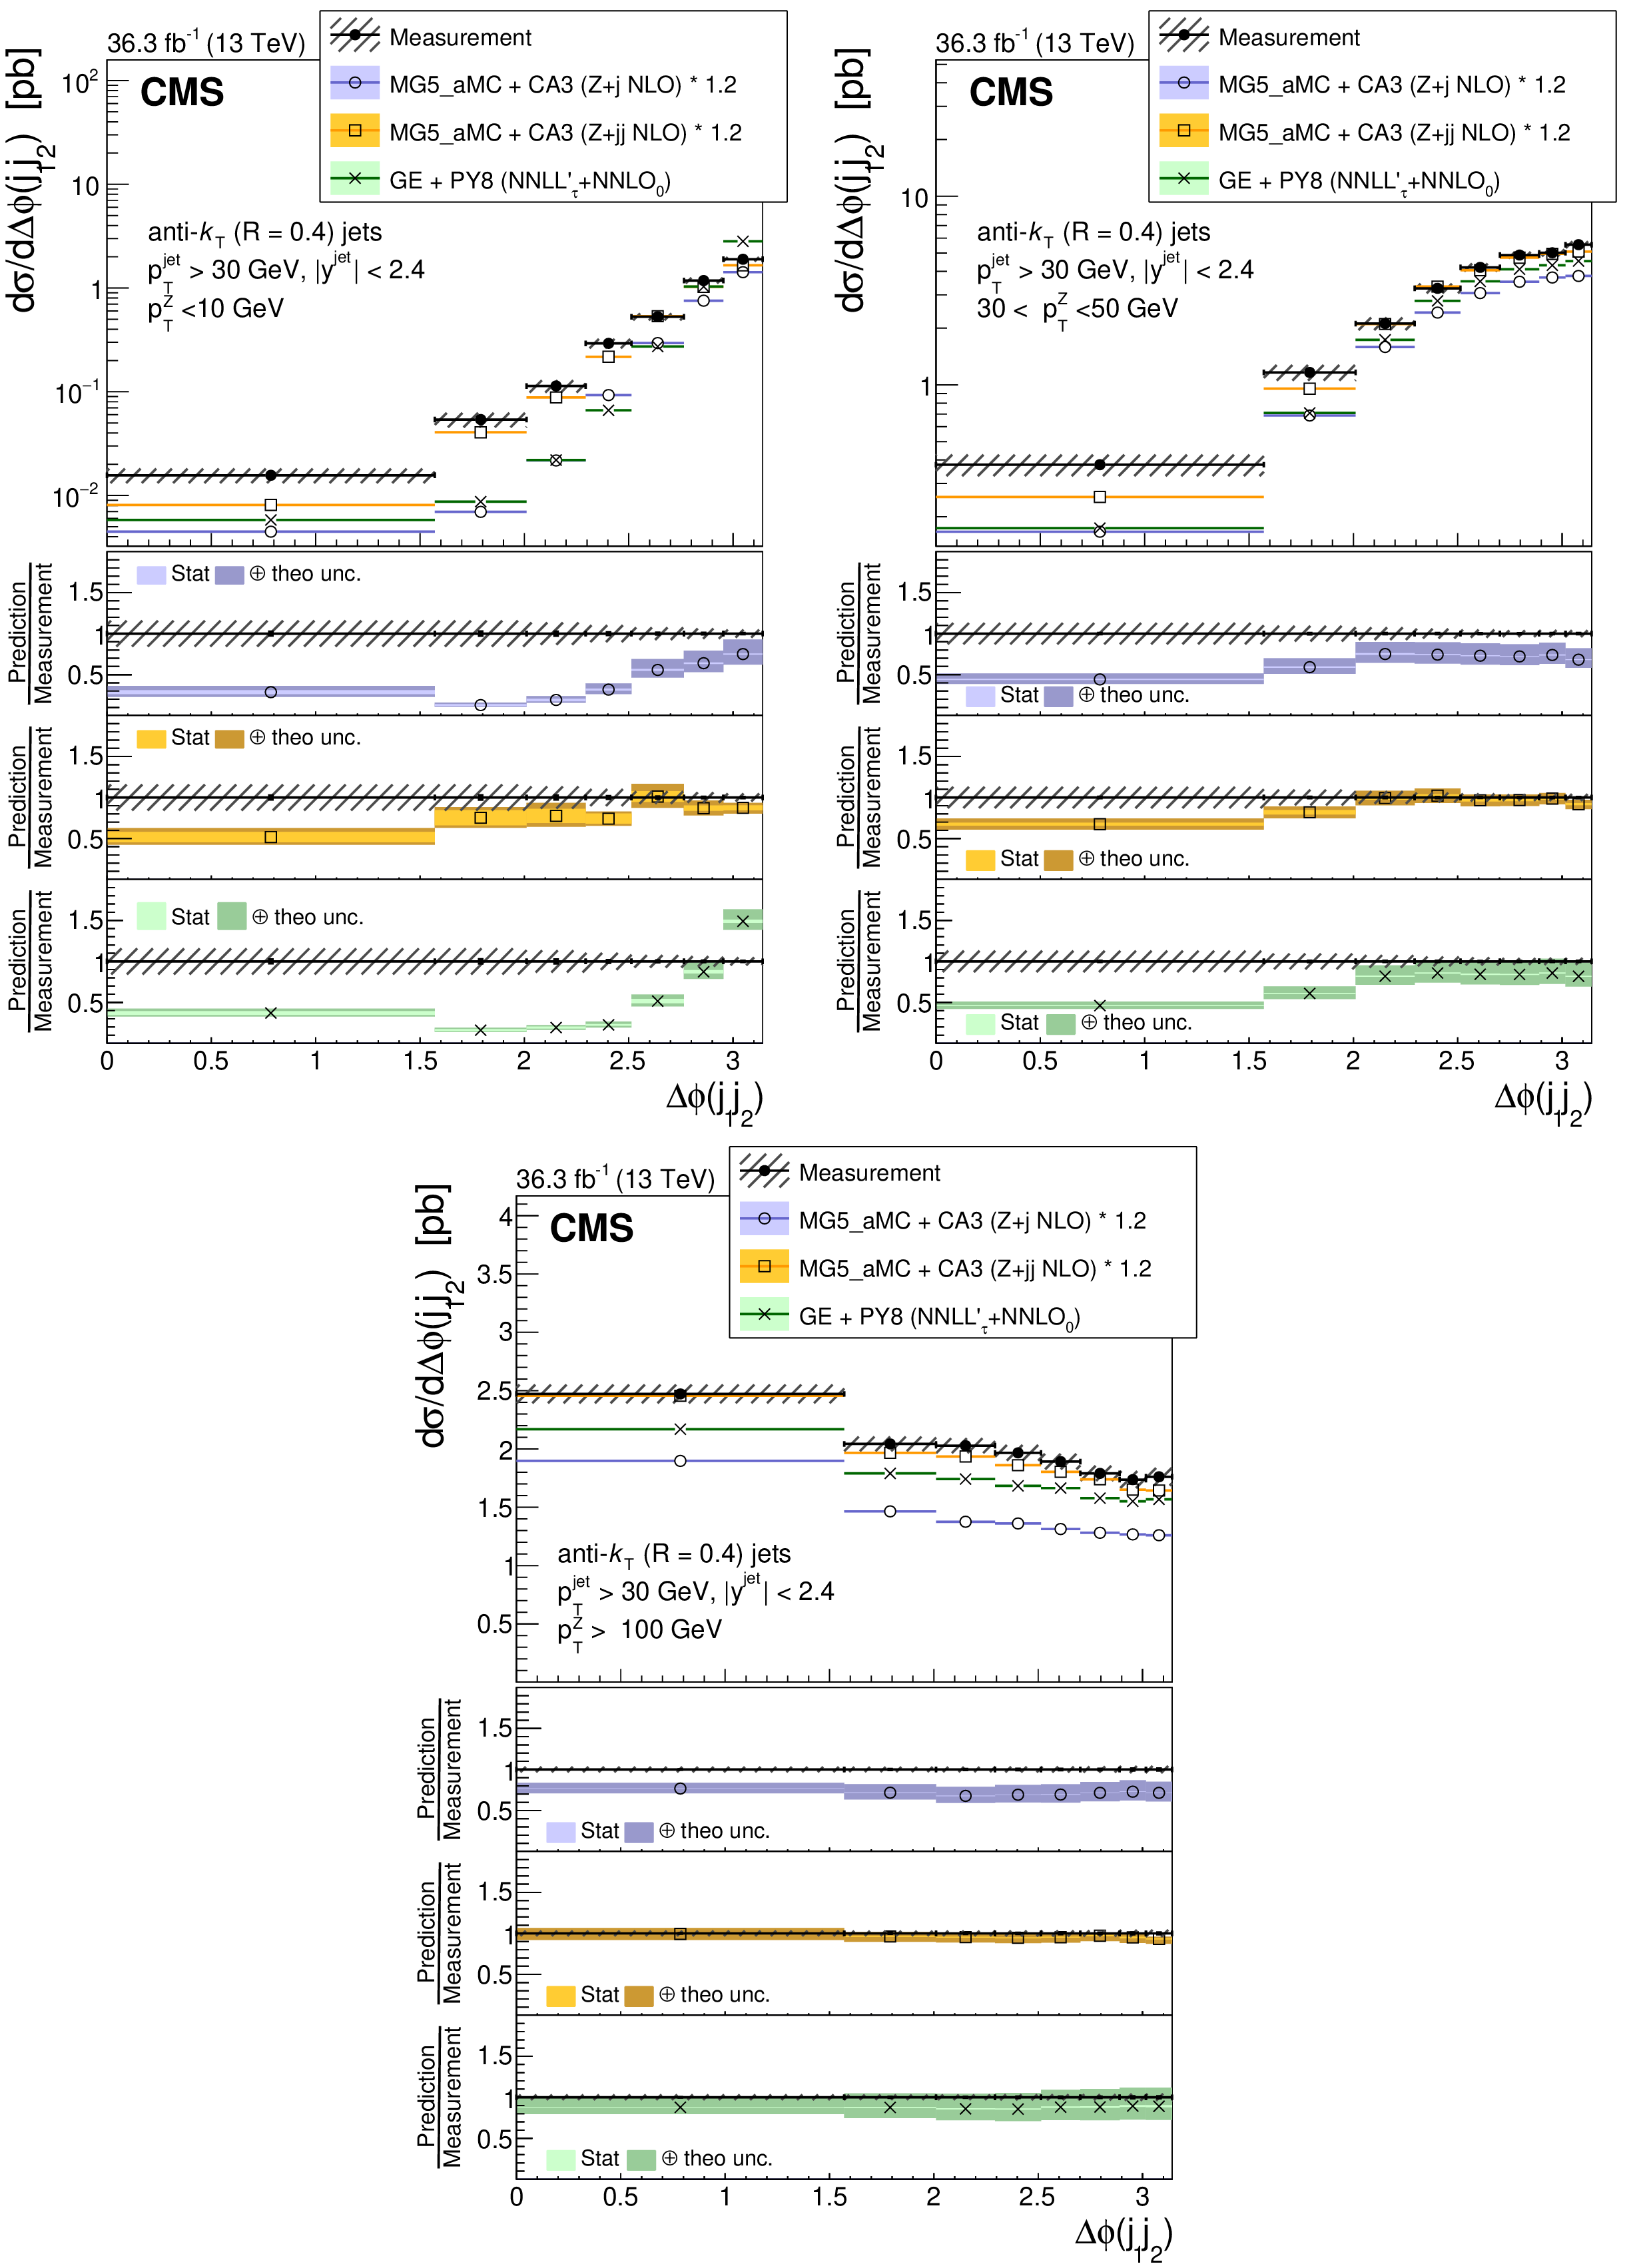
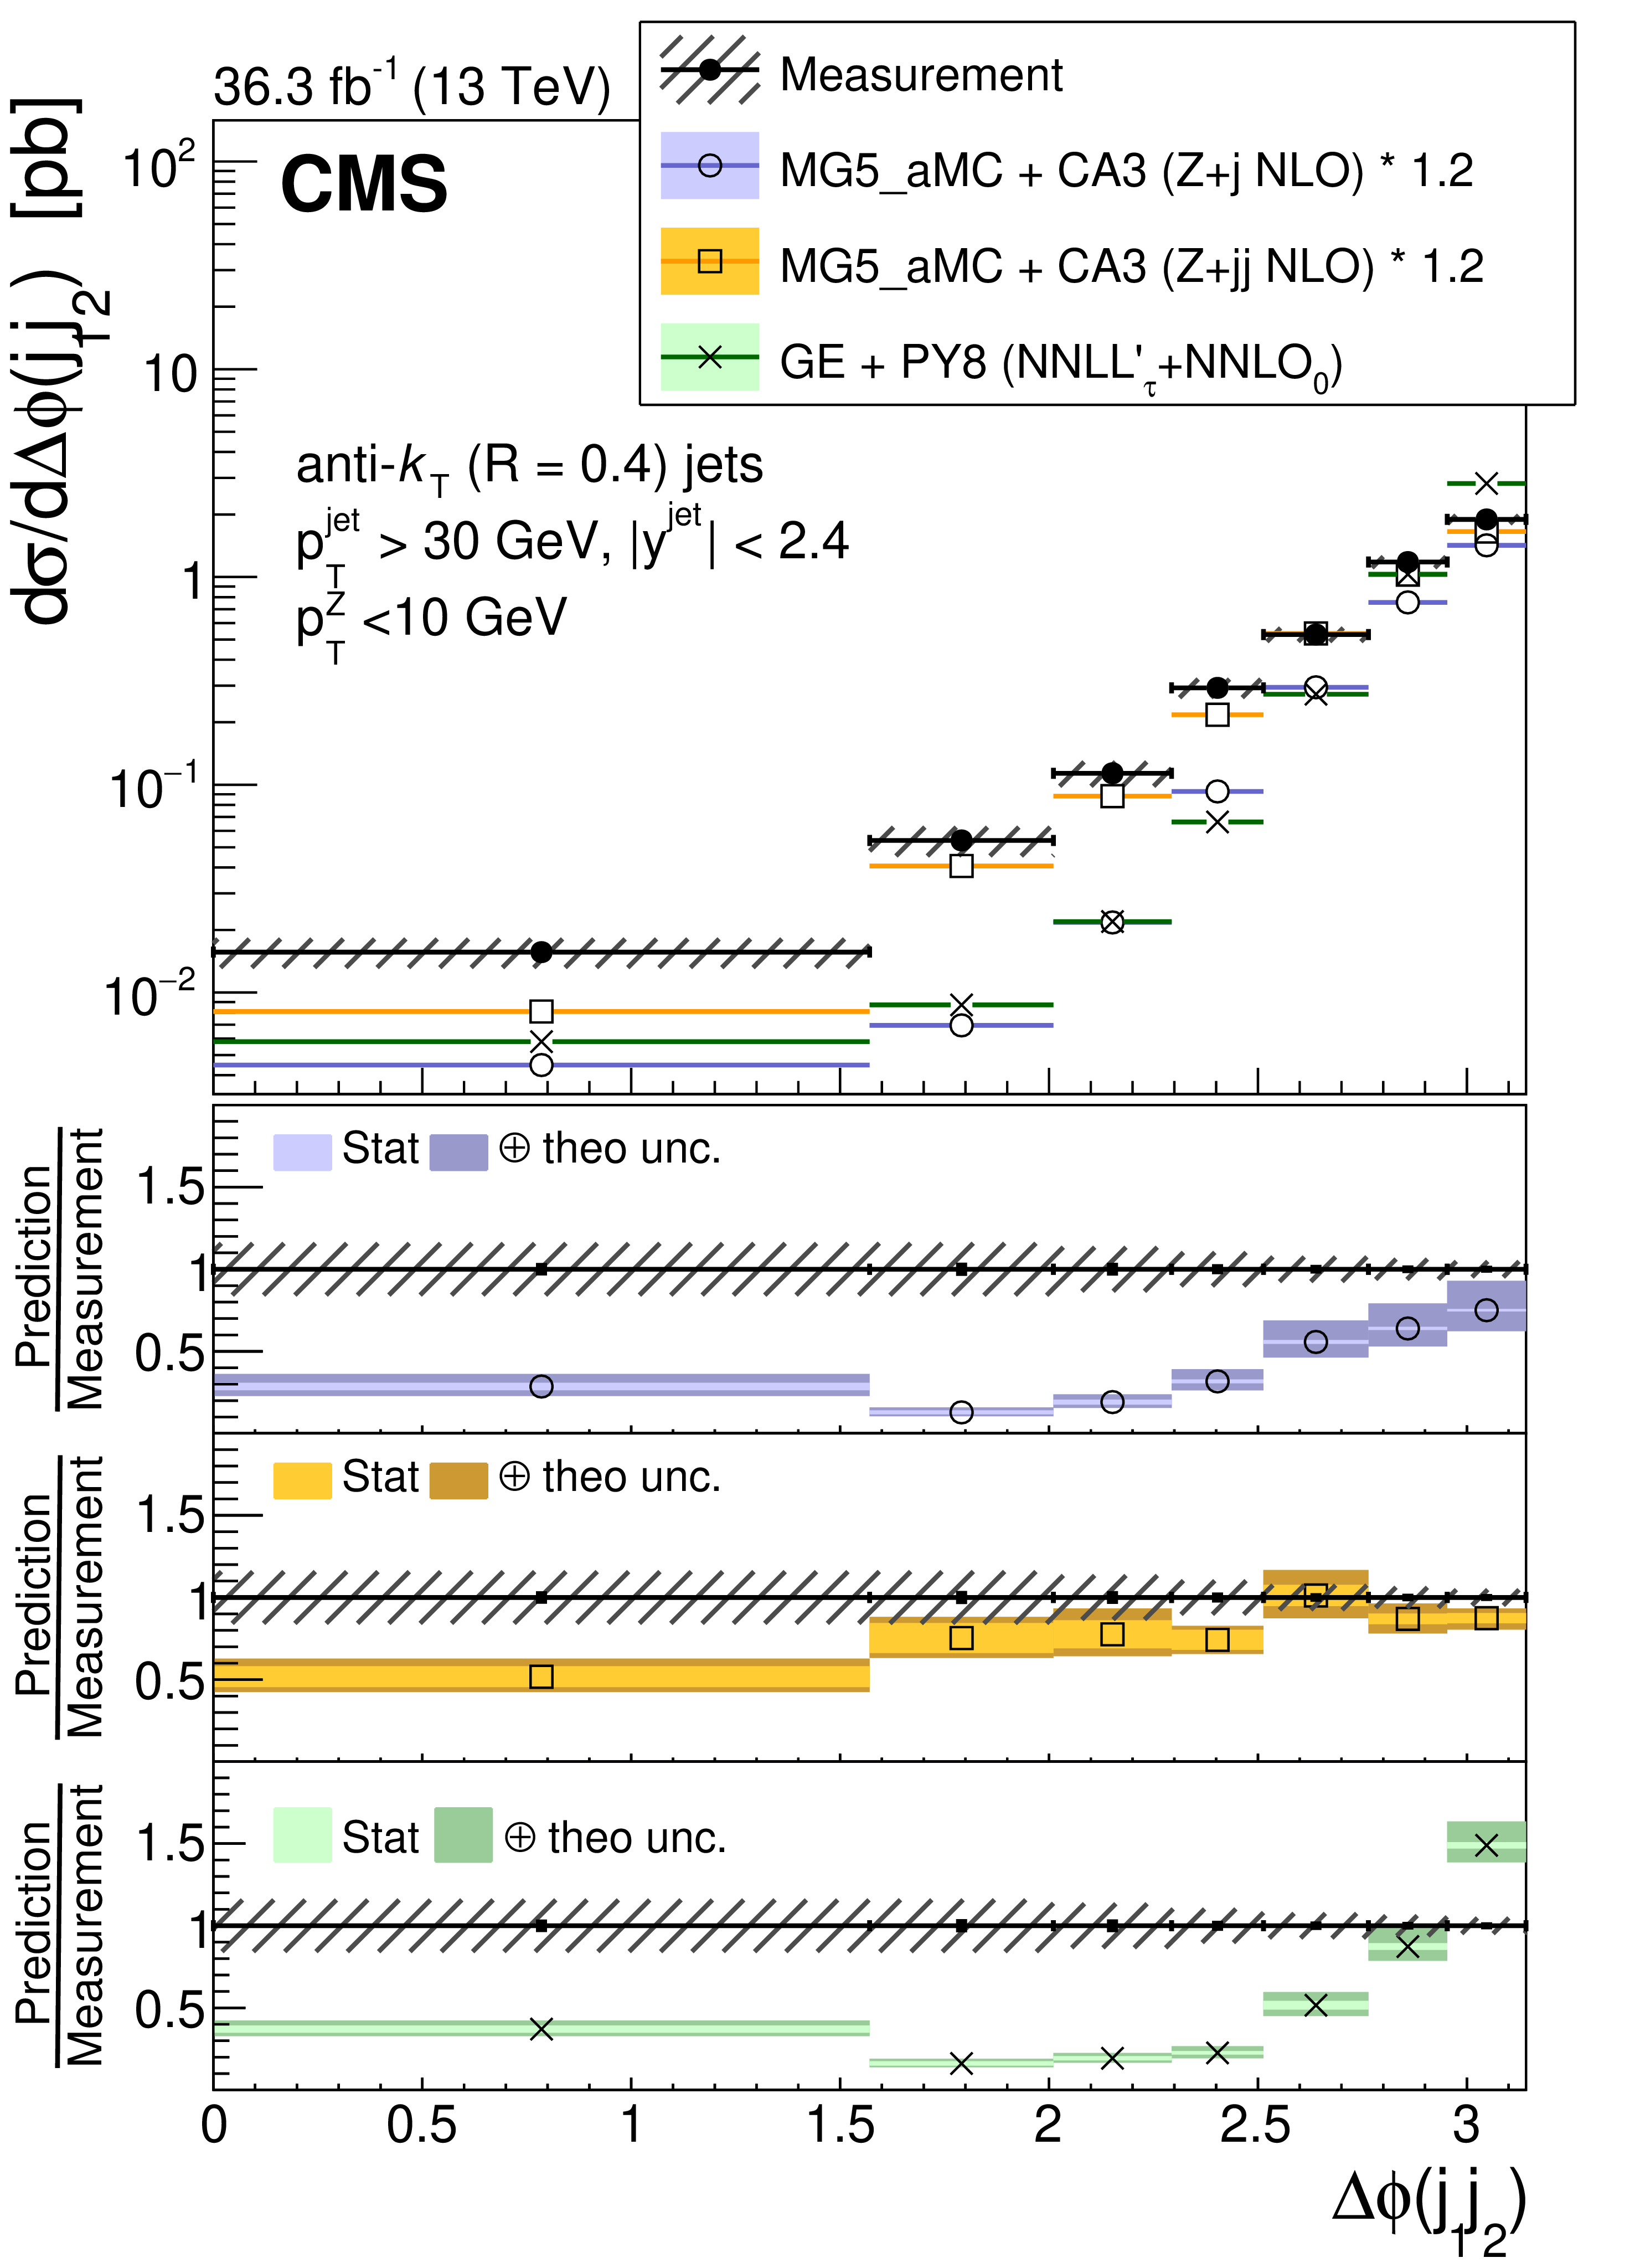
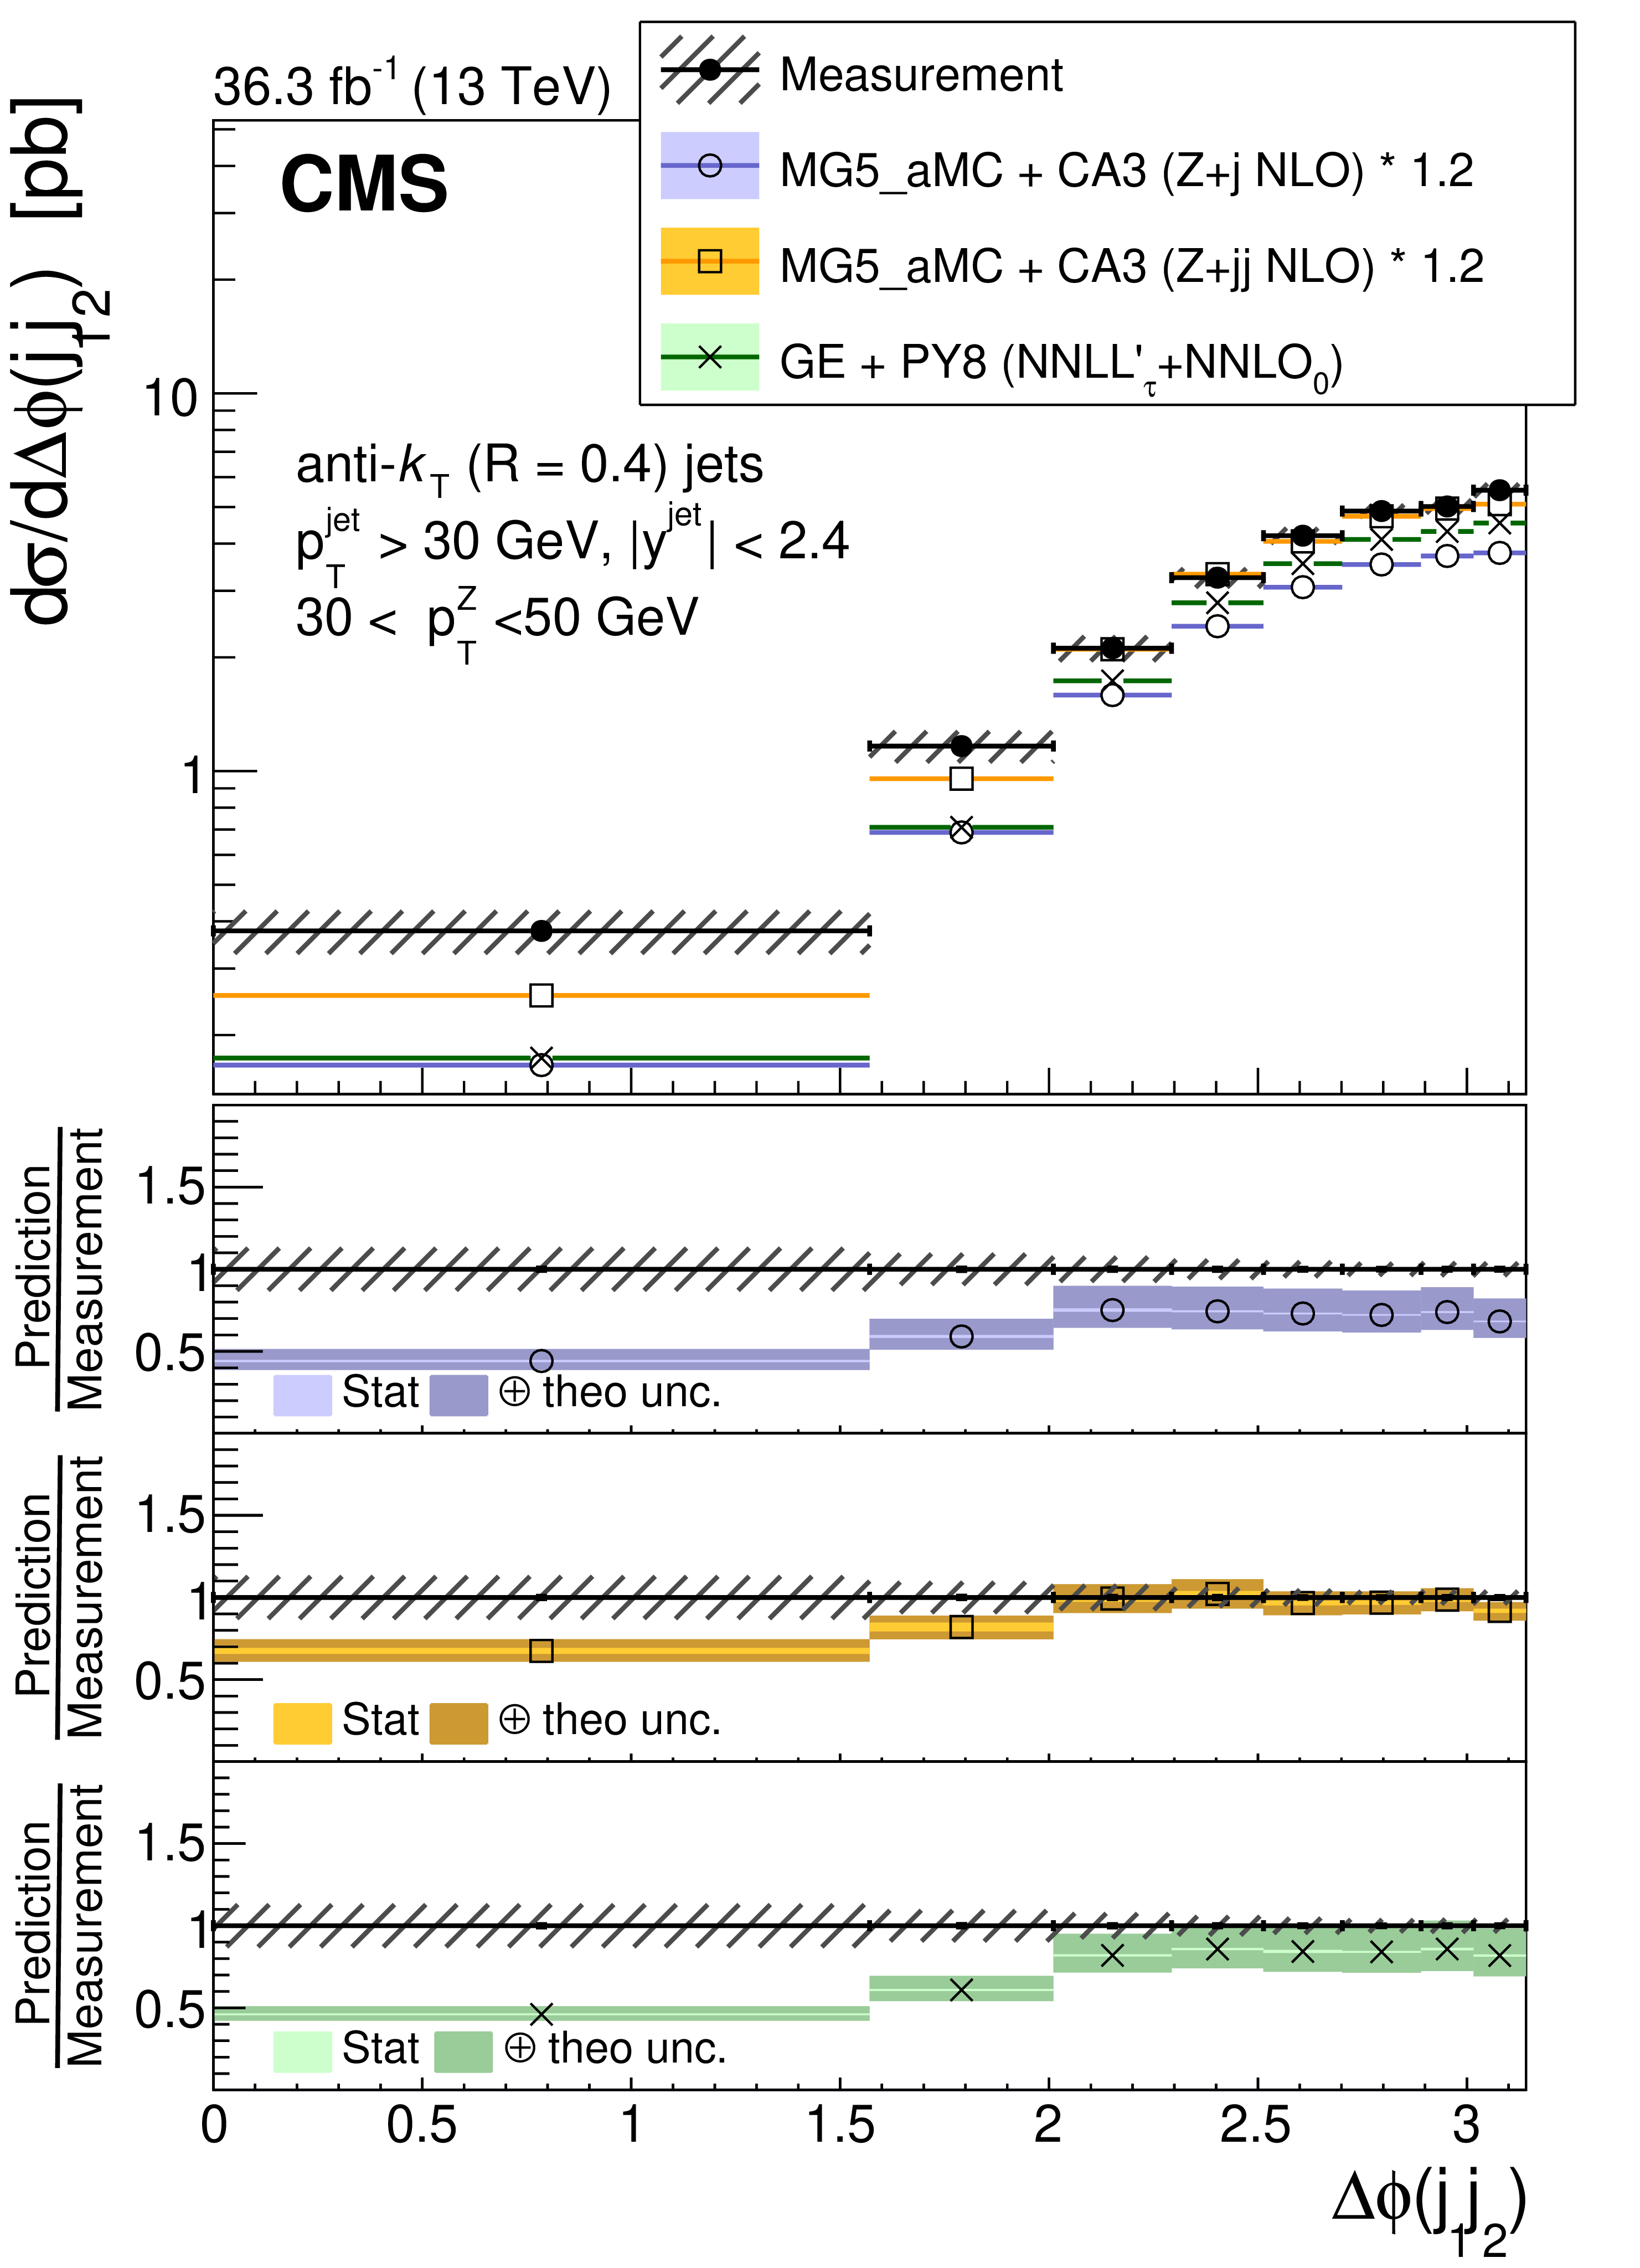
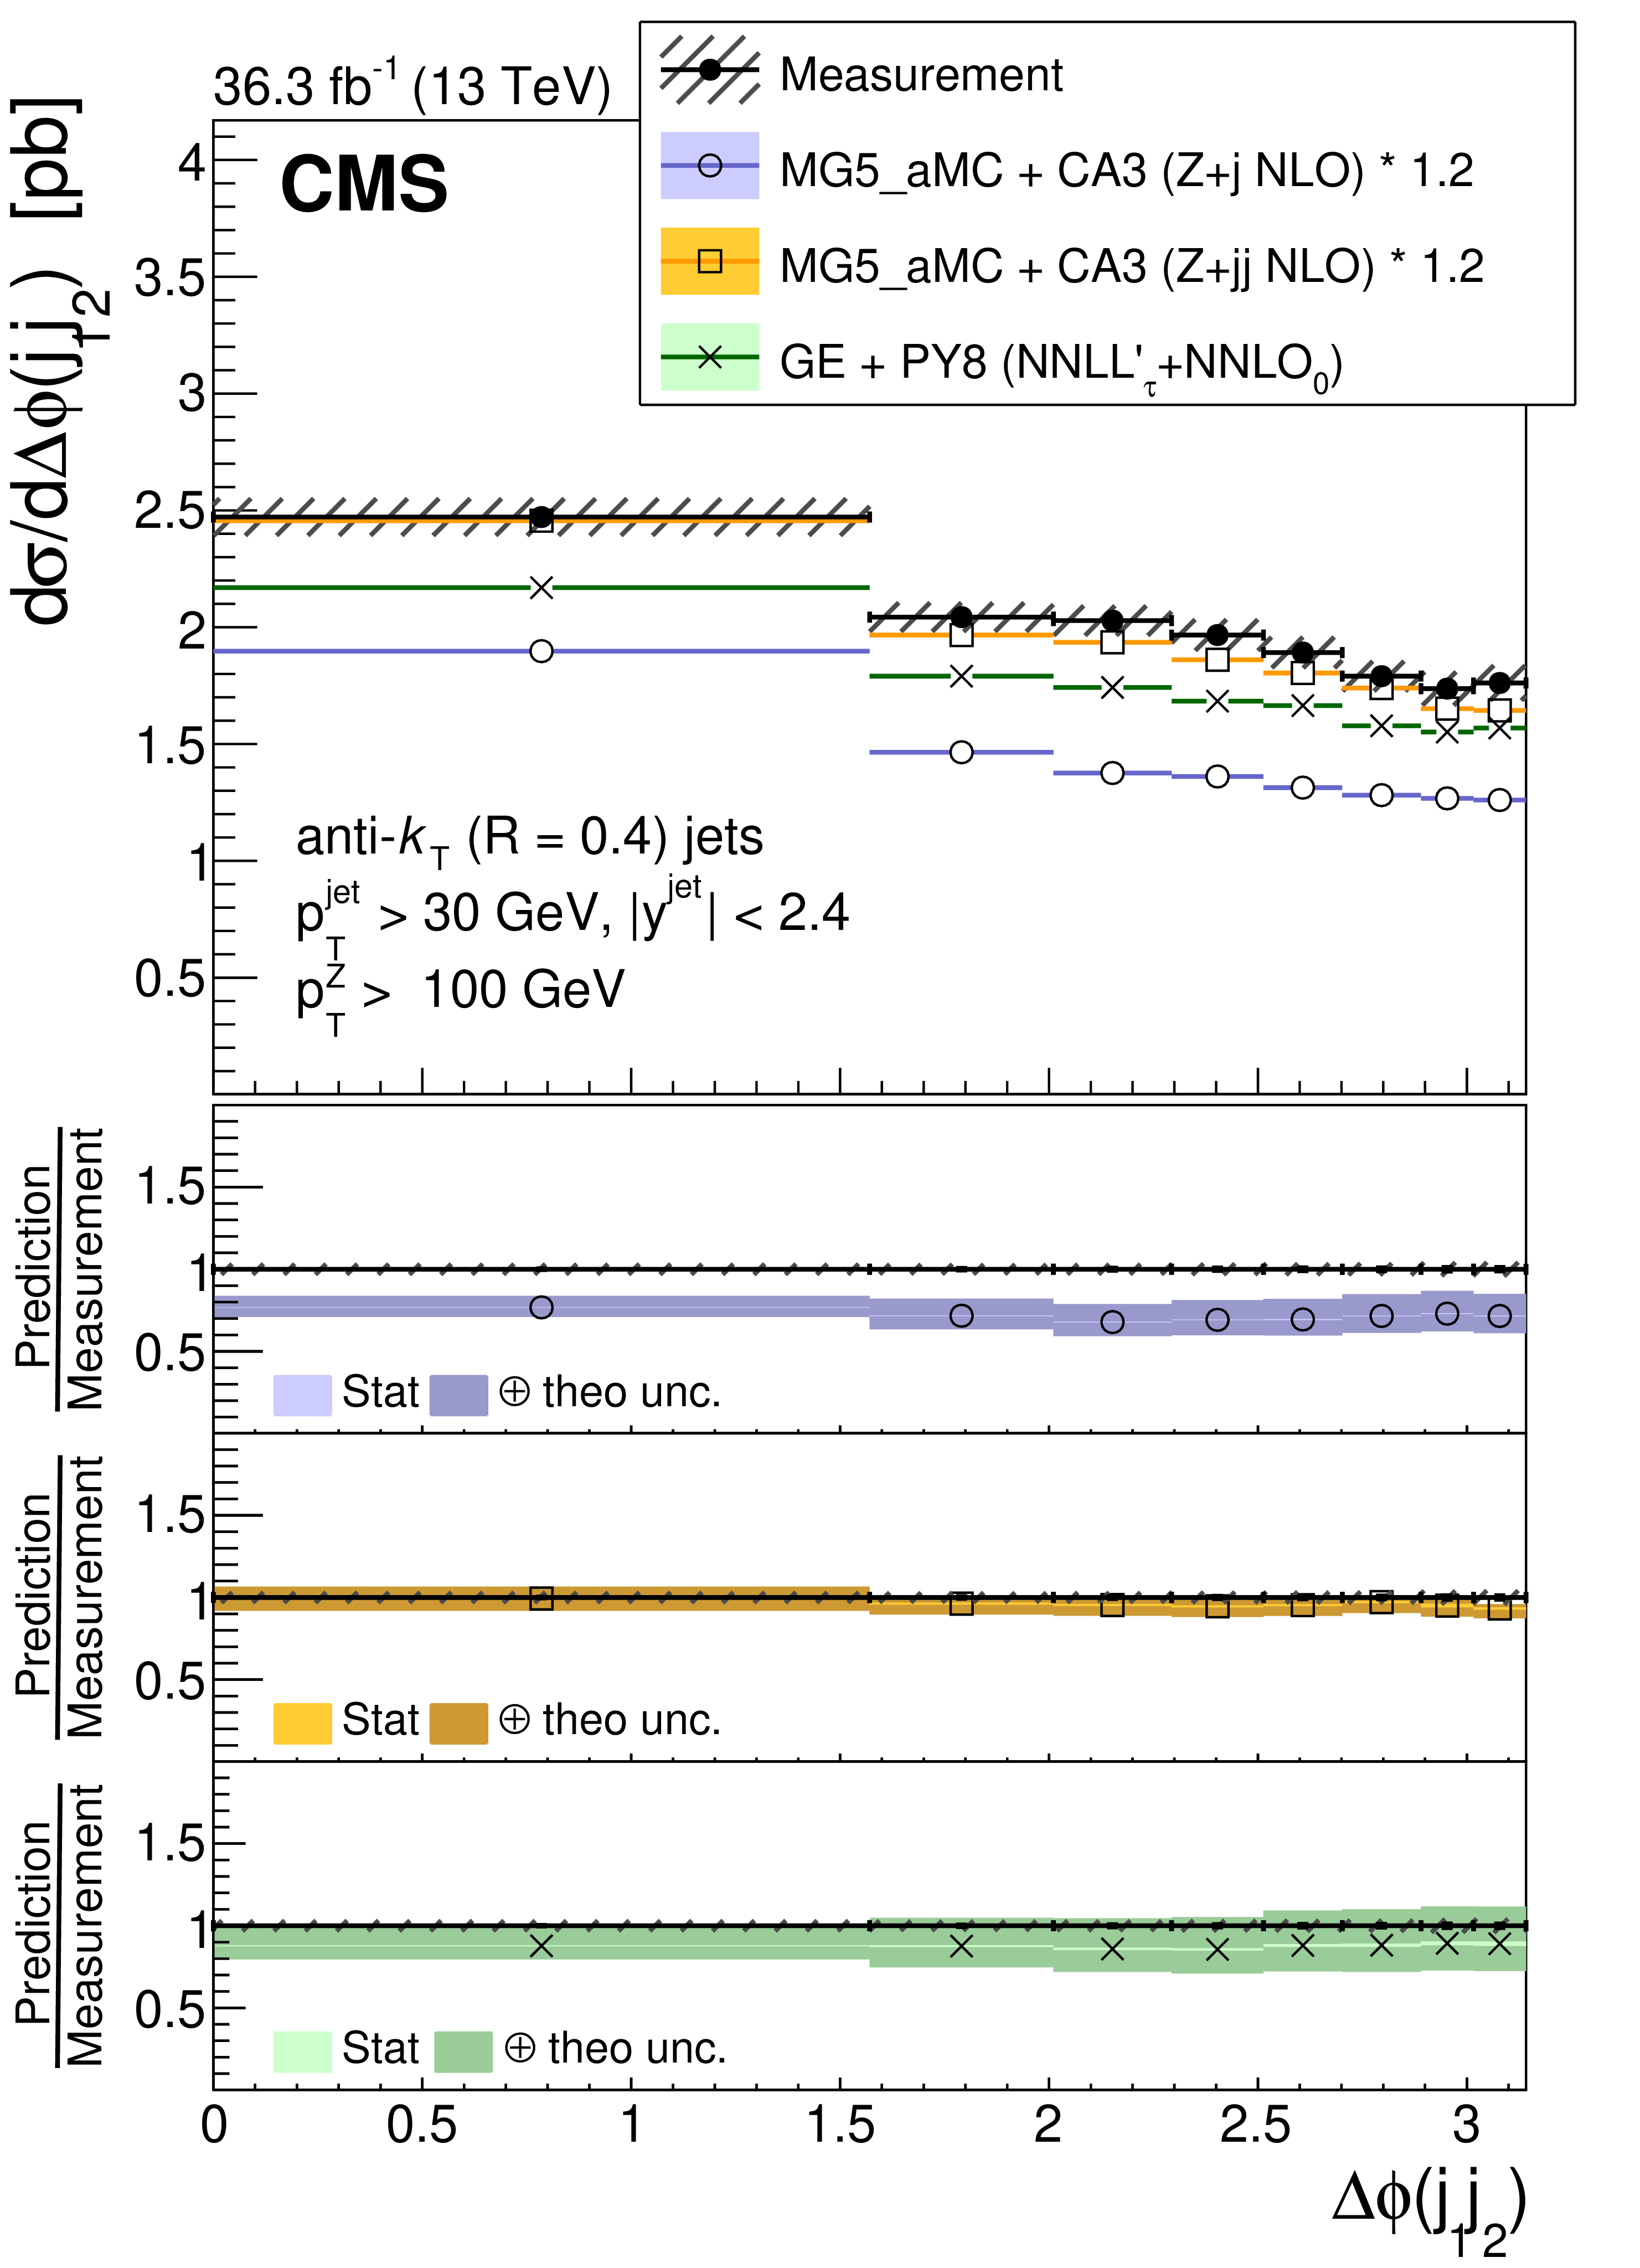
Figure 9:
Cross section as a function of $ \Delta\phi (j_1j_2) $ between two leading jets in three $ p_{\mathrm{T}}(\mathrm{Z}) $ regions: $ p_{\mathrm{T}}(\mathrm{Z}) < $ 10 GeV (upper left), 30 $ < p_{\mathrm{T}}(\mathrm{Z}) < $ 50 GeV (upper right), $ p_{\mathrm{T}}(\mathrm{Z}) > $ 100 GeV (lower). The error bars on the data points represent the statistical uncertainty of the measurement, and the hatched band shows the total statistical and systematic uncertainties added in quadrature. Predictions from MG5_AMC+CA3 (Z+1 NLO), MG5_AMC+CA3 (Z+2 NLO) and GENEVA (Z+0 NNLO) are shown. An overall normalization factor of 1.2 is applied to the MG5_AMC+CA3 (Z+1 NLO) and MG5_AMC+CA3 (Z+2 NLO) predictions. |
png pdf |
Figure 9-a:
Cross section as a function of $ \Delta\phi (j_1j_2) $ between two leading jets for $ p_{\mathrm{T}}(\mathrm{Z}) < $ 10 GeV. The error bars on the data points represent the statistical uncertainty of the measurement, and the hatched band shows the total statistical and systematic uncertainties added in quadrature. Predictions from MG5_AMC+CA3 (Z+1 NLO), MG5_AMC+CA3 (Z+2 NLO) and GENEVA (Z+0 NNLO) are shown. An overall normalization factor of 1.2 is applied to the MG5_AMC+CA3 (Z+1 NLO) and MG5_AMC+CA3 (Z+2 NLO) predictions. |
png pdf |
Figure 9-b:
Cross section as a function of $ \Delta\phi (j_1j_2) $ between two leading jets for 30 $ < p_{\mathrm{T}}(\mathrm{Z}) < $ 50 GeV. The error bars on the data points represent the statistical uncertainty of the measurement, and the hatched band shows the total statistical and systematic uncertainties added in quadrature. Predictions from MG5_AMC+CA3 (Z+1 NLO), MG5_AMC+CA3 (Z+2 NLO) and GENEVA (Z+0 NNLO) are shown. An overall normalization factor of 1.2 is applied to the MG5_AMC+CA3 (Z+1 NLO) and MG5_AMC+CA3 (Z+2 NLO) predictions. |
png pdf |
Figure 9-c:
Cross section as a function of $ \Delta\phi (j_1j_2) $ between two leading jets for $ p_{\mathrm{T}}(\mathrm{Z}) > $ 100 GeV. The error bars on the data points represent the statistical uncertainty of the measurement, and the hatched band shows the total statistical and systematic uncertainties added in quadrature. Predictions from MG5_AMC+CA3 (Z+1 NLO), MG5_AMC+CA3 (Z+2 NLO) and GENEVA (Z+0 NNLO) are shown. An overall normalization factor of 1.2 is applied to the MG5_AMC+CA3 (Z+1 NLO) and MG5_AMC+CA3 (Z+2 NLO) predictions. |
png pdf |
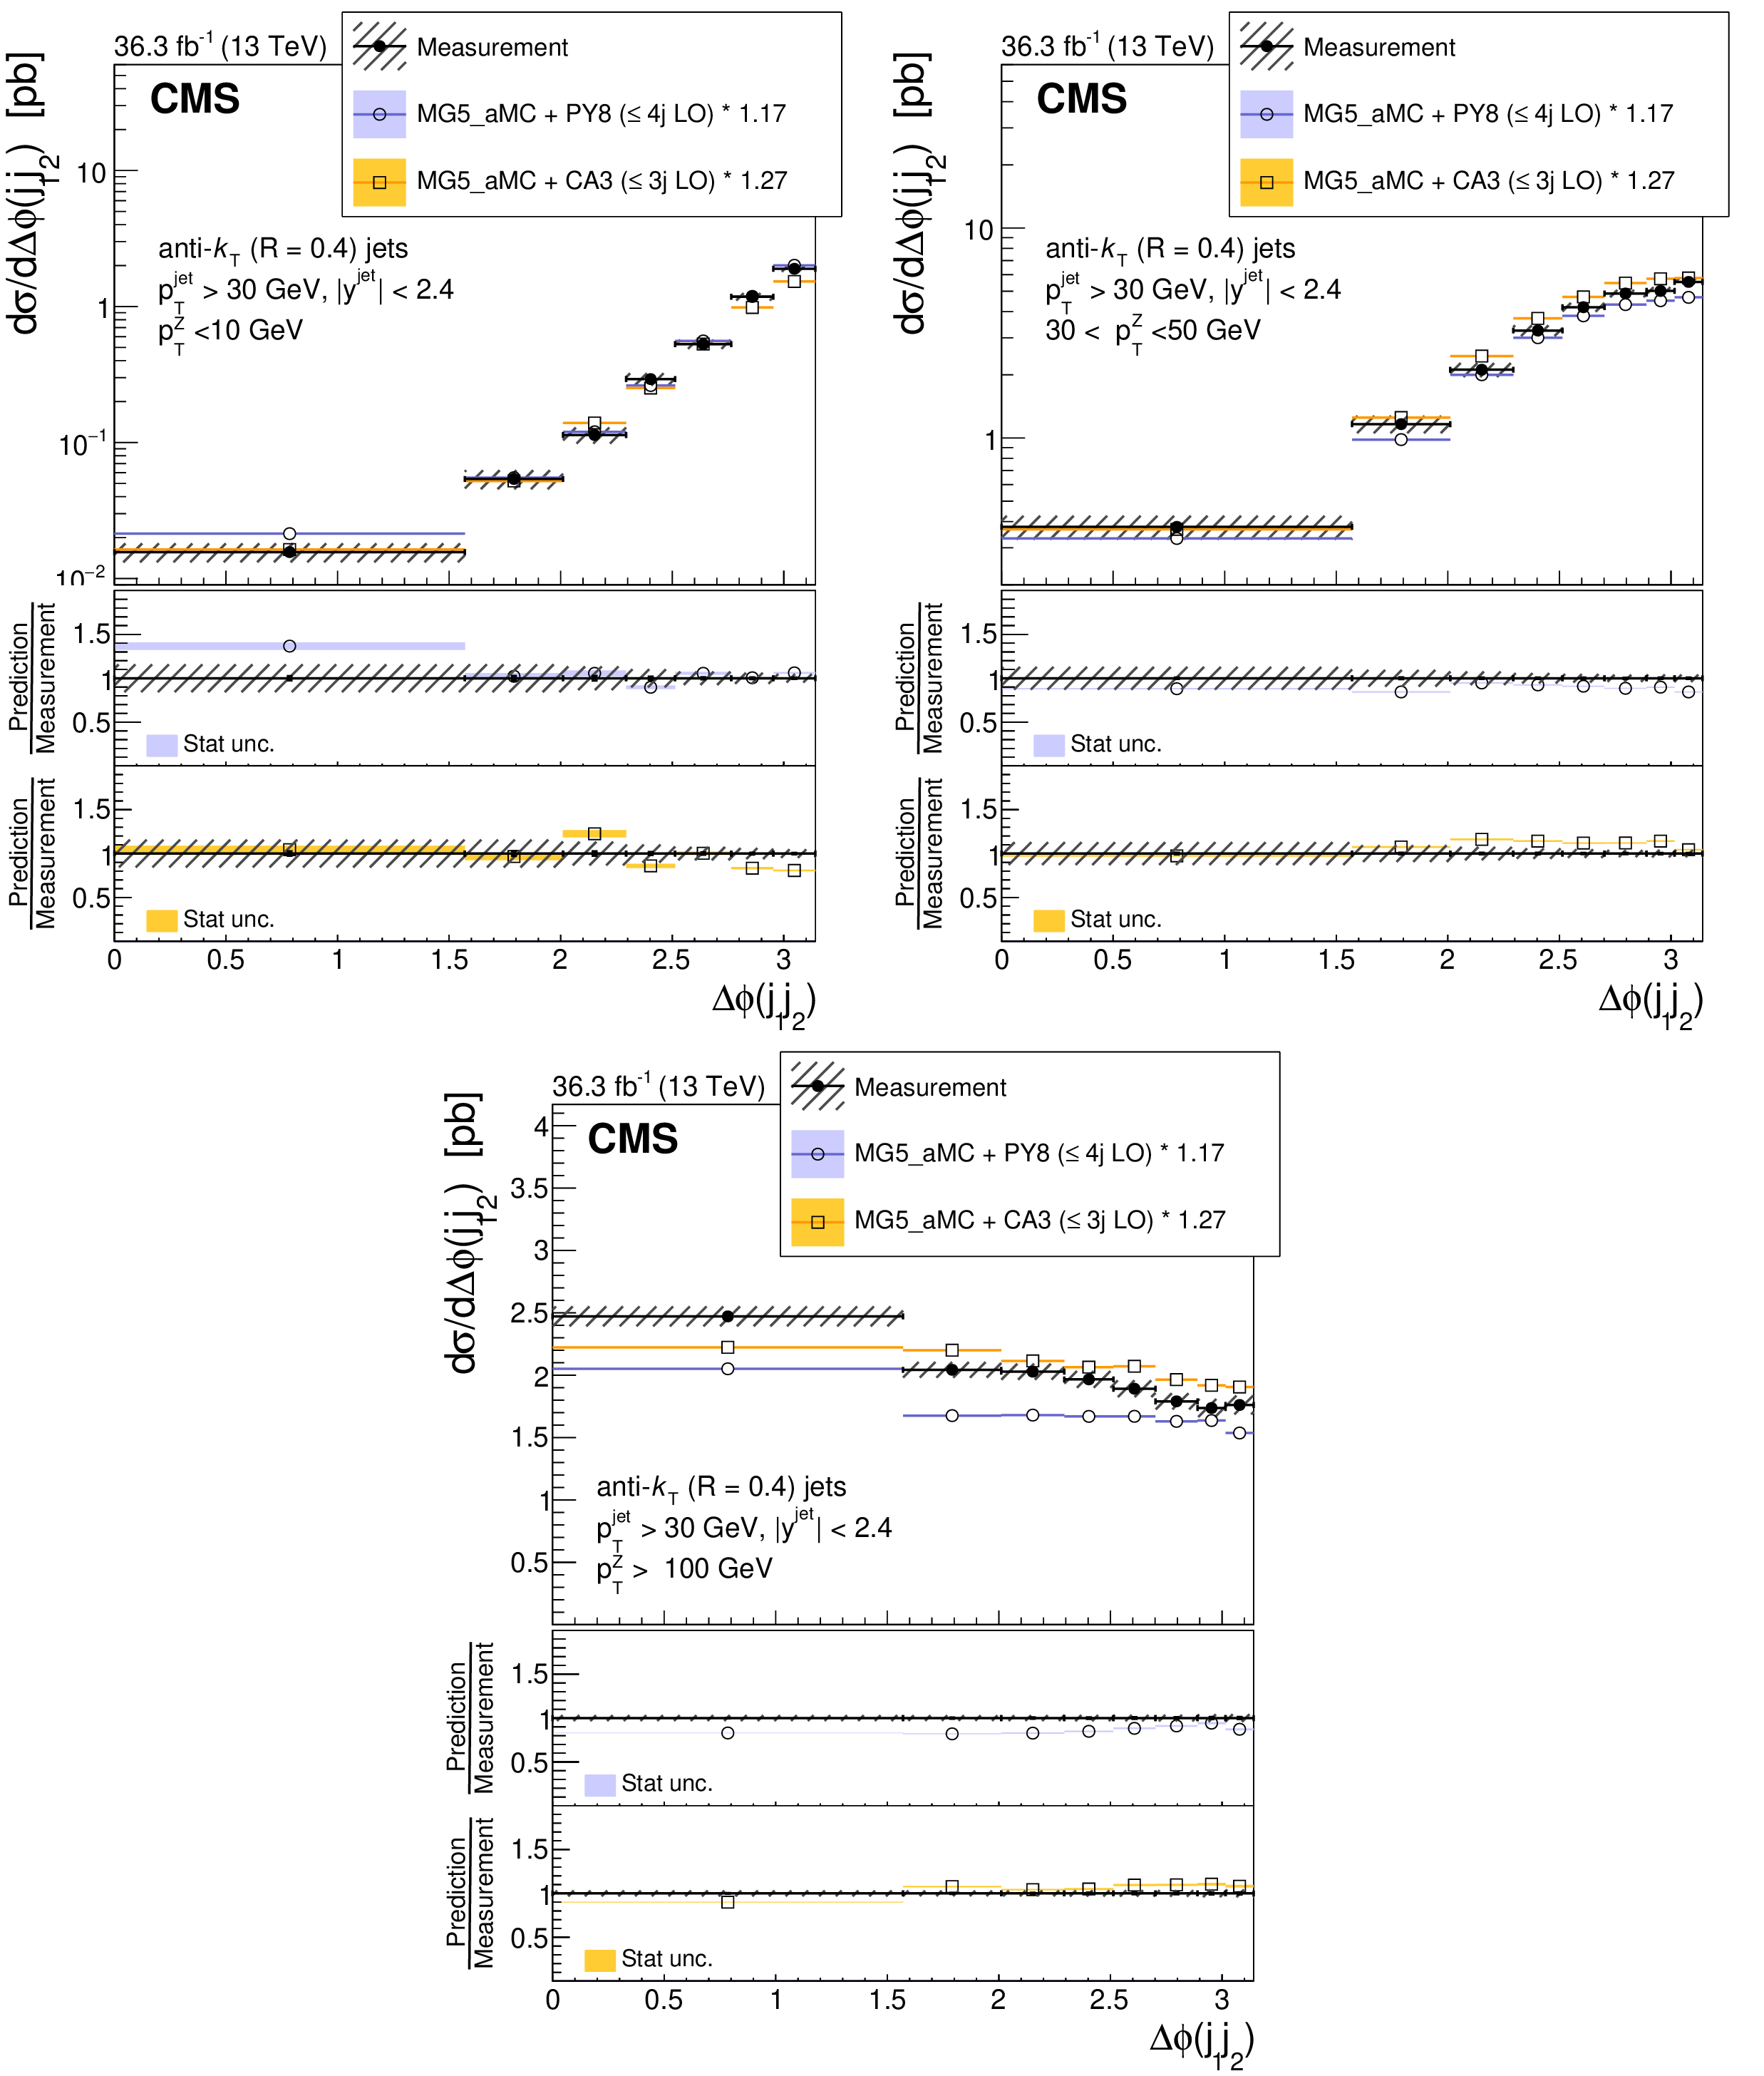
Figure 10:
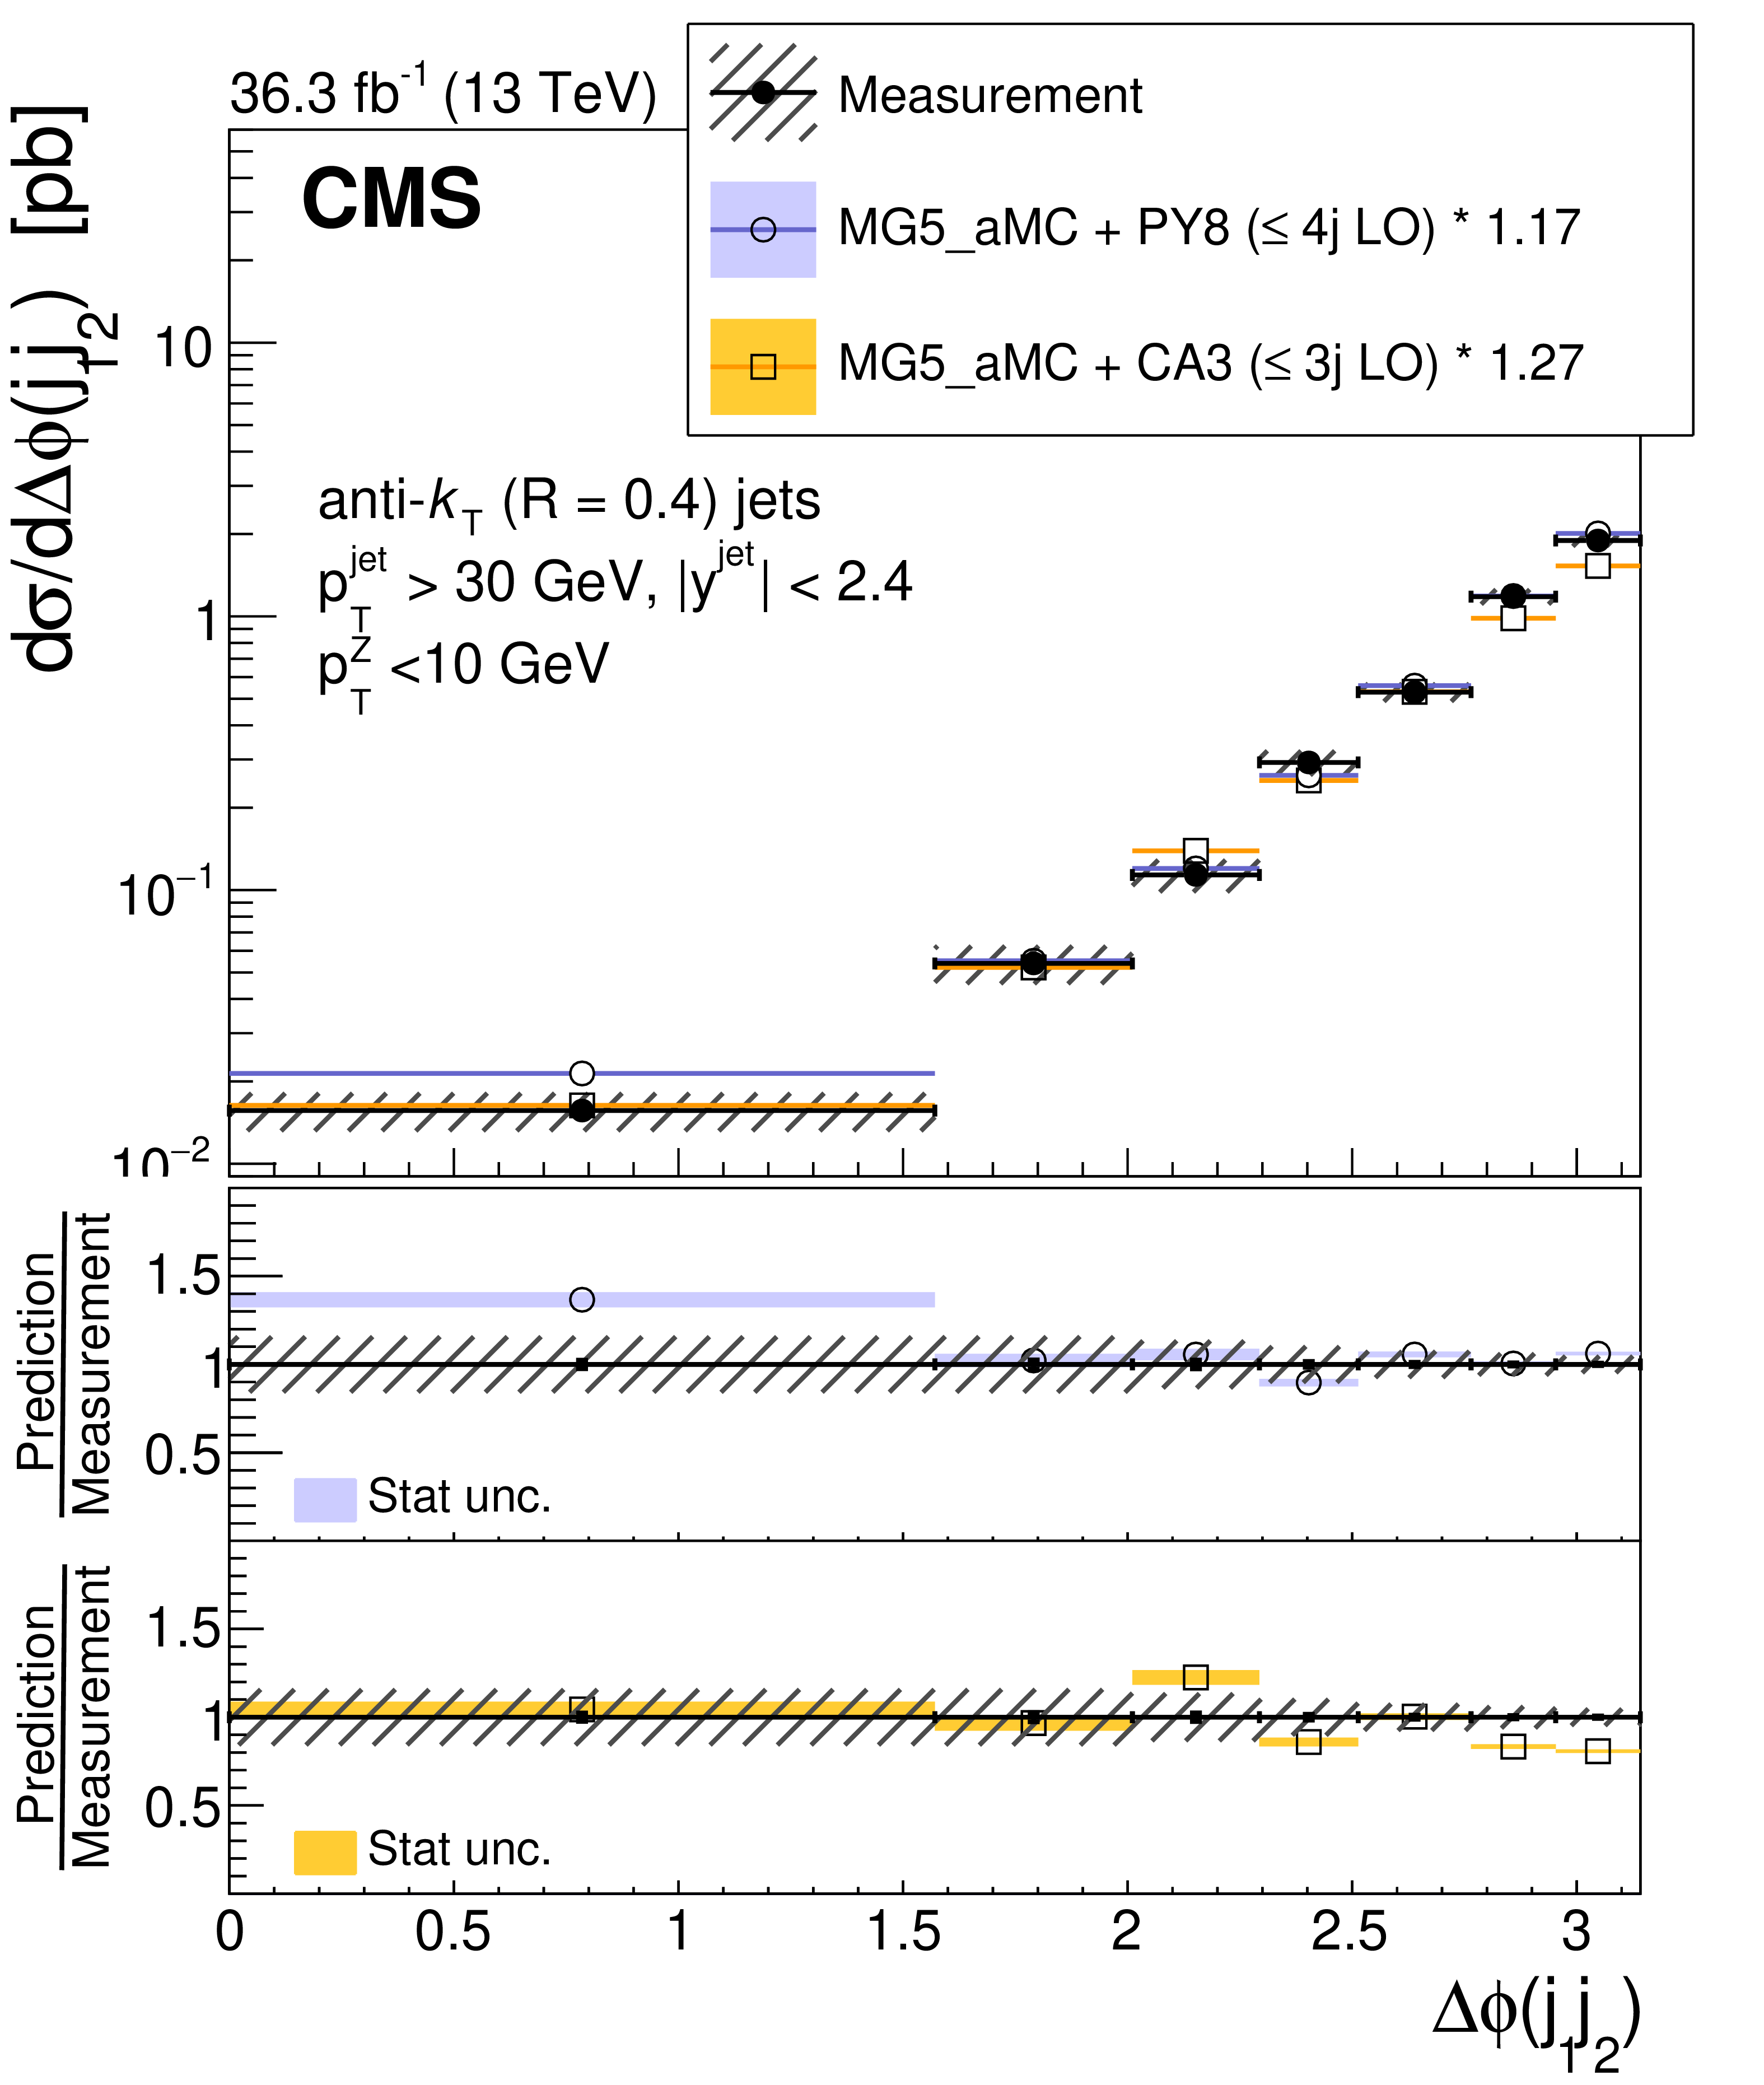
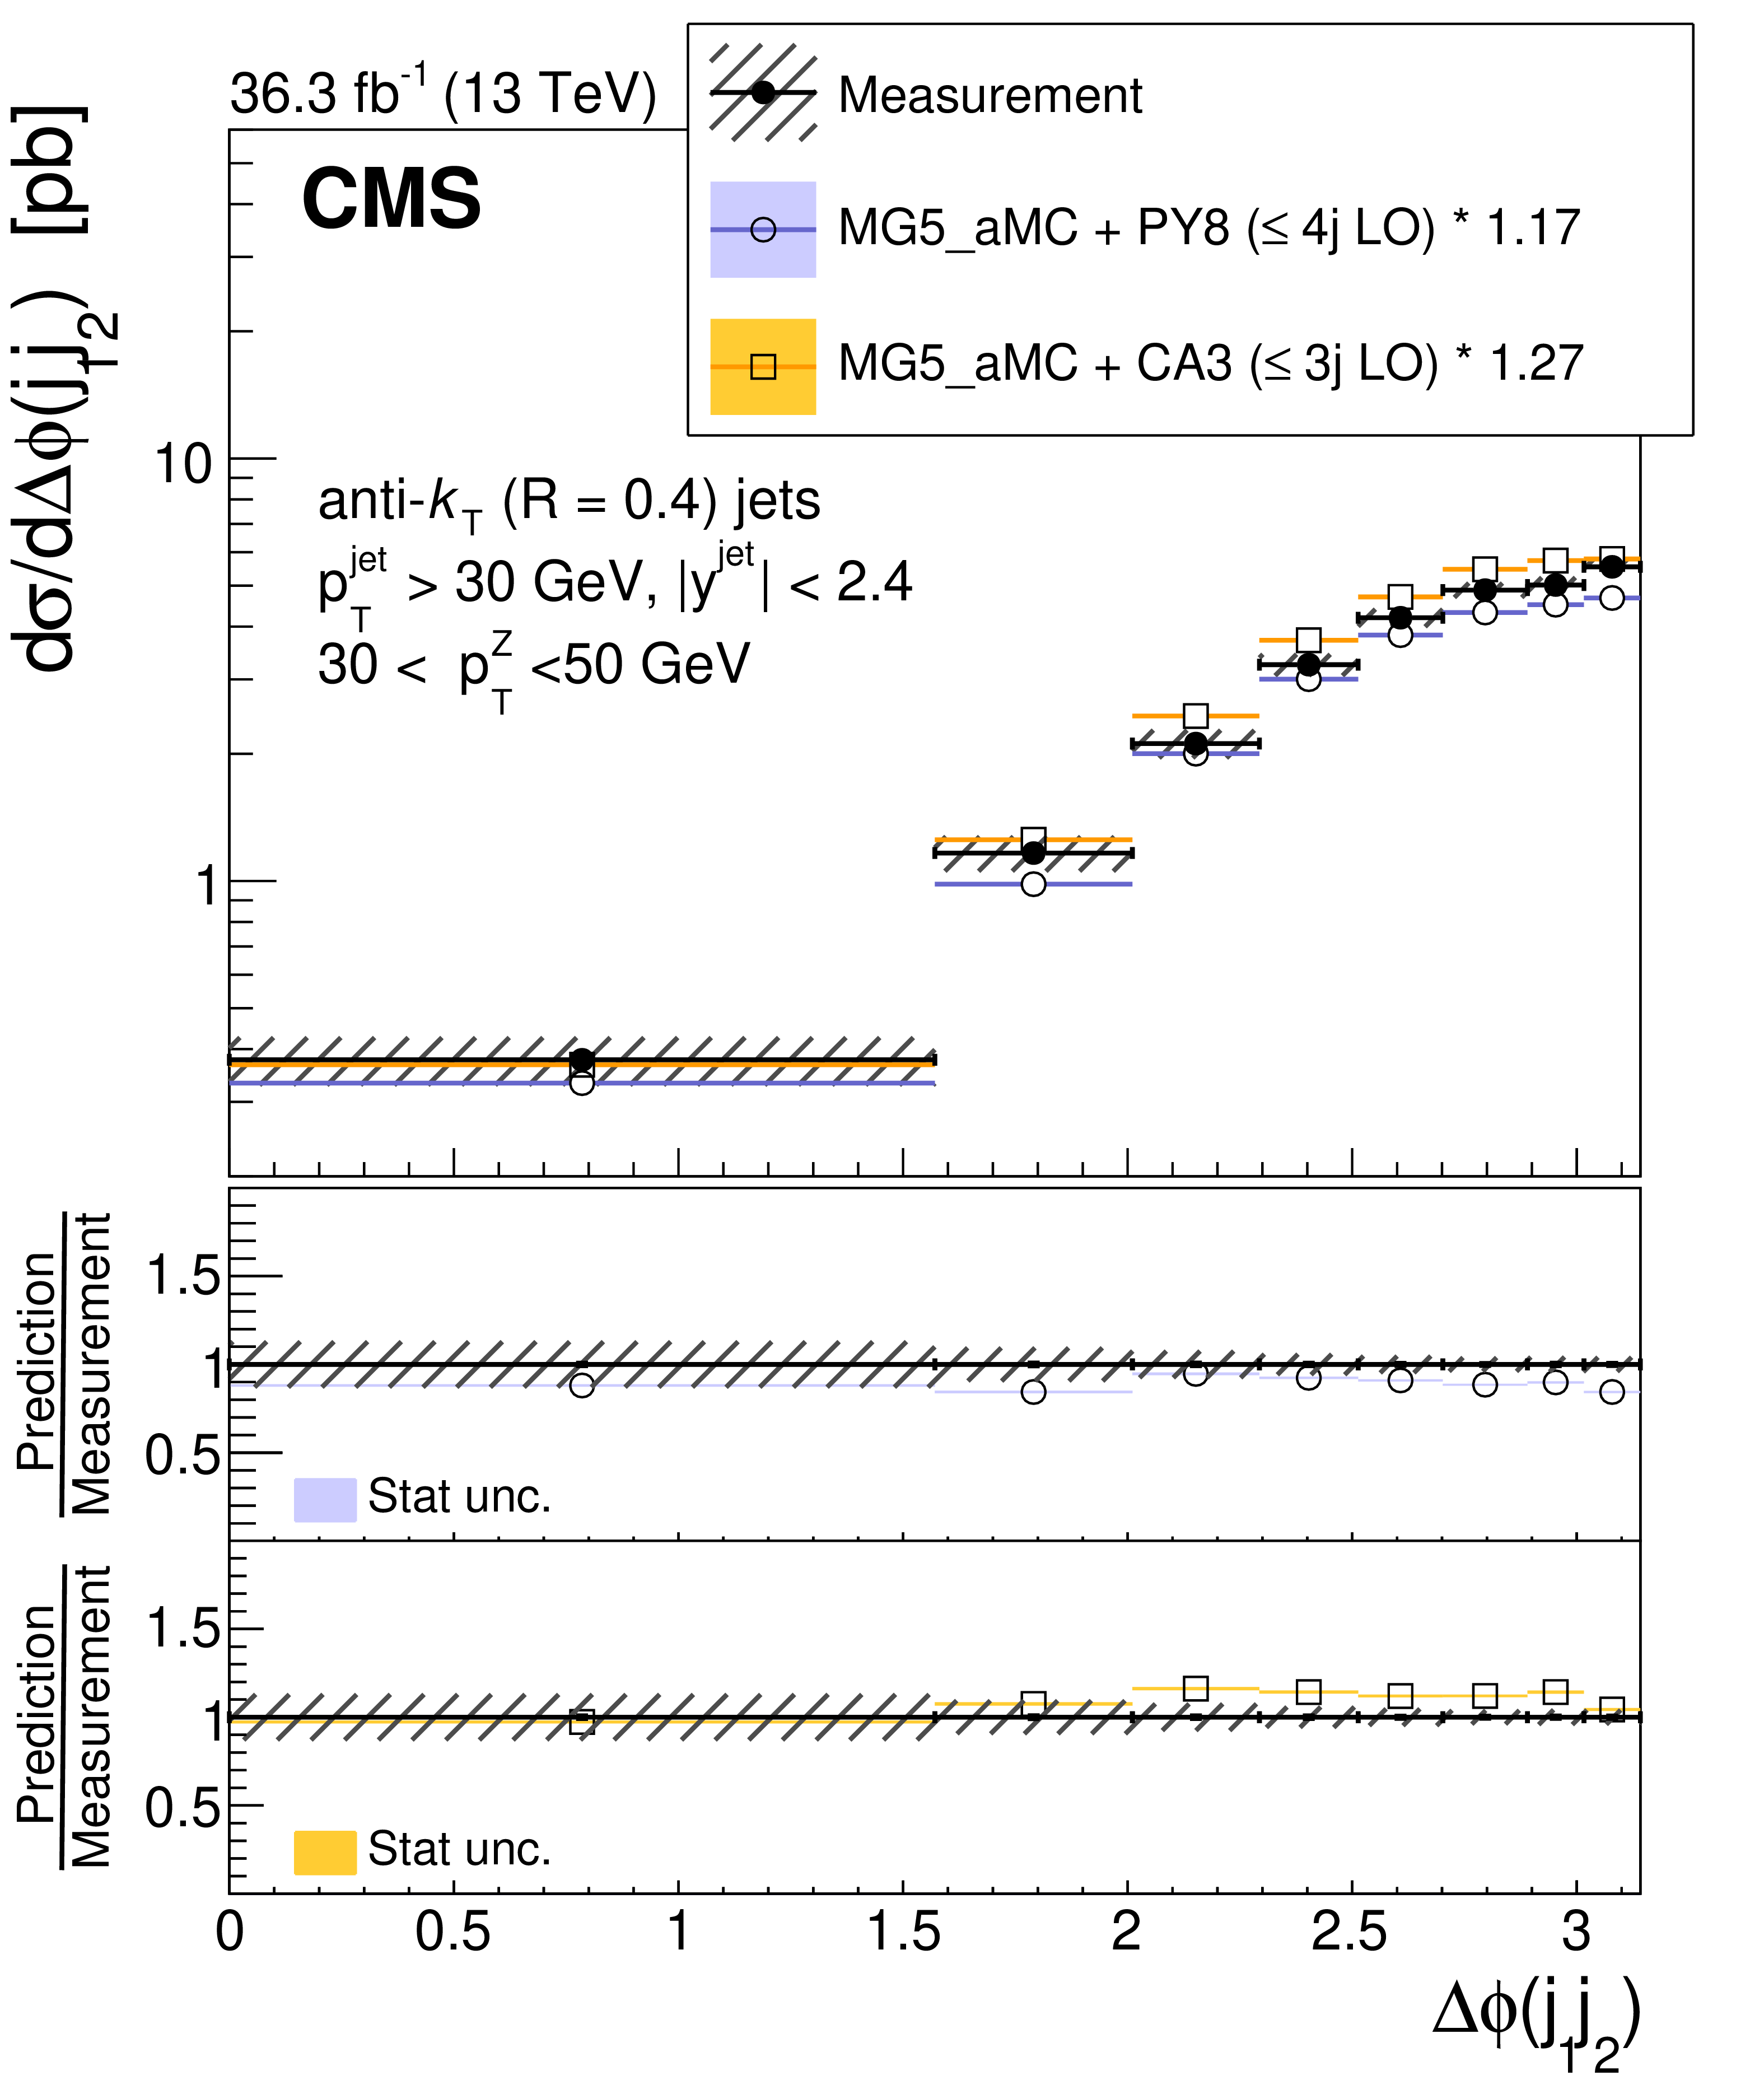
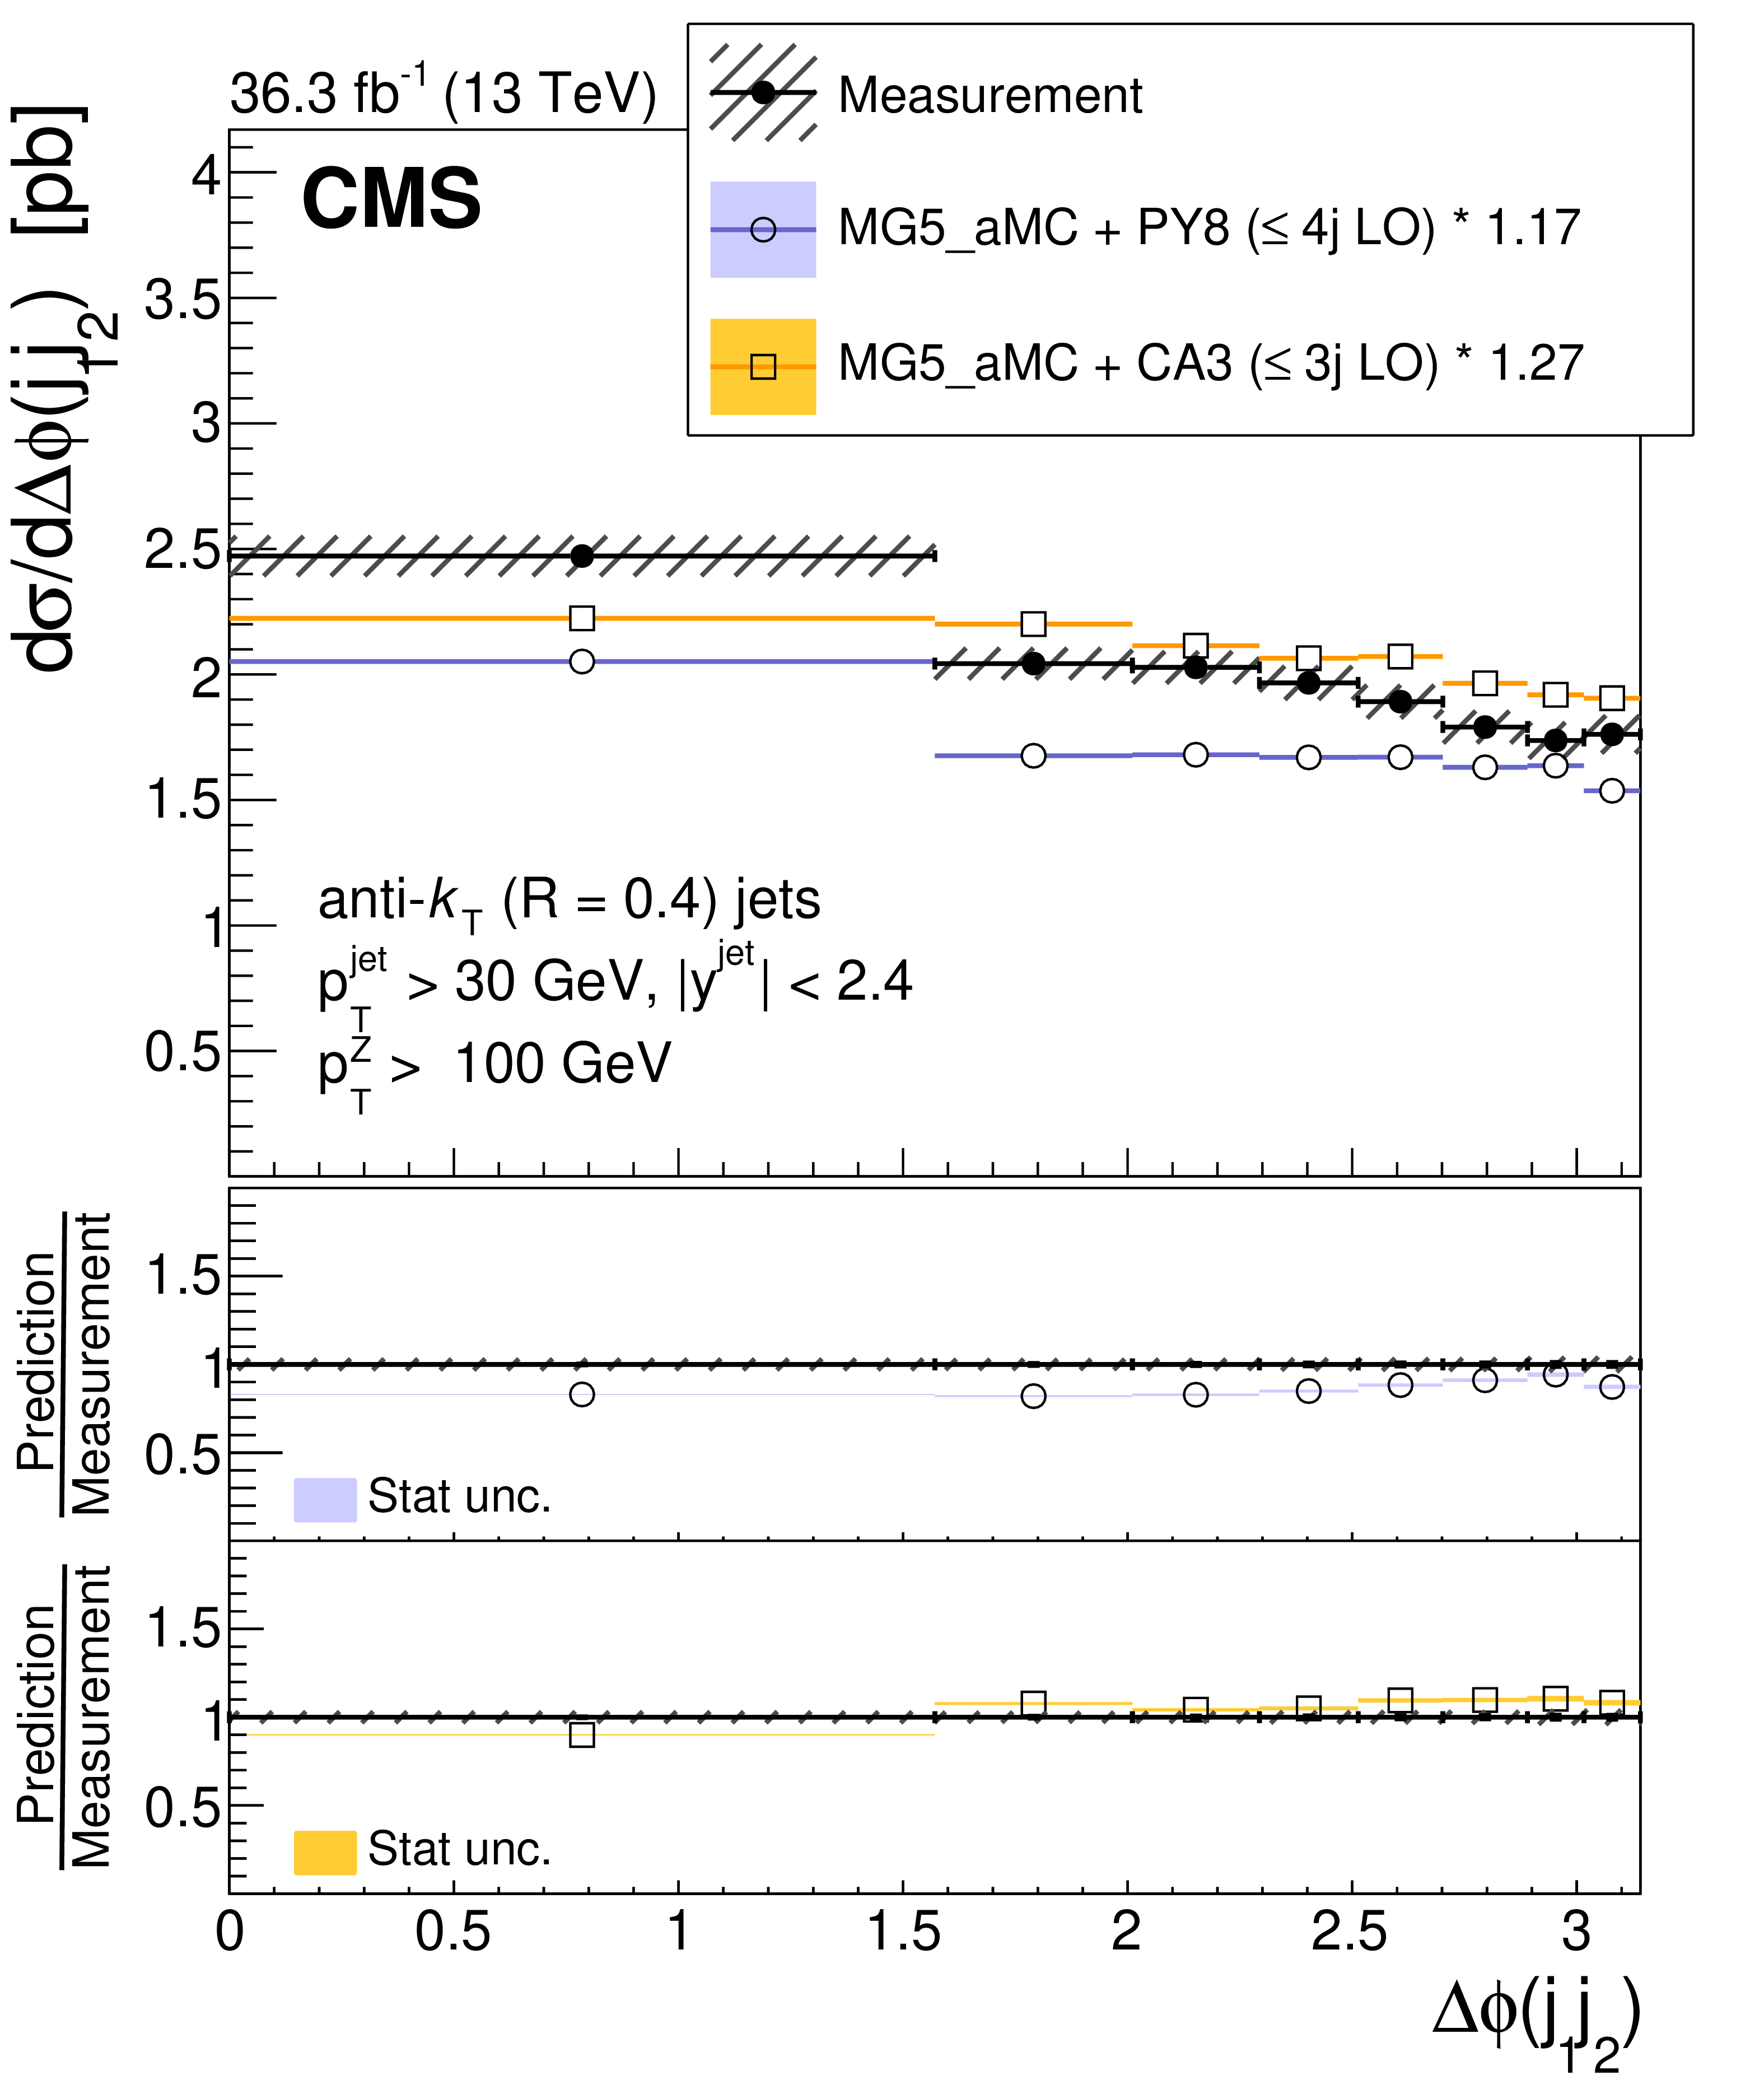
Cross section as a function of $ \Delta\phi (j_1j_2) $ between two leading jets in three $ p_{\mathrm{T}}(\mathrm{Z}) $ regions: $ p_{\mathrm{T}}(\mathrm{Z}) < $ 10 GeV (upper left), 30 $ < p_{\mathrm{T}}(\mathrm{Z}) < $ 50 GeV (upper right), $ p_{\mathrm{T}}(\mathrm{Z}) > $ 100 GeV (lower). The error bars on the data points represent the statistical uncertainty of the measurement, and the hatched band shows the total statistical and systematic uncertainties added in quadrature. Predictions from MG5_AMC+PY8 ($ \leq $ 4j LO) and MG5_AMC+CA3 (Z $ \leq $ 3j LO) are shown. Different normalization factors are applied, as described in the text. |
png pdf |
Figure 10-a:
Cross section as a function of $ \Delta\phi (j_1j_2) $ between two leading jets for $ p_{\mathrm{T}}(\mathrm{Z}) < $ 10 GeV. The error bars on the data points represent the statistical uncertainty of the measurement, and the hatched band shows the total statistical and systematic uncertainties added in quadrature. Predictions from MG5_AMC+PY8 ($ \leq $ 4j LO) and MG5_AMC+CA3 (Z $ \leq $ 3j LO) are shown. Different normalization factors are applied, as described in the text. |
png pdf |
Figure 10-b:
Cross section as a function of $ \Delta\phi (j_1j_2) $ between two leading jets for 30 $ < p_{\mathrm{T}}(\mathrm{Z}) < $ 50 GeV. The error bars on the data points represent the statistical uncertainty of the measurement, and the hatched band shows the total statistical and systematic uncertainties added in quadrature. Predictions from MG5_AMC+PY8 ($ \leq $ 4j LO) and MG5_AMC+CA3 (Z $ \leq $ 3j LO) are shown. Different normalization factors are applied, as described in the text. |
png pdf |
Figure 10-c:
Cross section as a function of $ \Delta\phi (j_1j_2) $ between two leading jets for $ p_{\mathrm{T}}(\mathrm{Z}) > $. The error bars on the data points represent the statistical uncertainty of the measurement, and the hatched band shows the total statistical and systematic uncertainties added in quadrature. Predictions from MG5_AMC+PY8 ($ \leq $ 4j LO) and MG5_AMC+CA3 (Z $ \leq $ 3j LO) are shown. Different normalization factors are applied, as described in the text. |
| Tables | |
png pdf |
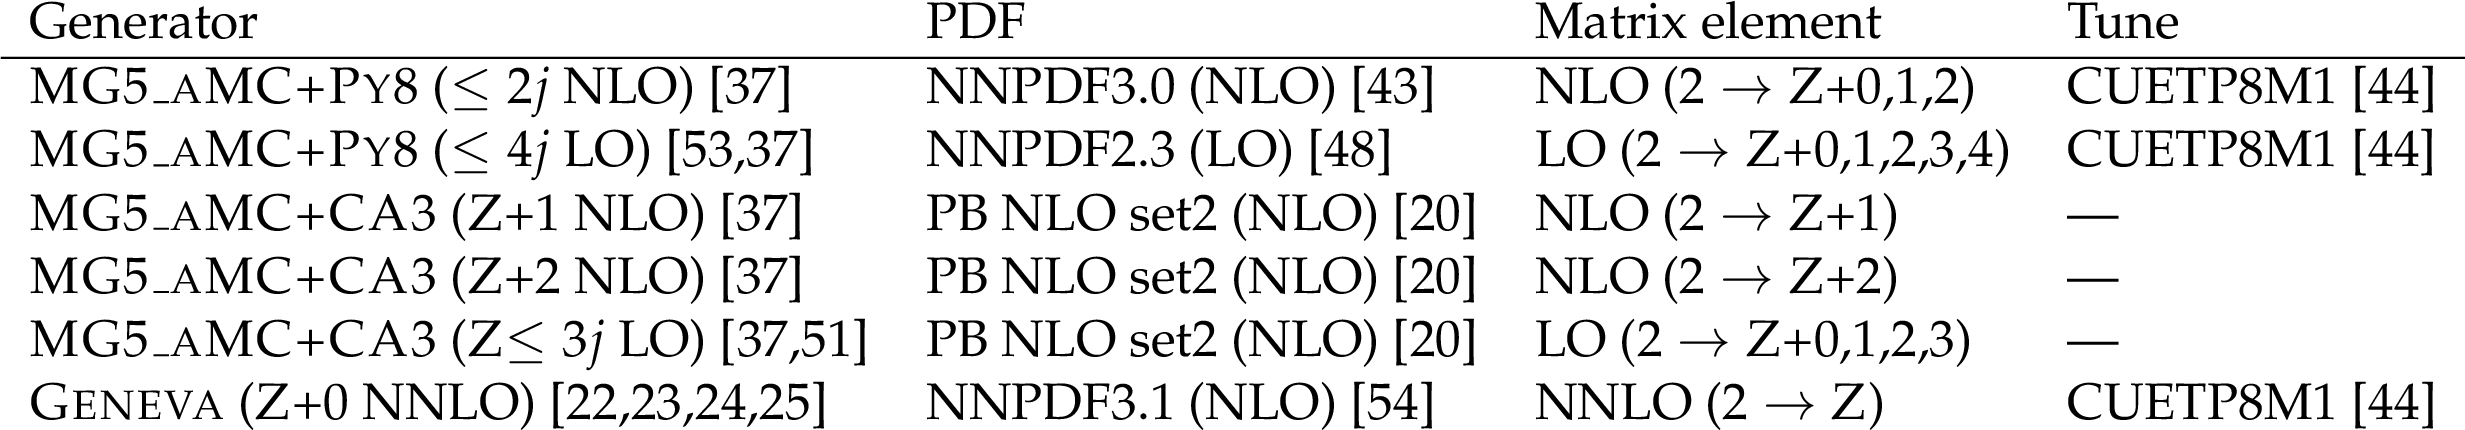
Table 1:
Description of the simulated samples used in the analysis. |
png pdf |
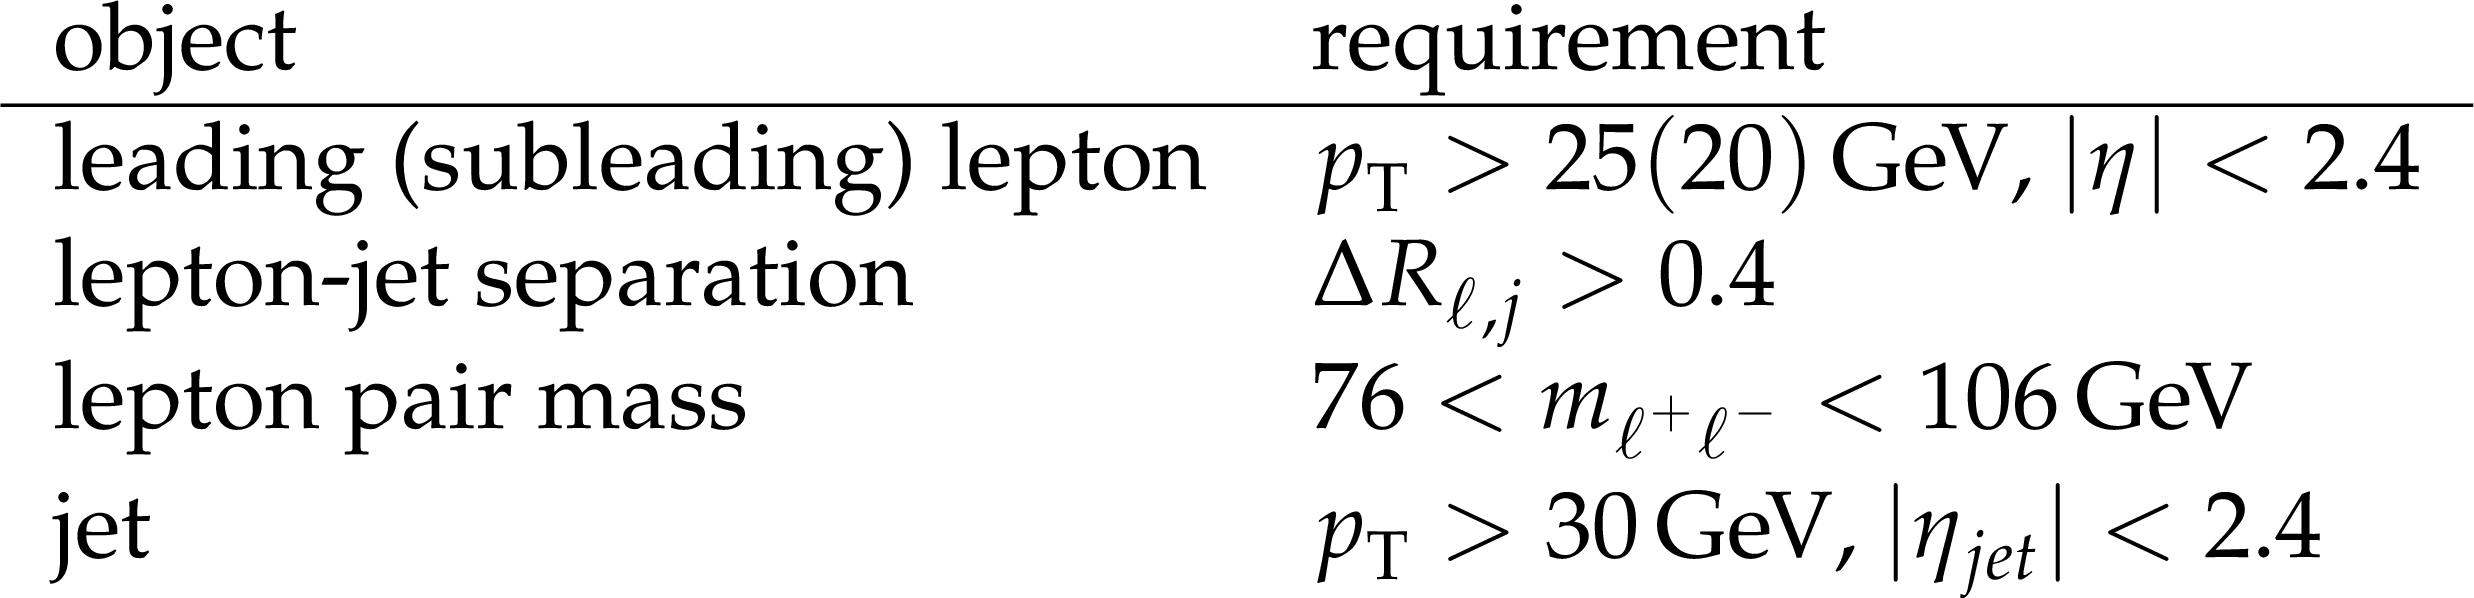
Table 2:
Particle-level phase space definition |
png pdf |
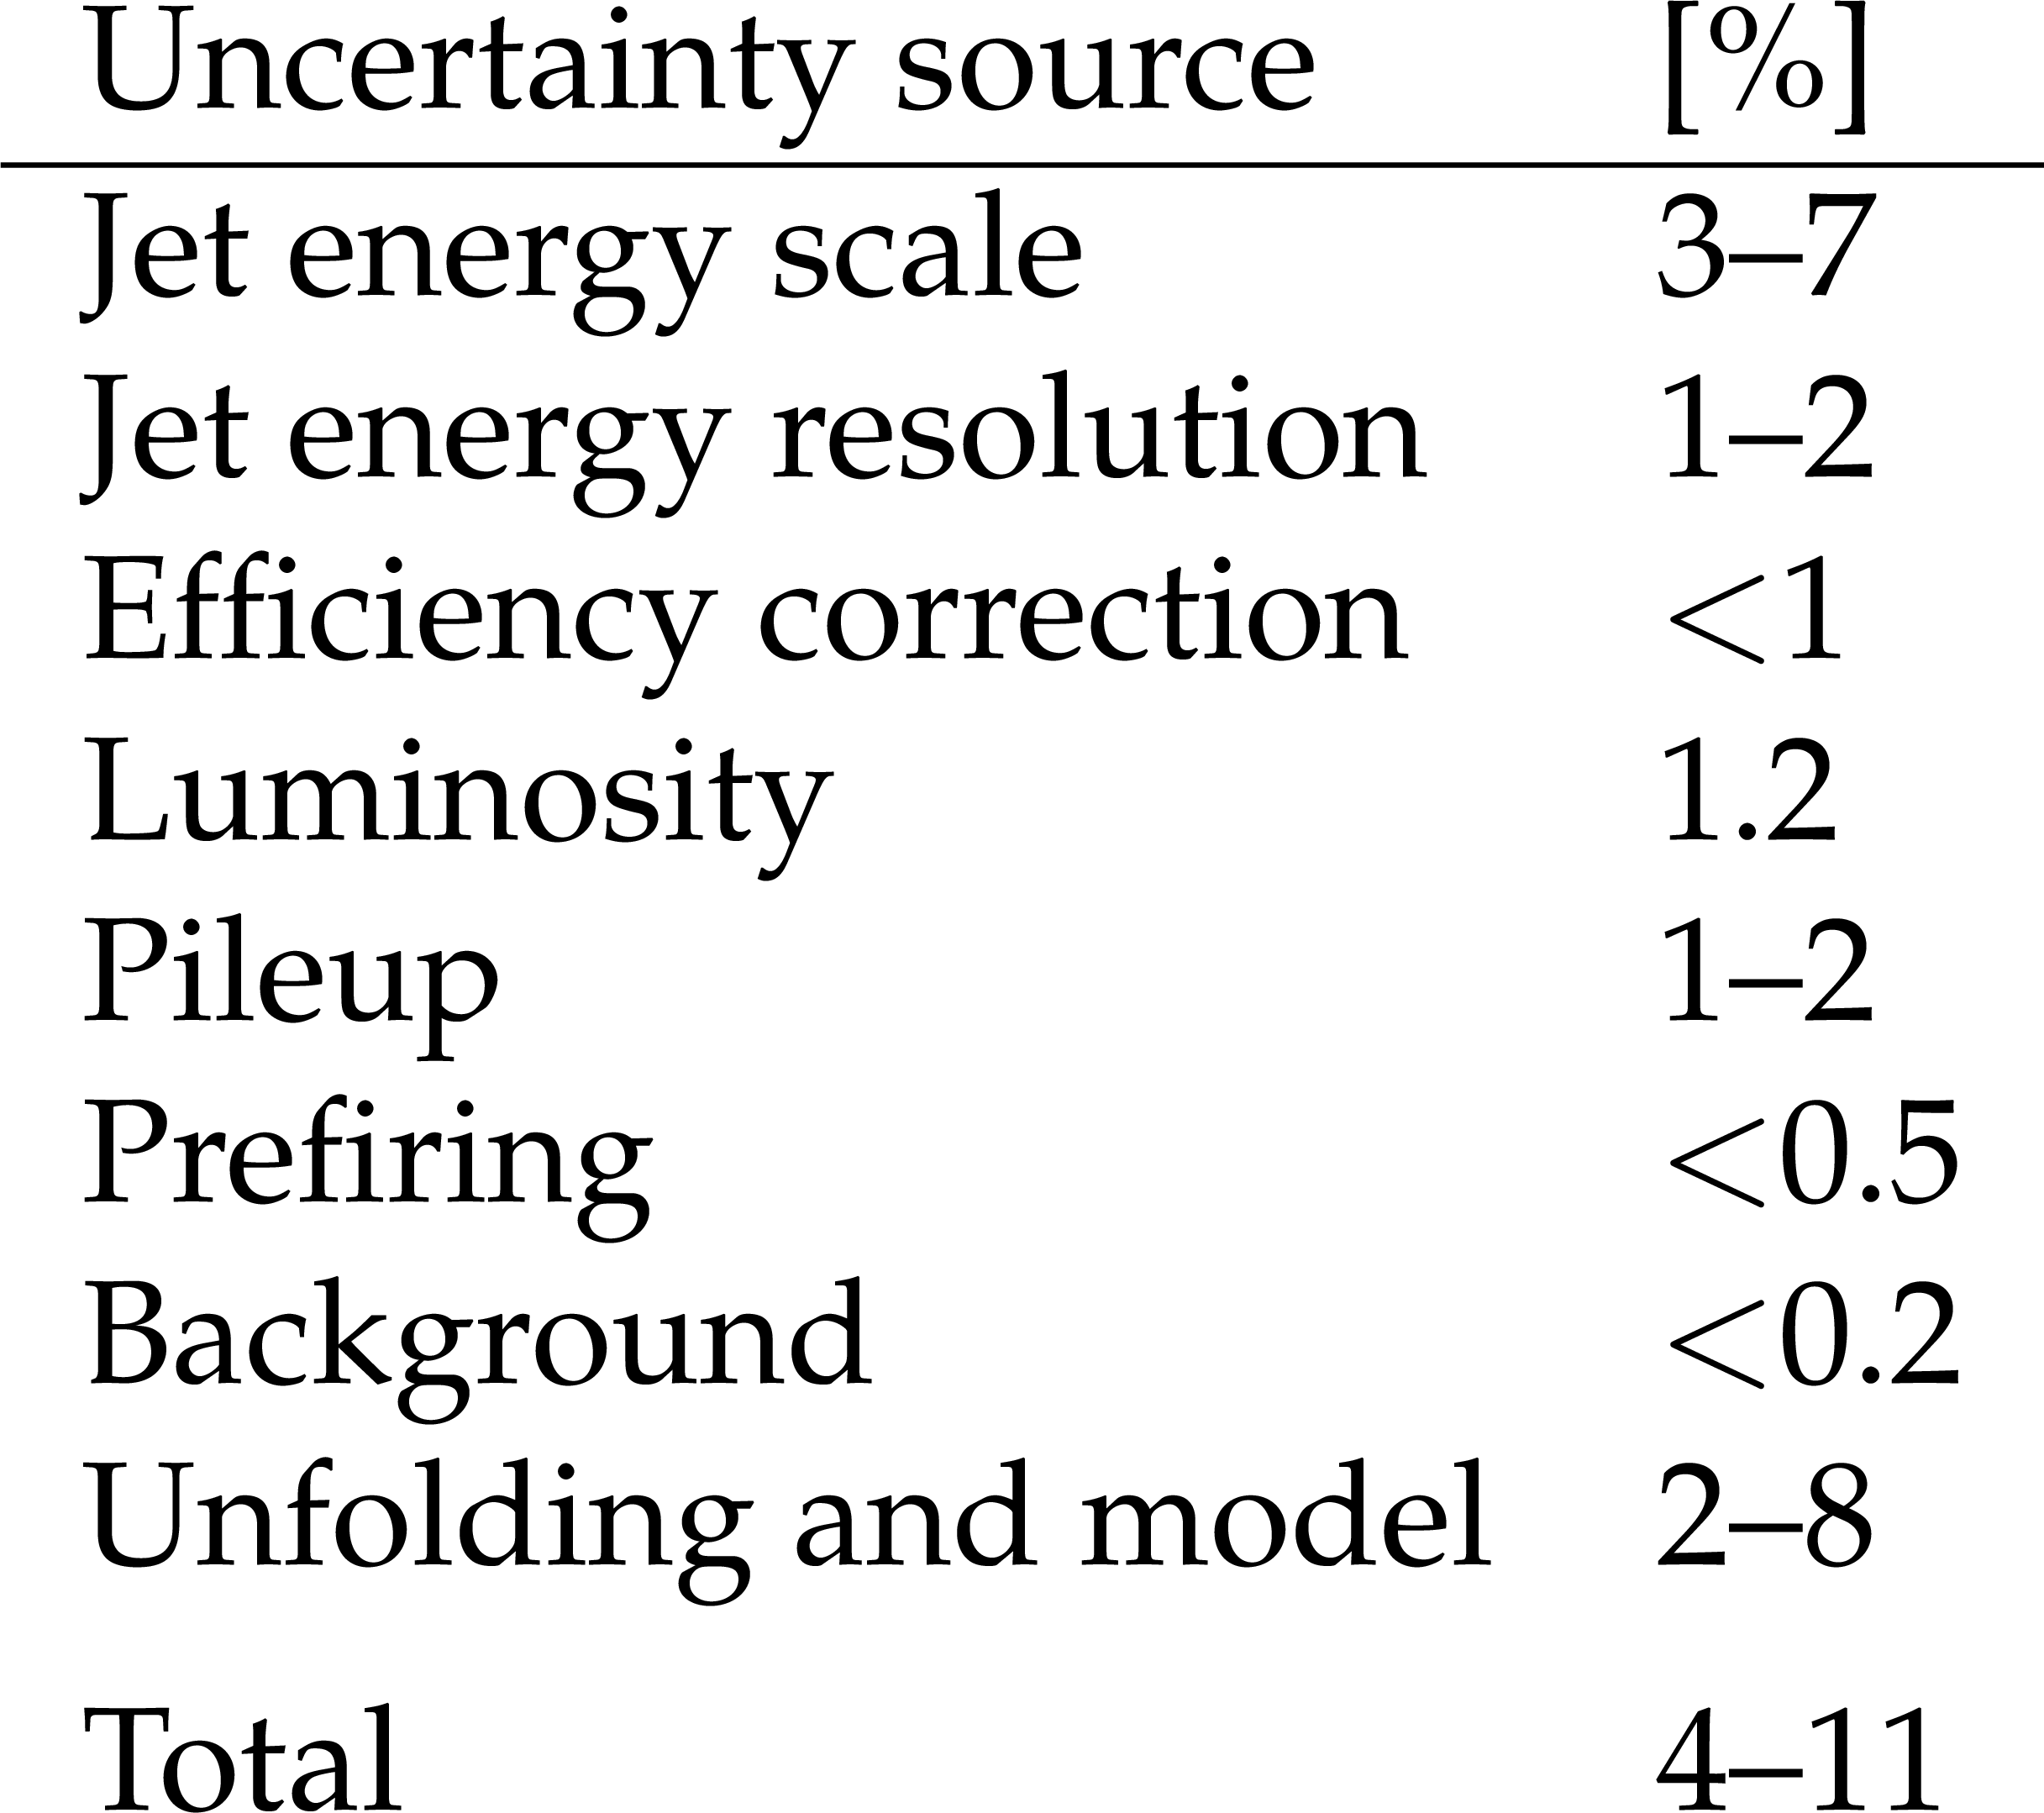
Table 3:
Systematic uncertainties on the unfolded differential cross section |
| Summary |
| We have measured the Z+jet production cross section in proton-proton collisions at the LHC at a center-of-mass energy of 13 TeV. The associated jet multiplicity for various regions of the transverse momentum of the Z boson, $ p_{\mathrm{T}}(\mathrm{Z}) $, was measured. At $ p_{\mathrm{T}}(\mathrm{Z}) < $ 10 GeV only about 1% of the events have jets with $ p_{\mathrm{T}} > $ 30 GeV, with nonnegligible cross sections at high jet multiplicity. At 30 $ < p_{\mathrm{T}}(\mathrm{Z}) < $ 50 GeV, most of the events have at least one jet, with a significant tail to higher jet multiplicities. The azimuthal angle $ \Delta\phi (\mathrm{Z} j_1) $ between the Z boson and the leading jet, as well as the azimuthal angle $ \Delta\phi (j_1j_2) $ between the two leading jets, was measured for the three $ p_{\mathrm{T}}(\mathrm{Z}) $ regions. At low $ p_{\mathrm{T}}(\mathrm{Z}) $, the Z boson is only loosely correlated with the jets, but the two leading jets are strongly correlated. At large $ p_{\mathrm{T}}(\mathrm{Z}) $, the Z boson is highly correlated with the leading jet, but the two leading jets are only weakly correlated. The measurement shows that at low $ p_{\mathrm{T}}(\mathrm{Z}) $ the Z boson appears as an electroweak correction to high-$ p_{\mathrm{T}} $ jet production, whereas at large $ p_{\mathrm{T}}(\mathrm{Z}) $ the dominant process is Z+jet production. The next-to-leading order (NLO) prediction of MG5_AMC+PY8 ($ \leq $ 2j NLO) with Z+0,1,2 partons, which is merged with the FxFx procedure and supplemented with parton showering (PS) and multiple parton interactions (MPI) from PYTHIA 8, agrees with the measurements. The predictions of MG5_AMC+CA3 (Z+1 NLO) and MG5_AMC+CA3 (Z+2 NLO) using the parton branching method with transverse-momentum dependent (PB -TMD) parton densities, which do not include MPI effects, and the corresponding PS agree with the measurements in the regions where MPI effects are negligible. The prediction from GENEVA (Z+0 NNLO) using matrix elements at next-to-next-to-leading order for Z production, supplemented with resummation, PS and MPI from PYTHIA 8, agrees with the measurements in the low jet multiplicity region. The leading order prediction of MG5_AMC+PY8 ($ \leq $ 4j LO), including merging of jet multiplicities, describes the measurements well. The prediction of MG5_AMC+CA3 (Z $ \leq $ 3j LO) using PB -TMD parton densities and PS with merging of jet multiplicities agrees well with the measurements in the regions where MPI is negligible. In summary, Z+jet measurements challenge theoretical predictions; a good agreement can be achieved by including contributions of multiparton interactions, parton showering, parton densities, as well as multijet matrix element merging. The differential measurements provided here help to disentangle the various contributions and illustrate where each contribution becomes important. |
| References | ||||
| 1 | R. K. Ellis, G. Martinelli, and R. Petronzio | Lepton pair production at large transverse momentum in second order QCD | NPB 211 (1983) 106 | |
| 2 | J. C. Collins, D. E. Soper, and G. Sterman | Transverse momentum distribution in Drell-Yan pair and W and Z boson production | NPB 250 (1985) 199 | |
| 3 | W. Bizon et al. | The transverse momentum spectrum of weak gauge bosons at N $ ^3 $ LL + NNLO | EPJC 79 (2019) 868 | 1905.05171 |
| 4 | A. Bermudez Martinez et al. | Production of Z-bosons in the parton branching method | PRD 100 (2019) 074027 | 1906.00919 |
| 5 | CMS Collaboration | Measurements of differential Z boson production cross sections in proton-proton collisions at $ \sqrt{s} $ = 13 TeV | JHEP 12 (2019) 061 | CMS-SMP-17-010 1909.04133 |
| 6 | CDF Collaboration | Measurement of inclusive jet cross-sections in $ \mathrm{Z}/\gamma^* \to \mathrm{e}^+\mathrm{e}^- $ + jets production in $ \mathrm{p} \overline{\mathrm{p}} $ collisions at $ \sqrt{s} $ = 1.96 TeV | PRL 100 (2008) 102001 | 0711.3717 |
| 7 | D0 Collaboration | Measurement of differential $ \mathrm{Z} / \gamma^{*} $ + jet + $ X $ cross sections in $ \mathrm{p}\overline{\mathrm{p}} $ collisions at $ \sqrt{s} $ = 1.96 TeV | PLB 669 (2008) 278 | 0808.1296 |
| 8 | ATLAS Collaboration | Measurement of the production cross section of jets in association with a Z boson in pp collisions at $ \sqrt{s} = $ 7 TeV with the ATLAS detector | JHEP 07 (2013) 032 | 1304.7098 |
| 9 | ATLAS Collaboration | Measurement of the production cross section for $ \mathrm{Z}/\gamma^* $ in association with jets in pp collisions at $ \sqrt{s}= $ 7 TeV with the ATLAS detector | PRD 85 (2012) 032009 | 1111.2690 |
| 10 | CMS Collaboration | Measurements of jet multiplicity and differential production cross sections of $ Z+ $jets events in proton-proton collisions at $ \sqrt{s} = $ 7 TeV | PRD 91 (2015) 052008 | CMS-SMP-12-017 1408.3104 |
| 11 | CMS Collaboration | Jet production rates in association with W and Z bosons in pp collisions at $ \sqrt{s}= $ 7 TeV | JHEP 01 (2012) 010 | CMS-EWK-10-012 1110.3226 |
| 12 | CMS Collaboration | Event shapes and azimuthal correlations in Z+jets events in pp collisions at $ \sqrt{s}= $ 7 TeV | PLB 722 (2013) 238 | CMS-EWK-11-021 1301.1646 |
| 13 | LHCb Collaboration | Study of forward Z+jet production in pp collisions at $ \sqrt{s} = $ 7 TeV | JHEP 01 (2014) 033 | 1310.8197 |
| 14 | CMS Collaboration | Measurements of differential production cross sections for a Z boson in association with jets in pp collisions at $ \sqrt{s}= $ 8 TeV | JHEP 04 (2017) 022 | CMS-SMP-14-013 1611.03844 |
| 15 | ATLAS Collaboration | Measurement of the inclusive cross-section for the production of jets in association with a Z boson in proton-proton collisions at 8 TeV using the ATLAS detector | EPJC 79 (2019) 847 | 1907.06728 |
| 16 | CMS Collaboration | Measurement of differential cross sections for Z boson production in association with jets in proton-proton collisions at $ \sqrt{s} = $ 13 TeV | EPJC 78 (2018) 965 | CMS-SMP-16-015 1804.05252 |
| 17 | ATLAS Collaboration | Measurements of the production cross section of a $ Z $ boson in association with jets in pp collisions at $ \sqrt{s} = $ 13 TeV with the ATLAS detector | EPJC 77 (2017) 361 | 1702.05725 |
| 18 | F. Hautmann et al. | Collinear and TMD quark and gluon densities from parton branching solution of QCD evolution equations | JHEP 01 (2018) 070 | 1708.03279 |
| 19 | F. Hautmann et al. | Soft-gluon resolution scale in QCD evolution equations | PLB 772 (2017) 446 | 1704.01757 |
| 20 | A. Bermudez Martinez et al. | Collinear and TMD parton densities from fits to precision DIS measurements in the parton branching method | PRD 99 (2019) 074008 | 1804.11152 |
| 21 | S. Baranov et al. | CASCADE3 A Monte Carlo event generator based on TMDs | EPJC 81 (2021) 425 | 2101.10221 |
| 22 | S. Alioli, C. W. Bauer, S. Guns, and F. J. Tackmann | Underlying event sensitive observables in Drell-Yan production using GENEVA | EPJC 76 (2016) 614 | 1605.07192 |
| 23 | S. Alioli et al. | Drell-Yan production at NNLL$ ' $+NNLO matched to parton showers | PRD 92 (2015) 094020 | 1508.01475 |
| 24 | S. Alioli et al. | Matching fully differential NNLO calculations and parton showers | JHEP 06 (2014) 089 | 1311.0286 |
| 25 | S. Alioli et al. | Combining higher-order resummation with multiple NLO calculations and parton showers in GENEVA | JHEP 09 (2013) 120 | 1211.7049 |
| 26 | CMS Collaboration | Performance of the CMS Level-1 trigger in proton-proton collisions at $ \sqrt{s} = $ 13\,TeV | JINST 15 (2020) P10017 | CMS-TRG-17-001 2006.10165 |
| 27 | CMS Collaboration | The CMS trigger system | JINST 12 (2017) P01020 | CMS-TRG-12-001 1609.02366 |
| 28 | CMS Collaboration | Particle-flow reconstruction and global event description with the CMS detector | JINST 12 (2017) P10003 | CMS-PRF-14-001 1706.04965 |
| 29 | CMS Collaboration | Technical proposal for the Phase-II upgrade of the Compact Muon Solenoid | CMS Technical Proposal CERN-LHCC-2015-010, CMS-TDR-15-02, 2015 link |
|
| 30 | CMS Collaboration | ECAL 2016 refined calibration and Run2 summary plots | CMS Detector Performance Summary CMS-DP-2020-021, 2020 link |
|
| 31 | CMS Collaboration | Electron and photon reconstruction and identification with the CMS experiment at the CERN LHC | JINST 16 (2021) P05014 | CMS-EGM-17-001 2012.06888 |
| 32 | CMS Collaboration | Performance of the CMS muon detector and muon reconstruction with proton-proton collisions at $ \sqrt{s}= $ 13 TeV | JINST 13 (2018) P06015 | CMS-MUO-16-001 1804.04528 |
| 33 | M. Cacciari, G. P. Salam, and G. Soyez | The anti-$ k_{\mathrm{T}} $ jet clustering algorithm | JHEP 04 (2008) 063 | 0802.1189 |
| 34 | M. Cacciari, G. P. Salam, and G. Soyez | FastJet user manual | EPJC 72 (2012) 1896 | 1111.6097 |
| 35 | CMS Collaboration | Jet energy scale and resolution in the CMS experiment in pp collisions at 8 TeV | JINST 12 (2017) P02014 | CMS-JME-13-004 1607.03663 |
| 36 | CMS Collaboration | The CMS experiment at the CERN LHC | JINST 3 (2008) S08004 | |
| 37 | J. Alwall et al. | The automated computation of tree-level and next-to-leading order differential cross sections, and their matching to parton shower simulations | JHEP 07 (2014) 079 | 1405.0301 |
| 38 | T. Sjöstrand et al. | An introduction to PYTHIA 8.2 | Comput. Phys. Commun. 191 (2015) 159 | 1410.3012 |
| 39 | Y. L. Dokshitzer, V. A. Khoze, S. I. Troian, and A. H. Mueller | QCD coherence in high-energy reactions | Rev. Mod. Phys. 60 (1988) 373 | |
| 40 | A. Bassetto, M. Ciafaloni, and G. Marchesini | Jet structure and infrared sensitive quantities in perturbative QCD | Phys. Rept. 100 (1983) 201 | |
| 41 | G. Marchesini and B. R. Webber | Monte Carlo simulation of general hard processes with coherent QCD radiation | NPB 310 (1988) 461 | |
| 42 | S. Catani, B. R. Webber, and G. Marchesini | QCD coherent branching and semiinclusive processes at large $ x $ | NPB 349 (1991) 635 | |
| 43 | NNPDF Collaboration | Parton distributions for the LHC Run II | JHEP 04 (2015) 040 | 1410.8849 |
| 44 | CMS Collaboration | Event generator tunes obtained from underlying event and multiparton scattering measurements | EPJC 76 (2016) 155 | CMS-GEN-14-001 1512.00815 |
| 45 | R. Frederix and S. Frixione | Merging meets matching in MC@NLO | JHEP 12 (2012) 061 | 1209.6215 |
| 46 | J. Alwall et al. | Comparative study of various algorithms for the merging of parton showers and matrix elements in hadronic collisions | EPJC 53 (2008) 473 | 0706.2569 |
| 47 | NNPDF Collaboration | Parton distributions with QED corrections | NPB 877 (2013) 290 | 1308.0598 |
| 48 | NNPDF Collaboration | Unbiased global determination of parton distributions and their uncertainties at NNLO and at LO | NPB 855 (2012) 153 | 1107.2652 |
| 49 | Y. Li and F. Petriello | Combining QCD and electroweak corrections to dilepton production in the framework of the FEWZ simulation code | PRD 86 (2012) 094034 | 1208.5967 |
| 50 | T. Sjöstrand, S. Mrenna, and P. Skands | PYTHIA 6.4 physics and manual | JHEP 05 (2006) 026 | hep-ph/0603175 |
| 51 | A. Bermudez Martinez , F. Hautmann, and M. L. Mangano | TMD evolution and multi-jet merging | PLB 822 (2021) 136700 | 2107.01224 |
| 52 | J. Butterworth et al. | PDF4lhc recommendations for LHC run II | Journal of Physics G:, 2016 Nuclear and Particle Physics 43 (2016) 023001 |
1510.03865 |
| 53 | J. Alwall et al. | MadGraph 5: going beyond | JHEP 06 (2011) 128 | 1106.0522 |
| 54 | NNPDF Collaboration | Parton distributions from high-precision collider data | EPJC 77 (2017) 663 | 1706.00428 |
| 55 | GEANT4 Collaboration | GEANT 4 --- a simulation toolkit | NIM A 506 (2003) 250 | |
| 56 | P. Nason | A new method for combining NLO QCD with shower Monte Carlo algorithms | JHEP 11 (2004) 040 | hep-ph/0409146 |
| 57 | S. Frixione, P. Nason, and C. Oleari | Matching NLO QCD computations with Parton Shower simulations: the POWHEG method | JHEP 11 (2007) 070 | 0709.2092 |
| 58 | S. Alioli, P. Nason, C. Oleari, and E. Re | A general framework for implementing NLO calculations in shower Monte Carlo programs: the POWHEG BOX | JHEP 06 (2010) 043 | 1002.2581 |
| 59 | E. Re | Single-top Wt-channel production matched with parton showers using the POWHEG method | EPJC 71 (2011) 1547 | 1009.2450 |
| 60 | S. Alioli, P. Nason, C. Oleari, and E. Re | NLO single-top production matched with shower in POWHEG: s- and t-channel contributions | JHEP 09 (2009) 111 | 0907.4076 |
| 61 | S. Frixione, P. Nason, and G. Ridolfi | A positive-weight next-to-leading-order Monte Carlo for heavy flavour hadroproduction | JHEP 09 (2007) 126 | 0707.3088 |
| 62 | M. Czakon and A. Mitov | Top++: a program for the calculation of the top-pair cross-section at hadron colliders | Comput. Phys. Commun. 185 (2014) 2930 | 1112.5675 |
| 63 | J. M. Campbell and R. K. Ellis | MCFM for the Tevatron and the LHC | Nucl. Phys. B -, 2010 Proc. Suppl. 205 (2010) 10 |
1007.3492 |
| 64 | CMS Collaboration | Performance of electron reconstruction and selection with the CMS detector in proton-proton collisions at $ \sqrt{s}= $ 8 TeV | JINST 10 (2015) P06005 | CMS-EGM-13-001 1502.02701 |
| 65 | G. D'Agostini | A multidimensional unfolding method based on Bayes' theorem | NIM A 362 (1995) 487 | |
| 66 | T. Adye | Unfolding algorithms and tests using RooUnfold | CERN-2011-006, 313, 2011 | 1105.1160 |
| 67 | CMS Collaboration | Jet algorithms performance in 13 TeV data | CMS Physics Analysis Summary , CERN, 2017 link |
CMS-PAS-JME-16-003 |
| 68 | CMS Collaboration | Precision luminosity measurement in proton-proton collisions at $ \sqrt{s} = $ 13 TeV in 2015 and 2016 at CMS | EPJC 81 (2021) 800 | CMS-LUM-17-003 2104.01927 |
| 69 | CMS Collaboration | Measurement of the inelastic proton-proton cross section at $ \sqrt{s}= $ 13 TeV | JHEP 07 (2018) 161 | CMS-FSQ-15-005 1802.02613 |
| 70 | L. Lyons, D. Gibaut, and P. Clifford | How to combine correlated estimates of a single physical quantity | NIM A 270 (1988) 110 | |
| 71 | A. Valassi | Combining correlated measurements of several different physical quantities | NIM 500 (2003) 391 | |
| 72 | M. Bansal, S. Bansal, R. Kumar, and J. B. Singh | New observables for multiple-parton interactions measurements using Z+jets processes at the LHC | PRD 93 (2016) 054019 | 1602.05392 |
| 73 | Y.-T. Chien et al. | Precision boson-jet azimuthal decorrelation at hadron colliders | 2205.05104 | |
| 74 | CMS Collaboration | HEPData record for this analysis | link | |
|
|
Compact Muon Solenoid LHC, CERN |
|

|

|

|

|

|