

Compact Muon Solenoid
LHC, CERN
| CMS-PAS-SMP-20-013 | ||
| Search for vector boson scattering at the LHC Run 2 with CMS data in the semi-leptonic $\ell\nu \mathrm{qq}$ final state | ||
| CMS Collaboration | ||
| July 2021 | ||
| Abstract: A search for electroweak (EW) vector boson scattering in the semi-leptonic decay $\ell\nu \mathrm{qq}$ channel is reported. The search uses the full Run-II CMS dataset of proton-proton collisions at 13 TeV corresponding to an integrated luminosity of 137 fb$^{-1}$. Events are selected requiring one lepton (electron or muon), moderate missing transverse momentum, two jets with large pseudorapidity separation and dijet mass, and an additional hadronic signature consistent with the decay of a W/Z boson. Events are separated in two categories: either the hadronically decaying W/Z boson is reconstructed as one large-radius jet, or it is identified as a pair of jets with dijet mass close to the boson mass. The signal strength is measured fitting the shape of multivariate machine learning discriminators, implemented to separate the signal from the backgrounds in each category. The observed EW signal strength is $\mu_{\text{EW}} = $ 0.85 $ ^{+0.24}_{-0.20}$ $=$ 0.85$^{+0.21}_{-0.17}$ (syst) $^{+0.12}_{-0.12}$ (stat), corresponding to a signal significance of 4.4 standard deviations (5.1 expected): the first evidence of vector boson scattering in the semileptonic channel at LHC. A simultaneous measurement of the EW and QCD WW and WZ production is also performed in the same phase space and found to be in agreement within uncertainty with the standard model prediction. | ||
|
Links:
CDS record (PDF) ;
CADI line (restricted) ;
These preliminary results are superseded in this paper, PLB 834 (2022) 137438. The superseded preliminary plots can be found here. |
||
| Figures | |

png pdf |
Figure 1:
Example of a Feynman diagram contributing to the EW component of the process under study. |

png pdf |
Figure 2:
Analysis workflow: objects and categories selection followed by control regions (CR) and signal regions definition. |
png pdf |
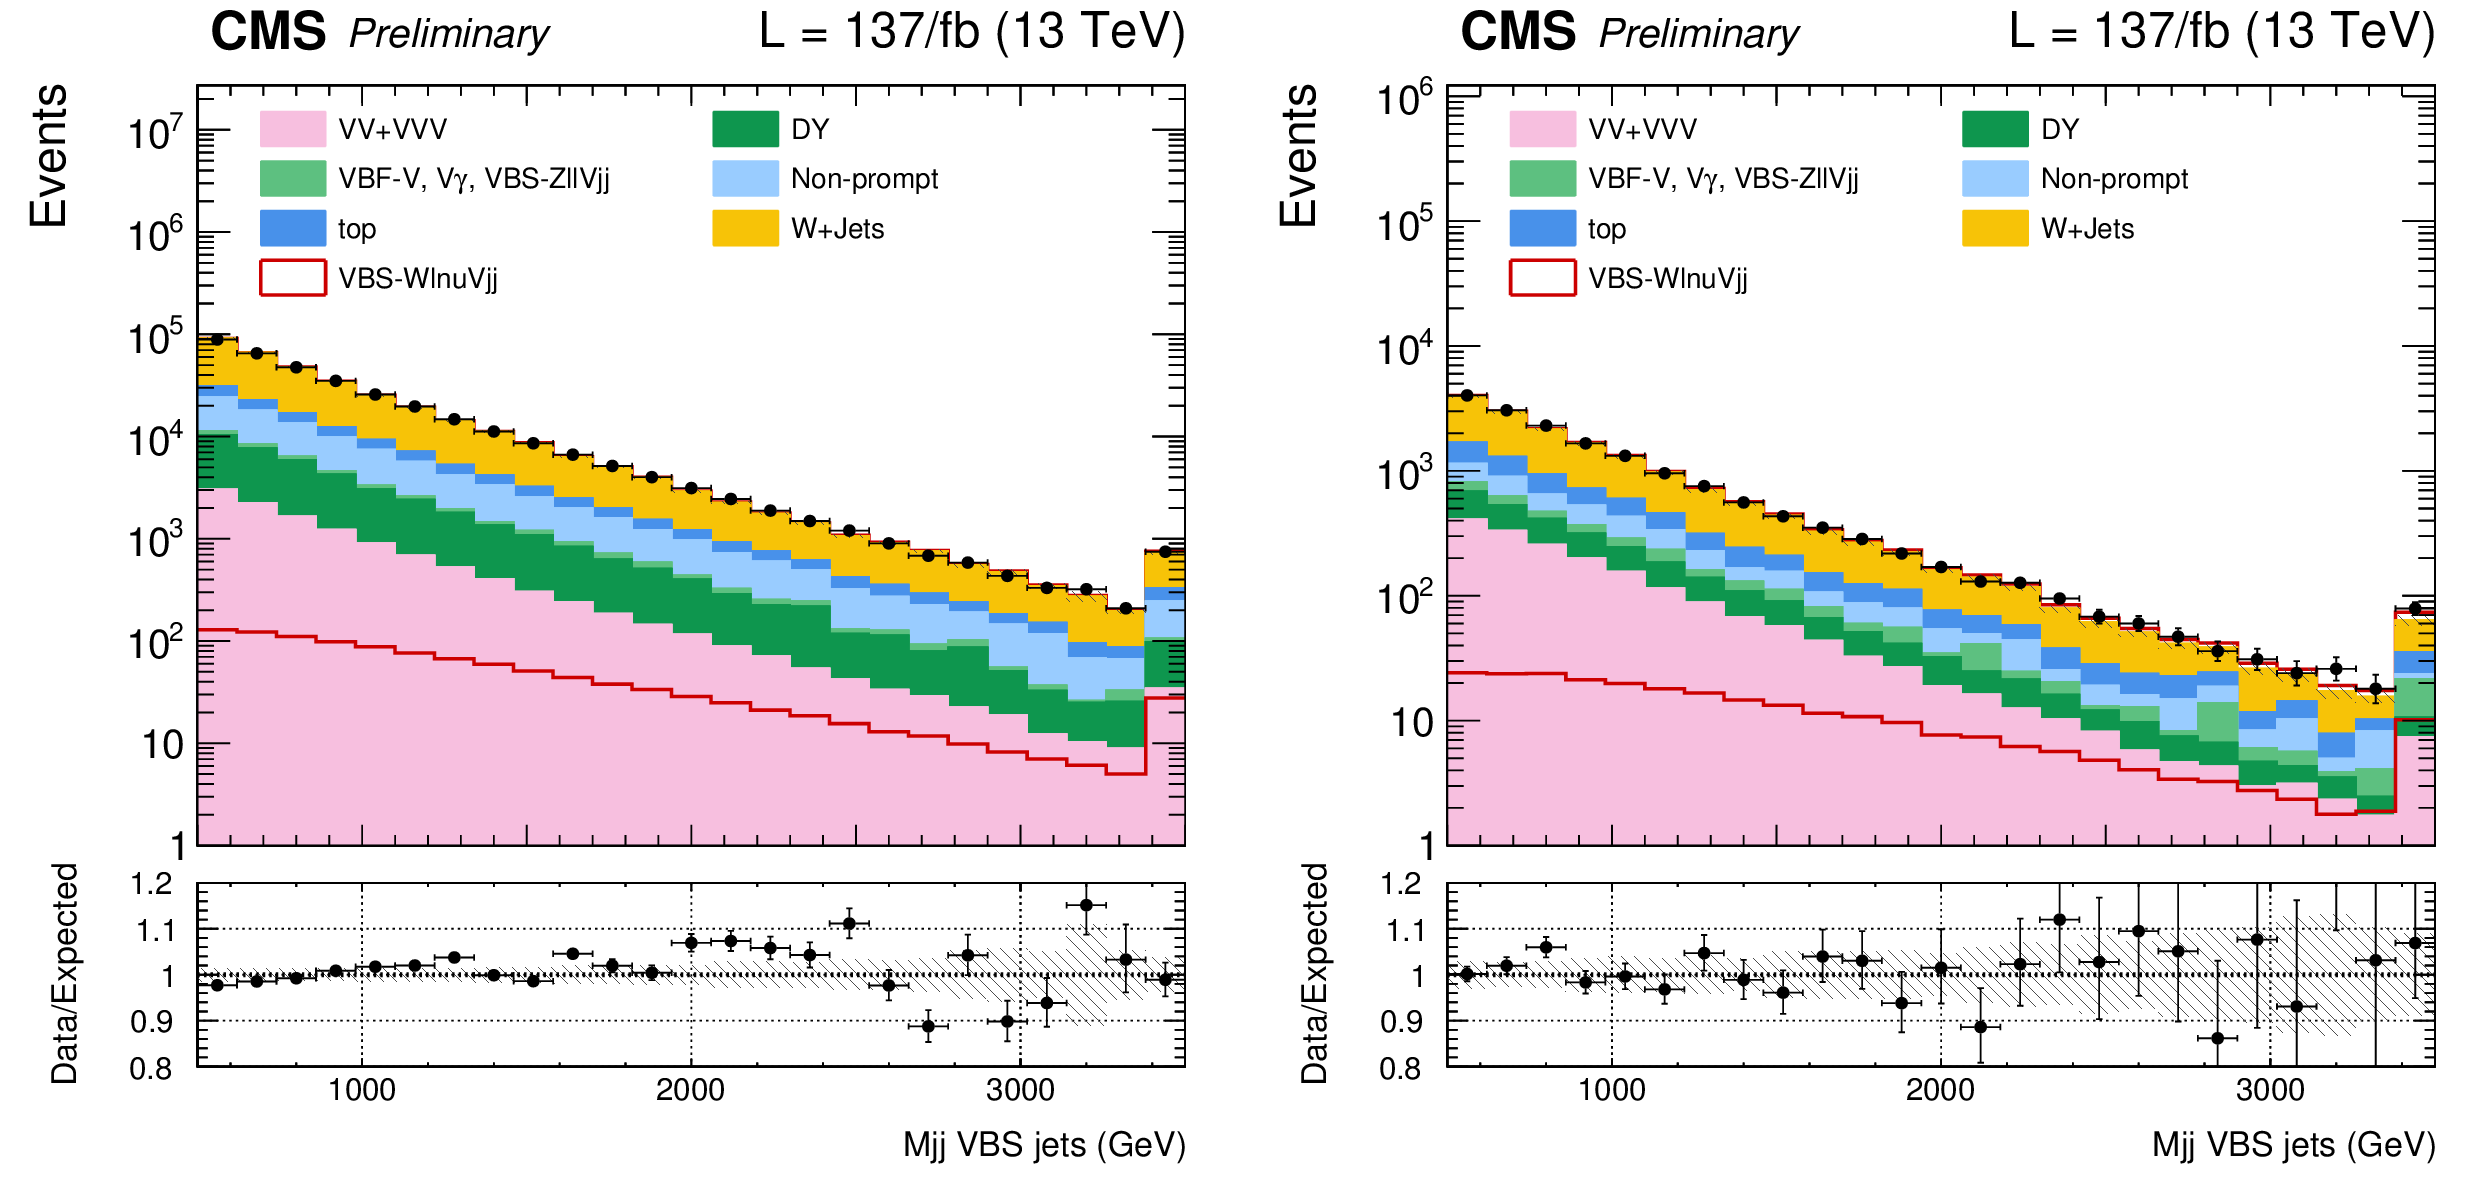
Figure 3:
Postfit distributions of ${m_{jj}^{\text{VBS}}}$ observable in the resolved (left) and boosted (right) signal regions. |

png pdf |
Figure 3-a:
Postfit distributions of ${m_{jj}^{\text{VBS}}}$ observable in the resolved (left) and boosted (right) signal regions. |
png pdf |
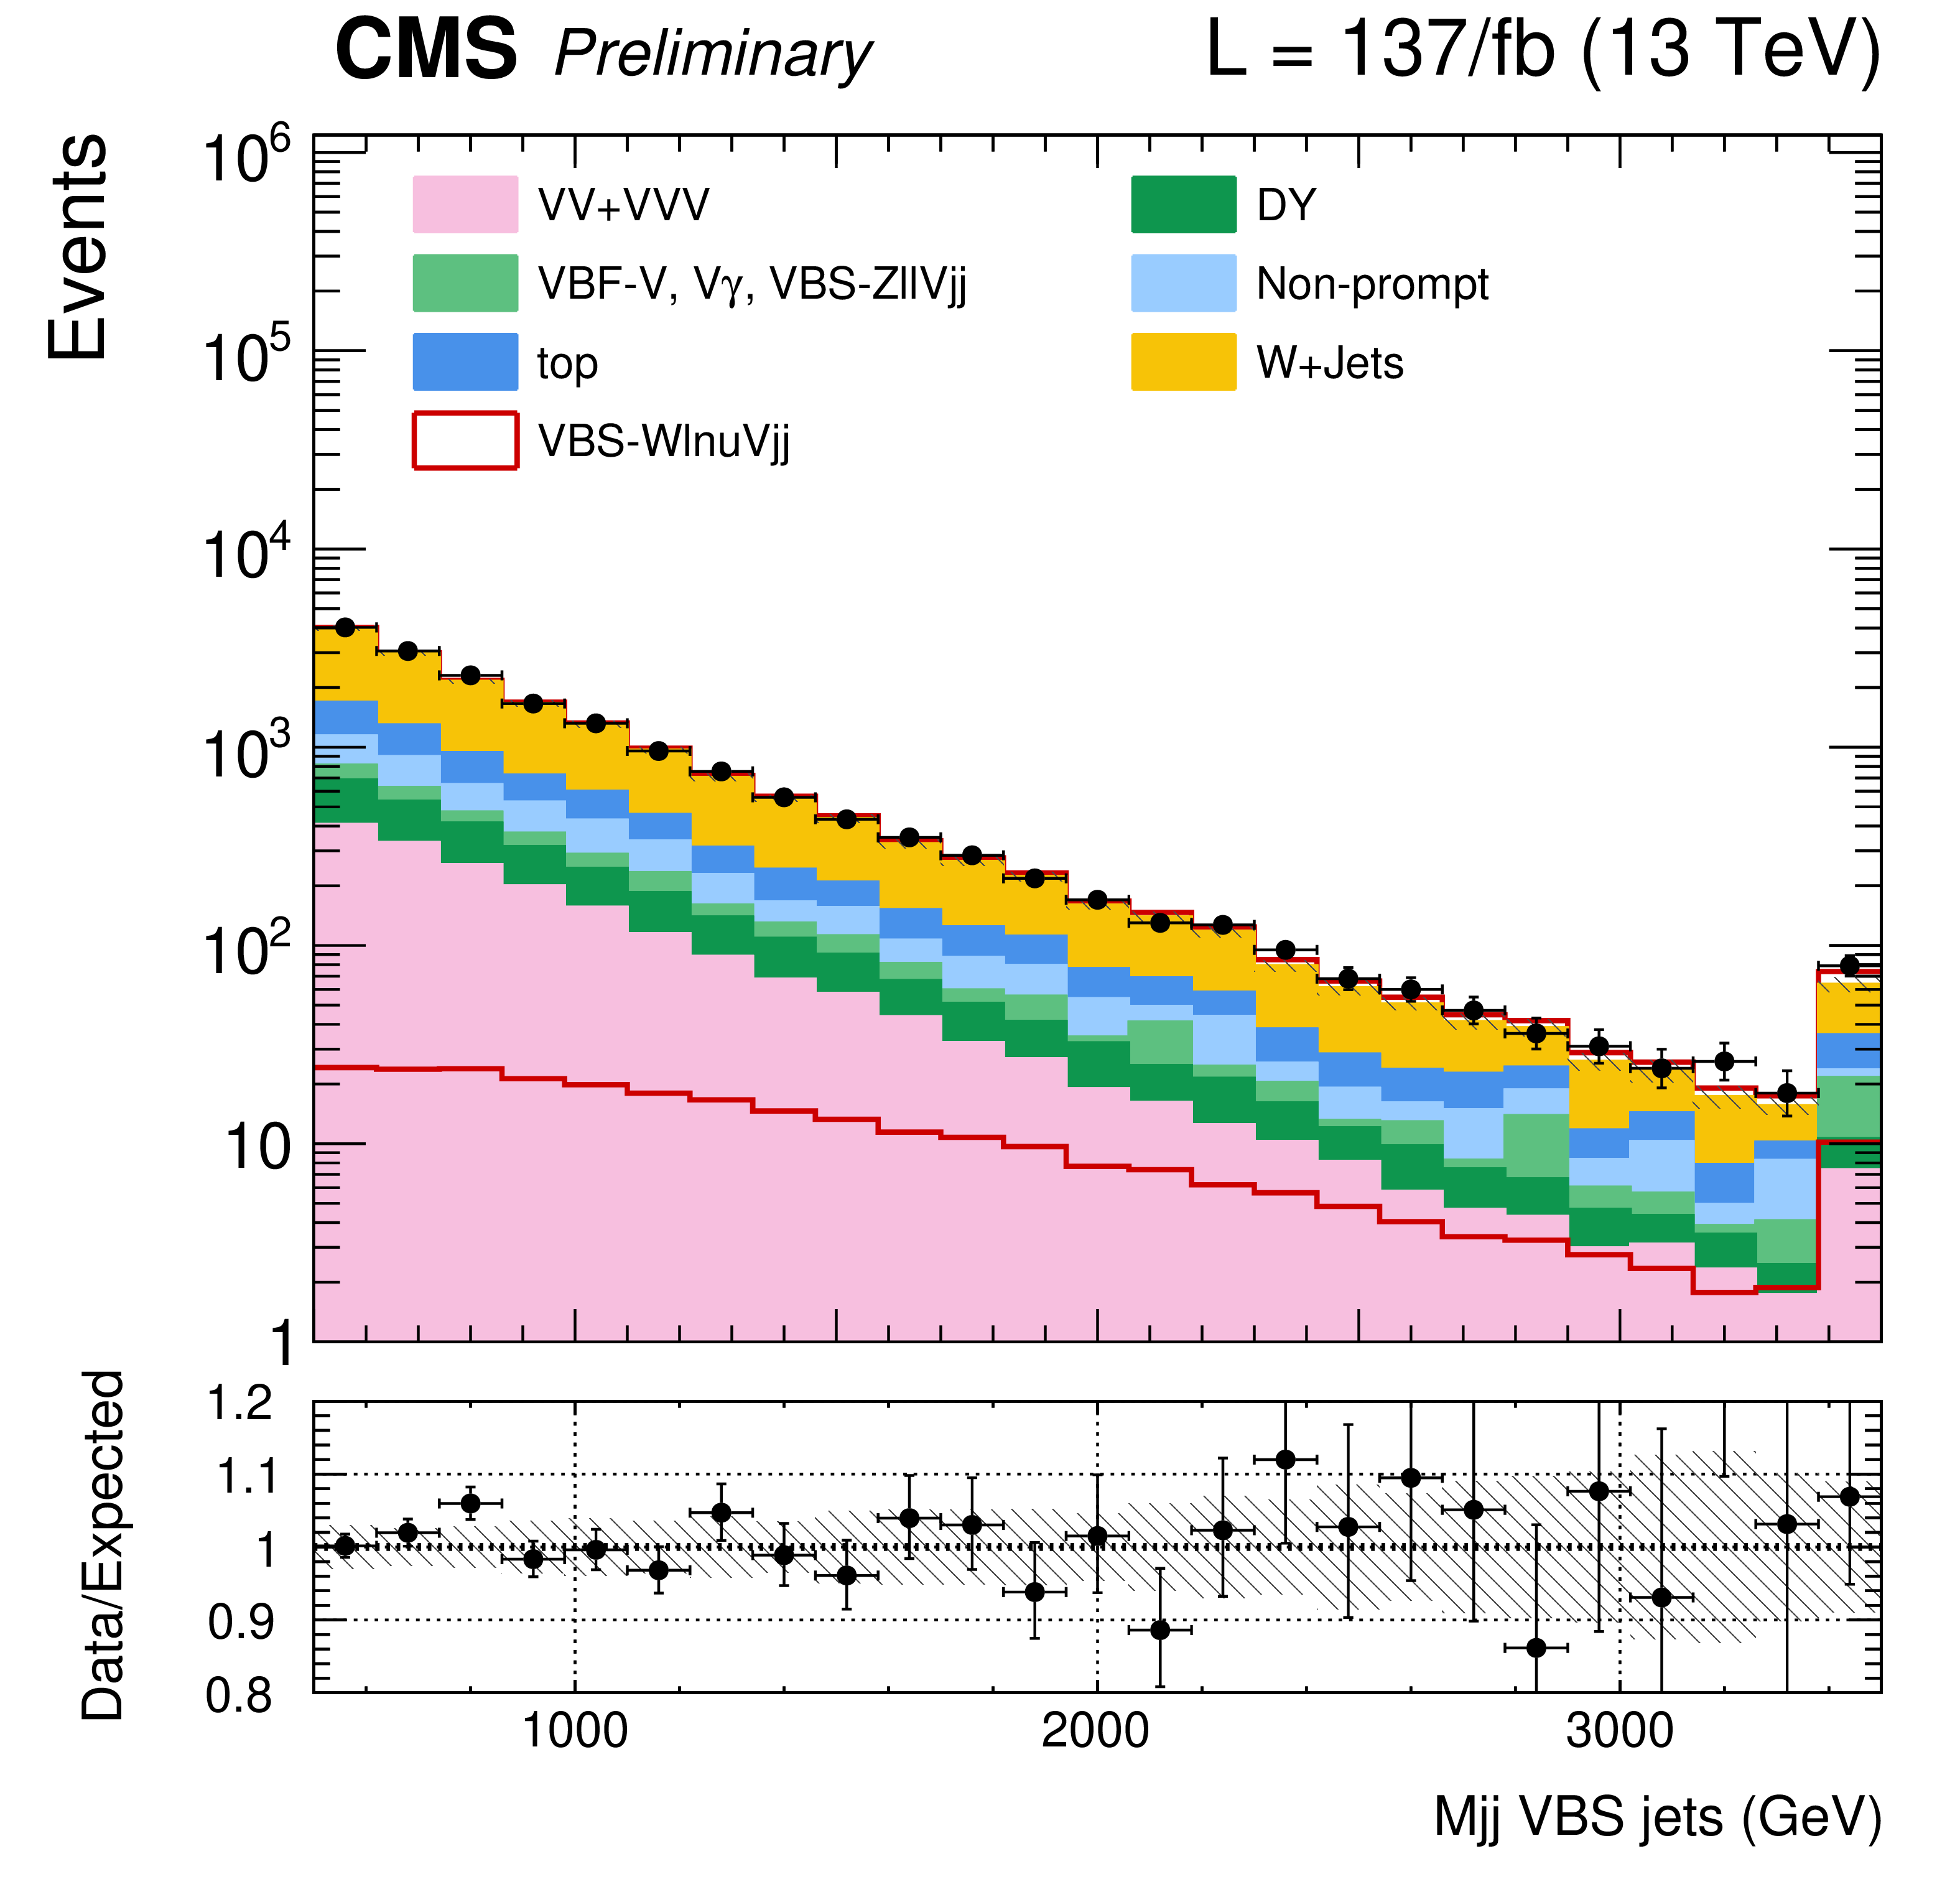
Figure 3-b:
Postfit distributions of ${m_{jj}^{\text{VBS}}}$ observable in the resolved (left) and boosted (right) signal regions. |
png pdf |
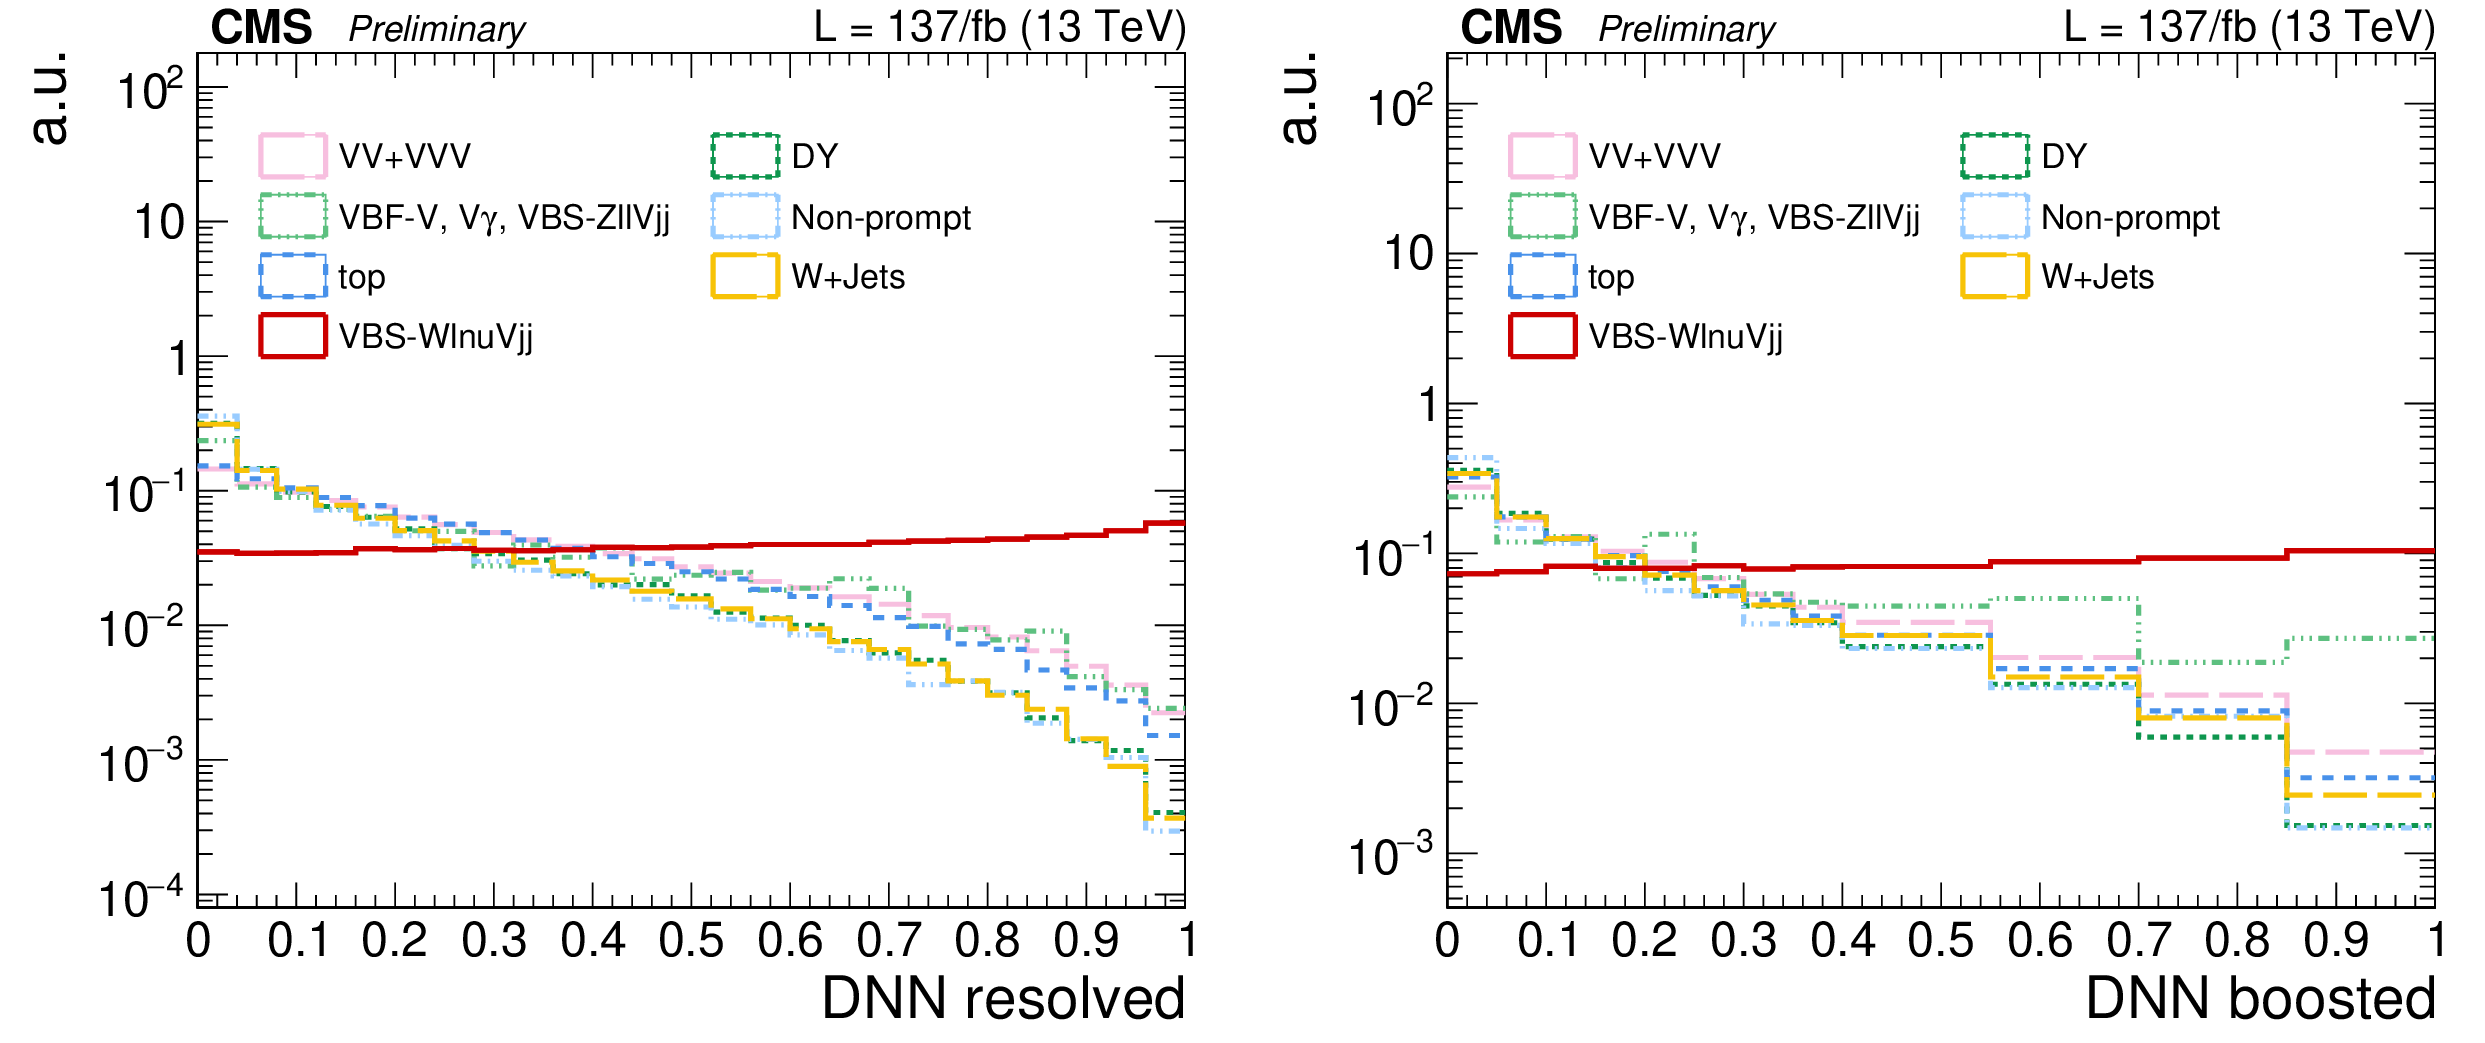
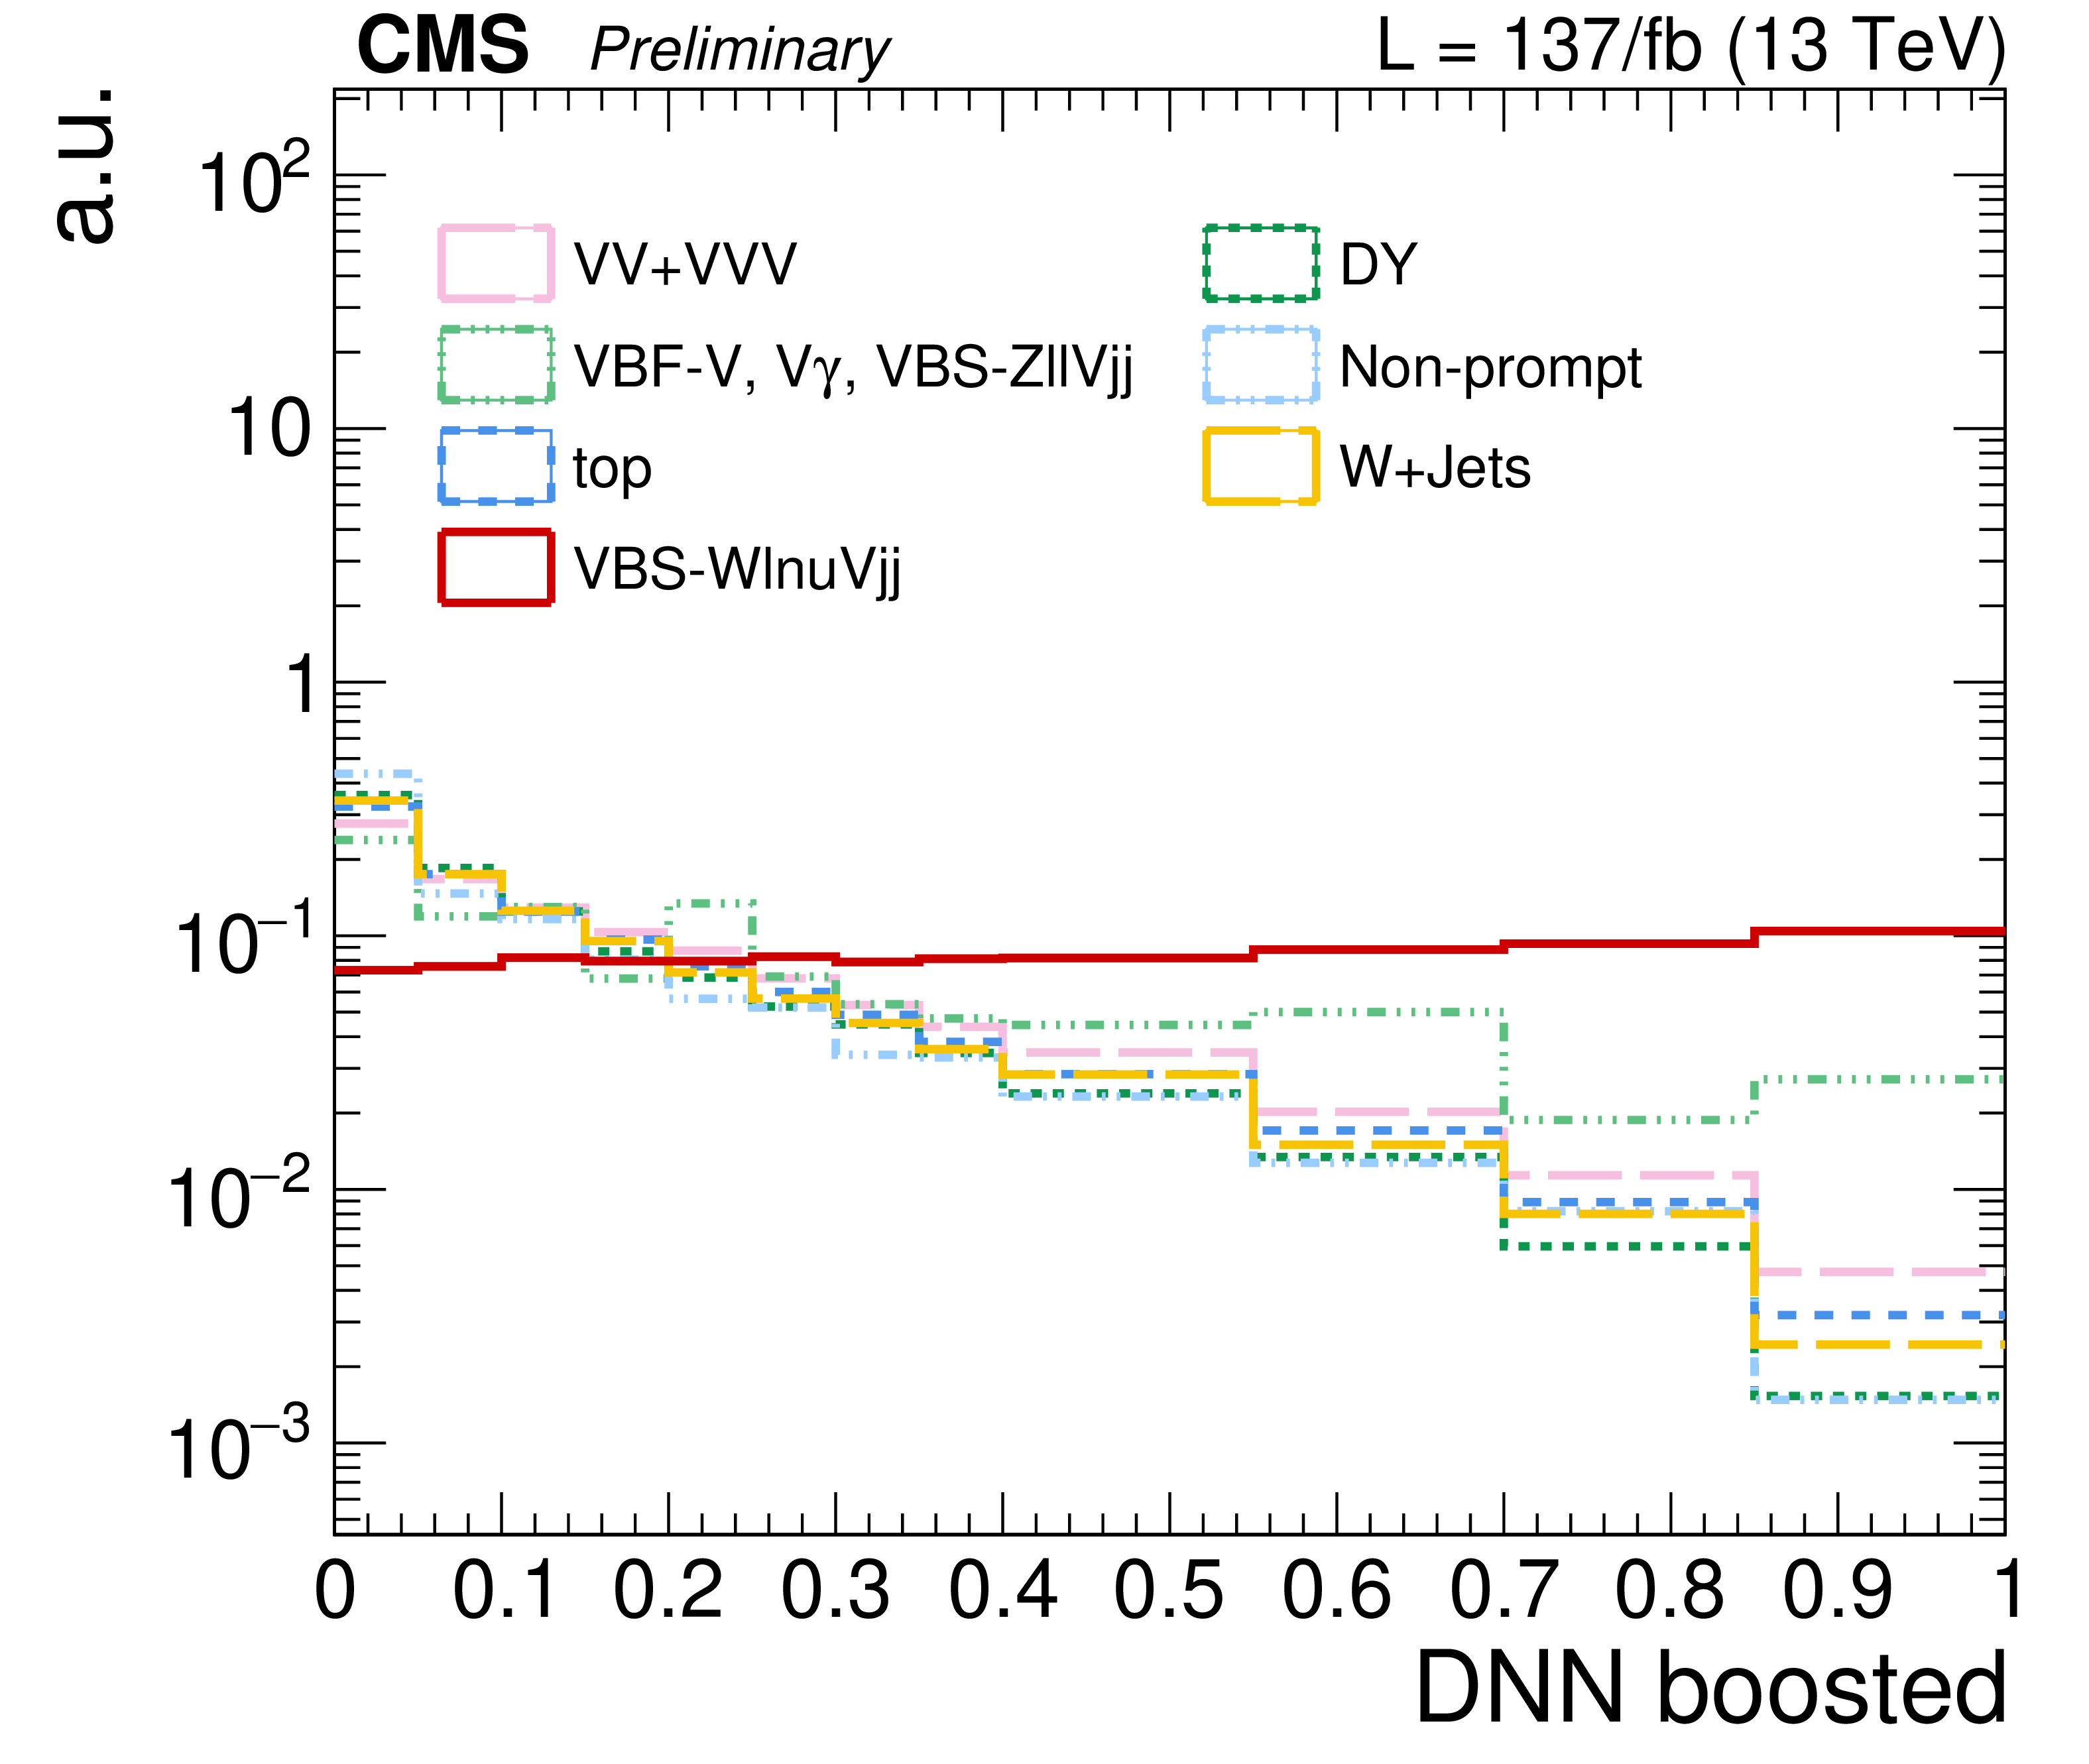
Figure 4:
The DNN distribution for VBS signal and backgrounds in the resolved (left) and boosted (right) signal regions normalized to 1. |
png pdf |
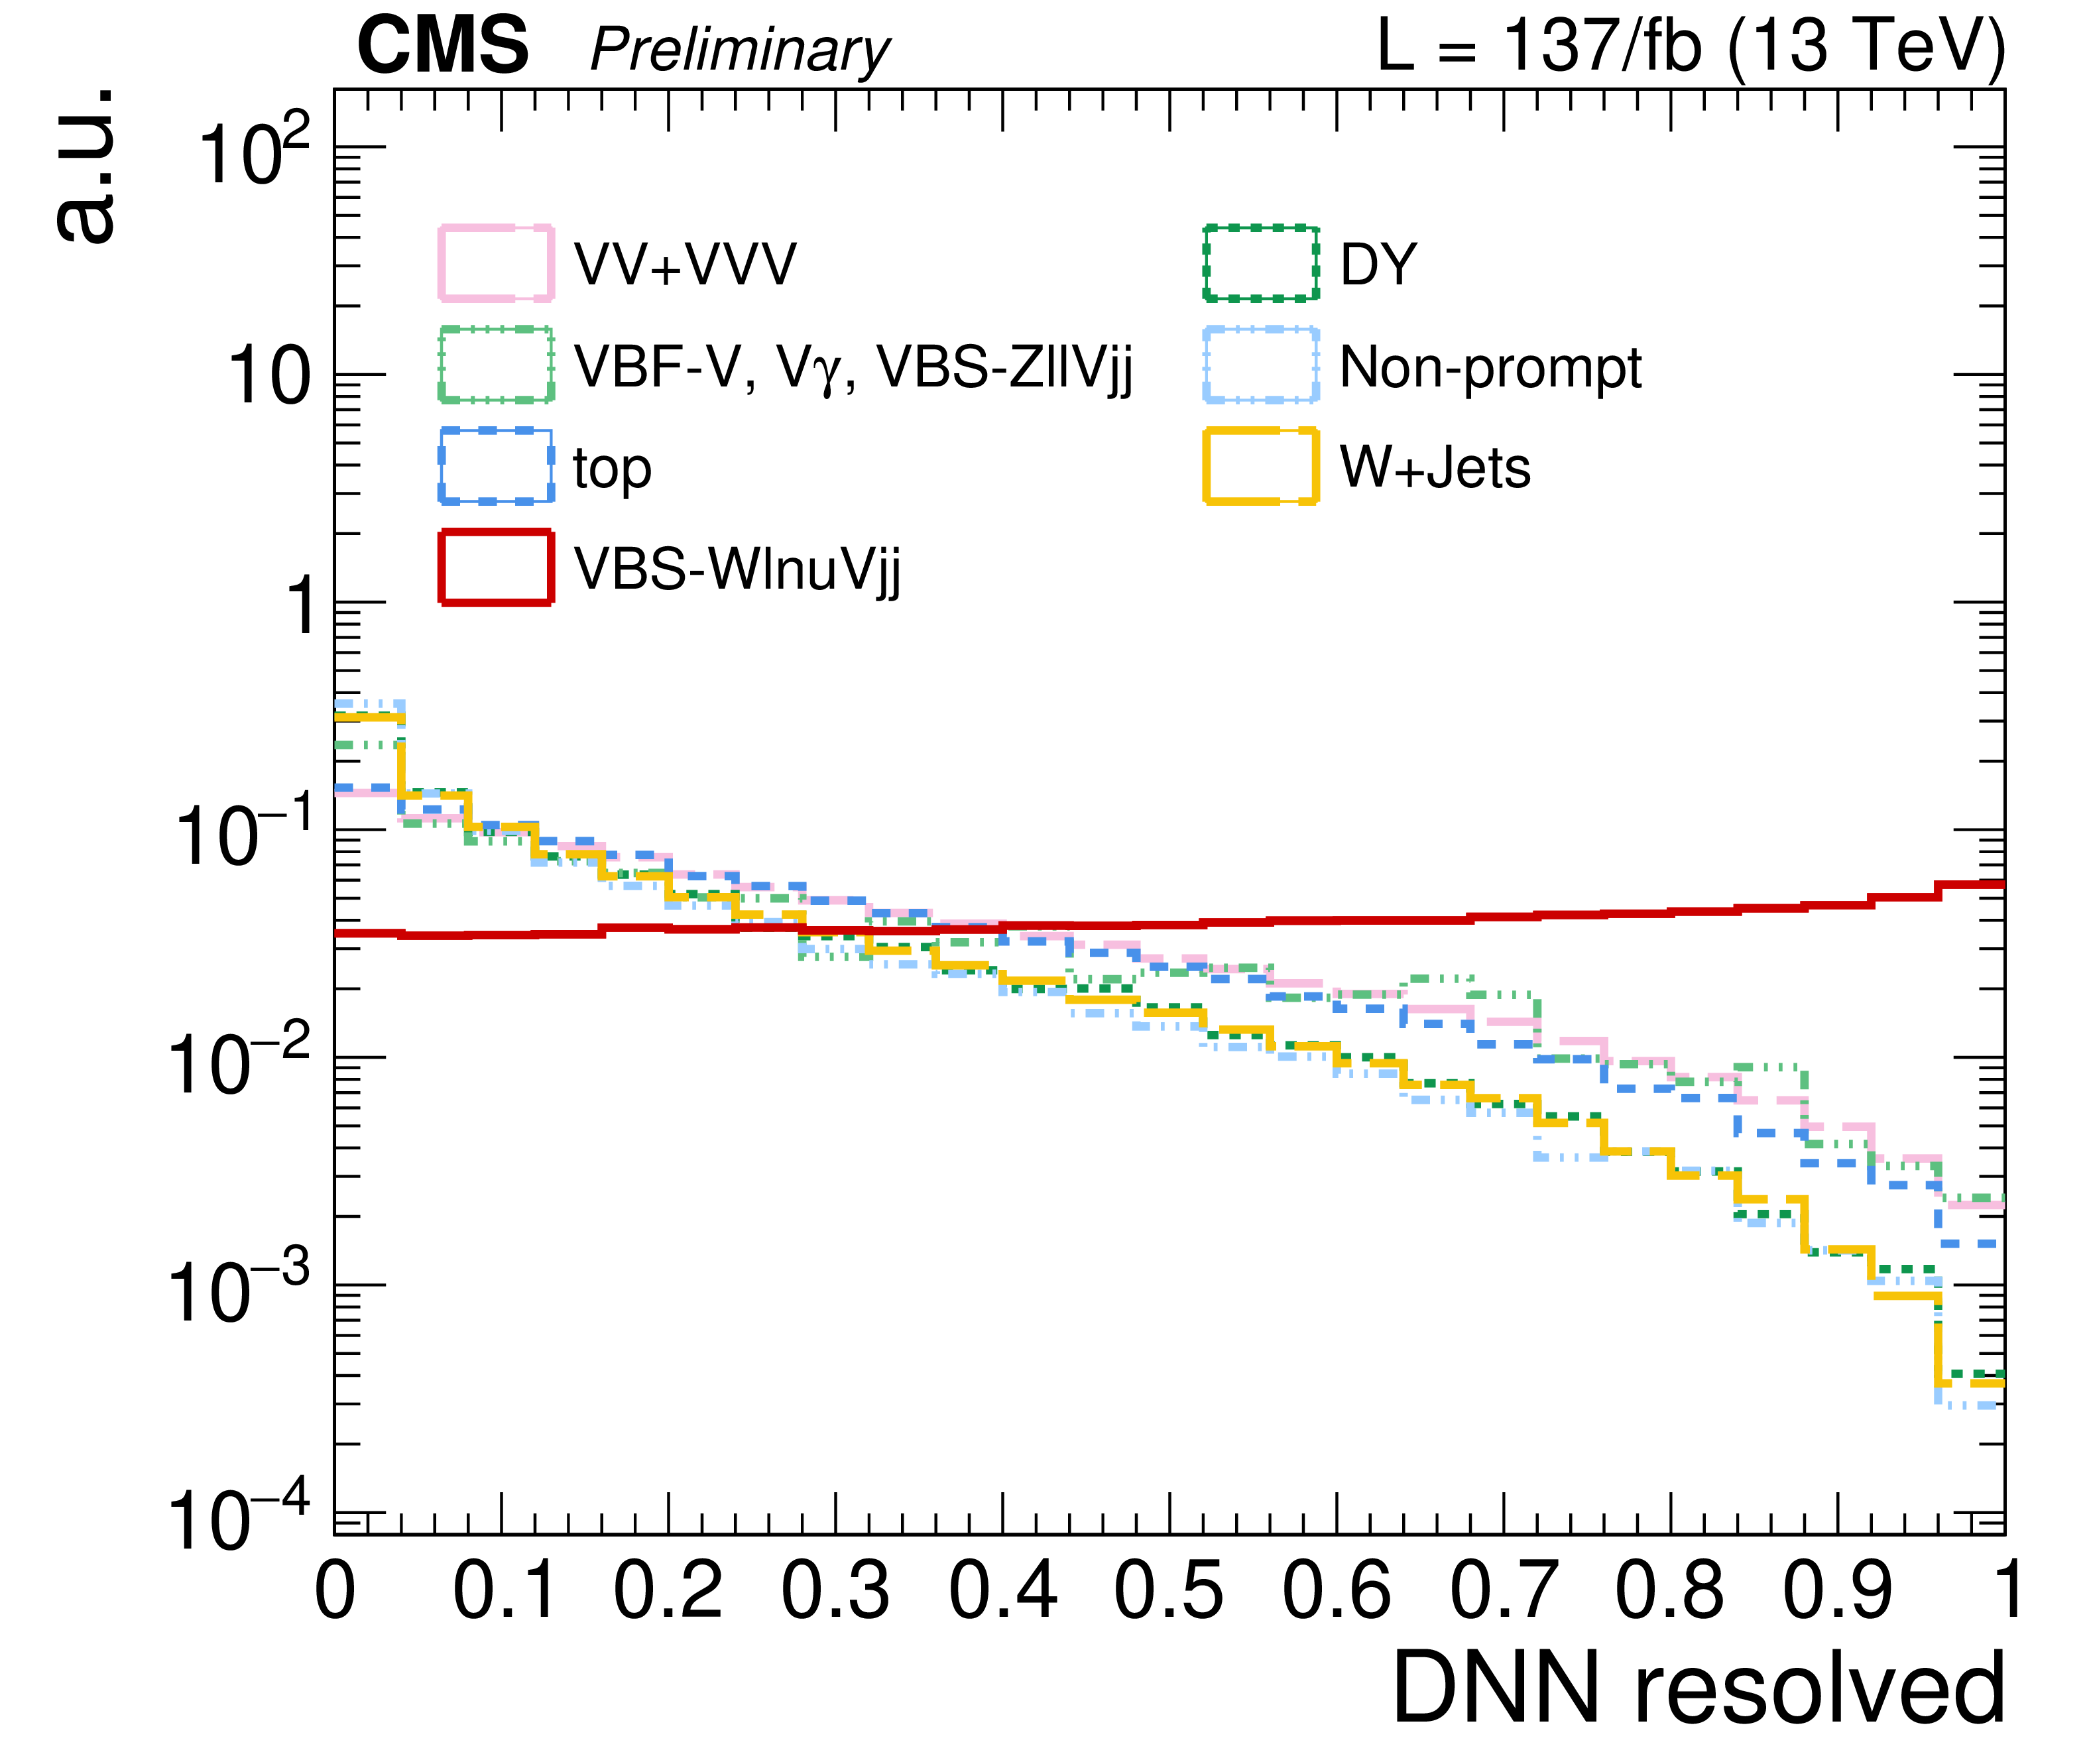
Figure 4-a:
The DNN distribution for VBS signal and backgrounds in the resolved (left) and boosted (right) signal regions normalized to 1. |
png pdf |
Figure 4-b:
The DNN distribution for VBS signal and backgrounds in the resolved (left) and boosted (right) signal regions normalized to 1. |
png pdf |
Figure 5:
The DNN distribution for the resolved (left) and boosted (right) phase space in the top-quark (upper plots) and W+jets (lower plots) control regions. The post-fit uncertainty band is also shown with all systematic uncertainties included. |
png pdf |
Figure 5-a:
The DNN distribution for the resolved (left) and boosted (right) phase space in the top-quark (upper plots) and W+jets (lower plots) control regions. The post-fit uncertainty band is also shown with all systematic uncertainties included. |

png pdf |
Figure 5-b:
The DNN distribution for the resolved (left) and boosted (right) phase space in the top-quark (upper plots) and W+jets (lower plots) control regions. The post-fit uncertainty band is also shown with all systematic uncertainties included. |
png pdf |
Figure 5-c:
The DNN distribution for the resolved (left) and boosted (right) phase space in the top-quark (upper plots) and W+jets (lower plots) control regions. The post-fit uncertainty band is also shown with all systematic uncertainties included. |
png pdf |
Figure 5-d:
The DNN distribution for the resolved (left) and boosted (right) phase space in the top-quark (upper plots) and W+jets (lower plots) control regions. The post-fit uncertainty band is also shown with all systematic uncertainties included. |
png pdf |
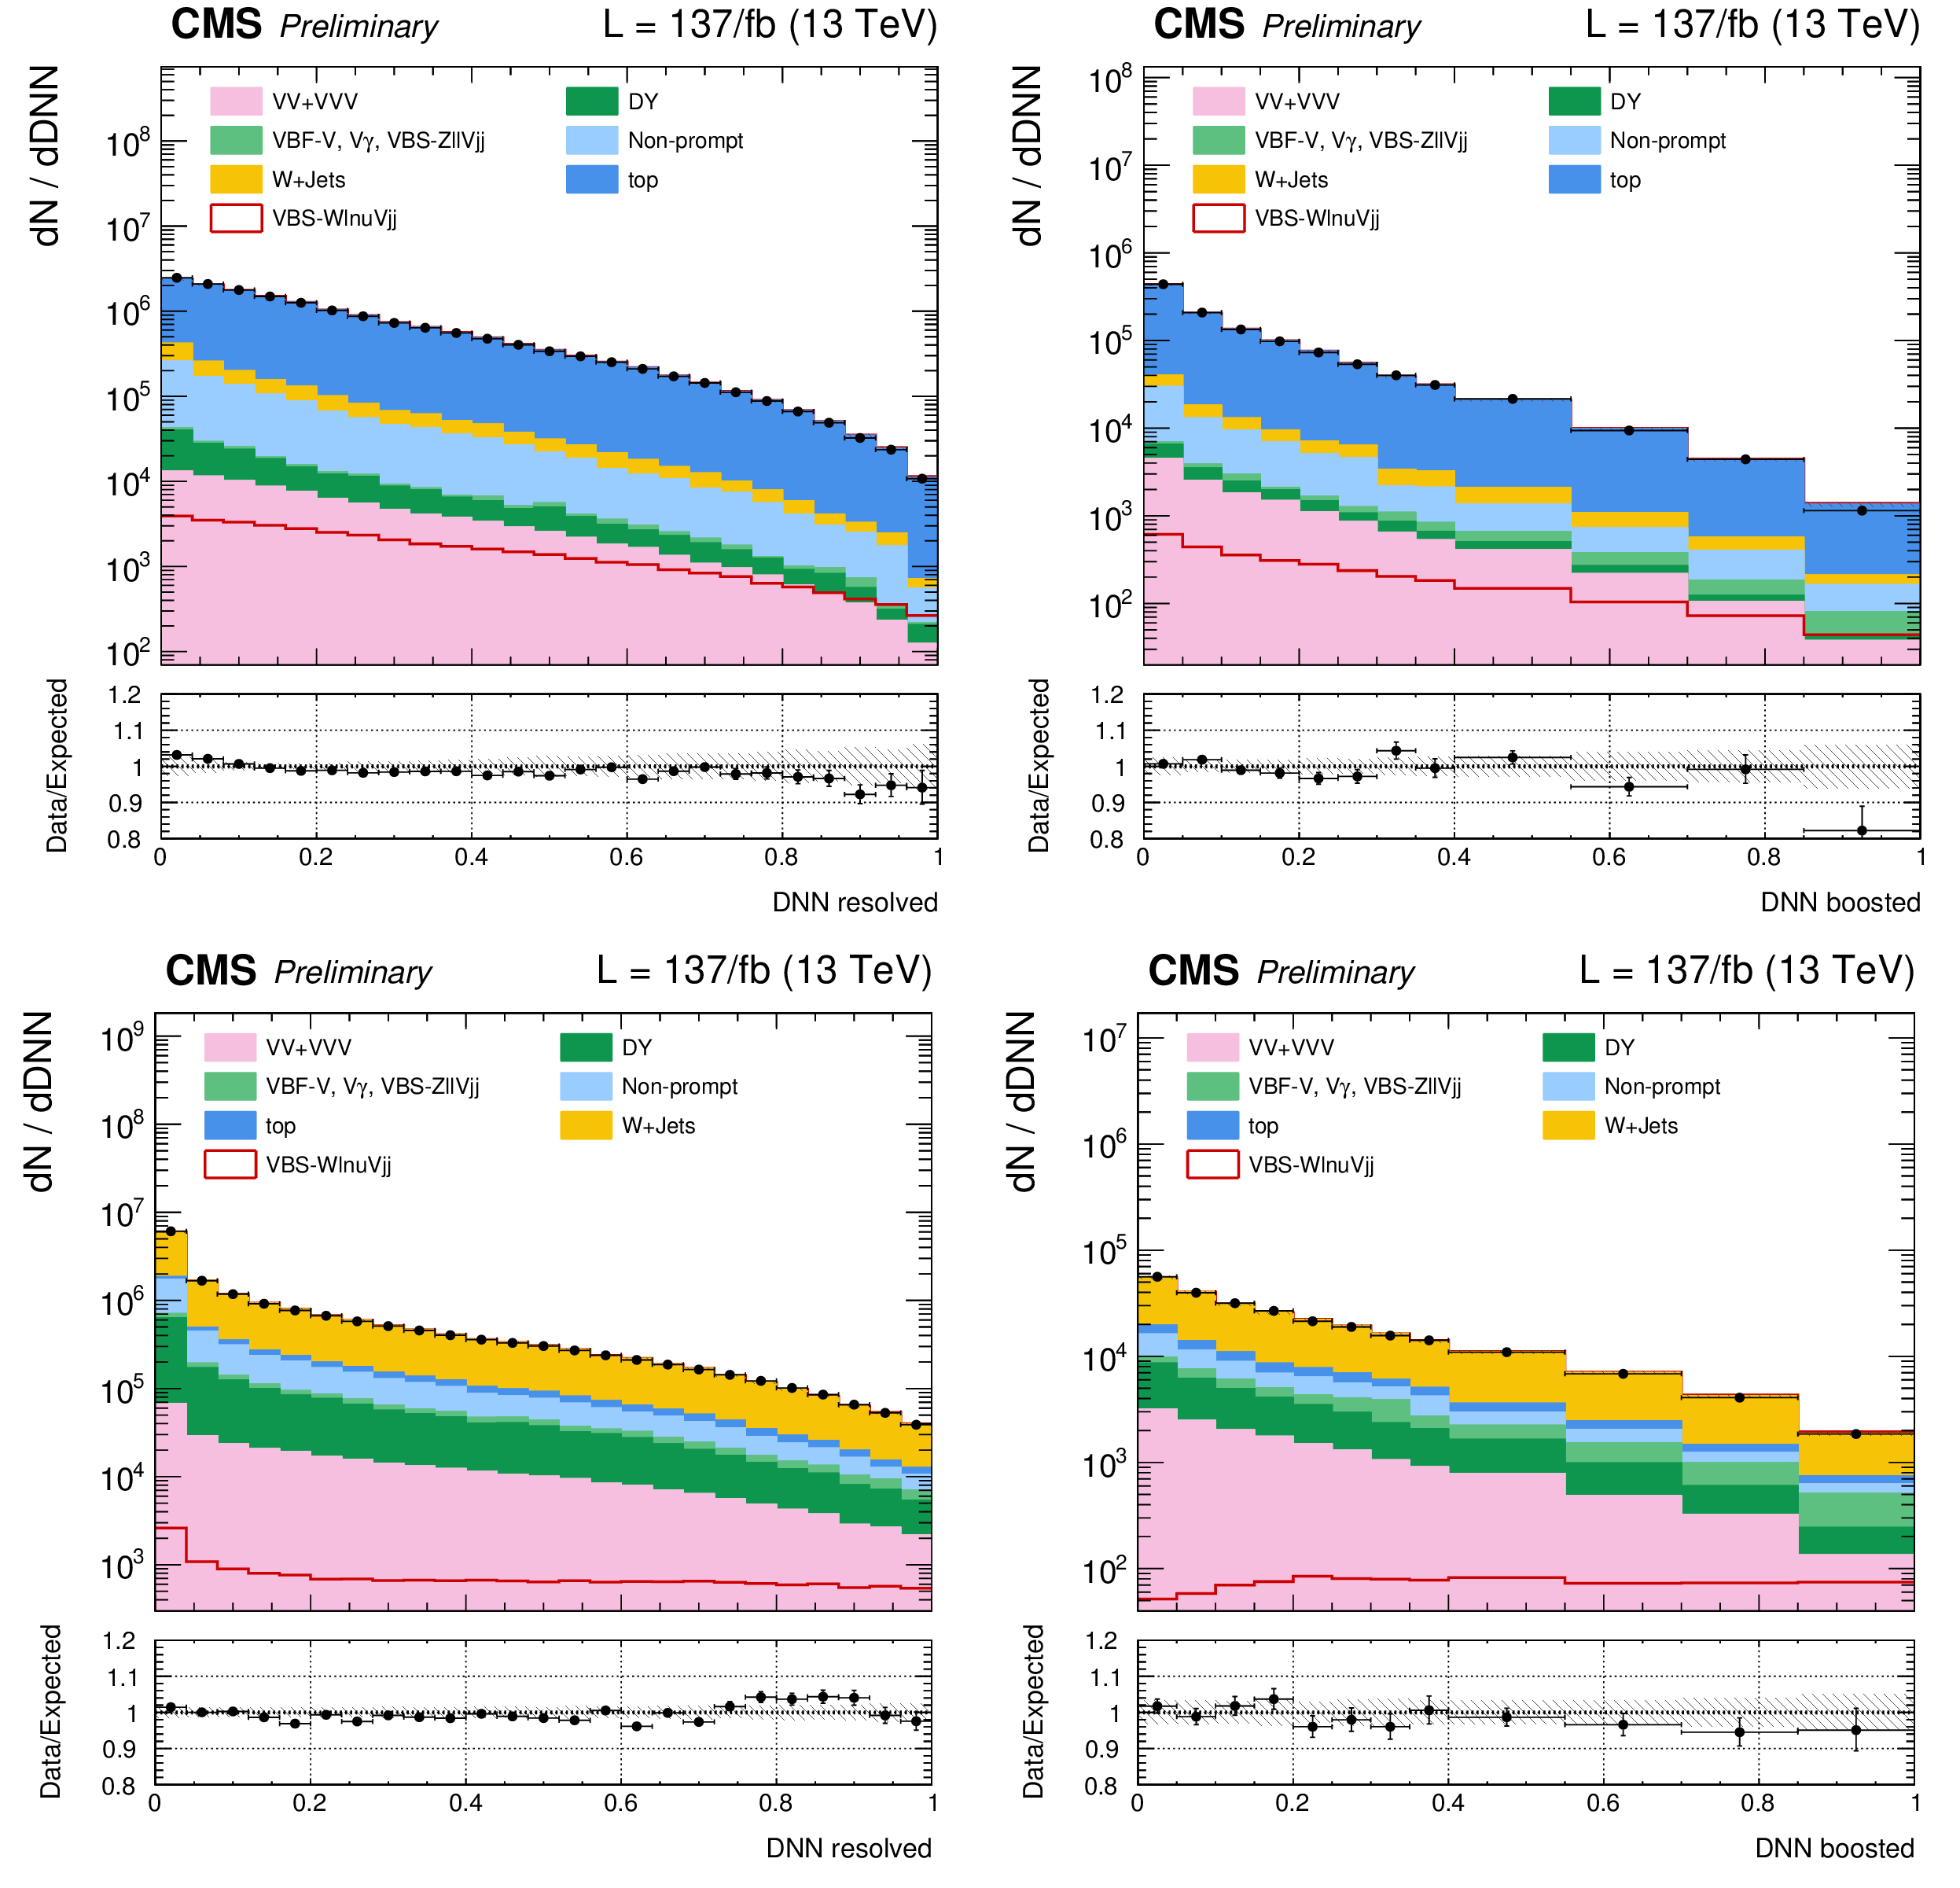
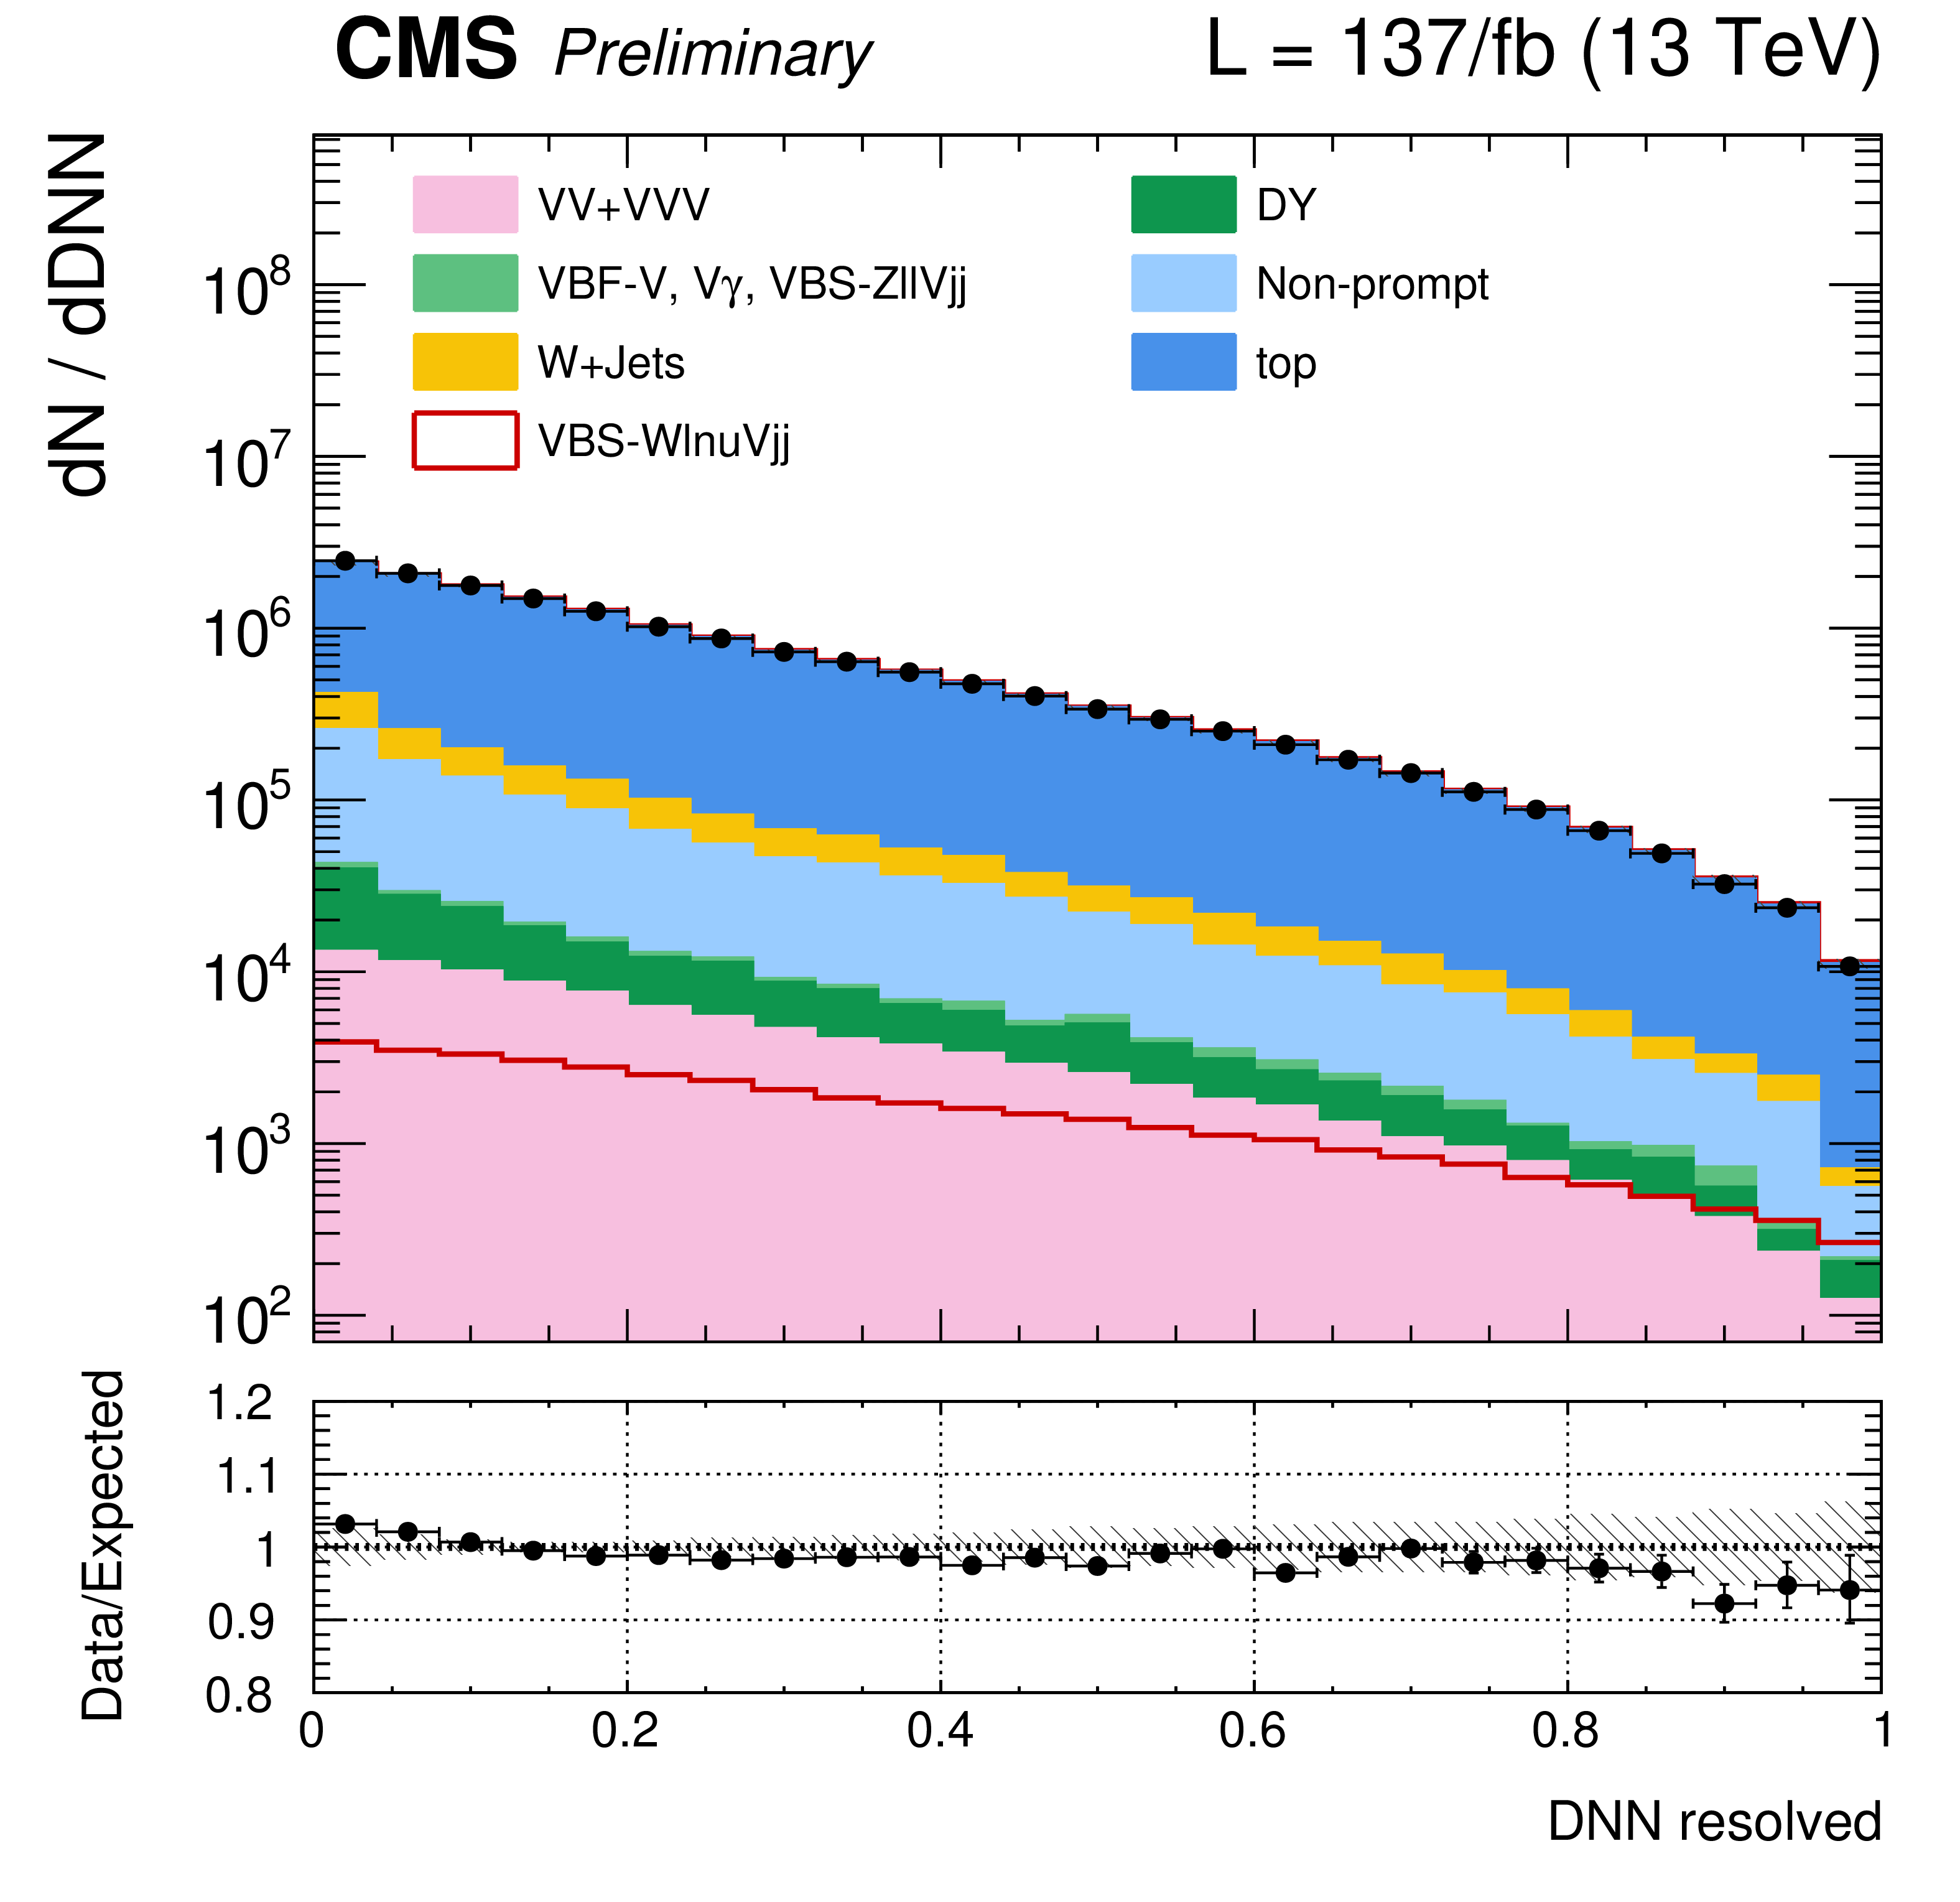
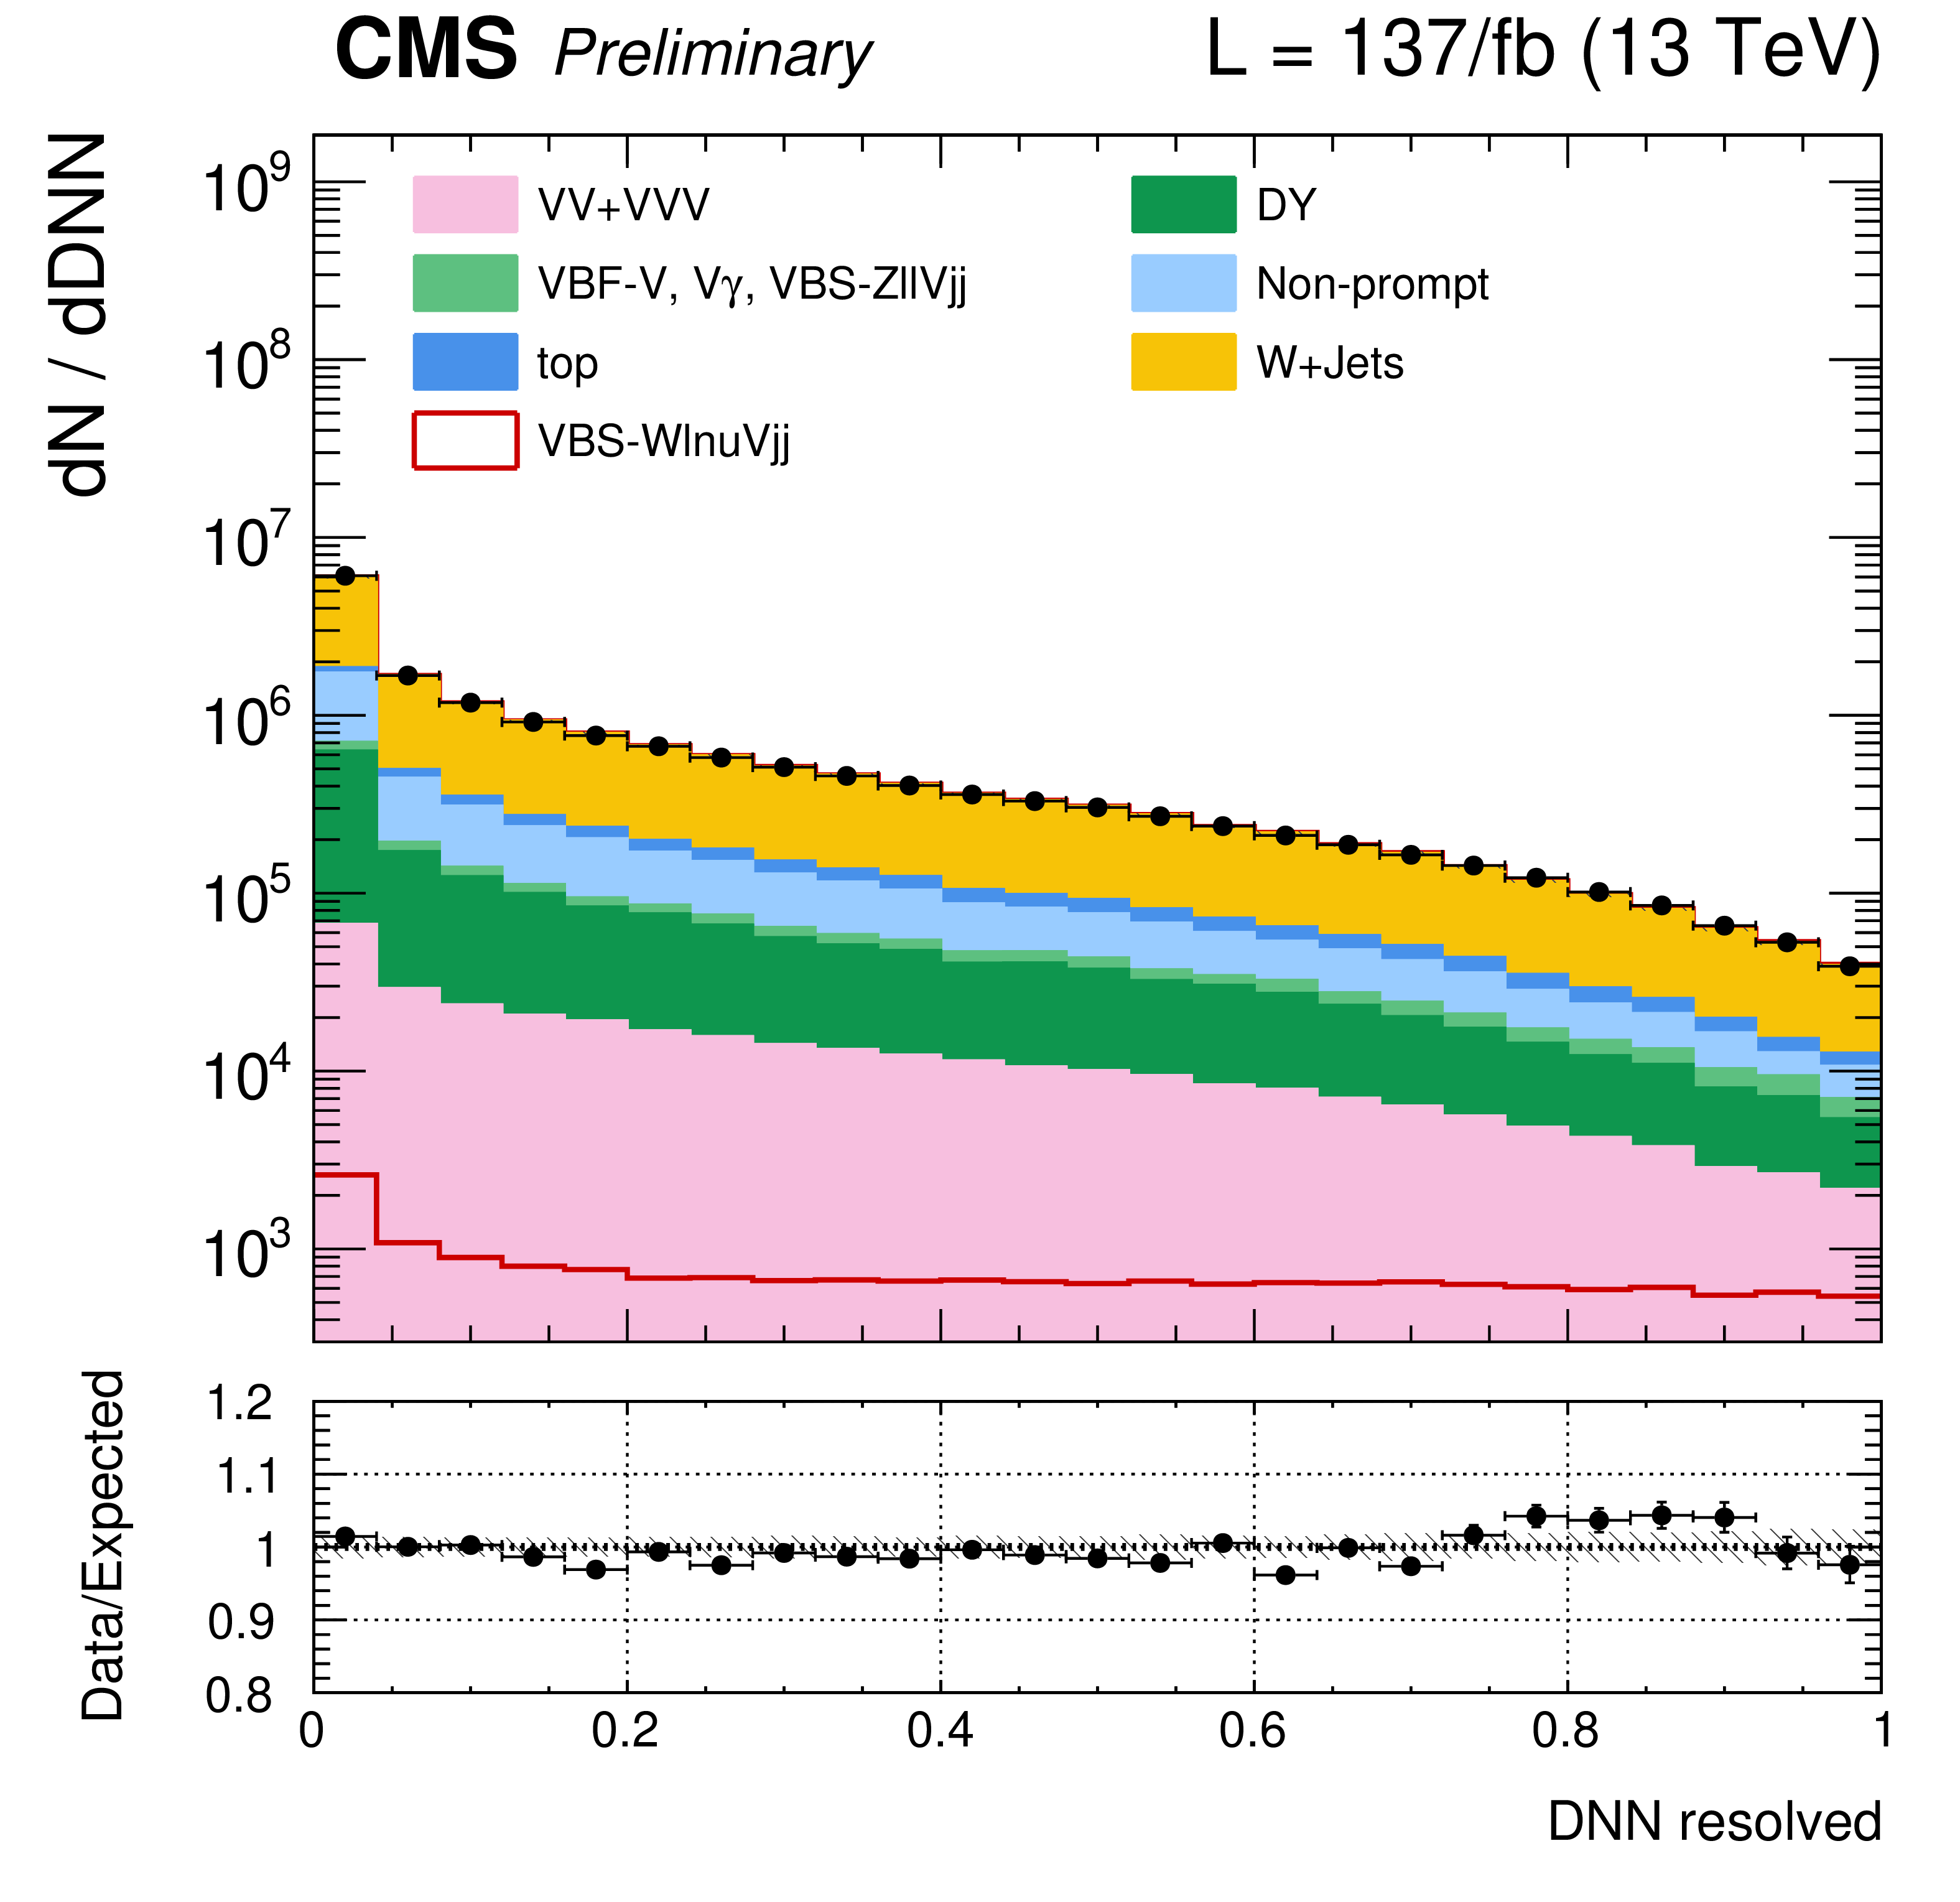
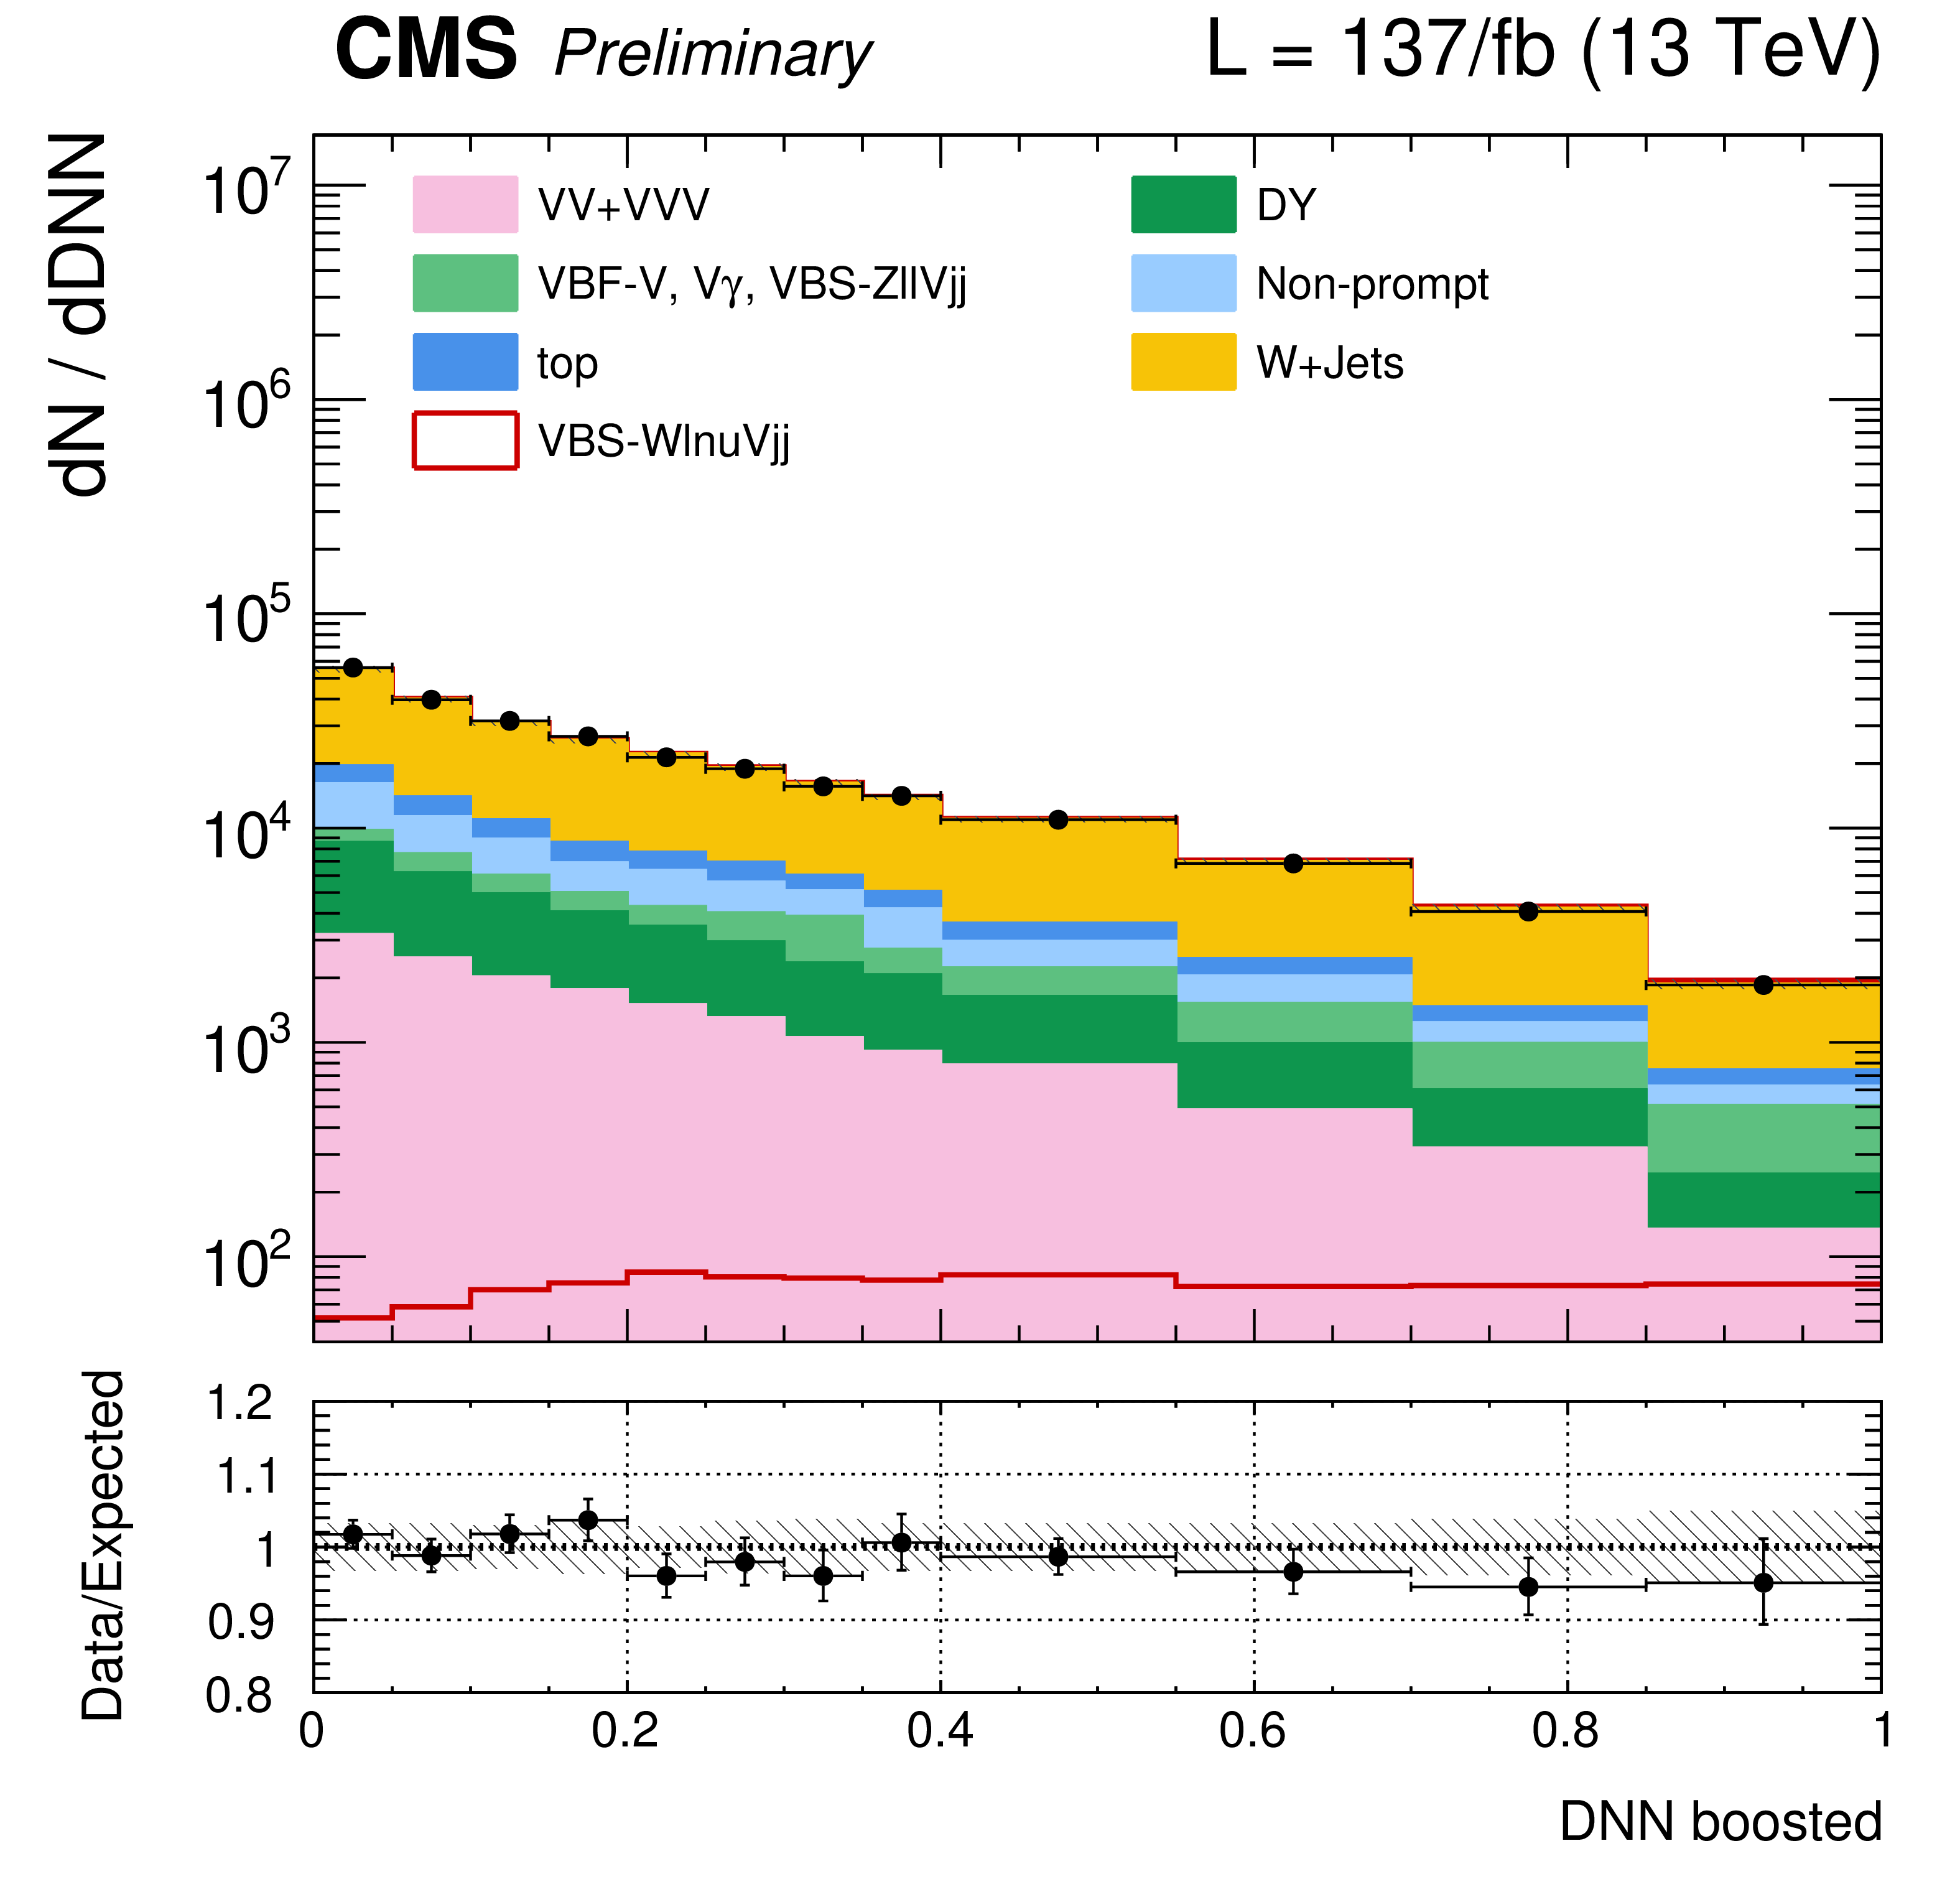
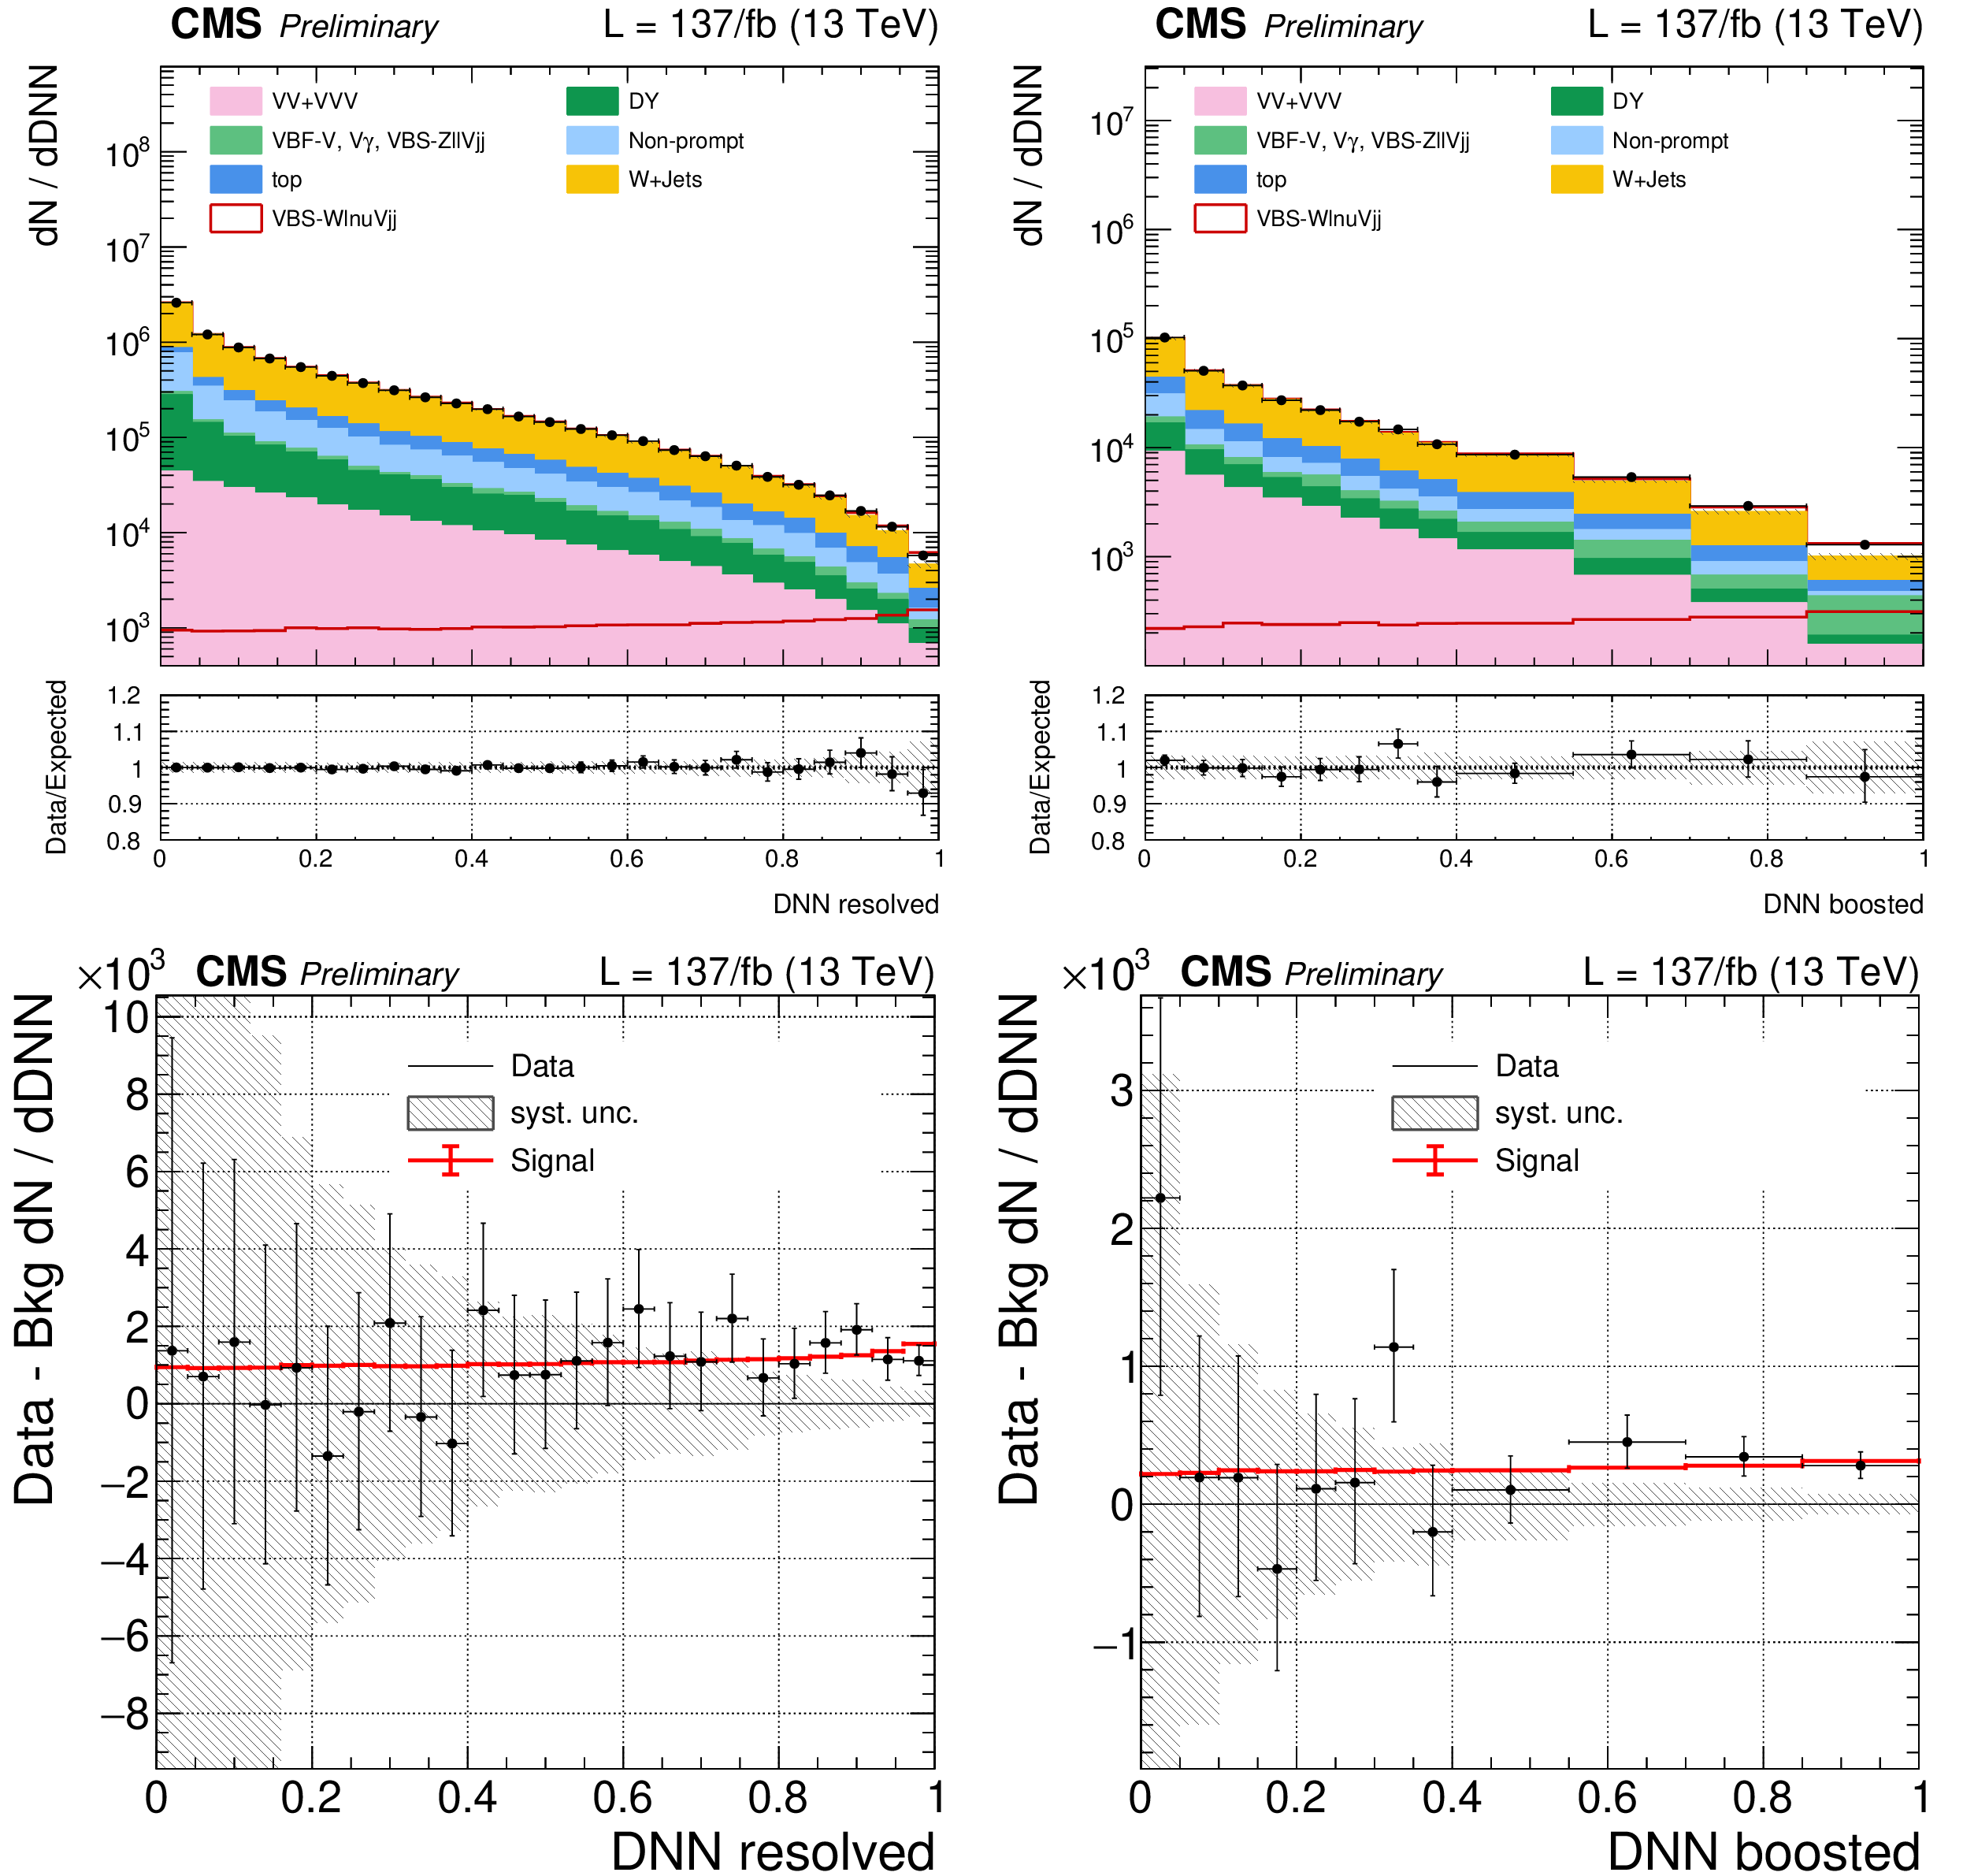
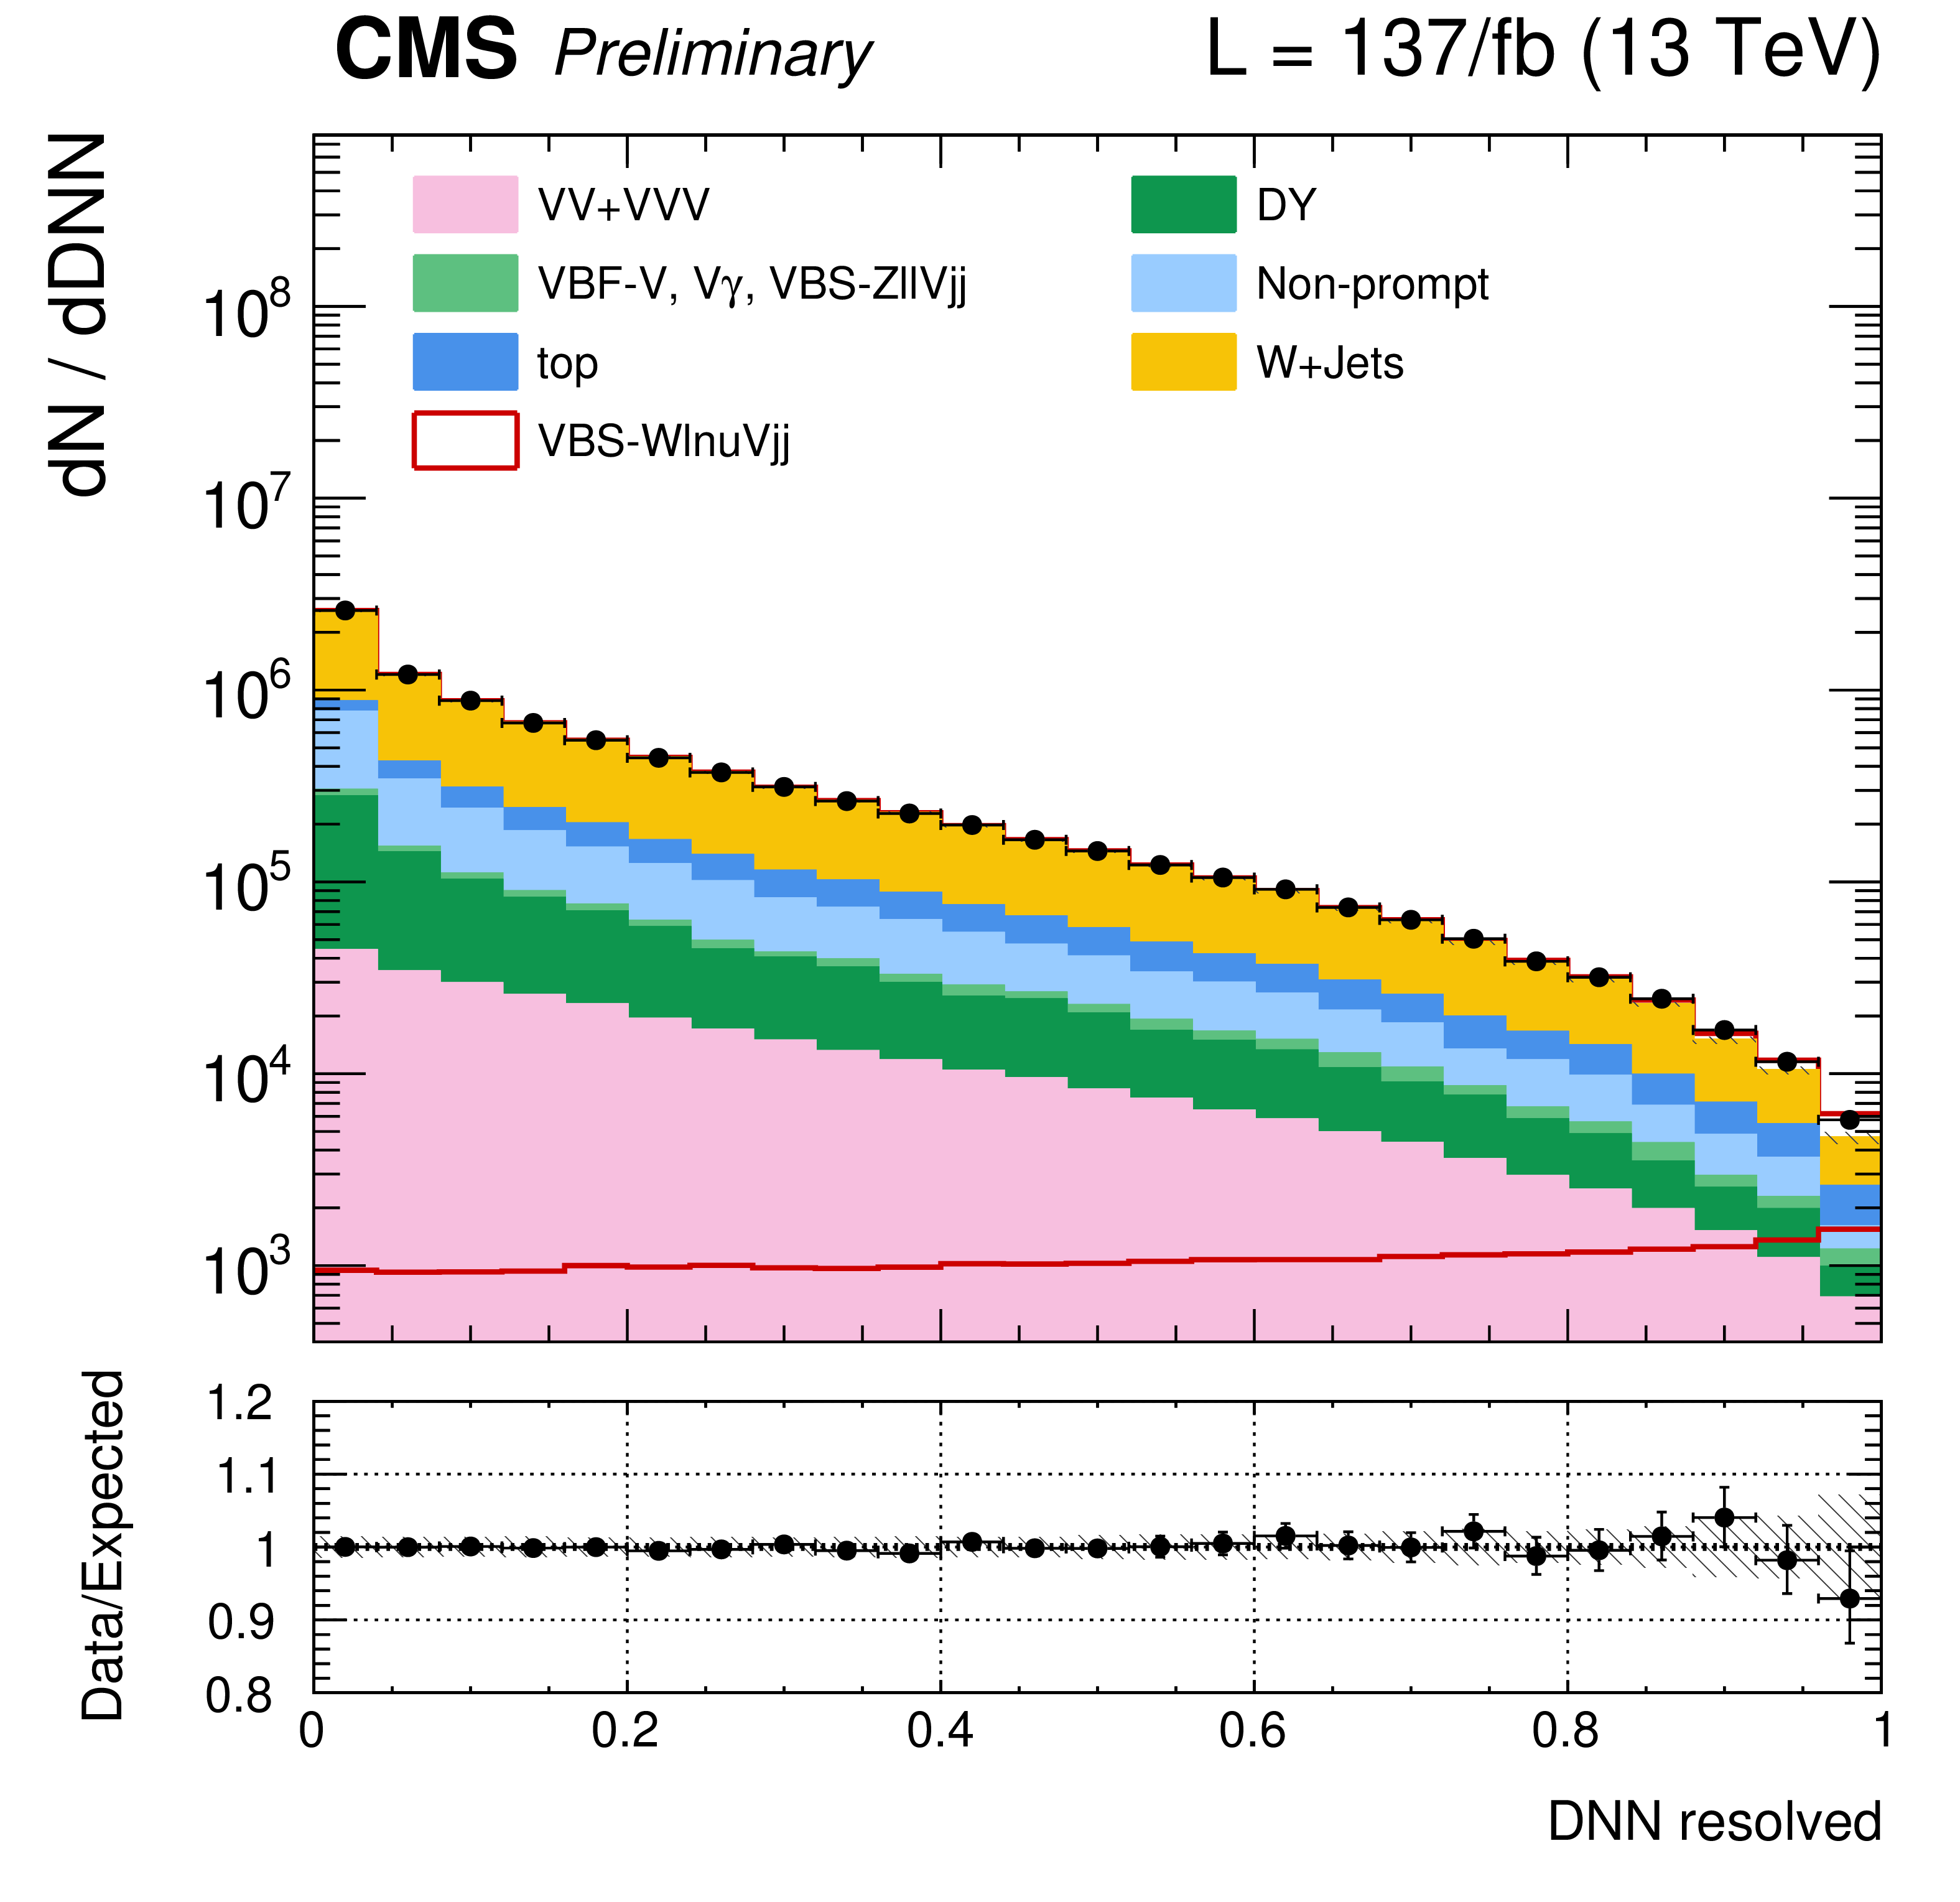
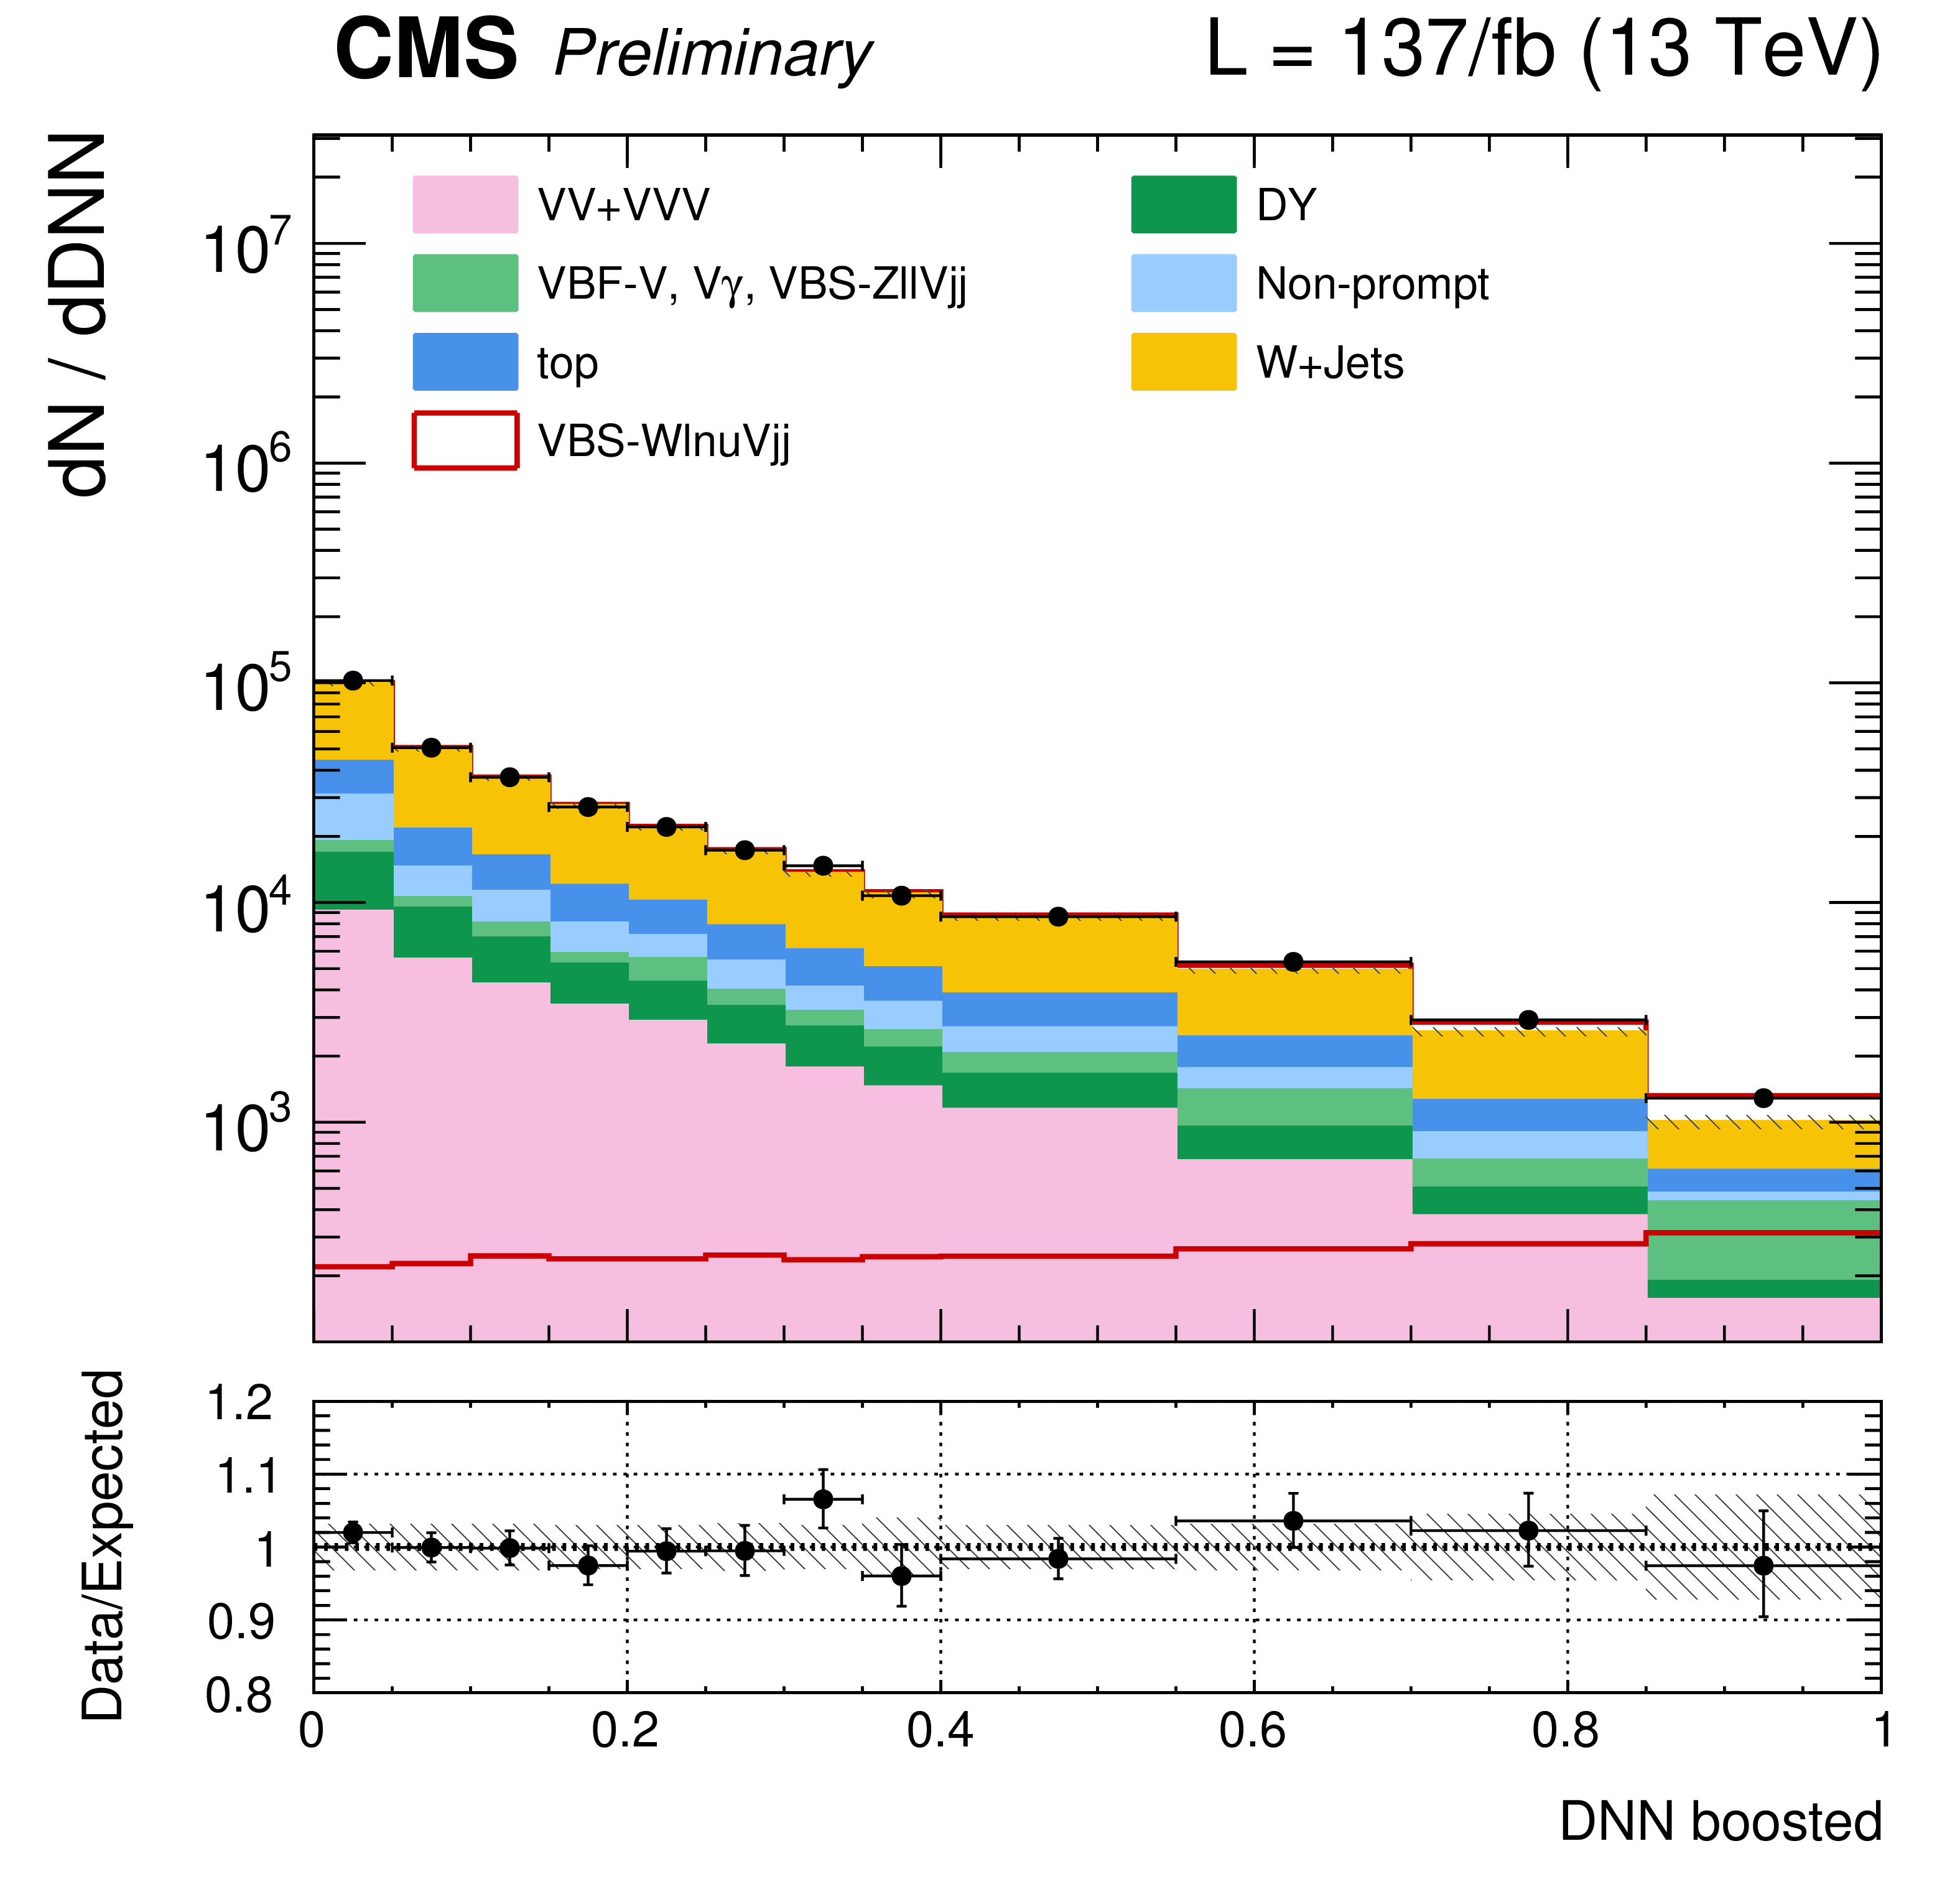
Figure 6:
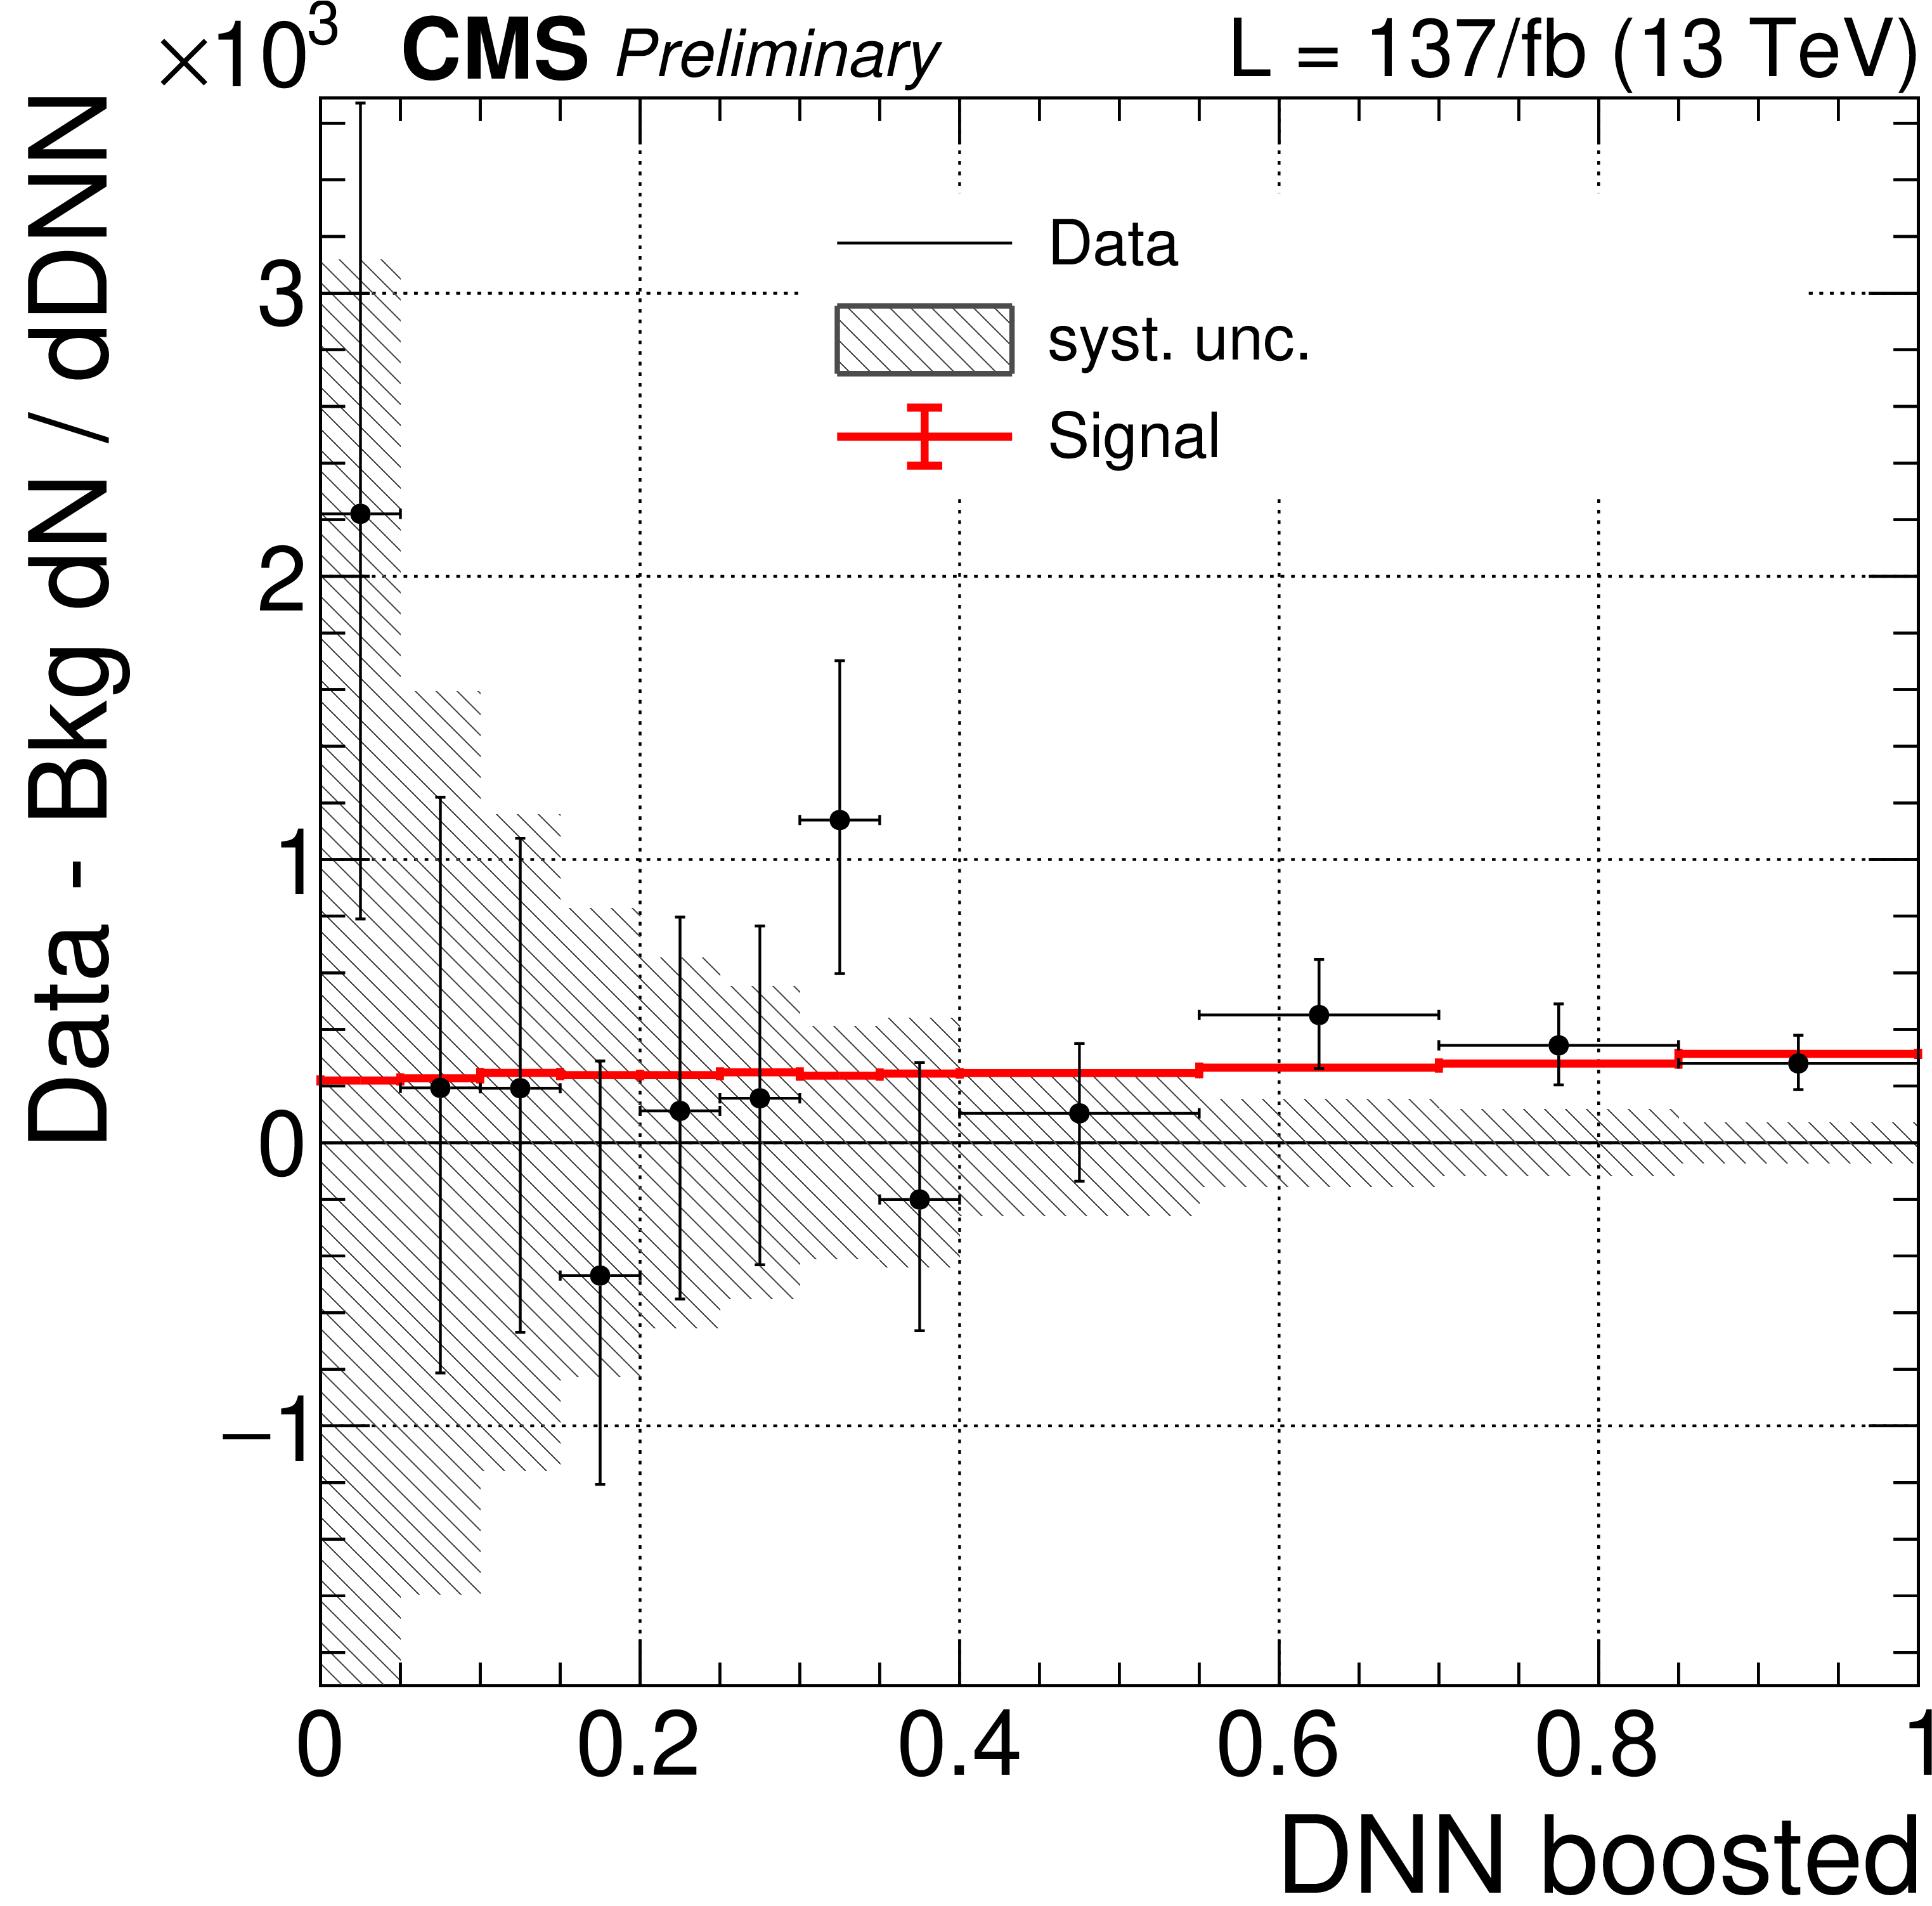
Results for the EW signal only fit, keeping the QCD WV contribution fixed to the SM prediction. Upper plots: post-fit DNN distributions for the resolved (left) and the boosted (right) signal regions, combining the full Run 2 statistics. The signal contribution is plotted both stacked on top of the background processes and also overlaid to show the signal postfit distribution. The expected yield is the sum of signal and backgrounds. Lower plots: background subtracted DNN distribution for the resolved (left) and the boosted (right) phase space, combining the full Run 2 statistics. Post-fit background yields in each bin are subtracted from data and compared with the signal post-fit distribution, plotted as a red line. The post-fit uncertainty band is also shown in the plots with all systematic uncertainties included. |
png pdf |
Figure 6-a:
Results for the EW signal only fit, keeping the QCD WV contribution fixed to the SM prediction. Upper plots: post-fit DNN distributions for the resolved (left) and the boosted (right) signal regions, combining the full Run 2 statistics. The signal contribution is plotted both stacked on top of the background processes and also overlaid to show the signal postfit distribution. The expected yield is the sum of signal and backgrounds. Lower plots: background subtracted DNN distribution for the resolved (left) and the boosted (right) phase space, combining the full Run 2 statistics. Post-fit background yields in each bin are subtracted from data and compared with the signal post-fit distribution, plotted as a red line. The post-fit uncertainty band is also shown in the plots with all systematic uncertainties included. |
png pdf |
Figure 6-b:
Results for the EW signal only fit, keeping the QCD WV contribution fixed to the SM prediction. Upper plots: post-fit DNN distributions for the resolved (left) and the boosted (right) signal regions, combining the full Run 2 statistics. The signal contribution is plotted both stacked on top of the background processes and also overlaid to show the signal postfit distribution. The expected yield is the sum of signal and backgrounds. Lower plots: background subtracted DNN distribution for the resolved (left) and the boosted (right) phase space, combining the full Run 2 statistics. Post-fit background yields in each bin are subtracted from data and compared with the signal post-fit distribution, plotted as a red line. The post-fit uncertainty band is also shown in the plots with all systematic uncertainties included. |

png pdf |
Figure 6-c:
Results for the EW signal only fit, keeping the QCD WV contribution fixed to the SM prediction. Upper plots: post-fit DNN distributions for the resolved (left) and the boosted (right) signal regions, combining the full Run 2 statistics. The signal contribution is plotted both stacked on top of the background processes and also overlaid to show the signal postfit distribution. The expected yield is the sum of signal and backgrounds. Lower plots: background subtracted DNN distribution for the resolved (left) and the boosted (right) phase space, combining the full Run 2 statistics. Post-fit background yields in each bin are subtracted from data and compared with the signal post-fit distribution, plotted as a red line. The post-fit uncertainty band is also shown in the plots with all systematic uncertainties included. |
png pdf |
Figure 6-d:
Results for the EW signal only fit, keeping the QCD WV contribution fixed to the SM prediction. Upper plots: post-fit DNN distributions for the resolved (left) and the boosted (right) signal regions, combining the full Run 2 statistics. The signal contribution is plotted both stacked on top of the background processes and also overlaid to show the signal postfit distribution. The expected yield is the sum of signal and backgrounds. Lower plots: background subtracted DNN distribution for the resolved (left) and the boosted (right) phase space, combining the full Run 2 statistics. Post-fit background yields in each bin are subtracted from data and compared with the signal post-fit distribution, plotted as a red line. The post-fit uncertainty band is also shown in the plots with all systematic uncertainties included. |
png pdf |
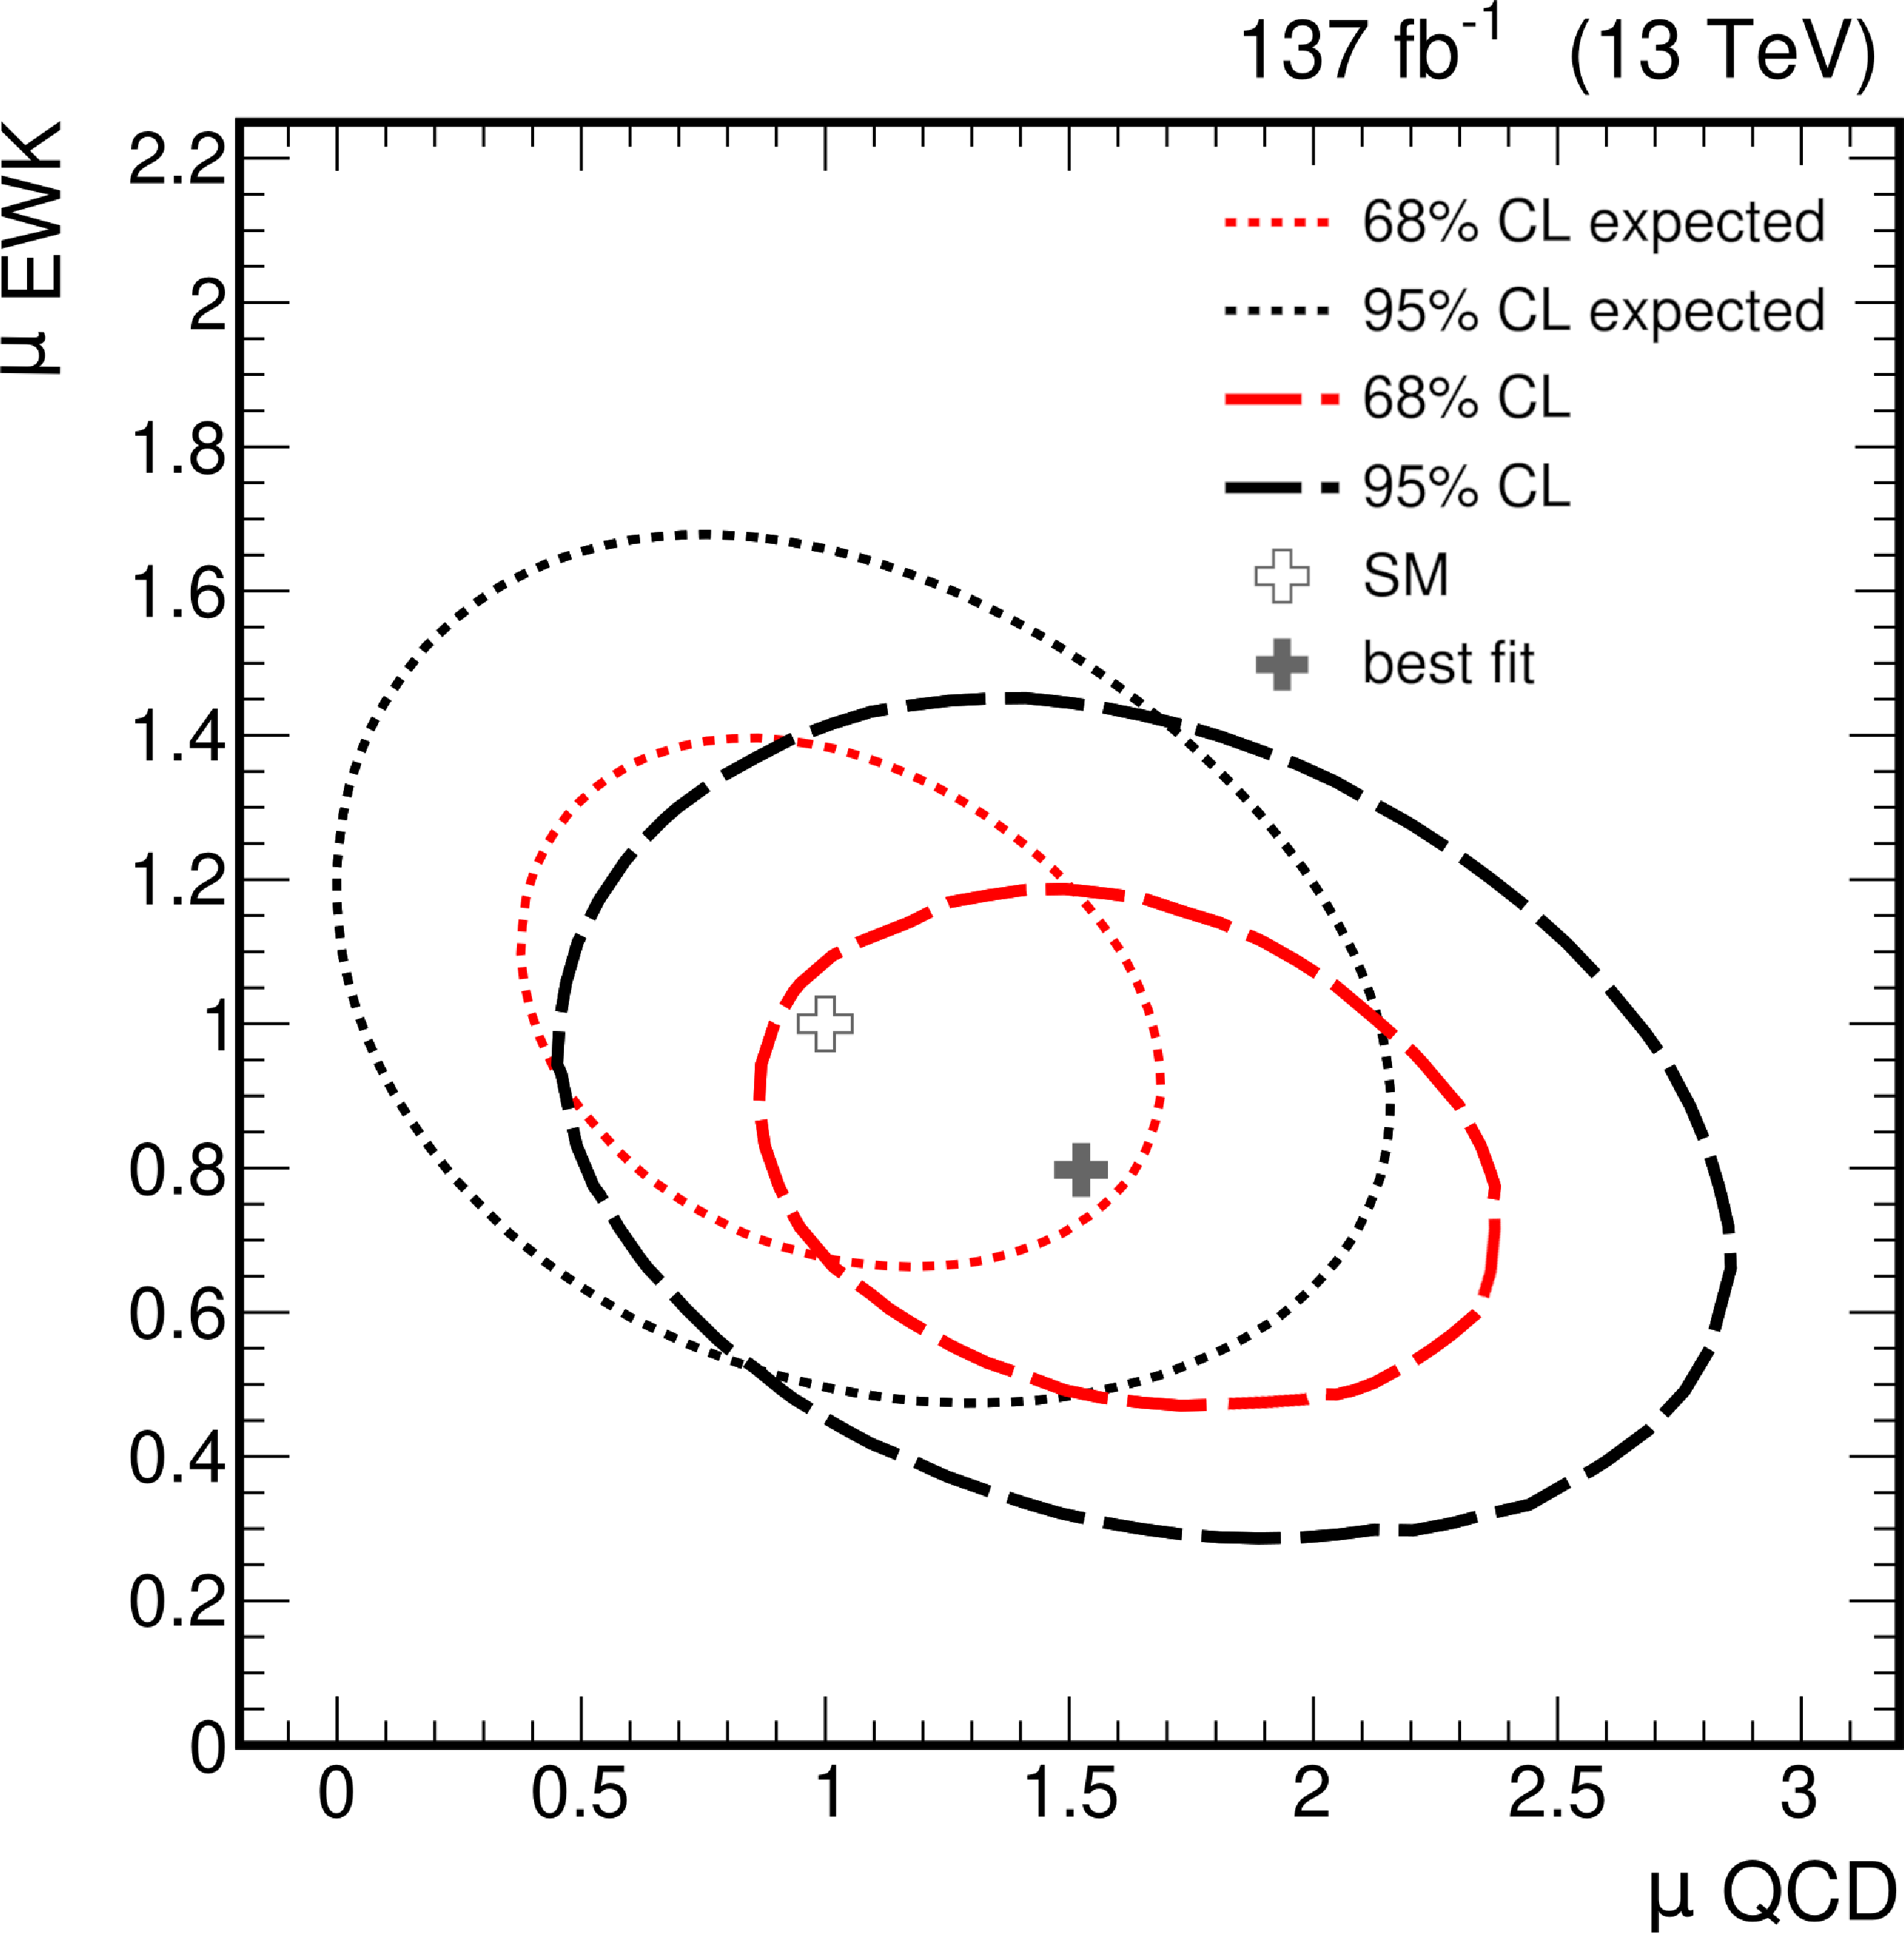
Figure 7:
Simultaneous EW and QCD WV production fit: the expected and observed 68% and 95% confidence level (CL) contours on the signal strengths are shown in the plot. The best-fit result is compatible with the SM prediction within the 68% confidence level area. |
| Tables | |
png pdf |
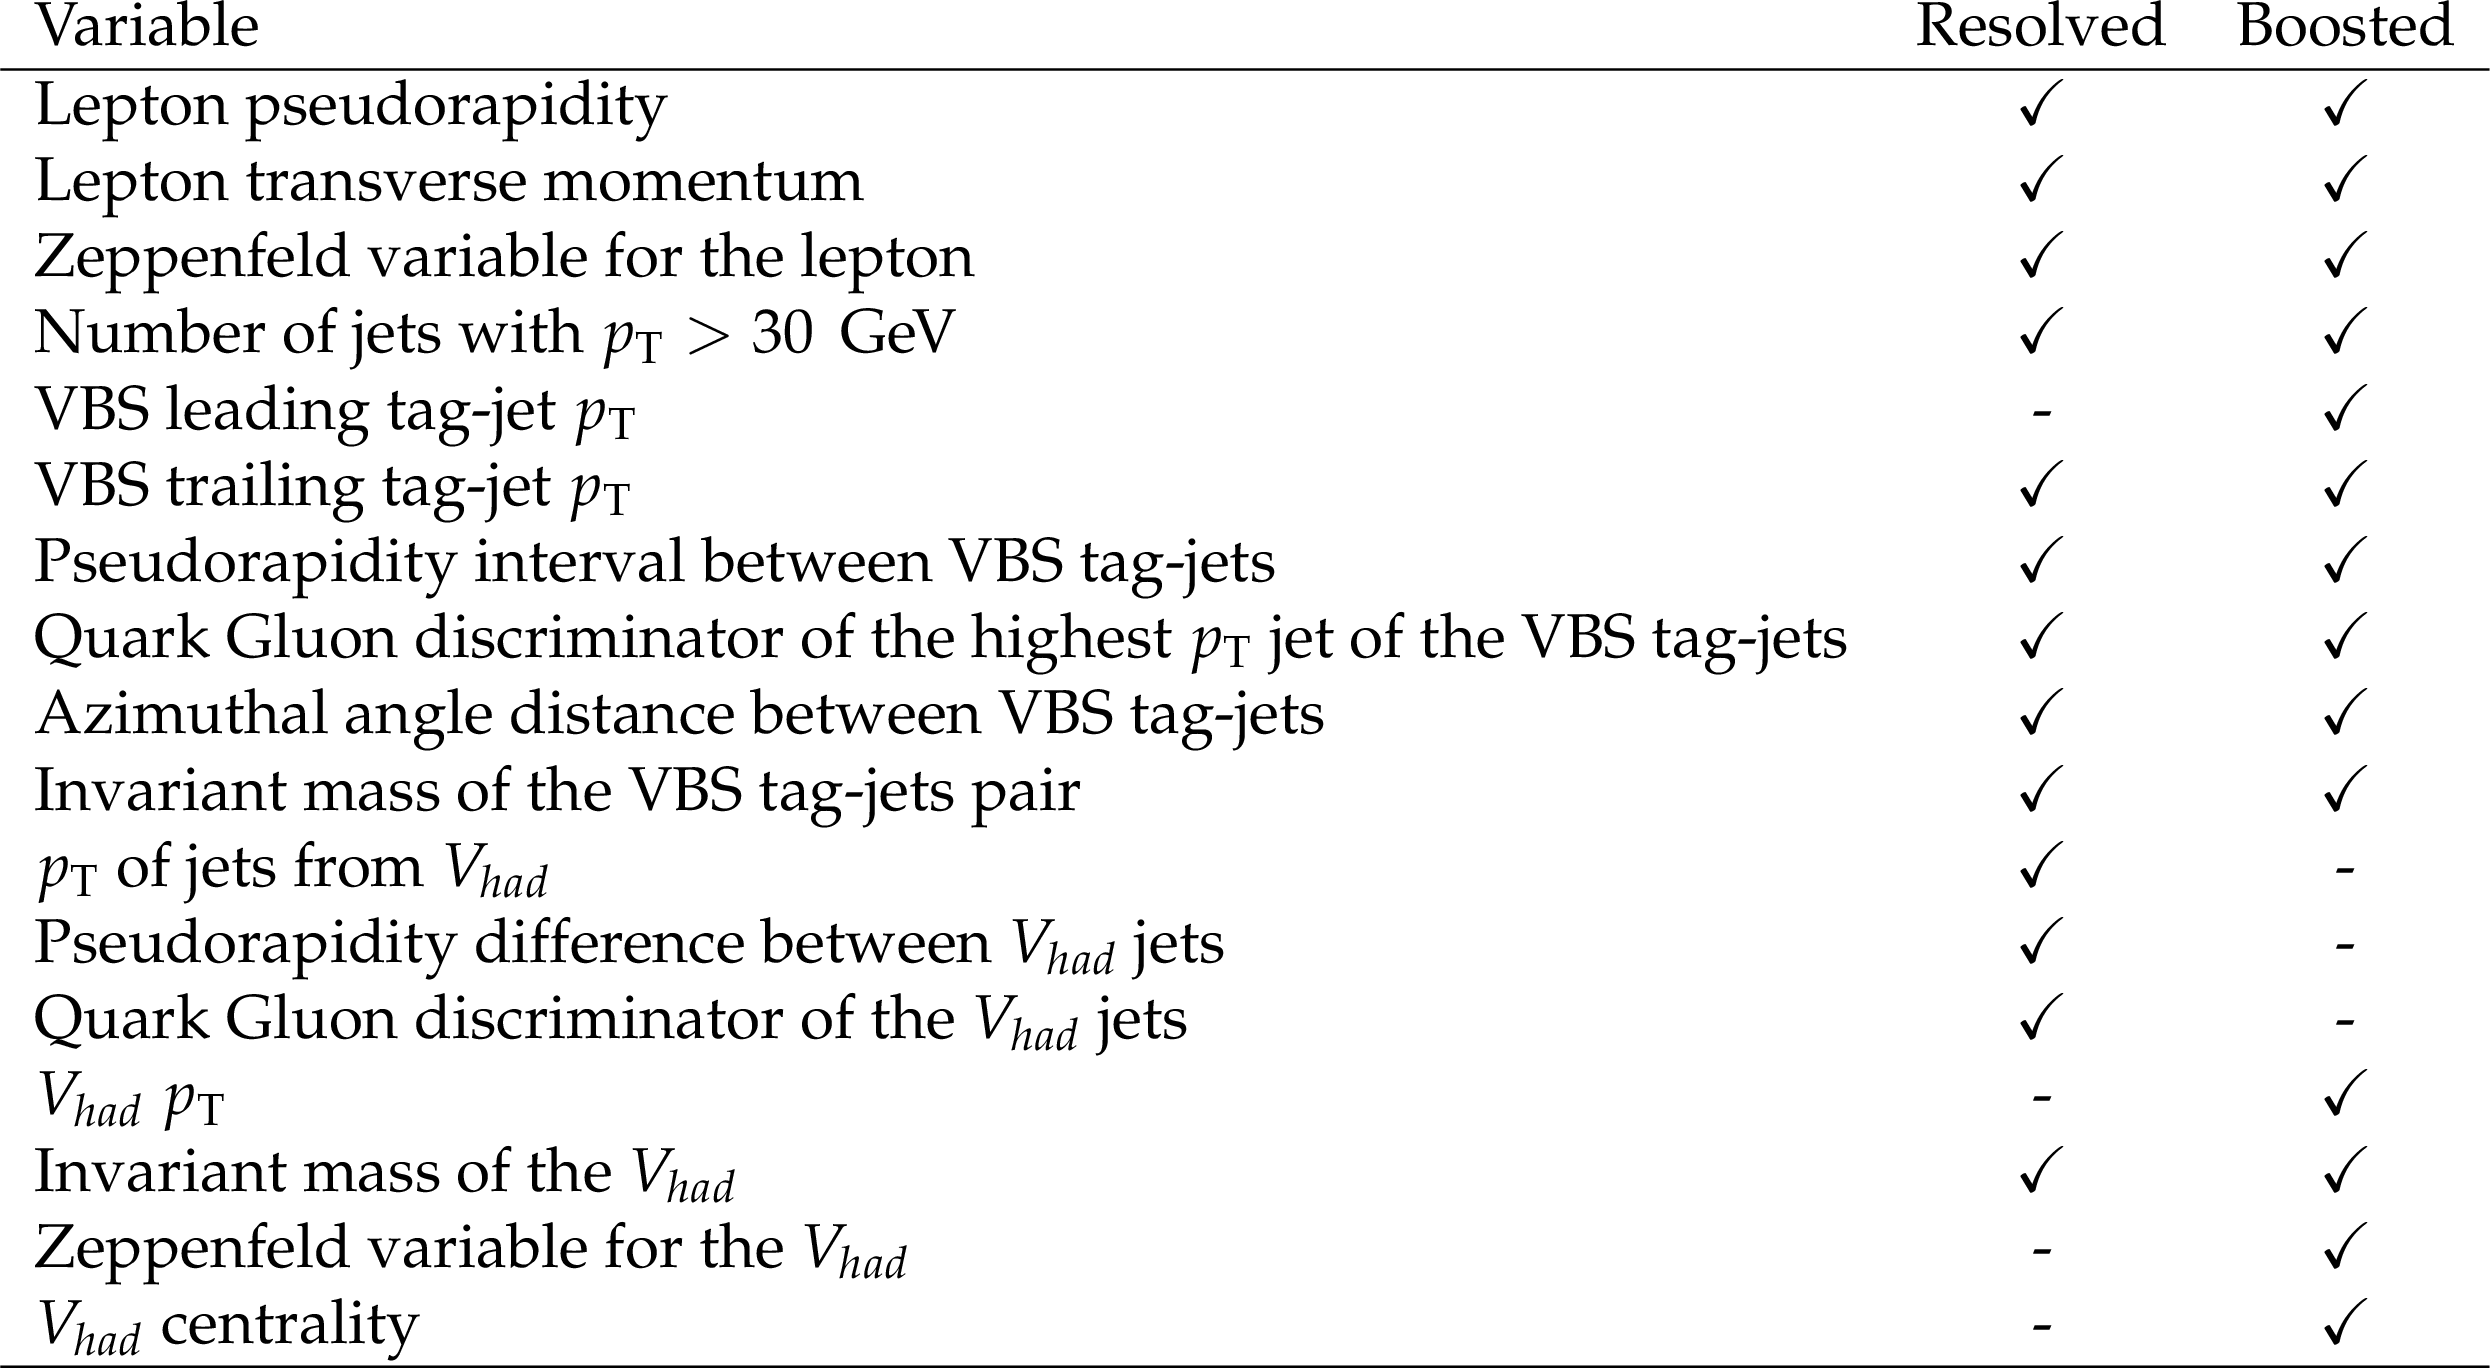
Table 1:
Variables used as input of the DNN for the resolved and boosted models. The Zeppenfeld variable of a particle X is defined as $Z_{X} = \frac {\eta ^{X} - \bar{\eta}^{\text{VBS}}}{{\Delta \eta ^{\text{VBS}}}}$, where $\bar{\eta}^{\text{VBS}}$ is the mean $\eta $ of VBS tag-jets, while the centrality [49,6] is $C_{VW} = \min(\Delta \eta _-, \Delta \eta _+) $, with $\Delta \eta _{+} = \max(\eta ^{\text{VBS}}) - \max(\eta ^{{V_{had}}}, \eta ^{W}) $ and $\Delta \eta _{-} = \min(\eta ^{\text{VBS}}) - \min(\eta ^{{V_{had}}}, \eta ^{W}) $. The $\eta ^{W}$ is built assuming the W-mass from the lepton and ${{p_{\mathrm {T}}} ^\text {miss}}$ kinematics. |

png pdf |
Table 2:
Uncertainties breakdown on electroweak SM signal measurement |
| Summary |
|
The first evidence for the EW vector boson scattering of a WV pair plus two jets in the semi-leptonic channel is reported. Events are separated in two categories: either the hadronically decaying W/Z boson is reconstructed as one large-radius jet, or it is identified as a pair of jets with dijet mass close to the boson mass. Multivariate machine learning discriminators are optimized to separate the signal from background in each category and their output is exploited in the statistical analysis. The large background from single W boson production accompanied by jets is estimated in a data-driven way to reduce the impact of MC mismodeling in this multi-jet phase space. The observed EW signal strength is 0.85 $^{+0.24}_{-0.20}$ $=$ 0.85 $^{+0.21}_{-0.17}$ (syst) $^{+0.12}_{-0.12}$ (stat), 1$^{+0.24}_{-0.22}$ expected, corresponding to an observed significance of the signal of 4.4 standard deviations, 5.1 expected. The electroweak WV fiducial signal cross section defined at parton level requiring all partons to have ${p_{\mathrm{T}}} > $ 10 GeV and at least one pair of outgoing quarks with invariant mass $m_{\mathrm{qq}} > $ 100 GeV, is measured to be 1.9 $\pm$ 0.5 pb, 2.23$^{+0.08}_{-0.11}$ (scale) $^{+0.05}_{-0.05}$ (pdf) pb expected. Considering instead as signal the overall EW and QCD WV plus two jets production, the signal strength is extracted as 0.98 $ ^{+0.20}_{-0.17}$ $ = $ 0.98$^{+0.19}_{-0.16}$ (syst) $^{+0.07}_{-0.07}$ (stat), (1$^{+0.19}_{-0.18}$ expected), corresponding to a cross-section, in the same fiducial phasespace as the EW only fit, of 16.6$^{+3.4}_{-2.9}$ pb, 16.9$^{+2.9}_{-2.1}$ (scale) $ ^{+0.5}_{-0.5}$ (pdf) pb expected. Finally a simultaneous two-dimensional fit of the EW and QCD WV production components is also performed. Overall, both the WV EW only measurement and the simultaneous EW and QCD WV ones are consistent between each other and in agreement with the SM predictions within the 68% confidence interval. |
| References | ||||
| 1 | ATLAS, CMS Collaboration | Measurements of the Higgs boson production and decay rates and constraints on its couplings from a combined ATLAS and CMS analysis of the LHC pp collision data at $ \sqrt{s}= $ 7 and 8 TeV | JHEP 08 (2016) 045 | 1606.02266 |
| 2 | B. W. Lee, C. Quigg, and H. B. Thacker | Weak interactions at very high energies: the role of the Higgs boson mass | PRD 16 (1977) 1519 | |
| 3 | CMS Collaboration | Observation of electroweak production of same-sign W boson pairs in the two jet and two same-sign lepton final state in proton-proton collisions at $ \sqrt{s} = $ 13 TeV | PRL 120 (2018) 081801 | CMS-SMP-17-004 1709.05822 |
| 4 | ATLAS Collaboration | Observation of electroweak production of a same-sign $ W $ boson pair in association with two jets in pp collisions at $ \sqrt{s}= $ 13 TeV with the ATLAS detector | PRL 123 (2019) 161801 | 1906.03203 |
| 5 | CMS Collaboration | Measurement of electroweak WZ boson production and search for new physics in WZ + two jets events in pp collisions at $ \sqrt{s} = $ 13 TeV | PLB 795 (2019) 281 | CMS-SMP-18-001 1901.04060 |
| 6 | ATLAS Collaboration | Observation of electroweak $ W^{\pm}Z $ boson pair production in association with two jets in pp collisions at $ \sqrt{s} = $ 13 TeV with the ATLAS detector | PLB 793 (2019) 469 | 1812.09740 |
| 7 | ATLAS Collaboration | Observation of electroweak production of two jets and a $ Z $-boson pair with the ATLAS detector at the LHC | 2020. Submitted to NPHYS | 2004.10612 |
| 8 | CMS Collaboration | Measurement of vector boson scattering and constraints on anomalous quartic couplings from events with four leptons and two jets in proton-proton collisions at $ \sqrt{s}= $ 13 TeV | PLB 774 (2017) 682 | CMS-SMP-17-006 1708.02812 |
| 9 | C. F. Anders et al. | Vector boson scattering: Recent experimental and theory developments | Rev. Phys. 3 (2018) 44 | 1801.04203 |
| 10 | ATLAS Collaboration | Search for the electroweak diboson production in association with a high-mass dijet system in semileptonic final states in pp collisions at $ \sqrt{s}= $ 13 TeV with the ATLAS detector | PRD 100 (2019) 032007 | 1905.07714 |
| 11 | CMS Collaboration | Search for anomalous electroweak production of vector boson pairs in association with two jets in proton-proton collisions at 13 TeV | PLB 798 (2019) 134985 | CMS-SMP-18-006 1905.07445 |
| 12 | CMS Collaboration | The CMS experiment at the CERN LHC | JINST 3 (2008) S08004 | CMS-00-001 |
| 13 | S. Frixione and B. R. Webber | Matching NLO QCD computations and parton shower simulations | JHEP 06 (2002) 029 | hep-ph/0204244 |
| 14 | P. Nason | A New method for combining NLO QCD with shower Monte Carlo algorithms | JHEP 11 (2004) 040 | hep-ph/0409146 |
| 15 | S. Frixione, P. Nason, and C. Oleari | Matching NLO QCD computations with parton shower simulations: the POWHEG method | JHEP 11 (2007) 070 | 0709.2092 |
| 16 | S. Alioli, P. Nason, C. Oleari, and E. Re | NLO vector-boson production matched with shower in POWHEG | JHEP 07 (2008) 060 | 0805.4802 |
| 17 | S. Alioli, P. Nason, C. Oleari, and E. Re | A general framework for implementing NLO calculations in shower Monte Carlo programs: the POWHEG BOX | JHEP 06 (2010) 043 | 1002.2581 |
| 18 | J. Alwall et al. | The automated computation of tree-level and next-to-leading order differential cross sections, and their matching to parton shower simulations | JHEP 07 (2014) 079 | 1405.0301 |
| 19 | J. Alwall et al. | Comparative study of various algorithms for the merging of parton showers and matrix elements in hadronic collisions | EPJC 53 (2008) 473 | 0706.2569 |
| 20 | J. Campbell and T. Neumann | Precision phenomenology with MCFM | JHEP 12 (2019) 034 | 1909.09117 |
| 21 | J. M. Campbell, R. K. Ellis, and W. T. Giele | A multi-threaded version of MCFM | EPJC 75 (2015) 246 | 1503.06182 |
| 22 | J. M. Campbell, R. K. Ellis, and C. Williams | Vector boson pair production at the LHC | JHEP 07 (2011) 018 | 1105.0020 |
| 23 | J. M. Campell and R. K. Ellis | An update on vector boson pair production at hadron colliders | PRD 60 (1999) 113006 | hep-ph/9905386 |
| 24 | P. Artoisenet, R. Frederix, O. Mattelaer, and R. Rietkerk | Automatic spin-entangled decays of heavy resonances in Monte Carlo simulations | JHEP 03 (2013) 015 | 1212.3460 |
| 25 | T. Sjostrand et al. | An Introduction to PYTHIA 8.2 | CPC 191 (2015) 159 | 1410.3012 |
| 26 | M. Bahr et al. | Herwig++ physics and manual | EPJC 58 (2008) 639 | 0803.0883 |
| 27 | R. Covarelli, M. Pellen, and M. Zaro | Vector-boson scattering at the LHC: unraveling the electroweak sector | Int. J. Mod. Phys. A 36 (2021) 2130009 | 2102.10991 |
| 28 | A. Ballestrero et al. | Precise predictions for same-sign W-boson scattering at the LHC | EPJC 78 (2018) 671 | 1803.07943 |
| 29 | GEANT4 Collaboration | GEANT4: a simulation toolkit | NIMA 506 (2003) 250 | |
| 30 | CMS Collaboration | Particle-flow reconstruction and global event description with the CMS detector | JINST 12 (2017) P10003 | CMS-PRF-14-001 1706.04965 |
| 31 | CMS Collaboration | Performance of the CMS Level-1 trigger in proton-proton collisions at $ \sqrt{s} = $ 13 TeV | JINST 15 (2020) P10017 | CMS-TRG-17-001 2006.10165 |
| 32 | CMS Collaboration | The CMS trigger system | JINST 12 (2017) P01020 | CMS-TRG-12-001 1609.02366 |
| 33 | M. Cacciari, G. P. Salam, and G. Soyez | The anti-$ k_t $ jet clustering algorithm | JHEP 04 (2008) 063 | 0802.1189 |
| 34 | M. Cacciari, G. P. Salam, and G. Soyez | FastJet user manual | EPJC 72 (2012) 1896 | 1111.6097 |
| 35 | J. Thaler and K. Van Tilburg | Identifying boosted objects with $ N $-subjettiness | JHEP 03 (2011) 015 | 1011.2268 |
| 36 | M. Dasgupta, A. Fregoso, S. Marzani, and G. P. Salam | Towards an understanding of jet substructure | JHEP 09 (2013) 029 | 1307.0007 |
| 37 | J. M. Butterworth, A. R. Davison, M. Rubin, and G. P. Salam | Jet substructure as a new Higgs search channel at the LHC | PRL 100 (2008) 242001 | 0802.2470 |
| 38 | A. J. Larkoski, S. Marzani, G. Soyez, and J. Thaler | Soft drop | JHEP 05 (2014) 146 | 1402.2657 |
| 39 | CMS Collaboration | Identification techniques for highly boosted W bosons that decay into hadrons | JHEP 12 (2014) 017 | CMS-JME-13-006 1410.4227 |
| 40 | CMS Collaboration | Performance of electron reconstruction and selection with the CMS Detector in proton-proton collisions at $ \surd $s = 8 TeV | JINST 10 (2015) P06005 | CMS-EGM-13-001 1502.02701 |
| 41 | CMS Collaboration | Performance of CMS muon reconstruction in pp collision events at $ \sqrt{s} = $ 7 TeV | JINST 7 (2012) P10002 | CMS-MUO-10-004 1206.4071 |
| 42 | CMS Collaboration | Performance of missing transverse momentum reconstruction in proton-proton collisions at $ \sqrt{s} = $ 13 TeV using the CMS detector | JINST 14 (2019) P07004 | CMS-JME-17-001 1903.06078 |
| 43 | D. Bertolini, P. Harris, M. Low, and N. Tran | Pileup per particle identification | JHEP 10 (2014) 059 | 1407.6013 |
| 44 | CMS Collaboration | Identification of heavy-flavour jets with the CMS detector in pp collisions at 13 TeV | JINST 13 (2018) P05011 | CMS-BTV-16-002 1712.07158 |
| 45 | D. P. Kingma and J. Ba | Adam: a method for stochastic optimization | technical report | 1412.6980 |
| 46 | I. Goodfellow, Y. Bengio, and A. Courville | MIT Press | ||
| 47 | S. M. Lundberg and S.-I. Lee | A unified approach to interpreting model predictions | in Proceedings of the 31st International Conference on Neural Information Processing Systems, NIPS'17, p. 4768 Curran Associates Inc., Red Hook, NY, USA | arXiv:1705.07874 |
| 48 | L. S. Shapley | A value for n-person games. | Contributions to the Theory of Games 2.28 (1953) 303 | |
| 49 | ATLAS Collaboration | Measurement of $ W^{\pm}W^{\pm} $ vector-boson scattering and limits on anomalous quartic gauge couplings with the ATLAS detector | PRD 96 (2017) 012007 | 1611.02428 |
| 50 | The ATLAS Collaboration, The CMS Collaboration, The LHC Higgs Combination Group | Procedure for the LHC Higgs boson search combination in Summer 2011 | CMS-NOTE-2011-005 | |
| 51 | CMS Collaboration | Precision luminosity measurement in proton-proton collisions at $ \sqrt{s} = $ 13 TeV in 2015 and 2016 at CMS | 2021. "Submitted to EPJC" | CMS-LUM-17-003 2104.01927 |
| 52 | CMS Collaboration | Jet energy scale and resolution in the CMS experiment in pp collisions at 8 TeV | JINST 12 (2017) P02014 | CMS-JME-13-004 1607.03663 |
| 53 | M. Cacciari et al. | The t anti-t cross-section at 1.8-TeV and 1.96-TeV: a study of the systematics due to parton densities and scale dependence | JHEP 04 (2004) 068 | hep-ph/0303085 |
| 54 | S. Catani, D. de Florian, M. Grazzini, and P. Nason | Soft gluon resummation for Higgs boson production at hadron colliders | JHEP 07 (2003) 028 | hep-ph/0306211 |
|
|
Compact Muon Solenoid LHC, CERN |
|

|

|

|

|

|