

Compact Muon Solenoid
LHC, CERN
| CMS-PAS-SMP-20-007 | ||
| Study of double-parton scattering in the inclusive production of four jets with low transverse momentum in proton-proton collisions at $\sqrt{s}$ = 13 TeV | ||
| CMS Collaboration | ||
| March 2021 | ||
| Abstract: A study of inclusive four-jet production in proton-proton collisions at a center-of-mass energy of 13 TeV is presented. The transverse momentum of jets within $|\eta| < $ 4.7 reaches down to 35, 30, 25, and 20 GeV for the first, second, third, and fourth leading jet, respectively. Differential cross sections are measured as a function of the jet transverse momentum and pseudorapidity, and of several other observables that exploit angular correlations between the jets. It is found that the measured distributions show sensitivity to different aspects of the underlying event, parton shower, and matrix element calculations. In particular, the interplay between decorrelations caused by parton shower and double-parton scattering contributions is shown to be important. The double-parton scattering contribution is extracted by means of a template fit of distributions for single-parton scattering obtained from Monte Carlo event generators and a double-parton scattering distribution constructed from inclusive single-jet events in data. Values of the effective cross section are calculated and discussed in view of earlier measurements and of their dependence on the models used for the single-parton scattering background. | ||
|
Links:
CDS record (PDF) ;
inSPIRE record ;
CADI line (restricted) ;
These preliminary results are superseded in this paper, Submitted to JHEP. The superseded preliminary plots can be found here. |
||
| Figures | |
png pdf |
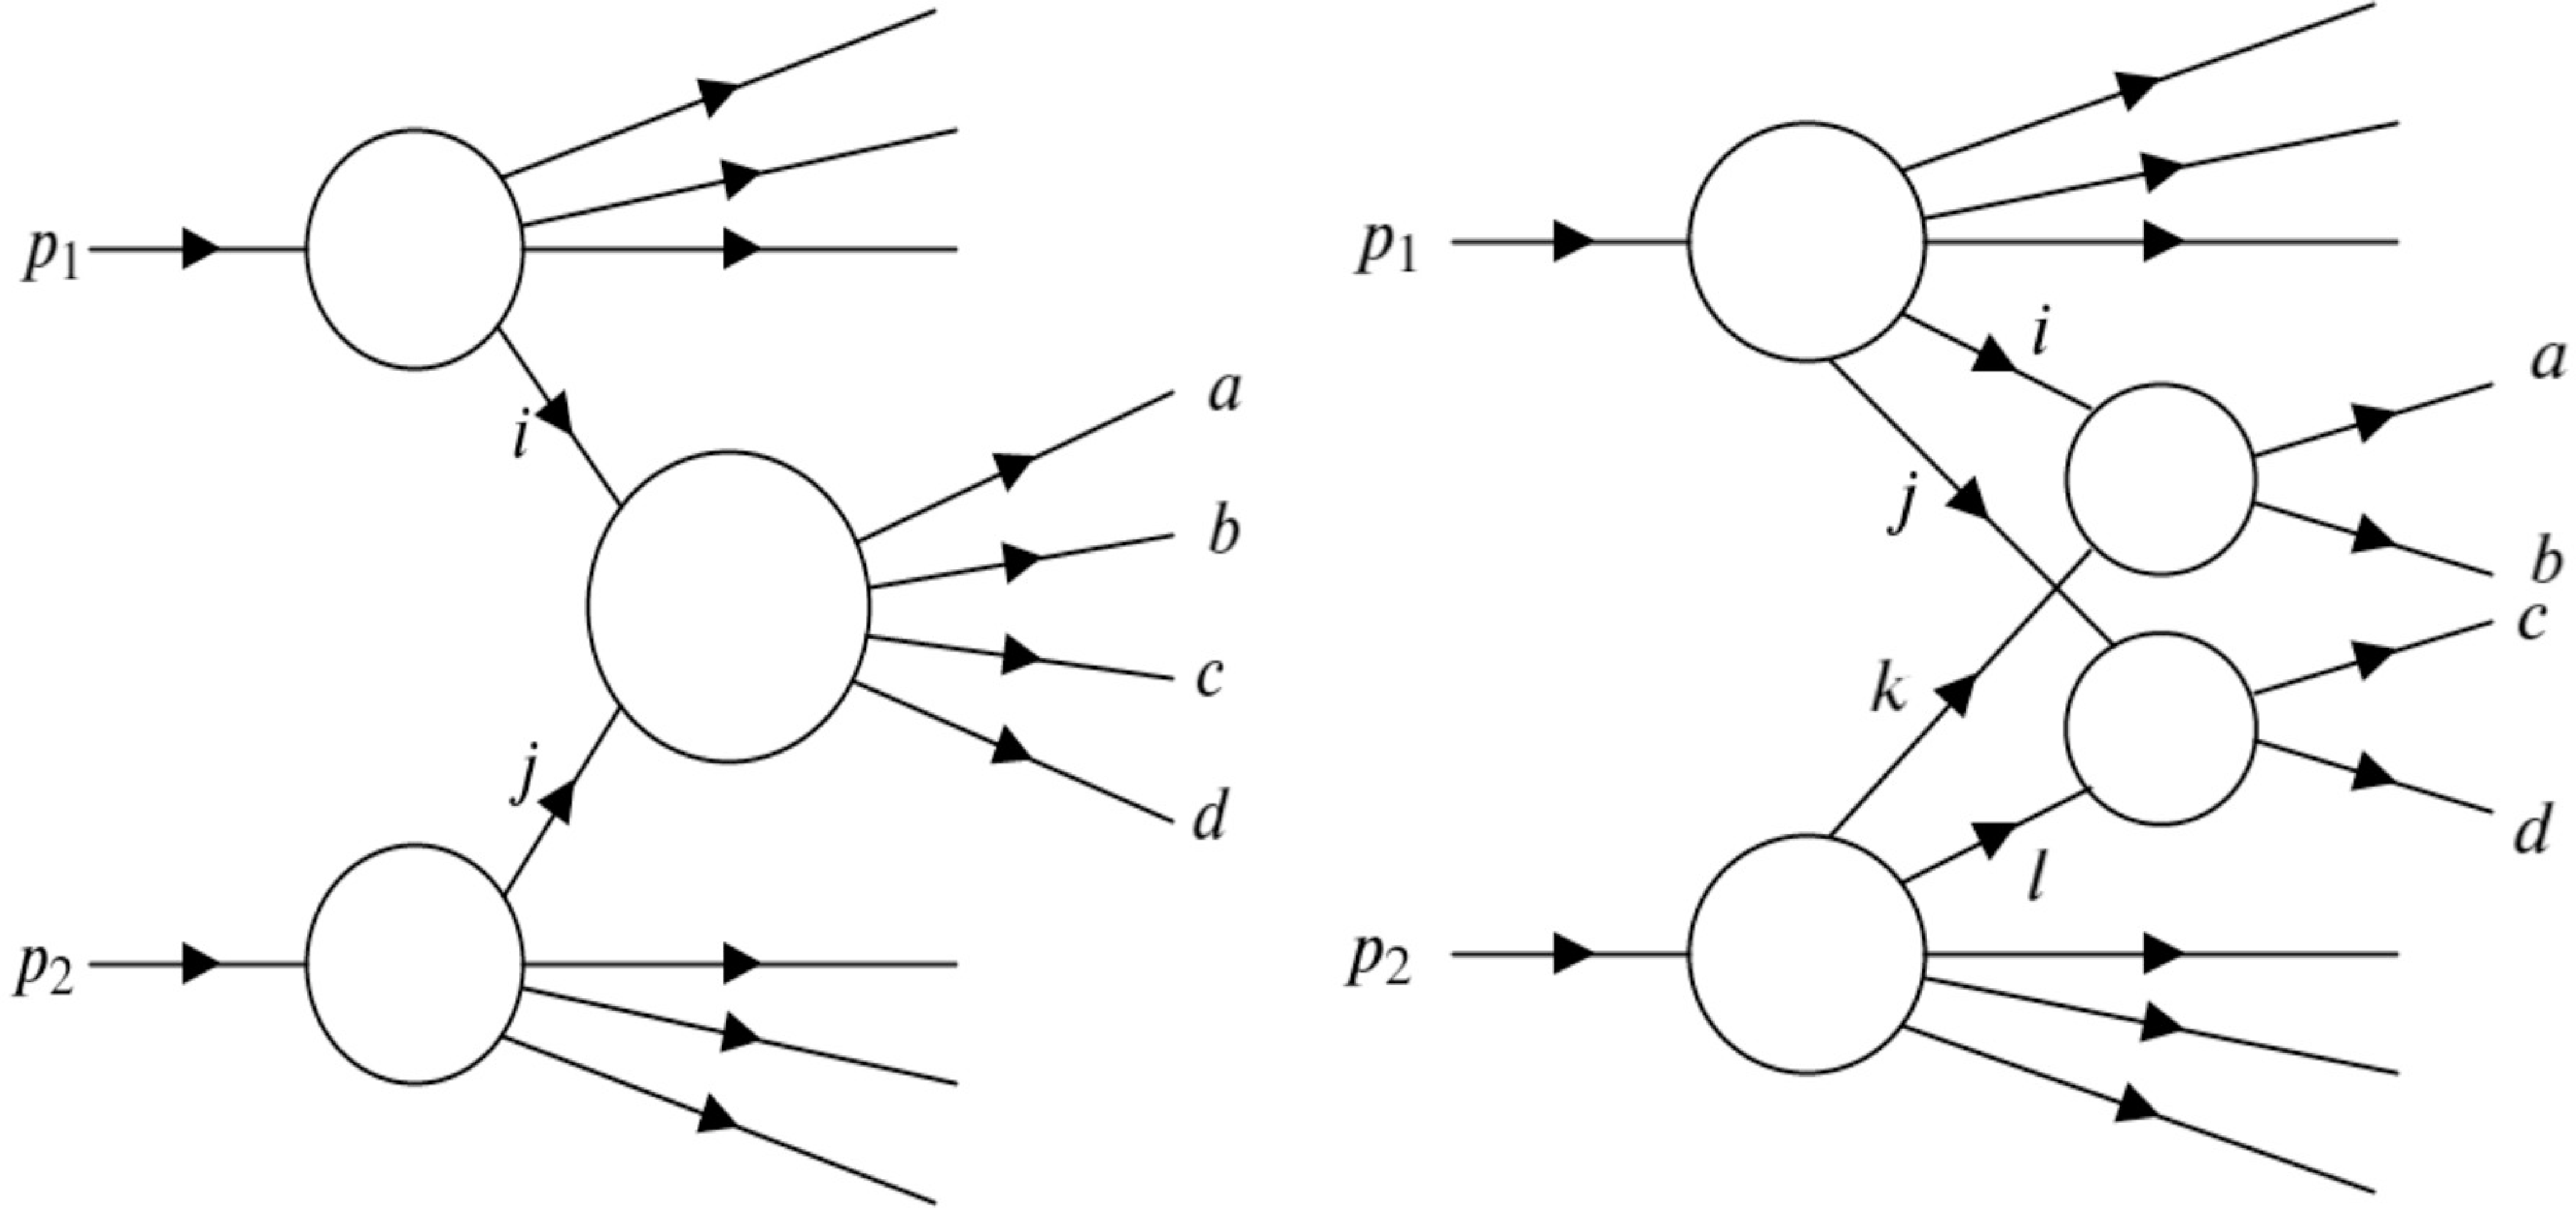
Figure 1:
A schematic depiction of inclusive four-jet production through SPS (left) and DPS (right). In the case of SPS, one hard scattering produces the jets $a$ through $d$, while two independent hard scatterings create two jets each in the case of DPS. As the two jet pairs are created independently in a DPS event, they are expected to show different kinematic correlations compared to the four jets originating from a SPS event. |
png pdf |
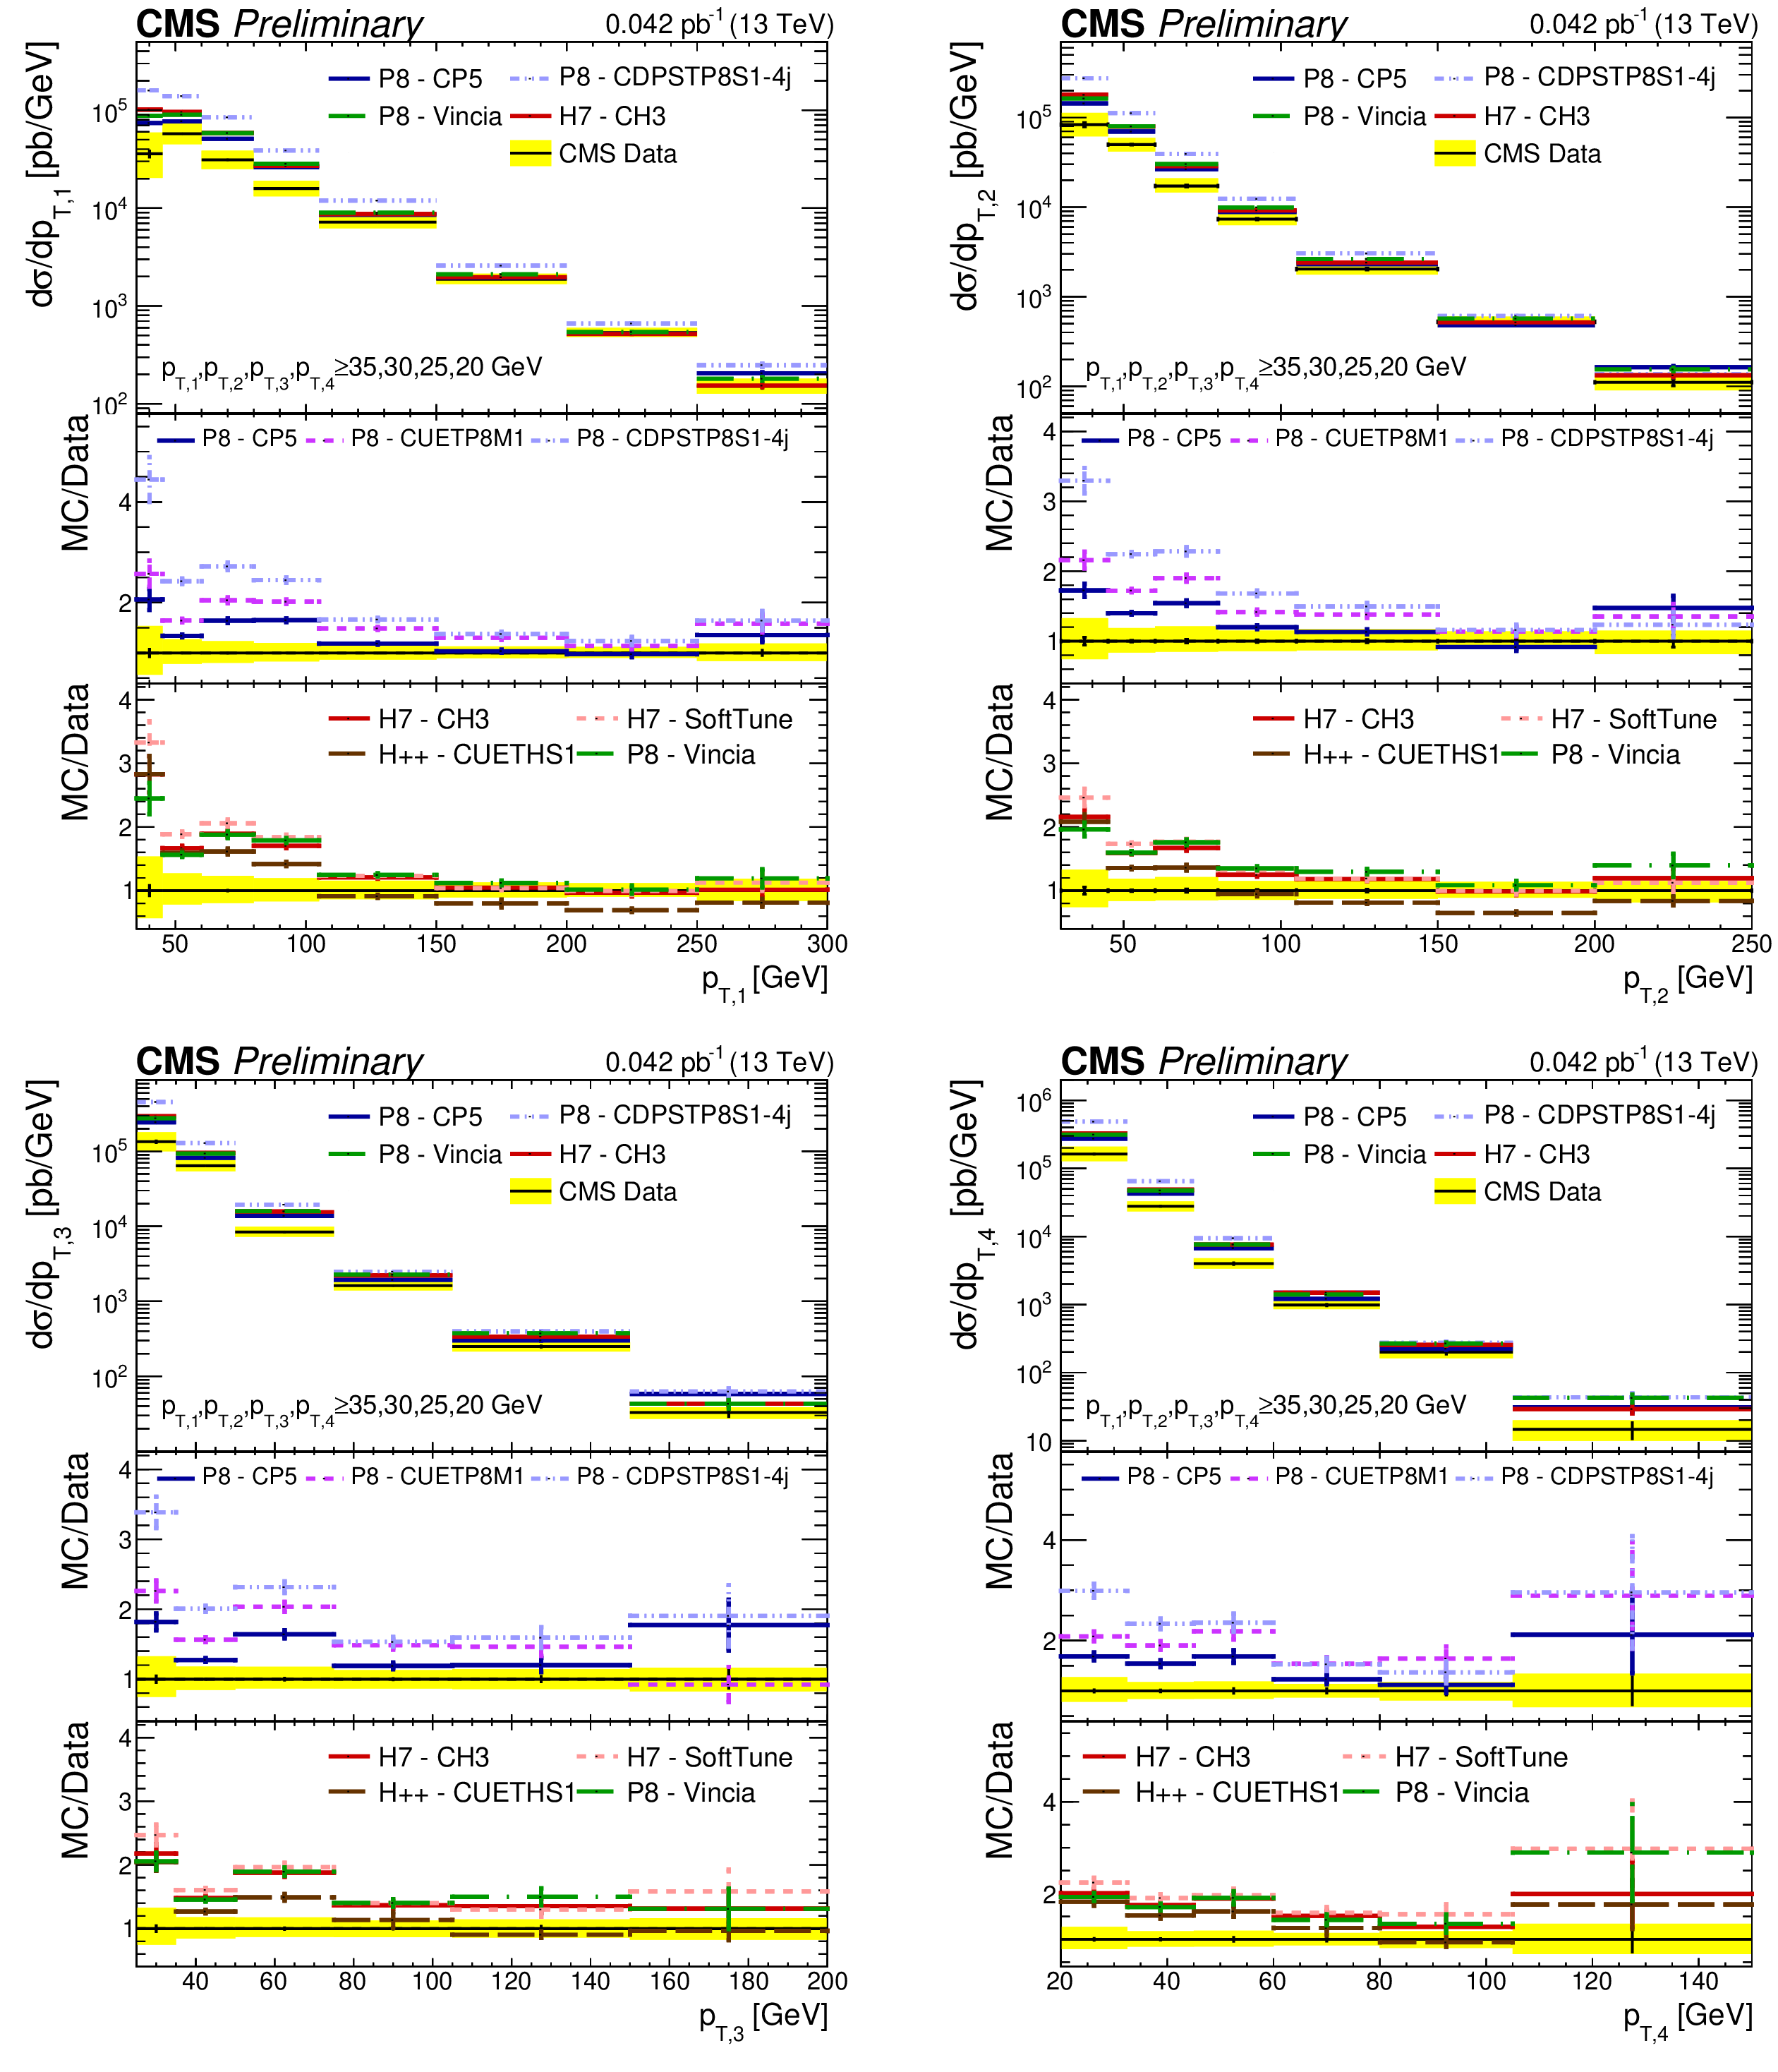
Figure 2:
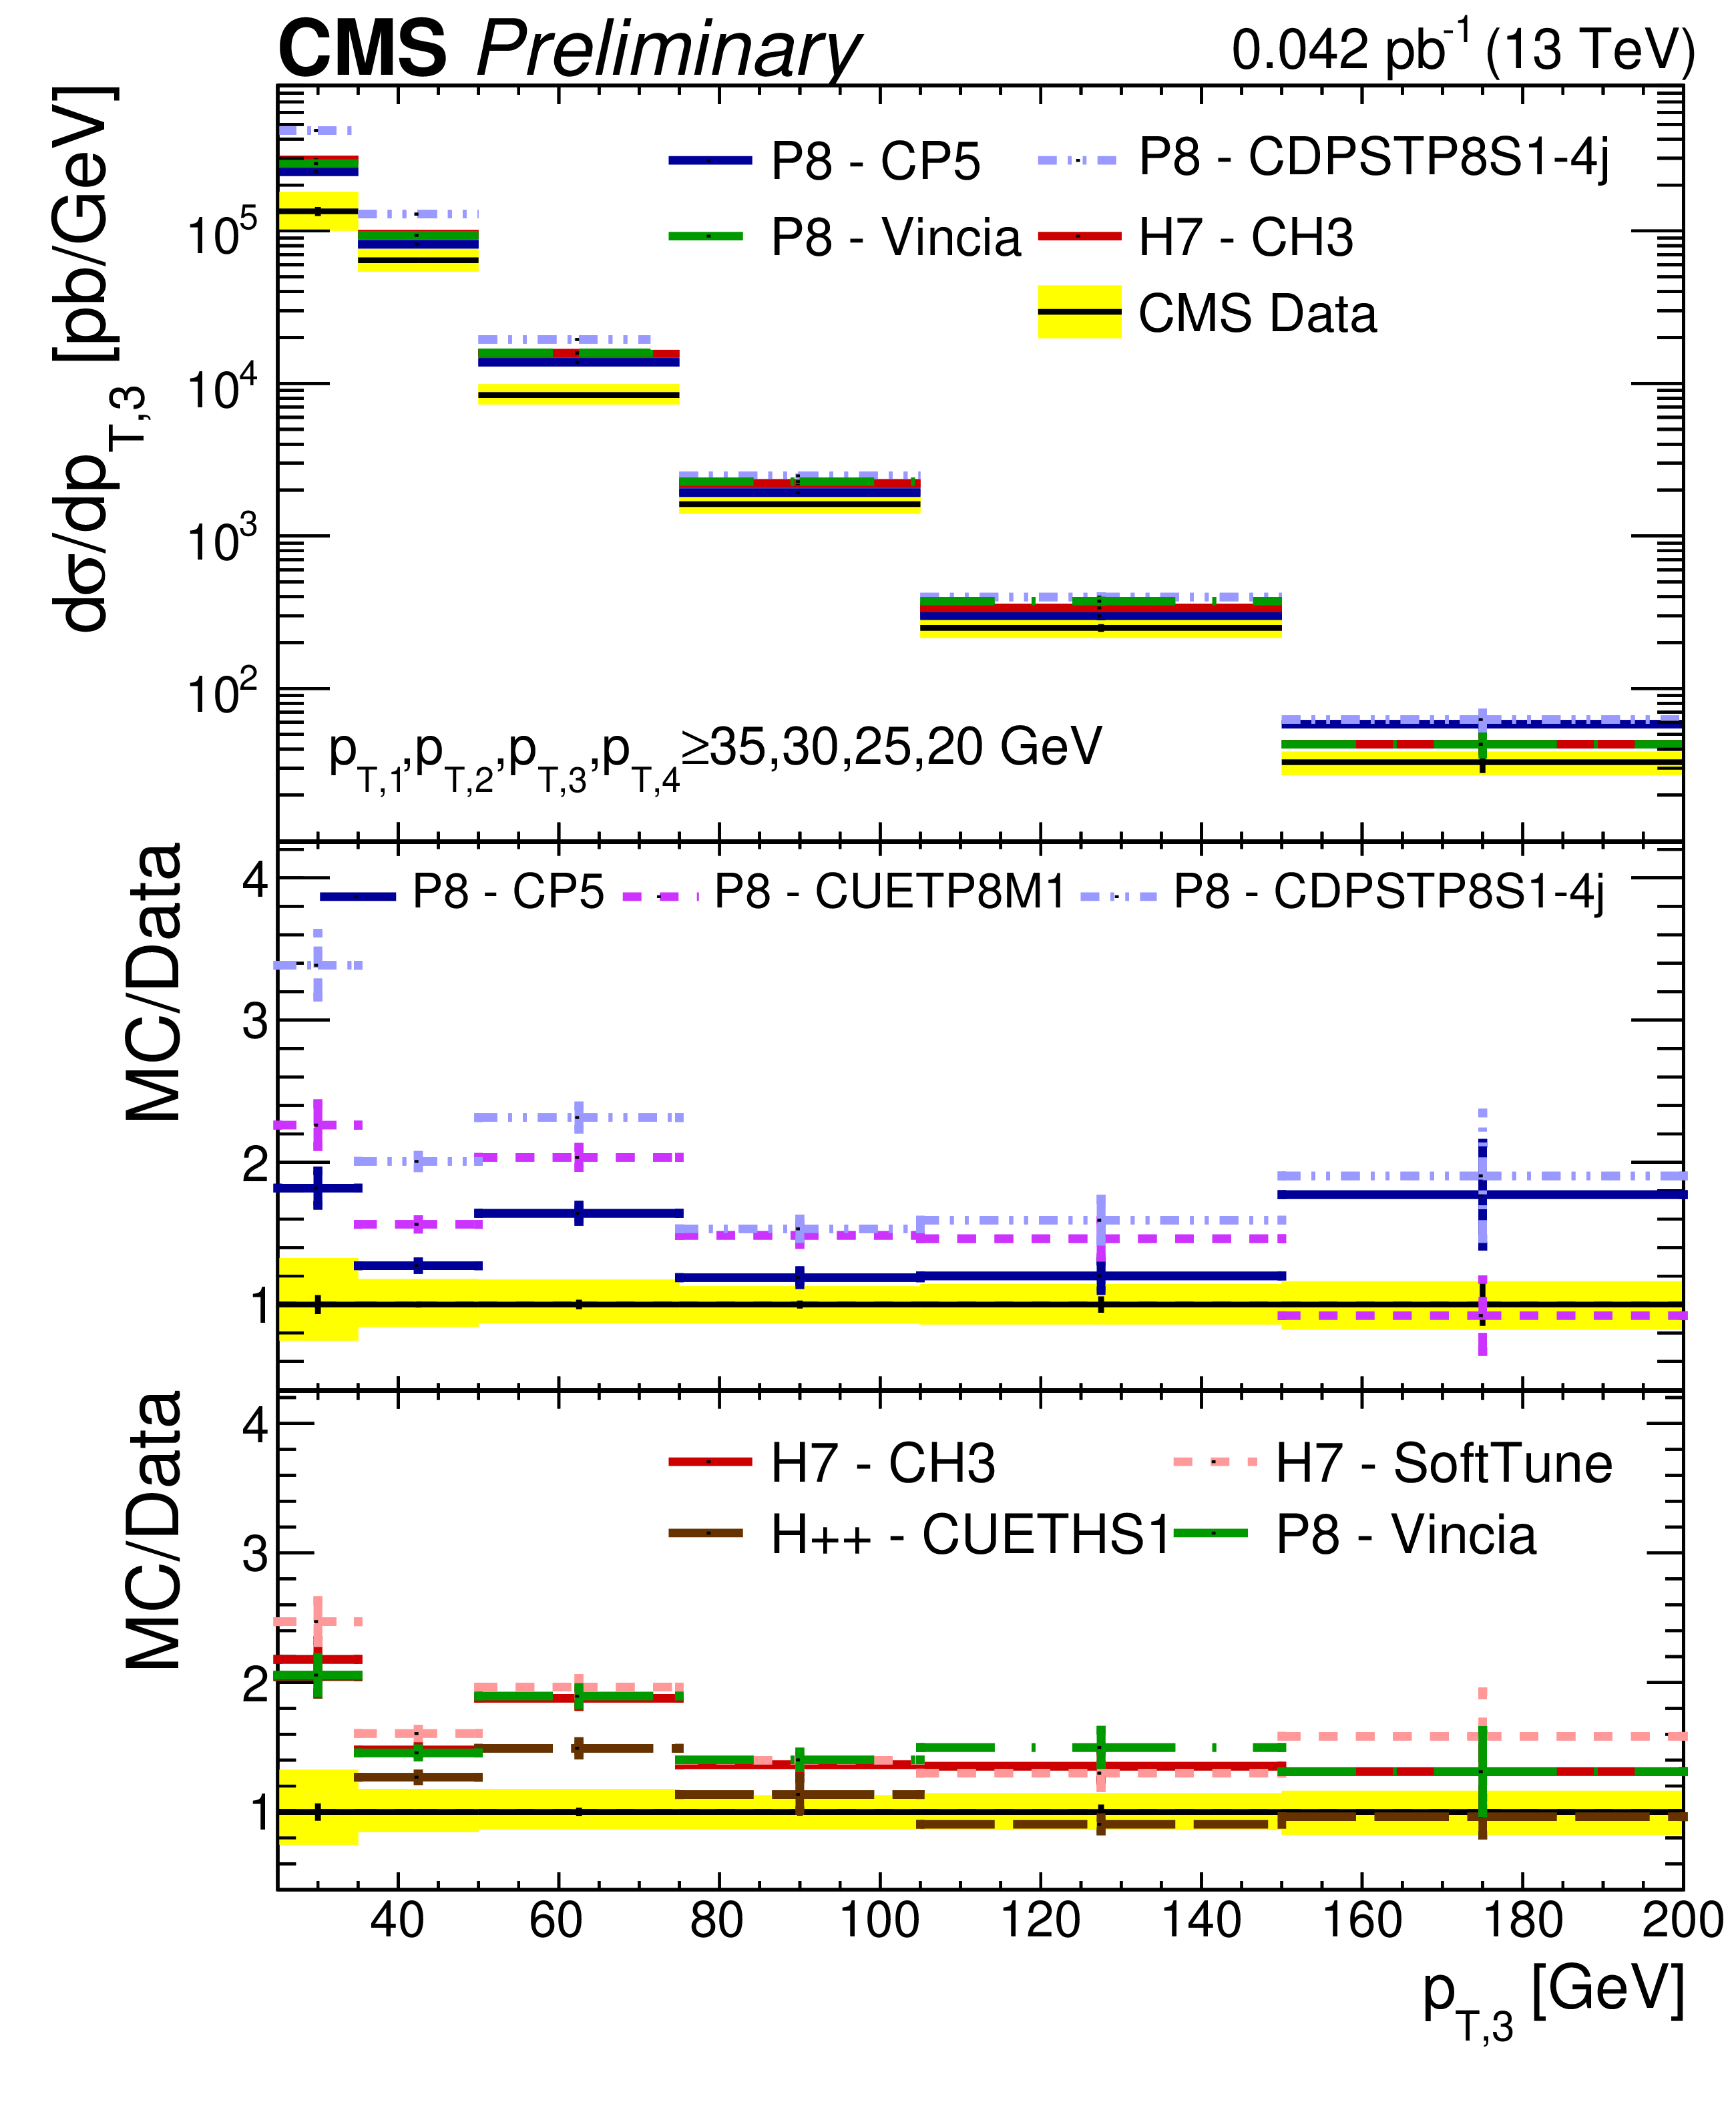
Comparison of the ${p_{\mathrm {T}}}$ spectra from data to different PYTHIA 8 (P8), HERWIG++ (H++), and HERWIG 7 (H7) tunes, for the leading (top left), subleading (top right), third leading (bottom left), and fourth leading (bottom right) jet. The error bars represent the statistical uncertainty, while the yellow band indicates the total (statistical+systematic) uncertainty on the measurement. |
png pdf |
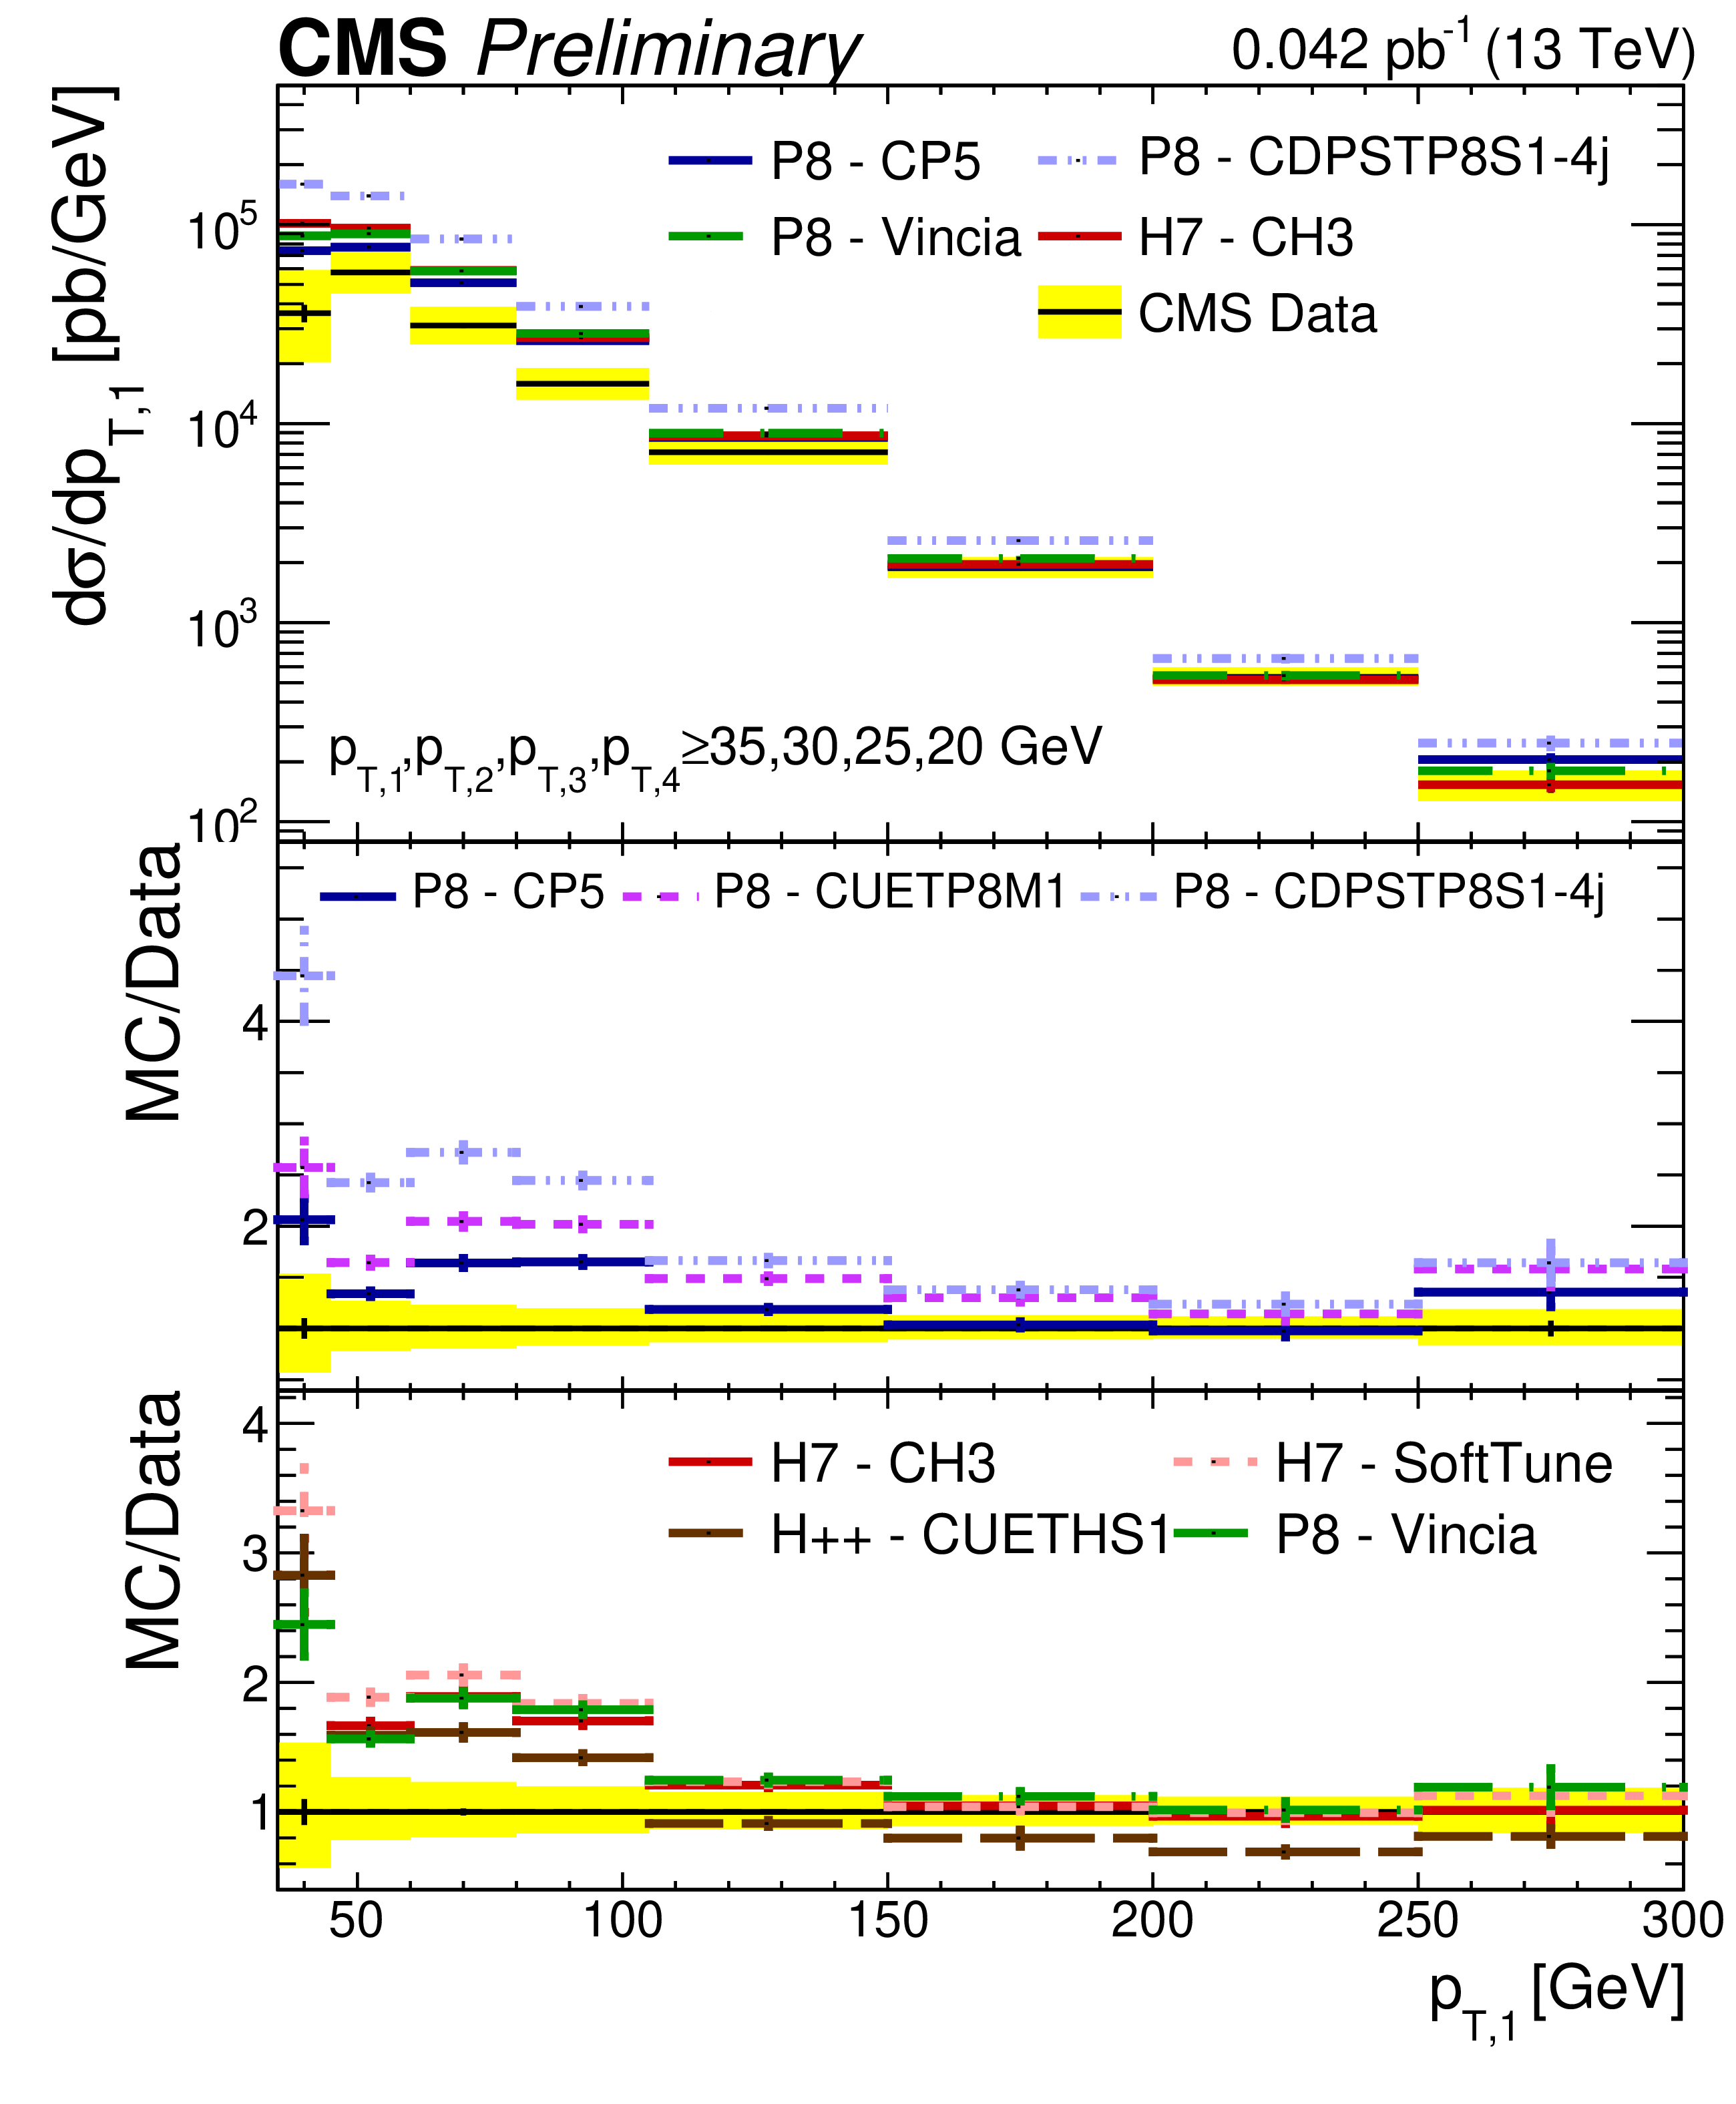
Figure 2-a:
Comparison of the ${p_{\mathrm {T}}}$ spectra from data to different PYTHIA 8 (P8), HERWIG++ (H++), and HERWIG 7 (H7) tunes, for the leading (top left), subleading (top right), third leading (bottom left), and fourth leading (bottom right) jet. The error bars represent the statistical uncertainty, while the yellow band indicates the total (statistical+systematic) uncertainty on the measurement. |
png pdf |
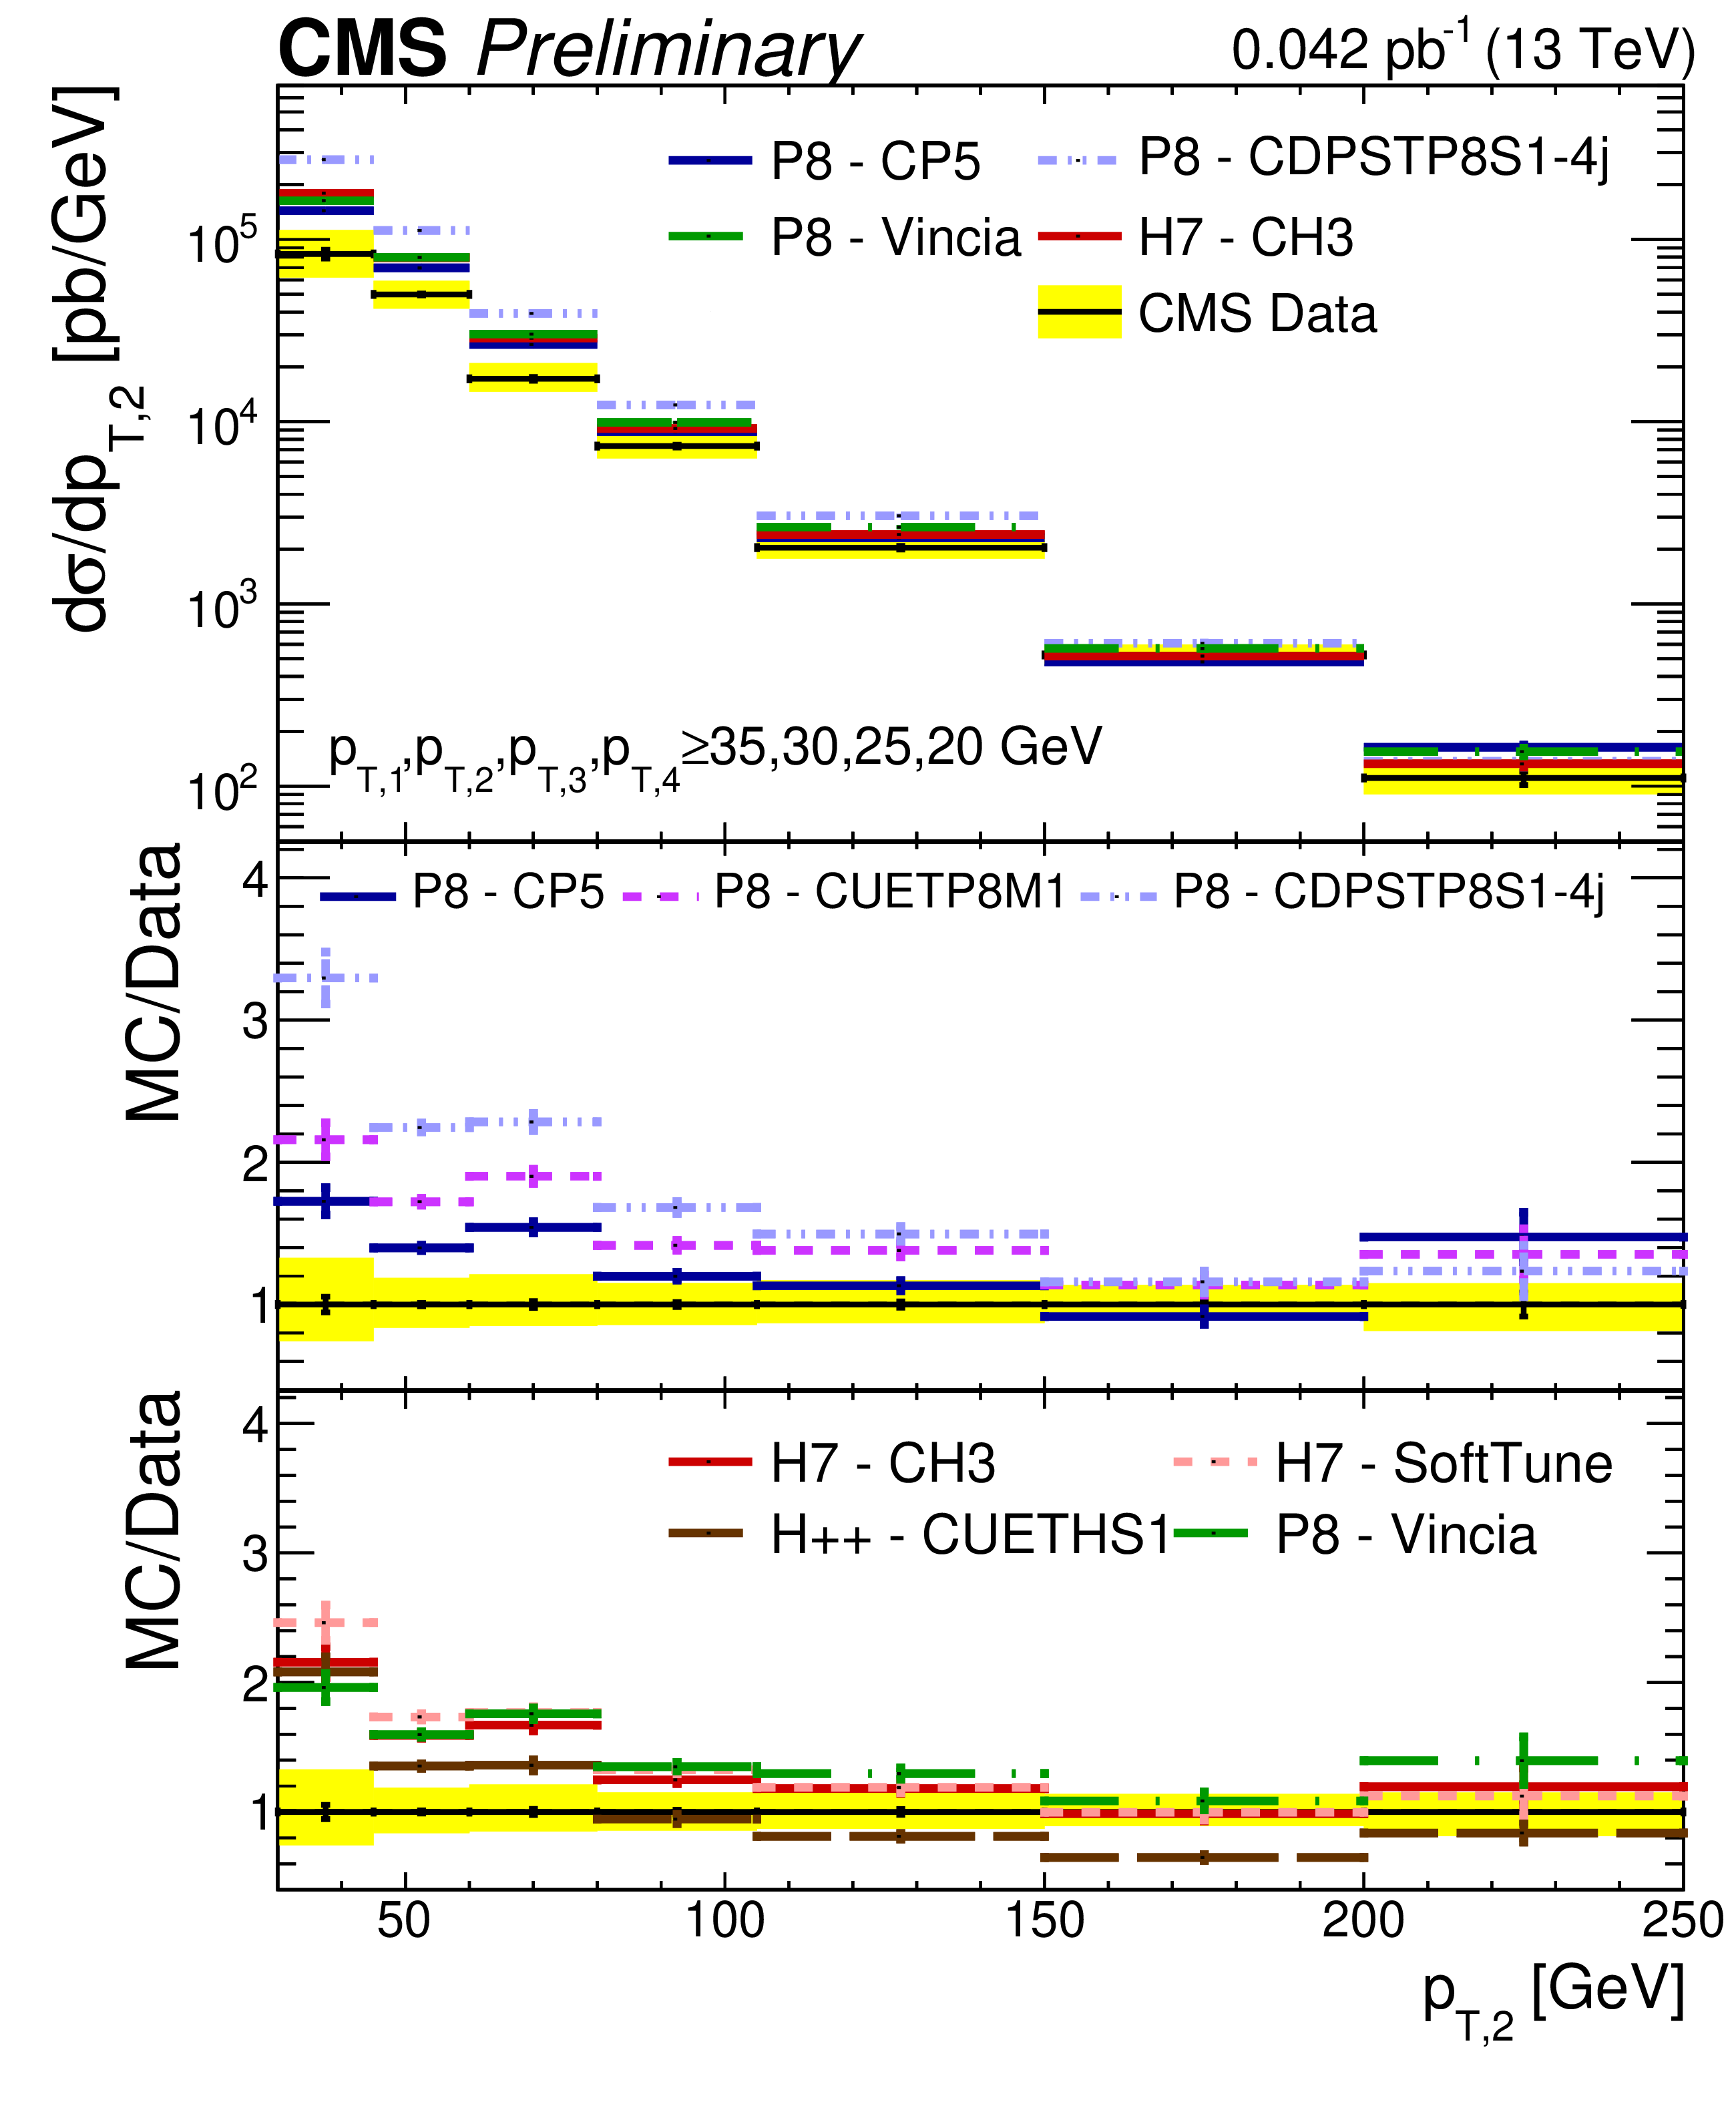
Figure 2-b:
Comparison of the ${p_{\mathrm {T}}}$ spectra from data to different PYTHIA 8 (P8), HERWIG++ (H++), and HERWIG 7 (H7) tunes, for the leading (top left), subleading (top right), third leading (bottom left), and fourth leading (bottom right) jet. The error bars represent the statistical uncertainty, while the yellow band indicates the total (statistical+systematic) uncertainty on the measurement. |
png pdf |
Figure 2-c:
Comparison of the ${p_{\mathrm {T}}}$ spectra from data to different PYTHIA 8 (P8), HERWIG++ (H++), and HERWIG 7 (H7) tunes, for the leading (top left), subleading (top right), third leading (bottom left), and fourth leading (bottom right) jet. The error bars represent the statistical uncertainty, while the yellow band indicates the total (statistical+systematic) uncertainty on the measurement. |

png pdf |
Figure 2-d:
Comparison of the ${p_{\mathrm {T}}}$ spectra from data to different PYTHIA 8 (P8), HERWIG++ (H++), and HERWIG 7 (H7) tunes, for the leading (top left), subleading (top right), third leading (bottom left), and fourth leading (bottom right) jet. The error bars represent the statistical uncertainty, while the yellow band indicates the total (statistical+systematic) uncertainty on the measurement. |
png pdf |
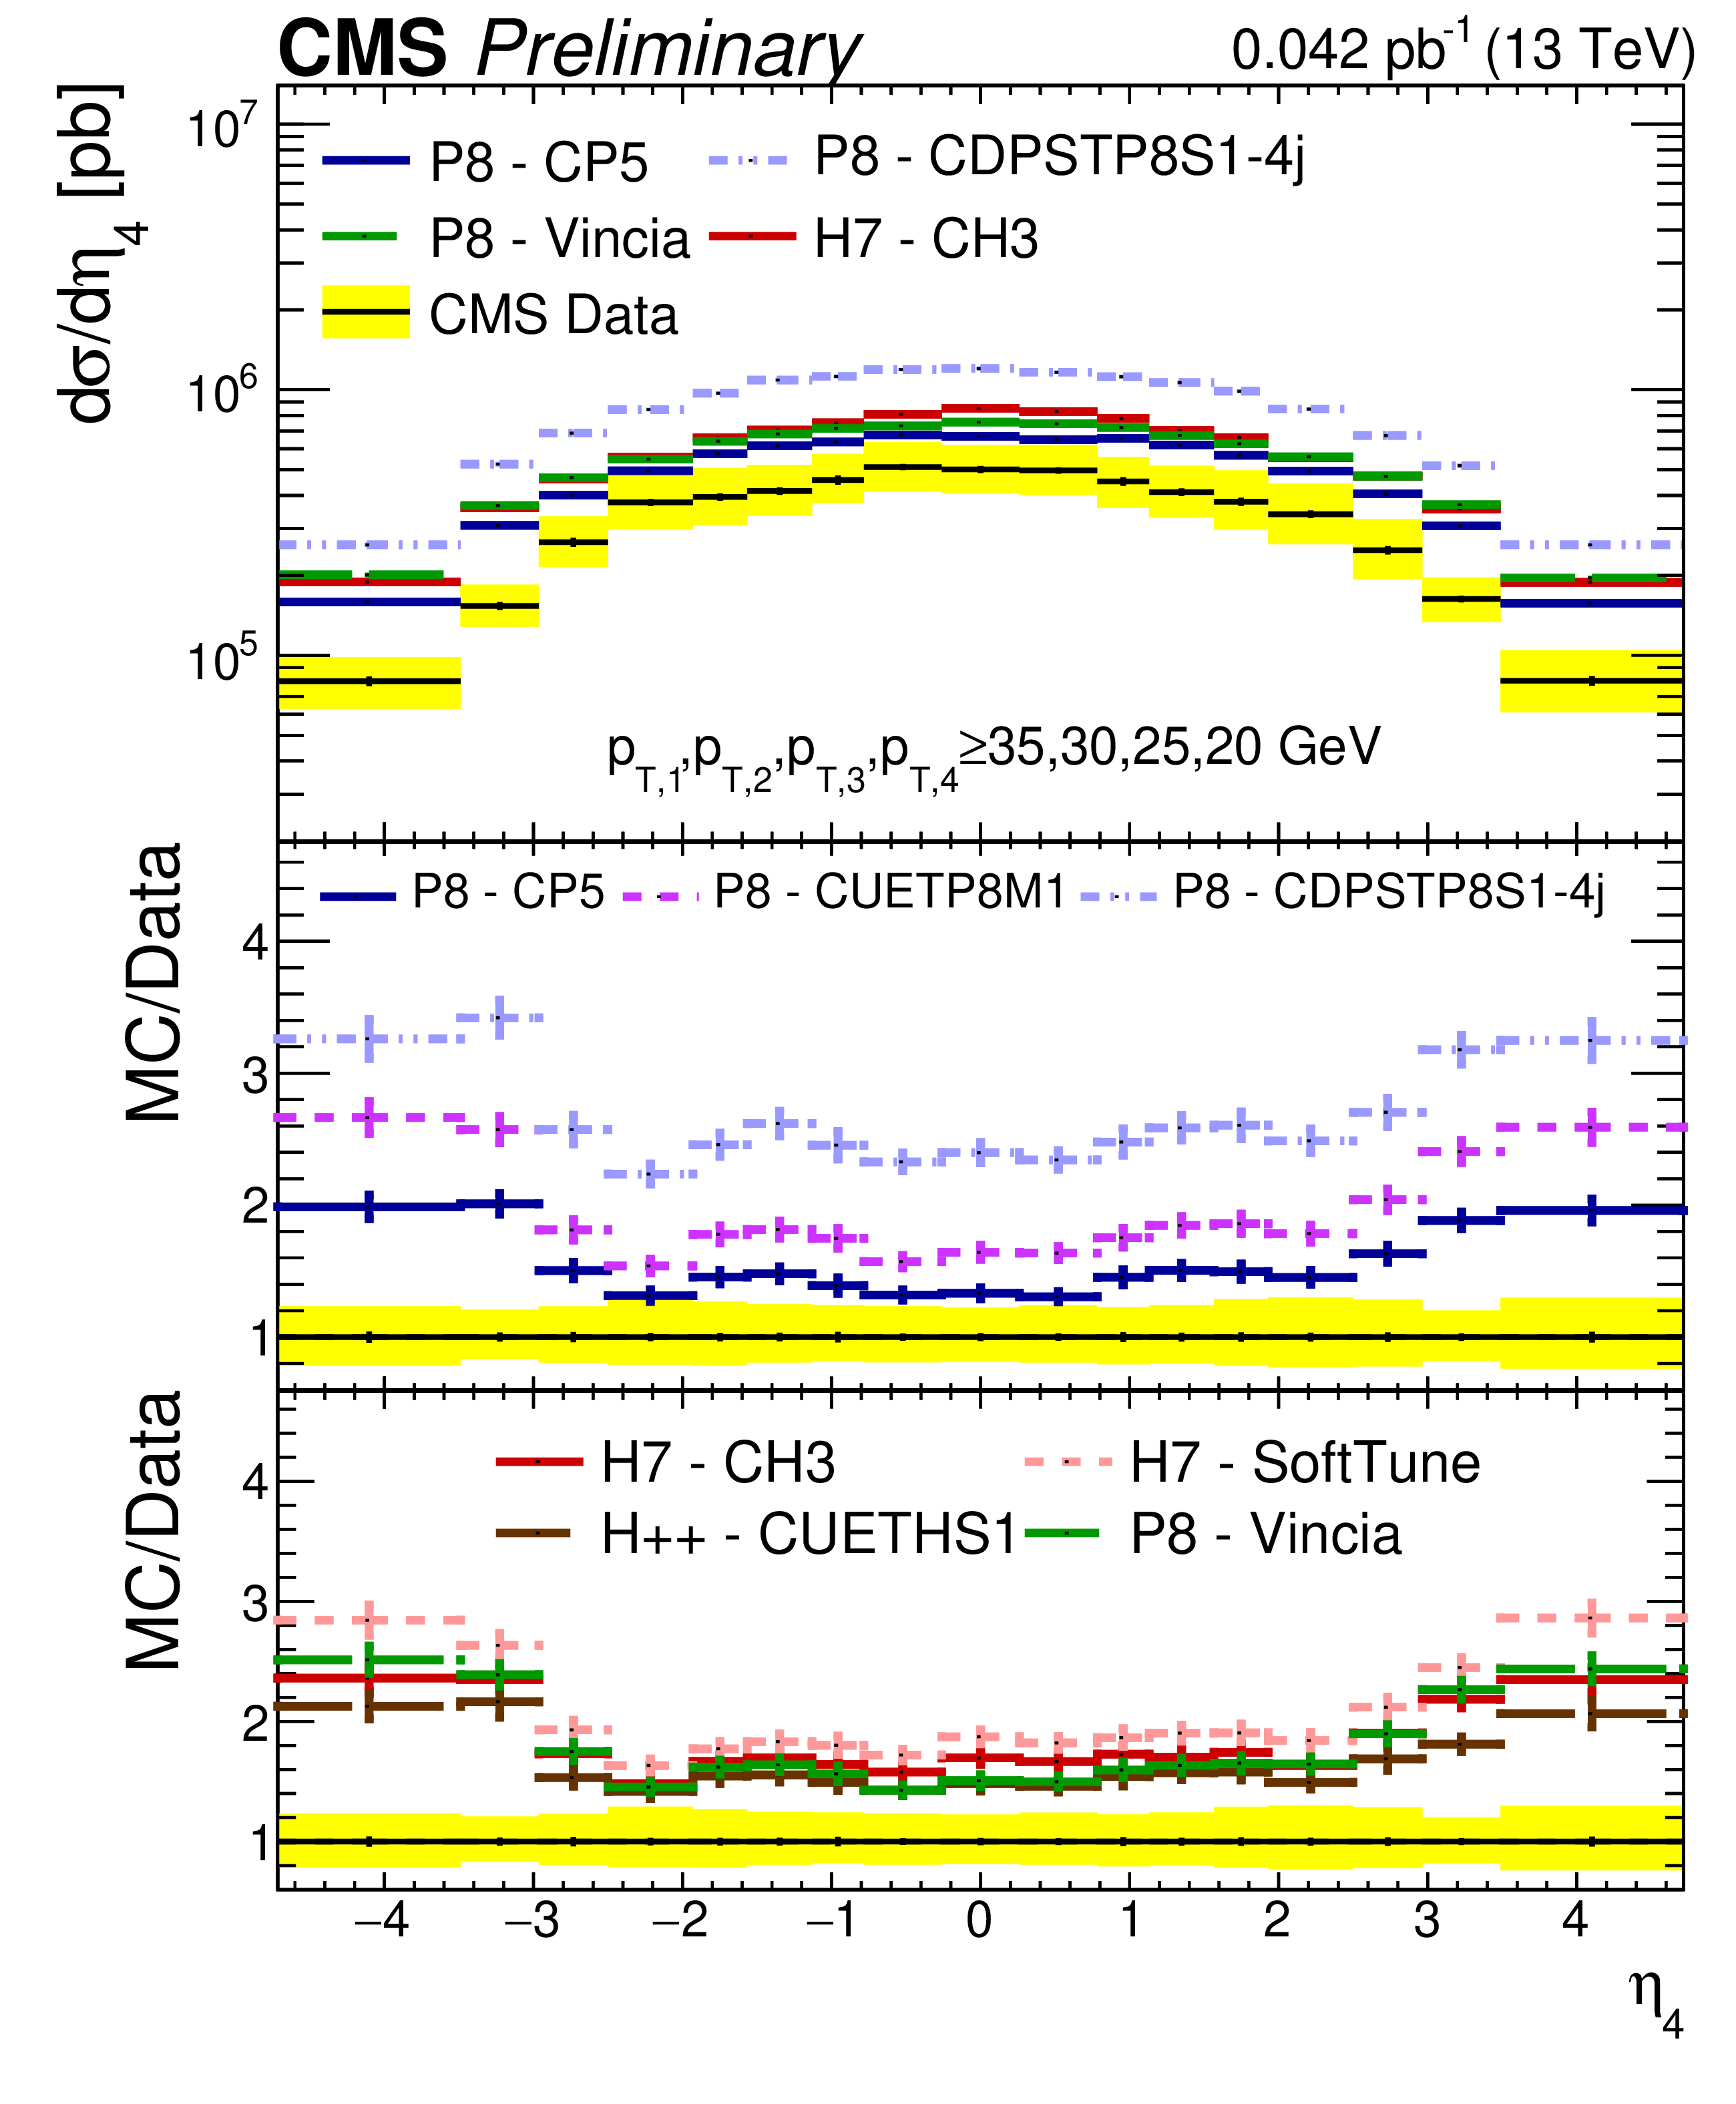
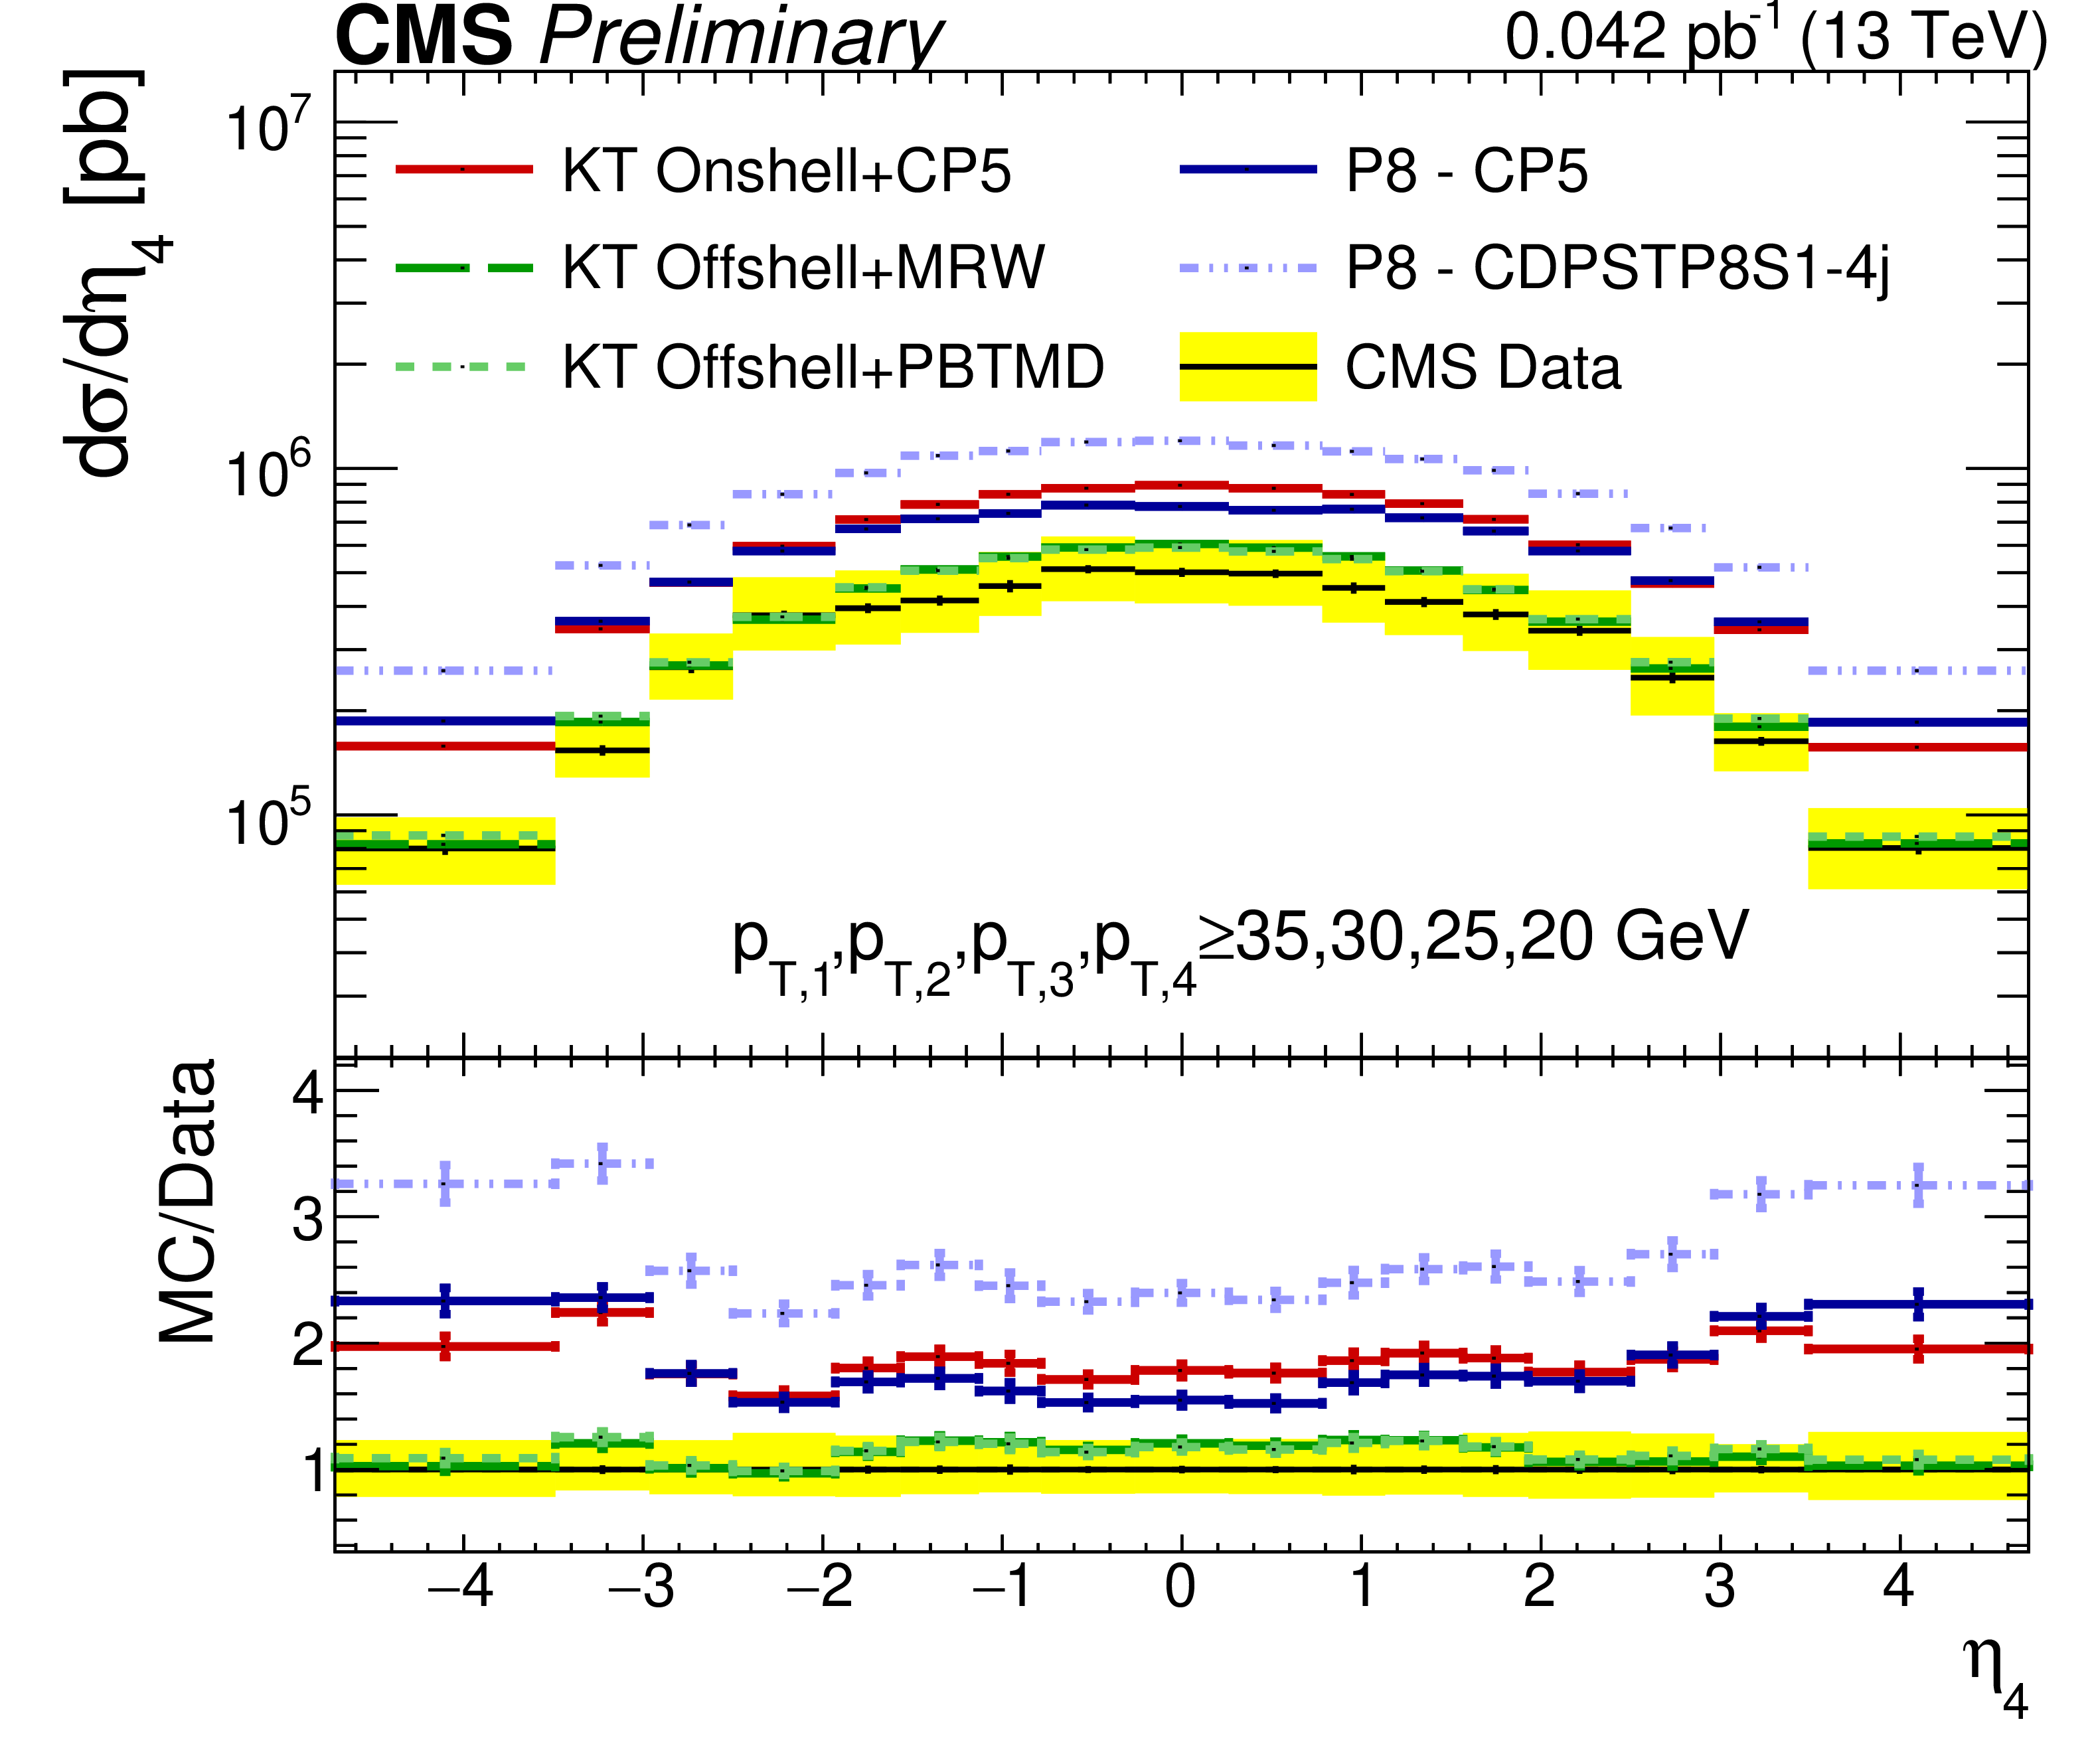
Figure 3:
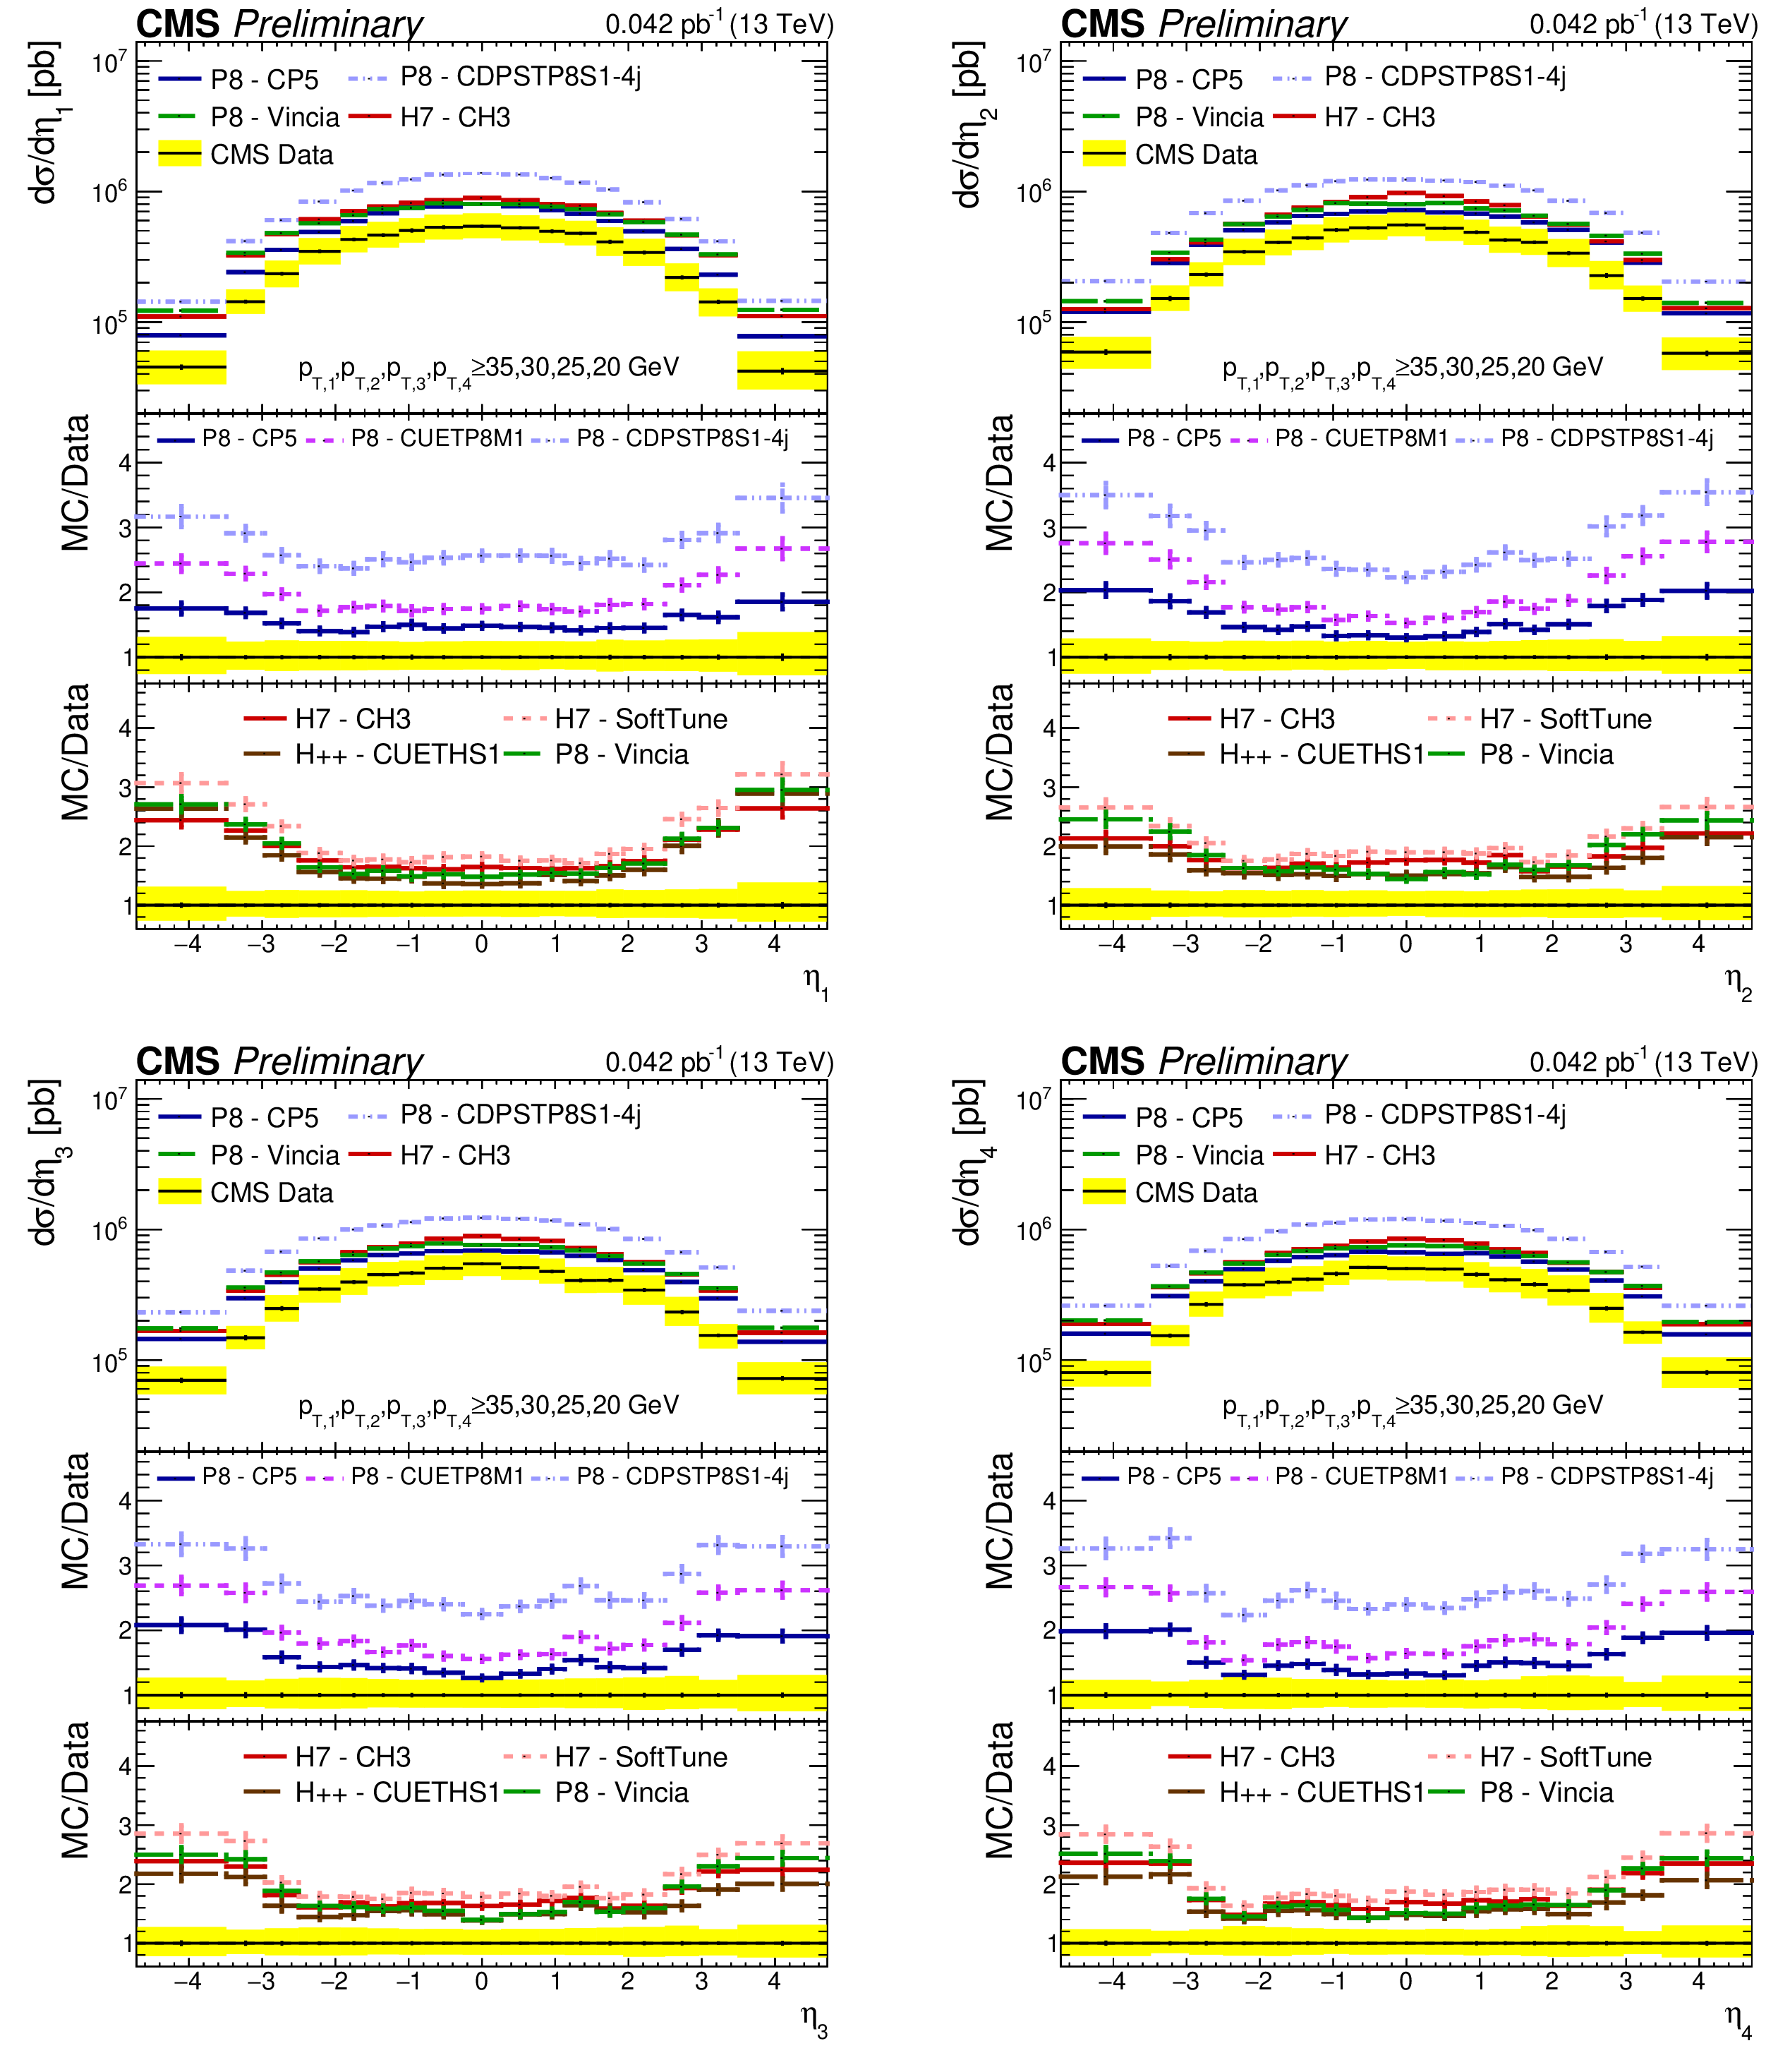
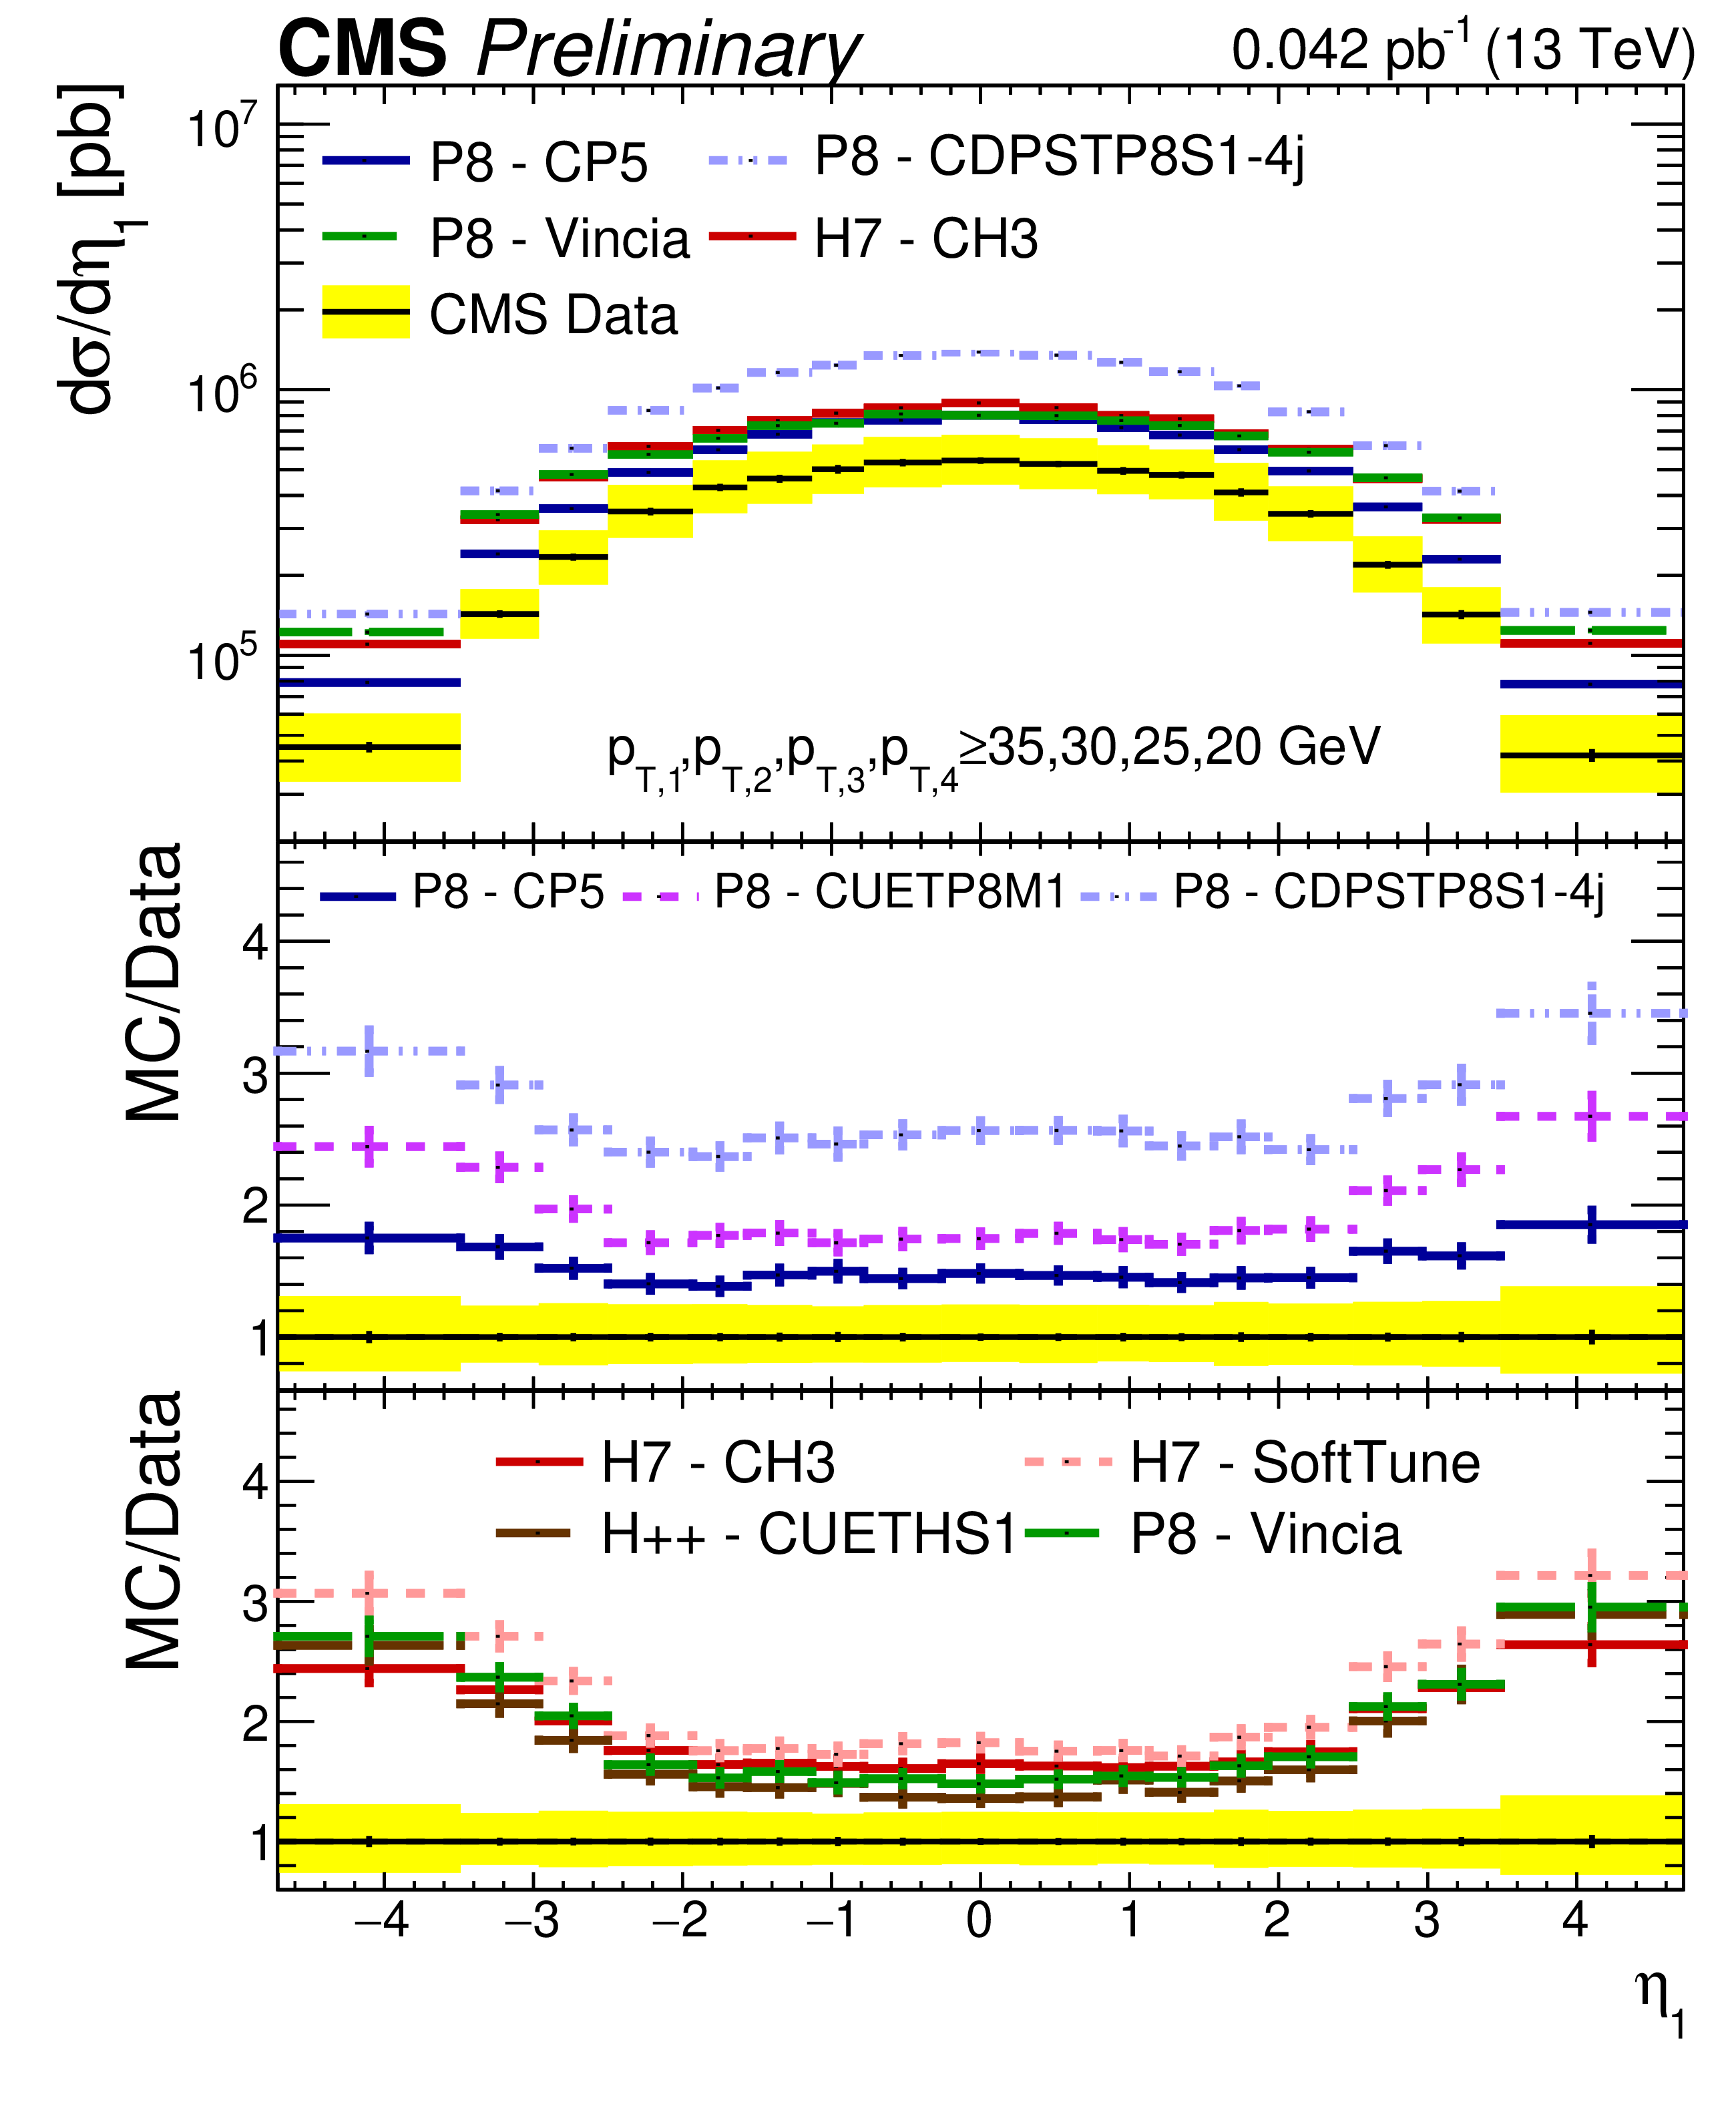
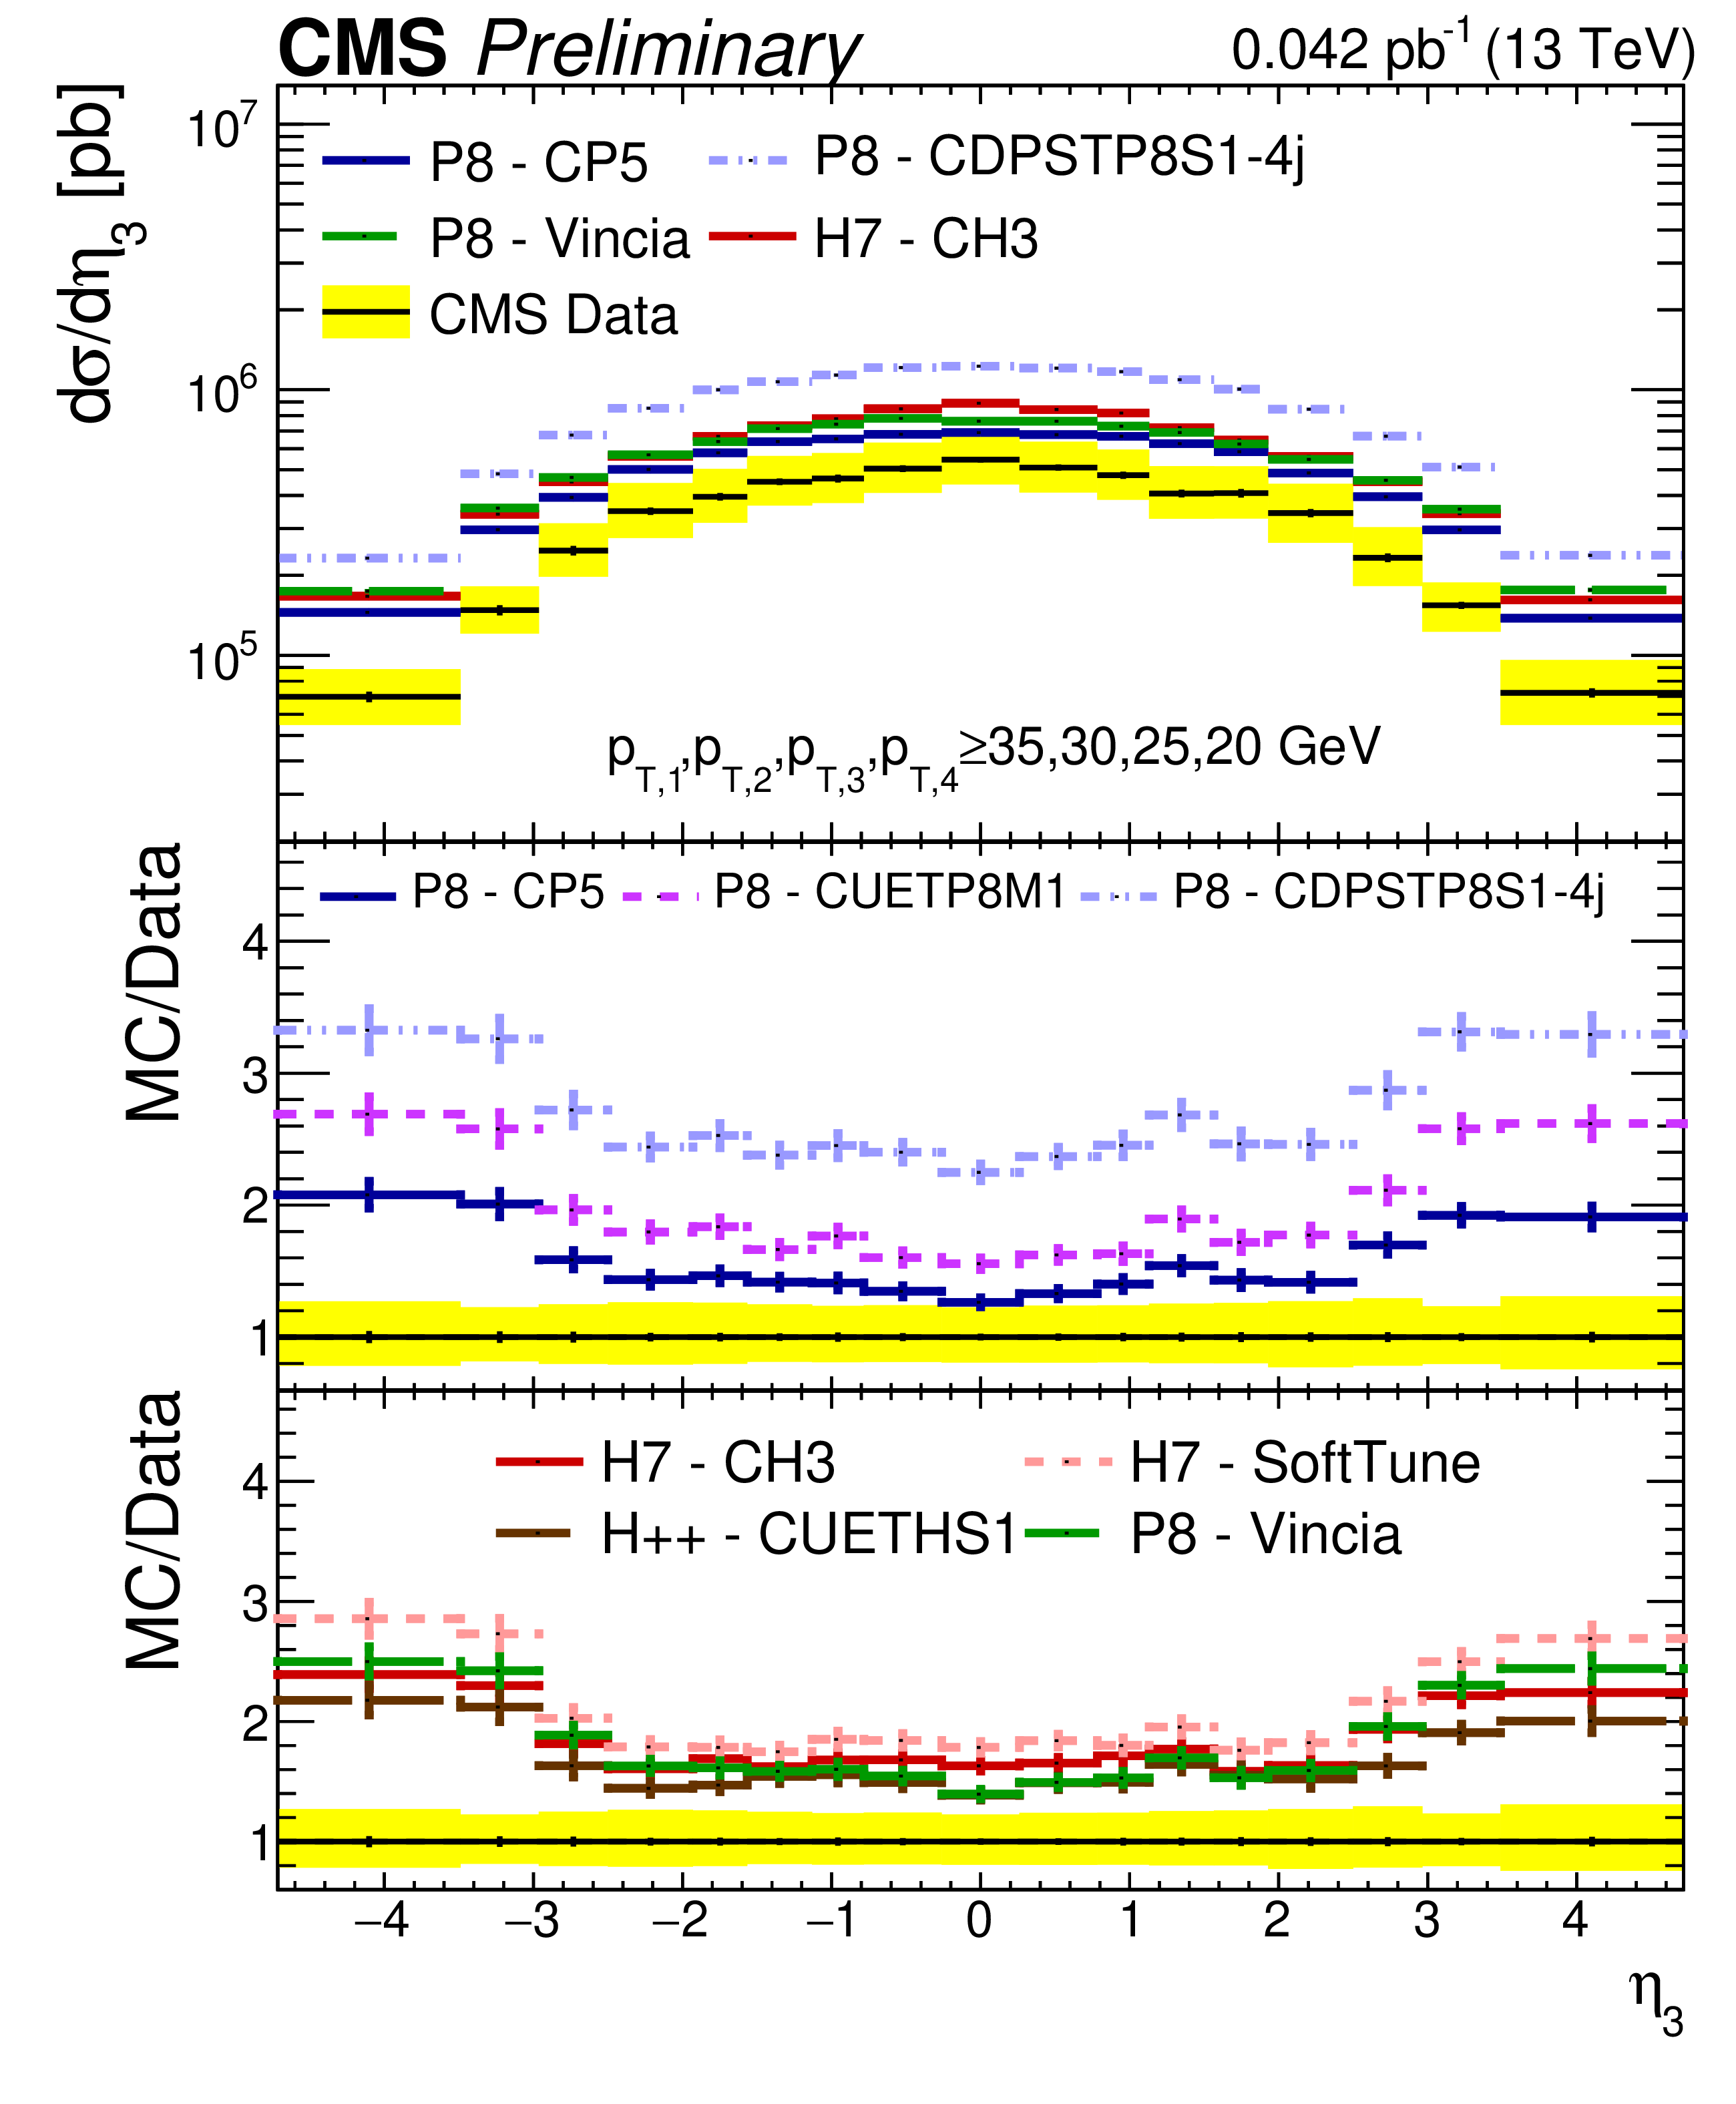
Comparison of the $\eta $ spectra from data to different PYTHIA 8 (P8), HERWIG++ (H++), and HERWIG 7 (H7) tunes, for the leading (top left), subleading (top right), third leading (bottom left), and fourth leading (bottom right) jet. The error bars represent the statistical uncertainty, while the yellow band indicates the total (statistical+systematic) uncertainty on the measurement. |
png pdf |
Figure 3-a:
Comparison of the $\eta $ spectra from data to different PYTHIA 8 (P8), HERWIG++ (H++), and HERWIG 7 (H7) tunes, for the leading (top left), subleading (top right), third leading (bottom left), and fourth leading (bottom right) jet. The error bars represent the statistical uncertainty, while the yellow band indicates the total (statistical+systematic) uncertainty on the measurement. |

png pdf |
Figure 3-b:
Comparison of the $\eta $ spectra from data to different PYTHIA 8 (P8), HERWIG++ (H++), and HERWIG 7 (H7) tunes, for the leading (top left), subleading (top right), third leading (bottom left), and fourth leading (bottom right) jet. The error bars represent the statistical uncertainty, while the yellow band indicates the total (statistical+systematic) uncertainty on the measurement. |
png pdf |
Figure 3-c:
Comparison of the $\eta $ spectra from data to different PYTHIA 8 (P8), HERWIG++ (H++), and HERWIG 7 (H7) tunes, for the leading (top left), subleading (top right), third leading (bottom left), and fourth leading (bottom right) jet. The error bars represent the statistical uncertainty, while the yellow band indicates the total (statistical+systematic) uncertainty on the measurement. |
png pdf |
Figure 3-d:
Comparison of the $\eta $ spectra from data to different PYTHIA 8 (P8), HERWIG++ (H++), and HERWIG 7 (H7) tunes, for the leading (top left), subleading (top right), third leading (bottom left), and fourth leading (bottom right) jet. The error bars represent the statistical uncertainty, while the yellow band indicates the total (statistical+systematic) uncertainty on the measurement. |
png pdf |
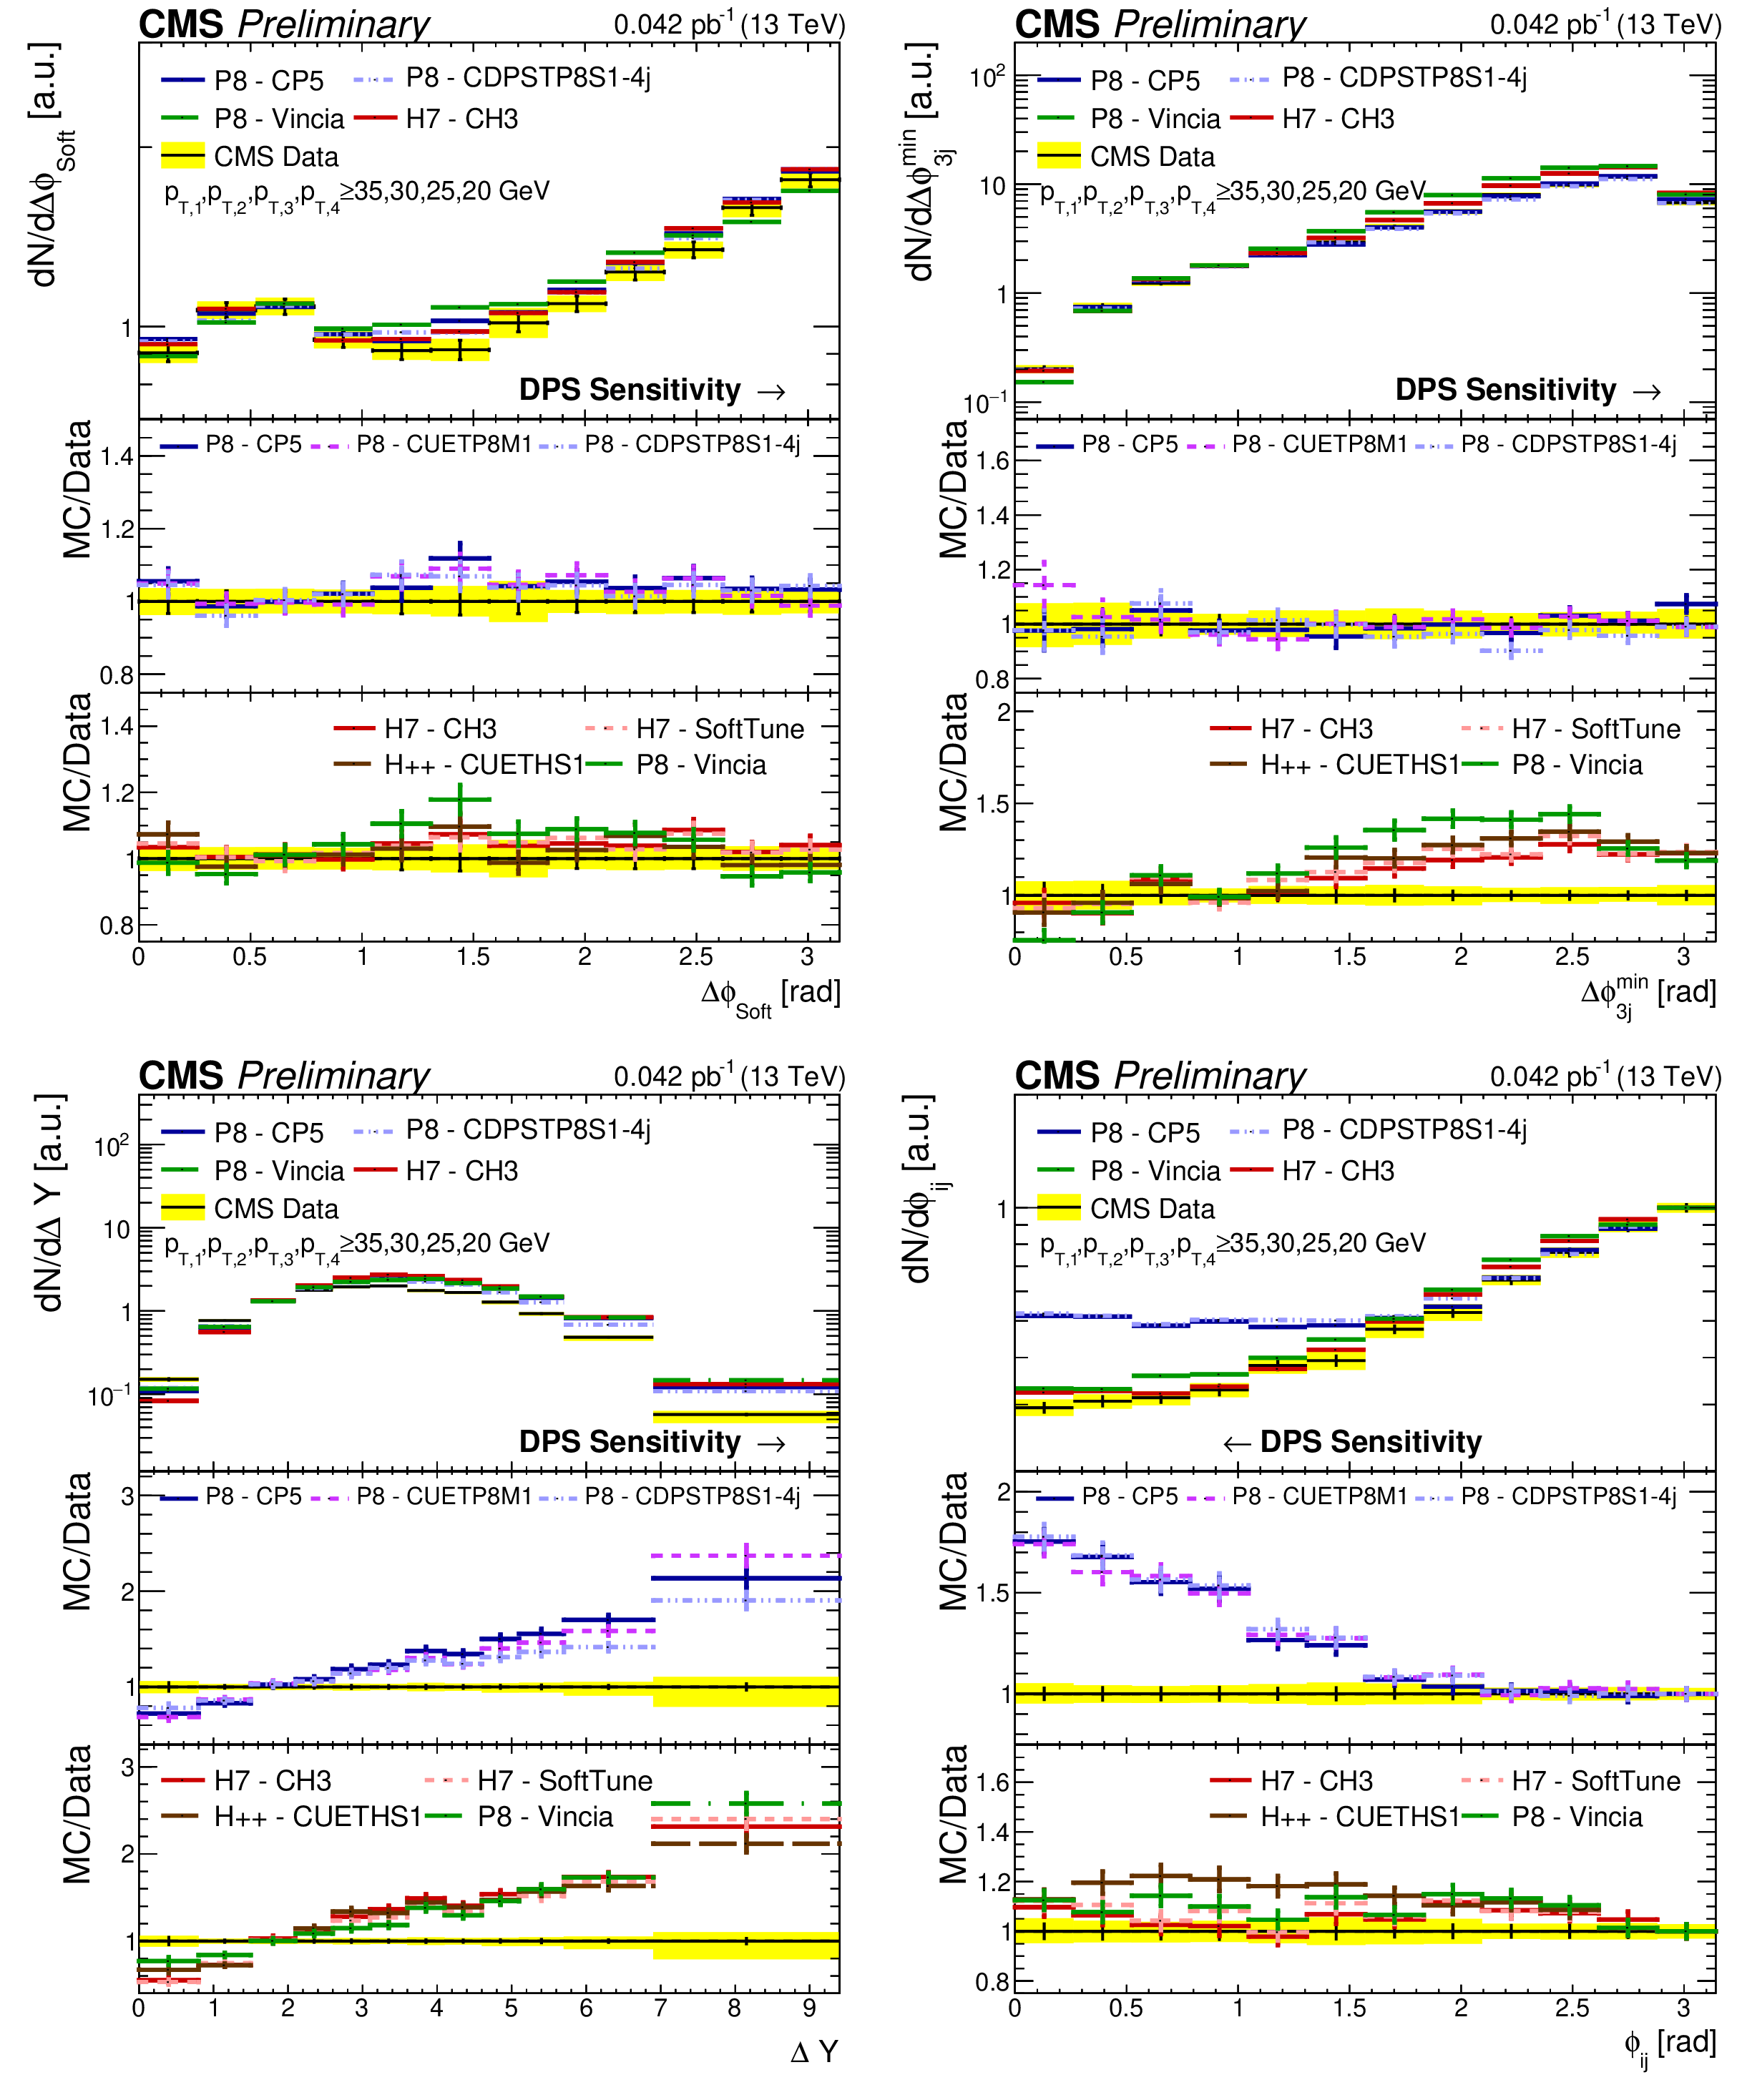
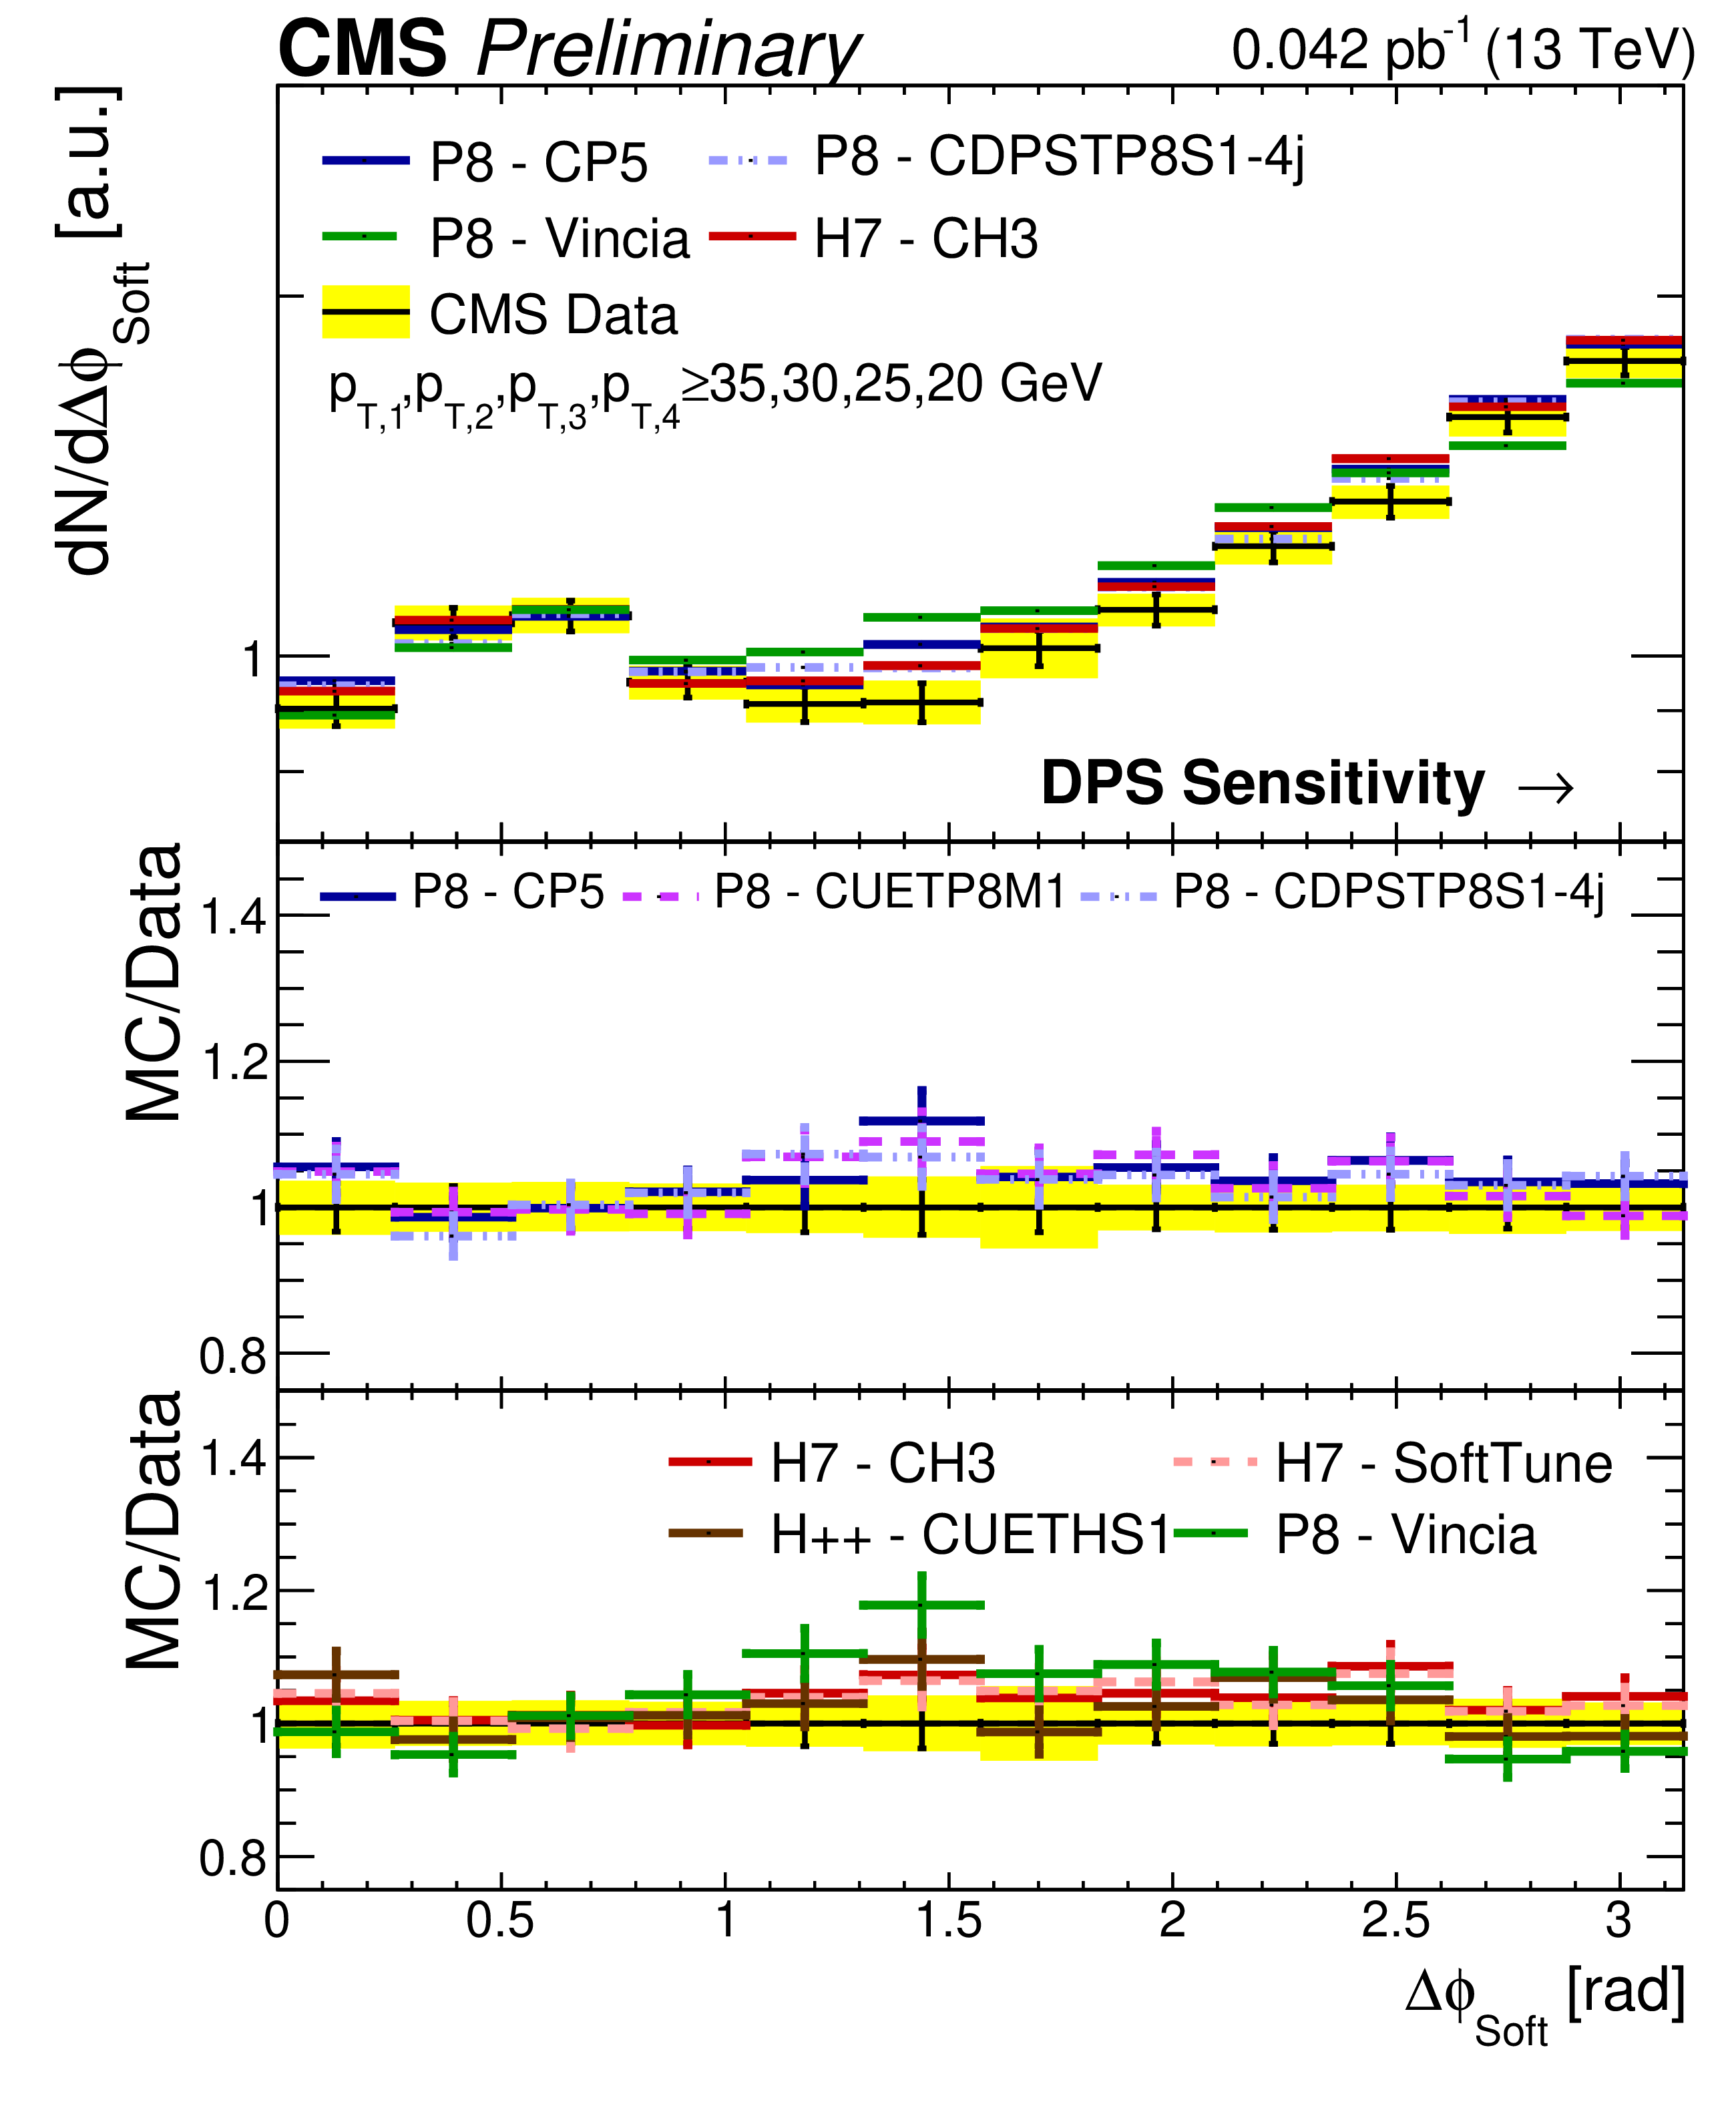
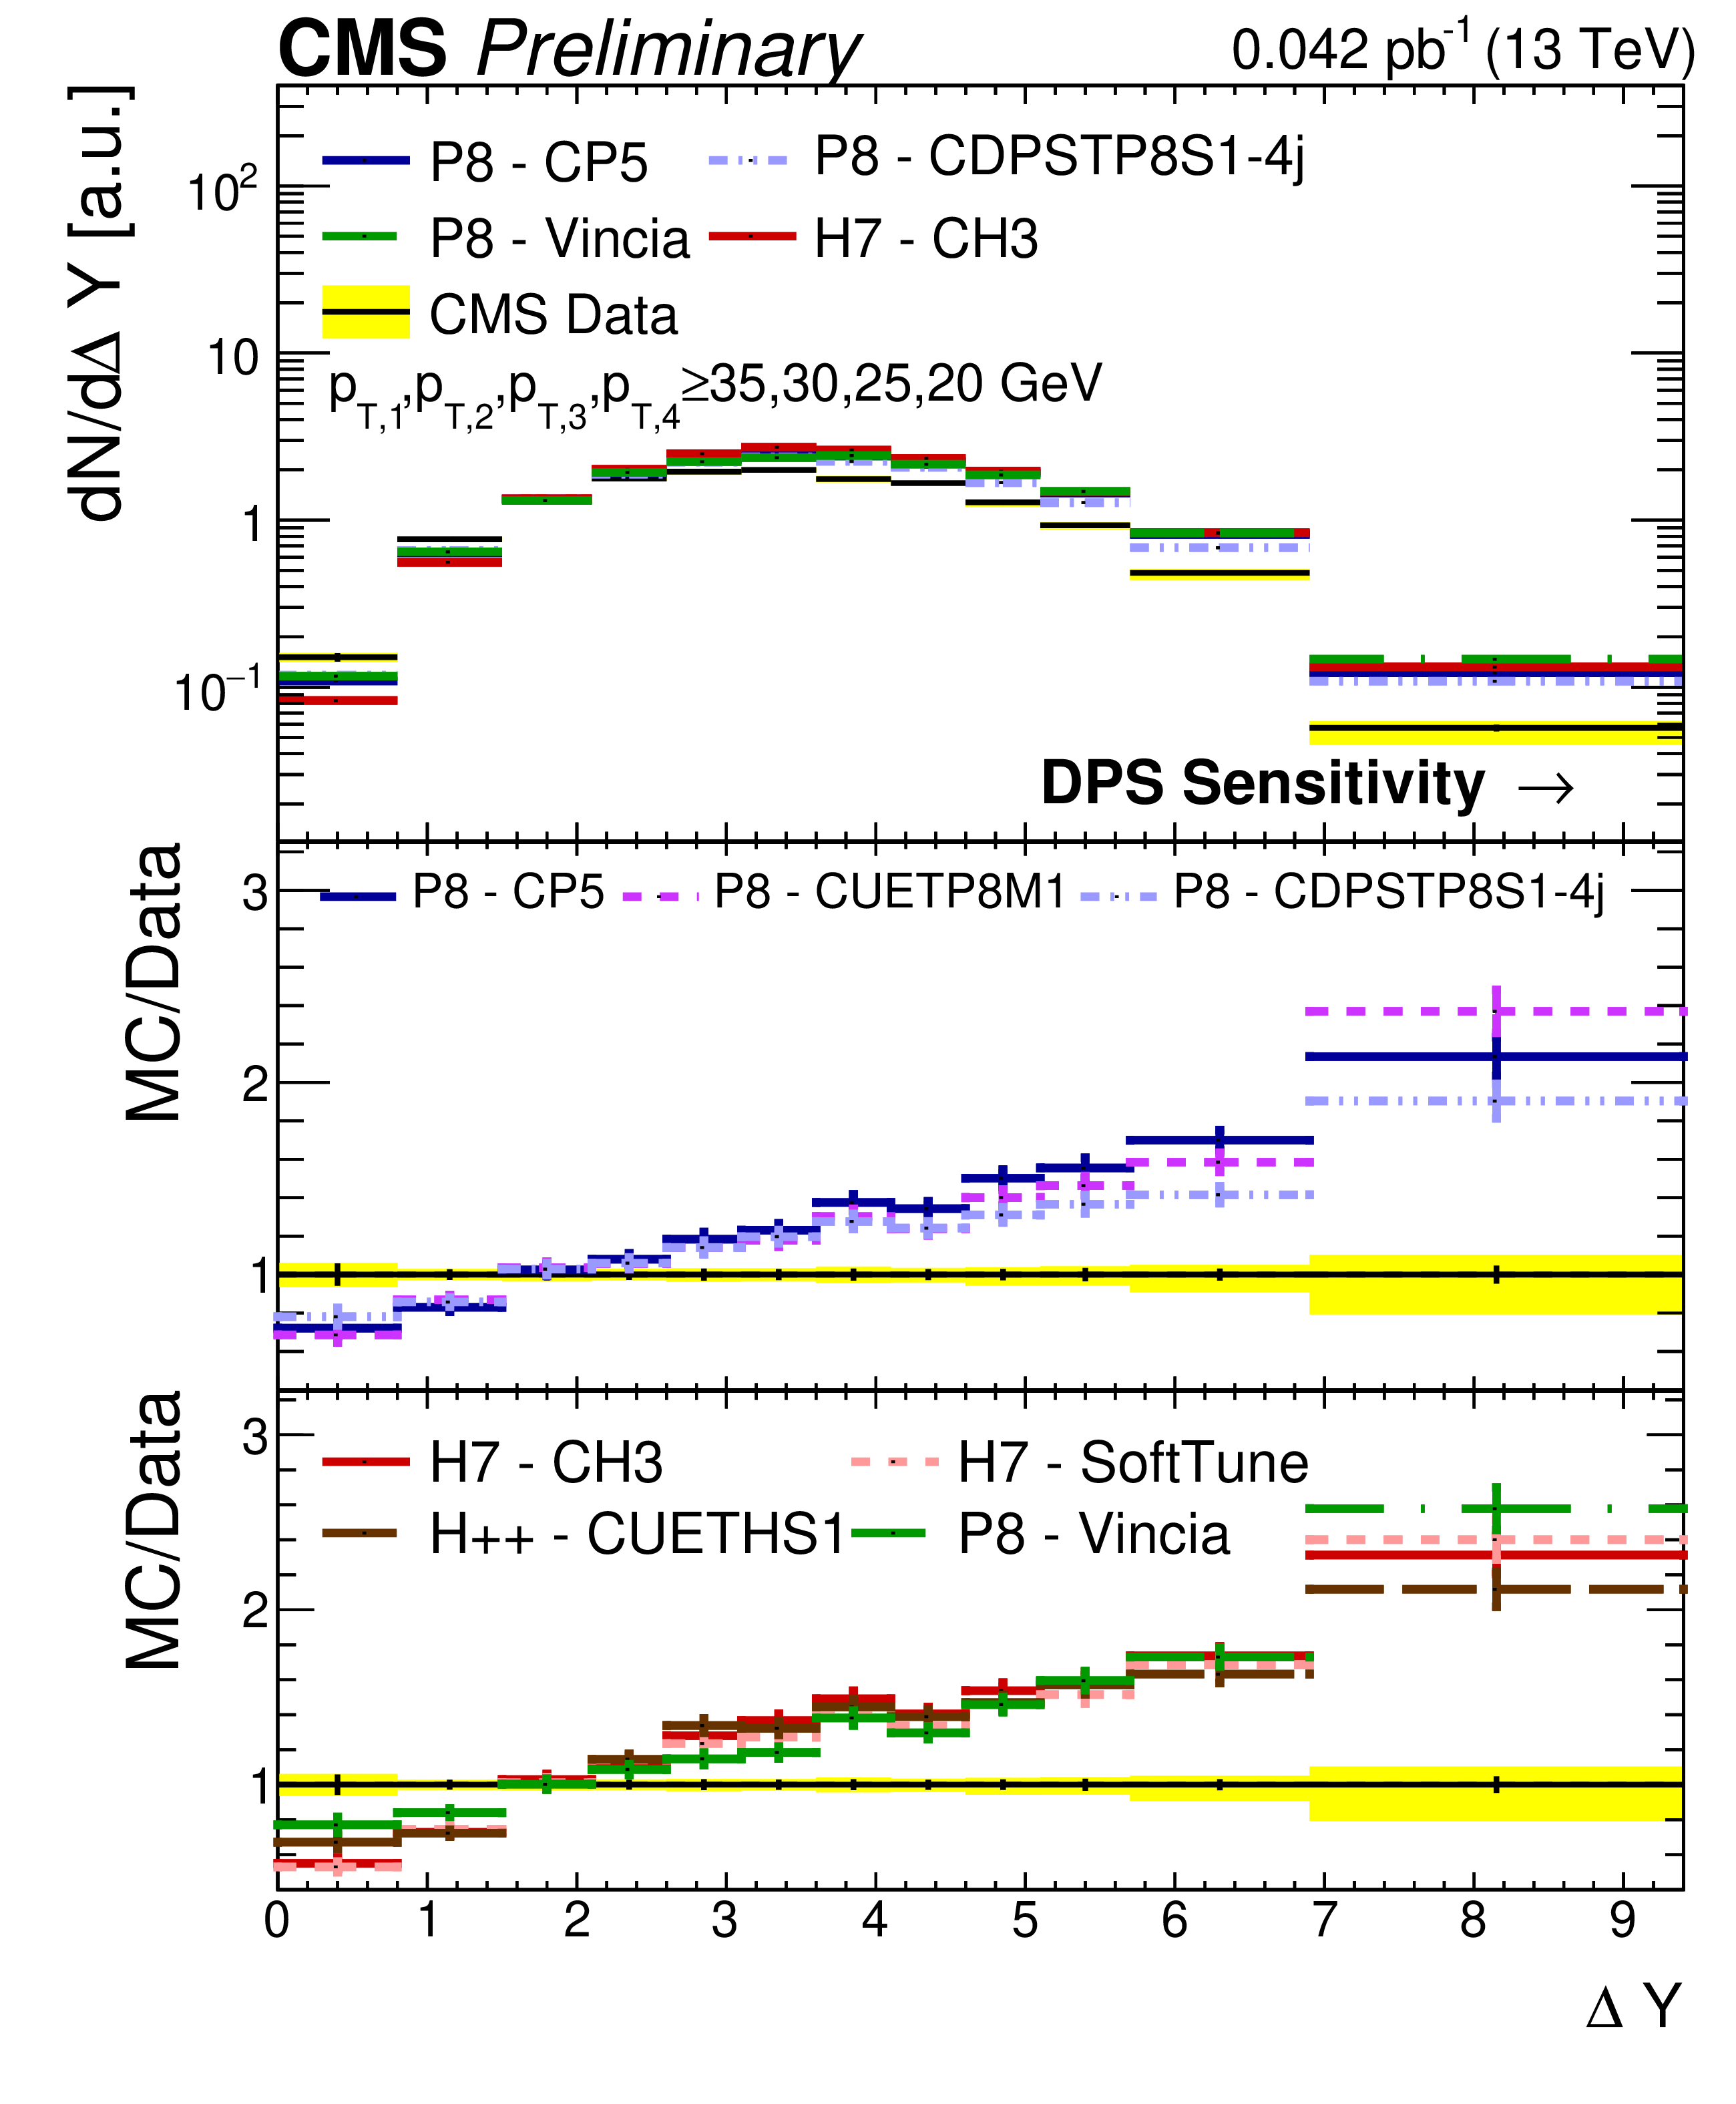
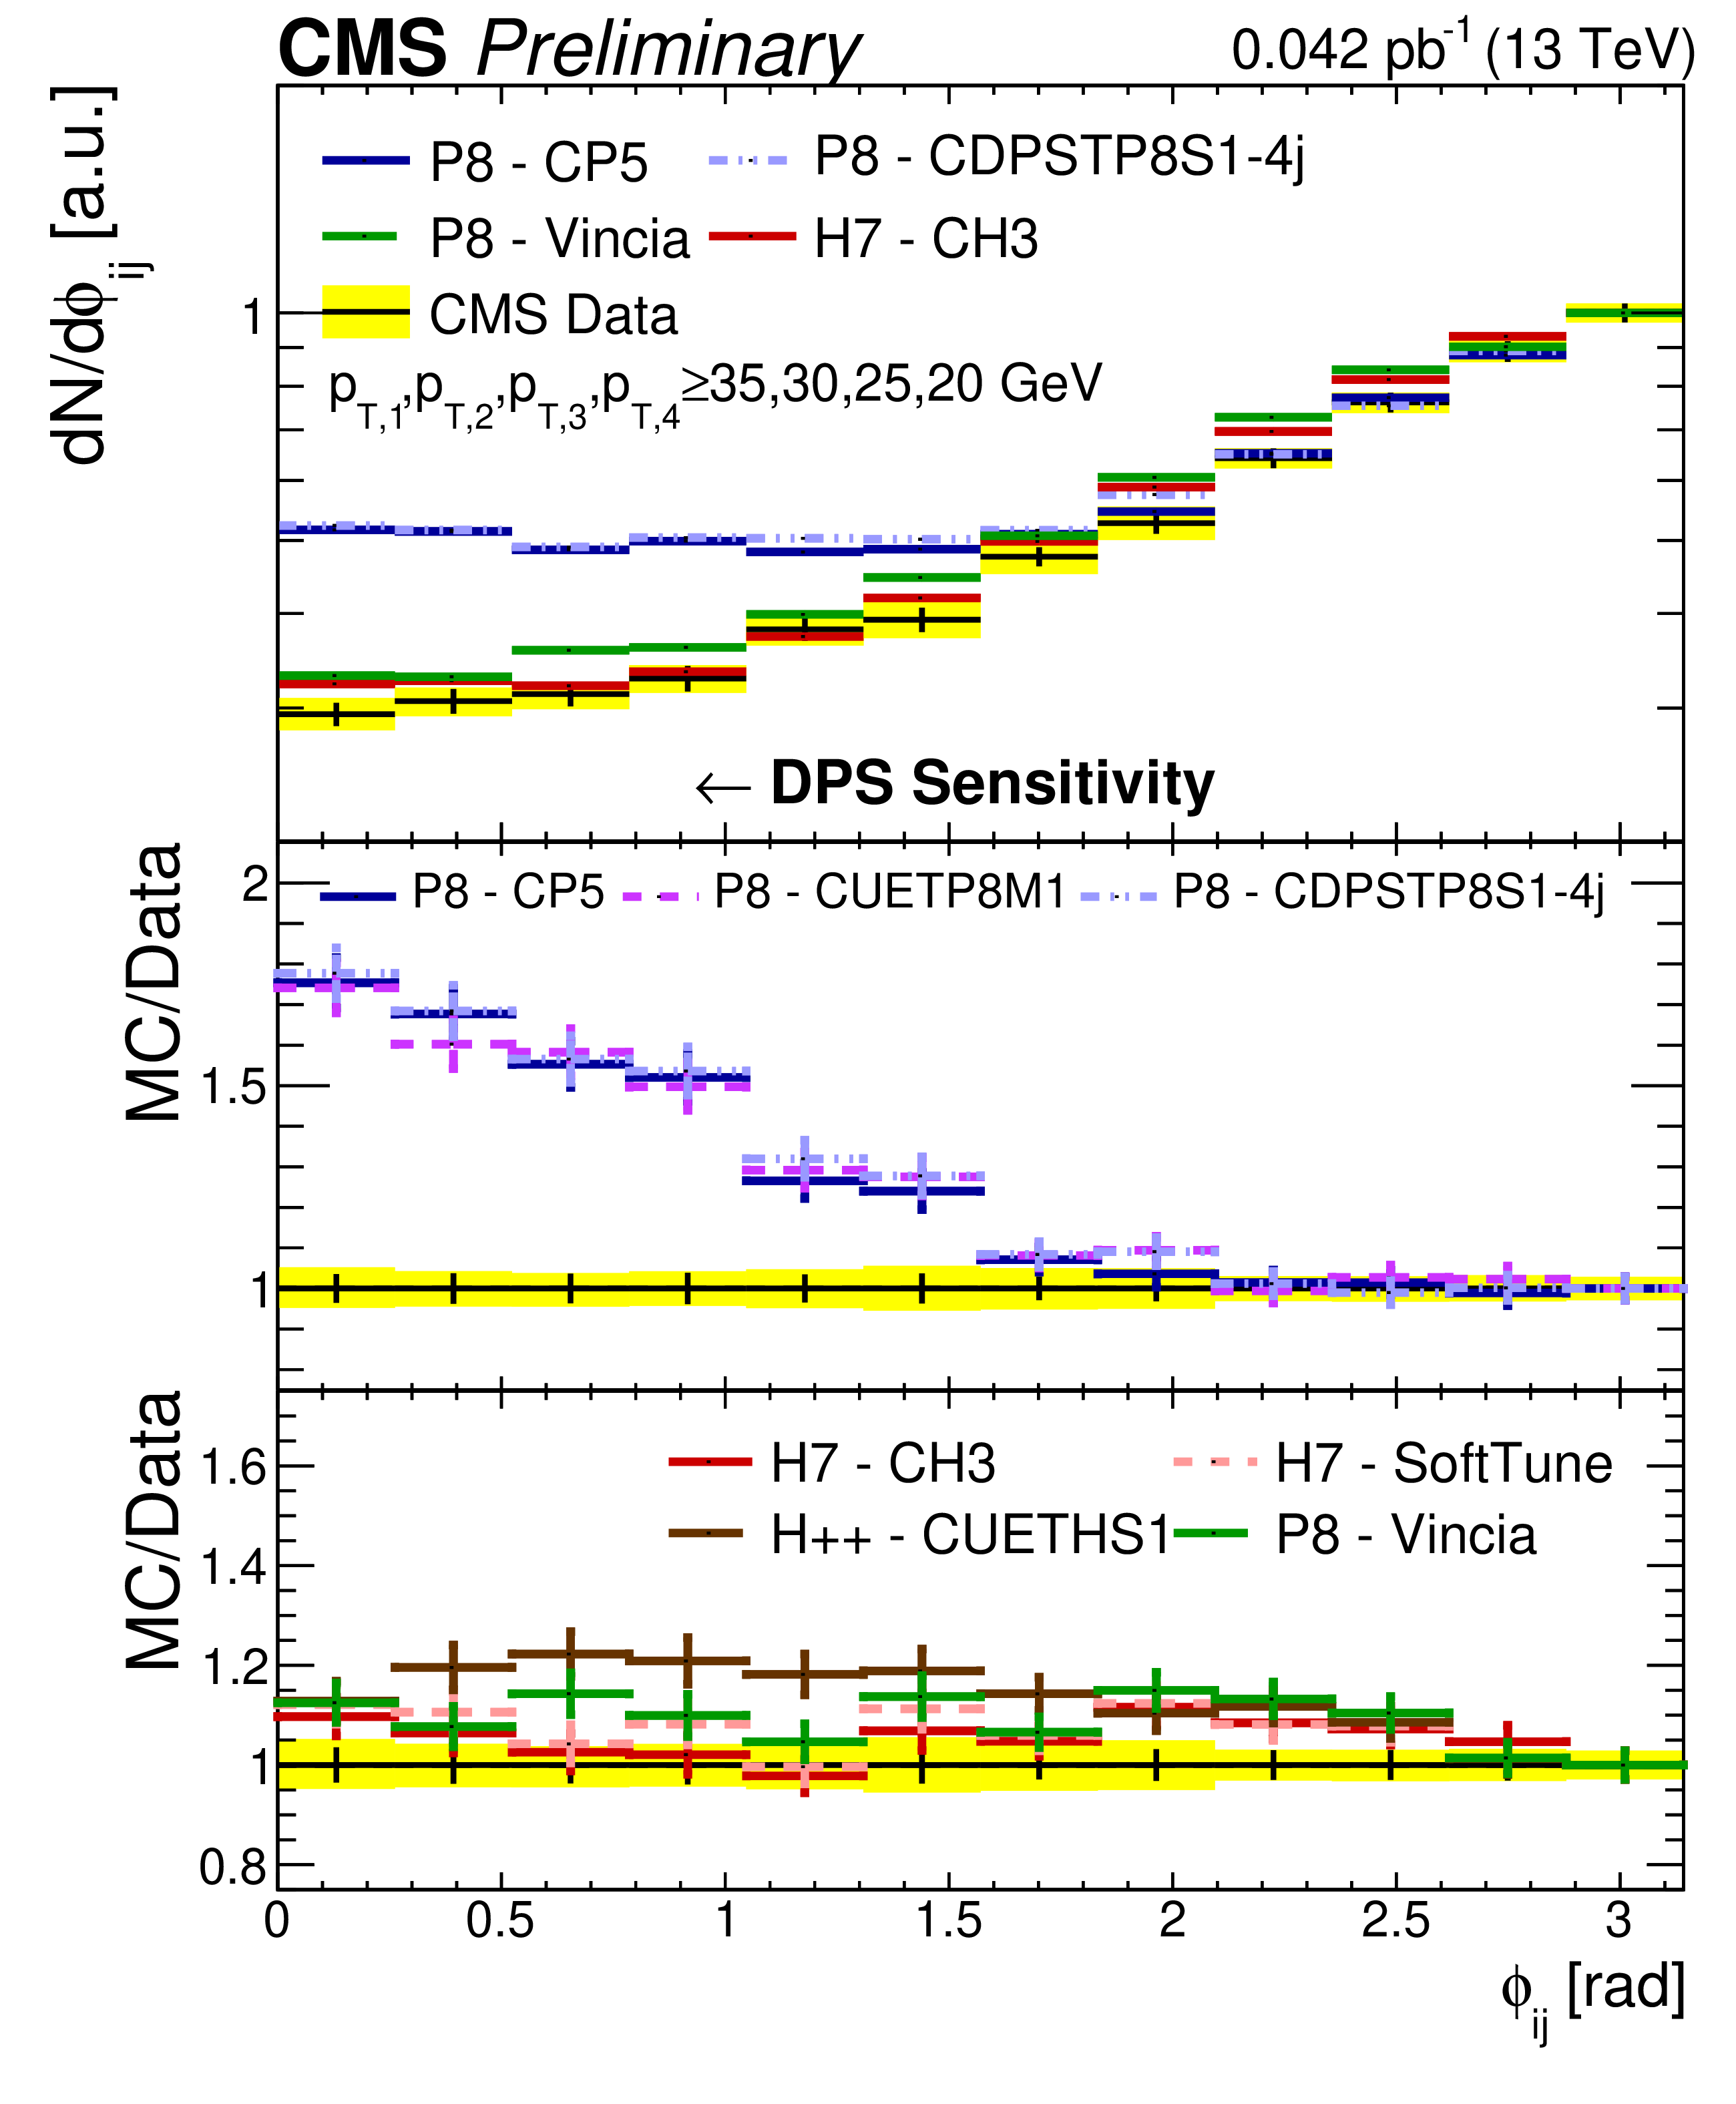
Figure 4:
Comparison of the ${\Delta \phi _\mathrm {soft}}$, ${\Delta \phi _\mathrm {3j}^\mathrm {min}}$, ${\Delta \mathrm {Y}}$, and ${\phi _{ij}}$ distributions from data to different PYTHIA 8 (P8), HERWIG++ (H++), and HERWIG 7 (H7) tunes. All distributions have been normalized to regions where a reduced DPS contribution is expected. The error bars represent the statistical uncertainty, while the yellow band indicates the total (statistical+systematic) uncertainty on the measurement. |
png pdf |
Figure 4-a:
Comparison of the ${\Delta \phi _\mathrm {soft}}$, ${\Delta \phi _\mathrm {3j}^\mathrm {min}}$, ${\Delta \mathrm {Y}}$, and ${\phi _{ij}}$ distributions from data to different PYTHIA 8 (P8), HERWIG++ (H++), and HERWIG 7 (H7) tunes. All distributions have been normalized to regions where a reduced DPS contribution is expected. The error bars represent the statistical uncertainty, while the yellow band indicates the total (statistical+systematic) uncertainty on the measurement. |
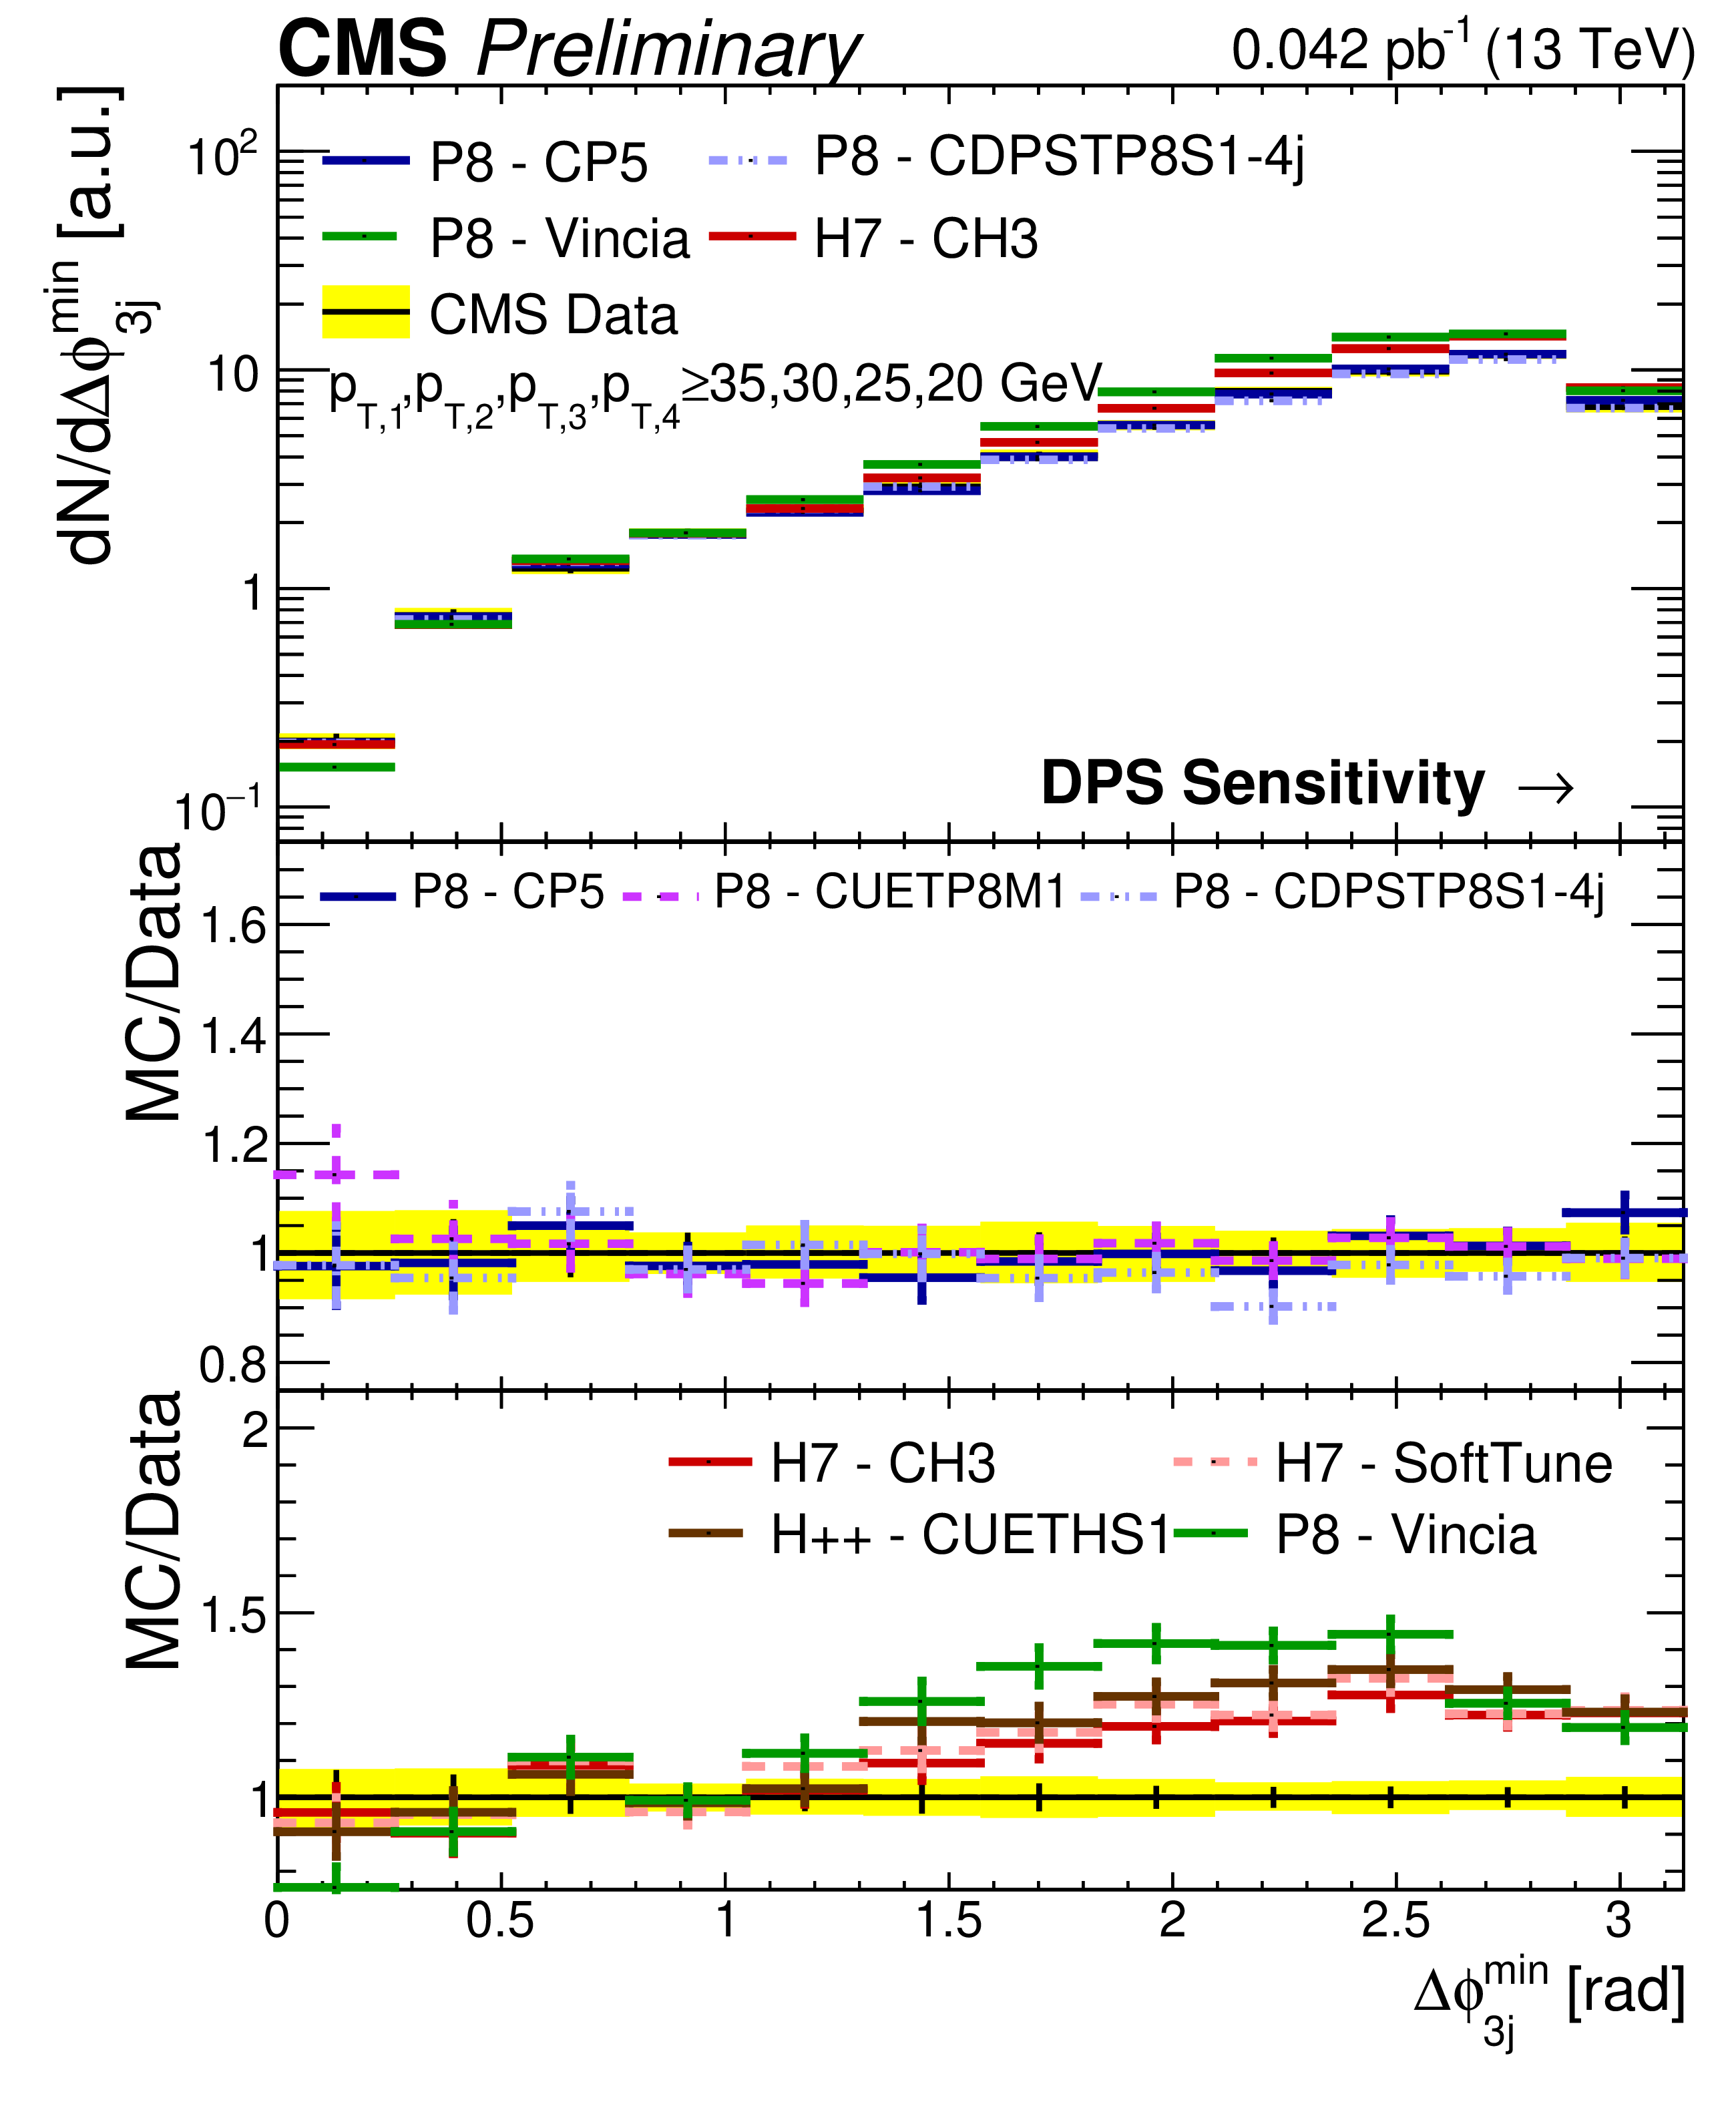
png pdf |
Figure 4-b:
Comparison of the ${\Delta \phi _\mathrm {soft}}$, ${\Delta \phi _\mathrm {3j}^\mathrm {min}}$, ${\Delta \mathrm {Y}}$, and ${\phi _{ij}}$ distributions from data to different PYTHIA 8 (P8), HERWIG++ (H++), and HERWIG 7 (H7) tunes. All distributions have been normalized to regions where a reduced DPS contribution is expected. The error bars represent the statistical uncertainty, while the yellow band indicates the total (statistical+systematic) uncertainty on the measurement. |
png pdf |
Figure 4-c:
Comparison of the ${\Delta \phi _\mathrm {soft}}$, ${\Delta \phi _\mathrm {3j}^\mathrm {min}}$, ${\Delta \mathrm {Y}}$, and ${\phi _{ij}}$ distributions from data to different PYTHIA 8 (P8), HERWIG++ (H++), and HERWIG 7 (H7) tunes. All distributions have been normalized to regions where a reduced DPS contribution is expected. The error bars represent the statistical uncertainty, while the yellow band indicates the total (statistical+systematic) uncertainty on the measurement. |
png pdf |
Figure 4-d:
Comparison of the ${\Delta \phi _\mathrm {soft}}$, ${\Delta \phi _\mathrm {3j}^\mathrm {min}}$, ${\Delta \mathrm {Y}}$, and ${\phi _{ij}}$ distributions from data to different PYTHIA 8 (P8), HERWIG++ (H++), and HERWIG 7 (H7) tunes. All distributions have been normalized to regions where a reduced DPS contribution is expected. The error bars represent the statistical uncertainty, while the yellow band indicates the total (statistical+systematic) uncertainty on the measurement. |
png pdf |
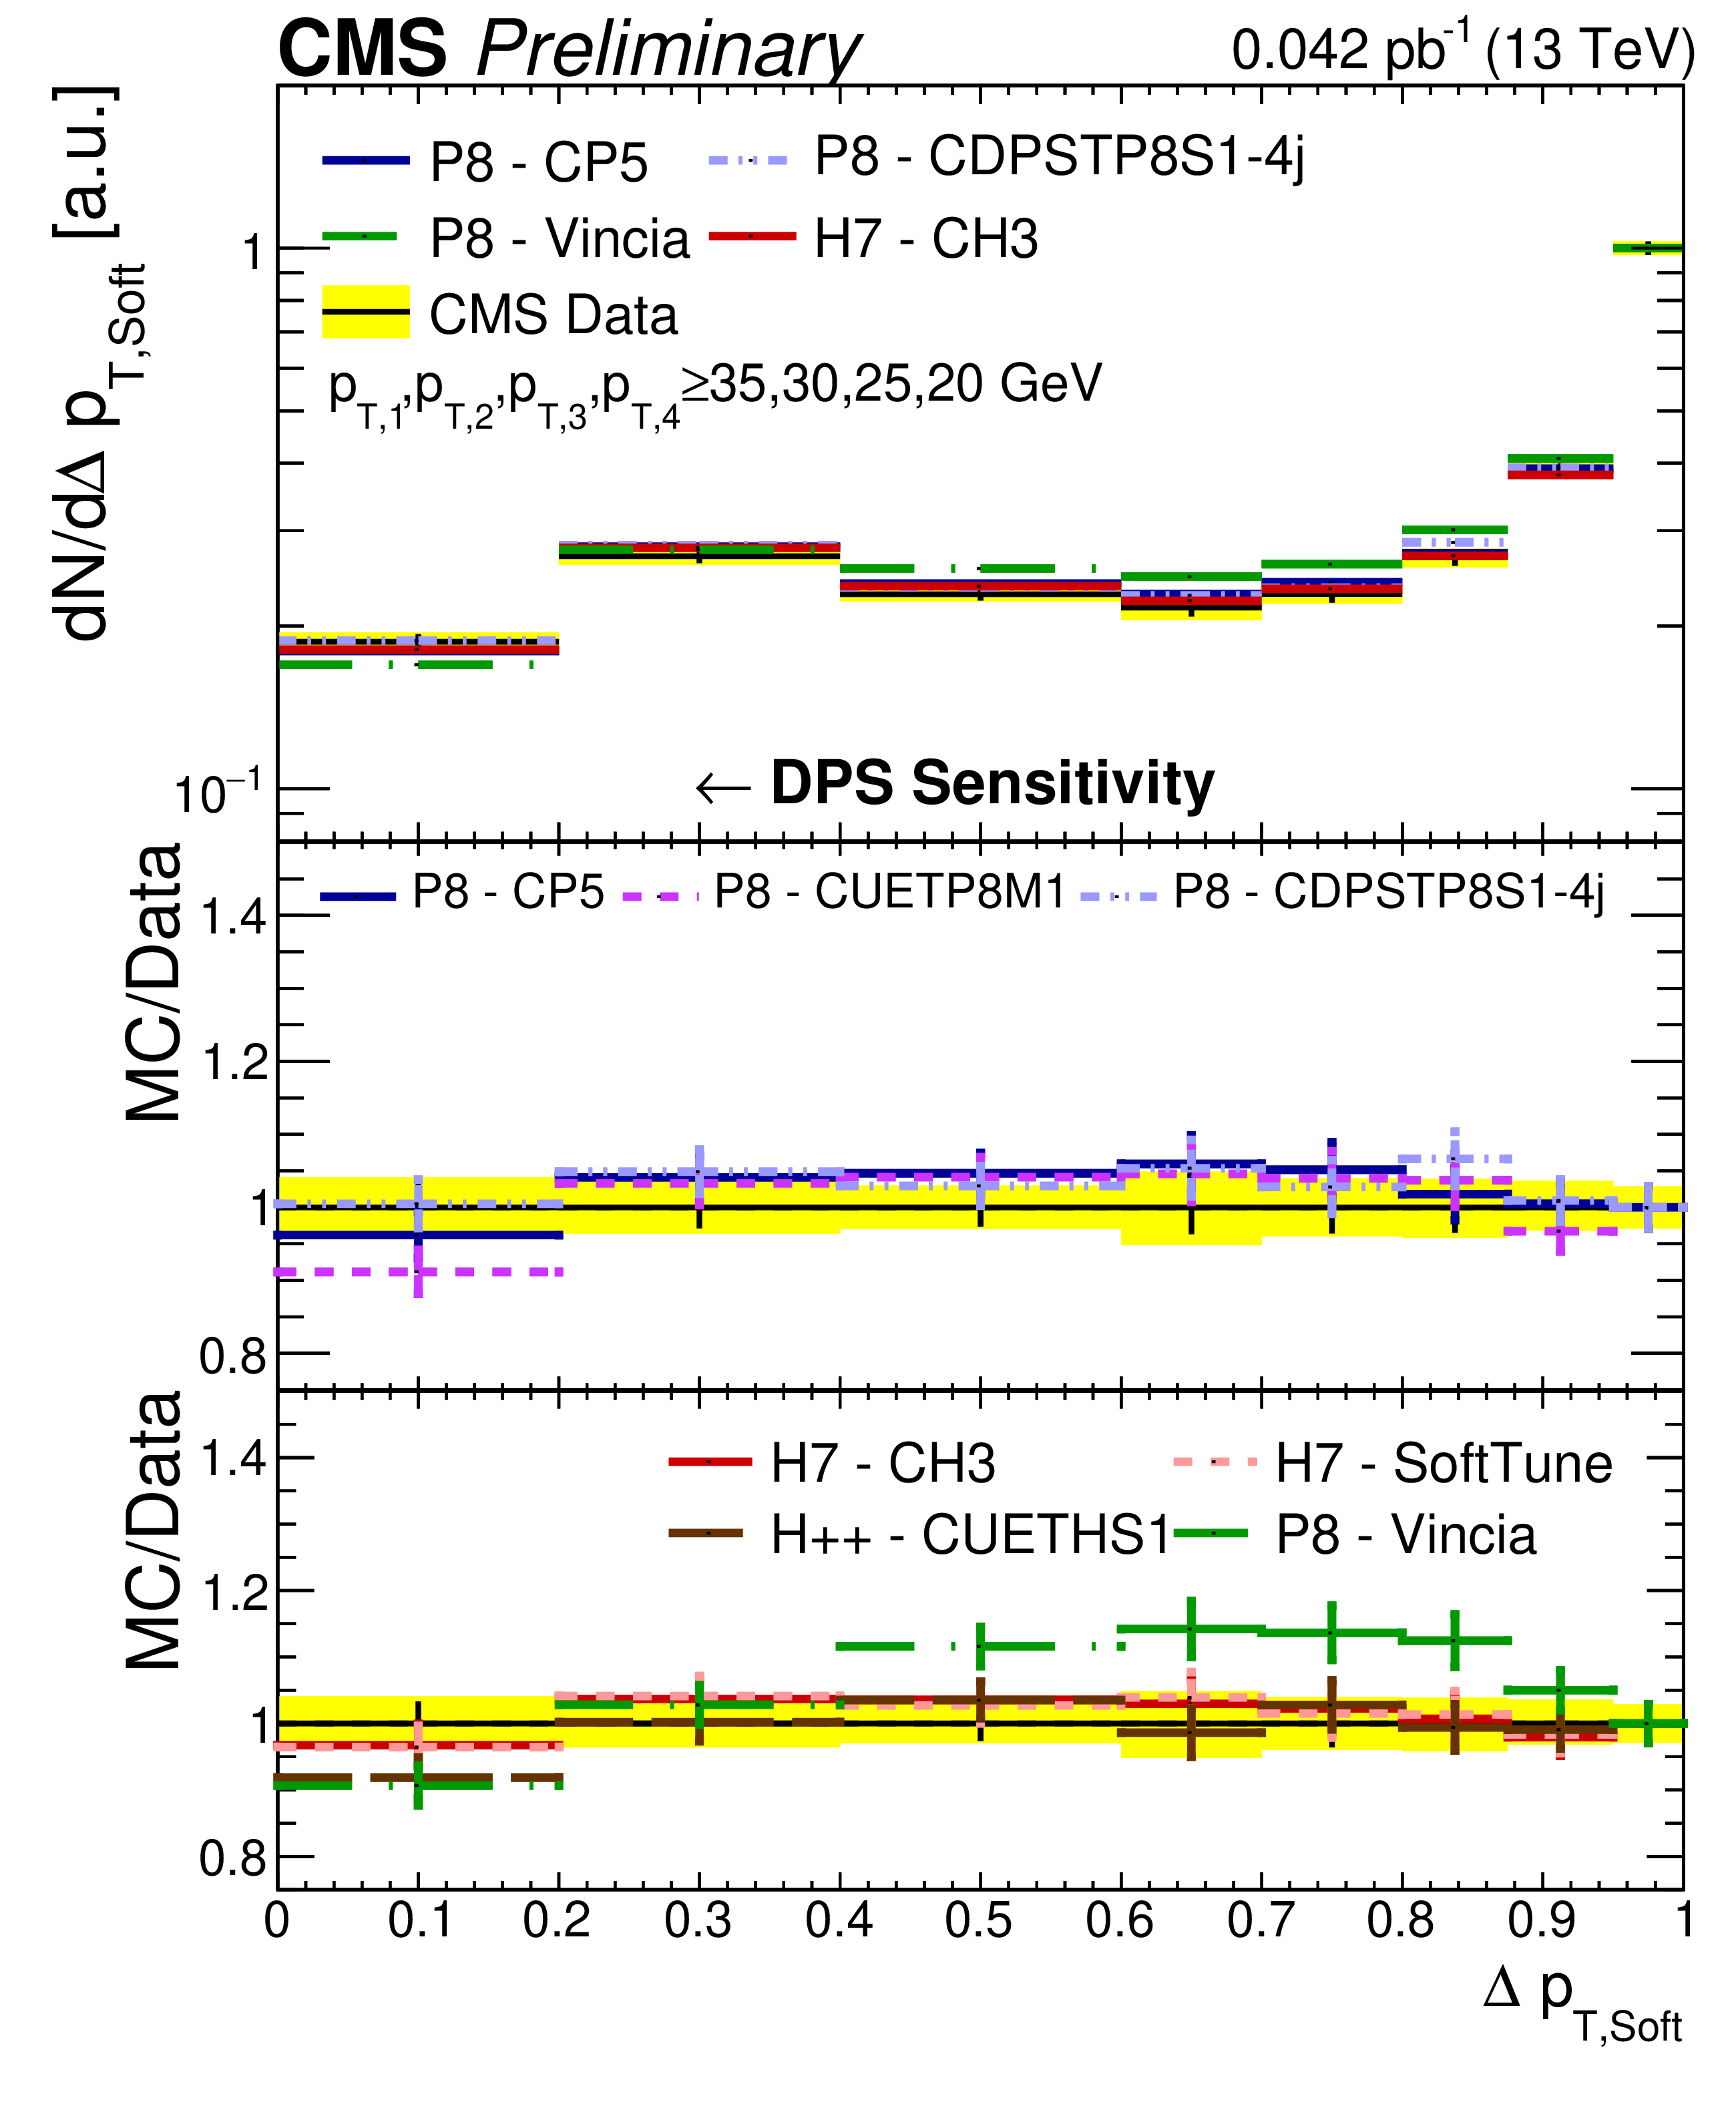
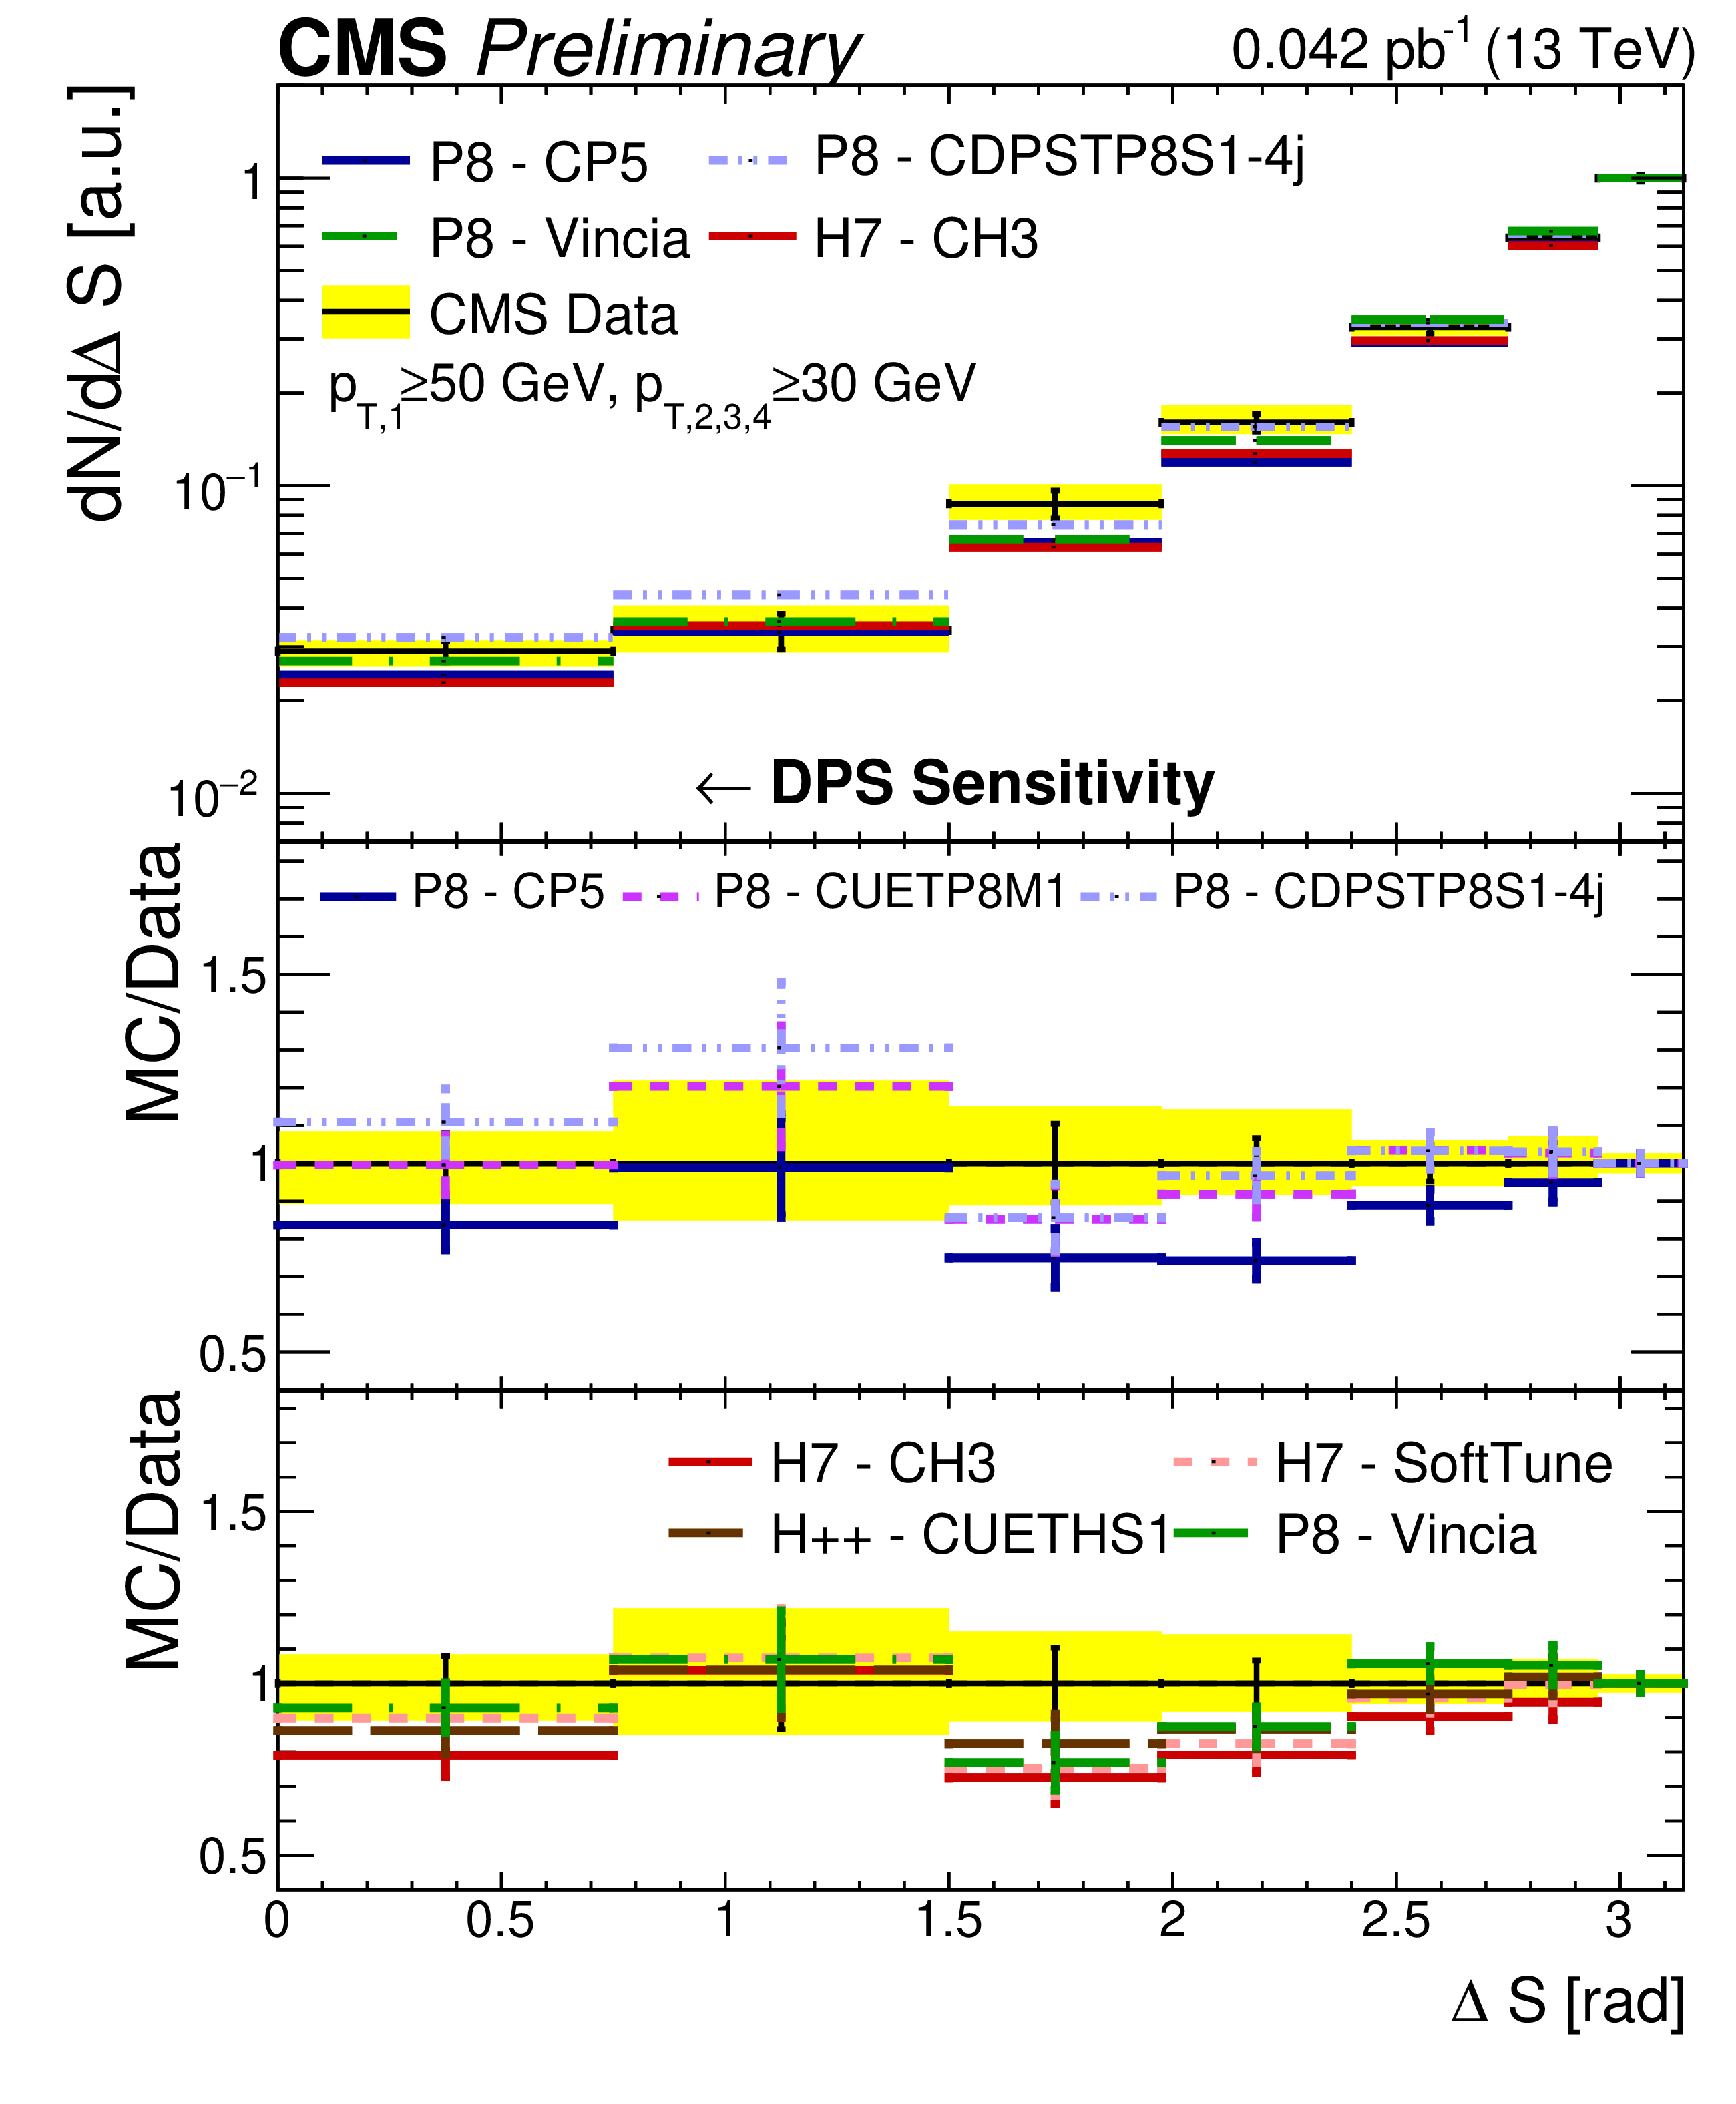
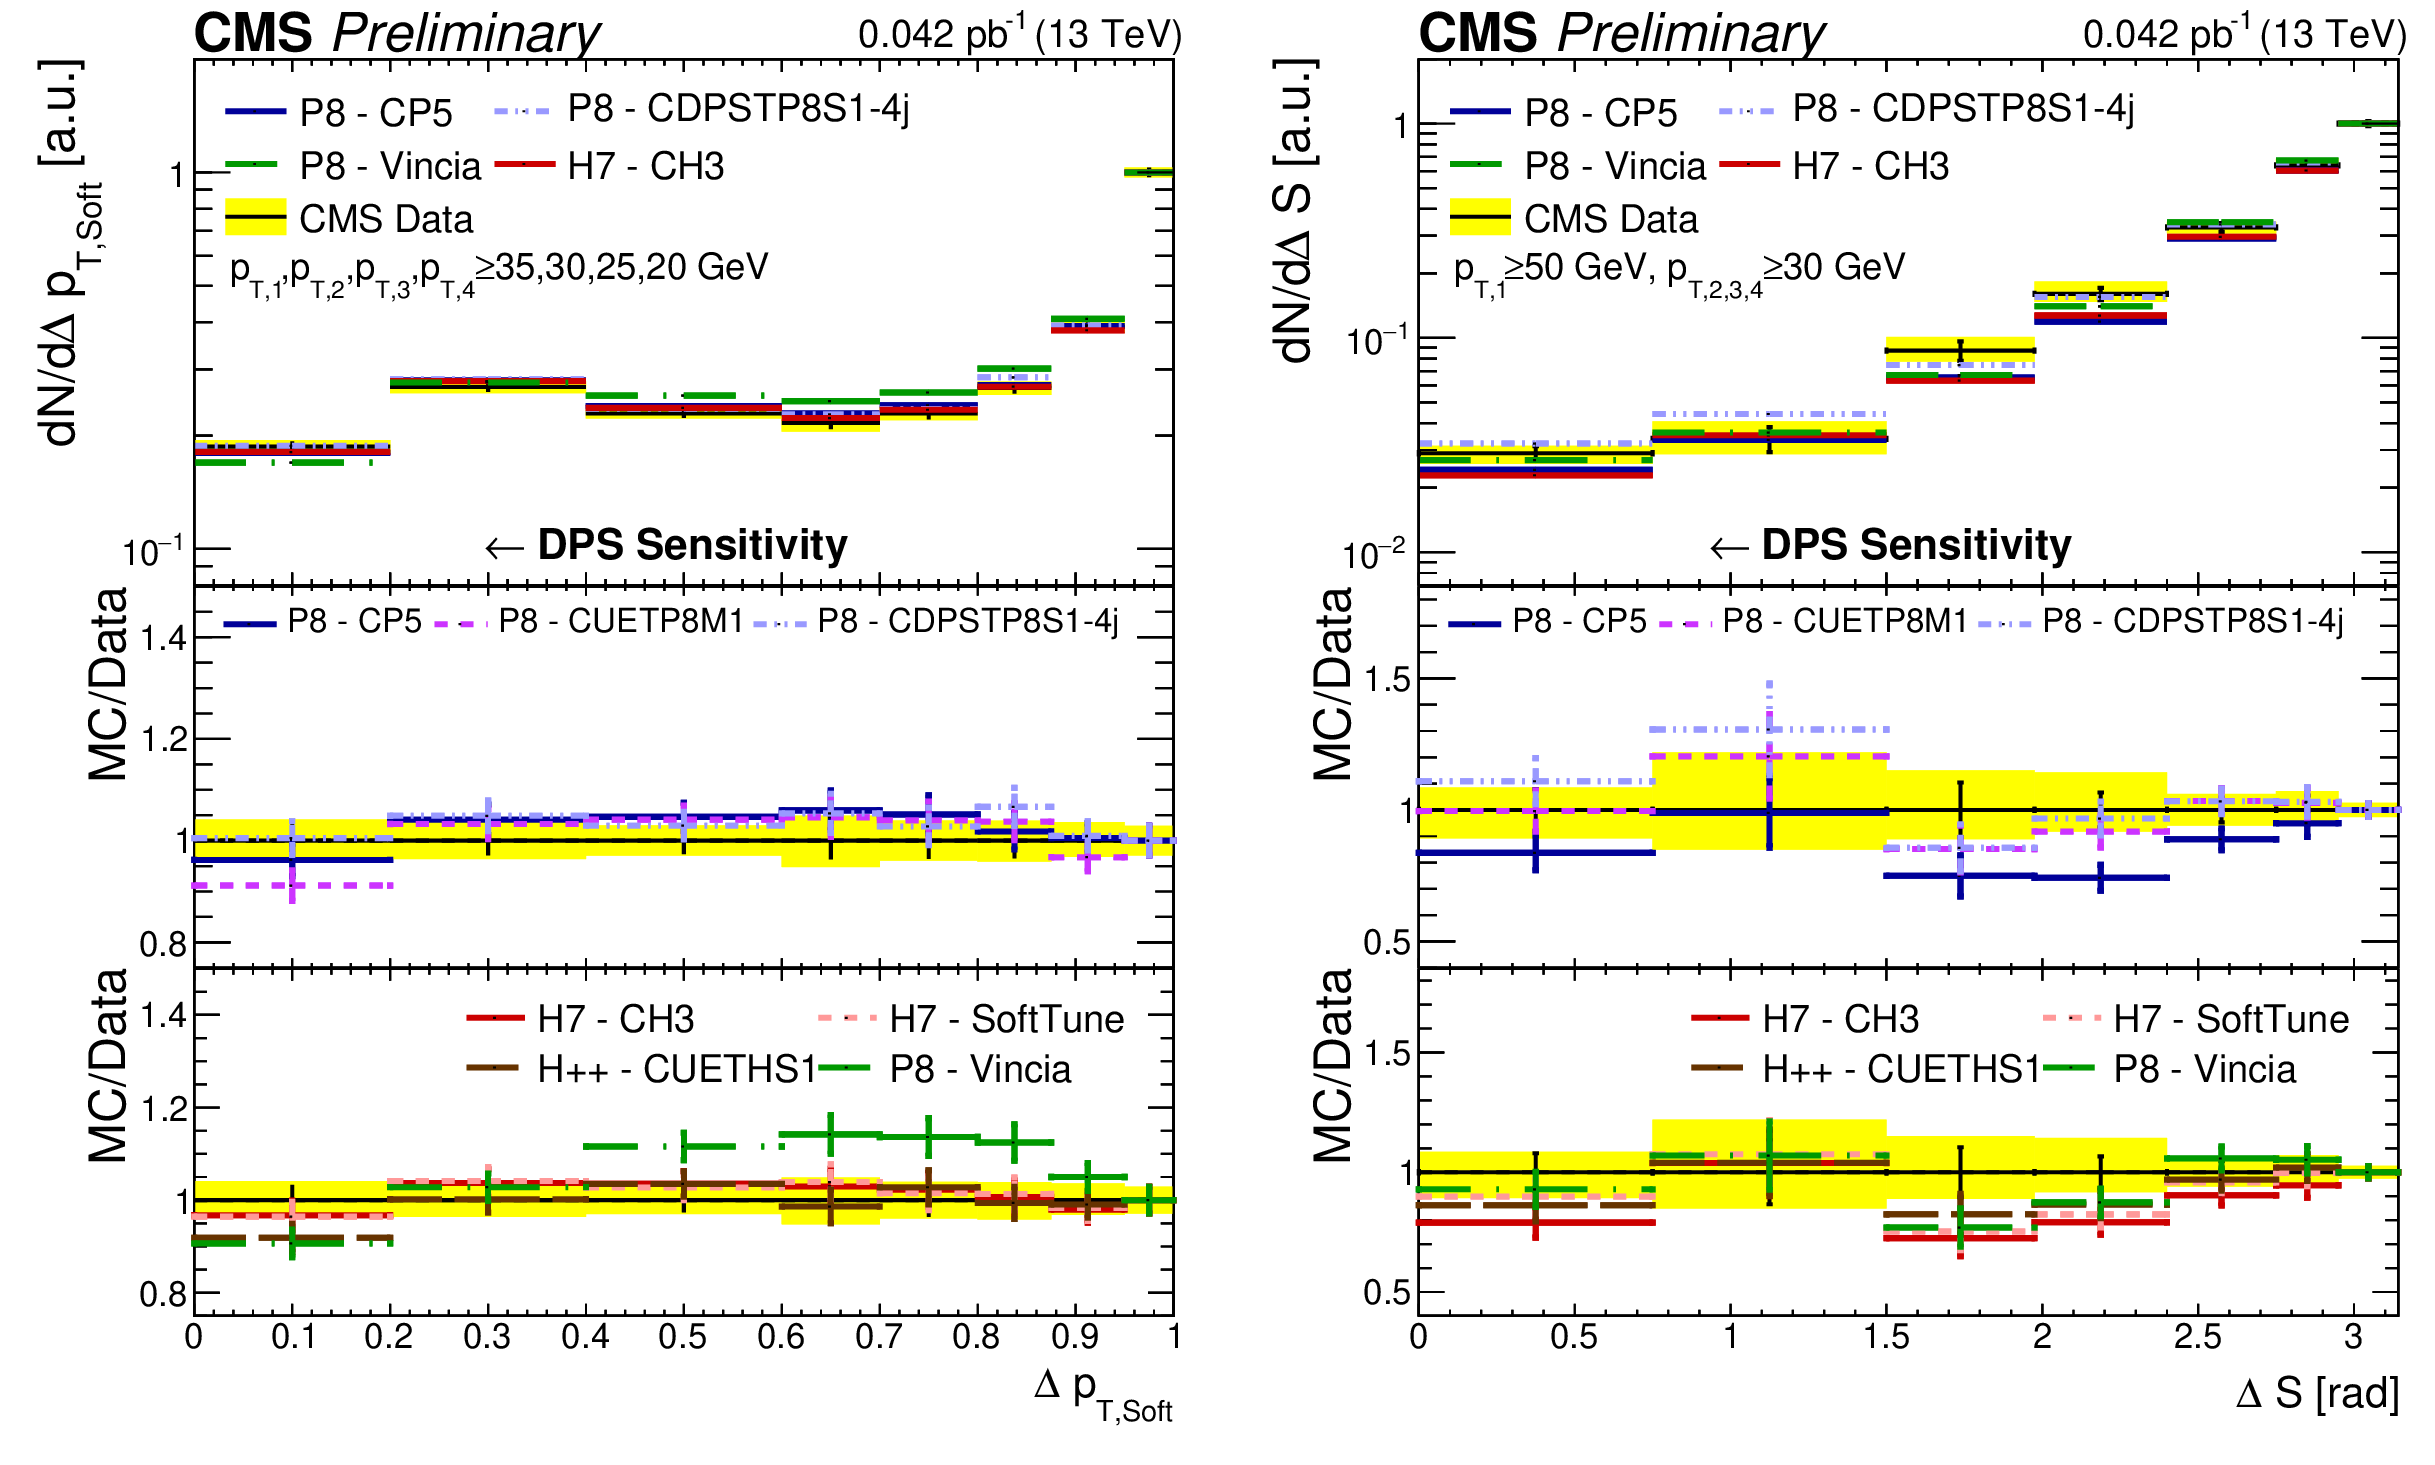
Figure 5-a:
Comparison of the ${\Delta p_{\mathrm {T,soft}}}$ and ${\Delta \mathrm {S}}$ distributions from data to different PYTHIA 8 (P8), HERWIG++ (H++), and HERWIG 7 (H7) tunes. All distributions have been normalized to regions where a reduced DPS contribution is expected. The error bars represent the statistical uncertainty, while the yellow band indicates the total (statistical+systematic) uncertainty on the measurement. |
png pdf |
Figure 5-b:
Comparison of the ${\Delta p_{\mathrm {T,soft}}}$ and ${\Delta \mathrm {S}}$ distributions from data to different PYTHIA 8 (P8), HERWIG++ (H++), and HERWIG 7 (H7) tunes. All distributions have been normalized to regions where a reduced DPS contribution is expected. The error bars represent the statistical uncertainty, while the yellow band indicates the total (statistical+systematic) uncertainty on the measurement. |
png pdf |
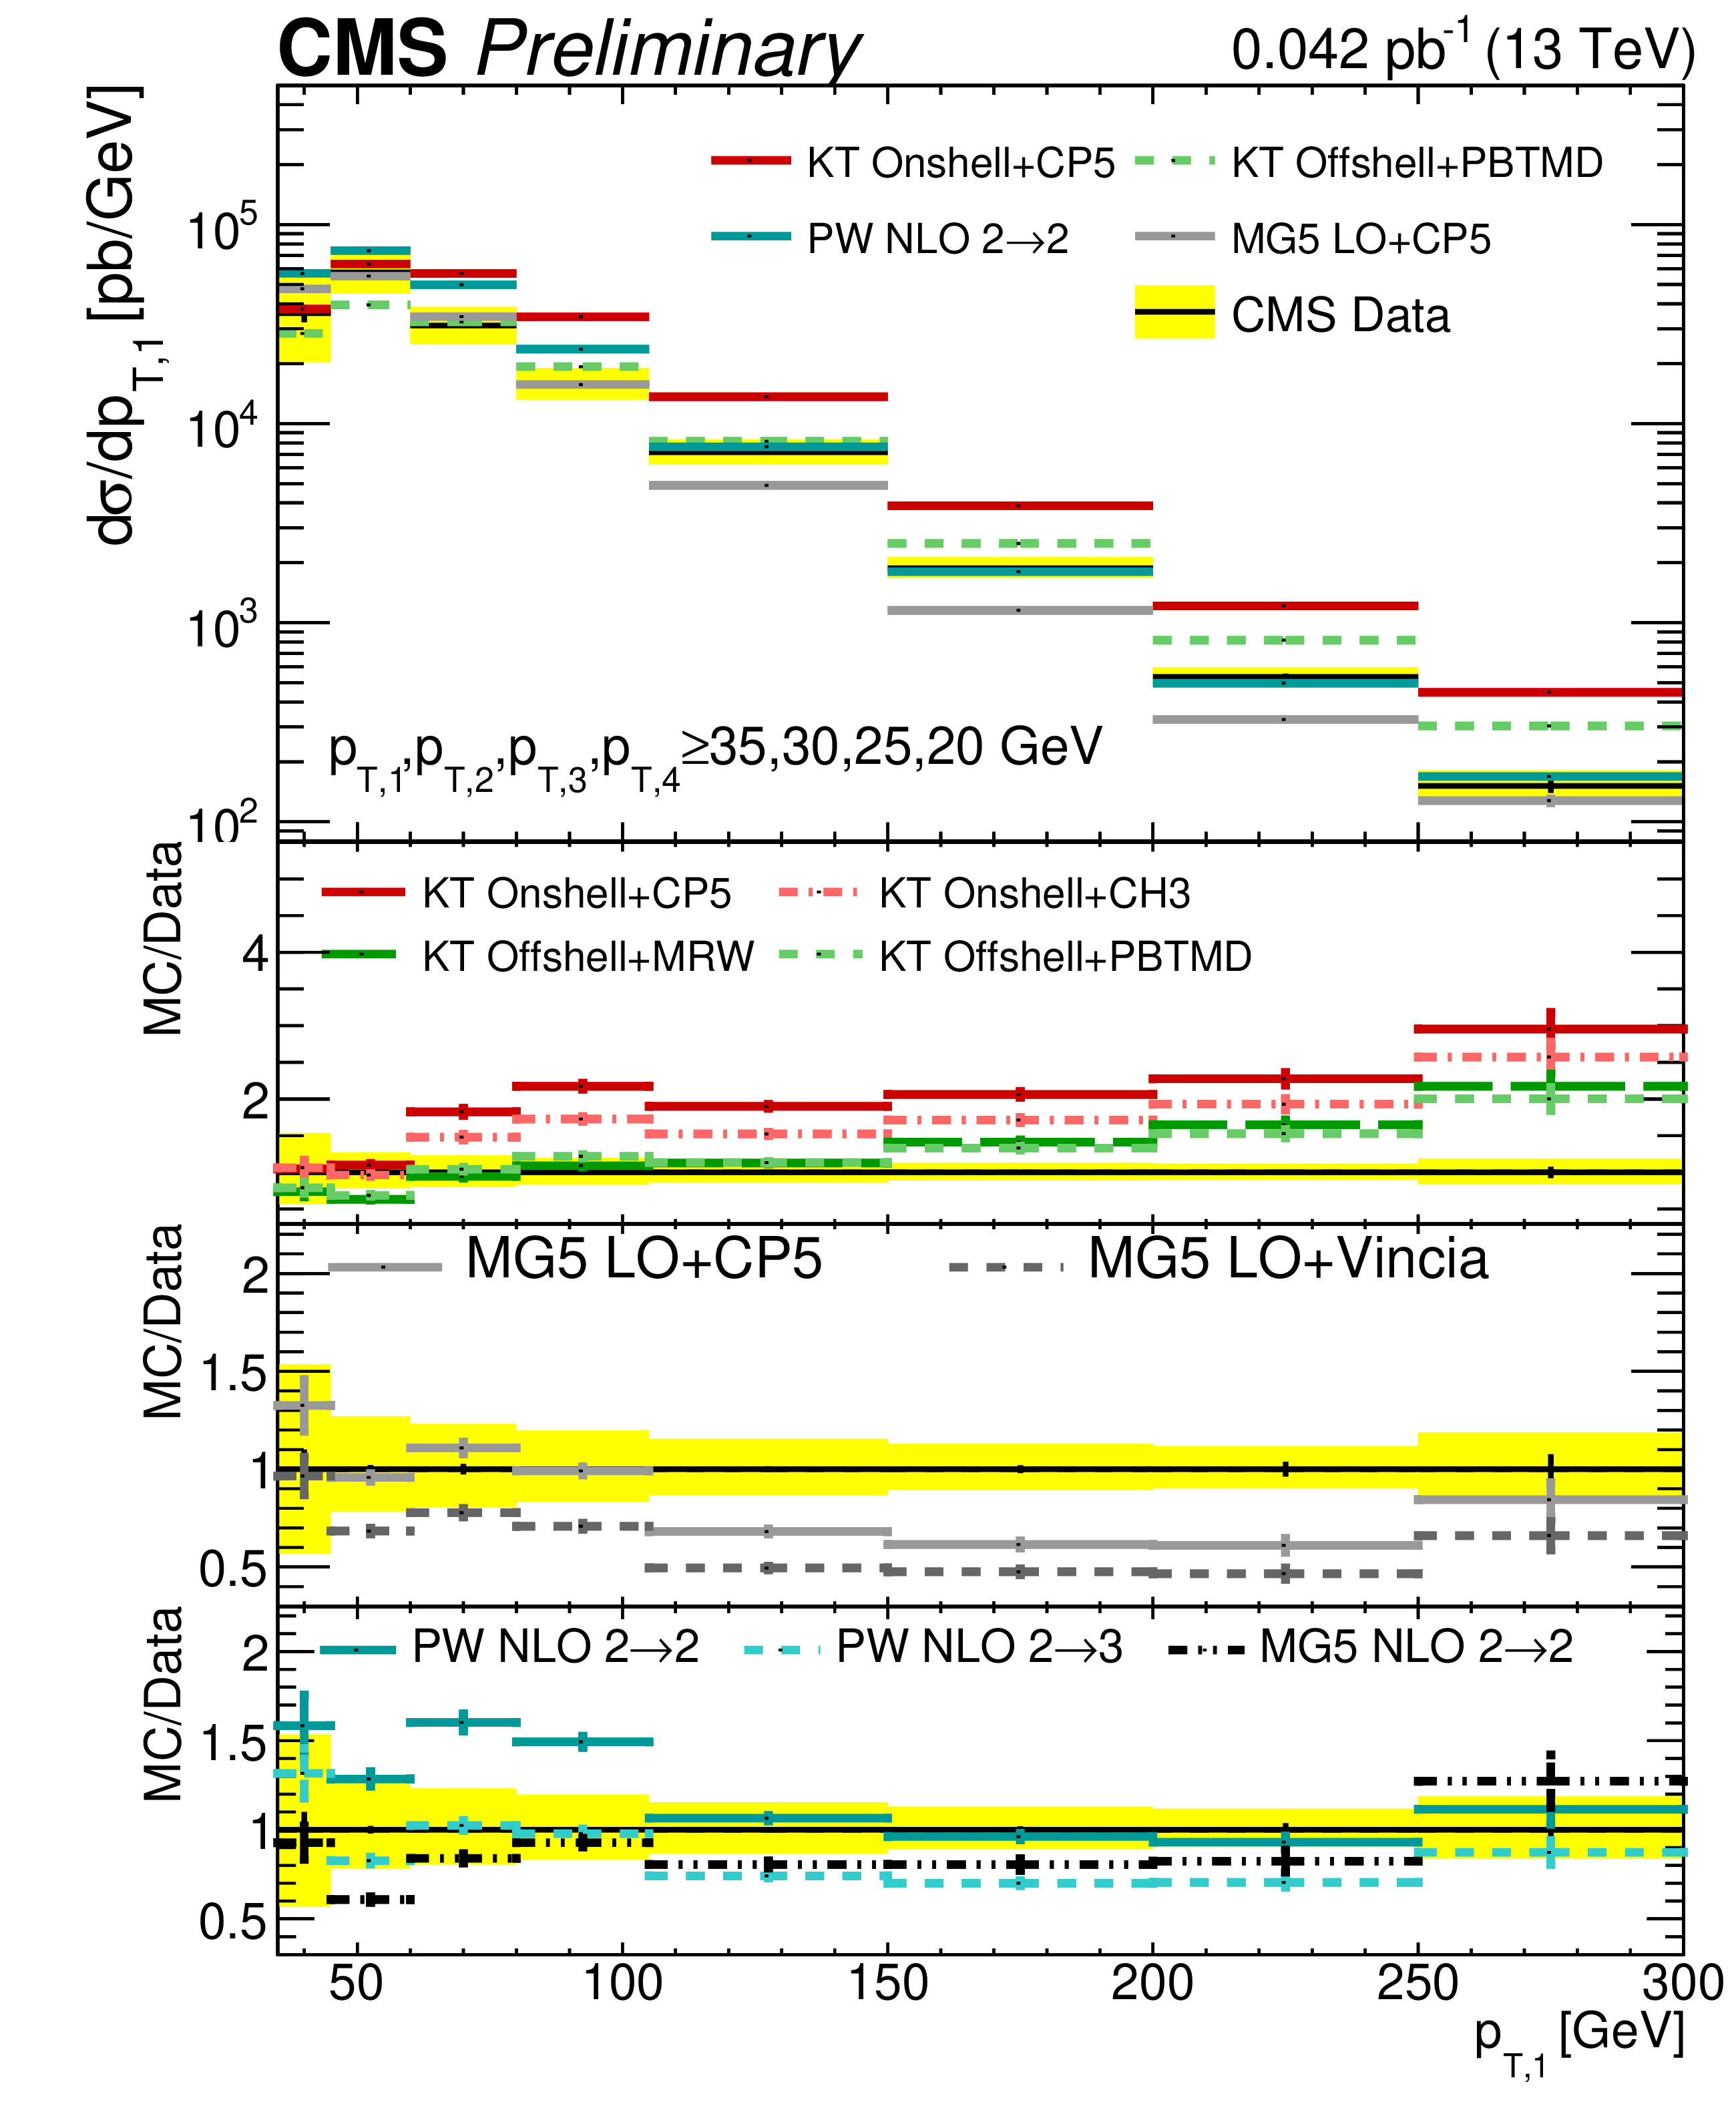
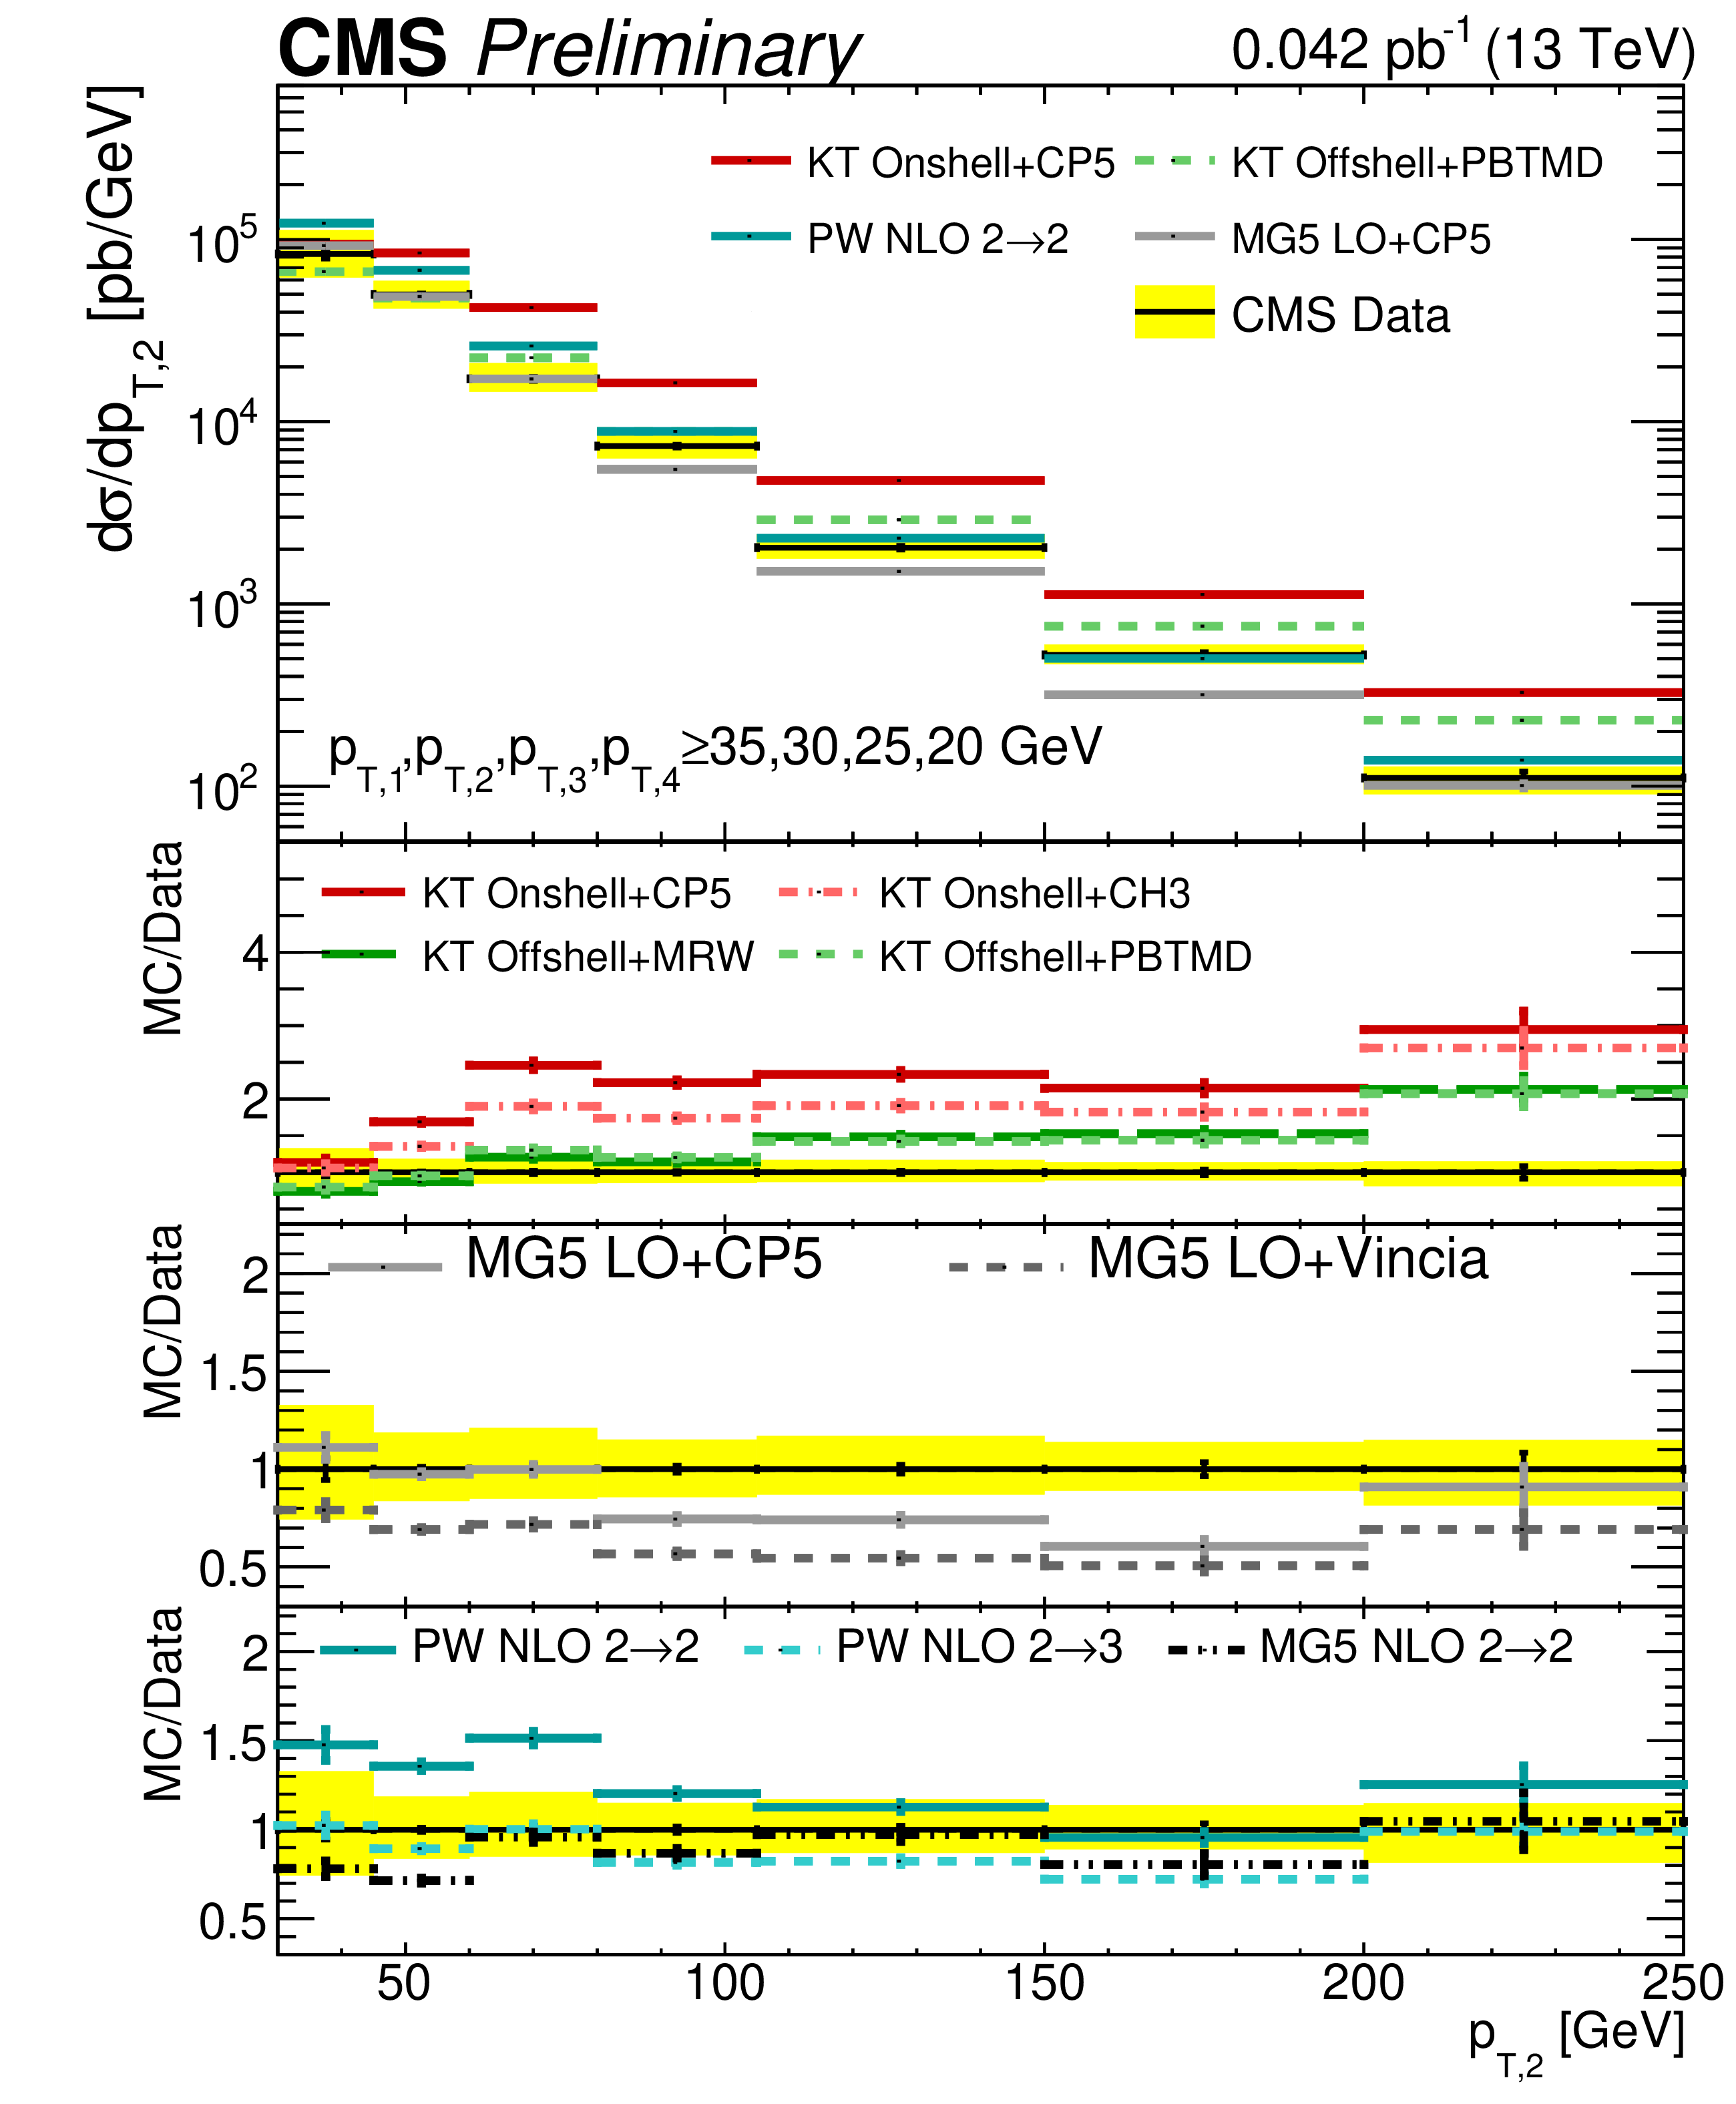
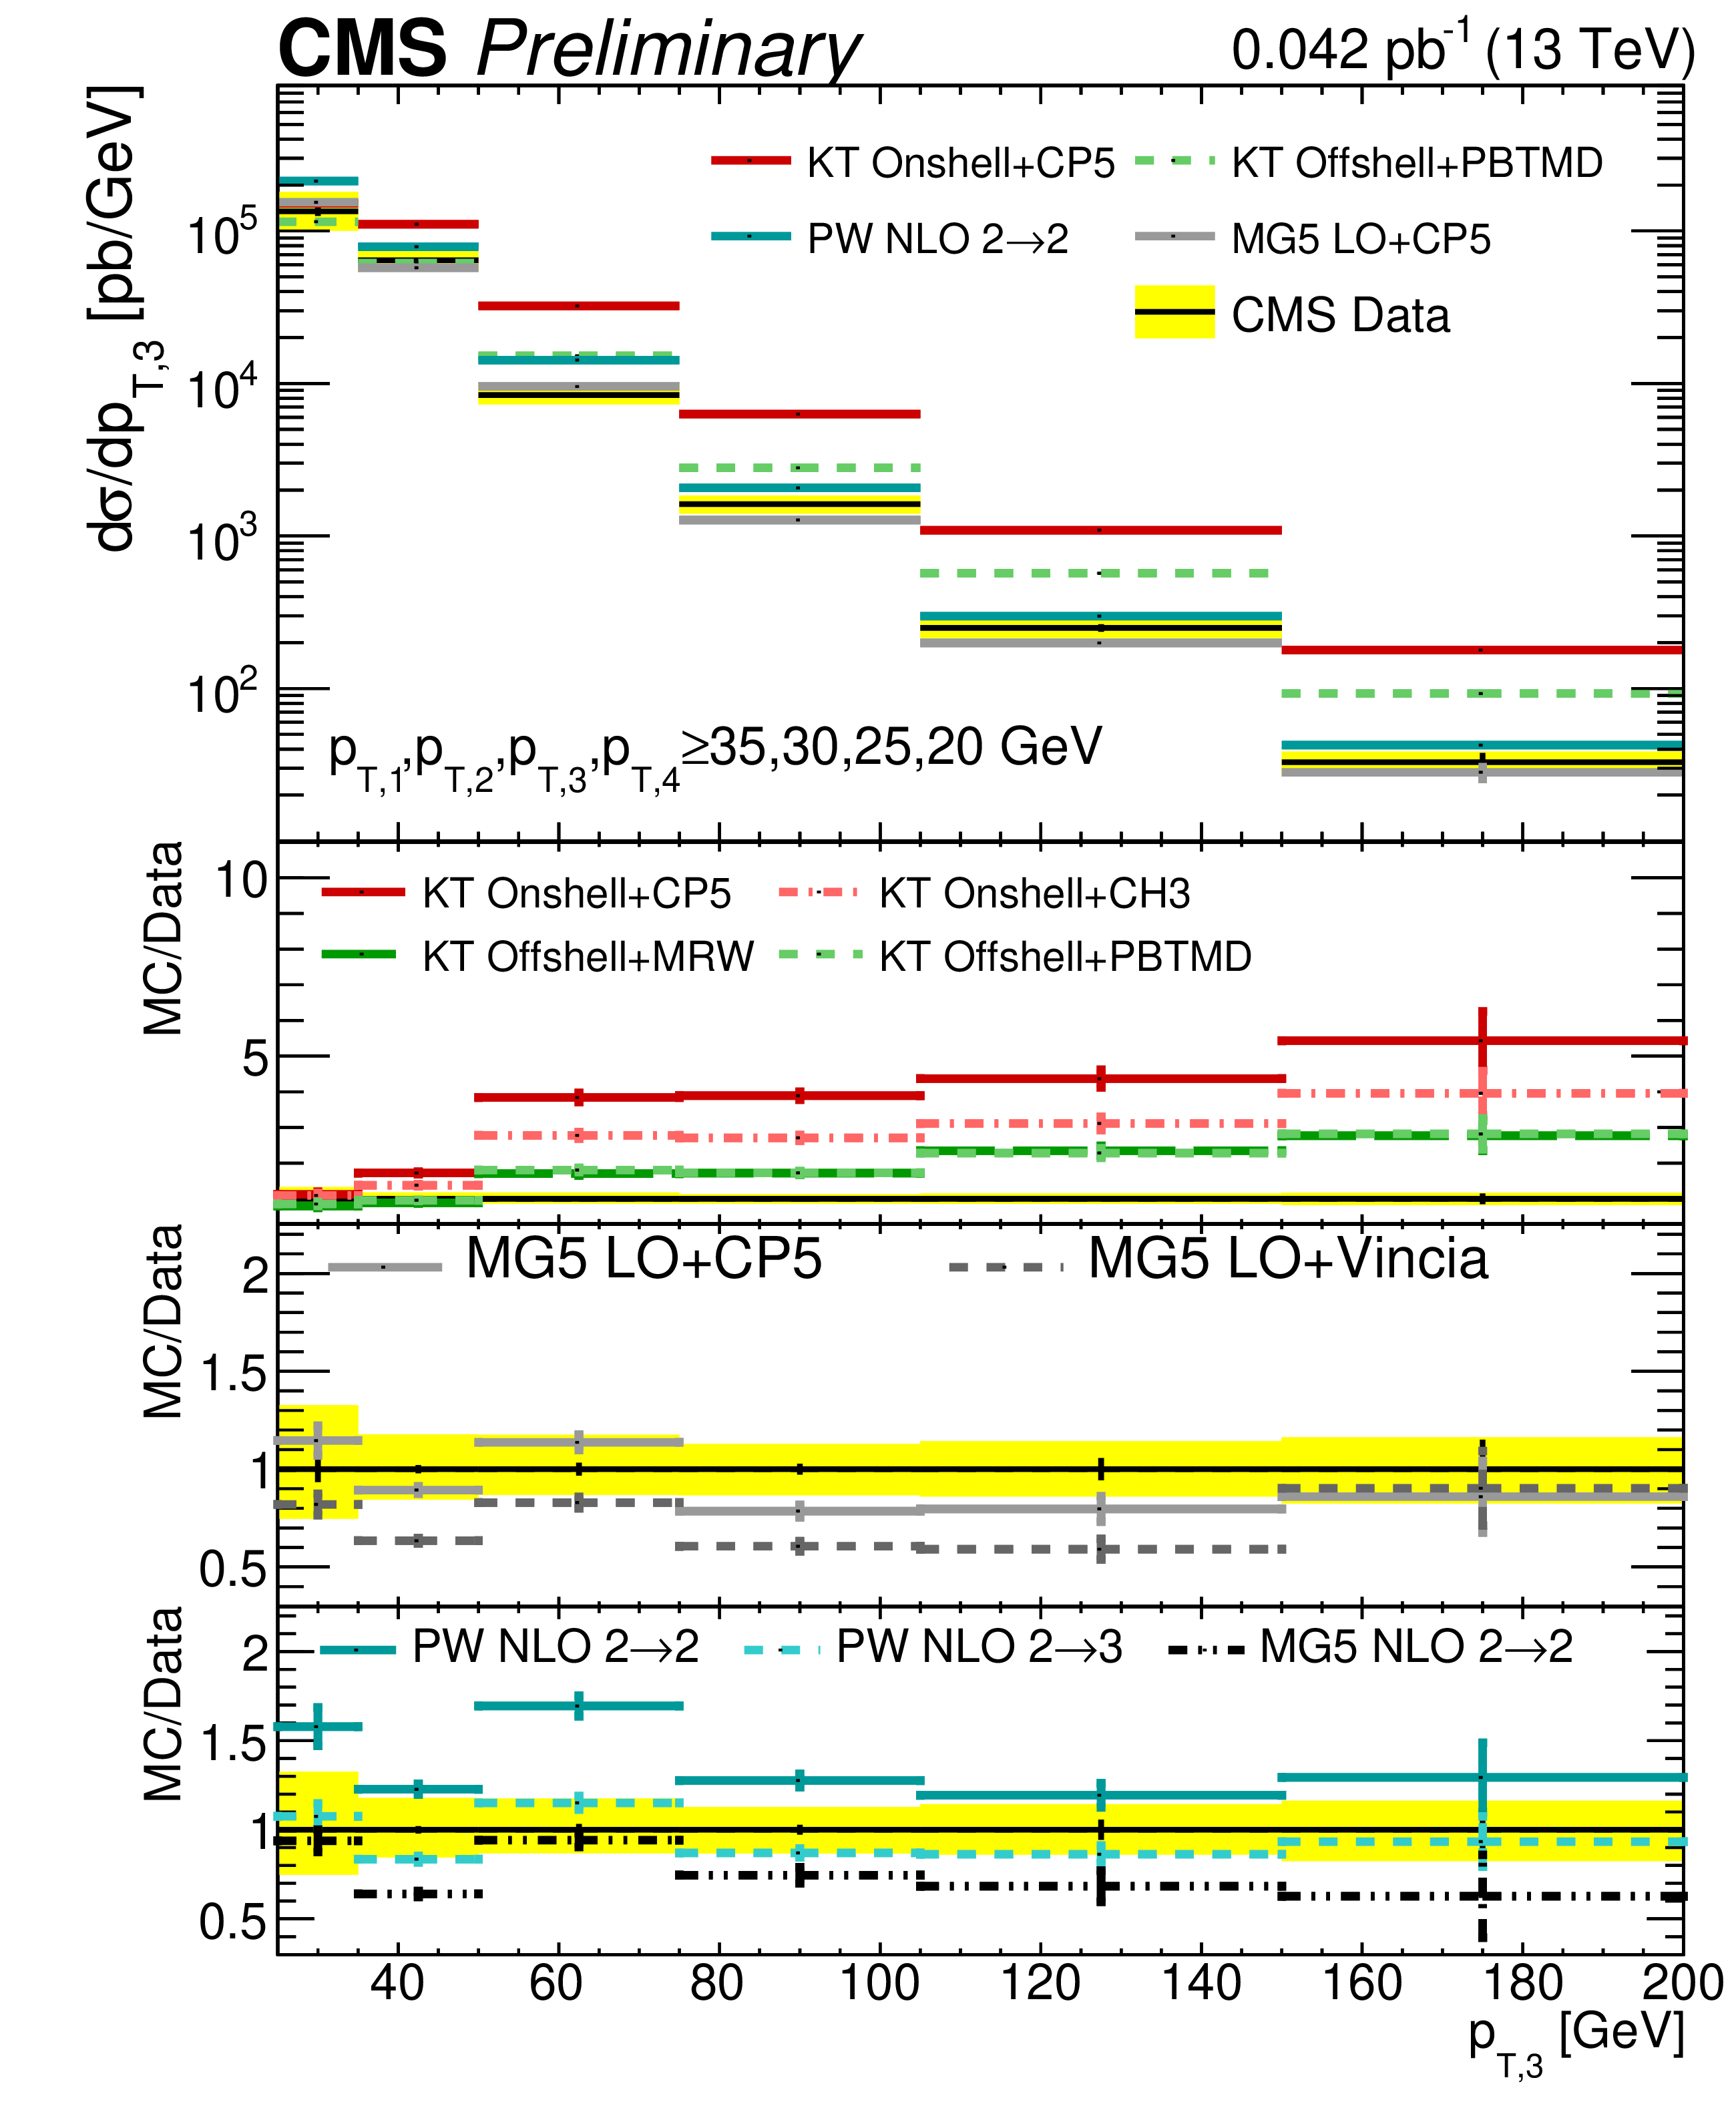
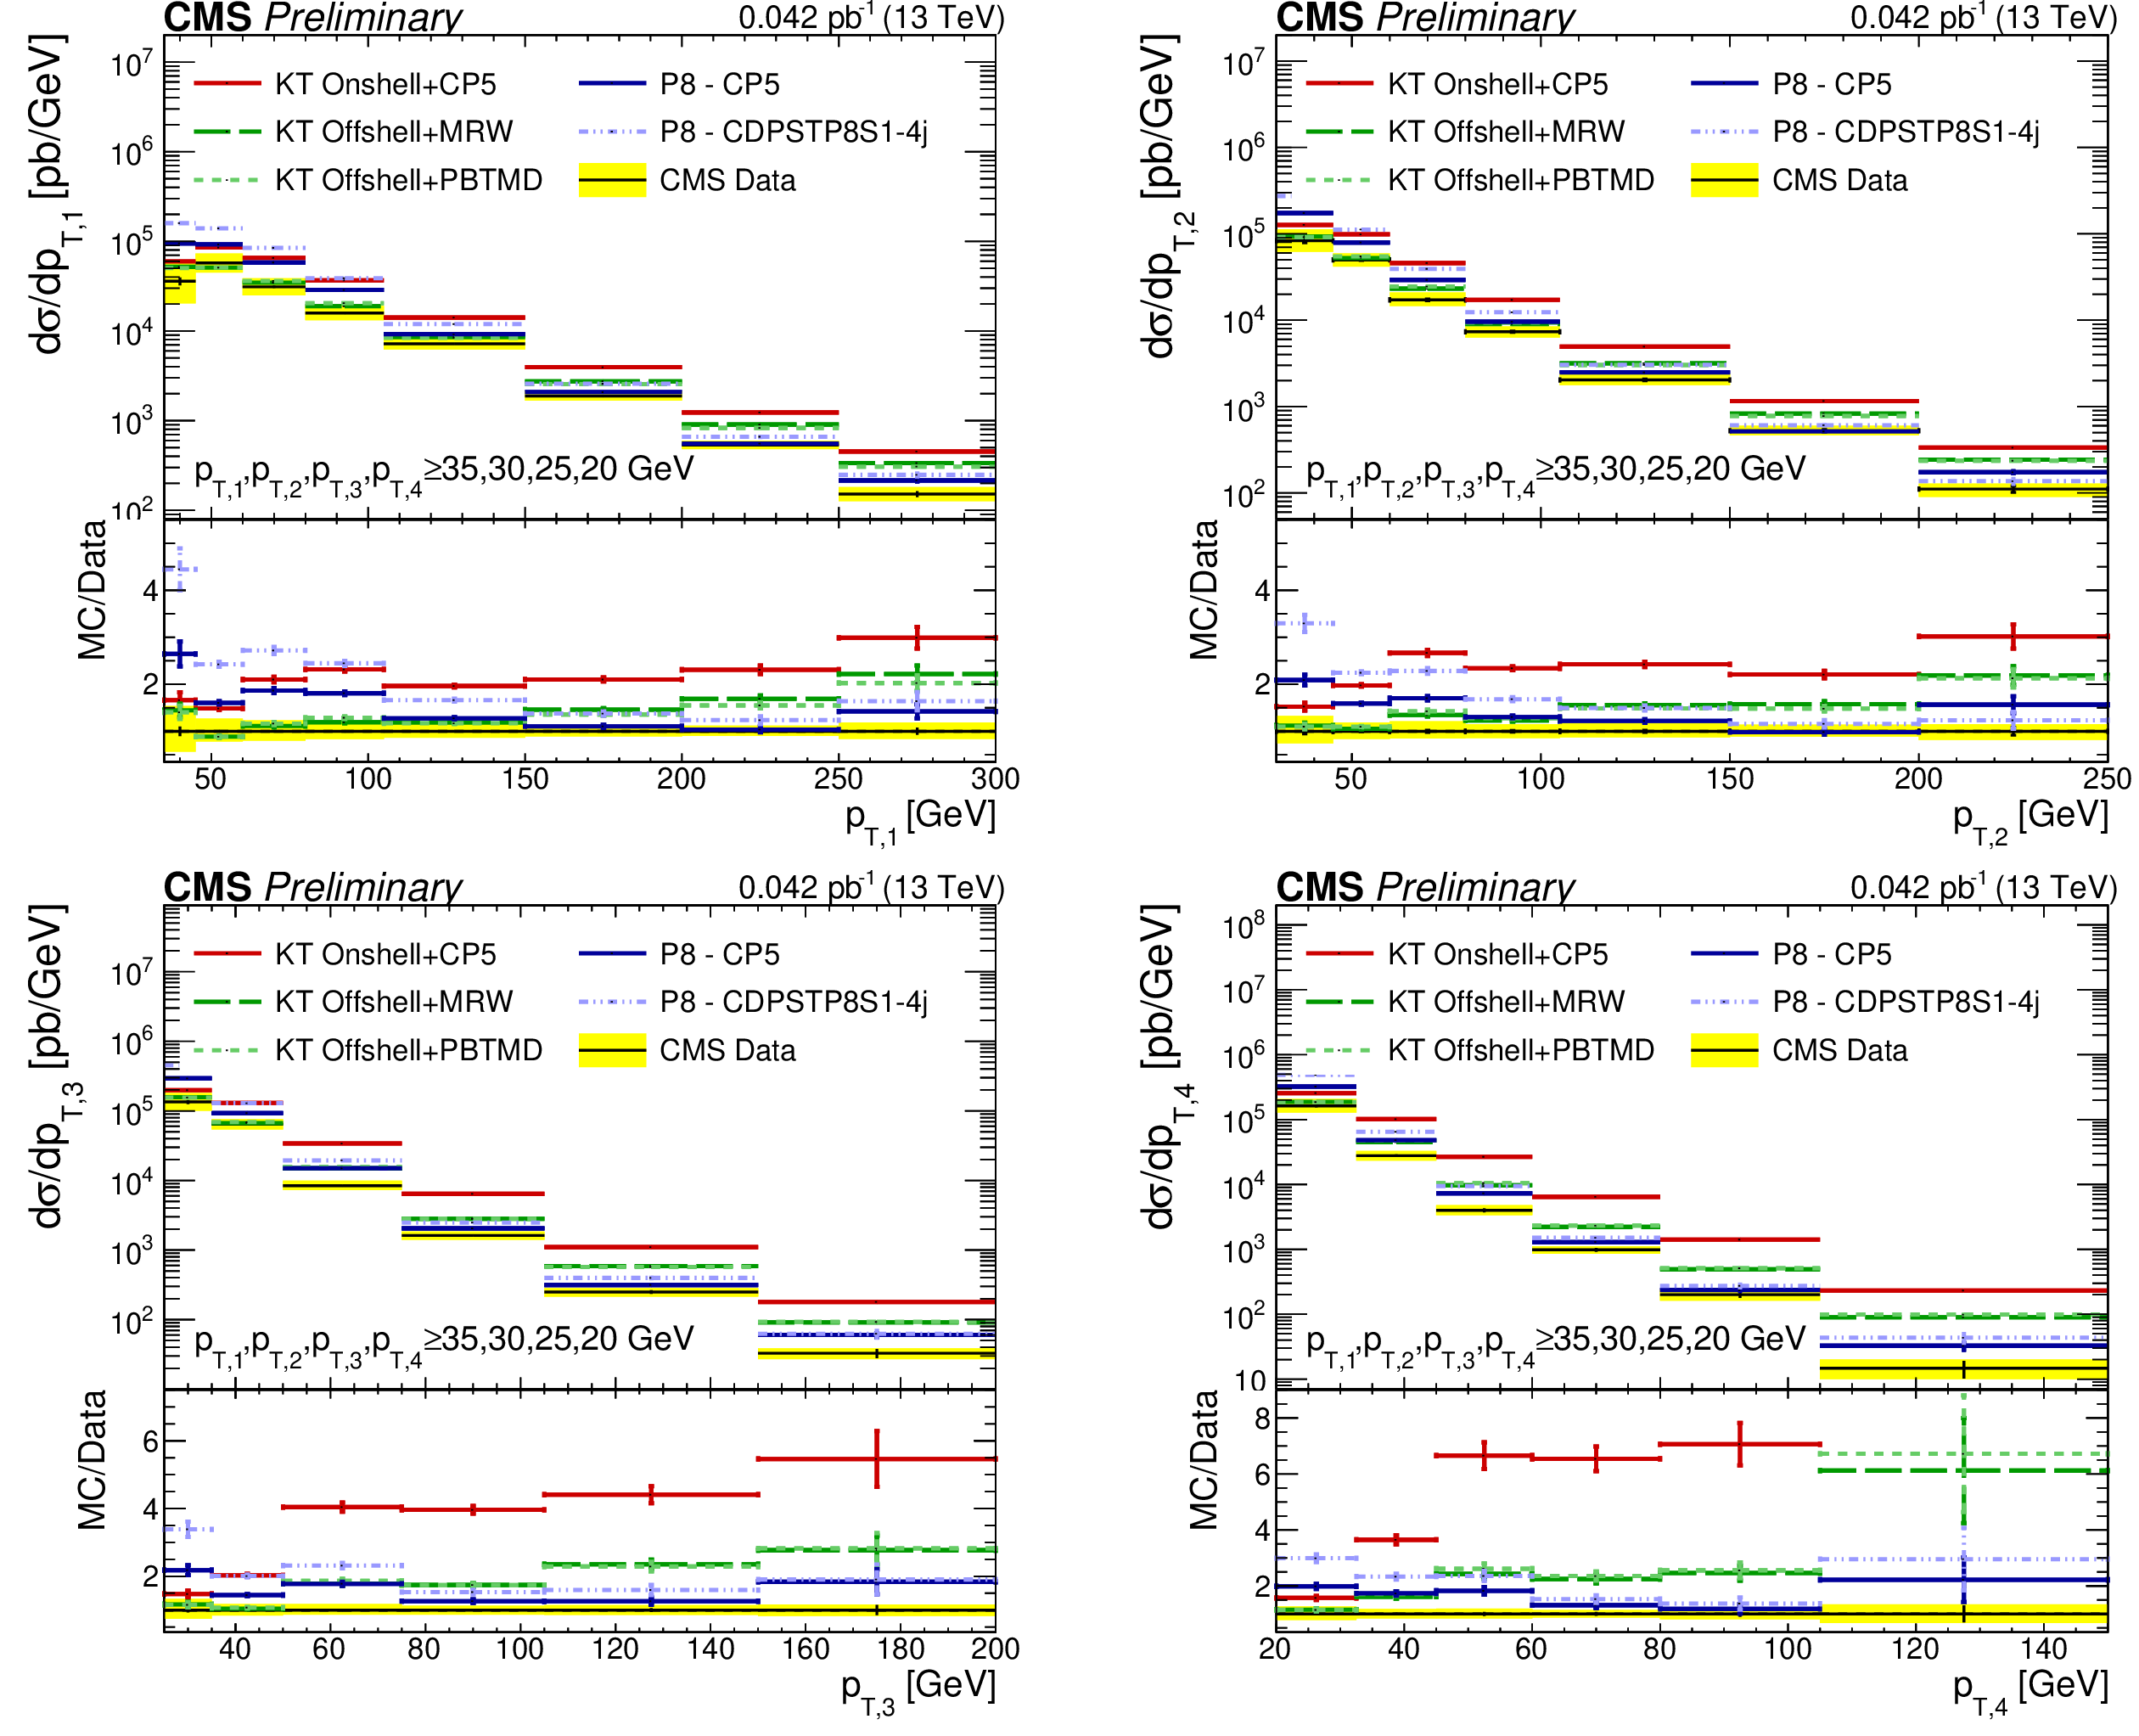
Figure 6:
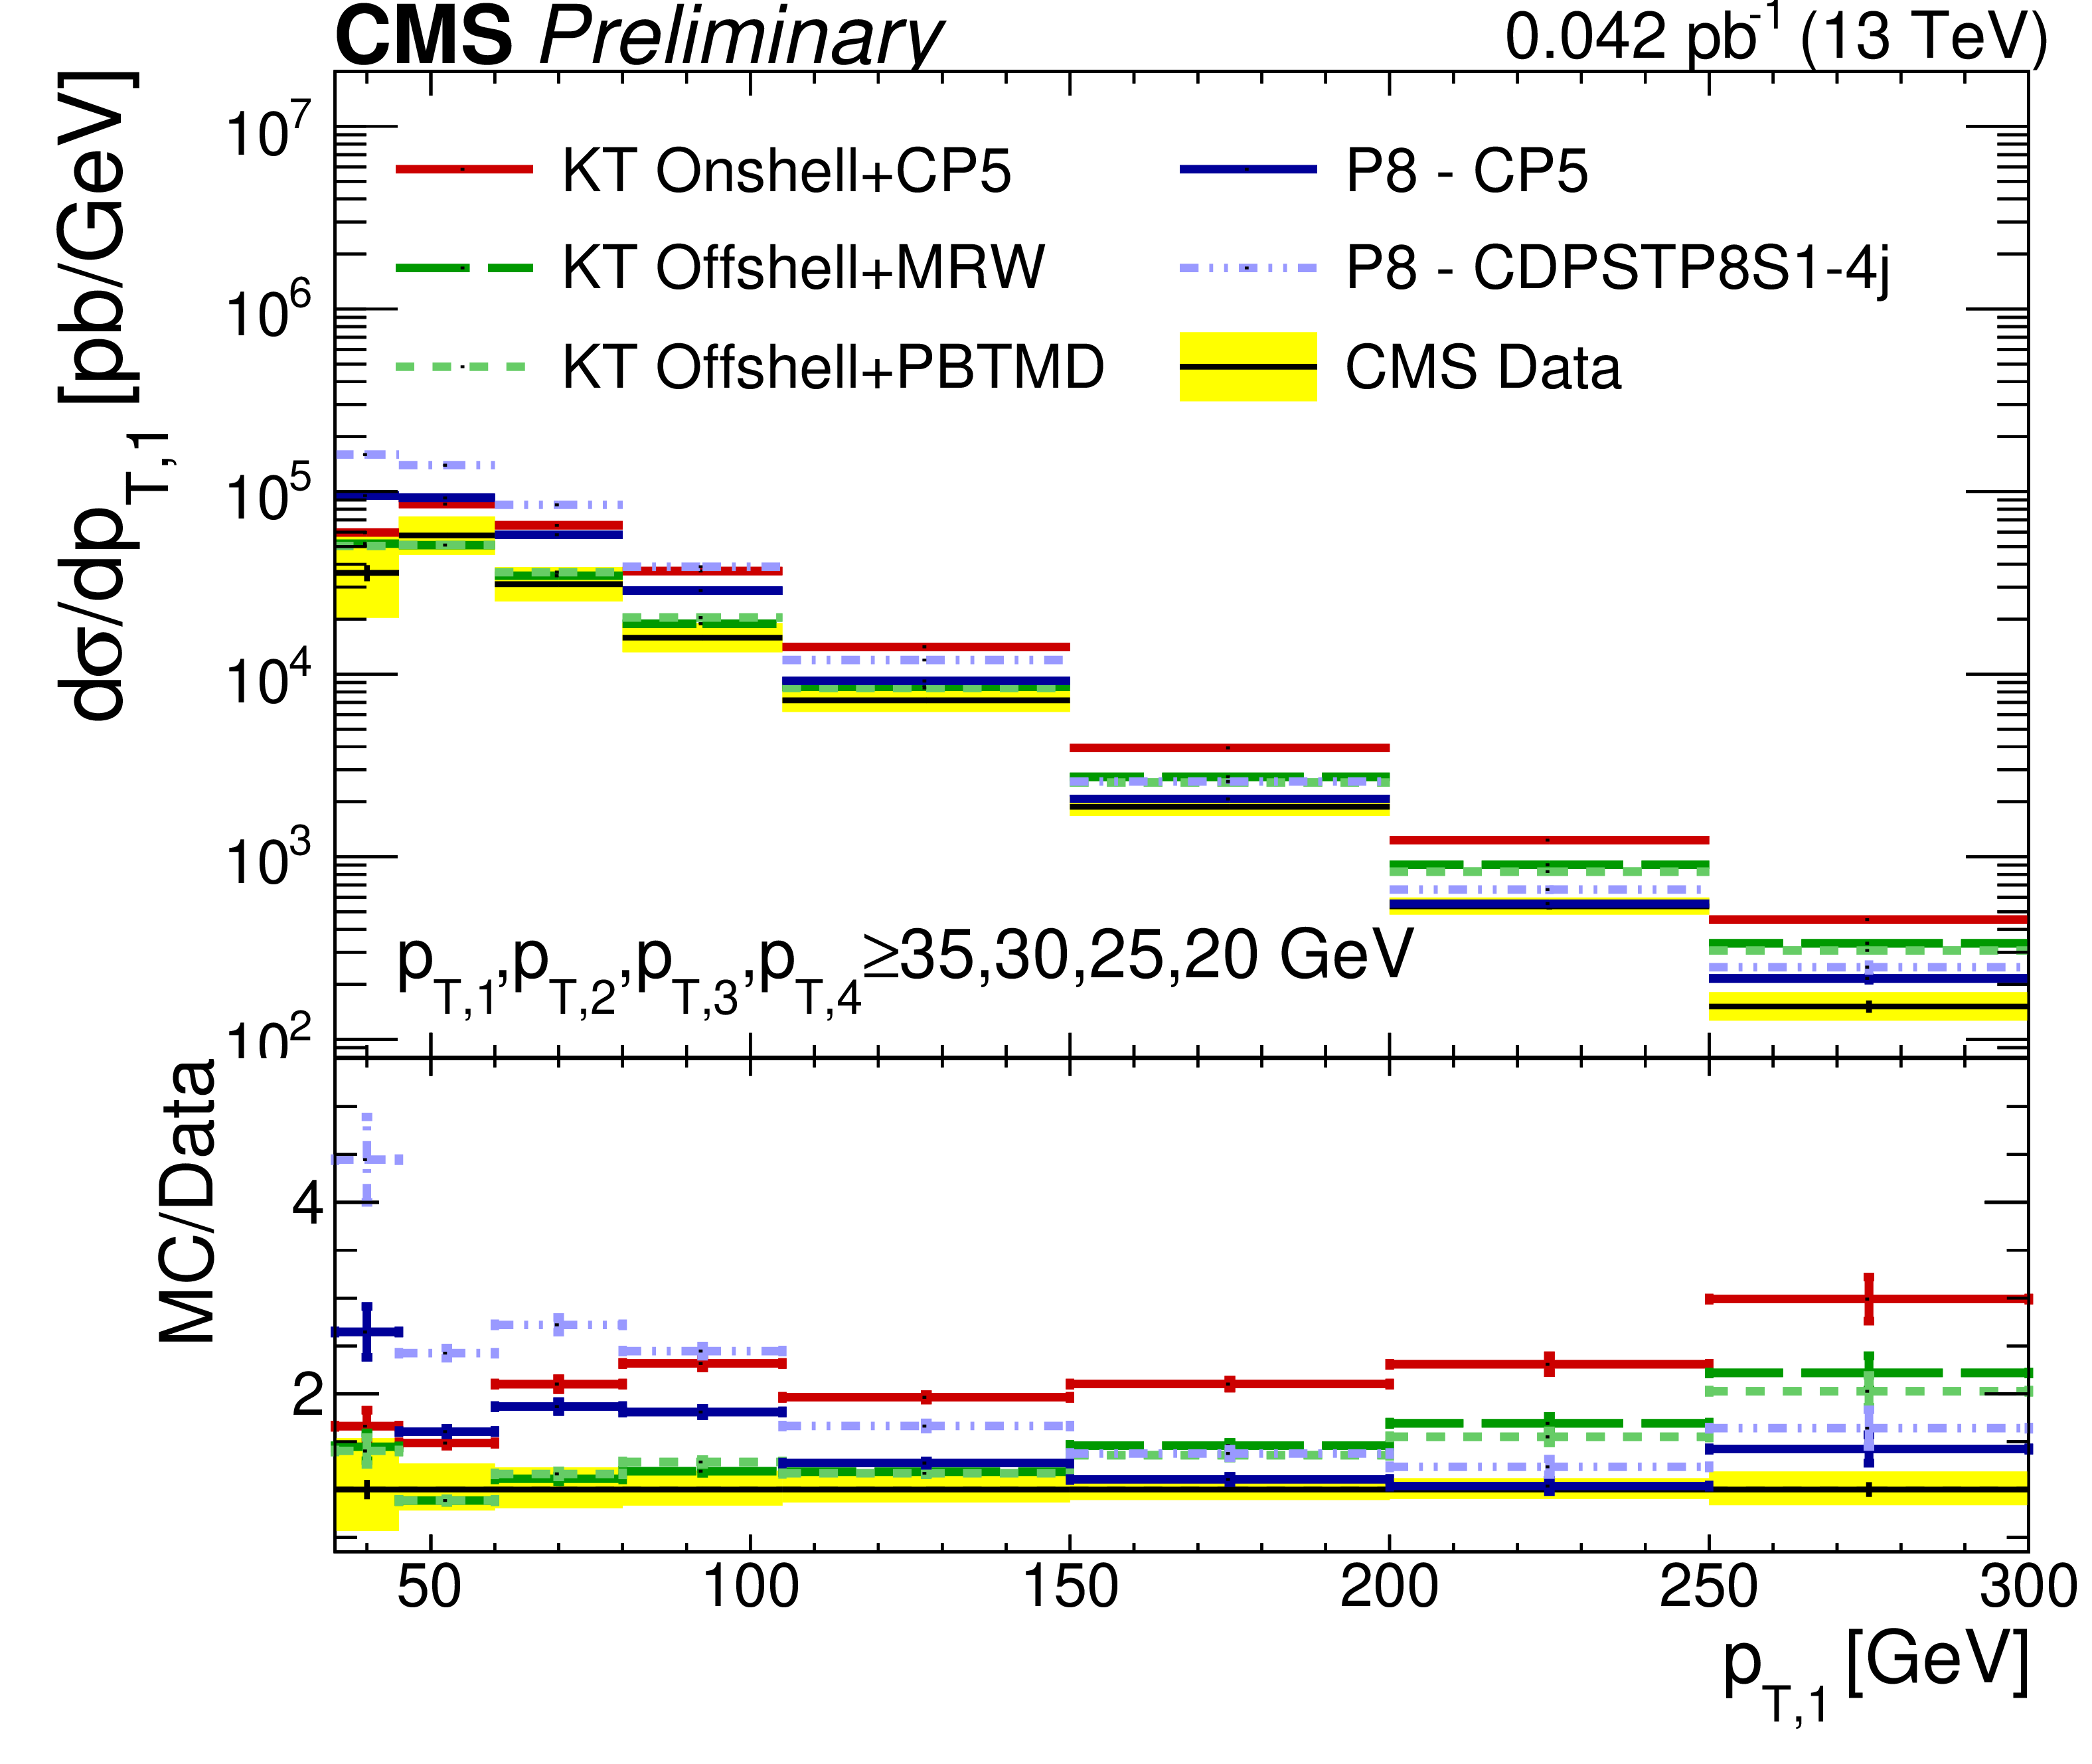
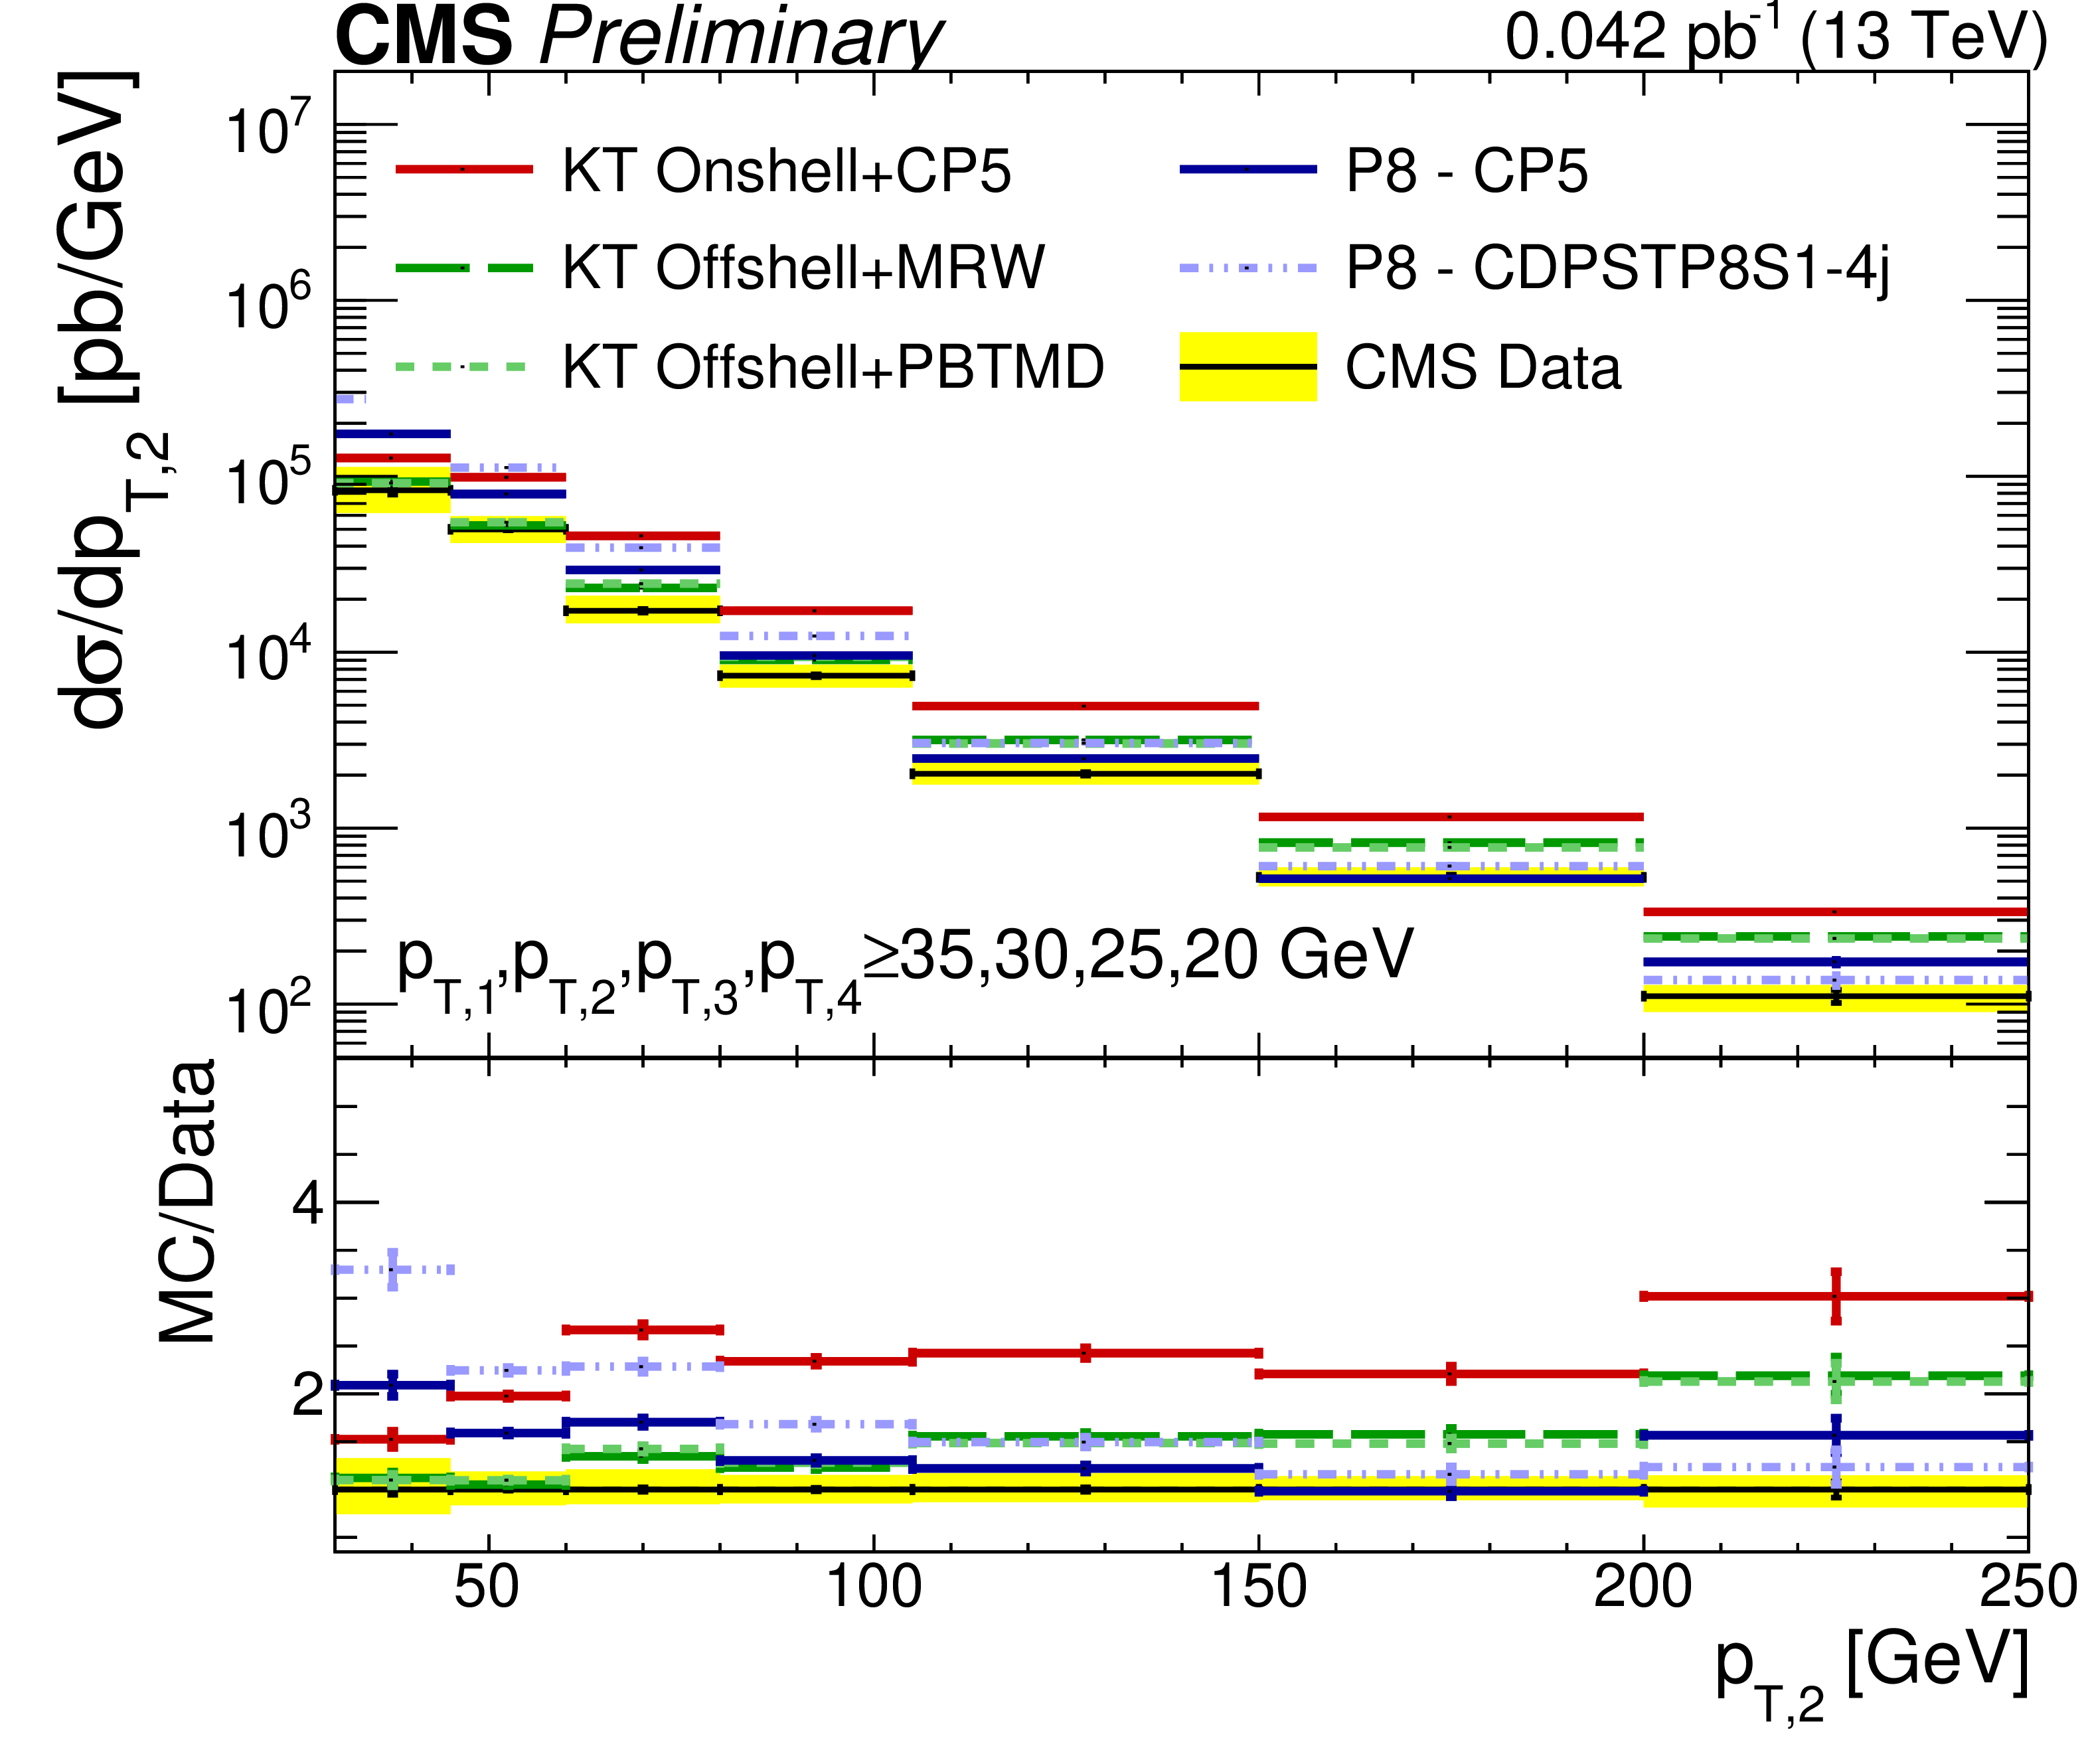
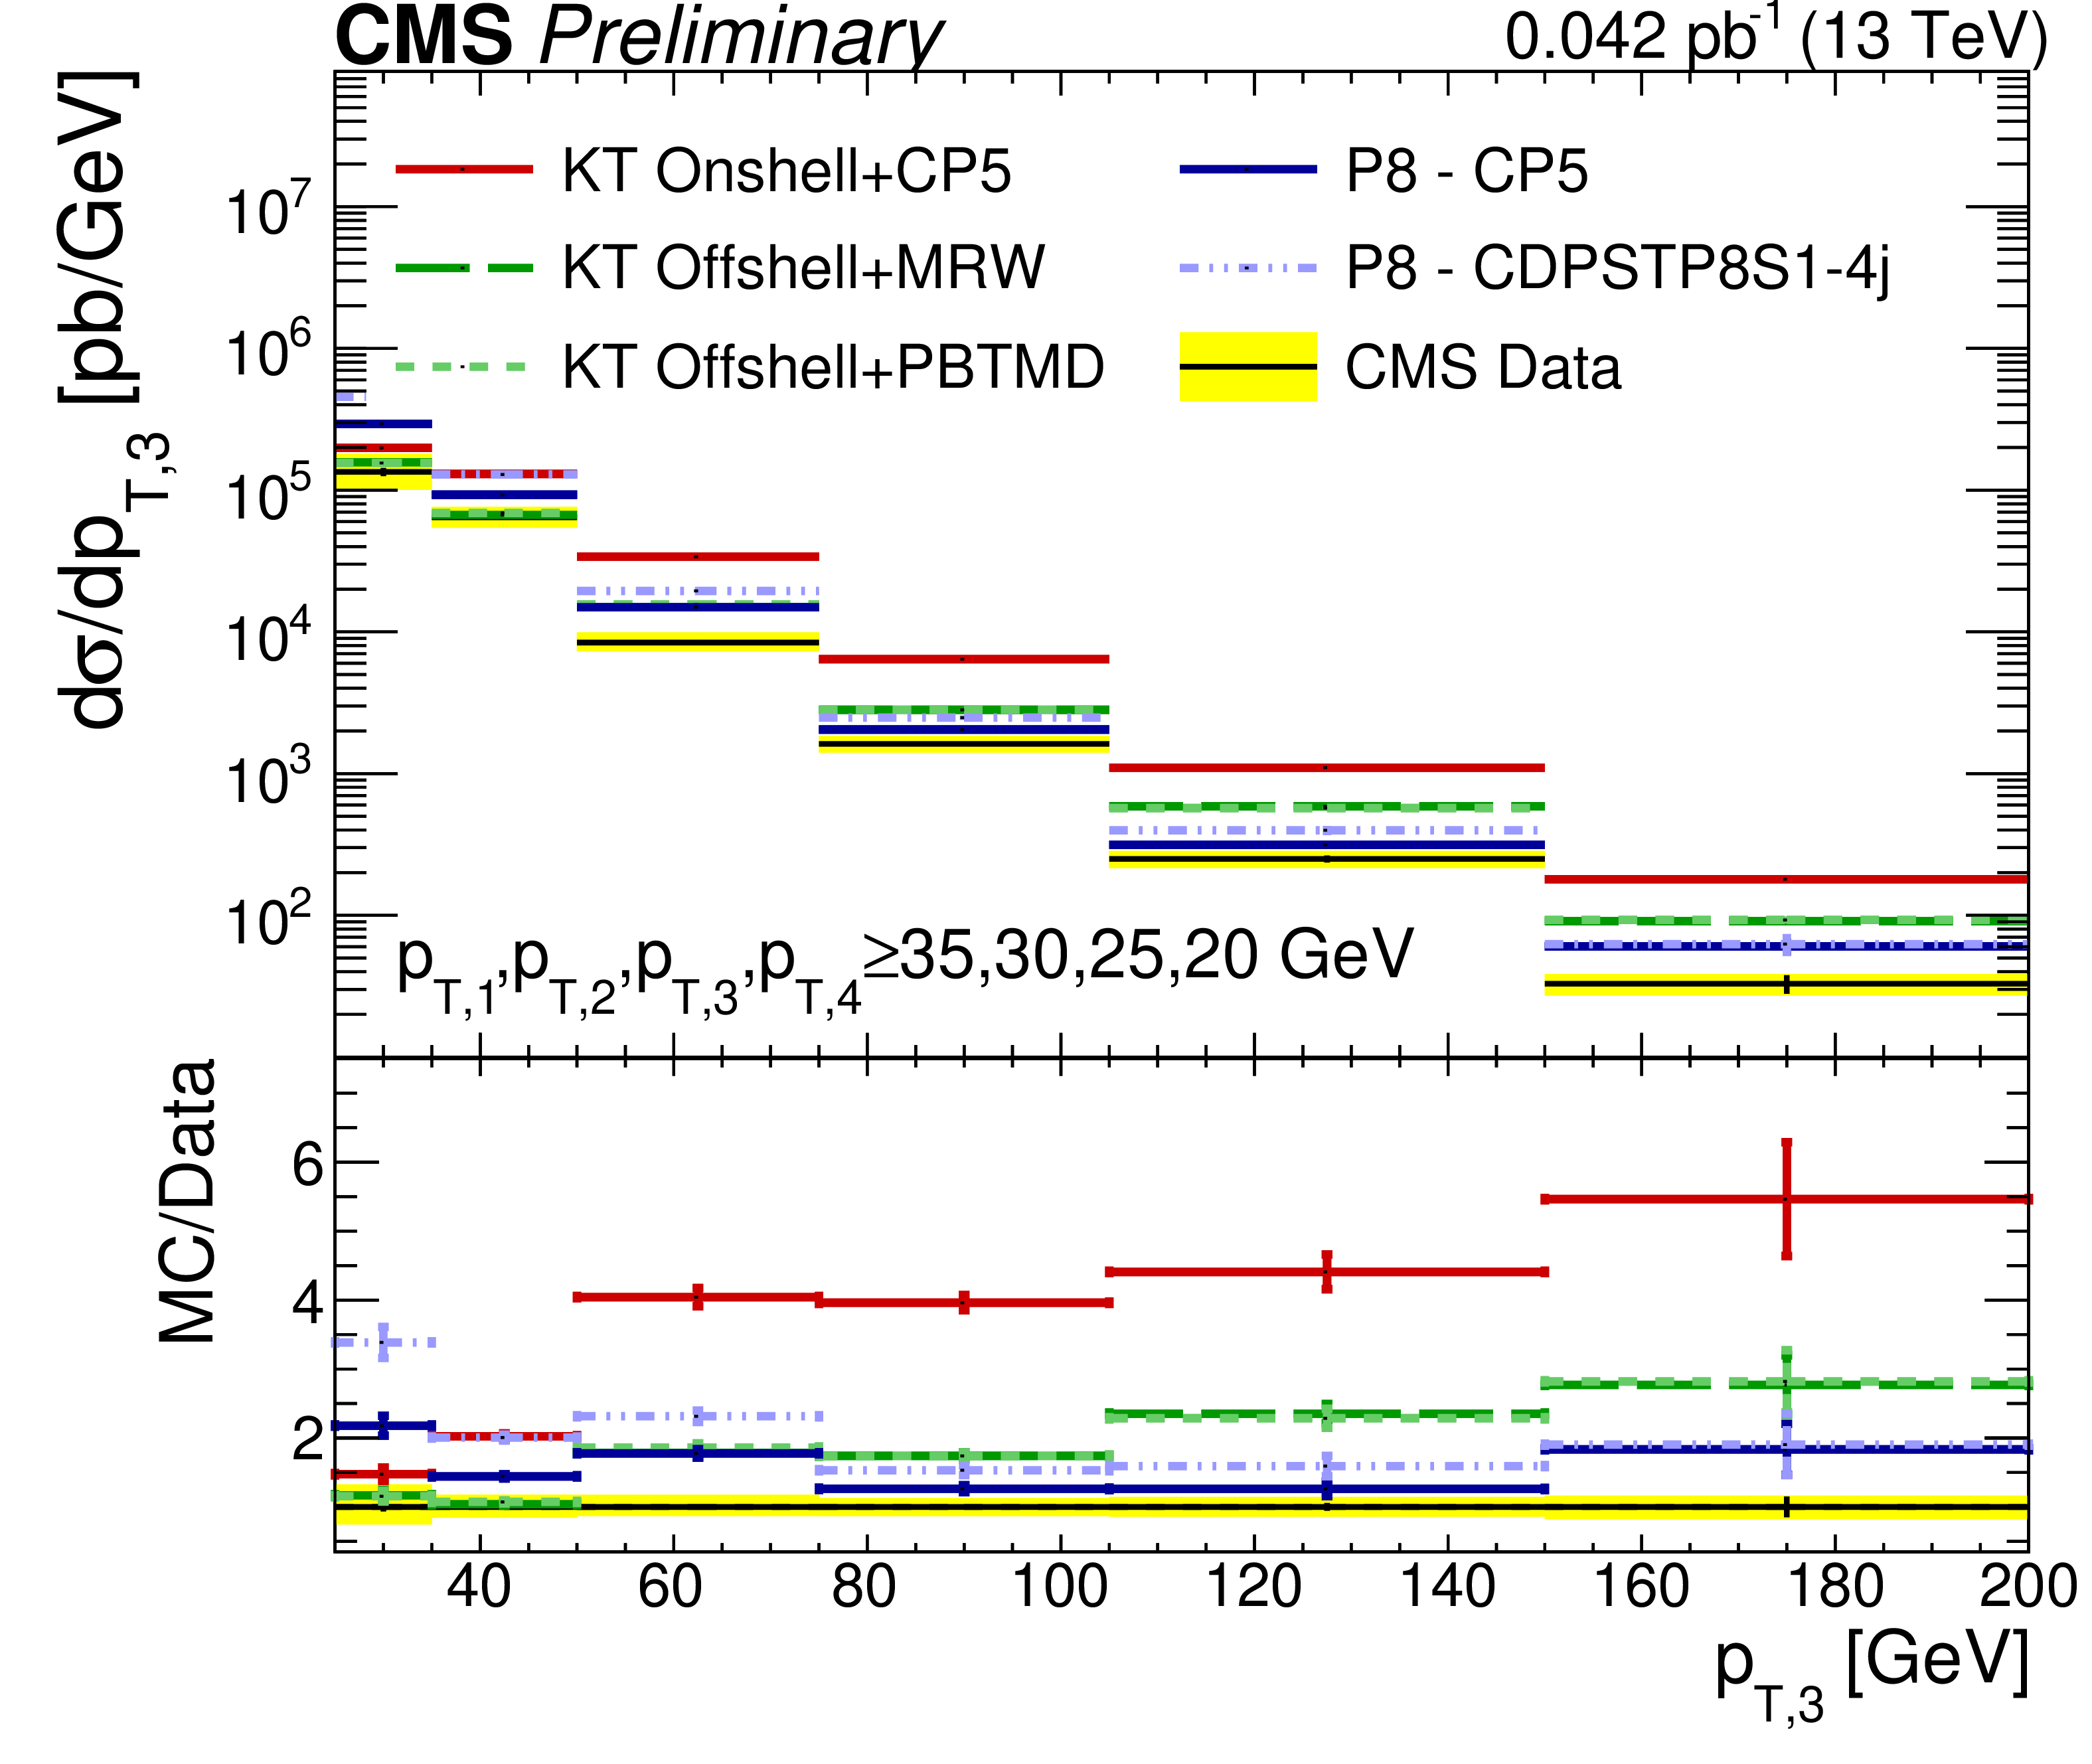
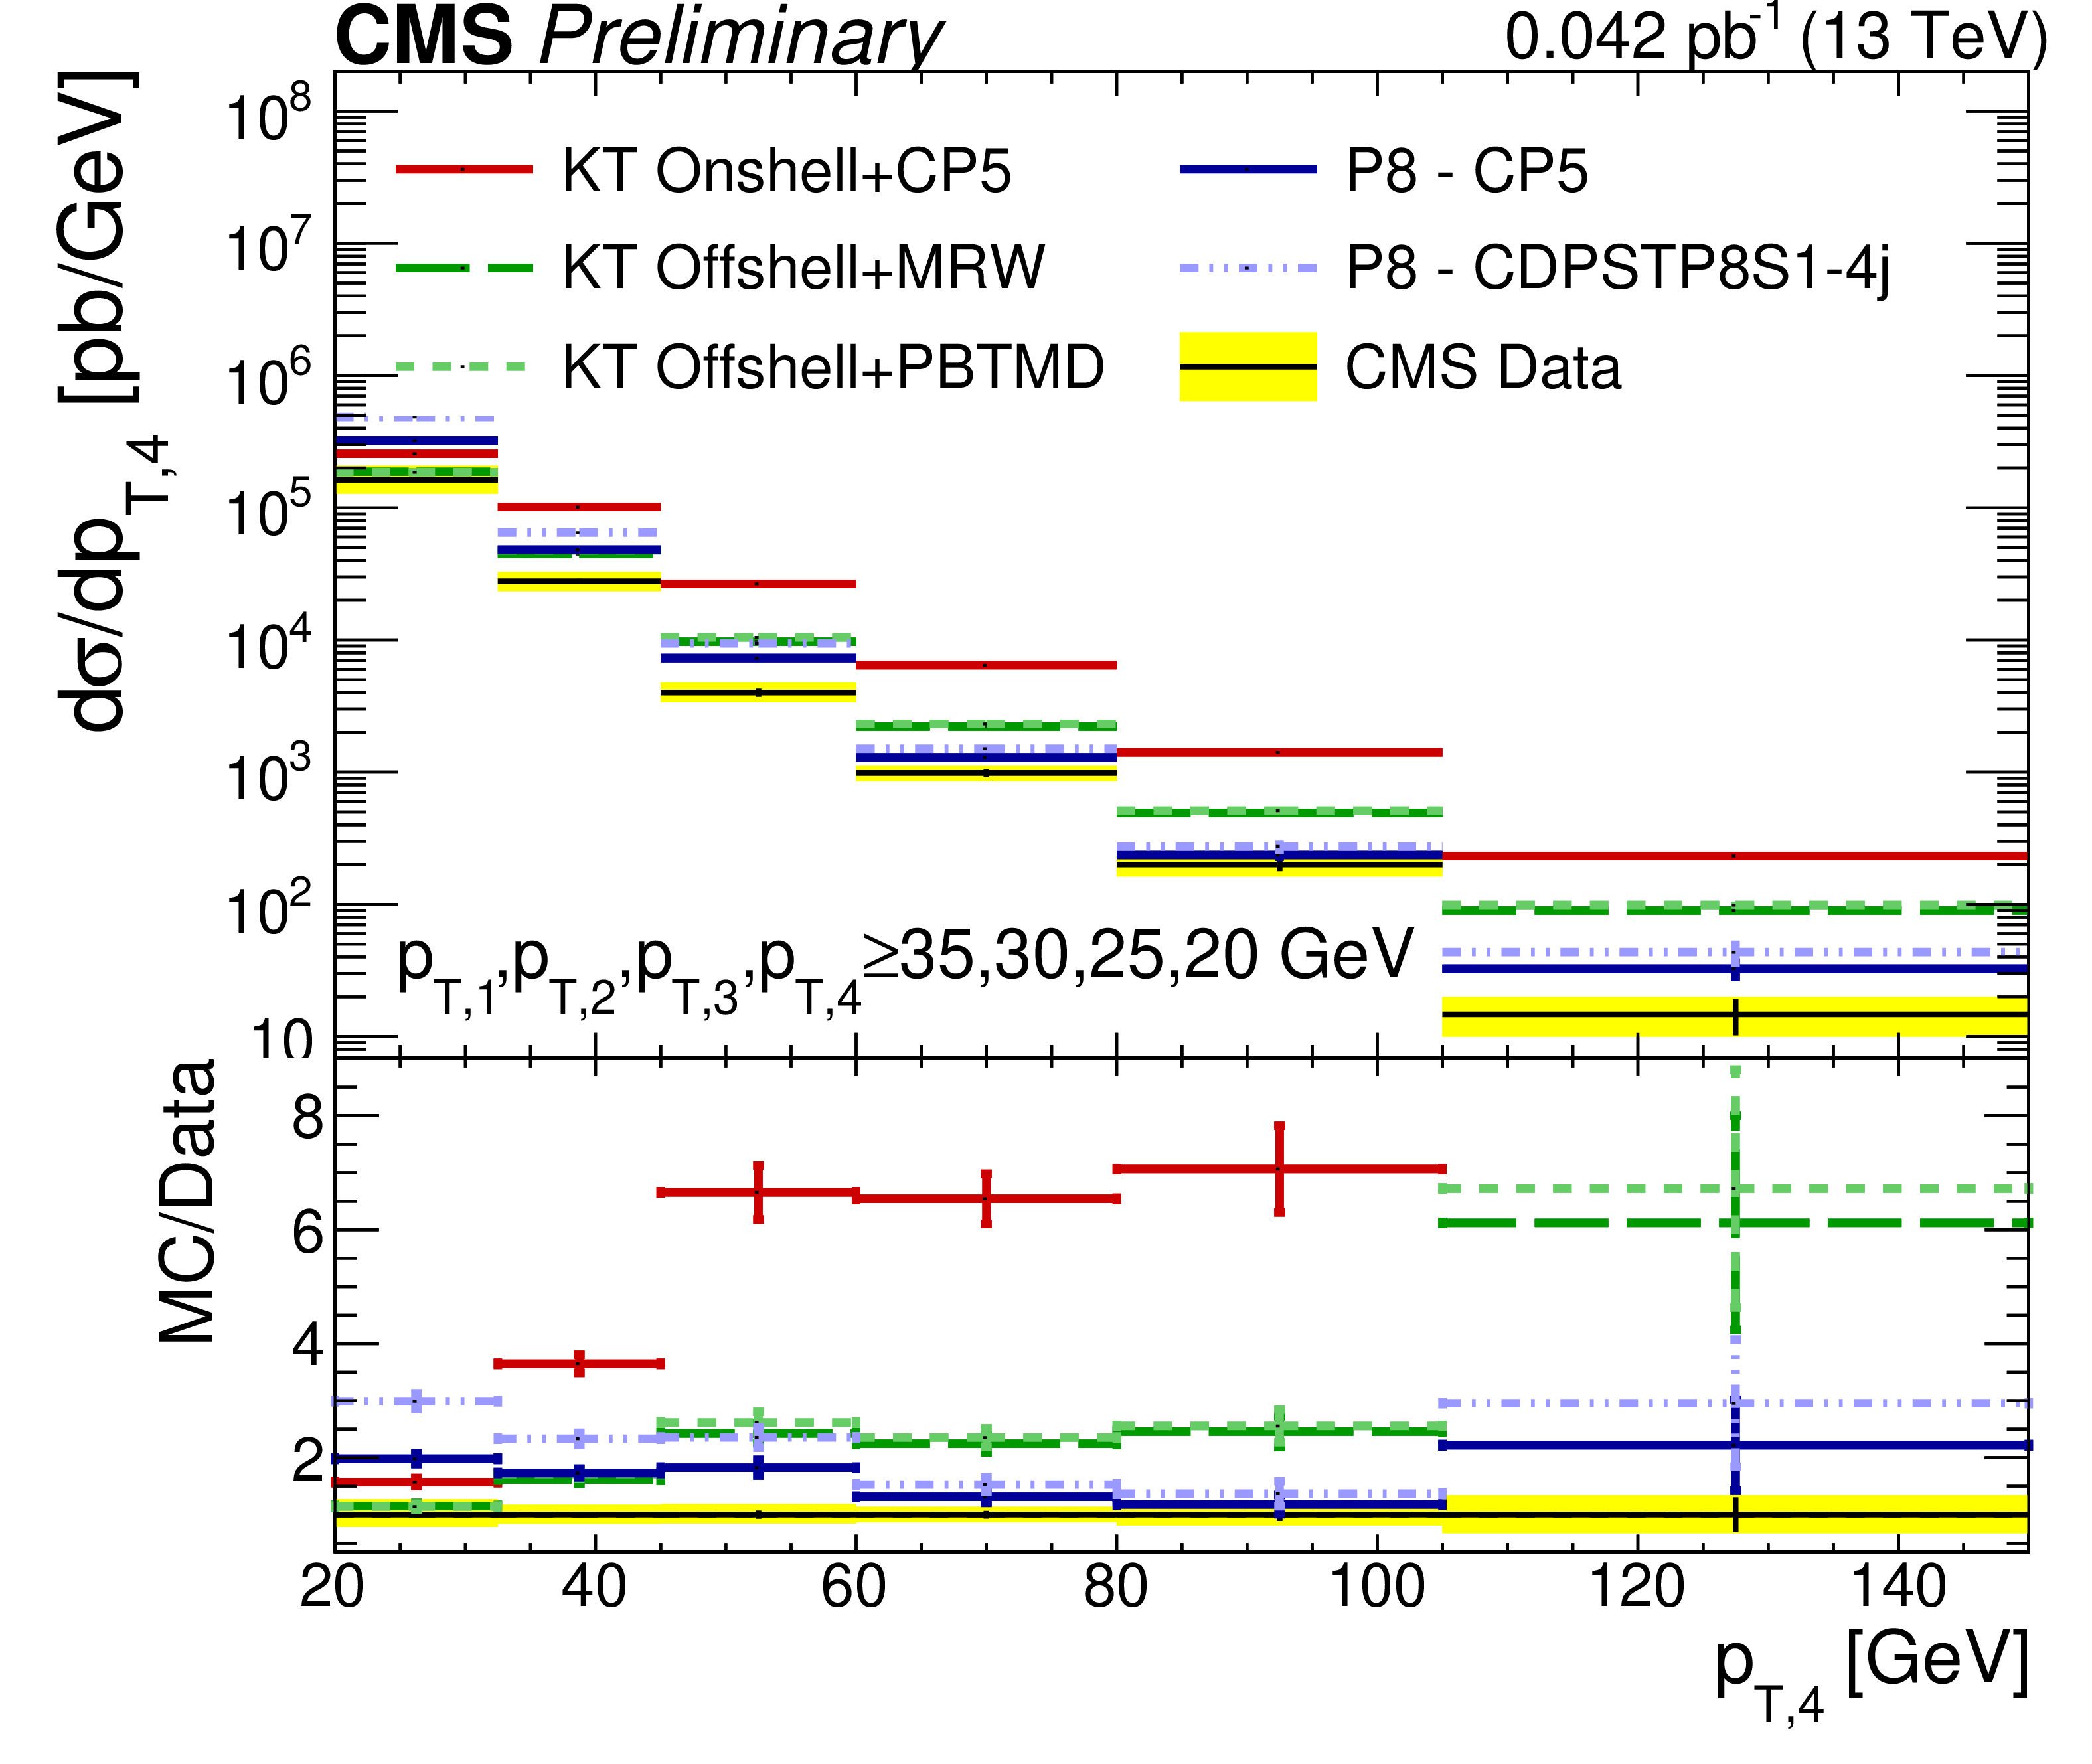
Comparison of the unfolded ${p_{\mathrm {T}}}$ spectra of data with different KATIE (KT), MadGraph 5 (MG5) and POWHEG (PW) models, for the leading (top left), subleading (top right), third leading (bottom left), and fourth leading (bottom right) jet. The error bars and bands are shown similarly to Fig. 2. |
png pdf |
Figure 6-a:
Comparison of the unfolded ${p_{\mathrm {T}}}$ spectra of data with different KATIE (KT), MadGraph 5 (MG5) and POWHEG (PW) models, for the leading (top left), subleading (top right), third leading (bottom left), and fourth leading (bottom right) jet. The error bars and bands are shown similarly to Fig. 2. |
png pdf |
Figure 6-b:
Comparison of the unfolded ${p_{\mathrm {T}}}$ spectra of data with different KATIE (KT), MadGraph 5 (MG5) and POWHEG (PW) models, for the leading (top left), subleading (top right), third leading (bottom left), and fourth leading (bottom right) jet. The error bars and bands are shown similarly to Fig. 2. |
png pdf |
Figure 6-c:
Comparison of the unfolded ${p_{\mathrm {T}}}$ spectra of data with different KATIE (KT), MadGraph 5 (MG5) and POWHEG (PW) models, for the leading (top left), subleading (top right), third leading (bottom left), and fourth leading (bottom right) jet. The error bars and bands are shown similarly to Fig. 2. |

png pdf |
Figure 6-d:
Comparison of the unfolded ${p_{\mathrm {T}}}$ spectra of data with different KATIE (KT), MadGraph 5 (MG5) and POWHEG (PW) models, for the leading (top left), subleading (top right), third leading (bottom left), and fourth leading (bottom right) jet. The error bars and bands are shown similarly to Fig. 2. |

png pdf |
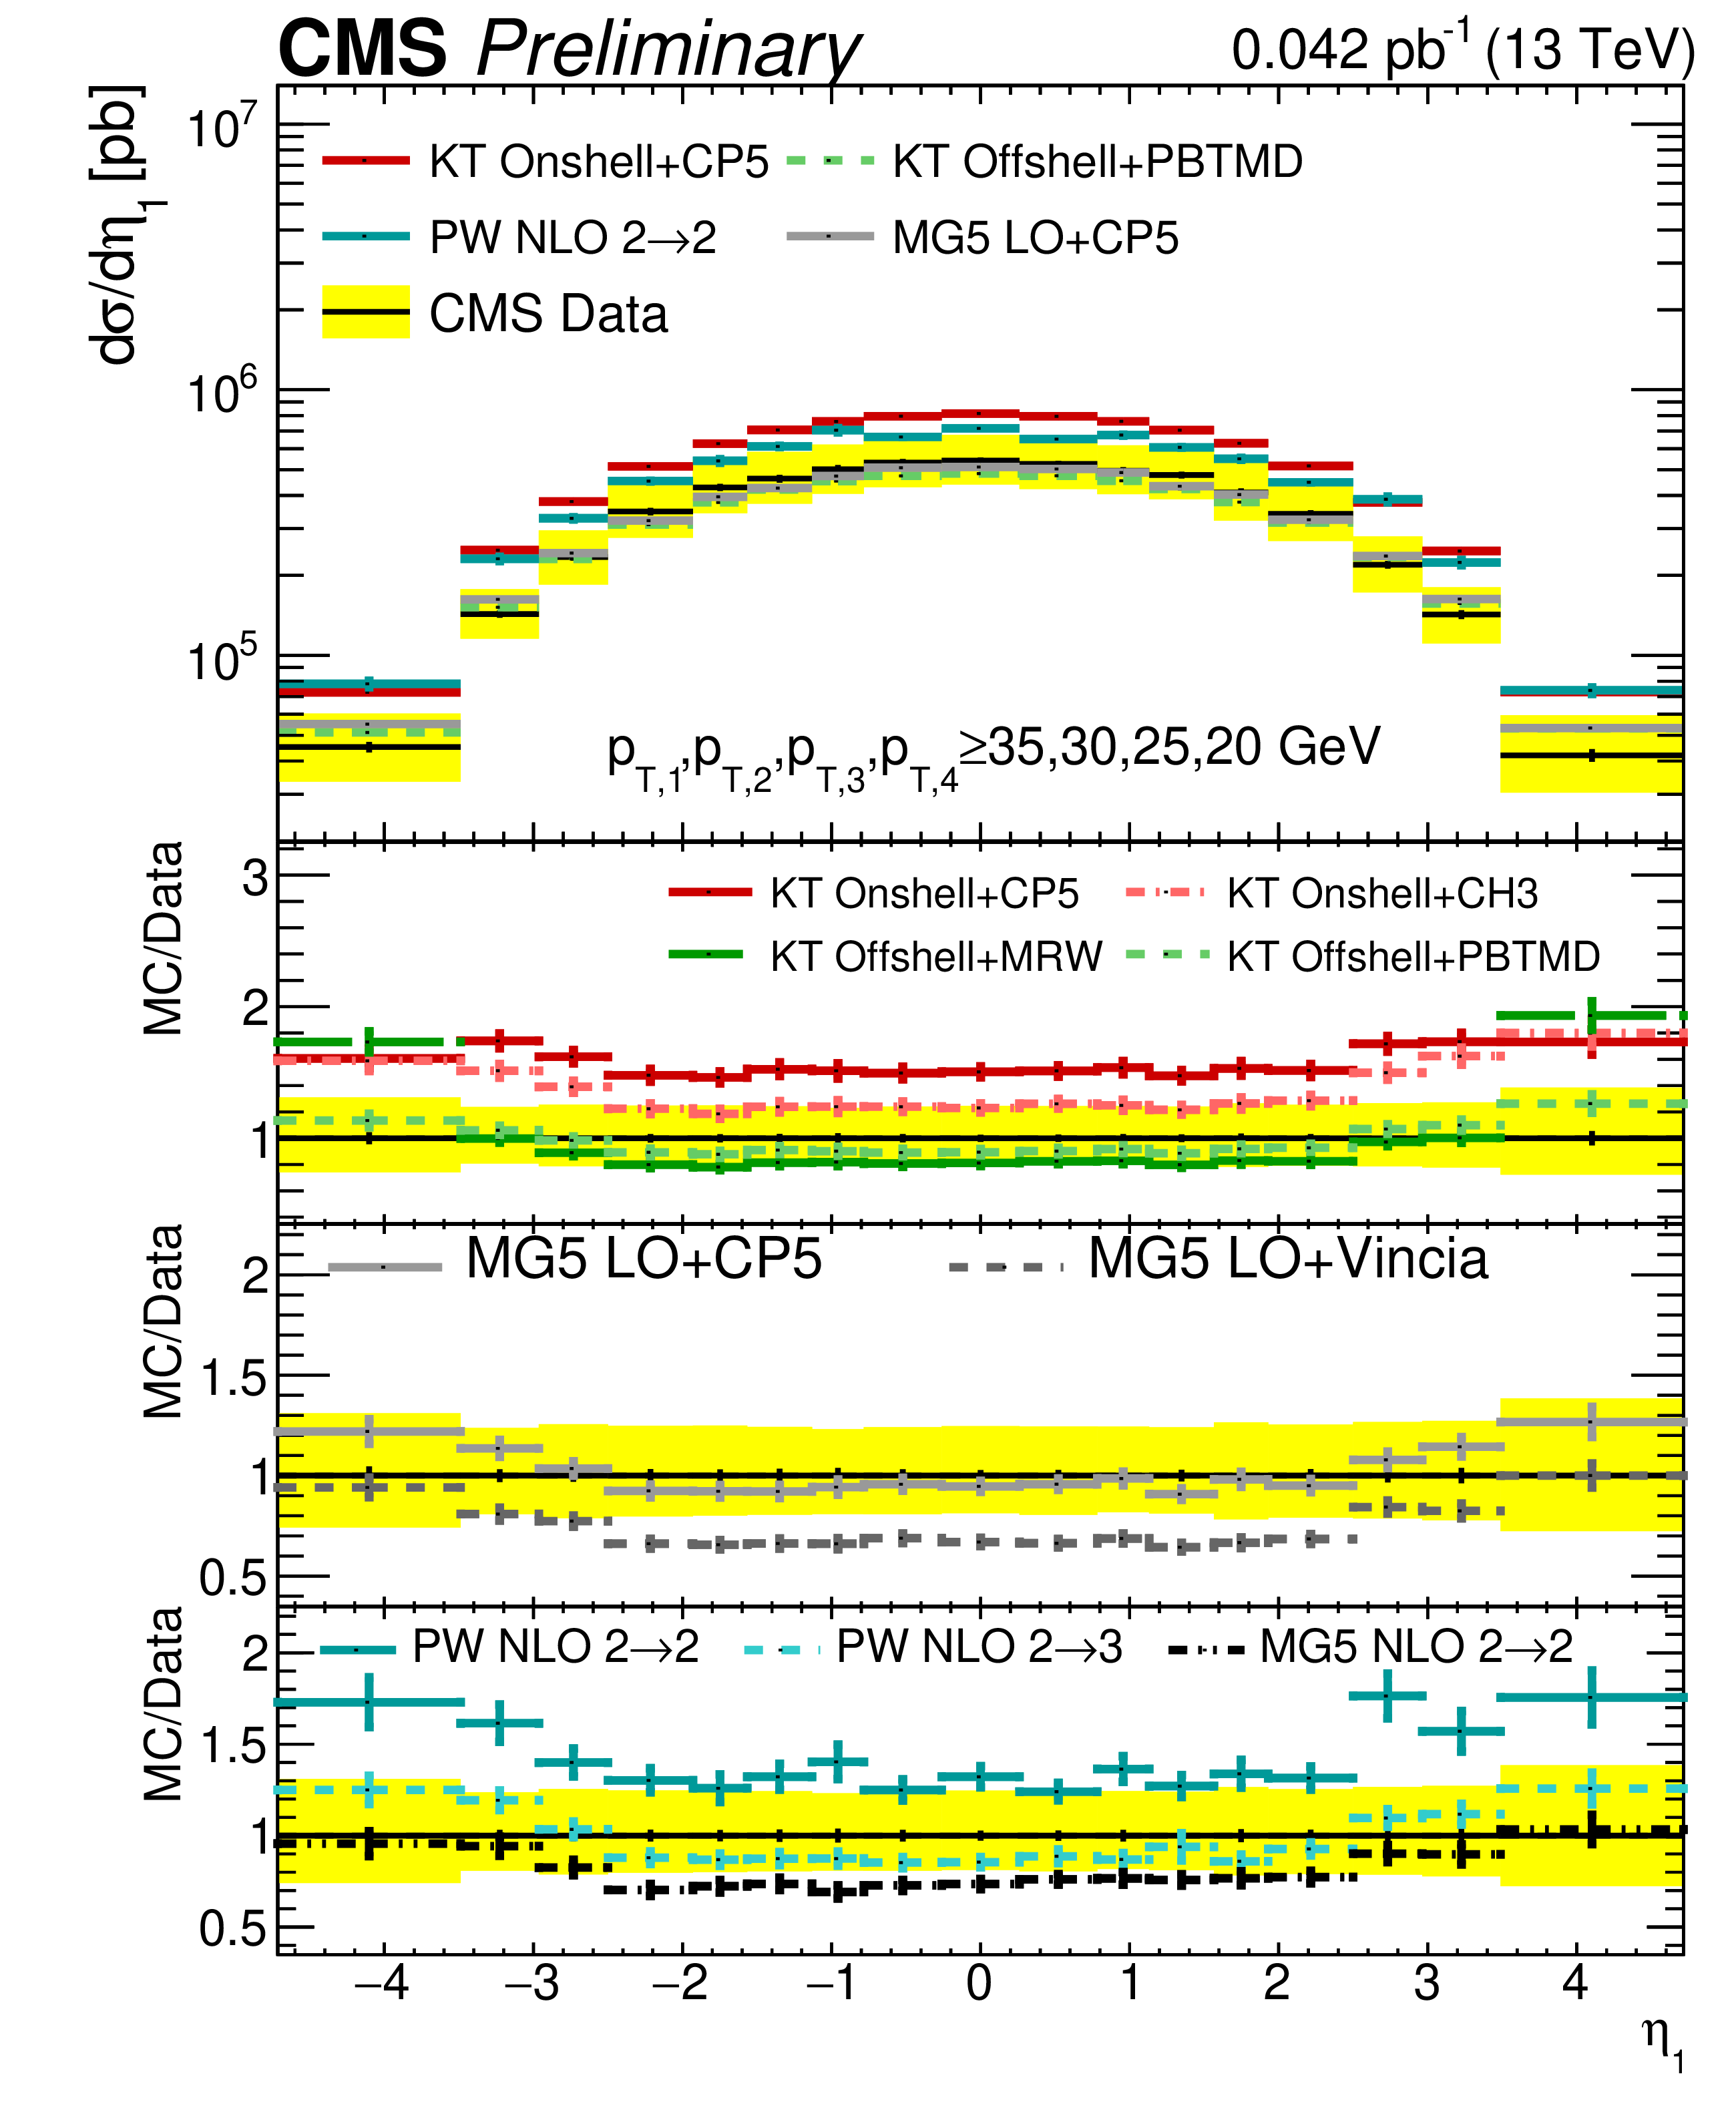
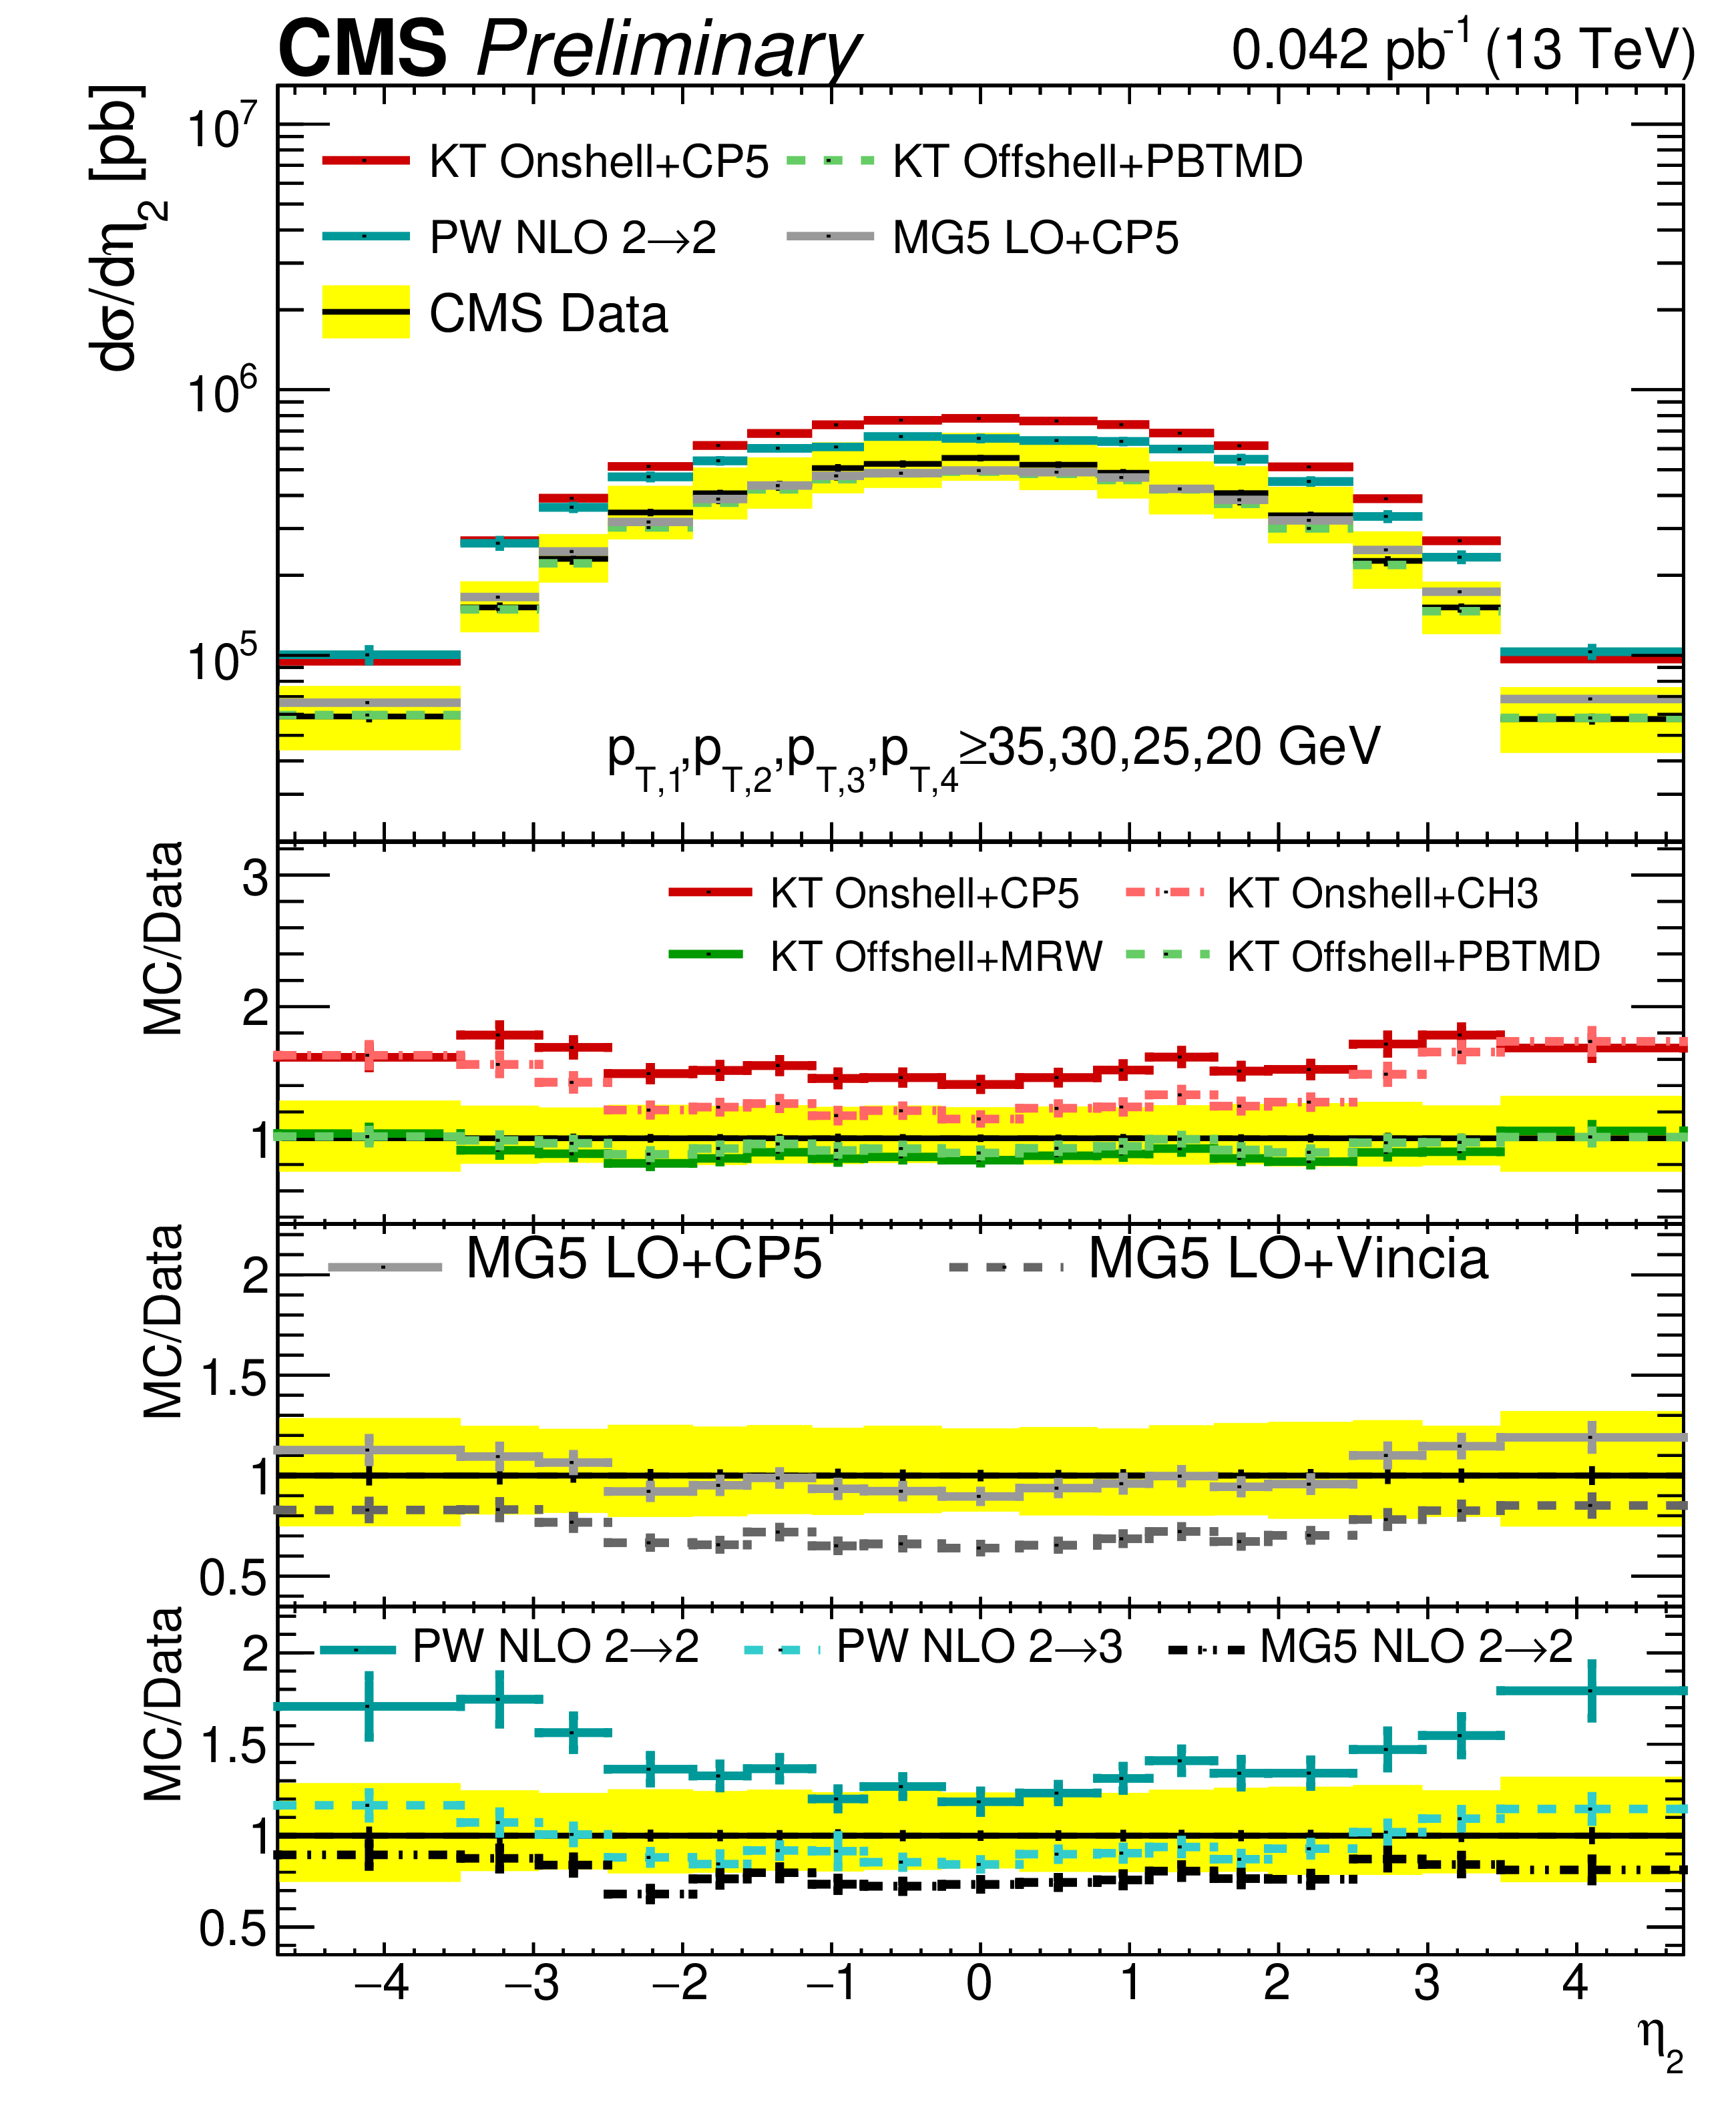
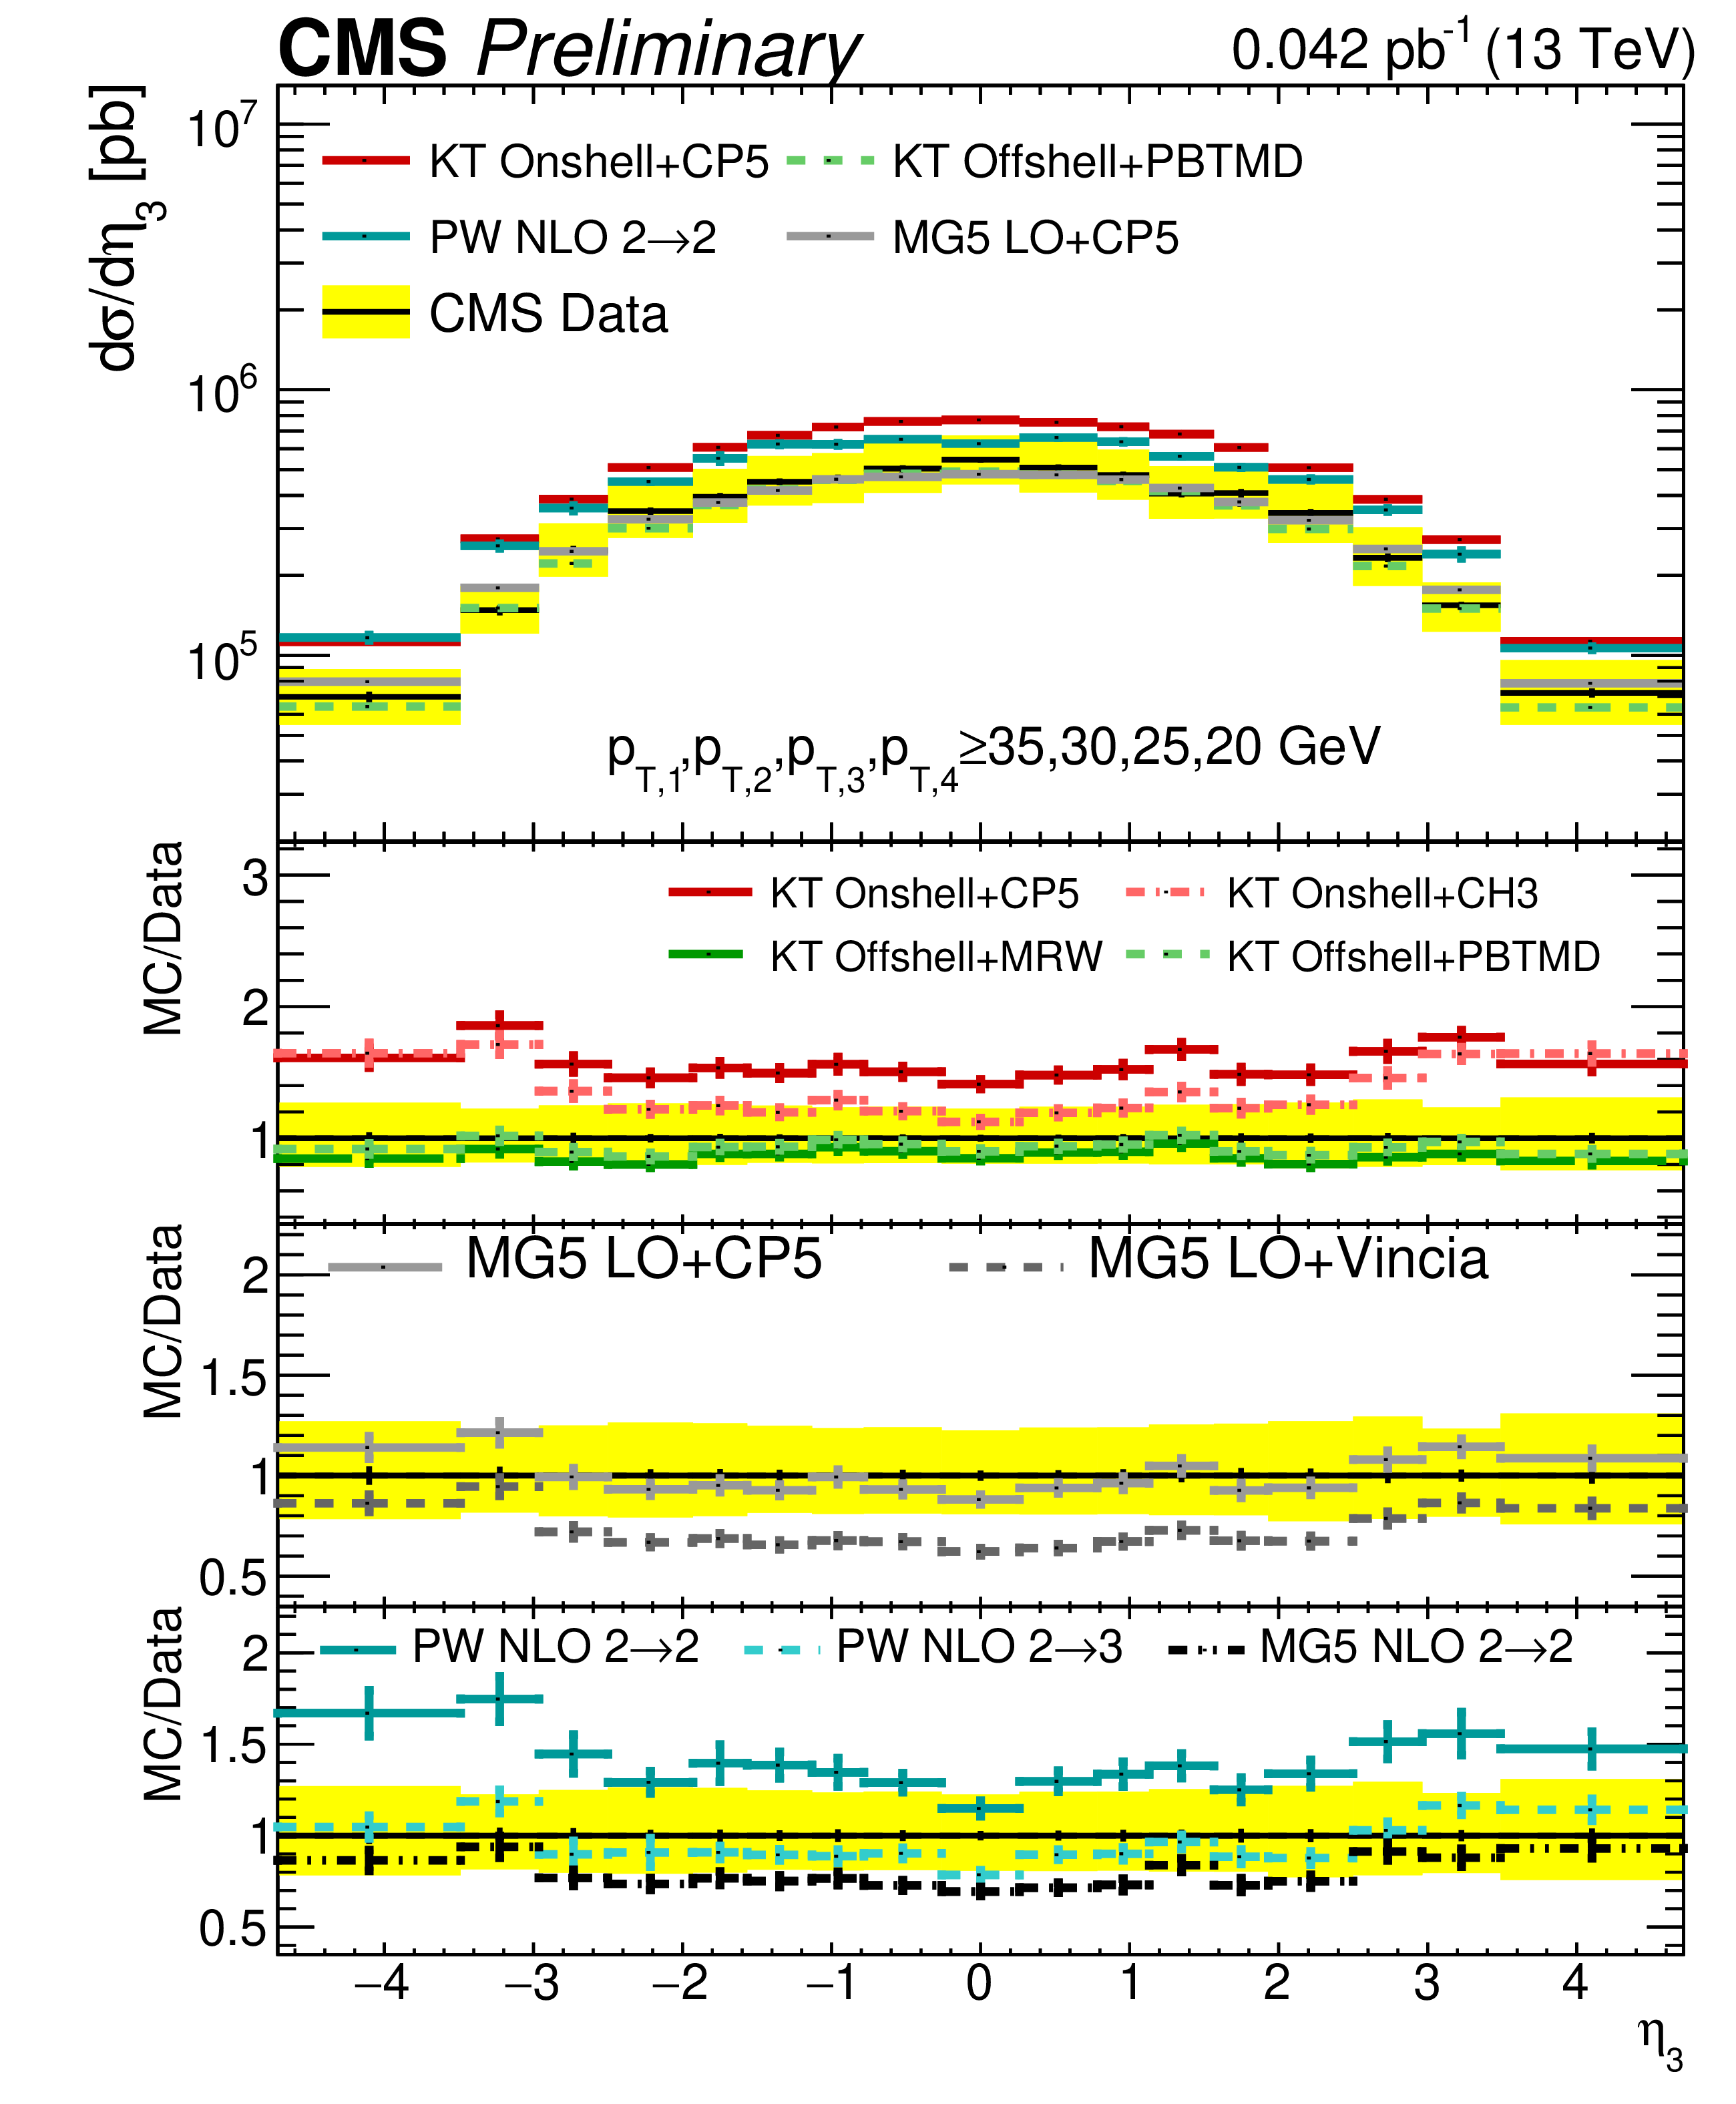
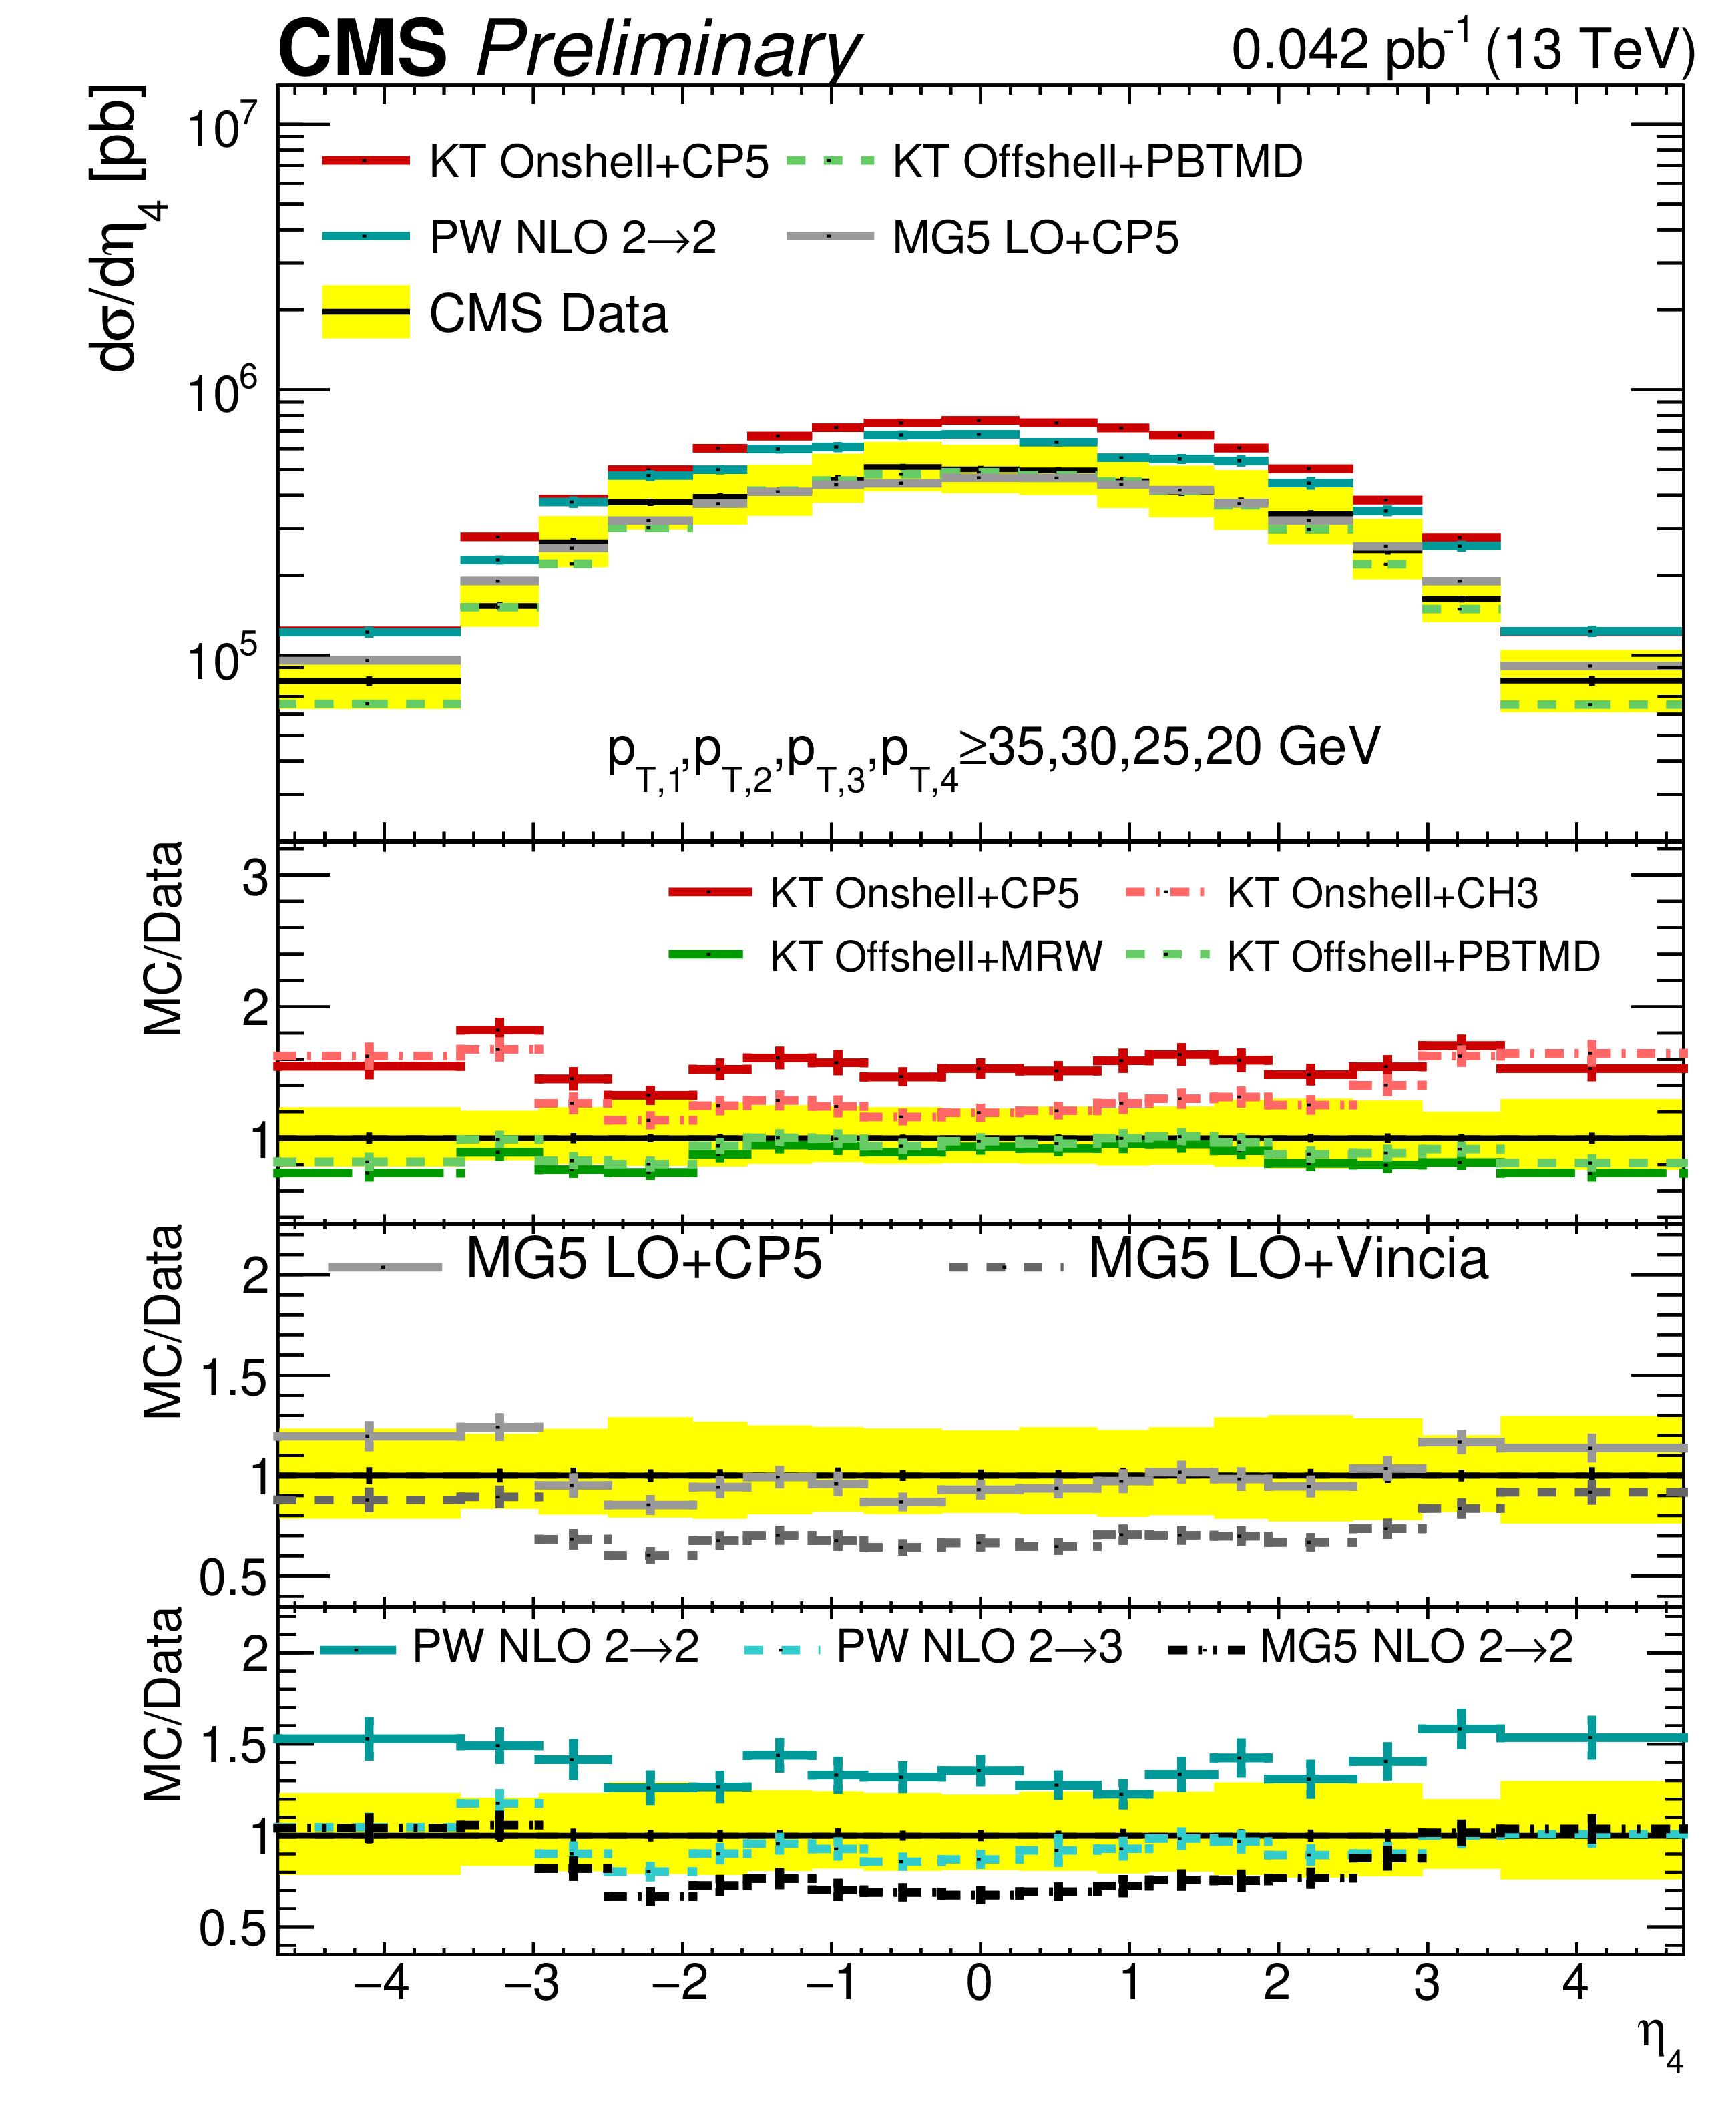
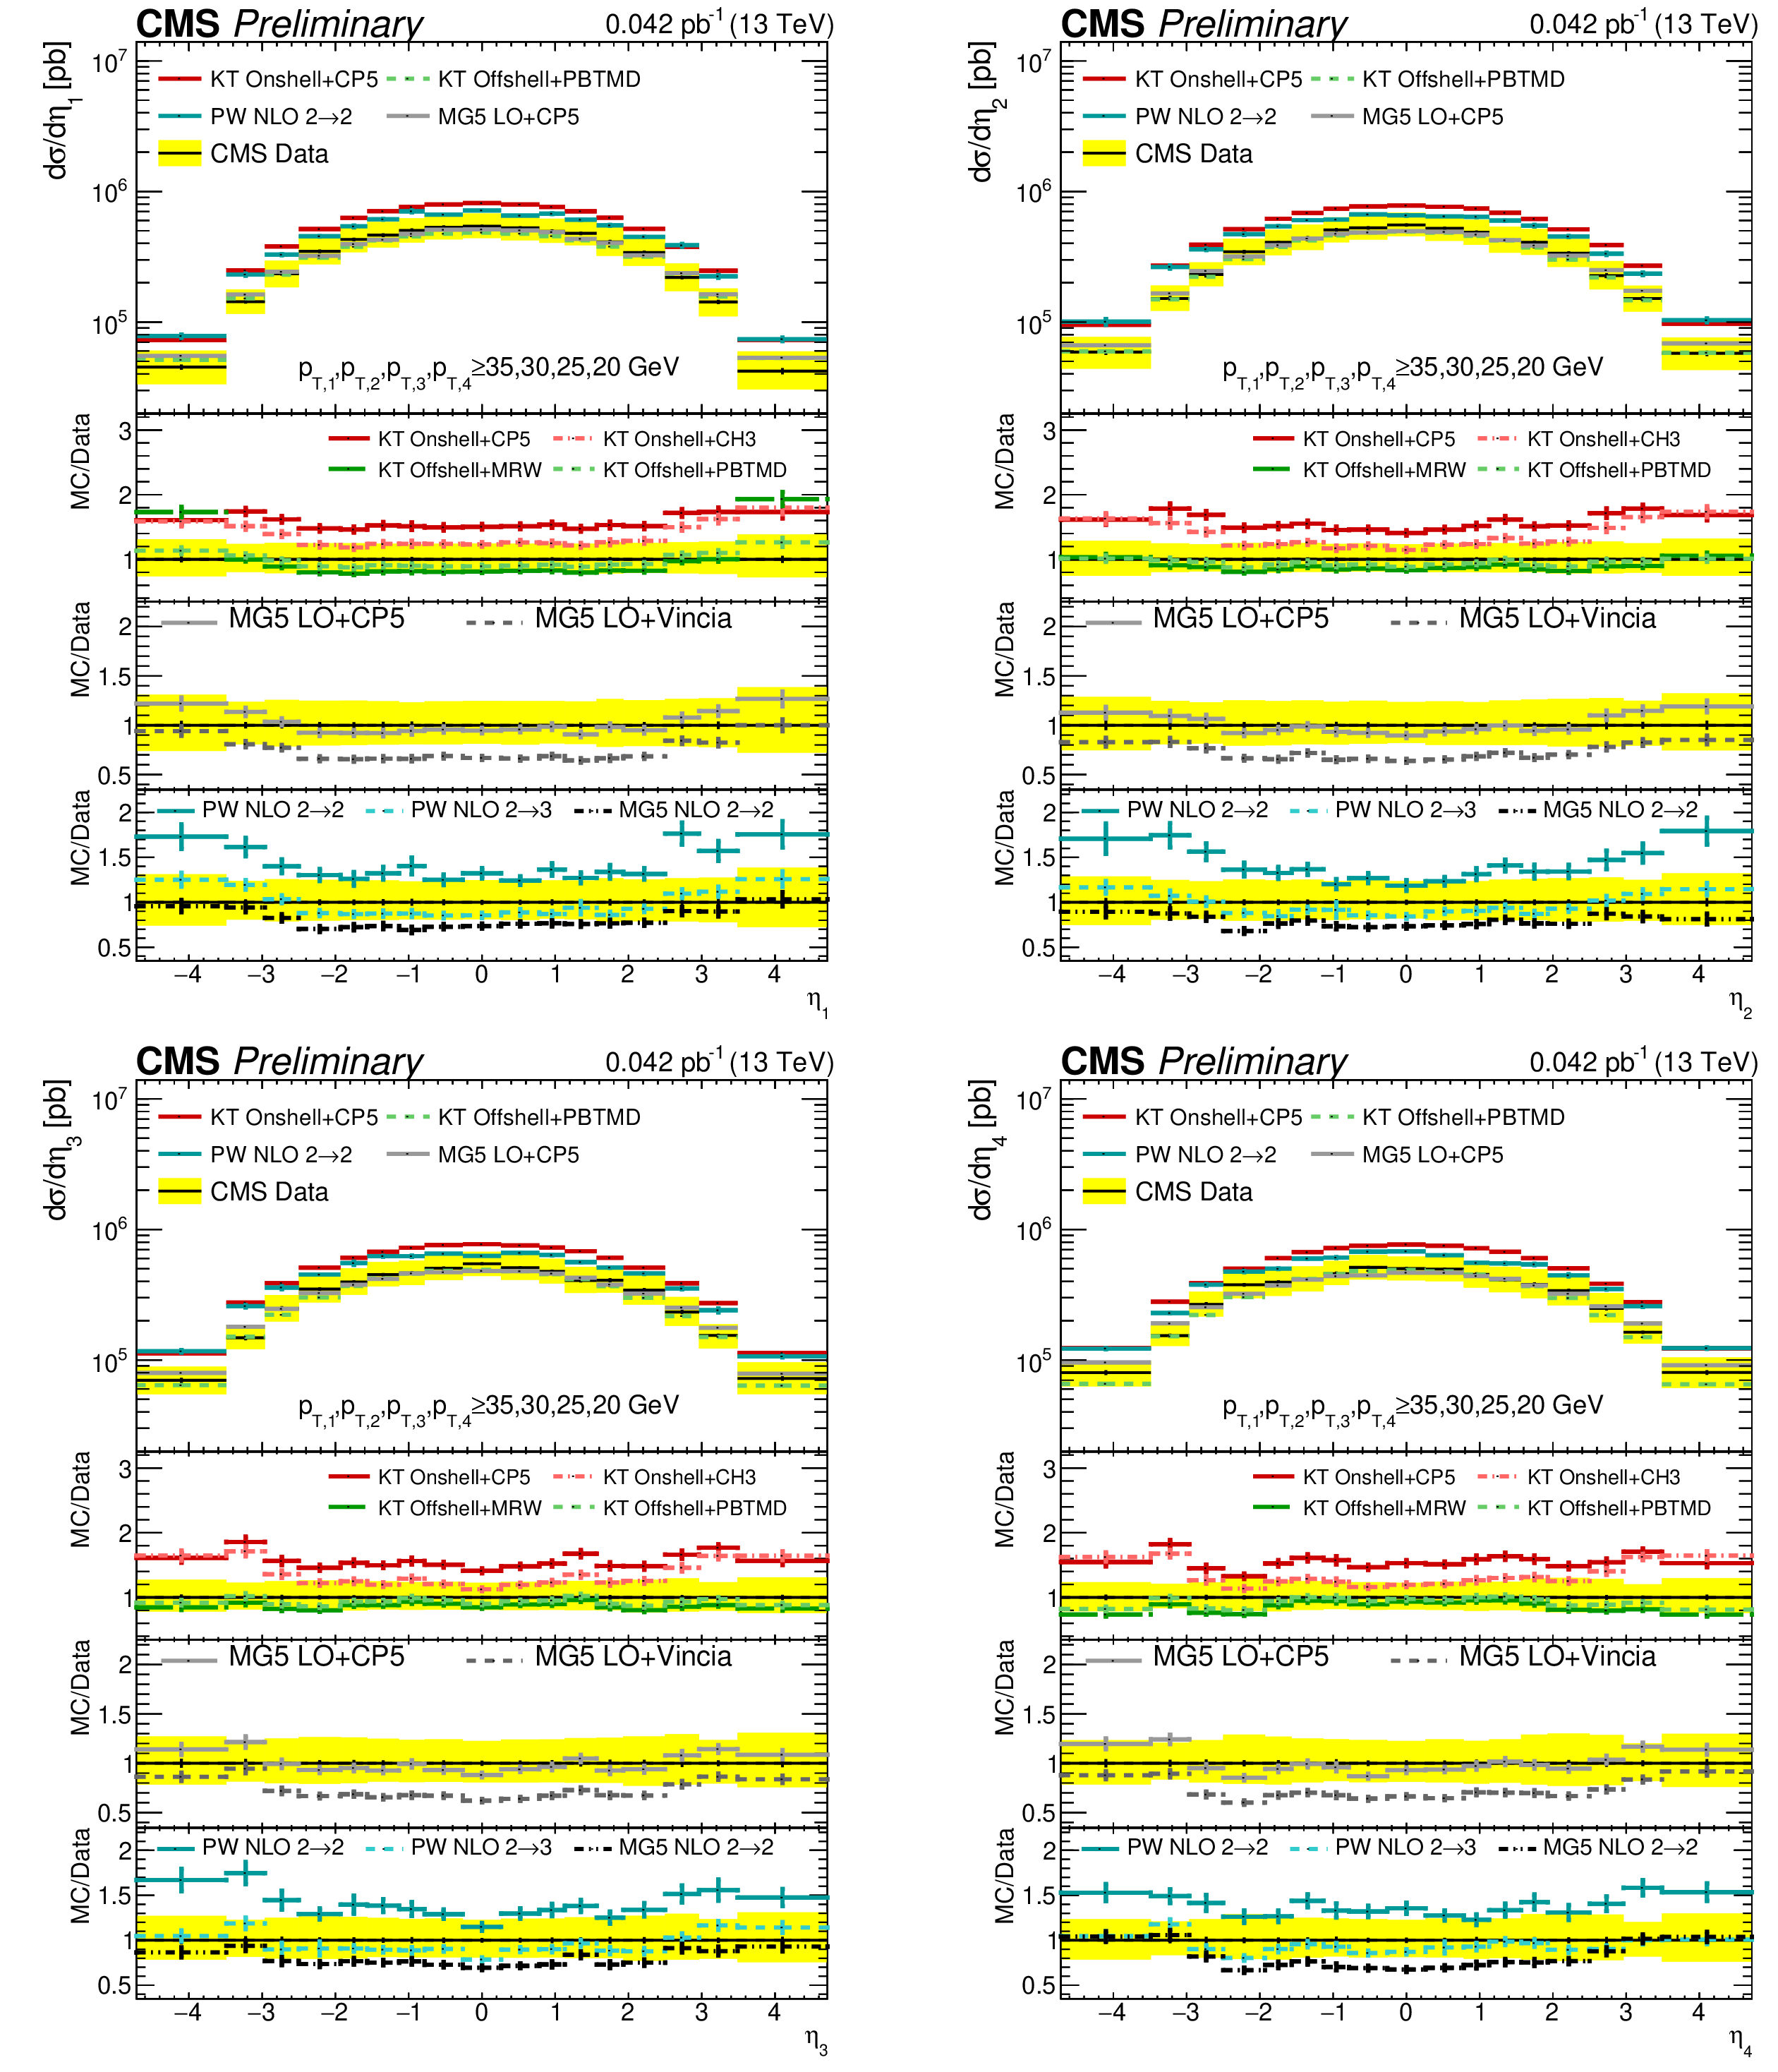
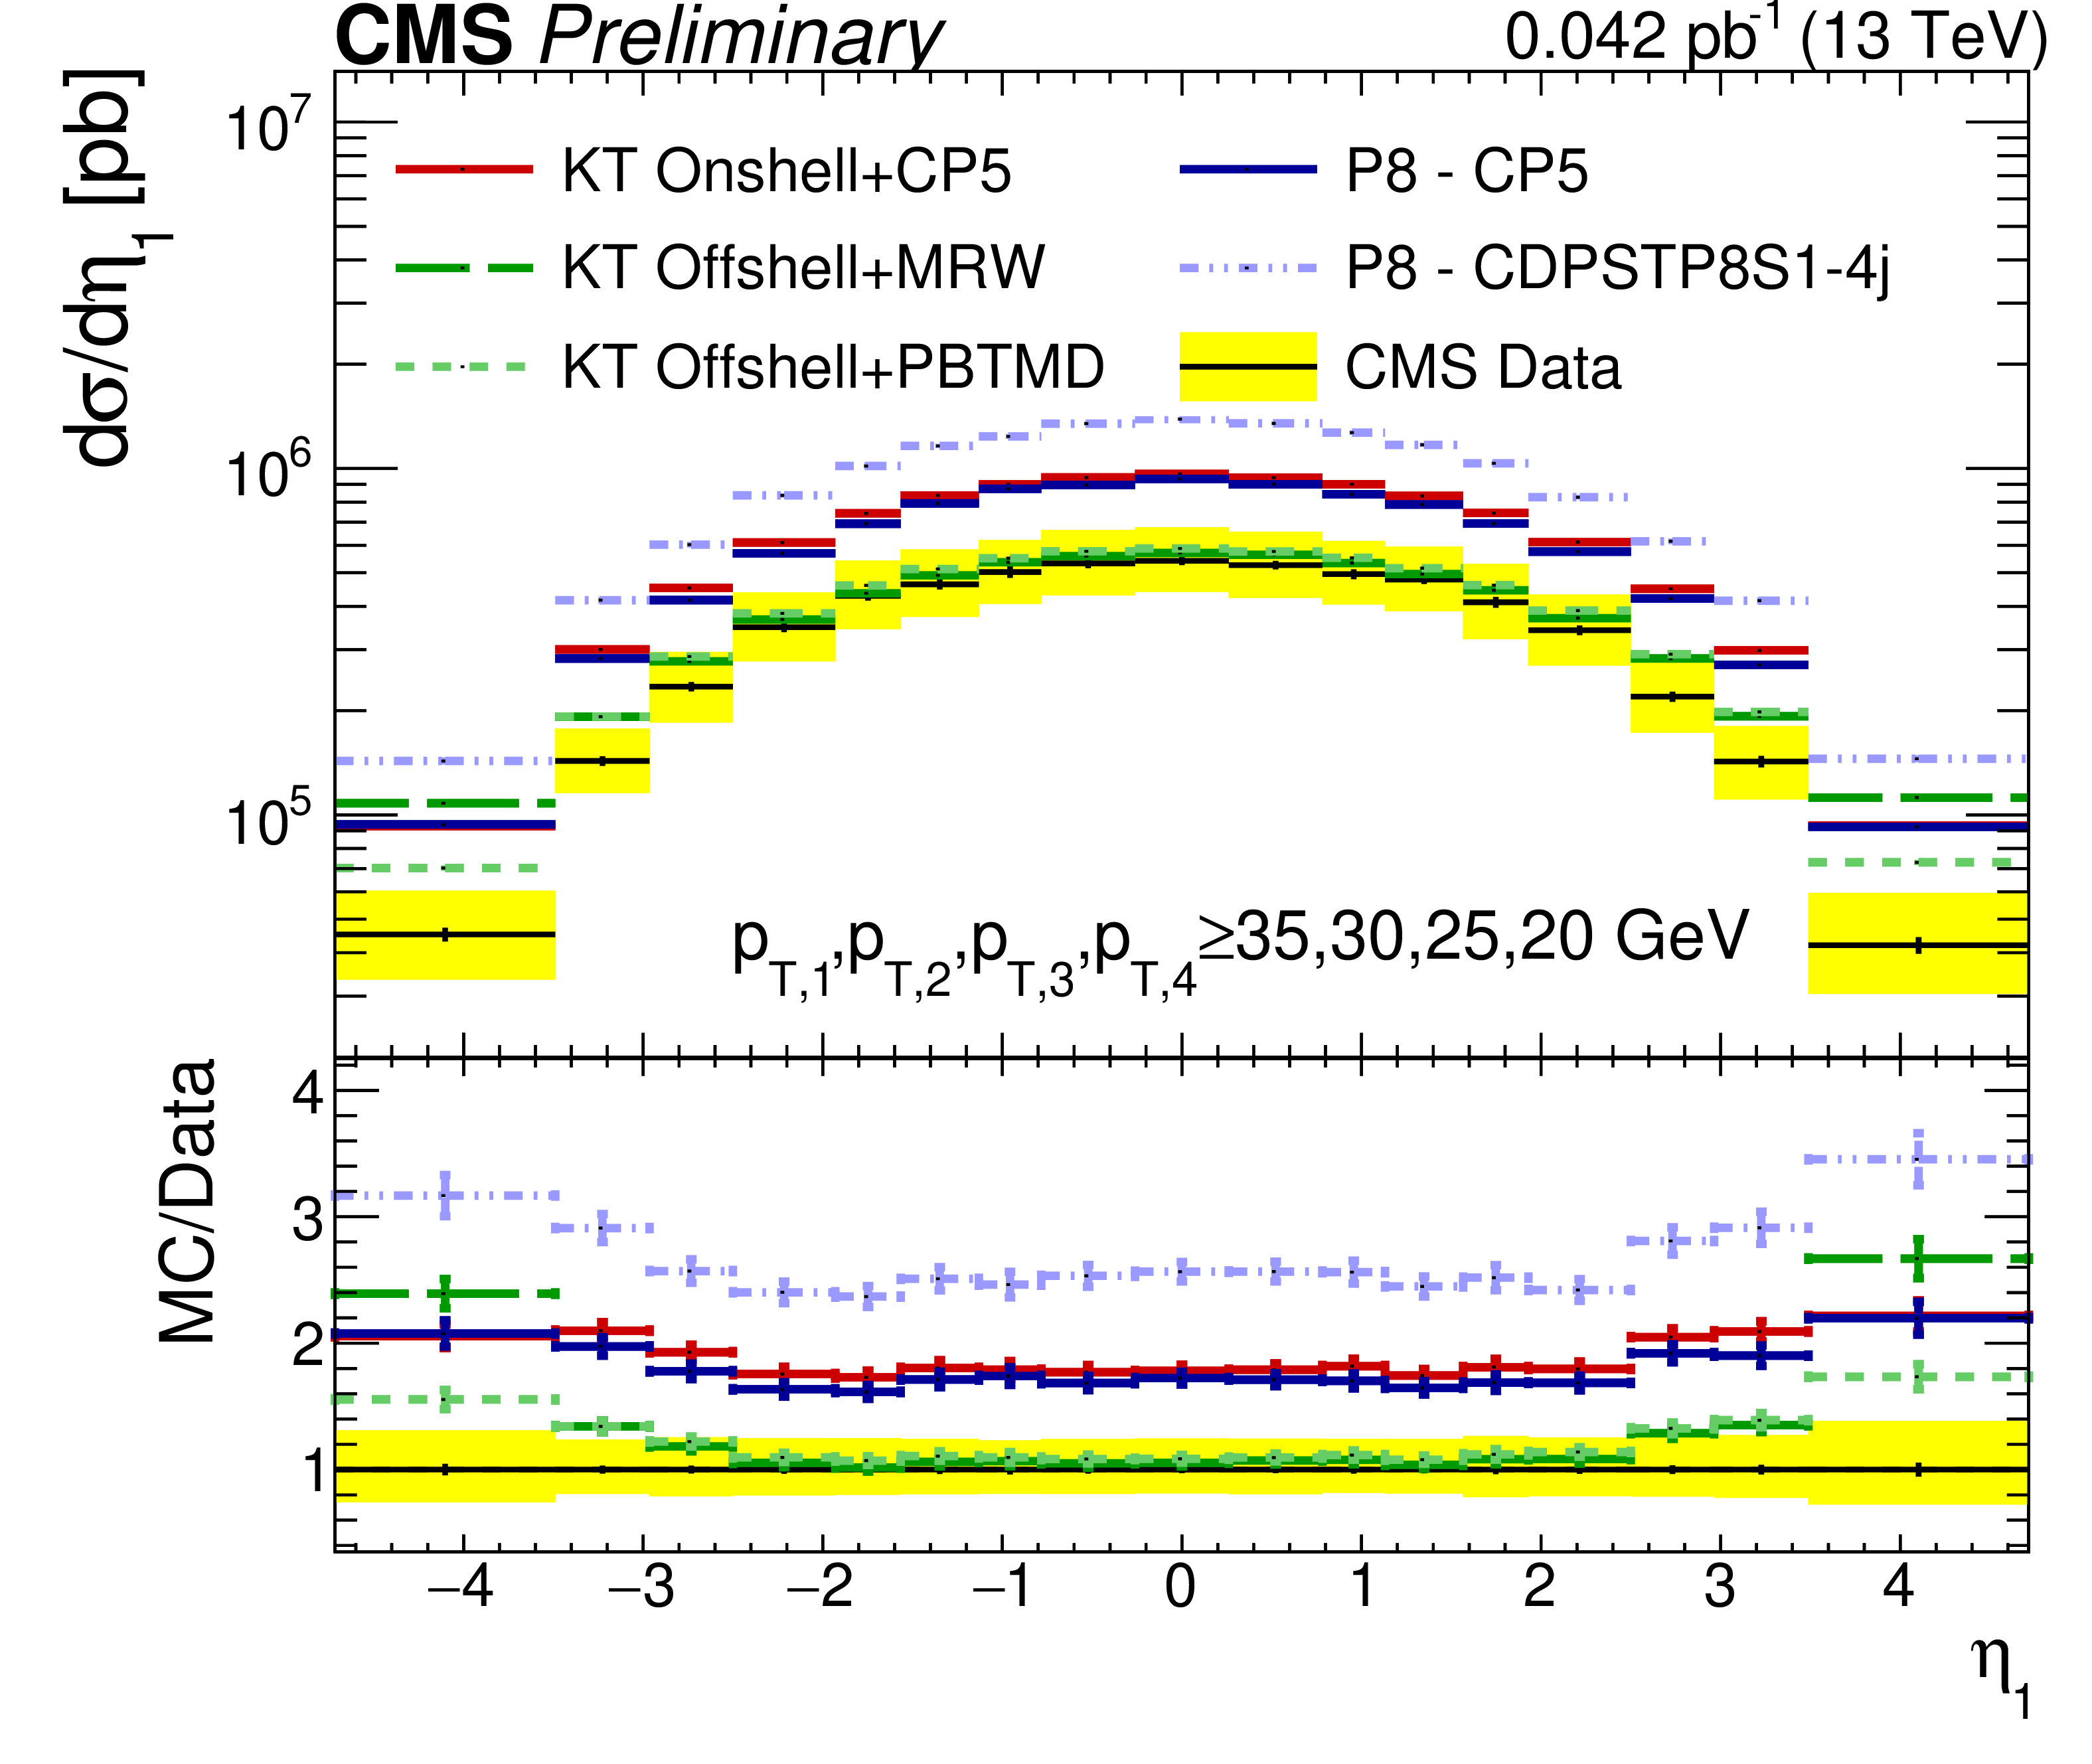
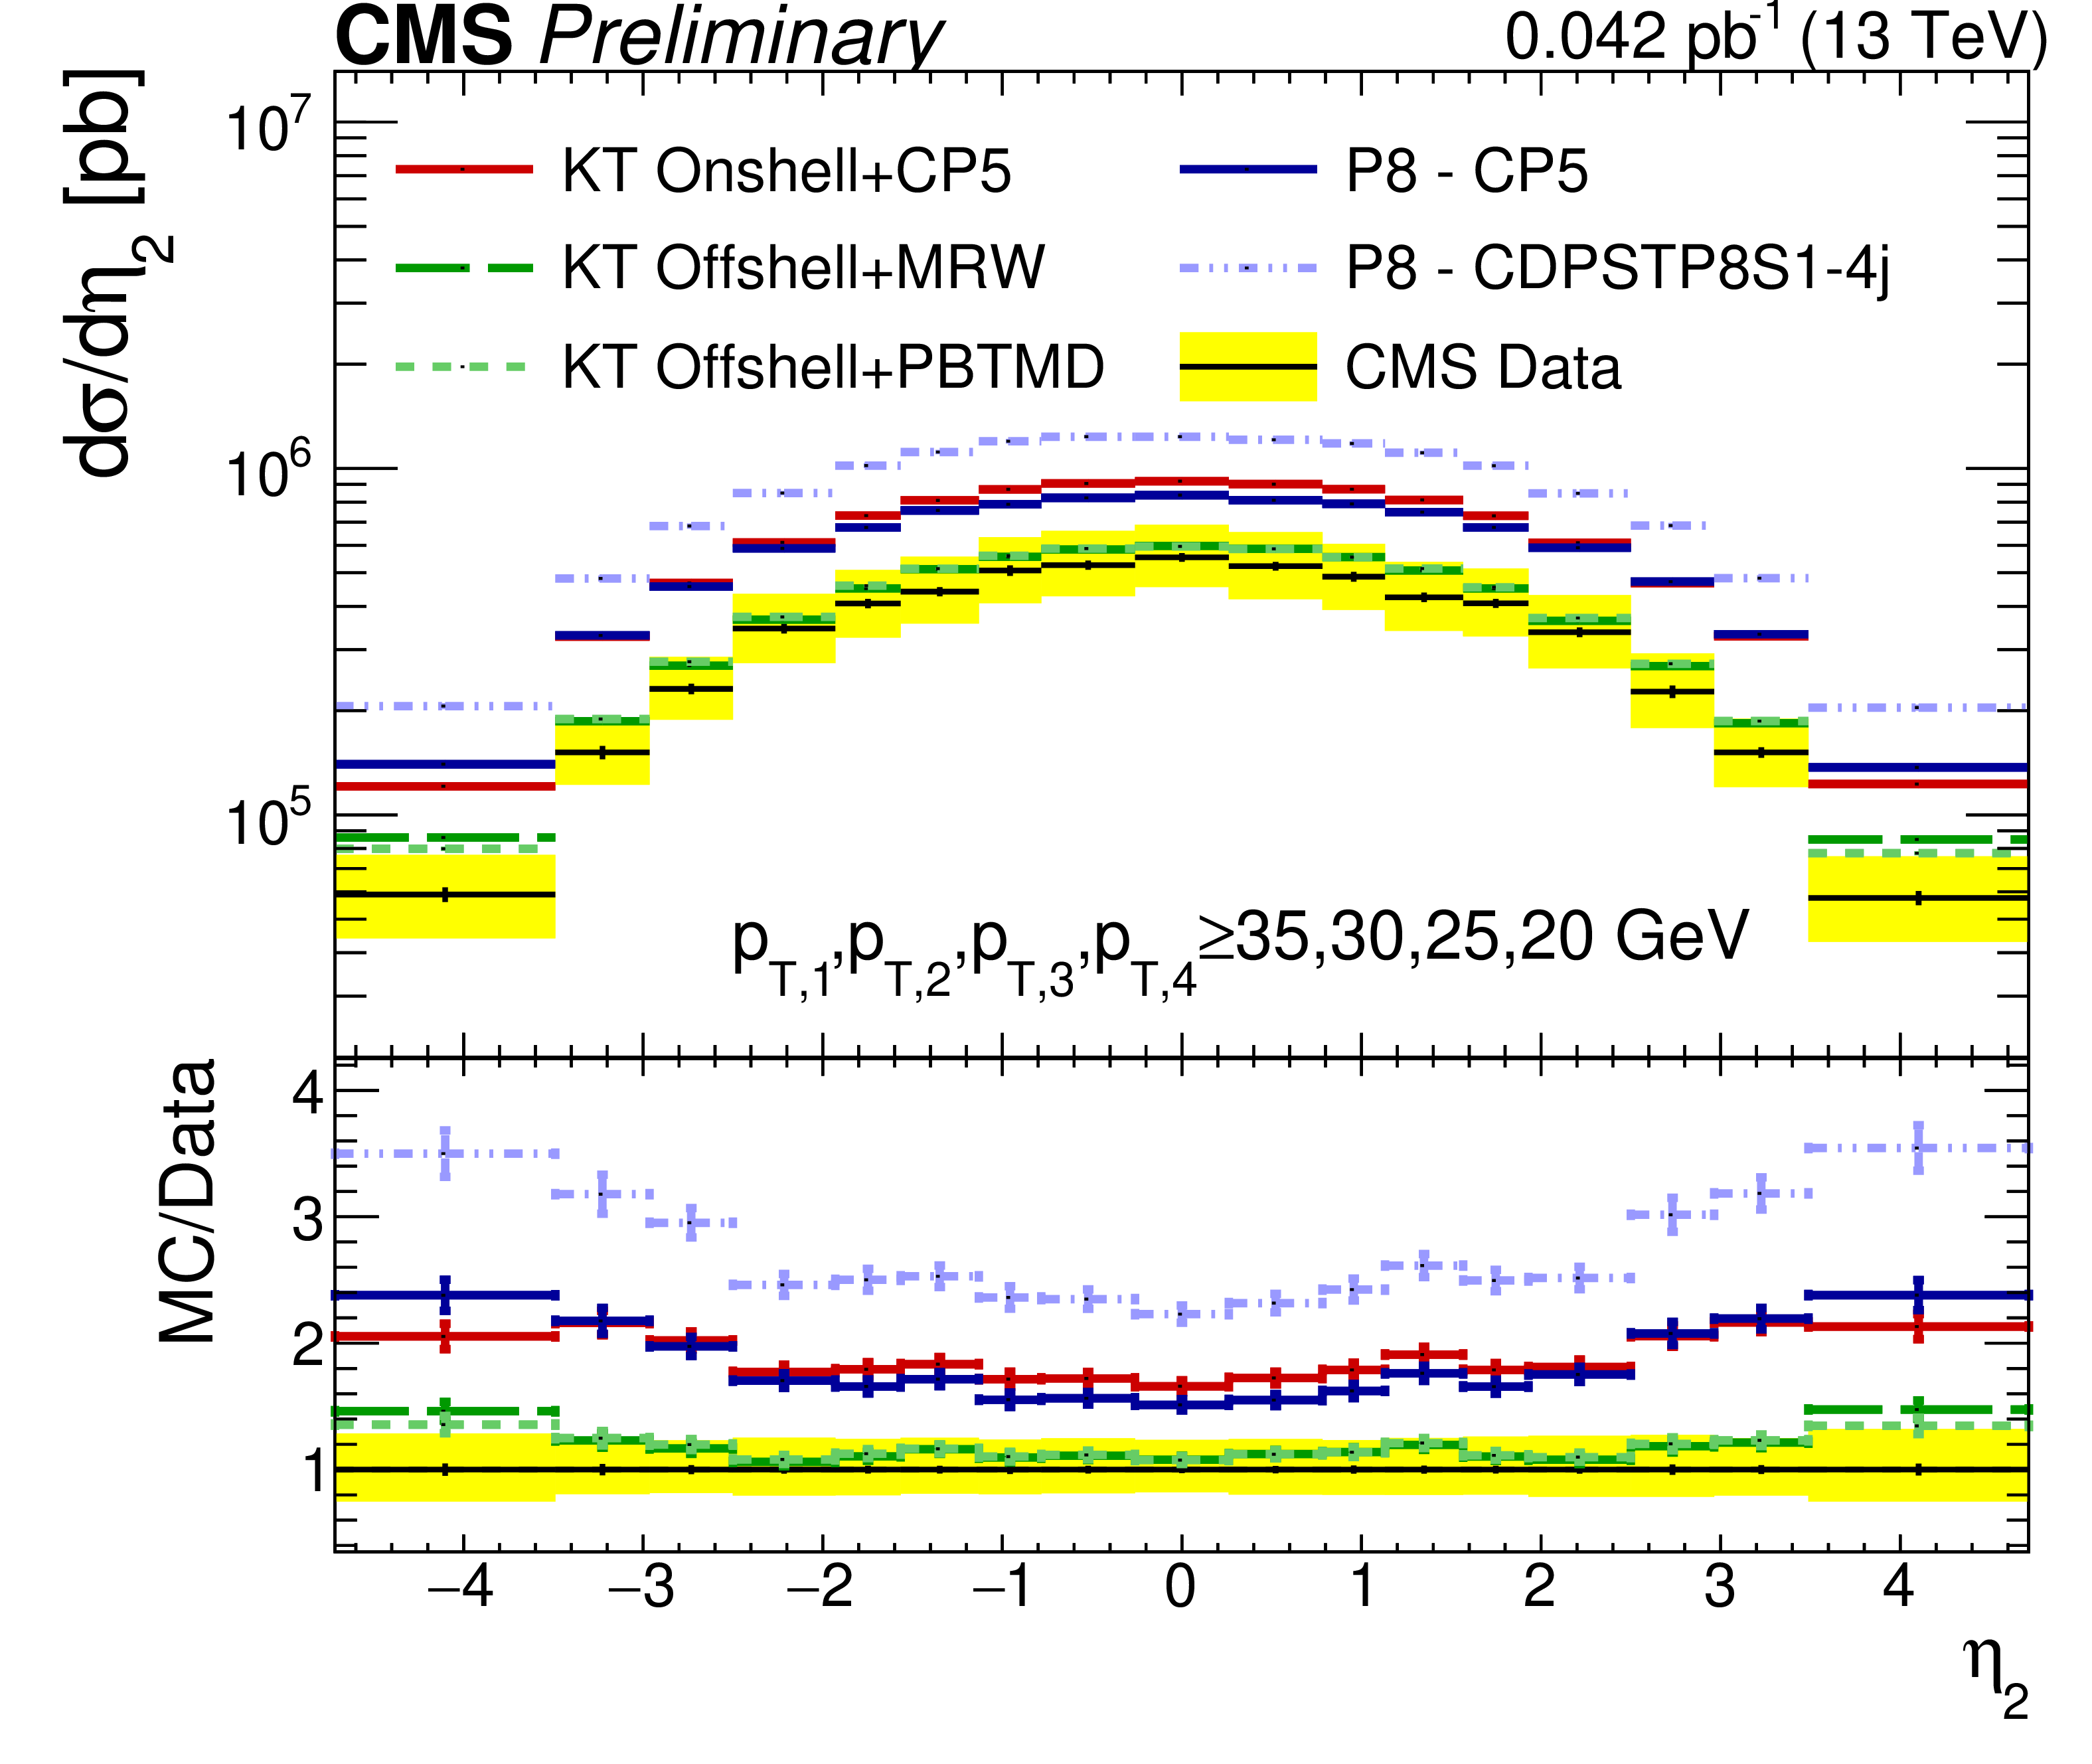
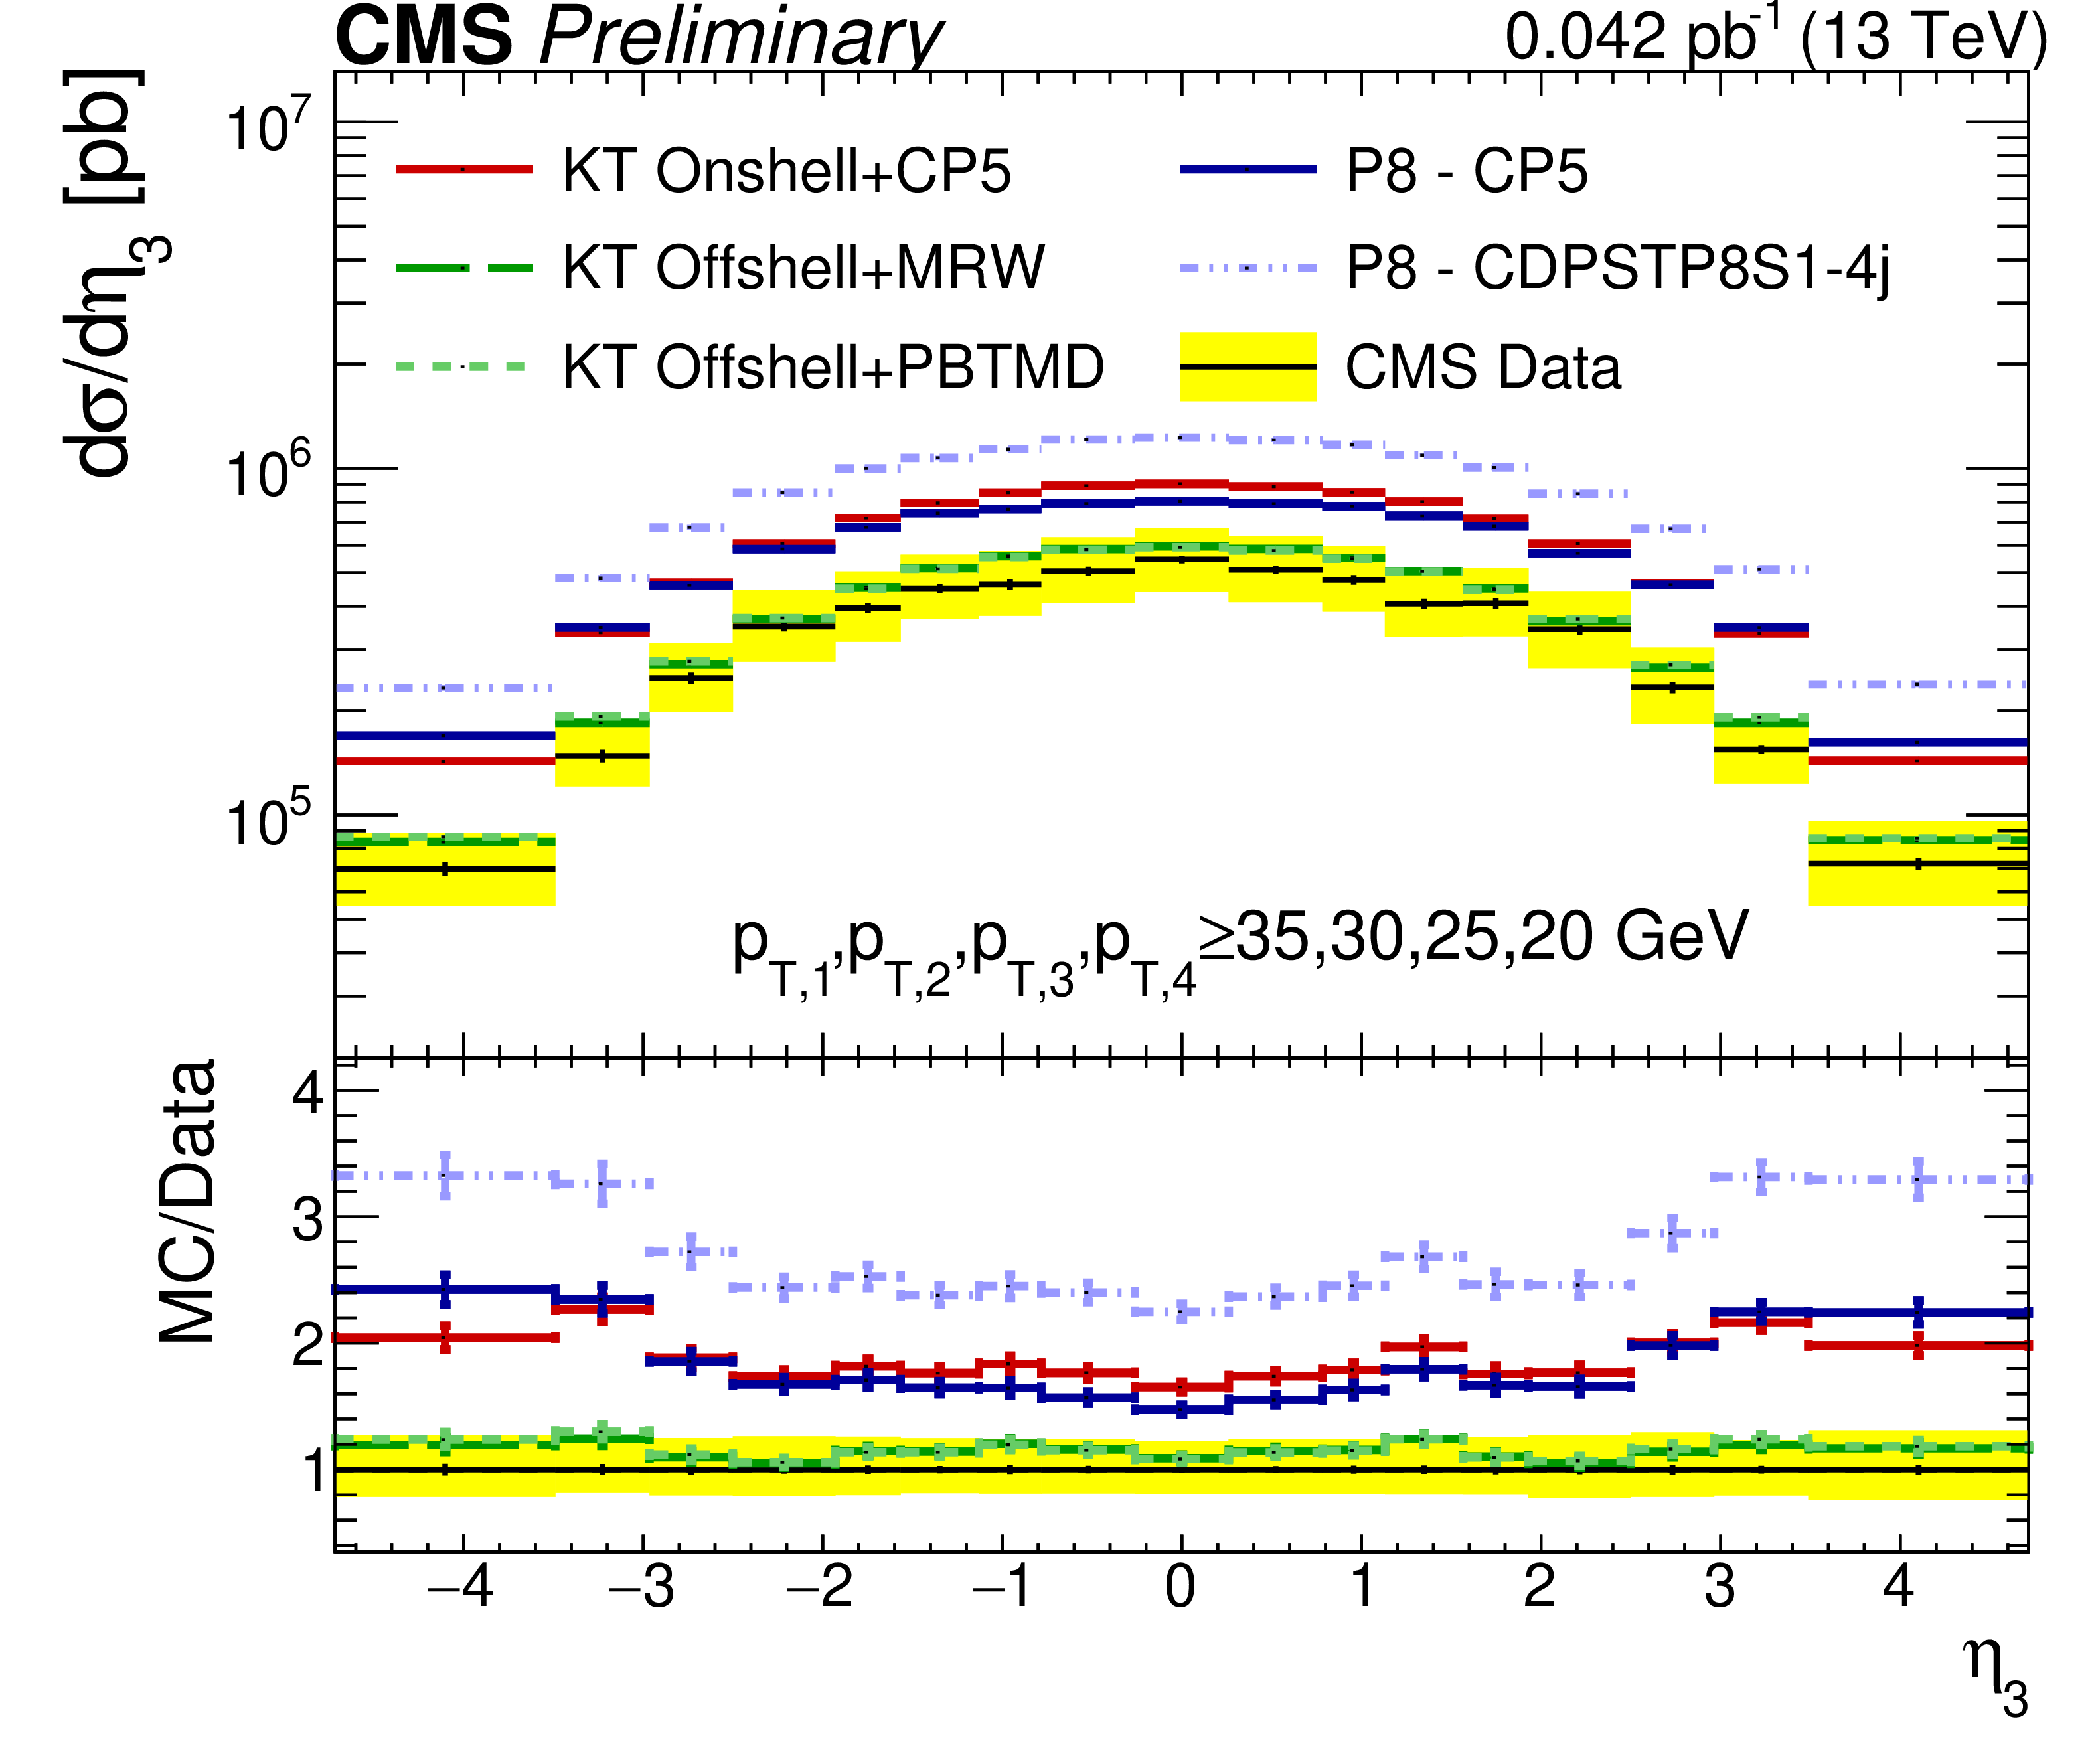
Figure 7:
Comparison of the unfolded $\eta $ spectra of data with different KATIE (KT), MadGraph 5 (MG5) and POWHEG (PW) models, for the leading (top left), subleading (top right), third leading (bottom left), and fourth leading (bottom right) jet. The error bars and bands are shown similarly to Fig. 2. |
png pdf |
Figure 7-a:
Comparison of the unfolded $\eta $ spectra of data with different KATIE (KT), MadGraph 5 (MG5) and POWHEG (PW) models, for the leading (top left), subleading (top right), third leading (bottom left), and fourth leading (bottom right) jet. The error bars and bands are shown similarly to Fig. 2. |
png pdf |
Figure 7-b:
Comparison of the unfolded $\eta $ spectra of data with different KATIE (KT), MadGraph 5 (MG5) and POWHEG (PW) models, for the leading (top left), subleading (top right), third leading (bottom left), and fourth leading (bottom right) jet. The error bars and bands are shown similarly to Fig. 2. |
png pdf |
Figure 7-c:
Comparison of the unfolded $\eta $ spectra of data with different KATIE (KT), MadGraph 5 (MG5) and POWHEG (PW) models, for the leading (top left), subleading (top right), third leading (bottom left), and fourth leading (bottom right) jet. The error bars and bands are shown similarly to Fig. 2. |
png pdf |
Figure 7-d:
Comparison of the unfolded $\eta $ spectra of data with different KATIE (KT), MadGraph 5 (MG5) and POWHEG (PW) models, for the leading (top left), subleading (top right), third leading (bottom left), and fourth leading (bottom right) jet. The error bars and bands are shown similarly to Fig. 2. |
png pdf |
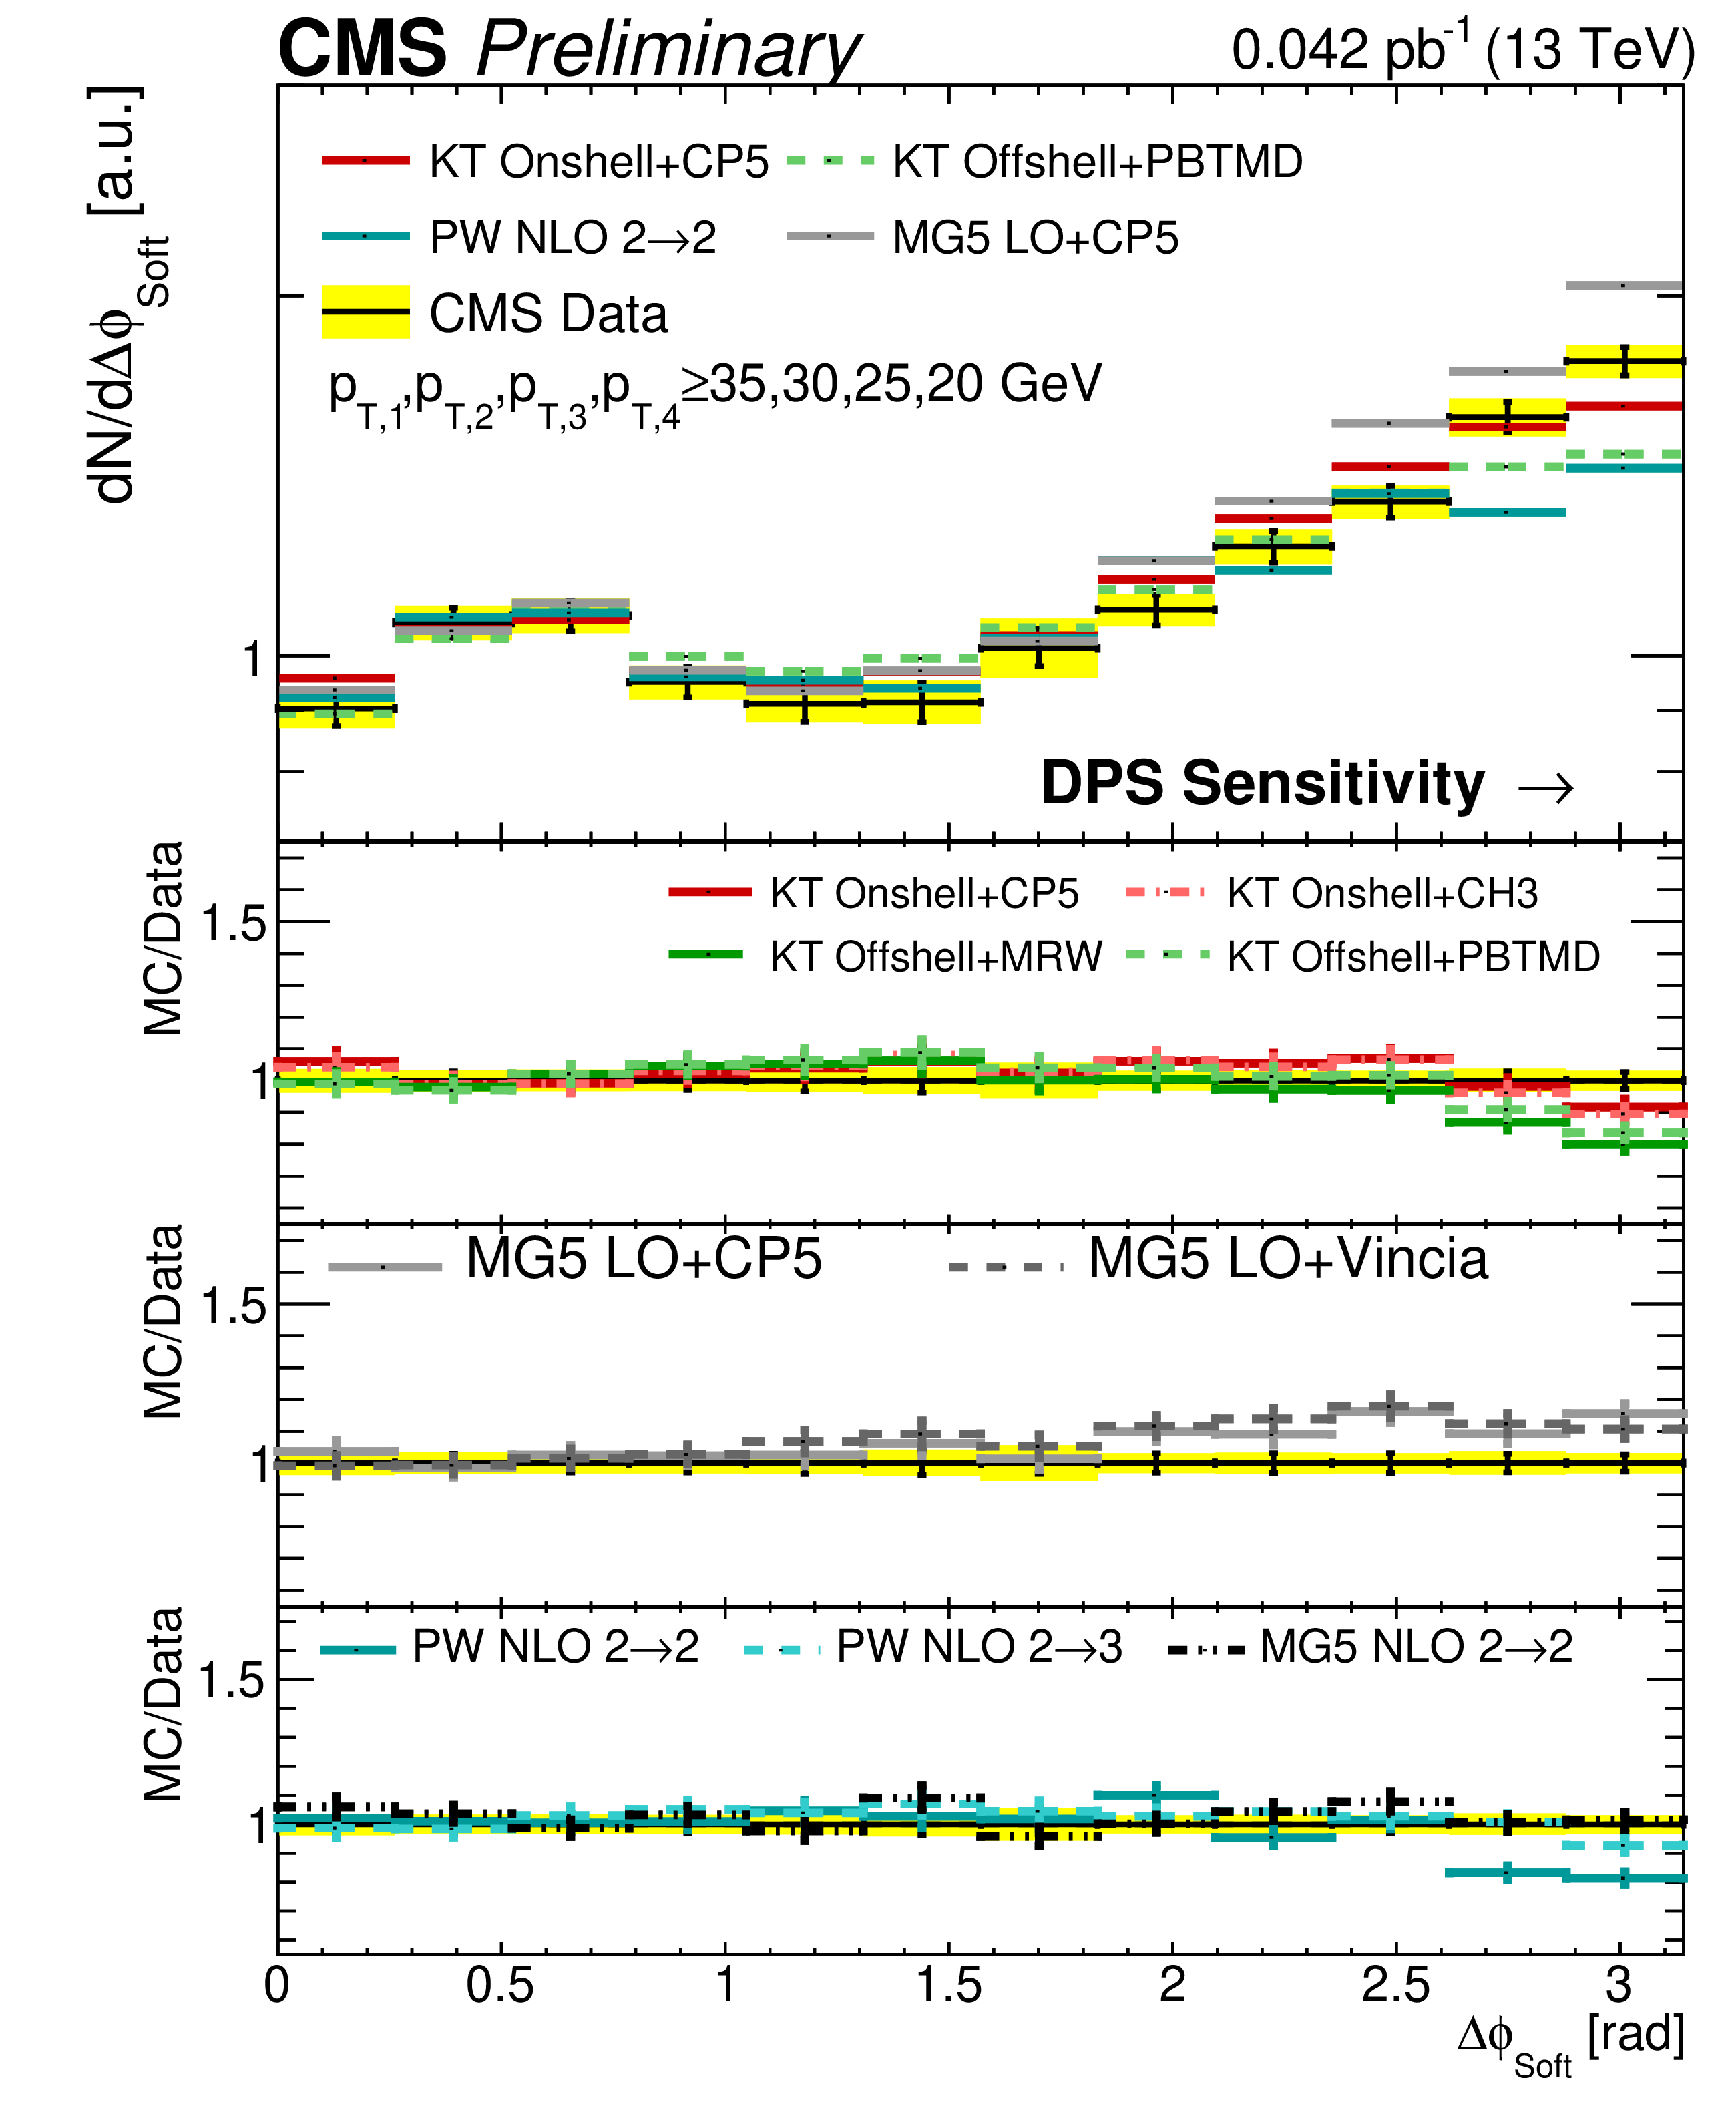
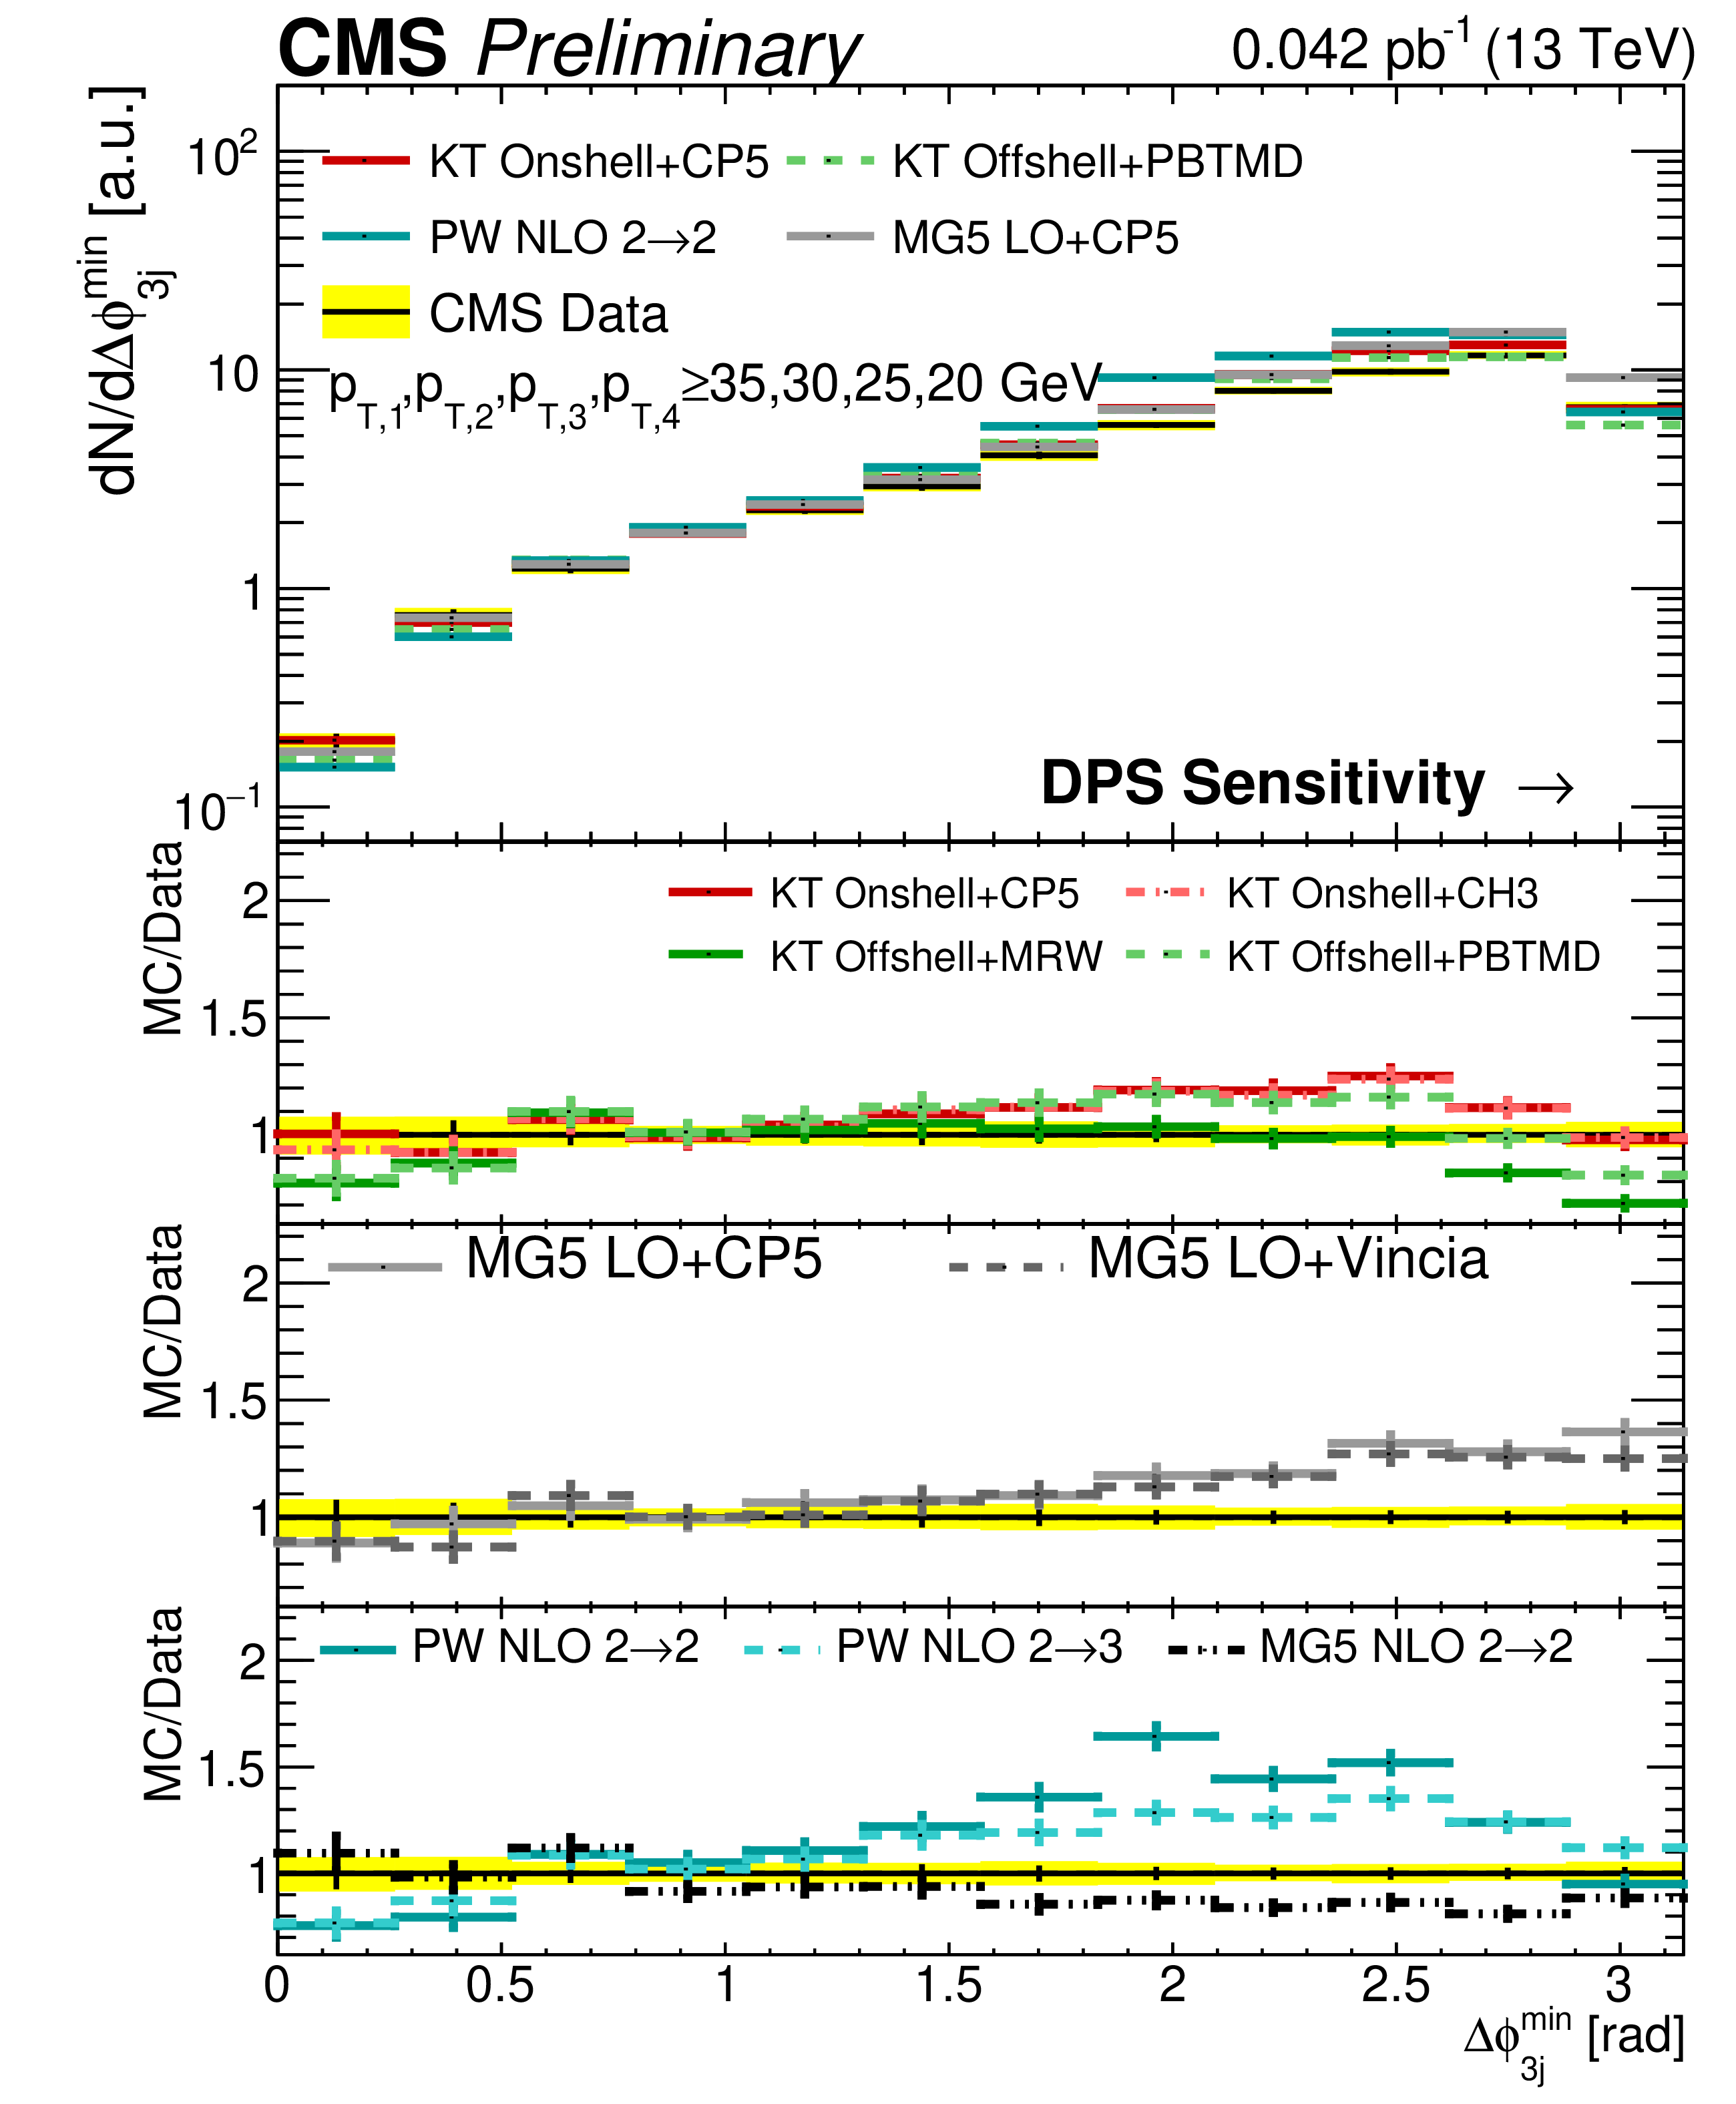
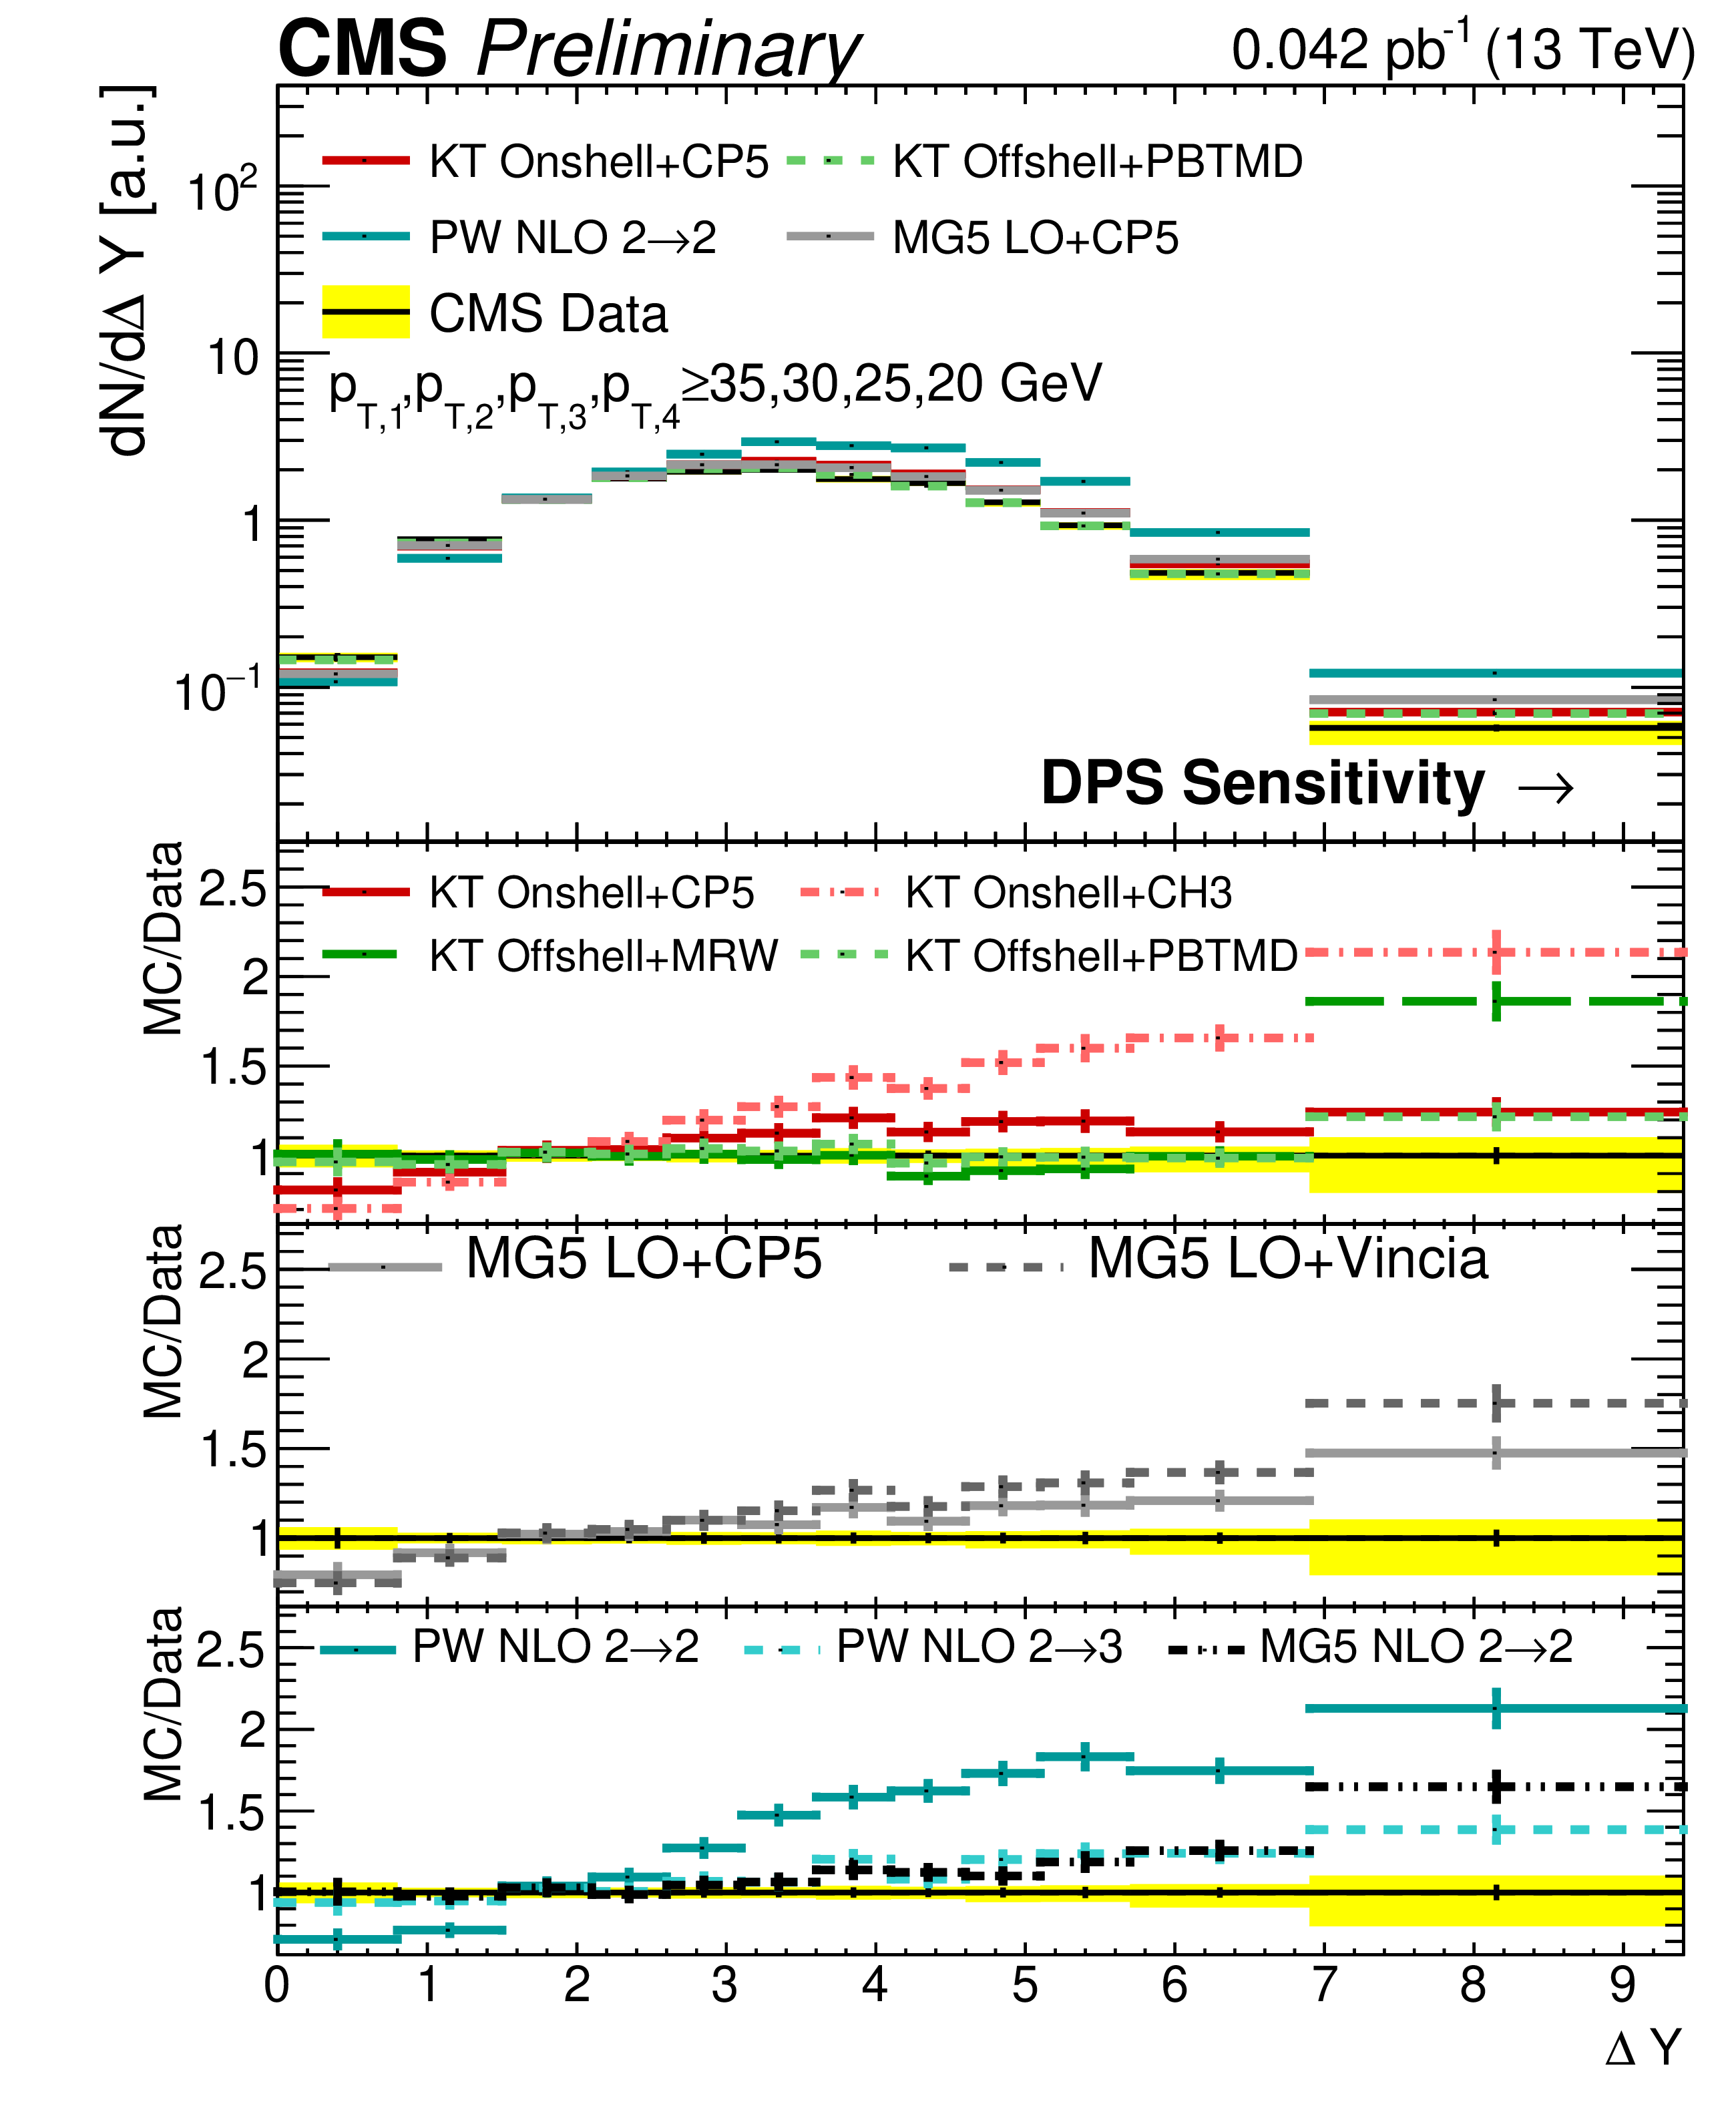
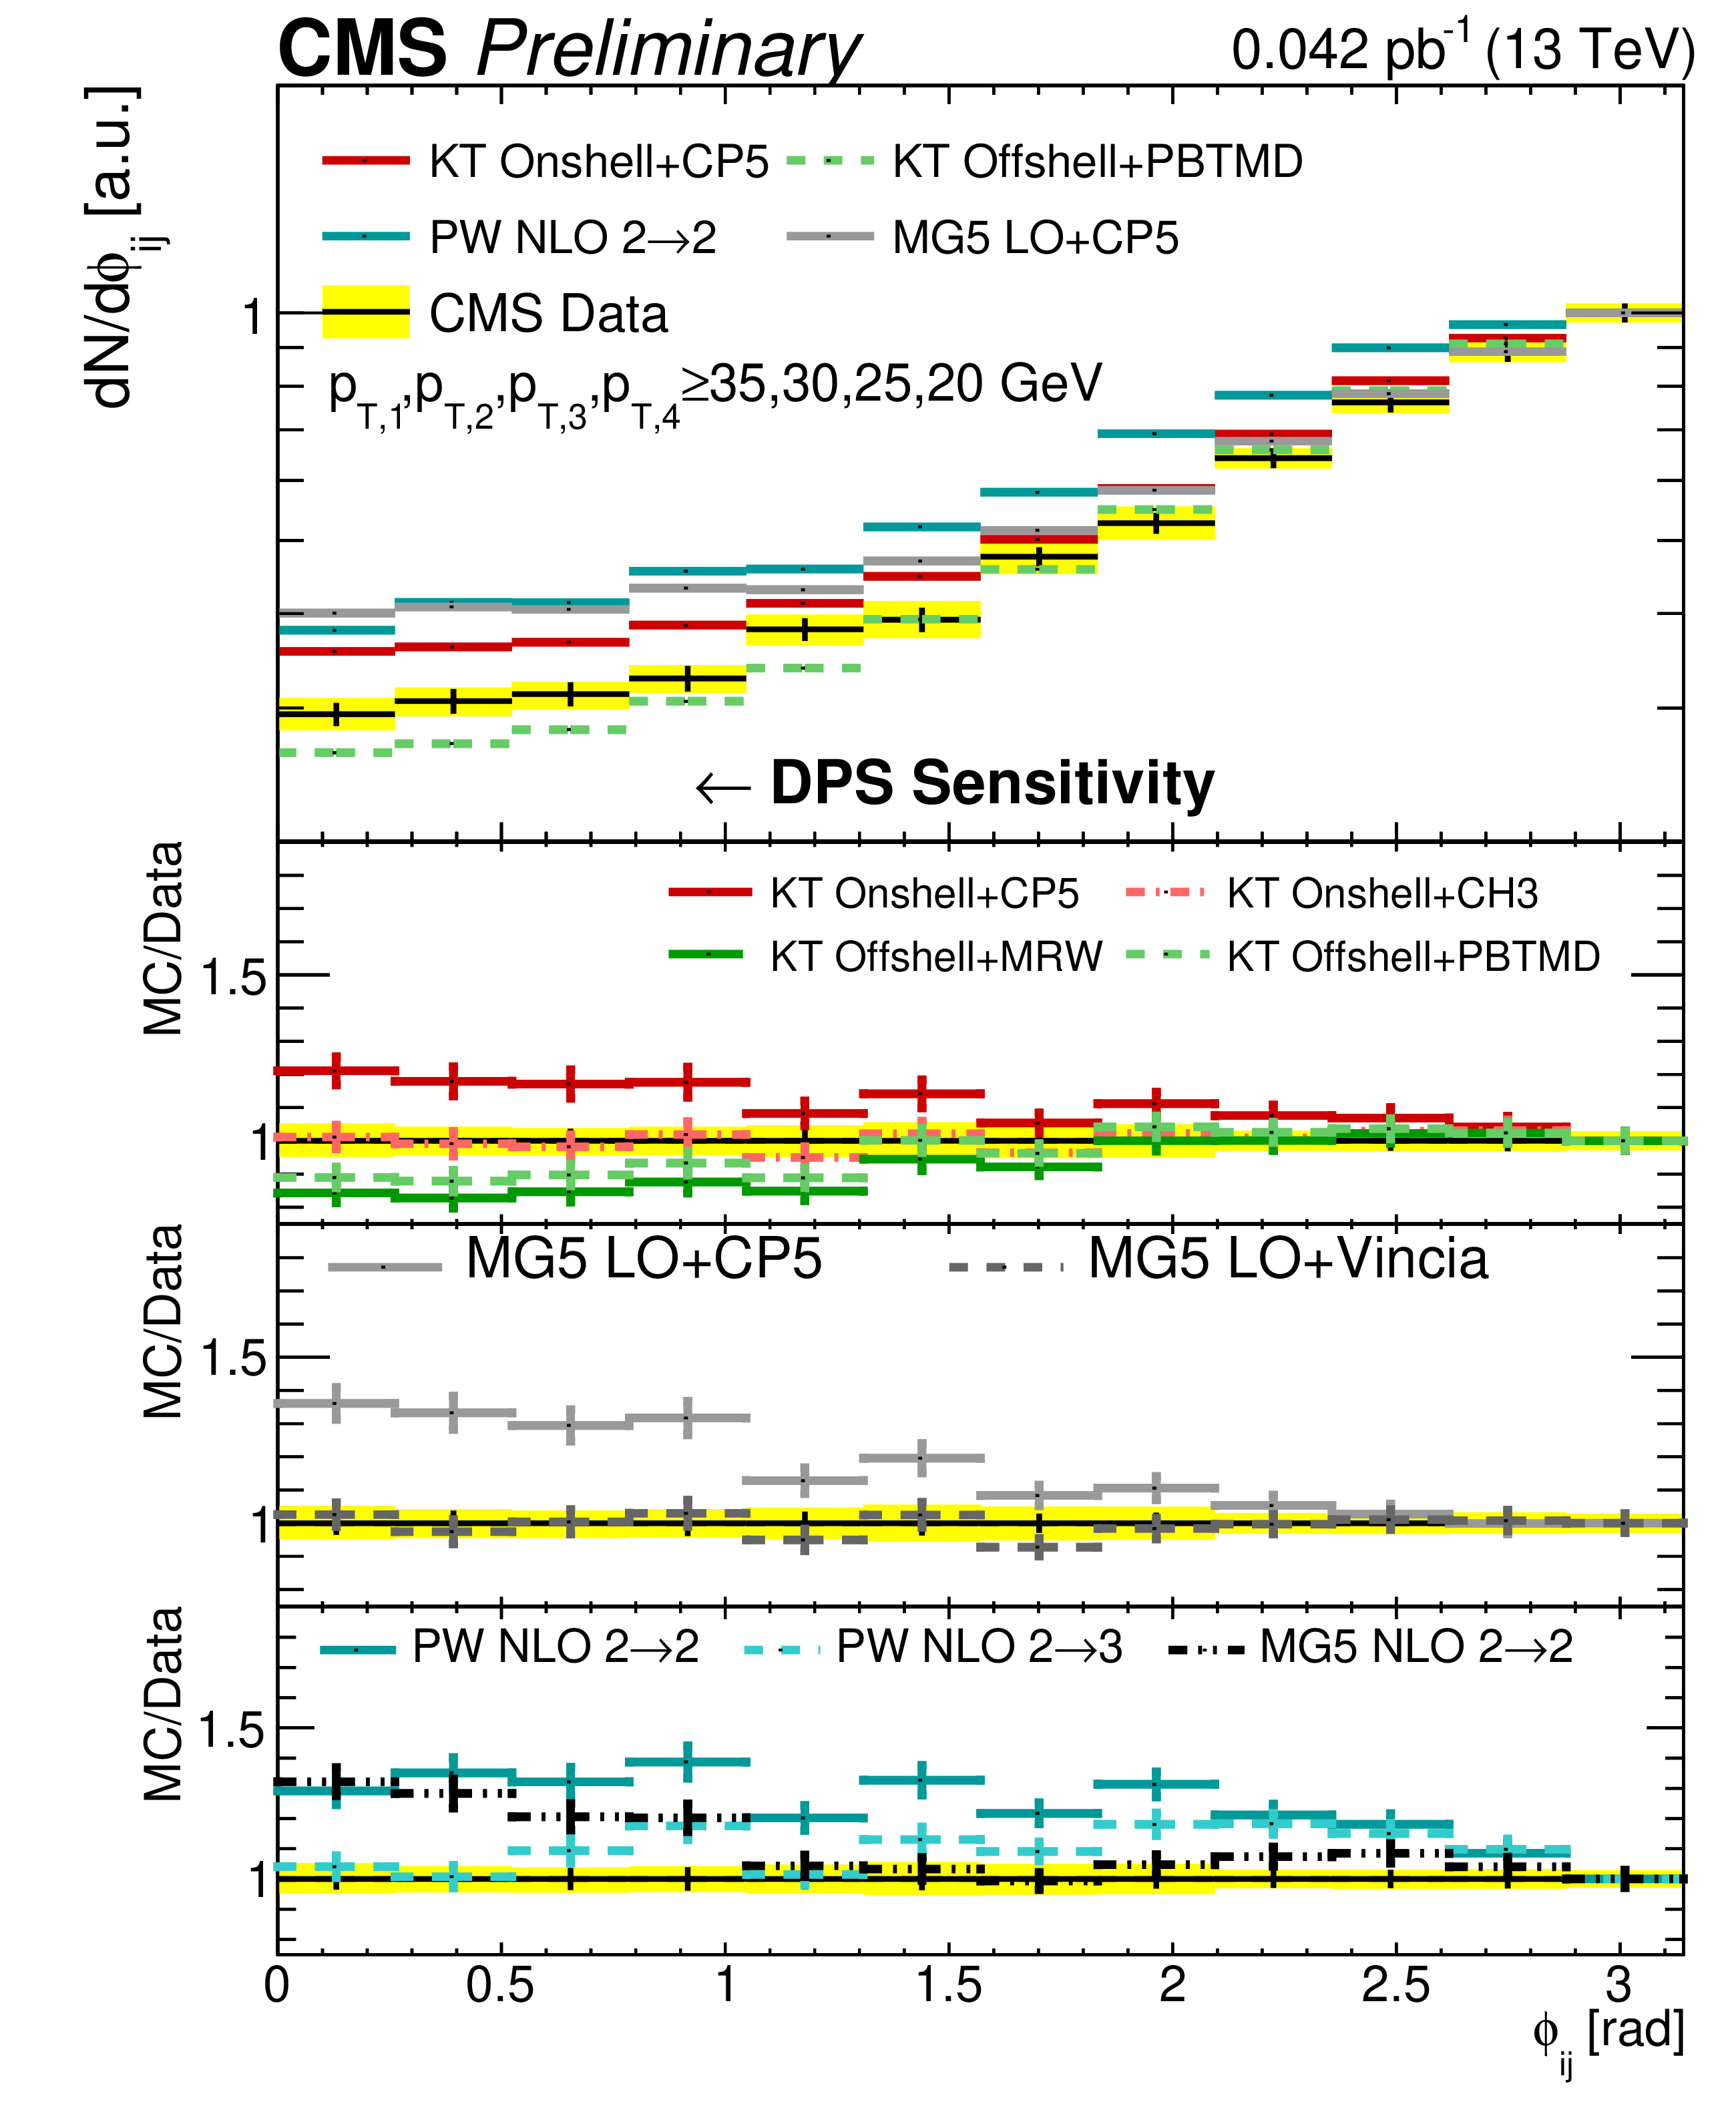
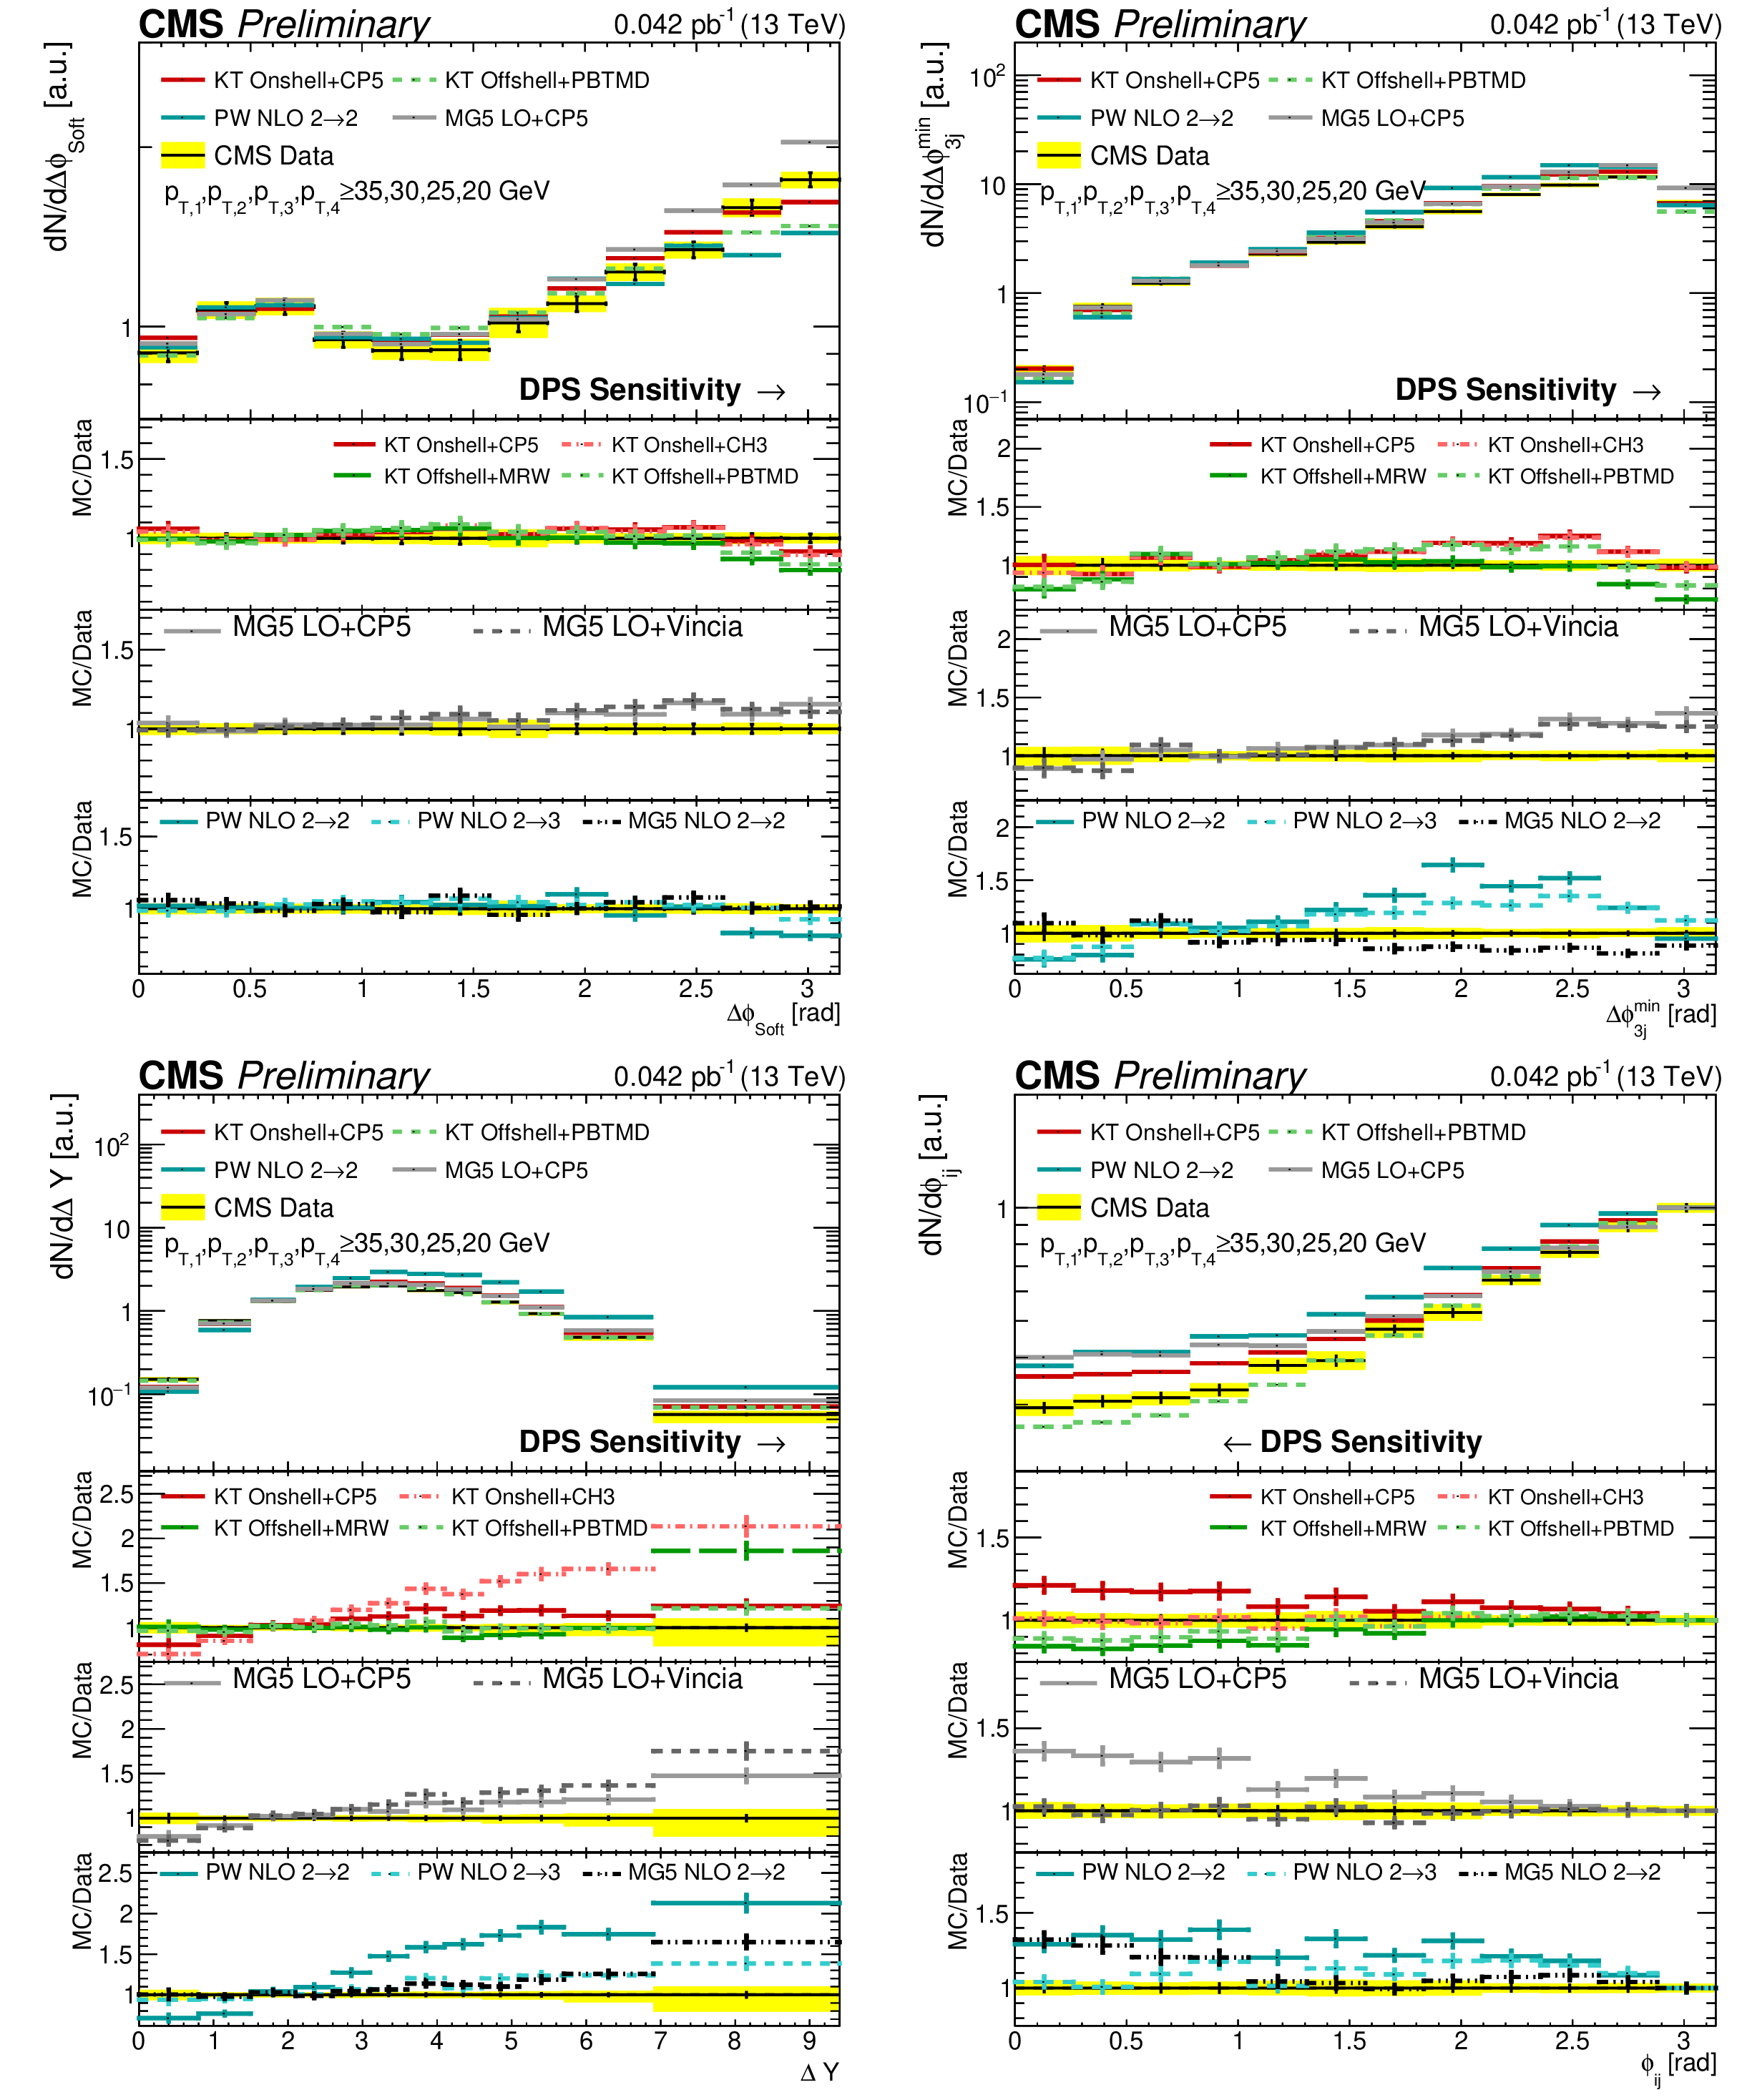
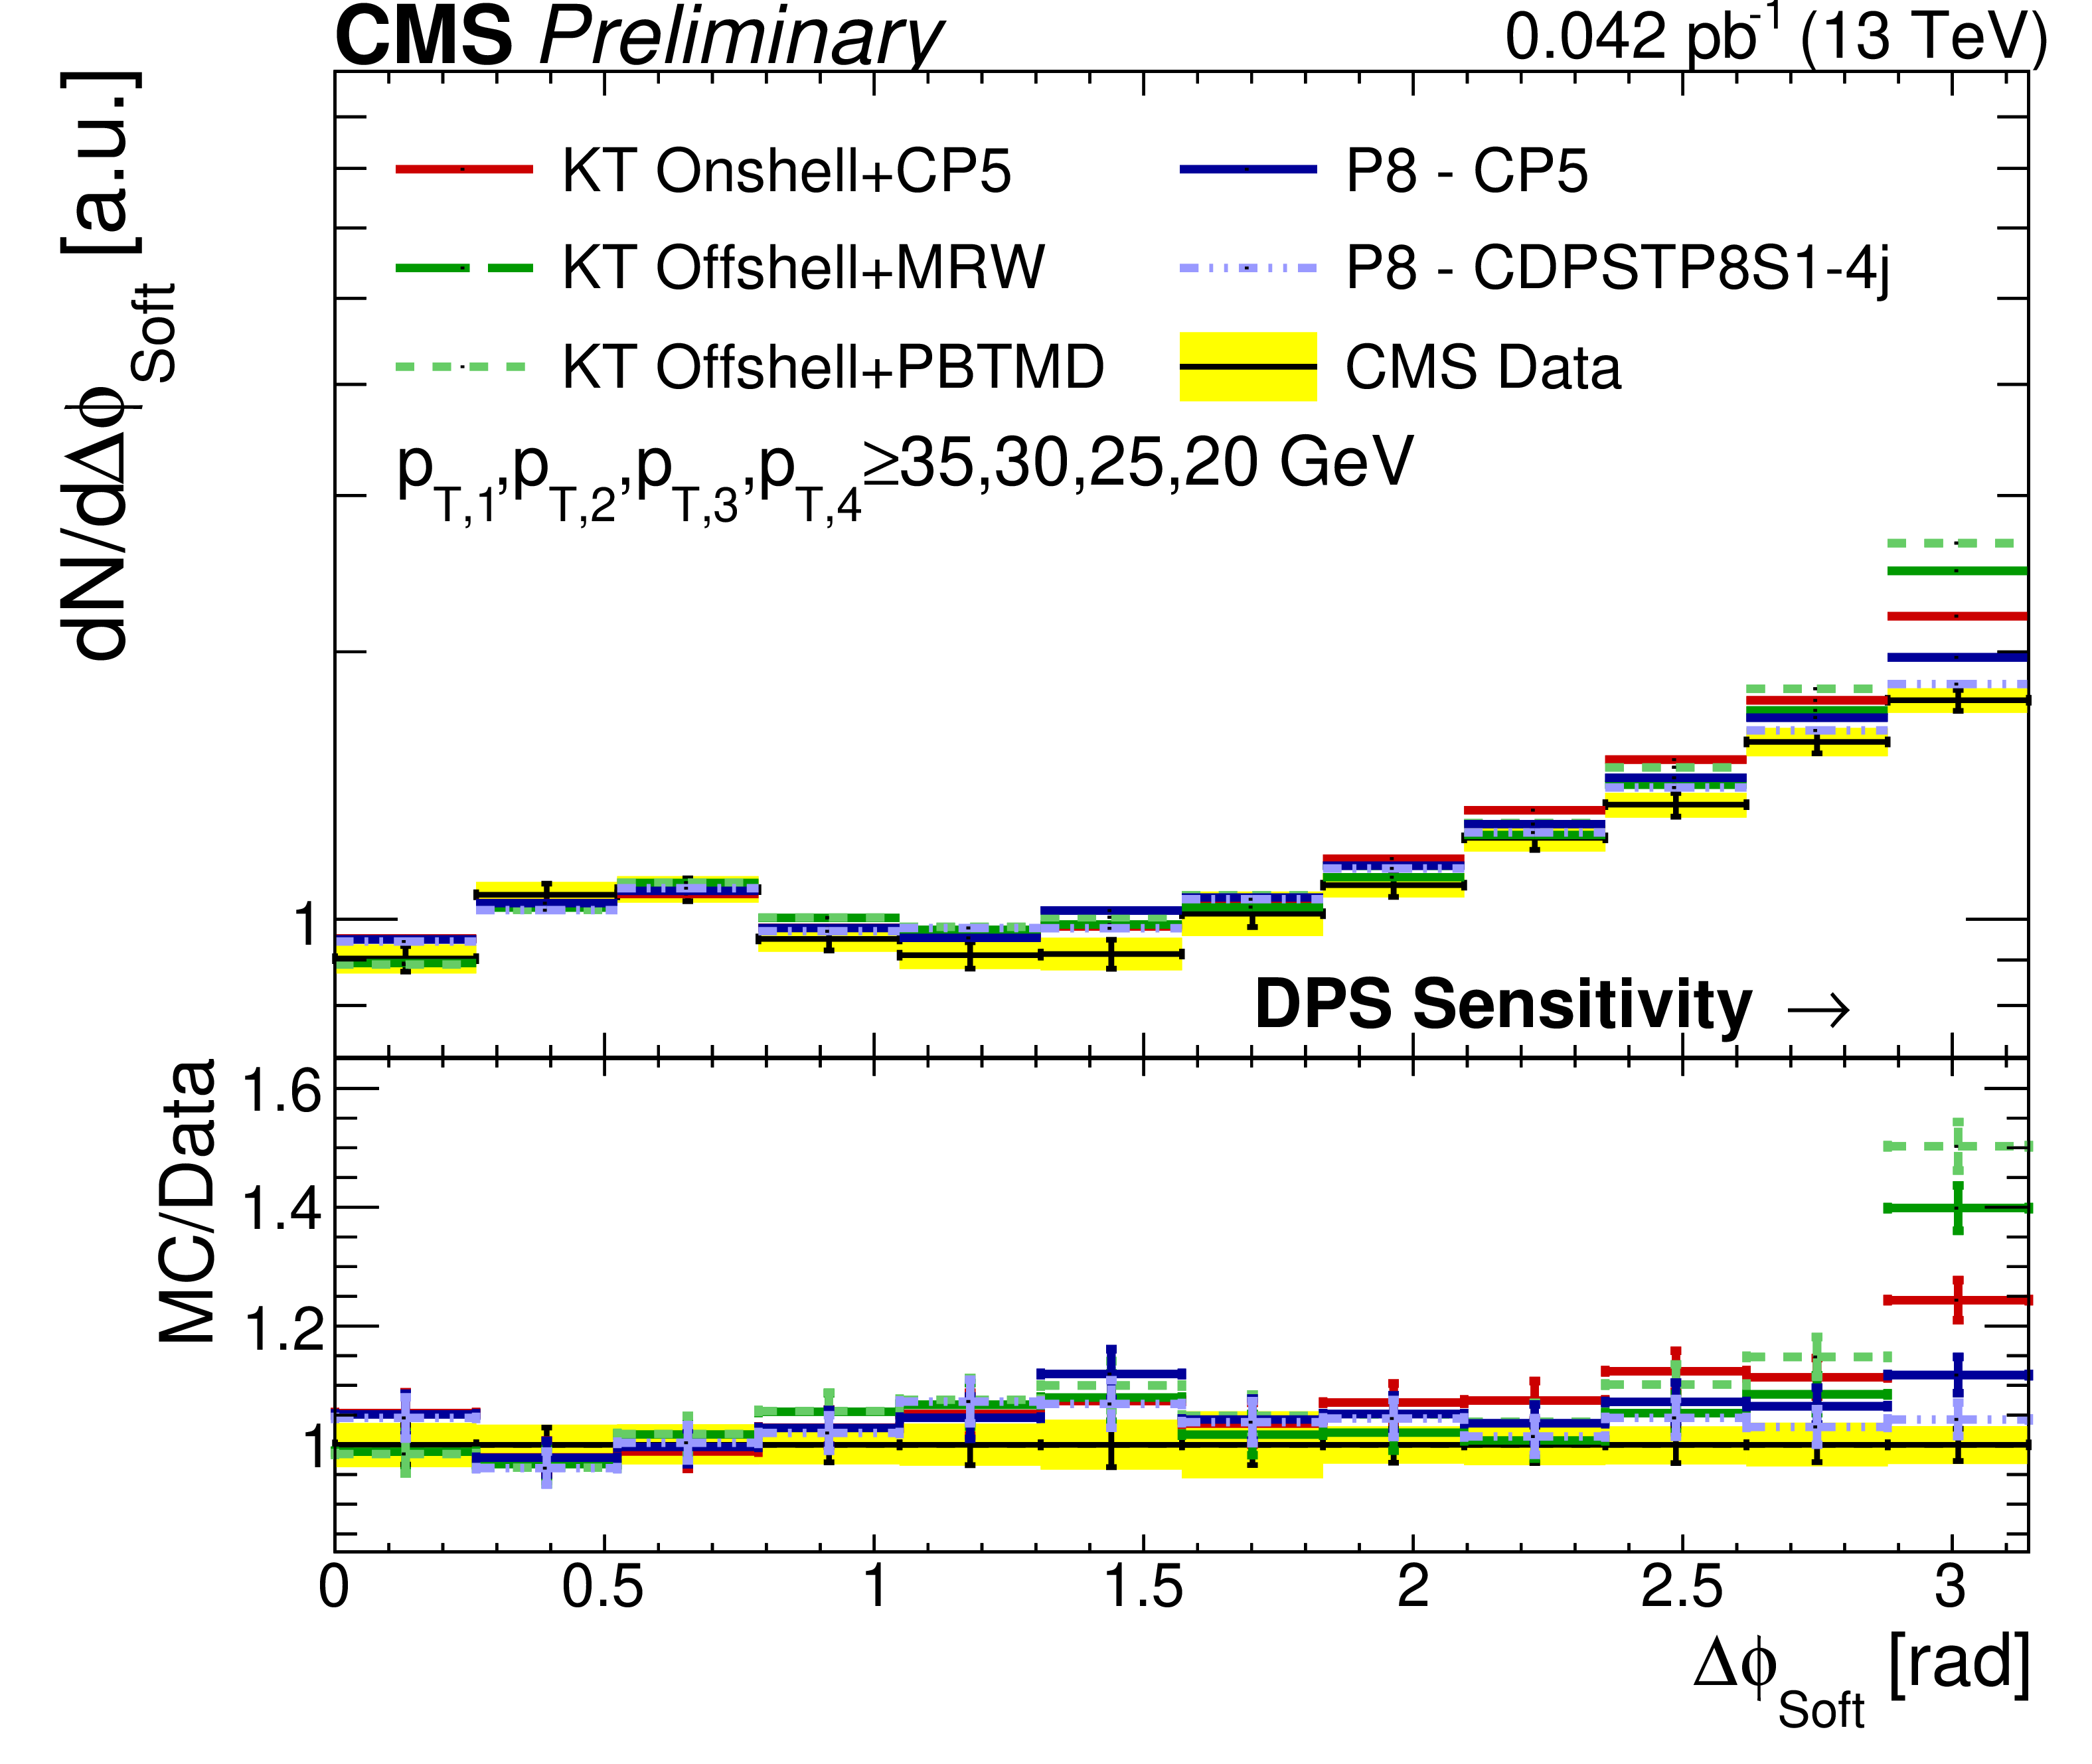
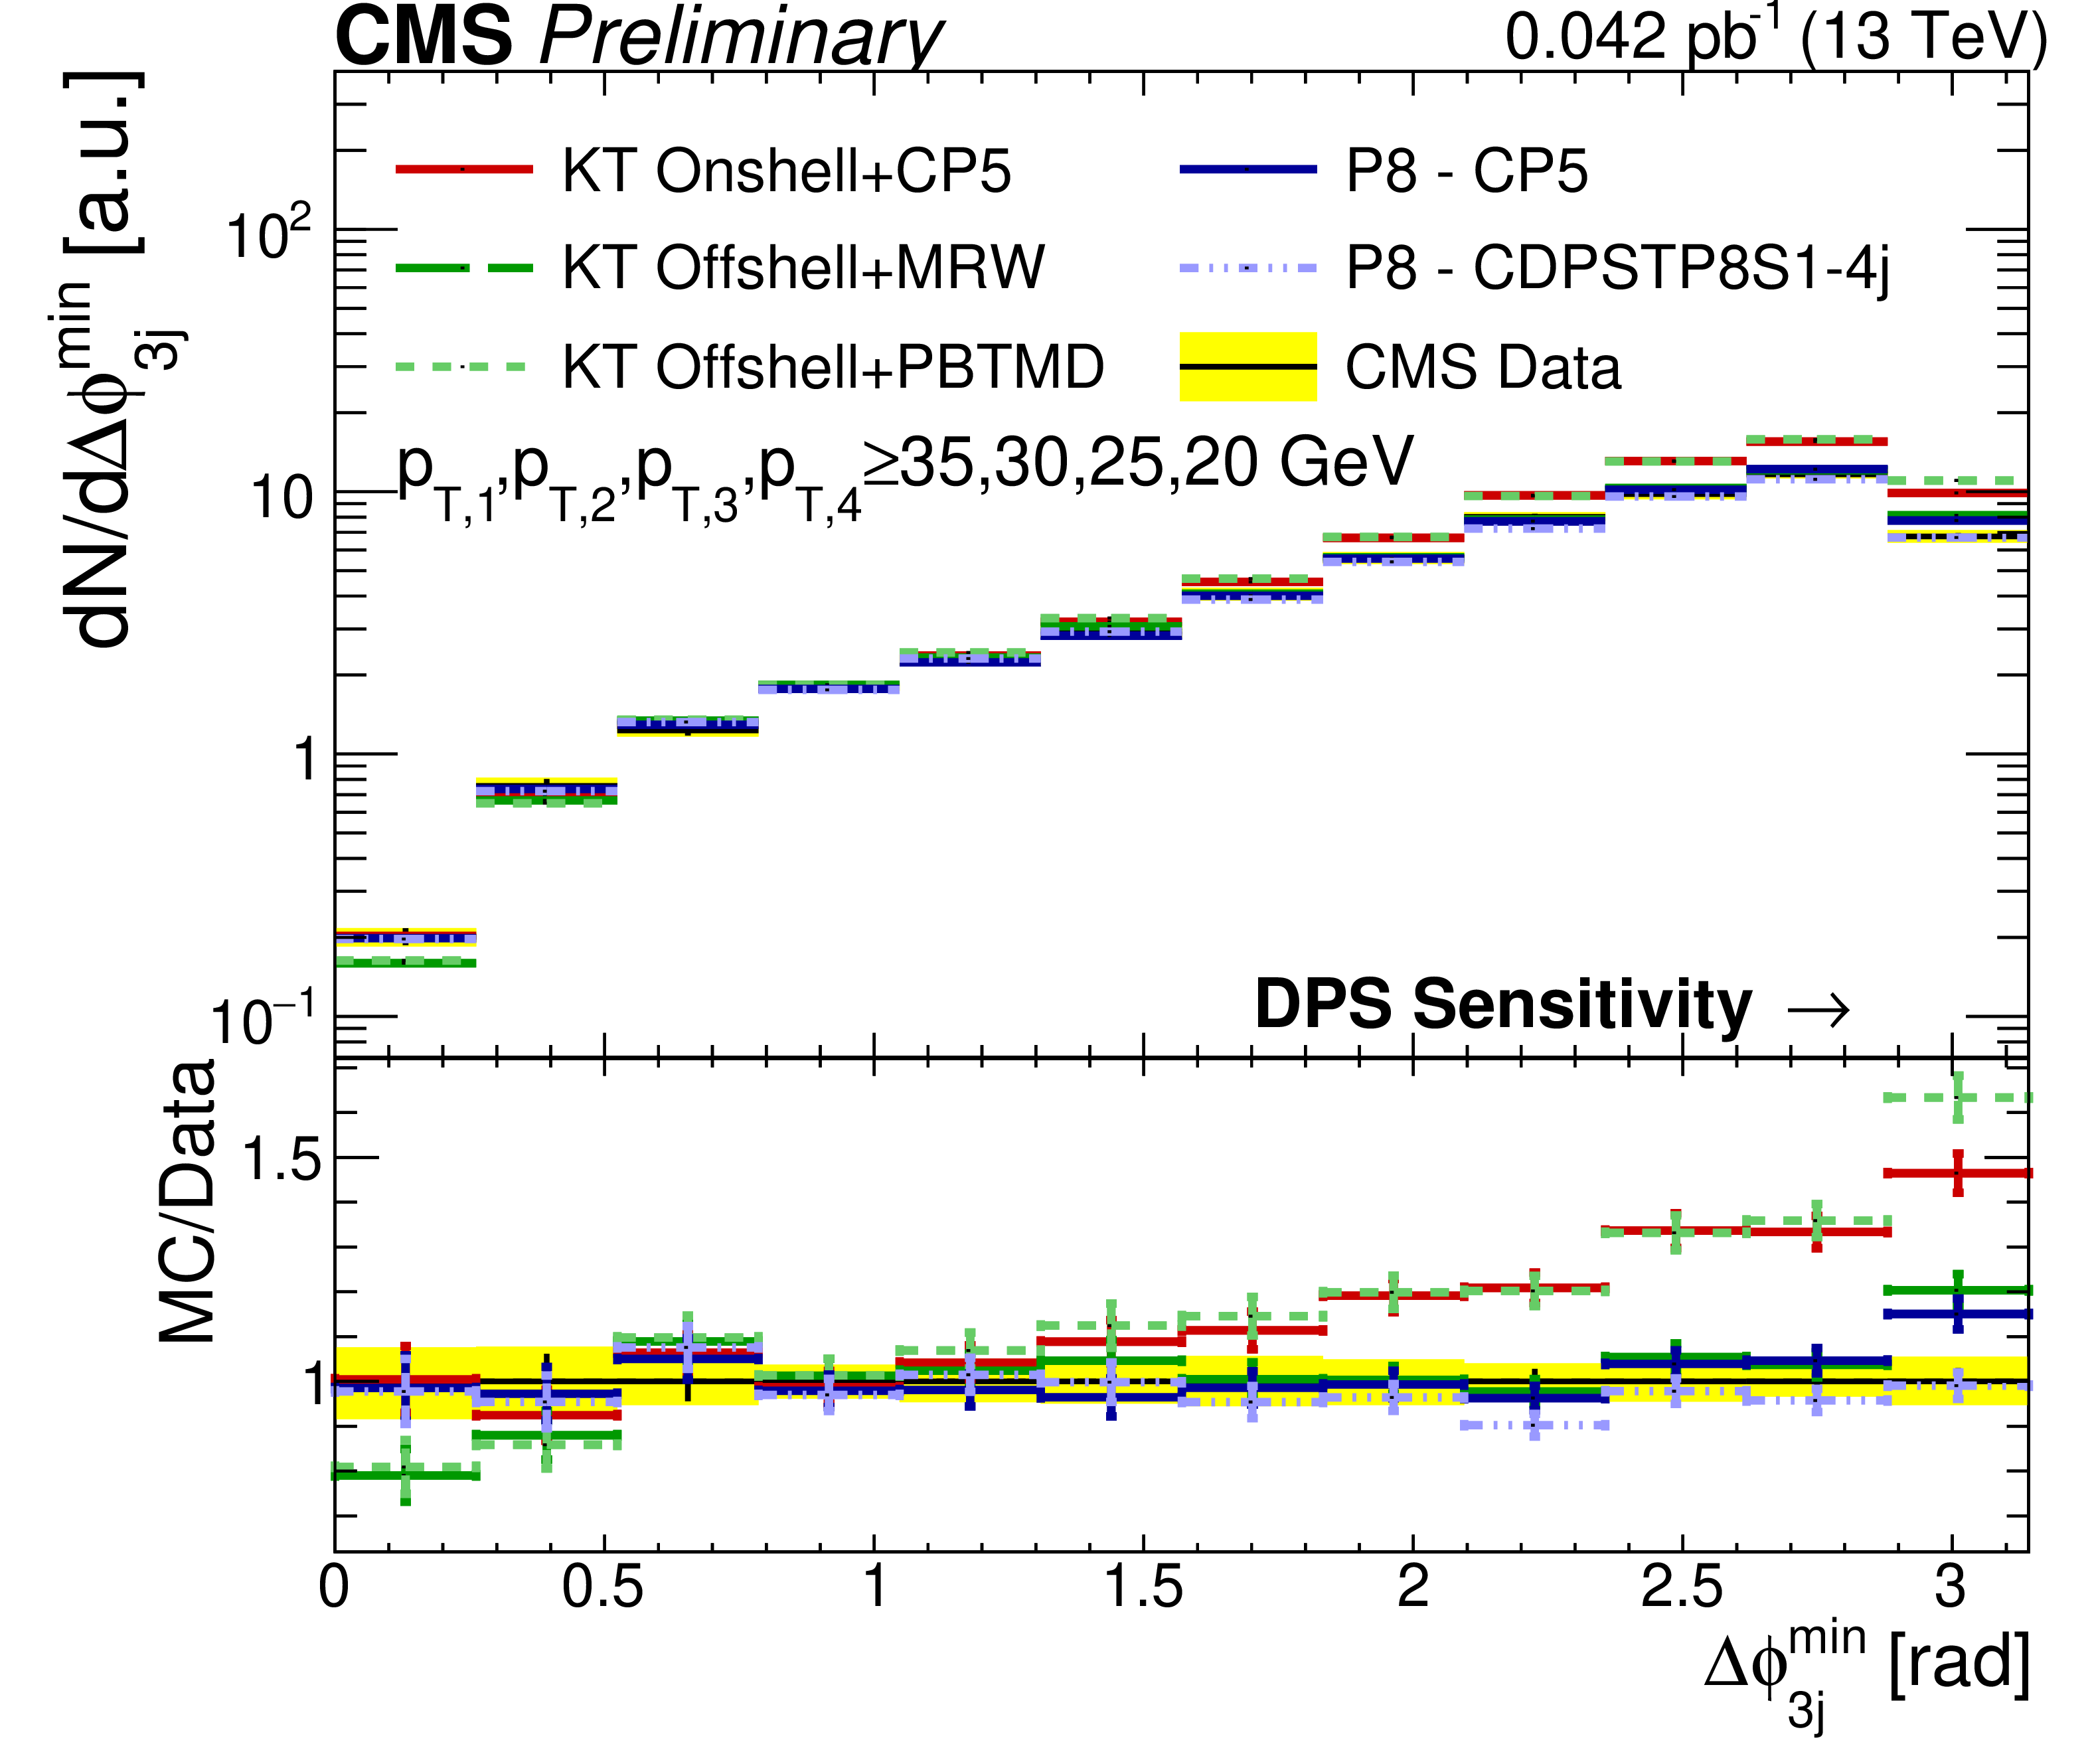
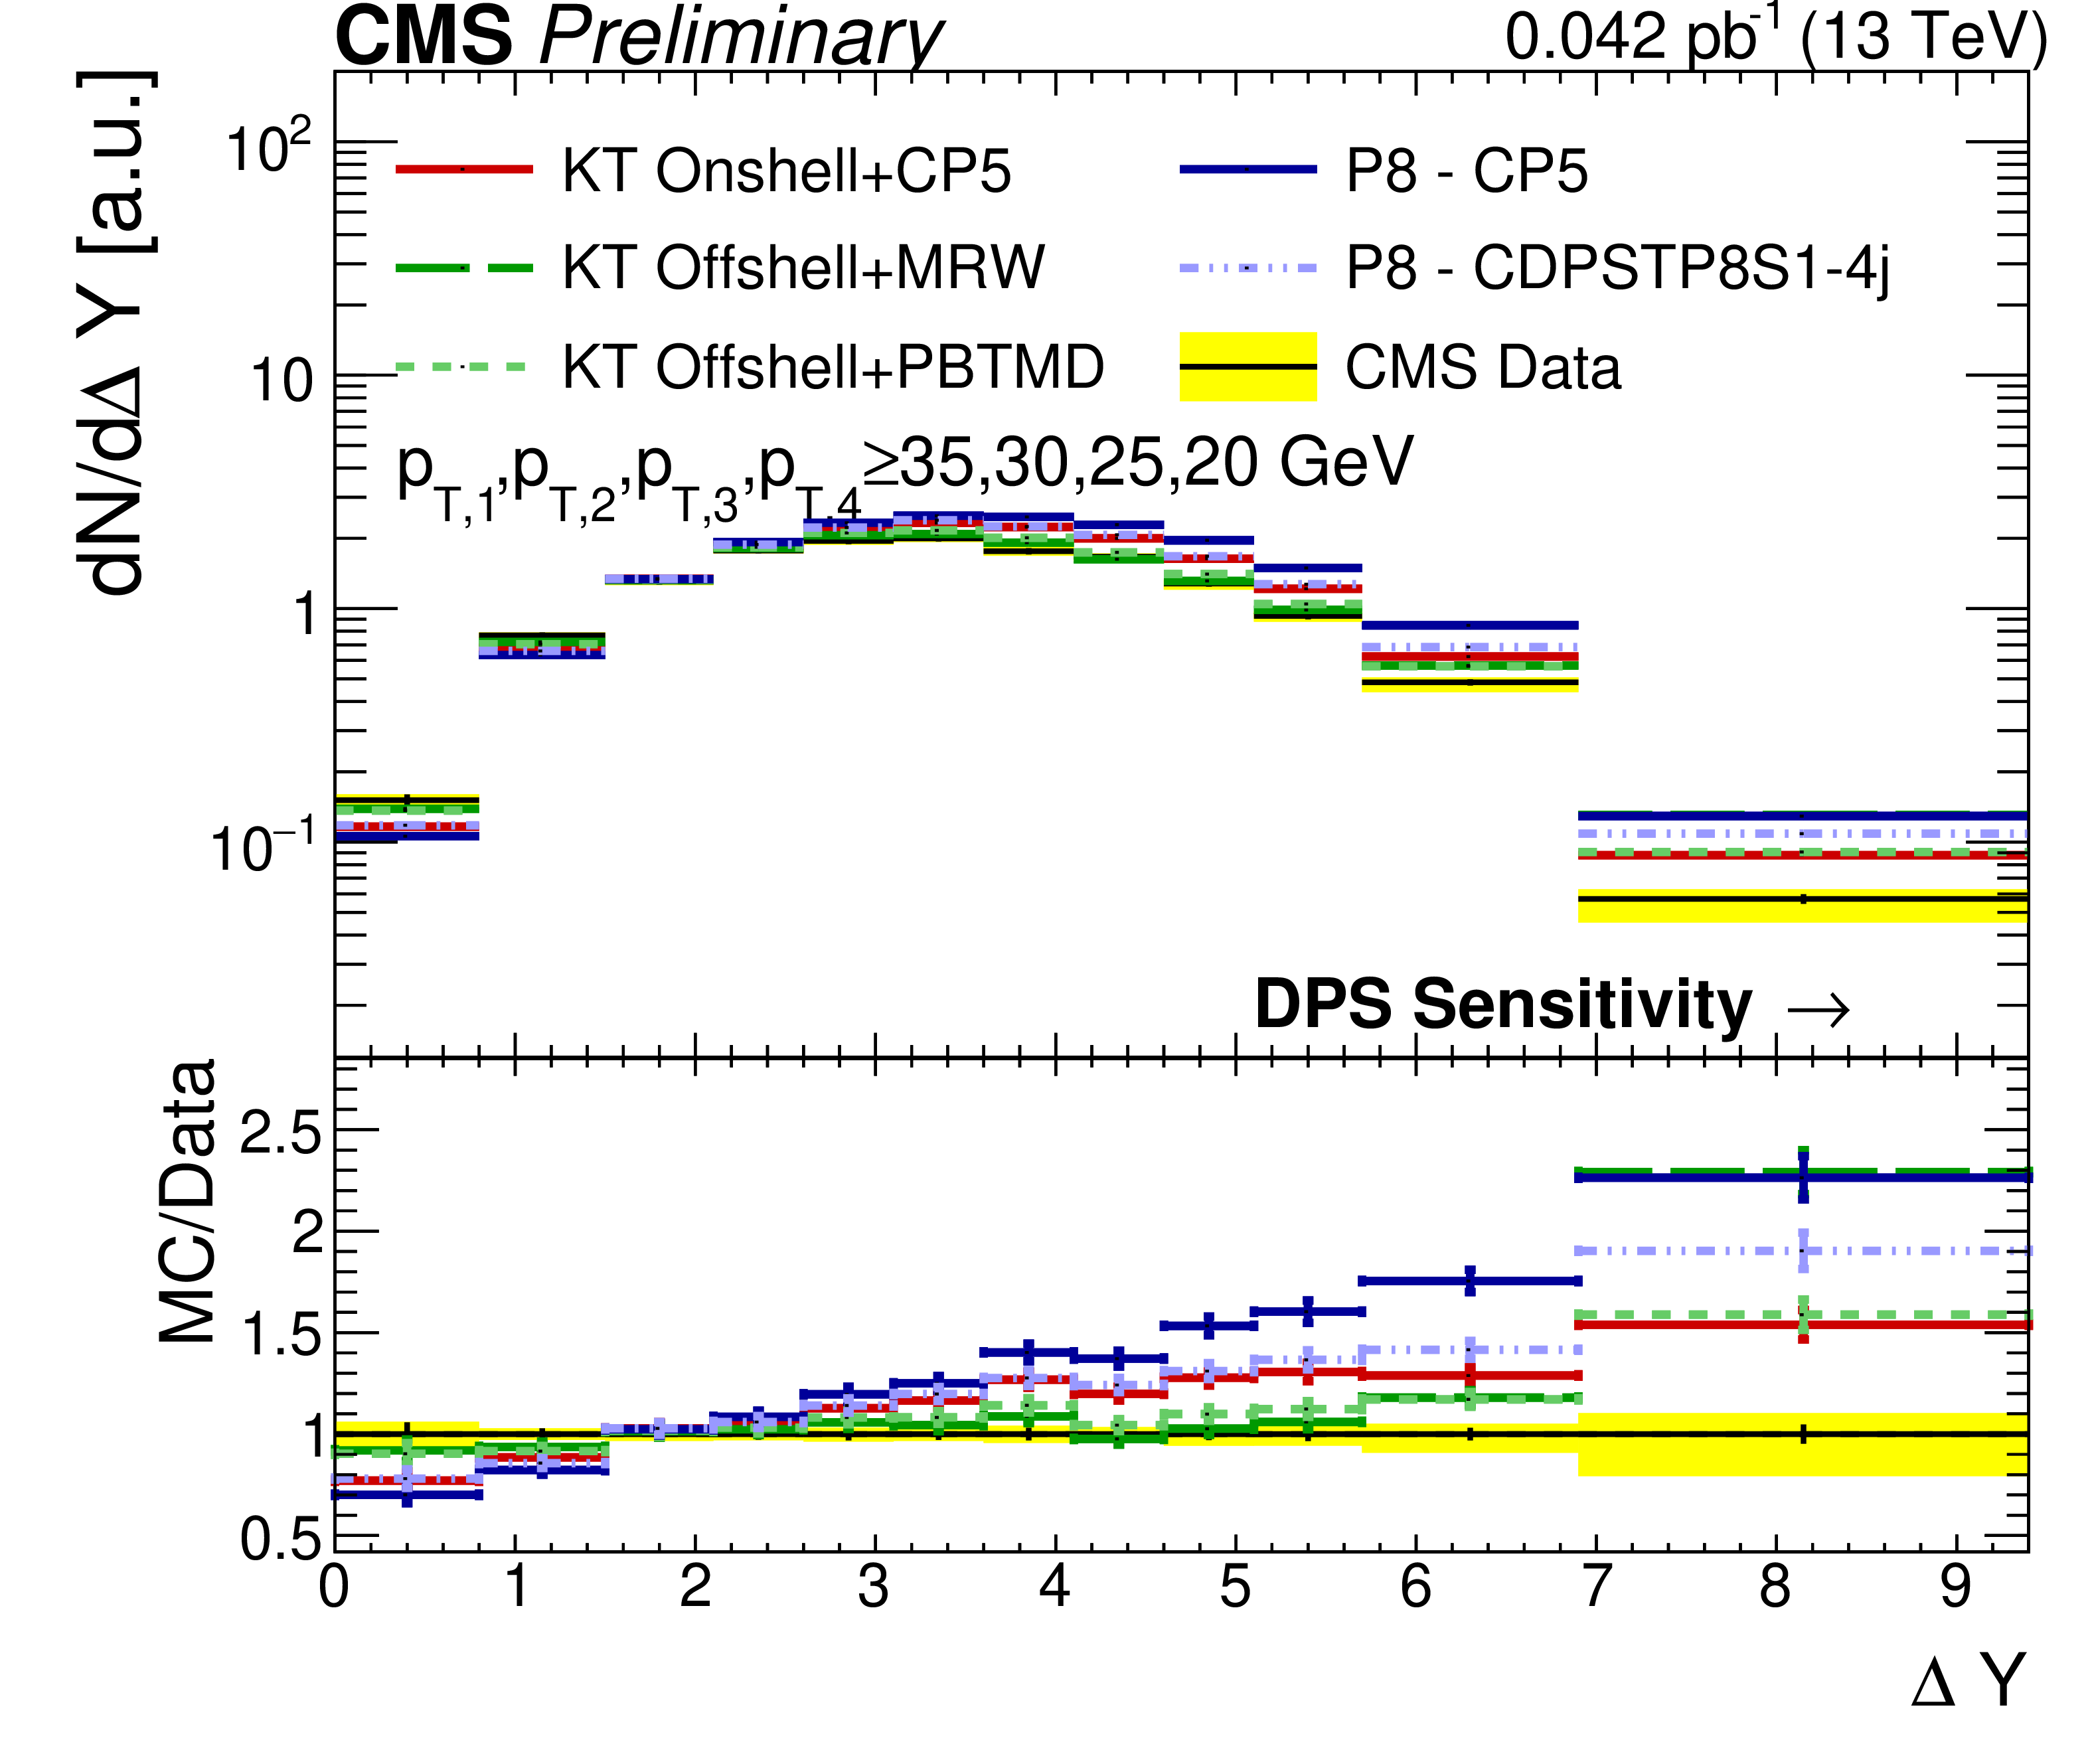
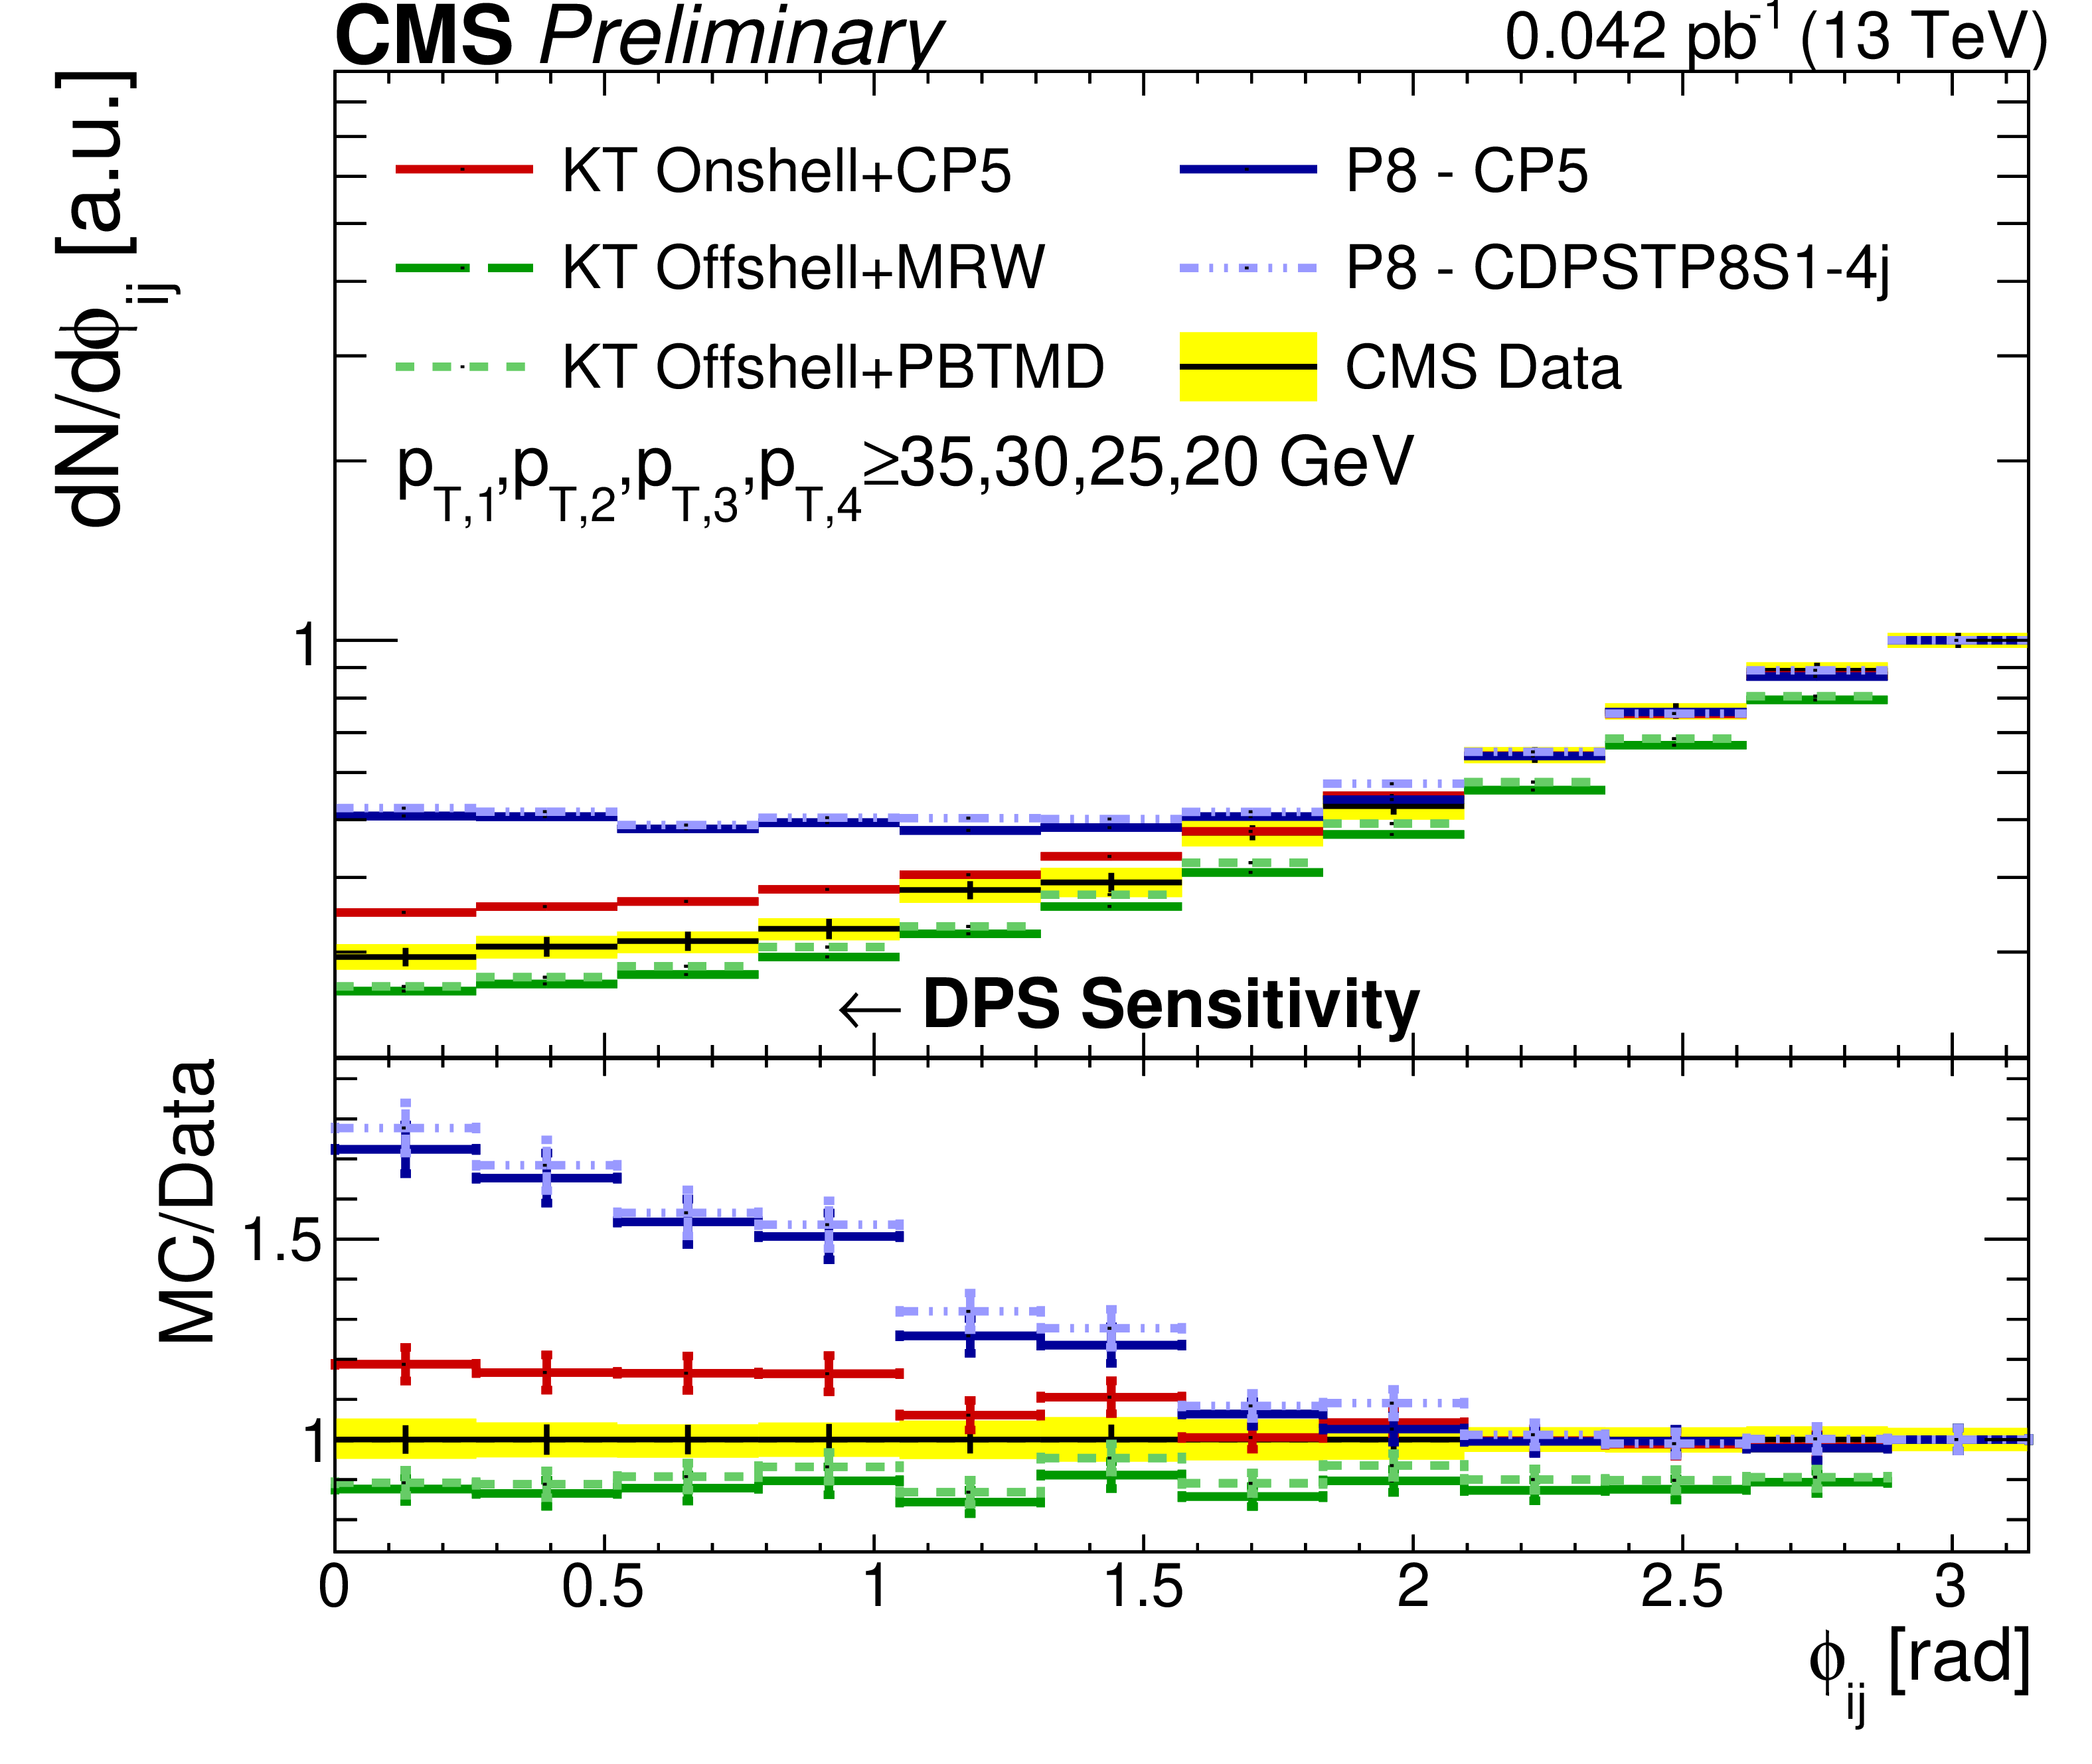
Figure 8:
Comparison of the ${\Delta \phi _\mathrm {soft}}$, ${\Delta \phi _\mathrm {3j}^\mathrm {min}}$, ${\Delta \mathrm {Y}}$, and ${\phi _{ij}}$ distributions from data to different KATIE (KT), MadGraph 5 (MG5), and POWHEG (PW) implementations. All distributions have been normalized to regions where a reduced DPS sensitivity is expected. The error bars represent the statistical uncertainty, while the yellow band indicates the total (statistical+systematic) uncertainty on the measurement. |
png pdf |
Figure 8-a:
Comparison of the ${\Delta \phi _\mathrm {soft}}$, ${\Delta \phi _\mathrm {3j}^\mathrm {min}}$, ${\Delta \mathrm {Y}}$, and ${\phi _{ij}}$ distributions from data to different KATIE (KT), MadGraph 5 (MG5), and POWHEG (PW) implementations. All distributions have been normalized to regions where a reduced DPS sensitivity is expected. The error bars represent the statistical uncertainty, while the yellow band indicates the total (statistical+systematic) uncertainty on the measurement. |
png pdf |
Figure 8-b:
Comparison of the ${\Delta \phi _\mathrm {soft}}$, ${\Delta \phi _\mathrm {3j}^\mathrm {min}}$, ${\Delta \mathrm {Y}}$, and ${\phi _{ij}}$ distributions from data to different KATIE (KT), MadGraph 5 (MG5), and POWHEG (PW) implementations. All distributions have been normalized to regions where a reduced DPS sensitivity is expected. The error bars represent the statistical uncertainty, while the yellow band indicates the total (statistical+systematic) uncertainty on the measurement. |
png pdf |
Figure 8-c:
Comparison of the ${\Delta \phi _\mathrm {soft}}$, ${\Delta \phi _\mathrm {3j}^\mathrm {min}}$, ${\Delta \mathrm {Y}}$, and ${\phi _{ij}}$ distributions from data to different KATIE (KT), MadGraph 5 (MG5), and POWHEG (PW) implementations. All distributions have been normalized to regions where a reduced DPS sensitivity is expected. The error bars represent the statistical uncertainty, while the yellow band indicates the total (statistical+systematic) uncertainty on the measurement. |
png pdf |
Figure 8-d:
Comparison of the ${\Delta \phi _\mathrm {soft}}$, ${\Delta \phi _\mathrm {3j}^\mathrm {min}}$, ${\Delta \mathrm {Y}}$, and ${\phi _{ij}}$ distributions from data to different KATIE (KT), MadGraph 5 (MG5), and POWHEG (PW) implementations. All distributions have been normalized to regions where a reduced DPS sensitivity is expected. The error bars represent the statistical uncertainty, while the yellow band indicates the total (statistical+systematic) uncertainty on the measurement. |
png pdf |
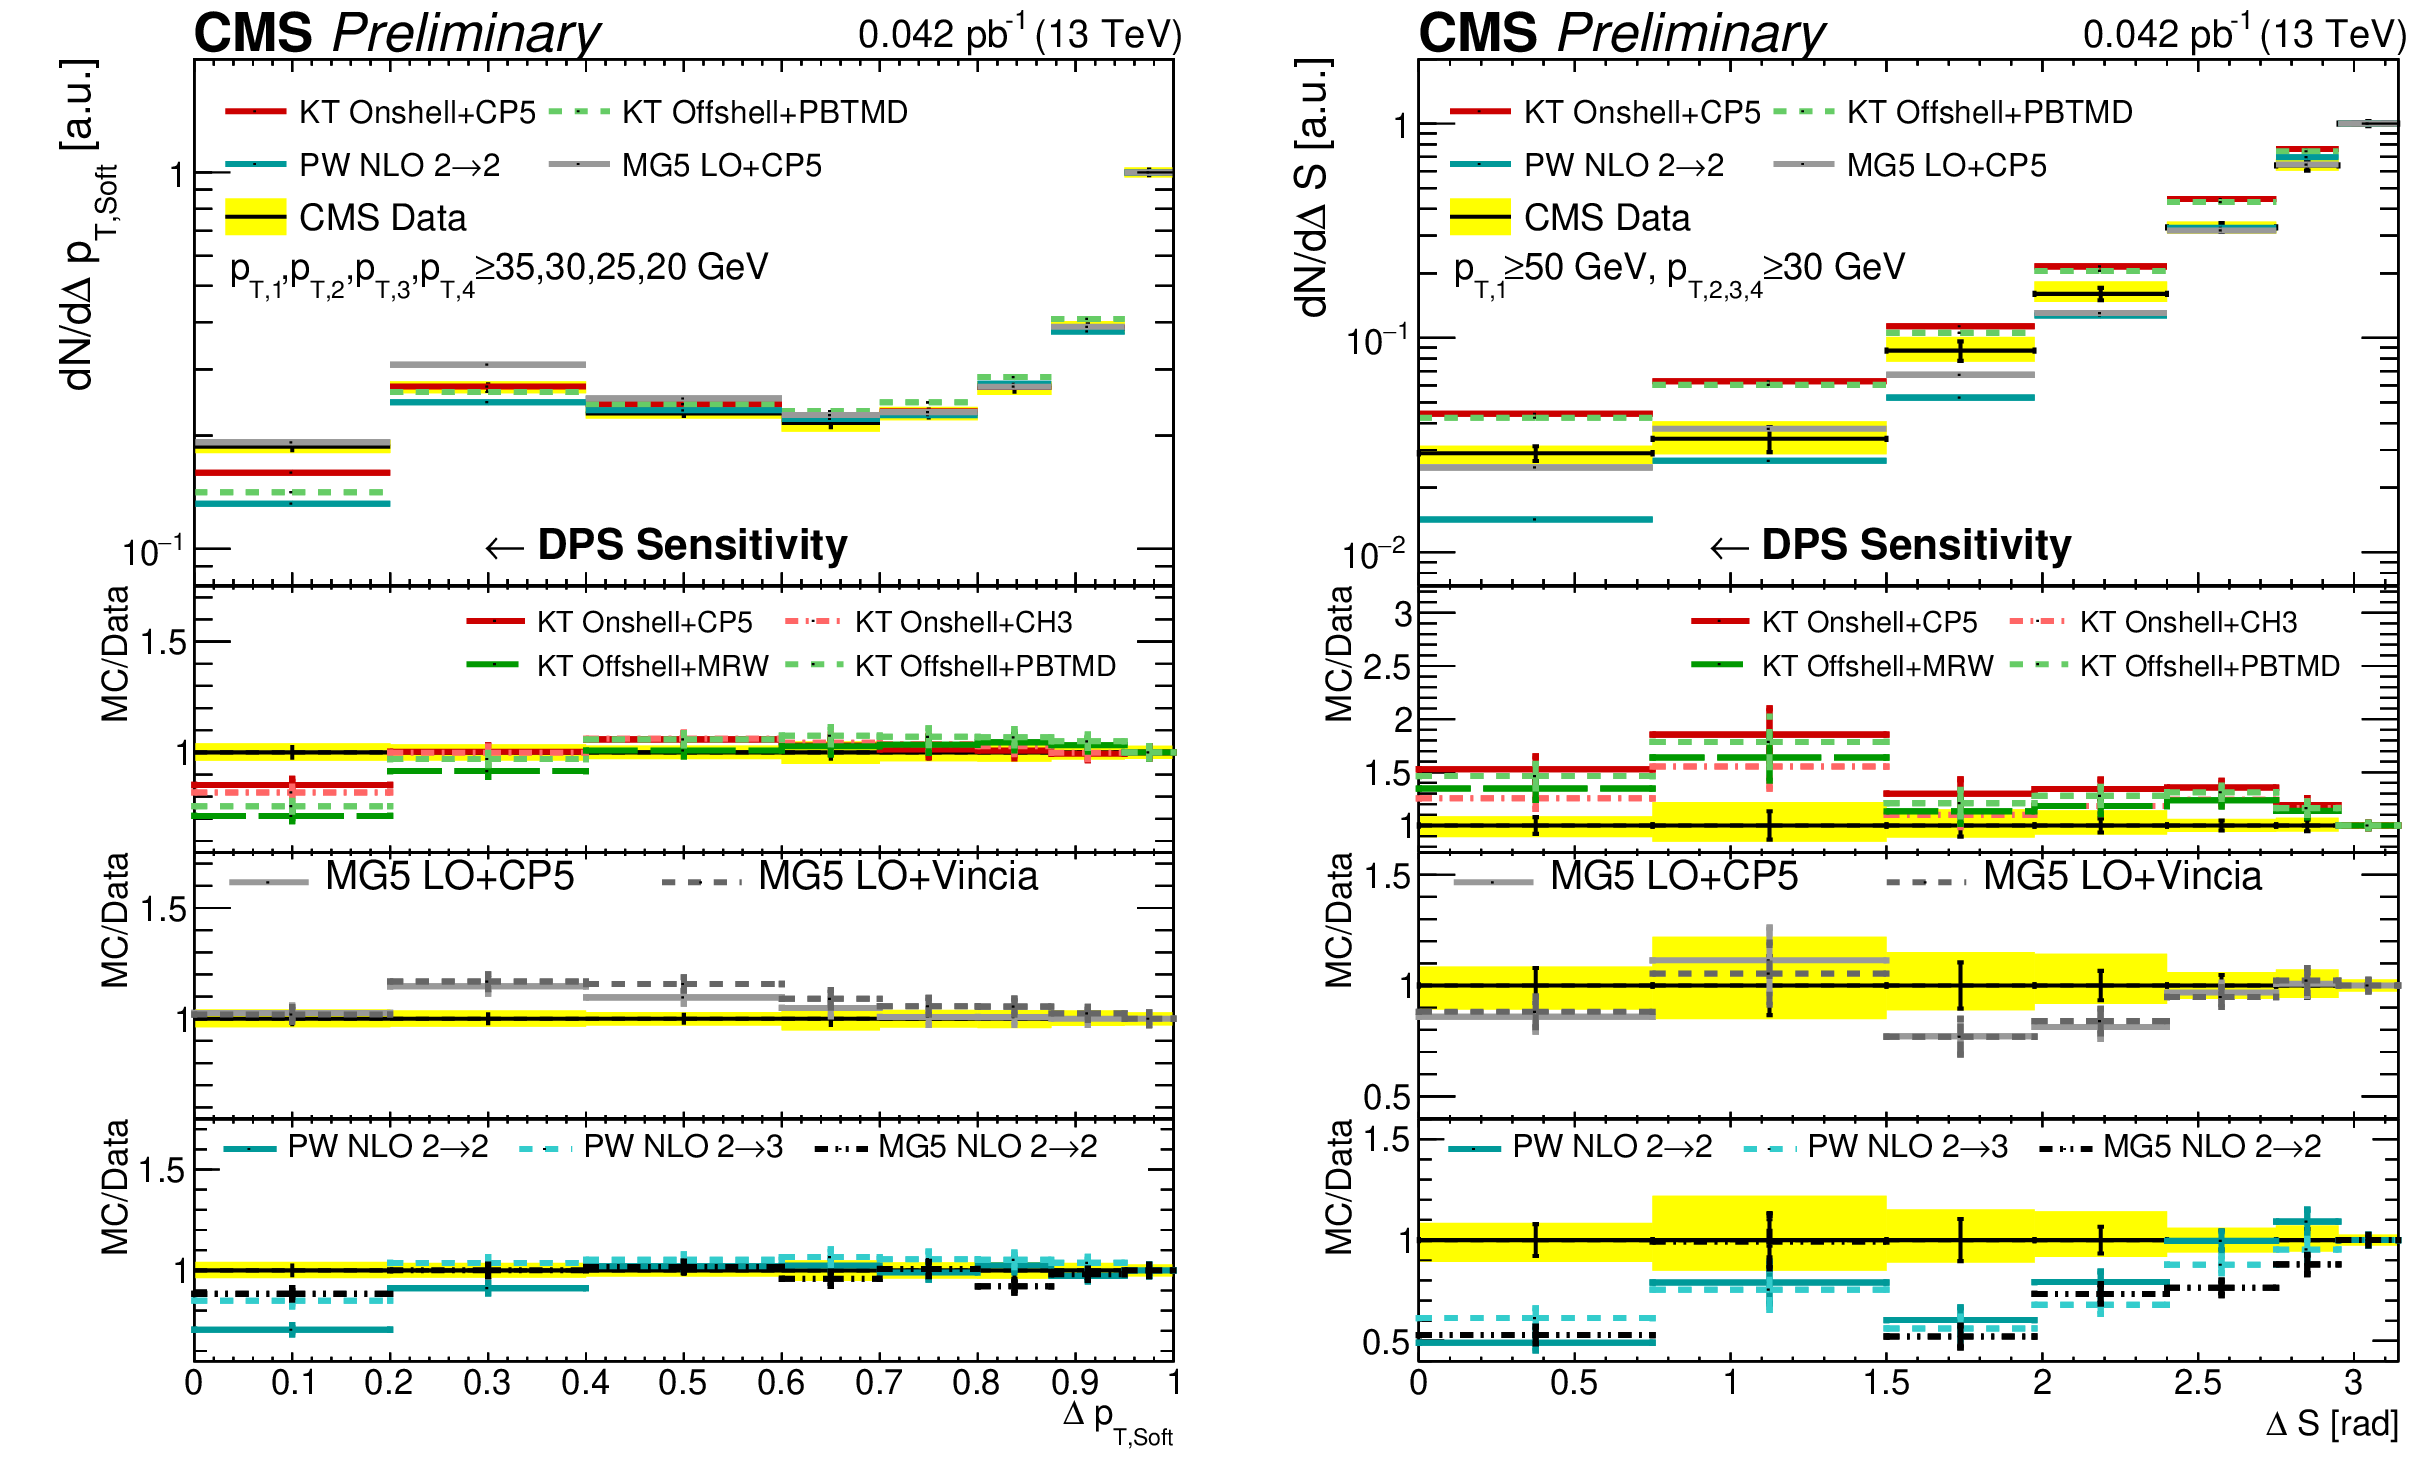
Figure 9:
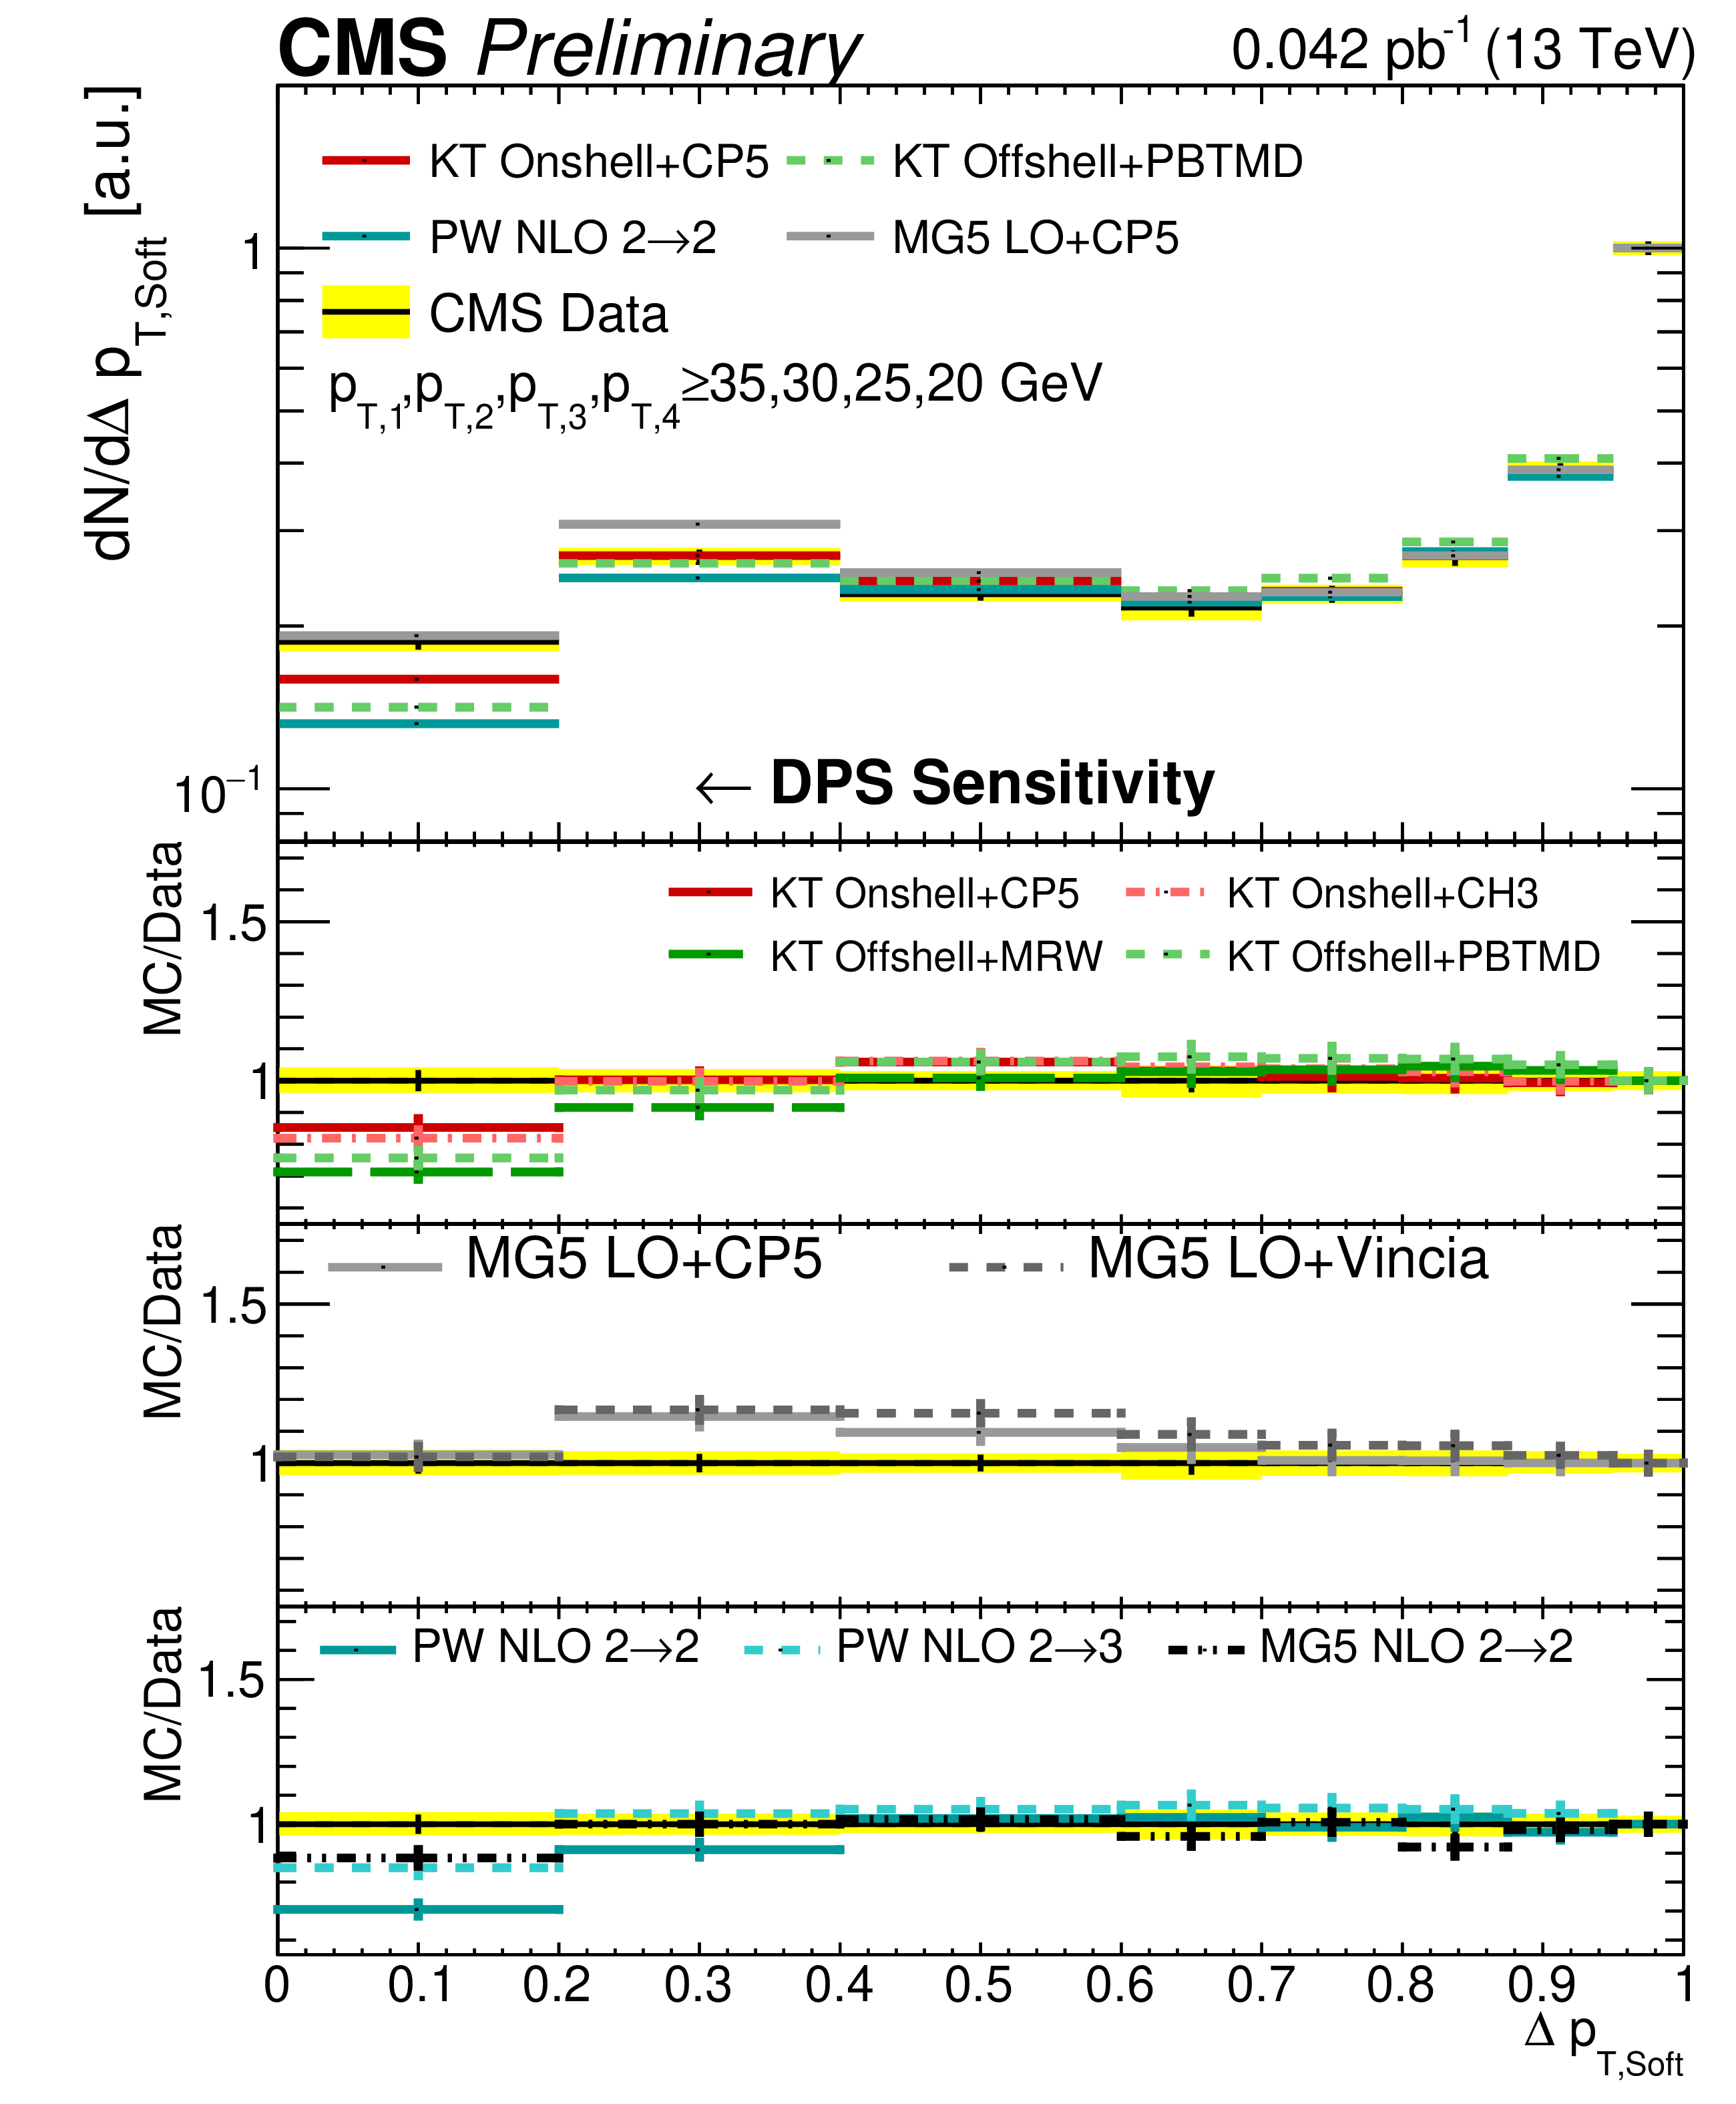
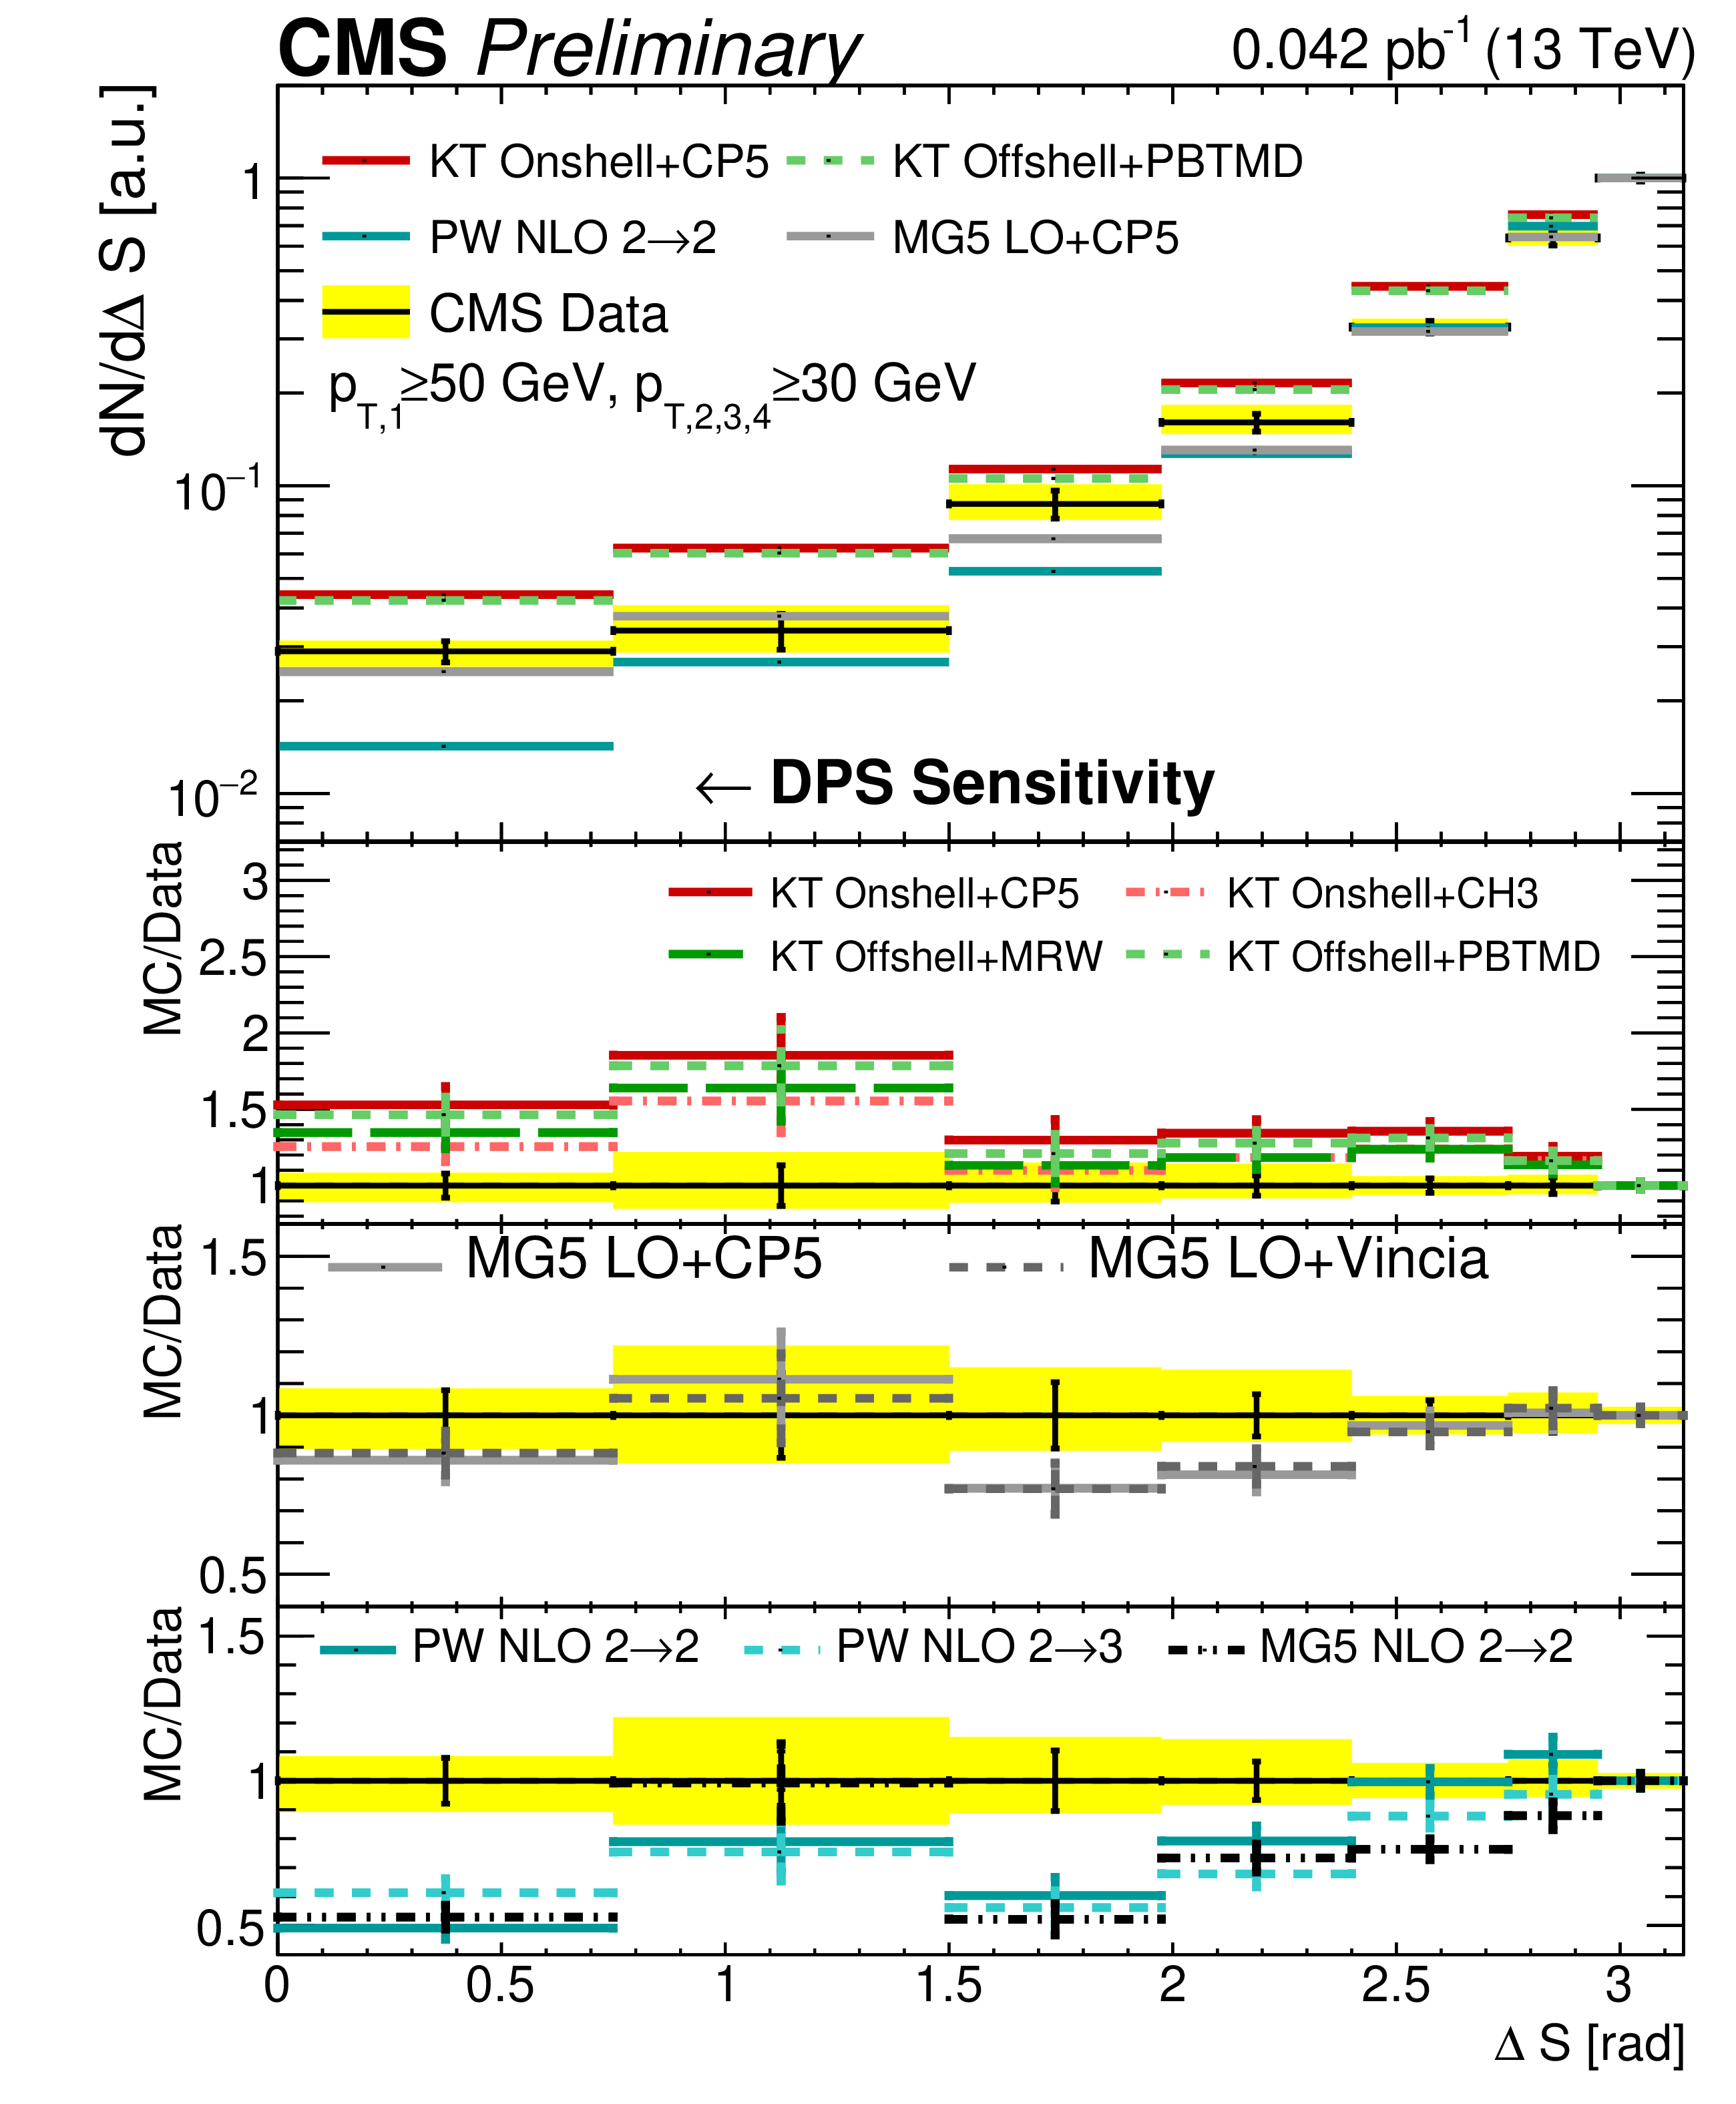
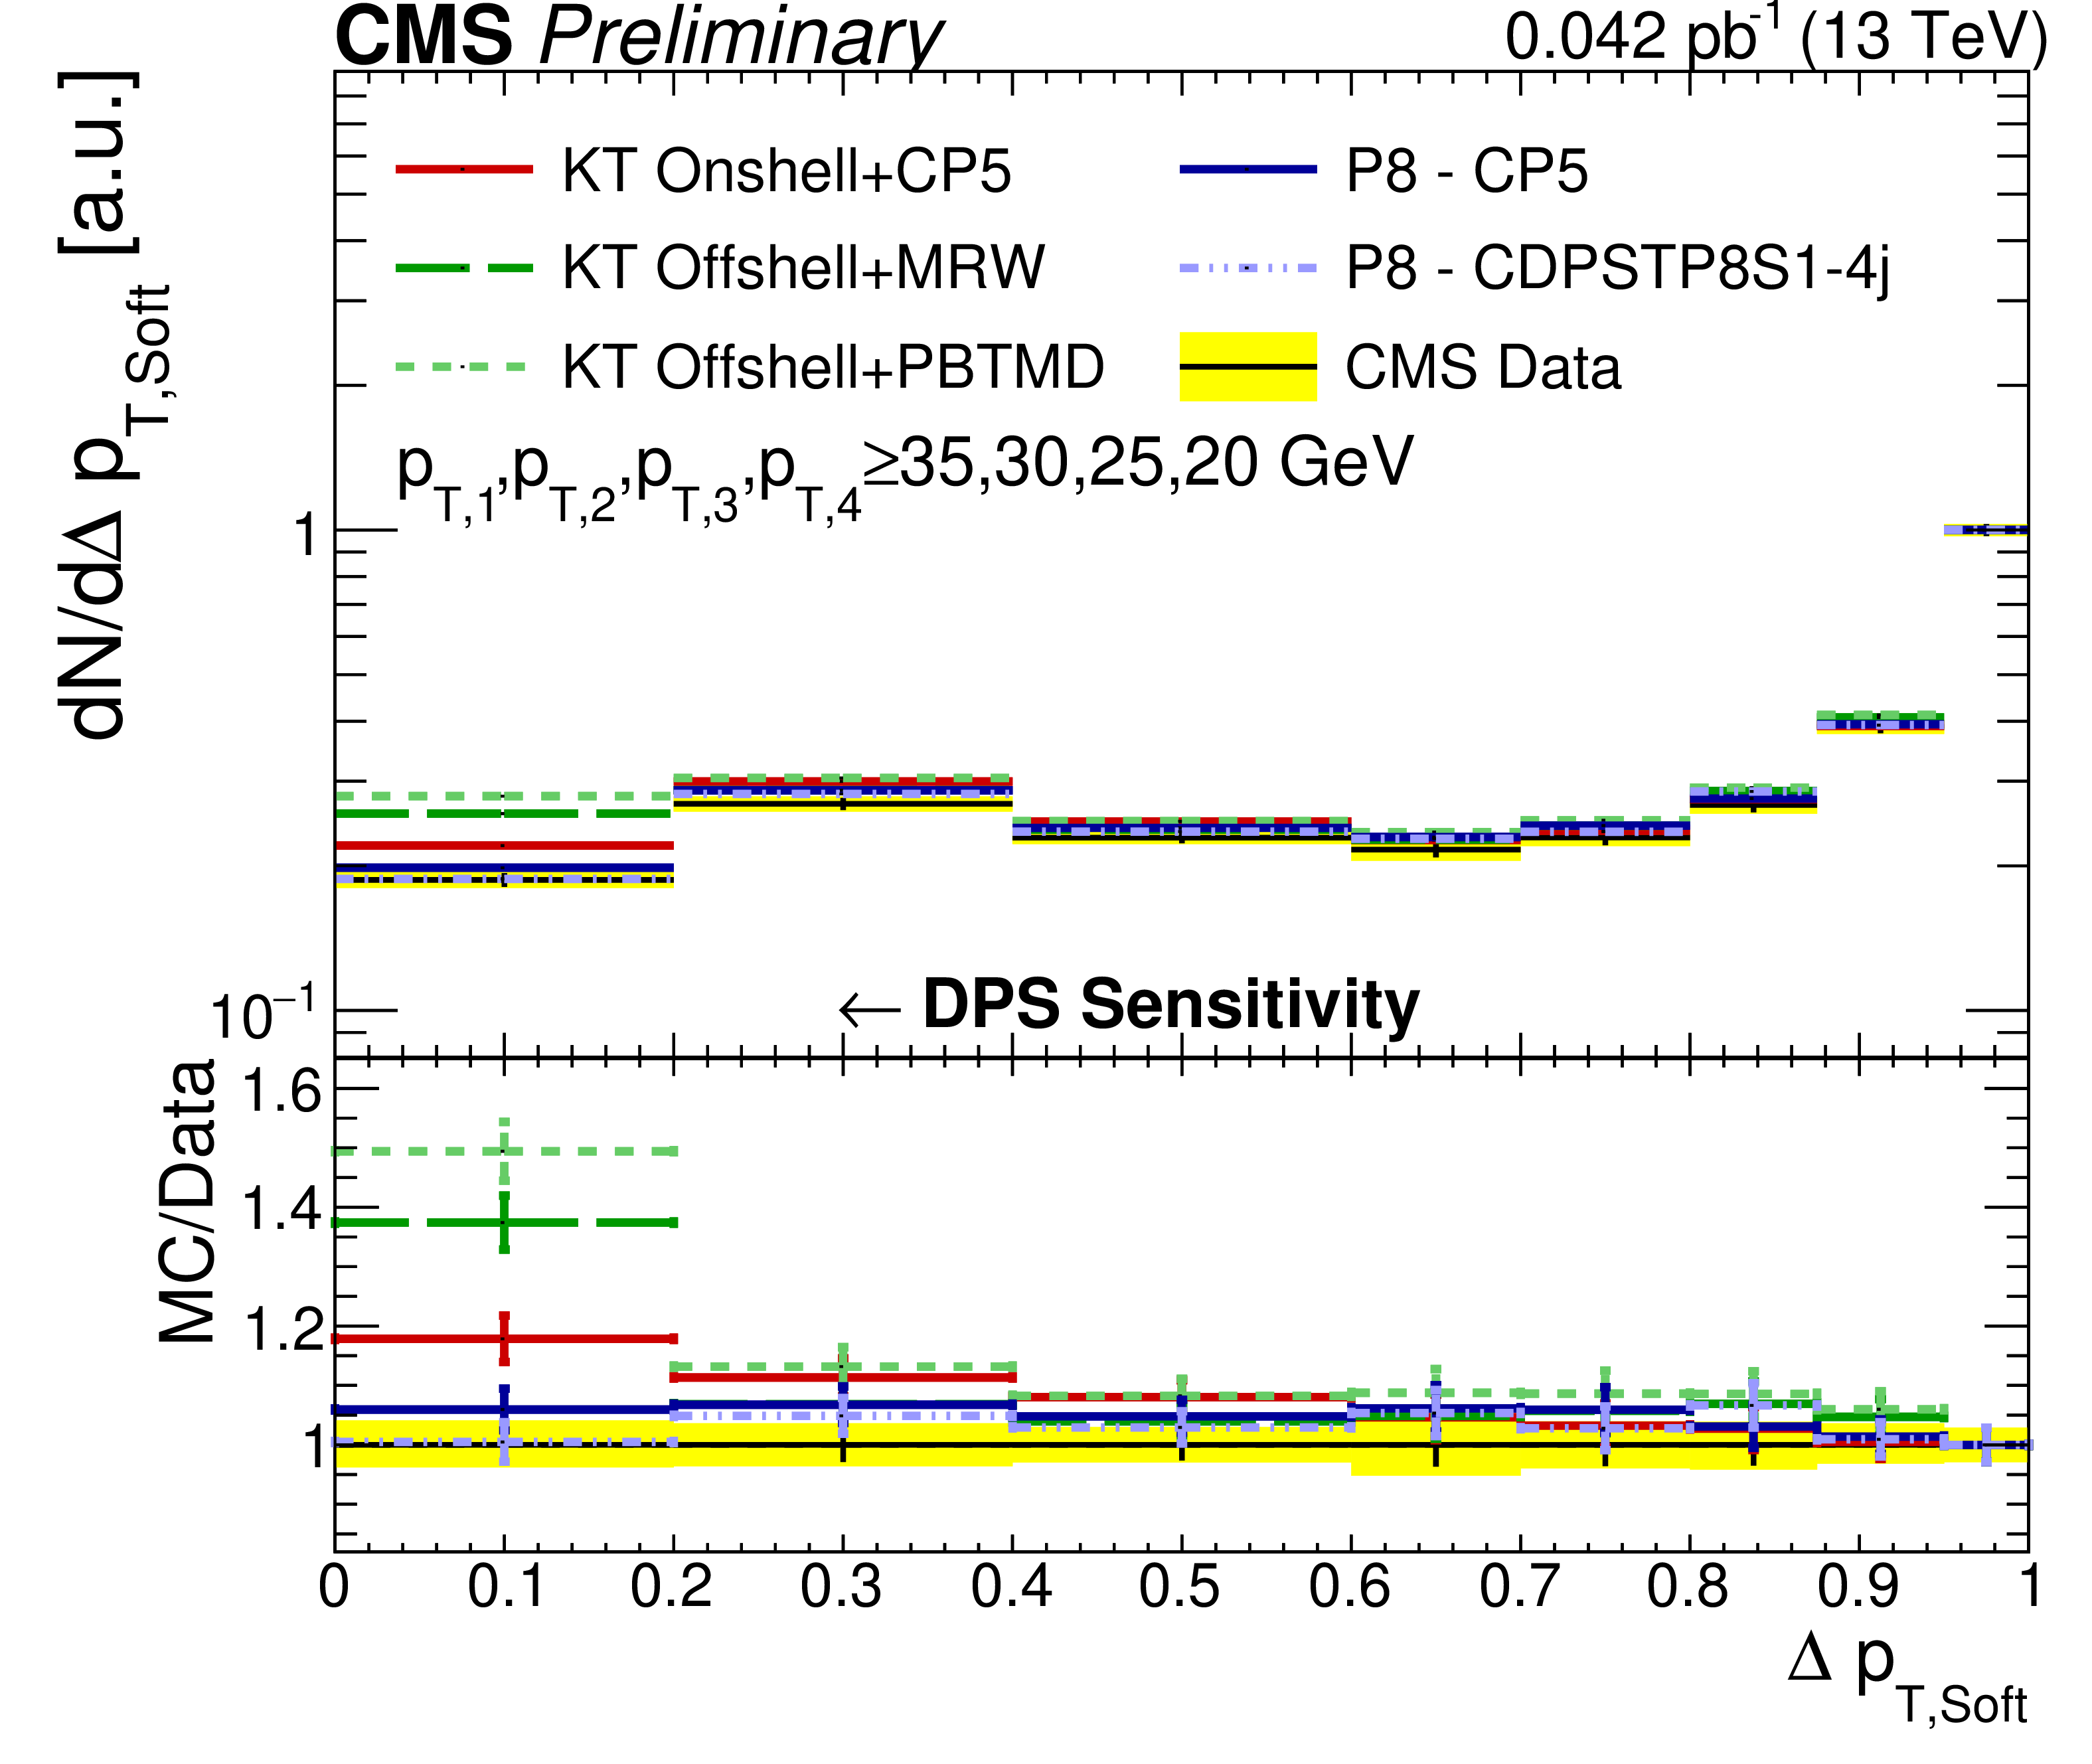
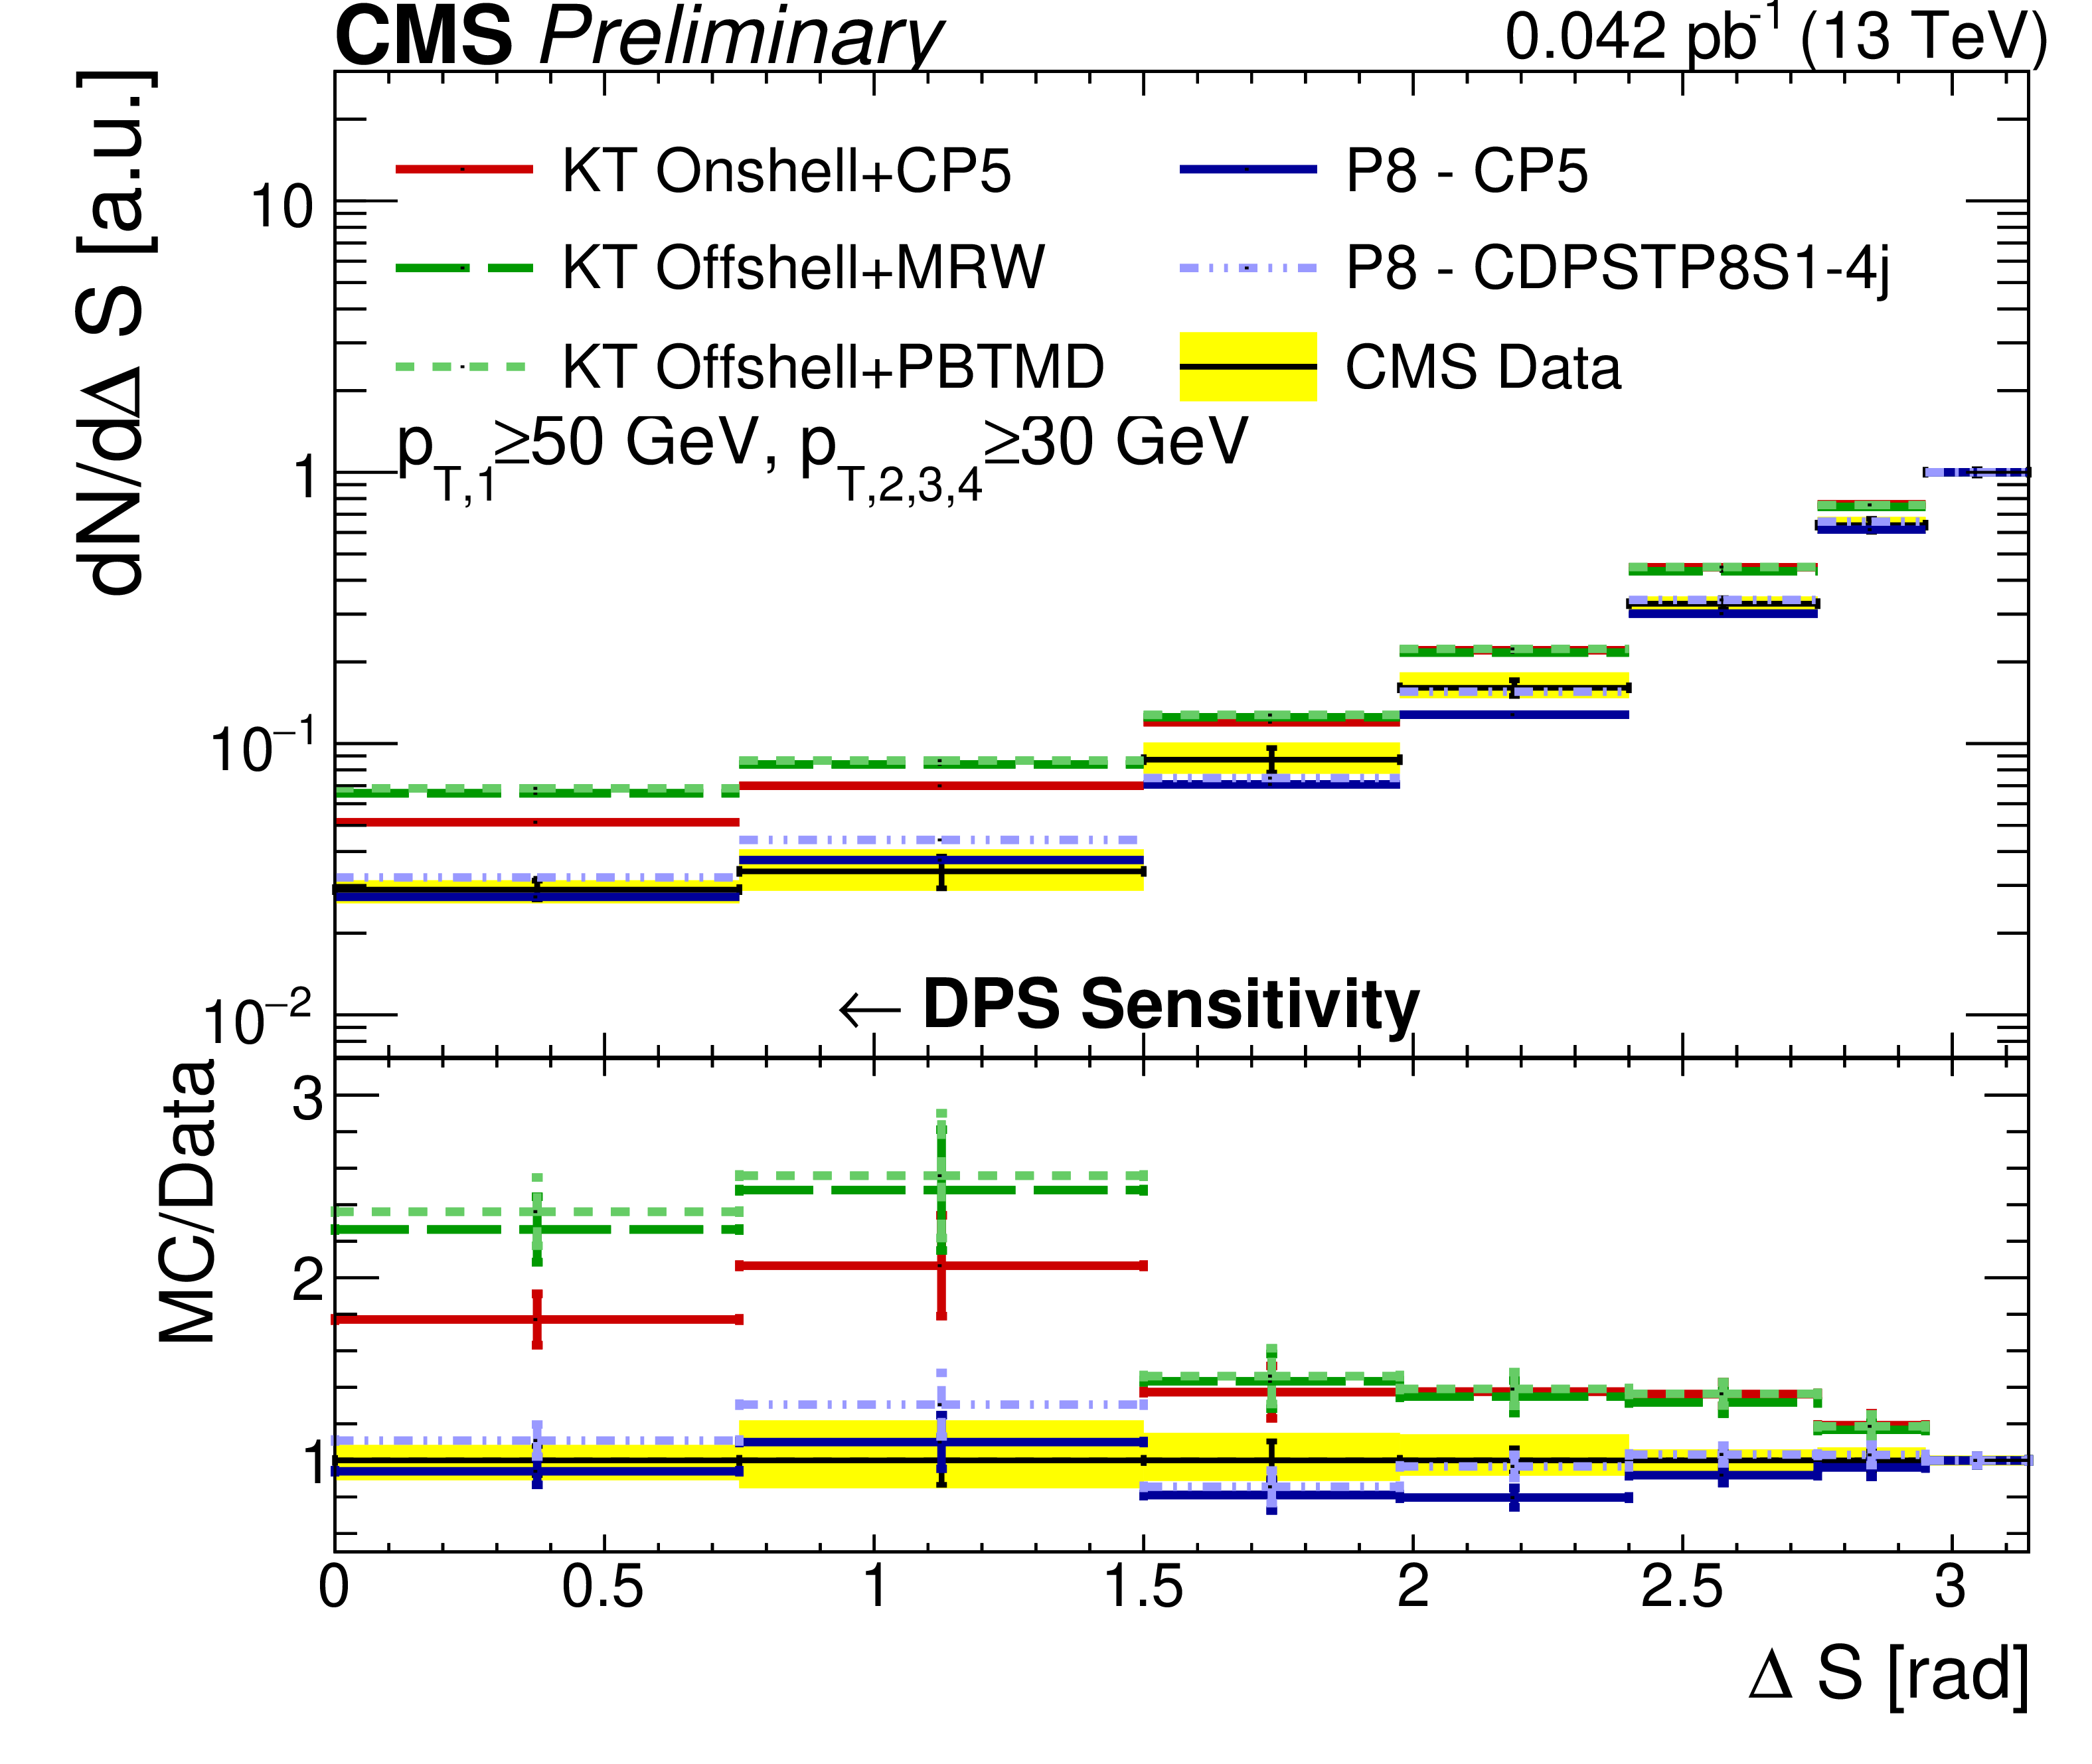
Comparison of the ${\Delta p_{\mathrm {T,soft}}}$ and ${\Delta \mathrm {S}}$ distributions from data to different KATIE (KT), MadGraph 5 (MG5), and POWHEG (PW) implementations. All distributions have been normalized to regions where a reduced DPS sensitivity is expected. The error bars represent the statistical uncertainty, while the yellow band indicates the total (statistical+systematic) uncertainty on the measurement. |
png pdf |
Figure 9-a:
Comparison of the ${\Delta p_{\mathrm {T,soft}}}$ and ${\Delta \mathrm {S}}$ distributions from data to different KATIE (KT), MadGraph 5 (MG5), and POWHEG (PW) implementations. All distributions have been normalized to regions where a reduced DPS sensitivity is expected. The error bars represent the statistical uncertainty, while the yellow band indicates the total (statistical+systematic) uncertainty on the measurement. |
png pdf |
Figure 9-b:
Comparison of the ${\Delta p_{\mathrm {T,soft}}}$ and ${\Delta \mathrm {S}}$ distributions from data to different KATIE (KT), MadGraph 5 (MG5), and POWHEG (PW) implementations. All distributions have been normalized to regions where a reduced DPS sensitivity is expected. The error bars represent the statistical uncertainty, while the yellow band indicates the total (statistical+systematic) uncertainty on the measurement. |
png pdf |
Figure 10-a:
Comparison of the unfolded ${p_{\mathrm {T}}}$ spectra of data with different SPS+DPS KATIE (KT) and PYTHIA 8 (P8) models, for the leading (top left), subleading (top right), third leading (bottom left), and fourth leading (bottom right) jet. The error bars and bands are shown similarly to Fig. 2. |
png pdf |
Figure 10-b:
Comparison of the unfolded ${p_{\mathrm {T}}}$ spectra of data with different SPS+DPS KATIE (KT) and PYTHIA 8 (P8) models, for the leading (top left), subleading (top right), third leading (bottom left), and fourth leading (bottom right) jet. The error bars and bands are shown similarly to Fig. 2. |
png pdf |
Figure 10-c:
Comparison of the unfolded ${p_{\mathrm {T}}}$ spectra of data with different SPS+DPS KATIE (KT) and PYTHIA 8 (P8) models, for the leading (top left), subleading (top right), third leading (bottom left), and fourth leading (bottom right) jet. The error bars and bands are shown similarly to Fig. 2. |
png pdf |
Figure 10-d:
Comparison of the unfolded ${p_{\mathrm {T}}}$ spectra of data with different SPS+DPS KATIE (KT) and PYTHIA 8 (P8) models, for the leading (top left), subleading (top right), third leading (bottom left), and fourth leading (bottom right) jet. The error bars and bands are shown similarly to Fig. 2. |
png pdf |
Figure 11:
Comparison of the unfolded $\eta $ spectra of data with different SPS+DPS KATIE (KT) and PYTHIA 8 (P8) models, for the leading (top left), subleading (top right), third leading (bottom left), and fourth leading (bottom right) jet. The error bars and bands are shown similarly to Fig. 2. |
png pdf |
Figure 11-a:
Comparison of the unfolded $\eta $ spectra of data with different SPS+DPS KATIE (KT) and PYTHIA 8 (P8) models, for the leading (top left), subleading (top right), third leading (bottom left), and fourth leading (bottom right) jet. The error bars and bands are shown similarly to Fig. 2. |
png pdf |
Figure 11-b:
Comparison of the unfolded $\eta $ spectra of data with different SPS+DPS KATIE (KT) and PYTHIA 8 (P8) models, for the leading (top left), subleading (top right), third leading (bottom left), and fourth leading (bottom right) jet. The error bars and bands are shown similarly to Fig. 2. |
png pdf |
Figure 11-c:
Comparison of the unfolded $\eta $ spectra of data with different SPS+DPS KATIE (KT) and PYTHIA 8 (P8) models, for the leading (top left), subleading (top right), third leading (bottom left), and fourth leading (bottom right) jet. The error bars and bands are shown similarly to Fig. 2. |
png pdf |
Figure 11-d:
Comparison of the unfolded $\eta $ spectra of data with different SPS+DPS KATIE (KT) and PYTHIA 8 (P8) models, for the leading (top left), subleading (top right), third leading (bottom left), and fourth leading (bottom right) jet. The error bars and bands are shown similarly to Fig. 2. |
png pdf |
Figure 12:
Comparison of the distributions in DPS-sensitive observables obtained from data to different SPS+DPS KATIE (KT) and PYTHIA 8 (P8) models. All distributions have been normalized to the region where a reduced DPS contribution is expected. The error bars represent the statistical uncertainty, while the yellow band indicates the total (statistical+systematic) uncertainty on the measurement. |
png pdf |
Figure 12-a:
Comparison of the distributions in DPS-sensitive observables obtained from data to different SPS+DPS KATIE (KT) and PYTHIA 8 (P8) models. All distributions have been normalized to the region where a reduced DPS contribution is expected. The error bars represent the statistical uncertainty, while the yellow band indicates the total (statistical+systematic) uncertainty on the measurement. |
png pdf |
Figure 12-b:
Comparison of the distributions in DPS-sensitive observables obtained from data to different SPS+DPS KATIE (KT) and PYTHIA 8 (P8) models. All distributions have been normalized to the region where a reduced DPS contribution is expected. The error bars represent the statistical uncertainty, while the yellow band indicates the total (statistical+systematic) uncertainty on the measurement. |
png pdf |
Figure 12-c:
Comparison of the distributions in DPS-sensitive observables obtained from data to different SPS+DPS KATIE (KT) and PYTHIA 8 (P8) models. All distributions have been normalized to the region where a reduced DPS contribution is expected. The error bars represent the statistical uncertainty, while the yellow band indicates the total (statistical+systematic) uncertainty on the measurement. |
png pdf |
Figure 12-d:
Comparison of the distributions in DPS-sensitive observables obtained from data to different SPS+DPS KATIE (KT) and PYTHIA 8 (P8) models. All distributions have been normalized to the region where a reduced DPS contribution is expected. The error bars represent the statistical uncertainty, while the yellow band indicates the total (statistical+systematic) uncertainty on the measurement. |
png pdf |
Figure 12-e:
Comparison of the distributions in DPS-sensitive observables obtained from data to different SPS+DPS KATIE (KT) and PYTHIA 8 (P8) models. All distributions have been normalized to the region where a reduced DPS contribution is expected. The error bars represent the statistical uncertainty, while the yellow band indicates the total (statistical+systematic) uncertainty on the measurement. |
png pdf |
Figure 12-f:
Comparison of the distributions in DPS-sensitive observables obtained from data to different SPS+DPS KATIE (KT) and PYTHIA 8 (P8) models. All distributions have been normalized to the region where a reduced DPS contribution is expected. The error bars represent the statistical uncertainty, while the yellow band indicates the total (statistical+systematic) uncertainty on the measurement. |
png pdf |
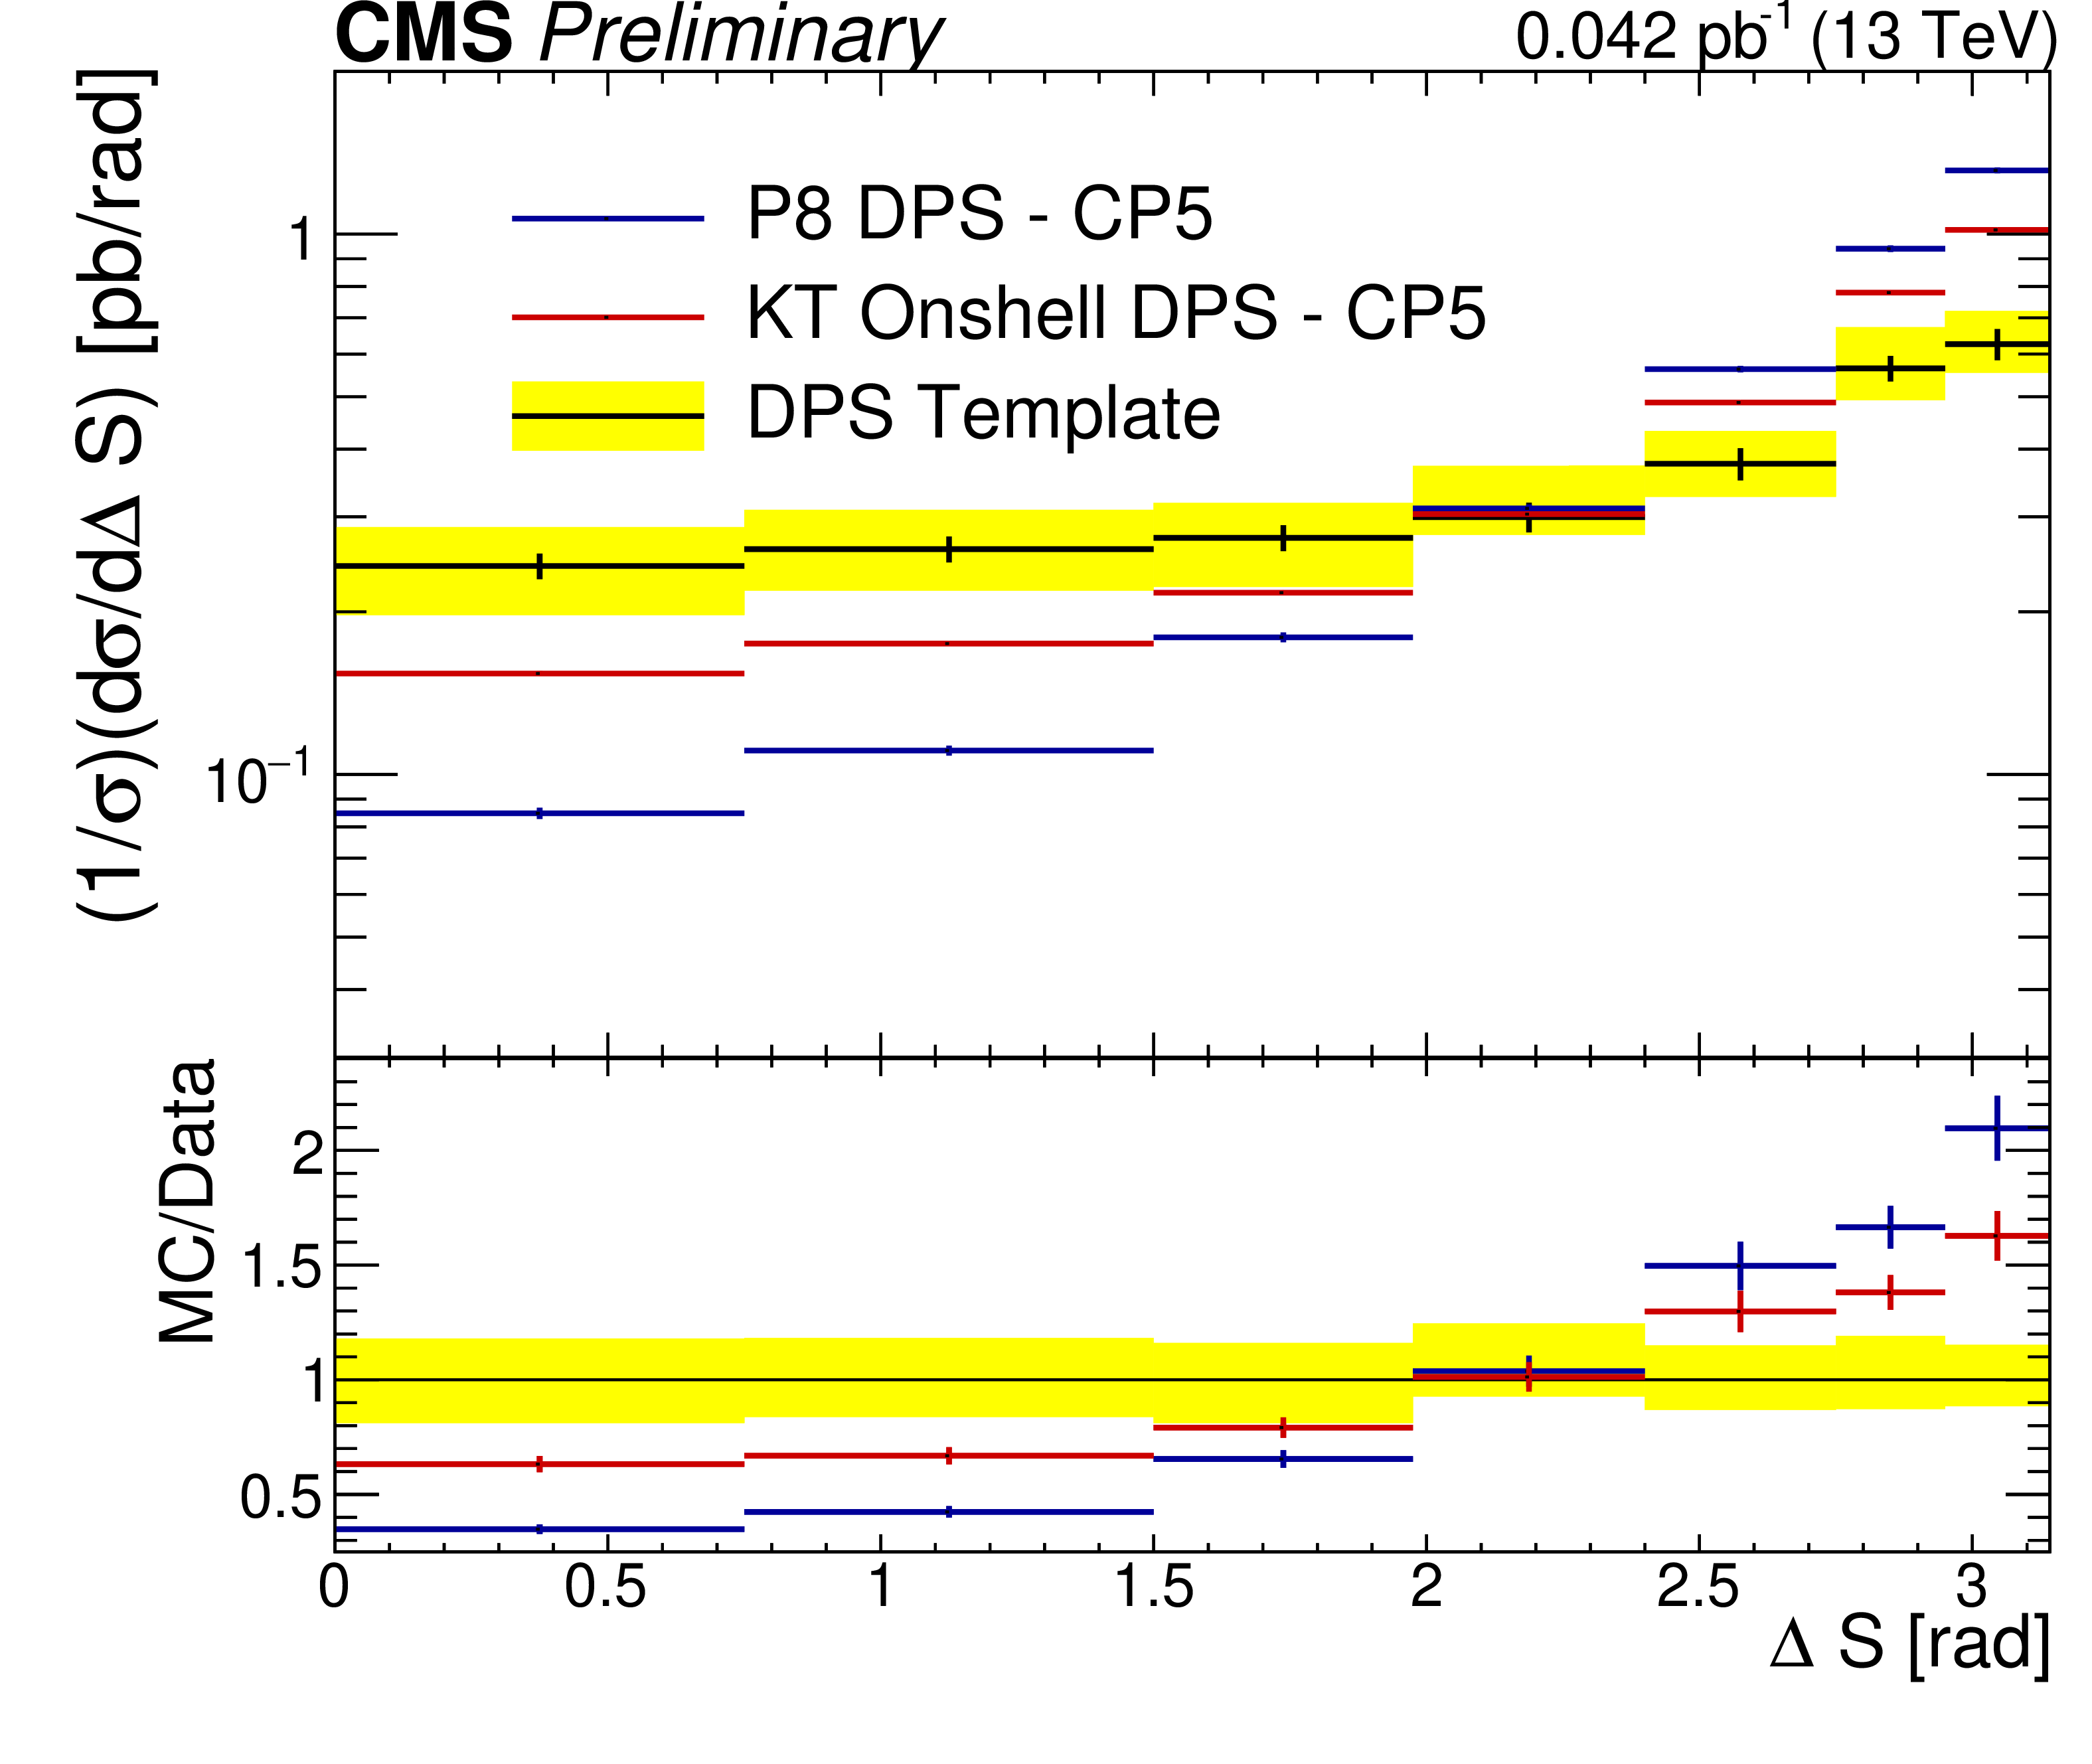
Figure 13:
The ${\Delta \mathrm {S}}$ distribution obtained from the mixed data sample compared to predictions from the DPS component in PYTHIA 8 and KATIE. The distributions are normalized to unity. The error bars represent the statistical uncertainty, while the yellow band indicates the total (statistical+systematic) uncertainty on the data. |
png pdf |
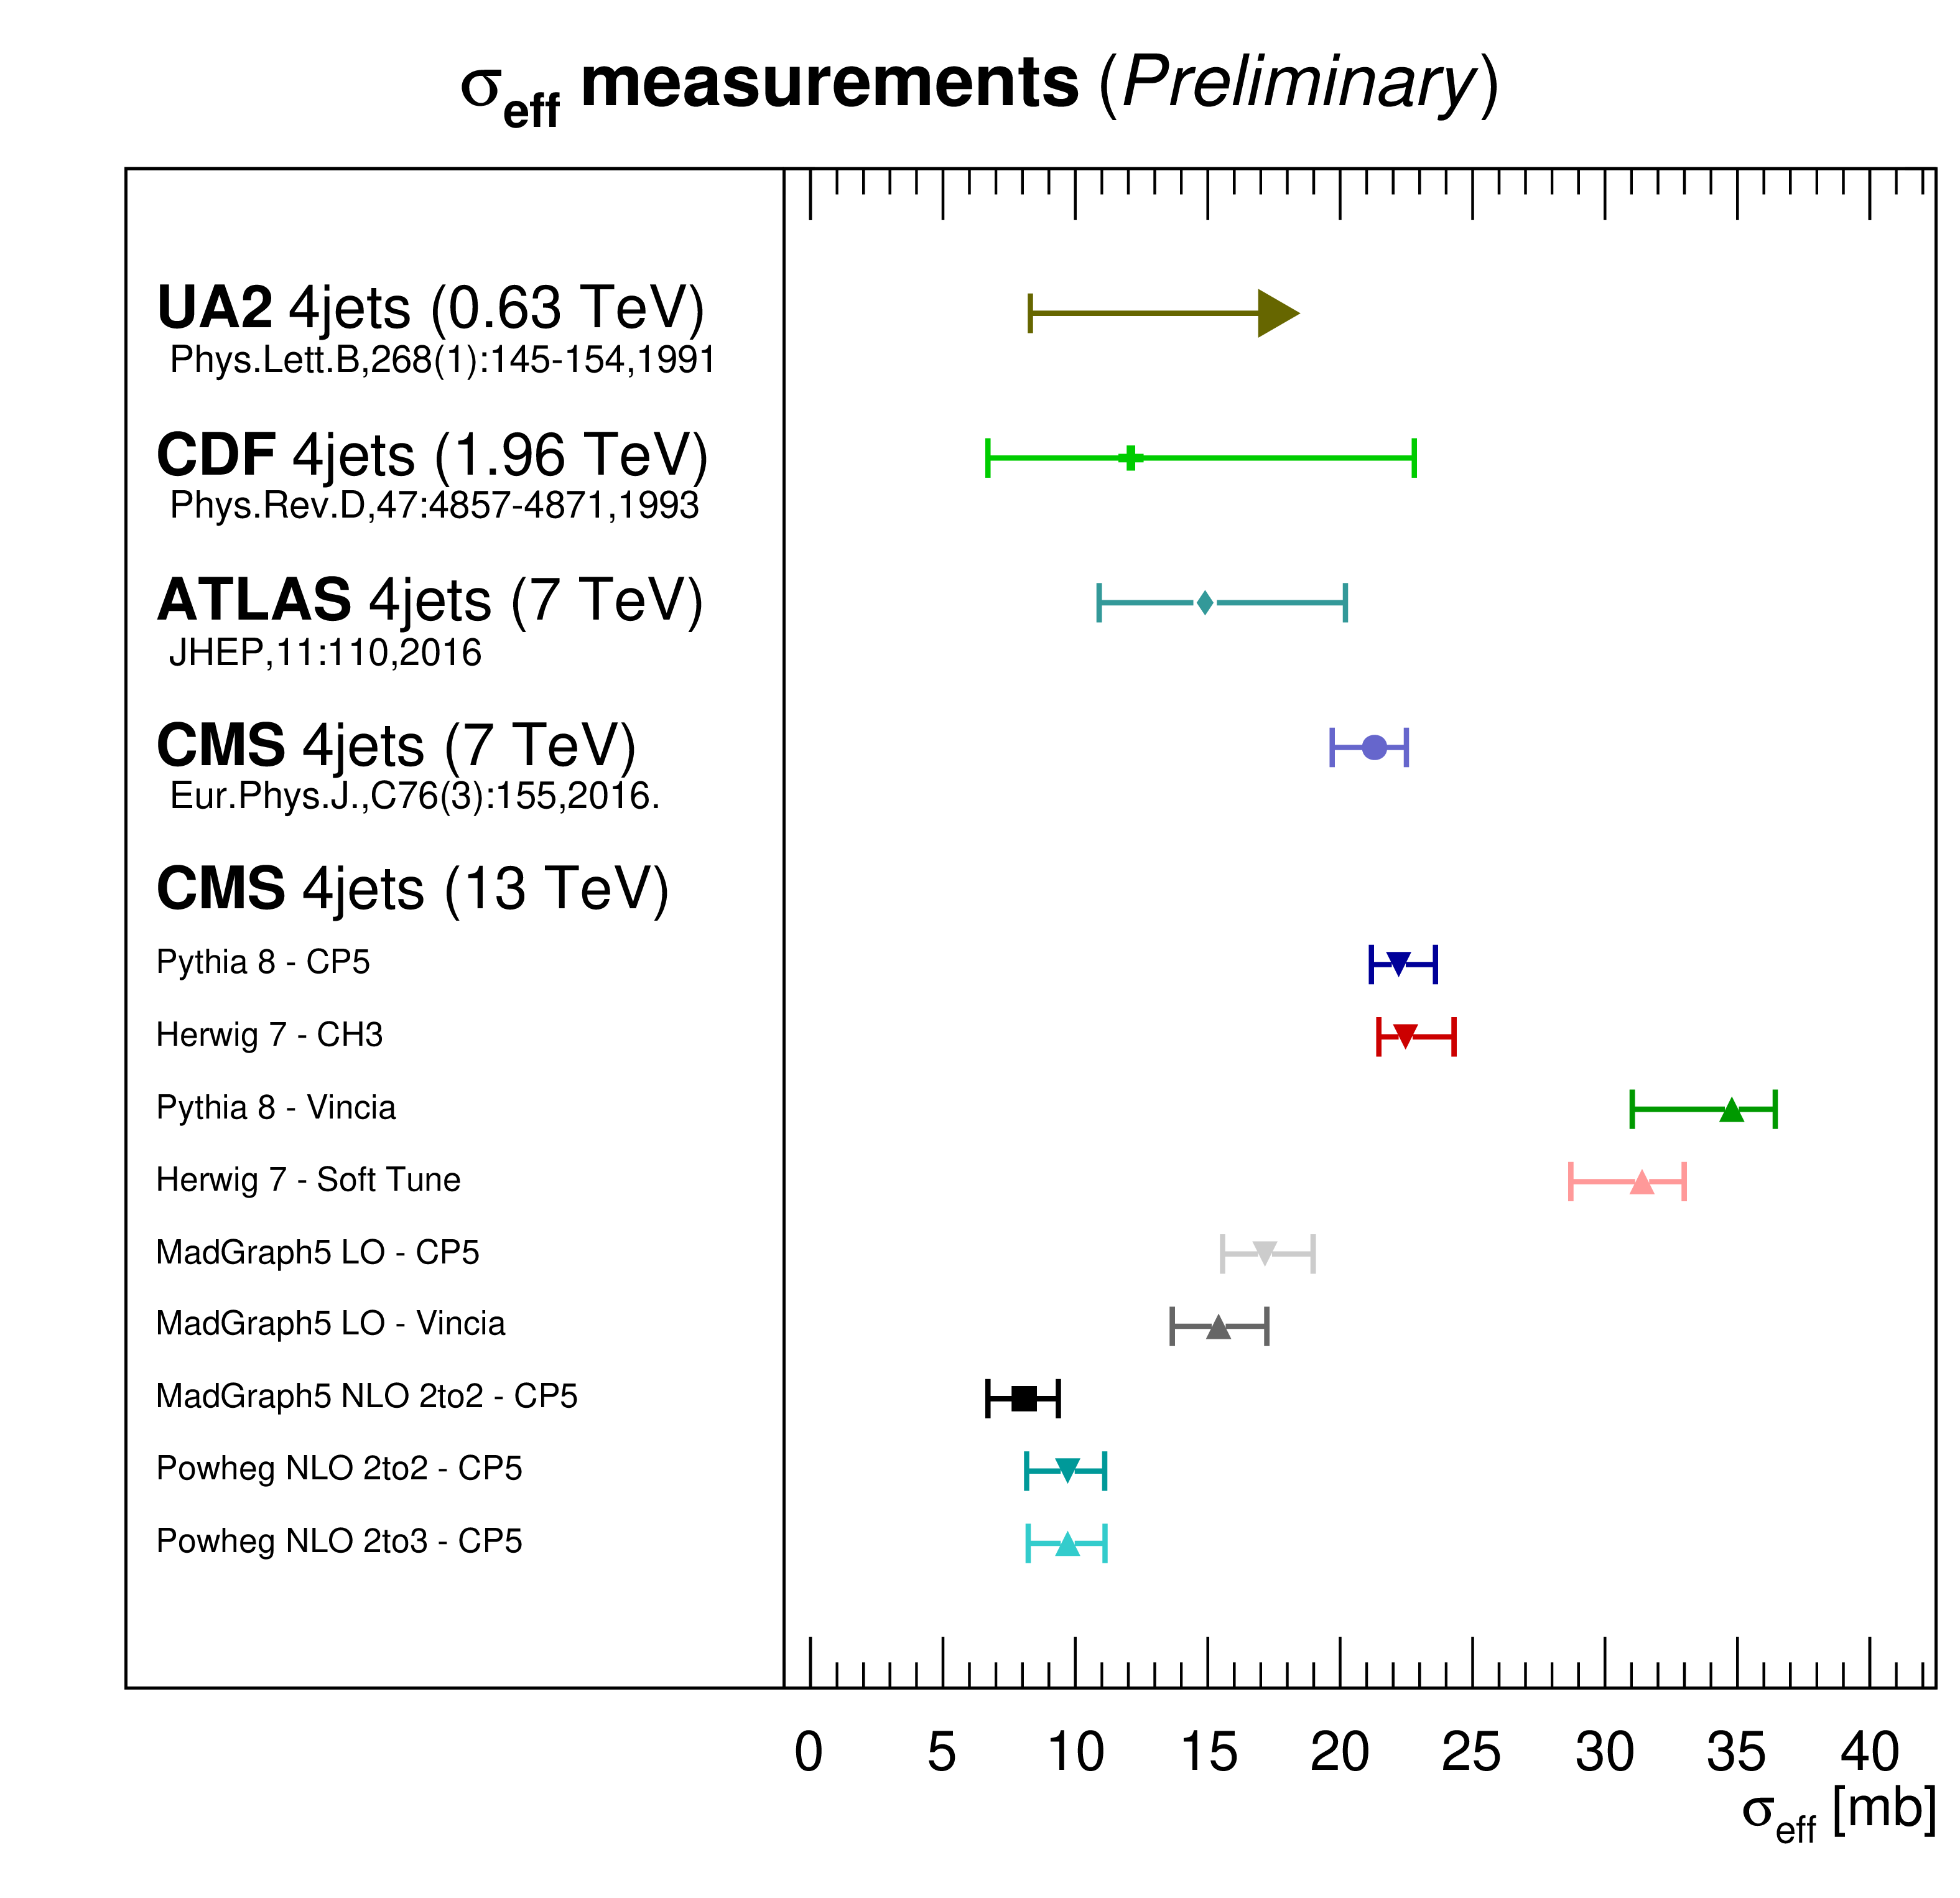
Figure 14:
Comparison of the values for ${\sigma _\mathrm {eff}}$ extracted from data using different SPS models, along with the results from four-jet measurements performed at lower center-of-mass energies [18,5,22,43]. |
png pdf |
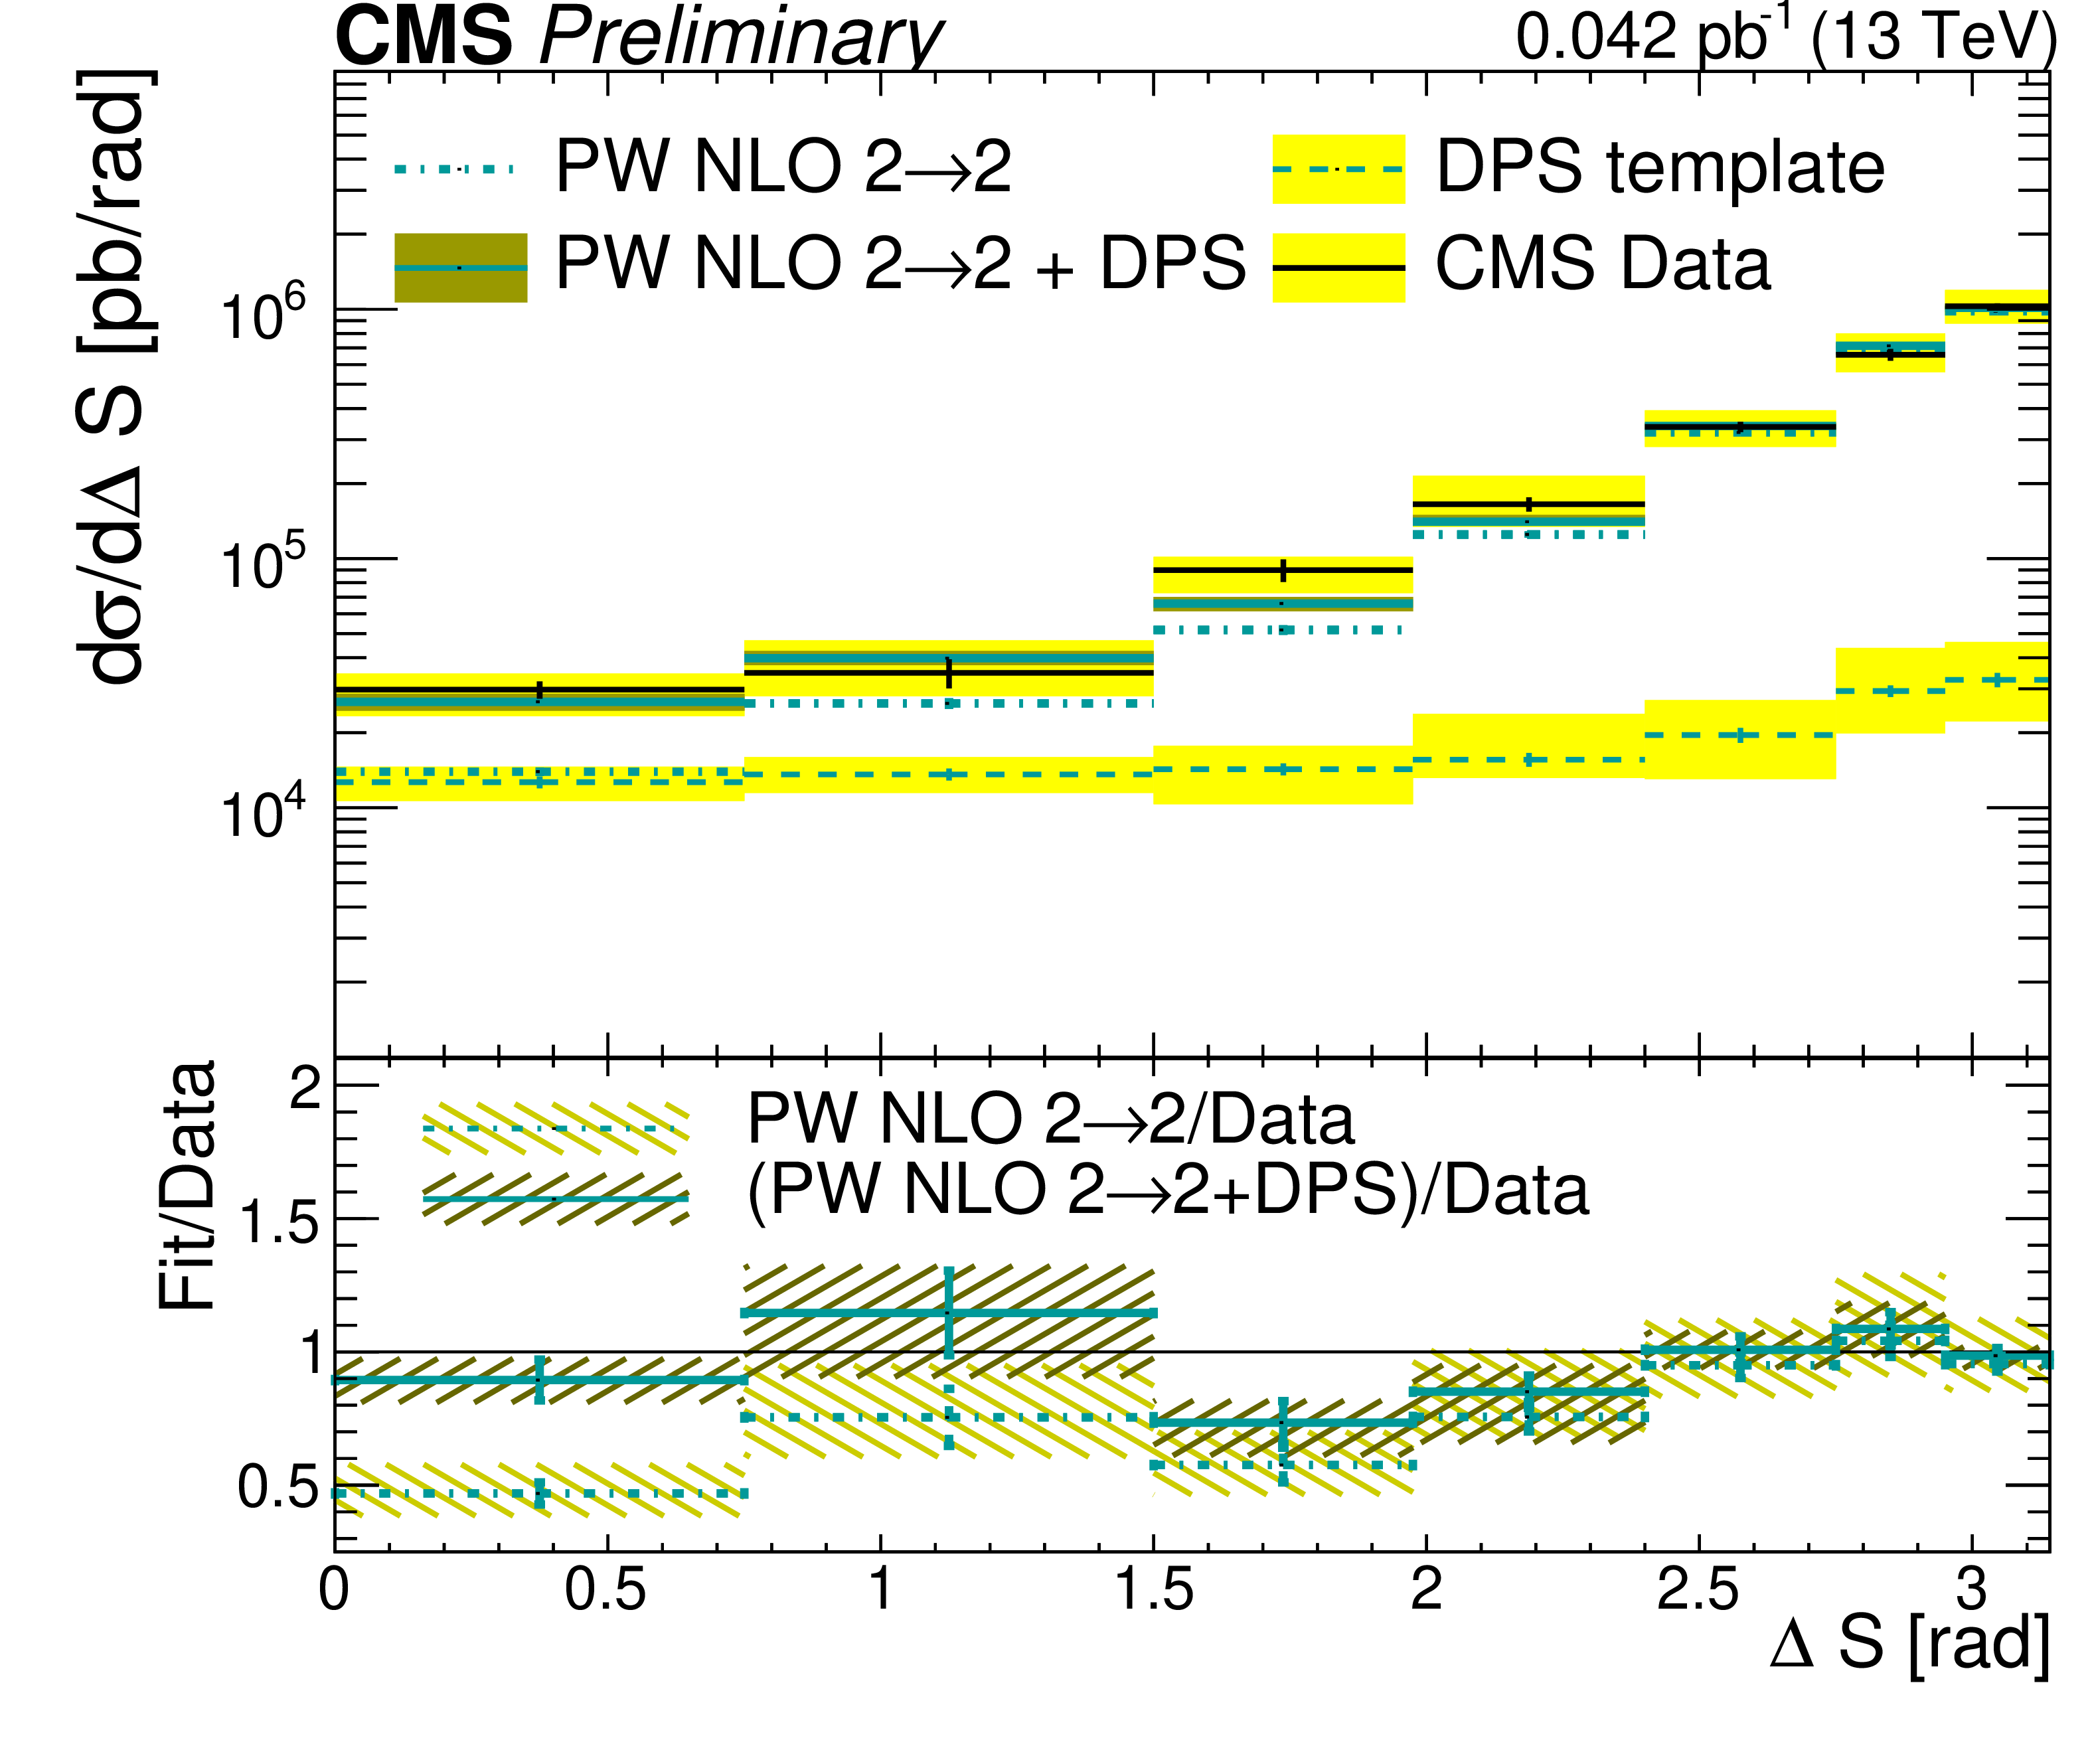
Figure 15:
The results of the template fit for the POWHEG (PW) NLO 2$\to $2 model. The yellow bands represent the total uncertainty of the distribution. In the ratio of the fitted MC model and of the total fitted result over the data are show in the bottom plot. As the ${\Delta \mathrm {S}_\mathrm {DPS}}$ carries a statistical and systematical uncertainty, so does the total fitted sample. The total uncertainty of the ratio is shown on the plot. |
| Tables | |
png pdf |
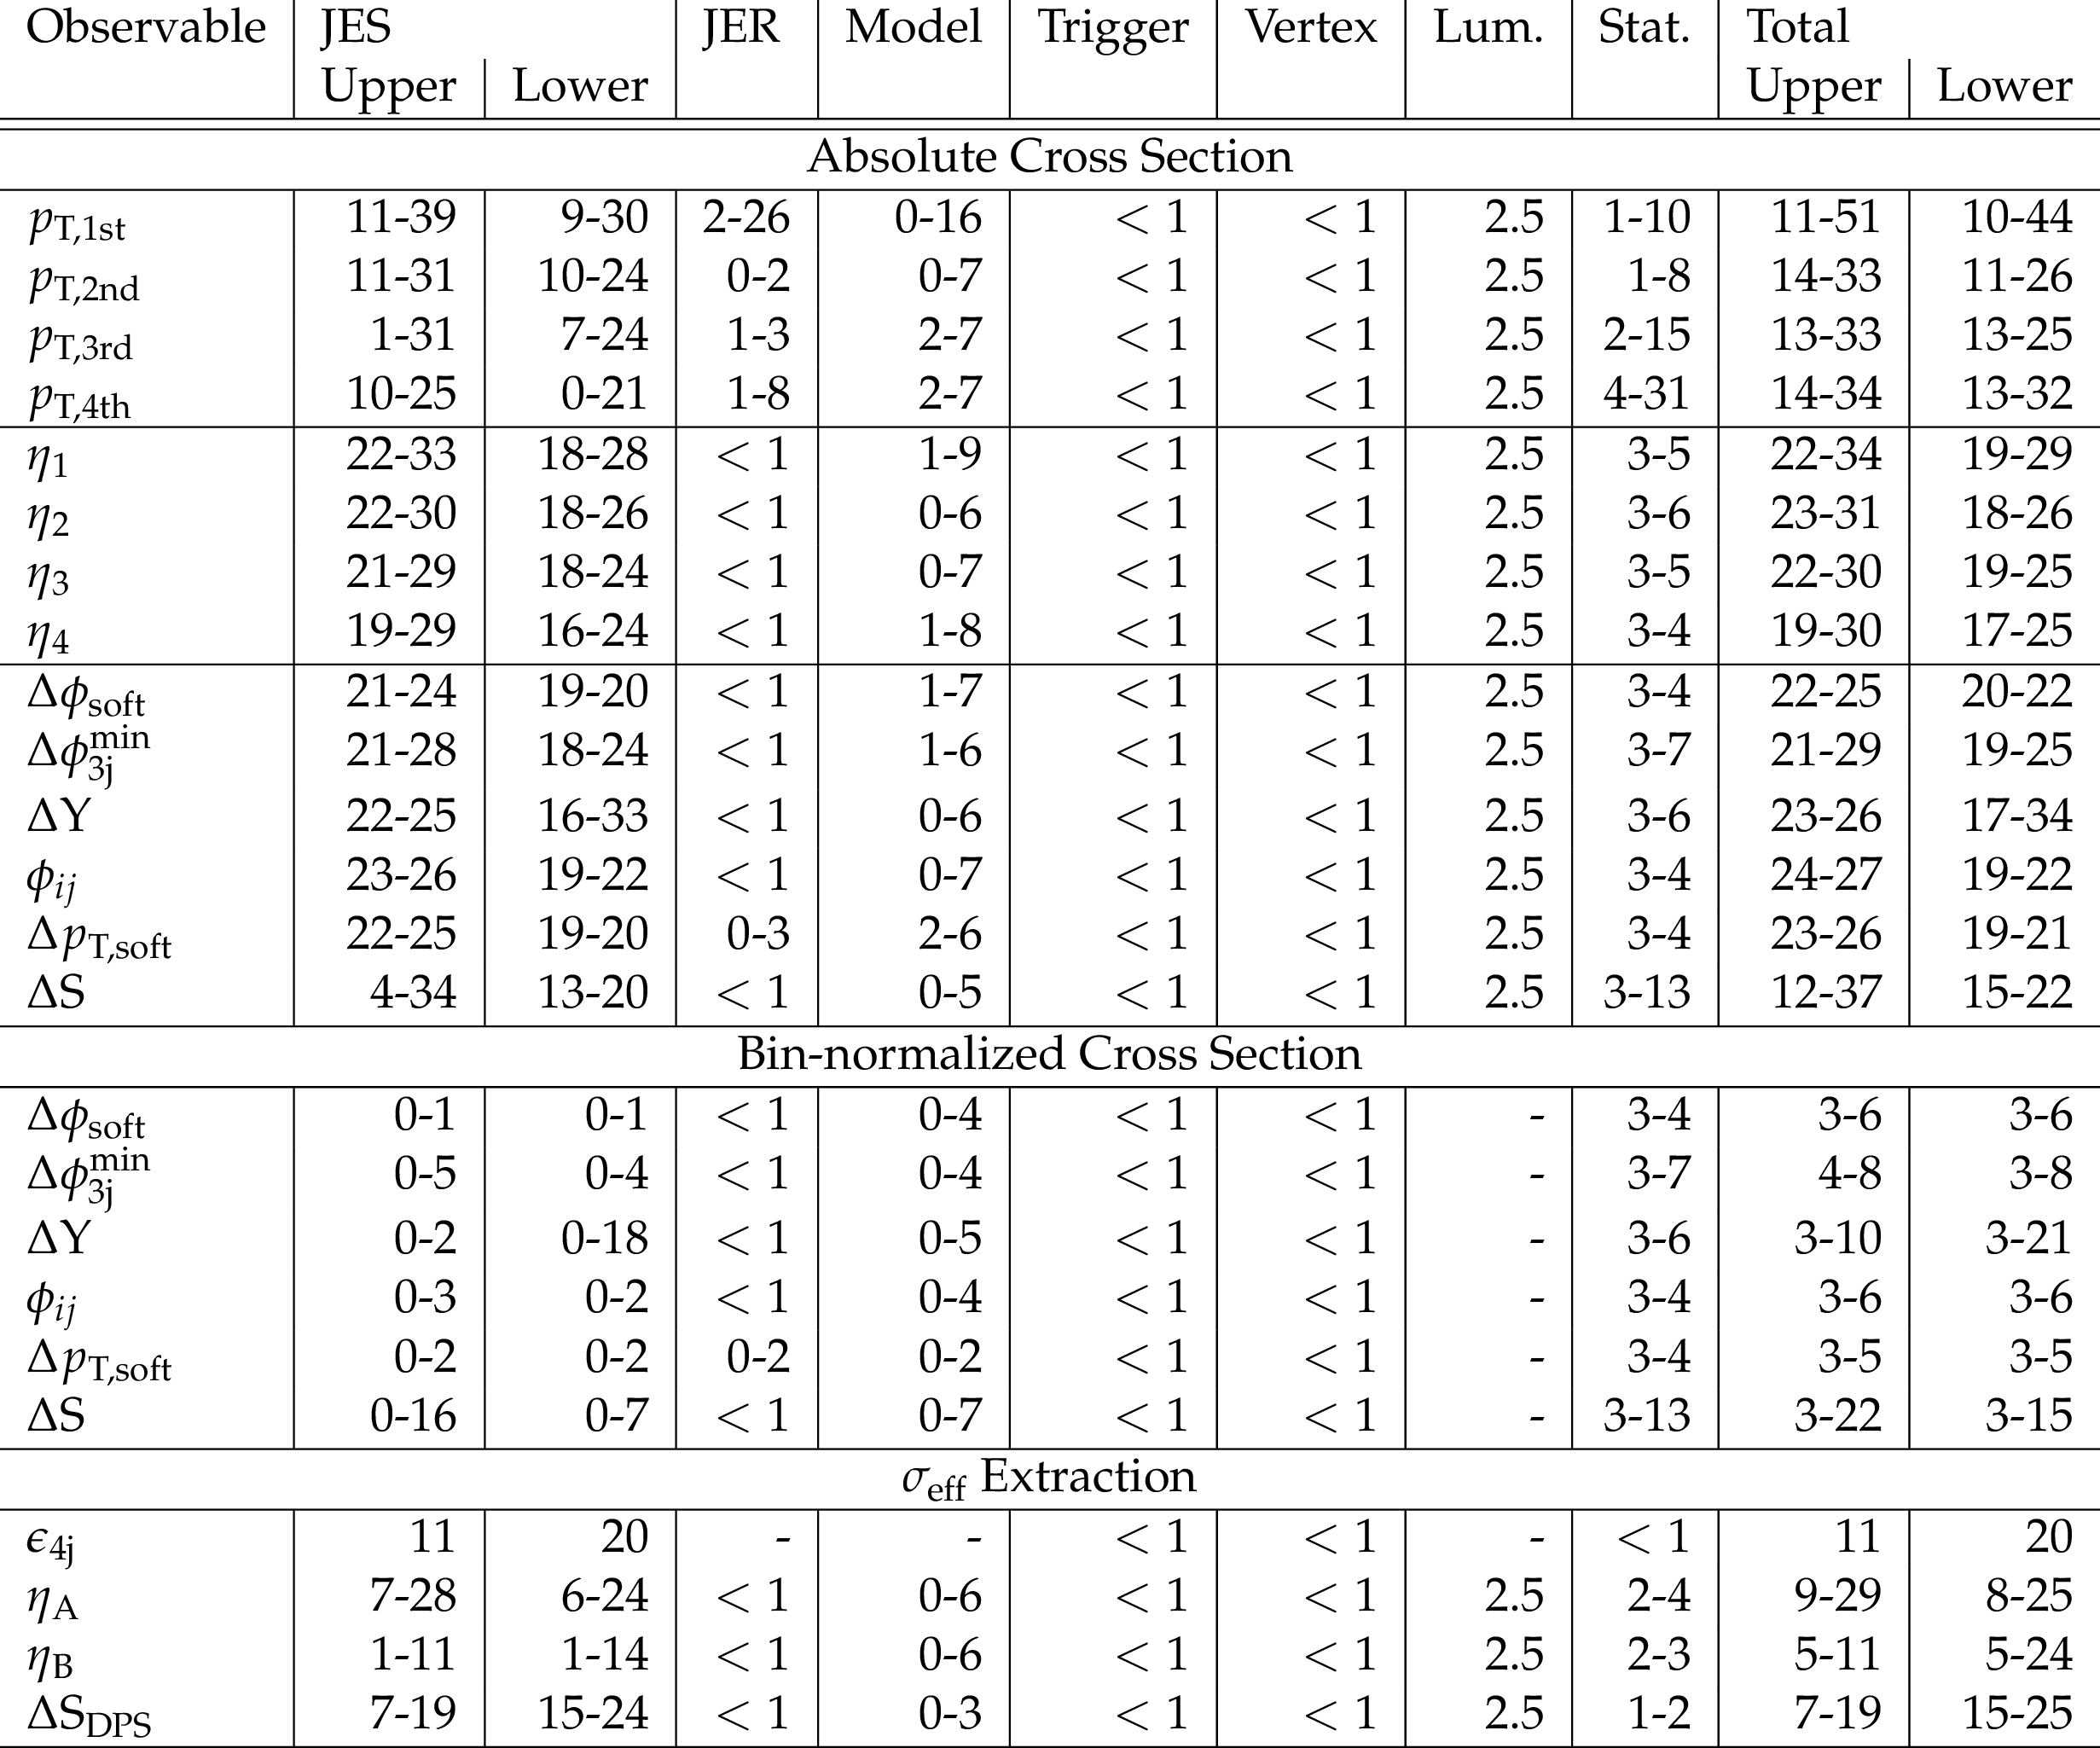
Table 1:
Systematic uncertainties, along with the statistical and the total uncertainties, in percent. The JES uncertainty leads to asymmetric errors, while all other systematic uncertainties as well as the statistical uncertainty are symmetric. An additional uncertainty on $\epsilon _{4j}$ due to possible differences between generator and detector level is estimated at 2%. |
png pdf |
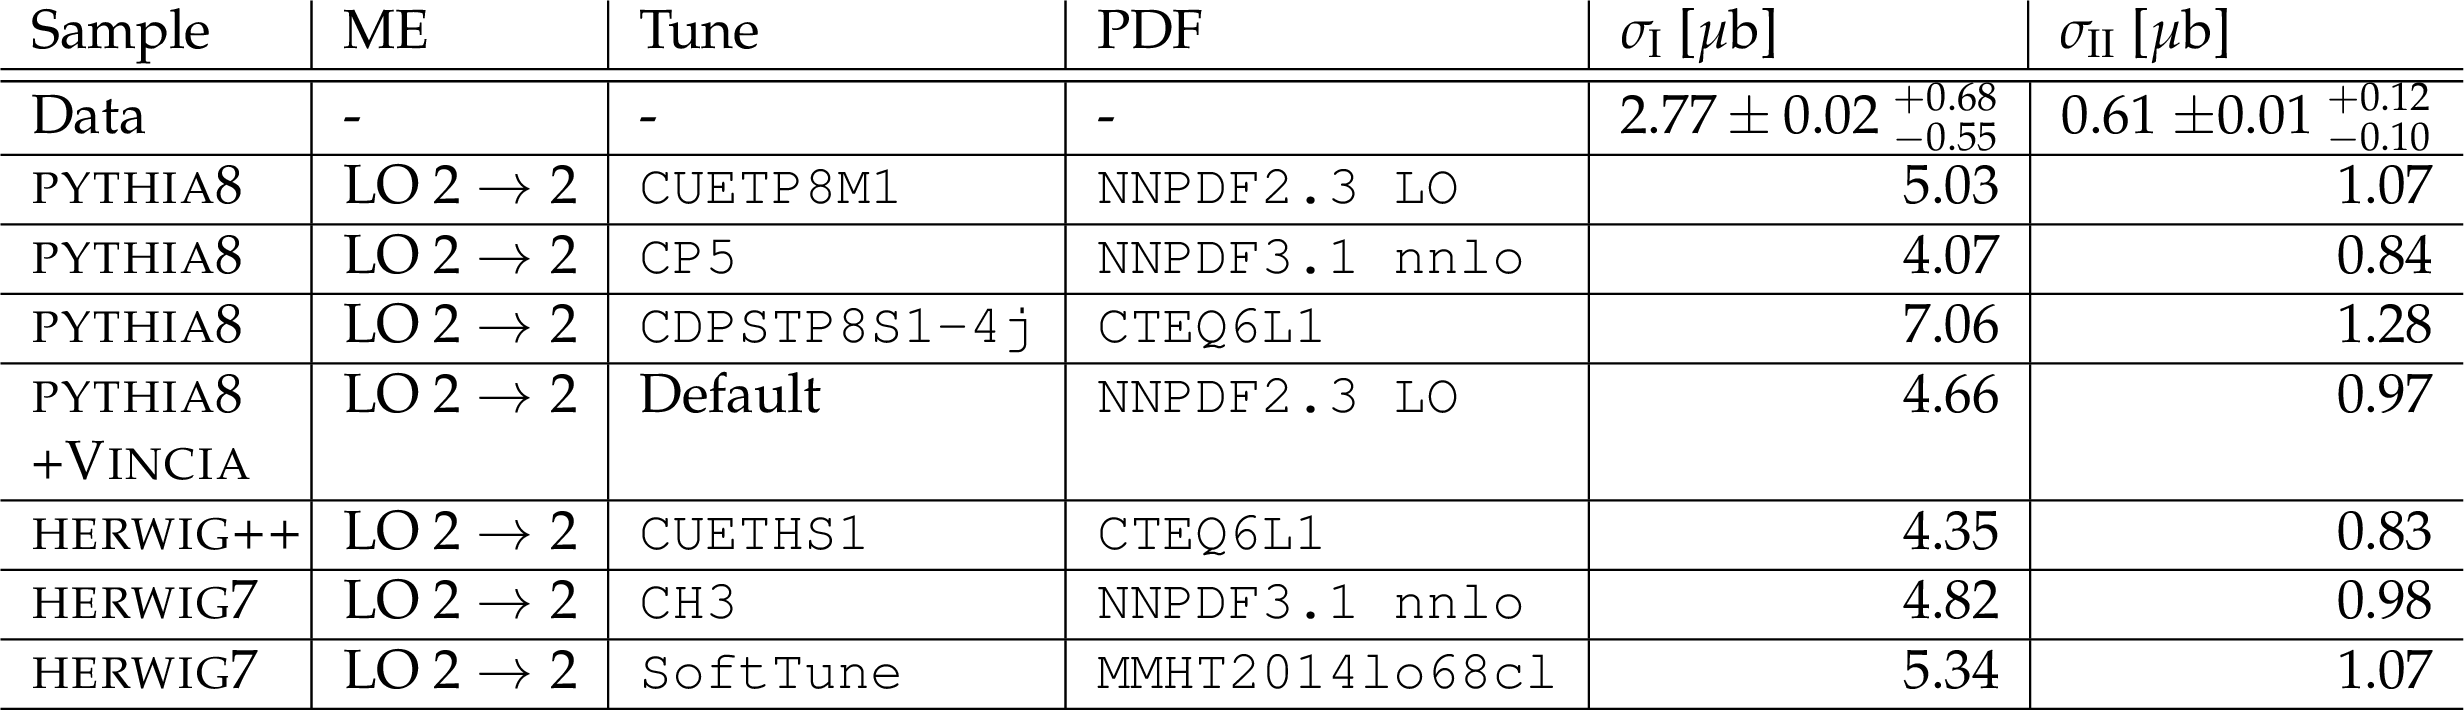
Table 2:
Cross sections obtained from data and from the PYTHIA 8, HERWIG++, and HERWIG 7 models in phase space region I and region II. |
png pdf |
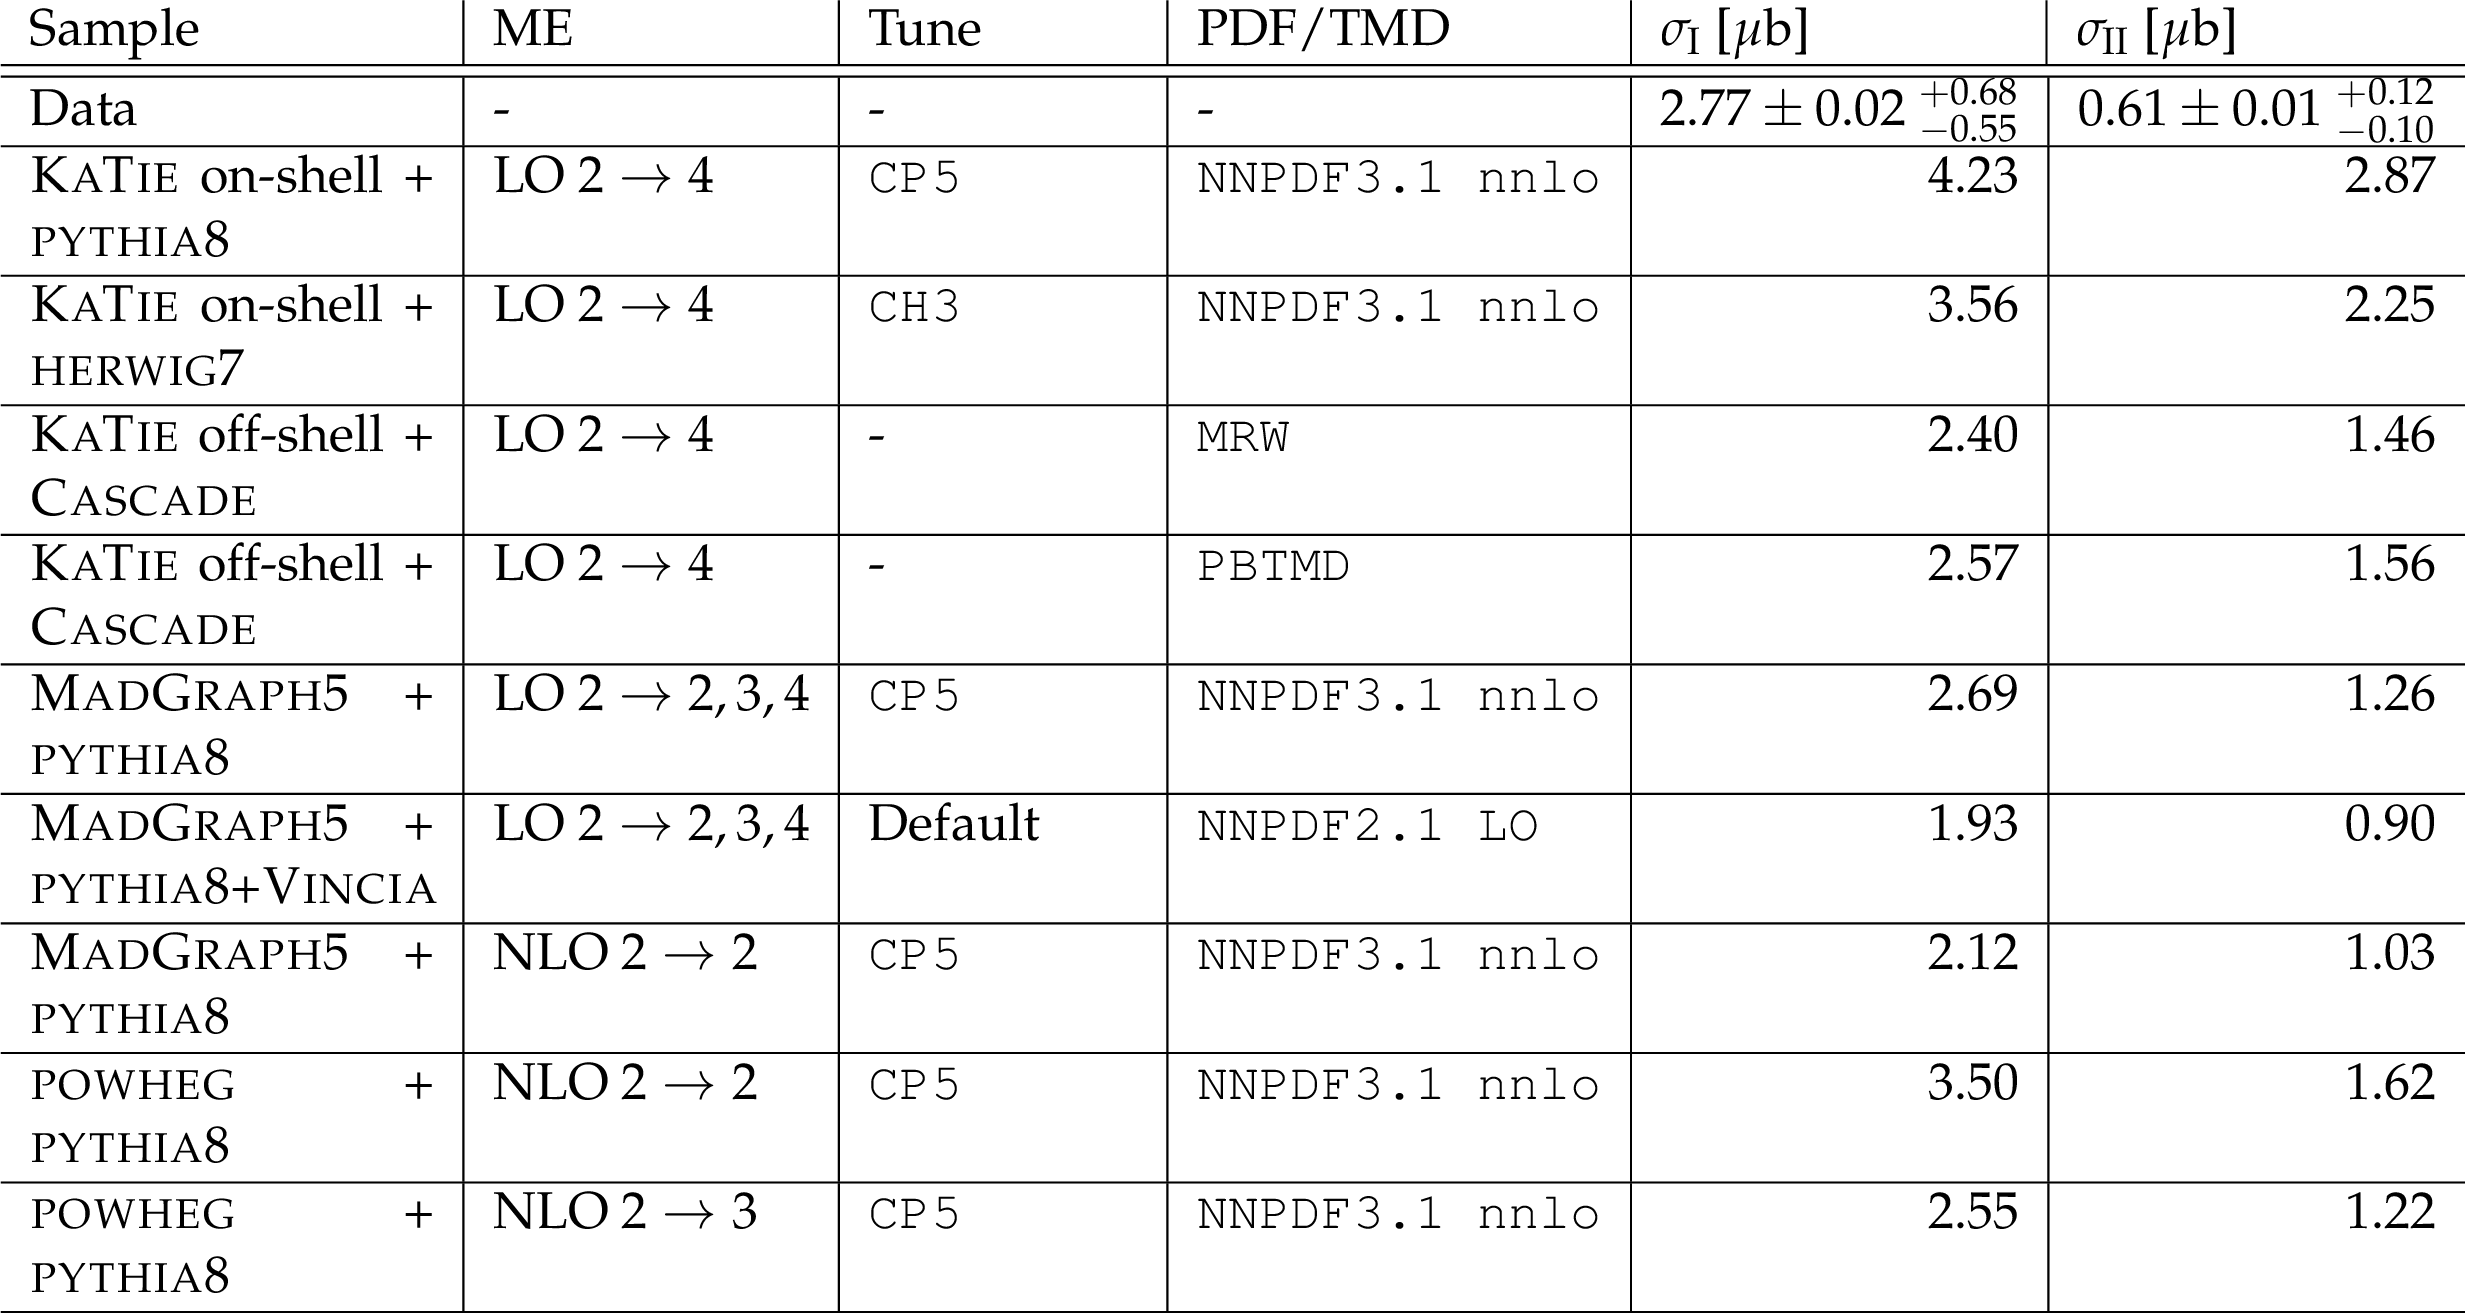
Table 3:
Cross sections obtained from data and from KATIE, MadGraph 5, and POWHEG in phase space region region I and region II. |
png pdf |
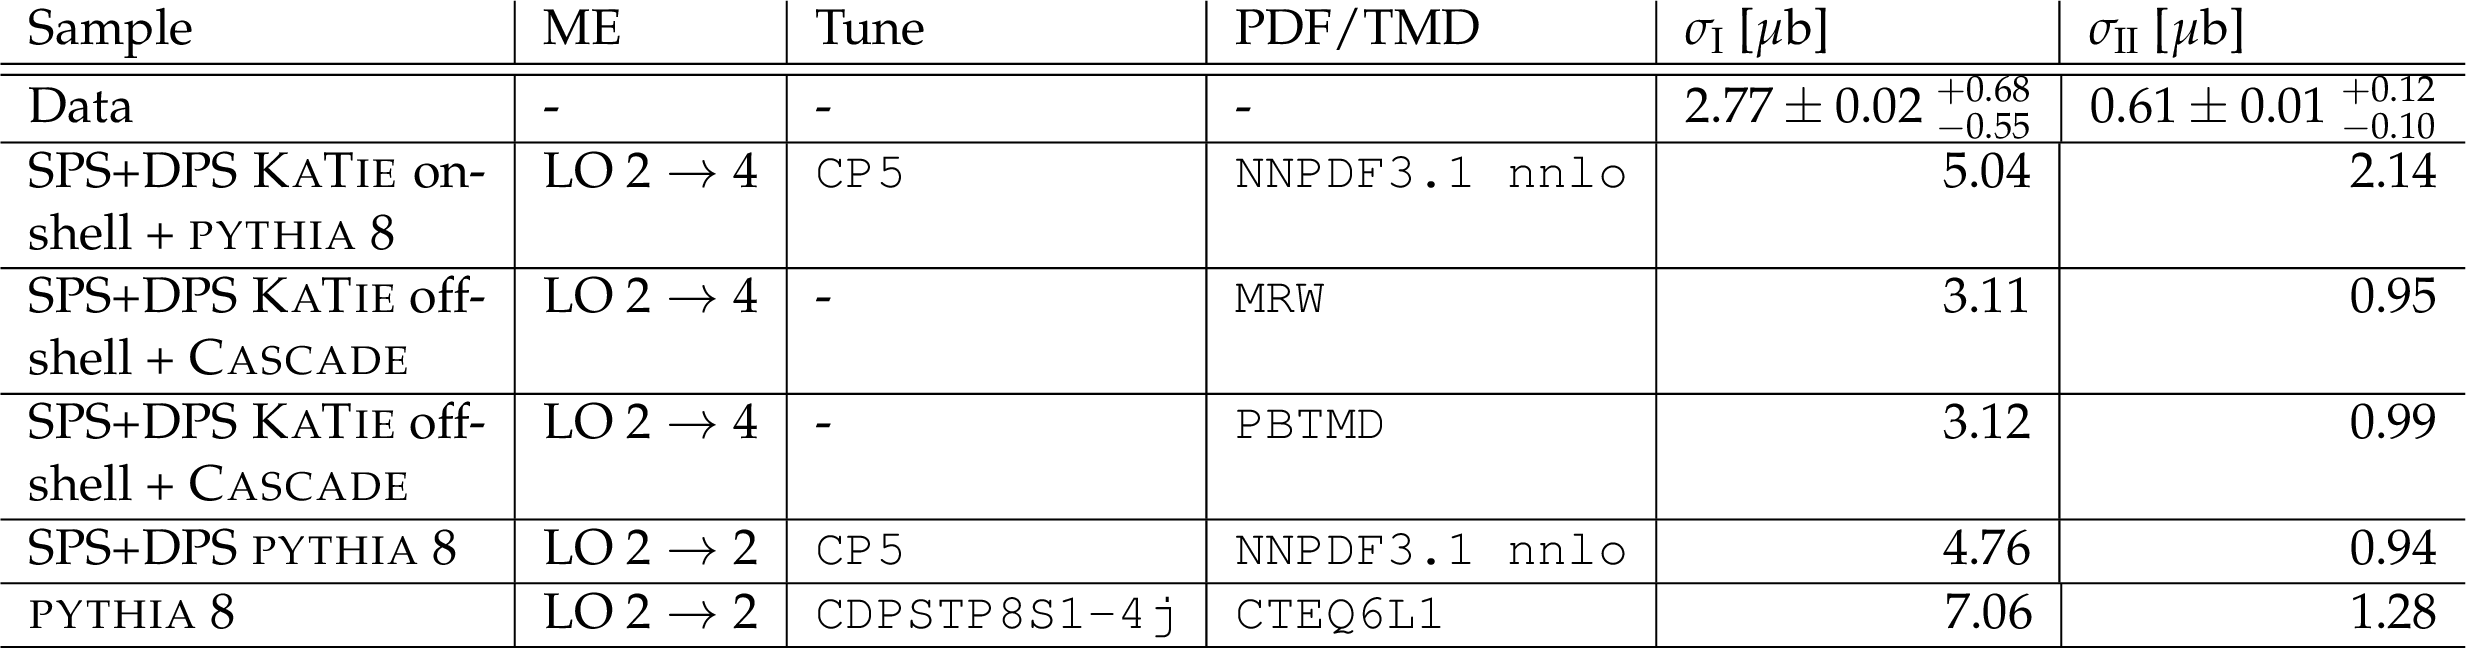
Table 4:
Cross sections obtained from data and from models with an explicit DPS contribution in phase space region I and region II. |
png pdf |
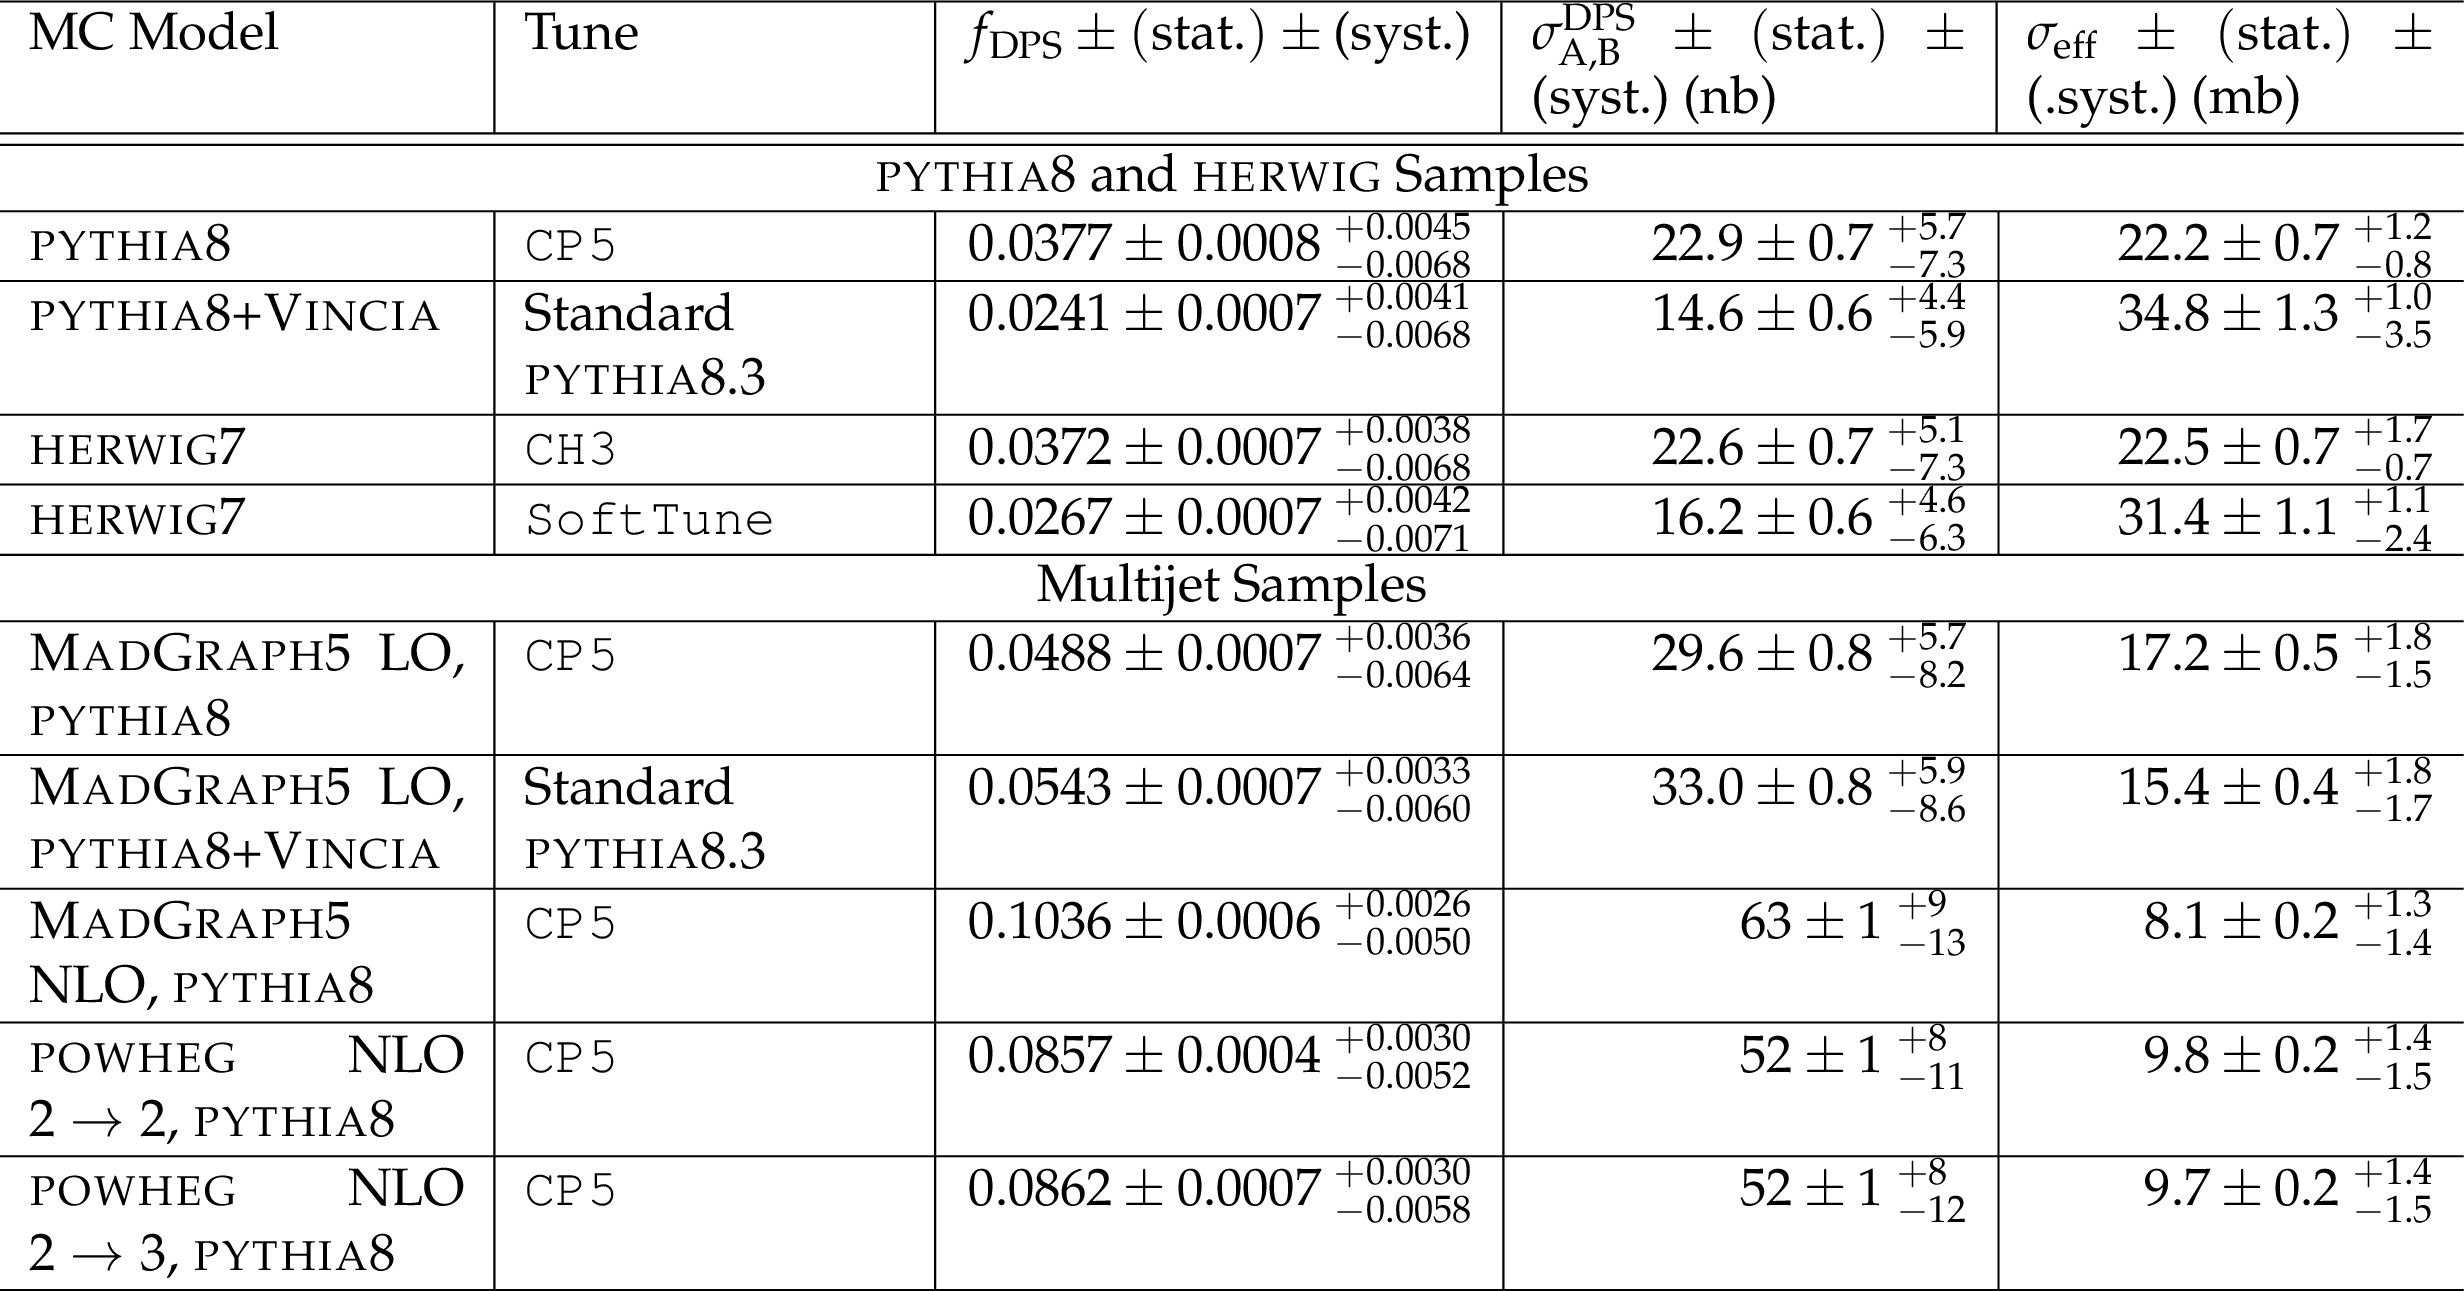
Table 5:
The values of the DPS fraction $f_\mathrm {DPS}$, the DPS cross section $\sigma _\mathrm {A,B}^\mathrm {DPS}$, and the effective cross section $\sigma _\mathrm {eff}$ extracted from data using different SPS models, along with their statistical and systematic uncertainties. |
| Summary |
|
A measurement of the inclusive production of four jet at low transverse momentum has been presented based on data from pp collisions collected with the CMS detector at a center-of-mass energy of $\sqrt{s}= $ 13 TeV. Various observables sensitive to double-parton scattering (DPS) have been studied and values for the effective cross section have been extracted. Models based on leading order (LO) 2$\to $2 matrix elements significantly overestimate the absolute four-jet cross section in the phase space domains studied in this note. This excess can be related to an abundance of low-${p_{\mathrm{T}}}$ and forward/backward jets. The predictions of the absolute cross section improve when next-to-leading order (NLO) and/or higher-multiplicity matrix elements are used, but not for all models and for all regions of phase space. The azimuthal-angle difference between the jets with the largest separation in pseudorapidity, $\phi_{ij}$, is found to have a strong discriminating power for different parton shower approaches and results from data favor the angular ordered/dipole antenna parton shower models over those with a ${p_{\mathrm{T}}}$-ordered shower. The yield of jet pairs with large rapidity separation $\Delta Y$ is however overestimated by all models, although models based on NLO and/or higher-multiplicity matrix elements are closer to the data. The distribution of the minimal combined azimuthal angular range of three jets, $\Delta \phi^{\text{min}}_{3j}$, also exhibits sensitivity to the parton shower implementation, with data favoring ${p_{\mathrm{T}}}$-ordered showers with the LO 2$\to $2 models for this observable. In the case of models based on NLO and/or higher-multiplicity matrix elements the distributions are less conclusive. Other observables, such as the azimuthal-angle difference between the two softest jets, $\Delta \phi_{\text{soft}}$, and their transverse momentum balance, $\Delta p_{\mathrm{T},\text{soft}}$, indicate the need for a DPS contribution in the models to various degrees, as confirmed by the extracted values of ${\sigma_\mathrm{eff}} $. The distribution of the azimuthal-angle separation between the hard and soft jet pairs, $\Delta S$, is found to be the most insensitive to the details of the parton shower modeling and is used for the extraction of the effective cross section, ${\sigma_\mathrm{eff}} $. A strong dependence of the extracted values of ${\sigma_\mathrm{eff}}$ on the model used to the describe the SPS contribution is observed. Models based on NLO 2$\to $2 or 2$\to $3 matrix elements yield the smallest ($\sim $10 mb) values of ${\sigma_\mathrm{eff}} $ and need the largest DPS contribution. Including 4 partons in the matrix element calculation of the SPS model introduces DPS-like correlations in the distributions of DPS-sensitive observables and yields values of ${\sigma_\mathrm{eff}}$ around 15 mb. The largest values of ${\sigma_\mathrm{eff}} $ ($\gtrsim $ 20 mb) are found for the models based on LO 2$\to $2 models with dedicated tunes of the parameters controlling the parton shower and multiple-parton interactions modeling. These results demonstrate the need for further development of models in order to accurately describe final states with multiple jets and the kinematic correlations between the jets. |
| References | ||||
| 1 | CMS Collaboration | Measurement of the ratio of inclusive jet cross sections using the anti-$ k_T $ algorithm with radius parameters R = 0.5 and 0.7 in pp collisions at $ \sqrt{s}= $ 7 TeV | CMS-SMP-13-002, CERN-PH-EP-2014-068 | CMS-SMP-13-002 1406.0324 |
| 2 | CMS Collaboration | Measurement and QCD analysis of double-differential inclusive jet cross sections in pp collisions at $ \sqrt{s}= $ 8 TeV and cross section ratios to 2.76 and 7 TeV | JHEP 03 (2017) 156 | CMS-SMP-14-001 1609.05331 |
| 3 | CMS Collaboration | Measurement of the double-differential inclusive jet cross section in proton-proton collisions at $ \sqrt{s} = $ 13 TeV | EPJC. 76 (2016) 451 | CMS-SMP-15-007 1605.04436 |
| 4 | CDF Collaboration | Measurement of double parton scattering in $ \mathrm{\overline{p}p} $ collisions at $ \sqrt{\mathit{s}}\phantom{\rule{0ex}{0ex}}=\phantom{\rule{0ex}{0ex}}1.8 \mathrm{TeV} $ | PRL 79 (1997) 584 | |
| 5 | CDF Collaboration | Double parton scattering in $ \mathrm{\overline{p}p} $ collisions at $ \sqrt{s}= $ 1.8 TeV | PRD 56 (1997) 3811 | |
| 6 | D0 Collaboration | Double parton interactions in $ {\gamma}+3 $ jet events in $ \mathrm{p\overline{p}} $ collisions at $ \sqrt{s}=1.96\text{}\text{}\mathrm{TeV} $ | PRD 81 (2010) 052012 | 0912.5104 |
| 7 | D0 Collaboration | Double parton interactions in $ \gamma+3 $ jet and $ \gamma+\mathrm{b/c jet}+2 $ jet events in $ \mathrm{p \bar p} $ collisions at $ \sqrt s= $ 1.96 TeV | PRD 89 (2014) 072006 | 1402.1550 |
| 8 | D0 Collaboration | Study of double parton interactions in diphoton + dijet events in $ \mathrm{p\bar{p}} $ collisions at $ \sqrt{s} = $ 1.96 TeV | PRD 93 (2016) 052008 | 1512.05291 |
| 9 | ATLAS Collaboration | Measurement of hard double-parton interactions in $ \mathrm{W}(\to \mathrm{l}\nu) $+ 2 jet events at $ \sqrt{s} = $ 7 TeV with the ATLAS detector | New J. Phys. 15 (2013) 033038 | 1301.6872 |
| 10 | CMS Collaboration | Study of double parton scattering using W + 2-jet events in proton-proton collisions at $ \sqrt{s} = $ 7 TeV | JHEP 03 (2014) 032 | CMS-FSQ-12-028 1312.5729 |
| 11 | CMS Collaboration | Constraints on the double-parton scattering cross section from same-sign W boson pair production in proton-proton collisions at $ \sqrt{s}= $ 8 TeV | JHEP 02 (2018) 032 | CMS-FSQ-16-005 1712.02280 |
| 12 | CMS Collaboration | Evidence for WW production from double-parton interactions in proton-proton collisions at $ \sqrt{s} = $ 13 TeV | EPJC 80 (2020) 41 | CMS-SMP-18-015 1909.06265 |
| 13 | LHCb Collaboration | Observation of double charm production involving open charm in pp collisions at $ \sqrt{s} = $ 7 TeV | JHEP 06 (2012) 141 | 1205.0975 |
| 14 | LHCb Collaboration | Observation of associated production of a Z boson with a D meson in the forward region | JHEP 04 (2014) 091 | 1401.3245 |
| 15 | D0 Collaboration | Observation and studies of double $ \mathrm{J}/ {\psi} $ production at the tevatron | PRD 90 (2014) 111101 | |
| 16 | LHCb Collaboration | Production of associated Y and open charm hadrons in pp collisions at $ \sqrt{s}= $ 7 and 8 TeV via double parton scattering | JHEP 07 (2016) 052 | 1510.05949 |
| 17 | LHCb Collaboration | Measurement of the J/$ \psi $ pair production cross-section in pp collisions at $ \sqrt{s}= $ 13 TeV | JHEP 06 (2017) 047 | 1612.07451 |
| 18 | J. Alitti et al. | A study of multi-jet events at the CERN pp collider and a search for double parton scattering | PLB 268 (1991) 145 | |
| 19 | CDF Collaboration | Study of four-jet events and evidence for double parton interactions in $ \mathrm{p\bar{p}} $ collisions at $ \sqrt{s} = $ 1.8 TeV | PRD 47 (1993) 4857 | |
| 20 | ATLAS Collaboration | Measurement of four-jet differential cross sections in $ \sqrt{s}= $ 8 TeV proton-proton collisions using the ATLAS detector | JHEP 12 (2015) 105 | 1509.07335 |
| 21 | I. Sadeh | PhD thesis, Tel Aviv U., 2013-01-01 | 1308.0587 | |
| 22 | ATLAS Collaboration | Study of hard double-parton scattering in four-jet events in pp collisions at $ \sqrt{s}= $ 7 TeV with the ATLAS experiment | JHEP 11 (2016) 110 | 1608.01857 |
| 23 | CMS Collaboration | Measurement of four-jet production in proton-proton collisions at $ \sqrt{s}= $ 7 TeV | PRD 89 (2014) 092010 | CMS-FSQ-12-013 1312.6440 |
| 24 | CMS Collaboration | Studies of inclusive four-jet production with two $ \mathrm{b} $-tagged jets in proton-proton collisions at 7 TeV | PRD 94 (2016) 112005 | CMS-FSQ-13-010 1609.03489 |
| 25 | S. Domdey, H.-J. Pirner, and U. A. Wiedemann | Testing the scale dependence of the scale factor $ \sigma_\mathrm{eff} $ in double dijet production at the LHC | EPJC 65 (2010) 153 | 0906.4335 |
| 26 | E. L. Berger, C. B. Jackson, and G. Shaughnessy | Characteristics and estimates of double parton scattering at the Large Hadron Collider | PRD 81 (2010) 014014 | 0911.5348 |
| 27 | R. Maciula and A. Szczurek | Searching for and exploring double-parton scattering effects in four-jet production at the LHC | PLB 749 (2015) 57 | 1503.08022 |
| 28 | K. Kutak et al. | Four-jet production in single- and double-parton scattering within high-energy factorization | JHEP 04 (2016) 175 | 1602.06814 |
| 29 | K. Kutak | Four-jet production in single- and double-parton scattering within high-energy factorization | PoS ICHEP2016 (2016) 610 | 1701.00410 |
| 30 | K. Kutak et al. | Search for optimal conditions for exploring double-parton scattering in four-jet production: $ k_T $-factorization approach | PRD 94 (2016) 014019 | 1605.08240 |
| 31 | CMS Collaboration | Particle-flow reconstruction and global event description with the CMS detector | JINST 12 (2017) P10003 | CMS-PRF-14-001 1706.04965 |
| 32 | M. Cacciari, G. P. Salam, and G. Soyez | The anti-$ k_t $ jet clustering algorithm | JHEP 04 (2008) 063 | 0802.1189 |
| 33 | M. Cacciari, G. P. Salam, and G. Soyez | FastJet user manual | EPJC 72 (2012) 1896 | 1111.6097 |
| 34 | CMS Collaboration | Jet energy scale and resolution in the CMS experiment in pp collisions at 8 TeV | JINST 12 (2017) P02014 | CMS-JME-13-004 1607.03663 |
| 35 | CMS Collaboration | The CMS experiment at the CERN LHC | JINST 3 (2008) S08004 | CMS-00-001 |
| 36 | T. Sjostrand, S. Mrenna, and P. Z. Skands | PYTHIA 6.4 physics and manual | JHEP 05 (2006) 026 | hep-ph/0603175 |
| 37 | T. Sjostrand, S. Mrenna, and P. Z. Skands | A brief introduction to PYTHIA 8.1 | CPC 178 (2008) 852 | 0710.3820 |
| 38 | M. Bahr et al. | Herwig++ physics and manual | EPJC 58 (2008) 639 | 0803.0883 |
| 39 | Bellm, Johannes and Gieseke, Stefan and Grellscheid, David and Platzer, Simon and Rauch, Michael and Reuschle, Christian and Richardson, Peter and Schichtel, Peter and Seymour, Michael H. and Si\'odmok, Andrzej and Wilcock, Alexandra and Fischer, Nadine and Harrendorf, Marco A. and Nail, Graeme and Papaefstathiou, Andreas and Rauch, Daniel | Herwig 7.0 / Herwig++ 3.0 release note | EPJC 76 (2015) 196 | 1512.0117 |
| 40 | B. Andersson, G. Gustafson, G. Ingelman, and T. Sjostrand | Parton fragmentation and string dynamics | Phys. Rep. 97 (1983) 31 | |
| 41 | D. Amati and G. Veneziano | Preconfinement as a property of perturbative QCD | PLB 83 (1979) 87 | |
| 42 | P. Skands, S. Carrazza, and J. Rojo | Tuning PYTHIA 8.1: the Monash 2013 tune | EPJC 74 (2014) 3024 | 1404.5630 |
| 43 | CMS Collaboration | Event generator tunes obtained from underlying event and multiparton scattering measurements | EPJC 76 (2016) 155 | CMS-GEN-14-001 1512.00815 |
| 44 | CMS Collaboration | Extraction and validation of a new set of CMS PYTHIA8 tunes from underlying-event measurements | EPJC 80 (2020) 4 | CMS-GEN-17-001 1903.12179 |
| 45 | NNPDF Collaboration | Parton distributions from high-precision collider data | EPJC 77 (2017) 663 | 1706.00428 |
| 46 | S. Agostinelli et al. | Geant4 - a simulation toolkit | NIMA 506 (2003) 250 | |
| 47 | R. Corke and T. Sjostrand | Interleaved parton showers and tuning prospects | JHEP 03 (2011) 032 | 1011.1759 |
| 48 | J. Pumplin et al. | New generation of parton distributions with uncertainties from global QCD analysis | JHEP 07 (2002) 012 | hep-ph/0201195 |
| 49 | N. Fischer, S. Prestel, M. Ritzmann, and P. Skands | VINCIA for hadron colliders | EPJC 76 (2016) 589 | 1605.06142 |
| 50 | L. A. Harland-Lang, A. D. Martin, P. Motylinski, and R. S. Thorne | Parton distributions in the LHC era: MMHT 2014 PDFs | EPJC 75 (2015) 204 | 1412.3989 |
| 51 | CMS Collaboration | Development and validation of HERWIG 7 tunes from CMS underlying-event measurements | Submitted to EPJC | CMS-GEN-19-001 2011.03422 |
| 52 | H. Jung et al. | The CCFM Monte Carlo generator CASCADE version 2.2.03 | EPJC 70 (2010) 1237 | 1008.0152 |
| 53 | J. Alwall et al. | The automated computation of tree-level and next-to-leading order differential cross sections, and their matching to parton shower simulations | JHEP 07 (2014) 079 | 1405.0301 |
| 54 | J. Alwall et al. | Comparative study of various algorithms for the merging of parton showers and matrix elements in hadronic collisions | EPJC 53 (2008) 473 | 0706.2569 |
| 55 | P. Nason | A New method for combining NLO QCD with shower Monte Carlo algorithms | JHEP 11 (2004) 040 | hep-ph/0409146 |
| 56 | S. Frixione, P. Nason, and C. Oleari | Matching NLO QCD computations with parton shower simulations: the POWHEG method | JHEP 11 (2007) 070 | 0709.2092 |
| 57 | S. Alioli, P. Nason, C. Oleari, and E. Re | A general framework for implementing NLO calculations in shower Monte Carlo programs: the POWHEG BOX | JHEP 06 (2010) 043 | 1002.2581 |
| 58 | S. Alioli et al. | Jet pair production in POWHEG | JHEP 04 (2011) 081 | 1012.3380 |
| 59 | A. Kardos, P. Nason, and C. Oleari | Three-jet production in POWHEG | JHEP 04 (2014) 043 | 1402.4001 |
| 60 | A. van Hameren | KaTie : For parton-level event generation with $ k_T $-dependent initial states | CPC 224 (2018) 371 | 1611.00680 |
| 61 | S. Catani and F. Hautmann | High-energy factorization and small-x deep inelastic scattering beyond leading order | NPB 427 (1994) 475 | hep-ph/9405388 |
| 62 | M. Deak, F. Hautmann, H. Jung, and K. Kutak | Forward jet production at the Large Hadron Collider | JHEP 09 (2009) 121 | 0908.0538 |
| 63 | S. Sapeta | QCD and Jets at Hadron Colliders | Prog. Part. NP 89 (2016) 1 | 1511.09336 |
| 64 | M. Bury et al. | Calculations with off-shell matrix elements, TMD parton densities and TMD parton showers | EPJC 78 (2018) 137 | 1712.05932 |
| 65 | Bermudez Martinez, A. and Connor, P. and Jung, H. and Lelek, A. and \uZleb\uc\'ik, R. and Hautmann, F. and Radescu, V. | Collinear and TMD parton densities from fits to precision DIS measurements in the parton branching method | PRD 99 (2019) 074008 | 1804.11152 |
| 66 | S. Schmitt | TUnfold, an algorithm for correcting migration effects in high energy physics | JINST 7 (2012) T10003 | 1205.6201 |
| 67 | S. Schmitt | Data unfolding methods in high energy physics | EPJ Web Conf. 137 (2017) 11008 | 1611.01927 |
| 68 | A. Hocker and V. Kartvelishvili | SVD approach to data unfolding | Nucl. Inst. Meth. A 372 (1996) 469 | |
| 69 | A. N. Tikhonov | Solution of incorrectly formulated problems and the regularization method | Soviet Math. Dokl. 4 (1963) 1035 | |
| 70 | R. Brun and F. Rademakers | ROOT- An object oriented data analysis framework | NIMA 389 (1997) 81 | |
| 71 | CMS Collaboration | CMS luminosity measurements for the 2016 data taking period | CMS-PAS-LUM-17-001 | CMS-PAS-LUM-17-001 |
|
|
Compact Muon Solenoid LHC, CERN |
|

|

|

|

|

|