

Compact Muon Solenoid
LHC, CERN
| CMS-PAS-SMP-19-009 | ||
| Measurement of multi-differential cross sections for the production of a Z boson in association with jets in proton-proton collisions at $\sqrt{s}= $ 13 TeV | ||
| CMS Collaboration | ||
| May 2021 | ||
| Abstract: A study of the production of Z bosons in association with jets in proton-proton (pp) collisions at a centre-of-mass energy of 13 TeV is presented. This study that involves Z bosons decaying either to two electrons or muons. The differential cross sections in data recorded by the CMS experiment at the LHC, correspond to an integrated luminosity of 35.9 fb$^{-1}$ are measured as a function of the transverse momentum ($p_\mathrm{T}$) of the Z boson and the transverse momentum and rapidities of five jets with largest $p_\mathrm{T}$. The jet multiplicity distribution is measured for up to eight jets. The scalar sum of the jet $p_\mathrm{T}$ which quantifies the hadronic activity in the event, is also studied. The measurements are unfolded to the stable particle level and compared with predictions from several Monte Carlo event generators, as well as with expectations at leading and next-to-leading order in perturbative quantum chromodynamics. | ||
|
Links:
CDS record (PDF) ;
inSPIRE record ;
CADI line (restricted) ;
These preliminary results are superseded in this paper, Submitted to PRD. The superseded preliminary plots can be found here. |
||
| Figures | |
png pdf |
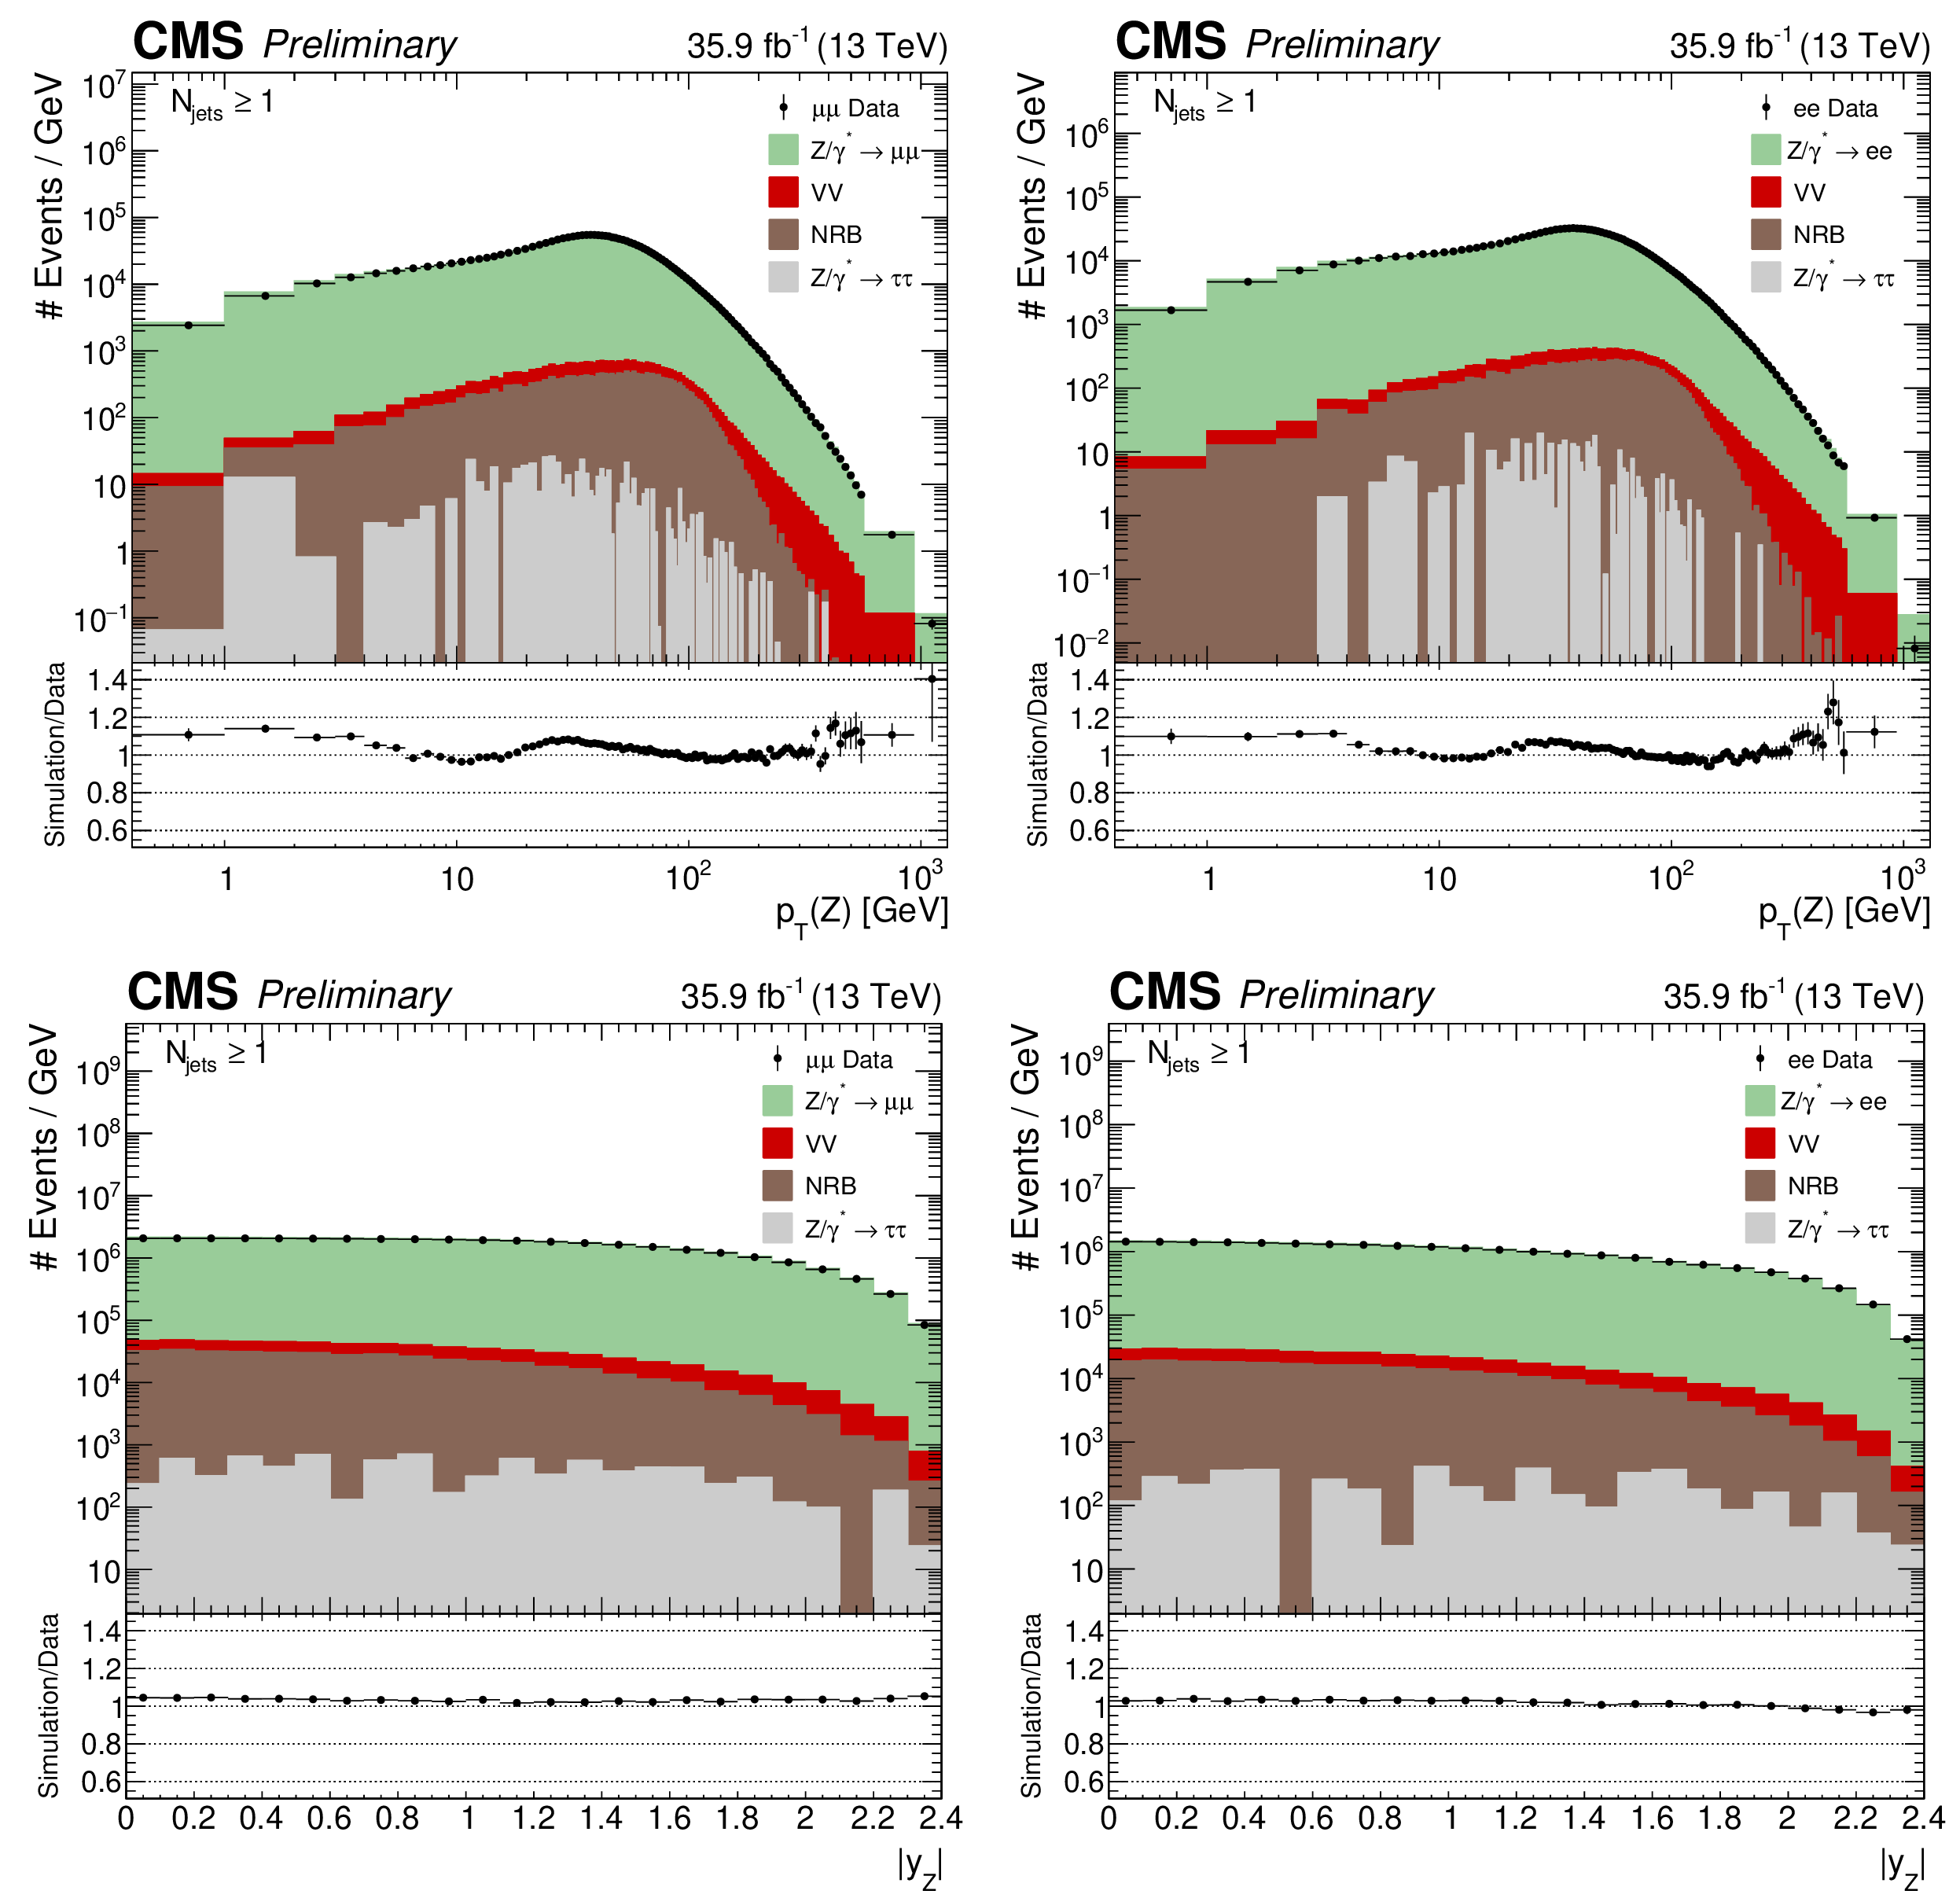
Figure 1:
Z boson candidate $ {p_{\mathrm {T}}} $ (upper) and $|y|$ (lower) for events with at least one jet. The muon (left) and electron (right) channels are shown separately. The background is estimated from both simulation and data driven methods described in Section 7. The distribution ratio of simulation to data is shown in the bottom frames, with error bars that represents the total statistical uncertainties from the data and simulation samples. |

png pdf |
Figure 1-a:
Z boson candidate $ {p_{\mathrm {T}}} $ (upper) and $|y|$ (lower) for events with at least one jet. The muon (left) and electron (right) channels are shown separately. The background is estimated from both simulation and data driven methods described in Section 7. The distribution ratio of simulation to data is shown in the bottom frames, with error bars that represents the total statistical uncertainties from the data and simulation samples. |

png pdf |
Figure 1-b:
Z boson candidate $ {p_{\mathrm {T}}} $ (upper) and $|y|$ (lower) for events with at least one jet. The muon (left) and electron (right) channels are shown separately. The background is estimated from both simulation and data driven methods described in Section 7. The distribution ratio of simulation to data is shown in the bottom frames, with error bars that represents the total statistical uncertainties from the data and simulation samples. |
png pdf |
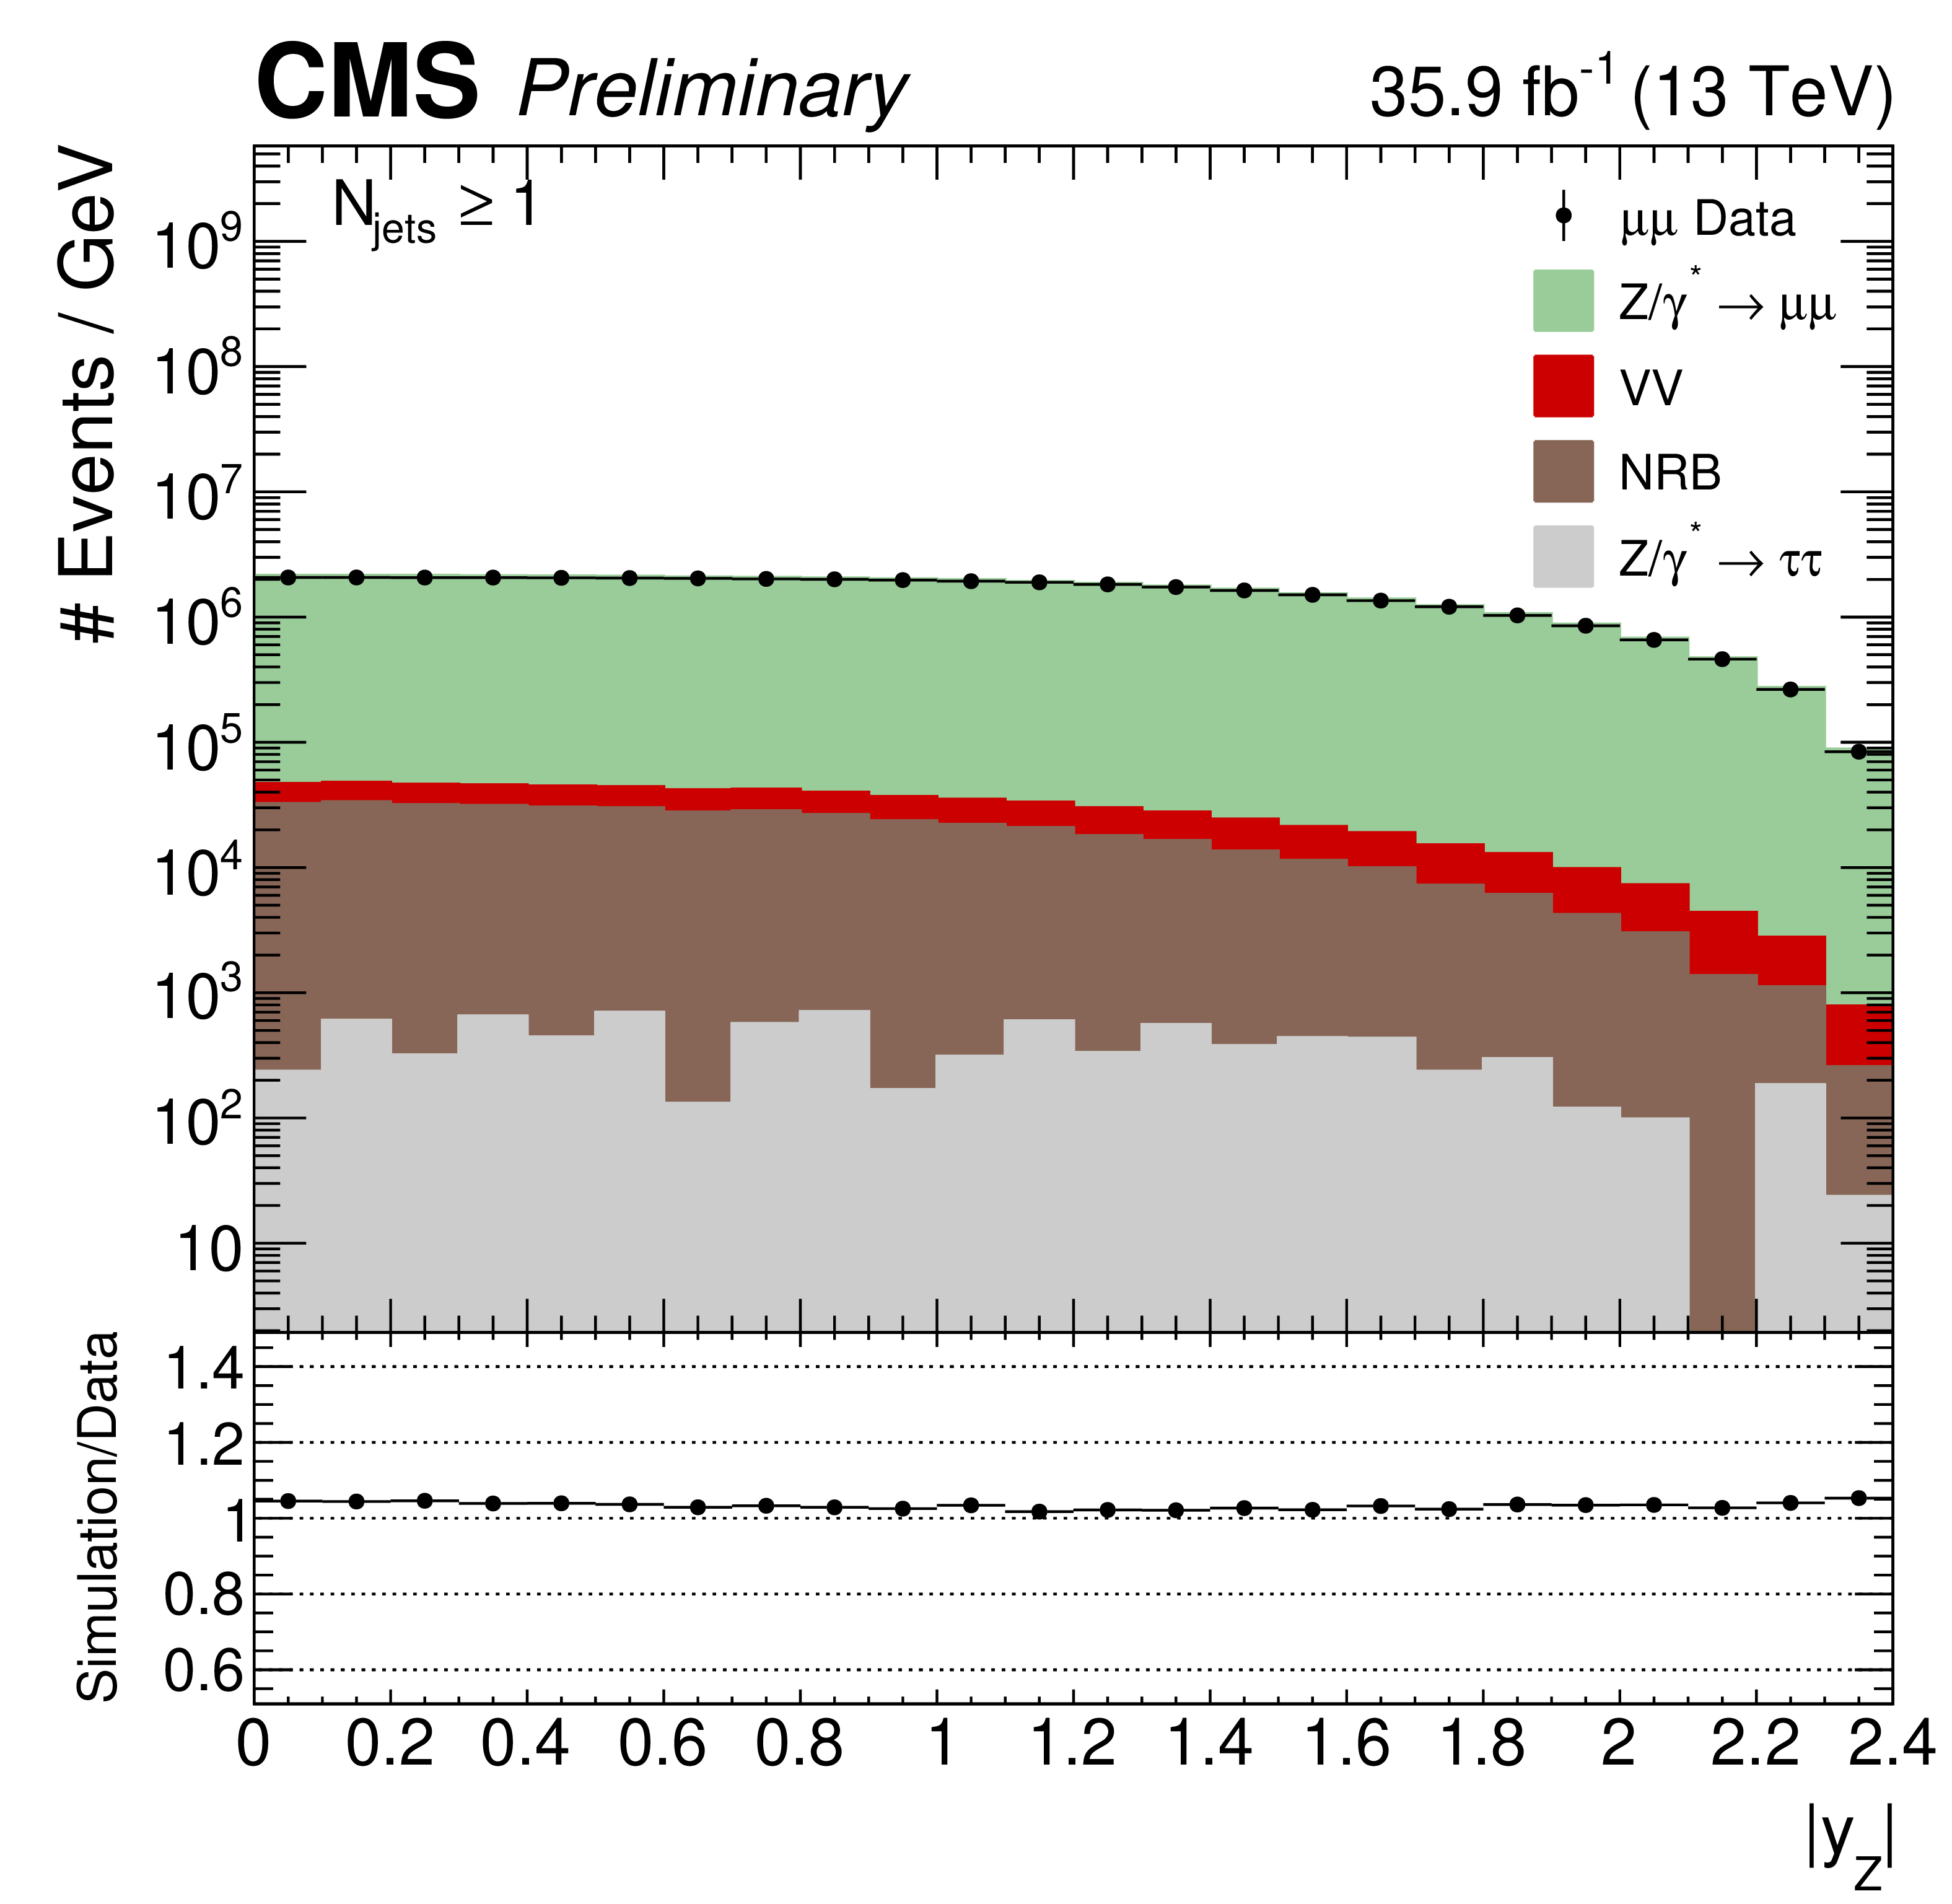
Figure 1-c:
Z boson candidate $ {p_{\mathrm {T}}} $ (upper) and $|y|$ (lower) for events with at least one jet. The muon (left) and electron (right) channels are shown separately. The background is estimated from both simulation and data driven methods described in Section 7. The distribution ratio of simulation to data is shown in the bottom frames, with error bars that represents the total statistical uncertainties from the data and simulation samples. |
png pdf |
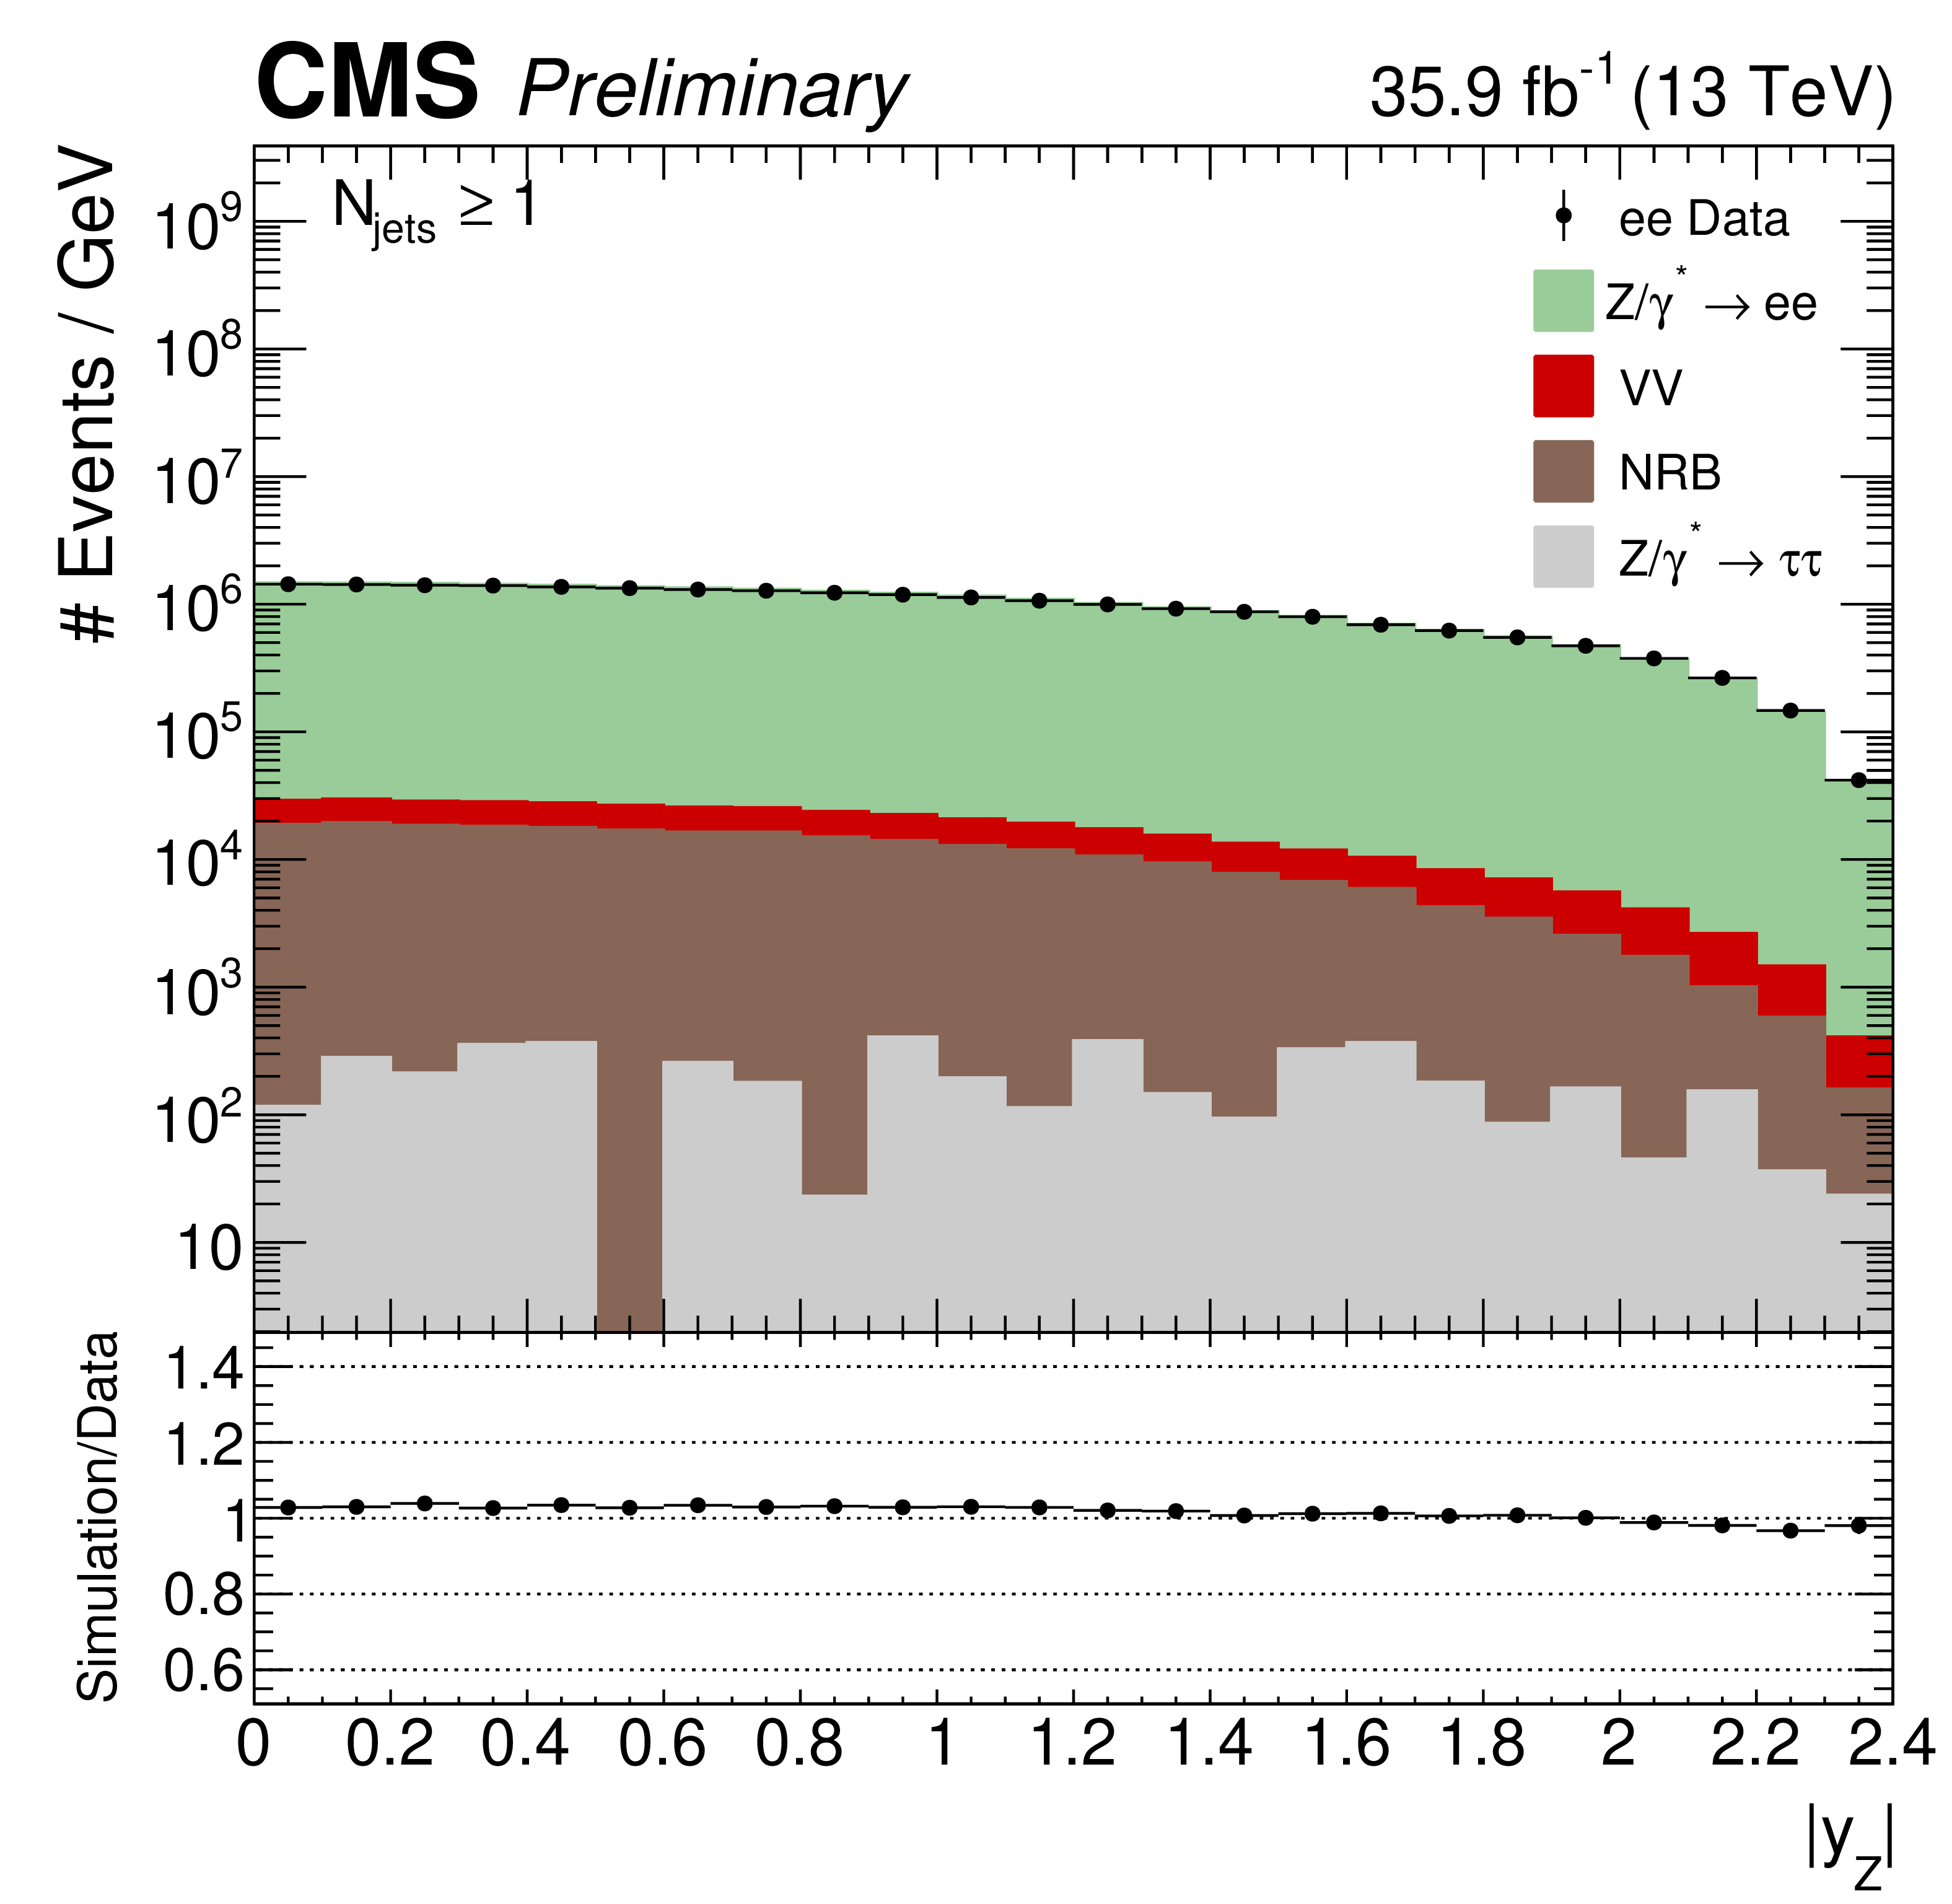
Figure 1-d:
Z boson candidate $ {p_{\mathrm {T}}} $ (upper) and $|y|$ (lower) for events with at least one jet. The muon (left) and electron (right) channels are shown separately. The background is estimated from both simulation and data driven methods described in Section 7. The distribution ratio of simulation to data is shown in the bottom frames, with error bars that represents the total statistical uncertainties from the data and simulation samples. |

png pdf |
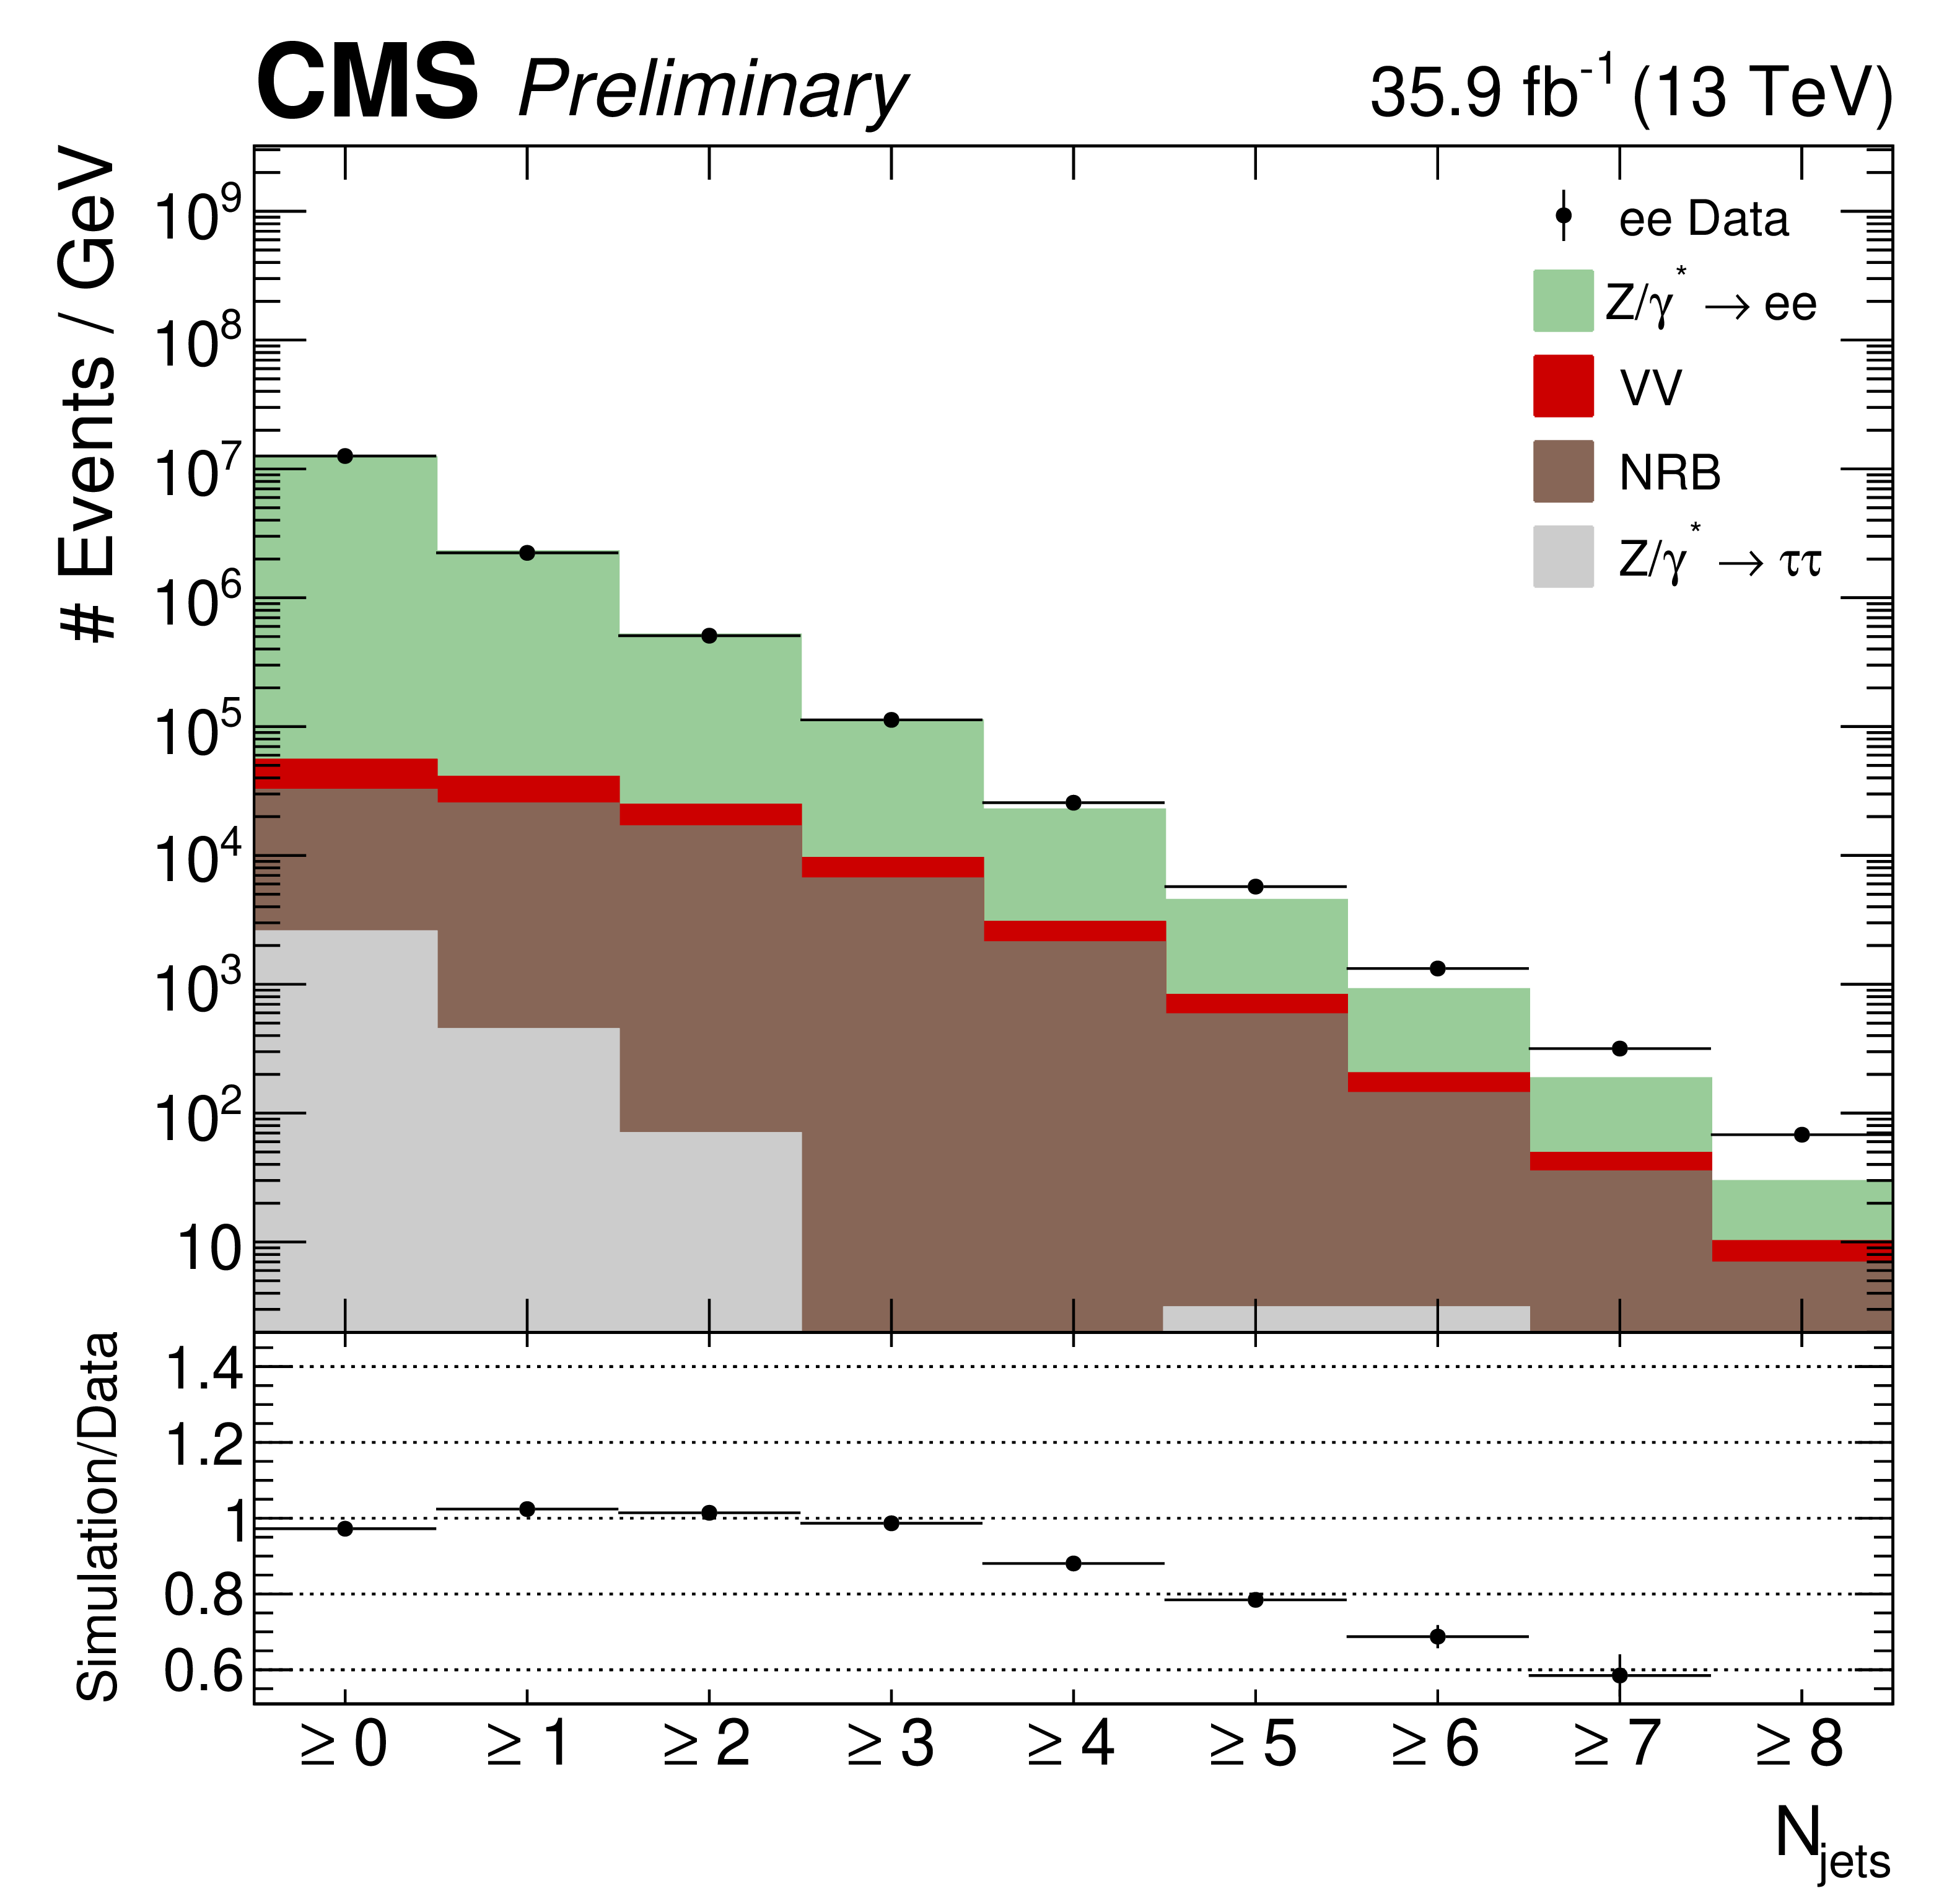
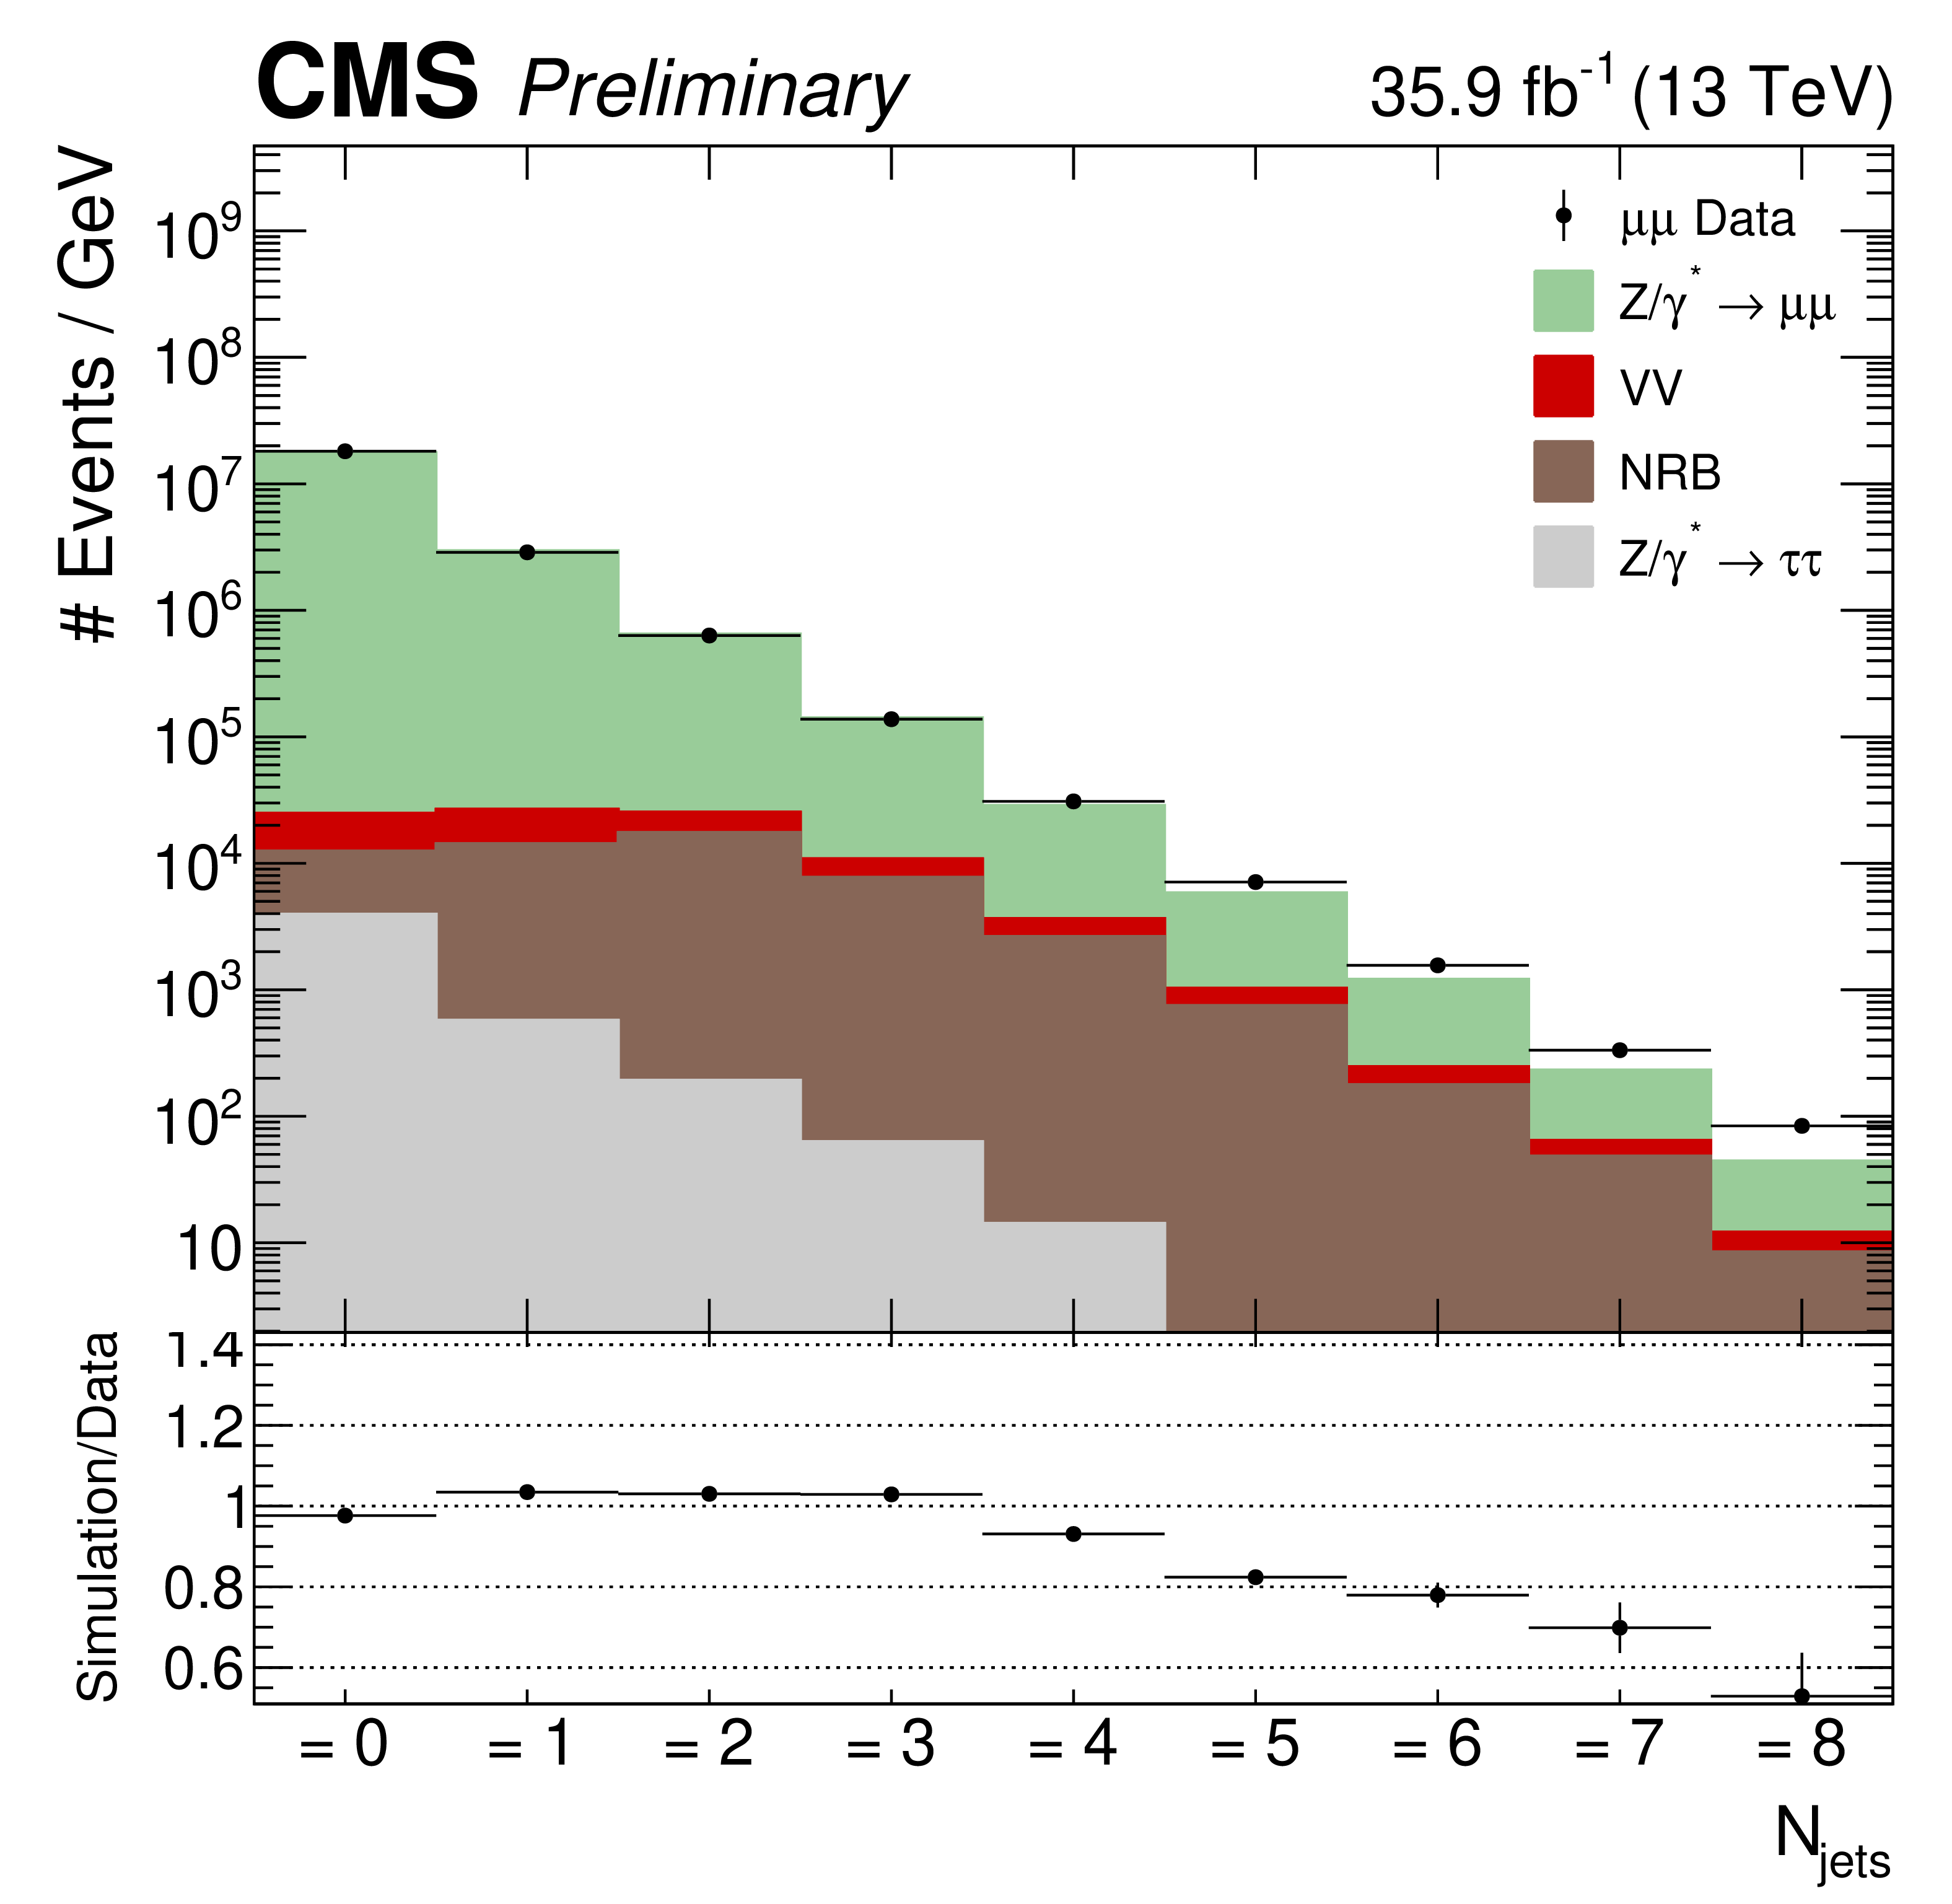
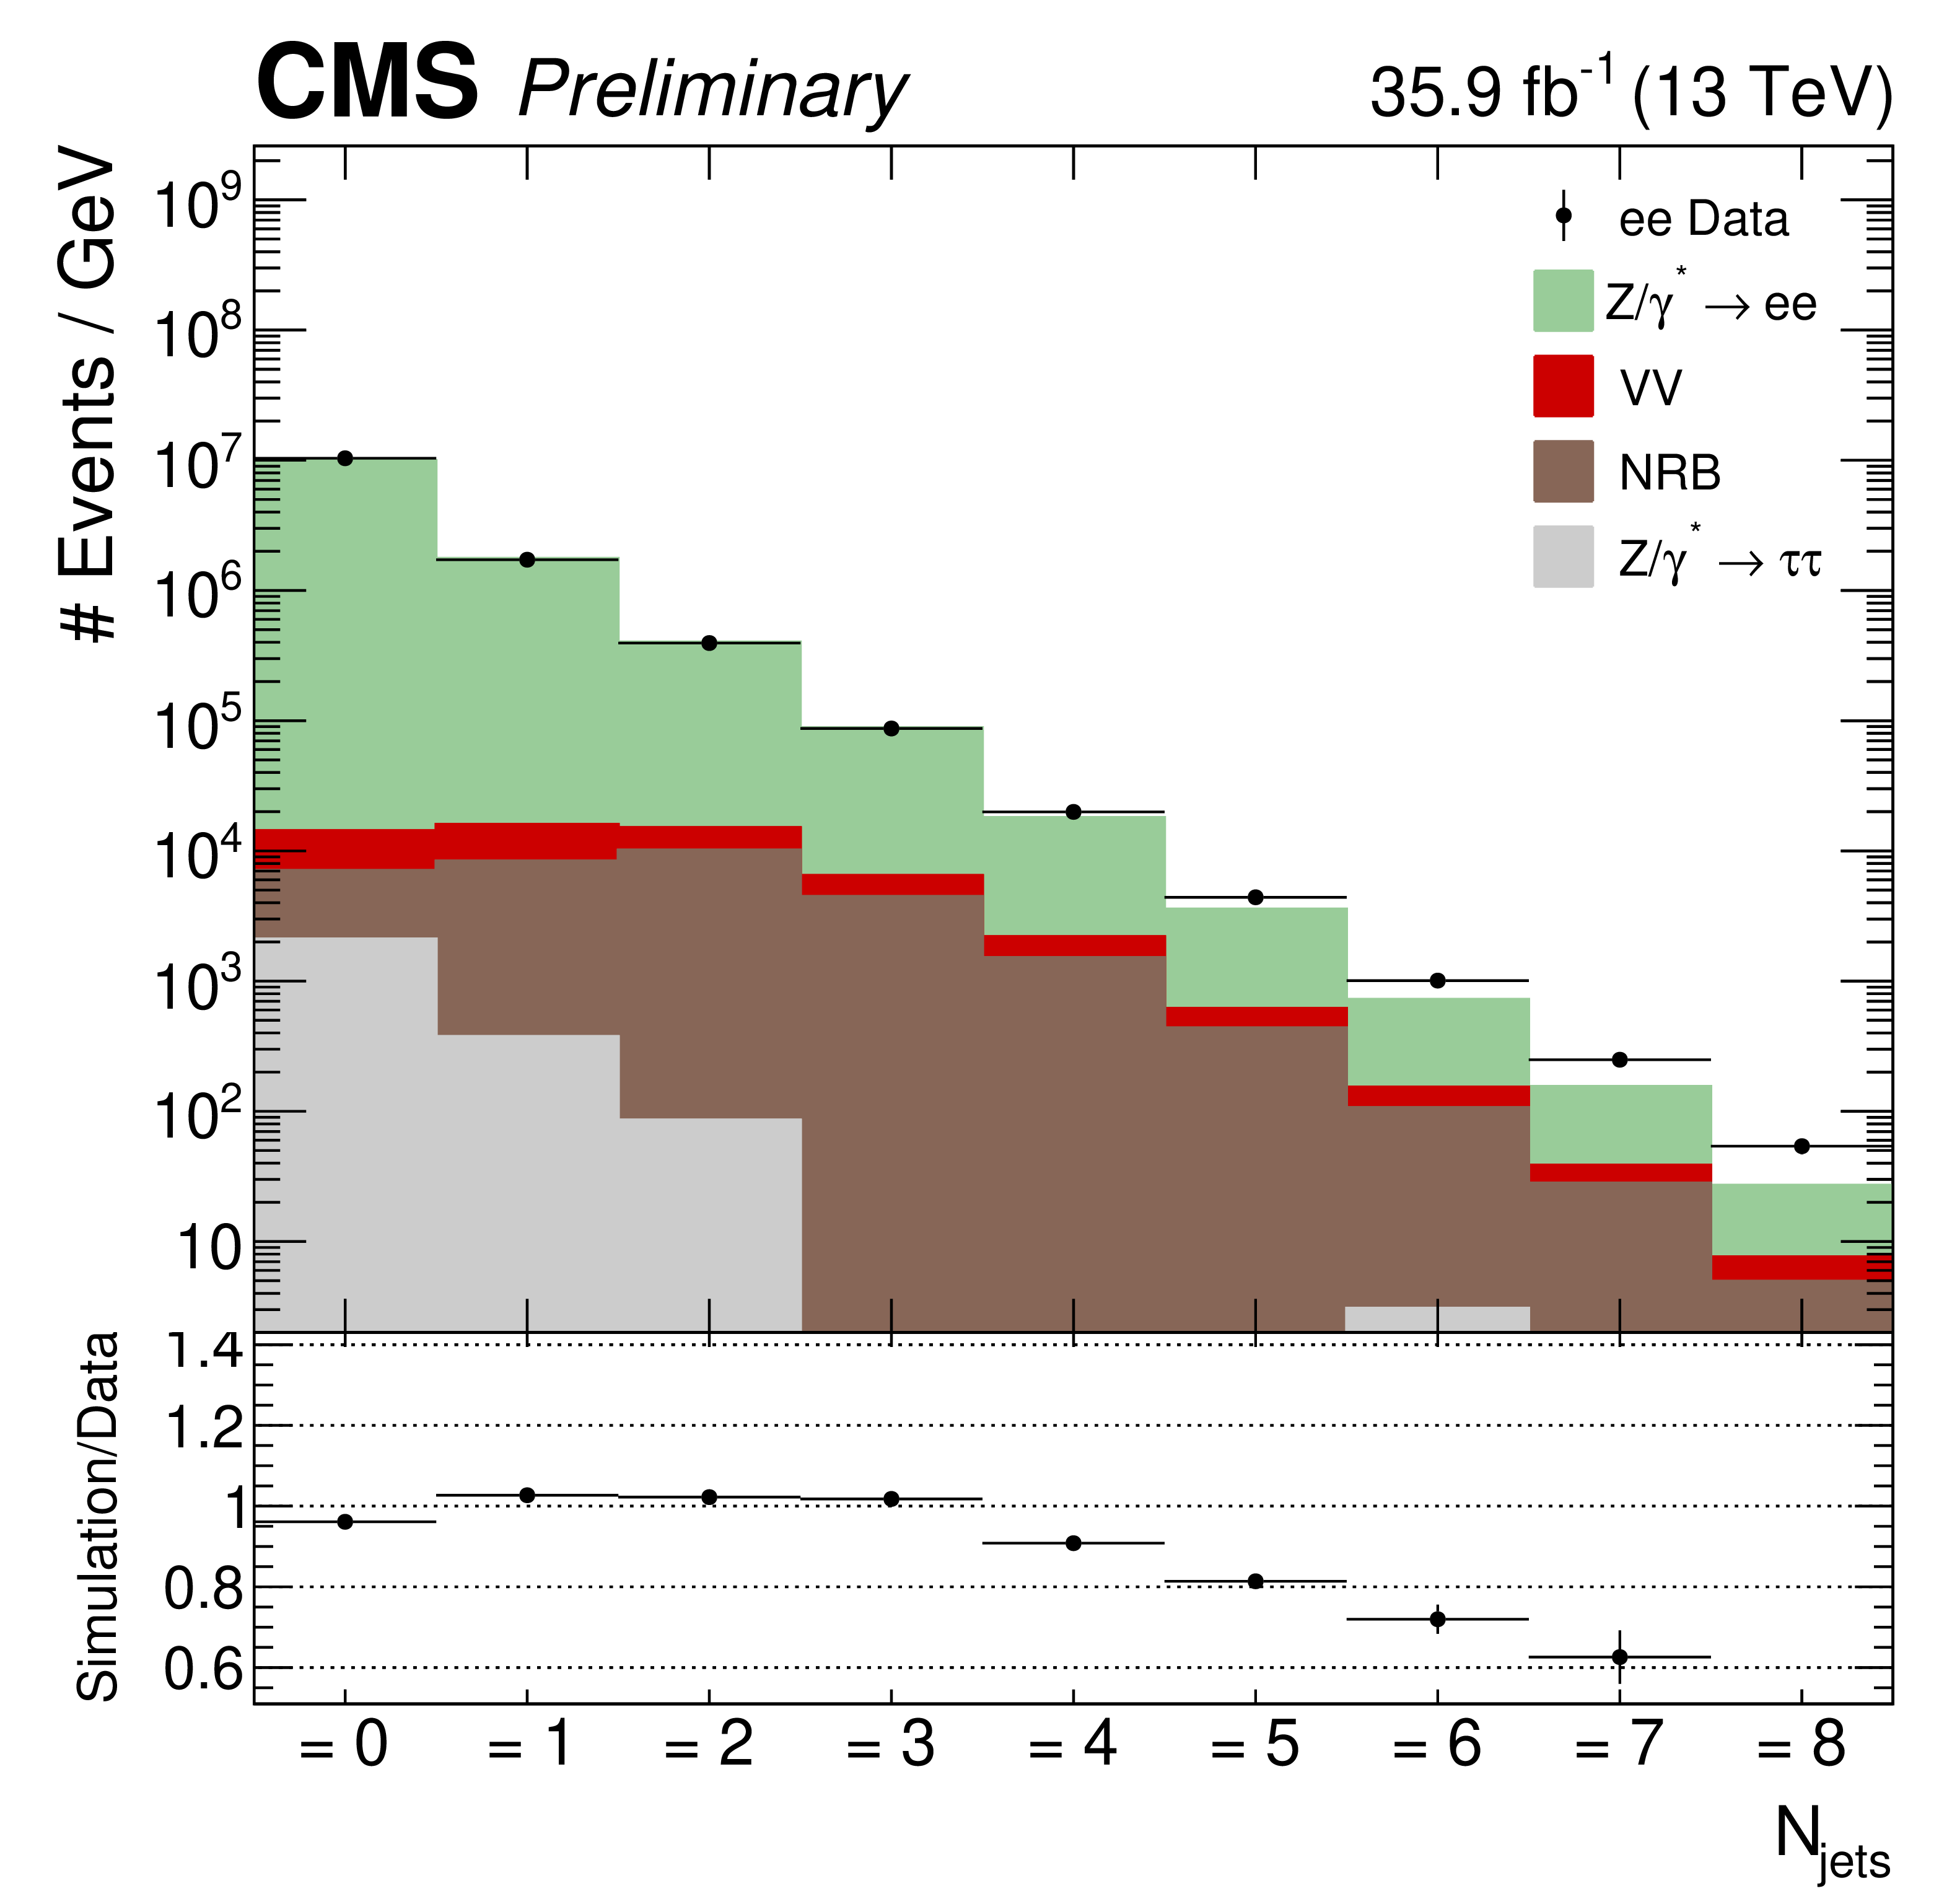
Figure 2:
Inclusive (upper) and exclusive (lower) jet multiplicity distributions. The muon (left) and electron (right) channels are shown separately. The background is estimated from both simulation and data driven methods described in Section 7. The distribution ratio of simulation to data is shown in the bottom frames, with error bars that represents the total statistical uncertainties from the data and simulation samples. |

png pdf |
Figure 2-a:
Inclusive (upper) and exclusive (lower) jet multiplicity distributions. The muon (left) and electron (right) channels are shown separately. The background is estimated from both simulation and data driven methods described in Section 7. The distribution ratio of simulation to data is shown in the bottom frames, with error bars that represents the total statistical uncertainties from the data and simulation samples. |
png pdf |
Figure 2-b:
Inclusive (upper) and exclusive (lower) jet multiplicity distributions. The muon (left) and electron (right) channels are shown separately. The background is estimated from both simulation and data driven methods described in Section 7. The distribution ratio of simulation to data is shown in the bottom frames, with error bars that represents the total statistical uncertainties from the data and simulation samples. |
png pdf |
Figure 2-c:
Inclusive (upper) and exclusive (lower) jet multiplicity distributions. The muon (left) and electron (right) channels are shown separately. The background is estimated from both simulation and data driven methods described in Section 7. The distribution ratio of simulation to data is shown in the bottom frames, with error bars that represents the total statistical uncertainties from the data and simulation samples. |
png pdf |
Figure 2-d:
Inclusive (upper) and exclusive (lower) jet multiplicity distributions. The muon (left) and electron (right) channels are shown separately. The background is estimated from both simulation and data driven methods described in Section 7. The distribution ratio of simulation to data is shown in the bottom frames, with error bars that represents the total statistical uncertainties from the data and simulation samples. |
png pdf |
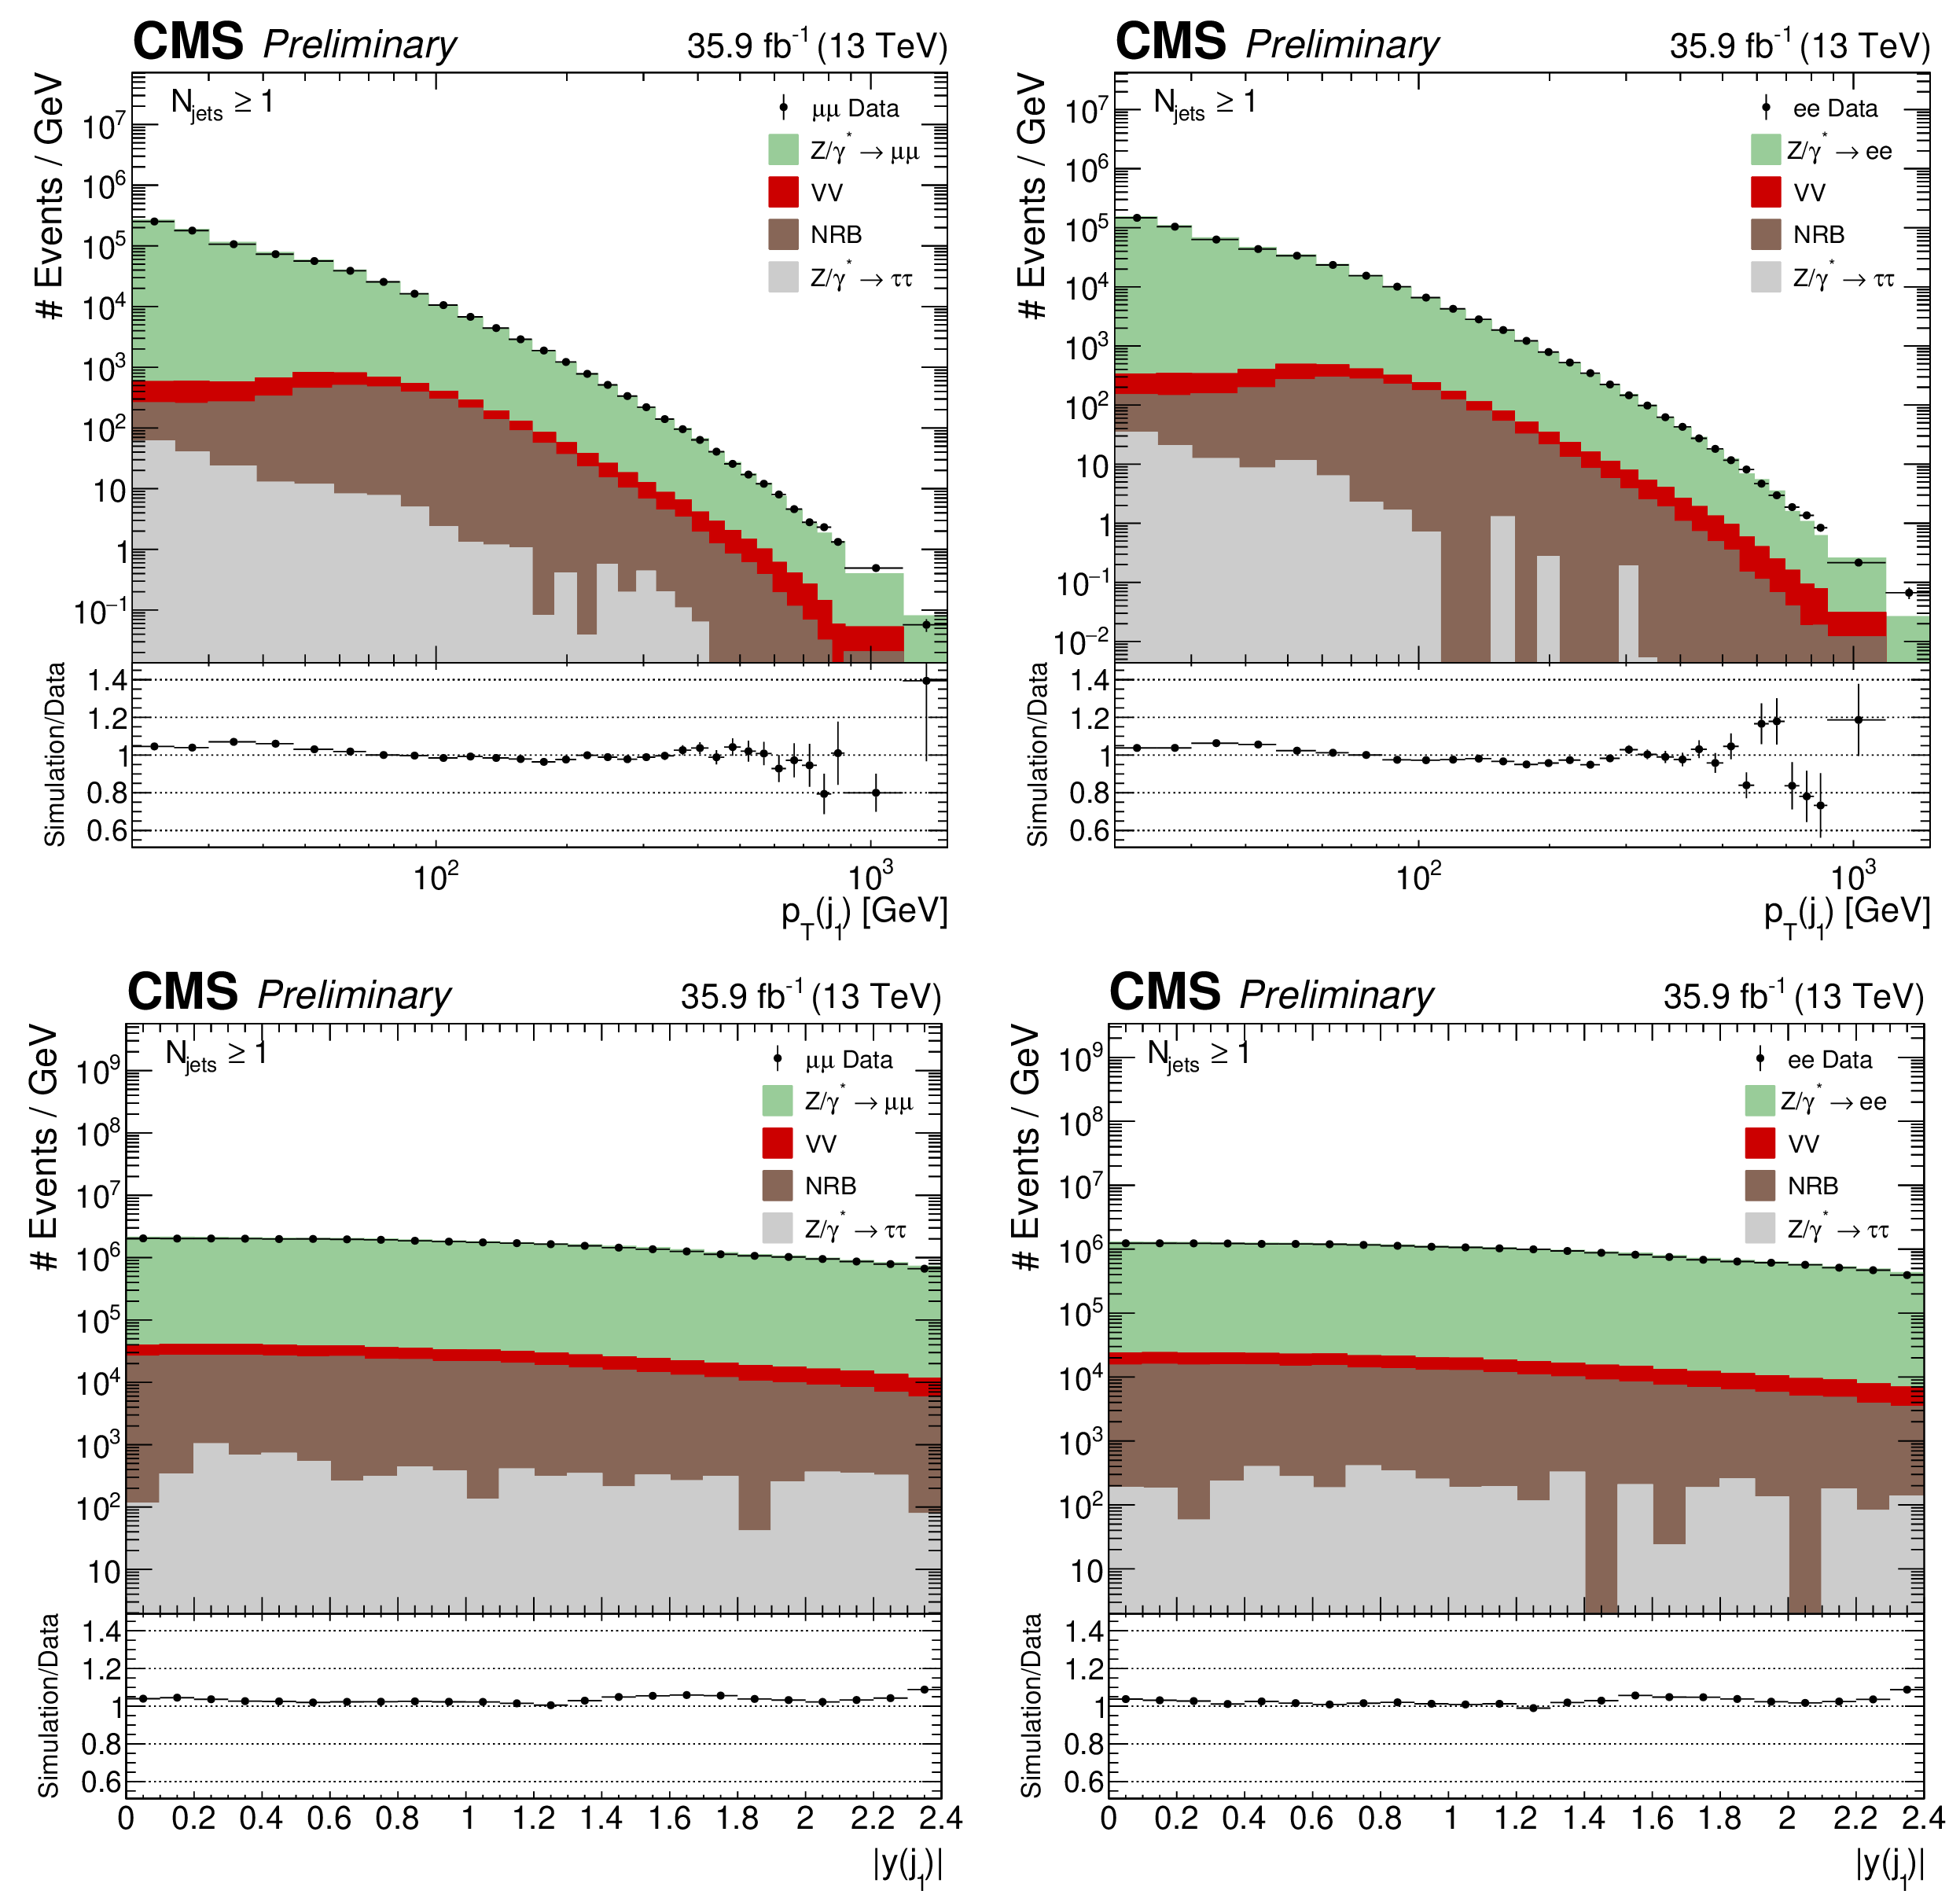
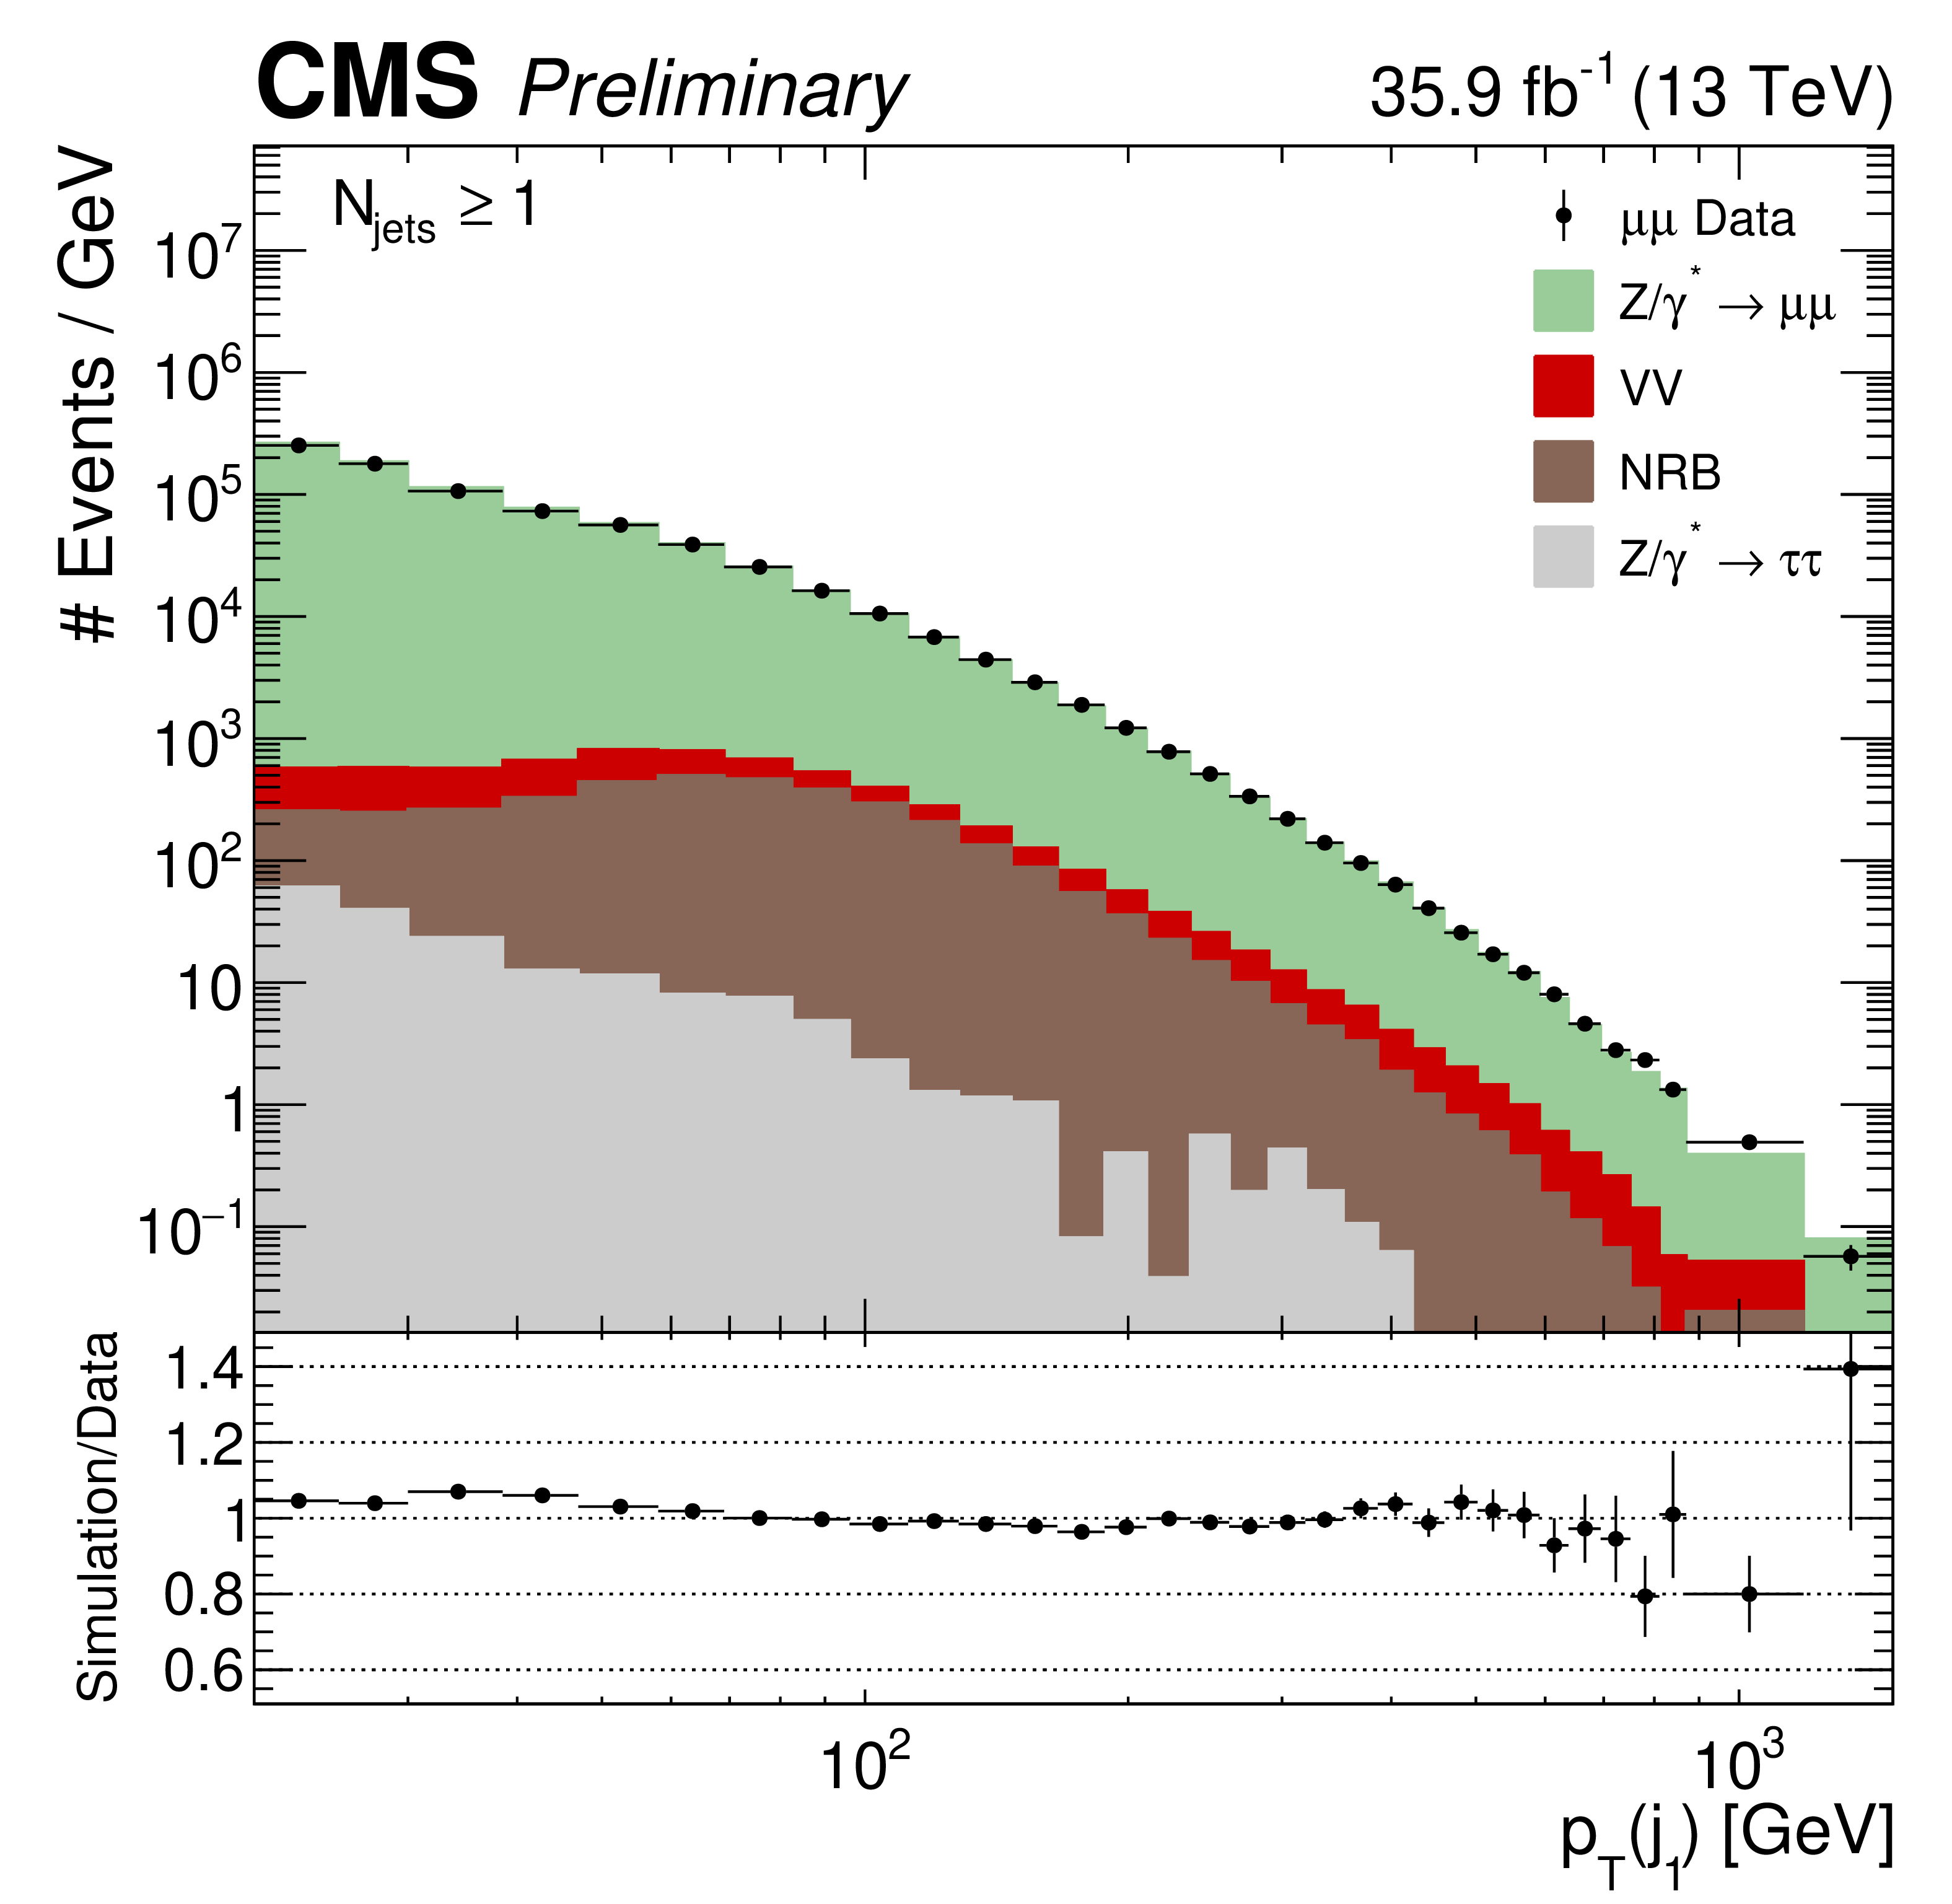
Figure 3:
First jet ${p_{\mathrm {T}}}$ (upper) and $|y|$ (lower) distributions. The muon (left) and electron (right) channels are shown separately. The background is estimated from both simulation and data driven methods described in Section 7. The distribution ratio of simulation to data is shown in the bottom frames, with error bars that represents the total statistical uncertainties from the data and simulation samples. |
png pdf |
Figure 3-a:
First jet ${p_{\mathrm {T}}}$ (upper) and $|y|$ (lower) distributions. The muon (left) and electron (right) channels are shown separately. The background is estimated from both simulation and data driven methods described in Section 7. The distribution ratio of simulation to data is shown in the bottom frames, with error bars that represents the total statistical uncertainties from the data and simulation samples. |

png pdf |
Figure 3-b:
First jet ${p_{\mathrm {T}}}$ (upper) and $|y|$ (lower) distributions. The muon (left) and electron (right) channels are shown separately. The background is estimated from both simulation and data driven methods described in Section 7. The distribution ratio of simulation to data is shown in the bottom frames, with error bars that represents the total statistical uncertainties from the data and simulation samples. |

png pdf |
Figure 3-c:
First jet ${p_{\mathrm {T}}}$ (upper) and $|y|$ (lower) distributions. The muon (left) and electron (right) channels are shown separately. The background is estimated from both simulation and data driven methods described in Section 7. The distribution ratio of simulation to data is shown in the bottom frames, with error bars that represents the total statistical uncertainties from the data and simulation samples. |

png pdf |
Figure 3-d:
First jet ${p_{\mathrm {T}}}$ (upper) and $|y|$ (lower) distributions. The muon (left) and electron (right) channels are shown separately. The background is estimated from both simulation and data driven methods described in Section 7. The distribution ratio of simulation to data is shown in the bottom frames, with error bars that represents the total statistical uncertainties from the data and simulation samples. |
png pdf |
Figure 4:
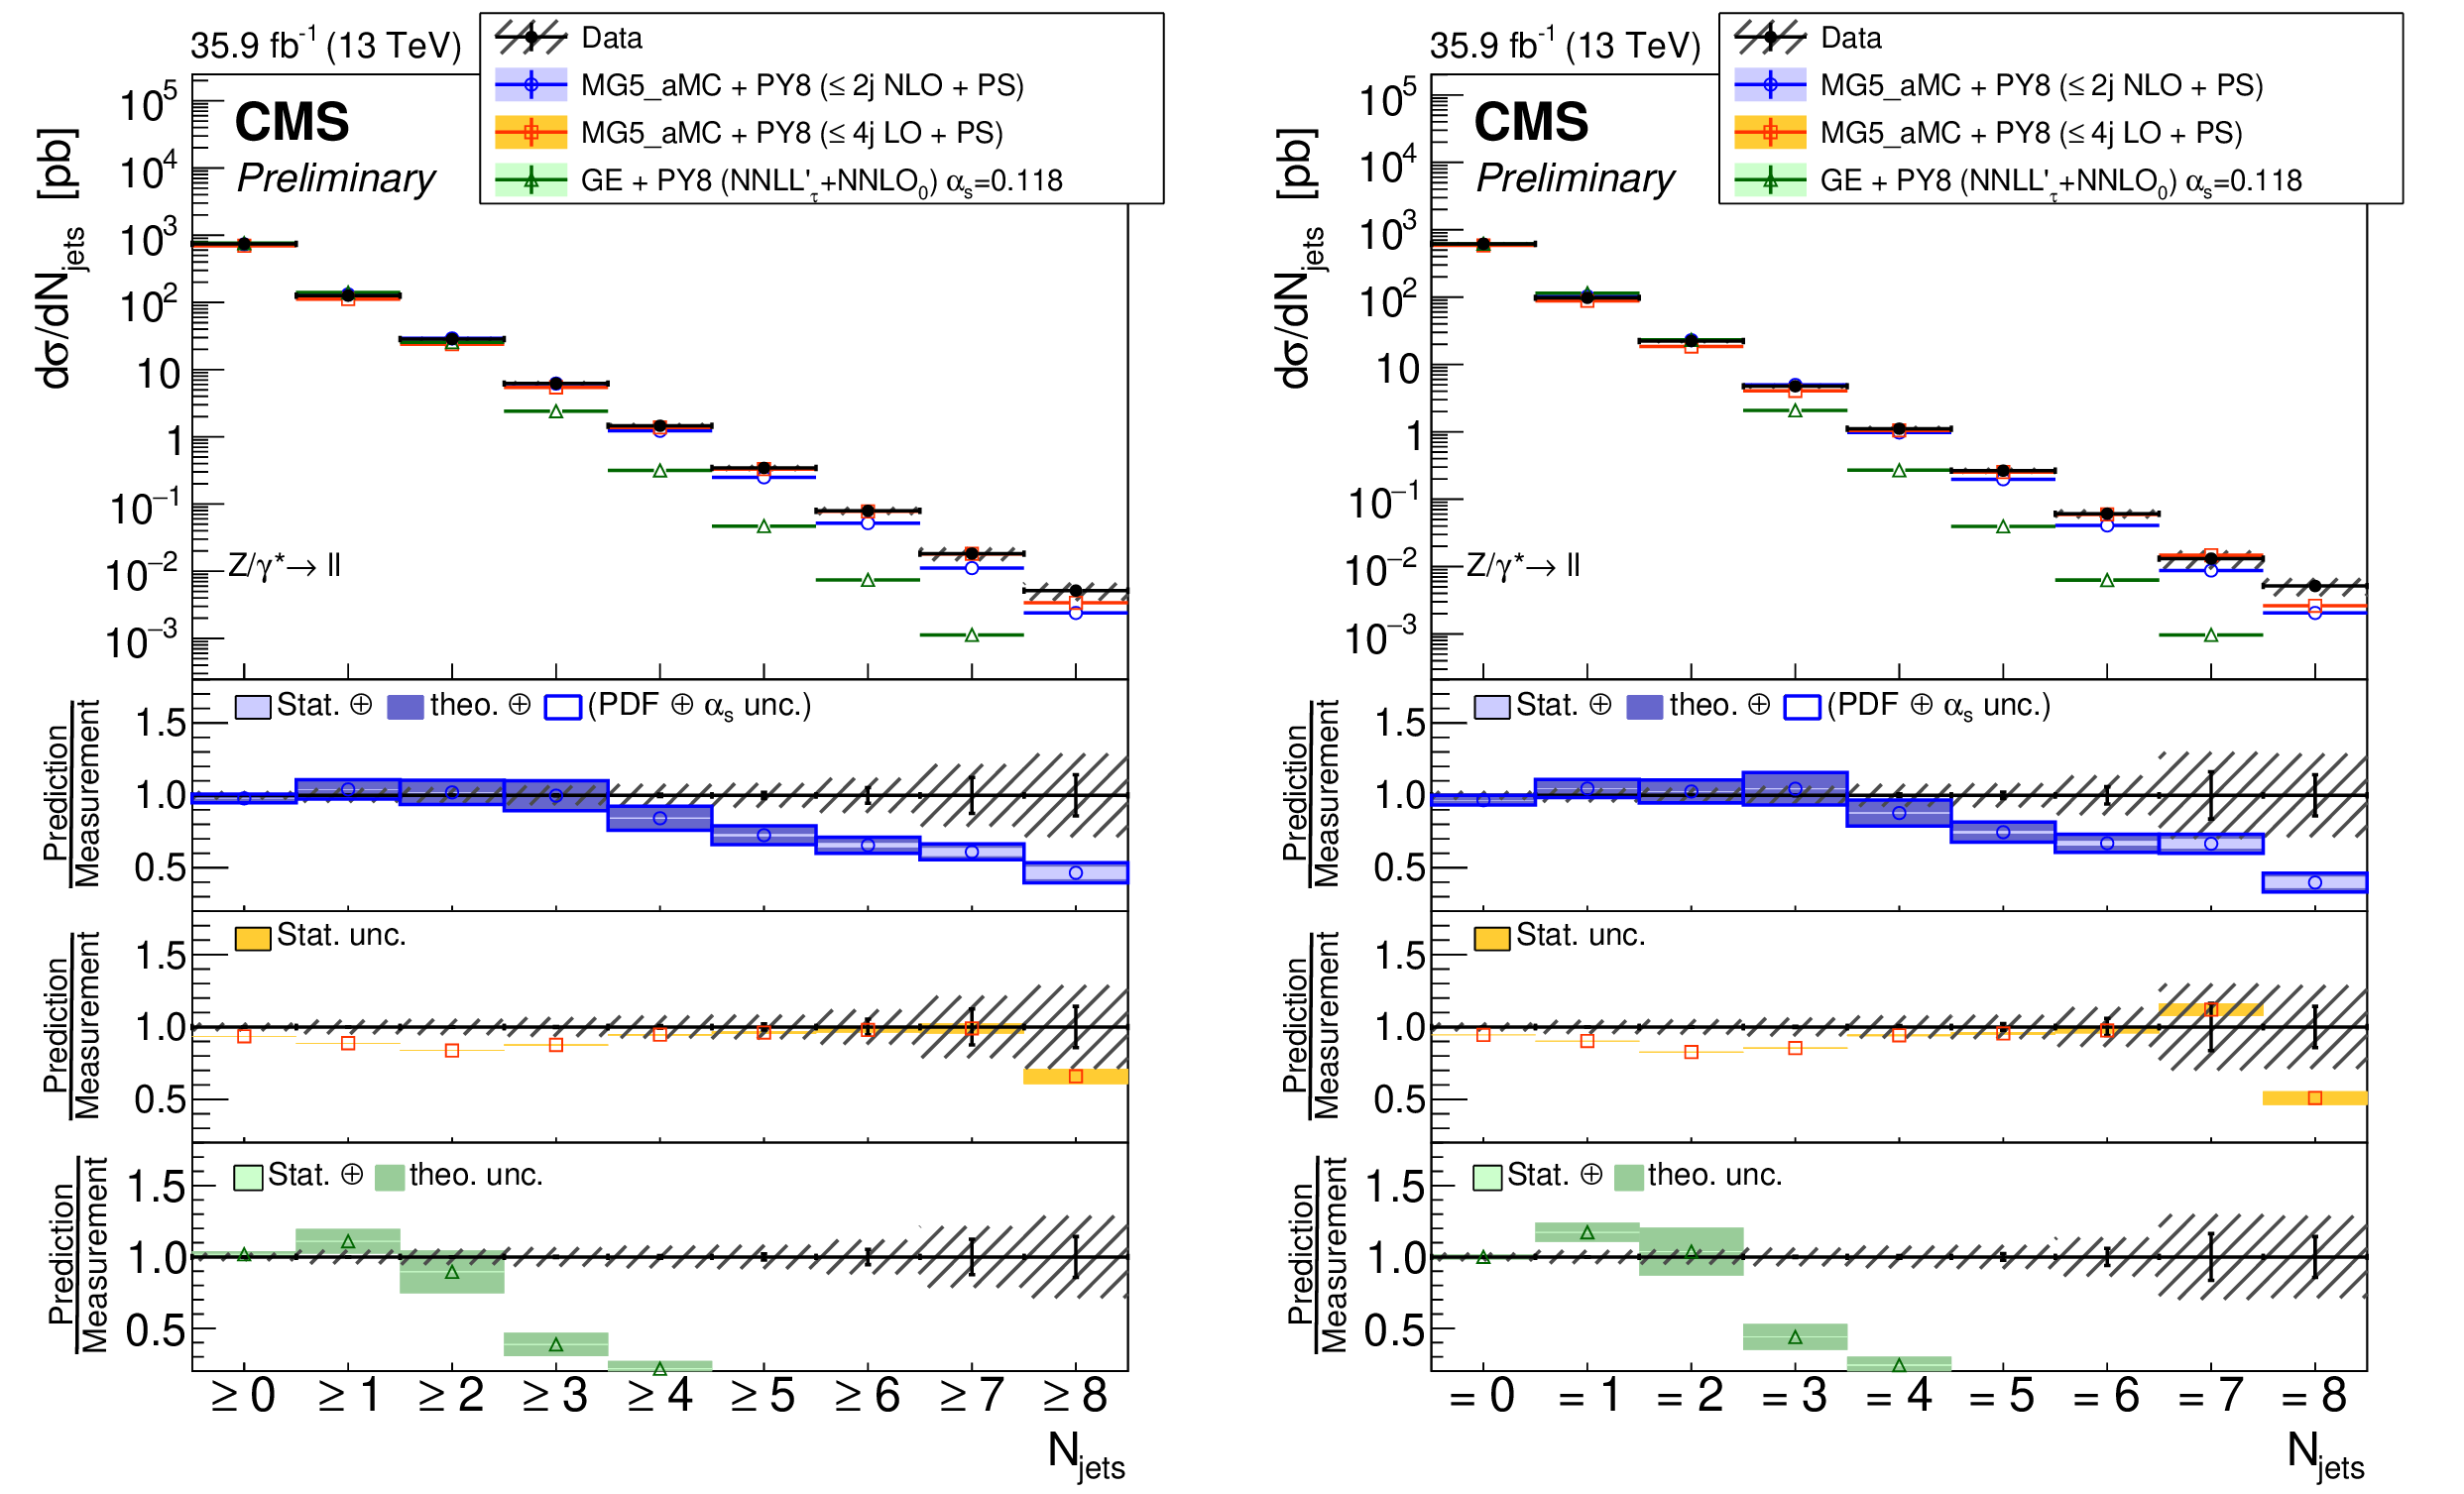
The measured differential cross section as a function of inclusive (left) and exclusive (right) jet multiplicities. The measurement statistical (resp. systematic) uncertainties are represented with vertical error bars (resp. hashed areas). The measurement is compared to the NLO MG5_aMC, LO MG5_aMC, and GENEVA predictions described in Section 6. The predictions uncertainties, estimated as explained in this section, are represented by coloured areas in the ratio plots (light colour for the statistical part and darker colour for the total). Only statistical uncertainty is computed for the LO prediction. |

png pdf |
Figure 4-a:
The measured differential cross section as a function of inclusive (left) and exclusive (right) jet multiplicities. The measurement statistical (resp. systematic) uncertainties are represented with vertical error bars (resp. hashed areas). The measurement is compared to the NLO MG5_aMC, LO MG5_aMC, and GENEVA predictions described in Section 6. The predictions uncertainties, estimated as explained in this section, are represented by coloured areas in the ratio plots (light colour for the statistical part and darker colour for the total). Only statistical uncertainty is computed for the LO prediction. |

png pdf |
Figure 4-b:
The measured differential cross section as a function of inclusive (left) and exclusive (right) jet multiplicities. The measurement statistical (resp. systematic) uncertainties are represented with vertical error bars (resp. hashed areas). The measurement is compared to the NLO MG5_aMC, LO MG5_aMC, and GENEVA predictions described in Section 6. The predictions uncertainties, estimated as explained in this section, are represented by coloured areas in the ratio plots (light colour for the statistical part and darker colour for the total). Only statistical uncertainty is computed for the LO prediction. |

png pdf |
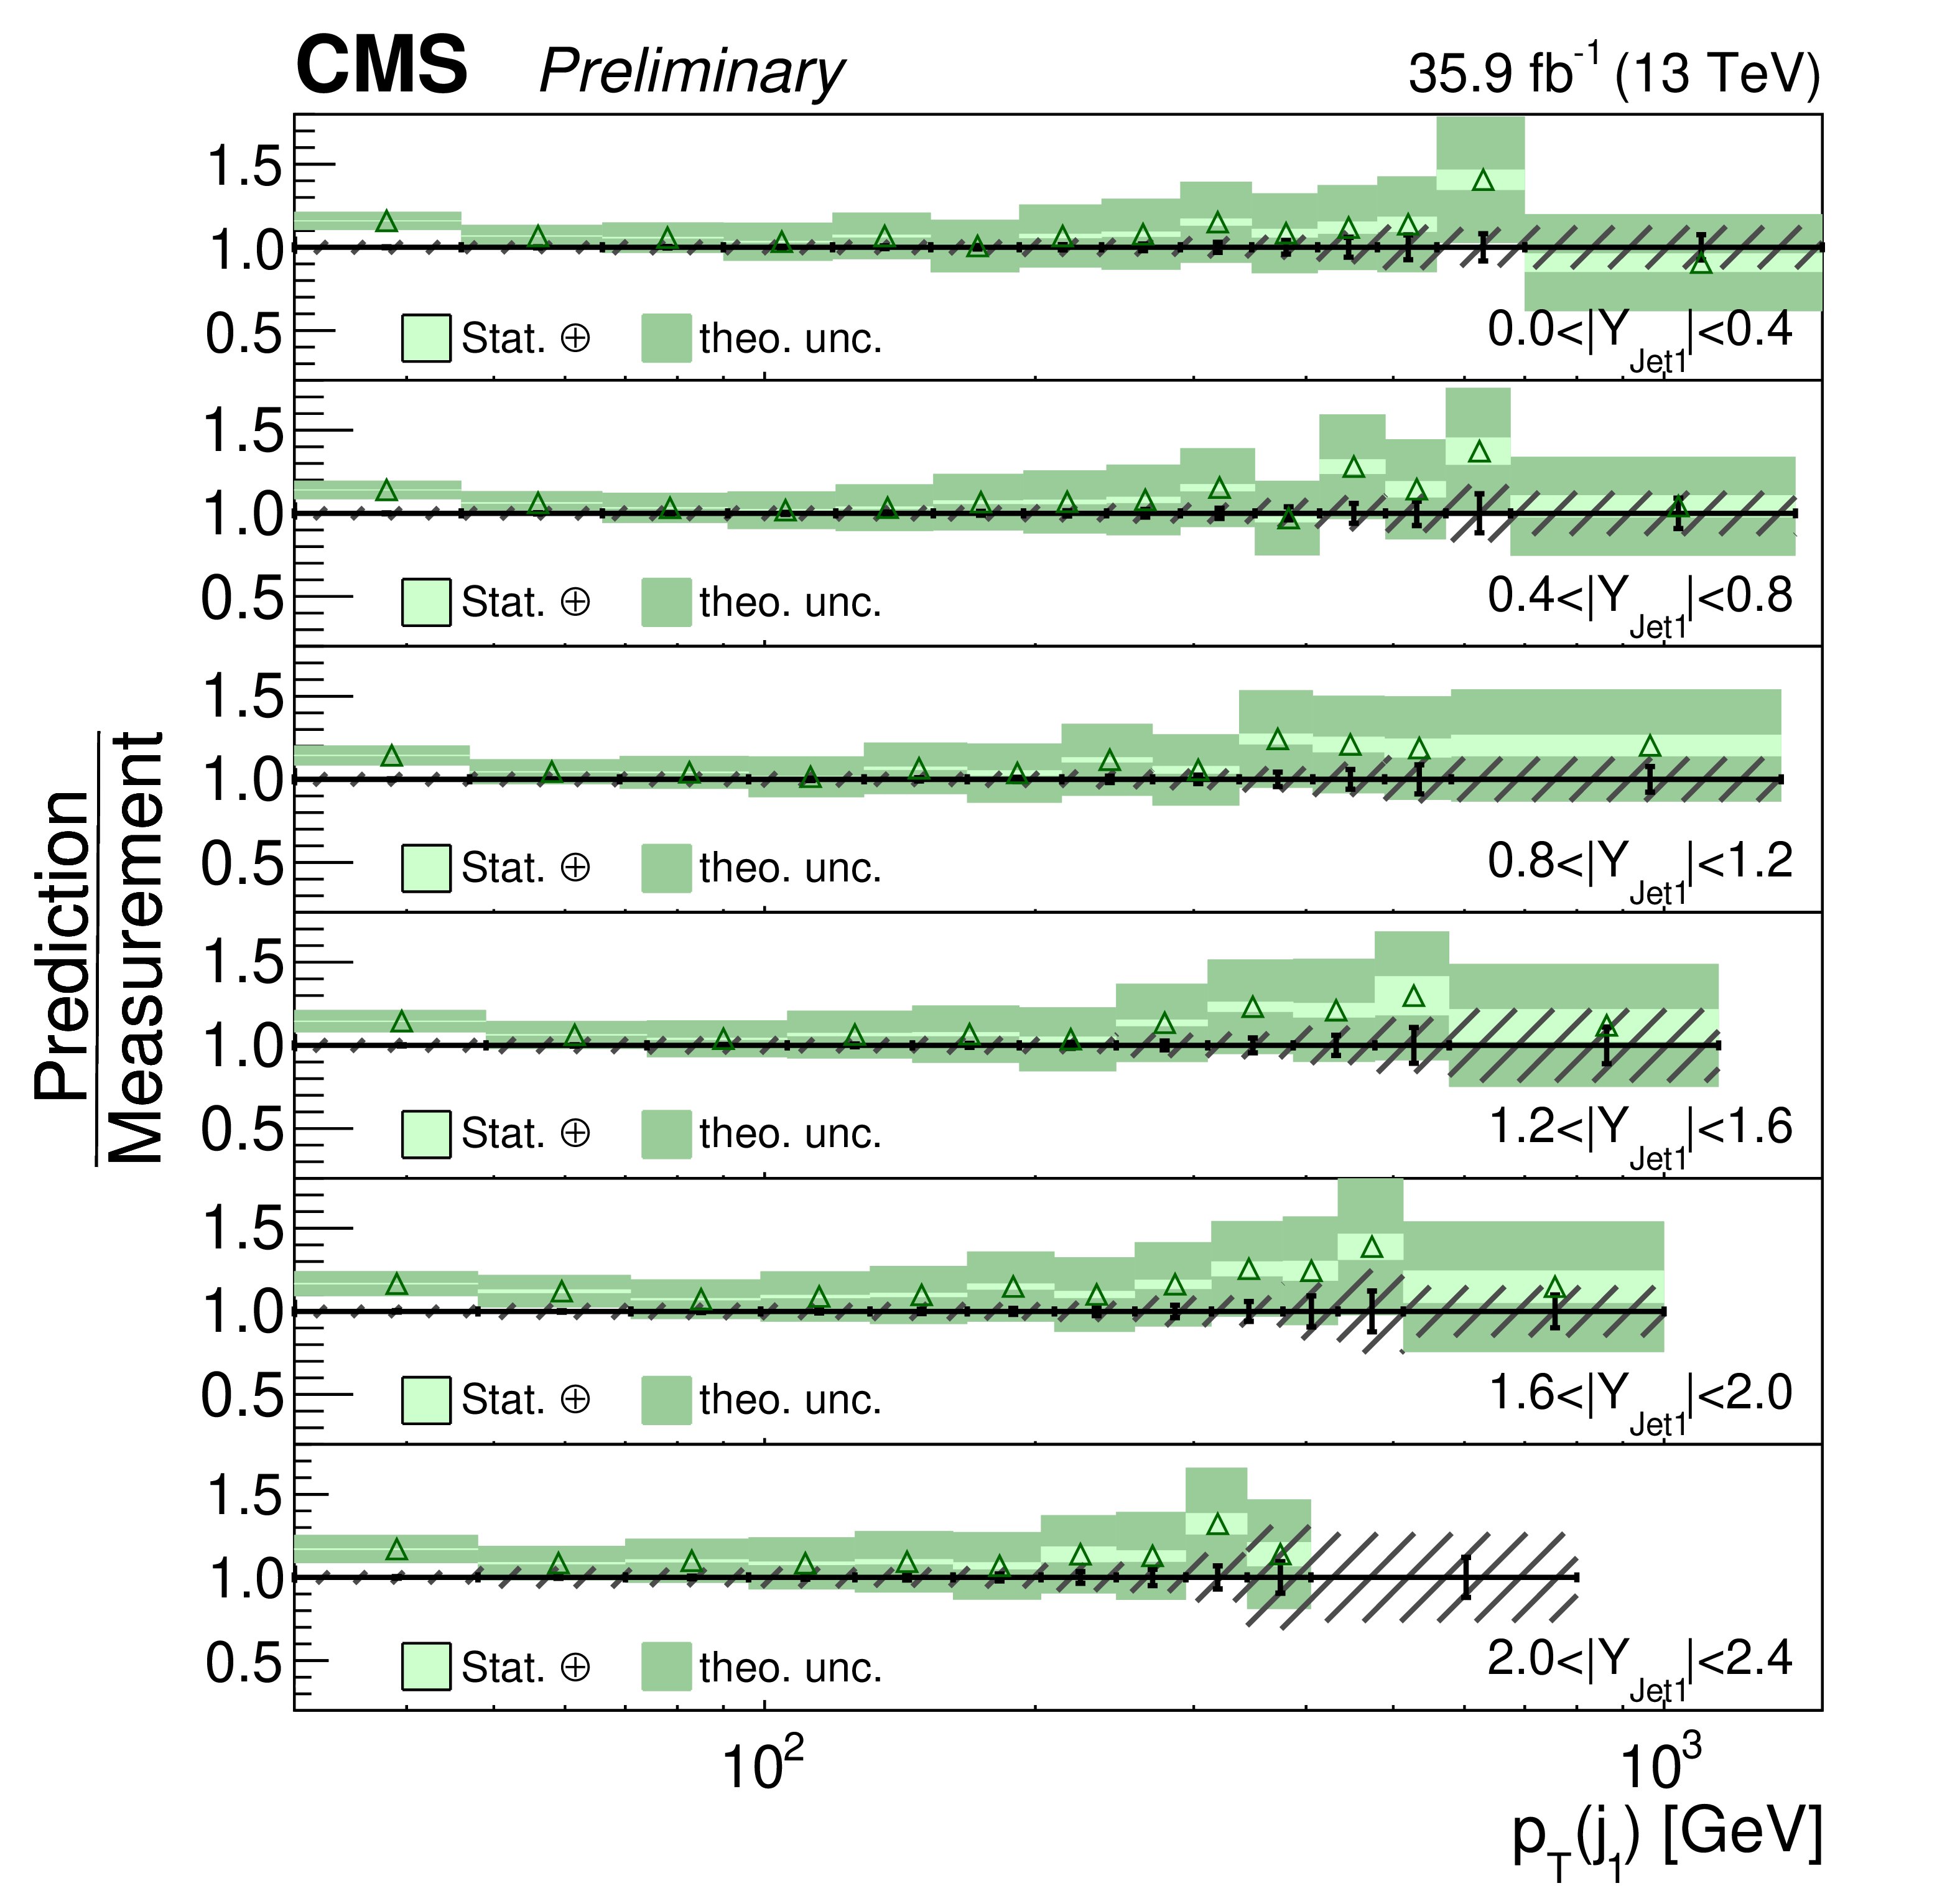
Figure 5:
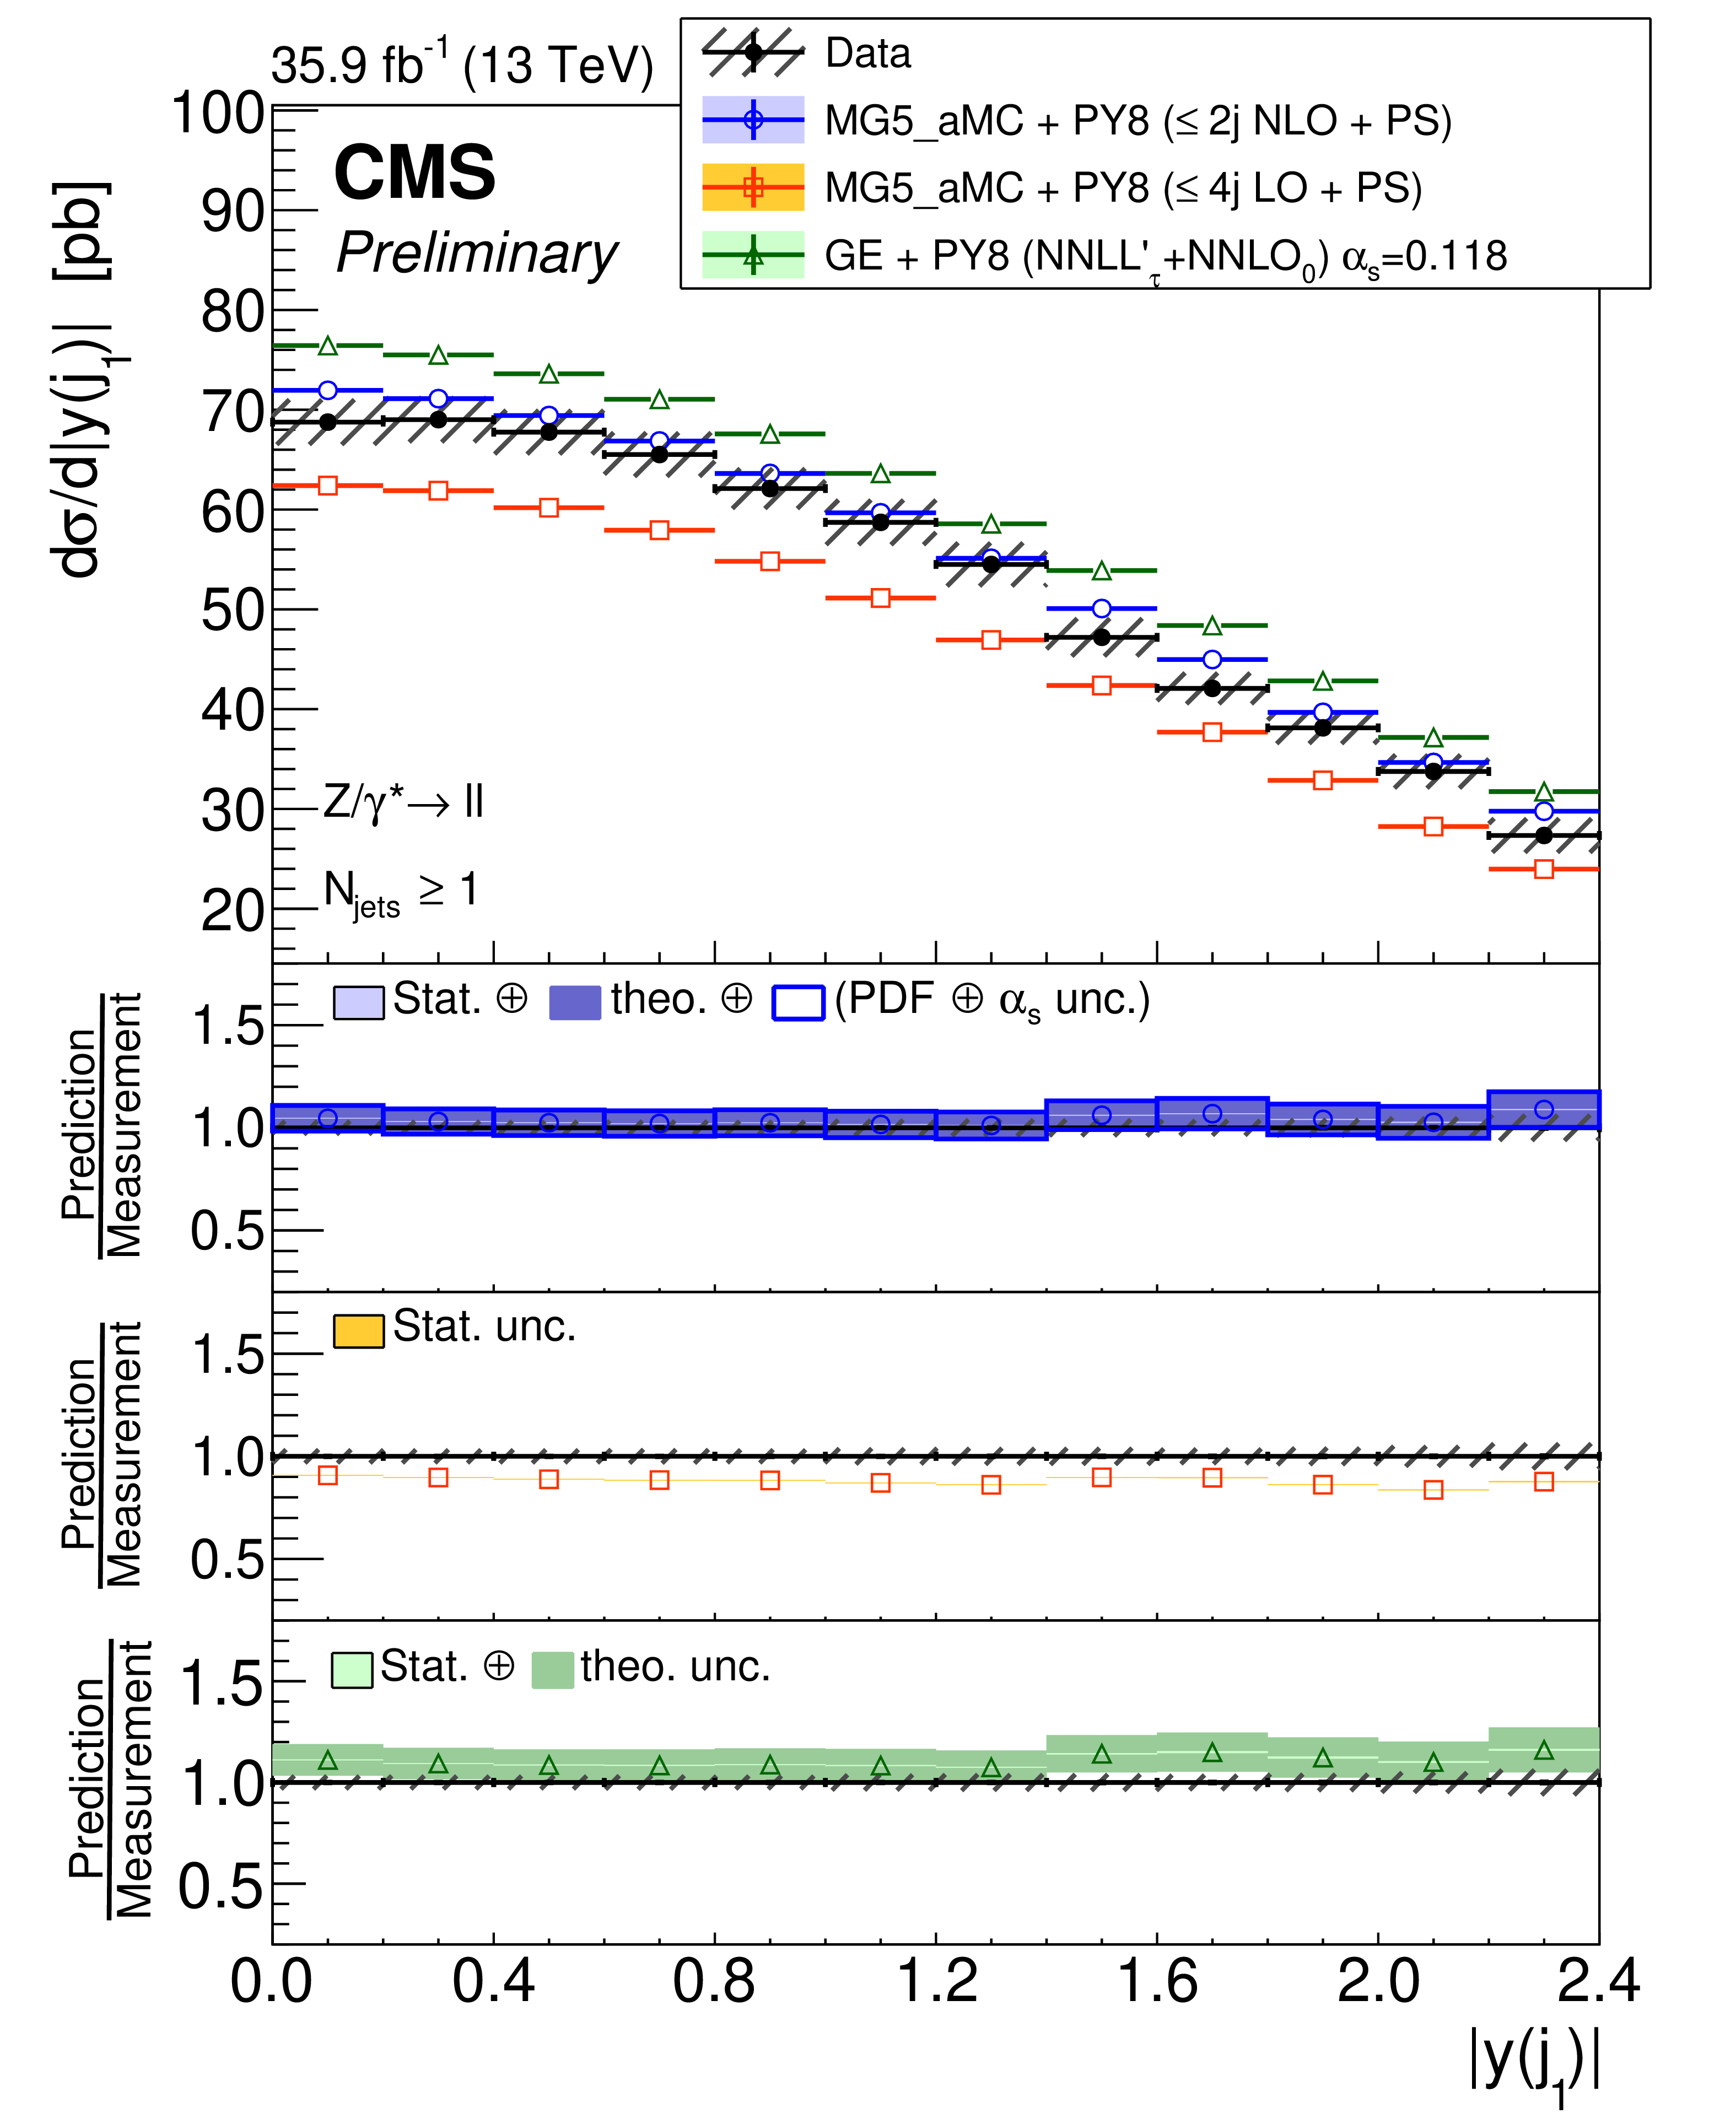
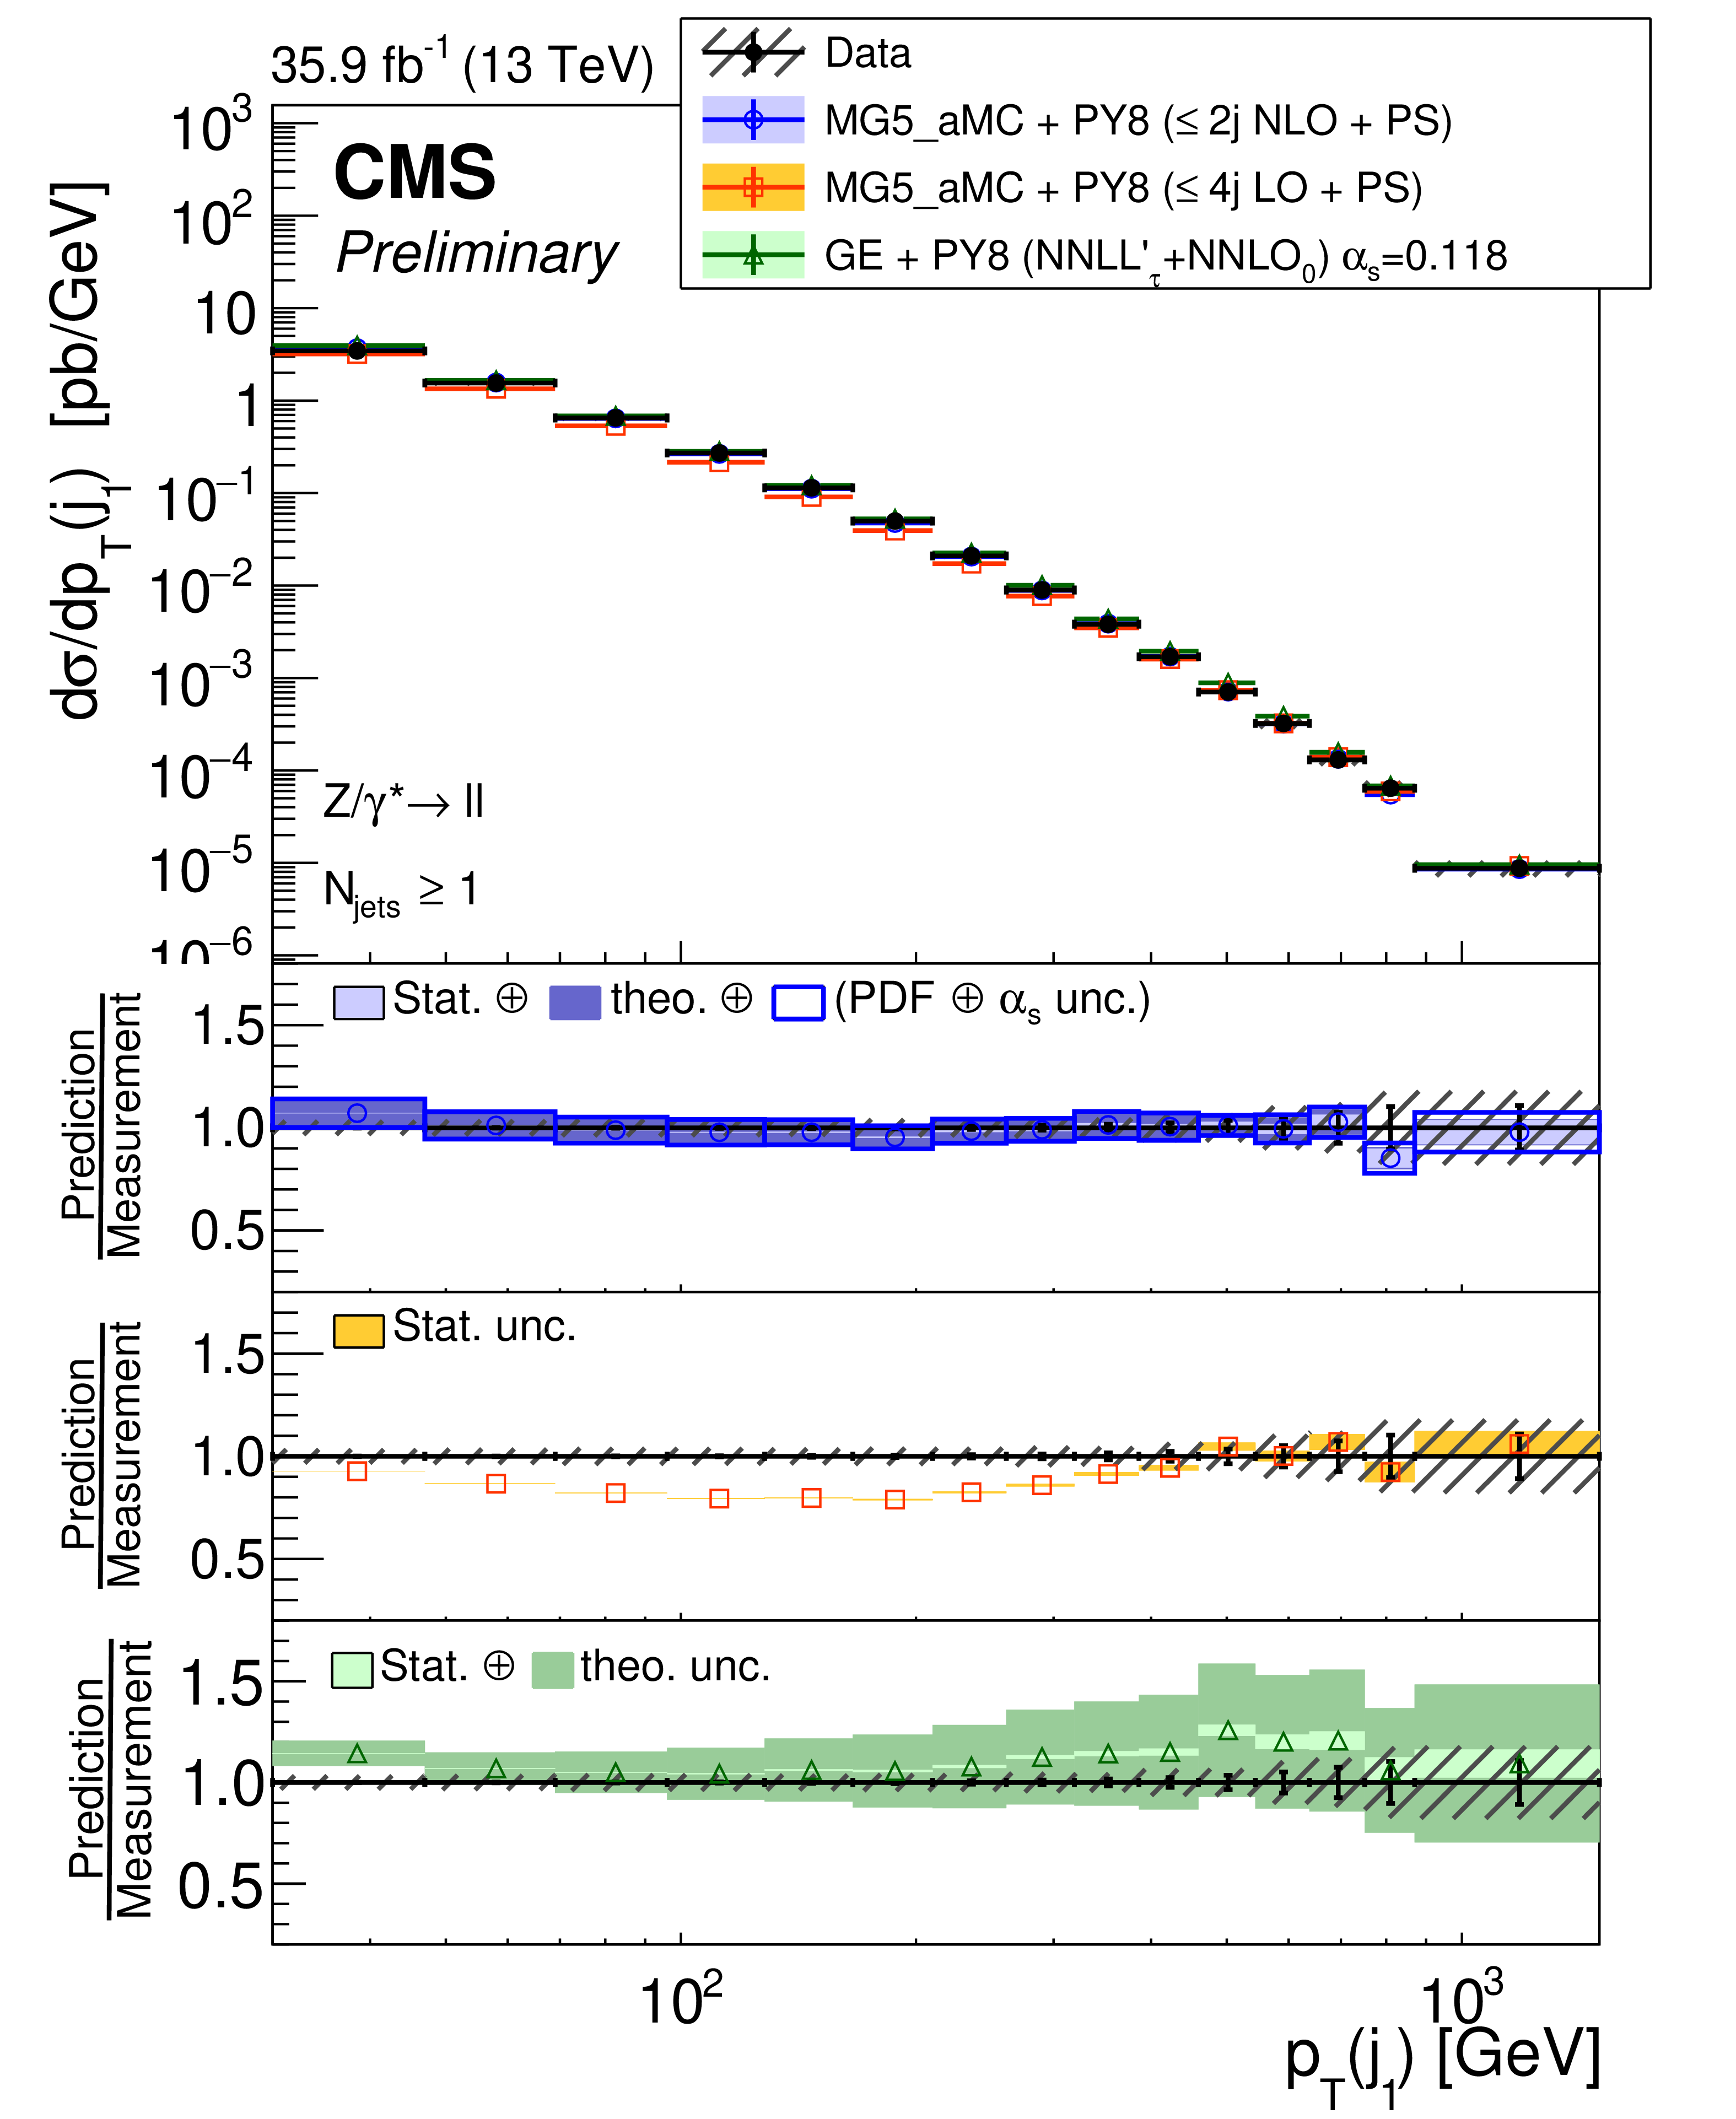
The measured differential cross section as a function of leading jet $|y|$ (left) and ${p_{\mathrm {T}}}$ (right) for events with at least one jet. The measurement statistical (resp. systematic) uncertainties are represented with vertical error bars (resp. hashed areas). The measurement is compared to the NLO MG5_aMC, LO MG5_aMC, and GENEVA predictions described in Section 6. The predictions uncertainties, estimated as explained in this section, are represented by coloured areas in the ratio plots (light colour for the statistical part and darker colour for the total). Only statistical uncertainty is computed for the LO prediction. |
png pdf |
Figure 5-a:
The measured differential cross section as a function of leading jet $|y|$ (left) and ${p_{\mathrm {T}}}$ (right) for events with at least one jet. The measurement statistical (resp. systematic) uncertainties are represented with vertical error bars (resp. hashed areas). The measurement is compared to the NLO MG5_aMC, LO MG5_aMC, and GENEVA predictions described in Section 6. The predictions uncertainties, estimated as explained in this section, are represented by coloured areas in the ratio plots (light colour for the statistical part and darker colour for the total). Only statistical uncertainty is computed for the LO prediction. |
png pdf |
Figure 5-b:
The measured differential cross section as a function of leading jet $|y|$ (left) and ${p_{\mathrm {T}}}$ (right) for events with at least one jet. The measurement statistical (resp. systematic) uncertainties are represented with vertical error bars (resp. hashed areas). The measurement is compared to the NLO MG5_aMC, LO MG5_aMC, and GENEVA predictions described in Section 6. The predictions uncertainties, estimated as explained in this section, are represented by coloured areas in the ratio plots (light colour for the statistical part and darker colour for the total). Only statistical uncertainty is computed for the LO prediction. |
png pdf |
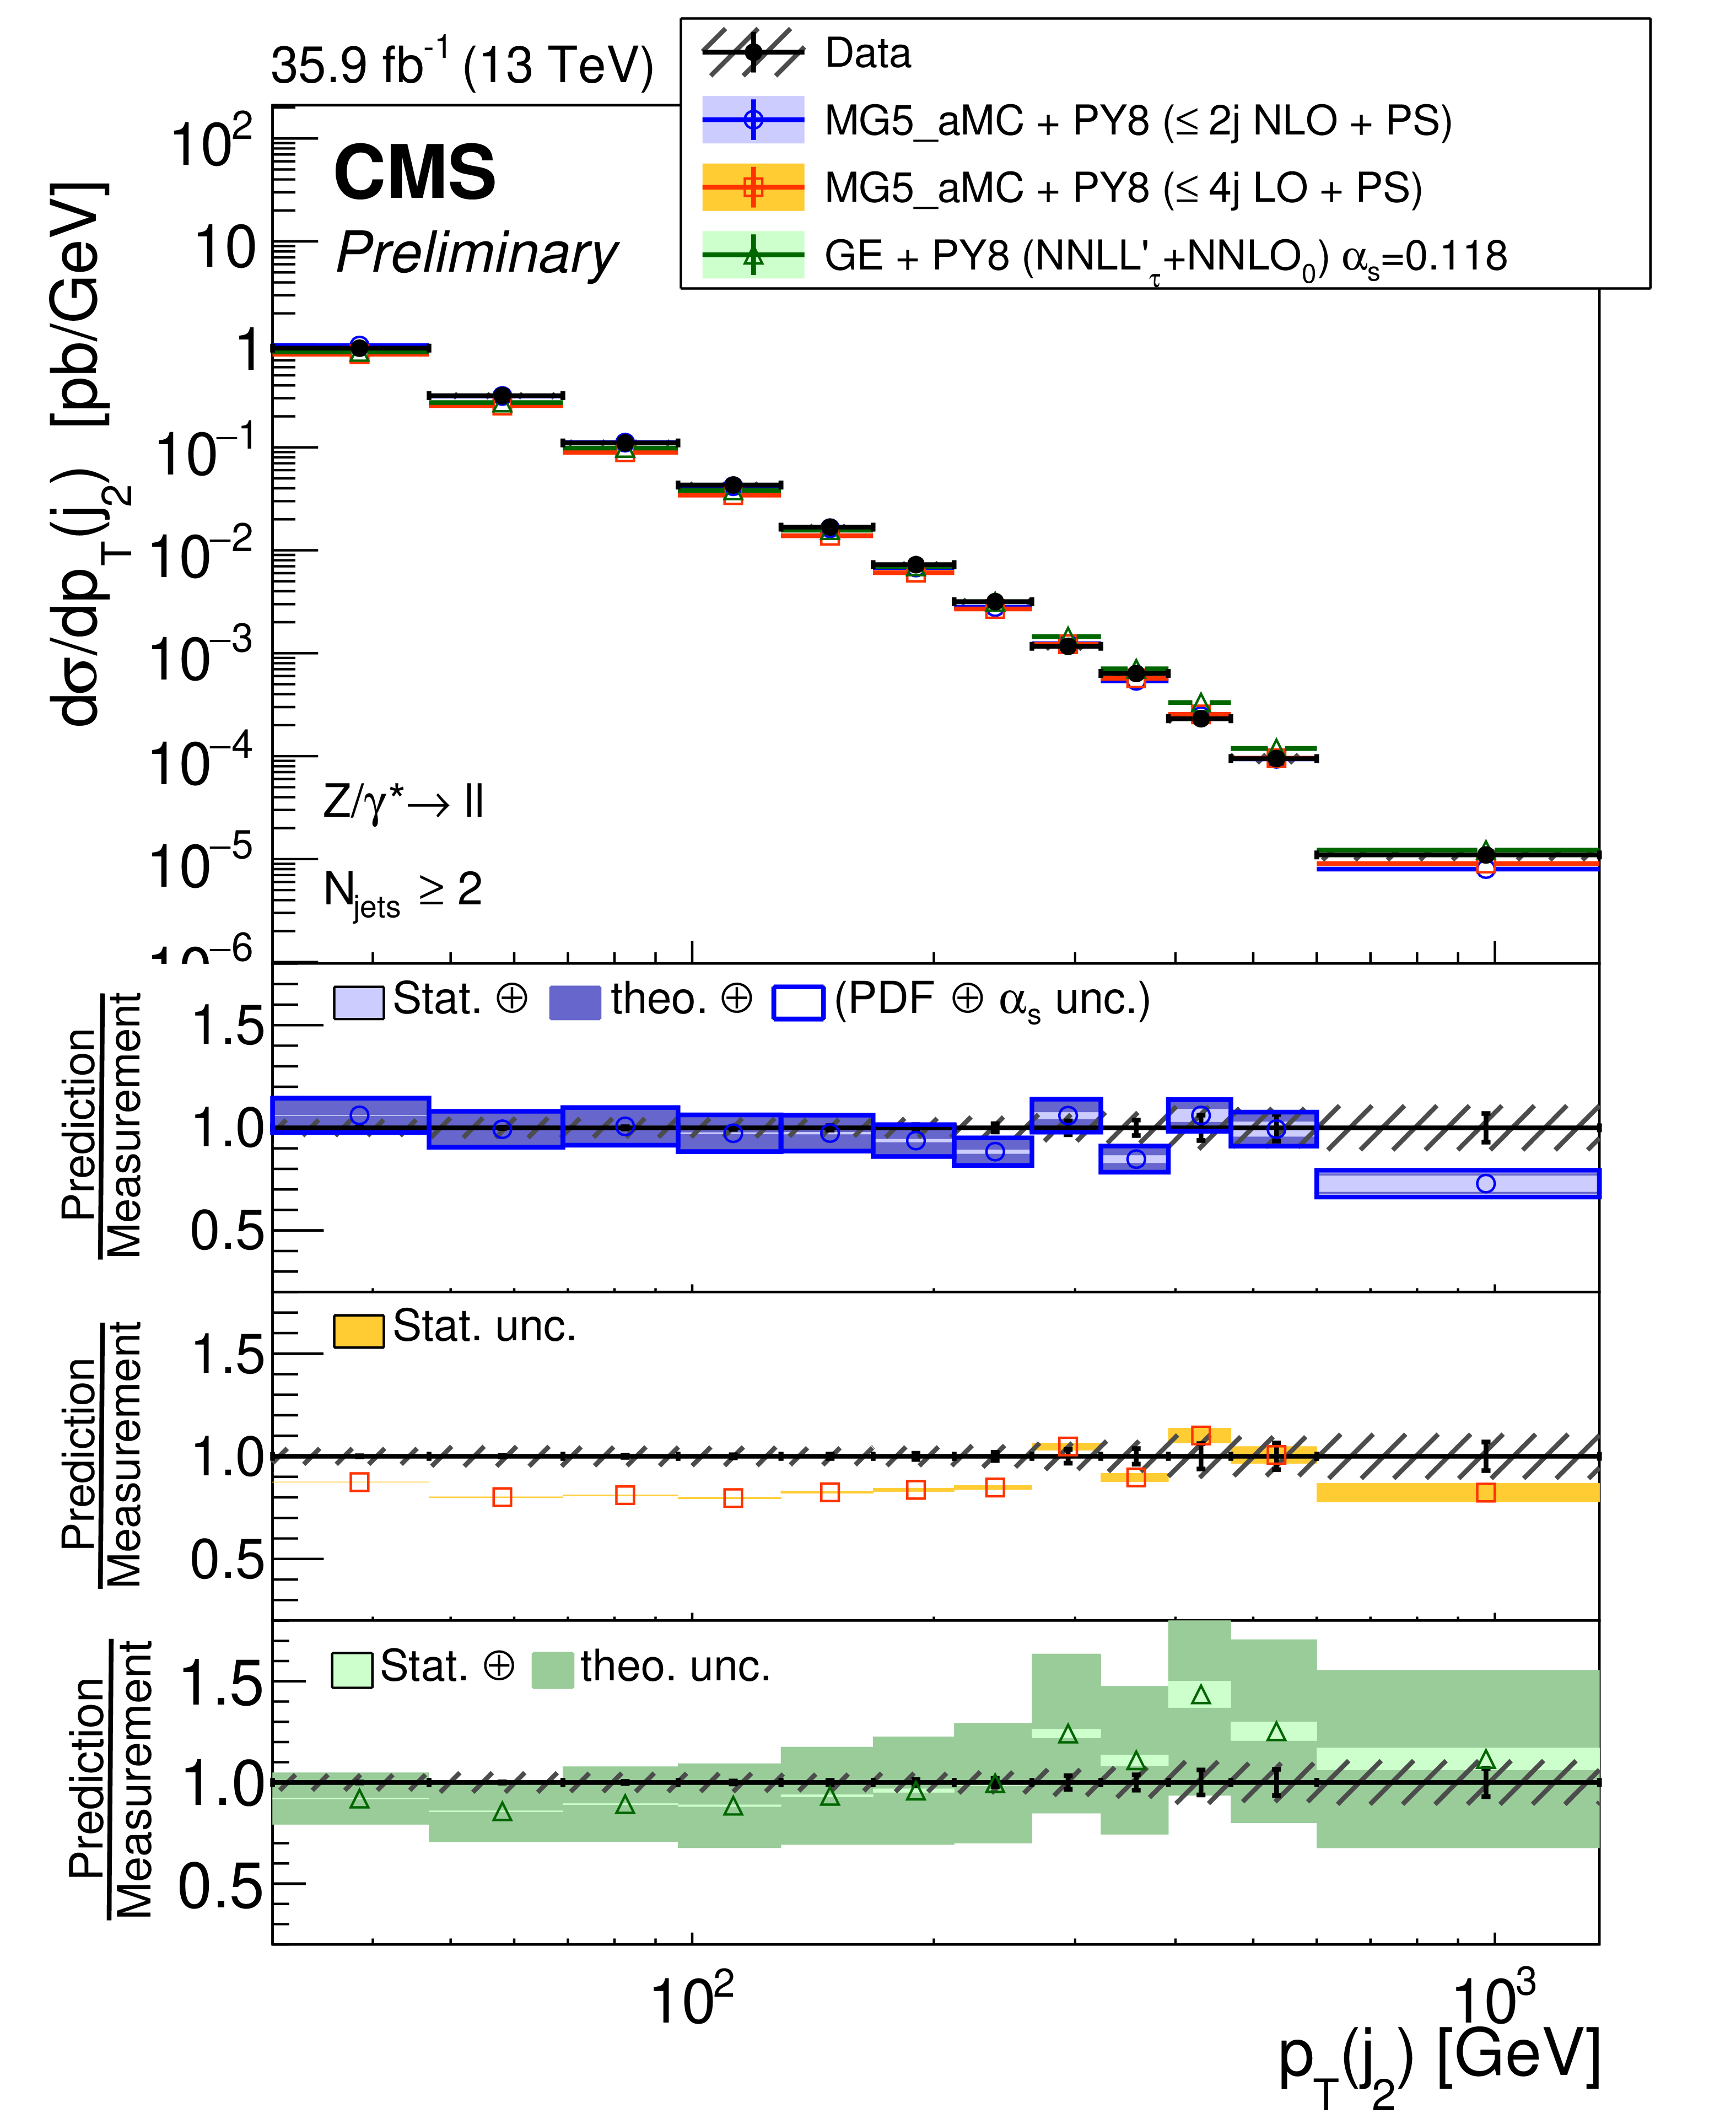
Figure 6:
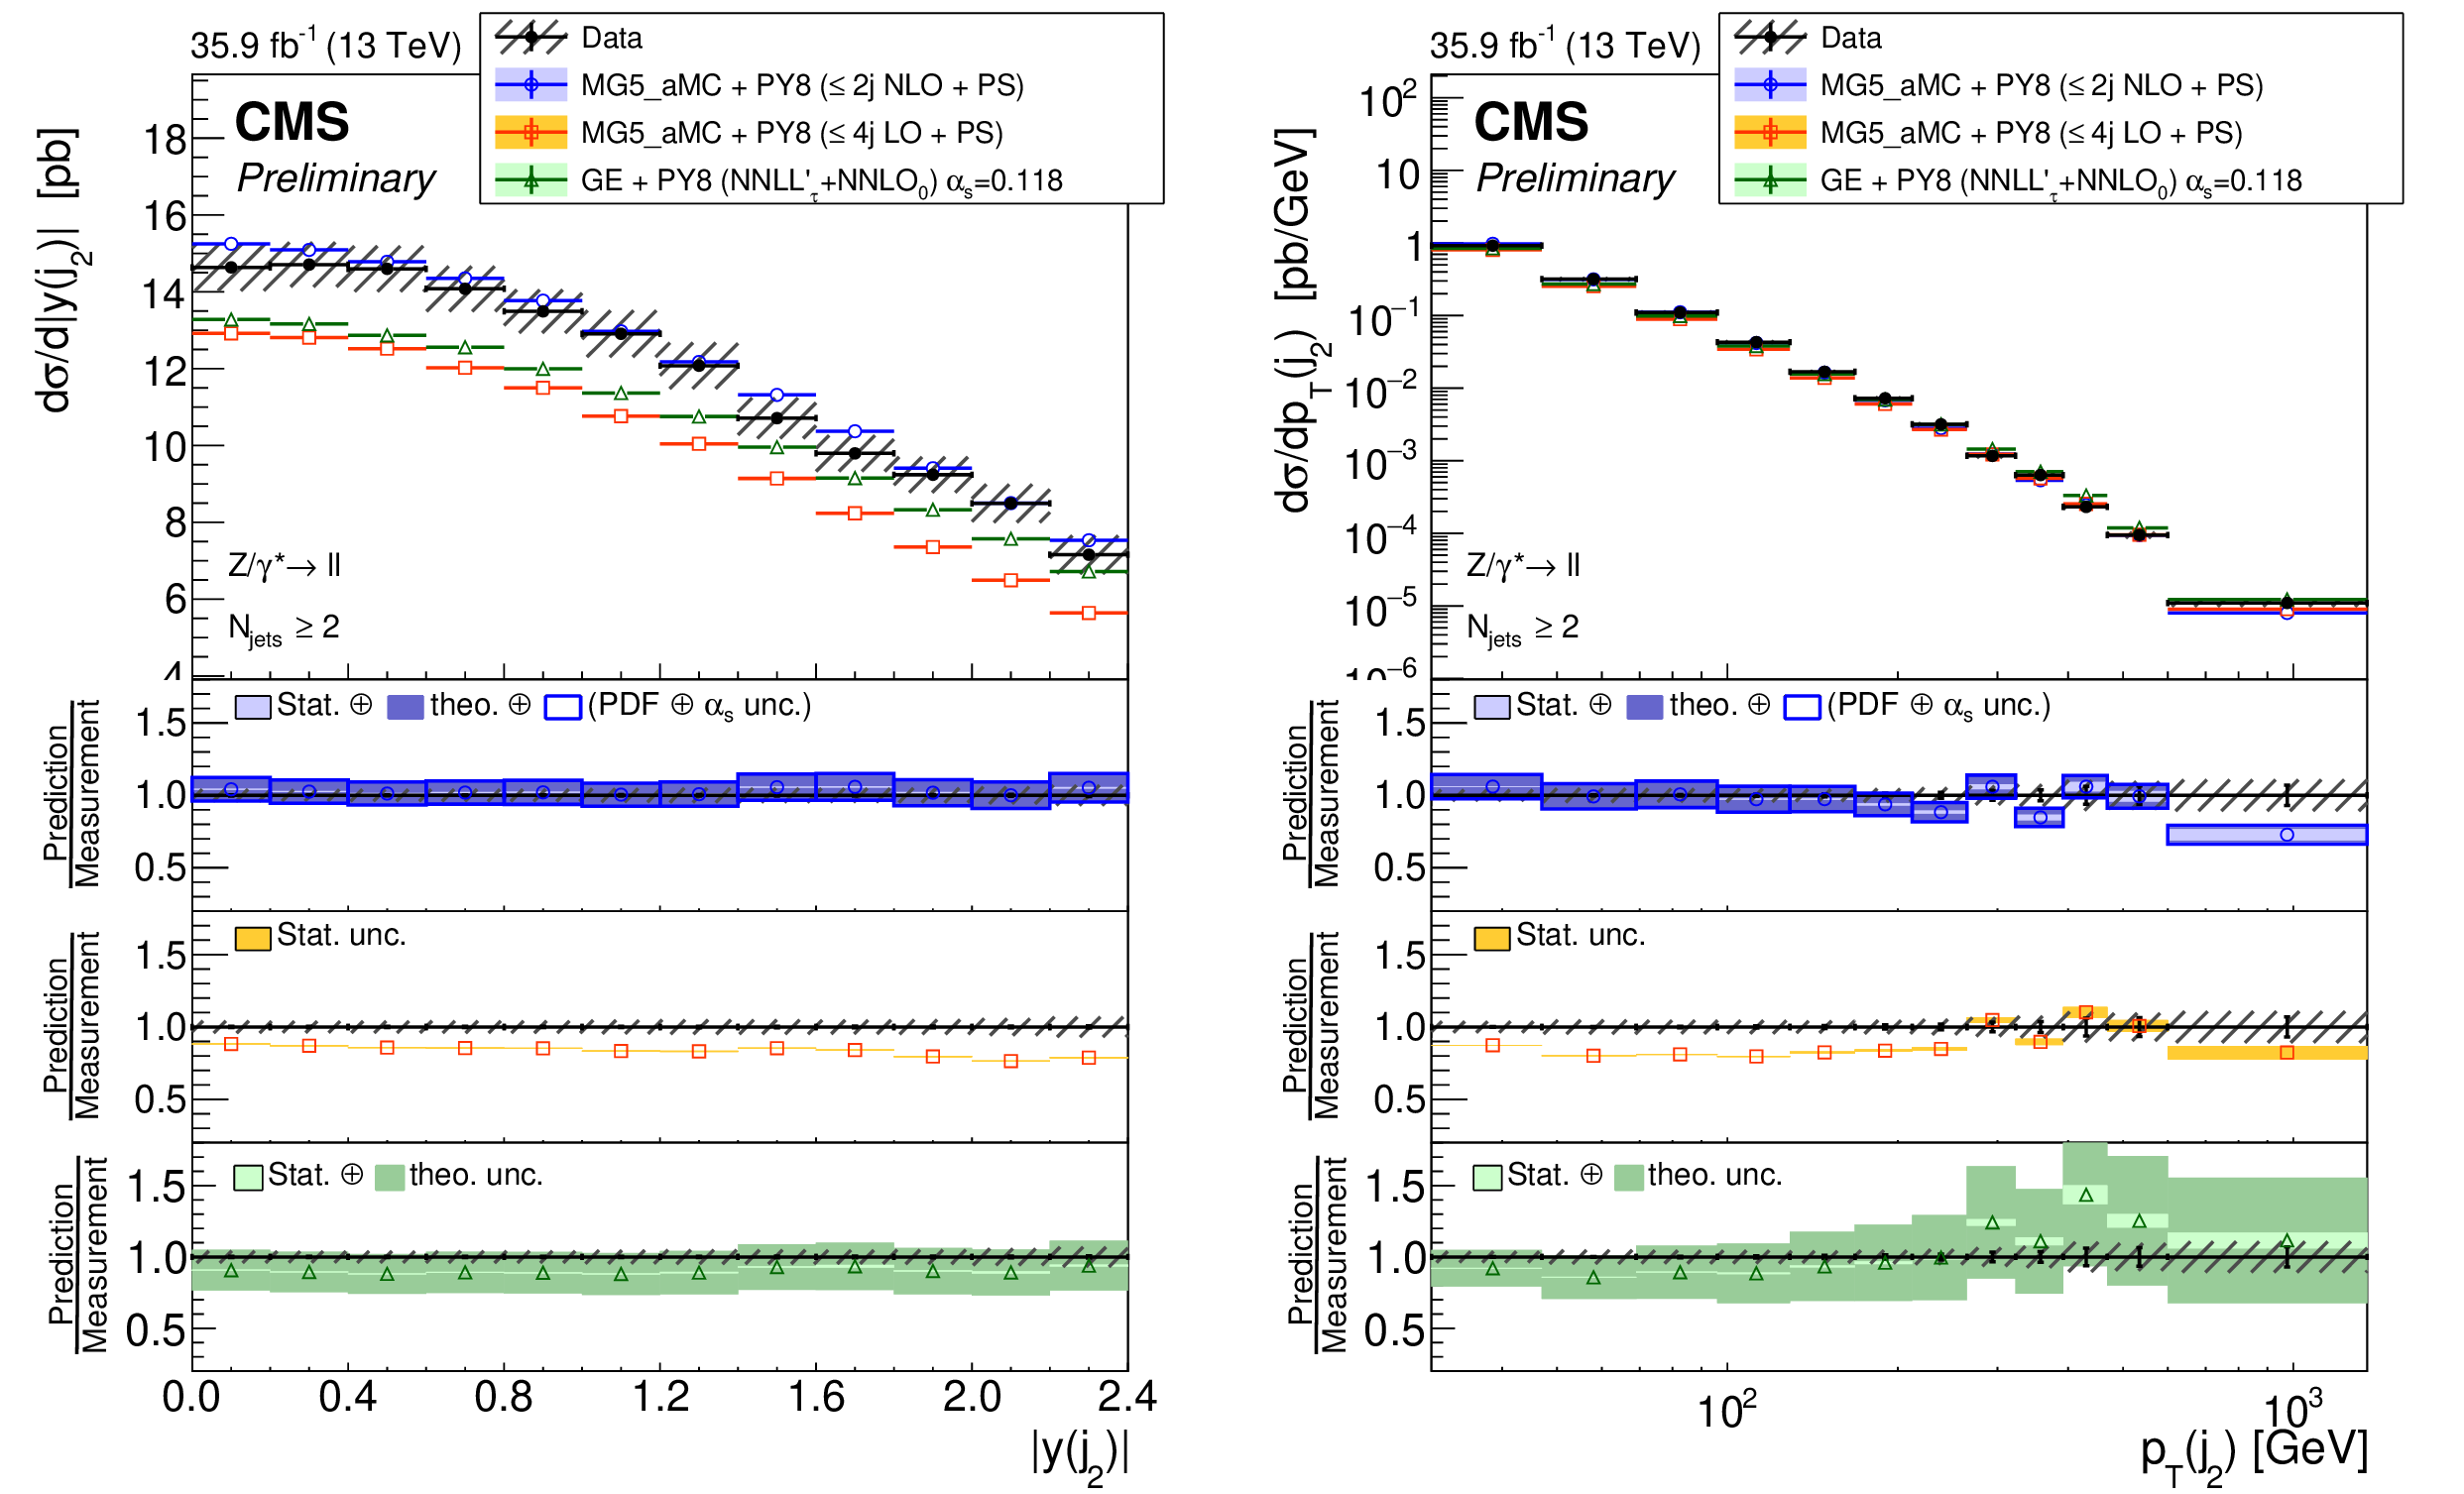
The measured differential cross section as a function of second jet $|y|$ (left) and ${p_{\mathrm {T}}}$ (right) for events with at least two jets. The measurement statistical (resp. systematic) uncertainties are represented with vertical error bars (resp. hashed areas). The measurement is compared to the NLO MG5_aMC, LO MG5_aMC, and GENEVA predictions described in Section 6. The predictions uncertainties, estimated as explained in this section, are represented by coloured areas in the ratio plots (light colour for the statistical part and darker colour for the total). Only statistical uncertainty is computed for the LO prediction. |

png pdf |
Figure 6-a:
The measured differential cross section as a function of second jet $|y|$ (left) and ${p_{\mathrm {T}}}$ (right) for events with at least two jets. The measurement statistical (resp. systematic) uncertainties are represented with vertical error bars (resp. hashed areas). The measurement is compared to the NLO MG5_aMC, LO MG5_aMC, and GENEVA predictions described in Section 6. The predictions uncertainties, estimated as explained in this section, are represented by coloured areas in the ratio plots (light colour for the statistical part and darker colour for the total). Only statistical uncertainty is computed for the LO prediction. |
png pdf |
Figure 6-b:
The measured differential cross section as a function of second jet $|y|$ (left) and ${p_{\mathrm {T}}}$ (right) for events with at least two jets. The measurement statistical (resp. systematic) uncertainties are represented with vertical error bars (resp. hashed areas). The measurement is compared to the NLO MG5_aMC, LO MG5_aMC, and GENEVA predictions described in Section 6. The predictions uncertainties, estimated as explained in this section, are represented by coloured areas in the ratio plots (light colour for the statistical part and darker colour for the total). Only statistical uncertainty is computed for the LO prediction. |
png pdf |
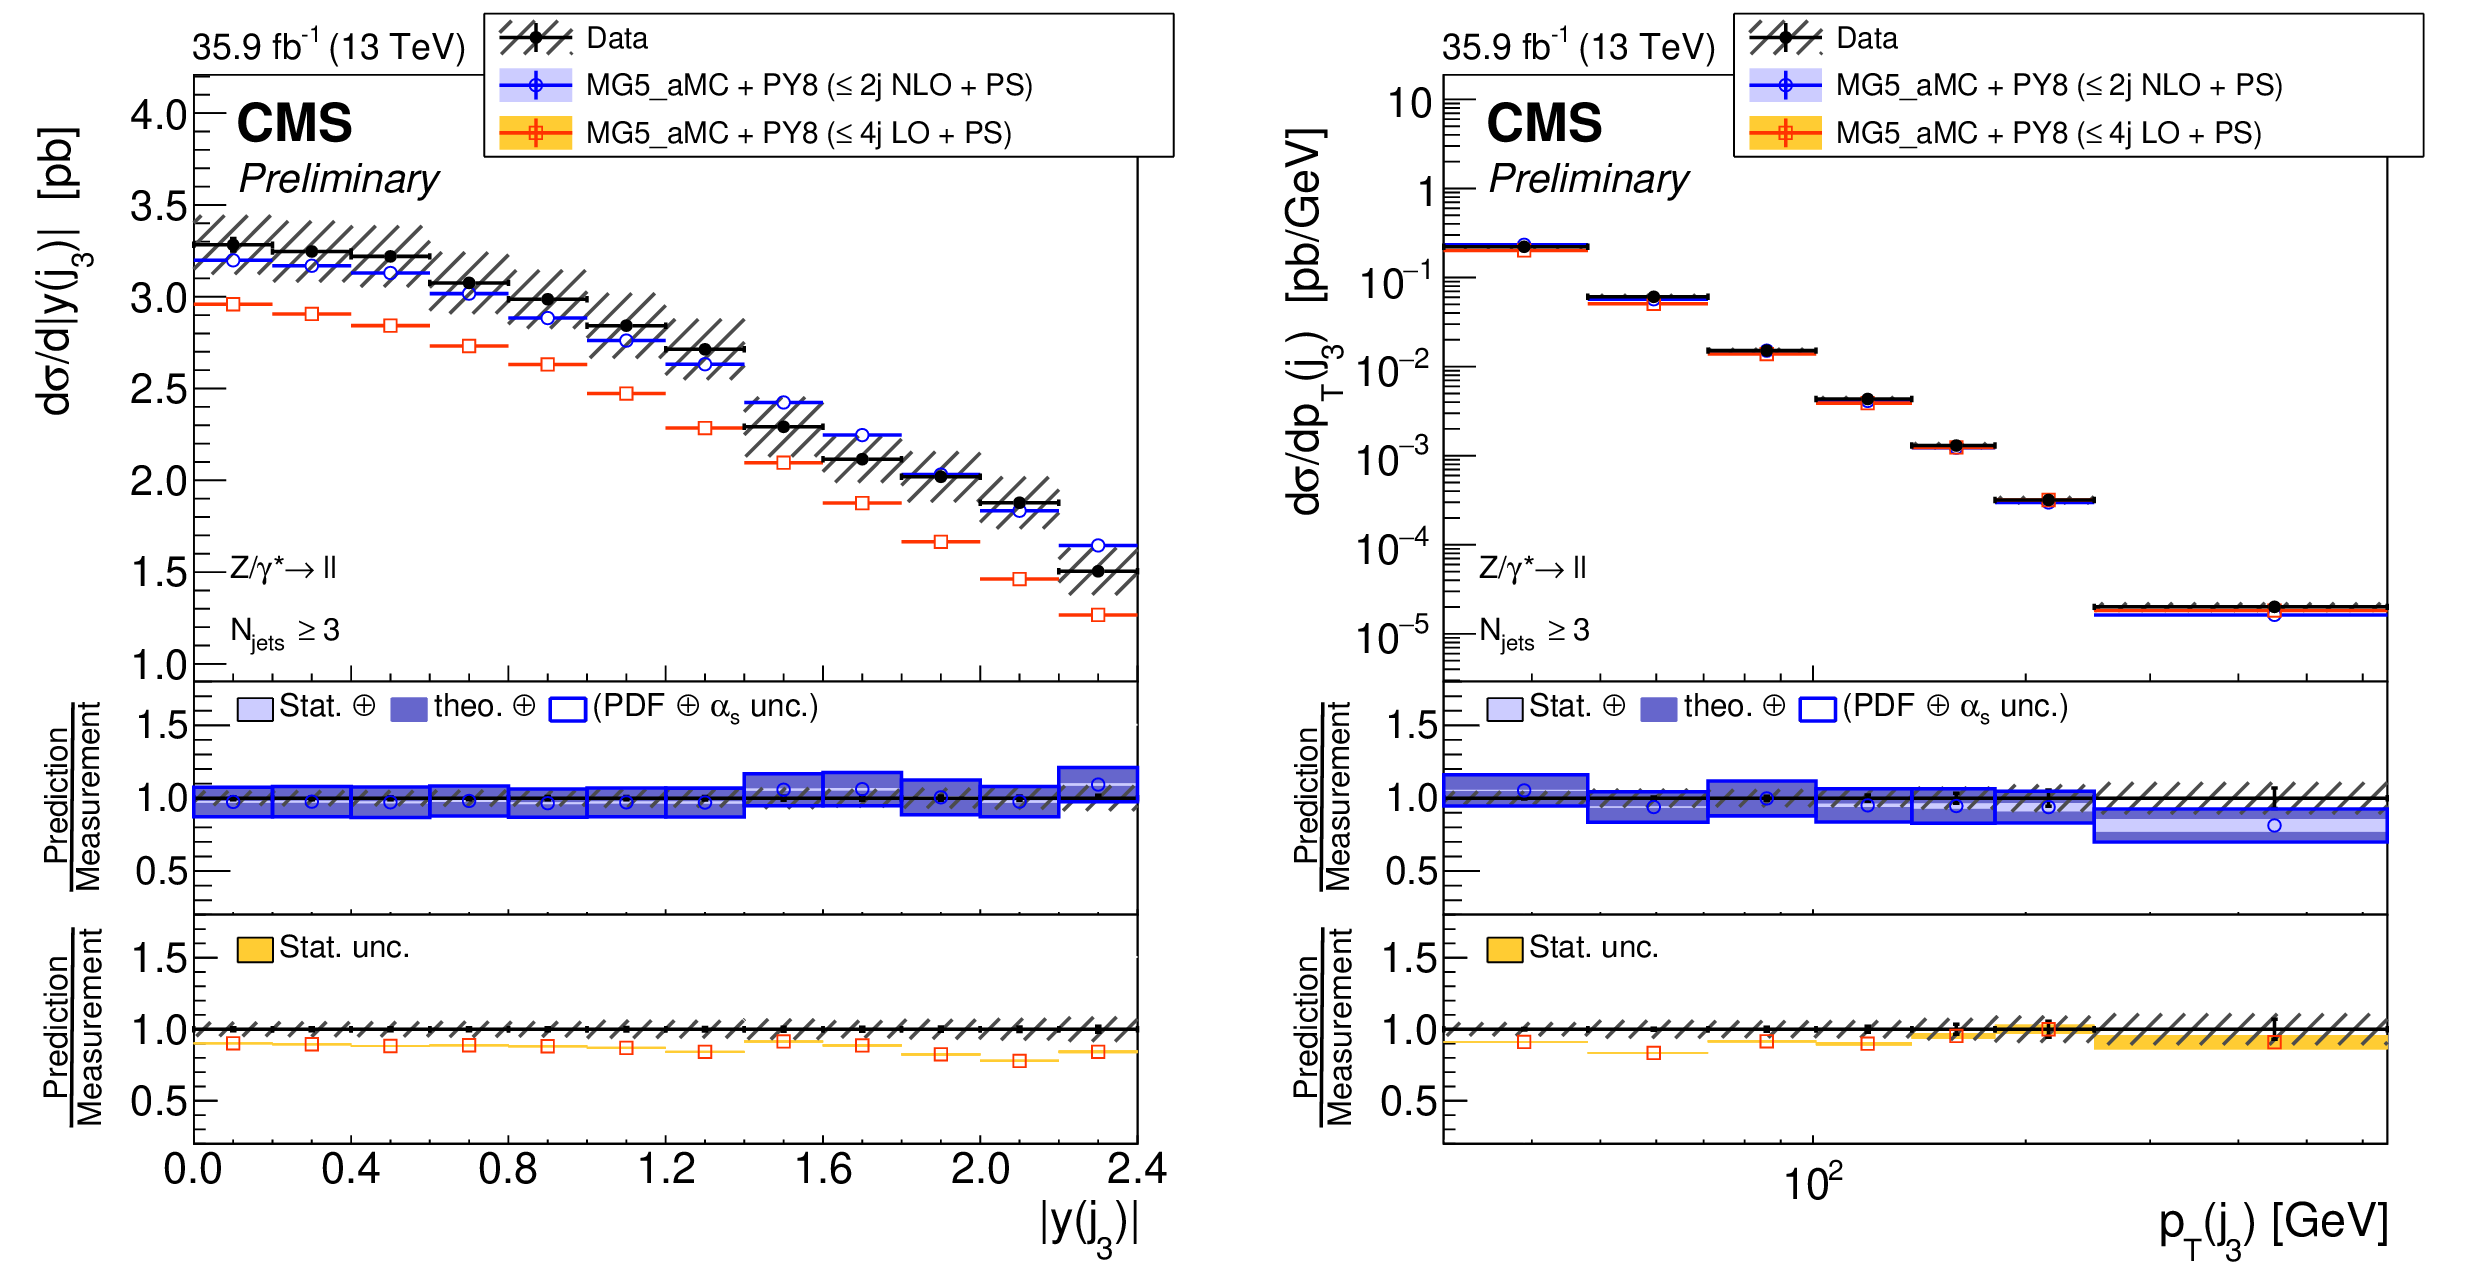
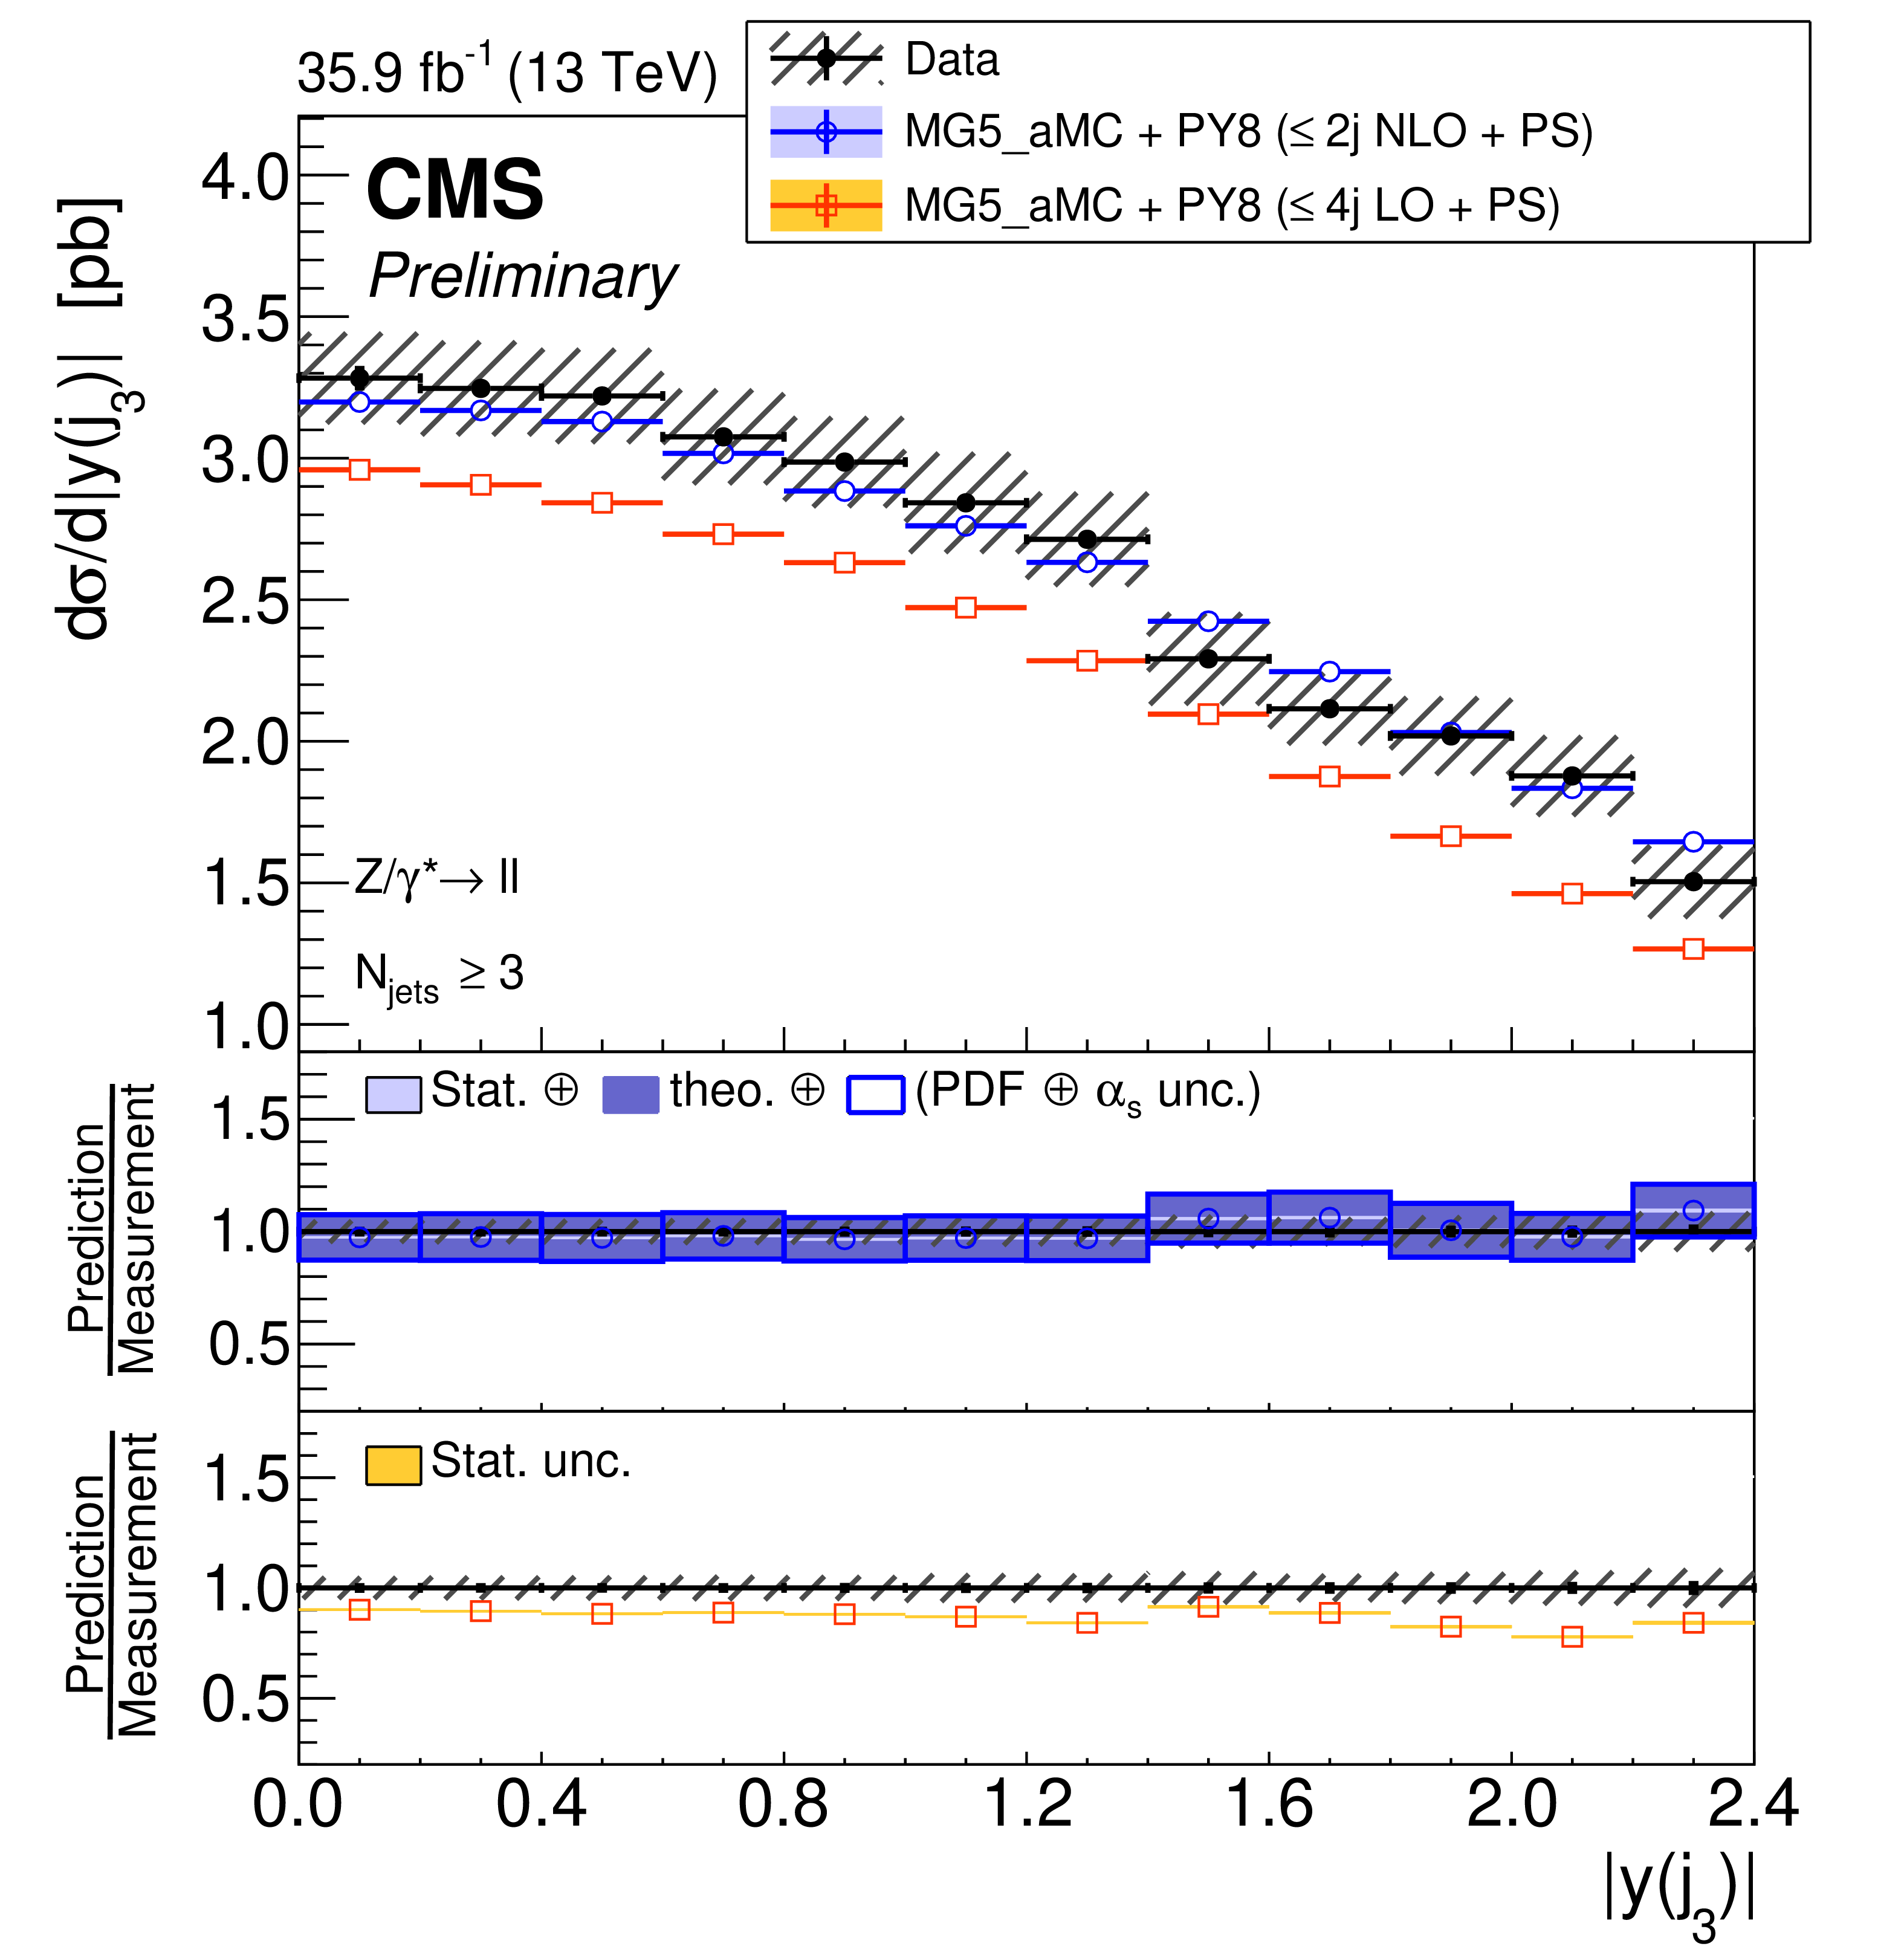
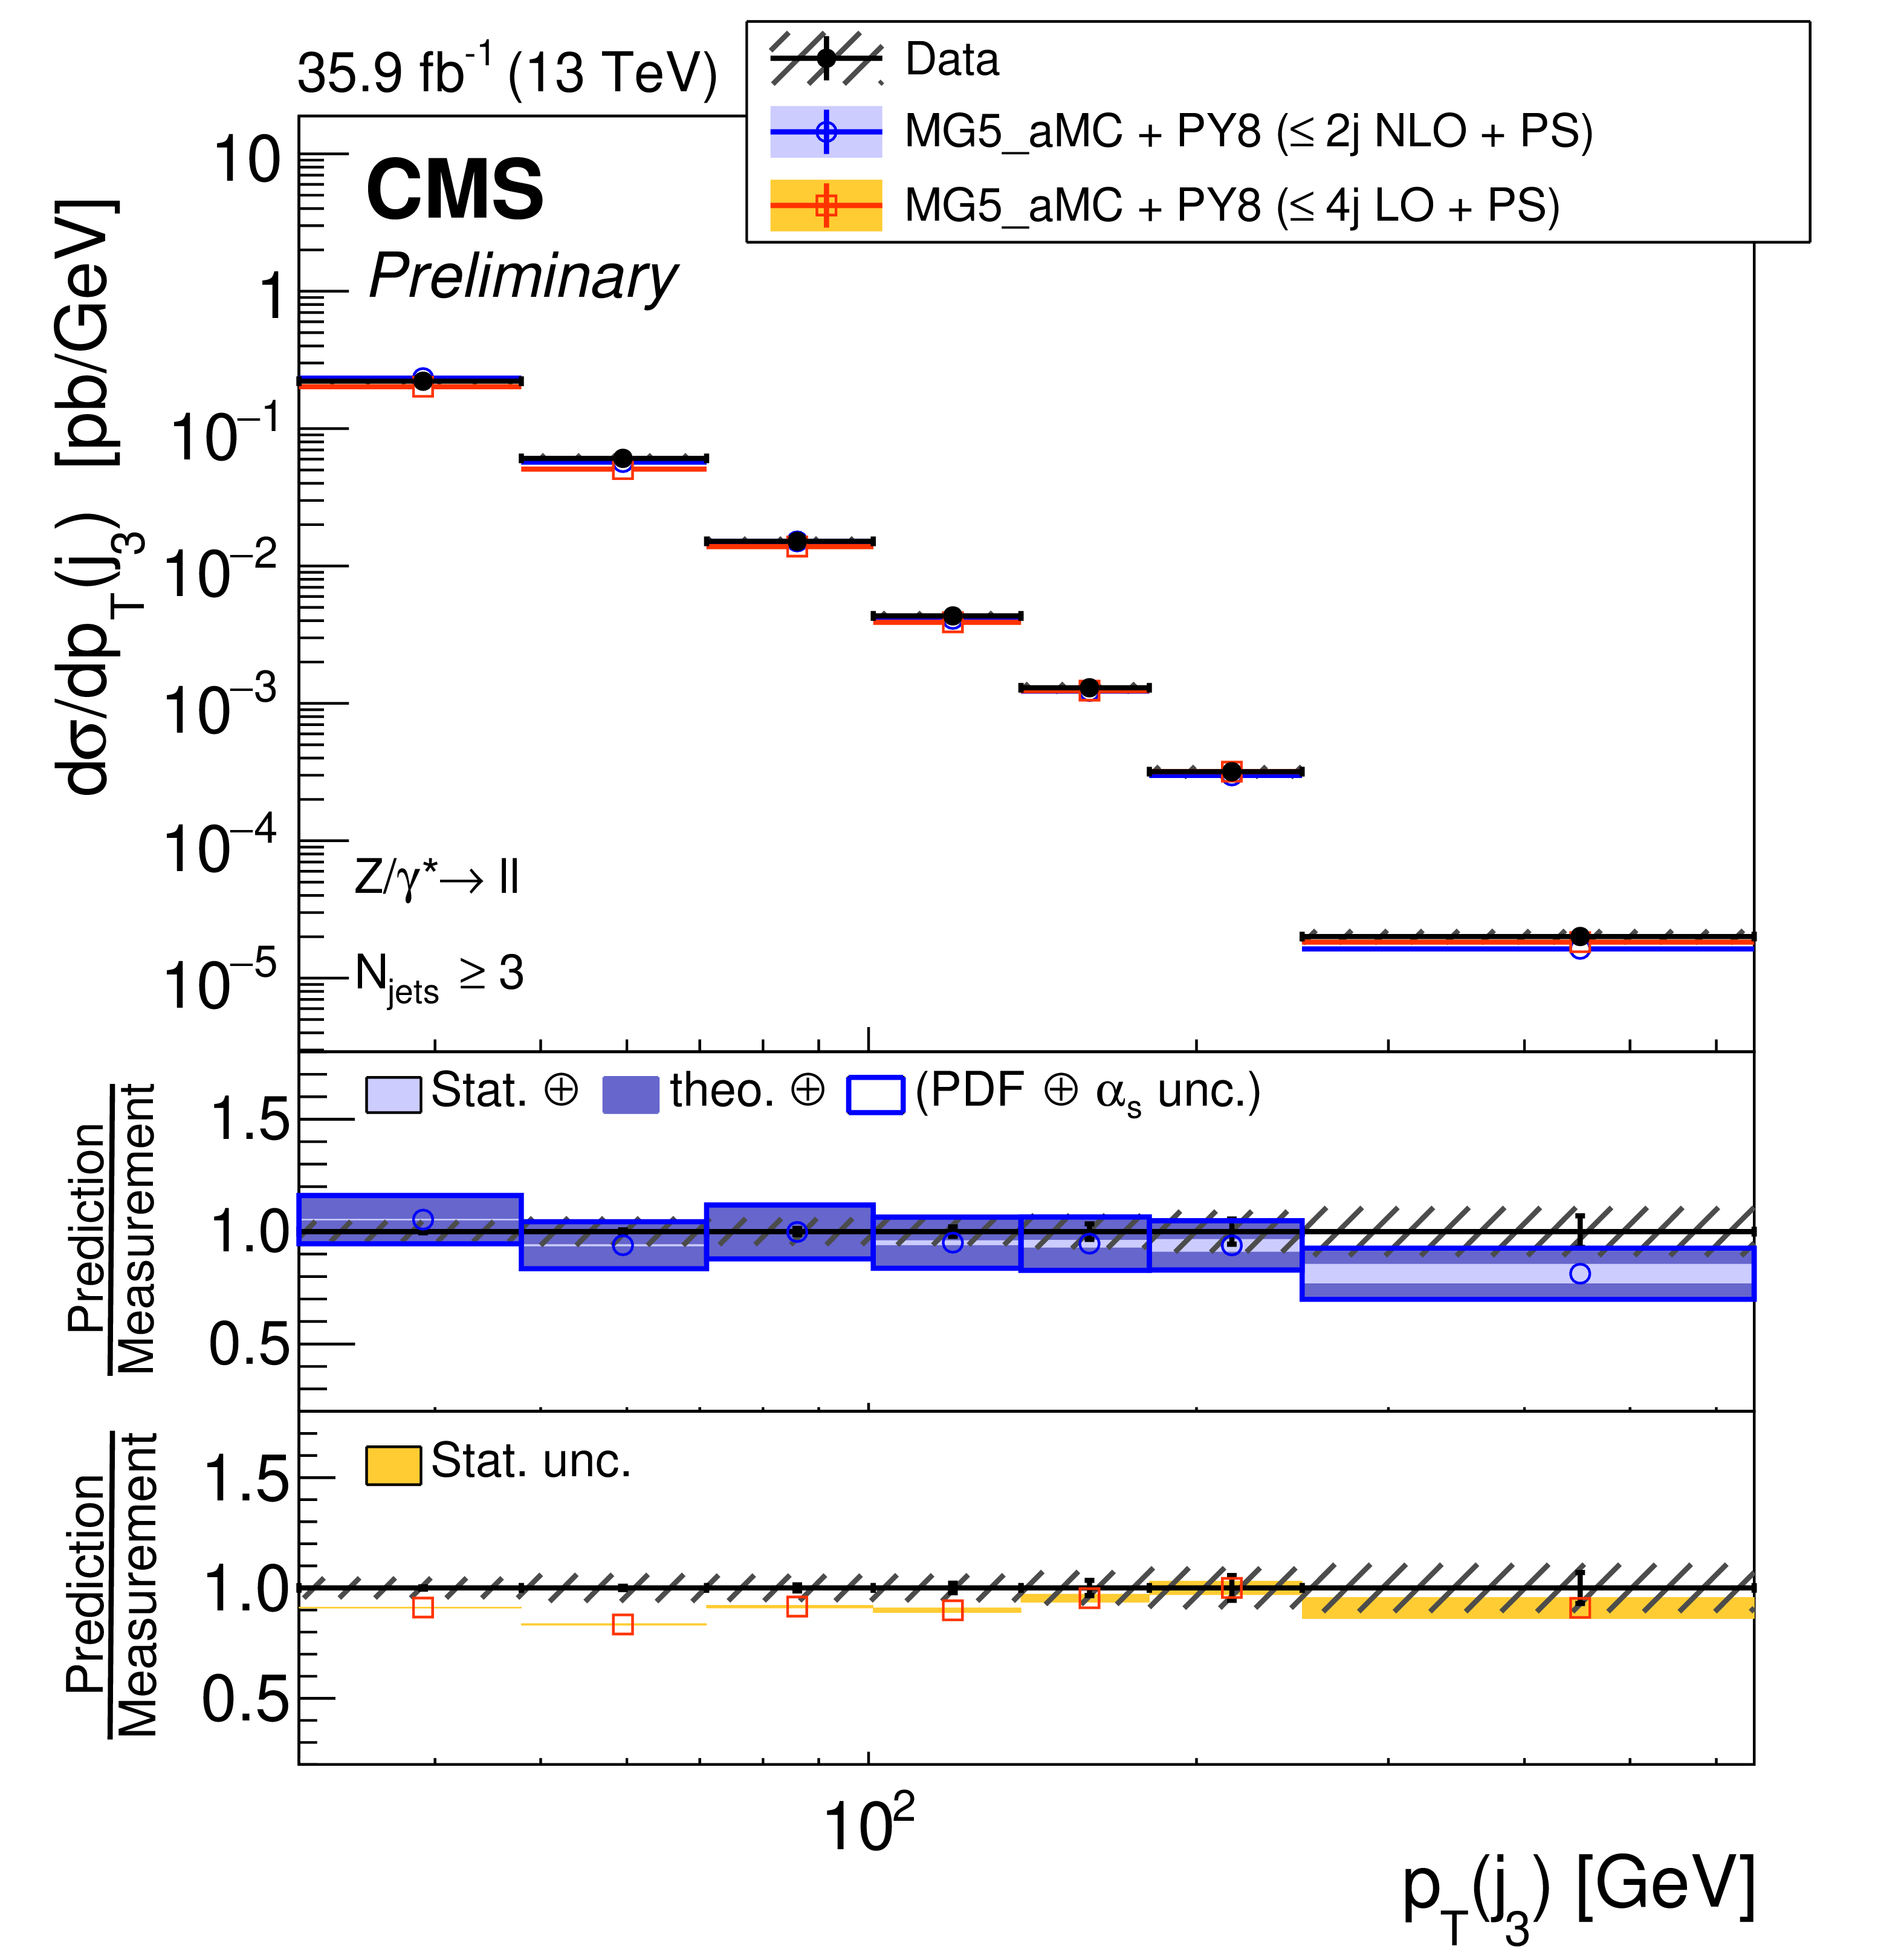
Figure 7:
The measured differential cross section as a function of third jet $|y|$ (left) and ${p_{\mathrm {T}}}$ (right) for events with at least three jets. The measurement statistical (resp. systematic) uncertainties are represented with vertical error bars (resp. hashed areas). The measurement is compared to the NLO and LO MG5_aMC predictions described in Section 6. The predictions uncertainties, estimated as explained in this section, are represented by coloured areas in the ratio plots (light colour for the statistical part and darker colour for the total). Only statistical uncertainty is computed for the LO prediction. |
png pdf |
Figure 7-a:
The measured differential cross section as a function of third jet $|y|$ (left) and ${p_{\mathrm {T}}}$ (right) for events with at least three jets. The measurement statistical (resp. systematic) uncertainties are represented with vertical error bars (resp. hashed areas). The measurement is compared to the NLO and LO MG5_aMC predictions described in Section 6. The predictions uncertainties, estimated as explained in this section, are represented by coloured areas in the ratio plots (light colour for the statistical part and darker colour for the total). Only statistical uncertainty is computed for the LO prediction. |
png pdf |
Figure 7-b:
The measured differential cross section as a function of third jet $|y|$ (left) and ${p_{\mathrm {T}}}$ (right) for events with at least three jets. The measurement statistical (resp. systematic) uncertainties are represented with vertical error bars (resp. hashed areas). The measurement is compared to the NLO and LO MG5_aMC predictions described in Section 6. The predictions uncertainties, estimated as explained in this section, are represented by coloured areas in the ratio plots (light colour for the statistical part and darker colour for the total). Only statistical uncertainty is computed for the LO prediction. |
png pdf |
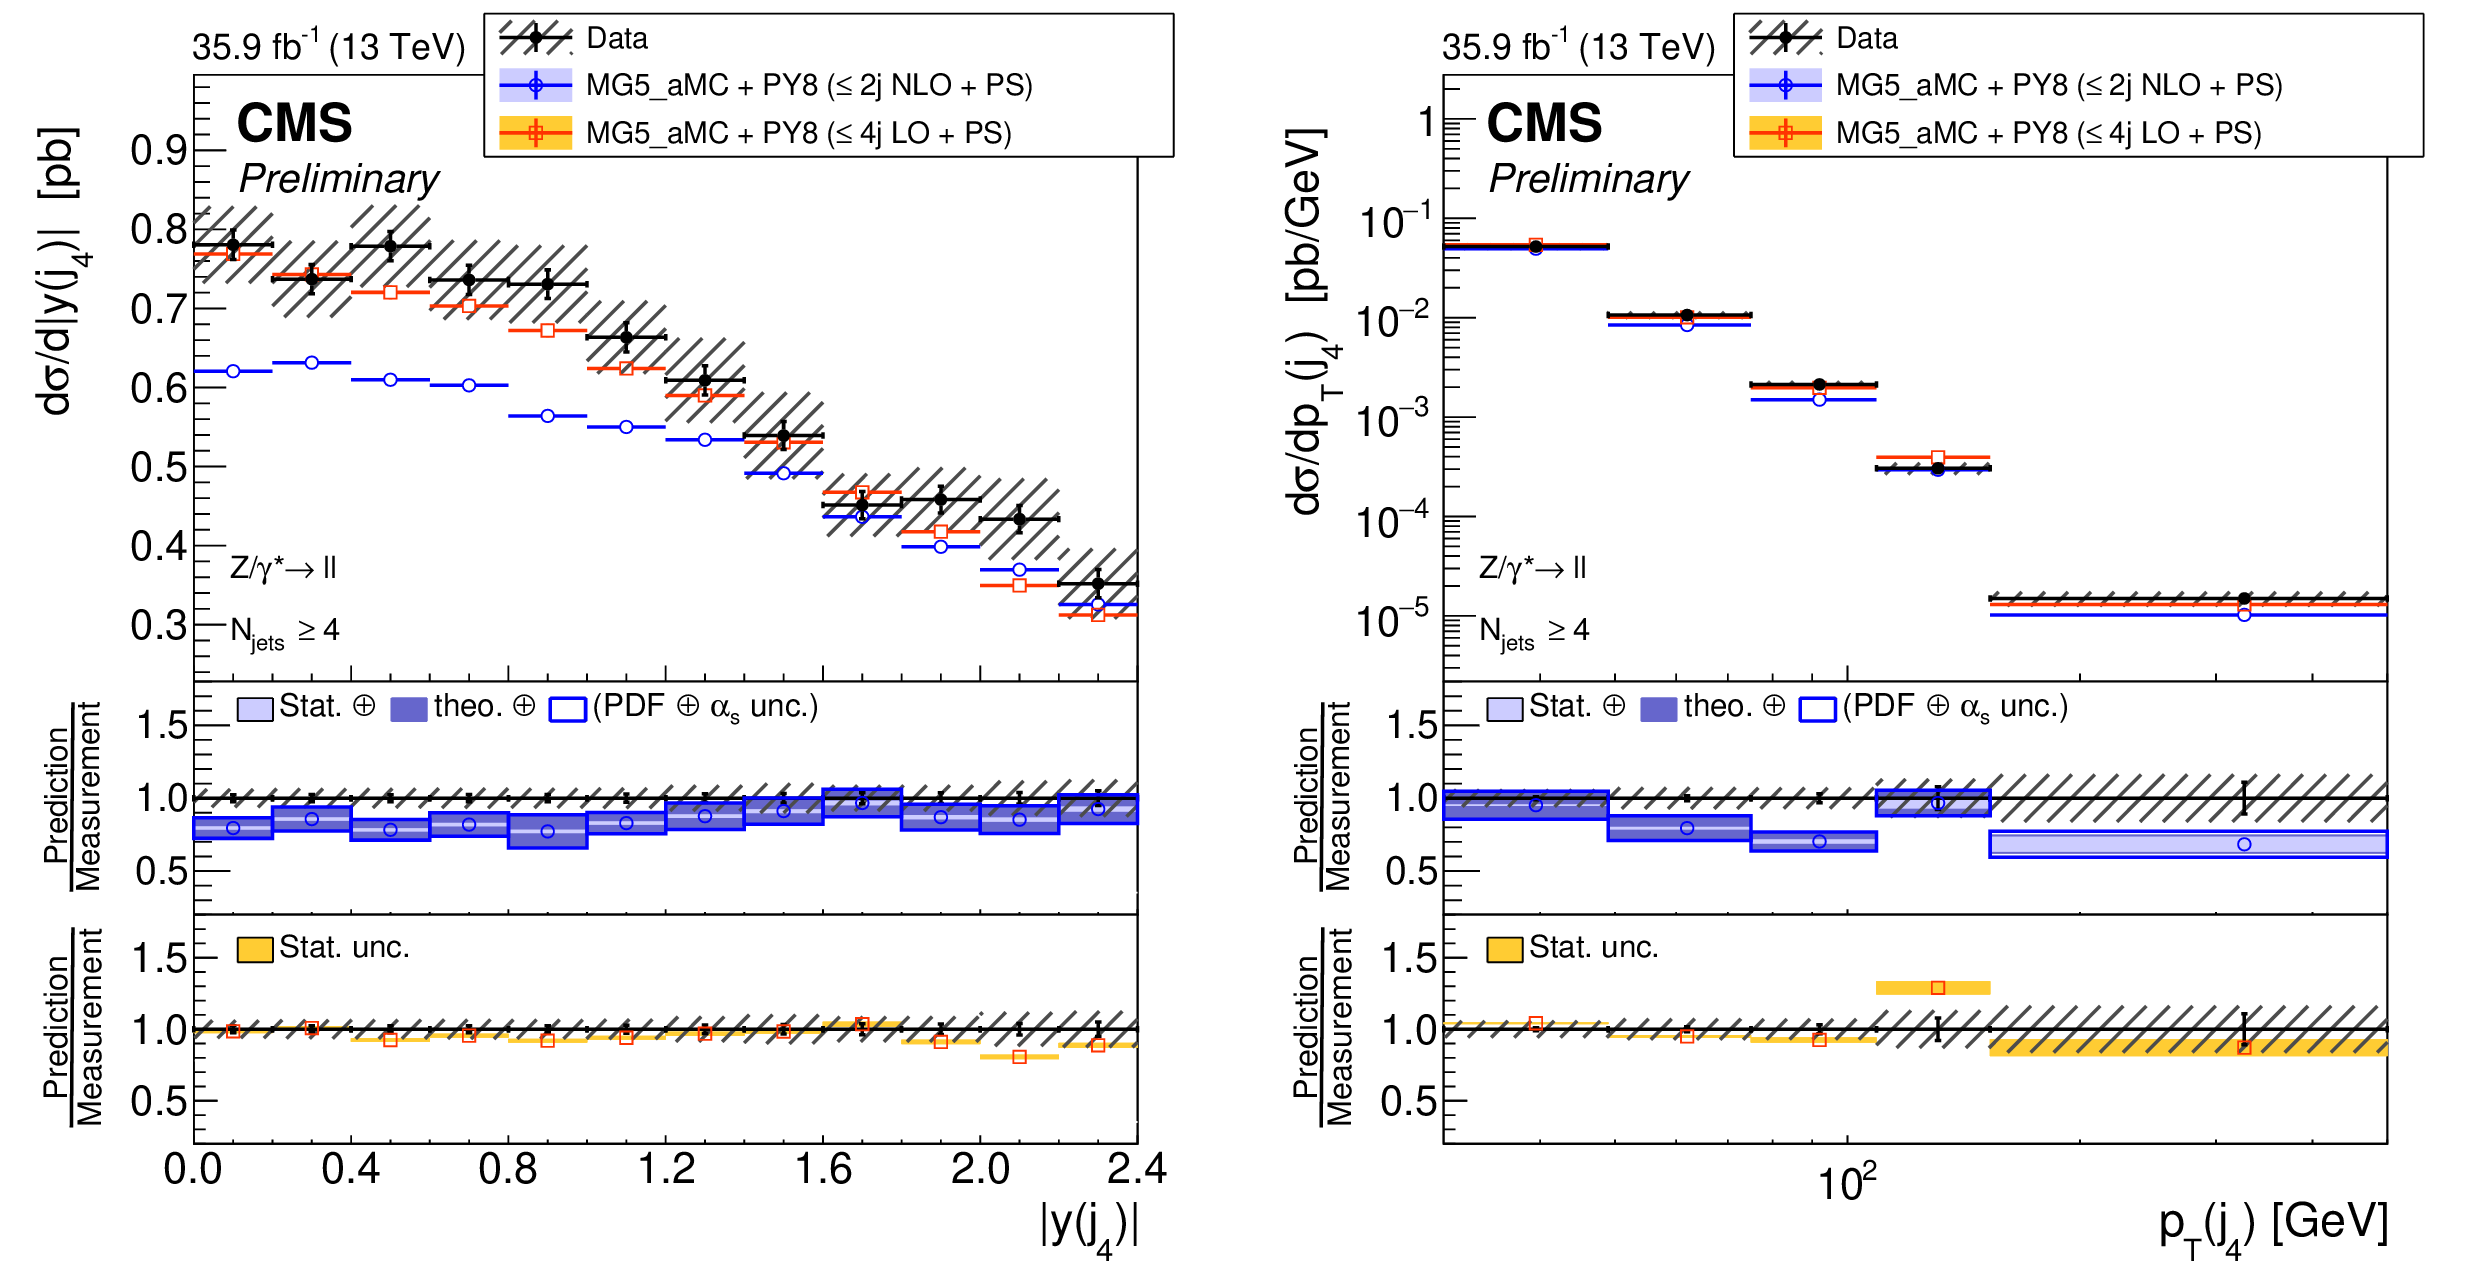
Figure 8:
The measured differential cross section as a function of fourth jet $|y|$ (left) and ${p_{\mathrm {T}}}$ (right) for events with at least four jets. The measurement statistical (resp. systematic) uncertainties are represented with vertical error bars (resp. hashed areas). The measurement is compared to the NLO and LO MG5_aMC predictions described in Section 6. The predictions uncertainties, estimated as explained in this section, are represented by coloured areas in the ratio plots (light colour for the statistical part and darker colour for the total). Only statistical uncertainty is computed for the LO prediction. |
png pdf |
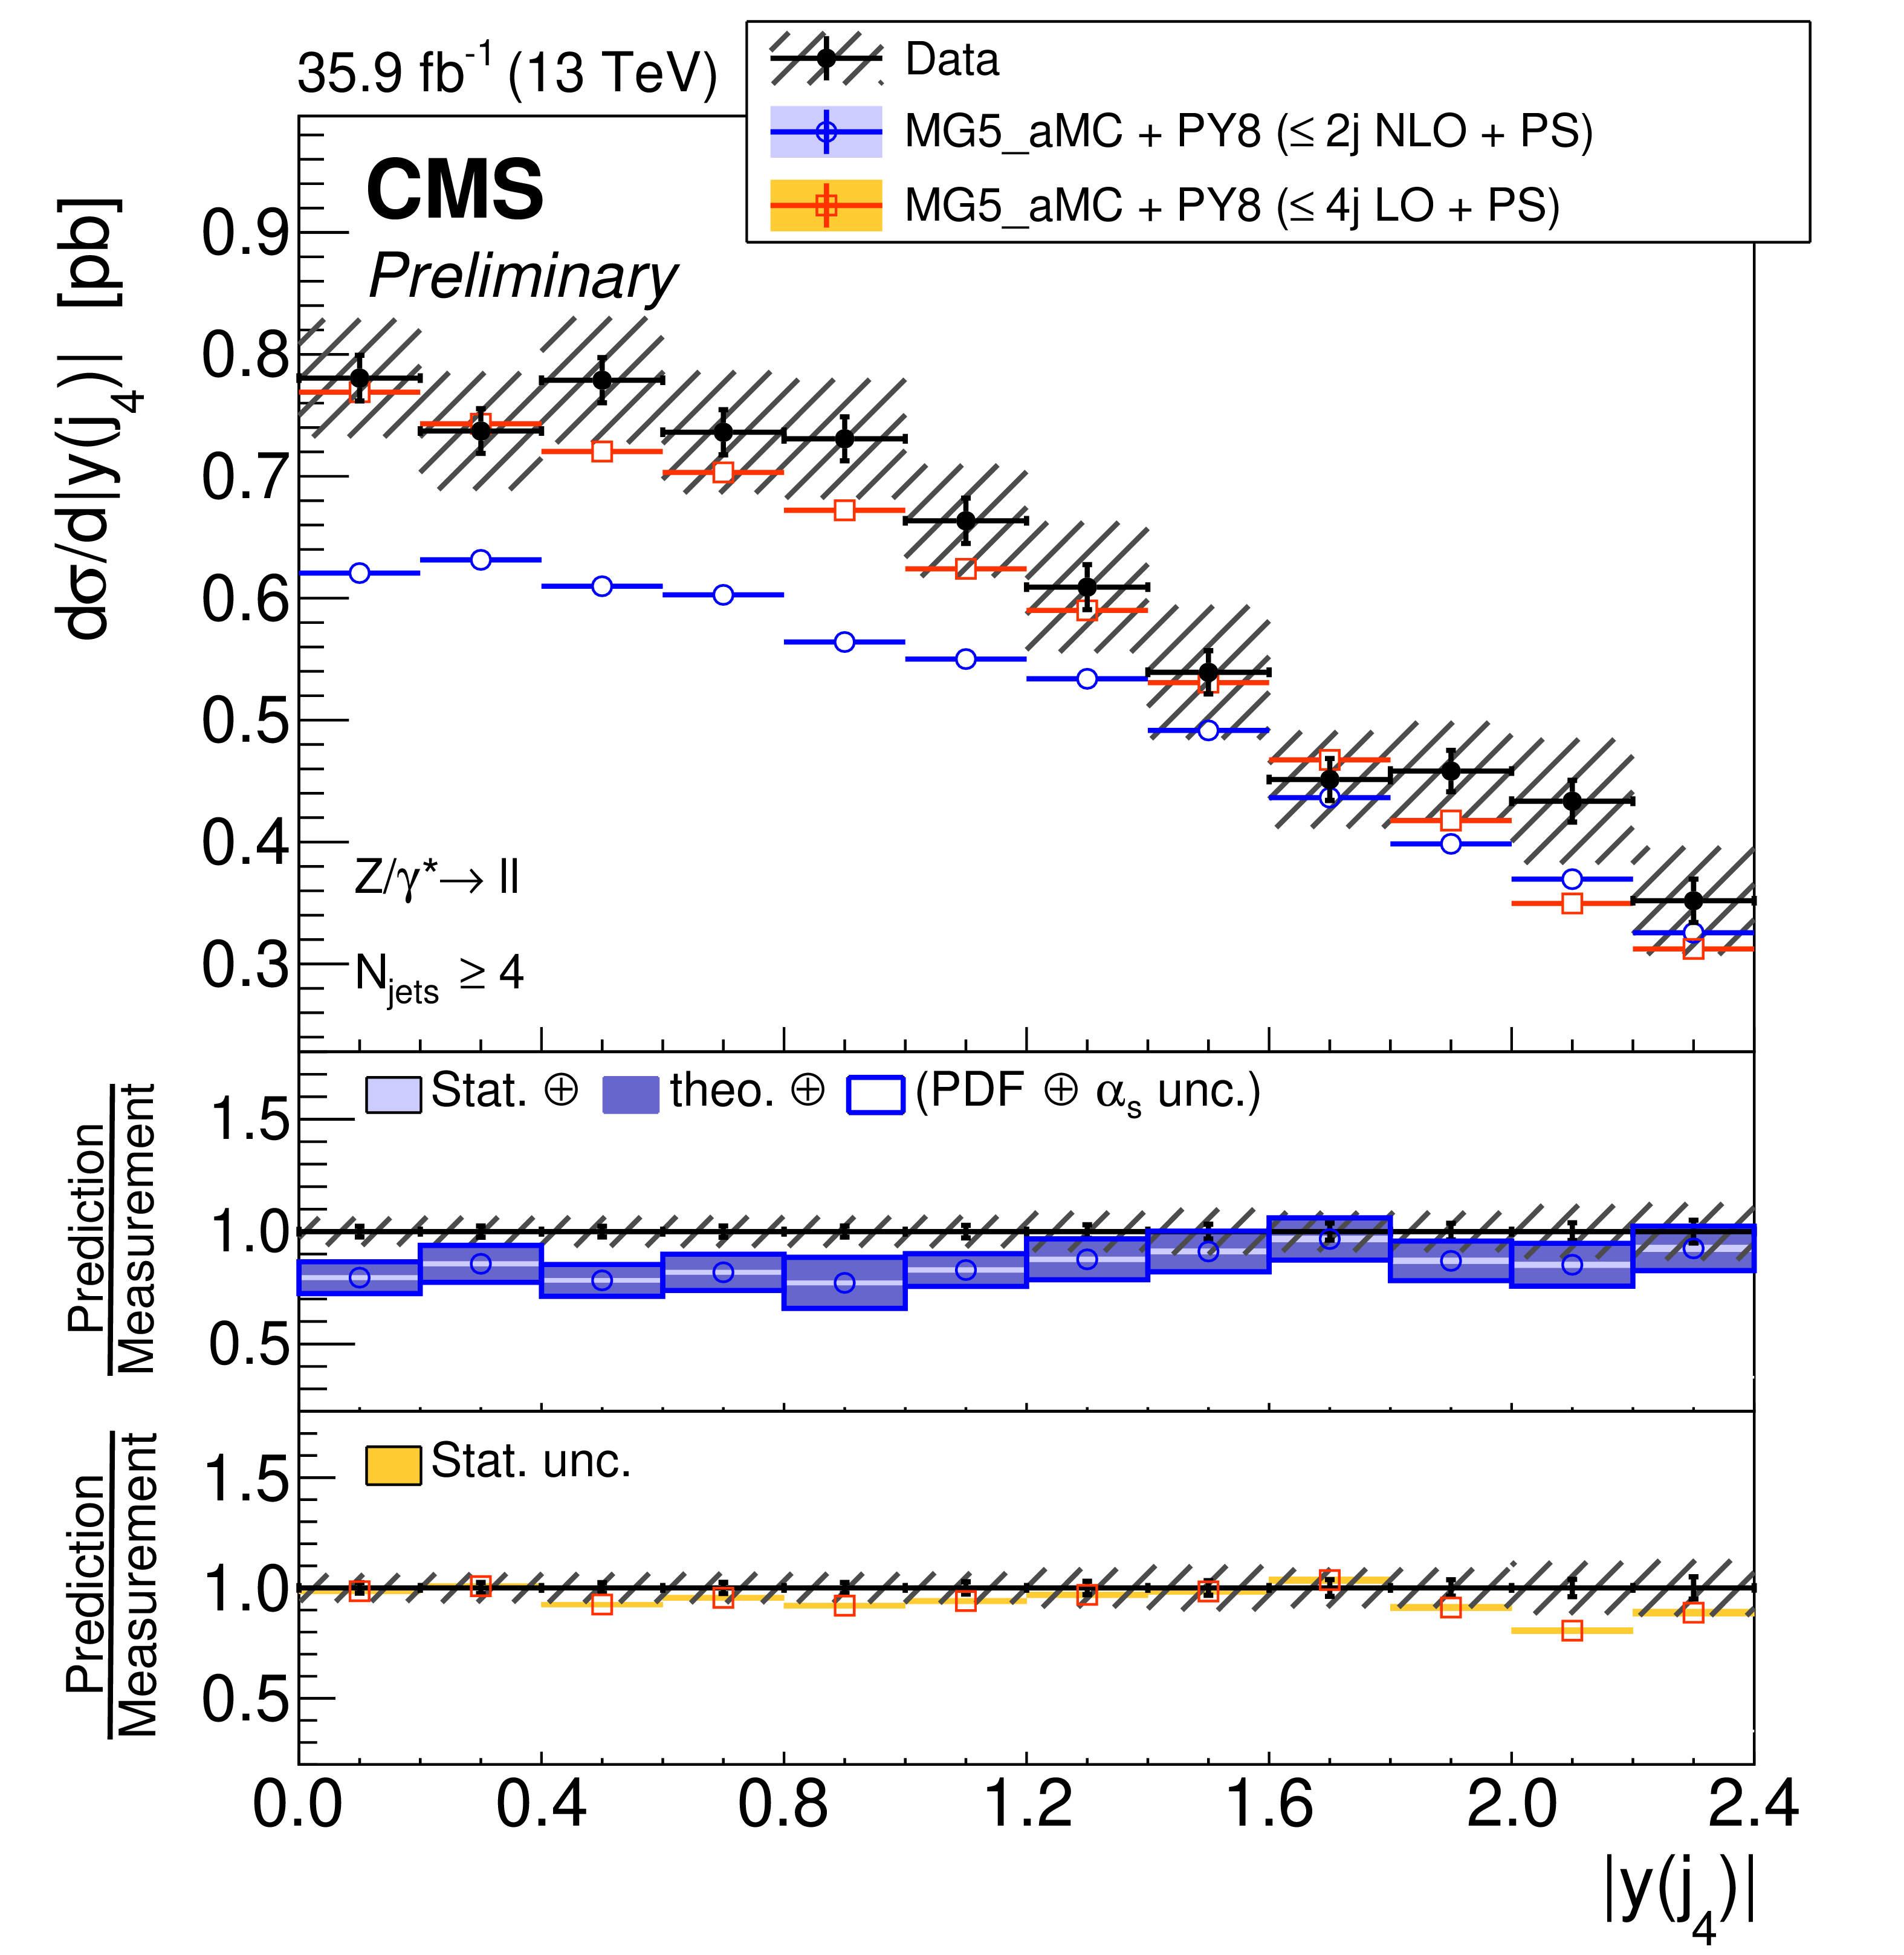
Figure 8-a:
The measured differential cross section as a function of fourth jet $|y|$ (left) and ${p_{\mathrm {T}}}$ (right) for events with at least four jets. The measurement statistical (resp. systematic) uncertainties are represented with vertical error bars (resp. hashed areas). The measurement is compared to the NLO and LO MG5_aMC predictions described in Section 6. The predictions uncertainties, estimated as explained in this section, are represented by coloured areas in the ratio plots (light colour for the statistical part and darker colour for the total). Only statistical uncertainty is computed for the LO prediction. |
png pdf |
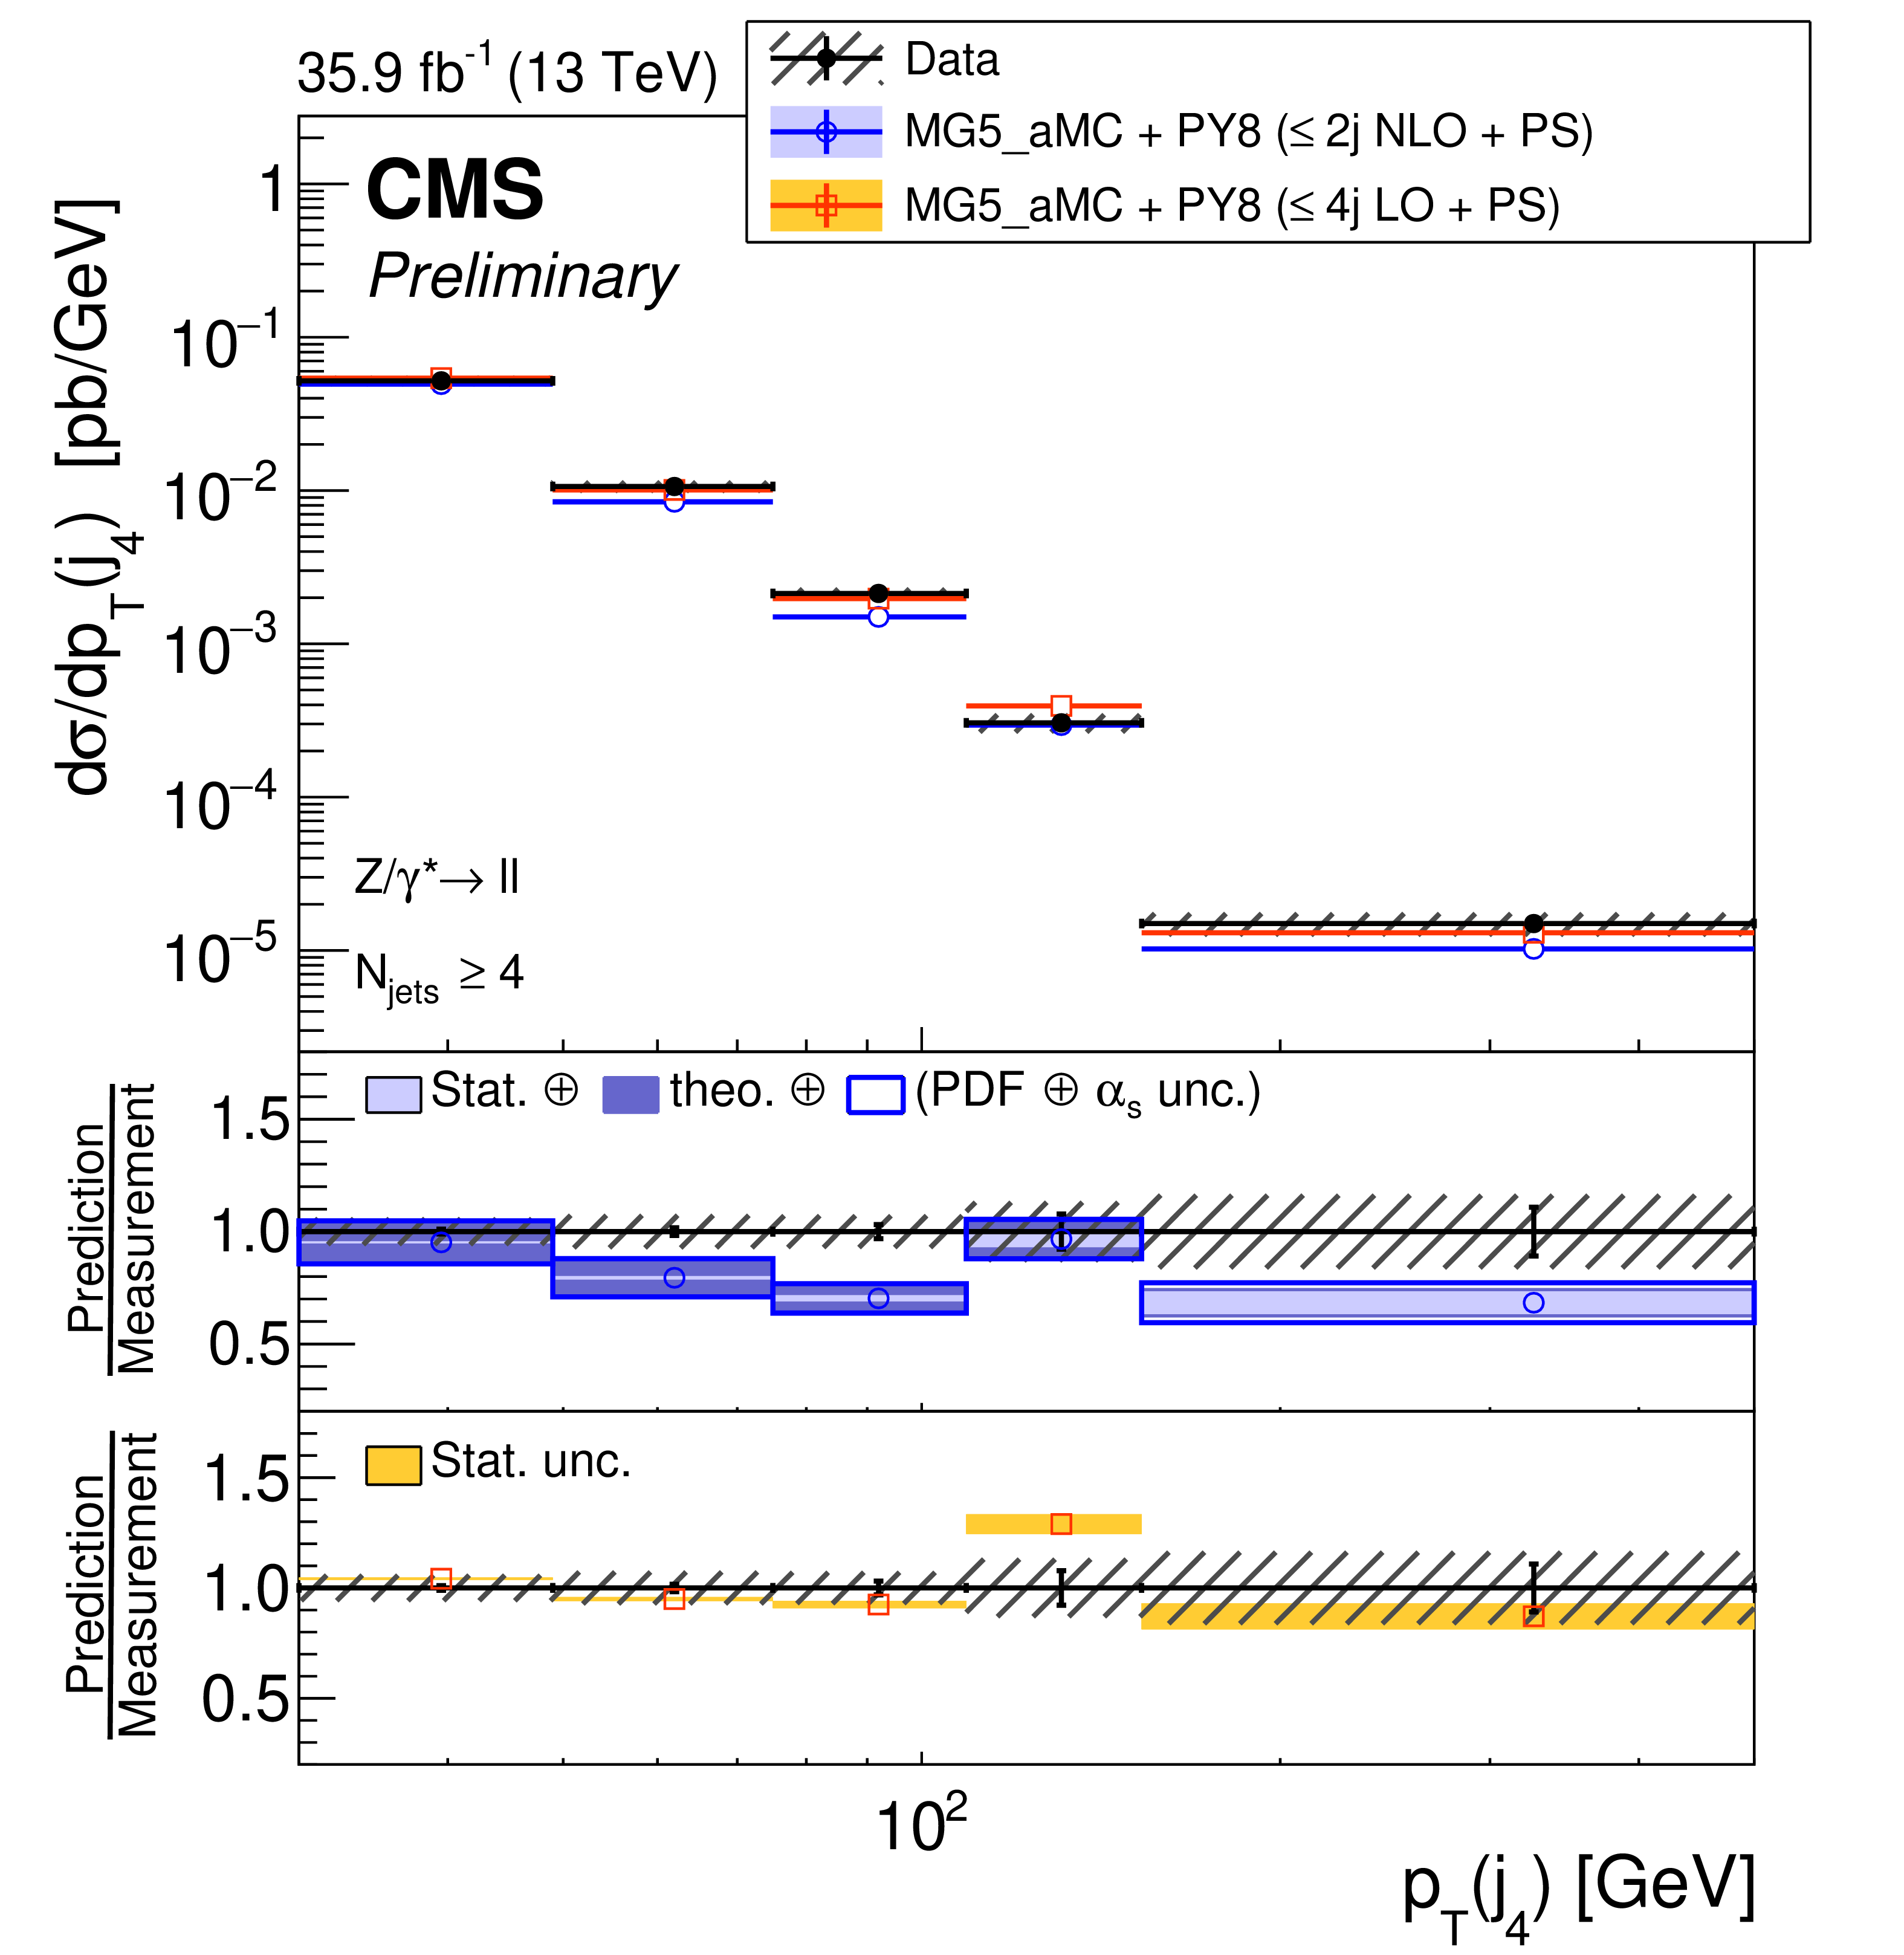
Figure 8-b:
The measured differential cross section as a function of fourth jet $|y|$ (left) and ${p_{\mathrm {T}}}$ (right) for events with at least four jets. The measurement statistical (resp. systematic) uncertainties are represented with vertical error bars (resp. hashed areas). The measurement is compared to the NLO and LO MG5_aMC predictions described in Section 6. The predictions uncertainties, estimated as explained in this section, are represented by coloured areas in the ratio plots (light colour for the statistical part and darker colour for the total). Only statistical uncertainty is computed for the LO prediction. |

png pdf |
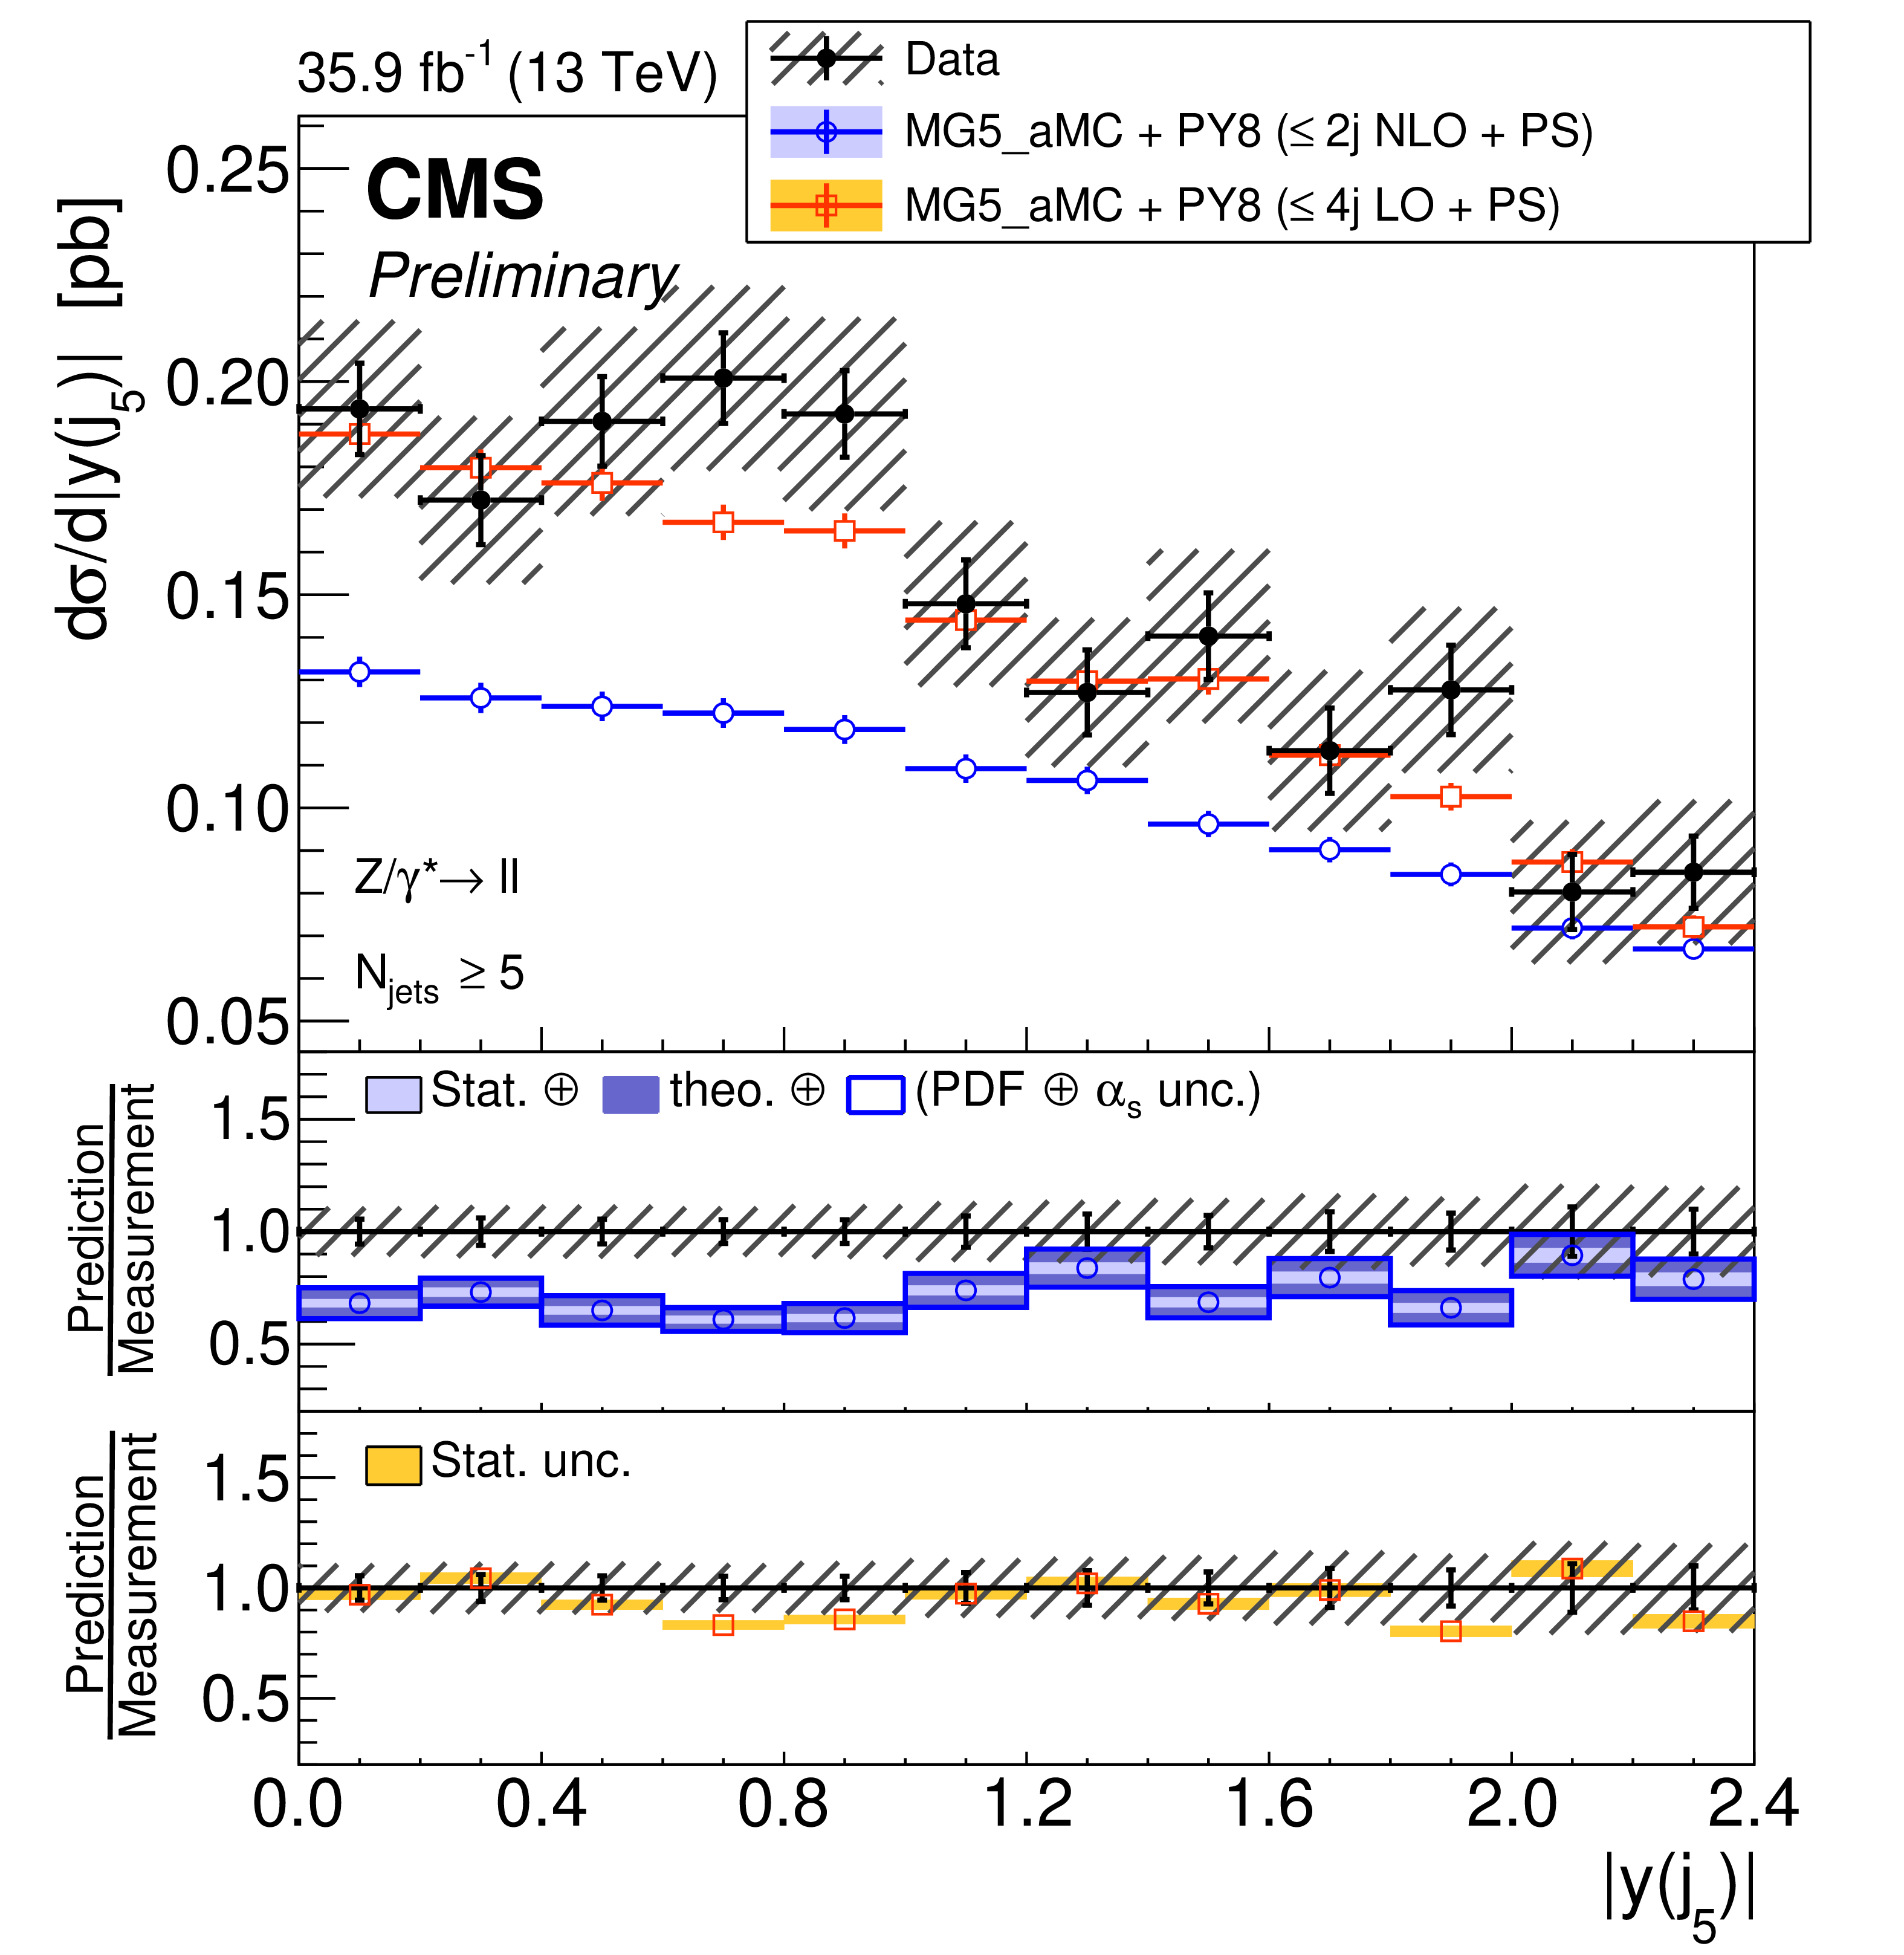
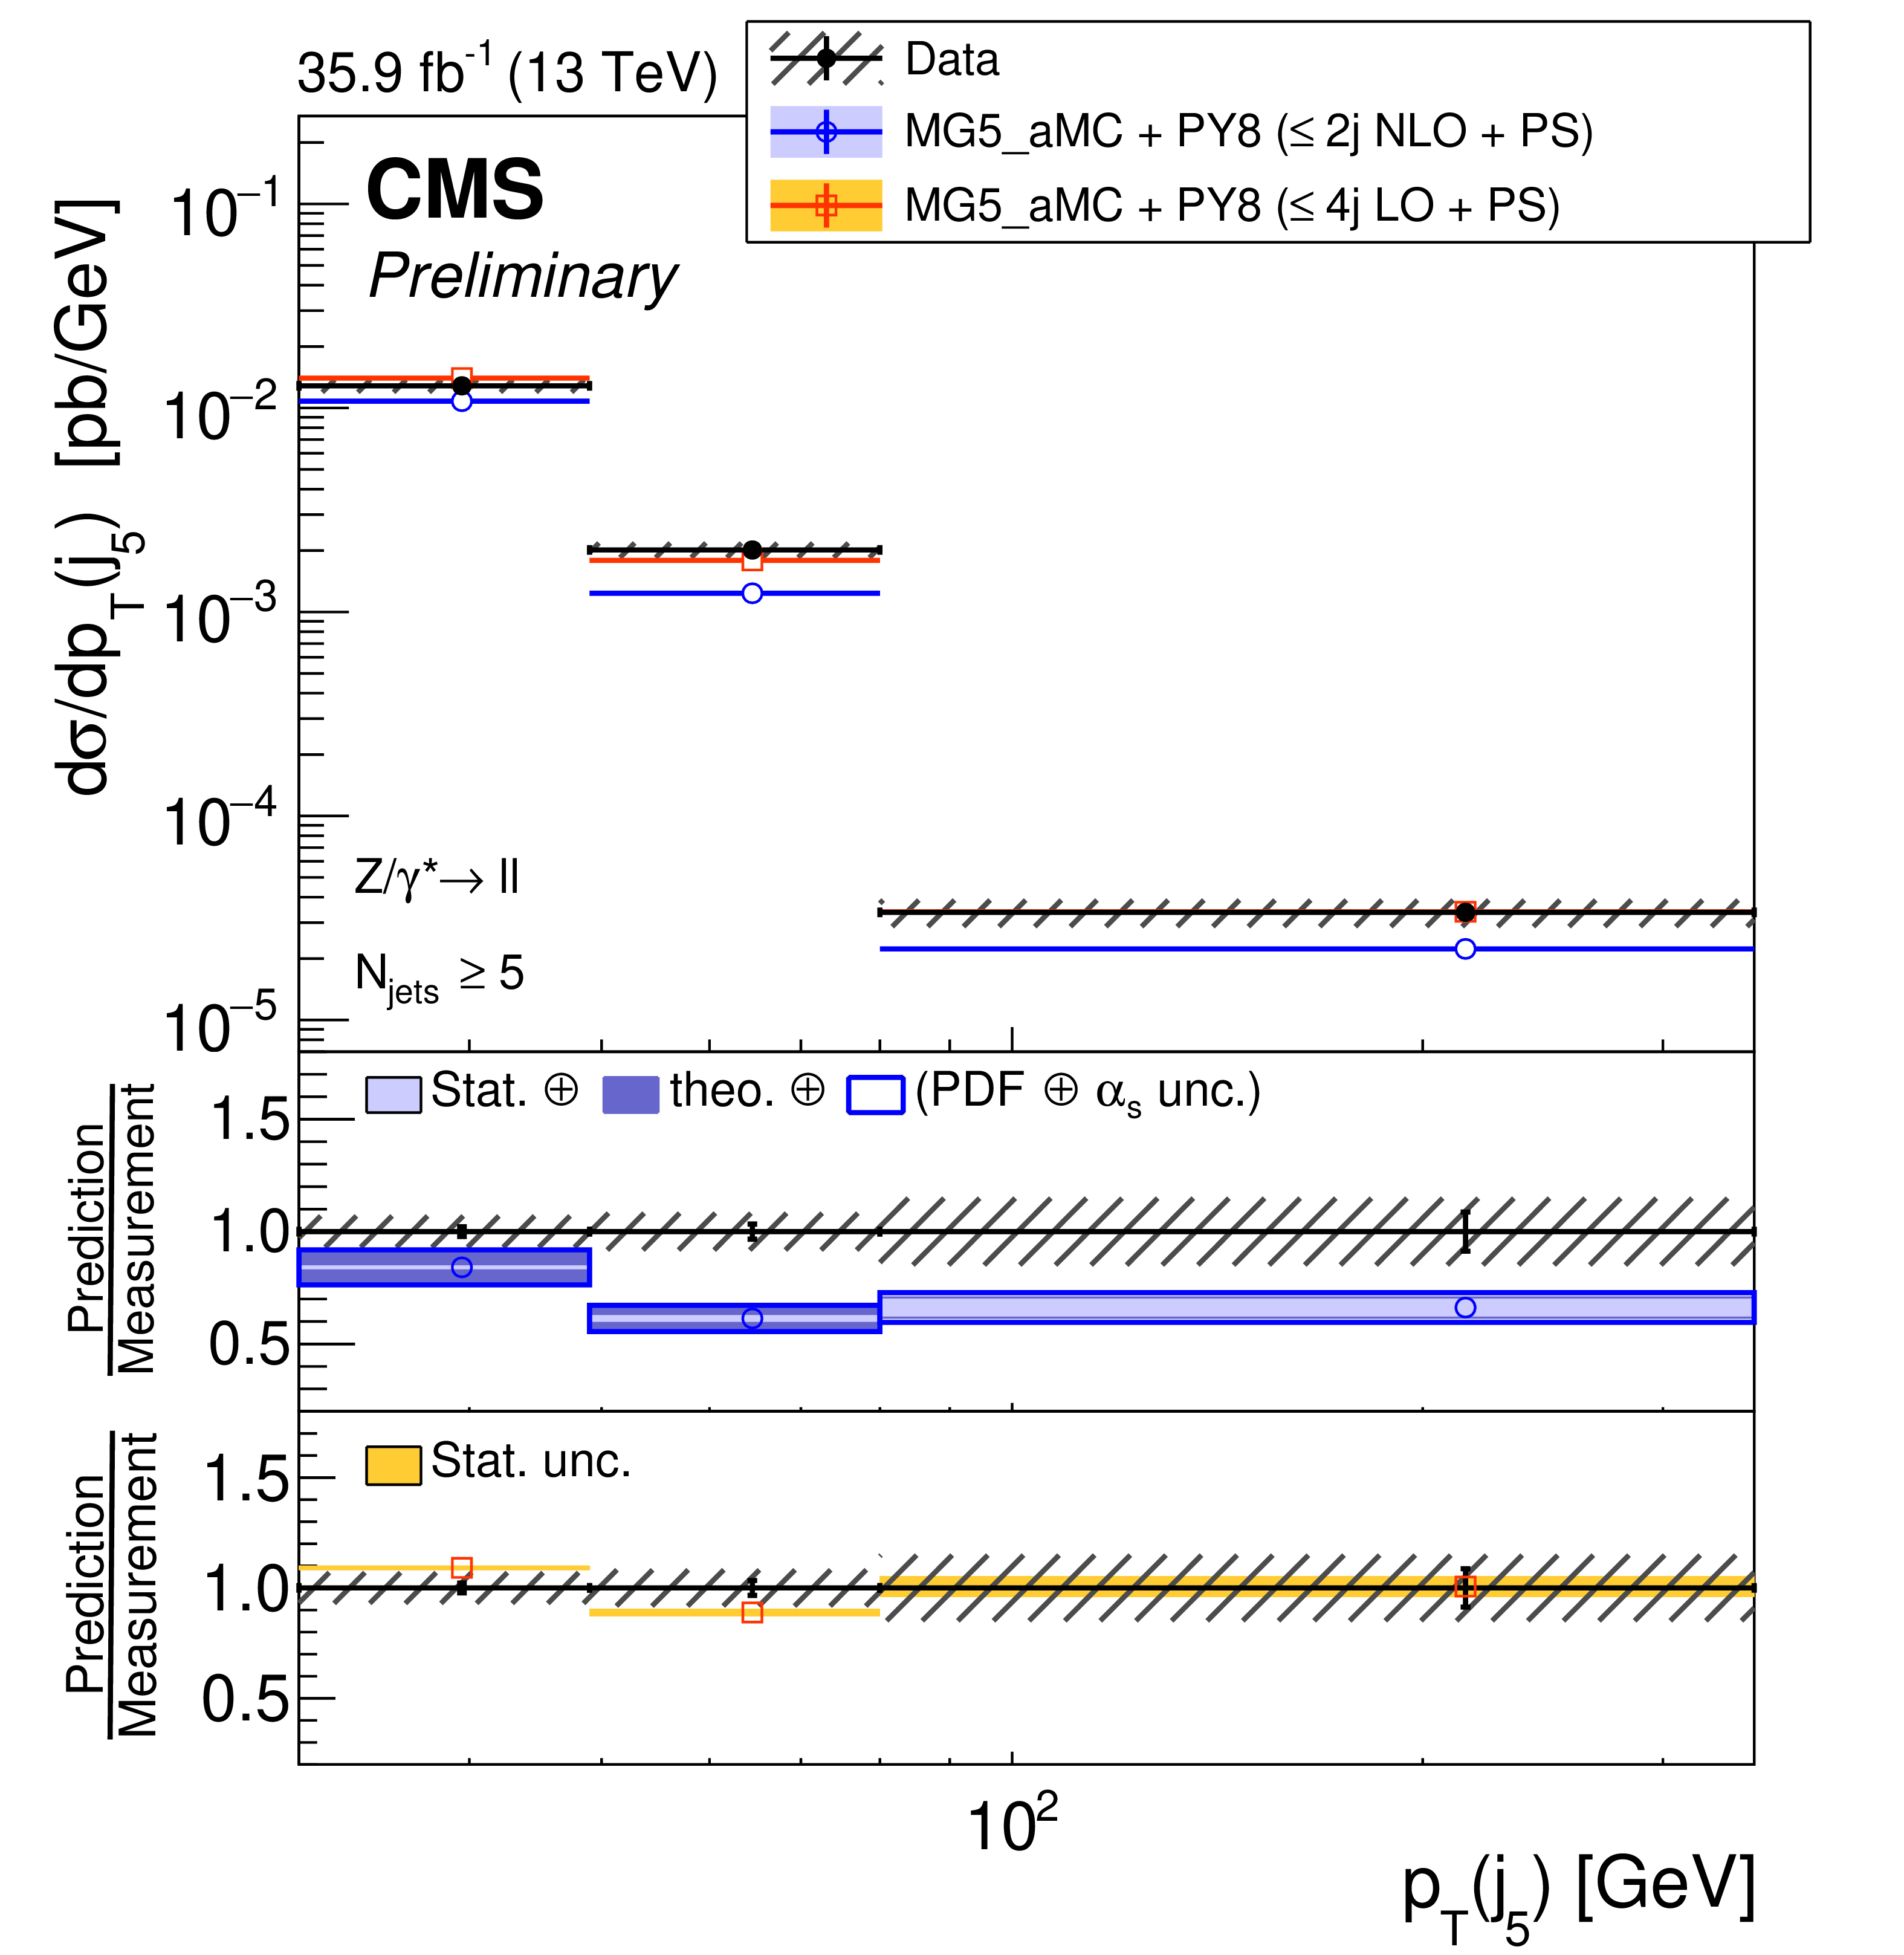
Figure 9:
The measured differential cross section as a function of fifth jet $|y|$ (left) and ${p_{\mathrm {T}}}$ (right) for events with at least five jets. The measurement statistical (resp. systematic) uncertainties are represented with vertical error bars (resp. hashed areas). The measurement is compared to the NLO and LO MG5_aMC predictions described in Section 6. The predictions uncertainties, estimated as explained in this section, are represented by coloured areas in the ratio plots (light colour for the statistical part and darker colour for the total). Only statistical uncertainty is computed for the LO prediction. |
png pdf |
Figure 9-a:
The measured differential cross section as a function of fifth jet $|y|$ (left) and ${p_{\mathrm {T}}}$ (right) for events with at least five jets. The measurement statistical (resp. systematic) uncertainties are represented with vertical error bars (resp. hashed areas). The measurement is compared to the NLO and LO MG5_aMC predictions described in Section 6. The predictions uncertainties, estimated as explained in this section, are represented by coloured areas in the ratio plots (light colour for the statistical part and darker colour for the total). Only statistical uncertainty is computed for the LO prediction. |
png pdf |
Figure 9-b:
The measured differential cross section as a function of fifth jet $|y|$ (left) and ${p_{\mathrm {T}}}$ (right) for events with at least five jets. The measurement statistical (resp. systematic) uncertainties are represented with vertical error bars (resp. hashed areas). The measurement is compared to the NLO and LO MG5_aMC predictions described in Section 6. The predictions uncertainties, estimated as explained in this section, are represented by coloured areas in the ratio plots (light colour for the statistical part and darker colour for the total). Only statistical uncertainty is computed for the LO prediction. |
png pdf |
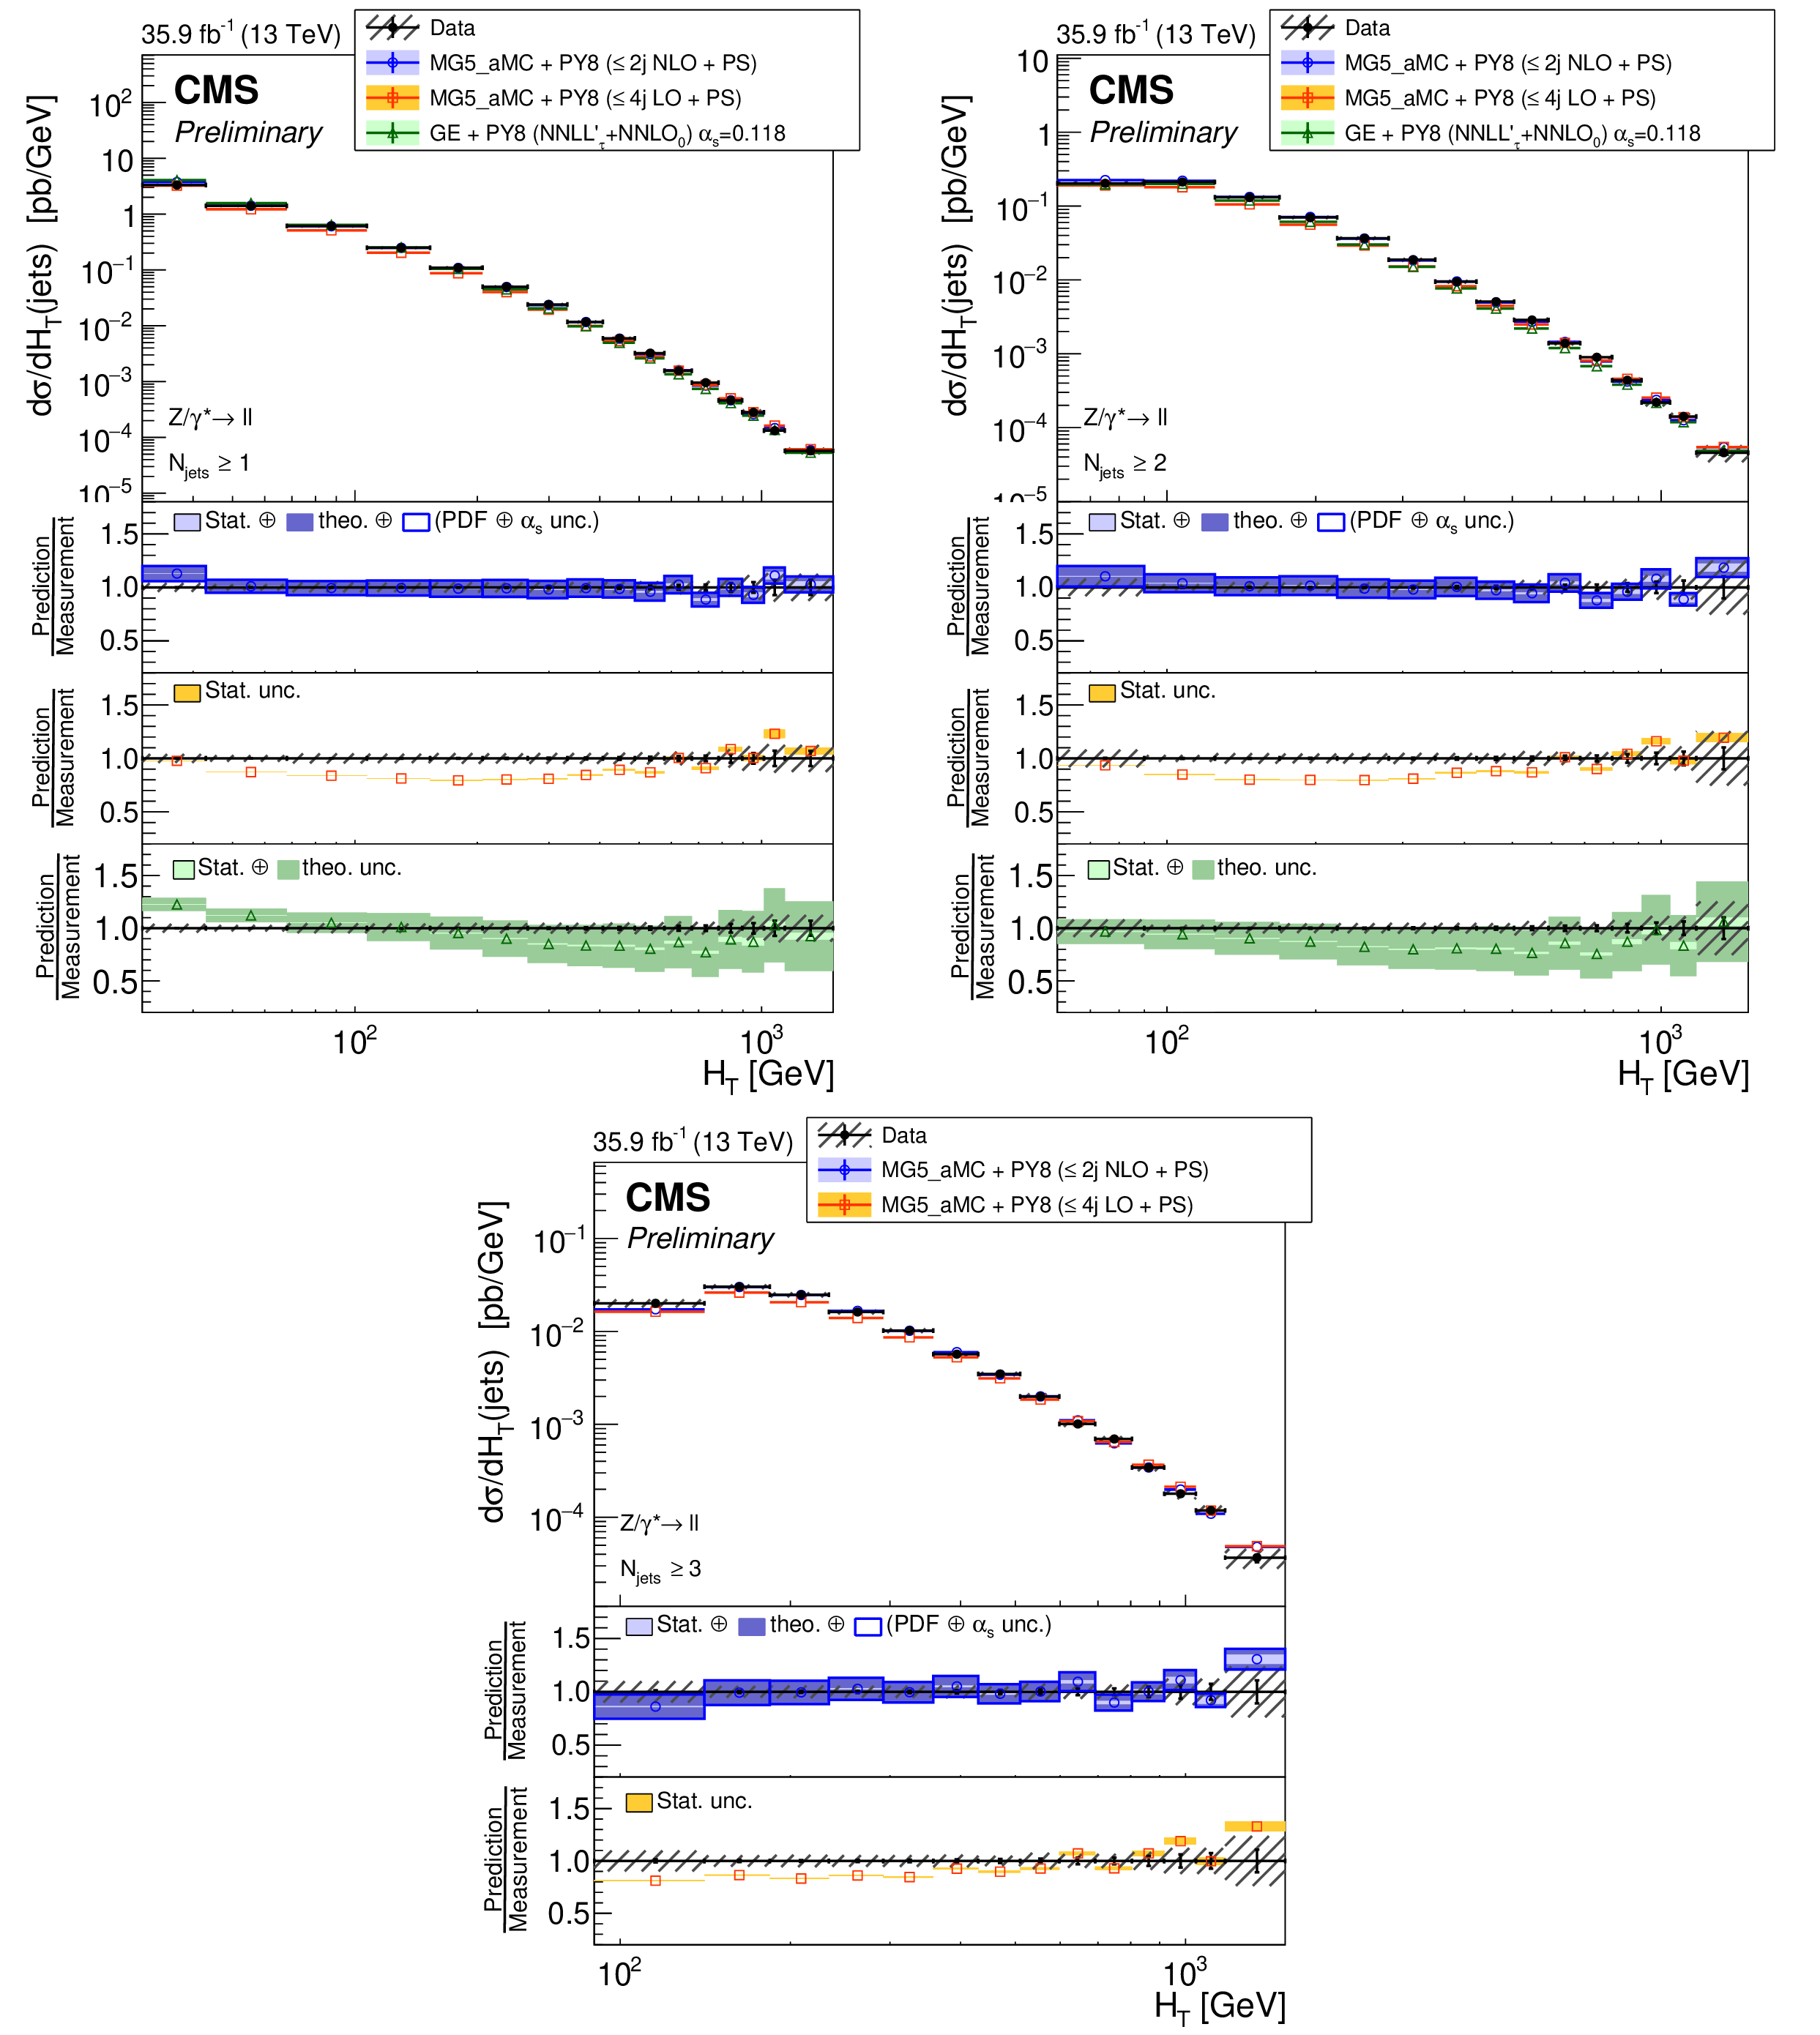
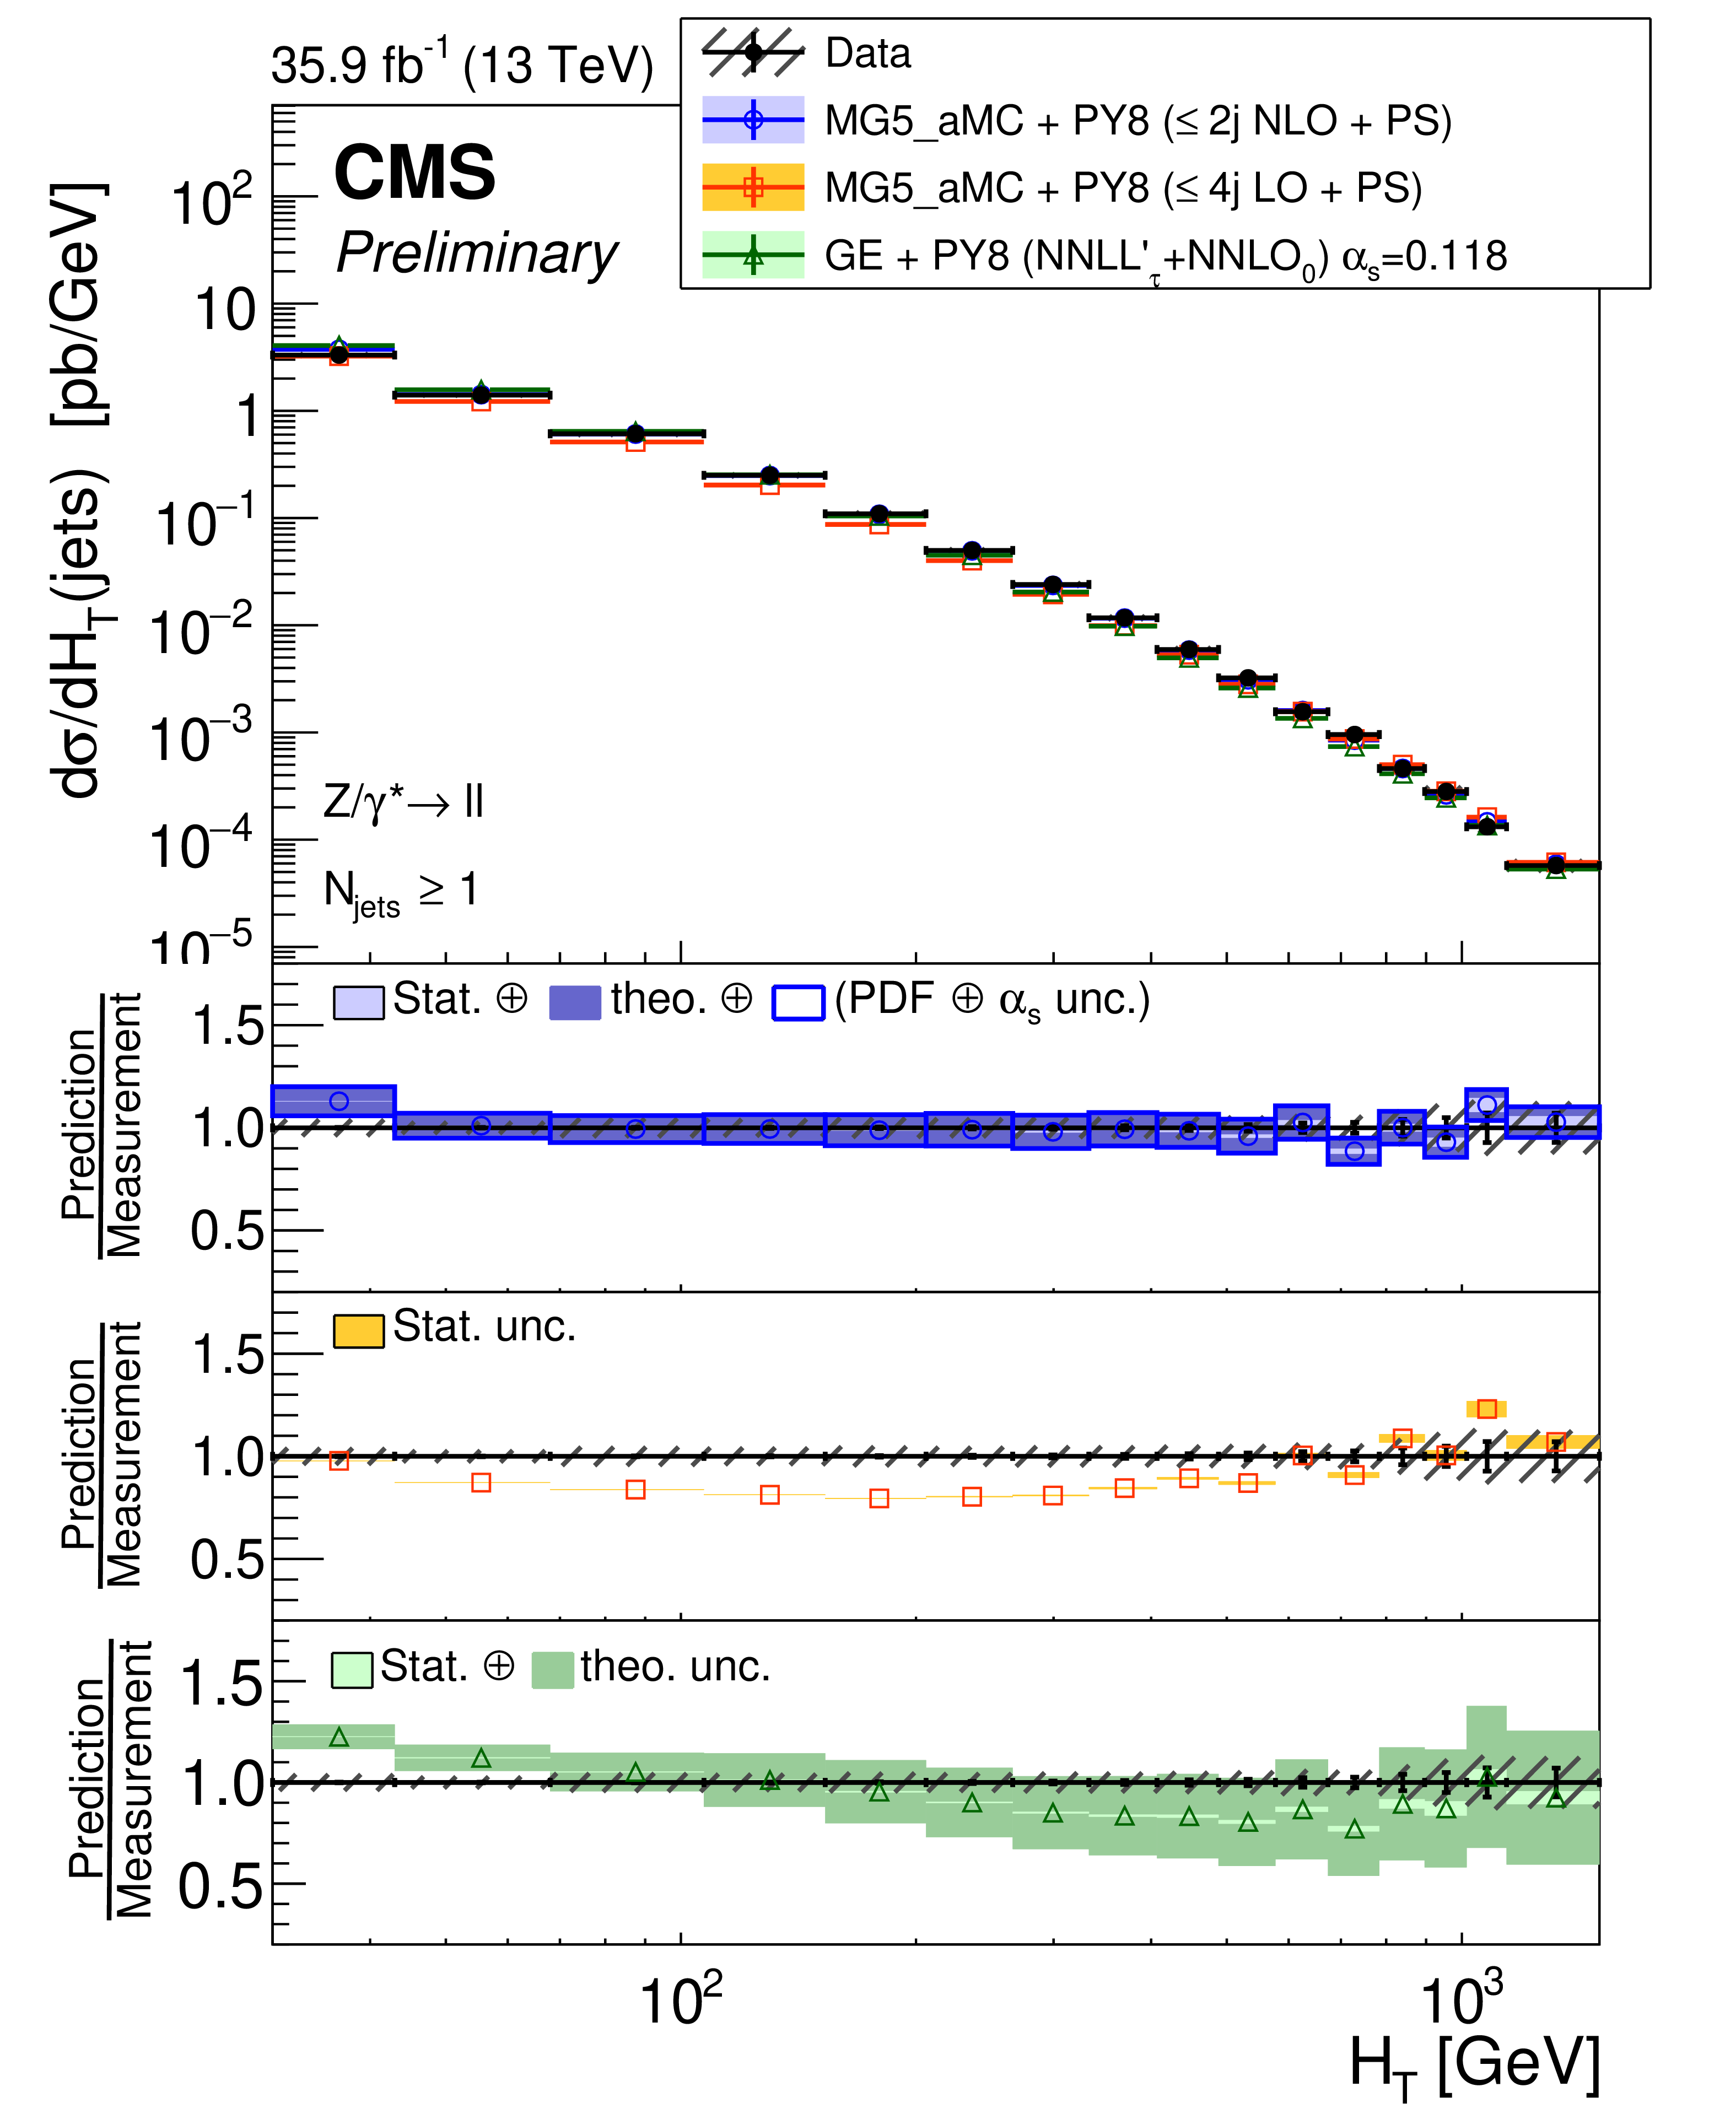
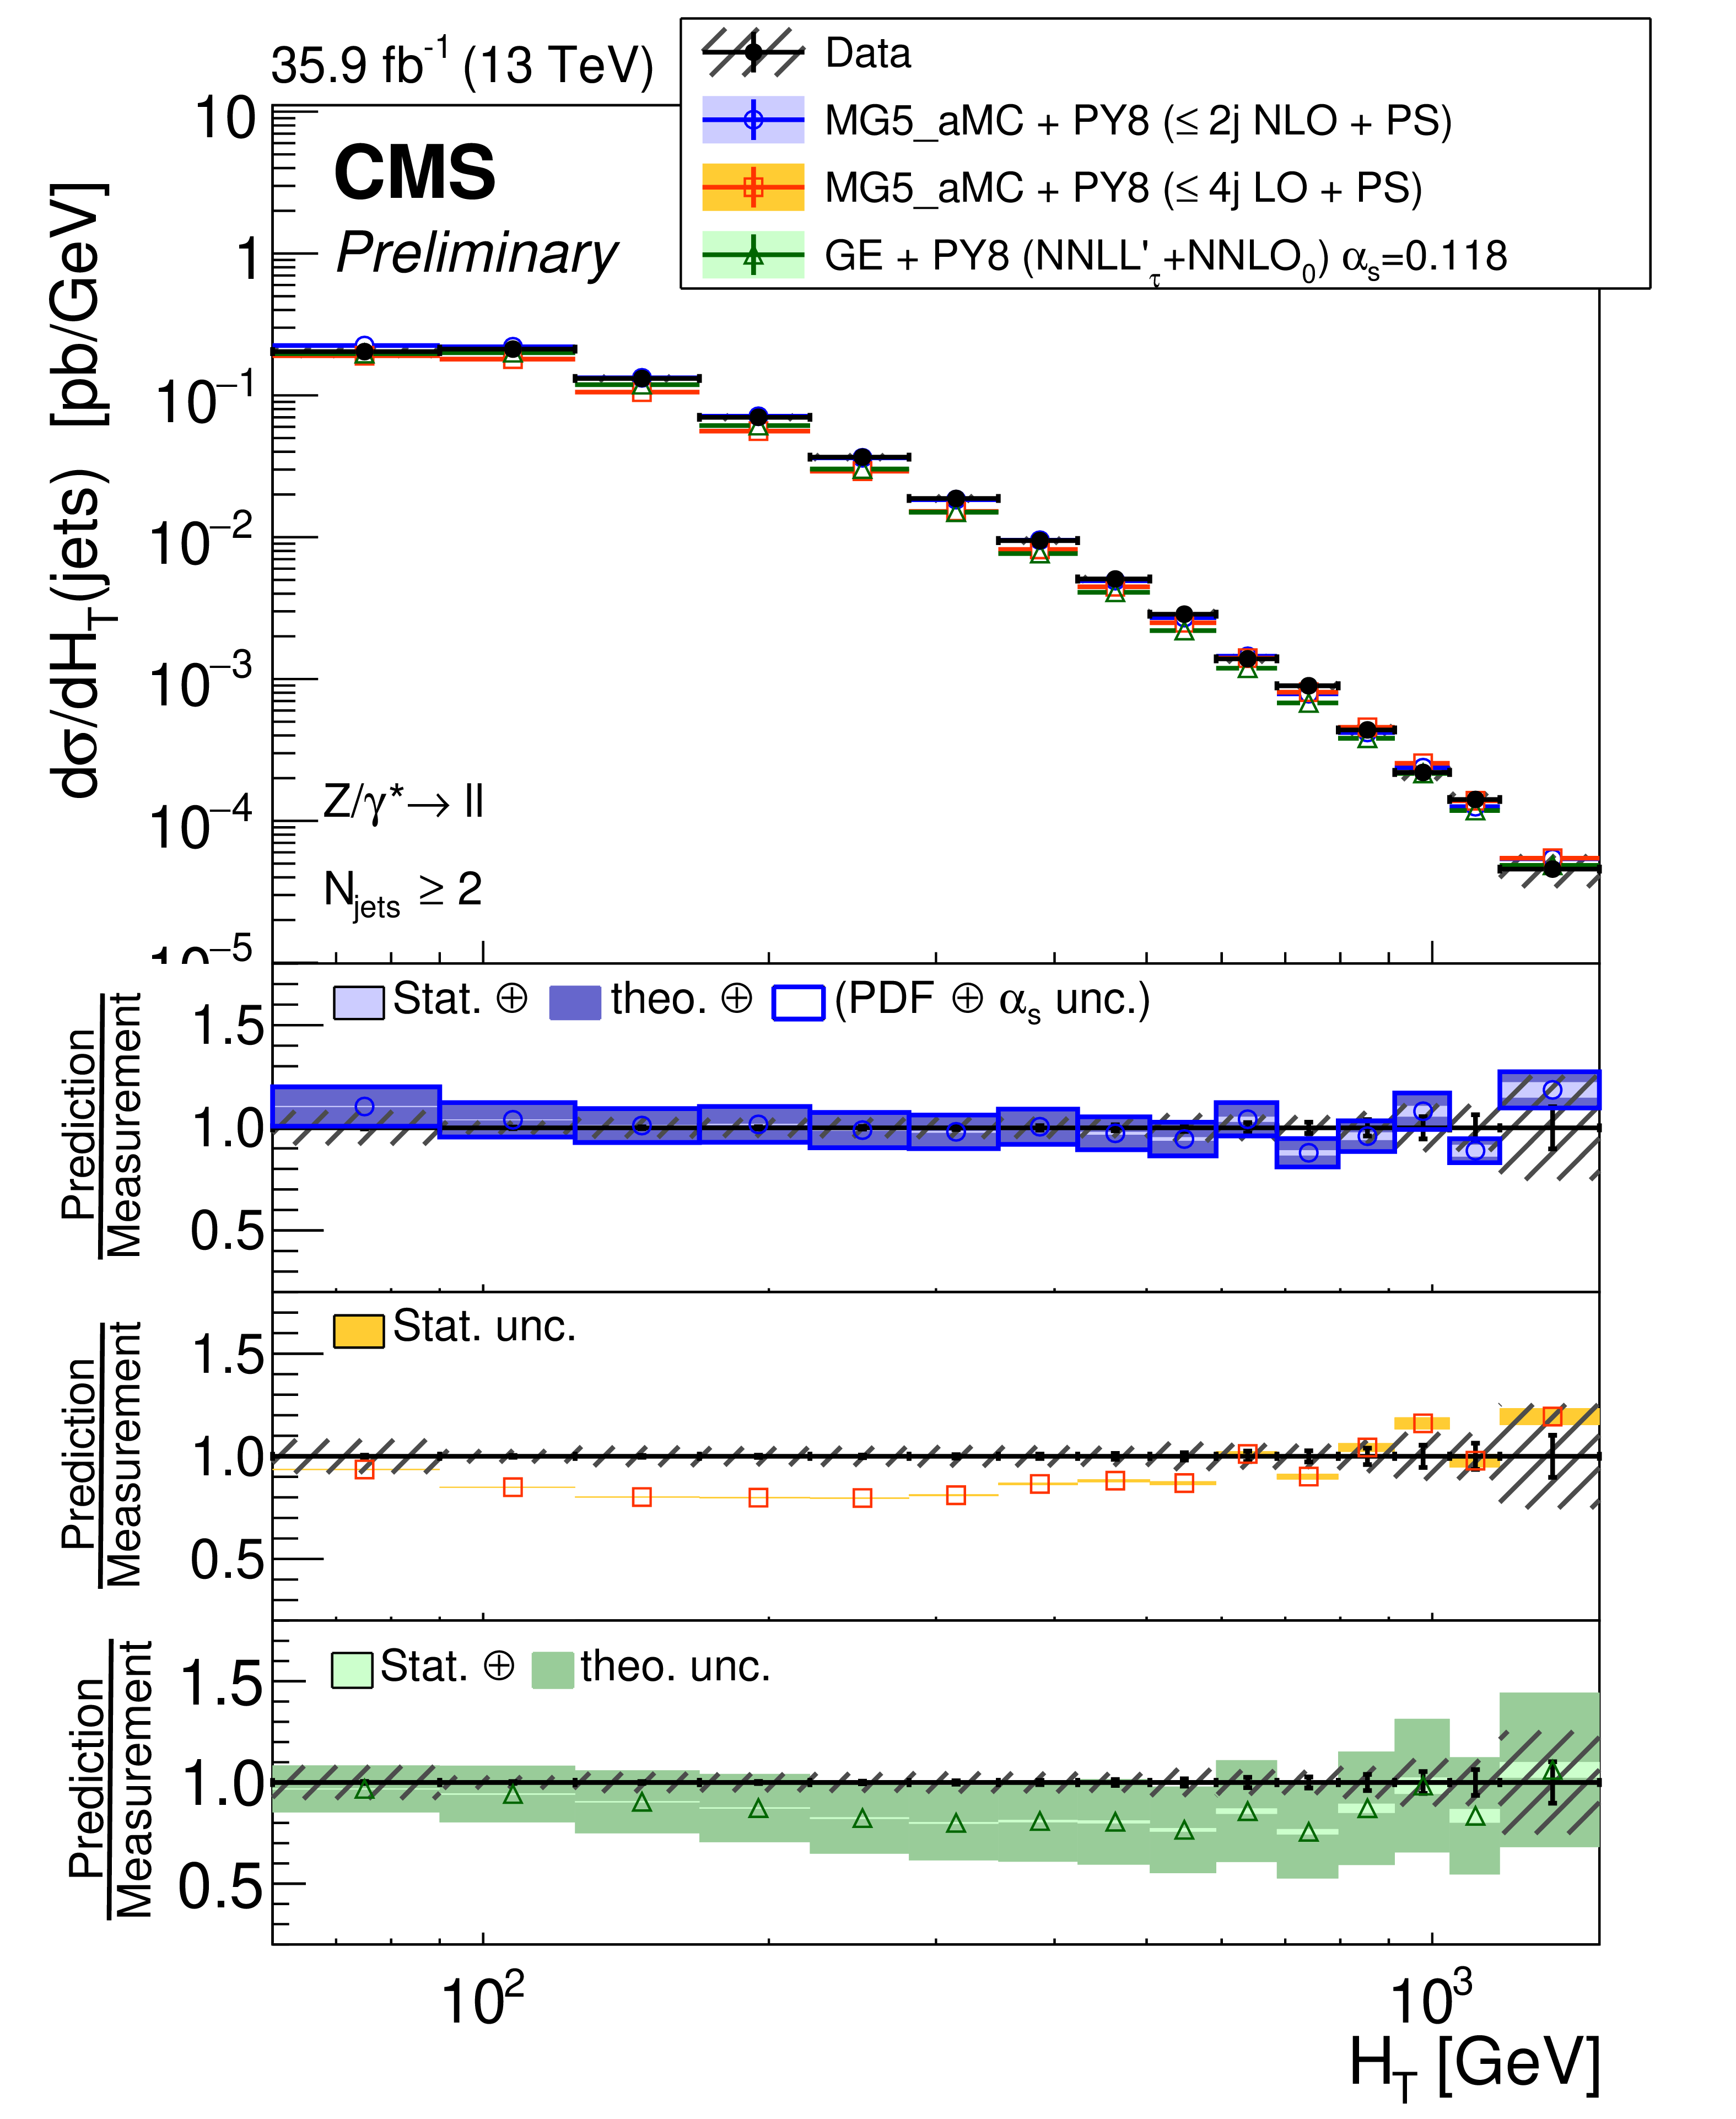
Figure 10:
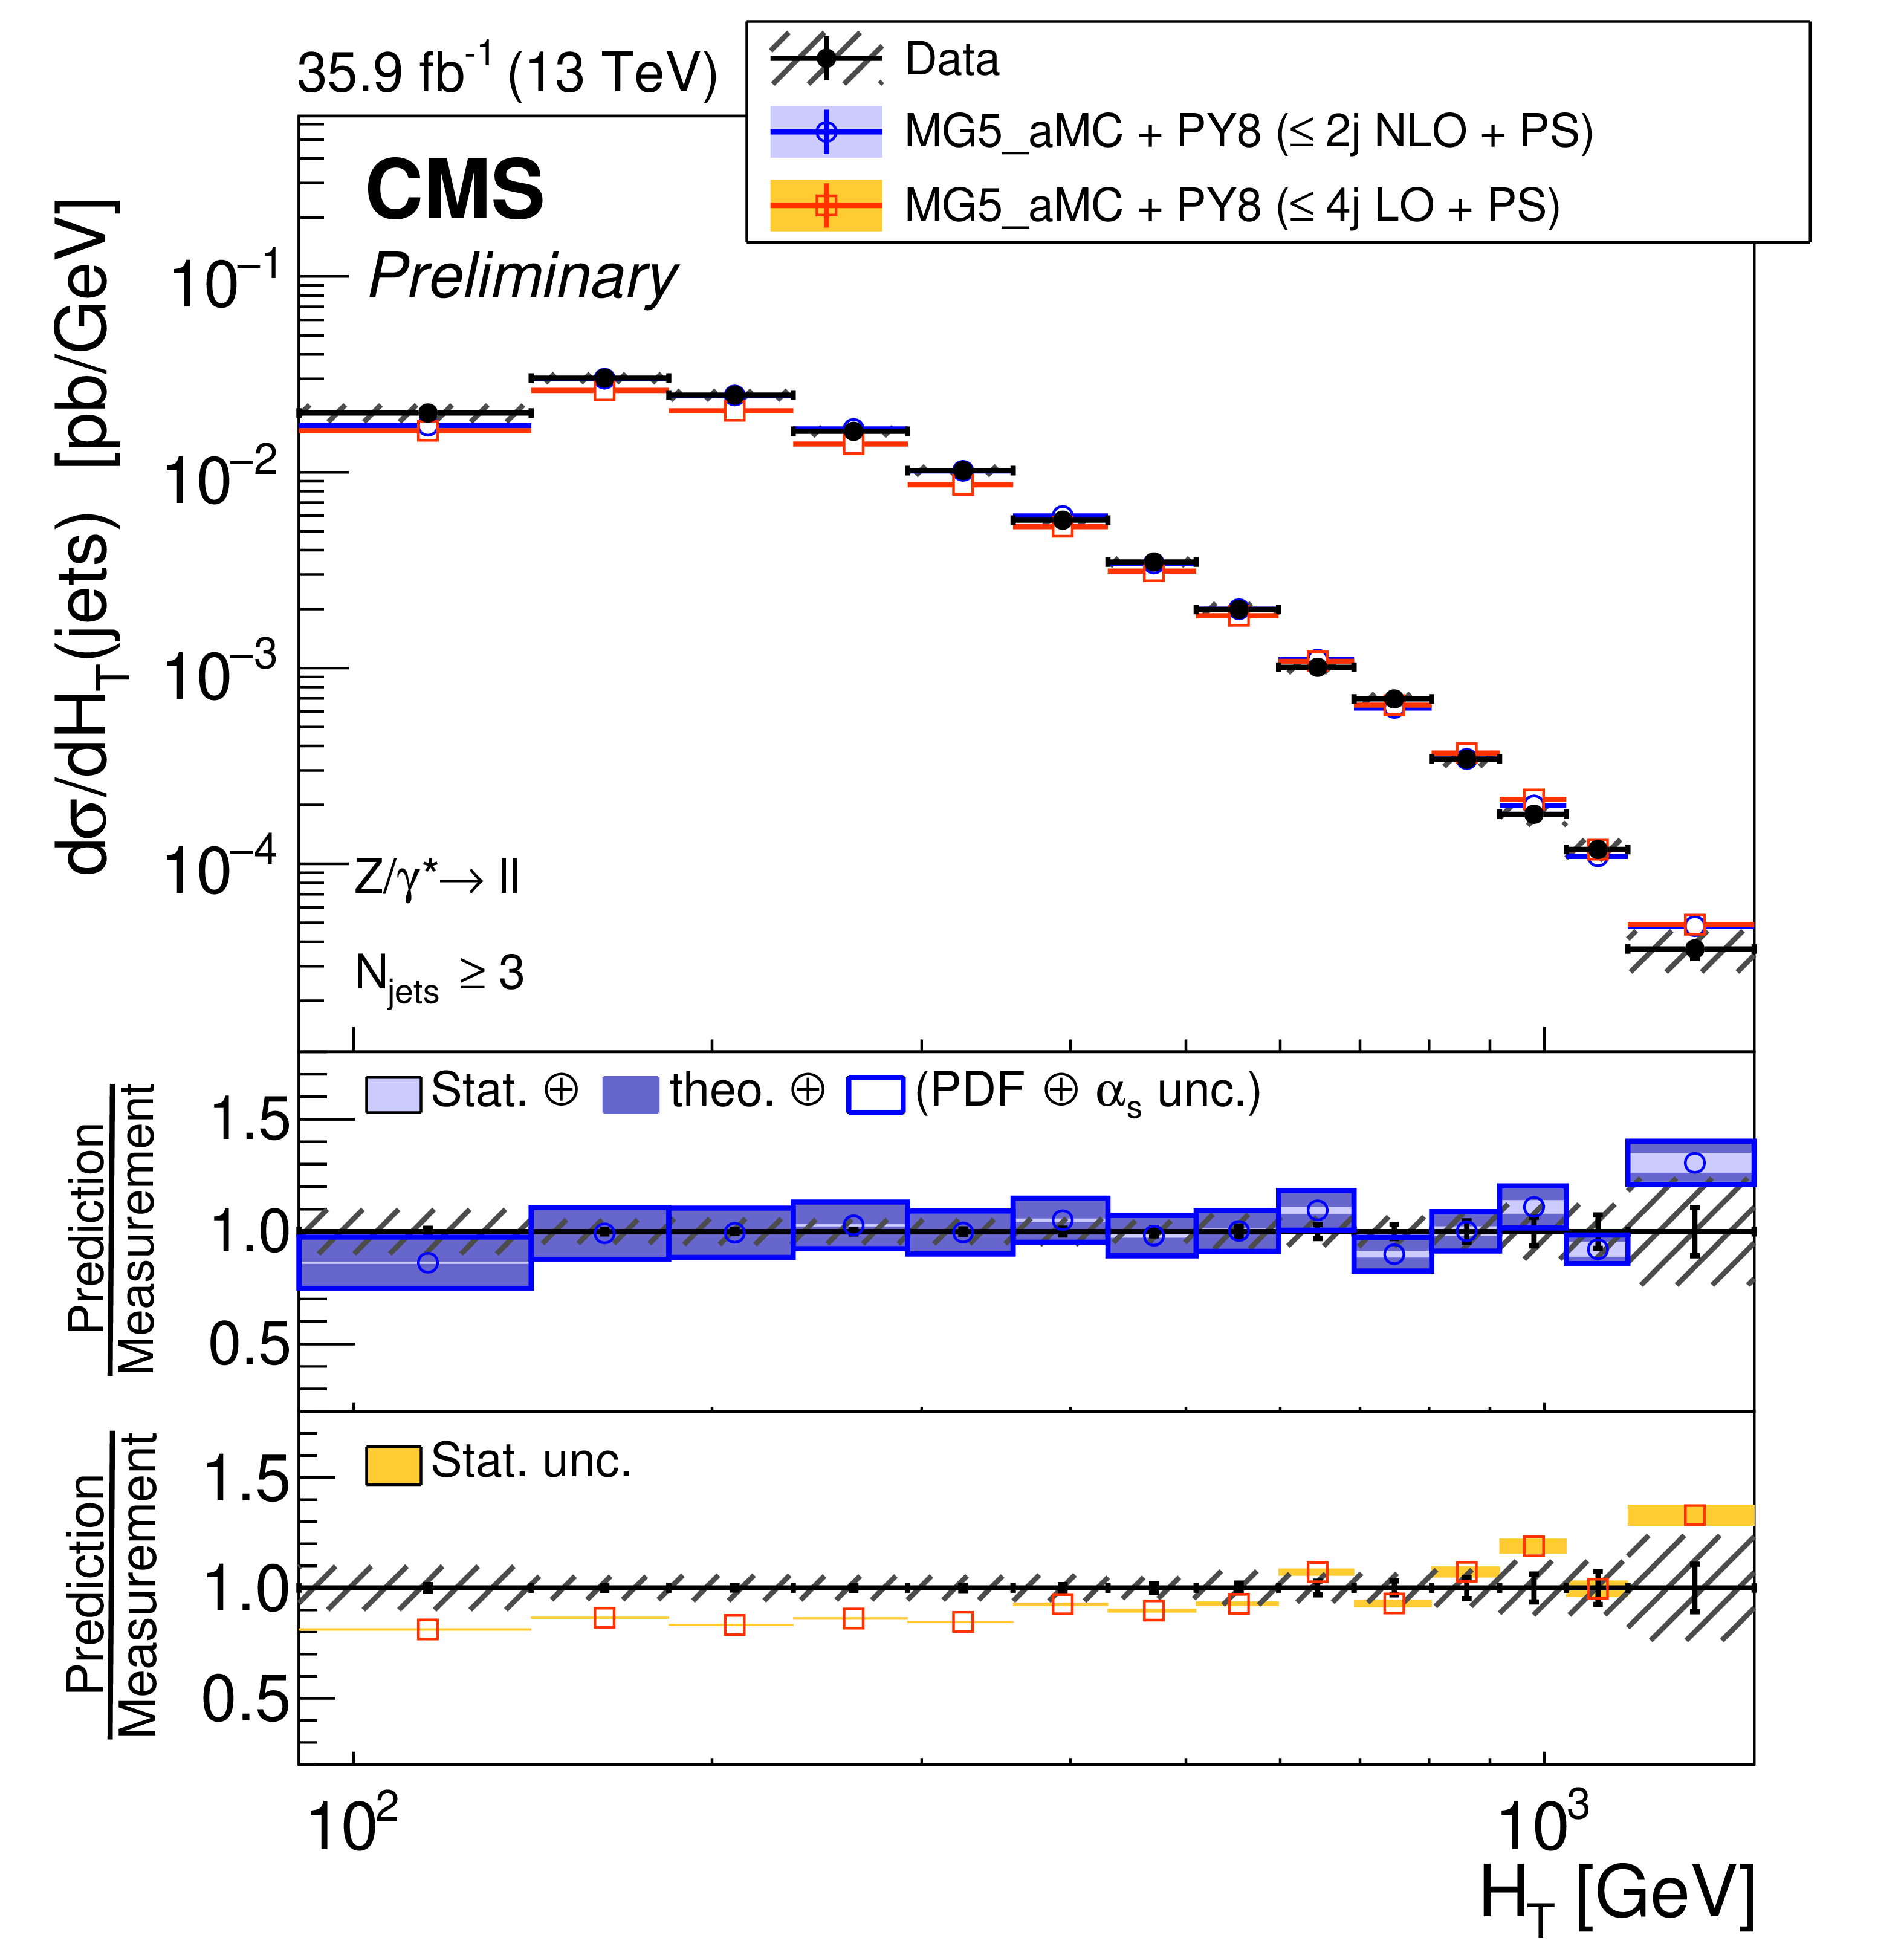
The measured differential cross section as a function of ${H_{\mathrm {T}}}$ for events with at least one (left) two (middle), and three (right) jets. The measurement statistical (resp. systematic) uncertainties are represented with vertical error bars (resp. hashed areas). The measurement is compared to the NLO MG5_aMC, LO MG5_aMC, and GENEVA (for $N_{\text {jets}}\geq $ 1 and $N_{\text {jets}}\geq $ 2) predictions described in Section 6. The predictions uncertainties, estimated as explained in this section, are represented by coloured areas in the ratio plots (light colour for the statistical part and darker colour for the total). Only statistical uncertainty is computed for the LO prediction. |
png pdf |
Figure 10-a:
The measured differential cross section as a function of ${H_{\mathrm {T}}}$ for events with at least one (left) two (middle), and three (right) jets. The measurement statistical (resp. systematic) uncertainties are represented with vertical error bars (resp. hashed areas). The measurement is compared to the NLO MG5_aMC, LO MG5_aMC, and GENEVA (for $N_{\text {jets}}\geq $ 1 and $N_{\text {jets}}\geq $ 2) predictions described in Section 6. The predictions uncertainties, estimated as explained in this section, are represented by coloured areas in the ratio plots (light colour for the statistical part and darker colour for the total). Only statistical uncertainty is computed for the LO prediction. |
png pdf |
Figure 10-b:
The measured differential cross section as a function of ${H_{\mathrm {T}}}$ for events with at least one (left) two (middle), and three (right) jets. The measurement statistical (resp. systematic) uncertainties are represented with vertical error bars (resp. hashed areas). The measurement is compared to the NLO MG5_aMC, LO MG5_aMC, and GENEVA (for $N_{\text {jets}}\geq $ 1 and $N_{\text {jets}}\geq $ 2) predictions described in Section 6. The predictions uncertainties, estimated as explained in this section, are represented by coloured areas in the ratio plots (light colour for the statistical part and darker colour for the total). Only statistical uncertainty is computed for the LO prediction. |
png pdf |
Figure 10-c:
The measured differential cross section as a function of ${H_{\mathrm {T}}}$ for events with at least one (left) two (middle), and three (right) jets. The measurement statistical (resp. systematic) uncertainties are represented with vertical error bars (resp. hashed areas). The measurement is compared to the NLO MG5_aMC, LO MG5_aMC, and GENEVA (for $N_{\text {jets}}\geq $ 1 and $N_{\text {jets}}\geq $ 2) predictions described in Section 6. The predictions uncertainties, estimated as explained in this section, are represented by coloured areas in the ratio plots (light colour for the statistical part and darker colour for the total). Only statistical uncertainty is computed for the LO prediction. |
png pdf |
Figure 11:
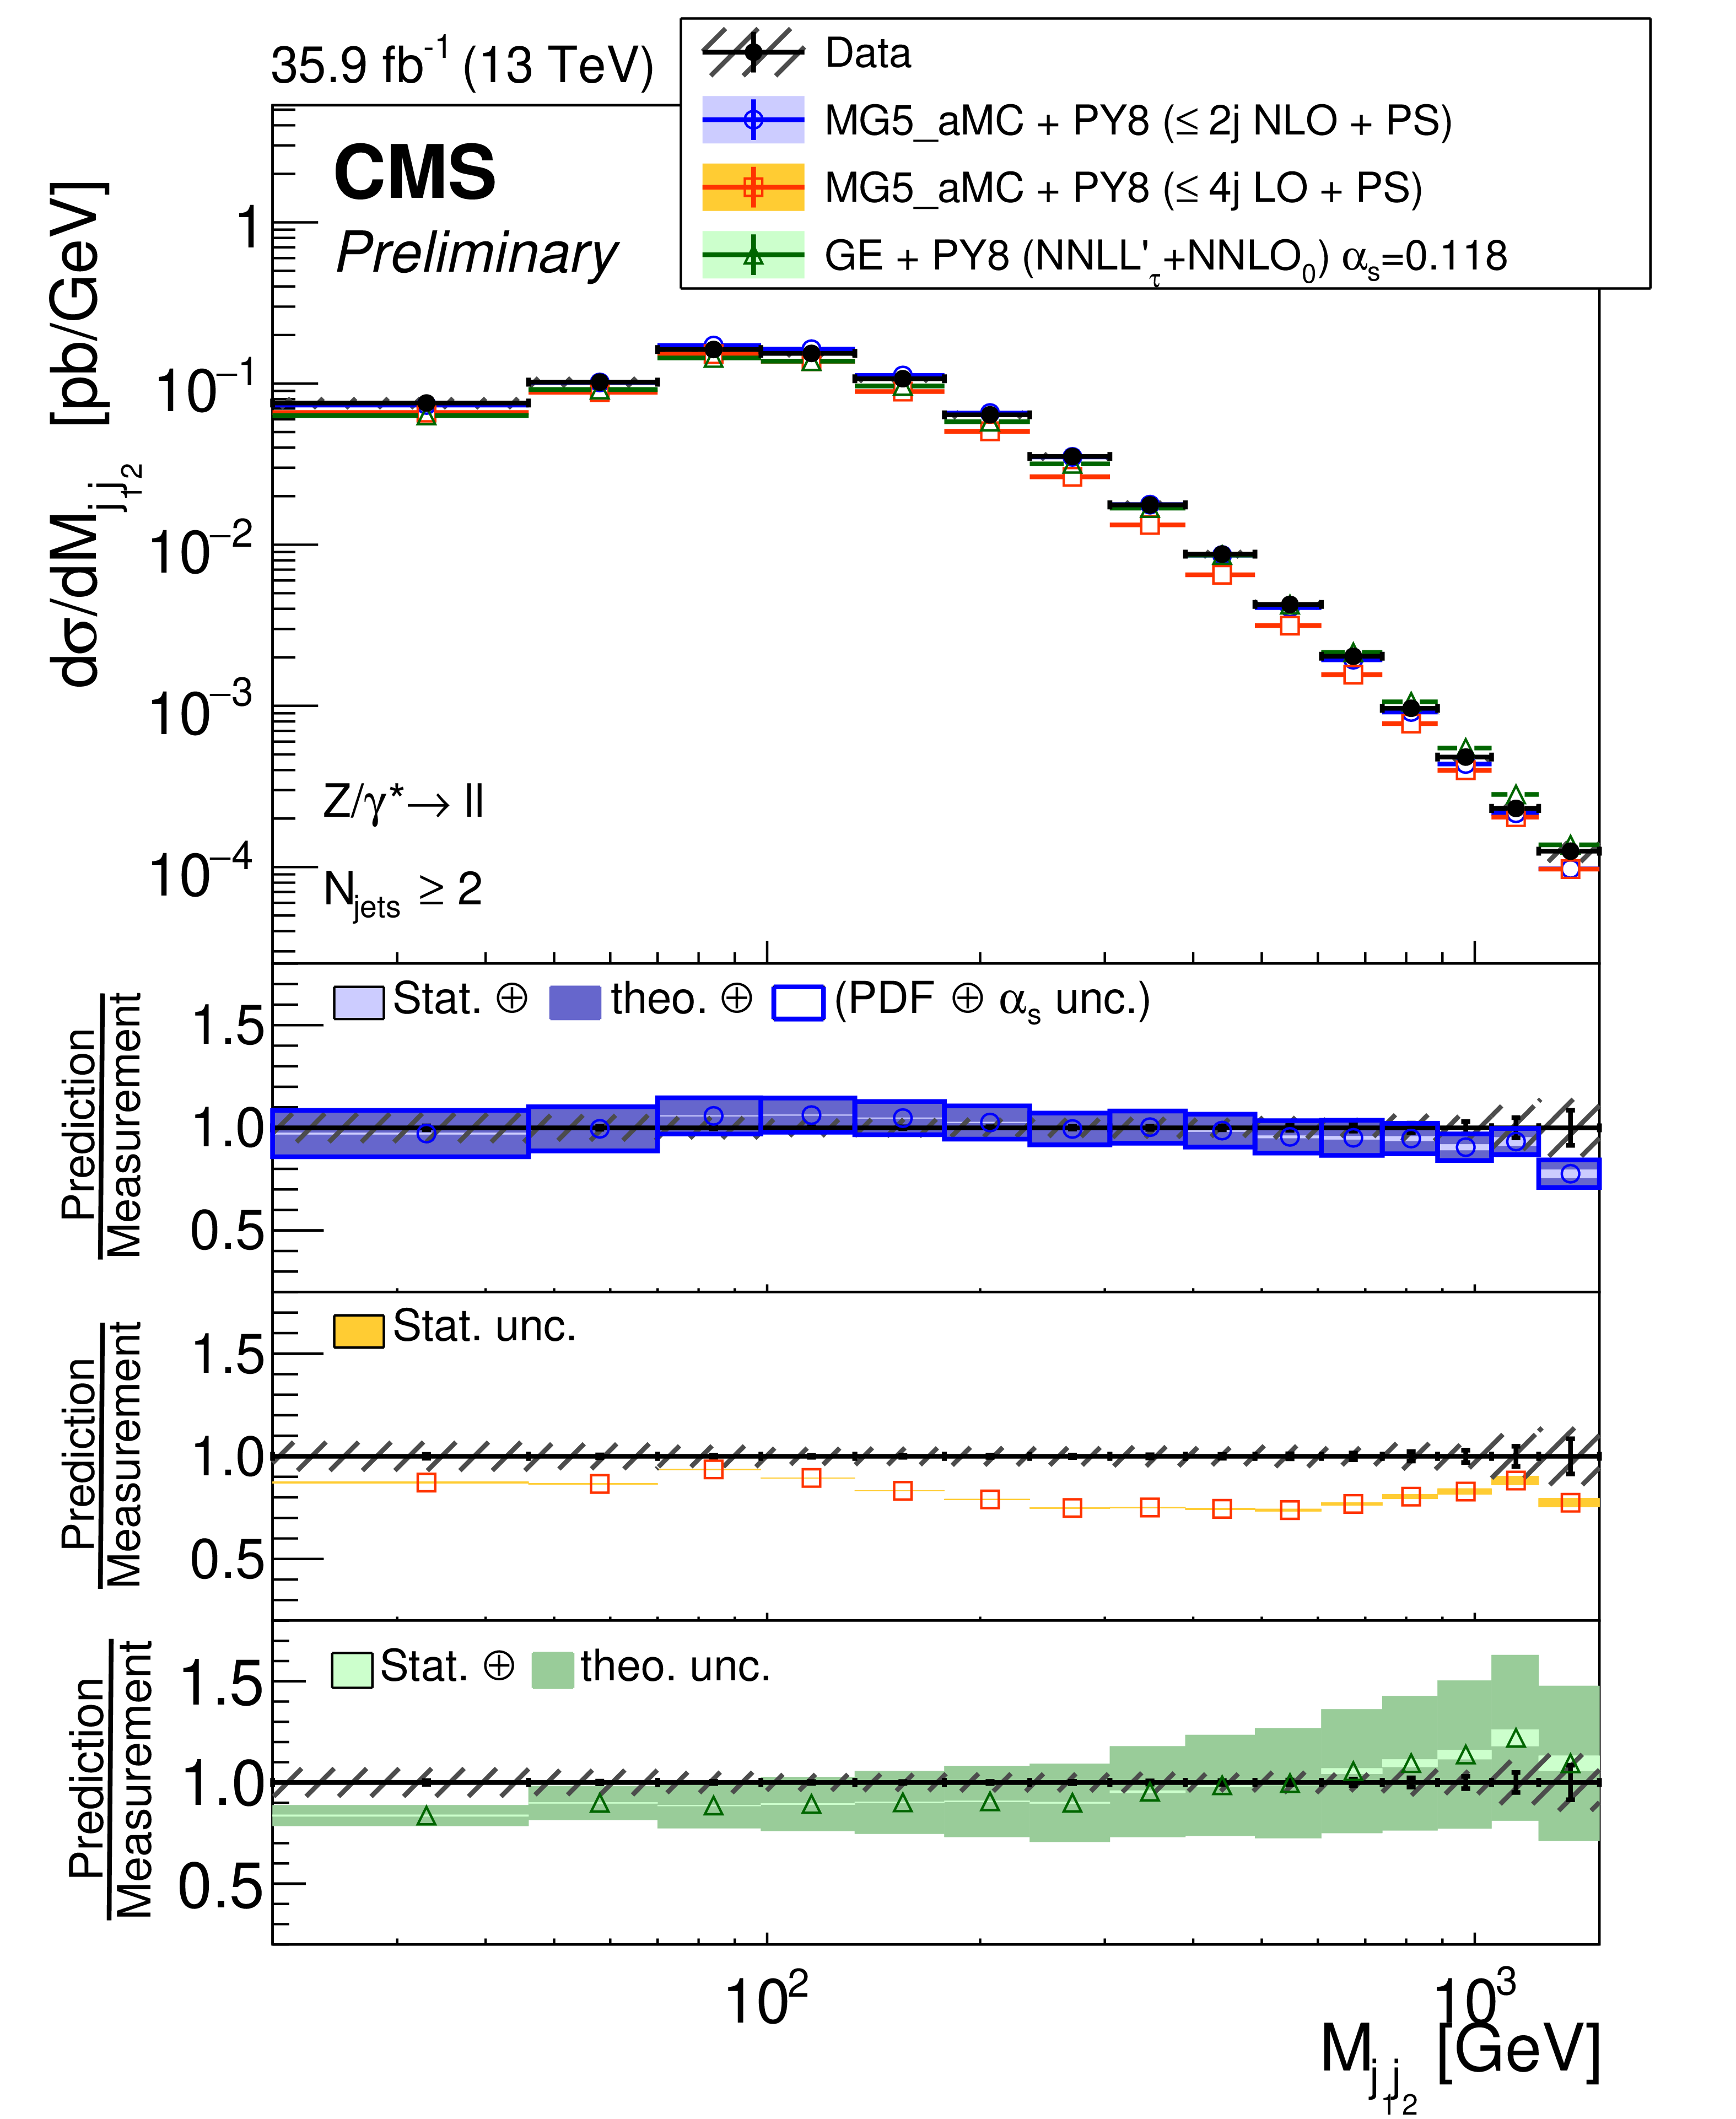
The measured differential cross section as a function of dijet mass for events with at least two jets. The measurement statistical (resp. systematic) uncertainties are represented with vertical error bars (resp. hashed areas). The measurement is compared to the NLO MG5_aMC, LO MG5_aMC, and GENEVA predictions described in Section 6. The predictions uncertainties, estimated as explained in this section, are represented by coloured areas in the ratio plots (light colour for the statistical part and darker colour for the total). Only statistical uncertainty is computed for the LO prediction. |
png pdf |
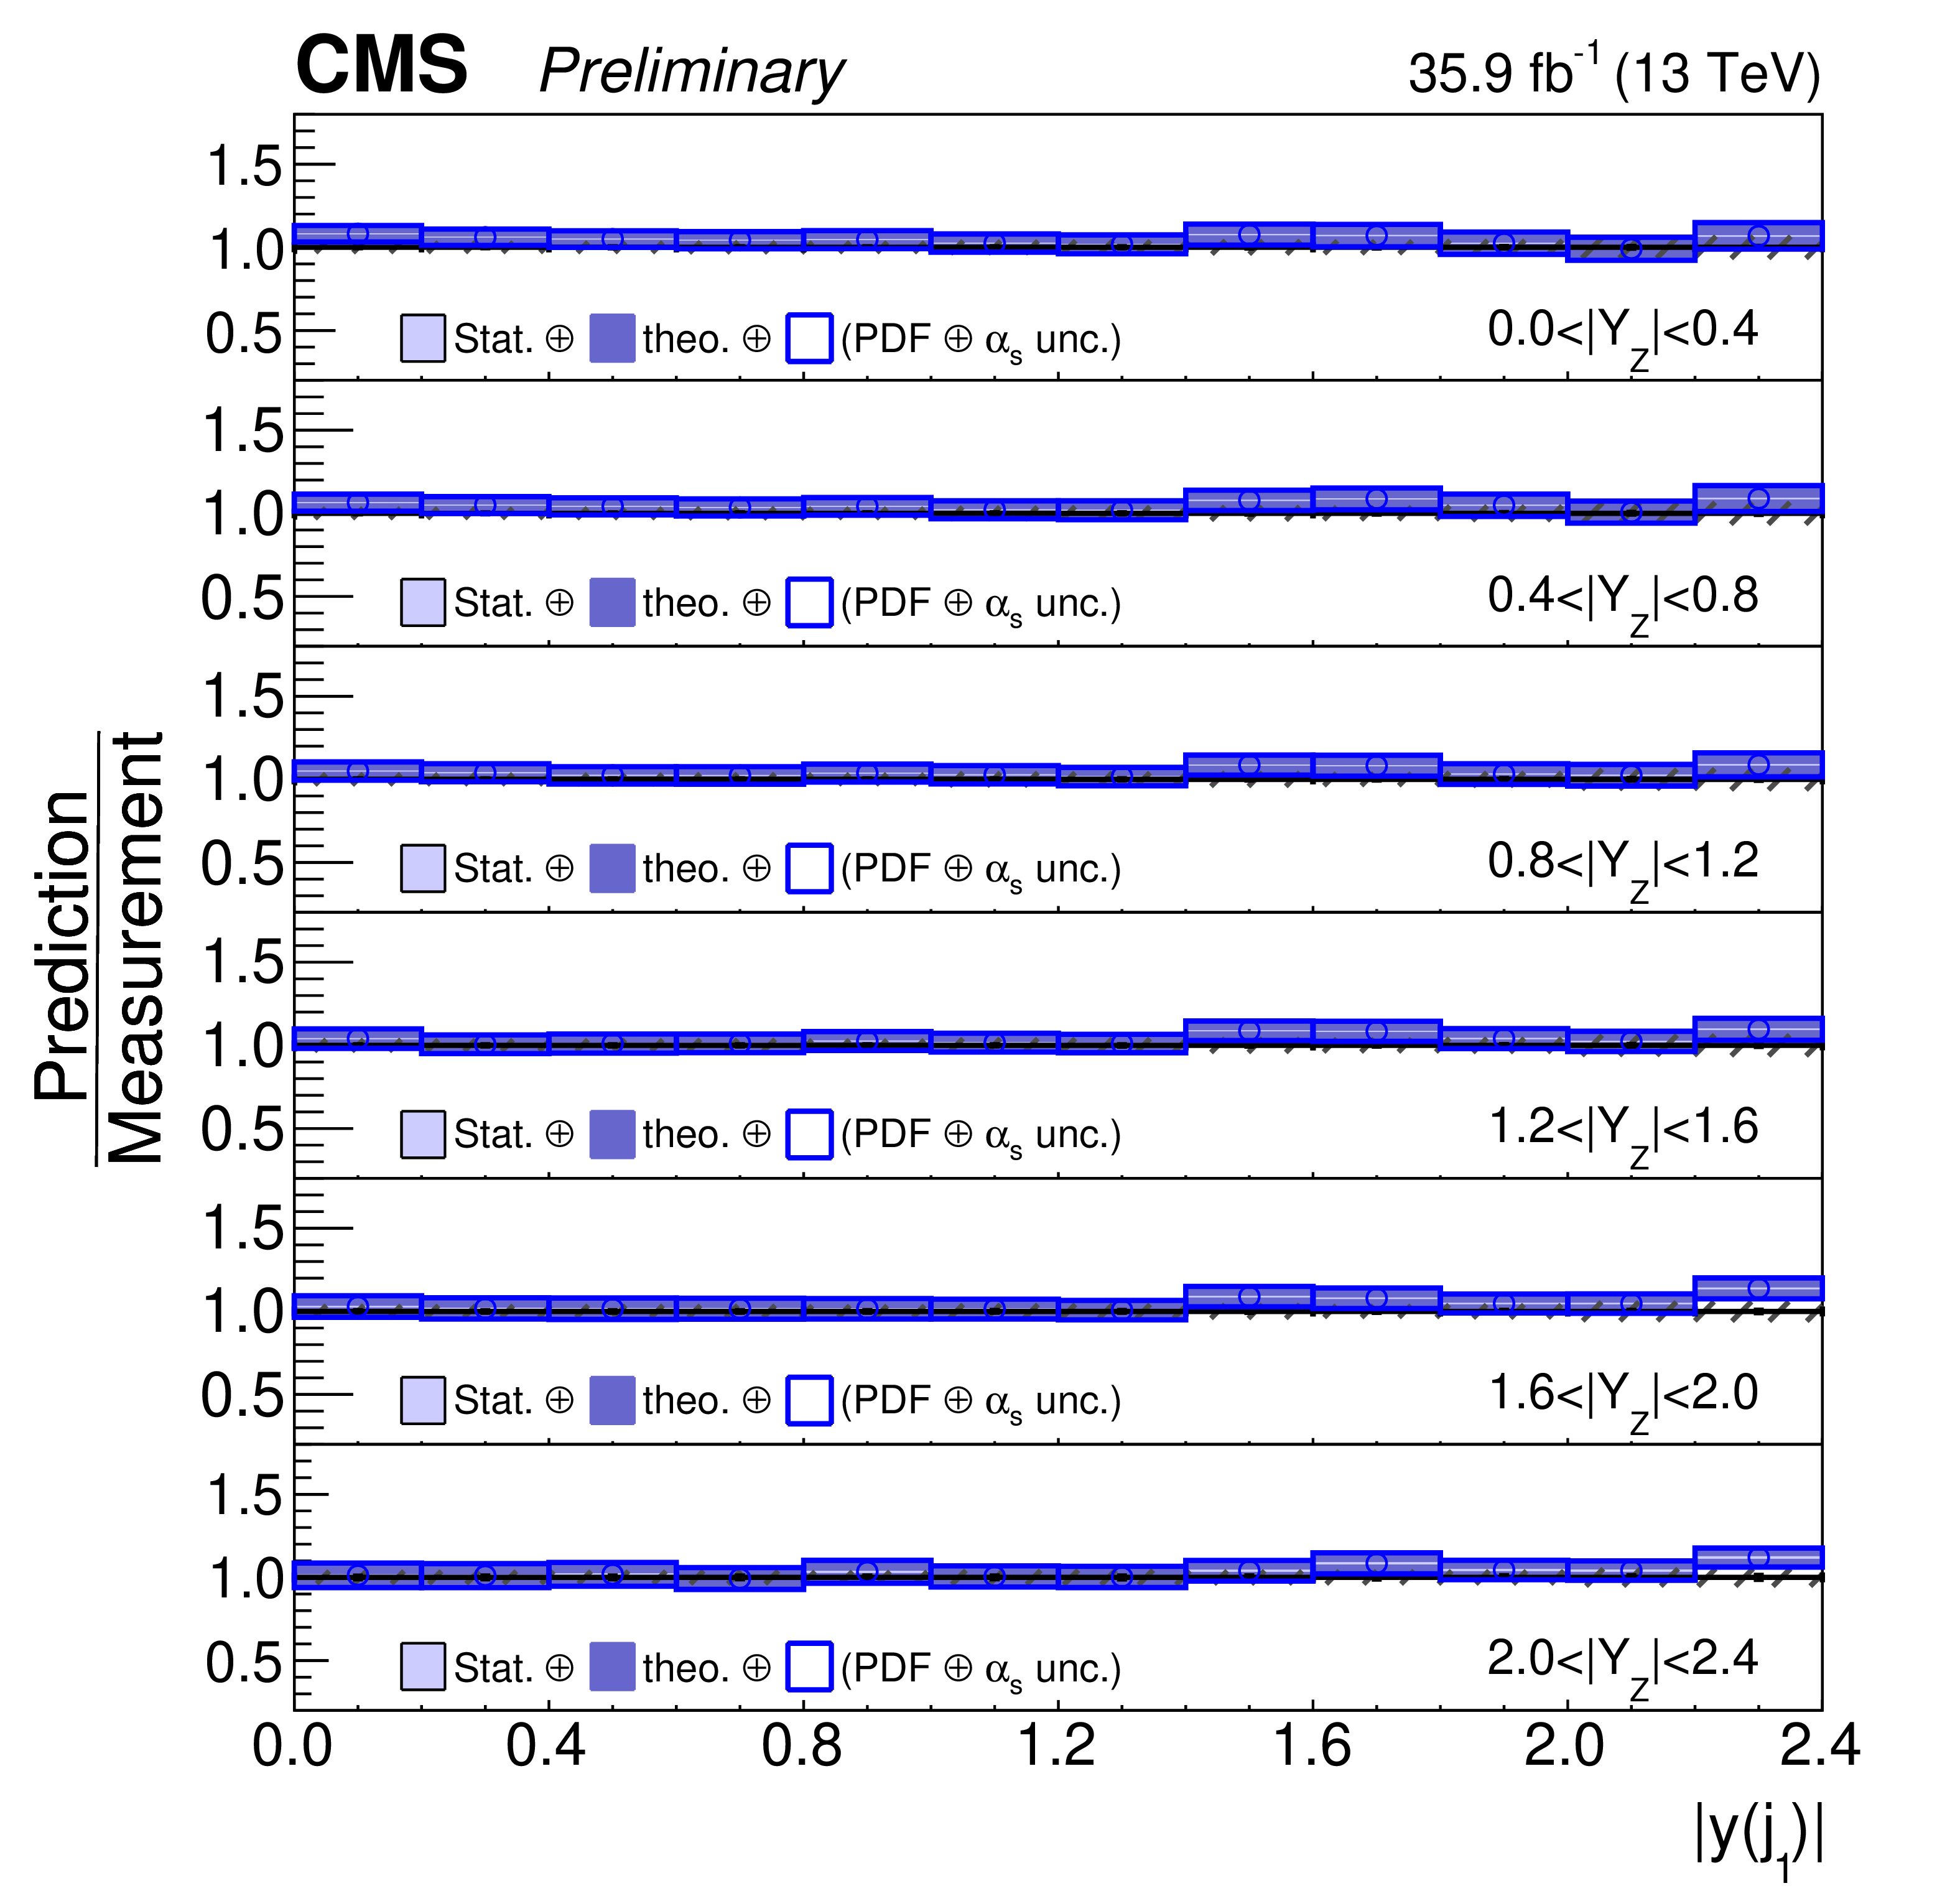
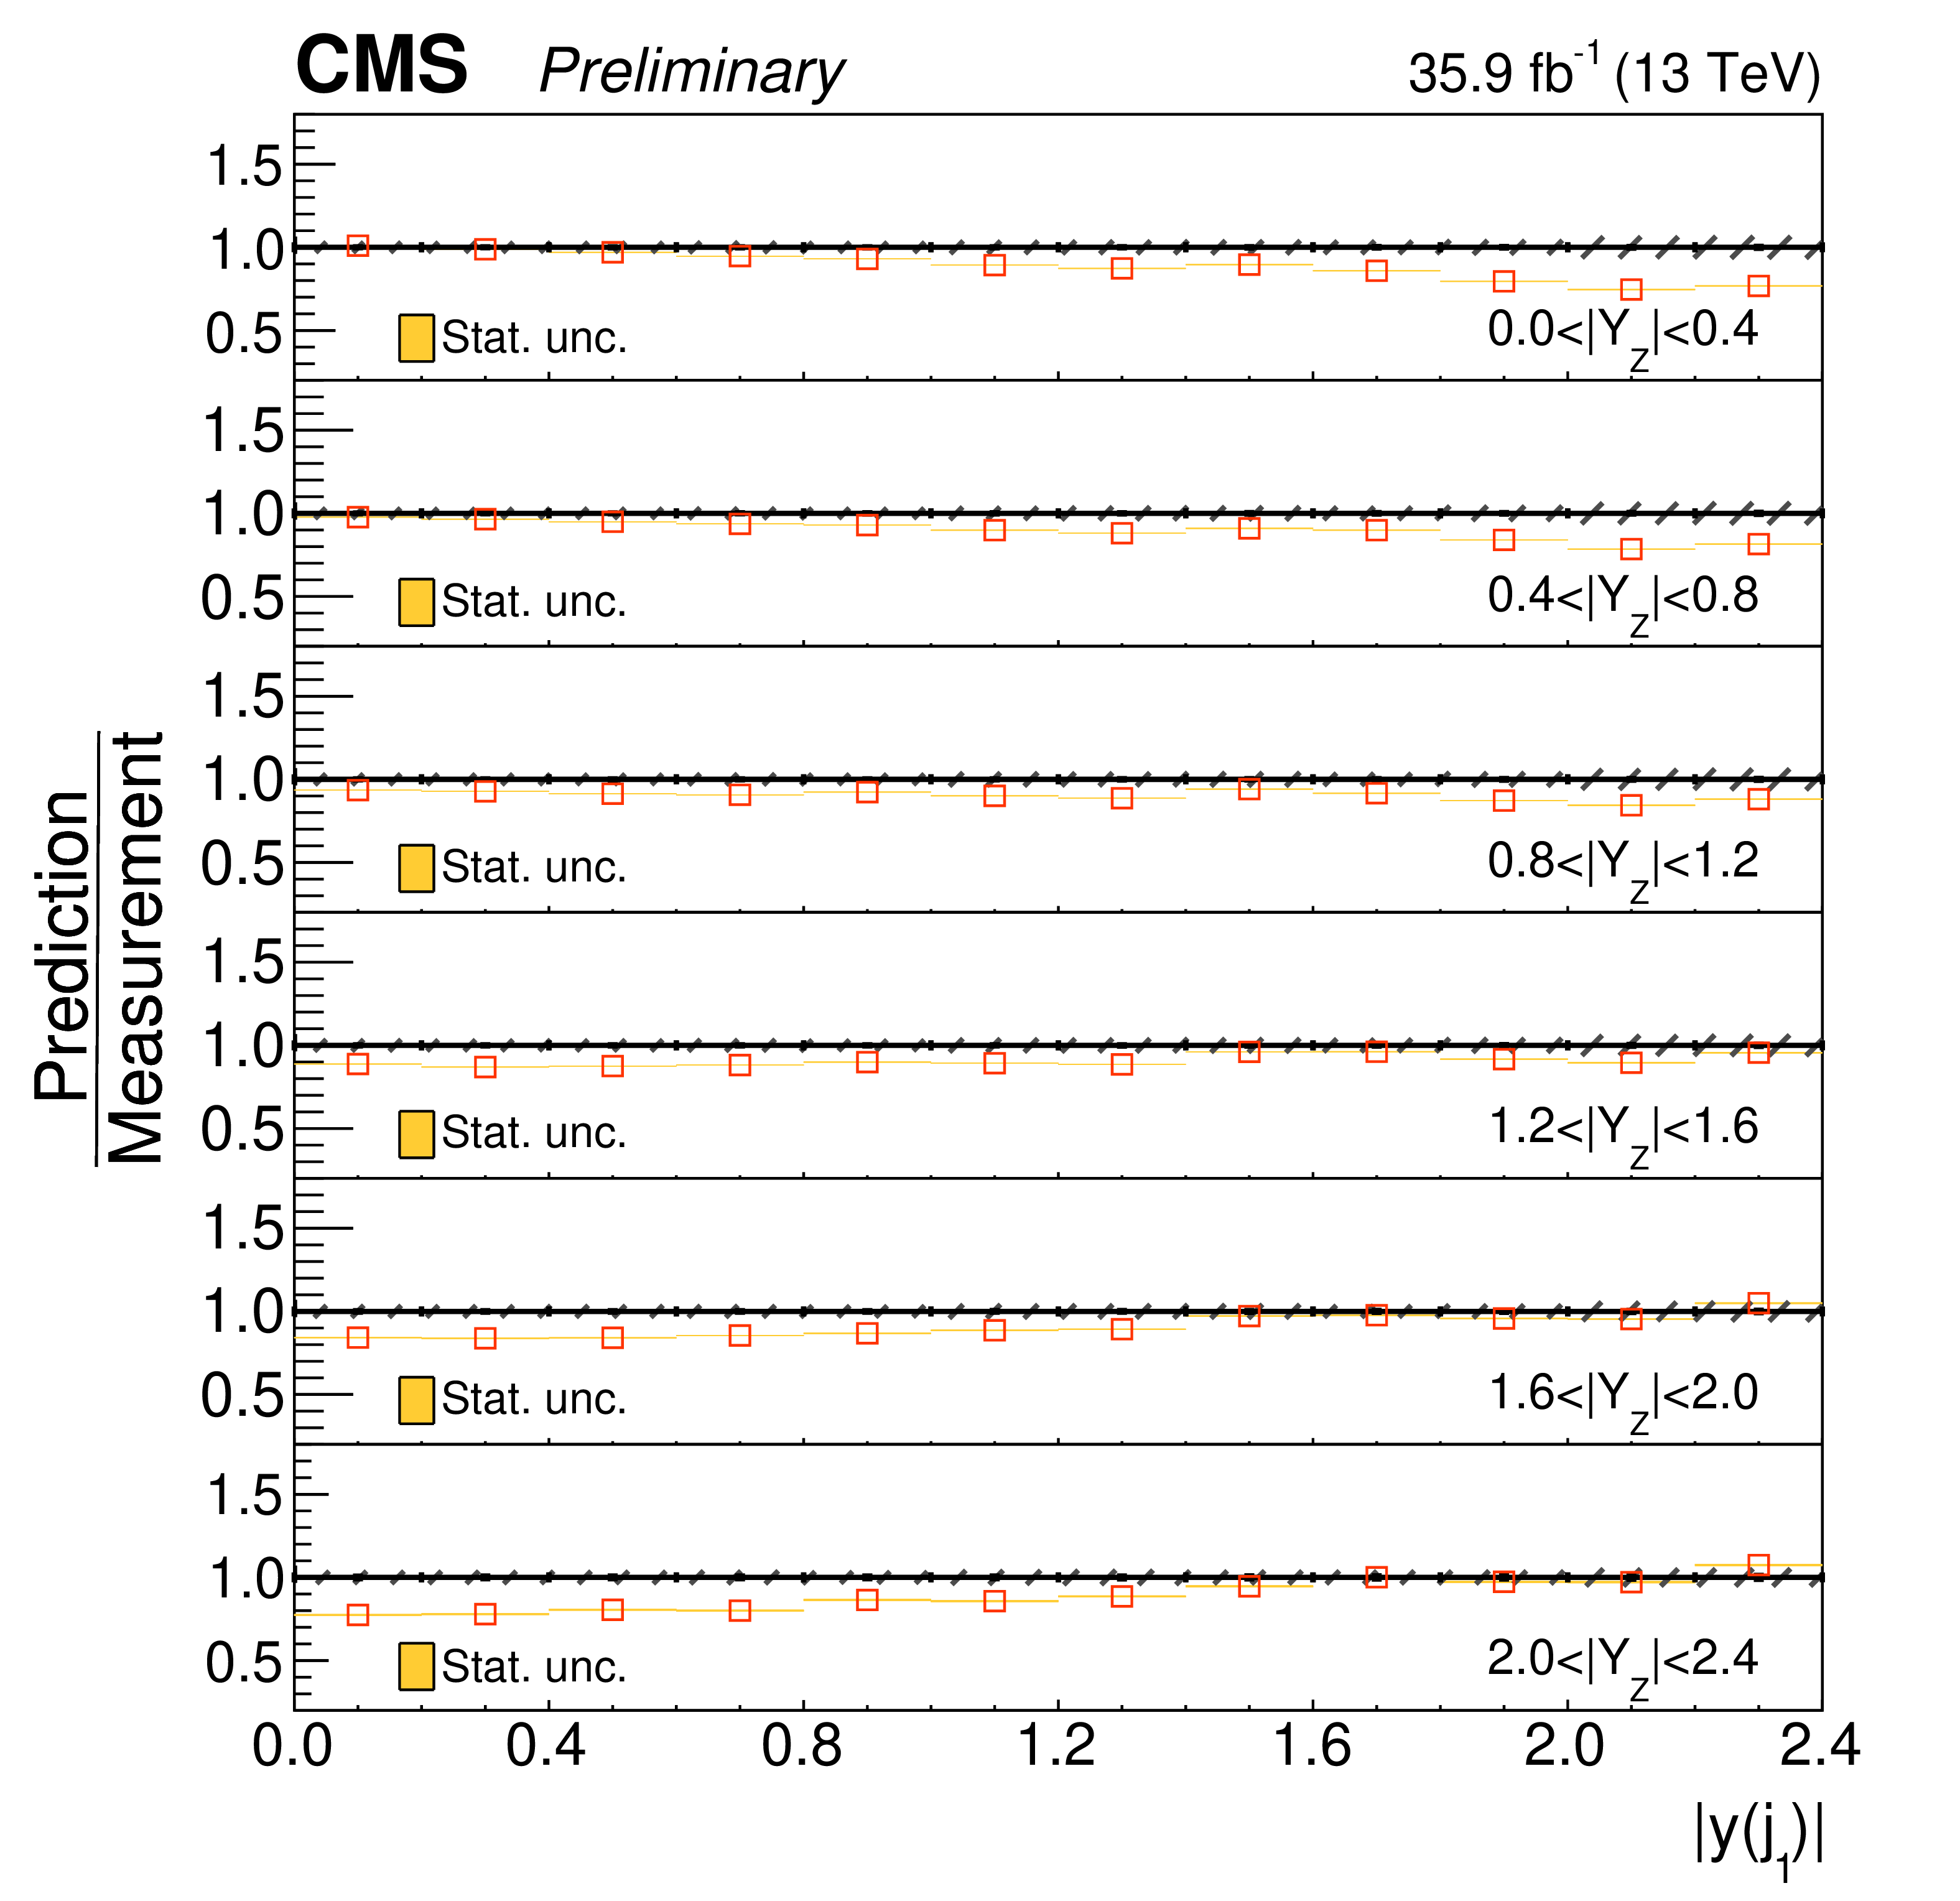
Figure 12:
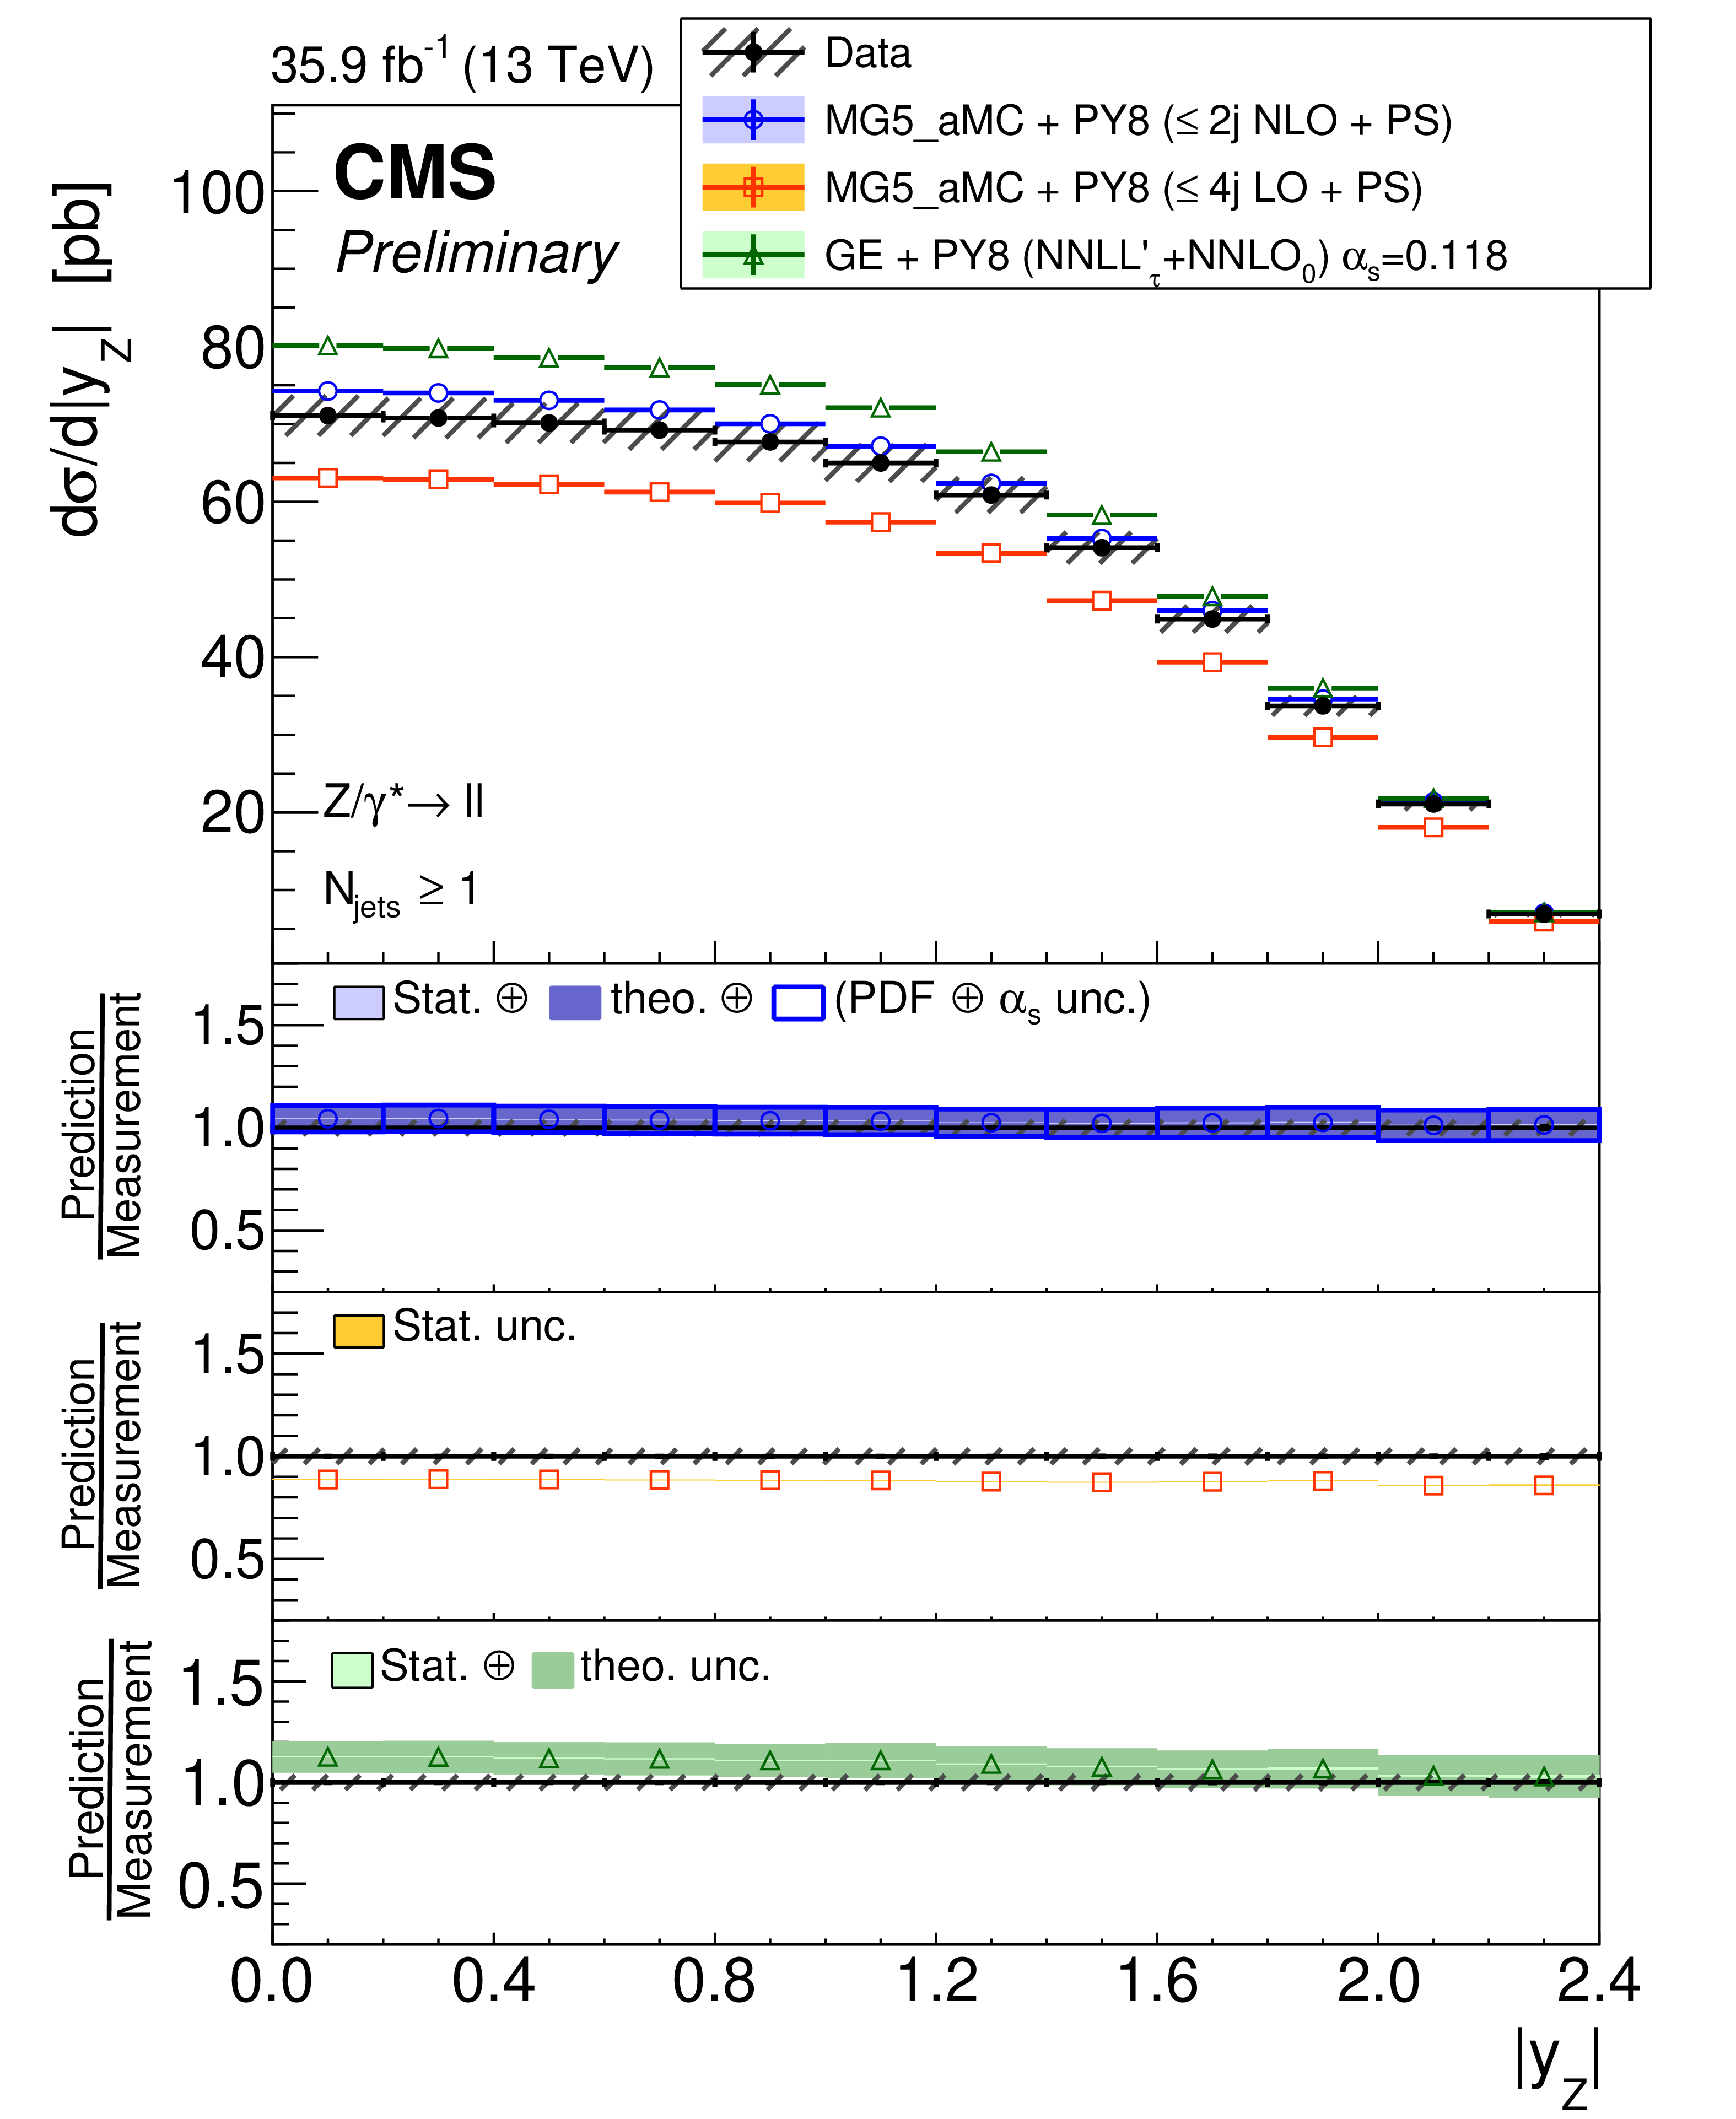
The measured differential cross section as a function of Z boson $|y|$ for events with at least one jet. The measurement statistical (resp. systematic) uncertainties are represented with vertical error bars (resp. hashed areas). The measurement is compared to the NLO MG5_aMC, LO MG5_aMC, and GENEVA predictions described in Section 6. The predictions uncertainties, estimated as explained in this section, are represented by coloured areas in the ratio plots (light colour for the statistical part and darker colour for the total). Only statistical uncertainty is computed for the LO prediction. |
png pdf |
Figure 13:
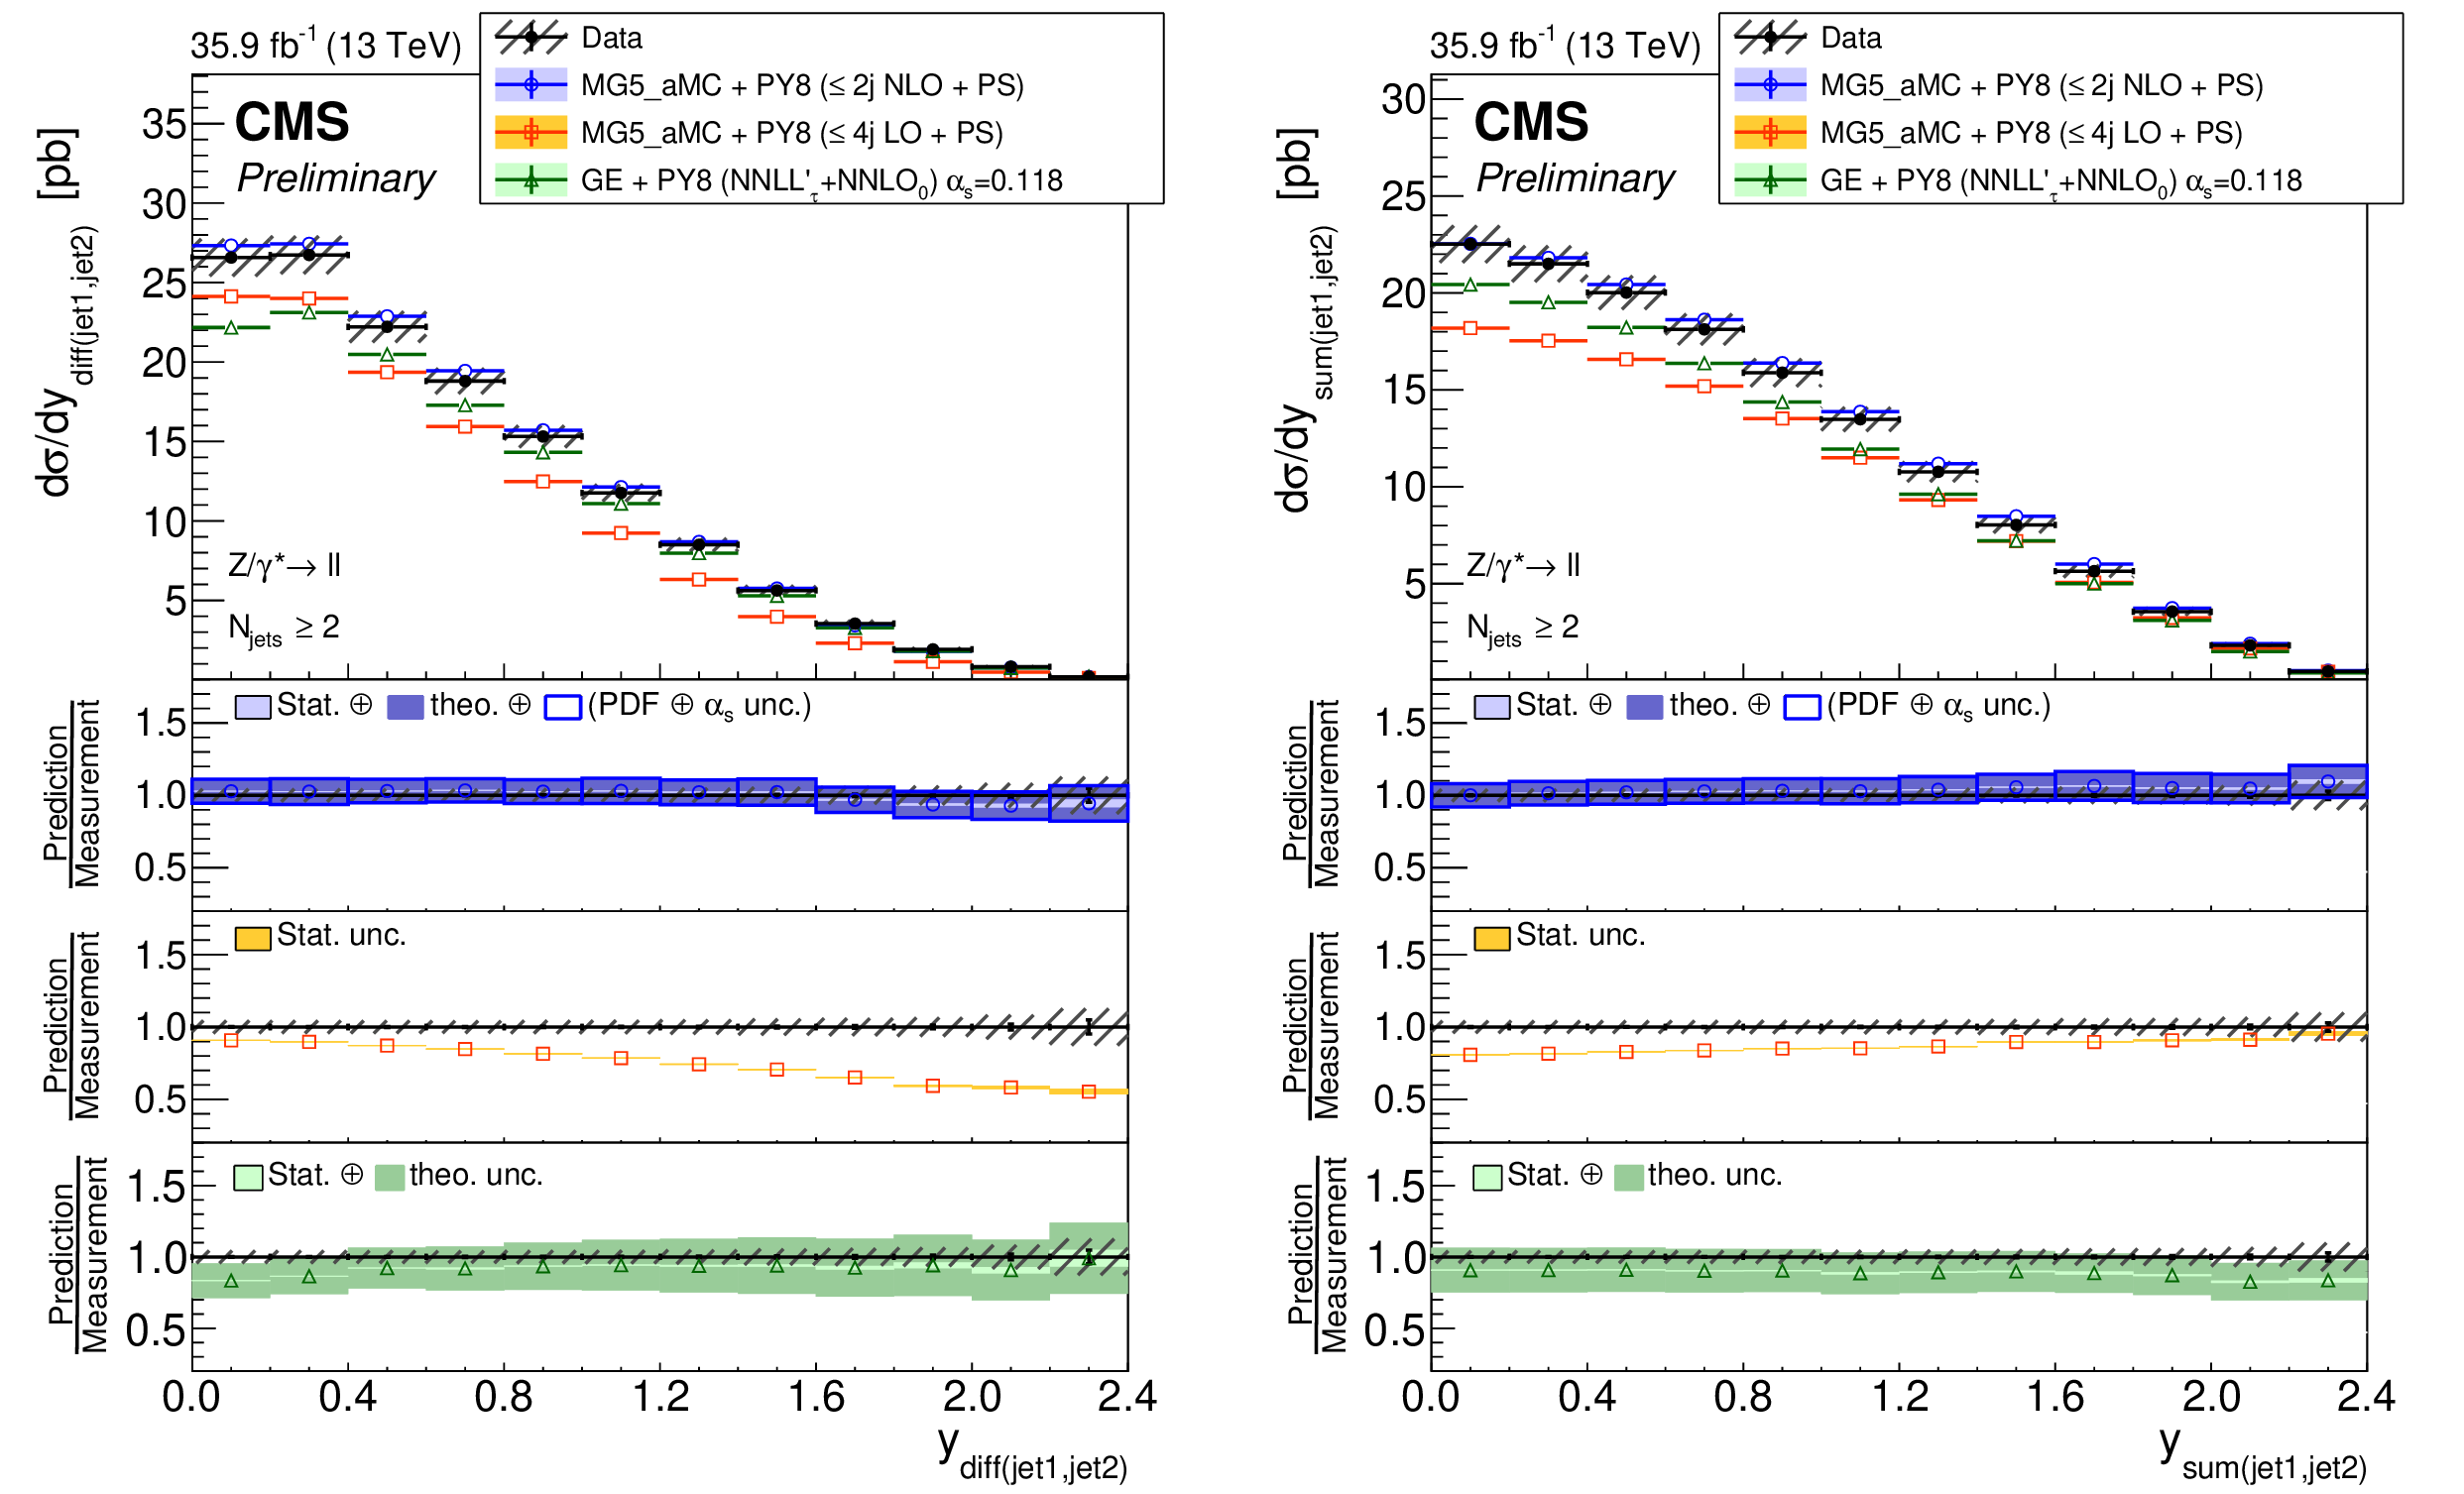
The measured differential cross section as a function of the leading and subleading jet rapidity difference (left) and sum (right) for events with at least two jets. The measurement statistical (resp. systematic) uncertainties are represented with vertical error bars (resp. hashed areas). The measurement is compared to the NLO MG5_aMC, LO MG5_aMC, and GENEVA predictions described in Section 6. The predictions uncertainties, estimated as explained in this section, are represented by coloured areas in the ratio plots (light colour for the statistical part and darker colour for the total). Only statistical uncertainty is computed for the LO prediction. |

png pdf |
Figure 13-a:
The measured differential cross section as a function of the leading and subleading jet rapidity difference (left) and sum (right) for events with at least two jets. The measurement statistical (resp. systematic) uncertainties are represented with vertical error bars (resp. hashed areas). The measurement is compared to the NLO MG5_aMC, LO MG5_aMC, and GENEVA predictions described in Section 6. The predictions uncertainties, estimated as explained in this section, are represented by coloured areas in the ratio plots (light colour for the statistical part and darker colour for the total). Only statistical uncertainty is computed for the LO prediction. |
png pdf |
Figure 13-b:
The measured differential cross section as a function of the leading and subleading jet rapidity difference (left) and sum (right) for events with at least two jets. The measurement statistical (resp. systematic) uncertainties are represented with vertical error bars (resp. hashed areas). The measurement is compared to the NLO MG5_aMC, LO MG5_aMC, and GENEVA predictions described in Section 6. The predictions uncertainties, estimated as explained in this section, are represented by coloured areas in the ratio plots (light colour for the statistical part and darker colour for the total). Only statistical uncertainty is computed for the LO prediction. |

png pdf |
Figure 14:
The measured differential cross section as a function of the Z boson and leading jet rapidity difference (left) and sum (right) for events with at least one jet. The measurement statistical (resp. systematic) uncertainties are represented with vertical error bars (resp. hashed areas). The measurement is compared to the NLO MG5_aMC, LO MG5_aMC, and GENEVA predictions described in Section 6. The predictions uncertainties, estimated as explained in this section, are represented by coloured areas in the ratio plots (light colour for the statistical part and darker colour for the total). Only statistical uncertainty is computed for the LO prediction. |

png pdf |
Figure 14-a:
The measured differential cross section as a function of the Z boson and leading jet rapidity difference (left) and sum (right) for events with at least one jet. The measurement statistical (resp. systematic) uncertainties are represented with vertical error bars (resp. hashed areas). The measurement is compared to the NLO MG5_aMC, LO MG5_aMC, and GENEVA predictions described in Section 6. The predictions uncertainties, estimated as explained in this section, are represented by coloured areas in the ratio plots (light colour for the statistical part and darker colour for the total). Only statistical uncertainty is computed for the LO prediction. |

png pdf |
Figure 14-b:
The measured differential cross section as a function of the Z boson and leading jet rapidity difference (left) and sum (right) for events with at least one jet. The measurement statistical (resp. systematic) uncertainties are represented with vertical error bars (resp. hashed areas). The measurement is compared to the NLO MG5_aMC, LO MG5_aMC, and GENEVA predictions described in Section 6. The predictions uncertainties, estimated as explained in this section, are represented by coloured areas in the ratio plots (light colour for the statistical part and darker colour for the total). Only statistical uncertainty is computed for the LO prediction. |

png pdf |
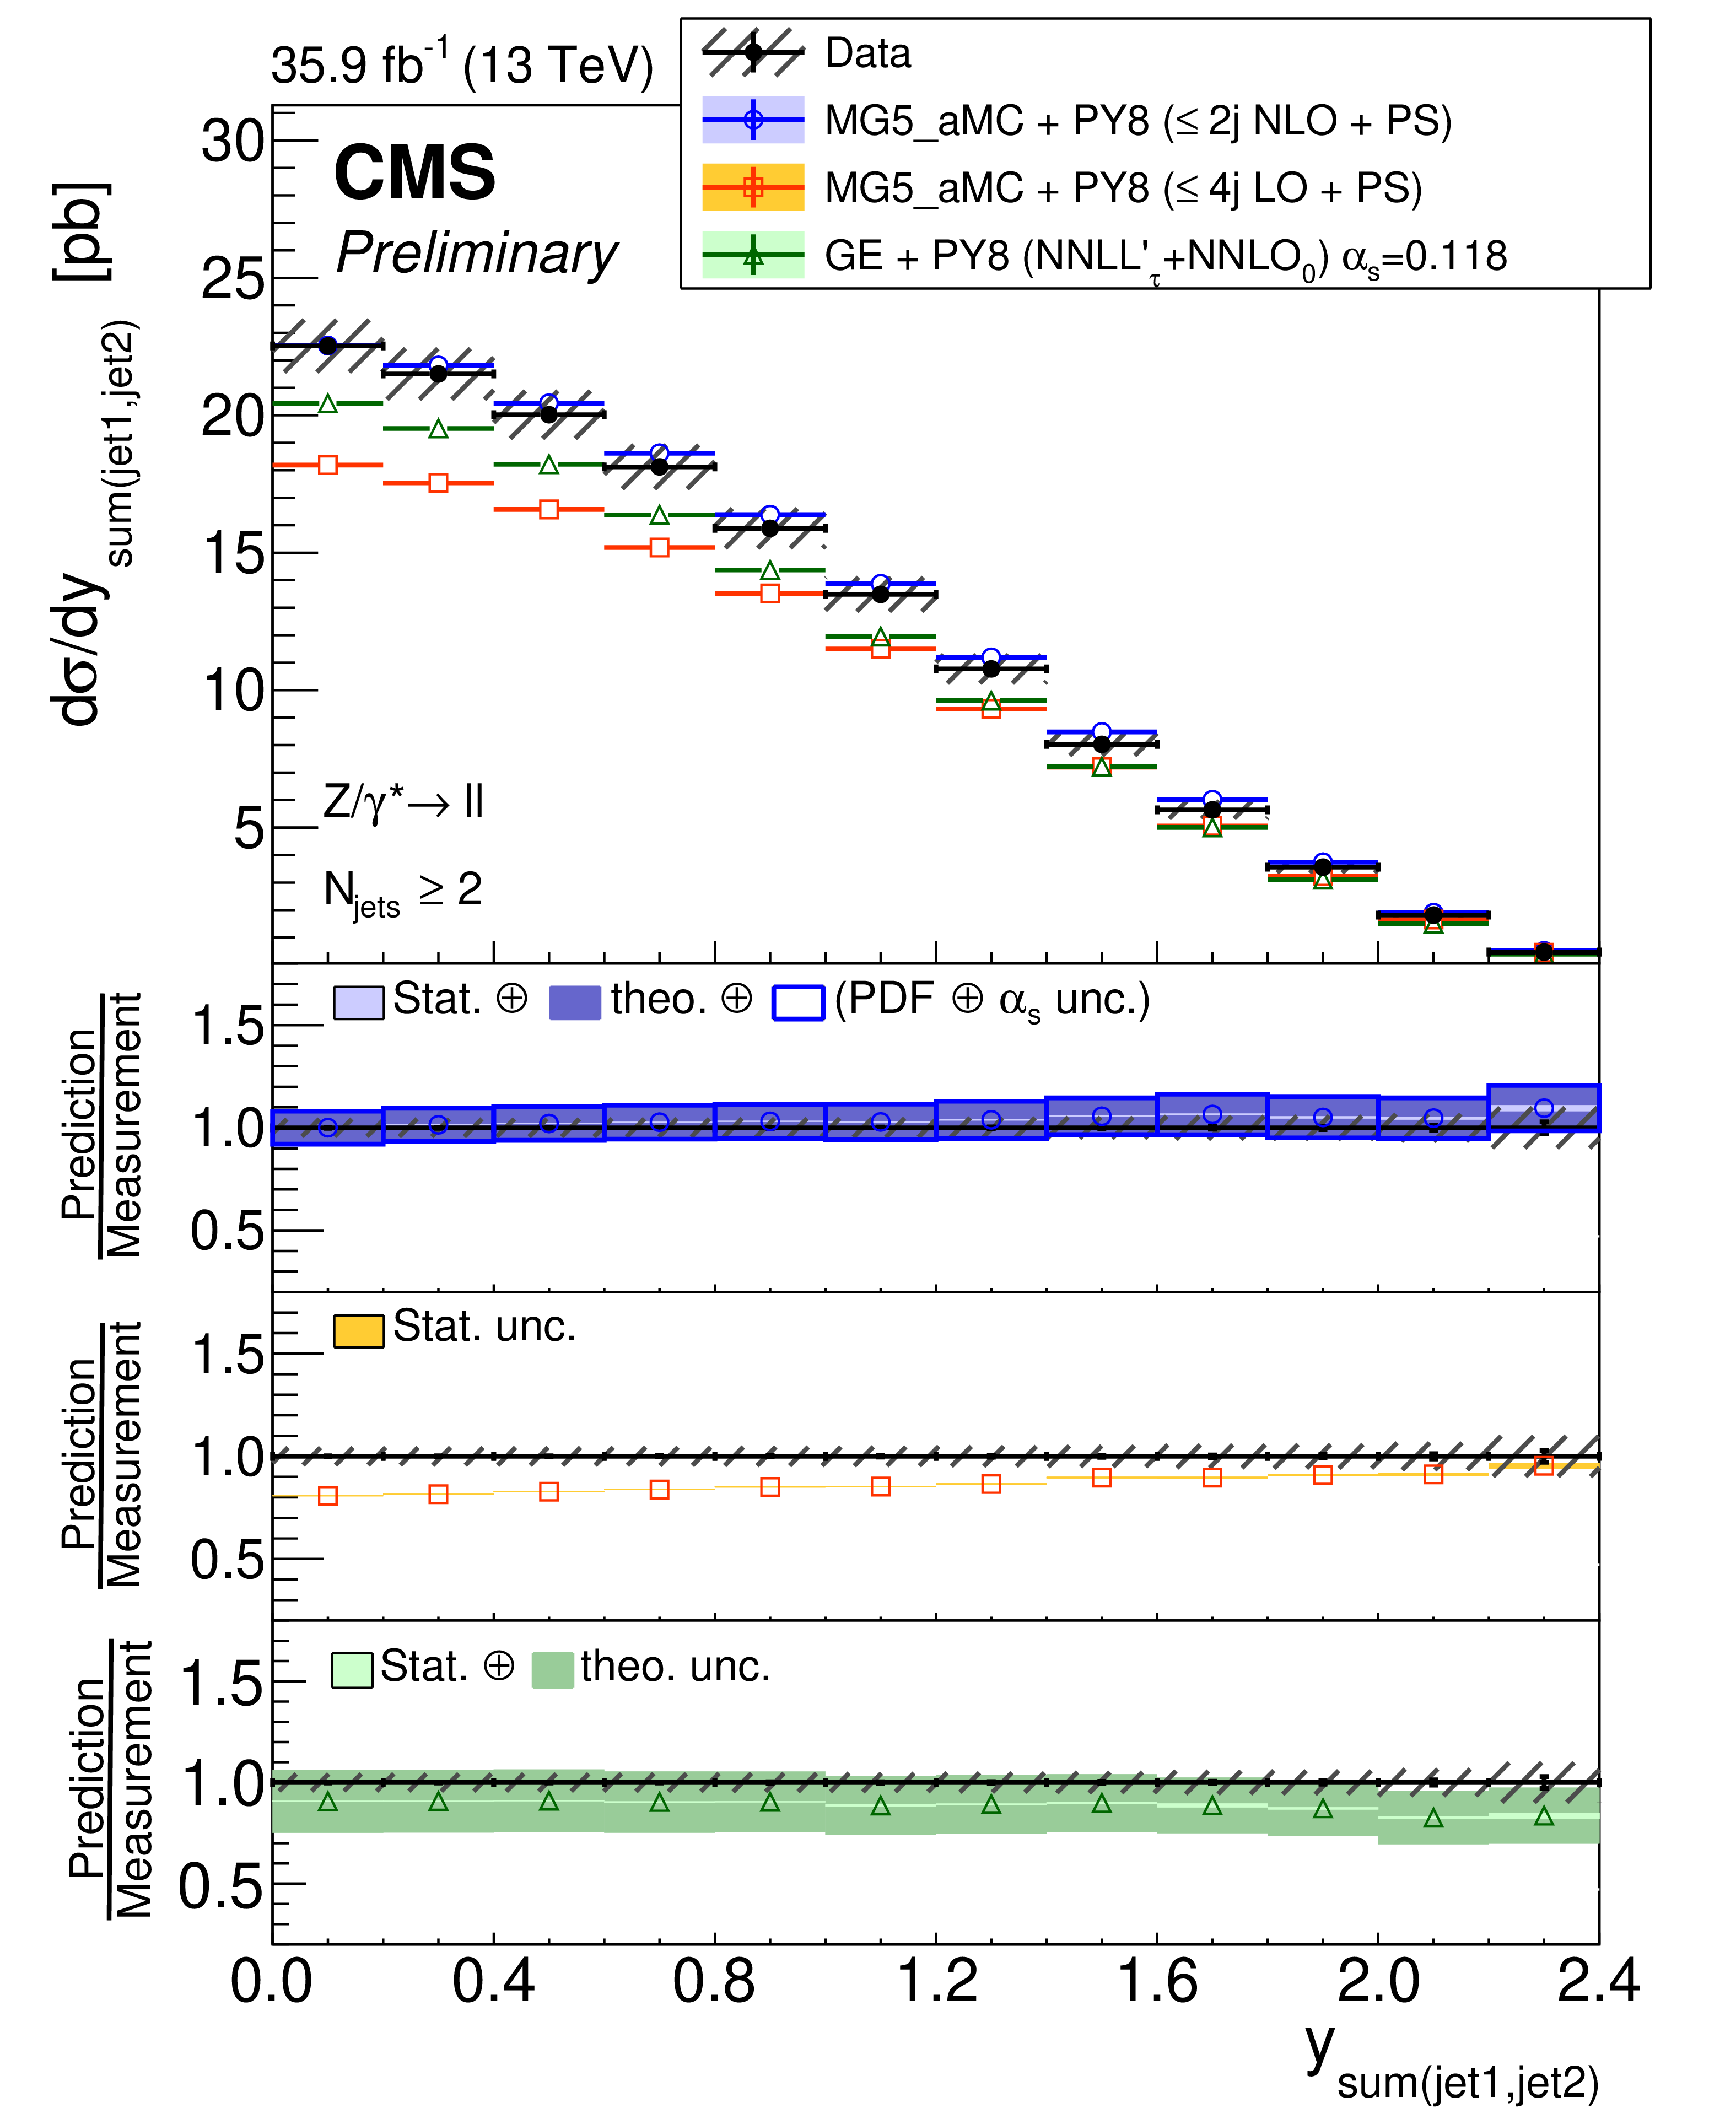
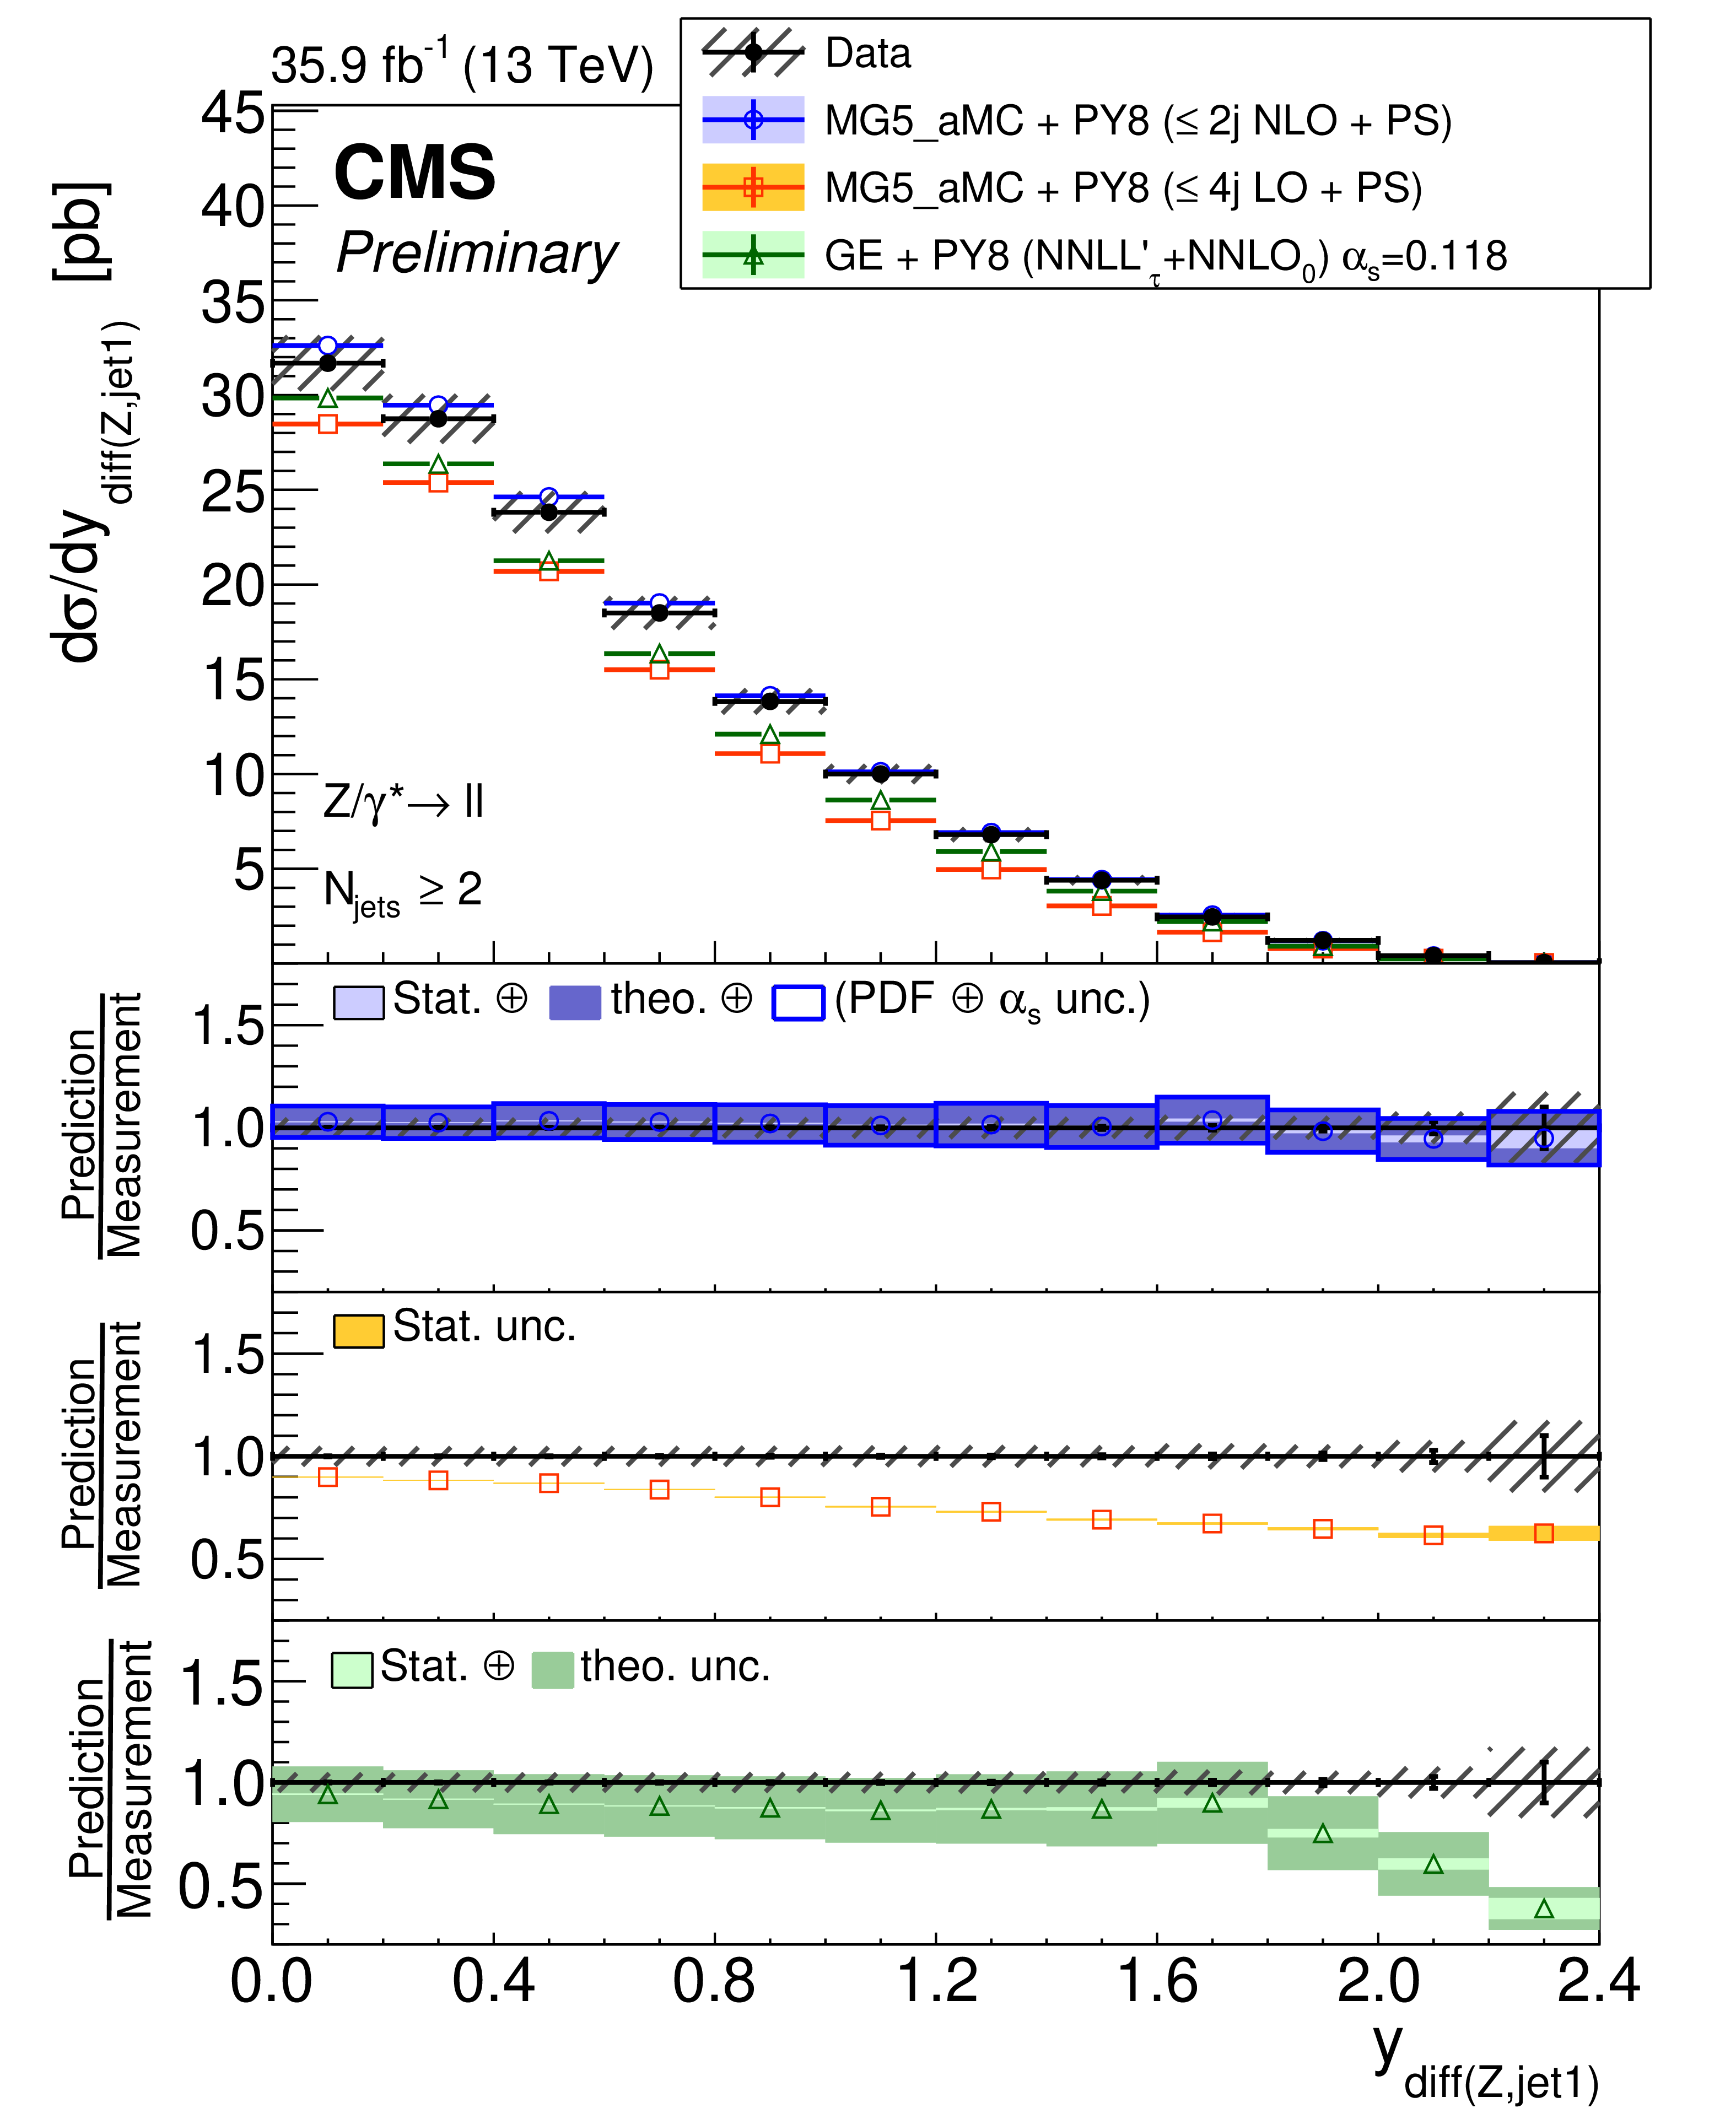
Figure 15:
The measured differential cross section as a function of the Z boson and leading jet rapidity difference (left) and sum (right) for events with at least two jets. The measurement statistical (resp. systematic) uncertainties are represented with vertical error bars (resp. hashed areas). The measurement is compared to the NLO MG5_aMC, LO MG5_aMC, and GENEVA predictions described in Section 6. The predictions uncertainties, estimated as explained in this section, are represented by coloured areas in the ratio plots (light colour for the statistical part and darker colour for the total). Only statistical uncertainty is computed for the LO prediction. |
png pdf |
Figure 15-a:
The measured differential cross section as a function of the Z boson and leading jet rapidity difference (left) and sum (right) for events with at least two jets. The measurement statistical (resp. systematic) uncertainties are represented with vertical error bars (resp. hashed areas). The measurement is compared to the NLO MG5_aMC, LO MG5_aMC, and GENEVA predictions described in Section 6. The predictions uncertainties, estimated as explained in this section, are represented by coloured areas in the ratio plots (light colour for the statistical part and darker colour for the total). Only statistical uncertainty is computed for the LO prediction. |

png pdf |
Figure 15-b:
The measured differential cross section as a function of the Z boson and leading jet rapidity difference (left) and sum (right) for events with at least two jets. The measurement statistical (resp. systematic) uncertainties are represented with vertical error bars (resp. hashed areas). The measurement is compared to the NLO MG5_aMC, LO MG5_aMC, and GENEVA predictions described in Section 6. The predictions uncertainties, estimated as explained in this section, are represented by coloured areas in the ratio plots (light colour for the statistical part and darker colour for the total). Only statistical uncertainty is computed for the LO prediction. |
png pdf |
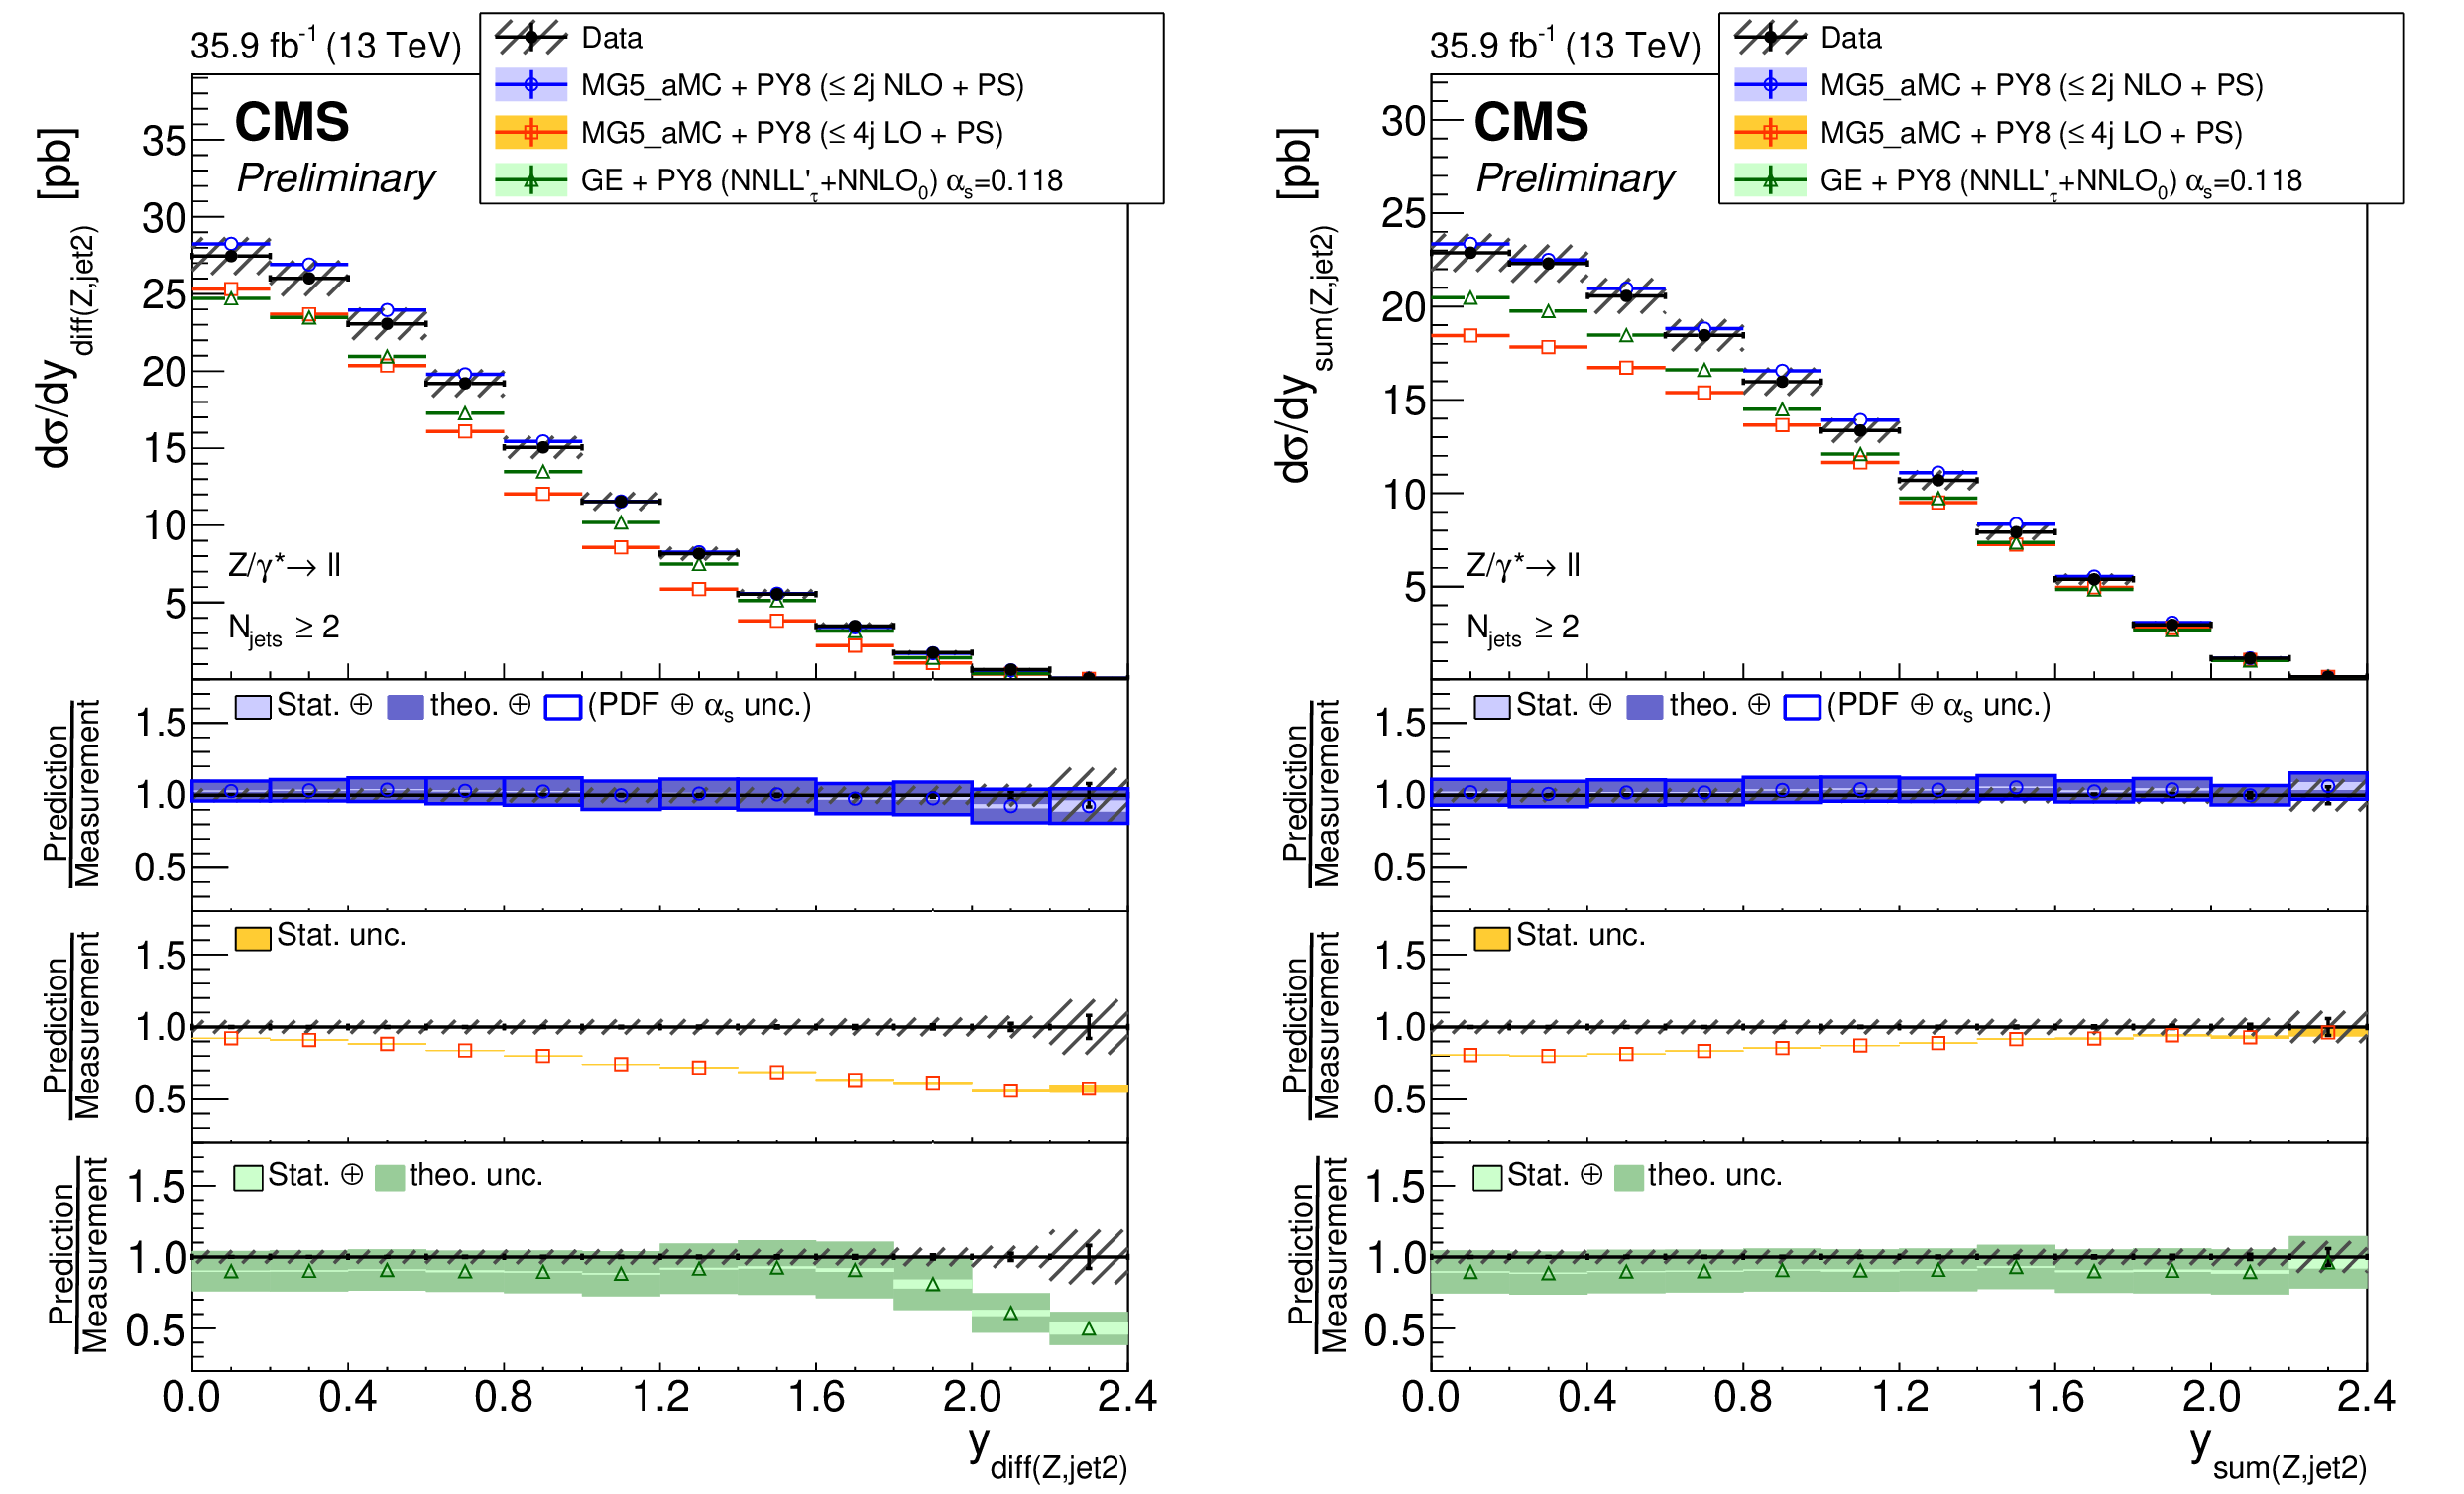
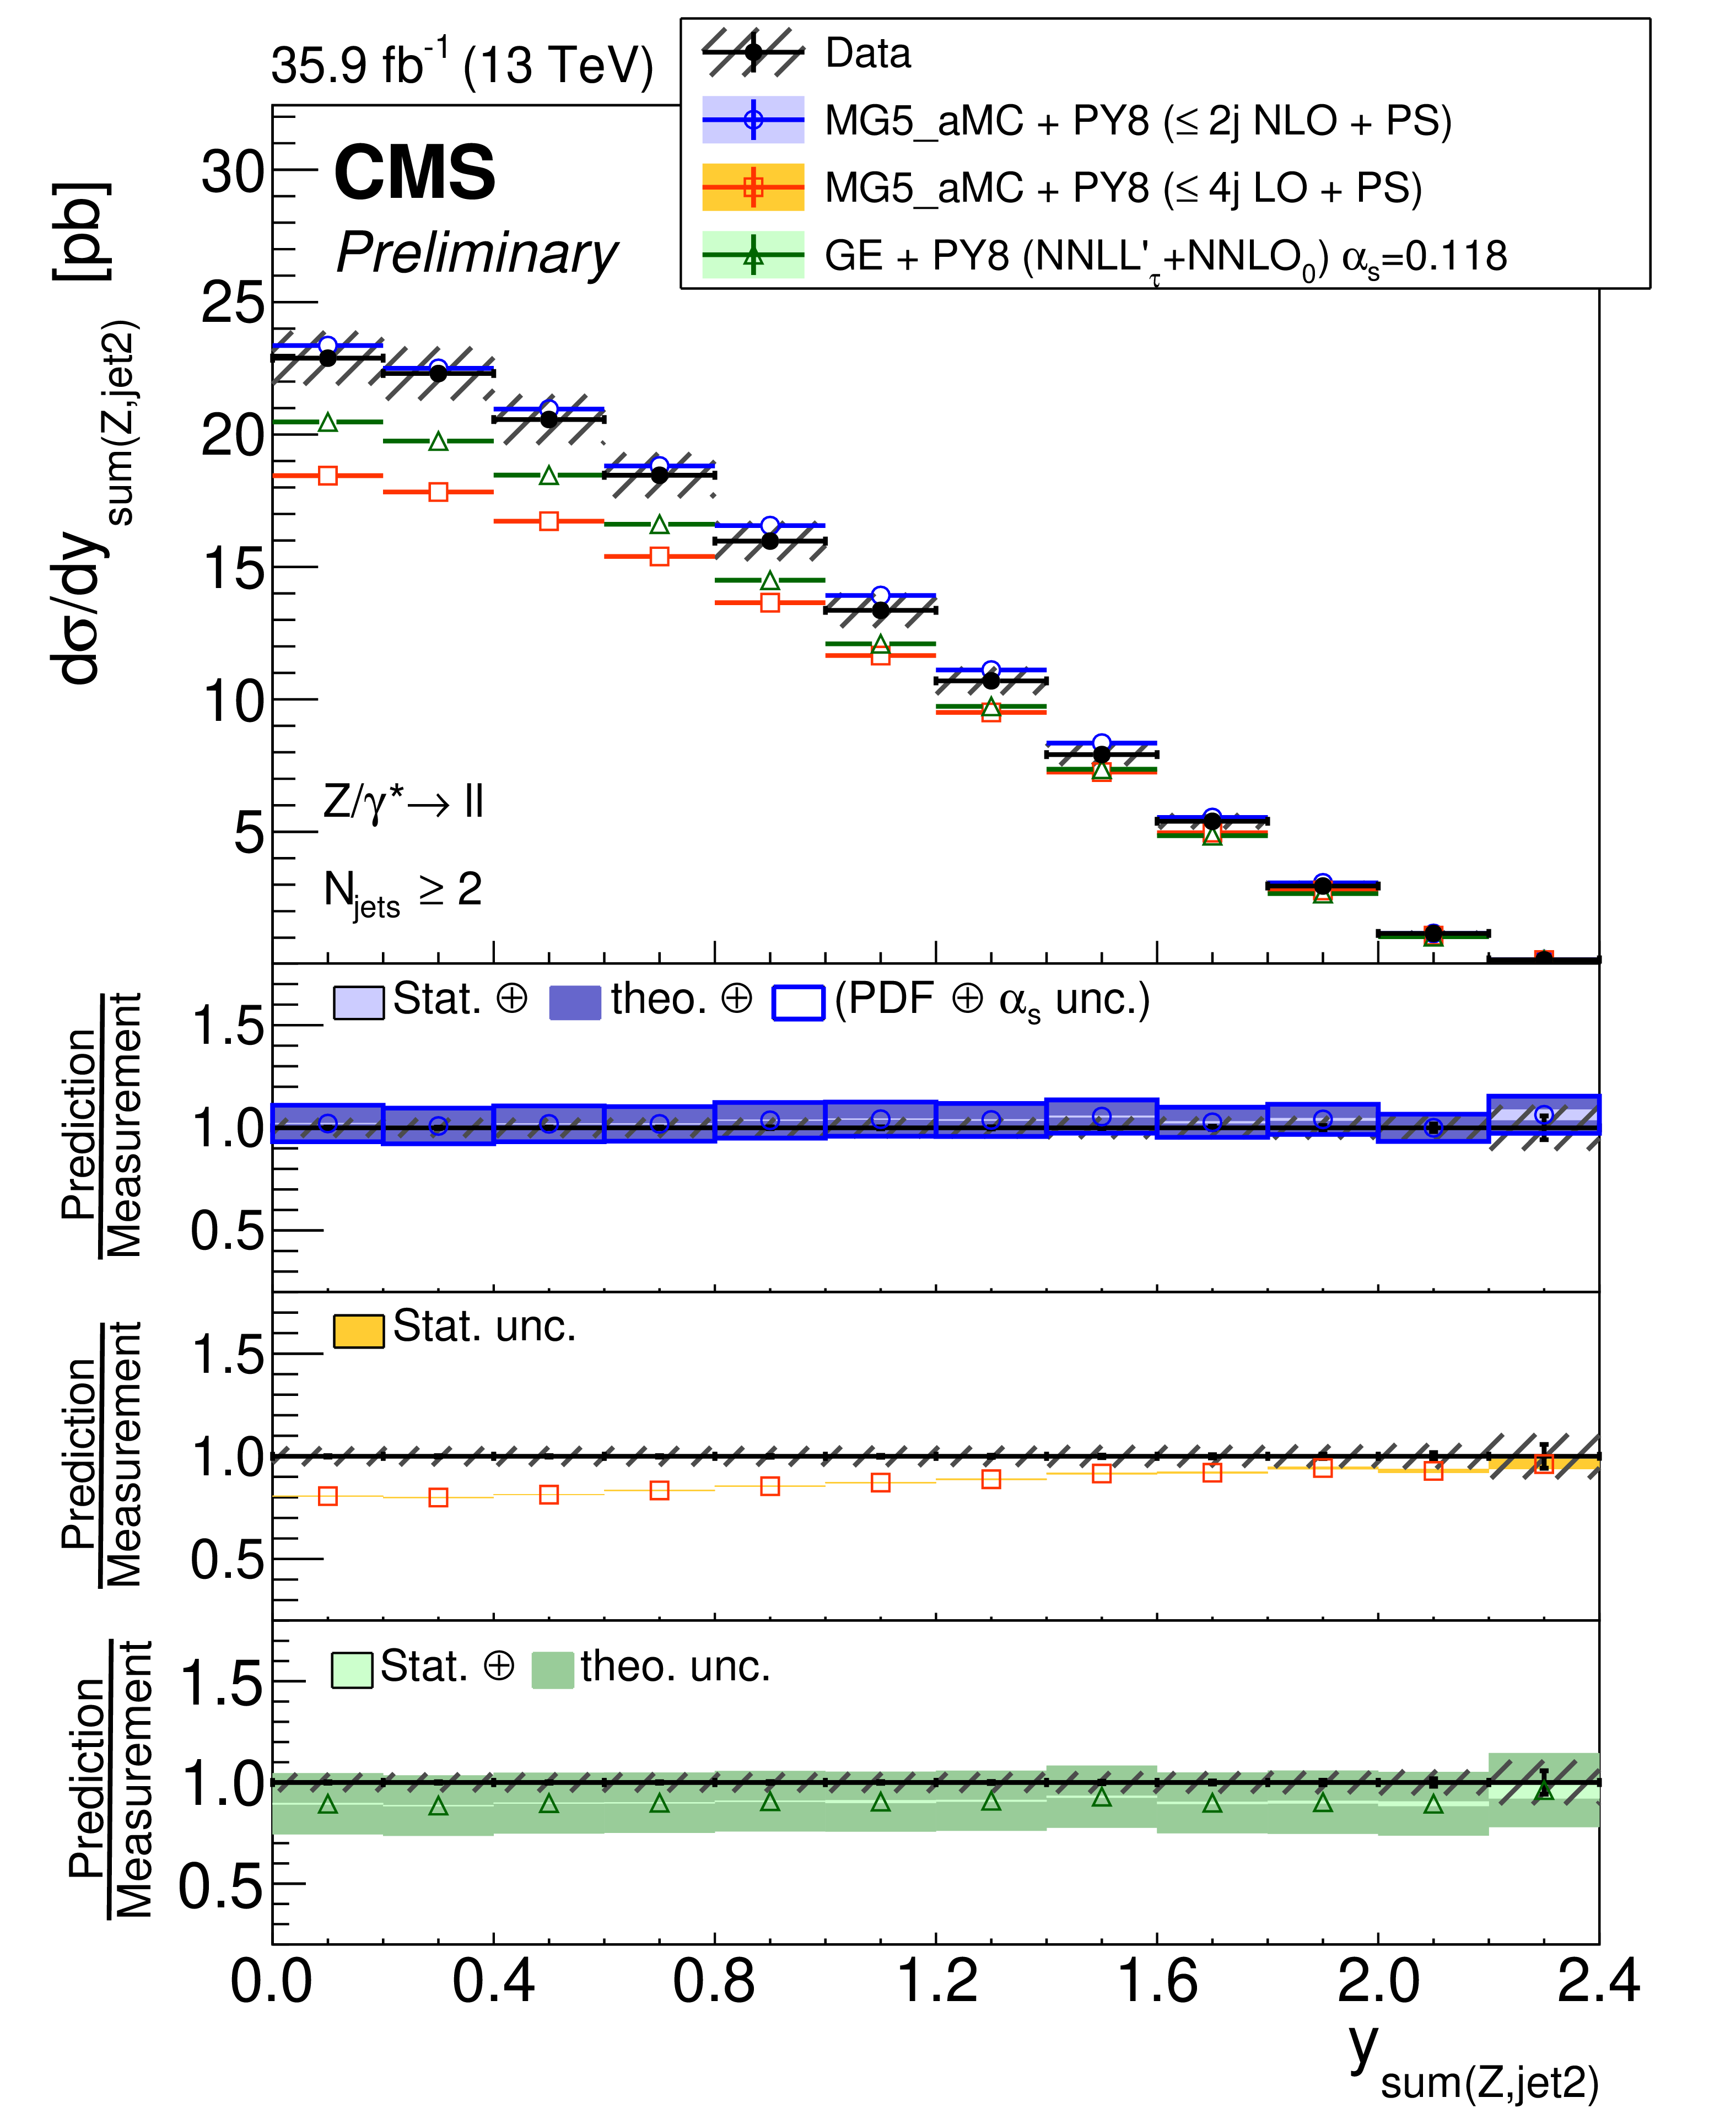
Figure 16:
The measured differential cross section as a function of the Z boson and subleading jet rapidity difference (left) and sum (right) for events with at least two jets. The measurement statistical (resp. systematic) uncertainties are represented with vertical error bars (resp. hashed areas). The measurement is compared to the NLO MG5_aMC, LO MG5_aMC, and GENEVA predictions described in Section 6. The predictions uncertainties, estimated as explained in this section, are represented by coloured areas in the ratio plots (light colour for the statistical part and darker colour for the total). Only statistical uncertainty is computed for the LO prediction. |

png pdf |
Figure 16-a:
The measured differential cross section as a function of the Z boson and subleading jet rapidity difference (left) and sum (right) for events with at least two jets. The measurement statistical (resp. systematic) uncertainties are represented with vertical error bars (resp. hashed areas). The measurement is compared to the NLO MG5_aMC, LO MG5_aMC, and GENEVA predictions described in Section 6. The predictions uncertainties, estimated as explained in this section, are represented by coloured areas in the ratio plots (light colour for the statistical part and darker colour for the total). Only statistical uncertainty is computed for the LO prediction. |
png pdf |
Figure 16-b:
The measured differential cross section as a function of the Z boson and subleading jet rapidity difference (left) and sum (right) for events with at least two jets. The measurement statistical (resp. systematic) uncertainties are represented with vertical error bars (resp. hashed areas). The measurement is compared to the NLO MG5_aMC, LO MG5_aMC, and GENEVA predictions described in Section 6. The predictions uncertainties, estimated as explained in this section, are represented by coloured areas in the ratio plots (light colour for the statistical part and darker colour for the total). Only statistical uncertainty is computed for the LO prediction. |
png pdf |
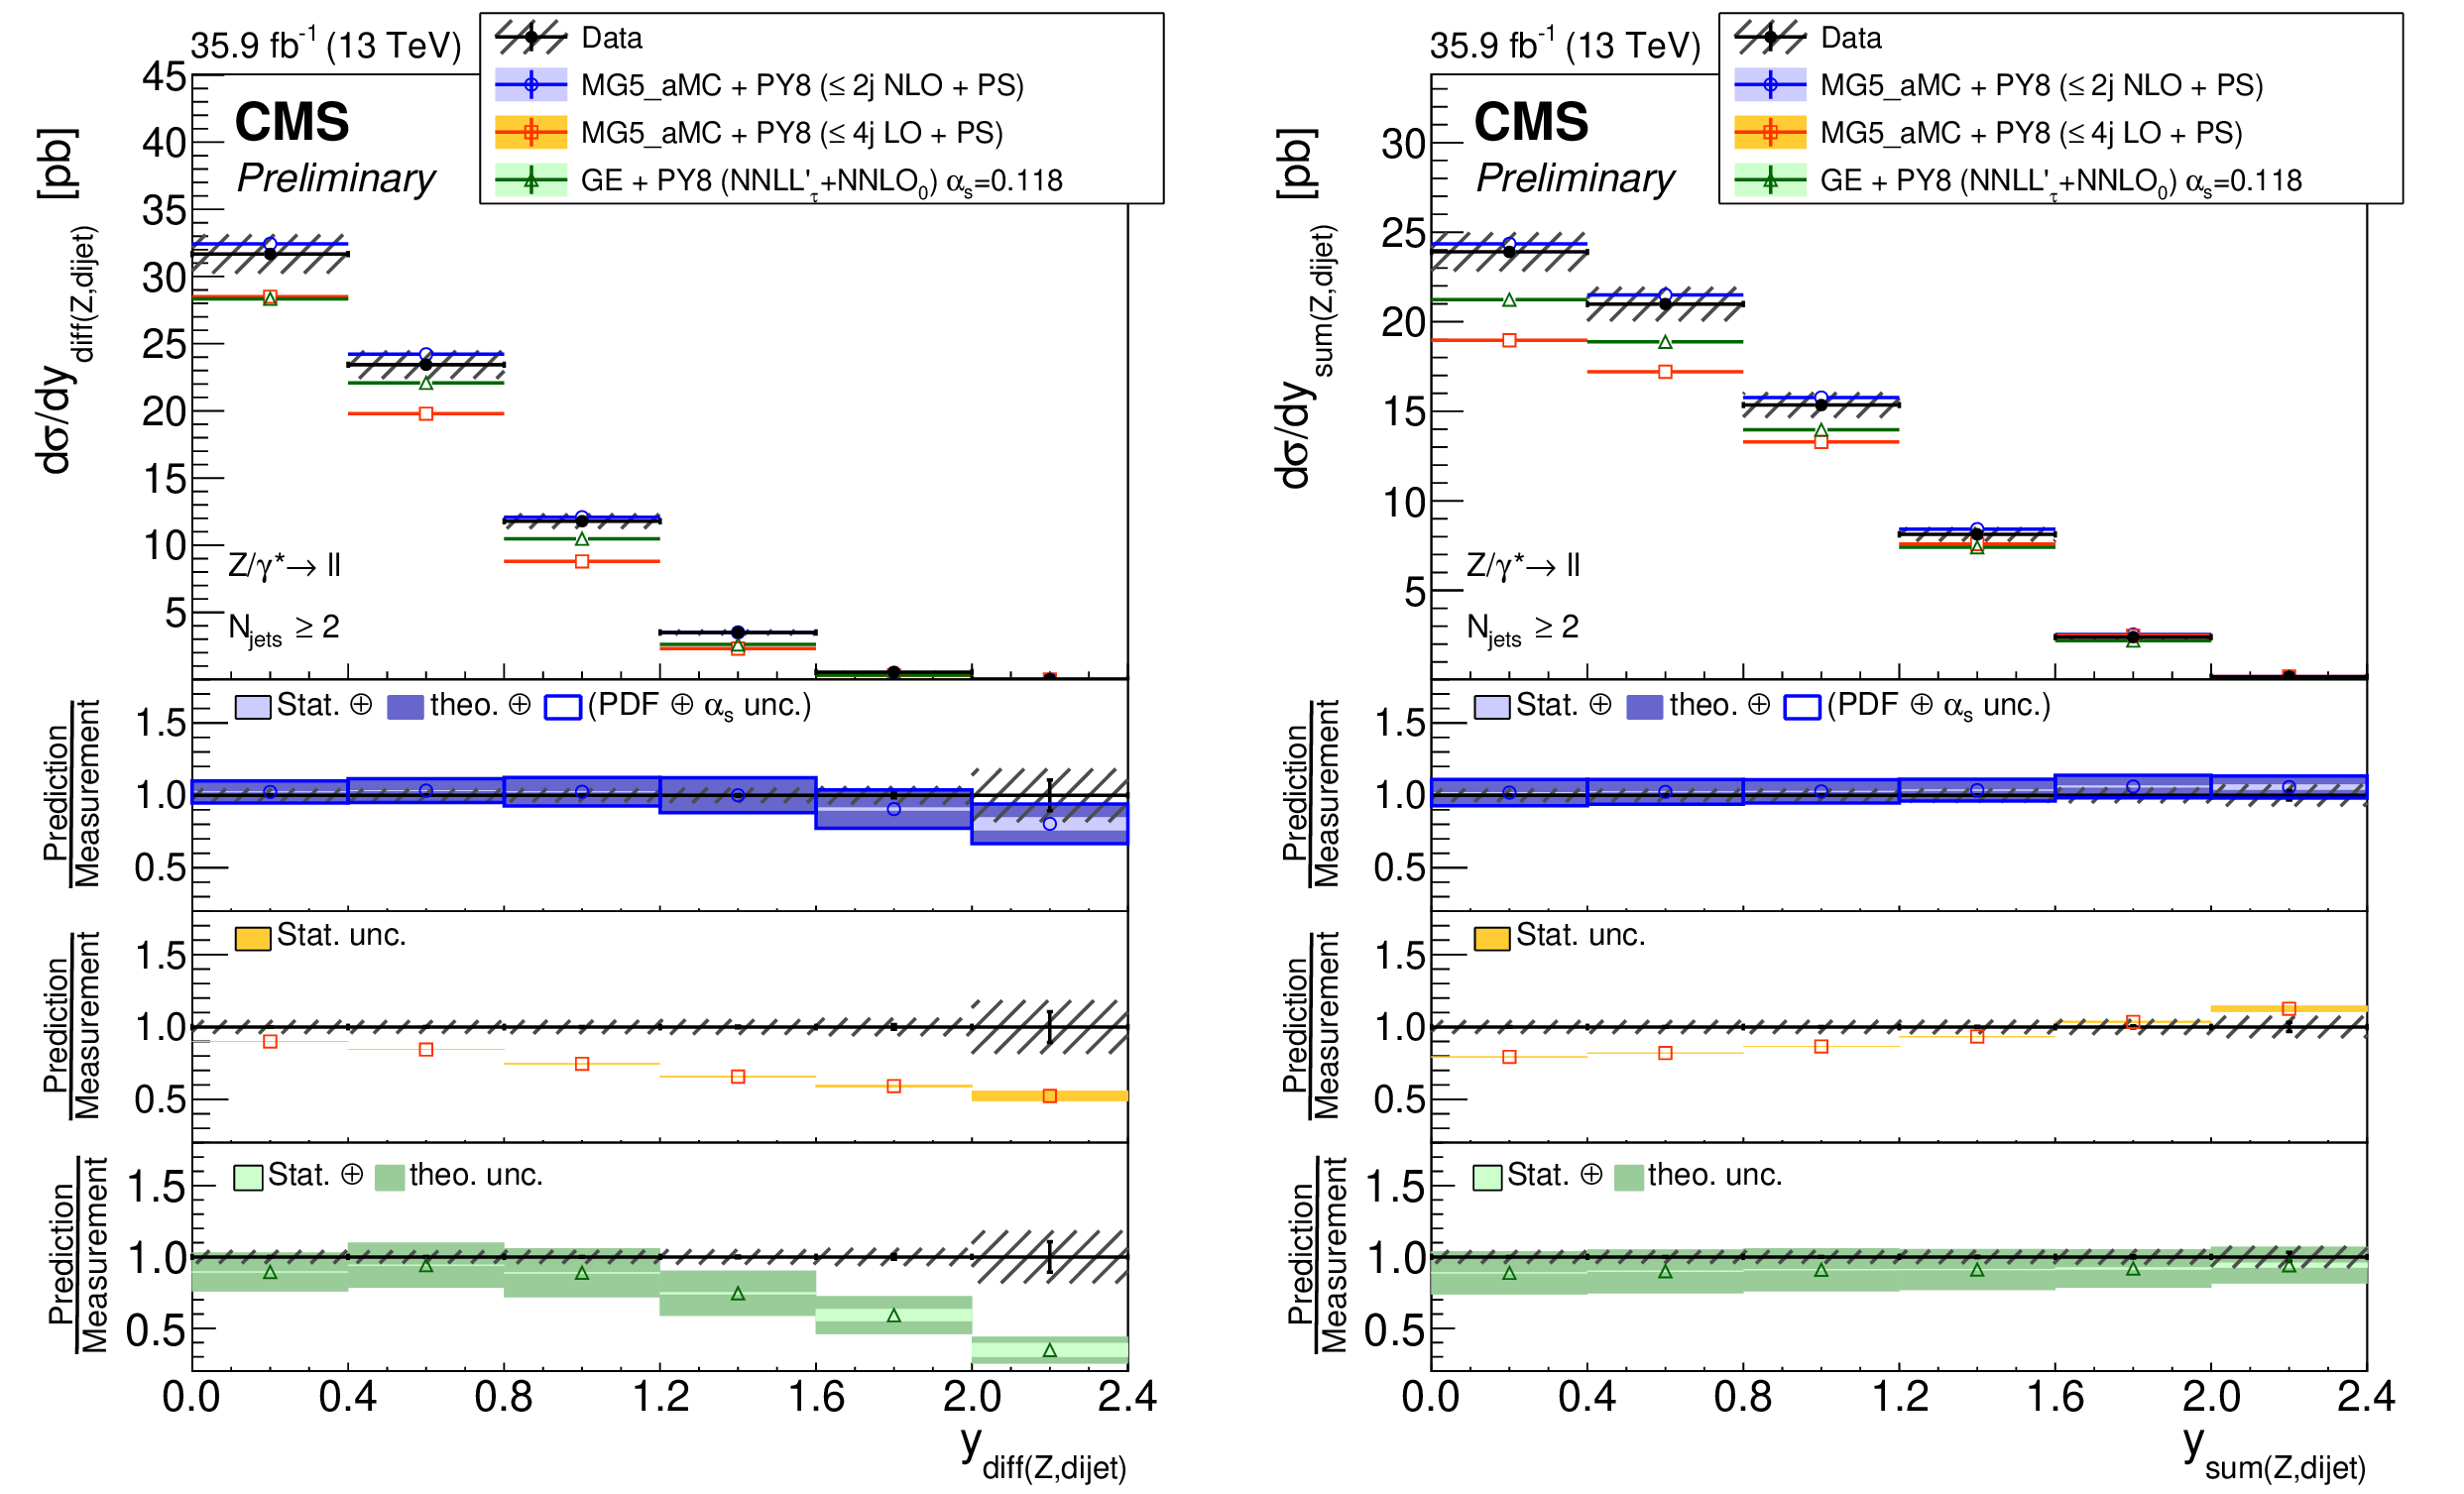
Figure 17:
The measured differential cross section as a function of the Z boson and dijet rapidity difference (left) and sum (right) with two jets inclusive. The measurement statistical (resp. systematic) uncertainties are represented with vertical error bars (resp. hashed areas). The measurement is compared to the NLO MG5_aMC, LO MG5_aMC, and GENEVA predictions described in Section 6. The predictions uncertainties, estimated as explained in this section, are represented by coloured areas in the ratio plots (light colour for the statistical part and darker colour for the total). Only statistical uncertainty is computed for the LO prediction. |
png pdf |
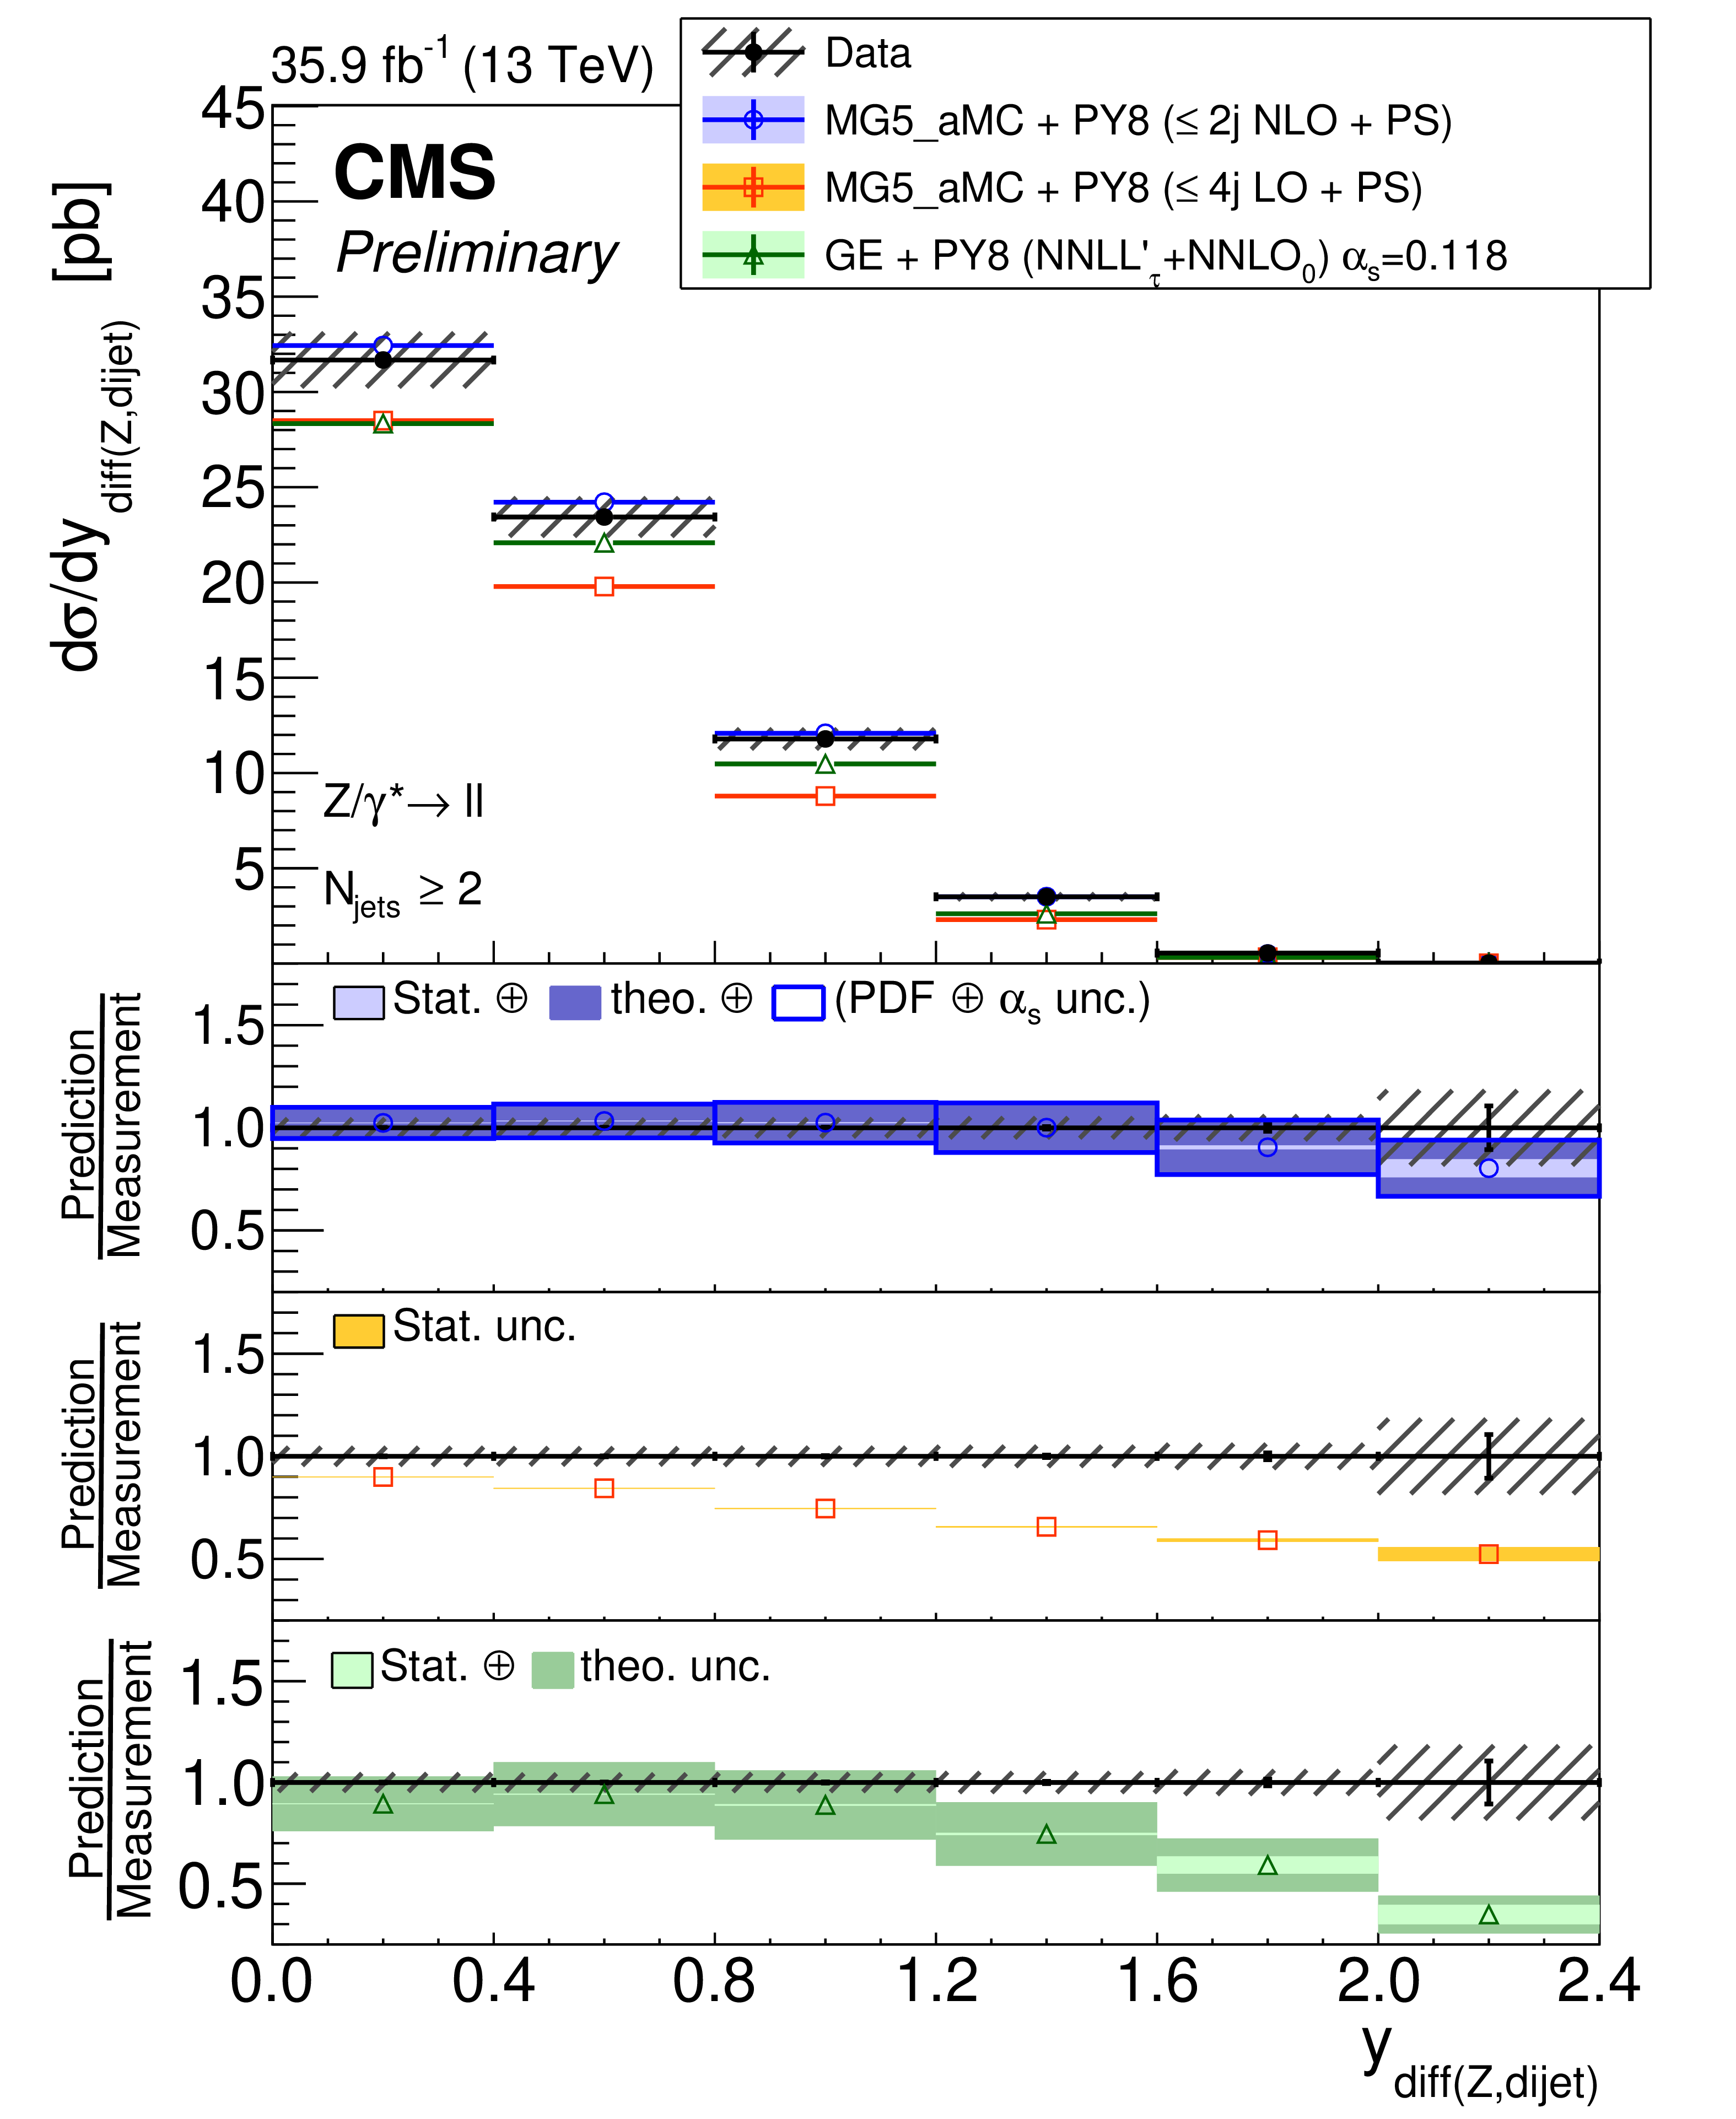
Figure 17-a:
The measured differential cross section as a function of the Z boson and dijet rapidity difference (left) and sum (right) with two jets inclusive. The measurement statistical (resp. systematic) uncertainties are represented with vertical error bars (resp. hashed areas). The measurement is compared to the NLO MG5_aMC, LO MG5_aMC, and GENEVA predictions described in Section 6. The predictions uncertainties, estimated as explained in this section, are represented by coloured areas in the ratio plots (light colour for the statistical part and darker colour for the total). Only statistical uncertainty is computed for the LO prediction. |
png pdf |
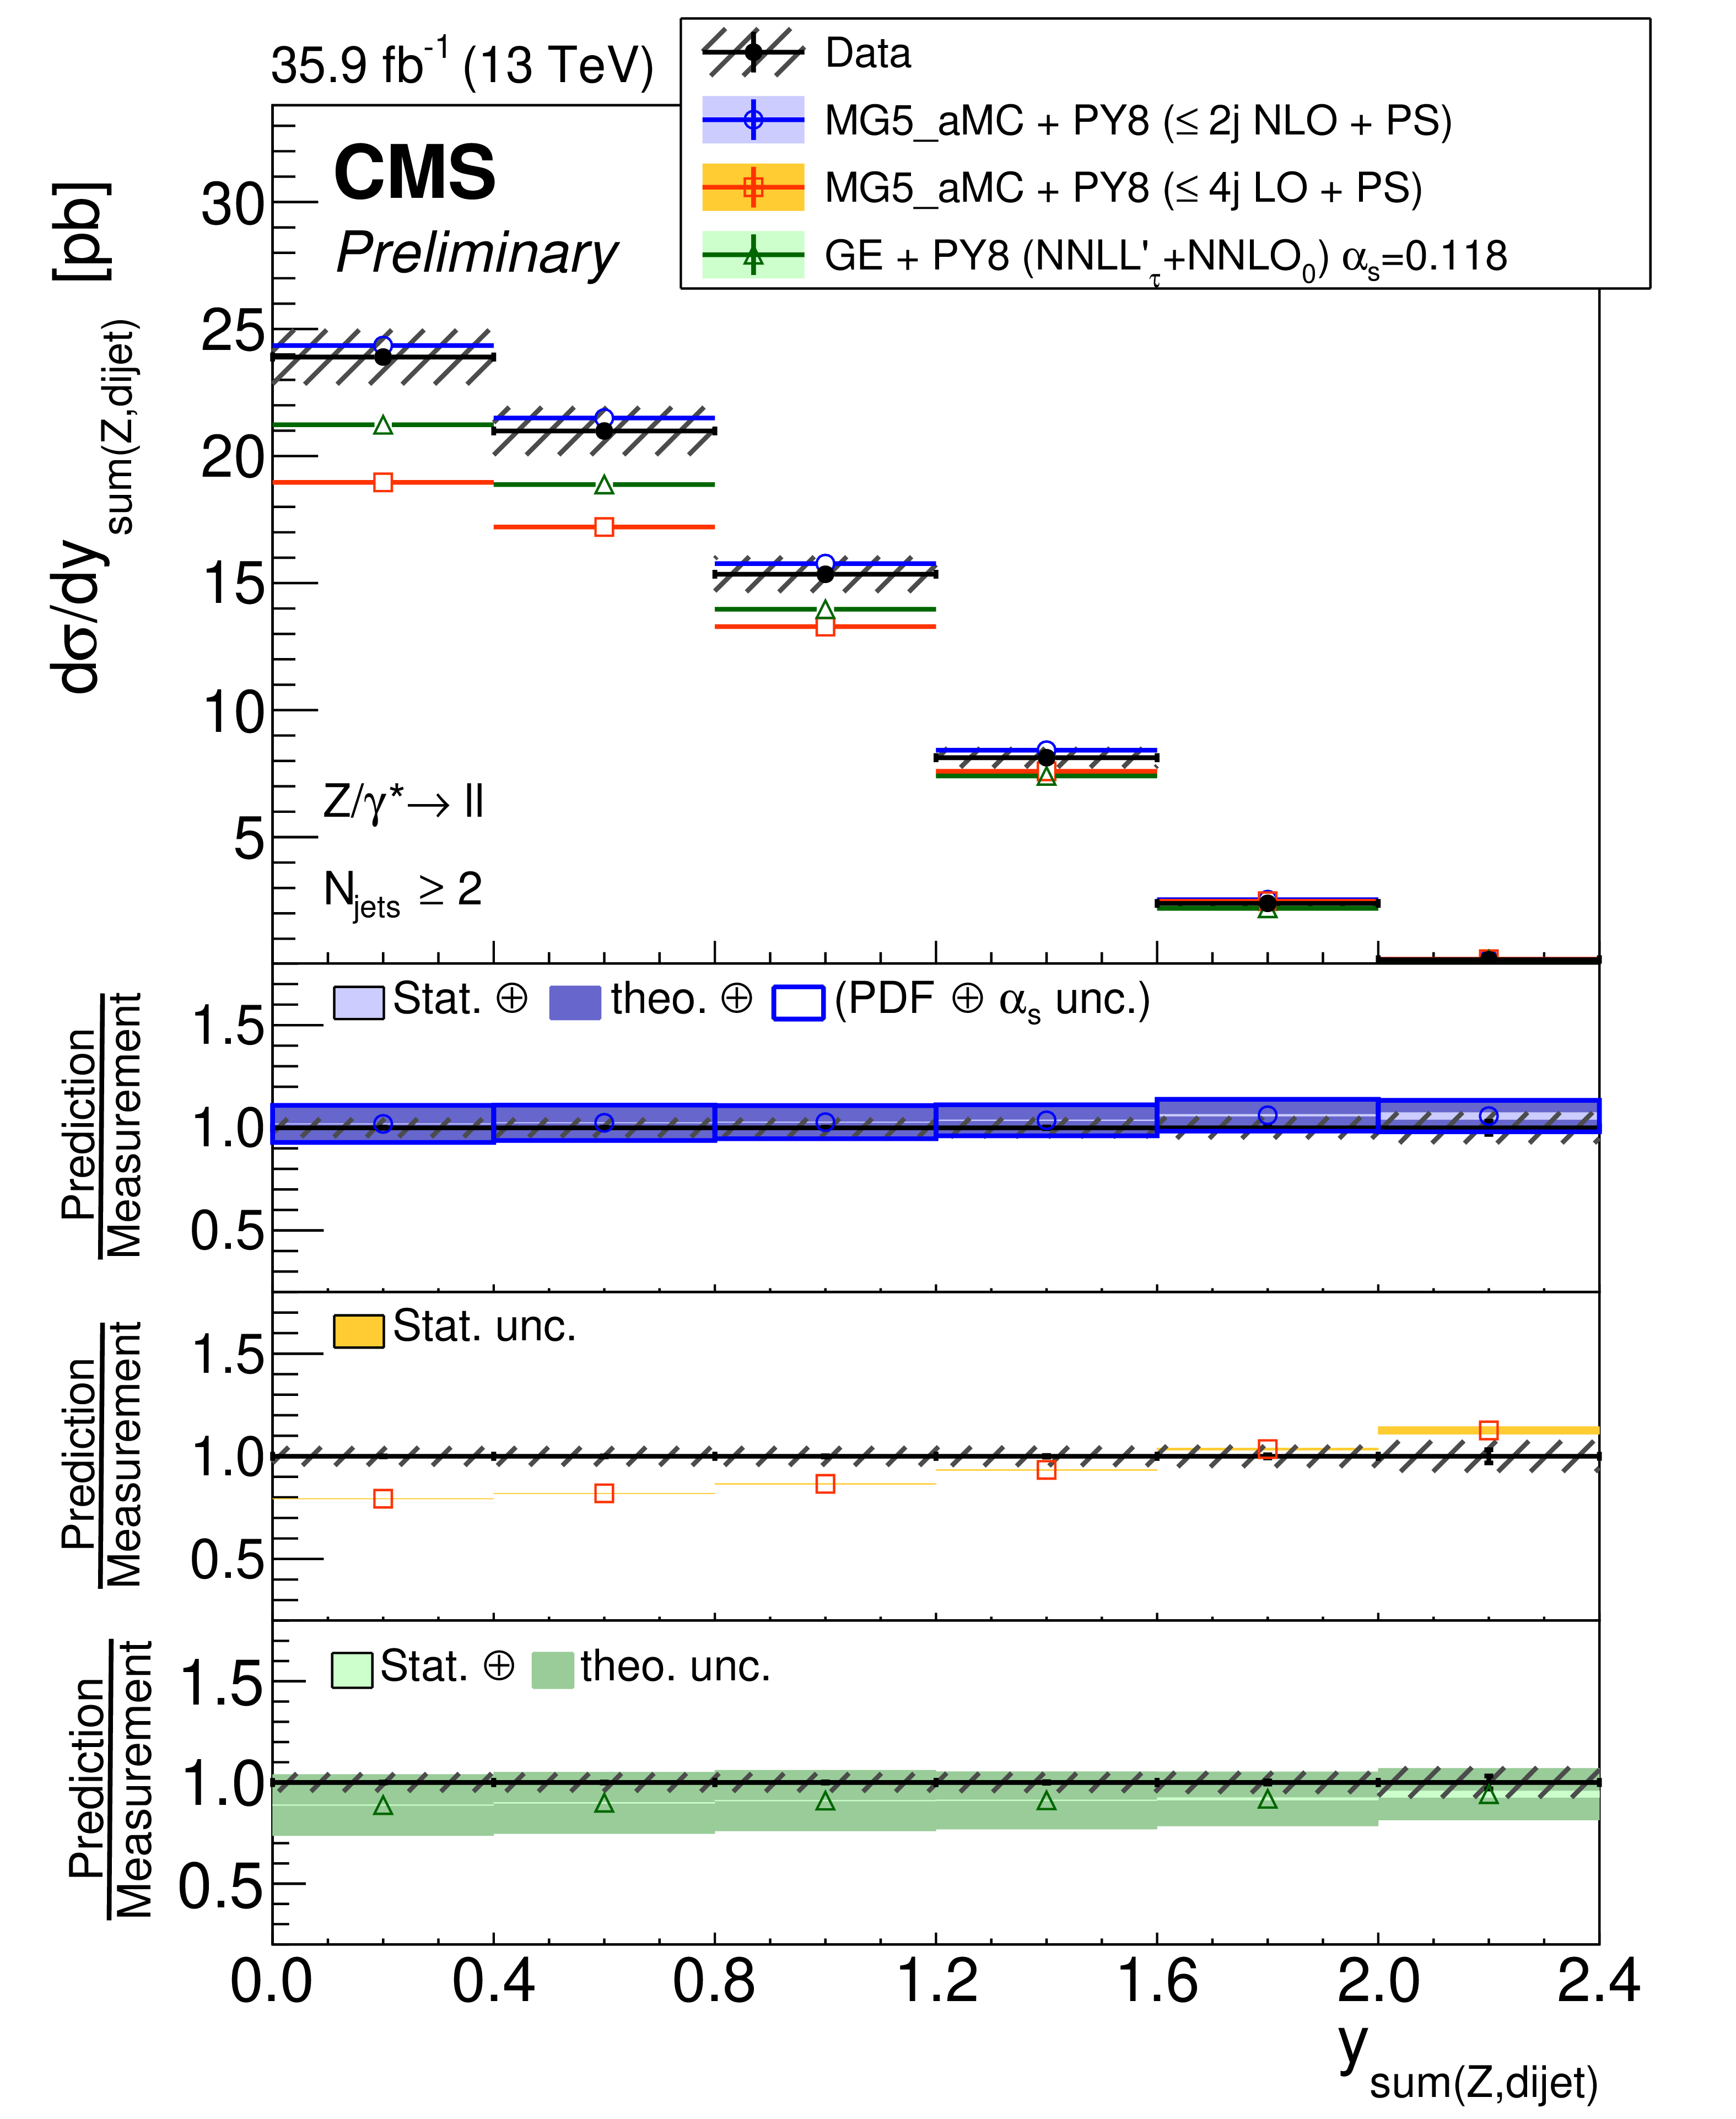
Figure 17-b:
The measured differential cross section as a function of the Z boson and dijet rapidity difference (left) and sum (right) with two jets inclusive. The measurement statistical (resp. systematic) uncertainties are represented with vertical error bars (resp. hashed areas). The measurement is compared to the NLO MG5_aMC, LO MG5_aMC, and GENEVA predictions described in Section 6. The predictions uncertainties, estimated as explained in this section, are represented by coloured areas in the ratio plots (light colour for the statistical part and darker colour for the total). Only statistical uncertainty is computed for the LO prediction. |
png pdf |
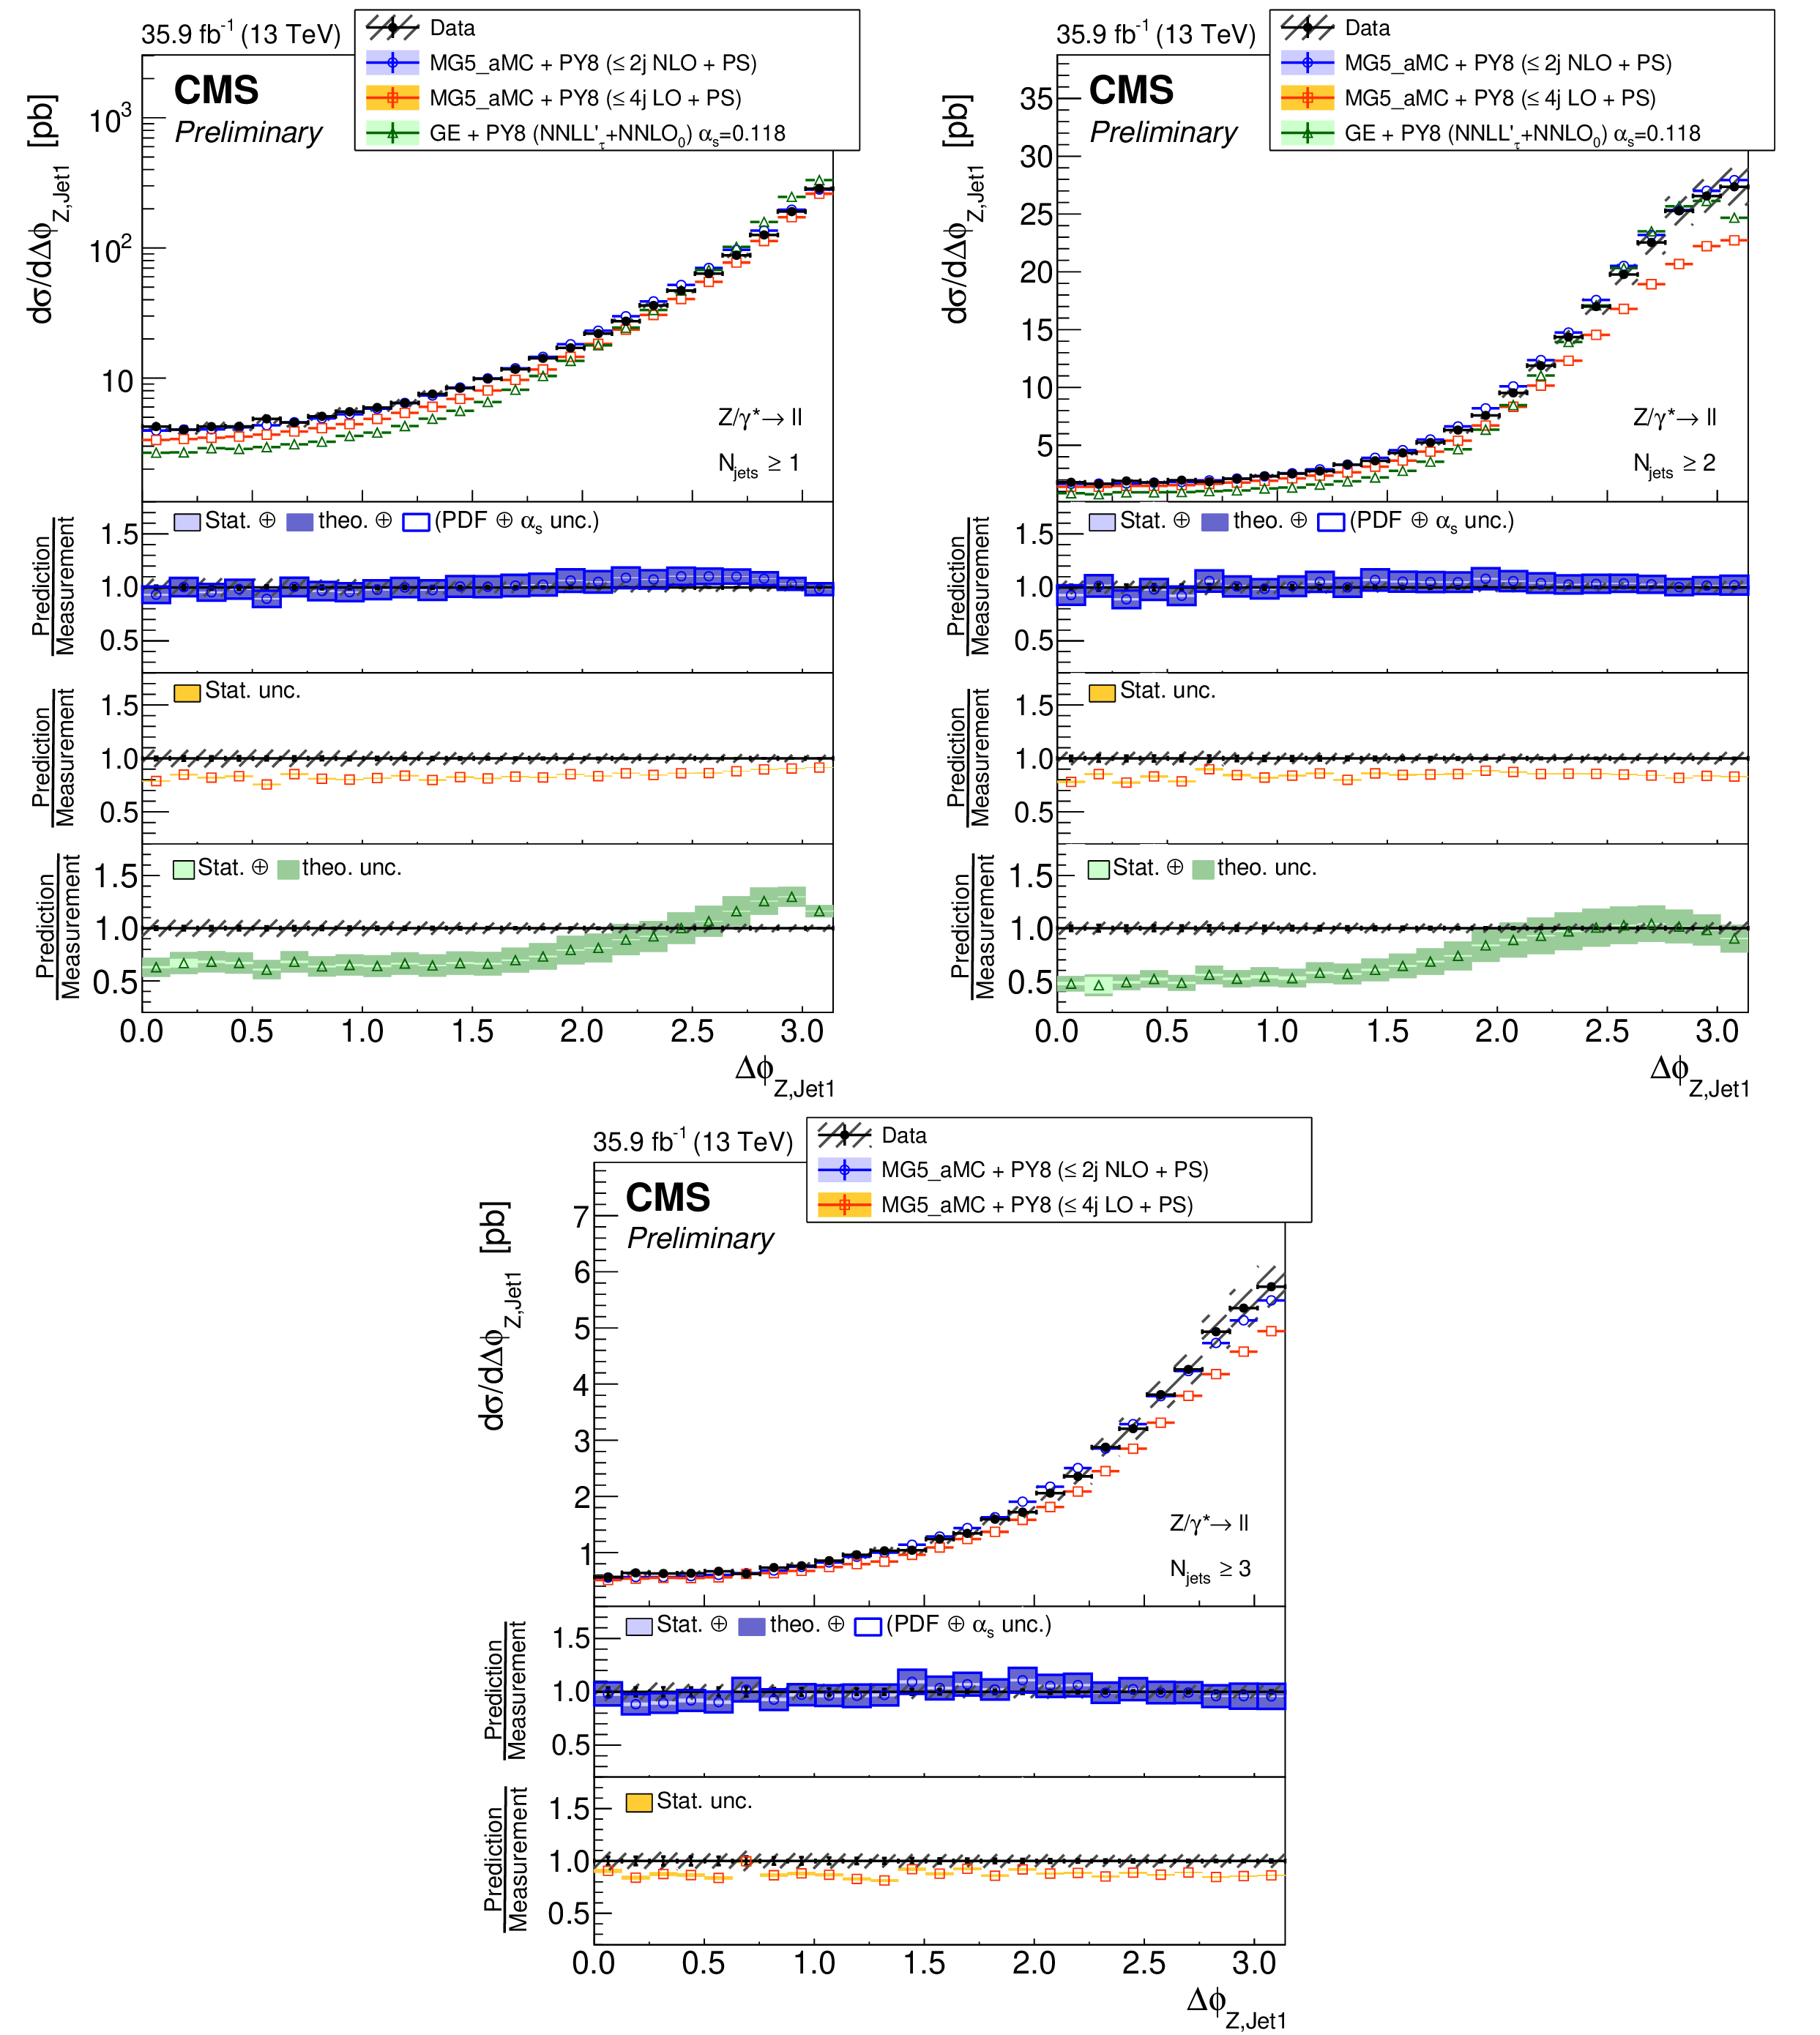
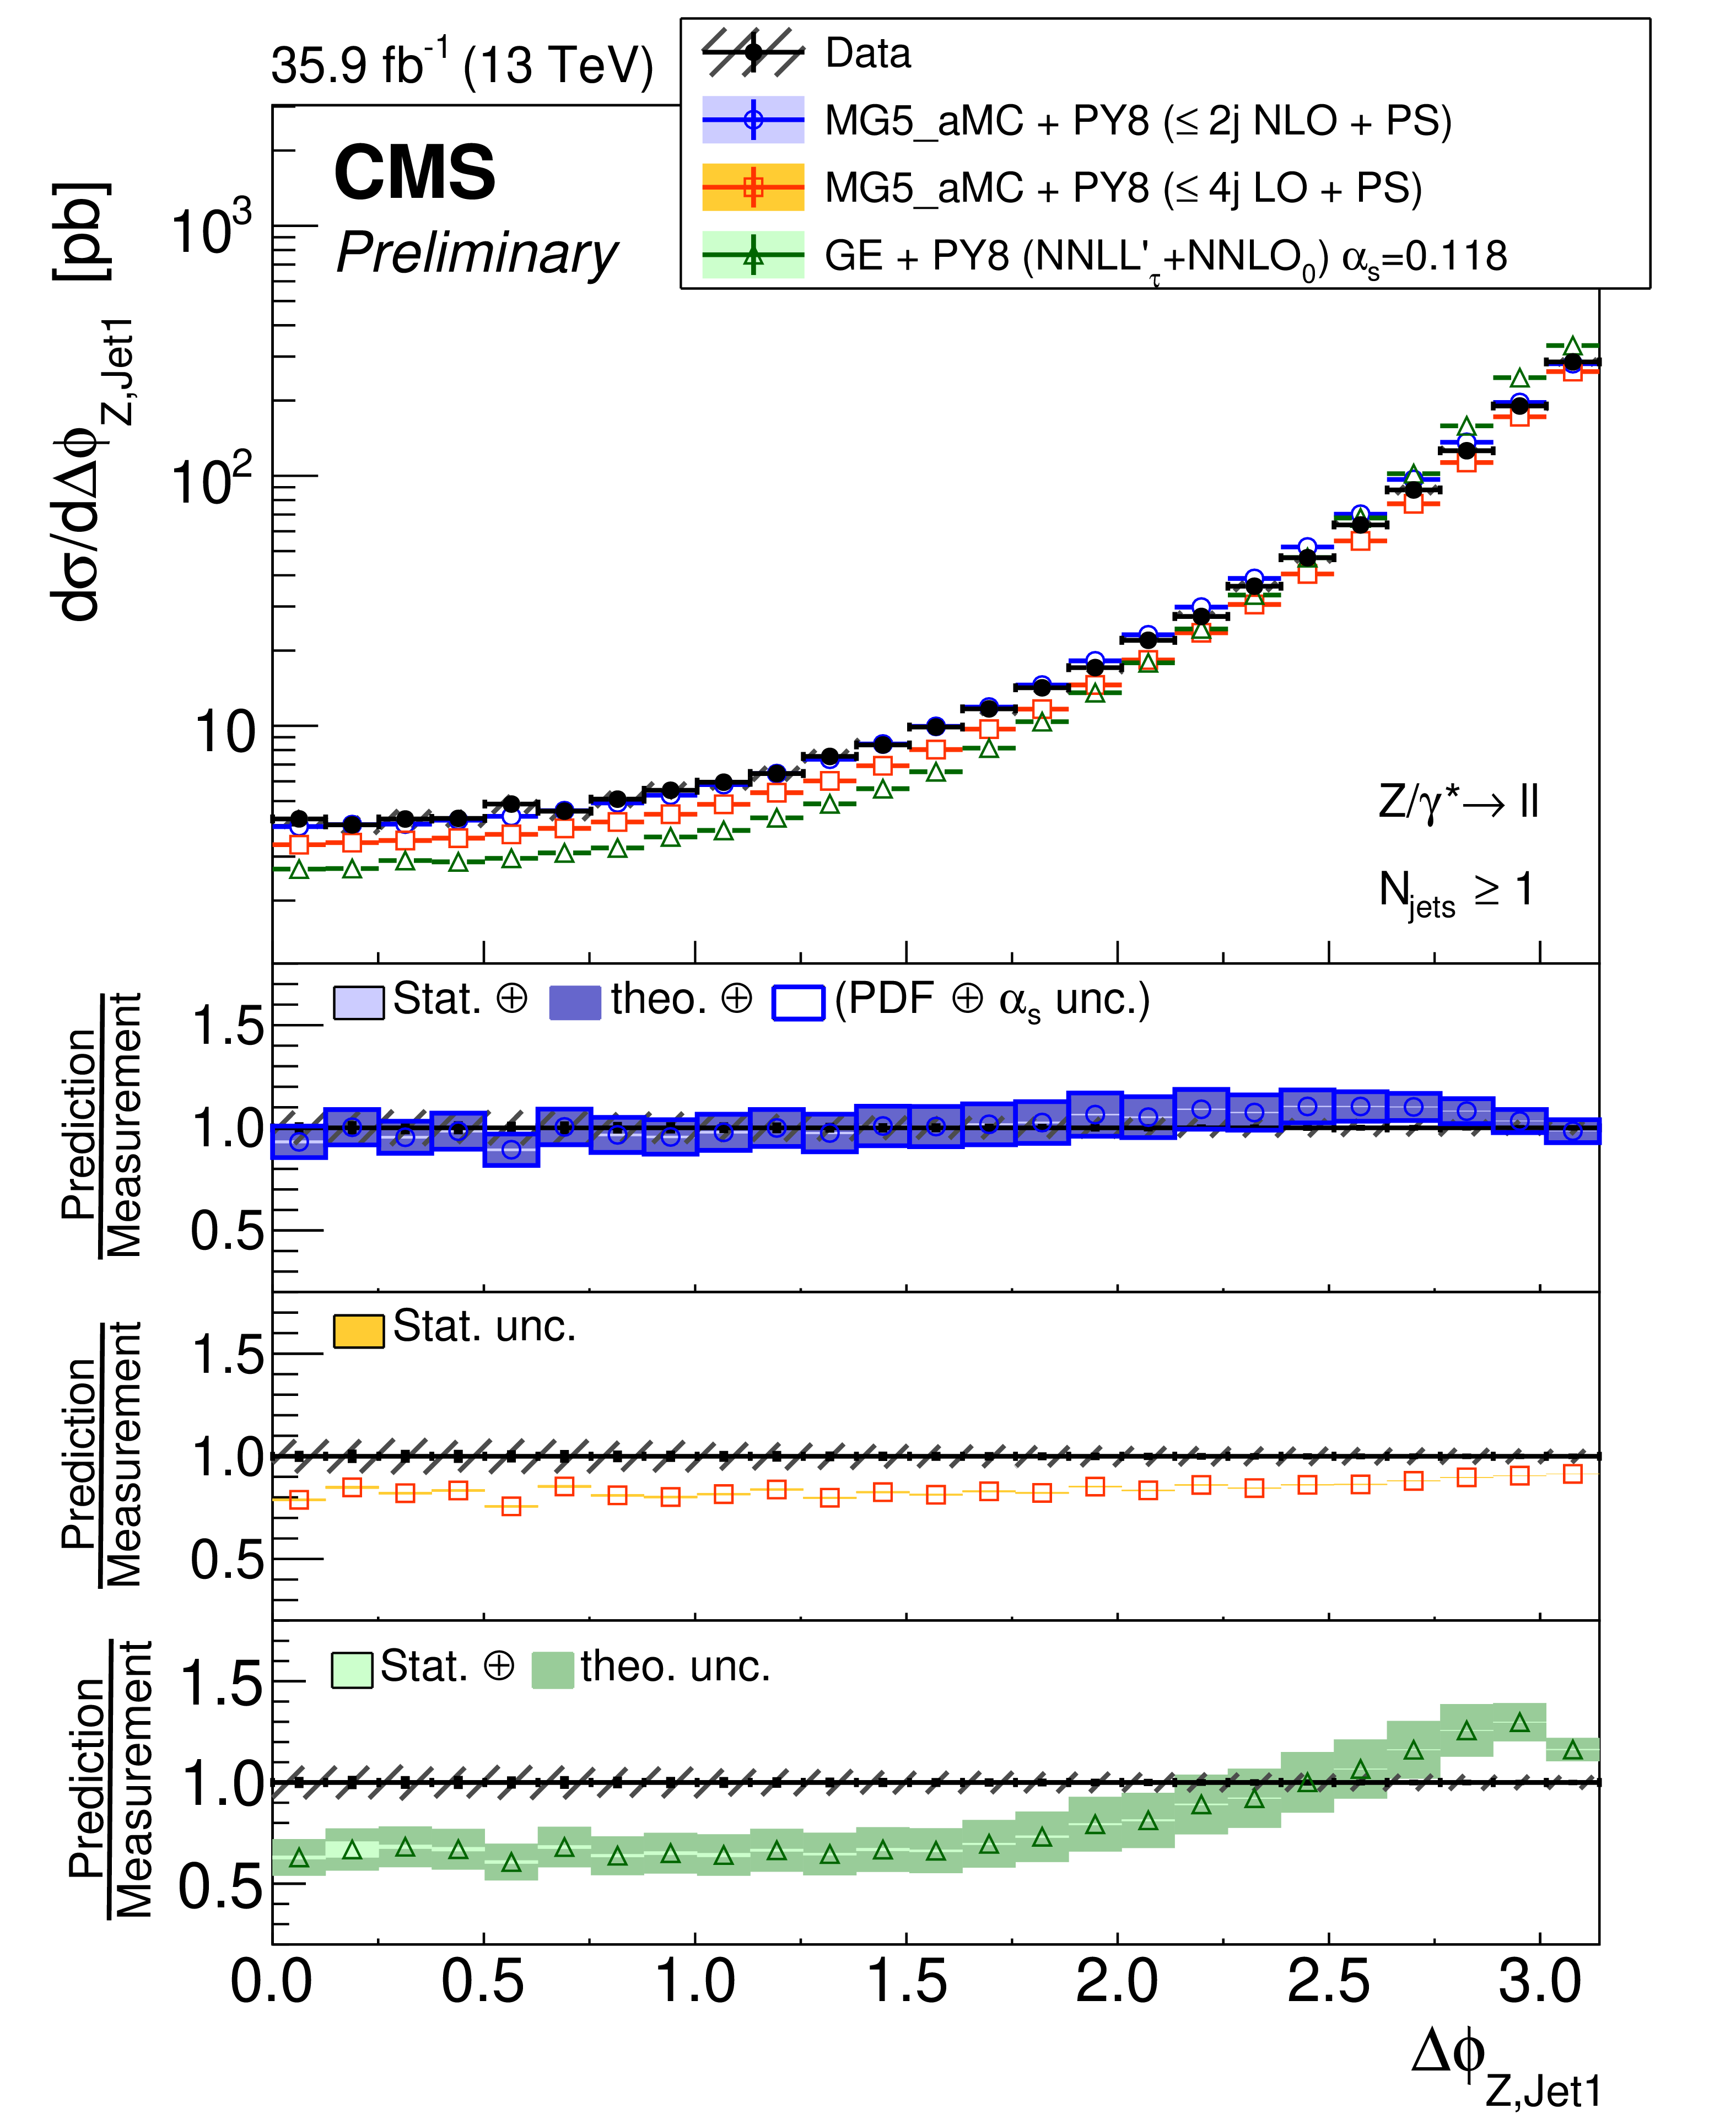
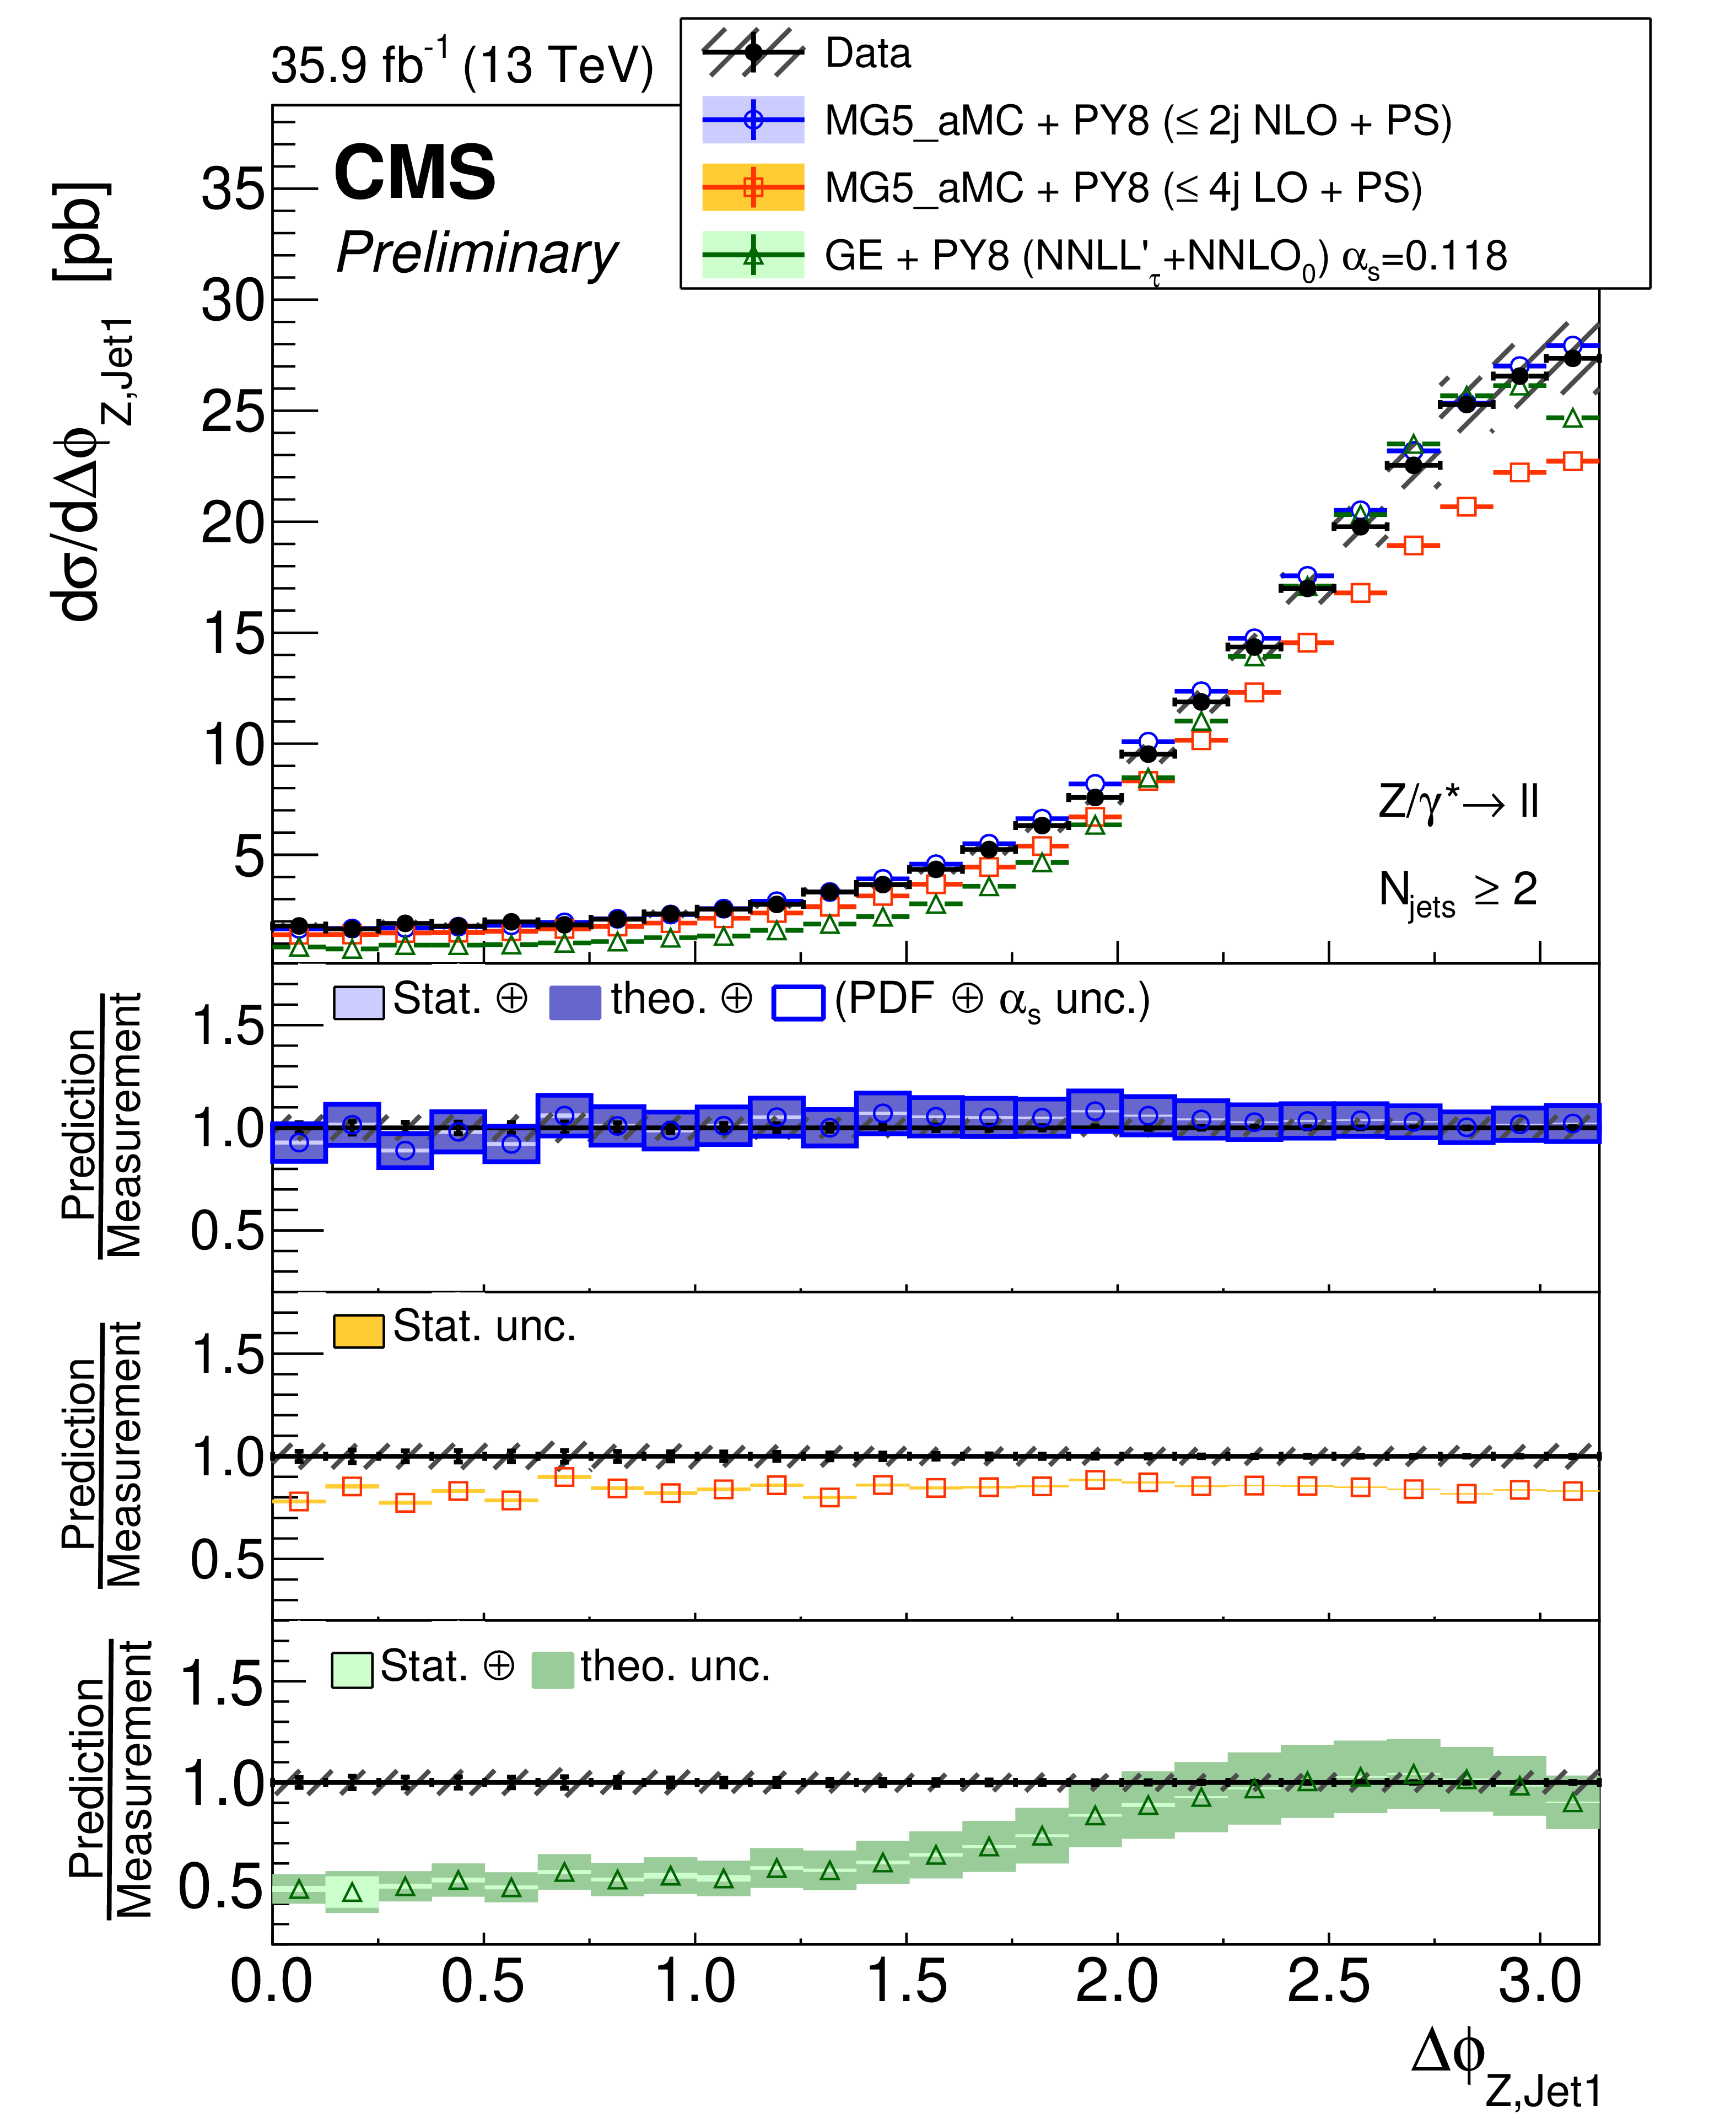
Figure 18:
The measured differential cross section as a function of the Z boson and leading jet azimuthal difference for events with at least one (left) two (middle), and three (right) jets. The measurement statistical (resp. systematic) uncertainties are represented with vertical error bars (resp. hashed areas). The measurement is compared to the NLO MG5_aMC, LO MG5_aMC, and GENEVA (for $N_{\text {jets}}\geq $ 1 and $N_{\text {jets}}\geq $ 2) predictions described in Section 6. The predictions uncertainties, estimated as explained in this section, are represented by coloured areas in the ratio plots (light colour for the statistical part and darker colour for the total). Only statistical uncertainty is computed for the LO prediction. |
png pdf |
Figure 18-a:
The measured differential cross section as a function of the Z boson and leading jet azimuthal difference for events with at least one (left) two (middle), and three (right) jets. The measurement statistical (resp. systematic) uncertainties are represented with vertical error bars (resp. hashed areas). The measurement is compared to the NLO MG5_aMC, LO MG5_aMC, and GENEVA (for $N_{\text {jets}}\geq $ 1 and $N_{\text {jets}}\geq $ 2) predictions described in Section 6. The predictions uncertainties, estimated as explained in this section, are represented by coloured areas in the ratio plots (light colour for the statistical part and darker colour for the total). Only statistical uncertainty is computed for the LO prediction. |
png pdf |
Figure 18-b:
The measured differential cross section as a function of the Z boson and leading jet azimuthal difference for events with at least one (left) two (middle), and three (right) jets. The measurement statistical (resp. systematic) uncertainties are represented with vertical error bars (resp. hashed areas). The measurement is compared to the NLO MG5_aMC, LO MG5_aMC, and GENEVA (for $N_{\text {jets}}\geq $ 1 and $N_{\text {jets}}\geq $ 2) predictions described in Section 6. The predictions uncertainties, estimated as explained in this section, are represented by coloured areas in the ratio plots (light colour for the statistical part and darker colour for the total). Only statistical uncertainty is computed for the LO prediction. |

png pdf |
Figure 18-c:
The measured differential cross section as a function of the Z boson and leading jet azimuthal difference for events with at least one (left) two (middle), and three (right) jets. The measurement statistical (resp. systematic) uncertainties are represented with vertical error bars (resp. hashed areas). The measurement is compared to the NLO MG5_aMC, LO MG5_aMC, and GENEVA (for $N_{\text {jets}}\geq $ 1 and $N_{\text {jets}}\geq $ 2) predictions described in Section 6. The predictions uncertainties, estimated as explained in this section, are represented by coloured areas in the ratio plots (light colour for the statistical part and darker colour for the total). Only statistical uncertainty is computed for the LO prediction. |

png pdf |
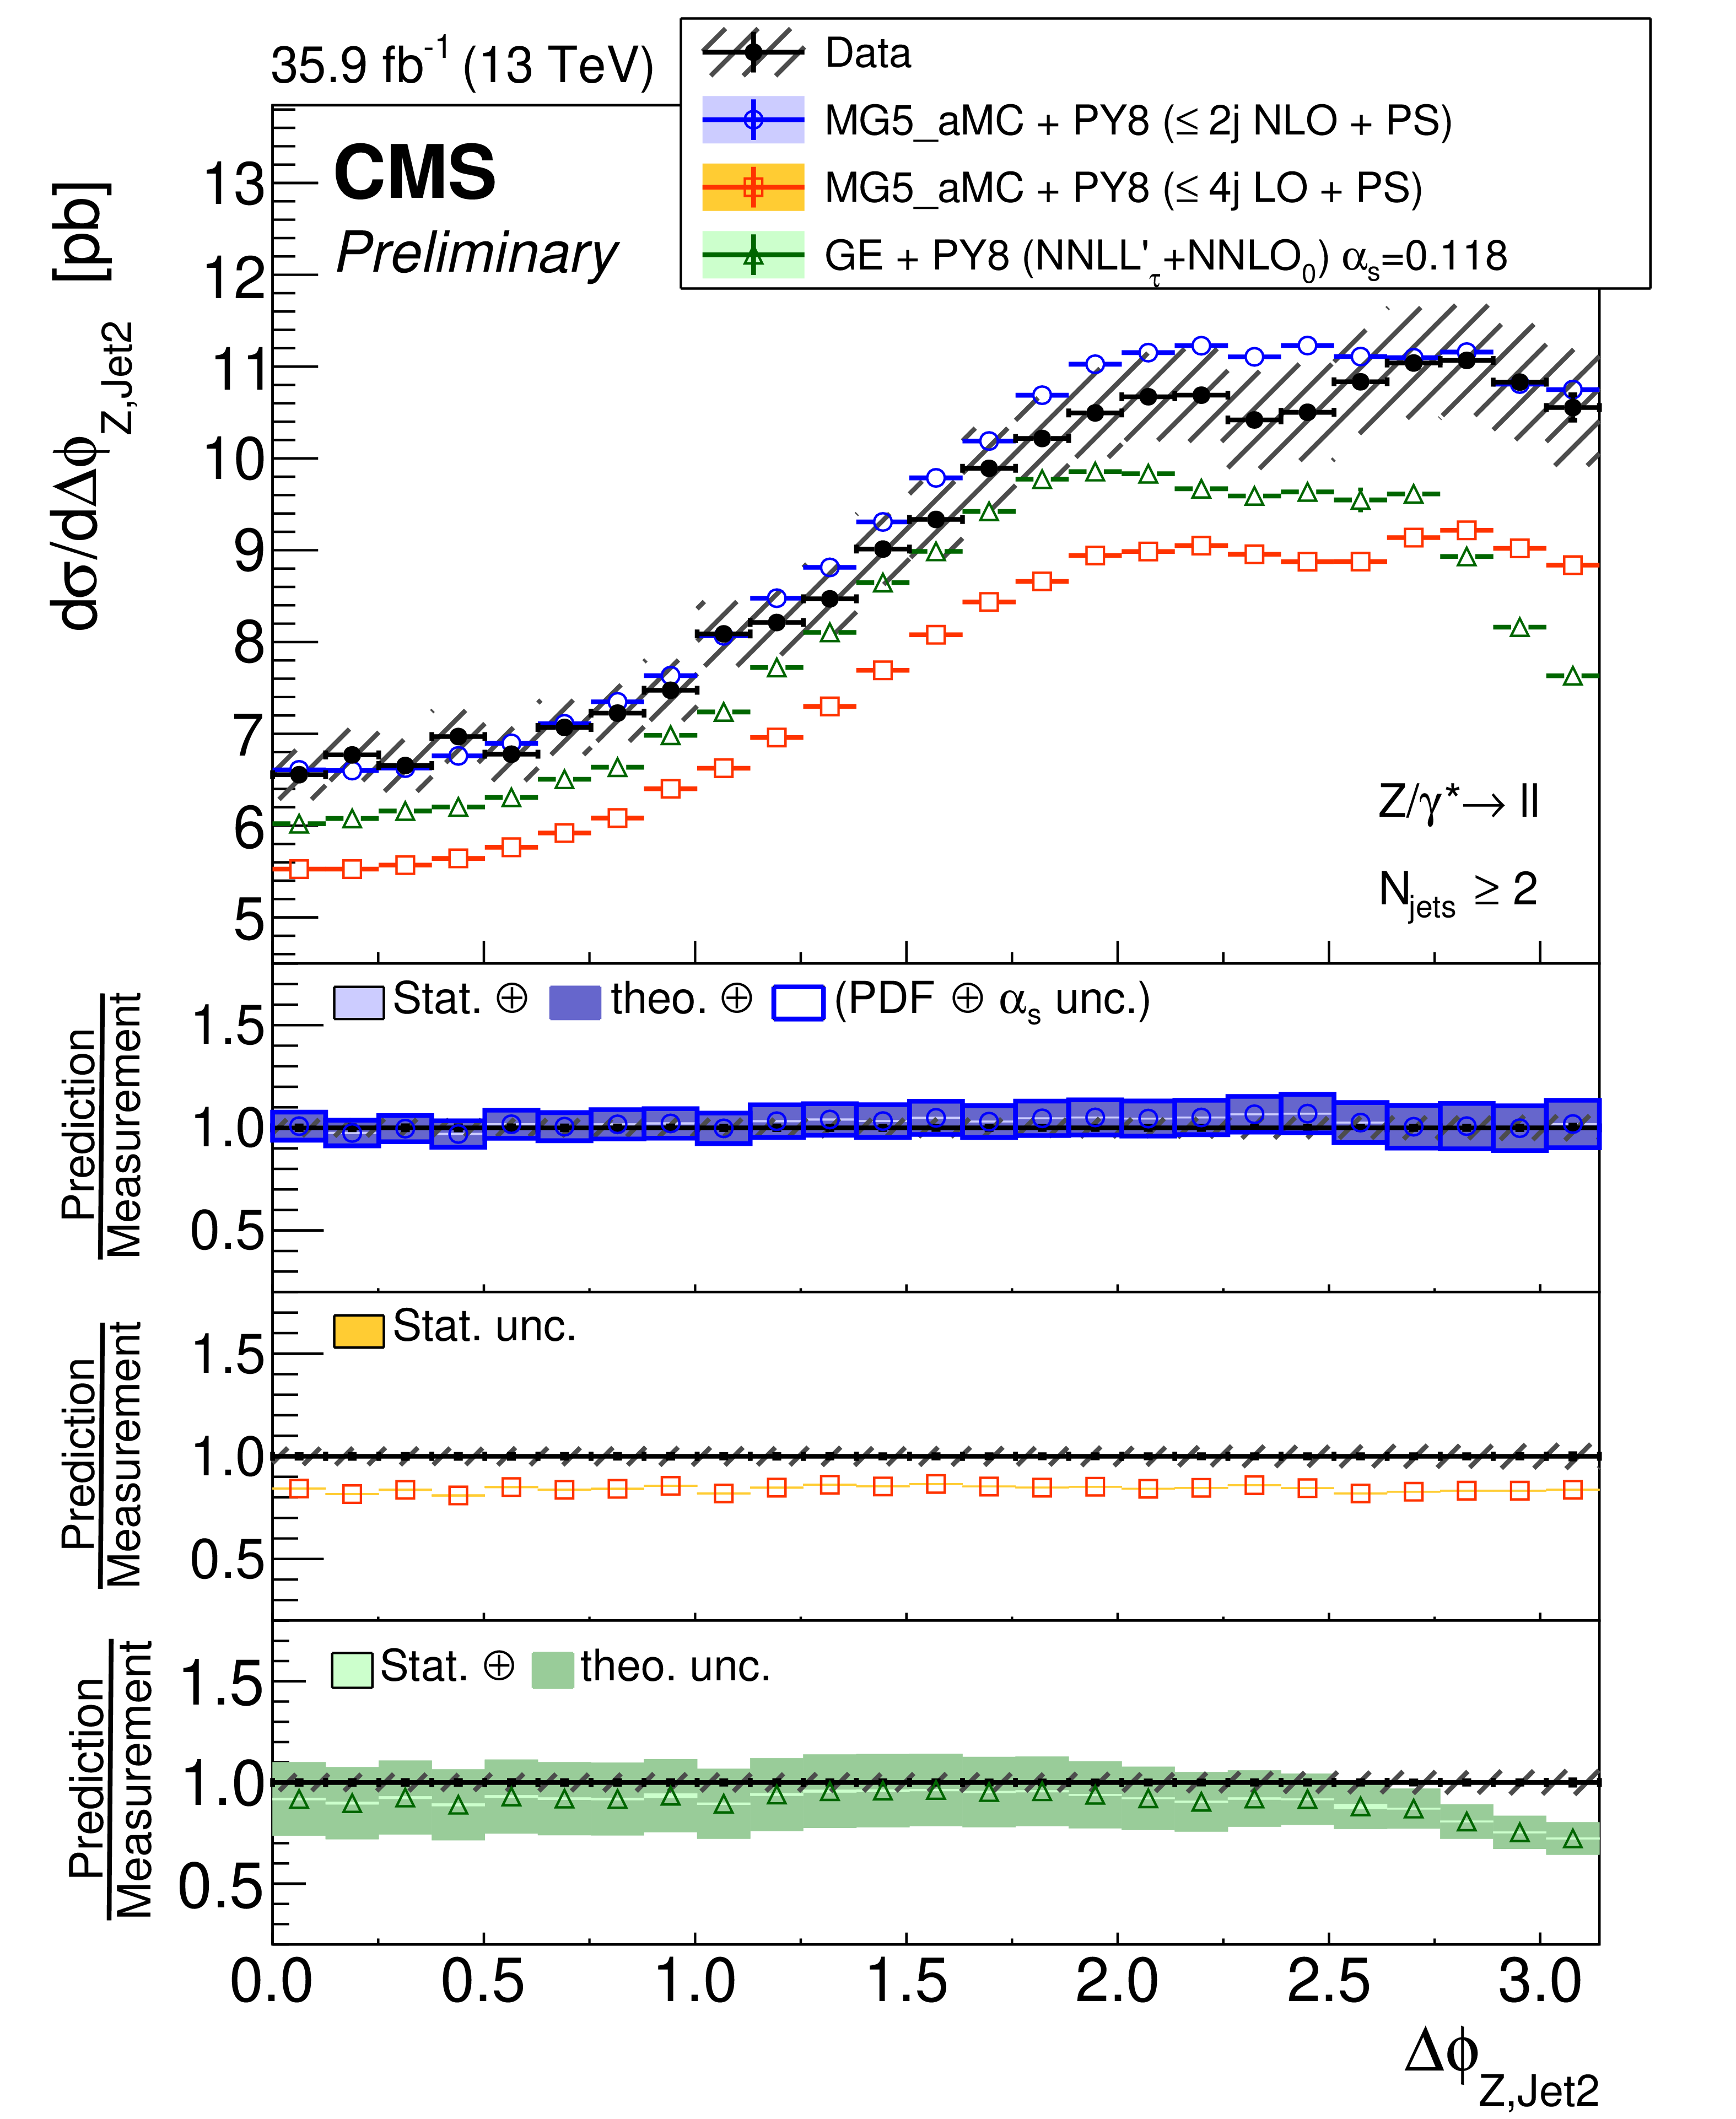
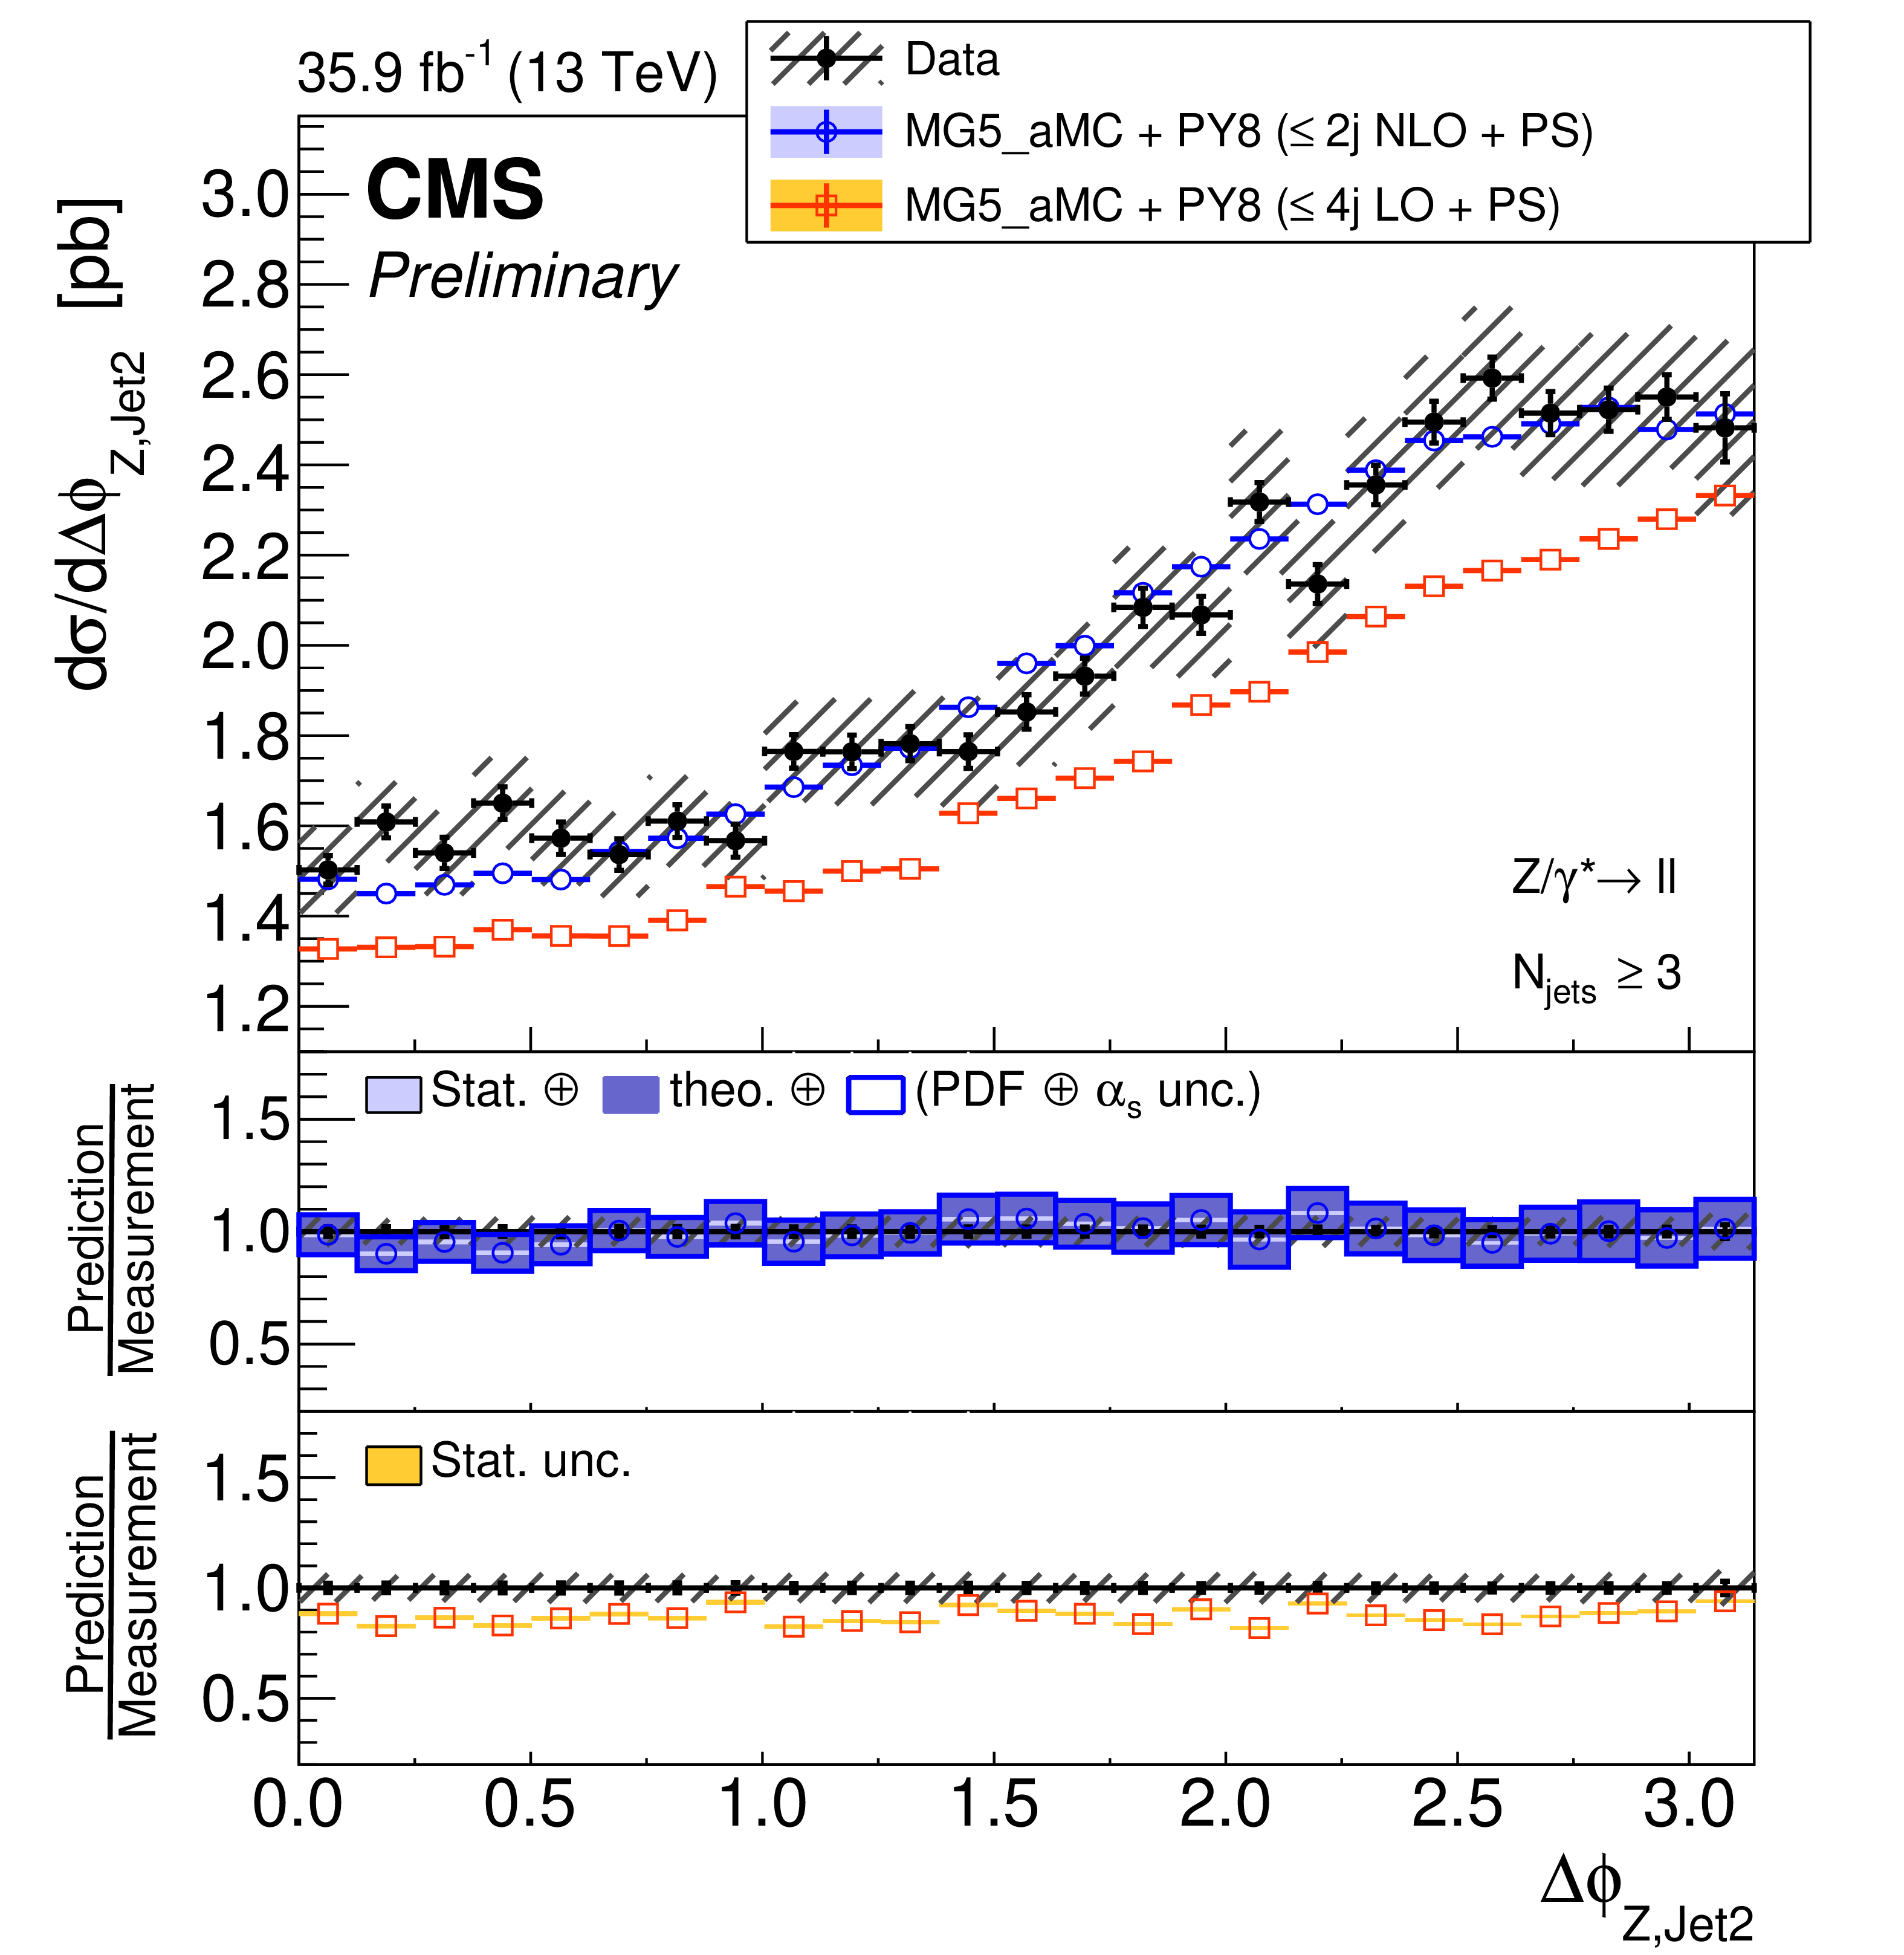
Figure 19:
The measured differential cross section as a function of the Z boson and subleading jet azimuthal difference for events with at least two (left) and three (right) jets. The measurement statistical (resp. systematic) uncertainties are represented with vertical error bars (resp. hashed areas). The measurement is compared to the NLO MG5_aMC, LO MG5_aMC, and GENEVA (for $N_{\text {jets}}\geq $ 2) predictions described in Section 6. The predictions uncertainties, estimated as explained in this section, are represented by coloured areas in the ratio plots (light colour for the statistical part and darker colour for the total). Only statistical uncertainty is computed for the LO prediction. |
png pdf |
Figure 19-a:
The measured differential cross section as a function of the Z boson and subleading jet azimuthal difference for events with at least two (left) and three (right) jets. The measurement statistical (resp. systematic) uncertainties are represented with vertical error bars (resp. hashed areas). The measurement is compared to the NLO MG5_aMC, LO MG5_aMC, and GENEVA (for $N_{\text {jets}}\geq $ 2) predictions described in Section 6. The predictions uncertainties, estimated as explained in this section, are represented by coloured areas in the ratio plots (light colour for the statistical part and darker colour for the total). Only statistical uncertainty is computed for the LO prediction. |
png pdf |
Figure 19-b:
The measured differential cross section as a function of the Z boson and subleading jet azimuthal difference for events with at least two (left) and three (right) jets. The measurement statistical (resp. systematic) uncertainties are represented with vertical error bars (resp. hashed areas). The measurement is compared to the NLO MG5_aMC, LO MG5_aMC, and GENEVA (for $N_{\text {jets}}\geq $ 2) predictions described in Section 6. The predictions uncertainties, estimated as explained in this section, are represented by coloured areas in the ratio plots (light colour for the statistical part and darker colour for the total). Only statistical uncertainty is computed for the LO prediction. |

png pdf |
Figure 20:
The measured differential cross section as a function of the Z boson and third jet azimuthal difference for events with at least three jets. The measurement statistical (resp. systematic) uncertainties are represented with vertical error bars (resp. hashed areas). The measurement is compared to the NLO and LO MG5_aMC predictions described in Section 6. The predictions uncertainties, estimated as explained in this section, are represented by coloured areas in the ratio plots (light colour for the statistical part and darker colour for the total). Only statistical uncertainty is computed for the LO prediction. |
png pdf |
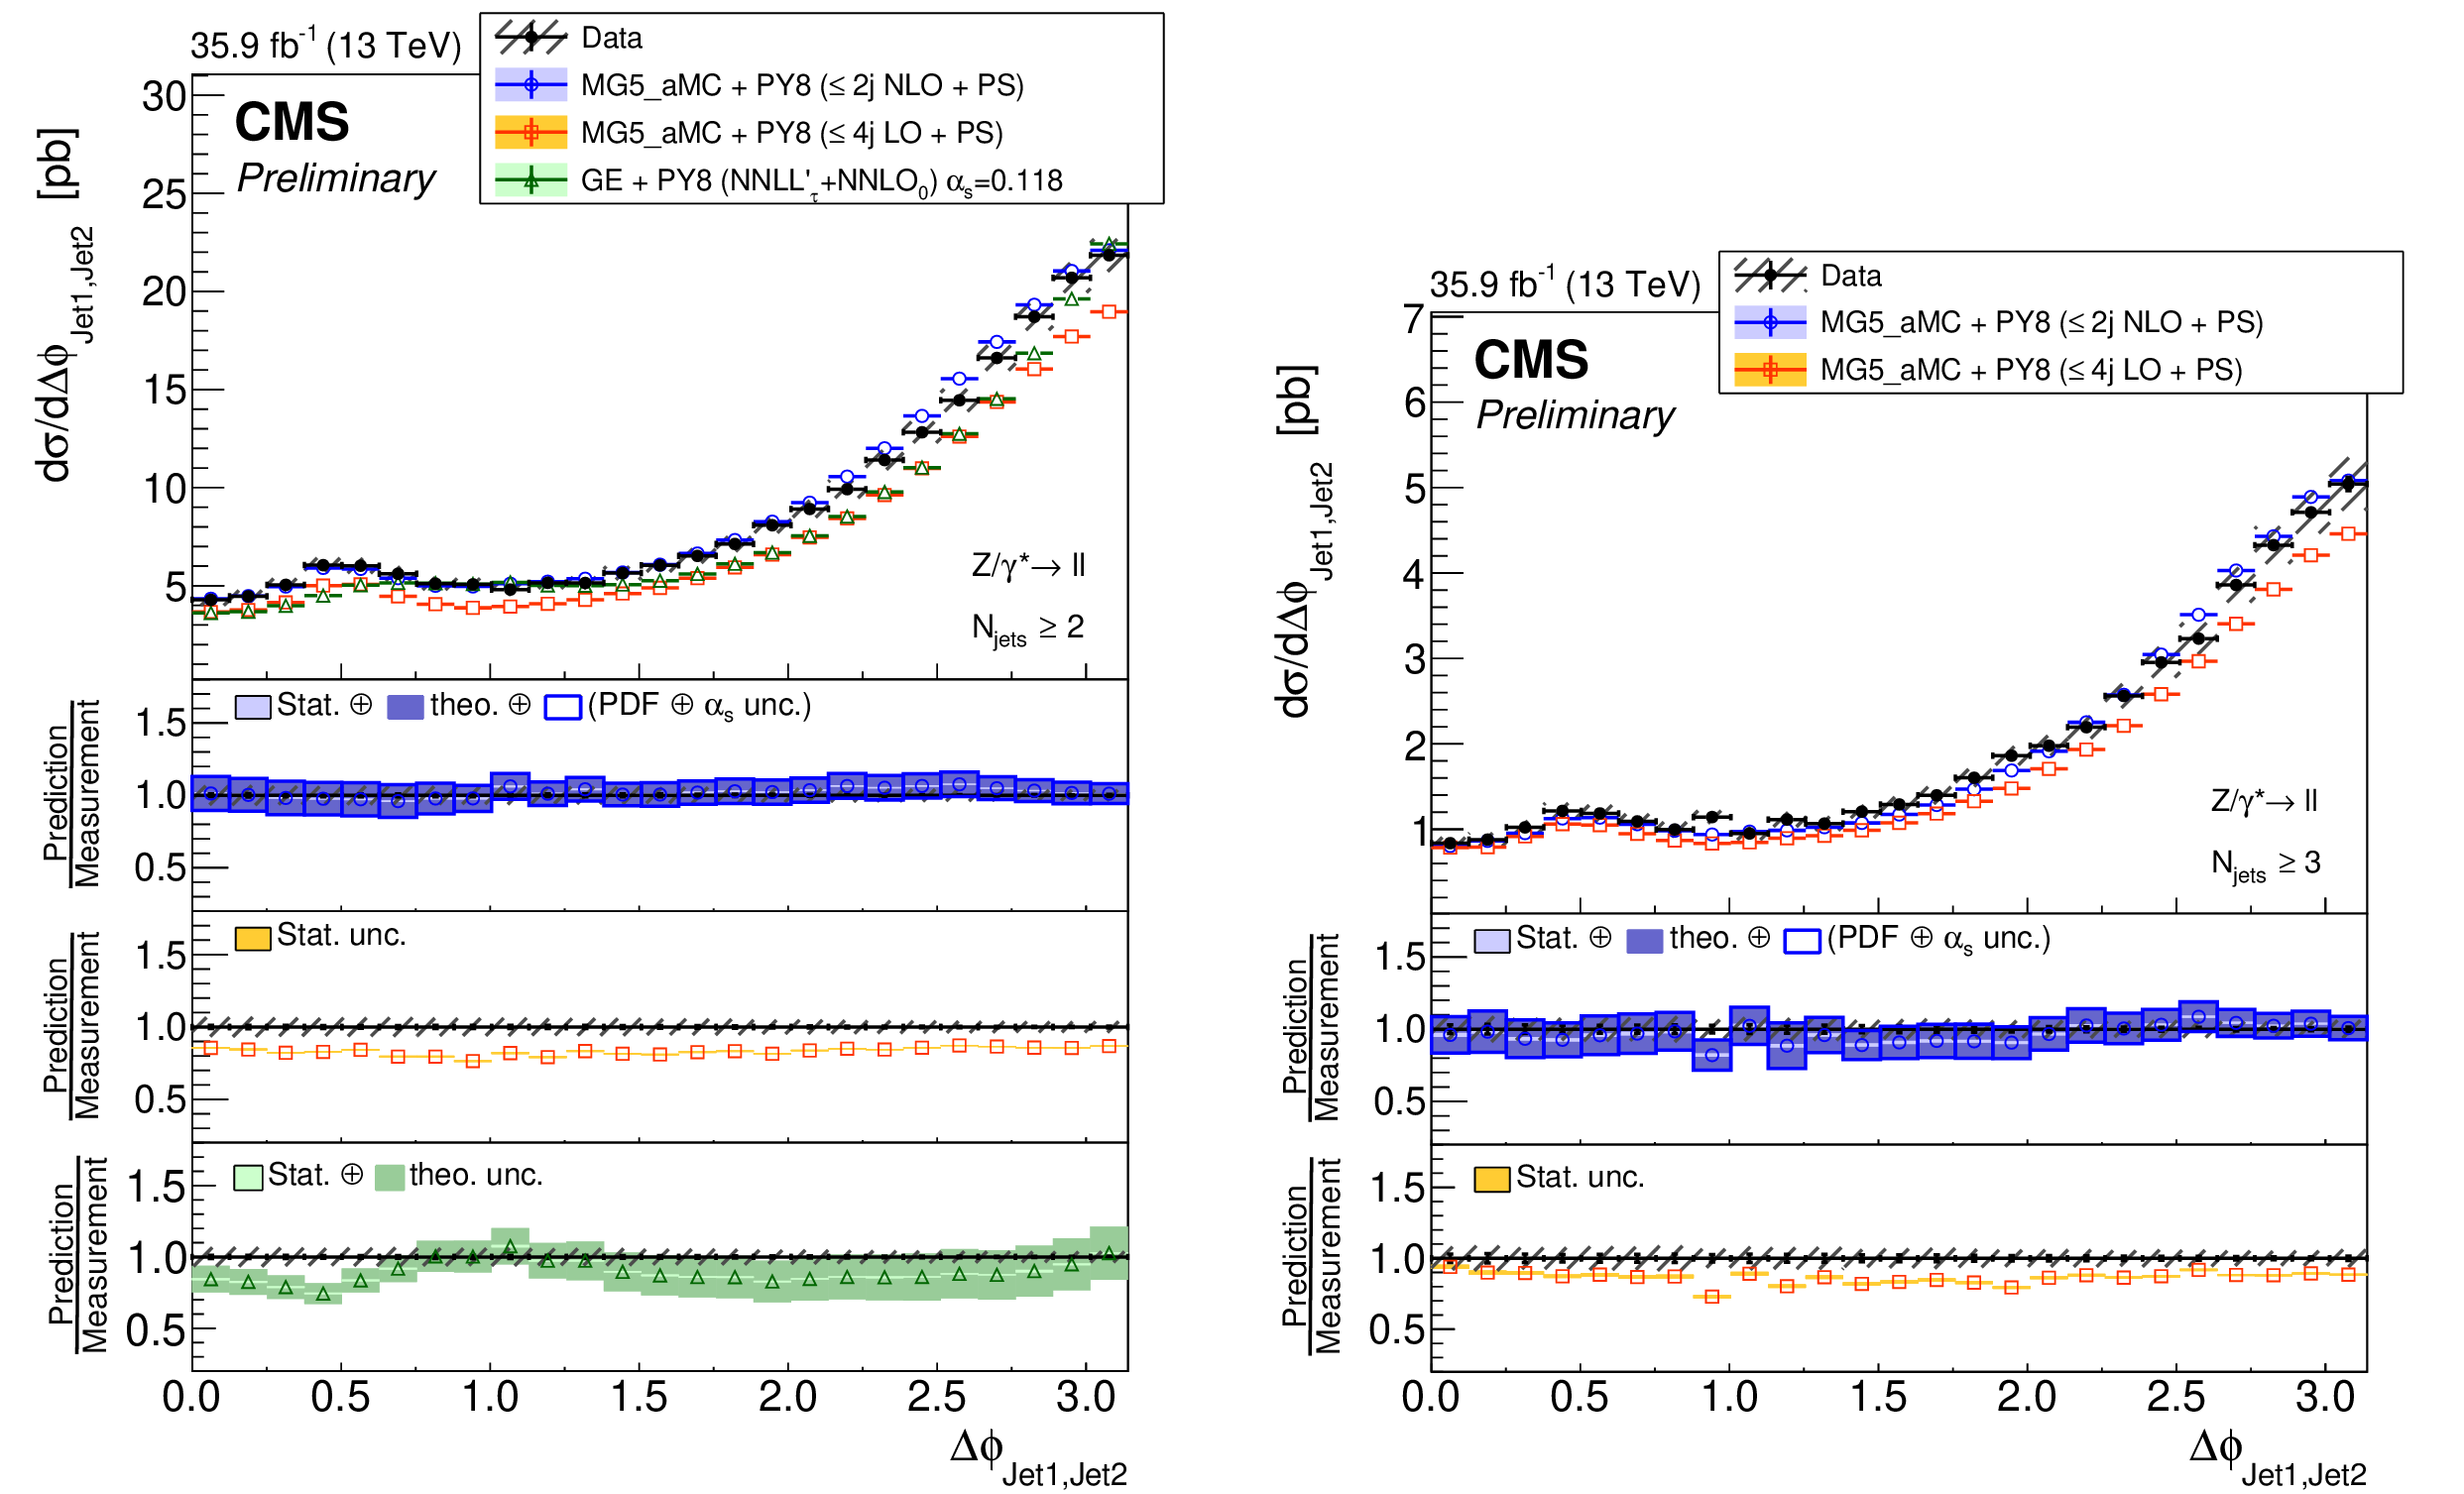
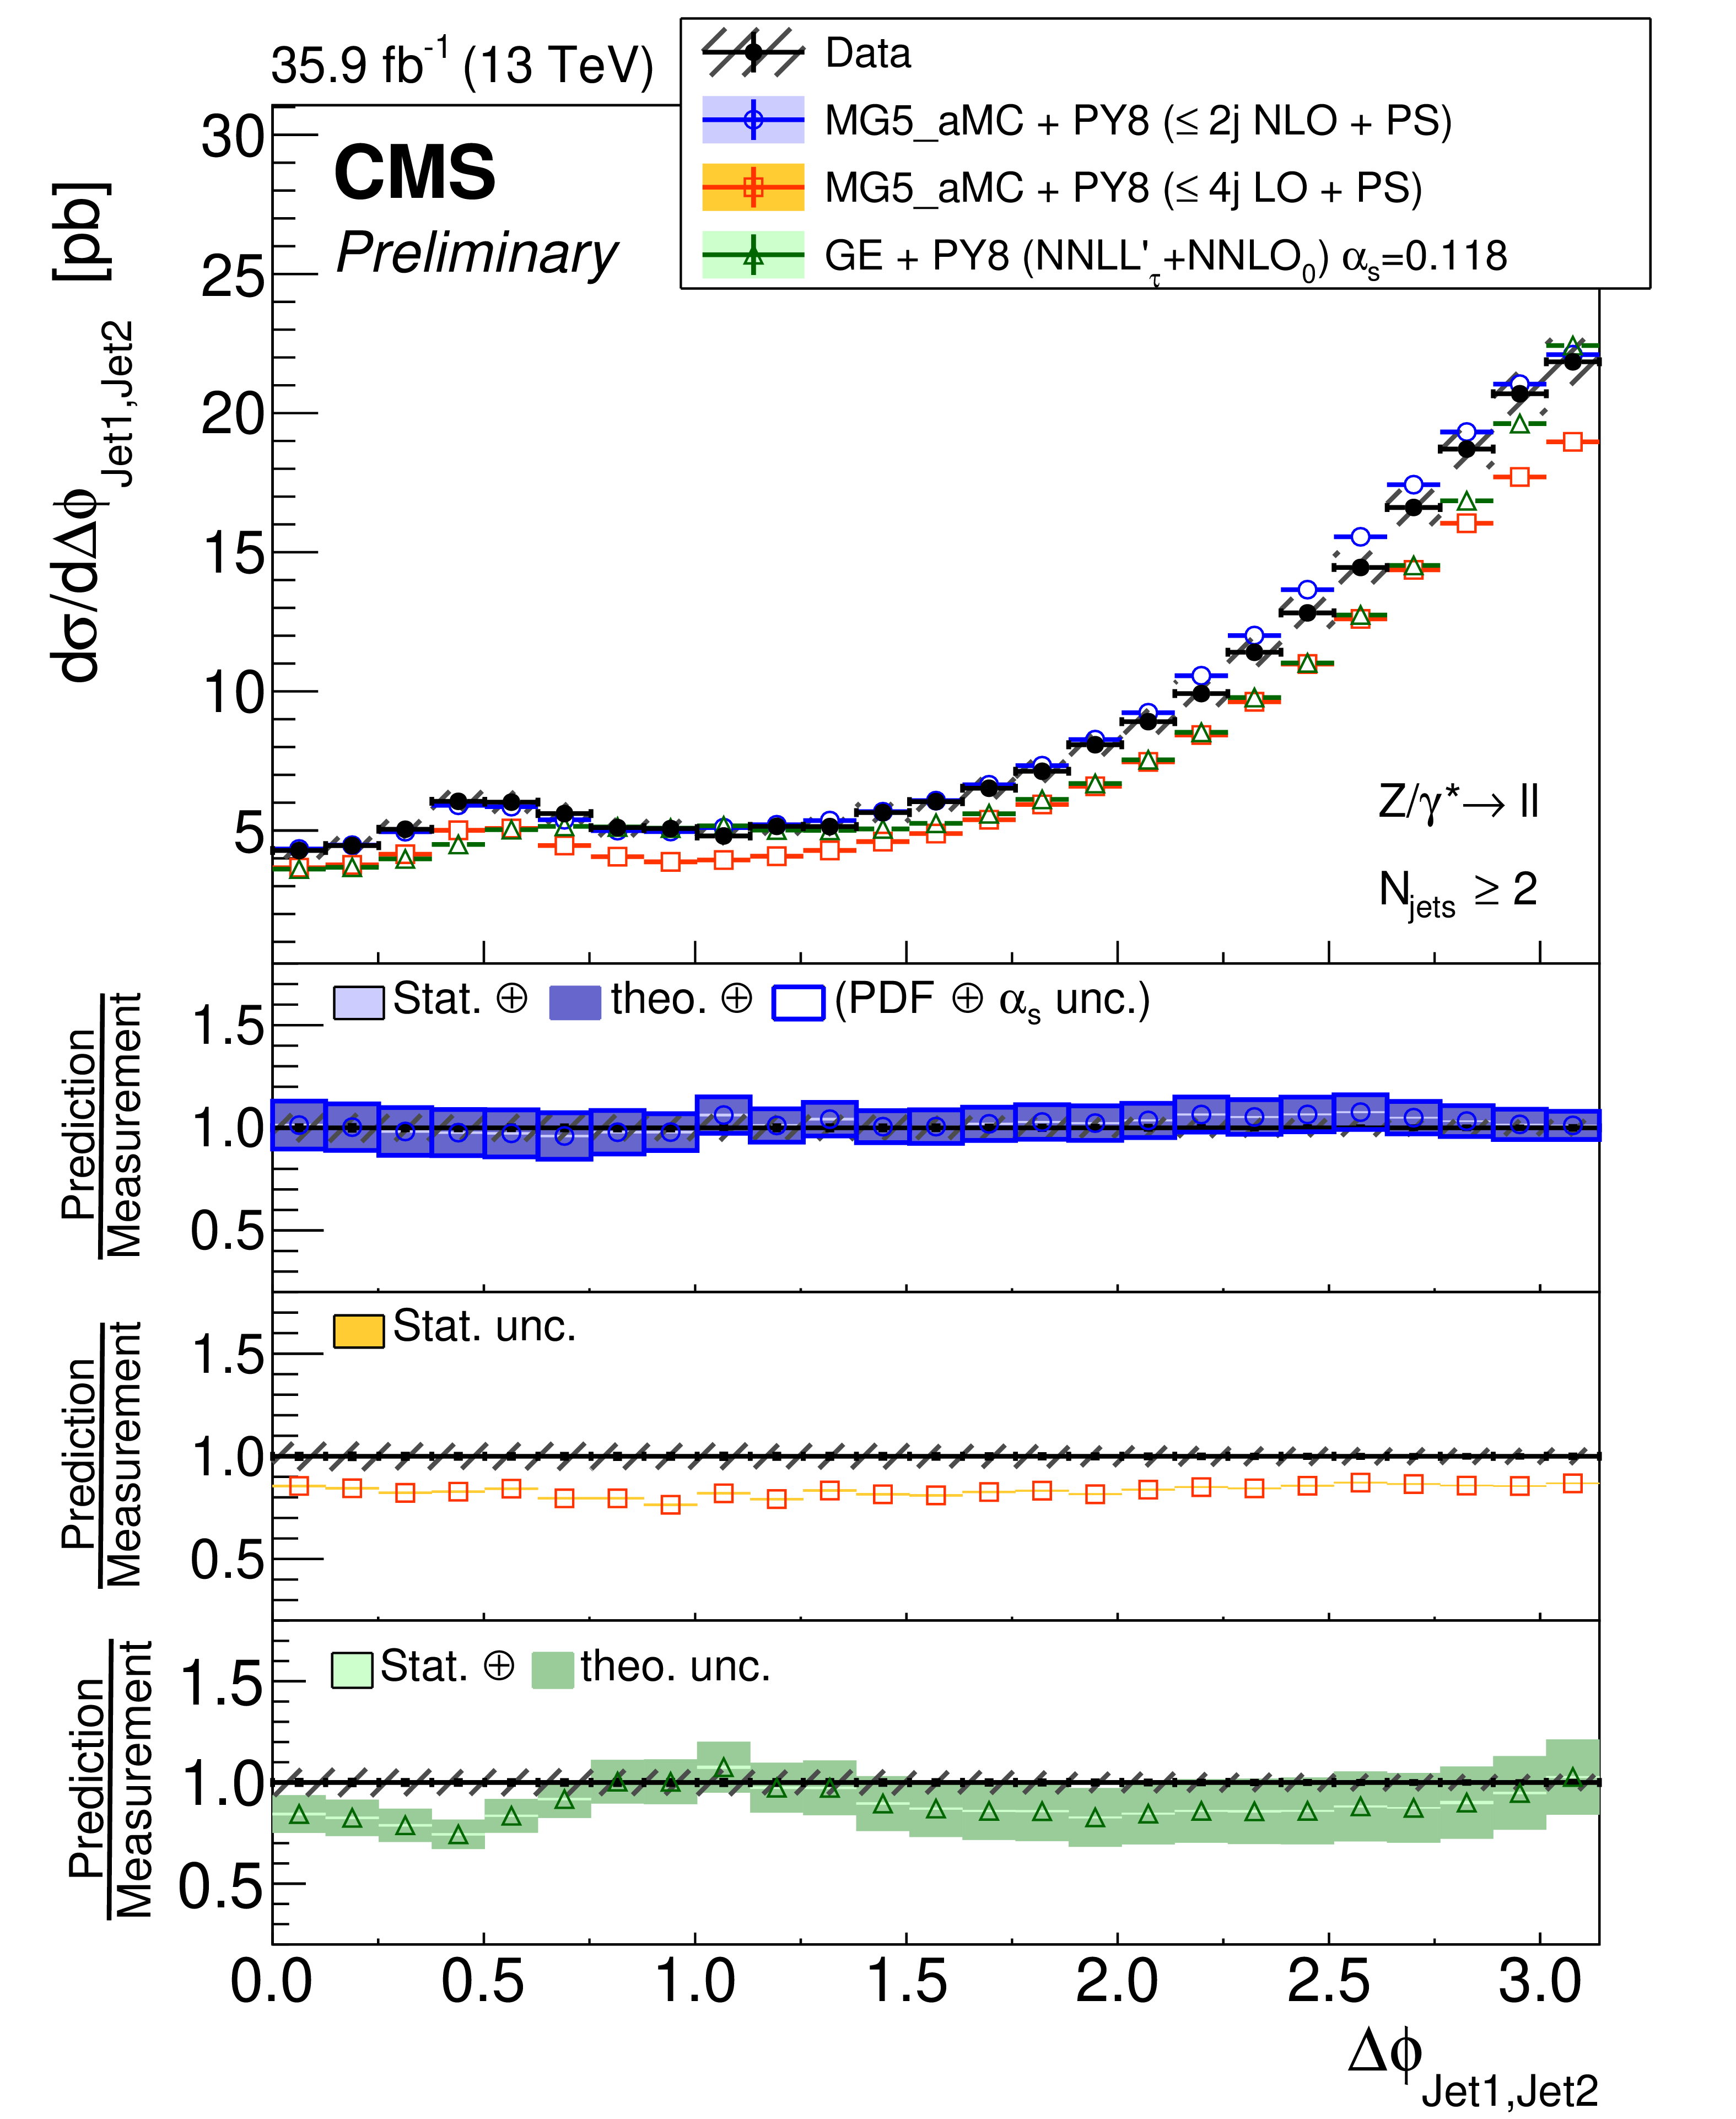
Figure 21:
The measured differential cross section as a function of the leading and subleading jet azimuthal difference for events with at least two (left) and three (right) jets. The measurement statistical (resp. systematic) uncertainties are represented with vertical error bars (resp. hashed areas). The measurement is compared to the NLO MG5_aMC, LO MG5_aMC, and GENEVA (for $N_{\text {jets}}\geq $ 2) predictions described in Section 6. The predictions uncertainties, estimated as explained in this section, are represented by coloured areas in the ratio plots (light colour for the statistical part and darker colour for the total). Only statistical uncertainty is computed for the LO prediction. |
png pdf |
Figure 21-a:
The measured differential cross section as a function of the leading and subleading jet azimuthal difference for events with at least two (left) and three (right) jets. The measurement statistical (resp. systematic) uncertainties are represented with vertical error bars (resp. hashed areas). The measurement is compared to the NLO MG5_aMC, LO MG5_aMC, and GENEVA (for $N_{\text {jets}}\geq $ 2) predictions described in Section 6. The predictions uncertainties, estimated as explained in this section, are represented by coloured areas in the ratio plots (light colour for the statistical part and darker colour for the total). Only statistical uncertainty is computed for the LO prediction. |

png pdf |
Figure 21-b:
The measured differential cross section as a function of the leading and subleading jet azimuthal difference for events with at least two (left) and three (right) jets. The measurement statistical (resp. systematic) uncertainties are represented with vertical error bars (resp. hashed areas). The measurement is compared to the NLO MG5_aMC, LO MG5_aMC, and GENEVA (for $N_{\text {jets}}\geq $ 2) predictions described in Section 6. The predictions uncertainties, estimated as explained in this section, are represented by coloured areas in the ratio plots (light colour for the statistical part and darker colour for the total). Only statistical uncertainty is computed for the LO prediction. |

png pdf |
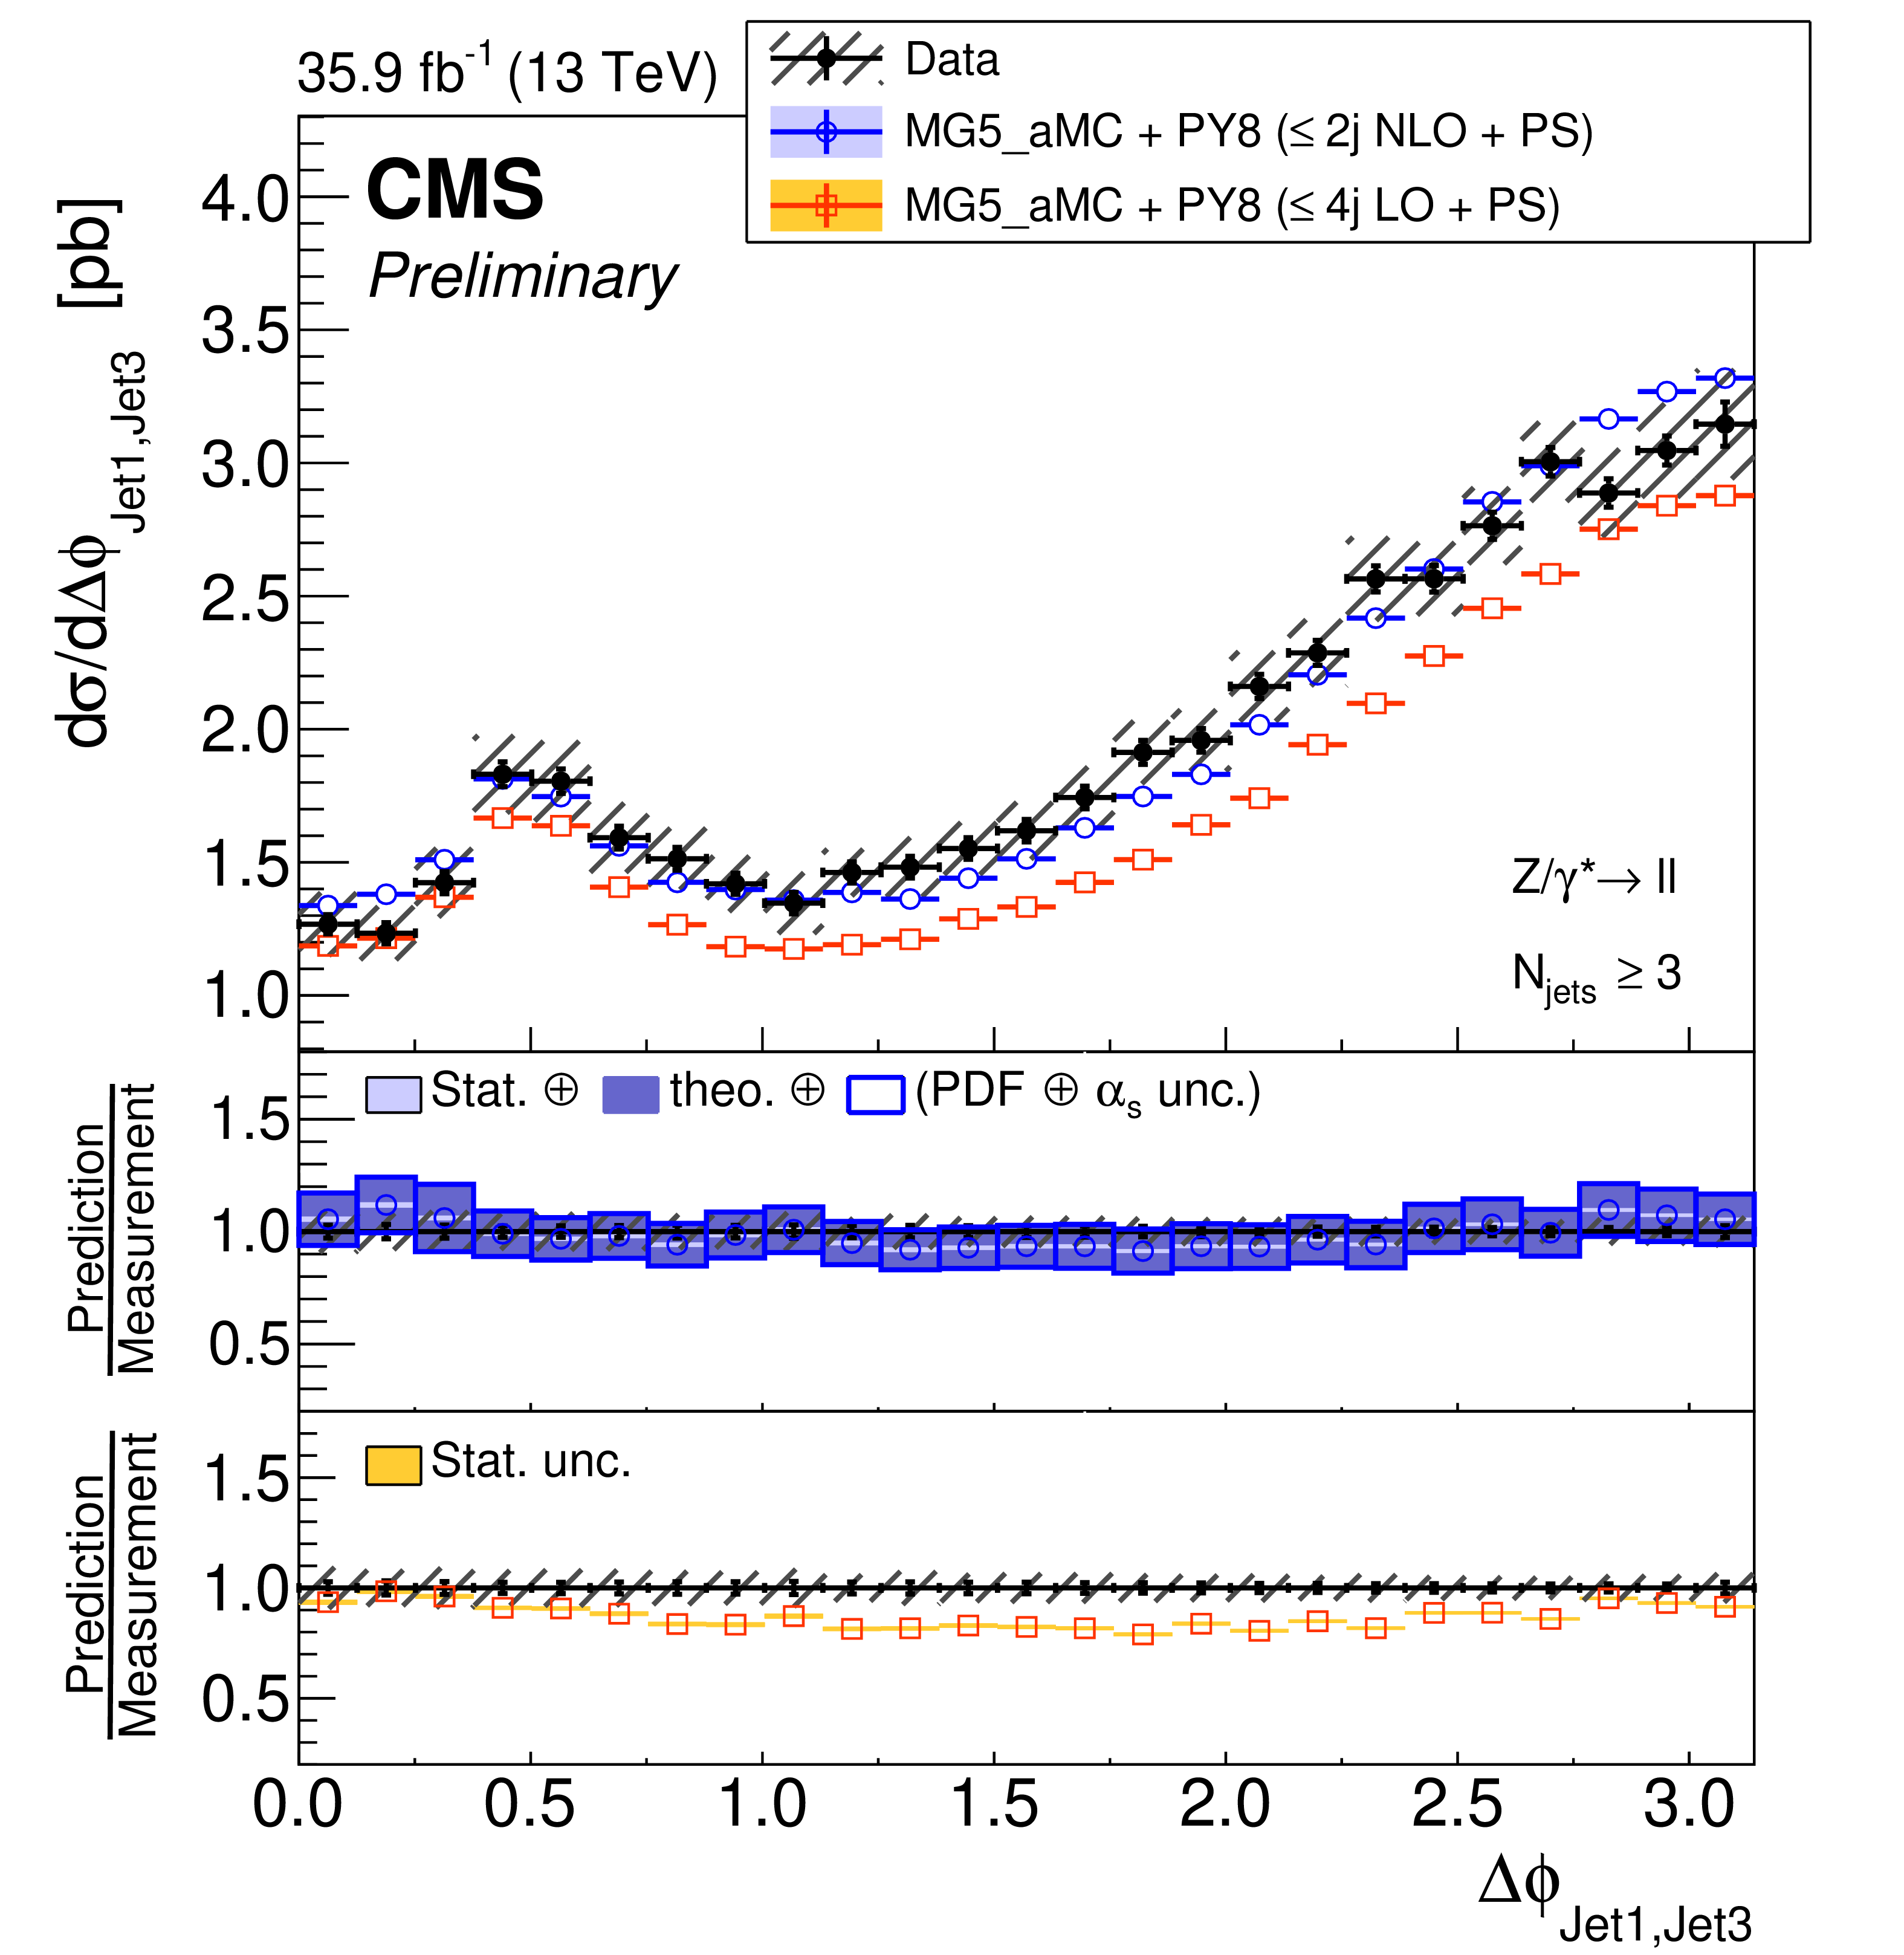
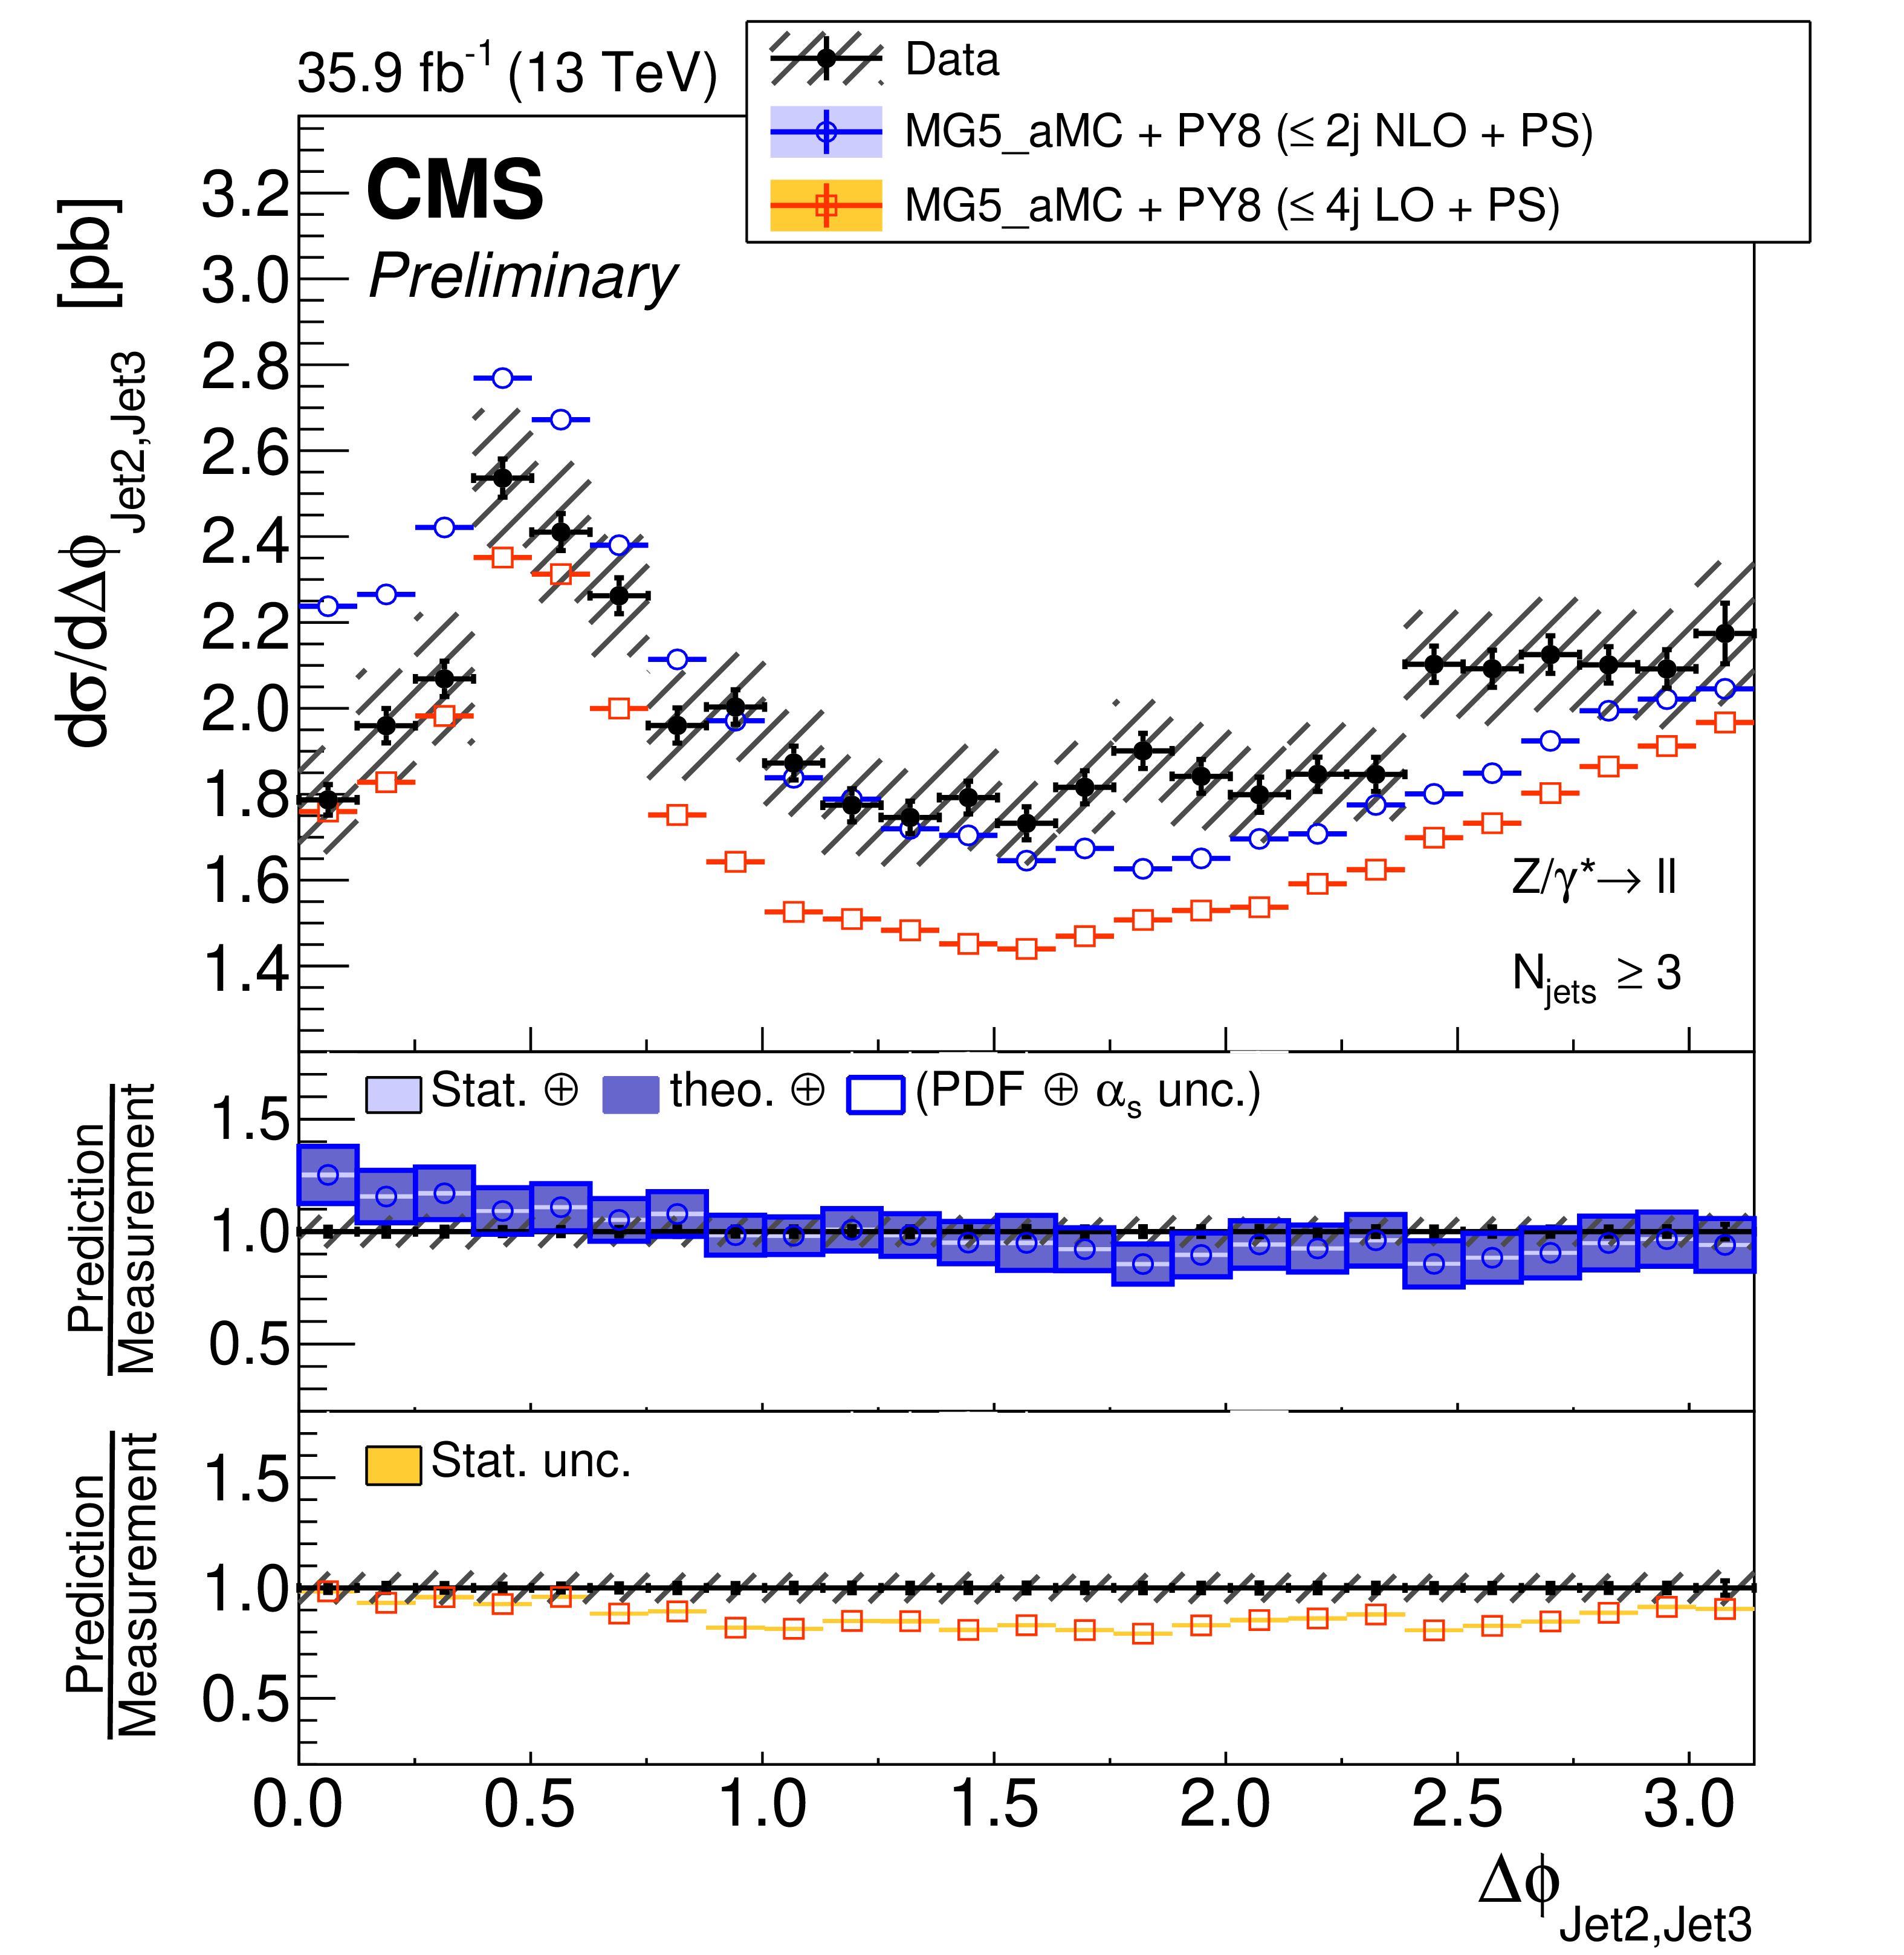
Figure 22:
The measured differential cross section as a function of the leading and third jet azimuthal difference (left) and subleading and third jet azimuthal difference (right) for events with at least three jets. The measurement statistical (resp. systematic) uncertainties are represented with vertical error bars (resp. hashed areas). The measurement is compared to the NLO and LO MG5_aMC predictions described in Section 6. The predictions uncertainties, estimated as explained in this section, are represented by coloured areas in the ratio plots (light colour for the statistical part and darker colour for the total). Only statistical uncertainty is computed for the LO prediction. |
png pdf |
Figure 22-a:
The measured differential cross section as a function of the leading and third jet azimuthal difference (left) and subleading and third jet azimuthal difference (right) for events with at least three jets. The measurement statistical (resp. systematic) uncertainties are represented with vertical error bars (resp. hashed areas). The measurement is compared to the NLO and LO MG5_aMC predictions described in Section 6. The predictions uncertainties, estimated as explained in this section, are represented by coloured areas in the ratio plots (light colour for the statistical part and darker colour for the total). Only statistical uncertainty is computed for the LO prediction. |
png pdf |
Figure 22-b:
The measured differential cross section as a function of the leading and third jet azimuthal difference (left) and subleading and third jet azimuthal difference (right) for events with at least three jets. The measurement statistical (resp. systematic) uncertainties are represented with vertical error bars (resp. hashed areas). The measurement is compared to the NLO and LO MG5_aMC predictions described in Section 6. The predictions uncertainties, estimated as explained in this section, are represented by coloured areas in the ratio plots (light colour for the statistical part and darker colour for the total). Only statistical uncertainty is computed for the LO prediction. |
png pdf |
Figure 23:
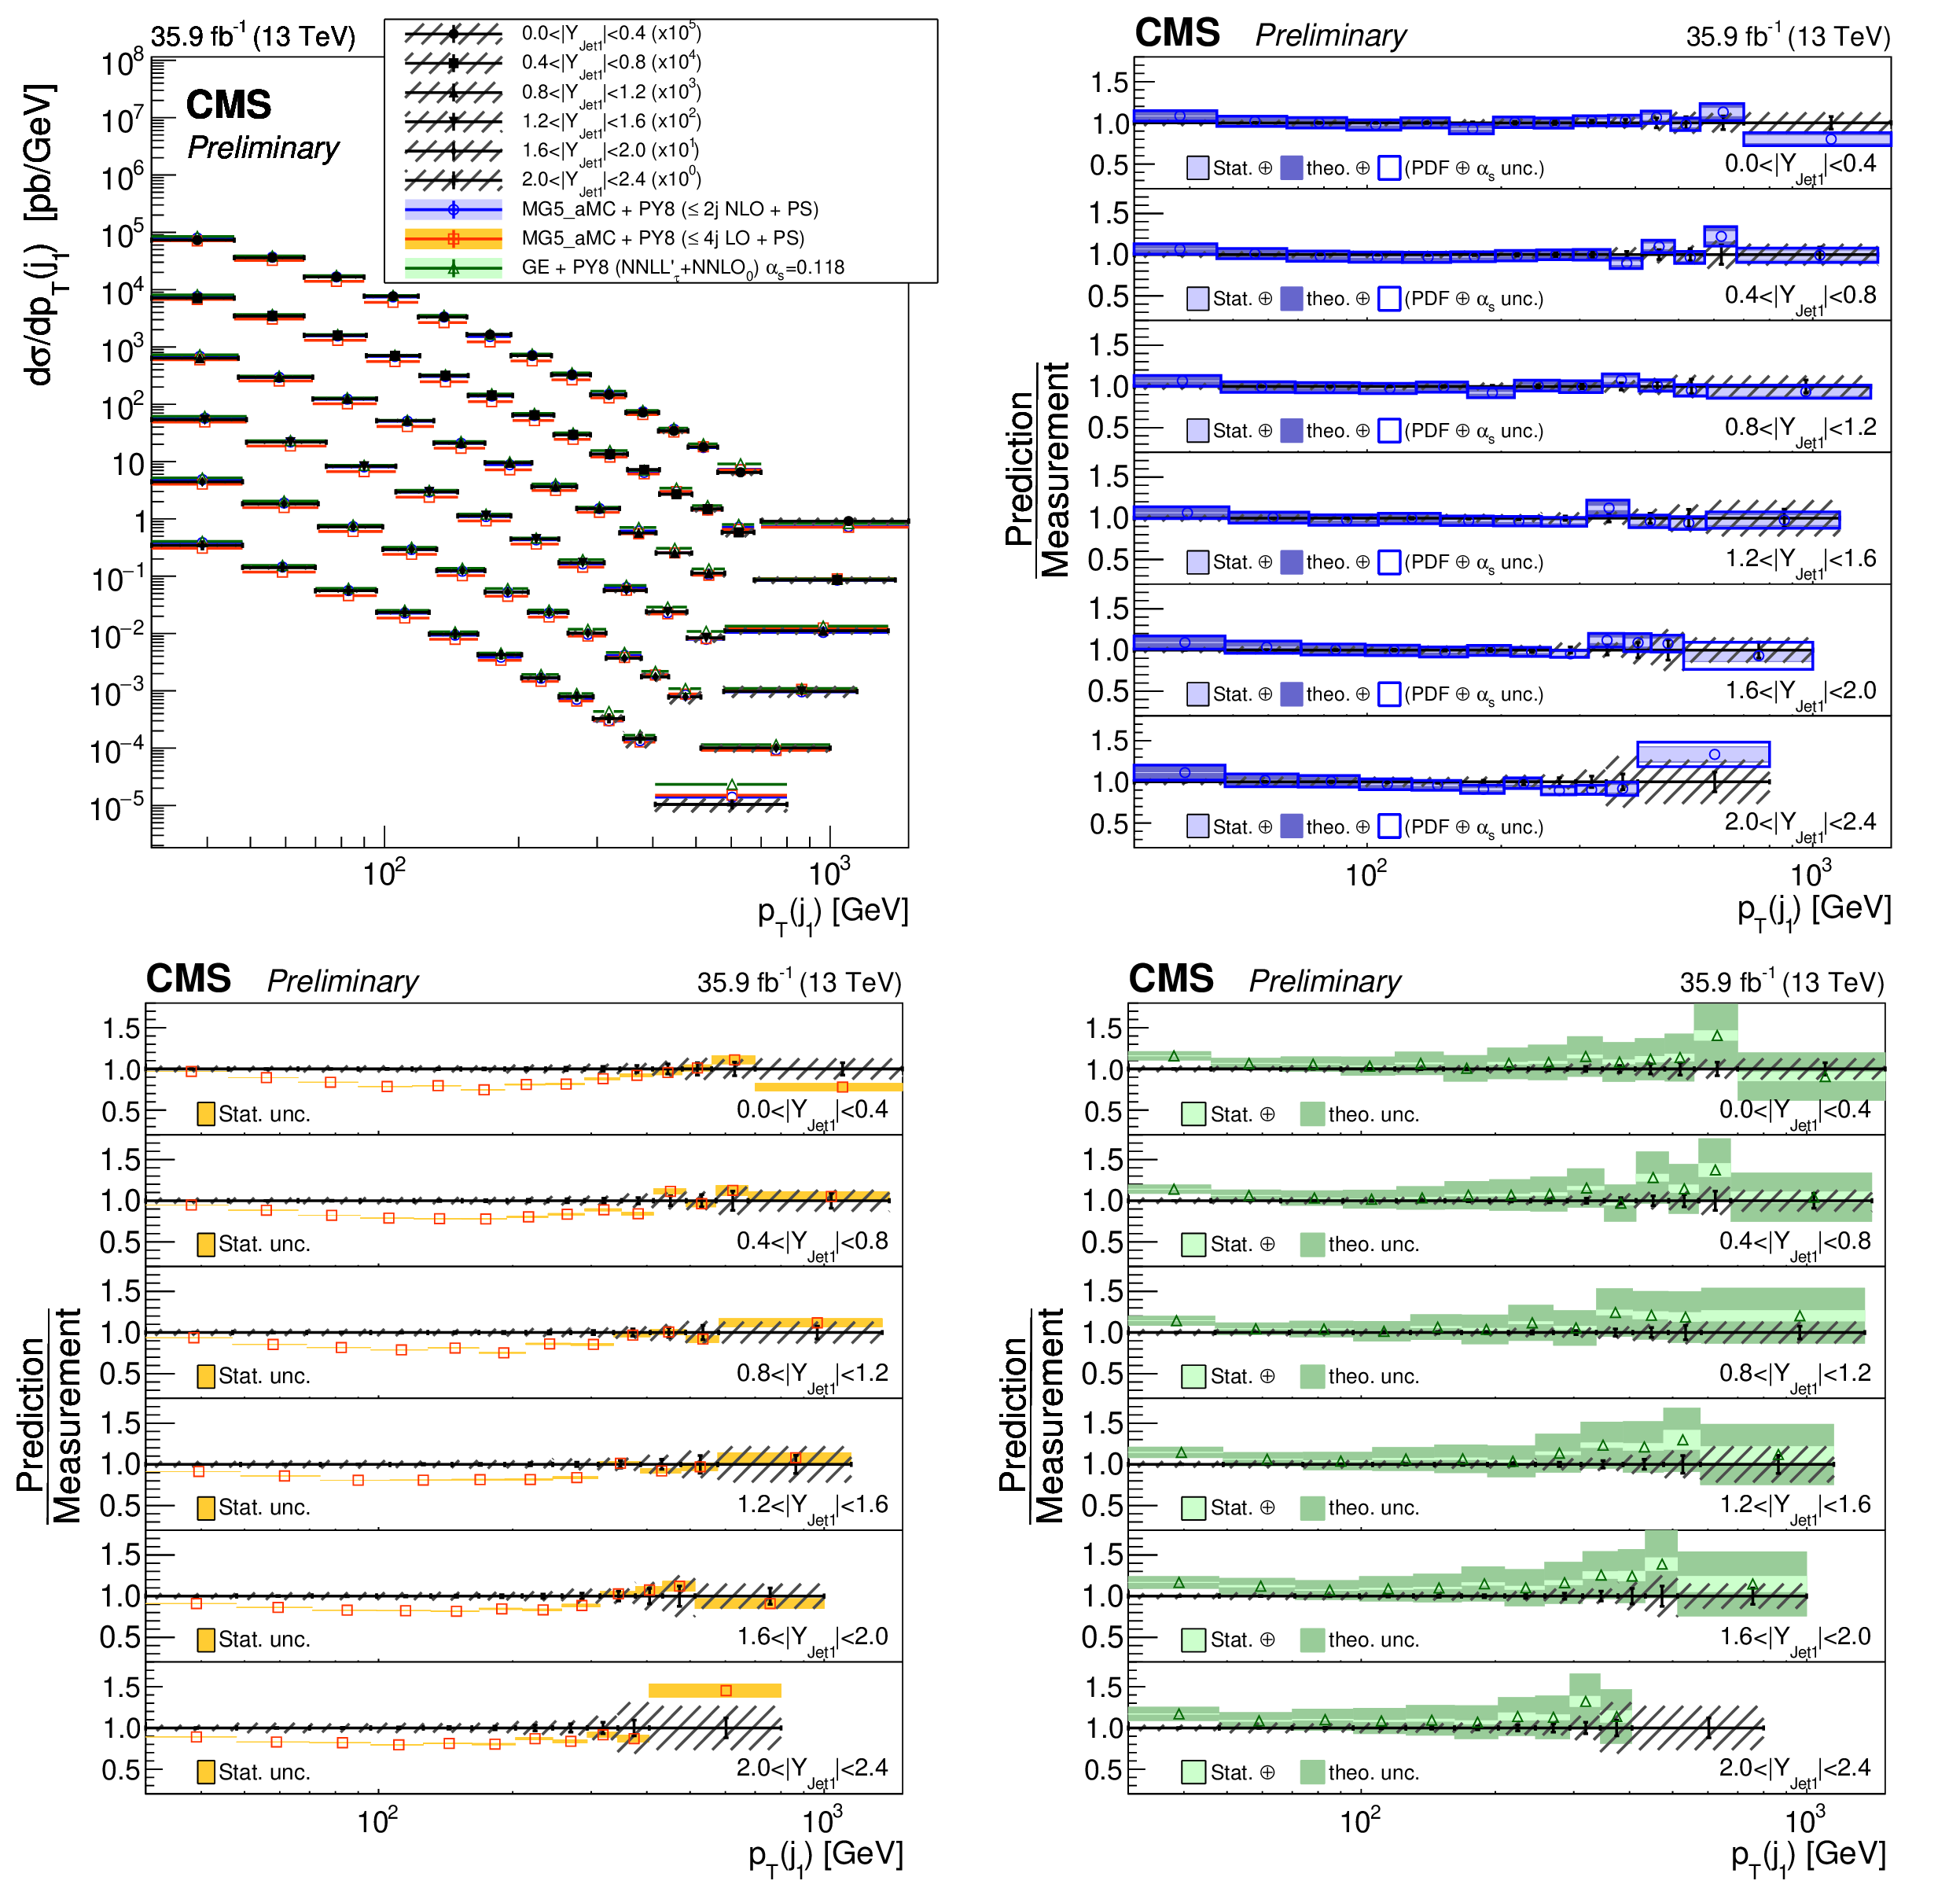
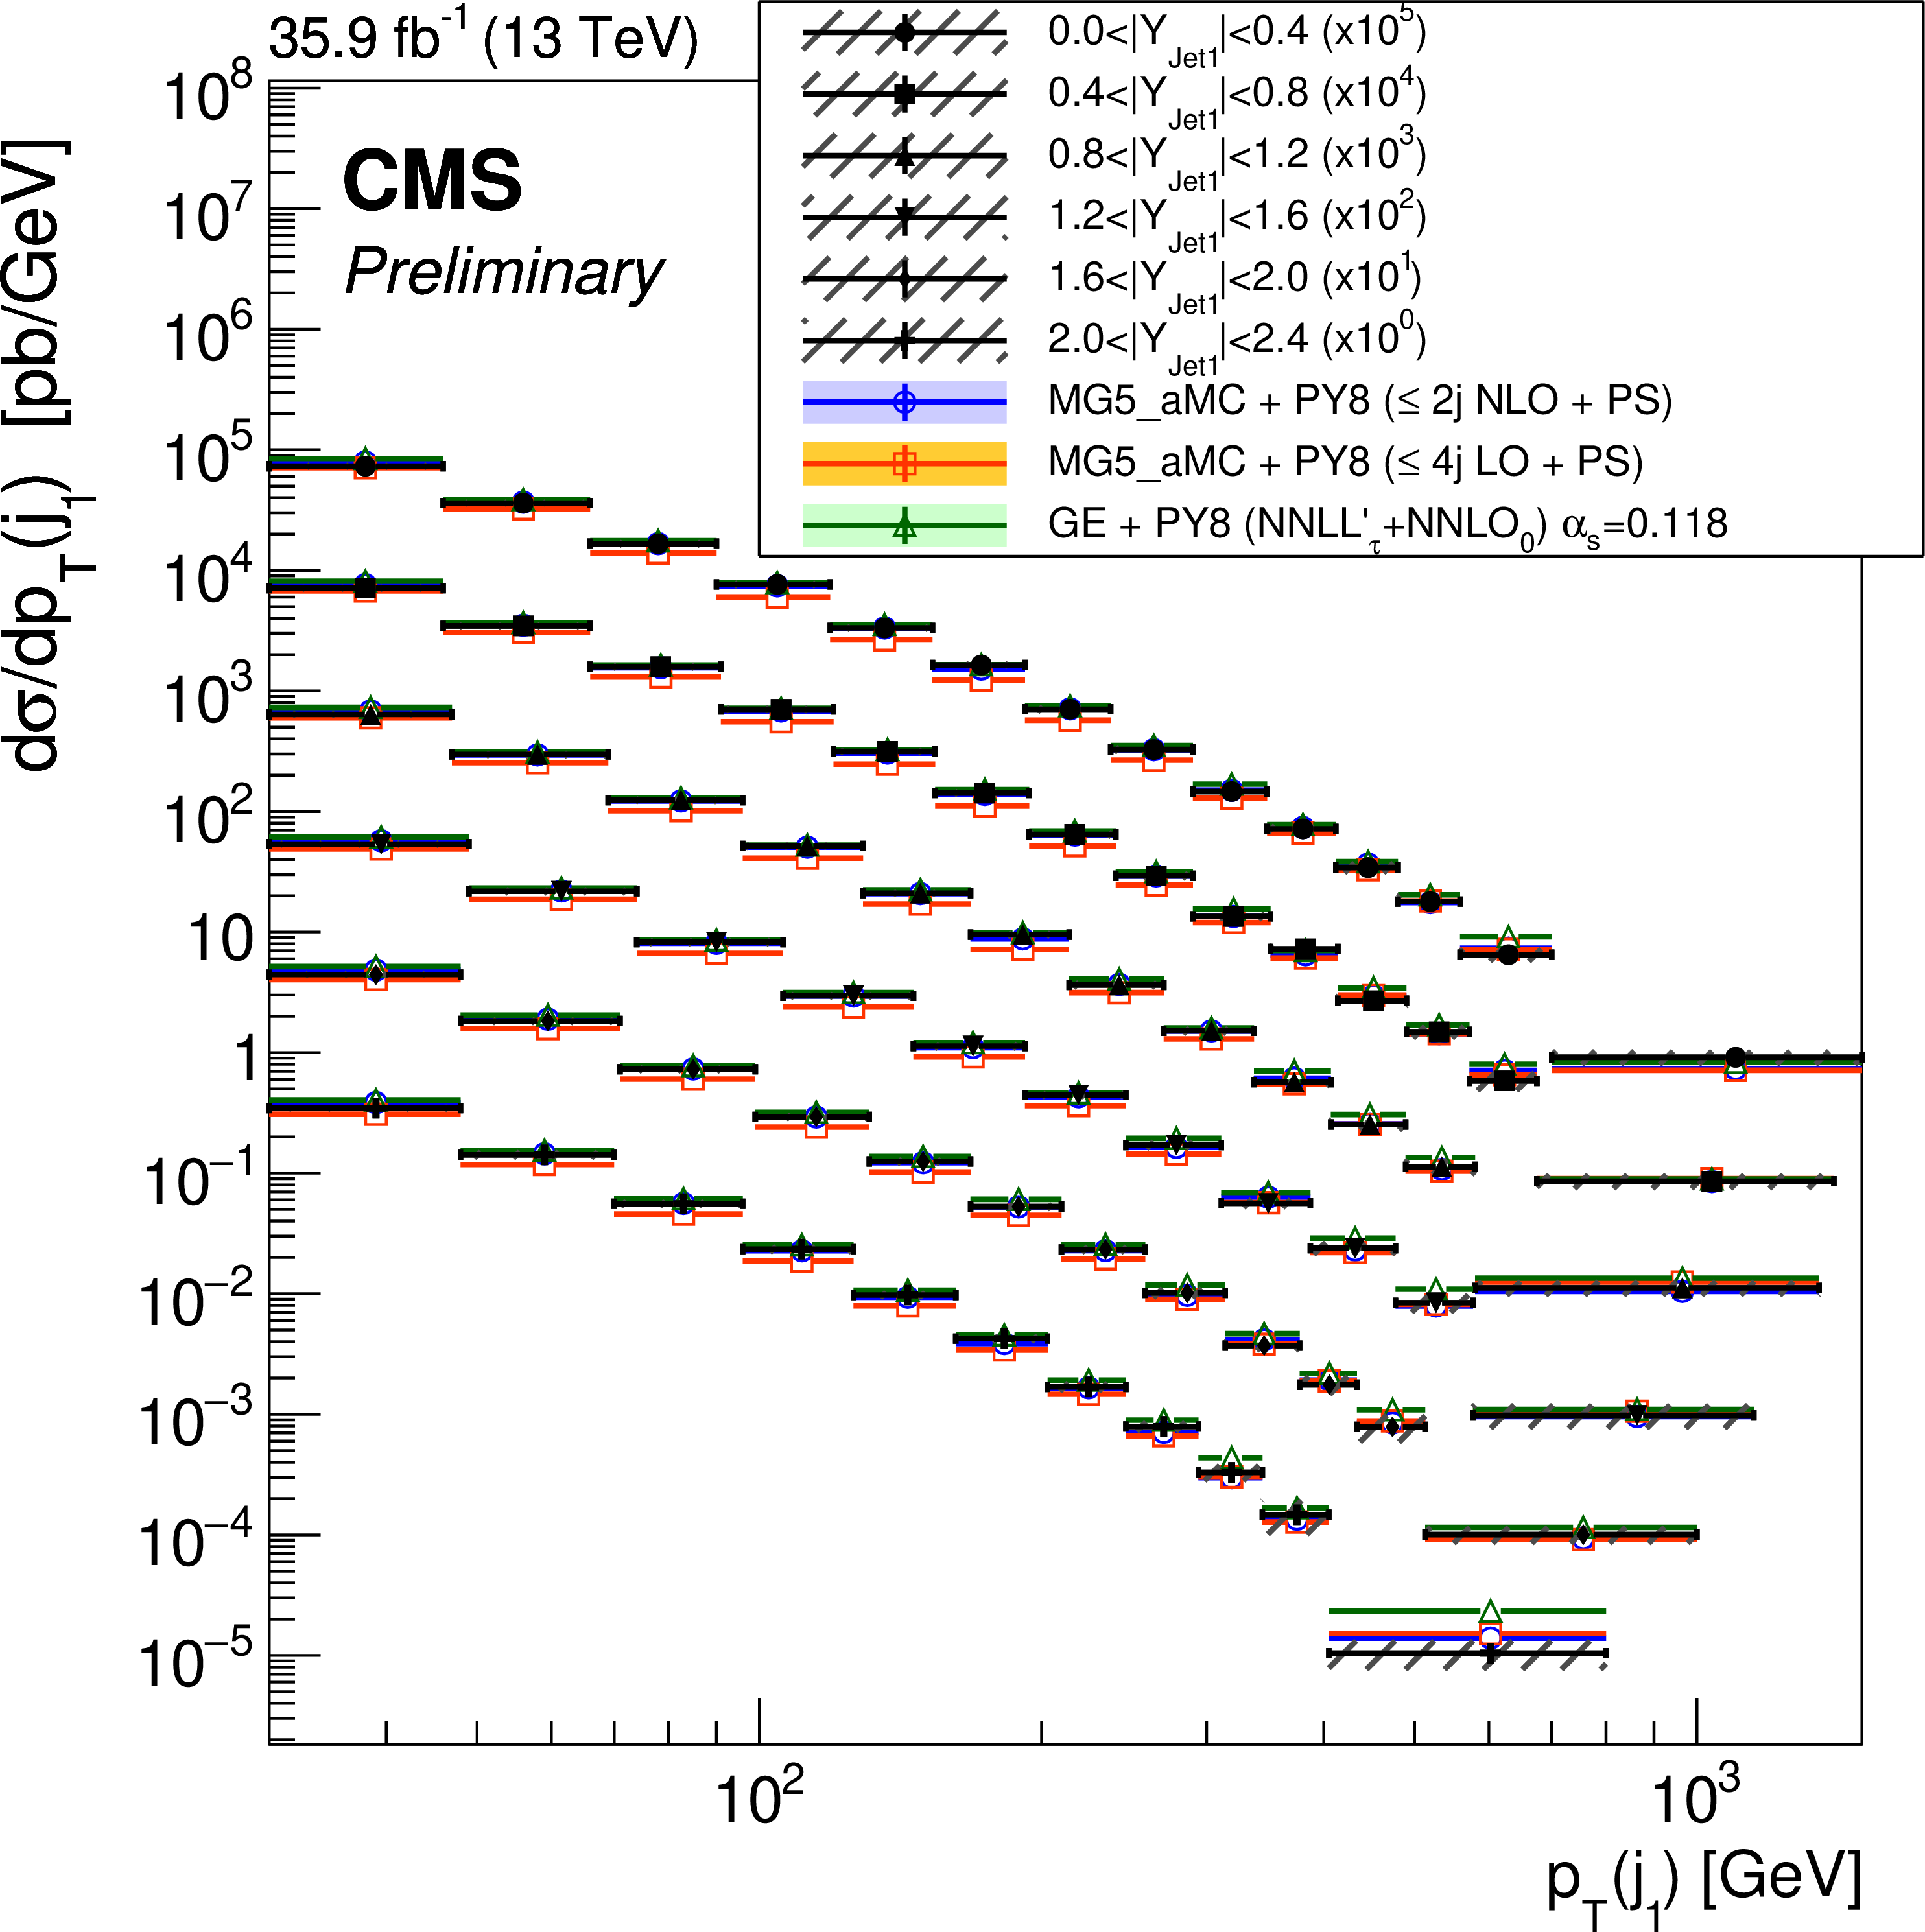
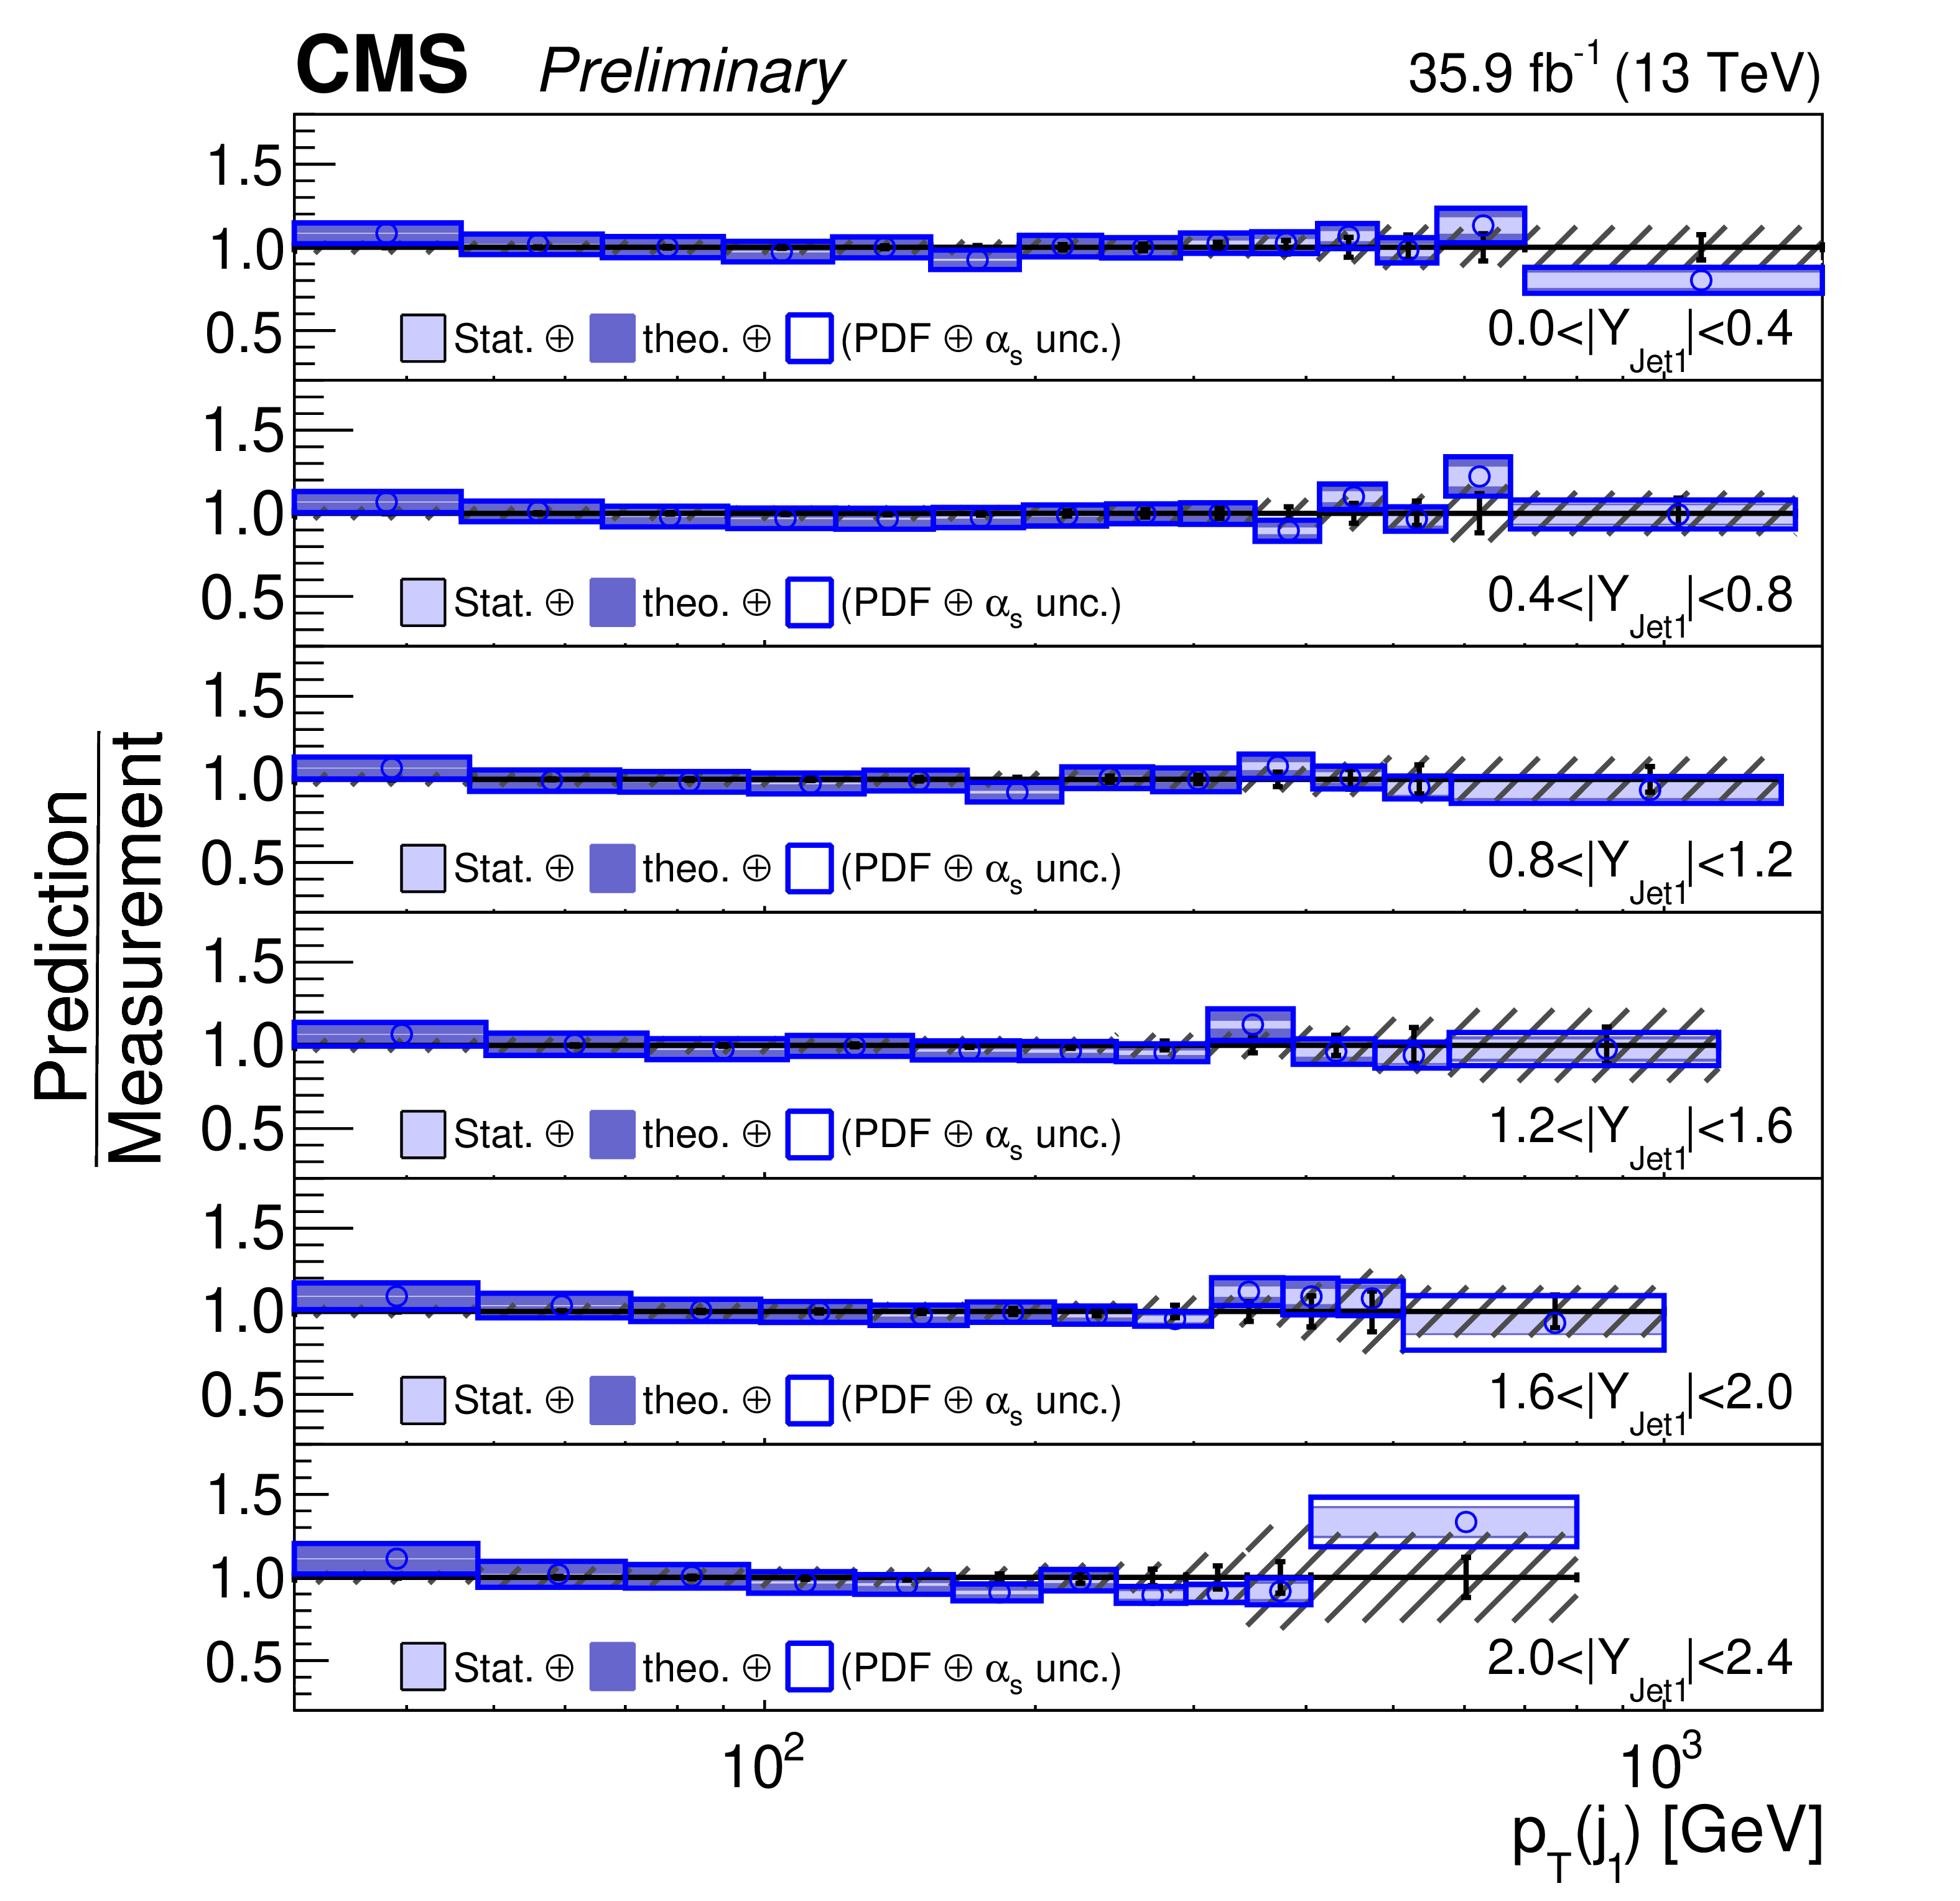
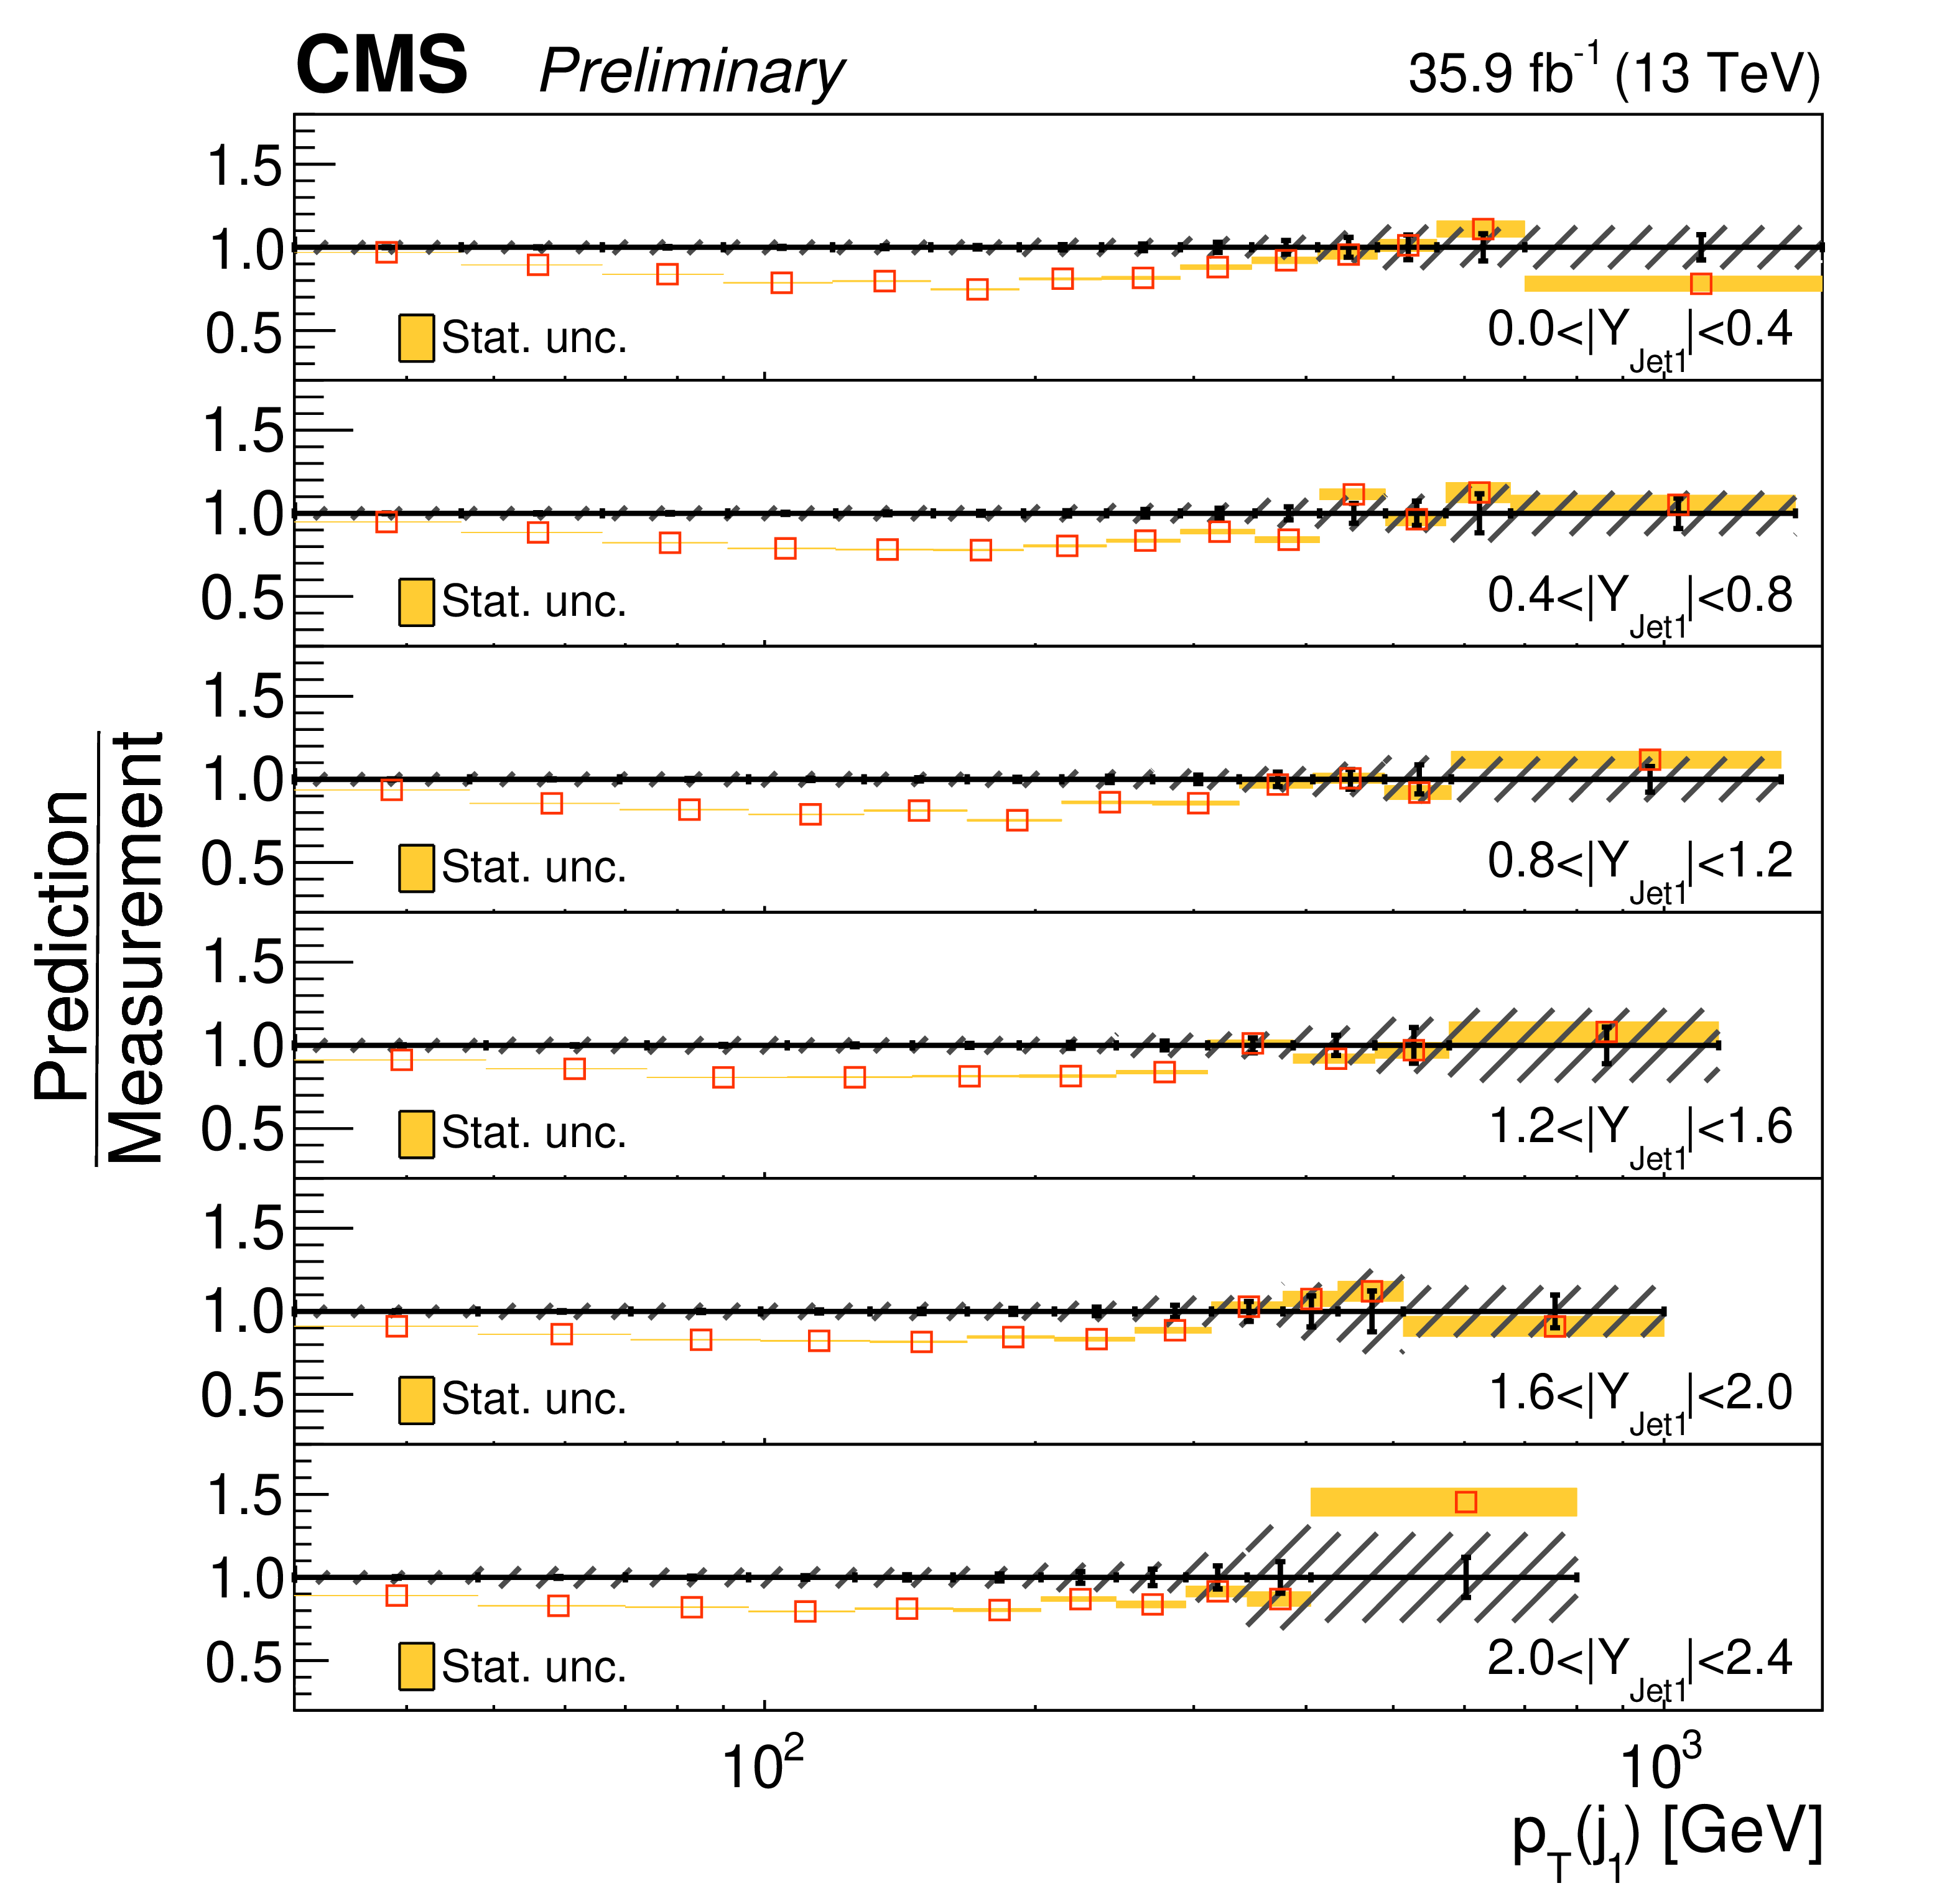
Double differential cross sections as a function of leading jet ${p_{\mathrm {T}}}$ and $|y|$ for events with at least one jet (upper left). The measurement statistical (resp. systematic) uncertainties are represented with vertical error bars (resp. hashed areas). The measurement is compared to the NLO MG5_aMC, LO MG5_aMC, and GENEVA predictions described in Section 6. The predictions uncertainties, estimated as explained in this section, are represented by coloured areas in the ratio plots (light colour for the statistical part and darker colour for the total). Only statistical uncertainty is computed for the LO prediction. |
png pdf |
Figure 23-a:
Double differential cross sections as a function of leading jet ${p_{\mathrm {T}}}$ and $|y|$ for events with at least one jet (upper left). The measurement statistical (resp. systematic) uncertainties are represented with vertical error bars (resp. hashed areas). The measurement is compared to the NLO MG5_aMC, LO MG5_aMC, and GENEVA predictions described in Section 6. The predictions uncertainties, estimated as explained in this section, are represented by coloured areas in the ratio plots (light colour for the statistical part and darker colour for the total). Only statistical uncertainty is computed for the LO prediction. |
png pdf |
Figure 23-b:
Double differential cross sections as a function of leading jet ${p_{\mathrm {T}}}$ and $|y|$ for events with at least one jet (upper left). The measurement statistical (resp. systematic) uncertainties are represented with vertical error bars (resp. hashed areas). The measurement is compared to the NLO MG5_aMC, LO MG5_aMC, and GENEVA predictions described in Section 6. The predictions uncertainties, estimated as explained in this section, are represented by coloured areas in the ratio plots (light colour for the statistical part and darker colour for the total). Only statistical uncertainty is computed for the LO prediction. |
png pdf |
Figure 23-c:
Double differential cross sections as a function of leading jet ${p_{\mathrm {T}}}$ and $|y|$ for events with at least one jet (upper left). The measurement statistical (resp. systematic) uncertainties are represented with vertical error bars (resp. hashed areas). The measurement is compared to the NLO MG5_aMC, LO MG5_aMC, and GENEVA predictions described in Section 6. The predictions uncertainties, estimated as explained in this section, are represented by coloured areas in the ratio plots (light colour for the statistical part and darker colour for the total). Only statistical uncertainty is computed for the LO prediction. |
png pdf |
Figure 23-d:
Double differential cross sections as a function of leading jet ${p_{\mathrm {T}}}$ and $|y|$ for events with at least one jet (upper left). The measurement statistical (resp. systematic) uncertainties are represented with vertical error bars (resp. hashed areas). The measurement is compared to the NLO MG5_aMC, LO MG5_aMC, and GENEVA predictions described in Section 6. The predictions uncertainties, estimated as explained in this section, are represented by coloured areas in the ratio plots (light colour for the statistical part and darker colour for the total). Only statistical uncertainty is computed for the LO prediction. |

png pdf |
Figure 24:
Double differential cross sections as a function of leading jet and Z boson $|y|$ for events with at least one jet. The measurement statistical (resp. systematic) uncertainties are represented with vertical error bars (resp. hashed areas). The measurement is compared to the NLO MG5_aMC, LO MG5_aMC, and GENEVA predictions described in Section 6. The predictions uncertainties, estimated as explained in this section, are represented by coloured areas in the ratio plots (light colour for the statistical part and darker colour for the total). Only statistical uncertainty is computed for the LO prediction. |

png pdf |
Figure 24-a:
Double differential cross sections as a function of leading jet and Z boson $|y|$ for events with at least one jet. The measurement statistical (resp. systematic) uncertainties are represented with vertical error bars (resp. hashed areas). The measurement is compared to the NLO MG5_aMC, LO MG5_aMC, and GENEVA predictions described in Section 6. The predictions uncertainties, estimated as explained in this section, are represented by coloured areas in the ratio plots (light colour for the statistical part and darker colour for the total). Only statistical uncertainty is computed for the LO prediction. |
png pdf |
Figure 24-b:
Double differential cross sections as a function of leading jet and Z boson $|y|$ for events with at least one jet. The measurement statistical (resp. systematic) uncertainties are represented with vertical error bars (resp. hashed areas). The measurement is compared to the NLO MG5_aMC, LO MG5_aMC, and GENEVA predictions described in Section 6. The predictions uncertainties, estimated as explained in this section, are represented by coloured areas in the ratio plots (light colour for the statistical part and darker colour for the total). Only statistical uncertainty is computed for the LO prediction. |
png pdf |
Figure 24-c:
Double differential cross sections as a function of leading jet and Z boson $|y|$ for events with at least one jet. The measurement statistical (resp. systematic) uncertainties are represented with vertical error bars (resp. hashed areas). The measurement is compared to the NLO MG5_aMC, LO MG5_aMC, and GENEVA predictions described in Section 6. The predictions uncertainties, estimated as explained in this section, are represented by coloured areas in the ratio plots (light colour for the statistical part and darker colour for the total). Only statistical uncertainty is computed for the LO prediction. |

png pdf |
Figure 24-d:
Double differential cross sections as a function of leading jet and Z boson $|y|$ for events with at least one jet. The measurement statistical (resp. systematic) uncertainties are represented with vertical error bars (resp. hashed areas). The measurement is compared to the NLO MG5_aMC, LO MG5_aMC, and GENEVA predictions described in Section 6. The predictions uncertainties, estimated as explained in this section, are represented by coloured areas in the ratio plots (light colour for the statistical part and darker colour for the total). Only statistical uncertainty is computed for the LO prediction. |

png pdf |
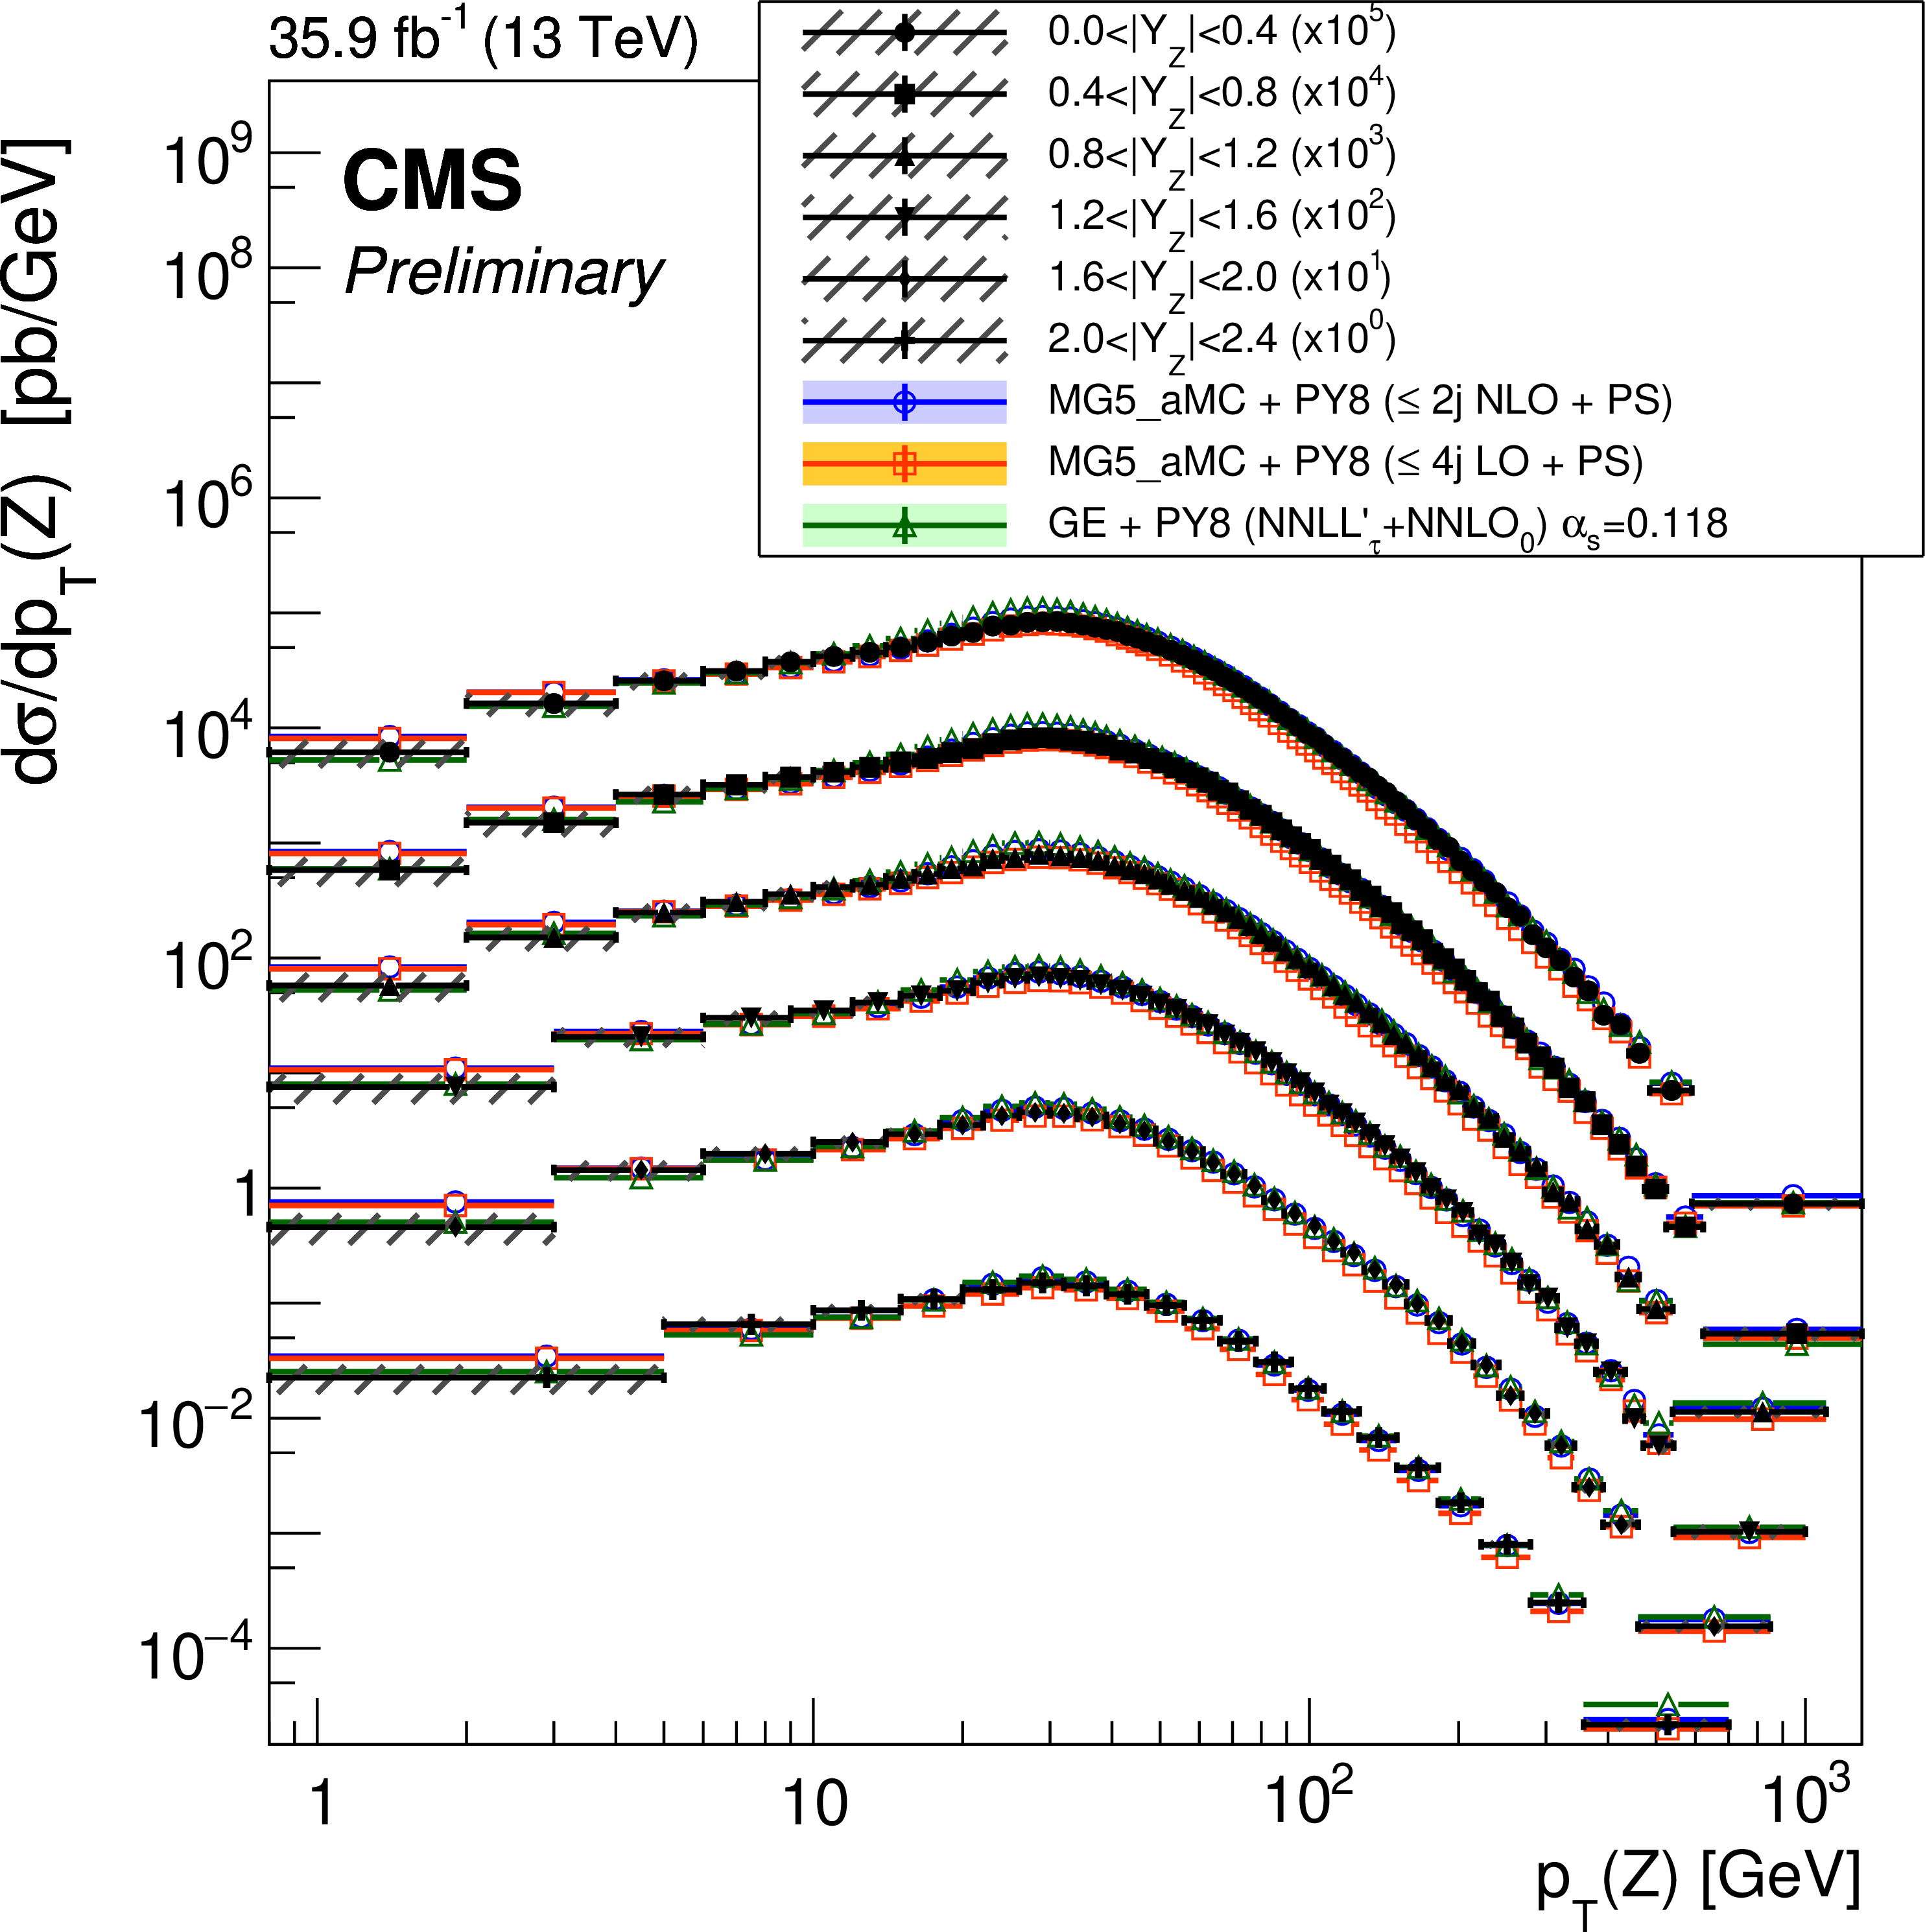
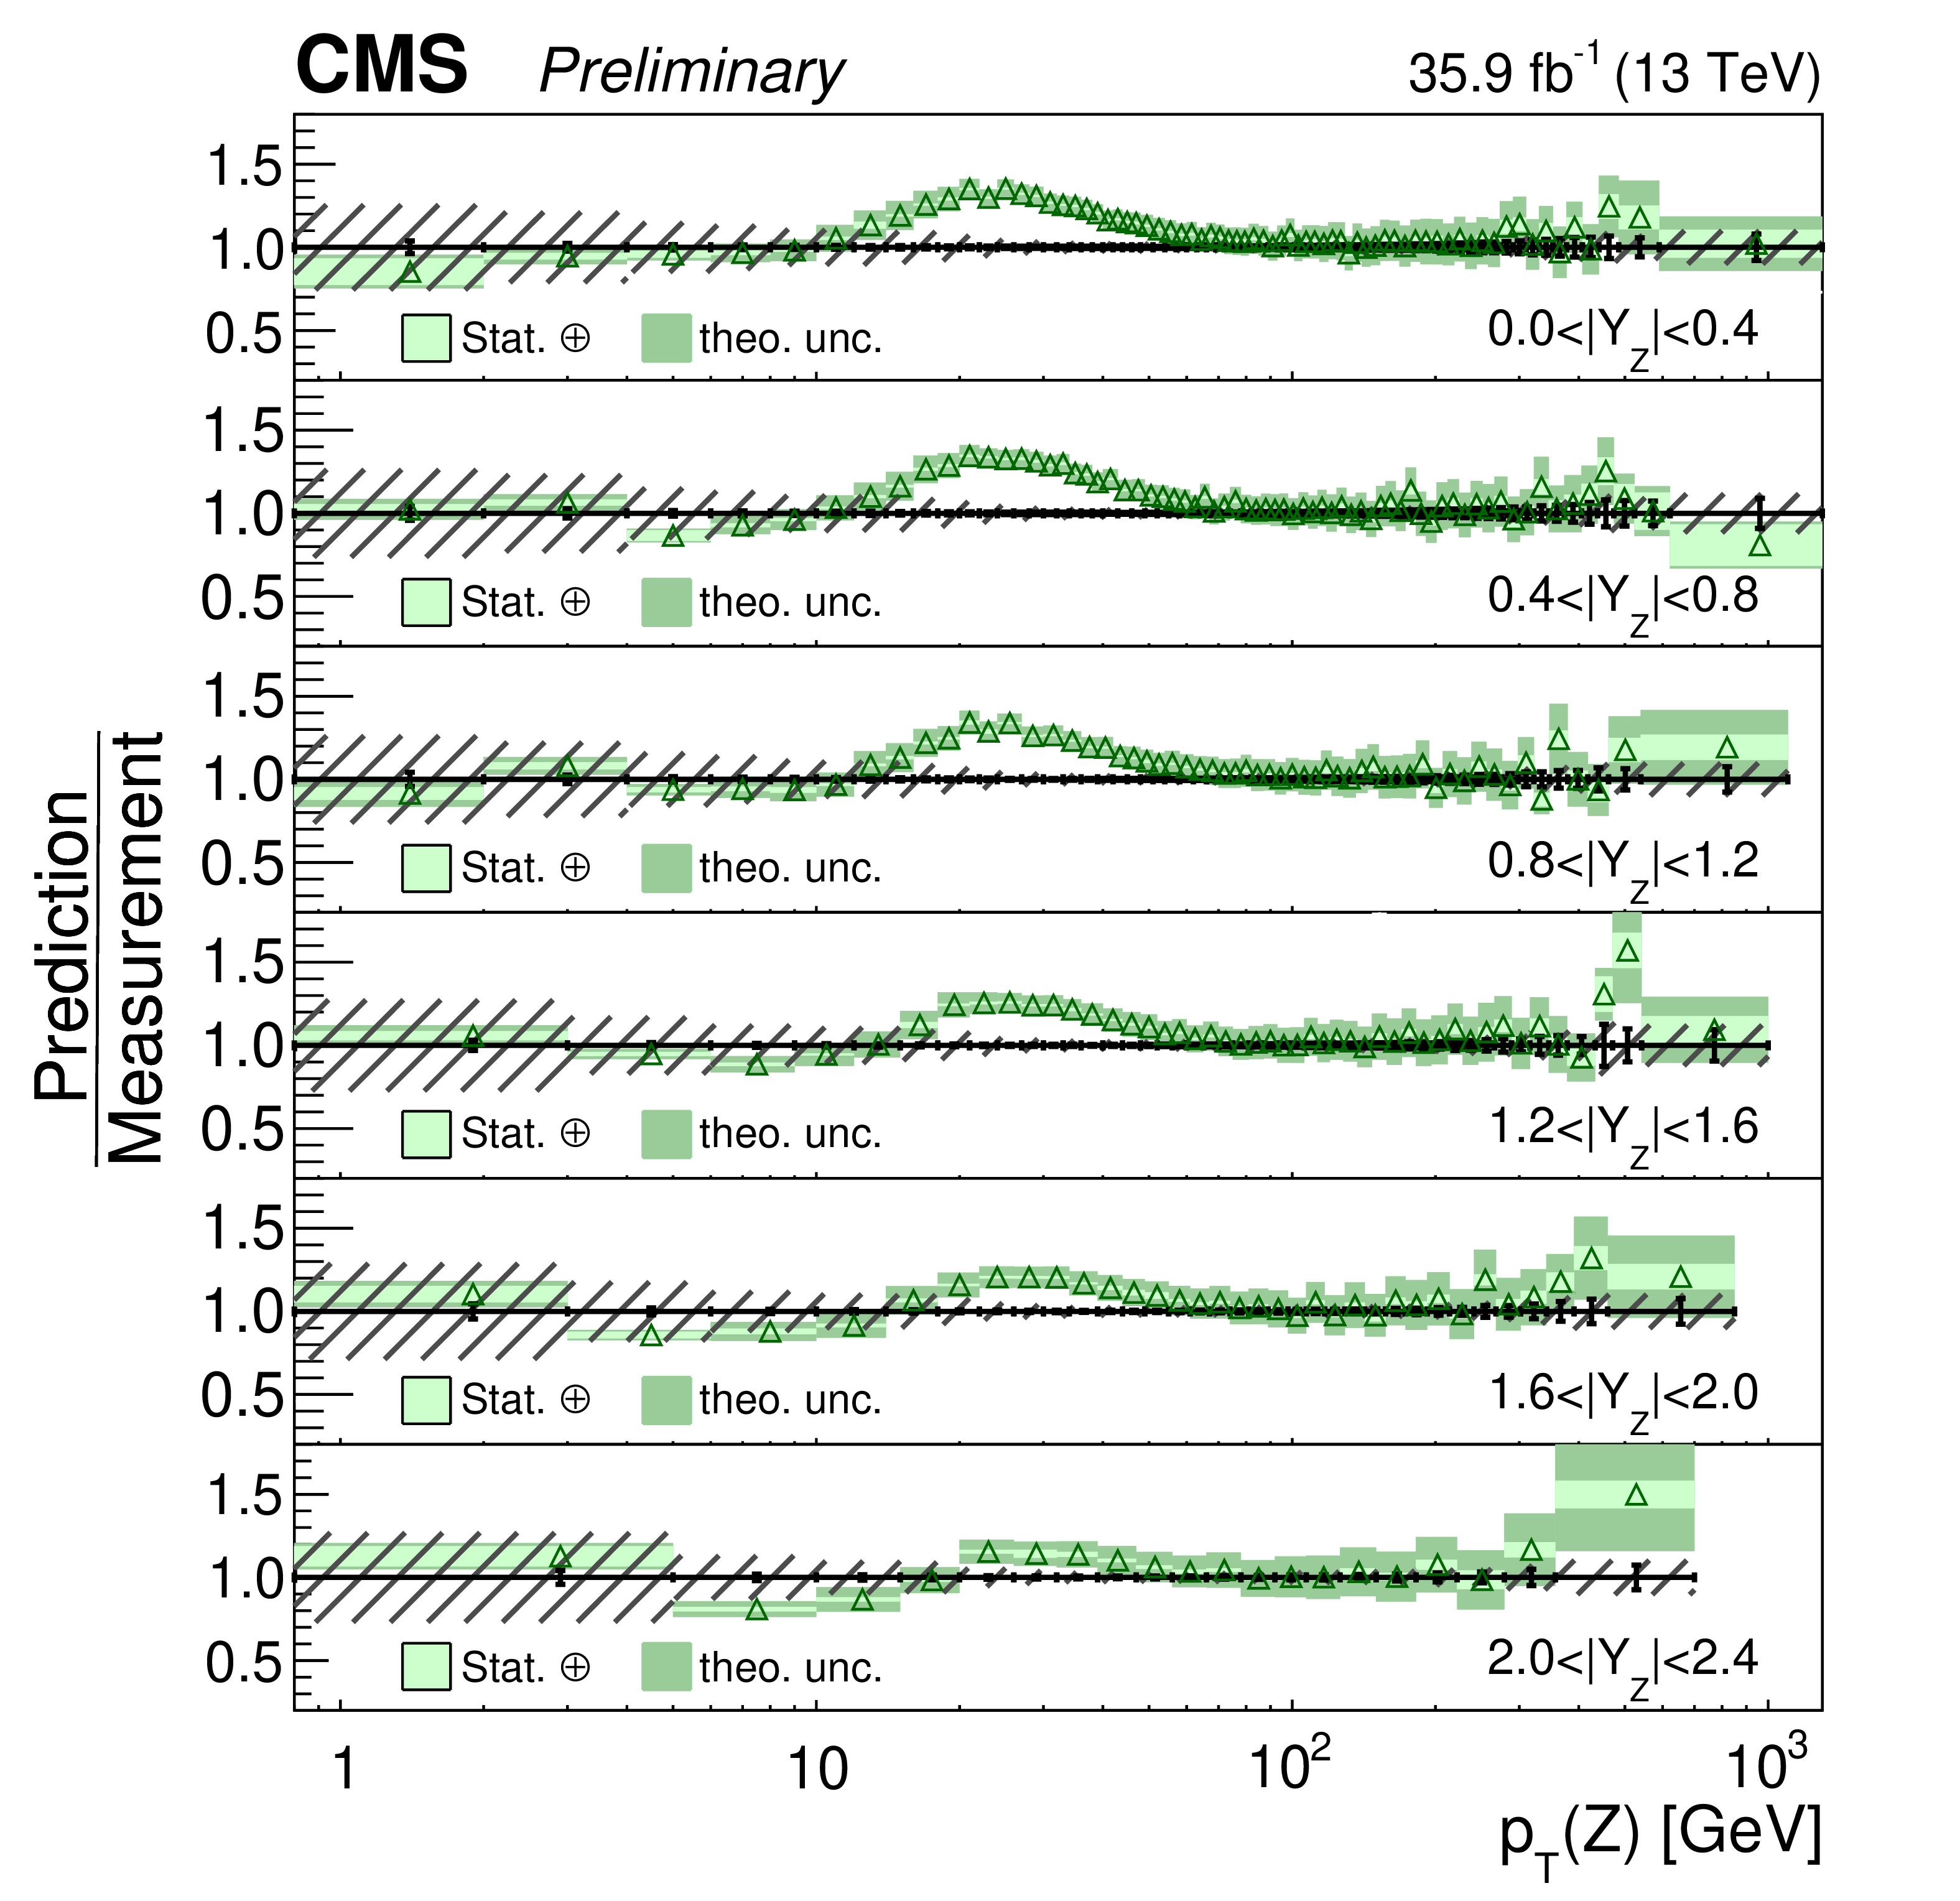
Figure 25:
Double differential cross sections as a function of Z boson ${p_{\mathrm {T}}}$ and $|y|$ for events with at least one jet. The measurement statistical (resp. systematic) uncertainties are represented with vertical error bars (resp. hashed areas). The measurement is compared to the NLO MG5_aMC, LO MG5_aMC, and GENEVA predictions described in Section 6. The predictions uncertainties, estimated as explained in this section, are represented by coloured areas in the ratio plots (light colour for the statistical part and darker colour for the total). Only statistical uncertainty is computed for the LO prediction. |
png pdf |
Figure 25-a:
Double differential cross sections as a function of Z boson ${p_{\mathrm {T}}}$ and $|y|$ for events with at least one jet. The measurement statistical (resp. systematic) uncertainties are represented with vertical error bars (resp. hashed areas). The measurement is compared to the NLO MG5_aMC, LO MG5_aMC, and GENEVA predictions described in Section 6. The predictions uncertainties, estimated as explained in this section, are represented by coloured areas in the ratio plots (light colour for the statistical part and darker colour for the total). Only statistical uncertainty is computed for the LO prediction. |

png pdf |
Figure 25-b:
Double differential cross sections as a function of Z boson ${p_{\mathrm {T}}}$ and $|y|$ for events with at least one jet. The measurement statistical (resp. systematic) uncertainties are represented with vertical error bars (resp. hashed areas). The measurement is compared to the NLO MG5_aMC, LO MG5_aMC, and GENEVA predictions described in Section 6. The predictions uncertainties, estimated as explained in this section, are represented by coloured areas in the ratio plots (light colour for the statistical part and darker colour for the total). Only statistical uncertainty is computed for the LO prediction. |

png pdf |
Figure 25-c:
Double differential cross sections as a function of Z boson ${p_{\mathrm {T}}}$ and $|y|$ for events with at least one jet. The measurement statistical (resp. systematic) uncertainties are represented with vertical error bars (resp. hashed areas). The measurement is compared to the NLO MG5_aMC, LO MG5_aMC, and GENEVA predictions described in Section 6. The predictions uncertainties, estimated as explained in this section, are represented by coloured areas in the ratio plots (light colour for the statistical part and darker colour for the total). Only statistical uncertainty is computed for the LO prediction. |
png pdf |
Figure 25-d:
Double differential cross sections as a function of Z boson ${p_{\mathrm {T}}}$ and $|y|$ for events with at least one jet. The measurement statistical (resp. systematic) uncertainties are represented with vertical error bars (resp. hashed areas). The measurement is compared to the NLO MG5_aMC, LO MG5_aMC, and GENEVA predictions described in Section 6. The predictions uncertainties, estimated as explained in this section, are represented by coloured areas in the ratio plots (light colour for the statistical part and darker colour for the total). Only statistical uncertainty is computed for the LO prediction. |
| Tables | |
png pdf |
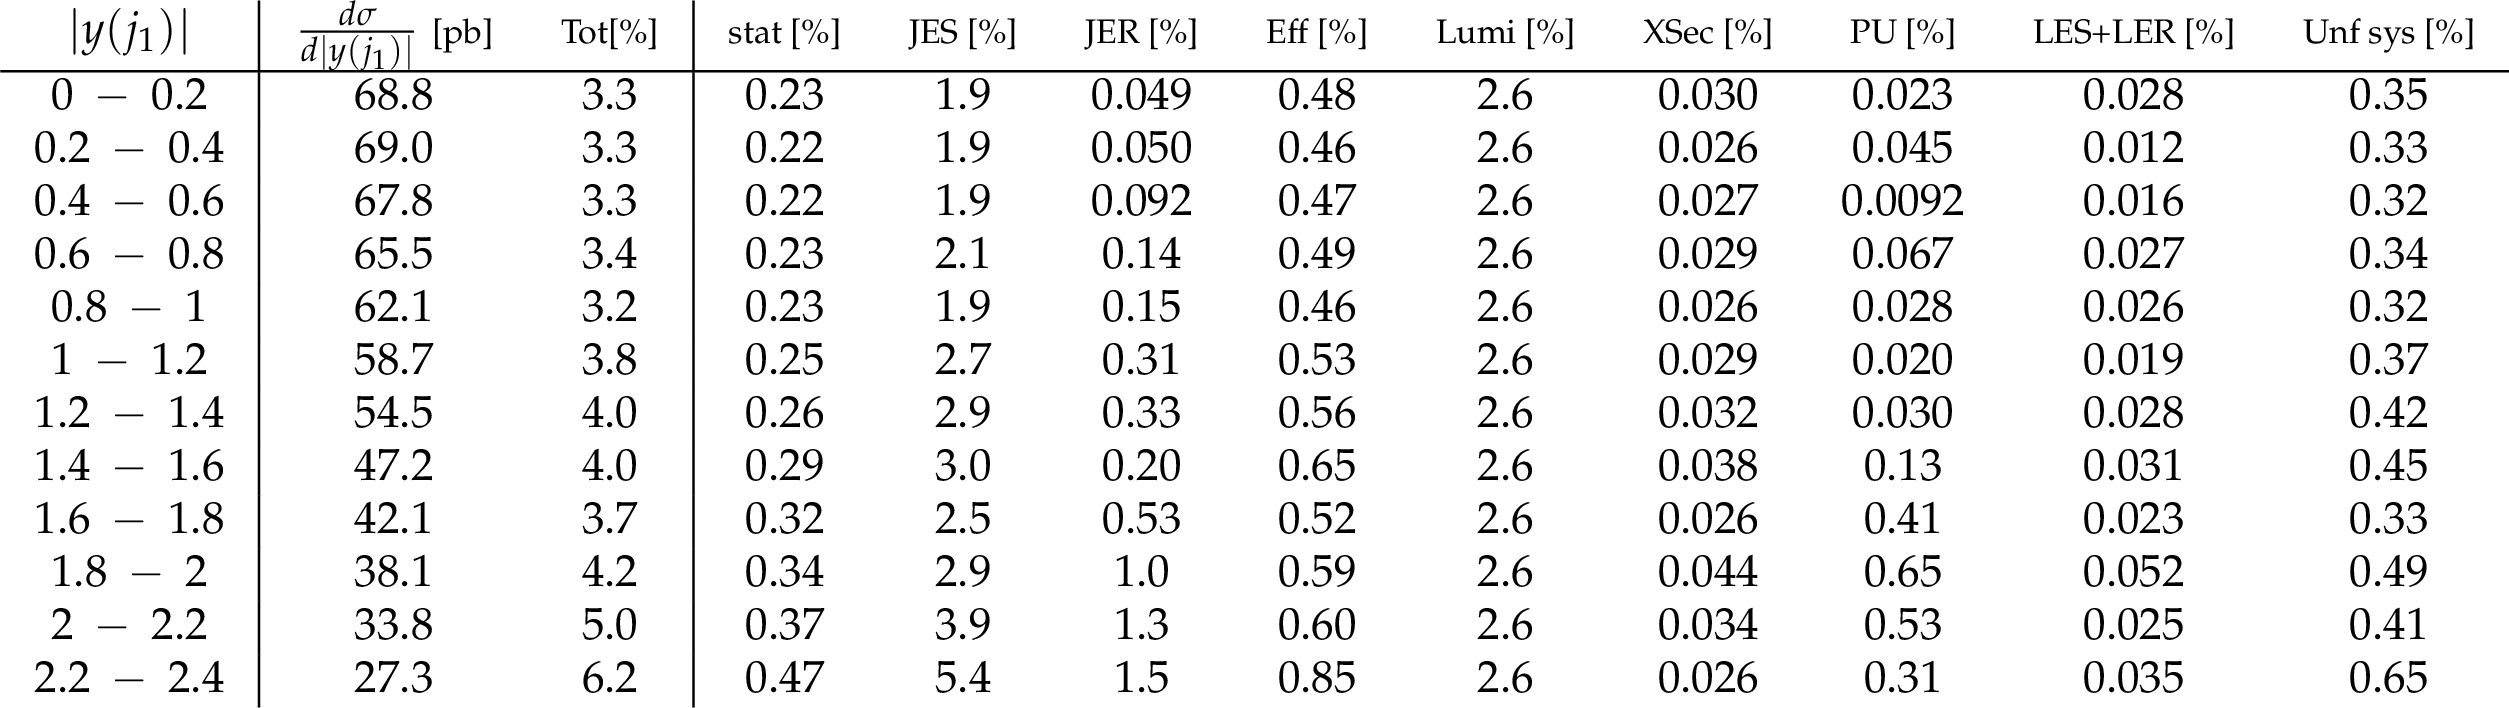
Table 1:
Differential cross section in $1^{\text {st}}$ jet $| \eta | $ ($N_{\text {jets}} \geq $ 1) and break down of the systematic uncertainties for the combination of both decay channels. |
png pdf |
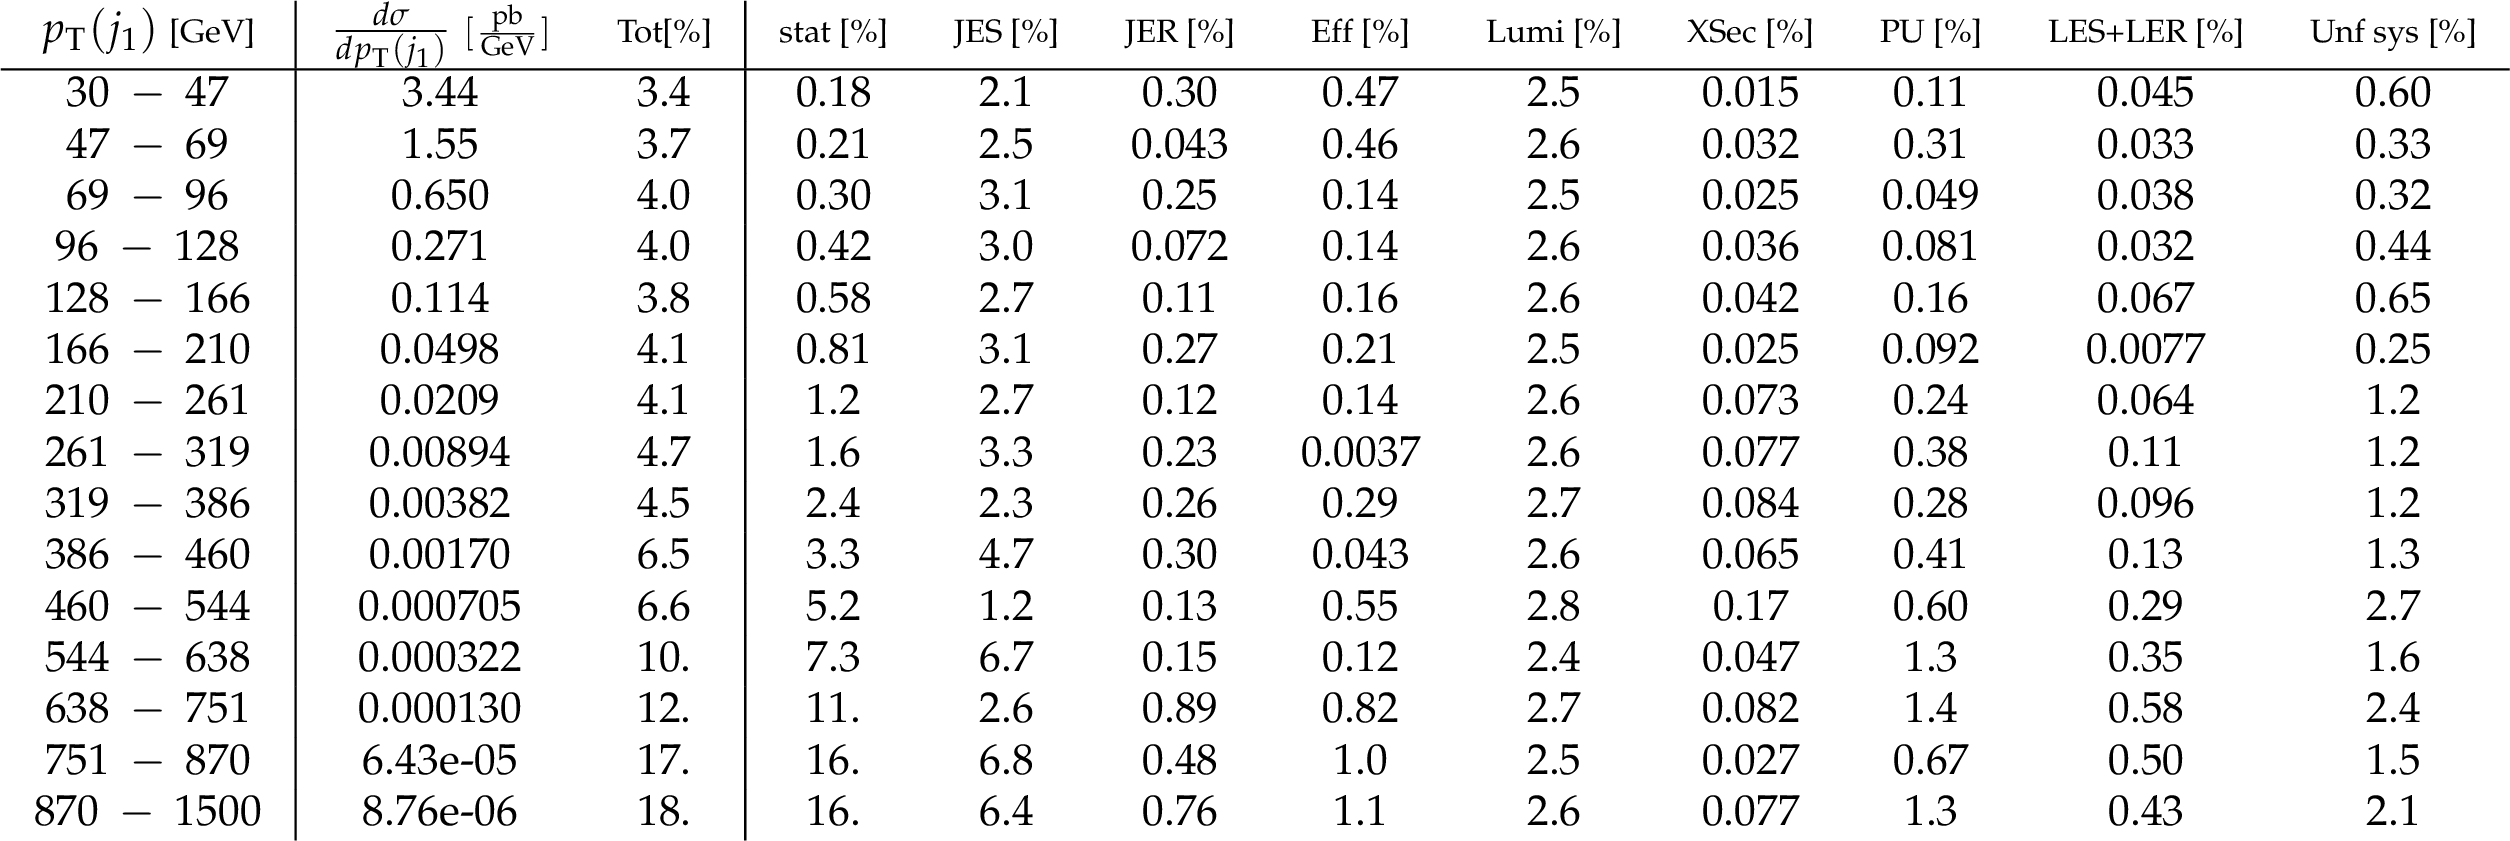
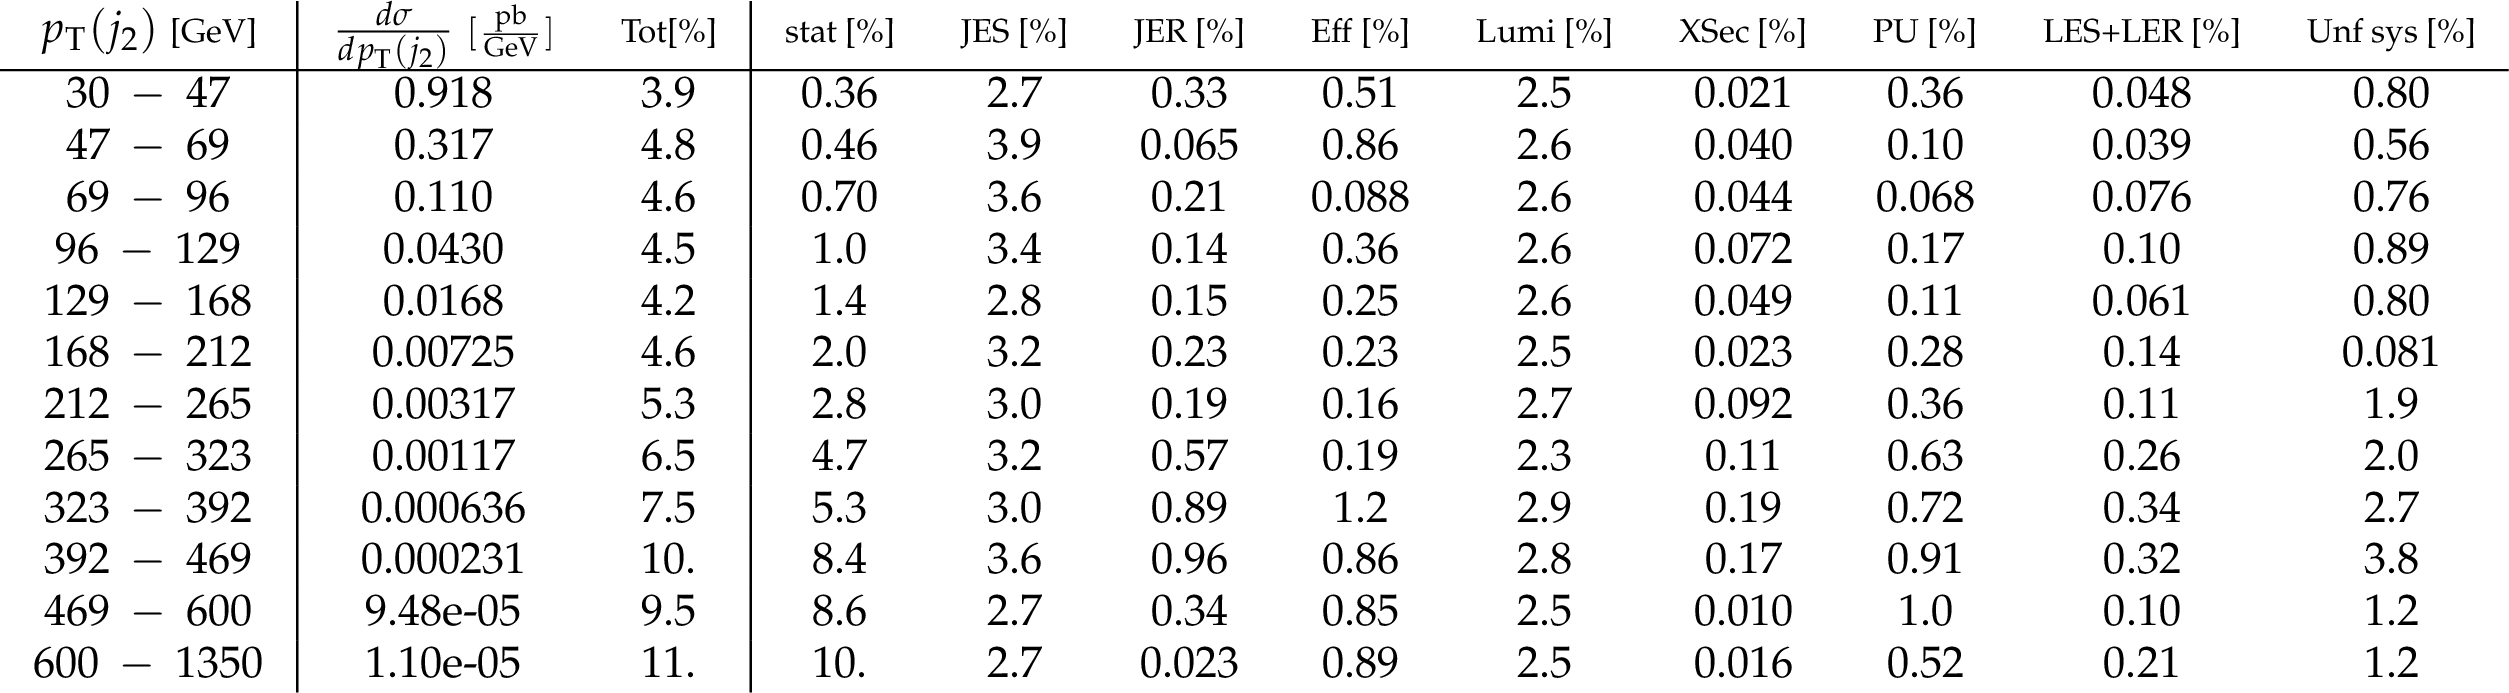
Table 2:
Differential cross section in $1^{\text {st}}$ jet $p_{\text {T}}$ ($N_{\text {jets}} \geq $ 1) and break down of the systematic uncertainties for the combination of both decay channels. |
png pdf |
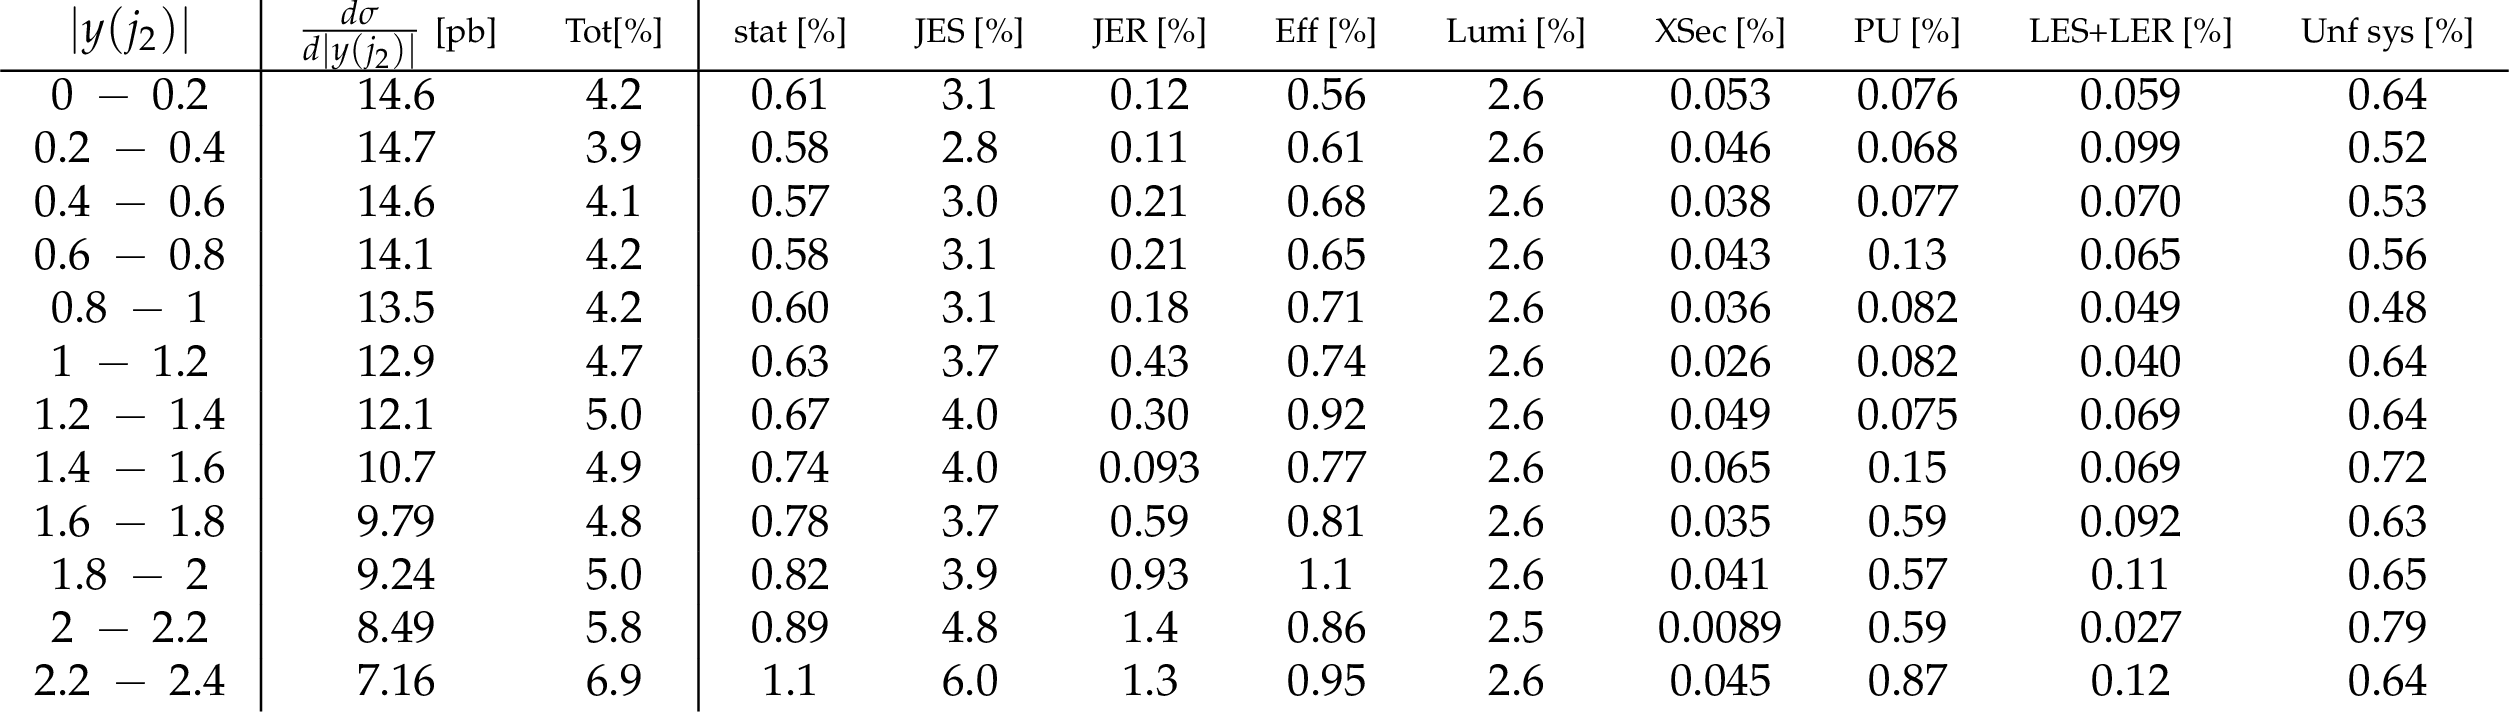
Table 3:
Differential cross section in $2^{\text {nd}}$ jet $| \eta | $ ($N_{\text {jets}} \geq $ 2) and break down of the systematic uncertainties for the combination of both decay channels. |
png pdf |
Table 4:
Differential cross section in $2^{\text {nd}}$ jet $p_{\text {T}}$ ($N_{\text {jets}} \geq $ 2) and break down of the systematic uncertainties for the combination of both decay channels. |

png pdf |
Table 5:
Differential cross section in $3^{\text {rd}}$ jet $| \eta | $ ($N_{\text {jets}} \geq $ 3) and break down of the systematic uncertainties for the combination of both decay channels. |
png pdf |
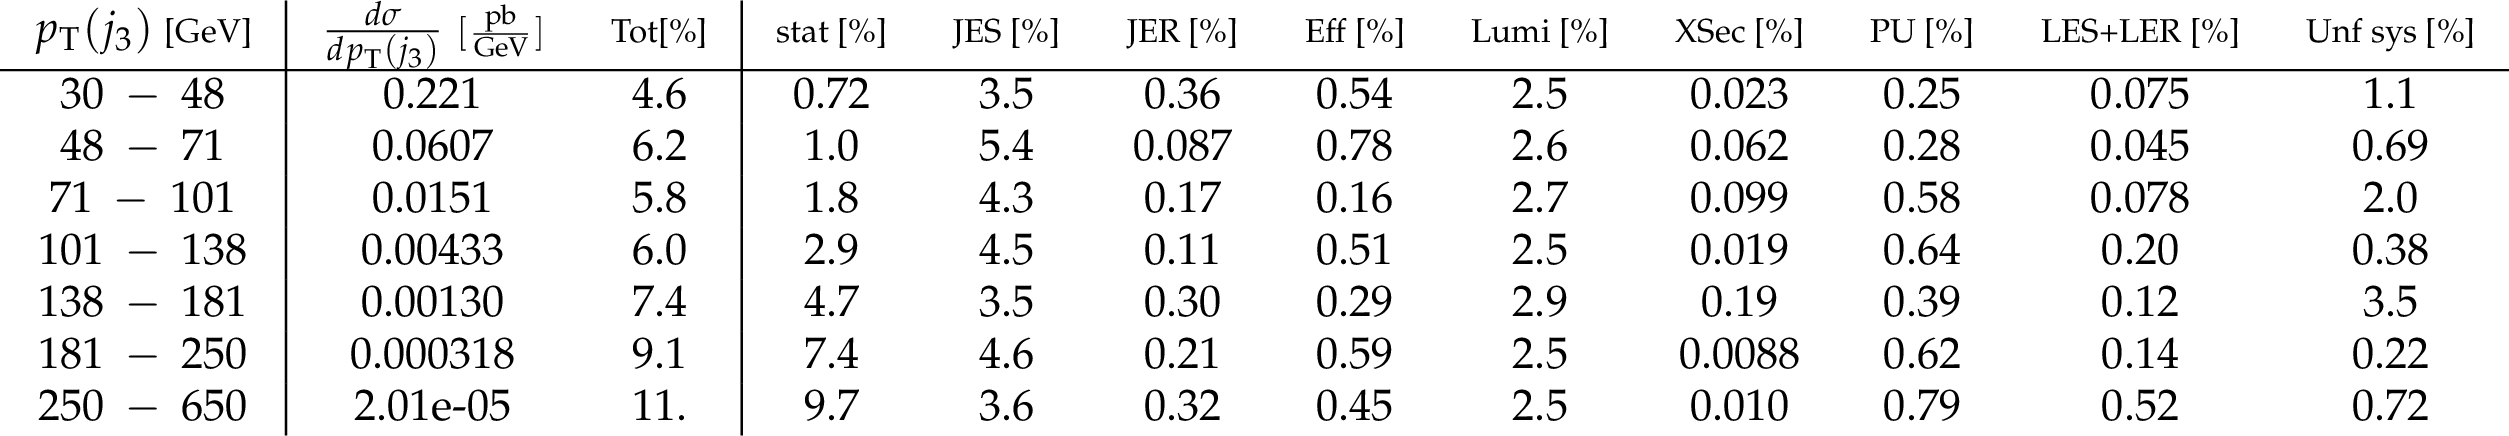
Table 6:
Differential cross section in $3^{\text {rd}}$ jet $p_{\text {T}}$ ($N_{\text {jets}} \geq $ 3) and break down of the systematic uncertainties for the combination of both decay channels. |
png pdf |
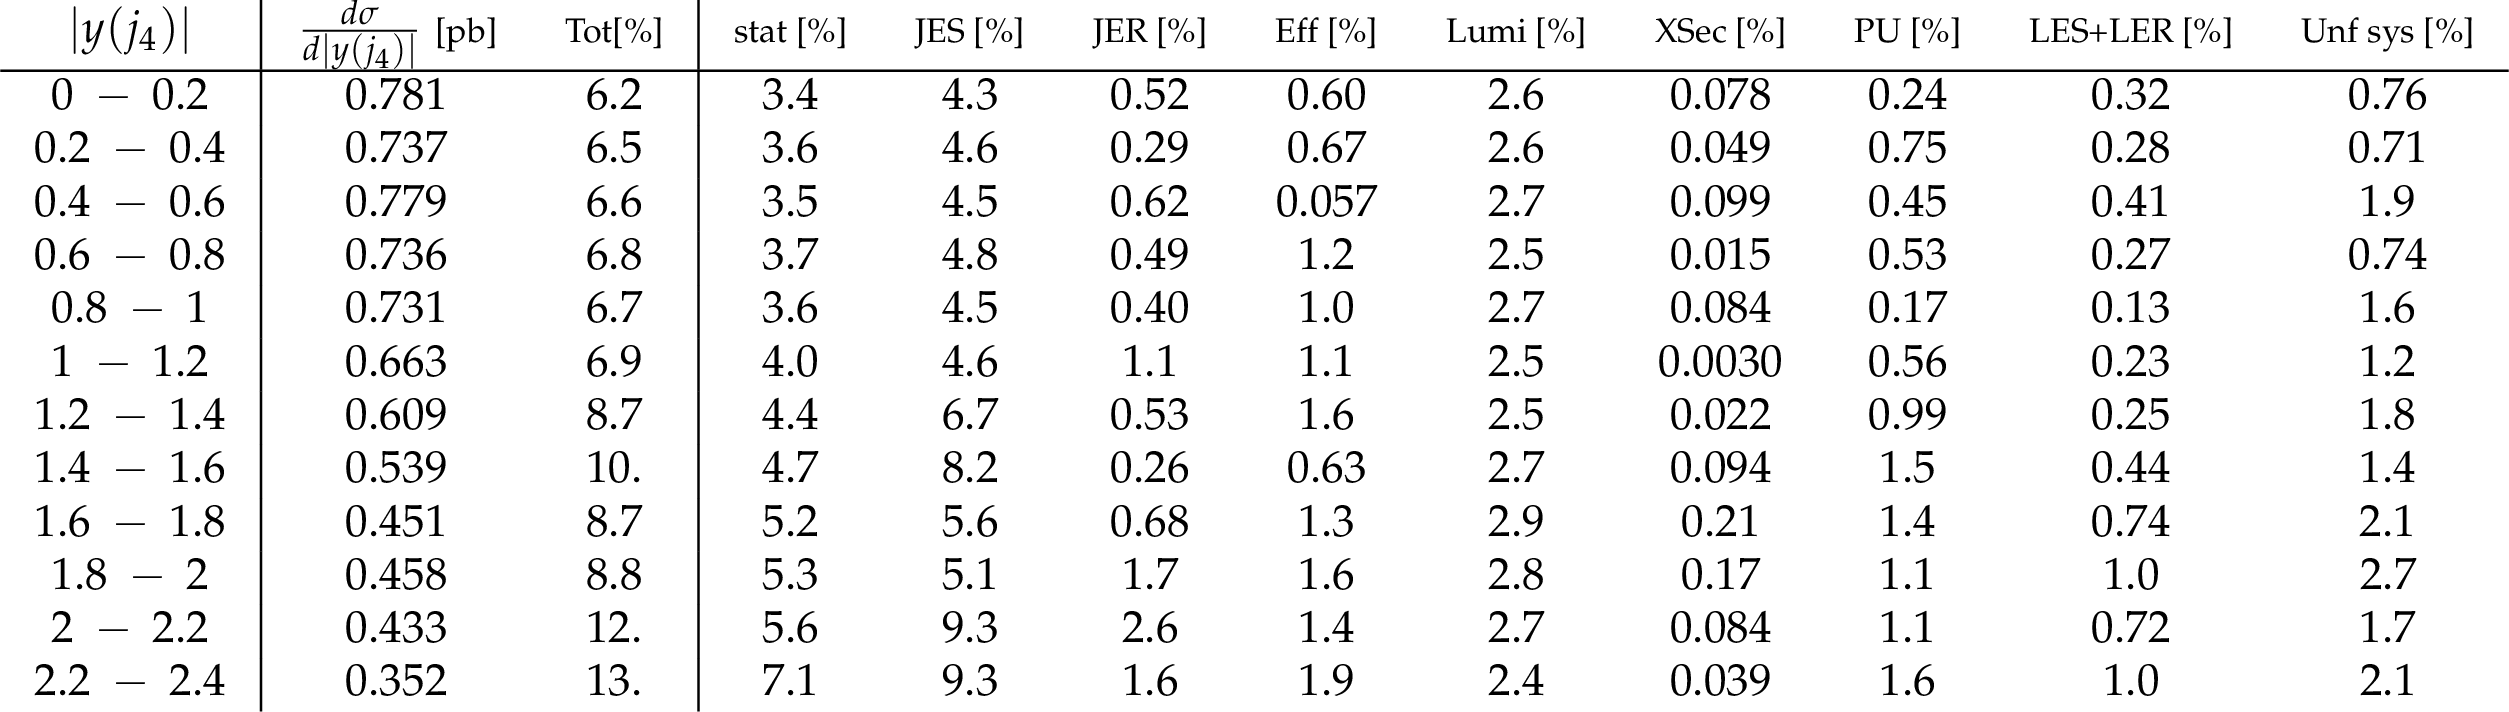
Table 7:
Differential cross section in $4^{\text {th}}$ jet $| \eta | $ ($N_{\text {jets}} \geq $ 4) and break down of the systematic uncertainties for the combination of both decay channels. |
png pdf |
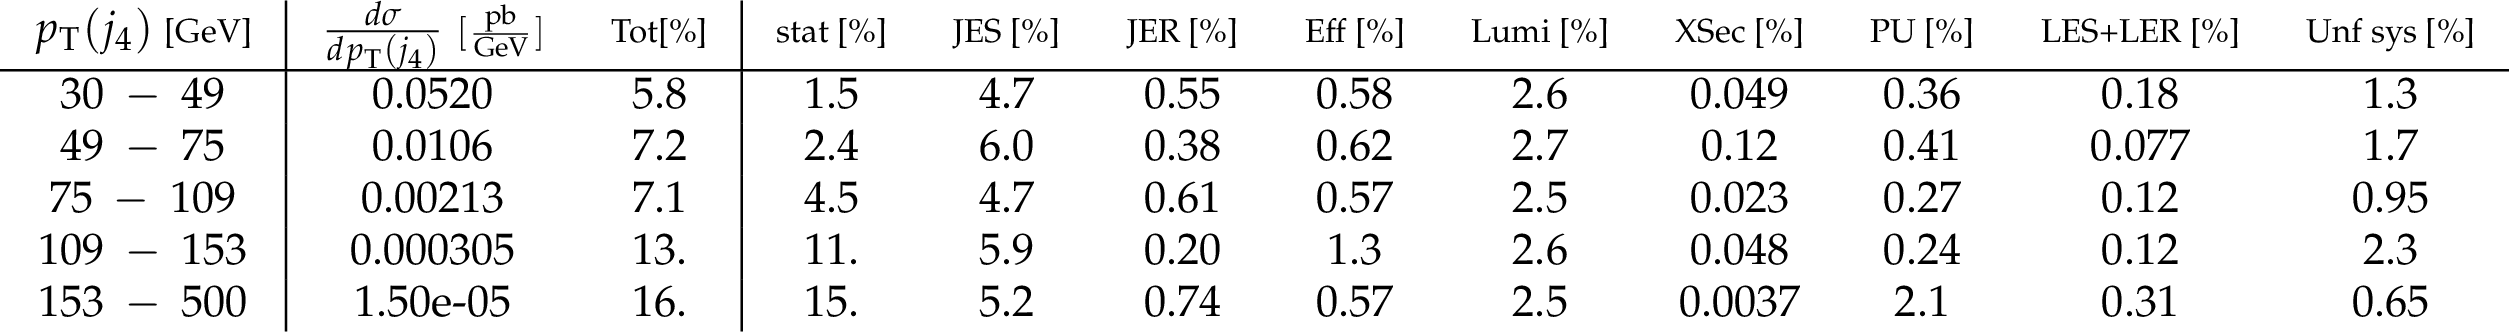
Table 8:
Differential cross section in $4^{\text {th}}$ jet $p_{\text {T}}$ ($N_{\text {jets}} \geq $ 4) and break down of the systematic uncertainties for the combination of both decay channels. |
png pdf |
Table 9:
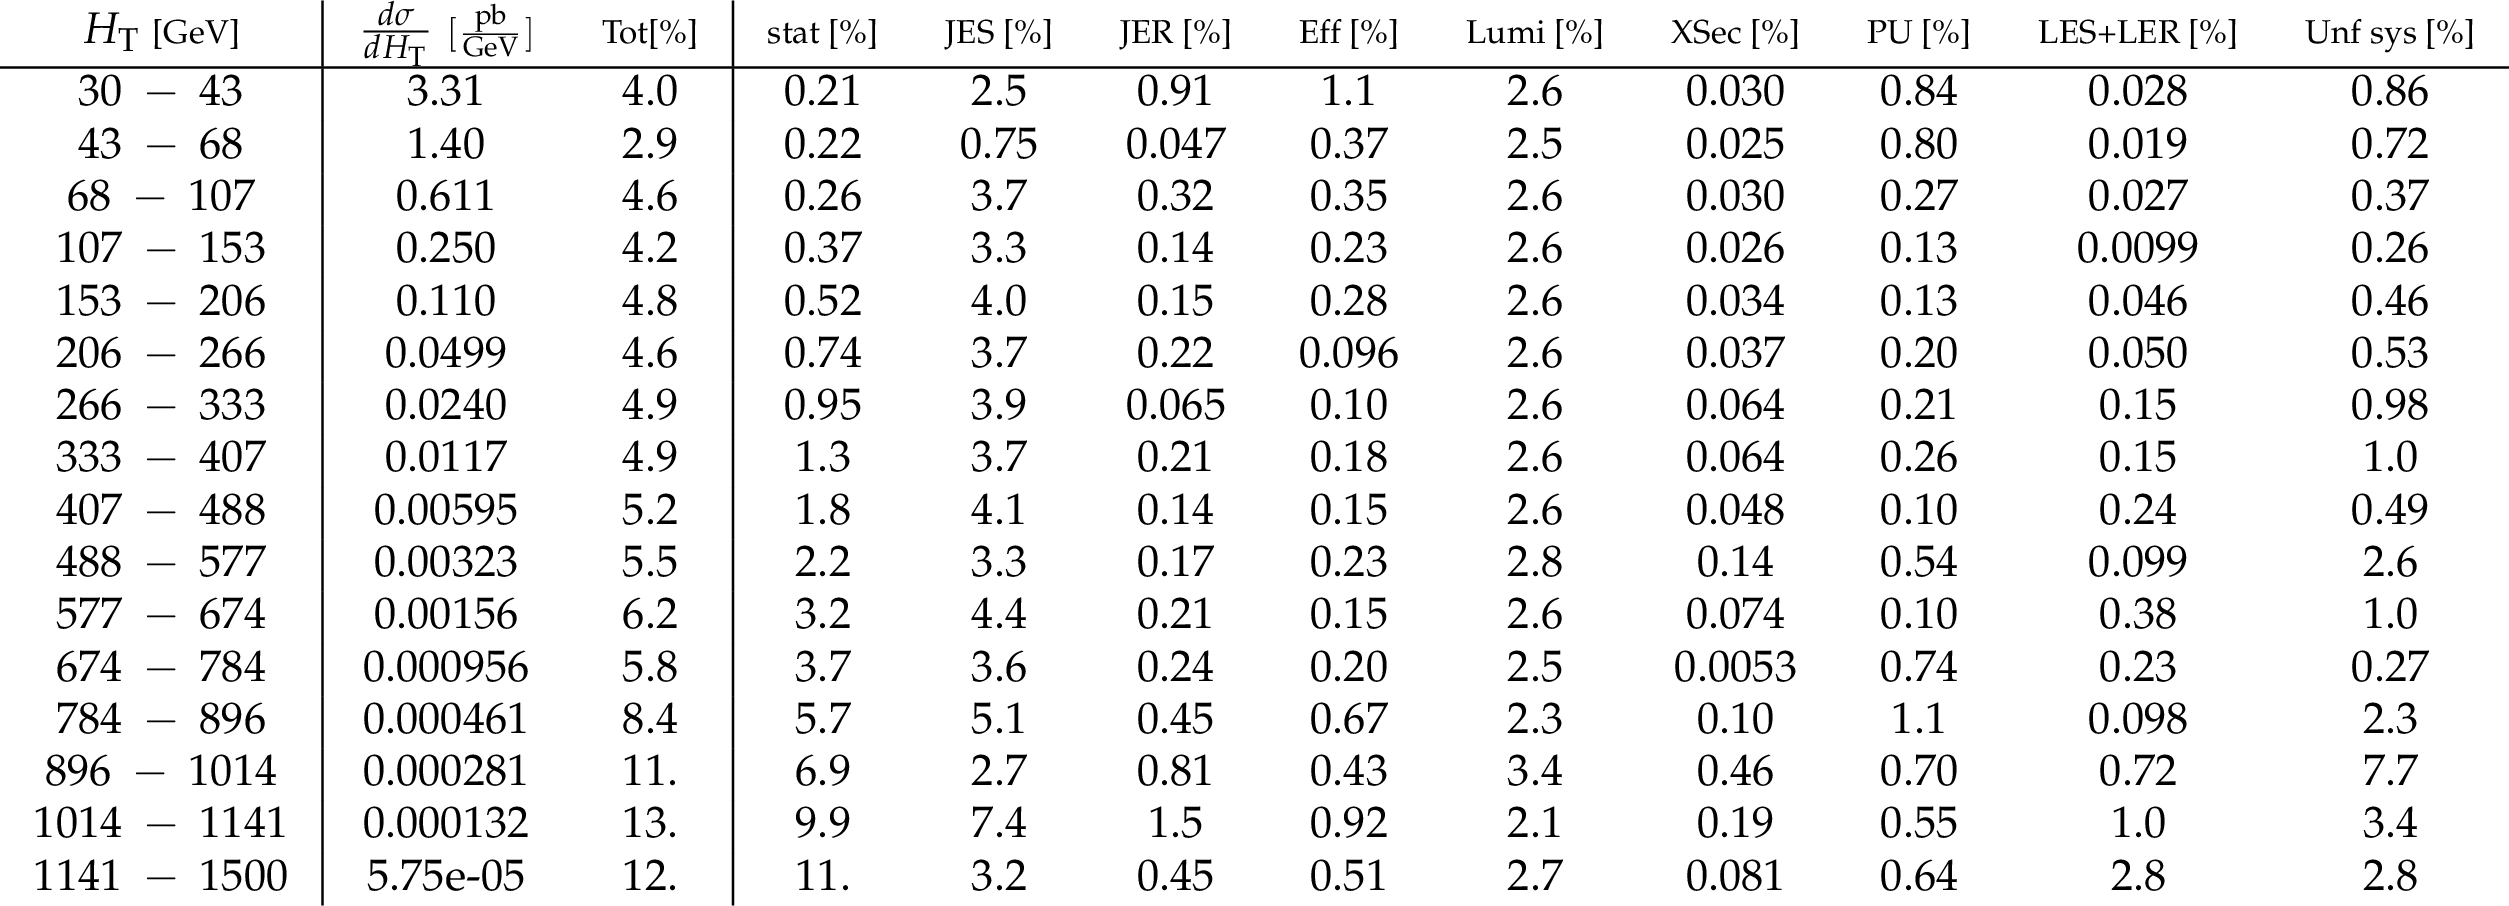
Differential cross section in $H_{\text {T}}$ ($N_{\text {jets}} \geq $ 1) and break down of the systematic uncertainties for the combination of both decay channels. |
png pdf |
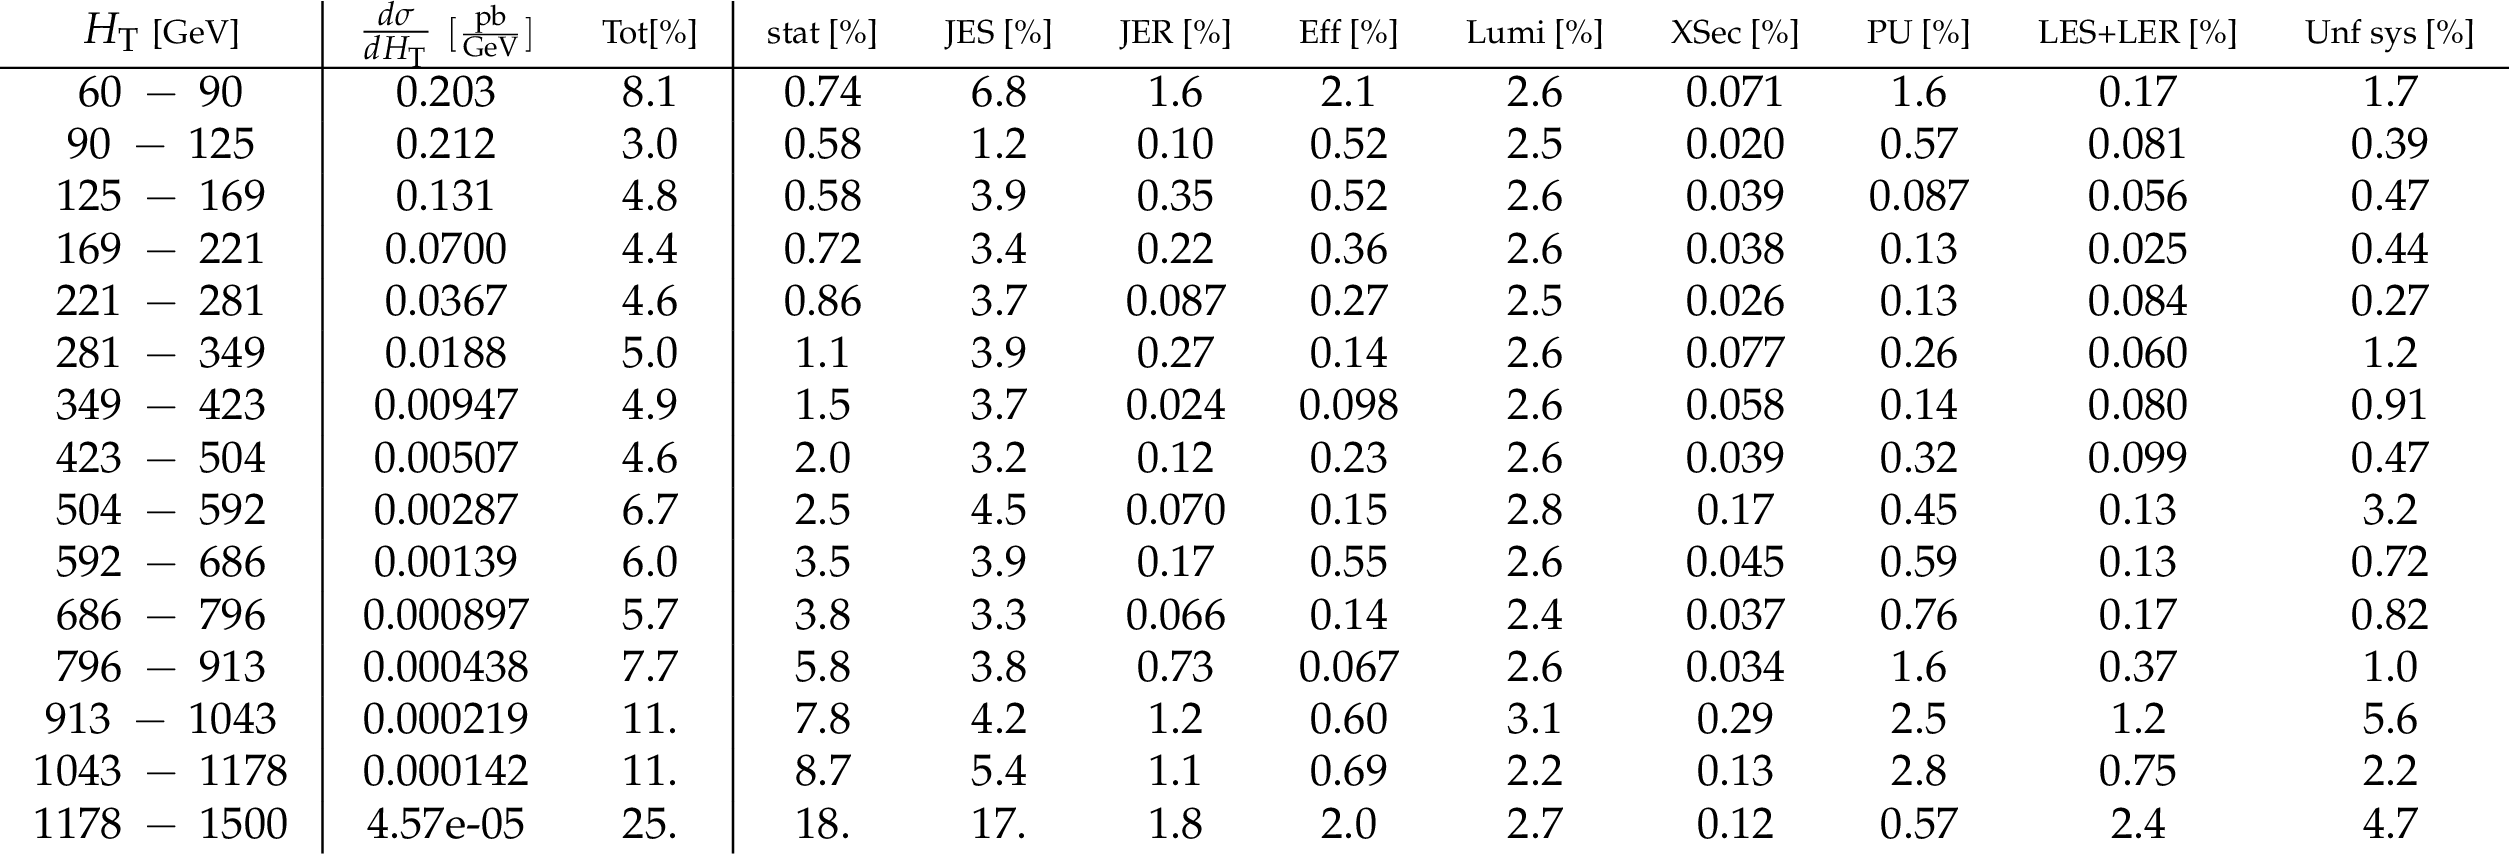
Table 10:
Differential cross section in $H_{\text {T}}$ ($N_{\text {jets}} \geq $ 2) and break down of the systematic uncertainties for the combination of both decay channels. |
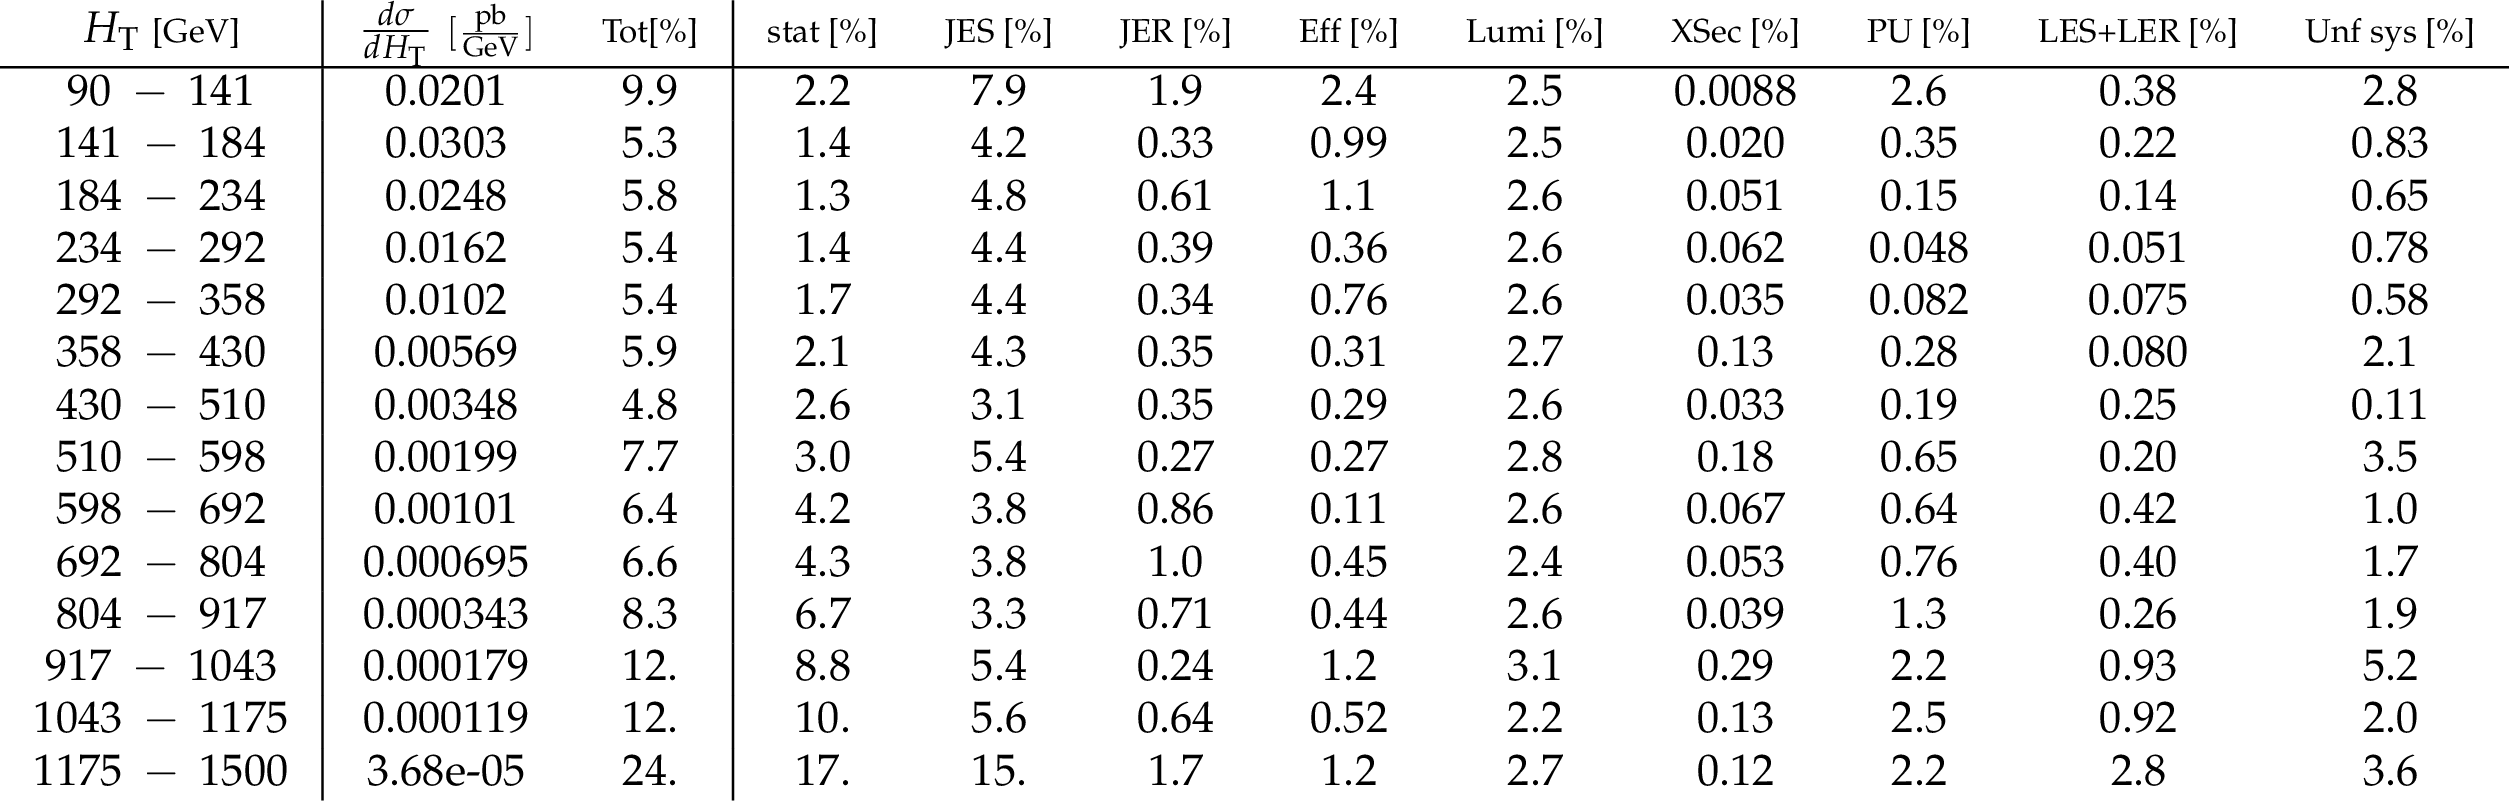
png pdf |
Table 11:
Differential cross section in $H_{\text {T}}$ ($N_{\text {jets}} \geq $ 3) and break down of the systematic uncertainties for the combination of both decay channels. |
png pdf |
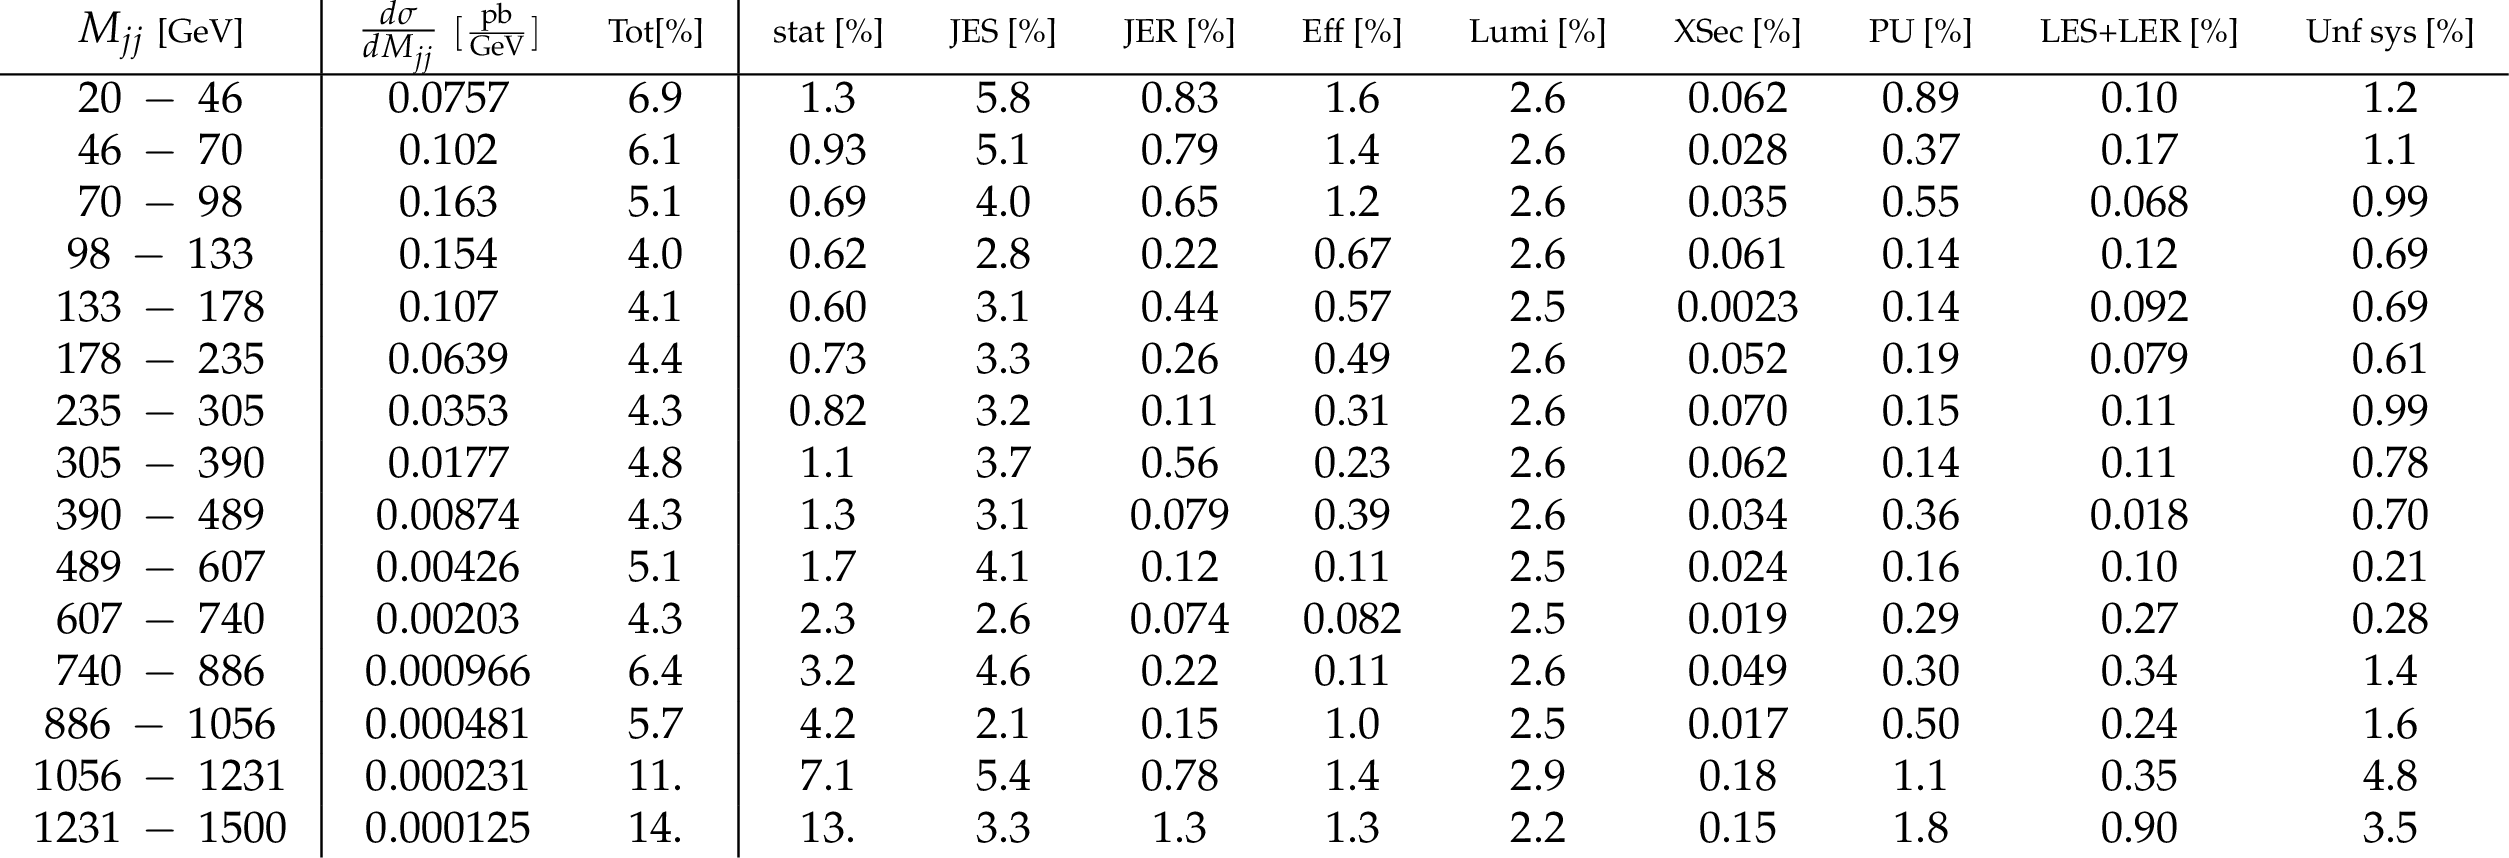
Table 12:
Differential cross section in dijet mass $M_{jj}$ ($N_{\text {jets}} \geq $ 2) and break down of the systematic uncertainties for the combination of both decay channels. |

png pdf |
Table 13:
Differential cross section in exclusive jet multiplicity and break down of the systematic uncertainties for the combination of both decay channels. |
png pdf |
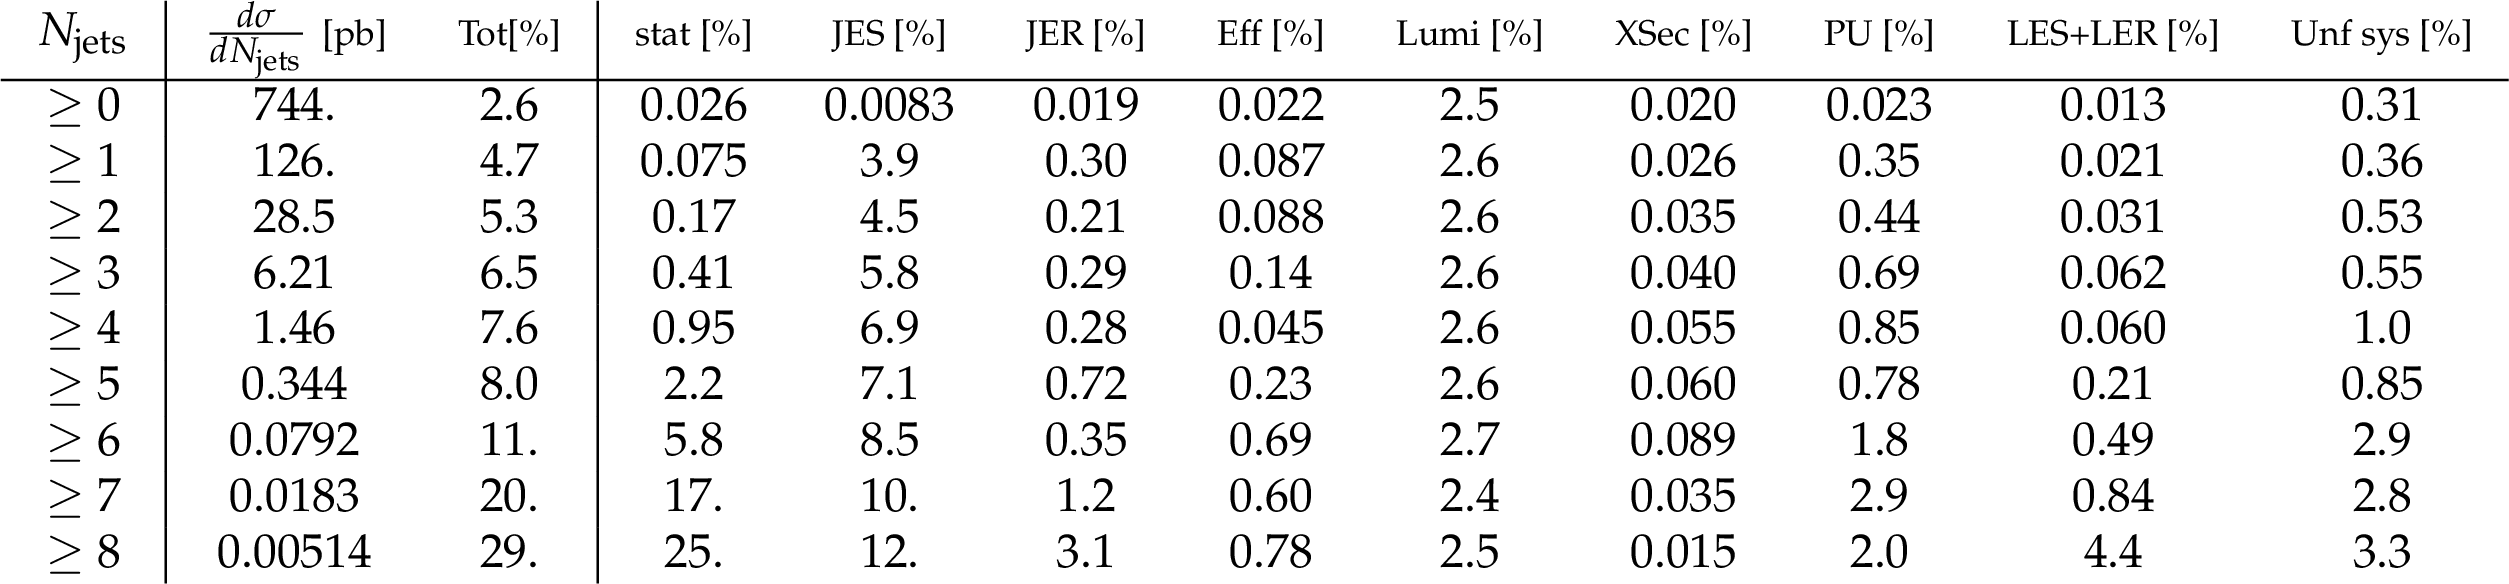
Table 14:
Differential cross section in inclusive jet multiplicity and break down of the systematic uncertainties for the combination of both decay channels. |
png pdf |
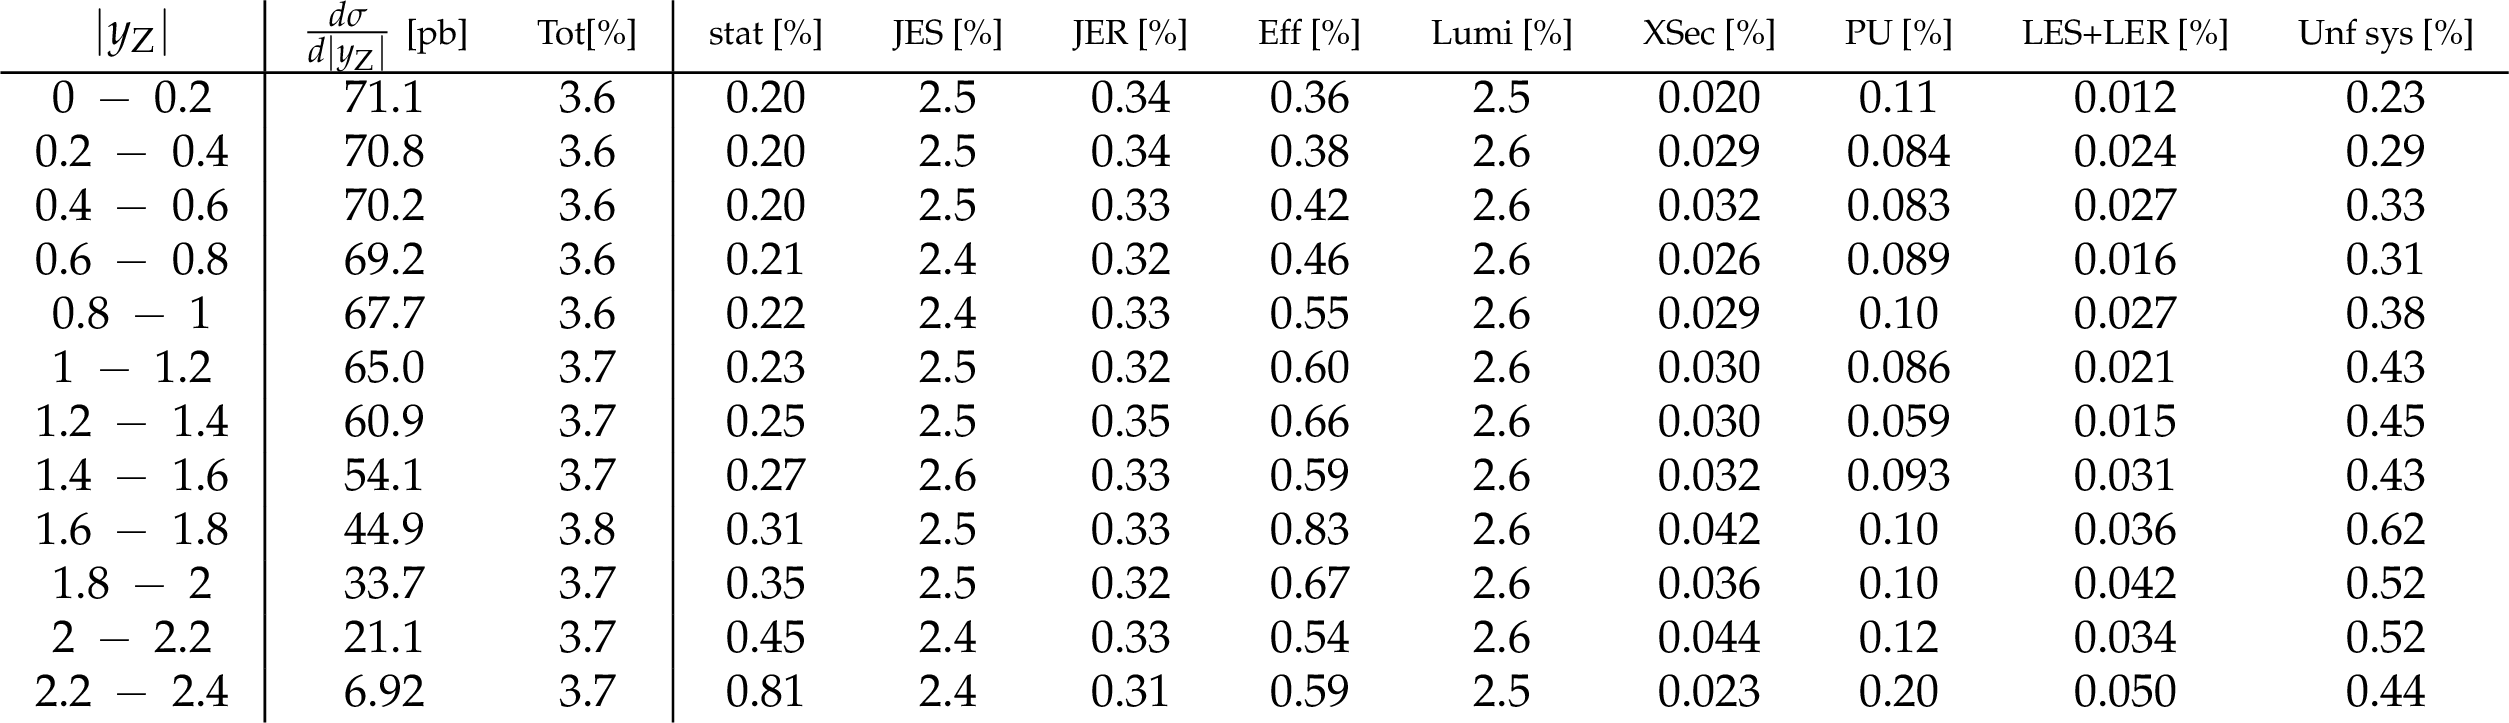
Table 15:
Differential cross section in $|y_\text {Z}|$ ($N_{\text {jets}} \geq $ 1) and break down of the systematic uncertainties for the combination of both decay channels. |

png pdf |
Table 16:
Differential cross section in $y_\text {diff(jet1,jet2)}$ ($N_{\text {jets}} \geq $ 2) and break down of the systematic uncertainties for the combination of both decay channels. |
png pdf |
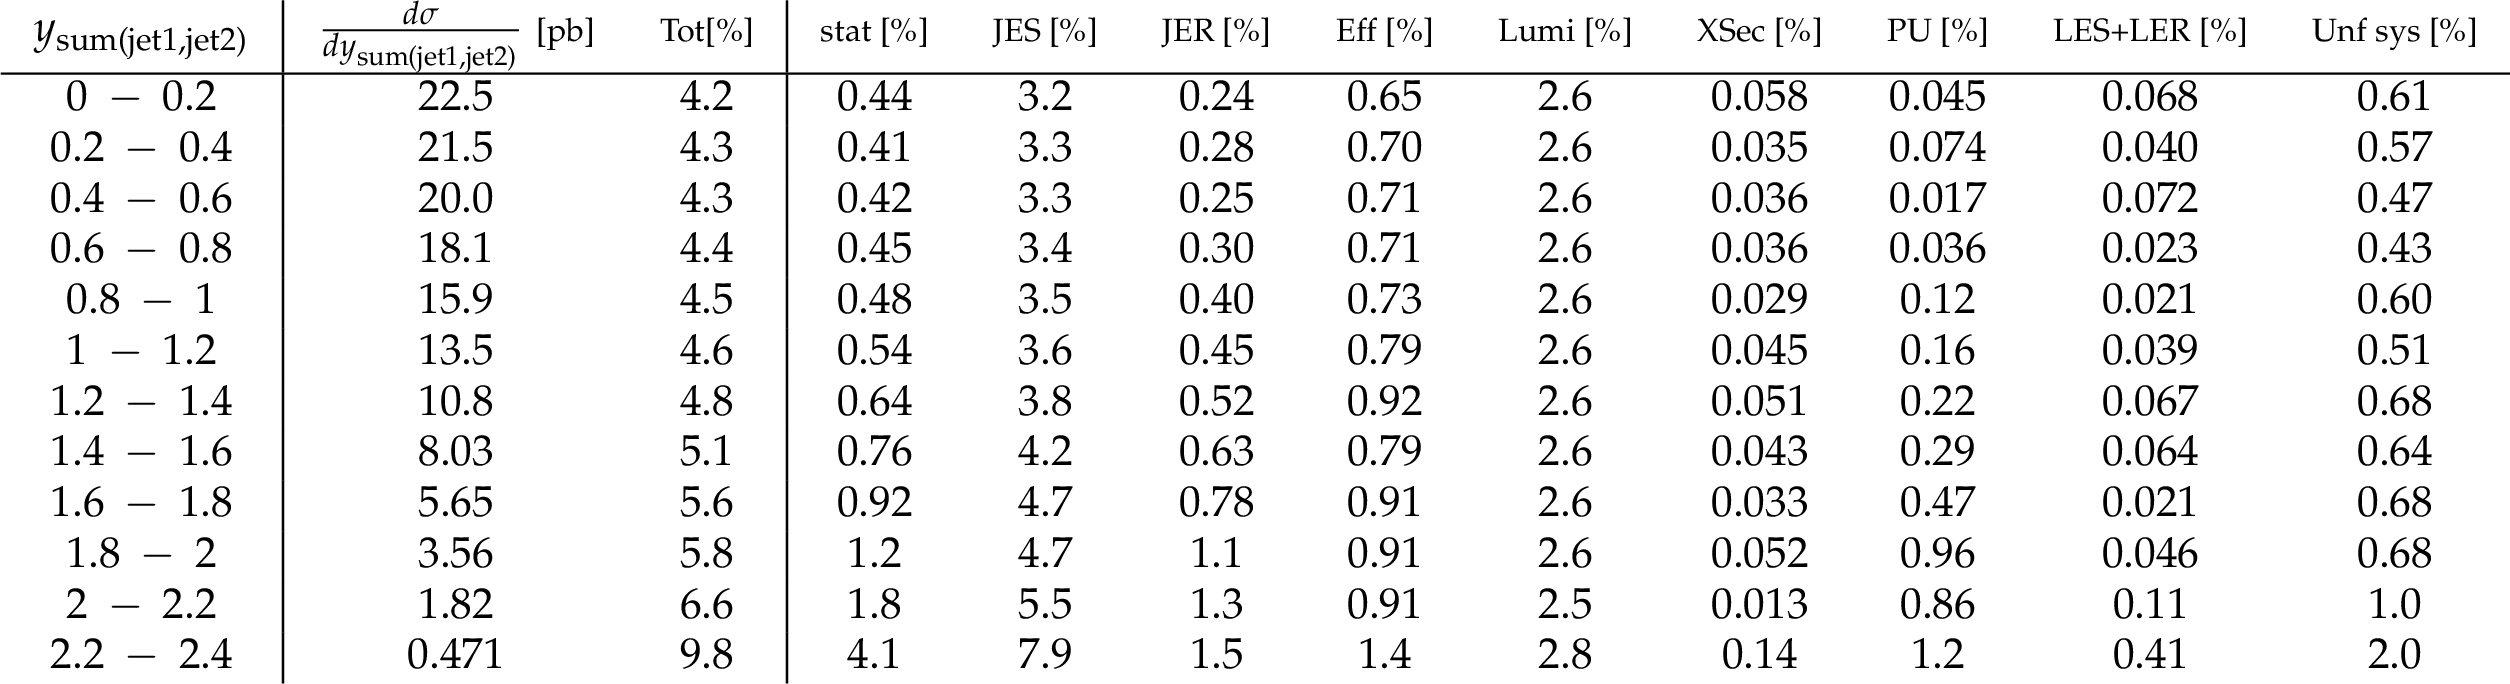
Table 17:
Differential cross section in $y_\text {sum(jet1,jet2)}$ ($N_{\text {jets}} \geq $ 2) and break down of the systematic uncertainties for the combination of both decay channels. |
png pdf |
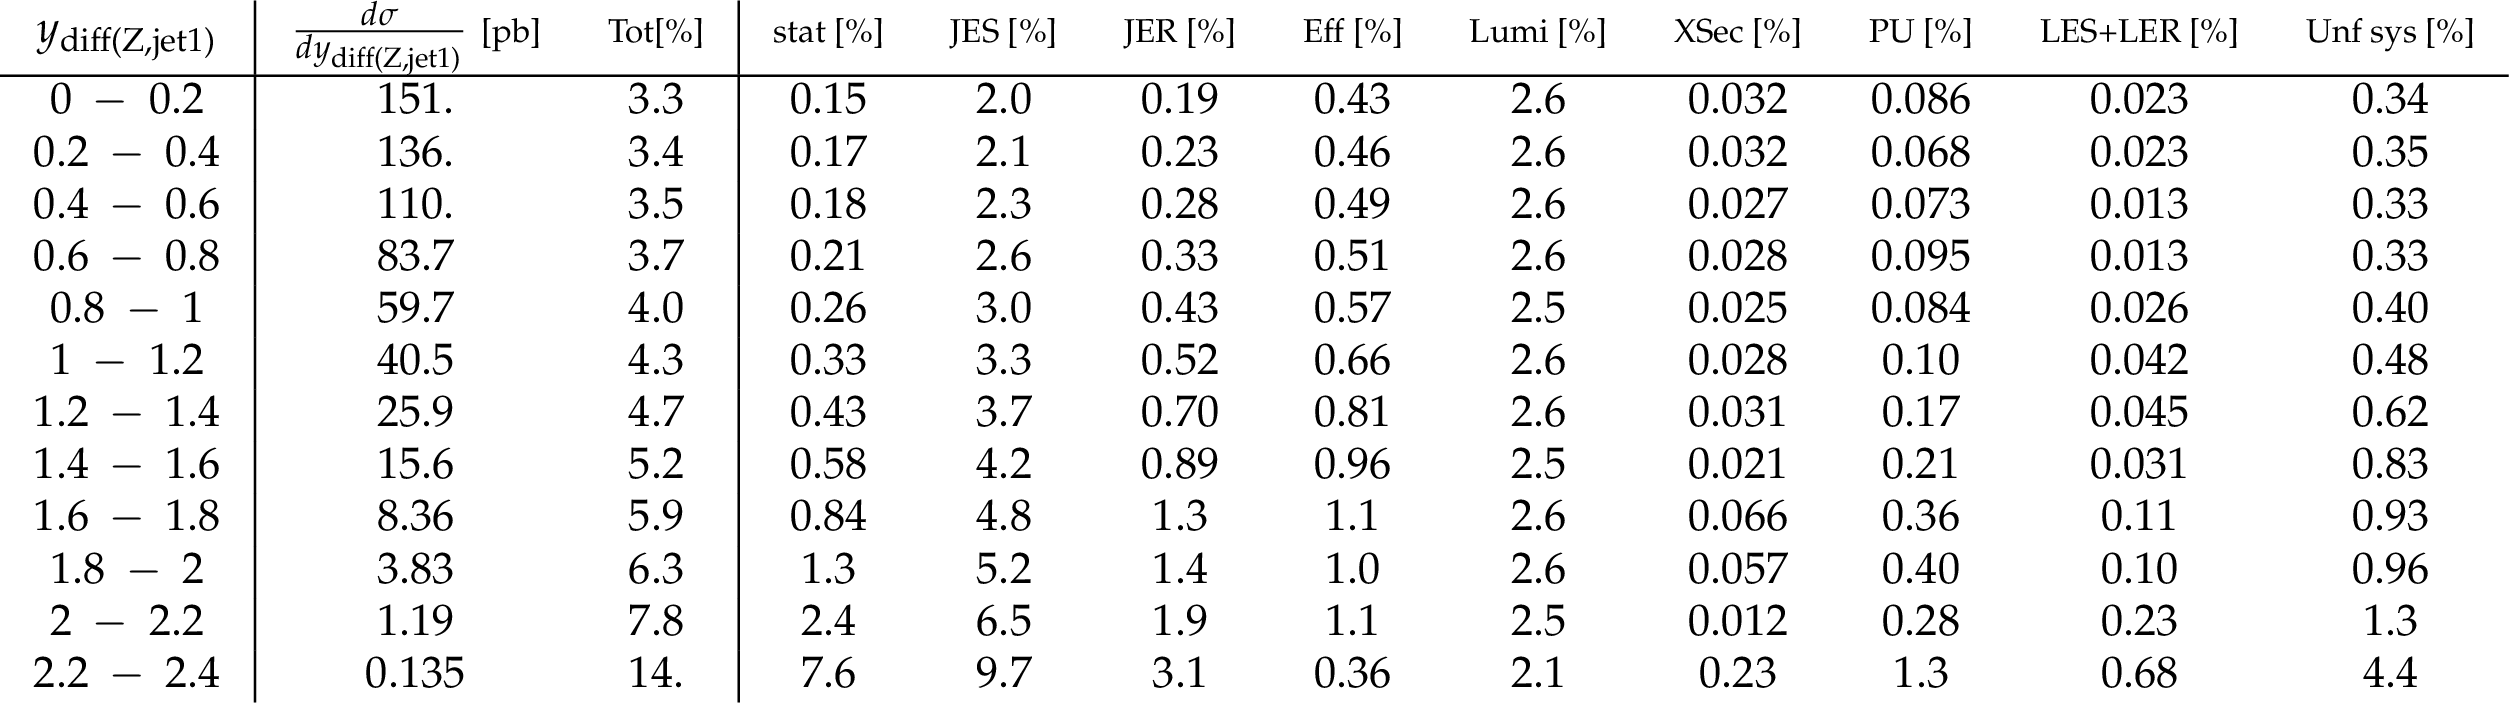
Table 18:
Differential cross section in $y_\text {diff(Z,jet1)}$ ($N_{\text {jets}} \geq $ 1) and break down of the systematic uncertainties for the combination of both decay channels. |
png pdf |
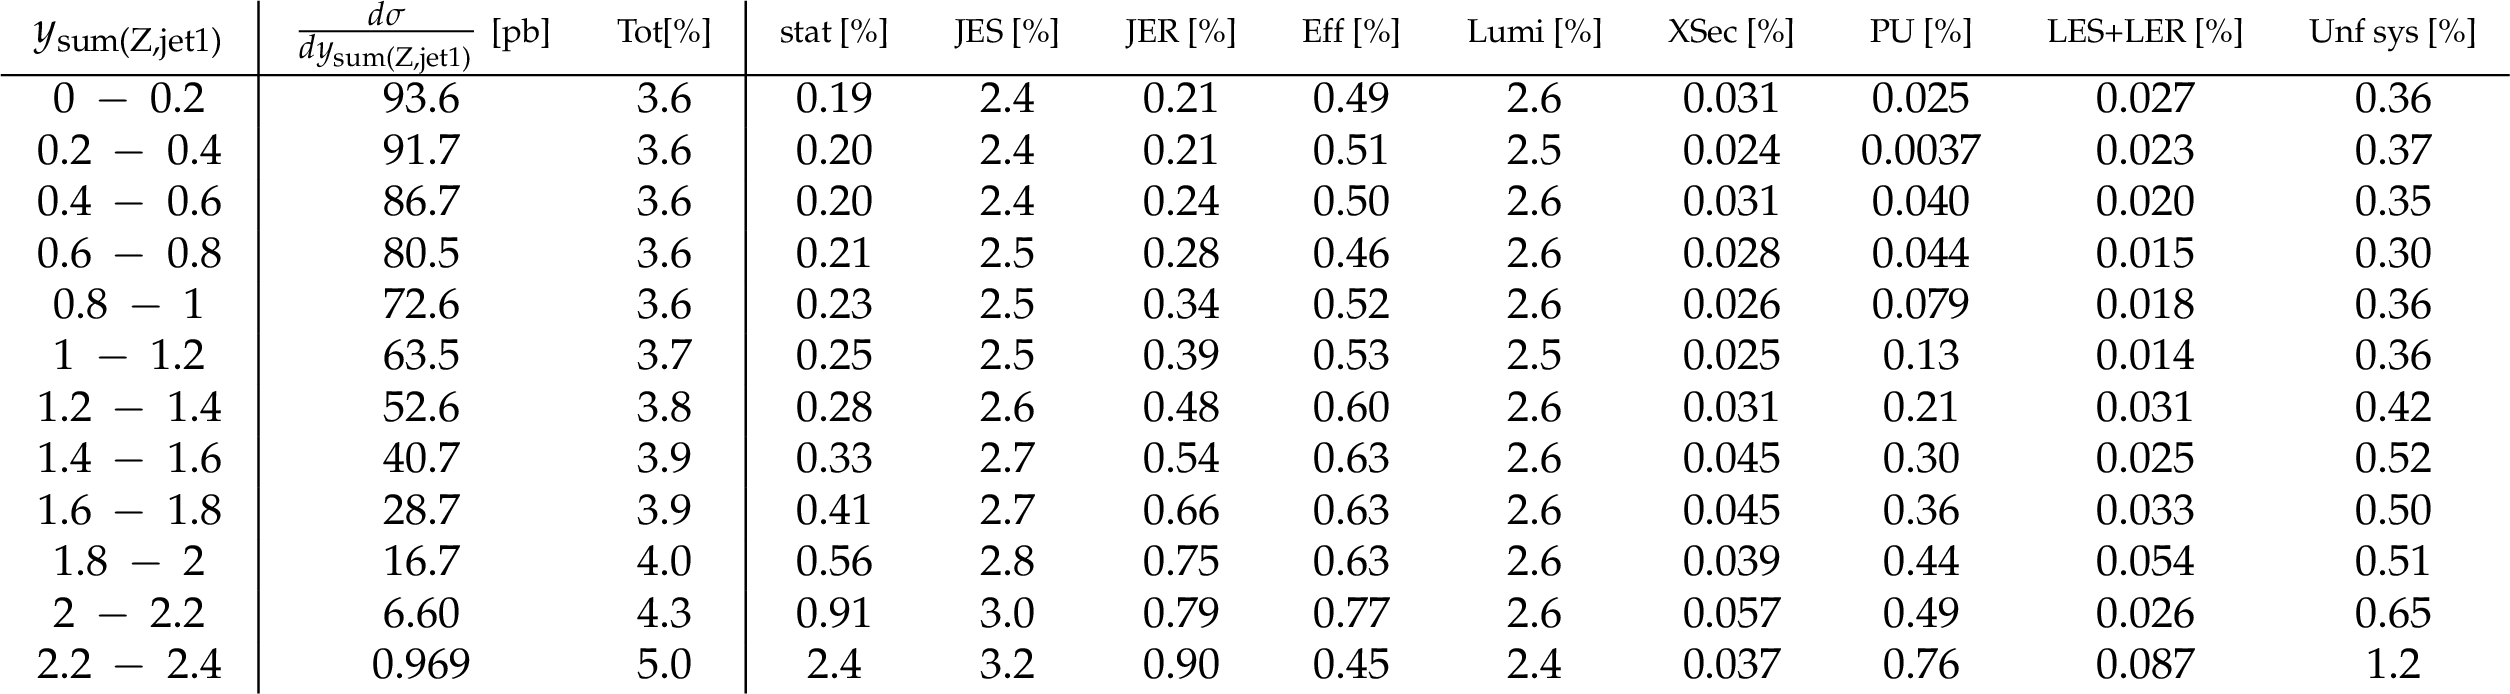
Table 19:
Differential cross section in $y_\text {sum(Z,jet1)}$ ($N_{\text {jets}} \geq $ 1) and break down of the systematic uncertainties for the combination of both decay channels. |

png pdf |
Table 20:
Differential cross section in $y_\text {diff(Z,jet1)}$ ($N_{\text {jets}} \geq $ 2) and break down of the systematic uncertainties for the combination of both decay channels. |

png pdf |
Table 21:
Differential cross section in $y_\text {sum(Z,jet1)}$ ($N_{\text {jets}} \geq $ 2) and break down of the systematic uncertainties for the combination of both decay channels. |
png pdf |
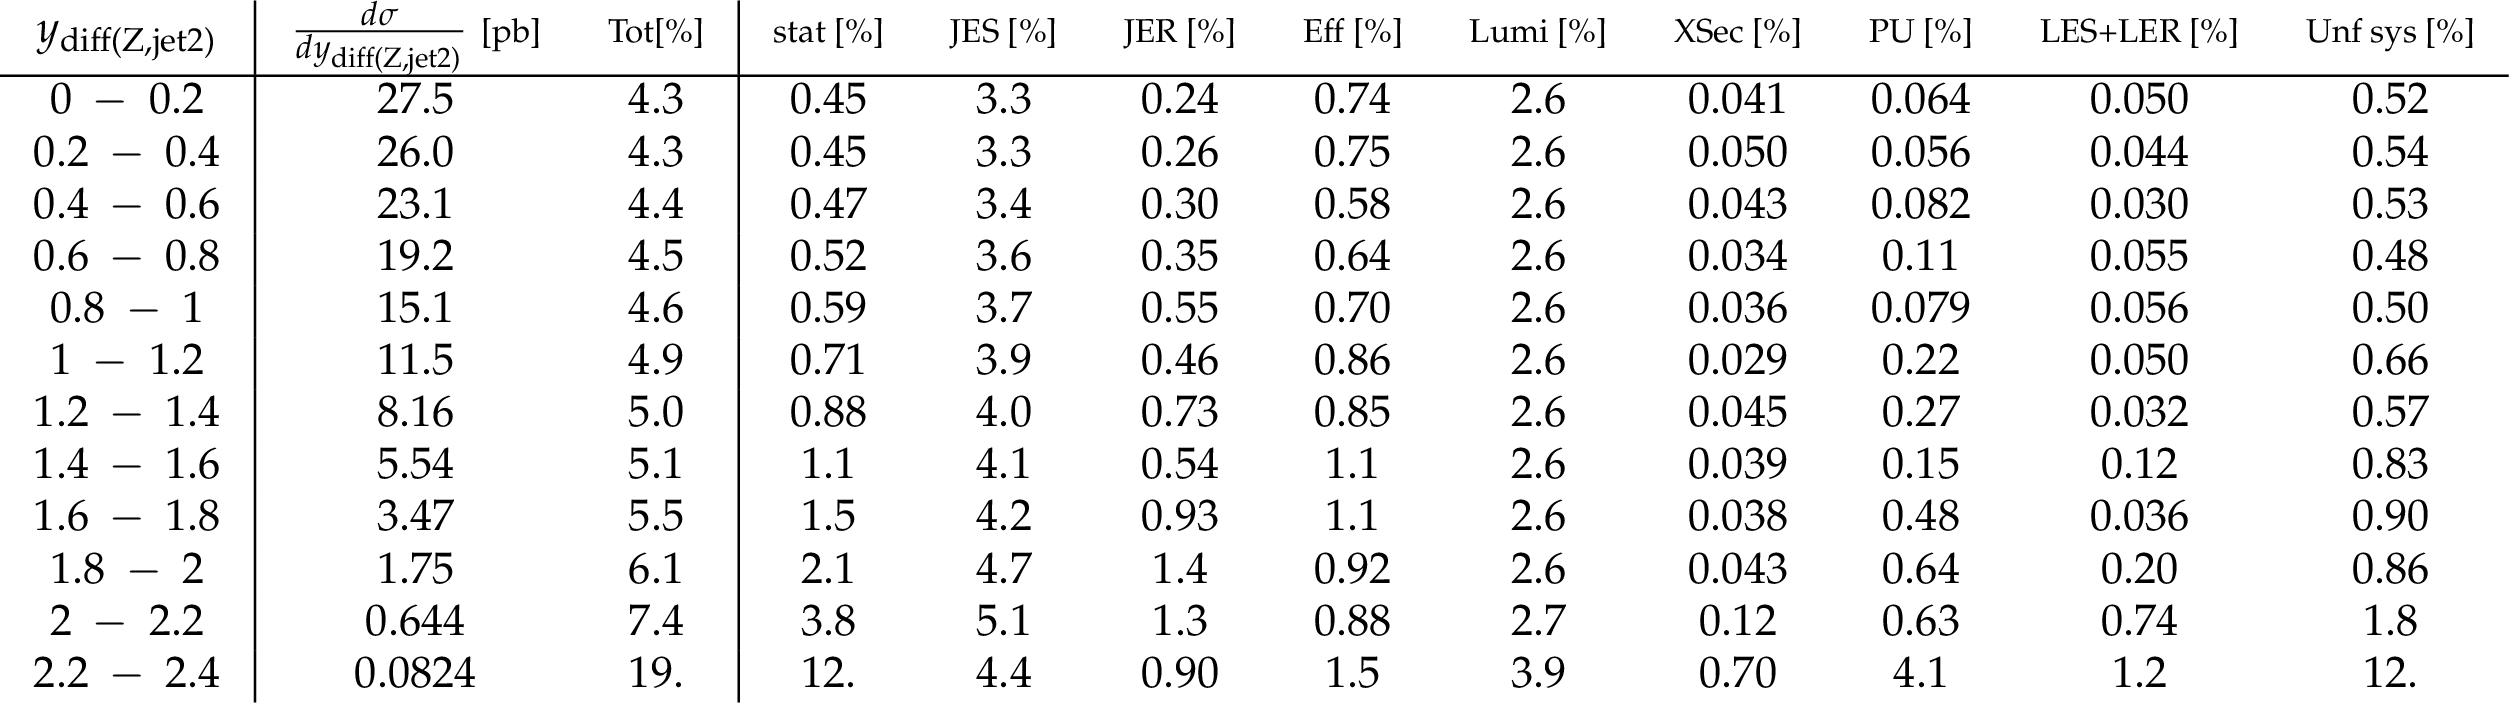
Table 22:
Differential cross section in $y_\text {diff(Z,jet2)}$ ($N_{\text {jets}} \geq $ 2) and break down of the systematic uncertainties for the combination of both decay channels. |
png pdf |
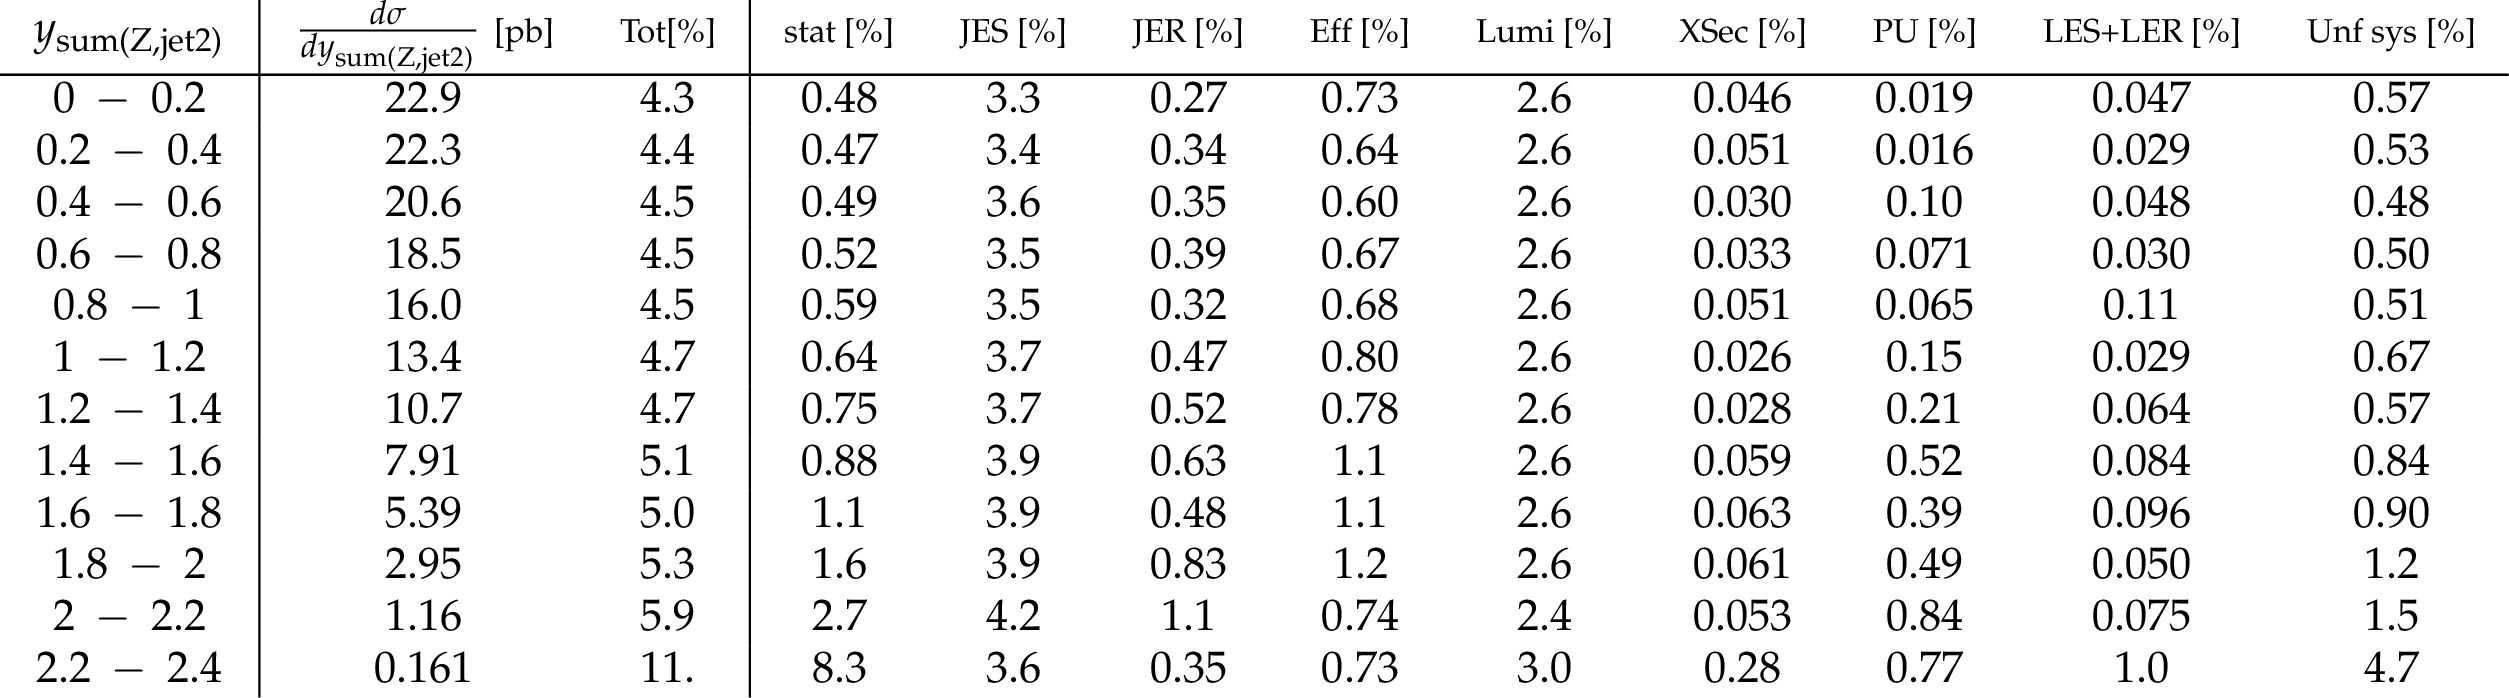
Table 23:
Differential cross section in $y_\text {sum(Z,jet2)}$ ($N_{\text {jets}} \geq $ 2) and break down of the systematic uncertainties for the combination of both decay channels. |

png pdf |
Table 24:
Differential cross section in $y_\text {diff(Z,jet1+jet2)}$ ($N_{\text {jets}} \geq $ 2) and break down of the systematic uncertainties for the combination of both decay channels. |
png pdf |
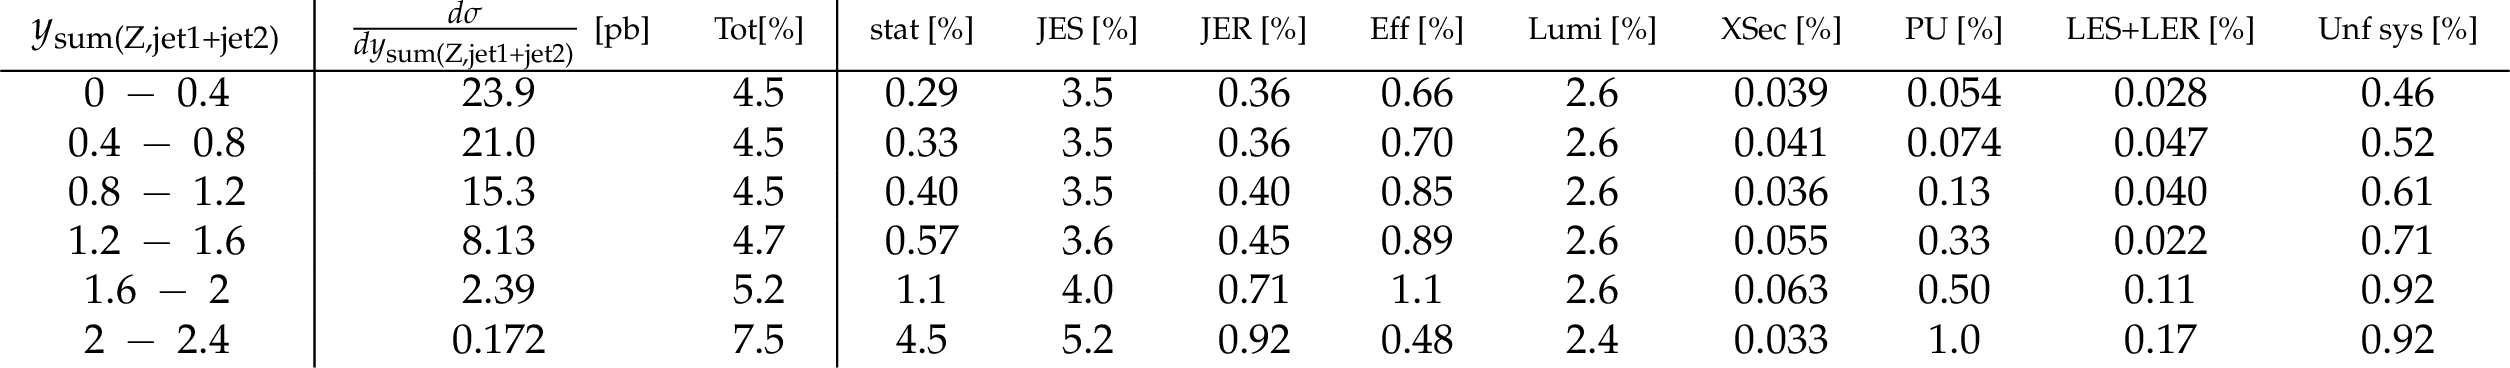
Table 25:
Differential cross section in $y_\text {sum(Z,jet1+jet2)}$ ($N_{\text {jets}} \geq $ 2) and break down of the systematic uncertainties for the combination of both decay channels. |
png pdf |
Table 26:
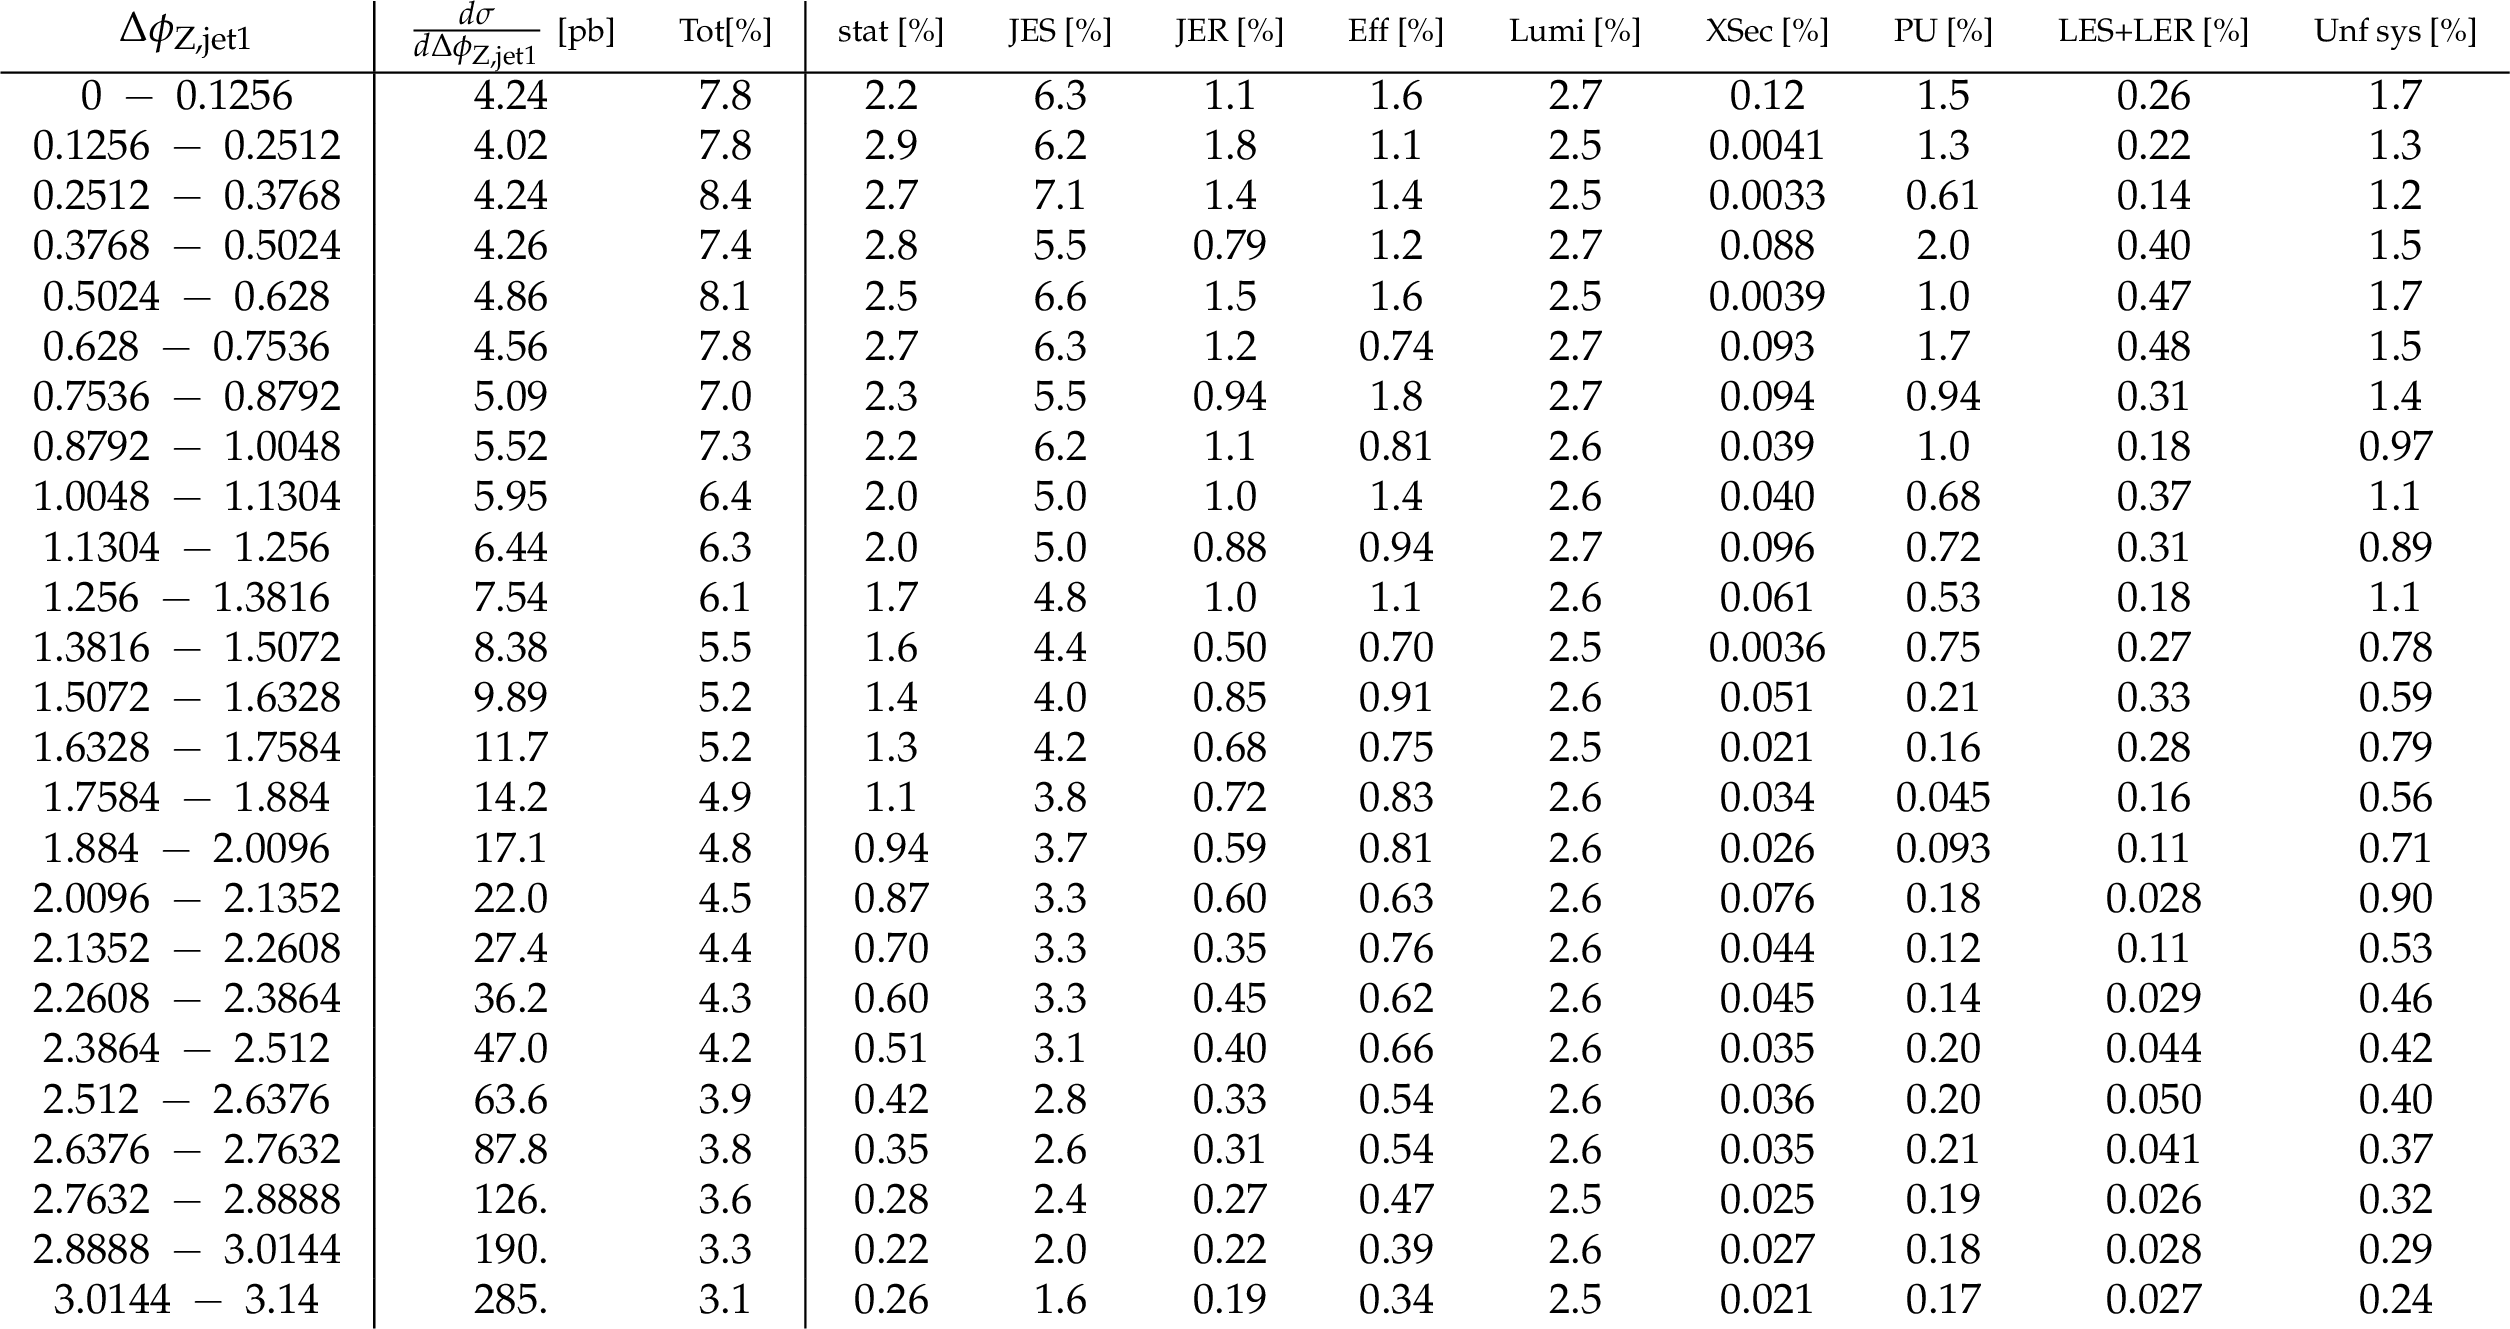
Differential cross section in $\Delta \phi _\text {Z,jet1}$ ($N_{\text {jets}} \geq $ 1) and break down of the systematic uncertainties for the combination of both decay channels. |
png pdf |
Table 27:
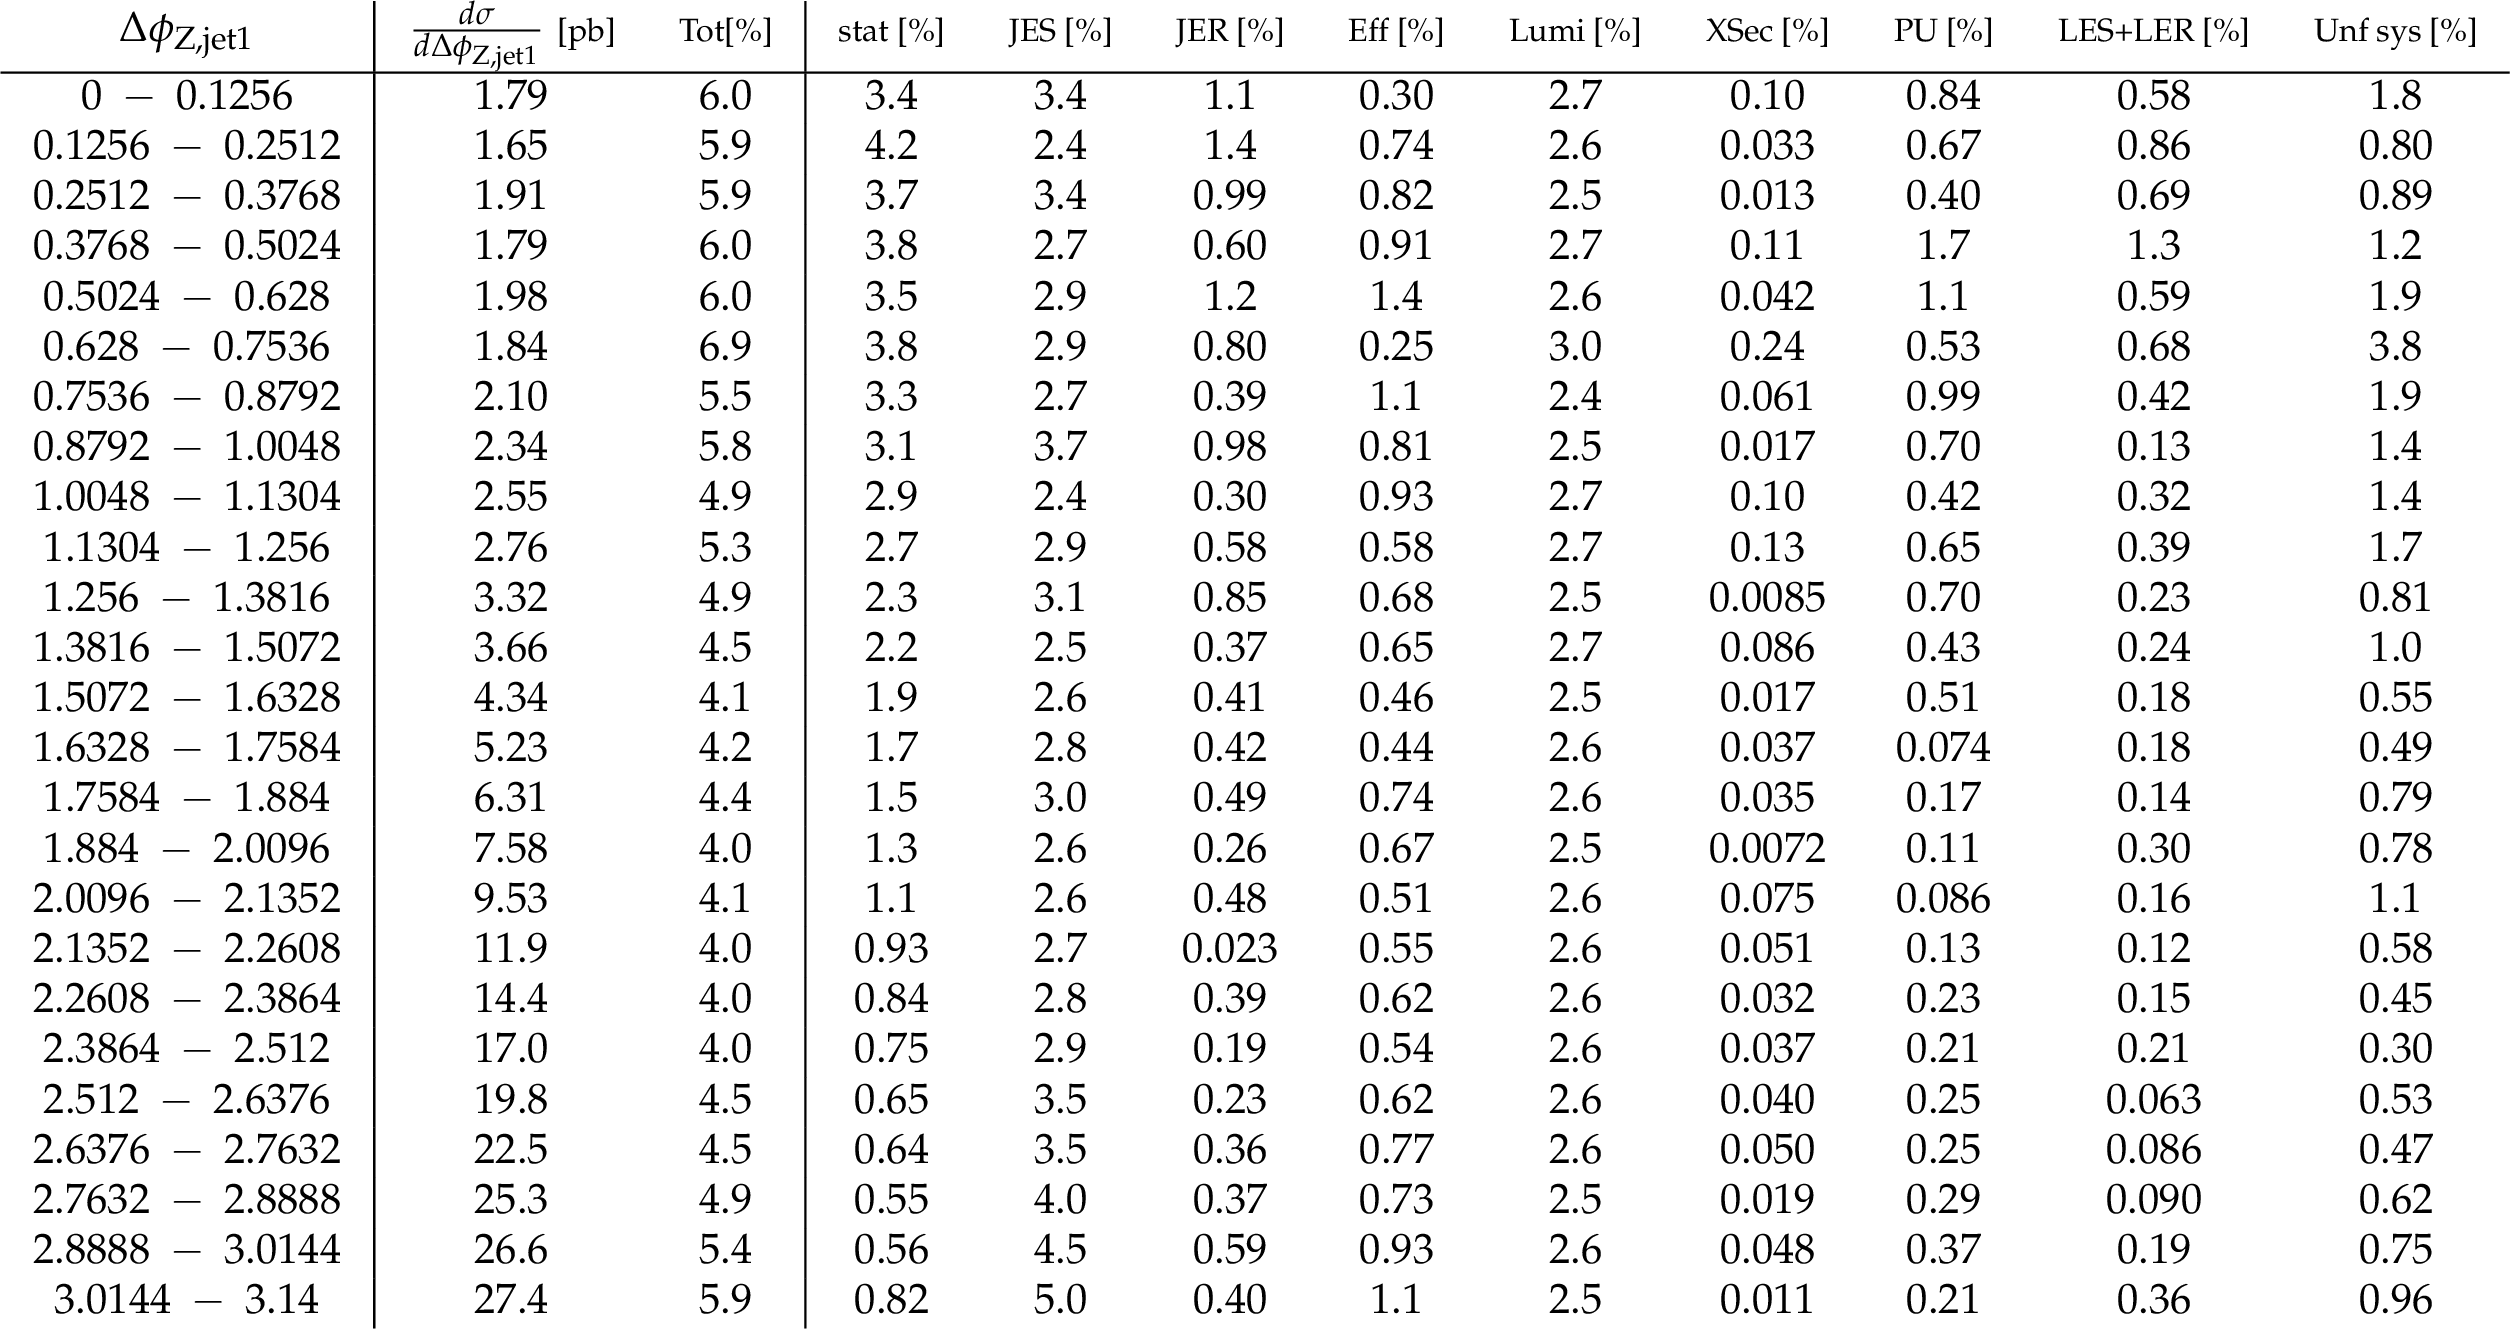
Differential cross section in $\Delta \phi _\text {Z,jet1}$ ($N_{\text {jets}} \geq $ 2) and break down of the systematic uncertainties for the combination of both decay channels. |
png pdf |
Table 28:
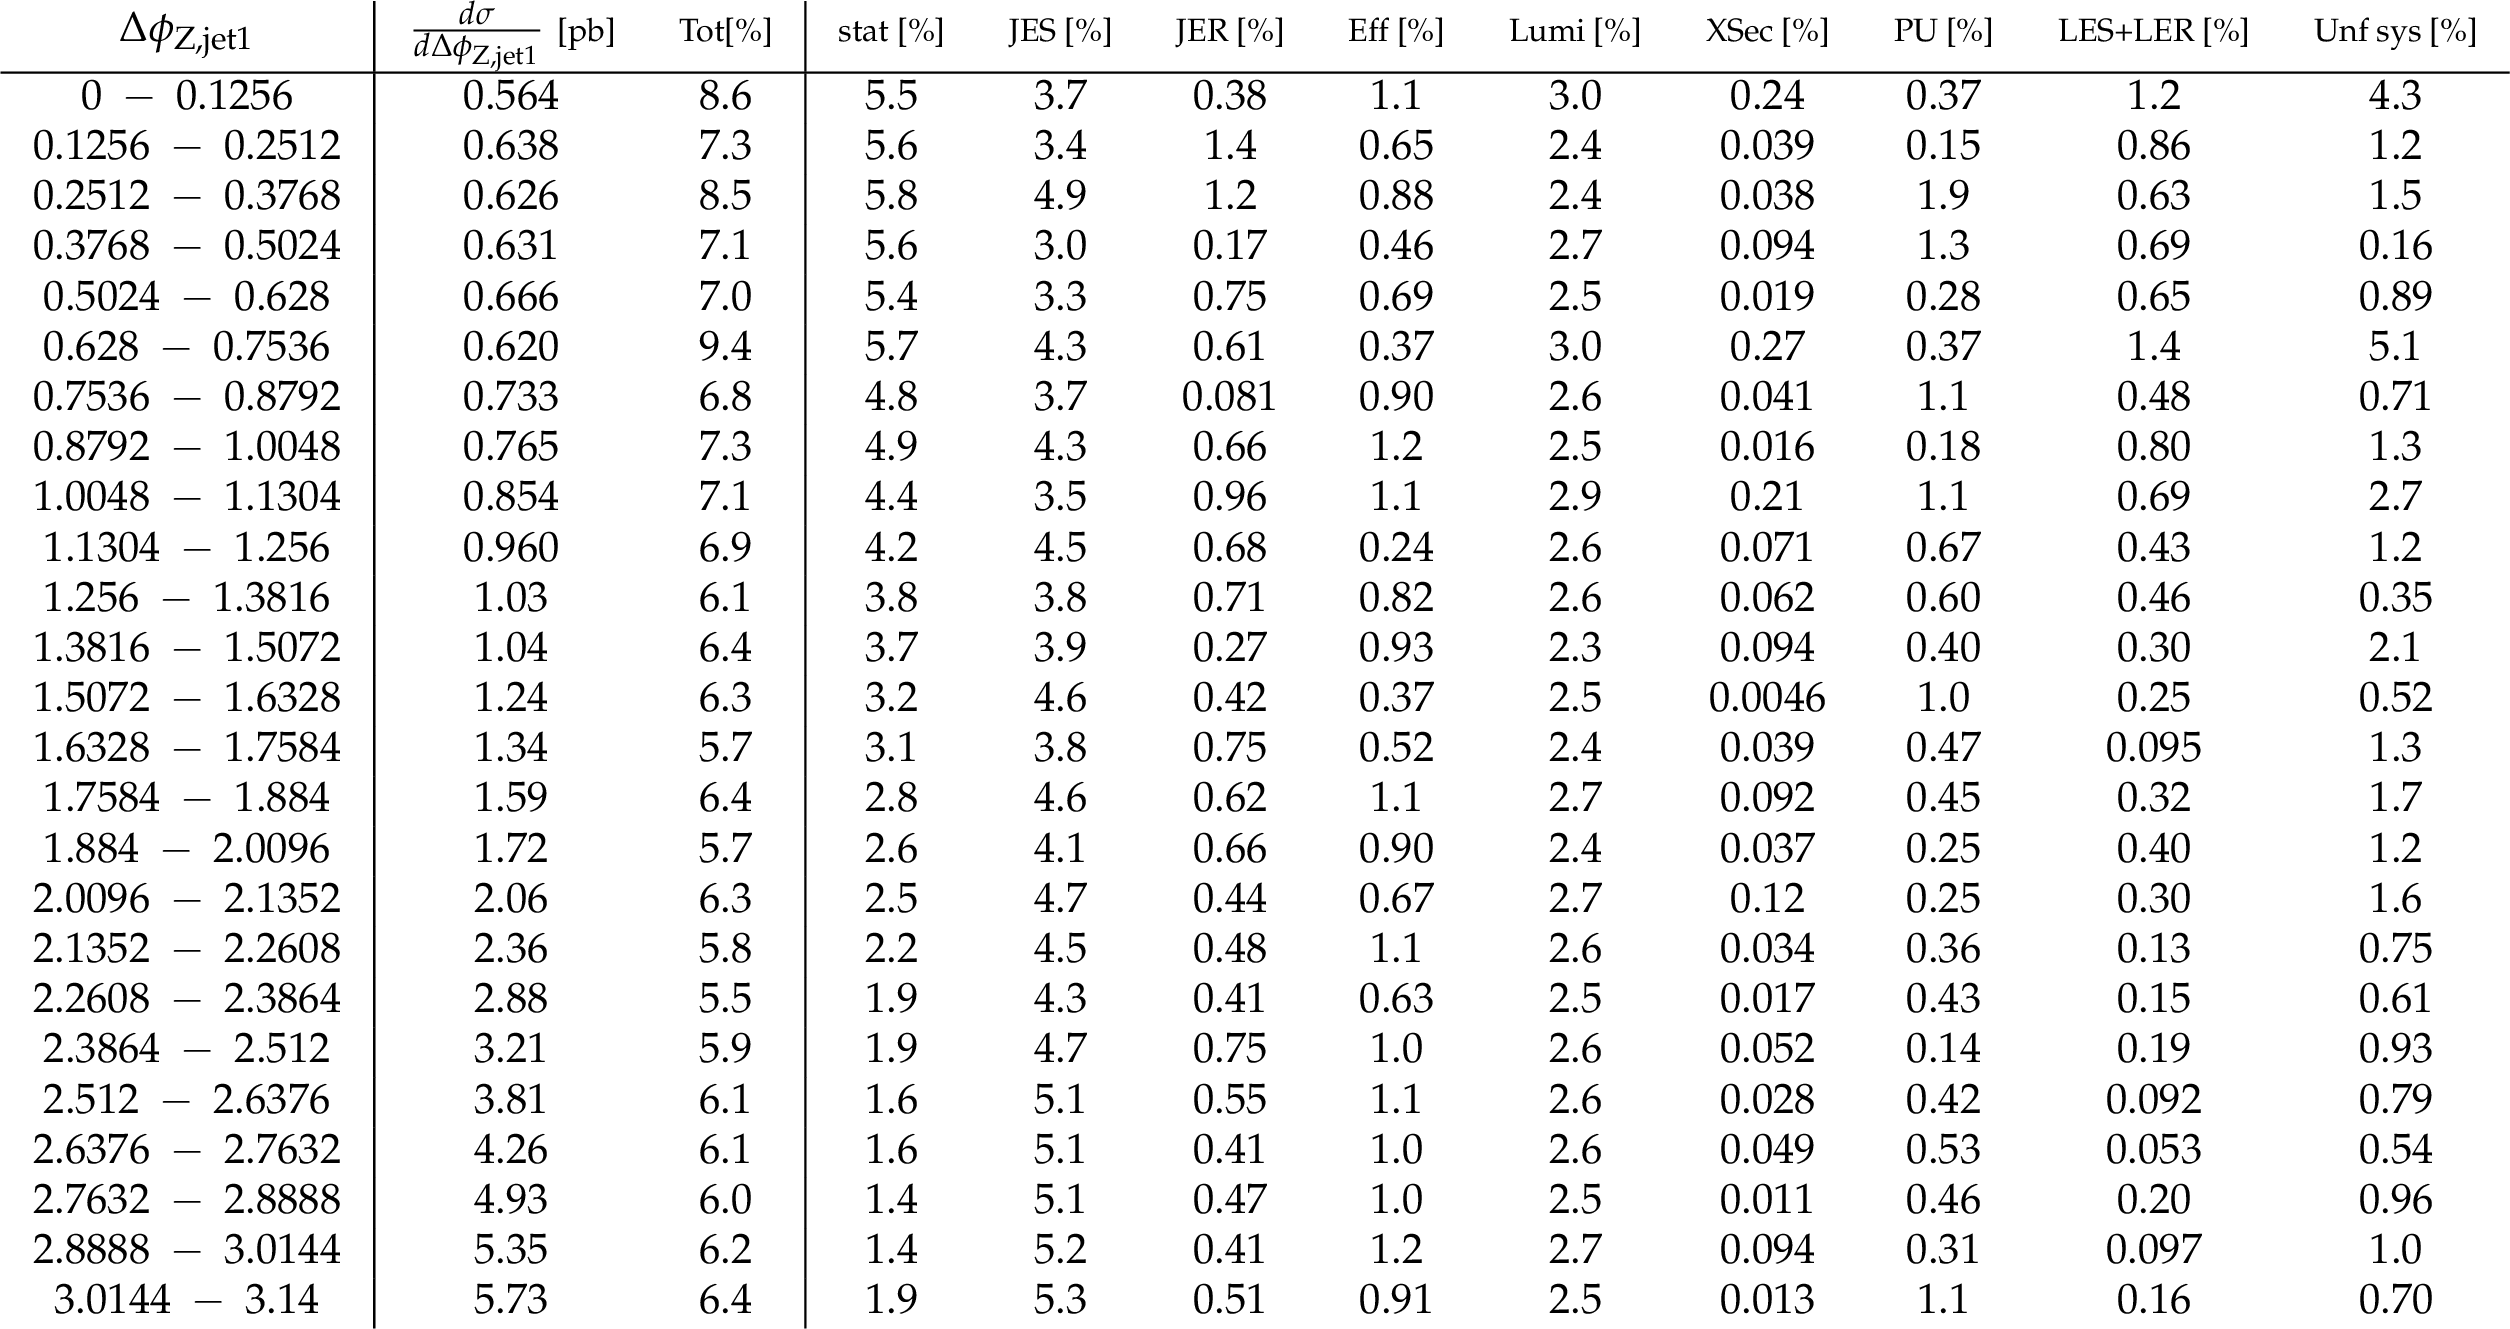
Differential cross section in $\Delta \phi _\text {Z,jet1}$ ($N_{\text {jets}} \geq $ 3) and break down of the systematic uncertainties for the combination of both decay channels. |
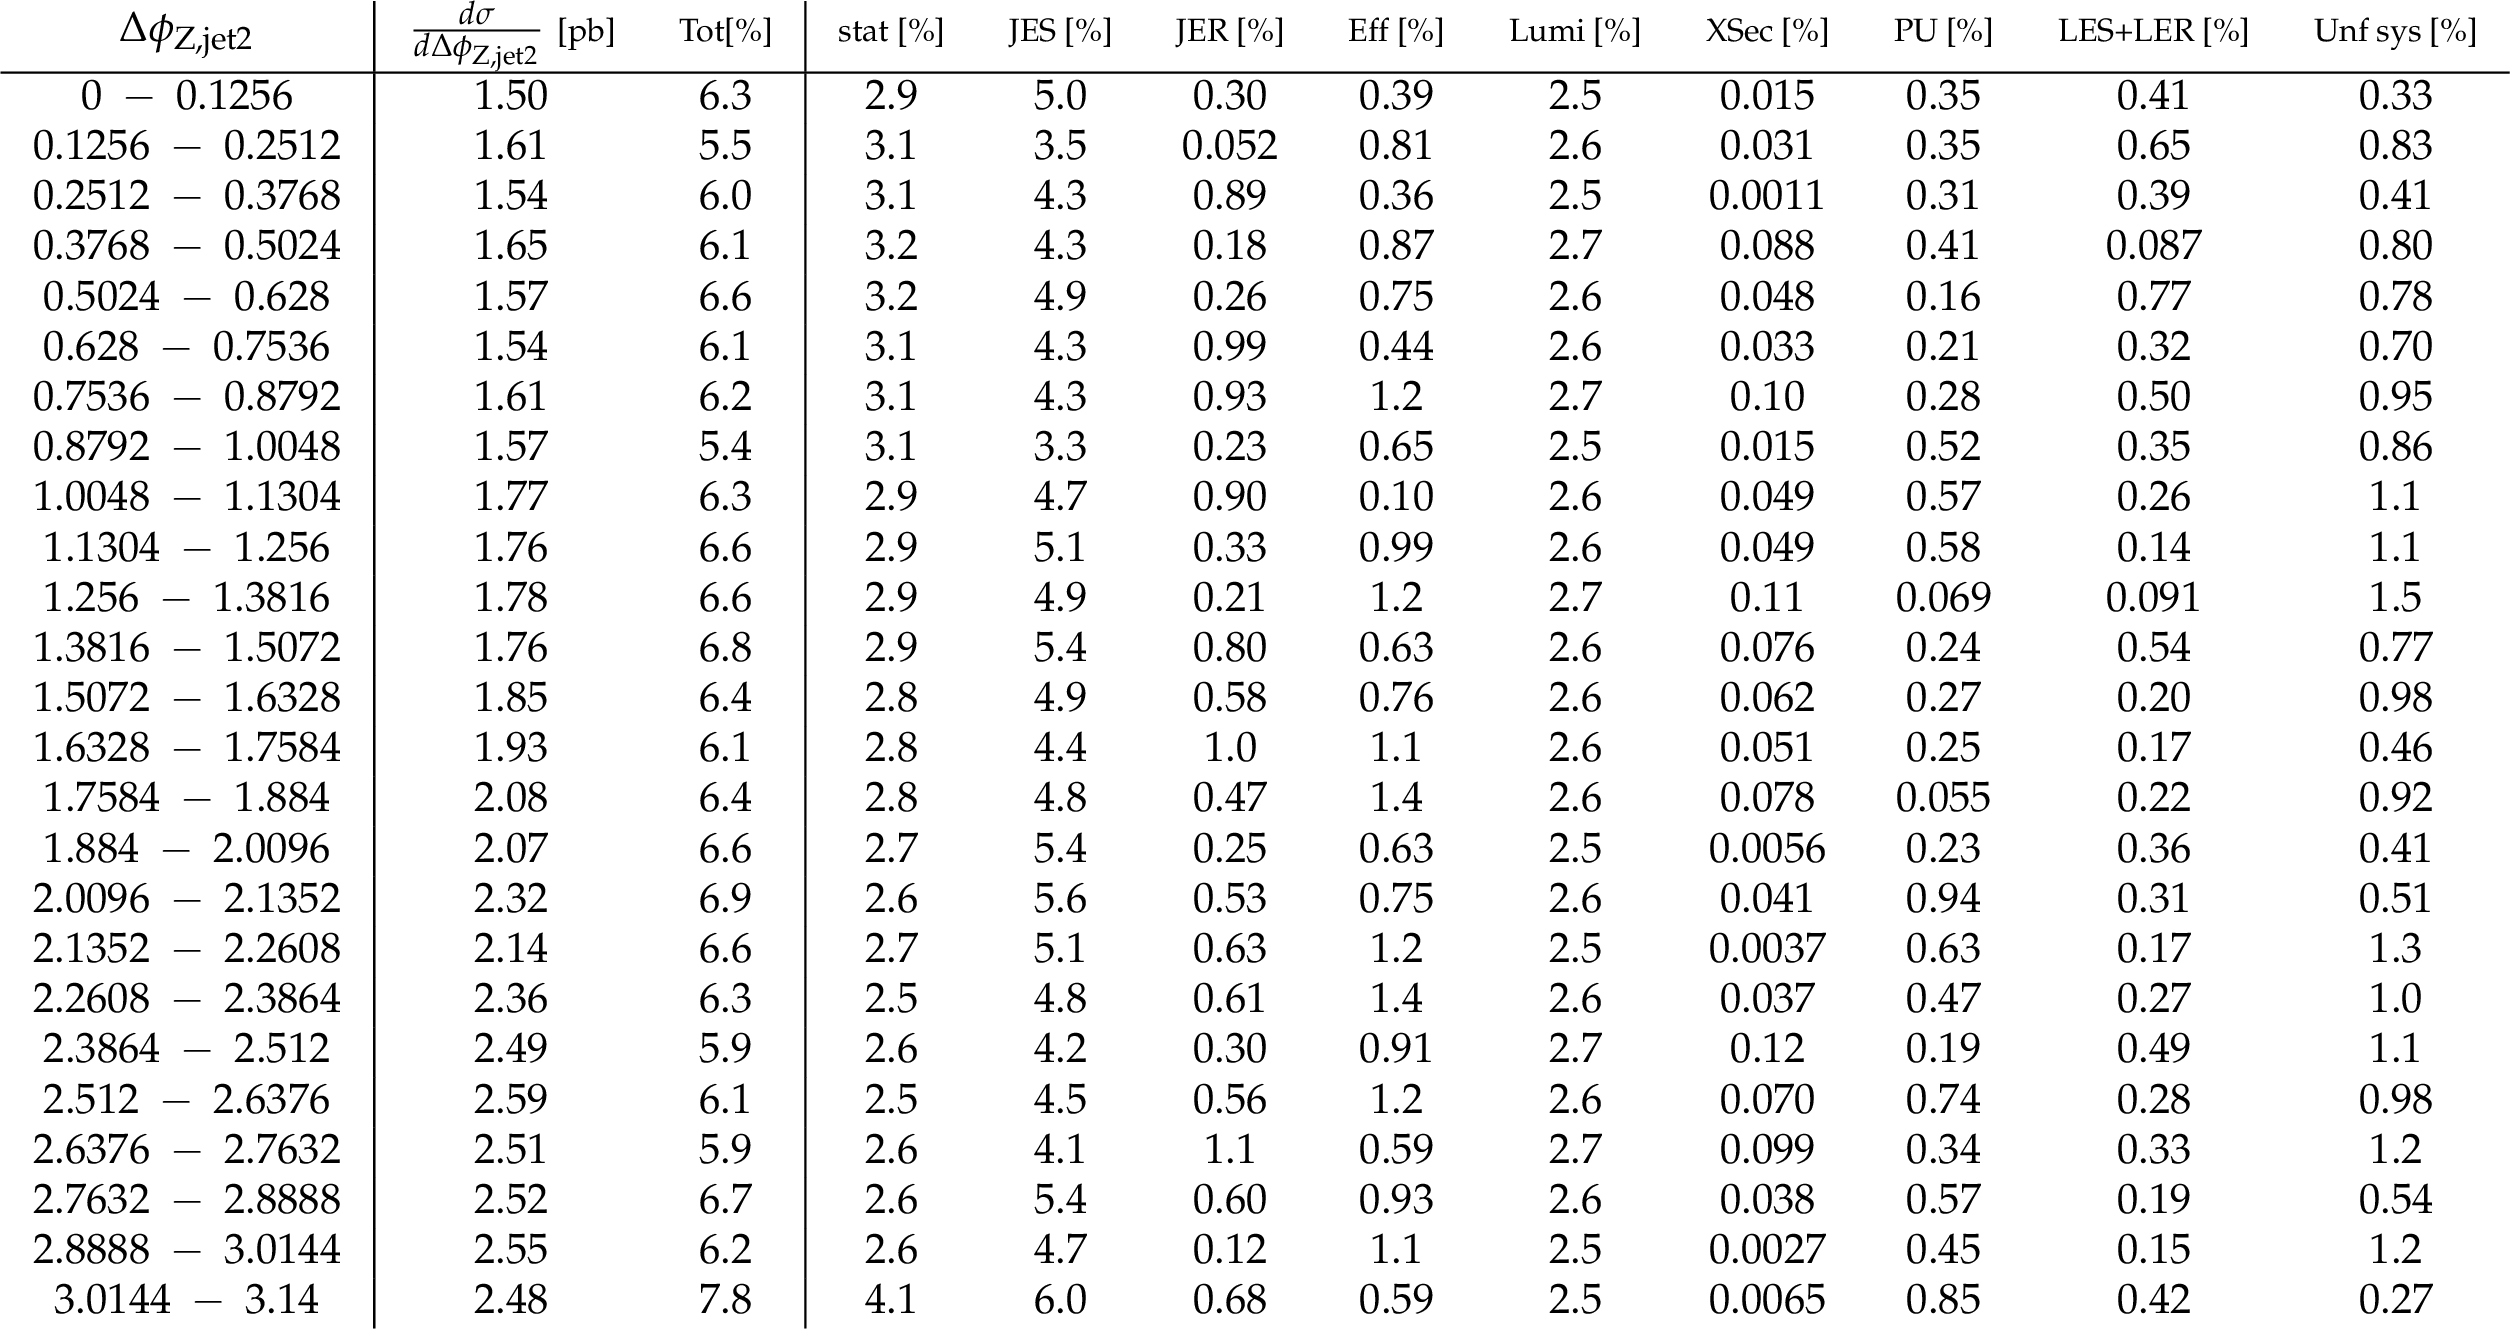
png pdf |
Table 29:
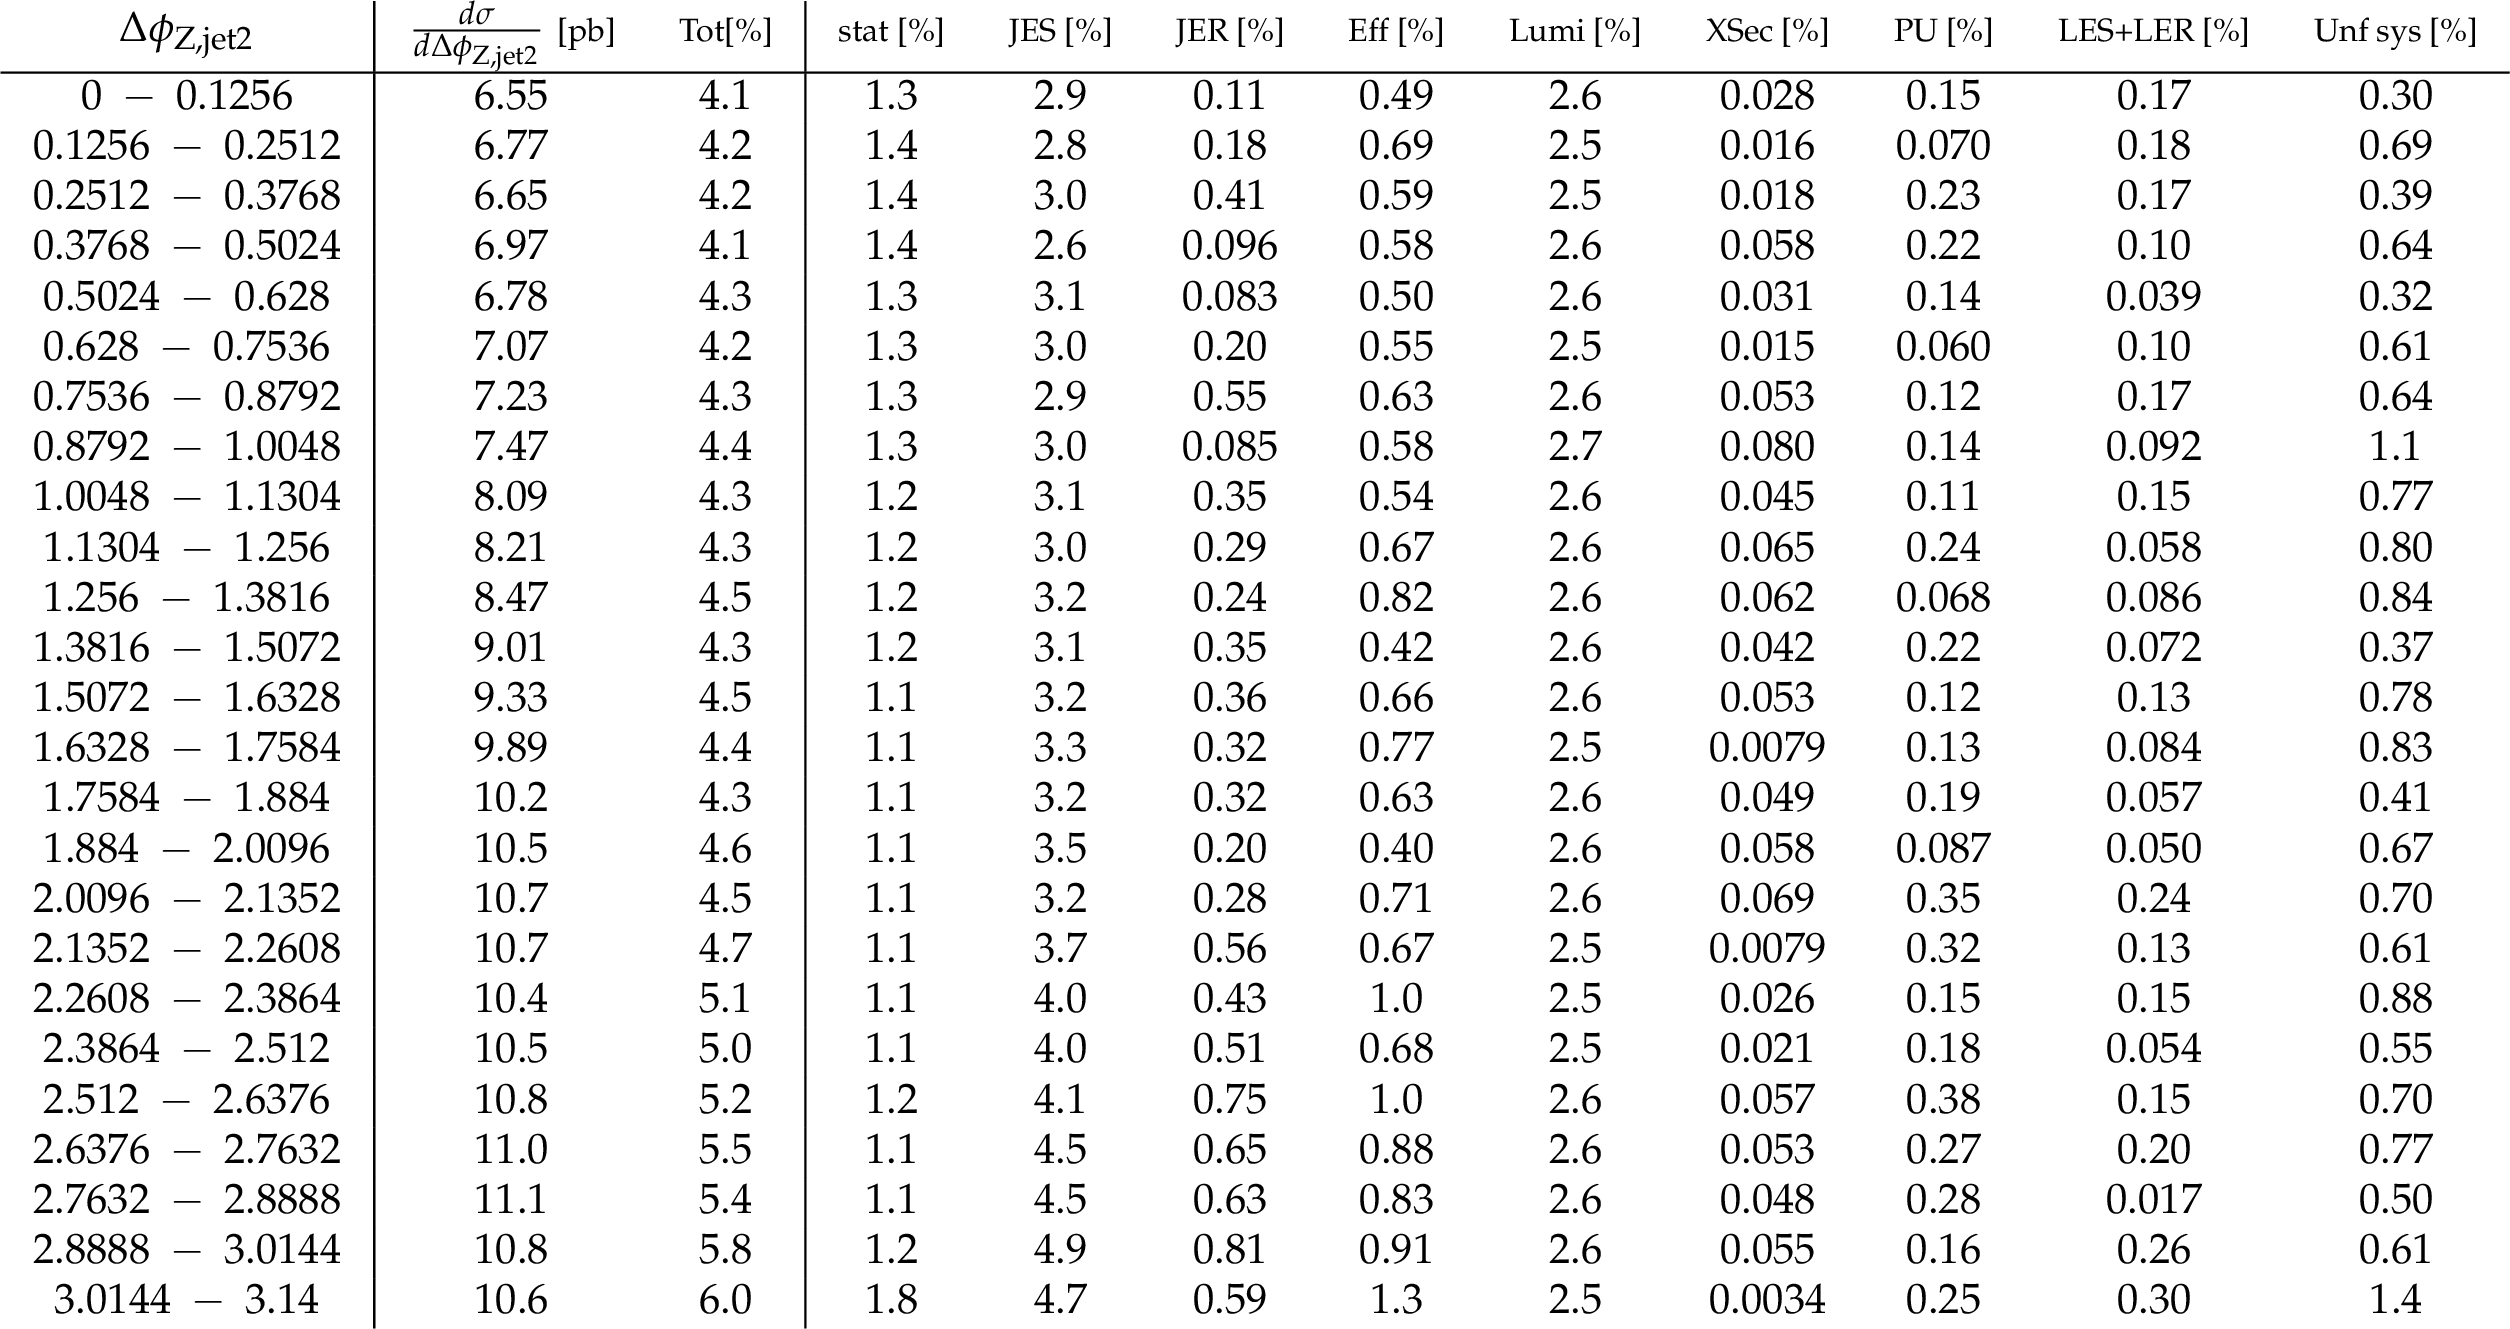
Differential cross section in $\Delta \phi _\text {Z,jet2}$ ($N_{\text {jets}} \geq $ 2) and break down of the systematic uncertainties for the combination of both decay channels. |
png pdf |
Table 30:
Differential cross section in $\Delta \phi _\text {Z,jet2}$ ($N_{\text {jets}} \geq $ 3) and break down of the systematic uncertainties for the combination of both decay channels. |
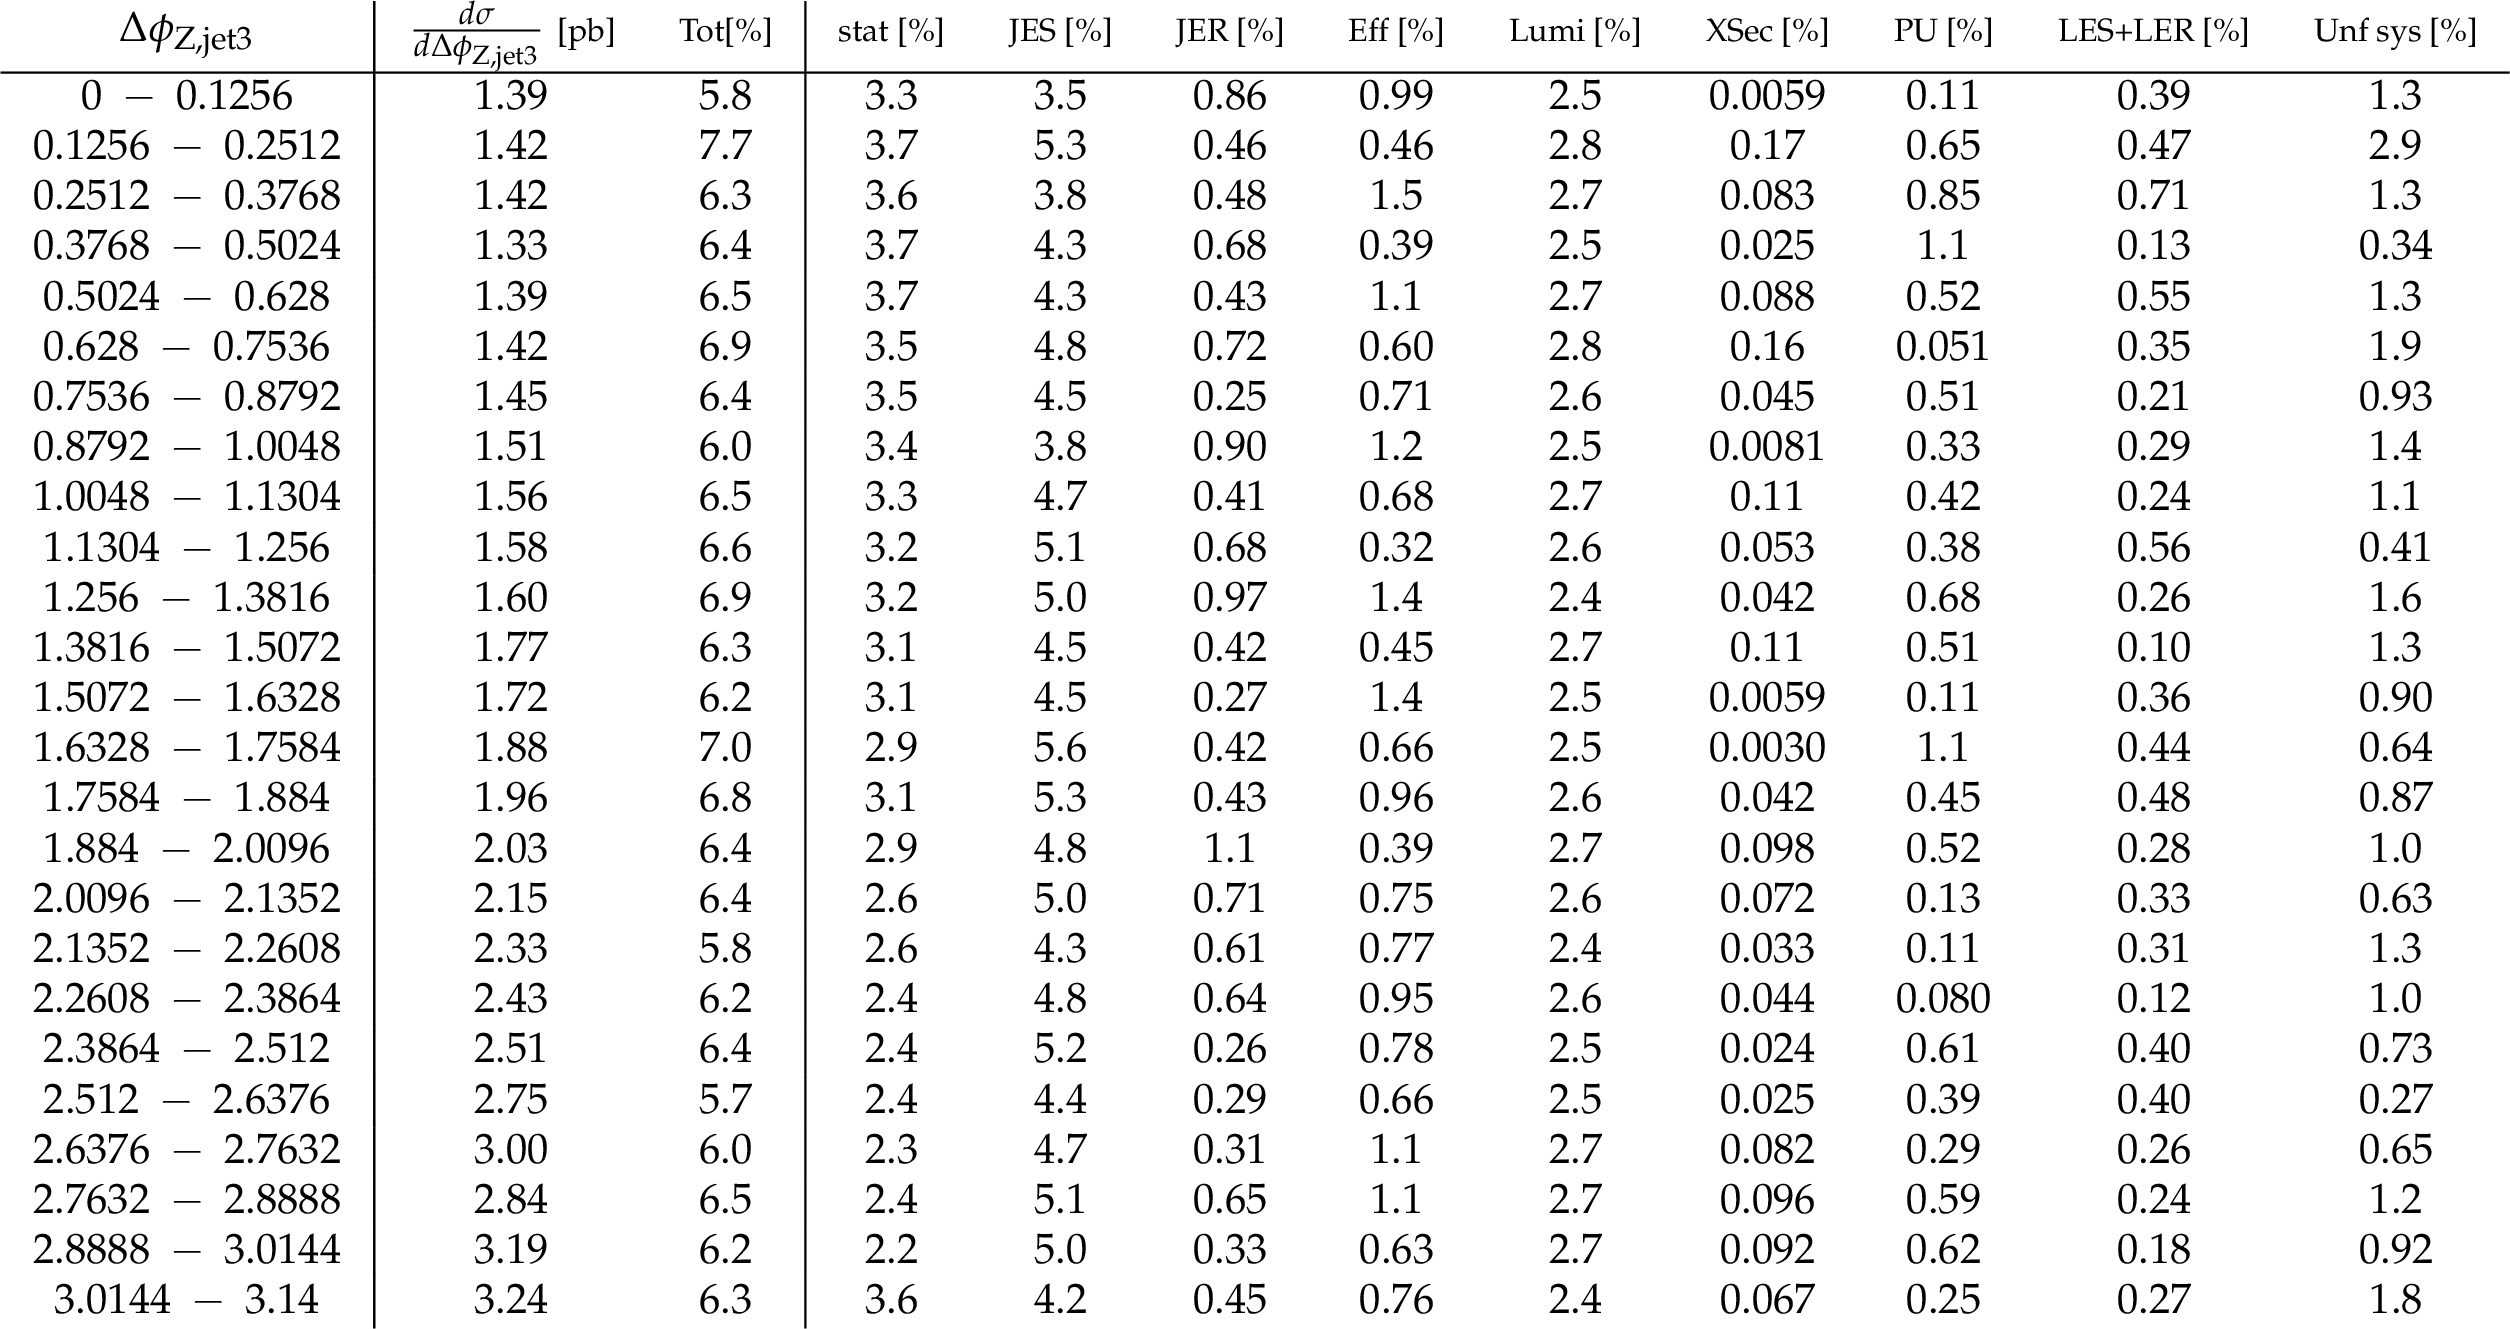
png pdf |
Table 31:
Differential cross section in $\Delta \phi _\text {Z,jet3}$ ($N_{\text {jets}} \geq $ 3) and break down of the systematic uncertainties for the combination of both decay channels. |
png pdf |
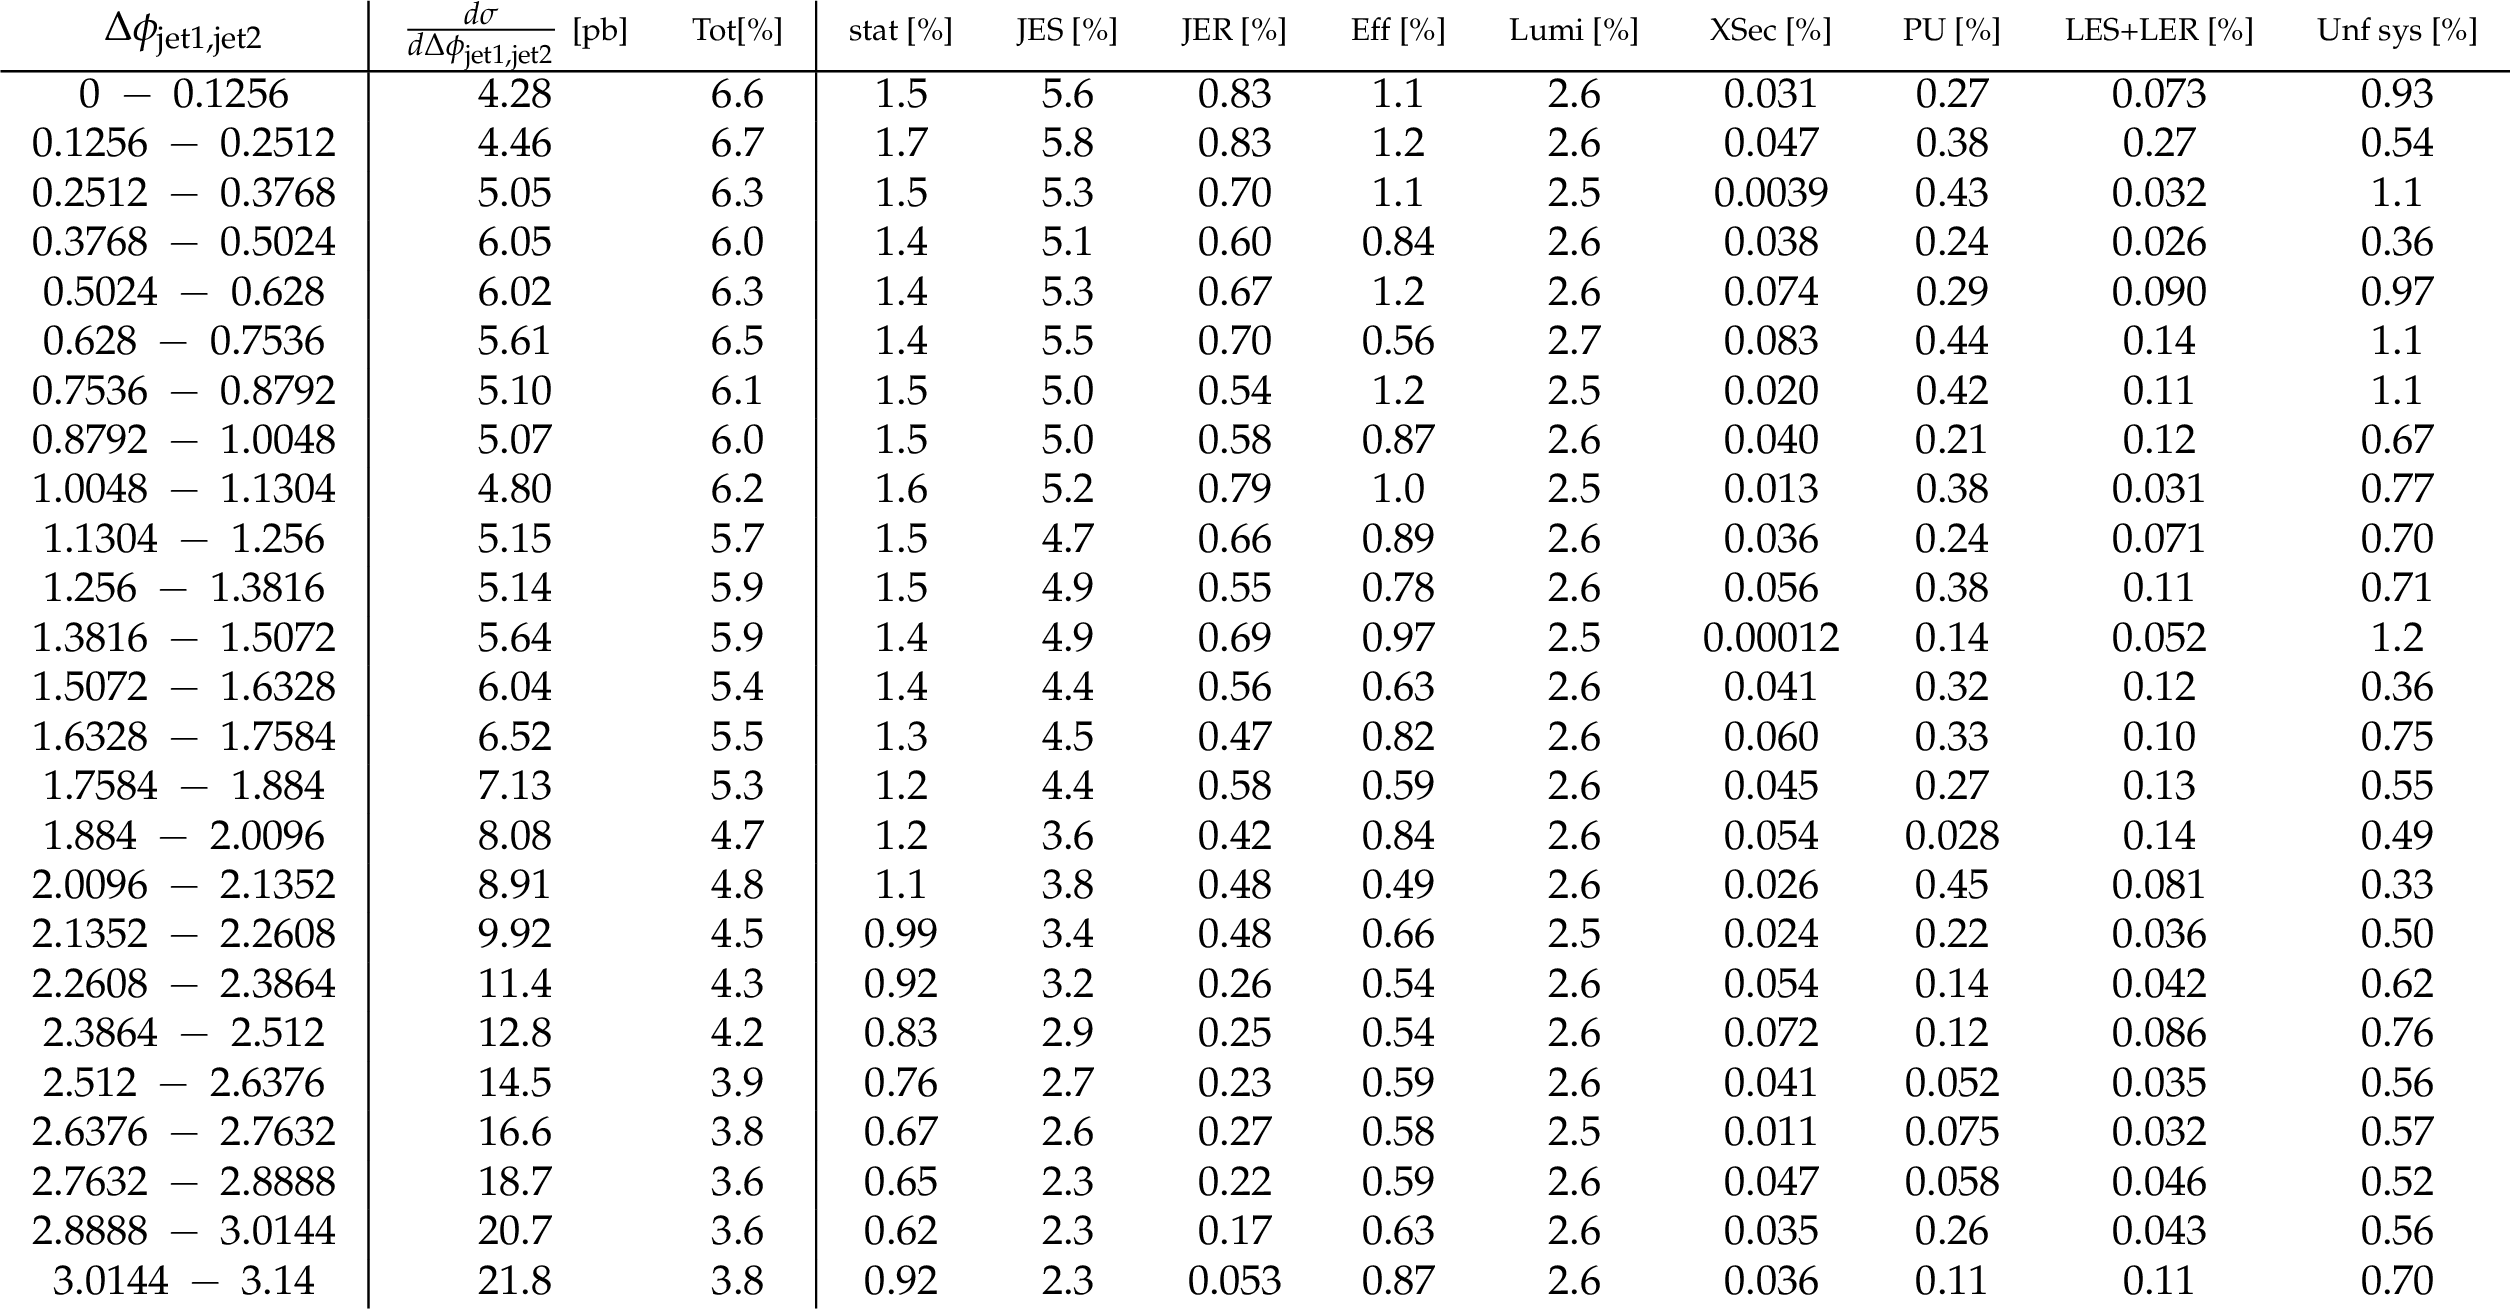
Table 32:
Differential cross section in $\Delta \phi _\text {jet1,jet2}$ ($N_{\text {jets}} \geq $ 2) and break down of the systematic uncertainties for the combination of both decay channels. |

png pdf |
Table 33:
Differential cross section in $\Delta \phi _\text {jet1,jet2}$ ($N_{\text {jets}} \geq $ 3) and break down of the systematic uncertainties for the combination of both decay channels. |
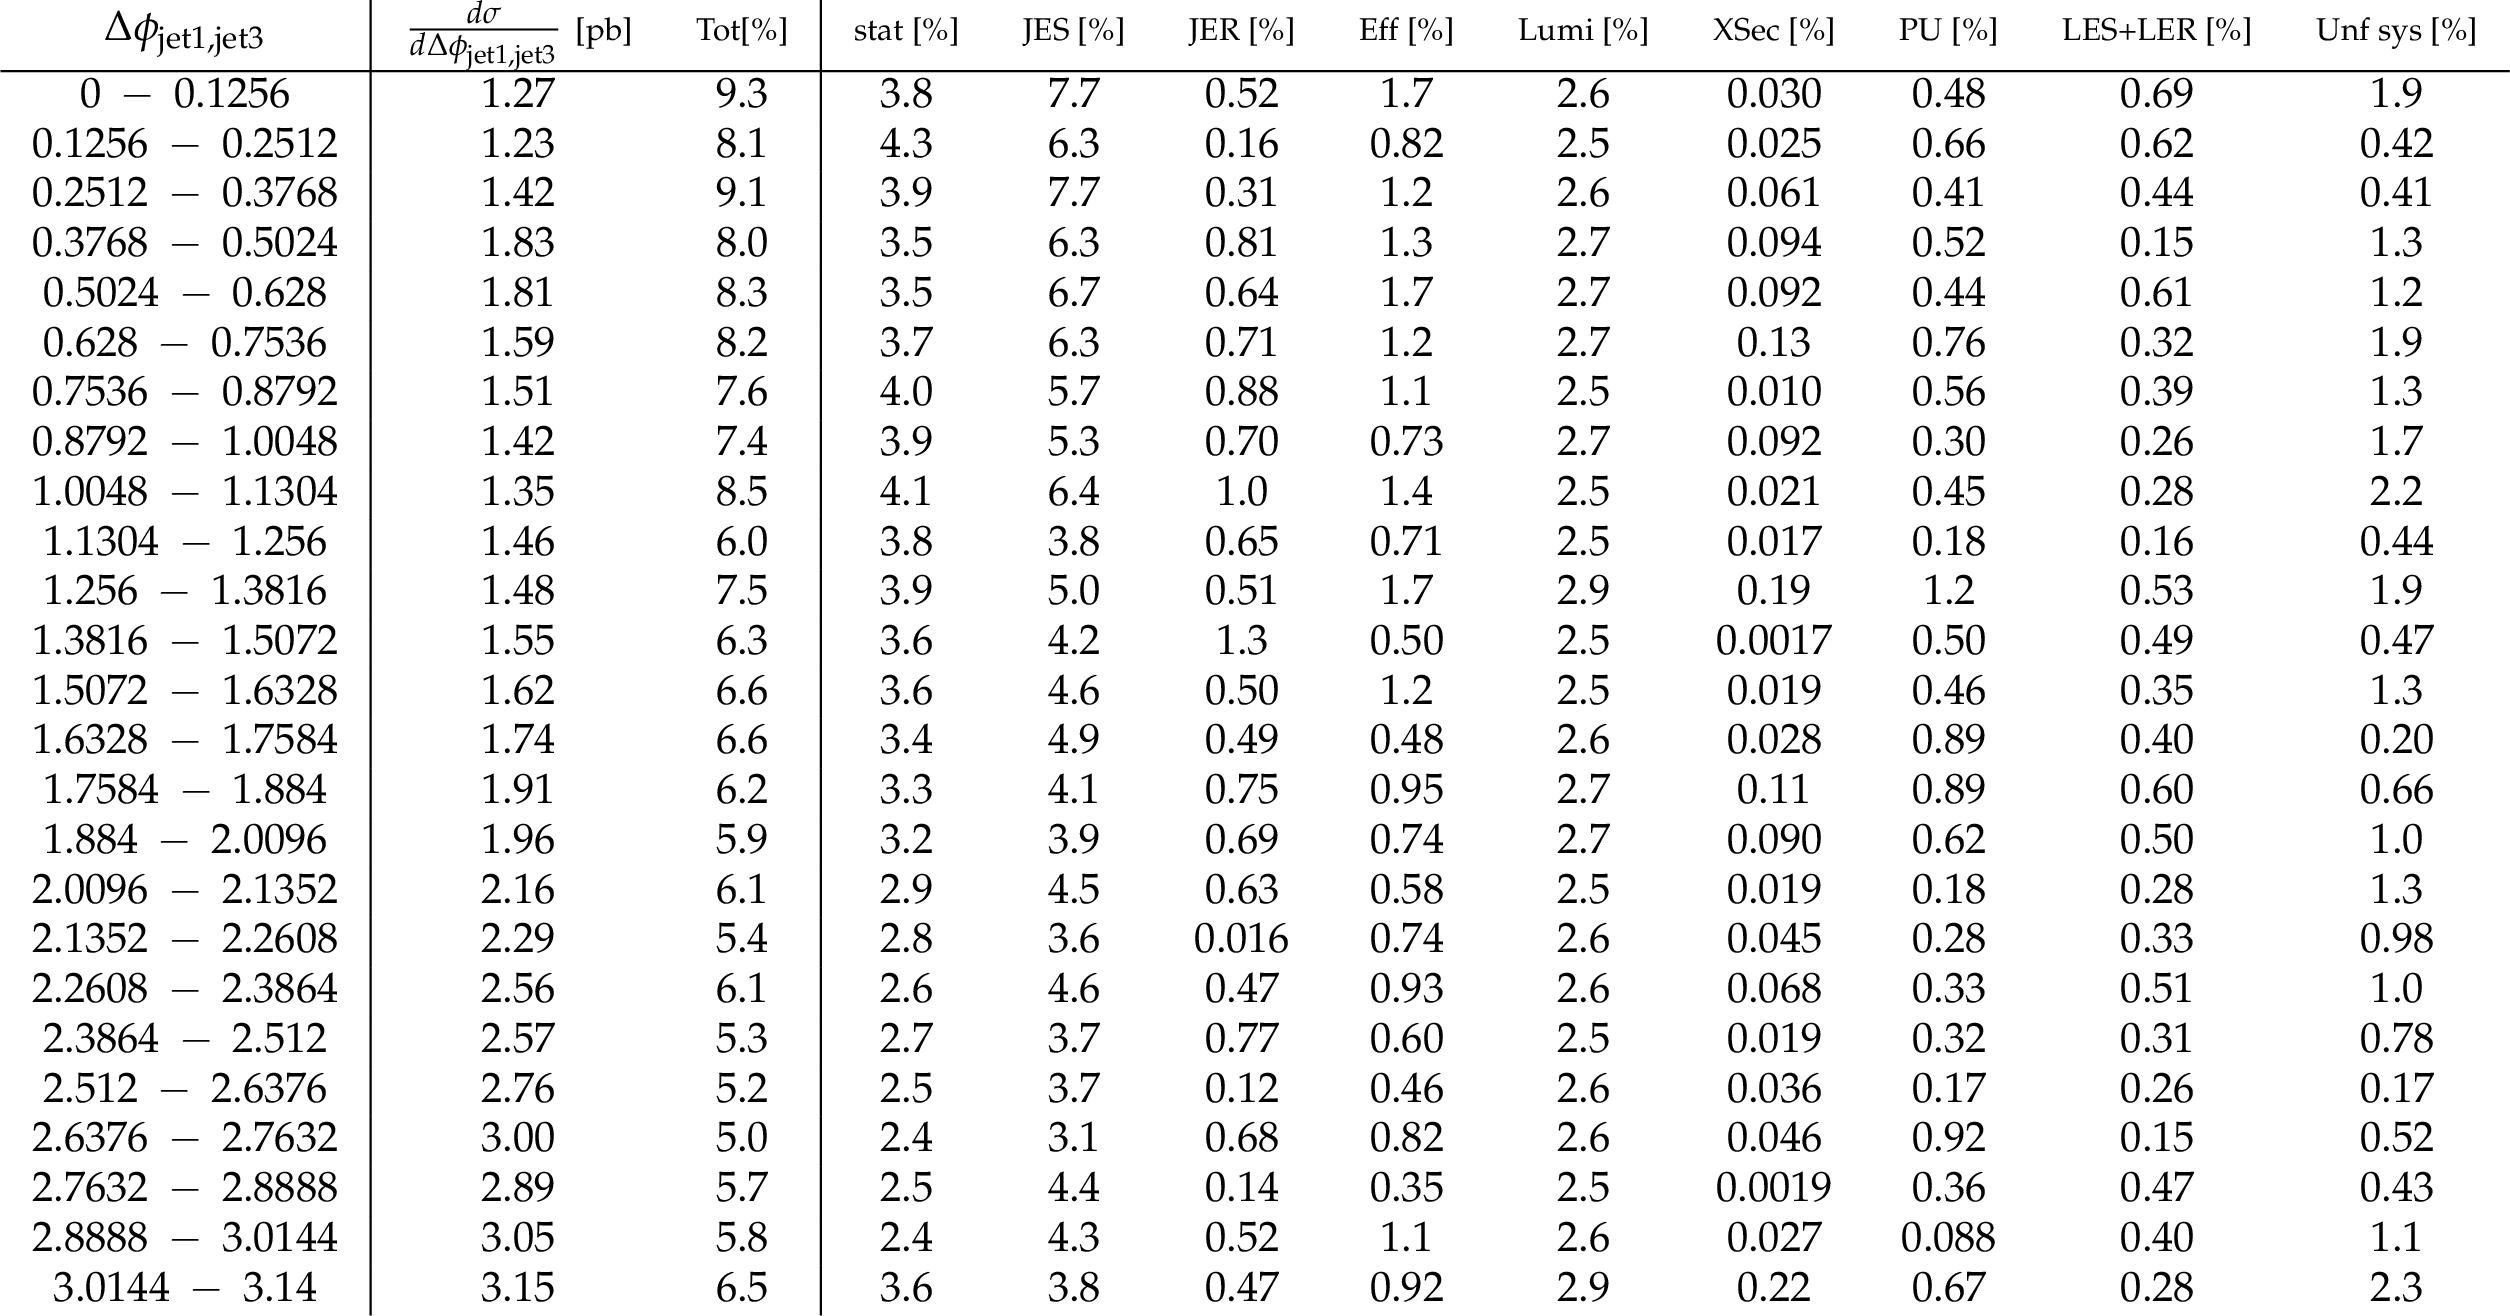
png pdf |
Table 34:
Differential cross section in $\Delta \phi _\text {jet1,jet3}$ ($N_{\text {jets}} \geq $ 3) and break down of the systematic uncertainties for the combination of both decay channels. |
png pdf |
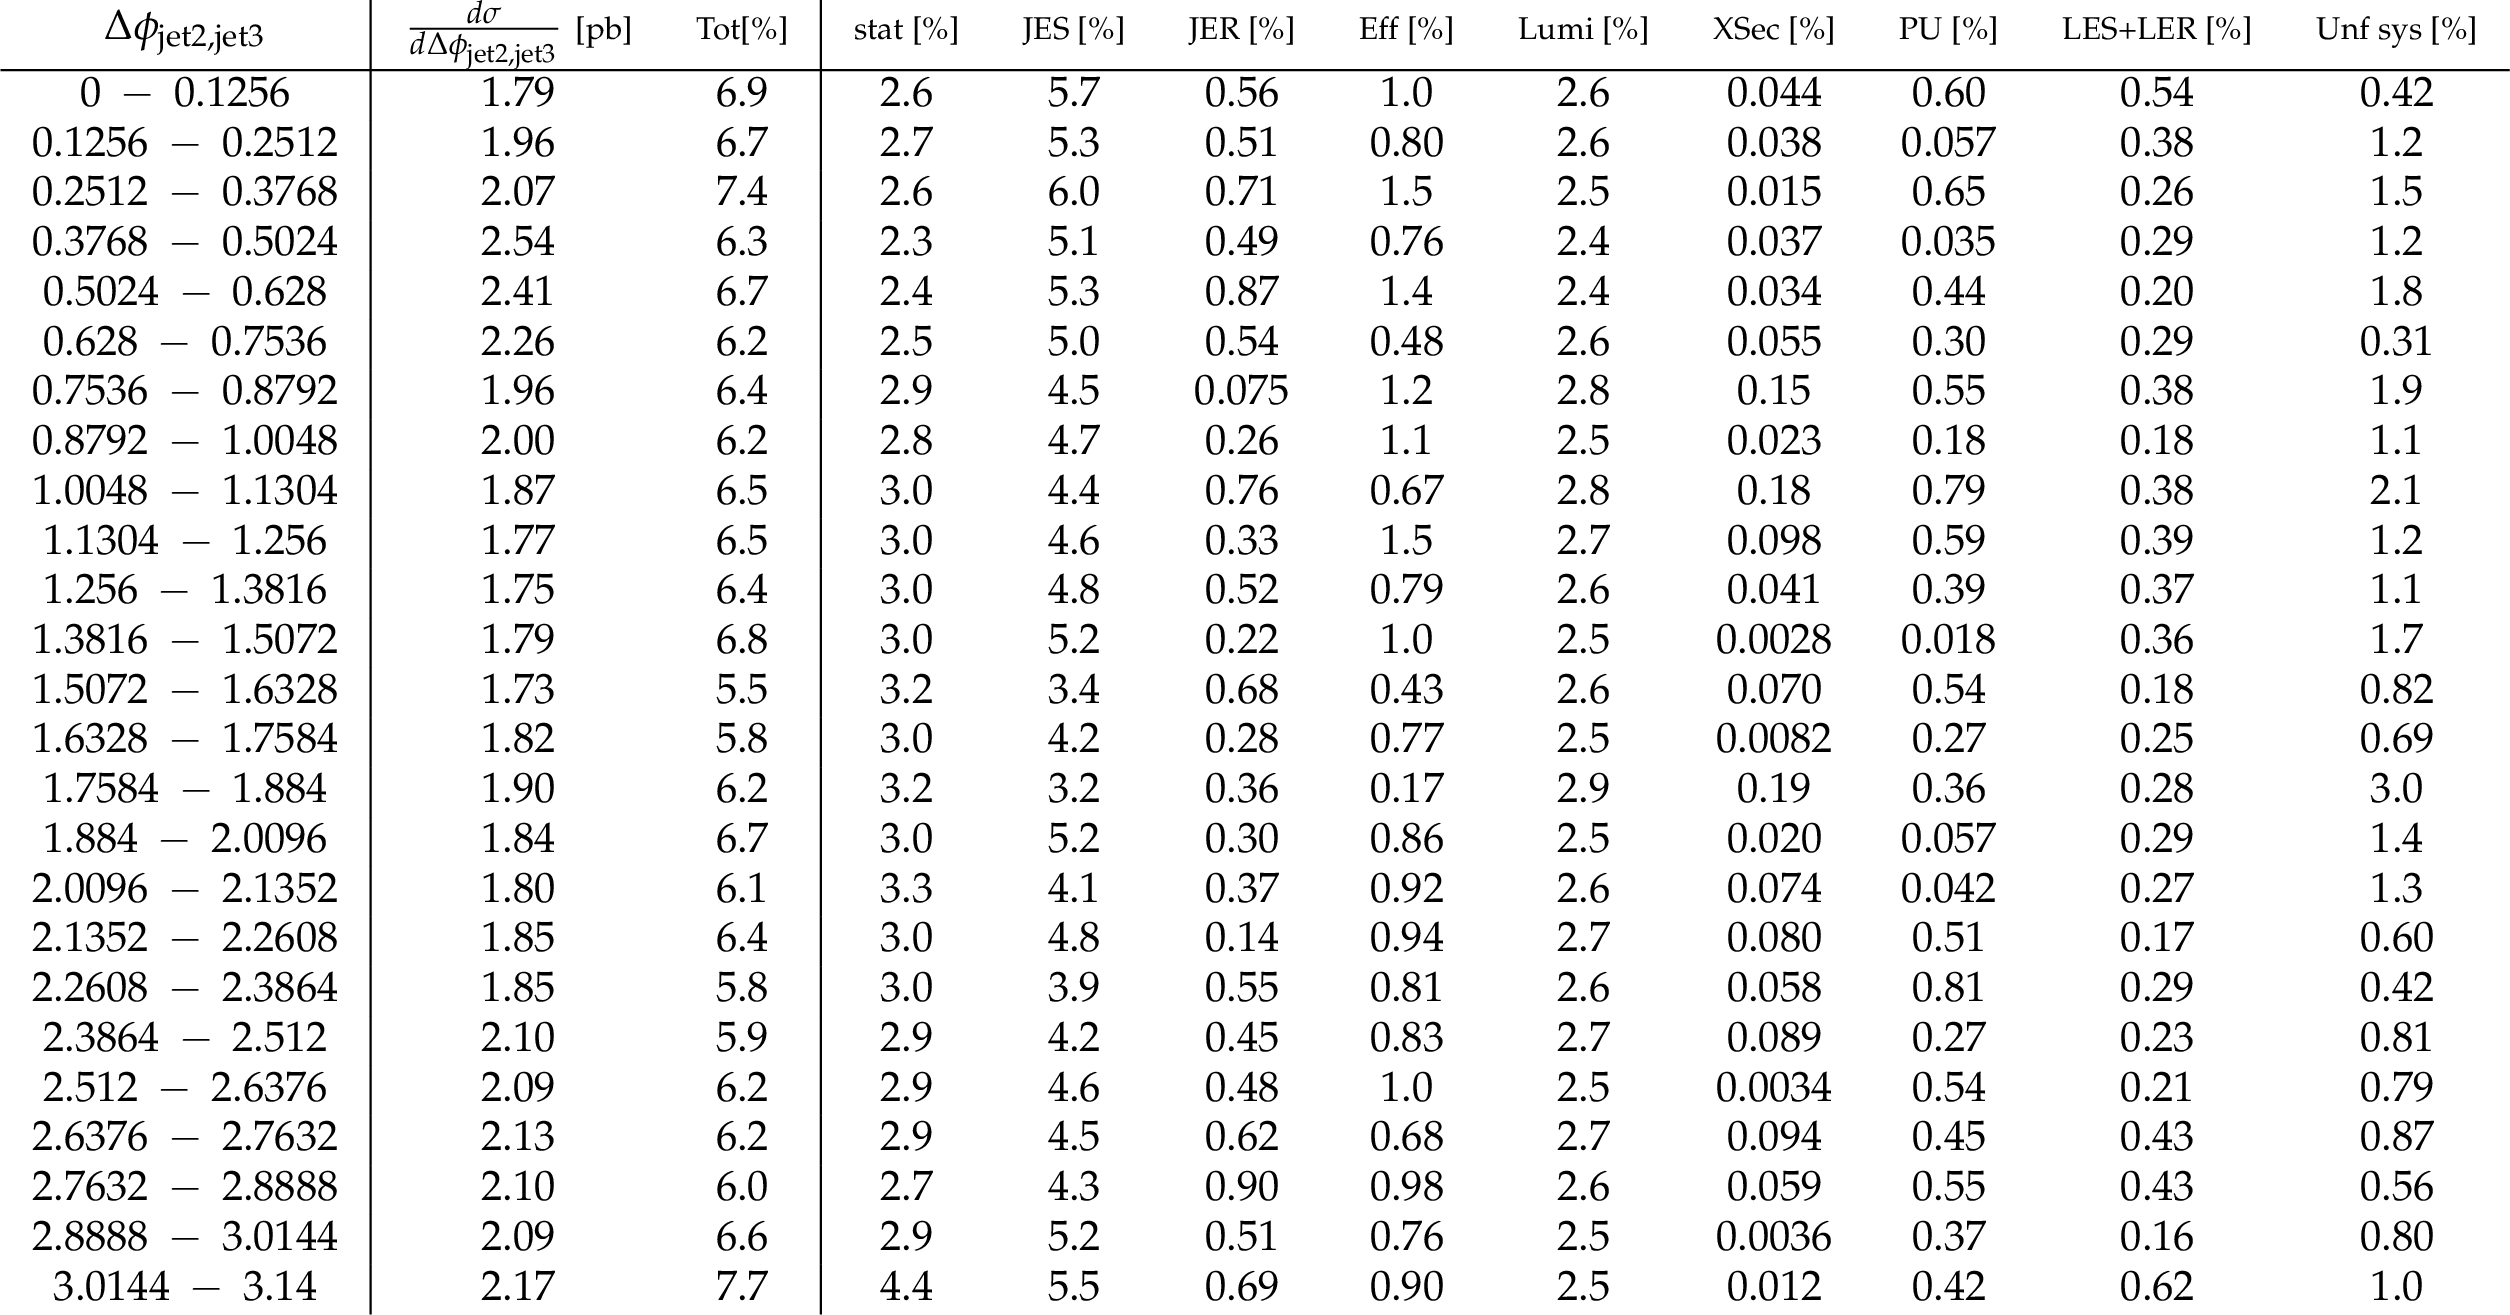
Table 35:
Differential cross section in $\Delta \phi _\text {jet2,jet3}$ ($N_{\text {jets}} \geq $ 3) and break down of the systematic uncertainties for the combination of both decay channels. |
| Summary |
|
The production of Z bosons, decaying into a pair of electrons or muons, in association with jets has been studied in proton-proton collisions at a centre-of-mass energy of 13 TeV at the LHC with the CMS experiment using data set corresponding to an integrated luminosity of 35.9 fb$^{-1}$ . Differential cross sections have been measured for Z bosons decaying to electrons or muons with transverse momenta ${p_{\mathrm{T}}} > $ 25 GeV and pseudorapidity $|{\eta}| < $ 2.4 requiring at least one jet with ${p_{\mathrm{T}}} > $ 30 GeV and $|{\eta}| < $ 2.4. Differential cross sections have been measured as a function of the exclusive and inclusive jet multiplicities ($N_\text{jets}$), in jet ${p_{\mathrm{T}}}$ of the Z boson, jet kinematic variables that include jet ${p_{\mathrm{T}}}$, the scalar sum of jet ${p_{\mathrm{T}}}$, and jet rapidity for up to five inclusive $N_\text{jets}$ values. The results, corrected for detector effects through regularized unfolding, have been compared with two calculations. One being where expectations are computed from particle-level simulations using multileg next-to-leading order predictions and the FxFx merging scheme and the other using multileg leading-order predictions using the MLM parton-shower and matrix-element matching scheme. High precision has been achieved in measuring the cross sections using the latest experimental methods and larger sets of data than were available in previous CMS publications. Increased number of events has extended the kinematic range of cross sections to higher values of ${p_{\mathrm{T}}}$ and mass opened the possibility of investigating new and rare processes not yet observed. The measurements presented in this note provide a detailed description of the topological structure of $\mathrm{Z} \to \ell^+ \ell^- + \text{jets}$ events that is complementary to the existing measurements of rates and associated jet multiplicities. In summary, the measured cross sections are in general within their experimental and theoretical uncertainties of the expectations from theory as are $N_\text{jets}$. Nevertheless with increasing deviations are observed for $N_\text{jets} > $ 3. General agreement is found in the distributions of jet variables considered. However, some deviations with respect to the data observed at larger energy scales. Such discrepancies offer the possibility of using the data to improve the modeling. The results also indicate that multiparton next-to-leading calculations and their associated uncertainty can be used to estimate the $\mathrm{Z} \to \ell^+ \ell^- + \text{jets}$ contributions to measurements and searches at the LHC. |
| References | ||||
| 1 | S. Drell and T.-M. Yan | Massive lepton pair production in hadron-hadron collisions at high-energies | PRL 25 (1970) 316, . [Erratum: PRLett. 25, (1970) 902] | |
| 2 | R. Hamberg, W. van Neerven, and T. Matsuura | A complete calculation of the order $ \alpha-s^{2} $ correction to the Drell-Yan $ K $ factor | NPB 359 (1991) 343, . [Erratum: Nucl.Phys.B 644 (2002), 403--404] | |
| 3 | S. Catani and M. Grazzini | An NNLO subtraction formalism in hadron collisions and its application to Higgs boson production at the LHC | PRL 98 (2007) 222002 | hep-ph/0703012 |
| 4 | K. Melnikov and F. Petriello | Electroweak gauge boson production at hadron colliders through $ \mathcal{O}({{\alpha}}_{s}^{2}) $ | PRD 74 (2006) 114017 | hep-ph/0609070 |
| 5 | ATLAS Collaboration | Measurement of the production cross section of jets in association with a Z boson in pp collisions at $ \sqrt{s} = $ 7 TeV with the ATLAS detector | JHEP 07 (2013) 032 | 1304.7098 |
| 6 | ATLAS Collaboration | Measurement of the production cross section for Z/gamma* in association with jets in pp collisions at $ \sqrt{s}= $ 7 TeV with the ATLAS detector | PRD 85 (2012) 032009 | 1111.2690 |
| 7 | CMS Collaboration | Jet Production Rates in Association with W and Z Bosons in pp Collisions at $ \sqrt{s}= $ 7 TeV | JHEP 01 (2012) 010 | CMS-EWK-10-012 1110.3226 |
| 8 | CMS Collaboration | Measurements of jet multiplicity and differential production cross sections of $ Z + $ jets events in proton-proton collisions at $ \sqrt{s} = $ 7 TeV | PRD 91 (2015) 052008 | CMS-SMP-12-017 1408.3104 |
| 9 | CMS Collaboration | Event shapes and azimuthal correlations in Z + jets events in pp collisions at $ \sqrt{s}= $ 7 TeV | PLB 722 (2013) 238 | CMS-EWK-11-021 1301.1646 |
| 10 | CMS Collaboration | Comparison of the Z/$ \gamma ^{*} $ + jets to $ \gamma $ + jets cross sections in pp collisions at $ \sqrt{s}= $ 8 TeV | JHEP 10 (2015) 128 | CMS-SMP-14-005 1505.06520 |
| 11 | CMS Collaboration | Measurements of differential production cross sections for a Z boson in association with jets in pp collisions at $ \sqrt{s}= $ 8 TeV | JHEP 04 (2017) 022 | CMS-SMP-14-013 1611.03844 |
| 12 | LHCb Collaboration | Measurement of forward $ W $ and $ Z $ boson production in association with jets in proton-proton collisions at $ \sqrt{s}= $ 8 TeV | JHEP 05 (2016) 131 | 1605.00951 |
| 13 | CMS Collaboration | Measurement of differential cross sections for Z boson production in association with jets in proton-proton collisions at $ \sqrt{s} = $ 13 TeV | EPJC 78 (2018) 965 | CMS-SMP-16-015 1804.05252 |
| 14 | ATLAS Collaboration | Measurements of the production cross section of a Z boson in association with jets in pp collisions at $ \sqrt{s} = $ 13 TeV with the ATLAS detector | EPJC 77 (2017) 361 | 1702.05725 |
| 15 | CDF Collaboration | Measurement of inclusive jet cross-sections in $ Z/\gamma^* \to \mathrm{e}^{+} \mathrm{e}^{-} $ + jets production in $ \mathrm{p} \bar{\mathrm{p}} $ collisions at $ \sqrt{s} = $ 1.96-TeV | PRL 100 (2008) 102001 | 0711.3717 |
| 16 | D0 Collaboration | Measurement of differential $ Z / \gamma^{*} $ + jet + $ X $ cross sections in $ p \bar{p} $ collisions at $ \sqrt{s} = $ 1.96-TeV | PLB 669 (2008) 278 | 0808.1296 |
| 17 | CMS Collaboration | Description and performance of track and primary-vertex reconstruction with the CMS tracker | JINST 9 (2014) P10009 | CMS-TRK-11-001 1405.6569 |
| 18 | CMS Collaboration | Performance of photon reconstruction and identification with the CMS detector in proton-proton collisions at $ \sqrt{s} = $ 8 TeV | JINST 10 (2015) P08010 | CMS-EGM-14-001 1502.02702 |
| 19 | CMS Collaboration | Performance of CMS muon reconstruction in pp collision events at $ \sqrt{s}= $ 7 TeV | JINST 7 (2012) P10002 | CMS-MUO-10-004 1206.4071 |
| 20 | CMS Collaboration | The CMS trigger system | JINST 12 (2017) P01020 | CMS-TRG-12-001 1609.02366 |
| 21 | CMS Collaboration | The CMS experiment at the CERN LHC | JINST 3 (2008) S08004 | CMS-00-001 |
| 22 | J. Allison et al. | GEANT4 developments and applications | IEEE Trans. Nucl. Sci. 53 (2006) 270 | |
| 23 | J. Alwall et al. | Comparative study of various algorithms for the merging of parton showers and matrix elements in hadronic collisions | EPJC 53 (2008) 473 | 0706.2569 |
| 24 | R. Frederix and S. Frixione | Merging meets matching in MC@NLO | JHEP 12 (2012) 061 | 1209.6215 |
| 25 | J. Alwall et al. | The automated computation of tree-level and next-to-leading order differential cross sections, and their matching to parton shower simulations | JHEP 07 (2014) 079 | 1405.0301 |
| 26 | T. Sjostrand et al. | An introduction to PYTHIA 8.2 | CPC 191 (2015) 159 | 1410.3012 |
| 27 | CMS Collaboration | Event generator tunes obtained from underlying event and multiparton scattering measurements | EPJC 76 (2016) 155 | CMS-GEN-14-001 1512.00815 |
| 28 | J. M. Campbell, R. K. Ellis, and C. Williams | Vector boson pair production at the LHC | JHEP 07 (2011) 018 | 1105.0020 |
| 29 | P. Nason | A new method for combining NLO QCD with shower Monte Carlo algorithms | JHEP 11 (2004) 040 | hep-ph/0409146 |
| 30 | S. Frixione, P. Nason, and C. Oleari | Matching NLO QCD computations with parton shower simulations: the POWHEG method | JHEP 11 (2007) 070 | 0709.2092 |
| 31 | S. Alioli, P. Nason, C. Oleari, and E. Re | A general framework for implementing NLO calculations in shower Monte Carlo programs: the POWHEG BOX | JHEP 06 (2010) 043 | 1002.2581 |
| 32 | S. Frixione, P. Nason, and G. Ridolfi | A Positive-weight next-to-leading-order Monte Carlo for heavy flavour hadroproduction | JHEP 09 (2007) 126 | 0707.3088 |
| 33 | CMS Collaboration | Particle-flow reconstruction and global event description with the cms detector | JINST 12 (2017) P10003 | CMS-PRF-14-001 1706.04965 |
| 34 | M. Cacciari, G. P. Salam, and G. Soyez | The anti-$ k_t $ jet clustering algorithm | JHEP 04 (2008) 063 | 0802.1189 |
| 35 | M. Cacciari, G. P. Salam, and G. Soyez | FastJet user manual | EPJC 72 (2012) 1896 | 1111.6097 |
| 36 | D. Krohn, M. D. Schwartz, M. Low, and L.-T. Wang | Jet cleansing: Separating data from secondary collision induced radiation at high luminosity | PRD 90 (2014) 065020 | 1309.4777 |
| 37 | CMS Collaboration | Measurement of the inclusive W and Z production cross sections in pp collisions at $ \sqrt{s}= $ 7 TeV | JHEP 10 (2011) 132 | CMS-EWK-10-005 1107.4789 |
| 38 | A. Bodek et al. | Extracting muon momentum scale corrections for hadron collider experiments | EPJC 72 (2012) 2194 | 1208.3710 |
| 39 | NNPDF Collaboration | Parton distributions for the LHC Run II | JHEP 04 (2015) 040 | 1410.8849 |
| 40 | NNPDF Collaboration | Parton distributions with LHC data | NPB 867 (2013) 244 | 1207.1303 |
| 41 | J. Alwall, S. de Visscher, and F. Maltoni | QCD radiation in the production of heavy colored particles at the LHC | JHEP 02 (2009) 017 | 0810.5350 |
| 42 | S. Alioli et al. | Drell-Yan production at NNLL'+NNLO matched to parton showers | PRD 92 (2015) 094020 | 1508.01475 |
| 43 | S. Alioli et al. | Combining higher-order resummation with multiple NLO calculations and parton showers in geneva | JHEP 09 (2013) 120 | 1211.7049 |
| 44 | I. W. Stewart, F. J. Tackmann, and W. J. Waalewijn | N-jettiness: An inclusive event shape to veto jets | PRL 105 (2010) 092002 | 1004.2489 |
| 45 | R. Abbate et al. | Thrust at $ \mathrm{N}^{3}\mathrm{LL} $ with power corrections and a precision global fit for $ {{\alpha}}_{s}({m}_{Z}) $ | PRD 83 (2011) 074021 | 1006.3080 |
| 46 | Z. Ligeti, I. W. Stewart, and F. J. Tackmann | Treating the b quark distribution function with reliable uncertainties | PRD 78 (2008) 114014 | 0807.1926 |
| 47 | R. Frederix et al. | Four-lepton production at hadron colliders: aMC@NLO predictions with theoretical uncertainties | JHEP 02 (2012) 099 | 1110.4738 |
| 48 | I. V. Tikhonov | Solution of incorrectly formulated problems and the regularization method | Soviet Mathematics 4 (1963) 1023 | |
| 49 | S. Schmitt | TUnfold: an algorithm for correcting migration effects in high energy physics | JINST 7 (2012) T10003 | 1205.6201 |
| 50 | D. Calvetti, L. Reichel, and A. Shuibi | L-Curve and curvature bounds for Tikhonov regularization | Numerical Algorithms 35 (2004) 301 | |
| 51 | CMS Collaboration | CMS Luminosity Measurements for the 2016 Data Taking Period | CMS-PAS-LUM-17-001 | CMS-PAS-LUM-17-001 |
| 52 | L. Lyons, D. Gibaut, and P. Clifford | How to combine correlated estimates of a single physical quantity | NIMA 270 (1988) 110 | |
| 53 | A. Valassi | Combining correlated measurements of several different physical quantities | NIMA 500 (2003) 391 | |
|
|
Compact Muon Solenoid LHC, CERN |
|

|

|

|

|

|