

Compact Muon Solenoid
LHC, CERN
| CMS-PAS-SMP-19-004 | ||
| Measurement of the associated production of a Z boson with charm or bottom quark jets in proton-proton collisions at $\sqrt{s}= $ 13 TeV | ||
| CMS Collaboration | ||
| August 2019 | ||
| Abstract: Ratios of cross sections, $\sigma$(Z + c jets)/$\sigma$(Z + jets), $\sigma$(Z + b jets)/$\sigma$(Z + jets), and $\sigma$(Z + c jets)/$\sigma$(Z + b jets) in the associated production of a Z boson with at least one charm or bottom quark jet are measured in pp collisions at $\sqrt{s}= $ 13 TeV using 35.9 fb$^{-1}$ of data collected by the CMS experiment at the CERN LHC. The fiducial volume of the measurement is defined by jet transverse momentum $p_{\mathrm{T}} > $ 30 GeV and pseudorapidity $|{\eta}| < $ 2.4. The Z bosons are selected within the mass range of 71 and 111 GeV requiring leptons (electrons or muons) with $p_{\mathrm{T}} > $ 25 GeV and $|{\eta}| < $ 2.4. Results on the inclusive and differential cross section ratios as functions of jet and Z boson transverse momentum are compared with predictions from leading and next-to-leading order perturbative QCD calculations. These are the first of a kind measurements at 13 TeV, and the measurement precision exceeds that of the current theoretical predictions. | ||
|
Links:
CDS record (PDF) ;
CADI line (restricted) ;
These preliminary results are superseded in this paper, PRD 102 (2020) 032007. The superseded preliminary plots can be found here. |
||
| Figures | |
png pdf |
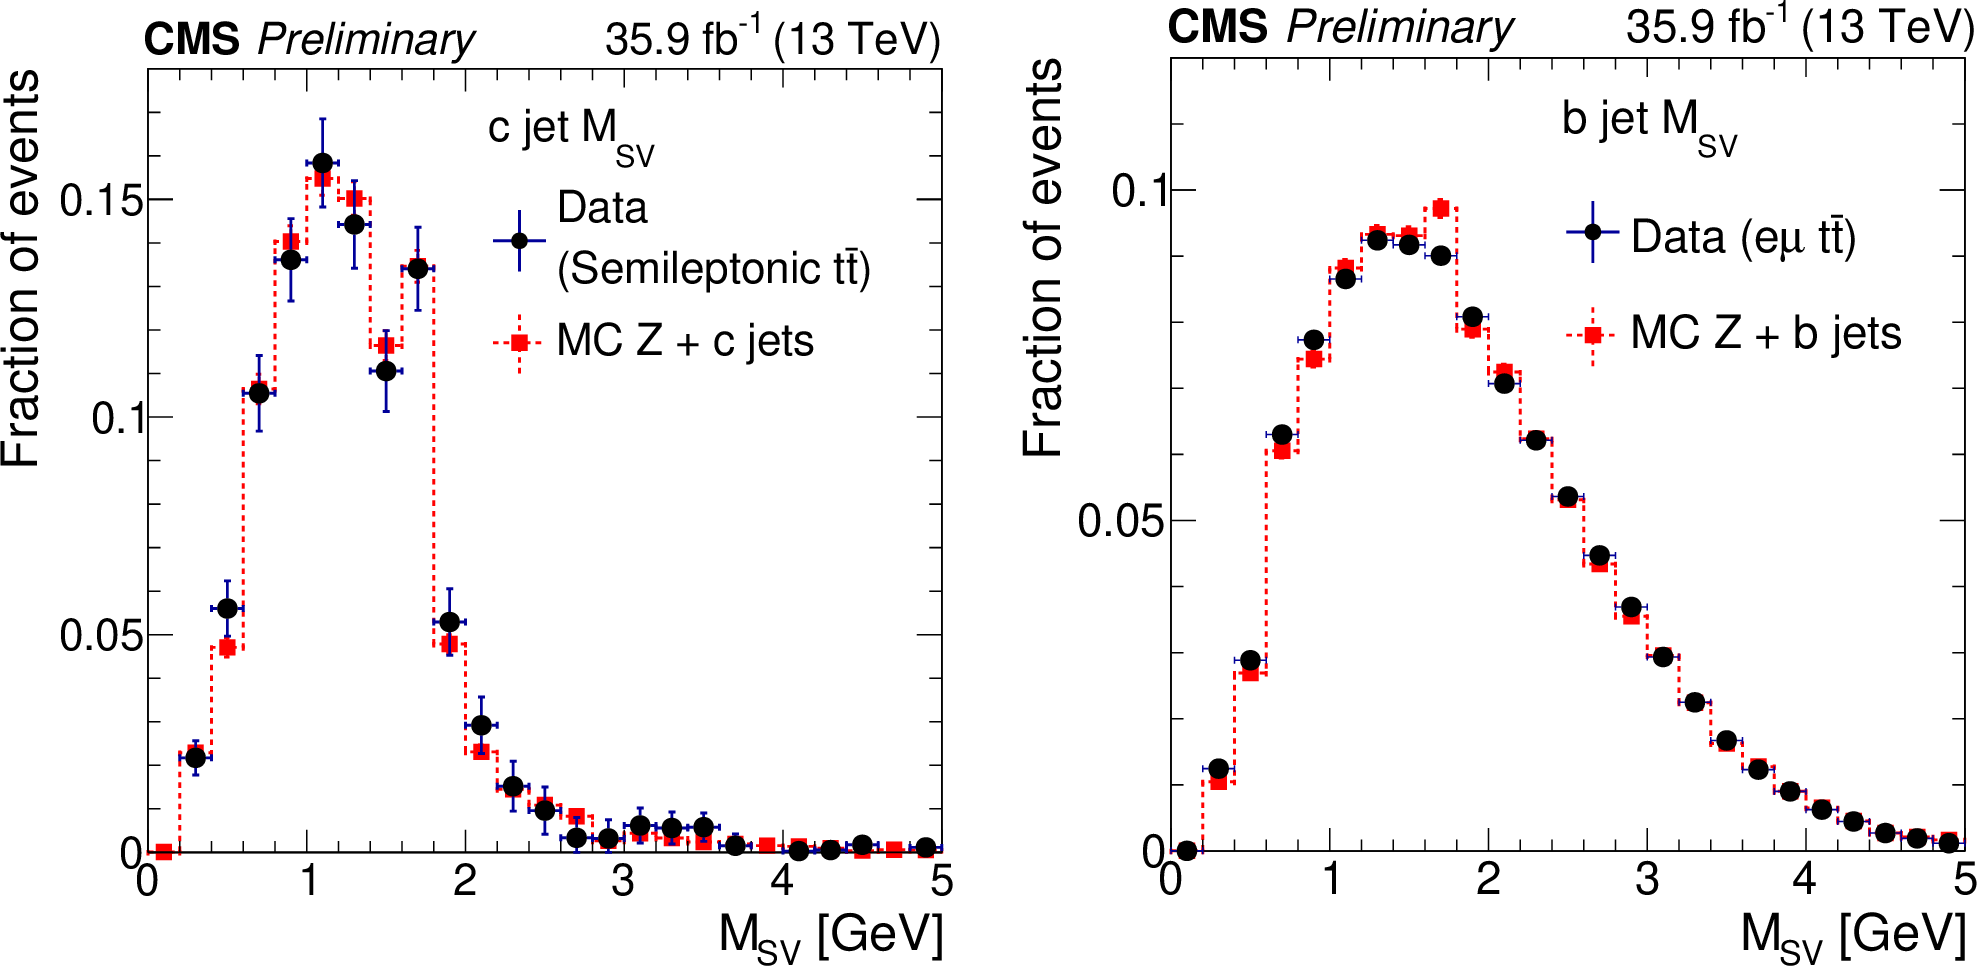
Figure 1:
Comparison of c jet (left), b jet (right) M$_{\text {SV}}$ in data and MC simulation. The correction to account for the difference between the b jets in ${\mathrm{t} {}\mathrm{\bar{t}}}$ and Z + b jets processes is applied to the data distribution in the right panel. |
png pdf |
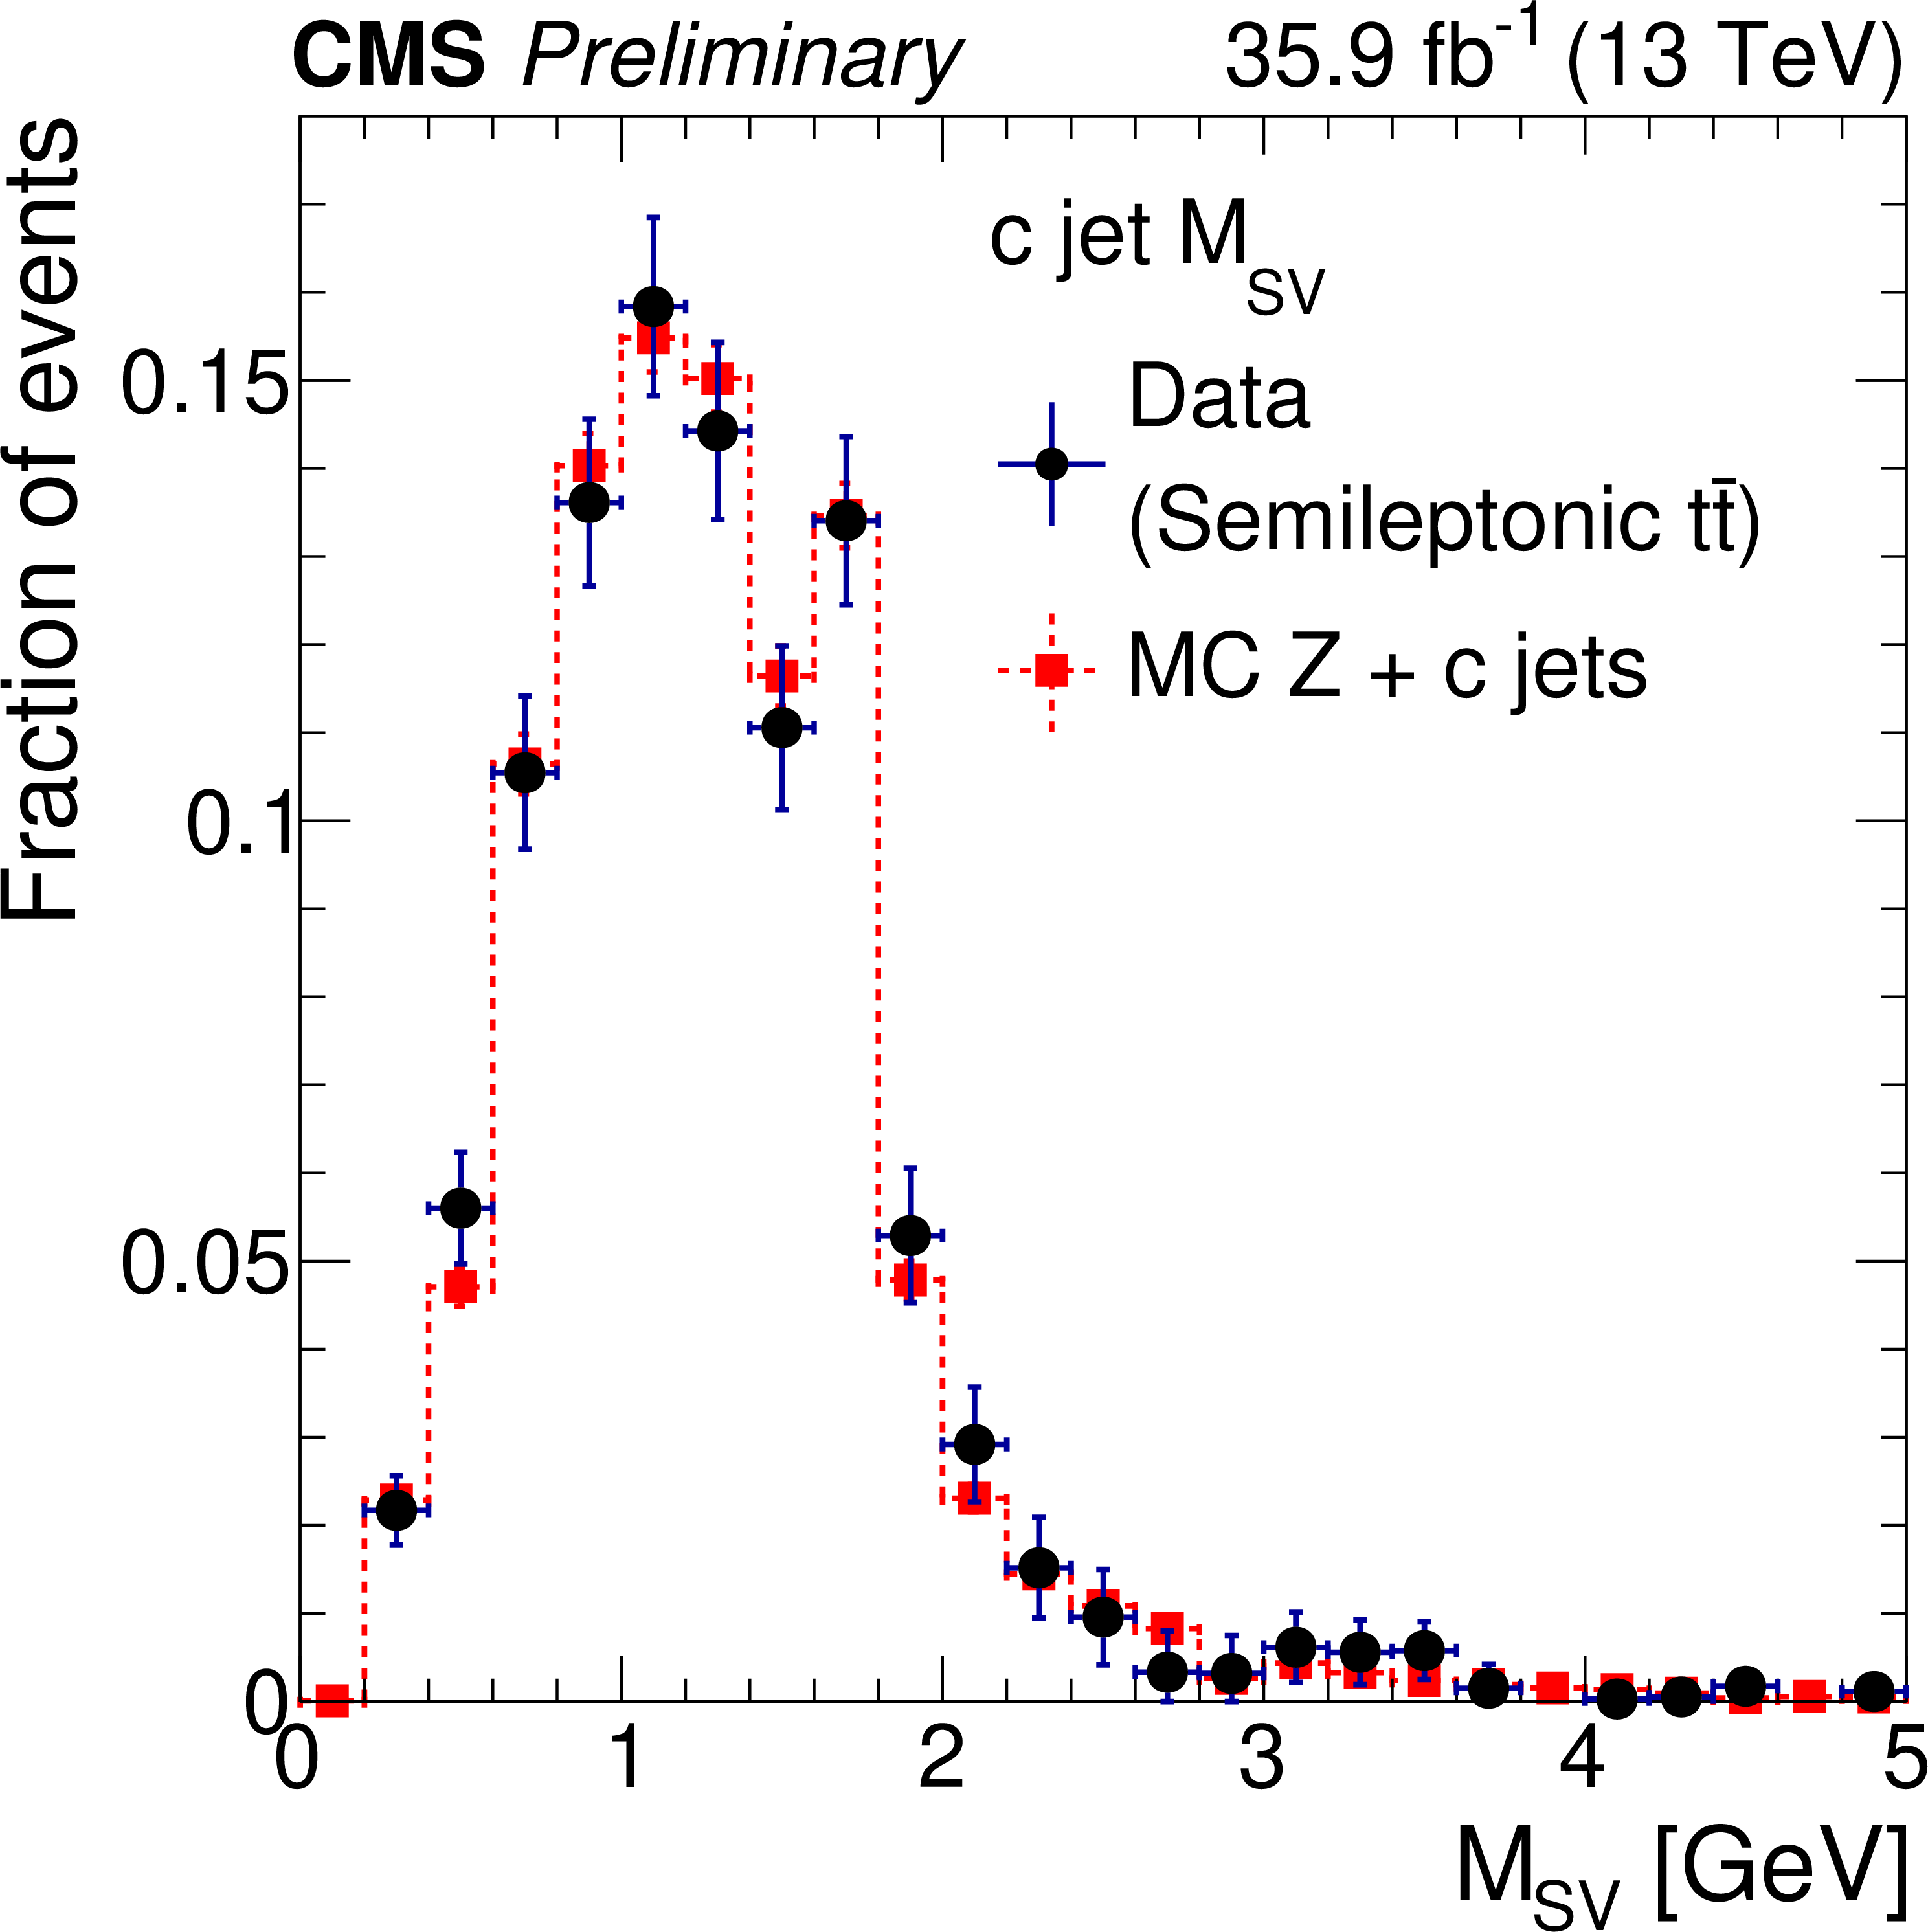
Figure 1-a:
Comparison of c jet (left), b jet (right) M$_{\text {SV}}$ in data and MC simulation. The correction to account for the difference between the b jets in ${\mathrm{t} {}\mathrm{\bar{t}}}$ and Z + b jets processes is applied to the data distribution in the right panel. |

png pdf |
Figure 1-b:
Comparison of c jet (left), b jet (right) M$_{\text {SV}}$ in data and MC simulation. The correction to account for the difference between the b jets in ${\mathrm{t} {}\mathrm{\bar{t}}}$ and Z + b jets processes is applied to the data distribution in the right panel. |

png pdf |
Figure 2:
Post-fit M$_{\text {SV}}$ distributions for electron (left) and muon (right) channels in the inclusive measurement. |

png pdf |
Figure 2-a:
Post-fit M$_{\text {SV}}$ distributions for electron (left) and muon (right) channels in the inclusive measurement. |

png pdf |
Figure 2-b:
Post-fit M$_{\text {SV}}$ distributions for electron (left) and muon (right) channels in the inclusive measurement. |
png pdf |
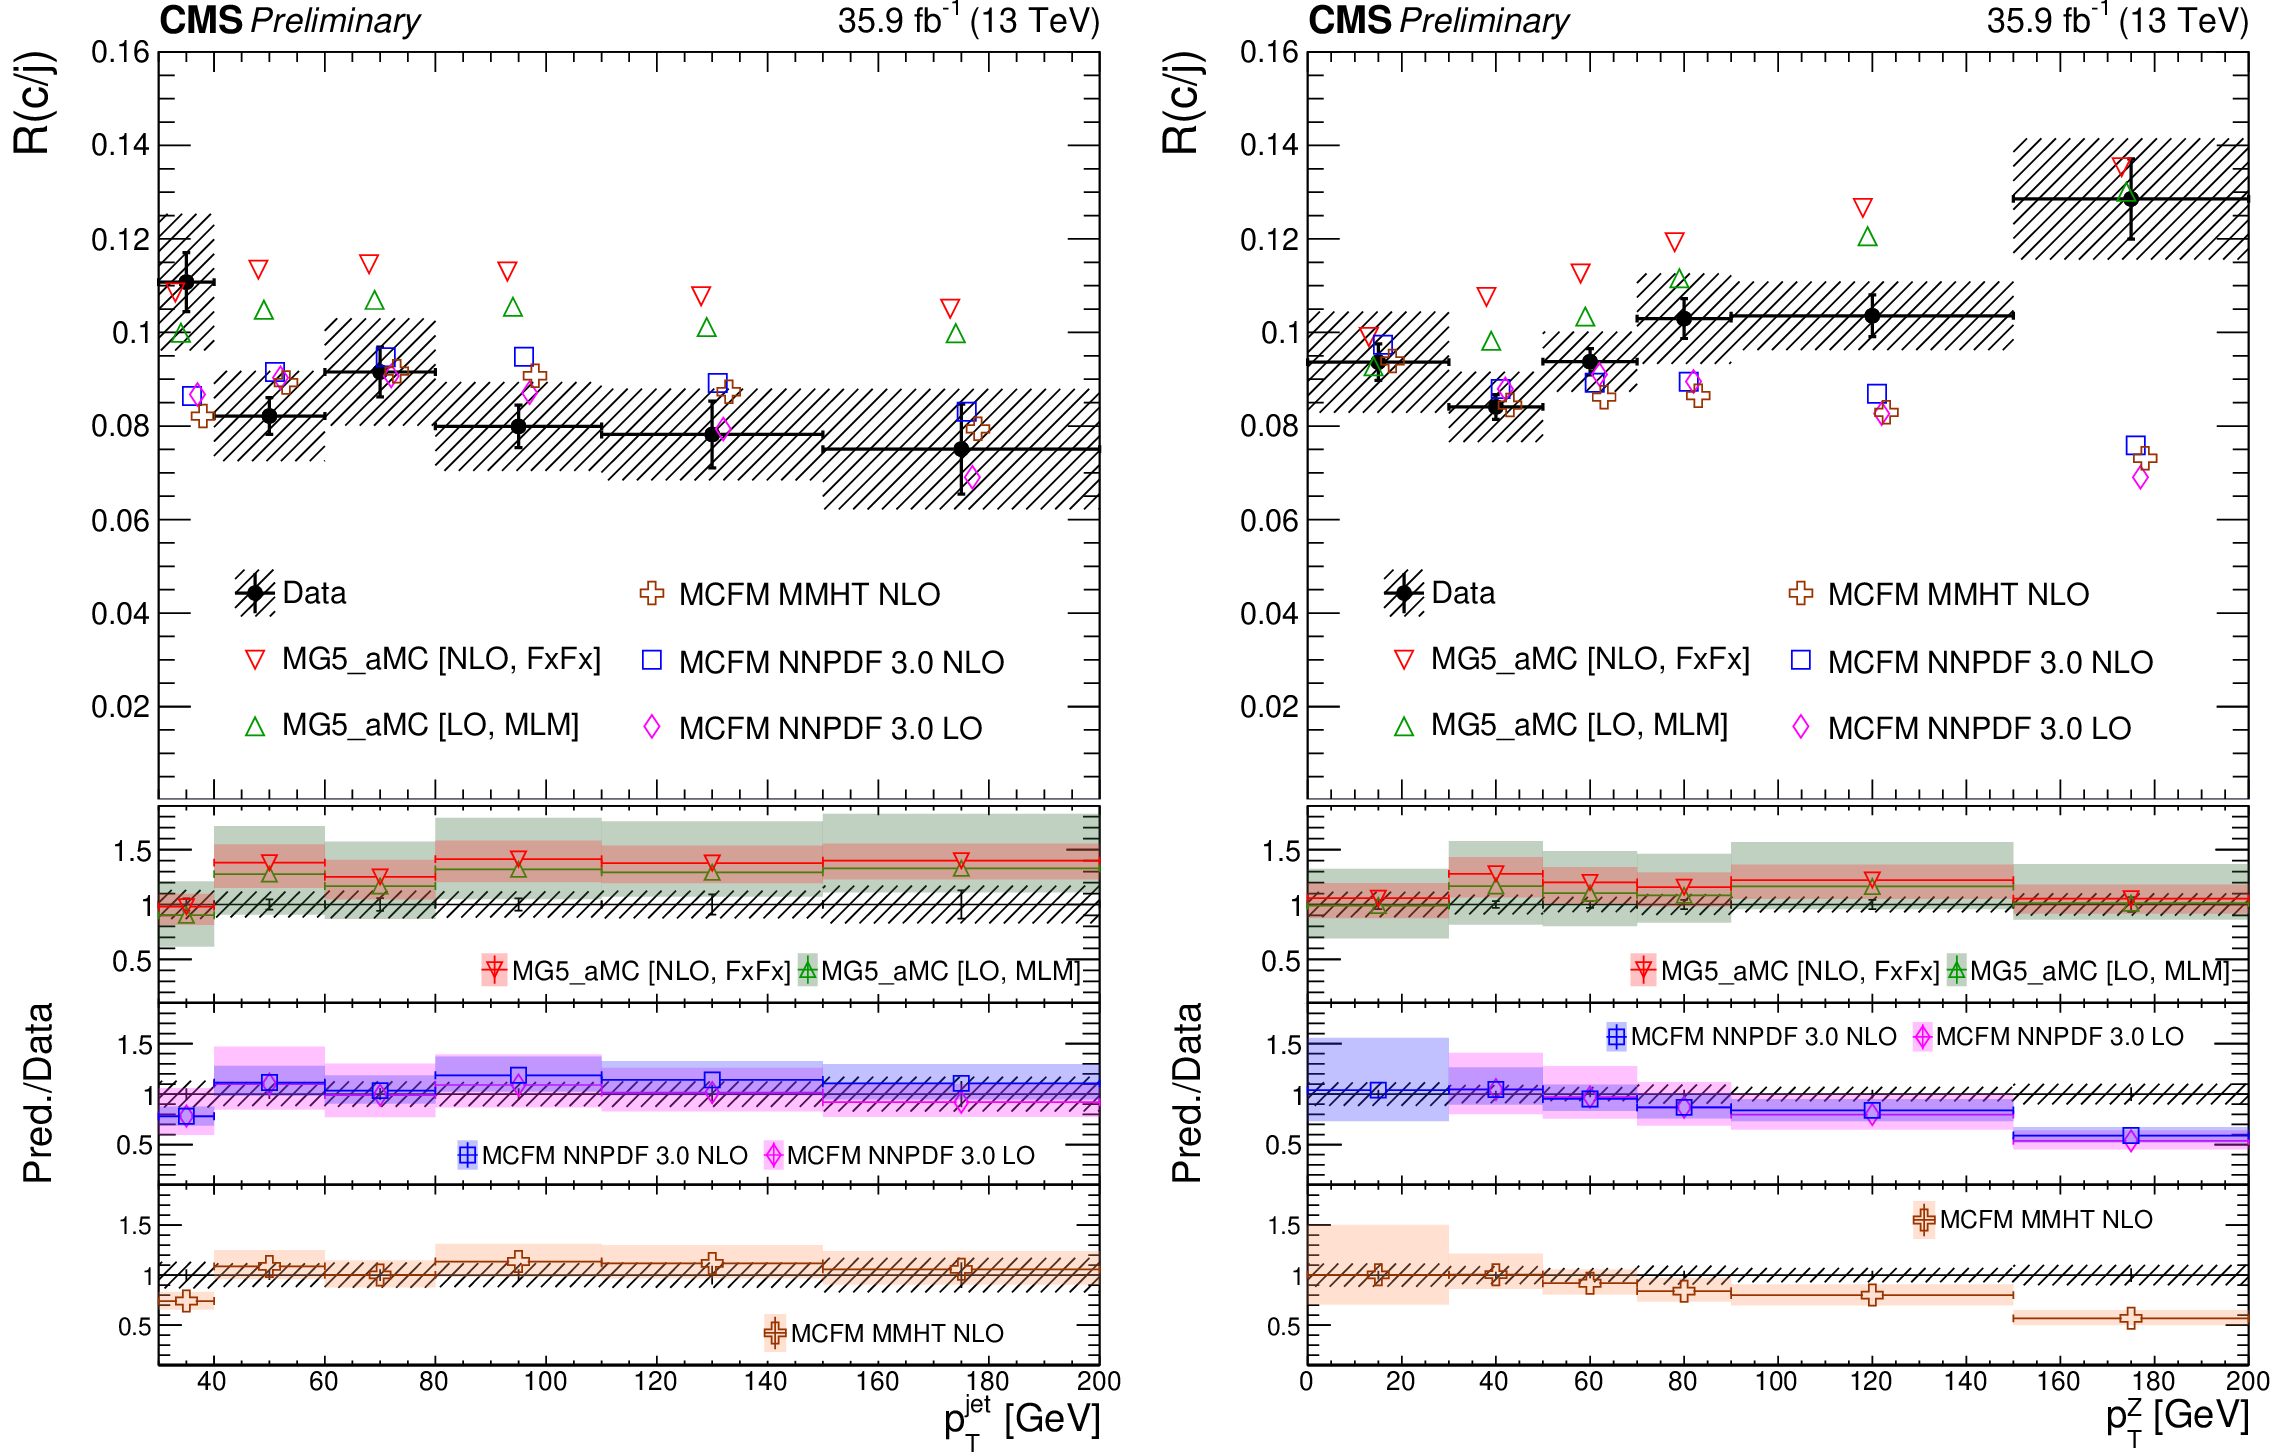
Figure 3:
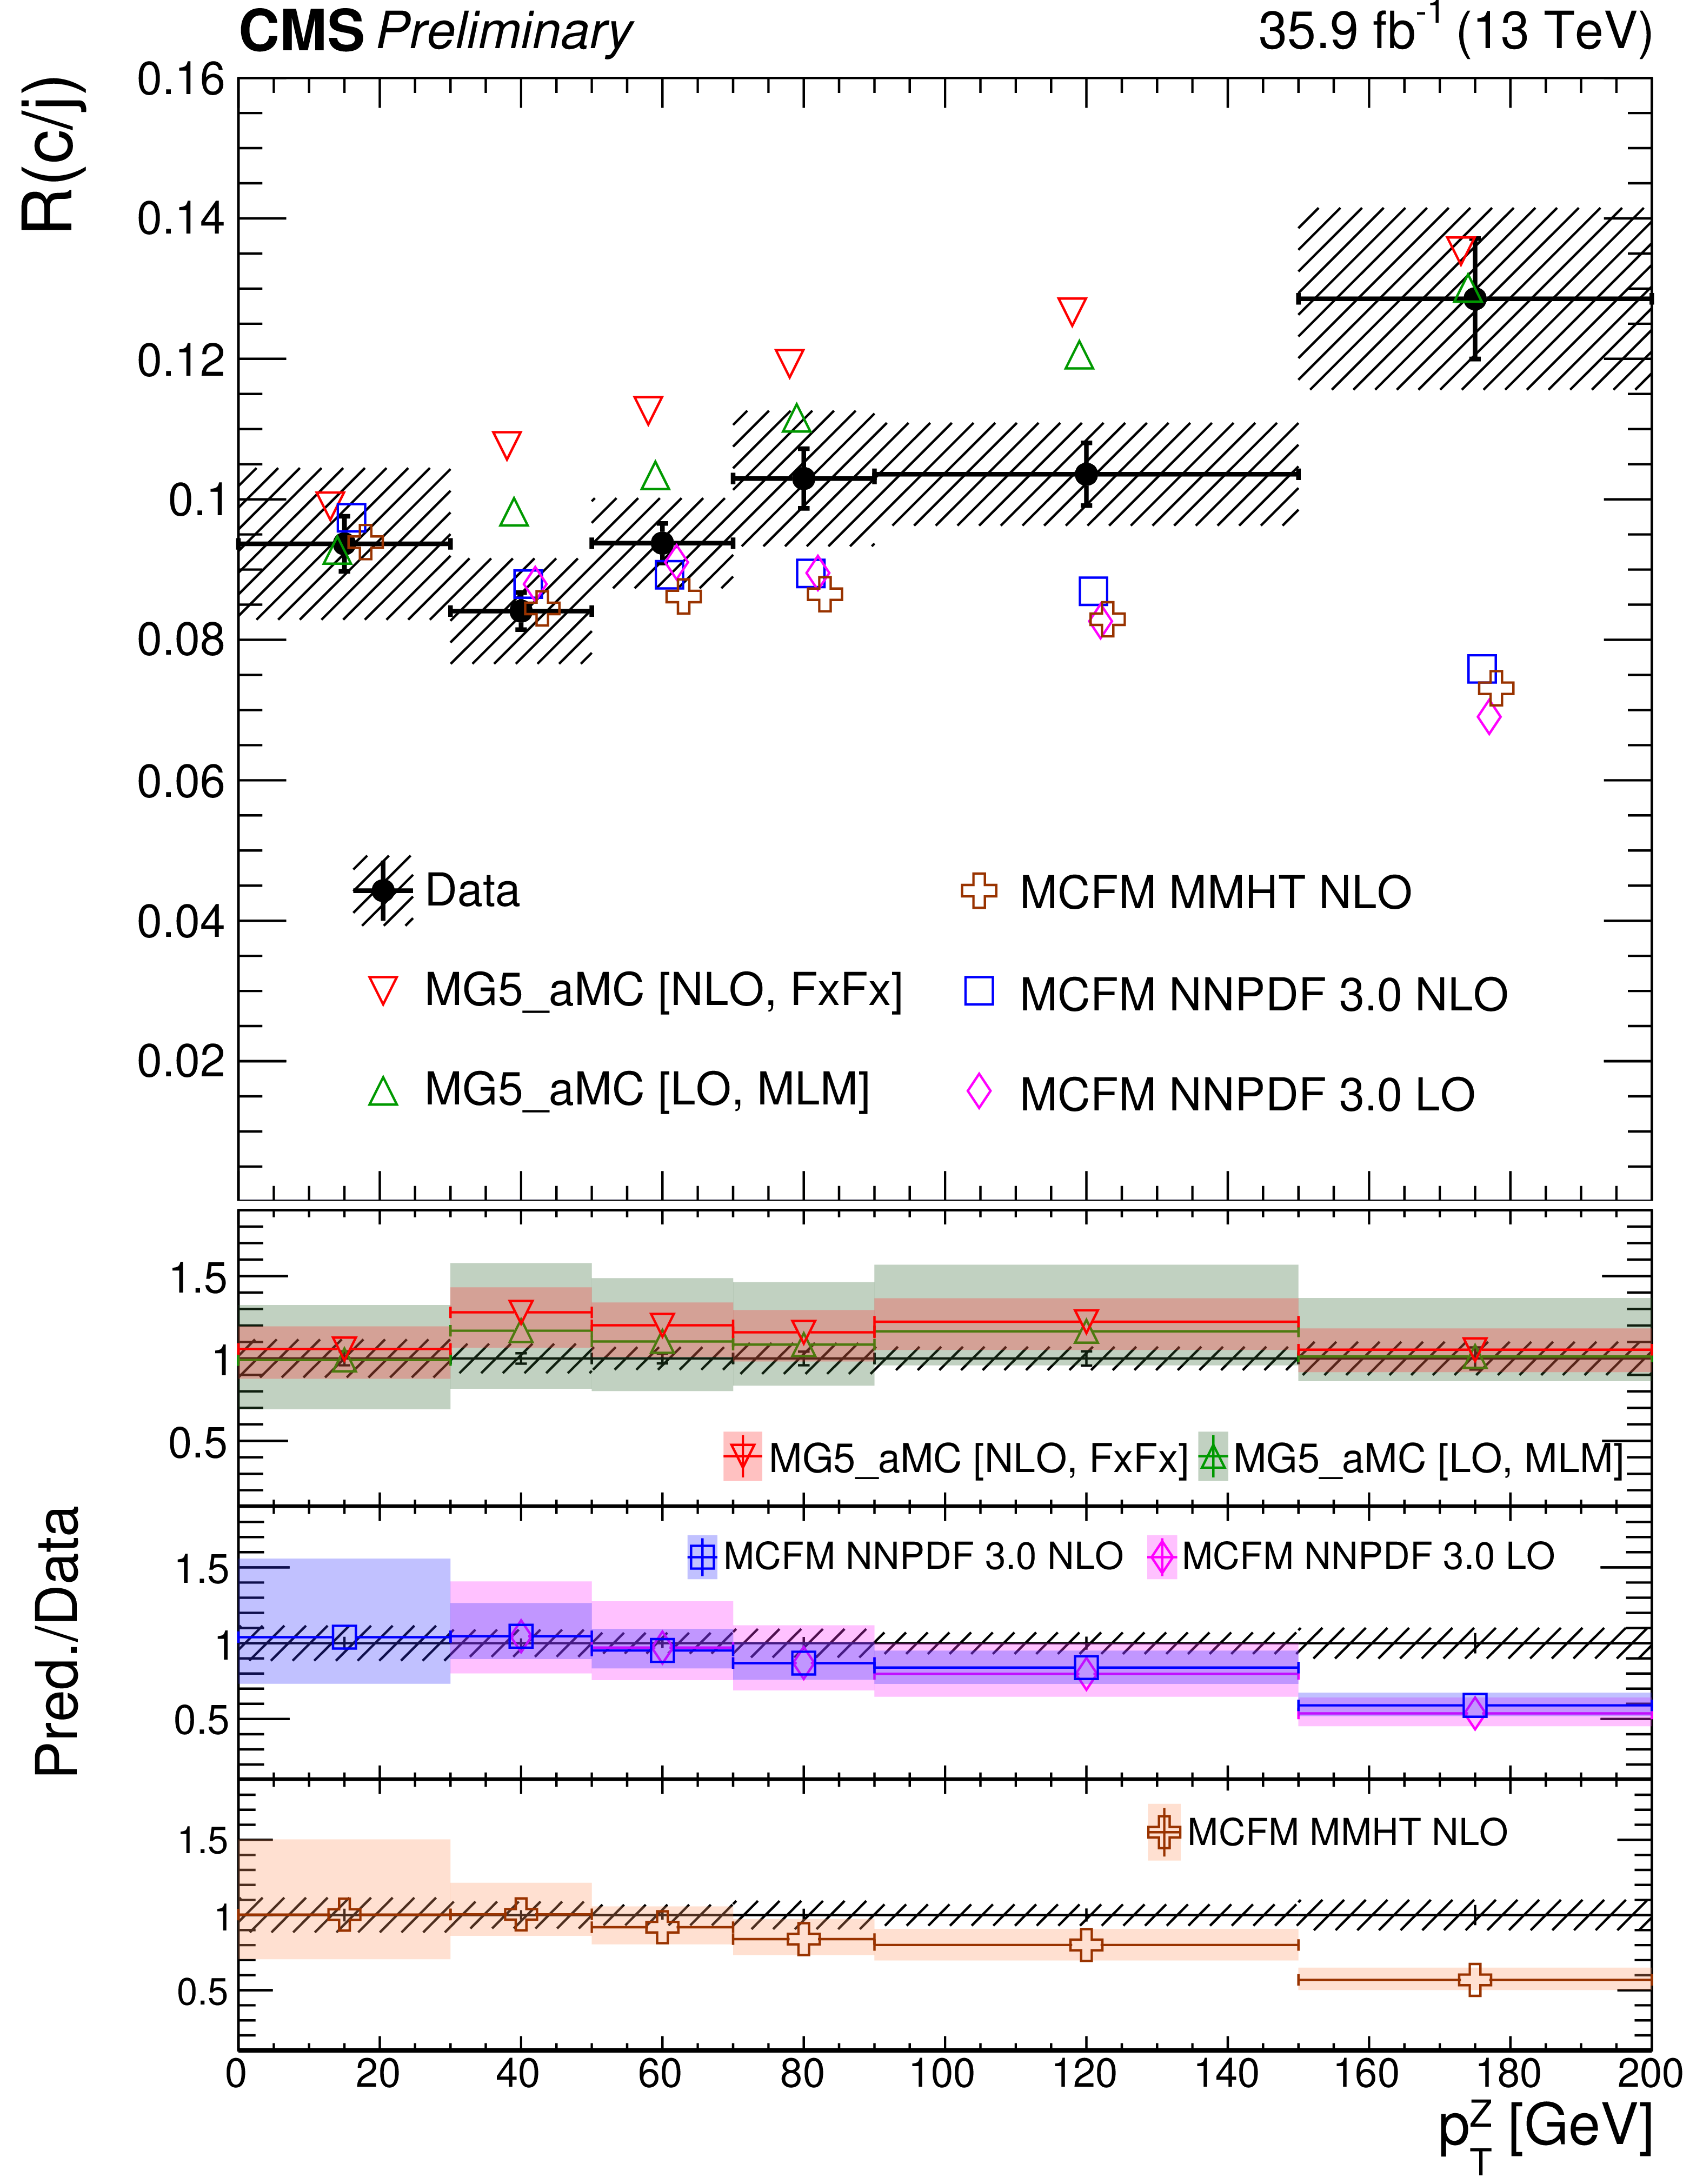
Unfolded, particle-level MG5_aMC and parton-level MCFM R(c/j) cross section ratios versus jet (left) and Z boson (right) transverse momentum. The vertical error bars for the data points are statistical while the hatched band represents the total uncertainties. The predictions are slightly shifted along the x-axis for readability in the upper plots and their total PDF and QCD scales (renormalization and factorization) uncertainties are shown as error bands in the ratio plots. |
png pdf |
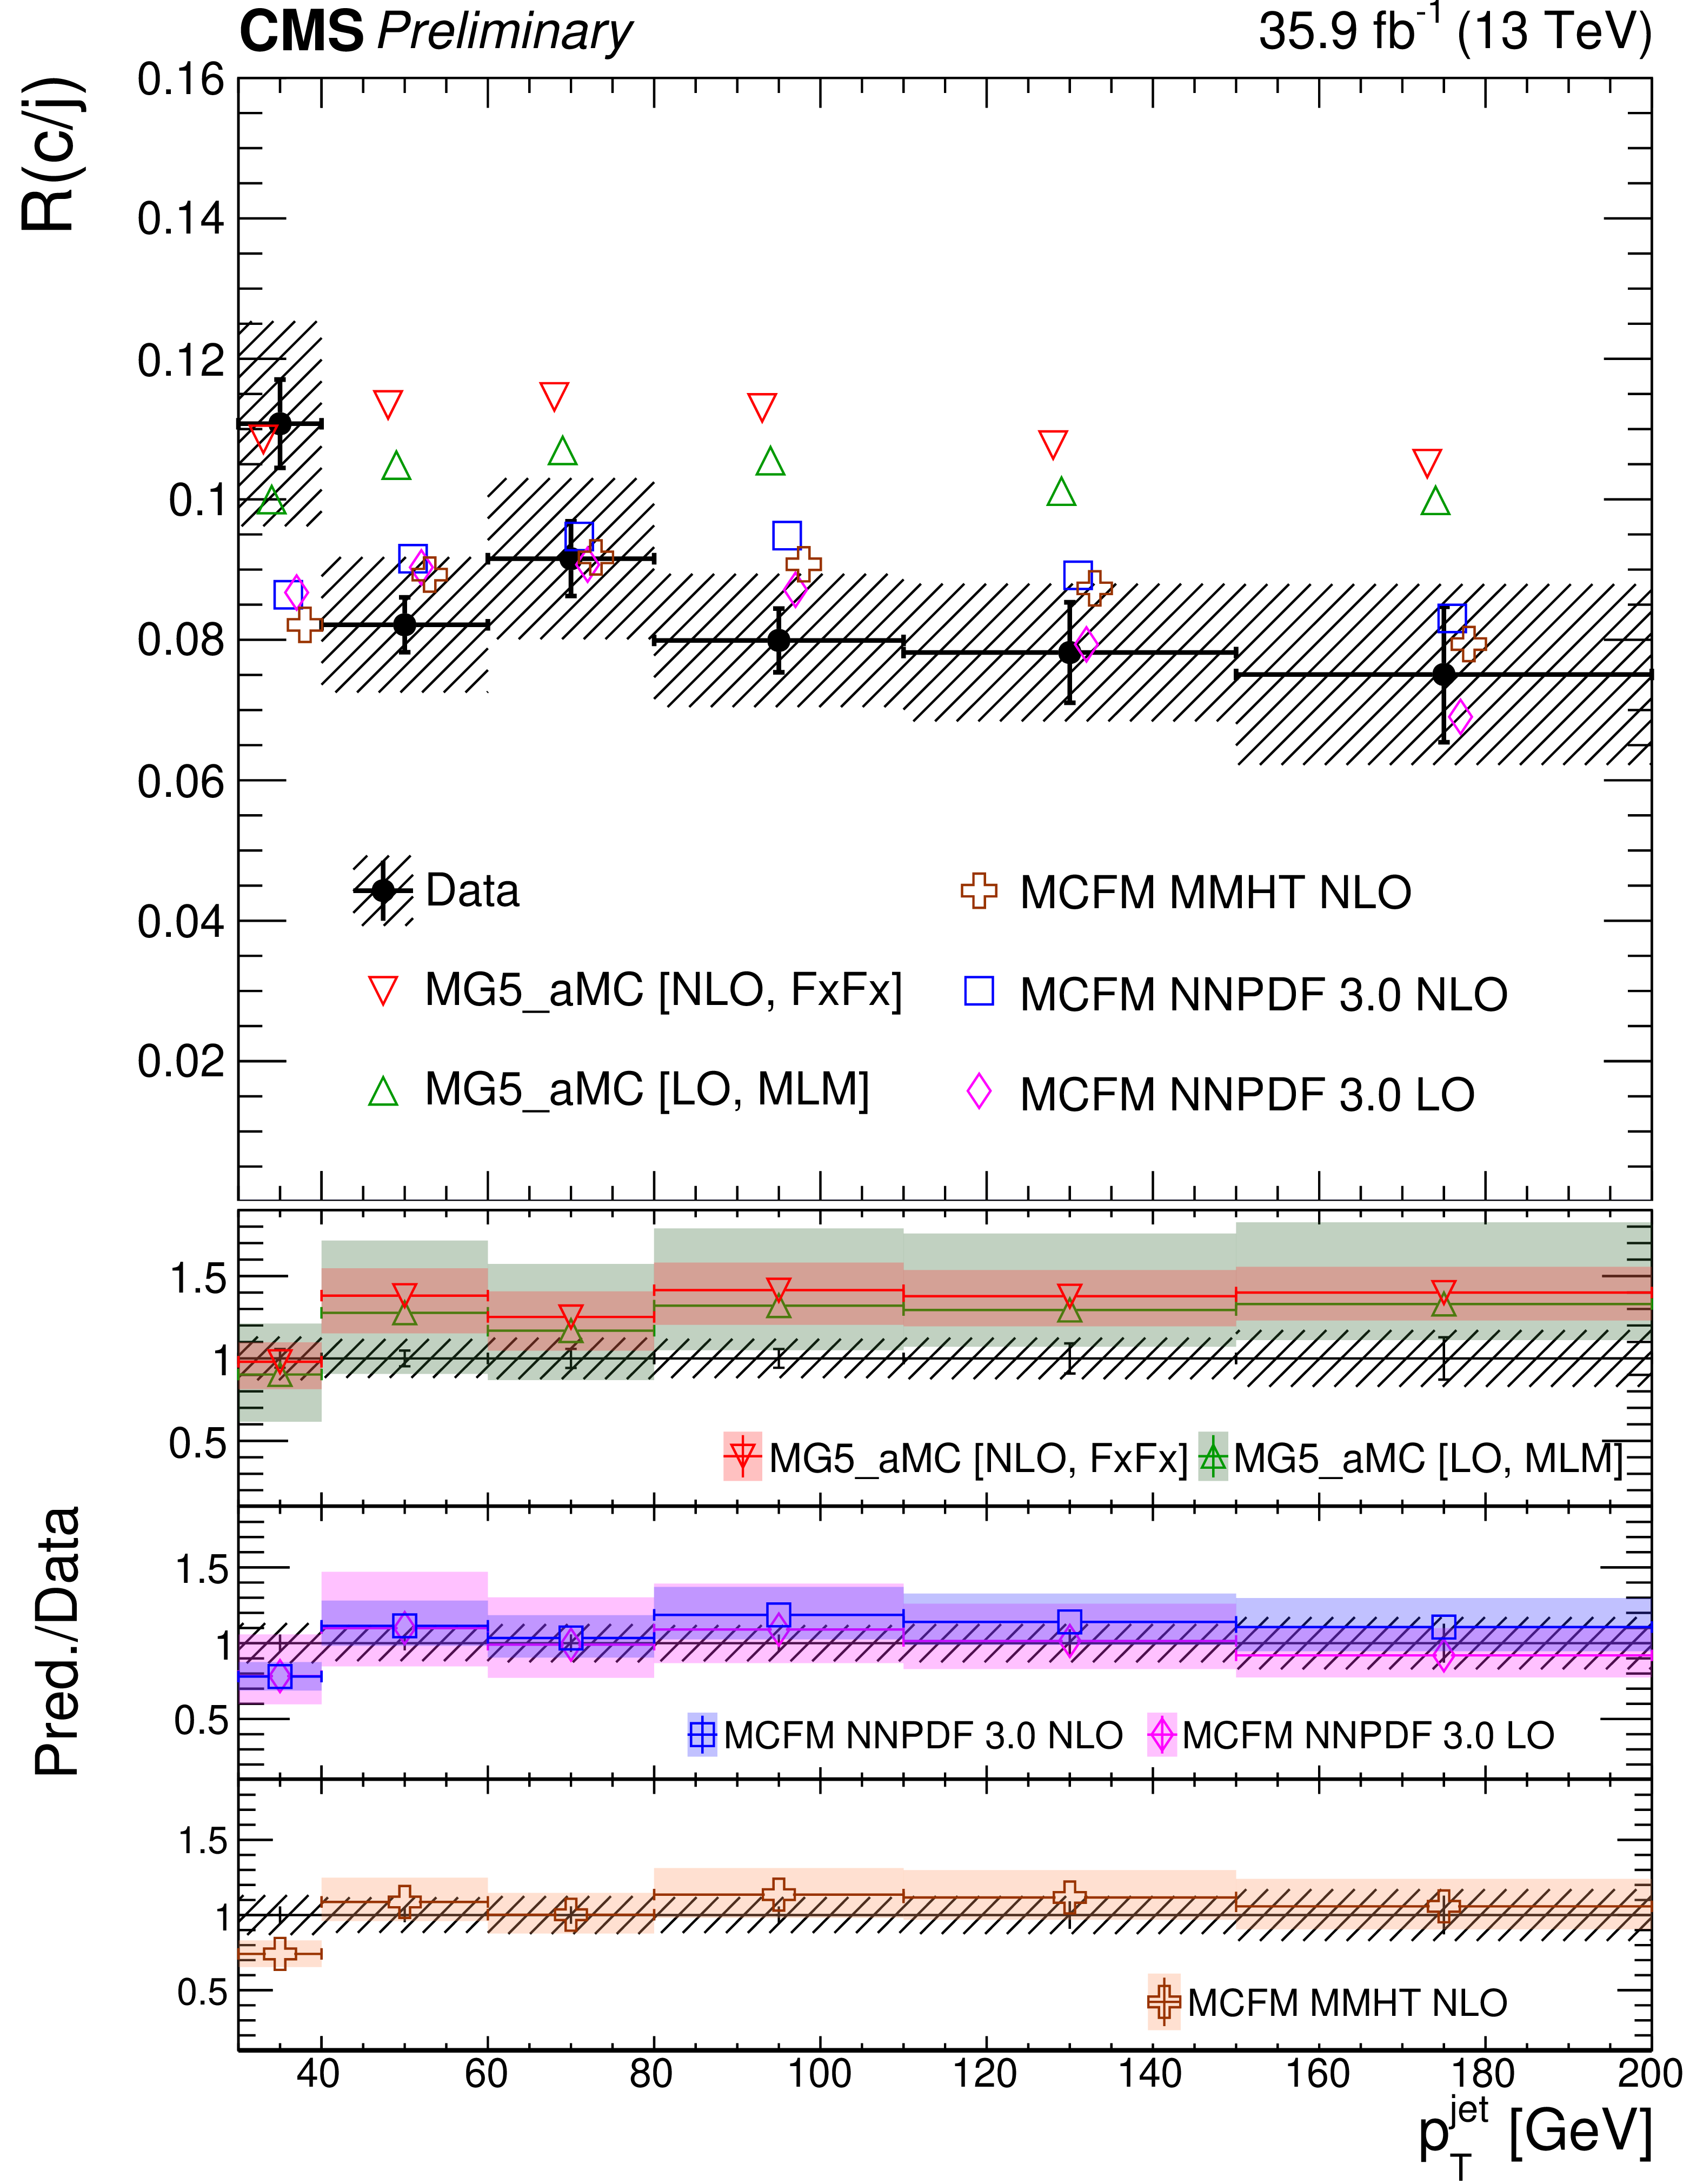
Figure 3-a:
Unfolded, particle-level MG5_aMC and parton-level MCFM R(c/j) cross section ratios versus jet (left) and Z boson (right) transverse momentum. The vertical error bars for the data points are statistical while the hatched band represents the total uncertainties. The predictions are slightly shifted along the x-axis for readability in the upper plots and their total PDF and QCD scales (renormalization and factorization) uncertainties are shown as error bands in the ratio plots. |
png pdf |
Figure 3-b:
Unfolded, particle-level MG5_aMC and parton-level MCFM R(c/j) cross section ratios versus jet (left) and Z boson (right) transverse momentum. The vertical error bars for the data points are statistical while the hatched band represents the total uncertainties. The predictions are slightly shifted along the x-axis for readability in the upper plots and their total PDF and QCD scales (renormalization and factorization) uncertainties are shown as error bands in the ratio plots. |

png pdf |
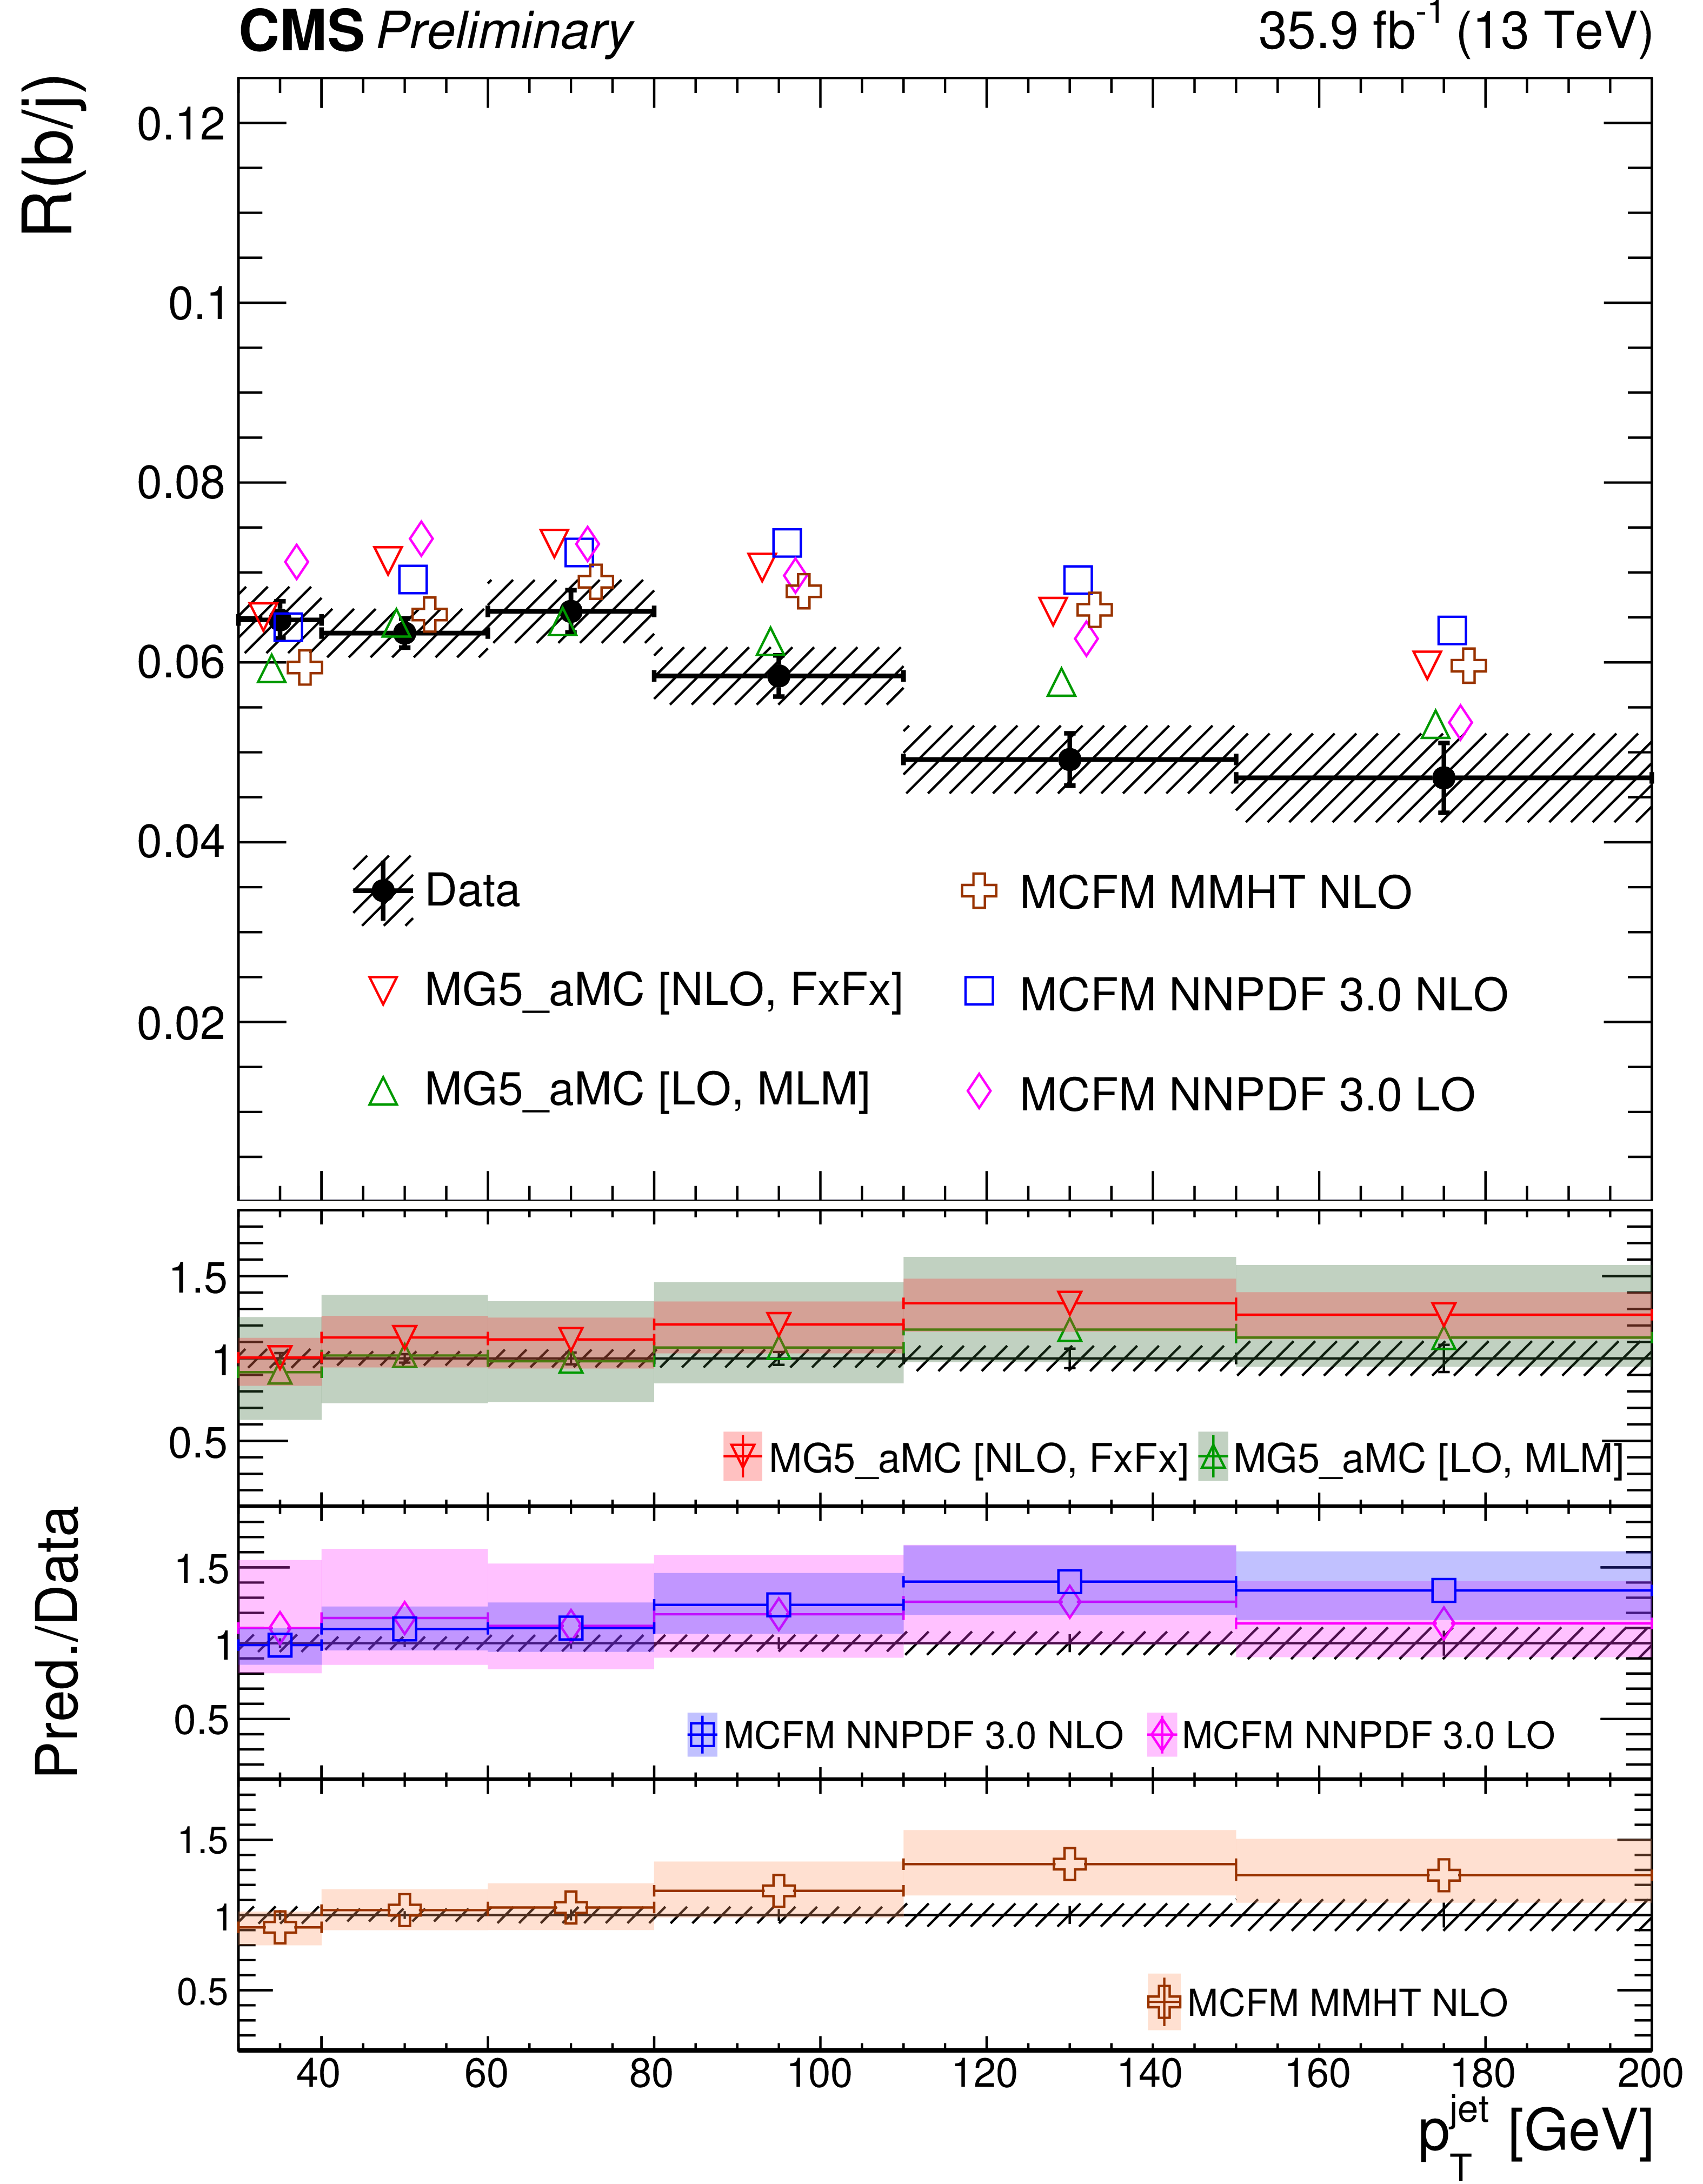
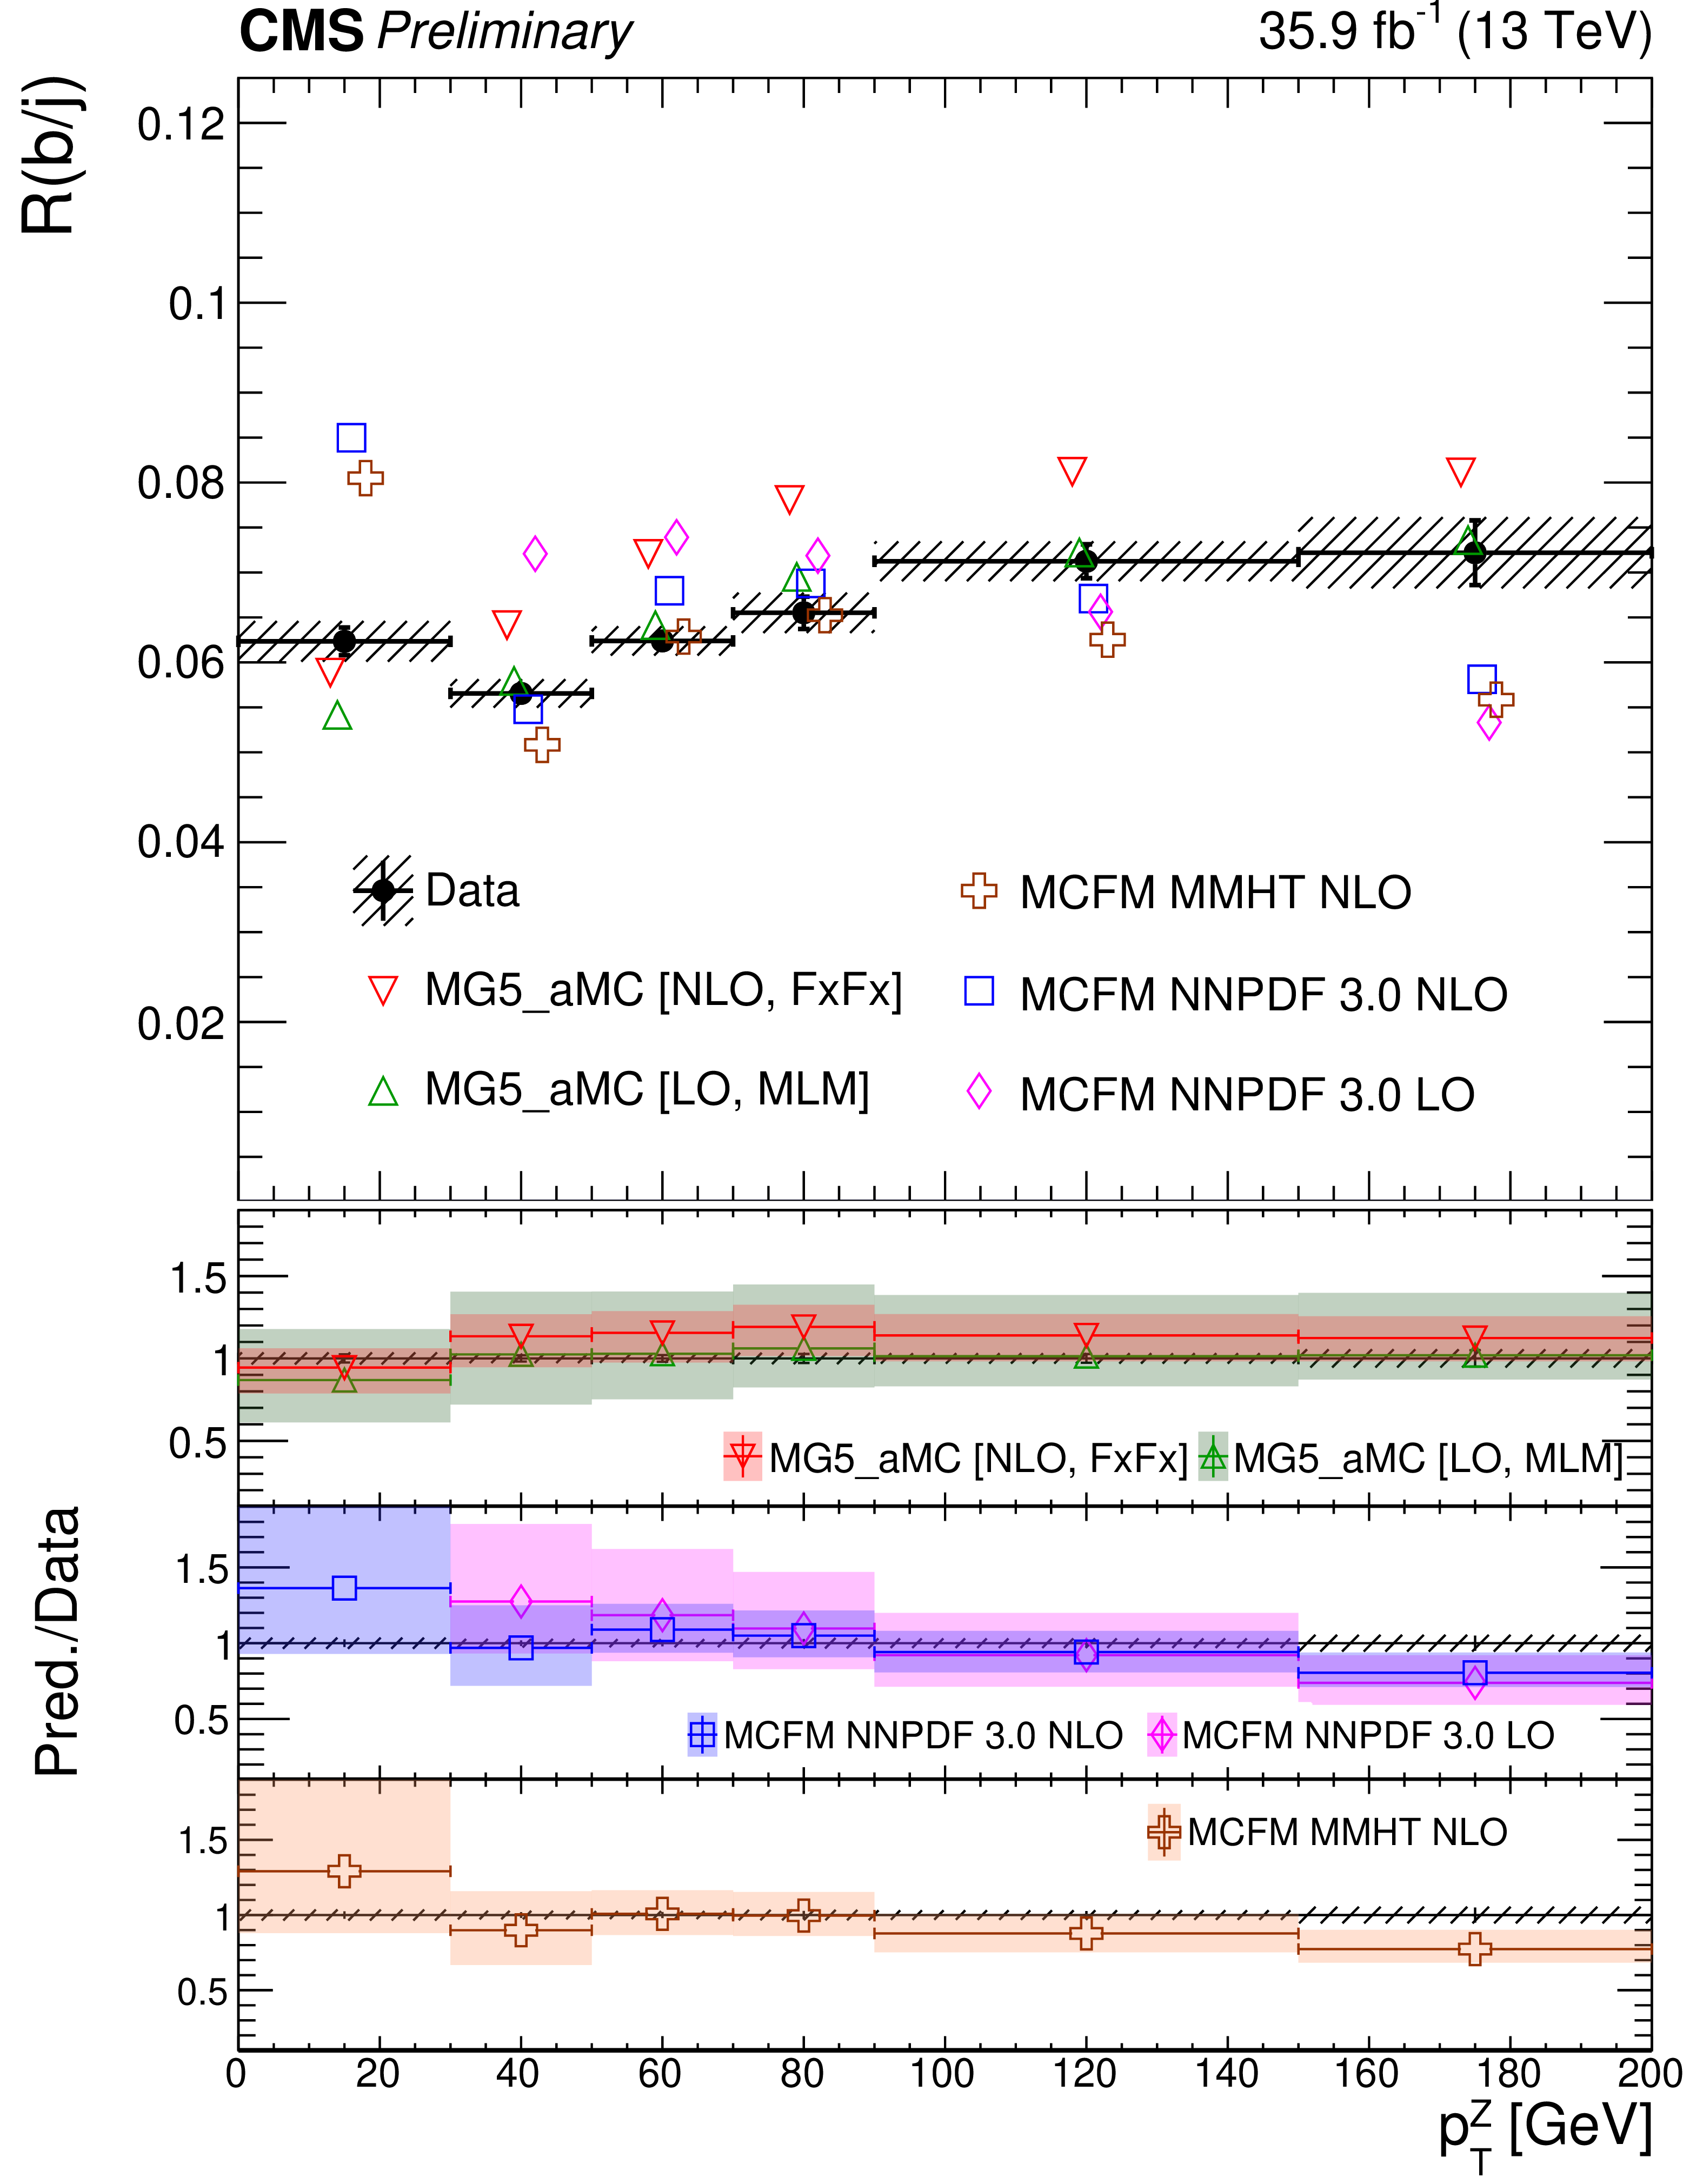
Figure 4:
Unfolded, particle-level MG5_aMC and parton-level MCFM R(b/j) cross section ratio versus jet (left) and Z boson (right) transverse momentum. The predictions are slightly shifted along the x-axis in the upper plots and their total PDF and QCD scales (renormalization and factorization) uncertainties are shown as error bands in the ratio plots. |
png pdf |
Figure 4-a:
Unfolded, particle-level MG5_aMC and parton-level MCFM R(b/j) cross section ratio versus jet (left) and Z boson (right) transverse momentum. The predictions are slightly shifted along the x-axis in the upper plots and their total PDF and QCD scales (renormalization and factorization) uncertainties are shown as error bands in the ratio plots. |
png pdf |
Figure 4-b:
Unfolded, particle-level MG5_aMC and parton-level MCFM R(b/j) cross section ratio versus jet (left) and Z boson (right) transverse momentum. The predictions are slightly shifted along the x-axis in the upper plots and their total PDF and QCD scales (renormalization and factorization) uncertainties are shown as error bands in the ratio plots. |

png pdf |
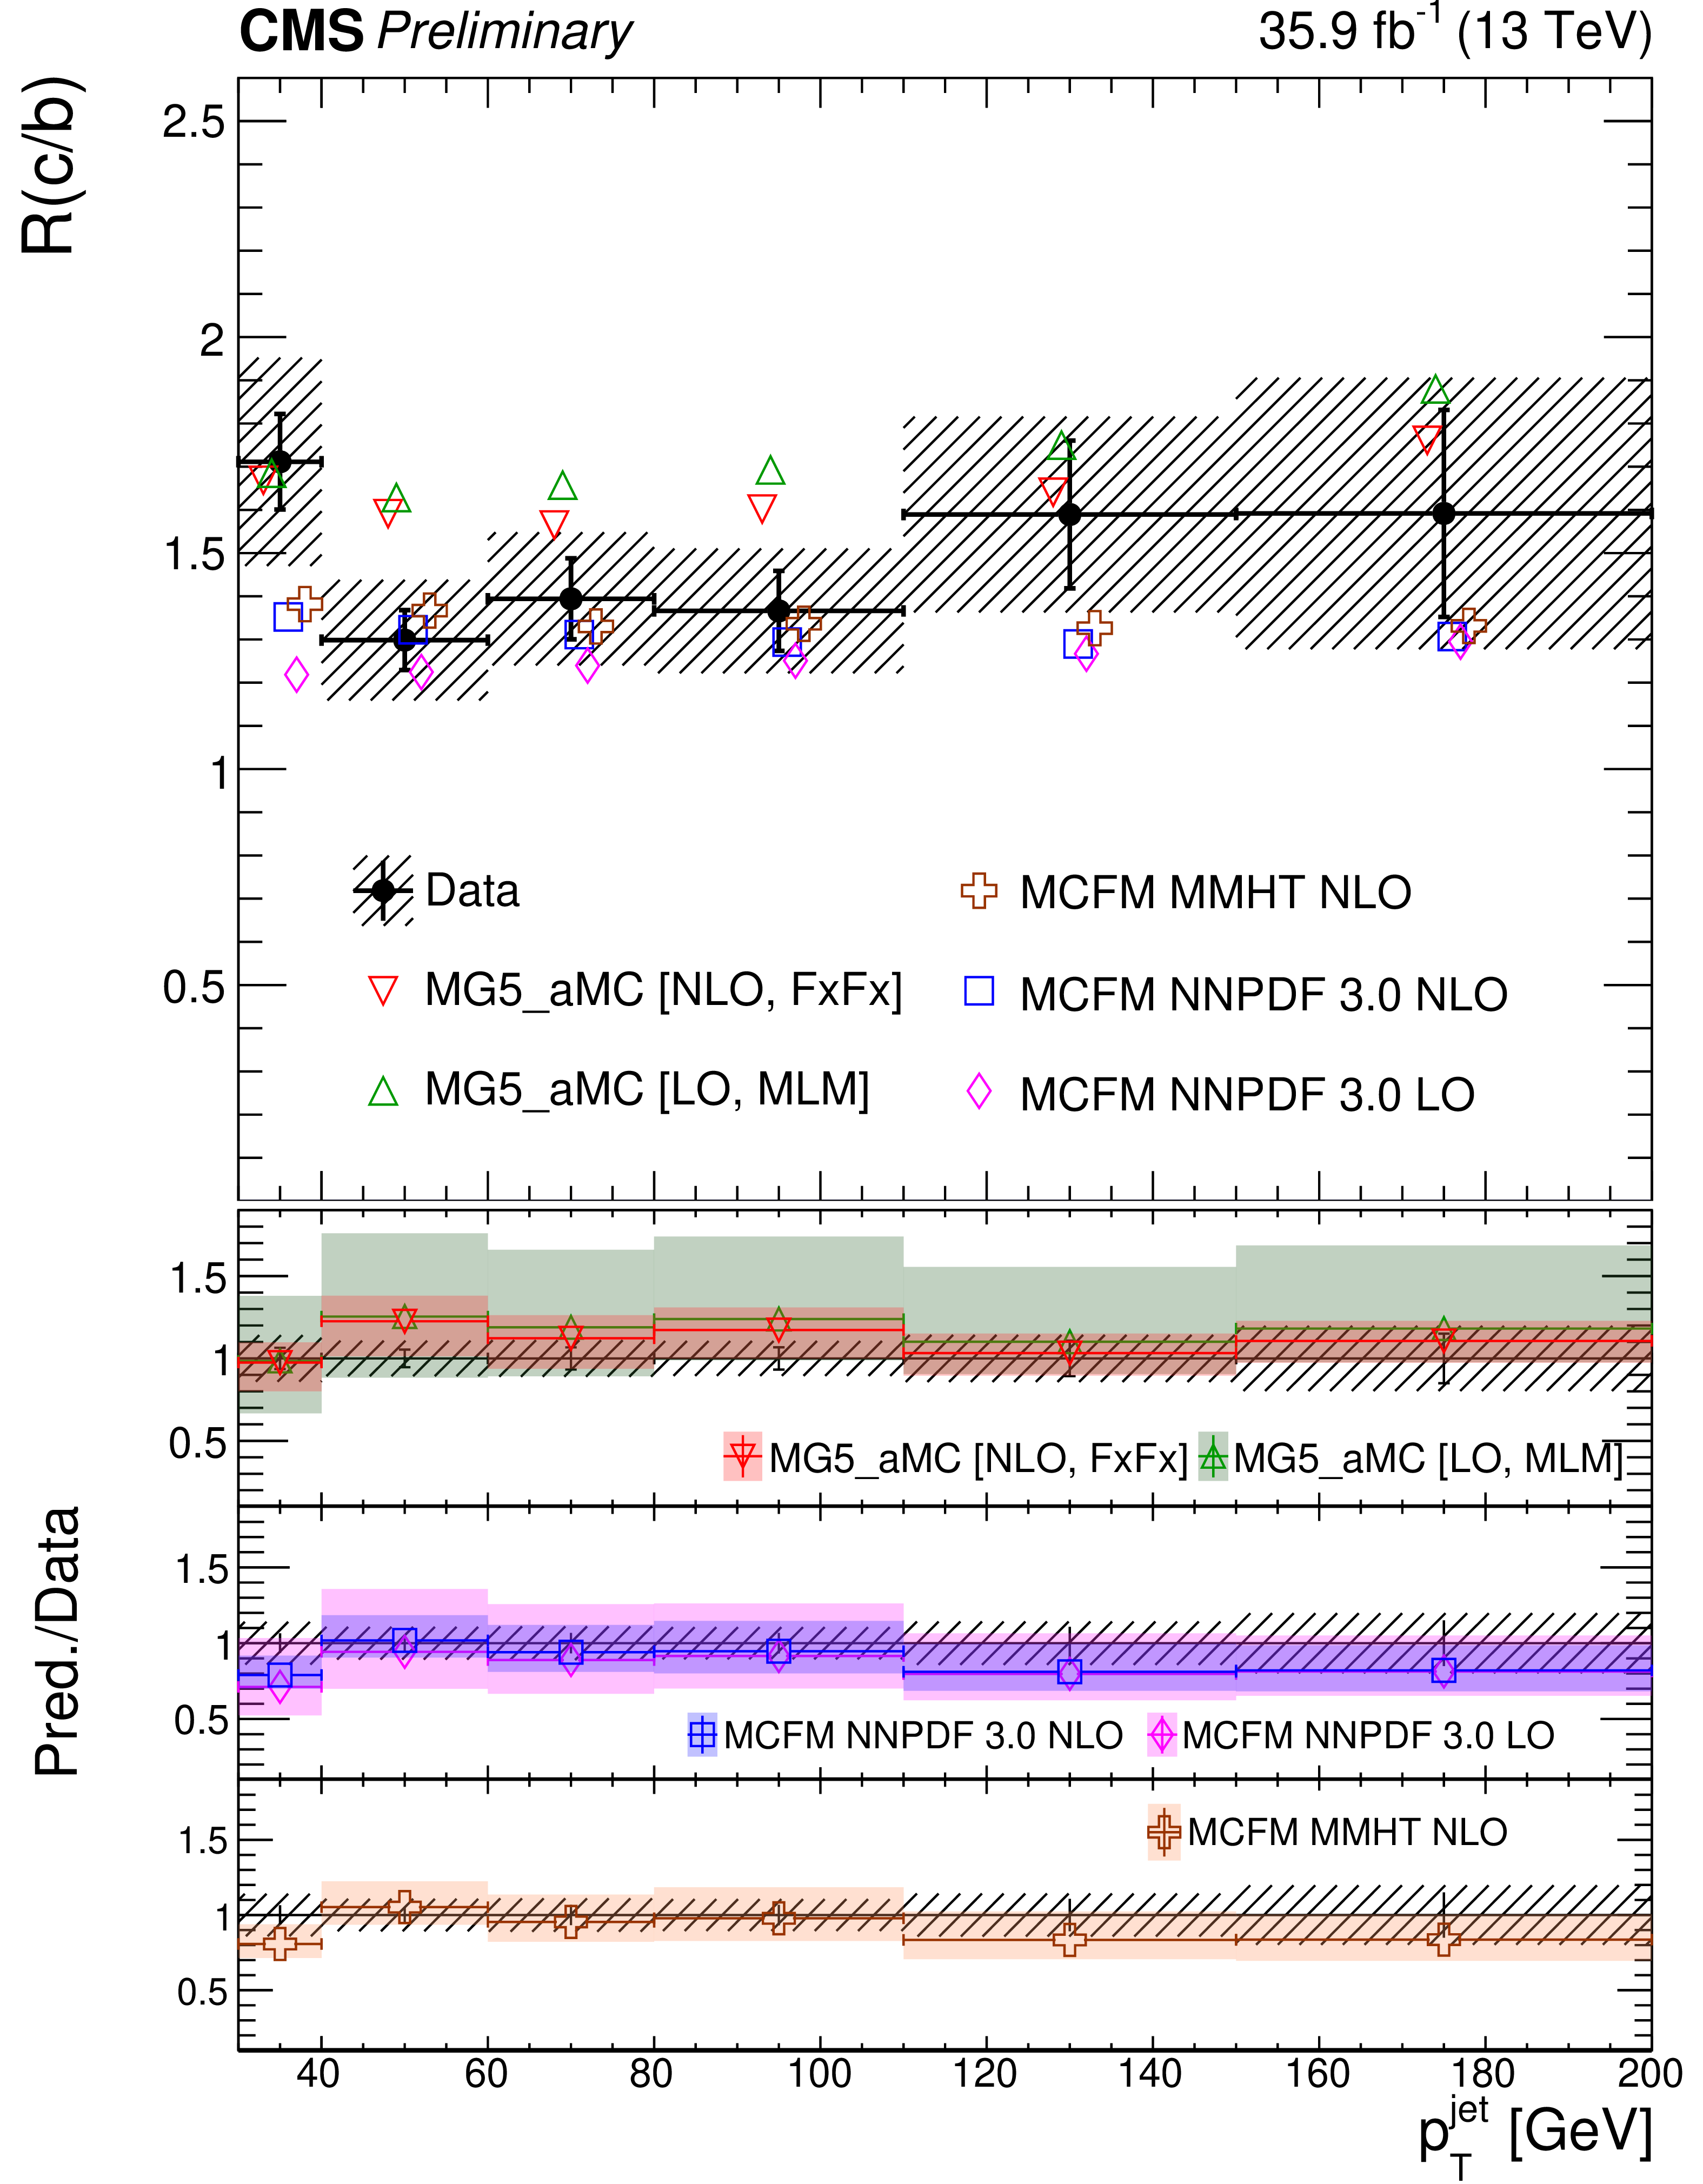
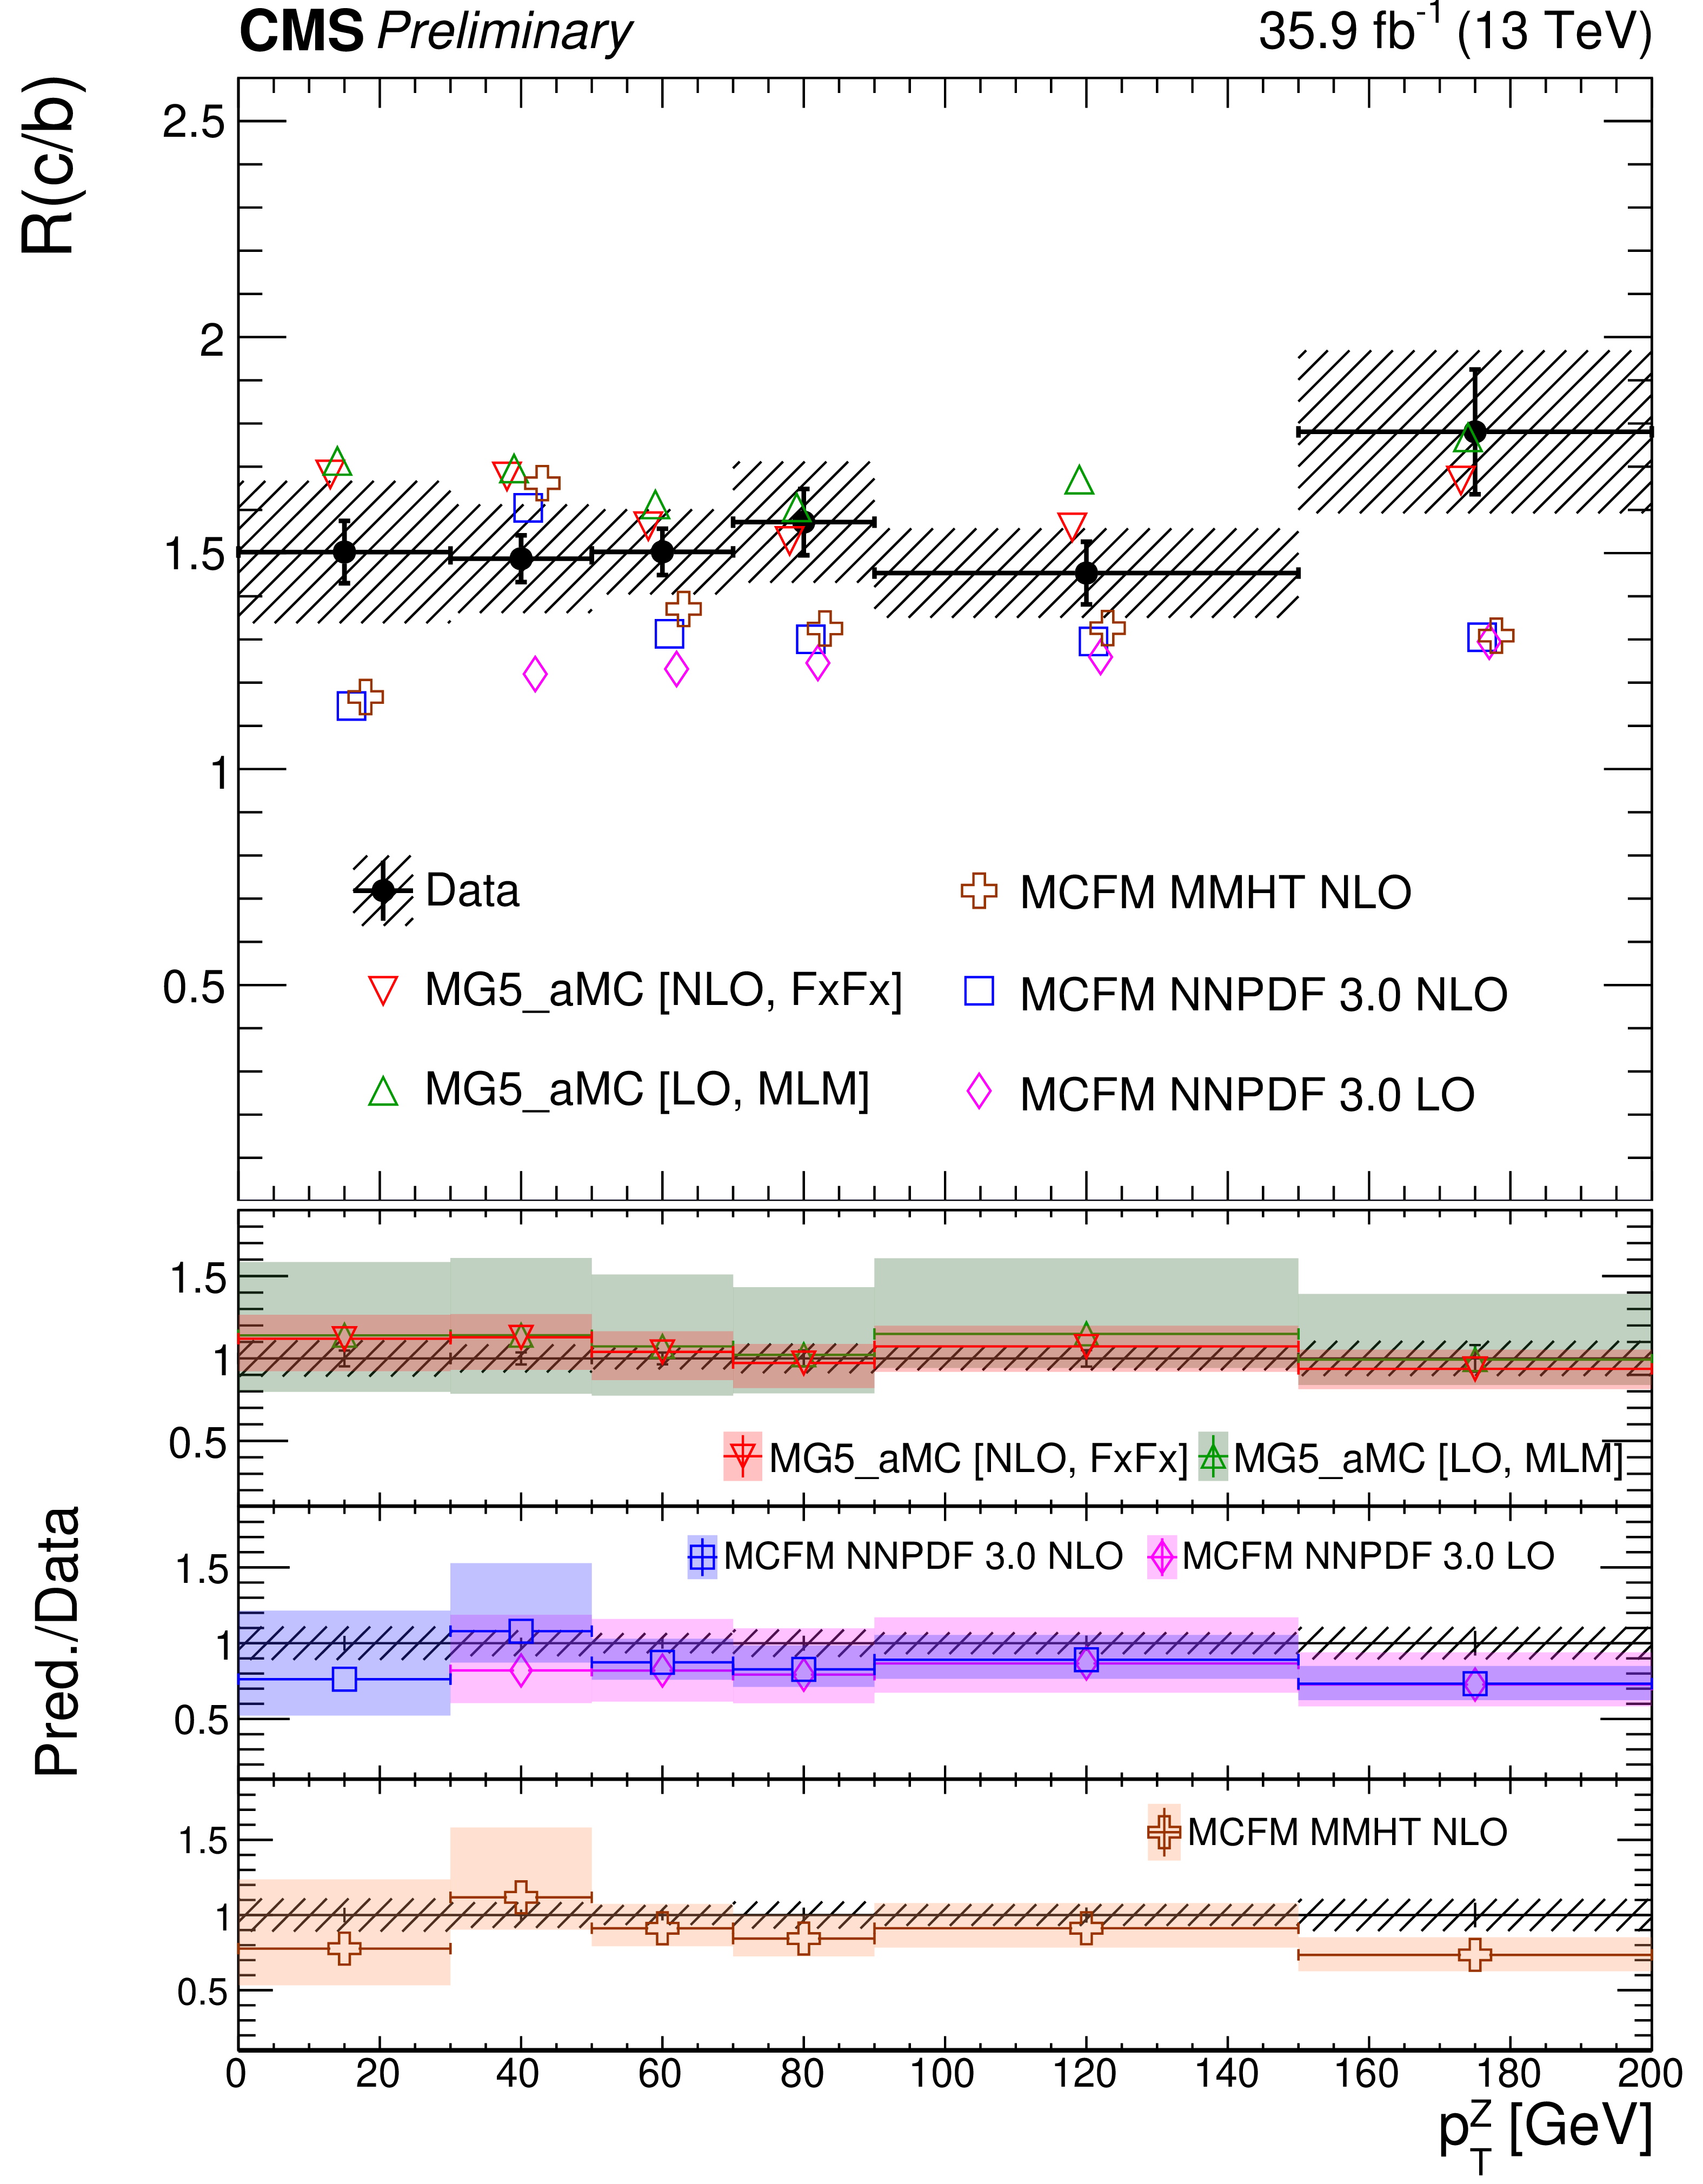
Figure 5:
Unfolded, particle-level MG5_aMC and parton-level MCFM R(c/b) cross section ratio versus jet (left) and Z boson (right) transverse momentum. The vertical error bars in data are statistical while the hatched band represents the total uncertainties. The predictions are slightly shifted along the x-axis to ease readability in the upper plots and their total PDF and QCD scales (renormalization and factorization) uncertainties are shown as error bands in the ratio plots. |
png pdf |
Figure 5-a:
Unfolded, particle-level MG5_aMC and parton-level MCFM R(c/b) cross section ratio versus jet (left) and Z boson (right) transverse momentum. The vertical error bars in data are statistical while the hatched band represents the total uncertainties. The predictions are slightly shifted along the x-axis to ease readability in the upper plots and their total PDF and QCD scales (renormalization and factorization) uncertainties are shown as error bands in the ratio plots. |
png pdf |
Figure 5-b:
Unfolded, particle-level MG5_aMC and parton-level MCFM R(c/b) cross section ratio versus jet (left) and Z boson (right) transverse momentum. The vertical error bars in data are statistical while the hatched band represents the total uncertainties. The predictions are slightly shifted along the x-axis to ease readability in the upper plots and their total PDF and QCD scales (renormalization and factorization) uncertainties are shown as error bands in the ratio plots. |
| Tables | |

png pdf |
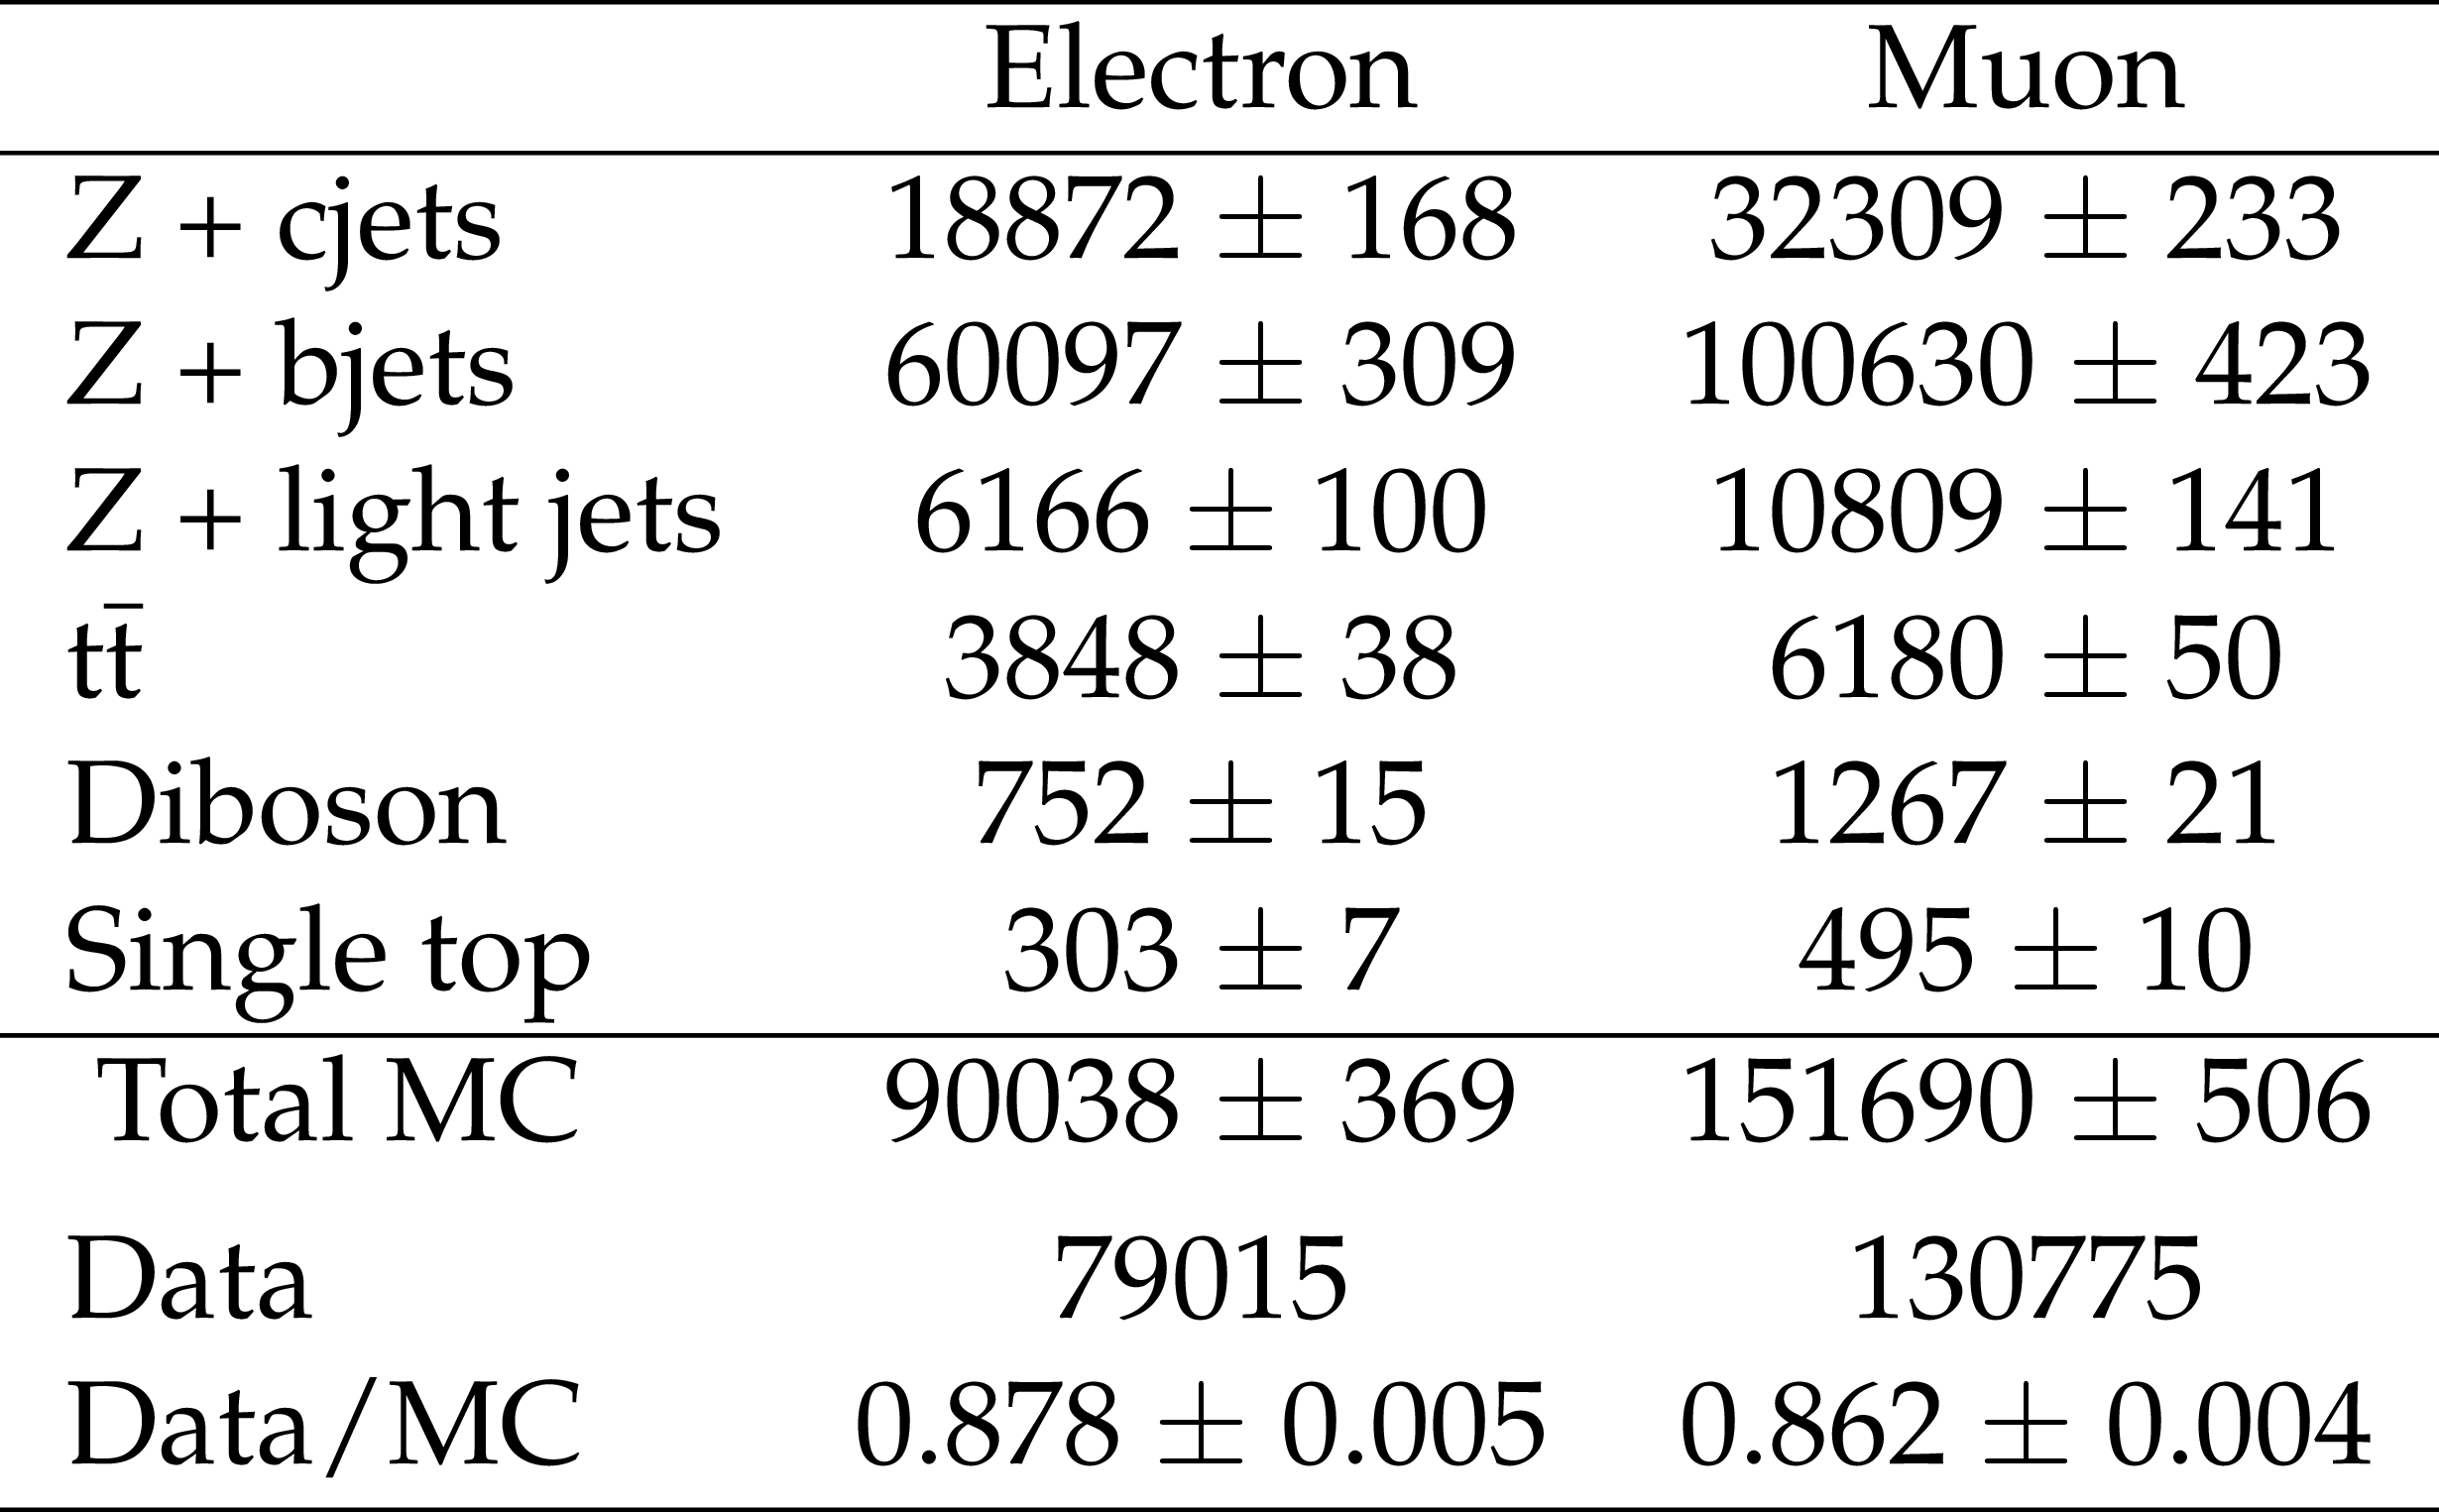
Table 1:
Numbers of events after the Z + jets selection in the electron and muon channels. The uncertainties are statistical only. |
png pdf |
Table 2:
Numbers of events after the Z + HF jets selection in the electron and muon channels. The uncertainties are statistical only. |

png pdf |
Table 3:
The SF$_\text {c}$, SF$_\text {b}$ scale factor fit results for electron, muon, and combined channels in jet ${p_{\mathrm {T}}}$ bins. The first and second uncertainty values correspond to the statistical and systematic contributions, respectively. The fraction of the observed number of Z + c jets and Z + b jets in the total Z + jets events are shown in the parentheses and are derived by applying the scale factors to the corresponding MC events. |

png pdf |
Table 4:
The SF$_\text {c}$, SF$_\text {b}$ scale factor fit results for electron, muon, and combined channels in Z ${p_{\mathrm {T}}}$ bins. The first and second uncertainty values correspond to the statistical and systematic contributions, respectively. The fraction of the observed number of Z + c jets and Z + b jets in the total Z + jets events with the total uncertainty are shown in the parentheses and are derived by applying the scale factors to the corresponding MC events. |

png pdf |
Table 5:
Systematic uncertainties in the scale factor measurements. The indicated ranges correspond to the various jet and Z ${p_{\mathrm {T}}}$ bins. |
png pdf |
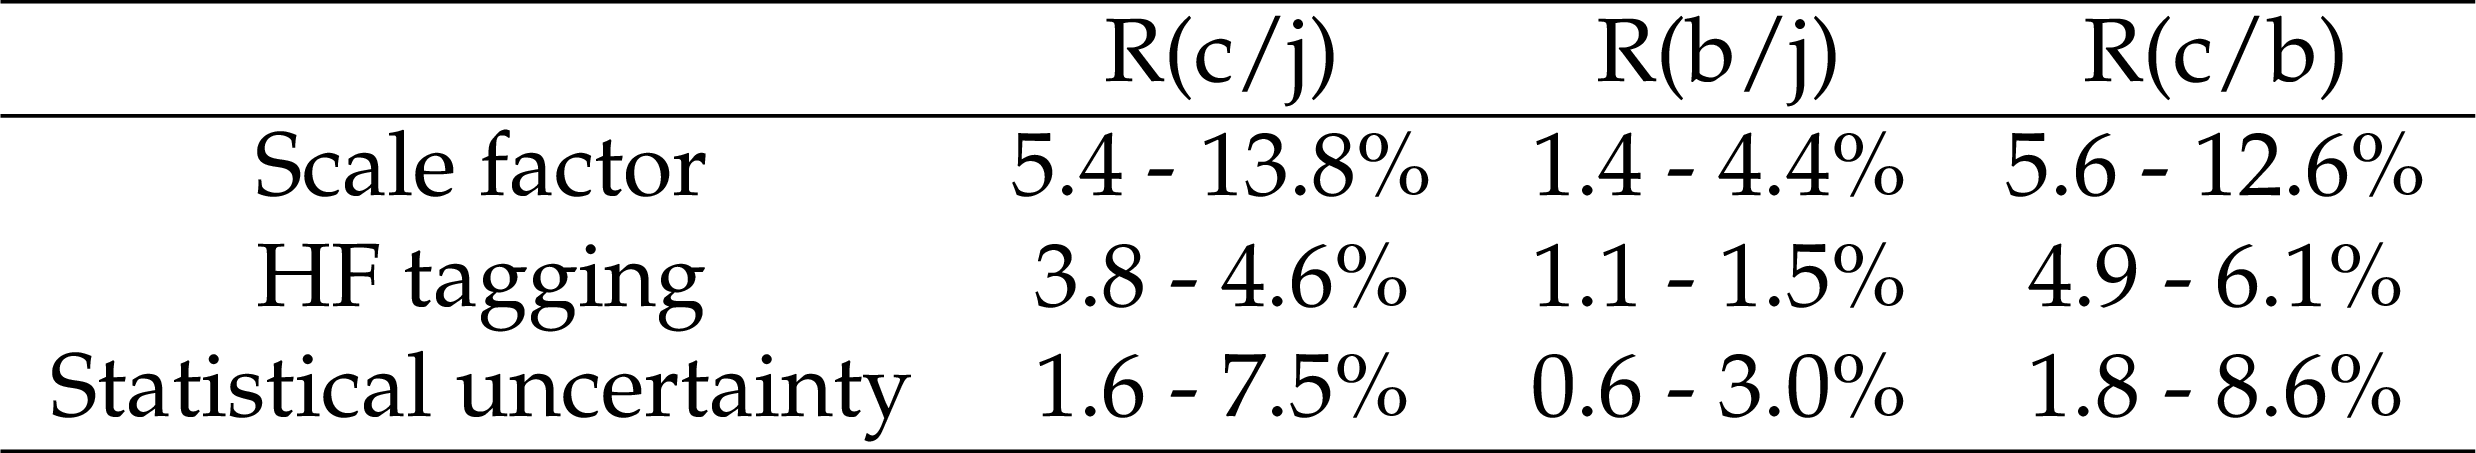
Table 6:
The systematic uncertainties in the cross section ratio measurements. The indicated ranges correspond to the various jet and Z ${p_{\mathrm {T}}}$ bins. |

png pdf |
Table 7:
The cross section ratios measured in the electron and muon channels, along with the combined results. The first and second uncertainty values correspond to the statistical and systematic contributions, respectively. |

png pdf |
Table 8:
The unfolded cross section ratios in the electron and muon channels, along with the combined results. The first and second uncertainty values correspond to the statistical and systematic contributions, respectively. |
png pdf |
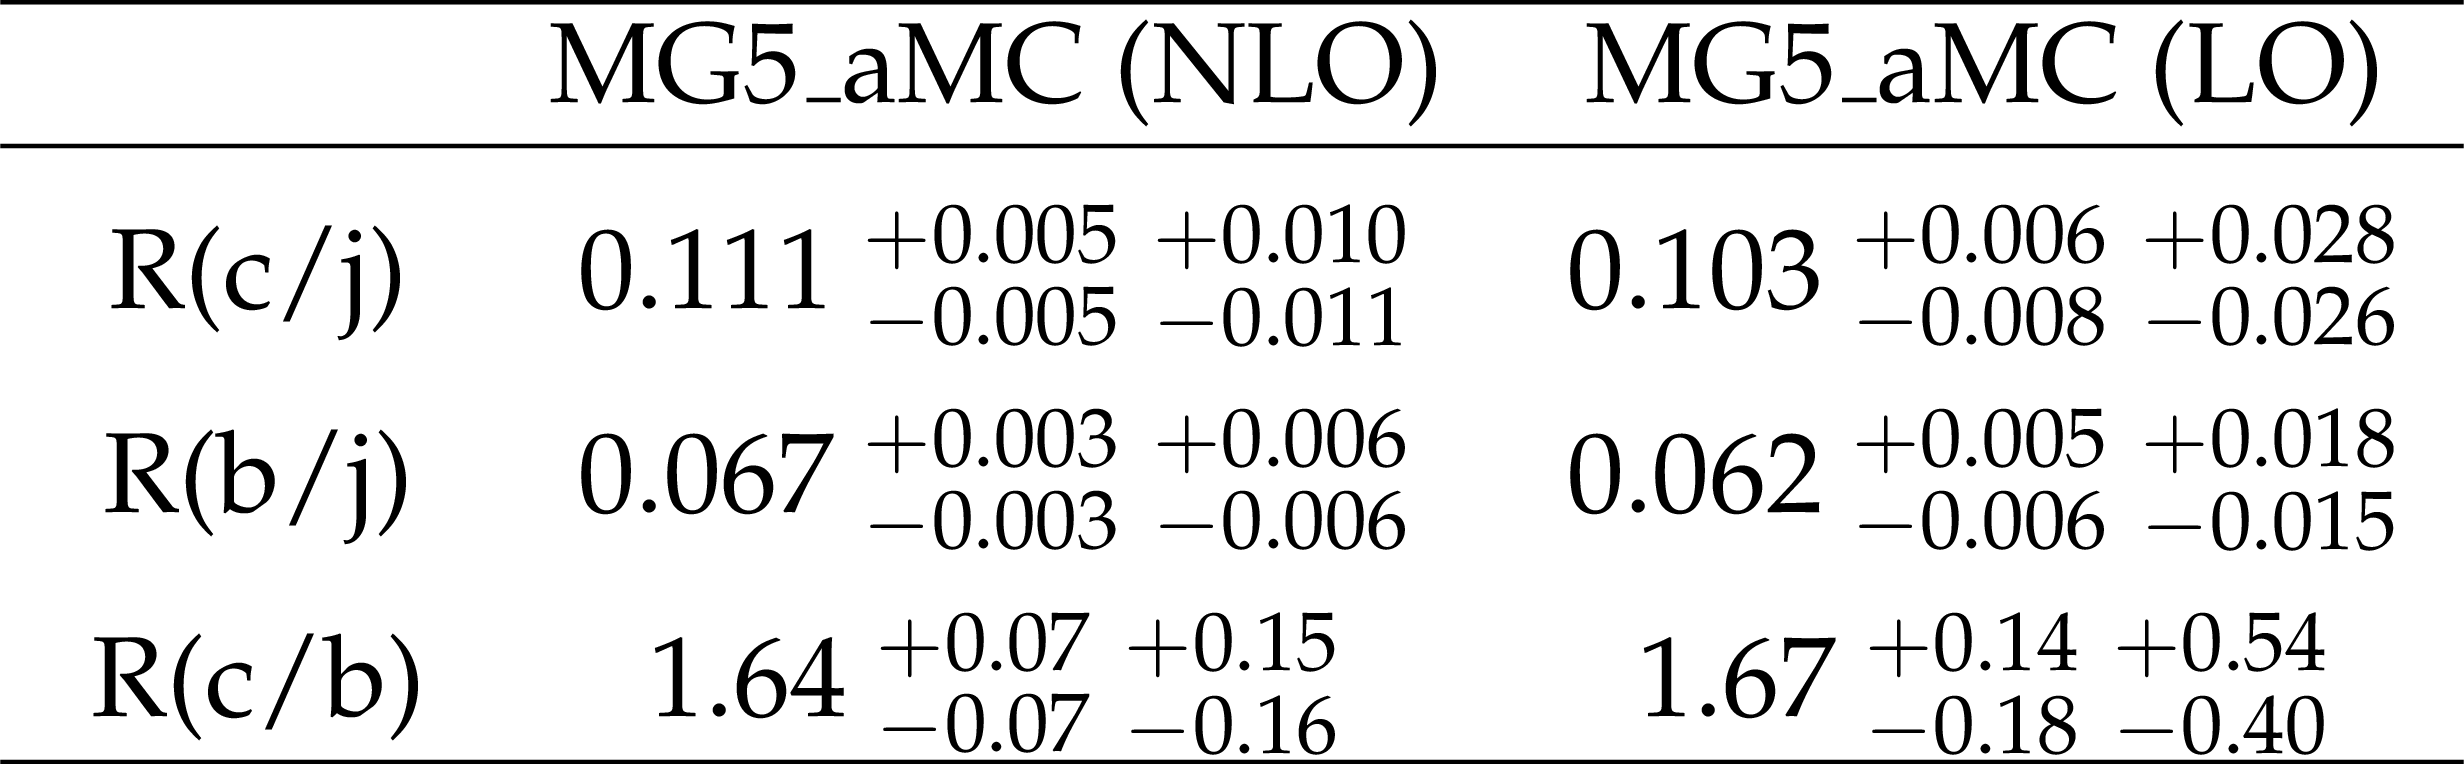
Table 9:
The predicted cross section ratios from NLO and LO MG5_aMC. The first and second sets of uncertainties correspond to PDF and QCD scales (renormalization and factorization) variations, respectively. |
png pdf |
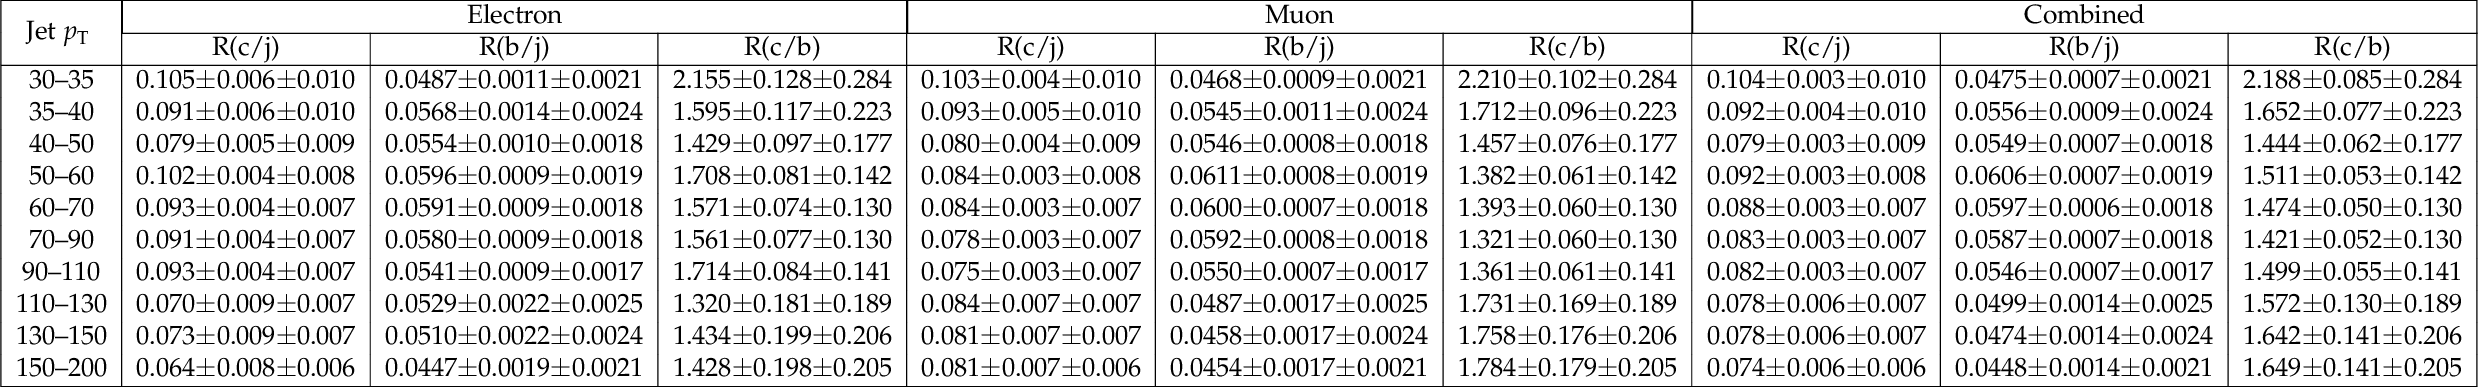
Table 10:
The cross section ratios measured in the electron and muon channels together with the combined results in jet ${p_{\mathrm {T}}}$ bins. |
png pdf |
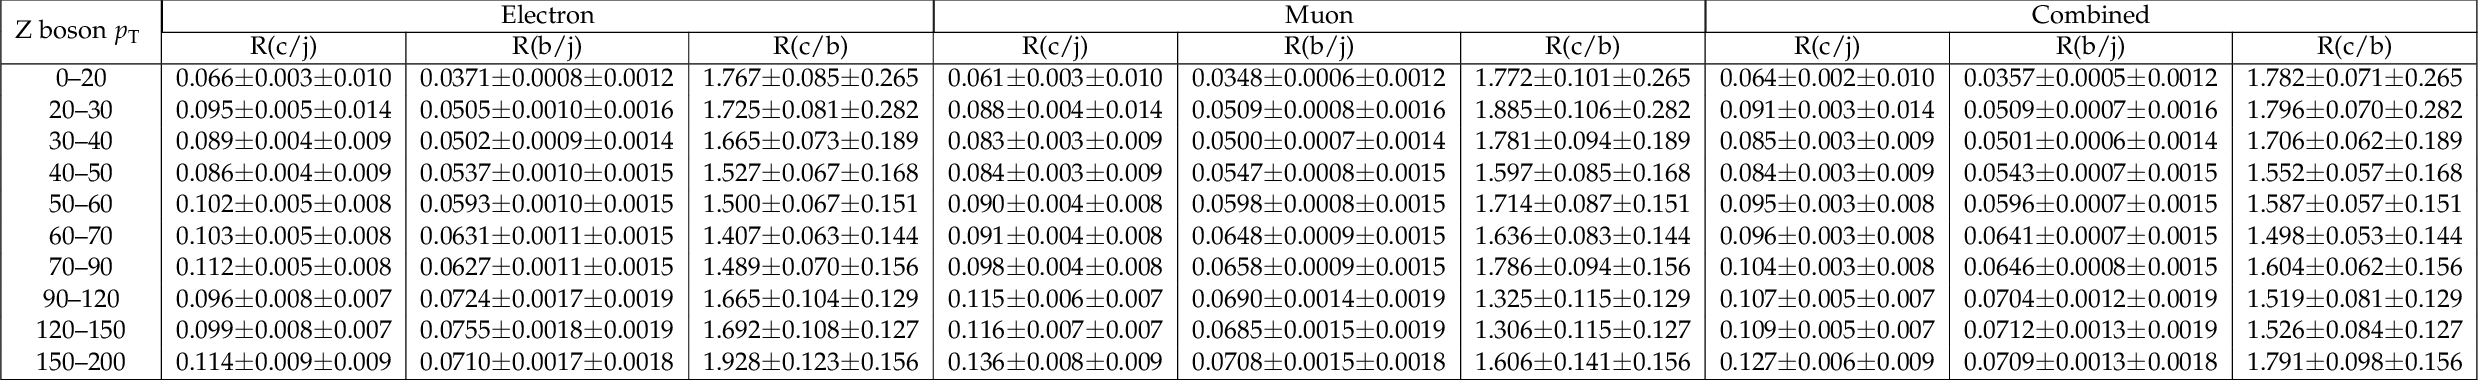
Table 11:
The cross section ratios measured in the electron and muon channels together with the combined results in Z ${p_{\mathrm {T}}}$ bins. |
| Summary |
| Ratios of cross sections, $\sigma$(Z + c jets )/$\sigma$(Z + jets ), $\sigma$(Z + b jets )/$\sigma$(Z + jets ), and $\sigma$(Z + c jets )/$\sigma$(Z + b jets ) in the associated production of a Z boson with at least one charm or bottom quark jet have been measured in proton-proton collisions at $\sqrt s=$ 13 TeV using 35.9 fb$^{-1}$ of data collected by the CMS experiment at the LHC. The fiducial volume of the measurement is defined by jet transverse momentum ${p_{\mathrm{T}}} > $ 30 GeV and pseudorapidity $|\eta| < $ 2.4. The Z bosons are selected within the mass range of 71 and 111 GeV requiring leptons (electrons or muons) with ${p_{\mathrm{T}}} > $ 25 GeV and $|\eta| < $ 2.4. The measured values are $\sigma$(Z + c jet )/$\sigma$(Z + jets ) $=$ 0.102 $\pm$ 0.002 $\pm$ 0.009, $\sigma$(Z + b jet )/$\sigma$(Z + jets ) $ =$ 0.0633 $\pm$ 0.0004 $\pm$ 0.0015, and $\sigma$(Z + c jet )/$\sigma$(Z + b jet ) $=$ 1.62 $\pm$ 0.03 $\pm$ 0.15. Results on the inclusive and differential cross section ratios as functions of jet and Z boson transverse momentum are compared to predictions from leading and next-to-leading order perturbative QCD calculations. These are the first of a kind measurements at 13 TeV, and the measurement precision exceeds that of the current theoretical predictions. |
| References | ||||
| 1 | J. M. Campbell, R. K. Ellis, F. Maltoni, and S. Willenbrock | Associated production of a Z boson and a single heavy quark jet | PRD 69 (2004) 074021 | hep-ph/0312024 |
| 2 | F. Febres Cordero, L. Reina, and D. Wackeroth | W- and Z-boson production with a massive bottom-quark pair at the Large Hadron Collider | PRD 80 (2009) 034015 | 0906.1923 |
| 3 | F. Maltoni, G. Ridolfi, and M. Ubiali | b-initiated processes at the LHC: a reappraisal | JHEP 07 (2012) 022 | 1203.6393 |
| 4 | CDF Collaboration | Measurement of cross sections for $ b $ jet production in events with a $ Z $ boson in $ p\bar{p} $ collisions at $ \sqrt{s} = $ 1.96 TeV | PRD 79 (2009) 052008 | 0812.4458 |
| 5 | D0 Collaboration | Measurement of associated production of Z bosons with charm quark jets in $ p\bar{p} $ collisions at $ \sqrt{s}= $ 1.96 TeV | PRL 112 (2014) 042001 | 1308.4384 |
| 6 | D0 Collaboration | Measurement of the ratio of inclusive cross sections $ \sigma (p\bar{p} \rightarrow Z + 2 b \text{jets}) / \sigma (p\bar{p} \rightarrow Z + \text{2 jets}) $ in $ p\bar{p} $ collisions at $ \sqrt s= $ 1.96 TeV | PRD 91 (2015) 052010 | 1501.05325 |
| 7 | ATLAS Collaboration | Measurement of differential production cross-sections for a $ Z $ boson in association with b-jets in 7 TeV proton-proton collisions with the ATLAS detector | JHEP 10 (2014) 141 | 1407.3643 |
| 8 | CMS Collaboration | Measurement of the production cross sections for a Z boson and one or more b jets in pp collisions at $ \sqrt{s} = $ 7 TeV | JHEP 06 (2014) 120 | CMS-SMP-13-004 1402.1521 |
| 9 | CMS Collaboration | Measurement of associated Z + charm production in proton-proton collisions at $ \sqrt{s}= $ 8 TeV | EPJC 78 (2018) 287 | 1711.02143v3 |
| 10 | CMS Collaboration | The CMS trigger system | JINST 12 (2017) P01020 | CMS-TRG-12-001 1609.02366 |
| 11 | CMS Collaboration | The CMS experiment at the CERN LHC | JINST 3 (2008) S08004 | CMS-00-001 |
| 12 | \textscGeant4 Collaboration | GEANT4---a simulation toolkit | NIMA 506 (2003) 250 | |
| 13 | J. Alwall et al. | The automated computation of tree-level and next-to-leading order differential cross sections, and their matching to parton shower simulations | JHEP 07 (2014) 079 | 1405.0301 |
| 14 | T. Sjostrand et al. | An introduction to PYTHIA 8.2 | CPC 191 (2015) 159 | 1410.3012 |
| 15 | R. Frederix and S. Frixione | Merging meets matching in MC@NLO | JHEP 12 (2012) 061 | 1209.6215 |
| 16 | P. Nason | A new method for combining NLO QCD with shower Monte Carlo algorithms | JHEP 11 (2004) 040 | hep-ph/0409146 |
| 17 | S. Frixione, P. Nason, and C. Oleari | Matching NLO QCD computations with parton shower simulations: the POWHEG method | JHEP 11 (2007) 070 | 0709.2092 |
| 18 | S. Alioli, P. Nason, C. Oleari, and E. Re | A general framework for implementing NLO calculations in shower Monte Carlo programs: the POWHEG BOX | JHEP 06 (2010) 043 | 1002.2581 |
| 19 | NNPDF Collaboration | Parton distributions for the LHC run II | JHEP 04 (2015) 040 | 1410.8849 |
| 20 | CMS Collaboration | Event generator tunes obtained from underlying event and multiparton scattering measurements | EPJC 76 (2016) 155 | CMS-GEN-14-001 1512.00815 |
| 21 | CMS Collaboration | Investigations of the impact of the parton shower tuning in Pythia 8 in the modelling of $ \mathrm{t}\bar{\mathrm{t}} $ at $ \sqrt{s}= $ 8 and 13 TeV | CMS-PAS-TOP-16-021 | CMS-PAS-TOP-16-021 |
| 22 | CMS Collaboration | Particle-flow reconstruction and global event description with the CMS detector | JINST 12 (2017) P10003 | CMS-PRF-14-001 1706.04965 |
| 23 | M. Cacciari, G. P. Salam, and G. Soyez | The anti-$ k_t $ jet clustering algorithm | JHEP 04 (2008) 063 | 0802.1189 |
| 24 | M. Cacciari, G. P. Salam, and G. Soyez | FastJet user manual | EPJC 72 (2012) 1896 | 1111.6097 |
| 25 | CMS Collaboration | Performance of electron reconstruction and selection with the CMS detector in proton-proton collisions at $ \sqrt{s} = $ 8 TeV | JINST 10 (2015) P06005 | CMS-EGM-13-001 1502.02701 |
| 26 | CMS Collaboration | Performance of the CMS muon detector and muon reconstruction with proton-proton collisions at $ \sqrt{s} = $ 13 TeV | JINST 13 (2018) P06015 | CMS-MUO-16-001 1804.04528 |
| 27 | CMS Collaboration | Jet energy scale and resolution in the CMS experiment in pp collisions at 8 TeV | JINST 12 (2017) P02014 | CMS-JME-13-004 1607.03663 |
| 28 | CMS Collaboration | Performance of missing transverse momentum in proton-proton collisions at $ \sqrt{s}= $ 13 TeV using the CMS detector | CMS-PAS-JME-17-001 | CMS-PAS-JME-17-001 |
| 29 | CMS Collaboration | Identification of heavy-flavour jets with the CMS detector in pp collisions at 13 TeV | JINST 13 (2018) P05011 | CMS-BTV-16-002 1712.07158 |
| 30 | ALEPH Collaboration | A measurement of the gluon splitting rate into $ \mathrm{c}\bar{\mathrm{c}} $ pairs in hadronic Z decays | PLB 561 (2003) 213 | 0302003[hep-ex] |
| 31 | ALEPH Collaboration | A measurement of the gluon splitting rate into $ \mathrm{b}\bar{\mathrm{b}} $ pairs in hadronic Z decays | PLB 434 (1998) 437 | |
| 32 | CMS Collaboration | Measurement of the $ \mathrm{t}\bar{\mathrm{t}} $ production cross section using events with one lepton and at least one jet in pp collisions at $ \sqrt{s} = $ 13 TeV | JHEP 09 (2017) 051 | CMS-TOP-16-006 1701.06228 |
| 33 | CMS Collaboration | Measurement of the $ \mathrm{t}\bar{\mathrm{t}} $ production cross section using events in the $ \mathrm{e}\mu $ final state in pp collisions at $ \sqrt{s} = $ 13 TeV | EPJC 77 (2017) 172 | CMS-TOP-16-005 1611.04040 |
| 34 | CMS Collaboration | Measurements of the pp$ \rightarrow $WZ inclusive and differential production cross section and constraints on charged anomalous triple gauge couplings at $ \sqrt{s} = $ 13 TeV | JHEP 04 (2019) 122 | CMS-SMP-18-002 1901.03428 |
| 35 | S. Schmitt | TUnfold: an algorithm for correcting migration effects in high energy physics | JINST 7 (2012) T10003 | 1205.6201 |
| 36 | J. Alwall et al. | Comparative study of various algorithms for the merging of parton showers and matrix elements in hadronic collisions | EPJC 53 (2008) 473 | 0706.2569 |
| 37 | J. Alwall, S. de Visscher, and F. Maltoni | QCD radiation in the production of heavy colored particles at the LHC | JHEP 02 (2009) 017 | 0810.5350 |
| 38 | J. M. Campbell and R. K. Ellis | An update on vector boson pair production at hadron colliders | PRD 60 (1999) 113006 | 9905386 |
| 39 | J. M. Campbell, R. K. Ellis, and C. Williams | Vector boson pair production at the LHC | JHEP 07 (2011) 018 | 1105.0020 |
| 40 | J. M. Campbell, R. K. Ellis, and W. Giele | A multi-threaded version of MCFM | EPJC 75 (2015) 246 | 1503.06182 |
| 41 | L. A. Harland-Lang, A. D. Martin, P. Motylinski, and R. S. Thorne | Parton distributions in the LHC era: MMHT 2014 PDFs | EPJC 75 (2015) 204 | 1412.3989 |
|
|
Compact Muon Solenoid LHC, CERN |
|

|

|

|

|

|