

Compact Muon Solenoid
LHC, CERN
| CMS-PAS-HIN-18-003 | ||
| Differential measurements of the Drell-Yan process in the muon channel in pPb collisions at ${\sqrt {\smash [b]{s_{_{\mathrm {NN}}}}}}= $ 8.16 TeV | ||
| CMS Collaboration | ||
| May 2020 | ||
| Abstract: Measurements of differential cross sections for the Drell-Yan process, including Z boson production, in proton-lead (pPb) collisions at a nucleon-nucleon centre-of-mass energy of 8.16 TeV are presented, in the muon channel. A data sample recorded with the CMS detector at the LHC is used, corresponding to an integrated luminosity of 173.4 $\pm$ 6.1 nb$^{-1}$. The differential cross section $\textrm{d}\sigma / \textrm{d}m_{\mu\mu}$ in the dimuon mass range 15 $ < m_{\mu\mu} < $ 600 GeV is measured with the CMS detector, for the first time in heavy ion collisions, and reported before and after correction to the full phase space, given by the dimuon rapidity $y_{\rm{CM}}$ in the centre-of-mass frame from $ -2.87 $ to $ 1.93 $. The differential cross section $\textrm{d}\sigma/\textrm{d}y_{\rm{CM}}$ is also measured over the mass ranges 15-60 and 60-120 GeV, and same dimuon rapidity range. Ratios of dimuon yields for the proton-going over the Pb-going beam directions are built in the range $|y_{\rm{CM}}| < $ 1.93. In both mass ranges, the differential cross sections $\textrm{d}\sigma / \textrm{d}p_{\rm{T}}$ and $\textrm{d}\sigma / \textrm{d}\phi^{*}$ are measured, where the kinematic observable $\phi^{*}$ correlates with the dimuon transverse momentum but only depends on angular quantities. Results are compared to predictions at next-to-leading order, including nuclear modifications of parton distribution functions, which they could help better constrain. | ||
|
Links:
CDS record (PDF) ;
CADI line (restricted) ;
These preliminary results are superseded in this paper, JHEP 05 (2021) 182. The superseded preliminary plots can be found here. |
||
| Figures | |
png pdf |
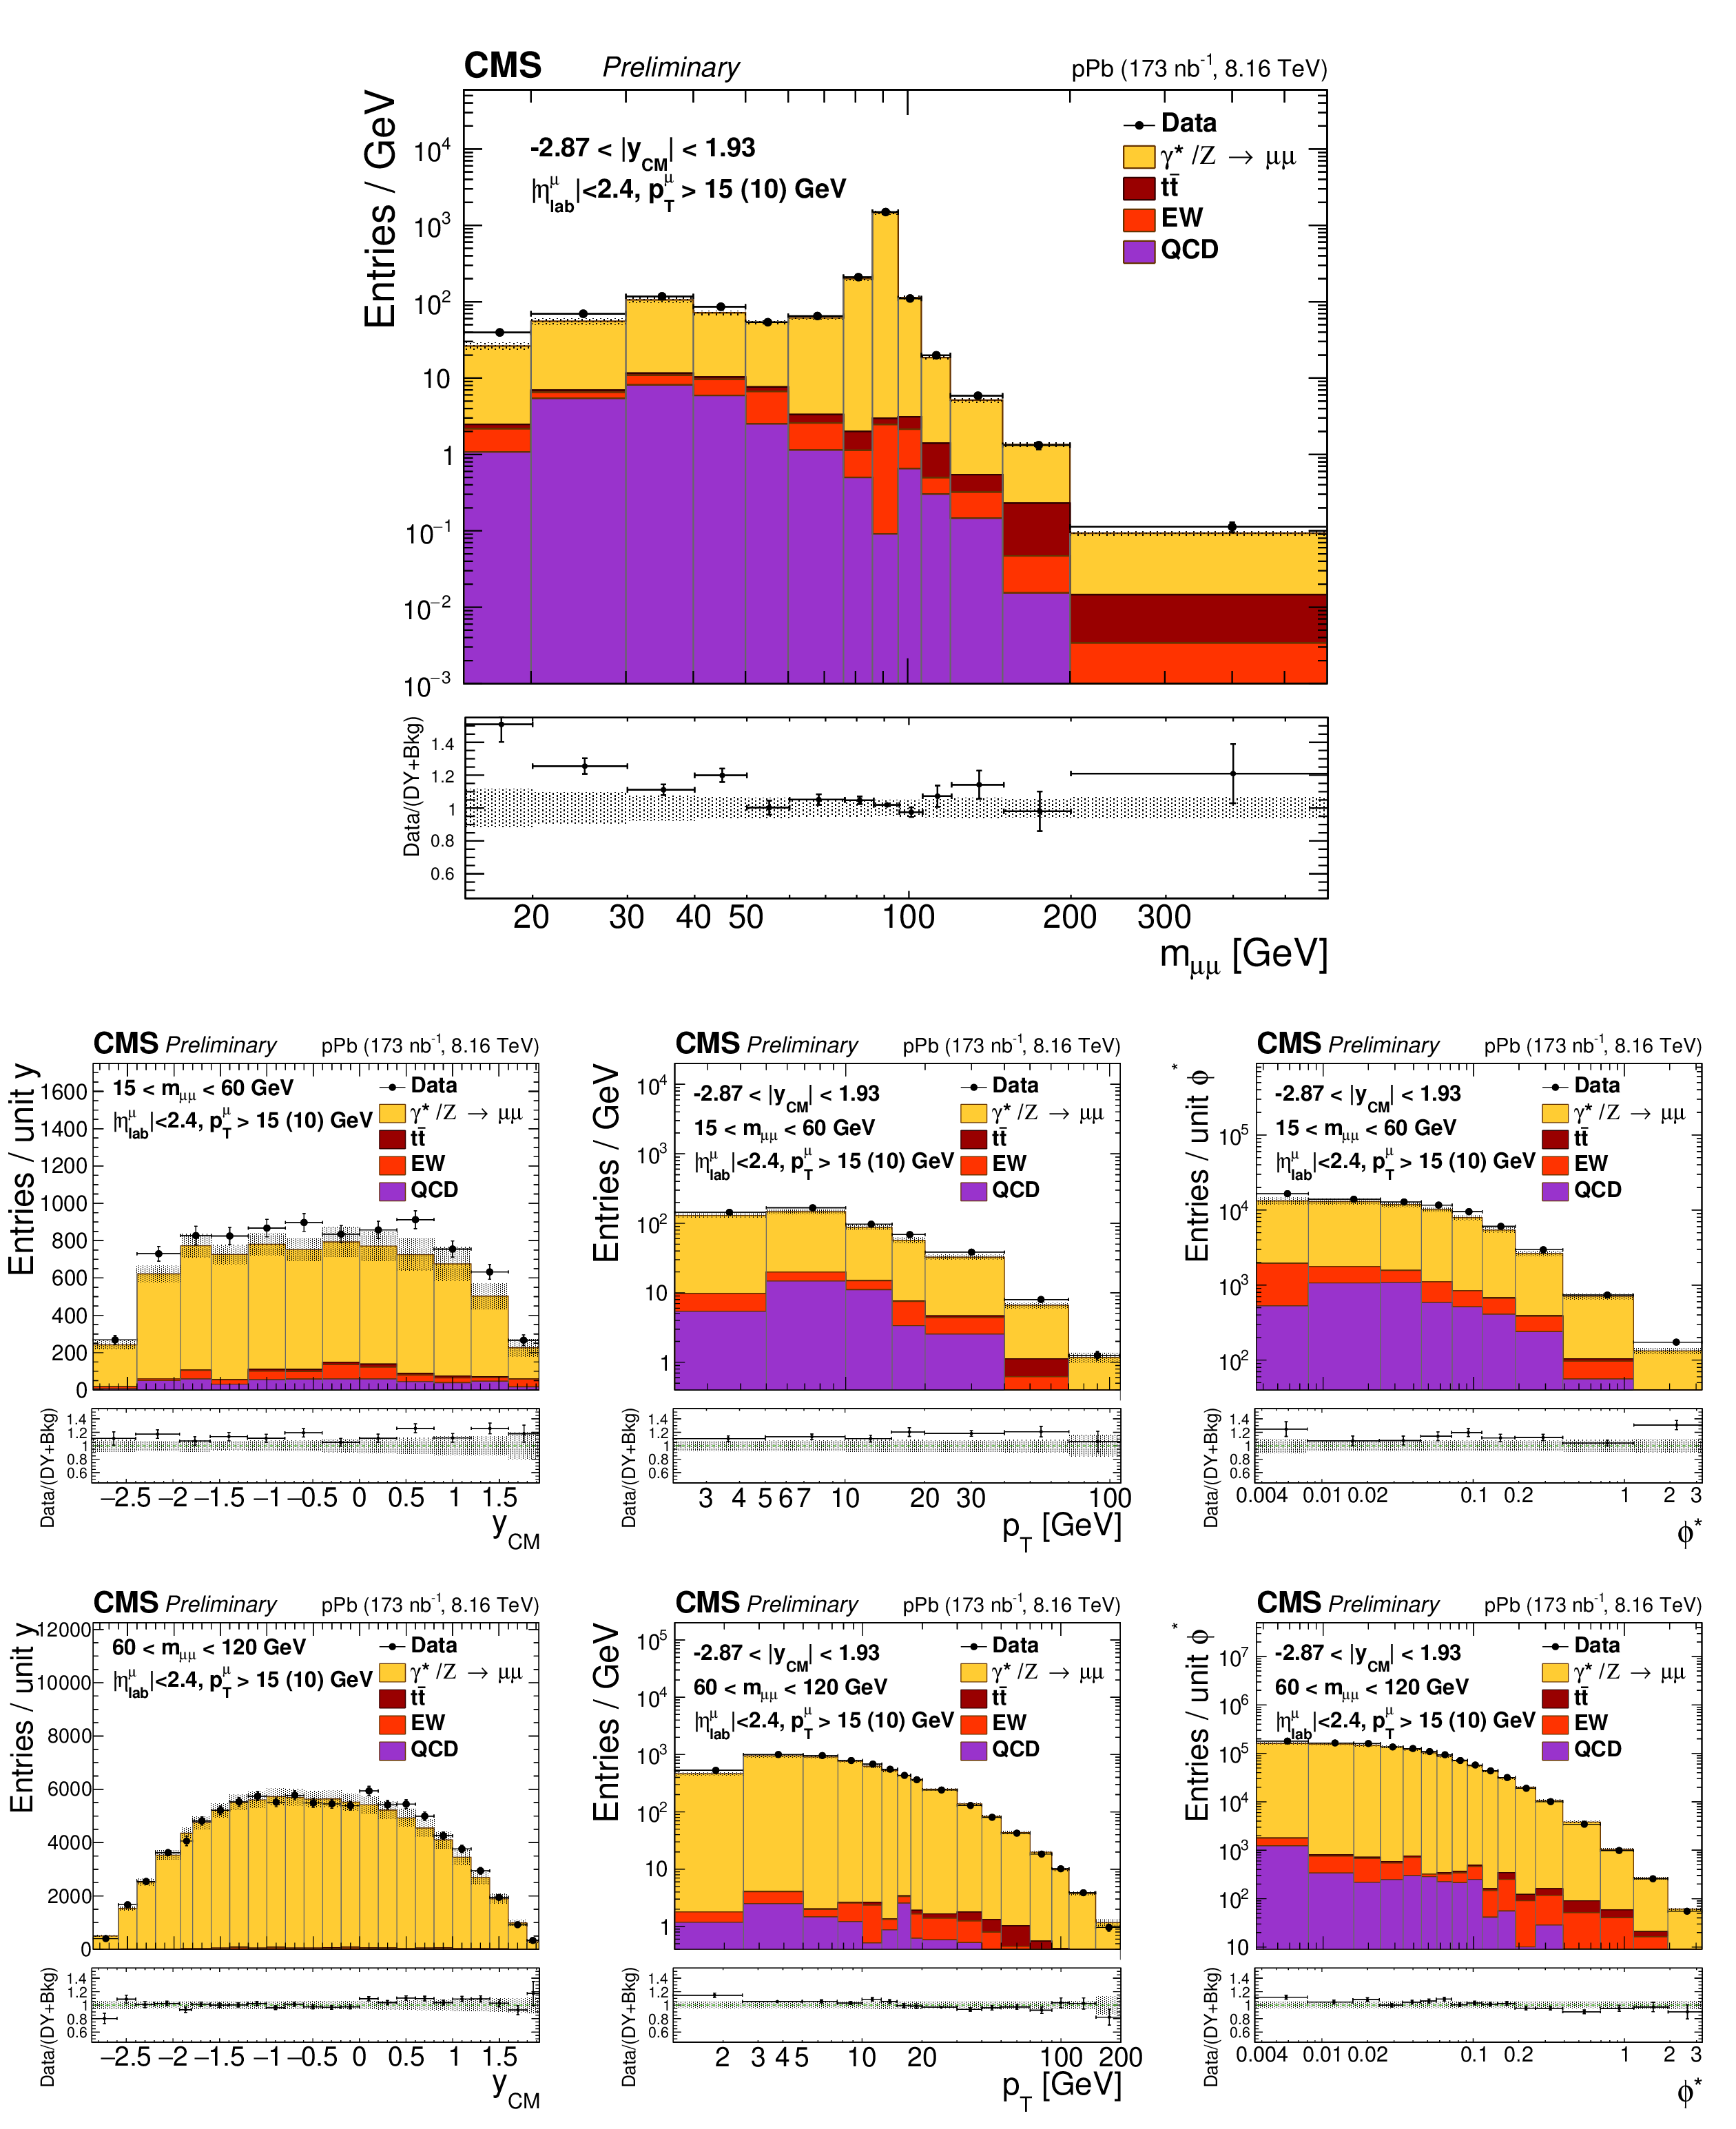
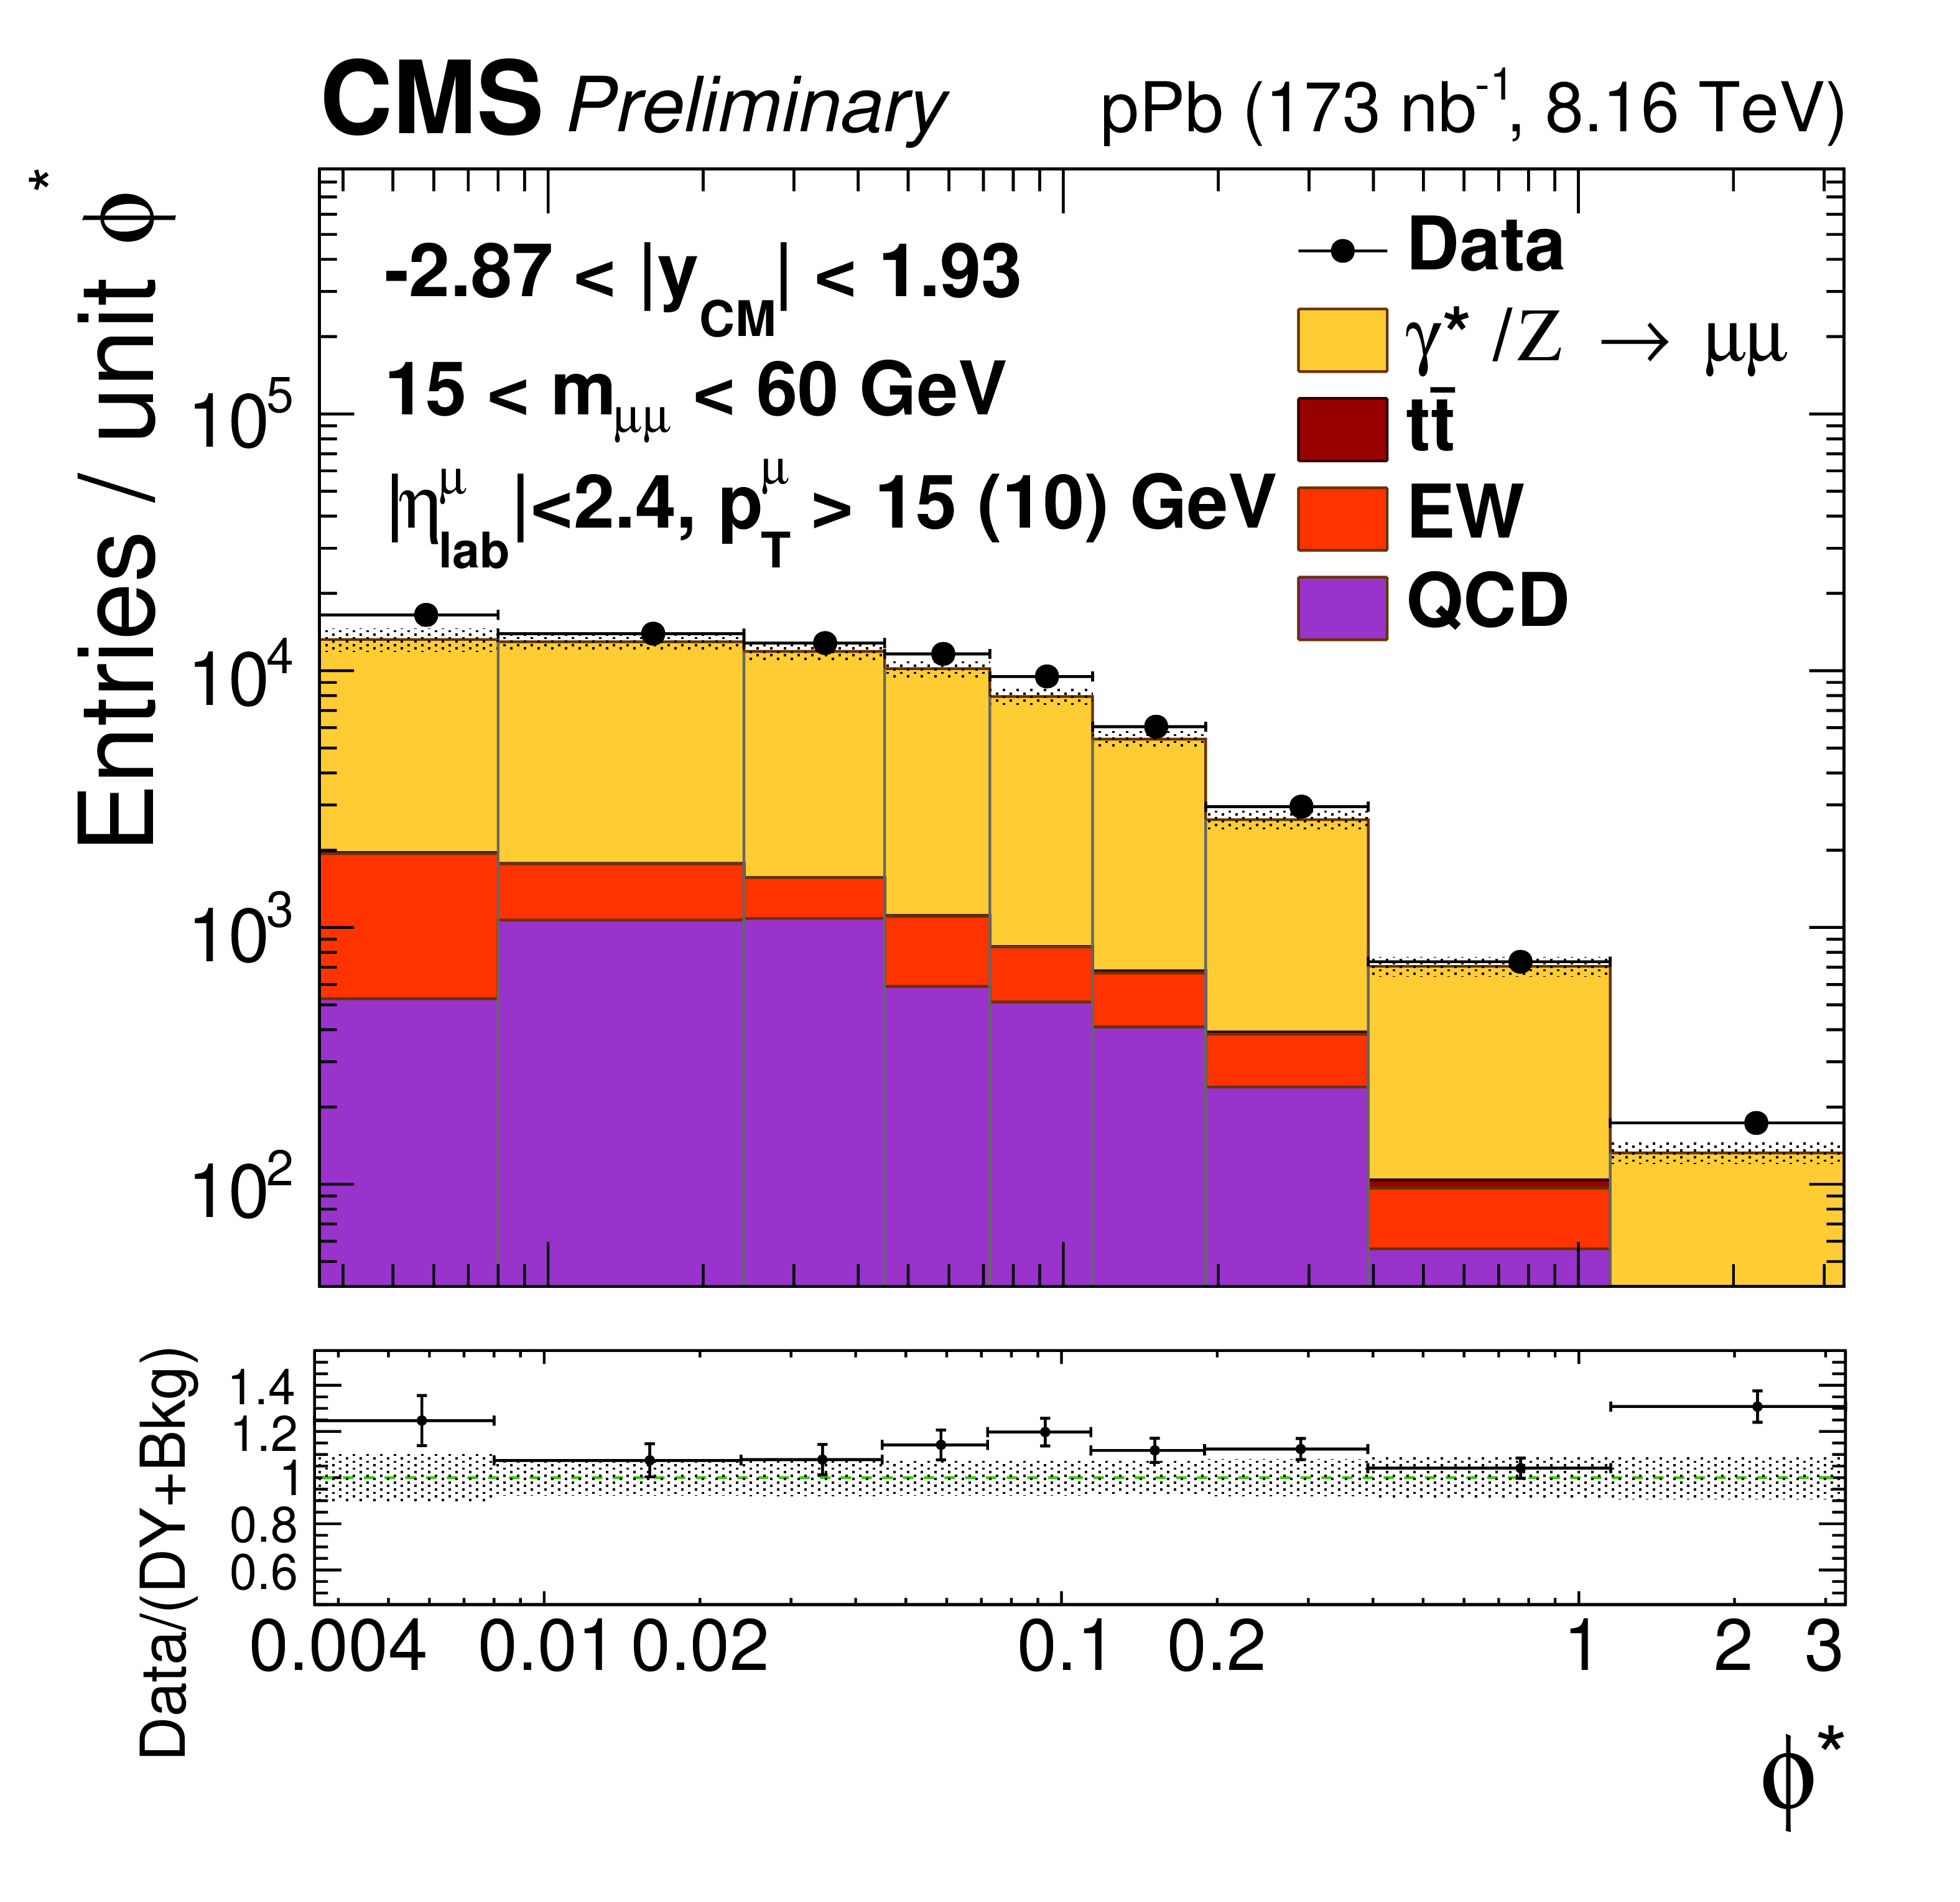
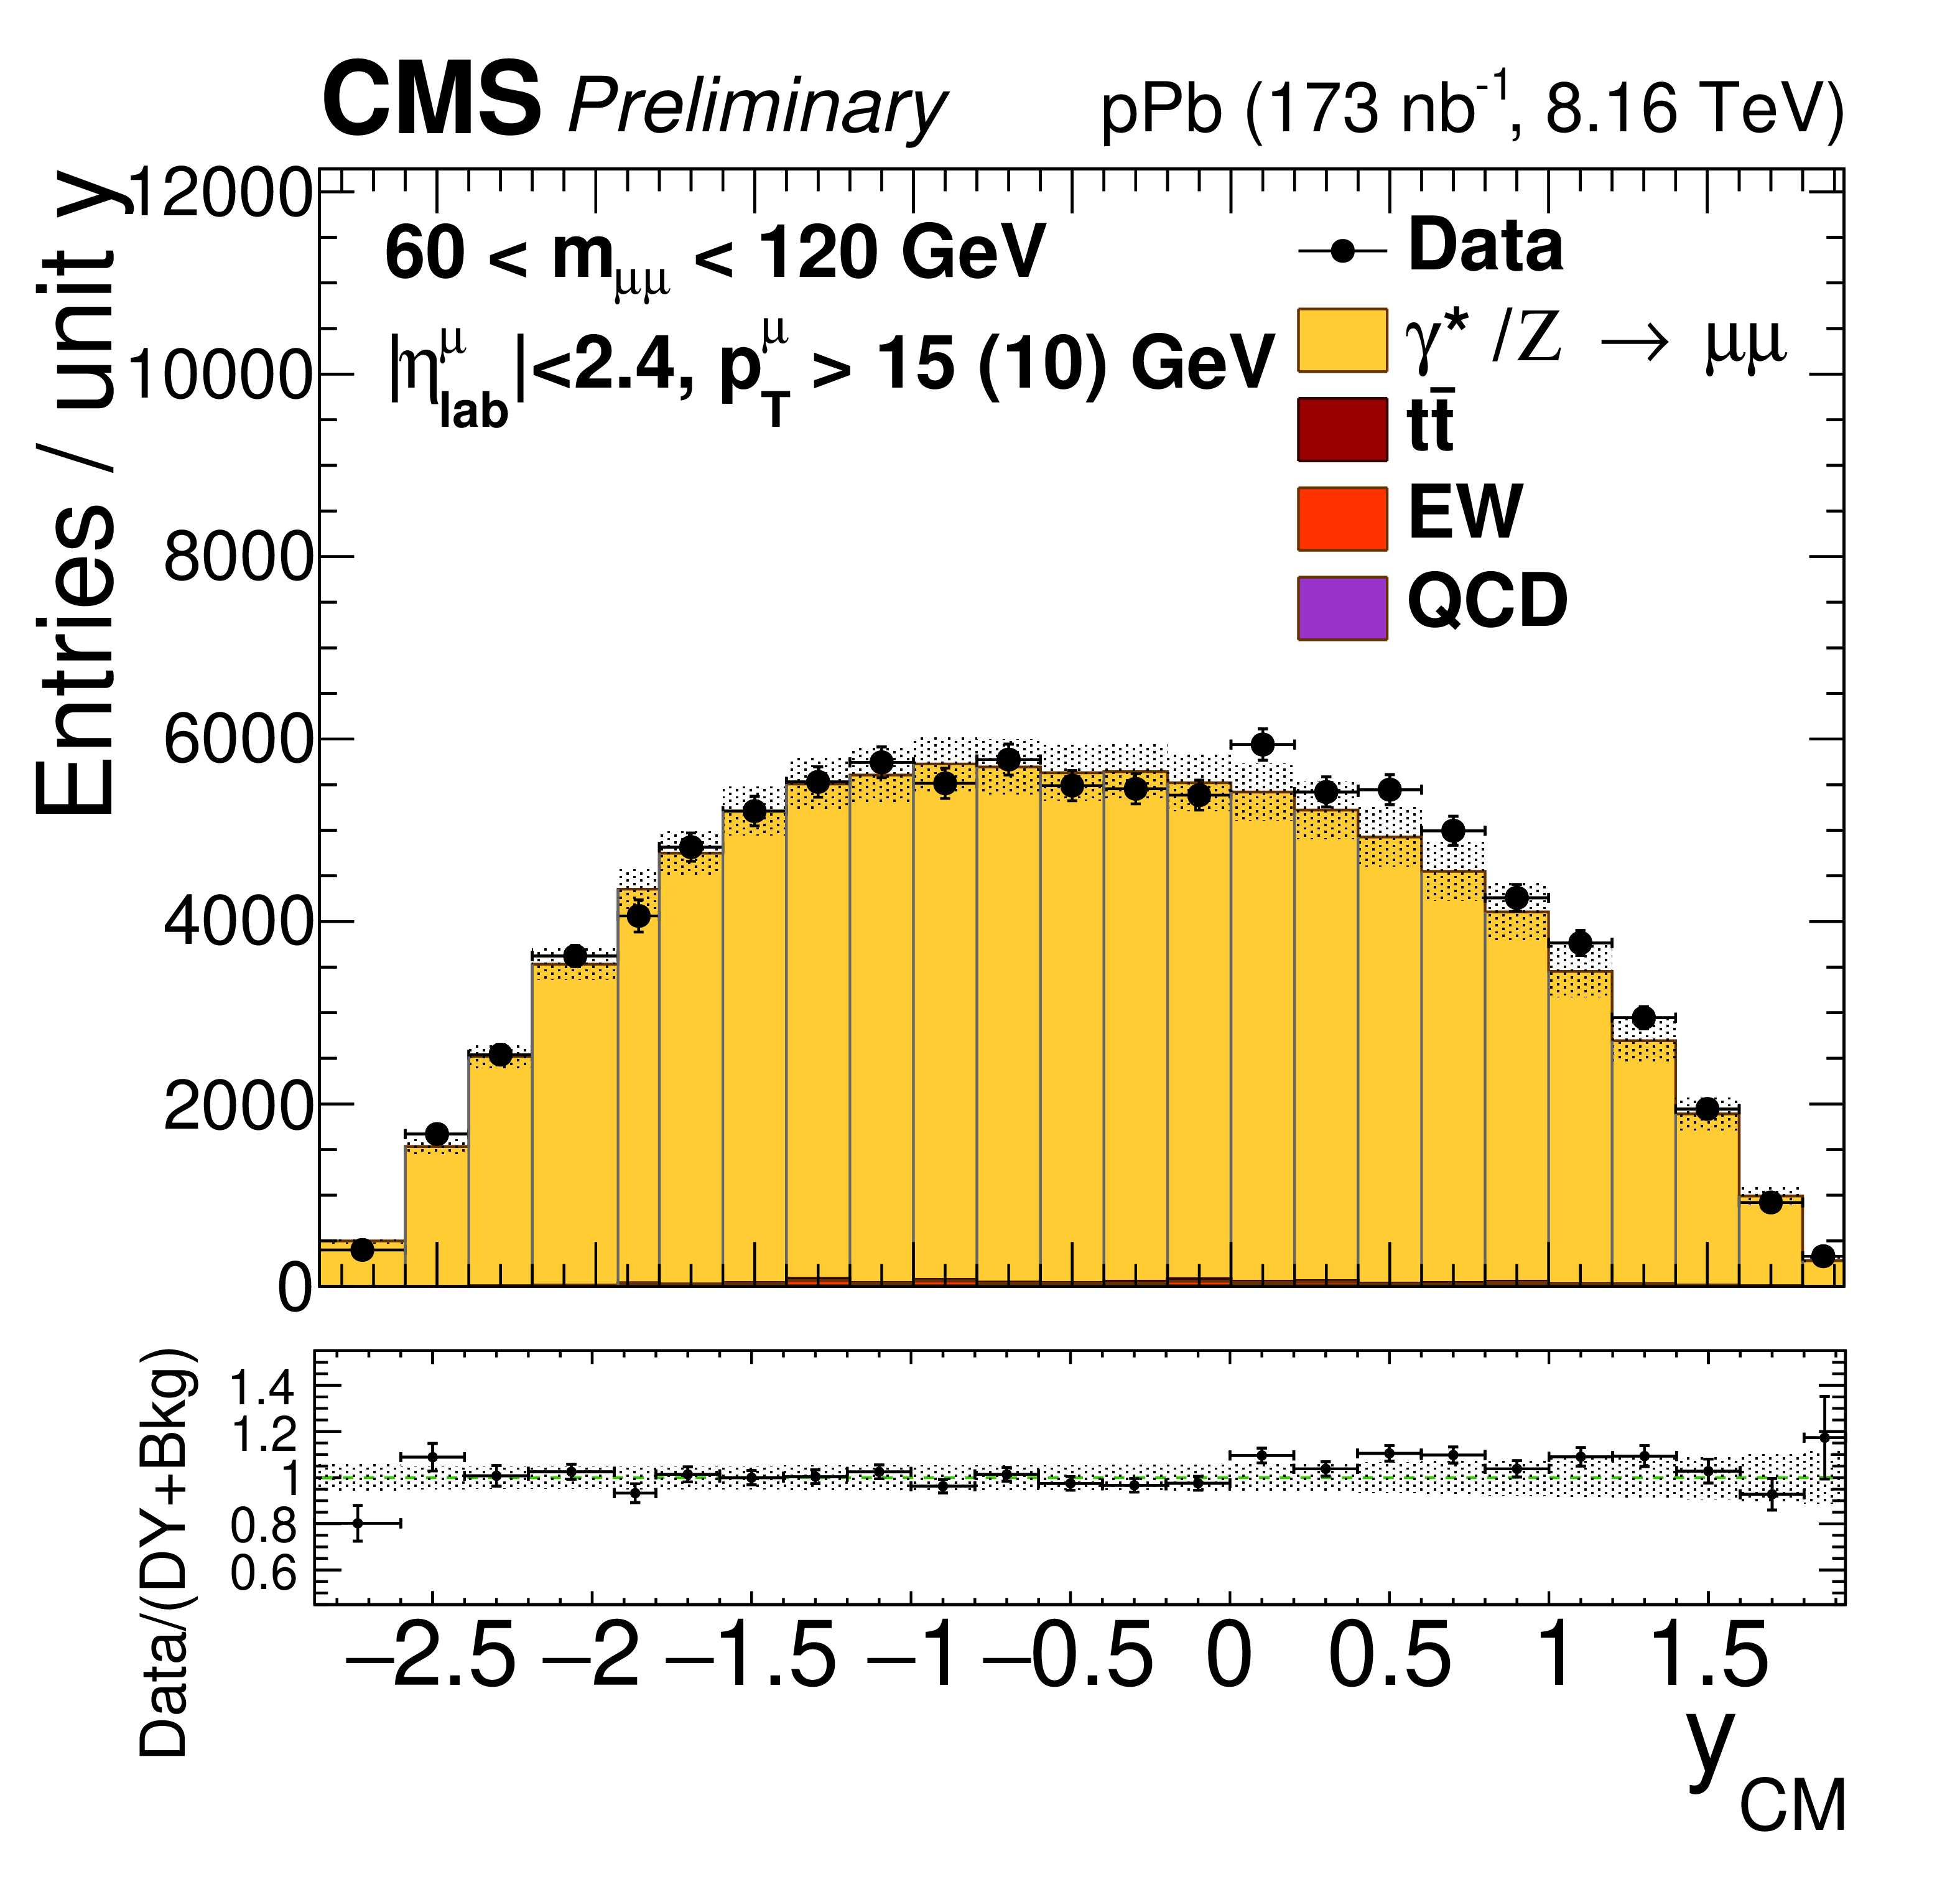
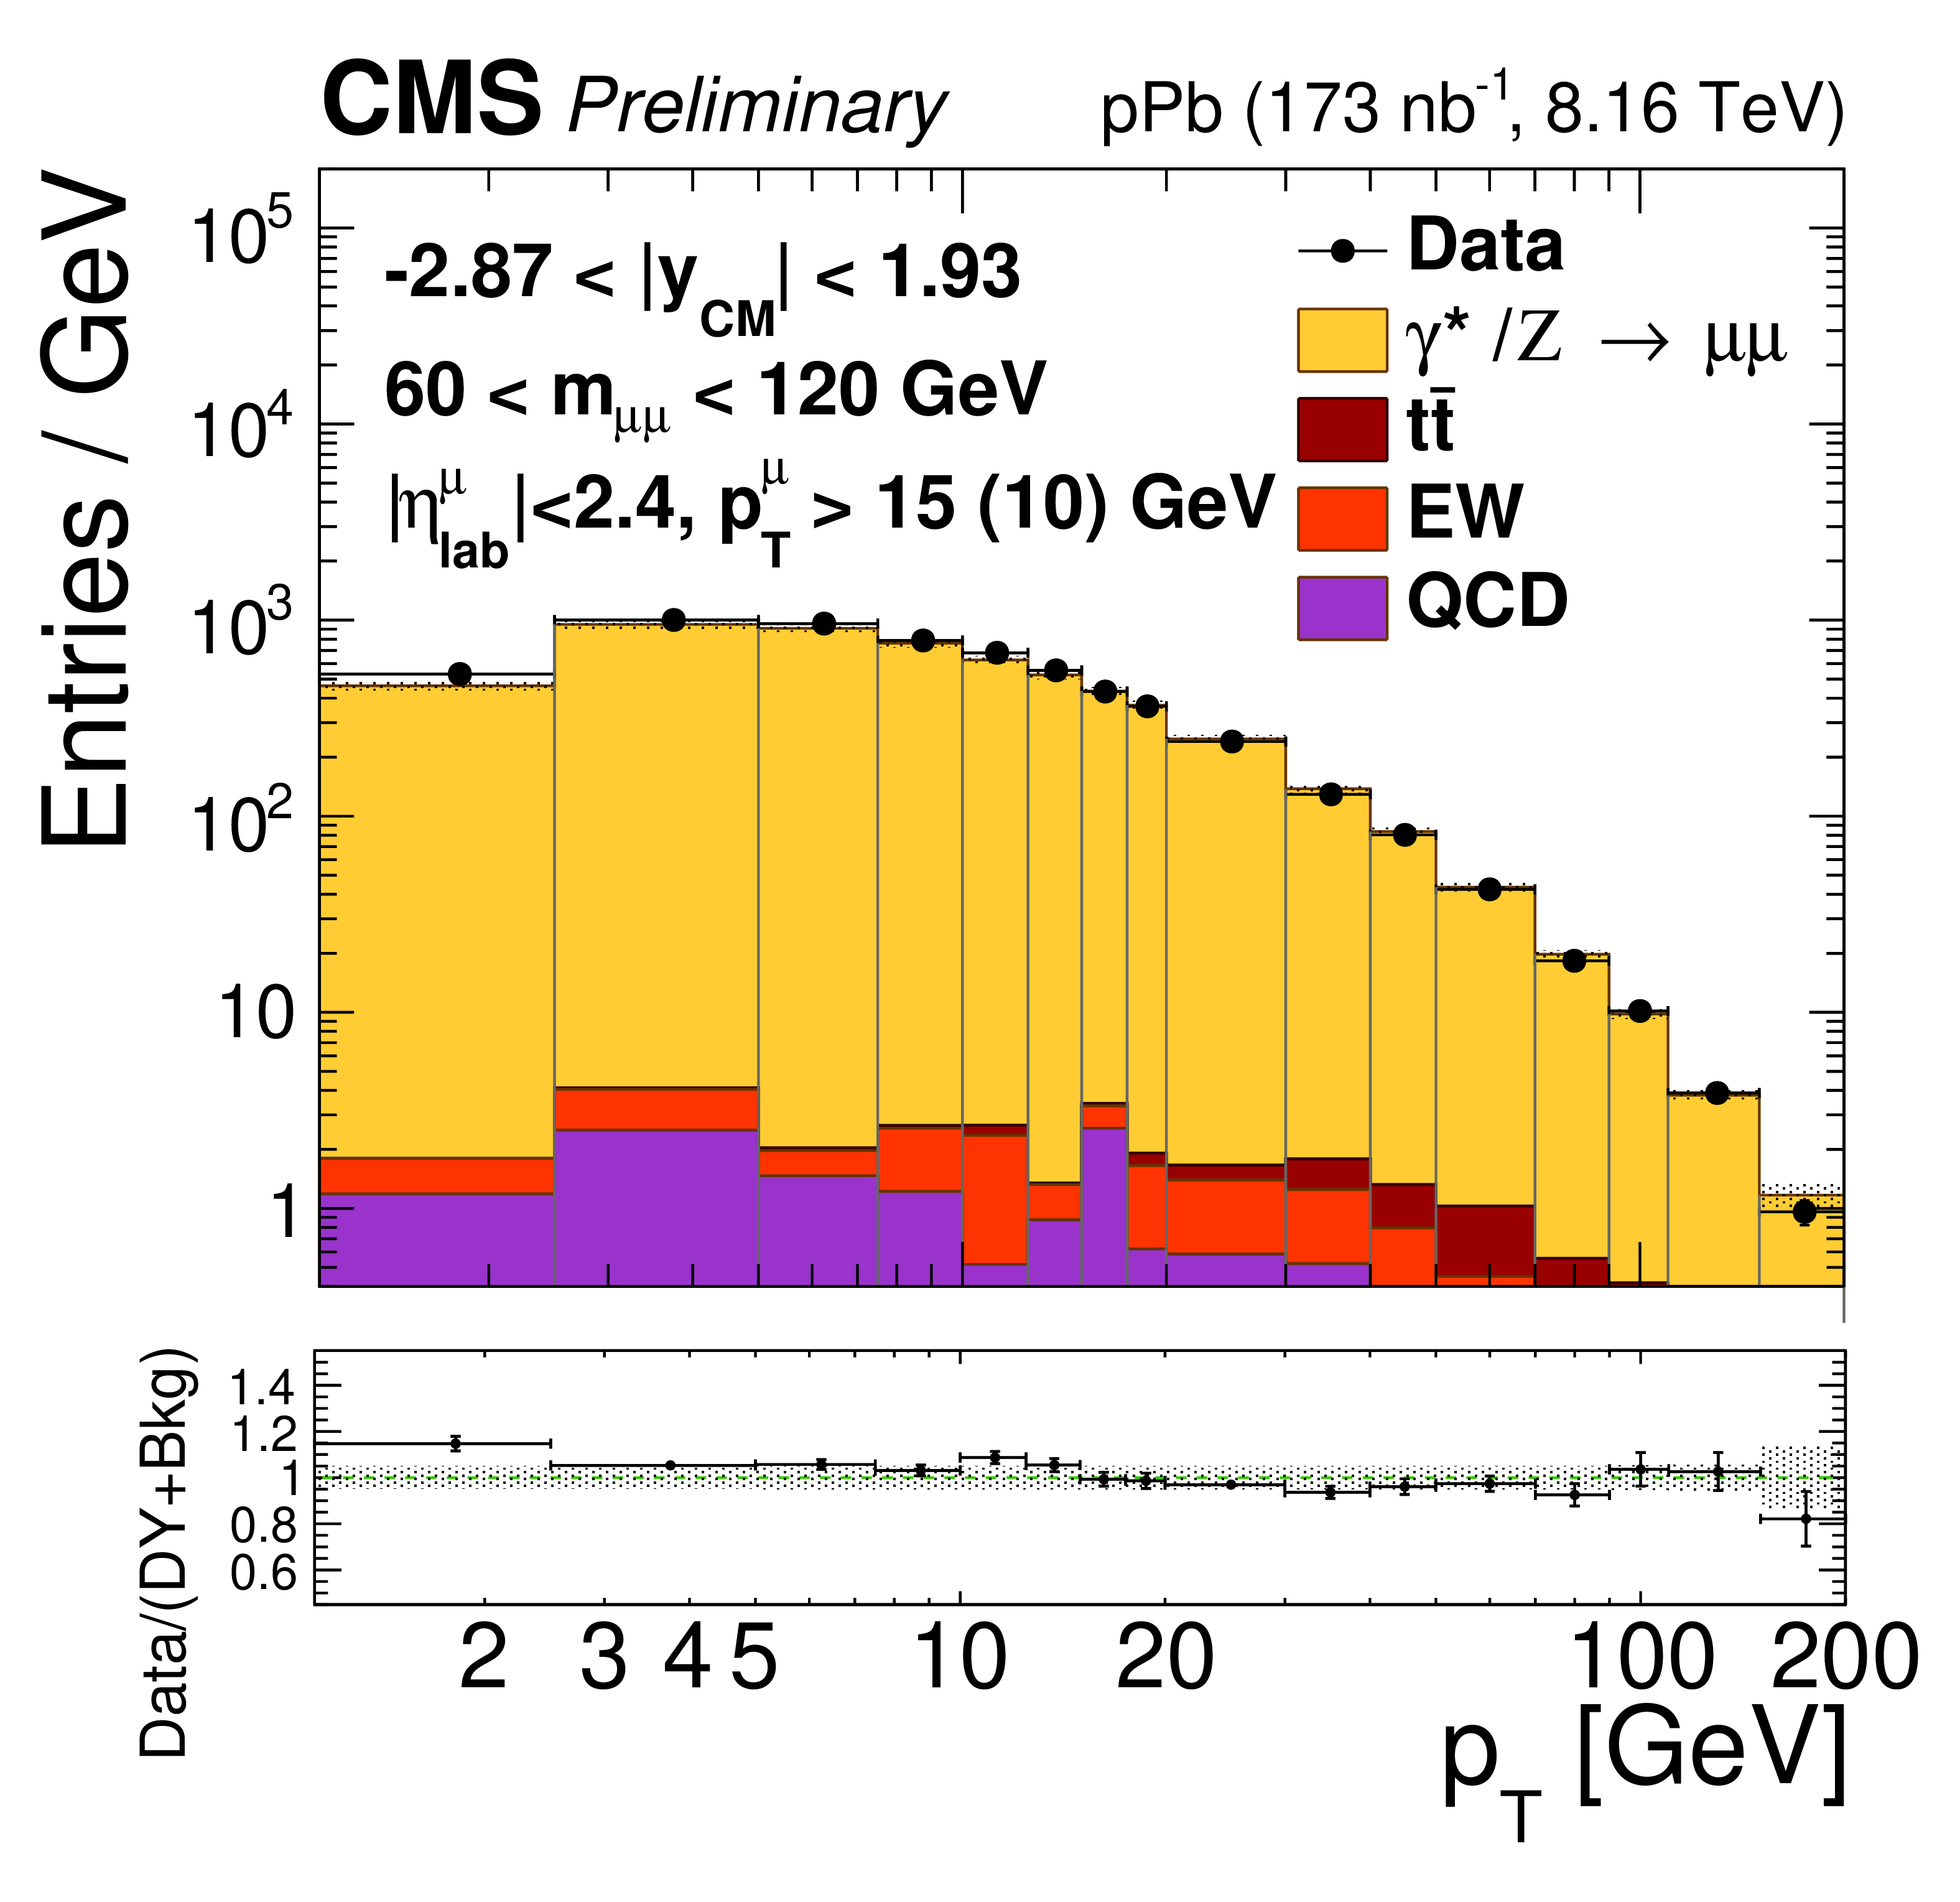
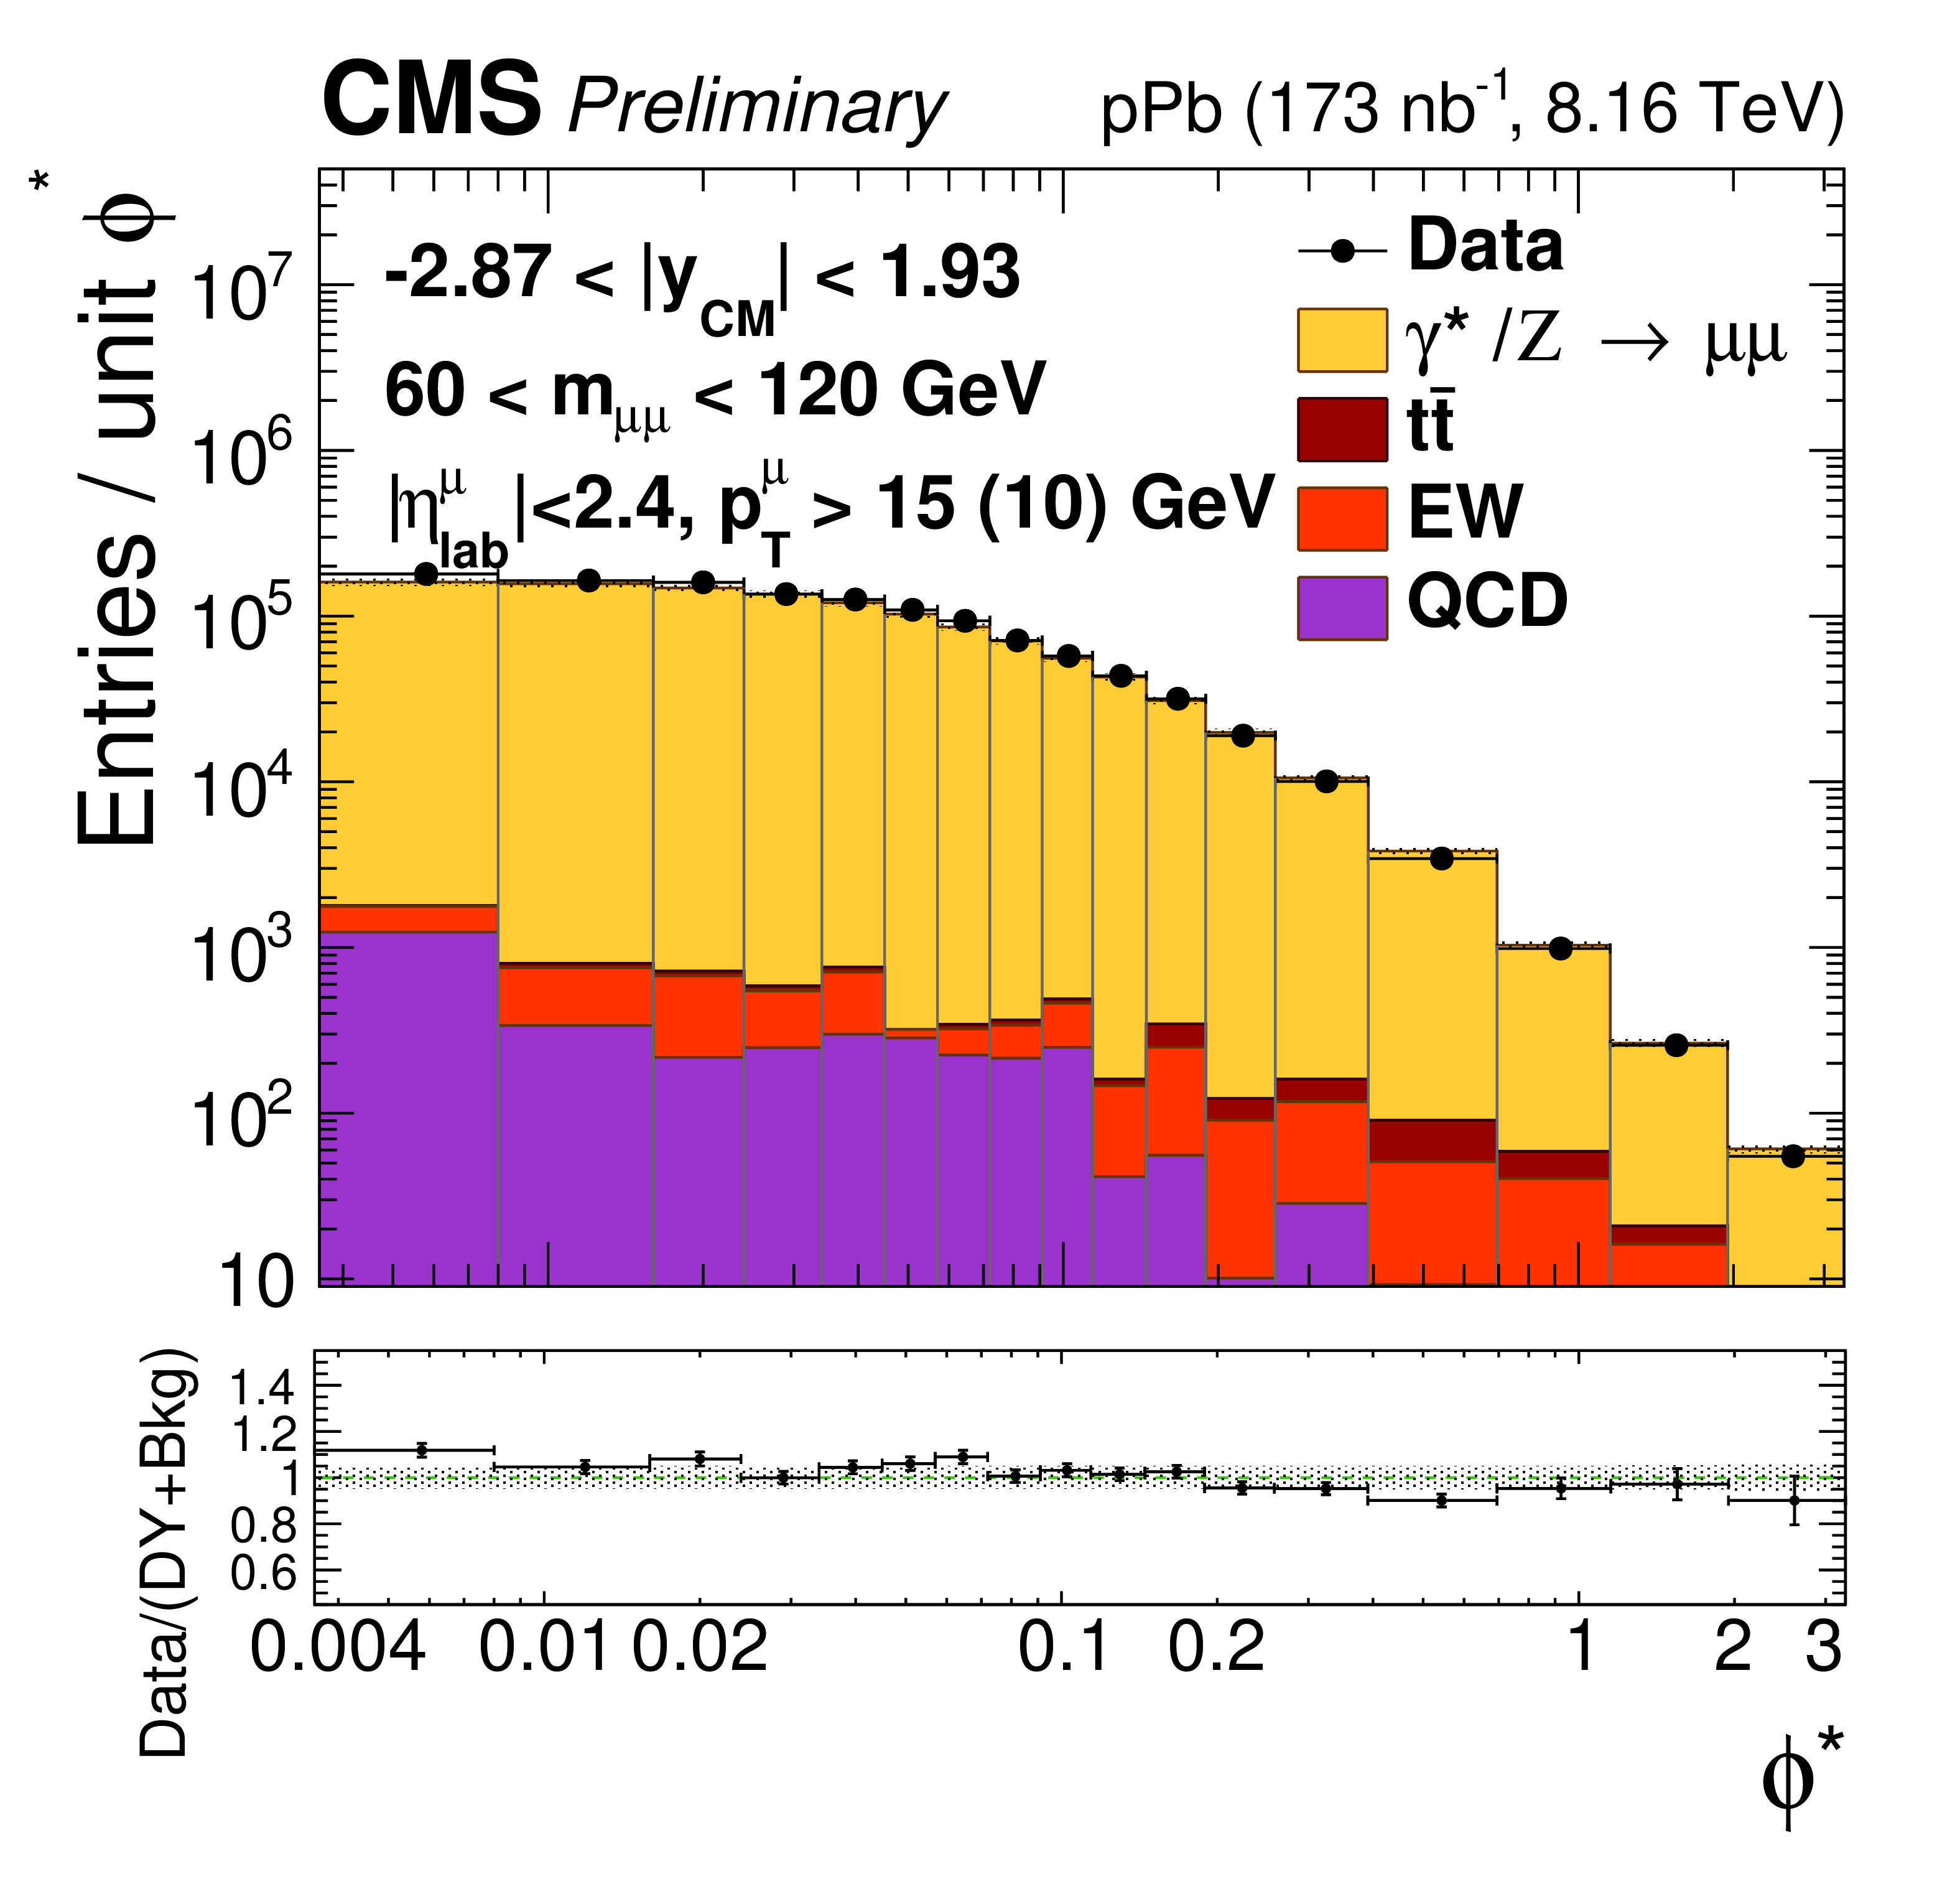
Figure 1:
Comparison of the data (black points) with the total of the Z/$\gamma^{*}$ signal and background predictions (filled histograms), estimated as described in the text, as a function of invariant mass (top), rapidity in the center-of-mass frame (left), ${p_{\mathrm {T}}}$ (center) and ${\phi ^*}$ (right), for 15 $ < {m_{\mu \mu}} < $ 60 GeV (middle row) and 60 $ < {m_{\mu \mu}} < $ 120 GeV (bottom row). The first bins of the ${p_{\mathrm {T}}}$ and ${\phi ^*}$ distributions start at 0. Vertical error bars represent statistical uncertainties. The ratio of the data to the prediction is shown in the bottom panels. The boson ${p_{\mathrm {T}}}$ reweighting described in the text is not applied to signal. The hatched regions show the quadratic sum of the systematic uncertainties (including luminosity, but excluding acceptance and unfolding uncertainties) and the nPDF uncertainties (CT14+EPPS16). |
png pdf |
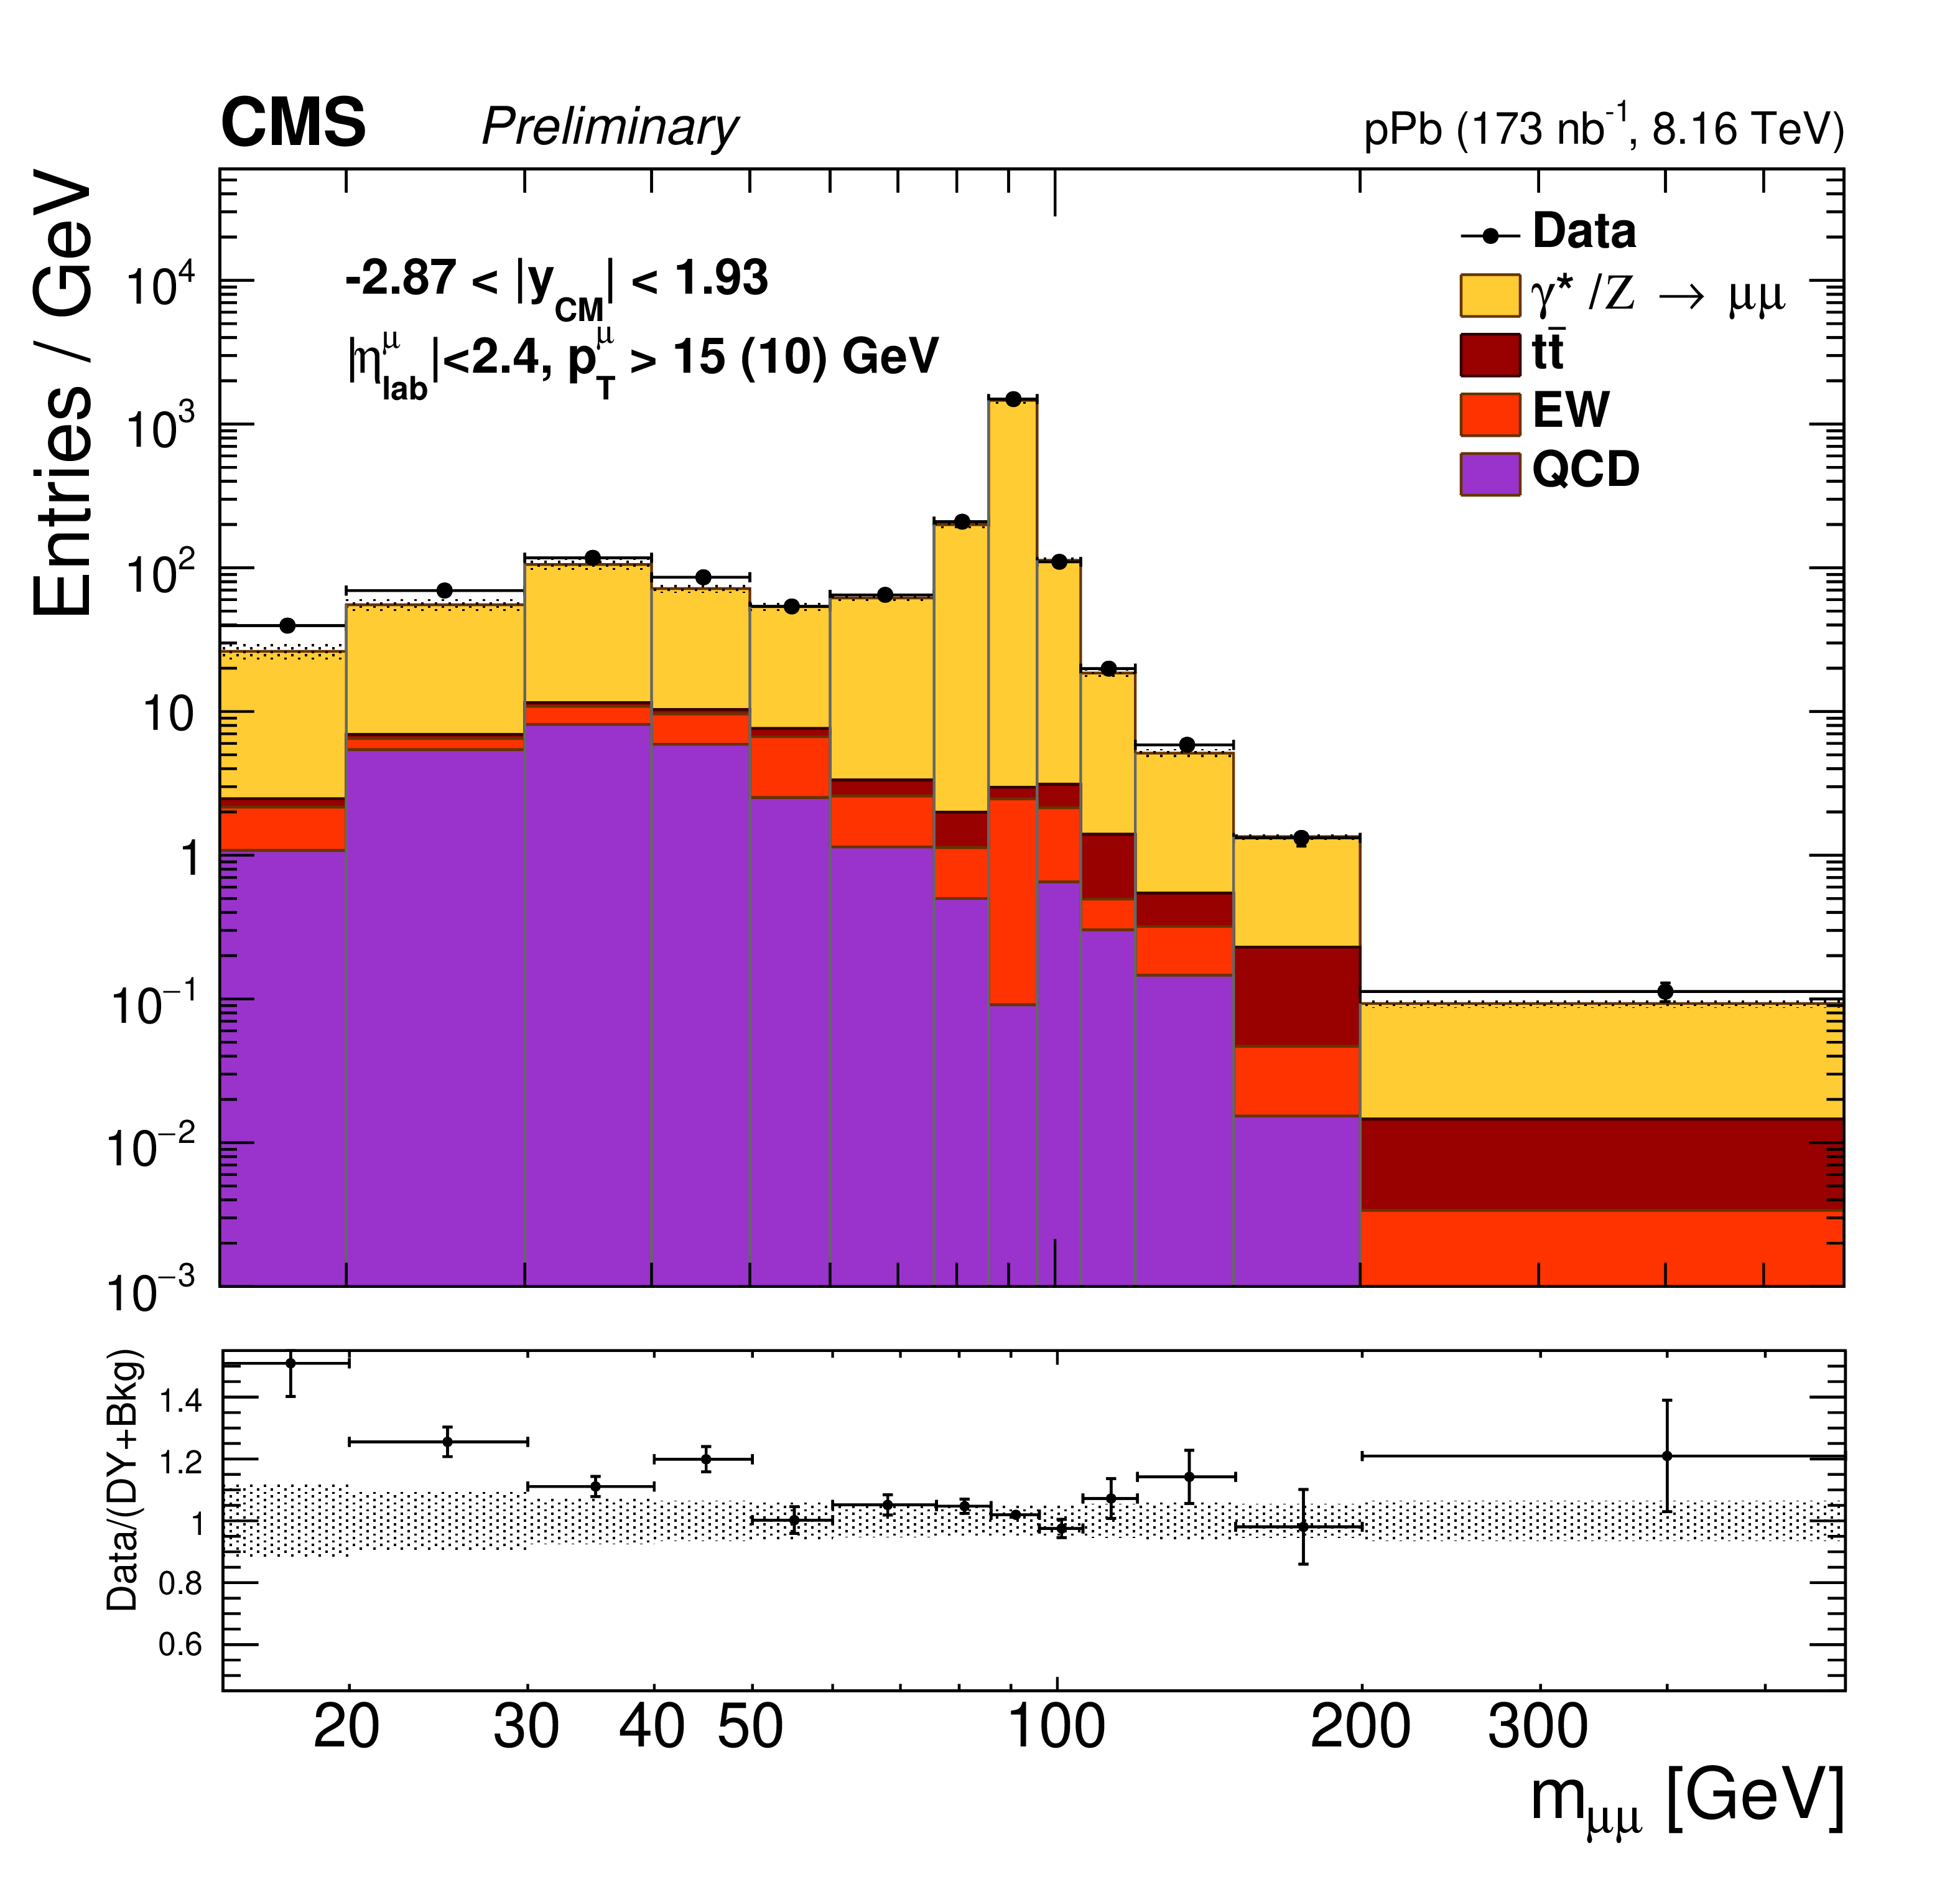
Figure 1-a:
Comparison of the data (black points) with the total of the Z/$\gamma^{*}$ signal and background predictions (filled histograms), estimated as described in the text, as a function of invariant mass (top), rapidity in the center-of-mass frame (left), ${p_{\mathrm {T}}}$ (center) and ${\phi ^*}$ (right), for 15 $ < {m_{\mu \mu}} < $ 60 GeV (middle row) and 60 $ < {m_{\mu \mu}} < $ 120 GeV (bottom row). The first bins of the ${p_{\mathrm {T}}}$ and ${\phi ^*}$ distributions start at 0. Vertical error bars represent statistical uncertainties. The ratio of the data to the prediction is shown in the bottom panels. The boson ${p_{\mathrm {T}}}$ reweighting described in the text is not applied to signal. The hatched regions show the quadratic sum of the systematic uncertainties (including luminosity, but excluding acceptance and unfolding uncertainties) and the nPDF uncertainties (CT14+EPPS16). |
png pdf |
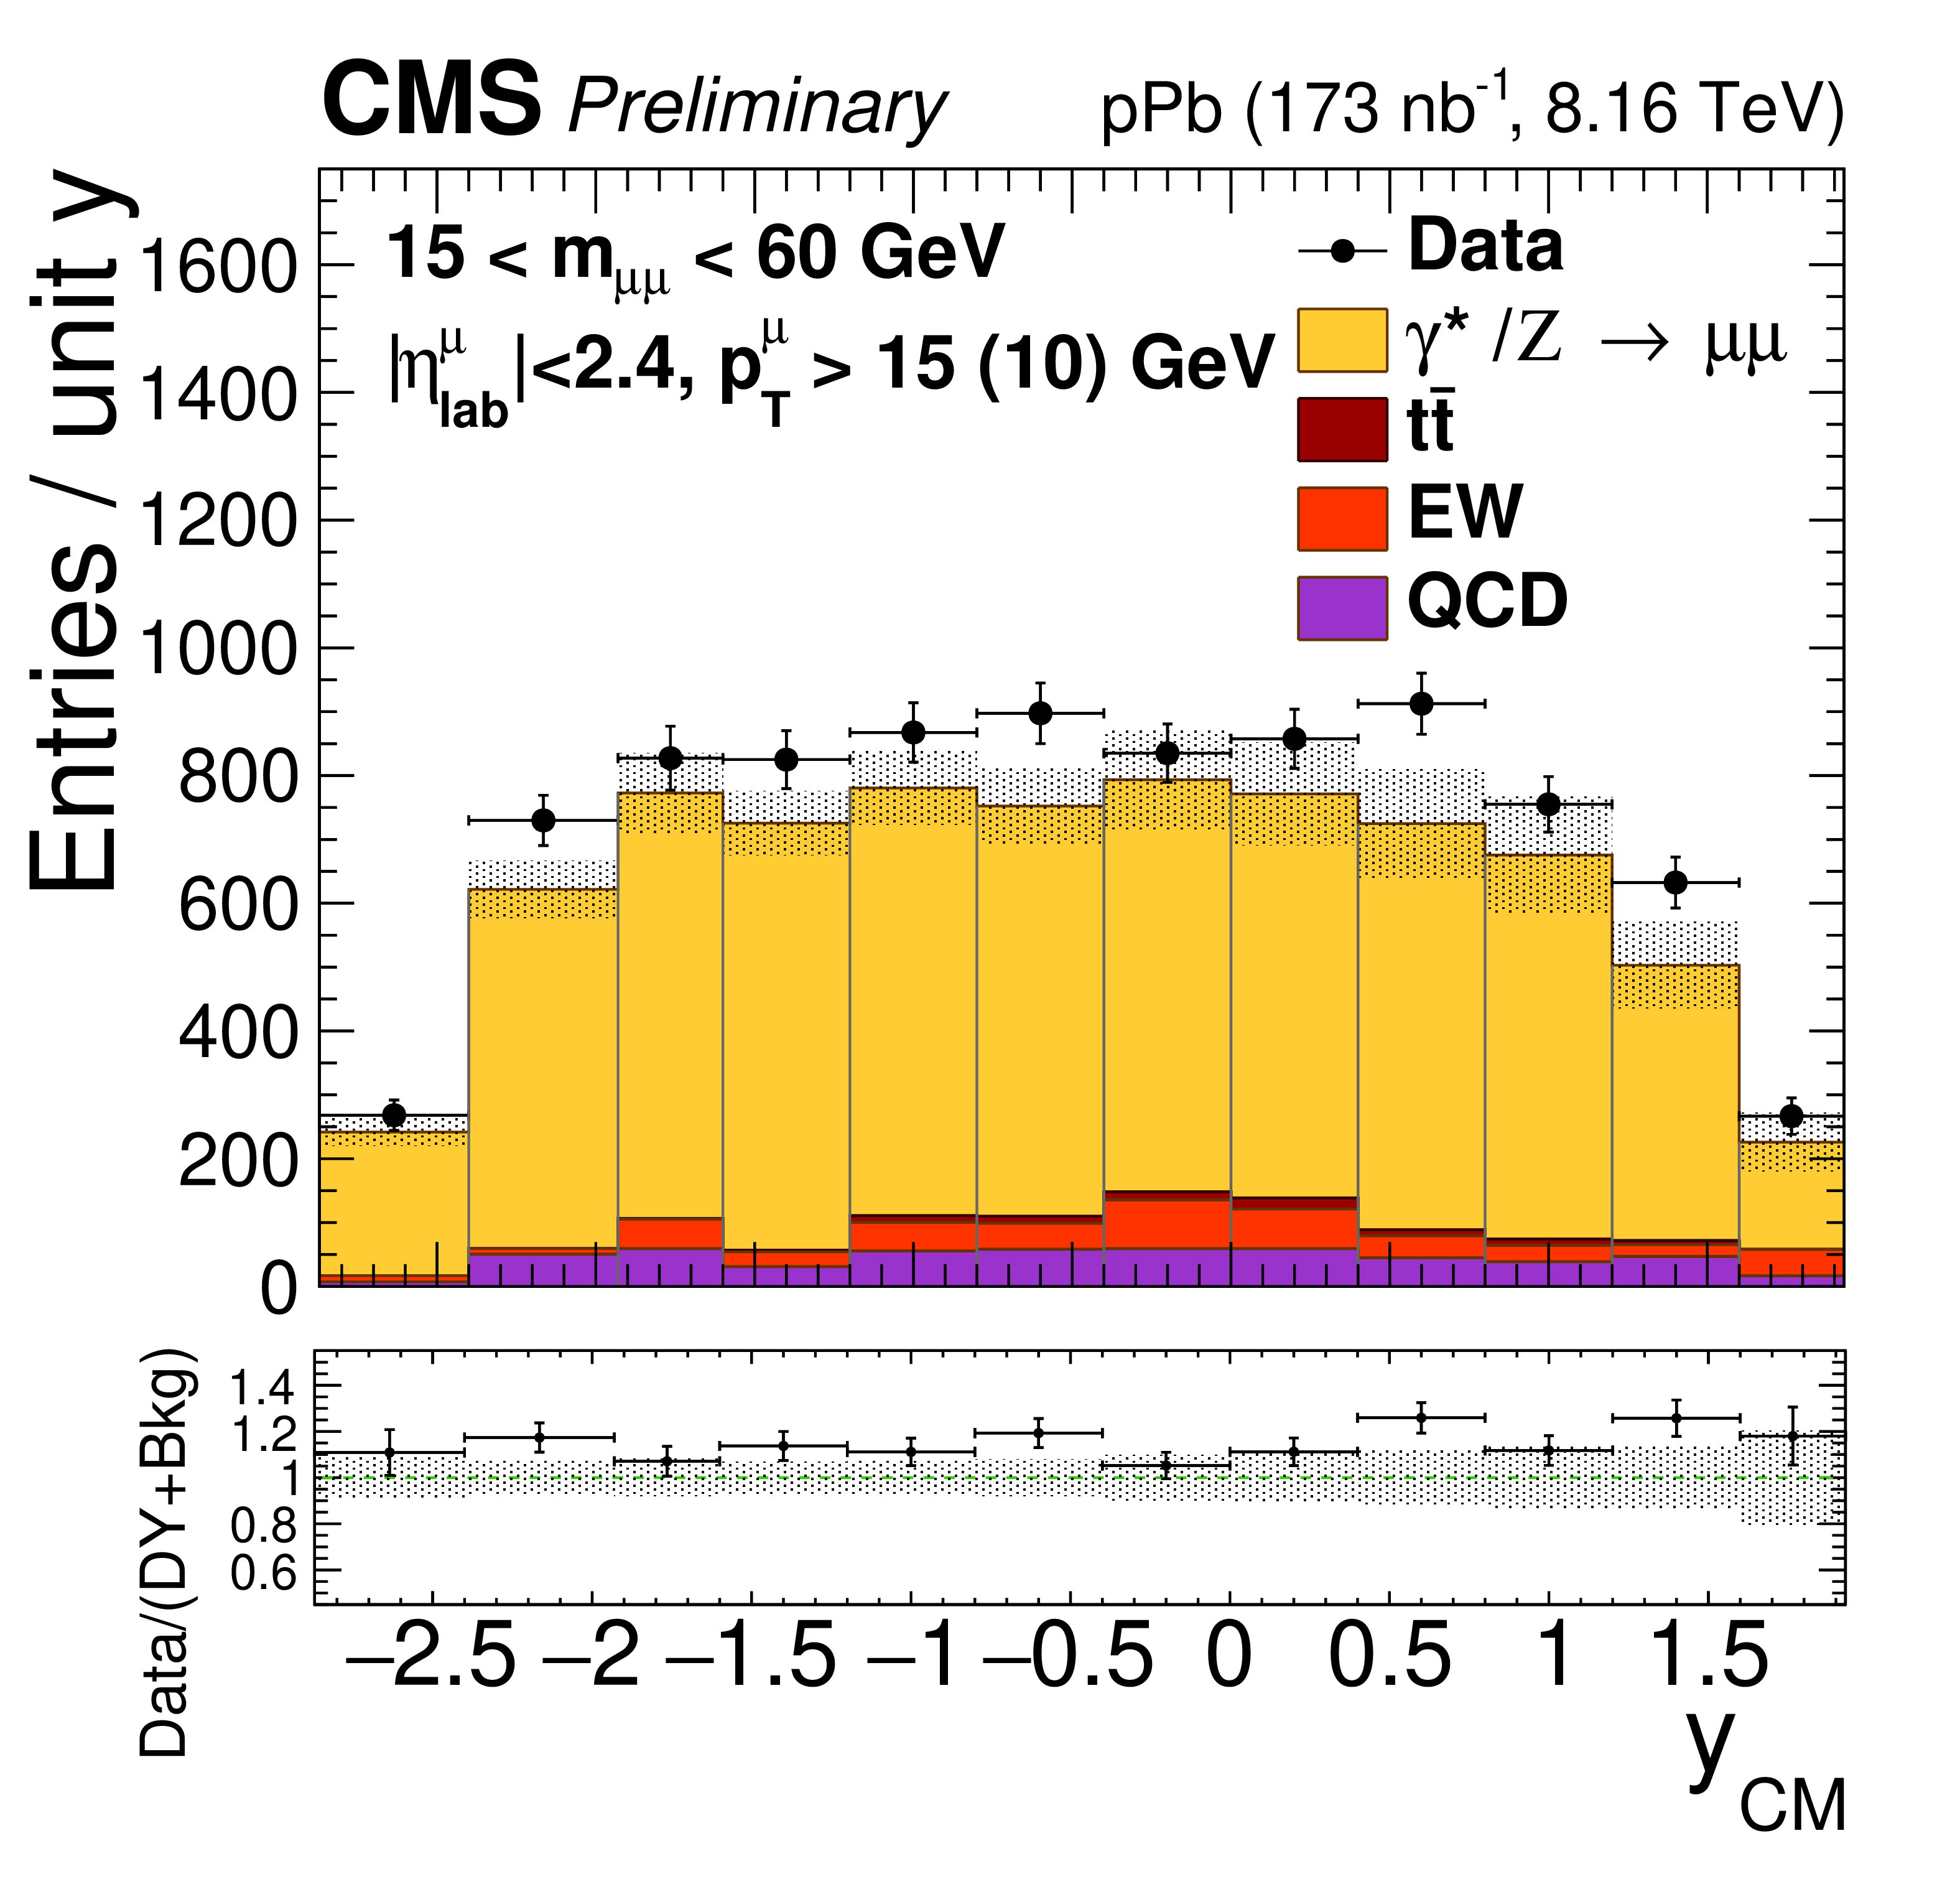
Figure 1-b:
Comparison of the data (black points) with the total of the Z/$\gamma^{*}$ signal and background predictions (filled histograms), estimated as described in the text, as a function of invariant mass (top), rapidity in the center-of-mass frame (left), ${p_{\mathrm {T}}}$ (center) and ${\phi ^*}$ (right), for 15 $ < {m_{\mu \mu}} < $ 60 GeV (middle row) and 60 $ < {m_{\mu \mu}} < $ 120 GeV (bottom row). The first bins of the ${p_{\mathrm {T}}}$ and ${\phi ^*}$ distributions start at 0. Vertical error bars represent statistical uncertainties. The ratio of the data to the prediction is shown in the bottom panels. The boson ${p_{\mathrm {T}}}$ reweighting described in the text is not applied to signal. The hatched regions show the quadratic sum of the systematic uncertainties (including luminosity, but excluding acceptance and unfolding uncertainties) and the nPDF uncertainties (CT14+EPPS16). |
png pdf |
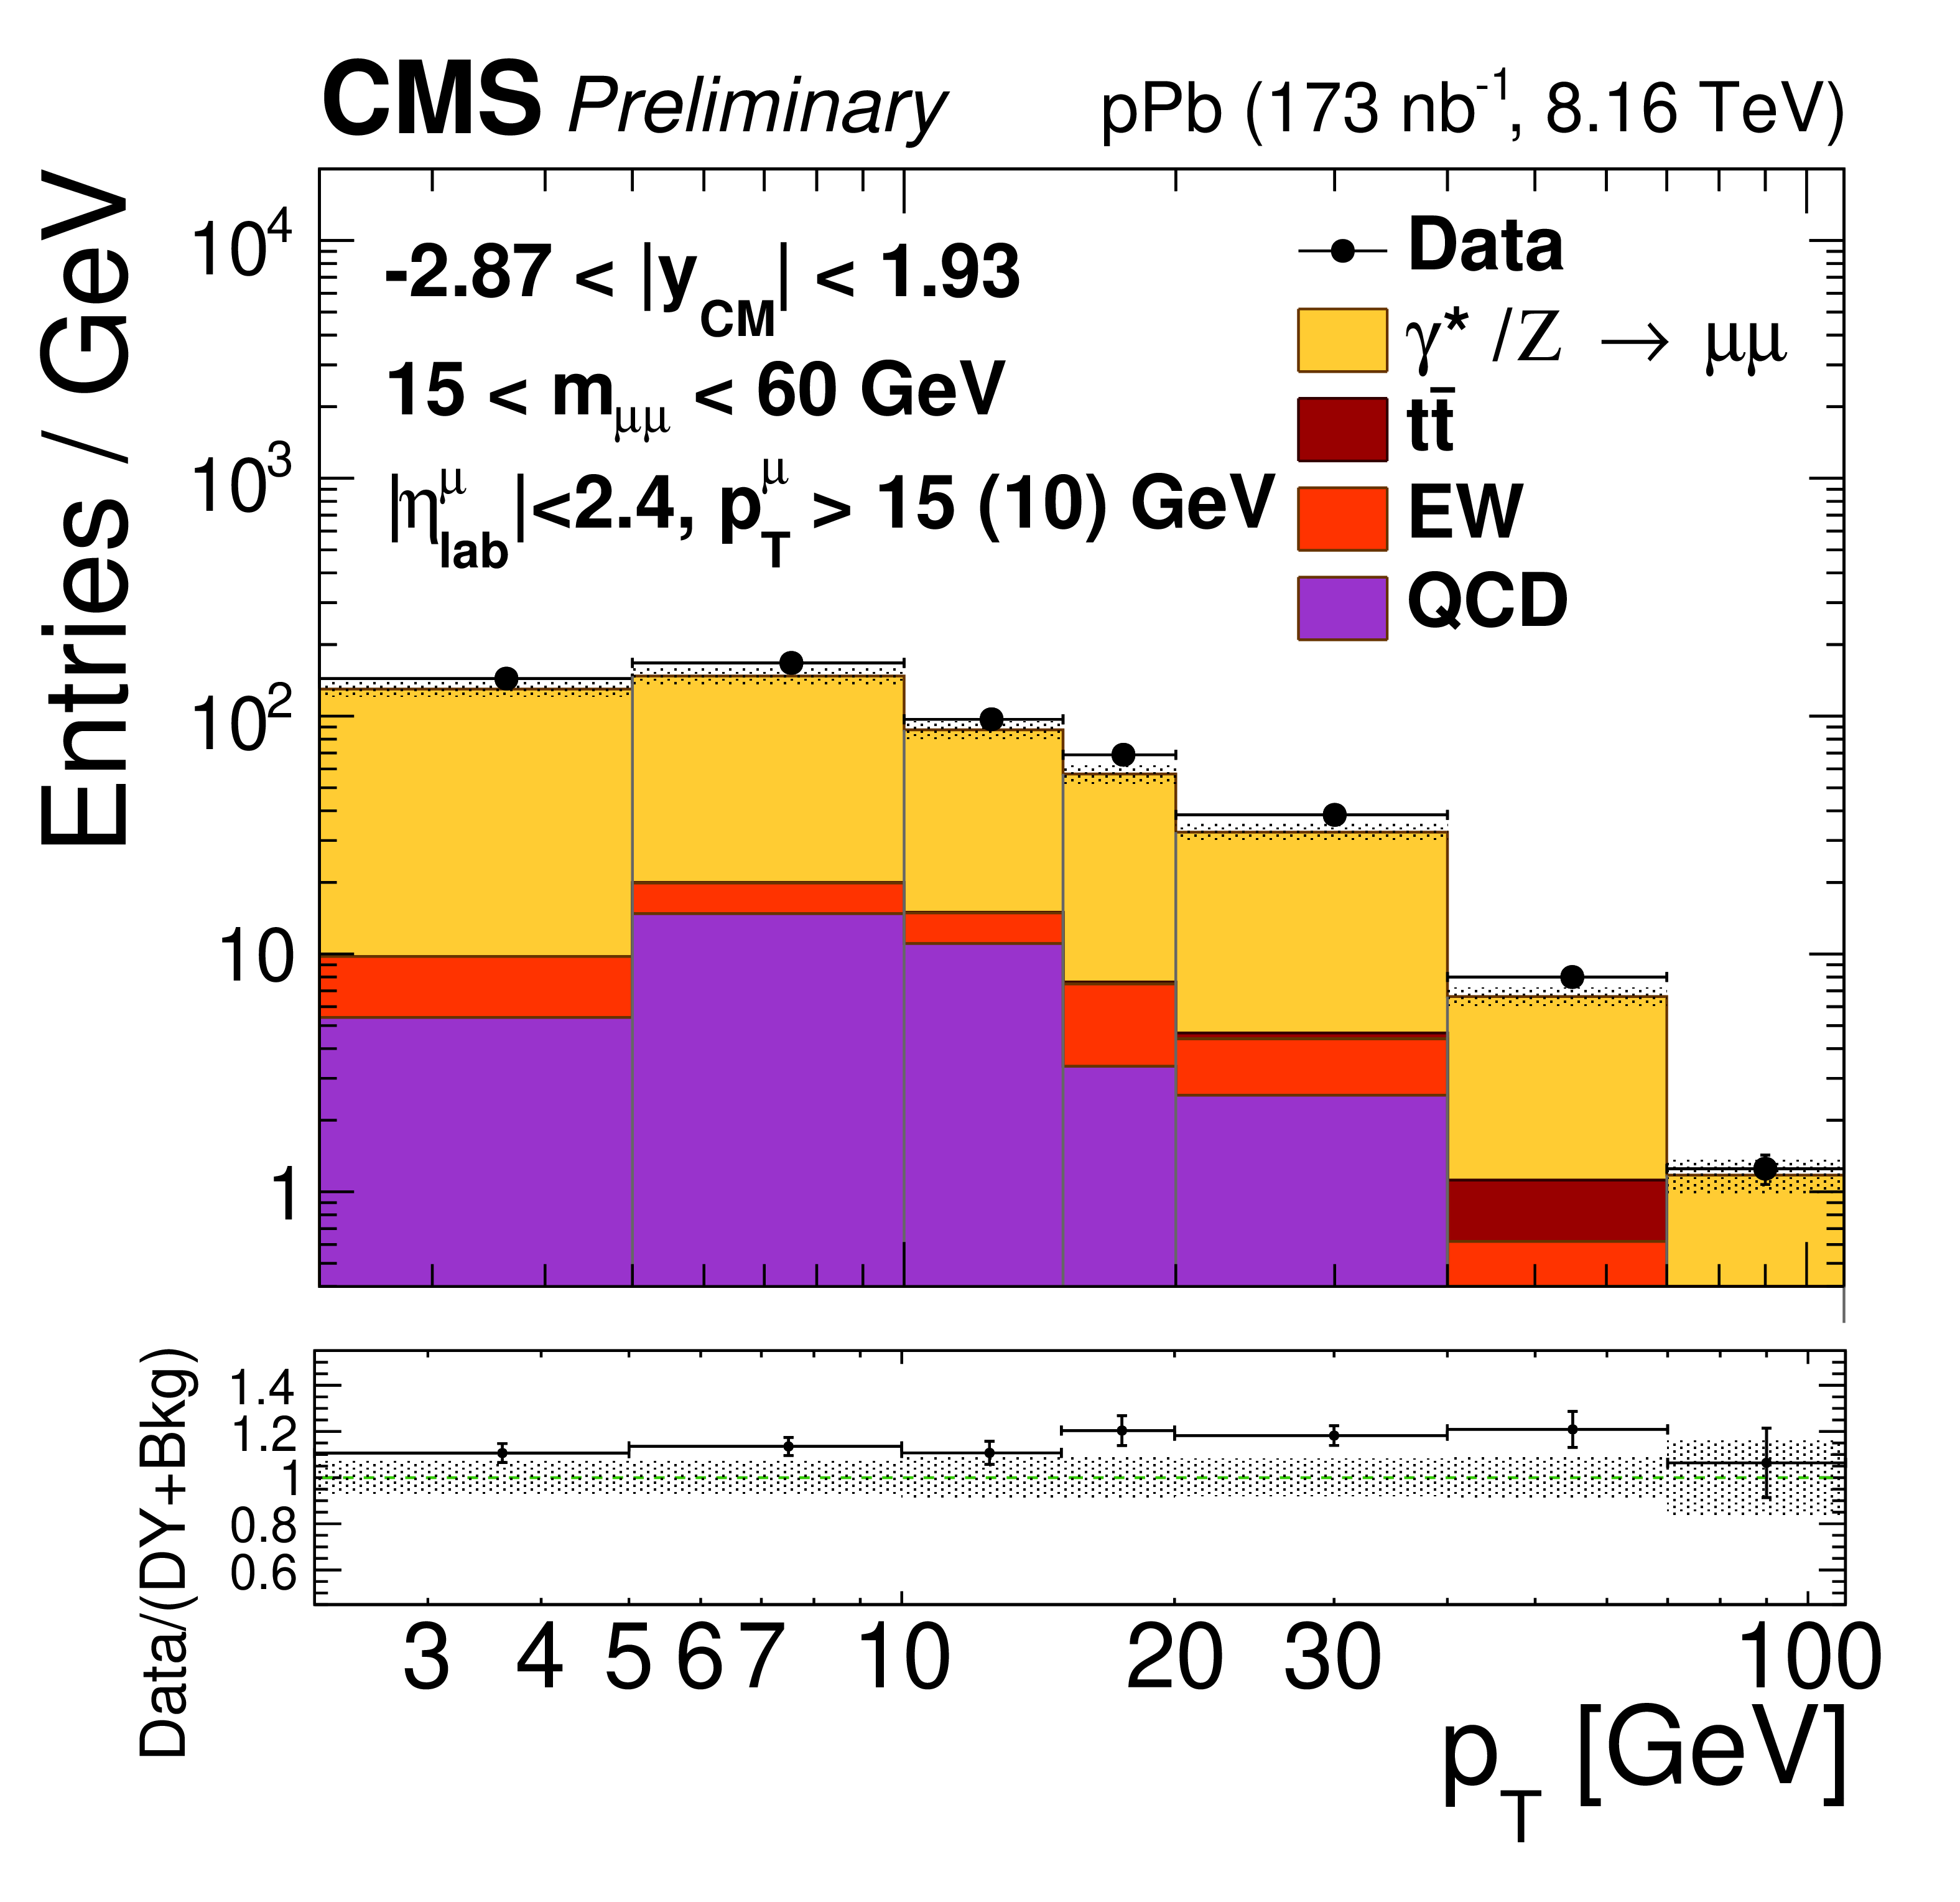
Figure 1-c:
Comparison of the data (black points) with the total of the Z/$\gamma^{*}$ signal and background predictions (filled histograms), estimated as described in the text, as a function of invariant mass (top), rapidity in the center-of-mass frame (left), ${p_{\mathrm {T}}}$ (center) and ${\phi ^*}$ (right), for 15 $ < {m_{\mu \mu}} < $ 60 GeV (middle row) and 60 $ < {m_{\mu \mu}} < $ 120 GeV (bottom row). The first bins of the ${p_{\mathrm {T}}}$ and ${\phi ^*}$ distributions start at 0. Vertical error bars represent statistical uncertainties. The ratio of the data to the prediction is shown in the bottom panels. The boson ${p_{\mathrm {T}}}$ reweighting described in the text is not applied to signal. The hatched regions show the quadratic sum of the systematic uncertainties (including luminosity, but excluding acceptance and unfolding uncertainties) and the nPDF uncertainties (CT14+EPPS16). |
png pdf |
Figure 1-d:
Comparison of the data (black points) with the total of the Z/$\gamma^{*}$ signal and background predictions (filled histograms), estimated as described in the text, as a function of invariant mass (top), rapidity in the center-of-mass frame (left), ${p_{\mathrm {T}}}$ (center) and ${\phi ^*}$ (right), for 15 $ < {m_{\mu \mu}} < $ 60 GeV (middle row) and 60 $ < {m_{\mu \mu}} < $ 120 GeV (bottom row). The first bins of the ${p_{\mathrm {T}}}$ and ${\phi ^*}$ distributions start at 0. Vertical error bars represent statistical uncertainties. The ratio of the data to the prediction is shown in the bottom panels. The boson ${p_{\mathrm {T}}}$ reweighting described in the text is not applied to signal. The hatched regions show the quadratic sum of the systematic uncertainties (including luminosity, but excluding acceptance and unfolding uncertainties) and the nPDF uncertainties (CT14+EPPS16). |
png pdf |
Figure 1-e:
Comparison of the data (black points) with the total of the Z/$\gamma^{*}$ signal and background predictions (filled histograms), estimated as described in the text, as a function of invariant mass (top), rapidity in the center-of-mass frame (left), ${p_{\mathrm {T}}}$ (center) and ${\phi ^*}$ (right), for 15 $ < {m_{\mu \mu}} < $ 60 GeV (middle row) and 60 $ < {m_{\mu \mu}} < $ 120 GeV (bottom row). The first bins of the ${p_{\mathrm {T}}}$ and ${\phi ^*}$ distributions start at 0. Vertical error bars represent statistical uncertainties. The ratio of the data to the prediction is shown in the bottom panels. The boson ${p_{\mathrm {T}}}$ reweighting described in the text is not applied to signal. The hatched regions show the quadratic sum of the systematic uncertainties (including luminosity, but excluding acceptance and unfolding uncertainties) and the nPDF uncertainties (CT14+EPPS16). |
png pdf |
Figure 1-f:
Comparison of the data (black points) with the total of the Z/$\gamma^{*}$ signal and background predictions (filled histograms), estimated as described in the text, as a function of invariant mass (top), rapidity in the center-of-mass frame (left), ${p_{\mathrm {T}}}$ (center) and ${\phi ^*}$ (right), for 15 $ < {m_{\mu \mu}} < $ 60 GeV (middle row) and 60 $ < {m_{\mu \mu}} < $ 120 GeV (bottom row). The first bins of the ${p_{\mathrm {T}}}$ and ${\phi ^*}$ distributions start at 0. Vertical error bars represent statistical uncertainties. The ratio of the data to the prediction is shown in the bottom panels. The boson ${p_{\mathrm {T}}}$ reweighting described in the text is not applied to signal. The hatched regions show the quadratic sum of the systematic uncertainties (including luminosity, but excluding acceptance and unfolding uncertainties) and the nPDF uncertainties (CT14+EPPS16). |
png pdf |
Figure 1-g:
Comparison of the data (black points) with the total of the Z/$\gamma^{*}$ signal and background predictions (filled histograms), estimated as described in the text, as a function of invariant mass (top), rapidity in the center-of-mass frame (left), ${p_{\mathrm {T}}}$ (center) and ${\phi ^*}$ (right), for 15 $ < {m_{\mu \mu}} < $ 60 GeV (middle row) and 60 $ < {m_{\mu \mu}} < $ 120 GeV (bottom row). The first bins of the ${p_{\mathrm {T}}}$ and ${\phi ^*}$ distributions start at 0. Vertical error bars represent statistical uncertainties. The ratio of the data to the prediction is shown in the bottom panels. The boson ${p_{\mathrm {T}}}$ reweighting described in the text is not applied to signal. The hatched regions show the quadratic sum of the systematic uncertainties (including luminosity, but excluding acceptance and unfolding uncertainties) and the nPDF uncertainties (CT14+EPPS16). |
png pdf |
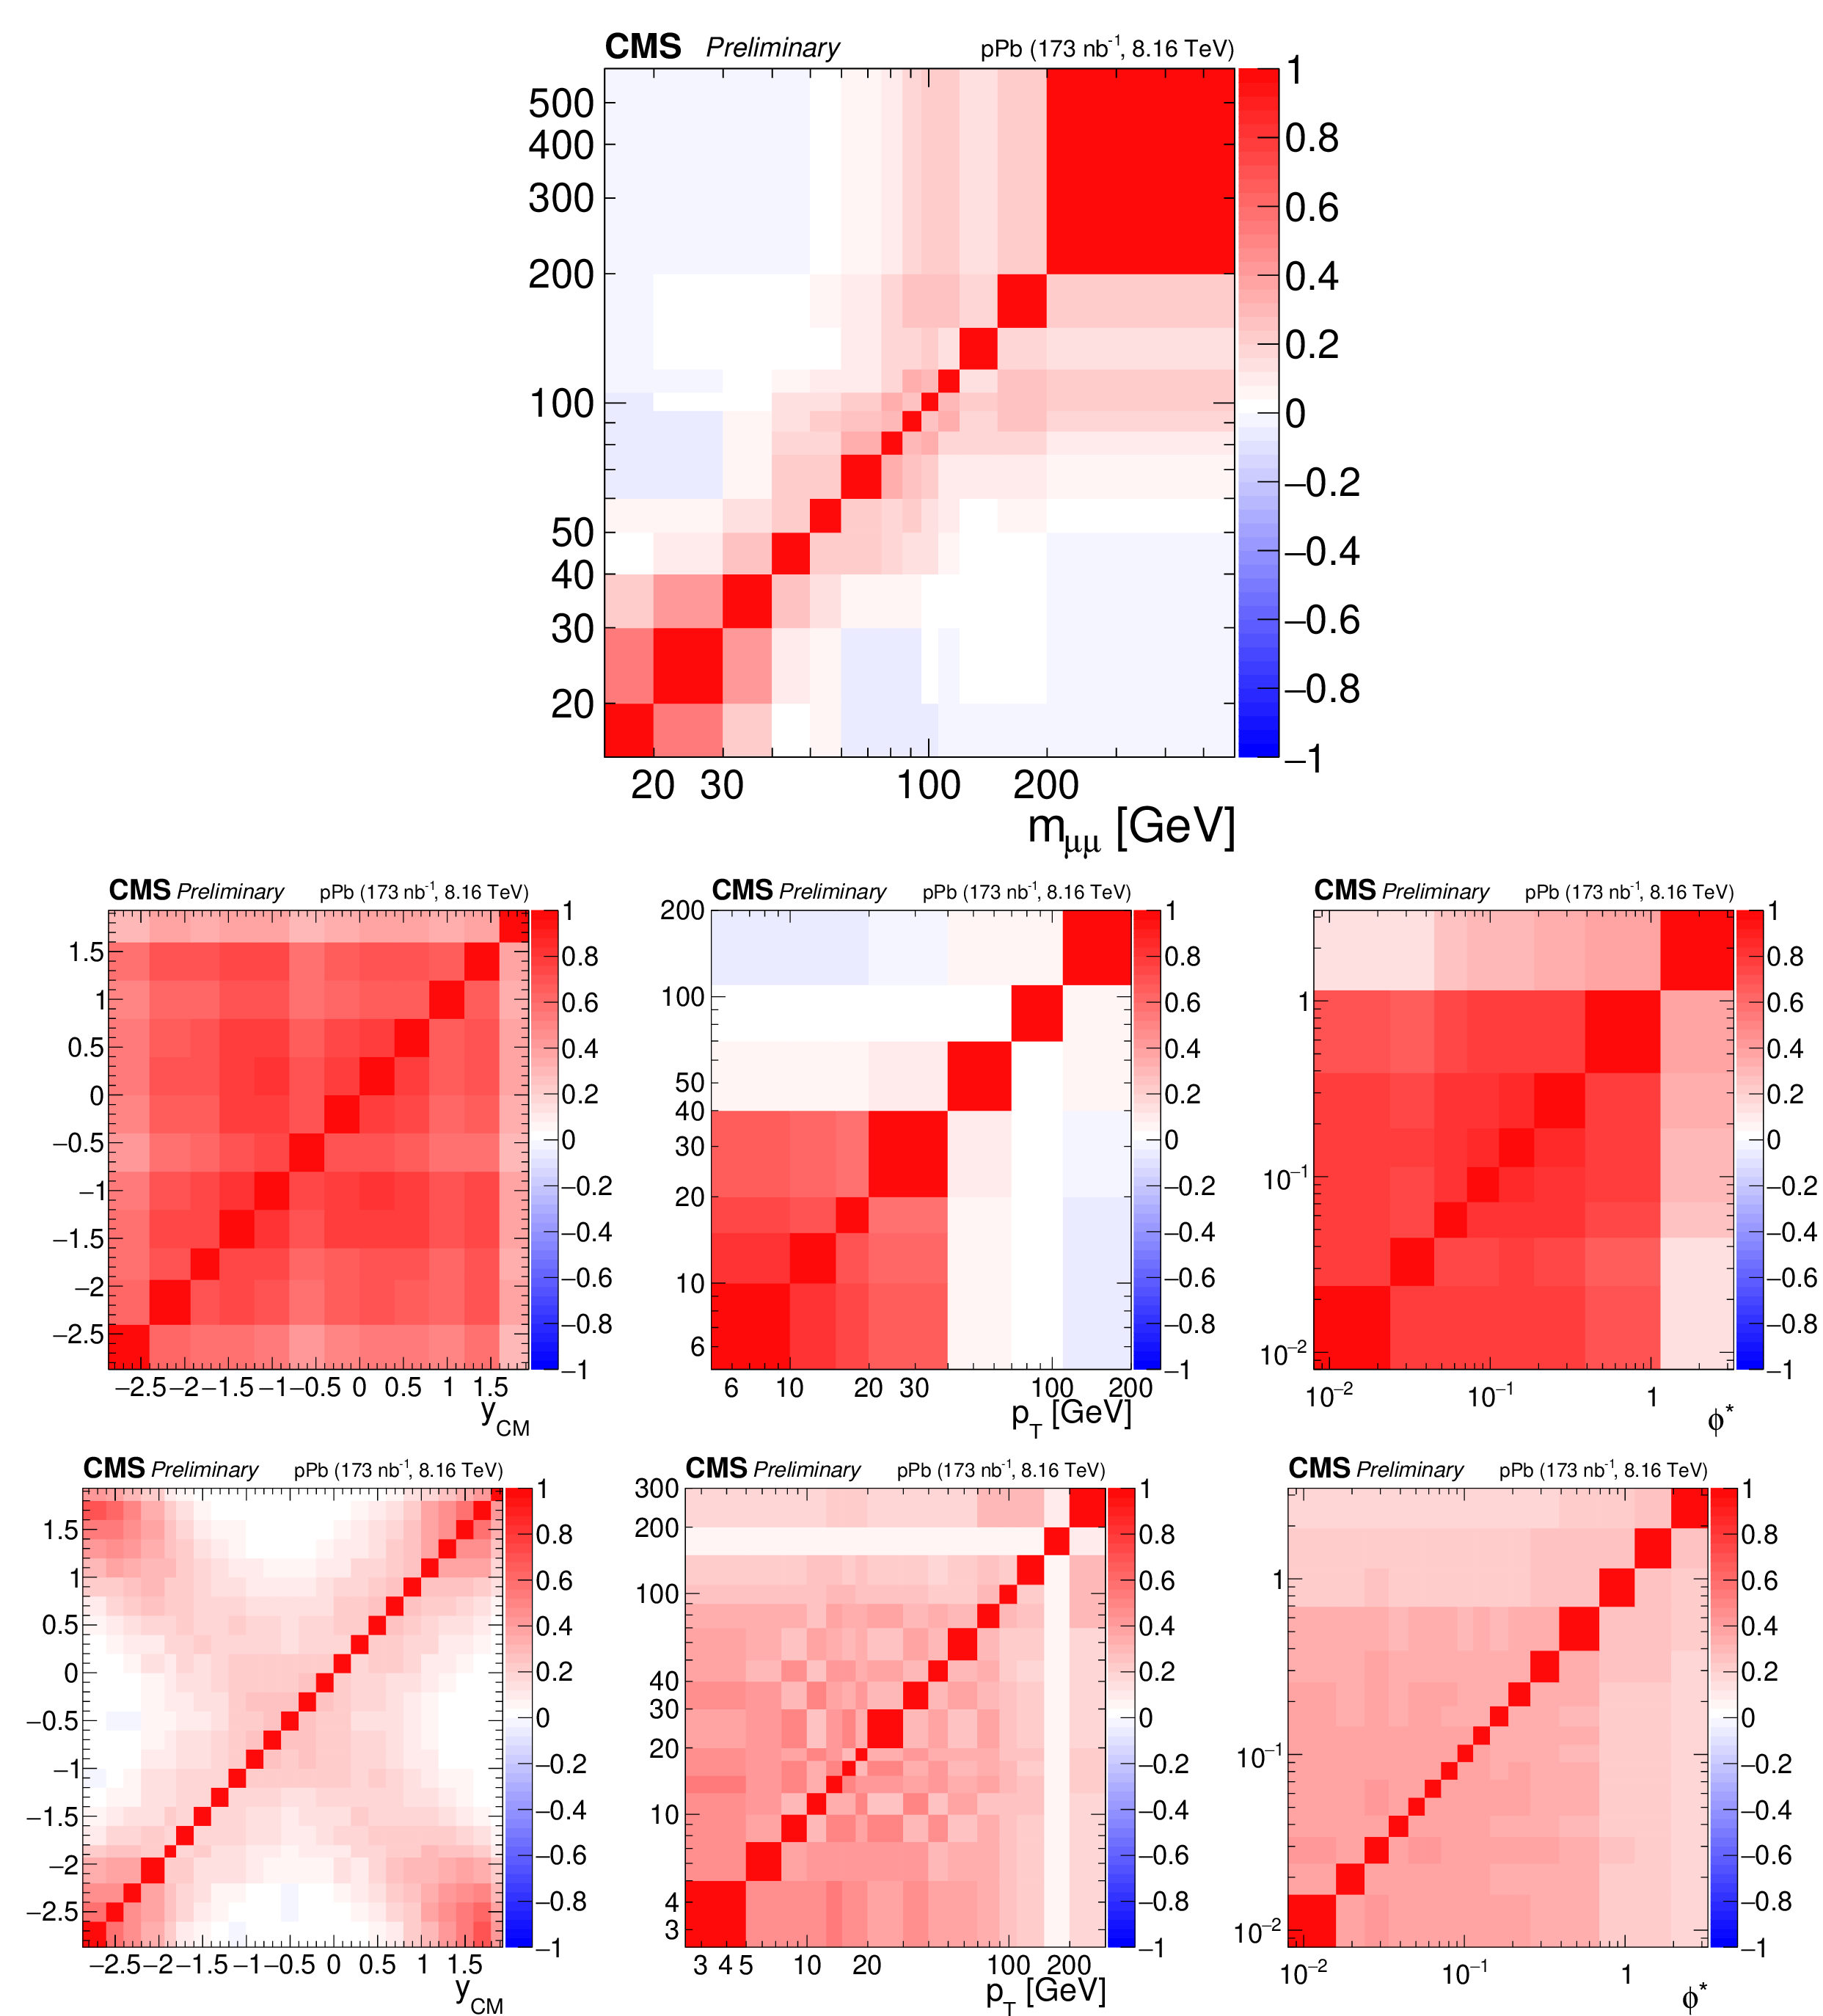
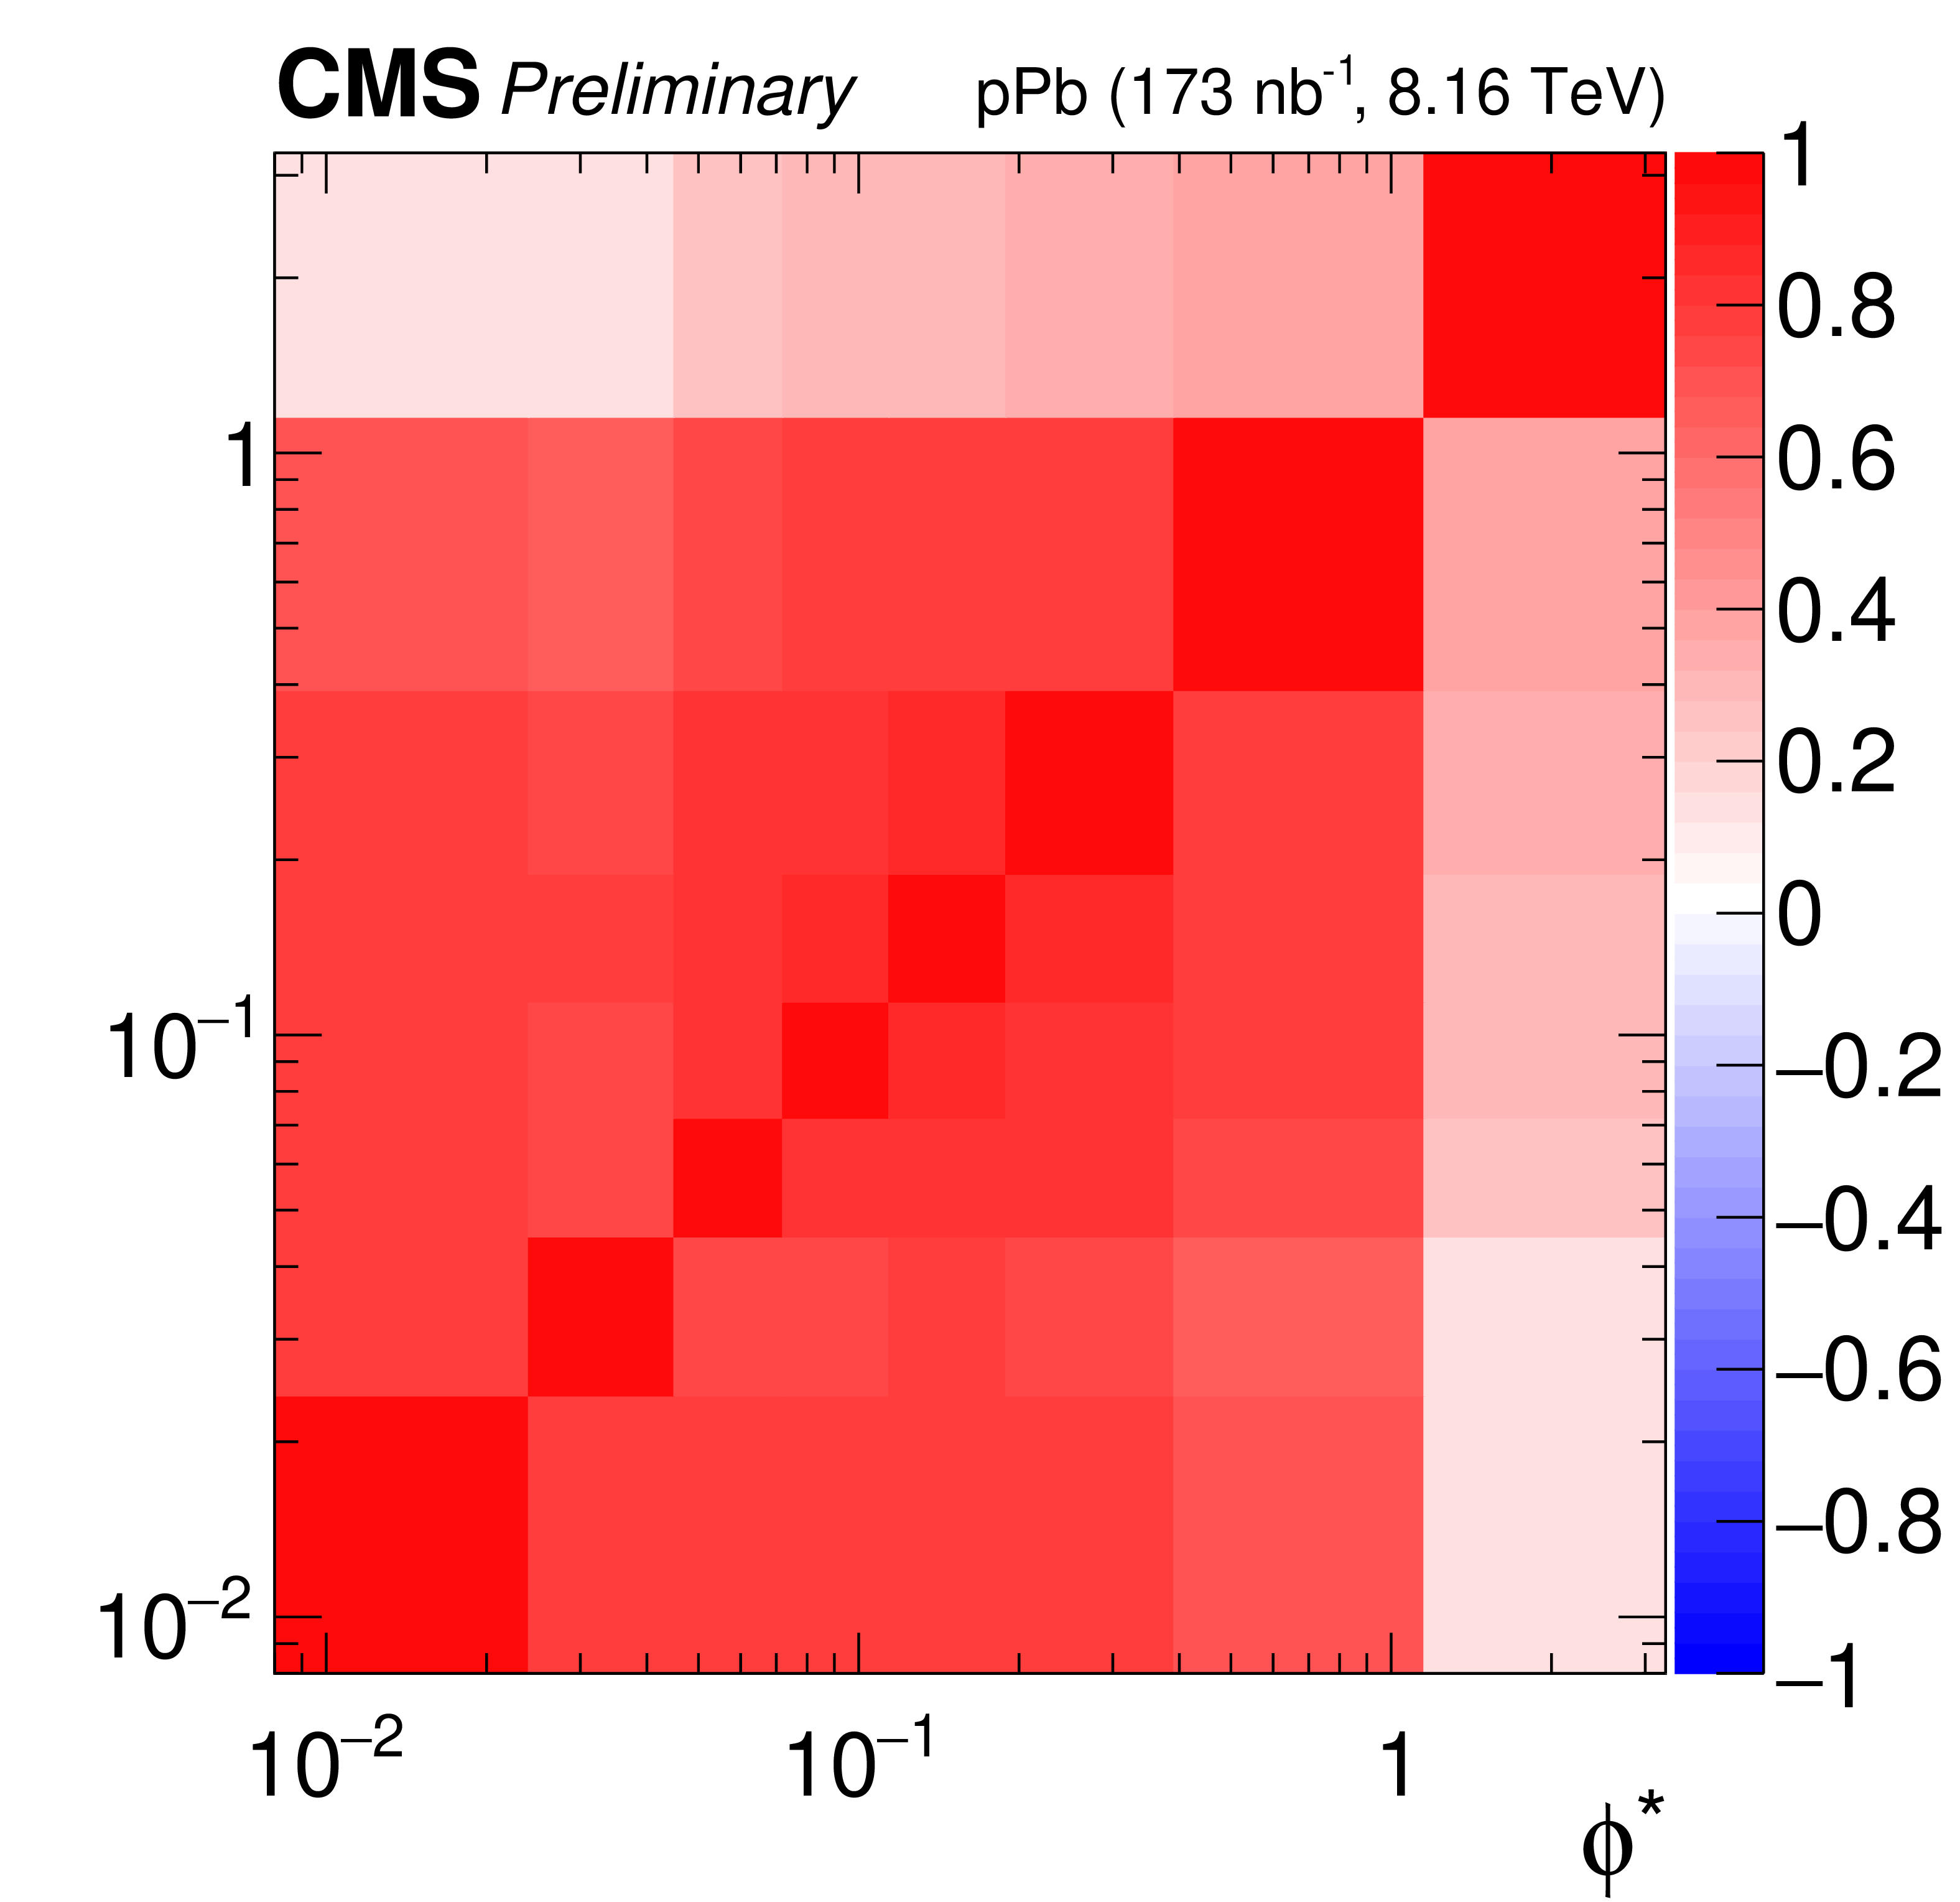
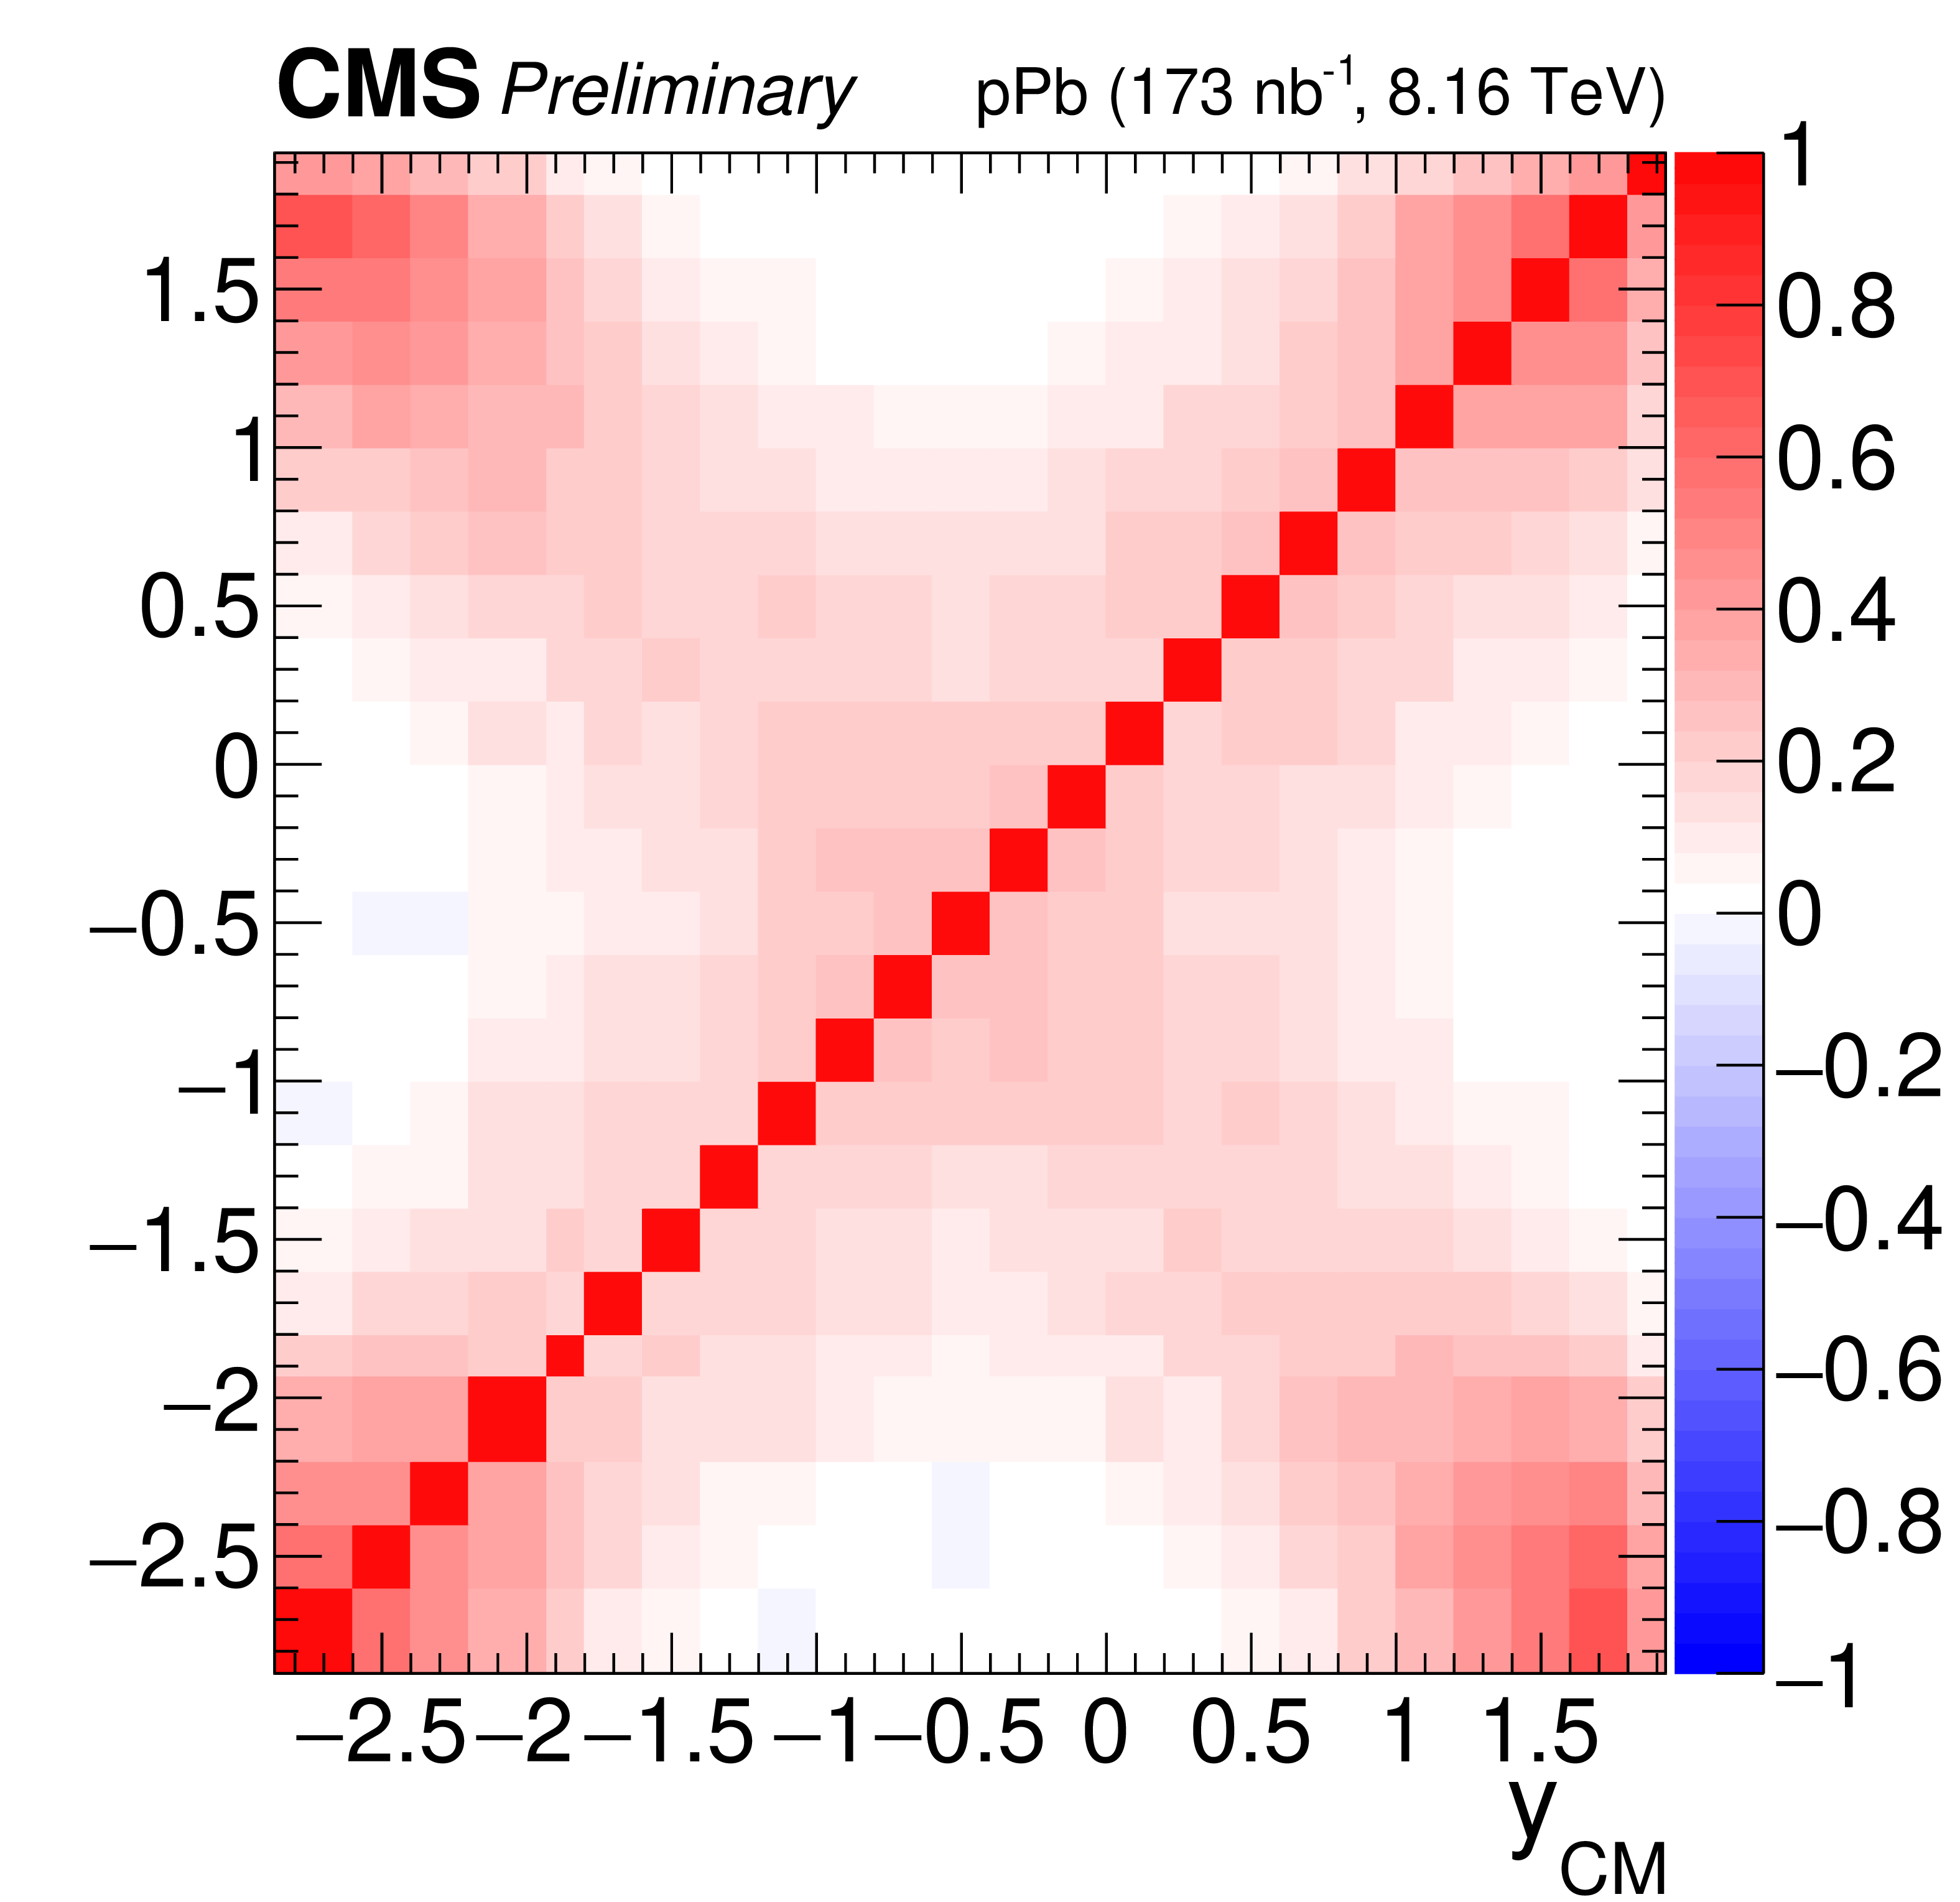
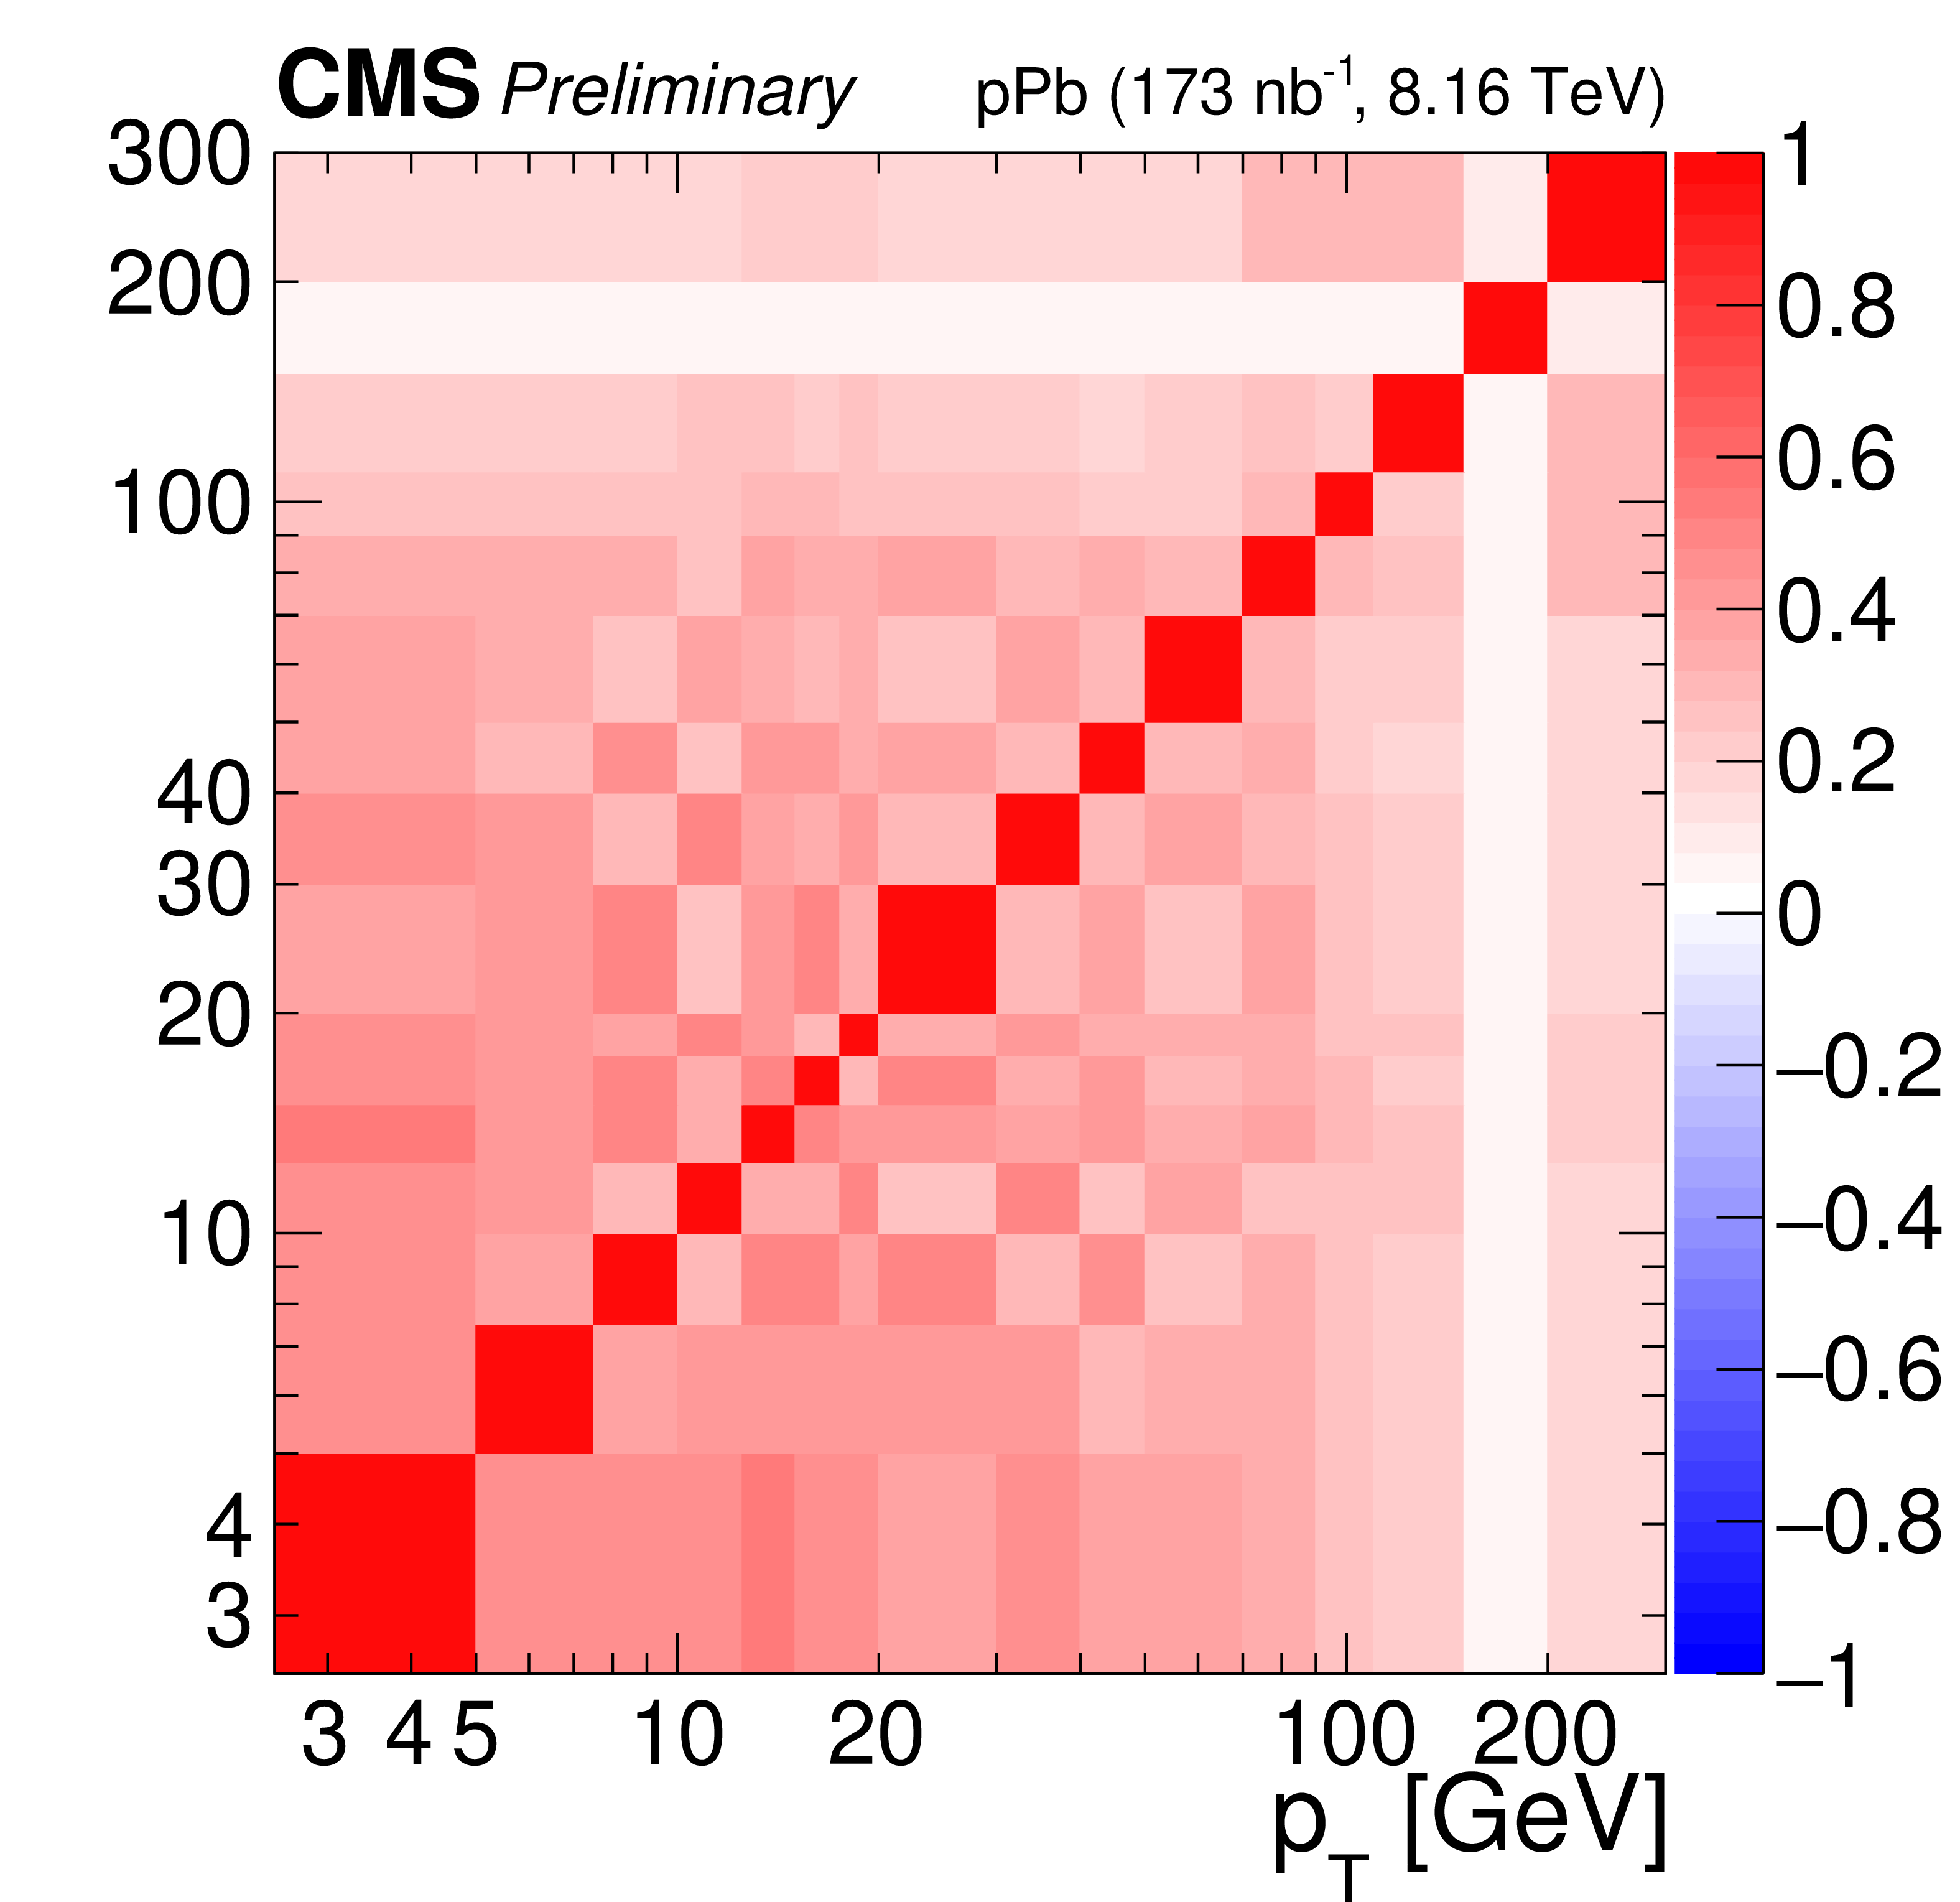
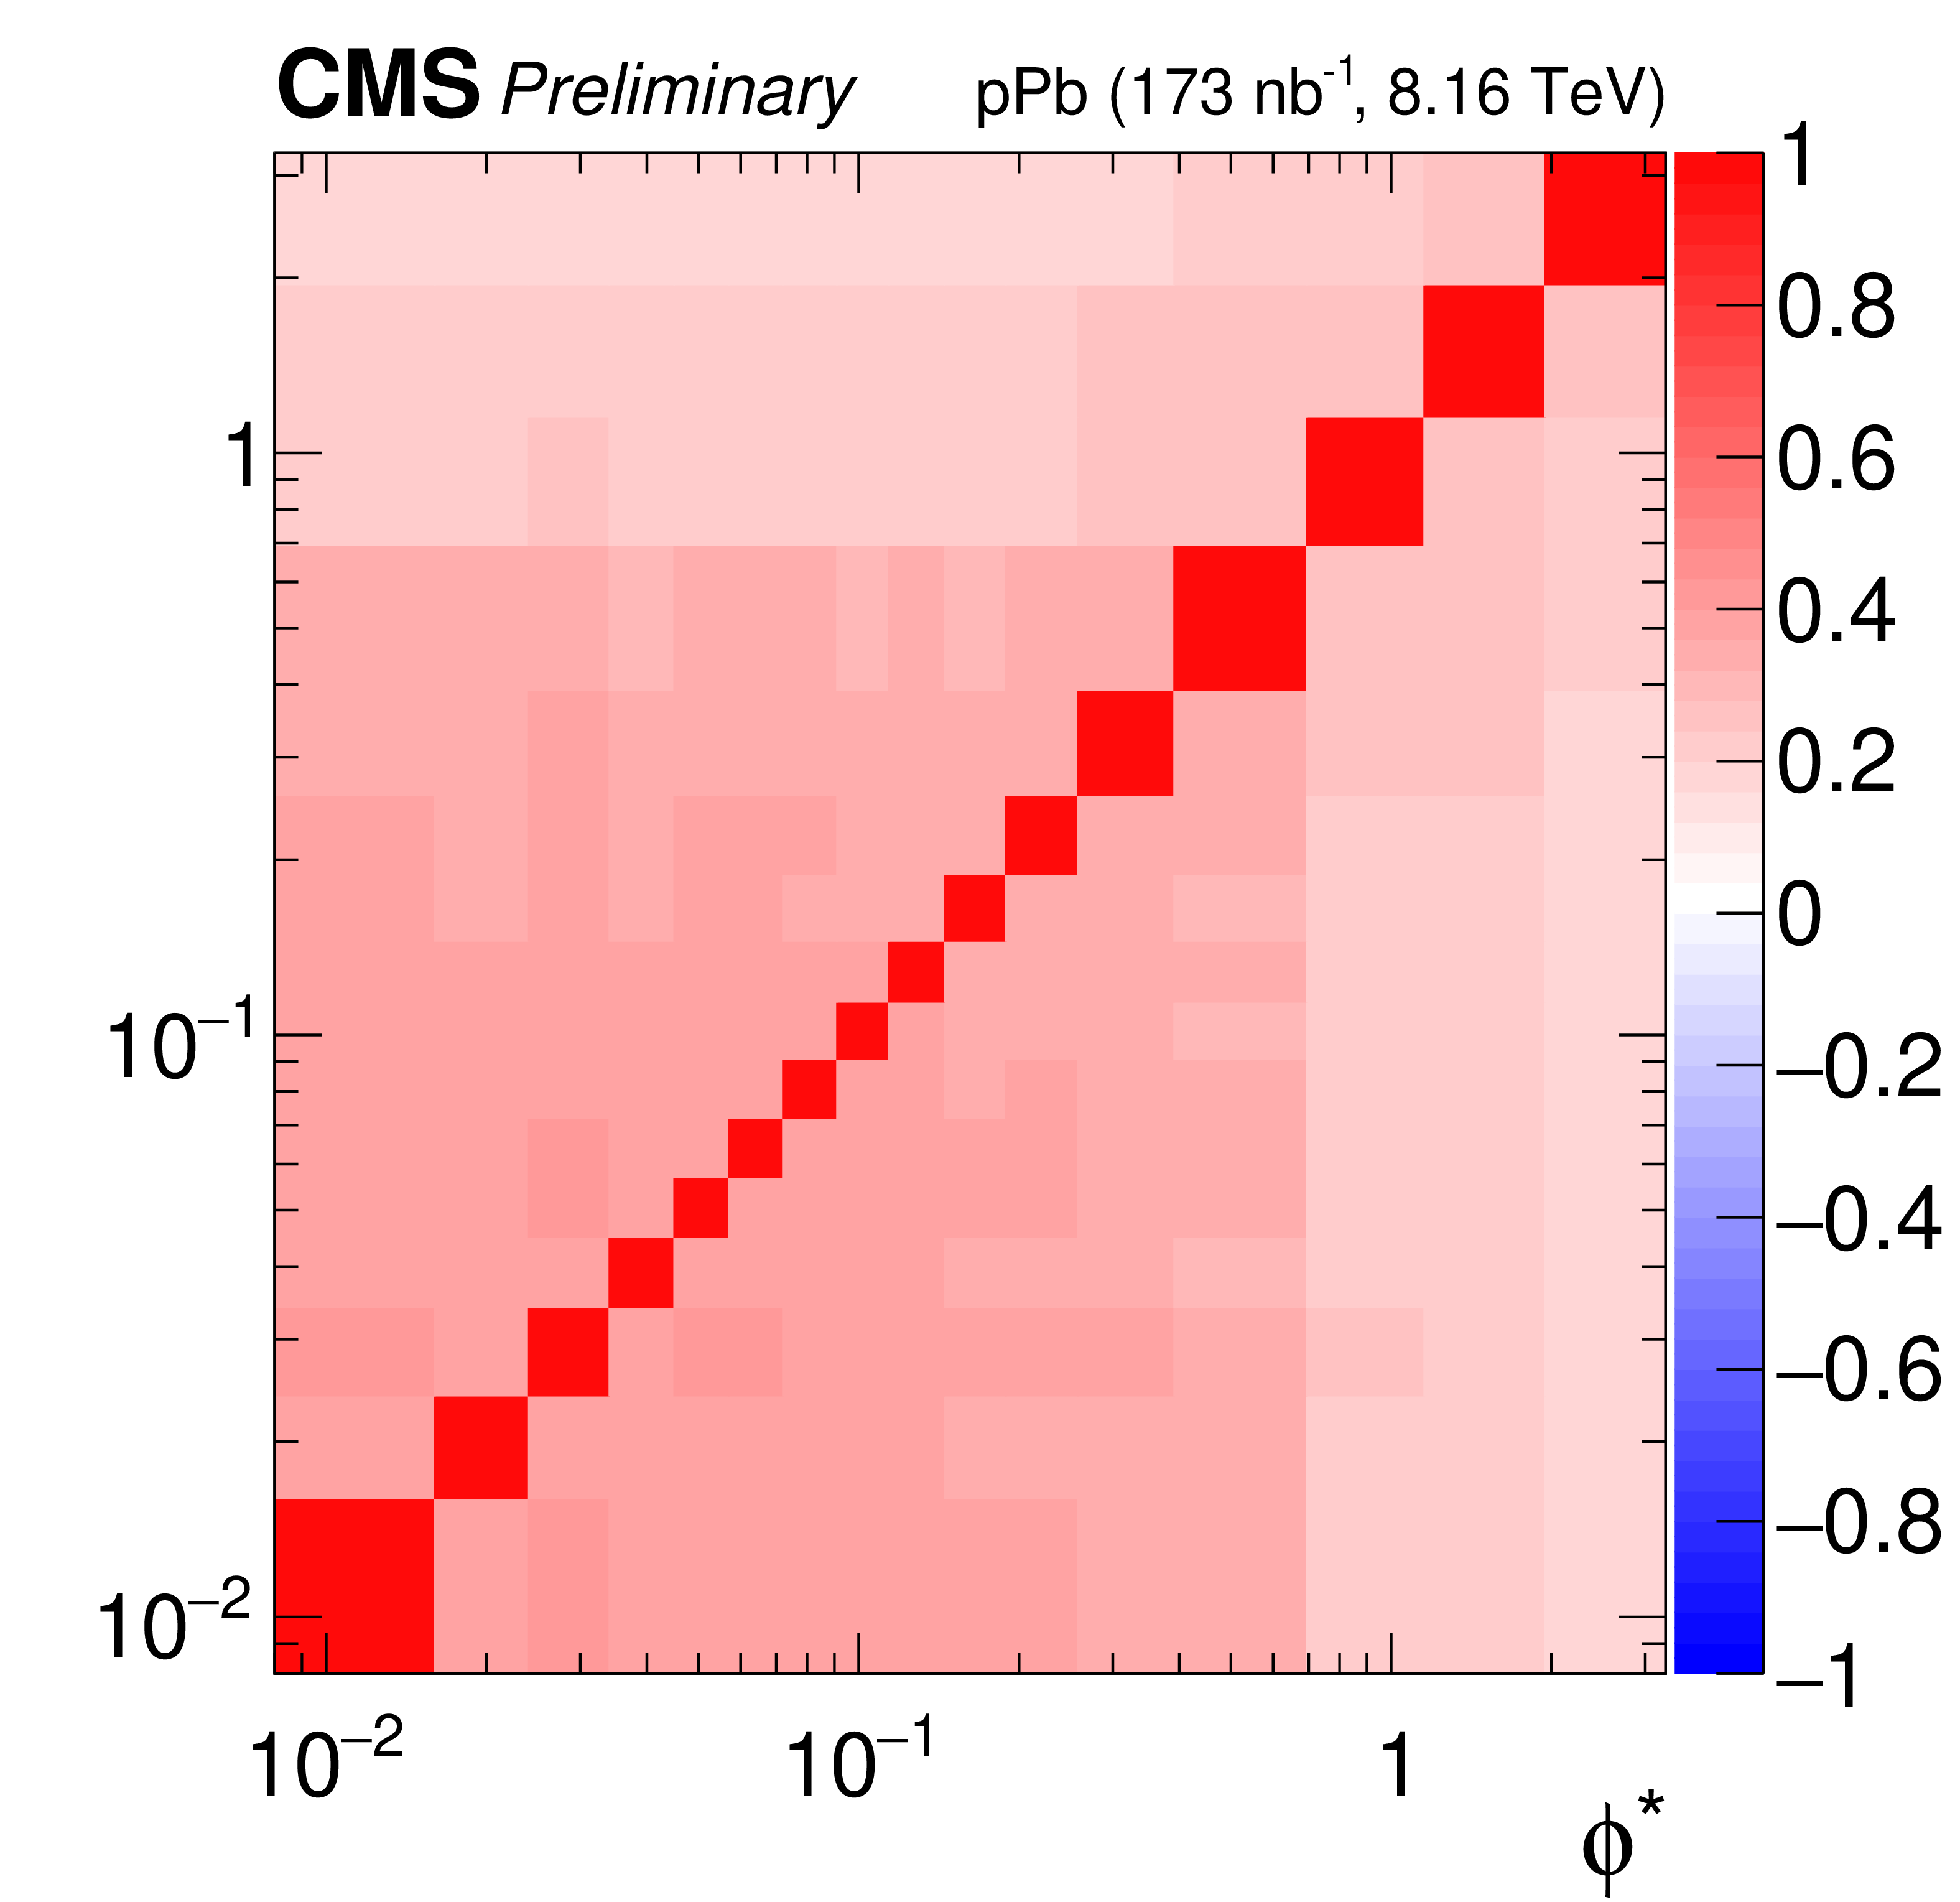
Figure 2:
Correlation matrices for the systematic uncertainties, as a function of invariant mass (top), rapidity in the center-of-mass frame (left), ${p_{\mathrm {T}}}$ (center) and ${\phi ^*}$ (right), for 15 $ < {m_{\mu \mu}} < $ 60 GeV (middle row) and 60 $ < {m_{\mu \mu}} < $ 120 GeV (bottom row). |
png pdf |
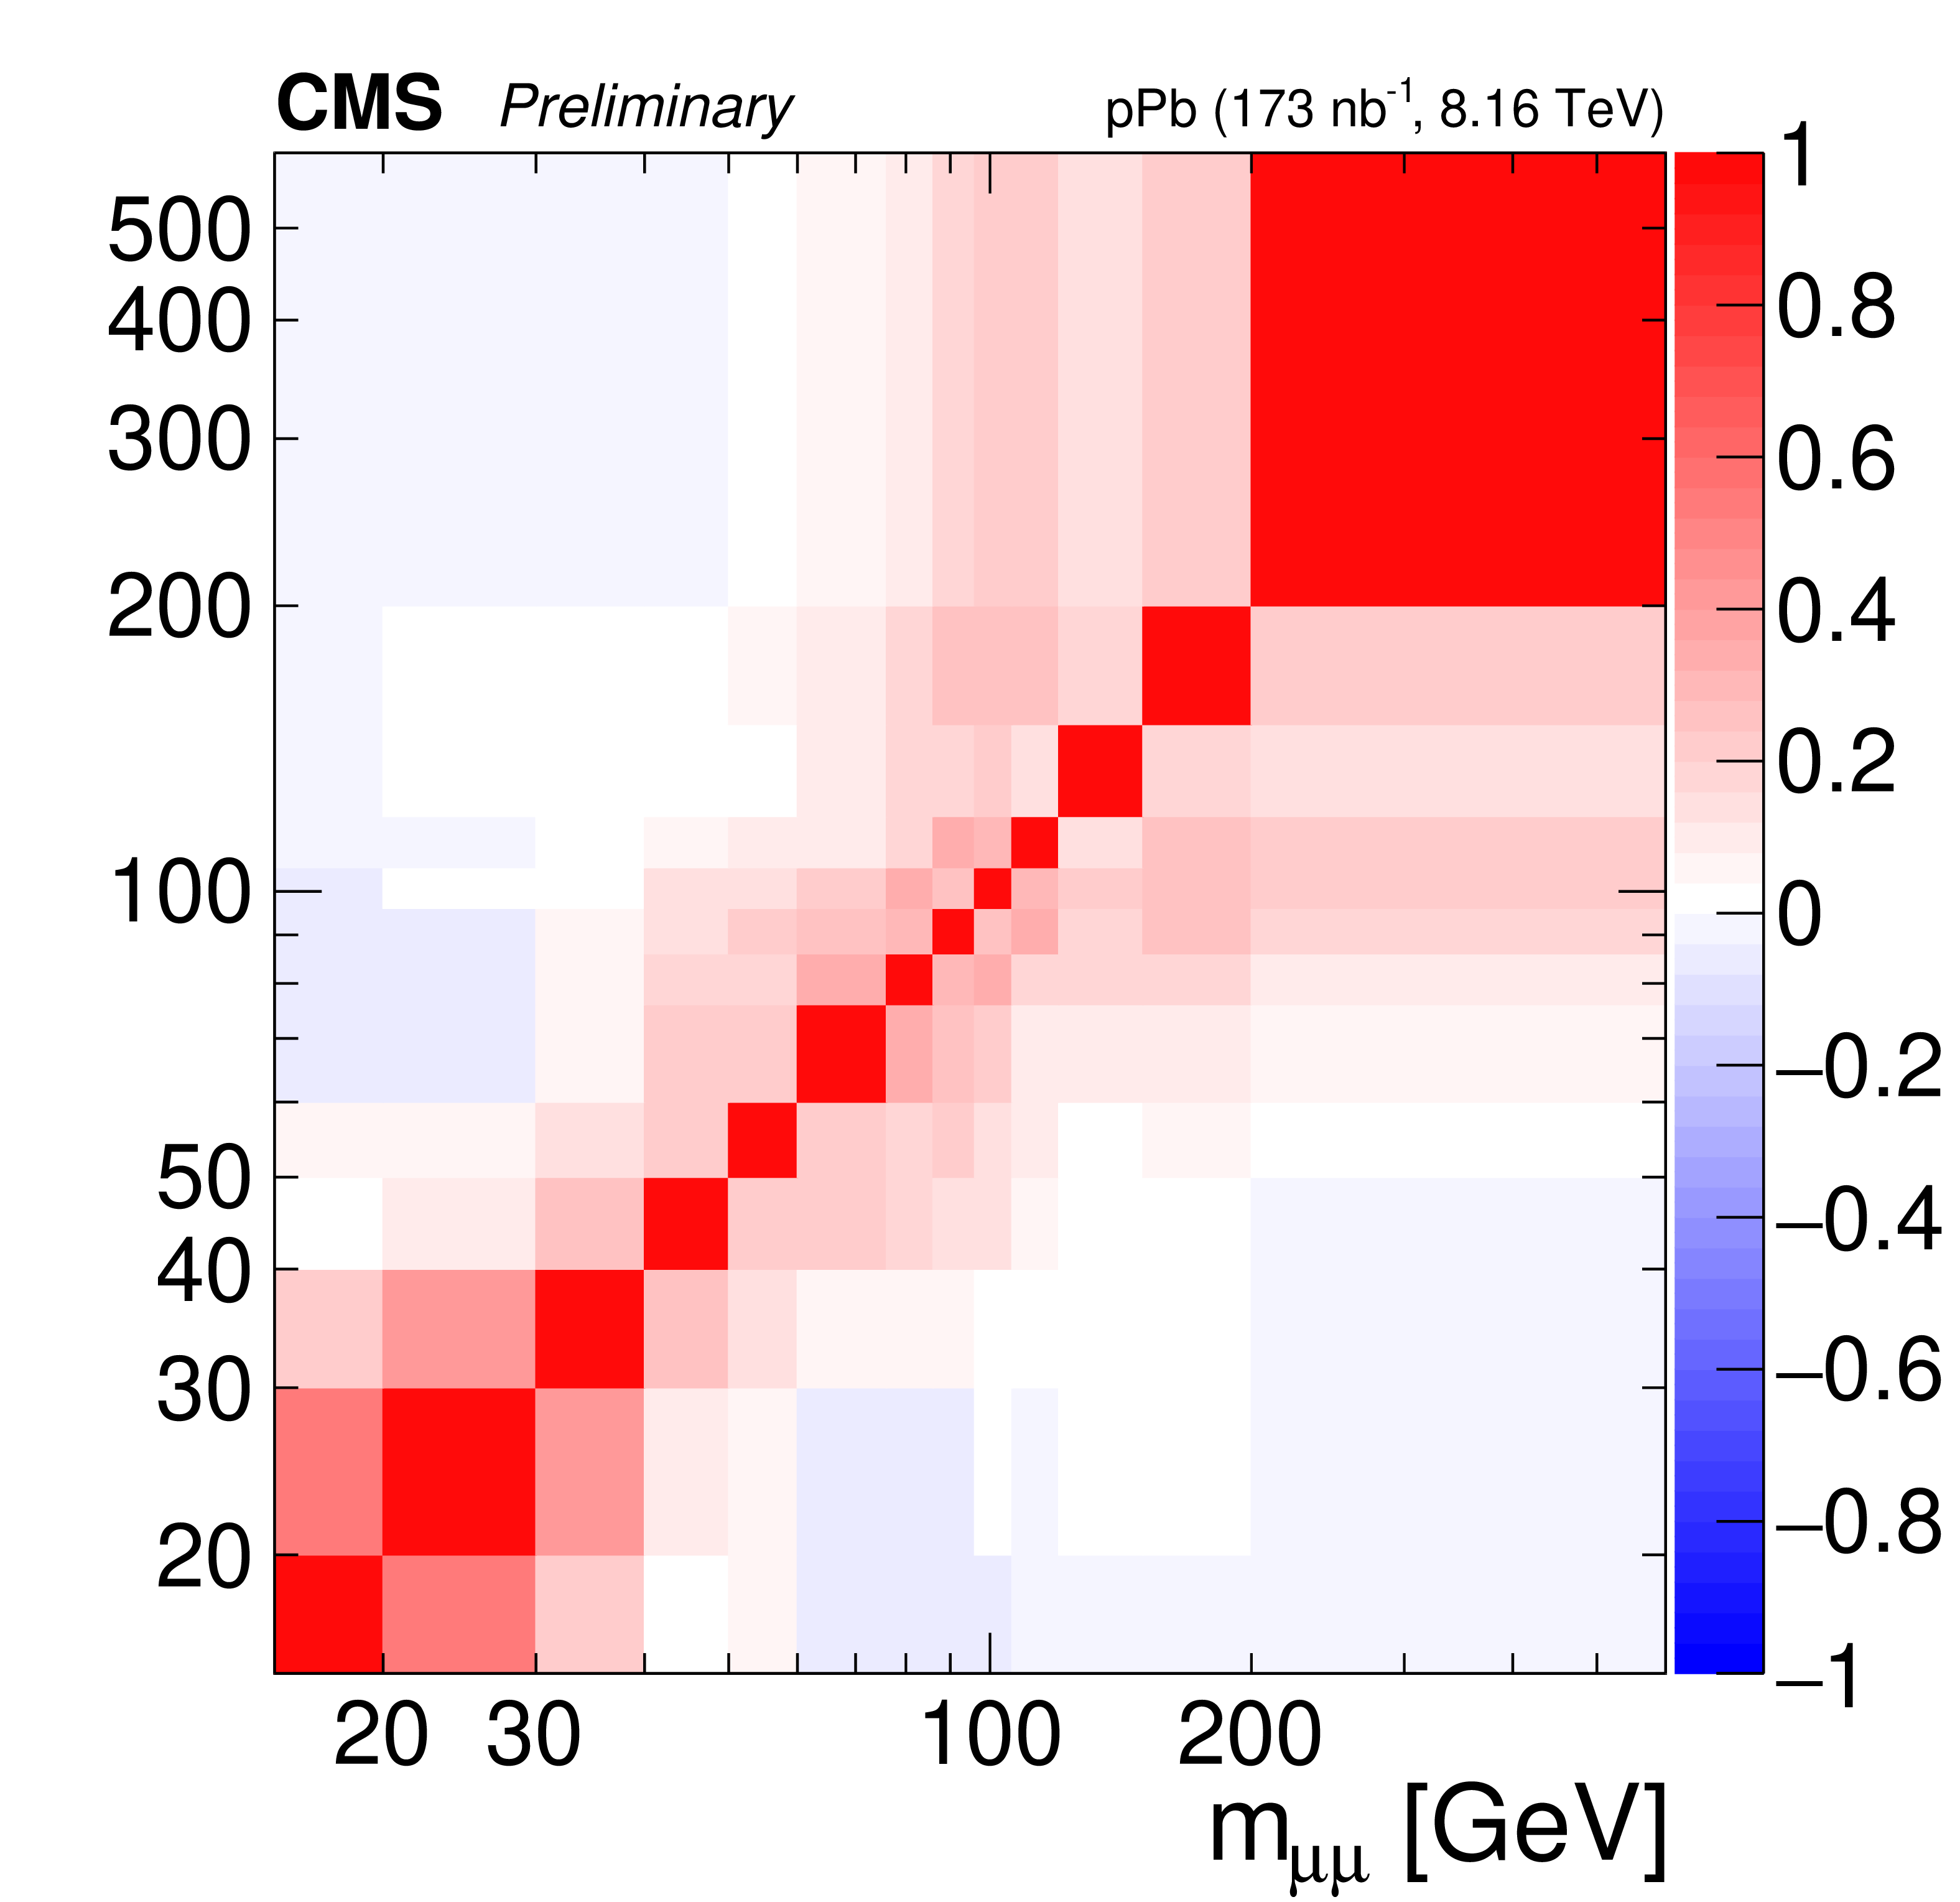
Figure 2-a:
Correlation matrices for the systematic uncertainties, as a function of invariant mass (top), rapidity in the center-of-mass frame (left), ${p_{\mathrm {T}}}$ (center) and ${\phi ^*}$ (right), for 15 $ < {m_{\mu \mu}} < $ 60 GeV (middle row) and 60 $ < {m_{\mu \mu}} < $ 120 GeV (bottom row). |
png pdf |
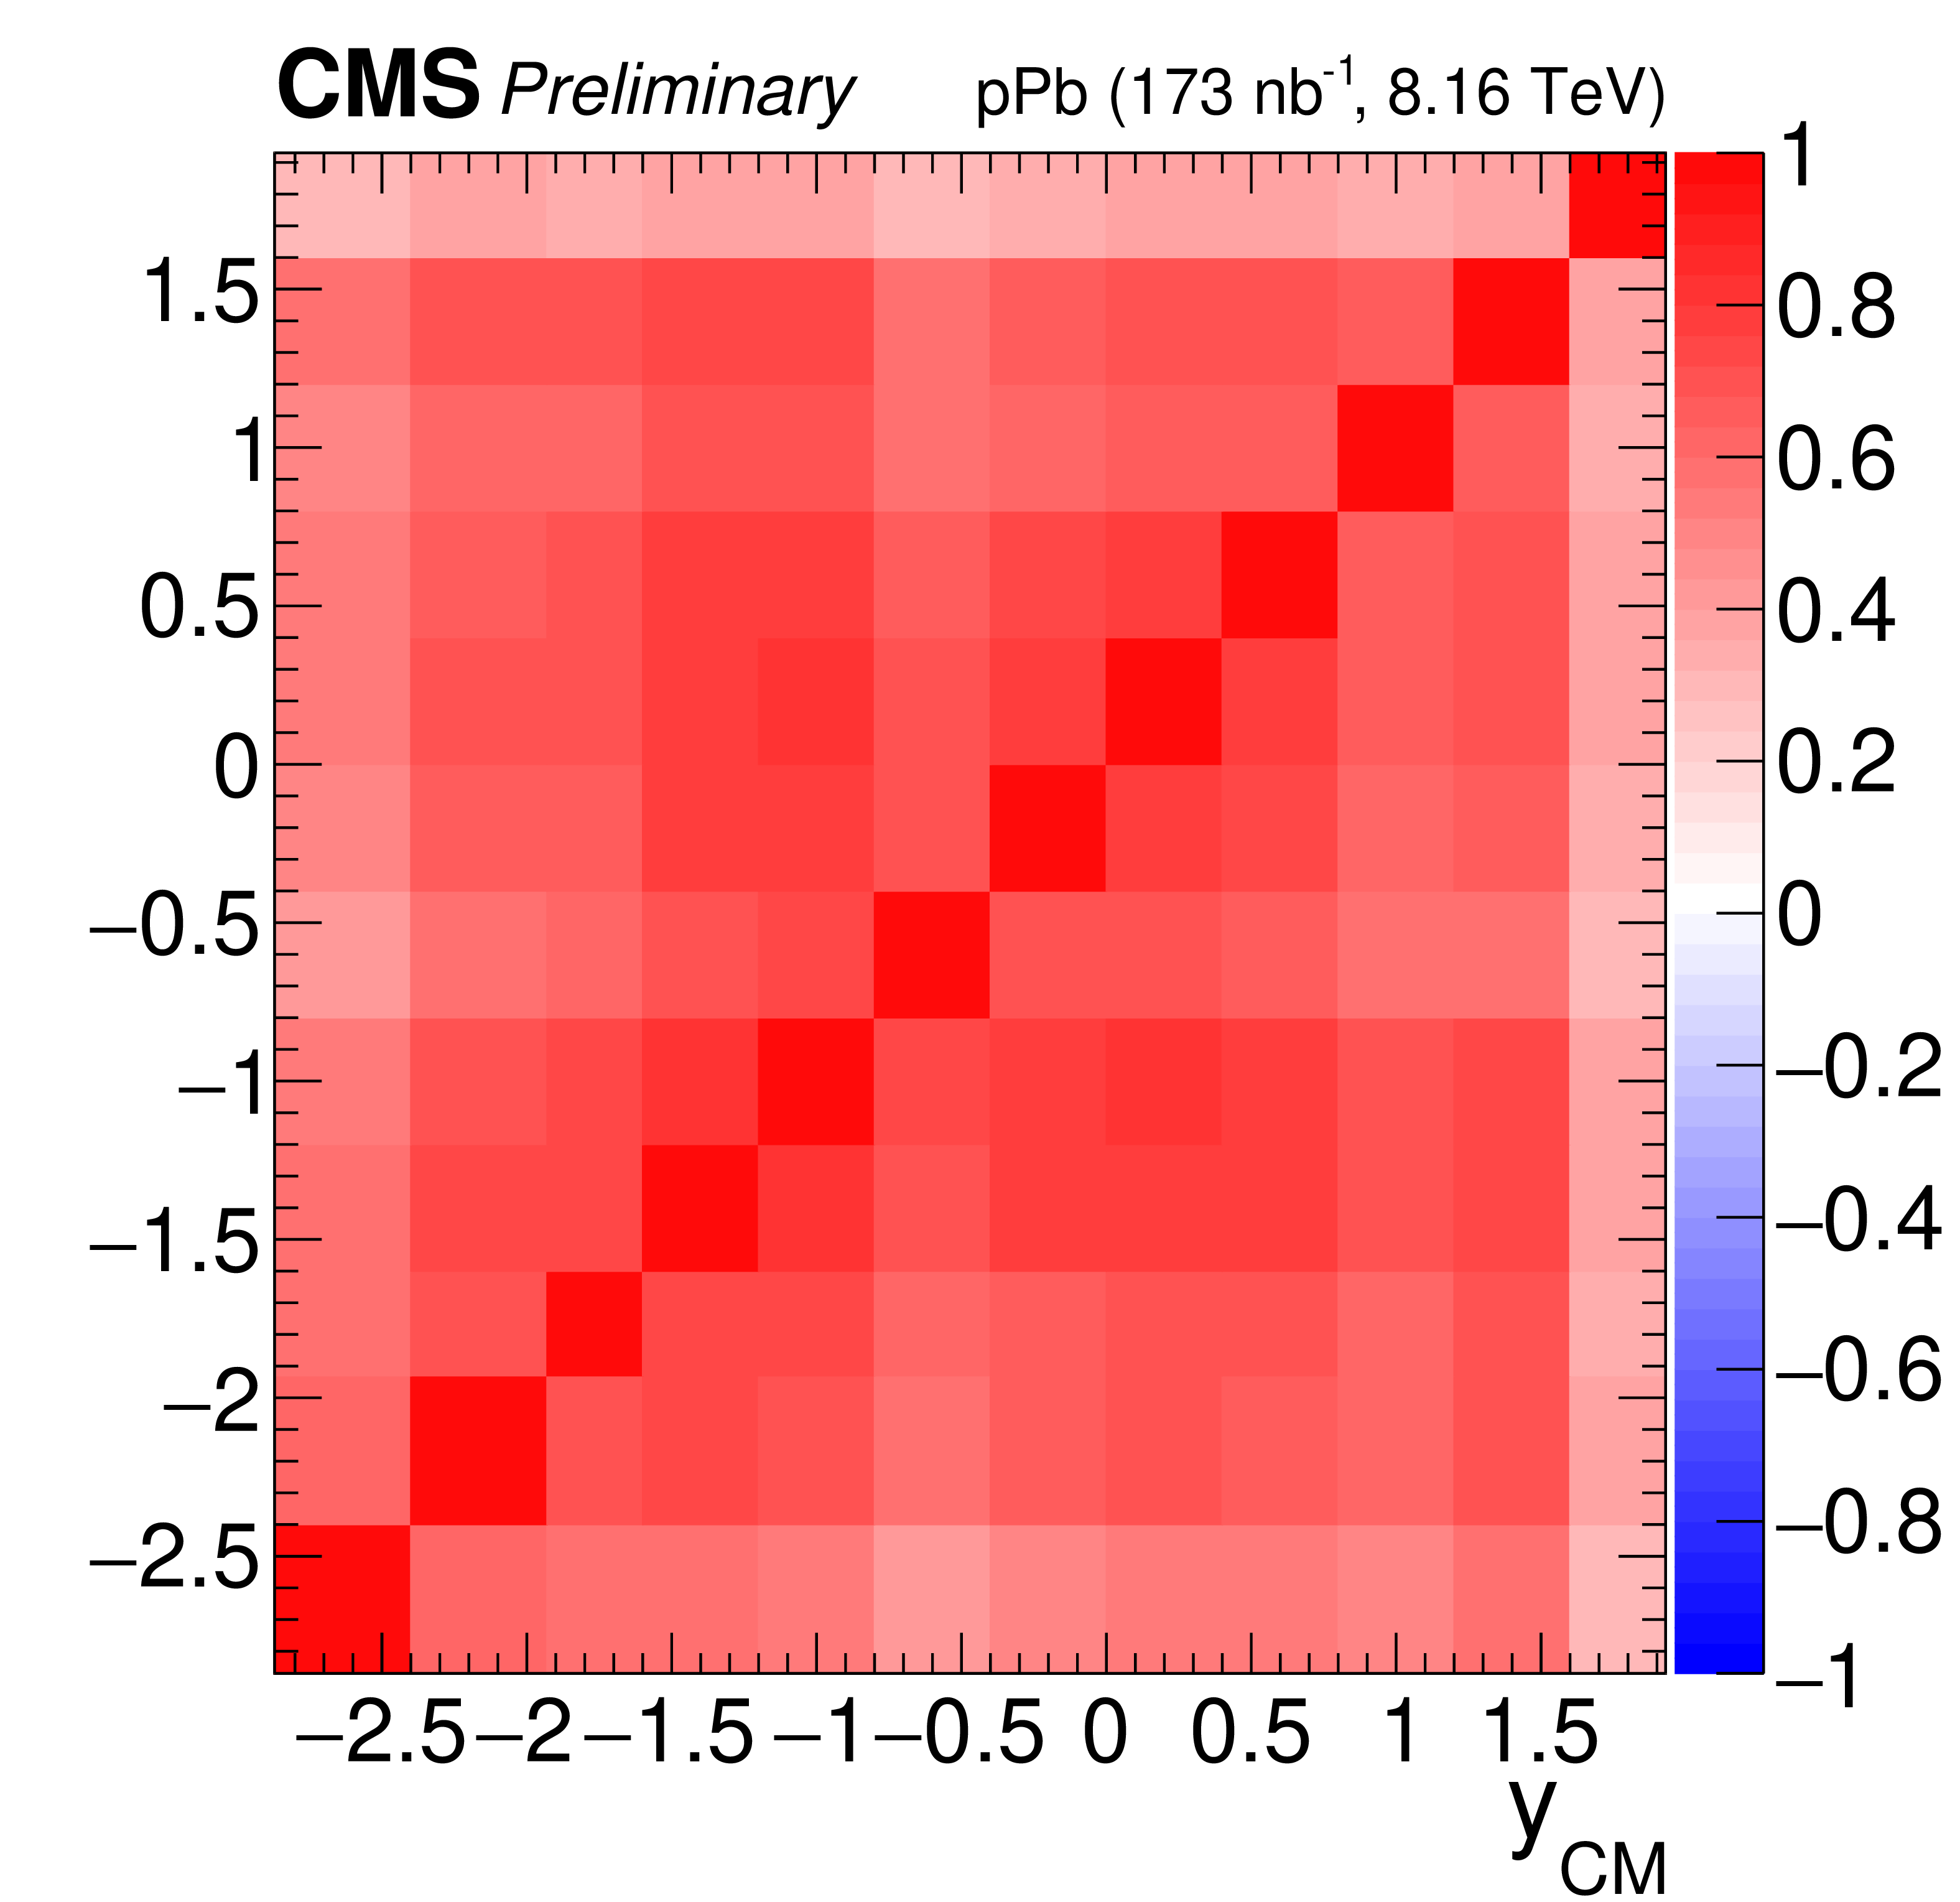
Figure 2-b:
Correlation matrices for the systematic uncertainties, as a function of invariant mass (top), rapidity in the center-of-mass frame (left), ${p_{\mathrm {T}}}$ (center) and ${\phi ^*}$ (right), for 15 $ < {m_{\mu \mu}} < $ 60 GeV (middle row) and 60 $ < {m_{\mu \mu}} < $ 120 GeV (bottom row). |
png pdf |
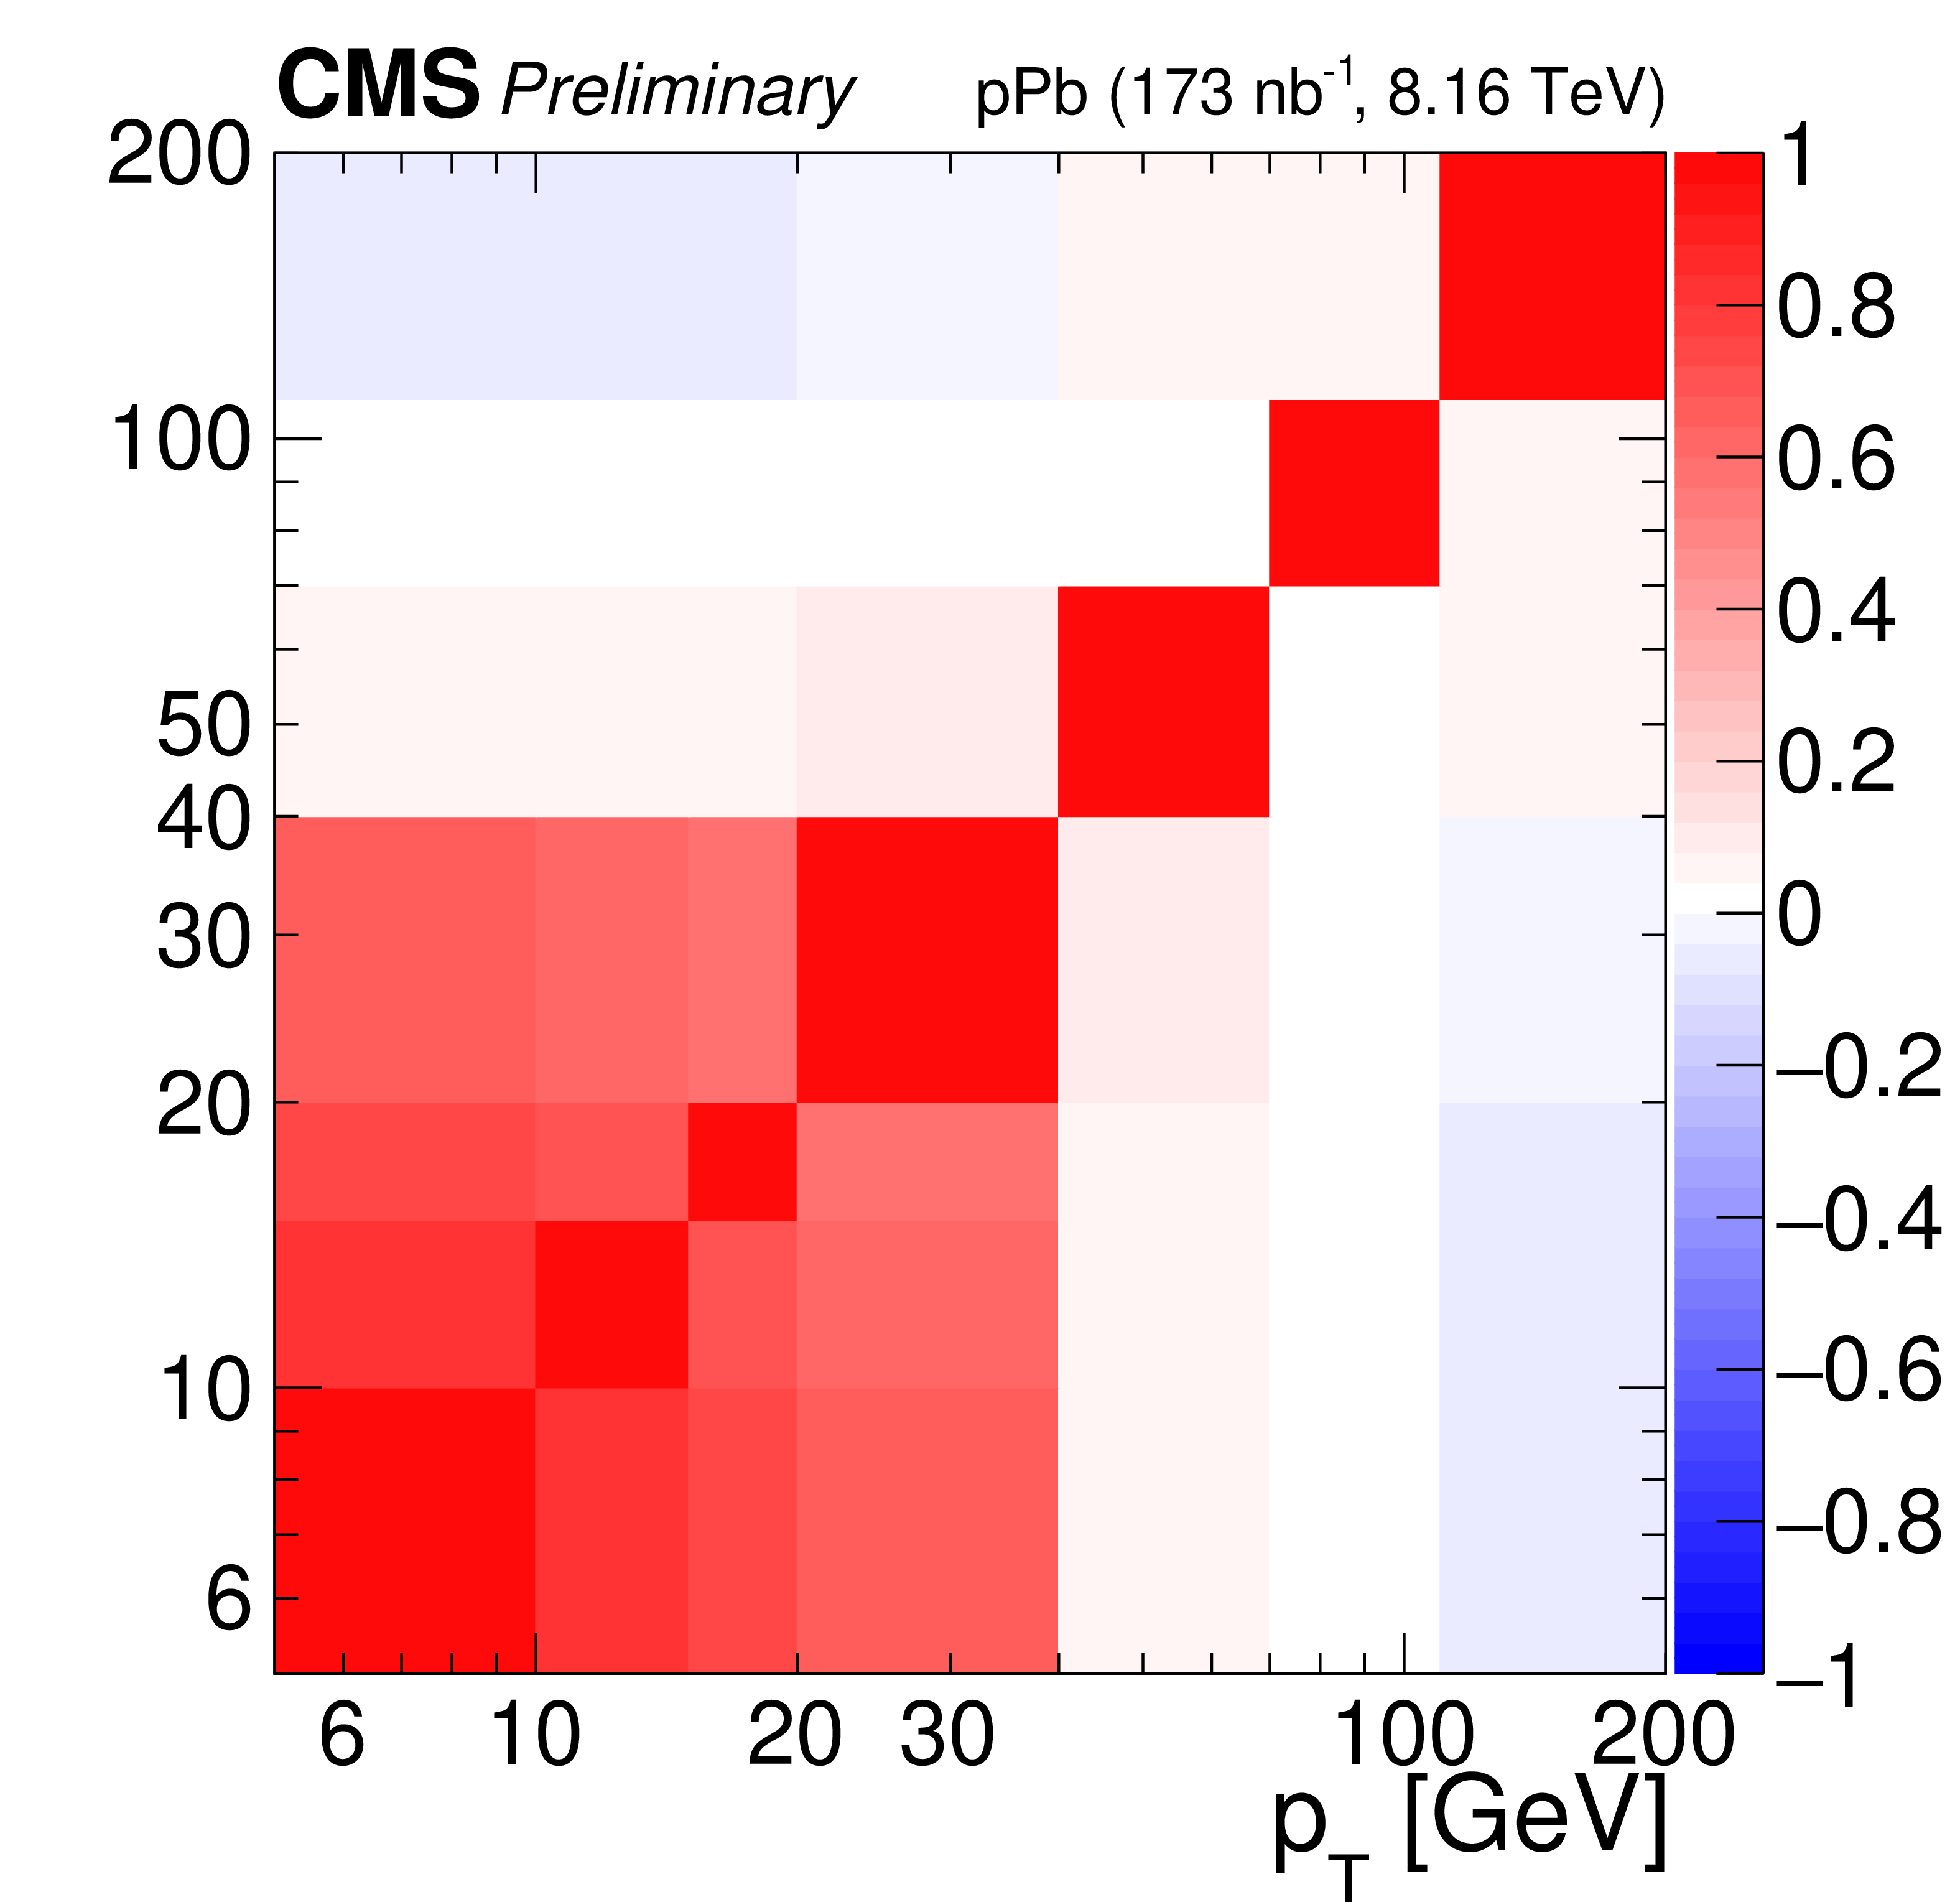
Figure 2-c:
Correlation matrices for the systematic uncertainties, as a function of invariant mass (top), rapidity in the center-of-mass frame (left), ${p_{\mathrm {T}}}$ (center) and ${\phi ^*}$ (right), for 15 $ < {m_{\mu \mu}} < $ 60 GeV (middle row) and 60 $ < {m_{\mu \mu}} < $ 120 GeV (bottom row). |
png pdf |
Figure 2-d:
Correlation matrices for the systematic uncertainties, as a function of invariant mass (top), rapidity in the center-of-mass frame (left), ${p_{\mathrm {T}}}$ (center) and ${\phi ^*}$ (right), for 15 $ < {m_{\mu \mu}} < $ 60 GeV (middle row) and 60 $ < {m_{\mu \mu}} < $ 120 GeV (bottom row). |
png pdf |
Figure 2-e:
Correlation matrices for the systematic uncertainties, as a function of invariant mass (top), rapidity in the center-of-mass frame (left), ${p_{\mathrm {T}}}$ (center) and ${\phi ^*}$ (right), for 15 $ < {m_{\mu \mu}} < $ 60 GeV (middle row) and 60 $ < {m_{\mu \mu}} < $ 120 GeV (bottom row). |
png pdf |
Figure 2-f:
Correlation matrices for the systematic uncertainties, as a function of invariant mass (top), rapidity in the center-of-mass frame (left), ${p_{\mathrm {T}}}$ (center) and ${\phi ^*}$ (right), for 15 $ < {m_{\mu \mu}} < $ 60 GeV (middle row) and 60 $ < {m_{\mu \mu}} < $ 120 GeV (bottom row). |
png pdf |
Figure 2-g:
Correlation matrices for the systematic uncertainties, as a function of invariant mass (top), rapidity in the center-of-mass frame (left), ${p_{\mathrm {T}}}$ (center) and ${\phi ^*}$ (right), for 15 $ < {m_{\mu \mu}} < $ 60 GeV (middle row) and 60 $ < {m_{\mu \mu}} < $ 120 GeV (bottom row). |
png pdf |
Figure 3:
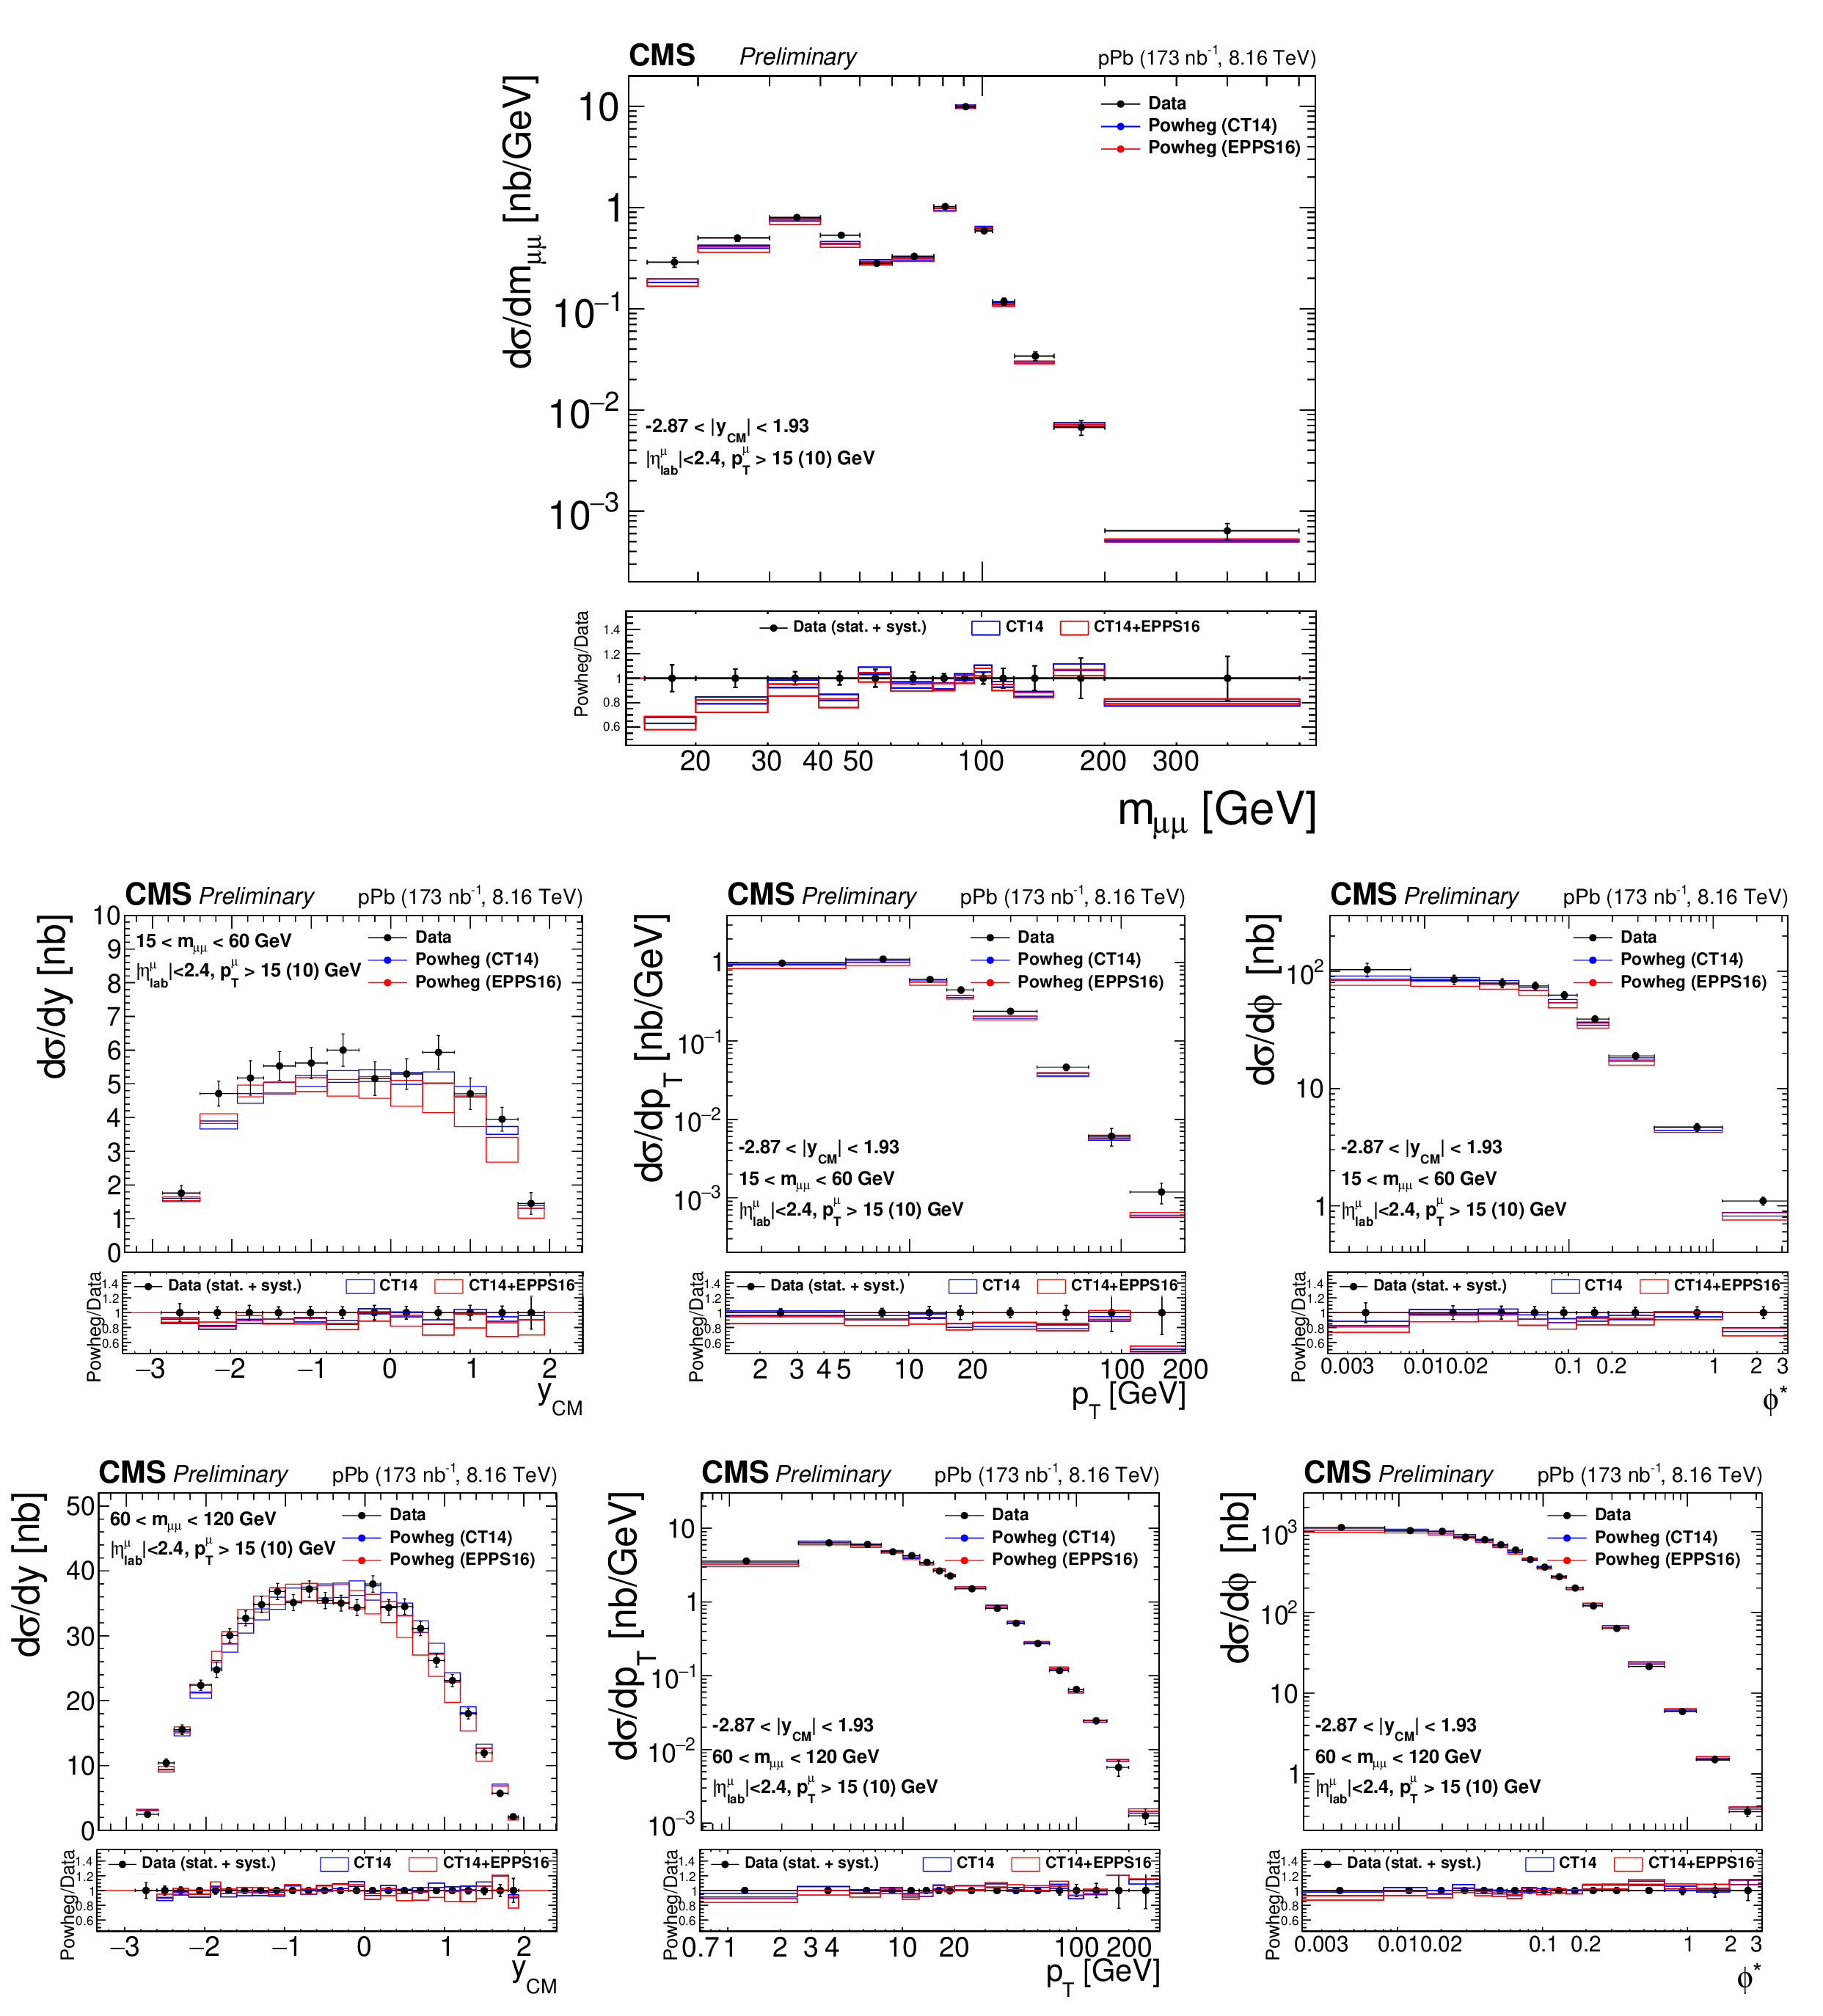
Differential fiducial cross sections (without acceptance correction) for the Drell-Yan process measured in the muon channel, as a function of invariant mass (top), rapidity in the center-of-mass frame (left), ${p_{\mathrm {T}}}$ (center) and ${\phi ^*}$ (right), for 15 $ < {m_{\mu \mu}} < $ 60 GeV (middle row) and 60 $ < {m_{\mu \mu}} < $ 120 GeV (bottom row). The first bin of the ${p_{\mathrm {T}}}$ and ${\phi ^*}$ measurements starts at 0. The error bars on the data represent the quadratic sum of the statistical and systematic uncertainties. Theory predictions from the {powheg} NLO generator are also provided, using CT14 (blue) or CT14+EPPS16 (red). The boxes show the 68% confidence level (n)PDF uncertainty on this prediction. The ratio of the predictions to the data is shown in the bottom panels, where the data and nPDF uncertainties are given separately, respectively as error bars around one and coloured boxes. |
png pdf |
Figure 3-a:
Differential fiducial cross sections (without acceptance correction) for the Drell-Yan process measured in the muon channel, as a function of invariant mass (top), rapidity in the center-of-mass frame (left), ${p_{\mathrm {T}}}$ (center) and ${\phi ^*}$ (right), for 15 $ < {m_{\mu \mu}} < $ 60 GeV (middle row) and 60 $ < {m_{\mu \mu}} < $ 120 GeV (bottom row). The first bin of the ${p_{\mathrm {T}}}$ and ${\phi ^*}$ measurements starts at 0. The error bars on the data represent the quadratic sum of the statistical and systematic uncertainties. Theory predictions from the {powheg} NLO generator are also provided, using CT14 (blue) or CT14+EPPS16 (red). The boxes show the 68% confidence level (n)PDF uncertainty on this prediction. The ratio of the predictions to the data is shown in the bottom panels, where the data and nPDF uncertainties are given separately, respectively as error bars around one and coloured boxes. |
png pdf |
Figure 3-b:
Differential fiducial cross sections (without acceptance correction) for the Drell-Yan process measured in the muon channel, as a function of invariant mass (top), rapidity in the center-of-mass frame (left), ${p_{\mathrm {T}}}$ (center) and ${\phi ^*}$ (right), for 15 $ < {m_{\mu \mu}} < $ 60 GeV (middle row) and 60 $ < {m_{\mu \mu}} < $ 120 GeV (bottom row). The first bin of the ${p_{\mathrm {T}}}$ and ${\phi ^*}$ measurements starts at 0. The error bars on the data represent the quadratic sum of the statistical and systematic uncertainties. Theory predictions from the {powheg} NLO generator are also provided, using CT14 (blue) or CT14+EPPS16 (red). The boxes show the 68% confidence level (n)PDF uncertainty on this prediction. The ratio of the predictions to the data is shown in the bottom panels, where the data and nPDF uncertainties are given separately, respectively as error bars around one and coloured boxes. |
png pdf |
Figure 3-c:
Differential fiducial cross sections (without acceptance correction) for the Drell-Yan process measured in the muon channel, as a function of invariant mass (top), rapidity in the center-of-mass frame (left), ${p_{\mathrm {T}}}$ (center) and ${\phi ^*}$ (right), for 15 $ < {m_{\mu \mu}} < $ 60 GeV (middle row) and 60 $ < {m_{\mu \mu}} < $ 120 GeV (bottom row). The first bin of the ${p_{\mathrm {T}}}$ and ${\phi ^*}$ measurements starts at 0. The error bars on the data represent the quadratic sum of the statistical and systematic uncertainties. Theory predictions from the {powheg} NLO generator are also provided, using CT14 (blue) or CT14+EPPS16 (red). The boxes show the 68% confidence level (n)PDF uncertainty on this prediction. The ratio of the predictions to the data is shown in the bottom panels, where the data and nPDF uncertainties are given separately, respectively as error bars around one and coloured boxes. |
png pdf |
Figure 3-d:
Differential fiducial cross sections (without acceptance correction) for the Drell-Yan process measured in the muon channel, as a function of invariant mass (top), rapidity in the center-of-mass frame (left), ${p_{\mathrm {T}}}$ (center) and ${\phi ^*}$ (right), for 15 $ < {m_{\mu \mu}} < $ 60 GeV (middle row) and 60 $ < {m_{\mu \mu}} < $ 120 GeV (bottom row). The first bin of the ${p_{\mathrm {T}}}$ and ${\phi ^*}$ measurements starts at 0. The error bars on the data represent the quadratic sum of the statistical and systematic uncertainties. Theory predictions from the {powheg} NLO generator are also provided, using CT14 (blue) or CT14+EPPS16 (red). The boxes show the 68% confidence level (n)PDF uncertainty on this prediction. The ratio of the predictions to the data is shown in the bottom panels, where the data and nPDF uncertainties are given separately, respectively as error bars around one and coloured boxes. |
png pdf |
Figure 3-e:
Differential fiducial cross sections (without acceptance correction) for the Drell-Yan process measured in the muon channel, as a function of invariant mass (top), rapidity in the center-of-mass frame (left), ${p_{\mathrm {T}}}$ (center) and ${\phi ^*}$ (right), for 15 $ < {m_{\mu \mu}} < $ 60 GeV (middle row) and 60 $ < {m_{\mu \mu}} < $ 120 GeV (bottom row). The first bin of the ${p_{\mathrm {T}}}$ and ${\phi ^*}$ measurements starts at 0. The error bars on the data represent the quadratic sum of the statistical and systematic uncertainties. Theory predictions from the {powheg} NLO generator are also provided, using CT14 (blue) or CT14+EPPS16 (red). The boxes show the 68% confidence level (n)PDF uncertainty on this prediction. The ratio of the predictions to the data is shown in the bottom panels, where the data and nPDF uncertainties are given separately, respectively as error bars around one and coloured boxes. |
png pdf |
Figure 3-f:
Differential fiducial cross sections (without acceptance correction) for the Drell-Yan process measured in the muon channel, as a function of invariant mass (top), rapidity in the center-of-mass frame (left), ${p_{\mathrm {T}}}$ (center) and ${\phi ^*}$ (right), for 15 $ < {m_{\mu \mu}} < $ 60 GeV (middle row) and 60 $ < {m_{\mu \mu}} < $ 120 GeV (bottom row). The first bin of the ${p_{\mathrm {T}}}$ and ${\phi ^*}$ measurements starts at 0. The error bars on the data represent the quadratic sum of the statistical and systematic uncertainties. Theory predictions from the {powheg} NLO generator are also provided, using CT14 (blue) or CT14+EPPS16 (red). The boxes show the 68% confidence level (n)PDF uncertainty on this prediction. The ratio of the predictions to the data is shown in the bottom panels, where the data and nPDF uncertainties are given separately, respectively as error bars around one and coloured boxes. |
png pdf |
Figure 3-g:
Differential fiducial cross sections (without acceptance correction) for the Drell-Yan process measured in the muon channel, as a function of invariant mass (top), rapidity in the center-of-mass frame (left), ${p_{\mathrm {T}}}$ (center) and ${\phi ^*}$ (right), for 15 $ < {m_{\mu \mu}} < $ 60 GeV (middle row) and 60 $ < {m_{\mu \mu}} < $ 120 GeV (bottom row). The first bin of the ${p_{\mathrm {T}}}$ and ${\phi ^*}$ measurements starts at 0. The error bars on the data represent the quadratic sum of the statistical and systematic uncertainties. Theory predictions from the {powheg} NLO generator are also provided, using CT14 (blue) or CT14+EPPS16 (red). The boxes show the 68% confidence level (n)PDF uncertainty on this prediction. The ratio of the predictions to the data is shown in the bottom panels, where the data and nPDF uncertainties are given separately, respectively as error bars around one and coloured boxes. |
png pdf |
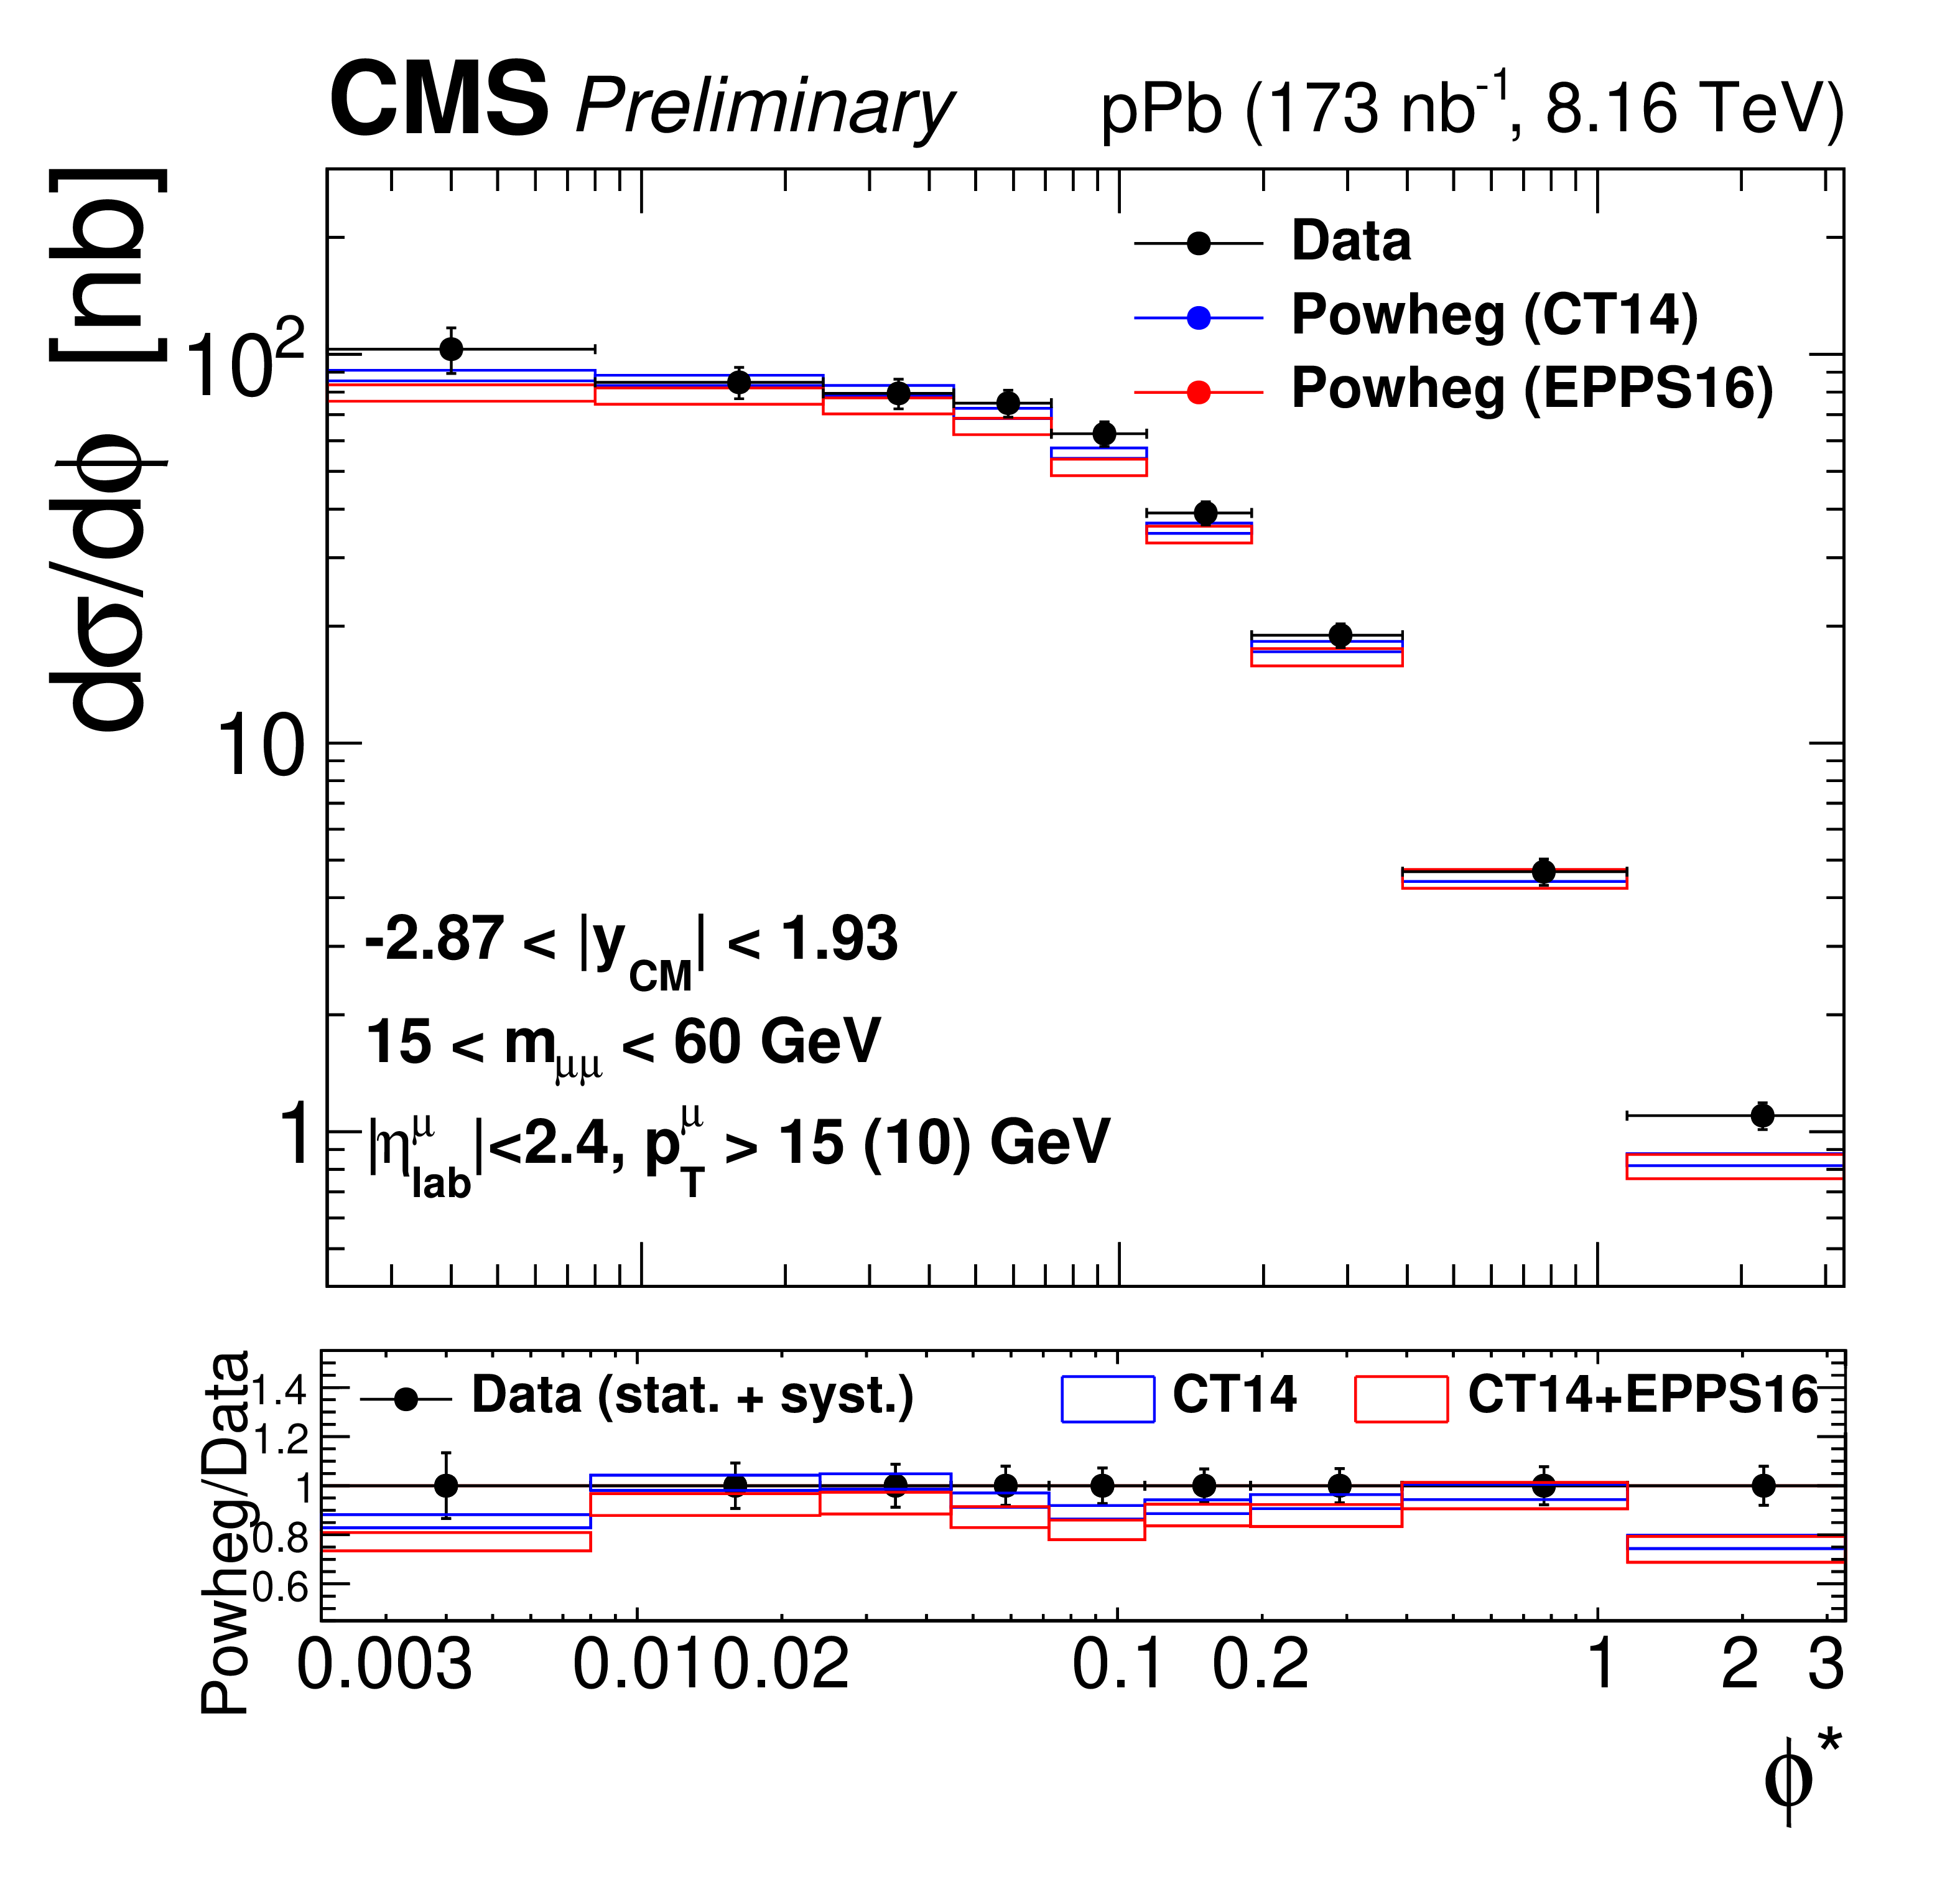
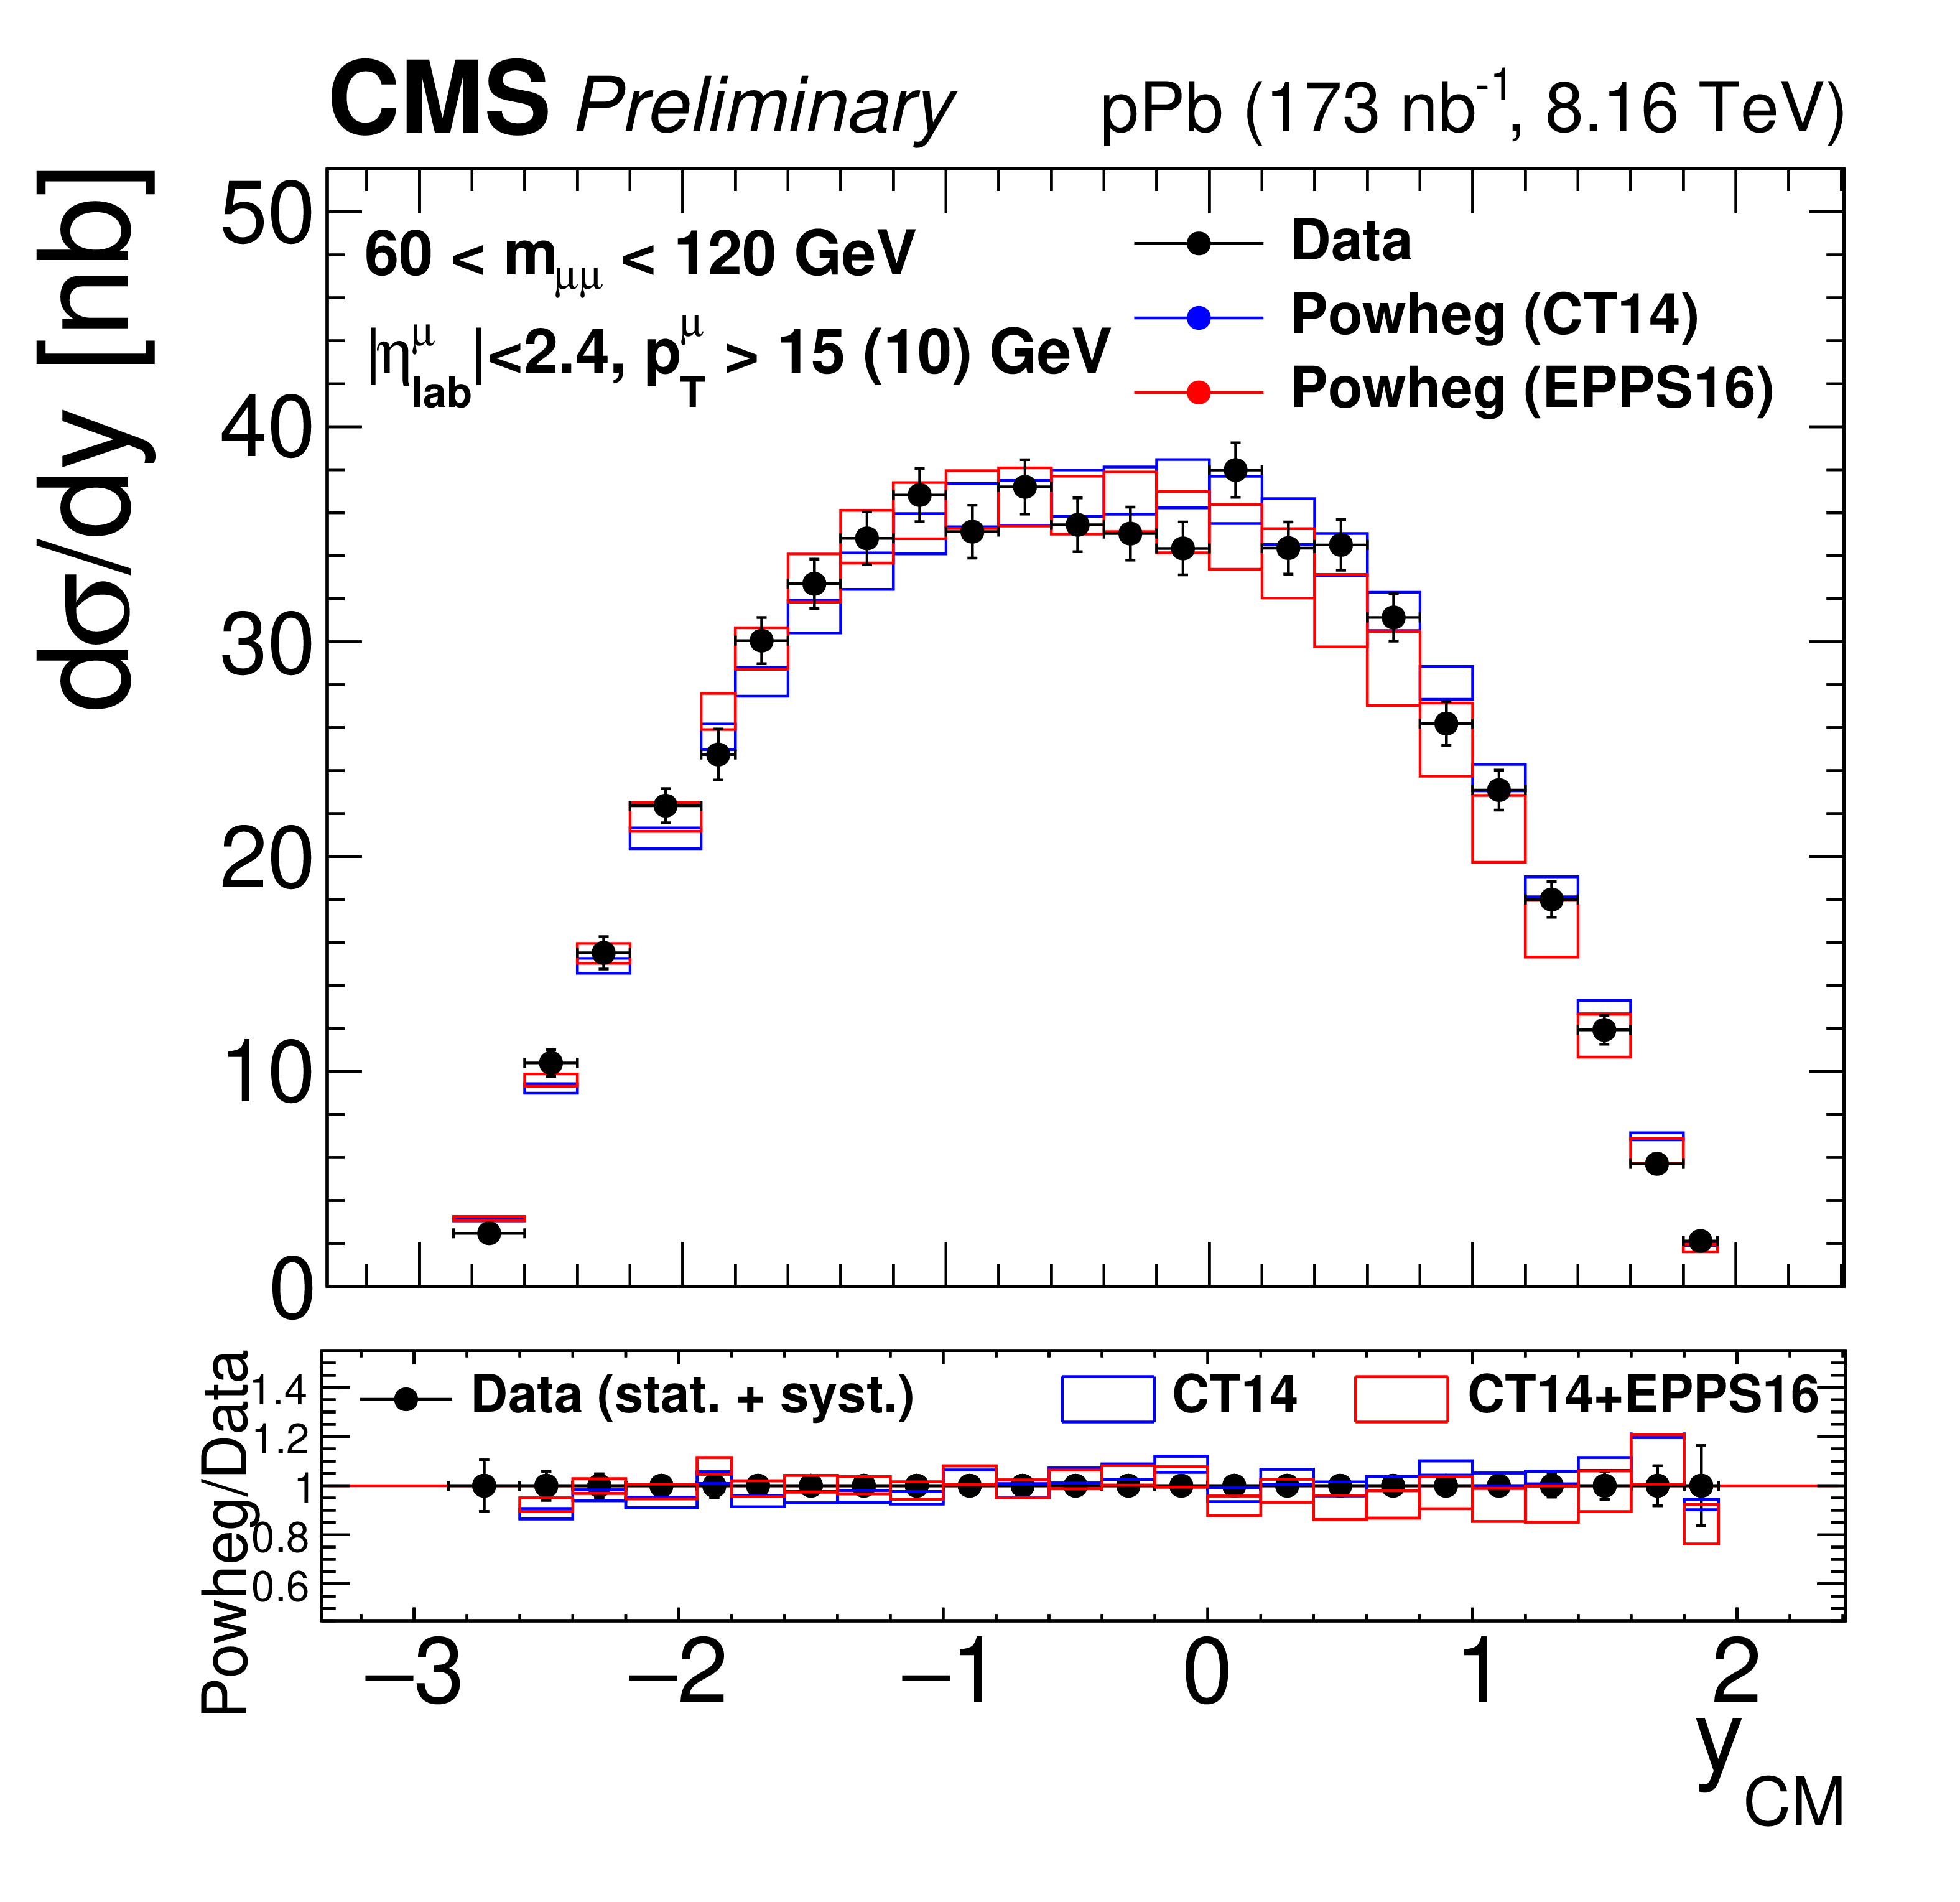
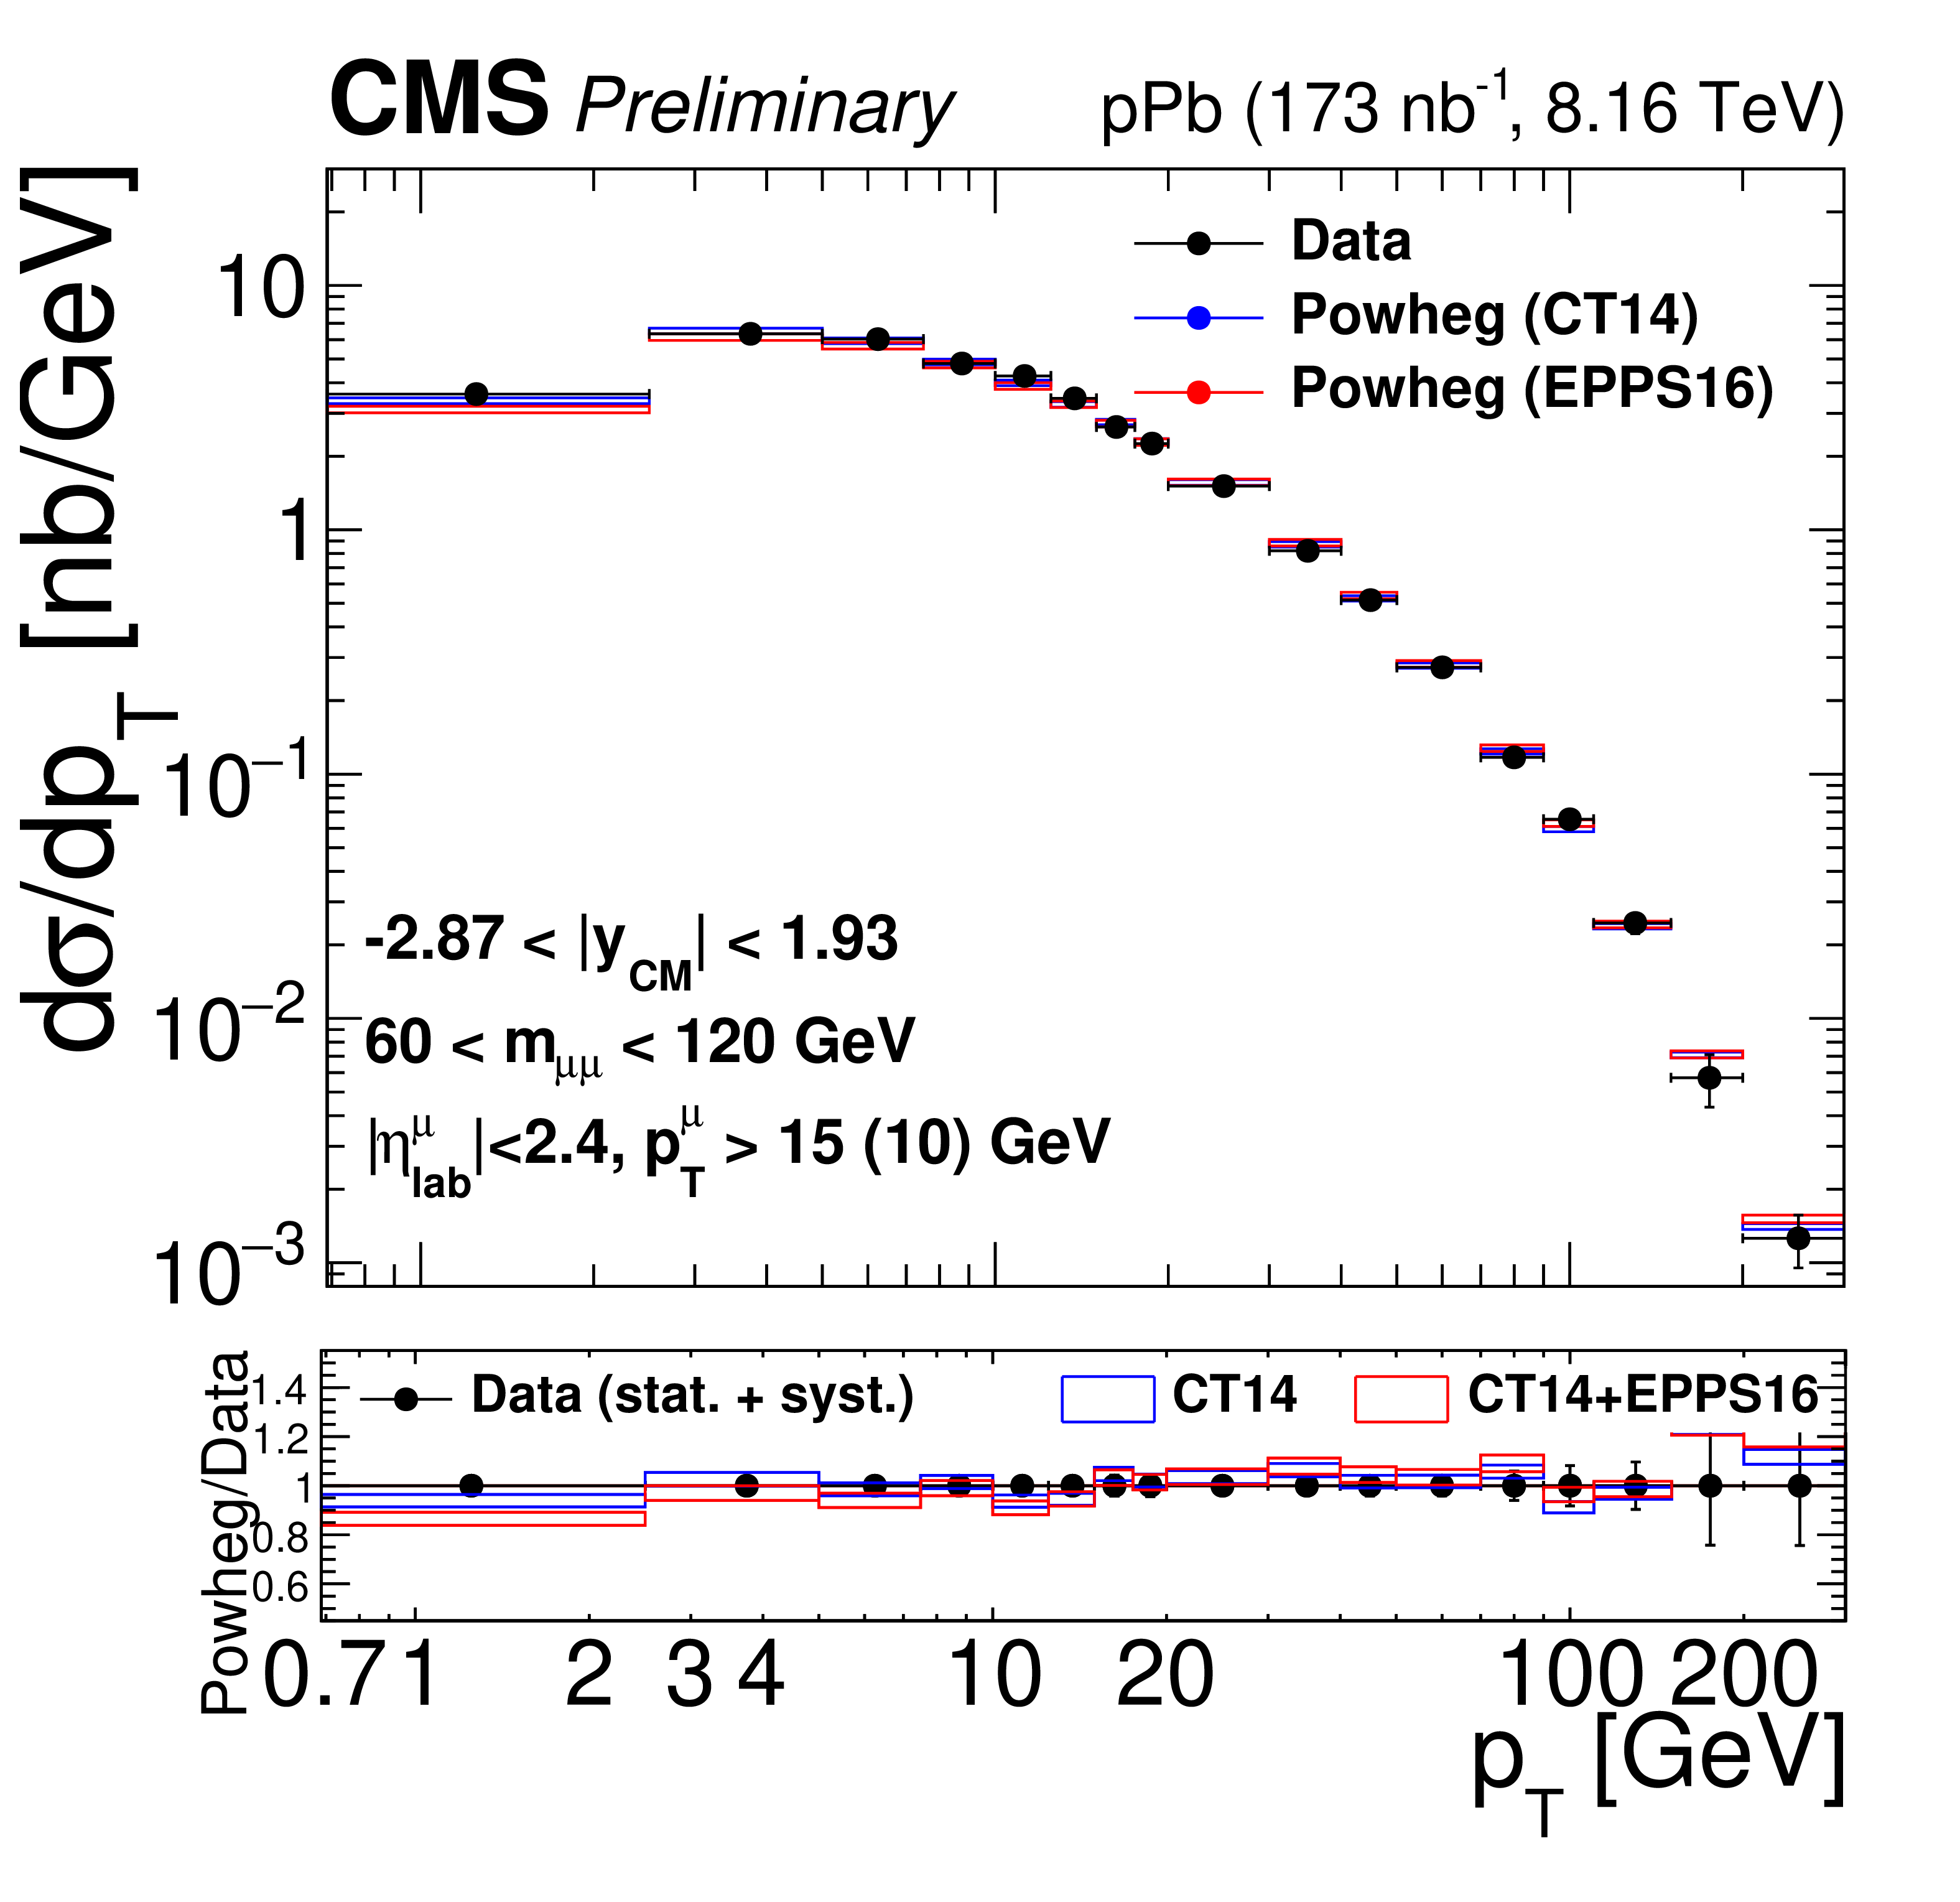
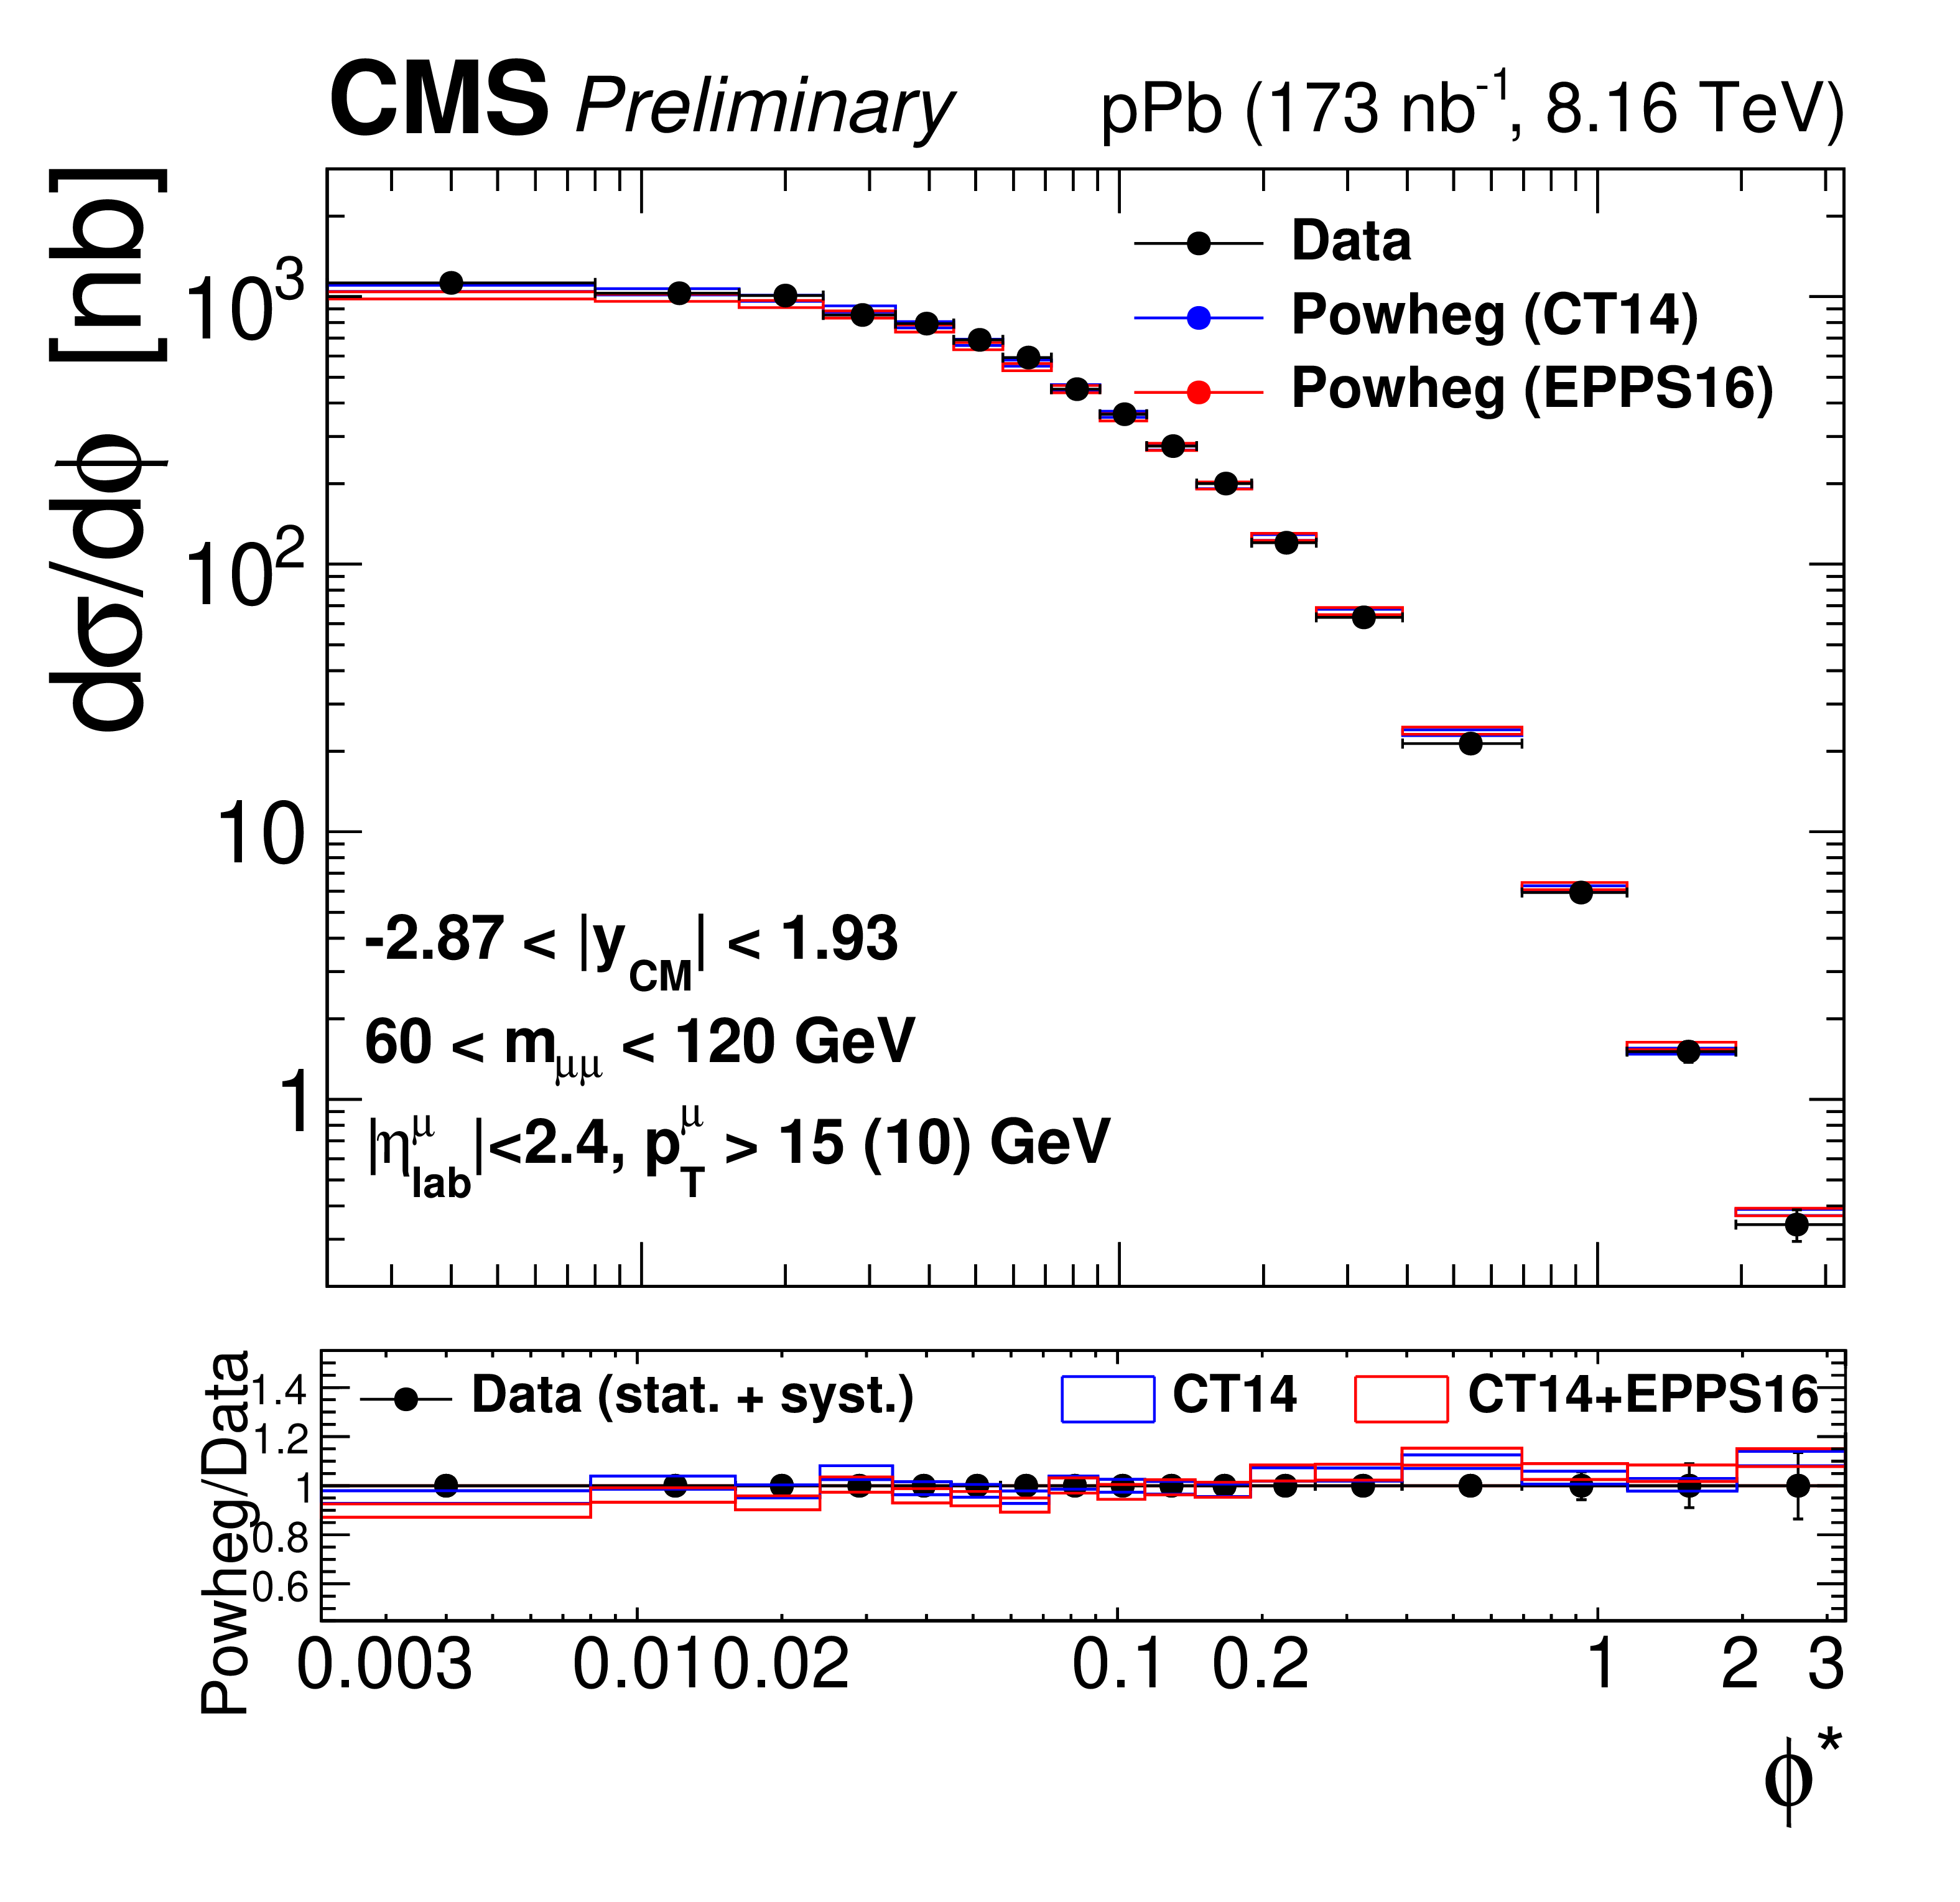
Figure 4:
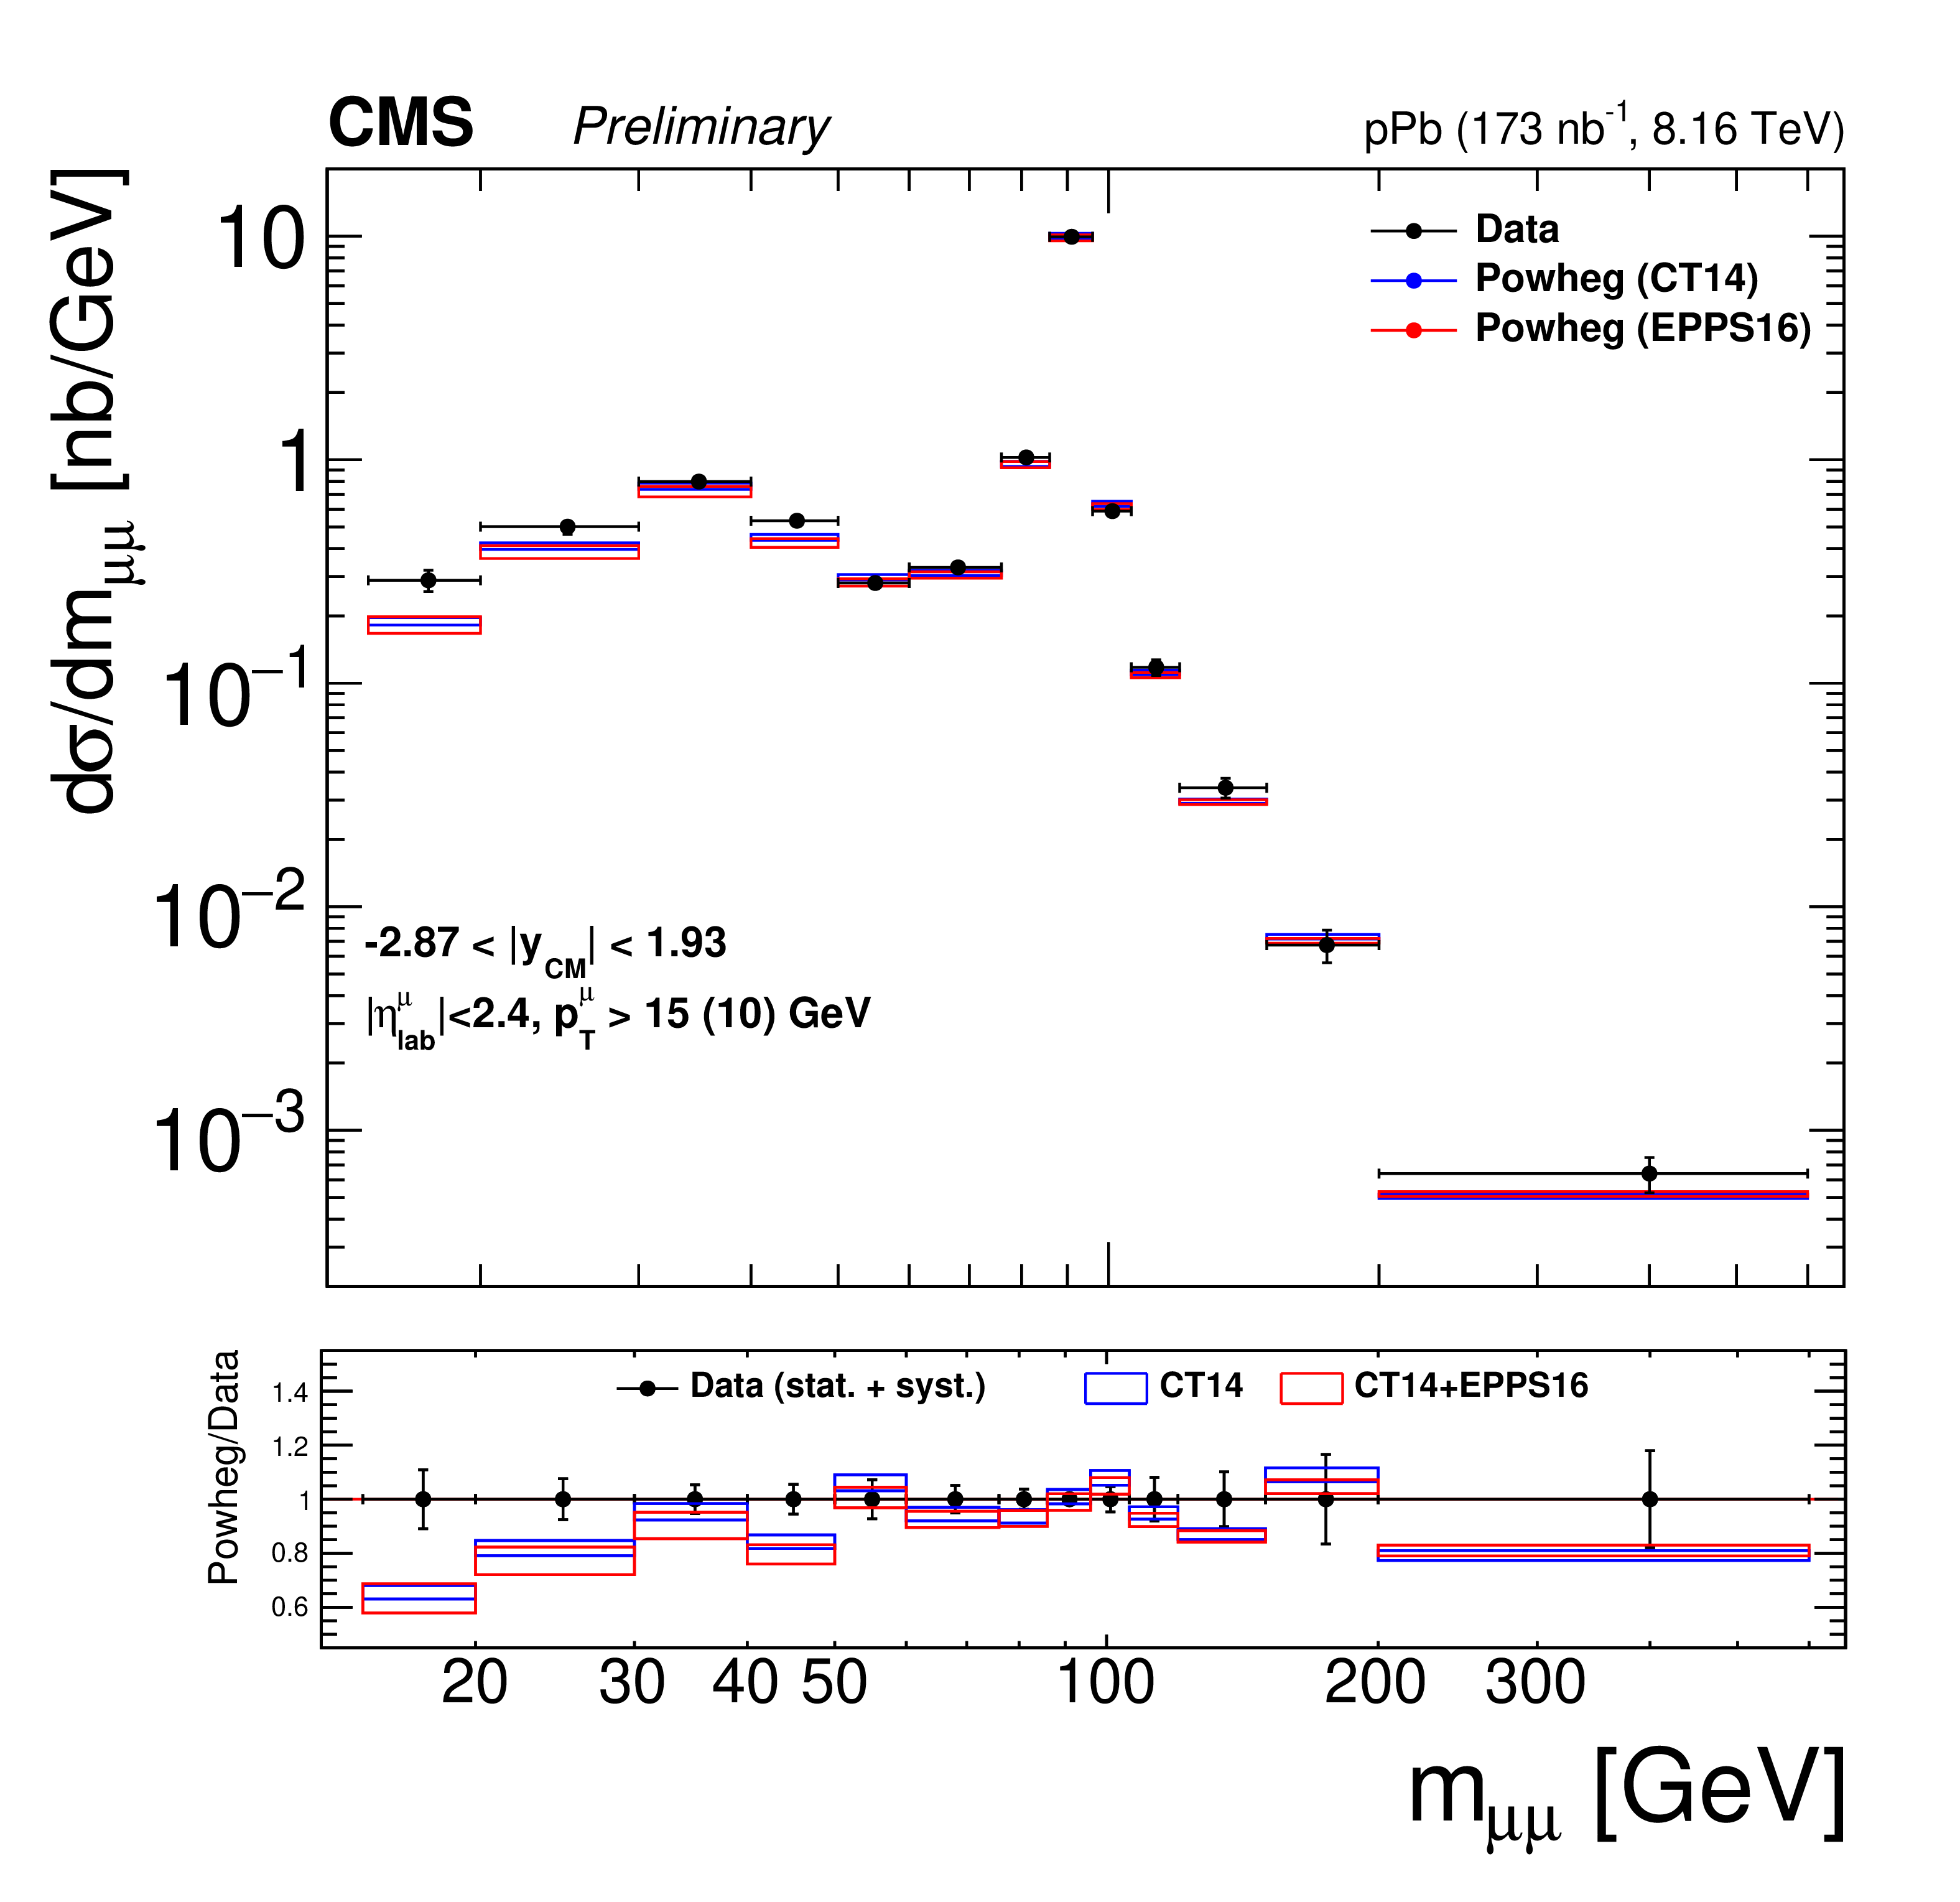
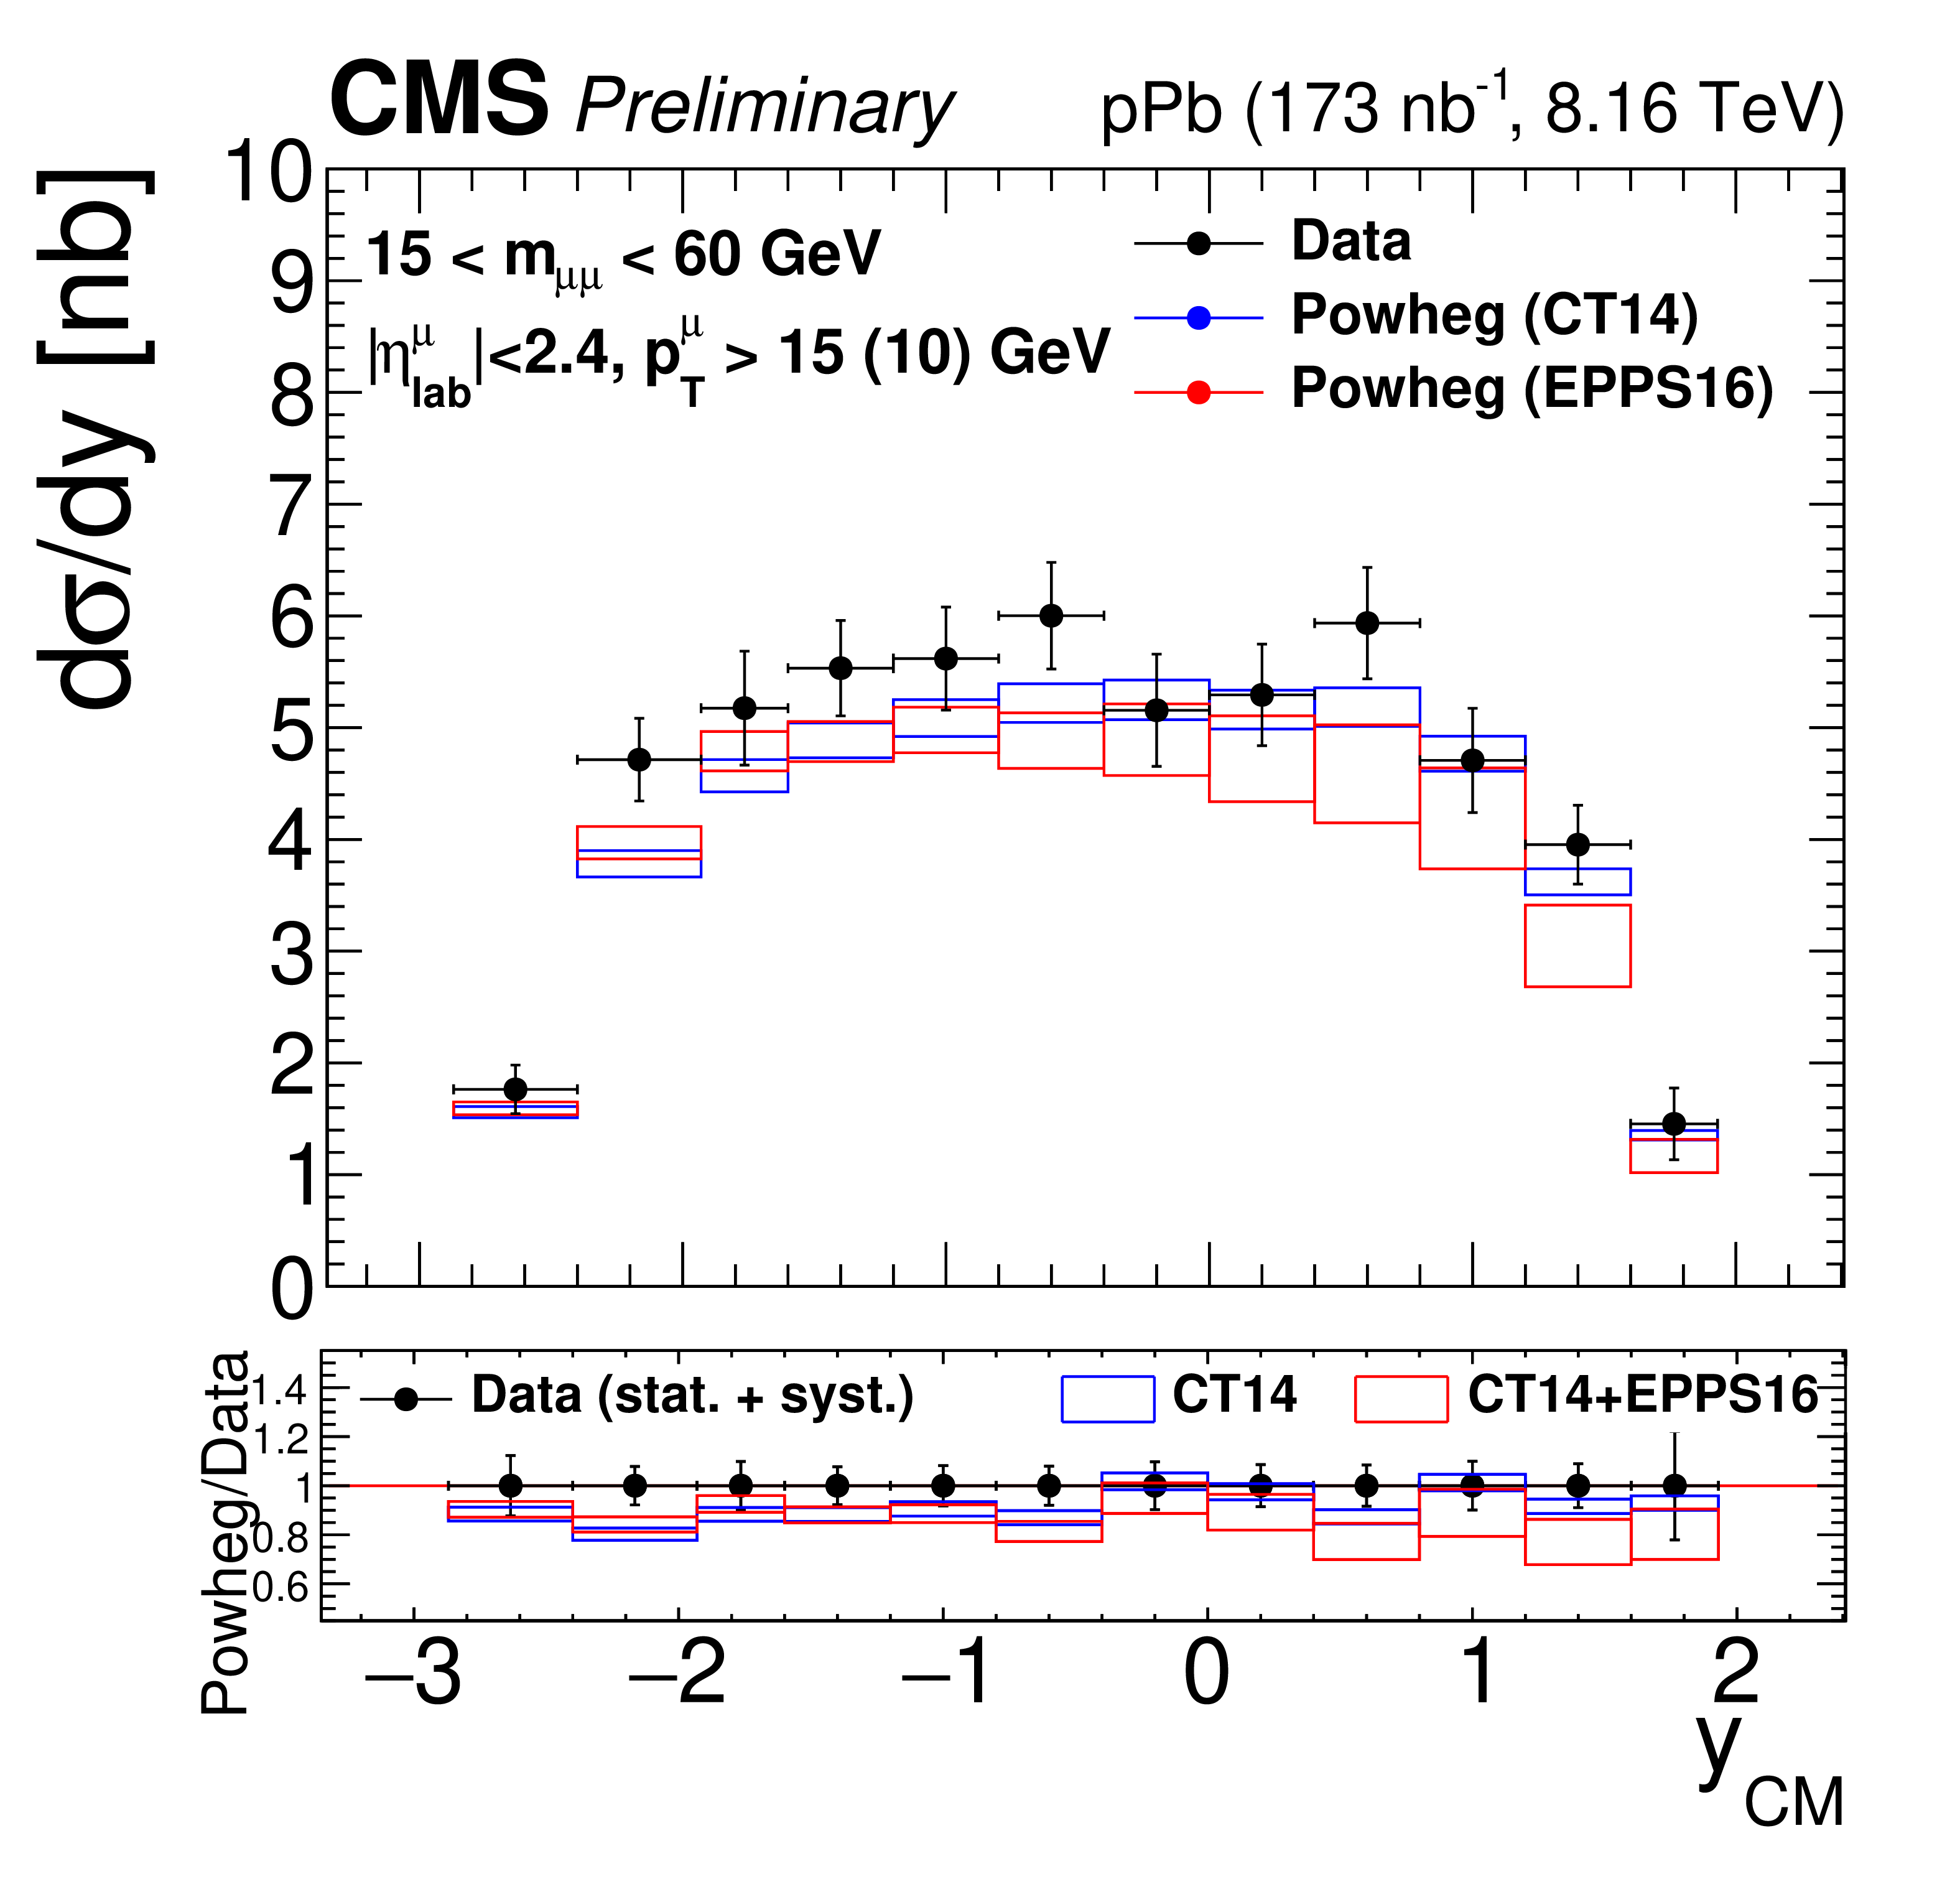
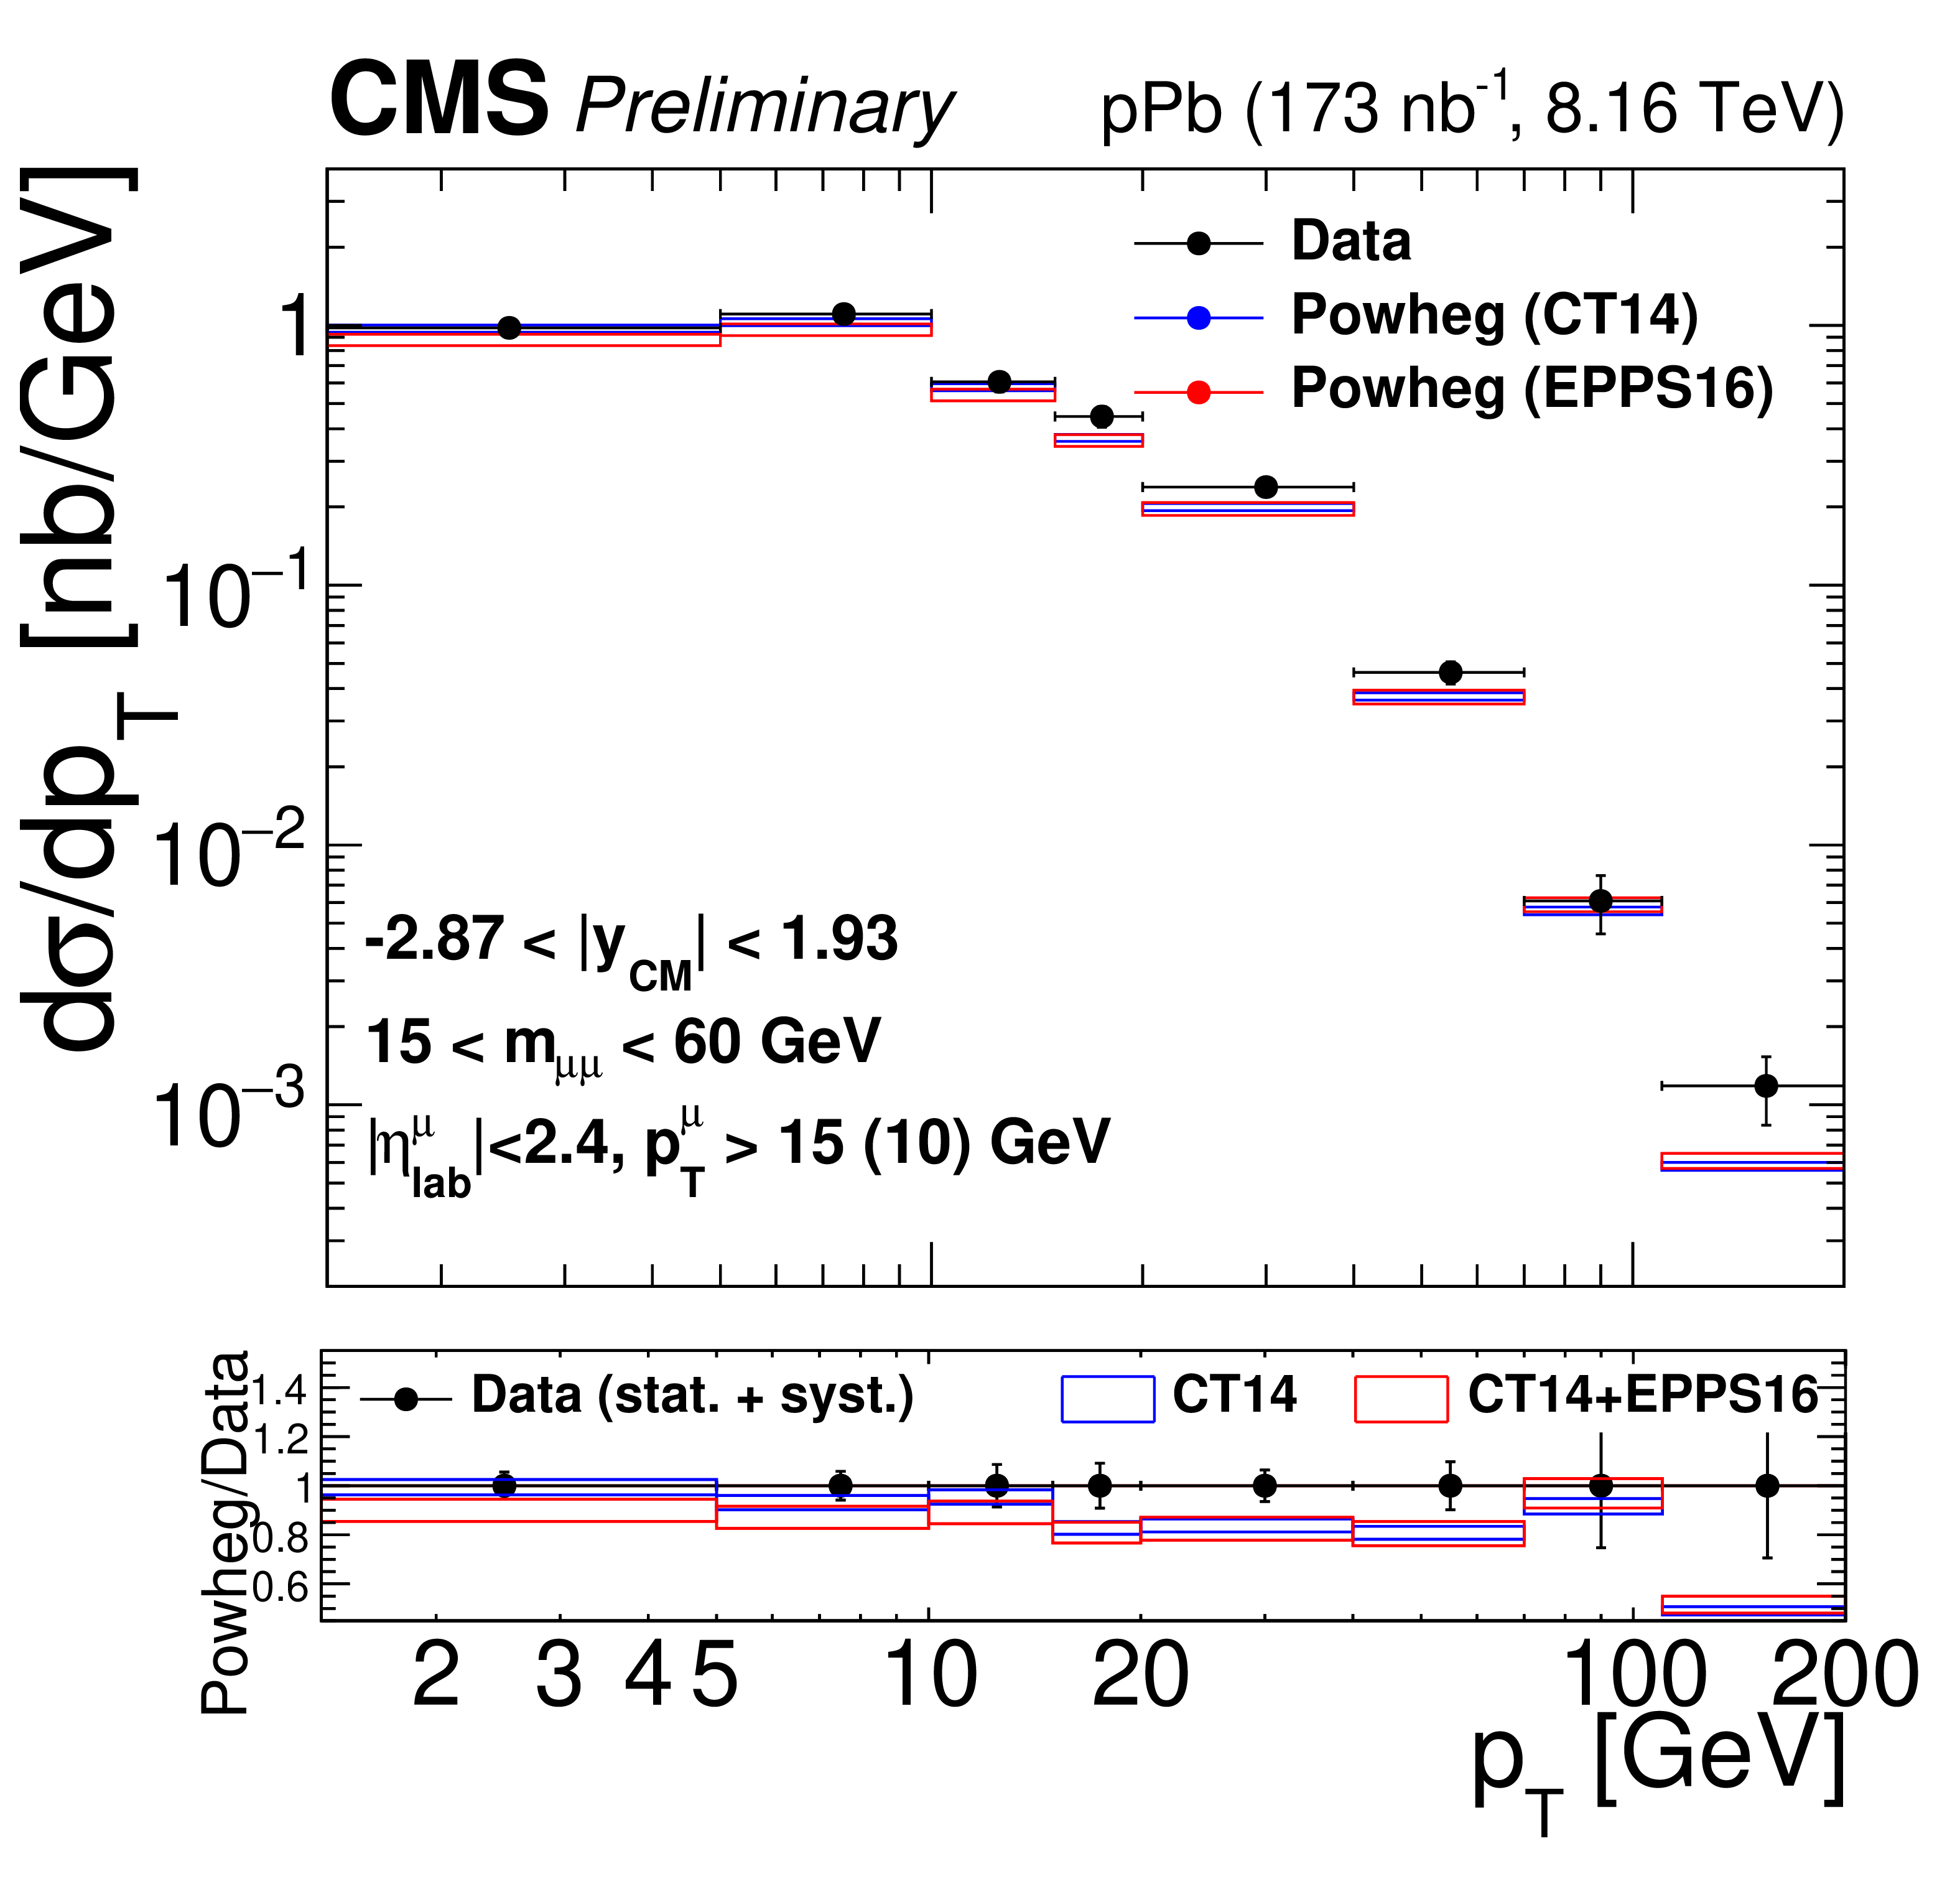
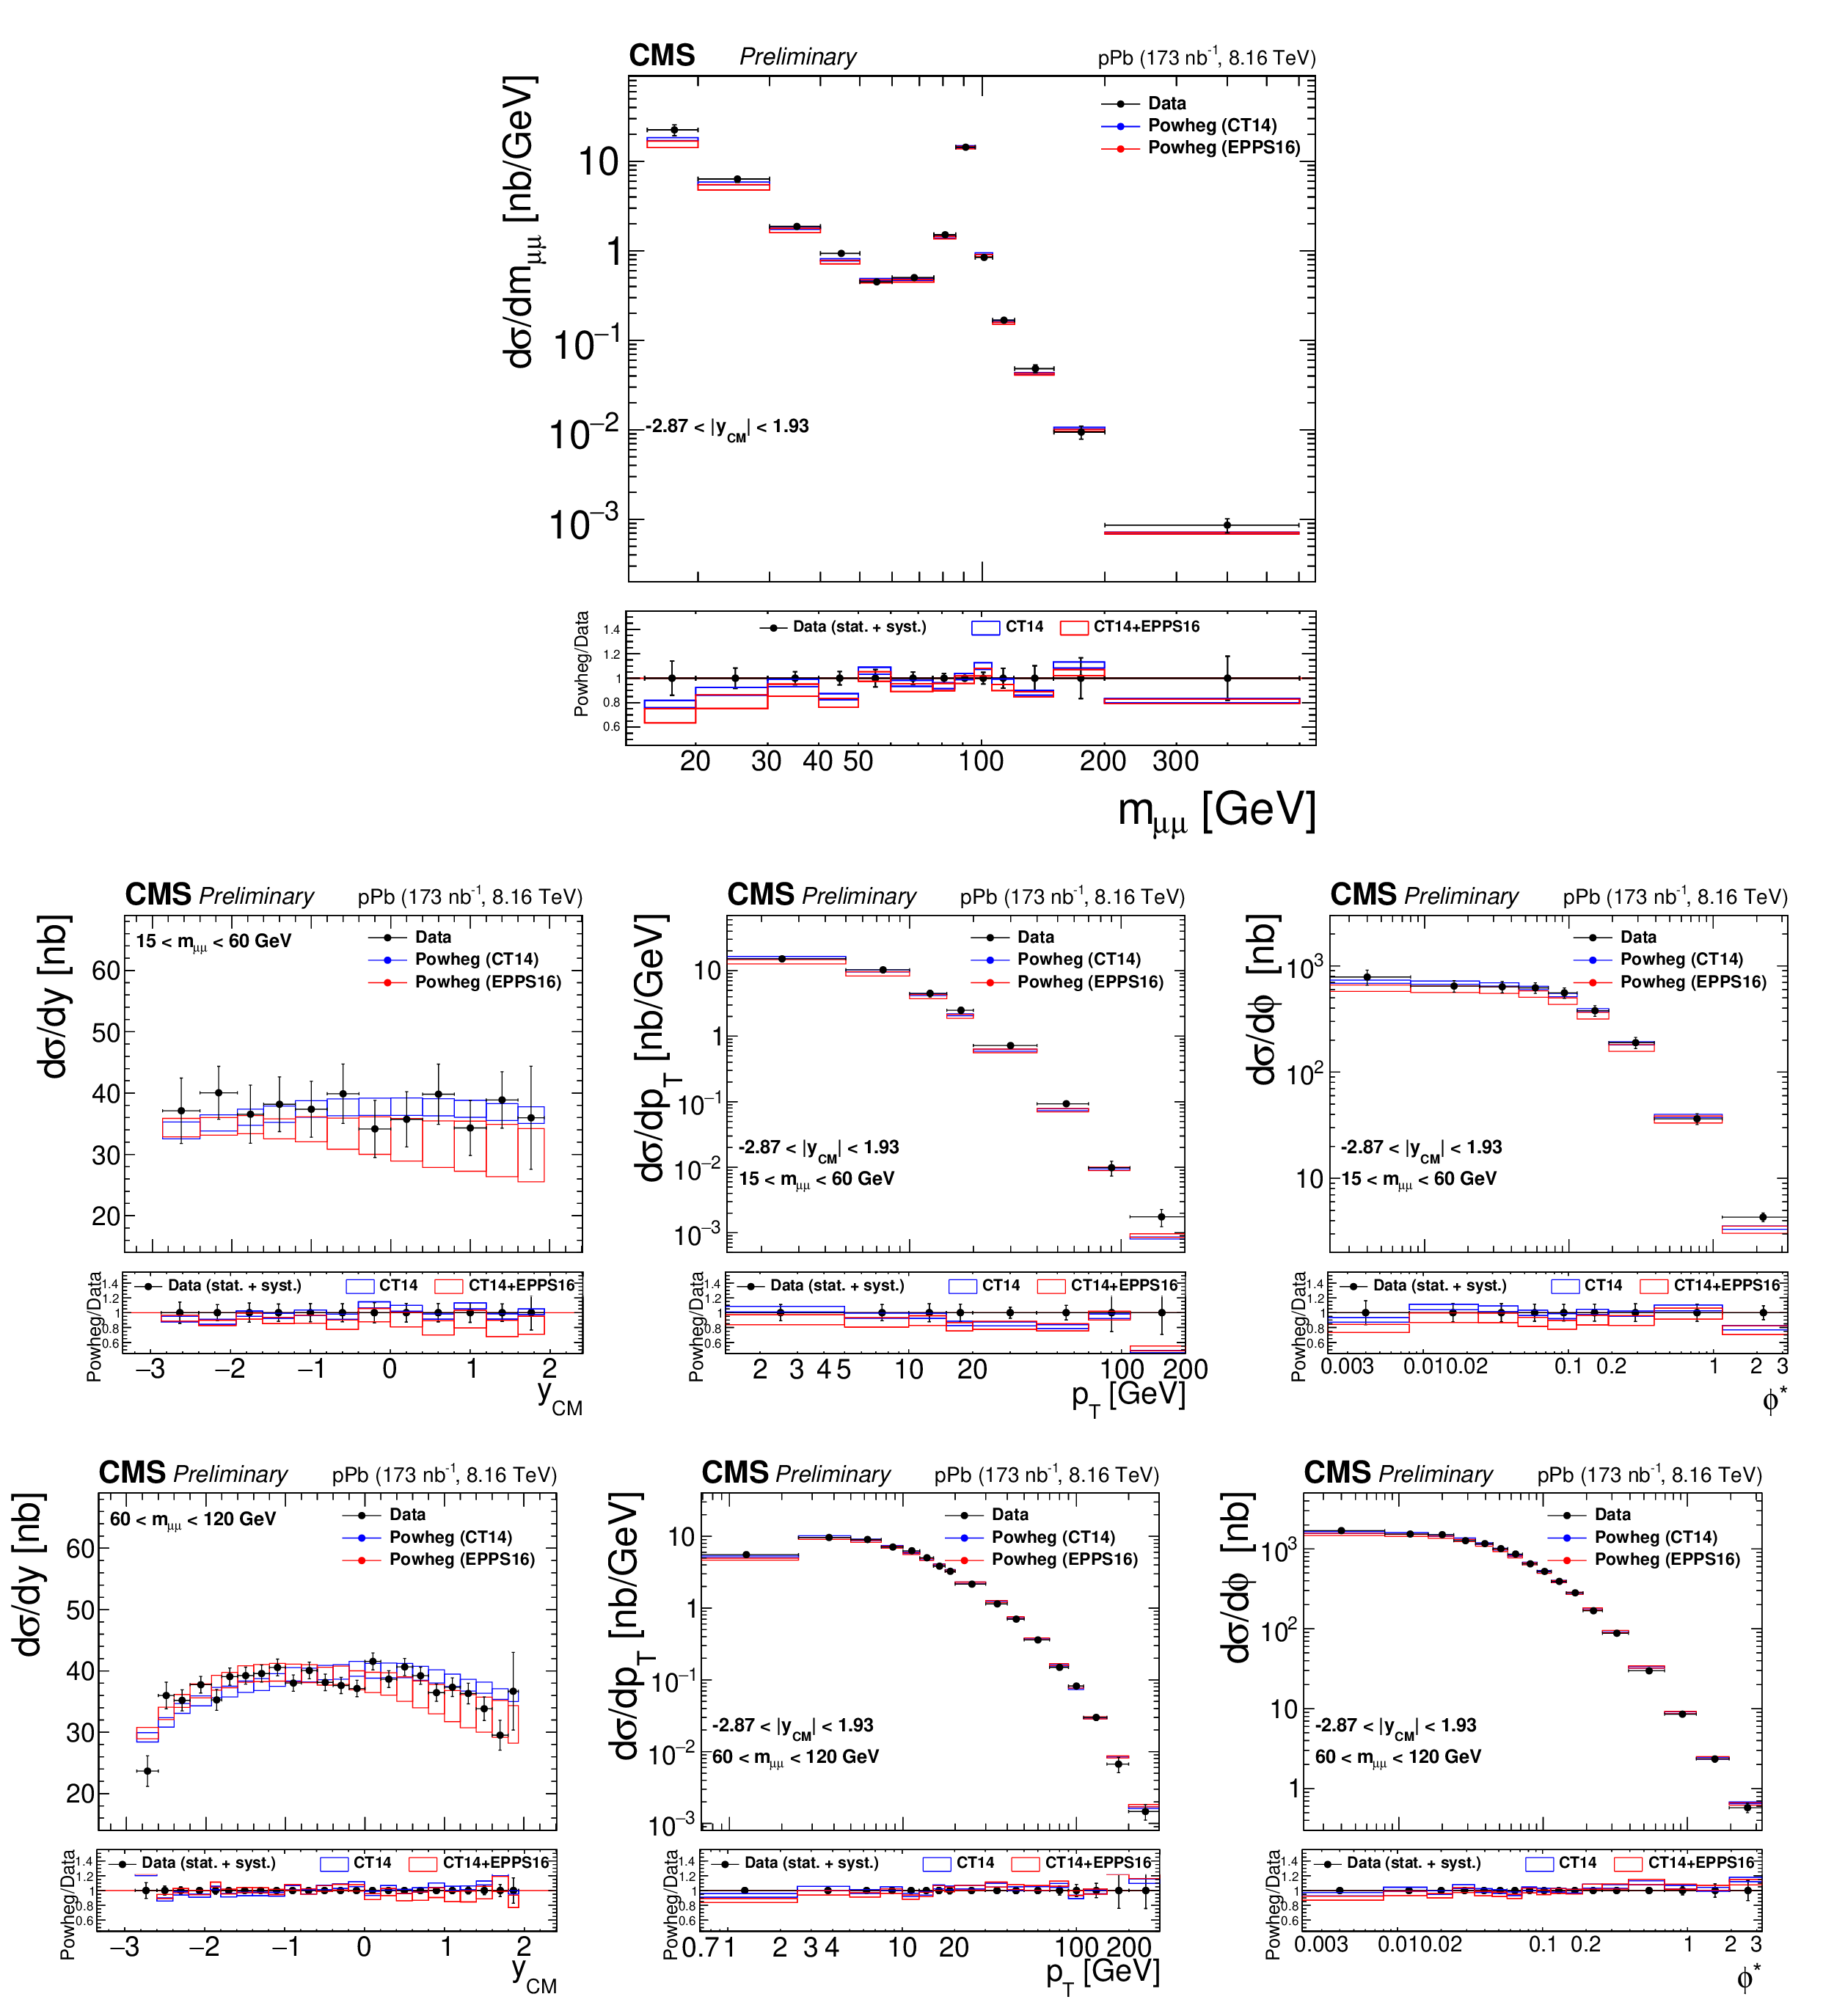
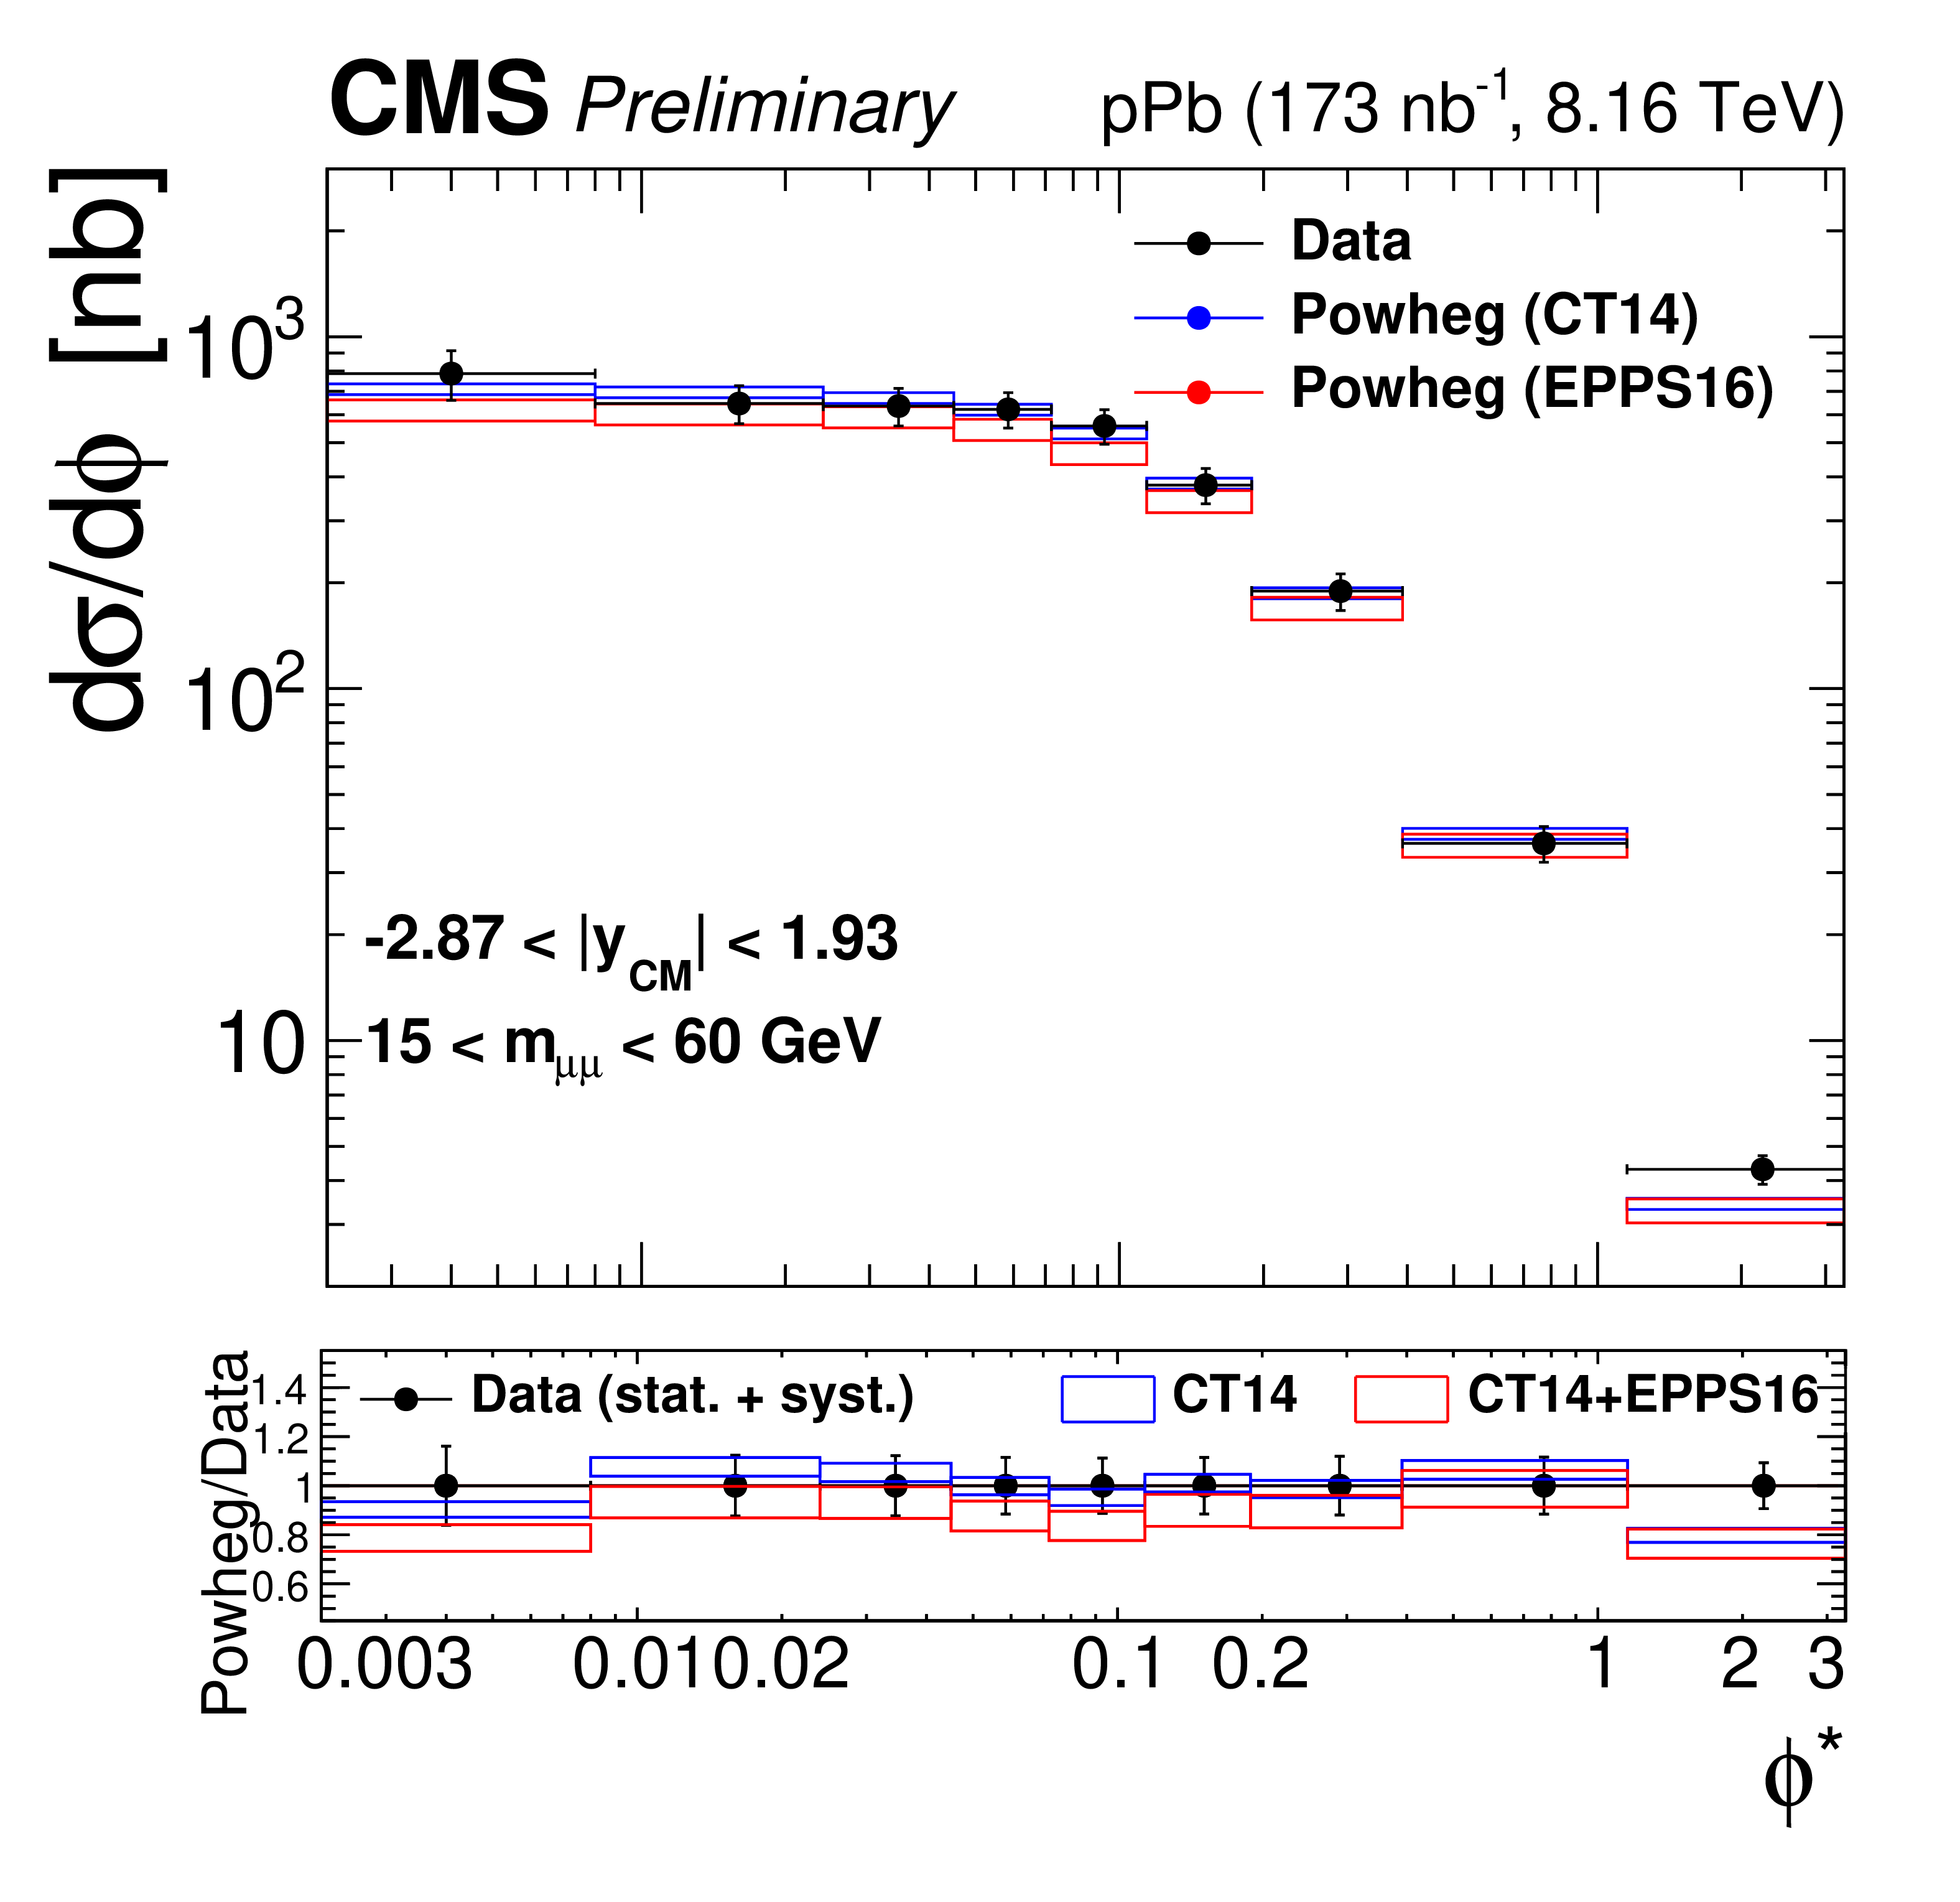
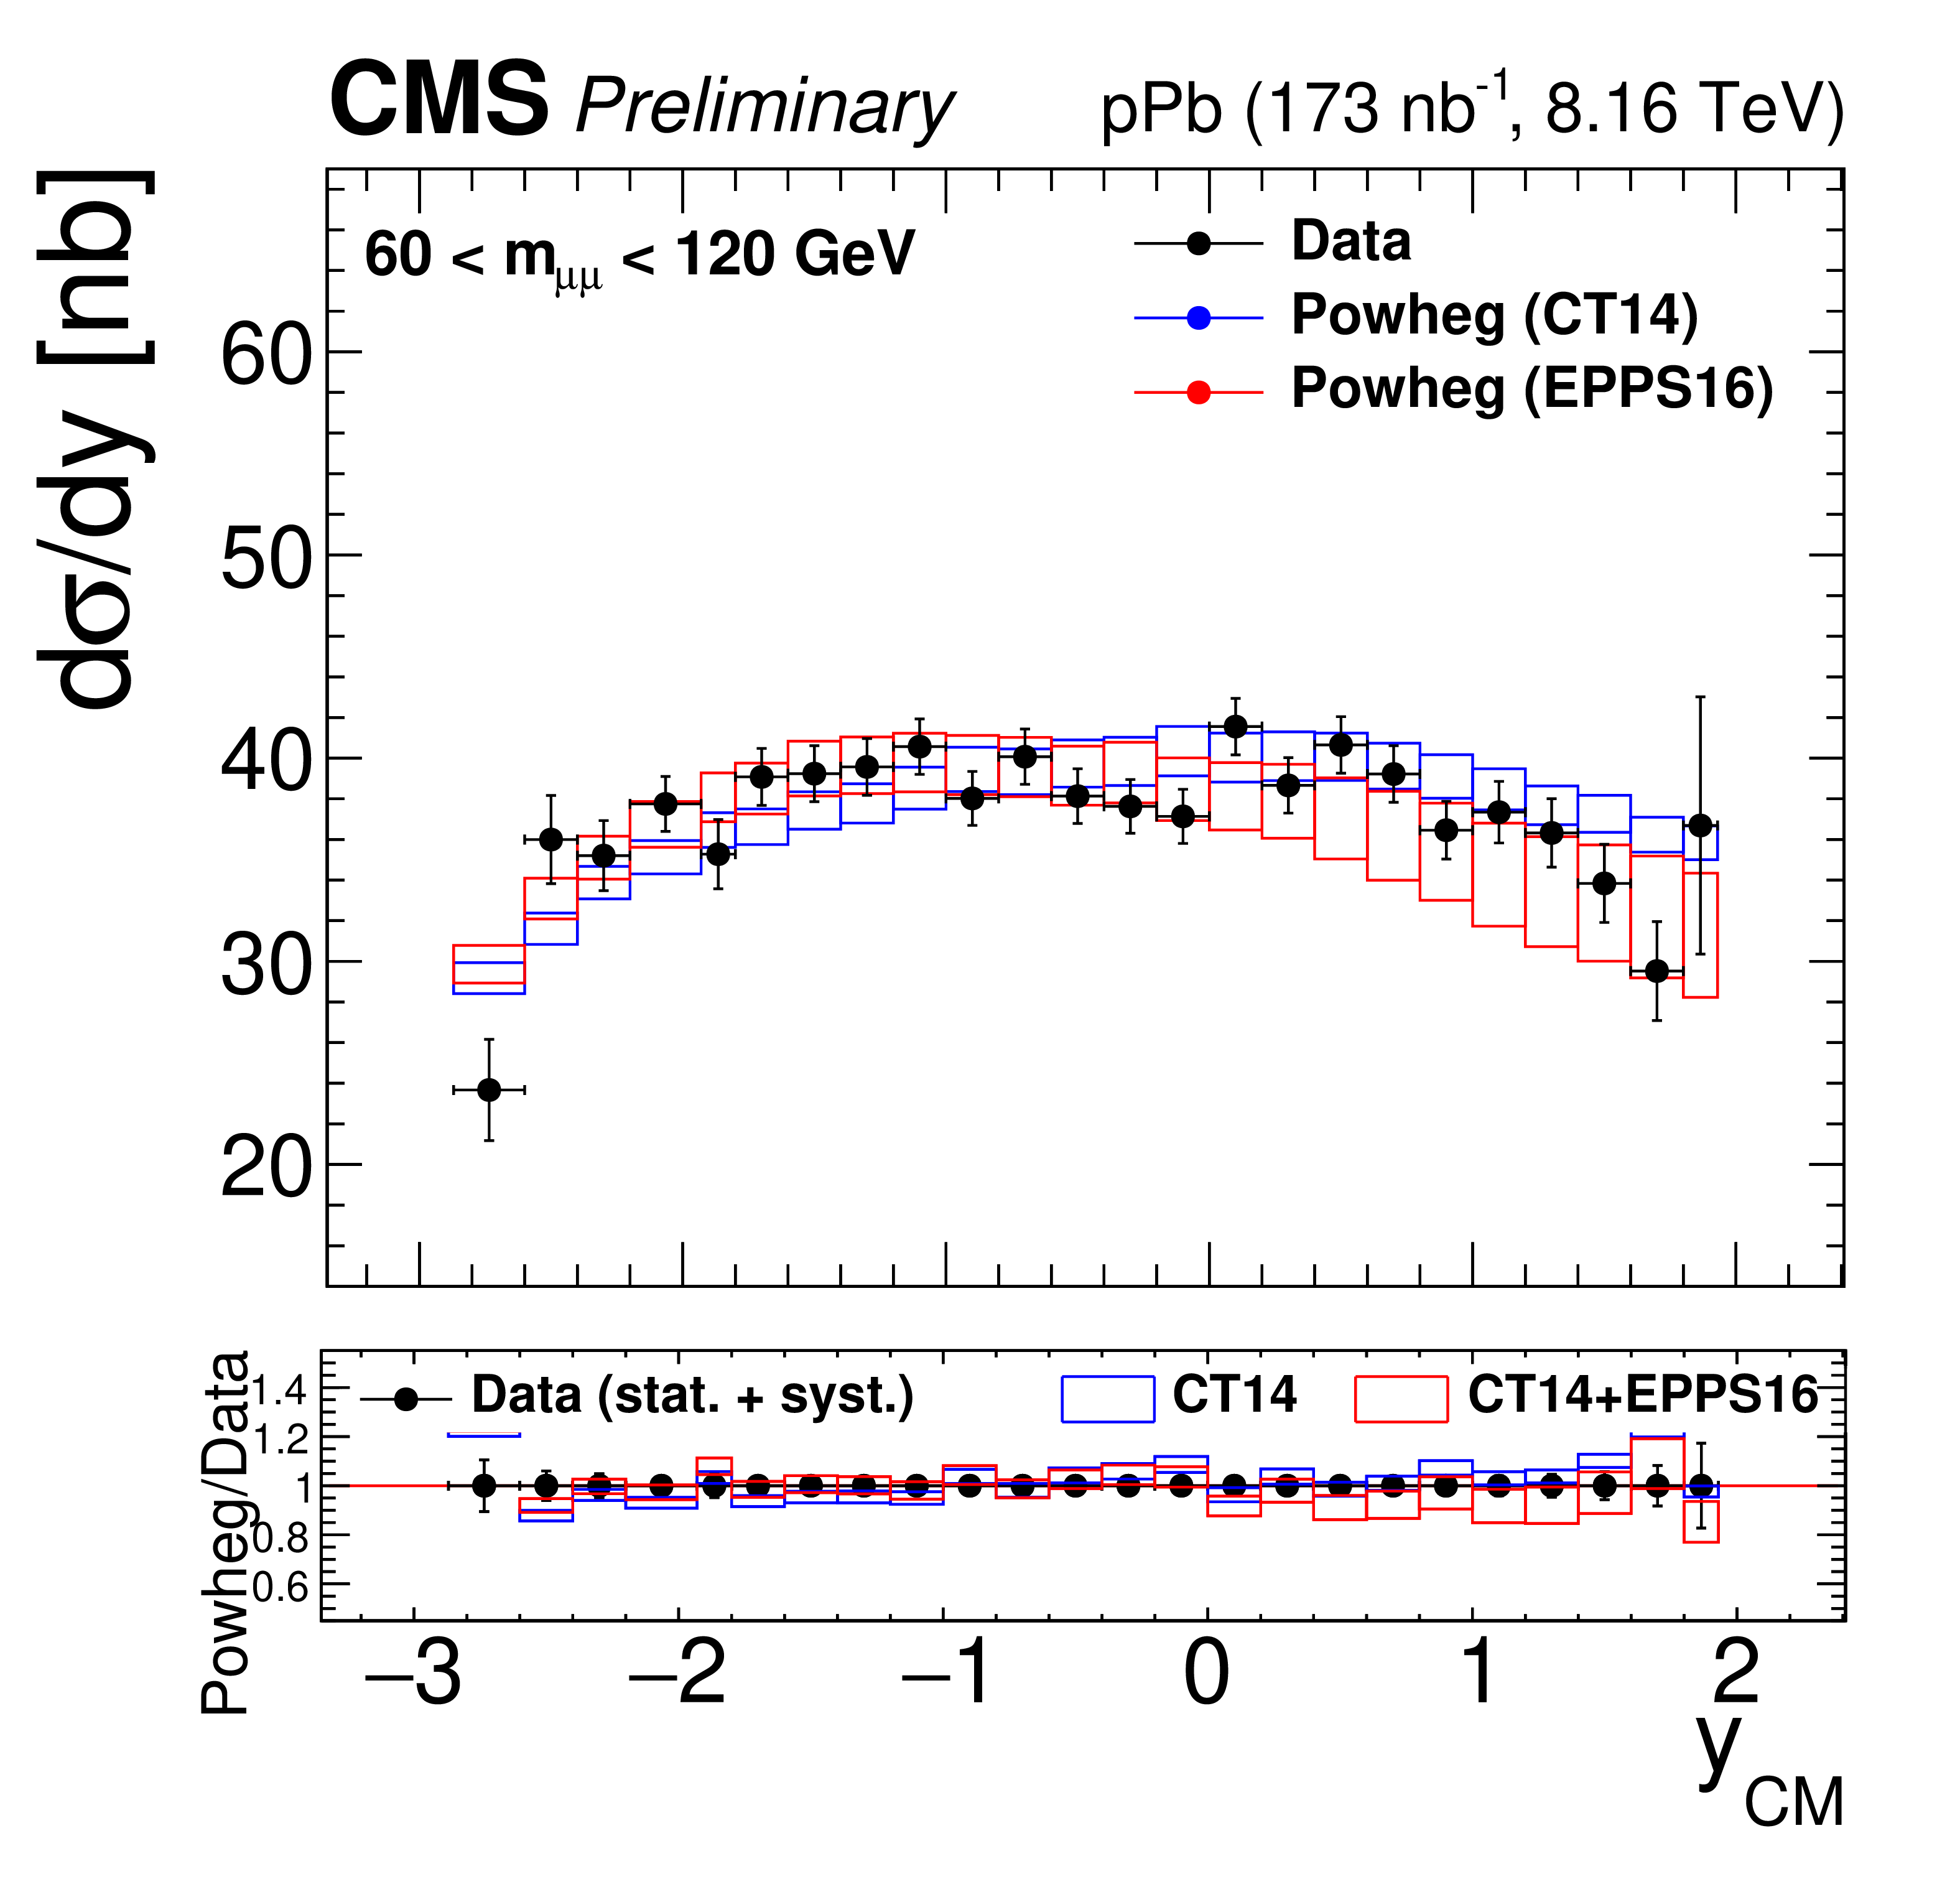
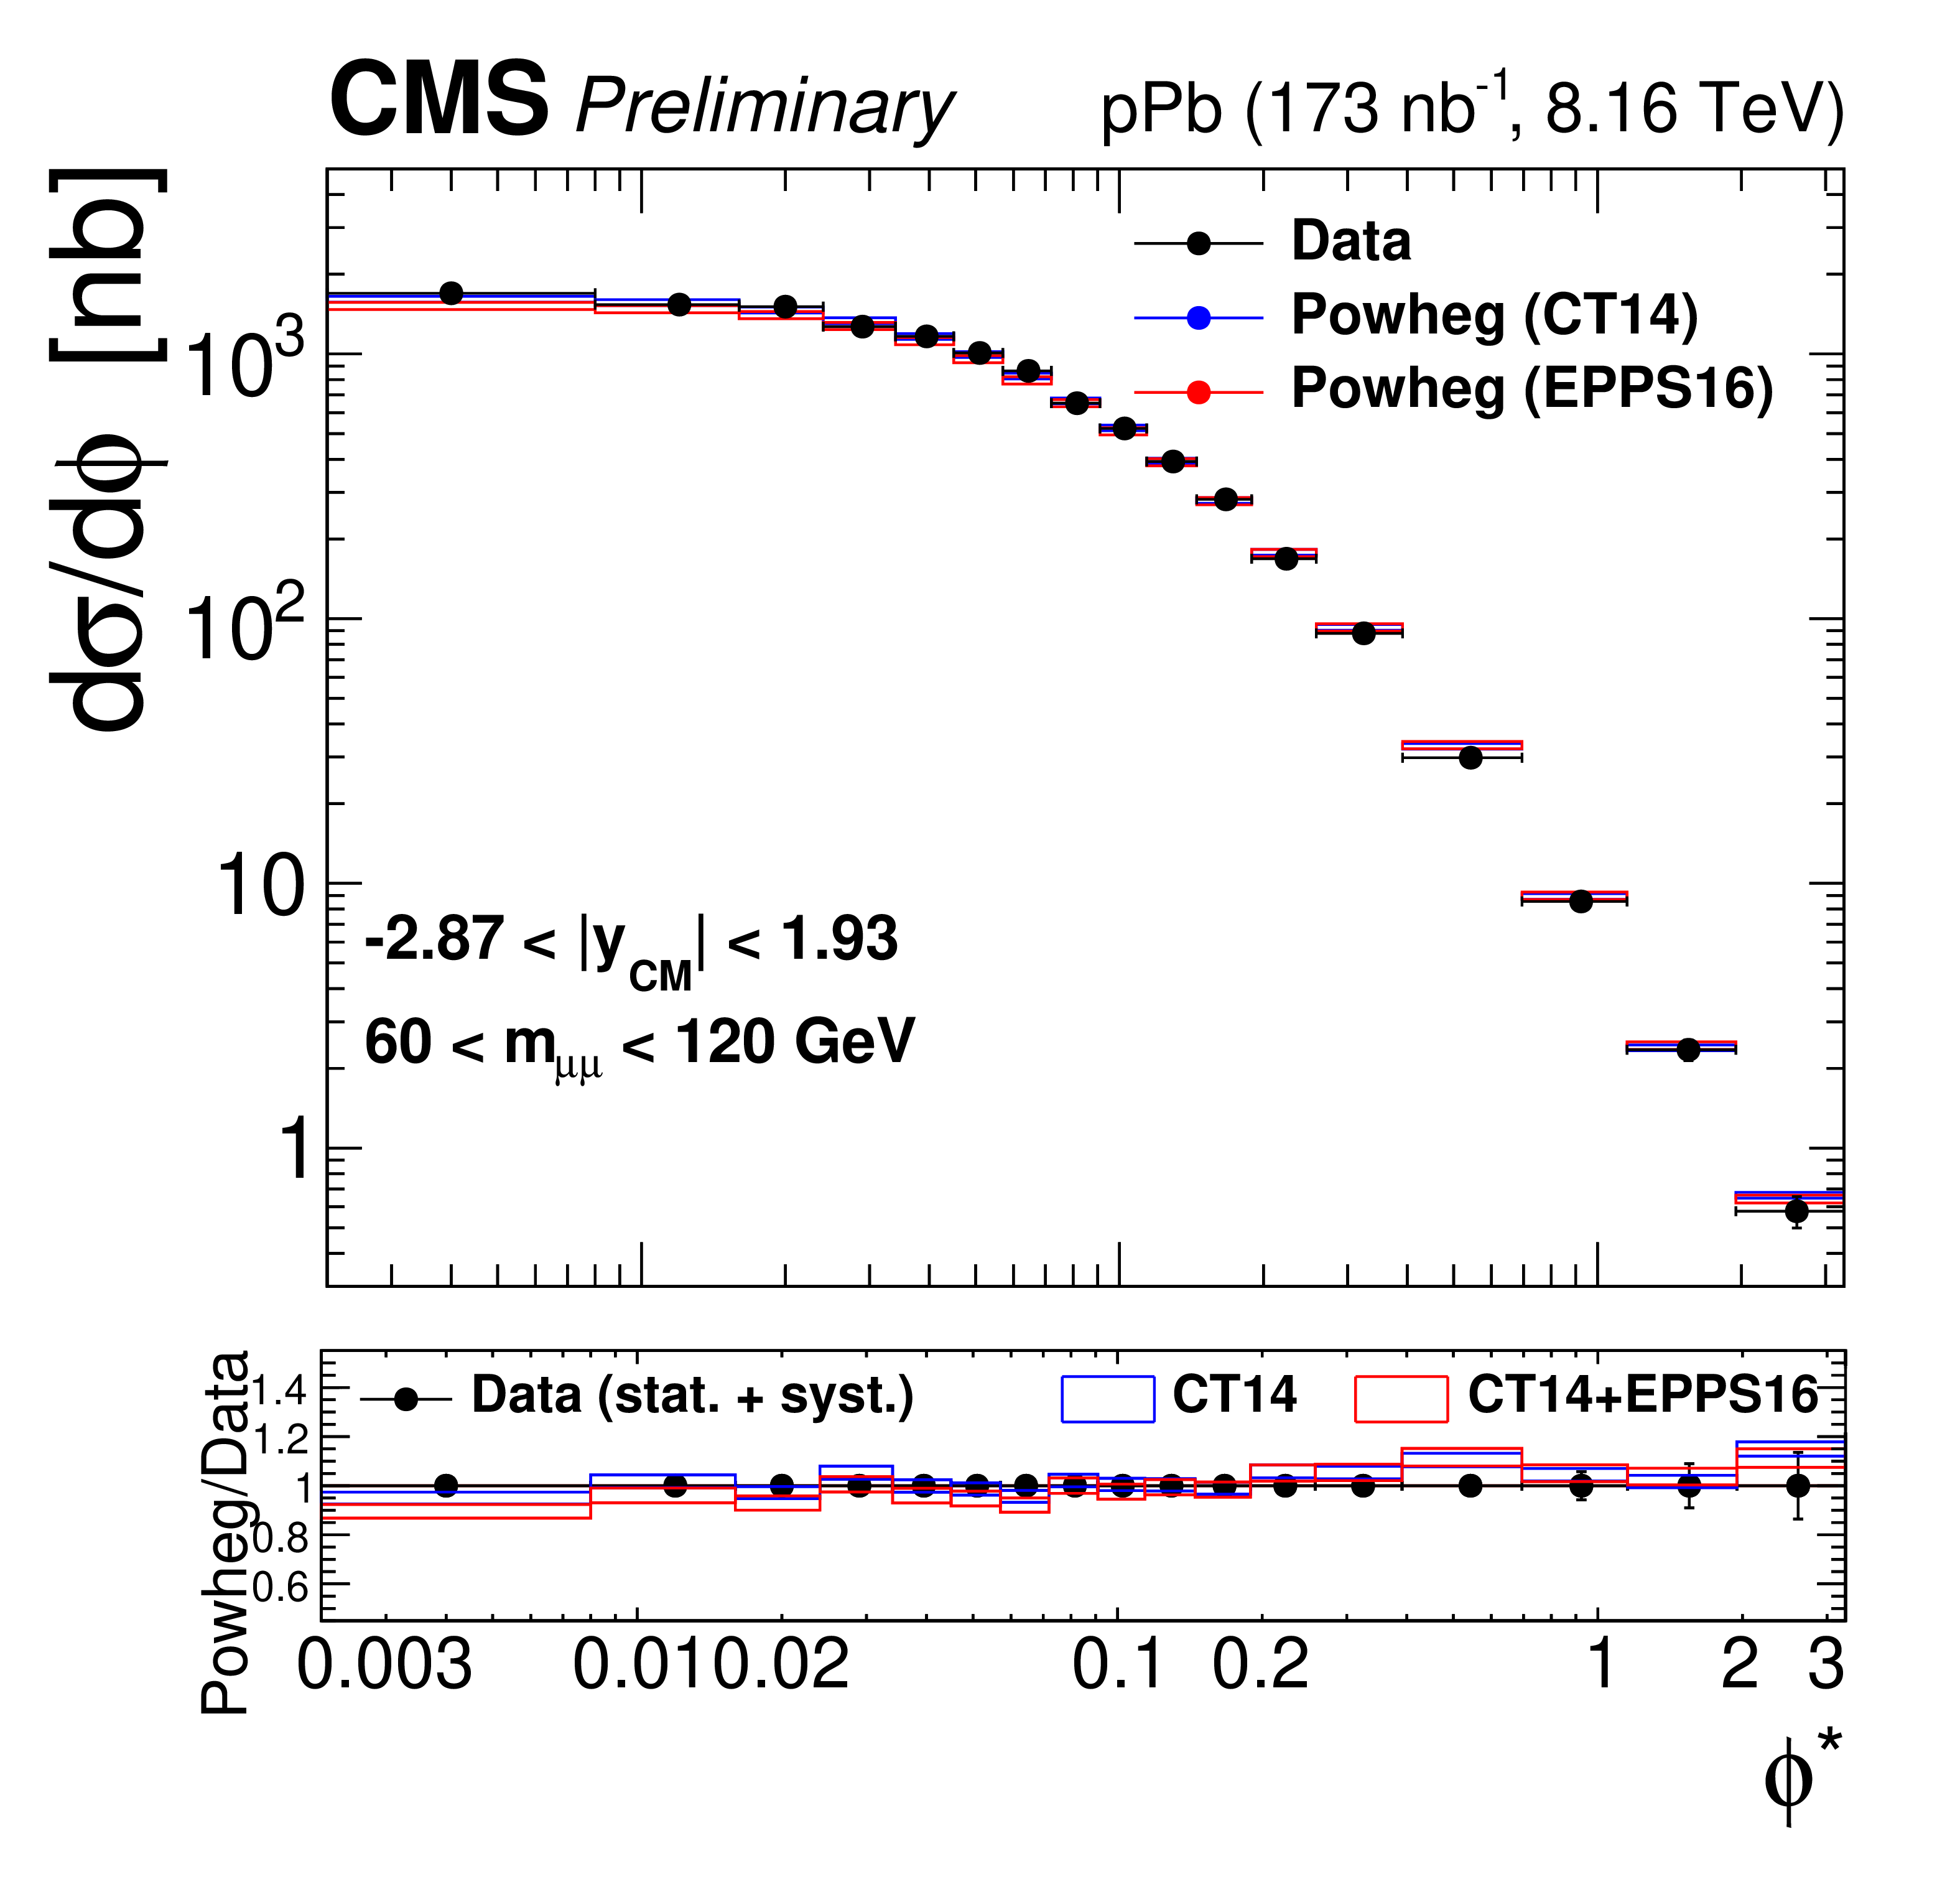
Differential cross sections for the Drell-Yan process measured in the muon channel, as a function of invariant mass (top), rapidity in the center-of-mass frame (left), ${p_{\mathrm {T}}}$ (center) and ${\phi ^*}$ (right), for 15 $ < {m_{\mu \mu}} < $ 60 GeV (middle row) and 60 $ < {m_{\mu \mu}} < $ 120 GeV (bottom row). The first bin of the ${p_{\mathrm {T}}}$ and ${\phi ^*}$ measurements starts at 0. The error bars on the data represent the quadratic sum of the statistical and systematic uncertainties. Theory predictions from the {powheg} NLO generator are also provided, using CT14 (blue) or CT14+EPPS16 (red). The boxes show the 68% confidence level (n)PDF uncertainty on this prediction. The ratio of the predictions to the data is shown in the bottom panels, where the data and nPDF uncertainties are given separately, respectively as error bars around one and coloured boxes. |
png pdf |
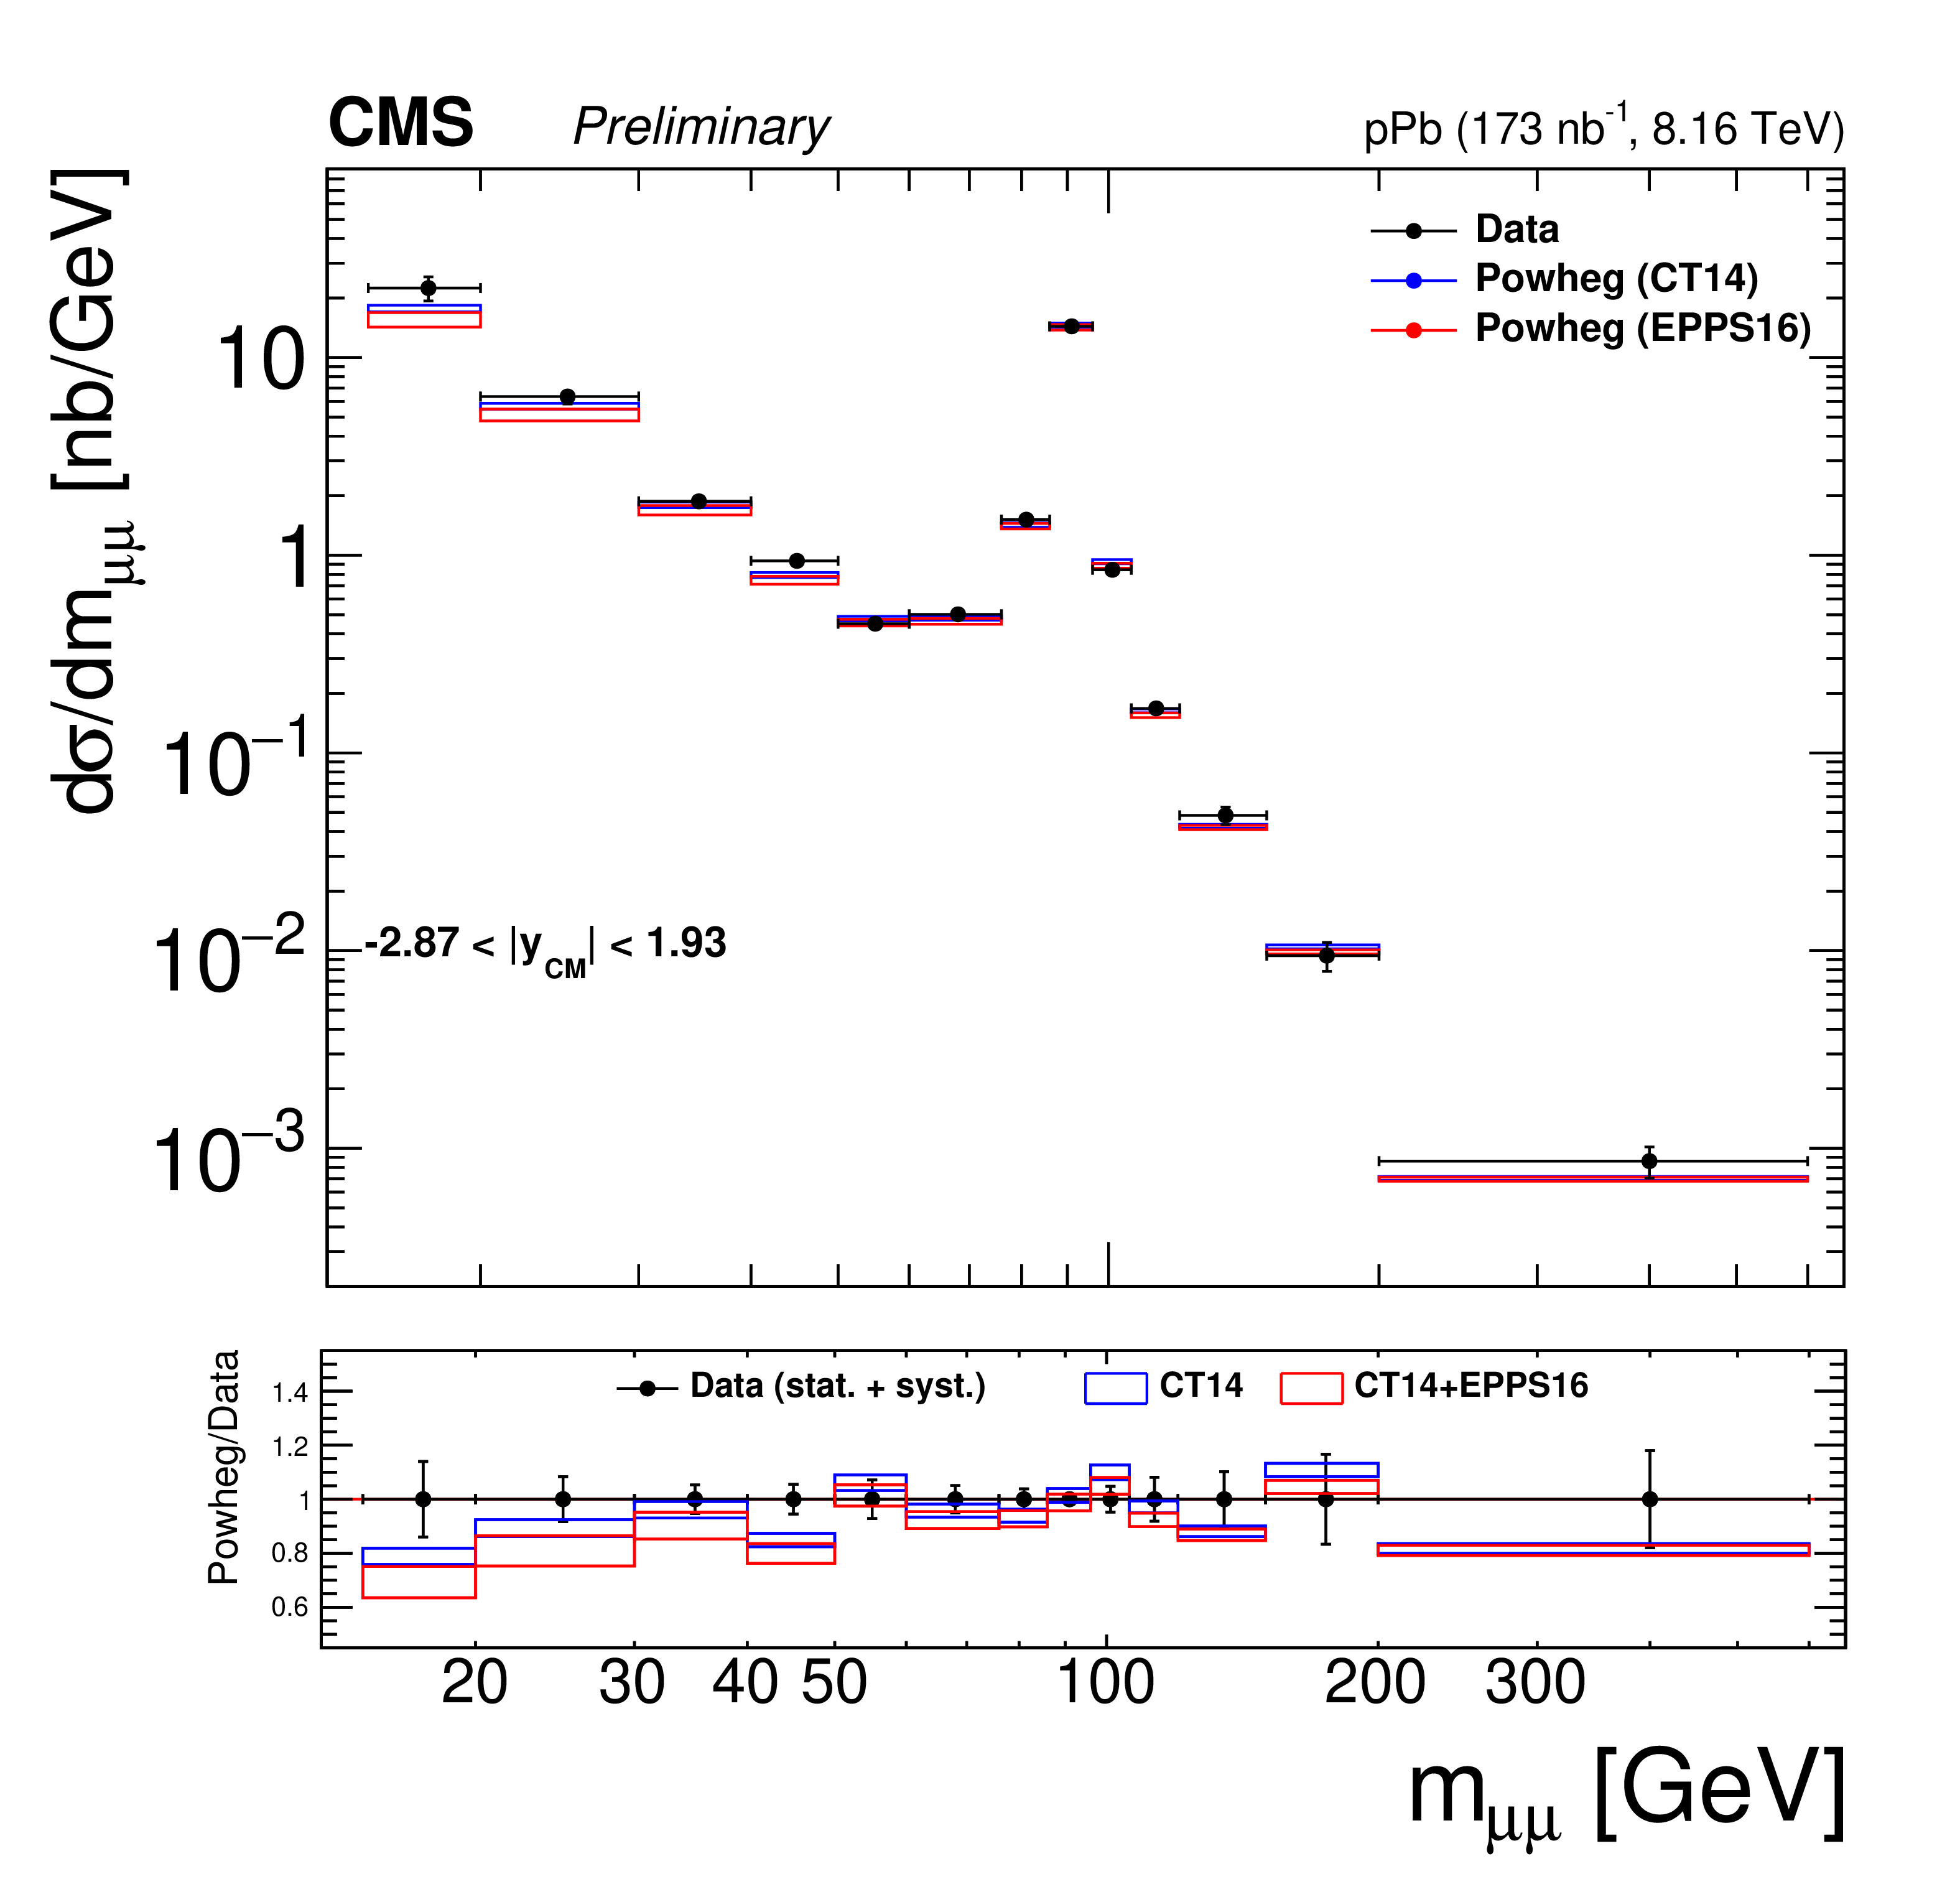
Figure 4-a:
Differential cross sections for the Drell-Yan process measured in the muon channel, as a function of invariant mass (top), rapidity in the center-of-mass frame (left), ${p_{\mathrm {T}}}$ (center) and ${\phi ^*}$ (right), for 15 $ < {m_{\mu \mu}} < $ 60 GeV (middle row) and 60 $ < {m_{\mu \mu}} < $ 120 GeV (bottom row). The first bin of the ${p_{\mathrm {T}}}$ and ${\phi ^*}$ measurements starts at 0. The error bars on the data represent the quadratic sum of the statistical and systematic uncertainties. Theory predictions from the {powheg} NLO generator are also provided, using CT14 (blue) or CT14+EPPS16 (red). The boxes show the 68% confidence level (n)PDF uncertainty on this prediction. The ratio of the predictions to the data is shown in the bottom panels, where the data and nPDF uncertainties are given separately, respectively as error bars around one and coloured boxes. |
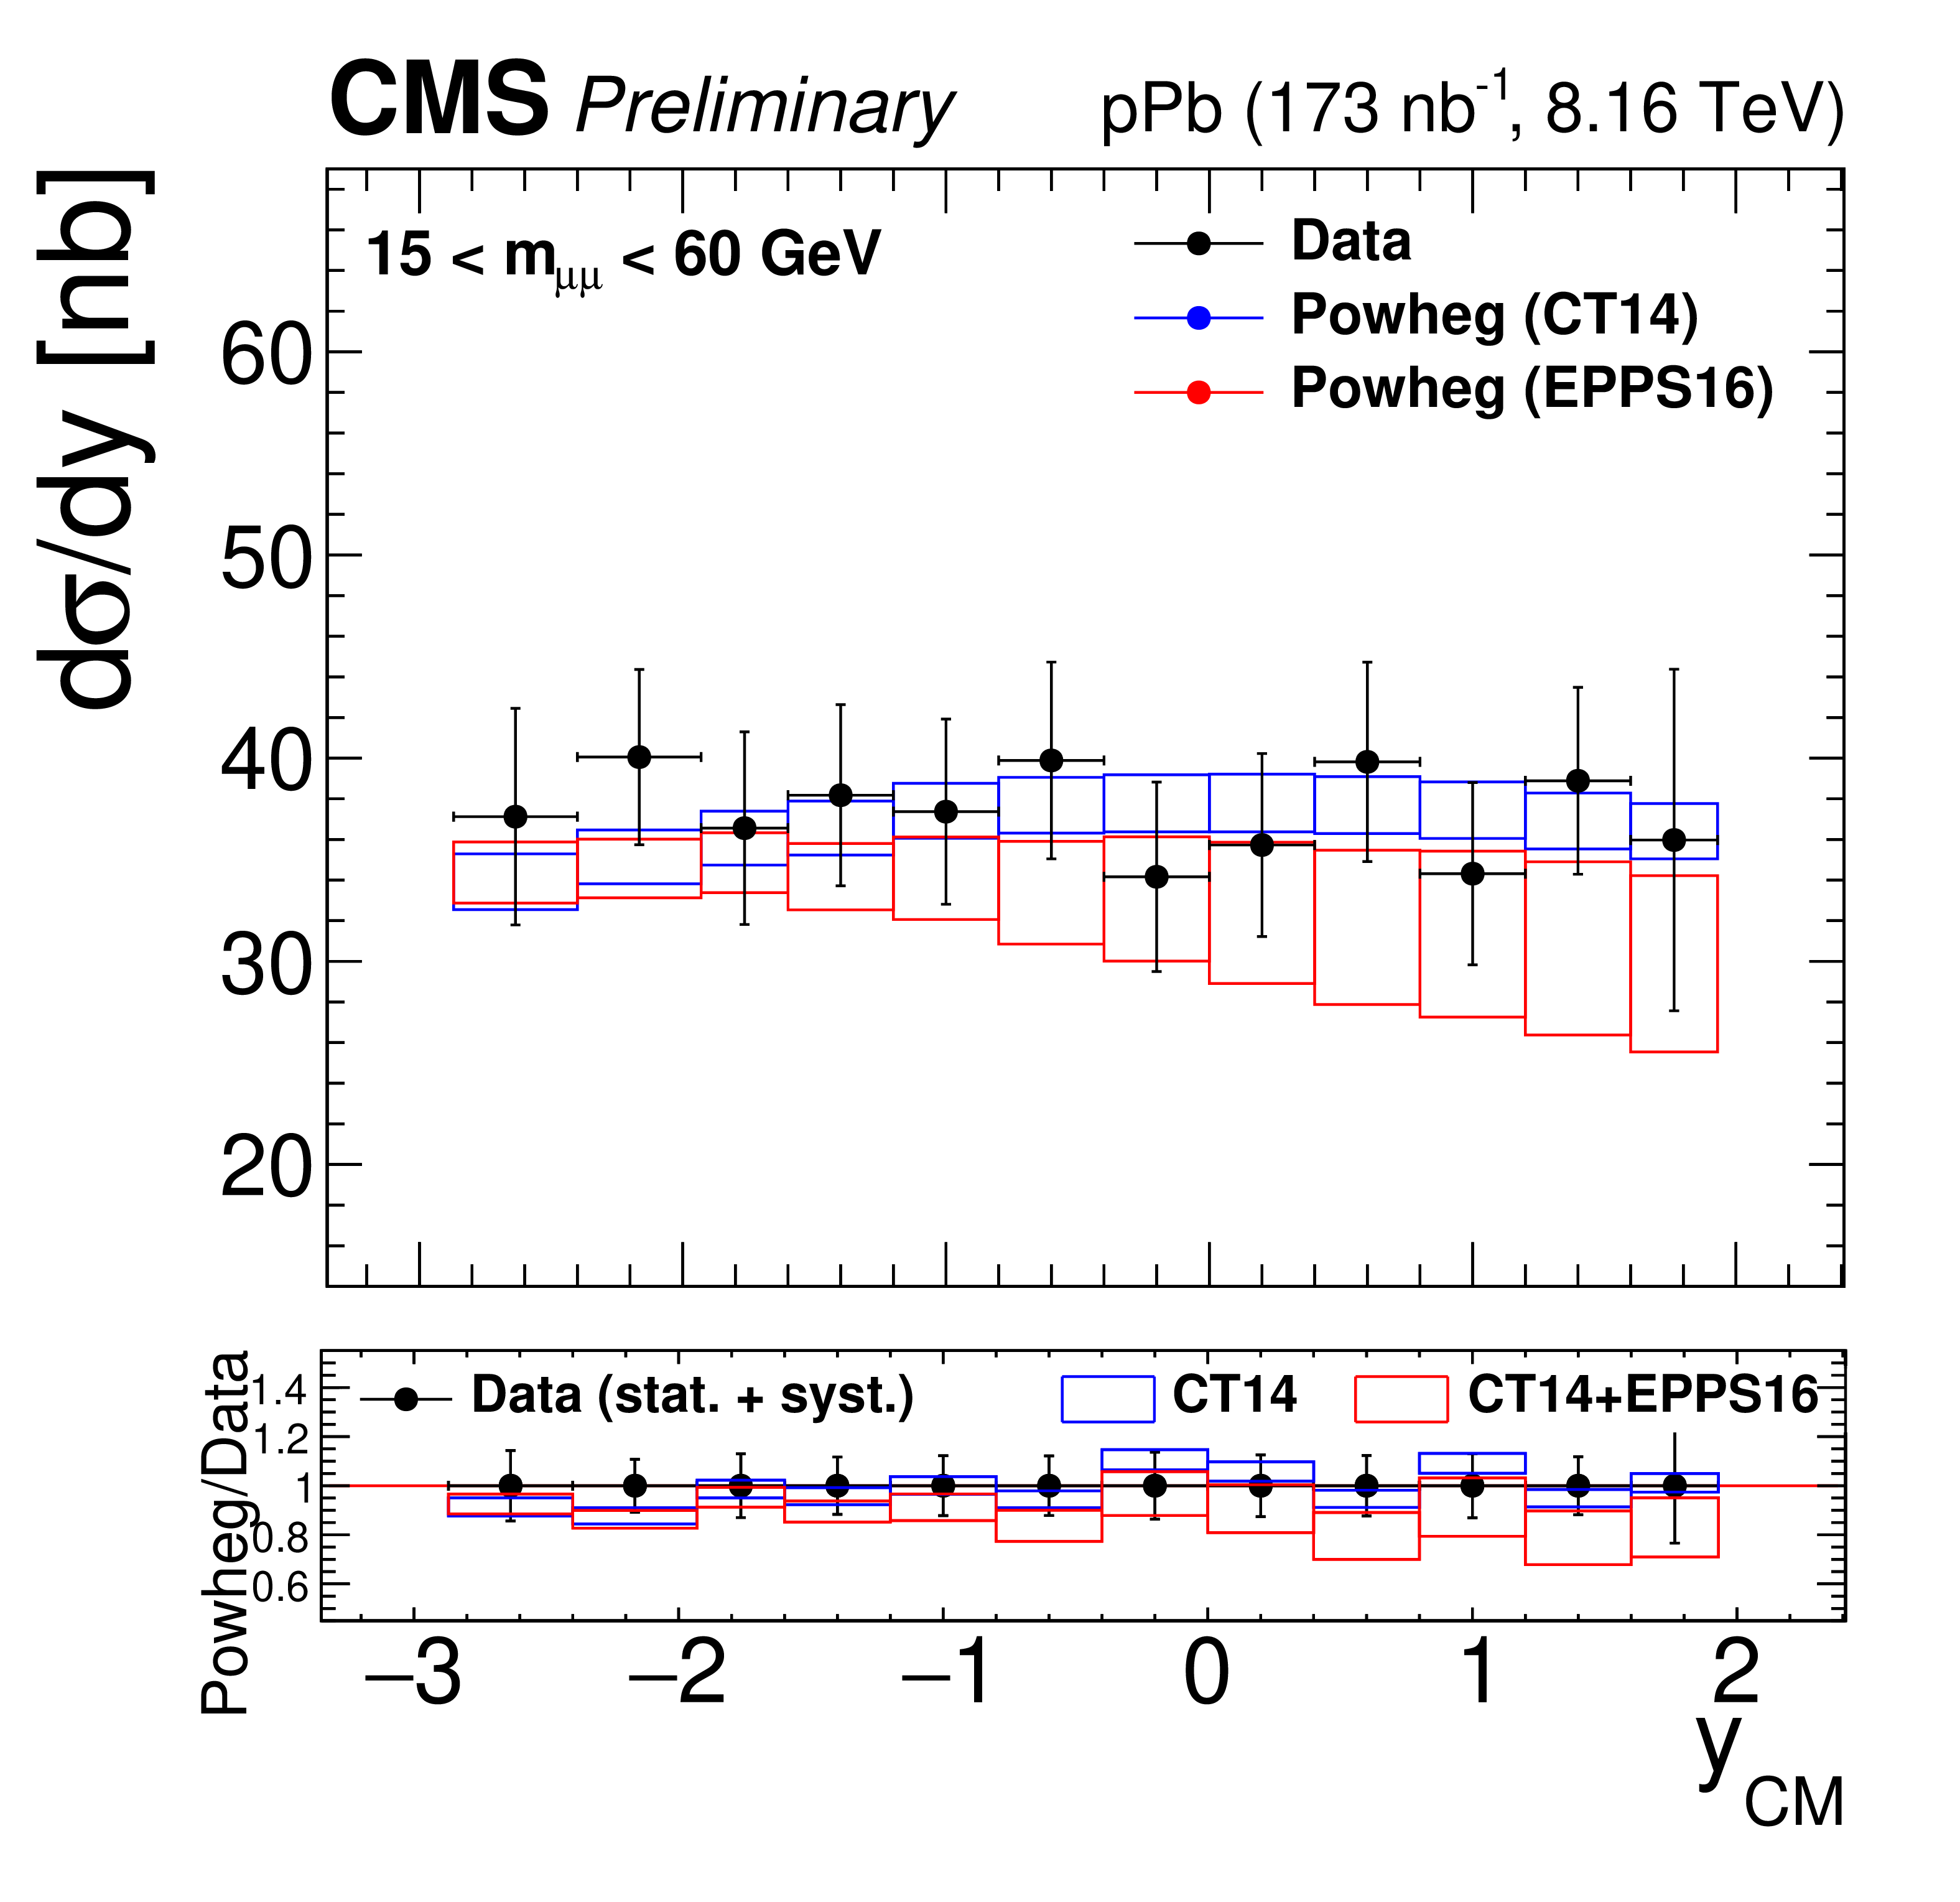
png pdf |
Figure 4-b:
Differential cross sections for the Drell-Yan process measured in the muon channel, as a function of invariant mass (top), rapidity in the center-of-mass frame (left), ${p_{\mathrm {T}}}$ (center) and ${\phi ^*}$ (right), for 15 $ < {m_{\mu \mu}} < $ 60 GeV (middle row) and 60 $ < {m_{\mu \mu}} < $ 120 GeV (bottom row). The first bin of the ${p_{\mathrm {T}}}$ and ${\phi ^*}$ measurements starts at 0. The error bars on the data represent the quadratic sum of the statistical and systematic uncertainties. Theory predictions from the {powheg} NLO generator are also provided, using CT14 (blue) or CT14+EPPS16 (red). The boxes show the 68% confidence level (n)PDF uncertainty on this prediction. The ratio of the predictions to the data is shown in the bottom panels, where the data and nPDF uncertainties are given separately, respectively as error bars around one and coloured boxes. |
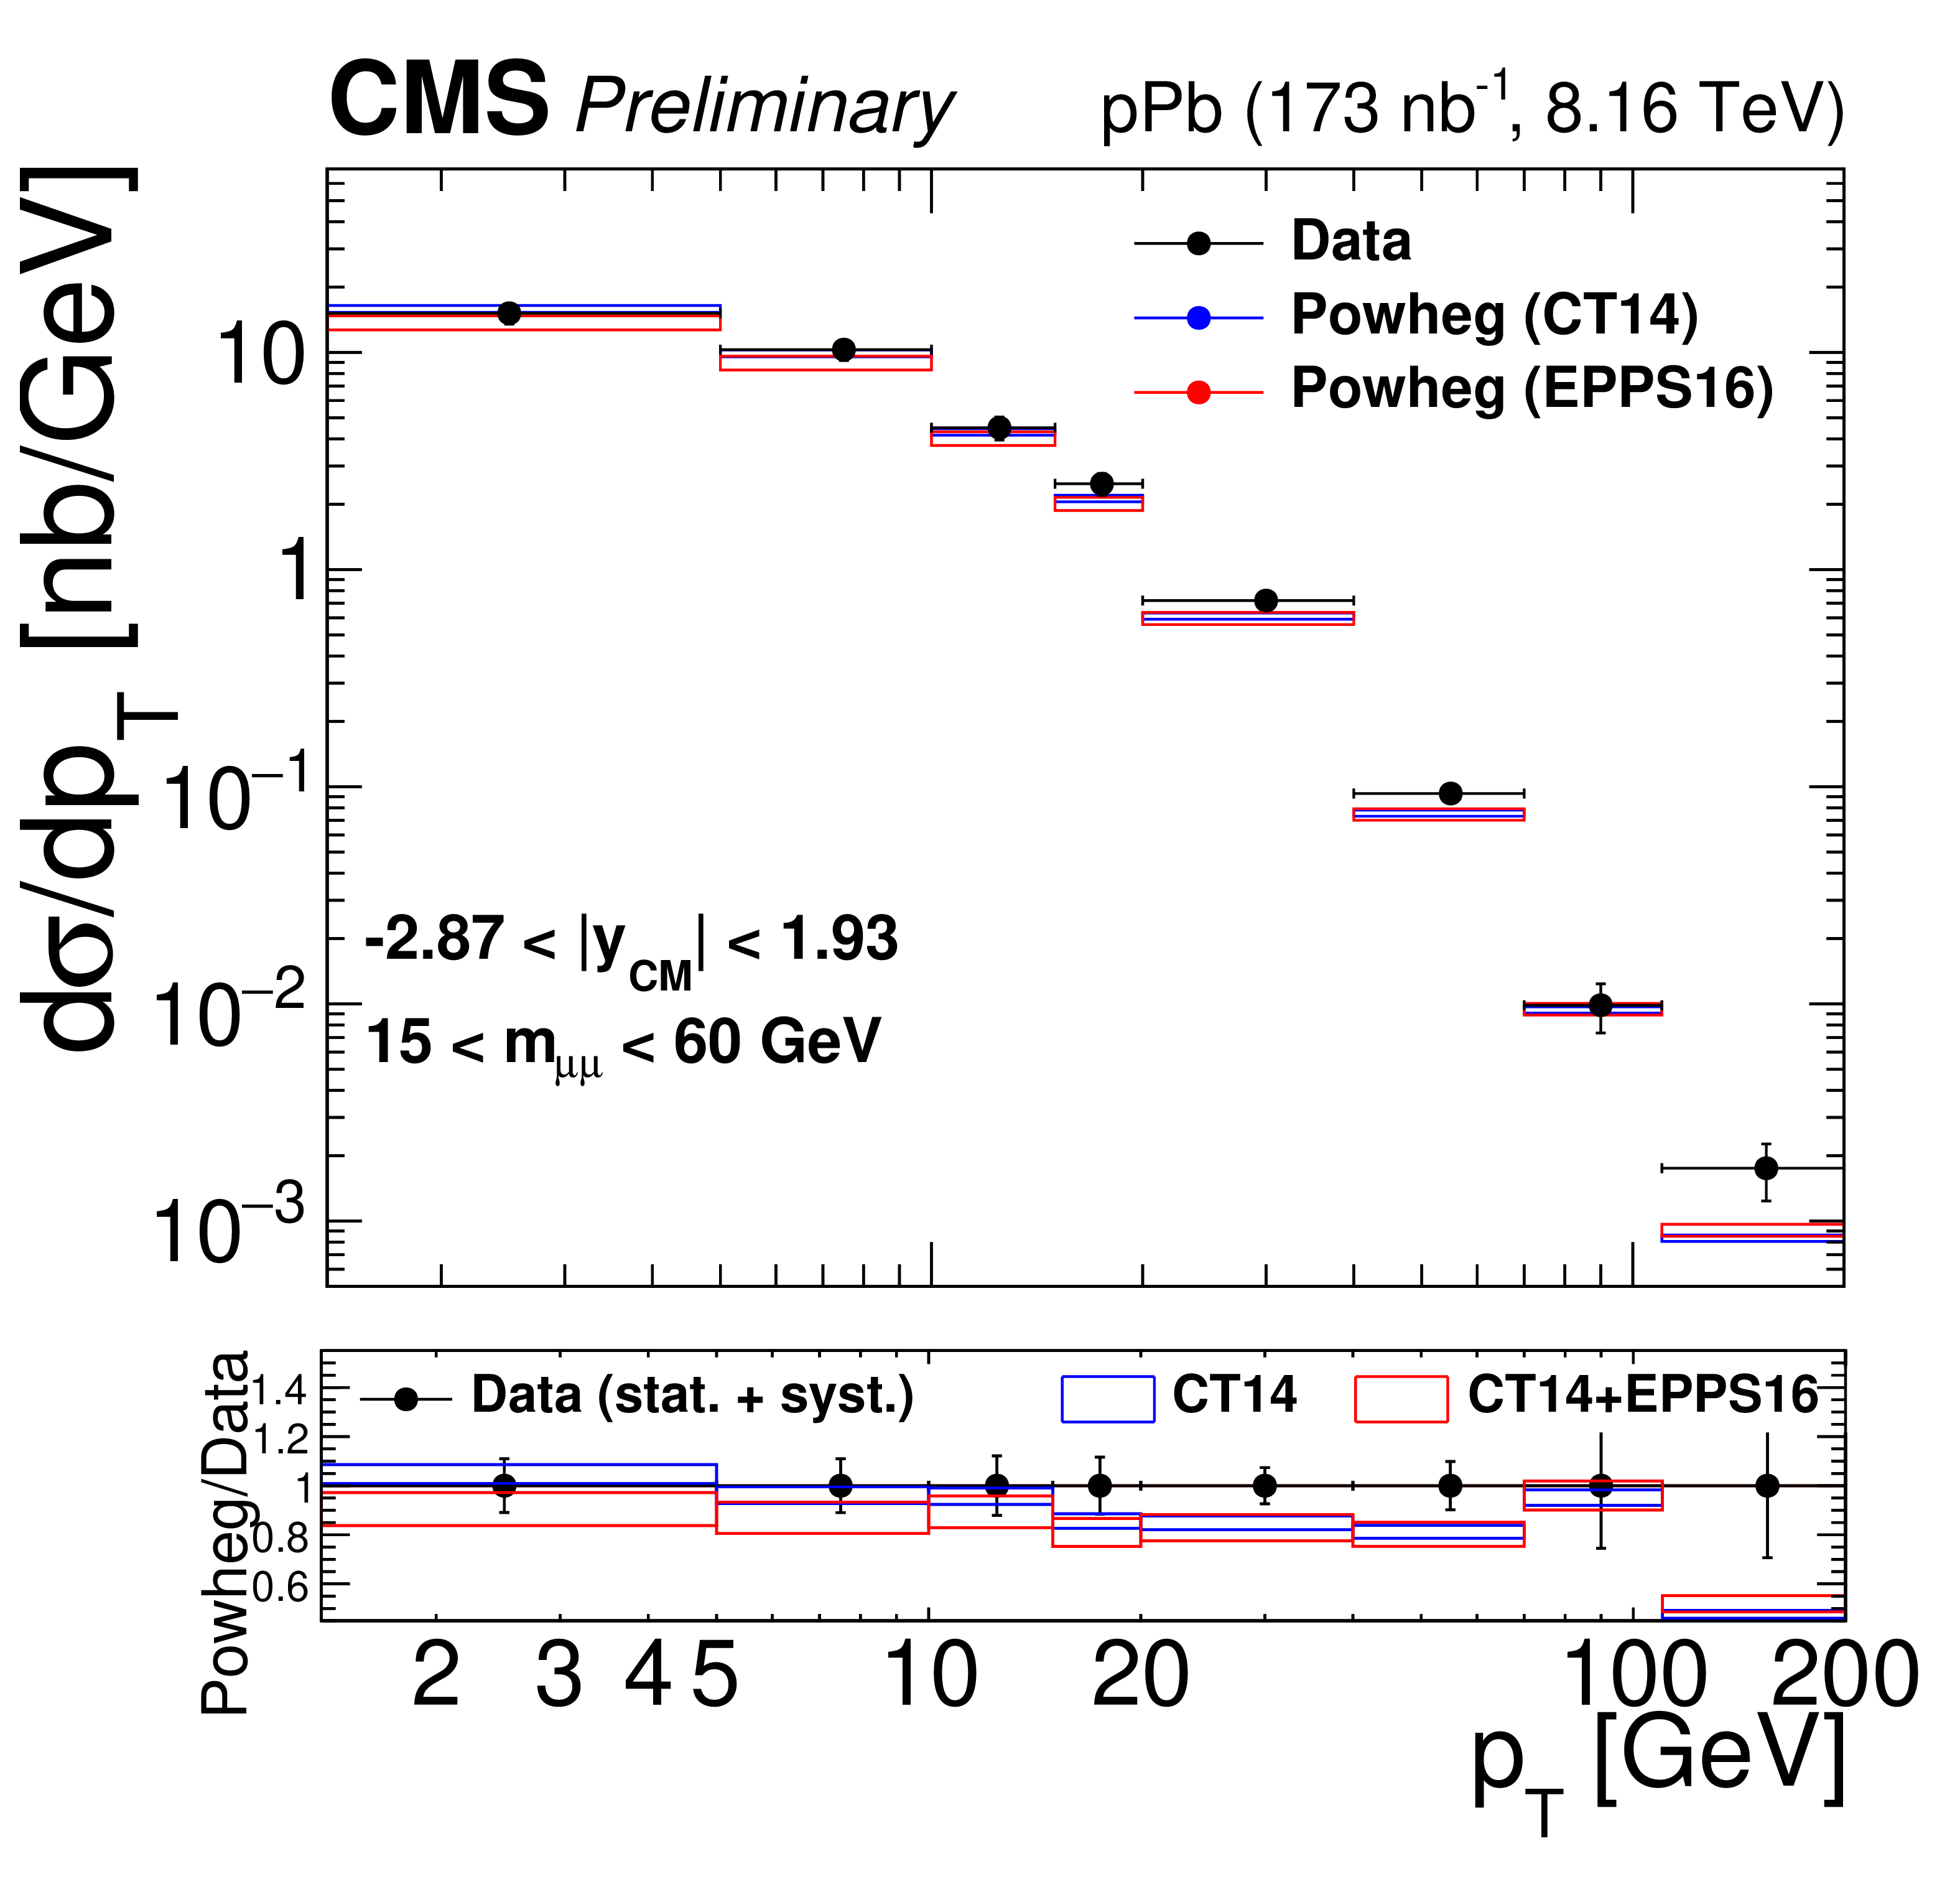
png pdf |
Figure 4-c:
Differential cross sections for the Drell-Yan process measured in the muon channel, as a function of invariant mass (top), rapidity in the center-of-mass frame (left), ${p_{\mathrm {T}}}$ (center) and ${\phi ^*}$ (right), for 15 $ < {m_{\mu \mu}} < $ 60 GeV (middle row) and 60 $ < {m_{\mu \mu}} < $ 120 GeV (bottom row). The first bin of the ${p_{\mathrm {T}}}$ and ${\phi ^*}$ measurements starts at 0. The error bars on the data represent the quadratic sum of the statistical and systematic uncertainties. Theory predictions from the {powheg} NLO generator are also provided, using CT14 (blue) or CT14+EPPS16 (red). The boxes show the 68% confidence level (n)PDF uncertainty on this prediction. The ratio of the predictions to the data is shown in the bottom panels, where the data and nPDF uncertainties are given separately, respectively as error bars around one and coloured boxes. |
png pdf |
Figure 4-d:
Differential cross sections for the Drell-Yan process measured in the muon channel, as a function of invariant mass (top), rapidity in the center-of-mass frame (left), ${p_{\mathrm {T}}}$ (center) and ${\phi ^*}$ (right), for 15 $ < {m_{\mu \mu}} < $ 60 GeV (middle row) and 60 $ < {m_{\mu \mu}} < $ 120 GeV (bottom row). The first bin of the ${p_{\mathrm {T}}}$ and ${\phi ^*}$ measurements starts at 0. The error bars on the data represent the quadratic sum of the statistical and systematic uncertainties. Theory predictions from the {powheg} NLO generator are also provided, using CT14 (blue) or CT14+EPPS16 (red). The boxes show the 68% confidence level (n)PDF uncertainty on this prediction. The ratio of the predictions to the data is shown in the bottom panels, where the data and nPDF uncertainties are given separately, respectively as error bars around one and coloured boxes. |
png pdf |
Figure 4-e:
Differential cross sections for the Drell-Yan process measured in the muon channel, as a function of invariant mass (top), rapidity in the center-of-mass frame (left), ${p_{\mathrm {T}}}$ (center) and ${\phi ^*}$ (right), for 15 $ < {m_{\mu \mu}} < $ 60 GeV (middle row) and 60 $ < {m_{\mu \mu}} < $ 120 GeV (bottom row). The first bin of the ${p_{\mathrm {T}}}$ and ${\phi ^*}$ measurements starts at 0. The error bars on the data represent the quadratic sum of the statistical and systematic uncertainties. Theory predictions from the {powheg} NLO generator are also provided, using CT14 (blue) or CT14+EPPS16 (red). The boxes show the 68% confidence level (n)PDF uncertainty on this prediction. The ratio of the predictions to the data is shown in the bottom panels, where the data and nPDF uncertainties are given separately, respectively as error bars around one and coloured boxes. |
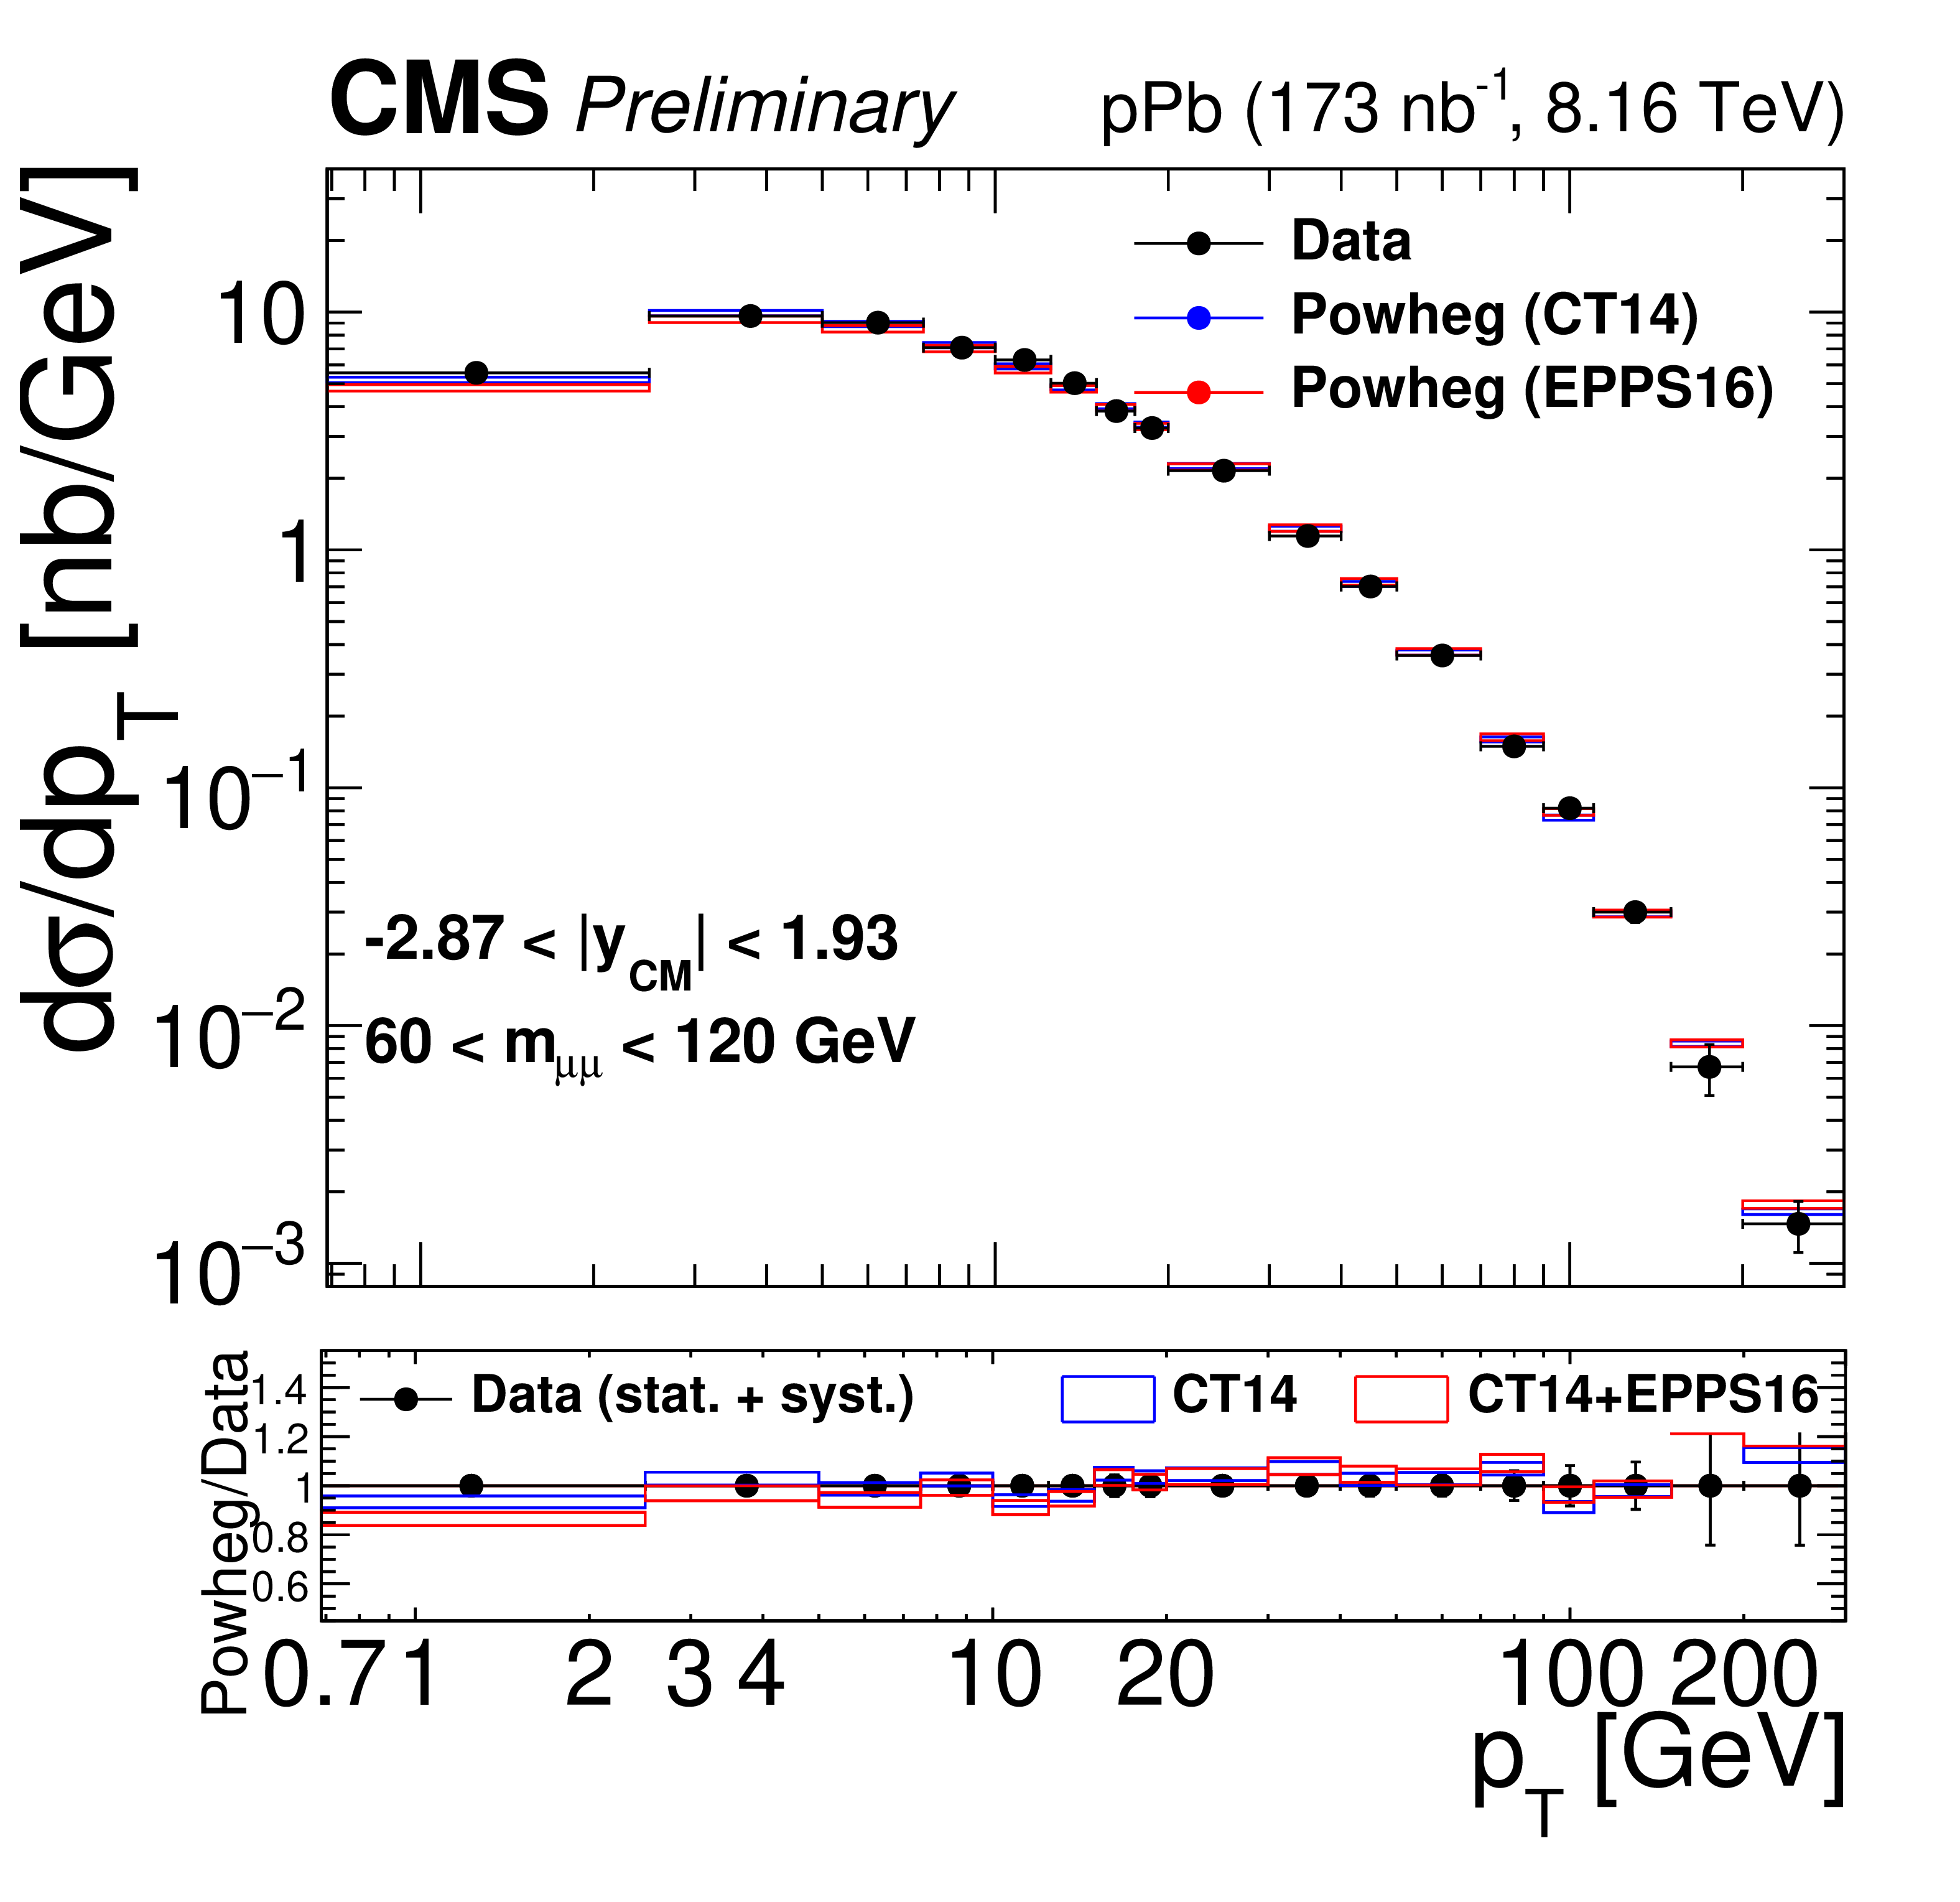
png pdf |
Figure 4-f:
Differential cross sections for the Drell-Yan process measured in the muon channel, as a function of invariant mass (top), rapidity in the center-of-mass frame (left), ${p_{\mathrm {T}}}$ (center) and ${\phi ^*}$ (right), for 15 $ < {m_{\mu \mu}} < $ 60 GeV (middle row) and 60 $ < {m_{\mu \mu}} < $ 120 GeV (bottom row). The first bin of the ${p_{\mathrm {T}}}$ and ${\phi ^*}$ measurements starts at 0. The error bars on the data represent the quadratic sum of the statistical and systematic uncertainties. Theory predictions from the {powheg} NLO generator are also provided, using CT14 (blue) or CT14+EPPS16 (red). The boxes show the 68% confidence level (n)PDF uncertainty on this prediction. The ratio of the predictions to the data is shown in the bottom panels, where the data and nPDF uncertainties are given separately, respectively as error bars around one and coloured boxes. |
png pdf |
Figure 4-g:
Differential cross sections for the Drell-Yan process measured in the muon channel, as a function of invariant mass (top), rapidity in the center-of-mass frame (left), ${p_{\mathrm {T}}}$ (center) and ${\phi ^*}$ (right), for 15 $ < {m_{\mu \mu}} < $ 60 GeV (middle row) and 60 $ < {m_{\mu \mu}} < $ 120 GeV (bottom row). The first bin of the ${p_{\mathrm {T}}}$ and ${\phi ^*}$ measurements starts at 0. The error bars on the data represent the quadratic sum of the statistical and systematic uncertainties. Theory predictions from the {powheg} NLO generator are also provided, using CT14 (blue) or CT14+EPPS16 (red). The boxes show the 68% confidence level (n)PDF uncertainty on this prediction. The ratio of the predictions to the data is shown in the bottom panels, where the data and nPDF uncertainties are given separately, respectively as error bars around one and coloured boxes. |
png pdf |
Figure 5:
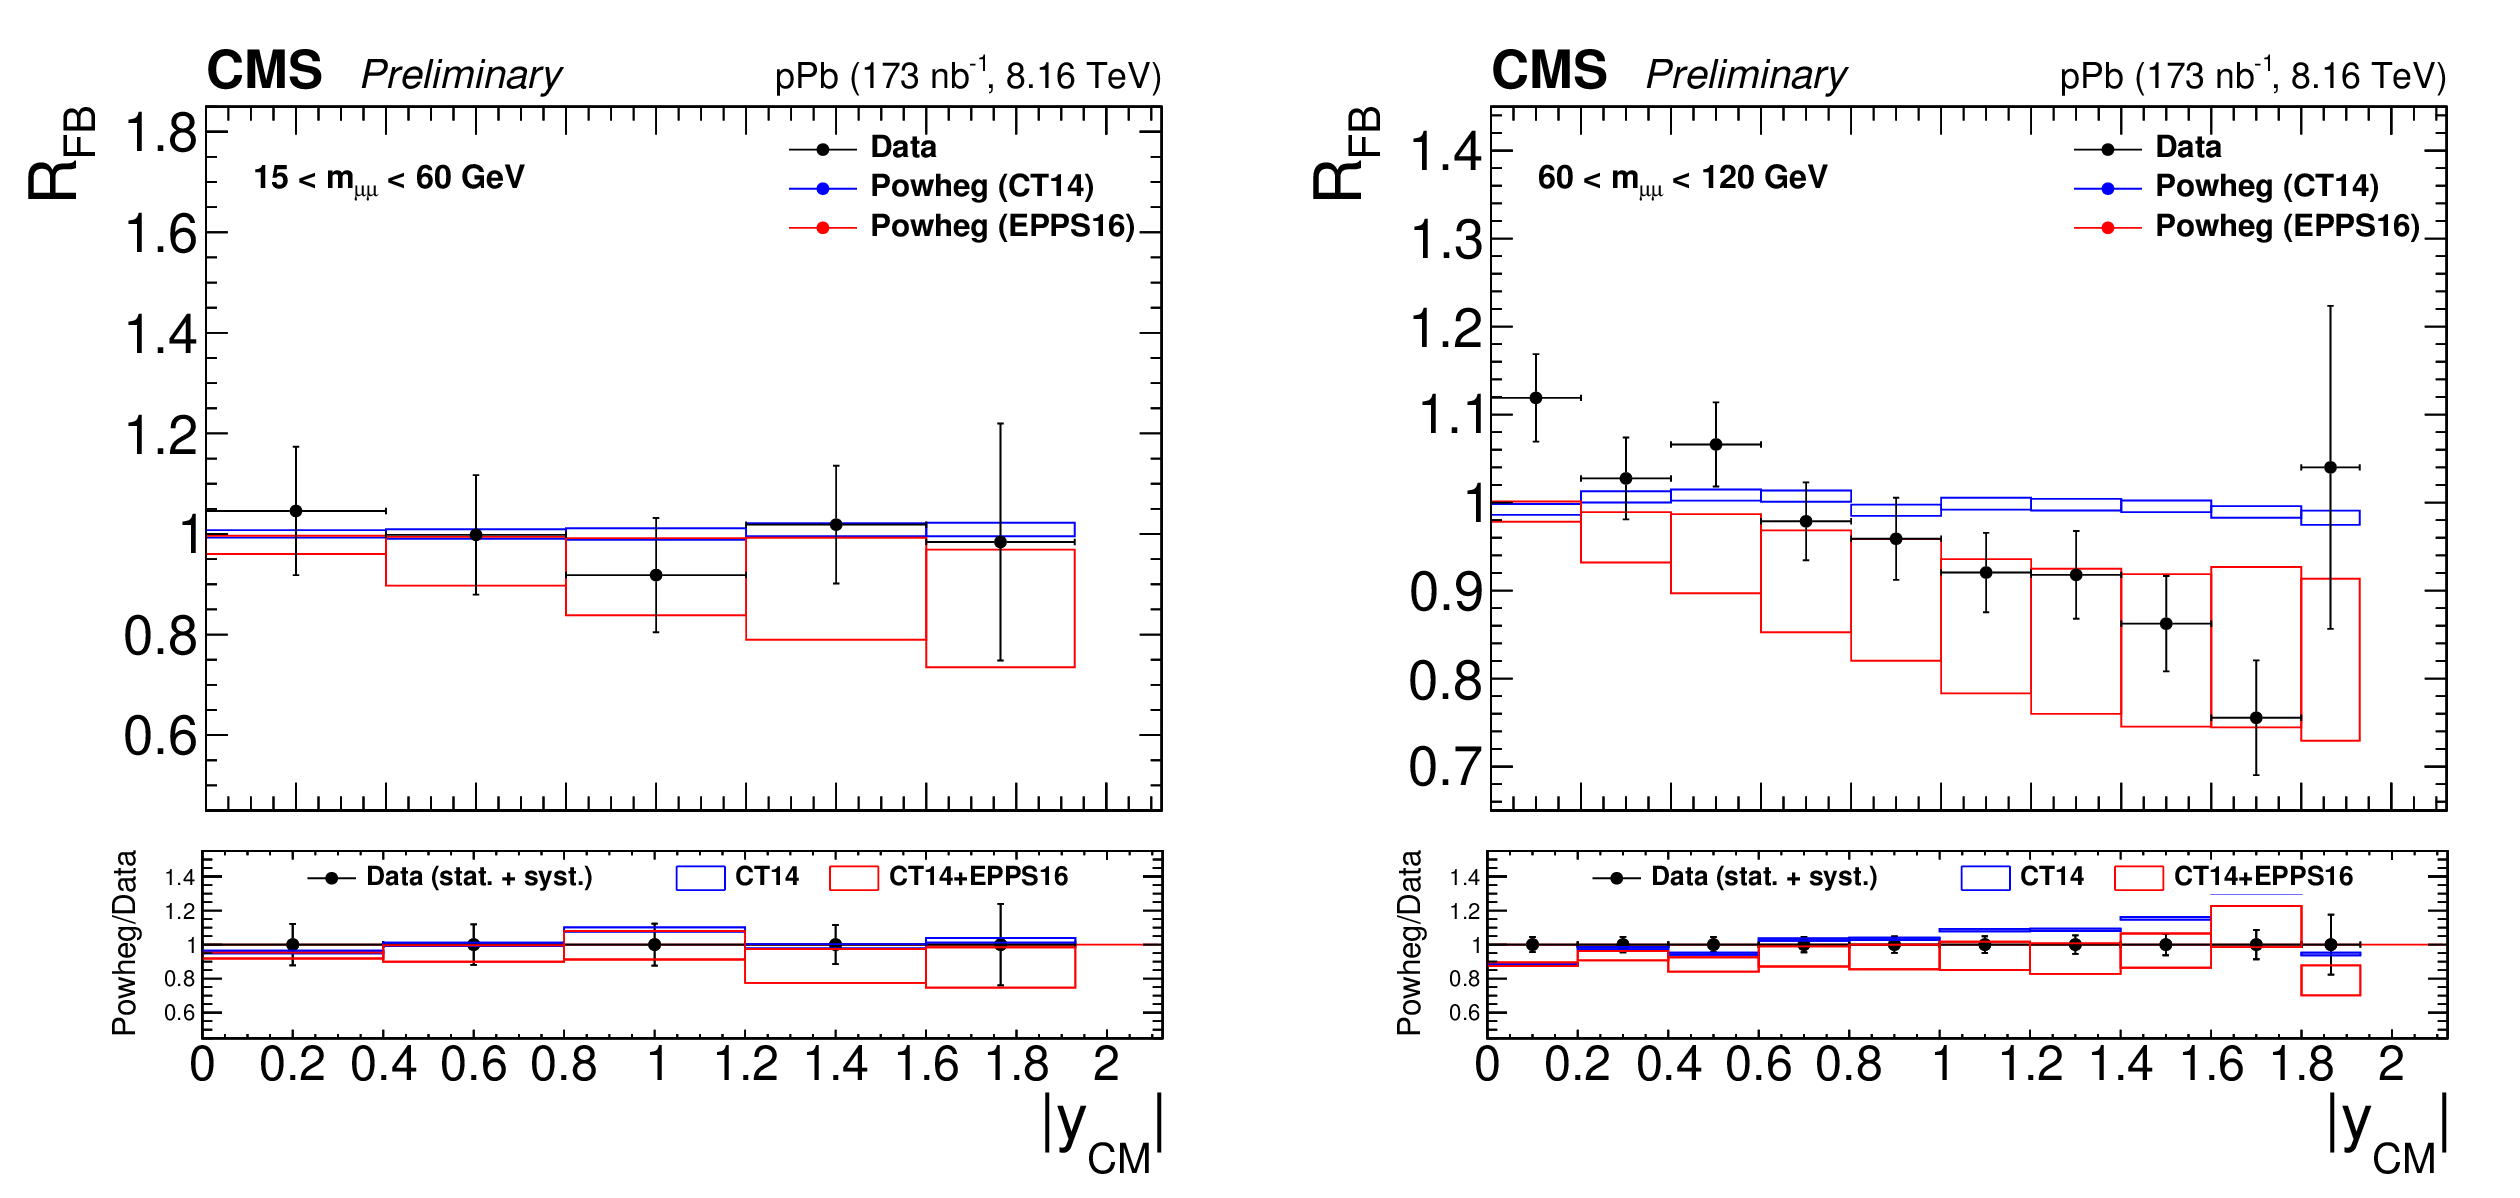
Forward-backward ratios for 15 $ < {m_{\mu \mu}} < $ 60 GeV (left) and 60 $ < {m_{\mu \mu}} < $ 120 GeV (right). The error bars on the data represent the quadratic sum of the statistical and systematic uncertainties. The theory predictions from the {powheg} NLO generator are also provided, using CT14 (blue) or CT14+EPPS16 (red). The boxes show the 68% confidence level (n)PDF uncertainty on this prediction. The ratio of the predictions to the data is shown in the bottom panels, where the data and nPDF uncertainties are given separately, respectively as error bars around one and coloured boxes. |
png pdf |
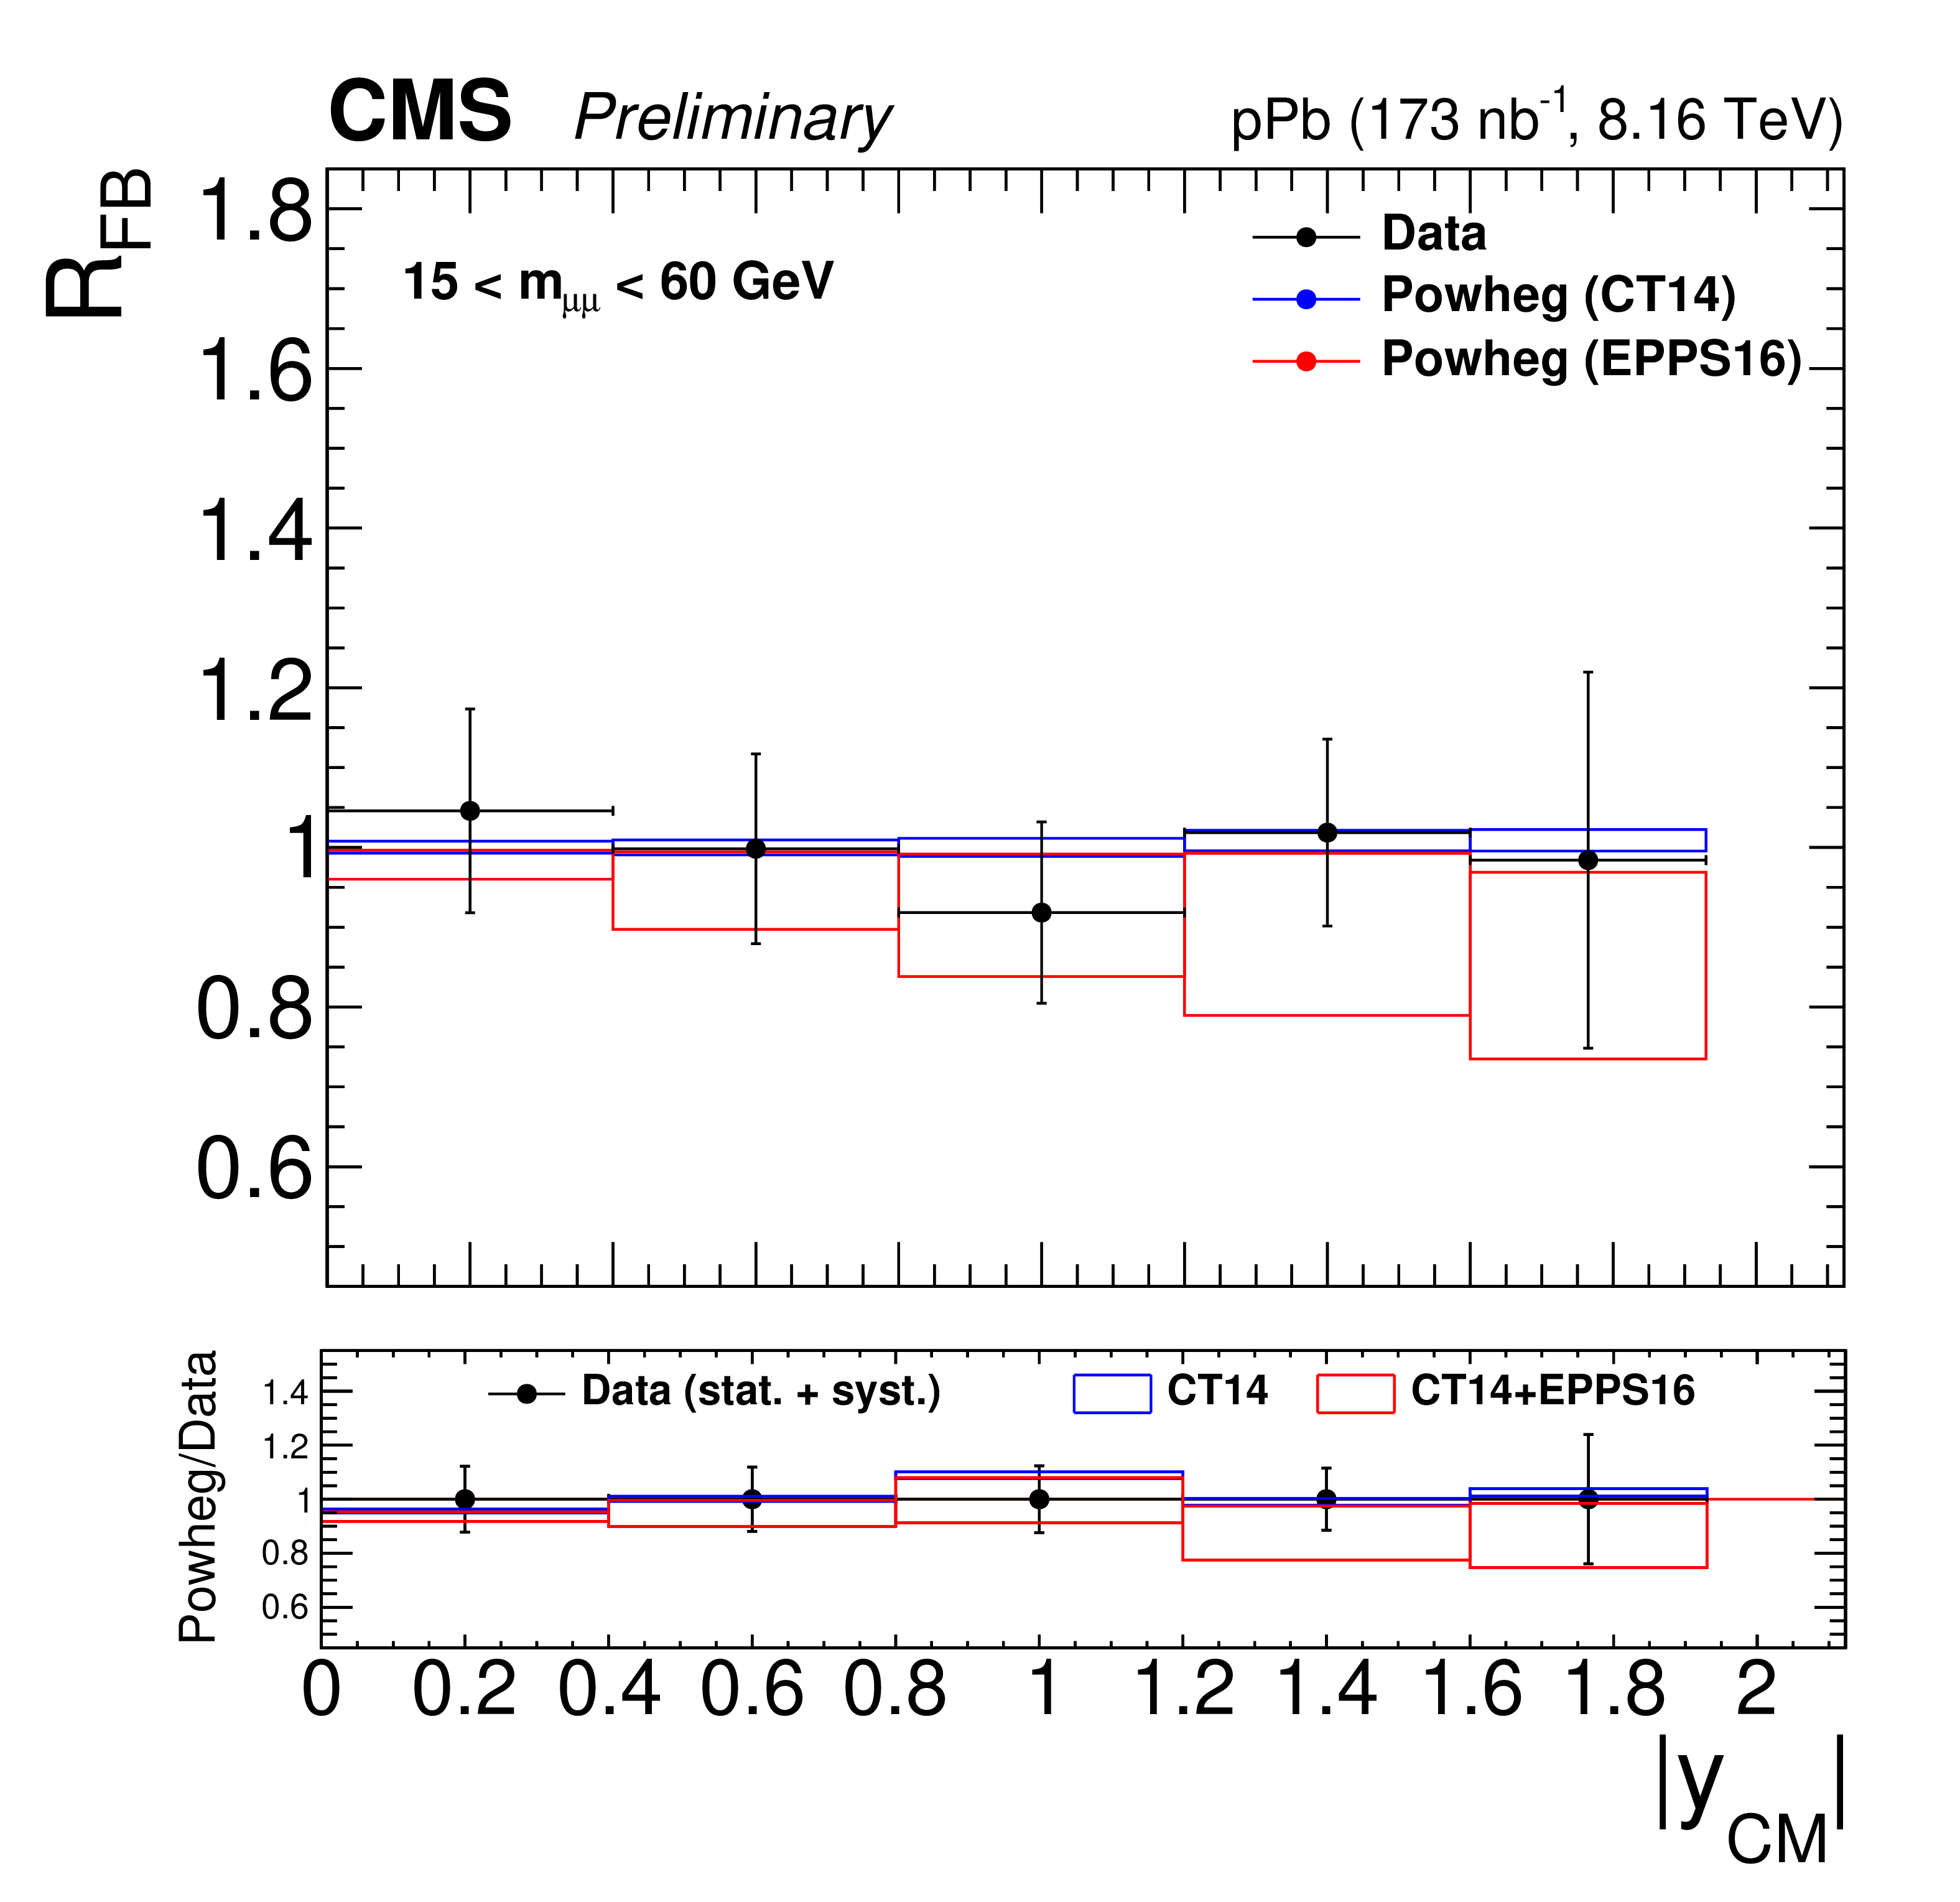
Figure 5-a:
Forward-backward ratios for 15 $ < {m_{\mu \mu}} < $ 60 GeV (left) and 60 $ < {m_{\mu \mu}} < $ 120 GeV (right). The error bars on the data represent the quadratic sum of the statistical and systematic uncertainties. The theory predictions from the {powheg} NLO generator are also provided, using CT14 (blue) or CT14+EPPS16 (red). The boxes show the 68% confidence level (n)PDF uncertainty on this prediction. The ratio of the predictions to the data is shown in the bottom panels, where the data and nPDF uncertainties are given separately, respectively as error bars around one and coloured boxes. |
png pdf |
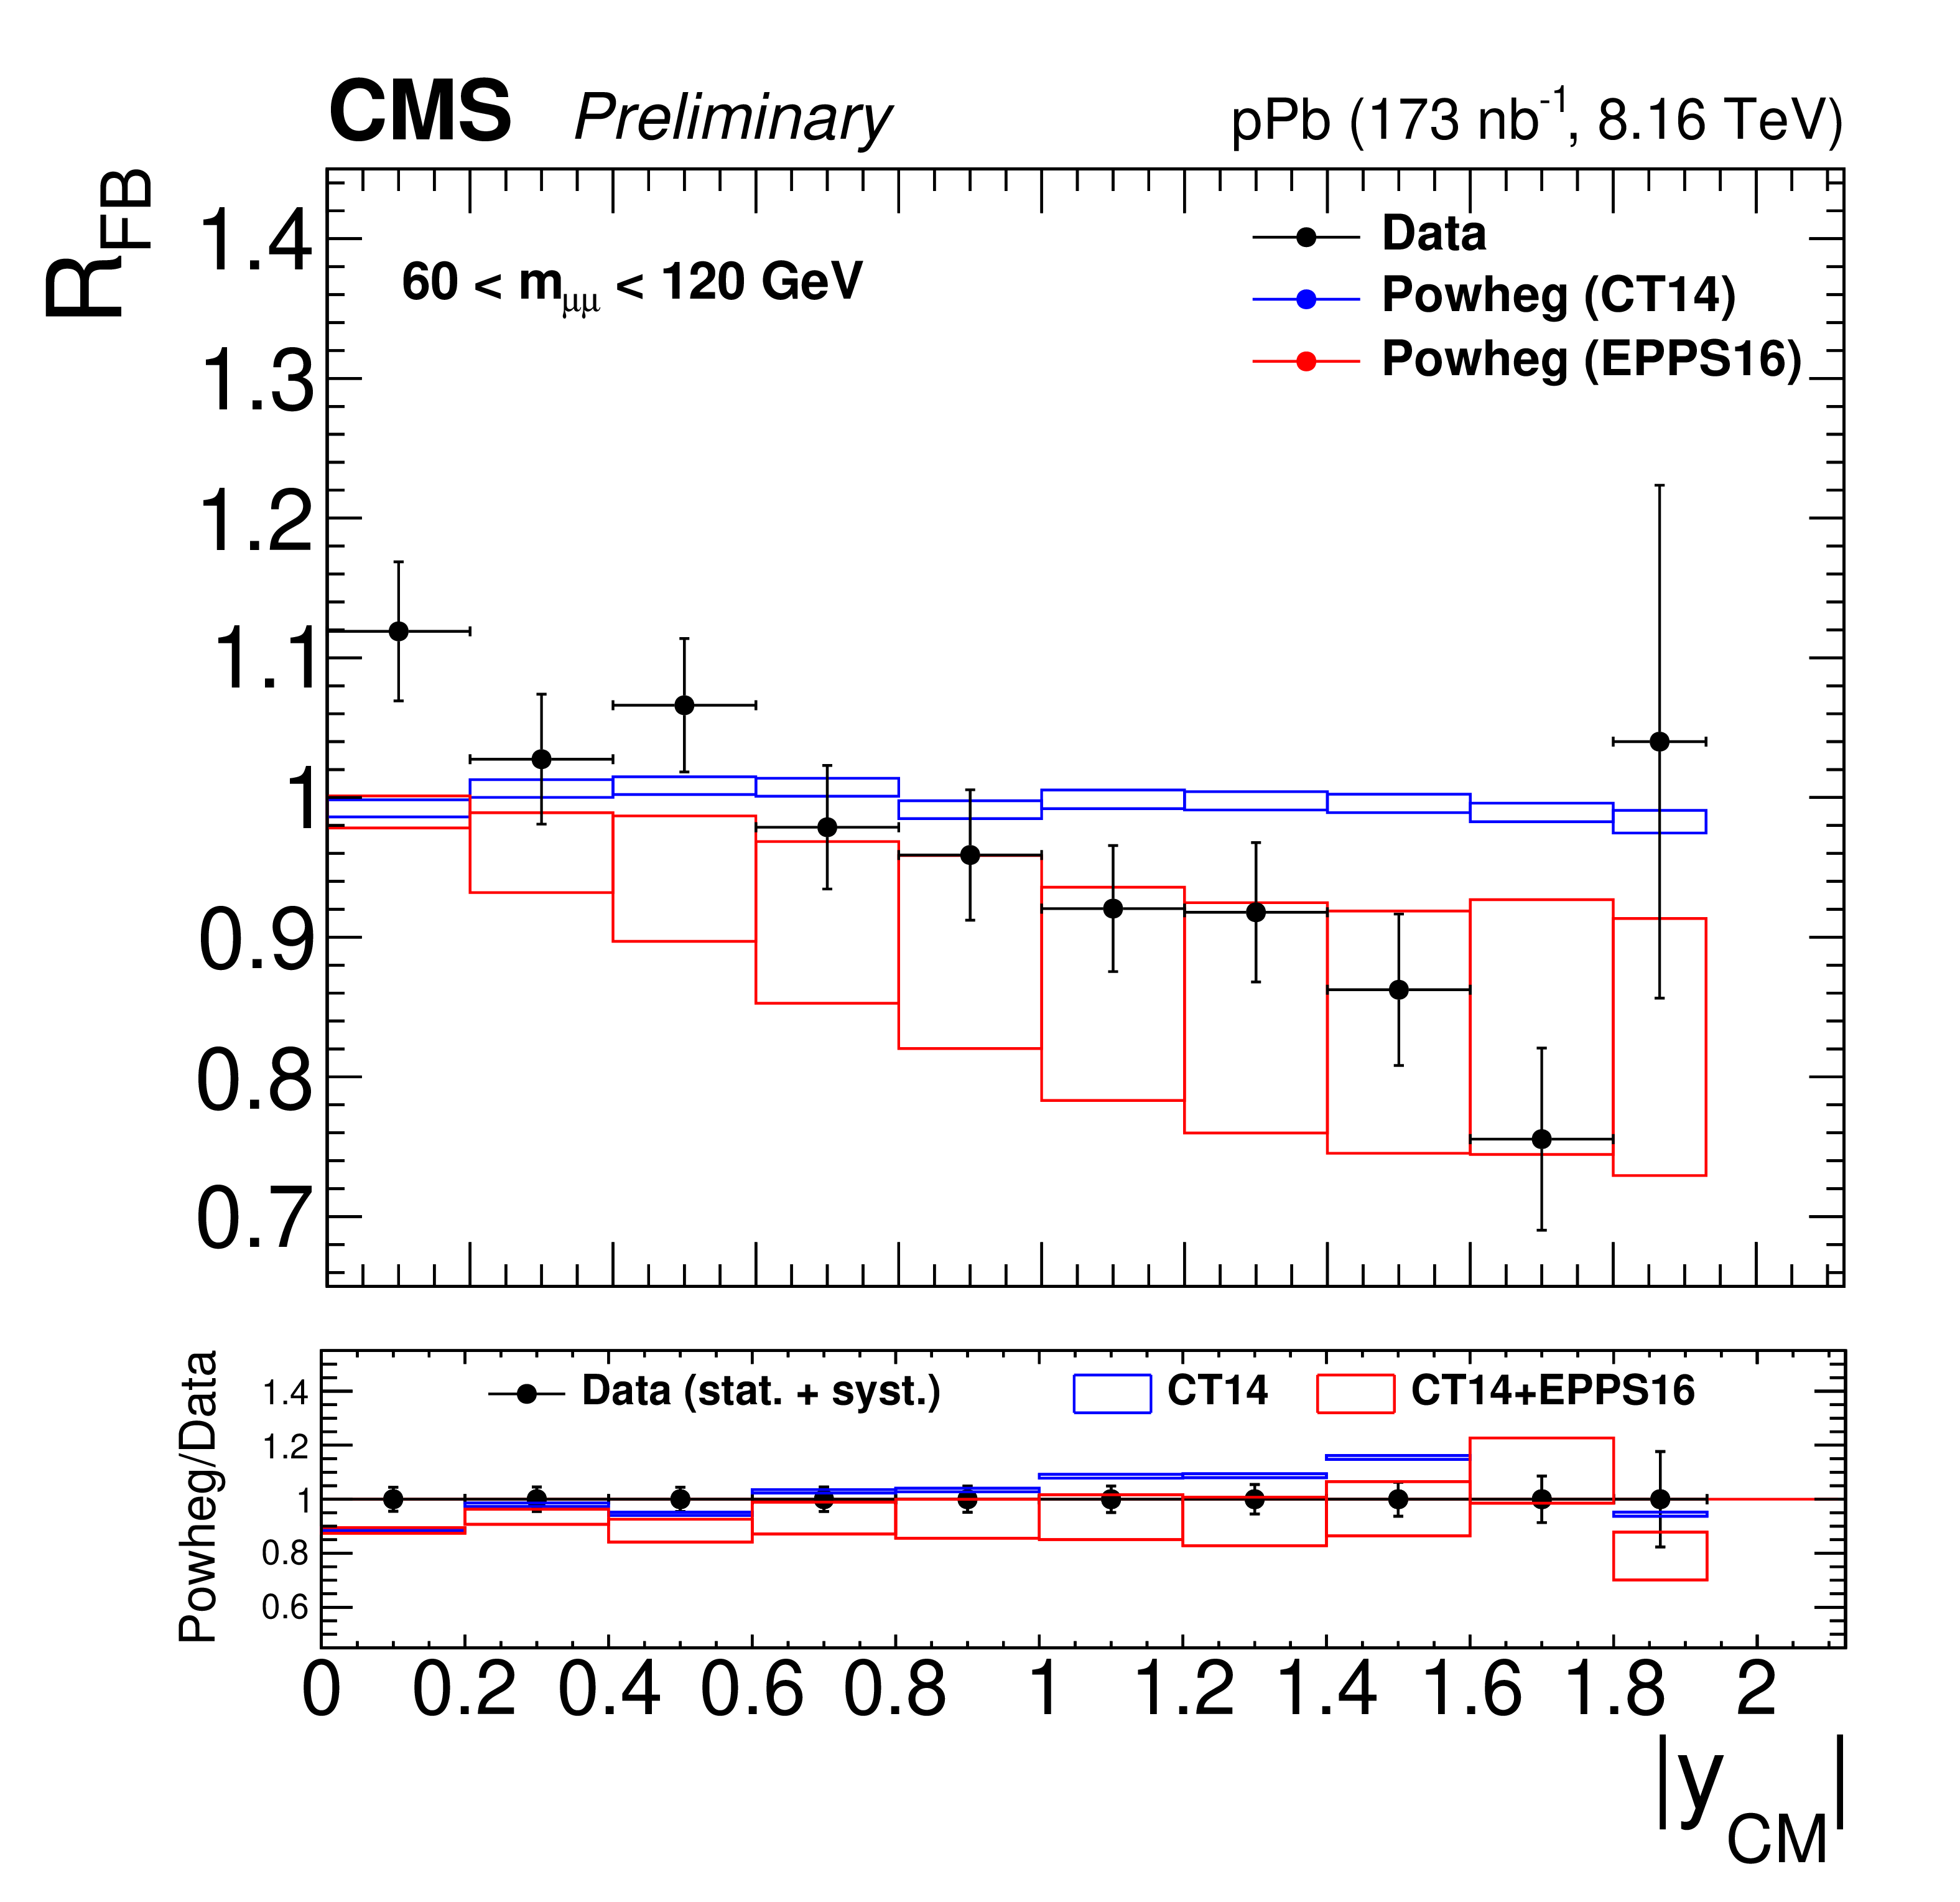
Figure 5-b:
Forward-backward ratios for 15 $ < {m_{\mu \mu}} < $ 60 GeV (left) and 60 $ < {m_{\mu \mu}} < $ 120 GeV (right). The error bars on the data represent the quadratic sum of the statistical and systematic uncertainties. The theory predictions from the {powheg} NLO generator are also provided, using CT14 (blue) or CT14+EPPS16 (red). The boxes show the 68% confidence level (n)PDF uncertainty on this prediction. The ratio of the predictions to the data is shown in the bottom panels, where the data and nPDF uncertainties are given separately, respectively as error bars around one and coloured boxes. |
| Tables | |
png pdf |
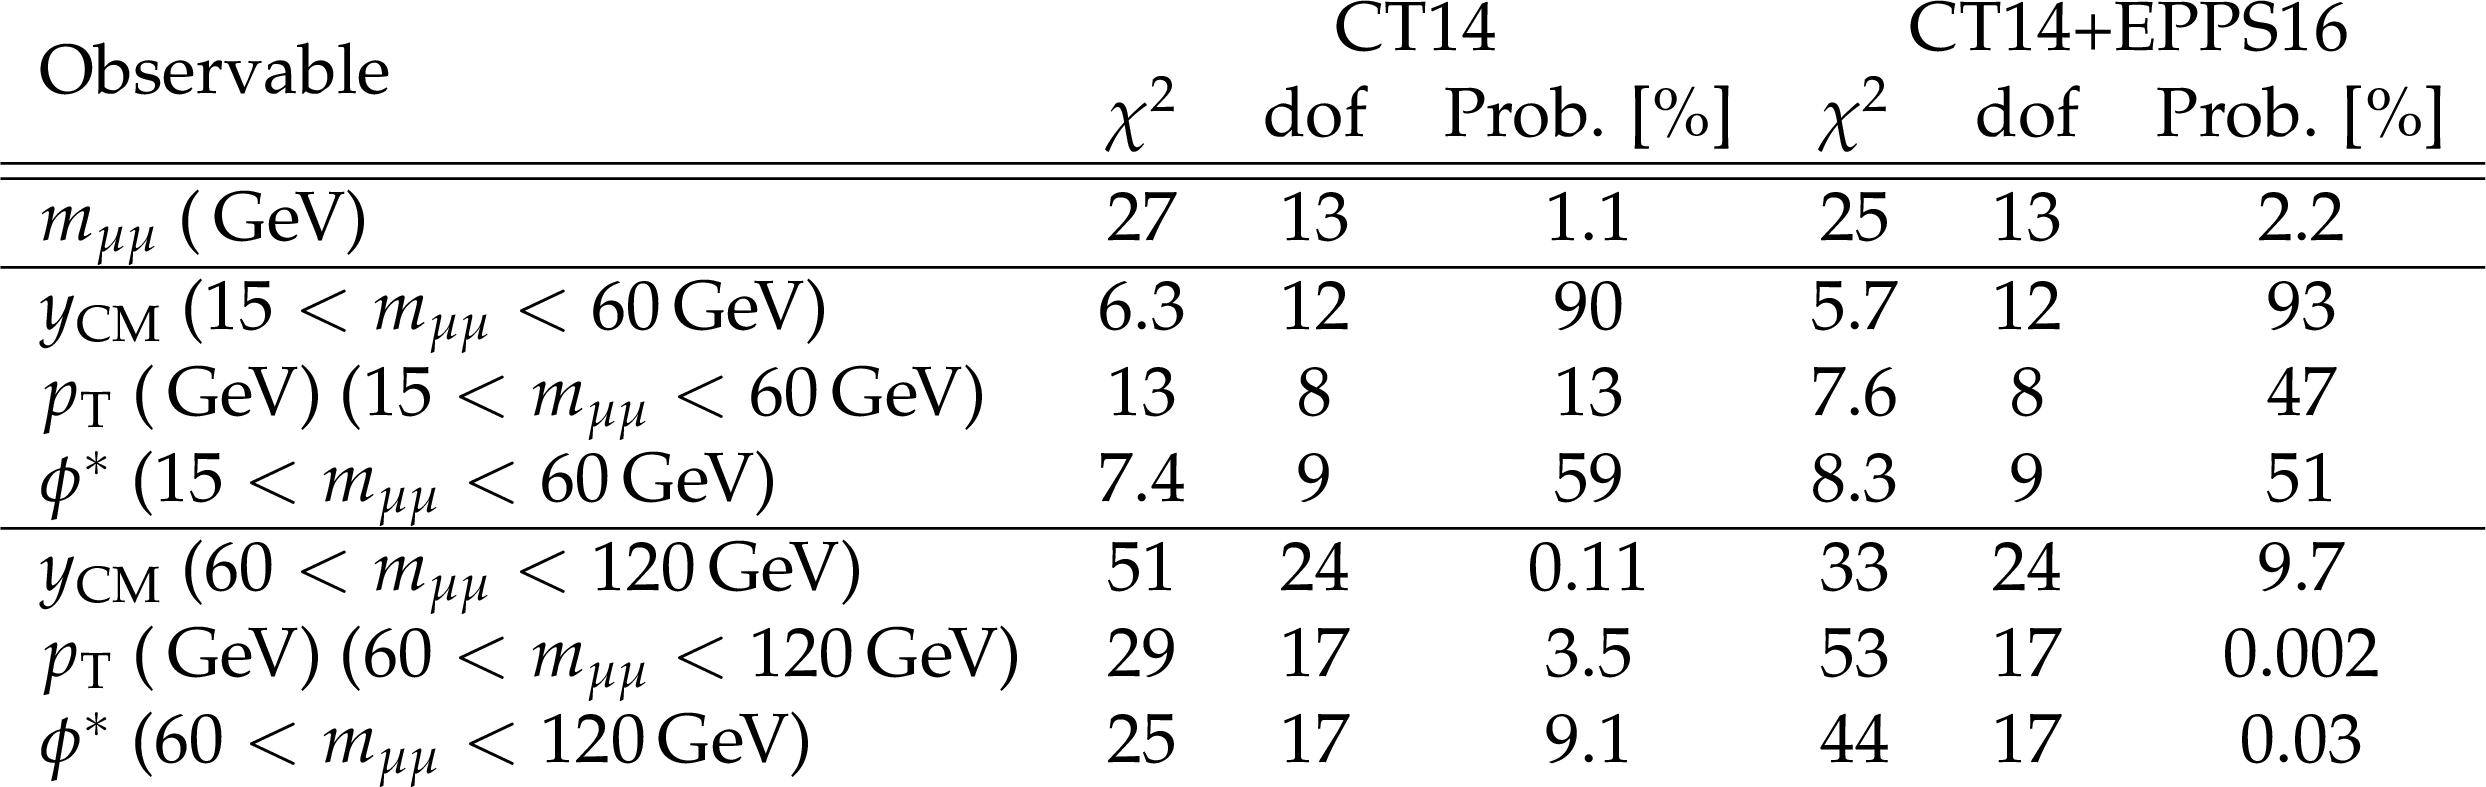
Table 1:
$\chi ^2$ values between the data and the {powheg} predictions, from the fiducial cross sections, when experimental and theoretical correlations are taken into account. The luminosity uncertainty is also included in the experimental uncertainties. |
png pdf |
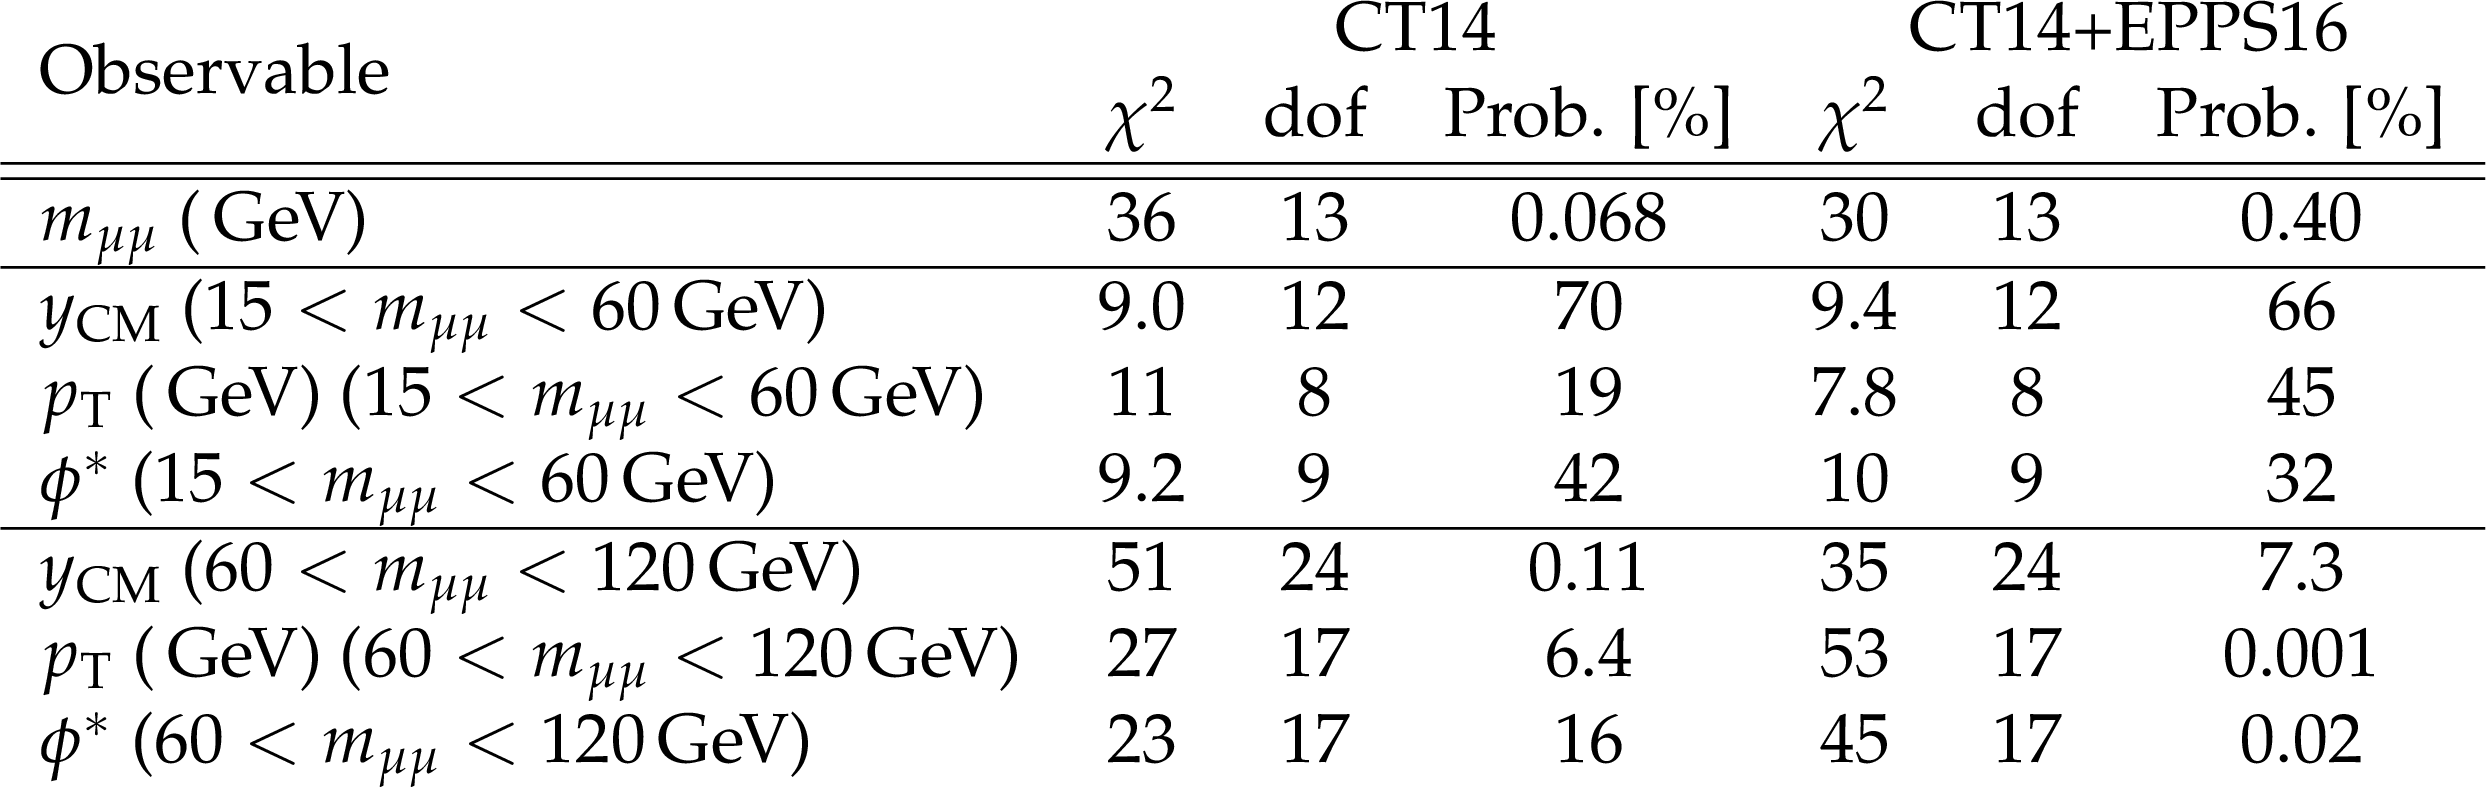
Table 2:
$\chi ^2$ values between the data and the {powheg} predictions, from the full phase space cross sections, when experimental and theoretical correlations are taken into account. The luminosity uncertainty is also included in the experimental uncertainties. |
| Summary |
| Differential cross section measurements of the Drell-Yan process in the dimuon channel in proton-lead collisions at ${{\sqrt {\smash [b]{s_{_{\mathrm {NN}}}}}}} = $ 8.16 TeV have been reported, including the ${p_{\mathrm{T}}}$ and rapidity dependencies in the Z boson mass region (60 $ < mmumu < $ 120 GeV). For the first time in heavy ion collisions, the ${p_{\mathrm{T}}}$ and rapidity dependence for smaller masses 15 $ < mmumu < $ 60 GeV, the ${\phi^*} $ dependence for both 15 $ < mmumu < $ 60 GeV and 60 $ < mmumu < $ 120 GeV, and the mass dependence from 15 to 600 GeV are measured. In addition, forward-backward ratios have been built from the rapidity-dependent cross sections, highlighting the presence of nuclear effects in the parton distribution functions. These new results may help constrain the quark and antiquark nuclear parton distribution functions, but also point to an imperfect modelling of the process in the POWHEG event generator, especially at low dimuon masses. |
| References | ||||
| 1 | R. Hamberg, W. L. van Neerven, and T. Matsuura | A complete calculation of the order $ \alpha^2_s $ correction to the Drell--Yan K-factor | NPB 359 (1991) 343, . [Erratum: \DOI10.1016/S0550-3213(02)00814-3] | |
| 2 | S. Catani et al. | Vector boson production at hadron colliders: a fully exclusive QCD calculation at next-to-next-to-leading order | PRL 103 (2009) 082001 | 0903.2120 |
| 3 | S. Catani and M. Grazzini | Next-to-next-to-leading-order subtraction formalism in hadron collisions and its application to Higgs-boson production at the Large Hadron Collider | PRL 98 (2007) 222002 | hep-ph/0703012 |
| 4 | K. Melnikov and F. Petriello | Electroweak gauge boson production at hadron colliders through O($ \alpha_s^2 $) | PRD 74 (2006) 114017 | hep-ph/0609070 |
| 5 | ATLAS Collaboration | Measurement of the high-mass Drell--Yan differential cross-section in pp collisions at $ \sqrt{s}= $ 7 TeV with the ATLAS detector | PLB 725 (2013) 223 | 1305.4192 |
| 6 | ATLAS Collaboration | Measurement of the low-mass Drell-Yan differential cross section at $ \sqrt{s} = $ 7 TeV using the ATLAS detector | JHEP 06 (2014) 112 | 1404.1212 |
| 7 | ATLAS Collaboration | Measurement of the double-differential high-mass Drell-Yan cross section in pp collisions at $ \sqrt{s}= $ 8 TeV with the ATLAS detector | JHEP 08 (2016) 009 | 1606.01736 |
| 8 | ATLAS Collaboration | Measurement of $ W^{\pm} $-boson and Z-boson production cross-sections in pp collisions at $ \sqrt{s}= $ 2.76 TeV with the ATLAS detector | EPJC 79 (2019), no. 11, 901 | 1907.03567 |
| 9 | ATLAS Collaboration | Measurement of the transverse momentum distribution of Drell-Yan lepton pairs in proton-proton collisions at $ \sqrt{s}= $ 13 TeV with the ATLAS detector | 1912.02844 | |
| 10 | CMS Collaboration | Measurement of the Drell-Yan cross section in pp collisions at $ \sqrt{s}= $ 7 TeV | JHEP 10 (2011) 007 | CMS-EWK-10-007 1108.0566 |
| 11 | CMS Collaboration | Measurement of the differential and double-differential Drell-Yan cross sections in proton-proton collisions at $ \sqrt{s} = $ 7 TeV | JHEP 12 (2013) 030 | CMS-SMP-13-003 1310.7291 |
| 12 | CMS Collaboration | Measurements of differential and double-differential Drell-Yan cross sections in proton-proton collisions at 8 TeV | EPJC 75 (2015) 147 | CMS-SMP-14-003 1412.1115 |
| 13 | CMS Collaboration | Measurement of the differential Drell-Yan cross section in proton-proton collisions at $ \sqrt{\mathrm{s}} = $ 13 TeV | JHEP 12 (2019) 059 | CMS-SMP-17-001 1812.10529 |
| 14 | LHCb Collaboration | Inclusive low mass Drell-Yan production in the forward region at $ \sqrt{s} = $ 7 TeV | LHCb Conference Note LHCb-CONF-2012-013 | |
| 15 | PHENIX Collaboration | Measurements of $ \mu\mu $ pairs from open heavy flavor and Drell-Yan in $ p+p $ collisions at $ \sqrt{s}= $ 200 GeV | PRD 99 (2019) 072003 | 1805.02448 |
| 16 | ALICE Collaboration | W and Z boson production in p-Pb collisions at $ \sqrt{s_{\rm NN}} = $ 5.02 TeV | JHEP 02 (2017) 077 | 1611.03002 |
| 17 | ATLAS Collaboration | $ Z $ boson production in $ p+ $Pb collisions at $ \sqrt{s_{NN}}= $ 5.02 TeV measured with the ATLAS detector | PRC 92 (2015) 044915 | 1507.06232 |
| 18 | CMS Collaboration | Study of Z boson production in pPb collisions at $ \sqrt {s_{NN}} = $ 5.02 TeV | PLB 759 (2016) 36 | CMS-HIN-15-002 1512.06461 |
| 19 | A. Banfi et al. | Optimisation of variables for studying dilepton transverse momentum distributions at hadron colliders | EPJC 71 (2011) 1600 | 1009.1580 |
| 20 | A. Banfi, M. Dasgupta, S. Marzani, and L. Tomlinson | Predictions for Drell-Yan $ \phi^* $ and $ Q_T $ observables at the LHC | PLB 715 (2012) 152 | 1205.4760 |
| 21 | S. Marzani | $ Q_T $ and $ \phi^* $ observables in Drell-Yan processes | in Proceedings, Hadron Collider Physics Symposium, 2012, HCP 2012, p. 14007 2013 | |
| 22 | D. de Florian, R. Sassot, P. Zurita, and M. Stratmann | Global Analysis of Nuclear Parton Distributions | PRD 85 (2012) 074028 | 1112.6324 |
| 23 | H. Khanpour and S. Atashbar Tehrani | Global Analysis of Nuclear Parton Distribution Functions and Their Uncertainties at Next-to-Next-to-Leading Order | PRD 93 (2016), no. 1, 014026 | 1601.00939 |
| 24 | K. J. Eskola, P. Paakkinen, H. Paukkunen, and C. A. Salgado | EPPS16: nuclear parton distributions with LHC data | EPJC 77 (2017) 163 | 1612.05741 |
| 25 | A. Kusina et al. | Vector boson production in pPb and PbPb collisions at the LHC and its impact on nCTEQ15 PDFs | EPJC 77 (2017) 488 | 1610.02925 |
| 26 | M. Walt, I. Helenius, and W. Vogelsang | Open-source QCD analysis of nuclear parton distribution functions at NLO and NNLO | PRD 100 (2019), no. 9, 096015 | 1908.03355 |
| 27 | NNPDF Collaboration | Nuclear parton distributions from lepton-nucleus scattering and the impact of an electron-ion collider | EPJC 79 (2019), no. 6, 471 | 1904.00018 |
| 28 | CMS Collaboration | CMS luminosity measurement using 2016 proton-nucleus collisions at nucleon-nucleon center-of-mass energy of 8.16 TeV | CMS-PAS-LUM-17-002 | CMS-PAS-LUM-17-002 |
| 29 | CMS Collaboration | The CMS experiment at the CERN LHC | JINST 3 (2008) S08004 | CMS-00-001 |
| 30 | M. Cacciari, G. P. Salam, and G. Soyez | The anti-$ {k_{\mathrm{T}}} $ jet clustering algorithm | JHEP 04 (2008) 063 | 0802.1189 |
| 31 | M. Cacciari, G. P. Salam, and G. Soyez | FastJet user manual | EPJC 72 (2012) 1896 | 1111.6097 |
| 32 | CMS Collaboration | Particle-flow reconstruction and global event description with the cms detector | JINST 12 (2017) P10003 | CMS-PRF-14-001 1706.04965 |
| 33 | CMS Collaboration | Performance of the CMS muon detector and muon reconstruction with proton-proton collisions at $ \sqrt{s}= $ 13 TeV | JINST 13 (2018), no. 06, P06015 | CMS-MUO-16-001 1804.04528 |
| 34 | CMS Collaboration | The CMS trigger system | JINST 12 (2017) P01020 | CMS-TRG-12-001 1609.02366 |
| 35 | P. Nason | A new method for combining NLO QCD with shower Monte Carlo algorithms | JHEP 11 (2004) 040 | hep-ph/0409146 |
| 36 | S. Frixione, P. Nason, and C. Oleari | Matching NLO QCD computations with parton shower simulations: the POWHEG method | JHEP 11 (2007) 070 | 0709.2092 |
| 37 | S. Alioli, P. Nason, C. Oleari, and E. Re | A general framework for implementing NLO calculations in shower Monte Carlo programs: the POWHEG BOX | JHEP 06 (2010) 043 | 1002.2581 |
| 38 | S. Alioli, P. Nason, C. Oleari, and E. Re | NLO vector-boson production matched with shower in POWHEG | JHEP 07 (2008) 060 | 0805.4802 |
| 39 | S. Dulat et al. | New parton distribution functions from a global analysis of quantum chromodynamics | PRD 93 (2016) 033006 | 1506.07443 |
| 40 | T. Sjostrand et al. | An introduction to PYTHIA 8.2 | CPC 191 (2015) 159 | 1410.3012 |
| 41 | CMS Collaboration | Event generator tunes obtained from underlying event and multiparton scattering measurements | EPJC 76 (2016), no. 3, 155 | CMS-GEN-14-001 1512.00815 |
| 42 | S. Jadach, J. H. Kuhn, and Z. W\cas | TAUOLA: a library of Monte Carlo programs to simulate decays of polarized tau leptons | CPC 64 (1990) 275 | |
| 43 | P. Golonka and Z. W\cas | PHOTOS Monte Carlo: a precision tool for QED corrections in Z and W decays | EPJC 45 (2006) 97 | hep-ph/0506026 |
| 44 | T. Pierog et al. | EPOS LHC: test of collective hadronization with data measured at the CERN Large hadron collider | PRC 92 (2015) 034906 | 1306.0121 |
| 45 | GEANT4 Collaboration | GEANT4--a simulation toolkit | NIMA 506 (2003) 250 | |
| 46 | CMS Collaboration | Measurement of the $ {{\mathrm{W}}^{+}}\mathrm{W}^{-} $ cross section in pp collisions at $ \sqrt{s} = $ 8 TeV and limits on anomalous gauge couplings | EPJC 76 (2016) 401 | CMS-SMP-14-016 1507.03268 |
| 47 | CMS Collaboration | Measurement of the WZ production cross section in pp collisions at $ \sqrt{s} = $ 7 and 8 TeV and search for anomalous triple gauge couplings at $ \sqrt{s} = $ 8 TeV | EPJC 77 (2017) 236 | CMS-SMP-14-014 1609.05721 |
| 48 | CMS Collaboration | Measurement of the $ pp \to ZZ $ production cross section and constraints on anomalous triple gauge couplings in four-lepton final states at $ \sqrt s= $ 8 TeV | PLB 740 (2015) 250 | CMS-SMP-13-005 1406.0113 |
| 49 | CMS Collaboration | Observation of top quark production in proton-nucleus collisions | PRL 119 (2017) 242001 | CMS-HIN-17-002 1709.07411 |
| 50 | CMS Collaboration | Observation of nuclear modifications in W$ ^\pm $ boson production in pPb collisions at $ \sqrt{s_\mathrm{NN}} = $ 8.16 TeV | PLB 800 (2020) 135048 | CMS-HIN-17-007 1905.01486 |
| 51 | CMS Collaboration | Performance of photon reconstruction and identification with the CMS detector in proton-proton collisions at $ \sqrt{s} = $ 8 TeV | JINST 10 (2015) P08010 | CMS-EGM-14-001 1502.02702 |
| 52 | Particle Data Group Collaboration | Review of Particle Physics | PRD 98 (2018), no. 3, 030001 | |
| 53 | A. Bodek et al. | Extracting muon momentum scale corrections for hadron collider experiments | EPJC 72 (2012) 2194 | 1208.3710 |
| 54 | J. Butterworth et al. | PDF4LHC recommendations for LHC Run II | JPG 43 (2016) 023001 | 1510.03865 |
| 55 | A. Buckley et al. | LHAPDF6: parton density access in the LHC precision era | EPJC 75 (2015) 132 | 1412.7420 |
| 56 | I. P. Lokhtin and A. M. Snigirev | A Model of jet quenching in ultrarelativistic heavy ion collisions and high-p(T) hadron spectra at RHIC | EPJC 45 (2006) 211 | hep-ph/0506189 |
| 57 | H.-L. Lai et al. | New parton distributions for collider physics | PRD 82 (2010) 074024 | 1007.2241 |
| 58 | F. Arleo and S. Peigné | Disentangling shadowing from coherent energy loss using the Drell-Yan process | PRD 95 (2017) 011502 | 1512.01794 |
|
|
Compact Muon Solenoid LHC, CERN |
|

|

|

|

|

|