

Compact Muon Solenoid
LHC, CERN
| CMS-PAS-HIG-18-012 | ||
| Search for 2HDM neutral Higgs bosons through the $\mathrm{H} \to \mathrm{Z}\mathrm{A} \to \ell^{+}\ell^{-}\mathrm{b}\overline{\mathrm{b}}$ process in proton-proton collisions at $\sqrt{s} = $ 13 TeV | ||
| CMS Collaboration | ||
| May 2019 | ||
| Abstract: This note reports on a search for an extended scalar sector of the standard model, where a new CP-even (odd) scalar decays to a Z boson and a lighter CP-odd (even) scalar, which further decays to $\mathrm{b}\overline{\mathrm{b}}$. The Z boson is reconstructed via its decays to leptons. The analysed data were recorded in proton-proton collisions at $\sqrt{s} = $ 13 TeV, collected by the CMS experiment at the LHC, corresponding to an integrated luminosity of 35.9 fb$^{-1}$. Data and predictions from the standard model are in agreement within uncertainties. Upper limits at 95% confidence level are set on the production cross section times branching ratio, with masses of the resonances ranging up to 1000 GeV. The results are interpreted in the context of the Two-Higgs Doublet Model. | ||
|
Links:
CDS record (PDF) ;
CADI line (restricted) ;
These preliminary results are superseded in this paper, JHEP 03 (2020) 055. The superseded preliminary plots can be found here. |
||
| Figures & Tables | Summary | Additional Figures | References | CMS Publications |
|---|
| Figures | |
png pdf |
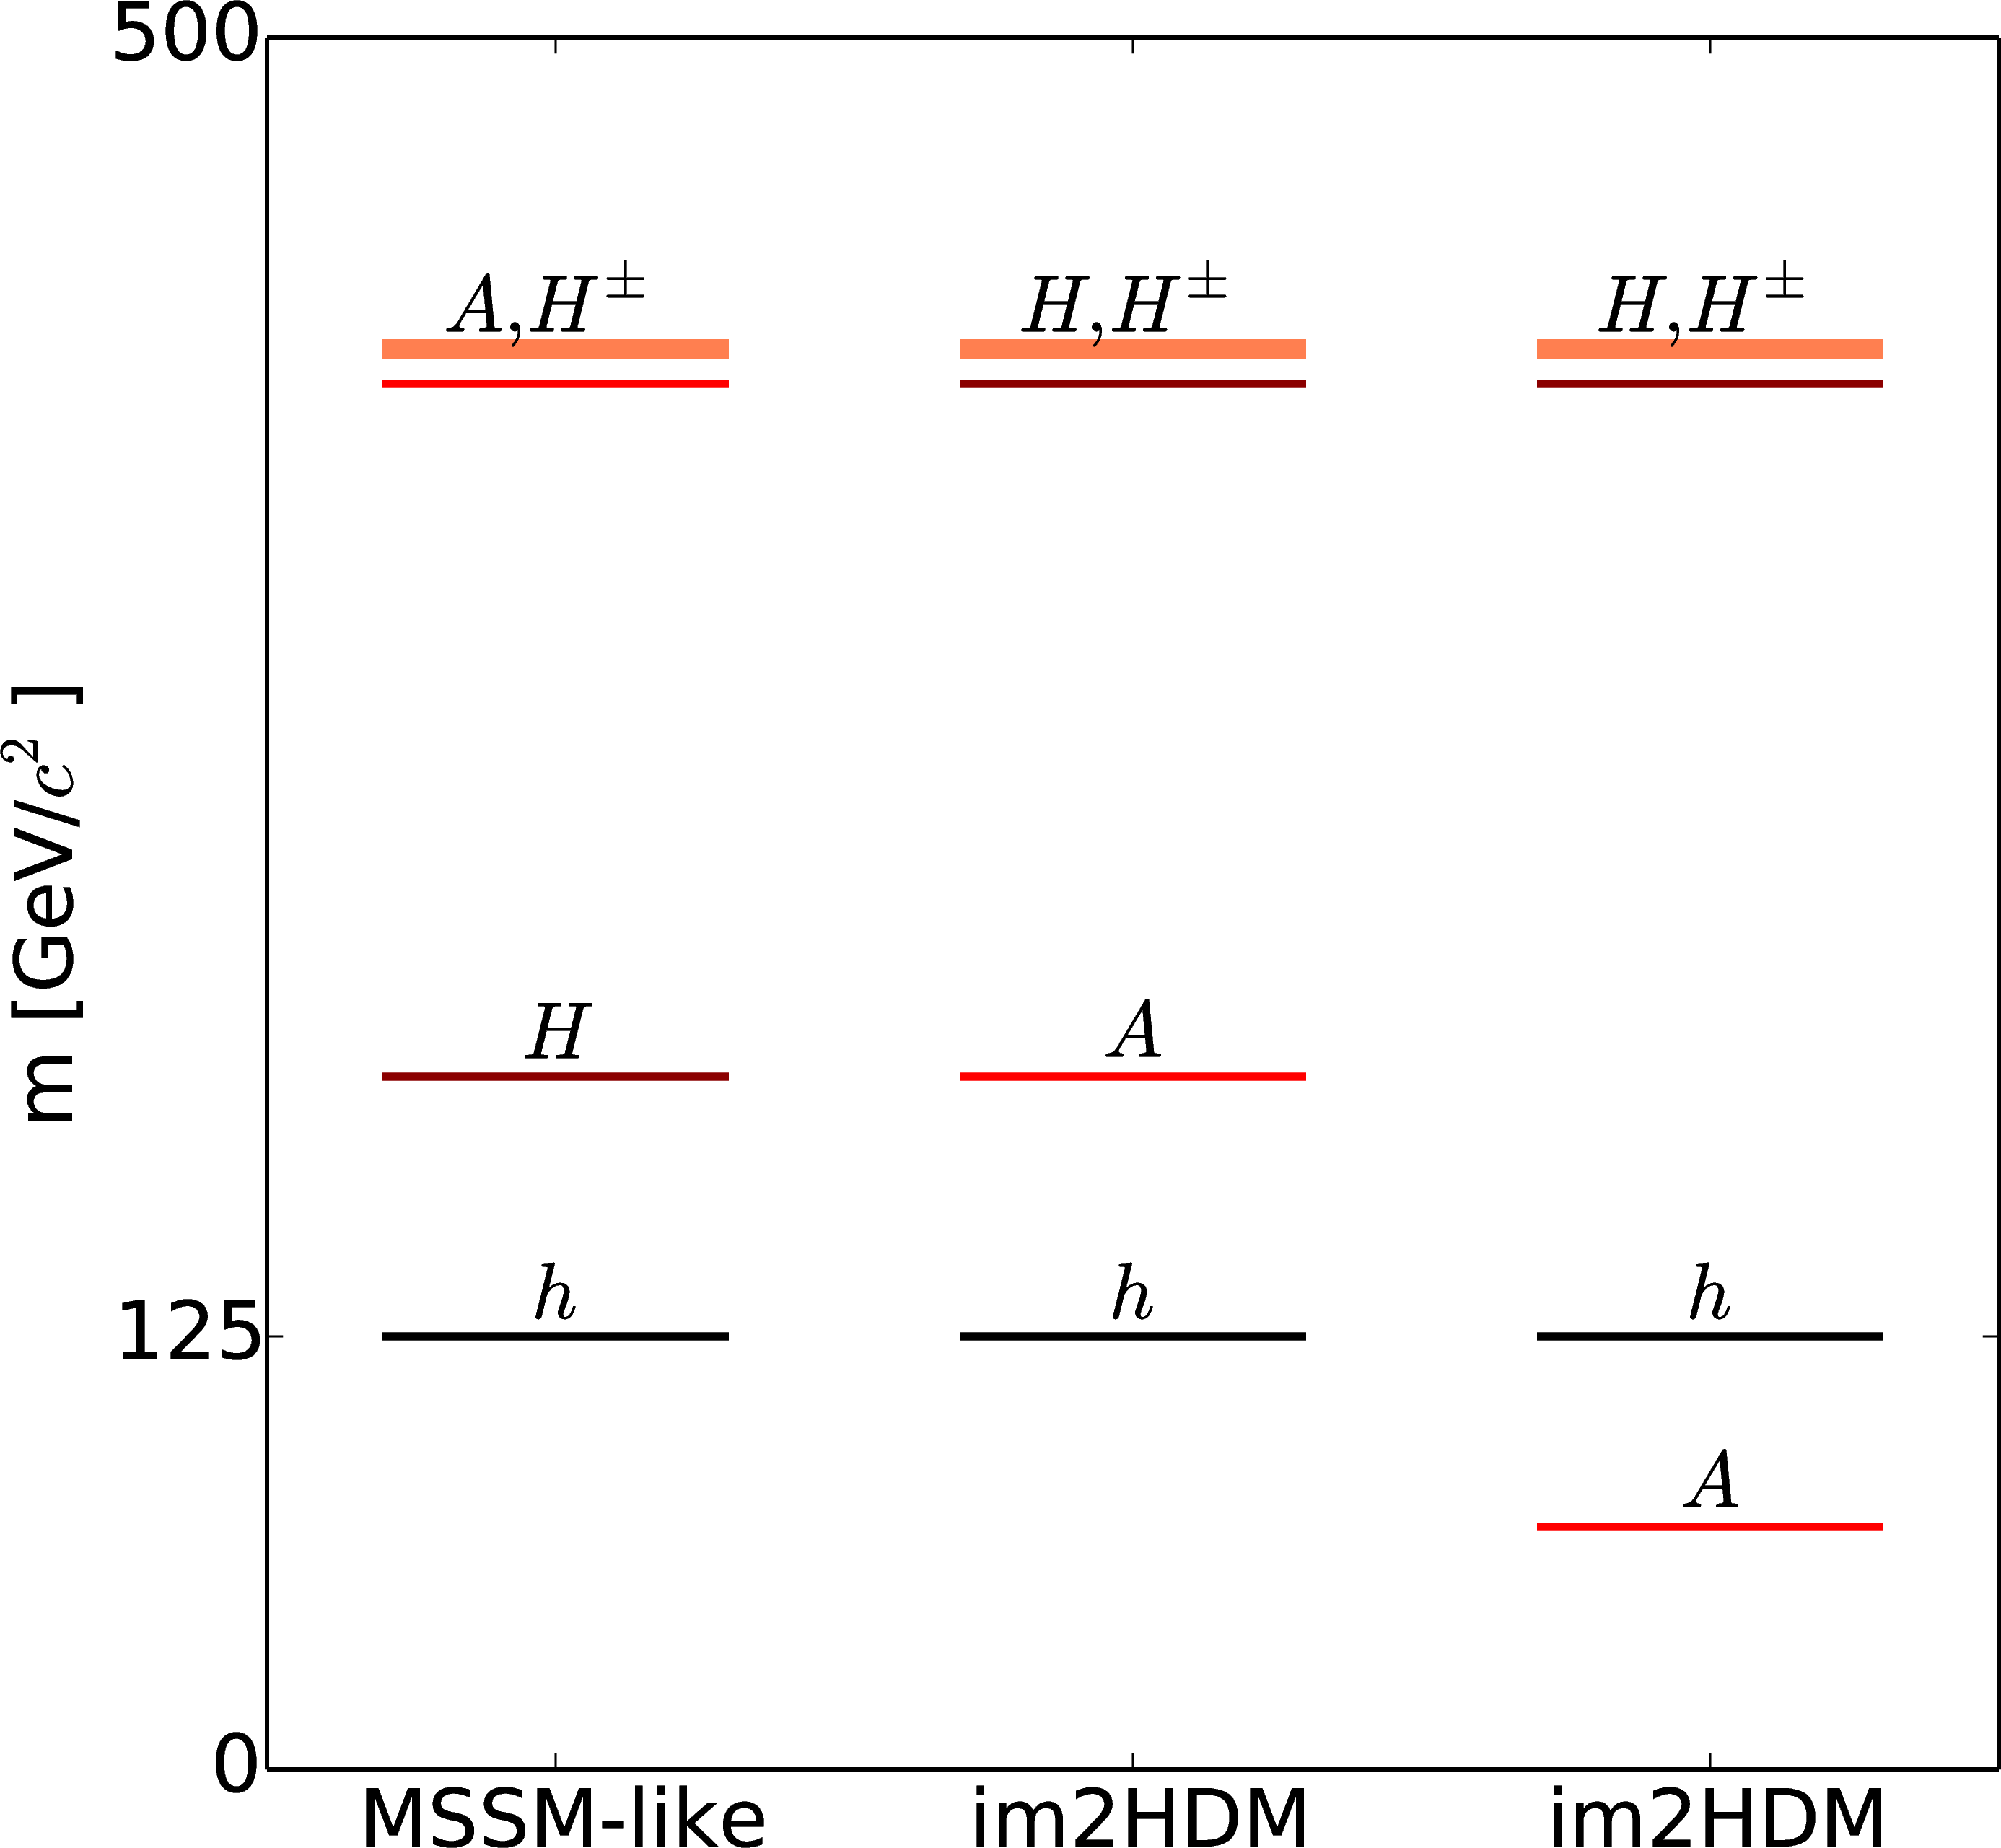
Figure 1:
2HDM mass hierarchies considered in the study: MSSM-like, where a heavy A is degenerate in mass with the charged scalars, and im2HDM [11], where the hierarchy is inverted making H the heaviest neutral scalar and degenerate in mass with charged scalars. |
png pdf |
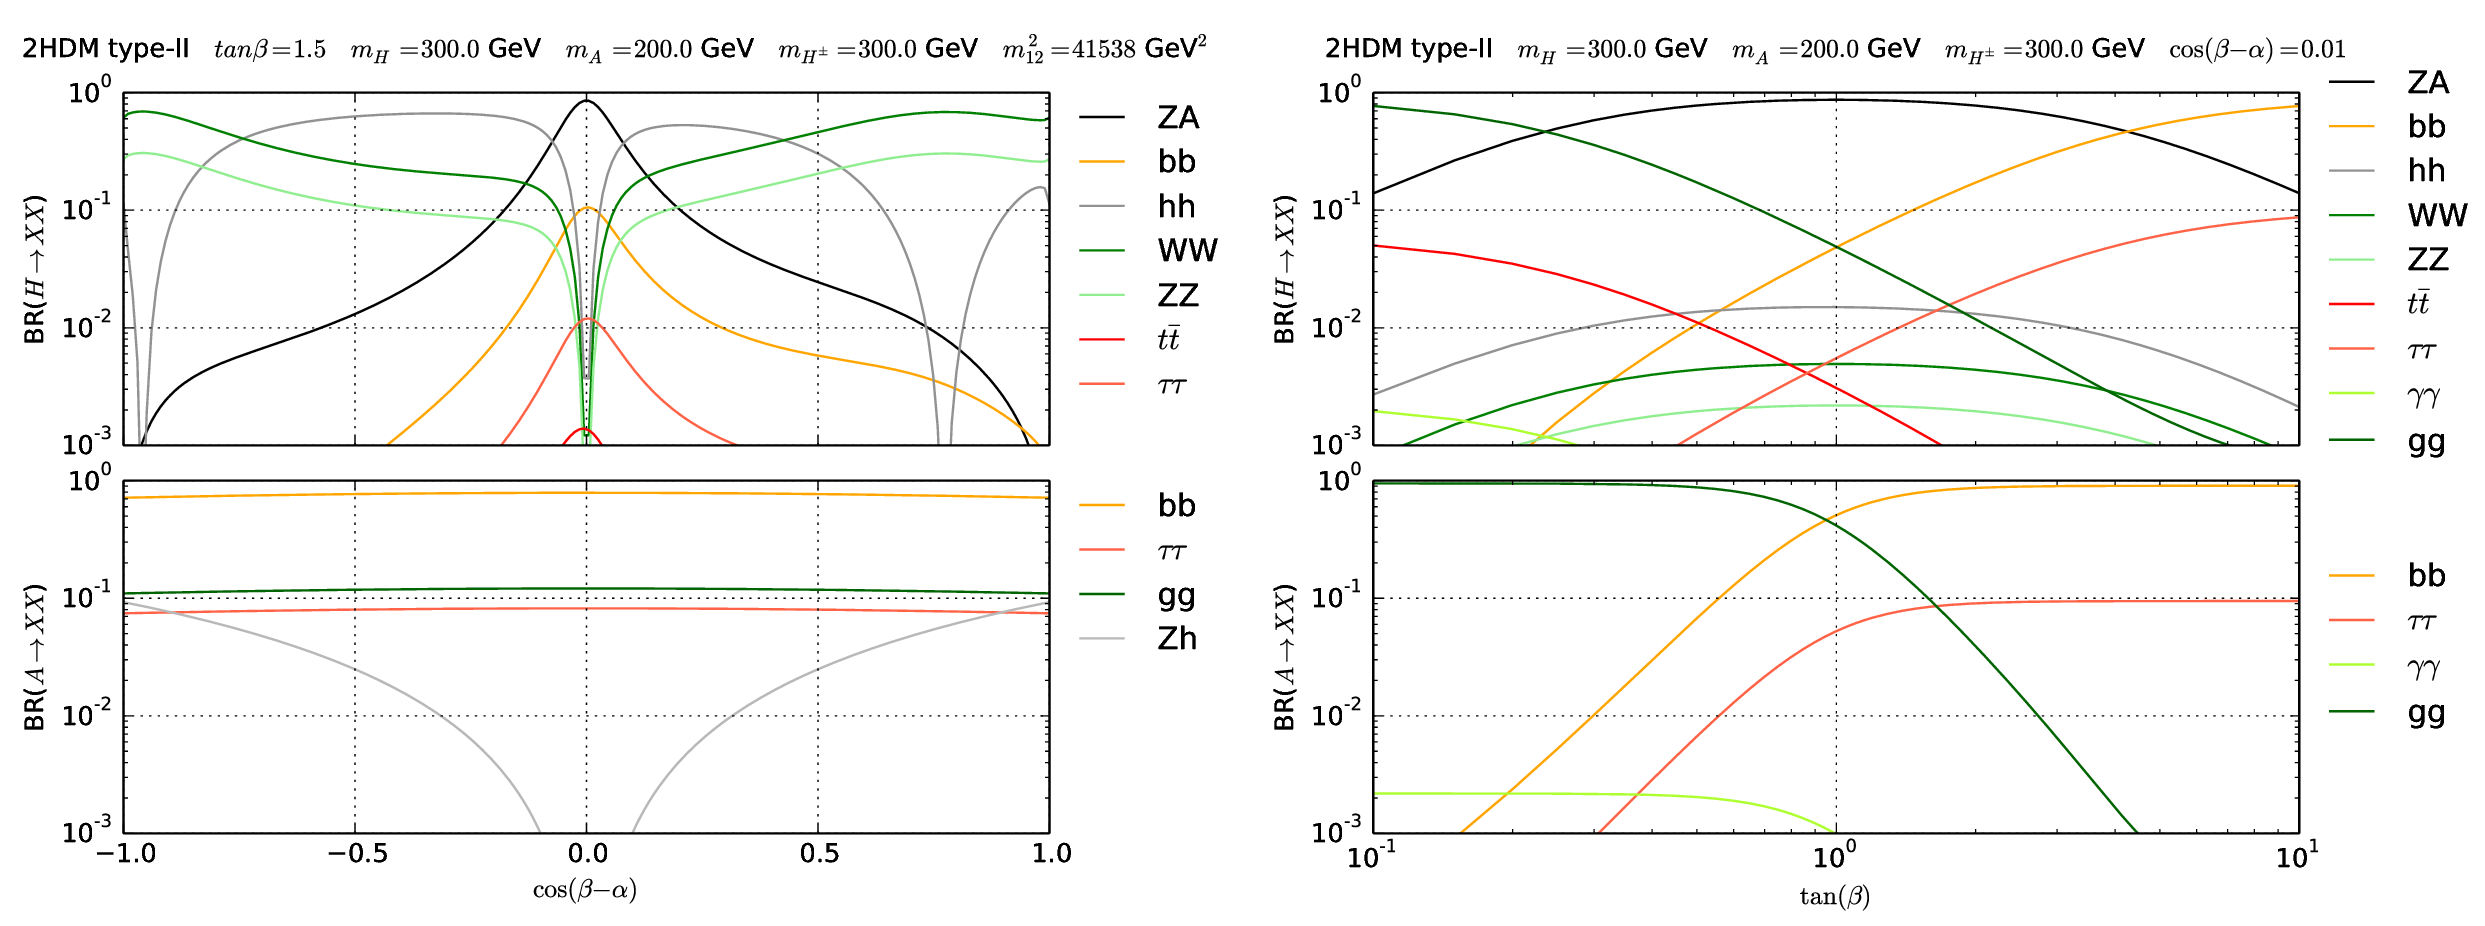
Figure 2:
H and A branching fractions as a function of $\cos(\beta - \alpha)$ for the following set of parameters: $\tan\beta = $ 1.5, $m_{\mathrm{H}} = $ 300 GeV, $m_{A} = $ 200 GeV (left). H and A branching fractions as a function of $\tan\beta $ for the following set of parameters: $\cos(\beta - \alpha) = $ 0.01, $m_{\mathrm{H}} = $ 300 GeV and $m_{A} = $ 200 GeV (right). |
png pdf |
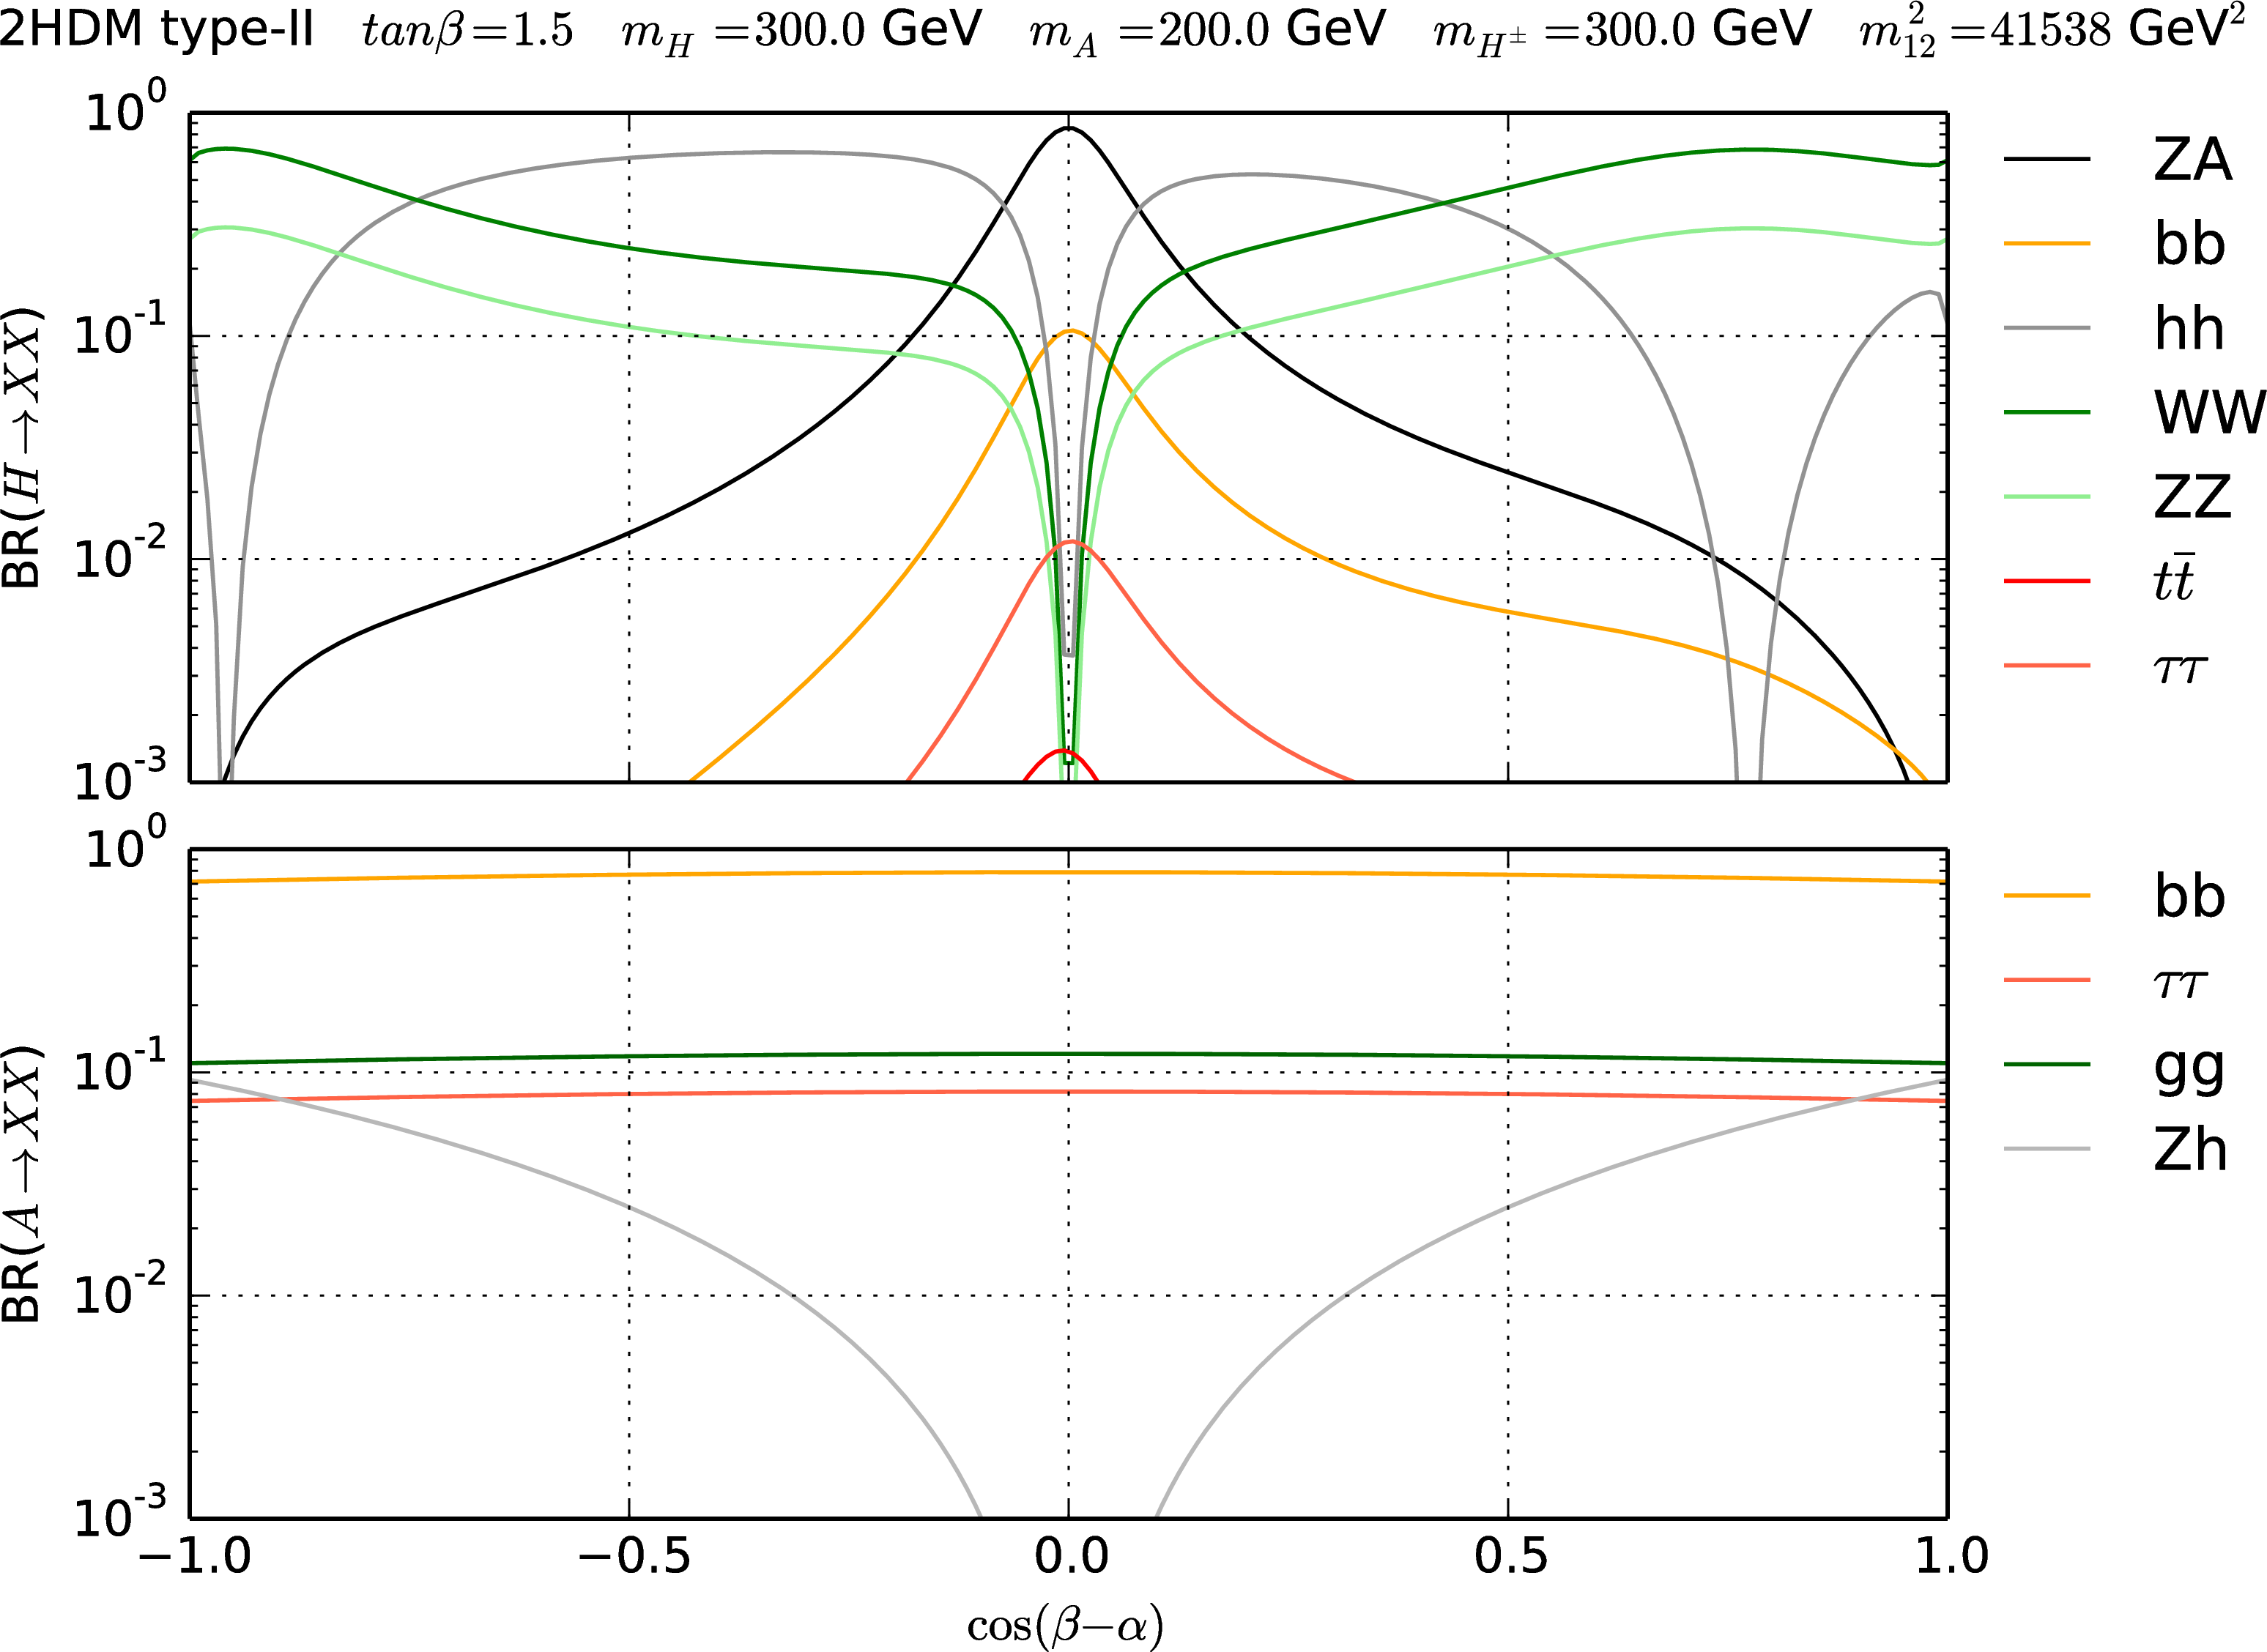
Figure 2-a:
H and A branching fractions as a function of $\cos(\beta - \alpha)$ for the following set of parameters: $\tan\beta = $ 1.5, $m_{\mathrm{H}} = $ 300 GeV, $m_{A} = $ 200 GeV. |
png pdf |
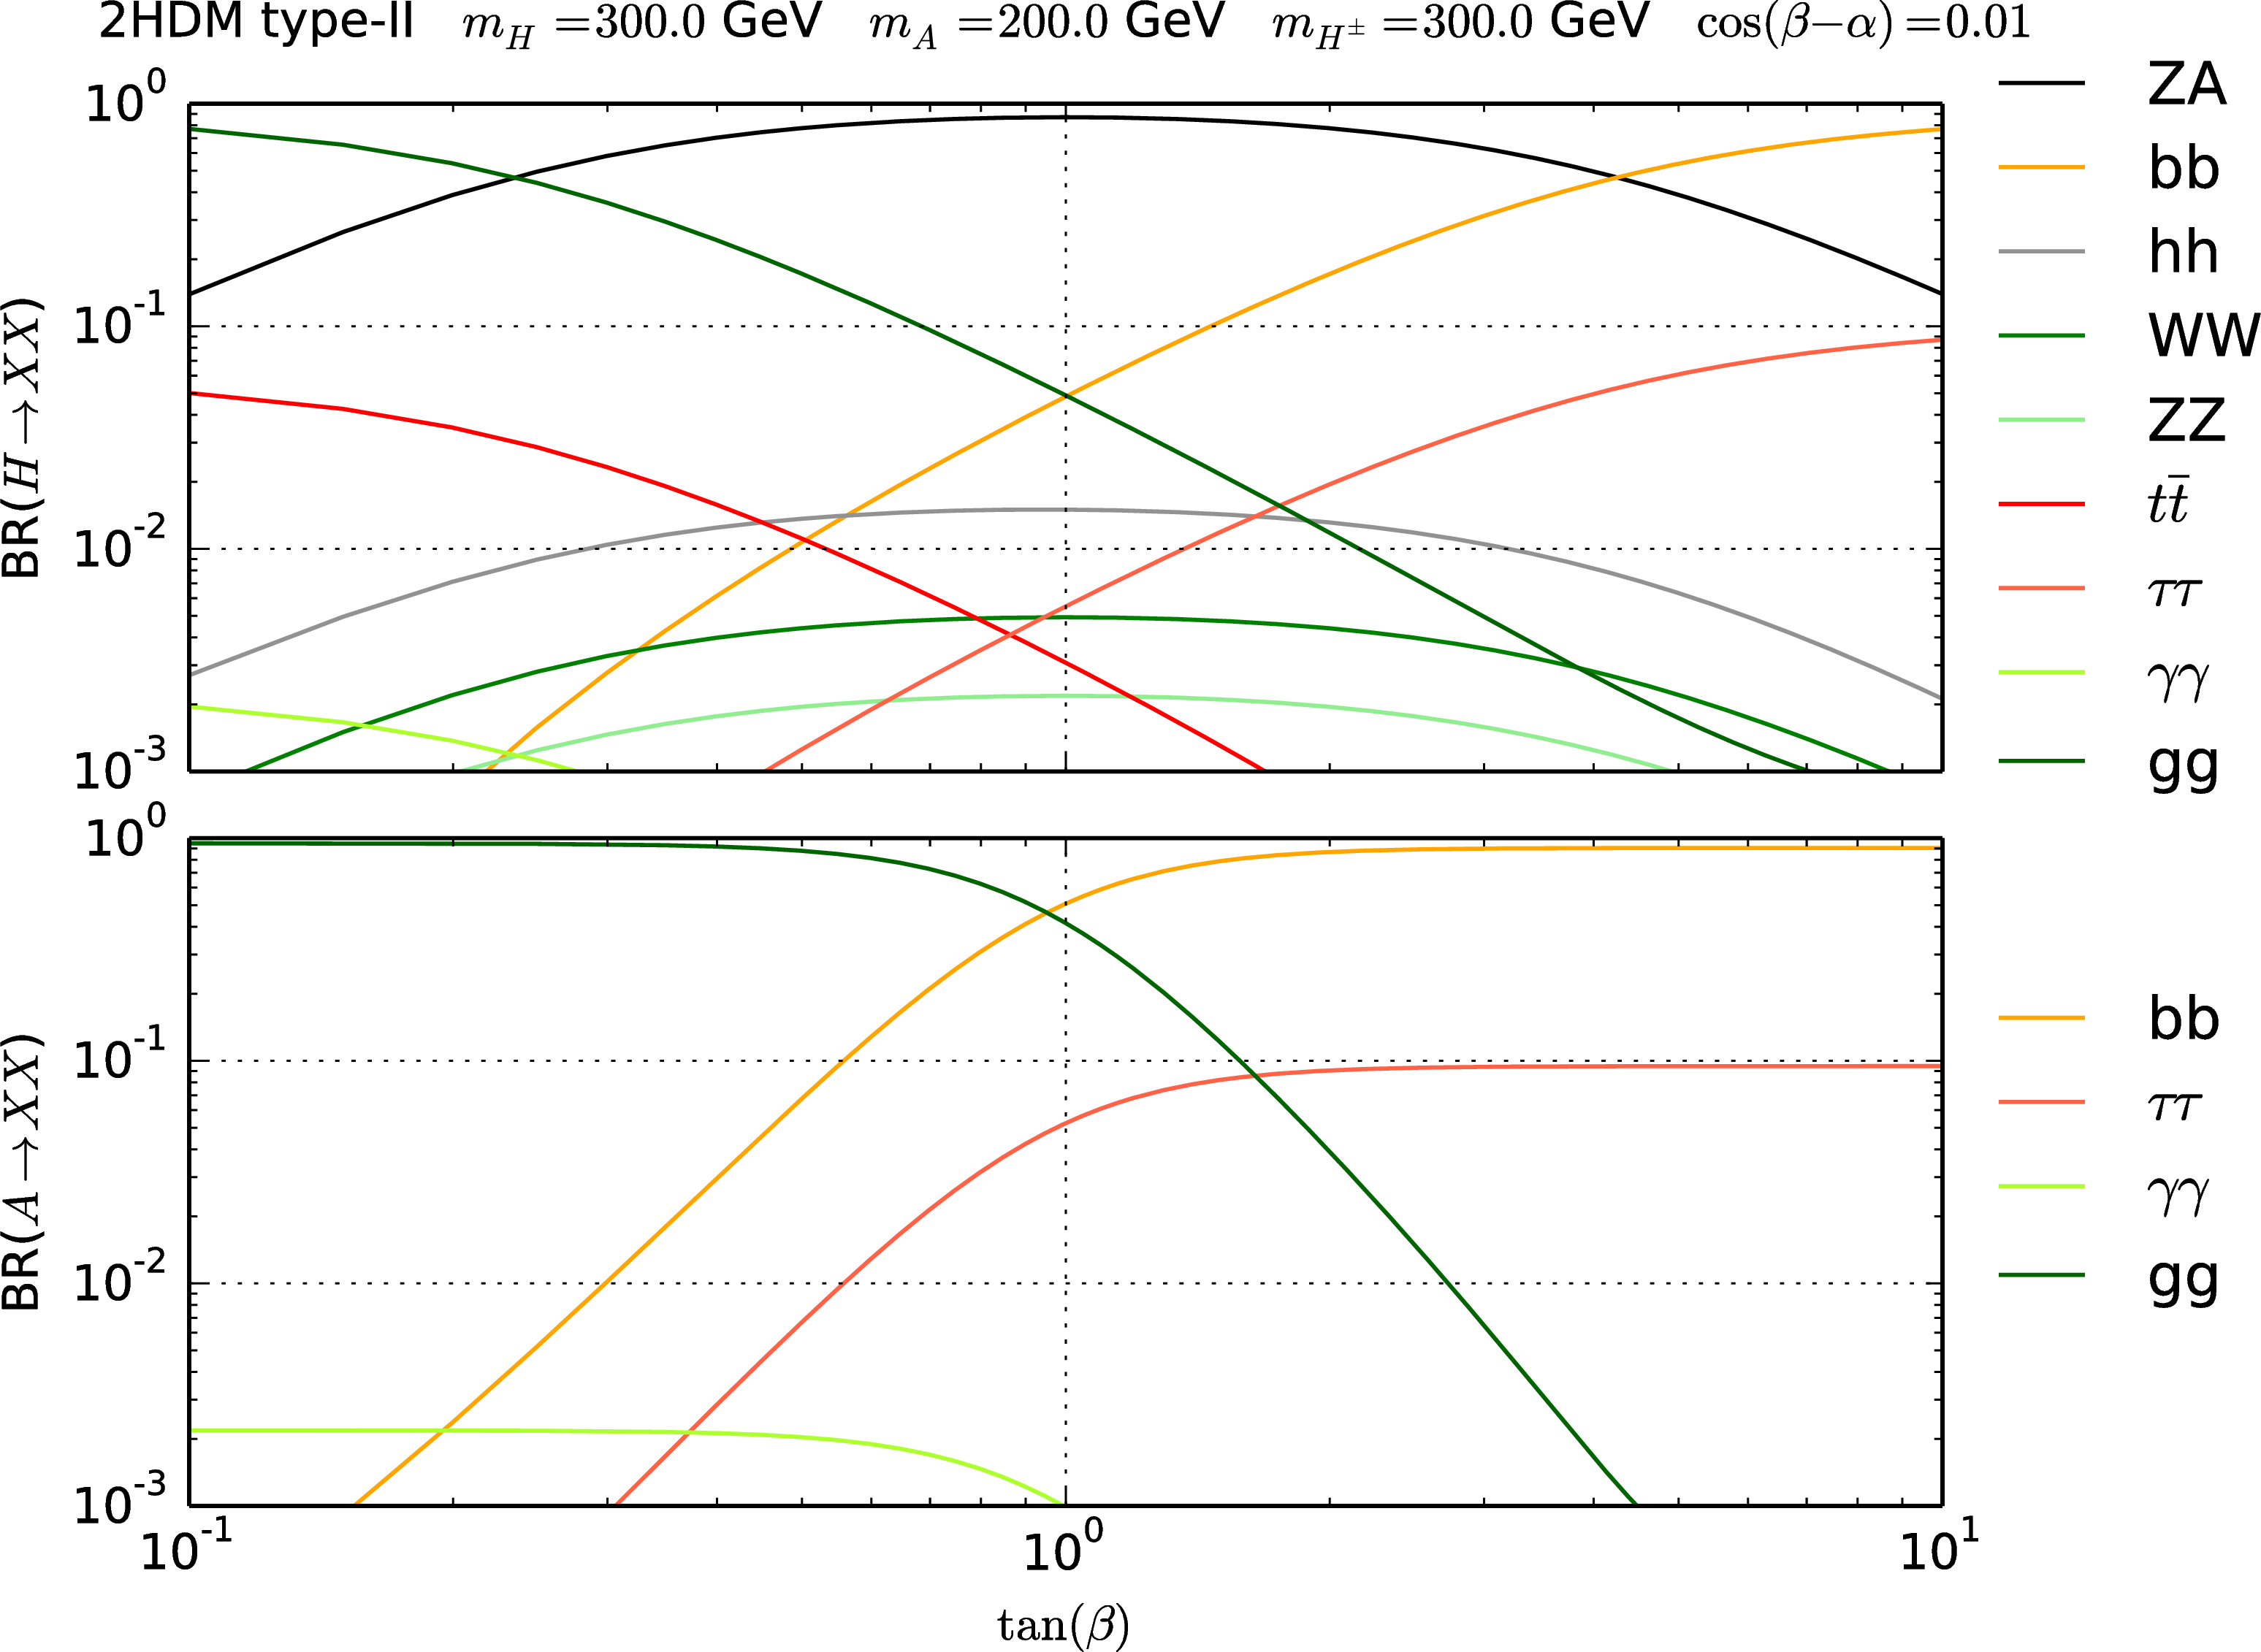
Figure 2-b:
H and A branching fractions as a function of $\tan\beta $ for the following set of parameters: $\cos(\beta - \alpha) = $ 0.01, $m_{\mathrm{H}} = $ 300 GeV and $m_{A} = $ 200 GeV. |
png pdf |
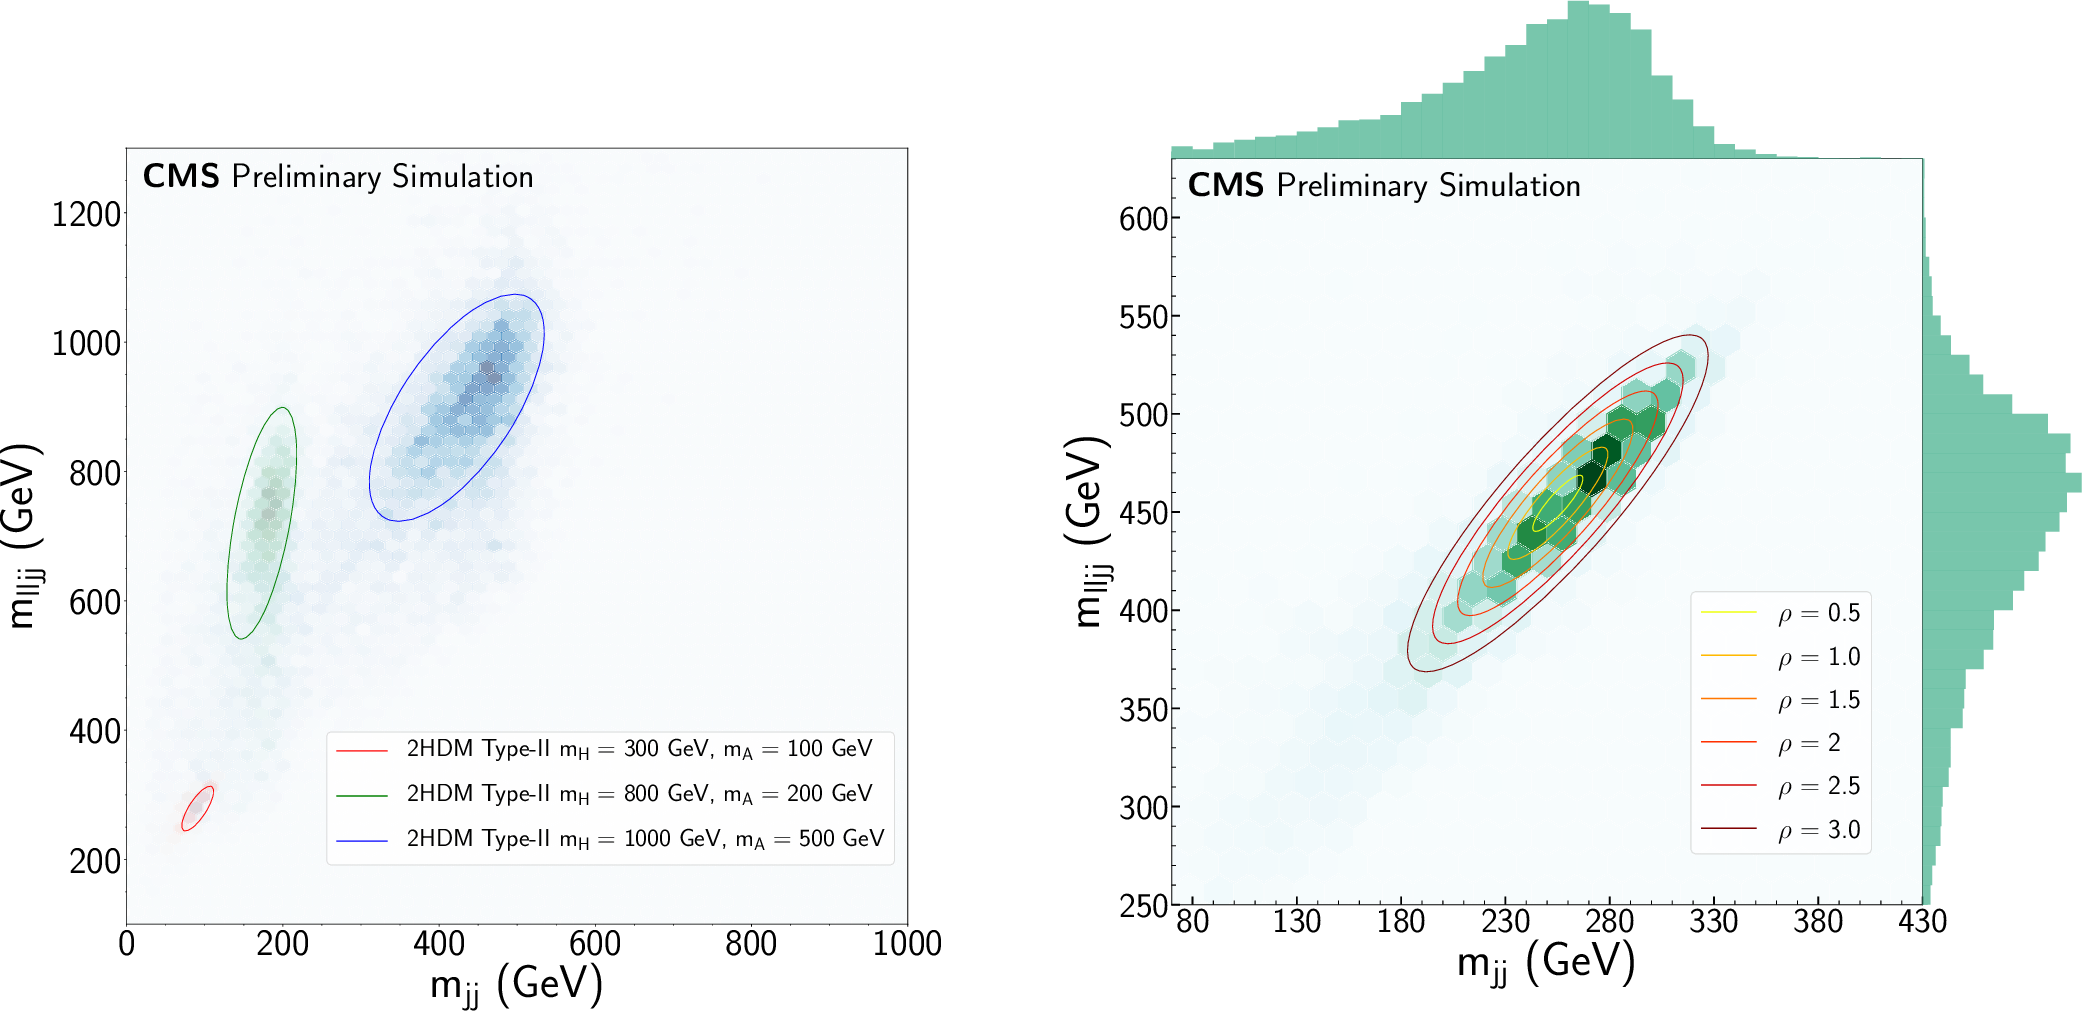
Figure 3:
The $ {\mathrm {m}_{\ell\ell{\mathrm {j}} {\mathrm {j}}}} $-$ {\mathrm {m}_{{\mathrm {j}} {\mathrm {j}}}} $ plane for signal samples under three different mass hypotheses, on which the parametrised ellipse is shown (left). A signal hypothesis with $m_{\mathrm{H}}=$ 500 GeV and $m_{{\text {A}}}=$ 300 GeV is shown in the $ {\mathrm {m}_{\ell\ell{\mathrm {j}} {\mathrm {j}}}} $-$ {\mathrm {m}_{{\mathrm {j}} {\mathrm {j}}}} $ plane (right). The different ellipses show the variation of the $\rho $ parameter in steps of 0.5, from 0 to 3. |
png pdf |
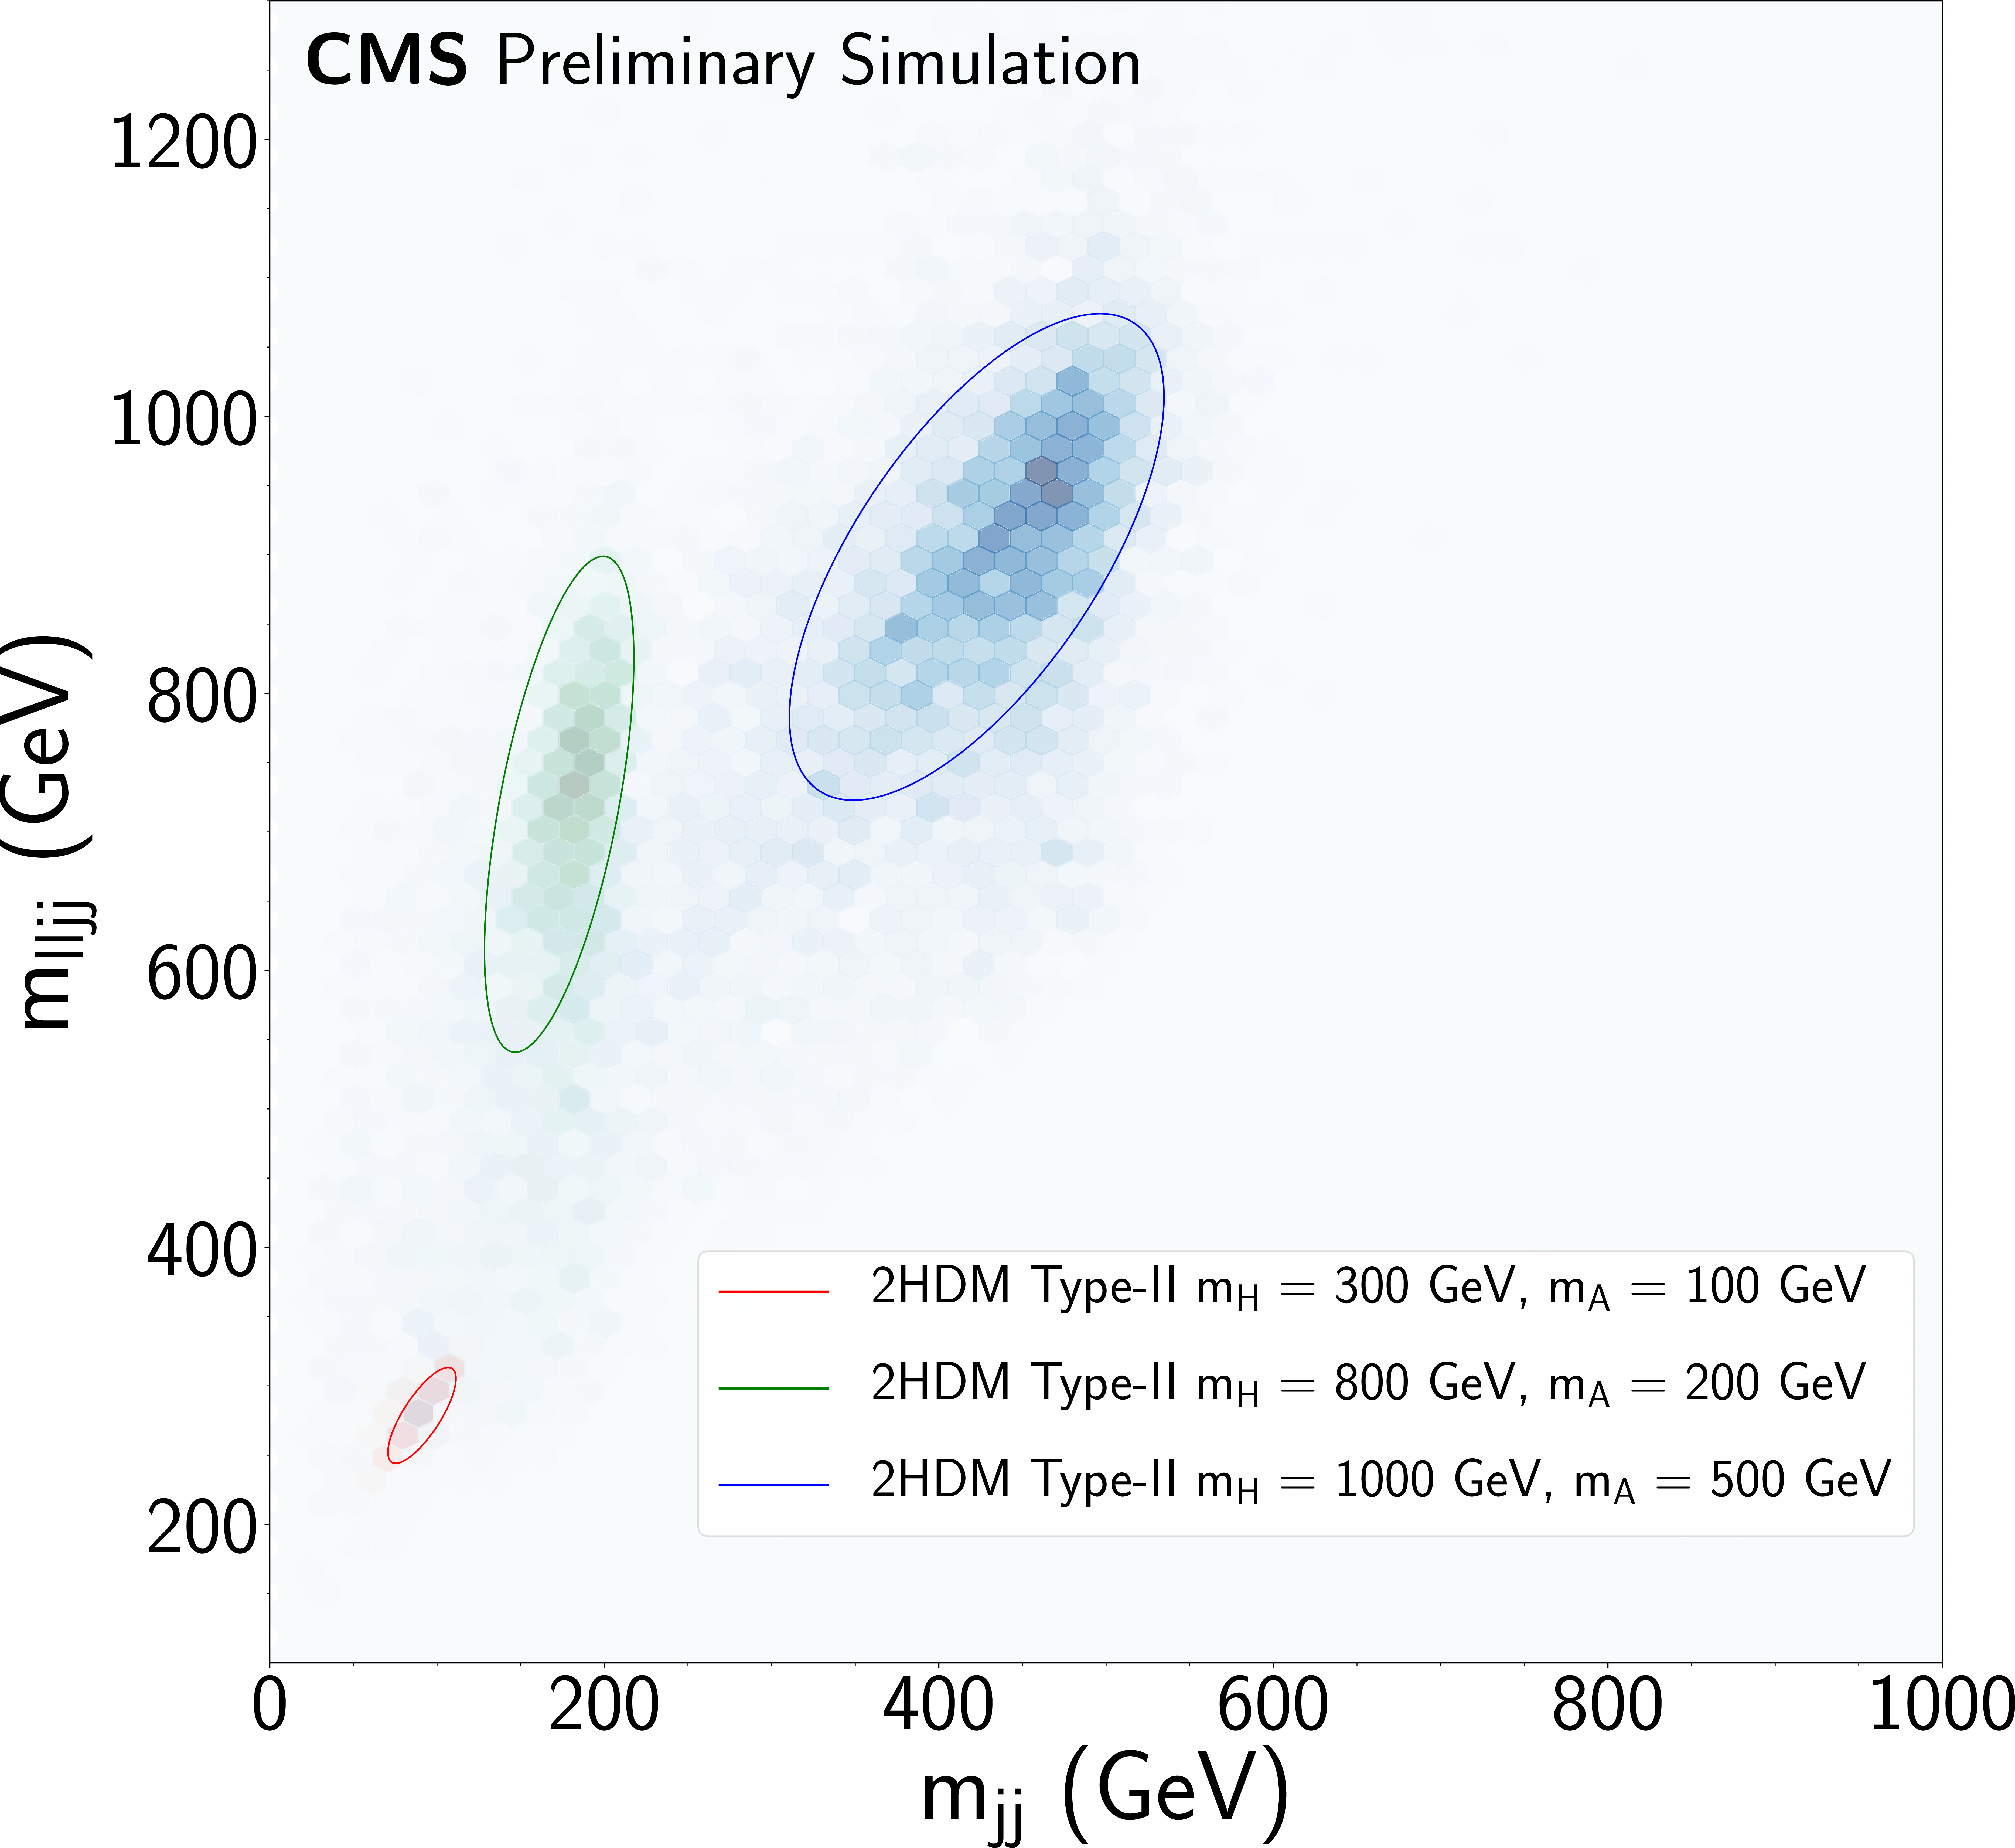
Figure 3-a:
The $ {\mathrm {m}_{\ell\ell{\mathrm {j}} {\mathrm {j}}}} $-$ {\mathrm {m}_{{\mathrm {j}} {\mathrm {j}}}} $ plane for signal samples under three different mass hypotheses, on which the parametrised ellipse is shown. The different ellipses show the variation of the $\rho $ parameter in steps of 0.5, from 0 to 3. |
png pdf |
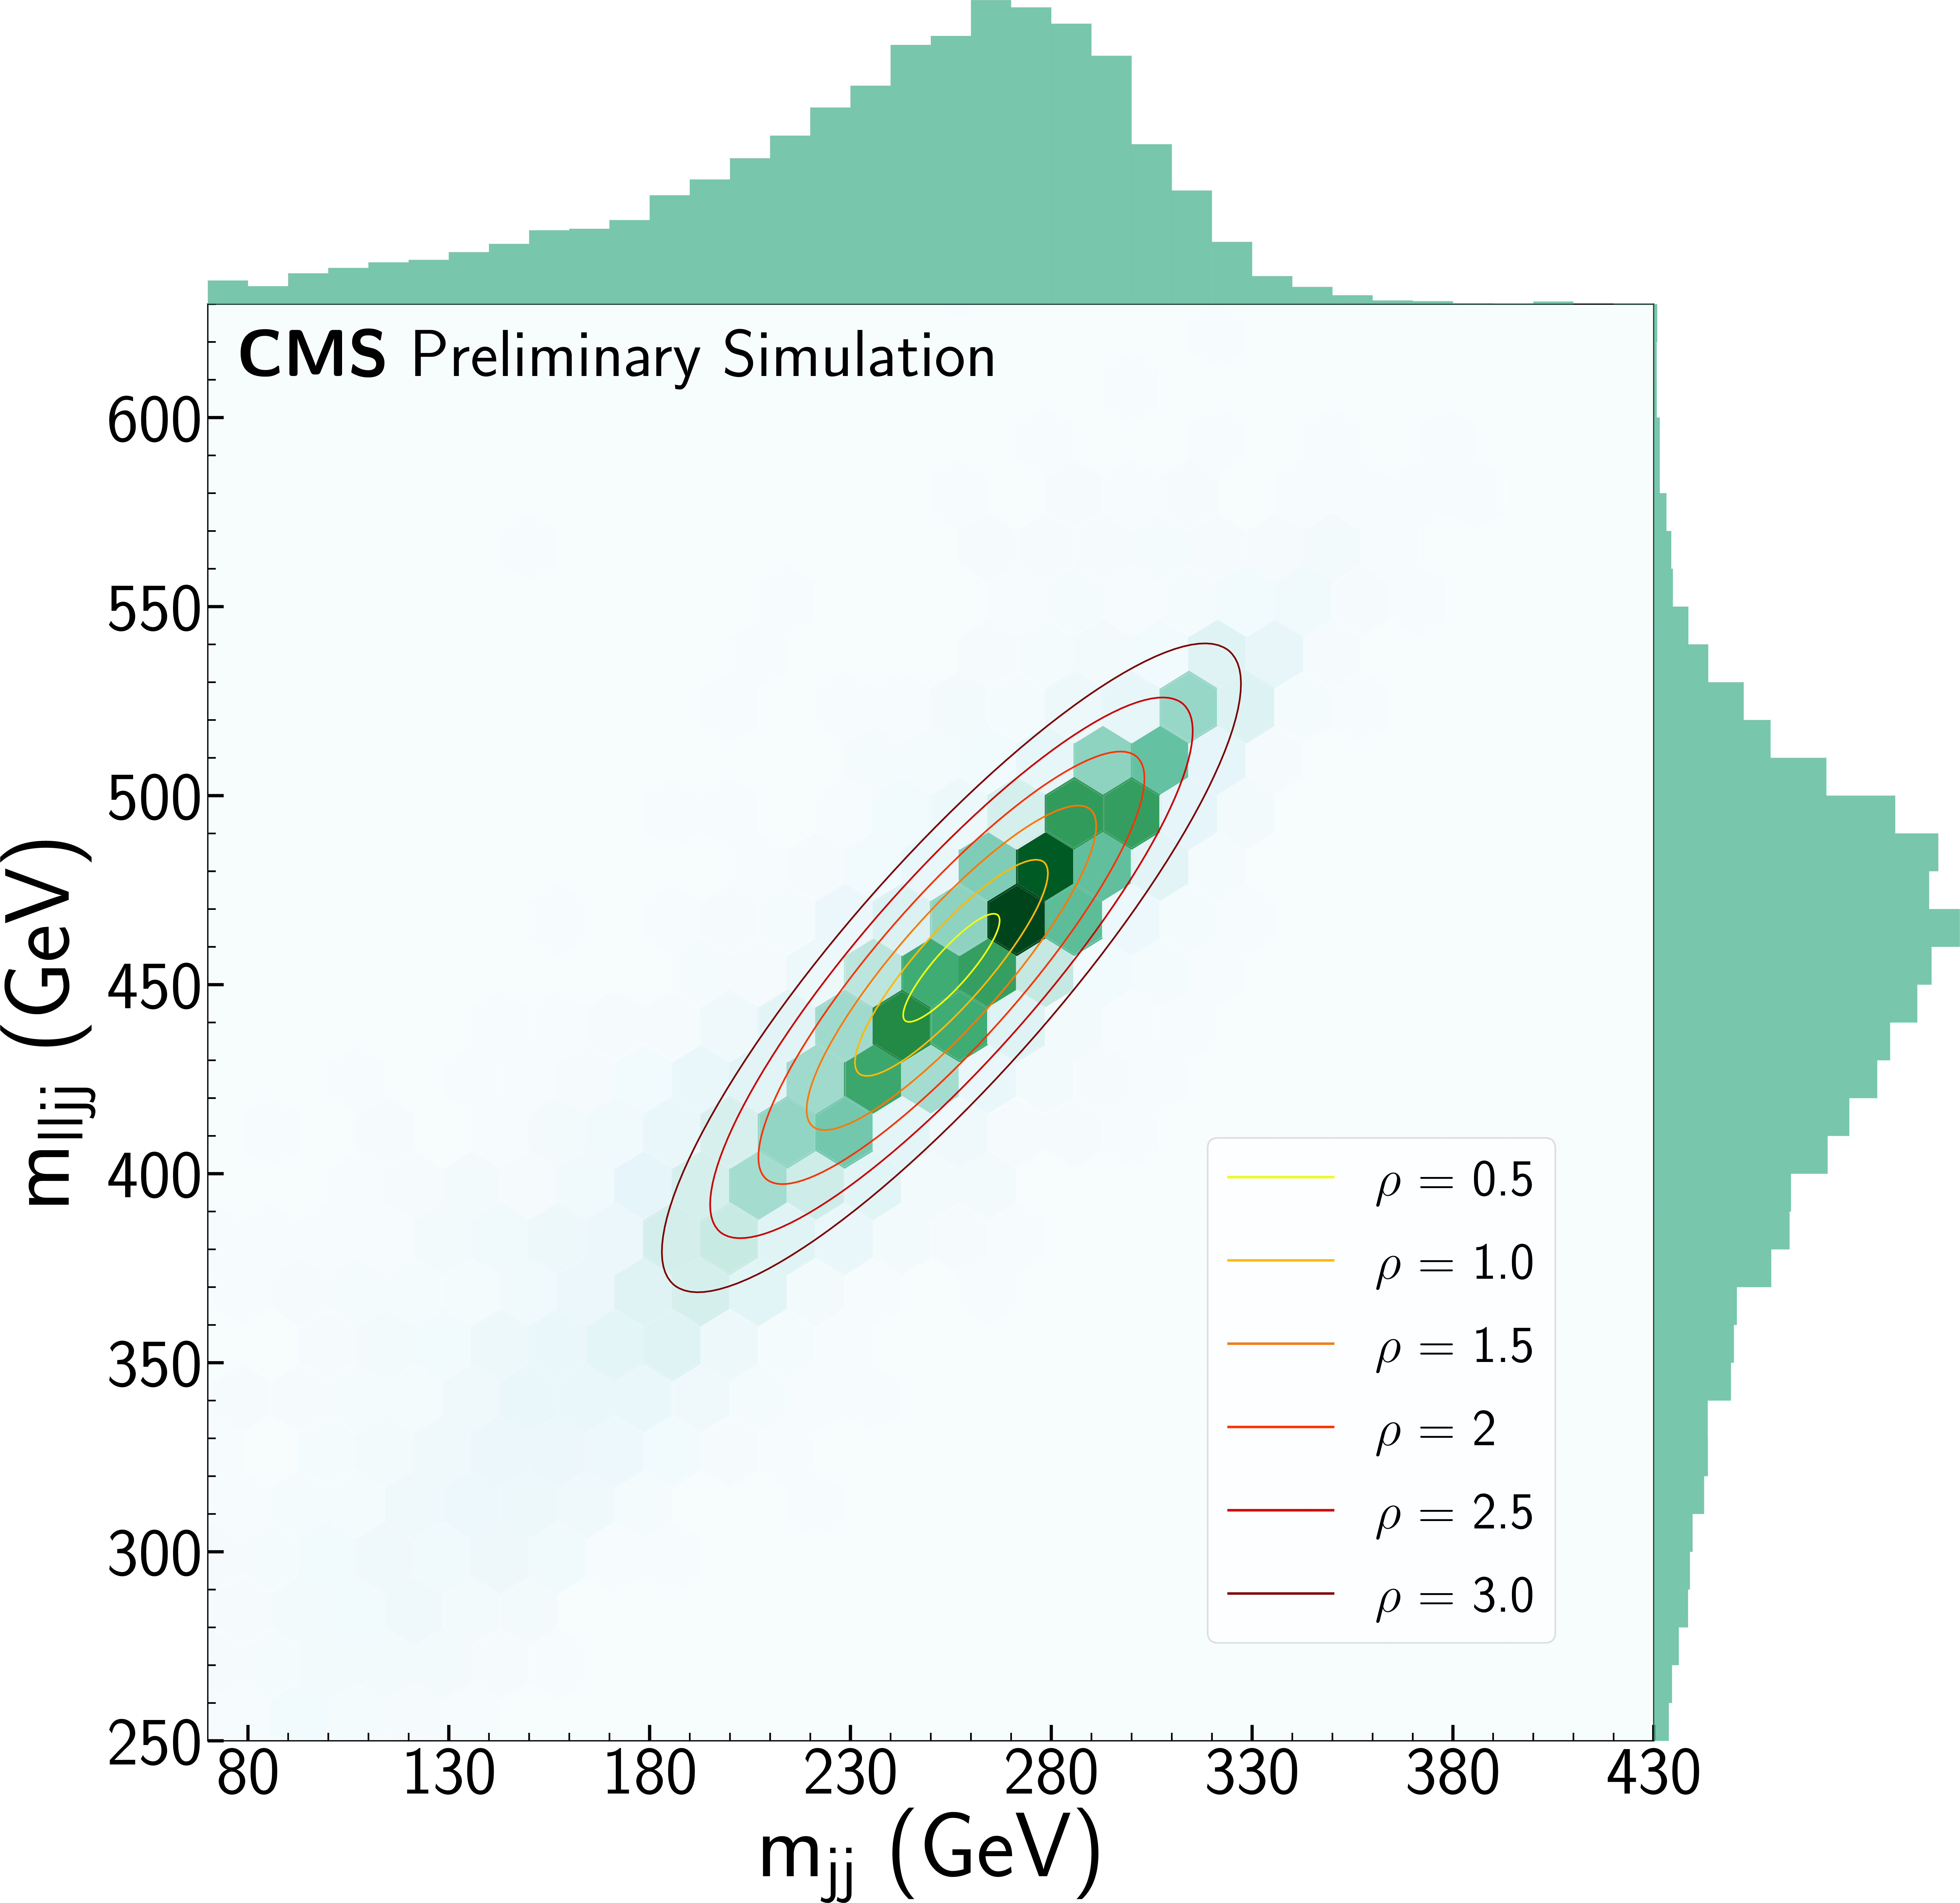
Figure 3-b:
A signal hypothesis with $m_{\mathrm{H}}=$ 500 GeV and $m_{{\text {A}}}=$ 300 GeV is shown in the $ {\mathrm {m}_{\ell\ell{\mathrm {j}} {\mathrm {j}}}} $-$ {\mathrm {m}_{{\mathrm {j}} {\mathrm {j}}}} $ plane. The different ellipses show the variation of the $\rho $ parameter in steps of 0.5, from 0 to 3. |
png pdf |
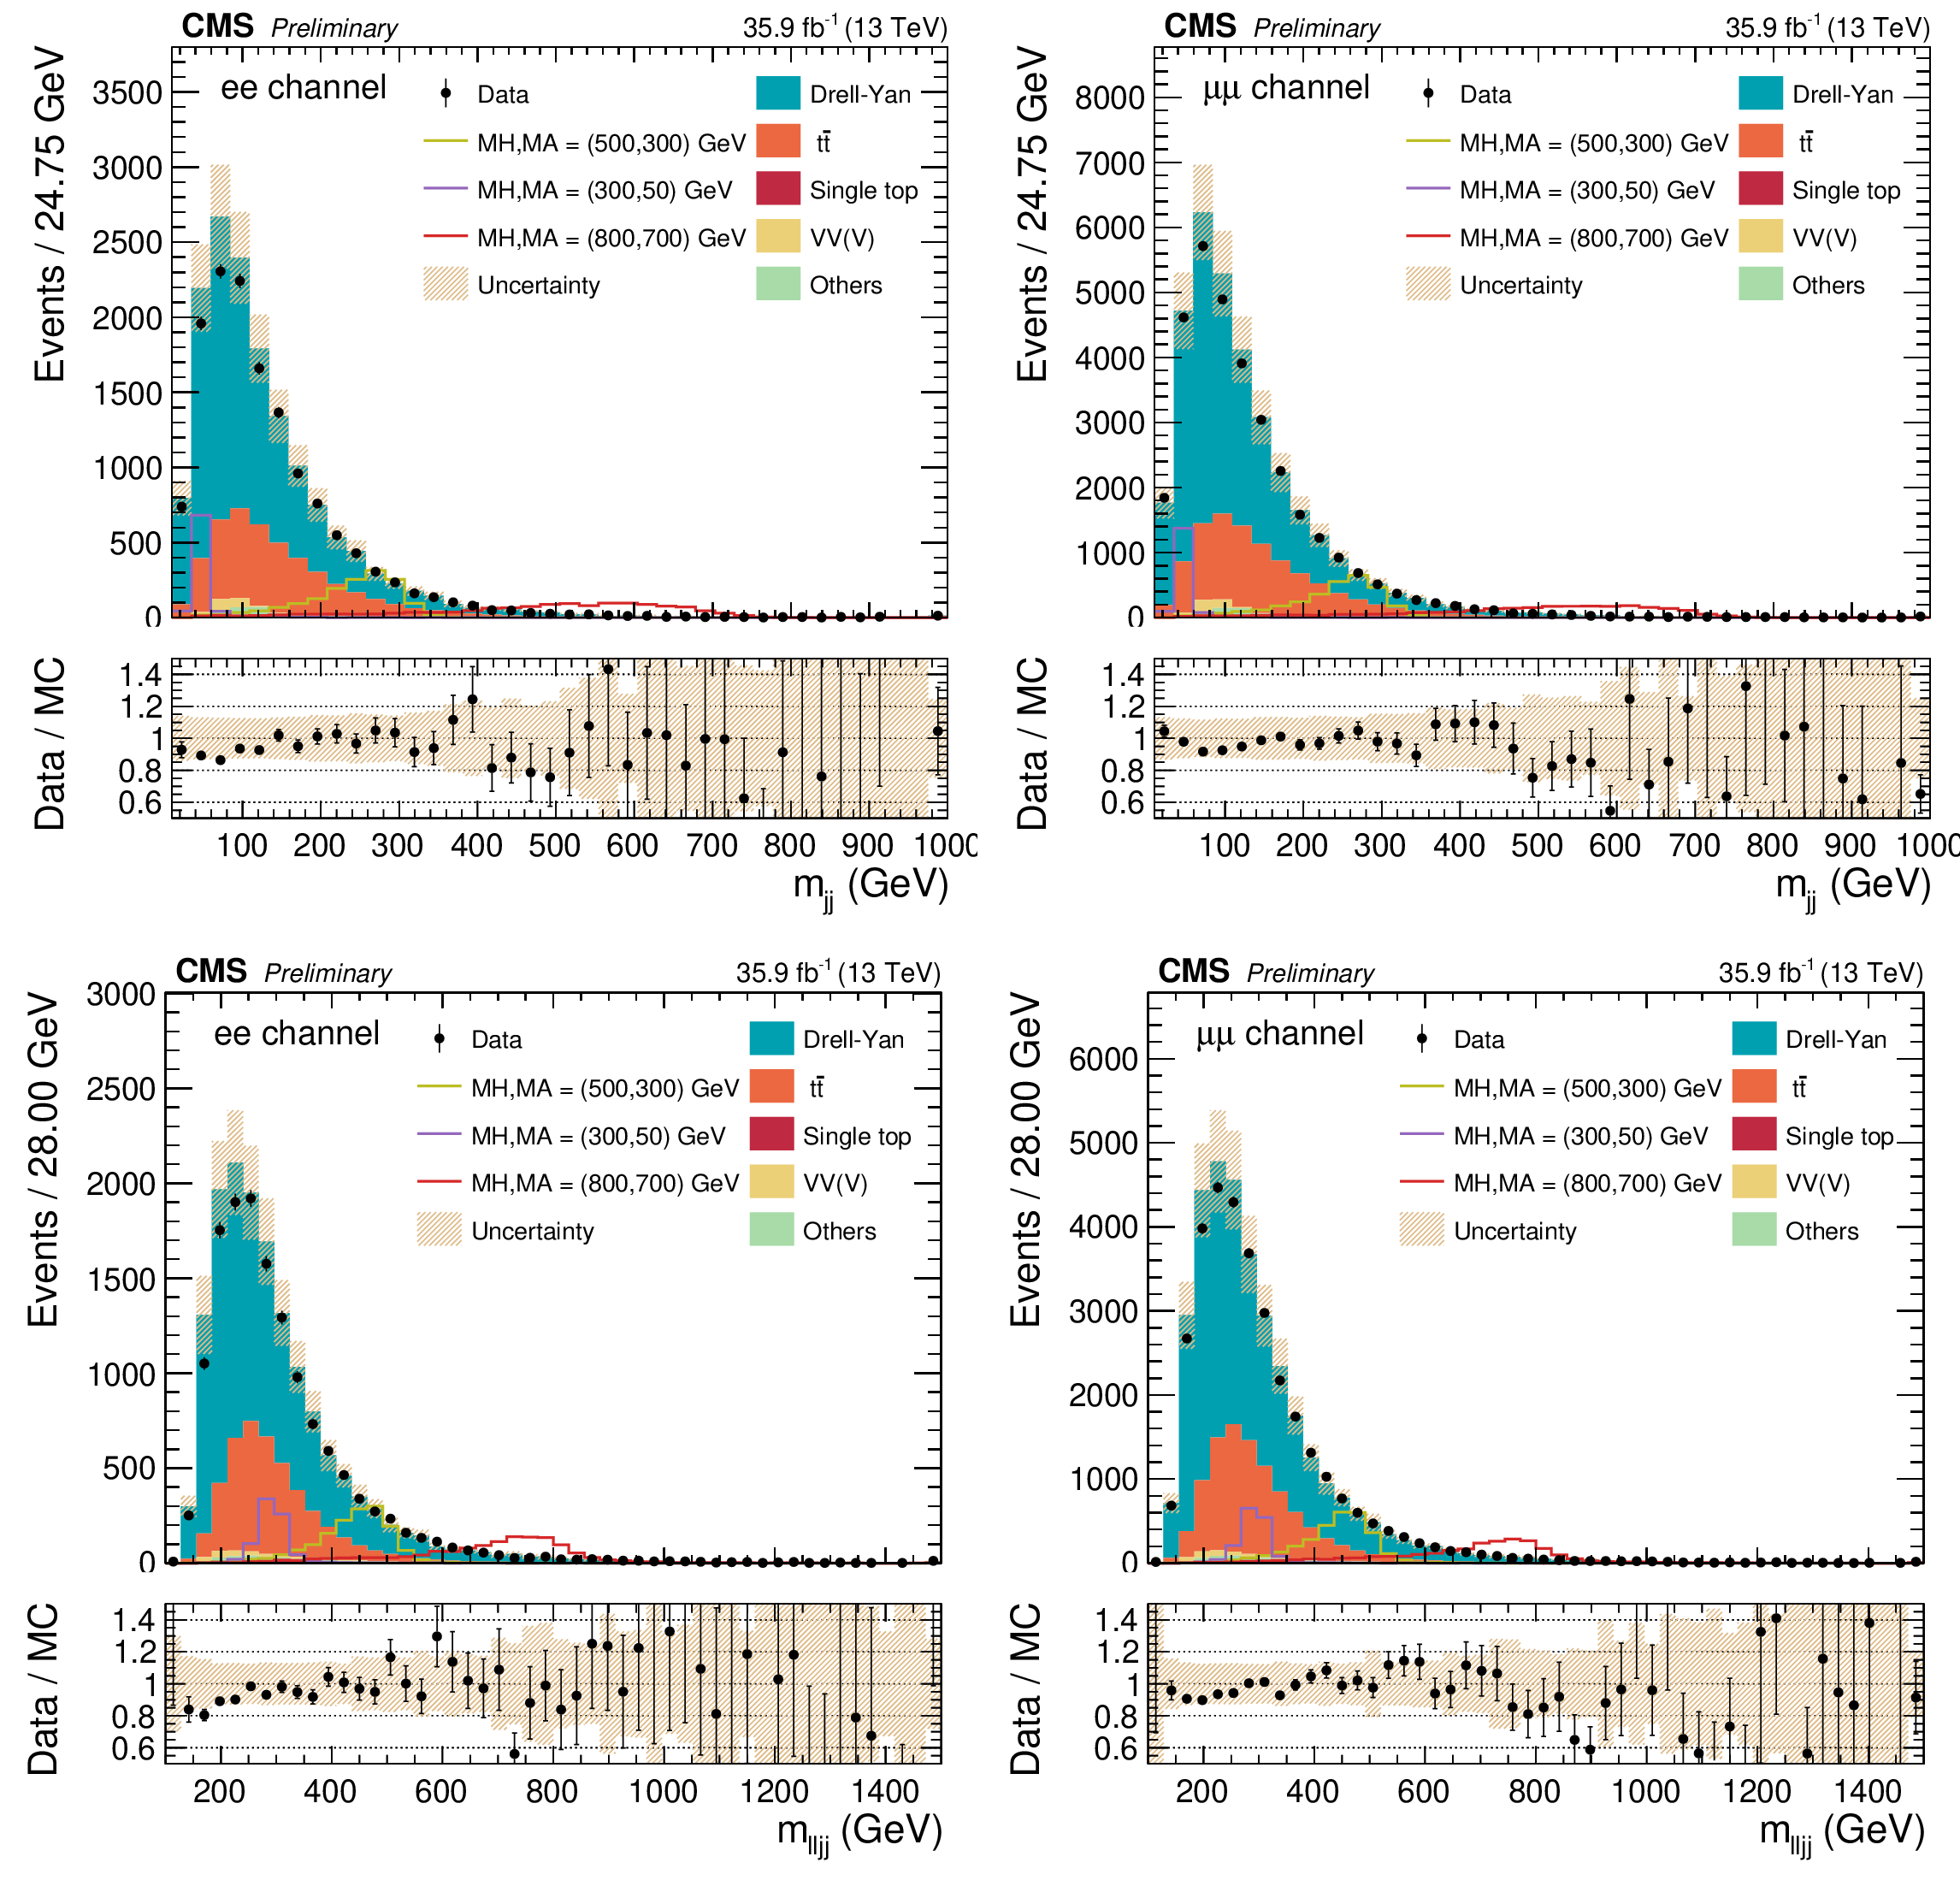
Figure 4:
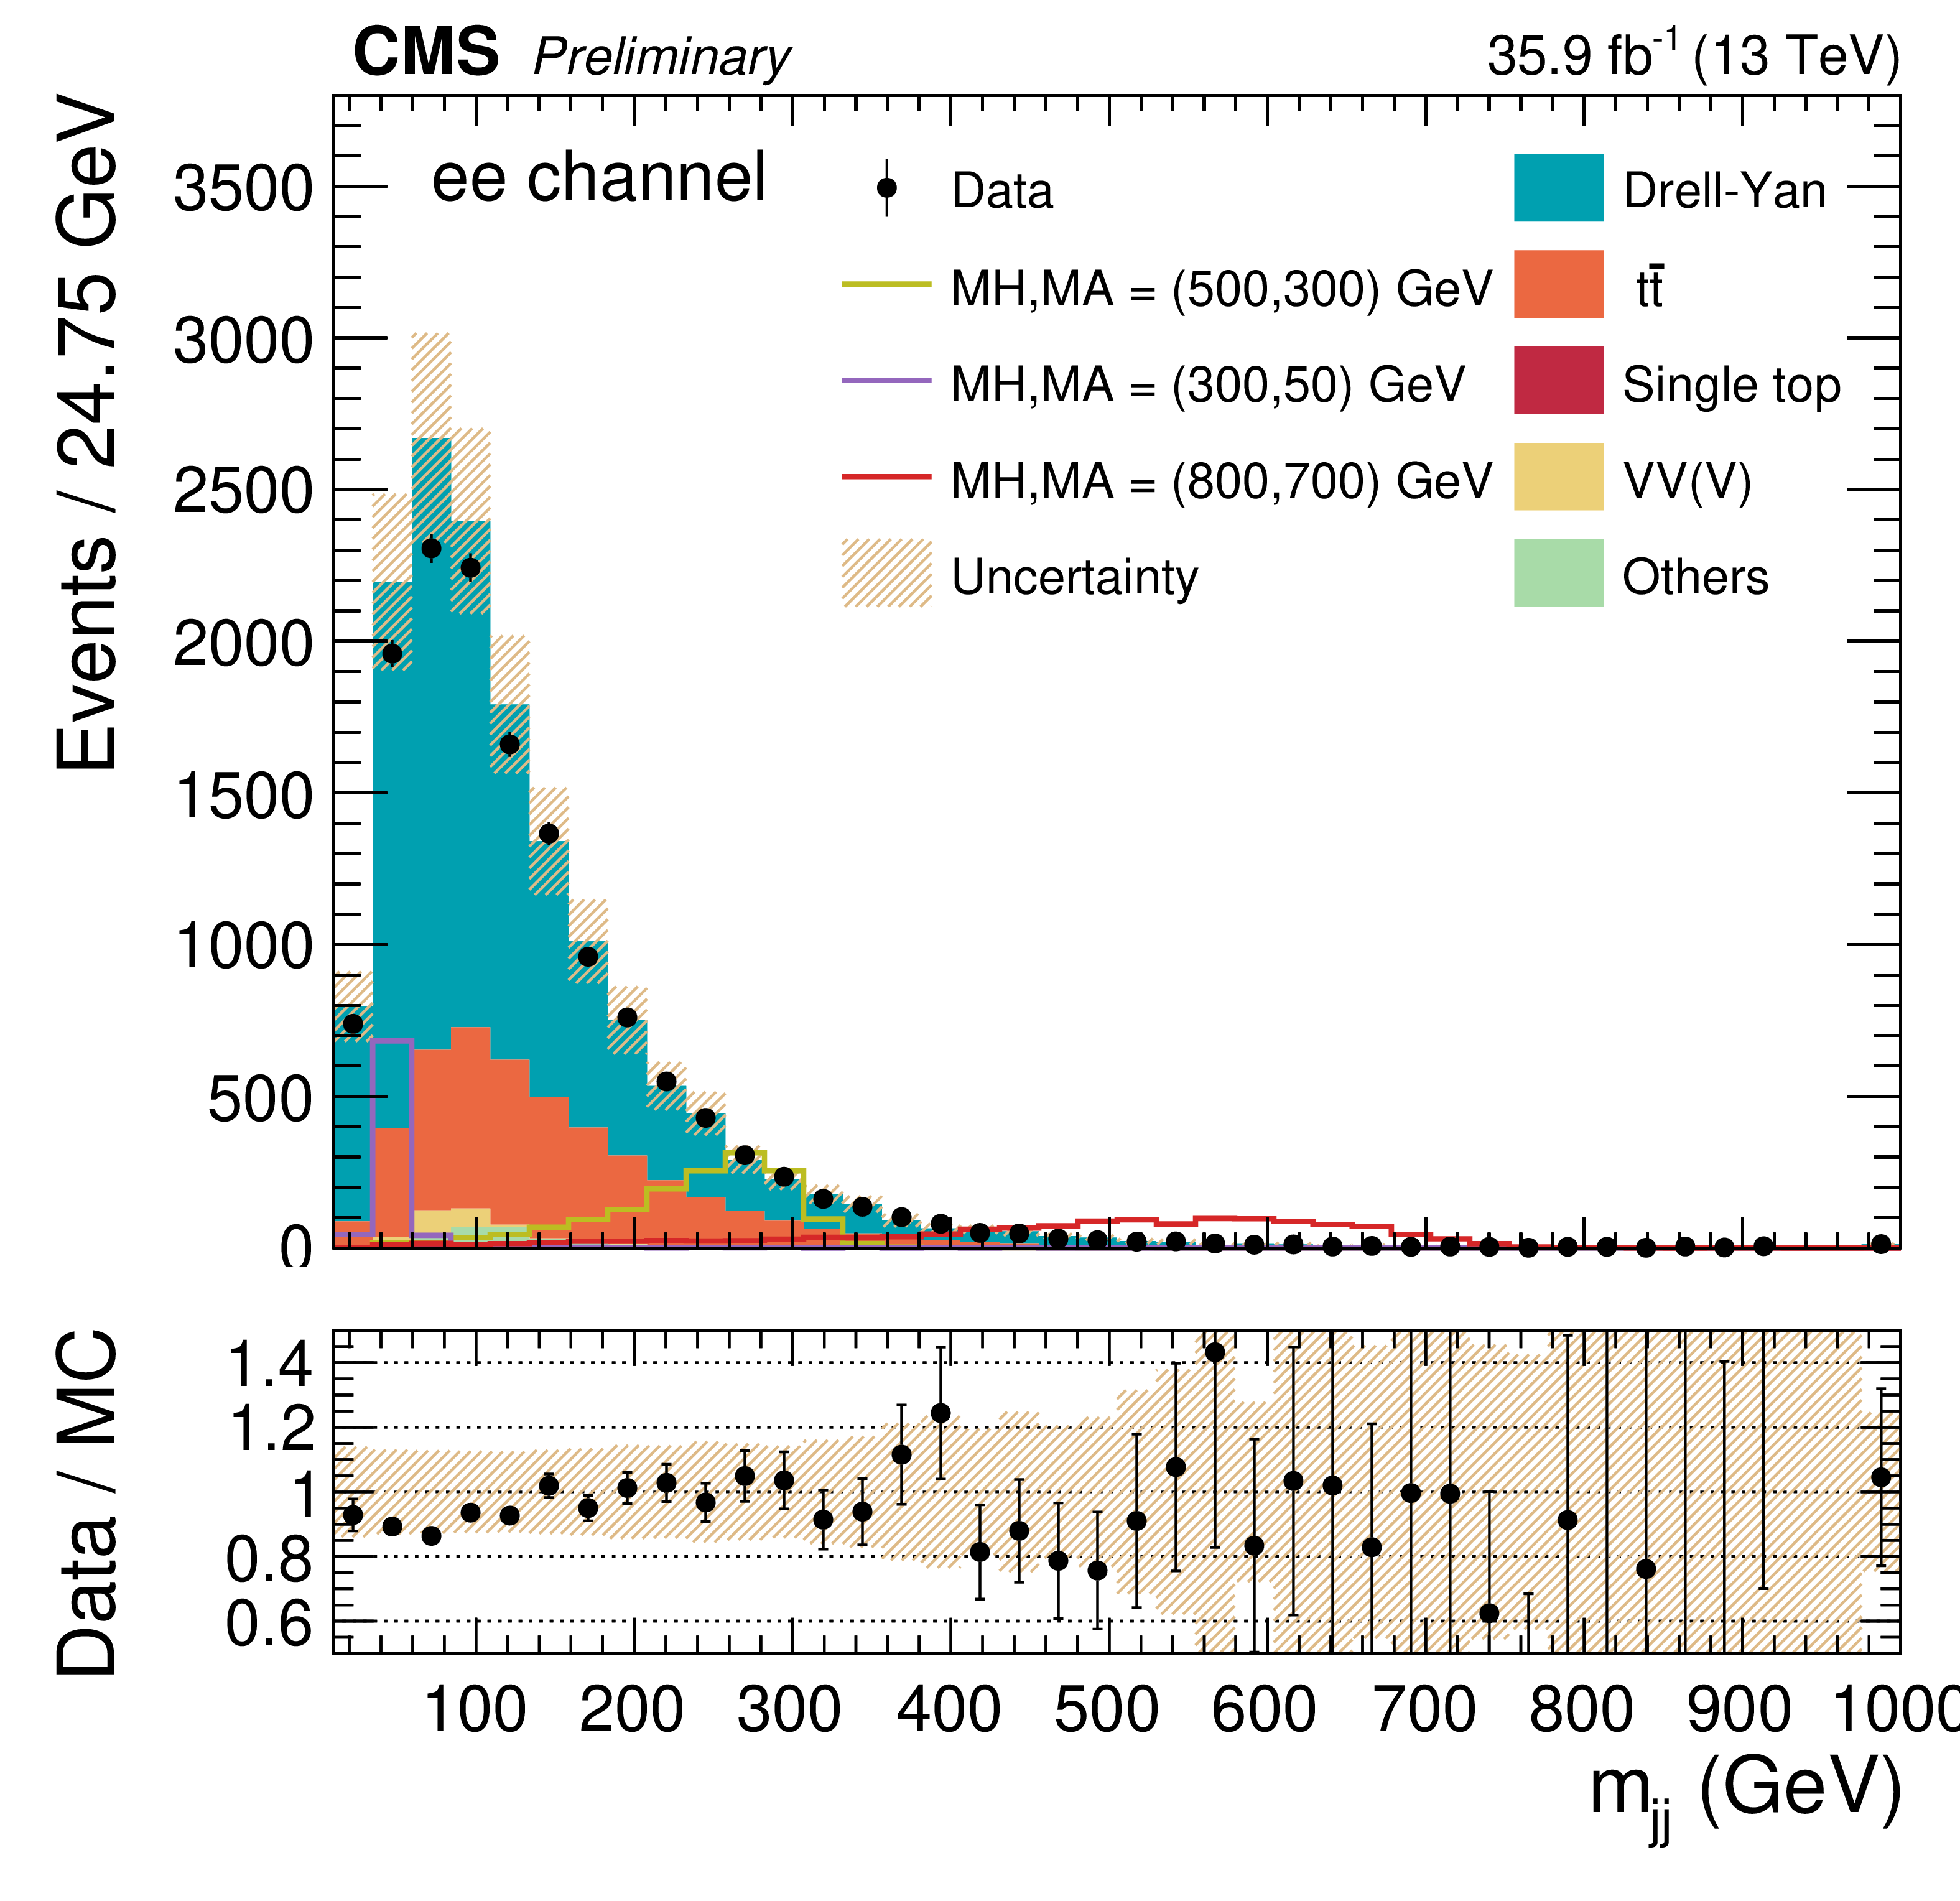
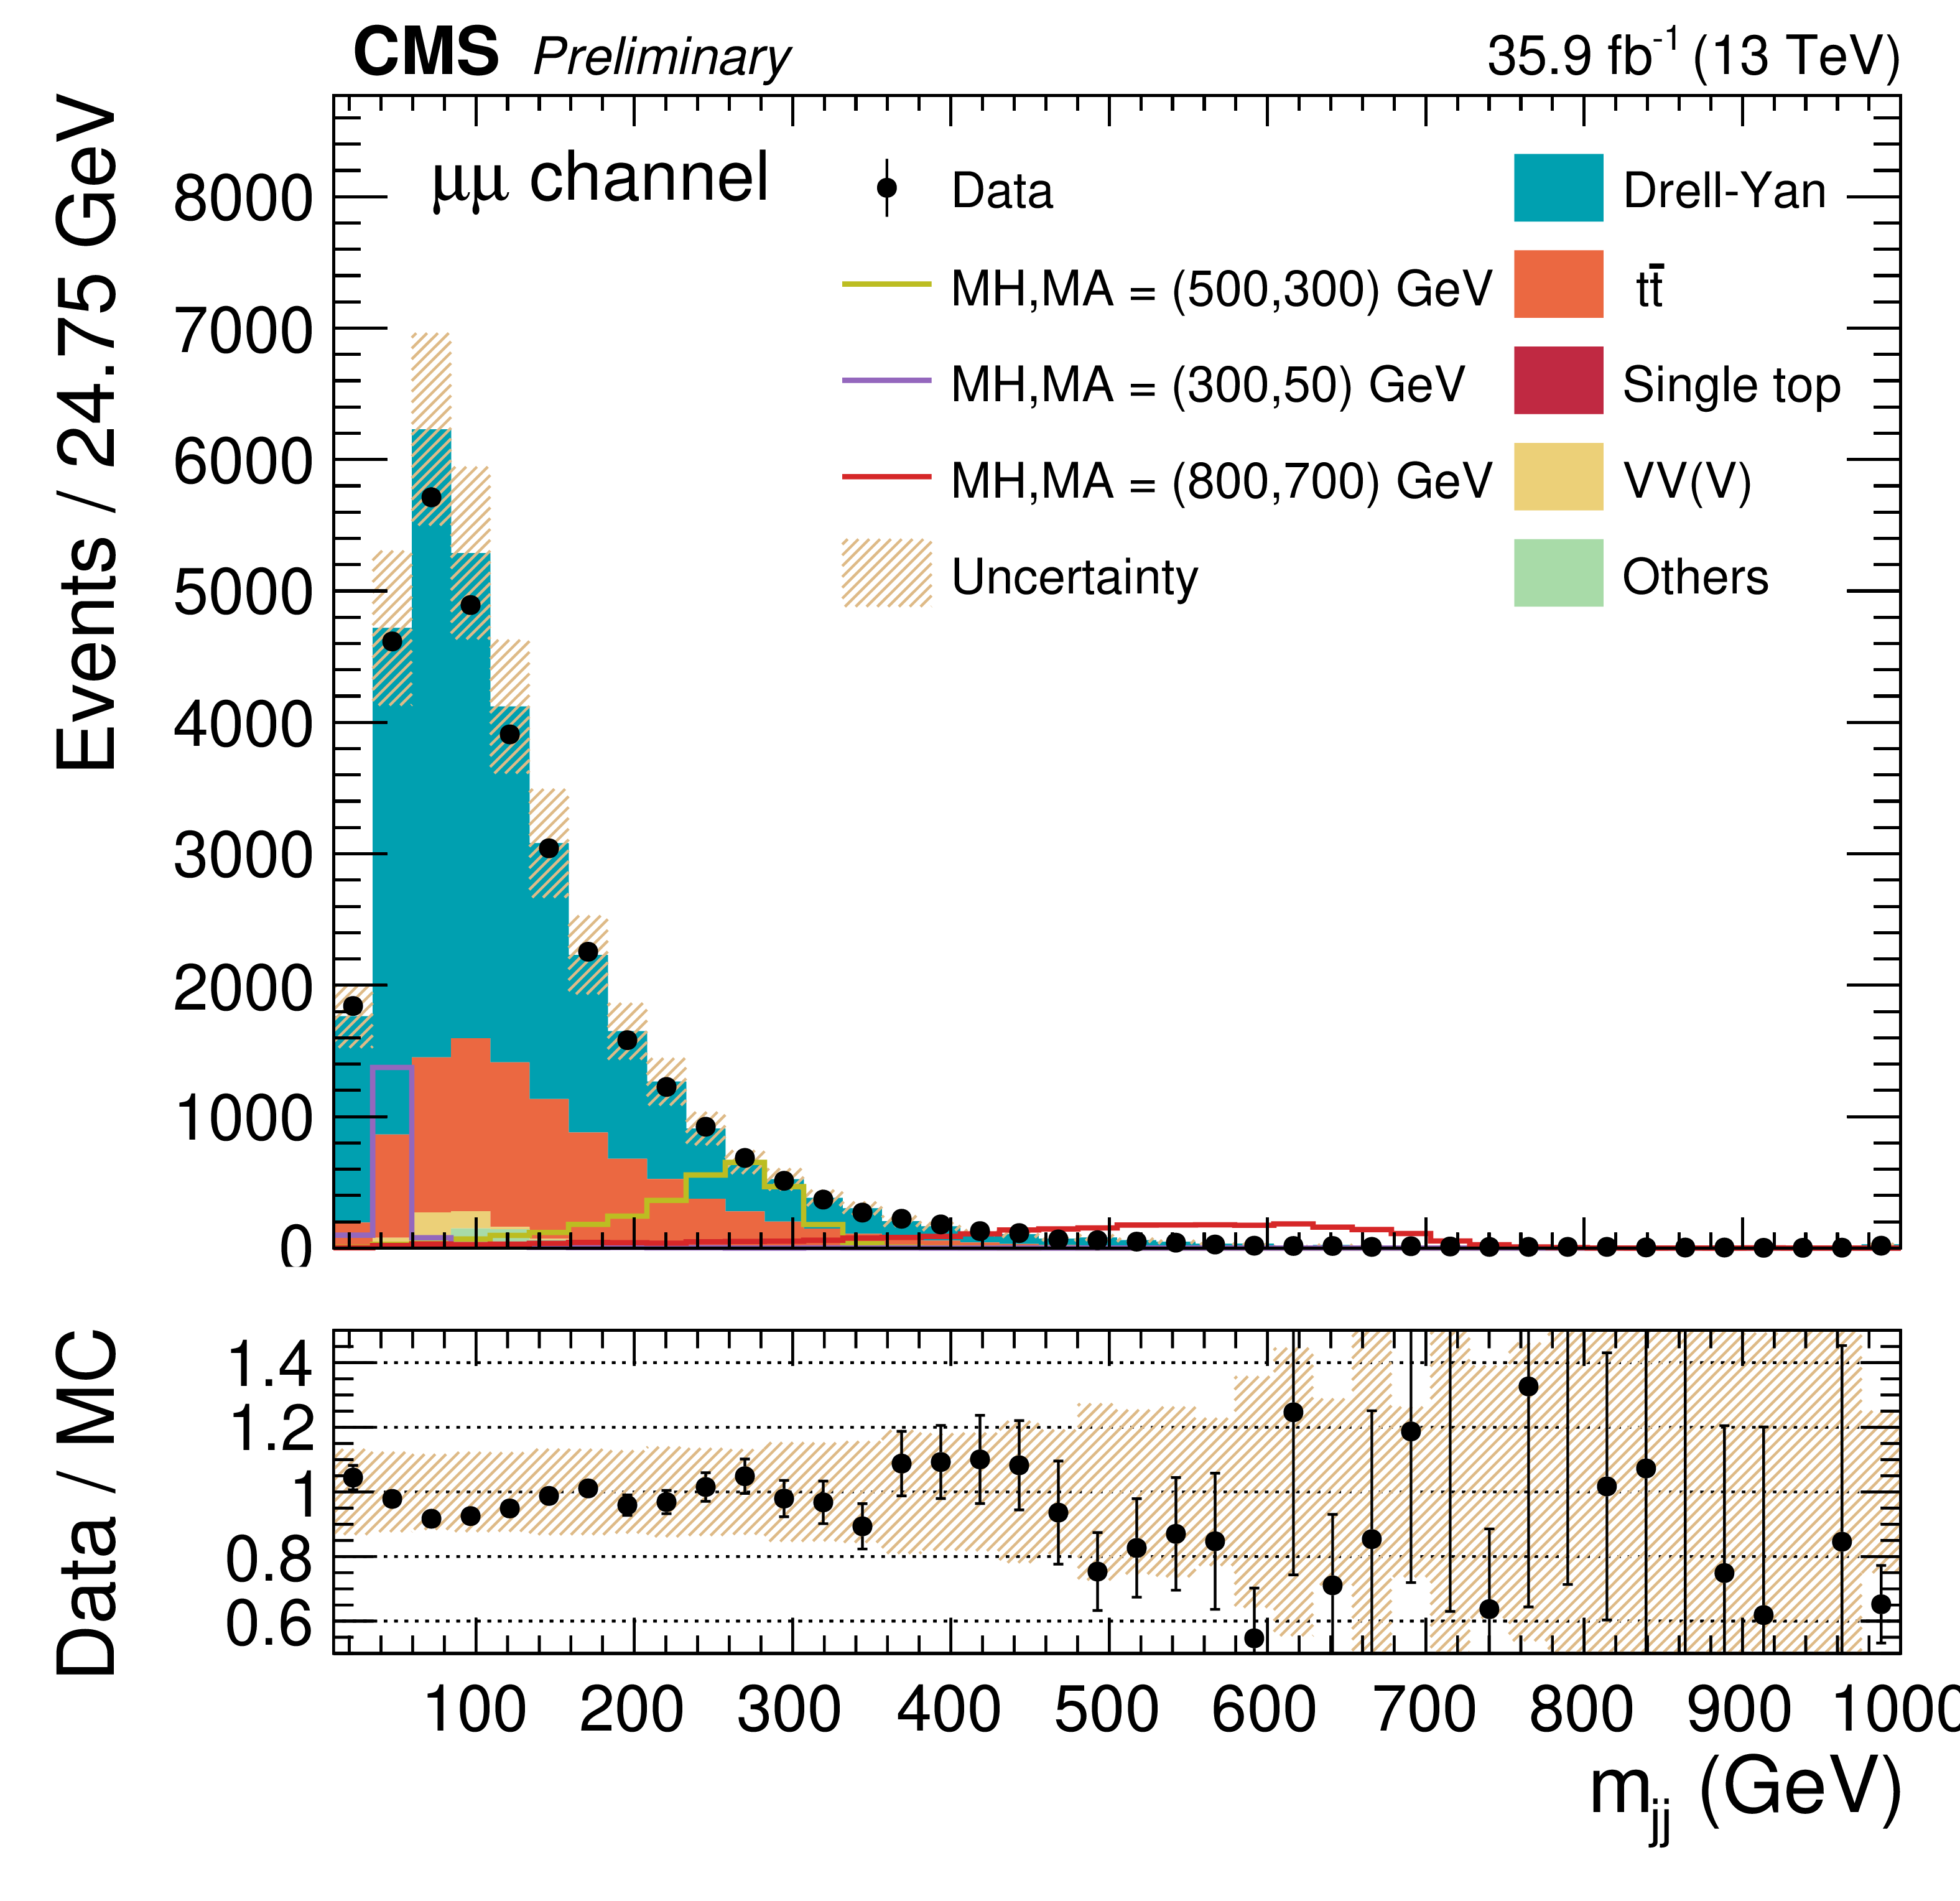
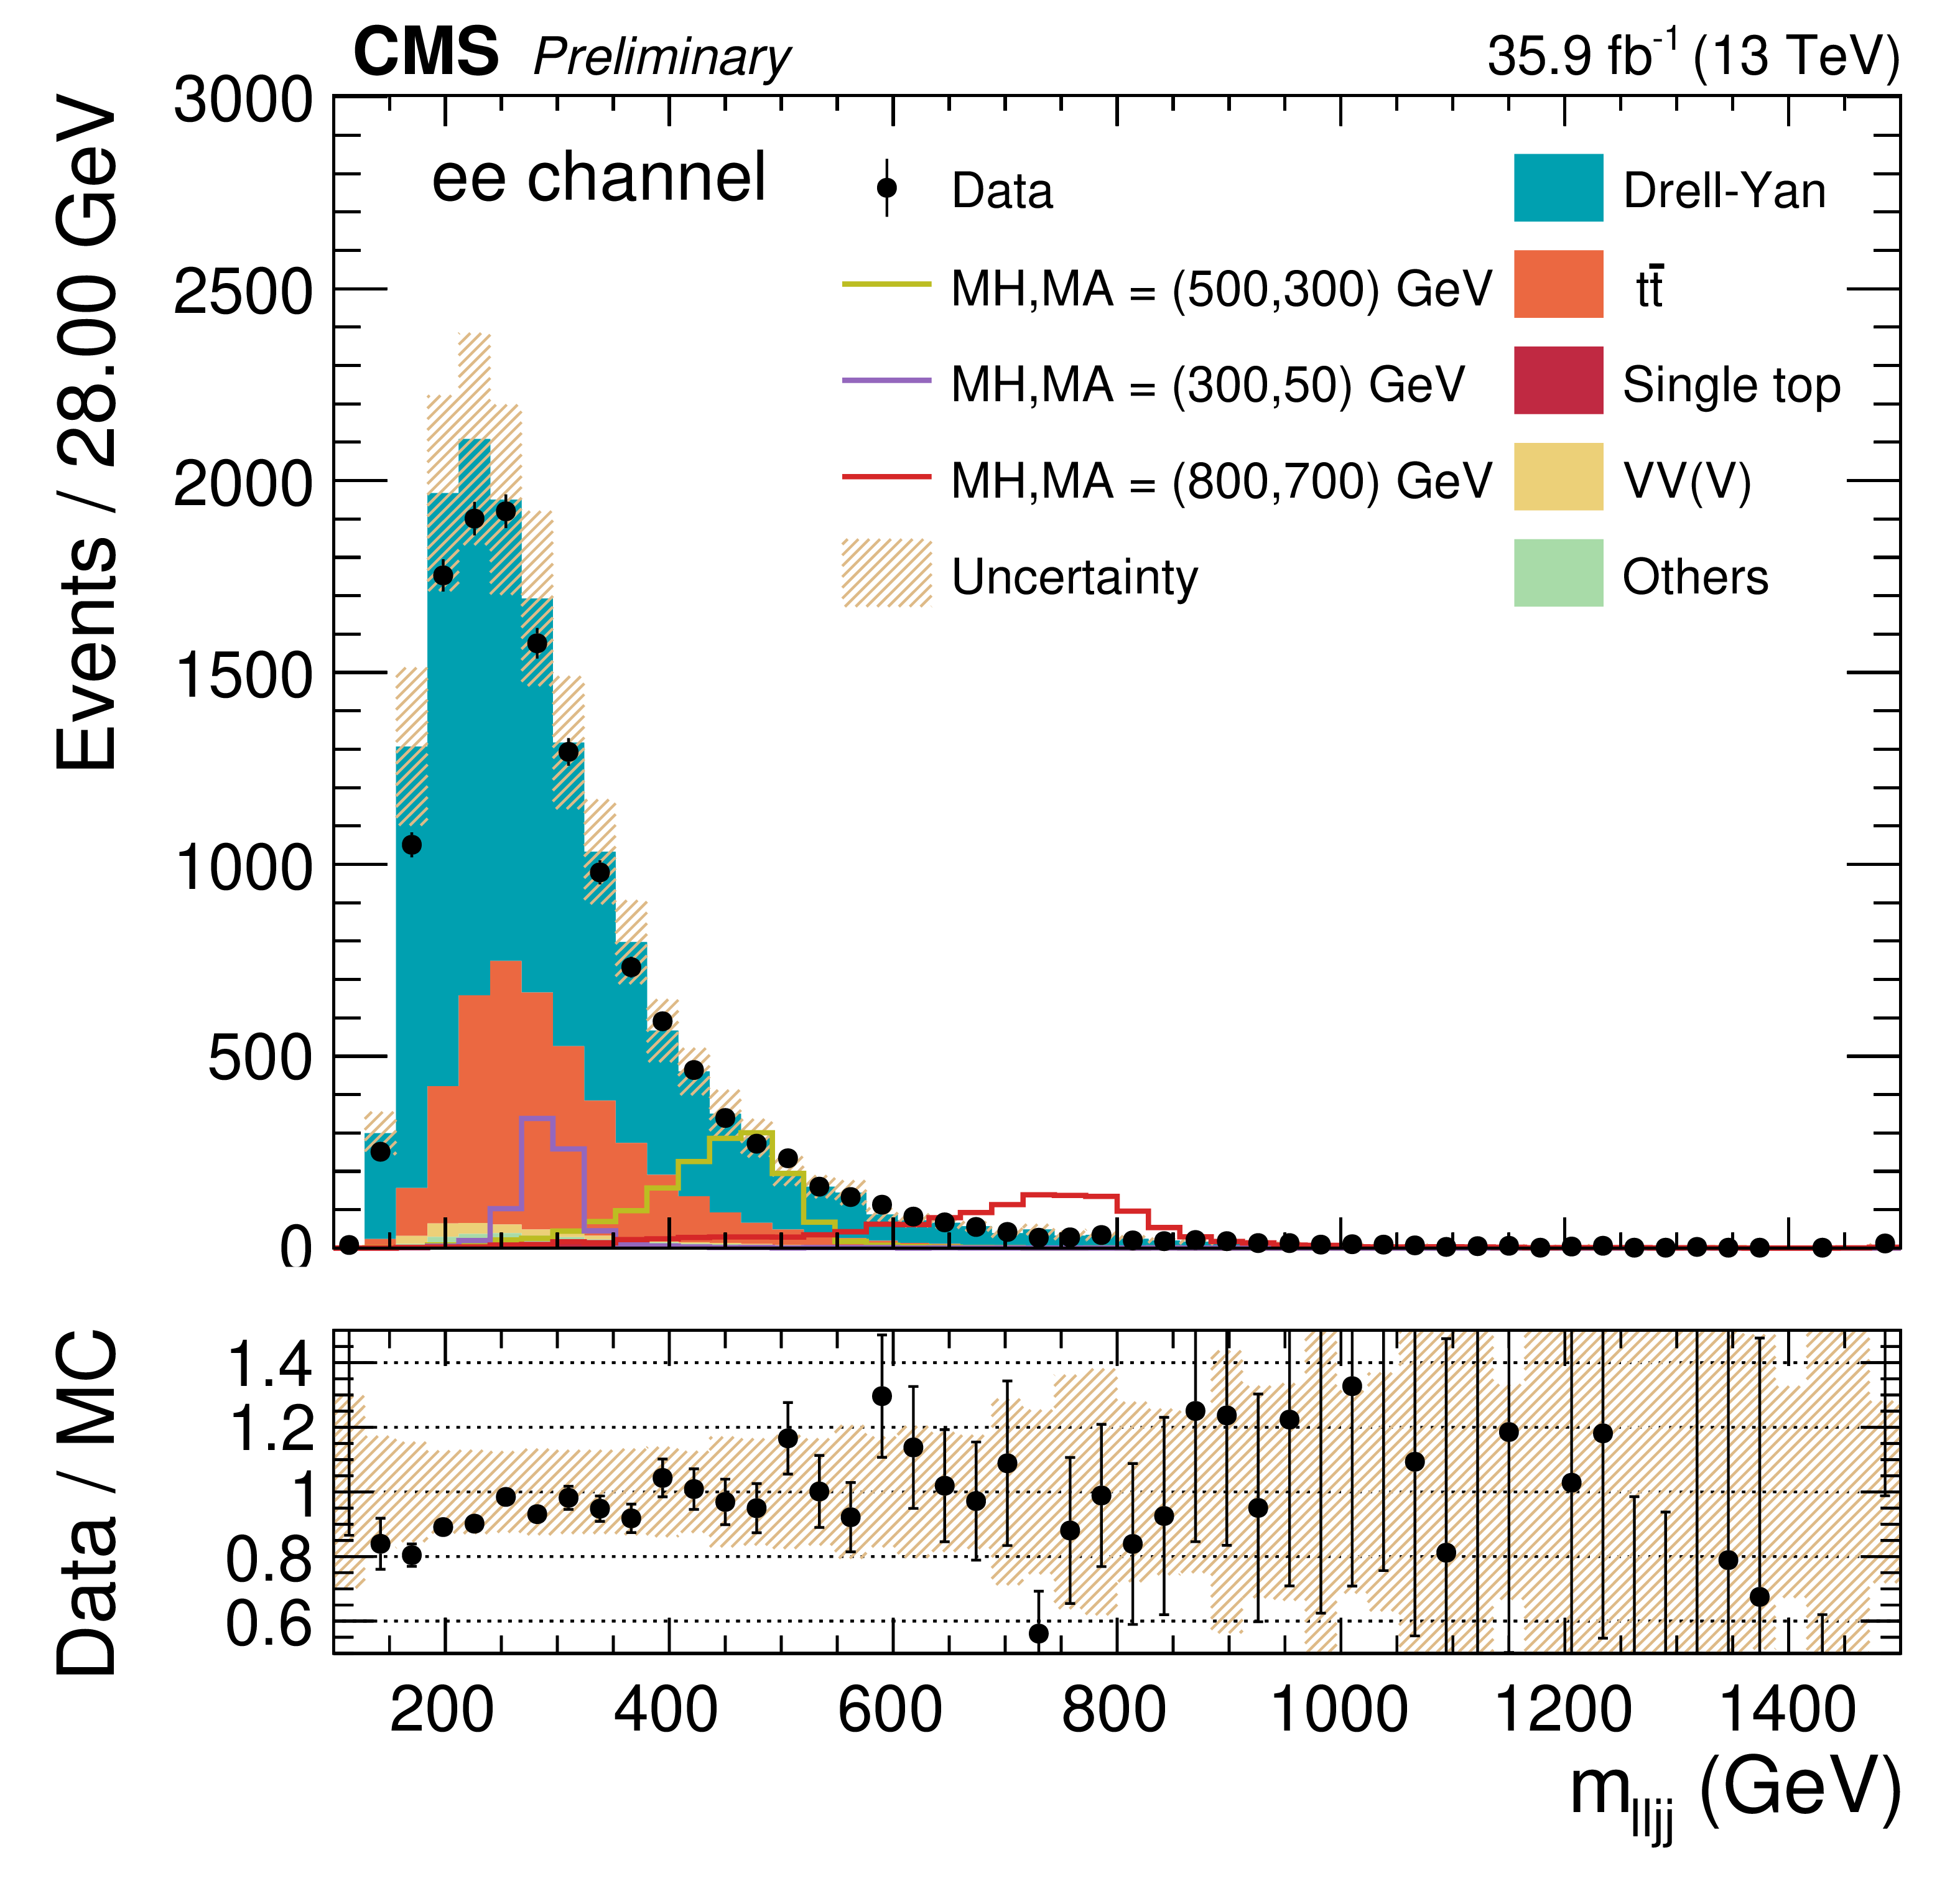
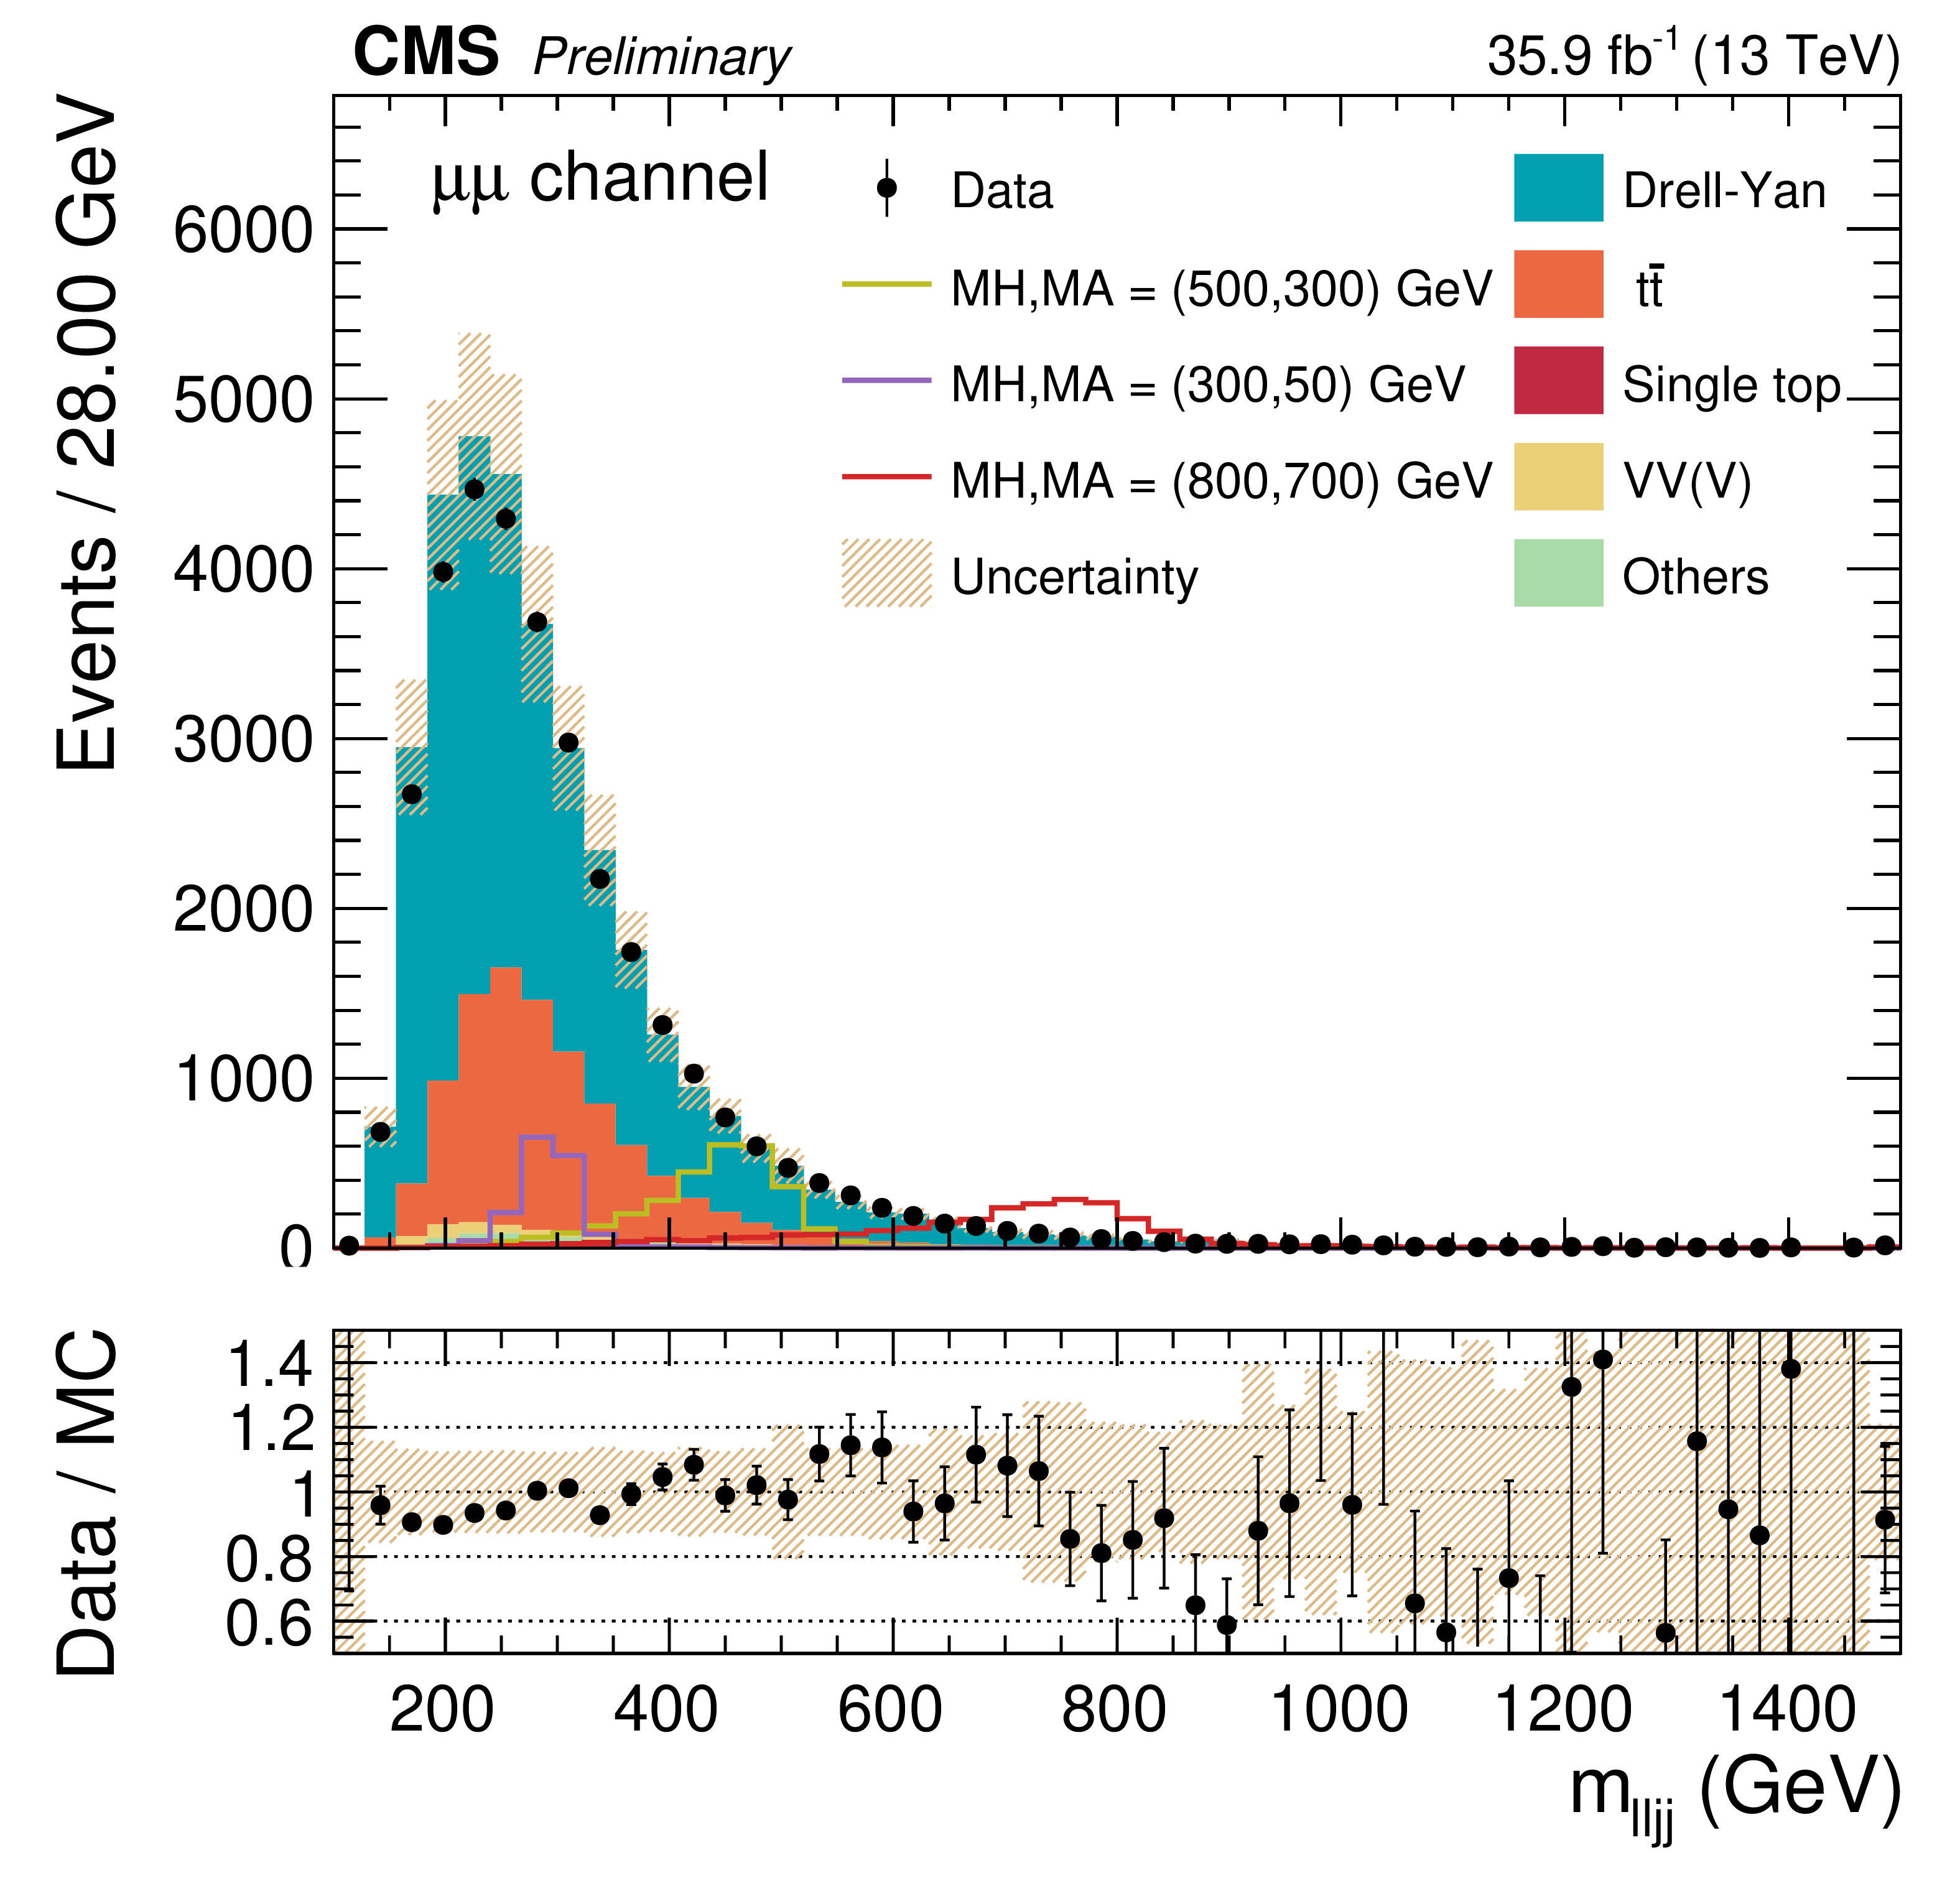
The $ {\mathrm {m}_{{\mathrm {j}} {\mathrm {j}}}} $ and $ {\mathrm {m}_{\ell\ell{\mathrm {j}} {\mathrm {j}}}} $ distributions in data and simulated background events after requiring all the analysis cuts, for $\mathrm{e^{+}} \mathrm{e^{-}} $ (left), and $\mu^{+} \mu^{-} $ (right) events. The various signal hypotheses displayed have been scaled to a cross section of 1 pb for display purposes. Error bars indicate statistical uncertainties, while shaded bands show systematic uncertainties prior to the fit. |
png pdf |
Figure 4-a:
The $ {\mathrm {m}_{{\mathrm {j}} {\mathrm {j}}}} $ distribution in data and simulated background events after requiring all the analysis cuts, for $\mathrm{e^{+}} \mathrm{e^{-}} $ events. The various signal hypotheses displayed have been scaled to a cross section of 1 pb for display purposes. Error bars indicate statistical uncertainties, while shaded bands show systematic uncertainties prior to the fit. |
png pdf |
Figure 4-b:
The $ {\mathrm {m}_{{\mathrm {j}} {\mathrm {j}}}} $ distribution in data and simulated background events after requiring all the analysis cuts, for $\mu^{+} \mu^{-} $ events. The various signal hypotheses displayed have been scaled to a cross section of 1 pb for display purposes. Error bars indicate statistical uncertainties, while shaded bands show systematic uncertainties prior to the fit. |
png pdf |
Figure 4-c:
The $ {\mathrm {m}_{\ell\ell{\mathrm {j}} {\mathrm {j}}}} $ distribution in data and simulated background events after requiring all the analysis cuts, for $\mathrm{e^{+}} \mathrm{e^{-}} $ events. The various signal hypotheses displayed have been scaled to a cross section of 1 pb for display purposes. Error bars indicate statistical uncertainties, while shaded bands show systematic uncertainties prior to the fit. |
png pdf |
Figure 4-d:
The $ {\mathrm {m}_{\ell\ell{\mathrm {j}} {\mathrm {j}}}} $ distribution in data and simulated background events after requiring all the analysis cuts, for $\mu^{+} \mu^{-} $ events. The various signal hypotheses displayed have been scaled to a cross section of 1 pb for display purposes. Error bars indicate statistical uncertainties, while shaded bands show systematic uncertainties prior to the fit. |
png pdf |
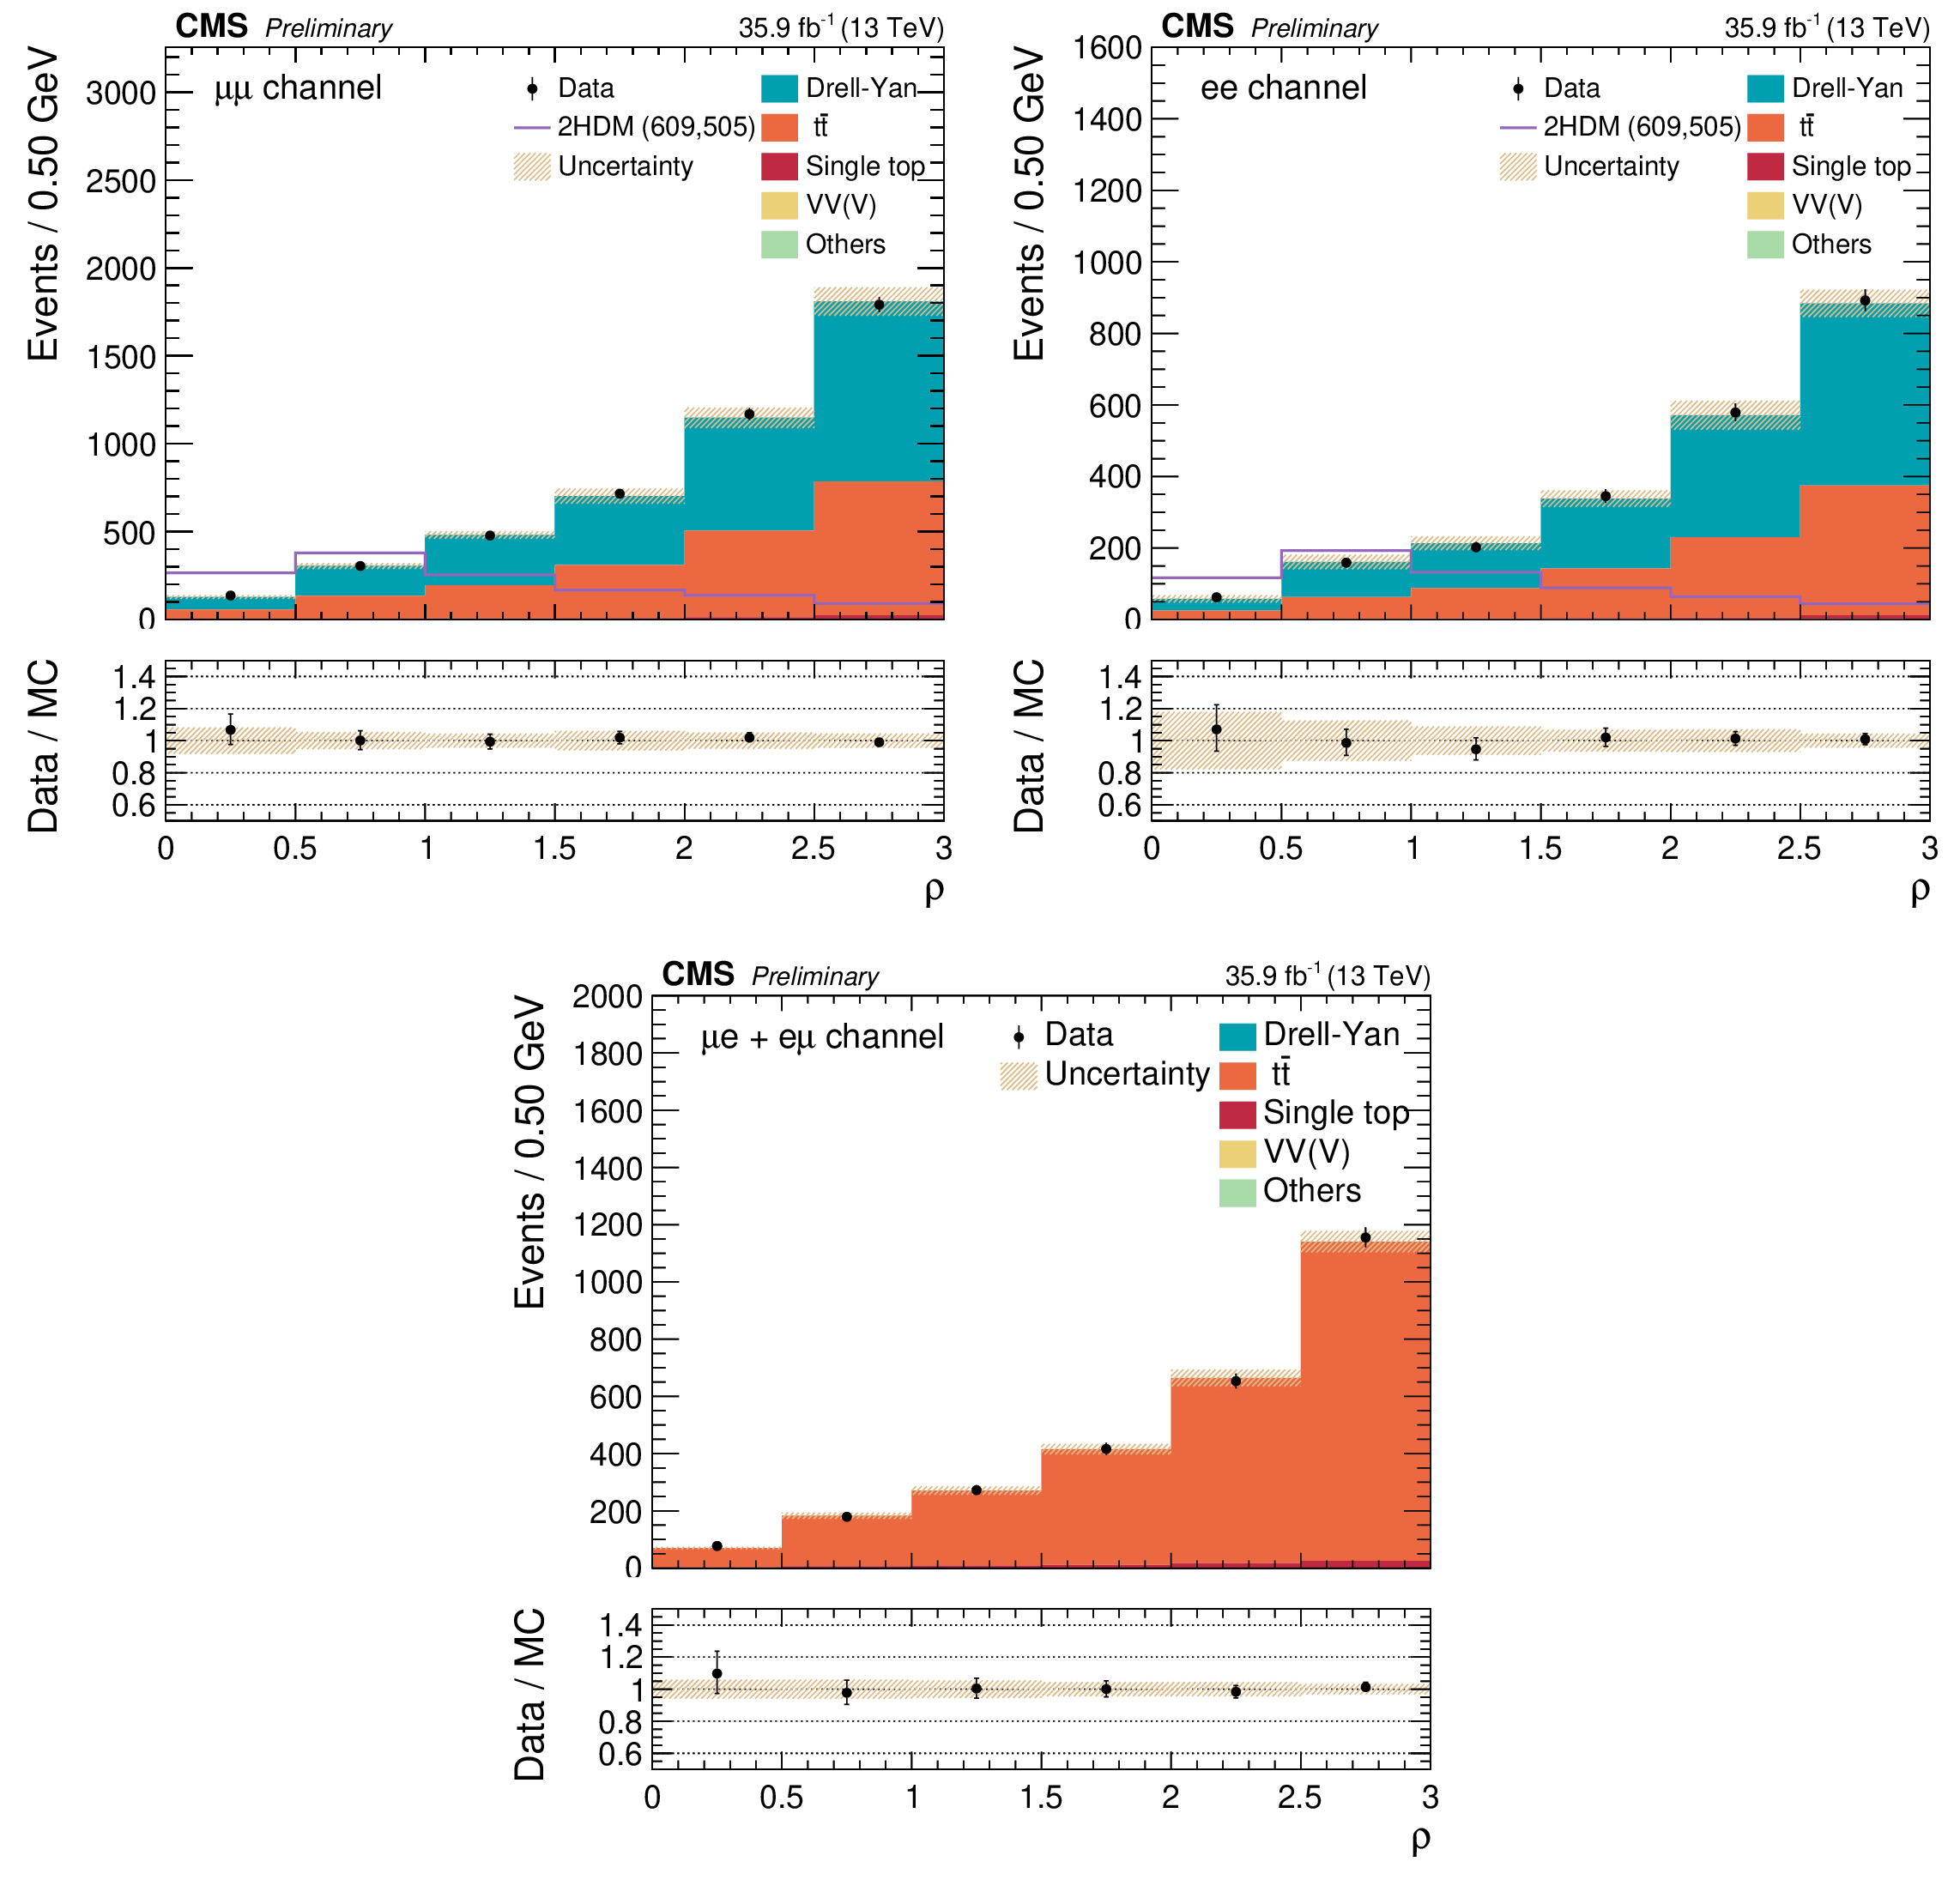
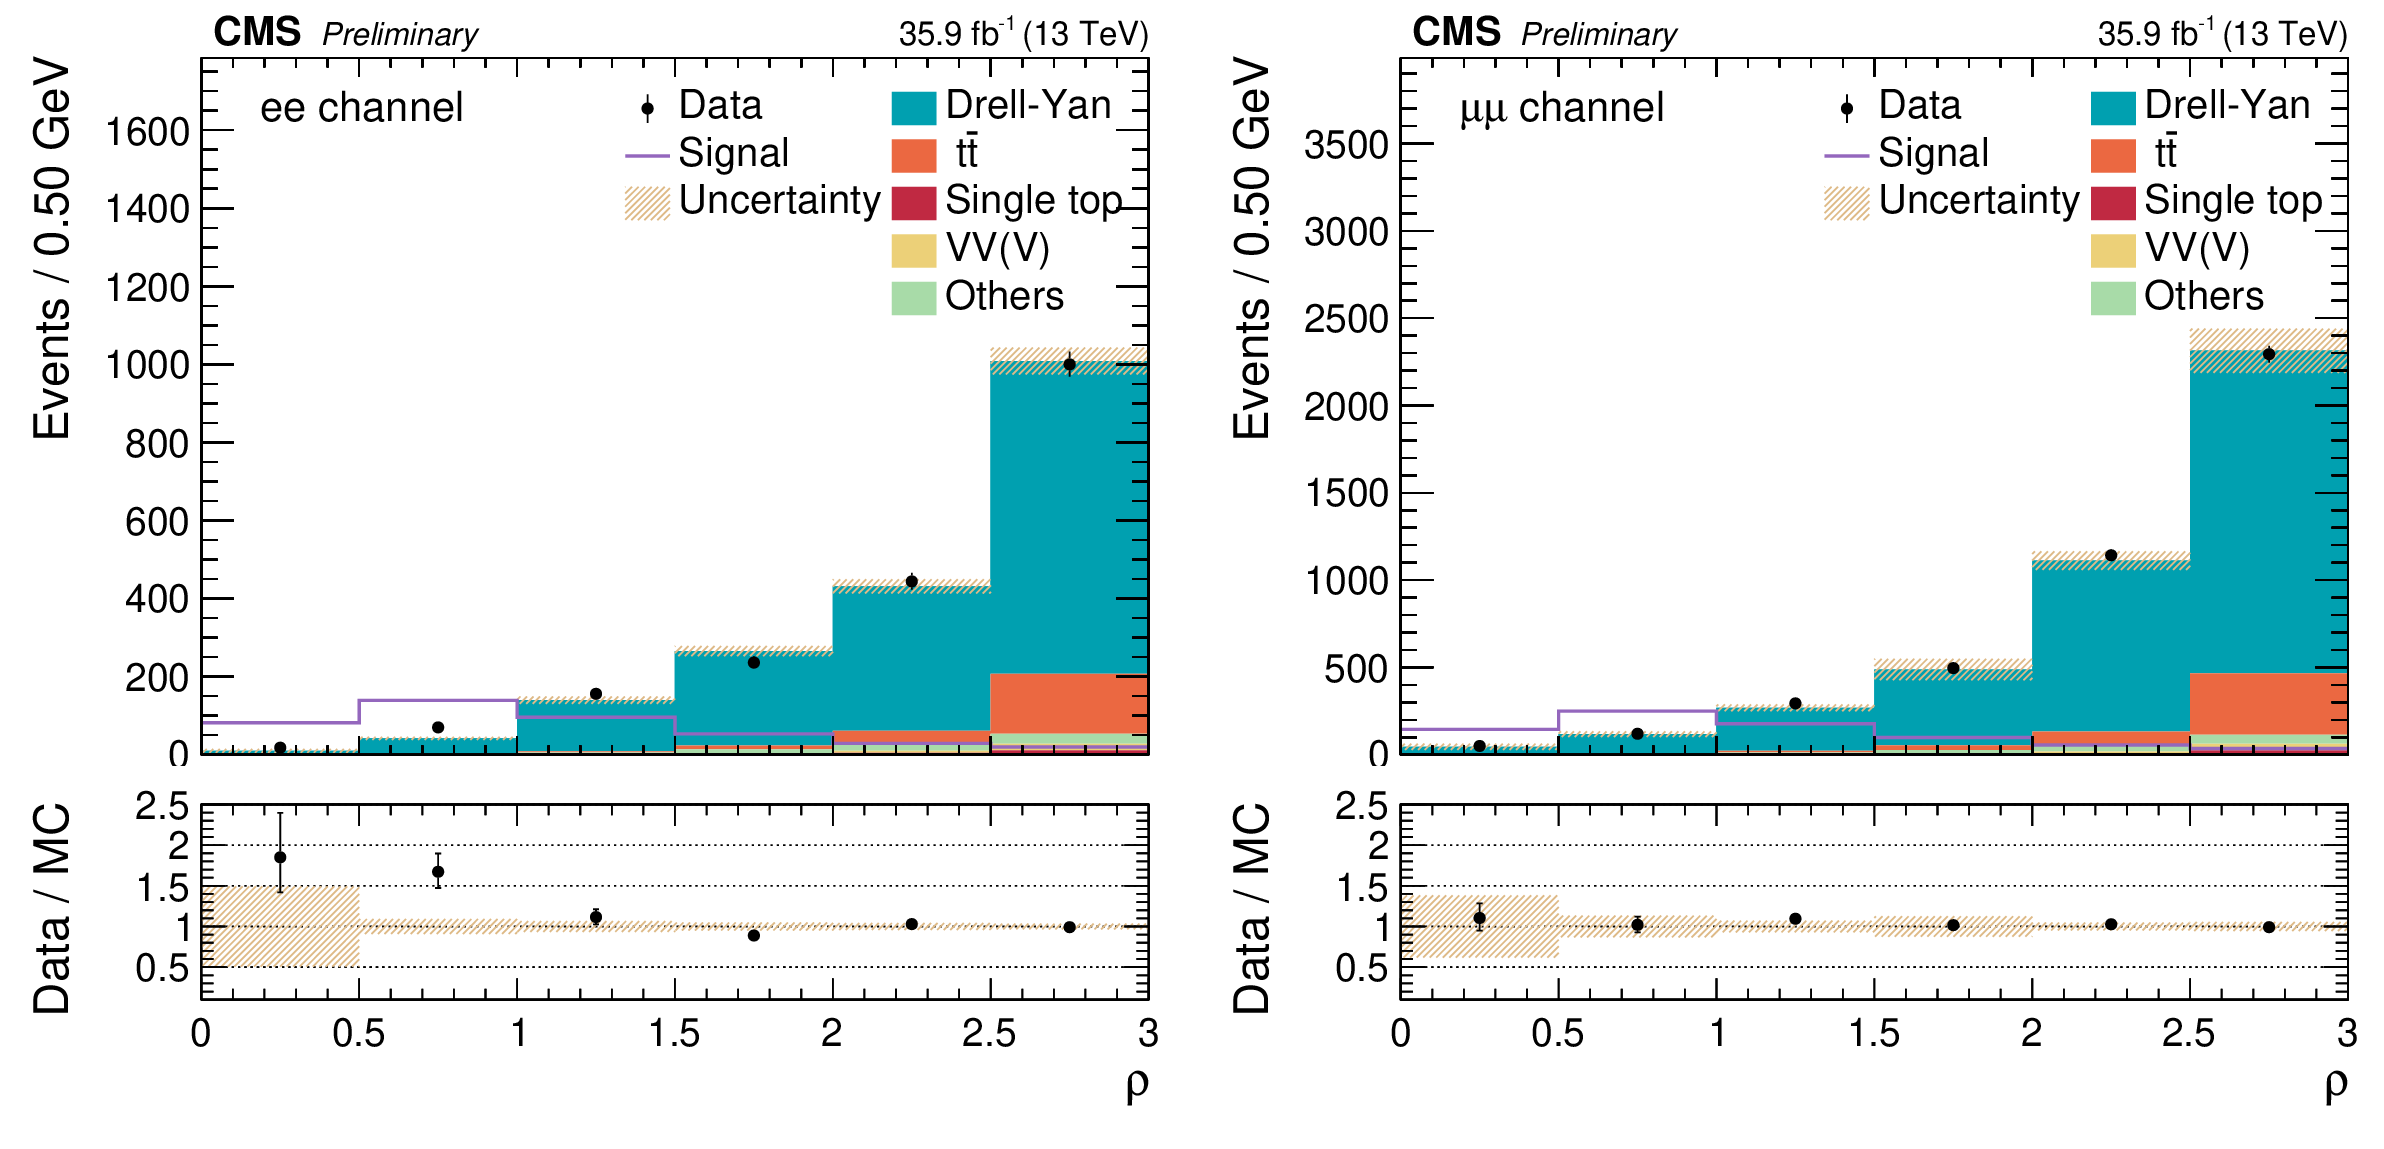
Figure 5:
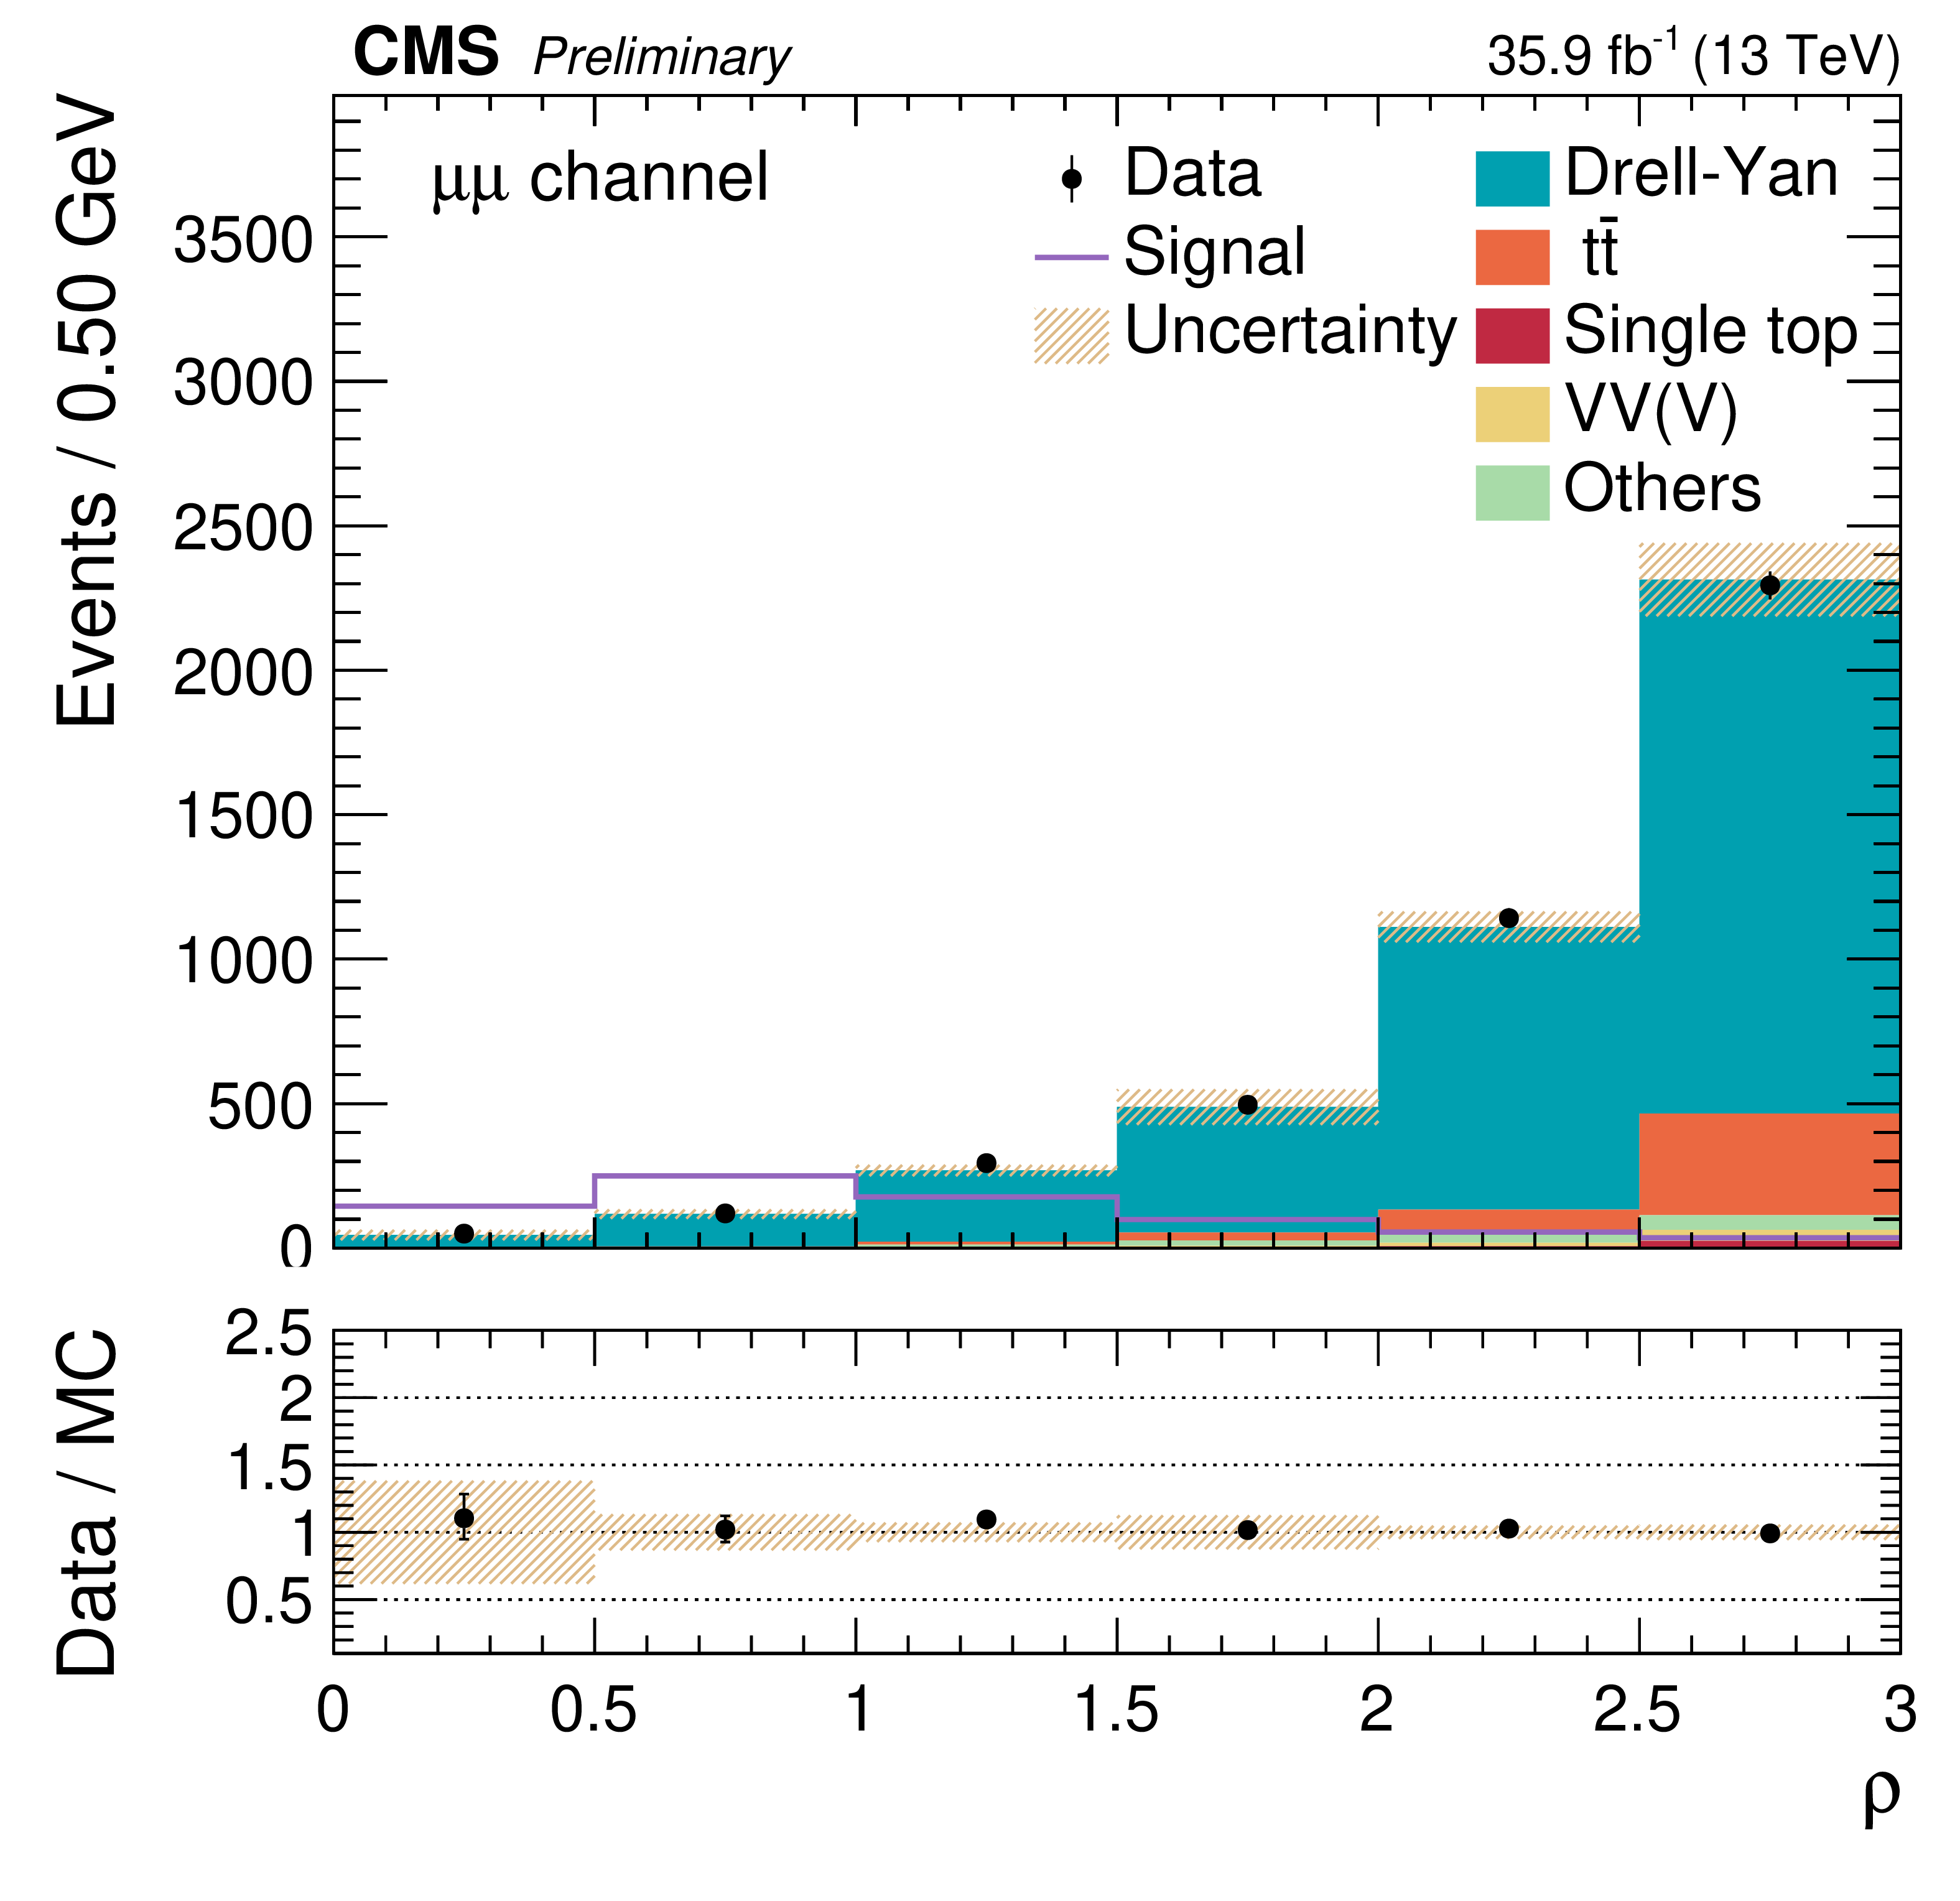
$\rho $ distributions for $\mu^{+} \mu^{-}$ (top left), $\mathrm{e^{+}} \mathrm{e^{-}}$ (top right), and $\mathrm{e^{\pm}} {\mu ^\mp}$ (bottom) events corresponding to a particle signal hypothesis with $m_{\mathrm{H}}=$ 609 GeV and $m_{{\text {A}}}=$ 505 GeV. The signal is normalised to 20 nb. The mixed-flavour lepton category is a control region used in the template fit to further constrain the ${\mathrm{t} \mathrm{\bar{t}}}$ background. The bins are defined by steps of 0.5 in $\rho $. Error bars indicate statistical uncertainties, while shaded bands show systematic uncertainties. |
png pdf |
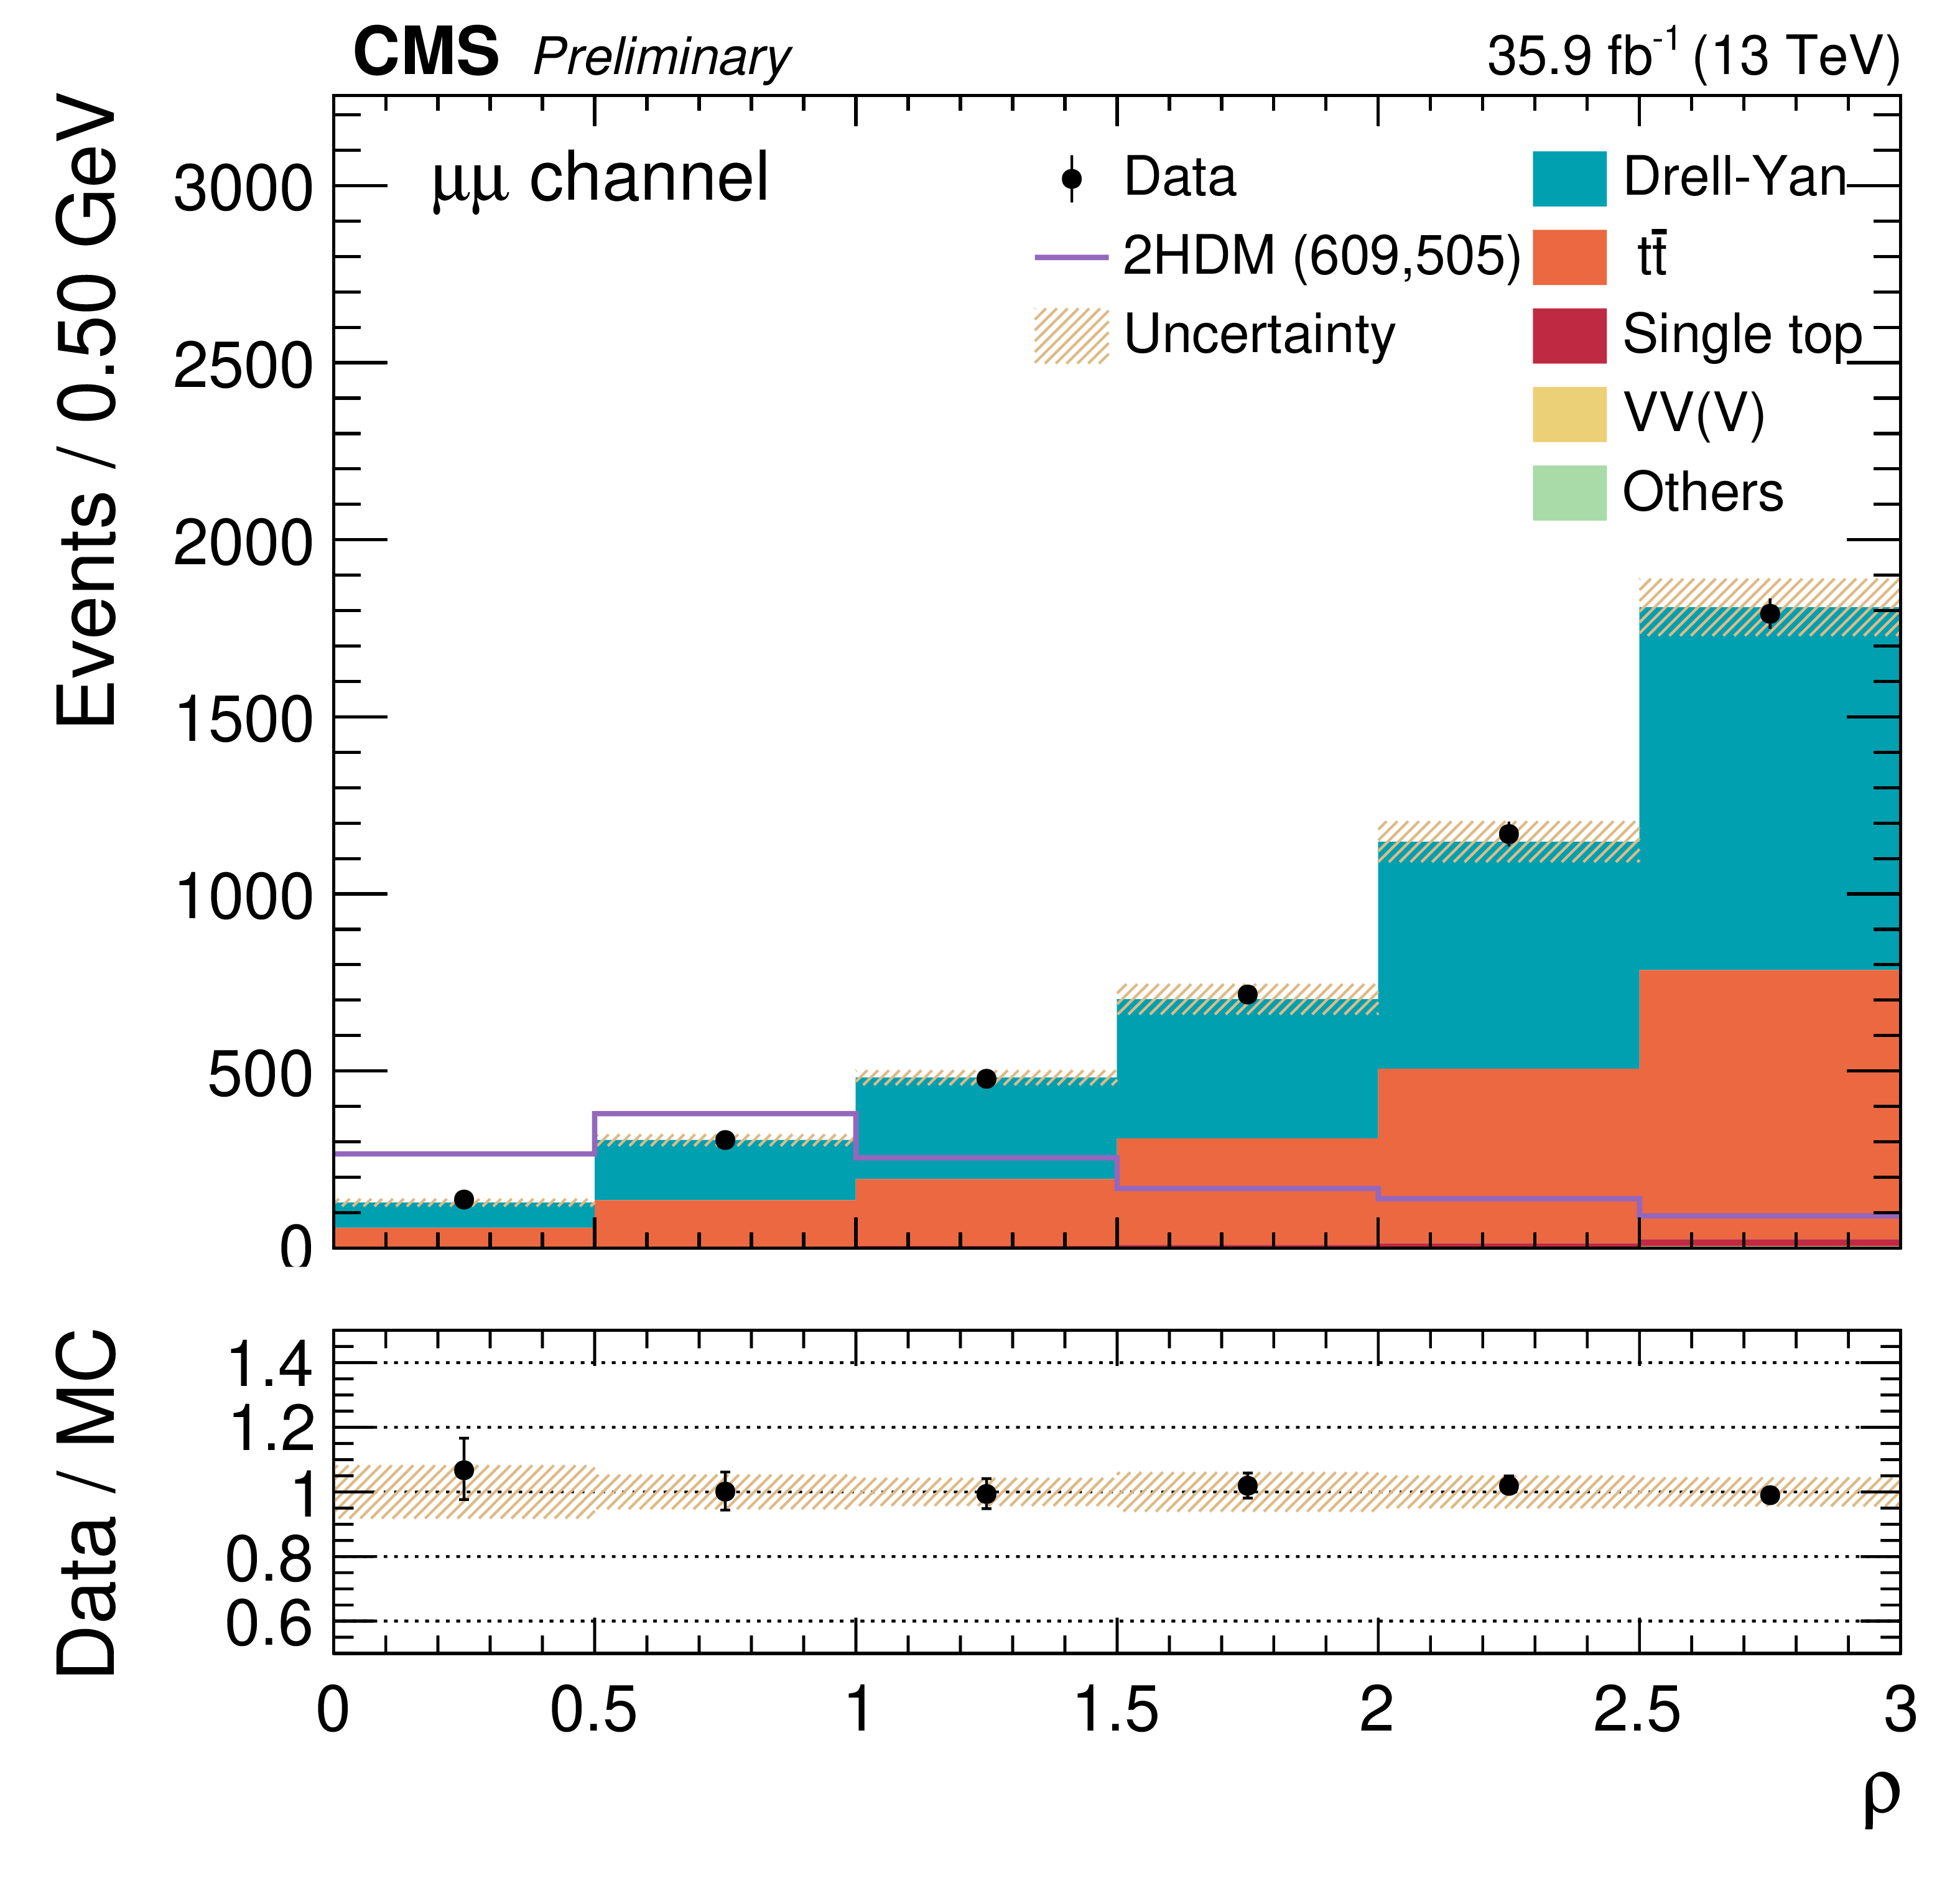
Figure 5-a:
$\rho $ distribution for $\mu^{+} \mu^{-}$ events corresponding to a particle signal hypothesis with $m_{\mathrm{H}}=$ 609 GeV and $m_{{\text {A}}}=$ 505 GeV. The signal is normalised to 20 nb. The mixed-flavour lepton category is a control region used in the template fit to further constrain the ${\mathrm{t} \mathrm{\bar{t}}}$ background. The bins are defined by steps of 0.5 in $\rho $. Error bars indicate statistical uncertainties, while shaded bands show systematic uncertainties. |
png pdf |
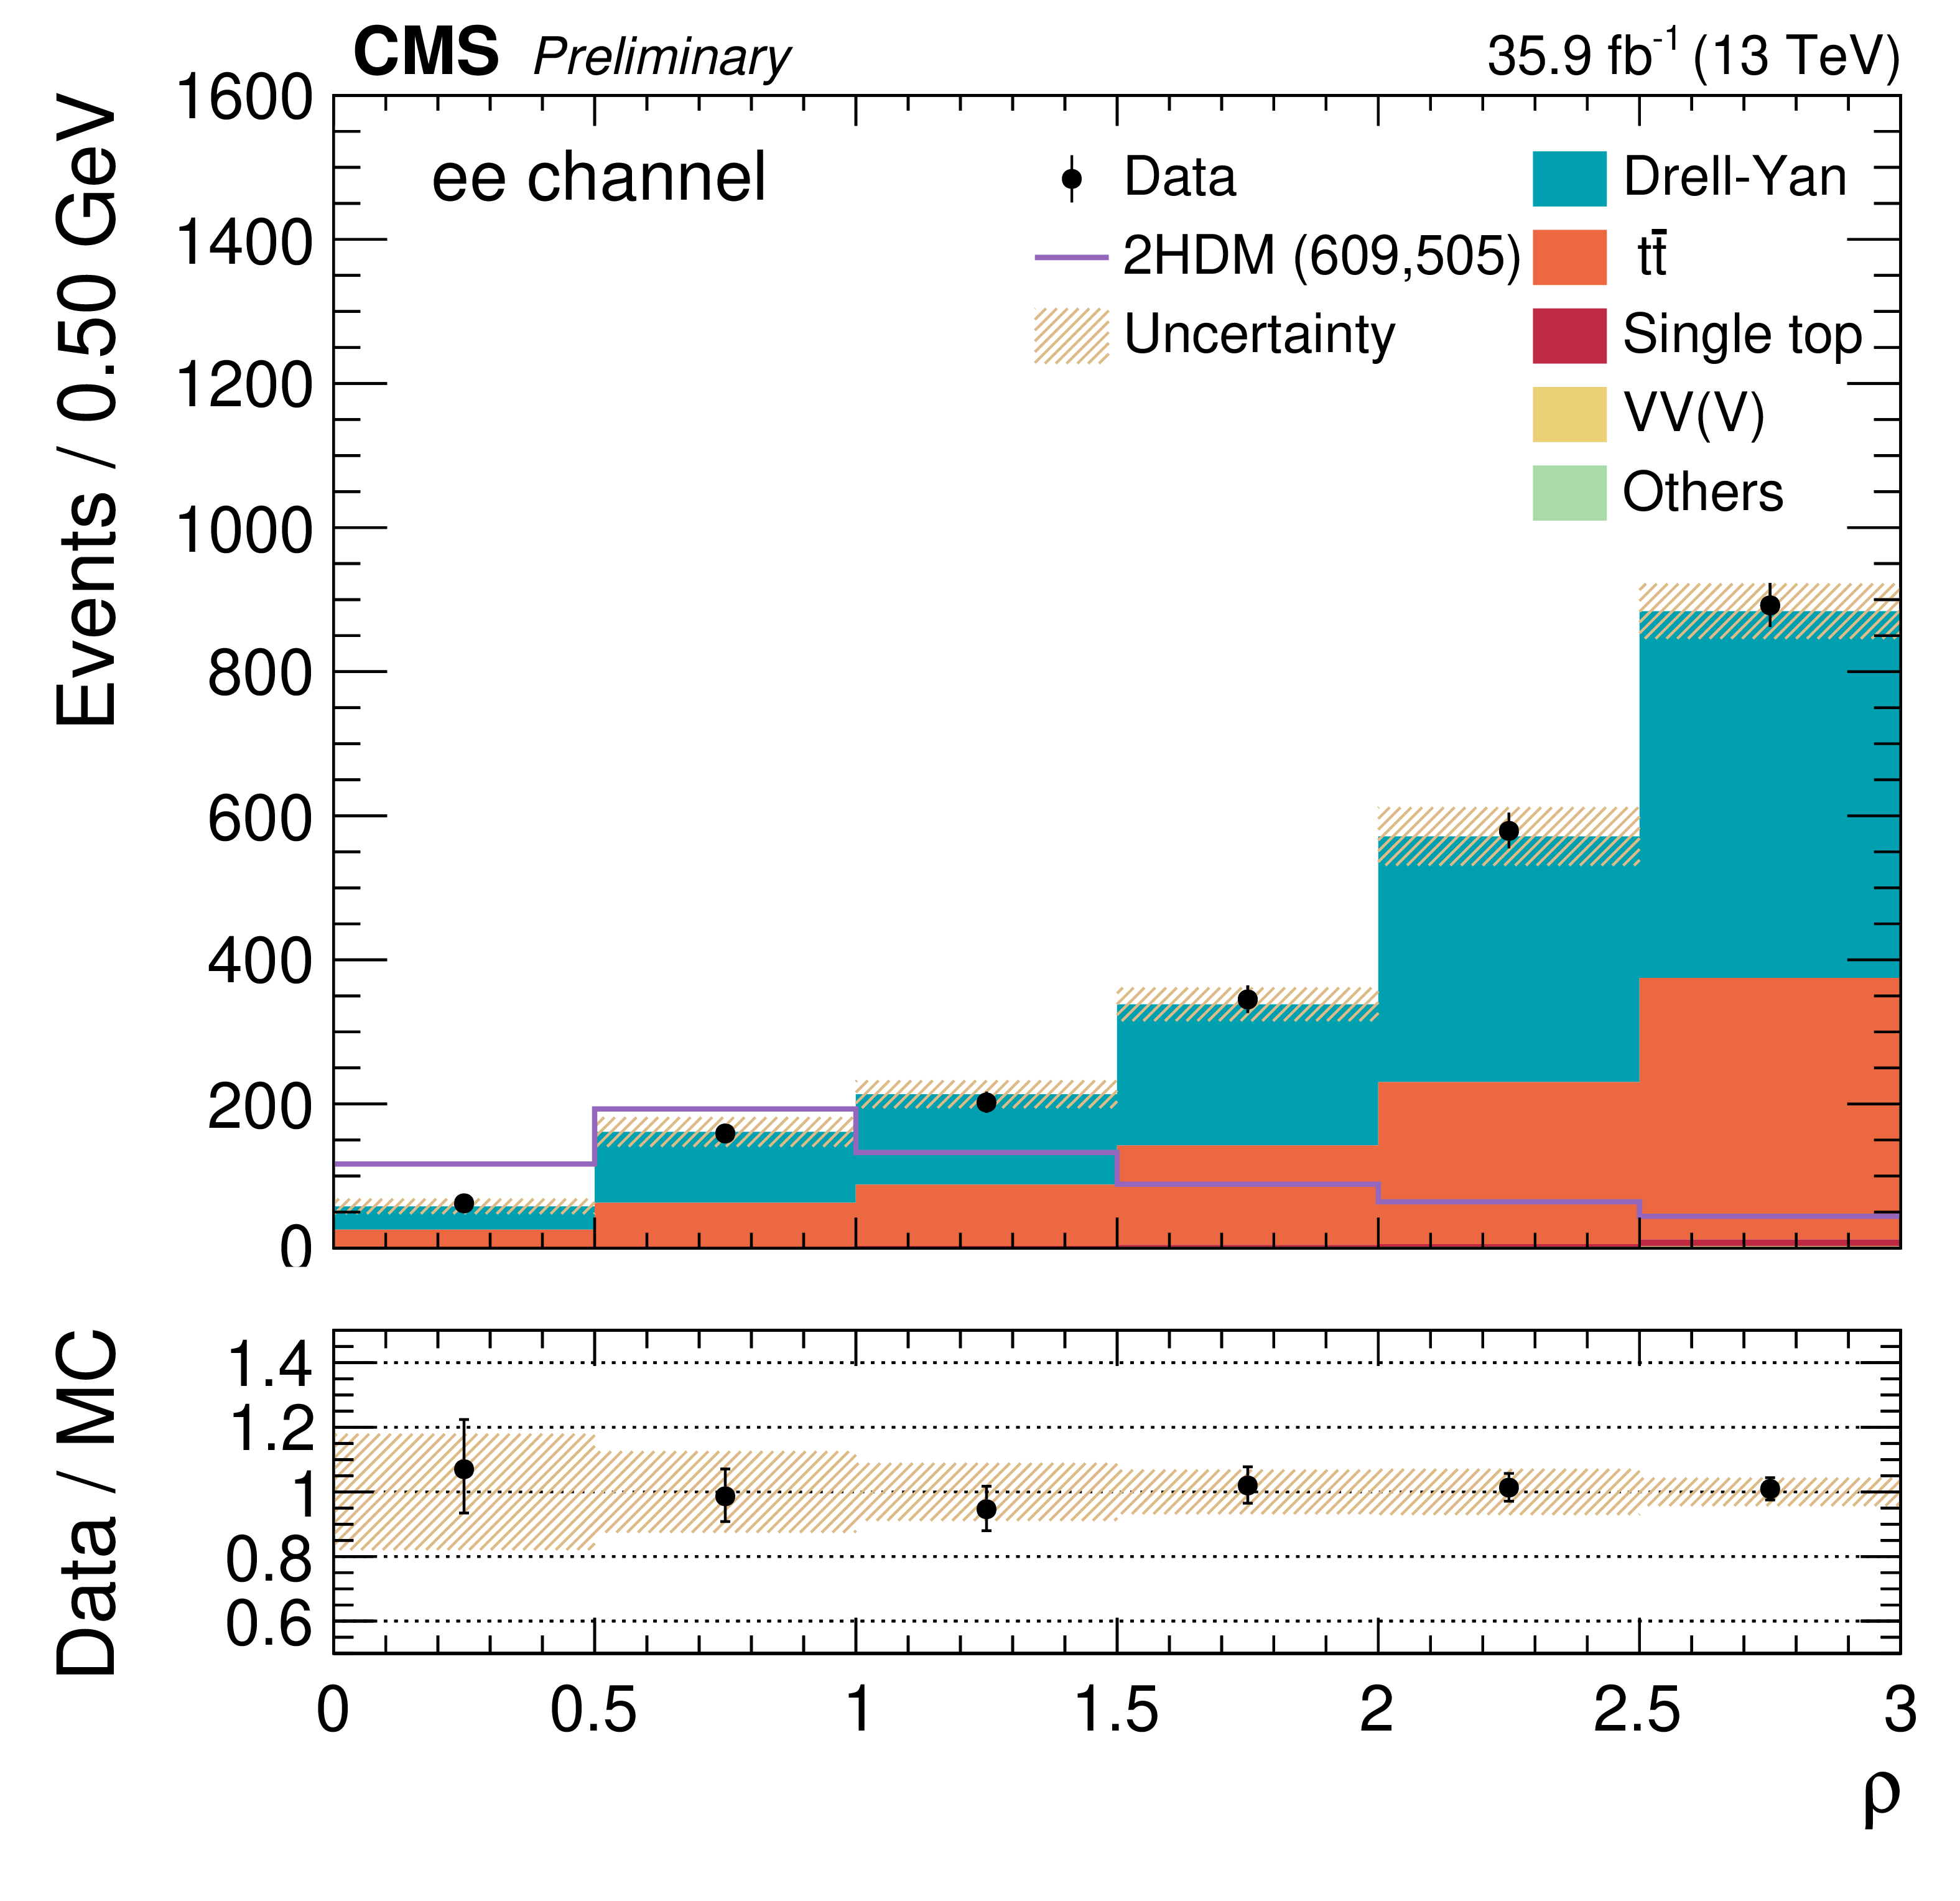
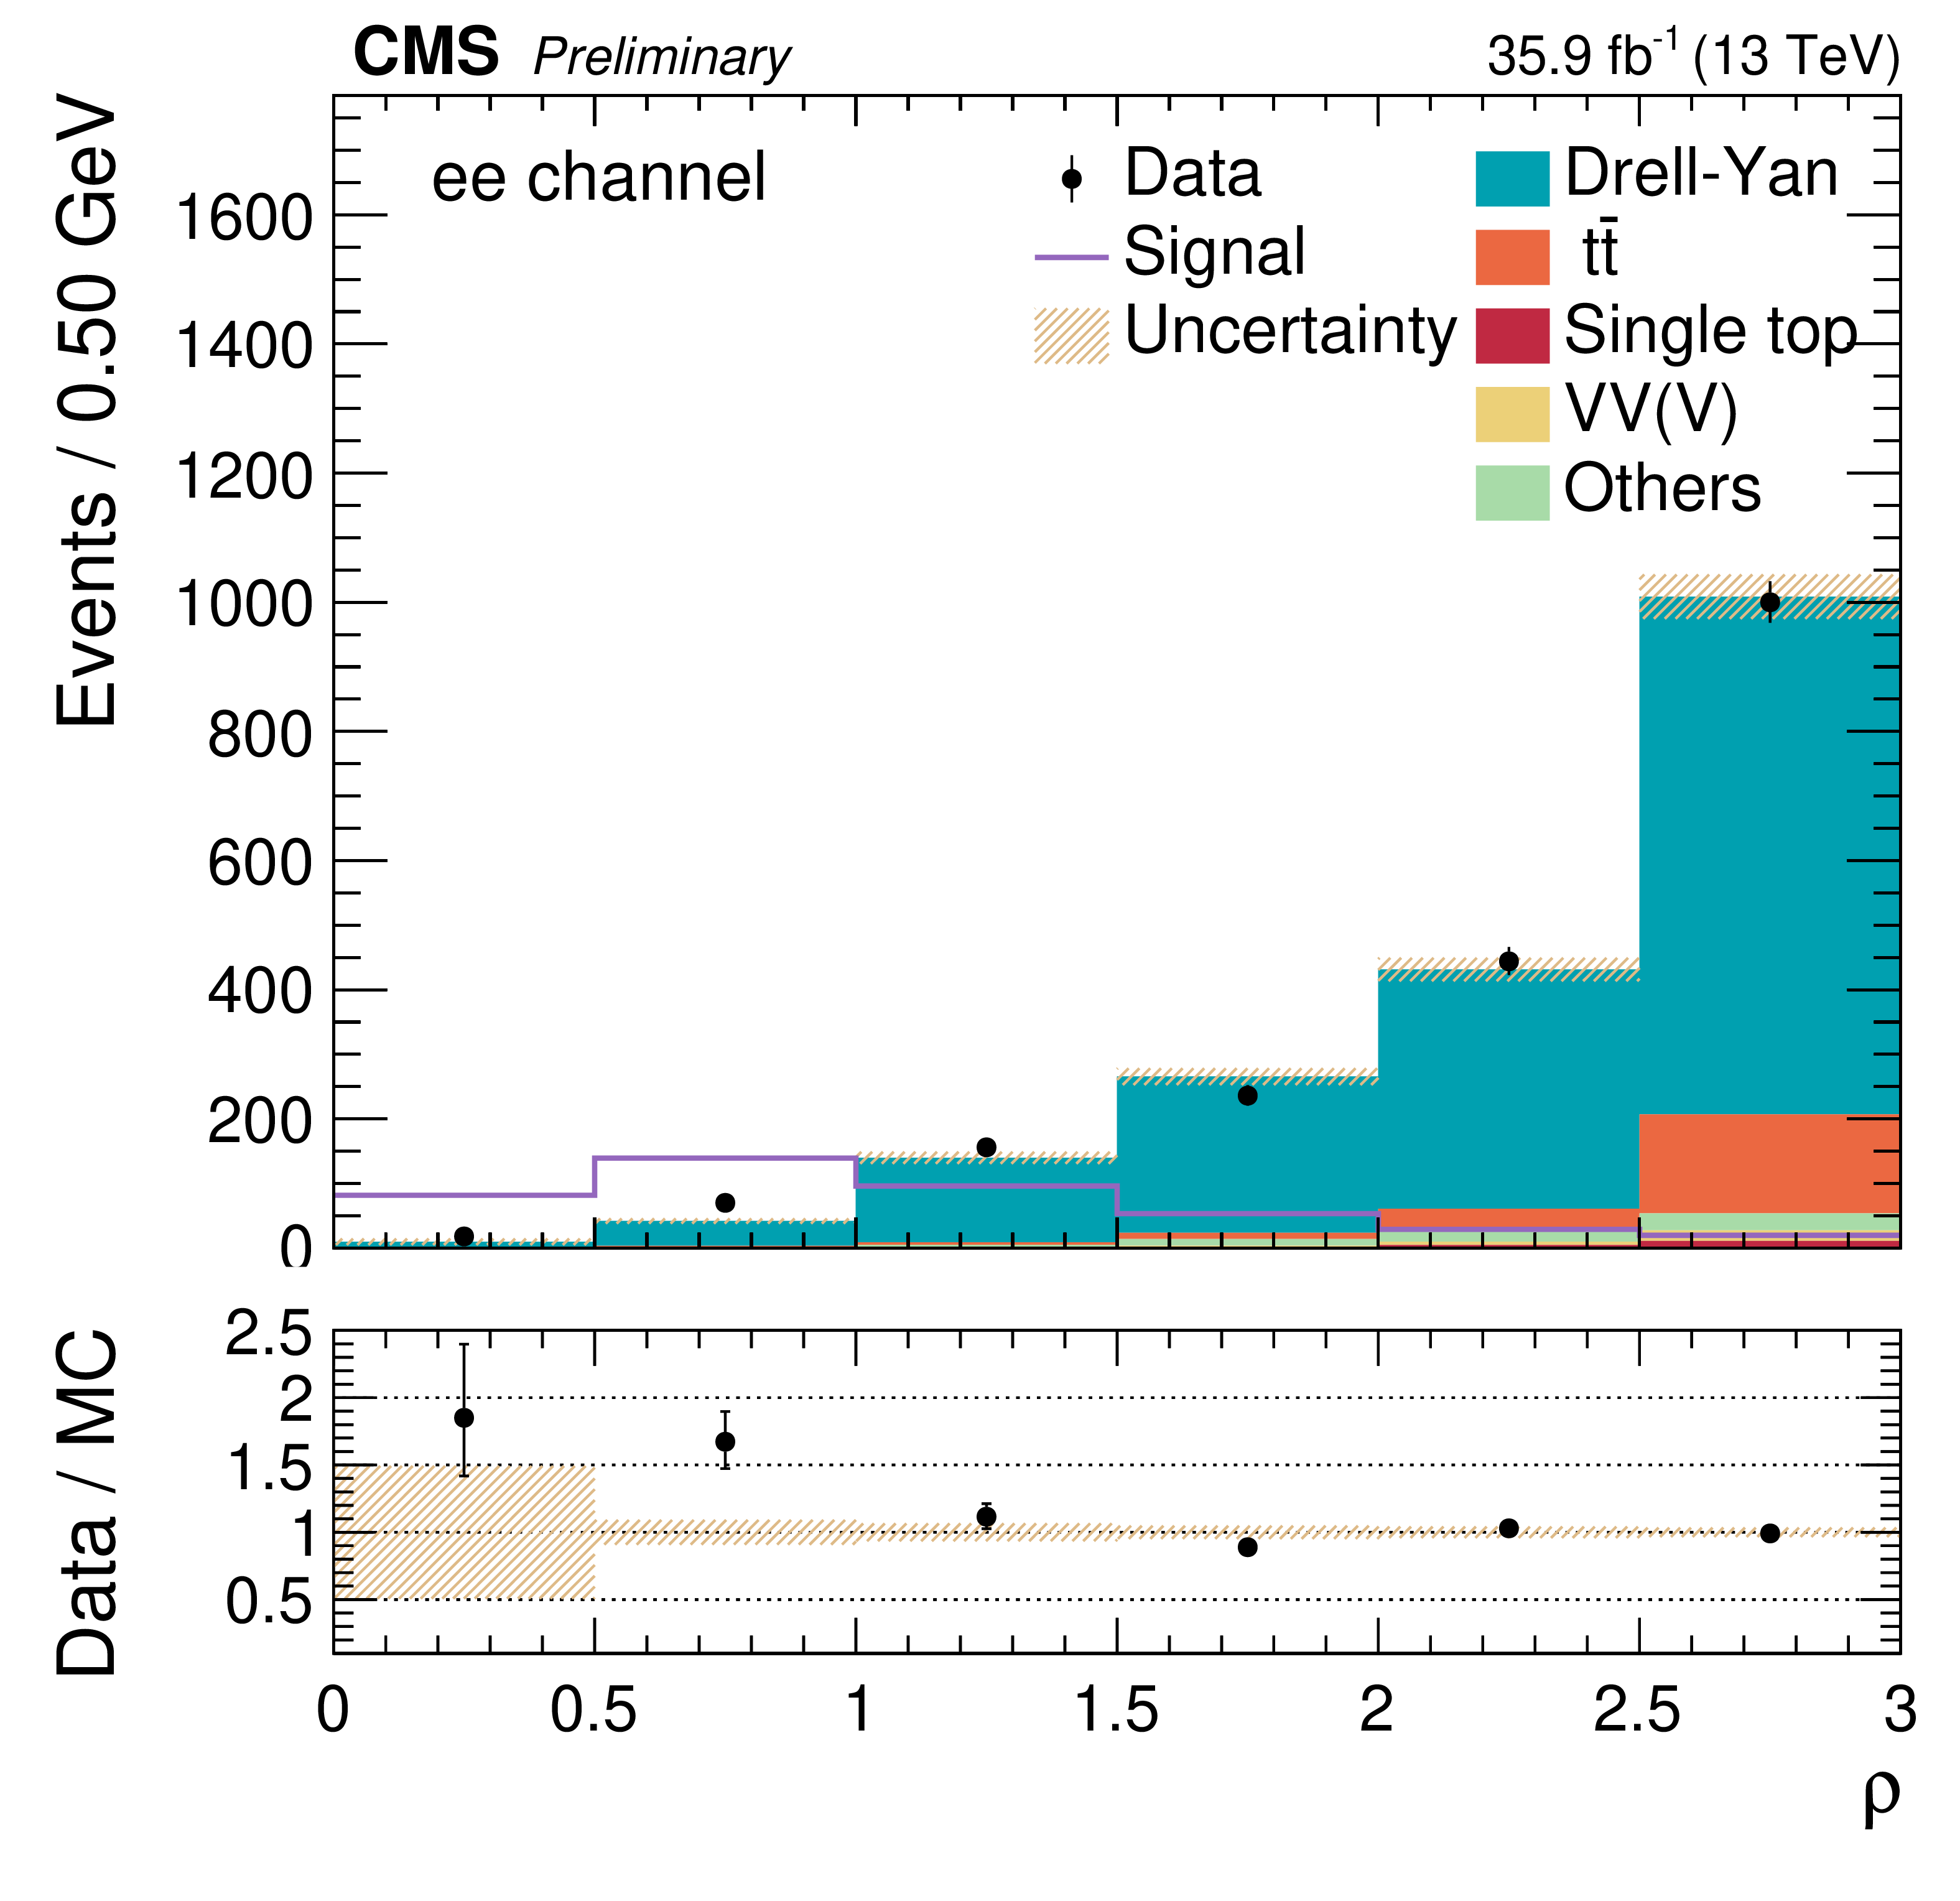
Figure 5-b:
$\rho $ distribution for $\mathrm{e^{+}} \mathrm{e^{-}}$ events corresponding to a particle signal hypothesis with $m_{\mathrm{H}}=$ 609 GeV and $m_{{\text {A}}}=$ 505 GeV. The signal is normalised to 20 nb. The mixed-flavour lepton category is a control region used in the template fit to further constrain the ${\mathrm{t} \mathrm{\bar{t}}}$ background. The bins are defined by steps of 0.5 in $\rho $. Error bars indicate statistical uncertainties, while shaded bands show systematic uncertainties. |
png pdf |
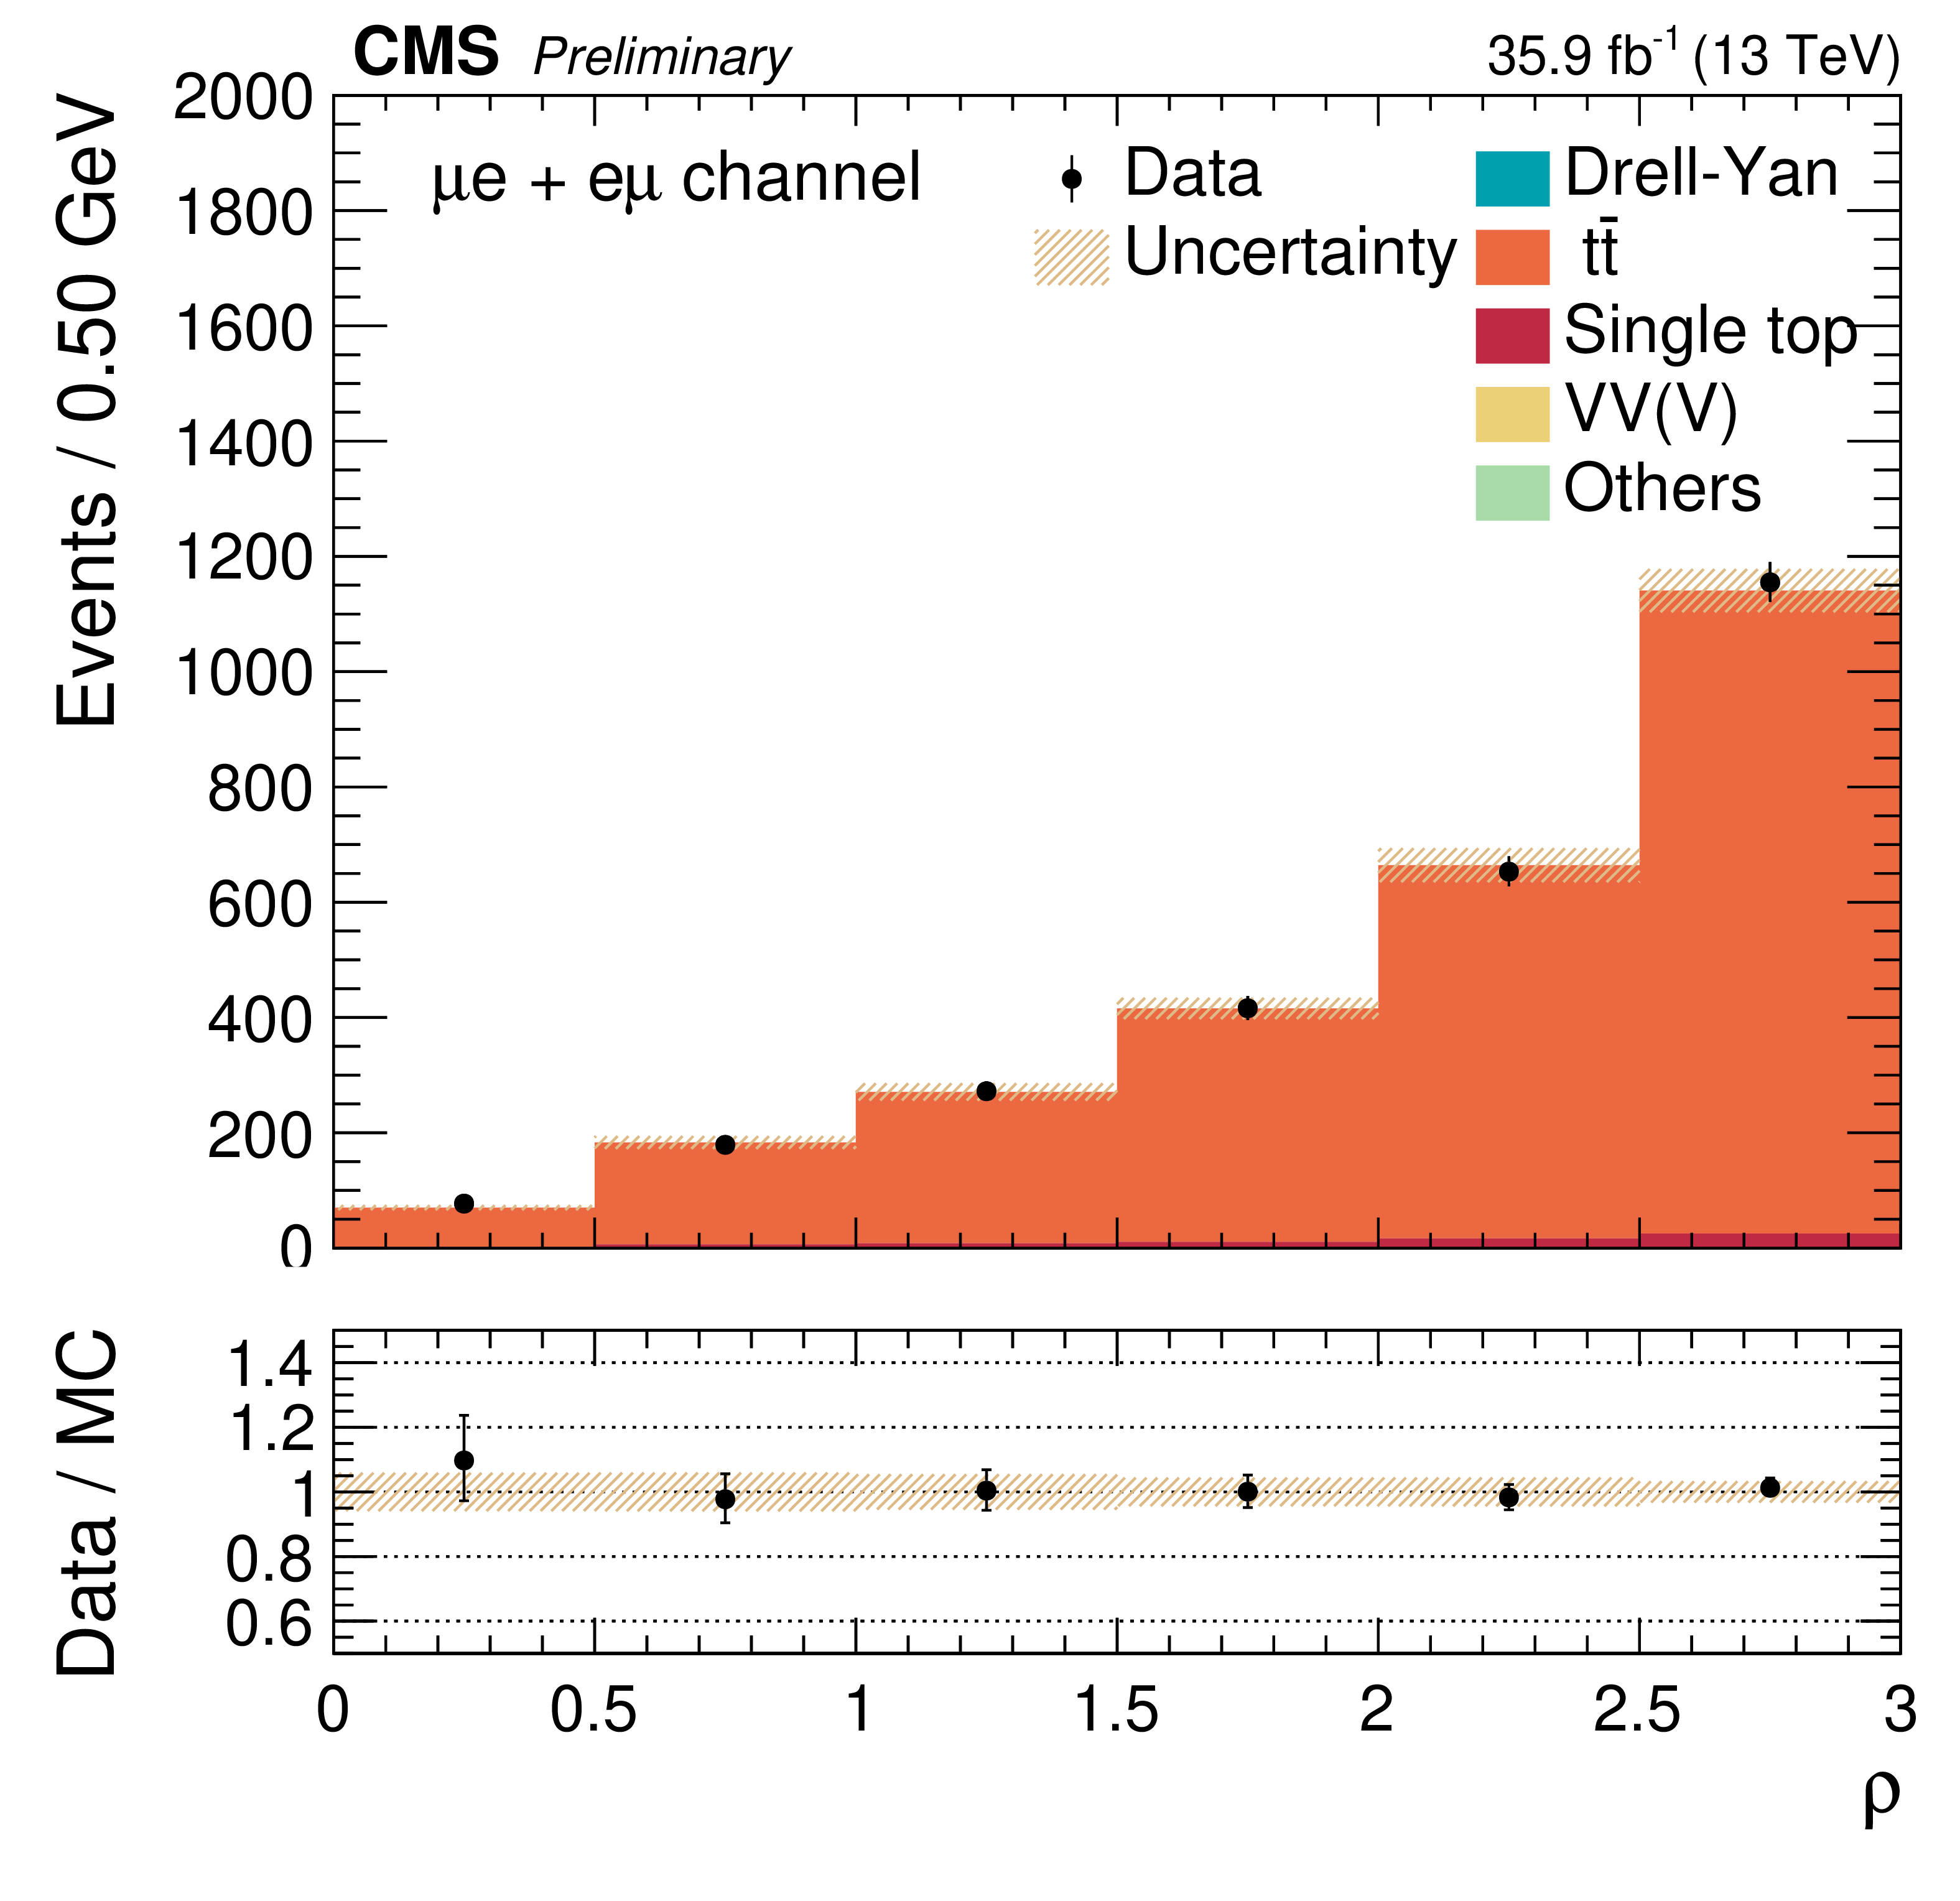
Figure 5-c:
$\rho $ distribution for $\mathrm{e^{\pm}} {\mu ^\mp}$ events corresponding to a particle signal hypothesis with $m_{\mathrm{H}}=$ 609 GeV and $m_{{\text {A}}}=$ 505 GeV. The signal is normalised to 20 nb. The mixed-flavour lepton category is a control region used in the template fit to further constrain the ${\mathrm{t} \mathrm{\bar{t}}}$ background. The bins are defined by steps of 0.5 in $\rho $. Error bars indicate statistical uncertainties, while shaded bands show systematic uncertainties. |
png pdf |
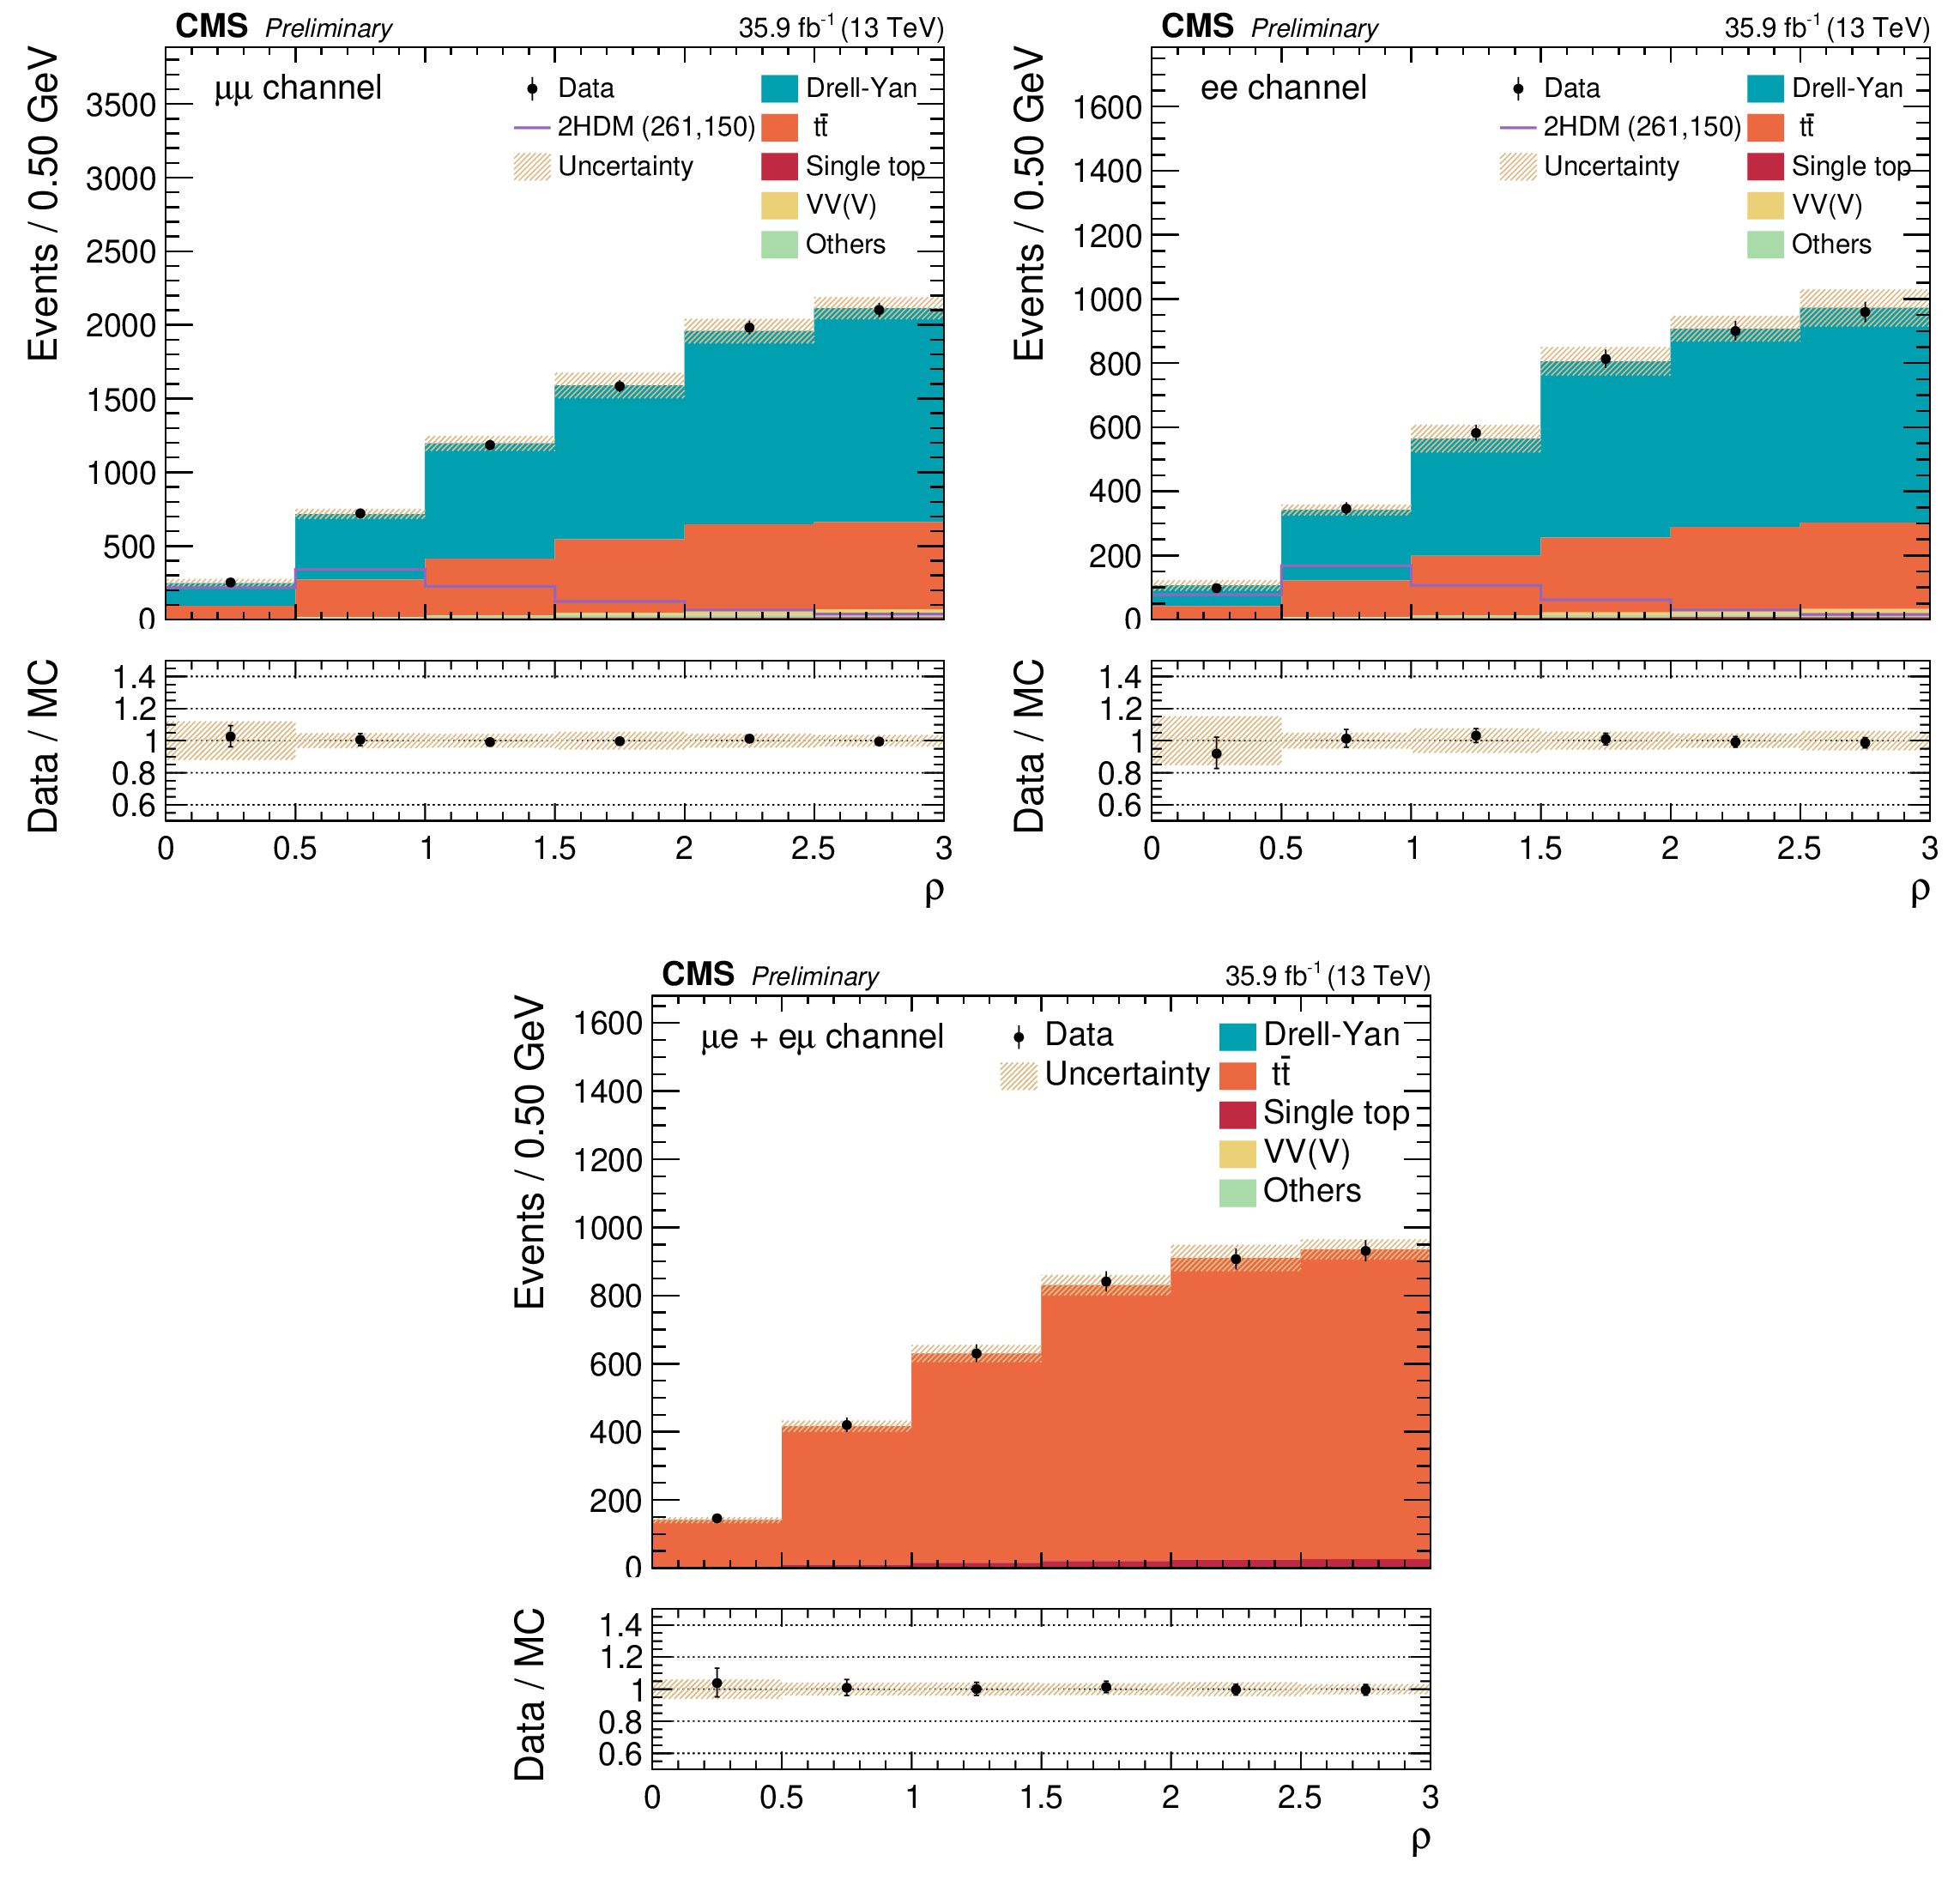
Figure 6:
$\rho $ distributions for $\mu^{+} \mu^{-}$ (top left), $\mathrm{e^{+}} \mathrm{e^{-}}$ (top right), and $\mathrm{e^{\pm}} {\mu ^\mp}$ (bottom) events corresponding to a particle signal hypothesis with $m_{\mathrm{H}}=$ 261 GeV and $m_{{\text {A}}}=$ 150 GeV. The signal is normalised to 20 nb. The mixed-flavour lepton category is a control region used in the template fit to further constrain the ${\mathrm{t} \mathrm{\bar{t}}}$ background. The bins are defined by steps of 0.5 in $\rho $. Error bars indicate statistical uncertainties, while shaded bands show systematic uncertainties. |
png pdf |
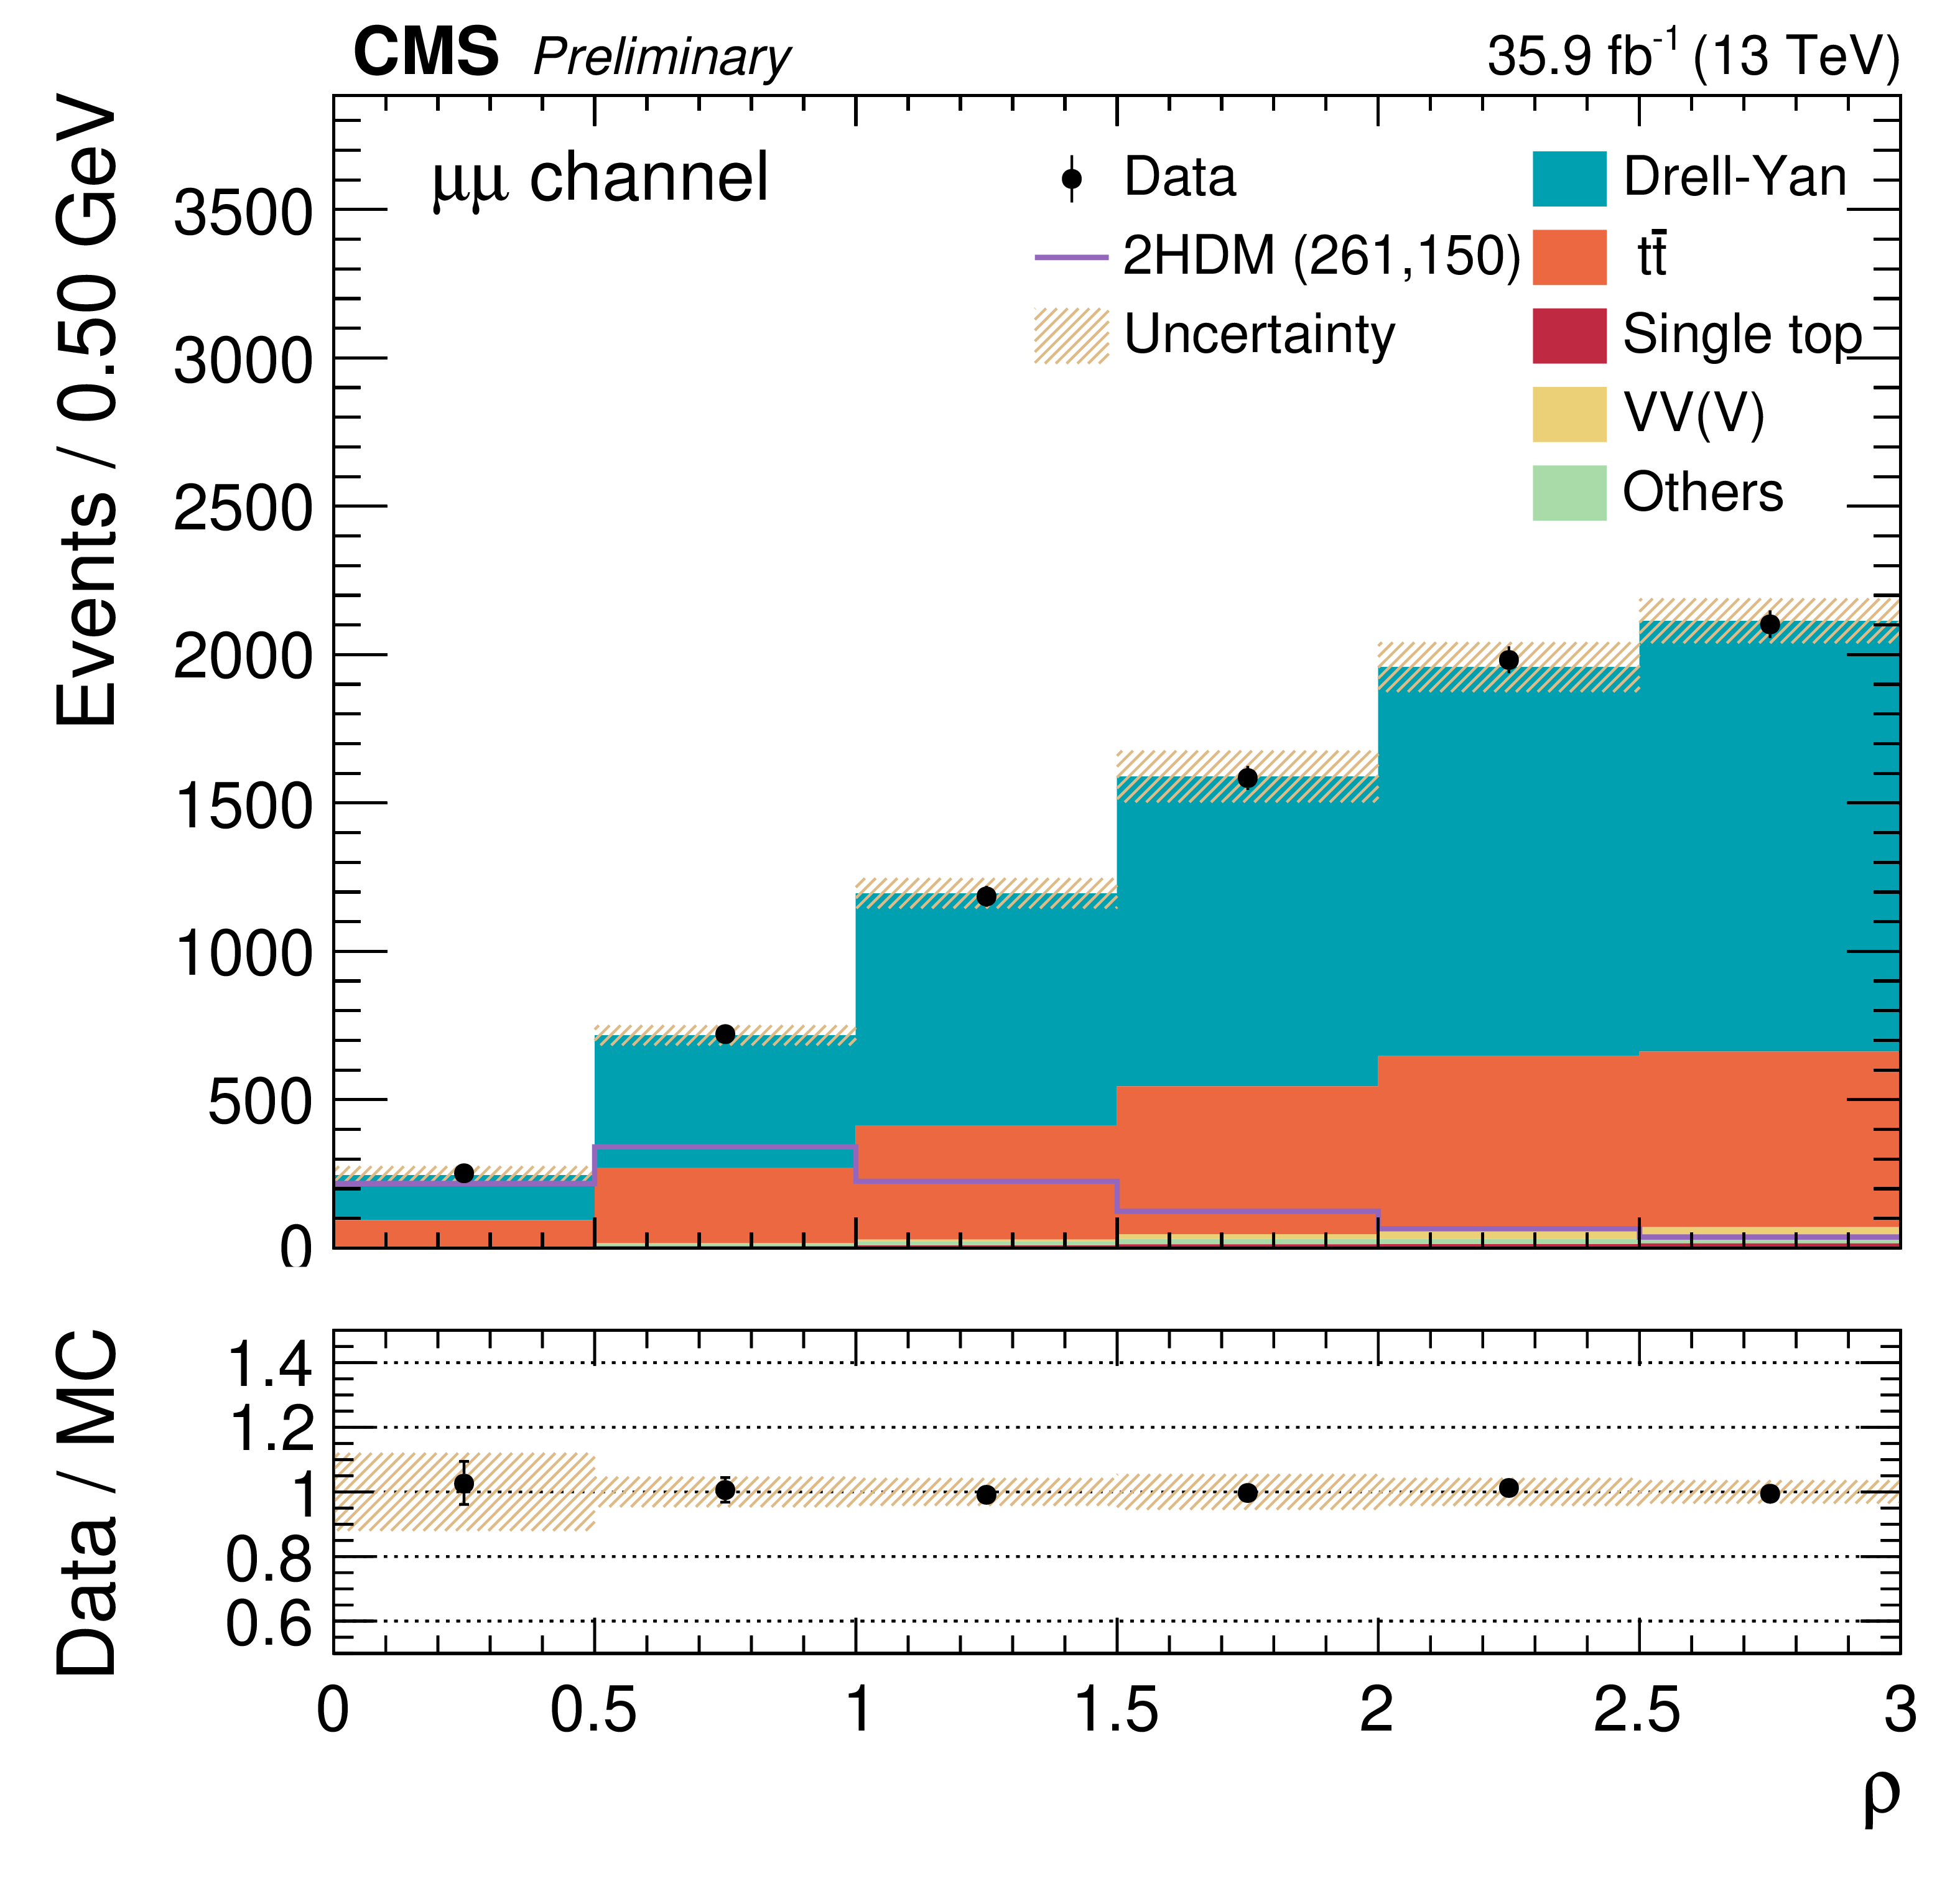
Figure 6-a:
$\rho $ distribution for $\mu^{+} \mu^{-}$ events corresponding to a particle signal hypothesis with $m_{\mathrm{H}}=$ 261 GeV and $m_{{\text {A}}}=$ 150 GeV. The signal is normalised to 20 nb. The mixed-flavour lepton category is a control region used in the template fit to further constrain the ${\mathrm{t} \mathrm{\bar{t}}}$ background. The bins are defined by steps of 0.5 in $\rho $. Error bars indicate statistical uncertainties, while shaded bands show systematic uncertainties. |
png pdf |
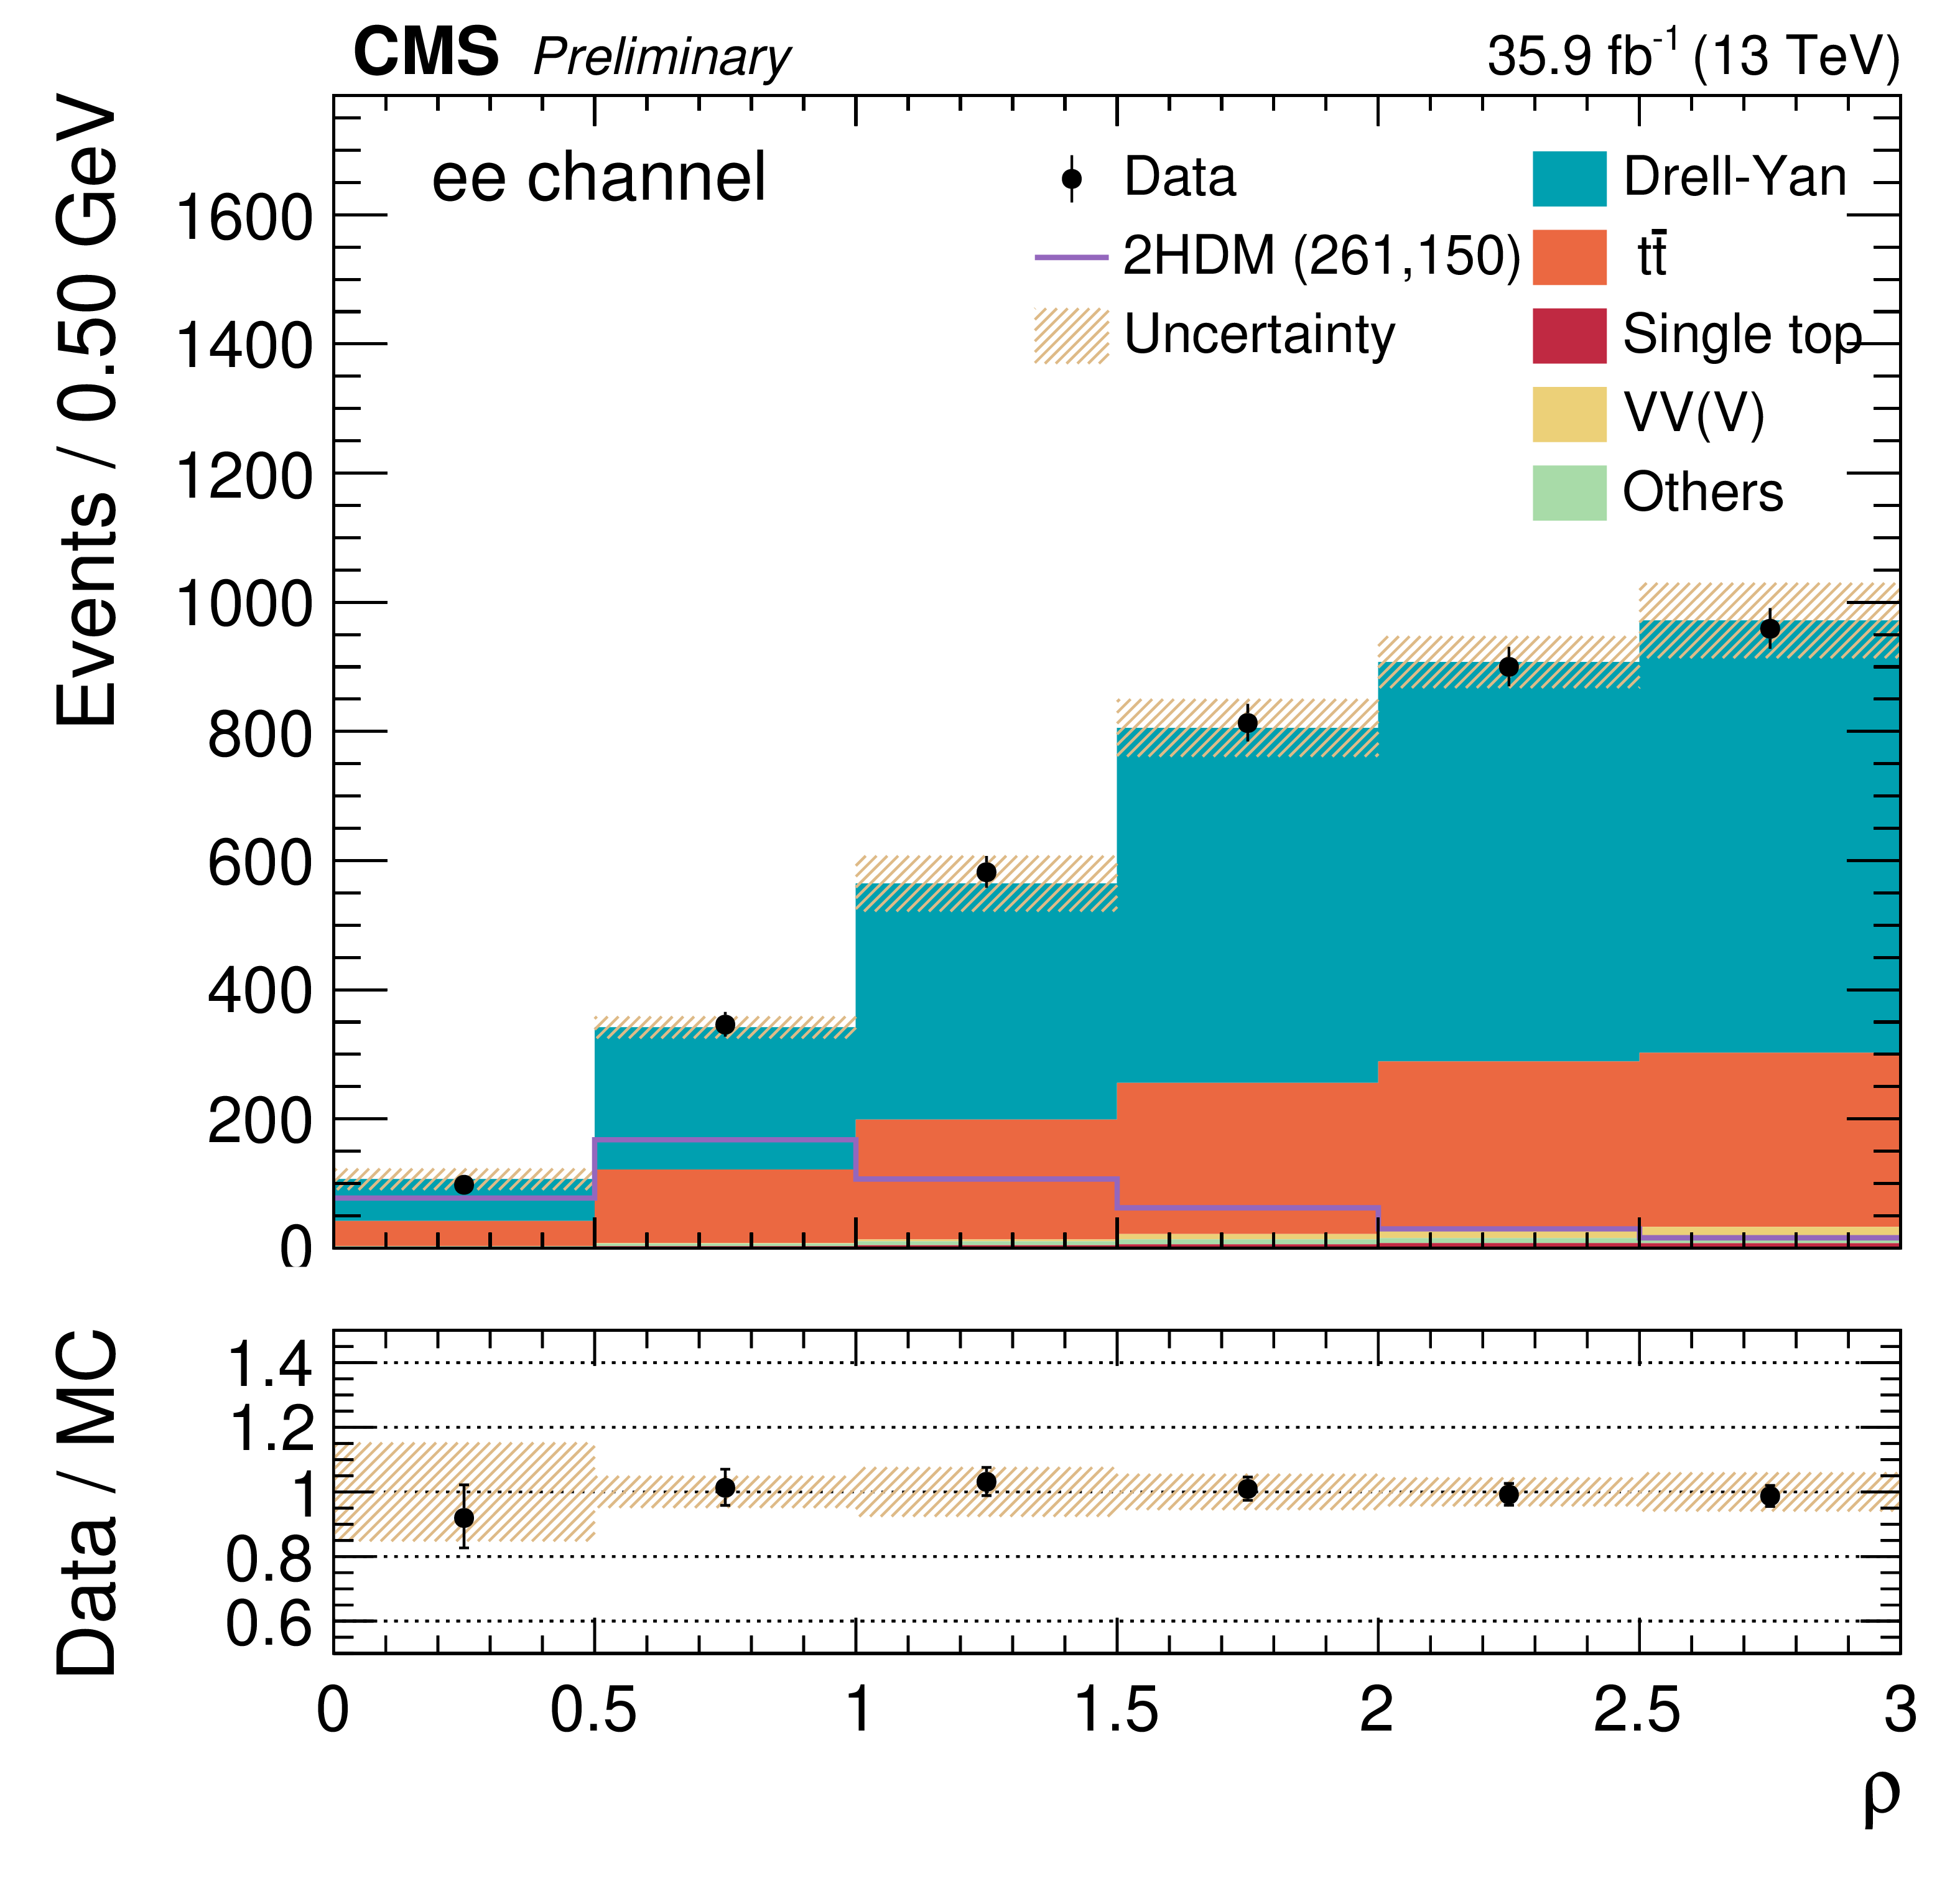
Figure 6-b:
$\rho $ distribution for $\mathrm{e^{+}} \mathrm{e^{-}}$ events corresponding to a particle signal hypothesis with $m_{\mathrm{H}}=$ 261 GeV and $m_{{\text {A}}}=$ 150 GeV. The signal is normalised to 20 nb. The mixed-flavour lepton category is a control region used in the template fit to further constrain the ${\mathrm{t} \mathrm{\bar{t}}}$ background. The bins are defined by steps of 0.5 in $\rho $. Error bars indicate statistical uncertainties, while shaded bands show systematic uncertainties. |
png pdf |
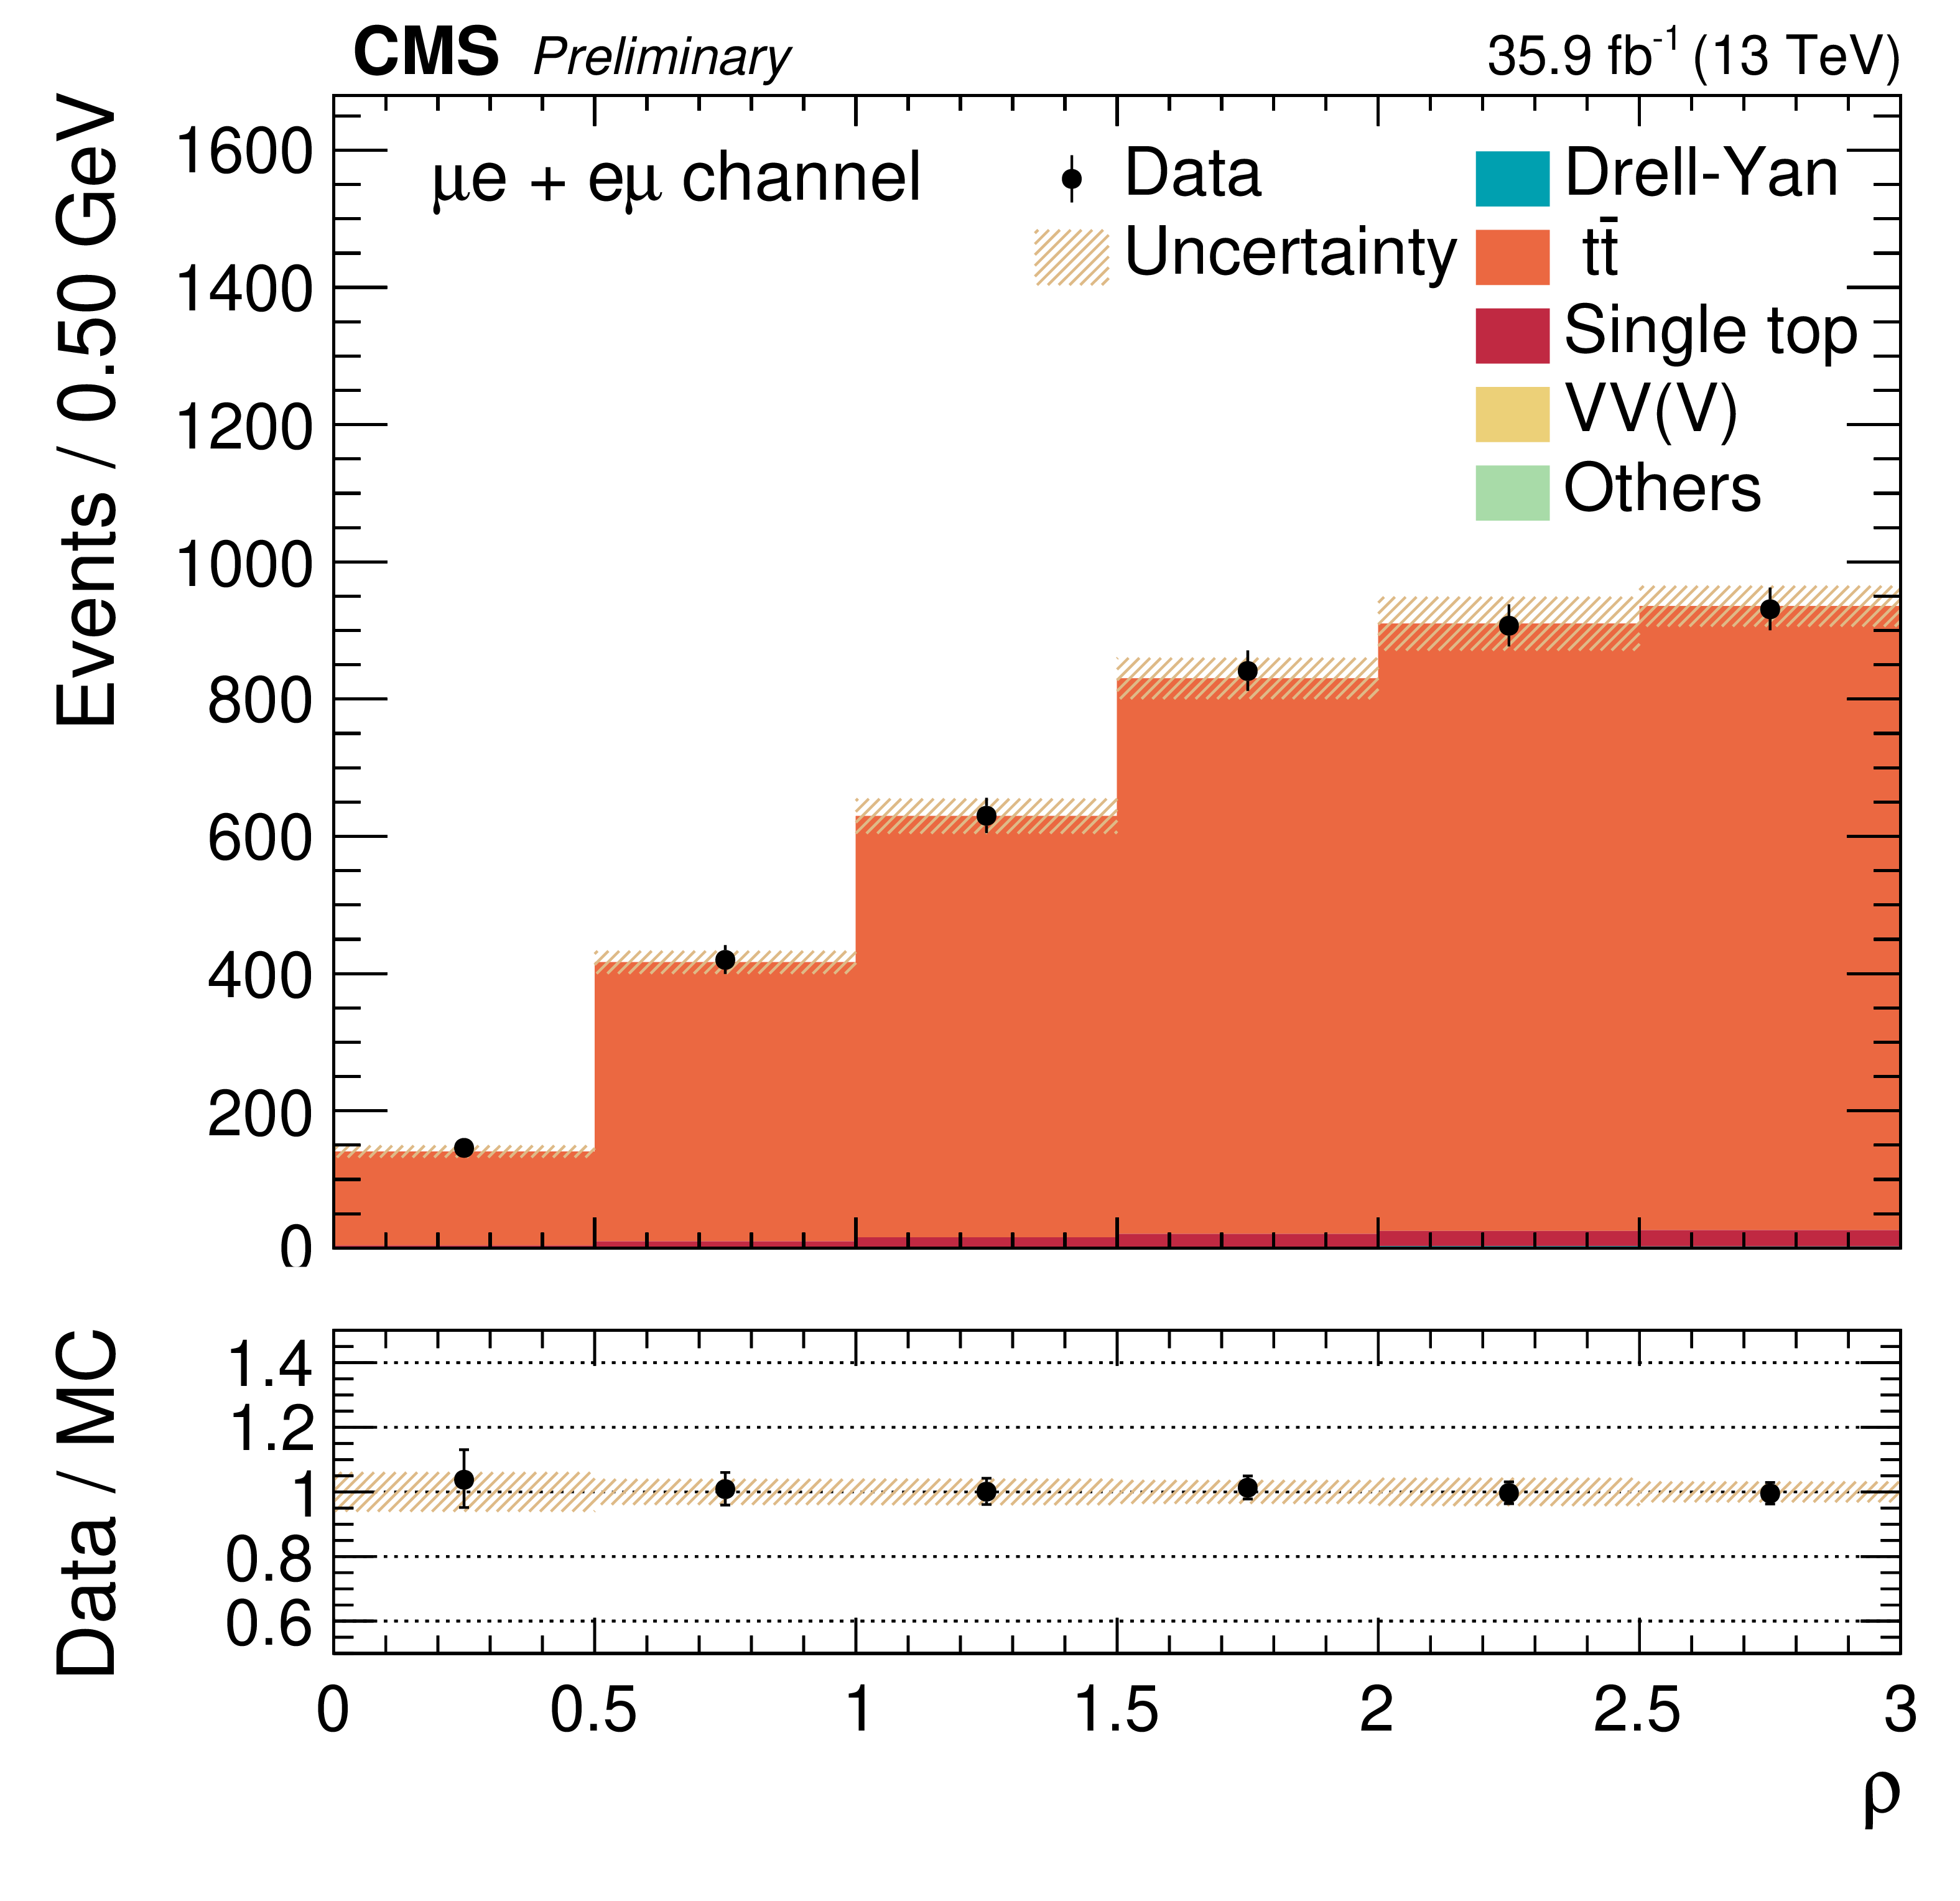
Figure 6-c:
$\rho $ distribution for $\mathrm{e^{\pm}} {\mu ^\mp}$ events corresponding to a particle signal hypothesis with $m_{\mathrm{H}}=$ 261 GeV and $m_{{\text {A}}}=$ 150 GeV. The signal is normalised to 20 nb. The mixed-flavour lepton category is a control region used in the template fit to further constrain the ${\mathrm{t} \mathrm{\bar{t}}}$ background. The bins are defined by steps of 0.5 in $\rho $. Error bars indicate statistical uncertainties, while shaded bands show systematic uncertainties. |
png pdf |
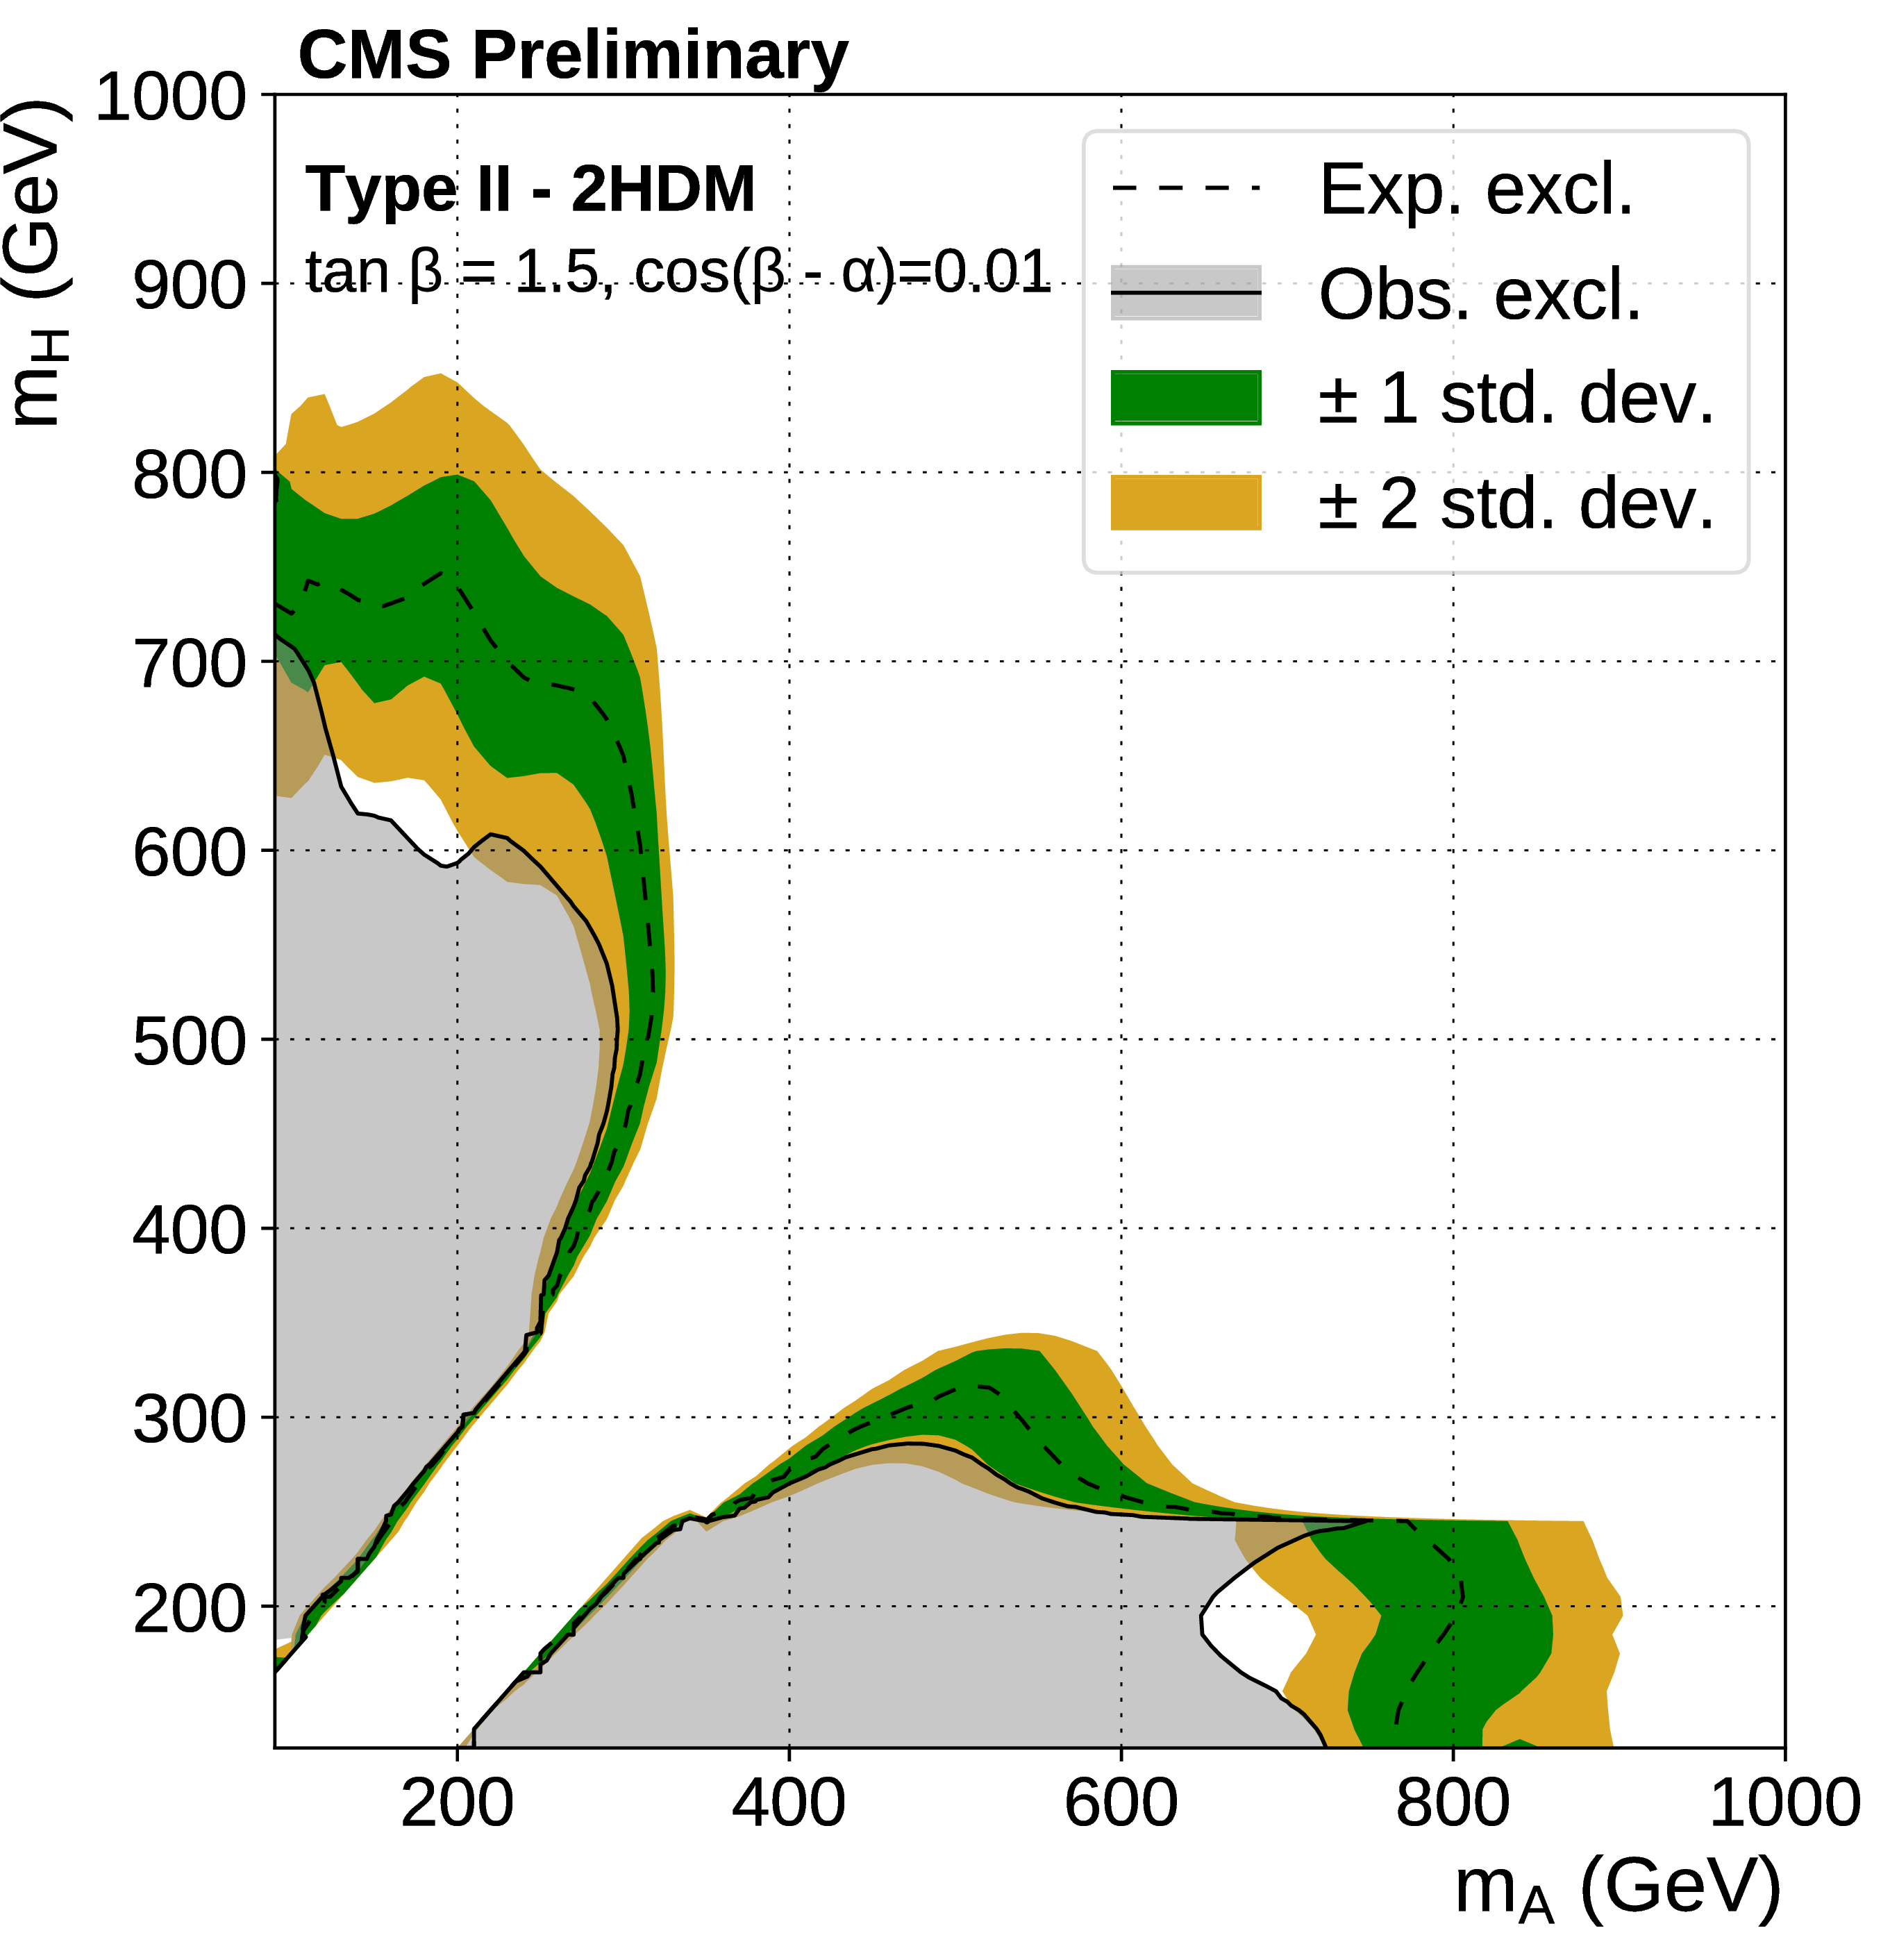
Figure 7:
Expected (with $ \pm$1, $ \pm$2 standard deviation bands) and observed 95% CL exclusion limits for $\tan\beta =$ 1.5 and $\cos(\beta - \alpha)=$ 0.01 as a function of $m_{{\text {A}}}$ and $m_{\mathrm{H}}$ in the Type-II 2HDM benchmark scenario. The limits are computed using the asymptotic CLs method, combining the $\mathrm{e^{+}} \mathrm{e^{-}}$ and $\mu^{+} \mu^{-}$ channels. |
png pdf |
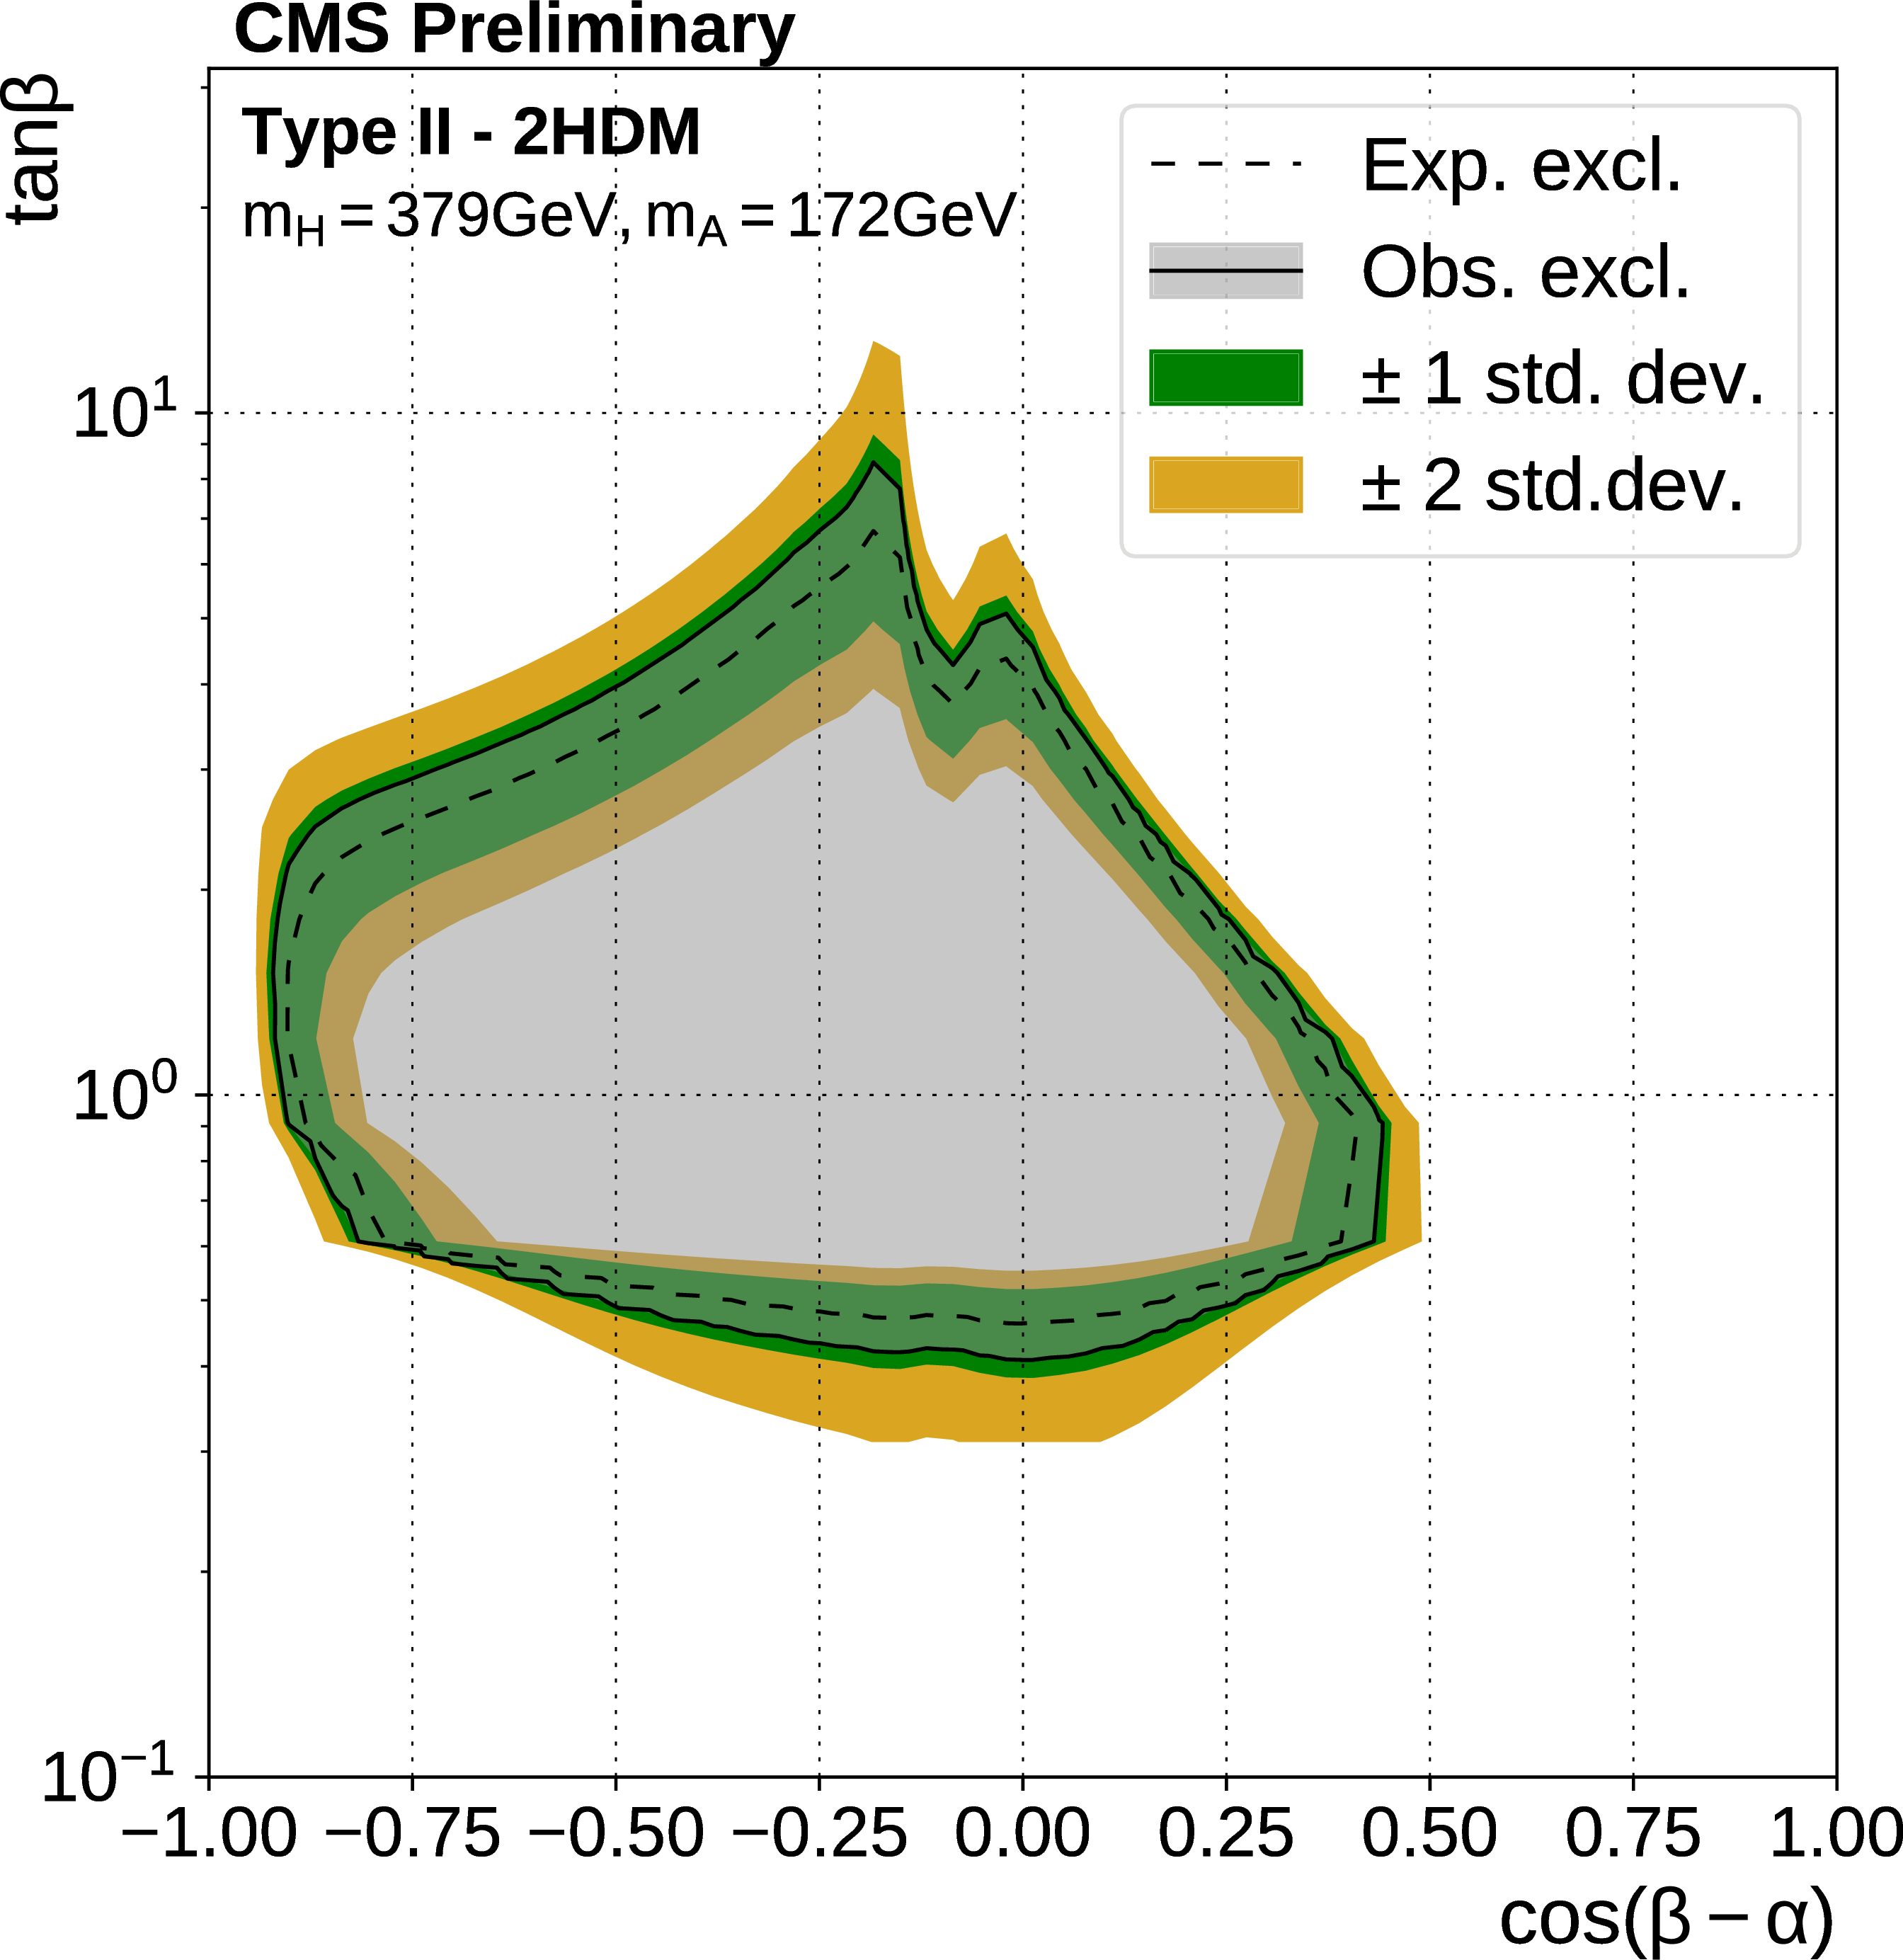
Figure 8:
Expected (with $ \pm$1, $ \pm$2 standard deviation bands) and observed 95% CL exclusion limits for $m_{\mathrm{H}}=$ 379 GeV and $m_{{\text {A}}}= $ 172 GeV as a function of $\tan\beta $ and $\cos(\beta - \alpha)$ in the Type-II 2HDM benchmark scenario. The limits are computed using the asymptotic CLs method, combining the $\mathrm{e^{+}} \mathrm{e^{-}}$ and $\mu^{+} \mu^{-}$ channels. |
| Tables | |
png pdf |
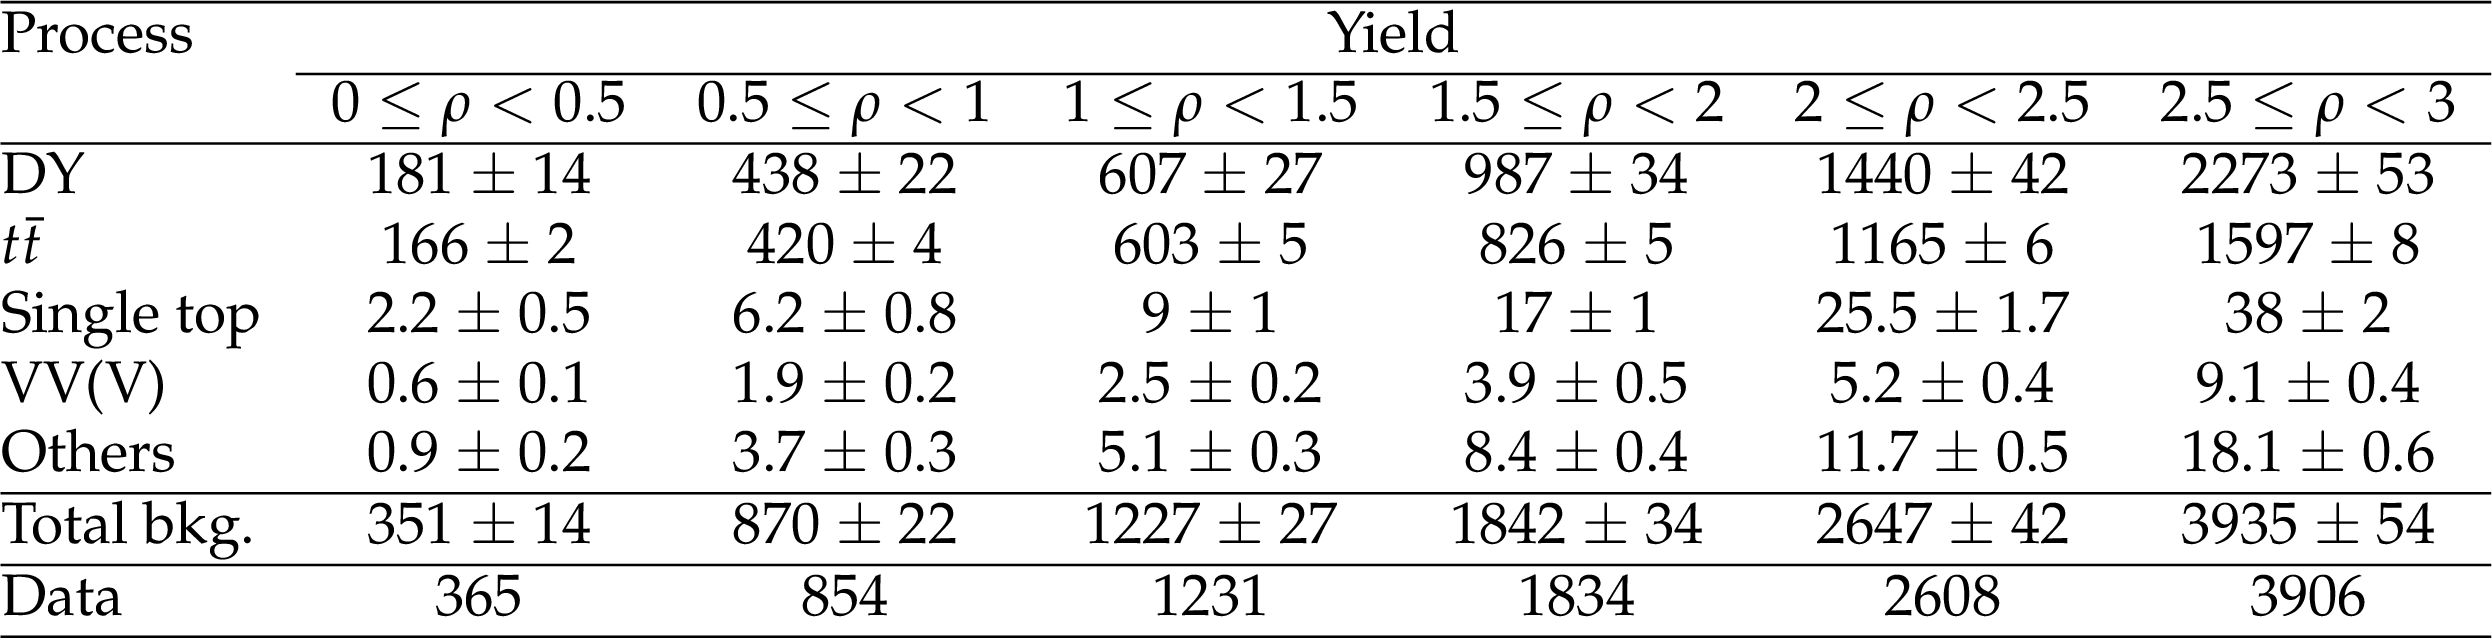
Table 1:
Expected and observed event yields prior to the fit in the signal region with $m_{\mathrm{H}}=$ 500 GeV and $m_{{\text {A}}}=$ 200 GeV for each elliptical bin. The $\mathrm{e^{+}} \mathrm{e^{-}}$ and $\mu^{+} \mu^{-}$ categories are summed together. |
png pdf |
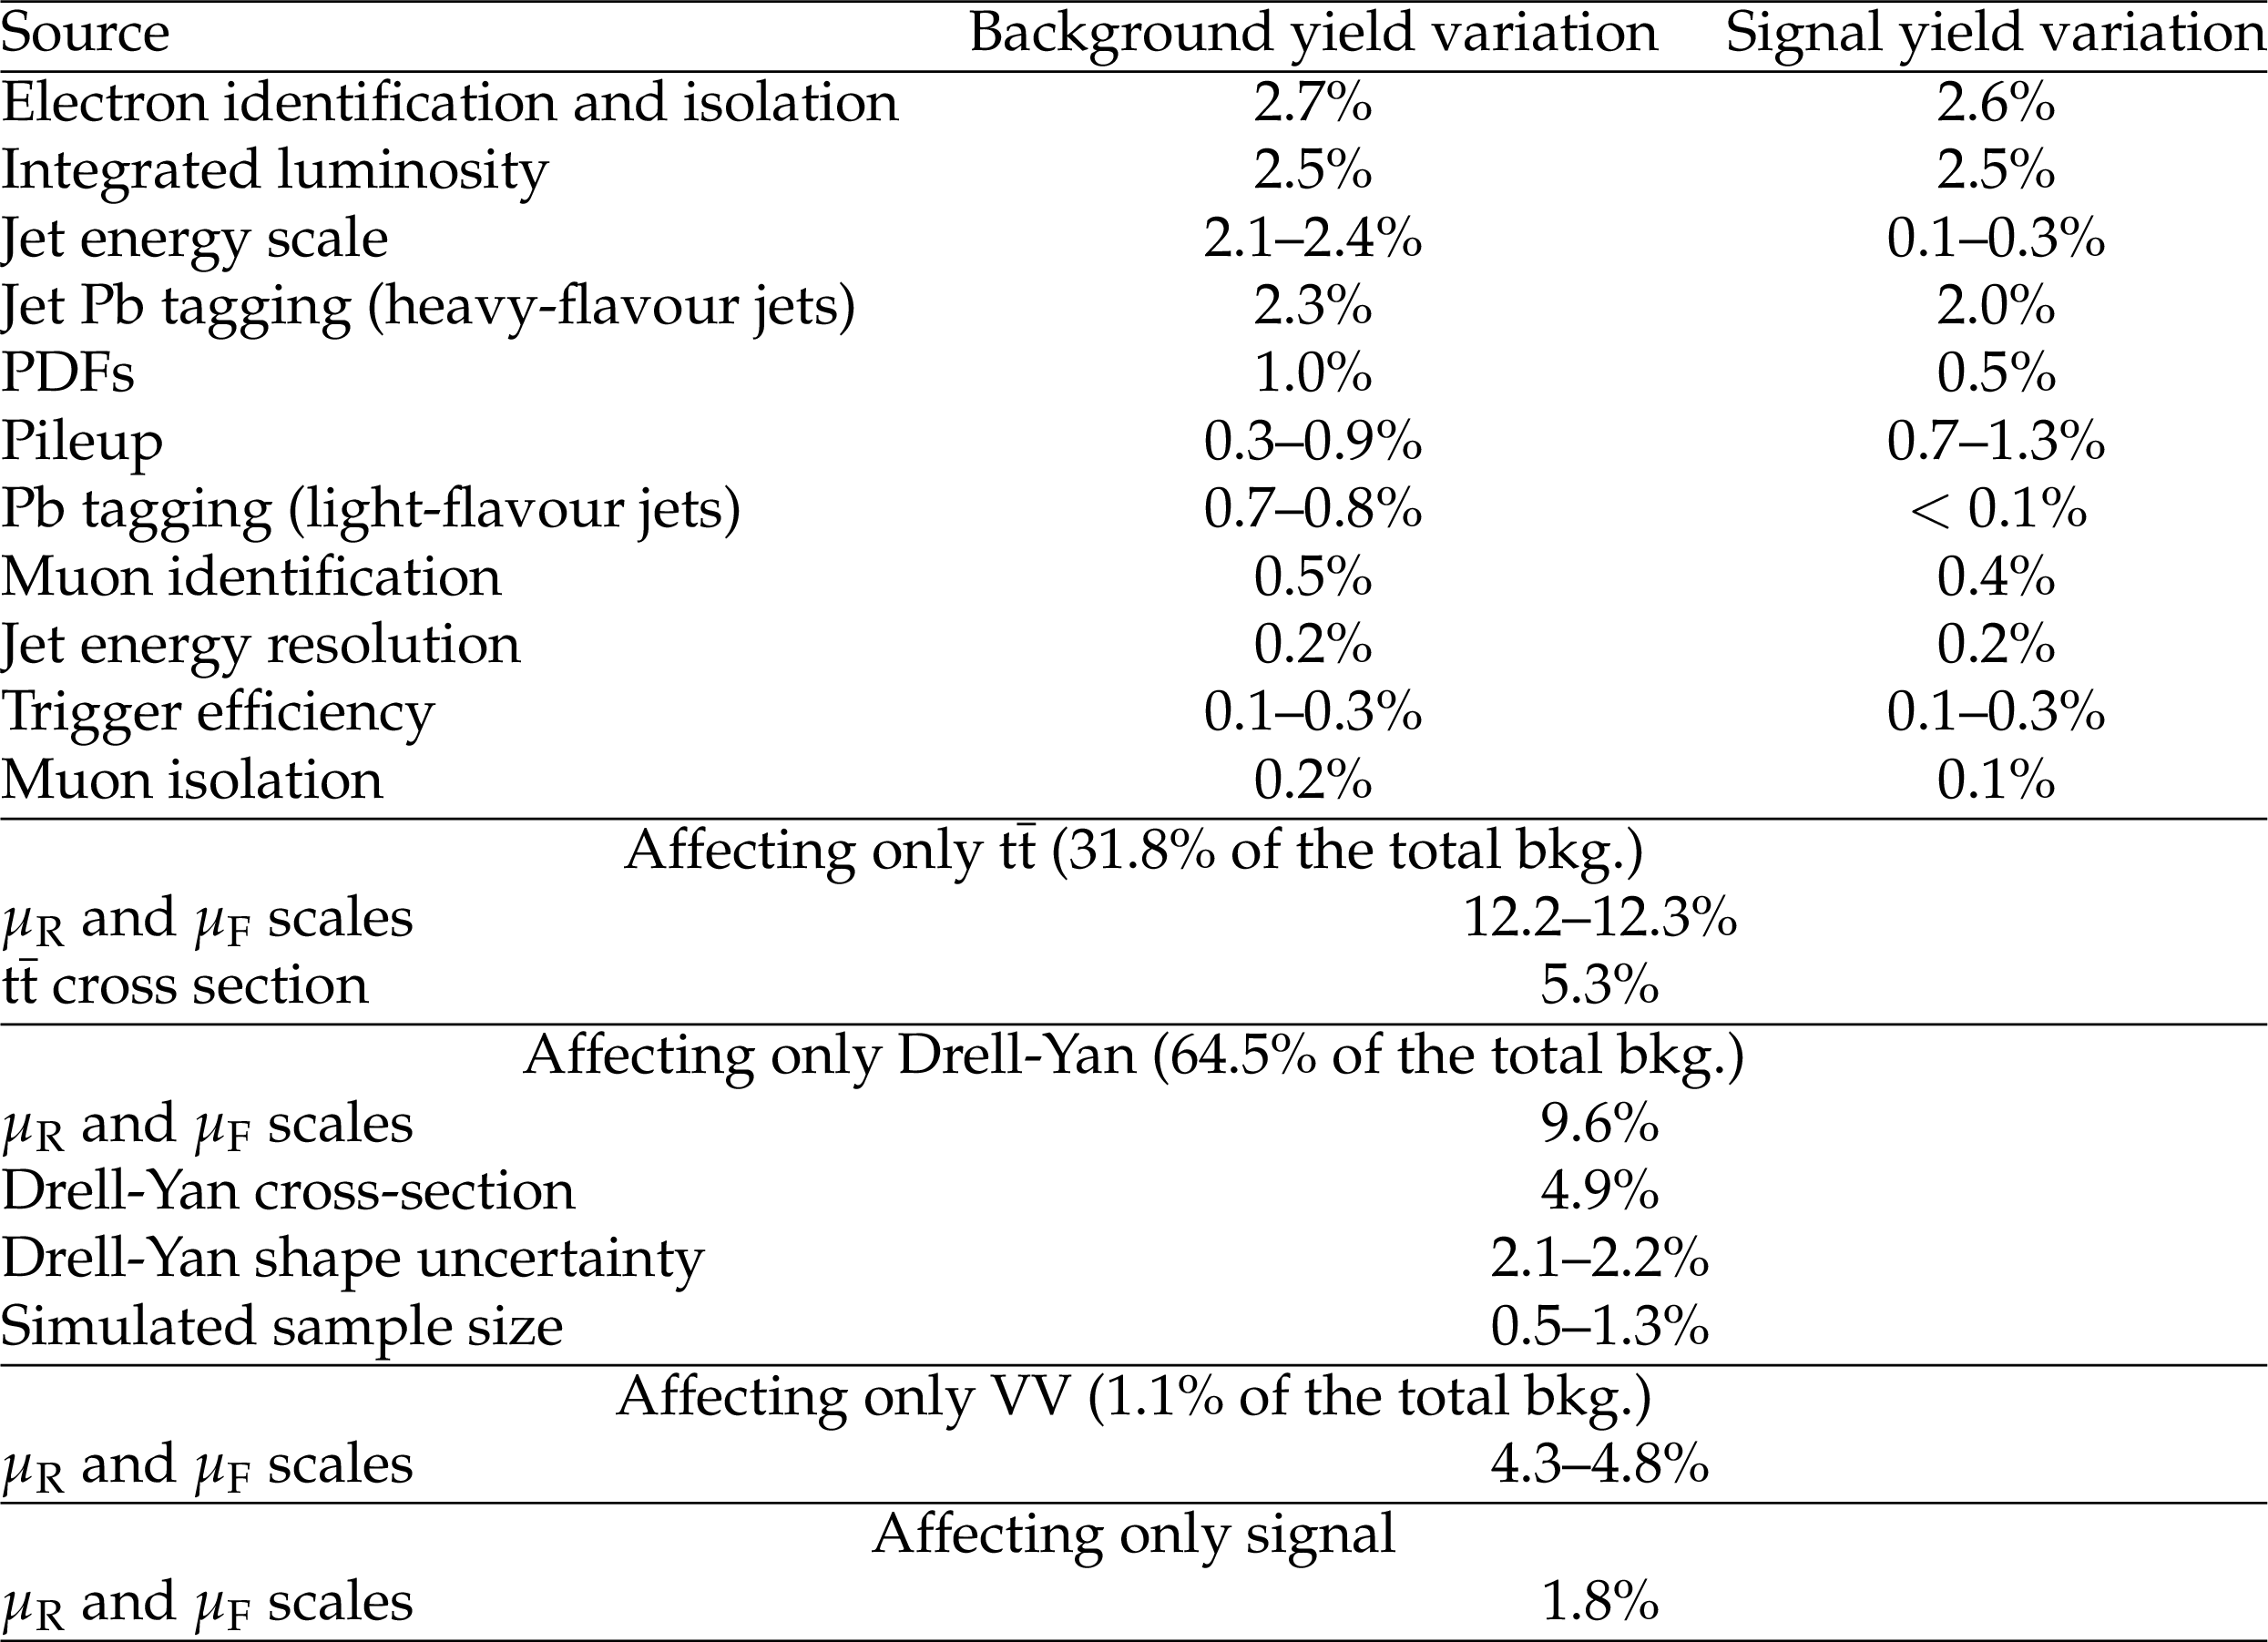
Table 2:
Summary of the systematic uncertainties prior to the fit and their impact in percentages on the total event yields for background and for a particular signal hypothesis of $m_{\mathrm{H}} = $ 379 GeV and $m_{{\text {A}}} = $ 172 GeV. |
| Summary |
| This note reports on a search for a new CP-even neutral Higgs boson, H, decaying into a Z boson and a lighter CP-odd Higgs boson, A, where the Z decays into $\ell^{+}\ell^{-}$, and the A into $\mathrm{b\bar{b}}$. The search is based on LHC proton-proton collision data at $\sqrt{s}=$ 13 TeV collected by the CMS experiment, corresponding to an integrated luminosity of 35.9 fb$^{-1}$. We consider decays such that $\mathrm{H} \to \mathrm{Z}{\text{A}} \to \ell\ell\mathrm{b\bar{b}}$, where H and A are additional neutral Higgs bosons with masses ranging from ${\mathrm{m}}_{\mathrm{Z}} $ to 1000 GeV for H and 30 to 1000 GeV for A. Deviations from the SM expectations are observed with a global significance of 1.3$\sigma$ and so upper limits on the product of cross section and branching ratio are set. Limits are also set on the parameters of the type-II 2HDM model. Within this theoretical framework, H and A are the CP-even and CP-odd scalar bosons, respectively. The specific benchmark scenario corresponding to $\tan\beta=$ 1.5 and $\cos (\beta - \alpha)=$ 0.01 is excluded for $m_{\mathrm{H}}$ in the range 150-700 GeV and $m_{{\text{A}} }$ in the range 30-295 GeV with $m_{\mathrm{H}} > m_{{\text{A}} }$, or alternatively, for $m_{\mathrm{H}}$ in the range 125-280 GeV and $m_{{\text{A}} }$ in the range 200-700 with $m_{\mathrm{H}} < m_{{\text{A}} }$. Results are also interpreted in the benchmark scenario where $m_{\mathrm{H}}=$ 379 GeV and $m_{{\text pbA}} = $ 172 GeV. In this context, the region with $\cos (\beta - \alpha)$ in the range -0.9-0.3 and $\tan\beta$ in the range 0.5-7 is excluded. A larger region of the Type-II 2HDM parameter space is excluded with respect to previous searches. |
| Additional Figures | |
png pdf |
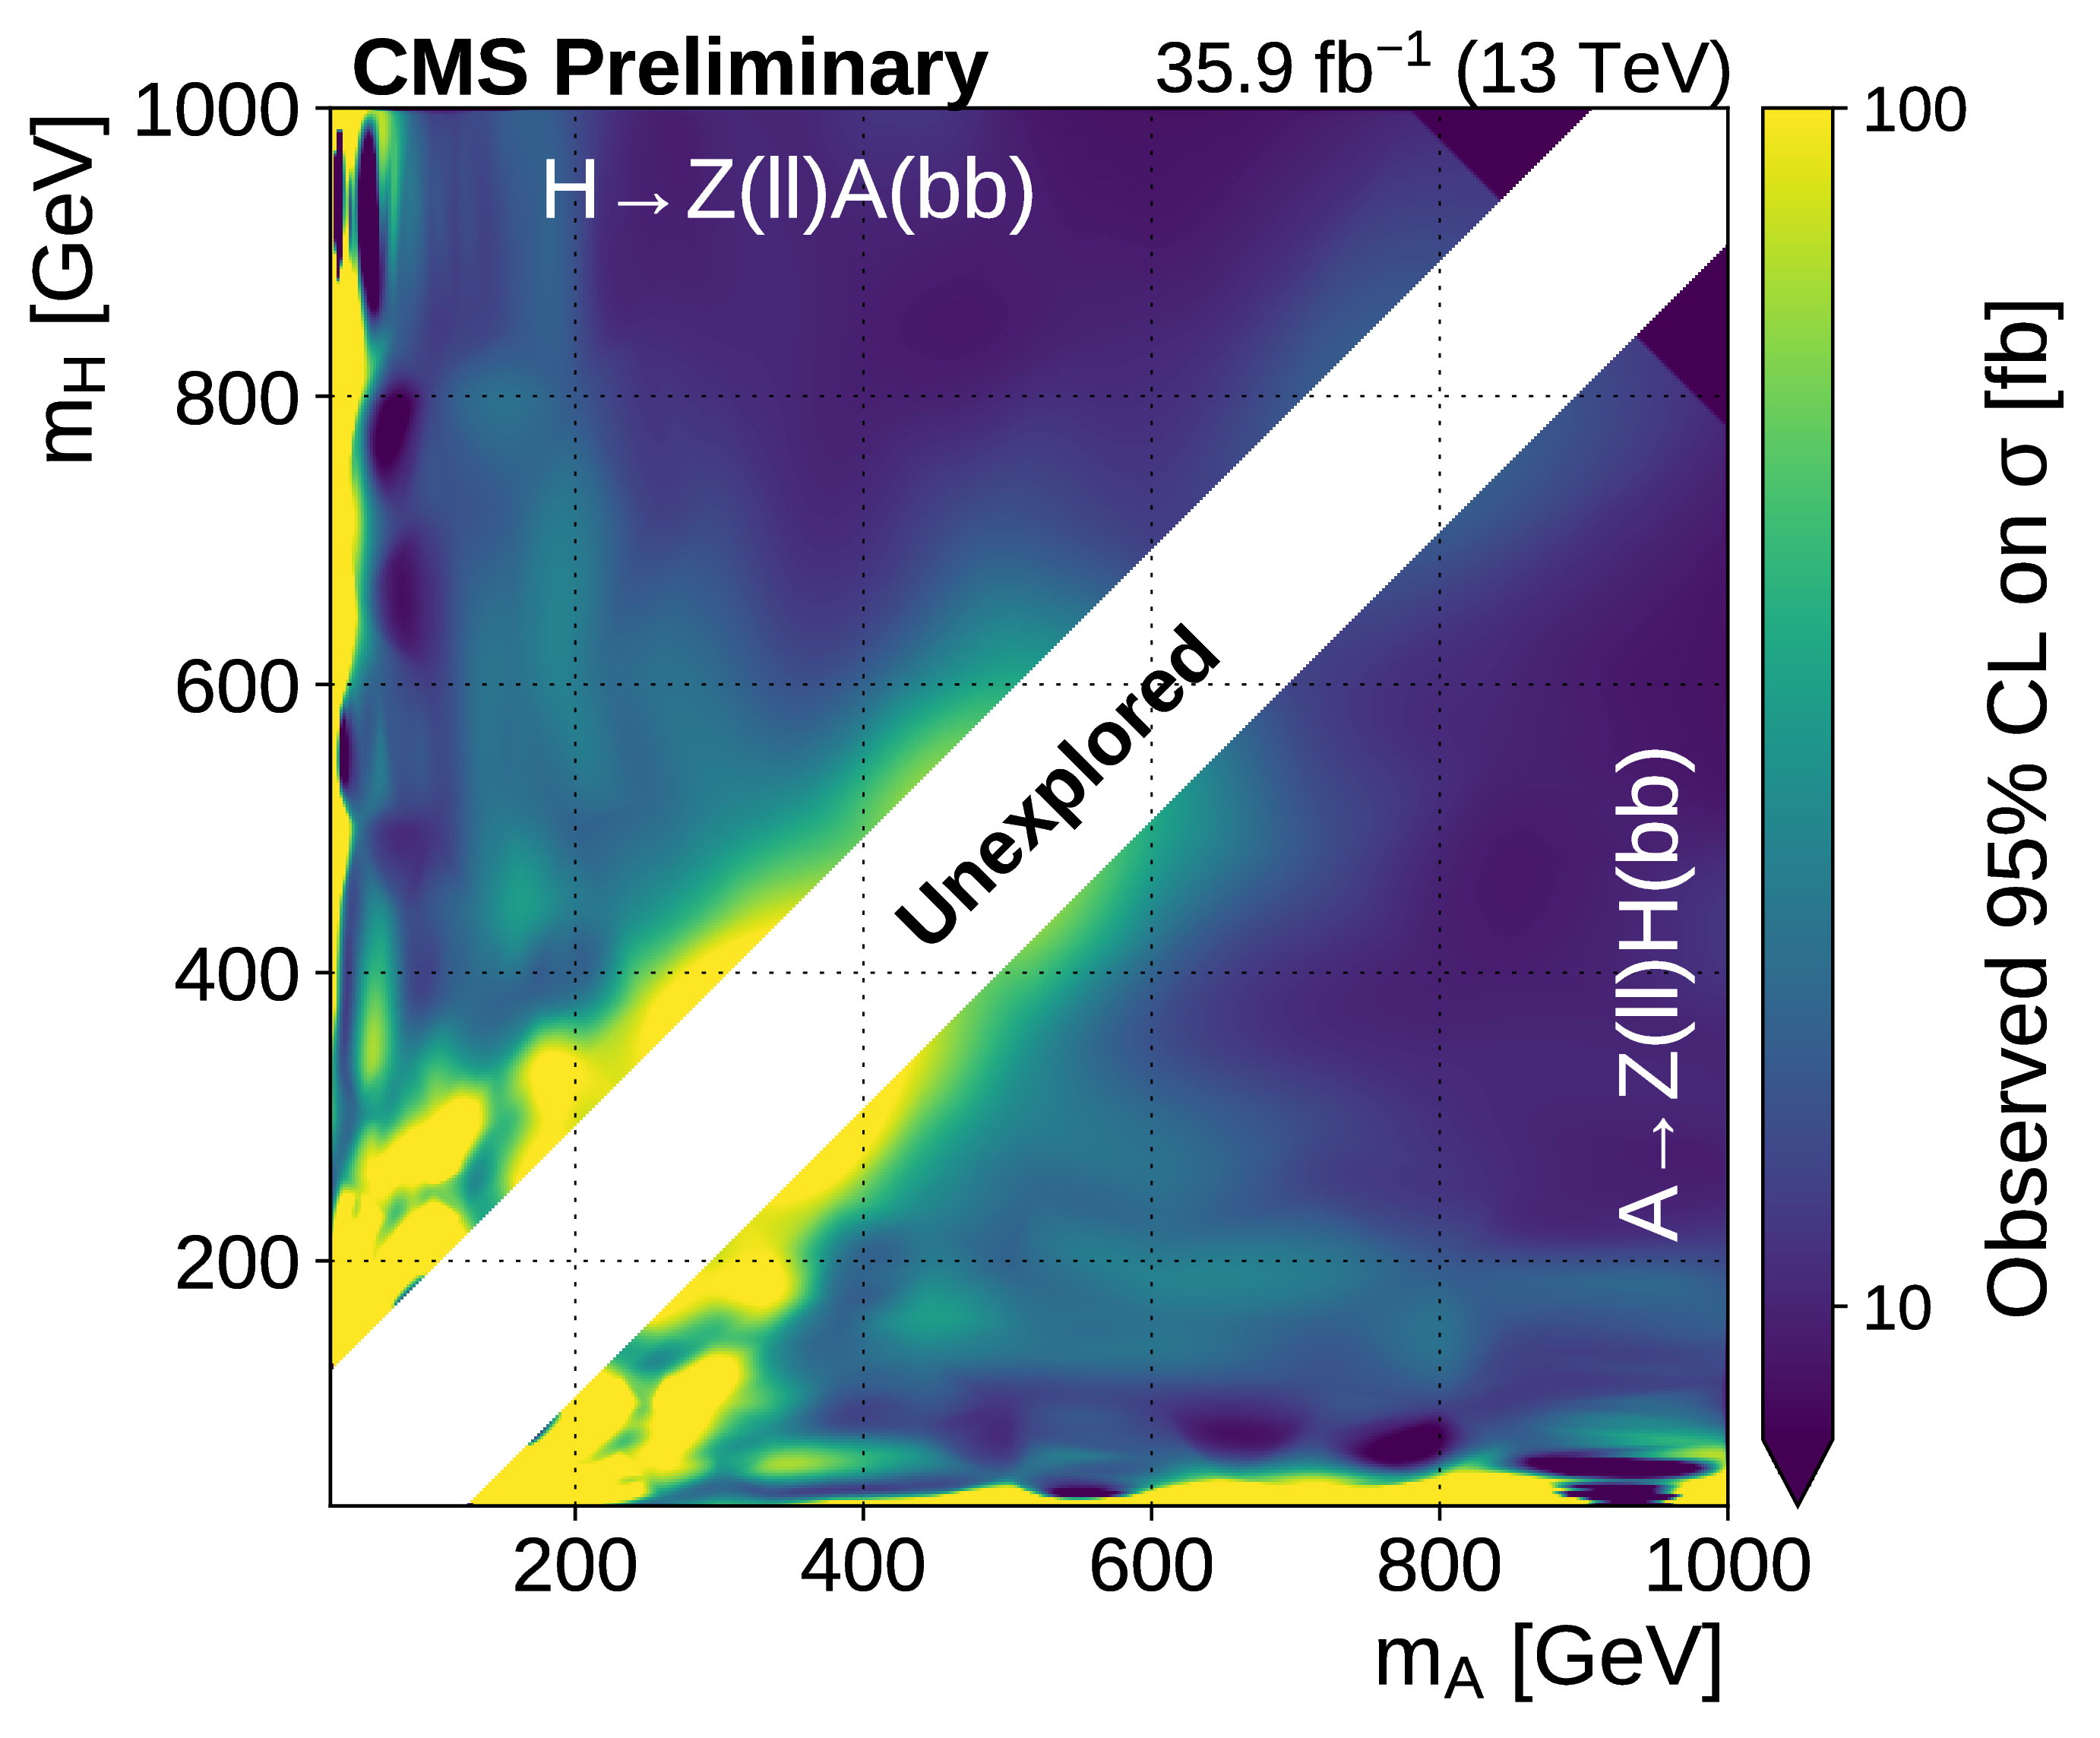
Additional Figure 1:
95% CL upper limit on the observed cross section across the mass parameter space.Text files for expected and observed 95% CL upper limits on the cross section [fb] for given values of $m_{{\text {A}}}$ and $m_{\mathrm{H}}$ [GeV]. |
png pdf |
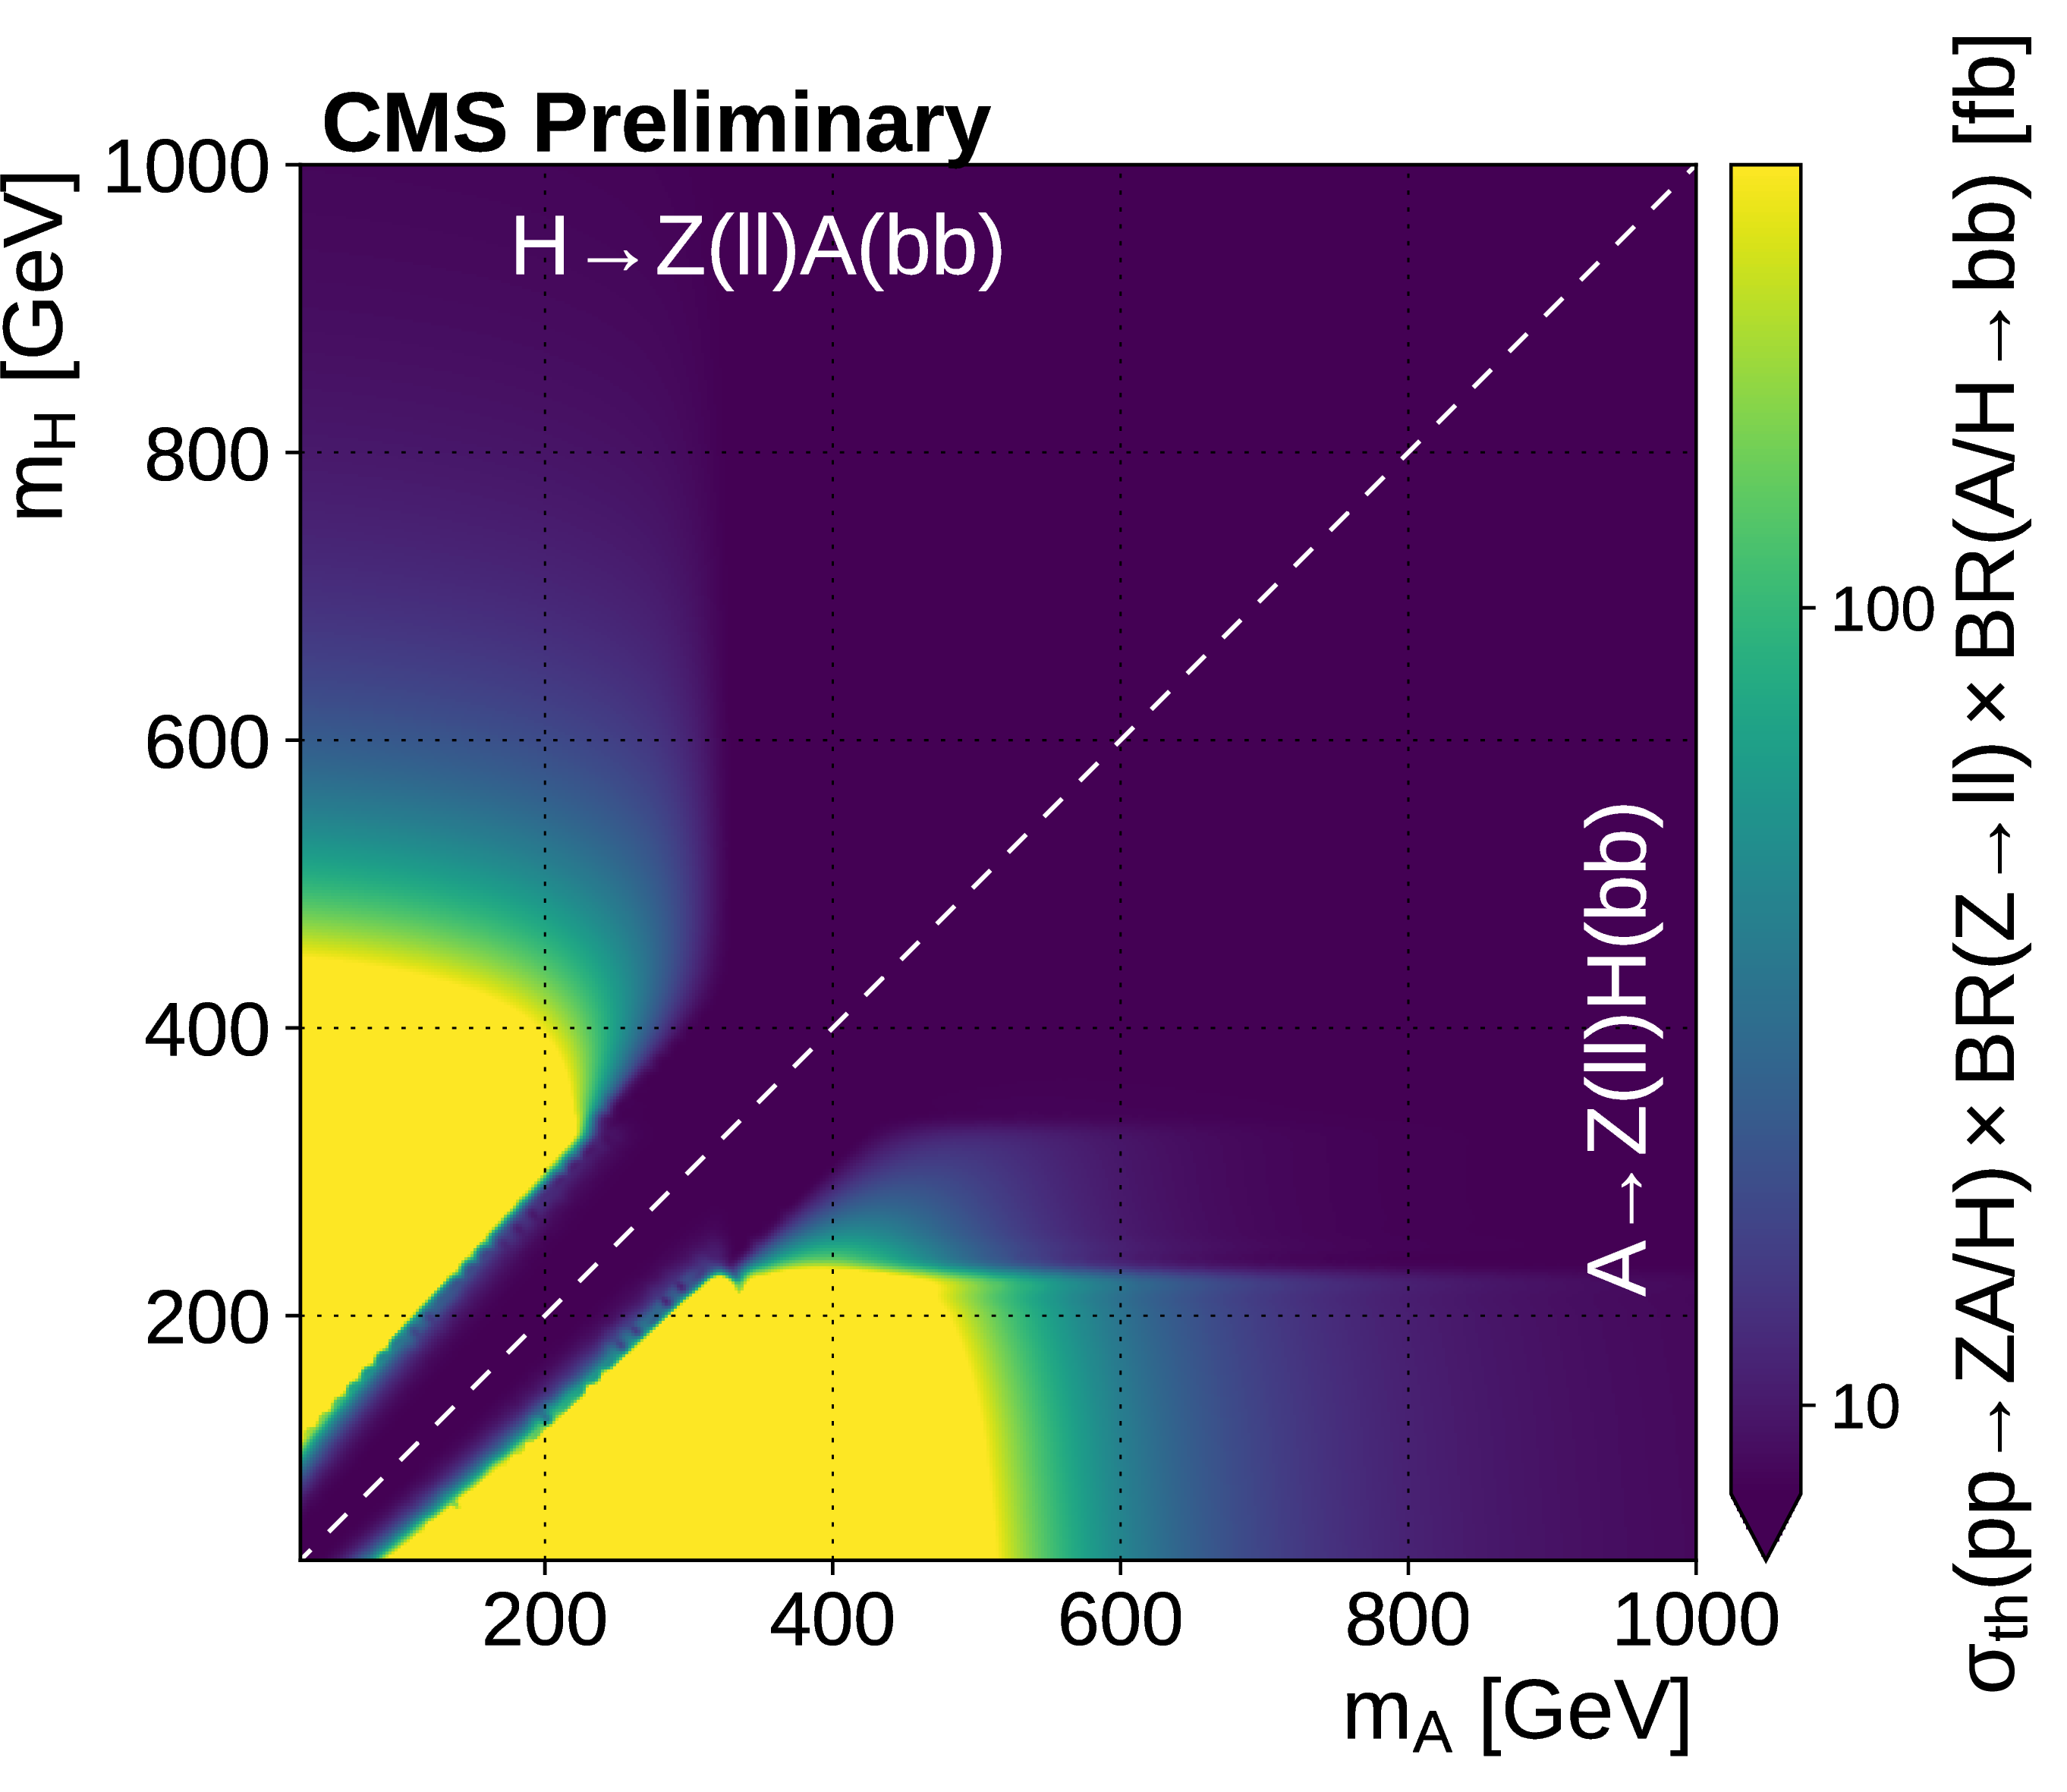
Additional Figure 2:
Theoretical cross section across the mass parameter space computed under the Type-II 2HDM benchmark scenario with $\tan\beta = $ 1.5 and $\cos(\beta - \alpha) = $ 0.01. |
png pdf |
Additional Figure 3:
$\rho $ distributions in the signal region corresponding to $m_{{\mathrm {H}}}=$ 627 GeV and $m_{{\text {A}}}=$ 162 GeV, where the local significance amounts to 3.9$\sigma $. The ${\mathrm {e}^+} {\mathrm {e}^-}$ (left) and ${\mu ^+} {\mu ^-}$ (right) categories are shown. The signal is normalised to 0.3 pb. Error bars indicate statistical uncertainties, while shaded bands show systematic uncertainties. |
png pdf |
Additional Figure 3-a:
$\rho $ distribution in the signal region corresponding to $m_{{\mathrm {H}}}=$ 627 GeV and $m_{{\text {A}}}=$ 162 GeV, where the local significance amounts to 3.9$\sigma $, in the ${\mathrm {e}^+} {\mathrm {e}^-}$ category. The signal is normalised to 0.3 pb. Error bars indicate statistical uncertainties, while shaded bands show systematic uncertainties. |
png pdf |
Additional Figure 3-b:
$\rho $ distribution in the signal region corresponding to $m_{{\mathrm {H}}}=$ 627 GeV and $m_{{\text {A}}}=$ 162 GeV, where the local significance amounts to 3.9$\sigma $, in the ${\mu ^+} {\mu ^-}$ category. The signal is normalised to 0.3 pb. Error bars indicate statistical uncertainties, while shaded bands show systematic uncertainties. |
| References | ||||
| 1 | ATLAS Collaboration | Observation of a new particle in the search for the Standard Model Higgs boson with the ATLAS detector at the LHC | PLB 716 (2012) 1 | 1207.7214 |
| 2 | CMS Collaboration | Observation of a new boson at a mass of 125~GeV with the CMS experiment at the LHC | PLB 716 (2012) 30 | CMS-HIG-12-028 1207.7235 |
| 3 | CMS Collaboration | Observation of a new boson with mass near 125~GeV in $ {\mathrm{p}}{\mathrm{p}} $ collisions at $ \sqrt{s} = $ 7 and 8~TeV | JHEP 06 (2013) 081 | CMS-HIG-12-036 1303.4571 |
| 4 | C. Csaki | The Minimal supersymmetric standard model (MSSM) | MPLA 11 (1996) 599 | hep-ph/9606414 |
| 5 | G. C. Branco et al. | Theory and phenomenology of two-Higgs-doublet models | PR 516 (2012) 1 | 1106.0034 |
| 6 | ATLAS Collaboration | Search for a CP-odd Higgs boson decaying to Zh in pp collisions at $ \sqrt{s} = $ 8 TeV with the ATLAS detector | PLB 744 (2015) 163 | 1502.04478 |
| 7 | ATLAS Collaboration | Search for a heavy Higgs boson decaying into a $ Z $ boson and another heavy Higgs boson in the $ \ell\ell\mathrm{bb} $ final state in $ \mathrm{pp} $ collisions at $ \sqrt{s}= $ 13 TeV with the ATLAS detector | 1804.01126 | |
| 8 | CMS Collaboration | Search for neutral resonances decaying into a Z boson and a pair of b jets or $ \tau $ leptons | PLB 759 (2016) 369 | CMS-HIG-15-001 1603.02991 |
| 9 | CMS Collaboration | Search for a pseudoscalar boson decaying into a Z boson and the 125 GeV Higgs boson in $ \ell^{+}\ell^{-} \mathrm{b}\overline{\mathrm{b}} $ final states | PLB 748 (2015) 221 | CMS-HIG-14-011 1504.04710 |
| 10 | CMS Collaboration | Search for a heavy pseudoscalar boson decaying to a Z boson and a Higgs boson at $ \sqrt{s} = $ 13 TeV | CDS | |
| 11 | S. de Visscher et al. | Unconventional phenomenology of a minimal two-Higgs-doublet model | JHEP 08 (2009) 042 | 0904.0705 |
| 12 | CMS Collaboration | The CMS experiment at the CERN LHC | JINST 03 (2008) S08004 | CMS-00-001 |
| 13 | P. Nason | A new method for combining NLO QCD with shower Monte Carlo algorithms | JHEP 11 (2004) 040 | hep-ph/0409146 |
| 14 | S. Frixione, P. Nason, and C. Oleari | Matching NLO QCD computations with parton shower simulations: the POWHEG method | JHEP 11 (2007) 070 | 0709.2092 |
| 15 | S. Alioli, P. Nason, C. Oleari, and E. Re | A general framework for implementing NLO calculations in shower Monte Carlo programs: the POWHEG BOX | JHEP 06 (2010) 043 | 1002.2581 |
| 16 | S. Alioli, S. Moch, and P. Uwer | Hadronic top-quark pair-production with one jet and parton showering | JHEP 01 (2012) 137 | 1110.5251 |
| 17 | S. Alioli, P. Nason, C. Oleari, and E. Re | NLO single-top production matched with shower in POWHEG: $ s $- and $ t $-channel contributions | JHEP 09 (2009) 111 | 0907.4076 |
| 18 | J. Alwall et al. | The automated computation of tree-level and next-to-leading order differential cross sections, and their matching to parton shower simulations | JHEP 07 (2014) 079 | 1405.0301 |
| 19 | R. Frederix and S. Frixione | Merging meets matching in MC@NLO | JHEP 12 (2012) 061 | 1209.6215 |
| 20 | P. Artoisenet, R. Frederix, O. Mattelaer, and R. Rietkerk | Automatic spin-entangled decays of heavy resonances in Monte Carlo simulations | JHEP 03 (2013) 015 | 1212.3460 |
| 21 | T. Sjostrand et al. | An Introduction to PYTHIA 8.2 | CPC 191 (2015) 159--177 | 1410.3012 |
| 22 | NNPDF Collaboration | Parton distributions for the LHC Run II | JHEP 04 (2015) 040 | 1410.8849 |
| 23 | CMS Collaboration | Event generator tunes obtained from underlying event and multiparton scattering measurements | EPJC 76 (2015) 155 | CMS-GEN-14-001 1512.00815 |
| 24 | P. Skands, S. Carrazza, and J. Rojo | Tuning PYTHIA 8.1: the Monash 2013 Tune | EPJC74 (2014), no. 8 | 1404.5630 |
| 25 | GEANT4 Collaboration | GEANT4---a simulation toolkit | NIMA 506 (2003) 250 | |
| 26 | M. Czakon and A. Mitov | Top++: A program for the calculation of the top-pair cross-section at hadron colliders | CPC 185 (2014) 2930 | 1112.5675 |
| 27 | Y. Li and F. Petriello | Combining QCD and electroweak corrections to dilepton production in the framework of the FEWZ simulation code | PRD 86 (2012) 094034 | 1208.5967 |
| 28 | M. Botje et al. | The PDF4LHC Working Group Interim Recommendations | 1101.0538 | |
| 29 | T. Gehrmann et al. | $ \mathrm{W}^+\mathrm{W}^- $ Production at Hadron Colliders in Next to Next to Leading Order QCD | PRL 113 (2014) 212001 | 1408.5243 |
| 30 | J. M. Campbell, R. K. Ellis, and C. Williams | Vector boson pair production at the LHC | JHEP 07 (2011) 018 | 1105.0020 |
| 31 | D. de Florian et al. | Handbook of LHC Higgs cross sections: 4. Deciphering the nature of the Higgs sector | 1610.07922 | |
| 32 | CMS Collaboration | Measurement of the inclusive W and Z production cross sections in pp collisions at $ \sqrt{s} = $ 7 TeV with the CMS experiment | JHEP. 10 (2011) 132 | CMS-EWK-10-005 1107.4789 |
| 33 | CMS Collaboration | Performance of electron reconstruction and selection with the CMS detector in proton-proton collisions at $ \sqrt{s} = $ 8~TeV | JINST 10 (2015) P06005 | CMS-EGM-13-001 1502.02701 |
| 34 | CMS Collaboration | Performance of CMS muon reconstruction in $ {\mathrm{p}}{\mathrm{p}} $ collision events at $ \sqrt{s}= $ 7 ~TeV | JINST 7 (2012) P10002 | CMS-MUO-10-004 1206.4071 |
| 35 | CMS Collaboration | Particle-flow reconstruction and global event description with the CMS detector | JINST 12 (2017) P10003 | CMS-PRF-14-001 1706.04965 |
| 36 | M. Cacciari, G. P. Salam, and G. Soyez | The anti-$ {k_{\mathrm{T}}} $ jet clustering algorithm | JHEP 04 (2008) 063 | 0802.1189 |
| 37 | M. Cacciari, G. P. Salam, and G. Soyez | FastJet user manual | EPJC 72 (2012) 1896 | 1111.6097 |
| 38 | CMS Collaboration | Jet energy scale and resolution in the CMS experiment in $ {\mathrm{p}}{\mathrm{p}} $ collisions at 8~TeV | JINST 12 (2017) P02014 | CMS-JME-13-004 1607.03663 |
| 39 | CMS Collaboration | Performance of the CMS missing transverse momentum reconstruction in $ {\mathrm{p}}{\mathrm{p}} $ data at $ \sqrt{s} = $ 8~TeV | JINST 10 (2015) P02006 | CMS-JME-13-003 1411.0511 |
| 40 | CMS Collaboration | Performance of missing transverse momentum reconstruction in proton-proton collisions at $ \sqrt{s} = $ 13 TeV using the CMS detector | Submitted to: JINST (2019) | CMS-JME-17-001 1903.06078 |
| 41 | CMS Collaboration | Identification of b-quark jets with the CMS experiment | JINST 8 (2013) P04013 | CMS-BTV-12-001 1211.4462 |
| 42 | CMS Collaboration | Heavy flavor identification at CMS with deep neural networks | CDS | |
| 43 | CMS Collaboration | CMS Luminosity Measurements for the 2016 Data Taking Period | CMS-PAS-LUM-17-001 | CMS-PAS-LUM-17-001 |
| 44 | CMS Collaboration | Identification of heavy-flavour jets with the CMS detector in pp collisions at 13 TeV | JINST 13 (2018), no. 05, P05011 | CMS-BTV-16-002 1712.07158 |
| 45 | CMS Collaboration | Measurement of the inelastic proton-proton cross section at $ \sqrt{s}= $ 13 TeV | JHEP 07 (2018) 161 | CMS-FSQ-15-005 1802.02613 |
| 46 | S. Alekhin et al. | The PDF4LHC Working Group interim report | 2011 | 1101.0536 |
| 47 | T. Junk | Confidence level computation for combining searches with small statistics | NIMA 434 (1999) 435 | hep-ex/9902006 |
| 48 | A. L. Read | Presentation of search results: the $ \mathrm{CL_s} $ technique | JPG 28 (2002) 2693 | |
| 49 | G. Cowan, K. Cranmer, E. Gross, and O. Vitells | Asymptotic formulae for likelihood-based tests of new physics | EPJC 71 (2011) 1554 | 1007.1727 |
| 50 | E. Gross and O. Vitells | Trial factors for the look elsewhere effect in high energy physics | EPJC70 (2010) 525--530 | 1005.1891 |
|
|
Compact Muon Solenoid LHC, CERN |
|

|

|

|

|

|