

Compact Muon Solenoid
LHC, CERN
| CMS-PAS-FSQ-12-033 | ||
| Measurement of dijet production with a leading proton in proton-proton collisions at $\sqrt{s}=$ 8 TeV | ||
| CMS Collaboration | ||
| September 2018 | ||
| Abstract: A study of dijet production associated with a leading proton is presented. The analysis is based on a common data set collected simultaneously with the CMS and TOTEM detectors at the LHC with proton-proton collisions at $\sqrt{s}=$ 8 TeV during a dedicated run with $\beta^{*}=$ 90 m, at low instantaneous luminosity. The data correspond to an integrated luminosity of 37.5 nb$^{-1}$. The analysis presents the measurement of the dijet production cross section, as a function of $\xi$, the proton fractional momentum loss, and as a function of $t$, the 4-momentum transfer squared at the proton vertex. The dijet cross section in the kinematic region defined by $\xi < $ 0.1, 0.03 $ < | t | < $ 1 GeV$^2$, with at least two jets with transverse momentum $p_{\mathrm{T}} > $ 40 GEV, and pseudorapidity $| \eta | < $ 4.4, is measured as 21.7 $\pm$ 0.9 (stat) $^{+3.0}_{-3.3}$ (syst) $\pm$ 0.9 (lumi) nb. Both the processes $\mathrm{pp} \to \mathrm{pX}$ and $\mathrm{pp} \to \mathrm{Xp}$, i.e. with the proton scattering to either side of the interaction, are measured, with X including a system of two jets. The results correspond to the average of their cross sections. The ratio of the single-diffractive to inclusive dijet yields, normalised per unit of $\xi$, is presented as a function of $x$, the longitudinal momentum fraction of the proton carried by the struck parton. The ratio in the kinematic region defined above, for $x$ values in the range $-2.9 \leq \log_{10} x \leq -1.6$, was measured as $R = (\sigma^{\mathrm{pX}}_{\mathrm{jj}}/\Delta\xi )/\sigma_{\mathrm{jj}} = $ 0.025 $\pm$ 0.001 (stat) $\pm$ 0.003 (syst). The results are compared to the predictions from models of diffractive and non-diffractive interactions. | ||
|
Links:
CDS record (PDF) ;
CADI line (restricted) ;
These preliminary results are superseded in this paper, EPJC 80, 1164 (2020). The superseded preliminary plots can be found here. |
||
| Figures | |
png pdf |
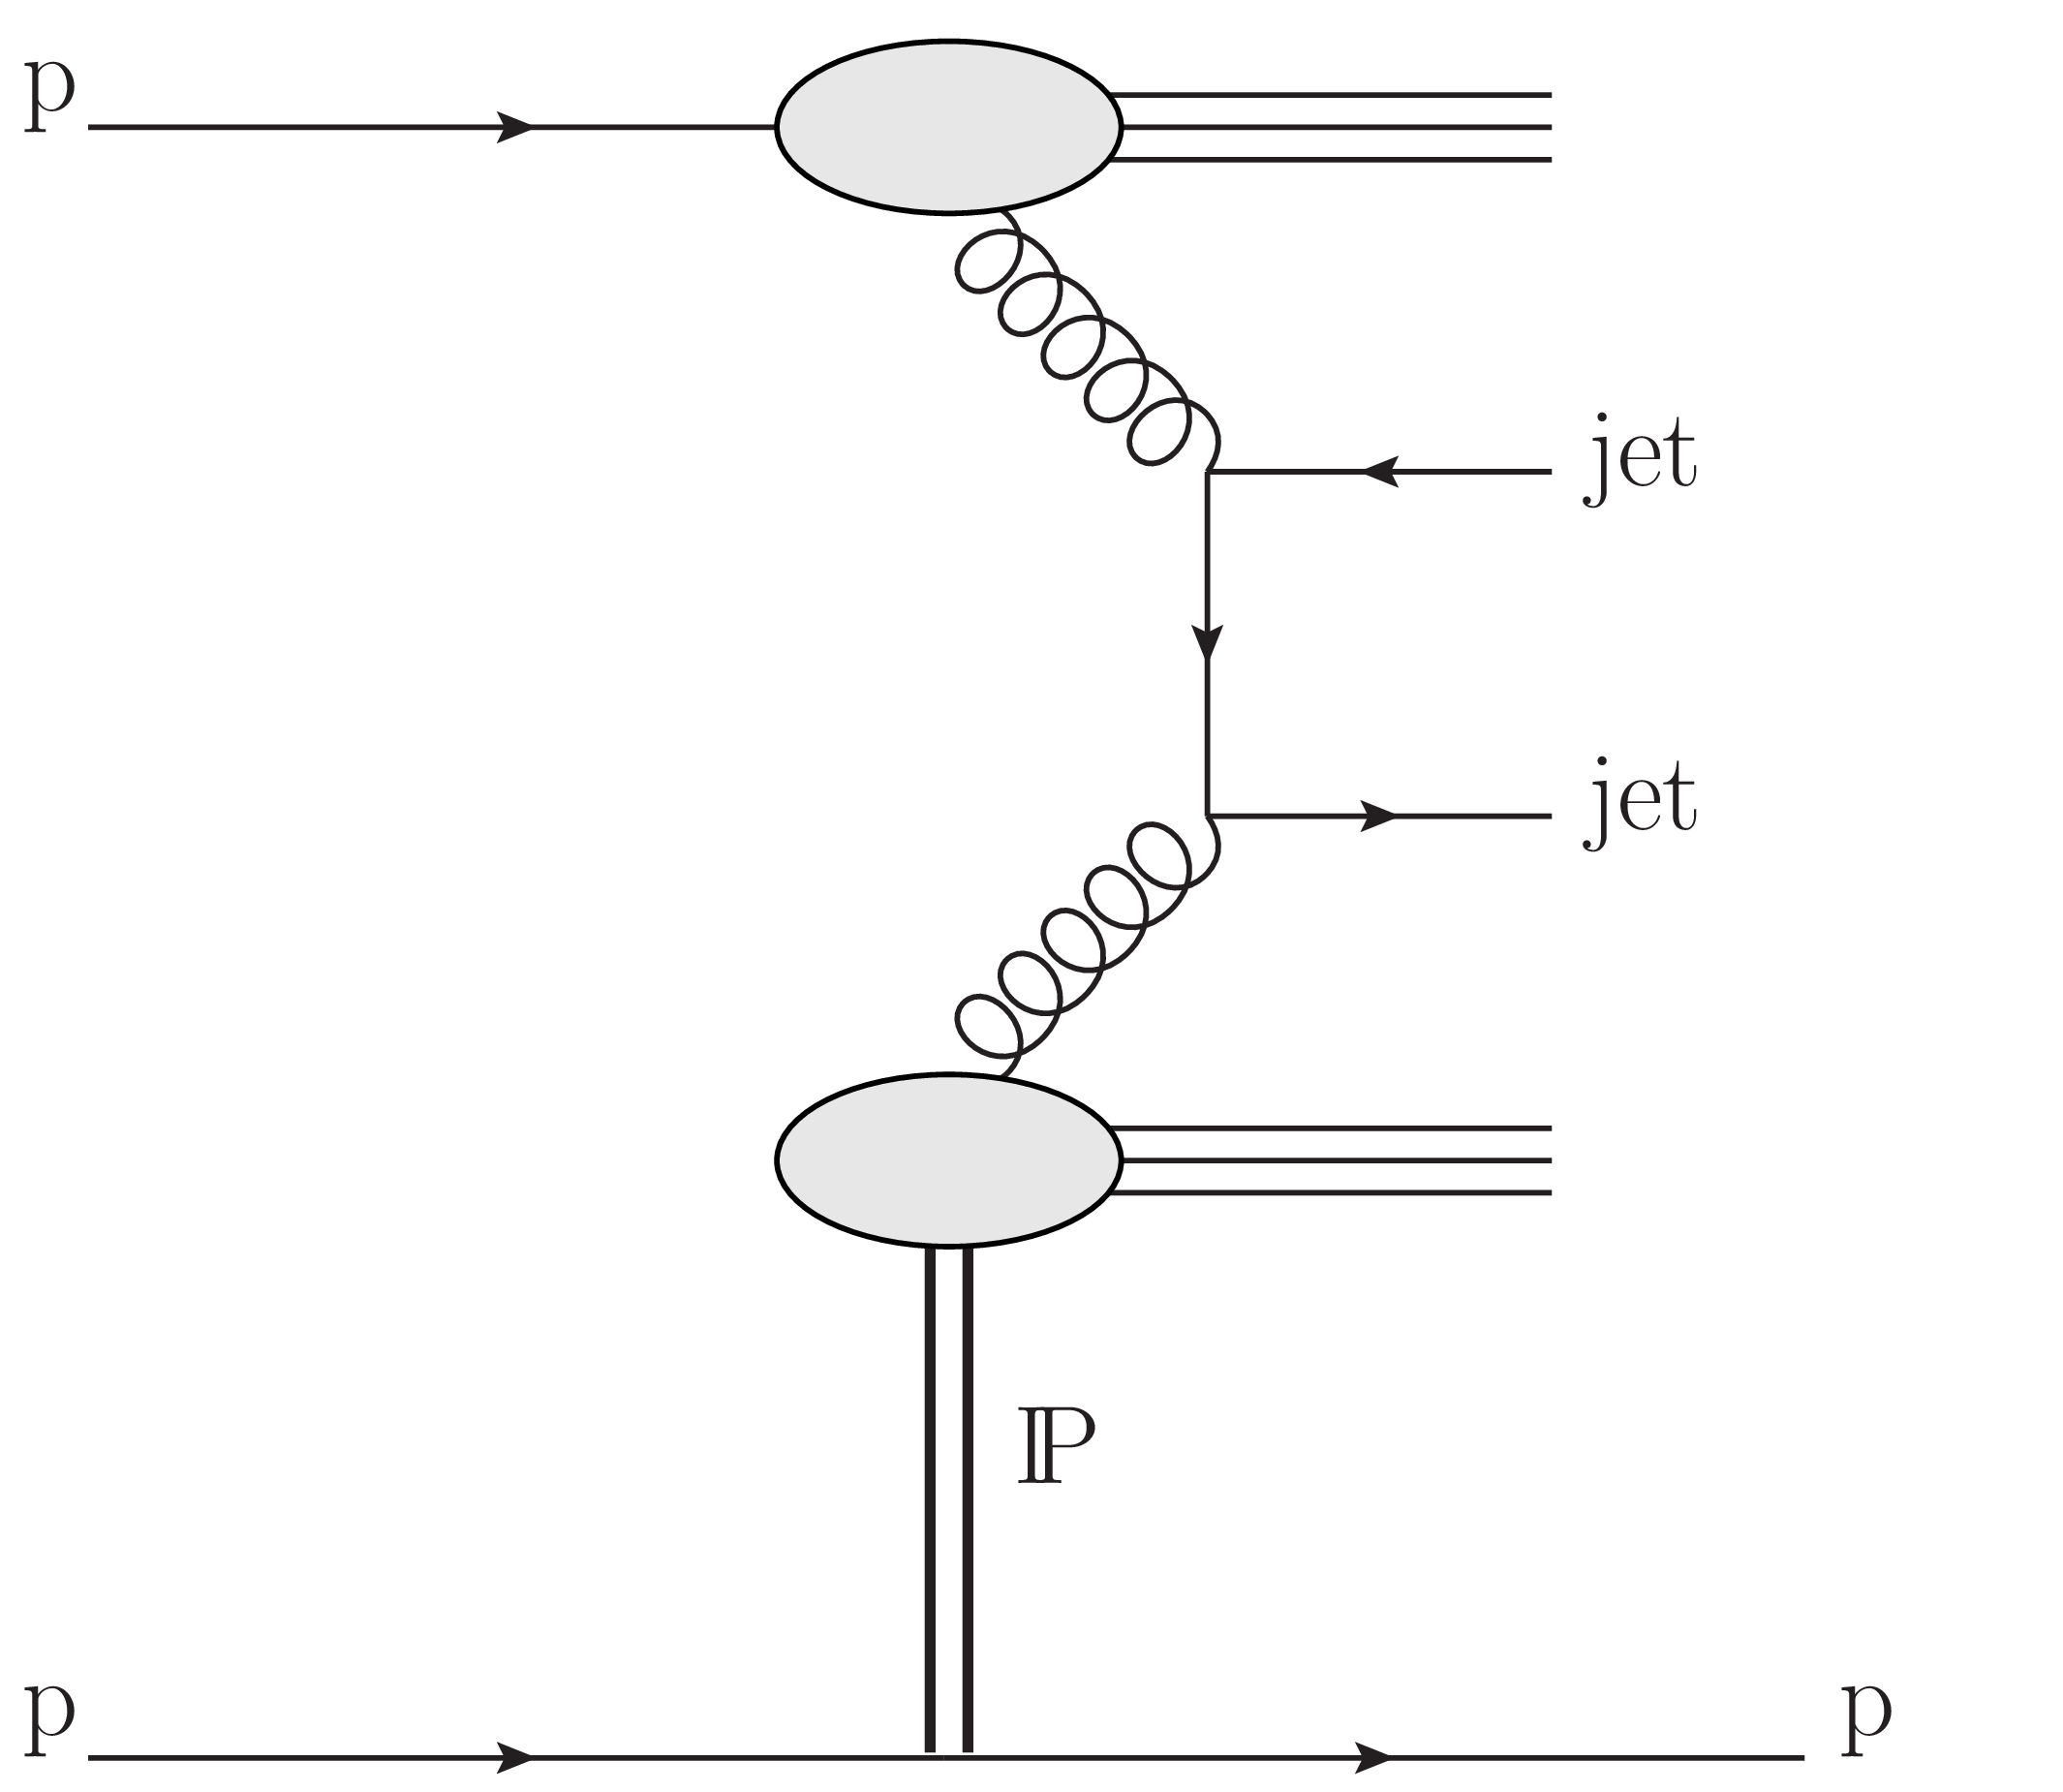
Figure 1:
Schematic diagram of diffractive dijet production. The diagram shows an example of the $ {\mathrm {g}} {\mathrm {g}} \to \text {dijet}$ hard scattering process; the $ {\mathrm {q}} {\mathrm {q}}$ and $ {\mathrm {g}} {\mathrm {q}}$ initial states also contribute. |
png pdf |
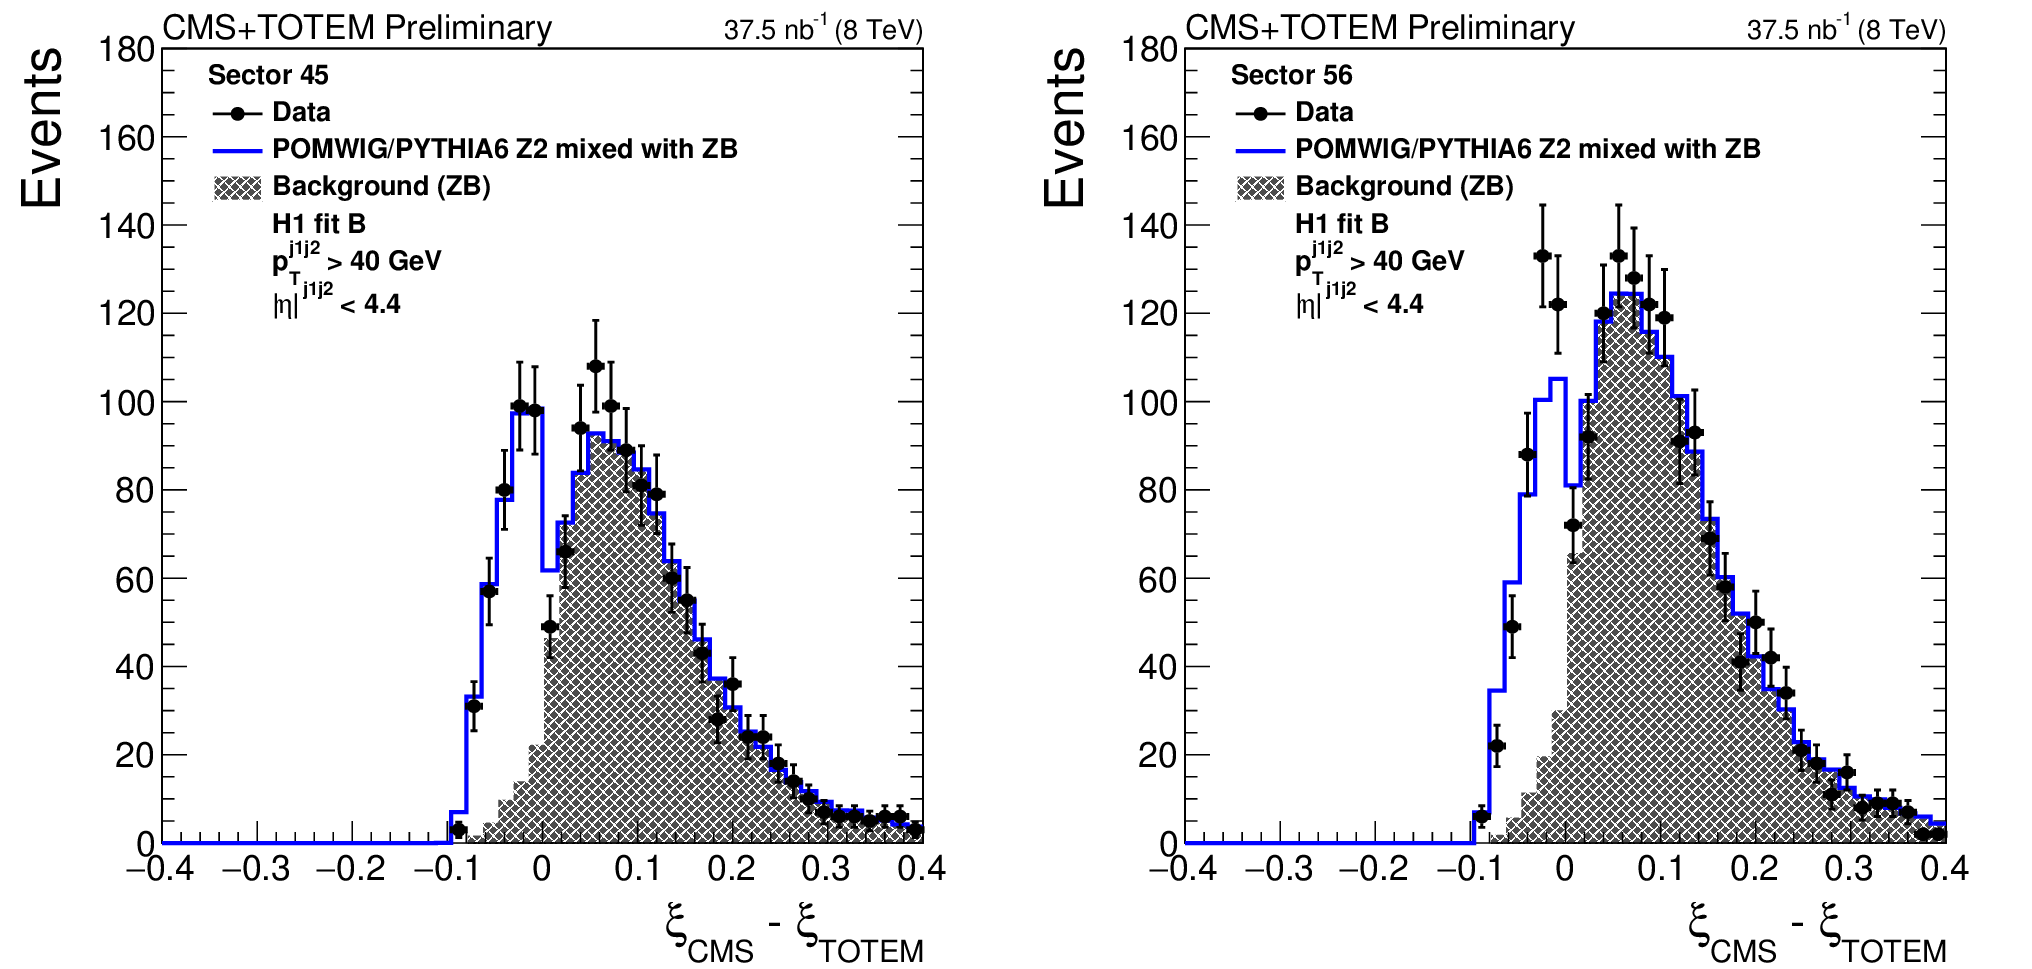
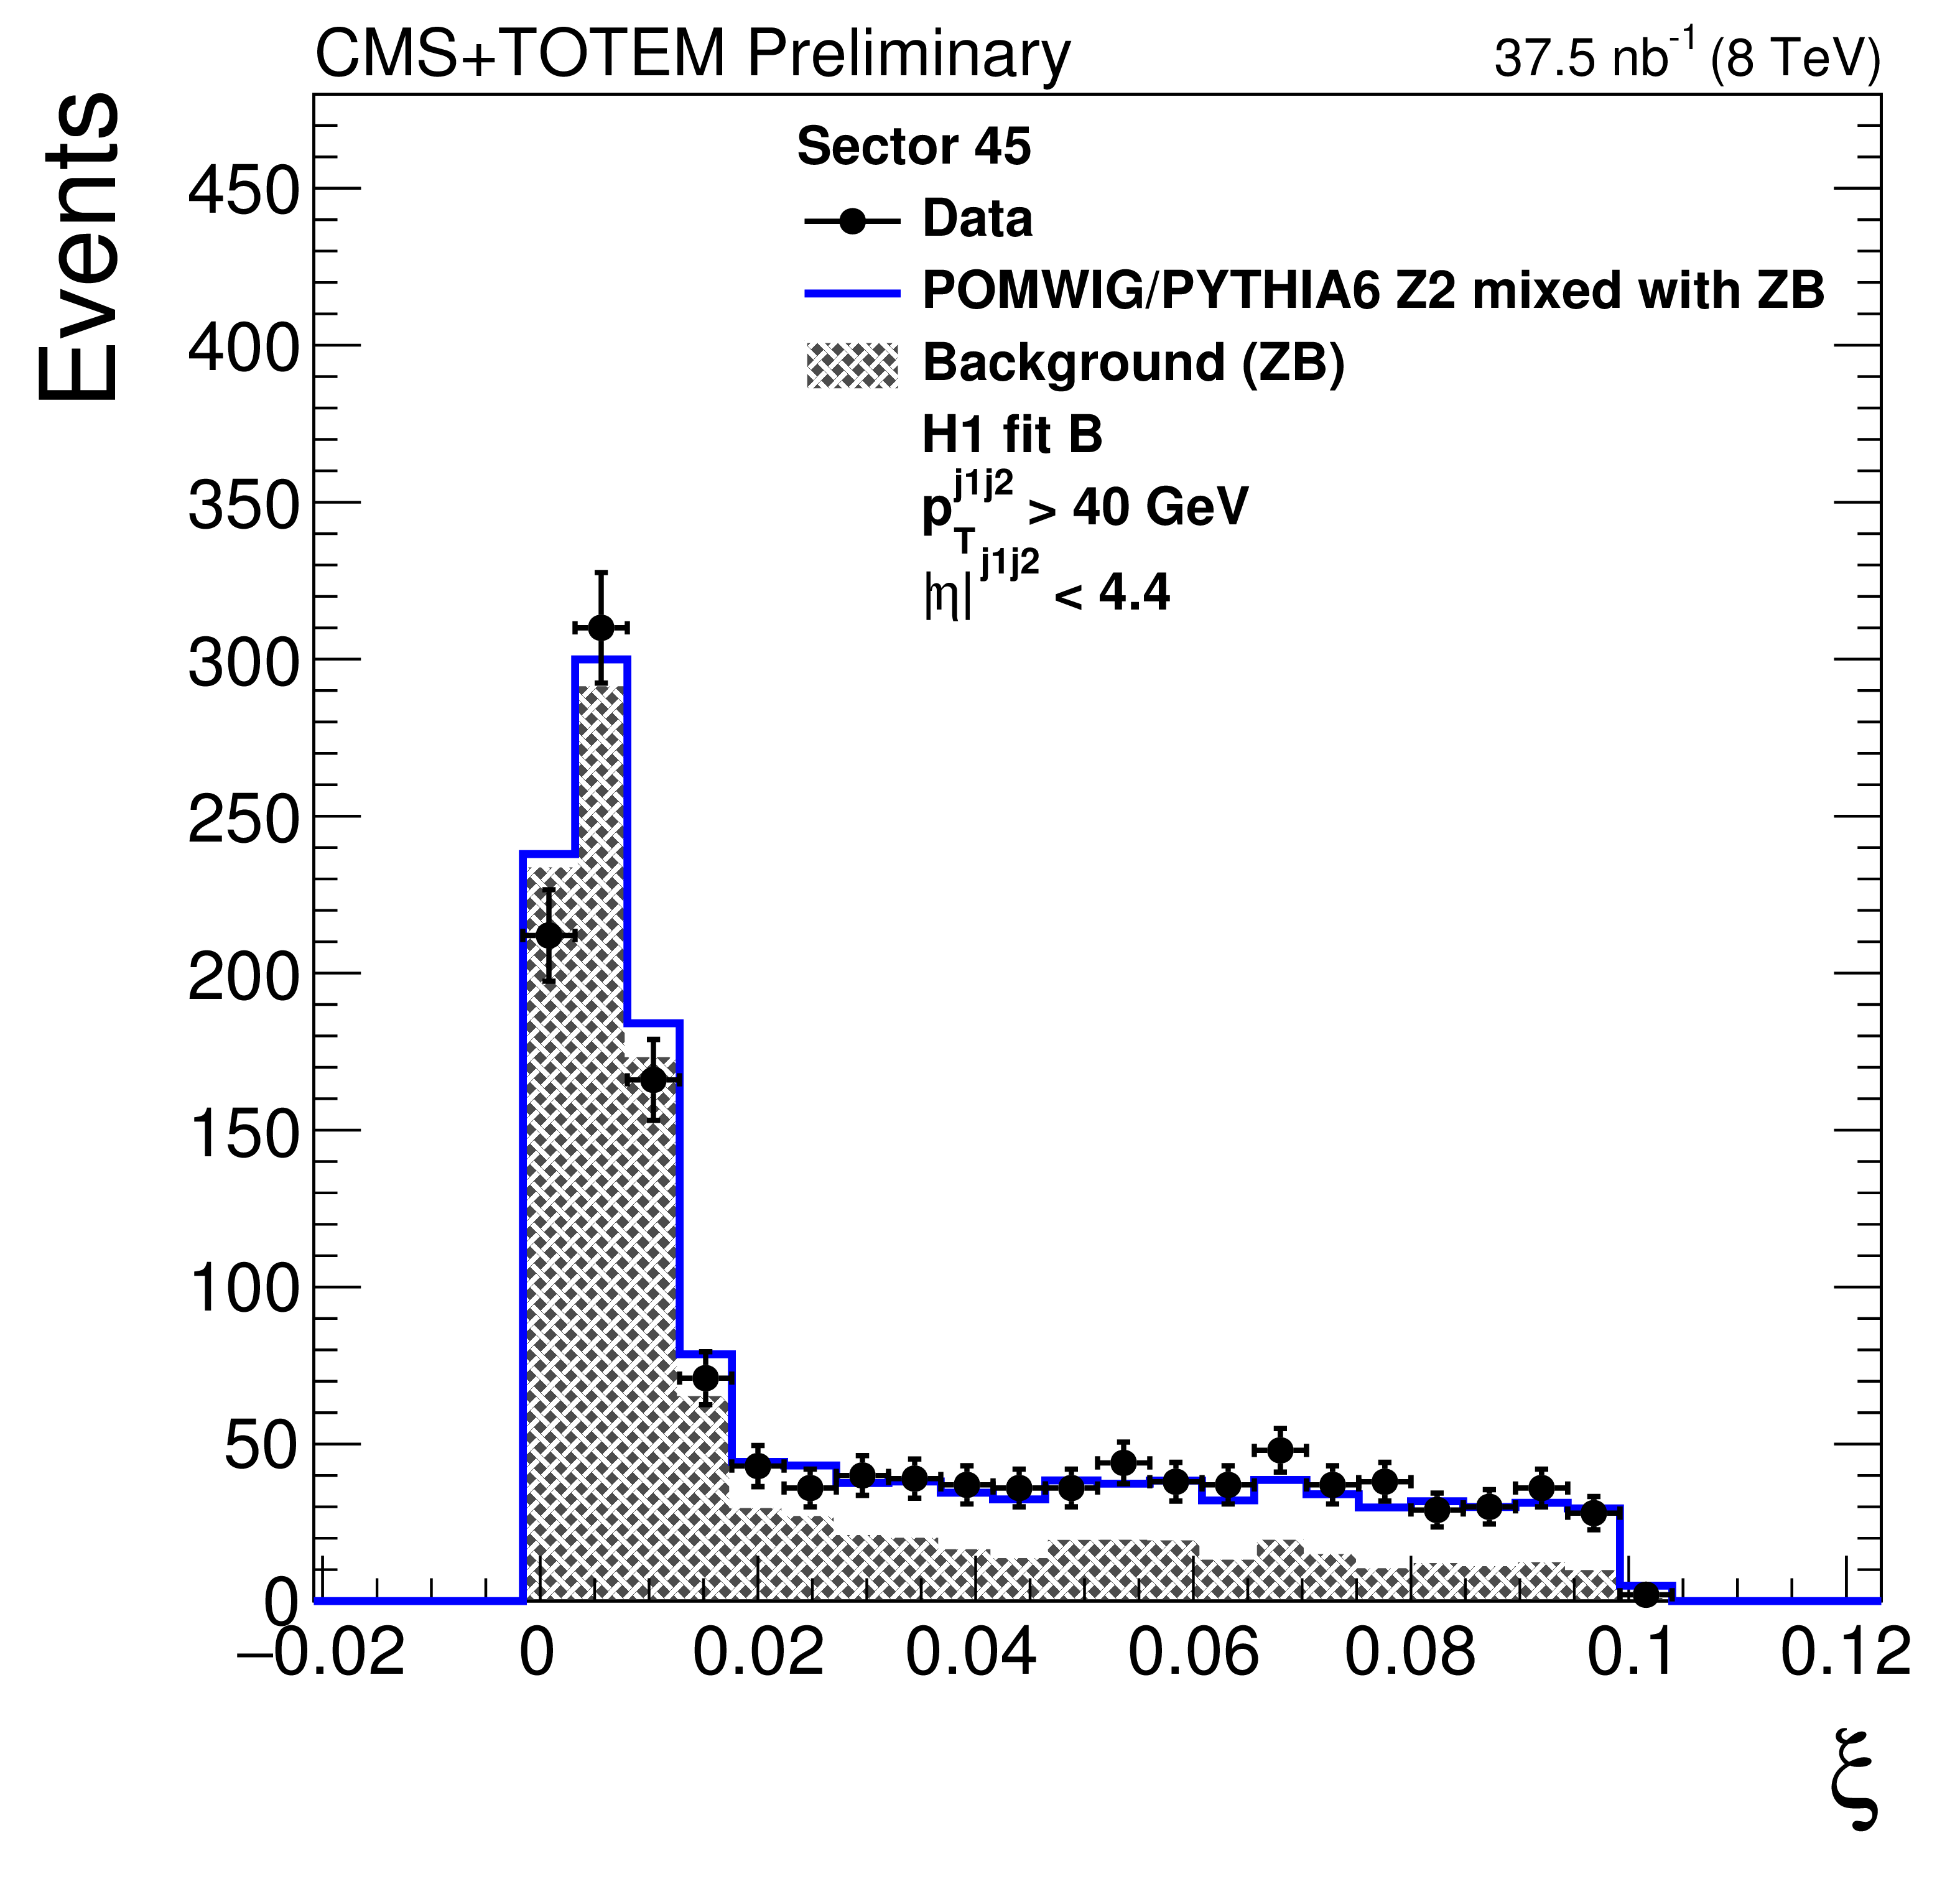
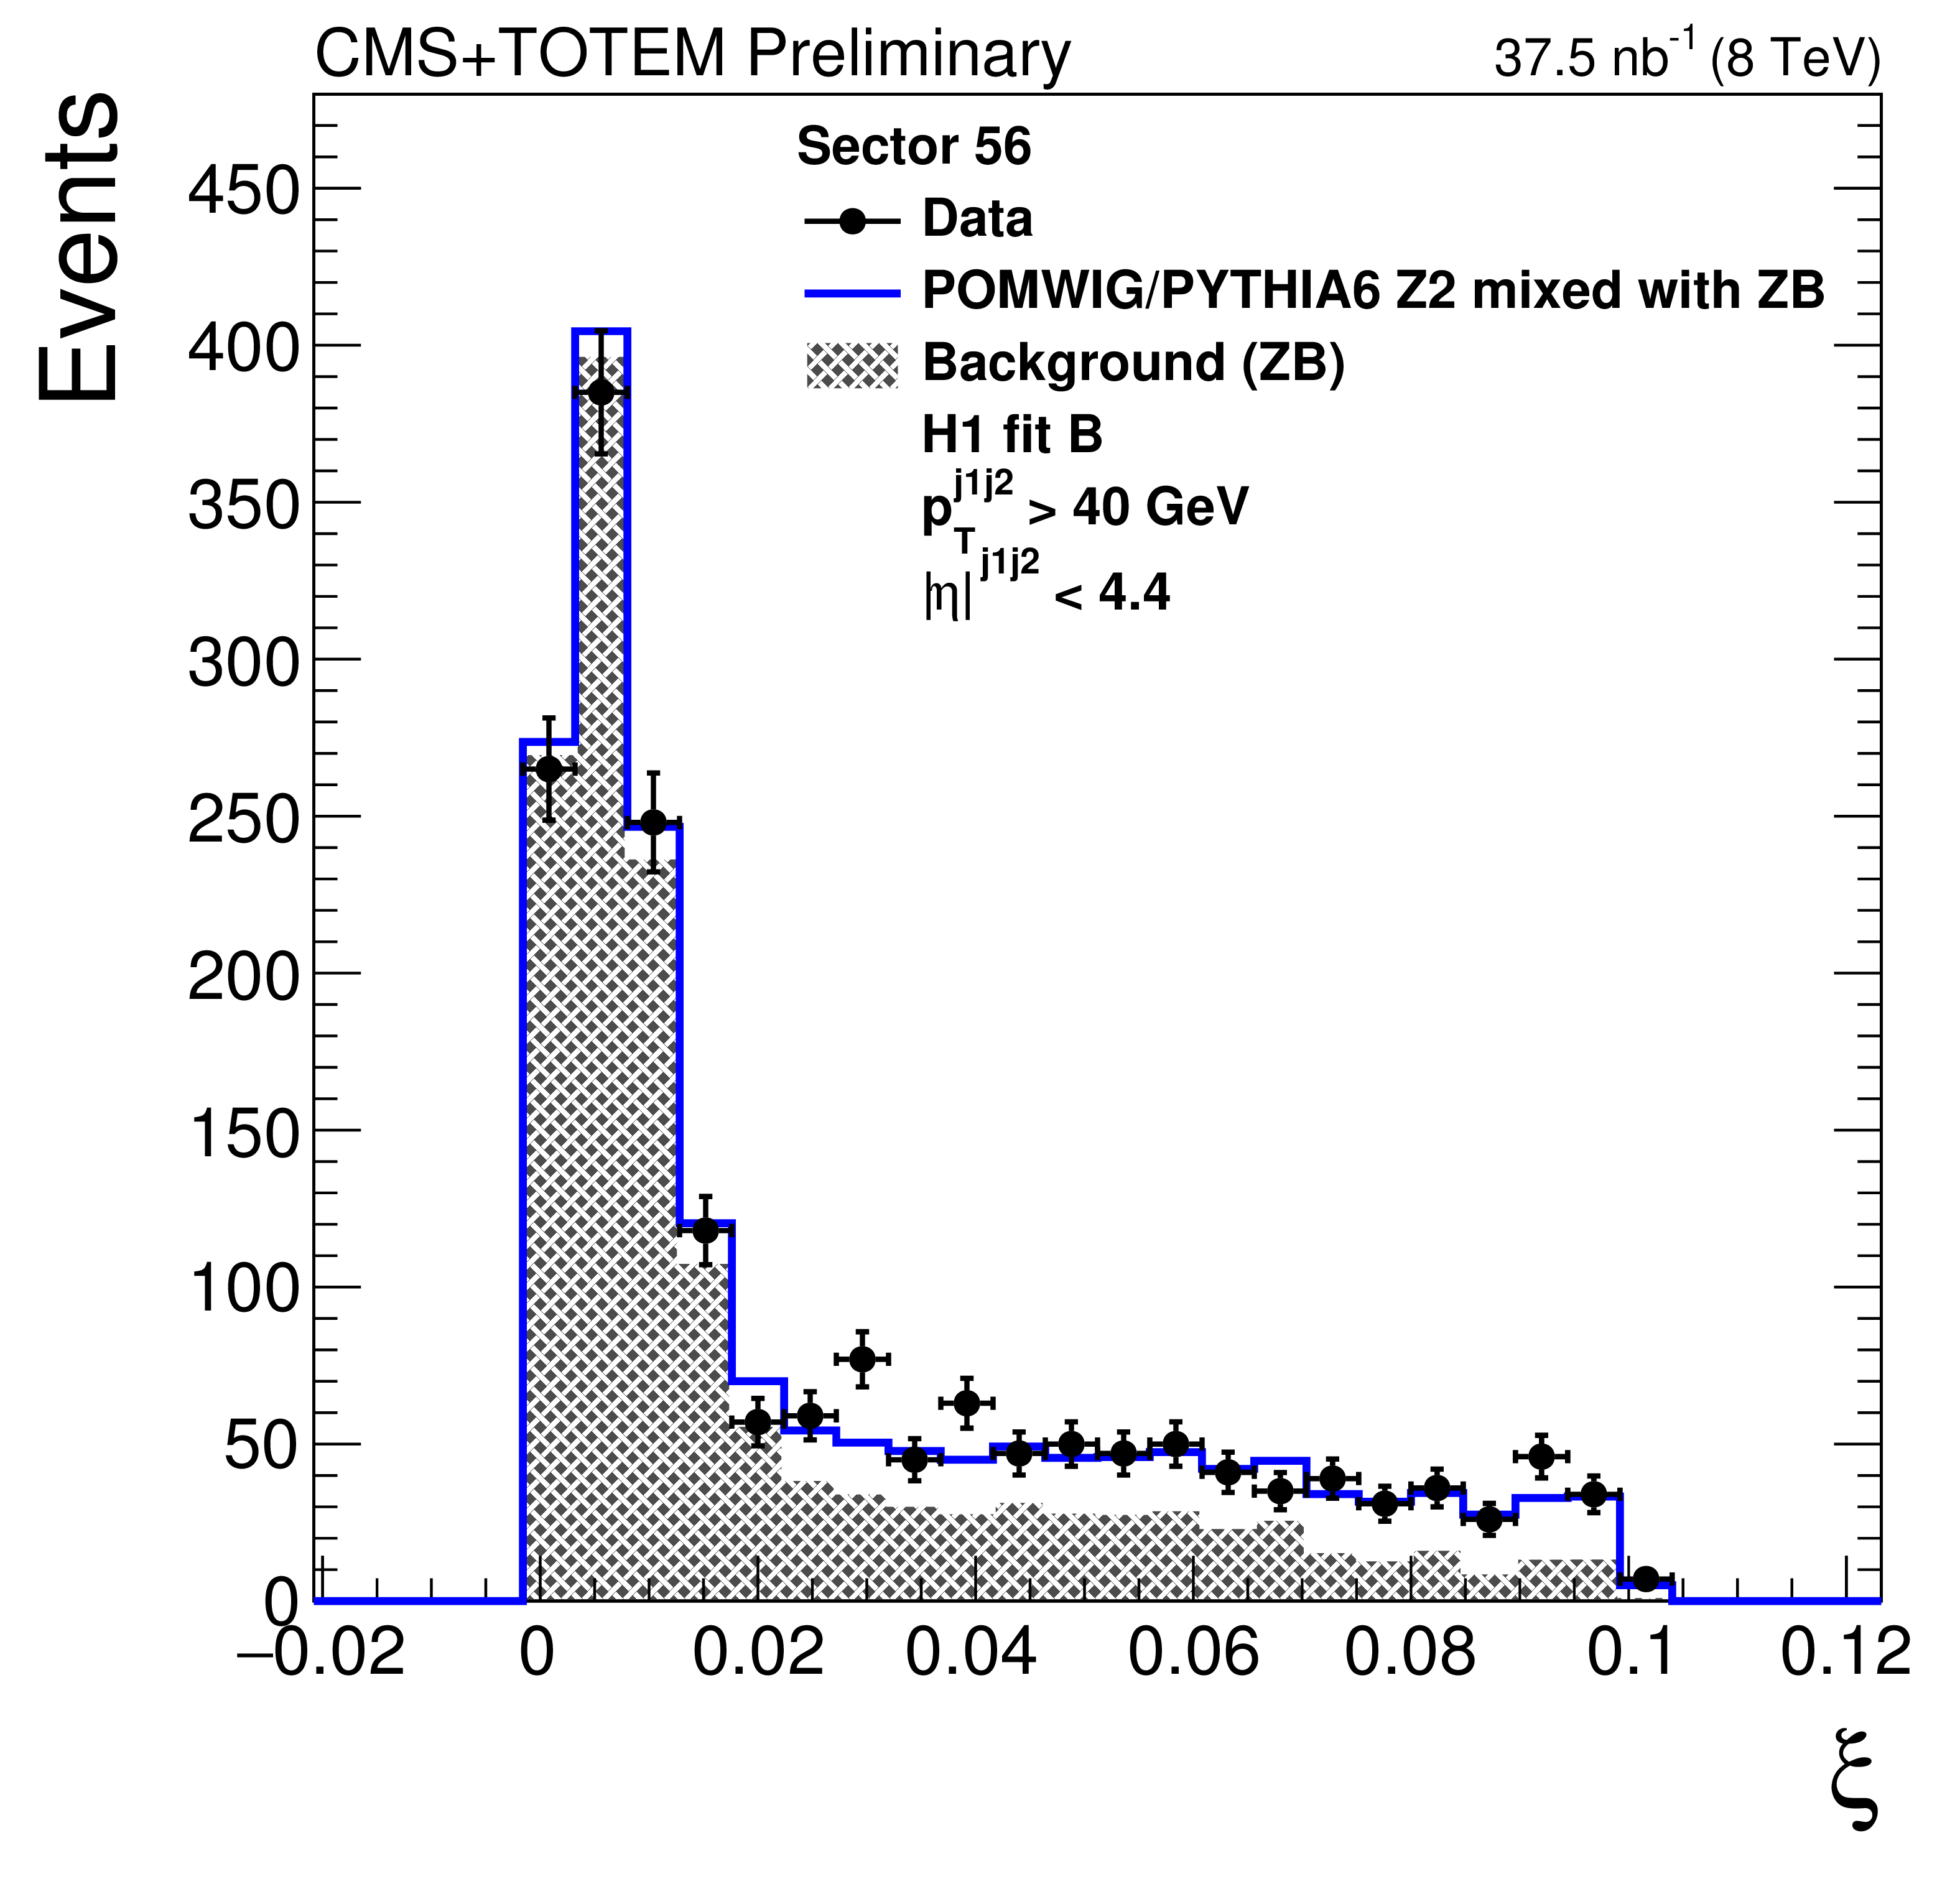
Figure 2:
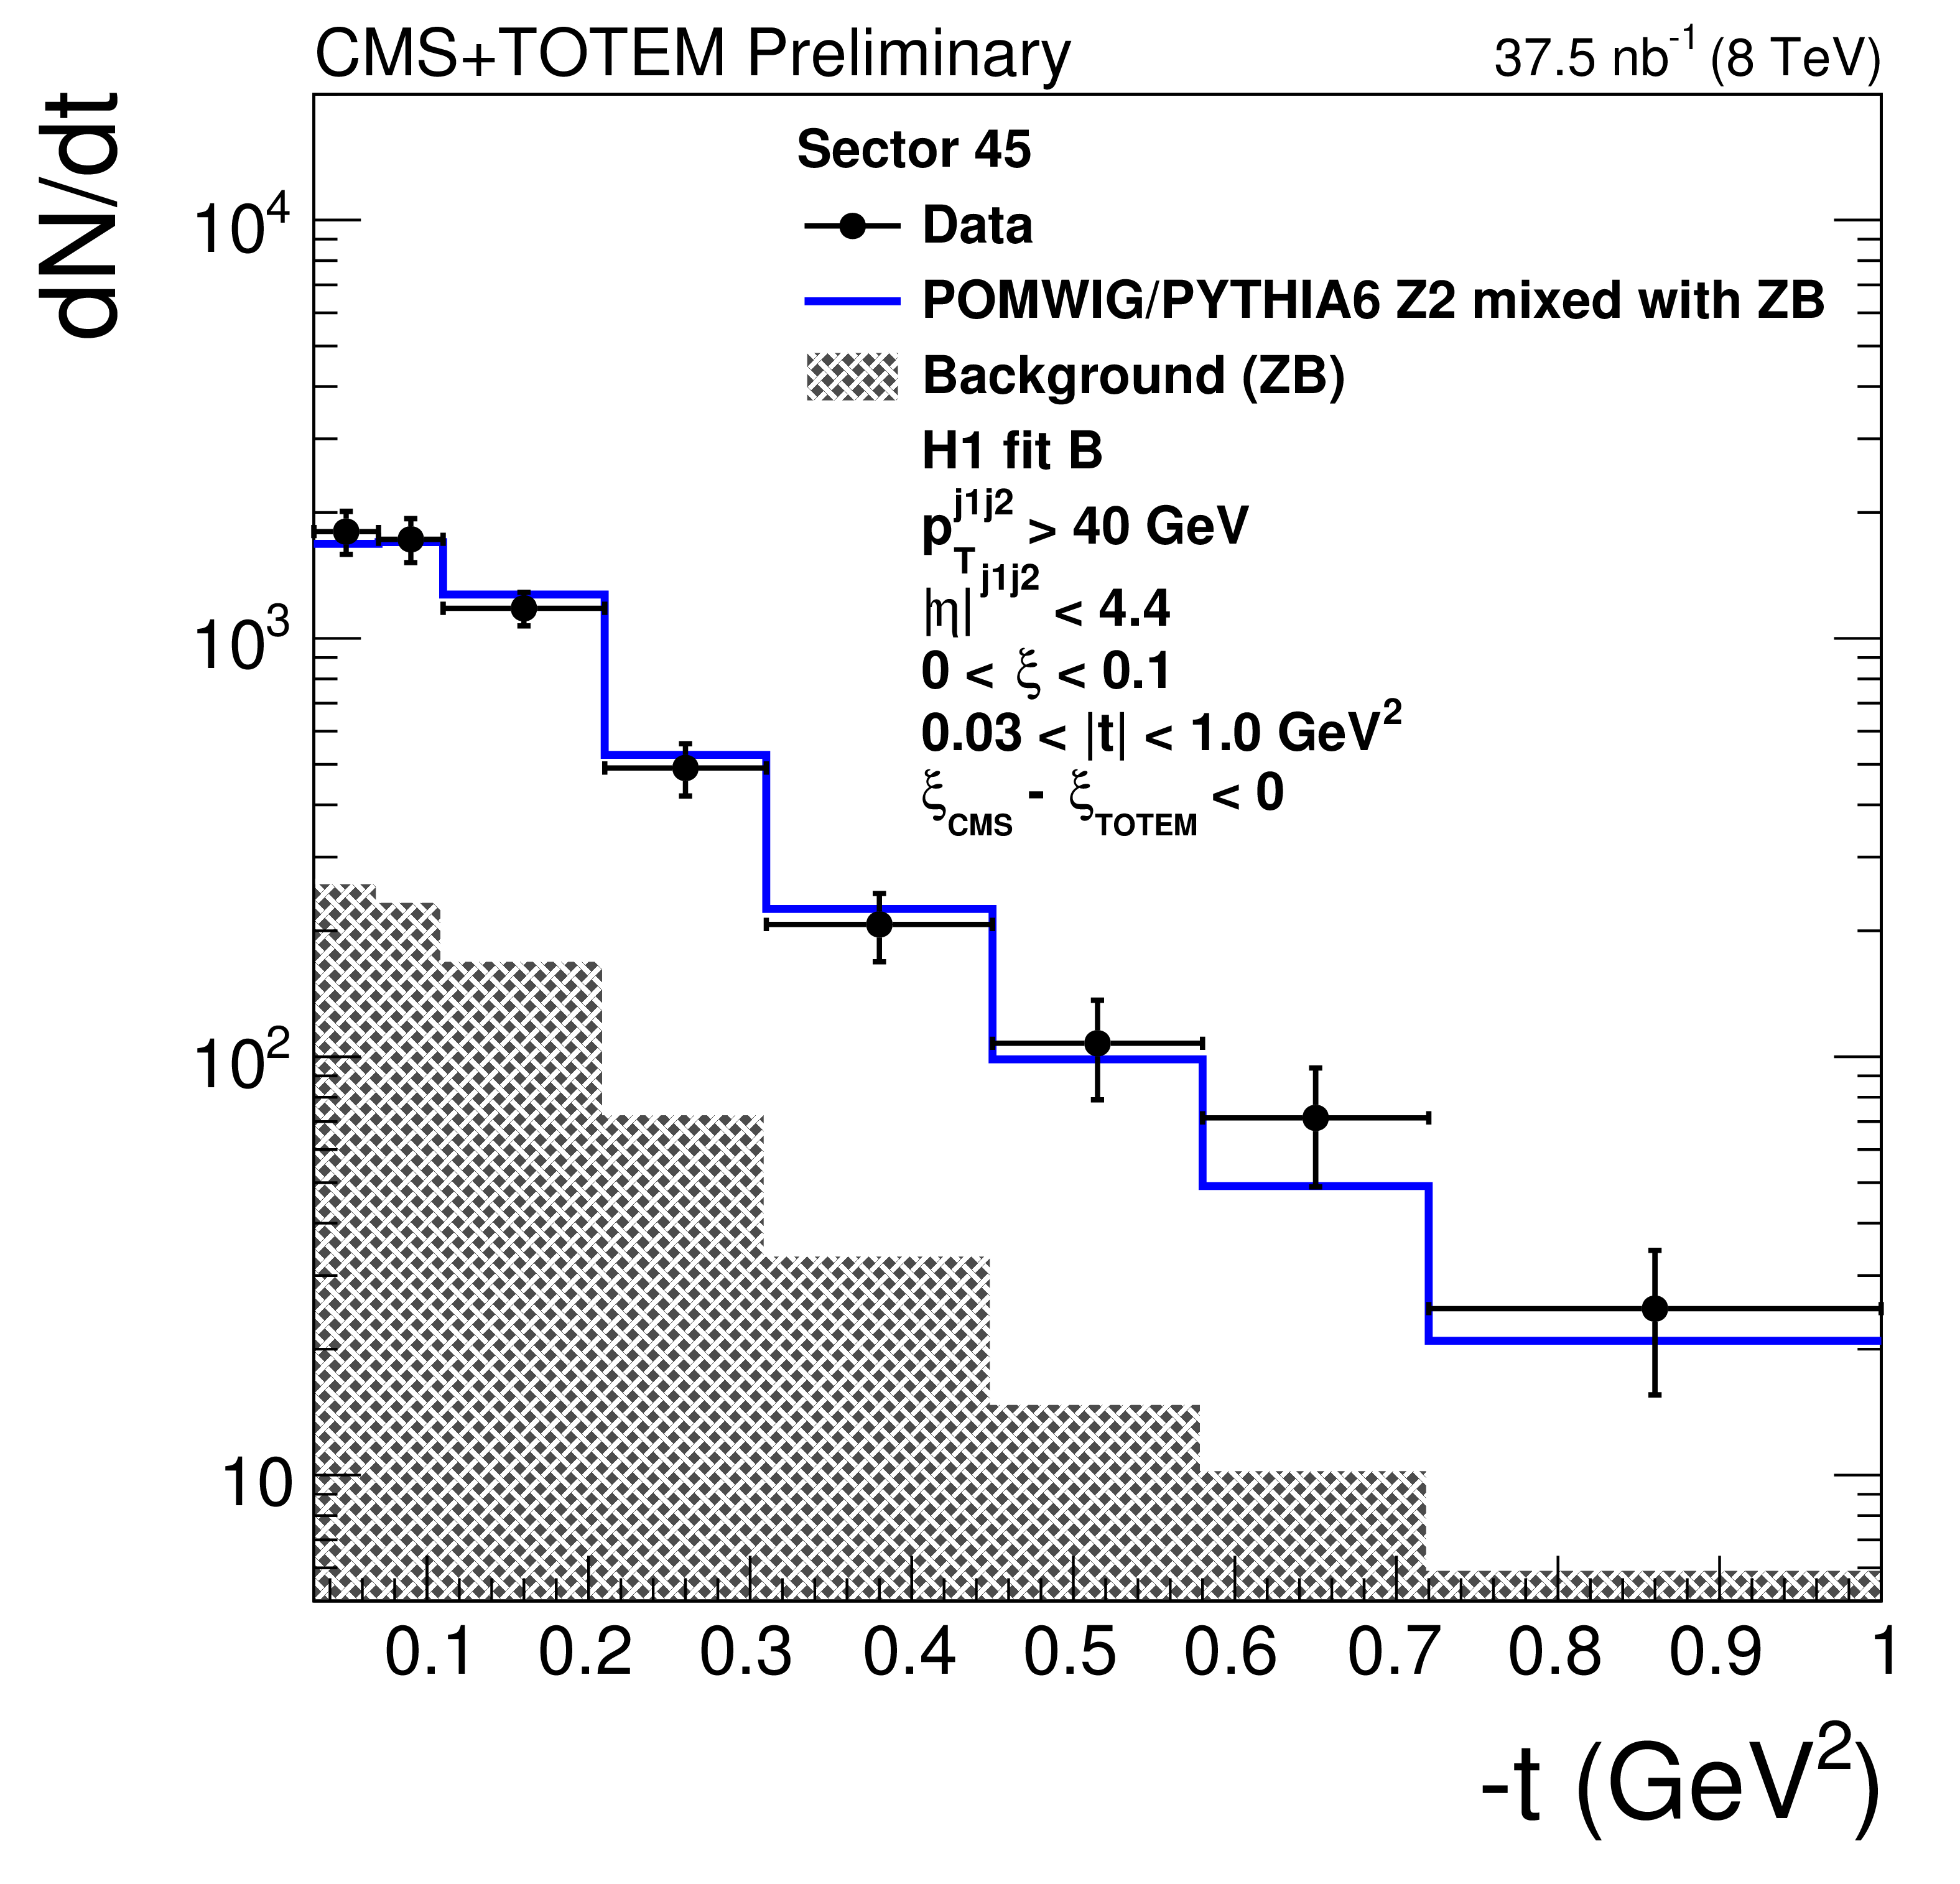
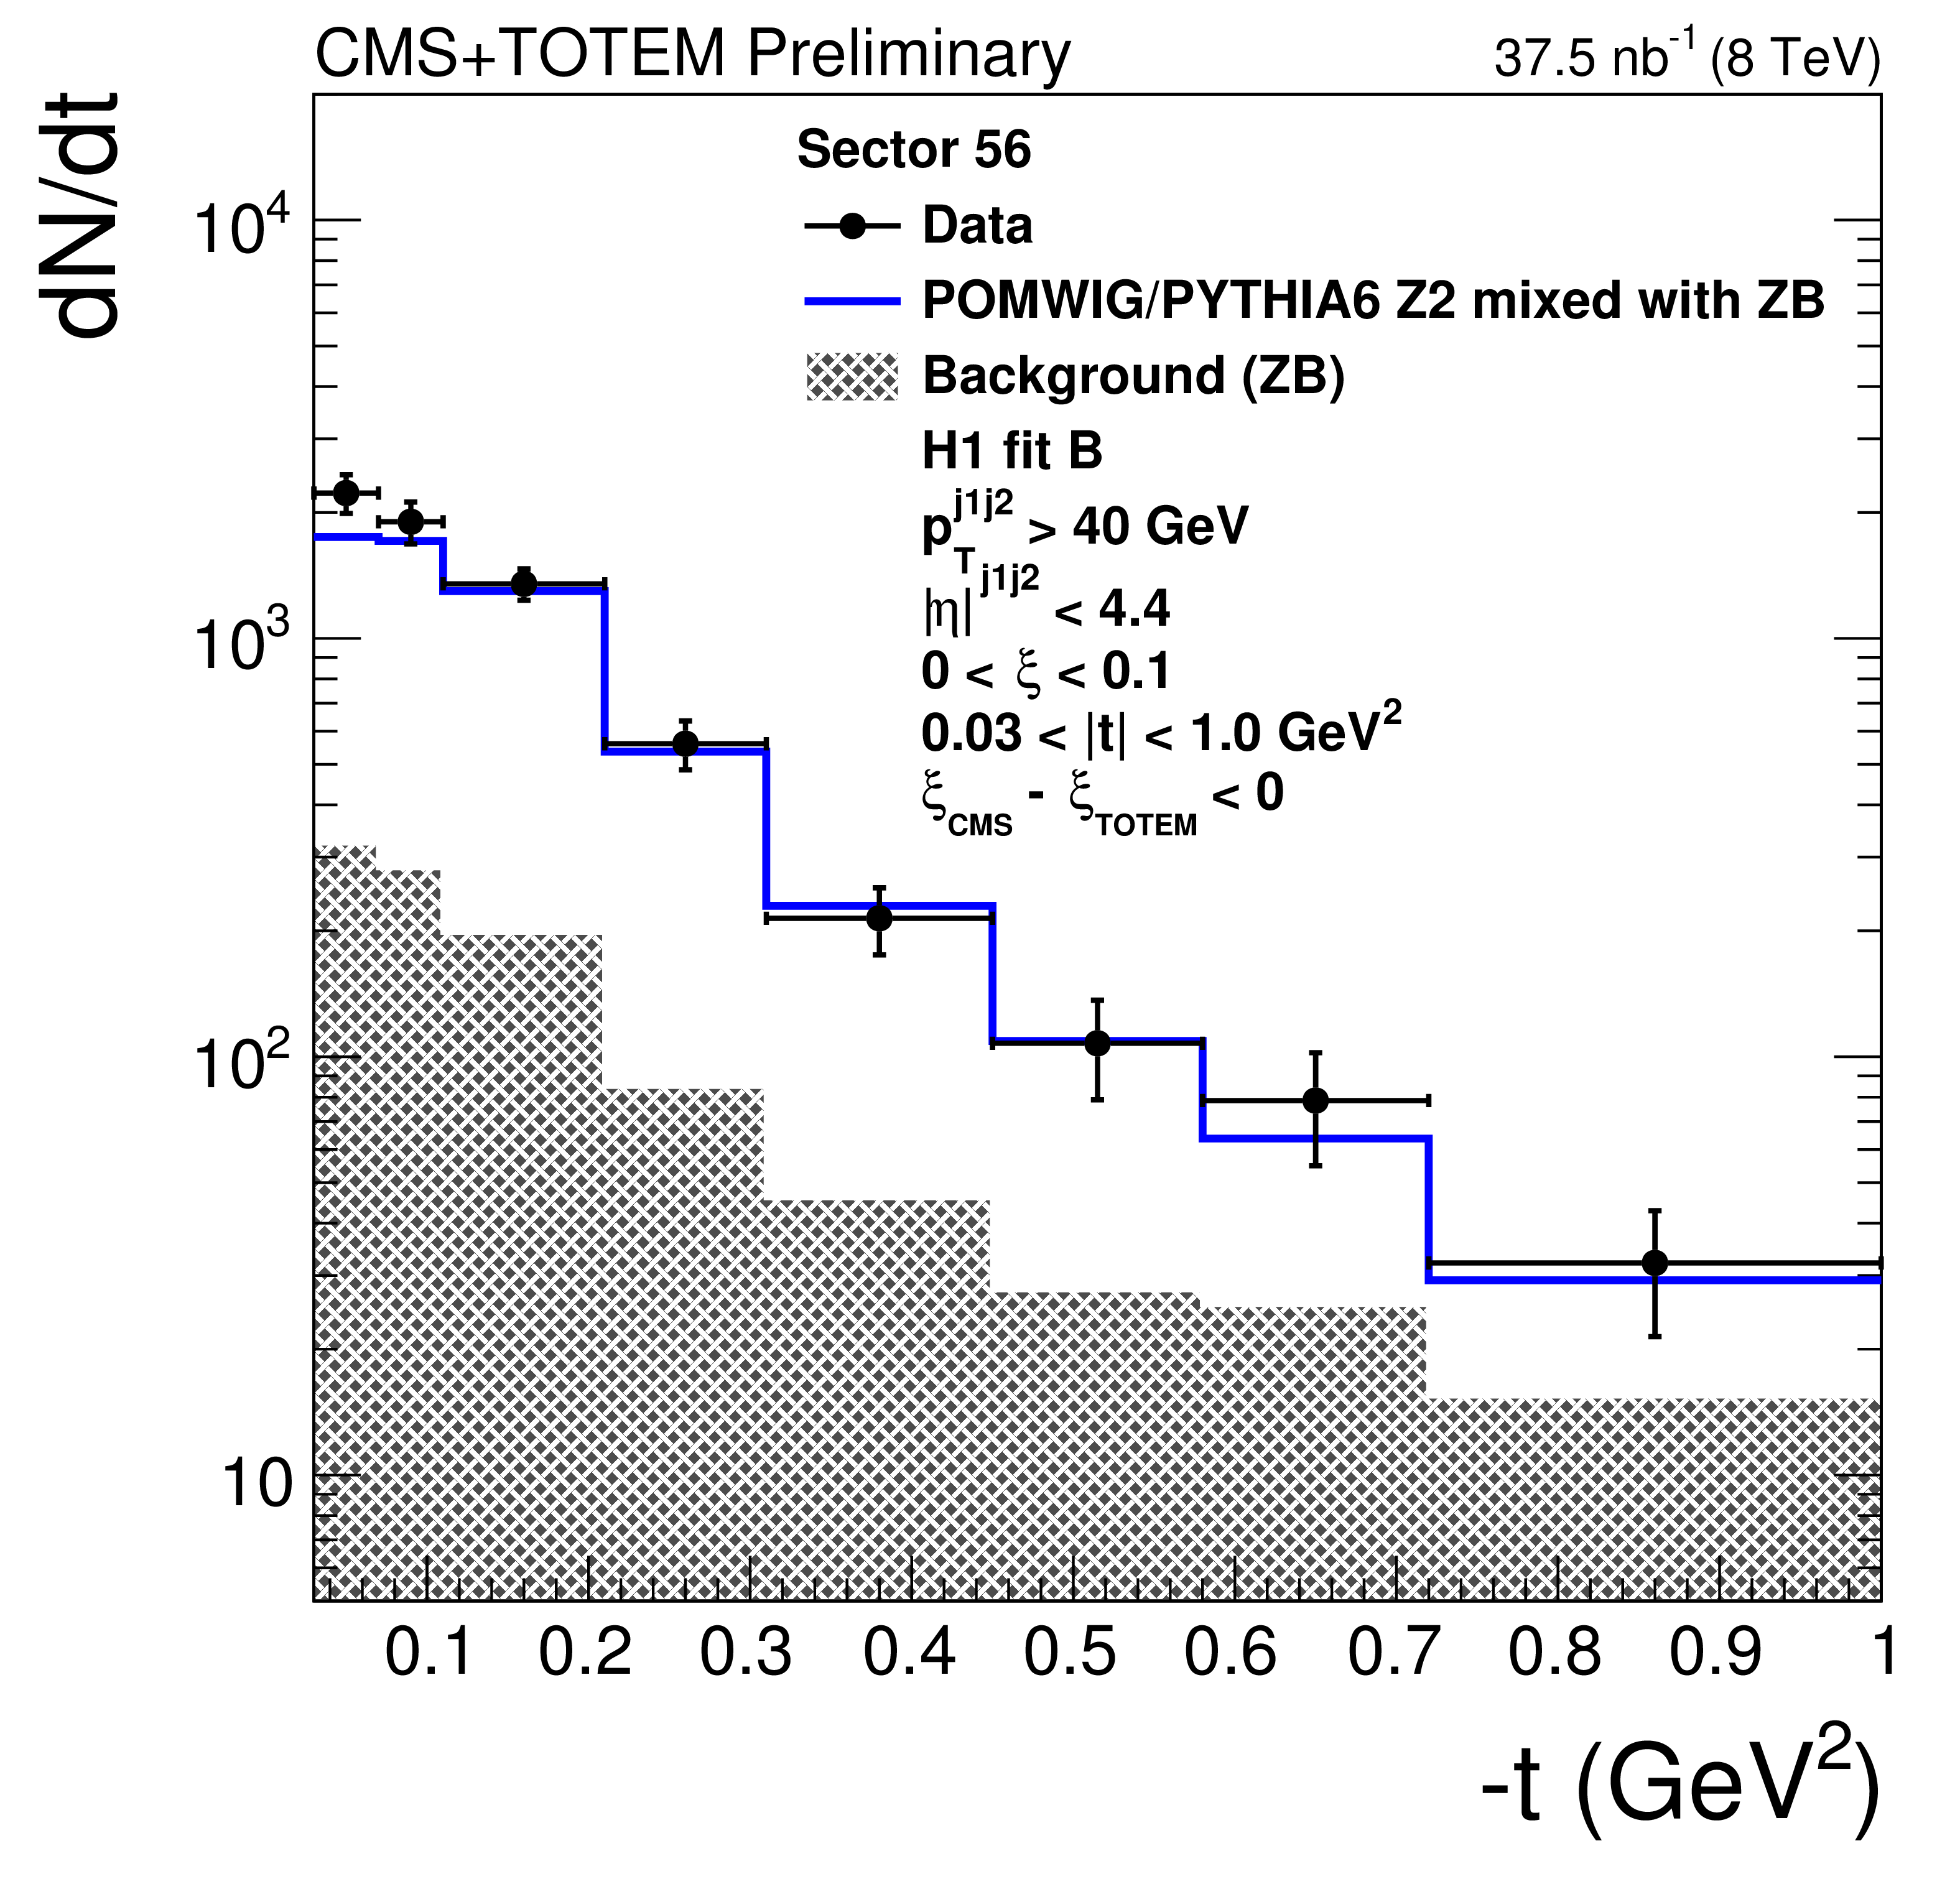
Distribution of $\xi _{\text {CMS}} - \xi _{\text {TOTEM}}$, sector 45 (left panel) and sector 56 (right panel). The data are indicated by solid circles. The blue histogram is the mixture of Pomwig or Pythia6 and zero-bias (ZB) data events described in the text. An event with the proton measured in the RPs contributes to the white histogram (signal) if the proton originates from the MC sample, or to the hatched histogram (background) if it originates from the ZB sample. |

png pdf |
Figure 2-a:
Distribution of $\xi _{\text {CMS}} - \xi _{\text {TOTEM}}$, sector 45 (left panel) and sector 56 (right panel). The data are indicated by solid circles. The blue histogram is the mixture of Pomwig or Pythia6 and zero-bias (ZB) data events described in the text. An event with the proton measured in the RPs contributes to the white histogram (signal) if the proton originates from the MC sample, or to the hatched histogram (background) if it originates from the ZB sample. |
png pdf |
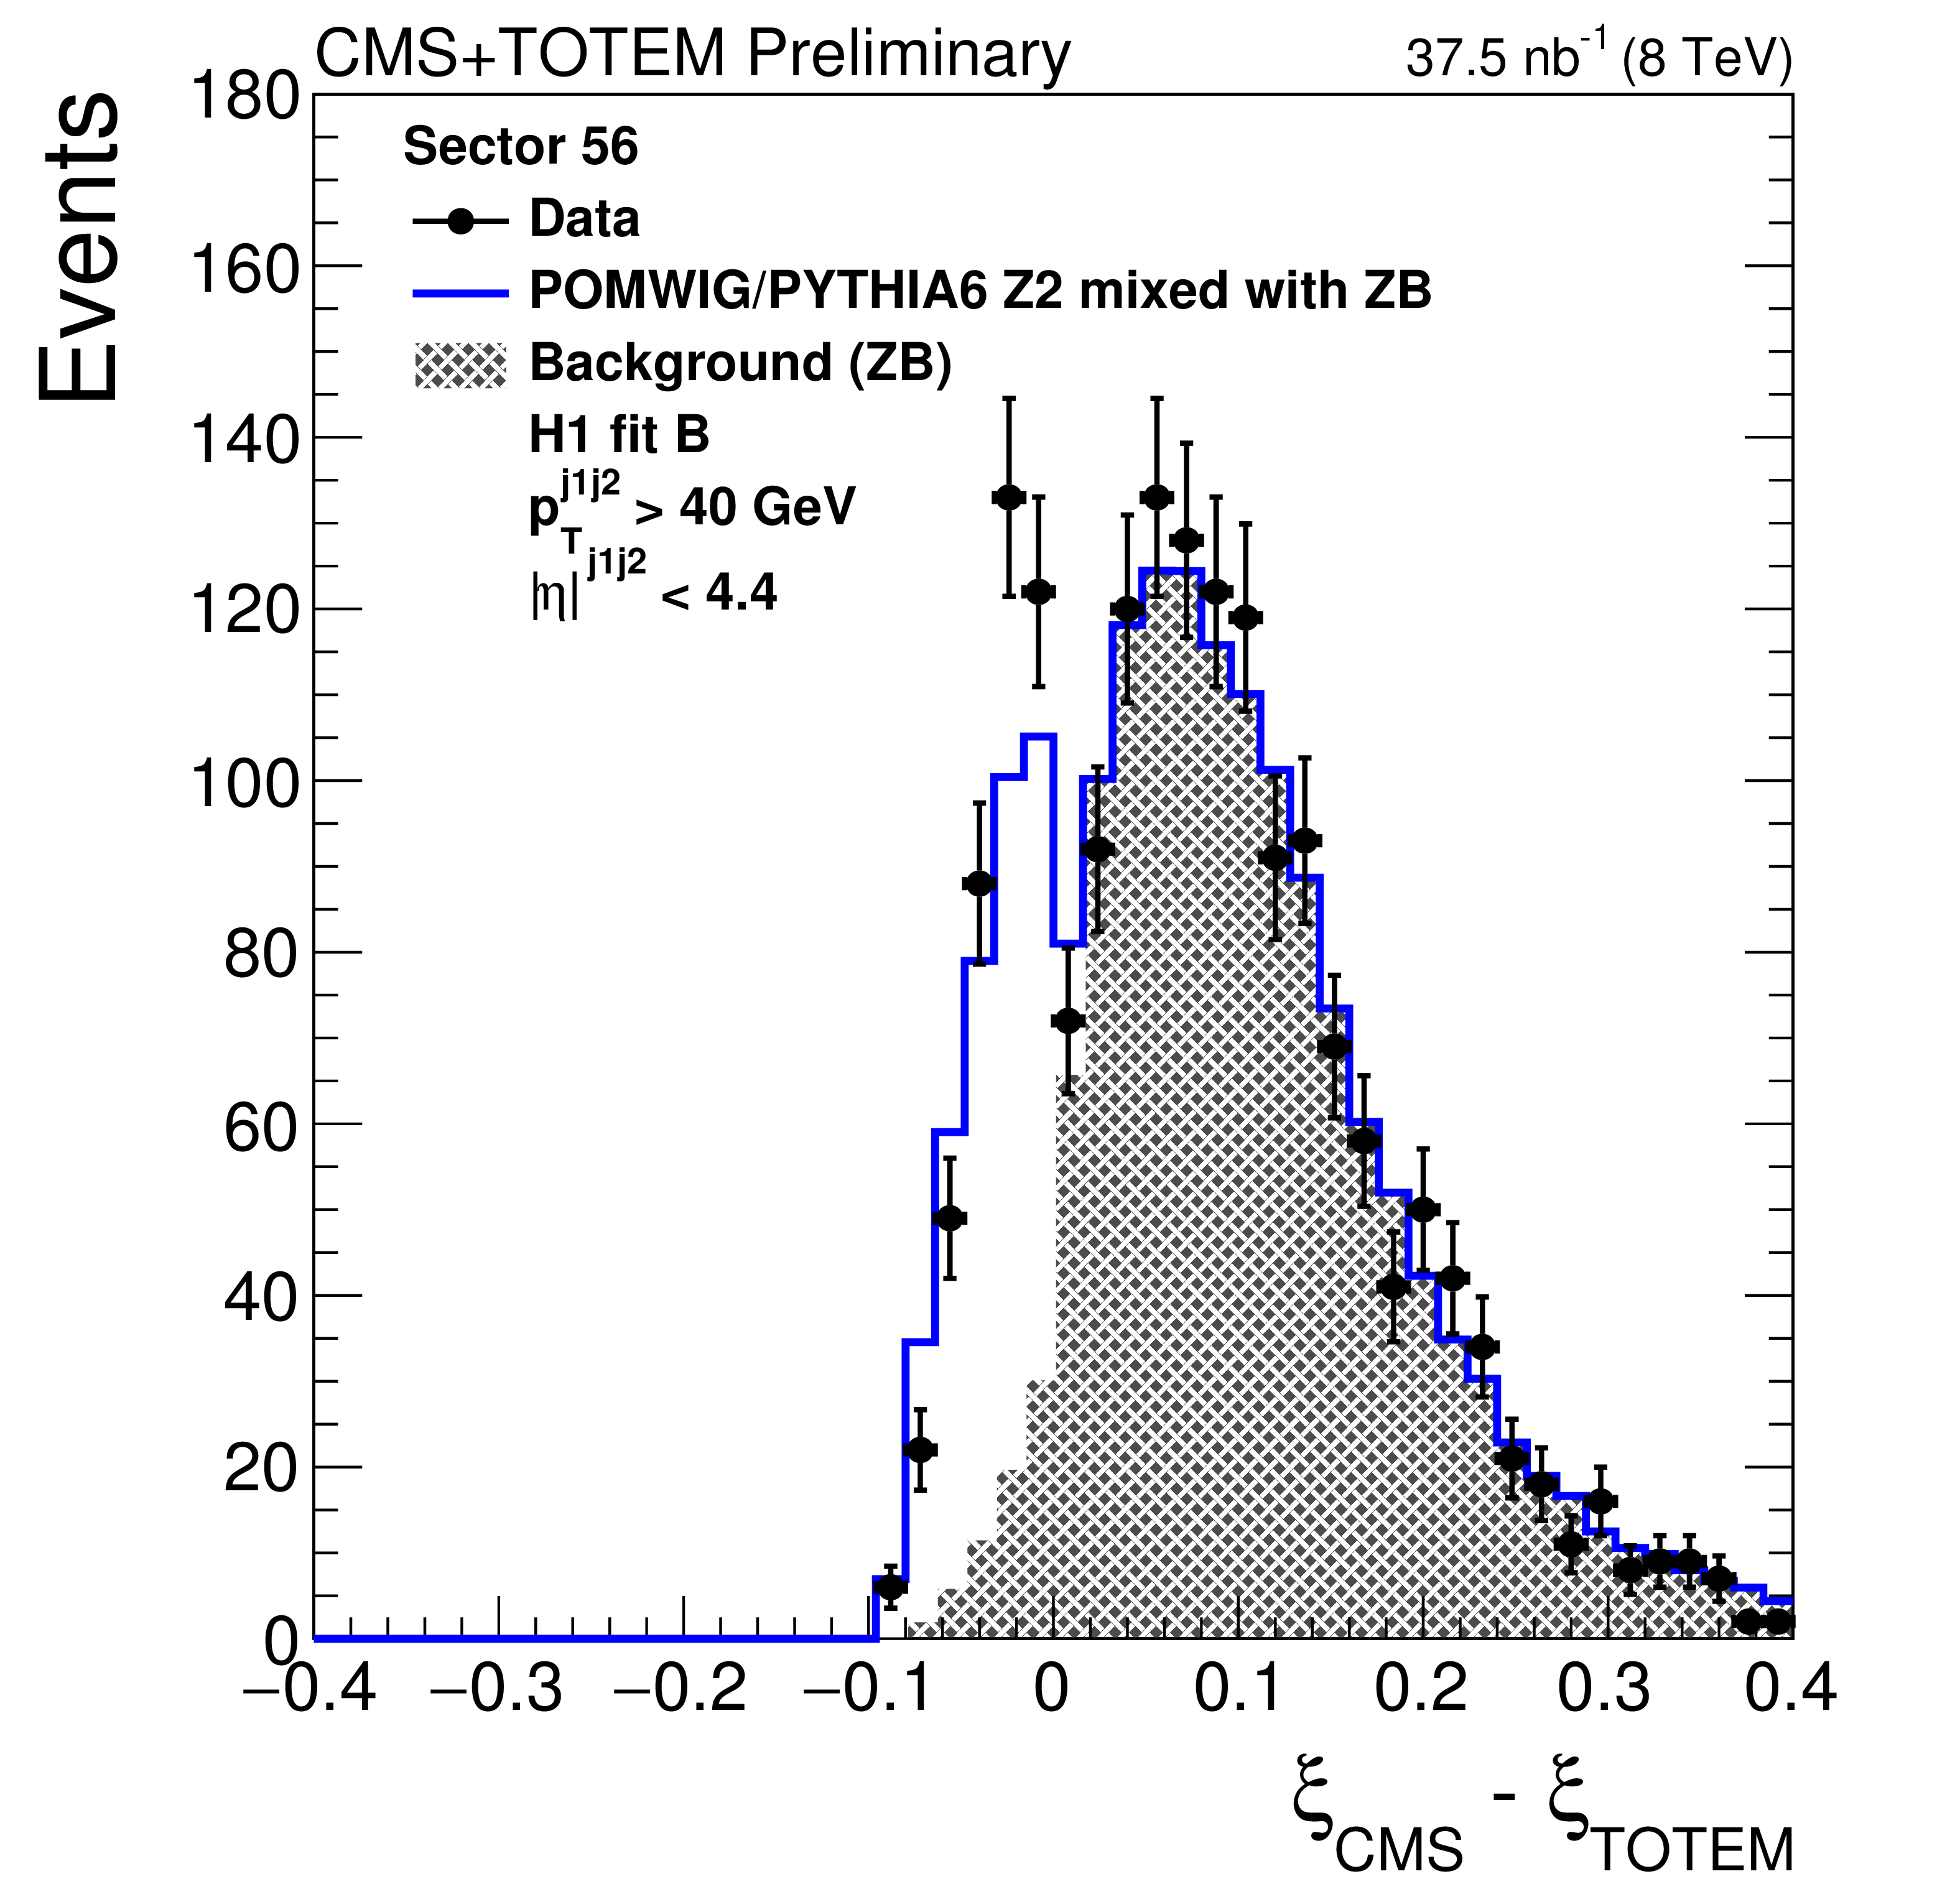
Figure 2-b:
Distribution of $\xi _{\text {CMS}} - \xi _{\text {TOTEM}}$, sector 45 (left panel) and sector 56 (right panel). The data are indicated by solid circles. The blue histogram is the mixture of Pomwig or Pythia6 and zero-bias (ZB) data events described in the text. An event with the proton measured in the RPs contributes to the white histogram (signal) if the proton originates from the MC sample, or to the hatched histogram (background) if it originates from the ZB sample. |
png pdf |
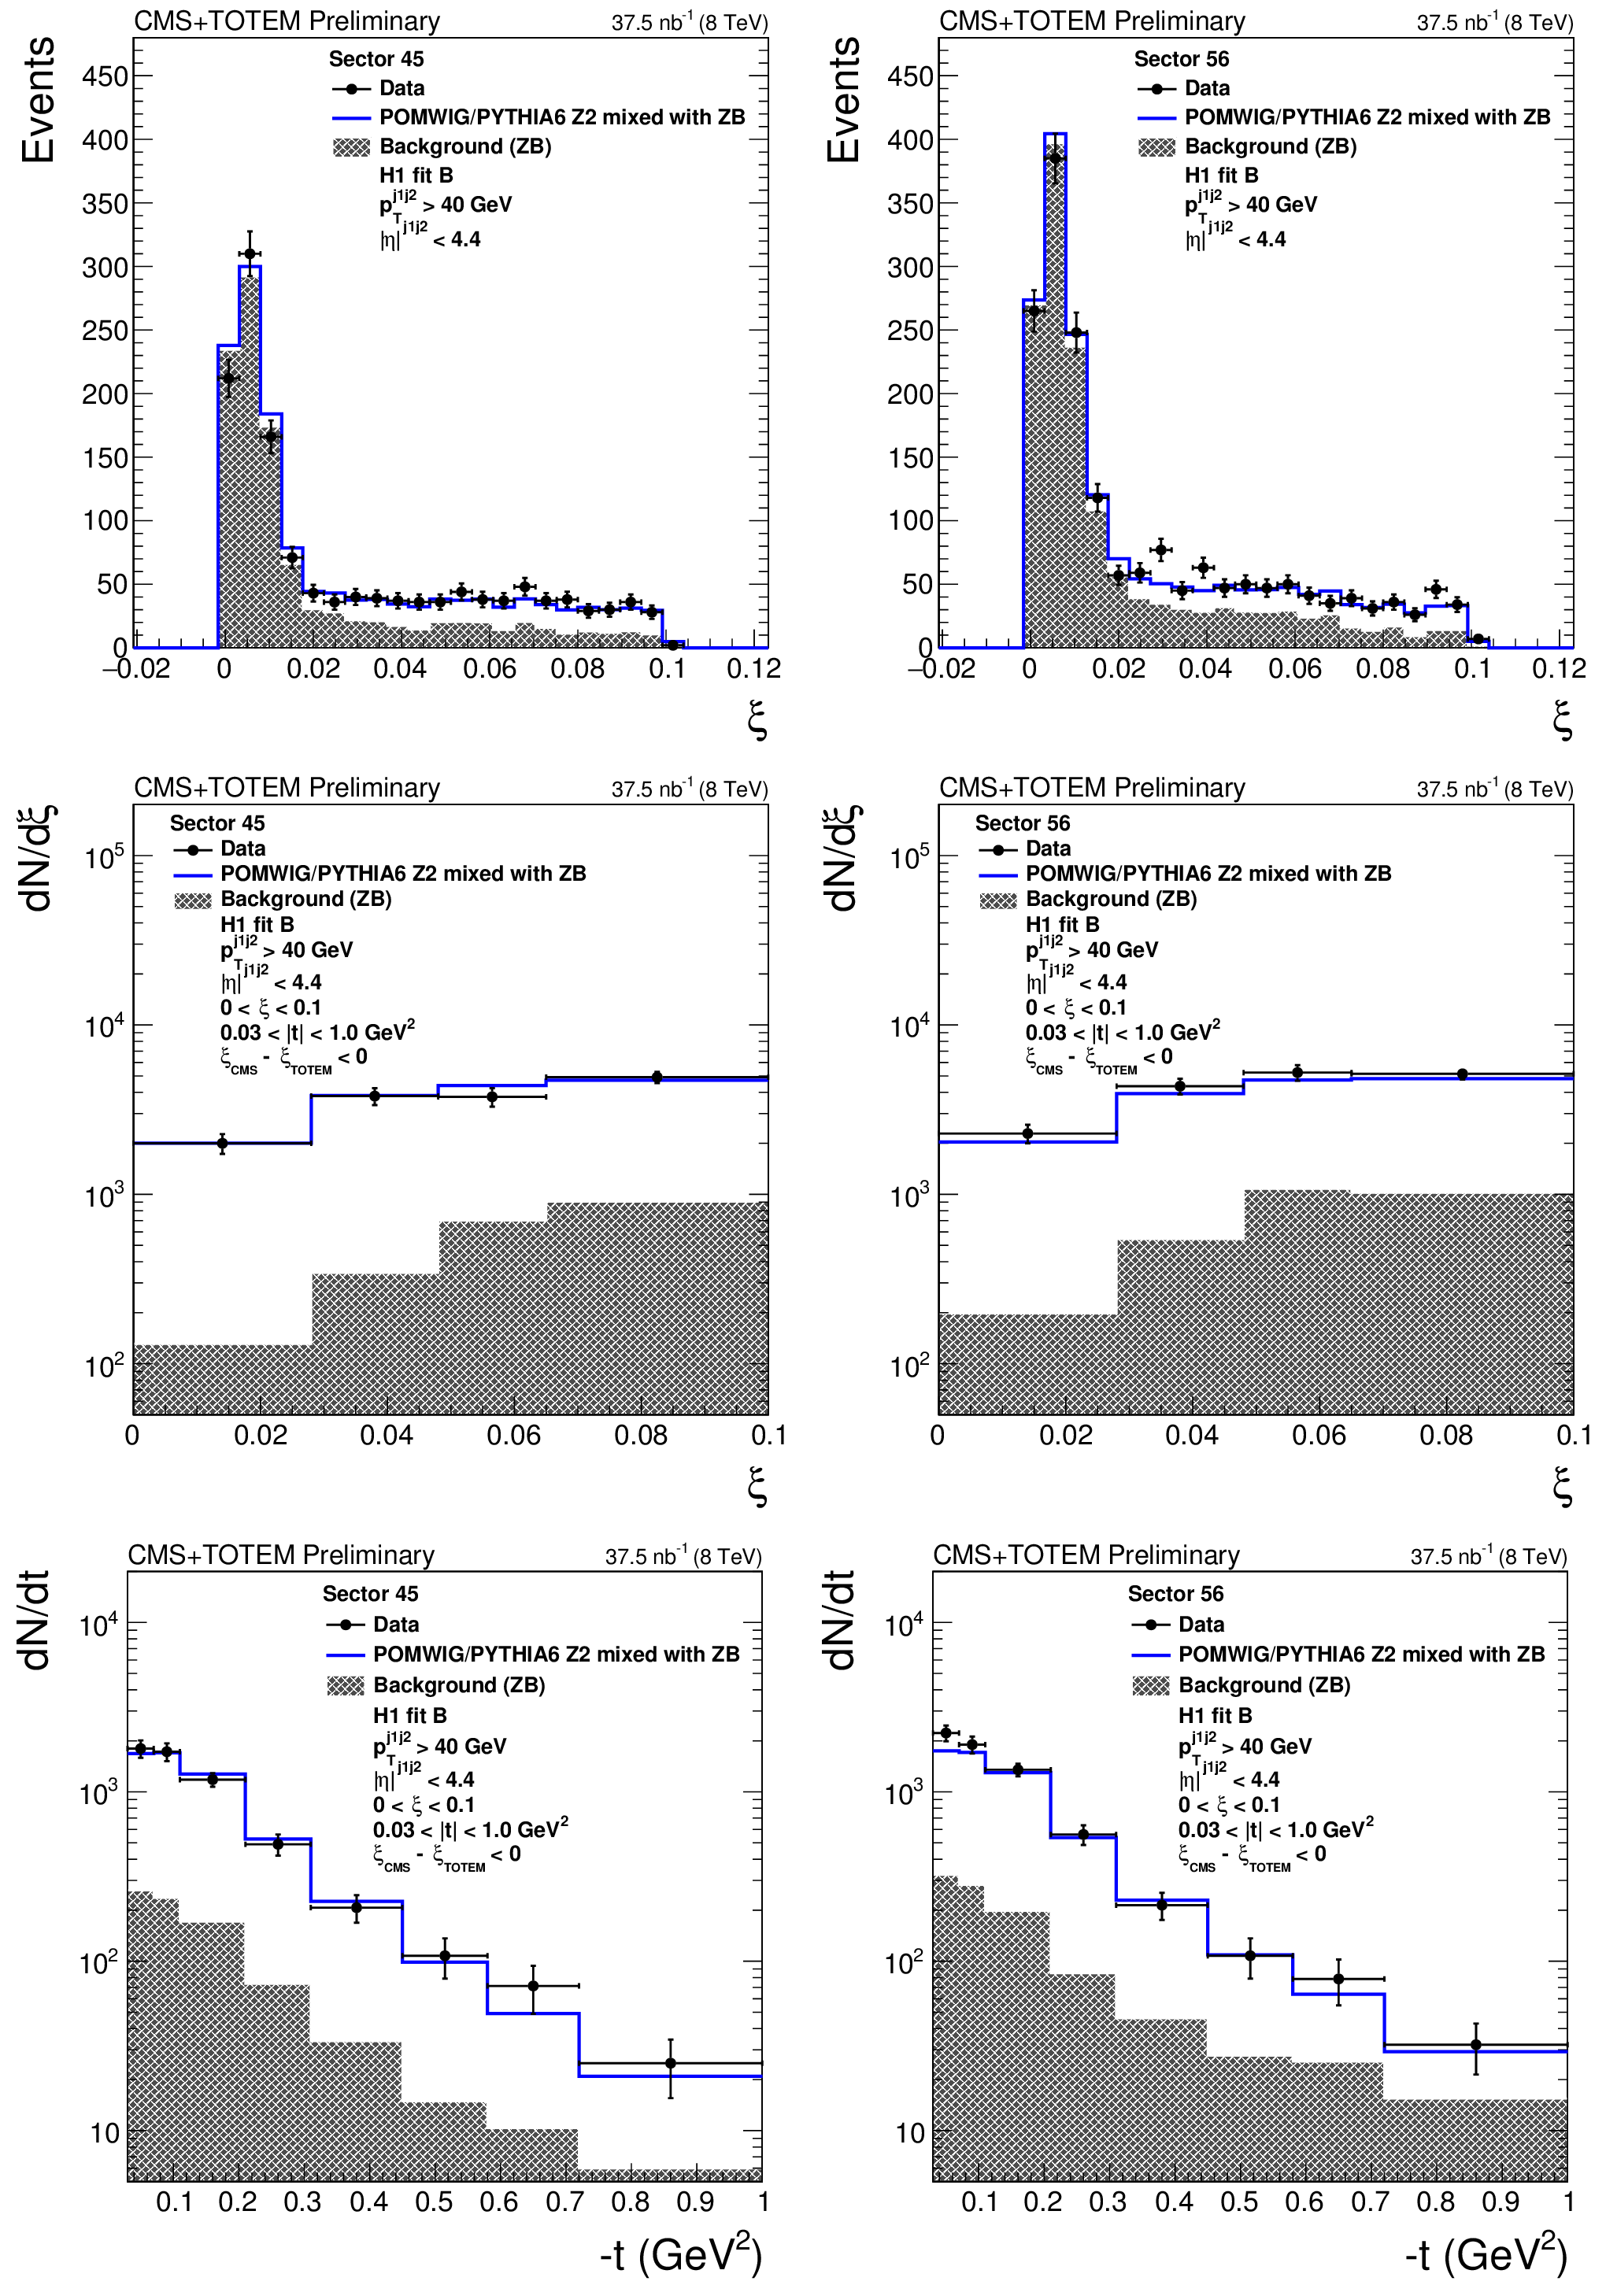
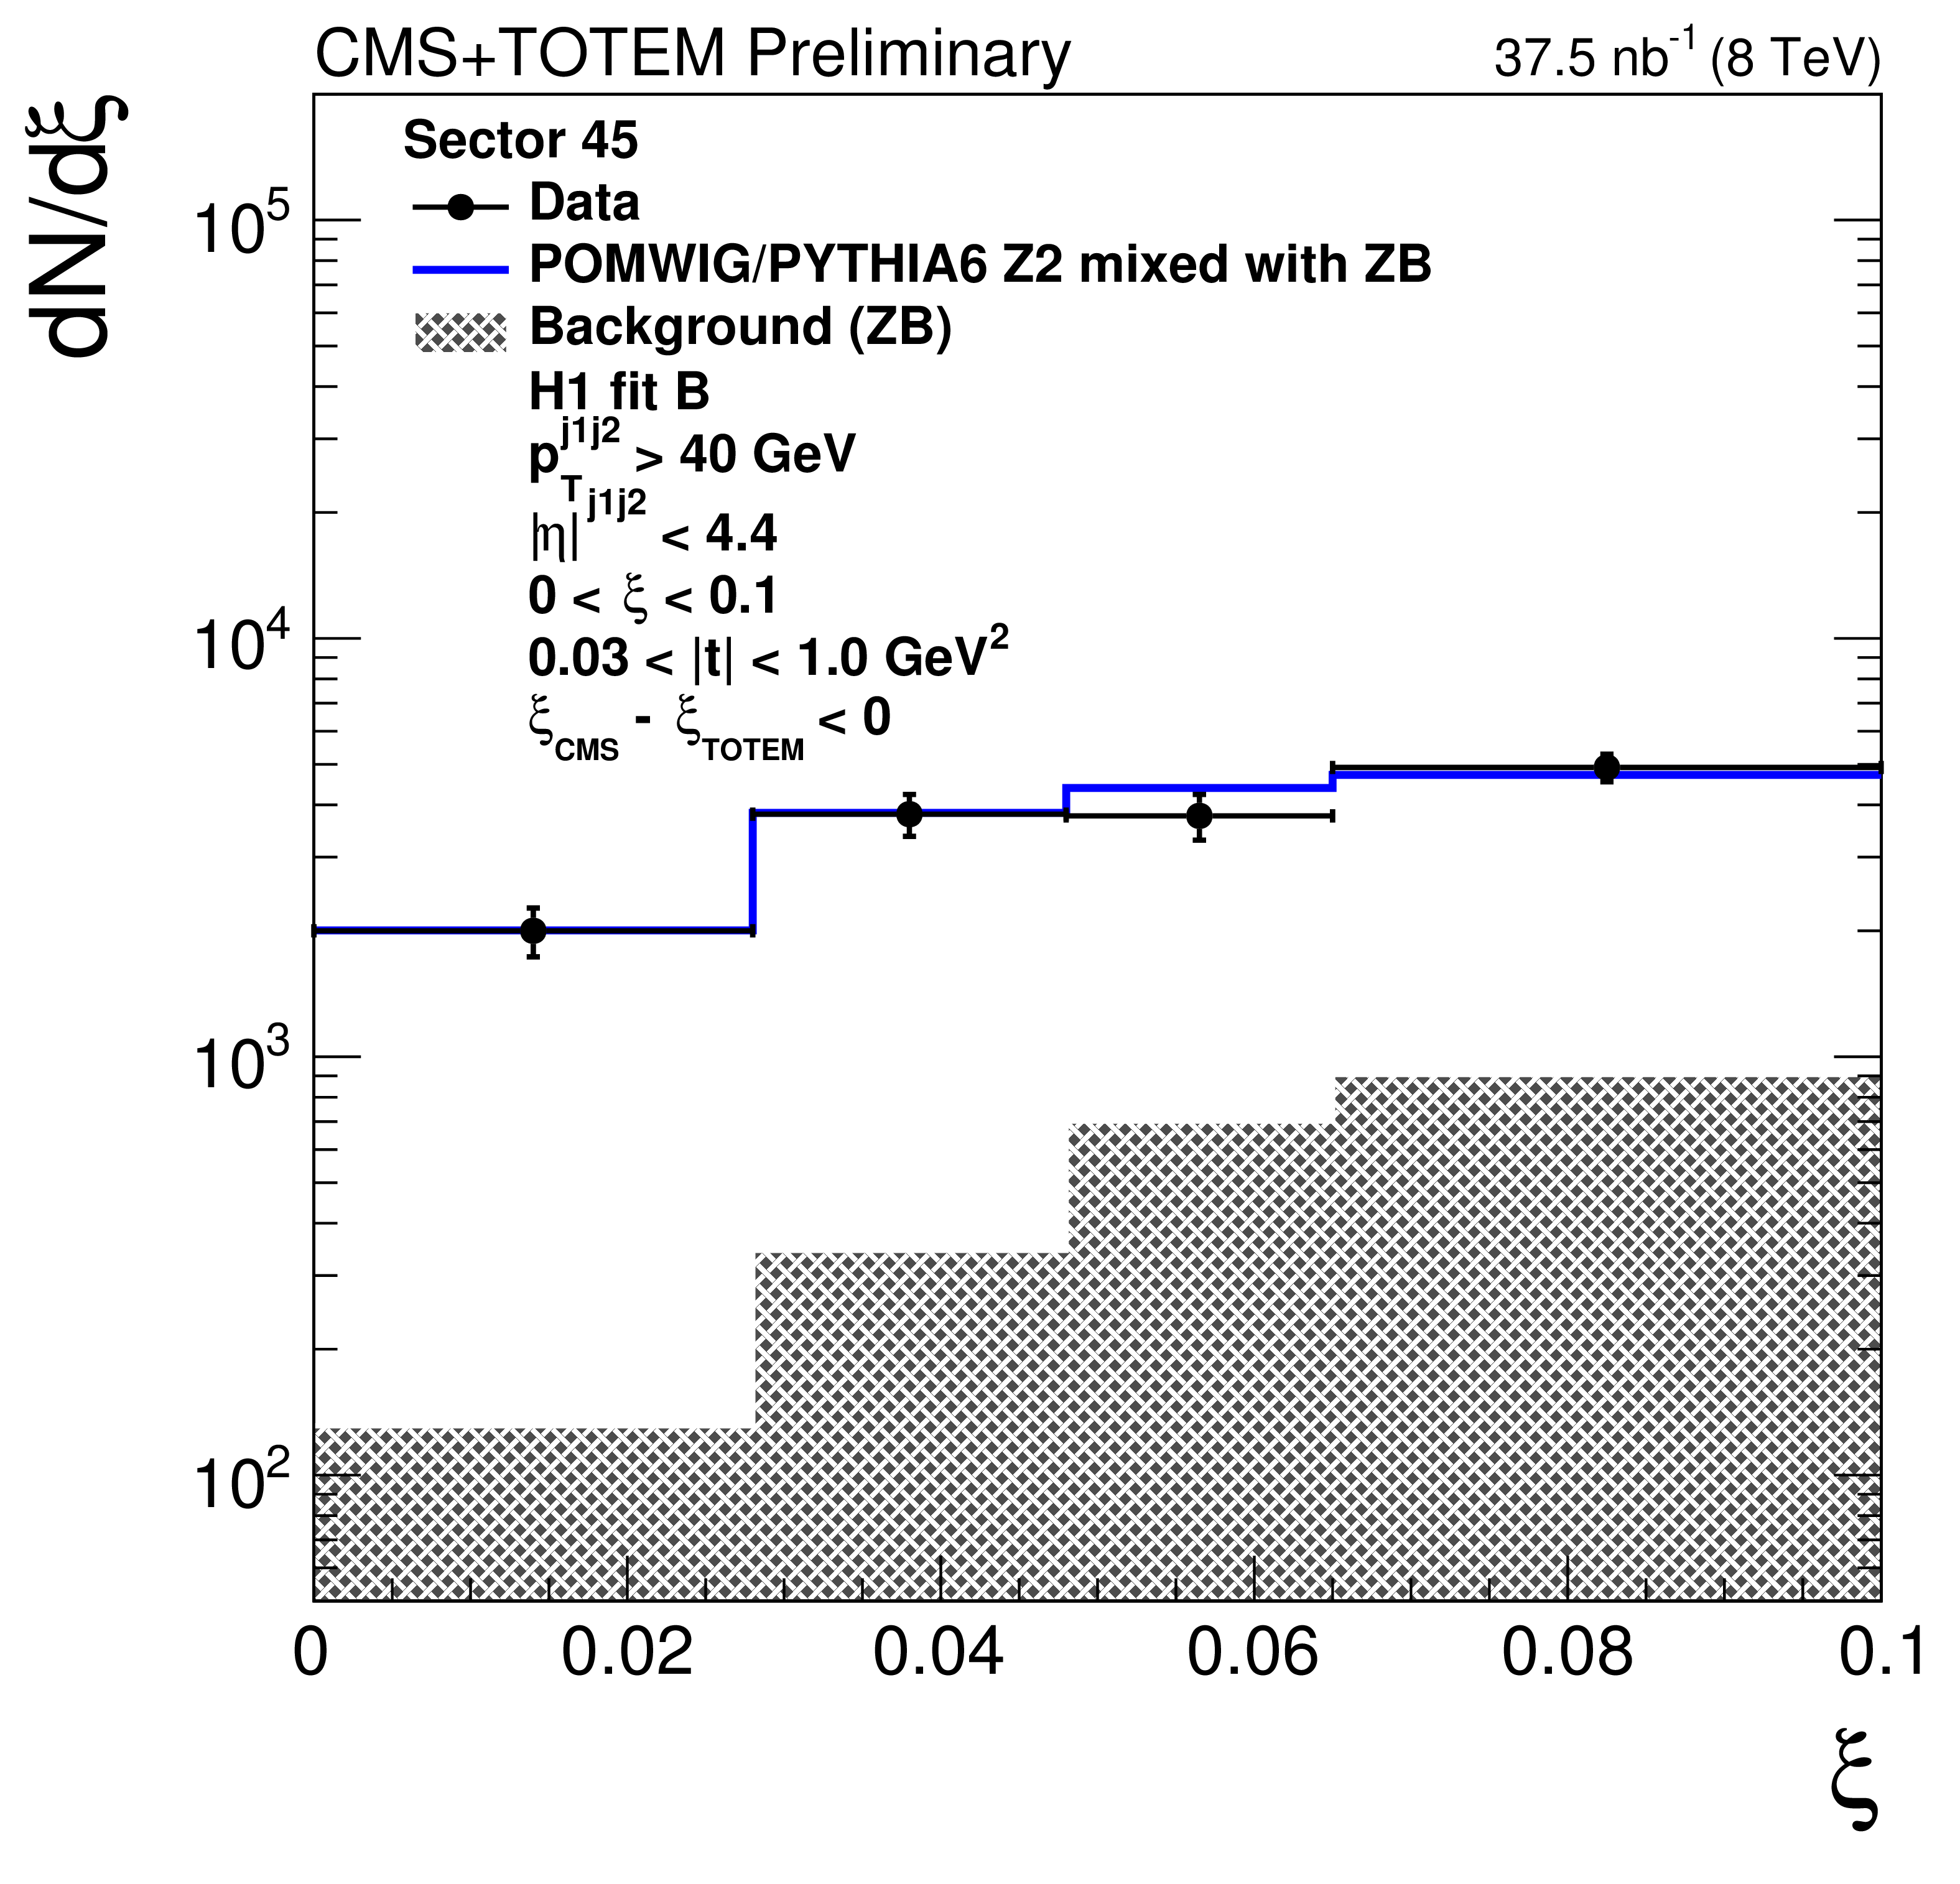
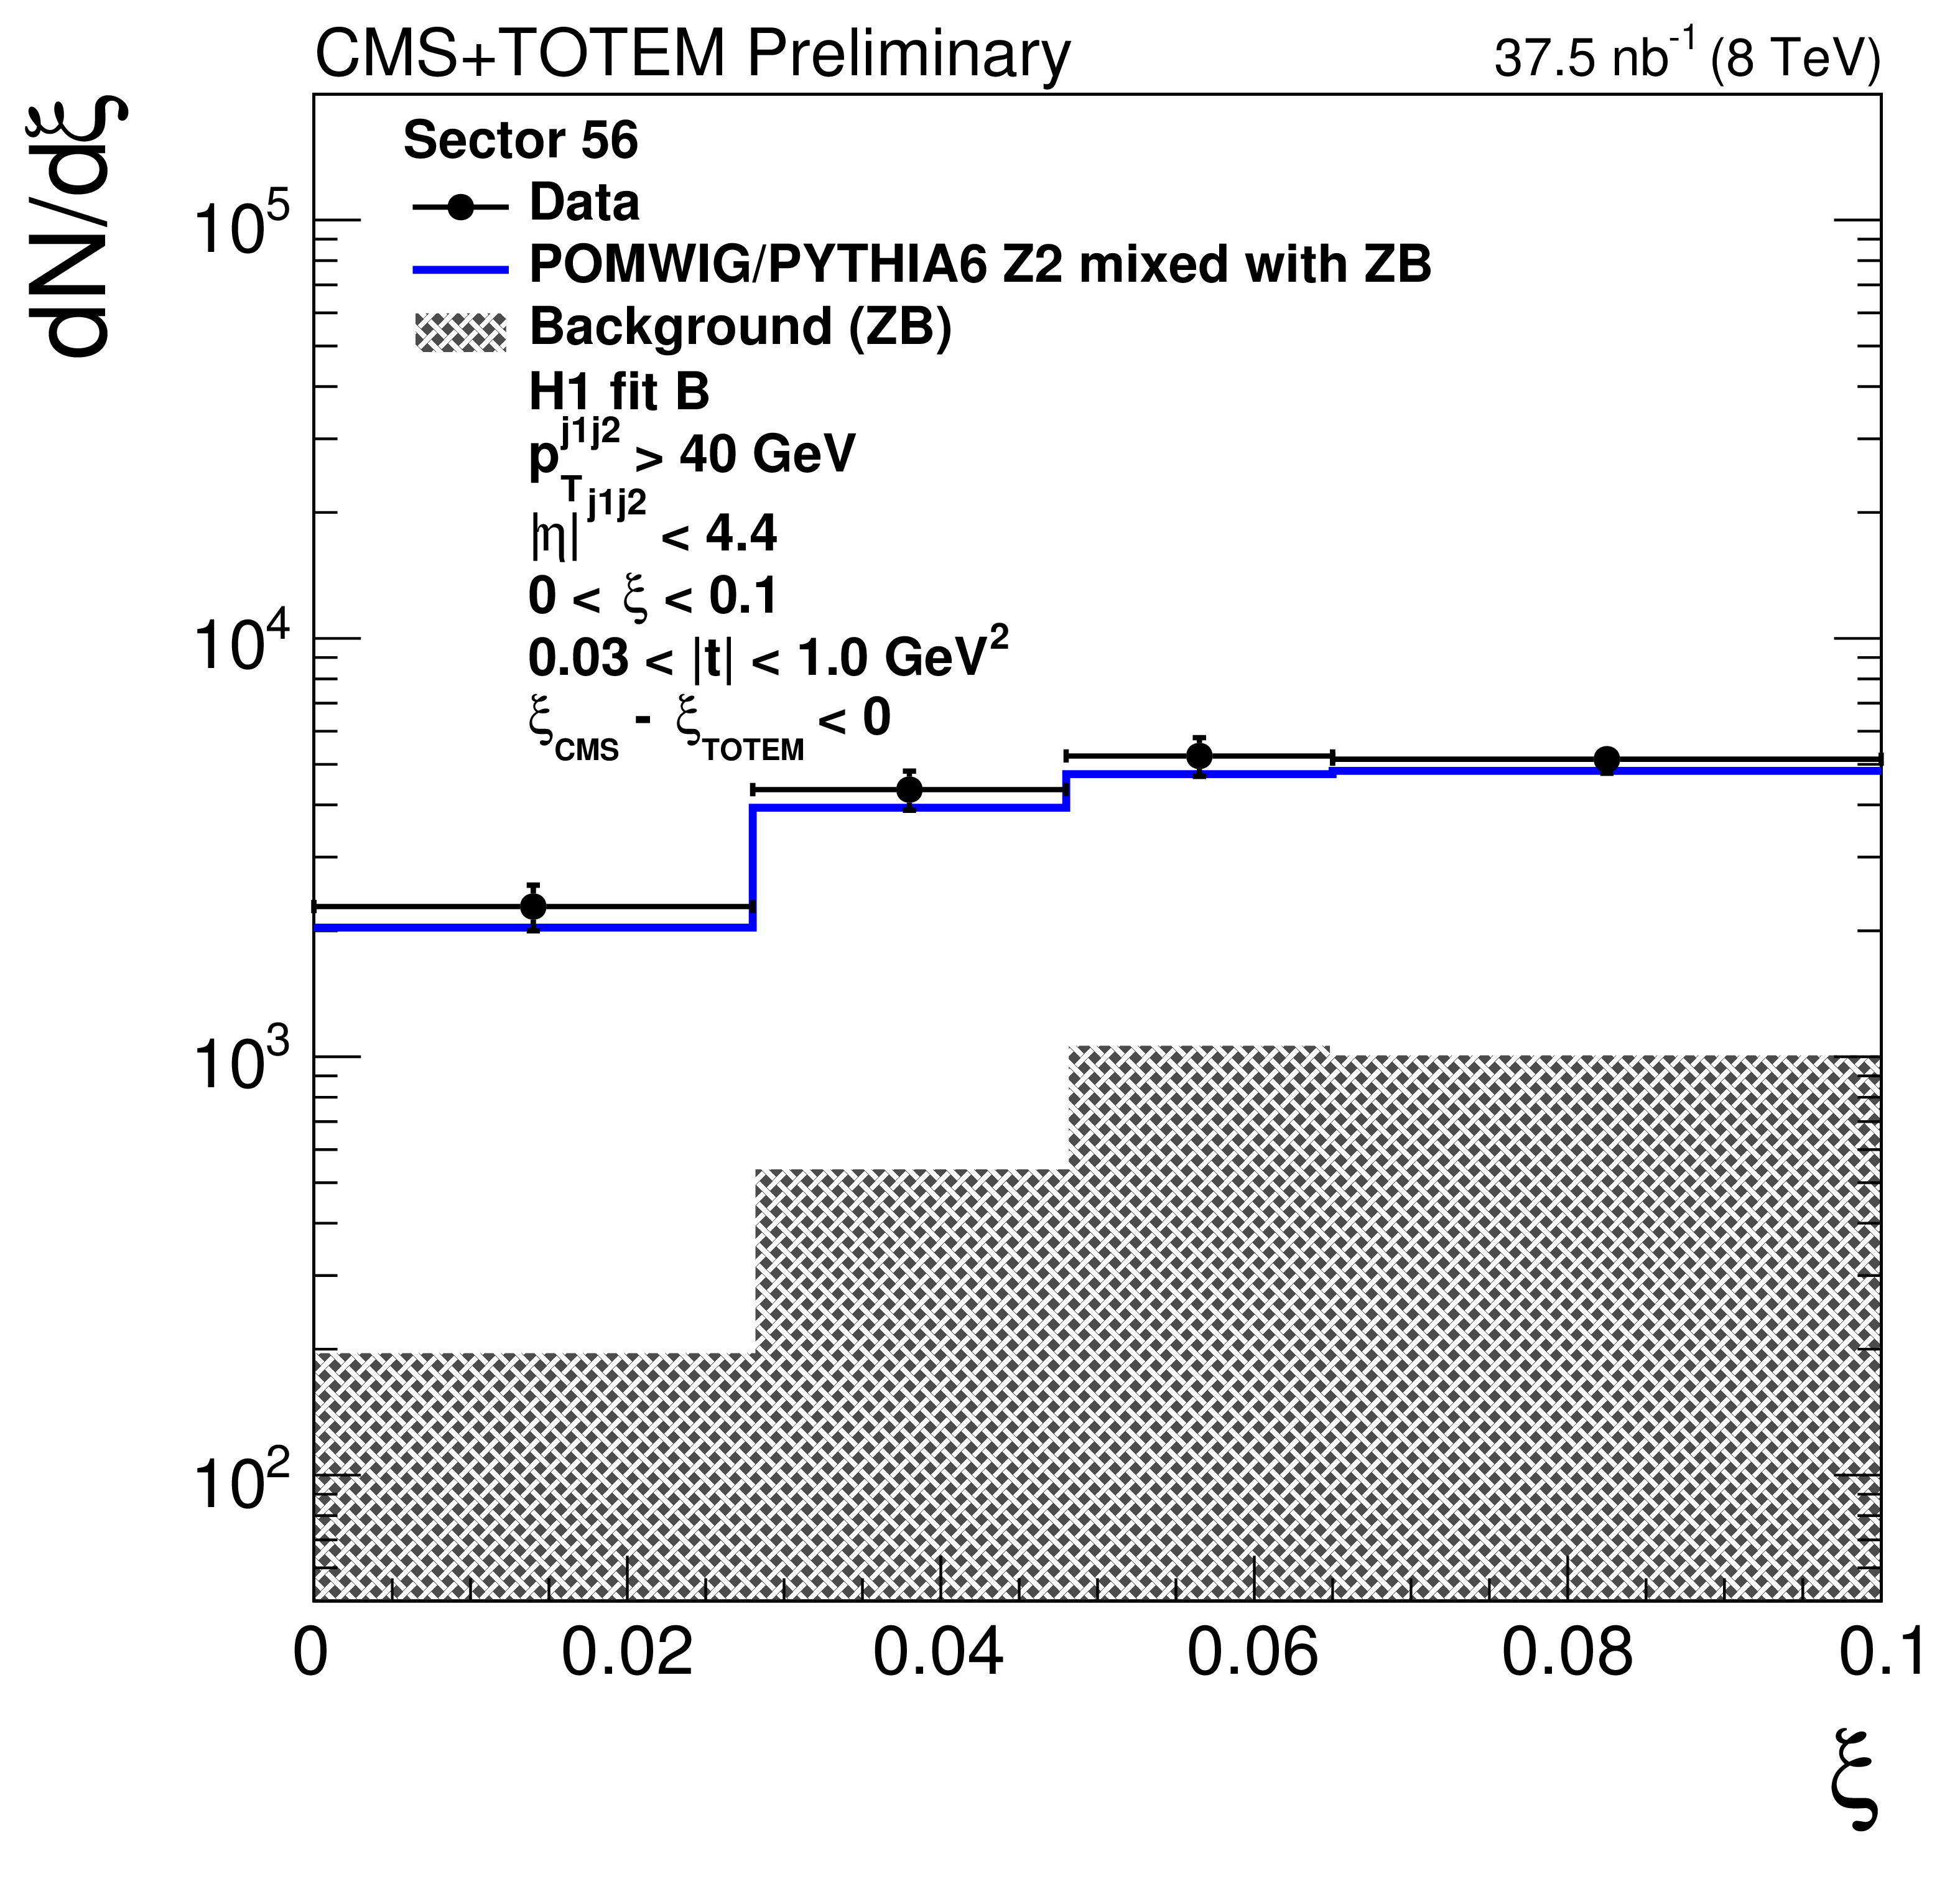
Figure 3:
Distribution of $\xi _{\text {TOTEM}}$ before (top) and after (middle) the $\xi _{\text {CMS}} - \xi _{\text {TOTEM}}$ cut and distribution of $t$ after the $\xi _{\text {CMS}} - \xi _{\text {TOTEM}}$ cut (bottom) for events in which the proton is detected in sector 45 (left) and sector 56 (right). The data are indicated by solid circles. The blue histogram is the mixture of Pomwig or Pythia6 and zero-bias (ZB) data events described in the text. An event with the proton measured in the RPs contributes to the white histogram (signal) if the proton originates from the MC sample, or to the hatched histogram (background) if it originates from the ZB sample. |
png pdf |
Figure 3-a:
Distribution of $\xi _{\text {TOTEM}}$ before (top) and after (middle) the $\xi _{\text {CMS}} - \xi _{\text {TOTEM}}$ cut and distribution of $t$ after the $\xi _{\text {CMS}} - \xi _{\text {TOTEM}}$ cut (bottom) for events in which the proton is detected in sector 45 (left) and sector 56 (right). The data are indicated by solid circles. The blue histogram is the mixture of Pomwig or Pythia6 and zero-bias (ZB) data events described in the text. An event with the proton measured in the RPs contributes to the white histogram (signal) if the proton originates from the MC sample, or to the hatched histogram (background) if it originates from the ZB sample. |
png pdf |
Figure 3-b:
Distribution of $\xi _{\text {TOTEM}}$ before (top) and after (middle) the $\xi _{\text {CMS}} - \xi _{\text {TOTEM}}$ cut and distribution of $t$ after the $\xi _{\text {CMS}} - \xi _{\text {TOTEM}}$ cut (bottom) for events in which the proton is detected in sector 45 (left) and sector 56 (right). The data are indicated by solid circles. The blue histogram is the mixture of Pomwig or Pythia6 and zero-bias (ZB) data events described in the text. An event with the proton measured in the RPs contributes to the white histogram (signal) if the proton originates from the MC sample, or to the hatched histogram (background) if it originates from the ZB sample. |
png pdf |
Figure 3-c:
Distribution of $\xi _{\text {TOTEM}}$ before (top) and after (middle) the $\xi _{\text {CMS}} - \xi _{\text {TOTEM}}$ cut and distribution of $t$ after the $\xi _{\text {CMS}} - \xi _{\text {TOTEM}}$ cut (bottom) for events in which the proton is detected in sector 45 (left) and sector 56 (right). The data are indicated by solid circles. The blue histogram is the mixture of Pomwig or Pythia6 and zero-bias (ZB) data events described in the text. An event with the proton measured in the RPs contributes to the white histogram (signal) if the proton originates from the MC sample, or to the hatched histogram (background) if it originates from the ZB sample. |
png pdf |
Figure 3-d:
Distribution of $\xi _{\text {TOTEM}}$ before (top) and after (middle) the $\xi _{\text {CMS}} - \xi _{\text {TOTEM}}$ cut and distribution of $t$ after the $\xi _{\text {CMS}} - \xi _{\text {TOTEM}}$ cut (bottom) for events in which the proton is detected in sector 45 (left) and sector 56 (right). The data are indicated by solid circles. The blue histogram is the mixture of Pomwig or Pythia6 and zero-bias (ZB) data events described in the text. An event with the proton measured in the RPs contributes to the white histogram (signal) if the proton originates from the MC sample, or to the hatched histogram (background) if it originates from the ZB sample. |
png pdf |
Figure 3-e:
Distribution of $\xi _{\text {TOTEM}}$ before (top) and after (middle) the $\xi _{\text {CMS}} - \xi _{\text {TOTEM}}$ cut and distribution of $t$ after the $\xi _{\text {CMS}} - \xi _{\text {TOTEM}}$ cut (bottom) for events in which the proton is detected in sector 45 (left) and sector 56 (right). The data are indicated by solid circles. The blue histogram is the mixture of Pomwig or Pythia6 and zero-bias (ZB) data events described in the text. An event with the proton measured in the RPs contributes to the white histogram (signal) if the proton originates from the MC sample, or to the hatched histogram (background) if it originates from the ZB sample. |
png pdf |
Figure 3-f:
Distribution of $\xi _{\text {TOTEM}}$ before (top) and after (middle) the $\xi _{\text {CMS}} - \xi _{\text {TOTEM}}$ cut and distribution of $t$ after the $\xi _{\text {CMS}} - \xi _{\text {TOTEM}}$ cut (bottom) for events in which the proton is detected in sector 45 (left) and sector 56 (right). The data are indicated by solid circles. The blue histogram is the mixture of Pomwig or Pythia6 and zero-bias (ZB) data events described in the text. An event with the proton measured in the RPs contributes to the white histogram (signal) if the proton originates from the MC sample, or to the hatched histogram (background) if it originates from the ZB sample. |
png pdf |
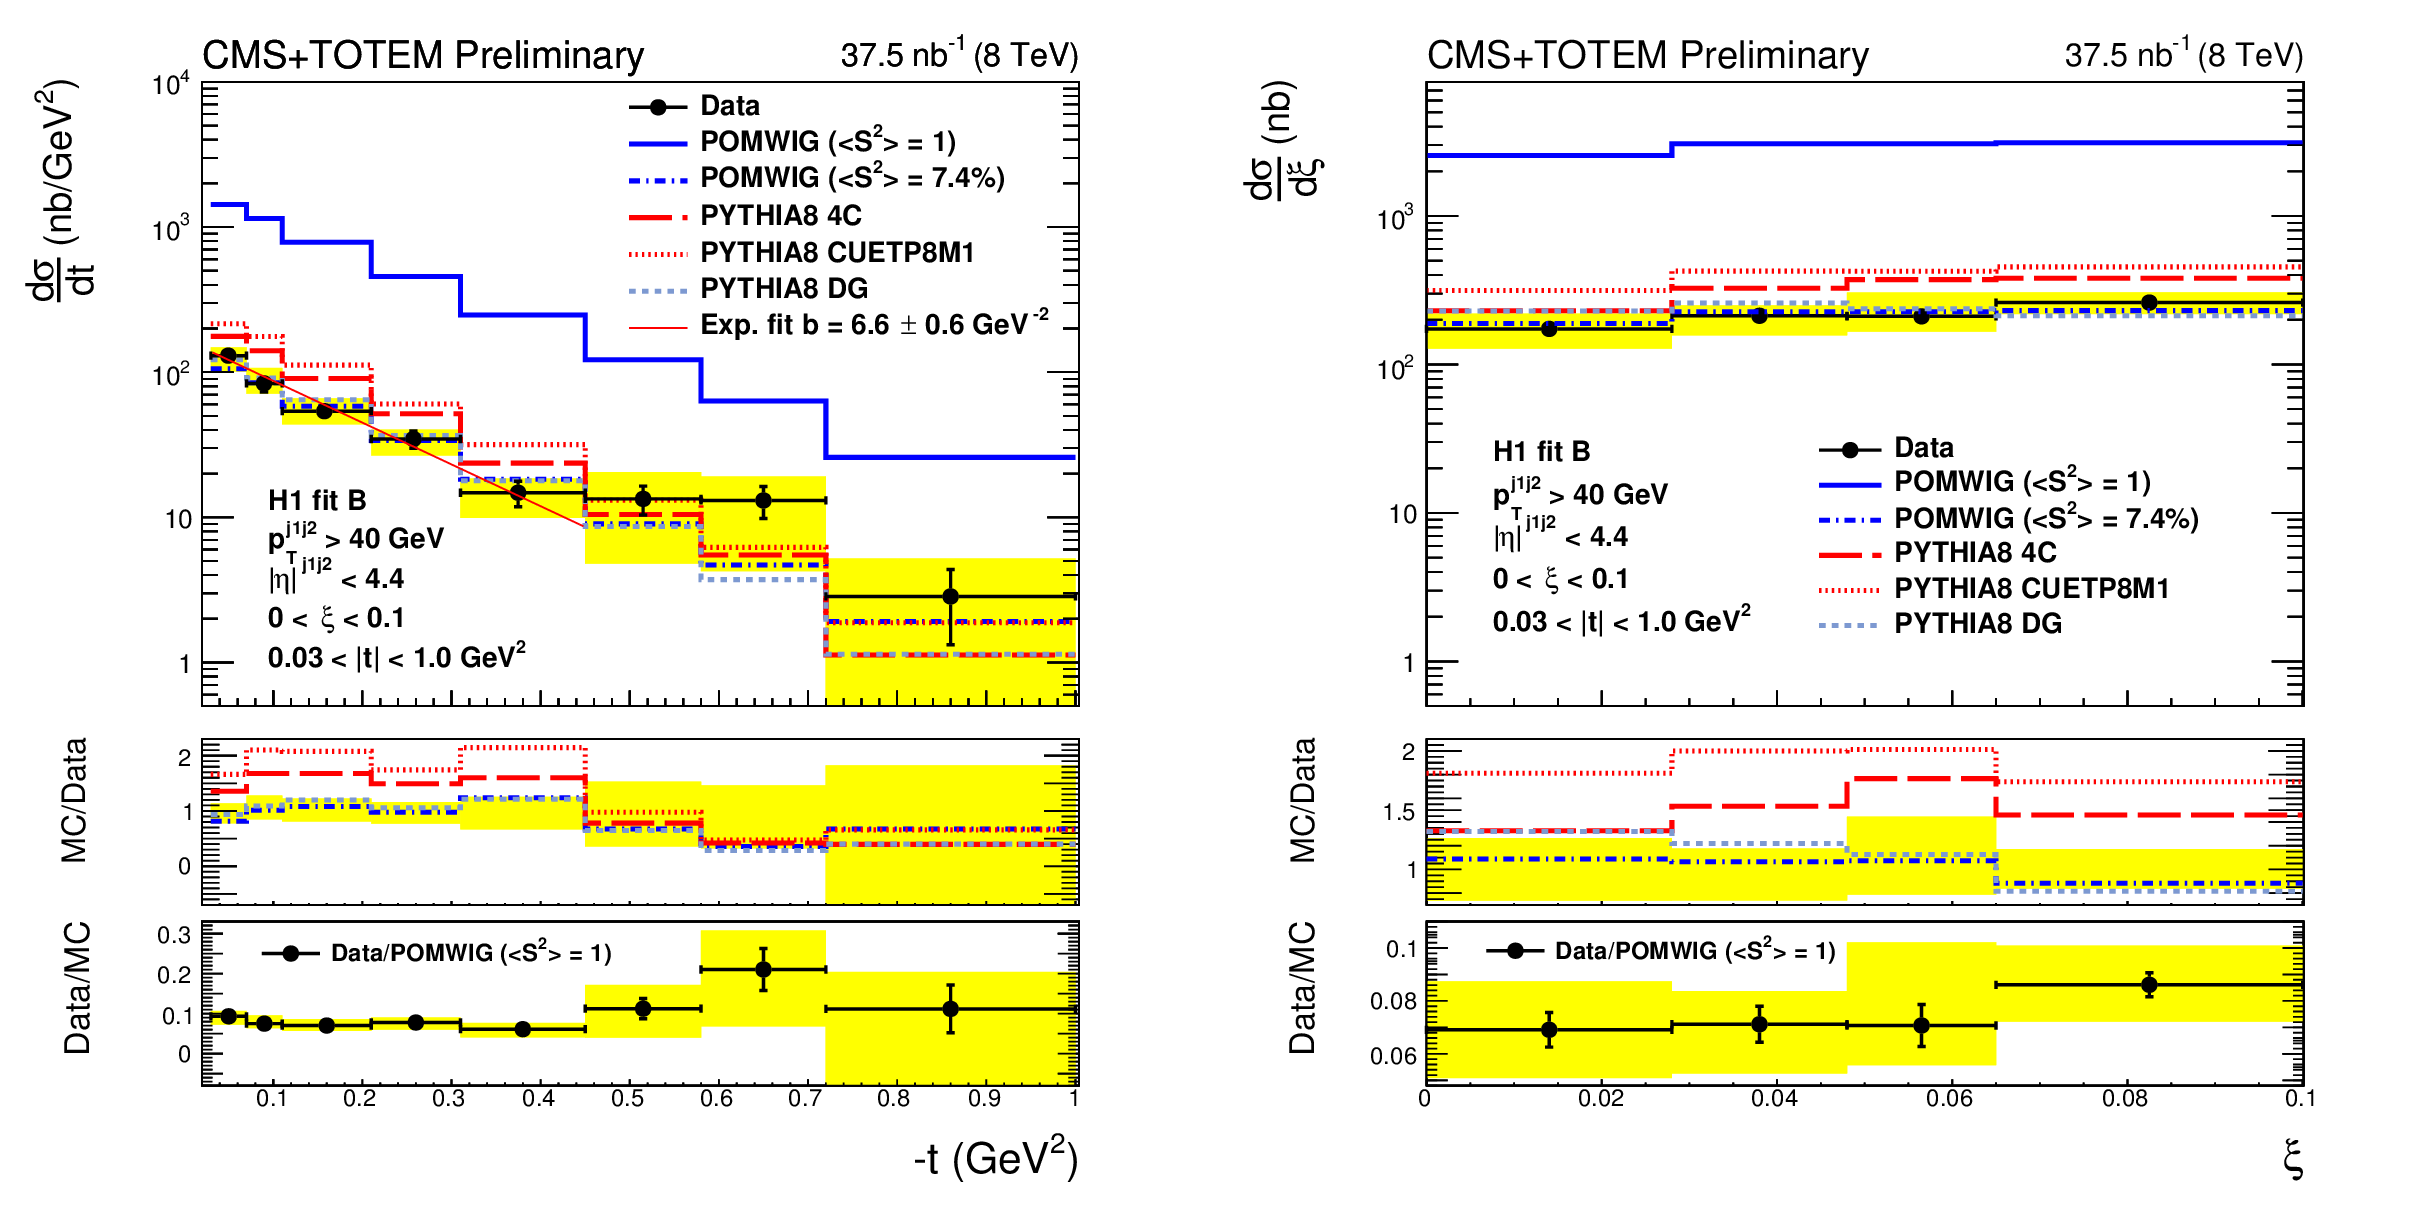
Figure 4:
Differential cross section as a function of $t$ (left) and as a function of $\xi $ (right) for single-diffractive dijet production, compared to the predictions from Pomwig, Pythia8 4C, Pythia8 CUETP8M1 and Pythia8 Dynamic Gap (DG). Pomwig is shown with no correction for the rapidity gap survival probability ($ < S^{2} > = $ 1) and with a correction of $ < S^{2} > =$ 7.4%. The vertical bars indicate the statistical uncertainties and the yellow band indicates the total systematic uncertainty. The average of the results for events in which the proton is detected in either side of the interaction point is shown. |

png pdf |
Figure 4-a:
Differential cross section as a function of $t$ (left) and as a function of $\xi $ (right) for single-diffractive dijet production, compared to the predictions from Pomwig, Pythia8 4C, Pythia8 CUETP8M1 and Pythia8 Dynamic Gap (DG). Pomwig is shown with no correction for the rapidity gap survival probability ($ < S^{2} > = $ 1) and with a correction of $ < S^{2} > =$ 7.4%. The vertical bars indicate the statistical uncertainties and the yellow band indicates the total systematic uncertainty. The average of the results for events in which the proton is detected in either side of the interaction point is shown. |
png pdf |
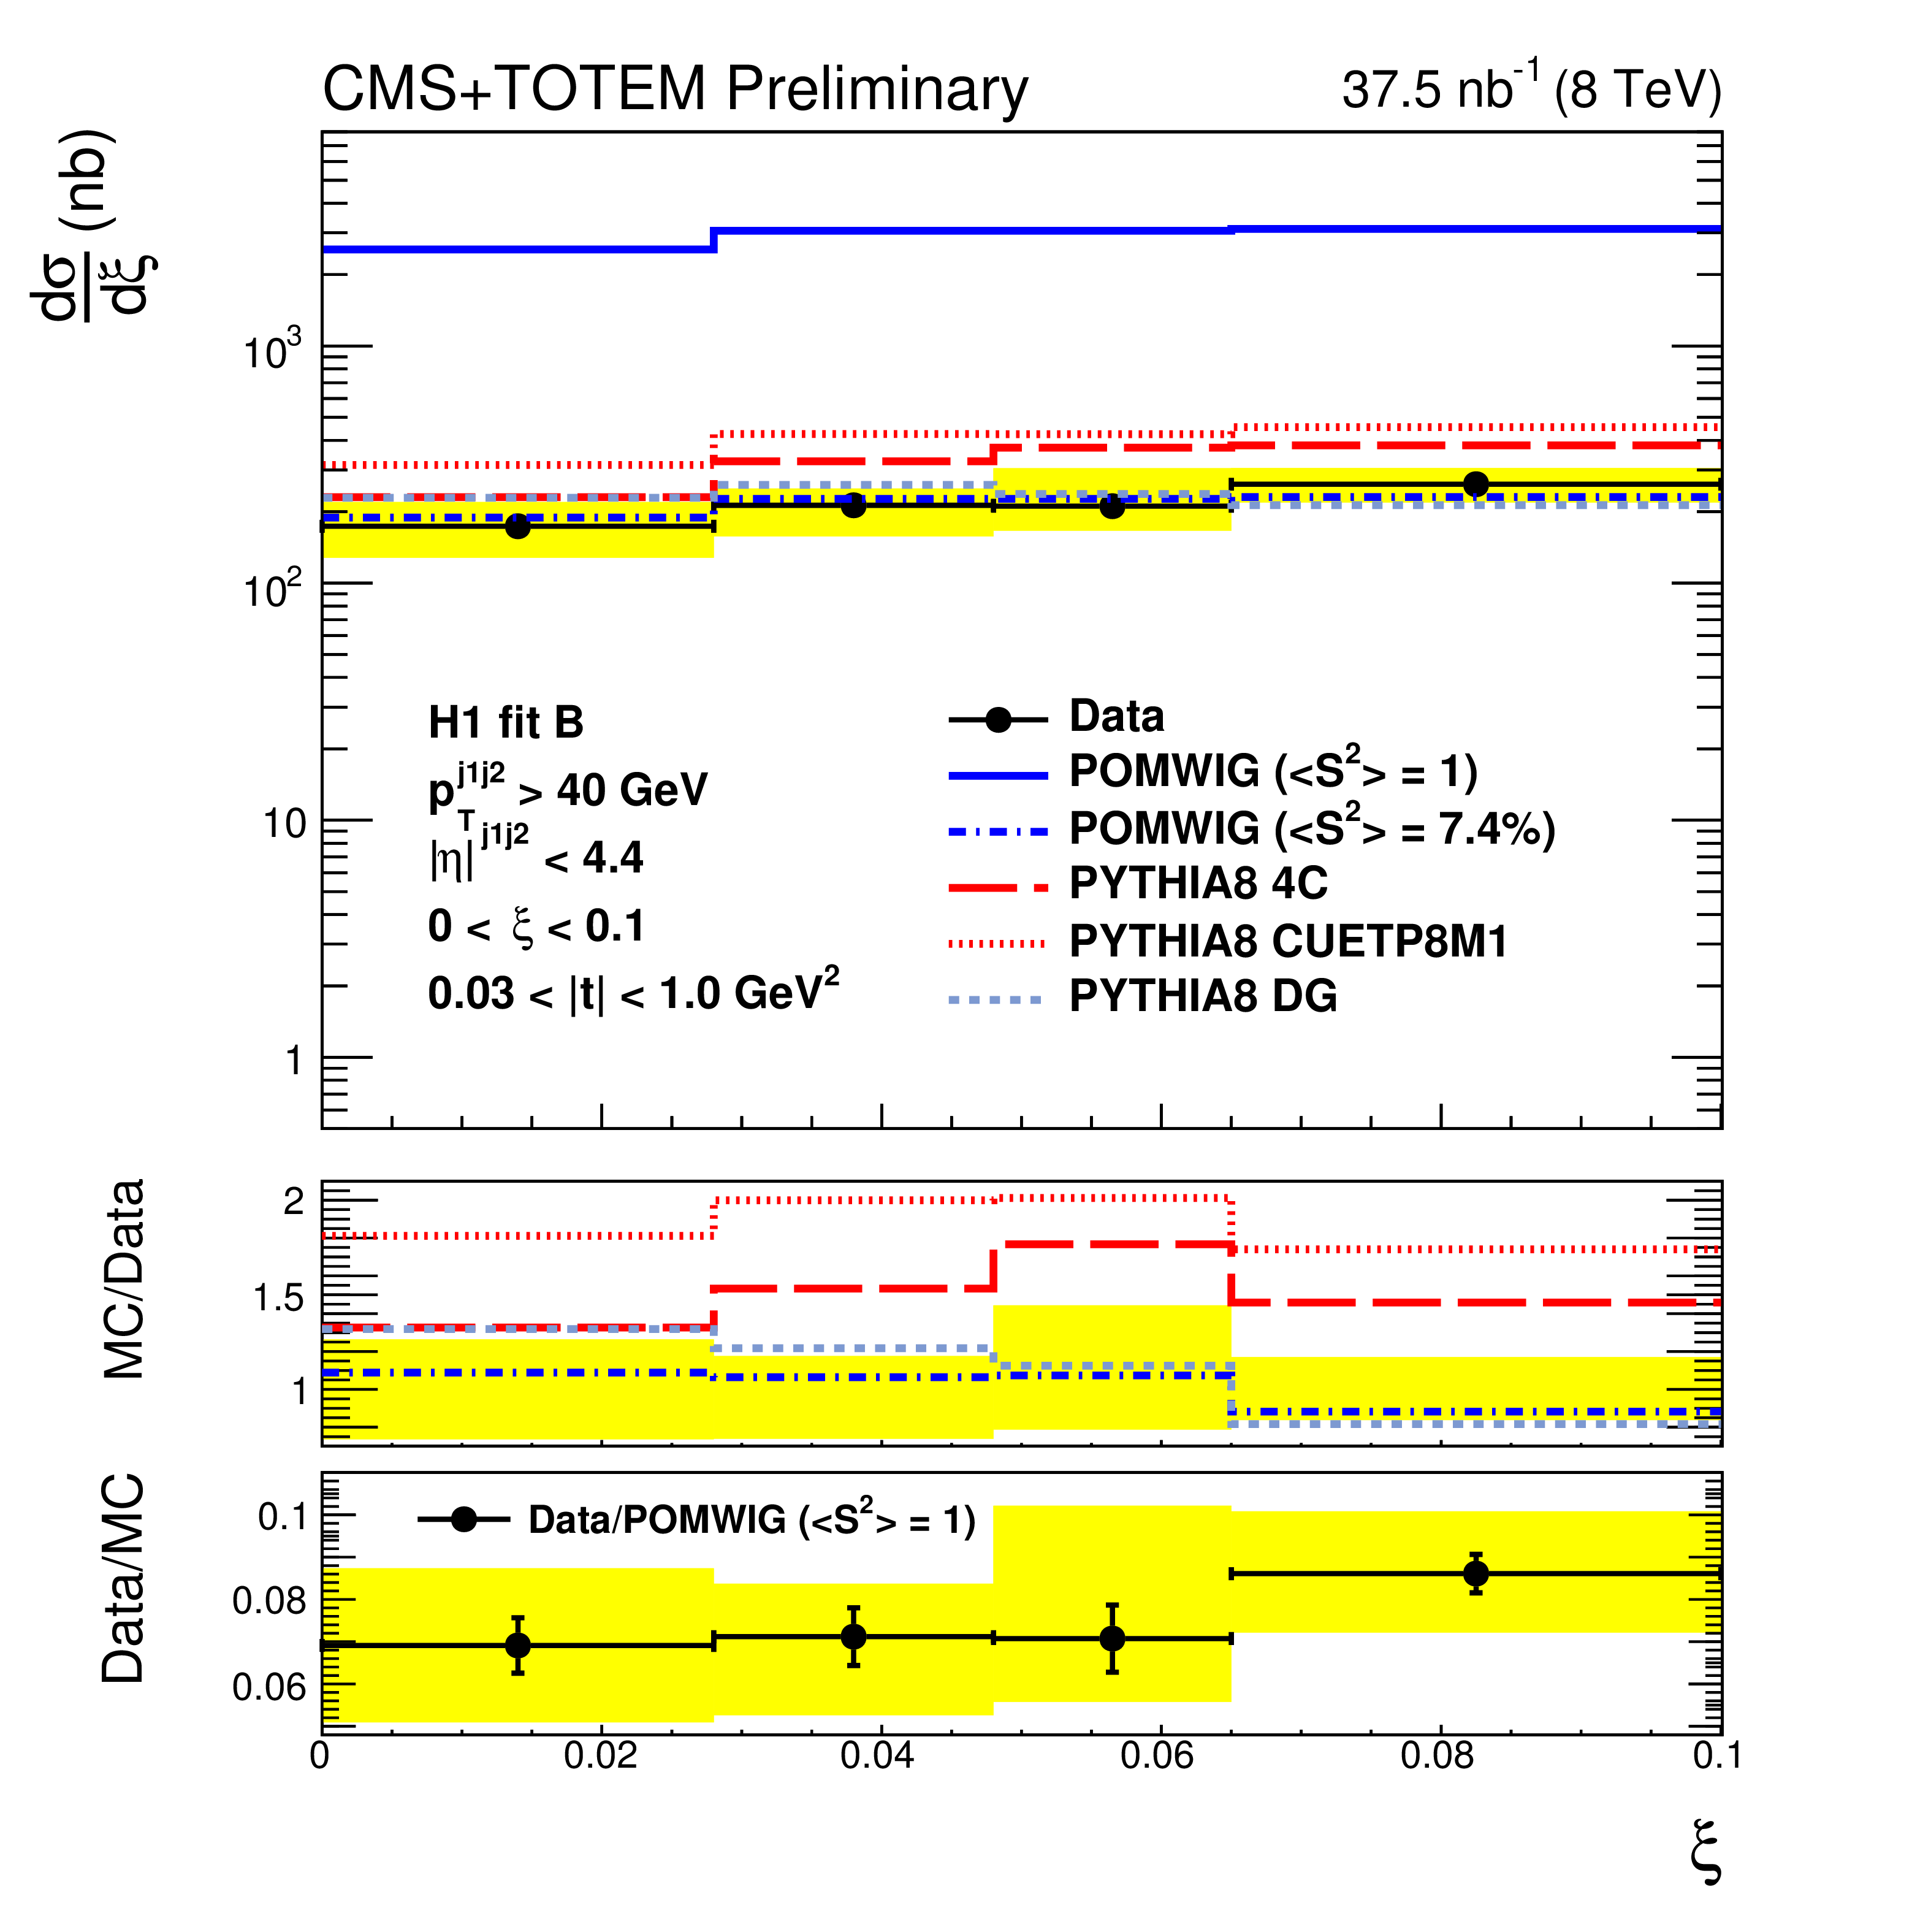
Figure 4-b:
Differential cross section as a function of $t$ (left) and as a function of $\xi $ (right) for single-diffractive dijet production, compared to the predictions from Pomwig, Pythia8 4C, Pythia8 CUETP8M1 and Pythia8 Dynamic Gap (DG). Pomwig is shown with no correction for the rapidity gap survival probability ($ < S^{2} > = $ 1) and with a correction of $ < S^{2} > =$ 7.4%. The vertical bars indicate the statistical uncertainties and the yellow band indicates the total systematic uncertainty. The average of the results for events in which the proton is detected in either side of the interaction point is shown. |
png pdf |
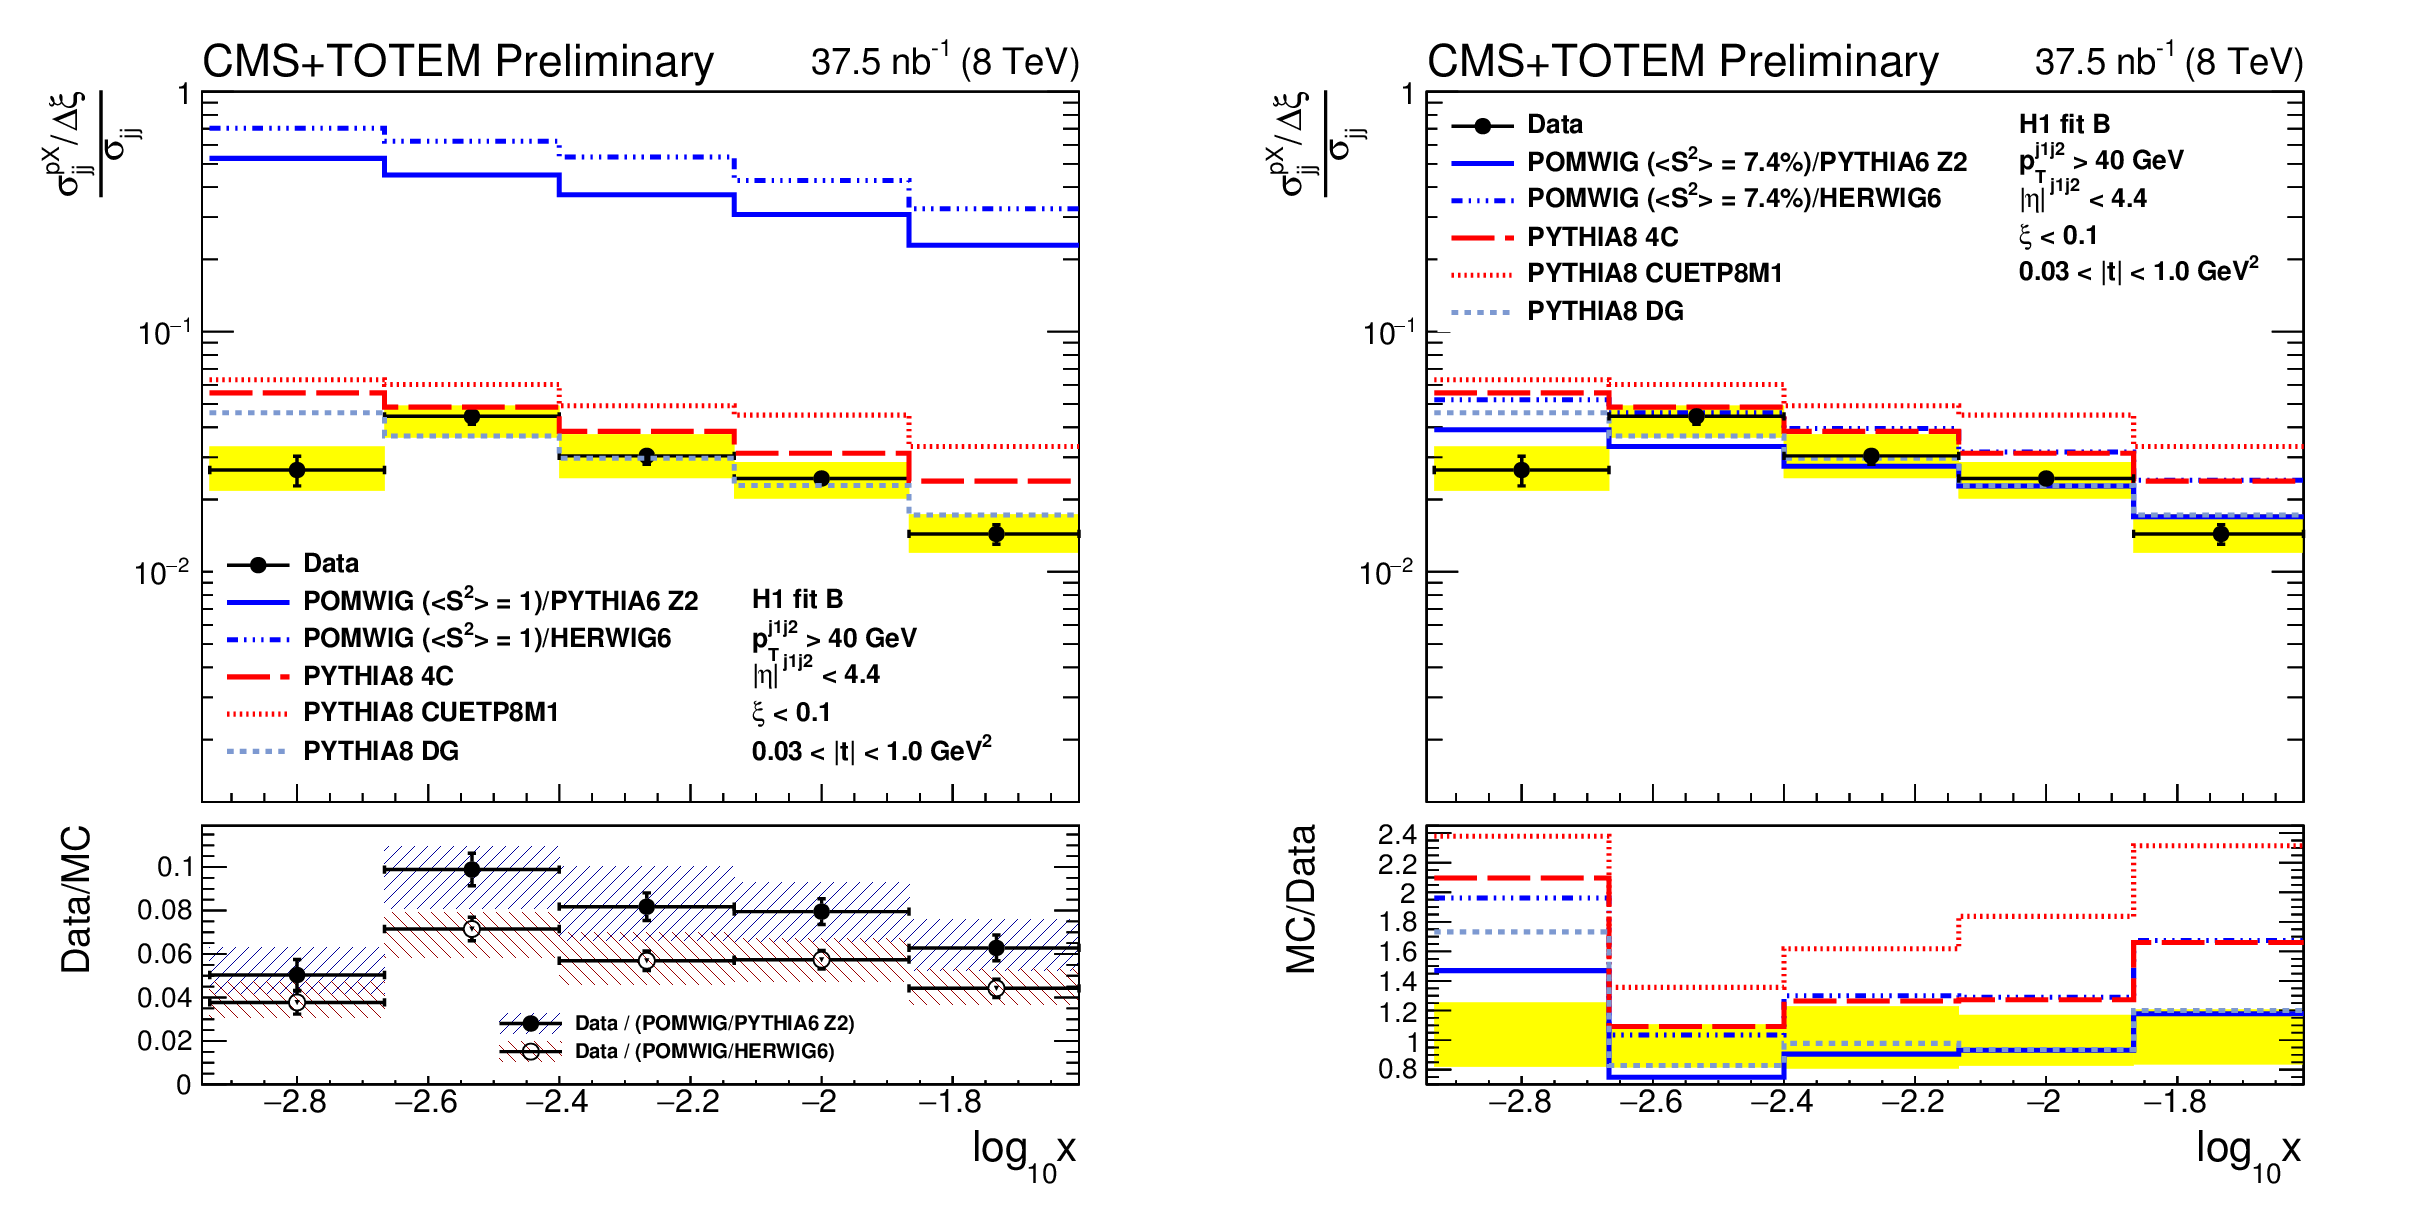
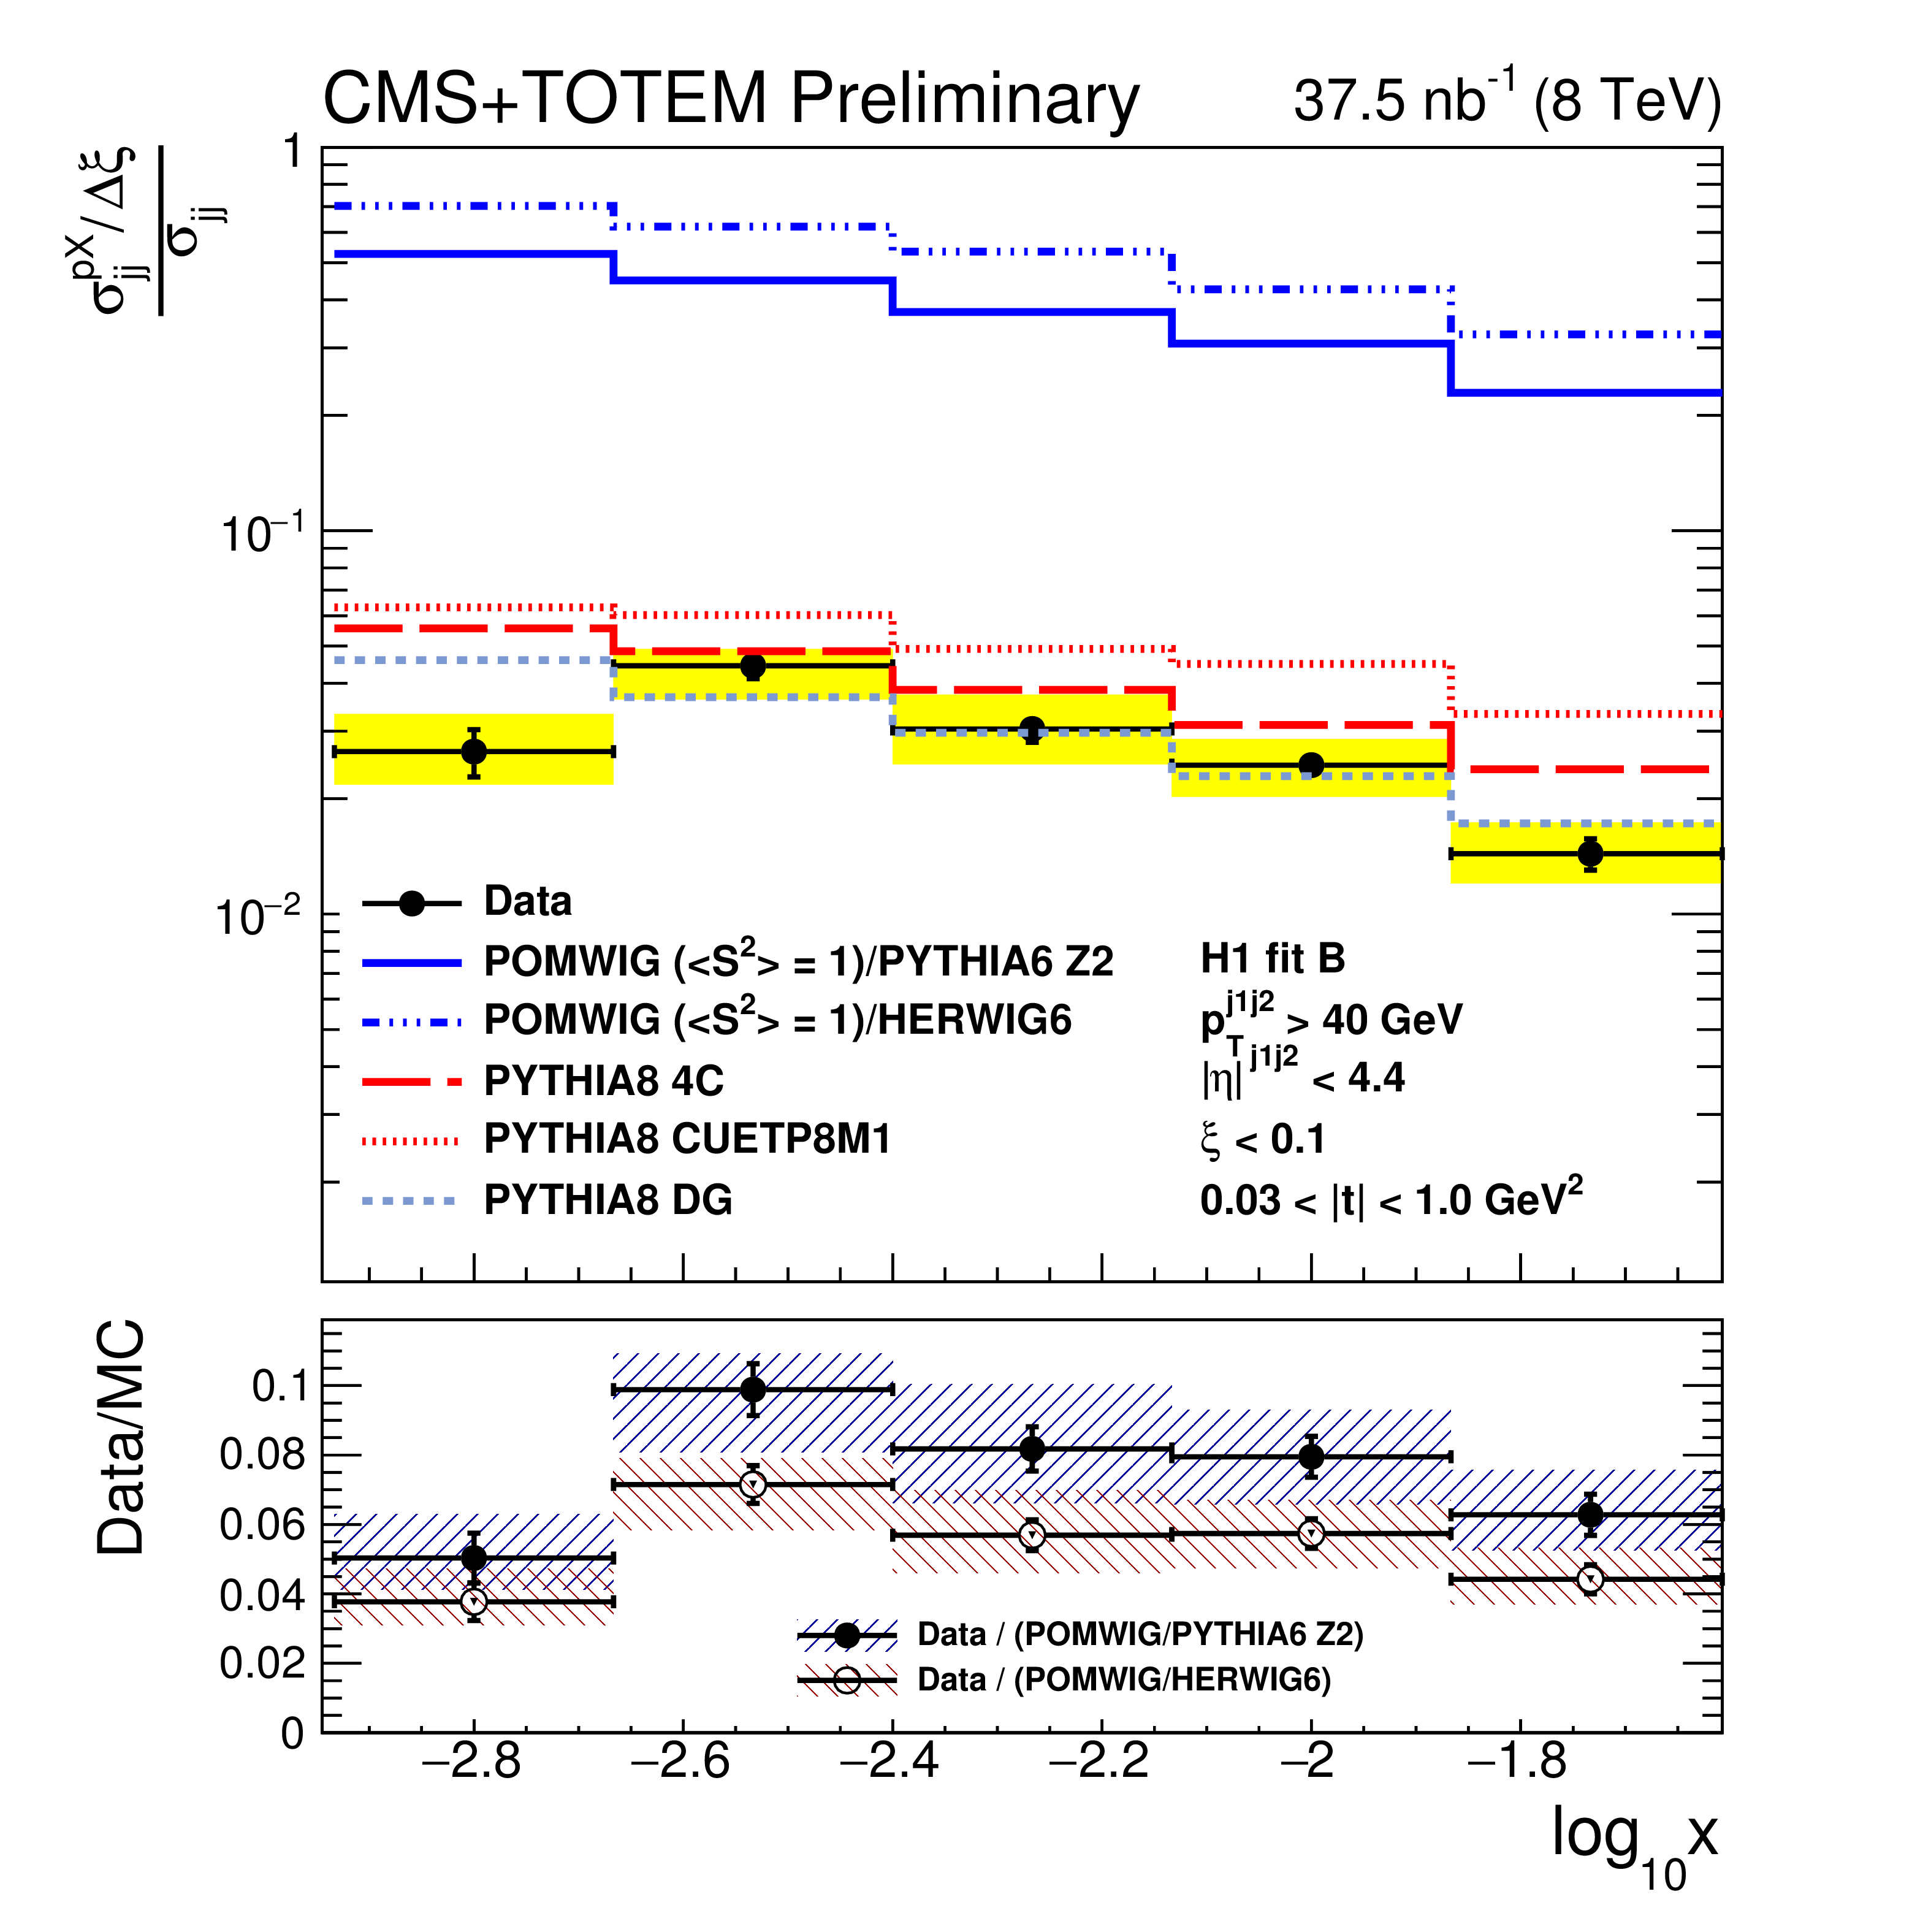
Figure 5:
Ratio per unit of $\xi $ of the single-diffractive and inclusive dijet cross sections in the region given by $\xi < $ 0.1 and 0.03 $ < | t | < $ 1 GeV$^2$, compared to the predictions from the different models for the ratio between the single-diffractive and non-diffractive cross sections. Pomwig is shown with no correction for the rapidity gap survival probability ($ < S^{2} > =$ 1) (left) and with a correction of $ < S^{2} > = $ 7.4% (right). The vertical bars indicate the statistical uncertainties and the yellow band indicates the total systematic uncertainty. The average of the results for events in which the proton is detected in either side of the interaction point is shown. |
png pdf |
Figure 5-a:
Ratio per unit of $\xi $ of the single-diffractive and inclusive dijet cross sections in the region given by $\xi < $ 0.1 and 0.03 $ < | t | < $ 1 GeV$^2$, compared to the predictions from the different models for the ratio between the single-diffractive and non-diffractive cross sections. Pomwig is shown with no correction for the rapidity gap survival probability ($ < S^{2} > =$ 1) (left) and with a correction of $ < S^{2} > = $ 7.4% (right). The vertical bars indicate the statistical uncertainties and the yellow band indicates the total systematic uncertainty. The average of the results for events in which the proton is detected in either side of the interaction point is shown. |

png pdf |
Figure 5-b:
Ratio per unit of $\xi $ of the single-diffractive and inclusive dijet cross sections in the region given by $\xi < $ 0.1 and 0.03 $ < | t | < $ 1 GeV$^2$, compared to the predictions from the different models for the ratio between the single-diffractive and non-diffractive cross sections. Pomwig is shown with no correction for the rapidity gap survival probability ($ < S^{2} > =$ 1) (left) and with a correction of $ < S^{2} > = $ 7.4% (right). The vertical bars indicate the statistical uncertainties and the yellow band indicates the total systematic uncertainty. The average of the results for events in which the proton is detected in either side of the interaction point is shown. |
png pdf |
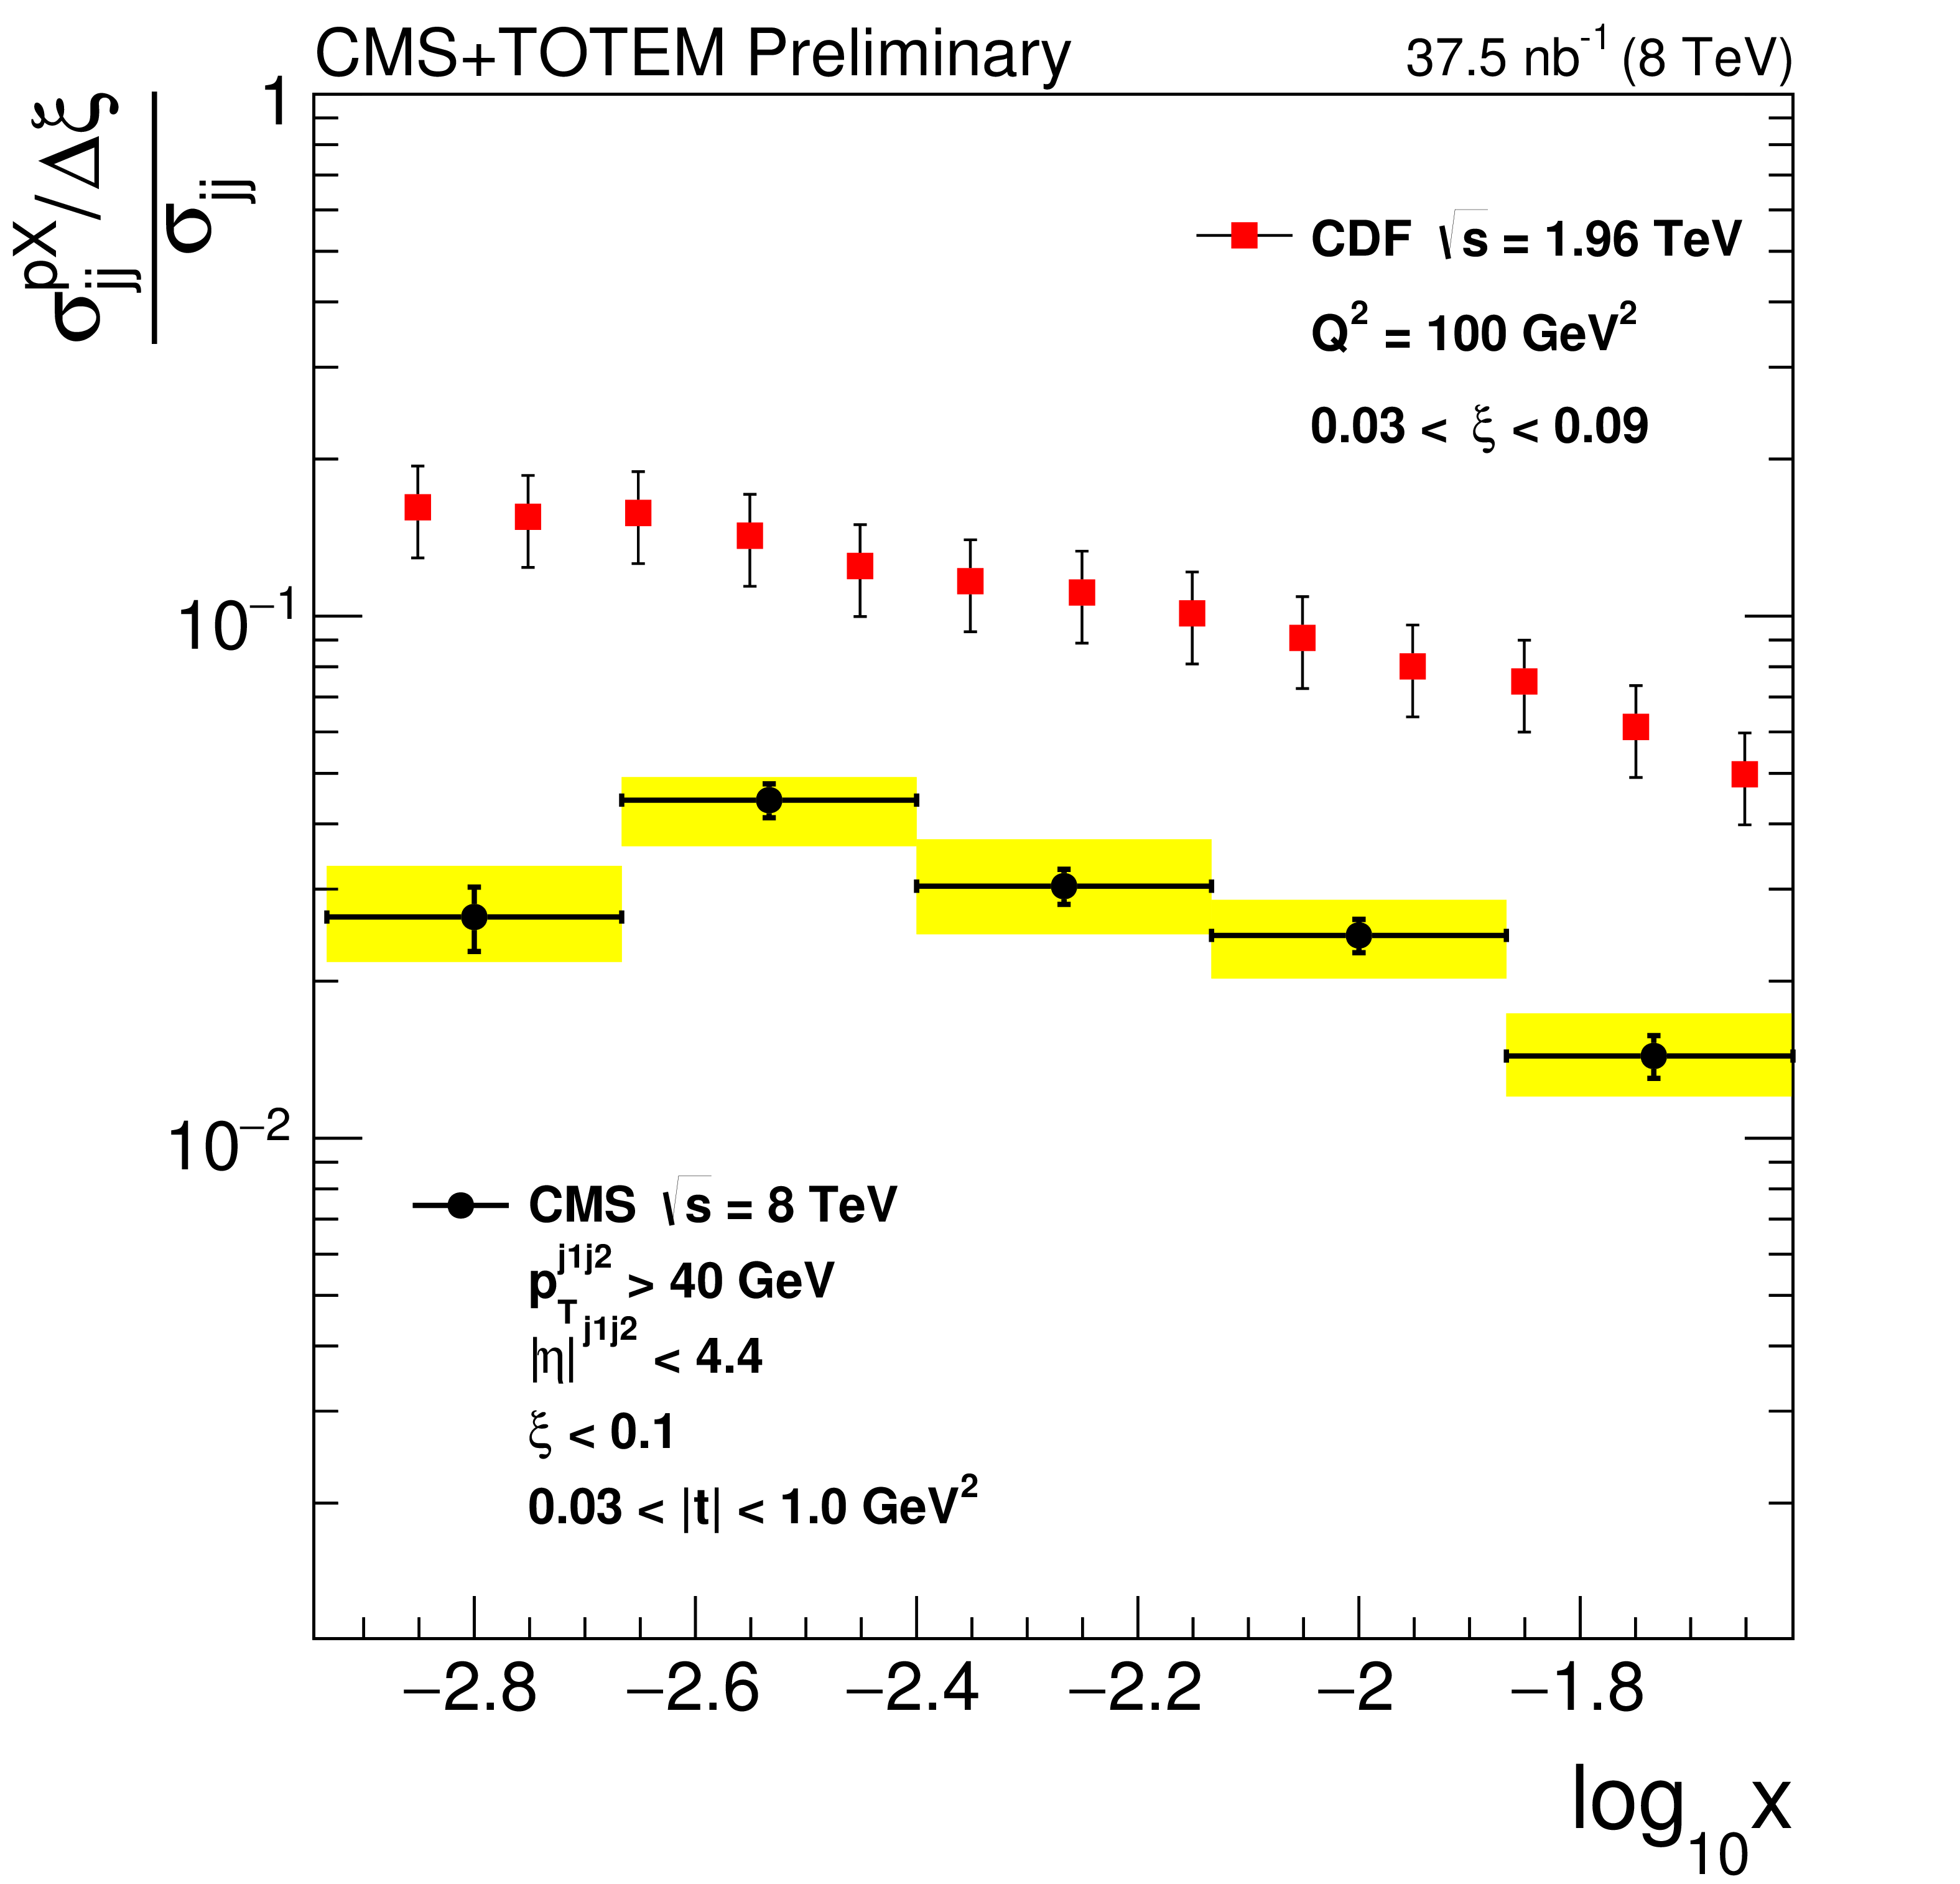
Figure 6:
Ratio per unit of $\xi $ of the single-diffractive and inclusive dijet cross sections in the kinematic region given by $\xi < $ 0.1 and 0.03 $ < | t | < $ 1 GeV$ ^2$. The vertical bars indicate the statistical uncertainties and the yellow band indicates the total systematic uncertainty. The red points represent the results obtained by CDF at $\sqrt {s} = $ 1.96 TeV for jets with $Q^2 \approx $ 100 GeV$ ^2$ and $ | \eta | < $ 2.5, with 0.03 $ < \xi < $ 0.09. |
| Tables | |

png pdf |
Table 1:
Number of events after each selection. |
png pdf |
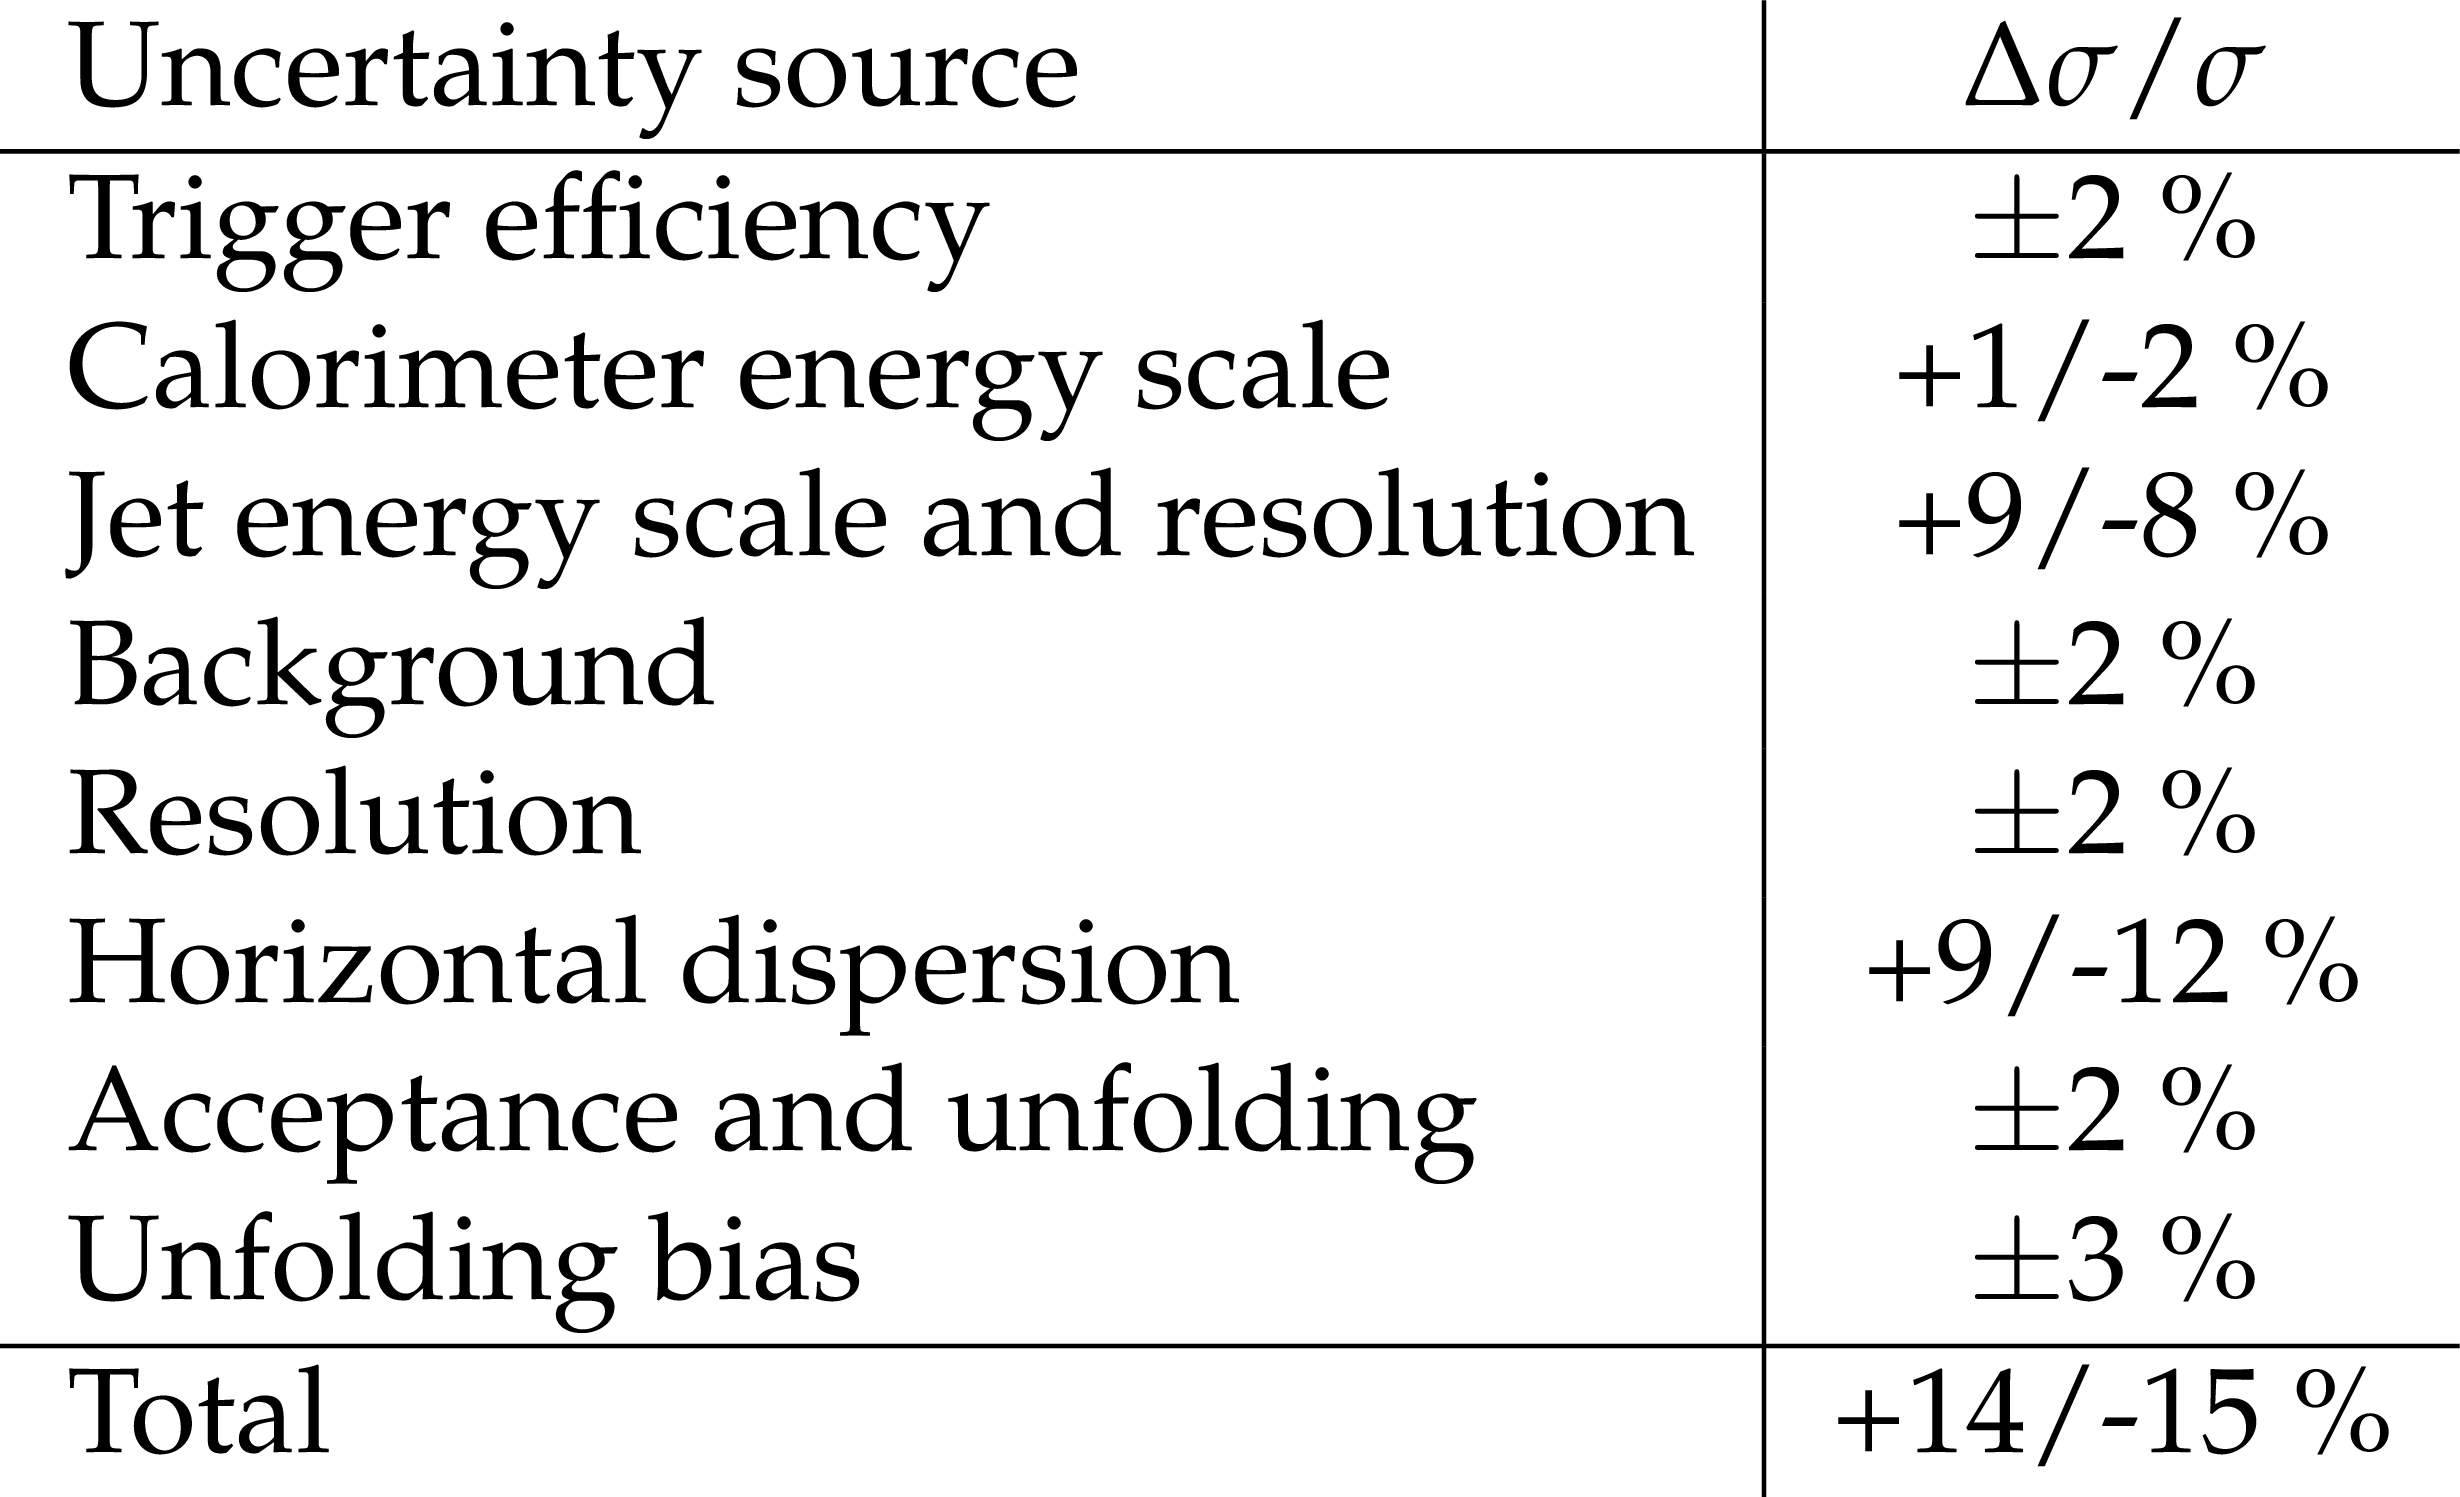
Table 2:
Individual contributions to the systematic uncertainties on the measurement of the single-diffractive dijet production cross section in the kinematic region $ {p_{\mathrm {T}}} > $ 40 GeV, $ | \eta | < $ 4.4, $\xi < $ 0.1 and 0.03 $ < | t | < $ 1 GeV$^2$. The total uncertainty is the quadratic sum of the individual contributions. |

png pdf |
Table 3:
Individual contributions to the systematic uncertainties on the measurement of the ratio of single-diffractive to inclusive dijet yields in the kinematic region $ {p_{\mathrm {T}}} > $ 40 GeV, $ | \eta | < $ 4.4, $\xi < $ 0.1, 0.03 $ < | t | < $ 1 GeV$ ^2$ and $-2.9 \leq \log_{10} x \leq -1.6$. The total uncertainty is the quadratic sum of the individual contributions. |
| Summary |
|
The differential cross section of single-diffractive dijet production at $\sqrt{s} = $ 8 TeV has been measured as a function of $\xi$ and $t$ using the CMS and TOTEM detectors. The data were collected using a non-standard optics configuration with $\beta^* = $ 90 m and correspond to an integrated luminosity of 37.5 nb$^{-1}$ . The considered processes are those of the type ${\mathrm{p}}{\mathrm{p}} \to {\mathrm{p}}\mathrm{X}$ or ${\mathrm{p}}{\mathrm{p}} \to \mathrm{X}{\mathrm{p}}$, with X including a system of two jets in the kinematic region $\xi < $ 0.1 and 0.03 $ < |t| < $ 1.0 GeV$^2$. The two jets were measured with ${p_{\mathrm{T}}} > $ 40 GeV and $|\eta| < $ 4.4. The integrated cross section in this kinematic region has been measured to be $\sigma^{{\mathrm{p}}\mathrm{X}}_\mathrm{jj} = $ 21.7 $\pm$ 0.9 {(stat)} $^{+3.0}_{-3.3}$ (syst) $\pm$ 0.9 (lumi) nb. It corresponds to the average of the cross sections when the proton scatters to either side of the interaction. The exponential slope of the cross section as a function of $t$ has been measured to be $b = $ 6.6 $\pm$ 0.6 {(stat)} $^{+1.0}_{-0.8}$ (syst) GeV$^{-2}$. The data have been compared to the predictions from different models of diffractive dijet production. After accounting for a constant correction, related to the rapidity gap survival probability, Pomwig shows a good agreement with the data. The Pythia8 Dynamic Gap model describes well the data overall both in shape and normalisation within the uncertainties. In this model the effects related to the rapidity gap survival probability are simulated within the framework of Multiparton interactions. No correction is needed to the normalisation of the Pythia8 Dynamic Gap model predictions. The ratio of the single-diffractive cross section and the predictions from Pomwig and Pythia8 gives an estimate of the suppression from the HERA dPDFs used in the analysis. After accounting for the correction in the dPDF normalisation due to proton dissociation, a suppression factor ${\cal S} = (9 \pm 2 )%$ has been found when using Pomwig as the reference cross section value, with a similar result when the Pythia8 cross section was used. The ratio of the single-diffractive to inclusive dijet cross sections has been measured as a function of the parton momentum fraction $x$. A decrease of the ratio has been observed when compared to the results from CDF at lower centre-of-mass energy. The ratio, normalised per unit of $\xi$ and in the kinematic region given by ${p_{\mathrm{T}}} > $ 40 GeV, $|\eta| < $ 4.4, $\xi < $ 0.1, 0.03 $ < |t| < 1.0 GeV^2$ and $-2.9 \leq \log_{10}x \leq -1.6$, has been measured to be $R = (\sigma^{{\mathrm{p}}\mathrm{X}}_{\mathrm{jj}}/\Delta\xi )/\sigma_{\mathrm{jj}} = $ 0.025 $\pm$ 0.001 (stat) $\pm$ 0.003 (syst). |
| References | ||||
| 1 | P. D. B. Collins | An Introduction to Regge Theory and High-Energy Physics | Cambridge Monographs on Mathematical Physics. Cambridge Univ. Press, Cambridge, UK, 2009ISBN 9780521110358 | |
| 2 | UA8 Collaboration | Evidence for a superhard pomeron structure | PLB 297 (1992) 417 | |
| 3 | CDF Collaboration | Measurement of diffractive dijet production at the Fermilab Tevatron | PRL 79 (1997) 2636 | |
| 4 | D0 Collaboration | Hard single diffraction in $ \bar{p}p $ collisions at $ \sqrt{s} = $ 630 and 1800 GeV | PLB 531 (2002) 52 | 9912061 |
| 5 | CDF Collaboration | Diffractive dijets with a leading antiproton in $ \bar{p}p $ collisions at $ \sqrt{s} = $ 1800 GeV | PRL 84 (2000) 5043 | |
| 6 | CDF Collaboration | Diffractive dijet production in $ \bar{p}p $ collisions at $ \sqrt{s} = $ 1.96 TeV | PRD 86 (2012) 032009 | |
| 7 | CDF Collaboration | Diffractive dijet production at $ \sqrt{s} = $ 630 and $ \sqrt{s} = $ 1800 GeV at the Fermilab Tevatron | PRL 88 (2002) 151802 | 0109025v1 |
| 8 | CMS Collaboration | Observation of a diffractive contribution to dijet production in proton-proton collisions at $ \sqrt{s}= $ 7 TeV | PRD 87 (2013) 012006 | CMS-FWD-10-004 1209.1805 |
| 9 | ATLAS Collaboration | Dijet production in $ \sqrt{s} = 7 TeV pp $ collisions with large rapidity gaps at the ATLAS experiment | PLB 754 (2016) 214 | 1511.00502 |
| 10 | H1 Collaboration | Measurement and QCD analysis of the diffractive deep-inelastic scattering cross-section at HERA | EPJC 48 (2006) 715 | 0606004 |
| 11 | ZEUS Collaboration | Deep inelastic scattering with leading protons or large rapidity gaps at HERA | NPB 816 (2009) 1 | 0812.2003 |
| 12 | ZEUS Collaboration | A QCD analysis of Zeus diffractive data | NPB 831 (2010) 1 | 0911.4119 |
| 13 | H1 Collaboration | Diffractive dijet photoproduction in $ ep $ collisions at HERA | EPJC 70 (2010) 15 | 1006.0946 |
| 14 | L. Trentadue and G. Veneziano | Fracture functions. an improved description of inclusive hard processes in QCD | PLB 323 (1994) 201 | |
| 15 | J. C. Collins | Proof of factorization for diffractive hard scattering | PRD 57 (1998) 3051 | 9709499 |
| 16 | M. Grazzini, L. Trentadue, and G. Veneziano | Fracture functions from cut vertices | NPB 519 (1998) 394 | 9709452 |
| 17 | J. D. Bjorken | Rapidity gaps and jets as a new physics signature in very high-energy hadron hadron collisions | PRD 47 (1993) 101 | |
| 18 | CMS Collaboration | Jet energy scale and resolution in the CMS experiment in pp collisions at 8 TeV | JINST 12 (2017) P02014 | CMS-JME-13-004 1607.03663 |
| 19 | CMS Collaboration | Particle-flow reconstruction and global event description with the CMS detector | JINST 12 (2017) P10003 | CMS-PRF-14-001 1706.04965 |
| 20 | CMS Collaboration | The CMS experiment at the CERN LHC | JINST 03 (2008) S08004 | CMS-00-001 |
| 21 | TOTEM Collaboration | The TOTEM experiment at the CERN Large Hadron Collider | JINST 3 (2008) S08007 | |
| 22 | TOTEM Collaboration | Performance of the TOTEM detectors at the LHC | Int. J. Mod. Phys. A 28 (2013) 1330046 | 1310.2908 |
| 23 | TOTEM Collaboration | LHC optics determination with proton tracks measured in the roman pots detectors of the TOTEM experiment | New J. Phys. 16 (2014) 103041 | |
| 24 | H. Niewiadomski | Reconstruction of protons in the TOTEM roman pot detectors at the LHC | PhD thesis, Manchester U. | |
| 25 | TOTEM Collaboration | Evidence for non-exponential elastic proton-proton differential cross-section at low $ |t| $ and $ \sqrt{s} = $ 8 TeV by TOTEM | NPB 899 (2015) 527 | 1503.08111 |
| 26 | T. Sjostrand, S. Mrenna, and P. Skands | PYTHIA 6.4 physics and manual | JHEP 05 (2006) 026 | hep-ph/0603175 |
| 27 | T. Sjostrand, S. Mrenna, and P. Skands | A brief introduction to PYTHIA 8.1 | Comput. Phys. Commun 178 (2008) 852 | 0710.3820 |
| 28 | G. Corcella et al. | HERWIG6: An event generator for hadron emission reactions with interfering gluons (including supersymmetric processes) | JHEP 101 (2001) 010 | hep-ph/0011363 |
| 29 | R. Field | Early LHC underlying event data - findings and surprises | in Hadron collider physics. Proceedings, 22nd Conference, HCP 2010, Toronto, Canada, August 23-27, 2010 2010 | 1010.3558 |
| 30 | CMS Collaboration | Event generator tunes obtained from underlying event and multiparton scattering measurements | EPJC 76 (2016) 155 | CMS-GEN-14-001 1512.00815 |
| 31 | B. E. Cox, J. R. Forshaw | POMWIG: HERWIG for diffractive interactions | CPC 144 (2002) 104 | 0010303 |
| 32 | S. Navin | Diffraction in Pythia | 1005.3894 | |
| 33 | C. O. Rasmussen and T. Sjostrand | Hard diffraction with dynamic gap survival | JHEP 02 (2016) 142 | 1512.05525 |
| 34 | GEANT4 Collaboration | $ GEANT4--a $ simulation toolkit | NIMA 506 (2003) 250 | |
| 35 | M. Cacciari, G. P. Salam, and G. Soyez | The anti-$ k_t $ jet clustering algorithm | JHEP 04 (2008) 063 | 0802.1189 |
| 36 | M. Cacciari, G. P. Salam, and G. Soyez | FastJet user manual | EPJC 72 (2012) 1896 | 1111.6097 |
| 37 | CMS Collaboration | Measurement of energy flow at large pseudorapidities in $ pp $ collisions at $ \sqrt{s} = $ 0.9 and 7 TeV | JHEP 11 (2011) 148 | CMS-FWD-10-011 1110.0211 |
| 38 | G. D'Agostini | A multidimensional unfolding method based on bayes' theorem | NIMA 362 (1995) 487 | |
| 39 | H1 Collaboration | Diffractive deep-inelastic scattering with a leading proton at HERA | EPJC 48 (2006) 749 | hep-ex/0606003 |
|
|
Compact Muon Solenoid LHC, CERN |
|

|

|

|

|

|