

Compact Muon Solenoid
LHC, CERN
| CMS-PAS-EXO-22-020 | ||
| Search for long-lived particles using displaced vertices and missing transverse momentum in proton-proton collisions at $ \sqrt{s}= $ 13 TeV | ||
| CMS Collaboration | ||
| 23 August 2023 | ||
| Abstract: A search for long-lived particles produced in proton-proton collisions at a center-of-mass energy of 13 TeV at the CERN LHC is presented. The search is based on data collected by the CMS experiment in 2016--2018 and corresponding to a total integrated luminosity of 137 fb$ ^{-1} $. This search is designed to be sensitive to long-lived particles with mean proper decay lengths between 0.1 and 1000 mm whose decay products produce a final state with at least one displaced vertex and missing transverse momentum. The observation is consistent with the standard model background prediction, and the results are used to constrain split supersymmetry models with different mean proper decay lengths and gluino masses. Gluinos with mean proper decay lengths between 1 and 100 mm are excluded at 95% confidence level in models for which the gluino mass is below 1800 and 2000 GeV when the difference in the gluino and neutrino masses is, respectively, 100 and 200 GeV. These limits are the most stringent to date for signal models with proper decay lengths up to 100 mm. | ||
|
Links:
CDS record (PDF) ;
CADI line (restricted) ;
These preliminary results are superseded in this paper, Submitted to PRD. The superseded preliminary plots can be found here. |
||
| Figures | |
png pdf |
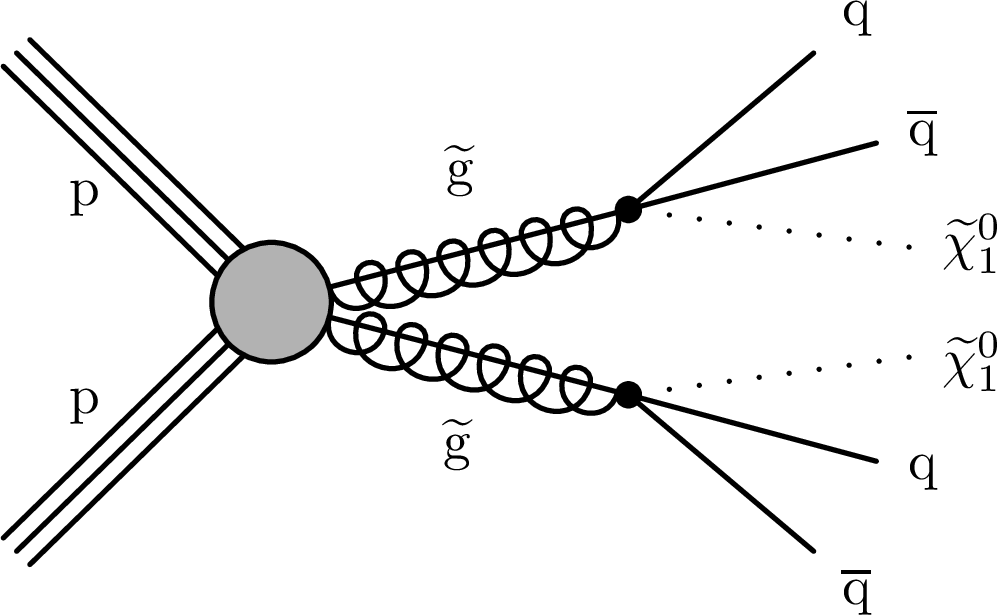
Figure 1:
Diagram of the split SUSY signal model, showing a pair of long-lived gluinos that each decay to two quarks and one neutralino. |
png pdf |
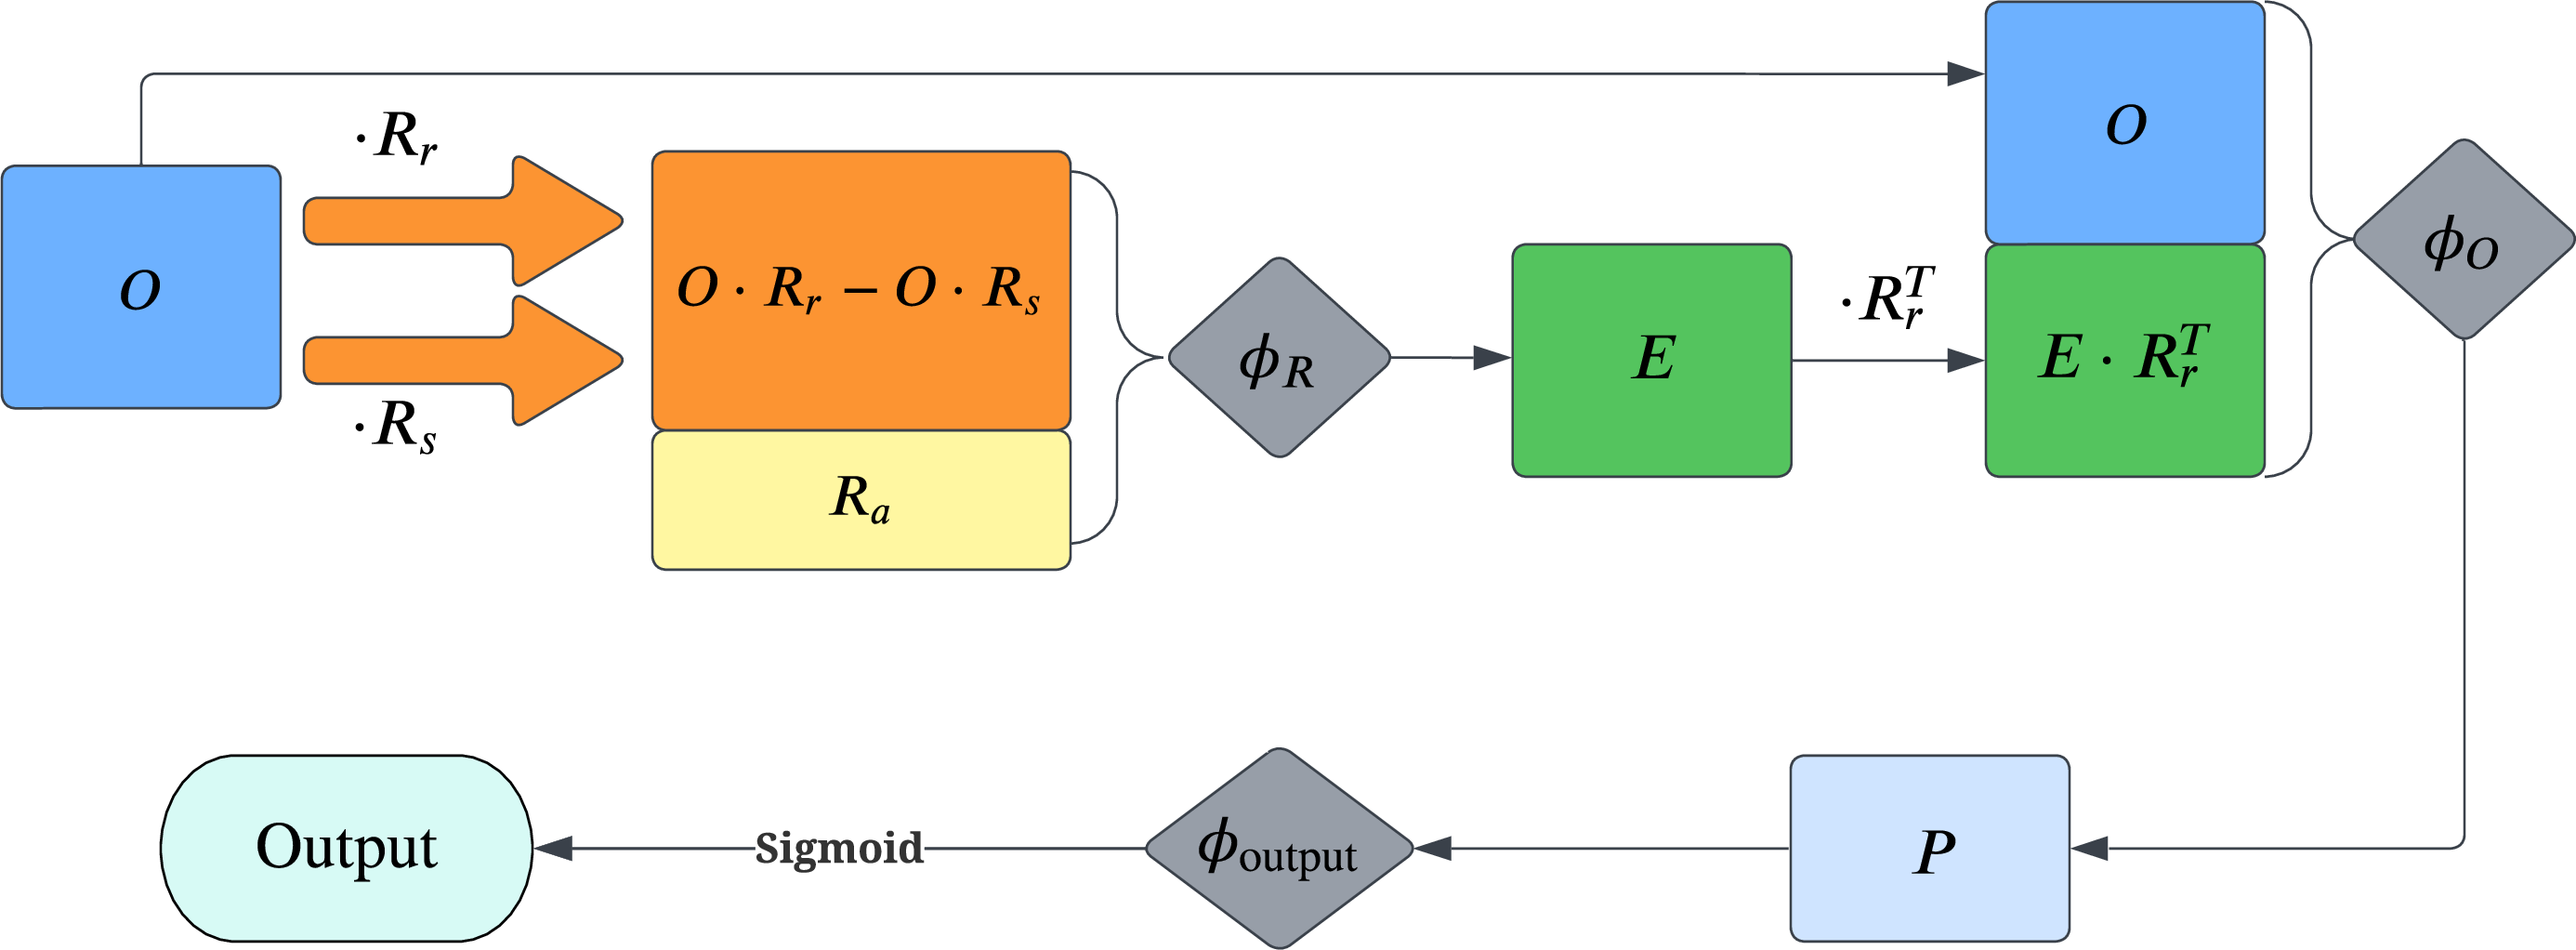
Figure 2:
This diagram illustrates the architecture of the IN, where the flow of data is indicated by arrows. Rectangular boxes represent data matrices, while diamonds represent multilayer perceptrons (MLPs). The input information ($ O $) is integrated with relation matrices ($ R_{\text{r}} $, $ R_{\text{s}} $, and $ R_{\text{a}} $) to form a graph that captures interactions between tracks. This graph is subsequently processed by an MLP ($ \phi_{\text{R}} $) to compute the effect ($ E $) of the interactions. The effect is then combined with $ R_{\text{r}} $ and merged with the original input $ O $ to form $ C $. To assess the influence ($ P $) of the effect on the original information, it undergoes further processing via another MLP ($ \phi_{\text{O}} $). Finally, the influence is passed through an MLP ($ \phi_{\text{output}} $) and a sigmoid function to produce the final output. |
png pdf |
Figure 3:
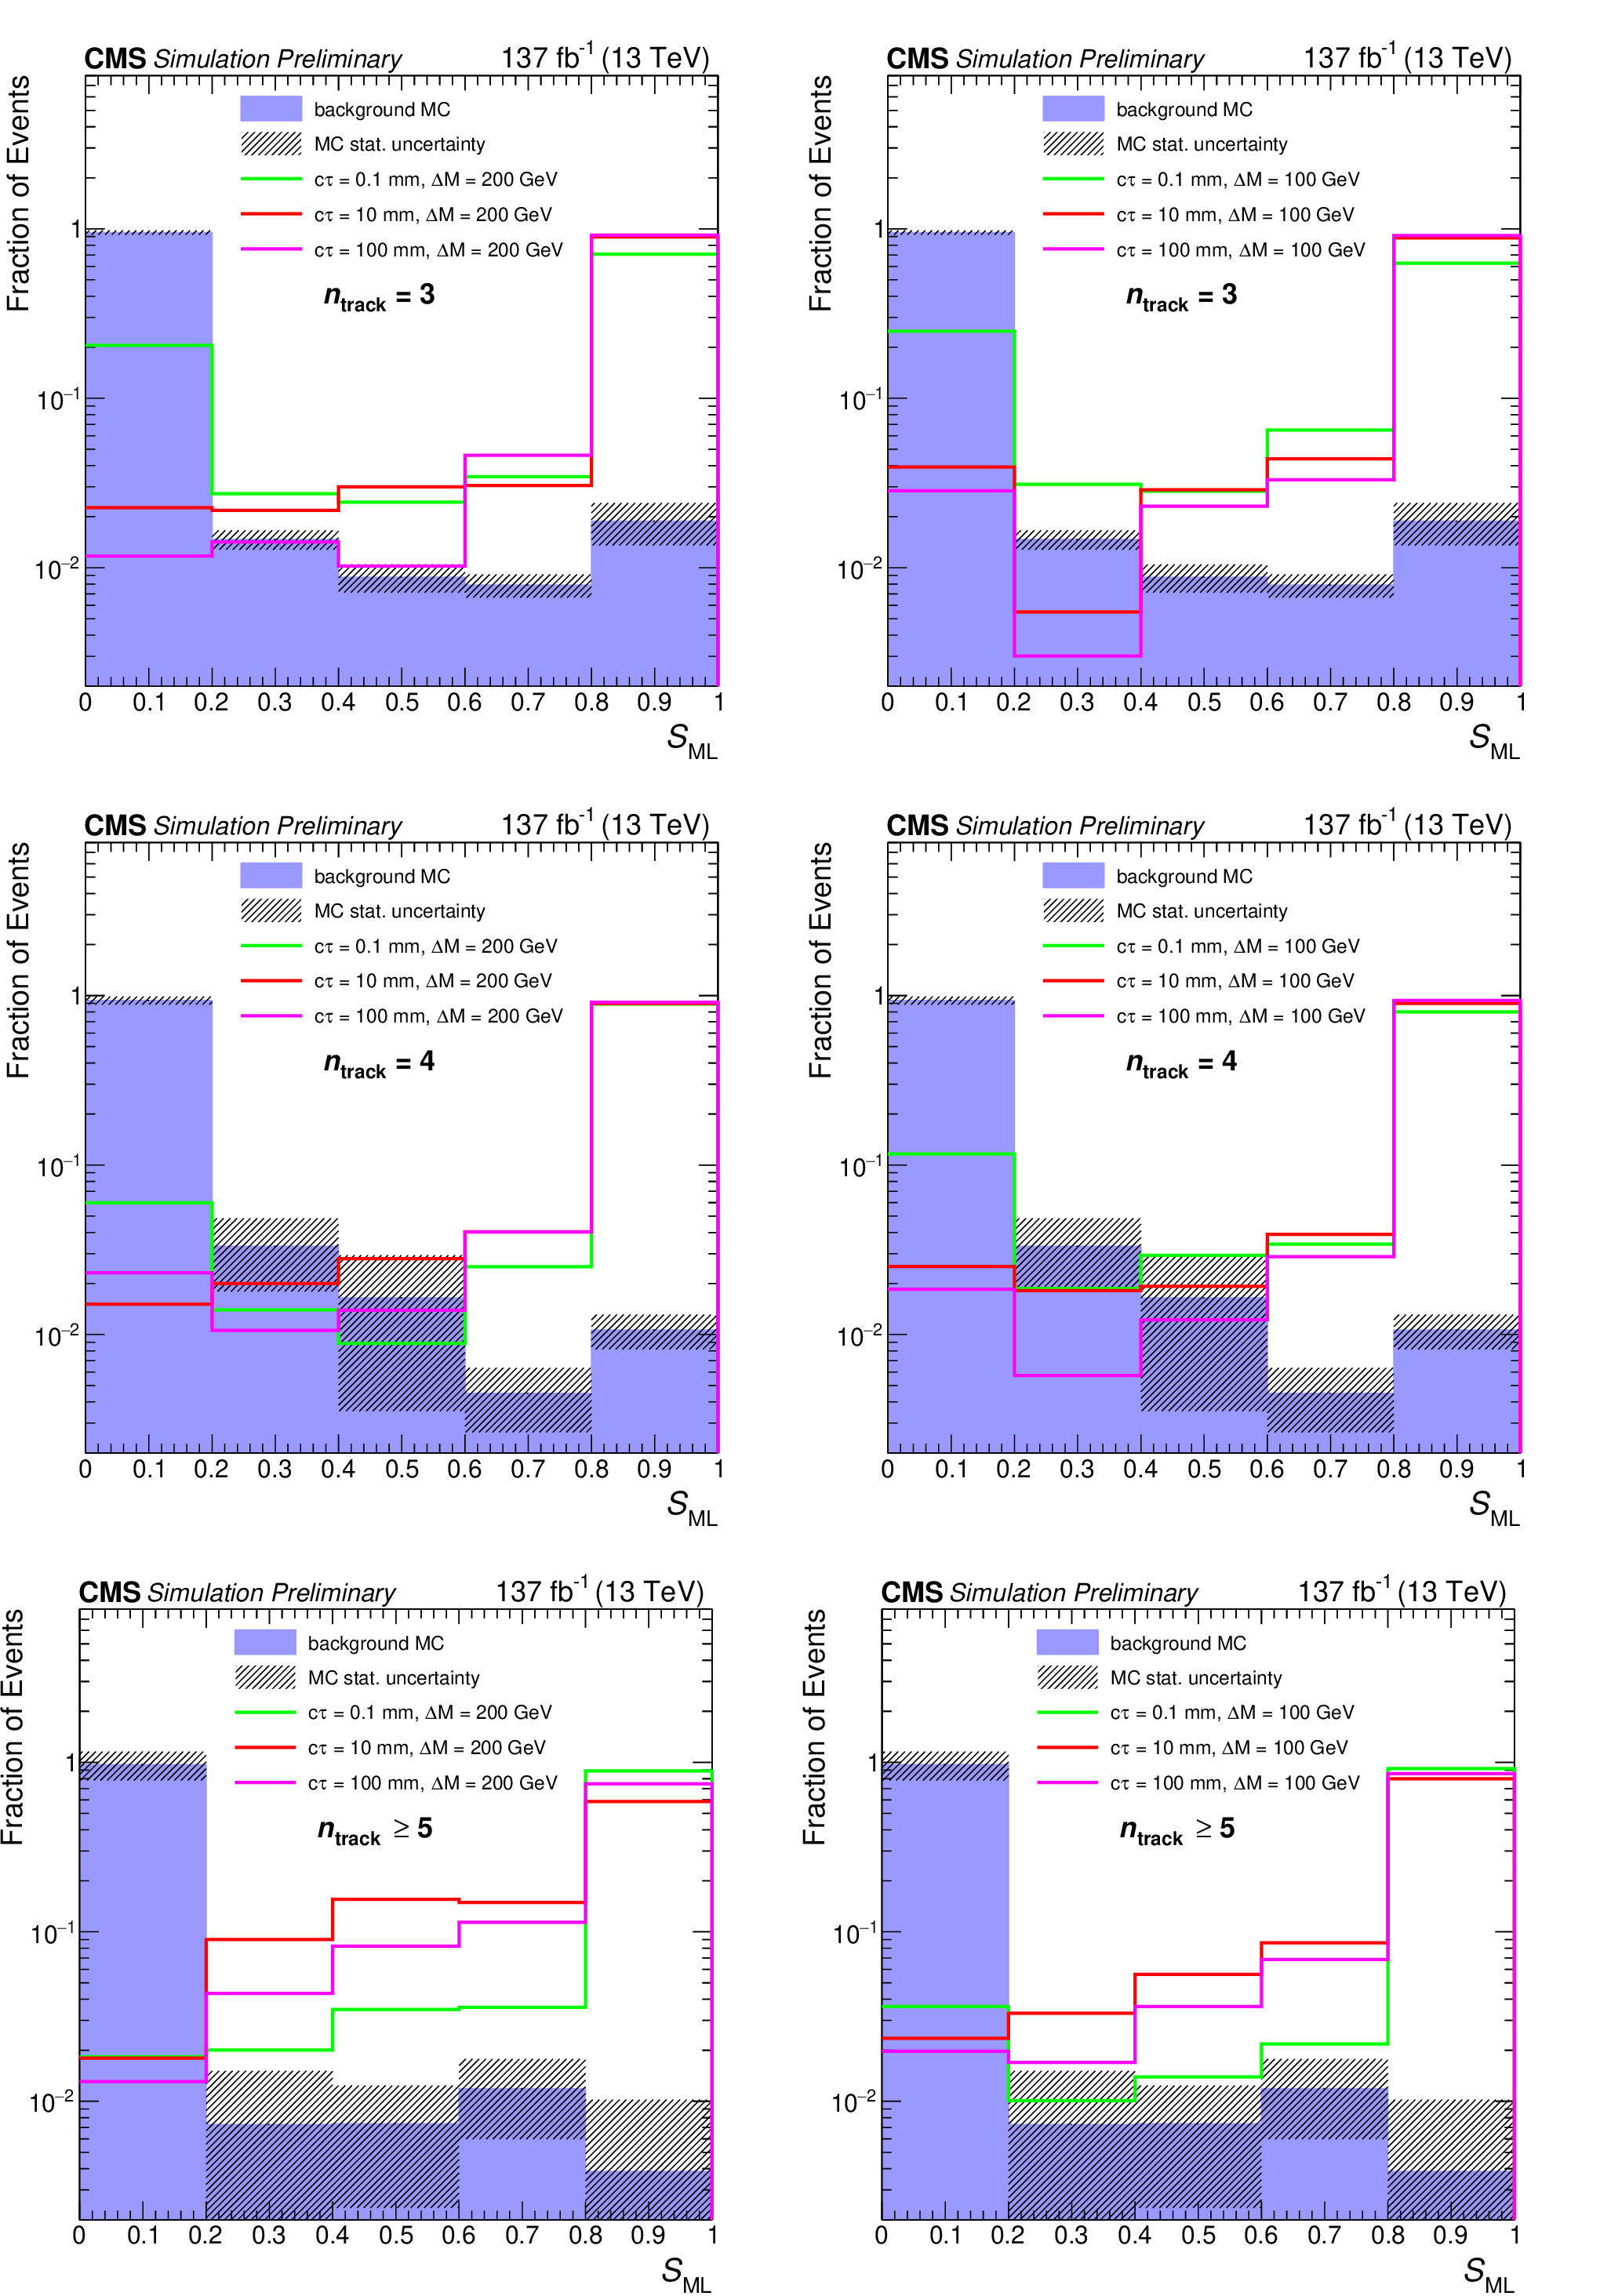
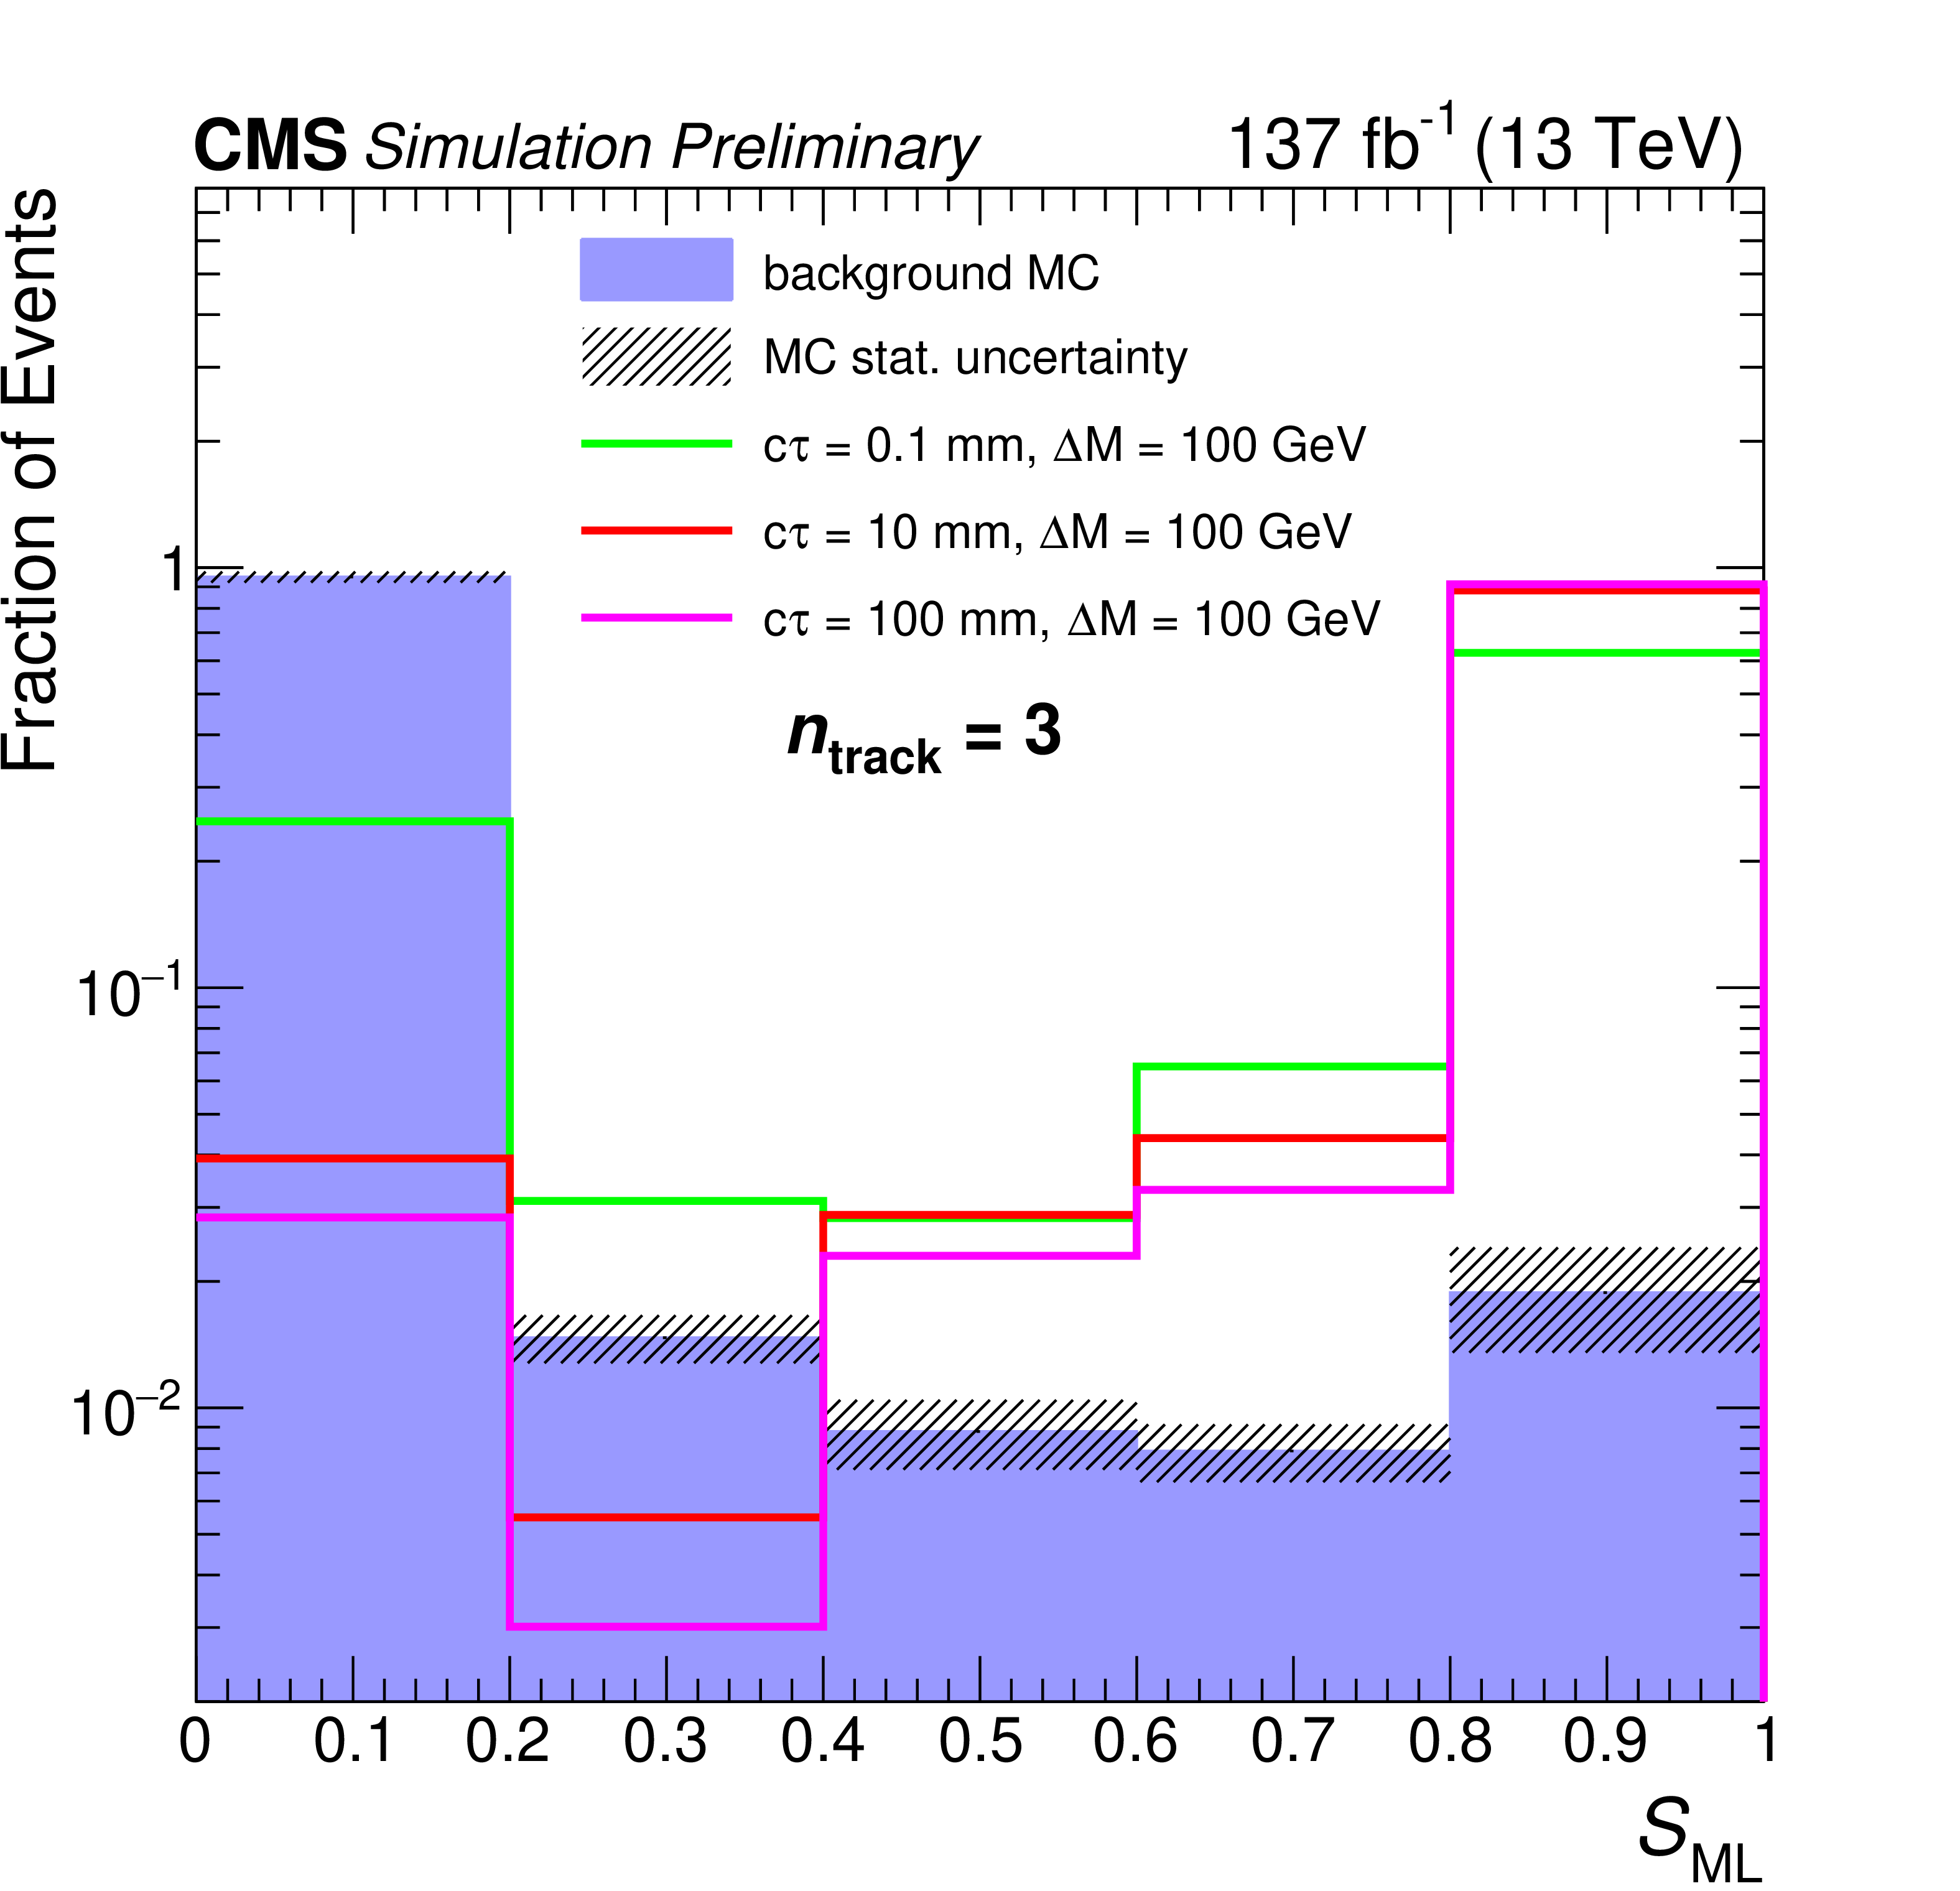
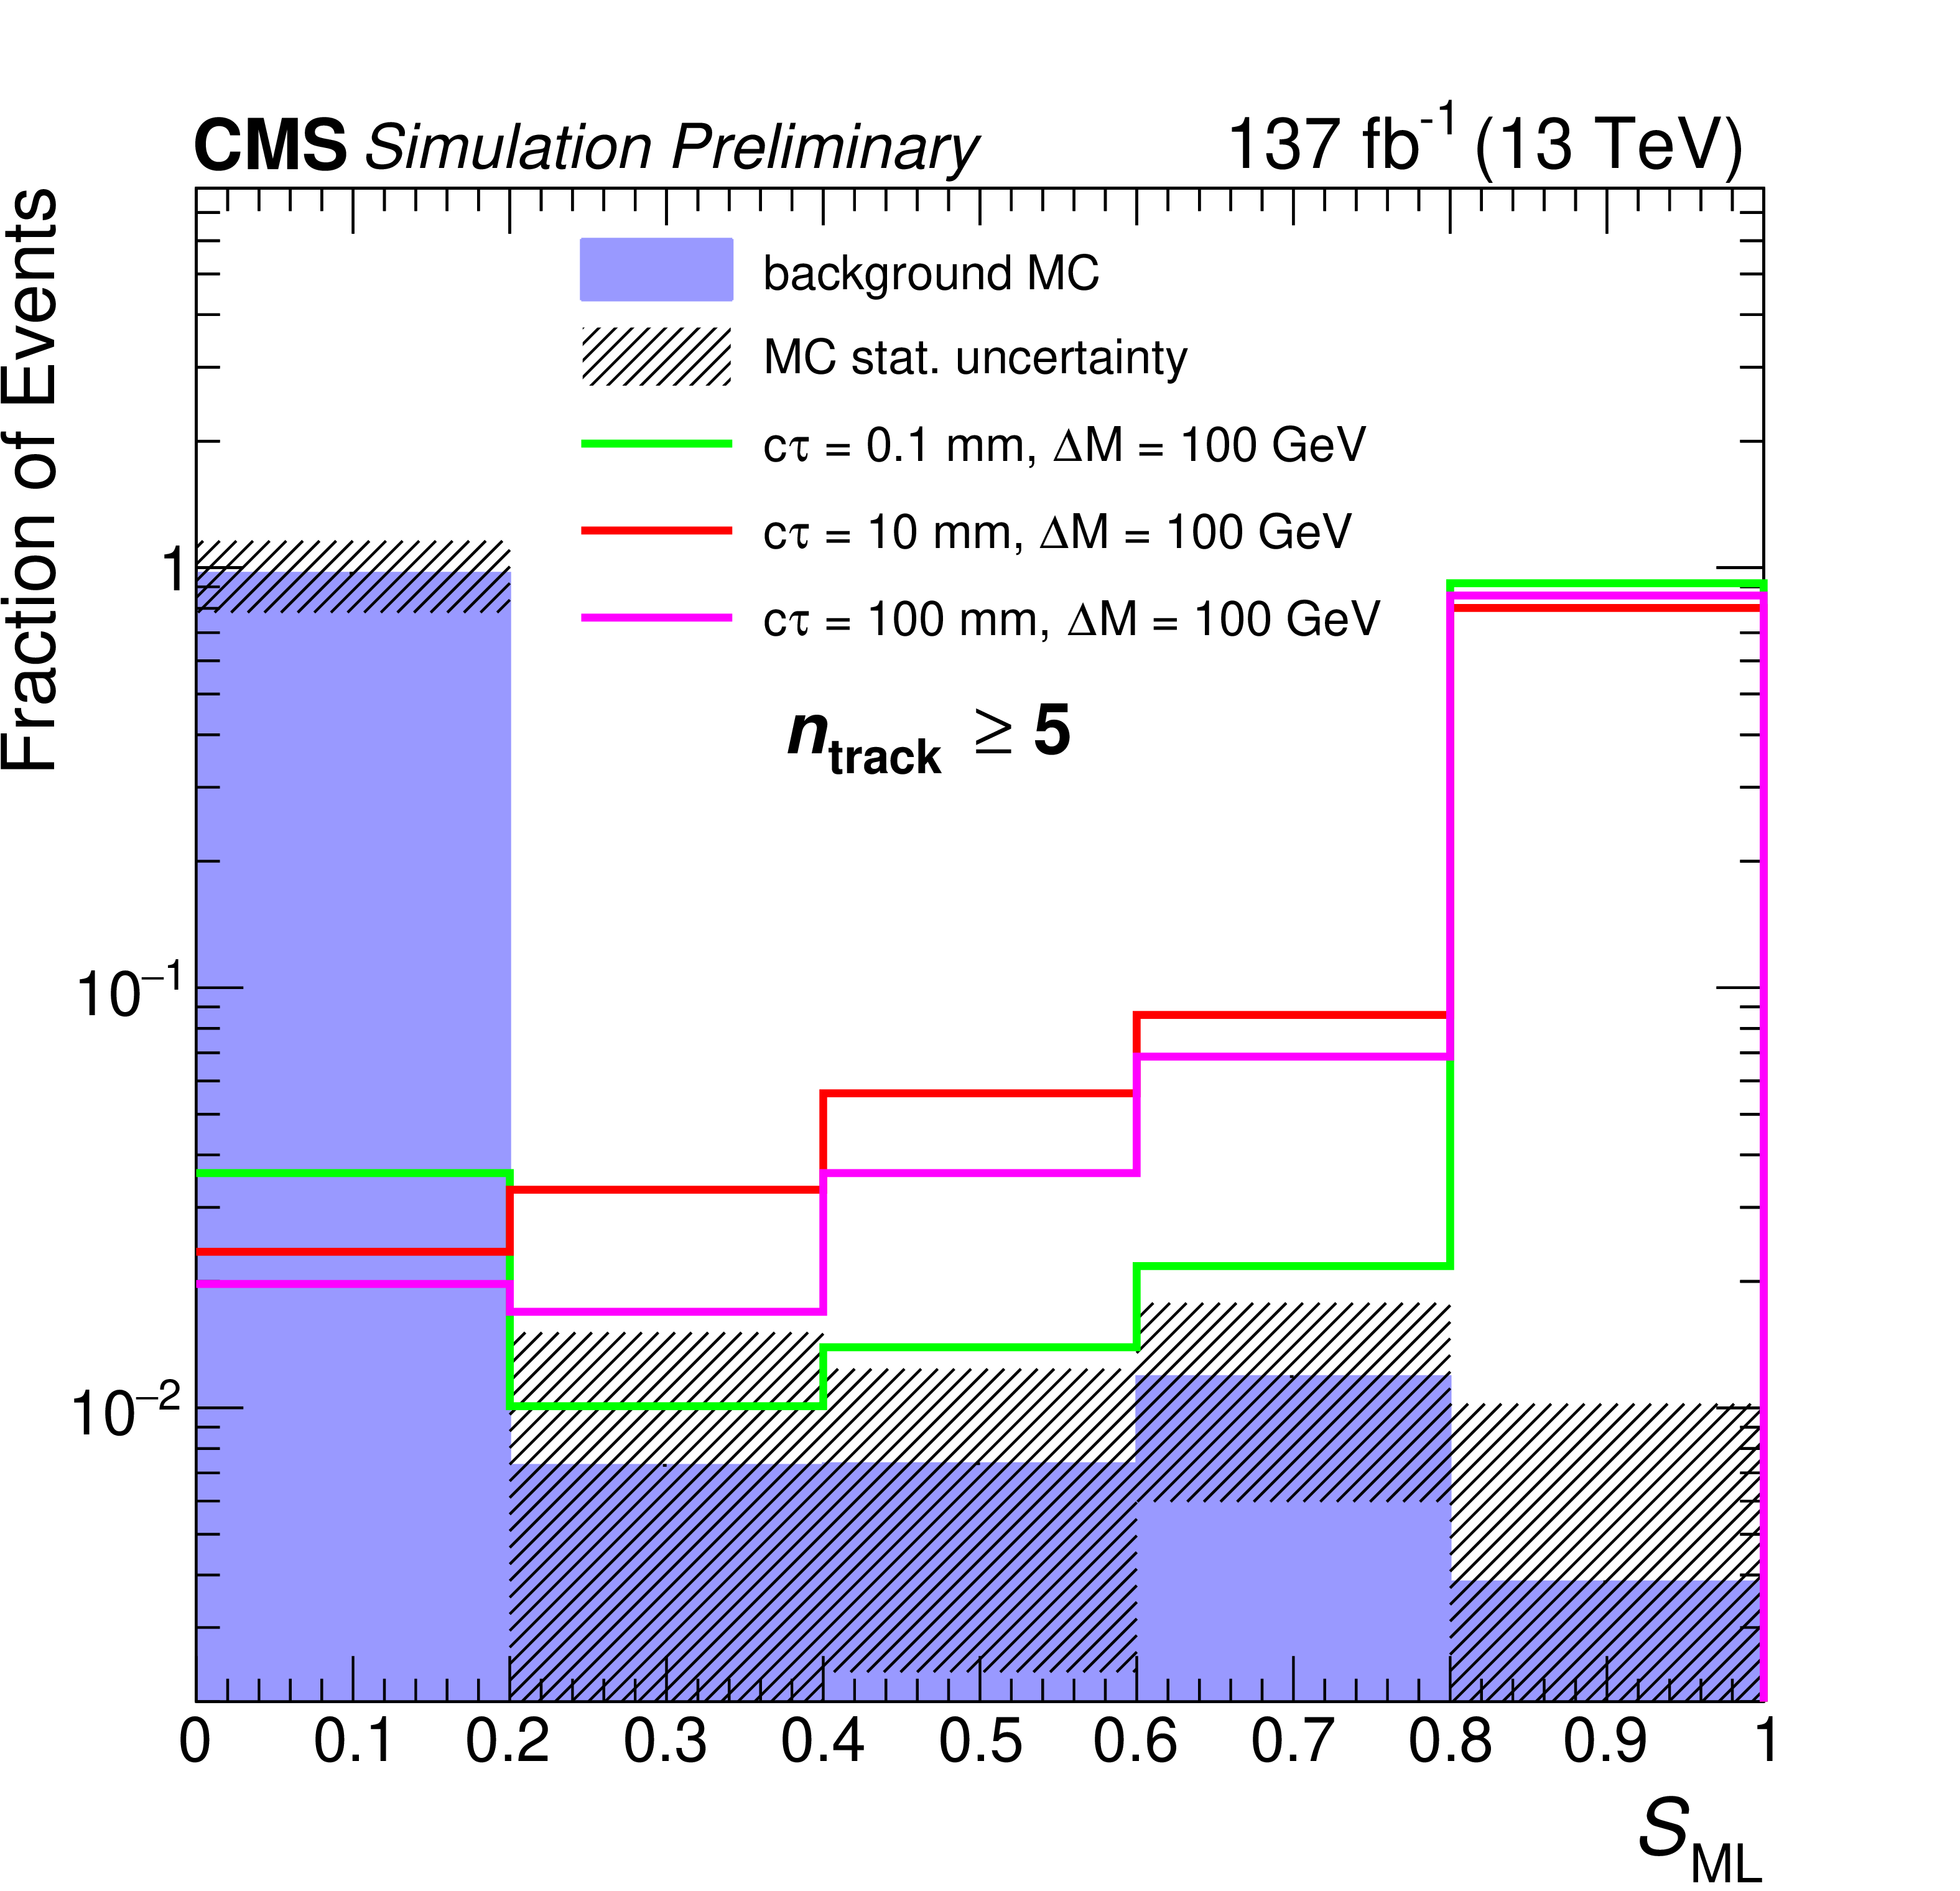
Distributions of $ S_{\text{ML}} $ for simulated background and signal in the Run-2 dataset. Events with $ n_{\text{track}} $ of 3 (top), 4 (middle), and $ \geq $5 (bottom) are shown individually. The distributions are shown for split SUSY signals with a gluino mass of 2000 GeV and neutralino mass of 1900 GeV (left) and 1800 GeV (right). Different gluino proper decay lengths are shown as $ c\tau $ in the legend. |
png pdf |
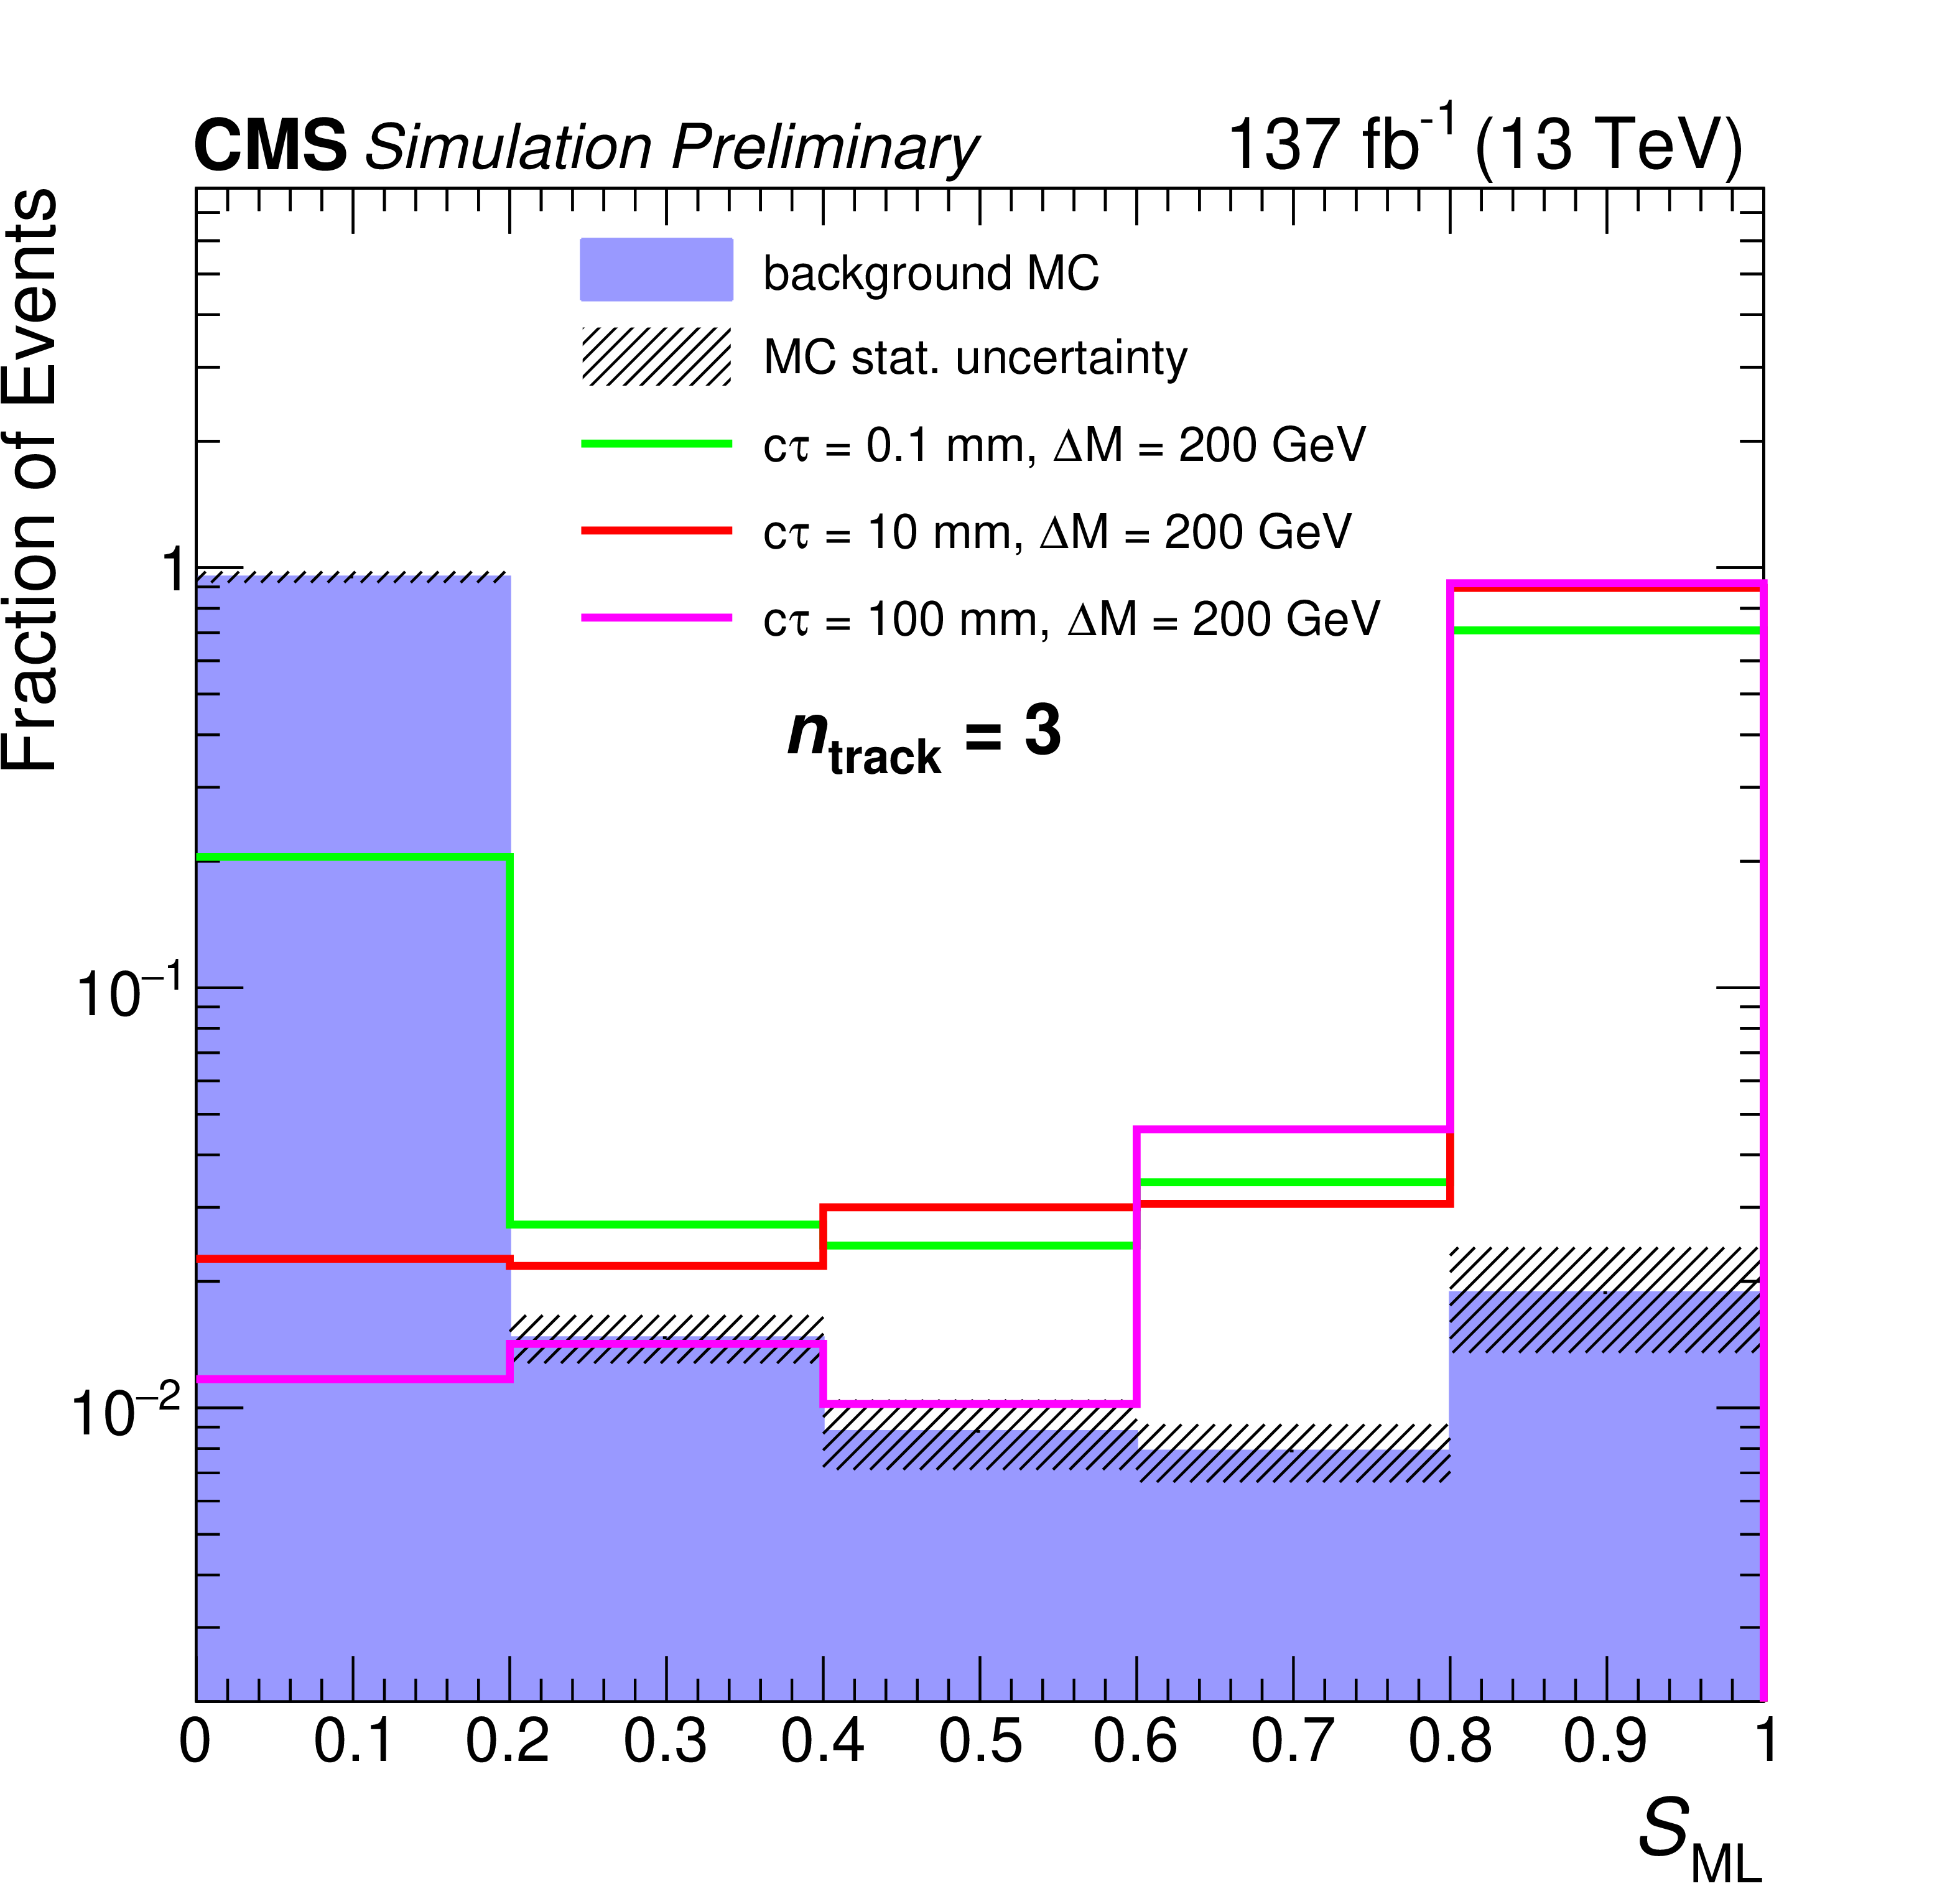
Figure 3-a:
Distributions of $ S_{\text{ML}} $ for simulated background and signal in the Run-2 dataset. Events with $ n_{\text{track}} $ of 3 (top), 4 (middle), and $ \geq $5 (bottom) are shown individually. The distributions are shown for split SUSY signals with a gluino mass of 2000 GeV and neutralino mass of 1900 GeV (left) and 1800 GeV (right). Different gluino proper decay lengths are shown as $ c\tau $ in the legend. |
png pdf |
Figure 3-b:
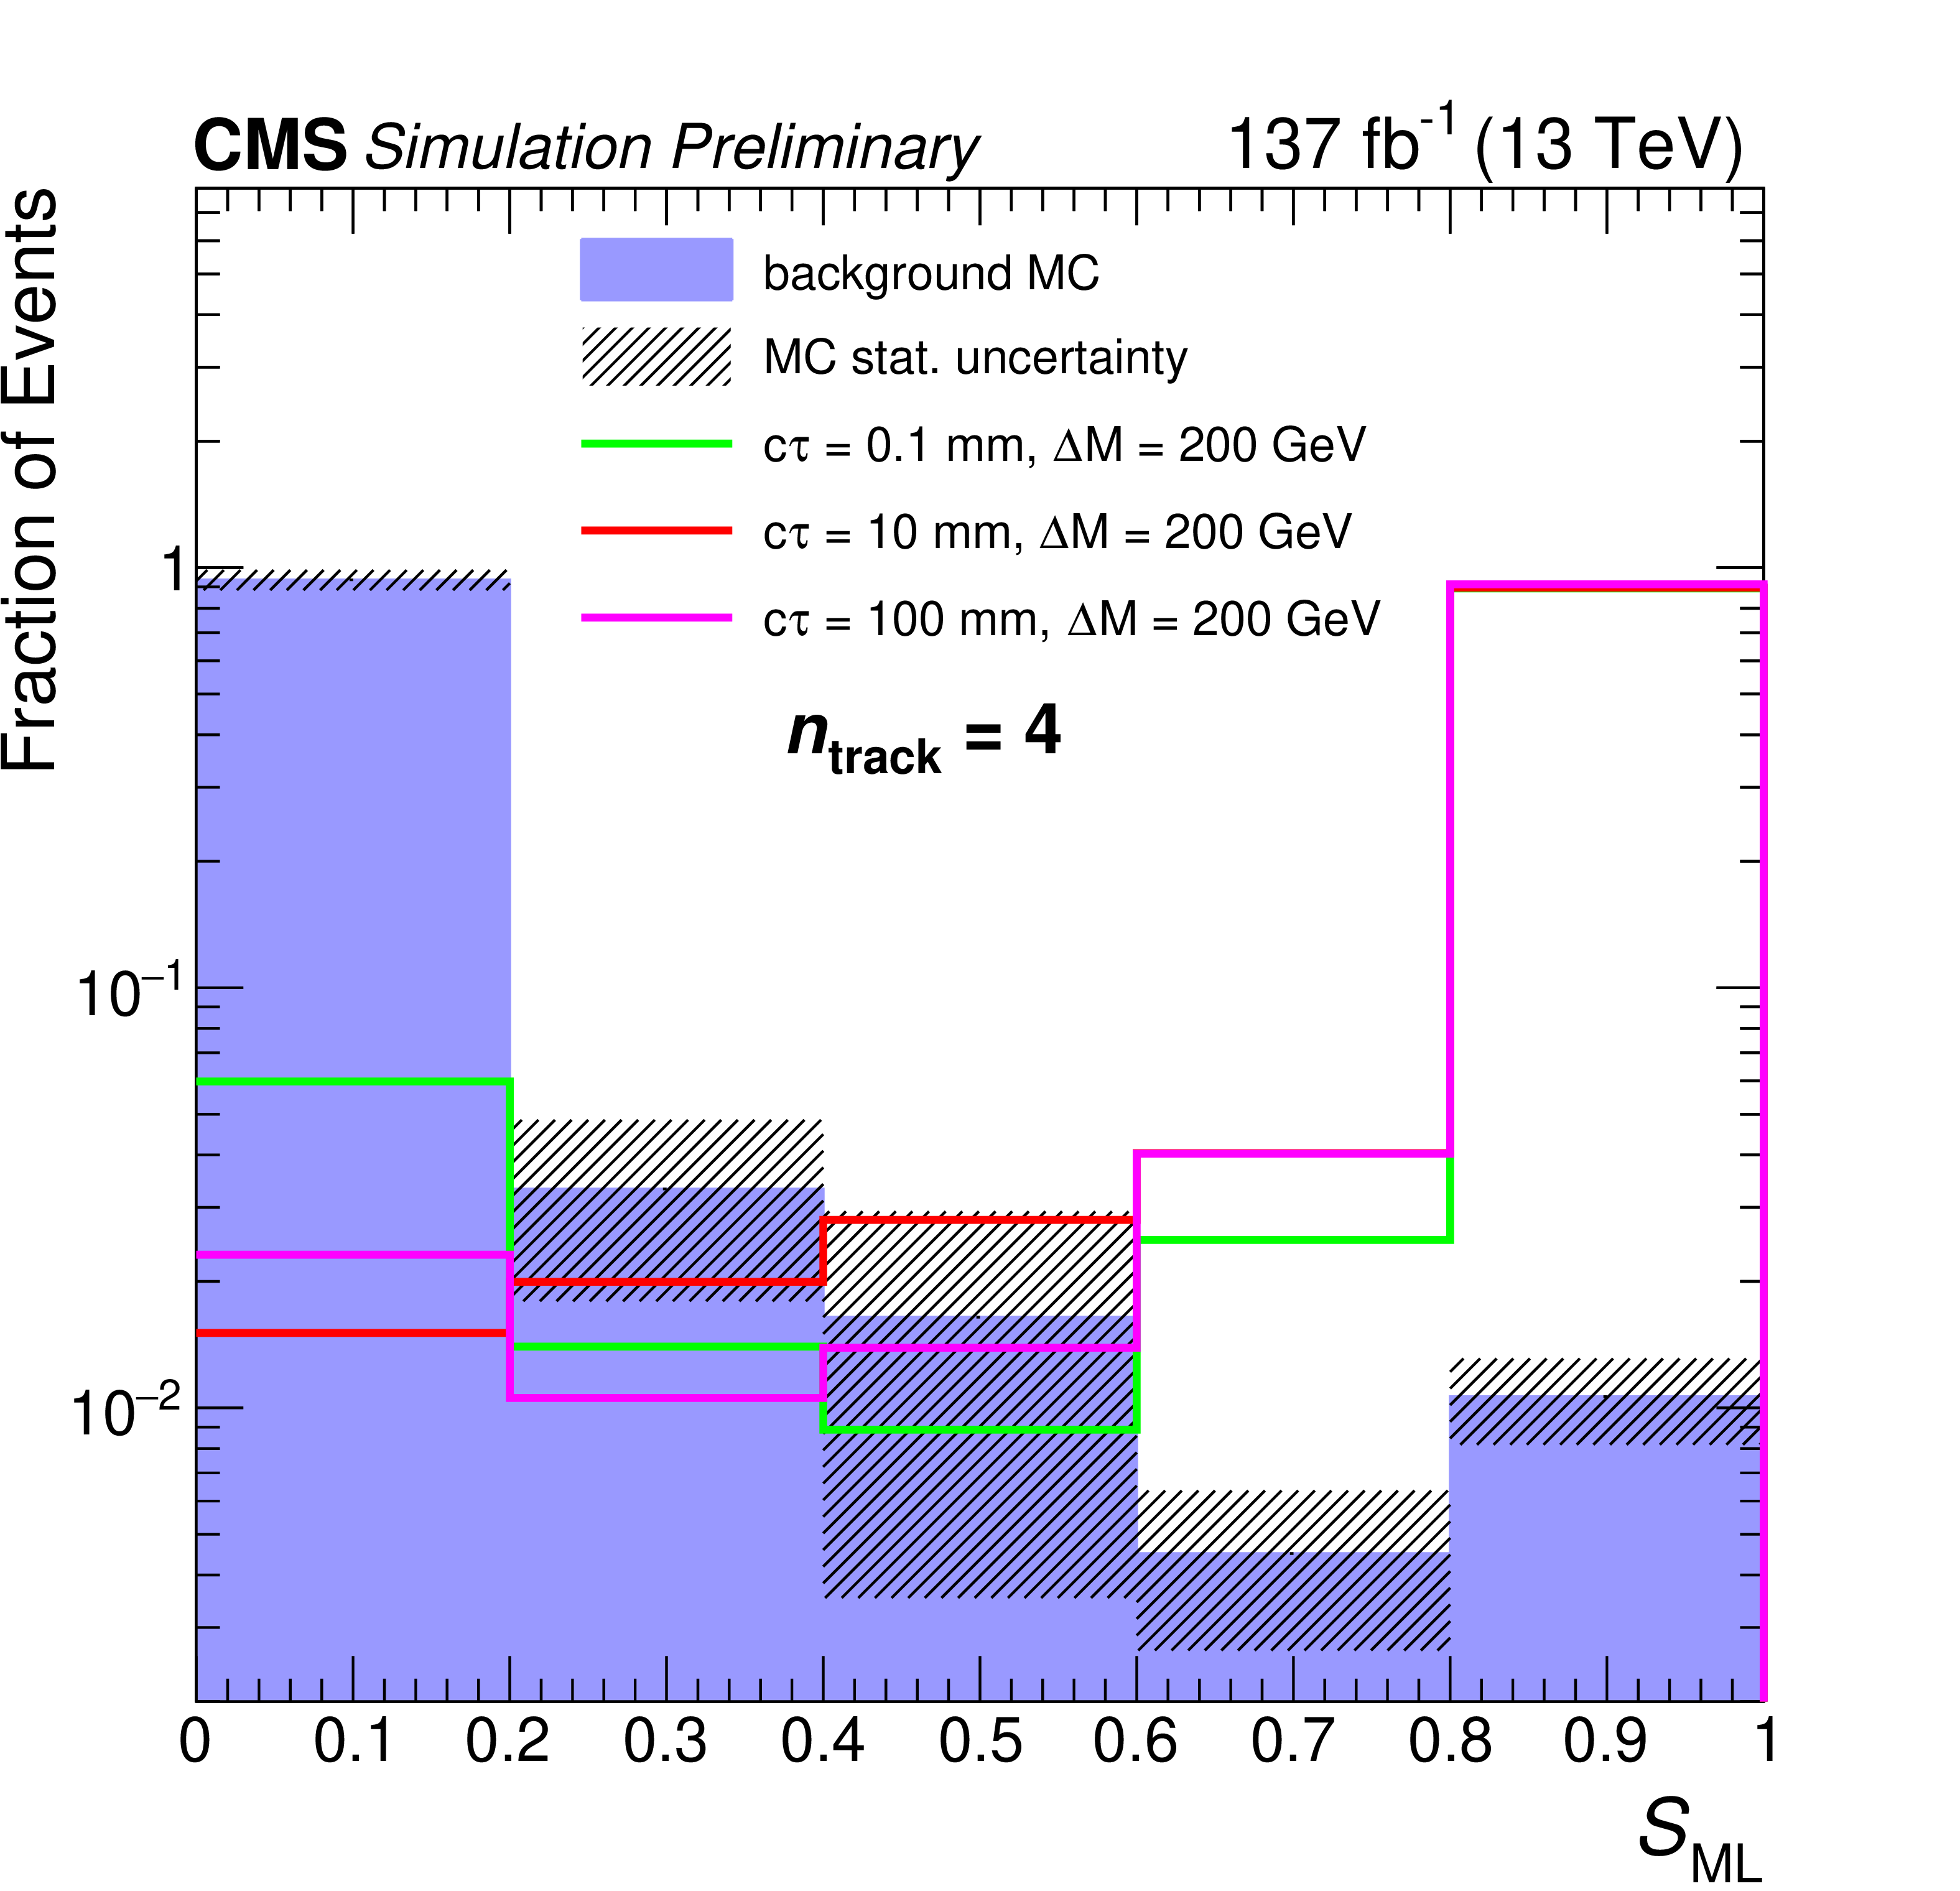
Distributions of $ S_{\text{ML}} $ for simulated background and signal in the Run-2 dataset. Events with $ n_{\text{track}} $ of 3 (top), 4 (middle), and $ \geq $5 (bottom) are shown individually. The distributions are shown for split SUSY signals with a gluino mass of 2000 GeV and neutralino mass of 1900 GeV (left) and 1800 GeV (right). Different gluino proper decay lengths are shown as $ c\tau $ in the legend. |
png pdf |
Figure 3-c:
Distributions of $ S_{\text{ML}} $ for simulated background and signal in the Run-2 dataset. Events with $ n_{\text{track}} $ of 3 (top), 4 (middle), and $ \geq $5 (bottom) are shown individually. The distributions are shown for split SUSY signals with a gluino mass of 2000 GeV and neutralino mass of 1900 GeV (left) and 1800 GeV (right). Different gluino proper decay lengths are shown as $ c\tau $ in the legend. |
png pdf |
Figure 3-d:
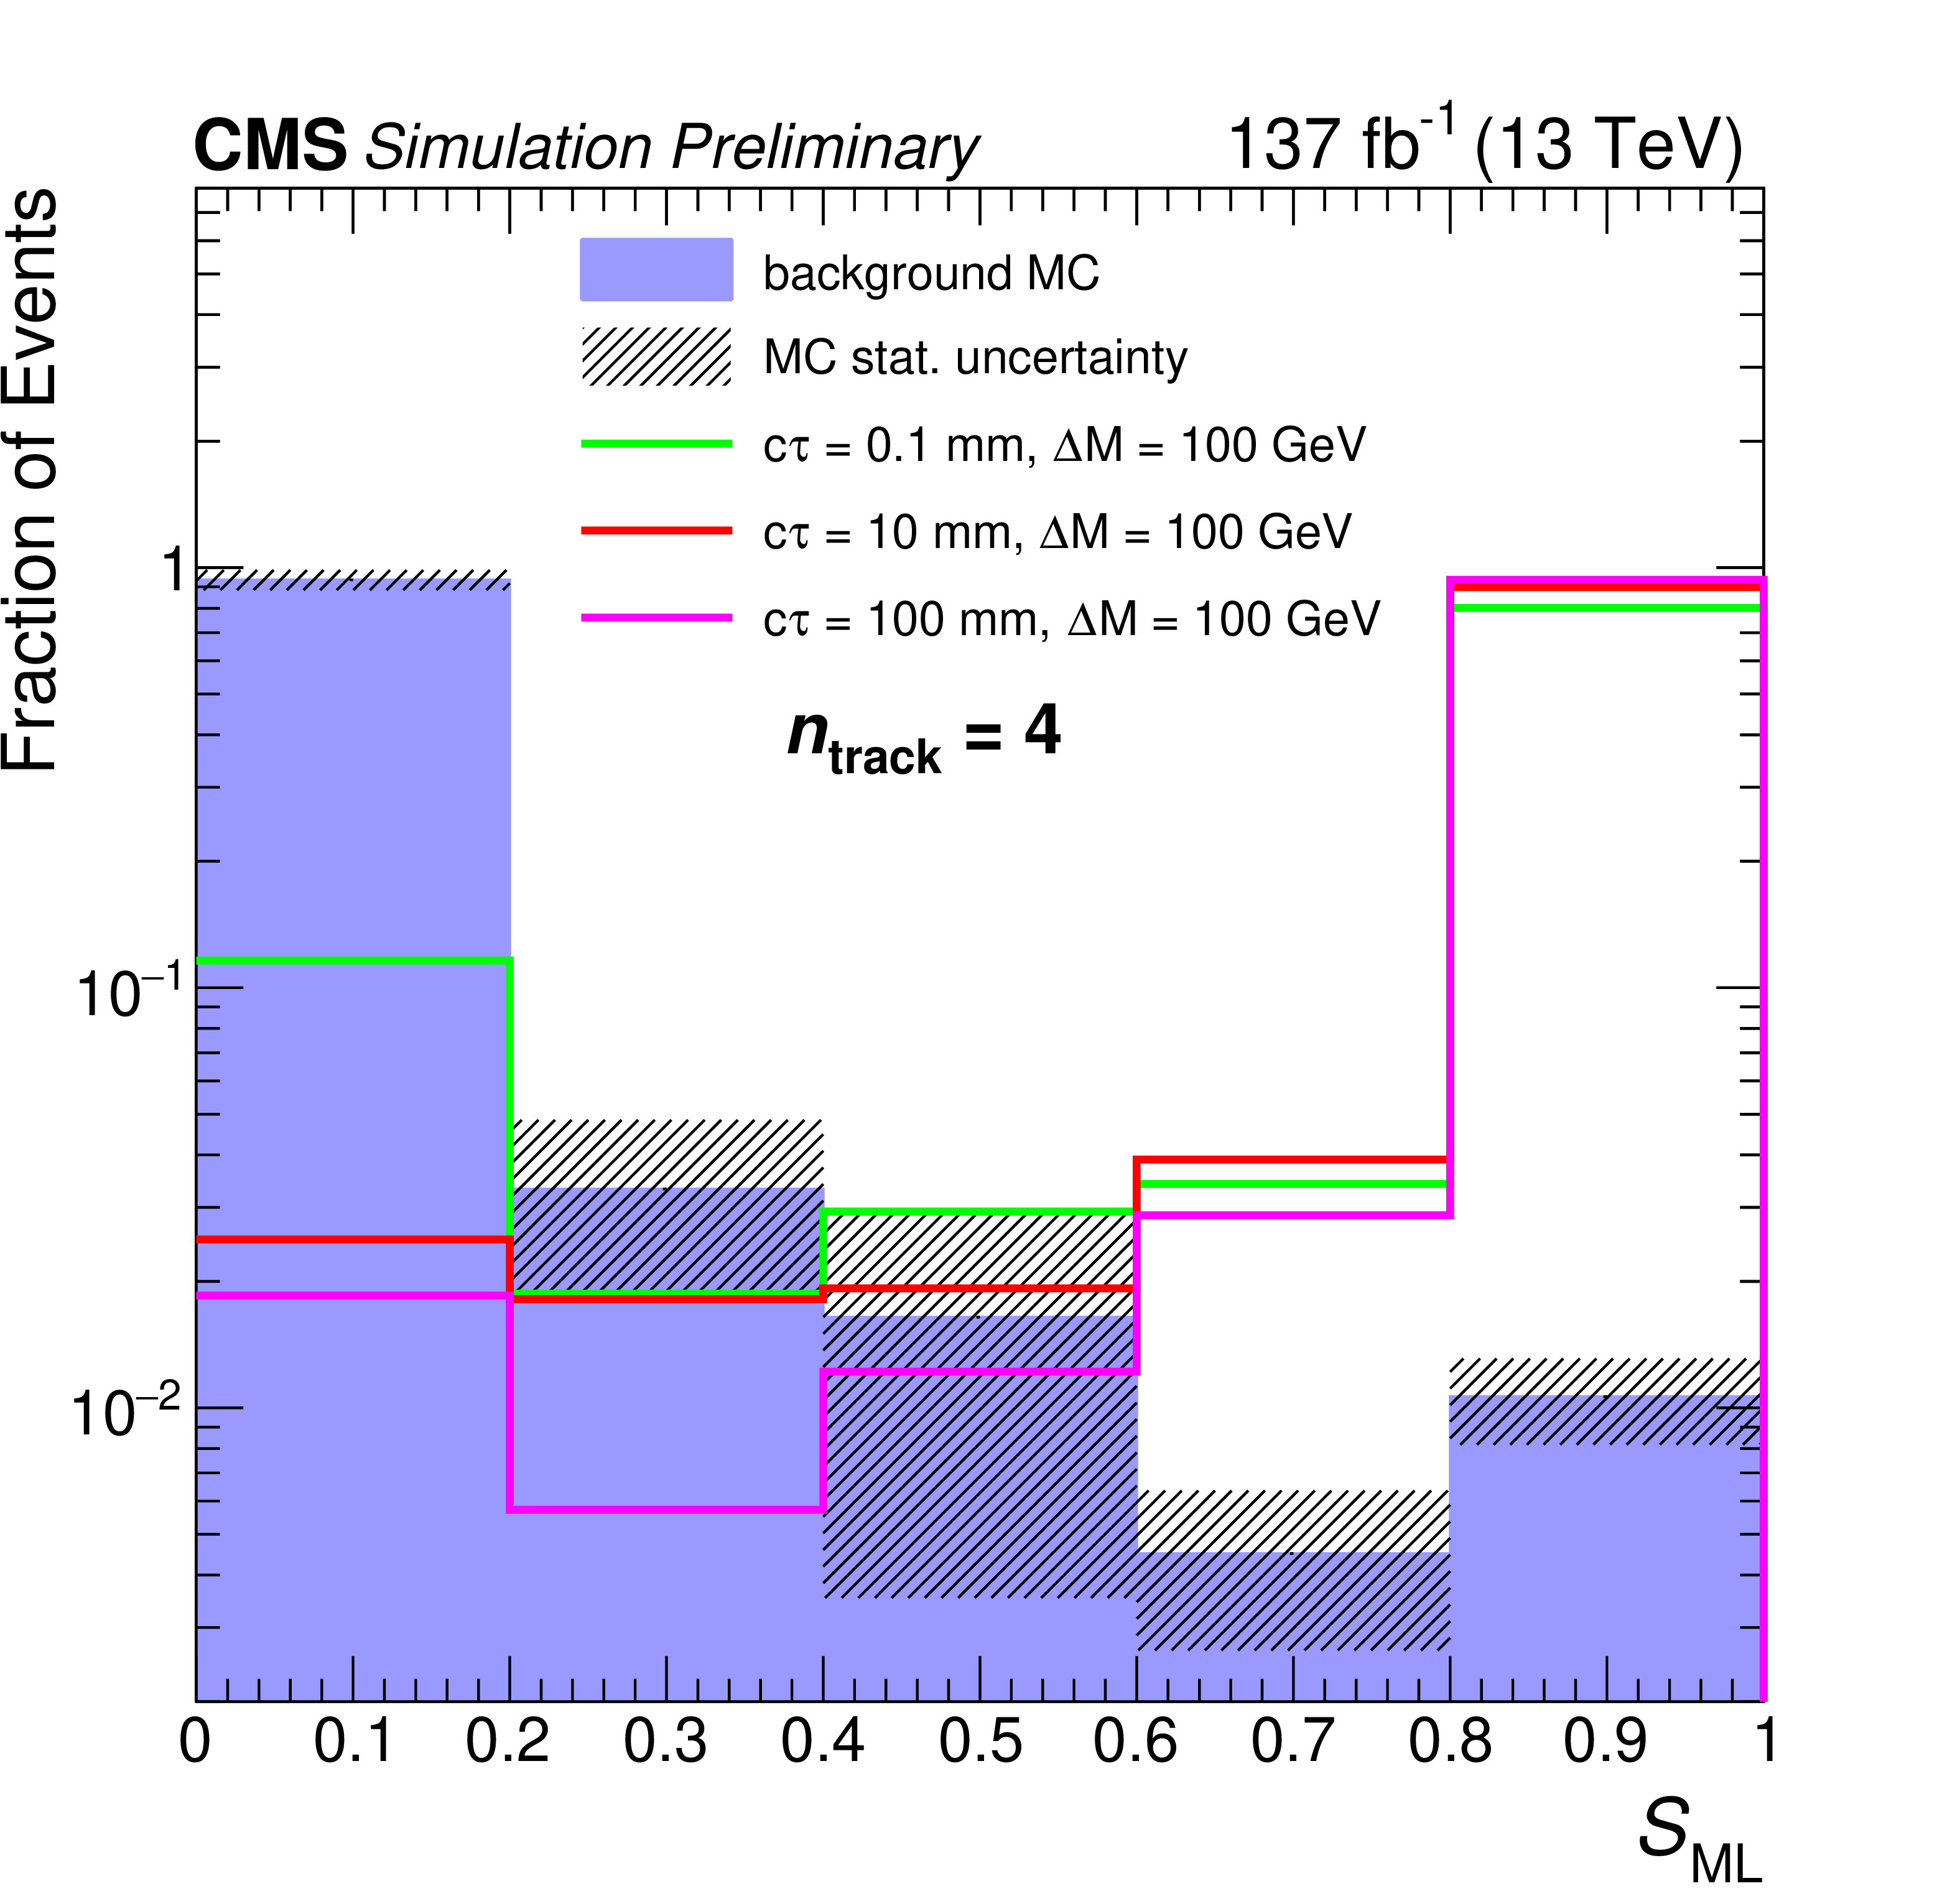
Distributions of $ S_{\text{ML}} $ for simulated background and signal in the Run-2 dataset. Events with $ n_{\text{track}} $ of 3 (top), 4 (middle), and $ \geq $5 (bottom) are shown individually. The distributions are shown for split SUSY signals with a gluino mass of 2000 GeV and neutralino mass of 1900 GeV (left) and 1800 GeV (right). Different gluino proper decay lengths are shown as $ c\tau $ in the legend. |
png pdf |
Figure 3-e:
Distributions of $ S_{\text{ML}} $ for simulated background and signal in the Run-2 dataset. Events with $ n_{\text{track}} $ of 3 (top), 4 (middle), and $ \geq $5 (bottom) are shown individually. The distributions are shown for split SUSY signals with a gluino mass of 2000 GeV and neutralino mass of 1900 GeV (left) and 1800 GeV (right). Different gluino proper decay lengths are shown as $ c\tau $ in the legend. |
png pdf |
Figure 3-f:
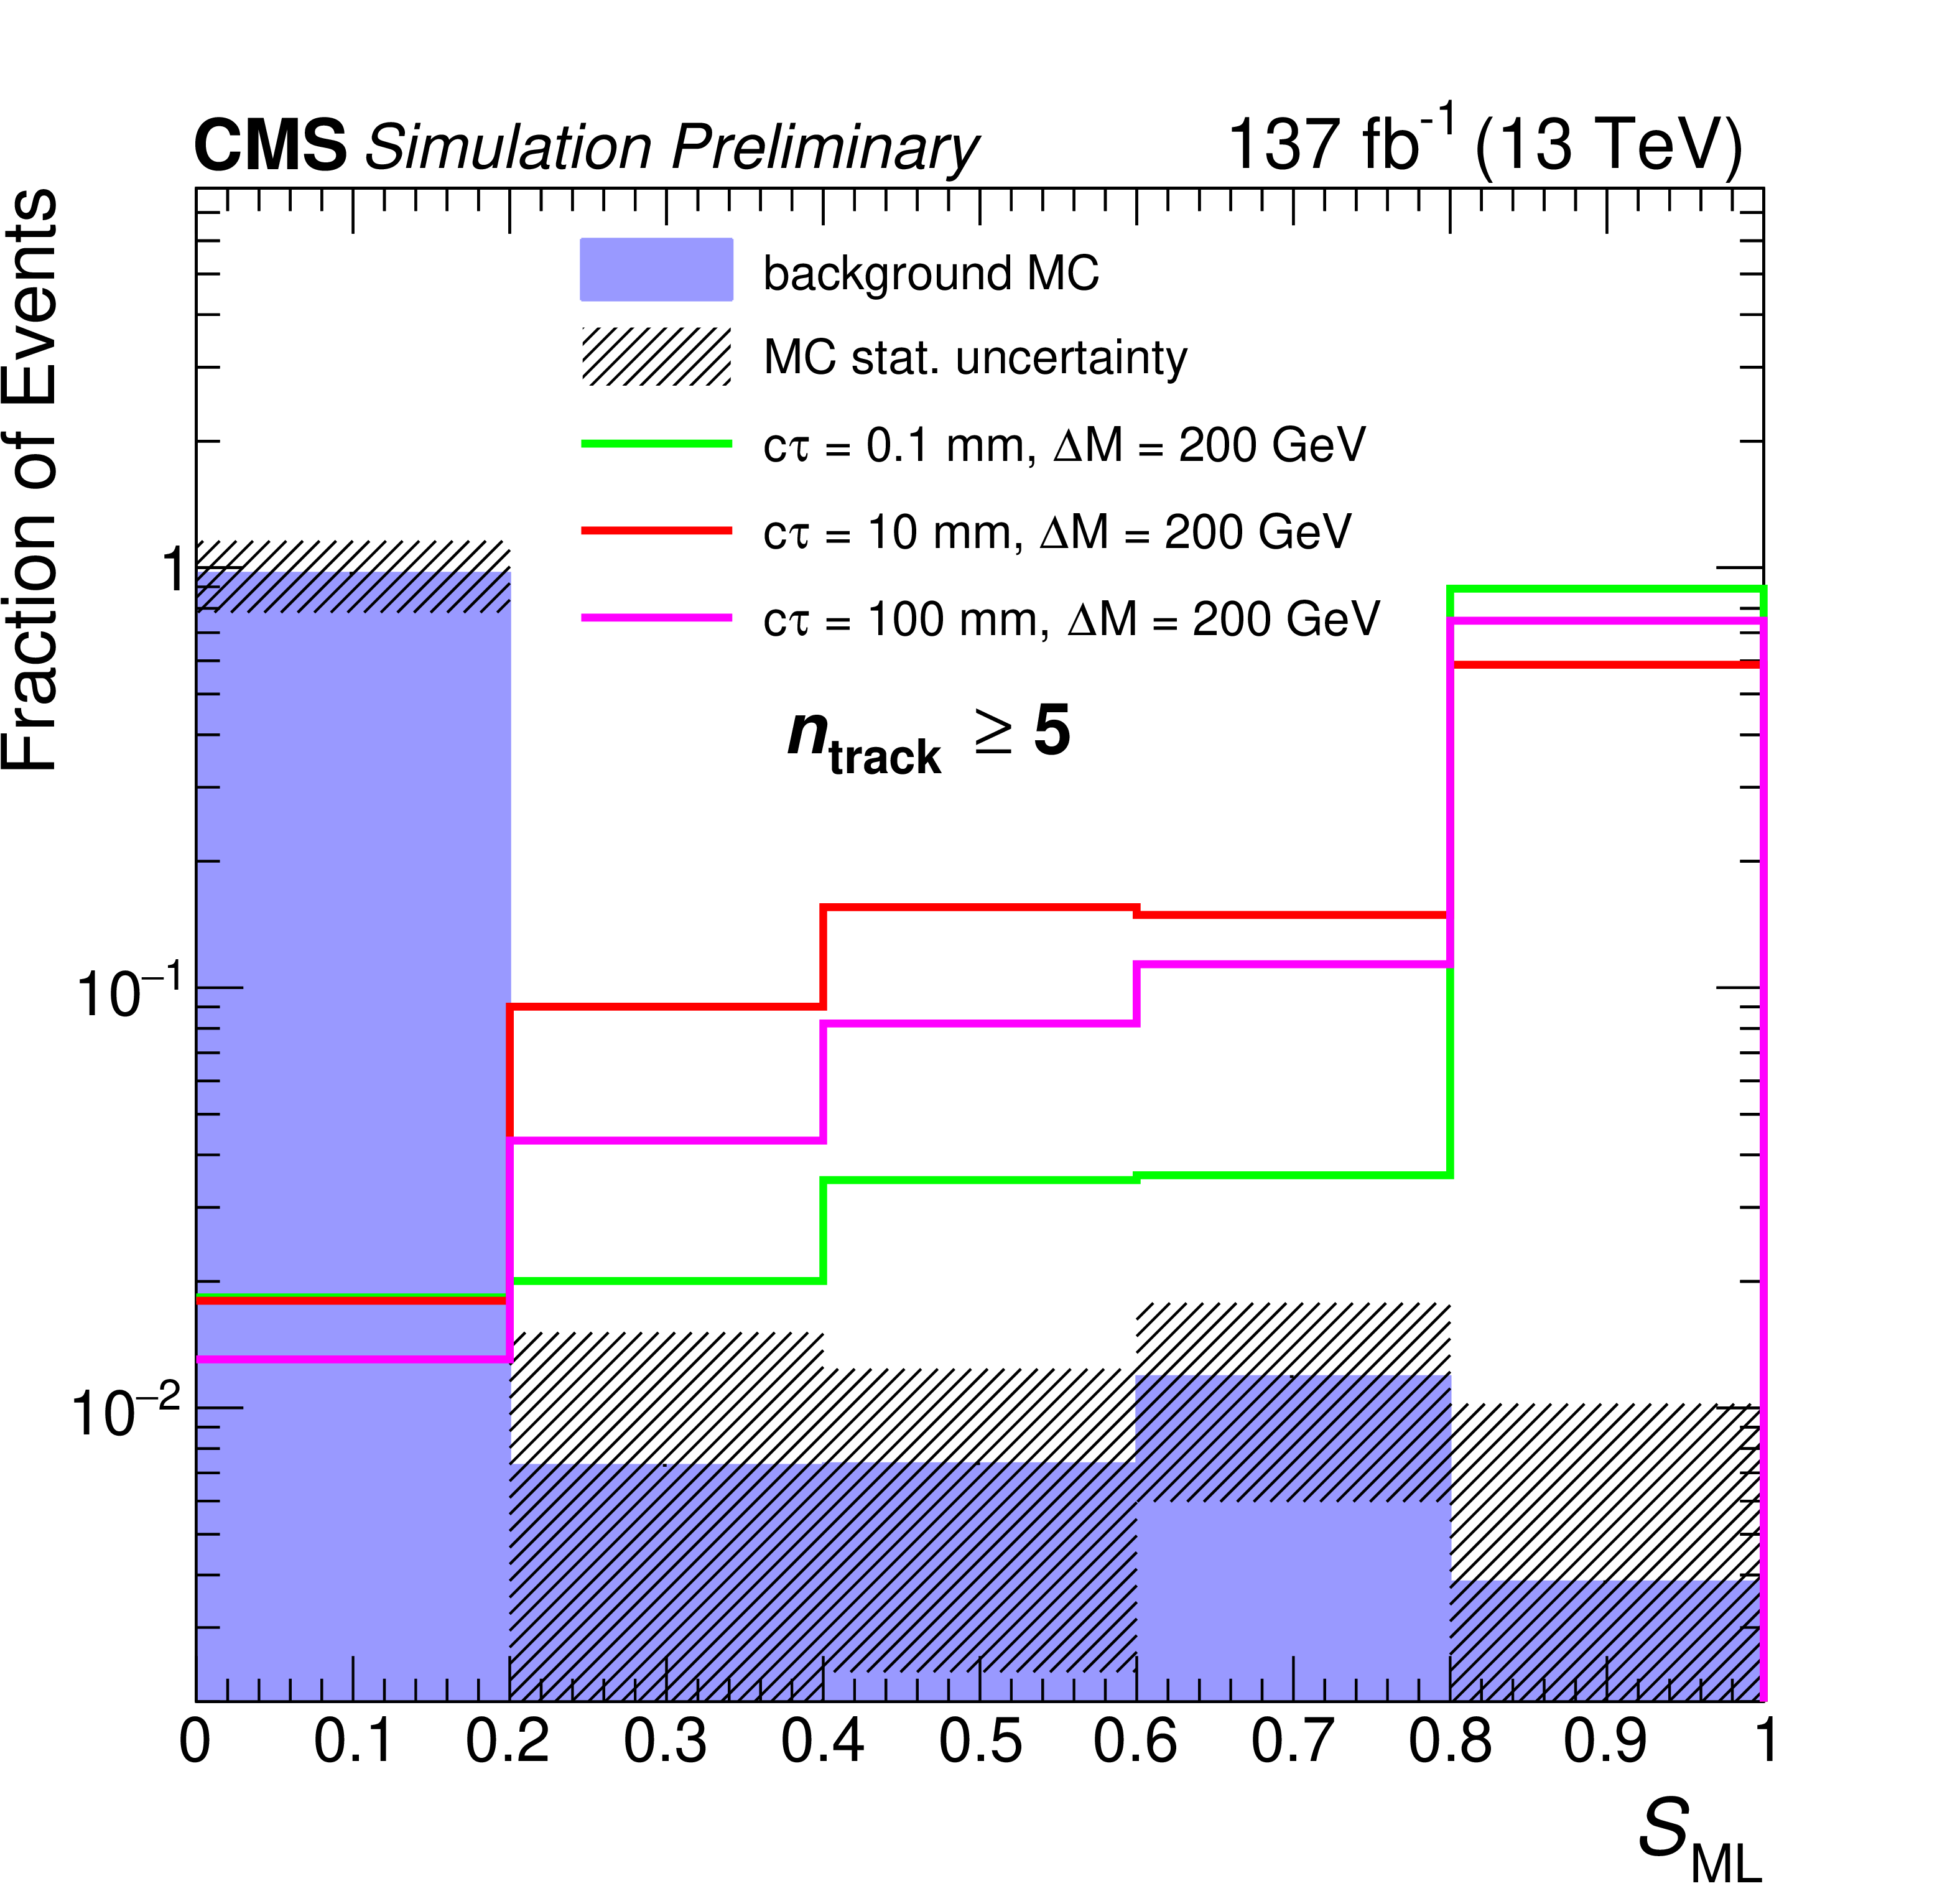
Distributions of $ S_{\text{ML}} $ for simulated background and signal in the Run-2 dataset. Events with $ n_{\text{track}} $ of 3 (top), 4 (middle), and $ \geq $5 (bottom) are shown individually. The distributions are shown for split SUSY signals with a gluino mass of 2000 GeV and neutralino mass of 1900 GeV (left) and 1800 GeV (right). Different gluino proper decay lengths are shown as $ c\tau $ in the legend. |
png pdf |
Figure 4:
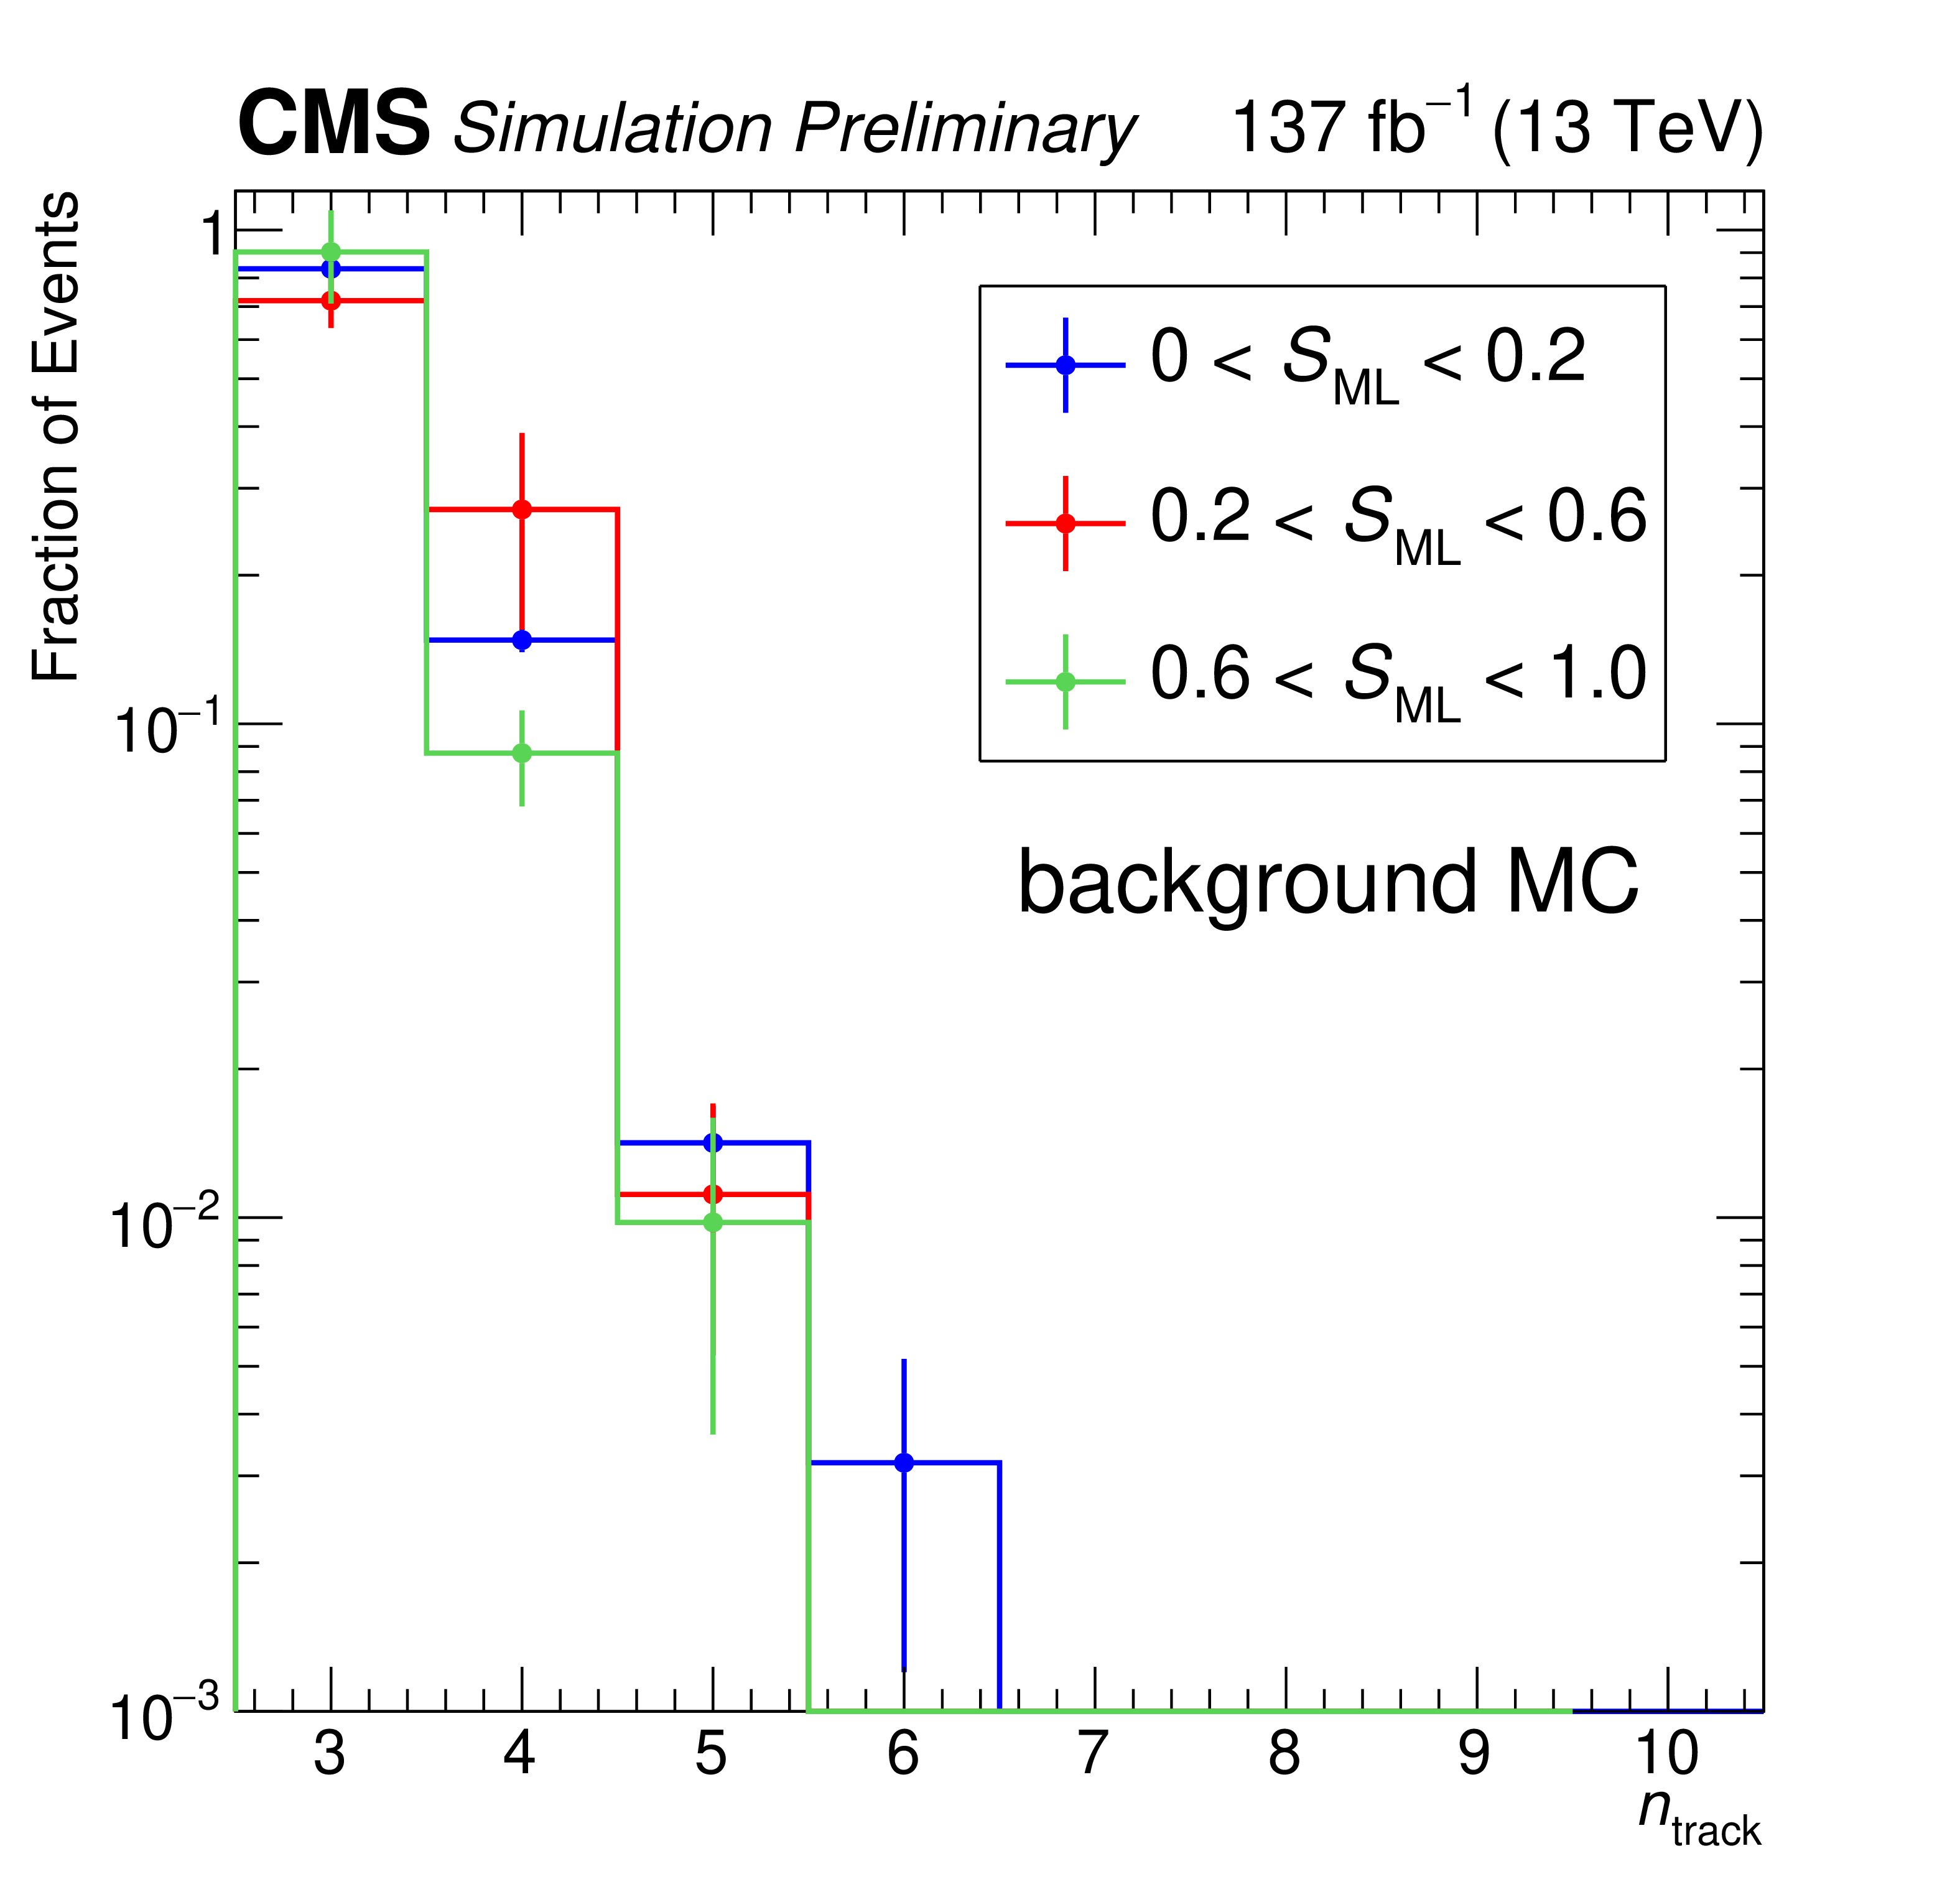
The distribution of $ n_{\text{track}} $ in different $ S_{\text{ML}} $ regions for simulated background events in Run-2. Events with 0 $ < S_{\text{ML}} < $ 0.2 (blue), 0.2 $ < S_{\text{ML}} < $ 0.6 (red), and 0.6 $ < S_{\text{ML}} < $ 1.0 (green) are compared. All distributions are normalized to the unity. The similar $ n_{\text{track}} $ distributions demonstrate that $ n_{\text{track}} $ and $ S_{\text{ML}} $ are decorrelated. |
png pdf |
Figure 5:
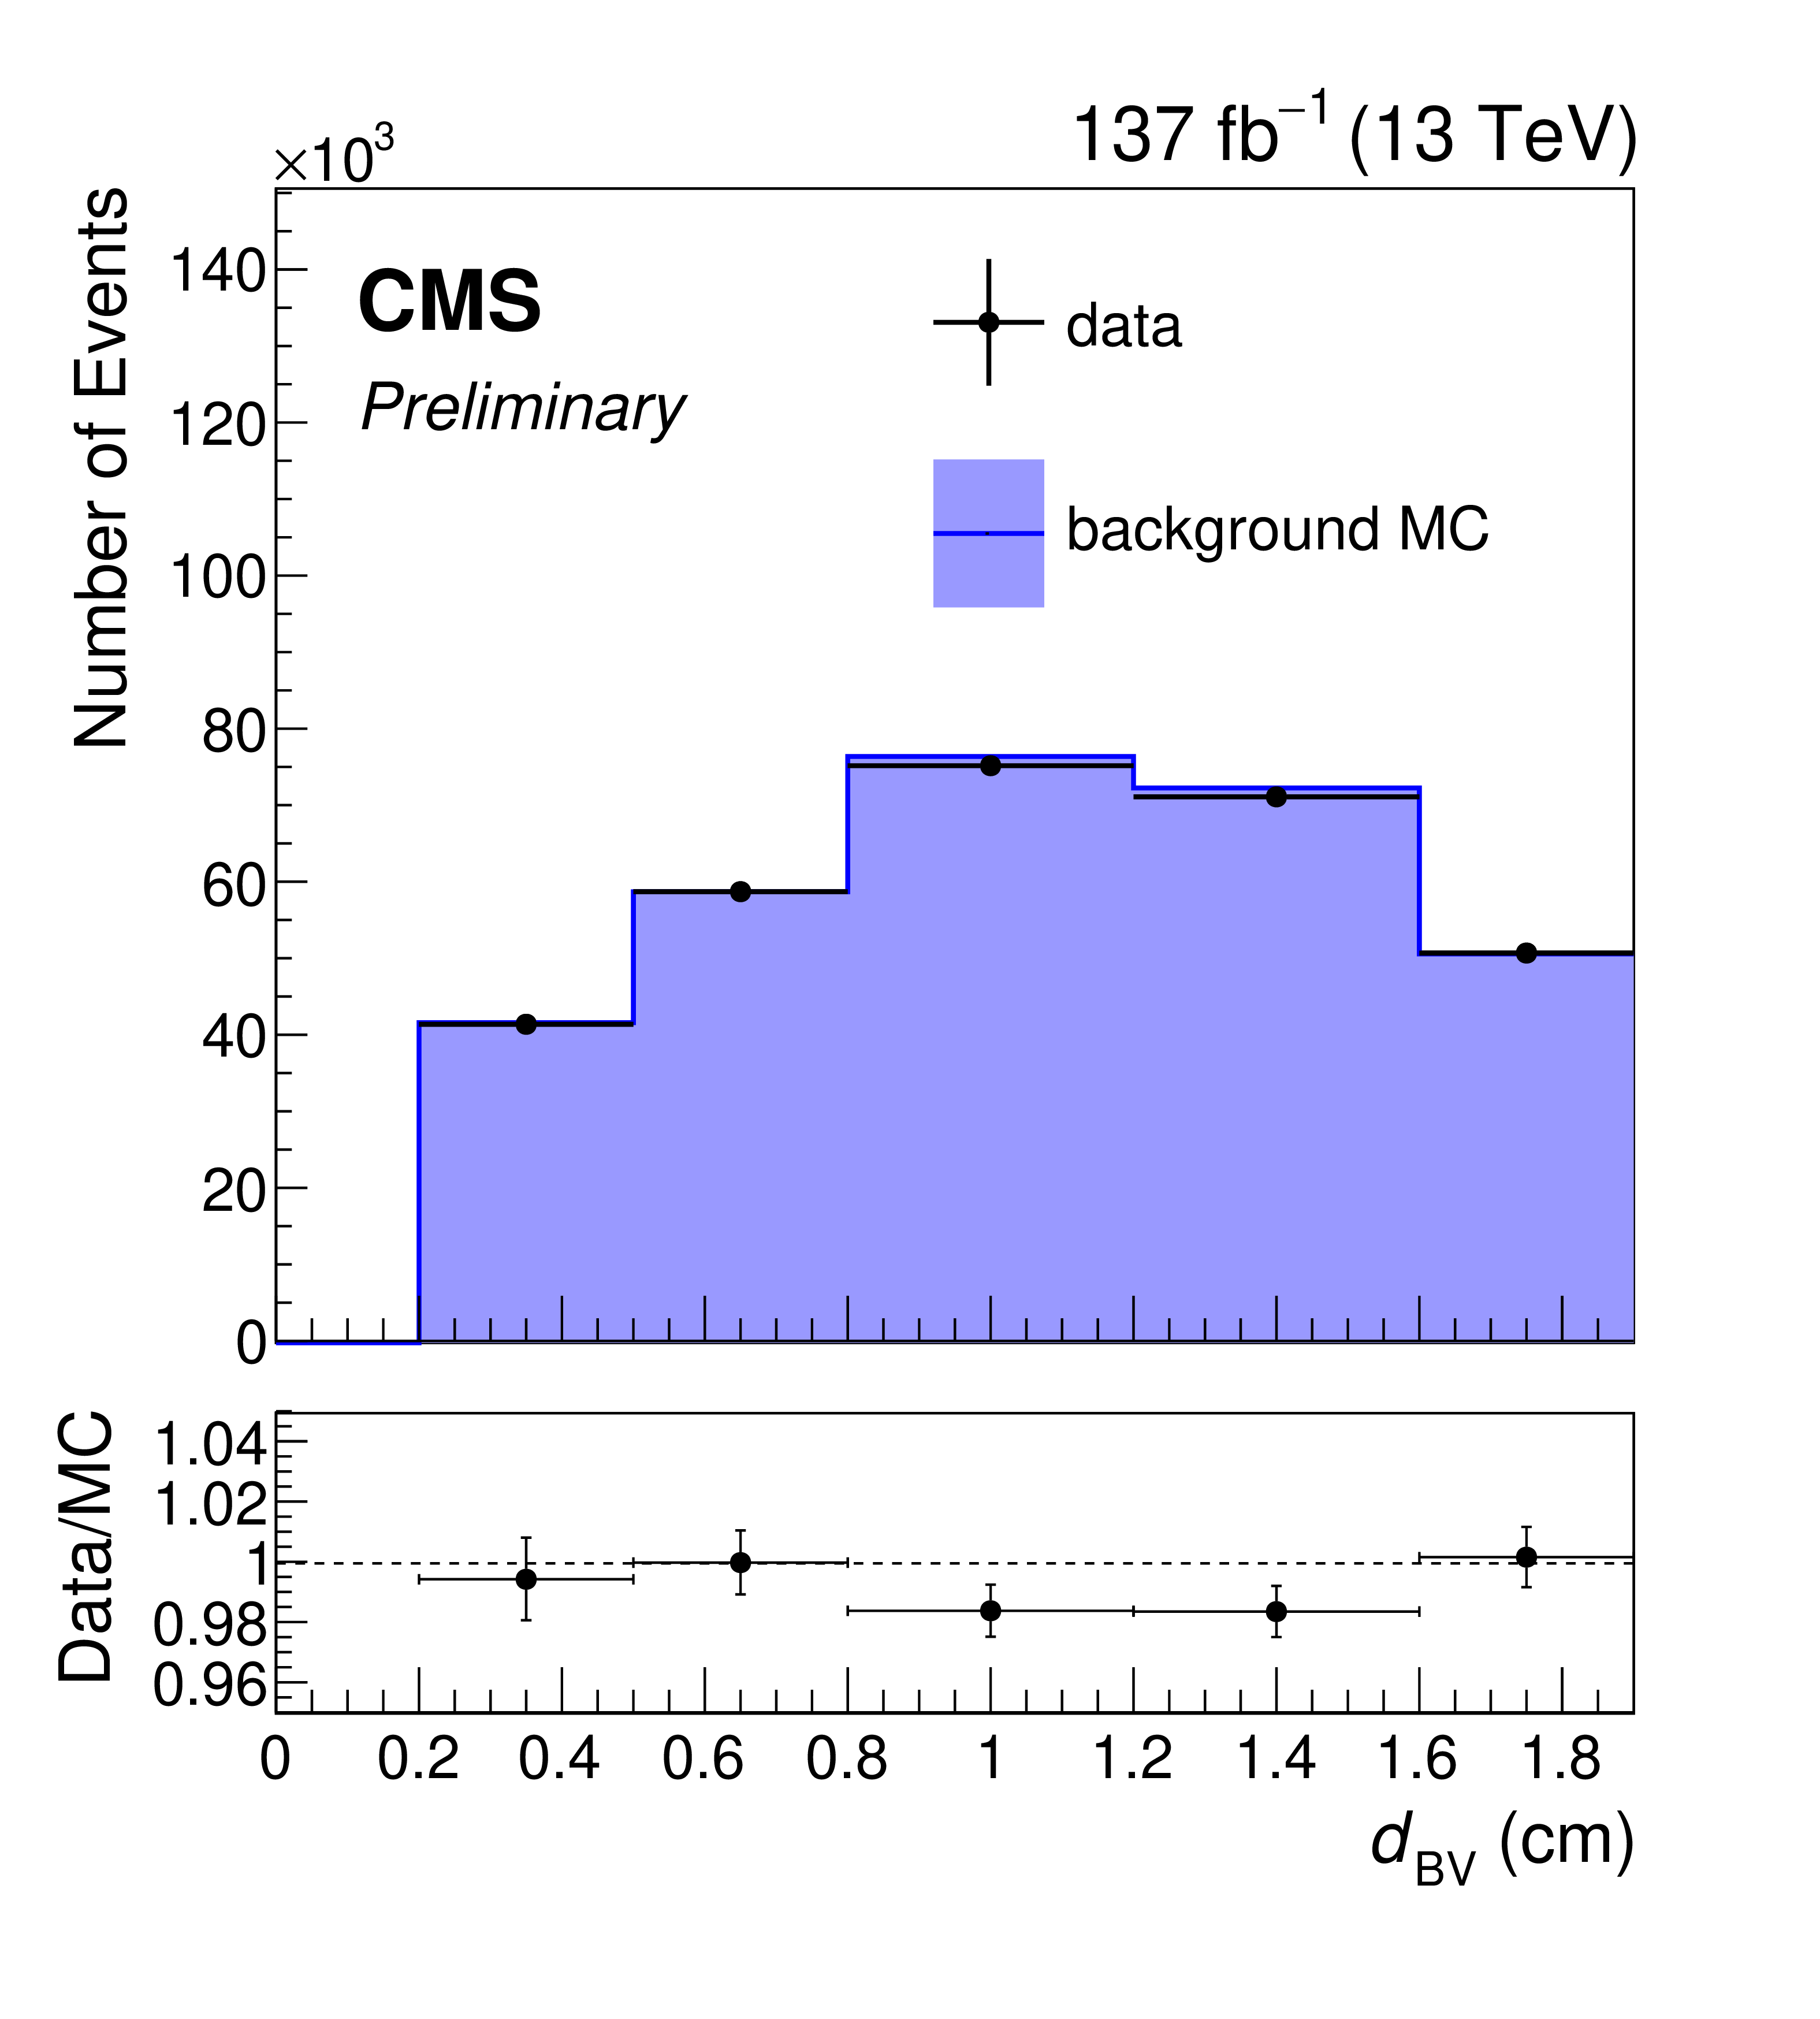
The distribution of $ d_{\text{BV}} $ in $ \mathrm{K^0_S} $ vertices between data (black) and simulation (purple) in Run-2. The lower panel shows the ratio between data and simulation. The data and simulation agree within 2% in all $ d_{\text{BV}} $ bins. |
png pdf |
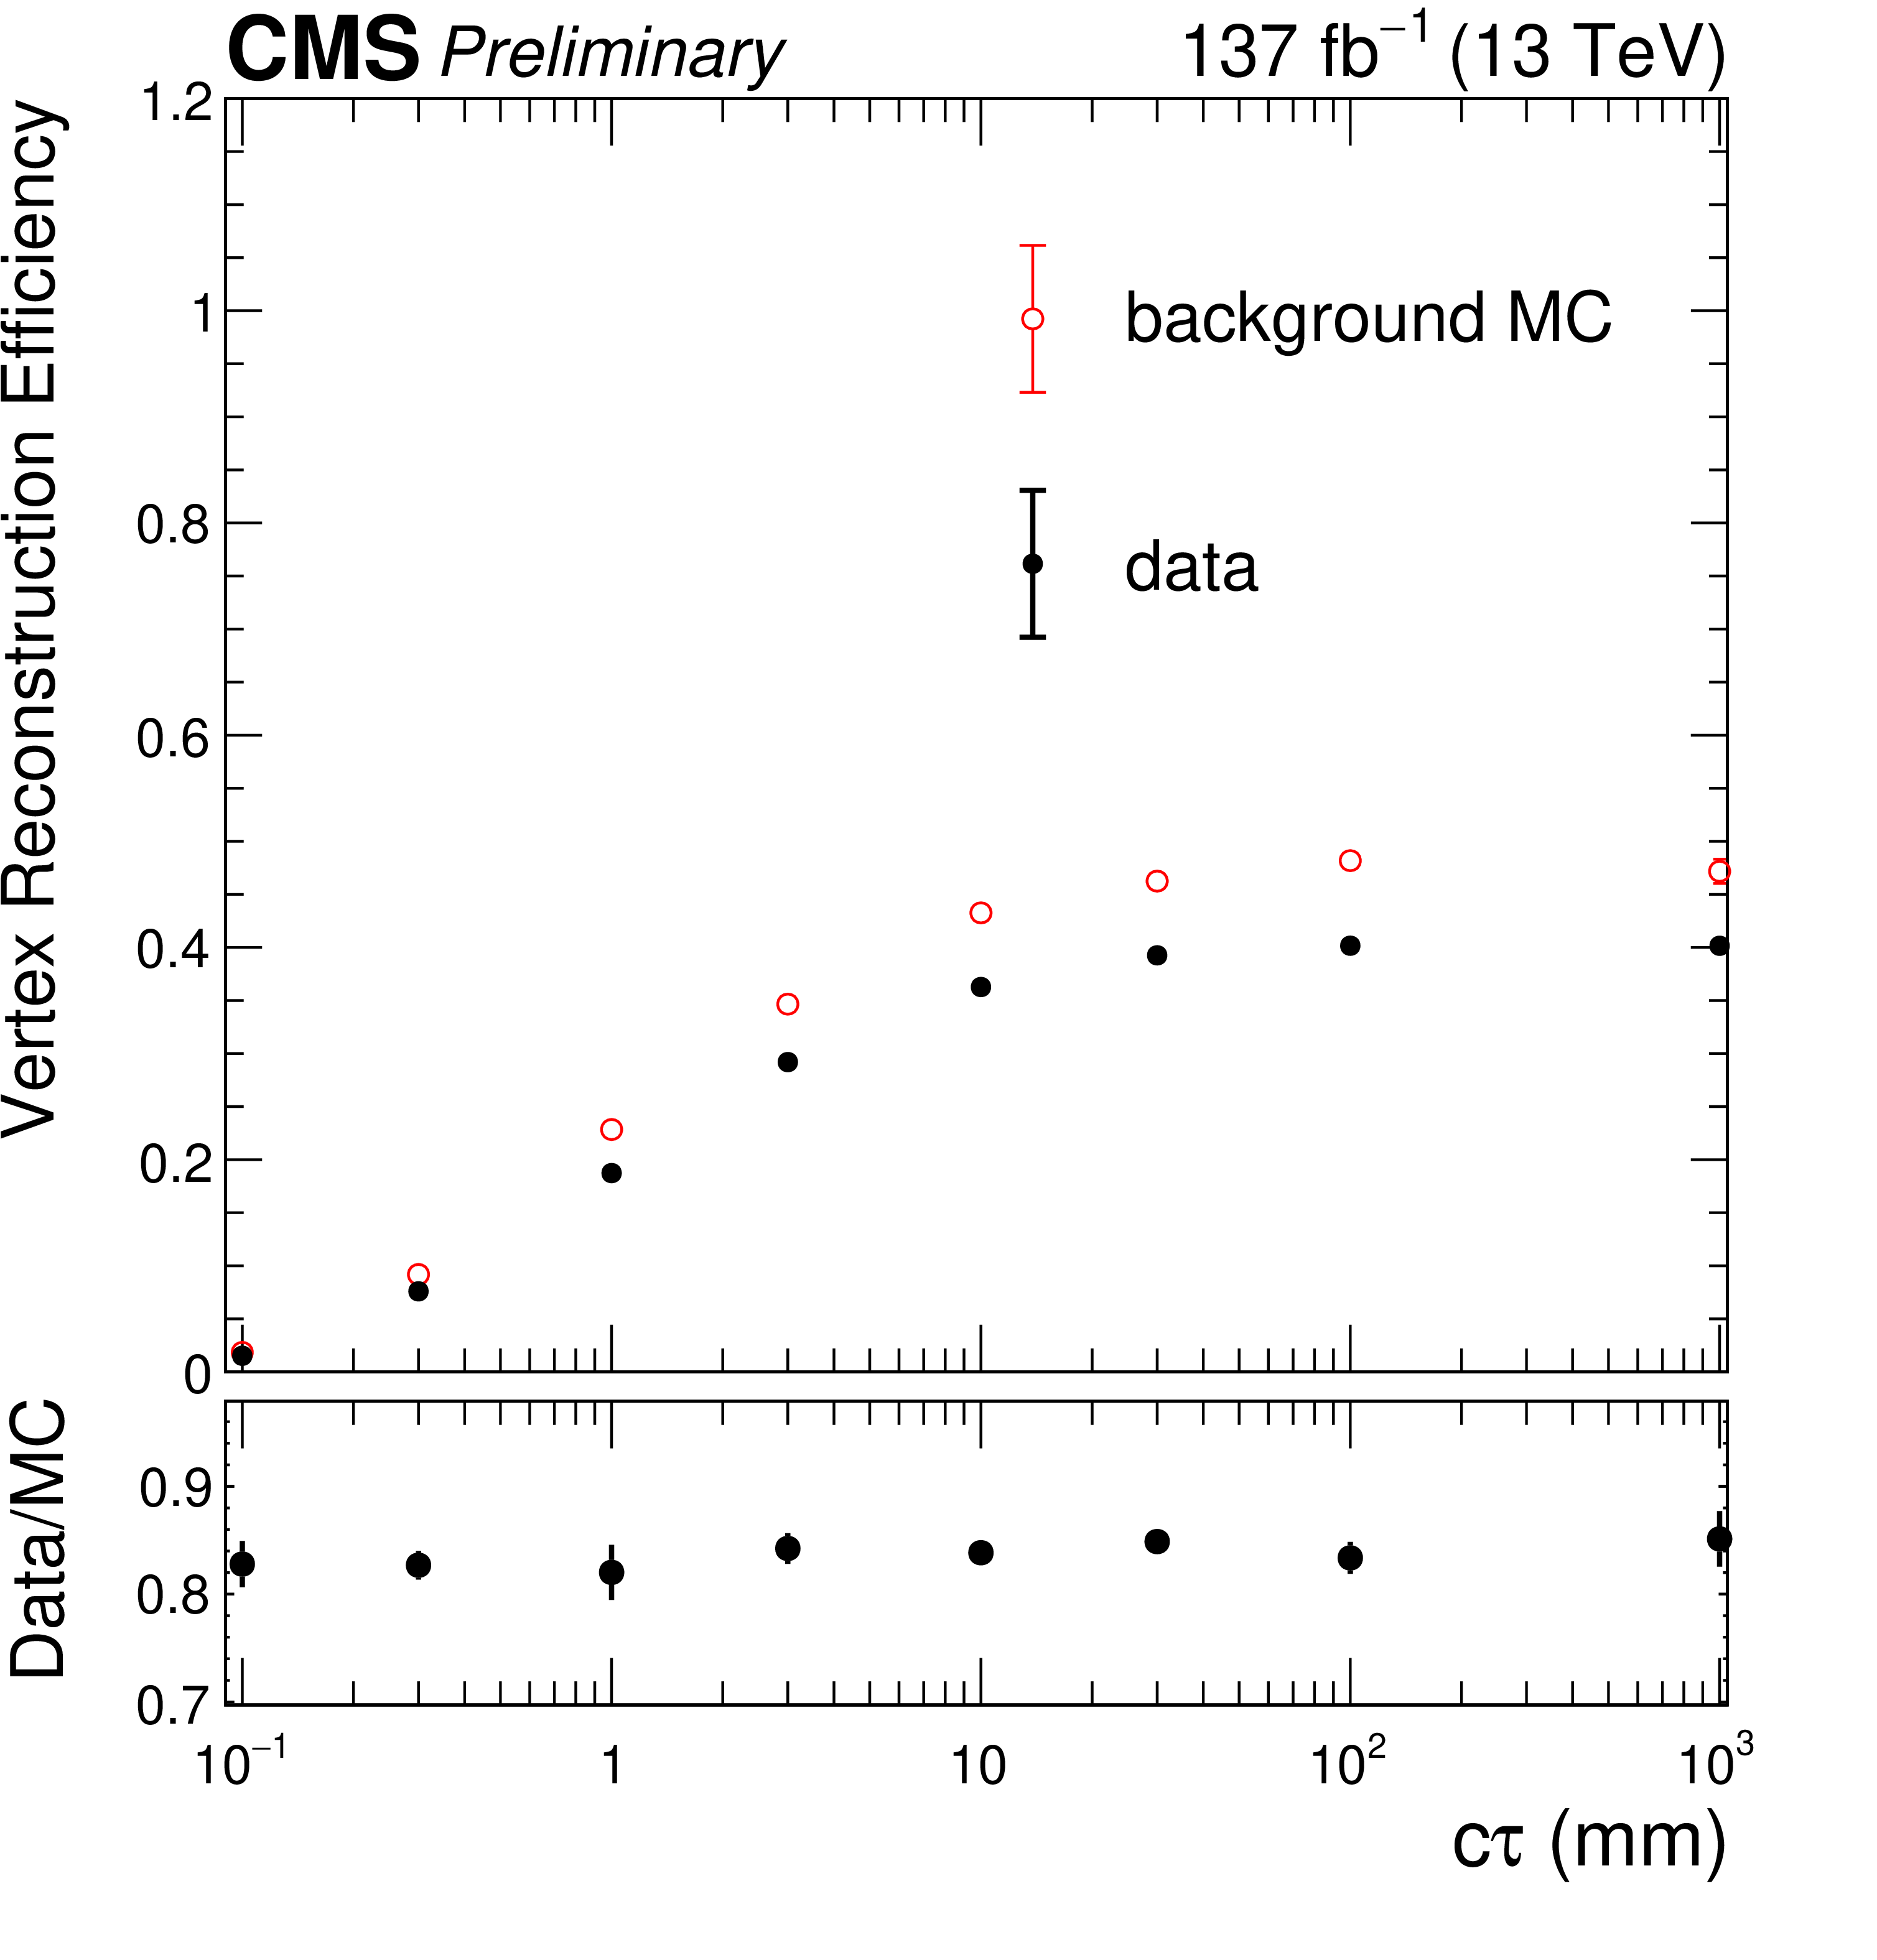
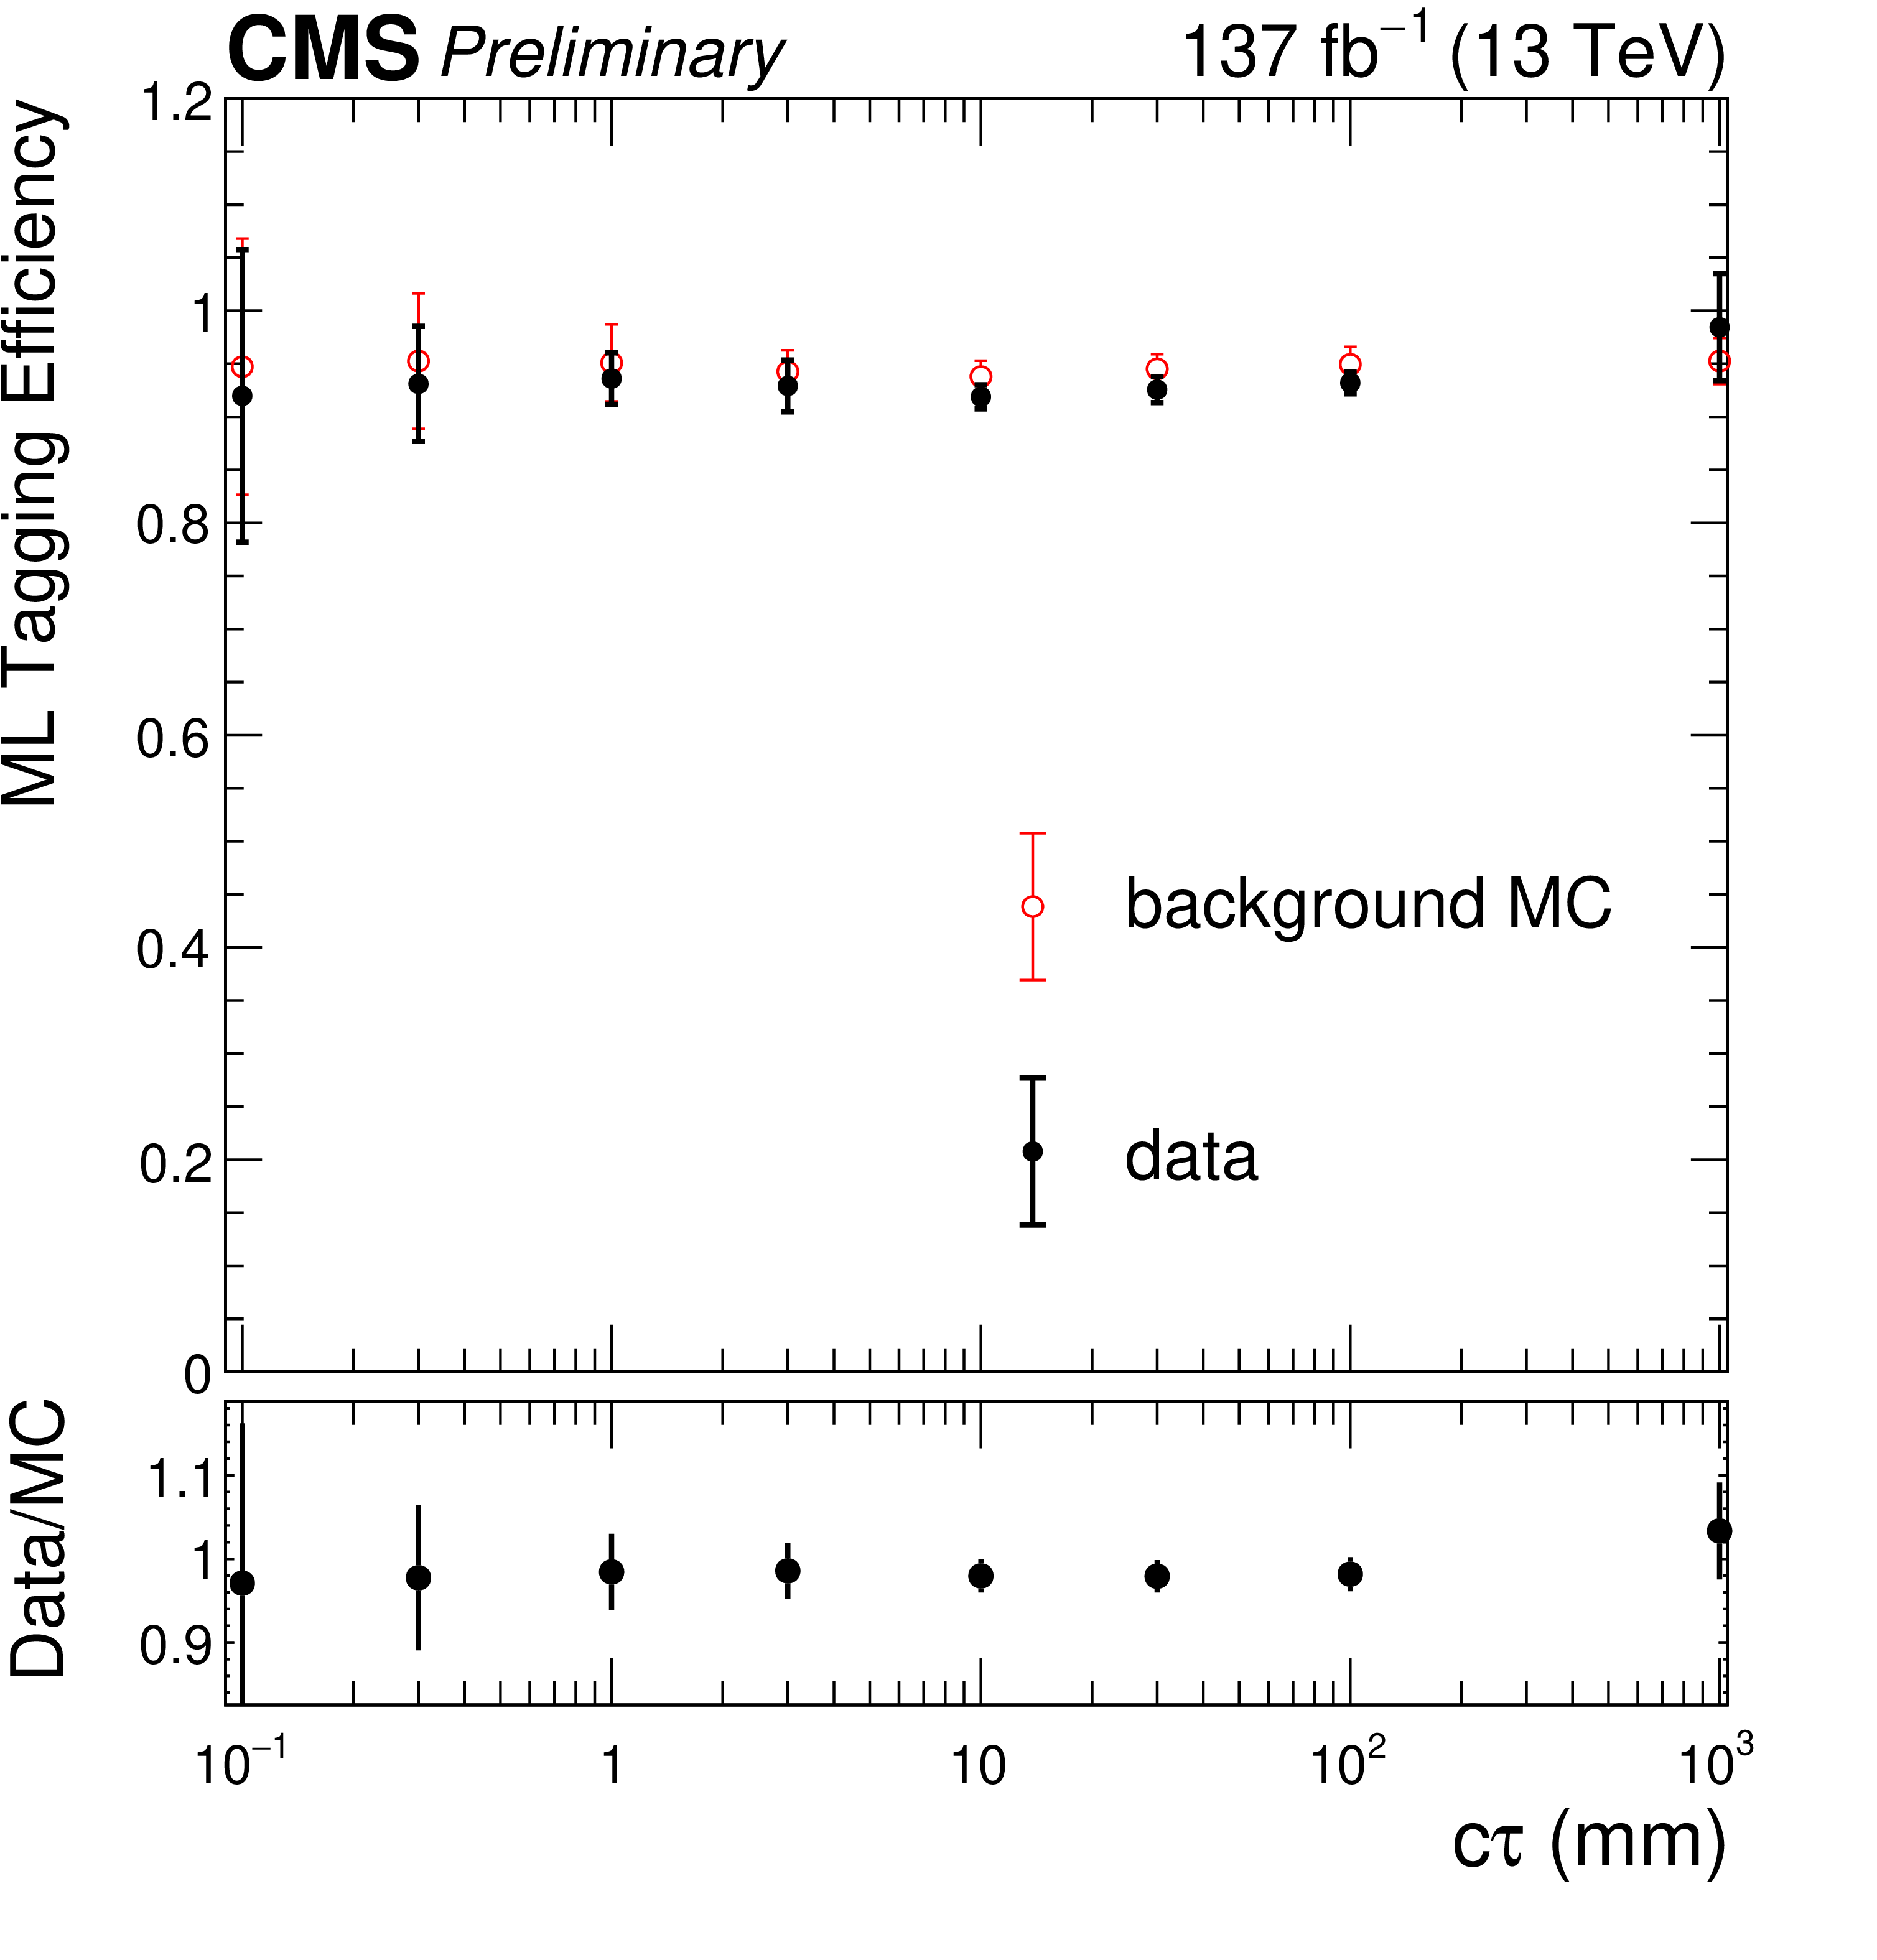
Figure 6:
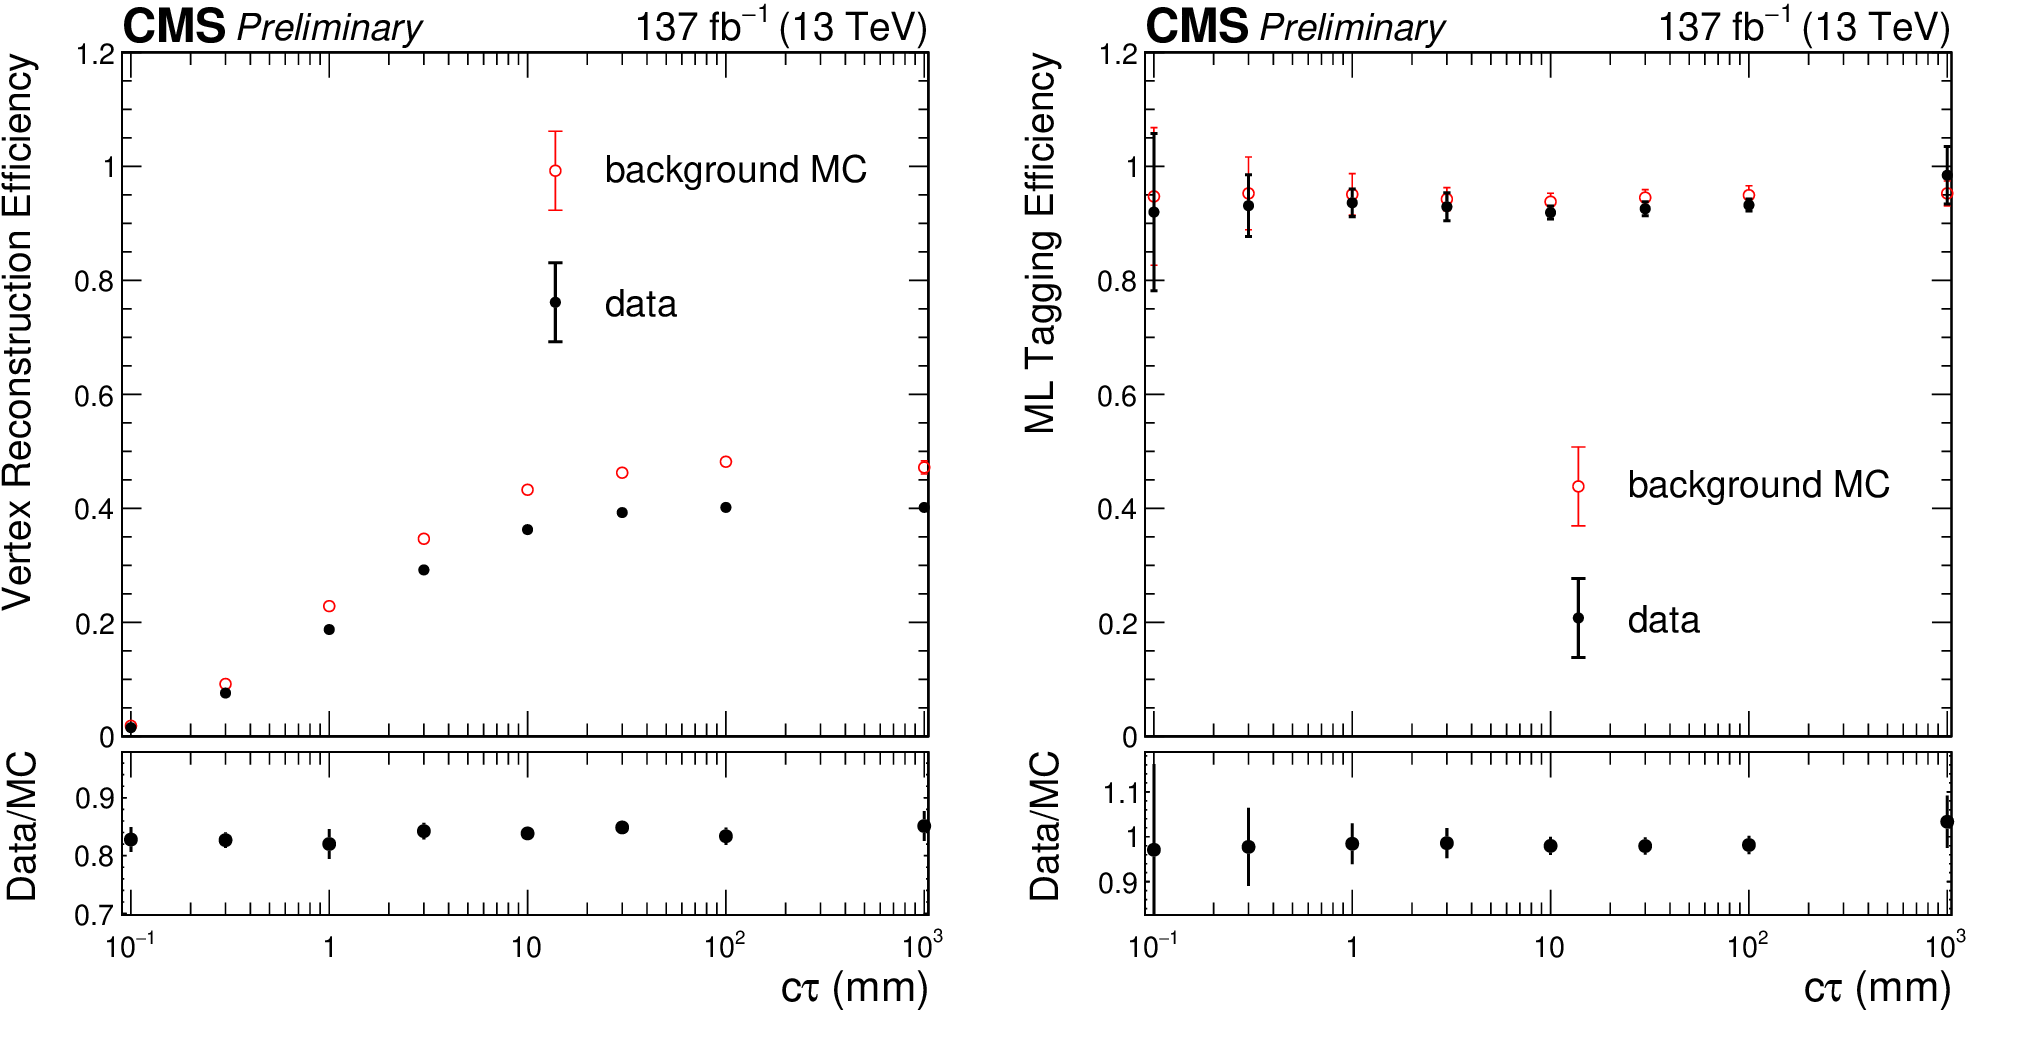
The vertex reconstruction efficiency (left) and ML tagging efficiency (right) in Run-2 data with artificially displaced vertices (black) and simulation (red). In this example, the artificially displaced vertices are corrected to mimic signal events with gluino mass of 2000 GeV and neutralino mass of 1800 GeV. |
png pdf |
Figure 6-a:
The vertex reconstruction efficiency (left) and ML tagging efficiency (right) in Run-2 data with artificially displaced vertices (black) and simulation (red). In this example, the artificially displaced vertices are corrected to mimic signal events with gluino mass of 2000 GeV and neutralino mass of 1800 GeV. |
png pdf |
Figure 6-b:
The vertex reconstruction efficiency (left) and ML tagging efficiency (right) in Run-2 data with artificially displaced vertices (black) and simulation (red). In this example, the artificially displaced vertices are corrected to mimic signal events with gluino mass of 2000 GeV and neutralino mass of 1800 GeV. |
png pdf |
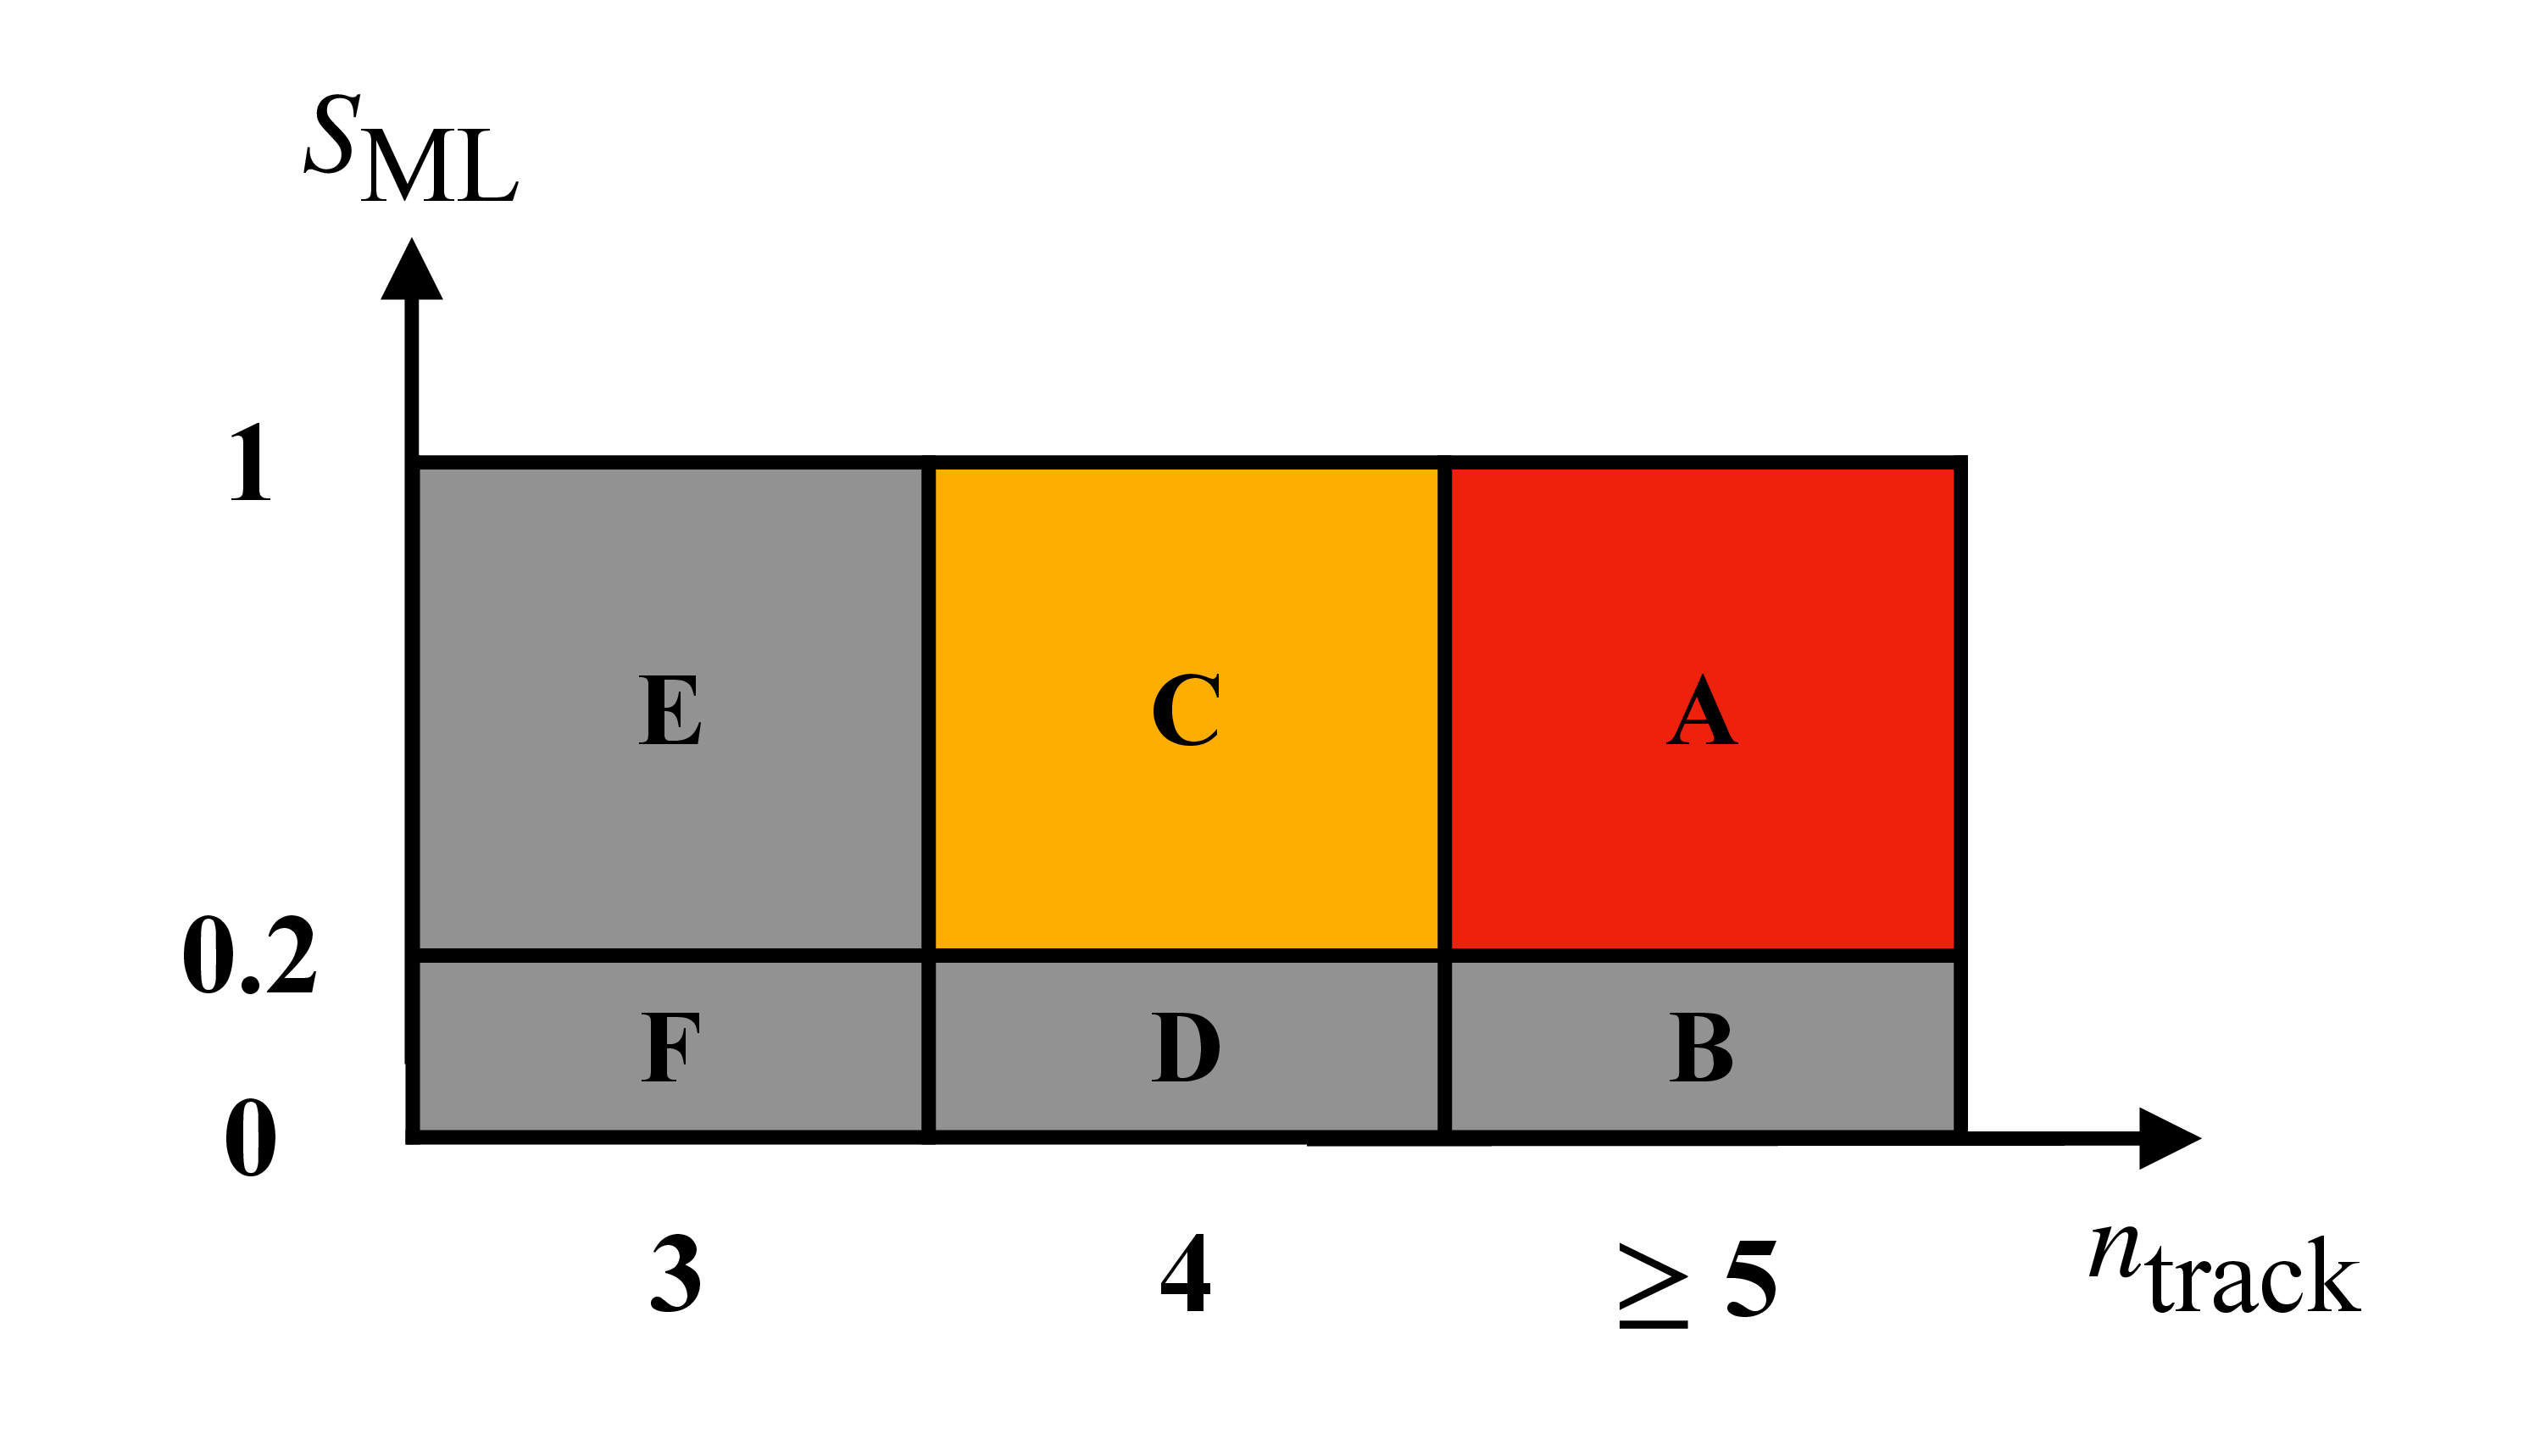
Figure 7:
A schematic diagram of the signal (red), validation (yellow), and control (gray) regions. |
png pdf |
Figure 8:
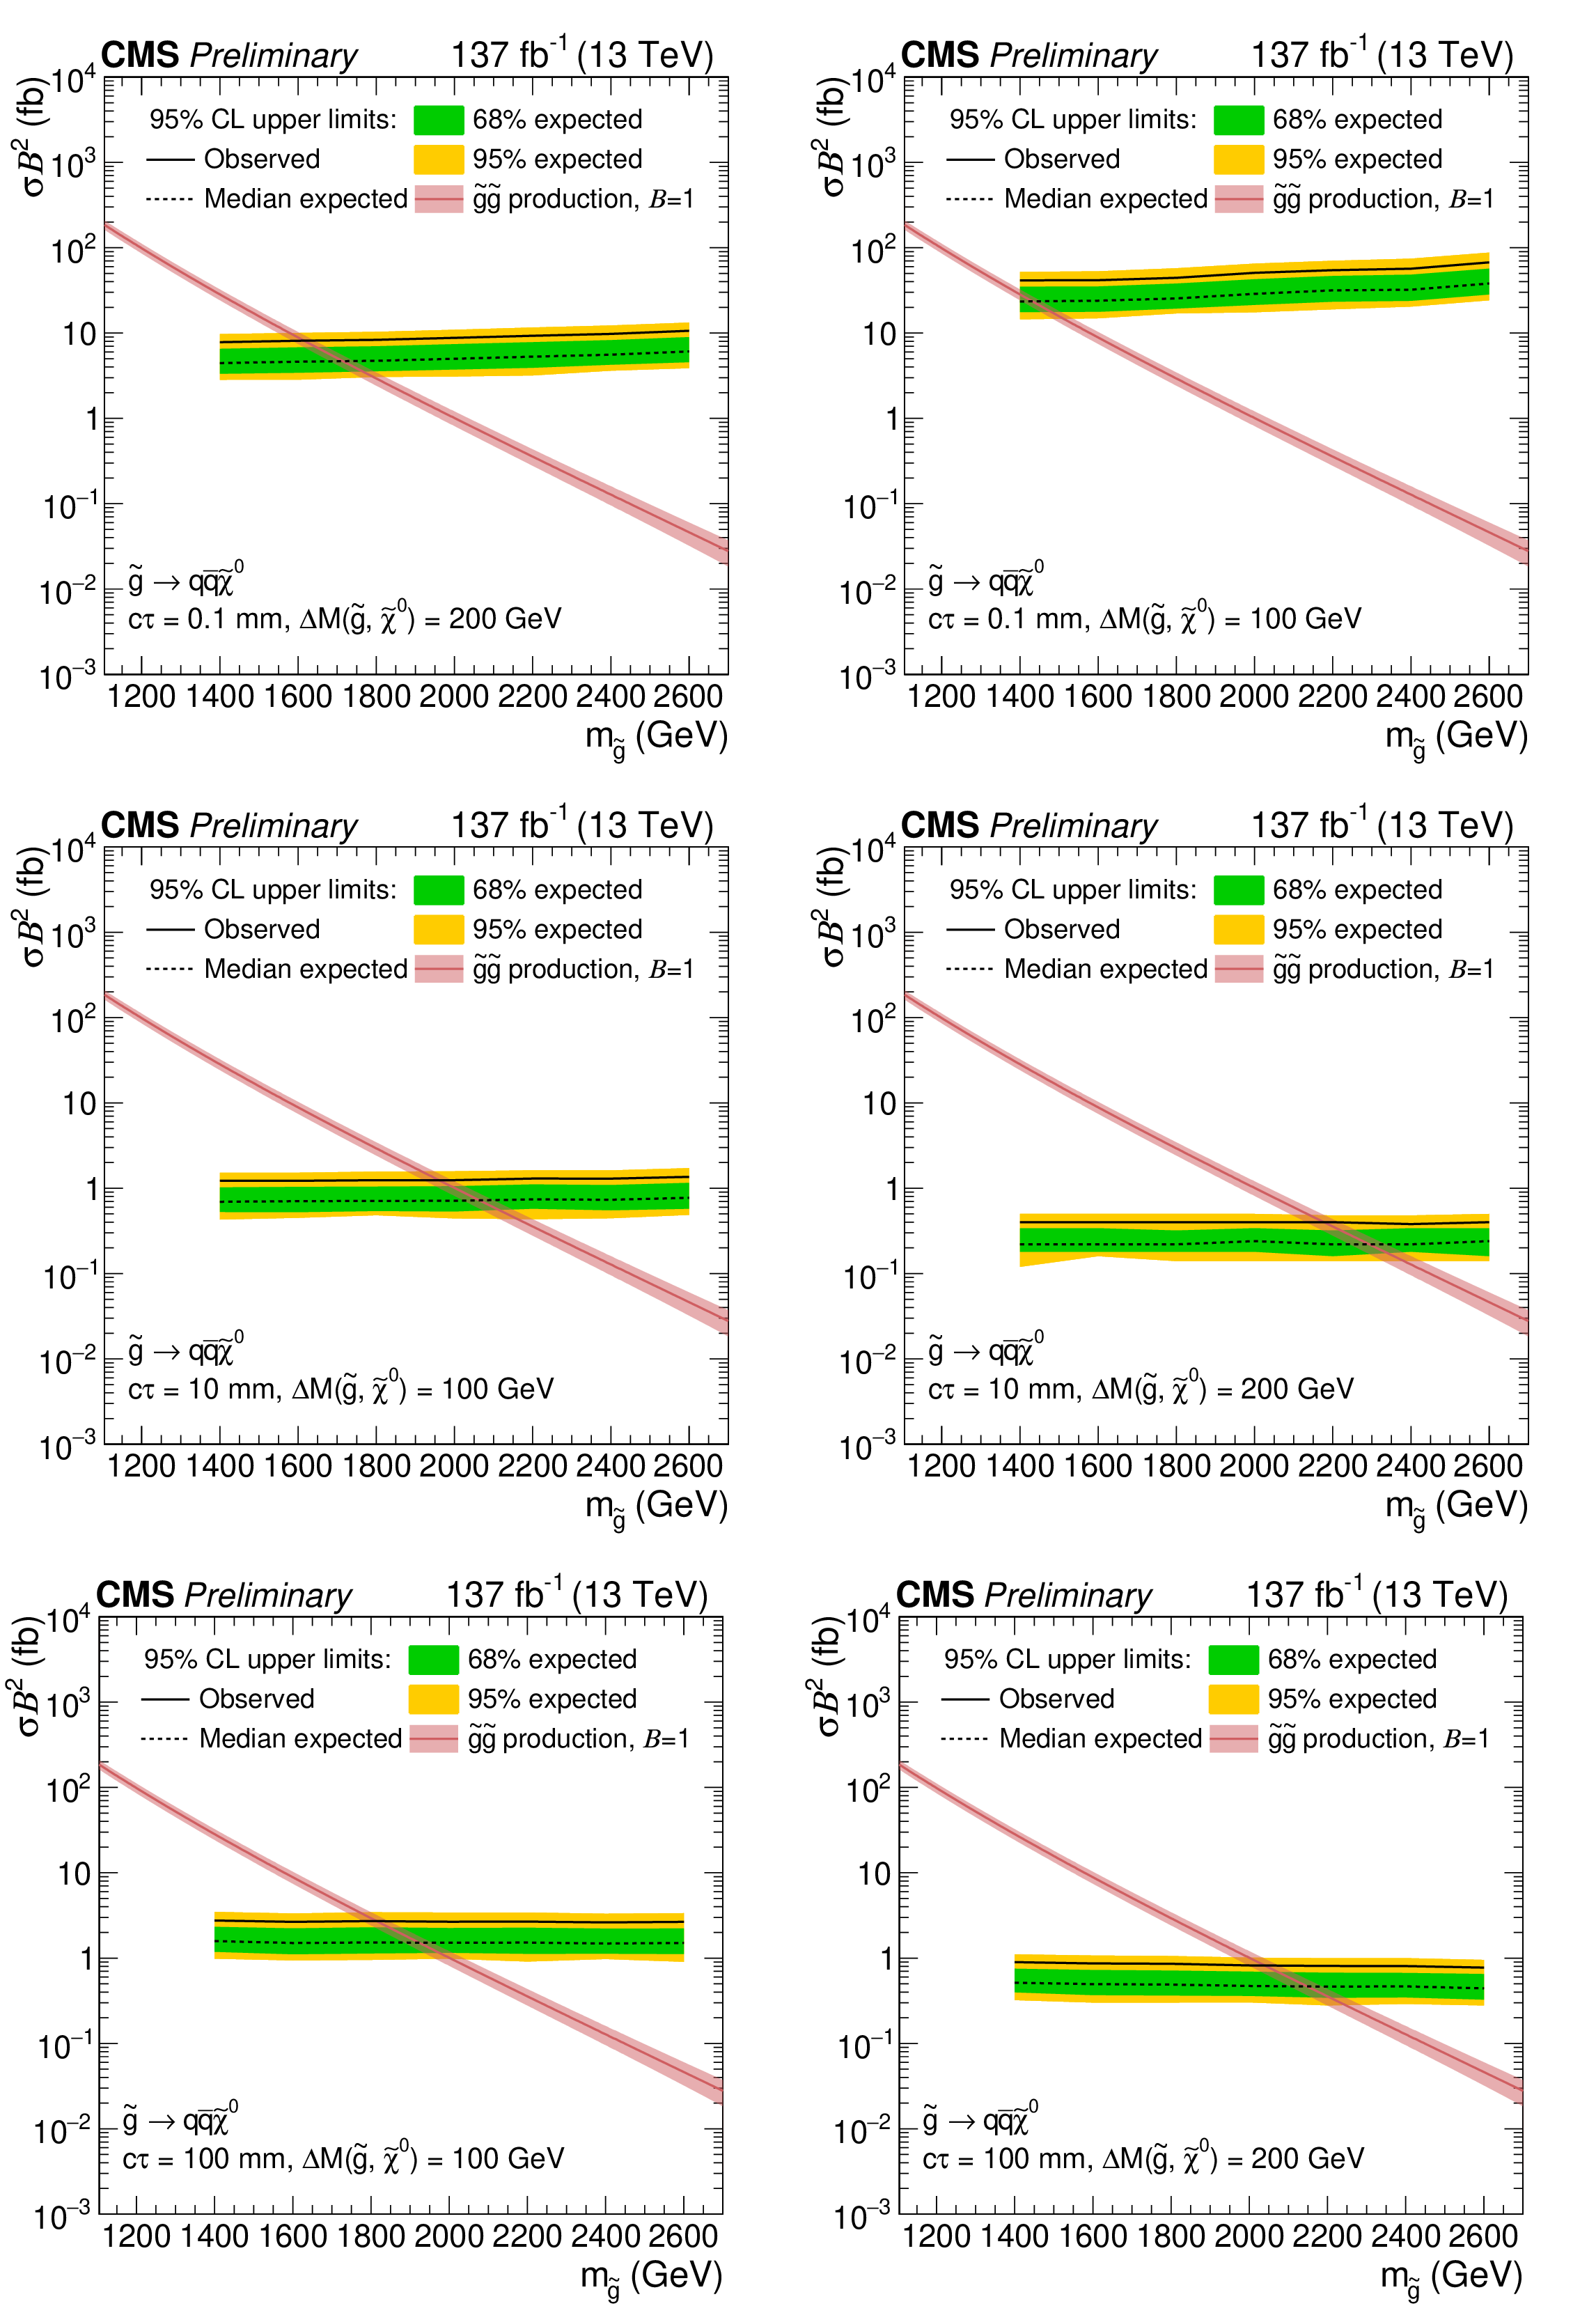
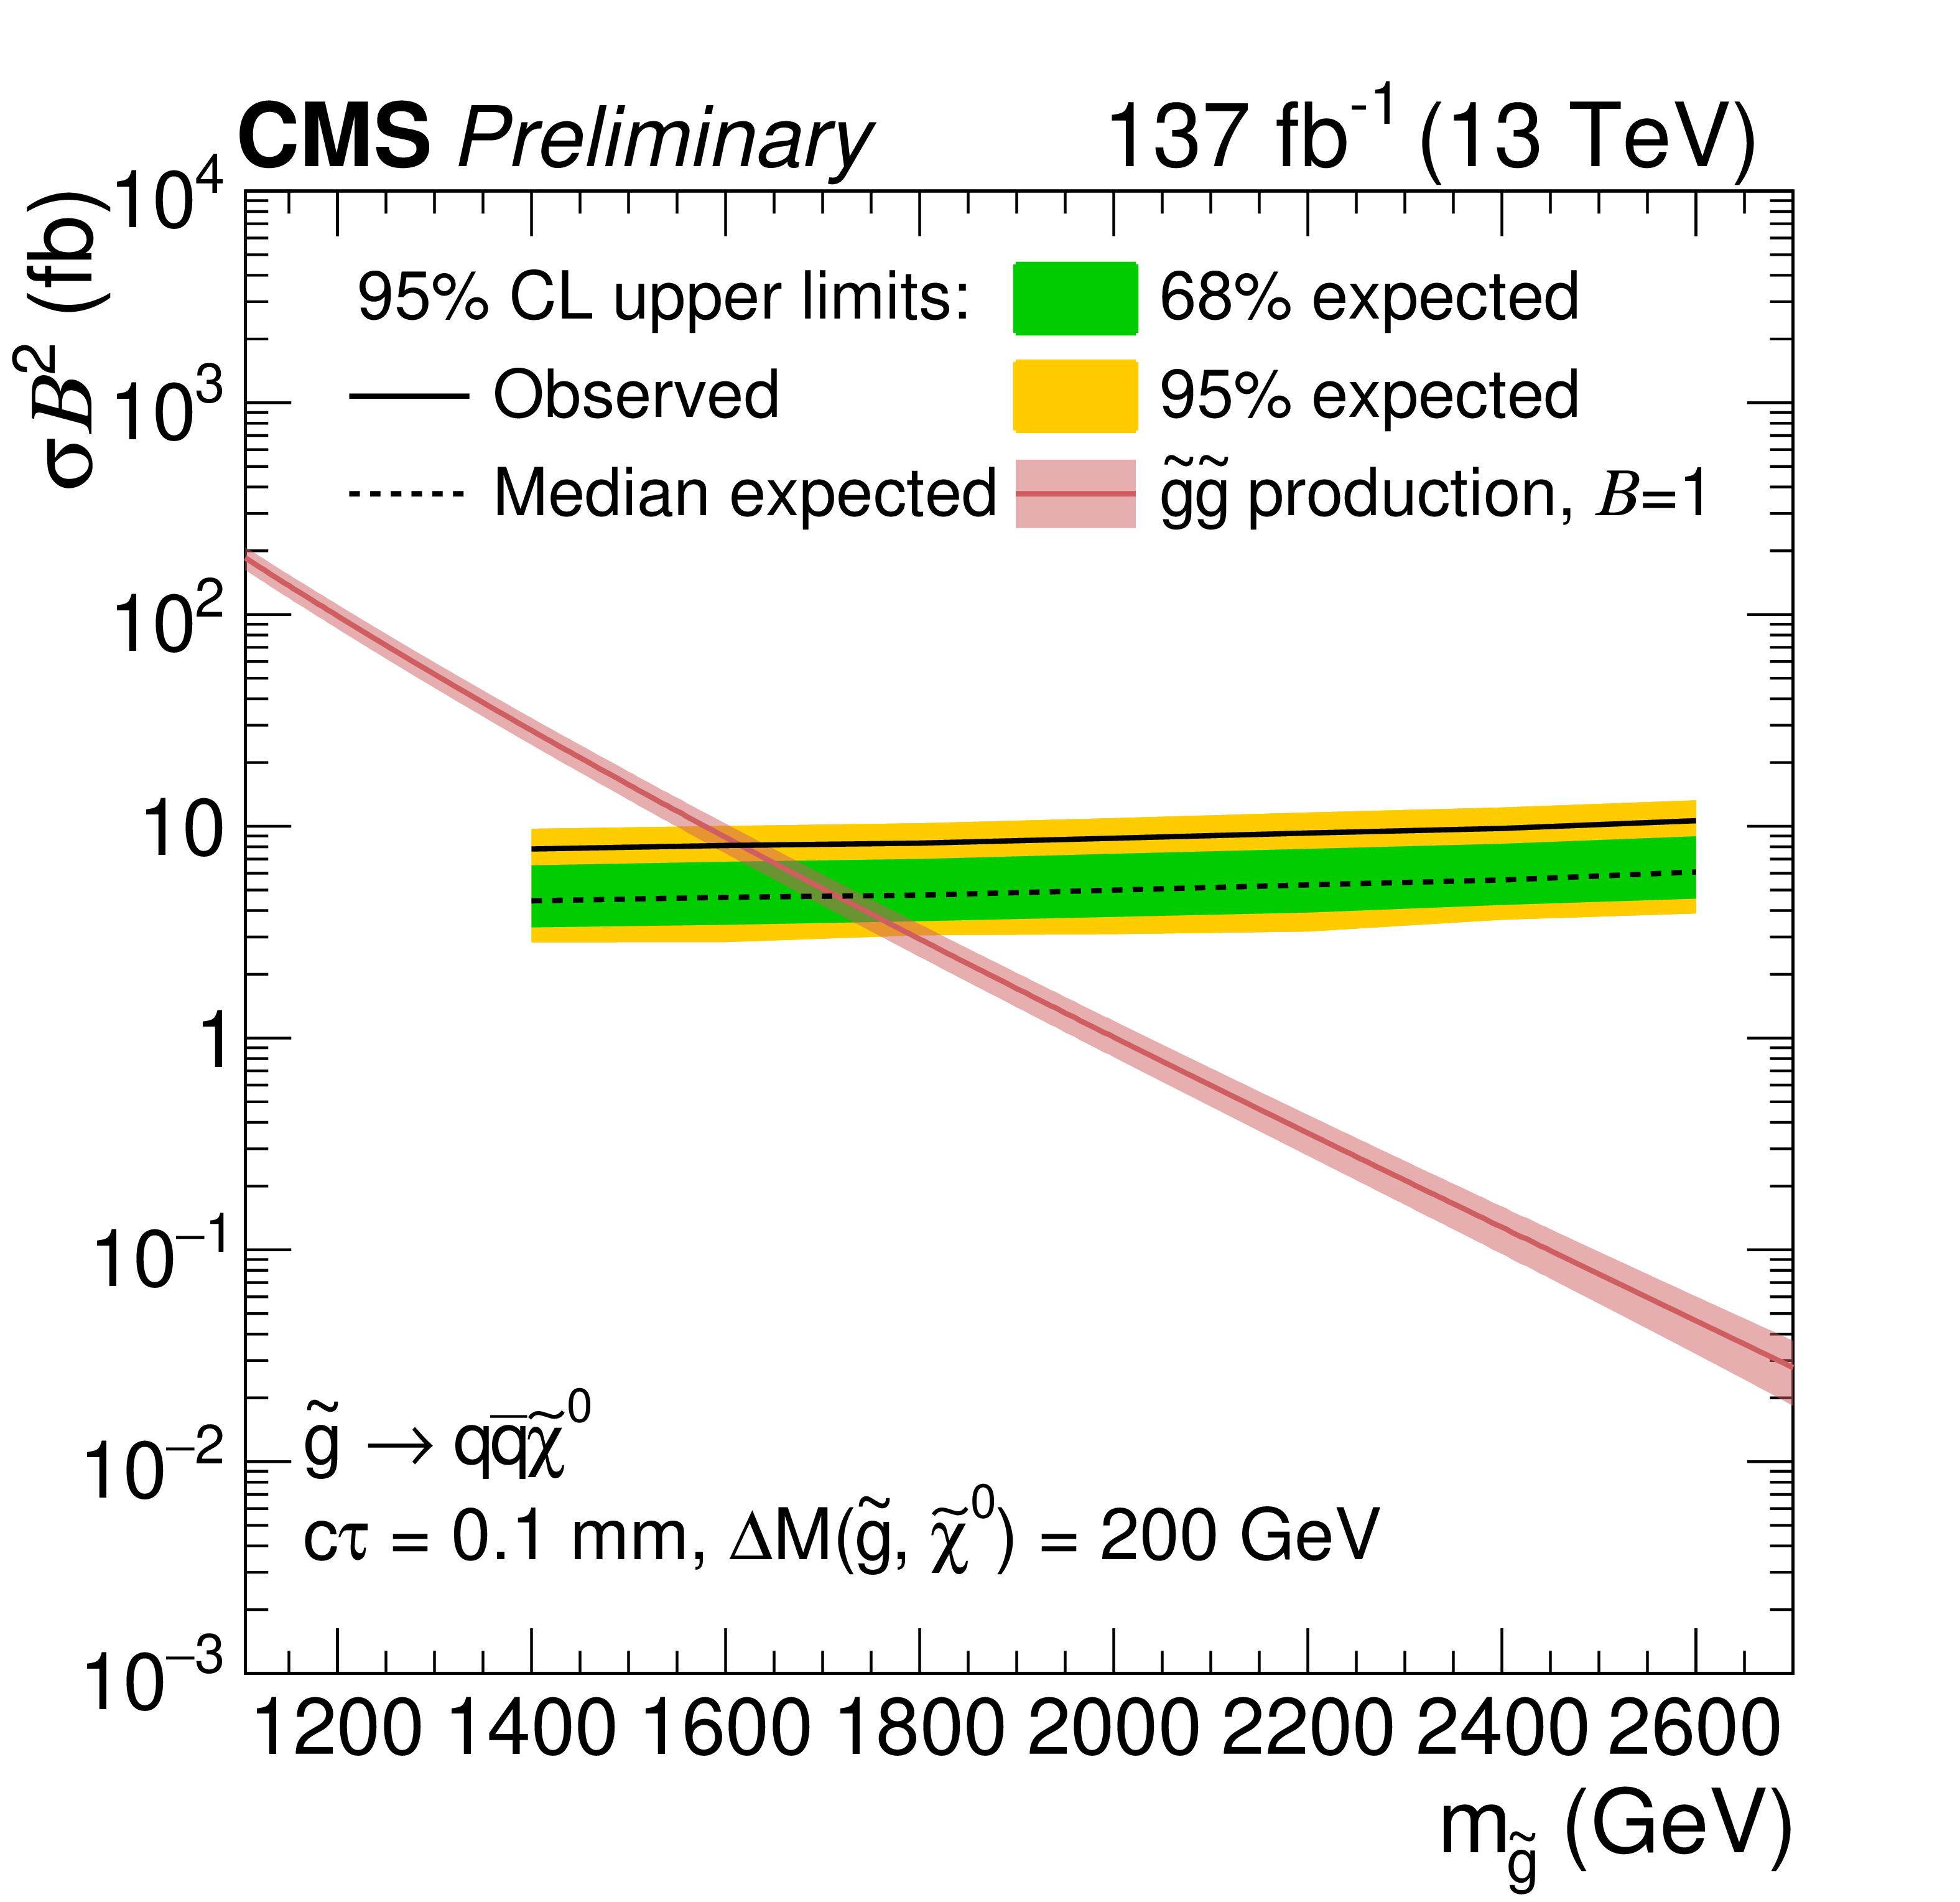
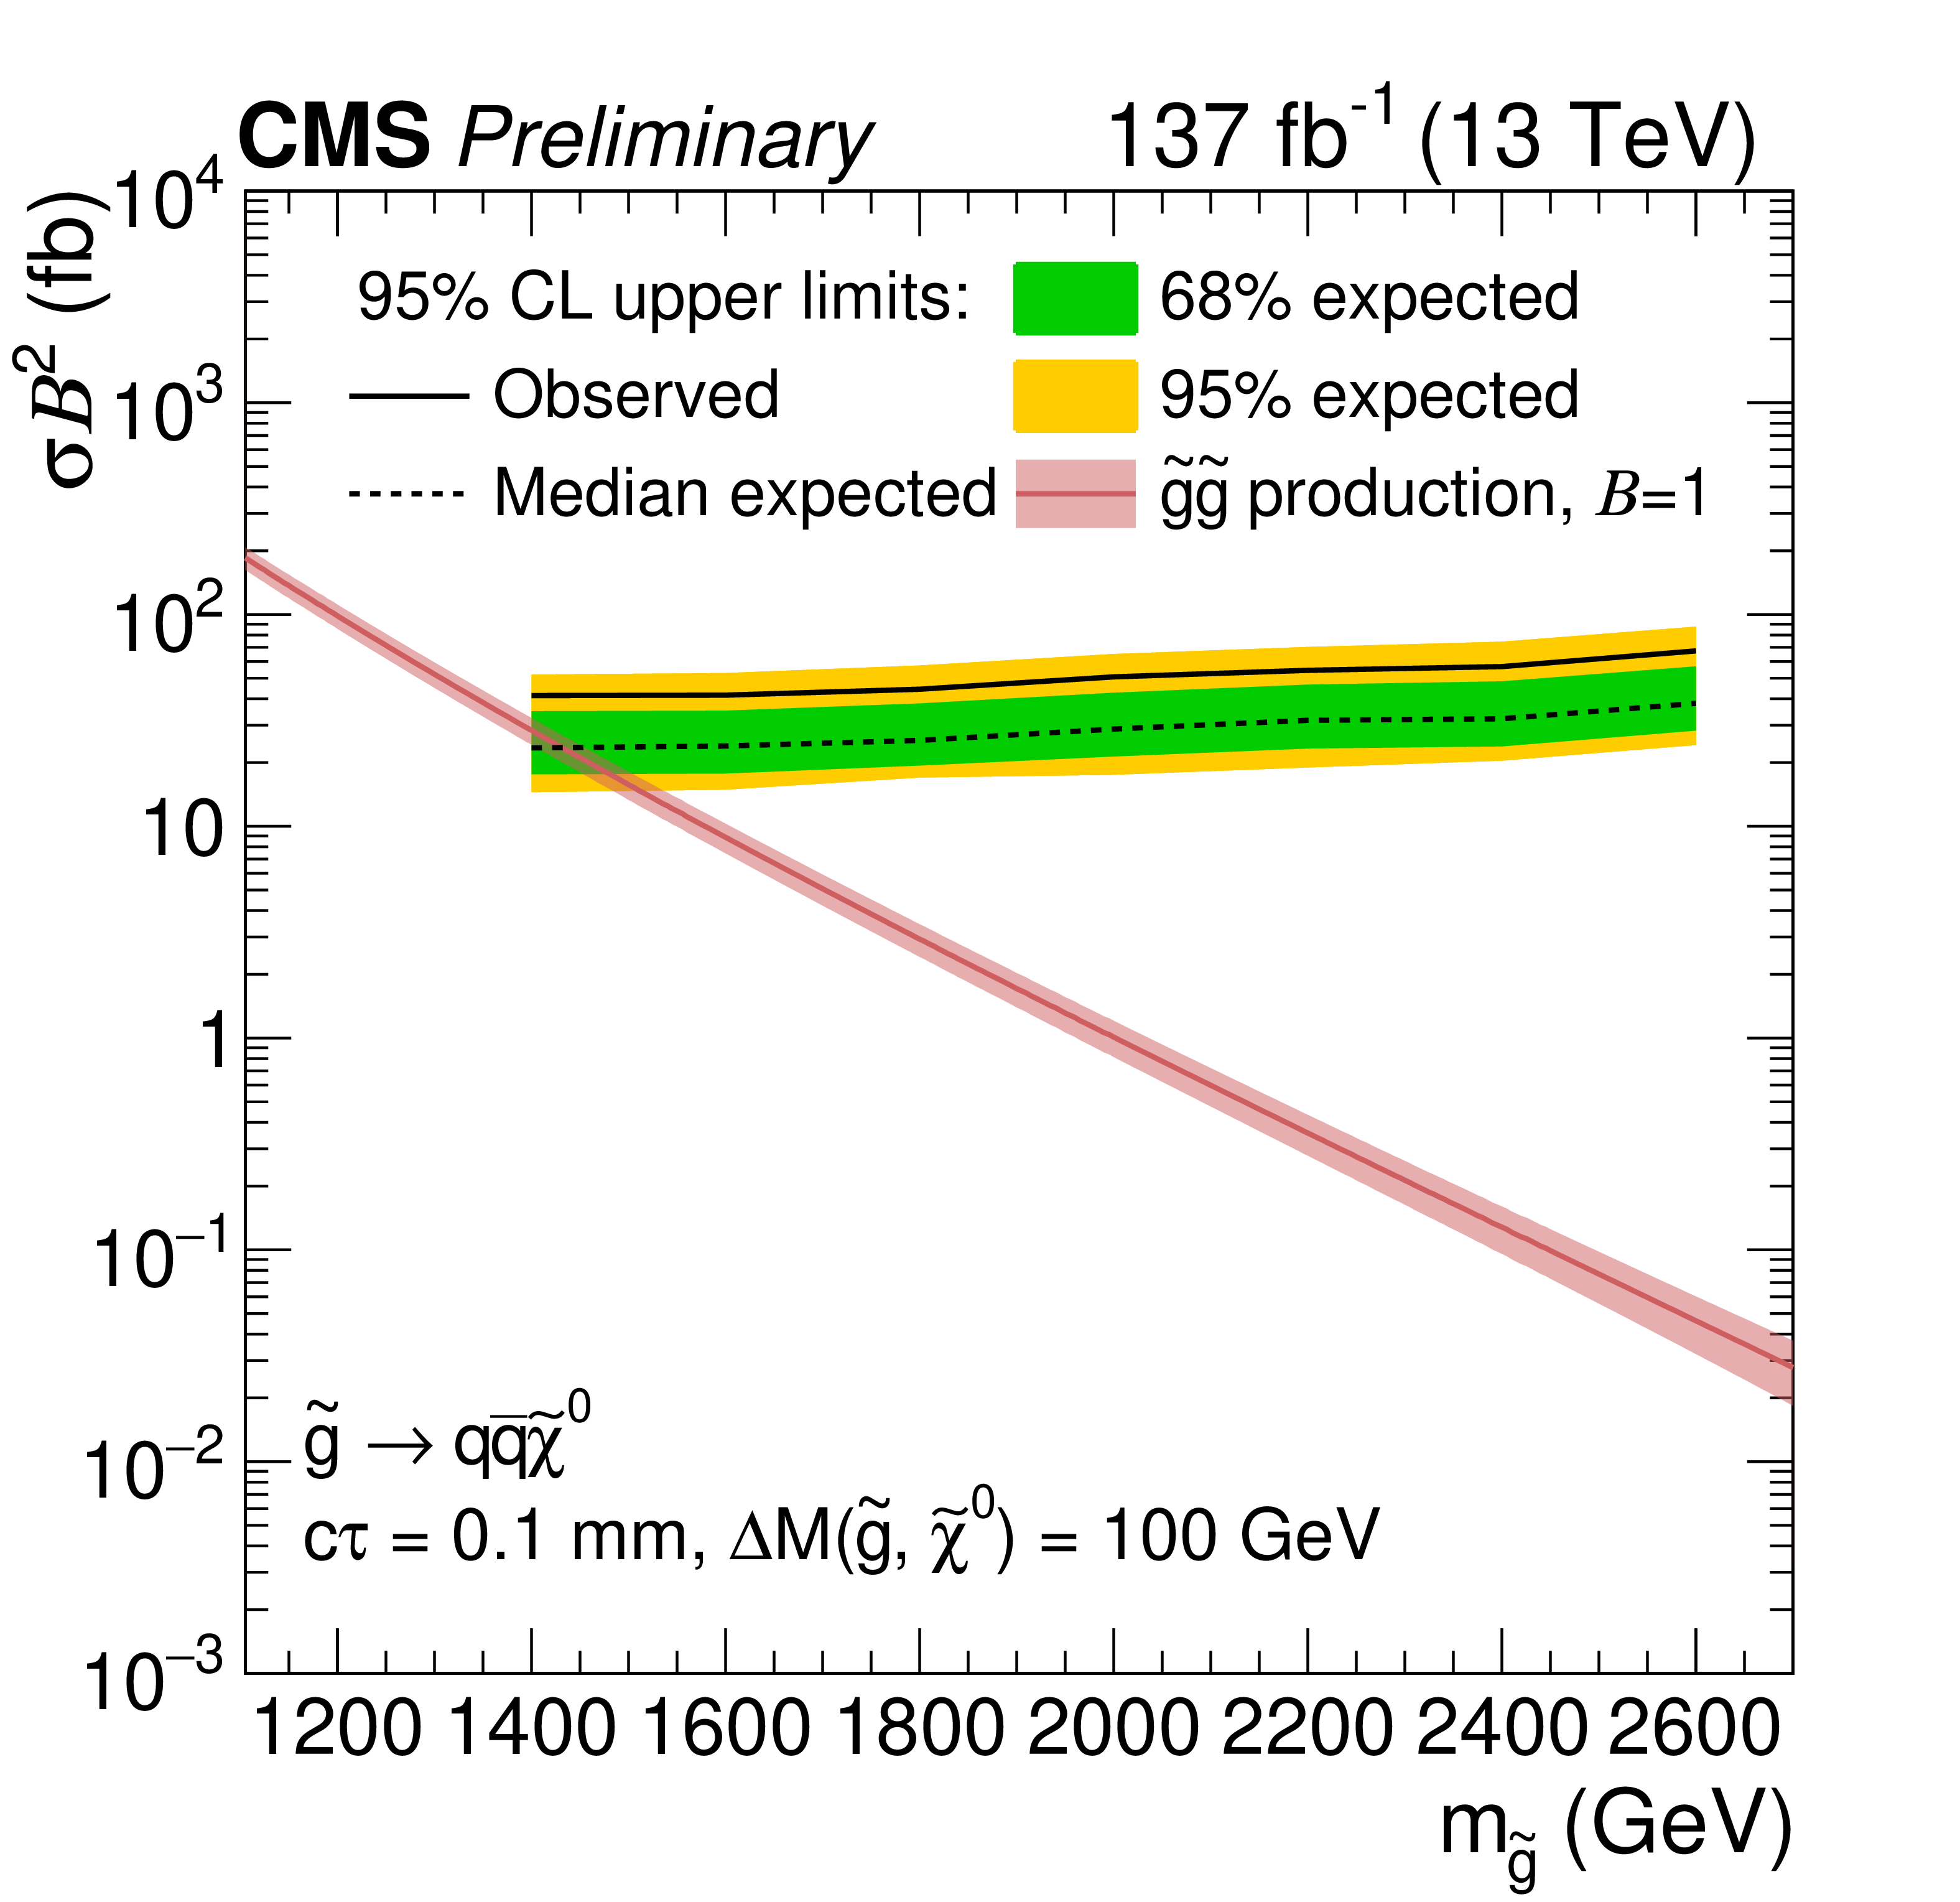
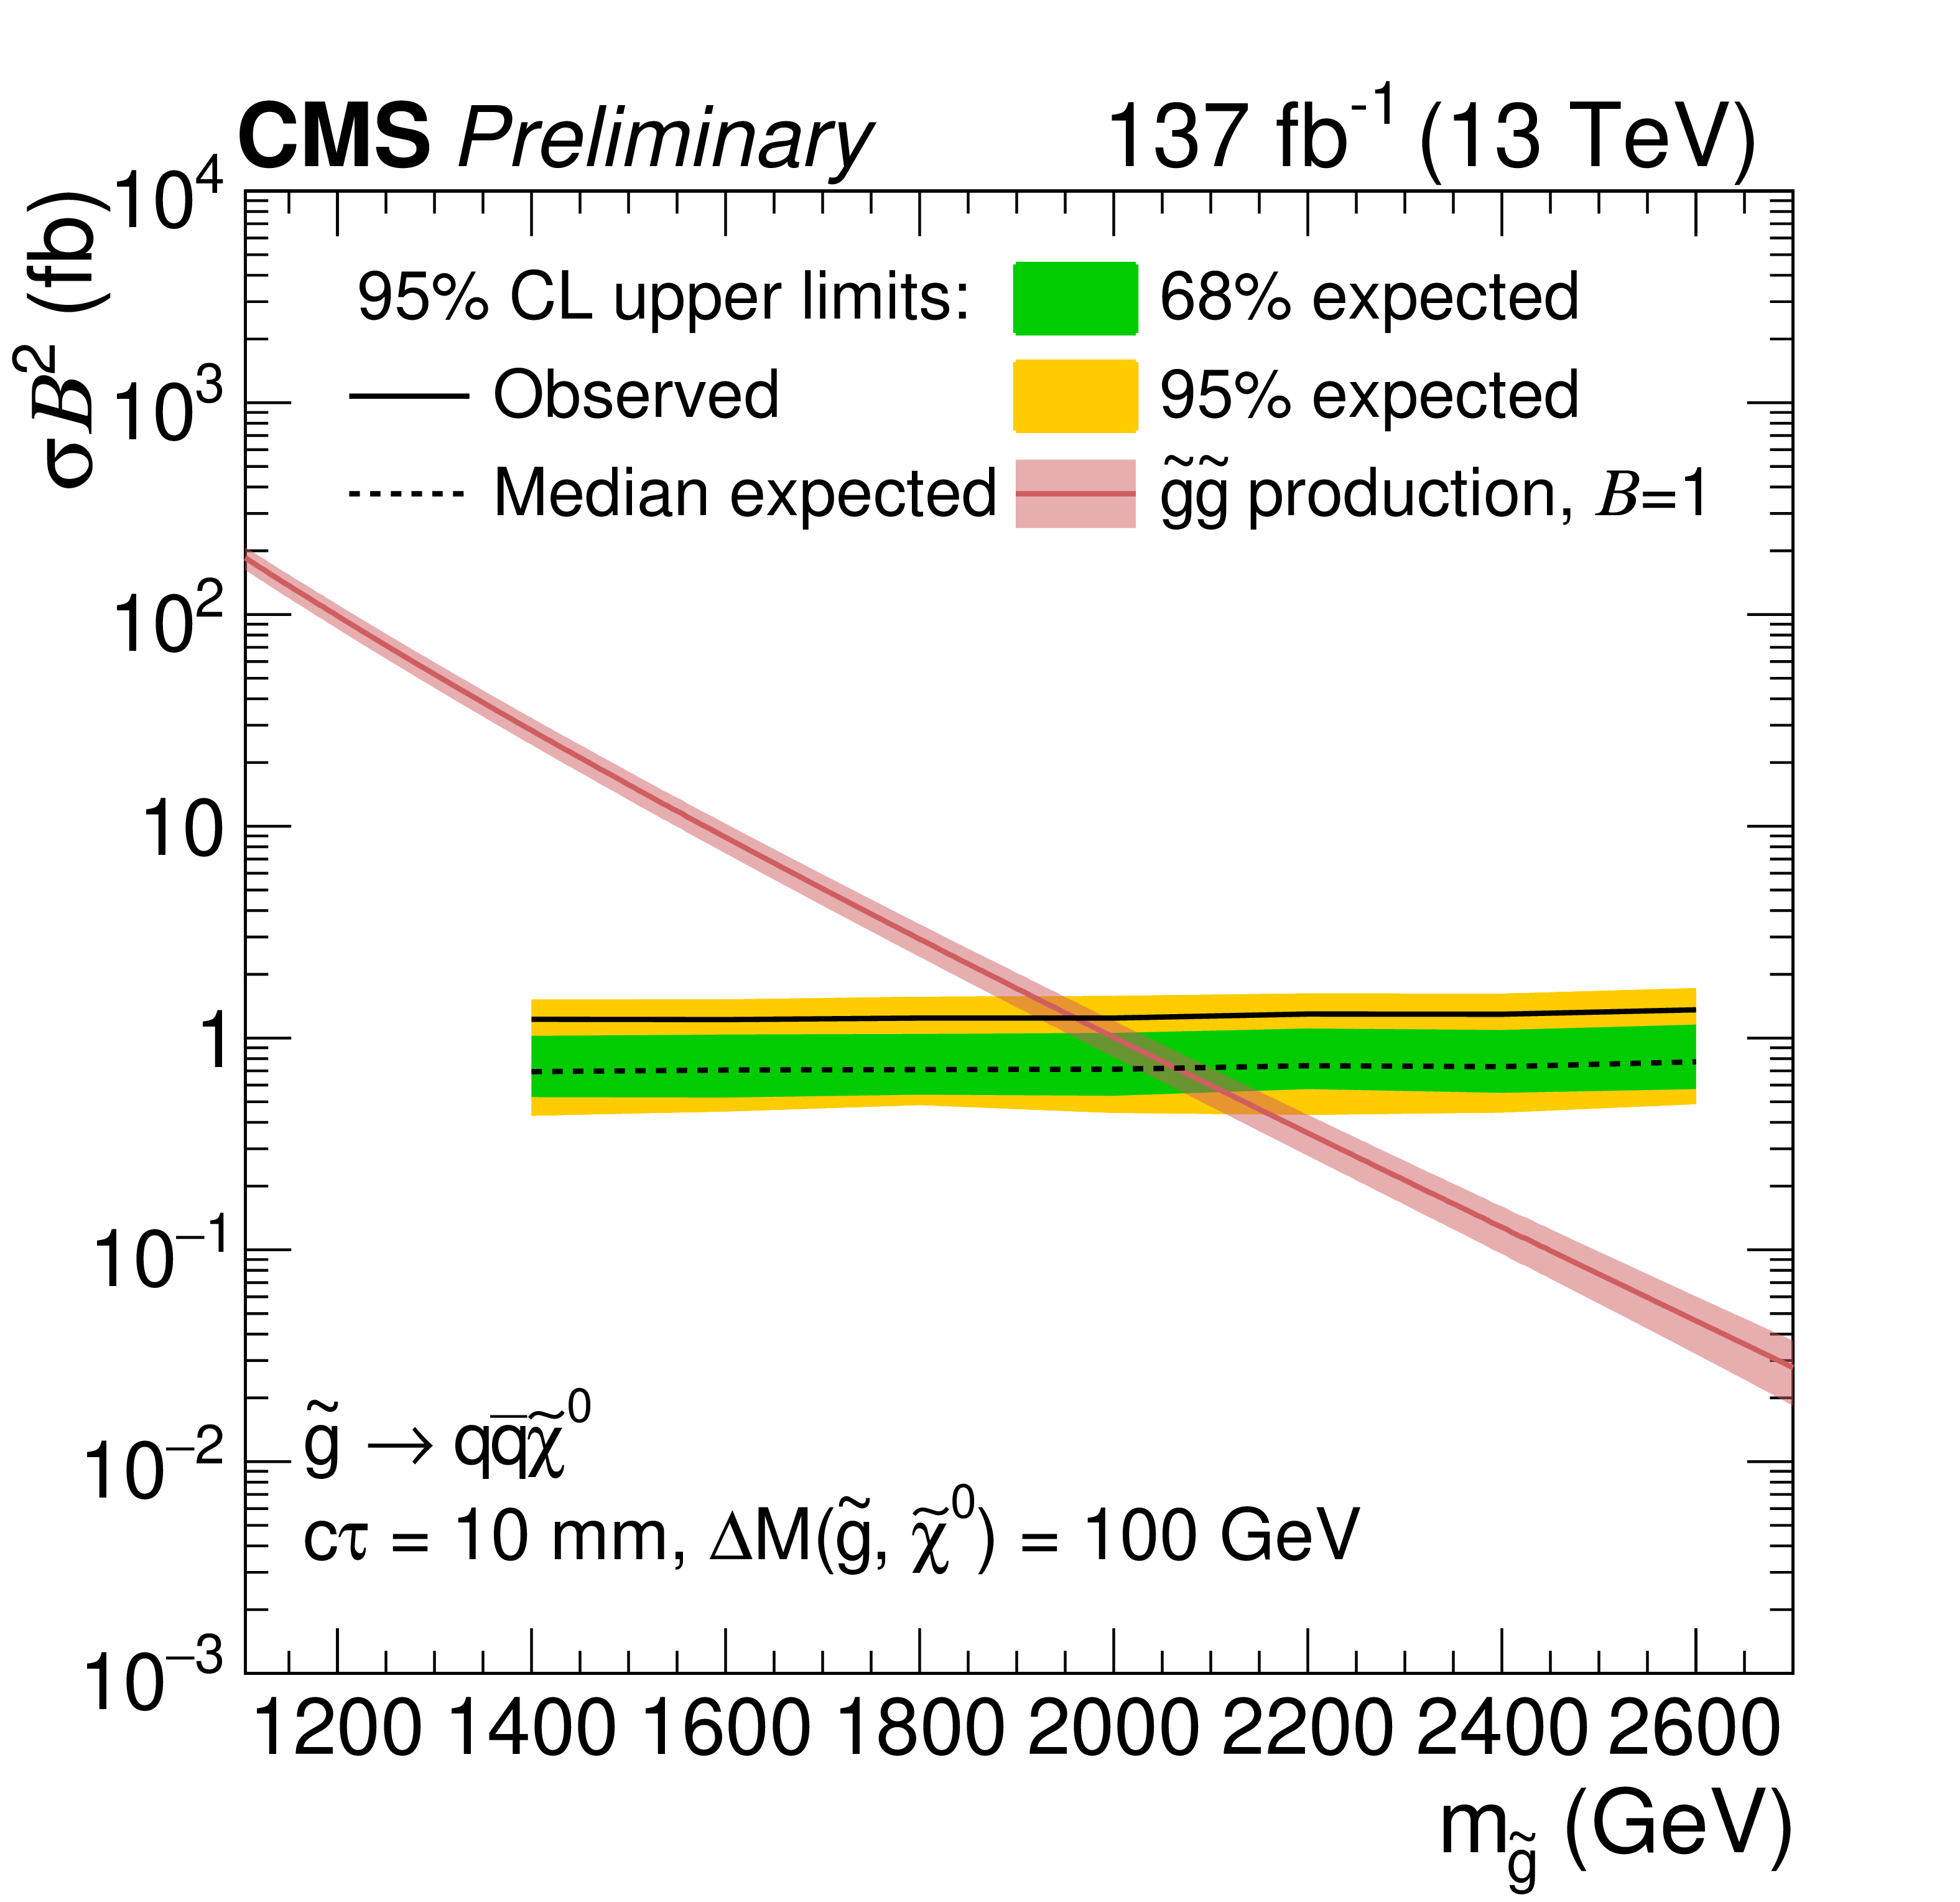
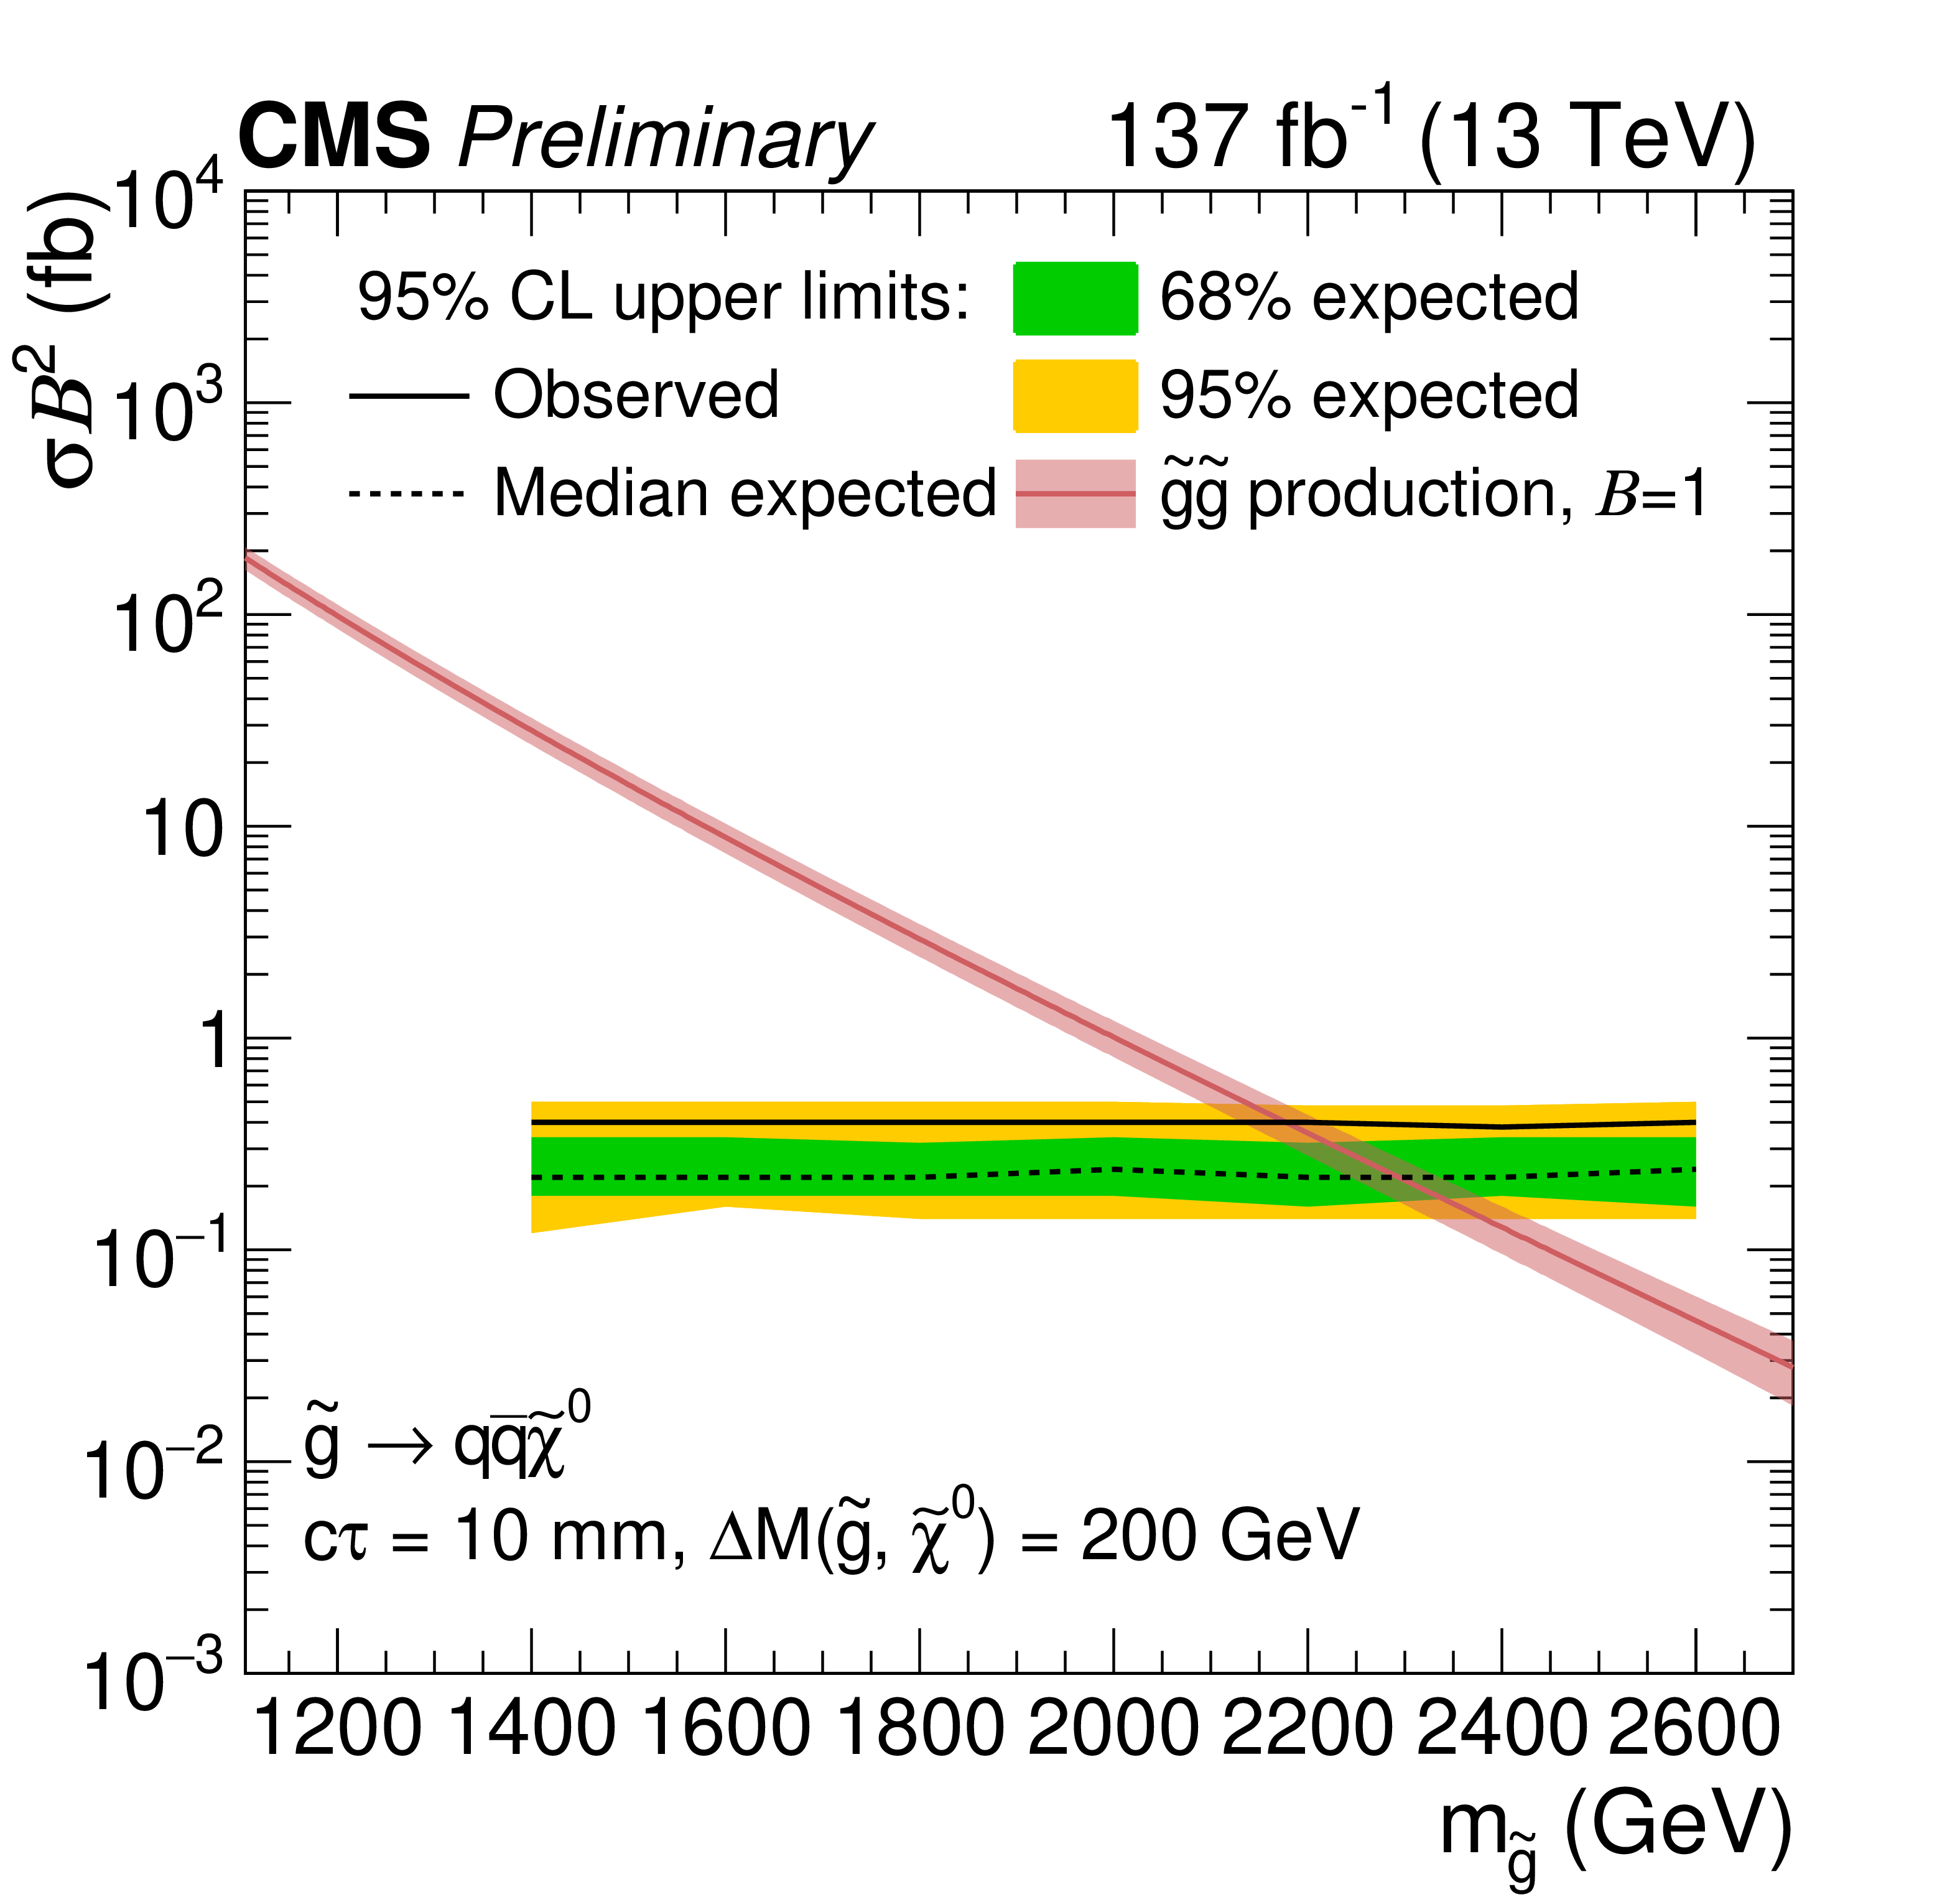
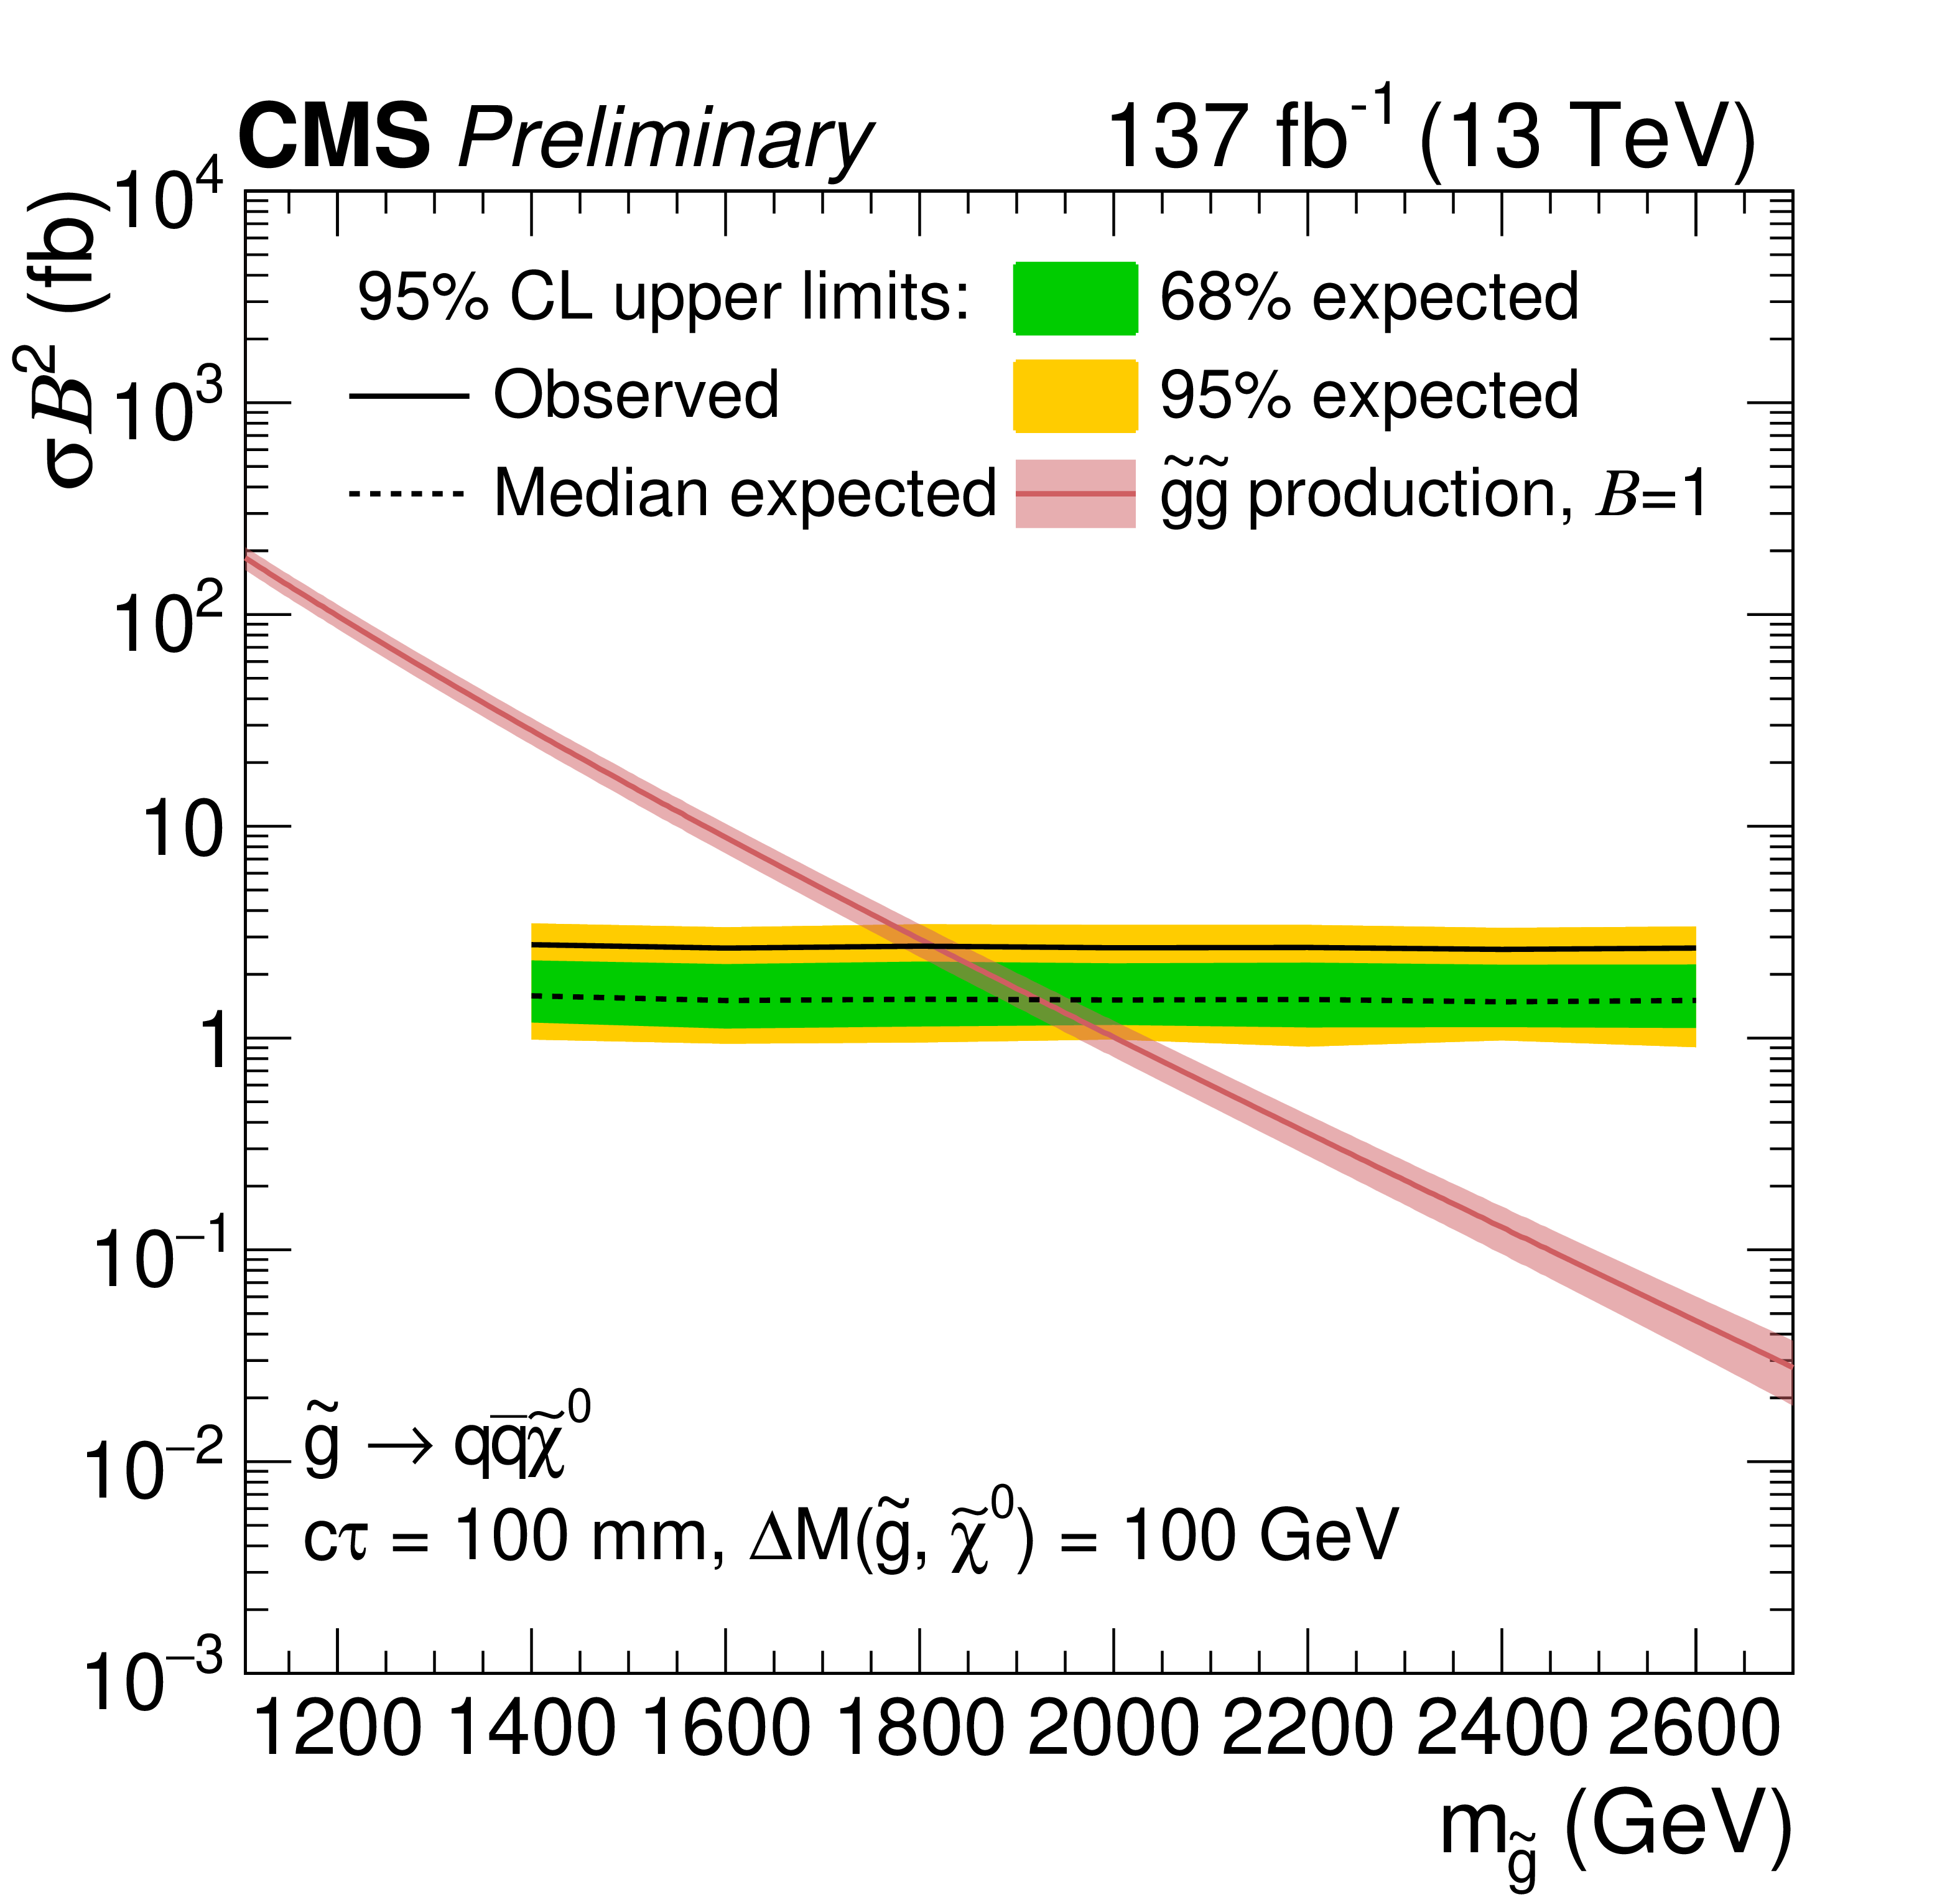
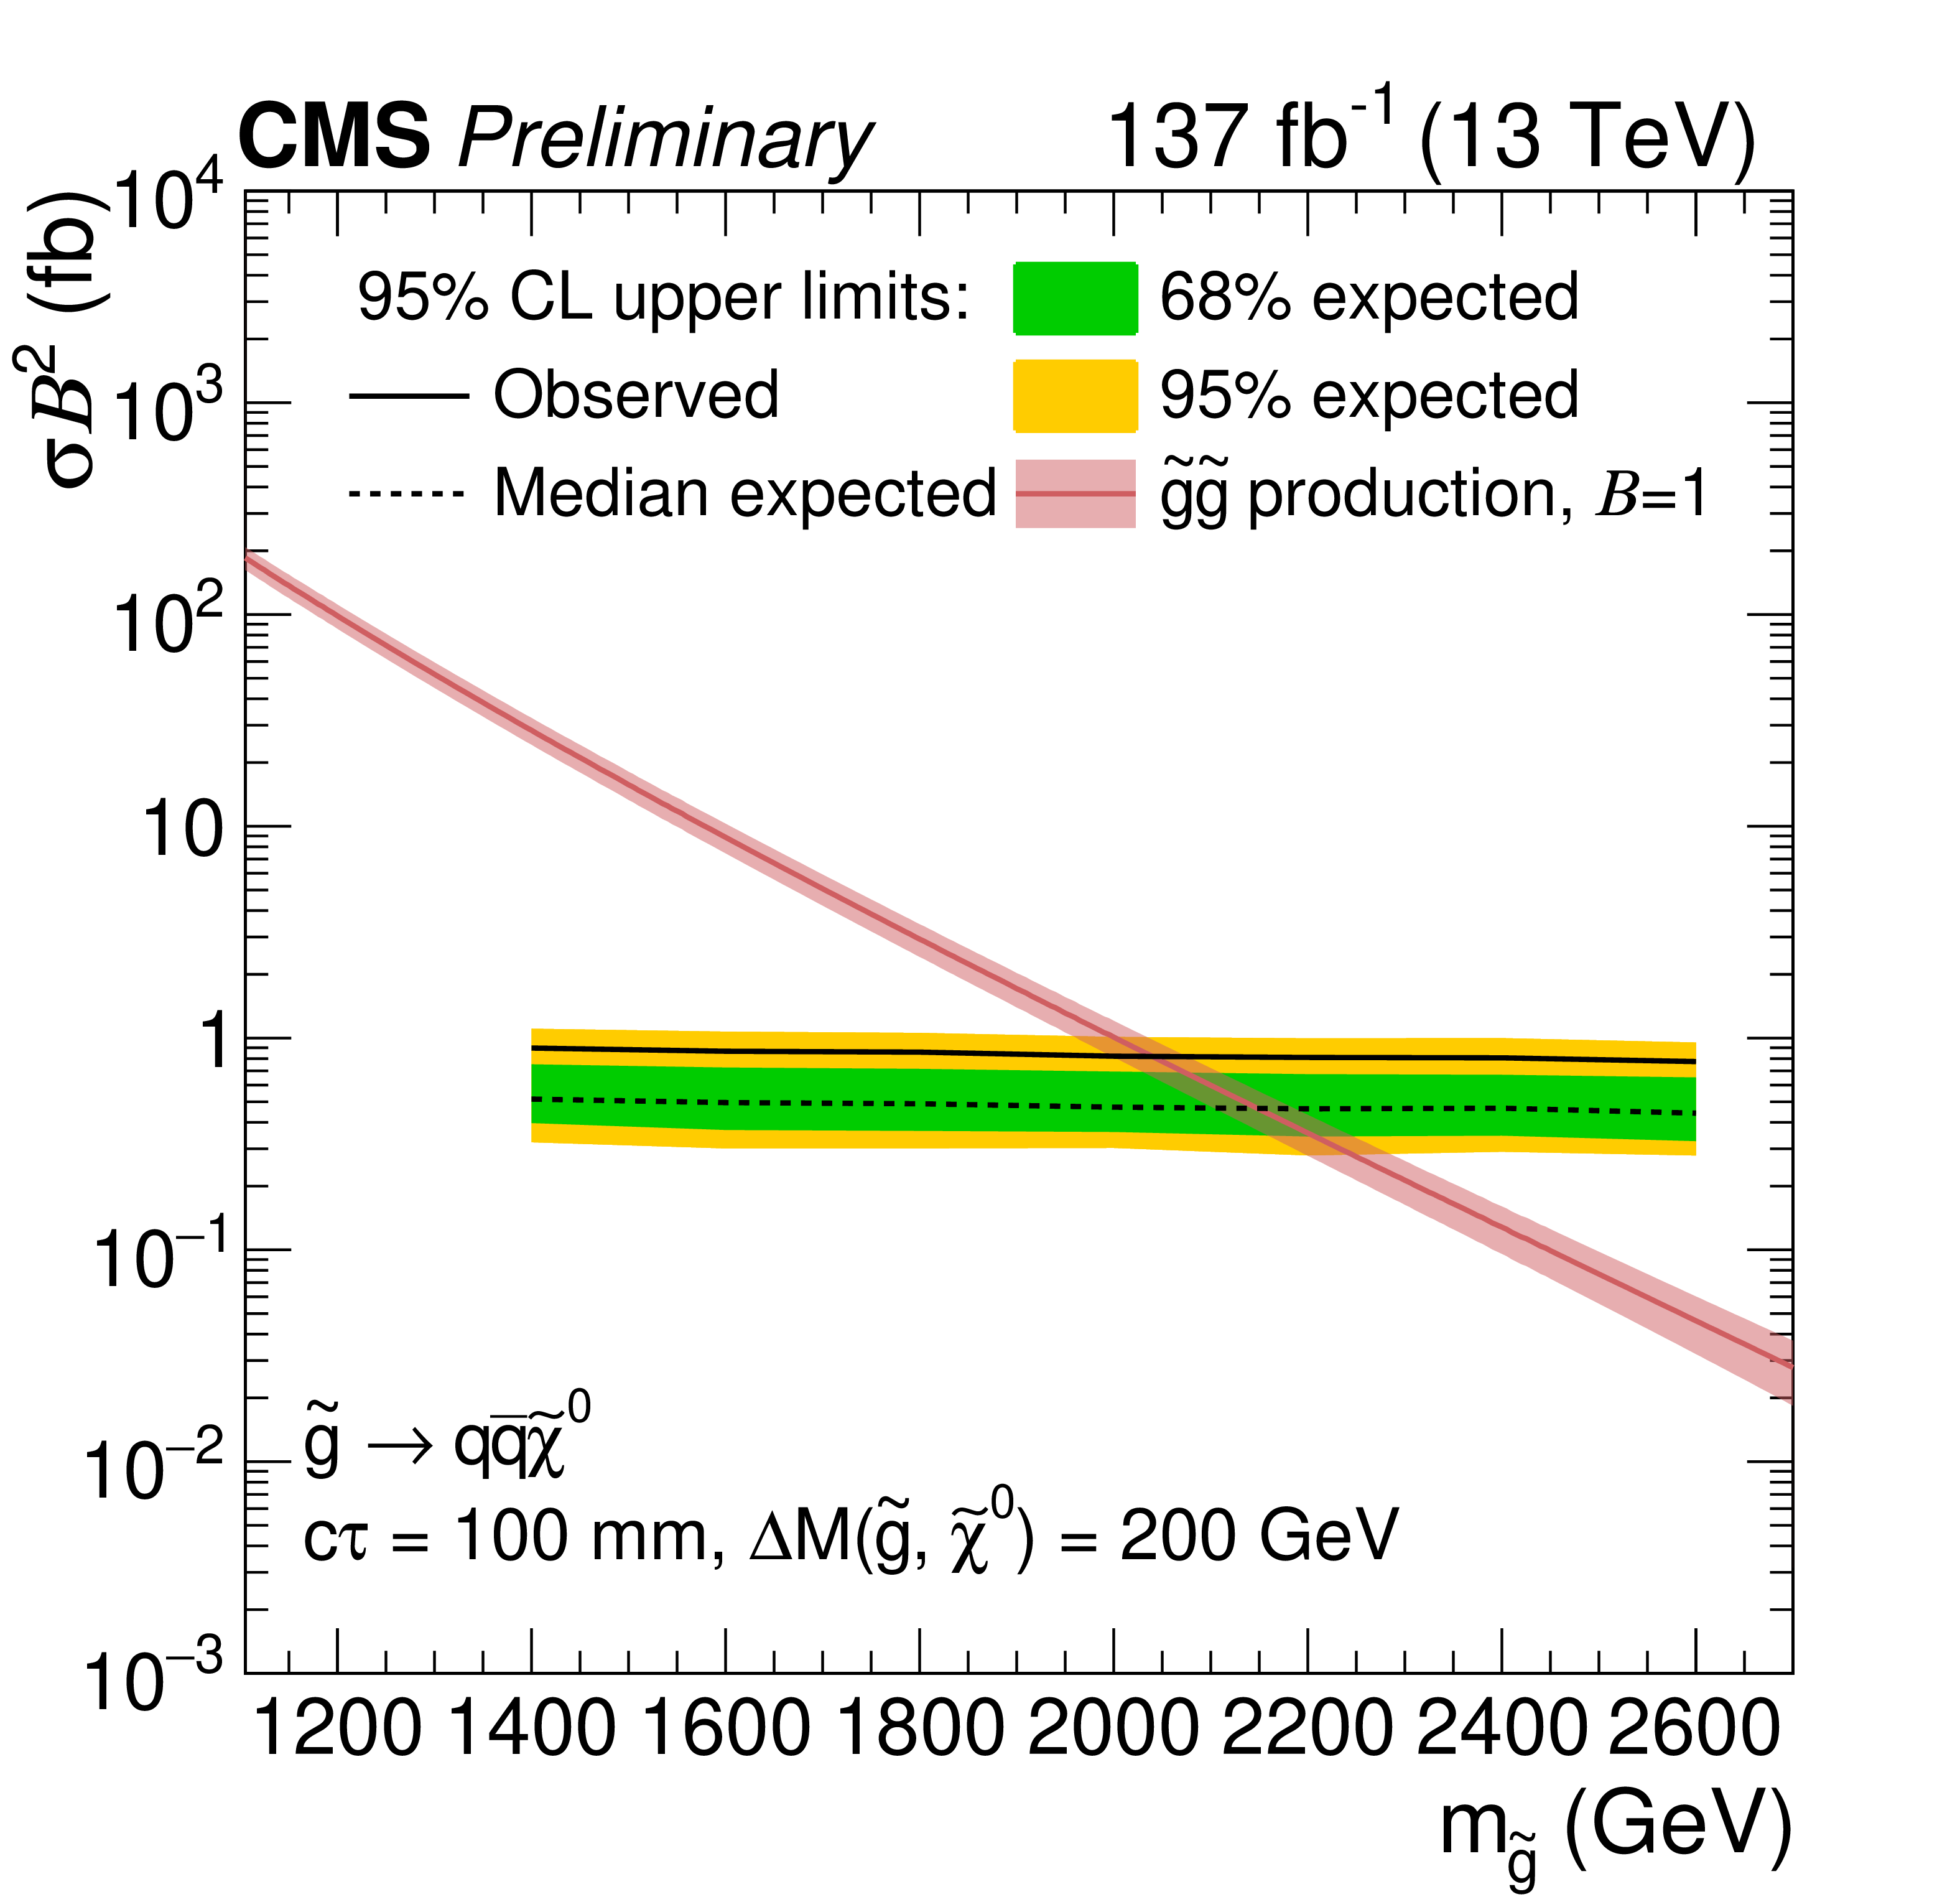
The 95% CL upper limits on the product of cross section and the branching fraction squared in the full Run-2 dataset, shown as a function of gluino mass for a fixed $ c\tau $ of 0.1 mm, 10 mm, and 100 mm from top to bottom (respectively) with a mass splitting of 100 GeV (left) and 200 GeV (right). The gluino pair production cross sections with their uncertainty are shown as the red curves and bands. |
png pdf |
Figure 8-a:
The 95% CL upper limits on the product of cross section and the branching fraction squared in the full Run-2 dataset, shown as a function of gluino mass for a fixed $ c\tau $ of 0.1 mm, 10 mm, and 100 mm from top to bottom (respectively) with a mass splitting of 100 GeV (left) and 200 GeV (right). The gluino pair production cross sections with their uncertainty are shown as the red curves and bands. |
png pdf |
Figure 8-b:
The 95% CL upper limits on the product of cross section and the branching fraction squared in the full Run-2 dataset, shown as a function of gluino mass for a fixed $ c\tau $ of 0.1 mm, 10 mm, and 100 mm from top to bottom (respectively) with a mass splitting of 100 GeV (left) and 200 GeV (right). The gluino pair production cross sections with their uncertainty are shown as the red curves and bands. |
png pdf |
Figure 8-c:
The 95% CL upper limits on the product of cross section and the branching fraction squared in the full Run-2 dataset, shown as a function of gluino mass for a fixed $ c\tau $ of 0.1 mm, 10 mm, and 100 mm from top to bottom (respectively) with a mass splitting of 100 GeV (left) and 200 GeV (right). The gluino pair production cross sections with their uncertainty are shown as the red curves and bands. |
png pdf |
Figure 8-d:
The 95% CL upper limits on the product of cross section and the branching fraction squared in the full Run-2 dataset, shown as a function of gluino mass for a fixed $ c\tau $ of 0.1 mm, 10 mm, and 100 mm from top to bottom (respectively) with a mass splitting of 100 GeV (left) and 200 GeV (right). The gluino pair production cross sections with their uncertainty are shown as the red curves and bands. |
png pdf |
Figure 8-e:
The 95% CL upper limits on the product of cross section and the branching fraction squared in the full Run-2 dataset, shown as a function of gluino mass for a fixed $ c\tau $ of 0.1 mm, 10 mm, and 100 mm from top to bottom (respectively) with a mass splitting of 100 GeV (left) and 200 GeV (right). The gluino pair production cross sections with their uncertainty are shown as the red curves and bands. |
png pdf |
Figure 8-f:
The 95% CL upper limits on the product of cross section and the branching fraction squared in the full Run-2 dataset, shown as a function of gluino mass for a fixed $ c\tau $ of 0.1 mm, 10 mm, and 100 mm from top to bottom (respectively) with a mass splitting of 100 GeV (left) and 200 GeV (right). The gluino pair production cross sections with their uncertainty are shown as the red curves and bands. |
png pdf |
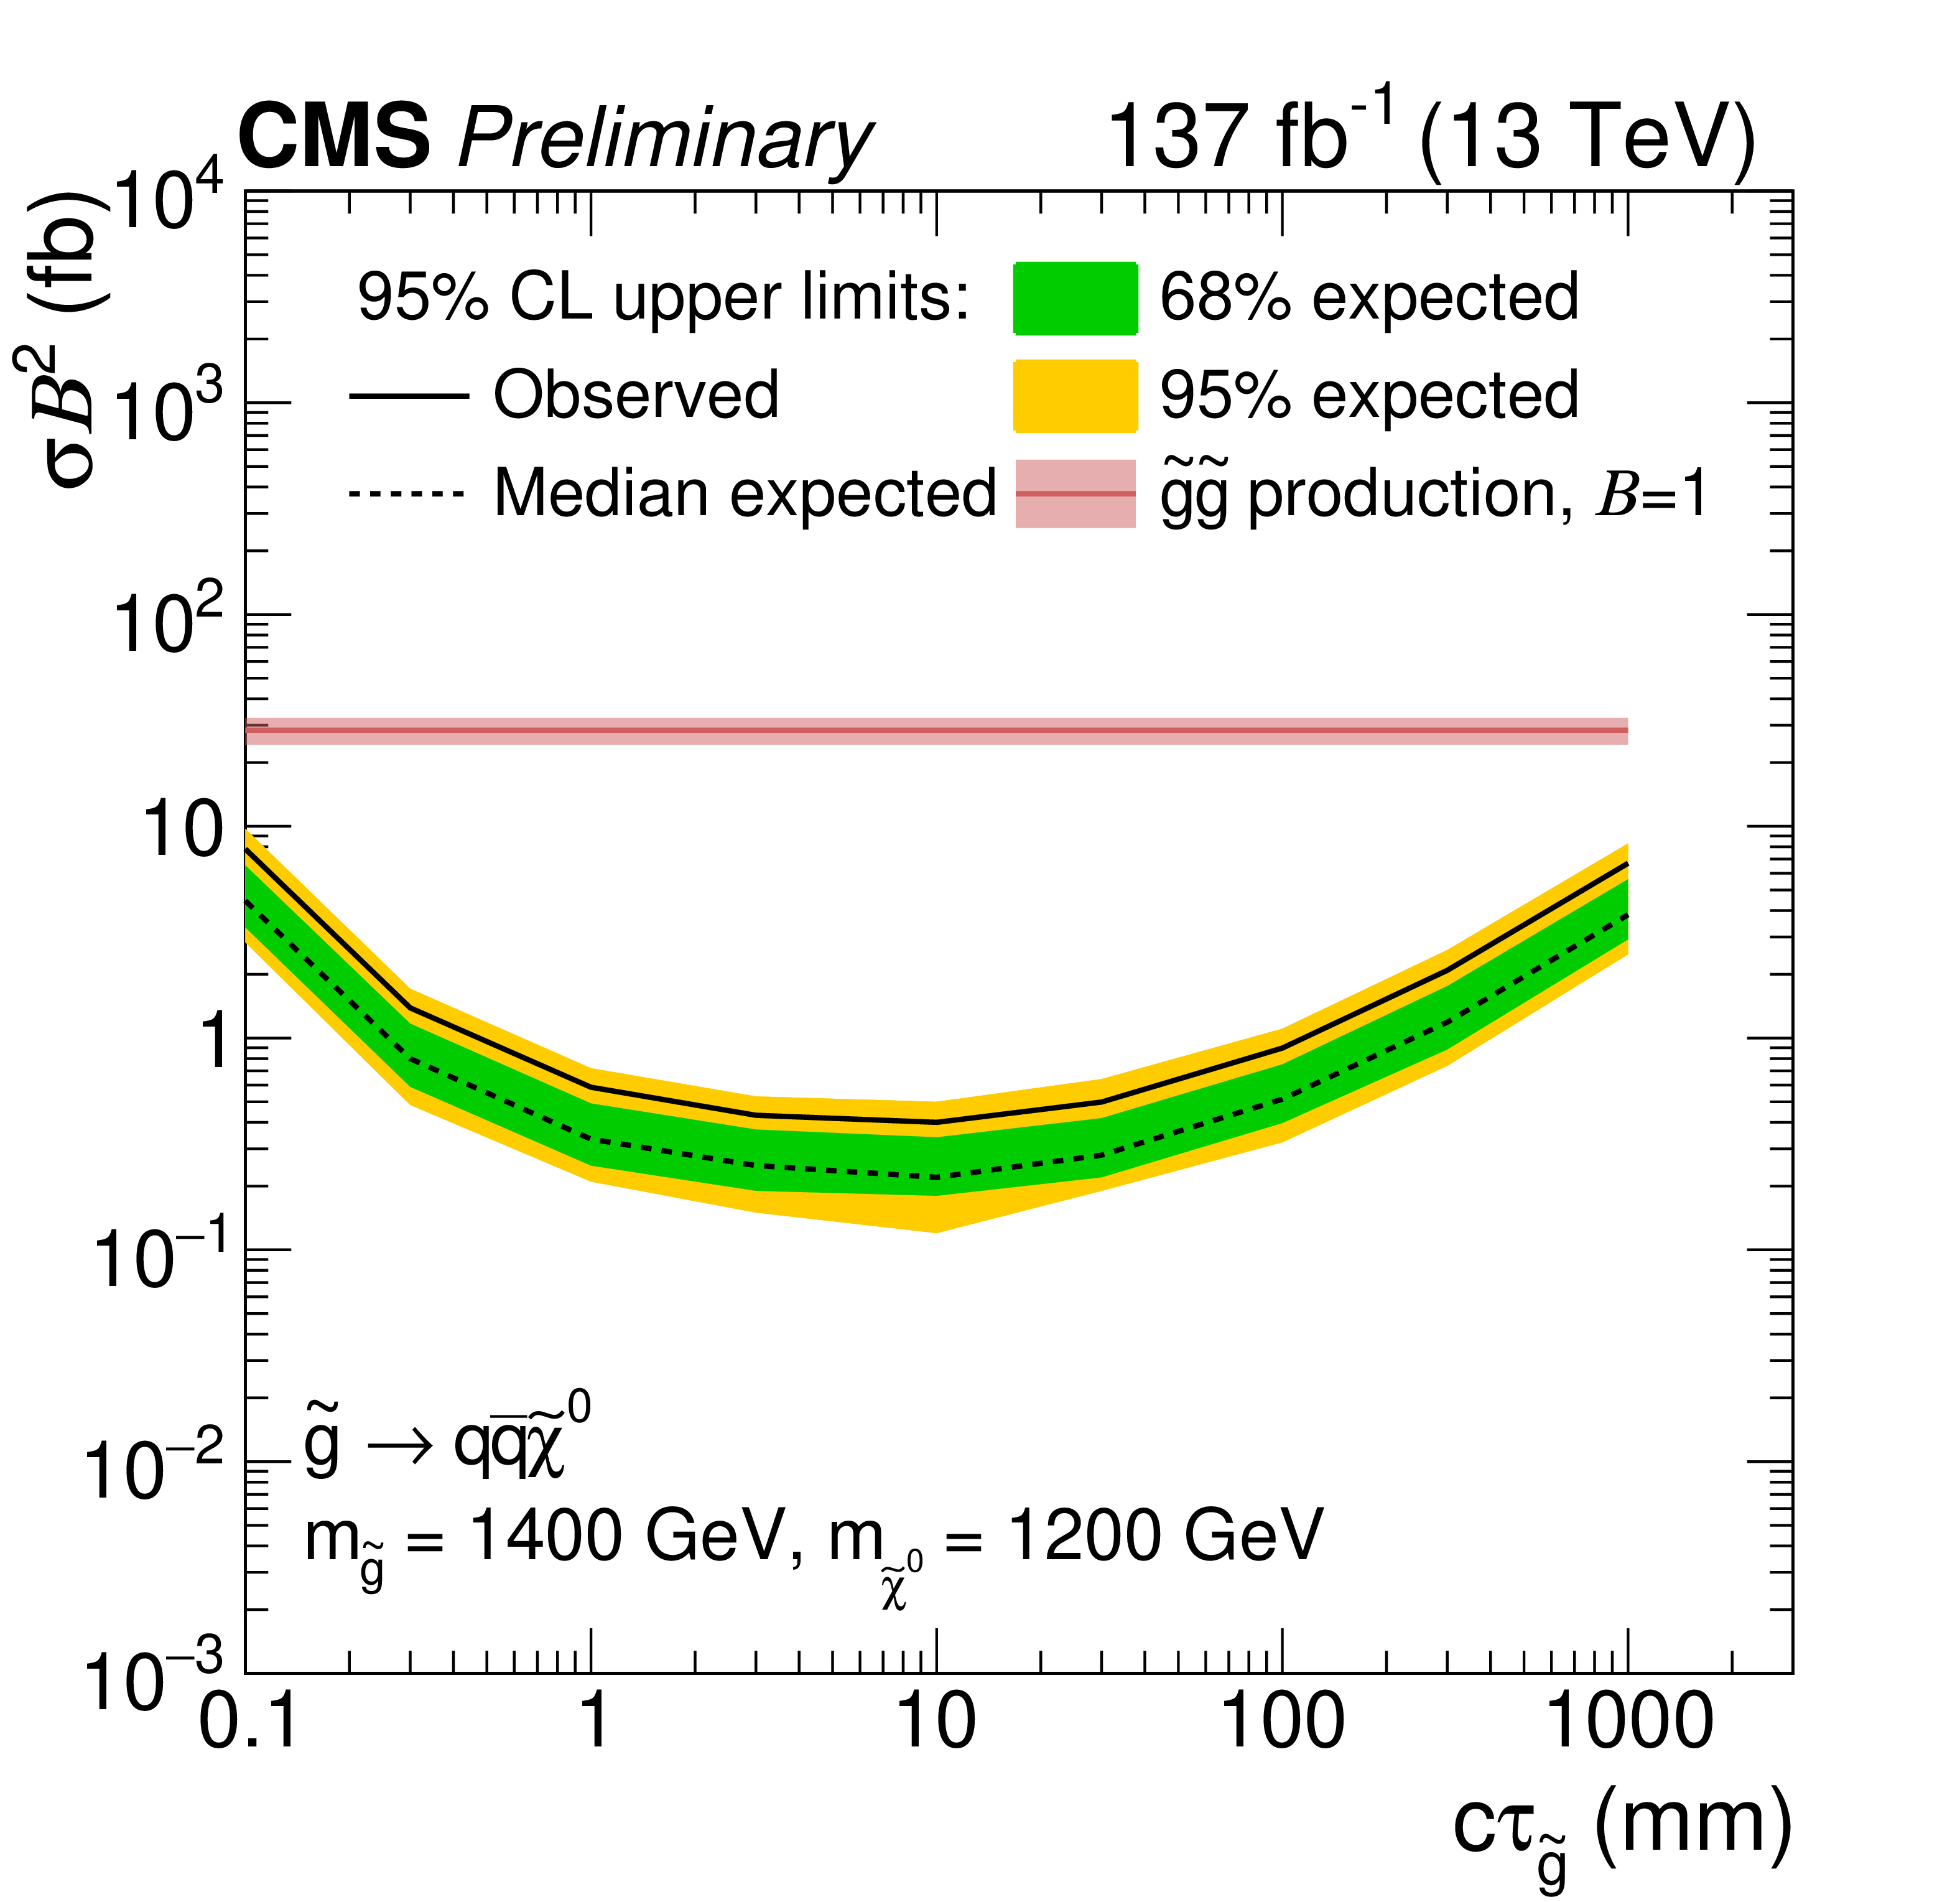
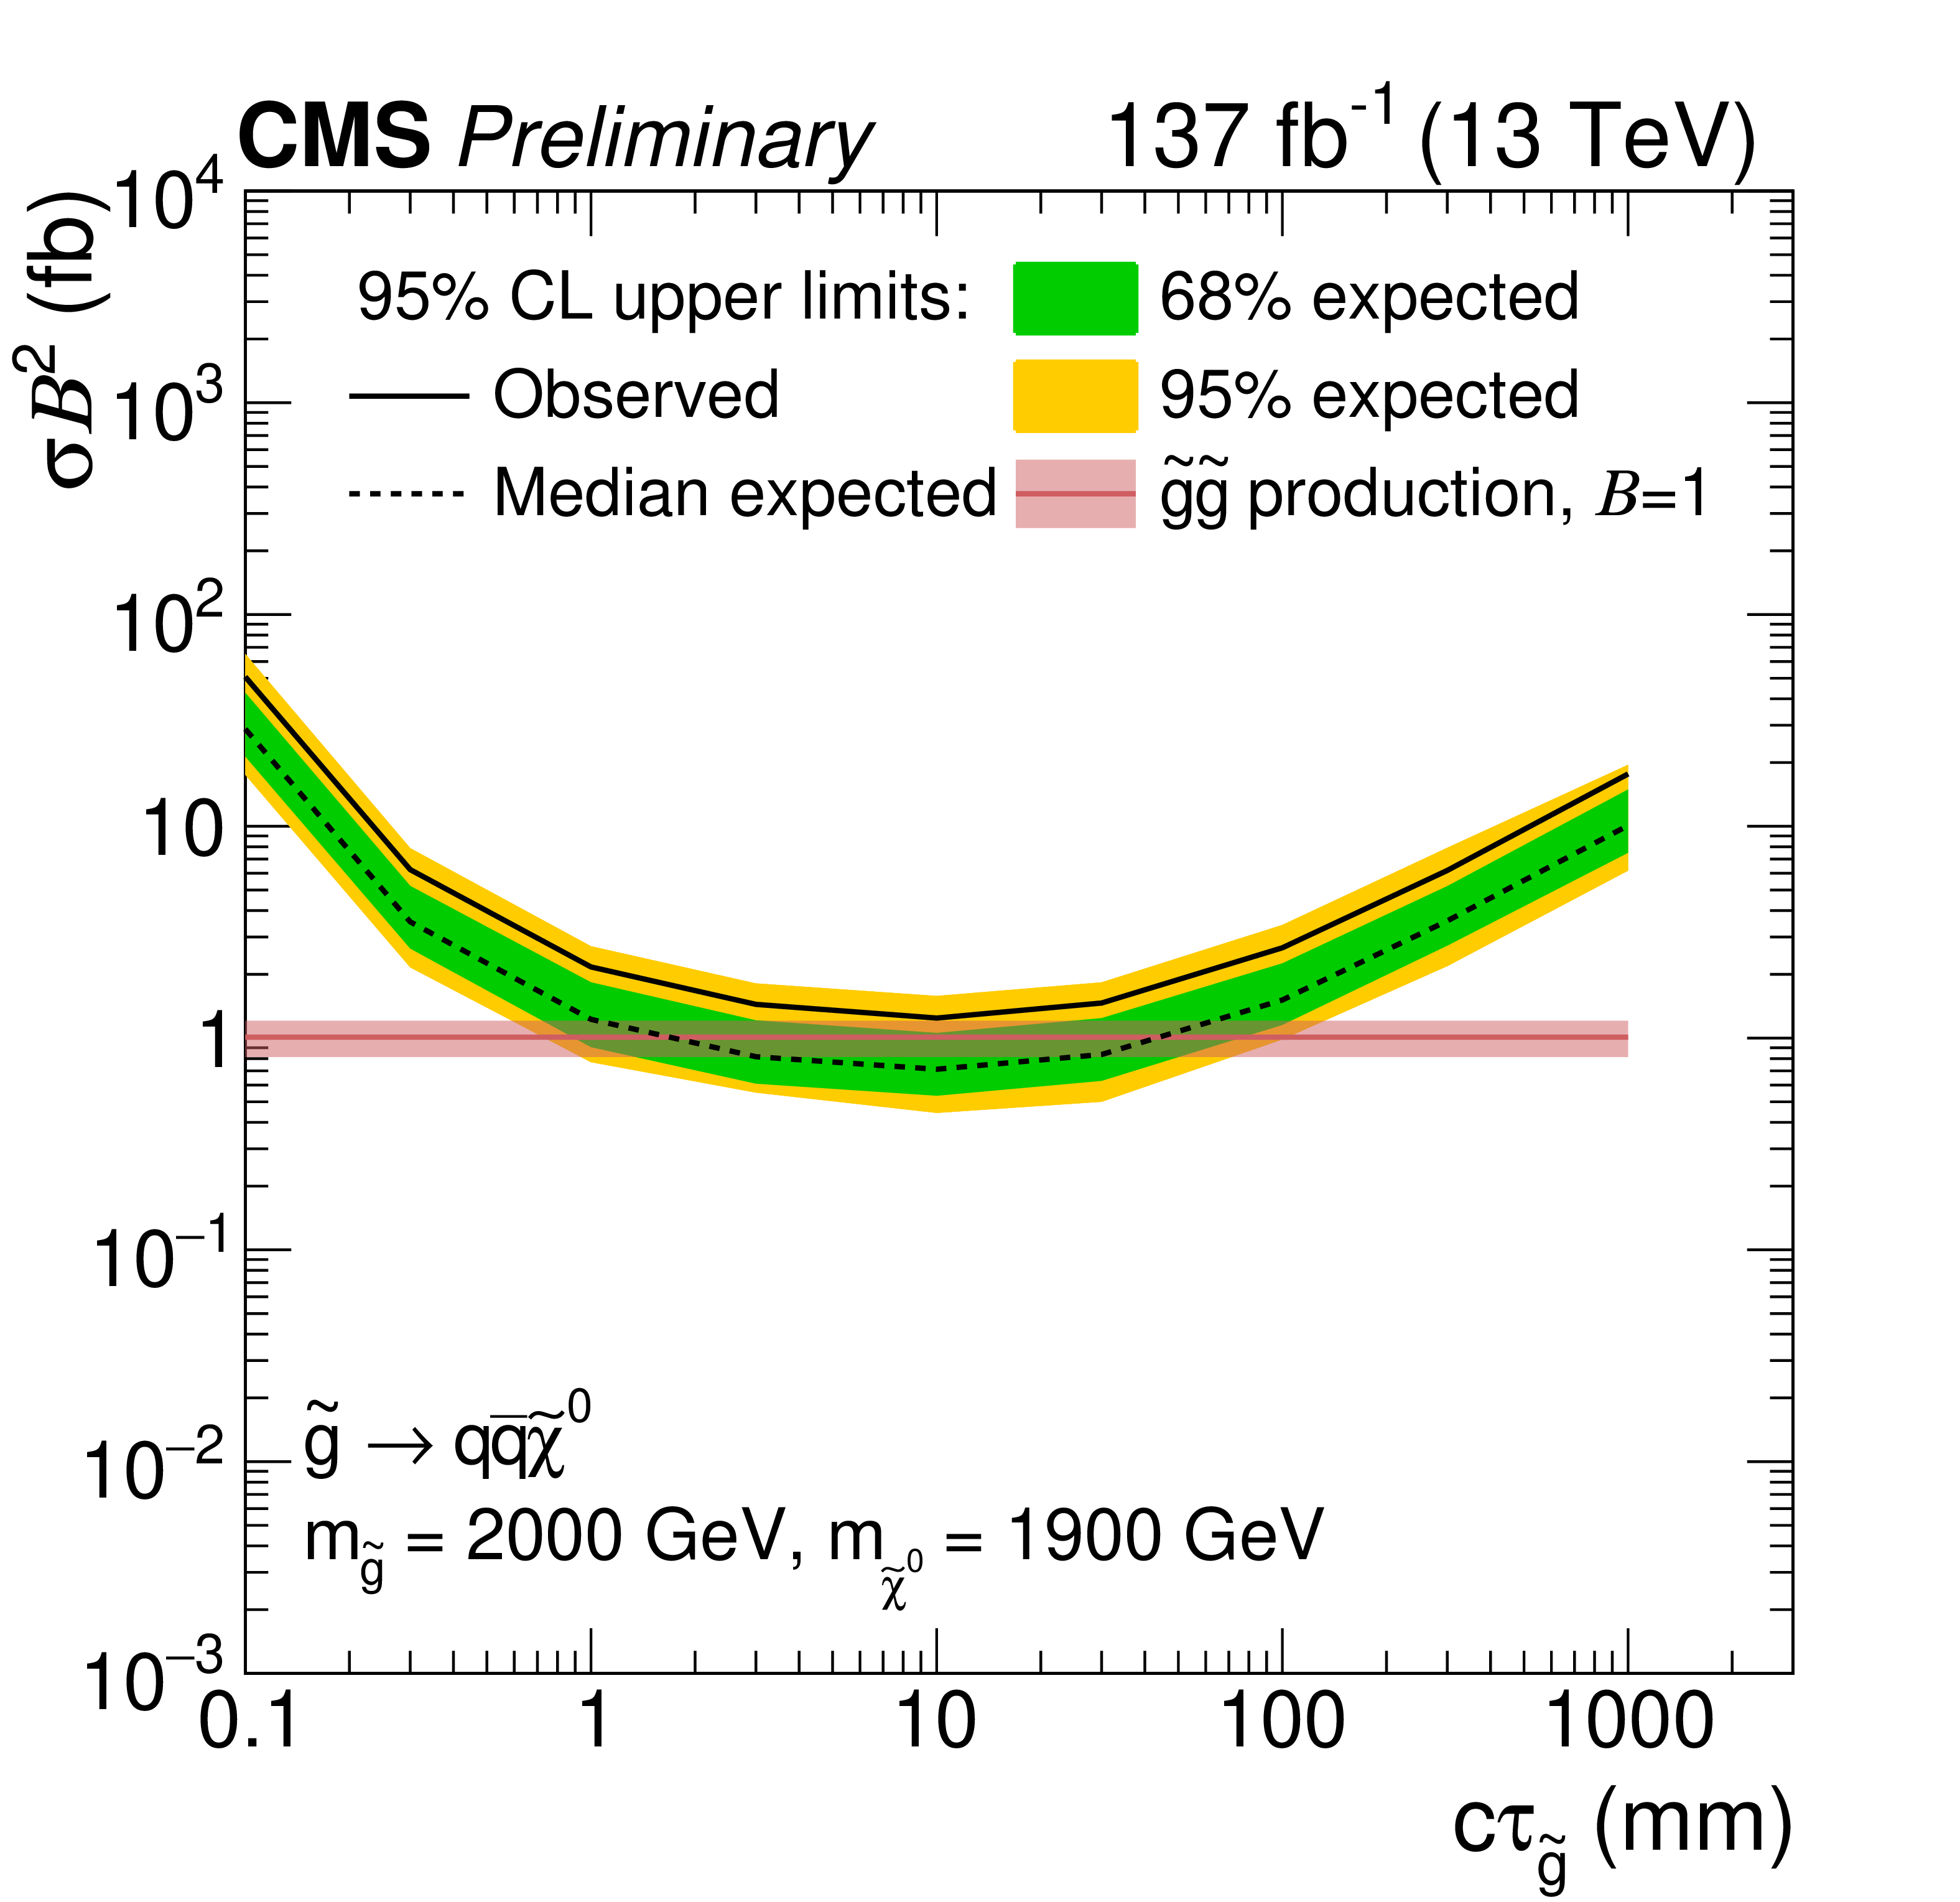
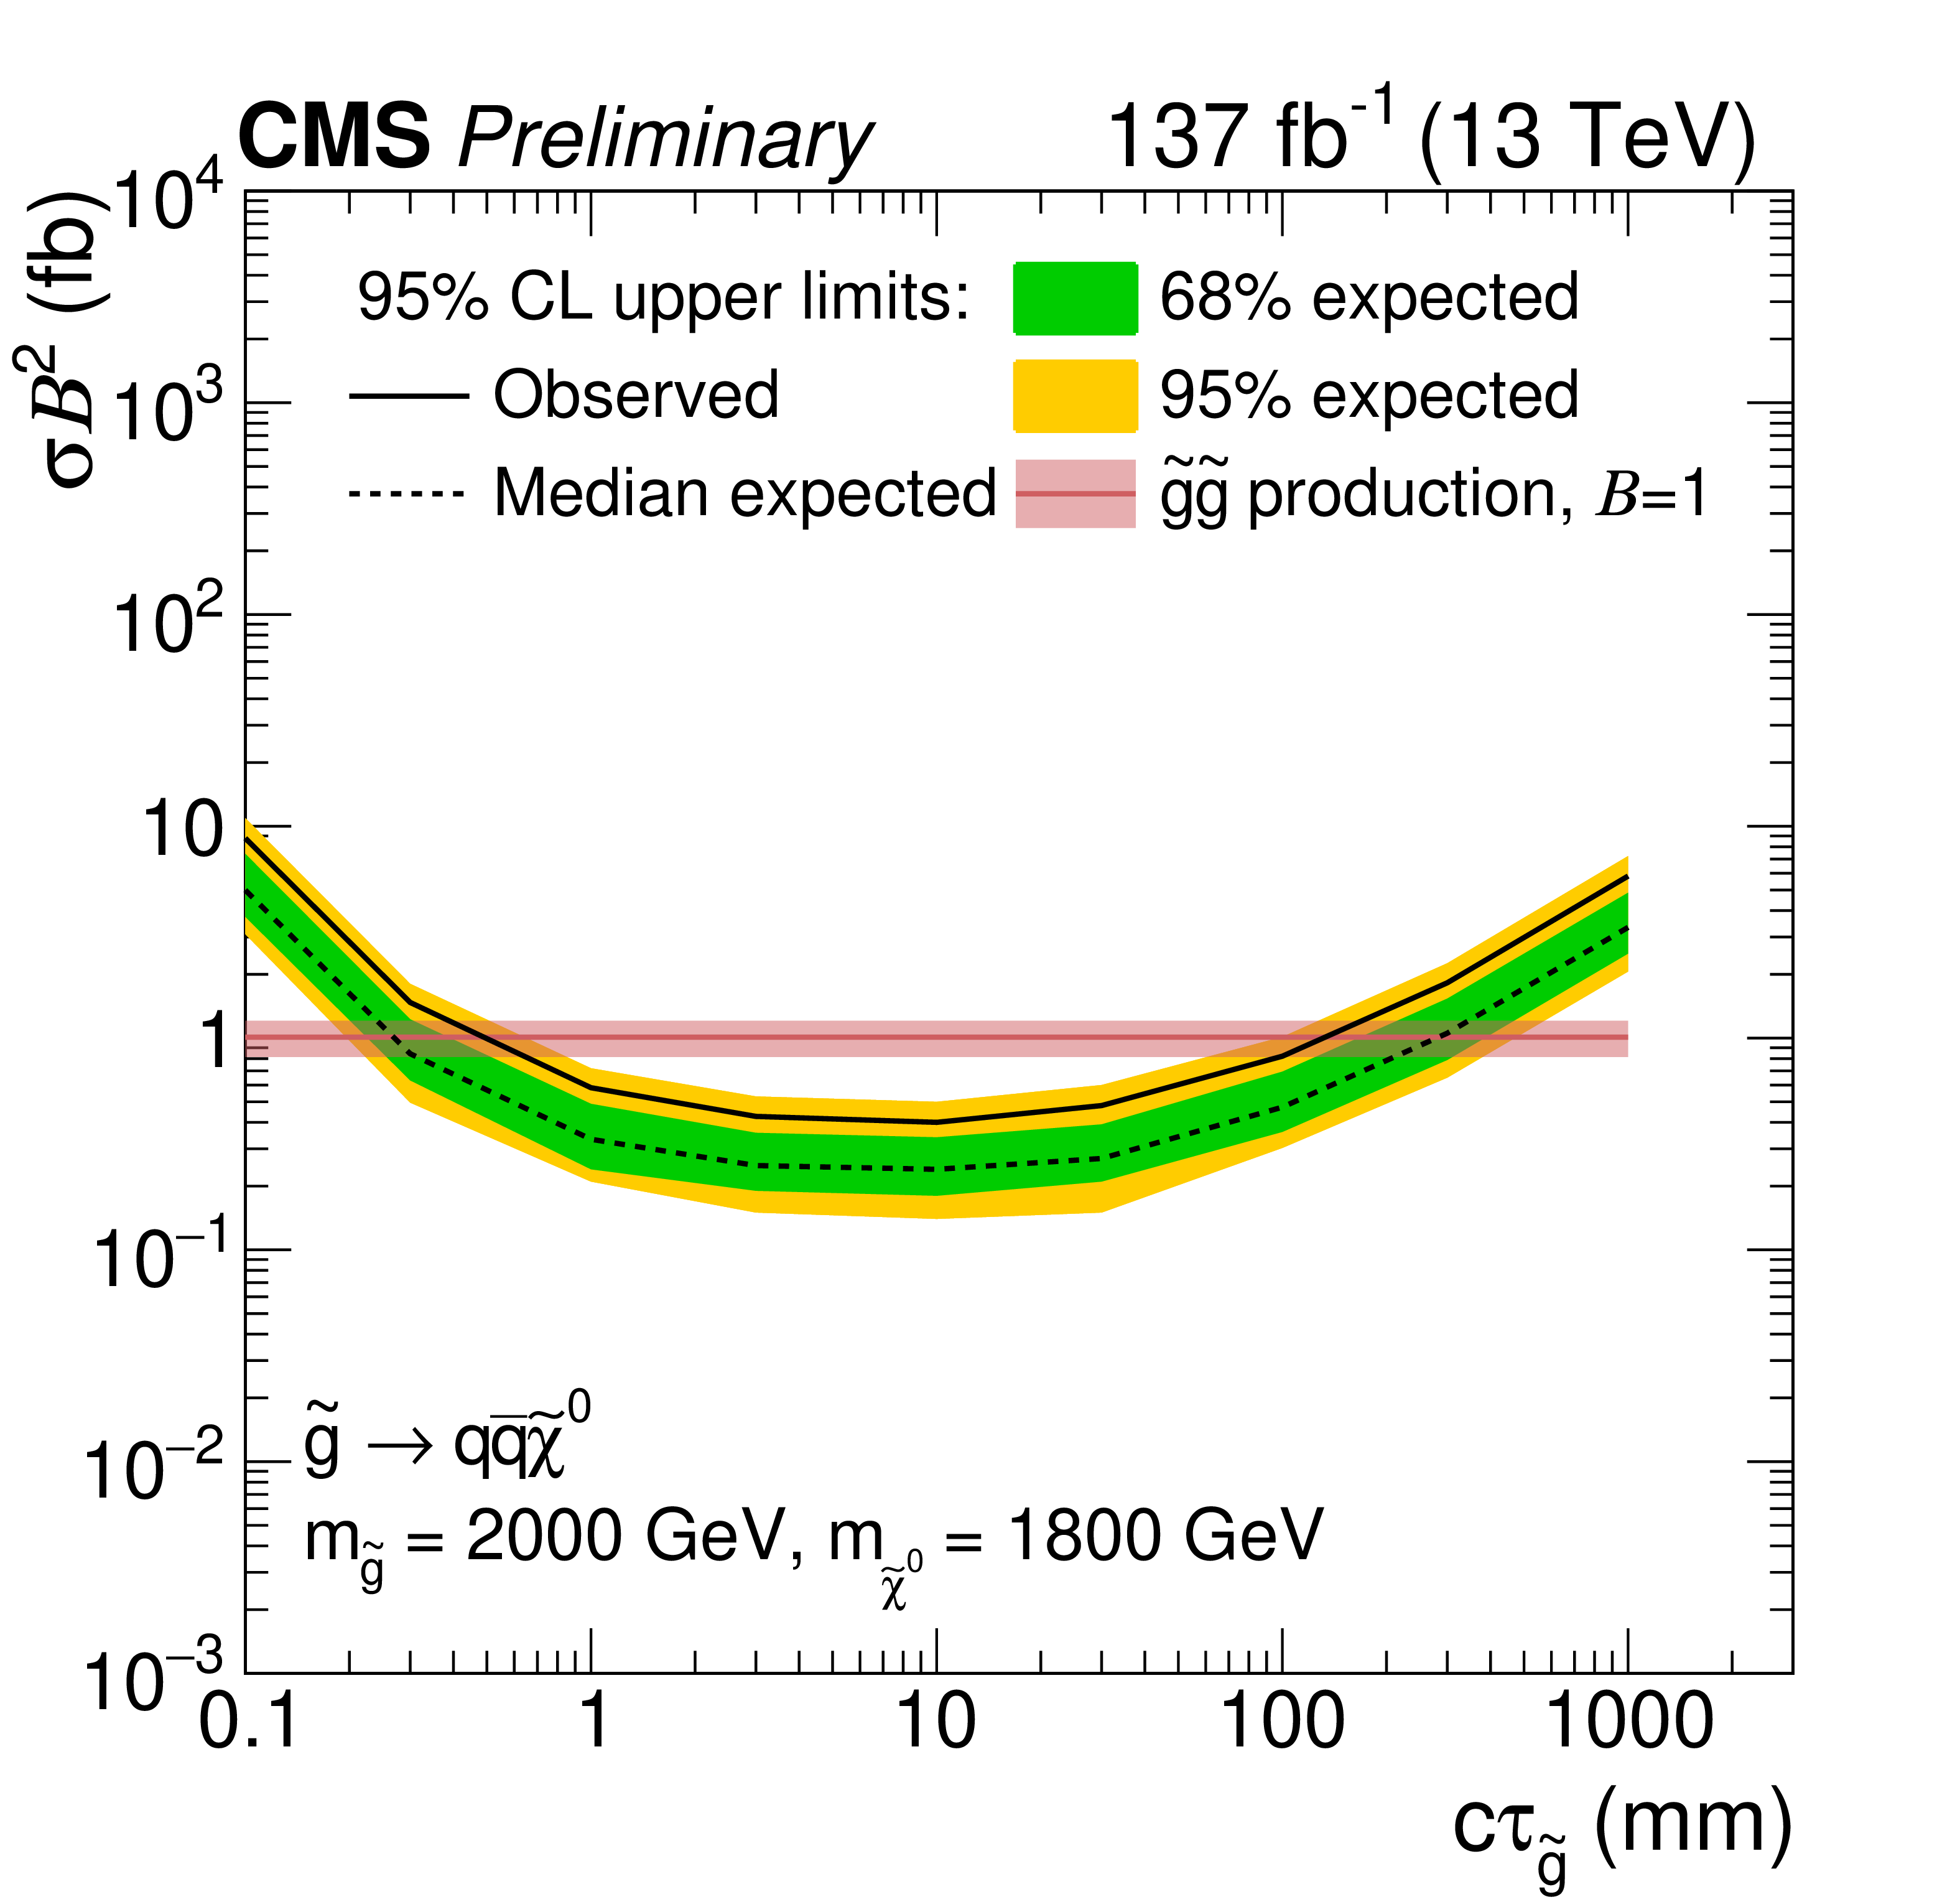
Figure 9:
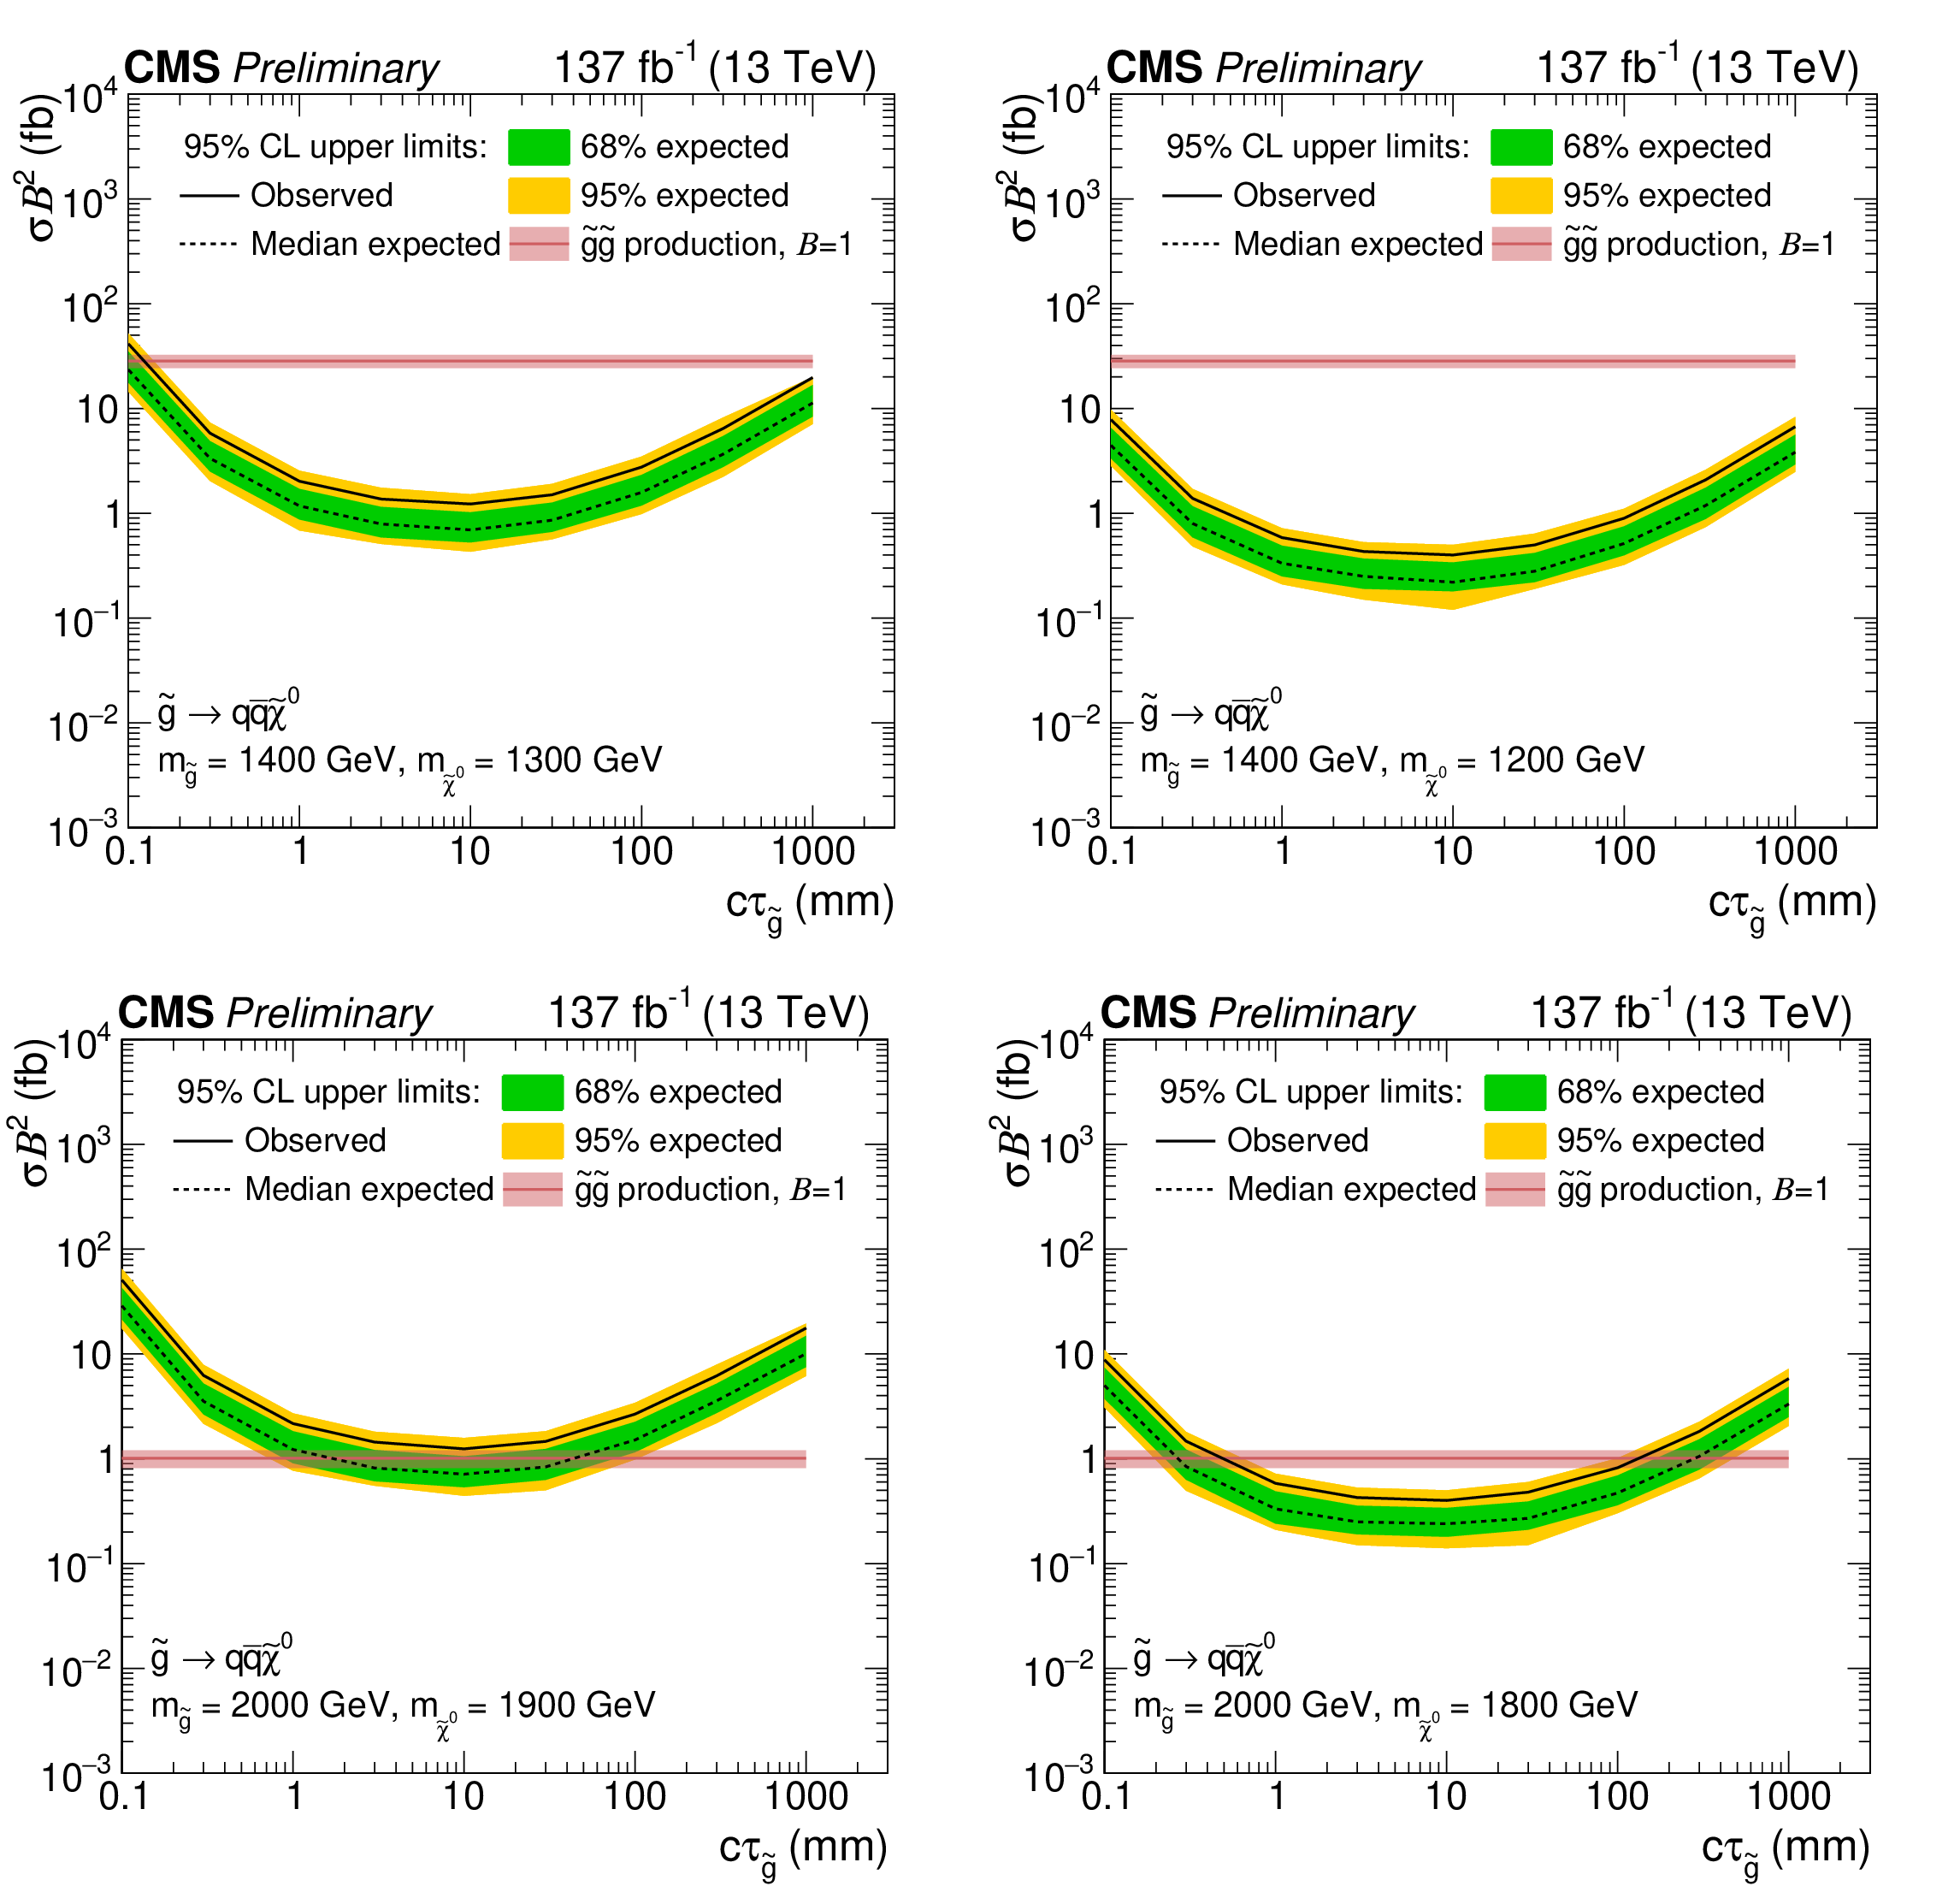
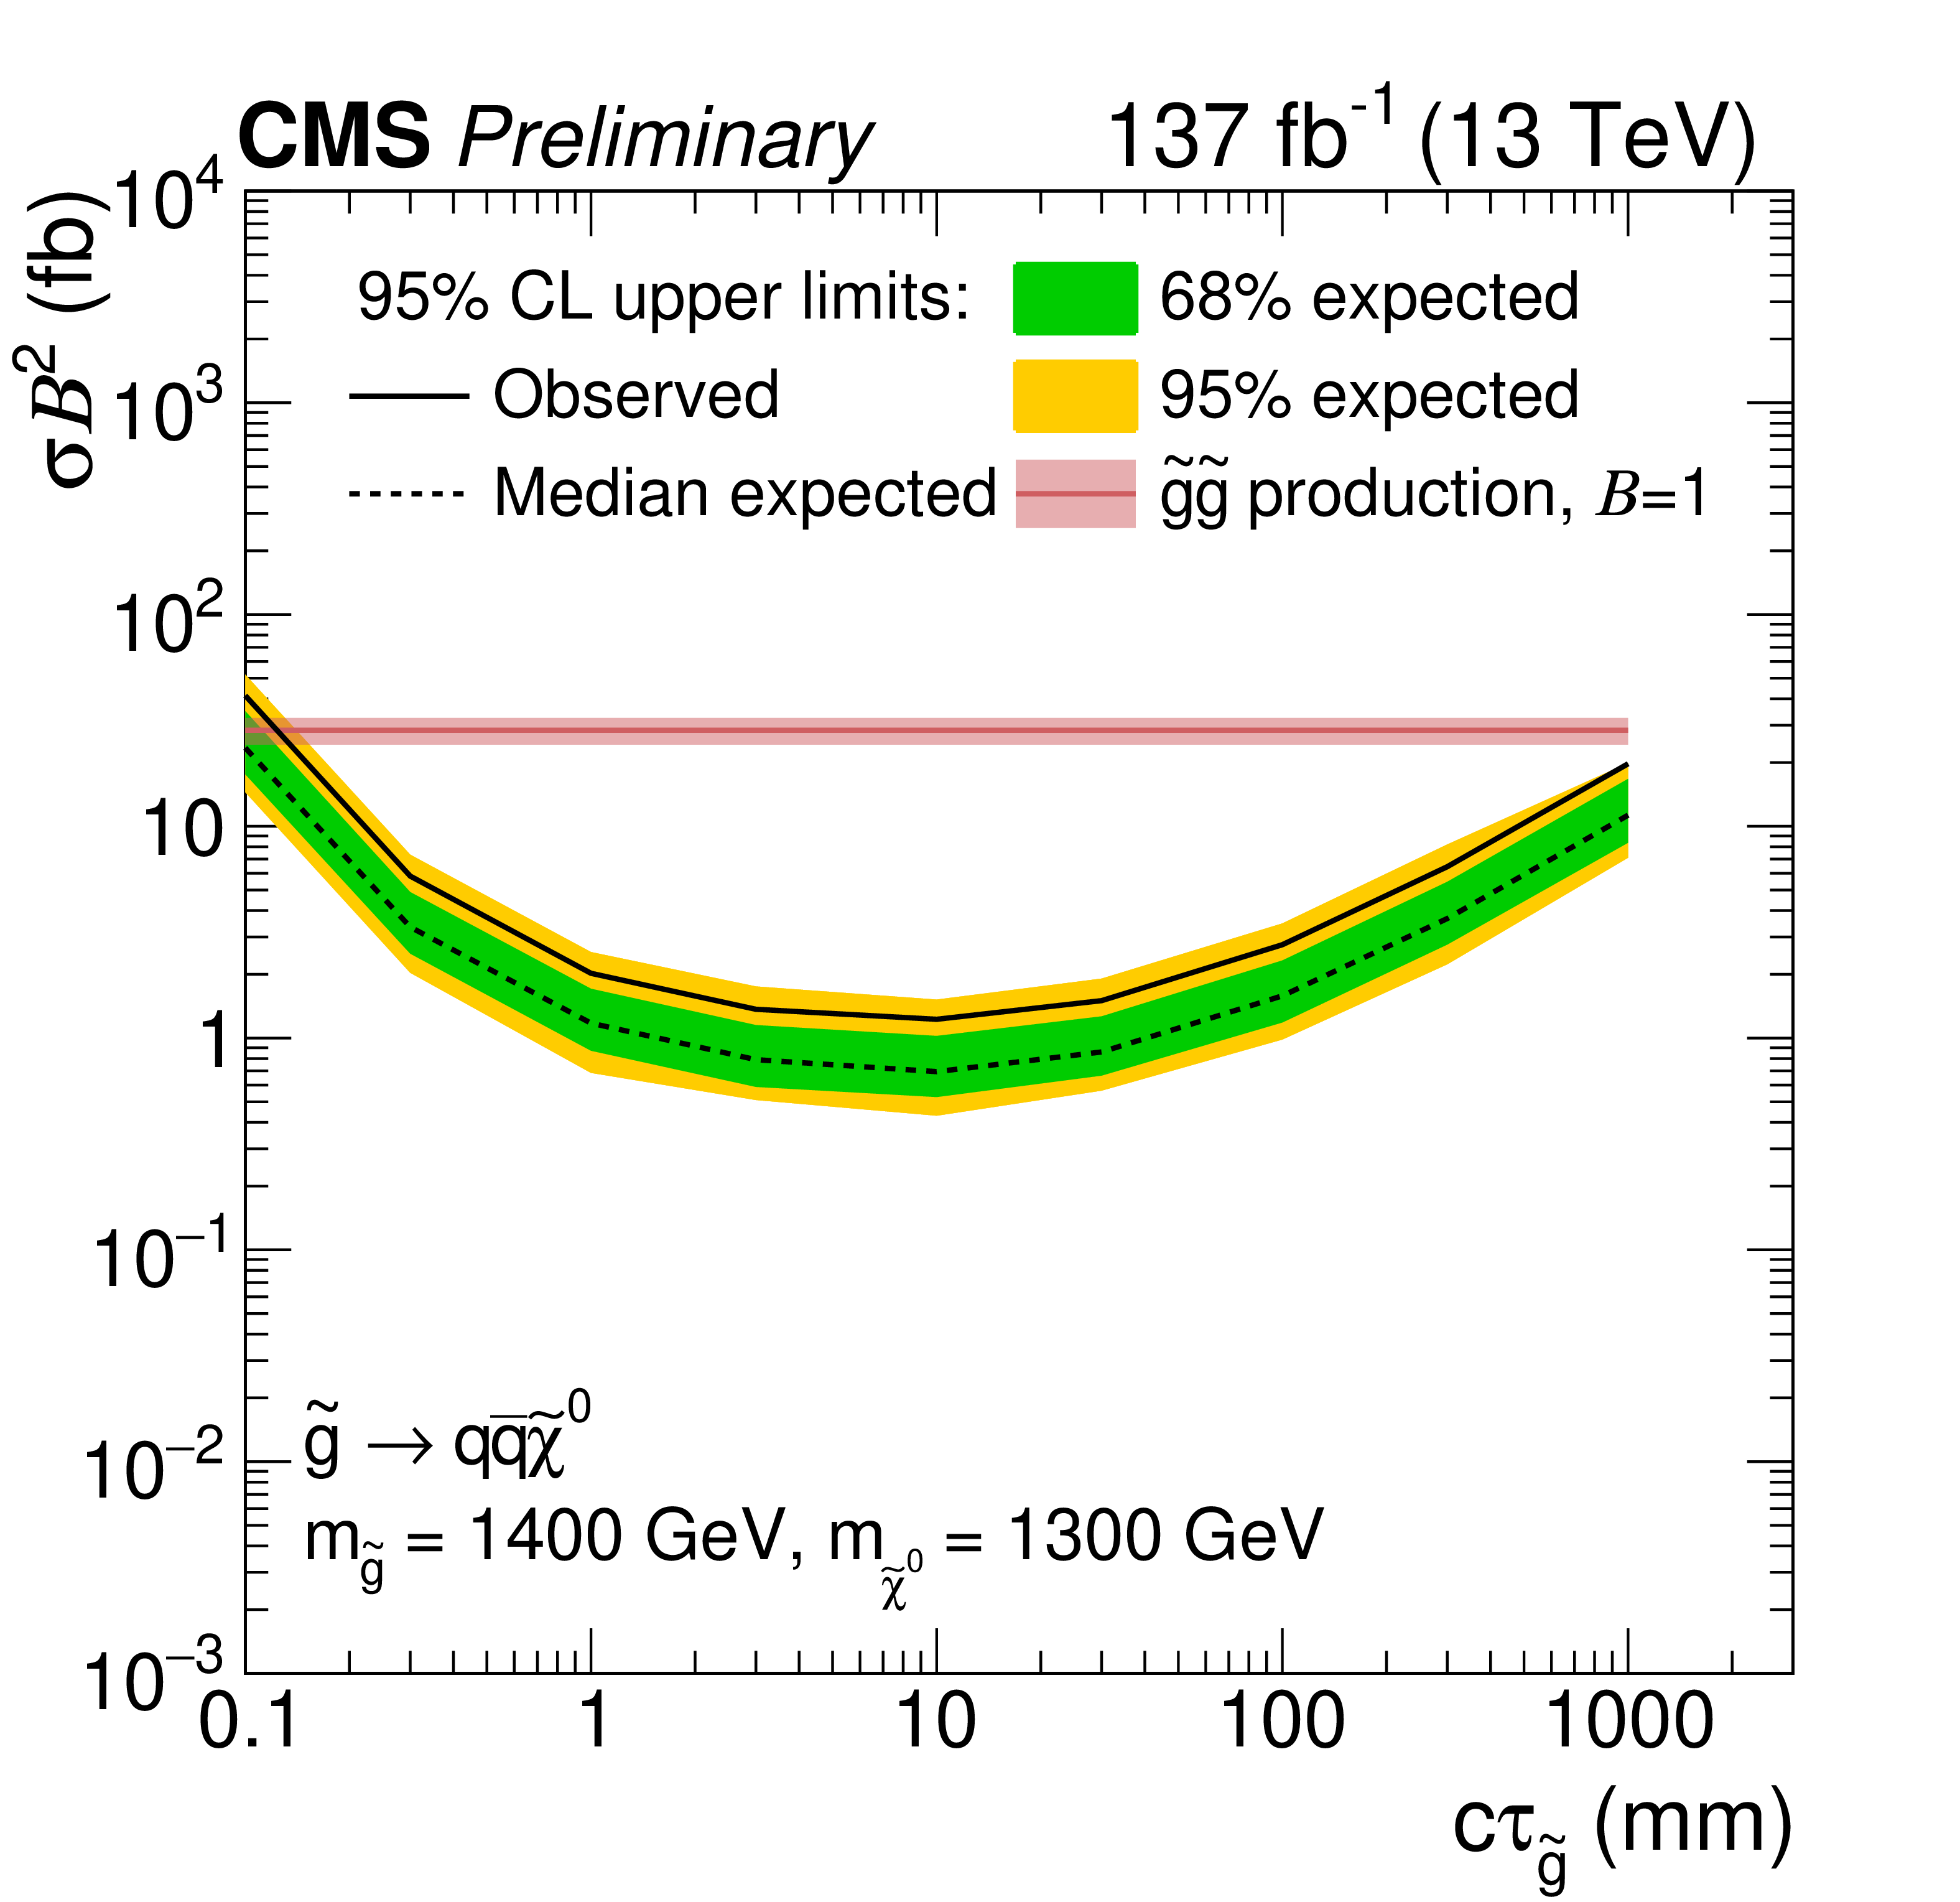
The 95% CL upper limits on the product of cross section and the branching fraction squared in the full Run-2 dataset, shown as a function of $ c\tau $ for a fixed gluino mass of 1400 GeV (top) and 2000 GeV (bottom) with a mass splitting of 100 GeV (left) and 200 GeV (right). The gluino pair production cross sections with their uncertainty are shown as the red curves and bands. |
png pdf |
Figure 9-a:
The 95% CL upper limits on the product of cross section and the branching fraction squared in the full Run-2 dataset, shown as a function of $ c\tau $ for a fixed gluino mass of 1400 GeV (top) and 2000 GeV (bottom) with a mass splitting of 100 GeV (left) and 200 GeV (right). The gluino pair production cross sections with their uncertainty are shown as the red curves and bands. |
png pdf |
Figure 9-b:
The 95% CL upper limits on the product of cross section and the branching fraction squared in the full Run-2 dataset, shown as a function of $ c\tau $ for a fixed gluino mass of 1400 GeV (top) and 2000 GeV (bottom) with a mass splitting of 100 GeV (left) and 200 GeV (right). The gluino pair production cross sections with their uncertainty are shown as the red curves and bands. |
png pdf |
Figure 9-c:
The 95% CL upper limits on the product of cross section and the branching fraction squared in the full Run-2 dataset, shown as a function of $ c\tau $ for a fixed gluino mass of 1400 GeV (top) and 2000 GeV (bottom) with a mass splitting of 100 GeV (left) and 200 GeV (right). The gluino pair production cross sections with their uncertainty are shown as the red curves and bands. |
png pdf |
Figure 9-d:
The 95% CL upper limits on the product of cross section and the branching fraction squared in the full Run-2 dataset, shown as a function of $ c\tau $ for a fixed gluino mass of 1400 GeV (top) and 2000 GeV (bottom) with a mass splitting of 100 GeV (left) and 200 GeV (right). The gluino pair production cross sections with their uncertainty are shown as the red curves and bands. |
png pdf |
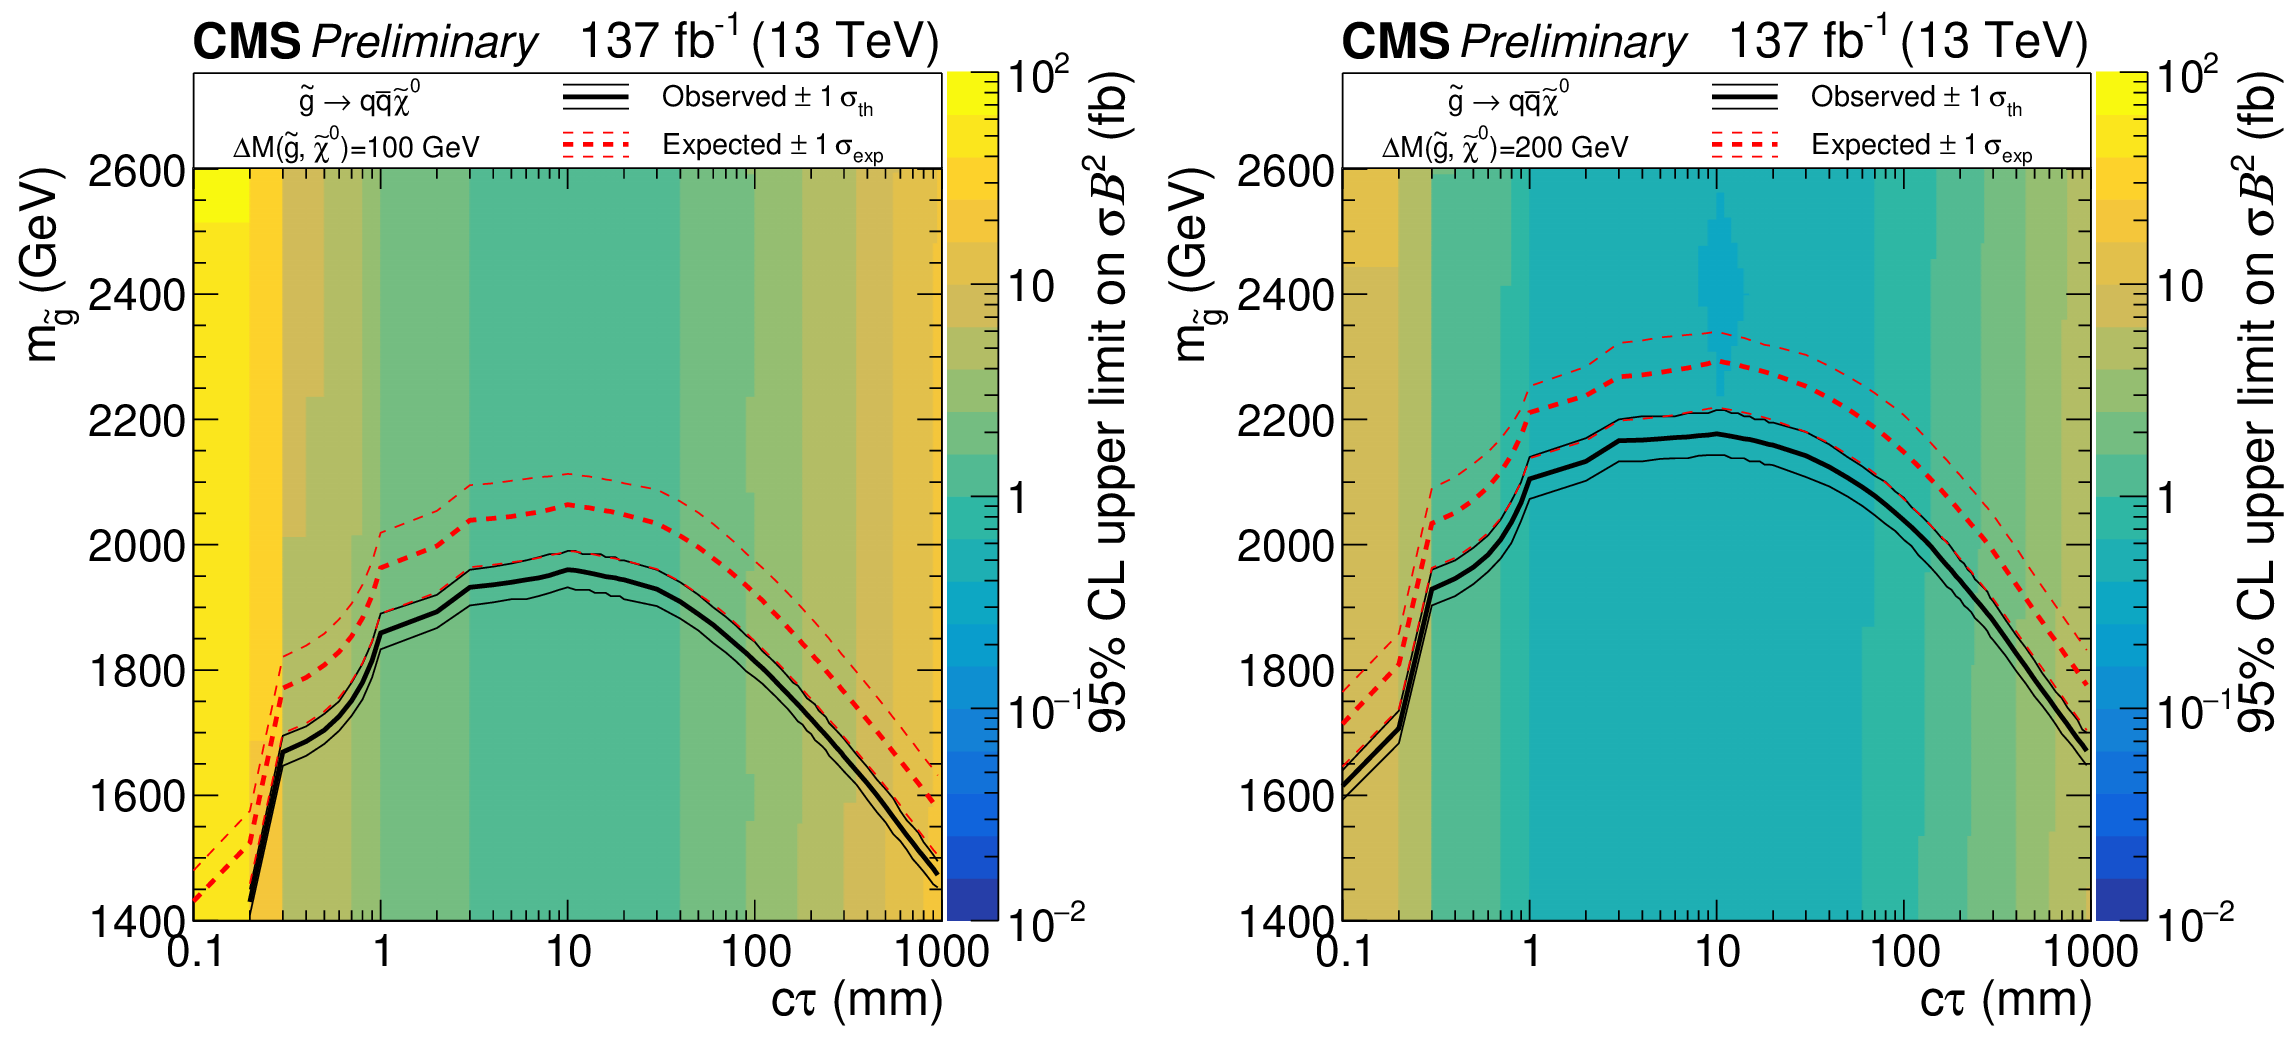
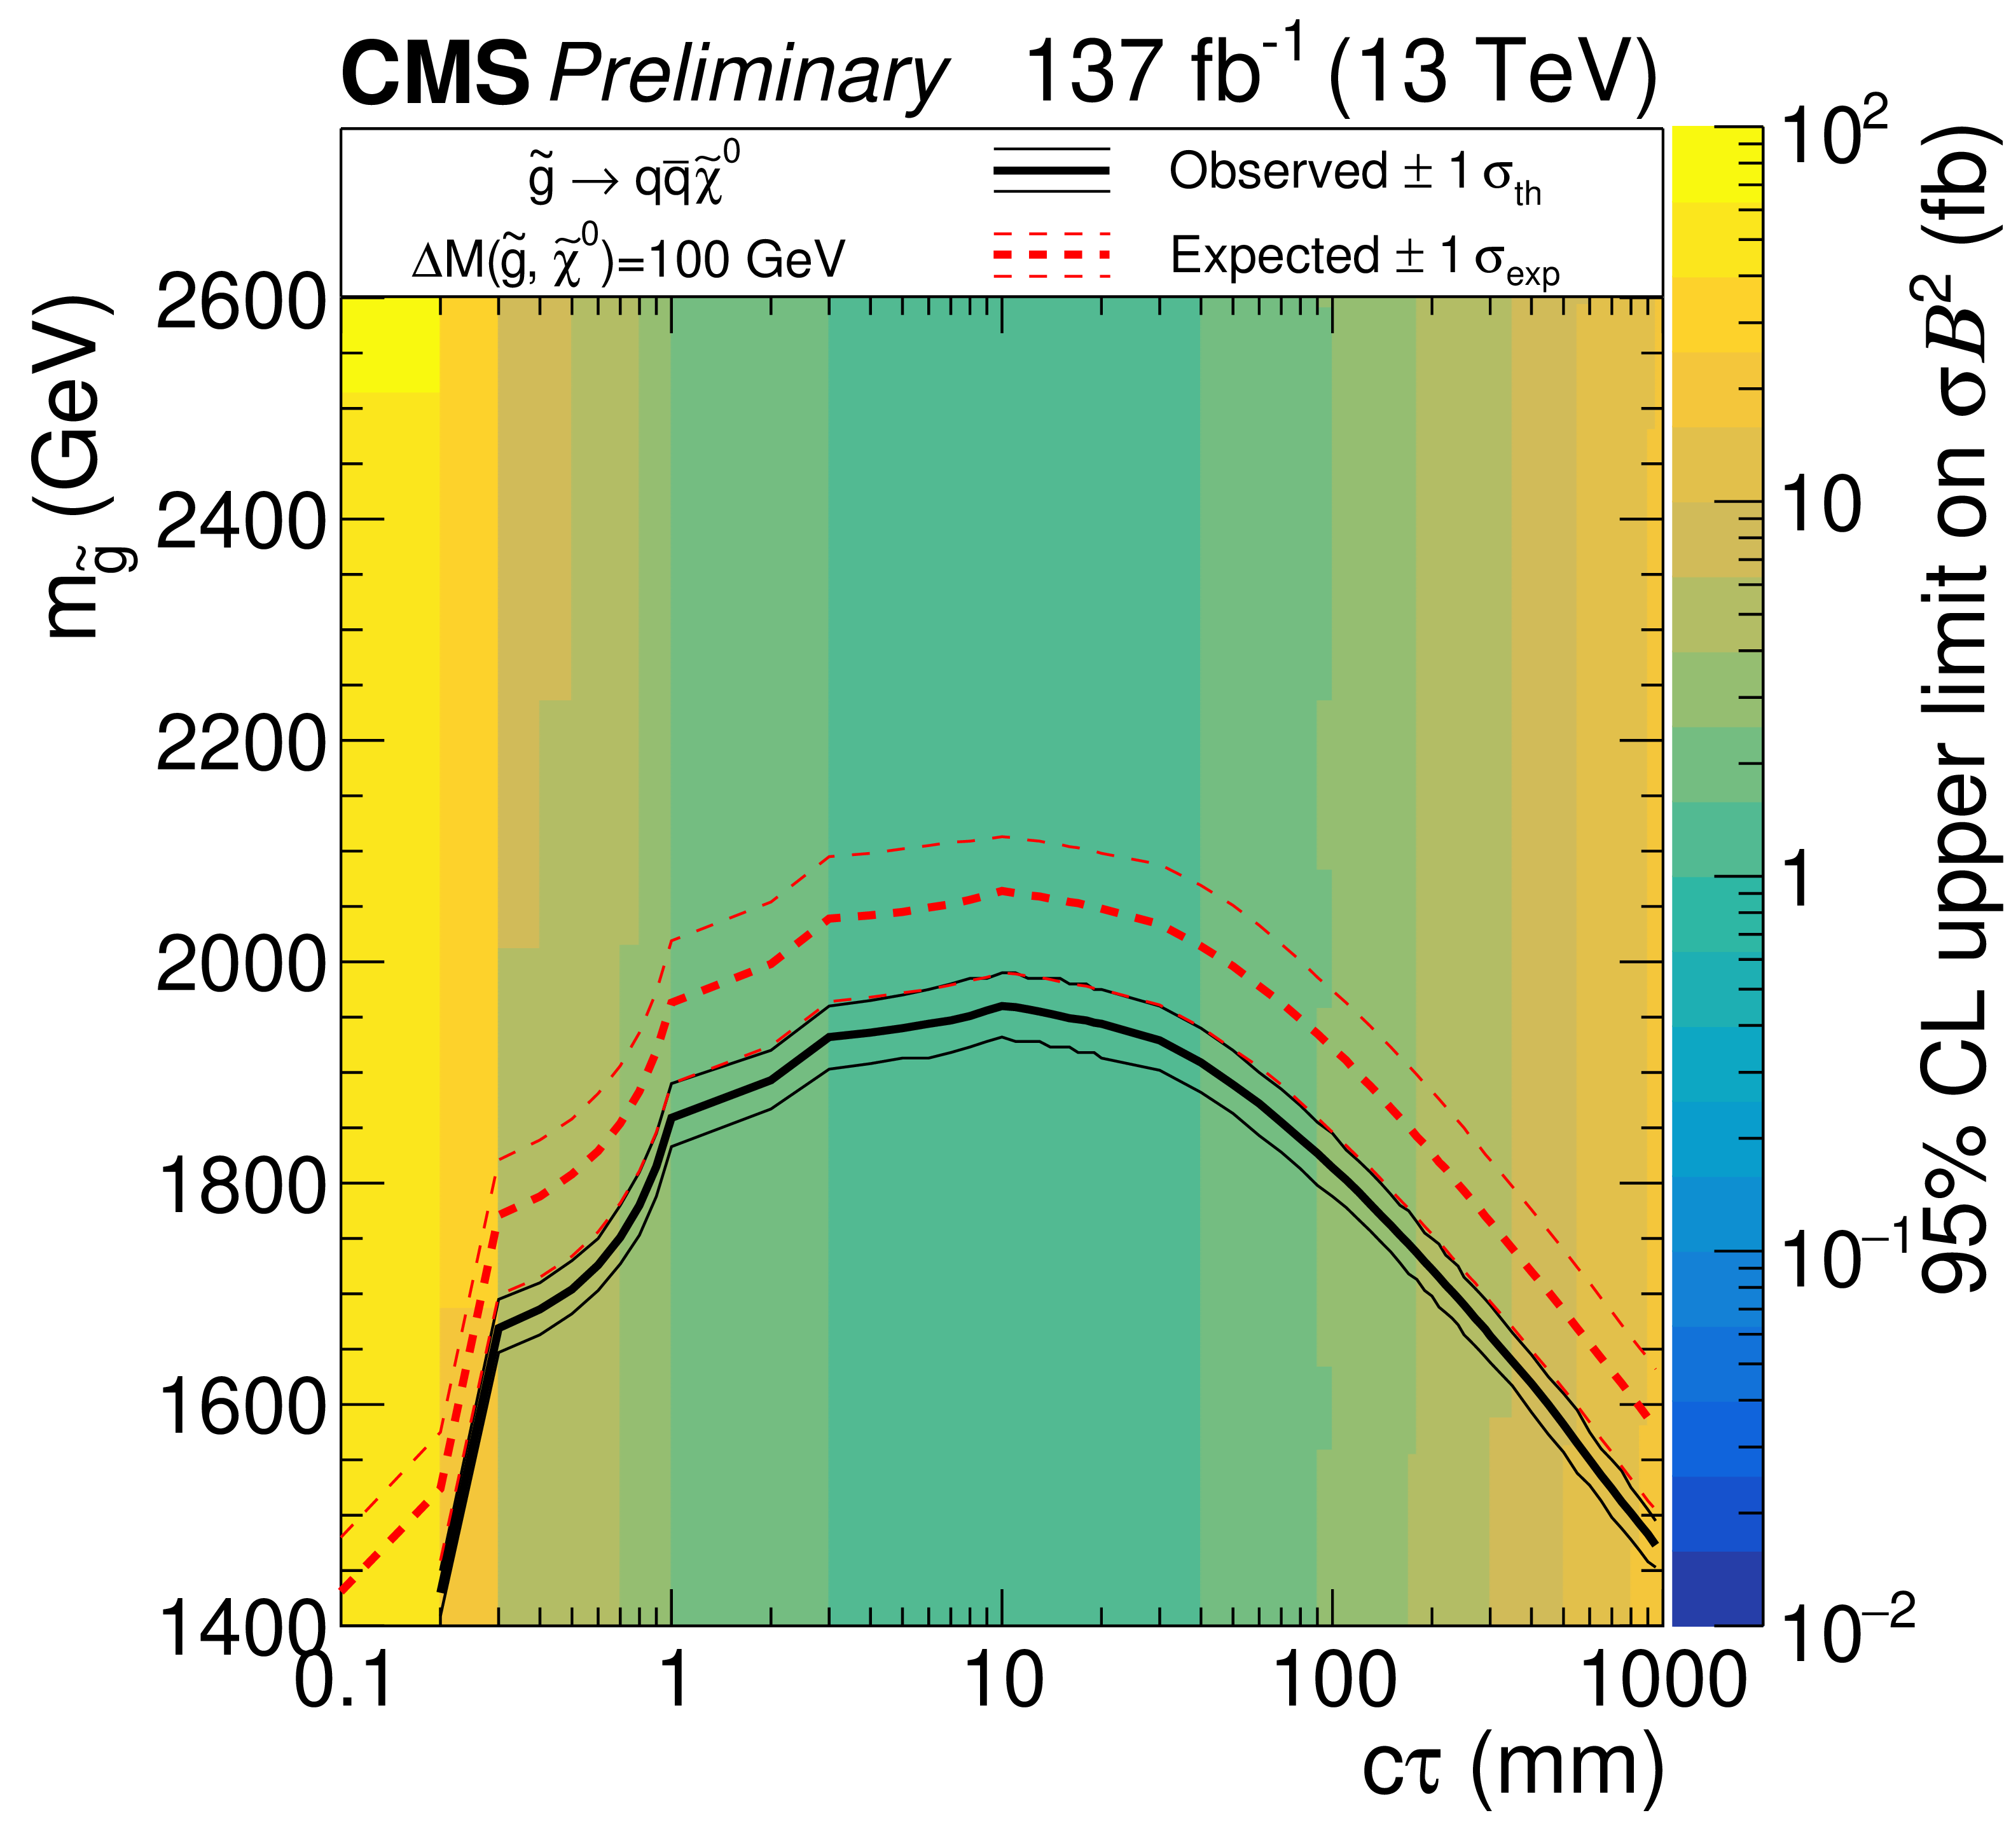
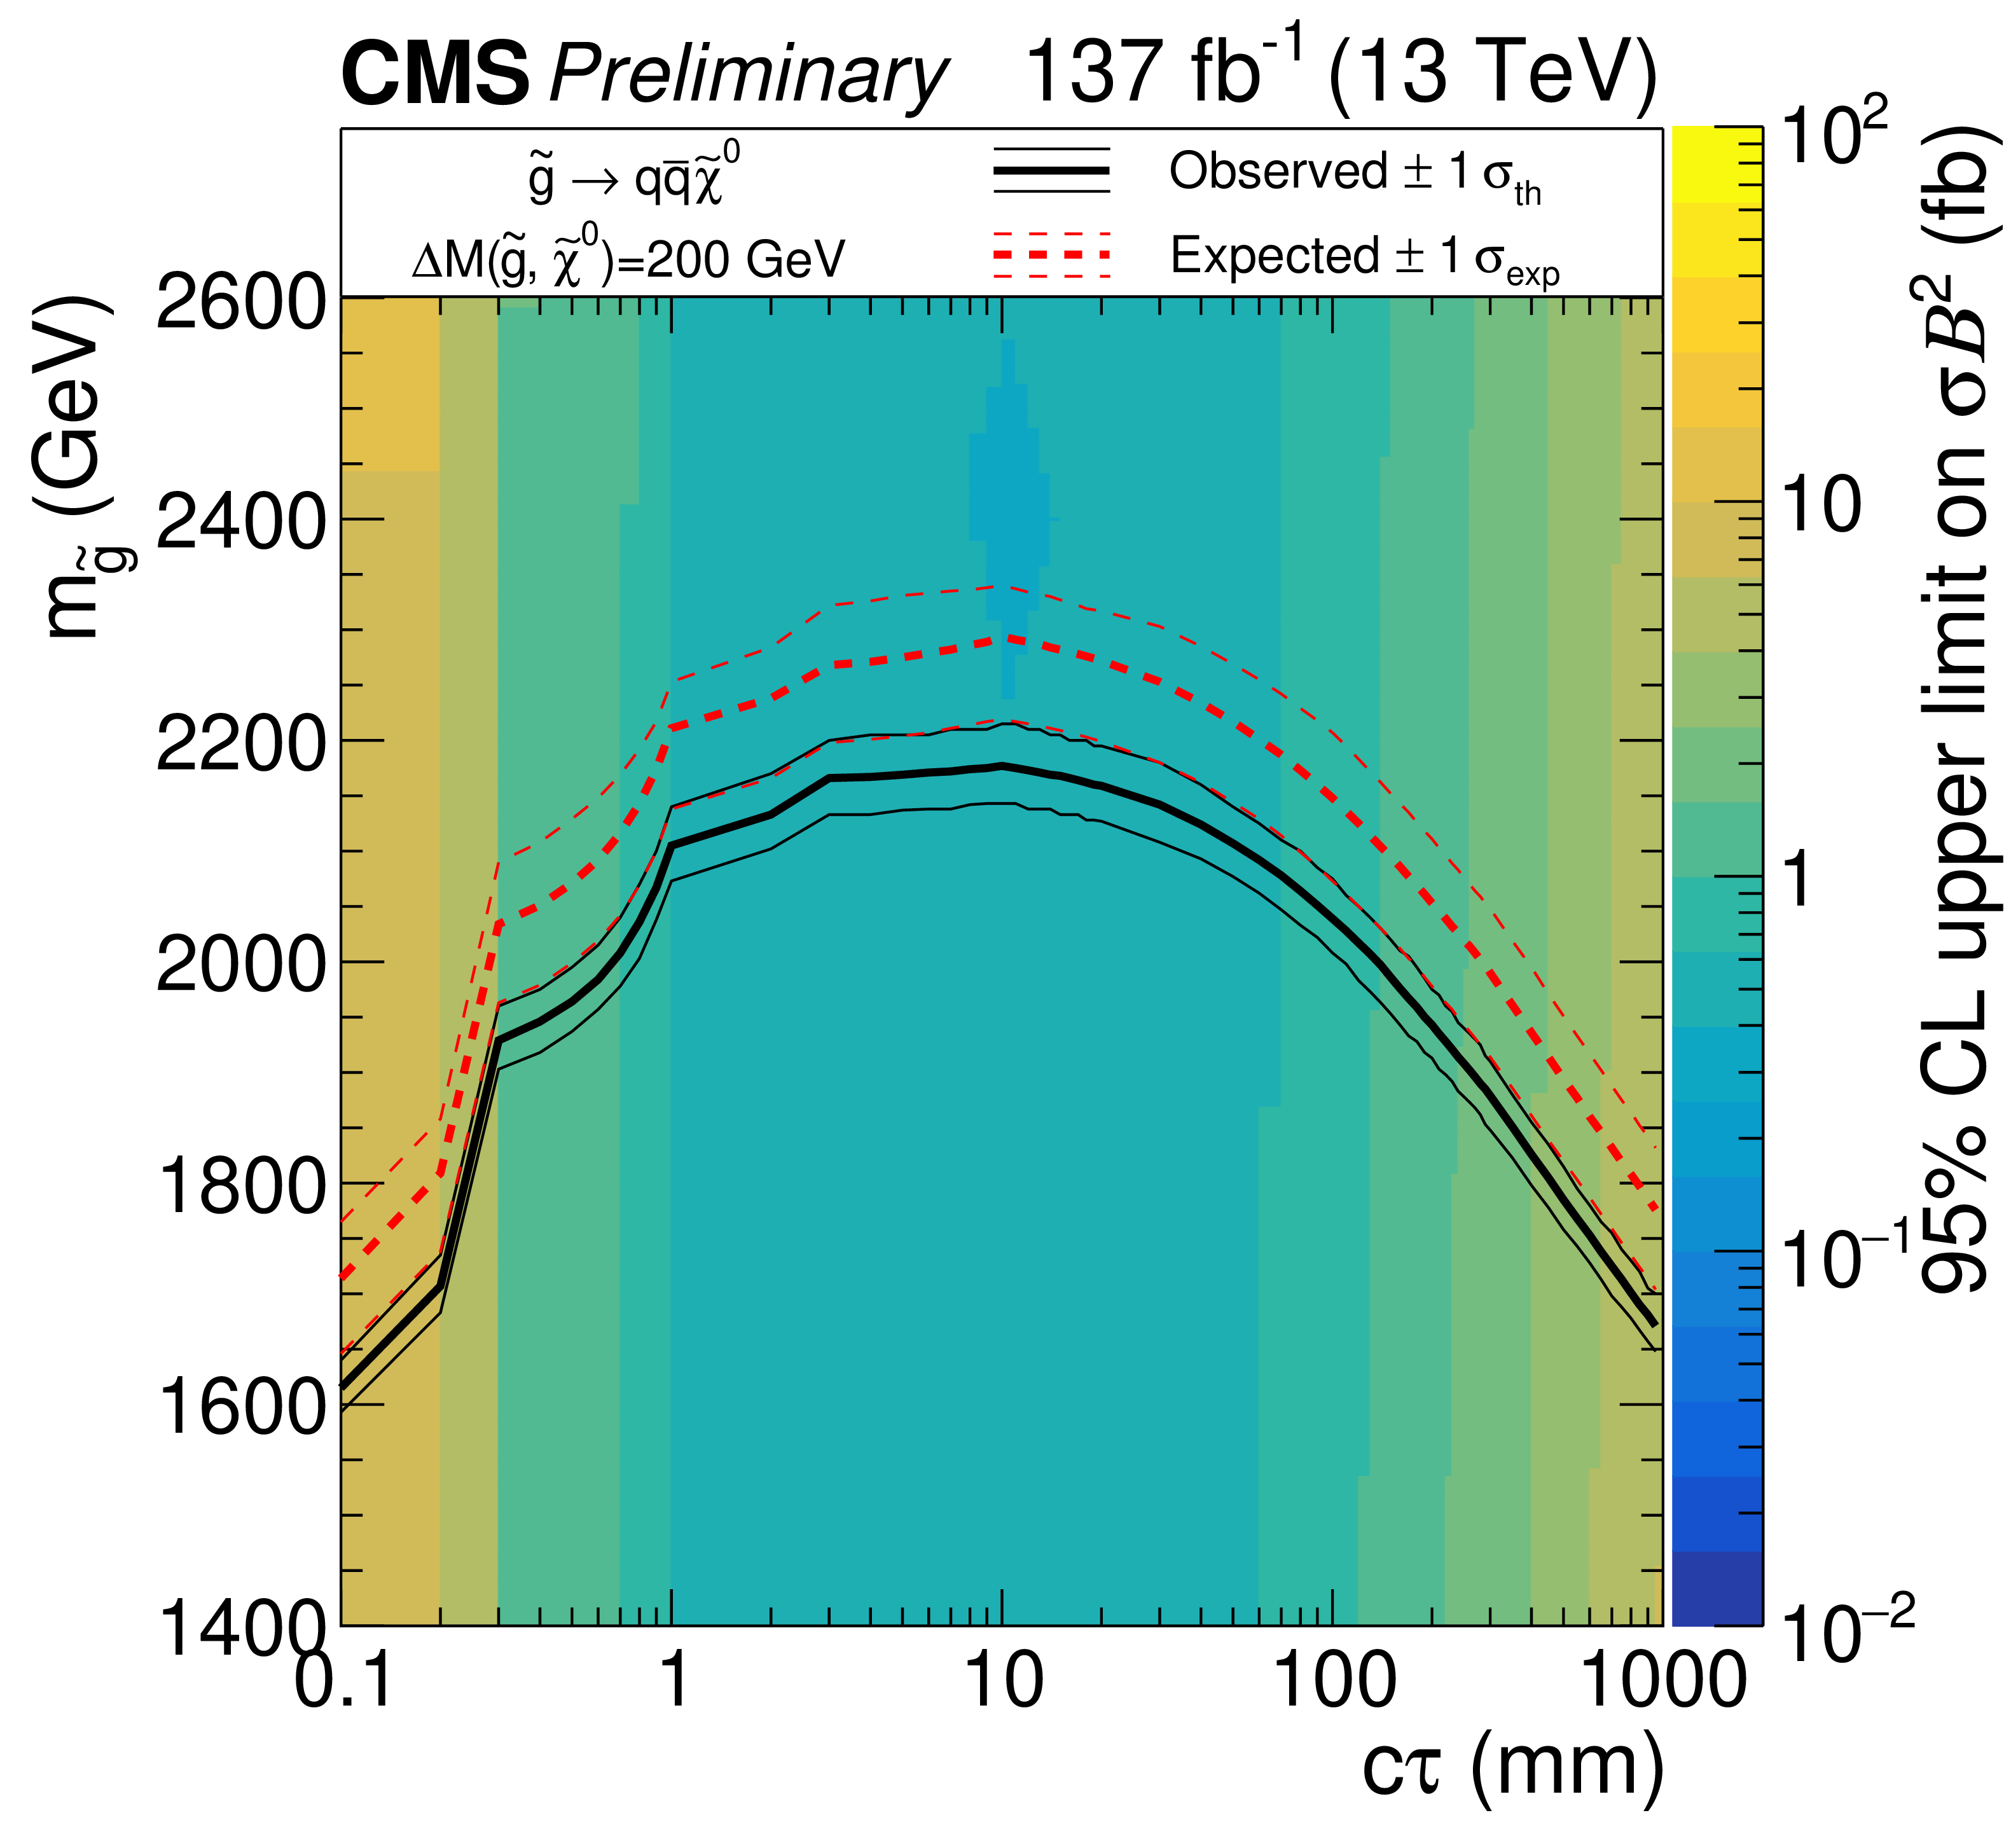
Figure 10:
The 95% CL upper limits on cross section times branching fraction squared in Run-2 for the split SUSY model with a mass splitting of 100 GeV (left) and 200 GeV (right), shown as a function of gluino mass and $ c\tau $. The observed (black) and expected (red) exclusion curves are overlaid on the limit plot. The gluino pair production cross sections with their uncertainty are shown as the red curves and bands. |
png pdf |
Figure 10-a:
The 95% CL upper limits on cross section times branching fraction squared in Run-2 for the split SUSY model with a mass splitting of 100 GeV (left) and 200 GeV (right), shown as a function of gluino mass and $ c\tau $. The observed (black) and expected (red) exclusion curves are overlaid on the limit plot. The gluino pair production cross sections with their uncertainty are shown as the red curves and bands. |
png pdf |
Figure 10-b:
The 95% CL upper limits on cross section times branching fraction squared in Run-2 for the split SUSY model with a mass splitting of 100 GeV (left) and 200 GeV (right), shown as a function of gluino mass and $ c\tau $. The observed (black) and expected (red) exclusion curves are overlaid on the limit plot. The gluino pair production cross sections with their uncertainty are shown as the red curves and bands. |
| Tables | |
png pdf |
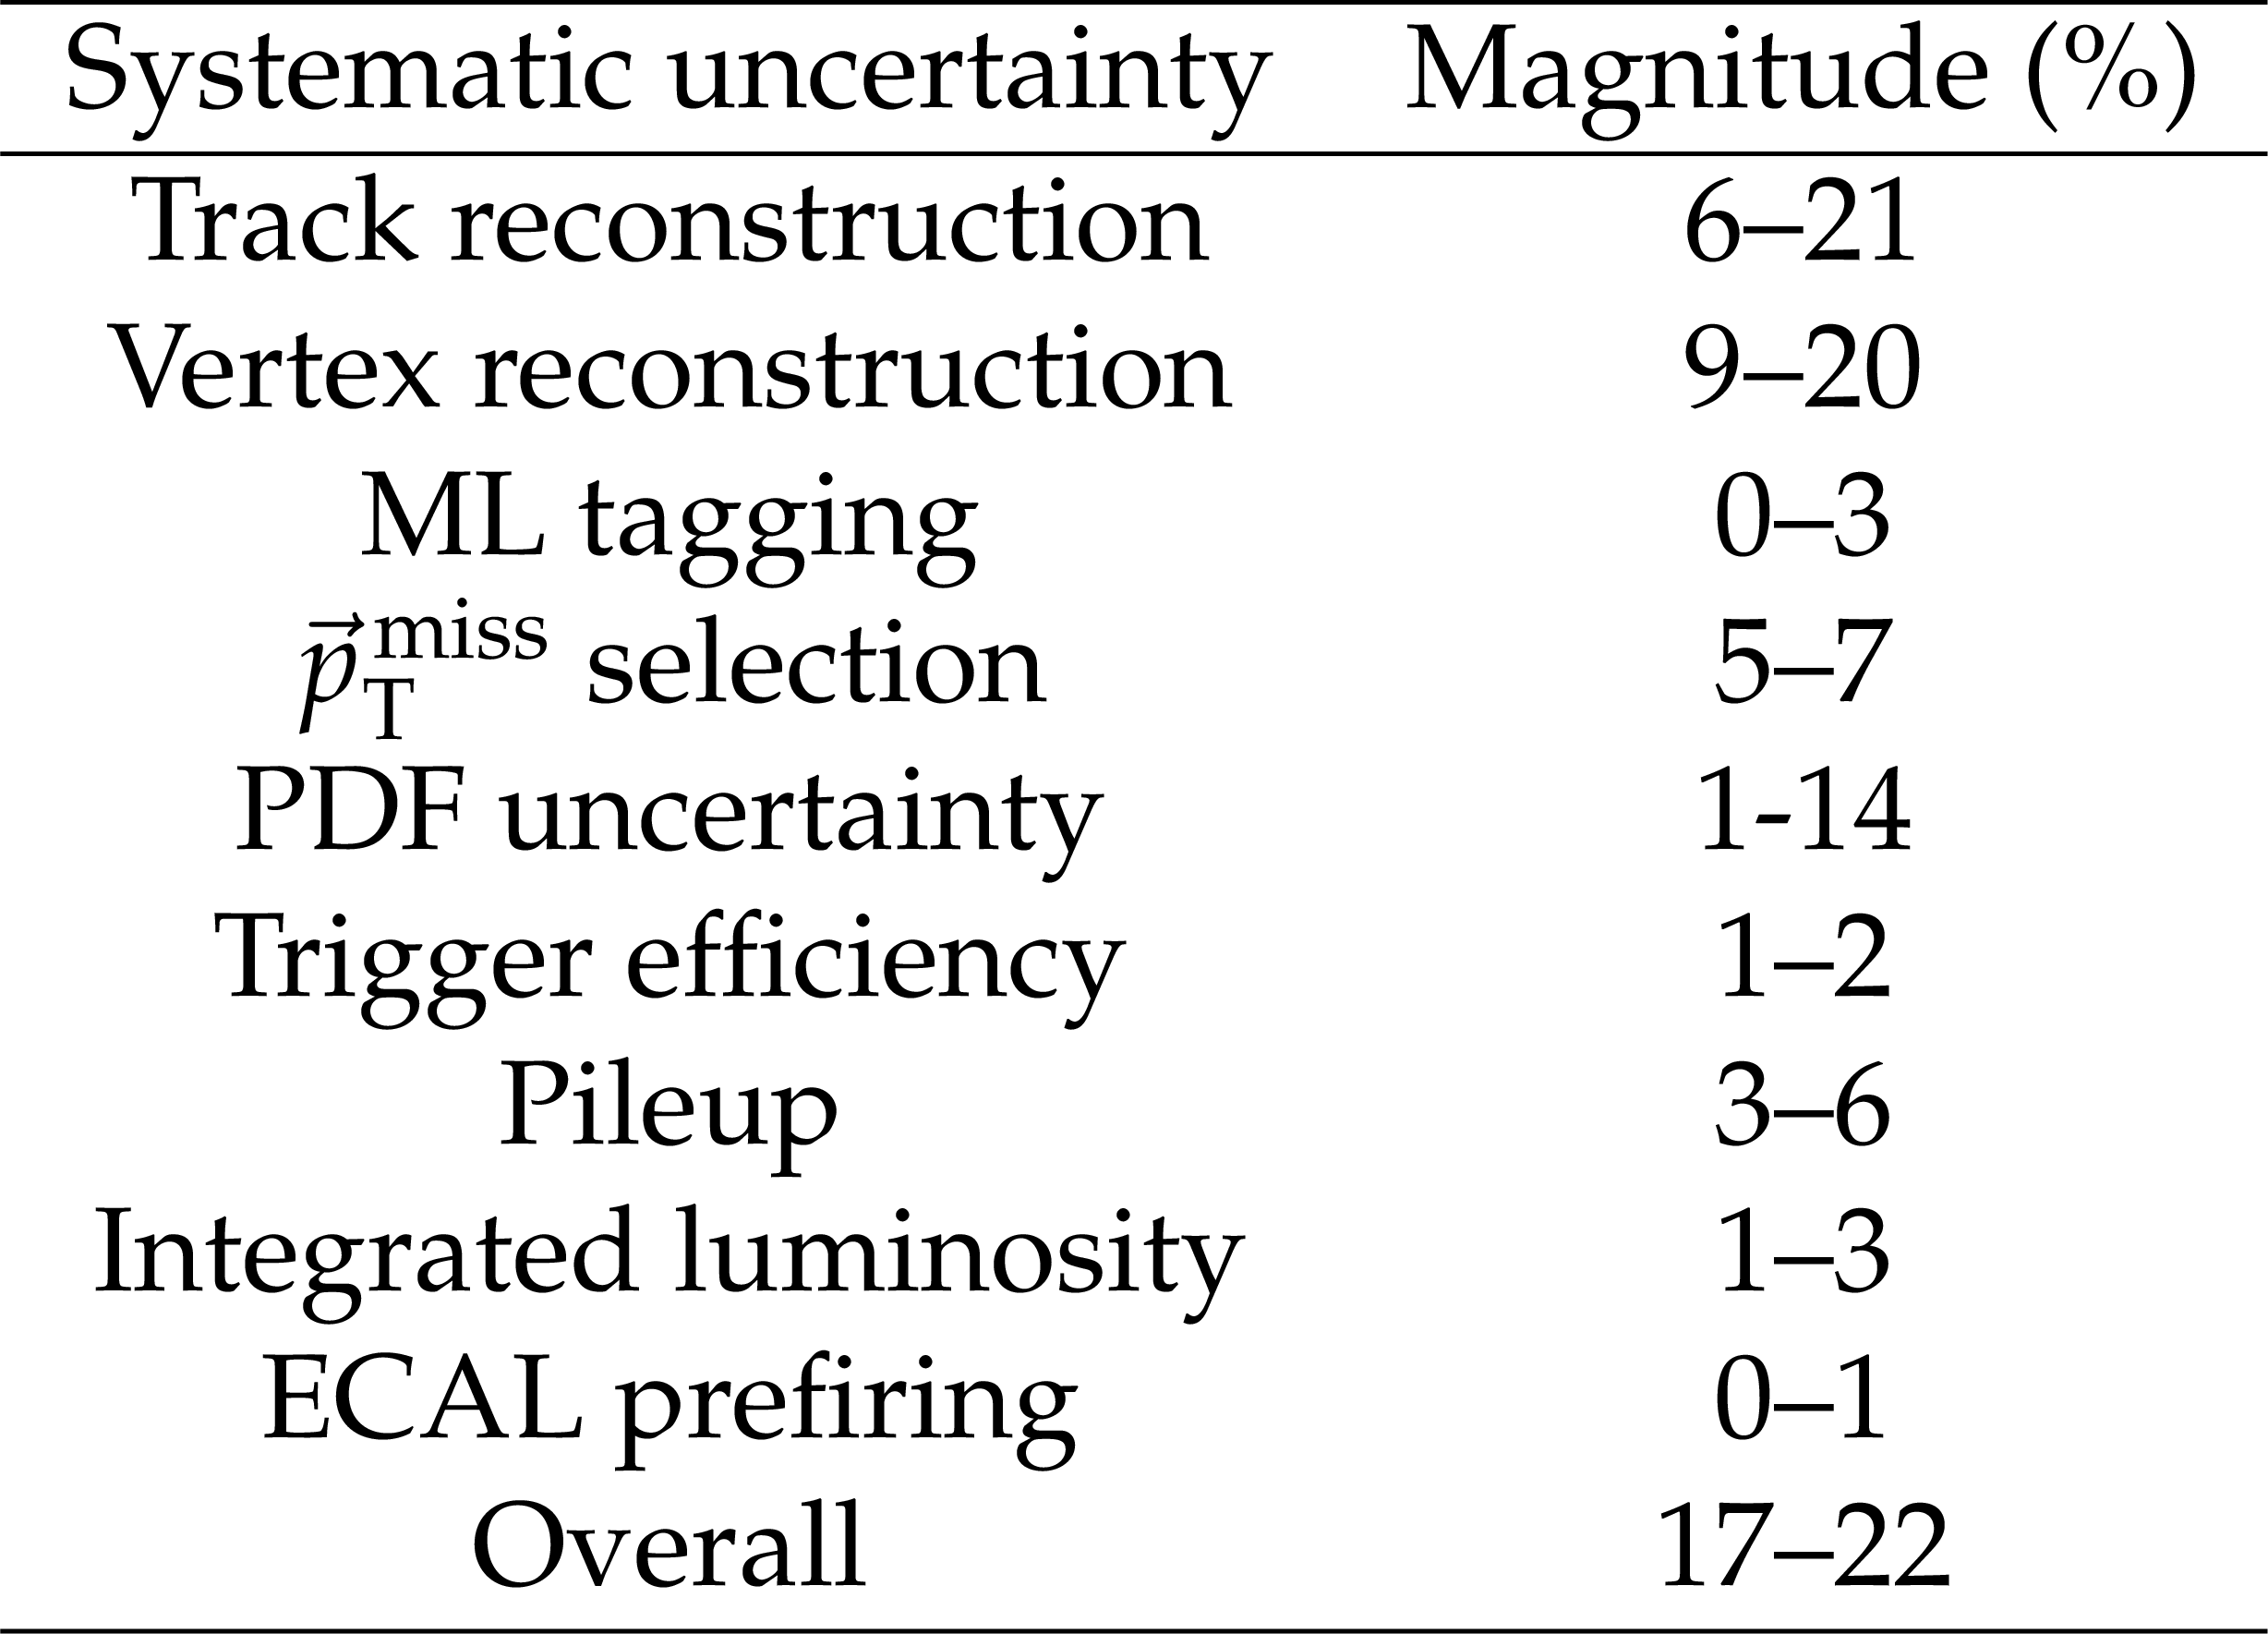
Table 1:
Summary of systematic uncertainties that affect the signal yield. The magnitude of each systematic varies by data-taking period and signal parameters, so the minimum and maximum values for each systematic uncertainty are reported. |
png pdf |
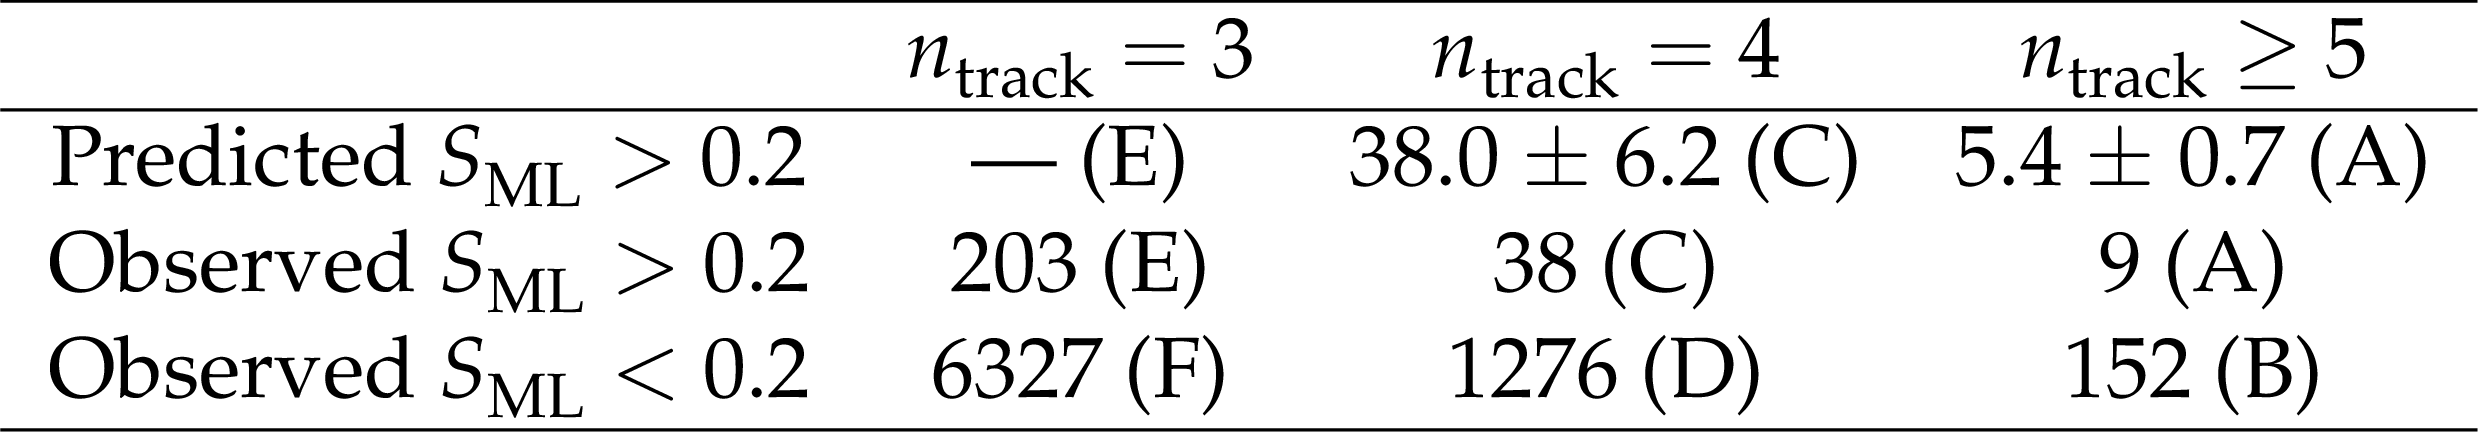
Table 2:
Number of predicted and observed events in the control, validation, and search regions. Regions are organized by $ S_{\text{ML}} $ and $ n_{\text{track}} $ values, and region names corresponding with Fig. 7 are given in parentheses. Specifically, the different columns correspond to events with $ n_{\text{track}} $ of 3, 4, and $ \geq $ 5. Predicted and observed number of events that pass or fail the $ S_{\text{ML}} $ selection are shown in different rows. |
| Summary |
| A search for the production of long-lived particles that decay to at least one displaced vertex with missing transverse momentum in proton-proton collisions at a center-of-mass energy of 13 TeV collected by the CMS detector is presented. The analysis extends the previous CMS search [24] by improving the sensitivity to events with low total jet energy, targeting events with as few as one displaced vertex, and introducing a dedicated machine learning algorithm. A benchmark signal model, split supersymmetry, is used for statistical interpretation in this search. The search sets 95% confidence level upper limits on long-lived gluinos with mass below 1800 GeV for mean proper decay lengths in the range of 1 to 100 mm, when the mass splitting is 100 GeV. For a 200 GeV mass splitting, gluinos with mass below 2000 GeV for mean proper decay lengths between 1 and 100 mm are excluded. |
| References | ||||
| 1 | G. F. Giudice and A. Romanino | Split supersymmetry | NPB 699 (2004) 65 | hep-ph/0406088 |
| 2 | J. L. Hewett, B. Lillie, M. Masip, and T. G. Rizzo | Signatures of long-lived gluinos in split supersymmetry | JHEP 09 (2004) 070 | hep-ph/0408248 |
| 3 | N. Arkani-Hamed, S. Dimopoulos, G. F. Giudice, and A. Romanino | Aspects of split supersymmetry | NPB 709 (2005) 3 | hep-ph/0409232 |
| 4 | P. Gambino, G. F. Giudice, and P. Slavich | Gluino decays in split supersymmetry | NPB 726 (2005) 35 | hep-ph/0506214 |
| 5 | A. Arvanitaki, N. Craig, S. Dimopoulos, and G. Villadoro | Mini-split | JHEP 02 (2013) 126 | 1210.0555 |
| 6 | N. Arkani-Hamed et al. | Simply unnatural supersymmetry | 1212.6971 | |
| 7 | P. Fayet | Supergauge invariant extension of the Higgs mechanism and a model for the electron and its neutrino | NPB 90 (1975) 104 | |
| 8 | G. R. Farrar and P. Fayet | Phenomenology of the production, decay, and detection of new hadronic states associated with supersymmetry | PLB 76 (1978) 575 | |
| 9 | S. Weinberg | Supersymmetry at ordinary energies. 1. masses and conservation laws | PRD 26 (1982) 287 | |
| 10 | R. Barbier et al. | $ R $-parity violating supersymmetry | Phys. Rept. 420 (2005) 1 | hep-ph/0406039 |
| 11 | G. F. Giudice and R. Rattazzi | Theories with gauge mediated supersymmetry breaking | Phys. Rept. 322 (1999) 419 | hep-ph/9801271 |
| 12 | P. Meade, N. Seiberg, and D. Shih | General gauge mediation | Prog. Theor. Phys. Suppl. 177 (2009) 143 | 0801.3278 |
| 13 | M. Buican, P. Meade, N. Seiberg, and D. Shih | Exploring general gauge mediation | JHEP 03 (2009) 016 | 0812.3668 |
| 14 | J. Fan, M. Reece, and J. T. Ruderman | Stealth supersymmetry | JHEP 11 (2011) 012 | 1105.5135 |
| 15 | J. Fan, M. Reece, and J. T. Ruderman | A stealth supersymmetry sampler | JHEP 07 (2012) 196 | 1201.4875 |
| 16 | M. J. Strassler and K. M. Zurek | Echoes of a hidden valley at hadron colliders | PLB 651 (2007) 374 | hep-ph/0604261 |
| 17 | M. J. Strassler and K. M. Zurek | Discovering the Higgs through highly-displaced vertices | PLB 661 (2008) 263 | hep-ph/0605193 |
| 18 | T. Han, Z. Si, K. M. Zurek, and M. J. Strassler | Phenomenology of hidden valleys at hadron colliders | JHEP 07 (2008) 008 | 0712.2041 |
| 19 | Z. Chacko, H.-S. Goh, and R. Harnik | Natural electroweak breaking from a mirror symmetry | PRL 96 (2006) 231802 | hep-ph/0506256 |
| 20 | D. Curtin and C. B. Verhaaren | Discovering uncolored naturalness in exotic Higgs decays | JHEP 12 (2015) 072 | 1506.06141 |
| 21 | H.-C. Cheng, S. Jung, E. Salvioni, and Y. Tsai | Exotic quarks in twin Higgs models | JHEP 03 (2016) 074 | 1512.02647 |
| 22 | ATLAS Collaboration | Search for long-lived, massive particles in events with displaced vertices and missing transverse momentum in $ \sqrt{s} = $ 13 TeV $ pp $ collisions with the ATLAS detector | PRD 97 (2018) 052012 | 1710.04901 |
| 23 | ATLAS Collaboration | Search for long-lived, massive particles in events with a displaced vertex and a muon with large impact parameter in $ pp $ collisions at $ \sqrt{s} = $ 13 TeV with the ATLAS detector | PRD 102 (2020) 032006 | 2003.11956 |
| 24 | CMS Collaboration | Search for long-lived particles decaying to jets with displaced vertices in proton-proton collisions at $ \sqrt{s}= $ 13 TeV | PRD 104 (2021) 052011 | CMS-EXO-19-013 2104.13474 |
| 25 | CMS Collaboration | Search for long-lived particles using displaced jets in proton-proton collisions at $ \sqrt{s} = $ 13 TeV | PRD 104 (2021) 012015 | CMS-EXO-19-021 2012.01581 |
| 26 | CMS Collaboration | Search for natural and split supersymmetry in proton-proton collisions at $ \sqrt{s}= $ 13 TeV in final states with jets and missing transverse momentum | JHEP 05 (2018) 025 | CMS-SUS-16-038 1802.02110 |
| 27 | CMS Collaboration | The CMS experiment at the CERN LHC | JINST 3 (2008) S08004 | |
| 28 | CMS Collaboration | Description and performance of track and primary-vertex reconstruction with the CMS tracker | JINST 9 (2014) P10009 | CMS-TRK-11-001 1405.6569 |
| 29 | The Tracker Group of the CMS Collaboration | The CMS Phase-1 pixel detector upgrade | JINST 16 (2021) P02027 | 2012.14304 |
| 30 | CMS Collaboration | Track impact parameter resolution for the full pseudo rapidity coverage in the 2017 dataset with the CMS Phase-1 Pixel detector | CMS Detector Performance Summary, 2020 CDS |
|
| 31 | CMS Collaboration | Particle-flow reconstruction and global event description with the CMS detector | JINST 12 (2017) P10003 | CMS-PRF-14-001 1706.04965 |
| 32 | CMS Collaboration | Technical proposal for the Phase-II upgrade of the Compact Muon Solenoid | CMS Technical Proposal CERN-LHCC-2015-010, CMS-TDR-15-02, 2015 CDS |
|
| 33 | M. Cacciari, G. P. Salam, and G. Soyez | The anti-$ k_{\mathrm{T}} $ jet clustering algorithm | JHEP 04 (2008) 063 | 0802.1189 |
| 34 | M. Cacciari, G. P. Salam, and G. Soyez | FastJet user manual | EPJC 72 (2012) 1896 | 1111.6097 |
| 35 | CMS Collaboration | Jet energy scale and resolution in the CMS experiment in pp collisions at 8 TeV | JINST 12 (2017) P02014 | CMS-JME-13-004 1607.03663 |
| 36 | CMS Collaboration | Performance of missing transverse momentum reconstruction in proton-proton collisions at $ \sqrt{s} = $ 13 TeV using the CMS detector | JINST 14 (2019) P07004 | CMS-JME-17-001 1903.06078 |
| 37 | CMS Collaboration | Performance of the CMS Level-1 trigger in proton-proton collisions at $ \sqrt{s} = $ 13 TeV | JINST 15 (2020) P10017 | CMS-TRG-17-001 2006.10165 |
| 38 | CMS Collaboration | The CMS trigger system | JINST 12 (2017) P01020 | CMS-TRG-12-001 1609.02366 |
| 39 | T. Sjöstrand et al. | An introduction to PYTHIA 8.2 | Comput. Phys. Commun. 191 (2015) 159 | 1410.3012 |
| 40 | CMS Collaboration | Extraction and validation of a new set of CMS PYTHIA8 tunes from underlying-event measurements | EPJC 80 (2020) 4 | CMS-GEN-17-001 1903.12179 |
| 41 | NNPDF Collaboration | Parton distributions from high-precision collider data | EPJC 77 (2017) 663 | 1706.00428 |
| 42 | W. Beenakker et al. | NNLL-fast: predictions for coloured supersymmetric particle production at the LHC with threshold and Coulomb resummation | JHEP 12 (2016) 133 | 1607.07741 |
| 43 | J. Alwall et al. | The automated computation of tree-level and next-to-leading order differential cross sections, and their matching to parton shower simulations | JHEP 07 (2014) 079 | 1405.0301 |
| 44 | J. Alwall et al. | Comparative study of various algorithms for the merging of parton showers and matrix elements in hadronic collisions | EPJC 53 (2008) 473 | 0706.2569 |
| 45 | R. Frederix and S. Frixione | Merging meets matching in MC@NLO | JHEP 12 (2012) 061 | 1209.6215 |
| 46 | S. Frixione, P. Nason, and C. Oleari | Matching NLO QCD computations with parton shower simulations: the POWHEG method | JHEP 11 (2007) 070 | 0709.2092 |
| 47 | S. Alioli, P. Nason, C. Oleari, and E. Re | NLO single-top production matched with shower in POWHEG: s- and t-channel contributions | JHEP 09 (2009) 111 | 0907.4076 |
| 48 | NNPDF Collaboration | Parton distributions for the LHC Run II | JHEP 04 (2015) 040 | 1410.8849 |
| 49 | GEANT4 Collaboration | GEANT 4--a simulation toolkit | NIM A 506 (2003) 250 | |
| 50 | R. Fruhwirth | Application of Kalman filtering to track and vertex fitting | NIM A 262 (1987) 444 | |
| 51 | P. Billoir and S. Qian | Simultaneous pattern recognition and track fitting by the Kalman filtering method | NIM A 294 (1990) 219 | |
| 52 | P. Billoir and S. Qian | Further test for the simultaneous pattern recognition and track fitting by the Kalman filtering method | NIM A 295 (1990) 492 | |
| 53 | J. Zhou et al. | Graph neural networks: A review of methods and applications | AI Open 1 (2020) 57 | 1812.08434 |
| 54 | T. Gneiting and A. E. Raftery | Strictly proper scoring rules, prediction, and estimation | Journal of the American Statistical Association 102 (2007) 359 | |
| 55 | A. Y. Ng | Feature selection, L1 vs. L2 regularization, and rotational invariance | in Proceedings of the Twenty-First International Conference on Machine Learning, ICML '04, Association for Computing Machinery, New York, 2004 link |
|
| 56 | G. Kasieczka and D. Shih | Robust Jet Classifiers through Distance Correlation | PRL 125 (2020) 122001 | 2001.05310 |
| 57 | G. Kasieczka, B. Nachman, M. D. Schwartz, and D. Shih | Automating the ABCD method with machine learning | PRD 103 (2021) 035021 | 2007.14400 |
| 58 | D. P. Kingma and J. Ba | Adam: A method for stochastic optimization | link | |
| 59 | E. Bols et al. | Jet flavour classification using DeepJet | JINST 15 (2020) P12012 | 2008.10519 |
| 60 | J. Butterworth et al. | PDF4LHC recommendations for LHC Run II | JPG 43 (2016) 023001 | 1510.03865 |
| 61 | CMS Collaboration | Precision luminosity measurement in proton-proton collisions at $ \sqrt{s} = $ 13 TeV in 2015 and 2016 at CMS | EPJC 81 (2021) 800 | CMS-LUM-17-003 2104.01927 |
| 62 | CMS Collaboration | CMS luminosity measurement for the 2017 data-taking period at $ \sqrt{s} = $ 13 TeV | CMS Physics Analysis Summary, 2018 link |
|
| 63 | CMS Collaboration | CMS luminosity measurement for the 2018 data-taking period at $ \sqrt{s} = $ 13 TeV | CMS Physics Analysis Summary, 2019 link |
|
| 64 | A. L. Read | Presentation of search results: The CL$ _{\text{s}} $ technique | JPG 28 (2002) 2693 | |
| 65 | T. Junk | Confidence level computation for combining searches with small statistics | NIM A 434 (1999) 435 | hep-ex/9902006 |
| 66 | ATLAS and CMS Collaborations, and LHC Higgs Combination Group | Procedure for the LHC Higgs boson search combination in Summer 2011 | Technical Report CMS-NOTE-2011-005, ATL-PHYS-PUB-2011-11, 2011 | |
| 67 | C. Borschensky et al. | Squark and gluino production cross sections in pp collisions at $ \sqrt{s} = $ 13, 14, 33 and 100 TeV | EPJC 74 (2014) 3174 | 1407.5066 |
|
|
Compact Muon Solenoid LHC, CERN |
|

|

|

|

|

|