

Compact Muon Solenoid
LHC, CERN
| CMS-PAS-BPH-21-005 | ||
| Search for lepton flavor violating $ \tau \!\to\! $ 3$\mu $ decays in proton-proton collisions at $ \sqrt{s} $ = 13 TeV | ||
| CMS Collaboration | ||
| 26 May 2023 | ||
| Abstract: A search for lepton flavor violating $ \tau\to $ 3$\mu $ decays is performed using 97.7 fb$ ^{-1} $ of proton-proton collisions at a center-of-mass energy of 13 TeV collected by the CMS experiment at the LHC in 2017 and 2018. Tau leptons produced in heavy-flavor hadron decays and produced in W boson decays are exploited in the analysis. The results of this search are combined with the previous result based on data collected in 2016, to obtain a total integrated luminosity of 131 fb$ ^{-1} $. The observed (expected) upper limit at 90% confidence level on the branching fraction $ \mathcal{B}(\tau\to3\mu) $ is 2.9 $ \times$ 10$^{-8} $ (2.4 $ \times $ 10$^{-8} $). The observed (expected) upper limit at 95% confidence level on the branching fraction $ \mathcal{B}(\tau\to3\mu) $ is 3.6 $ \times $ 10$^{-8} $ (3.0 $ \times $ 10$^{-8} $). | ||
|
Links:
CDS record (PDF) ;
Physics Briefing ;
CADI line (restricted) ;
These preliminary results are superseded in this paper, Accepted by PLB. The superseded preliminary plots can be found here. |
||
| Figures | |

png pdf |
Figure 1:
The $ \mu\mu\pi $ invariant mass distribution with the fits to the $ \mathrm{D^+} $ and $ \mathrm{D}_{s}^{+} $ peaks and the background in 2017 data. |

png pdf |
Figure 2:
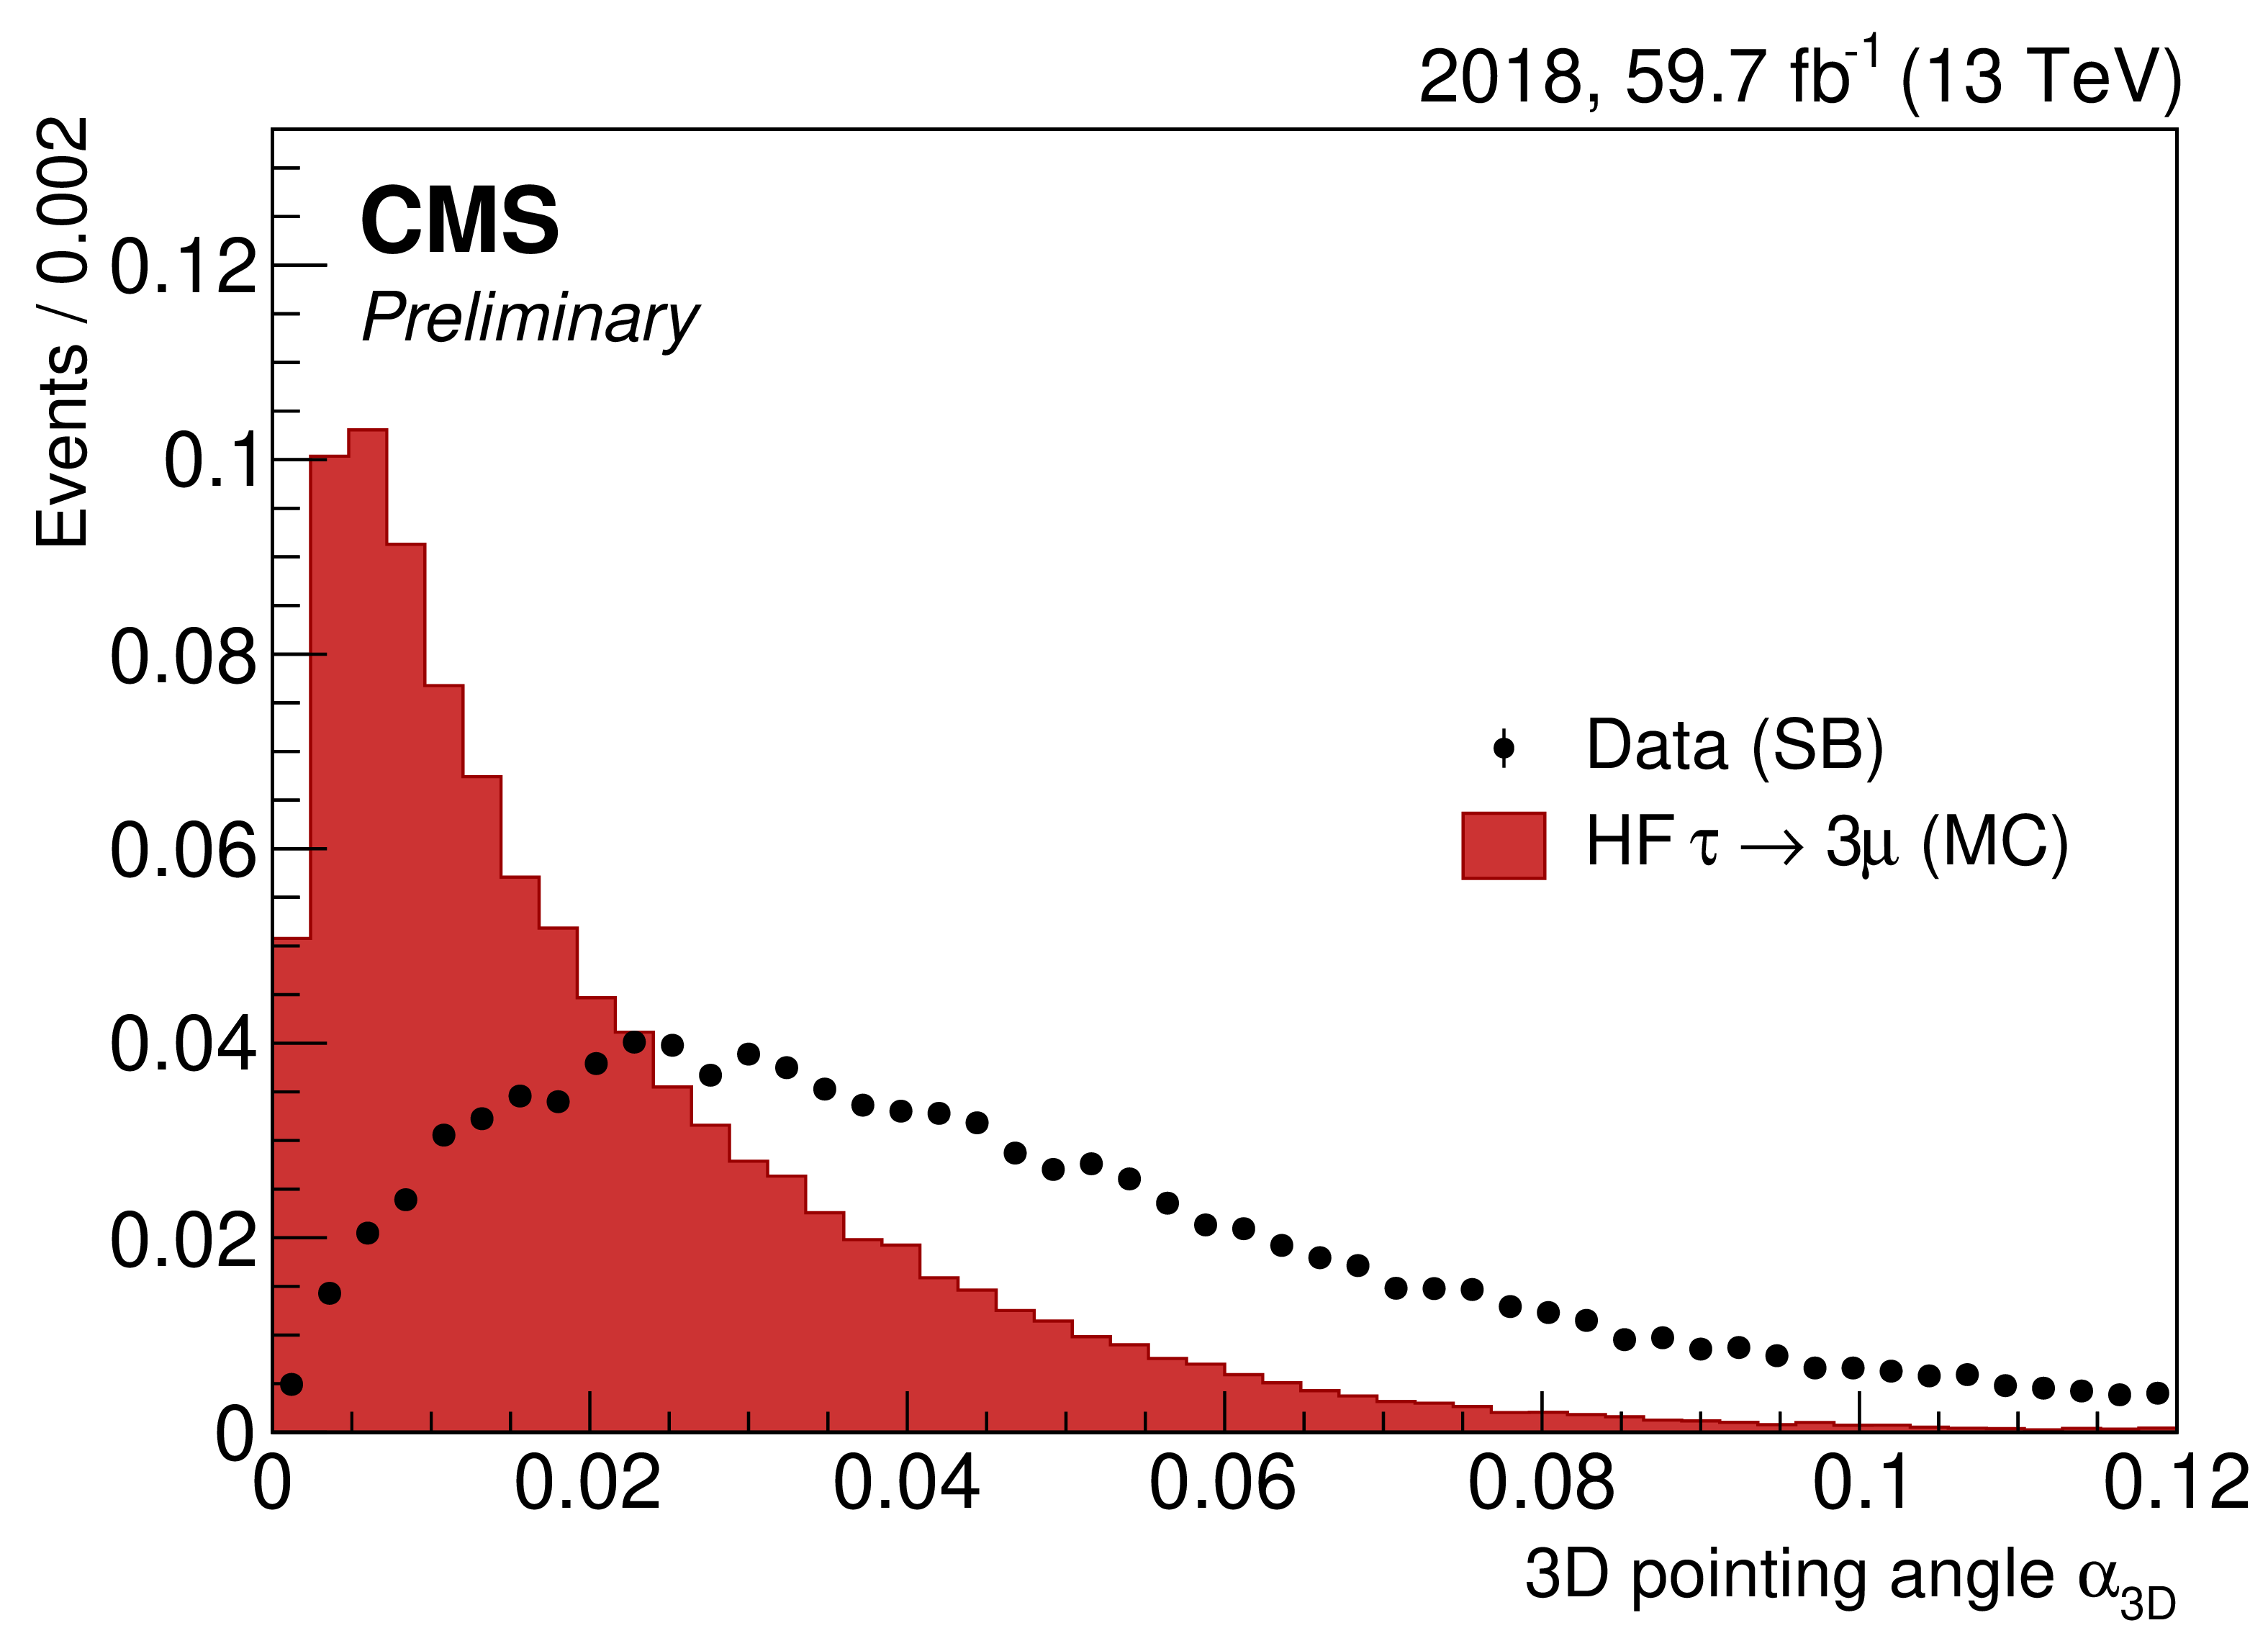
Signal and background distributions for the four observables with the highest discrimination power used for the heavy-flavor analysis BDT training: $ \alpha_{3D} $ as defined in the text (top left), the normalized $ \chi^2 $ of the trimuon vertex fit (top right), the smallest distance of closest approach to the trimuon vertex of all the other tracks in the event with $ p_{\mathrm{T}} > $ 1 GeV (bottom left), and the muon reconstruction quality BDT score of the lowest $ p_{\mathrm{T}} $ muon of the triplet (bottom right). The background distributions are from 2018 data in the mass sidebands. |
png pdf |
Figure 2-a:
Signal and background distributions for one of the variables used for the heavy-flavor analysis BDT training: $ \alpha_{3D} $ as defined in the text. The background distributions are from 2018 data in the mass sidebands. |

png pdf |
Figure 2-b:
Signal and background distributions for one of the variables used for the heavy-flavor analysis BDT training: the normalized $ \chi^2 $ of the trimuon vertex fit. The background distributions are from 2018 data in the mass sidebands. |
png pdf |
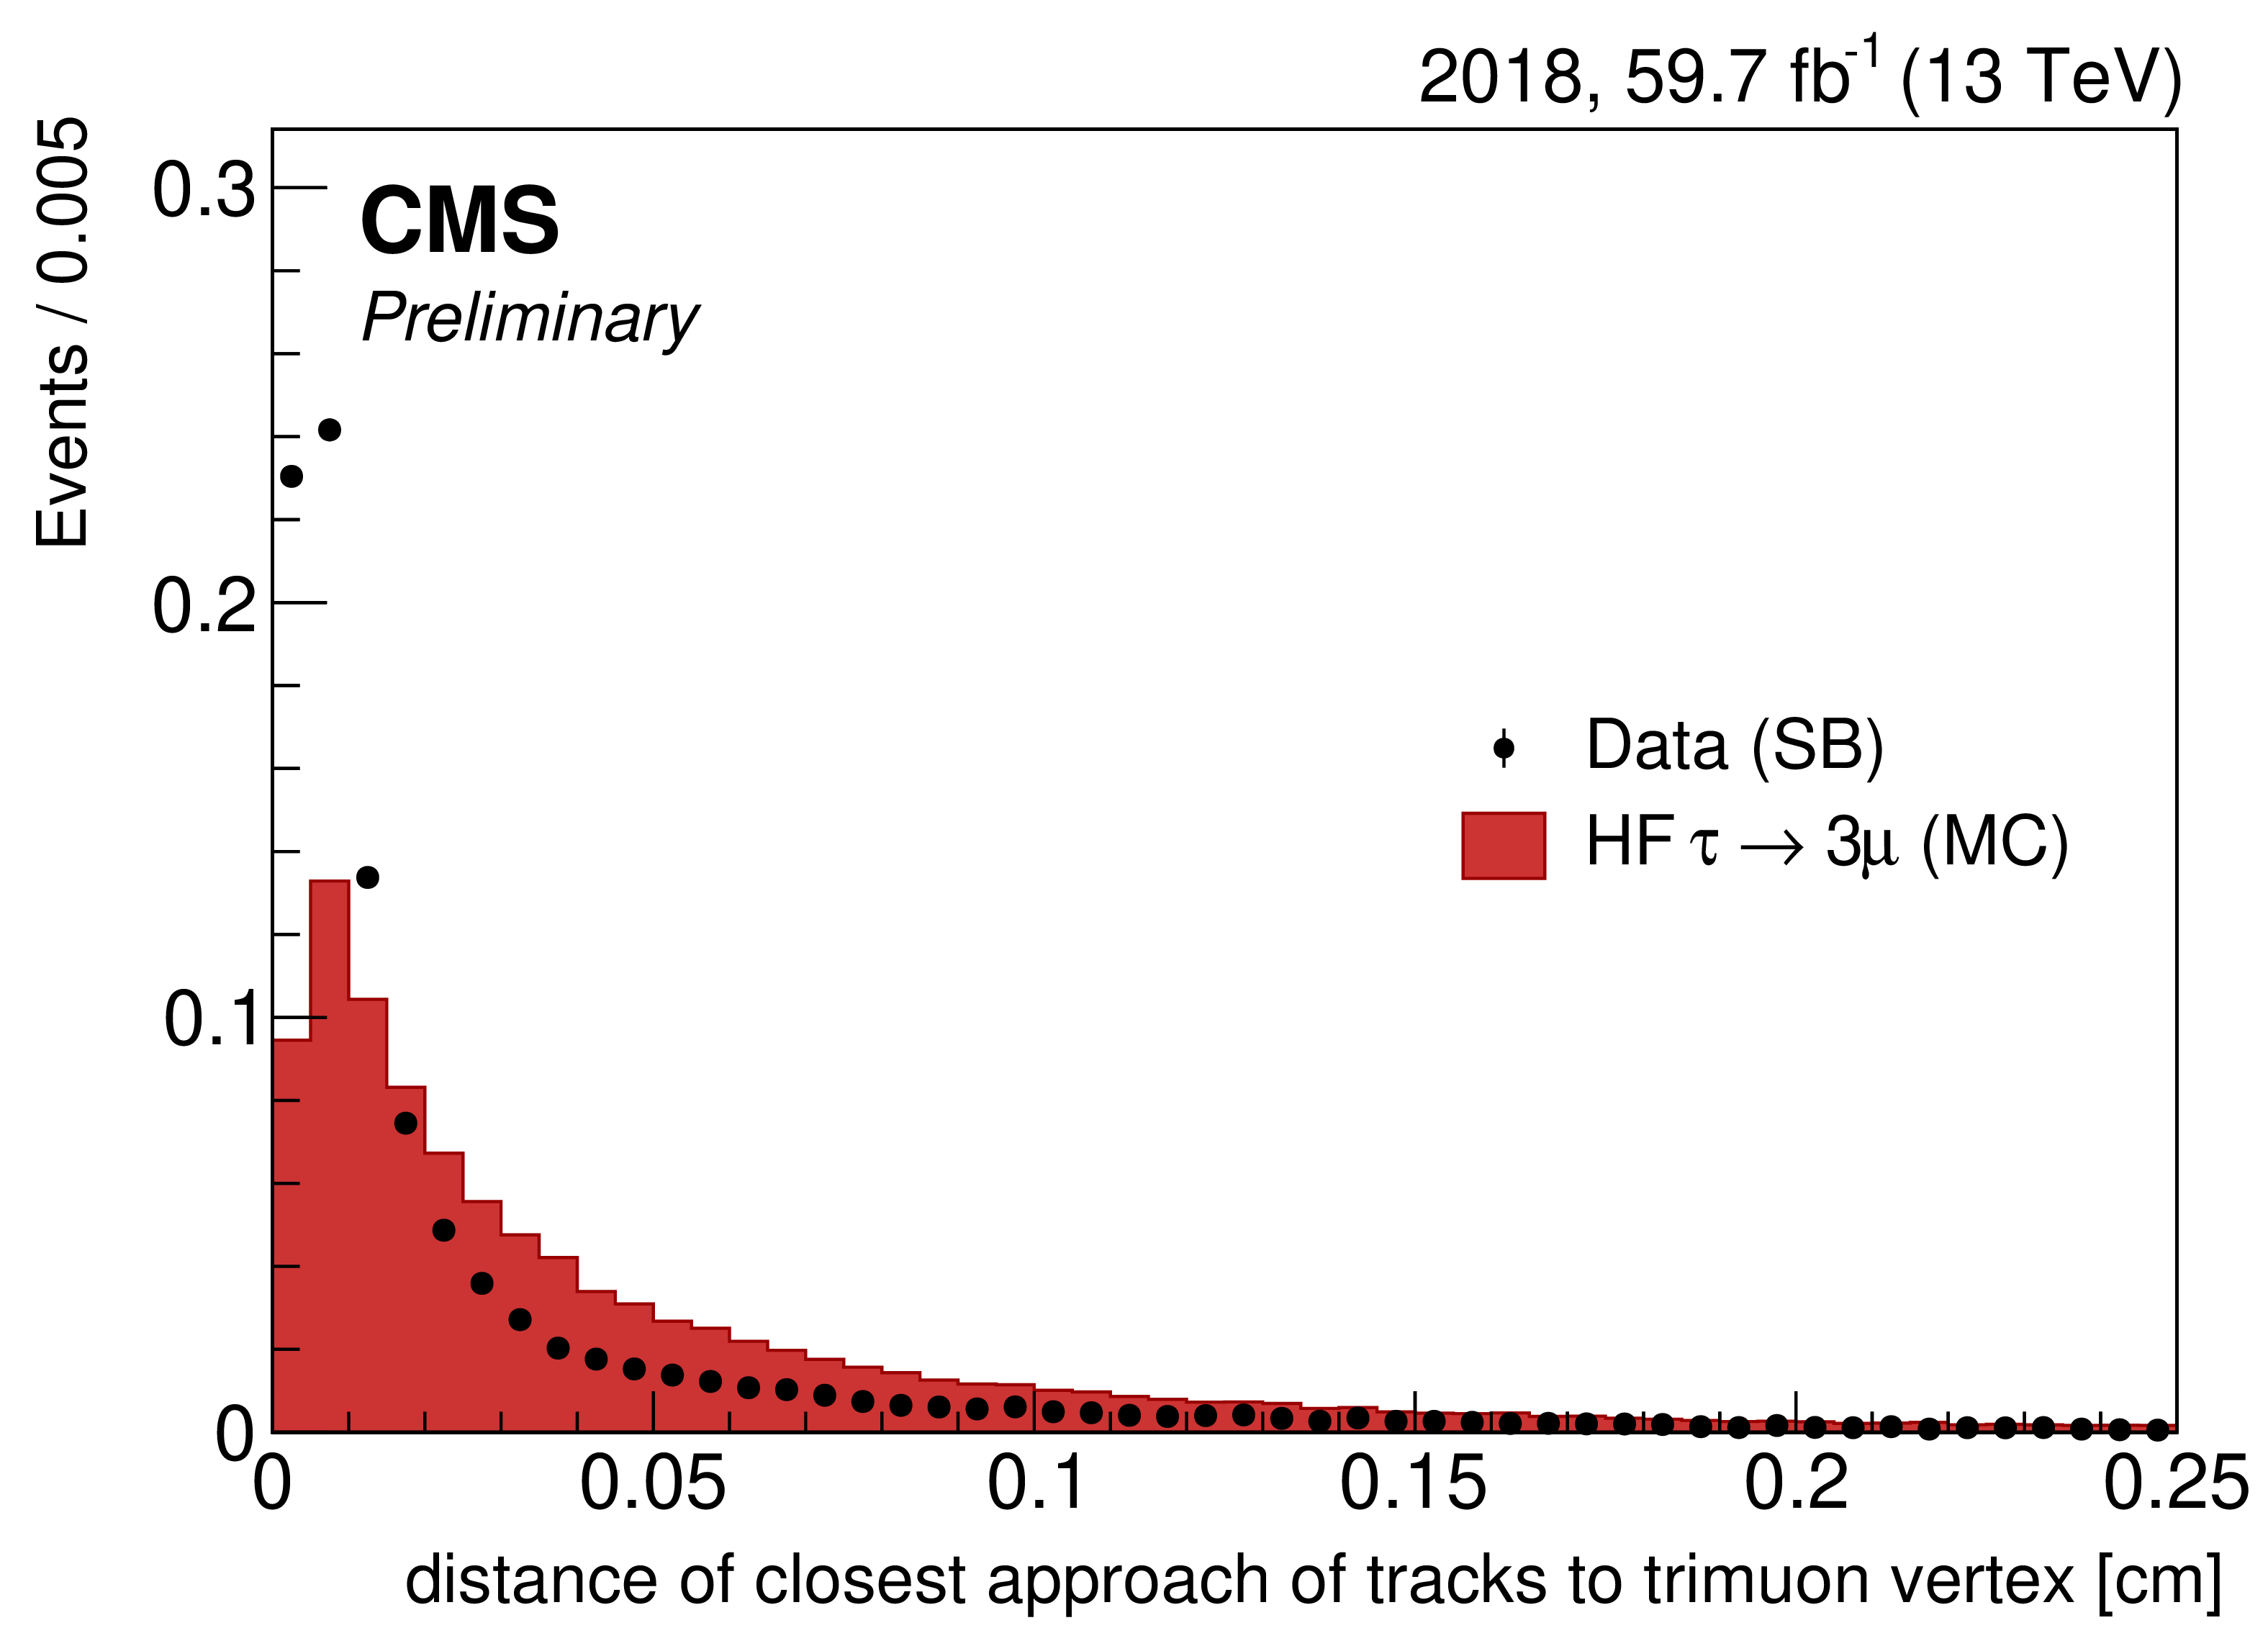
Figure 2-c:
Signal and background distributions for one of the variables used for the heavy-flavor analysis BDT training: the smallest distance of closest approach to the trimuon vertex of all the other tracks in the event with $ p_{\mathrm{T}} > $ 1 GeV. The background distributions are from 2018 data in the mass sidebands. |
png pdf |
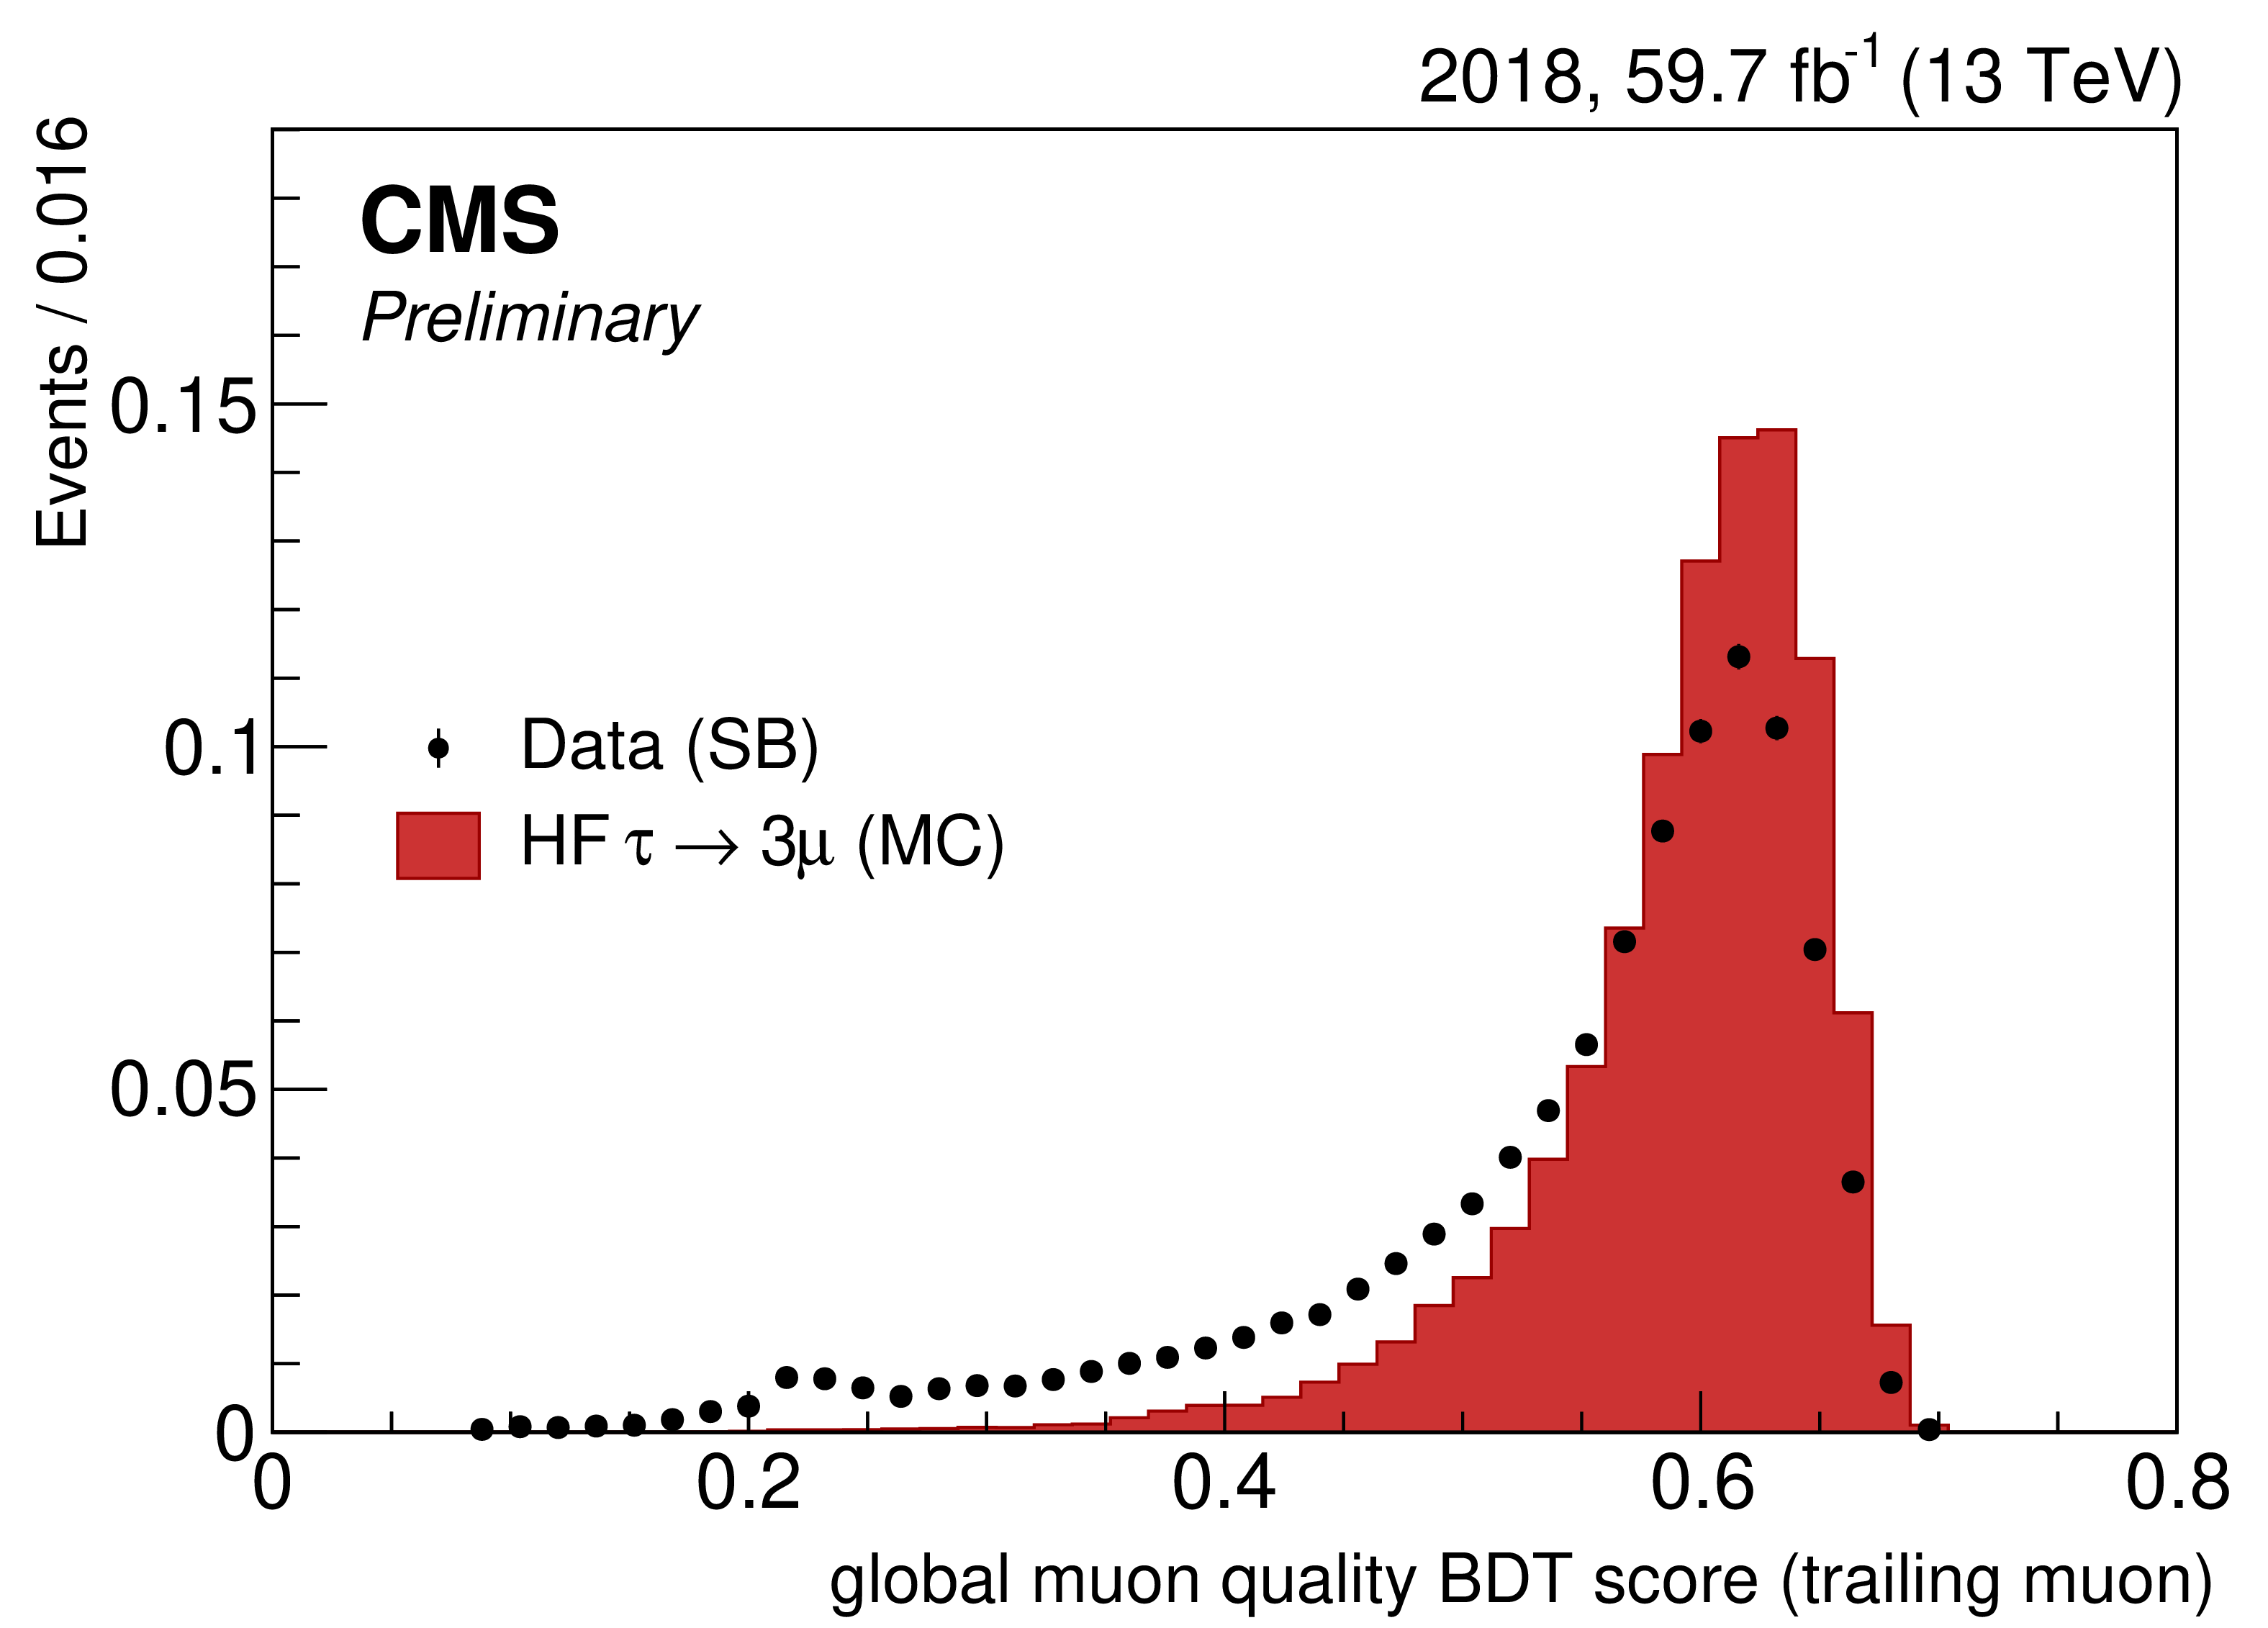
Figure 2-d:
Signal and background distributions for one of the variables used for the heavy-flavor analysis BDT training: the muon reconstruction quality BDT score of the lowest $ p_{\mathrm{T}} $ muon of the triplet. The background distributions are from 2018 data in the mass sidebands. |

png pdf |
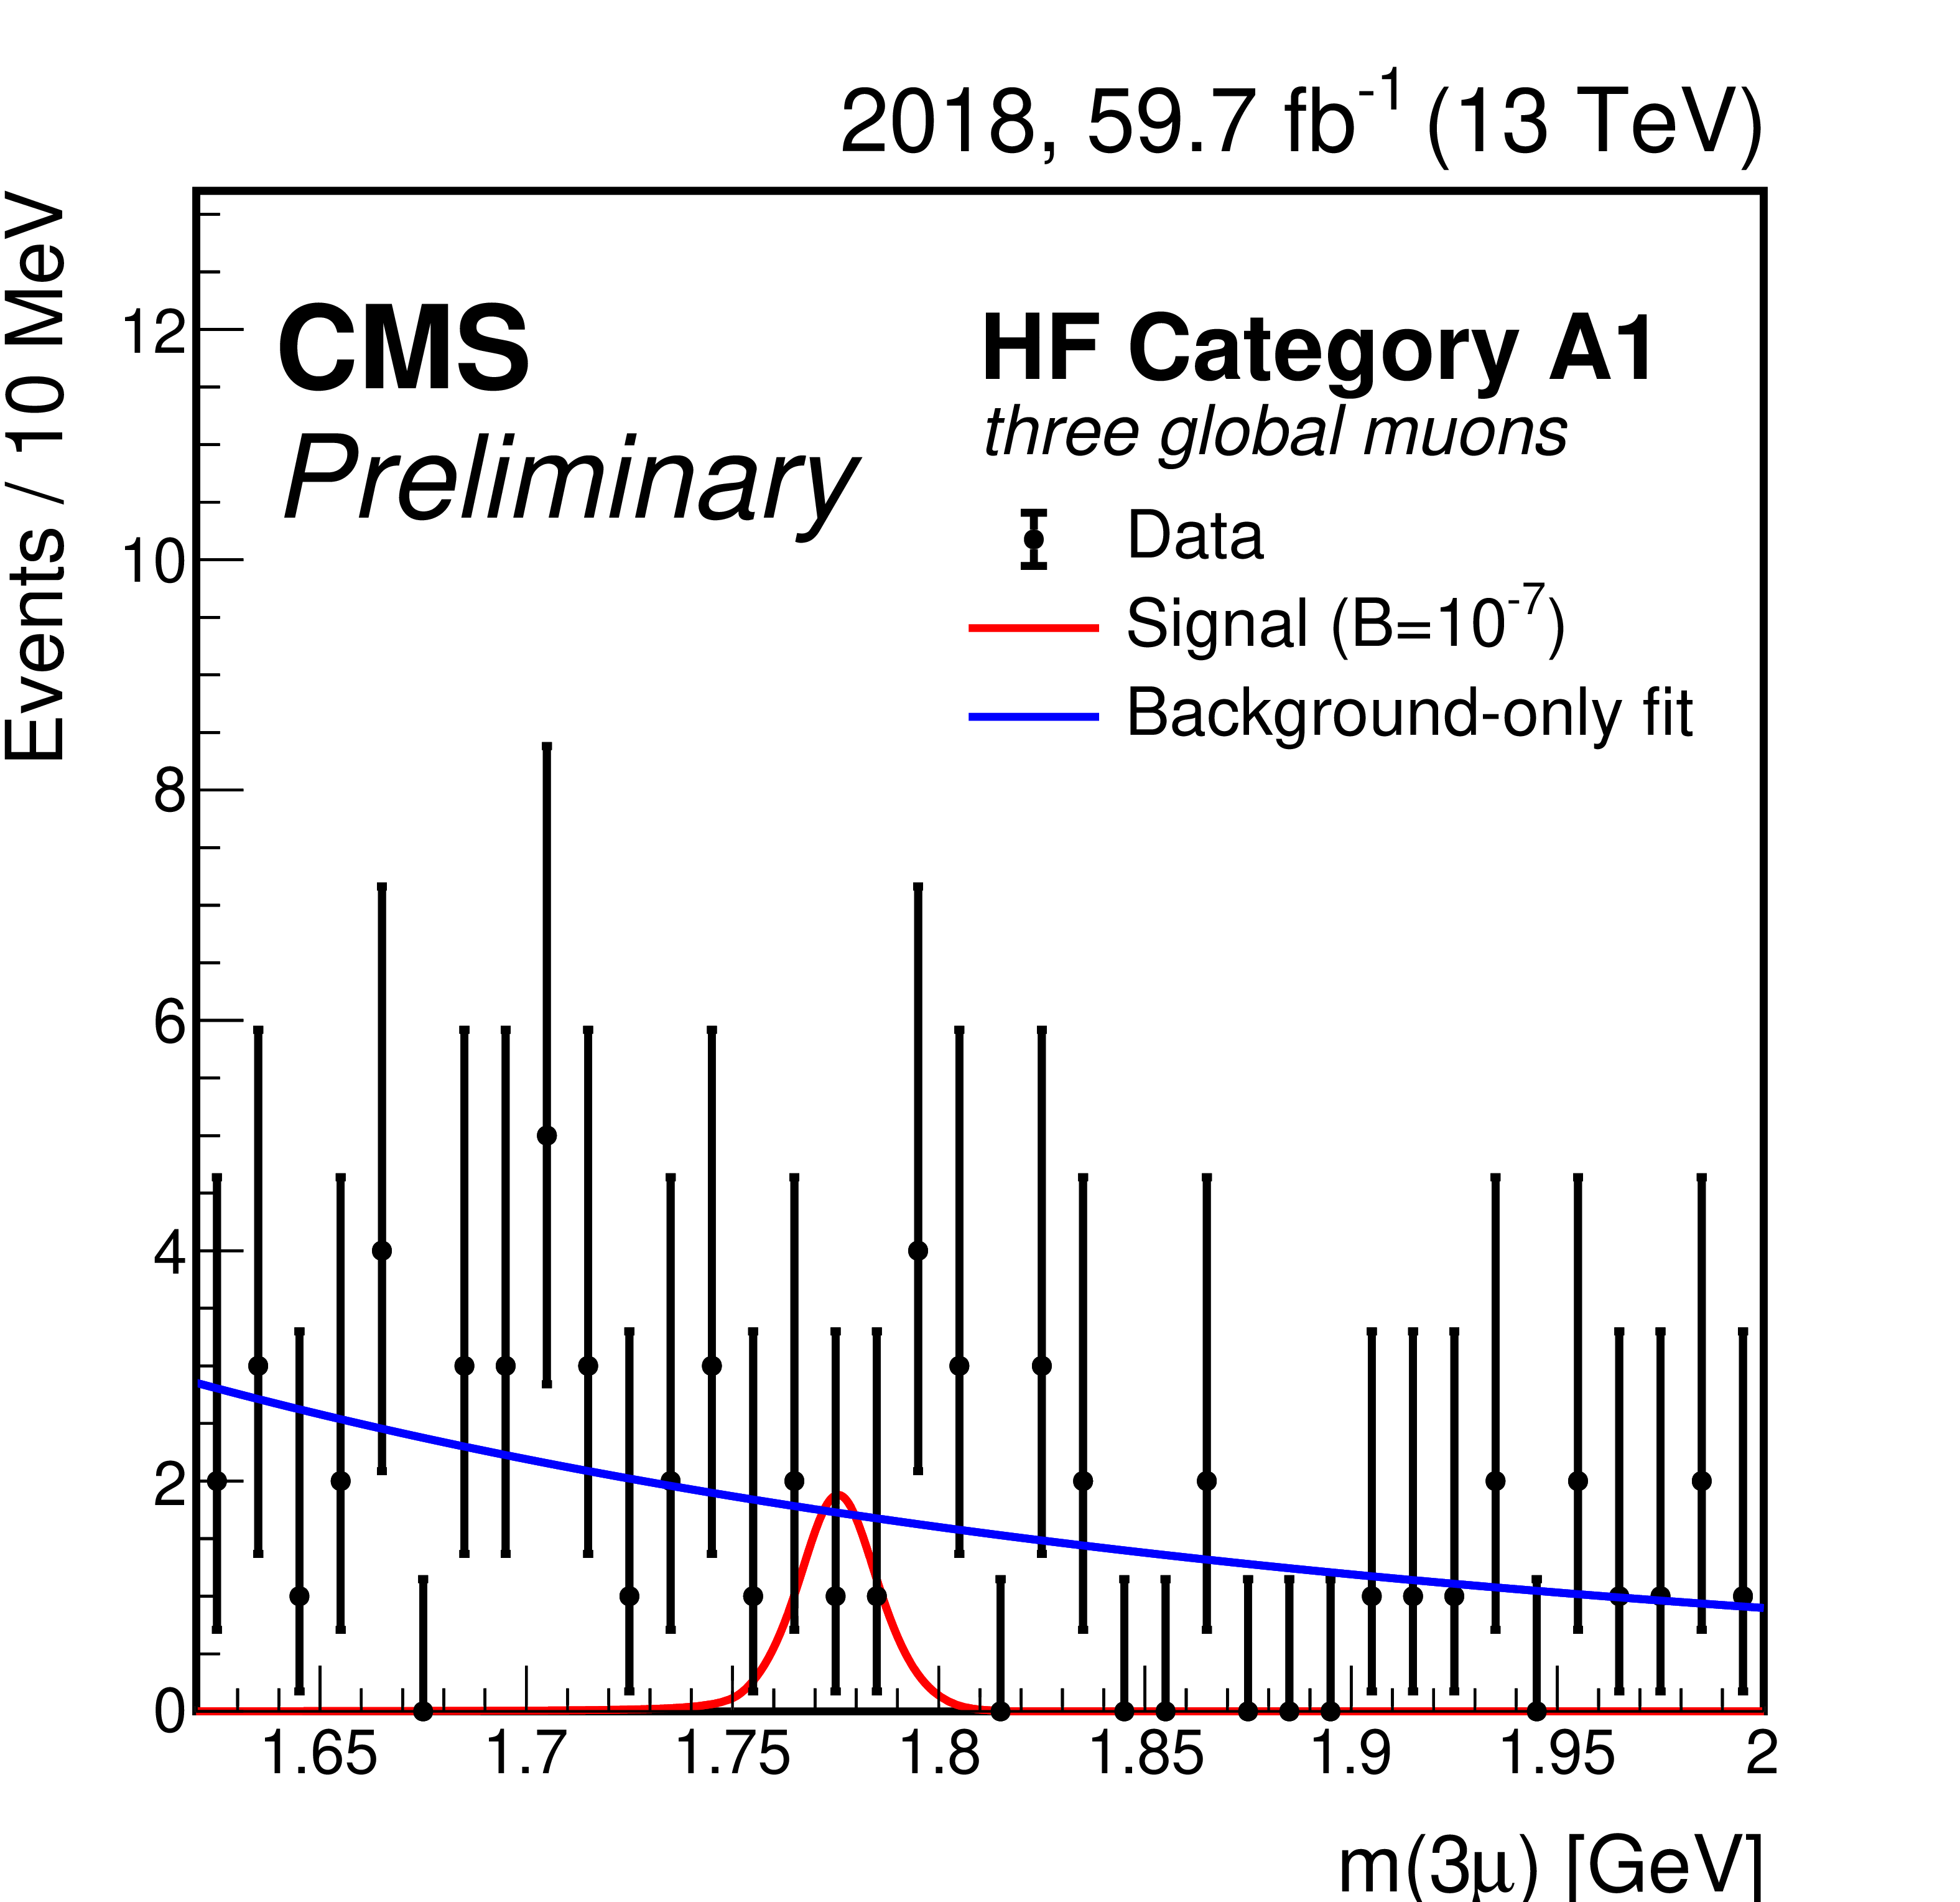
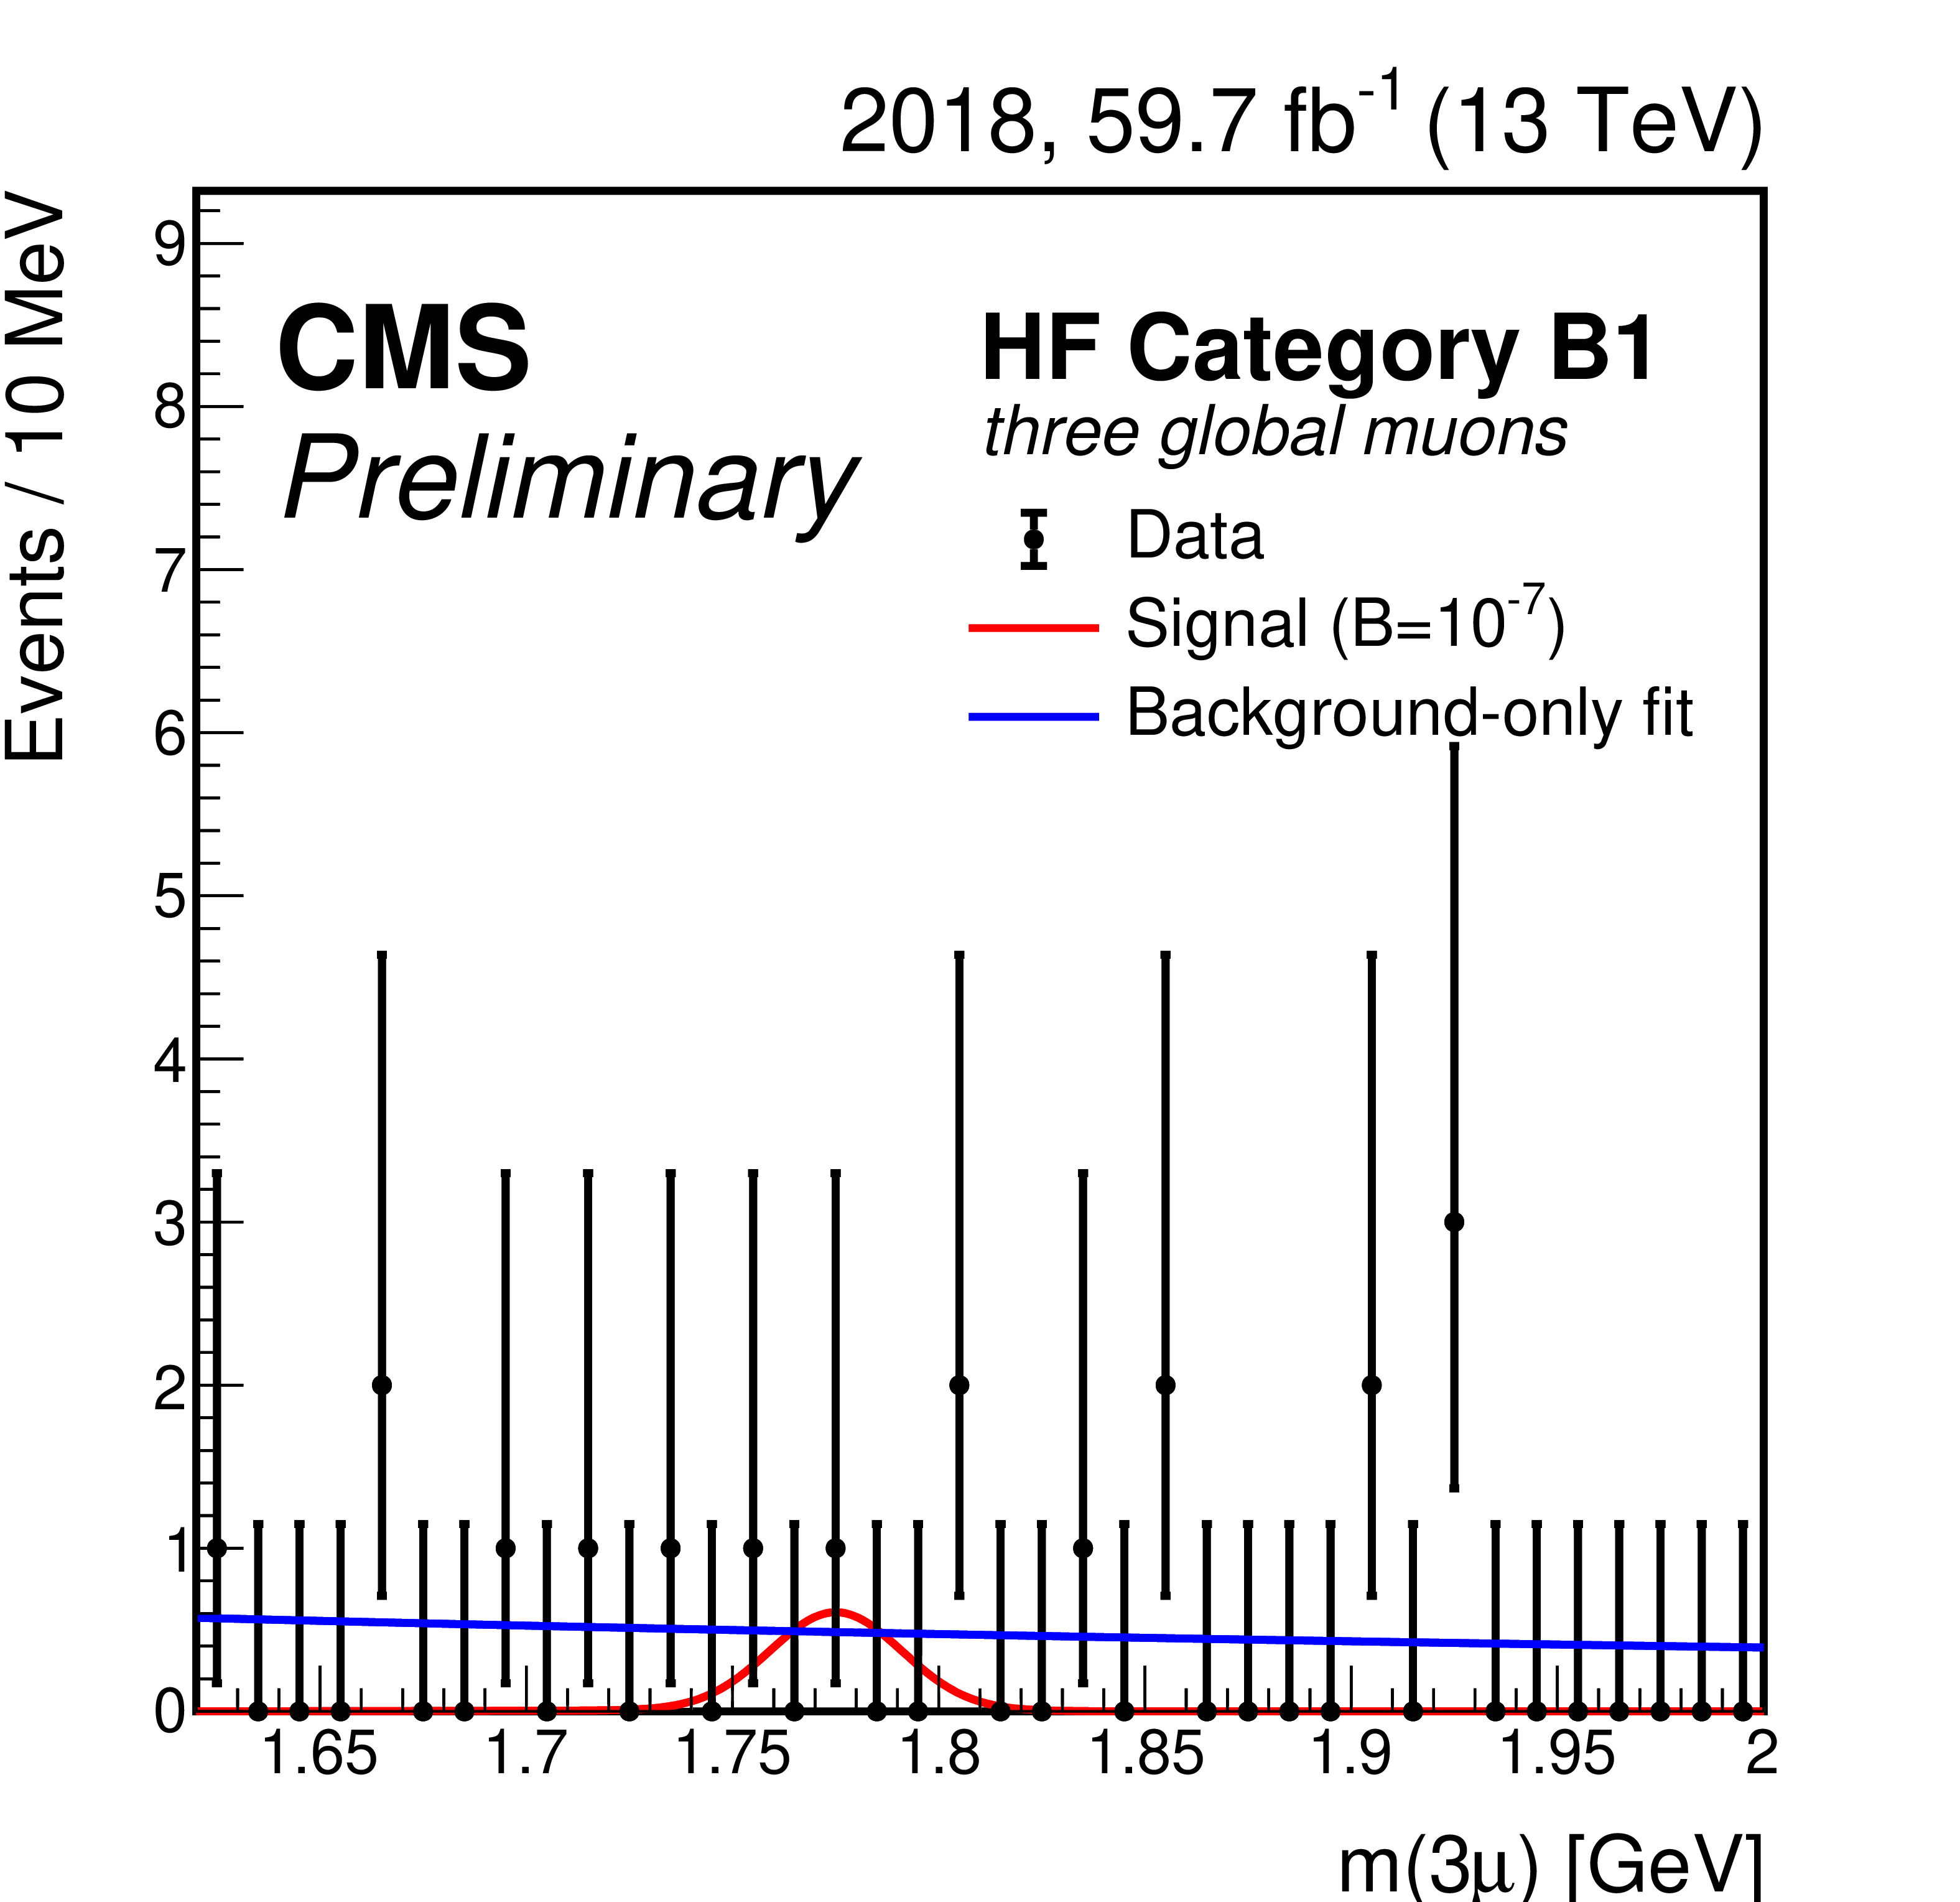
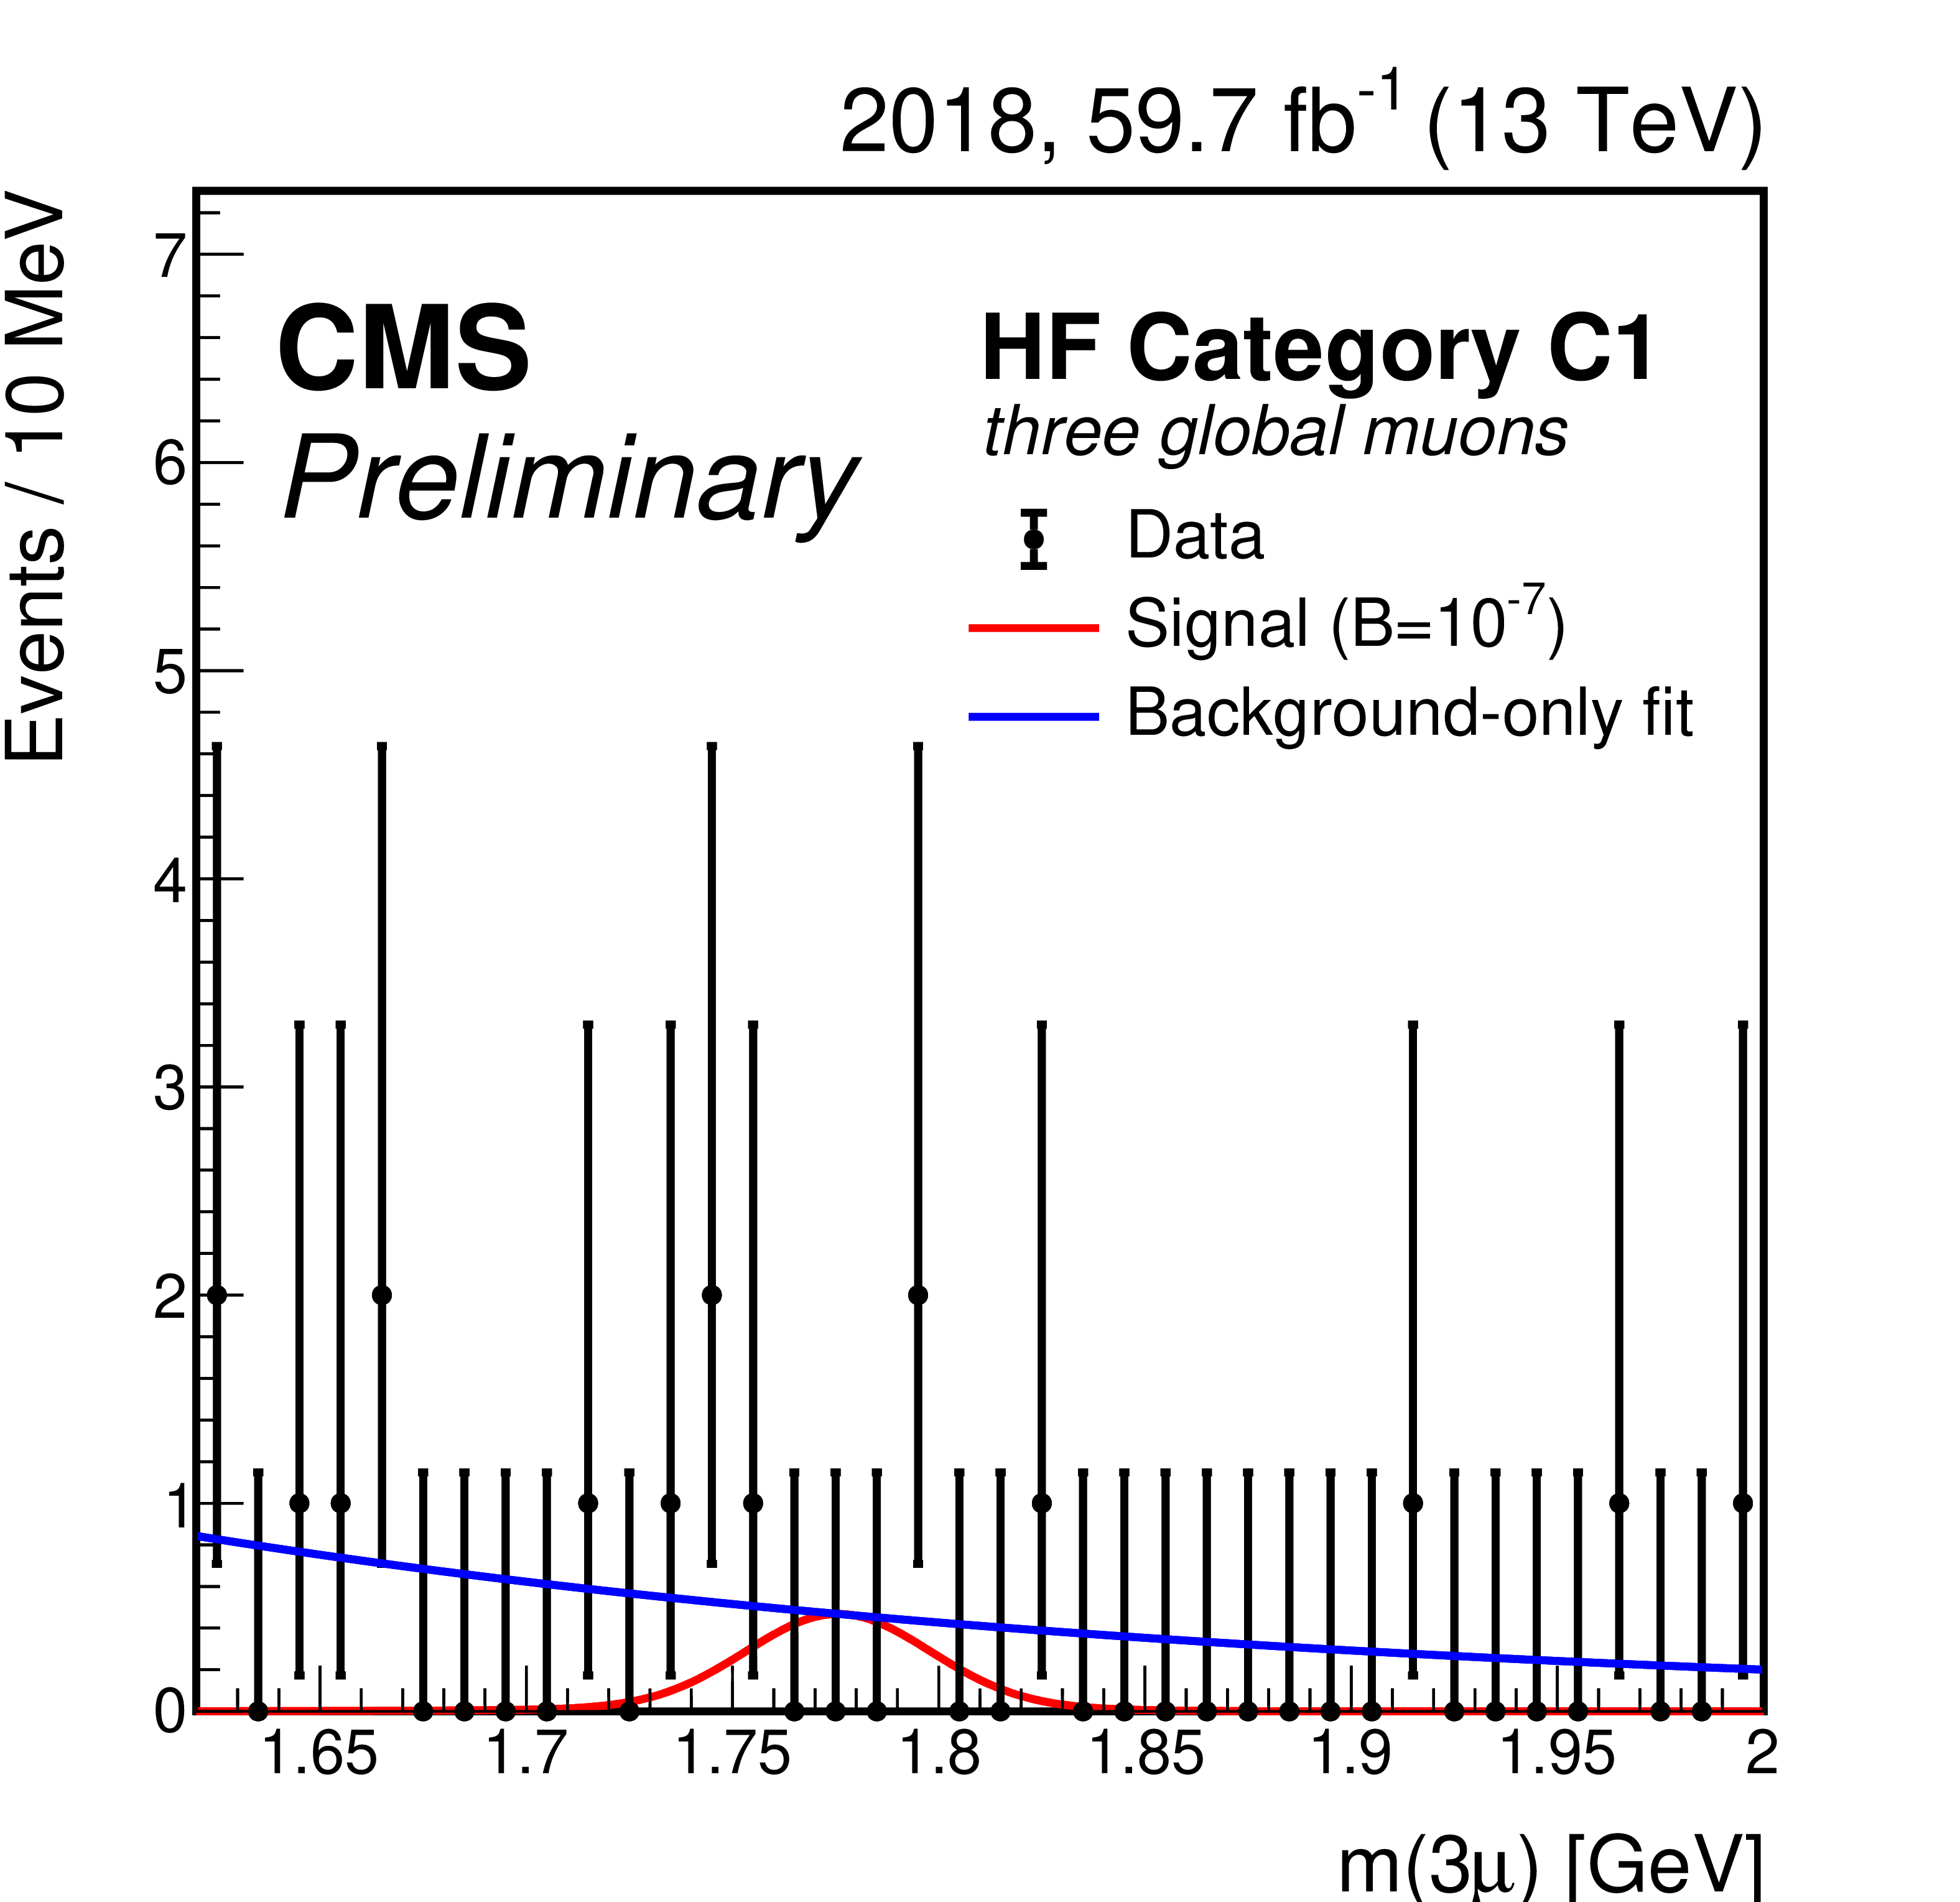
Figure 3:
Trimuon mass distributions in the highest BDT score subcategory of each of the three mass resolution categories of the heavy-flavor analysis: A1, B1, and C1, in the 2018 data events with three global muons. Data are shown with black markers. The background-only fit and the expected signal for $ \mathcal{B}(\tau \!\to\! 3\mu) = $ 10$^{-7} $ are shown with blue and red lines, respectively. |
png pdf |
Figure 3-a:
Trimuon mass distribution in the A1 category of the heavy-flavor analysis, in the 2018 data events with three global muons. Data are shown with black markers. The background-only fit and the expected signal for $ \mathcal{B}(\tau \!\to\! 3\mu) = $ 10$^{-7} $ are shown with blue and red lines, respectively. |
png pdf |
Figure 3-b:
Trimuon mass distribution in the B1 category of the heavy-flavor analysis, in the 2018 data events with three global muons. Data are shown with black markers. The background-only fit and the expected signal for $ \mathcal{B}(\tau \!\to\! 3\mu) = $ 10$^{-7} $ are shown with blue and red lines, respectively. |
png pdf |
Figure 3-c:
Trimuon mass distribution in the C1 category of the heavy-flavor analysis, in the 2018 data events with three global muons. Data are shown with black markers. The background-only fit and the expected signal for $ \mathcal{B}(\tau \!\to\! 3\mu) = $ 10$^{-7} $ are shown with blue and red lines, respectively. |

png pdf |
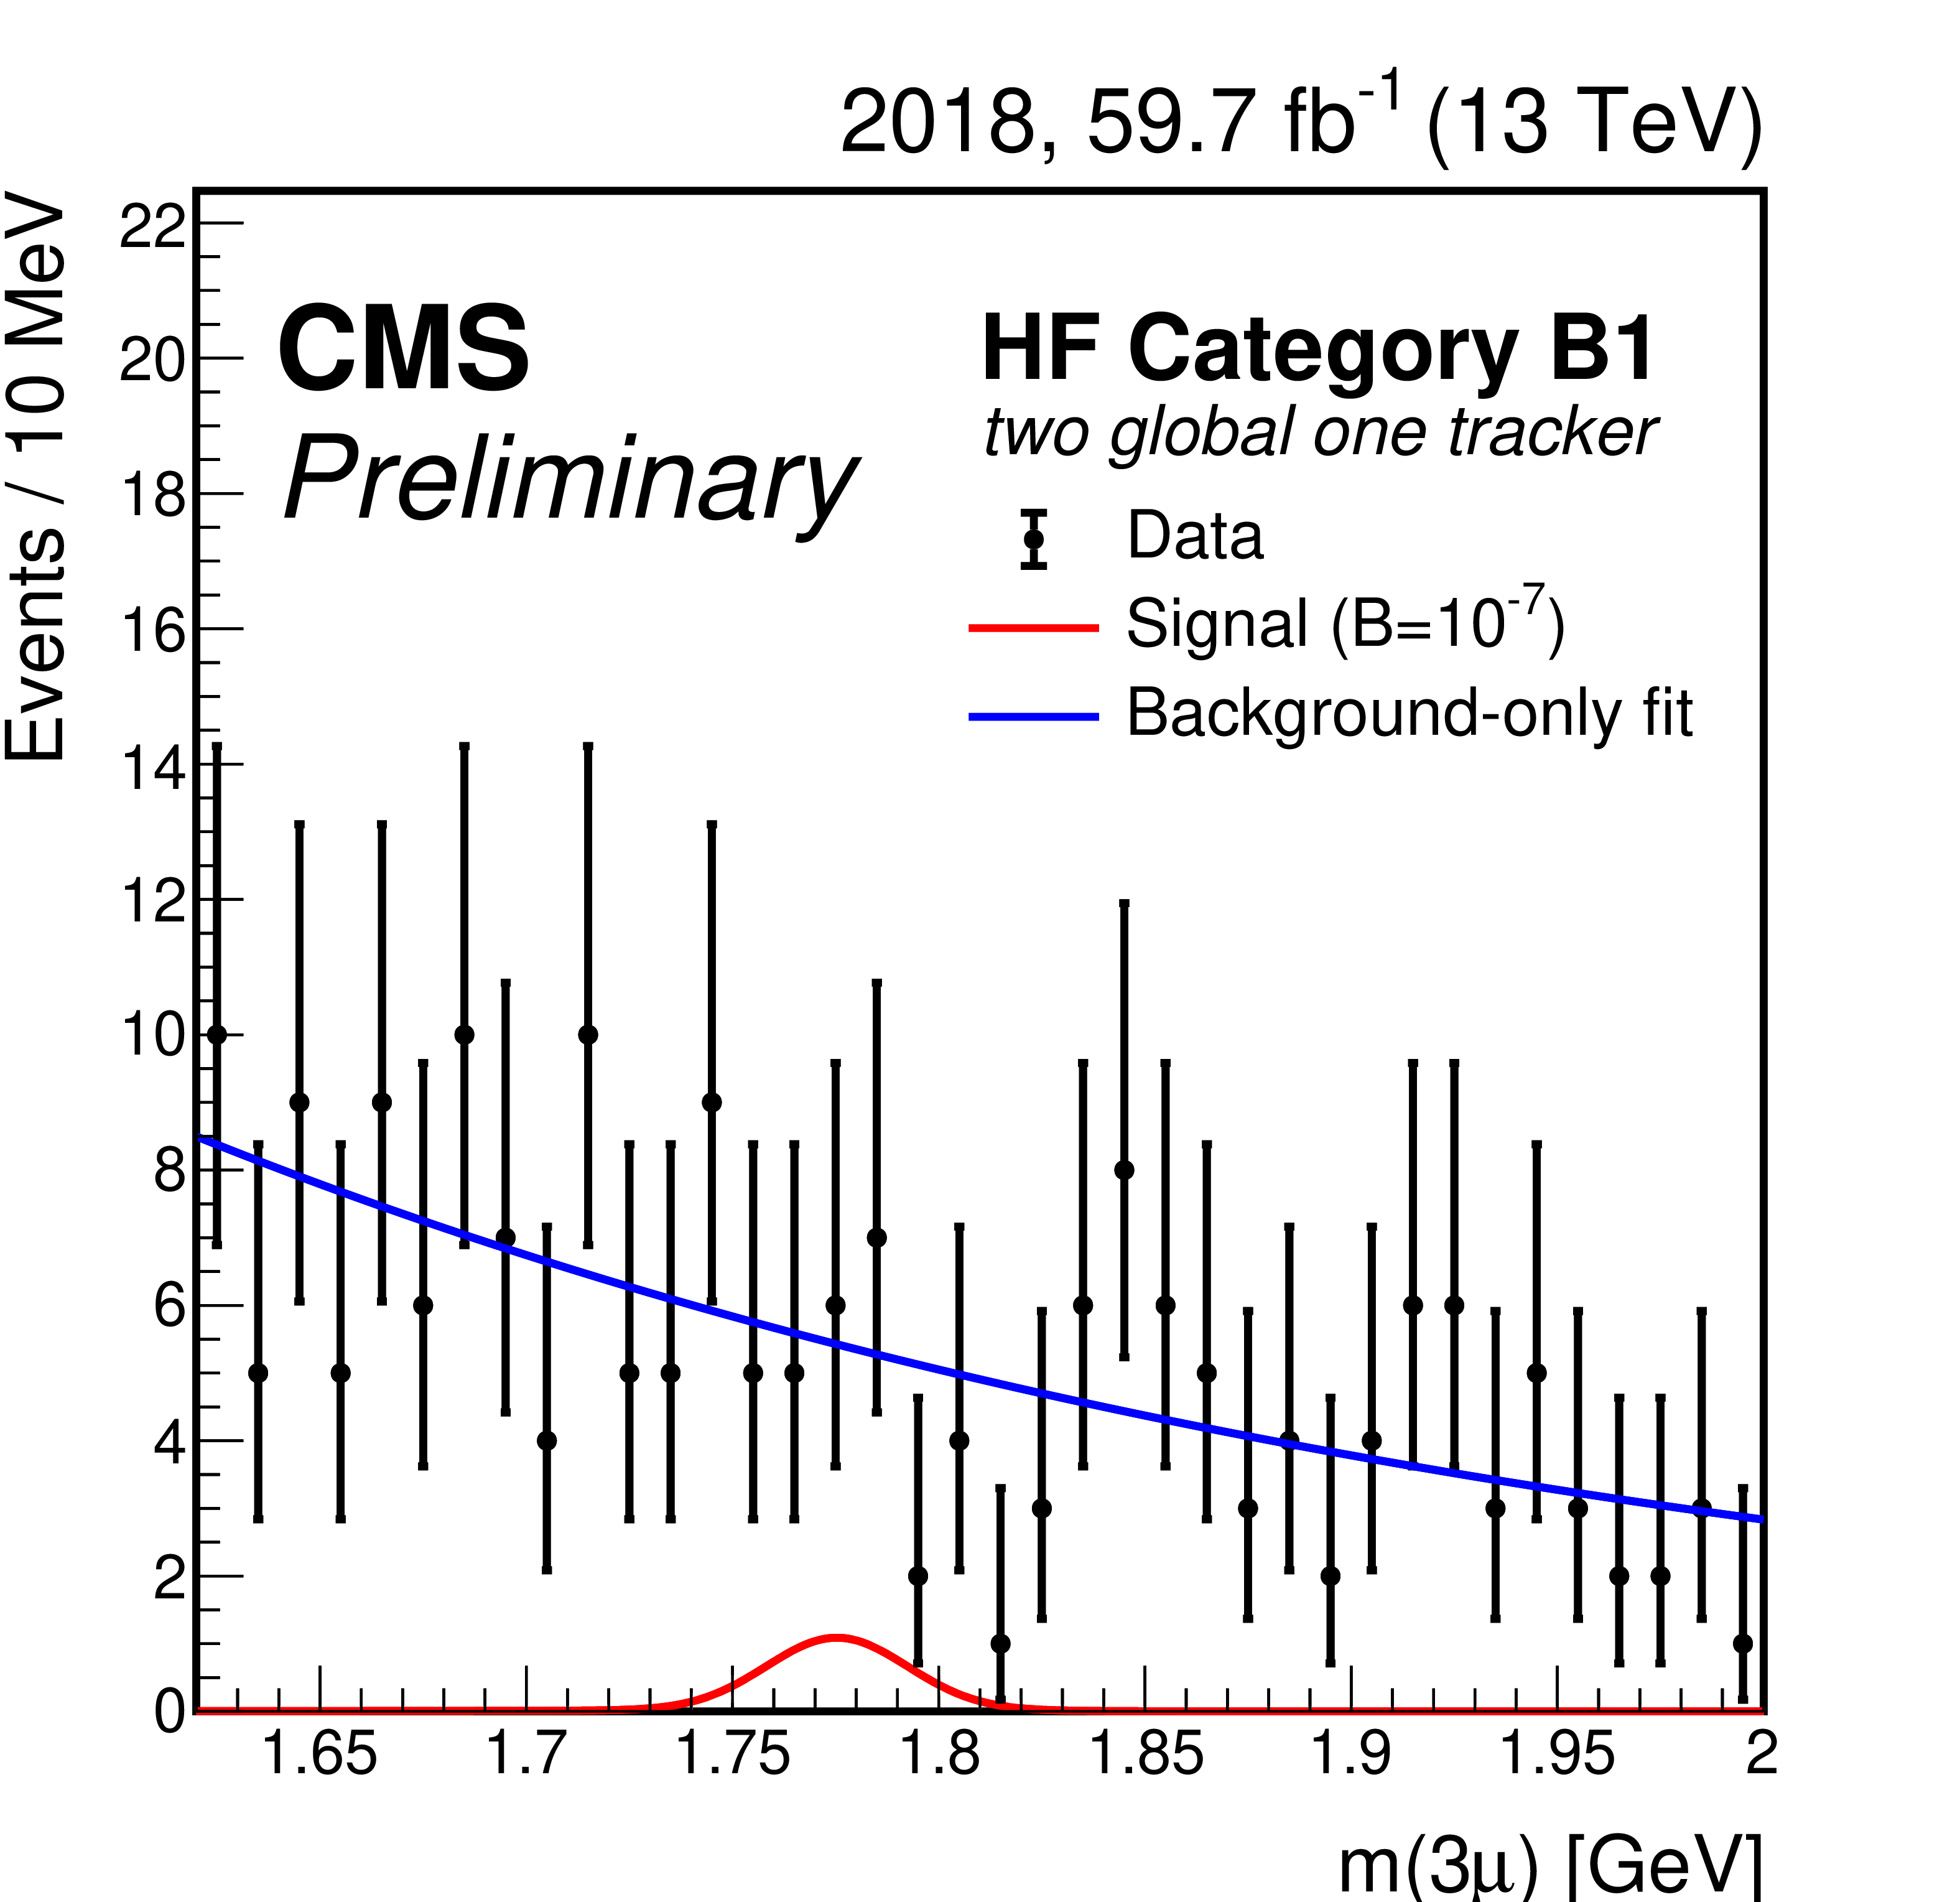
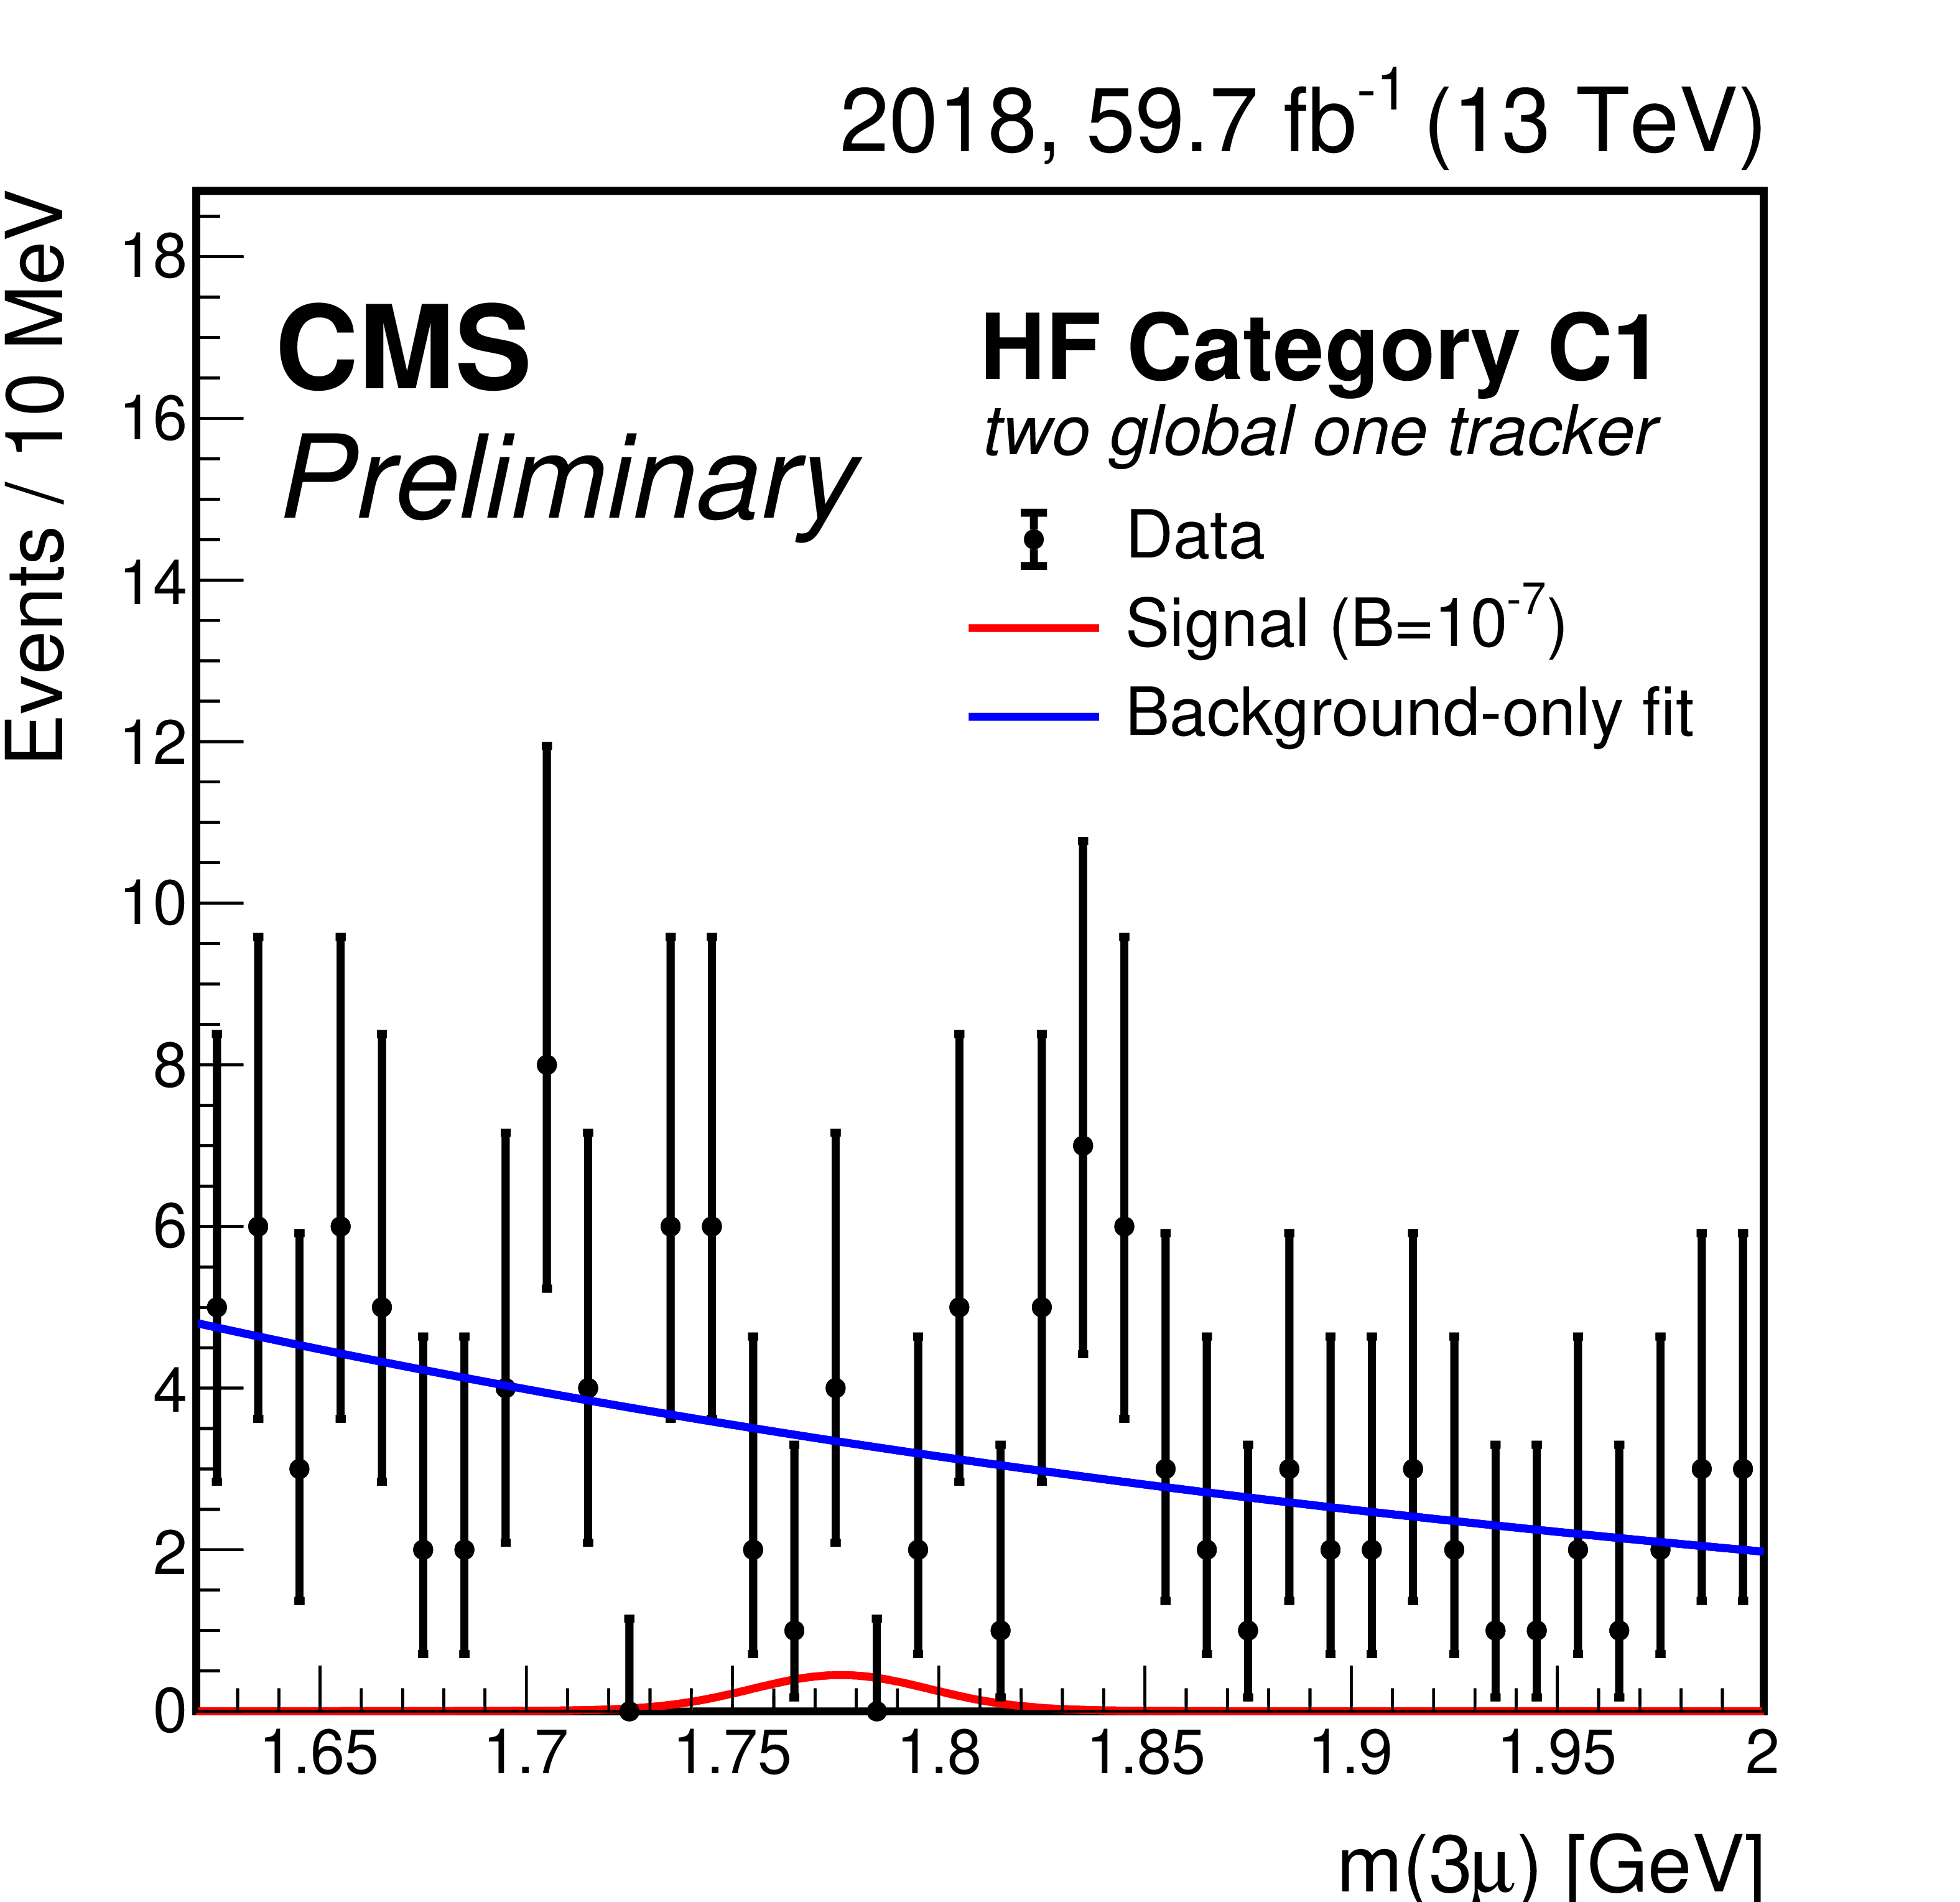
Figure 4:
Trimuon mass distributions in the highest BDT score subcategories of each of the three mass resolution categories of the heavy-flavor analysis: A1, B1, and C1, in the 2018 data events with two global muons and one tracker muon. Data are shown with black markers. The background-only fit and the expected signal for $ \mathcal{B}(\tau \!\to\! 3\mu) < $ 10$^{-7} $ are shown with blue and red lines, respectively. |

png pdf |
Figure 4-a:
Trimuon mass distribution in the A1 category of the heavy-flavor analysis, in the 2018 data events with two global muons and one tracker muon. Data are shown with black markers. The background-only fit and the expected signal for $ \mathcal{B}(\tau \!\to\! 3\mu) < $ 10$^{-7} $ are shown with blue and red lines, respectively. |
png pdf |
Figure 4-b:
Trimuon mass distribution in the B1 category of the heavy-flavor analysis, in the 2018 data events with two global muons and one tracker muon. Data are shown with black markers. The background-only fit and the expected signal for $ \mathcal{B}(\tau \!\to\! 3\mu) < $ 10$^{-7} $ are shown with blue and red lines, respectively. |
png pdf |
Figure 4-c:
Trimuon mass distribution in the C1 category of the heavy-flavor analysis, in the 2018 data events with two global muons and one tracker muon. Data are shown with black markers. The background-only fit and the expected signal for $ \mathcal{B}(\tau \!\to\! 3\mu) < $ 10$^{-7} $ are shown with blue and red lines, respectively. |

png pdf |
Figure 5:
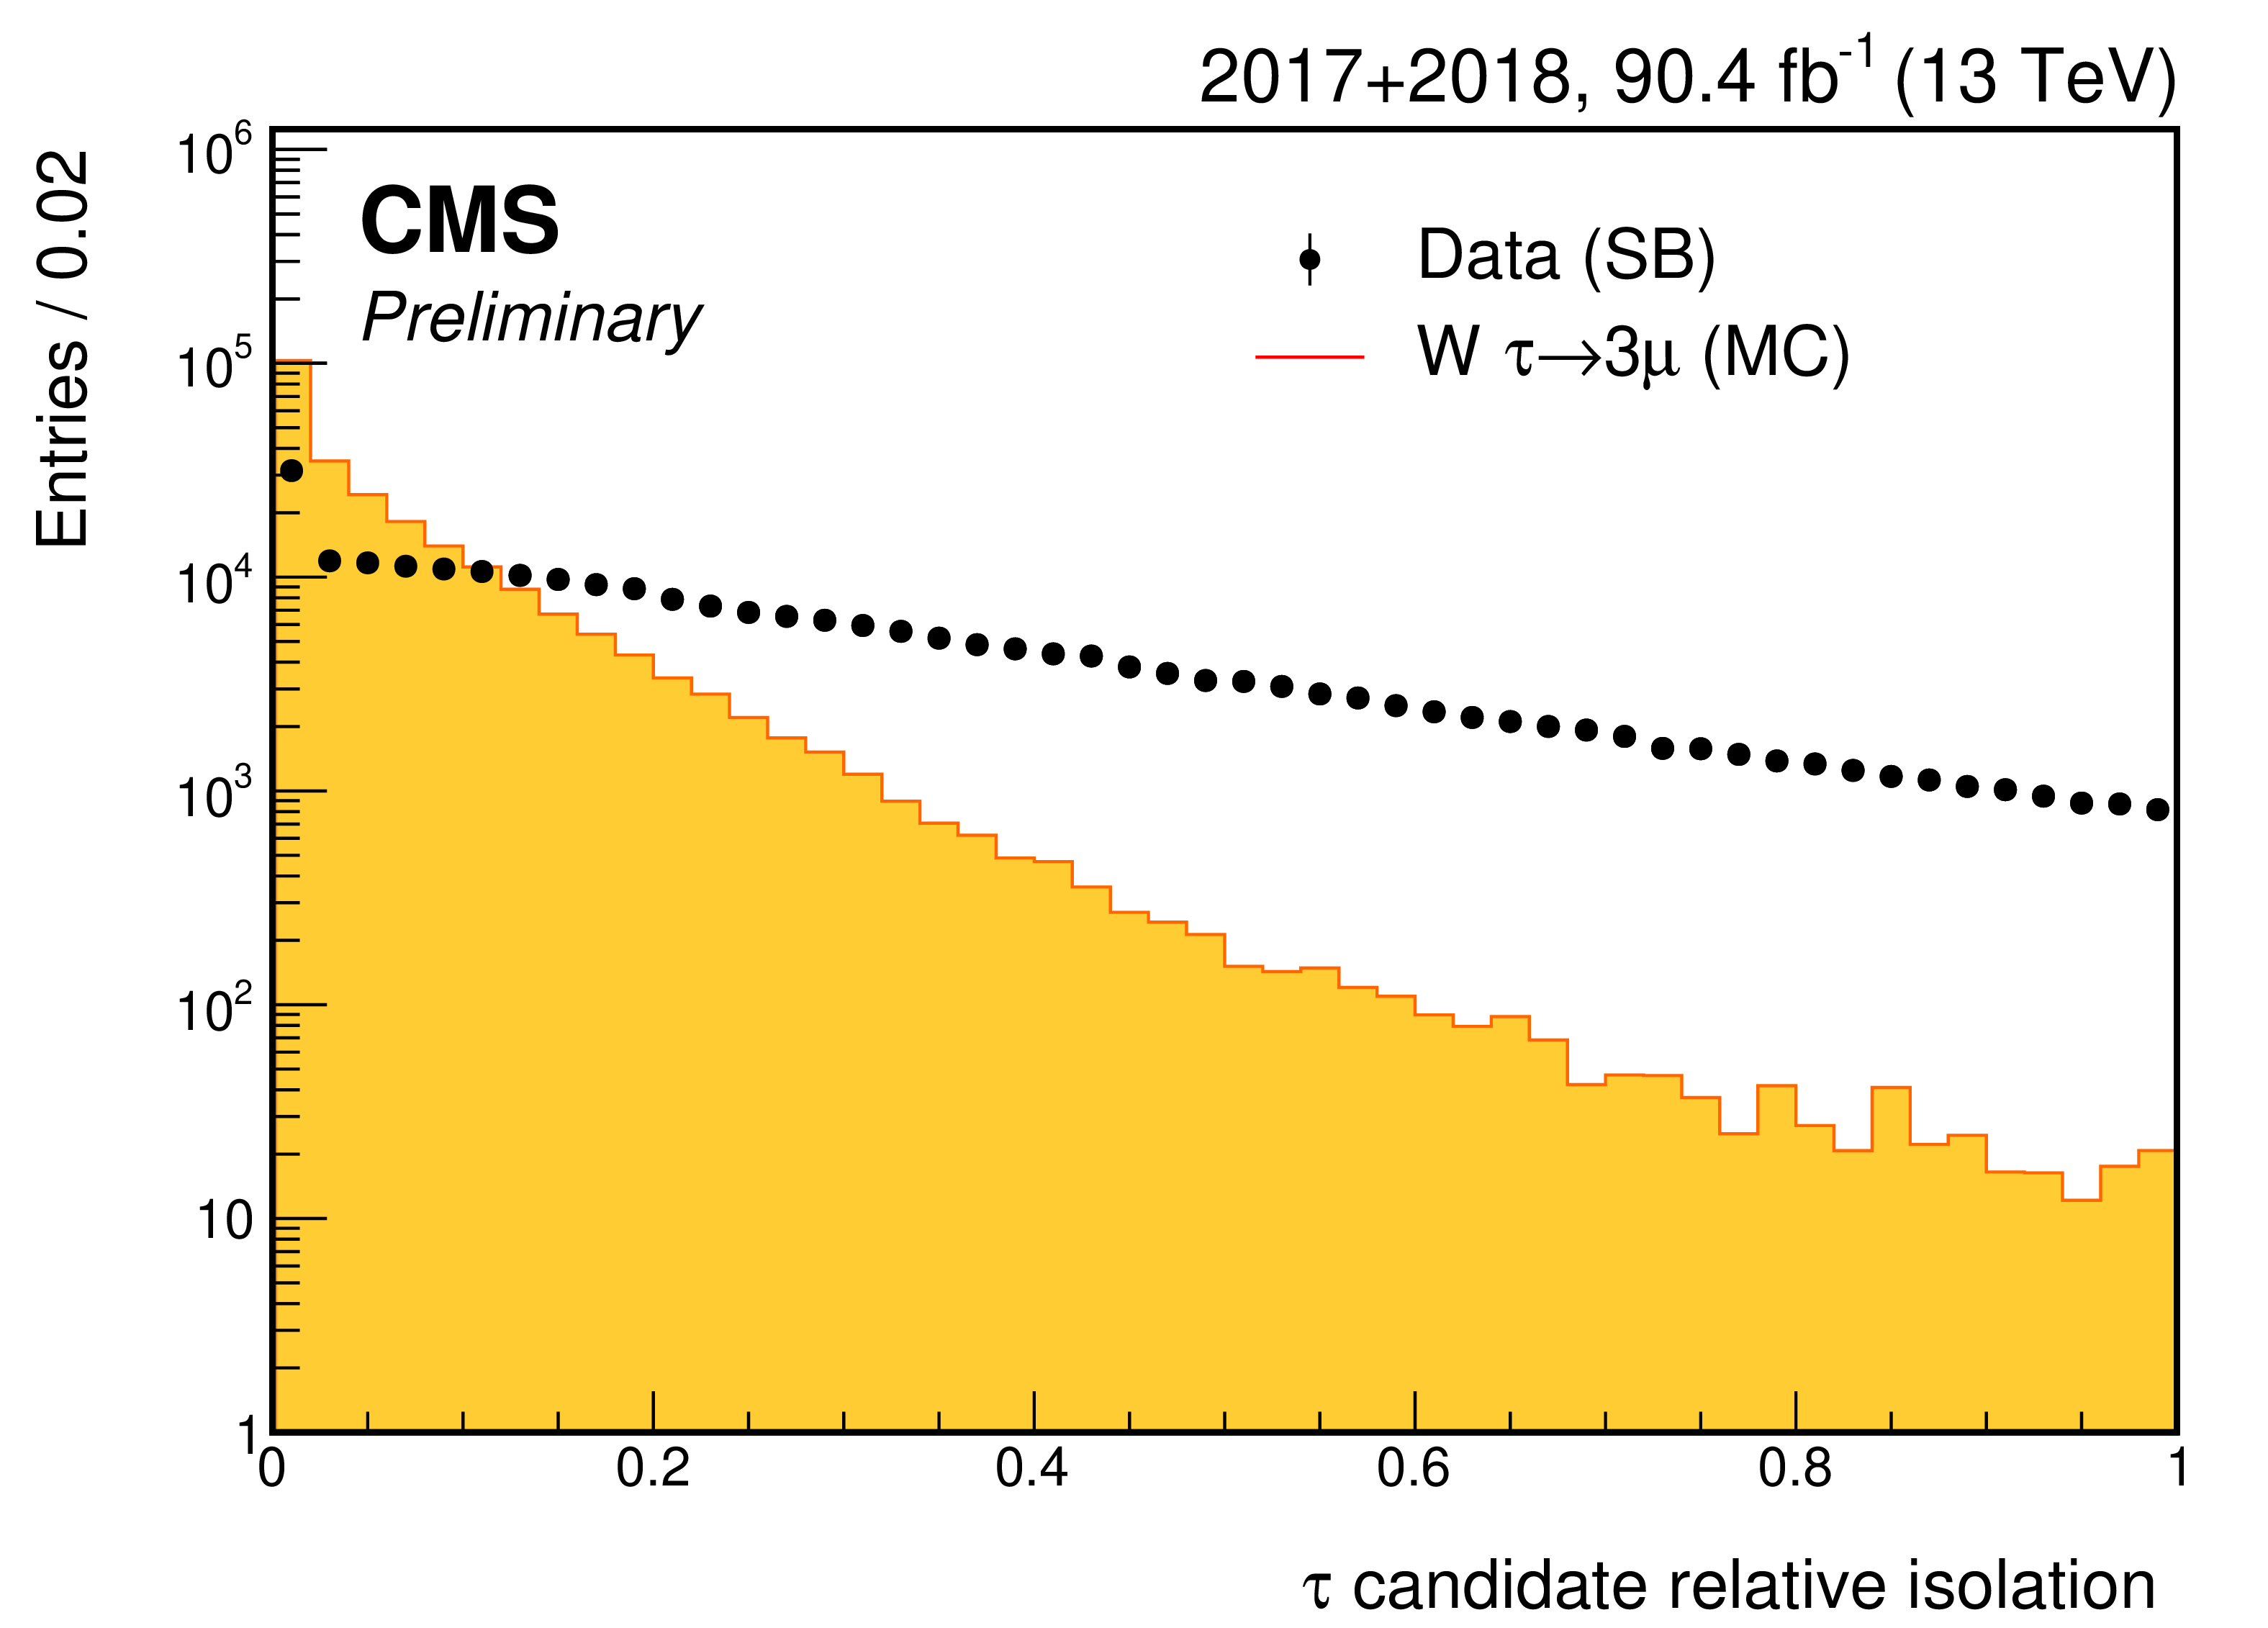
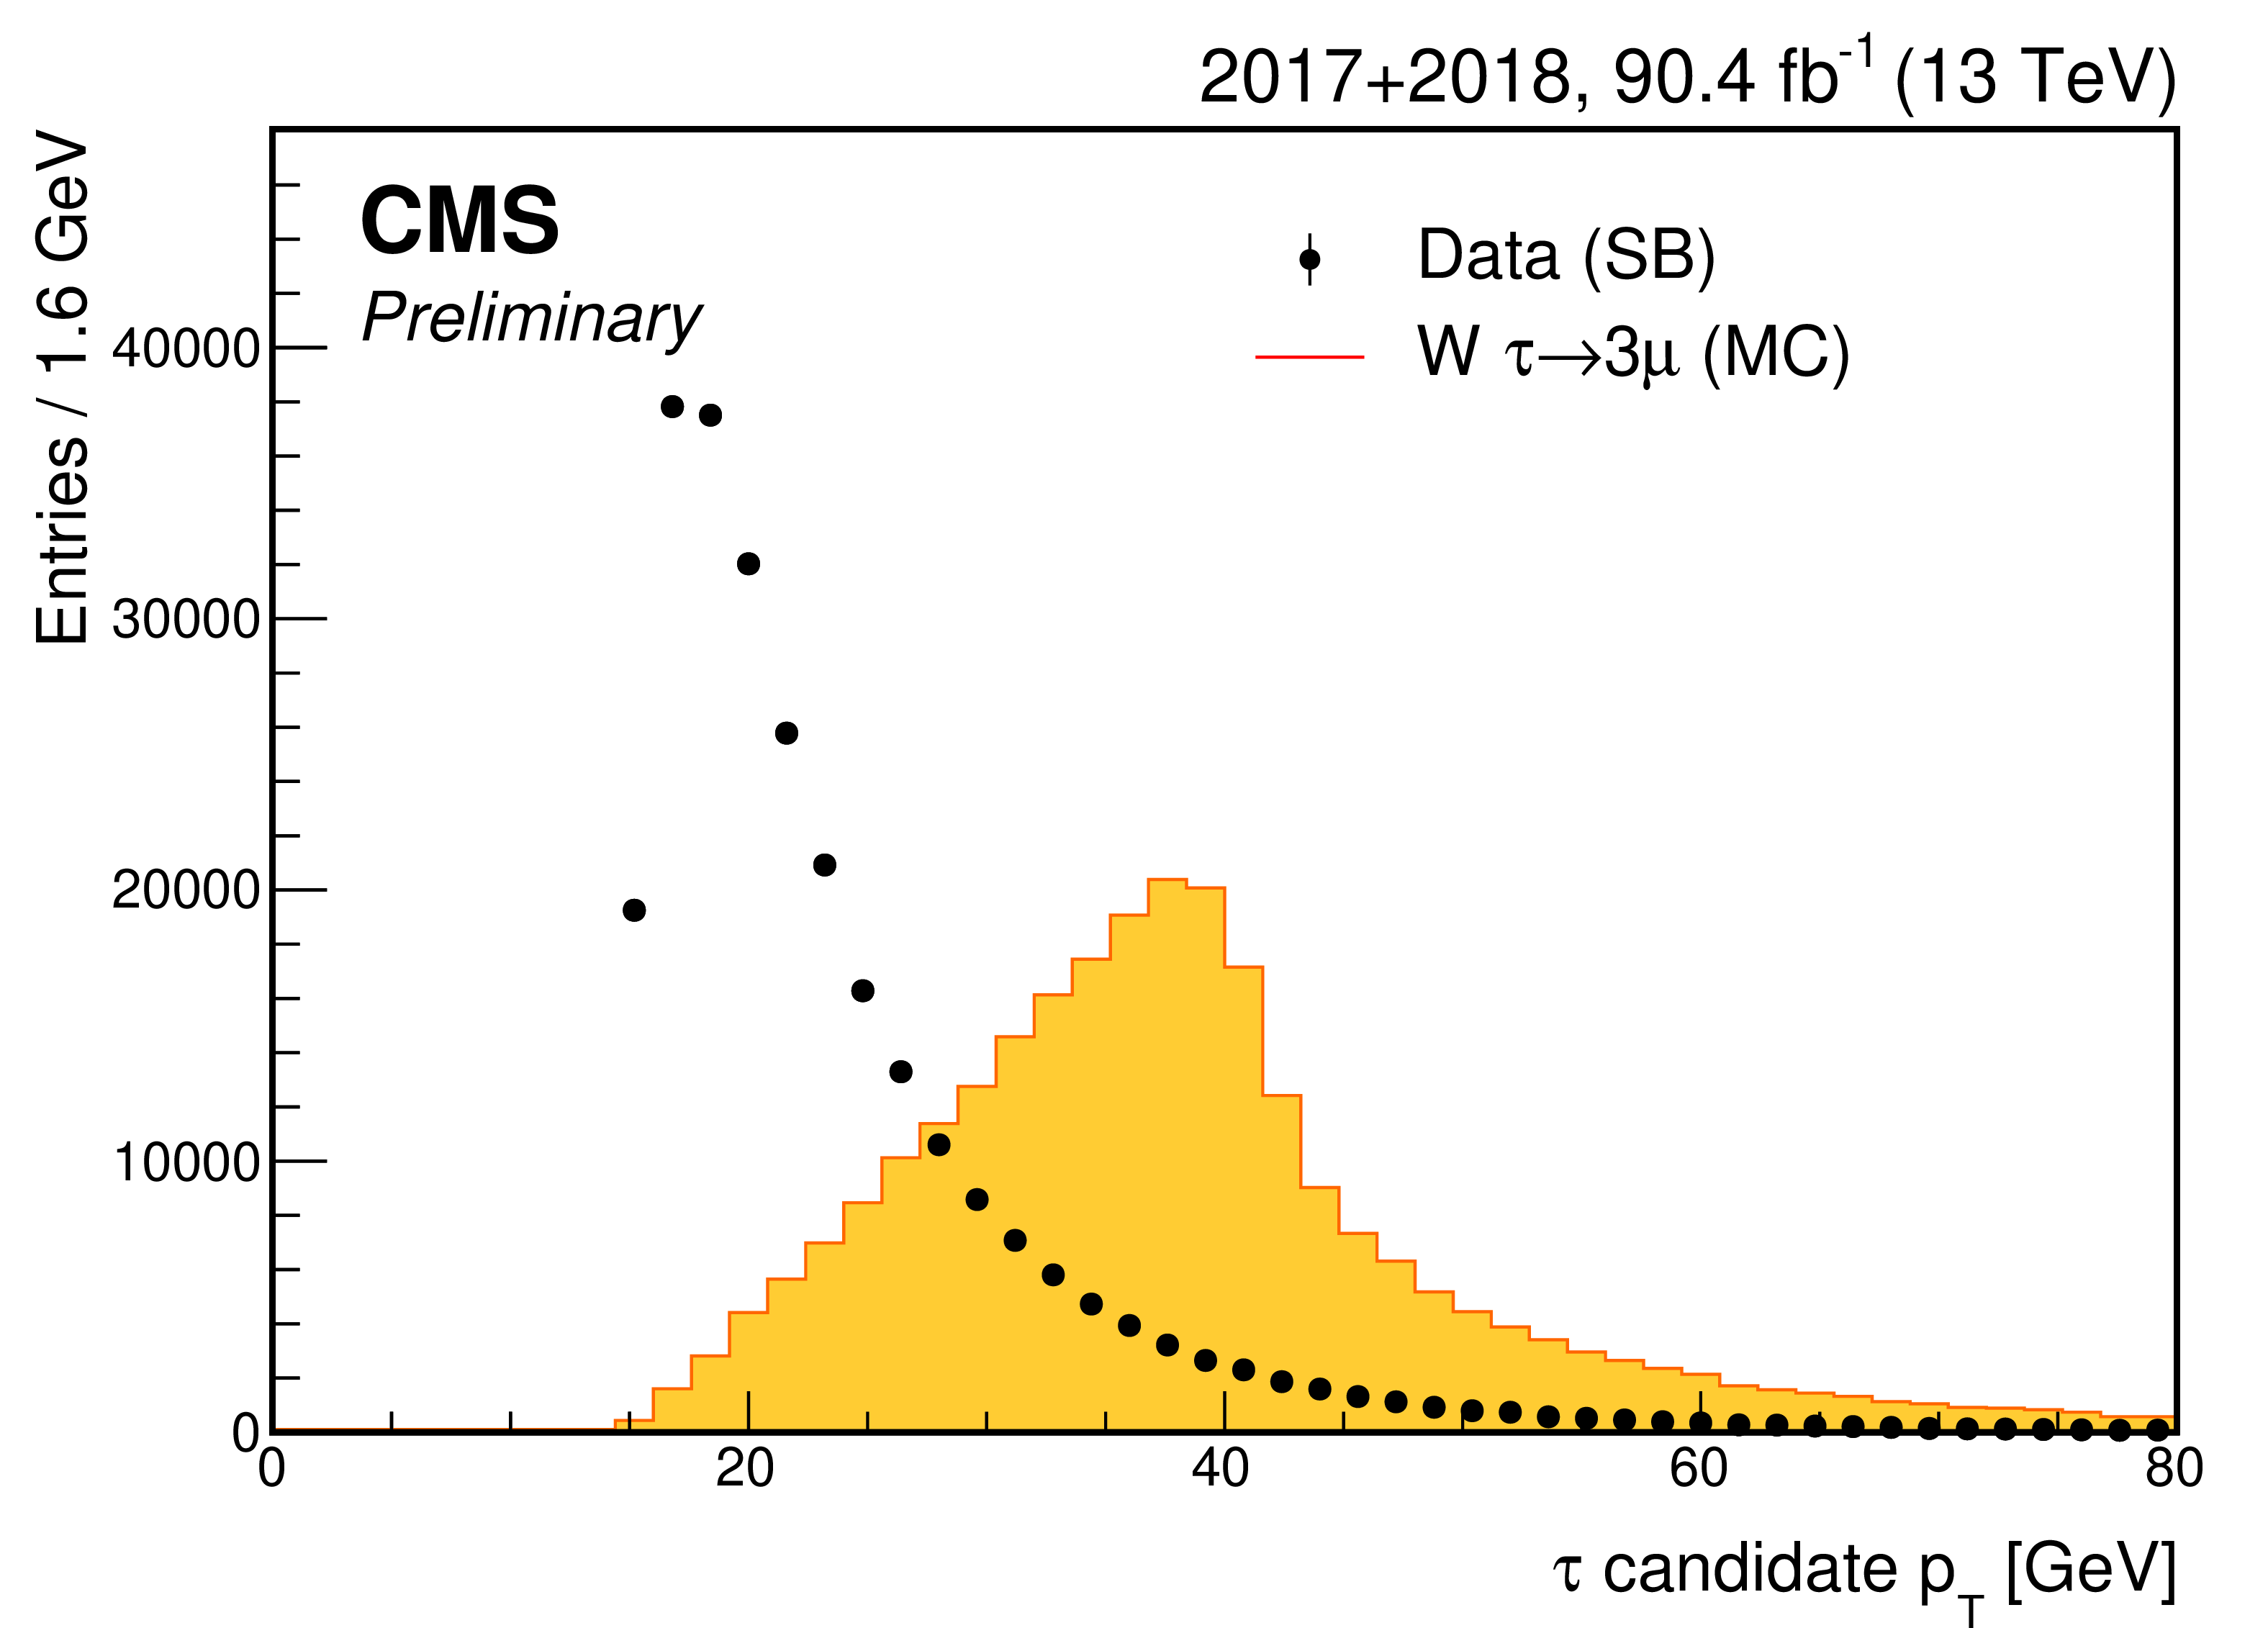
Signal and background distributions for the four observables with the highest discrimination power used for the W analysis BDT training: cos($ \alpha_{2D} $) (top left), isolation observable of the $ \tau $ candidate (top right), trimuon vertex fit p-value (bottom left), $ \tau $ candidate $ p_{\mathrm{T}} $ (bottom right). |

png pdf |
Figure 5-a:
Signal and background distributions for one of the observables used for the W analysis BDT training: cos($ \alpha_{2D} $). |
png pdf |
Figure 5-b:
Signal and background distributions for one of the observables used for the W analysis BDT training: isolation observable of the $ \tau $ candidate. |

png pdf |
Figure 5-c:
Signal and background distributions for one of the observables used for the W analysis BDT training: trimuon vertex fit p-value. |
png pdf |
Figure 5-d:
Signal and background distributions for one of the observables used for the W analysis BDT training: $ \tau $ candidate $ p_{\mathrm{T}} $. |

png pdf |
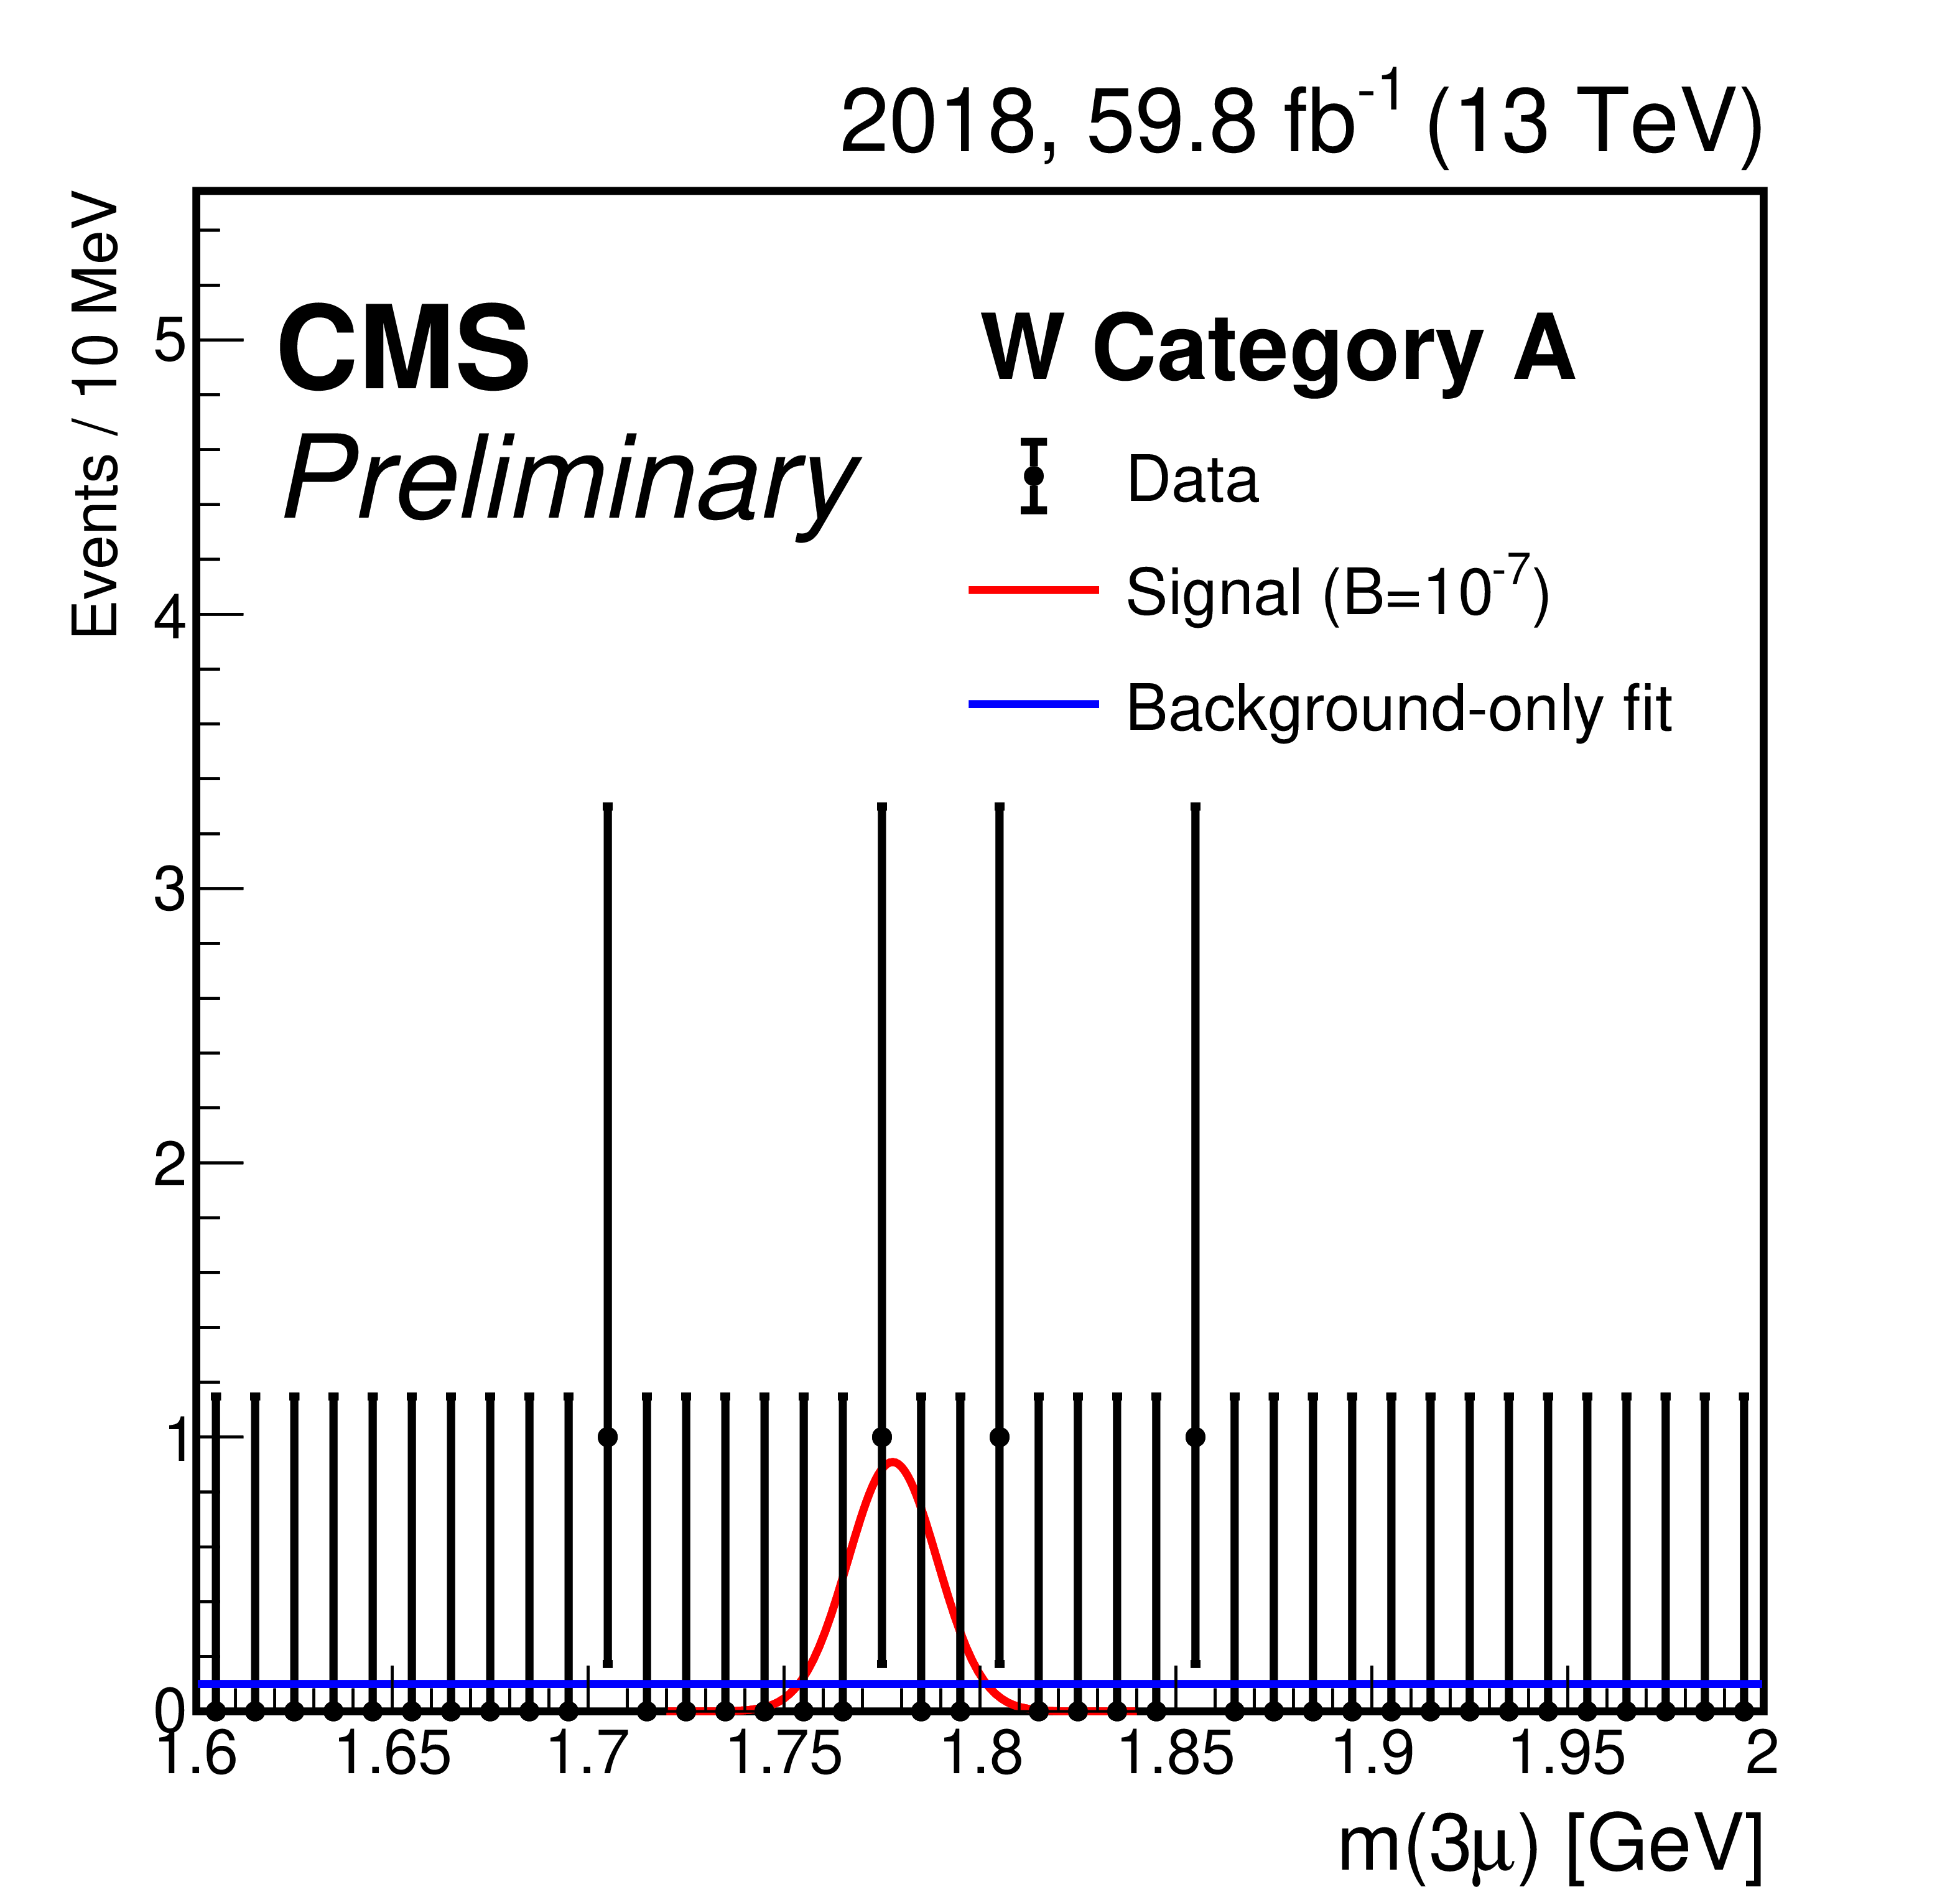
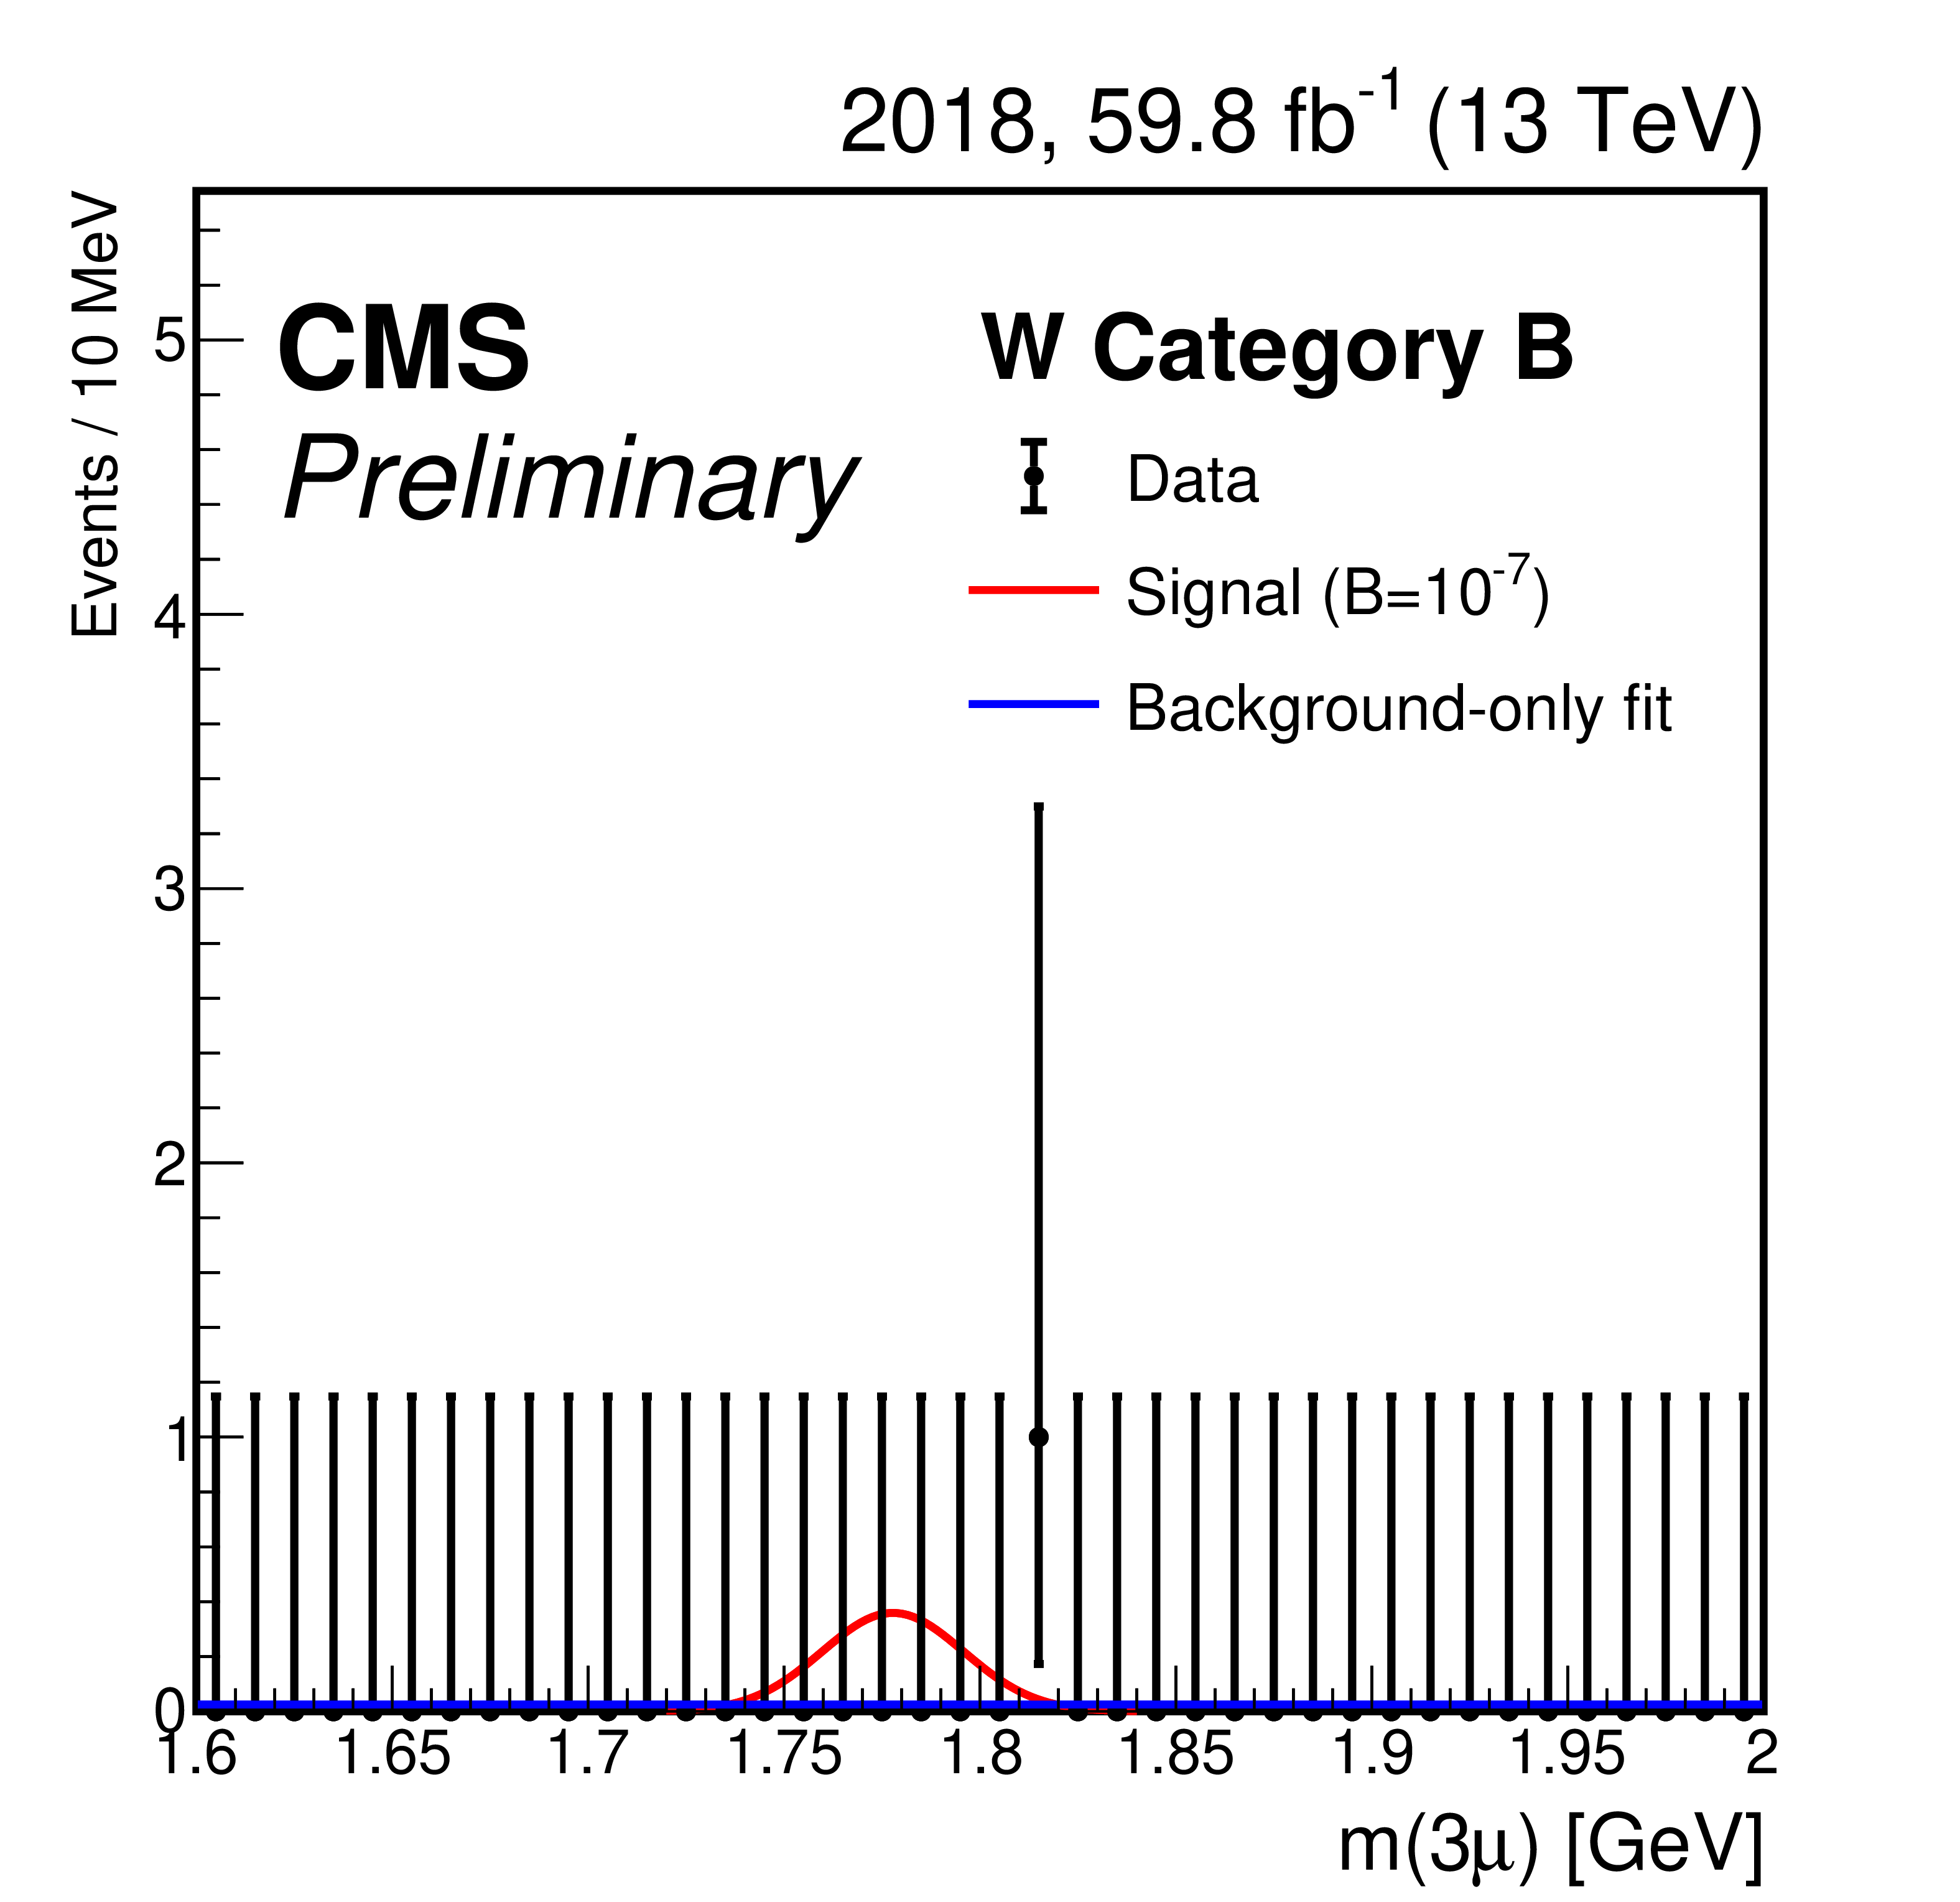
Figure 6:
Trimuon mass distributions of the 2018 data events in the three mass resolution categories of the W analysis. Data are shown with black markers. The background-only fit and the expected signal for $ \mathcal{B}(\tau \!\to\! 3\mu) = $ 10$^{-7} $ are shown with blue and red lines, respectively. |
png pdf |
Figure 6-a:
Trimuon mass distribution of the 2018 data events in category A of the W analysis. Data are shown with black markers. The background-only fit and the expected signal for $ \mathcal{B}(\tau \!\to\! 3\mu) = $ 10$^{-7} $ are shown with blue and red lines, respectively. |
png pdf |
Figure 6-b:
Trimuon mass distribution of the 2018 data events in category B of the W analysis. Data are shown with black markers. The background-only fit and the expected signal for $ \mathcal{B}(\tau \!\to\! 3\mu) = $ 10$^{-7} $ are shown with blue and red lines, respectively. |
png pdf |
Figure 6-c:
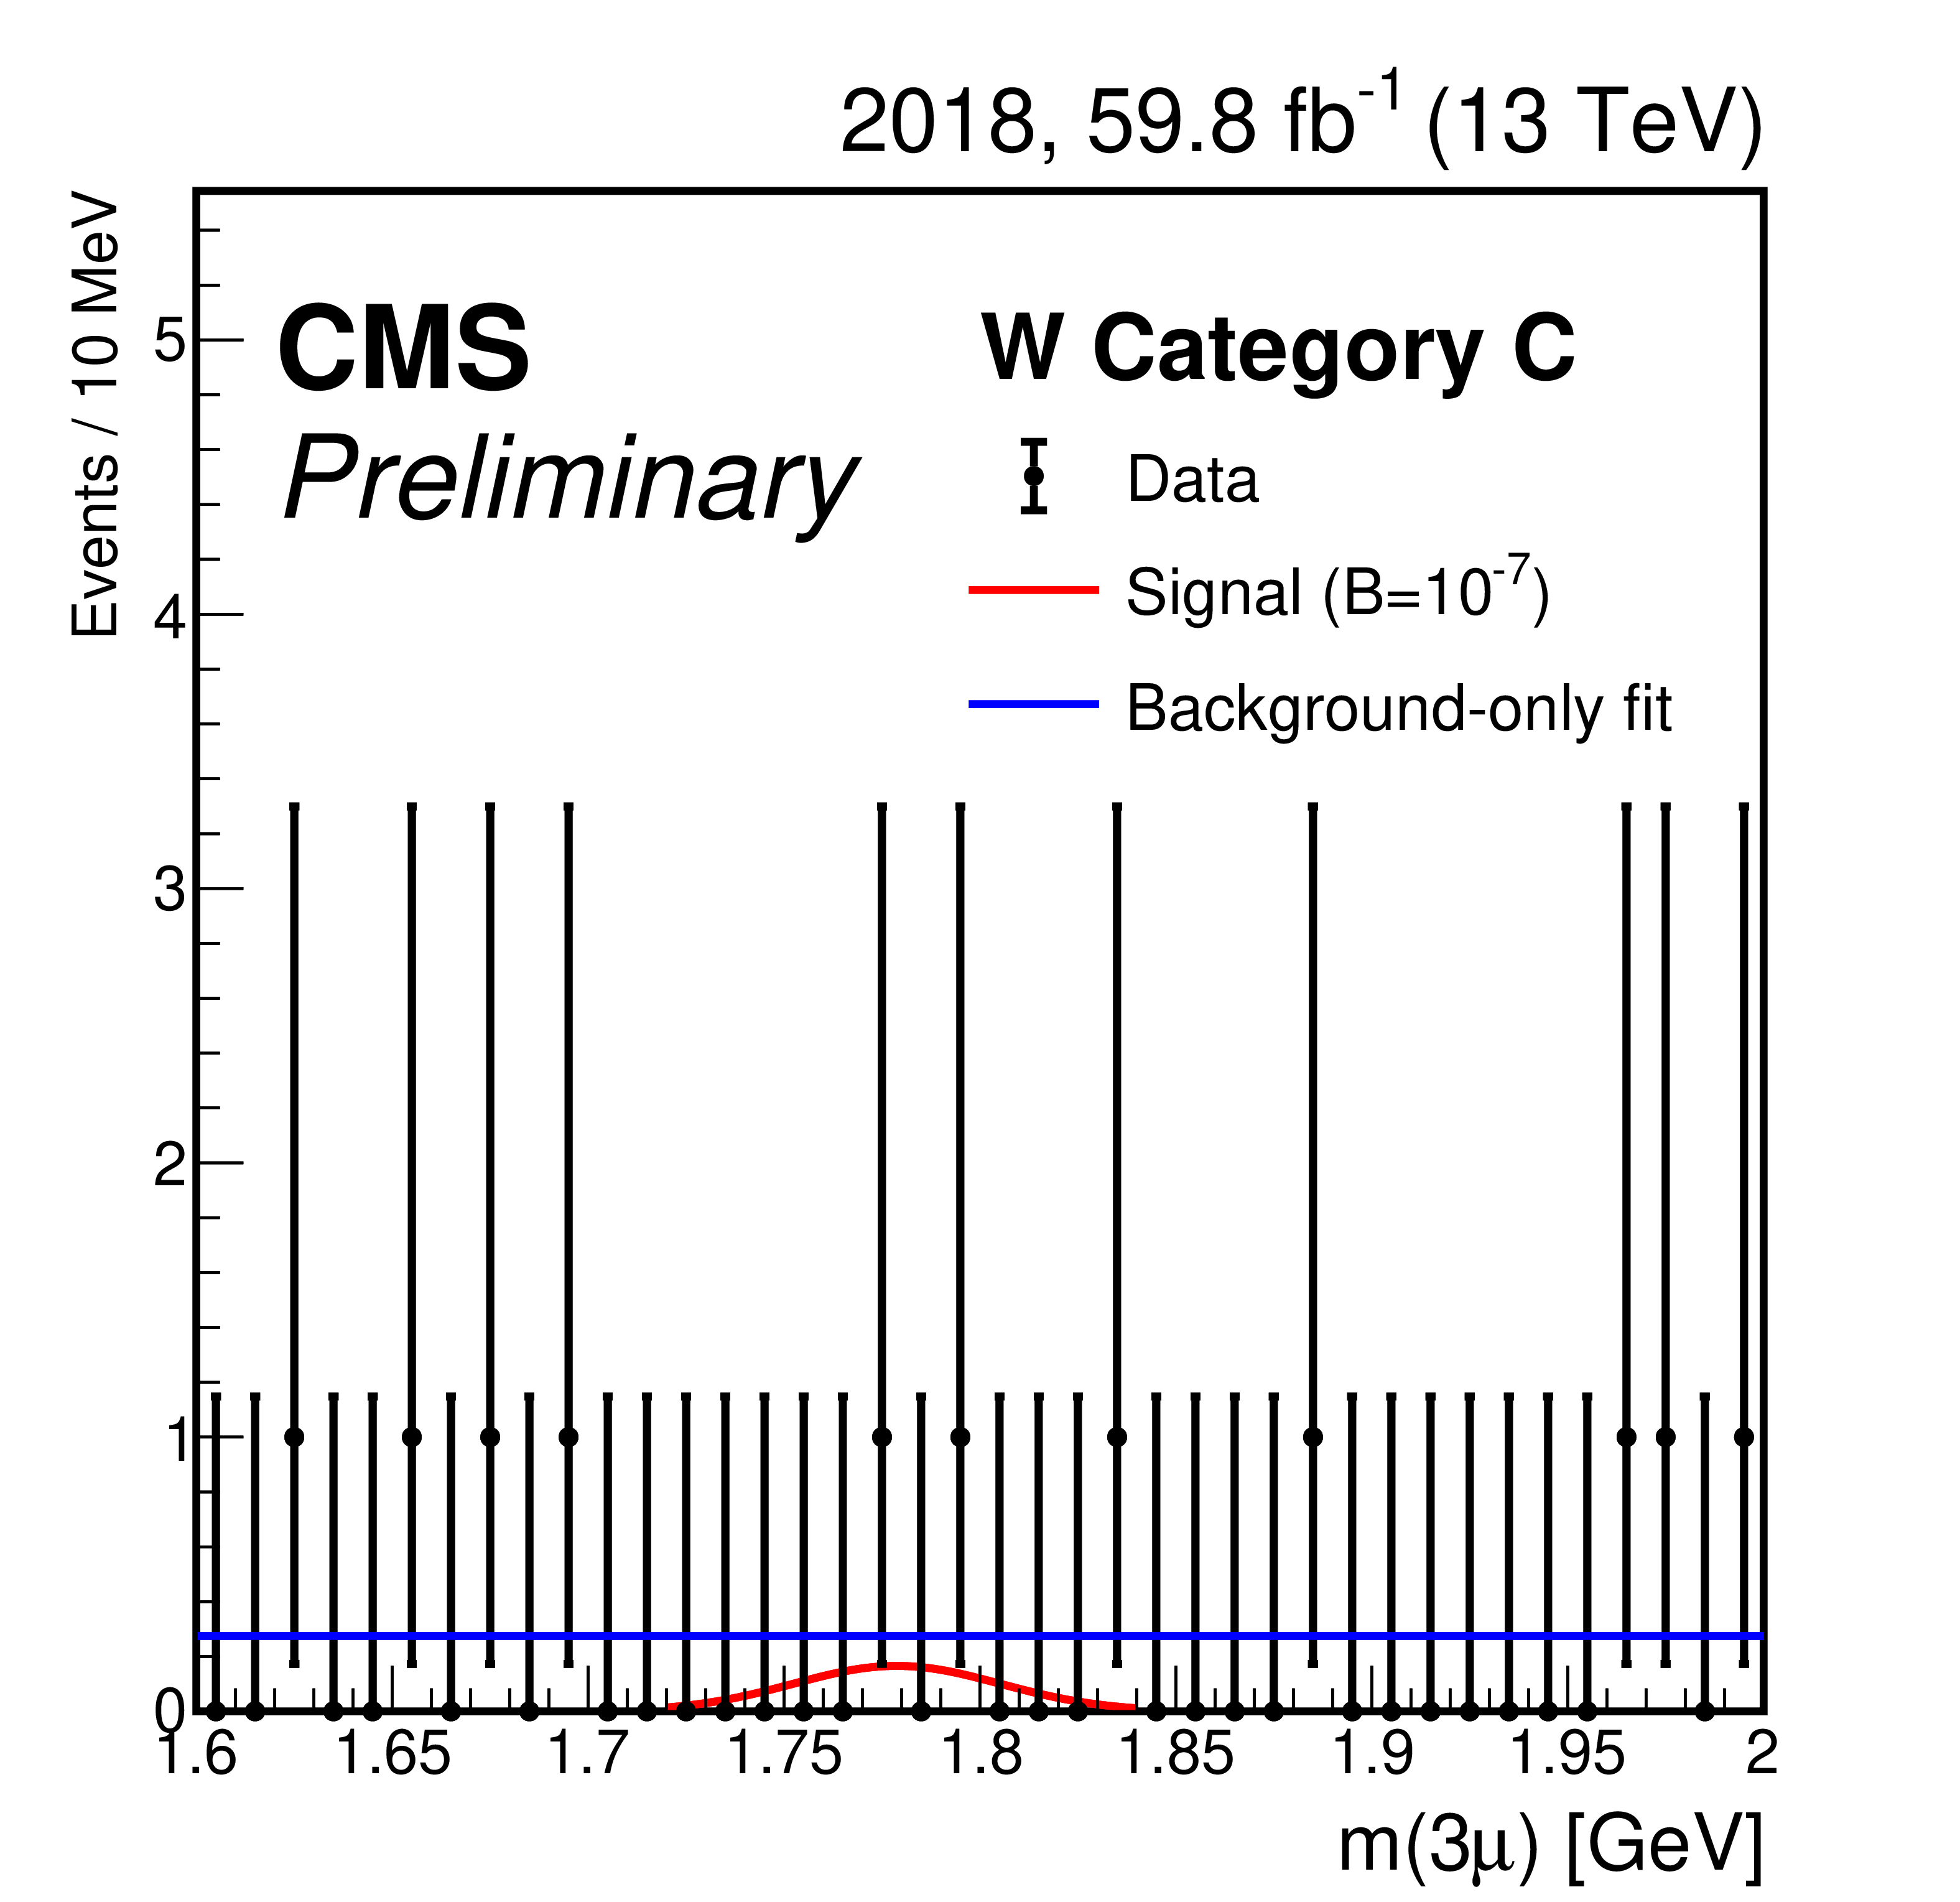
Trimuon mass distribution of the 2018 data events in category C of the W analysis. Data are shown with black markers. The background-only fit and the expected signal for $ \mathcal{B}(\tau \!\to\! 3\mu) = $ 10$^{-7} $ are shown with blue and red lines, respectively. |
png pdf |
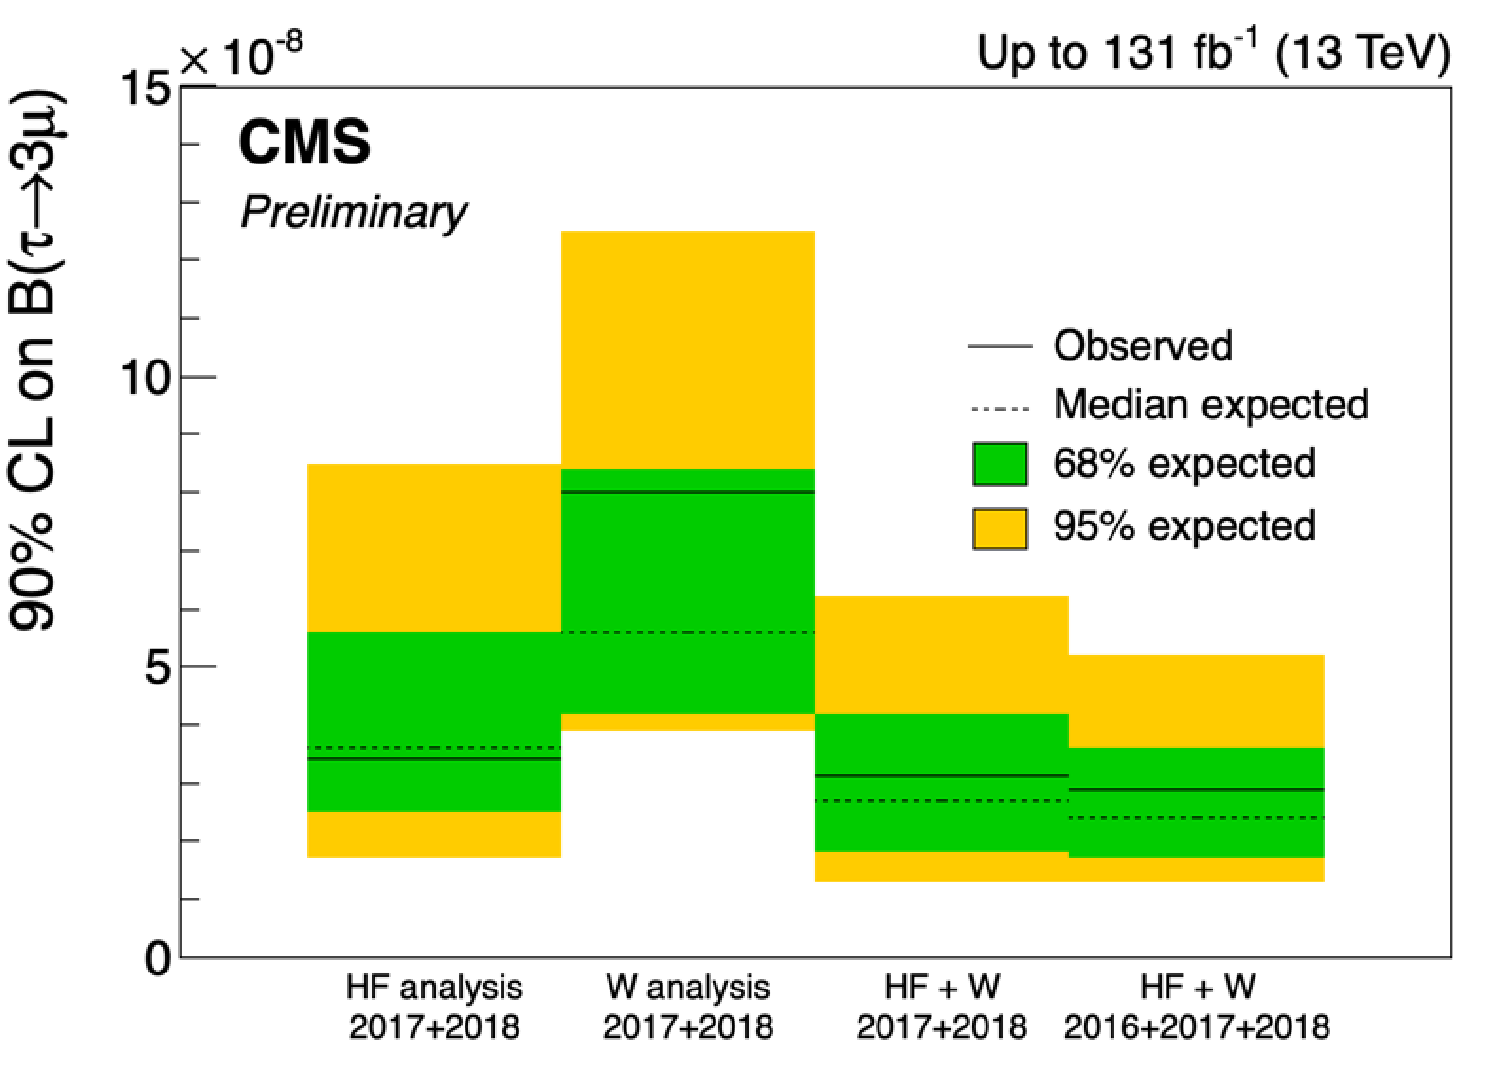
Figure 7:
Observed and expected upper limits on $ \mathcal{B}(\tau \!\to\! 3\mu) $ at 90% CL, from the heavy-flavor analysis, the W analysis, the combination of the two analyses, as well as their combination with the previously published result using 2016 data. |
| Summary |
| A search for the lepton flavor violating decay $ \tau \!\to\! 3\mu $, using pp collisions with a center-of-mass energy of 13 TeV recorded by the CMS experiment at the CERN LHC in the years 2017--2018 has been presented. Tau leptons produced from heavy-flavor hadron decays and W boson decays are exploited in the analysis. The results are combined with a previous result using 2016 data, to obtain a total integrated luminosity of 131 fb$ ^{-1} $, yielding an observed upper limit on the branching fraction $ \mathcal{B}(\tau \!\to\! 3\mu) $ of 2.9 $ \times 10^{-8} $ at 90% confidence level, with an expected upper limit of 2.4 $ \times 10^{-8} $. |
| References | ||||
| 1 | X.-Y. Pham | Lepton flavor changing in neutrinoless $ \tau $ decays | EPJC 8 (1999) 513 | hep-ph/9810484 |
| 2 | G. Hernàndez-Tom é , G. López Castro, and P. Roig | Flavor violating leptonic decays of $ \tau $ and $ \mu $ leptons in the Standard Model with massive neutrinos | EPJC 79 (2019) 84 | 1807.06050 |
| 3 | P. Blackstone, M. Fael, and E. Passemar | $ \tau \to \mu\mu\mu $ at a rate of one out of 10$^{14} $ tau decays? | EPJC 80 (2020) 506 | 1912.09862 |
| 4 | W. J. Marciano, T. Mori, and J. M. Roney | Charged lepton flavor violation experiments | Ann. Rev. Nucl. Part. Sci. 58 (2008) 315 | |
| 5 | M. Raidal et al. | Flavour physics of leptons and dipole moments | EPJC 57 (2008) 13 | 0801.1826 |
| 6 | E. Arganda and M. J. Herrero | Testing supersymmetry with lepton flavor violating $ \tau $ and $ \mu $ decays | PRD 73 (2006) 055003 | hep-ph/0510405 |
| 7 | Belle Collaboration | Search for lepton flavor violating $ \tau $ decays into three leptons with 719 million produced $ \tau^+\tau^- $ pairs | PLB 687 (2010) 139 | 1001.3221 |
| 8 | BaBar Collaboration | Limits on $ \tau $ lepton-flavor violating decays in three charged leptons | PRD 81 (2010) 111101 | 1002.4550 |
| 9 | LHCb Collaboration | Search for the lepton flavour violating decay $ \tau^- \to \mu^-\mu^+\mu^- $ | JHEP 02 (2015) 121 | 1409.8548 |
| 10 | ATLAS Collaboration | Probing lepton flavour violation via neutrinoless $ \tau \to $ 3$\mu $ decays with the ATLAS detector | EPJC 76 (2016) 232 | 1601.03567 |
| 11 | CMS Collaboration | Search for the lepton flavor violating decay $ \tau \to $ 3$ \mu $ in proton-proton collisions at $ \sqrt{s} = $ 13 TeV | JHEP 01 (2021) 163 | CMS-BPH-17-004 2007.05658 |
| 12 | CMS Collaboration | The CMS experiment at the CERN LHC | JINST 3 (2008) S08004 | |
| 13 | CMS Collaboration | Performance of the CMS Level-1 trigger in proton-proton collisions at $ \sqrt{s} = $ 13 TeV | JINST 15 (2020) P10017 | CMS-TRG-17-001 2006.10165 |
| 14 | CMS Collaboration | The CMS trigger system | JINST 12 (2017) P01020 | CMS-TRG-12-001 1609.02366 |
| 15 | CMS Collaboration | Electron and photon reconstruction and identification with the CMS experiment at the CERN LHC | JINST 16 (2021) P05014 | CMS-EGM-17-001 2012.06888 |
| 16 | CMS Collaboration | Performance of the CMS muon detector and muon reconstruction with proton-proton collisions at $ \sqrt{s}= $ 13 TeV | JINST 13 (2018) P06015 | CMS-MUO-16-001 1804.04528 |
| 17 | CMS Collaboration | Description and performance of track and primary-vertex reconstruction with the CMS tracker | JINST 9 (2014) P10009 | CMS-TRK-11-001 1405.6569 |
| 18 | CMS Collaboration | Particle-flow reconstruction and global event description with the CMS detector | JINST 12 (2017) P10003 | CMS-PRF-14-001 1706.04965 |
| 19 | CMS Collaboration | Performance of reconstruction and identification of $ \tau $ leptons decaying to hadrons and $ \nu_\tau $ in pp collisions at $ \sqrt{s}= $ 13 TeV | JINST 13 (2018) P10005 | CMS-TAU-16-003 1809.02816 |
| 20 | CMS Collaboration | Jet energy scale and resolution in the CMS experiment in pp collisions at 8 TeV | JINST 12 (2017) P02014 | CMS-JME-13-004 1607.03663 |
| 21 | CMS Collaboration | Performance of missing transverse momentum reconstruction in proton-proton collisions at $ \sqrt{s} = $ 13 TeV using the CMS detector | JINST 14 (2019) P07004 | CMS-JME-17-001 1903.06078 |
| 22 | CMS Collaboration | The CMS trigger system | JINST 12 (2017) P01020 | CMS-TRG-12-001 1609.02366 |
| 23 | T. Sjöstrand et al. | An introduction to PYTHIA 8.2 | Comput. Phys. Commun. 191 (2015) 159 | 1410.3012 |
| 24 | CMS Collaboration | Event generator tunes obtained from underlying event and multiparton scattering measurements | EPJC 76 (2016) 155 | CMS-GEN-14-001 1512.00815 |
| 25 | D. J. Lange | The EvtGen particle decay simulation package | NIM A 462 (2001) 152 | |
| 26 | GEANT4 Collaboration | GEANT 4---a simulation toolkit | NIM A 506 (2003) 250 | |
| 27 | M. J. Oreglia | A study of the reactions $ \psi^\prime \to \gamma \gamma \psi $ | PhD thesis, Stanford University, SLAC Report SLAC-R-236, 1980 link |
|
| 28 | T. Chen and C. Guestrin | XGBoost: A scalable tree boosting system | in 22nd ACM SIGKDD International Conference on Knowledge Discovery and Data Mining, KDD '16, New York, 2016 link |
|
| 29 | Particle Data Group, M. Tanabashi et al. | Review of particle physics | PRD 98 (2018) 030001 | |
| 30 | CMS Collaboration | Measurement of the inclusive W and Z production cross sections in pp collisions at $ \sqrt{s}= $ 7 TeV | JHEP 10 (2011) 132 | CMS-EWK-10-005 1107.4789 |
| 31 | ATLAS and CMS Collaborations, and LHC Higgs Combination Group | Procedure for the LHC Higgs boson search combination in Summer 2011 | Technical Report CMS-NOTE-2011-005, ATL-PHYS-PUB-2011-11, 2011 | |
| 32 | A. L. Read | Presentation of search results: The CL$ _{\text{s}} $ technique | JPG 28 (2002) 2693 | |
| 33 | T. Junk | Confidence level computation for combining searches with small statistics | NIM A 434 (1999) 435 | hep-ex/9902006 |
| 34 | R. D. Cousins and V. L. Highland | Incorporating systematic uncertainties into an upper limit | NIMA 320 (1992) 331 | |
|
|
Compact Muon Solenoid LHC, CERN |
|

|

|

|

|

|