

Compact Muon Solenoid
LHC, CERN
| CMS-TOP-15-014 ; CERN-EP-2016-202 | ||
| Measurement of the mass of the top quark in decays with a $ \mathrm{ J } / \psi $ meson in pp collisions at 8 TeV | ||
| CMS Collaboration | ||
| 11 August 2016 | ||
| JHEP 12 (2016) 123 | ||
| Abstract: A first measurement is presented of the top quark mass using the decay channel $\mathrm{ t }\to(\mathrm{ W }\to\ell\nu)\,(\mathrm{ b }\to\mathrm{ J } / \psi+\mathrm{X}\to\mu^+\mu^-+\mathrm{X})$, in events selected in proton-proton collisions and recorded with the CMS detector at the LHC at a center-of-mass energy of 8 TeV. The data correspond to an integrated luminosity of 19.7 fb$^{-1}$, with 666 $\mathrm{ t \bar{t} }$ and single top quark candidate events containing a reconstructed $\mathrm{ J } / \psi$ candidate decaying into an oppositely-charged muon pair. The mass of the ($\mathrm{ J } / \psi+\ell$) system, where $\ell$ is an electron or a muon from W boson decay, is used to extract a top quark mass of 173.5 $\pm$ 3.0 (stat) $\pm$ 0.9 (syst) GeV. | ||
| Links: e-print arXiv:1608.03560 [hep-ex] (PDF) ; CDS record ; inSPIRE record ; HepData record ; CADI line (restricted) ; | ||
| Figures | |

png pdf |
Figure 1:
Pictorial view of the $\mathrm{ J } / \psi$ meson produced in a ${\mathrm{ t } {}\mathrm{ \bar{t} } }$ system. |
png pdf |
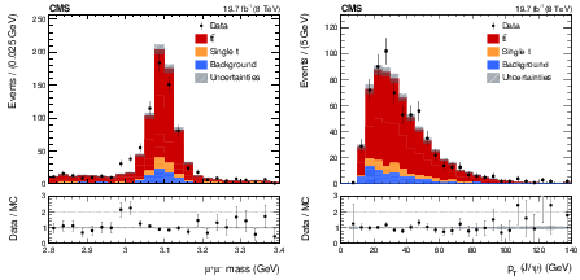
Figure 2:
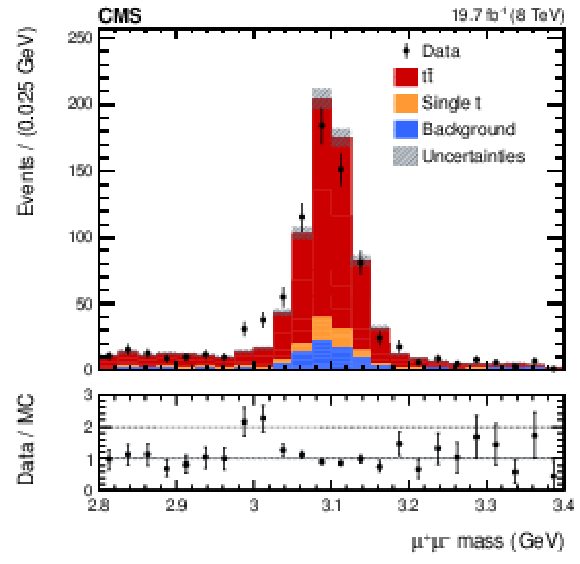
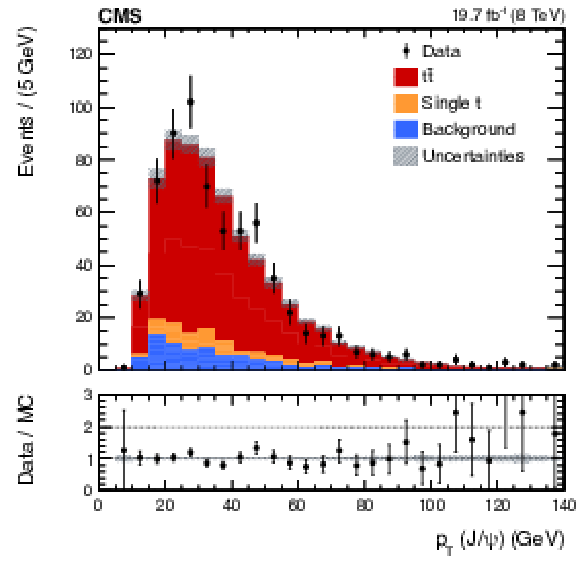
Distributions of the dimuon invariant mass between 2.8 and 3.4 GeV (a) and of the ${p_{\mathrm {T}}}$ of the $\mathrm{ J } / \psi$ meson candidate (b). Processes are normalized to their theoretical cross sections. The simulation assumes a value of $m_\mathrm{ t } = $ 172.5 GeV. The lower panel shows the ratio of the number of events observed in data to the number expected from simulation. |
png pdf |
Figure 2-a:
Distributions of the dimuon invariant mass between 2.8 and 3.4 GeV (a) and of the ${p_{\mathrm {T}}}$ of the $\mathrm{ J } / \psi$ meson candidate (b). Processes are normalized to their theoretical cross sections. The simulation assumes a value of $m_\mathrm{ t } = $ 172.5 GeV. The lower panel shows the ratio of the number of events observed in data to the number expected from simulation. |
png pdf |
Figure 2-b:
Distributions of the dimuon invariant mass between 2.8 and 3.4 GeV (a) and of the ${p_{\mathrm {T}}}$ of the $\mathrm{ J } / \psi$ meson candidate (b). Processes are normalized to their theoretical cross sections. The simulation assumes a value of $m_\mathrm{ t } = $ 172.5 GeV. The lower panel shows the ratio of the number of events observed in data to the number expected from simulation. |
png pdf |
Figure 3:
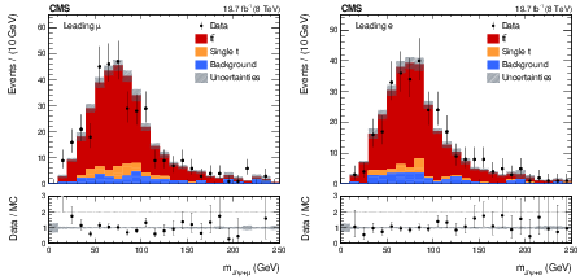
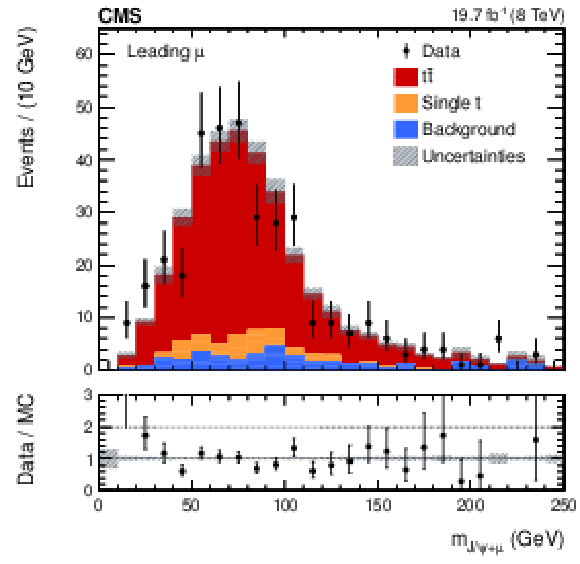
Distributions of the invariant mass of the $\mathrm{ J } / \psi$ meson candidate and the leading lepton combination, in the leading $\mu $ (a) and leading e (b) combinations. Processes are normalized to their theoretical cross sections. The simulation assumes a value of $m_\mathrm{ t } = $ 172.5 GeV. The lower panel shows the ratio of the number of events observed in data to the number expected from simulation. |
png pdf |
Figure 3-a:
Distributions of the invariant mass of the $\mathrm{ J } / \psi$ meson candidate and the leading lepton combination, in the leading $\mu $ (a) and leading e (b) combinations. Processes are normalized to their theoretical cross sections. The simulation assumes a value of $m_\mathrm{ t } = $ 172.5 GeV. The lower panel shows the ratio of the number of events observed in data to the number expected from simulation. |

png pdf |
Figure 3-b:
Distributions of the invariant mass of the $\mathrm{ J } / \psi$ meson candidate and the leading lepton combination, in the leading $\mu $ (a) and leading e (b) combinations. Processes are normalized to their theoretical cross sections. The simulation assumes a value of $m_\mathrm{ t } = $ 172.5 GeV. The lower panel shows the ratio of the number of events observed in data to the number expected from simulation. |
png pdf |
Figure 4:
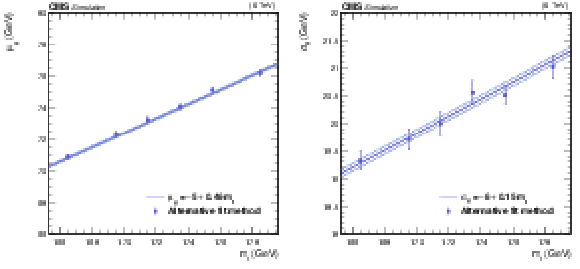
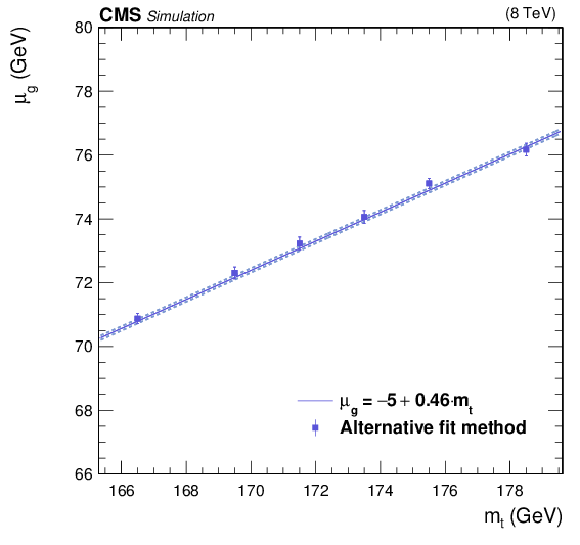
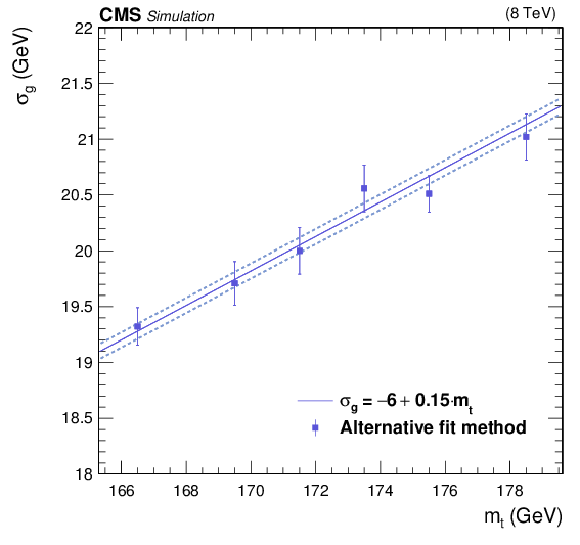
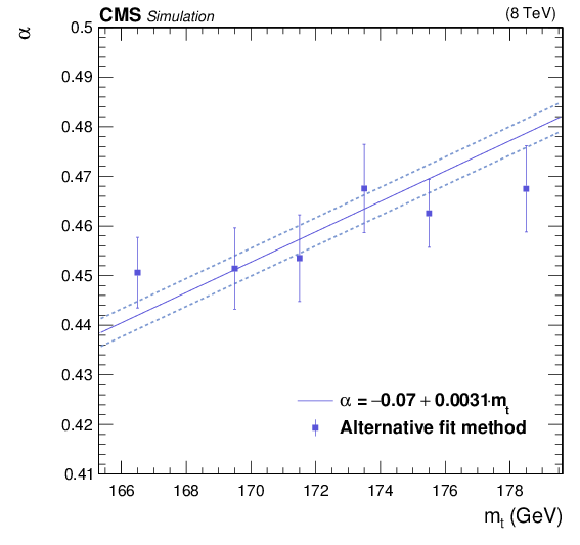
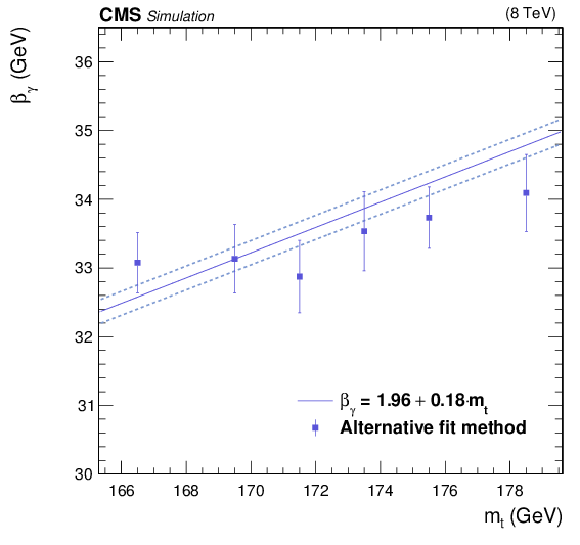
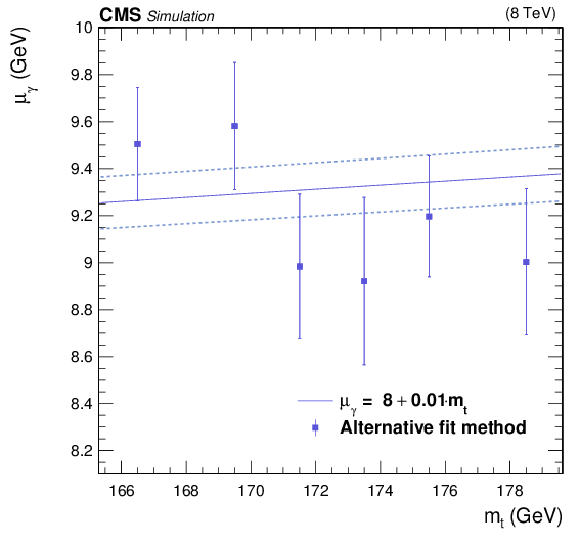
Mean (a) and standard deviation (b) of the Gaussian distribution describing the peak of the $m_{\mathrm{ J } / \psi +\ell }$ distributions, relative contribution of the Gaussian distribution to $P_\text {sig+bkg}$ (c), and shape (d), scale(e), and shift (f) parameters of the gamma distribution, as a function of input $m_\mathrm{ t } $. The solid lines are the result of the simultaneous fit described in Section 3.1, while the dashed lines indicate the 68% confidence level of the fit. The superimposed data points are the result of the alternative fitting method described in Section 3.2. |
png pdf |
Figure 4-a:
Mean (a) and standard deviation (b) of the Gaussian distribution describing the peak of the $m_{\mathrm{ J } / \psi +\ell }$ distributions, relative contribution of the Gaussian distribution to $P_\text {sig+bkg}$ (c), and shape (d), scale(e), and shift (f) parameters of the gamma distribution, as a function of input $m_\mathrm{ t } $. The solid lines are the result of the simultaneous fit described in Section 3.1, while the dashed lines indicate the 68% confidence level of the fit. The superimposed data points are the result of the alternative fitting method described in Section 3.2. |
png pdf |
Figure 4-b:
Mean (a) and standard deviation (b) of the Gaussian distribution describing the peak of the $m_{\mathrm{ J } / \psi +\ell }$ distributions, relative contribution of the Gaussian distribution to $P_\text {sig+bkg}$ (c), and shape (d), scale(e), and shift (f) parameters of the gamma distribution, as a function of input $m_\mathrm{ t } $. The solid lines are the result of the simultaneous fit described in Section 3.1, while the dashed lines indicate the 68% confidence level of the fit. The superimposed data points are the result of the alternative fitting method described in Section 3.2. |
png pdf |
Figure 4-c:
Mean (a) and standard deviation (b) of the Gaussian distribution describing the peak of the $m_{\mathrm{ J } / \psi +\ell }$ distributions, relative contribution of the Gaussian distribution to $P_\text {sig+bkg}$ (c), and shape (d), scale(e), and shift (f) parameters of the gamma distribution, as a function of input $m_\mathrm{ t } $. The solid lines are the result of the simultaneous fit described in Section 3.1, while the dashed lines indicate the 68% confidence level of the fit. The superimposed data points are the result of the alternative fitting method described in Section 3.2. |

png pdf |
Figure 4-d:
Mean (a) and standard deviation (b) of the Gaussian distribution describing the peak of the $m_{\mathrm{ J } / \psi +\ell }$ distributions, relative contribution of the Gaussian distribution to $P_\text {sig+bkg}$ (c), and shape (d), scale(e), and shift (f) parameters of the gamma distribution, as a function of input $m_\mathrm{ t } $. The solid lines are the result of the simultaneous fit described in Section 3.1, while the dashed lines indicate the 68% confidence level of the fit. The superimposed data points are the result of the alternative fitting method described in Section 3.2. |
png pdf |
Figure 4-e:
Mean (a) and standard deviation (b) of the Gaussian distribution describing the peak of the $m_{\mathrm{ J } / \psi +\ell }$ distributions, relative contribution of the Gaussian distribution to $P_\text {sig+bkg}$ (c), and shape (d), scale(e), and shift (f) parameters of the gamma distribution, as a function of input $m_\mathrm{ t } $. The solid lines are the result of the simultaneous fit described in Section 3.1, while the dashed lines indicate the 68% confidence level of the fit. The superimposed data points are the result of the alternative fitting method described in Section 3.2. |
png pdf |
Figure 4-f:
Mean (a) and standard deviation (b) of the Gaussian distribution describing the peak of the $m_{\mathrm{ J } / \psi +\ell }$ distributions, relative contribution of the Gaussian distribution to $P_\text {sig+bkg}$ (c), and shape (d), scale(e), and shift (f) parameters of the gamma distribution, as a function of input $m_\mathrm{ t } $. The solid lines are the result of the simultaneous fit described in Section 3.1, while the dashed lines indicate the 68% confidence level of the fit. The superimposed data points are the result of the alternative fitting method described in Section 3.2. |
png pdf |
Figure 5:
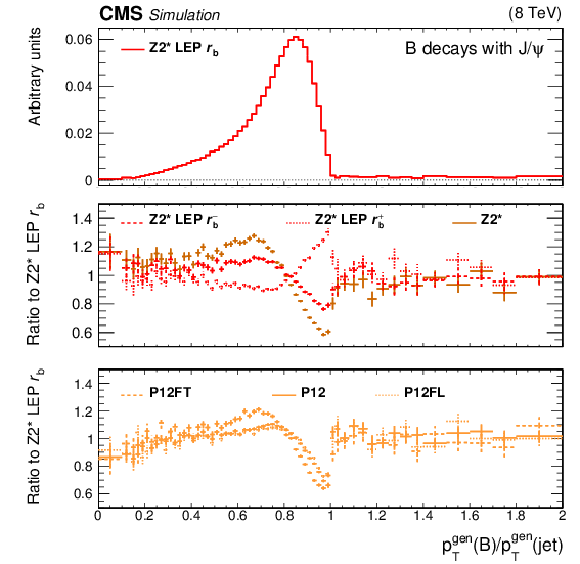
Ratio of the ${p_{\mathrm {T}}}$ of the b hadrons to the ${p_{\mathrm {T}}}$ of the matched generator-level jet for the Z2* LEP $r_\mathrm{ b } $ tune(upper), the ratio to Z2* LEP $r_\mathrm{ b } $ for the Z2*, $\text {Z}2^\ast \text {LEP} r_\mathrm{ b } ^{-}$, and $\text {Z}2^\ast \text {LEP} r_\mathrm{ b } ^{+}$ tunes (middle), and the ratio to Z2* LEP $r_\mathrm{ b } $ for the P12, P12FT, and P12FL tunes (lower). As neutrinos are not clustered within jets, it happens in very rare cases that $ {p_{\mathrm {T}}} ^\text {gen}(\text {B})> {p_{\mathrm {T}}} ^\text {gen}(\text {jet})$. For this effect to be visible, the horizontal axis range is extended beyond 1 unit. |
png pdf |
Figure 6:
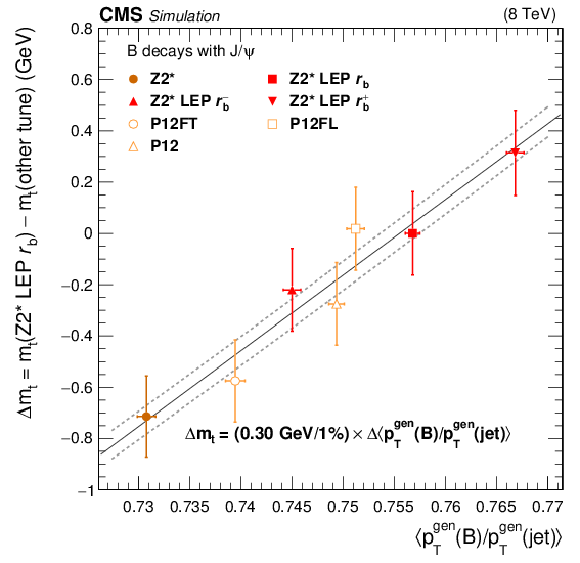
Dependence of the extracted $m_\mathrm{ t } $ value on the average fragmentation ratio $ < {p_{\mathrm {T}}} ^\text {gen}(\text {B})/ {p_{\mathrm {T}}} ^\text {gen}(\text {jet}) > $, fitted to a linear function. |
png pdf |
Figure 7:
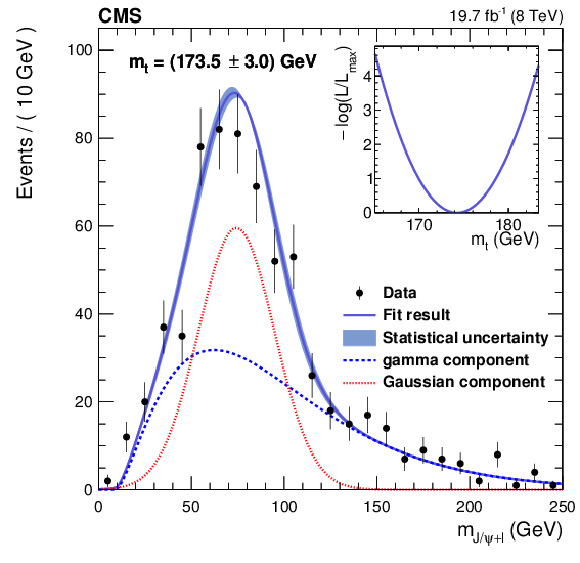
Distribution in the invariant mass of the $\mathrm{ J } / \psi$ meson candidate and the leading lepton combination, fitted to $P_\text {sig+bkg}$ of Eq.(1) through the maximization of a likelihood function. The inset shows the negative logarithm of the likelihood function $L$ relative to its maximum $L_\text {max}$ as a function of the only free parameter, which is $m_\mathrm{ t } $. |
| Tables | |
png pdf |
Table 1:
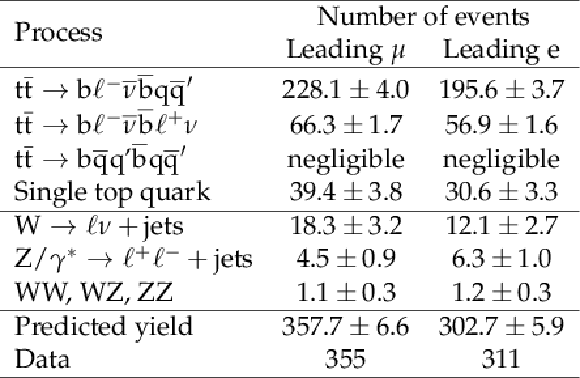
Number of selected events from simulations and observed in data. The uncertainties are statistical. |
png pdf |
Table 2:
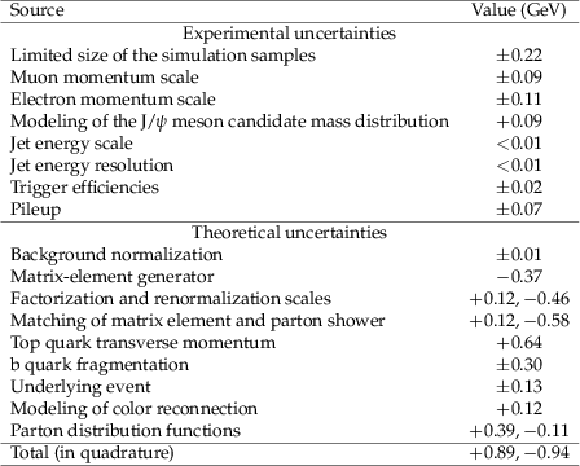
Summary of the impact of systematic uncertainties on the top quark mass according to the contributions from each source. |
| Summary |
| The first measurement of the mass of the top quark is presented in the decay channel $\mathrm{ t }\to(\mathrm{ W }\to\ell\nu)\,(\mathrm{ b }\to\mathrm{ J } / \psi+\mathrm{X}\to\mu^+\mu^-+\mathrm{X})$. An event selection is implemented in proton-proton collisions recorded with the CMS detector at $ \sqrt{s} = $ 8 TeV, to obtain a sample of high purity leptonically-decaying top quarks in $\mathrm{ t \bar{t} }$ and single top quark production events containing one $\mathrm{ J } / \psi$ meson candidate that decays into an oppositely-charged muon pair. The data correspond to an integrated luminosity of 19.7 fb$^{-1}$. There are 355 events observed with a muon and 311 with an electron as leading isolated lepton, in agreement with expectations from simulation. The top quark mass is extracted from an unbinned maximum-likelihood fit to the invariant mass of the leading lepton and $\mathrm{ J } / \psi$ meson candidate. The resulting $m_\mathrm{ t }$ measurement is 173.5 GeV, with a statistical uncertainty of 3.0 GeV and a systematic uncertainty of 0.9 GeV. This is the first time that this method has been applied to a physics analysis and the systematic uncertainty is of the same order of magnitude as that estimated in Ref. [9]. Even though the results are statistically limited, the dominant systematic uncertainties are different from those of the most precise direct reconstruction methods. As the sensitivity to jet-related uncertainties is negligible, this allows the possibility to contribute significantly in combination with other $m_\mathrm{ t }$ measurements. Furthermore, with the larger data set expected in the next runs of the LHC, the method described in this paper will provide a result which will be more competitive with those obtained from the conventional reconstruction techniques. |
| References | ||||
| 1 | M. Baak et al. | The global electroweak fit at NNLO and prospects for the LHC and ILC | EPJC 74 (2014) 3046 | 1407.3792 |
| 2 | A. J. Buras, J. Girrbach, D. Guadagnoli, and G. Isidori | On the Standard Model prediction for BR($ \text{B}_\text{s, d} \to \mu^+\mu^- $) | EPJC 72 (2012) 2172 | 1208.0934 |
| 3 | G. Degrassi et al. | Higgs mass and vacuum stability in the Standard Model at NNLO | JHEP 08 (2012) 098 | 1205.6497 |
| 4 | CDF Collaboration | Observation of Top Quark Production in $ \bar{p}p $ Collisions | PRL 74 (1995) 2626 | hep-ex/9503002 |
| 5 | D0 Collaboration | Observation of the Top Quark | PRL 74 (1995) 2632 | hep-ex/9503003 |
| 6 | ATLAS Collaboration | Measurement of the top quark mass in the $ \text{t}\bar{\text{t}}\rightarrow\text{lepton+jets} $ and $ \text{t}\bar{\text{t}}\rightarrow\text{dilepton} $ channels using $ \sqrt{s}=7\;\text{TeV} $ ATLAS data | EPJC 75 (2015) 330 | 1503.05427 |
| 7 | CMS Collaboration | Measurement of the top quark mass using proton-proton data at $ \sqrt{s} = 7 $ and $ 8\;\text{TeV} $ | PRD 93 (2016) 072004 | CMS-TOP-14-022 1509.04044 |
| 8 | CMS Collaboration | Letter of intent: by the CMS Collaboration for a general purpose detector at LHC | CDS | |
| 9 | A. Kharchilava | Top mass determination in leptonic final states with $ \mathrm{J} / \psi $ | PLB 476 (2000) 73 | hep-ph/9912320 |
| 10 | CMS Collaboration | Performance of CMS muon reconstruction in pp collision events at $ \sqrt{s} = 7\;\text{TeV} $ | JINST 7 (2012) P10002 | CMS-MUO-10-004 1206.4071 |
| 11 | CMS Collaboration | The CMS experiment at the CERN LHC | JINST 3 (2008) S08004 | CMS-00-001 |
| 12 | CMS Collaboration | CMS Luminosity Based on Pixel Cluster Counting -- Summer 2013 Update | CMS-PAS-LUM-13-001 | CMS-PAS-LUM-13-001 |
| 13 | J. Alwall et al. | The automated computation of tree-level and next-to-leading order differential cross sections, and their matching to parton shower simulations | JHEP 07 (2014) 079 | 1405.0301 |
| 14 | T. Sj\"ostrand, S. Mrenna, and P. Z. Skands | PYTHIA 6.4 Physics and Manual | JHEP 05 (2006) 026 | hep-ph/0603175 |
| 15 | N. Davidson et al. | Universal Interface of TAUOLA Technical and Physics Documentation | CPC 183 (2012) 821 | 1002.0543 |
| 16 | J. Pumplin et al. | New generation of parton distributions with uncertainties from global QCD analysis | JHEP 07 (2002) 012 | hep-ph/0201195 |
| 17 | R. Field | Early LHC Underlying Event Data - Findings and Surprises | Hadron collider physics. Proceedings, 22nd Conference, HCP 2010, Toronto, Canada, August 23-27 | 1010.3558 |
| 18 | M. L. Mangano, M. Moretti, F. Piccinini, and M. Treccani | Matching matrix elements and shower evolution for top-quark production in hadronic collisions | JHEP 01 (2007) 013 | hep-ph/0611129 |
| 19 | B. Andersson, G. Gustafson, G. Ingelman, and T. Sj\"ostrand | Parton fragmentation and string dynamics | Phys. Rep. 97 (1983) 31 | |
| 20 | M. G. Bowler | $ \text{e}^+\text{e}^- $ Production of Heavy Quarks in the String Model | Z. Phys. C 11 (1981) 169 | |
| 21 | T. Kinoshita | Mass Singularities of Feynman Amplitudes | J. Math. Phys. 3 (1962) 650 | |
| 22 | T. D. Lee and M. Nauenberg | Degenerate Systems and Mass Singularities | PRB 133 (1964) 1549 | |
| 23 | "LEP Electroweak Physics Group" | Z physics at LEP 1, vol. 3: Event generators and software | CERN-YELLOW-89-08-V-3 | |
| 24 | S. Alioli, P. Nason, C. Oleari, and E. Re | NLO single-top production matched with shower in POWHEG: $ s $- and $ t $-channel contributions | JHEP 09 (2009) 111, , [Erratum: \DOI10.1007/JHEP02(2010)011] | 0907.4076 |
| 25 | E. Re | Single-top Wt-channel production matched with parton showers using the POWHEG method | EPJC 71 (2011) 1547 | 1009.2450 |
| 26 | M. Czakon, P. Fiedler, and A. Mitov | The total top quark pair production cross section hadron colliders through O($ \alpha_S^4 $) | PRL 110 (2013) 252004 | 1303.6254 |
| 27 | N. Kidonakis | NNLL threshold resummation for top-pair and single-top production | Phys. Part. Nucl. 45 (2014) 714 | 1210.7813 |
| 28 | R. Gavin, Y. Li, F. Petriello, and S. Quackenbush | FEWZ 2.0: A code for hadronic Z production at next-to-next-to-leading order | CPC 182 (2011) 2388 | 1011.3540 |
| 29 | R. Gavin, Y. Li, F. Petriello, and S. Quackenbush | W Physics at the LHC with FEWZ 2.1 | CPC 184 (2013) 208 | 1201.5896 |
| 30 | J. M. Campbell, R. K. Ellis, and C. Williams | Vector boson pair production at the LHC | JHEP 07 (2011) 018 | 1105.0020 |
| 31 | GEANT4 Collaboration | GEANT4---a simulation toolkit | NIMA 506 (2003) 250 | |
| 32 | CMS Collaboration | Particle-flow event reconstruction in CMS and performance for jets, taus, and $ E_{\mathrm{T}}^{\text{miss}} $ | CDS | |
| 33 | CMS Collaboration | Commissioning of the particle-flow event reconstruction with the first LHC collisions recorded in the CMS detector | CDS | |
| 34 | CMS Collaboration | Performance of electron reconstruction and selection with the CMS detector in proton-proton collisions at $ \sqrt{s} = 8\;\text{TeV} $ | JINST 10 (2015) P06005 | CMS-EGM-13-001 1502.02701 |
| 35 | M. Cacciari, G. P. Salam, and G. Soyez | The anti-$ k_t $ jet clustering algorithm | JHEP 04 (2008) 063 | 0802.1189 |
| 36 | CMS Collaboration | Determination of jet energy calibration and transverse momentum resolution in CMS | JINST 6 (2011) P11002 | CMS-JME-10-011 1107.4277 |
| 37 | CMS Collaboration | Measurement of the $ \text{t}\bar{\text{t}} $ production cross section in the e-$ \mu $ channel in proton-proton collisions at $ \sqrt{s} = 7 $ and 8 TeV | Submitted to JHEP | CMS-TOP-13-004 1603.02303 |
| 38 | R. Fruhwirth | Application of Kalman filtering to track and vertex fitting | NIMA 262 (1987) 444 | |
| 39 | R. Fr\"uhwirth, W. Waltenberger, and P. Vanlaer | Adaptive vertex fitting | JPG 34 (2007) N343 | |
| 40 | CMS Collaboration | Measurement of $ \mathrm{J} / \psi $ and $ \psi $(2S) Prompt Double-Differential Cross Sections in pp Collisions at $ \sqrt{s}=7\;\text{TeV} $ | PRL 114 (2015) 191802 | CMS-BPH-14-001 1502.04155 |
| 41 | CMS Collaboration | Measurement of the top quark mass using charged particles in pp collisions at $ \sqrt{s} = 8\;\text{TeV} $ | PRD 93 (2016) 2006 | CMS-TOP-12-030 1603.06536 |
| 42 | P. Z. Skands | Tuning Monte Carlo Generators: The Perugia Tunes | PRD 82 (2010) 074018 | 1005.3457 |
| 43 | CMS Collaboration | Measurement of the inelastic proton-proton cross section at $ \sqrt{s}=7 $ TeV | PLB 722 (2013) 5 | CMS-FWD-11-001 1210.6718 |
| 44 | CMS Collaboration | Measurement of the differential cross section for top quark pair production in pp collisions at $ \sqrt{s} = 8\;\text{TeV} $ | EPJC 75 (2015) 542 | CMS-TOP-12-028 1505.04480 |
| 45 | CMS Collaboration | Measurement of the $ \text{t}\bar{\text{t}} $ Production Cross Section in the All-Jets Final State in pp Collisions at $ \sqrt{s}=8\;\text{TeV} $ | EPJC 76 (2016) 128 | CMS-TOP-14-018 1509.06076 |
| 46 | BaBar Collaboration | Study of inclusive production of charmonium mesons in B decay | PRD 67 (2003) 032002 | hep-ex/0207097 |
| 47 | T. Gleisberg et al. | Event generation with SHERPA 1.1 | JHEP 02 (2009) 007 | 0811.4622 |
| 48 | S. Schumann and F. Krauss | A parton shower algorithm based on Catani-Seymour dipole factorisation | JHEP 03 (2008) 038 | 0709.1027 |
| 49 | S. Dulat et al. | New parton distribution functions from a global analysis of quantum chromodynamics | PRD 93 (2016) 033006 | 1506.07443 |
| 50 | L. A. Harland-Lang, A. D. Martin, P. Motylinski, and R. S. Thorne | Parton distributions in the LHC era: MMHT 2014 PDFs | EPJC 75 (2015) 204 | 1412.3989 |
| 51 | NNPDF Collaboration | Parton distributions for the LHC Run II | JHEP 04 (2015) 040 | 1410.8849 |
| 52 | S. Alekhin et al. | The PDF4LHC Working Group Interim Report | 1101.0536 | |
| 53 | M. Botje et al. | The PDF4LHC Working Group Interim Recommendations | 1101.0538 | |

|
Compact Muon Solenoid LHC, CERN |

|

|

|

|

|

|