

Compact Muon Solenoid
LHC, CERN
| CMS-SUS-14-007 ; CERN-PH-EP-2016-008 | ||
| Search for supersymmetry in pp collisions at $\sqrt{s}=$ 8 TeV in final states with boosted W bosons and b jets using razor variables | ||
| CMS Collaboration | ||
| 9 February 2016 | ||
| Phys. Rev. D 93 (2016) 092009 | ||
| Abstract: A search for supersymmetry in hadronic final states with highly boosted W bosons and b jets is presented, focusing on compressed scenarios. The search is performed using proton-proton collision data at a center-of-mass energy of 8 TeV, collected by the CMS experiment at the LHC, corresponding to an integrated luminosity of 19.7 fb$^{-1}$. Events containing candidates for hadronic decays of boosted W bosons are identified using jet substructure techniques, and are analyzed using the razor variables $M_\mathrm{R}$ and $R^2$, which characterize a possible signal as a peak on a smoothly falling background. The observed event yields in the signal regions are found to be consistent with the expected contributions from standard model processes, which are predicted using control samples in the data. The results are interpreted in terms of gluino-pair production followed by their exclusive decay into top squarks and top quarks. The analysis excludes gluino masses up to 1.1 TeV for light top squarks decaying solely to a charm quark and a neutralino, and up to 700 GeV for heavier top squarks decaying solely to a top quark and a neutralino. | ||
| Links: e-print arXiv:1602.02917 [hep-ex] (PDF) ; CDS record ; inSPIRE record ; CADI line (restricted) ; | ||
| Figures | |

png pdf |
Figure 1-a:
Diagram for the T1ttcc simplified model spectrum. Here, an asterisk ($^*$) denotes an antiparticle of a supersymmetric partner. |
png pdf |
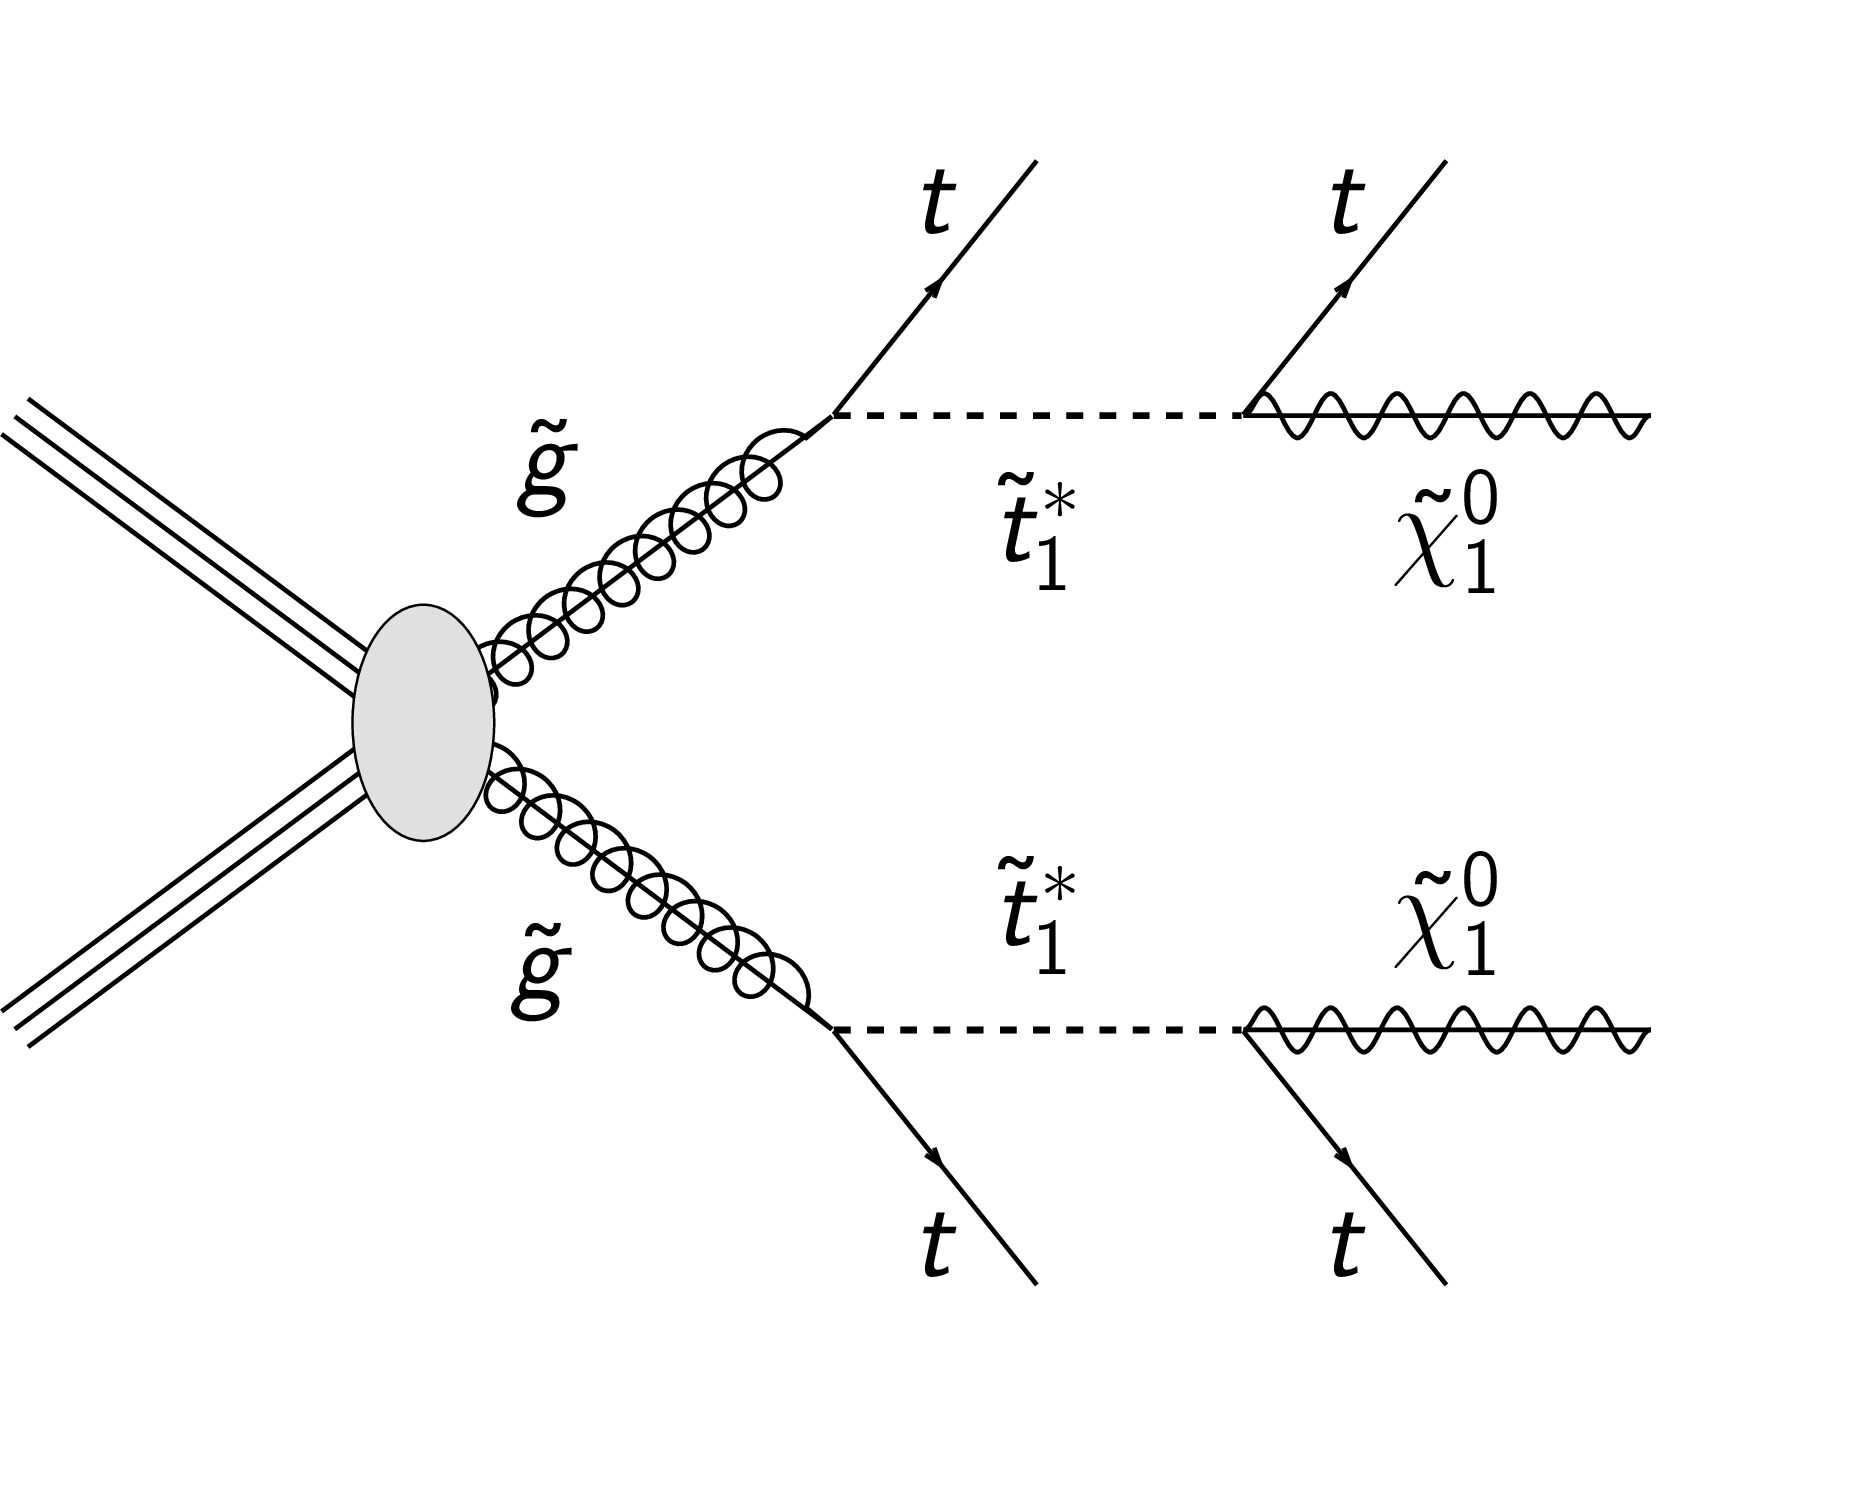
Figure 1-b:
Diagram for the T1t1t simplified model spectrum. Here, an asterisk ($^*$) denotes an antiparticle of a supersymmetric partner. |
png pdf |
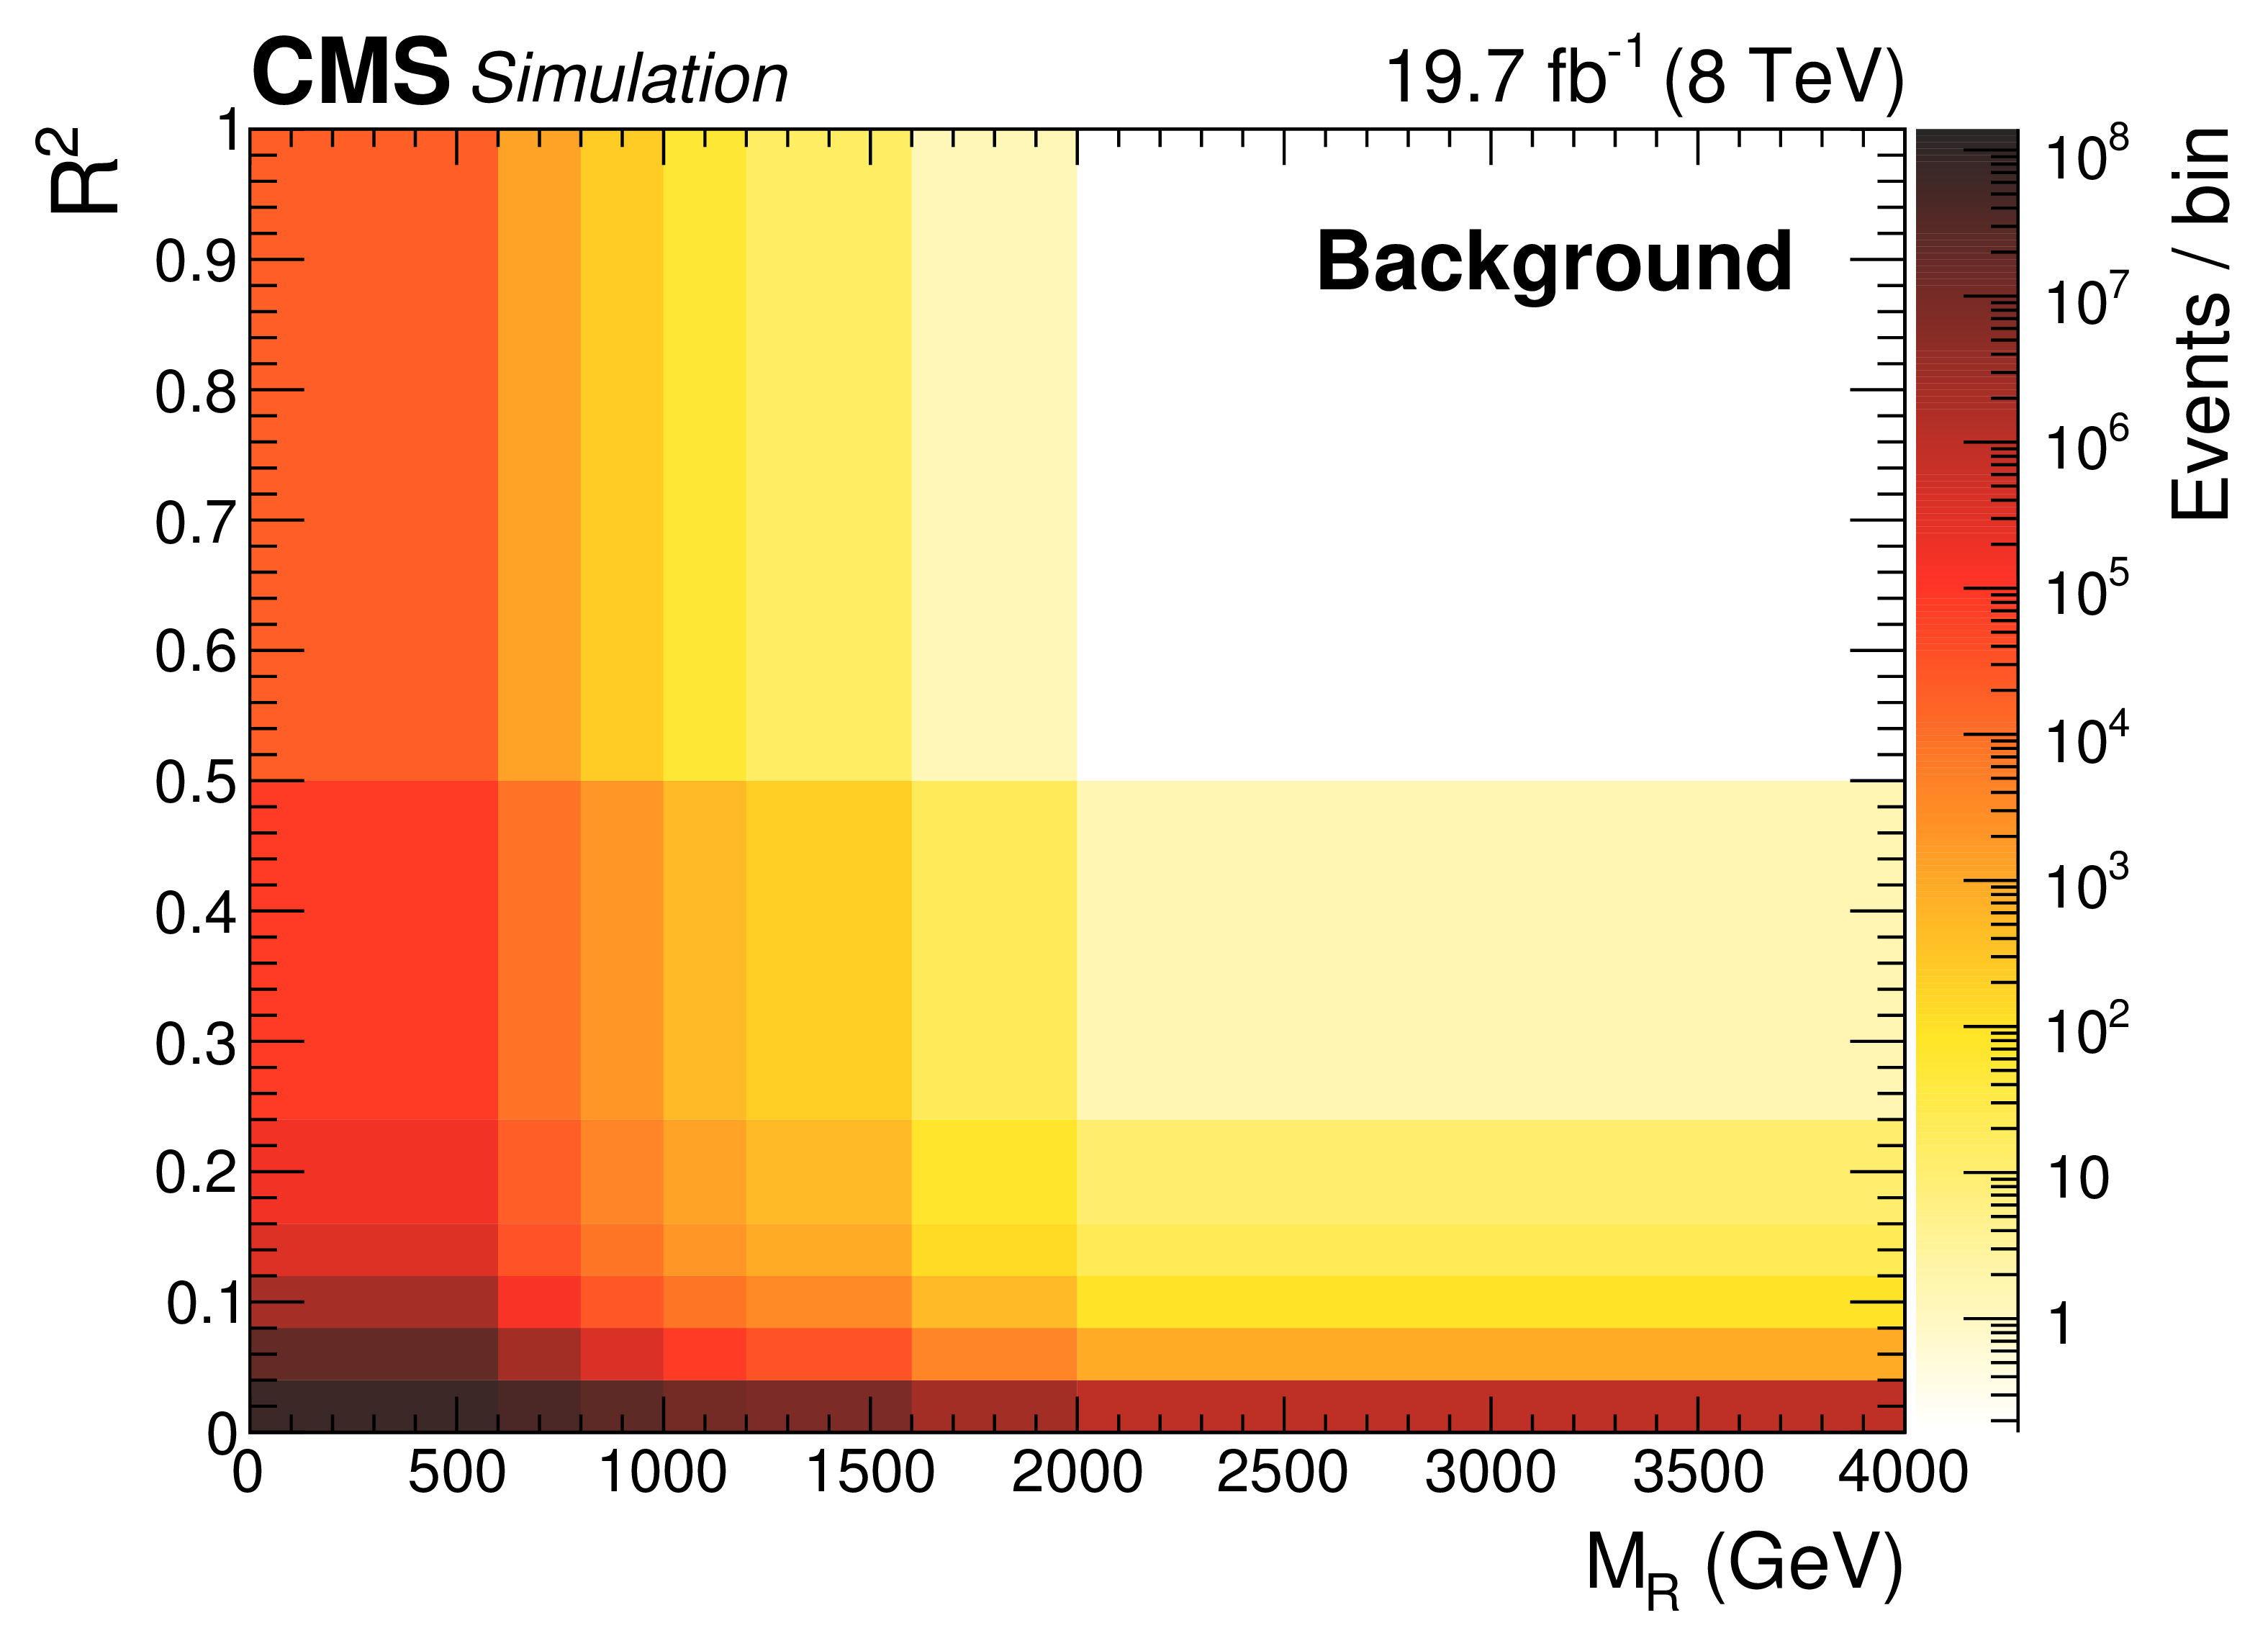
Figure 2-a:
Distributions in the ($ {M_R} $,$R^2$) space of the overall SM backgrounds and a T1ttcc signal with $m_{\tilde{ \mathrm{ g } } } = $ 1 TeV, $m_{\tilde{ mathrm{ t } } } = $ 325 GeV and $m_{\tilde{\chi}^0_1 } = $ 300 GeV, both obtained from simulation. A very loose selection is used: a good primary vertex and at least three jets, one of which is required to have $ {p_{\mathrm {T}}} > $ 200 GeV. |

png pdf |
Figure 2-b:
Distributions in the ($ {M_R} $,$R^2$) space of the overall SM backgrounds and a T1ttcc signal with $m_{\tilde{ \mathrm{ g } } } = $ 1 TeV, $m_{\tilde{ mathrm{ t } } } = $ 325 GeV and $m_{\tilde{\chi}^0_1 } = $ 300 GeV, both obtained from simulation. A very loose selection is used: a good primary vertex and at least three jets, one of which is required to have $ {p_{\mathrm {T}}} > $ 200 GeV. |

png pdf |
Figure 3-a:
(a) The trigger efficiency, obtained from data, as a function of $ {H_{\mathrm {T}}} $ and leading jet $ {p_{\mathrm {T}}} $ after the baseline selection discussed in Section IV. (b) The trigger efficiency as a function of $ {M_R} $ and $R^2$ after the same baseline selection, obtained by applying the trigger efficiency as a function of $ {H_{\mathrm {T}}} $ and leading jet $ {p_{\mathrm {T}}} $ to the simulated background. |
png pdf |
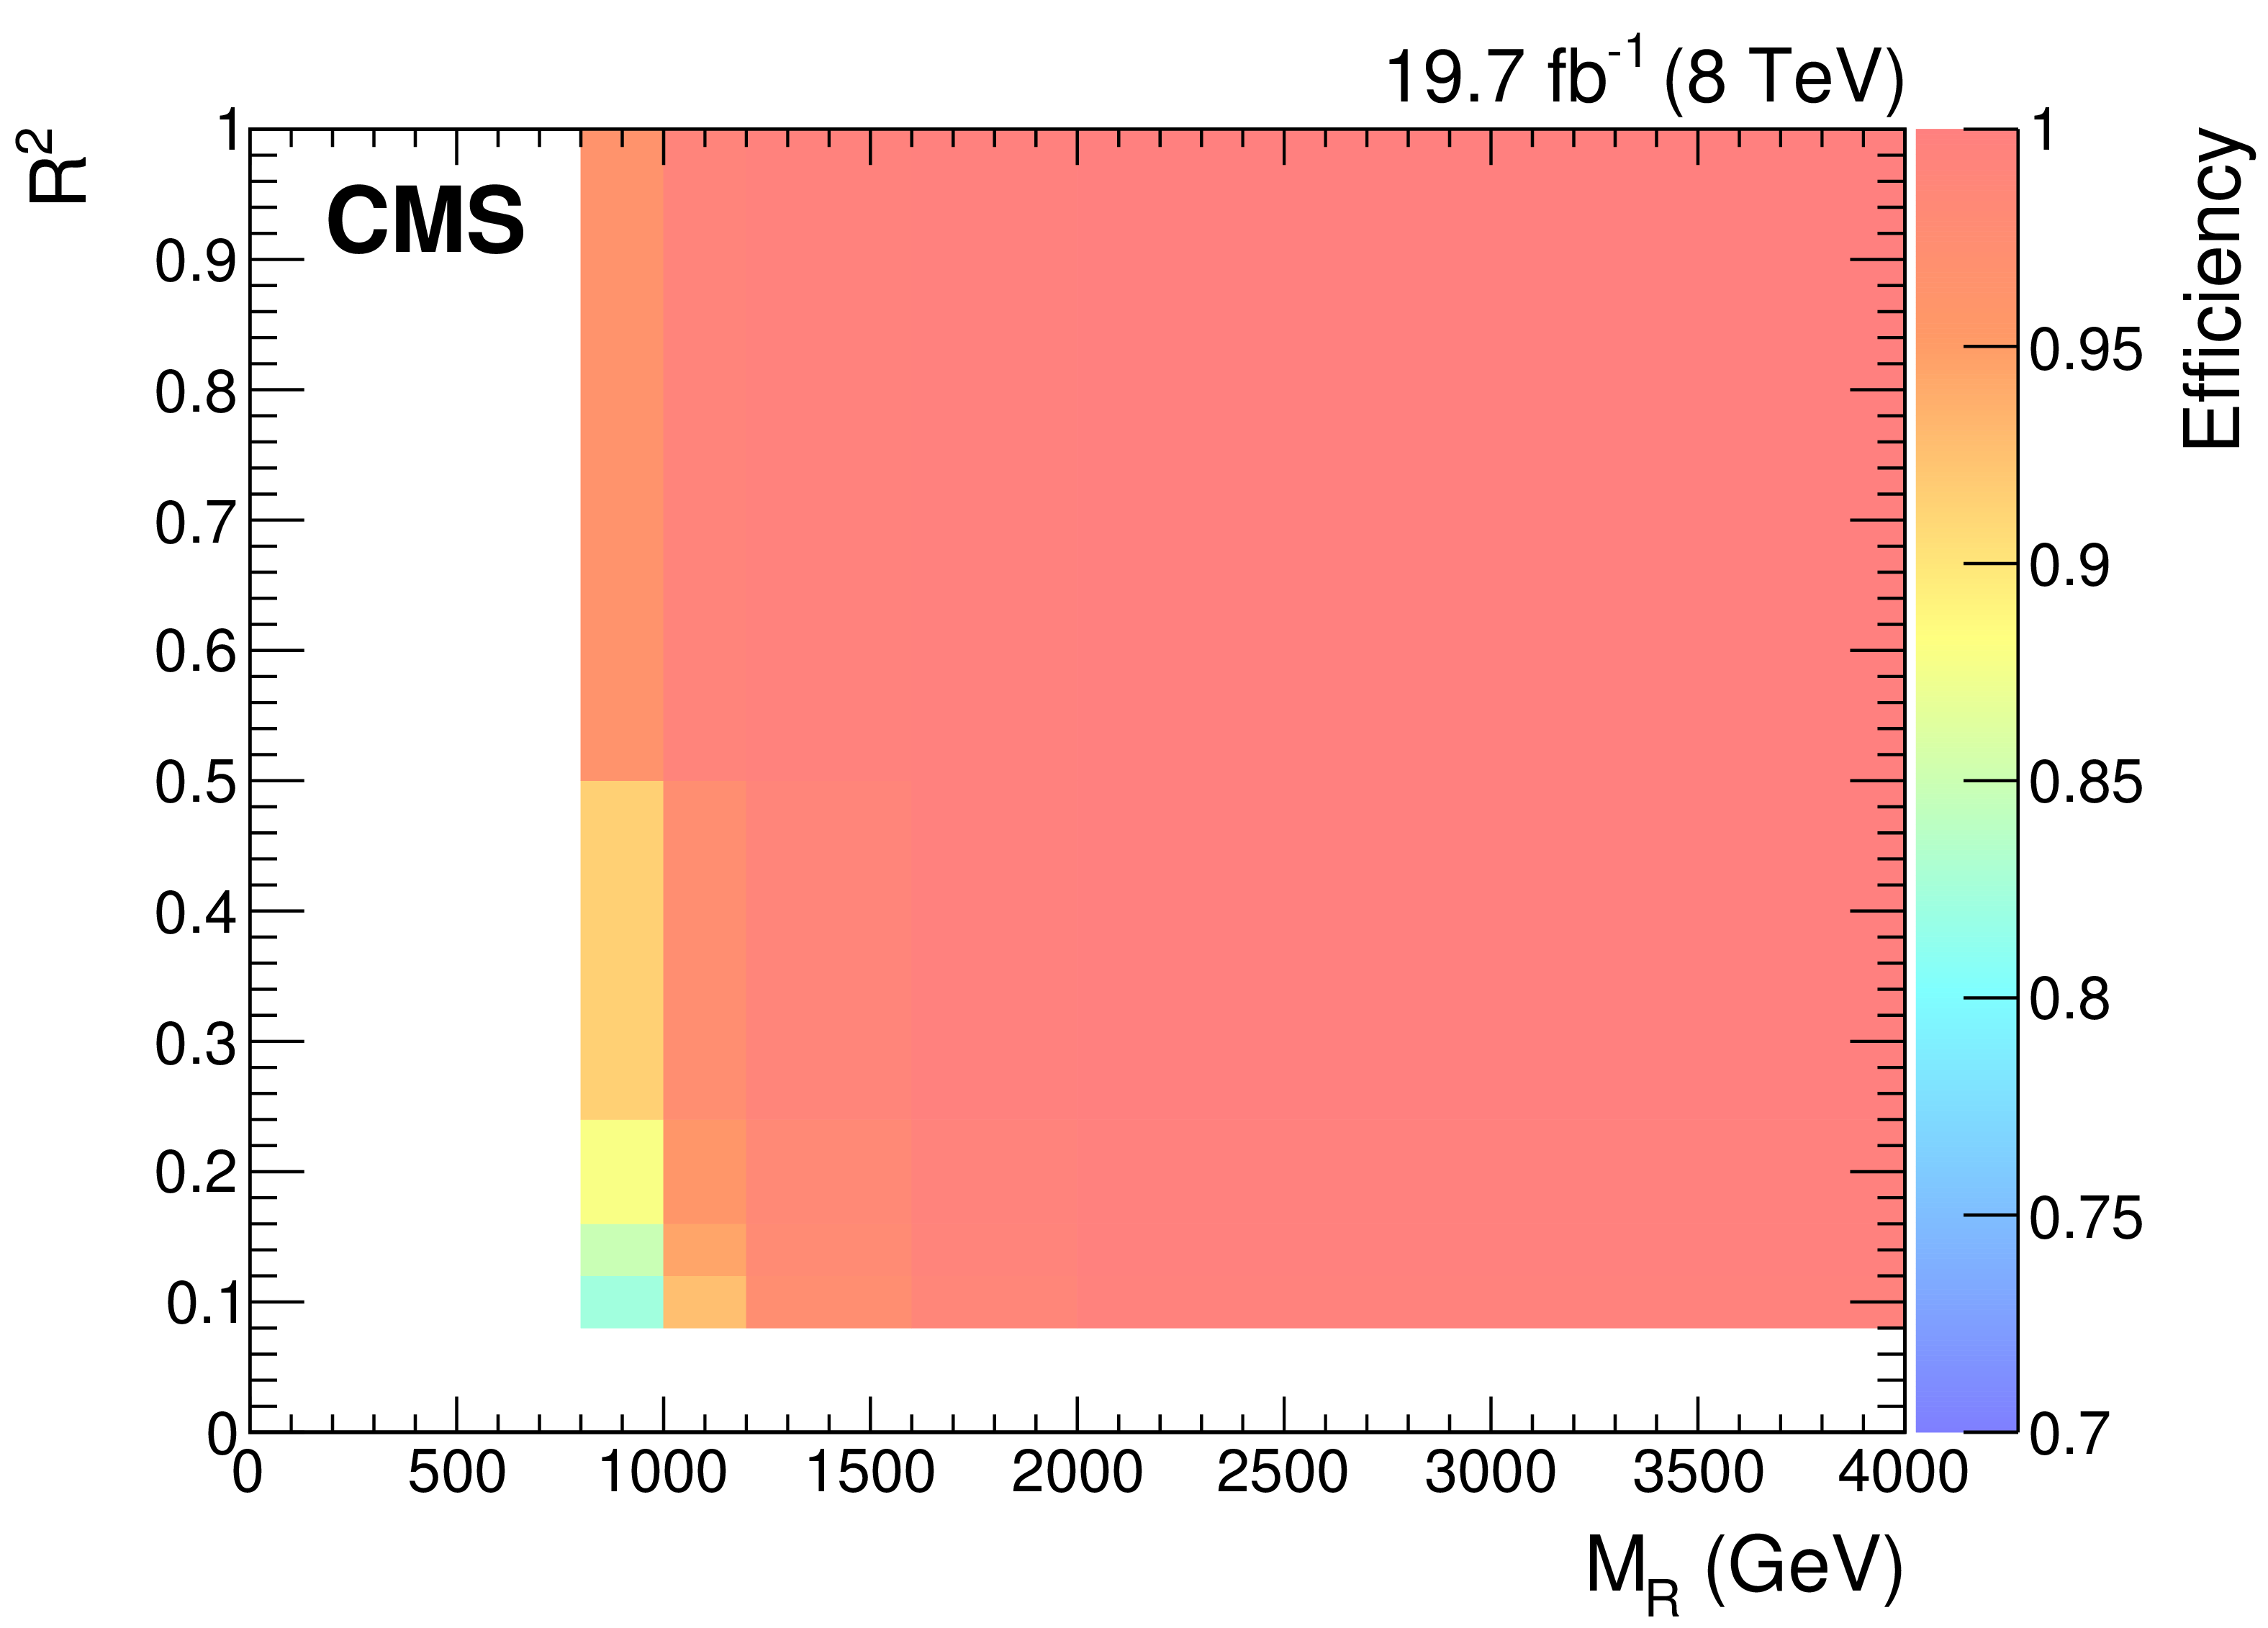
Figure 3-b:
(a) The trigger efficiency, obtained from data, as a function of $ {H_{\mathrm {T}}} $ and leading jet $ {p_{\mathrm {T}}} $ after the baseline selection discussed in Section IV. (b) The trigger efficiency as a function of $ {M_R} $ and $R^2$ after the same baseline selection, obtained by applying the trigger efficiency as a function of $ {H_{\mathrm {T}}} $ and leading jet $ {p_{\mathrm {T}}} $ to the simulated background. |
png pdf |
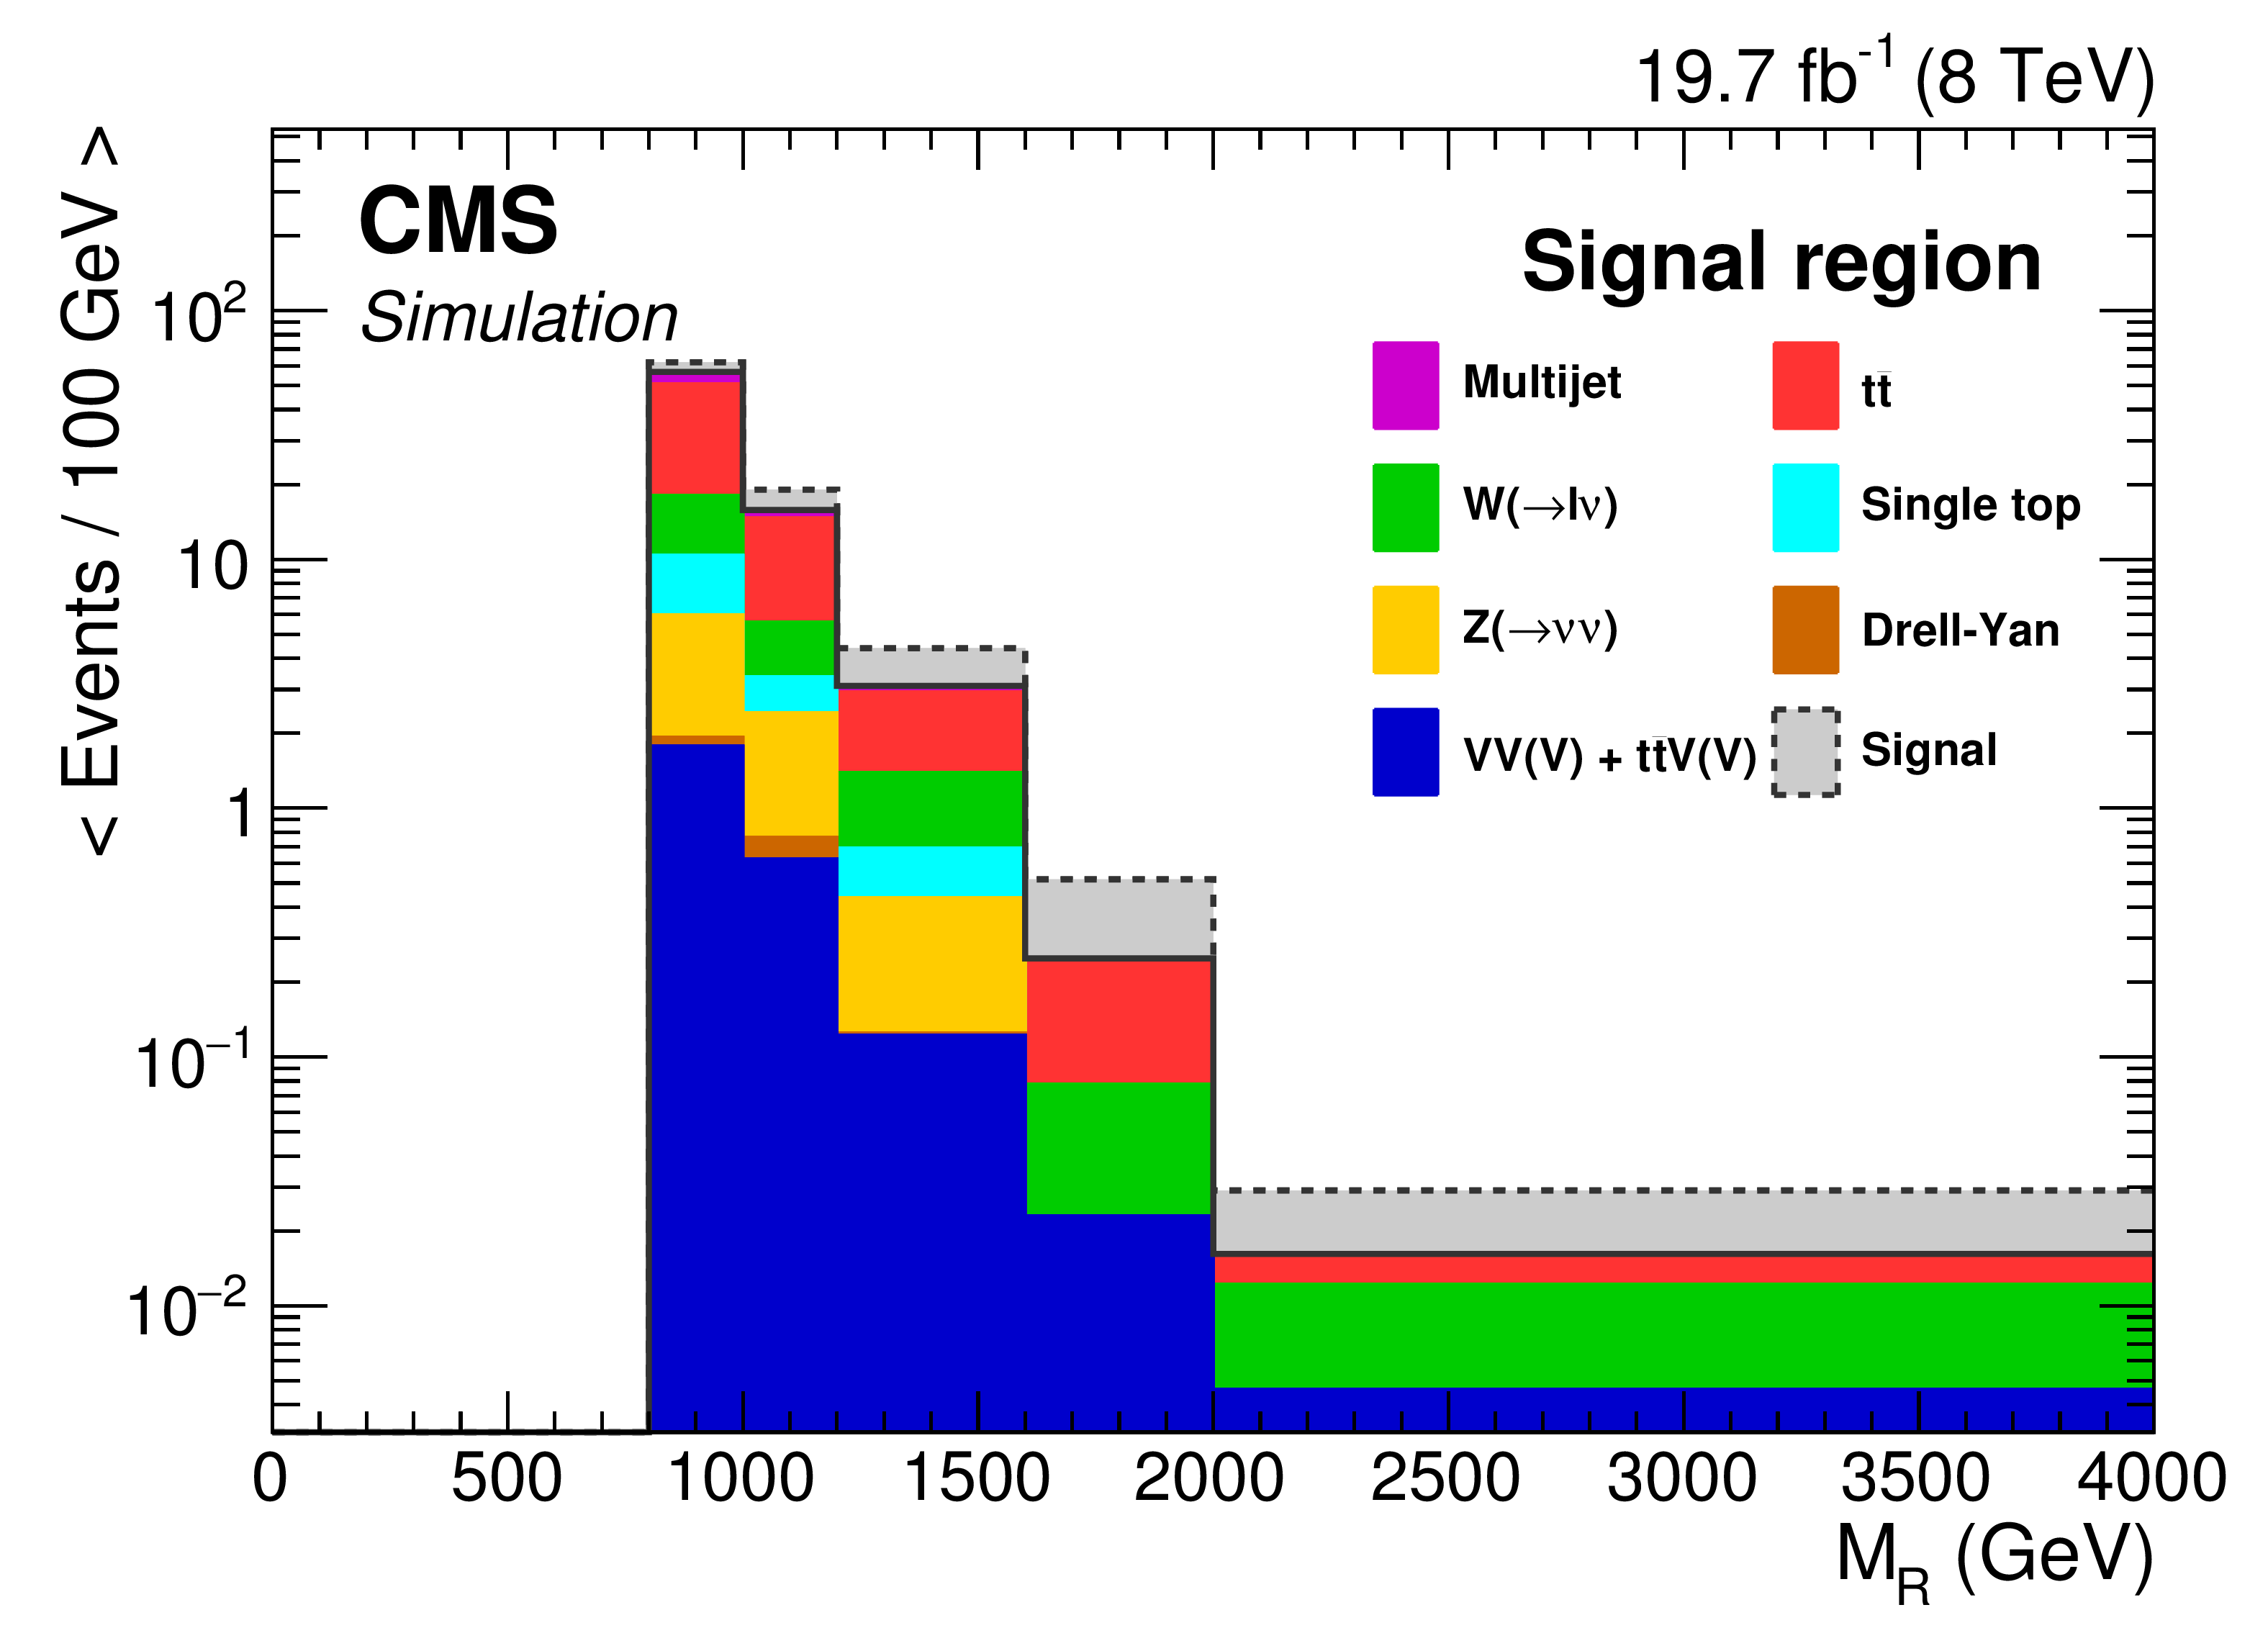
Figure 4-a:
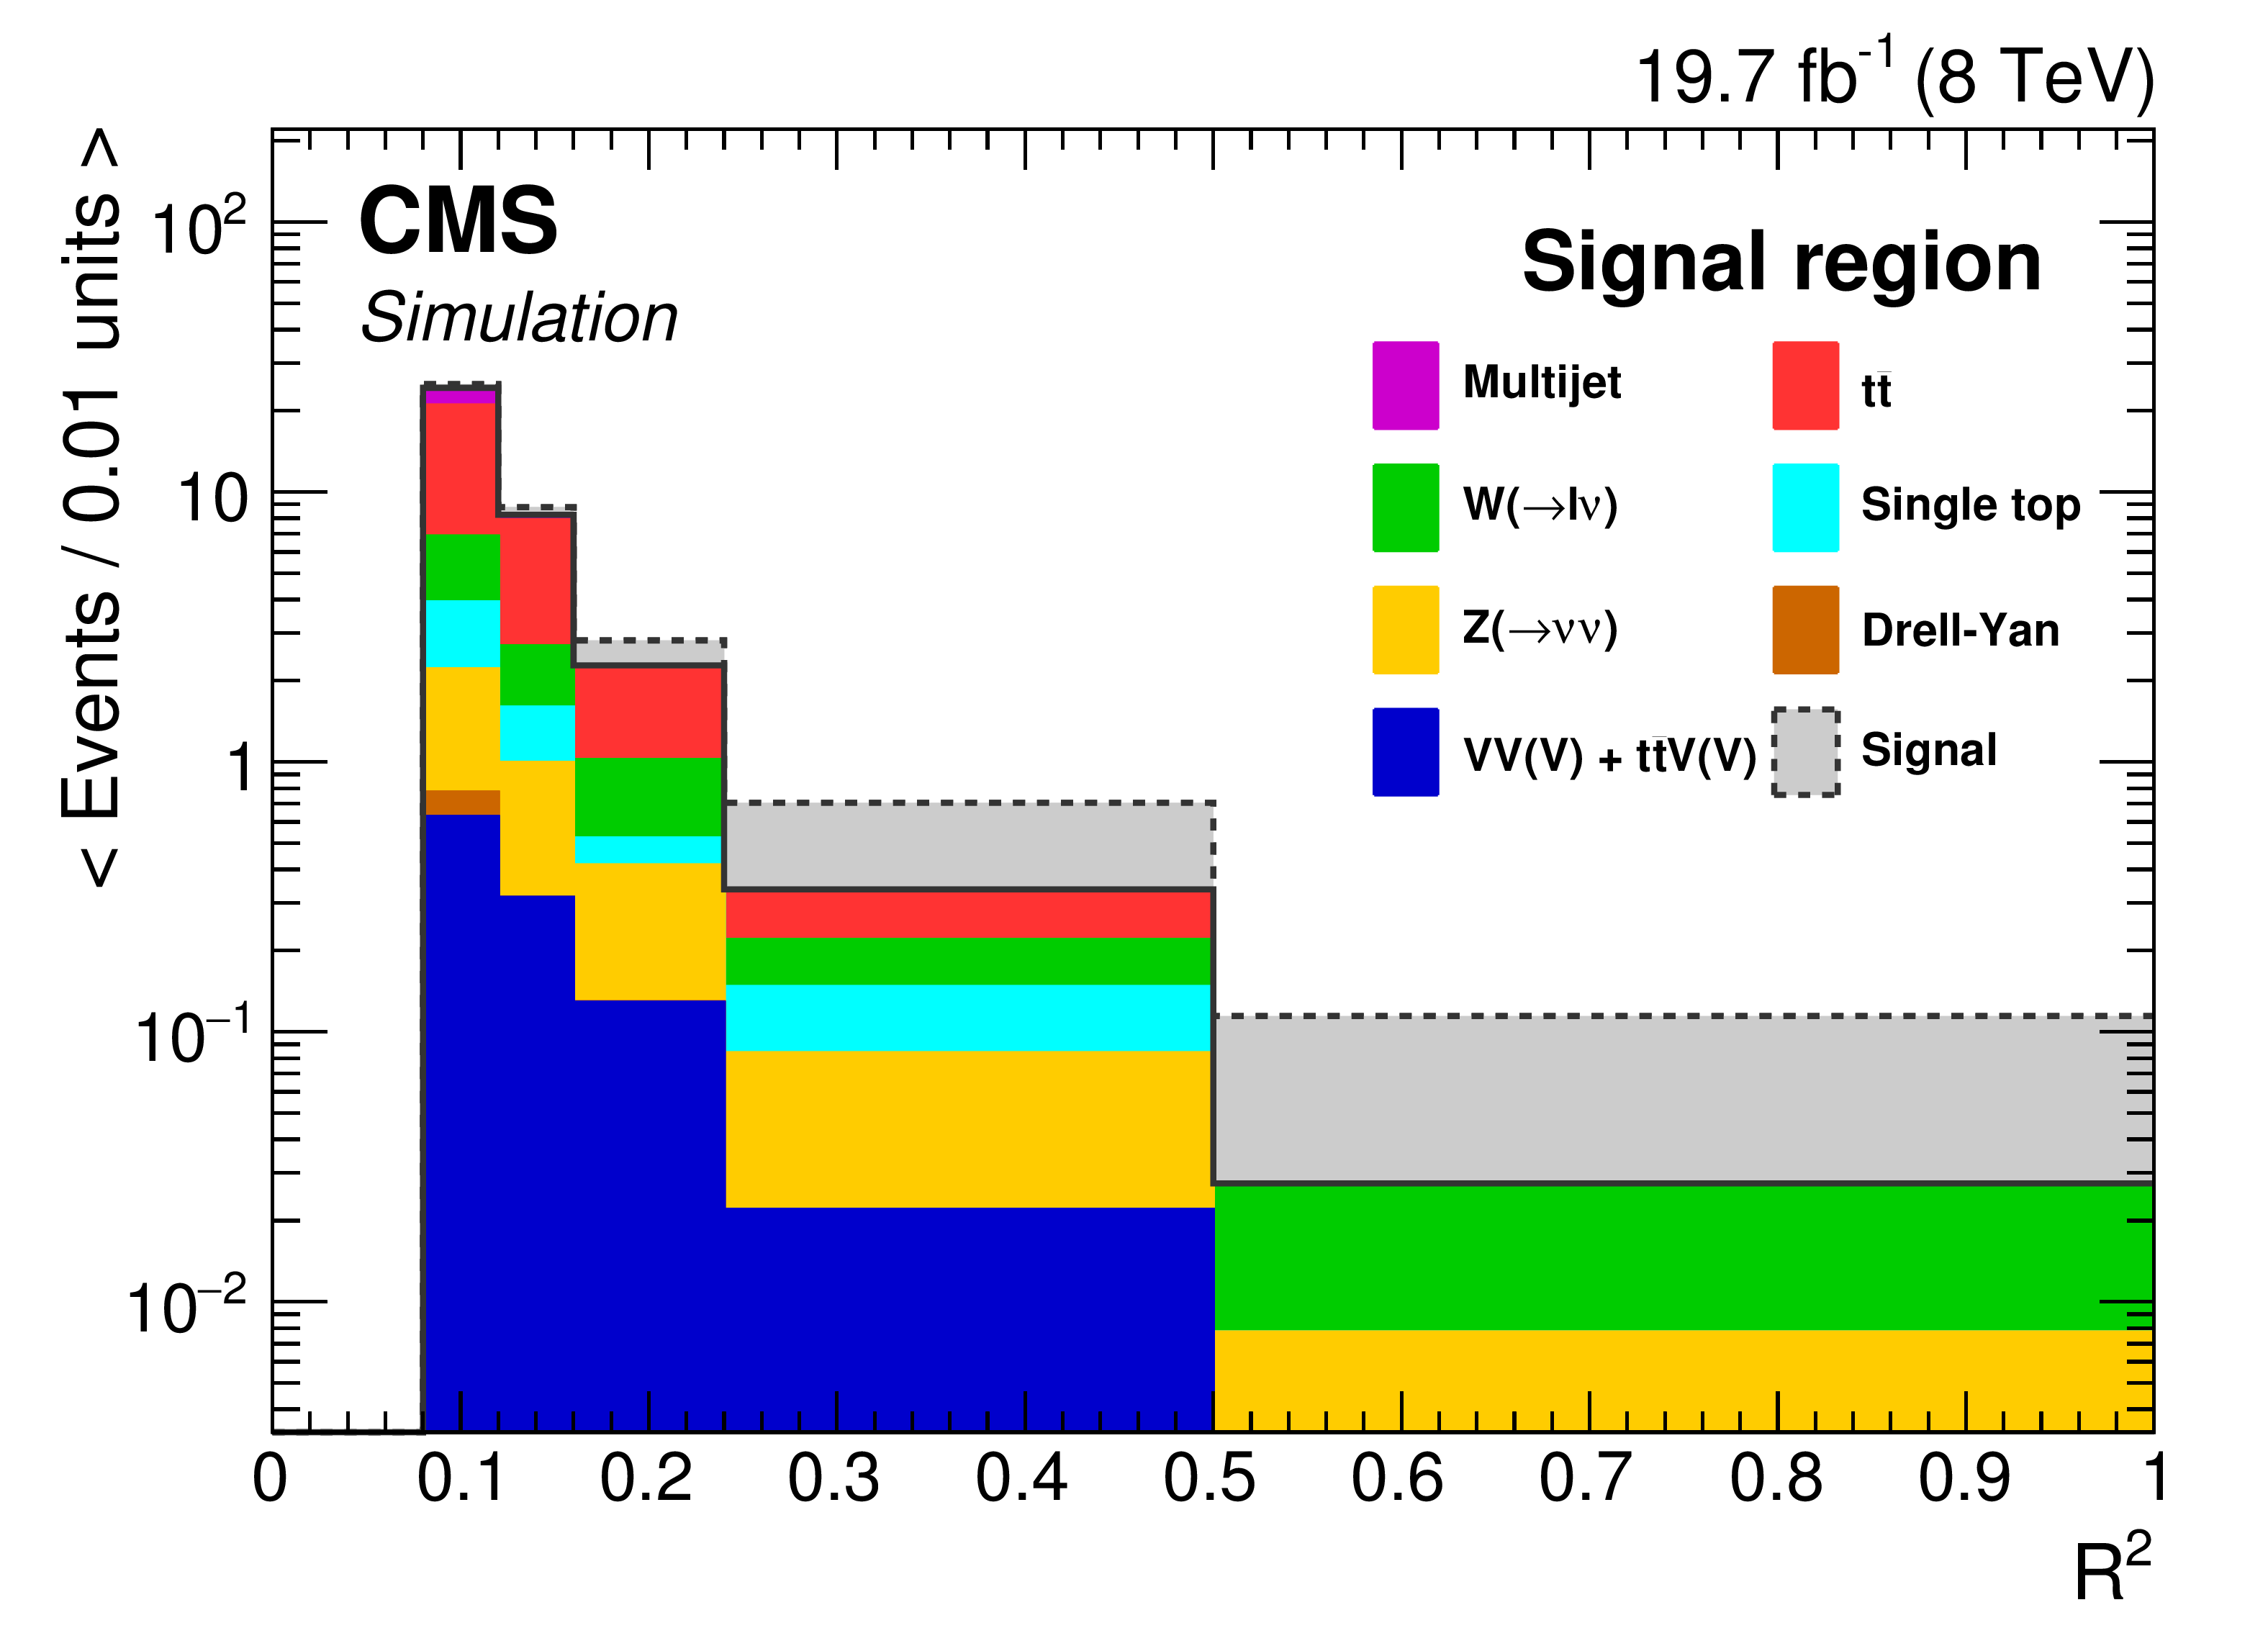
Simulated $ {M_R} $ (a) and $R^2$ (b) distributions in the signal region, $S$. Stacked on top of the background distributions is the predicted signal contribution from an example T1ttcc model, with parameters $m_{\tilde{ \mathrm{ g } } } = $ 1 TeV, $m_{\tilde{ mathrm{ t } } } = $ 325 GeV, and $m_{\tilde{\chi}^0_1 } = $ 300 GeV. The bin entries are normalized proportionally to the bin width. |
png pdf |
Figure 4-b:
Simulated $ {M_R} $ (a) and $R^2$ (b) distributions in the signal region, $S$. Stacked on top of the background distributions is the predicted signal contribution from an example T1ttcc model, with parameters $m_{\tilde{ \mathrm{ g } } } = $ 1 TeV, $m_{\tilde{ mathrm{ t } } } = $ 325 GeV, and $m_{\tilde{\chi}^0_1 } = $ 300 GeV. The bin entries are normalized proportionally to the bin width. |
png pdf |
Figure 5-a:
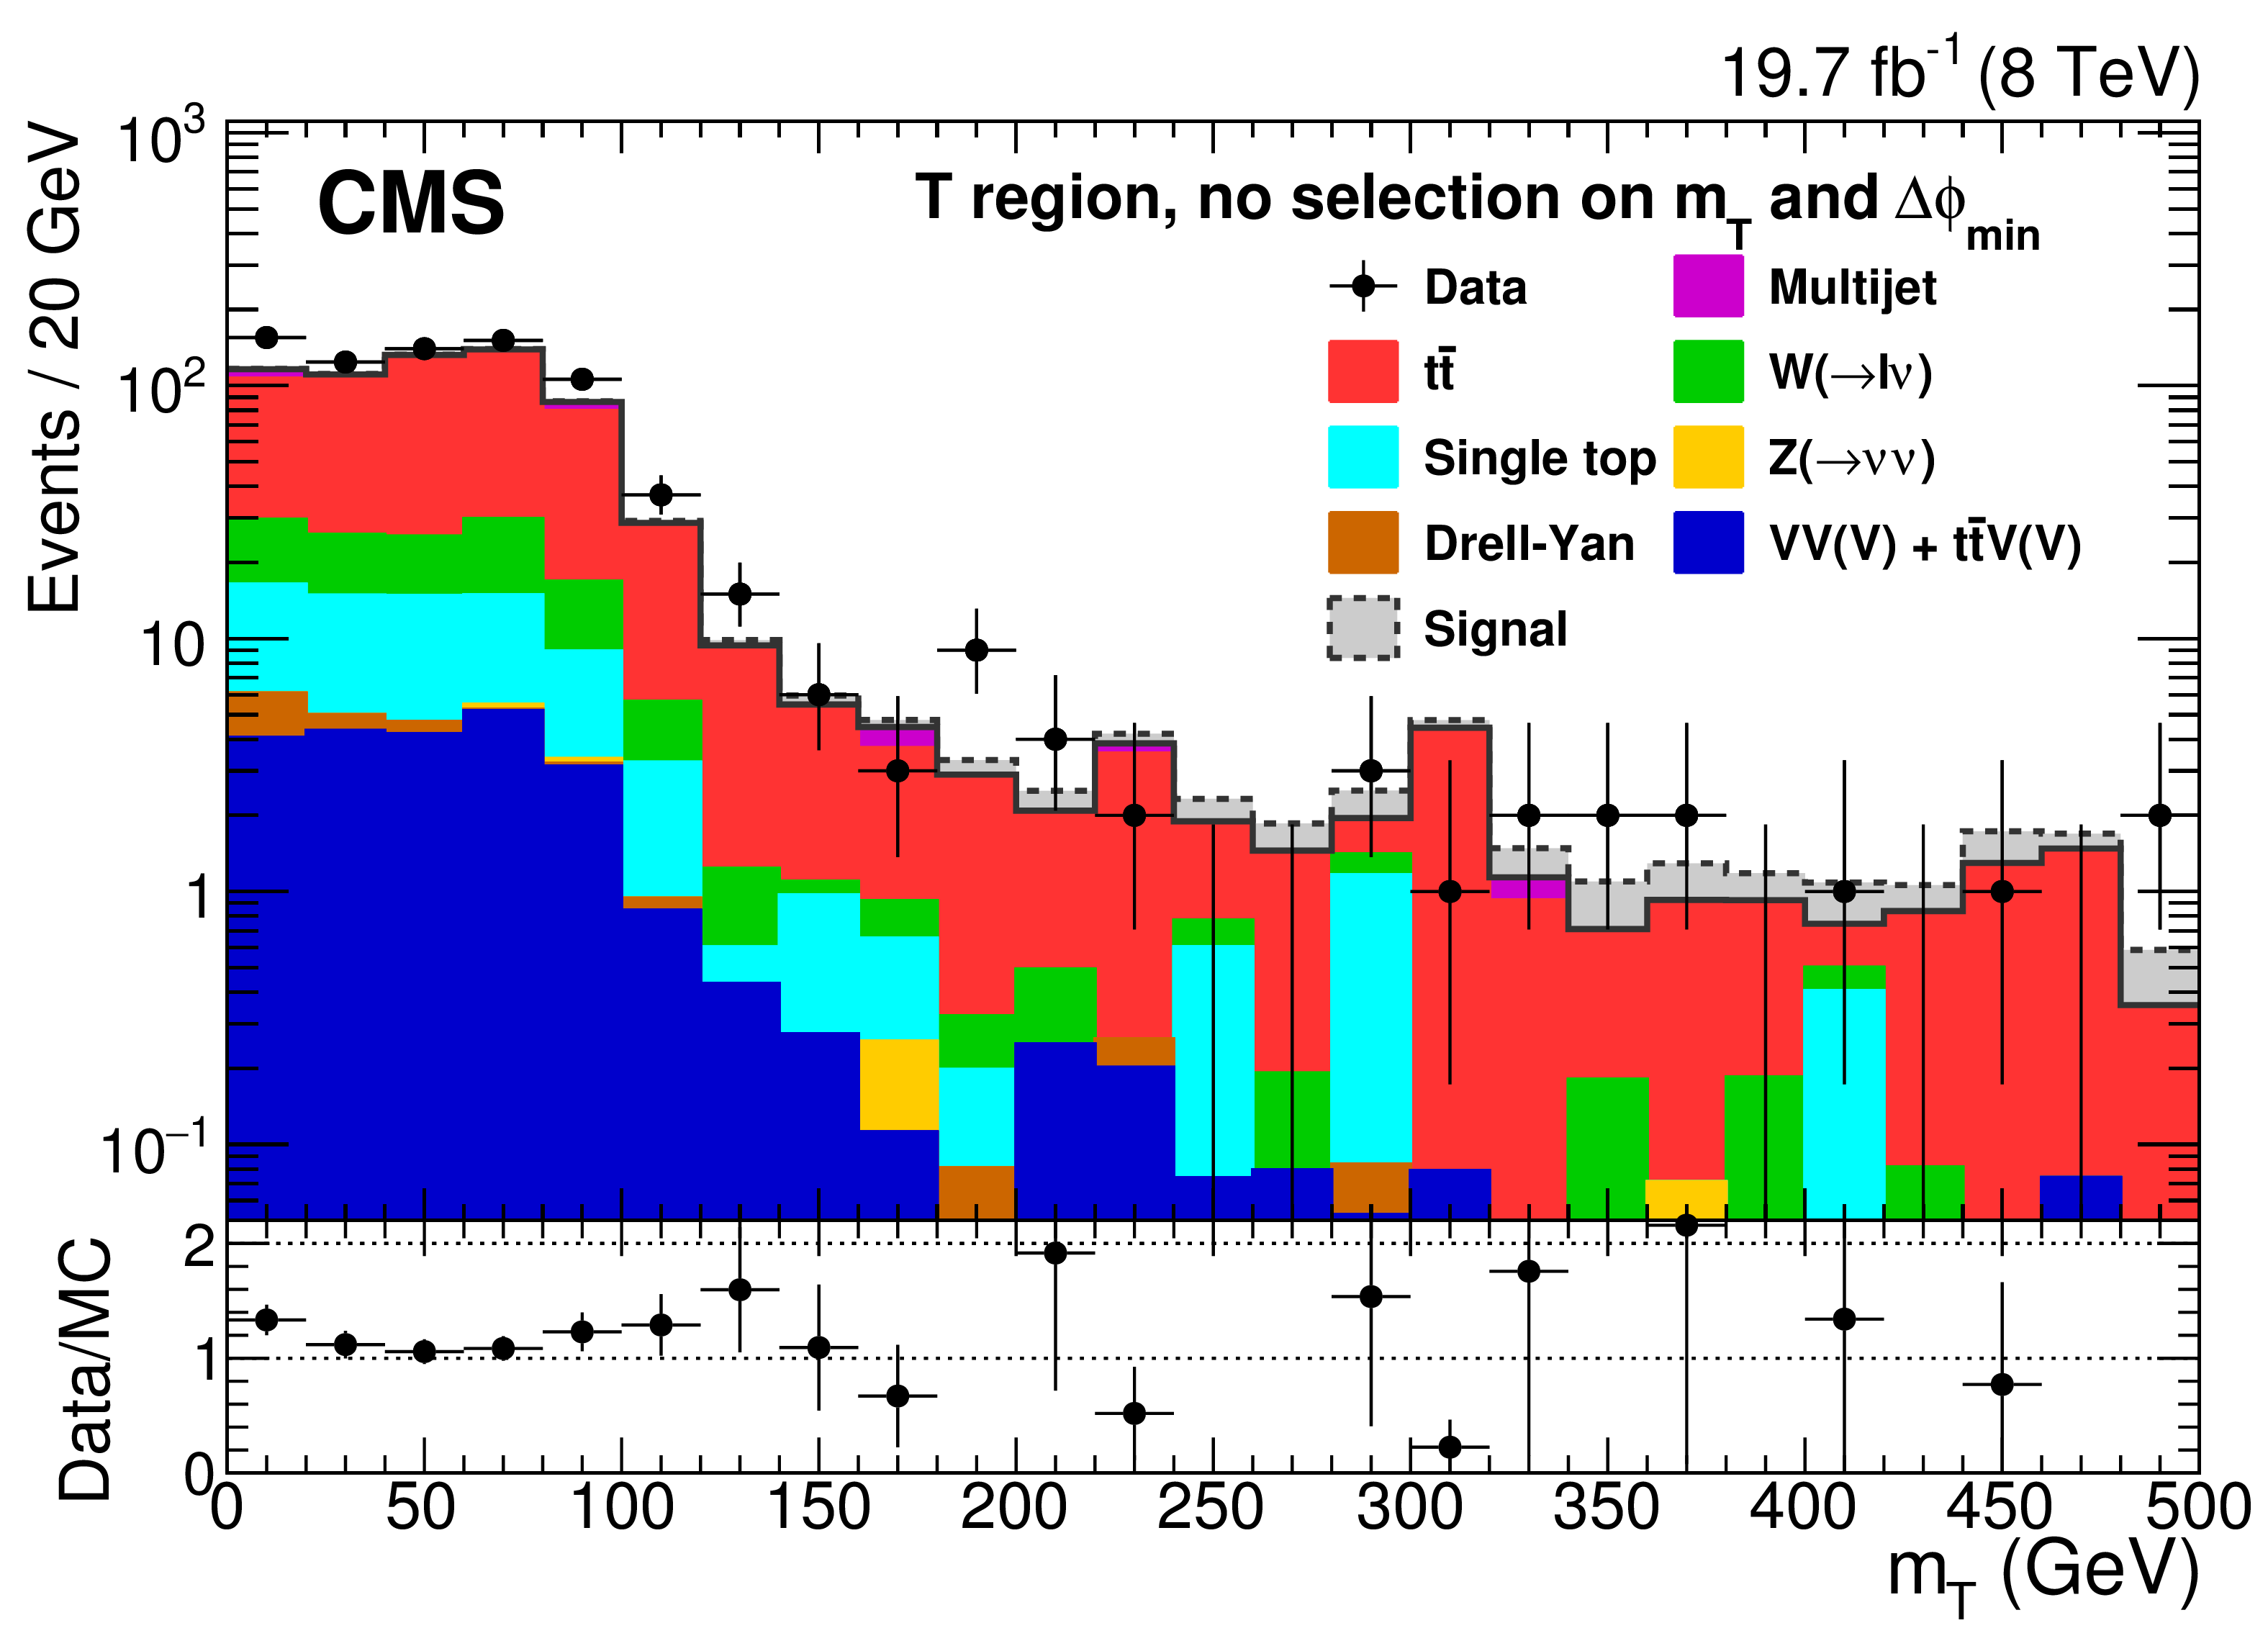
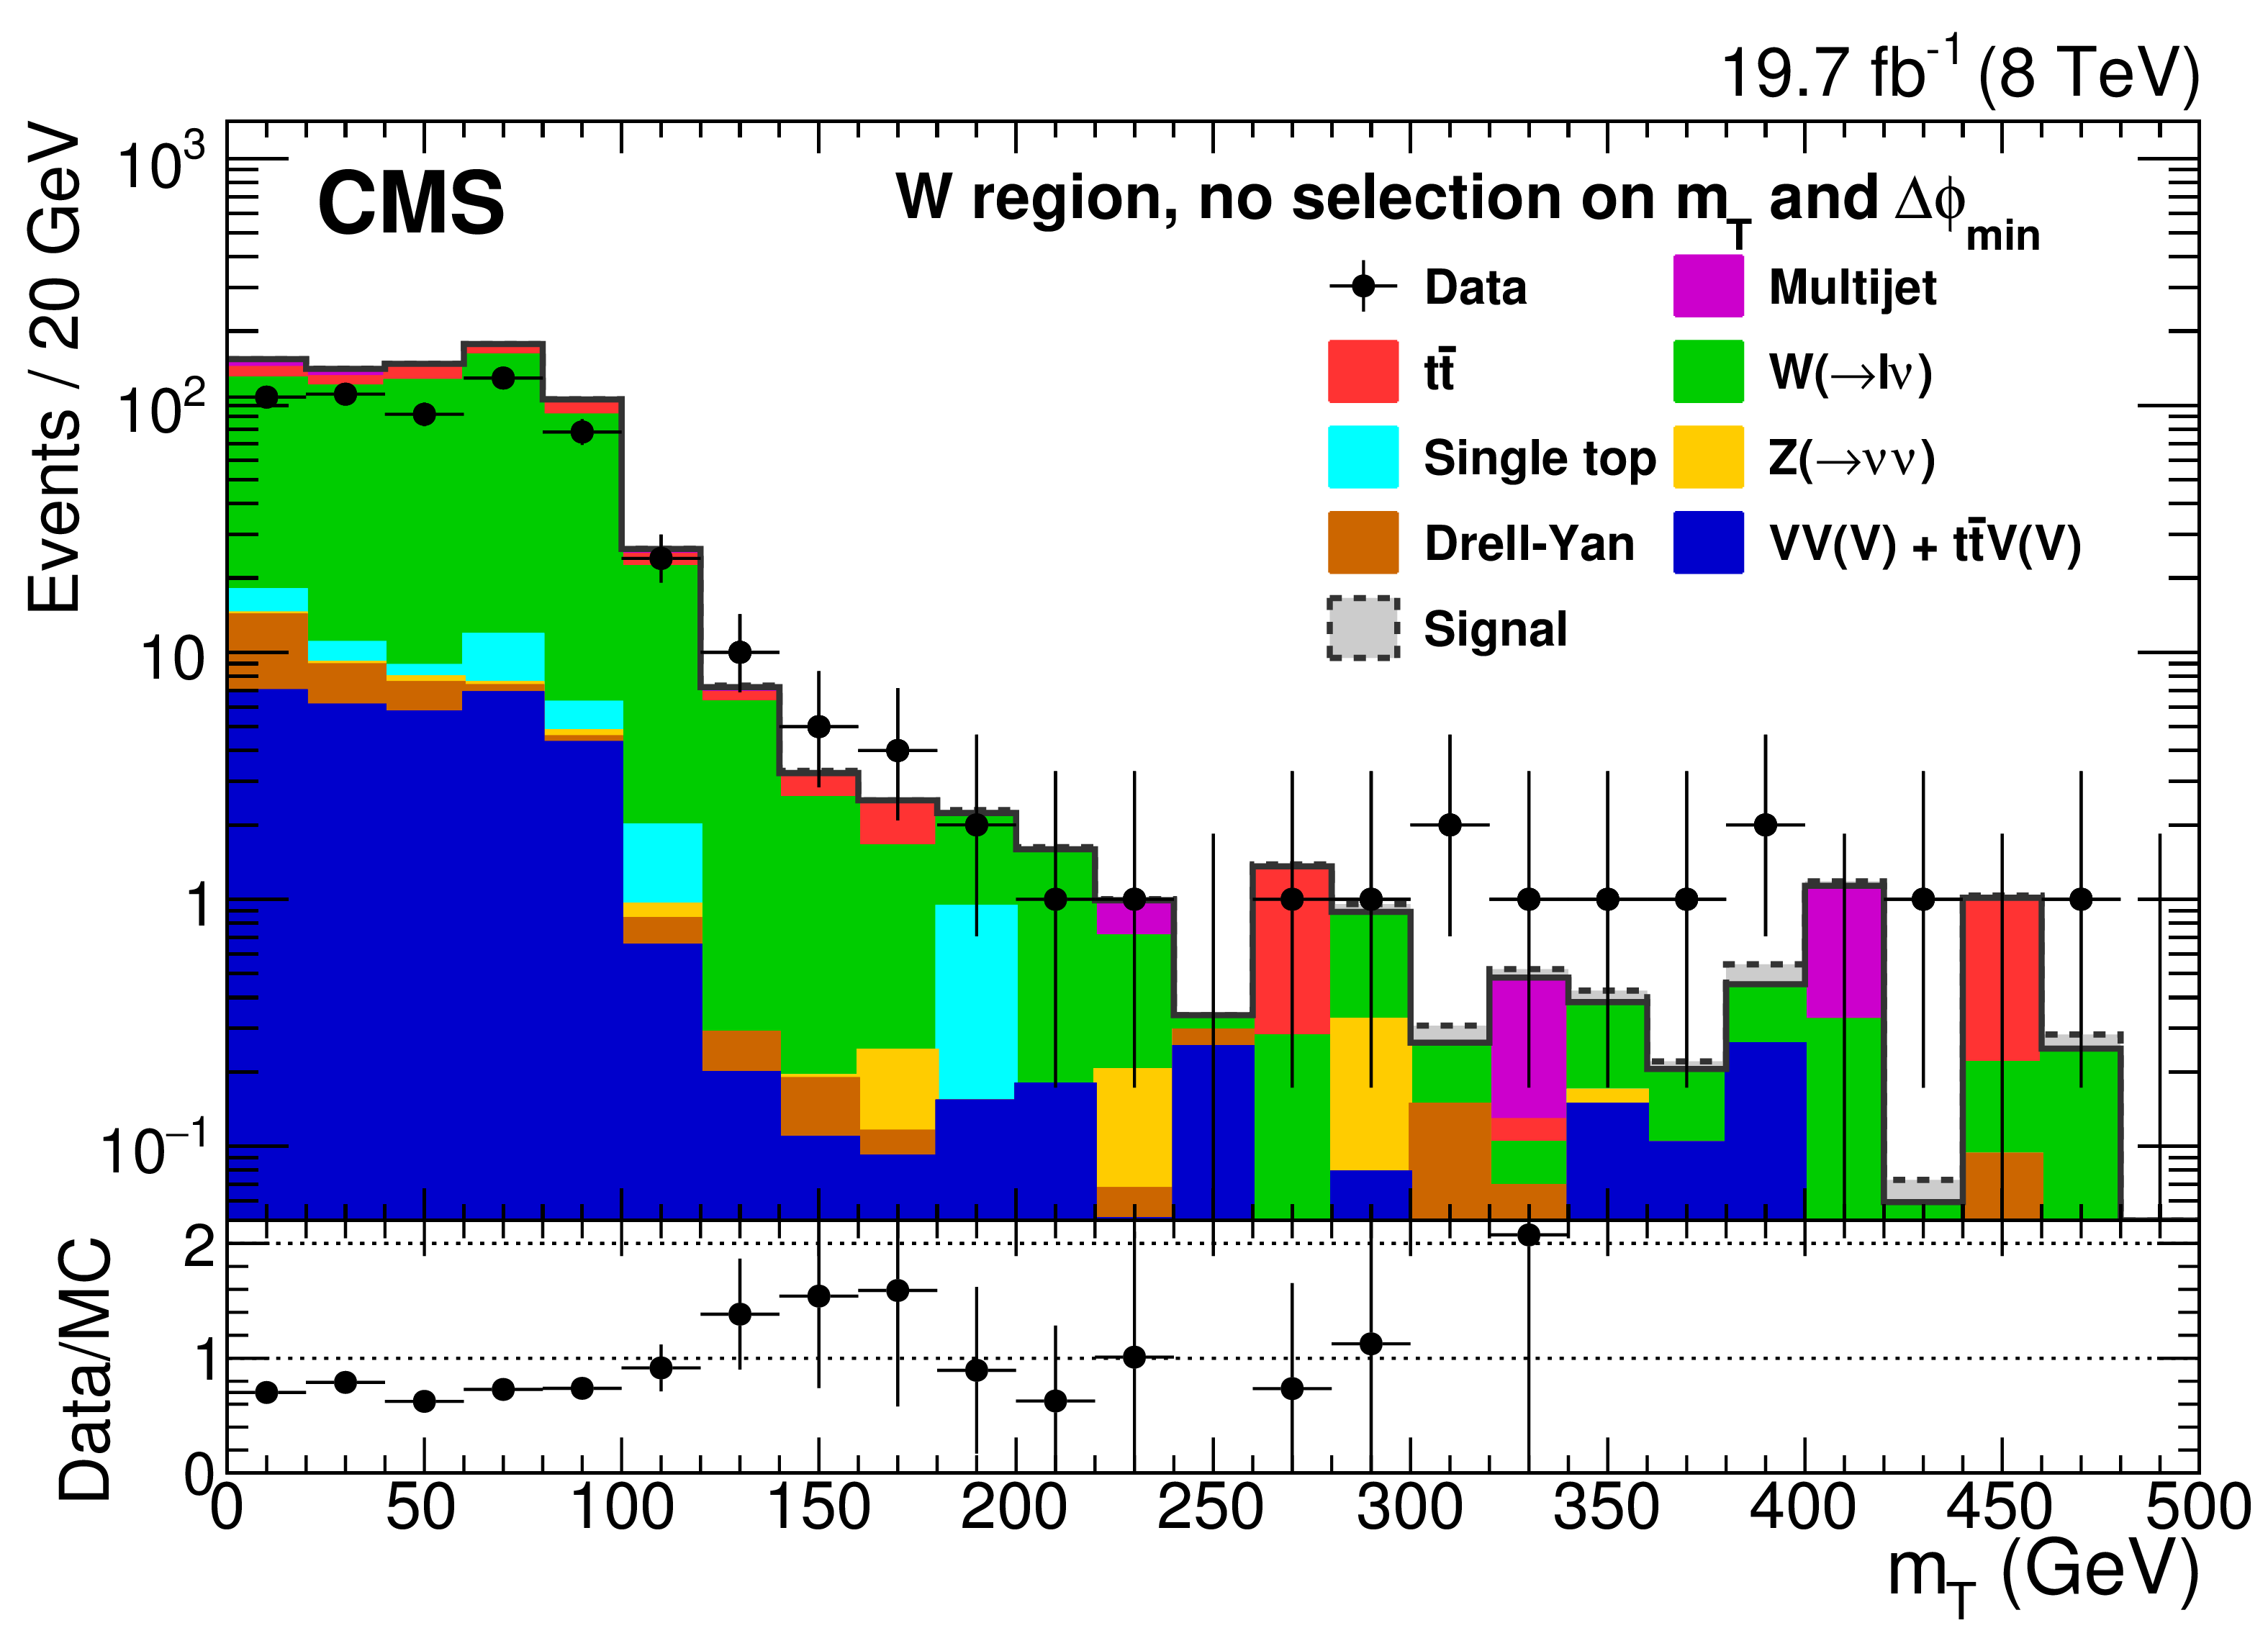
Distributions of $m_\mathrm {T}$ for data and simulated backgrounds, in the $T$ (a) and $W$ (b) control regions, without applying any selection on $m_\mathrm {T}$ and $\Delta \phi _\text {min}$. The contribution from an example signal corresponding to the T1ttcc model with $m_{\tilde{ \mathrm{ g } } } = $ 1 TeV, $m_{\tilde{ mathrm{ t } } } = $ 325 GeV, and $m_{\tilde{\chi}^0_1 } = $ 300 GeV, is stacked on top of the background processes. Only statistical uncertainties are shown. |
png pdf |
Figure 5-b:
Distributions of $m_\mathrm {T}$ for data and simulated backgrounds, in the $T$ (a) and $W$ (b) control regions, without applying any selection on $m_\mathrm {T}$ and $\Delta \phi _\text {min}$. The contribution from an example signal corresponding to the T1ttcc model with $m_{\tilde{ \mathrm{ g } } } = $ 1 TeV, $m_{\tilde{ mathrm{ t } } } = $ 325 GeV, and $m_{\tilde{\chi}^0_1 } = $ 300 GeV, is stacked on top of the background processes. Only statistical uncertainties are shown. |
png pdf |
Figure 6:
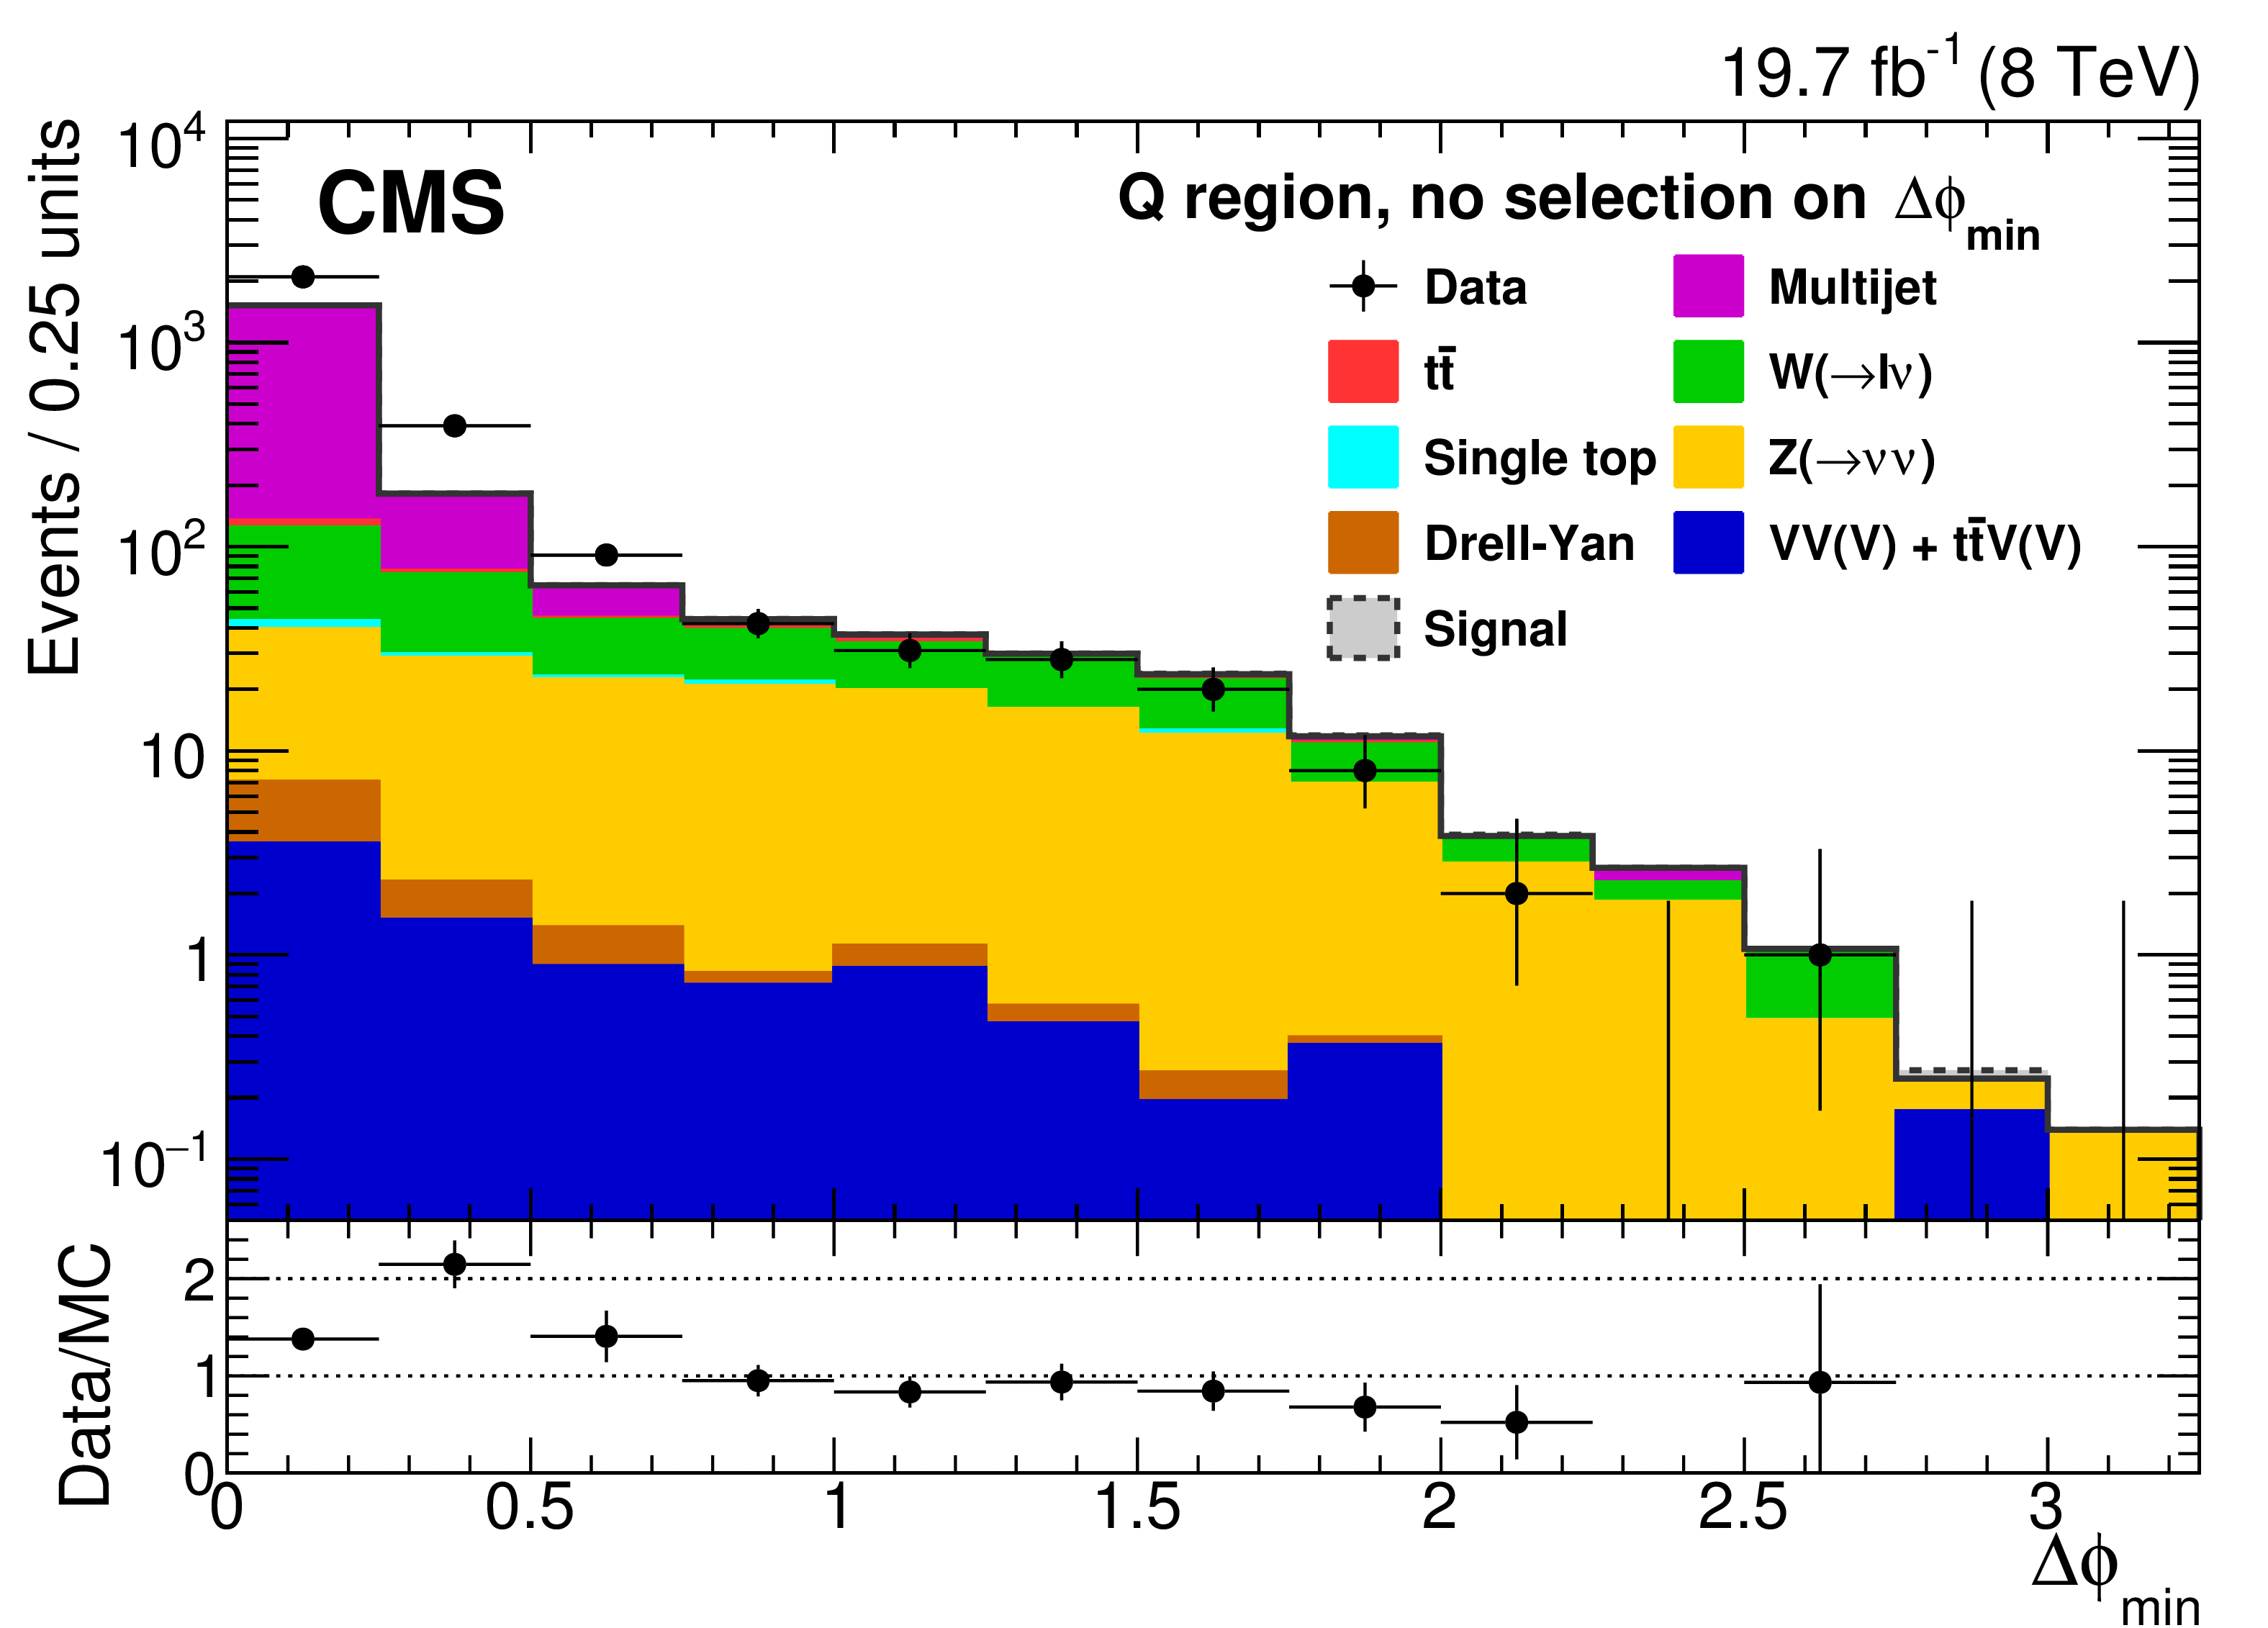
Distributions of $\Delta \phi _\text {min}$ for data and simulated backgrounds in the $Q$ region without applying a selection on $\Delta \phi _\text {min}$. Only statistical uncertainties are shown. Signal contamination in this control region is negligible. |
png pdf |
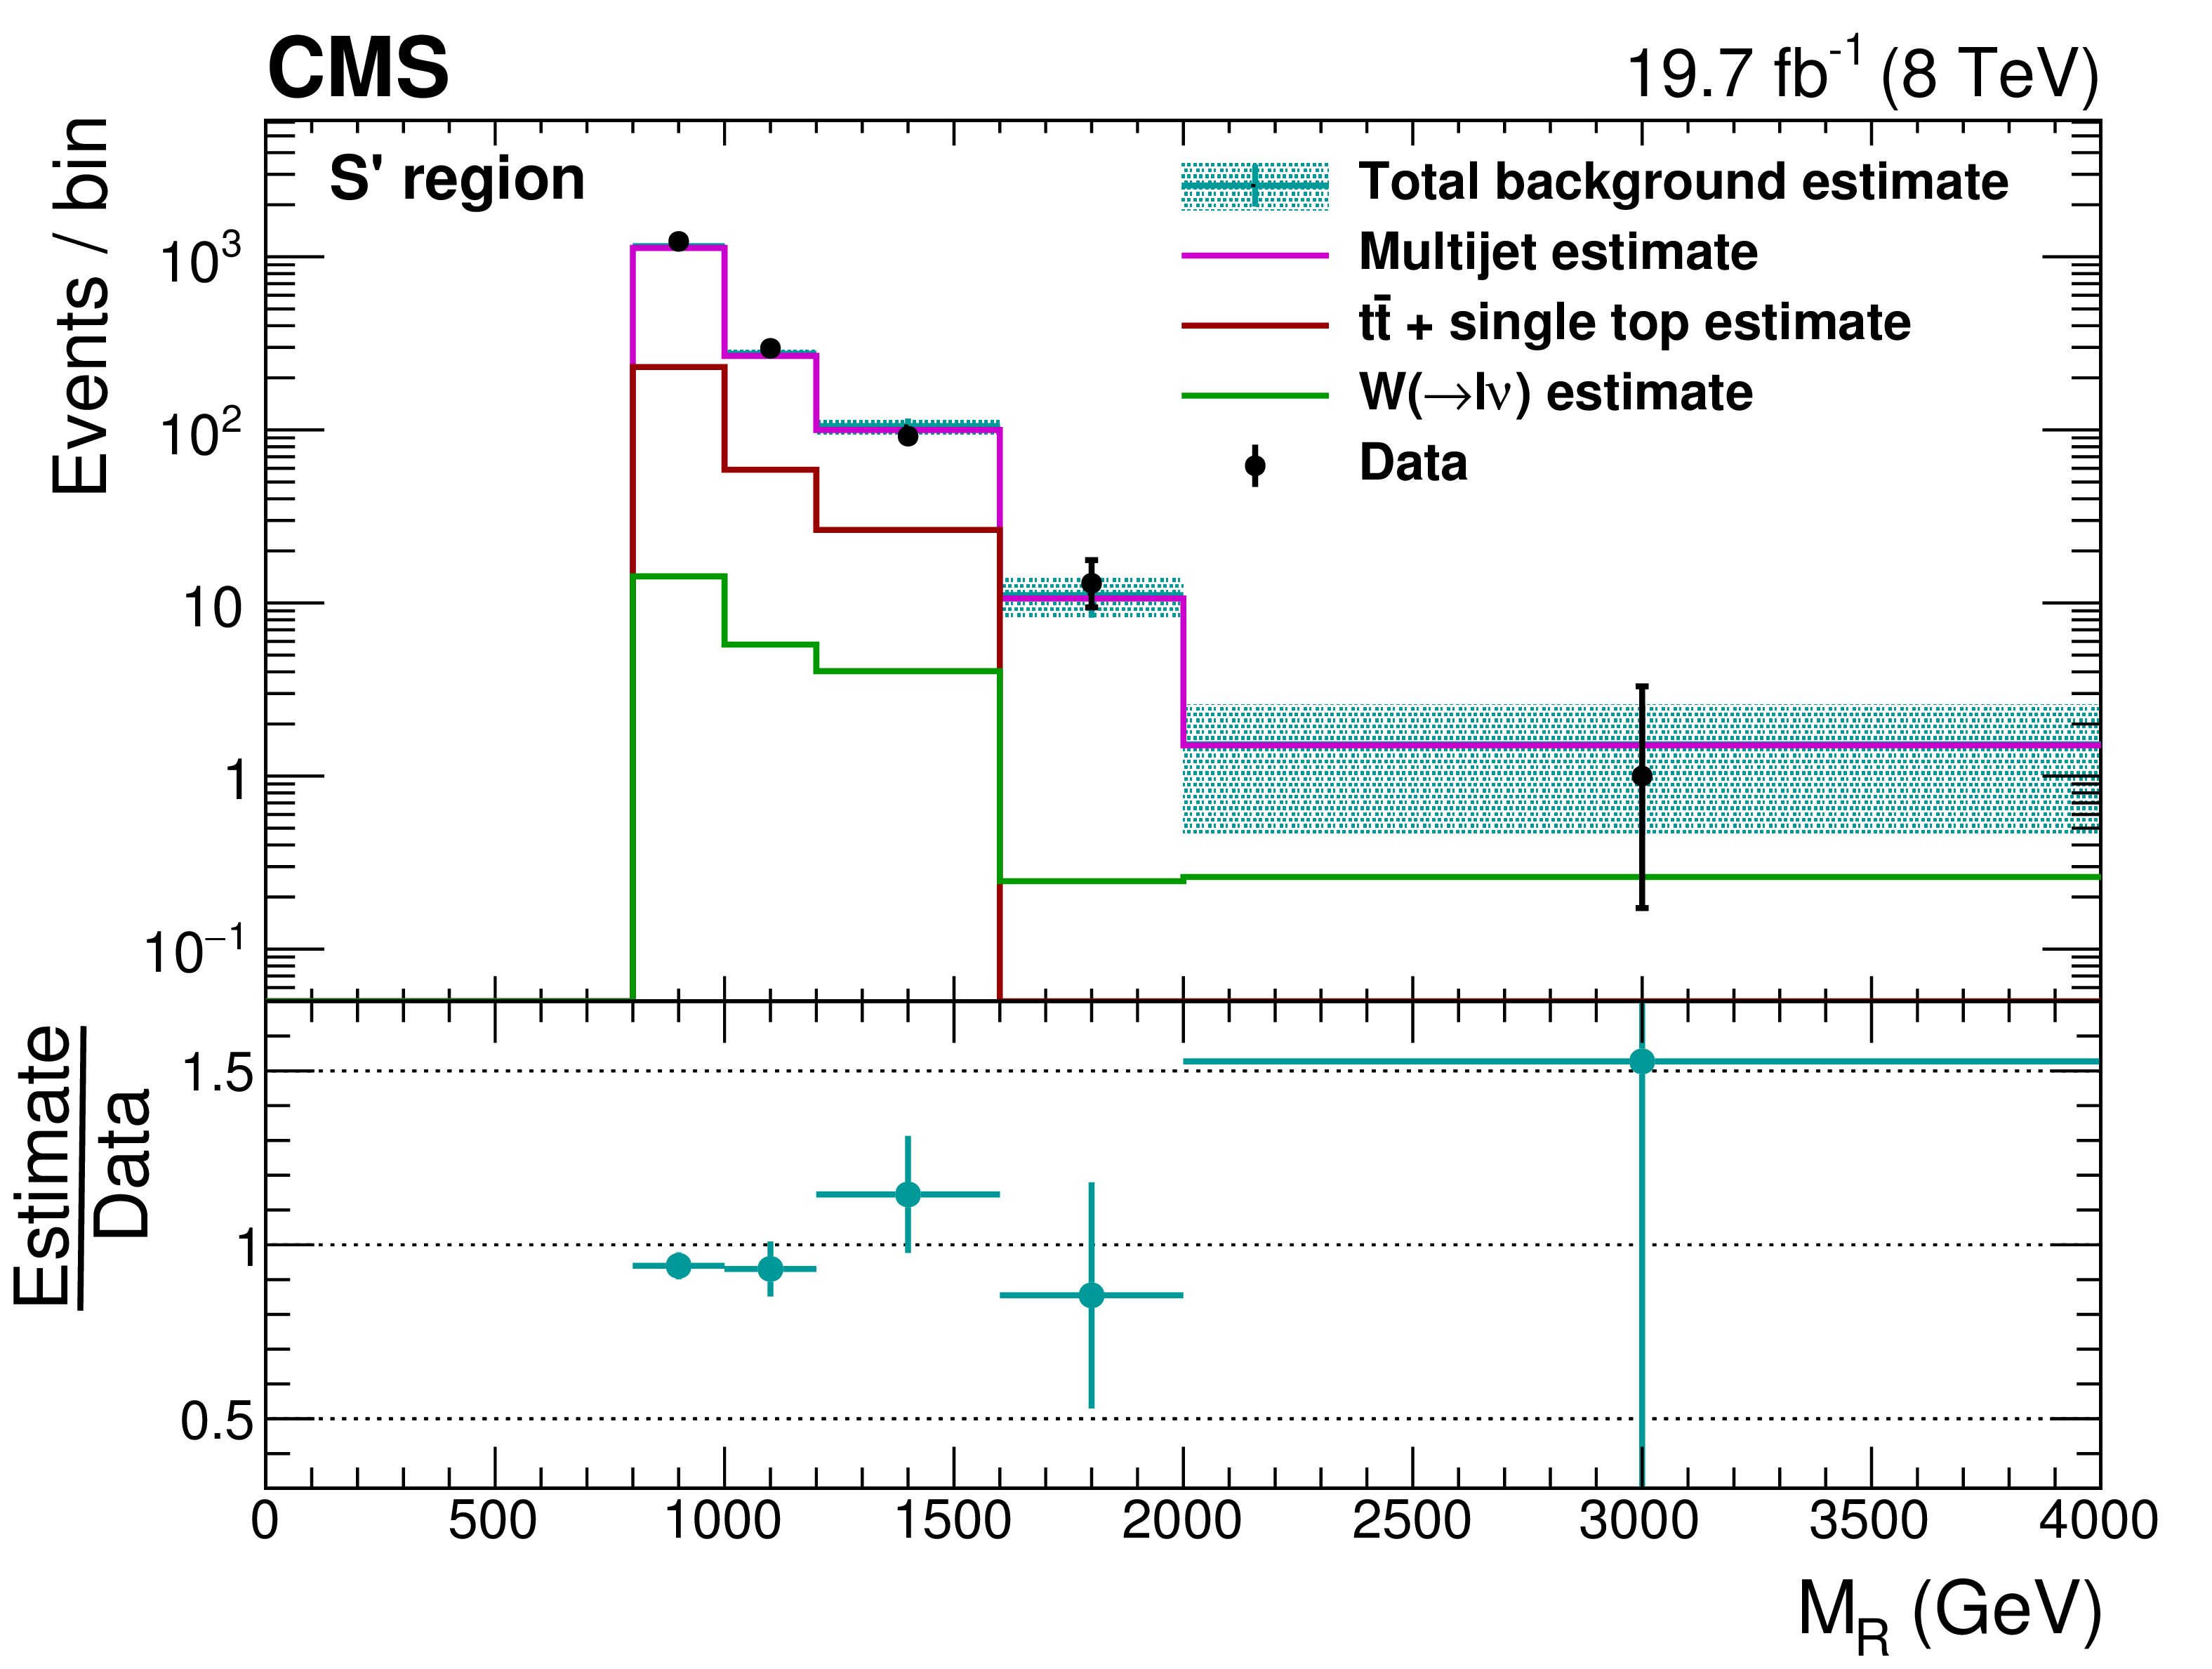
Figure 7-a:
One-dimensional projection of $ {M_R} $ (a) and $R^2$ (b) for the cross-check predicting the $\Delta \phi _\text {min}$ sideband region $S'$. The estimates for the three different background processes are stacked on top of each other. The uncertainties shown are statistical only. The horizontal error bars indicate the bin width. |
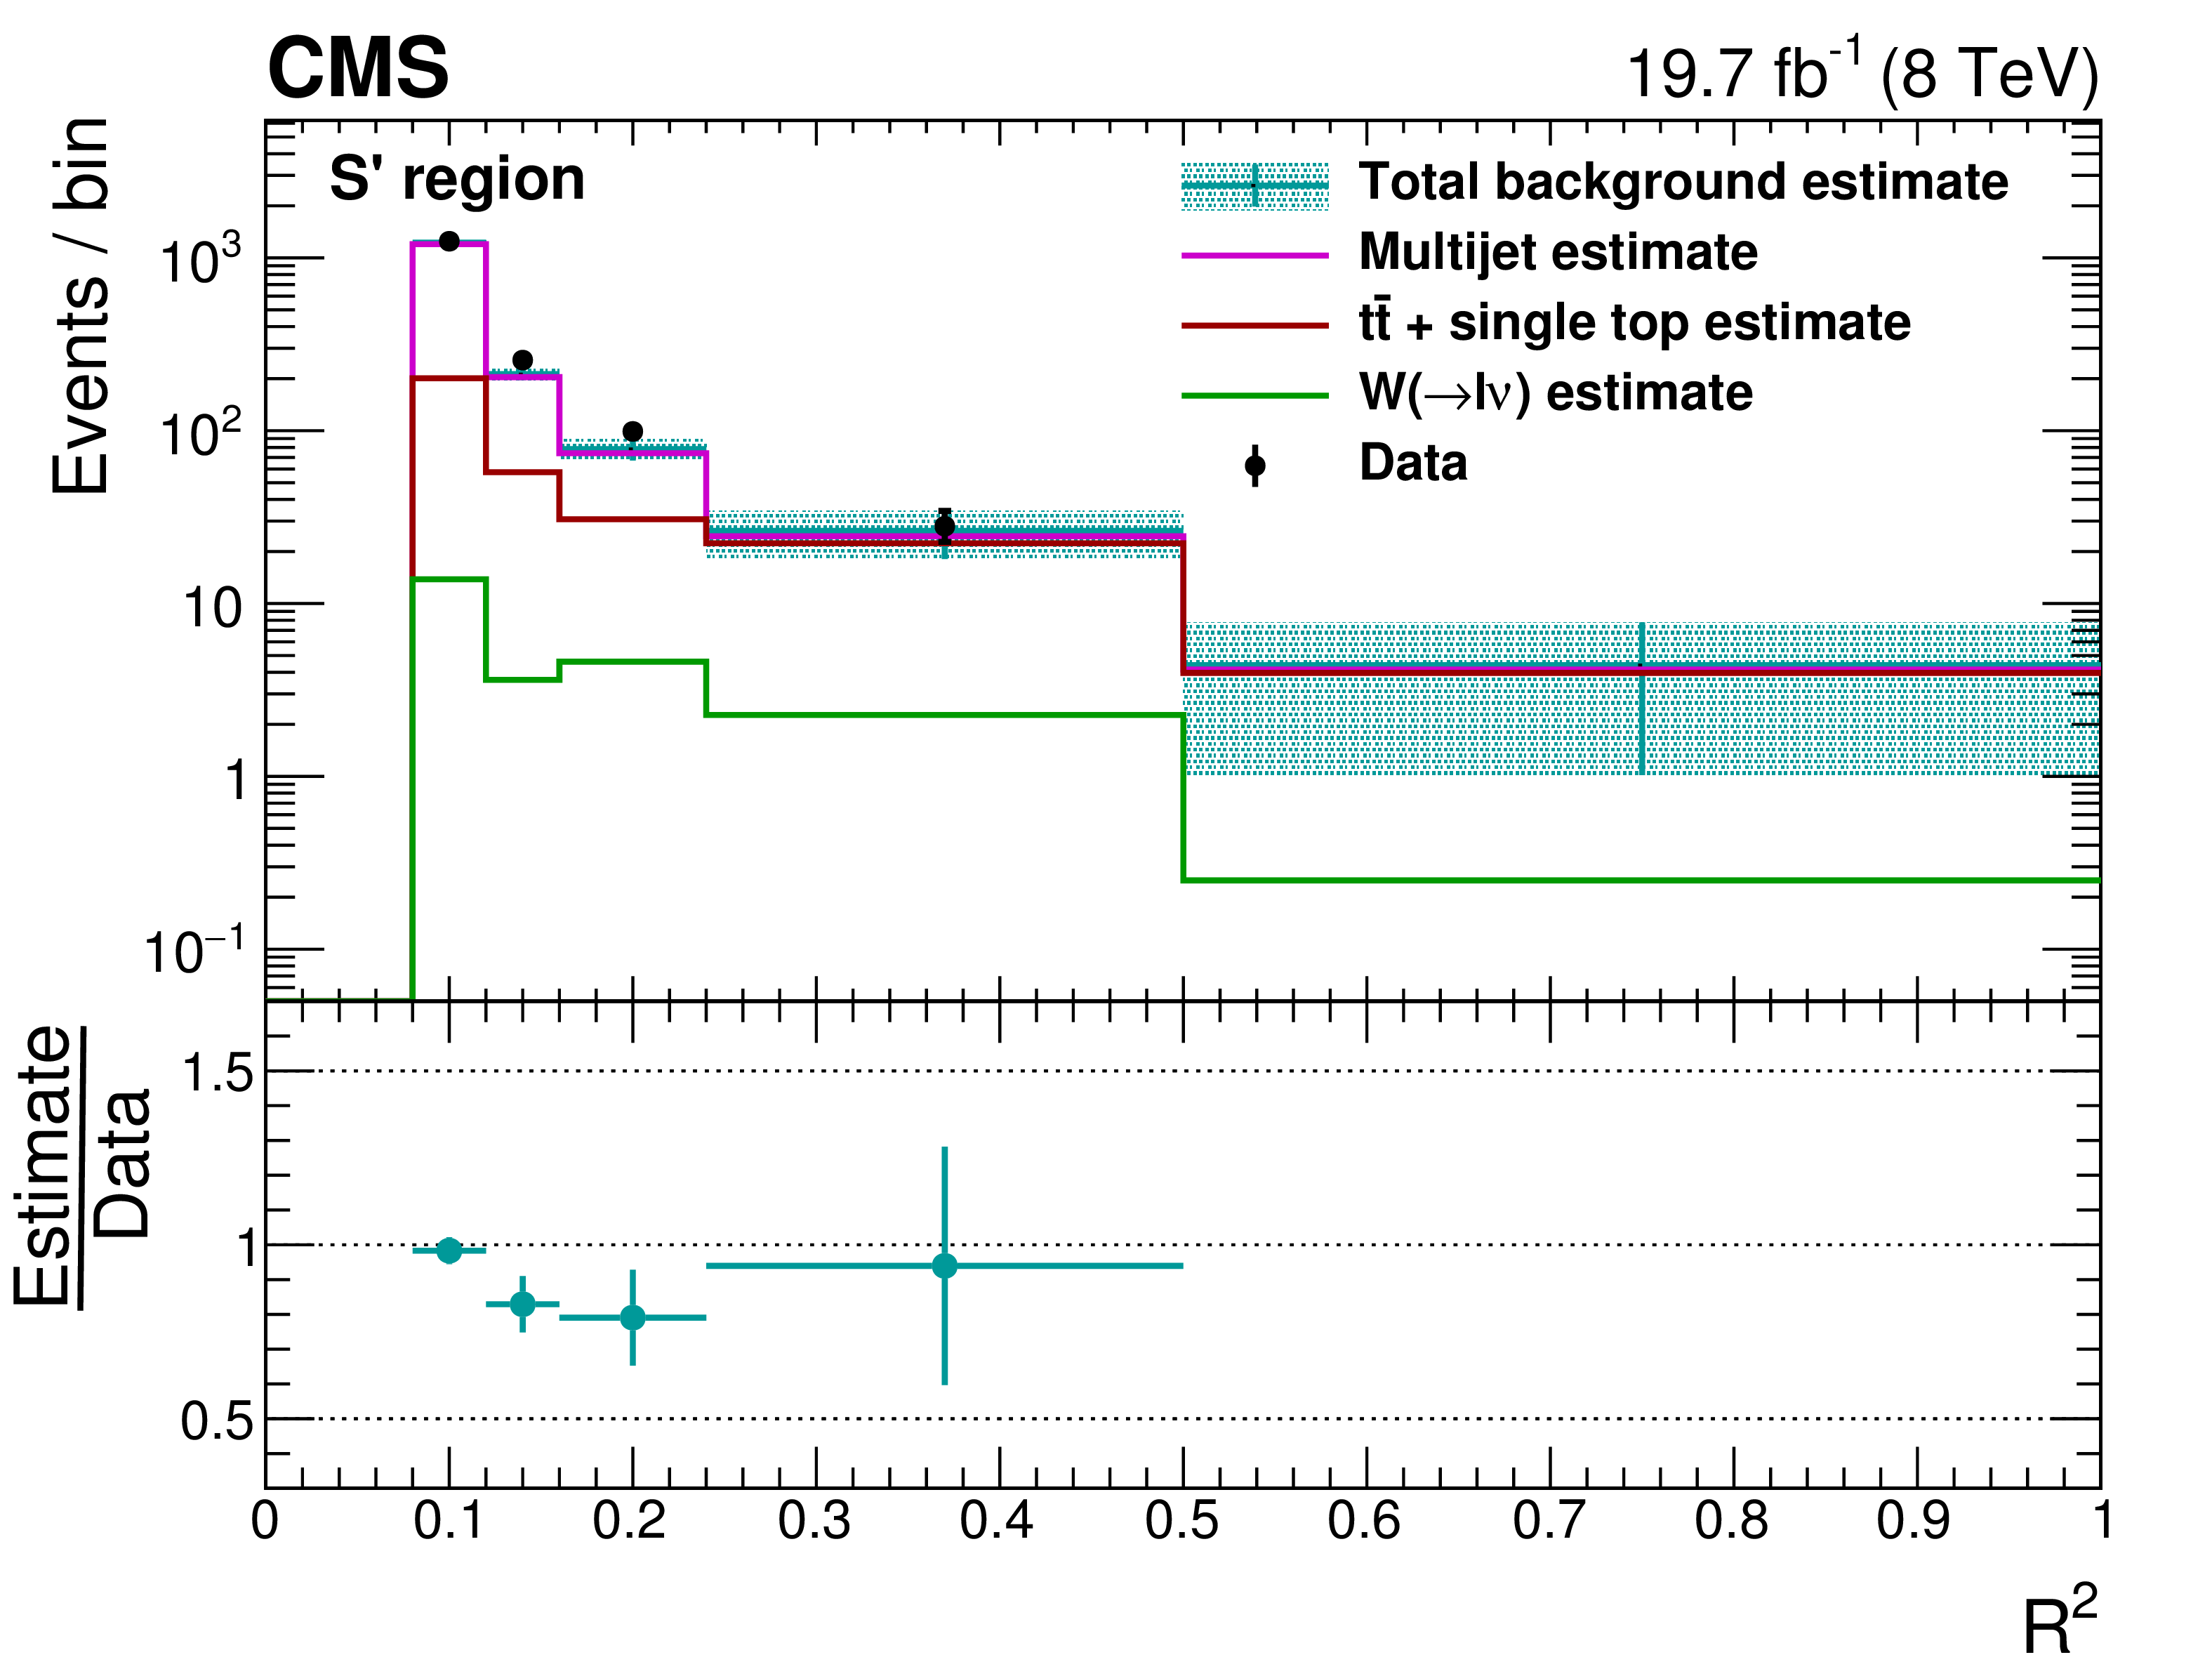
png pdf |
Figure 7-b:
One-dimensional projection of $ {M_R} $ (a) and $R^2$ (b) for the cross-check predicting the $\Delta \phi _\text {min}$ sideband region $S'$. The estimates for the three different background processes are stacked on top of each other. The uncertainties shown are statistical only. The horizontal error bars indicate the bin width. |

png pdf |
Figure 8-a:
One-dimensional projection of $ {M_R} $ (a) and $R^2$ (right panelb) for the cross-check predicting the background in region $Q'$ defined by $\Delta \phi _\text {min} > $ 0.5. The uncertainties shown are statistical only. The horizontal error bars indicate the bin width. |
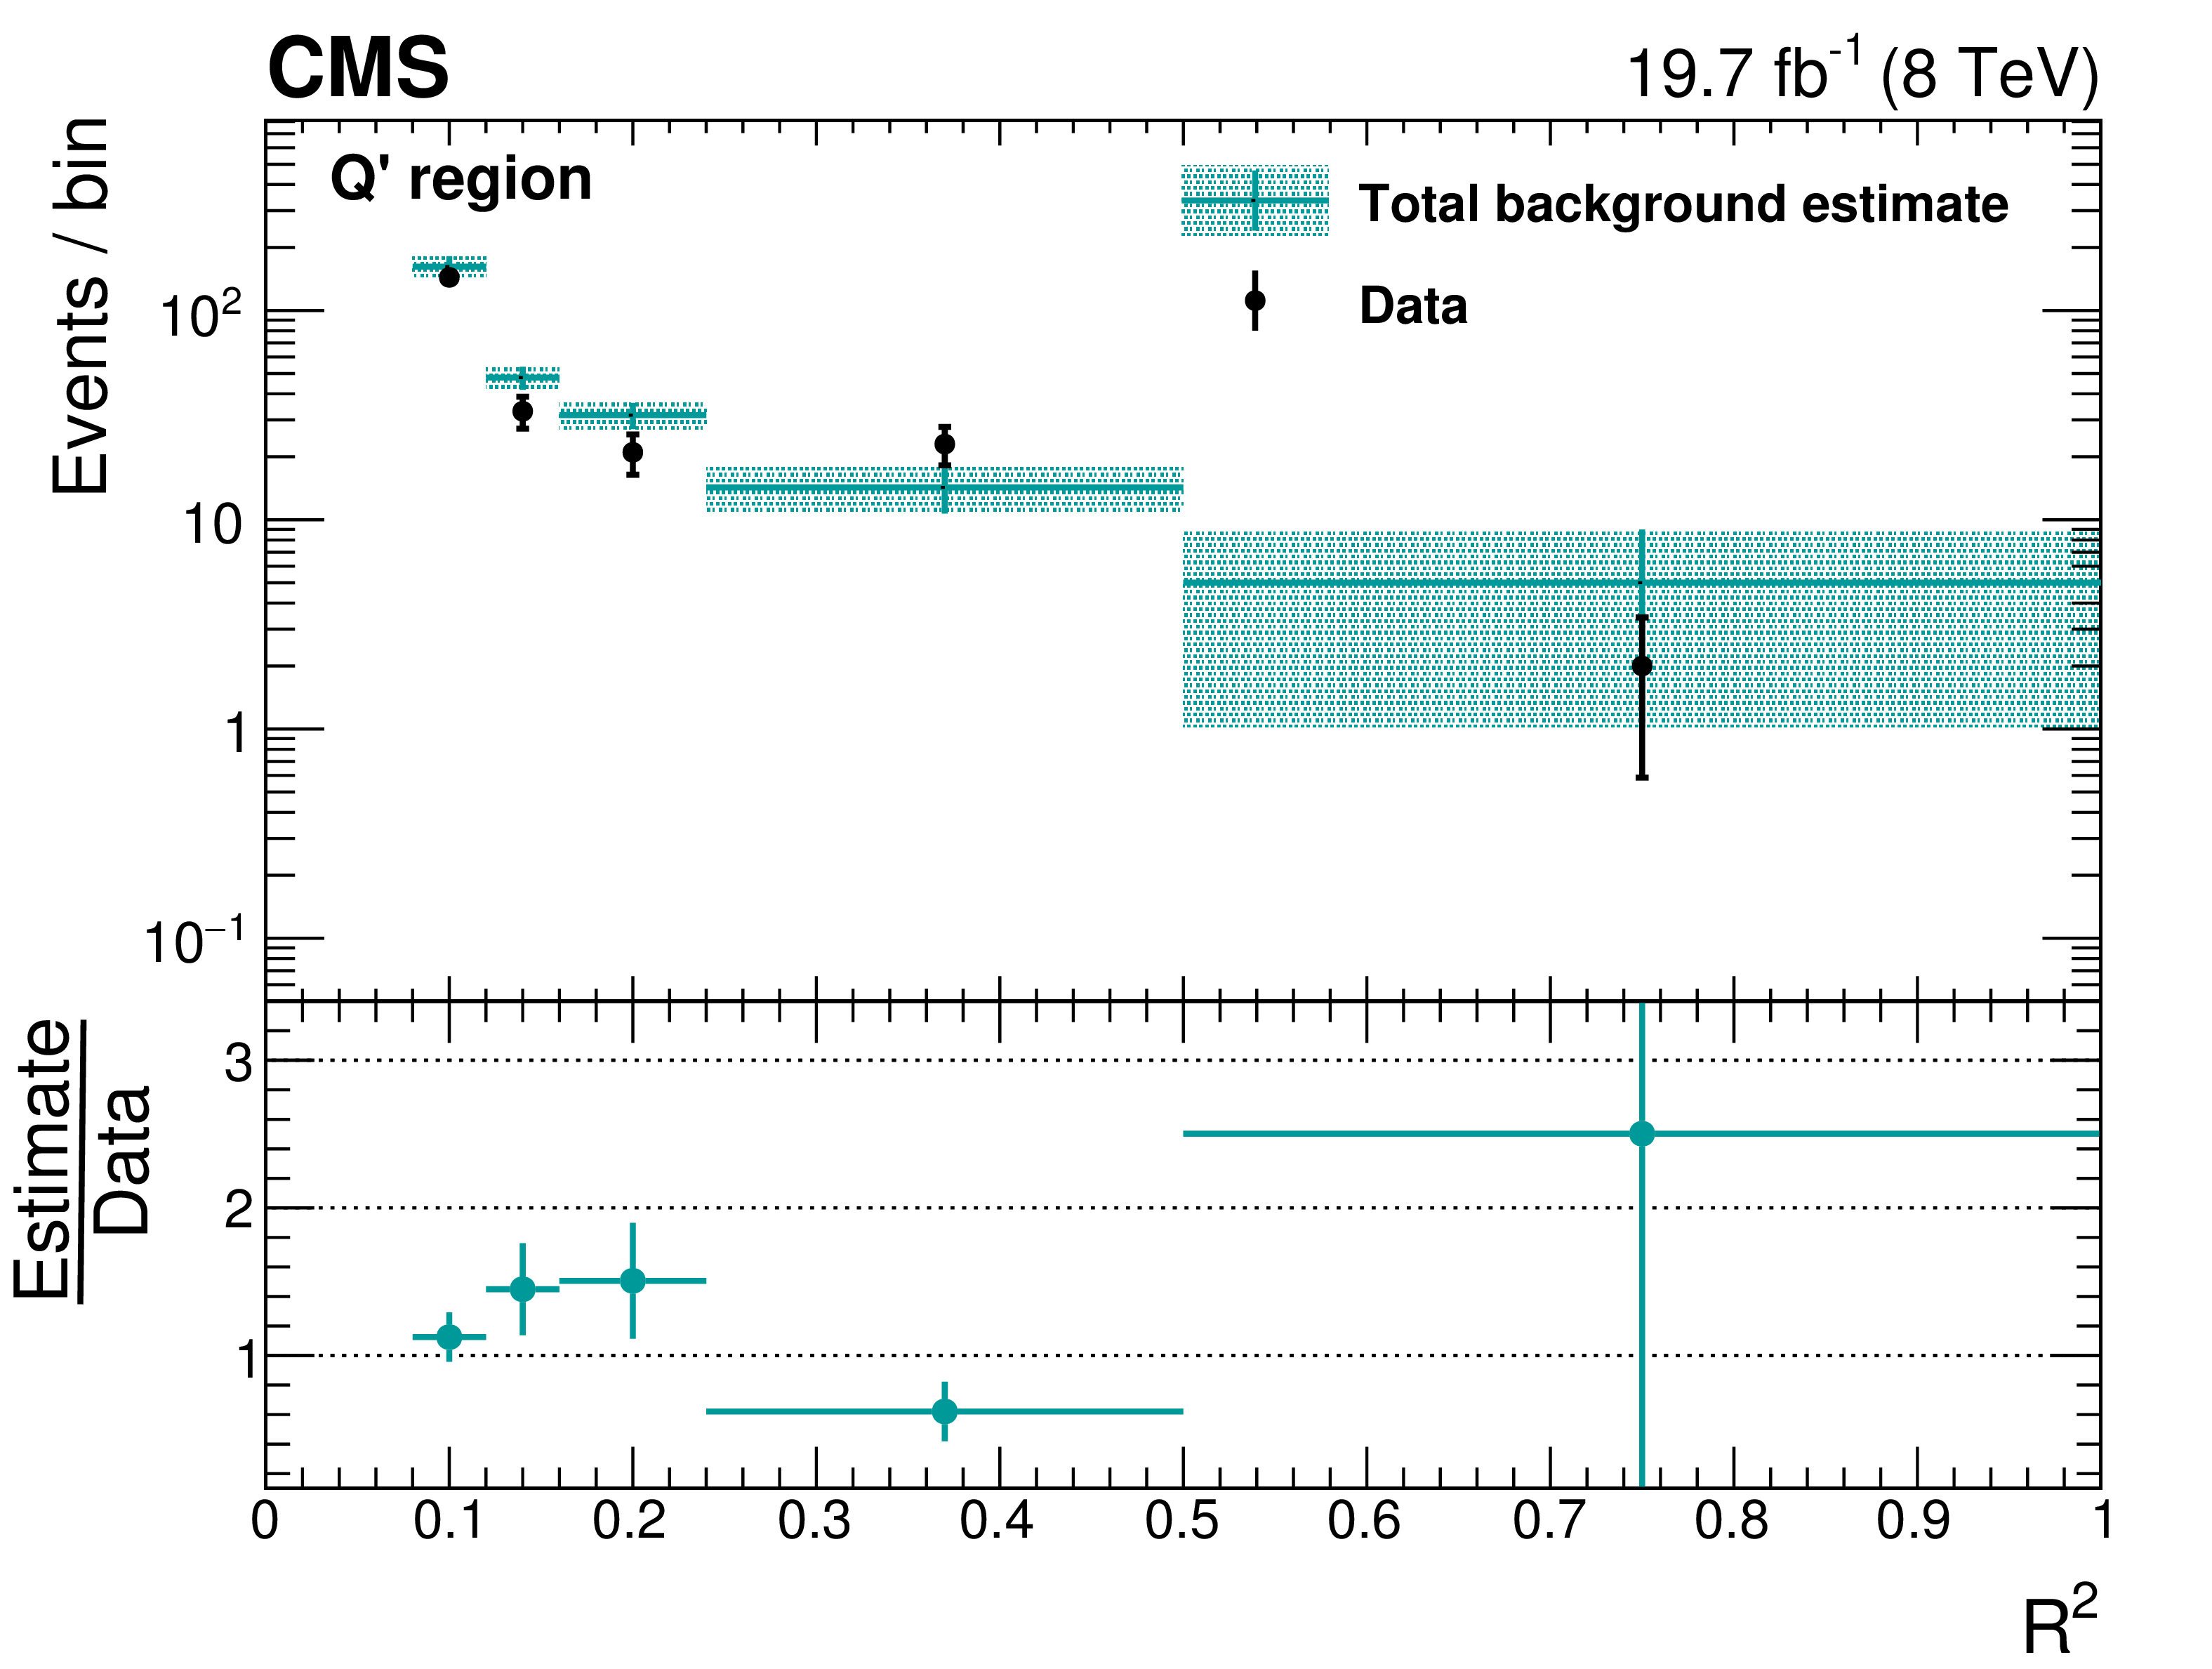
png pdf |
Figure 8-b:
One-dimensional projection of $ {M_R} $ (a) and $R^2$ (right panelb) for the cross-check predicting the background in region $Q'$ defined by $\Delta \phi _\text {min} > $ 0.5. The uncertainties shown are statistical only. The horizontal error bars indicate the bin width. |
png pdf |
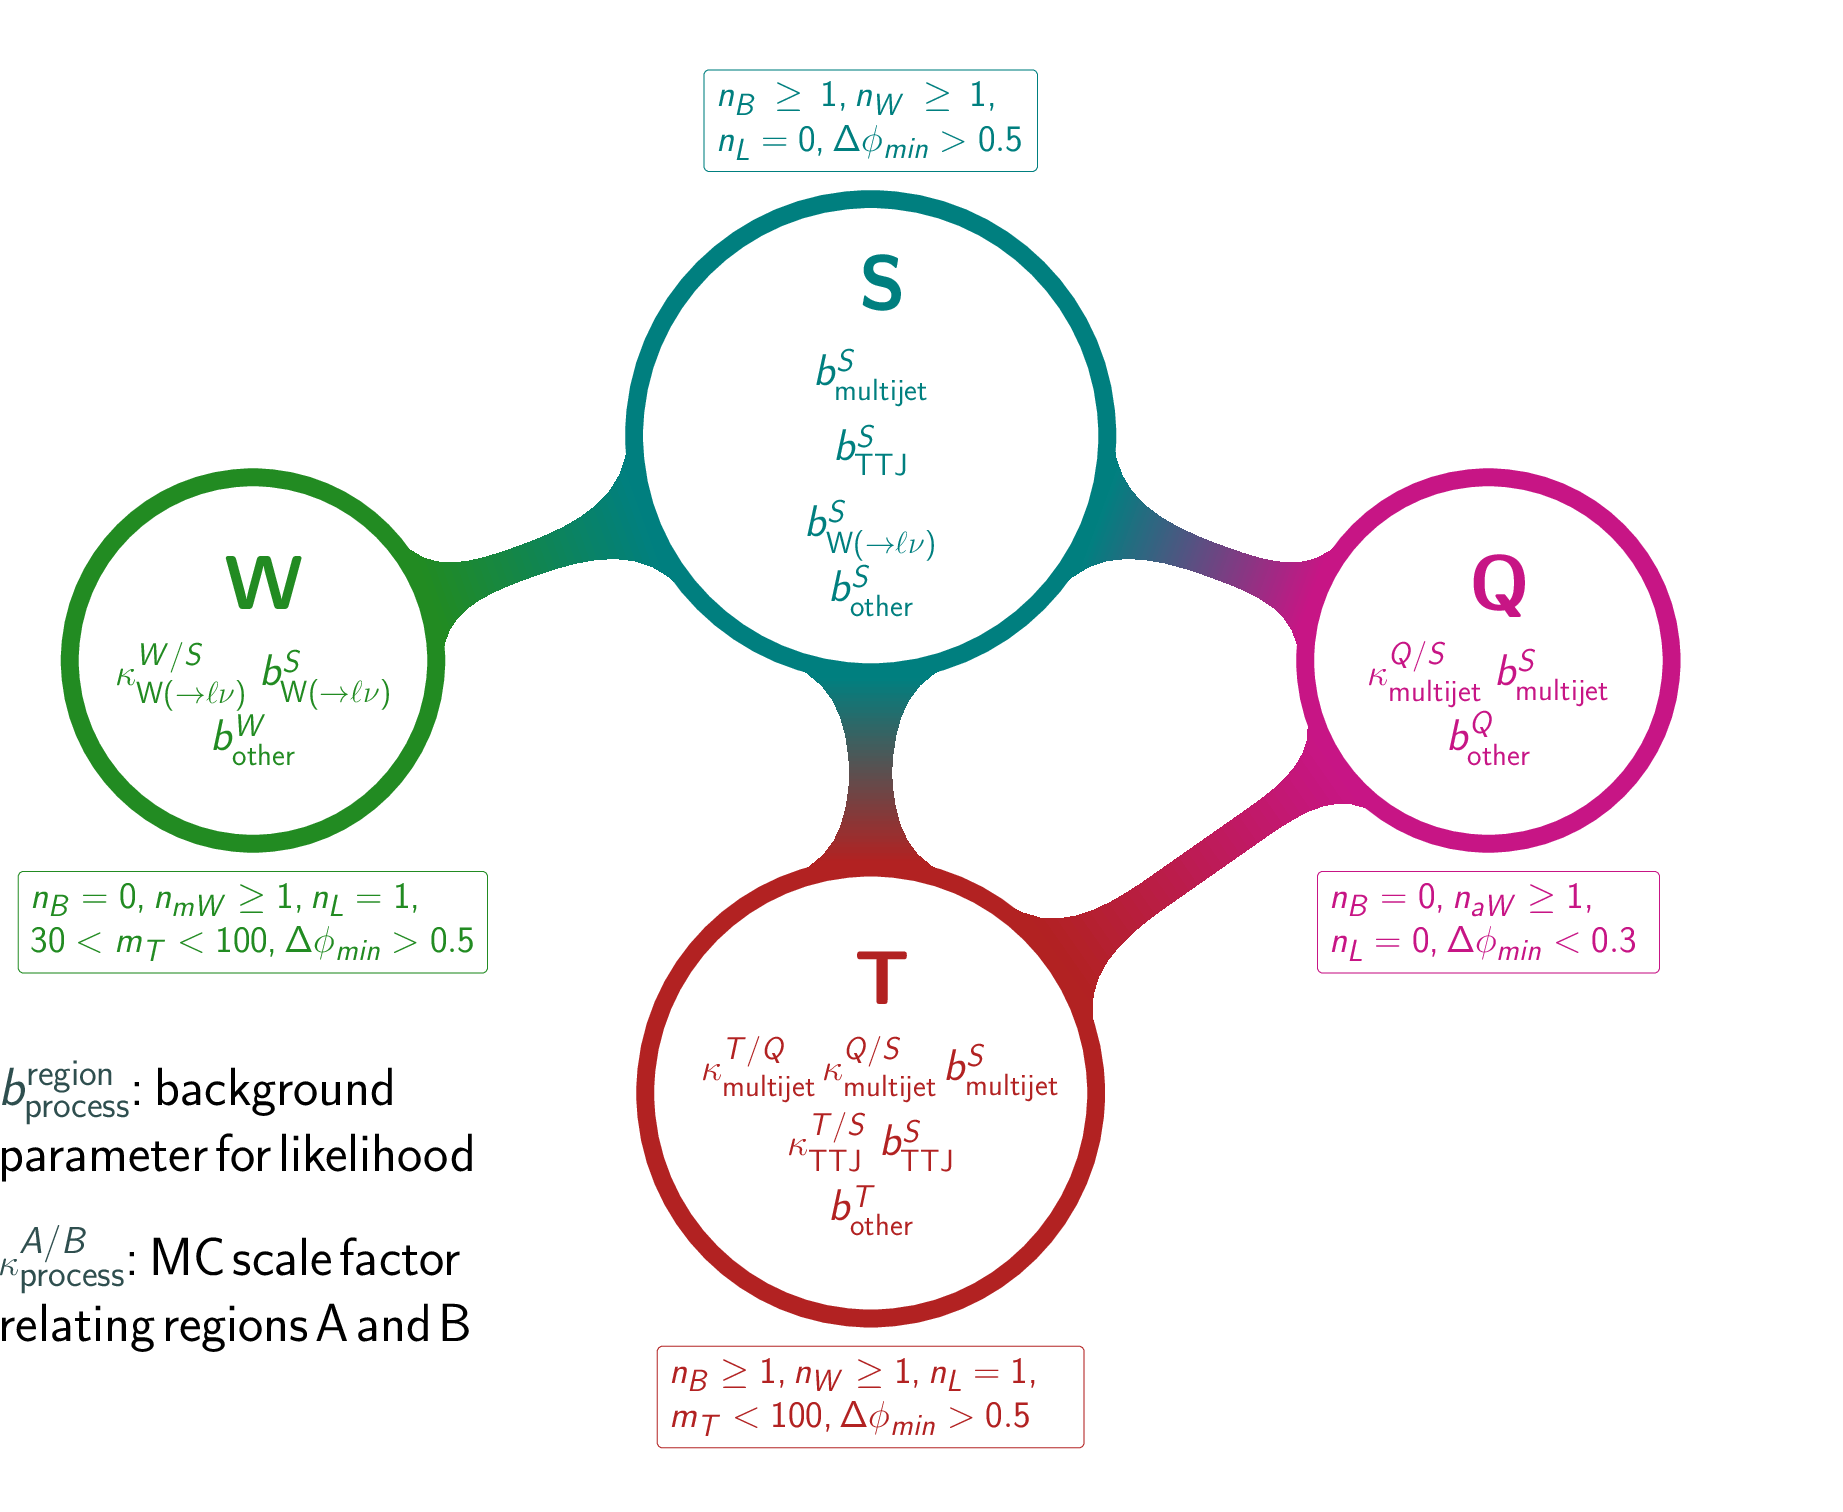
Figure 9:
Graphical representation of the analysis method. The circles represent the signal ($S$) and control ($Q,T,W$) regions, with their definition summarized in the associated boxes. Listed inside each circle are the likelihood parameters relevant to that region: the bin-by-bin background parameters $b^\text {region}_\text {process}$ for the given region and background process, as well as the global scale factors $\kappa ^{A/B}_\text {process} = \sum_i b^A_{{\rm process, MC,} i} / \sum_i b^B_{{\rm process, MC,} i}$, where the sum is over all bins of the simulated data. A connection between two regions indicates that one or more parameters are shared. The total expected background, per the $( {M_R},R^2)$ bin, is the sum of the terms shown for each region. Furthermore, associated with each bin of each region is an observed count, $N^\text {region}$, a simulated count, $N^\text {region}_{\text {process}, \mathrm {MC}}$, and a count $N^\text {region}_{\text {other}, \mathrm {MC}}$ equal to the sum of the smaller backgrounds, $\mathrm{ Z } / \gamma^* \rightarrow \ell \bar{\ell }+$jets, diboson, triboson, and $\mathrm{ t \bar{t} } \mathrm{V}$, with an associated parameter in the likelihood $b^\text {region}_\text {other}$. |

png pdf |
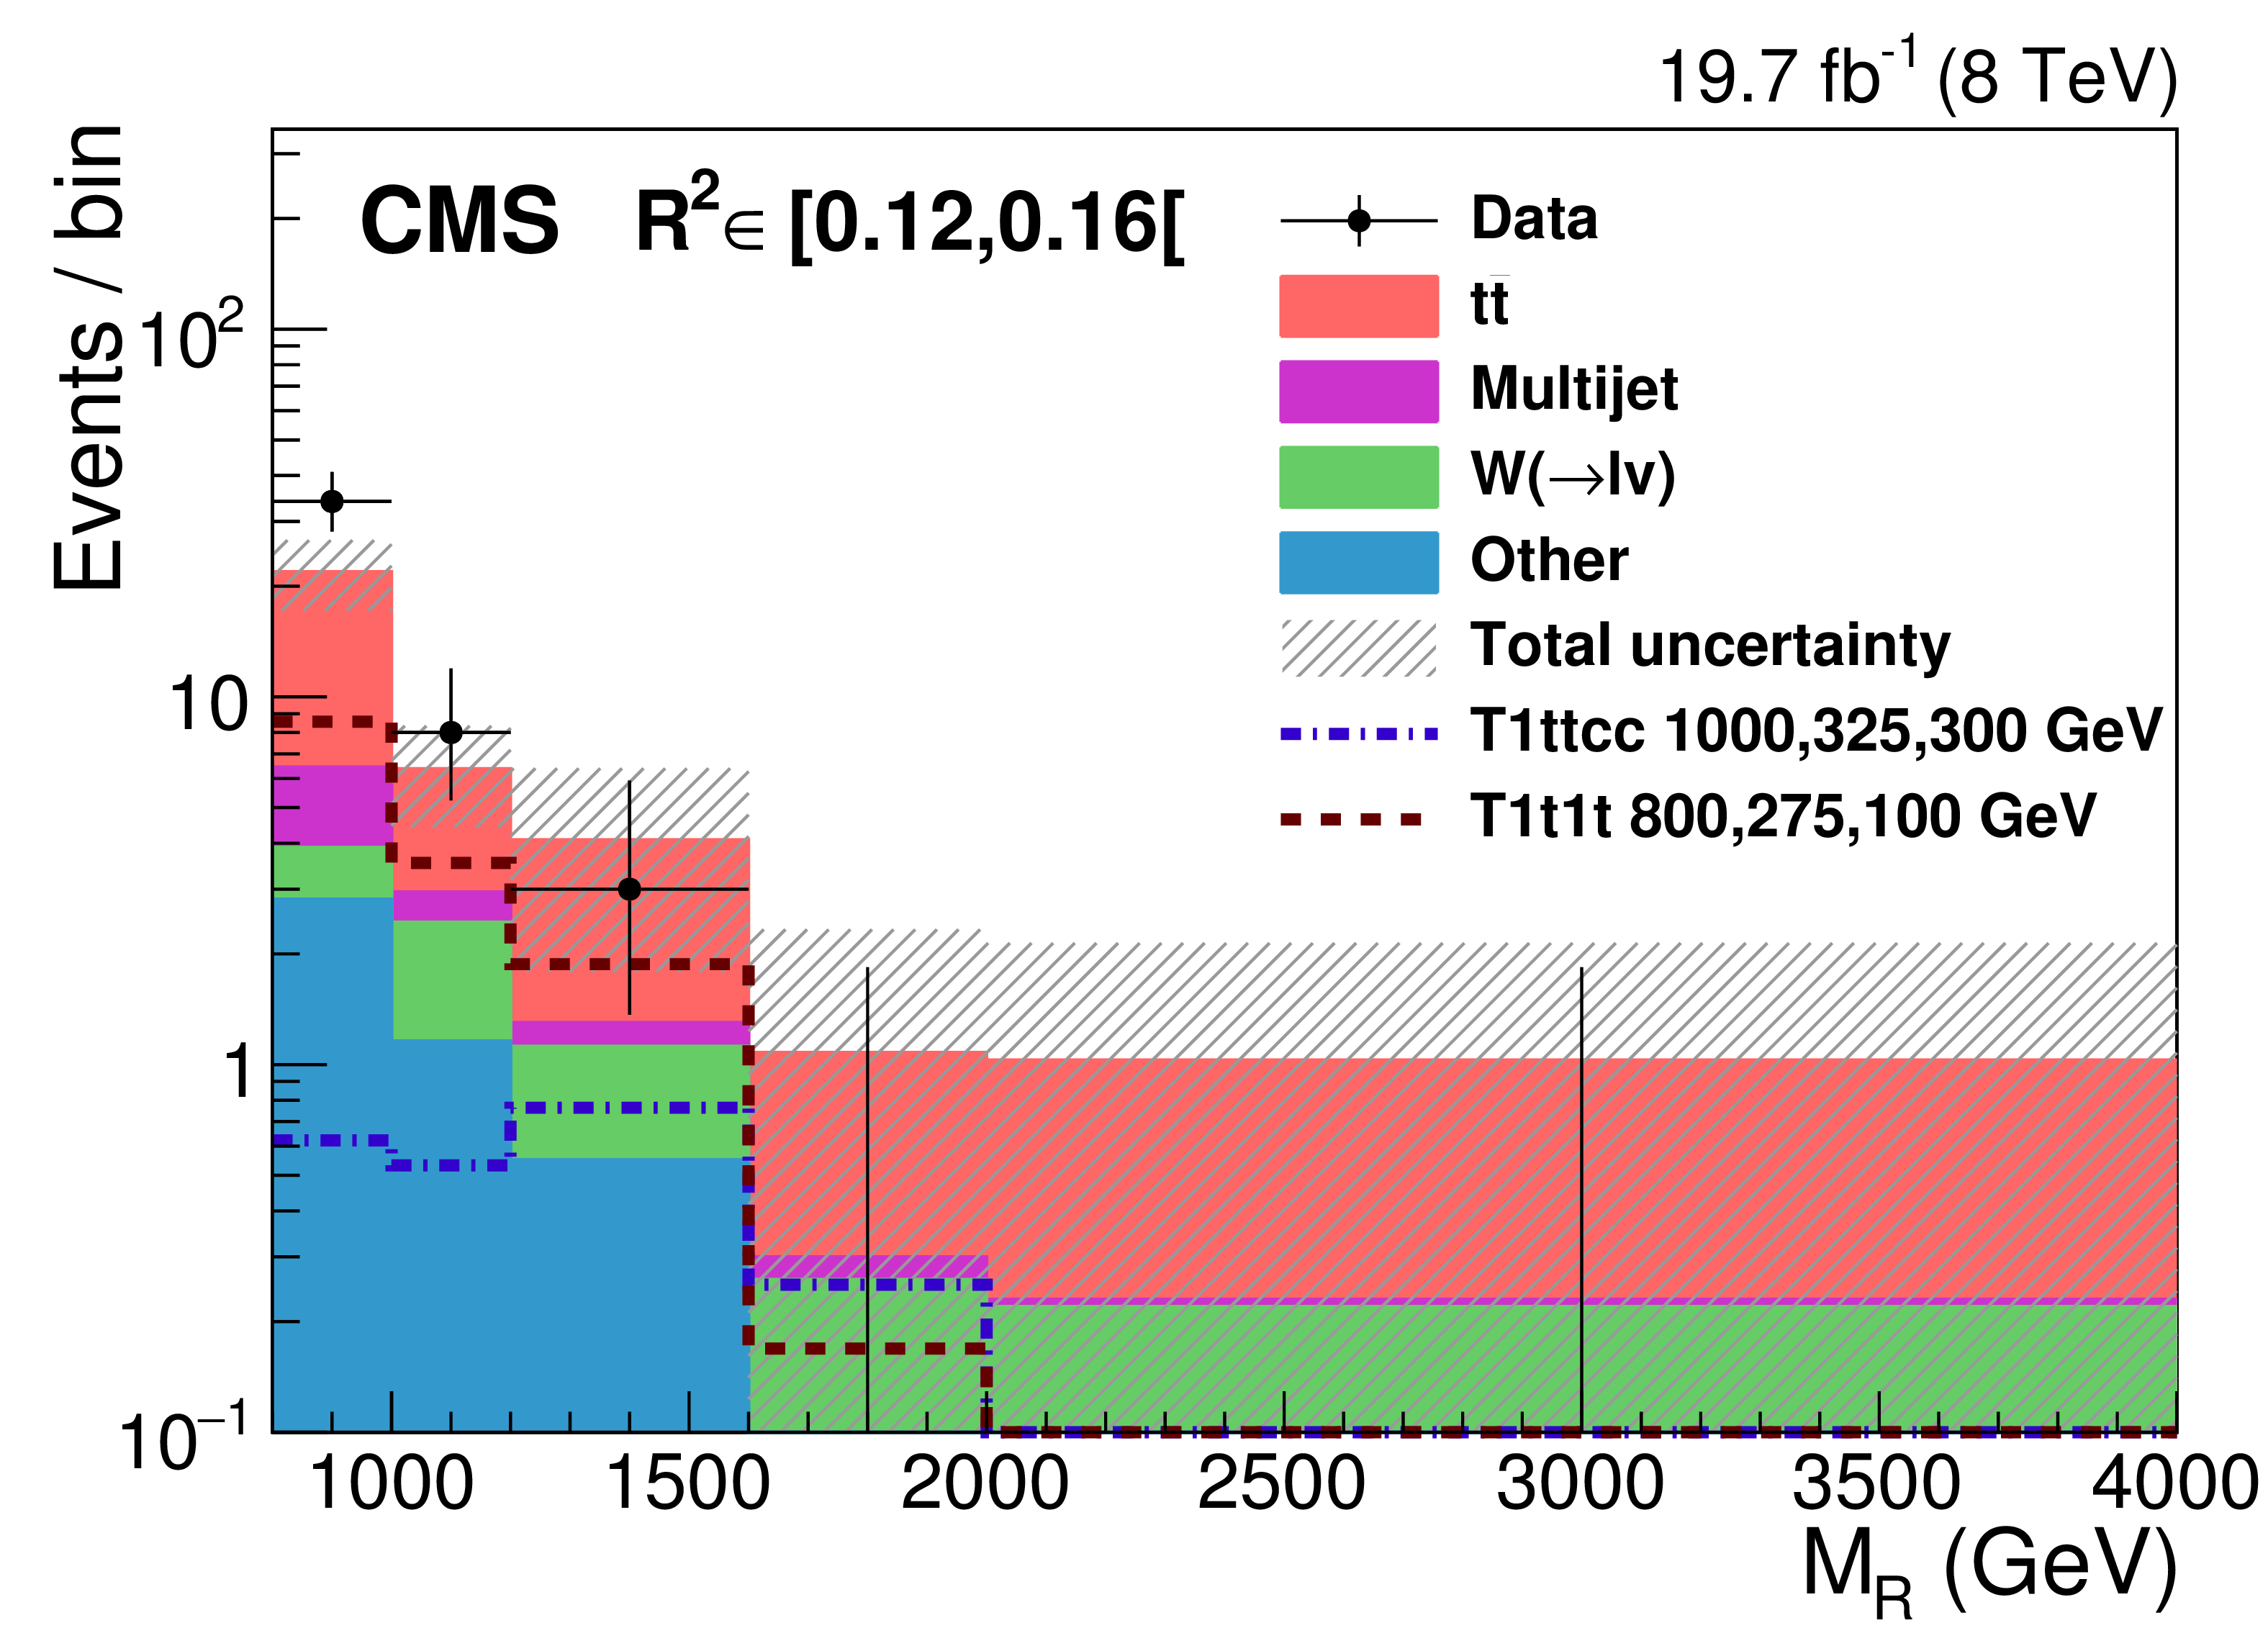
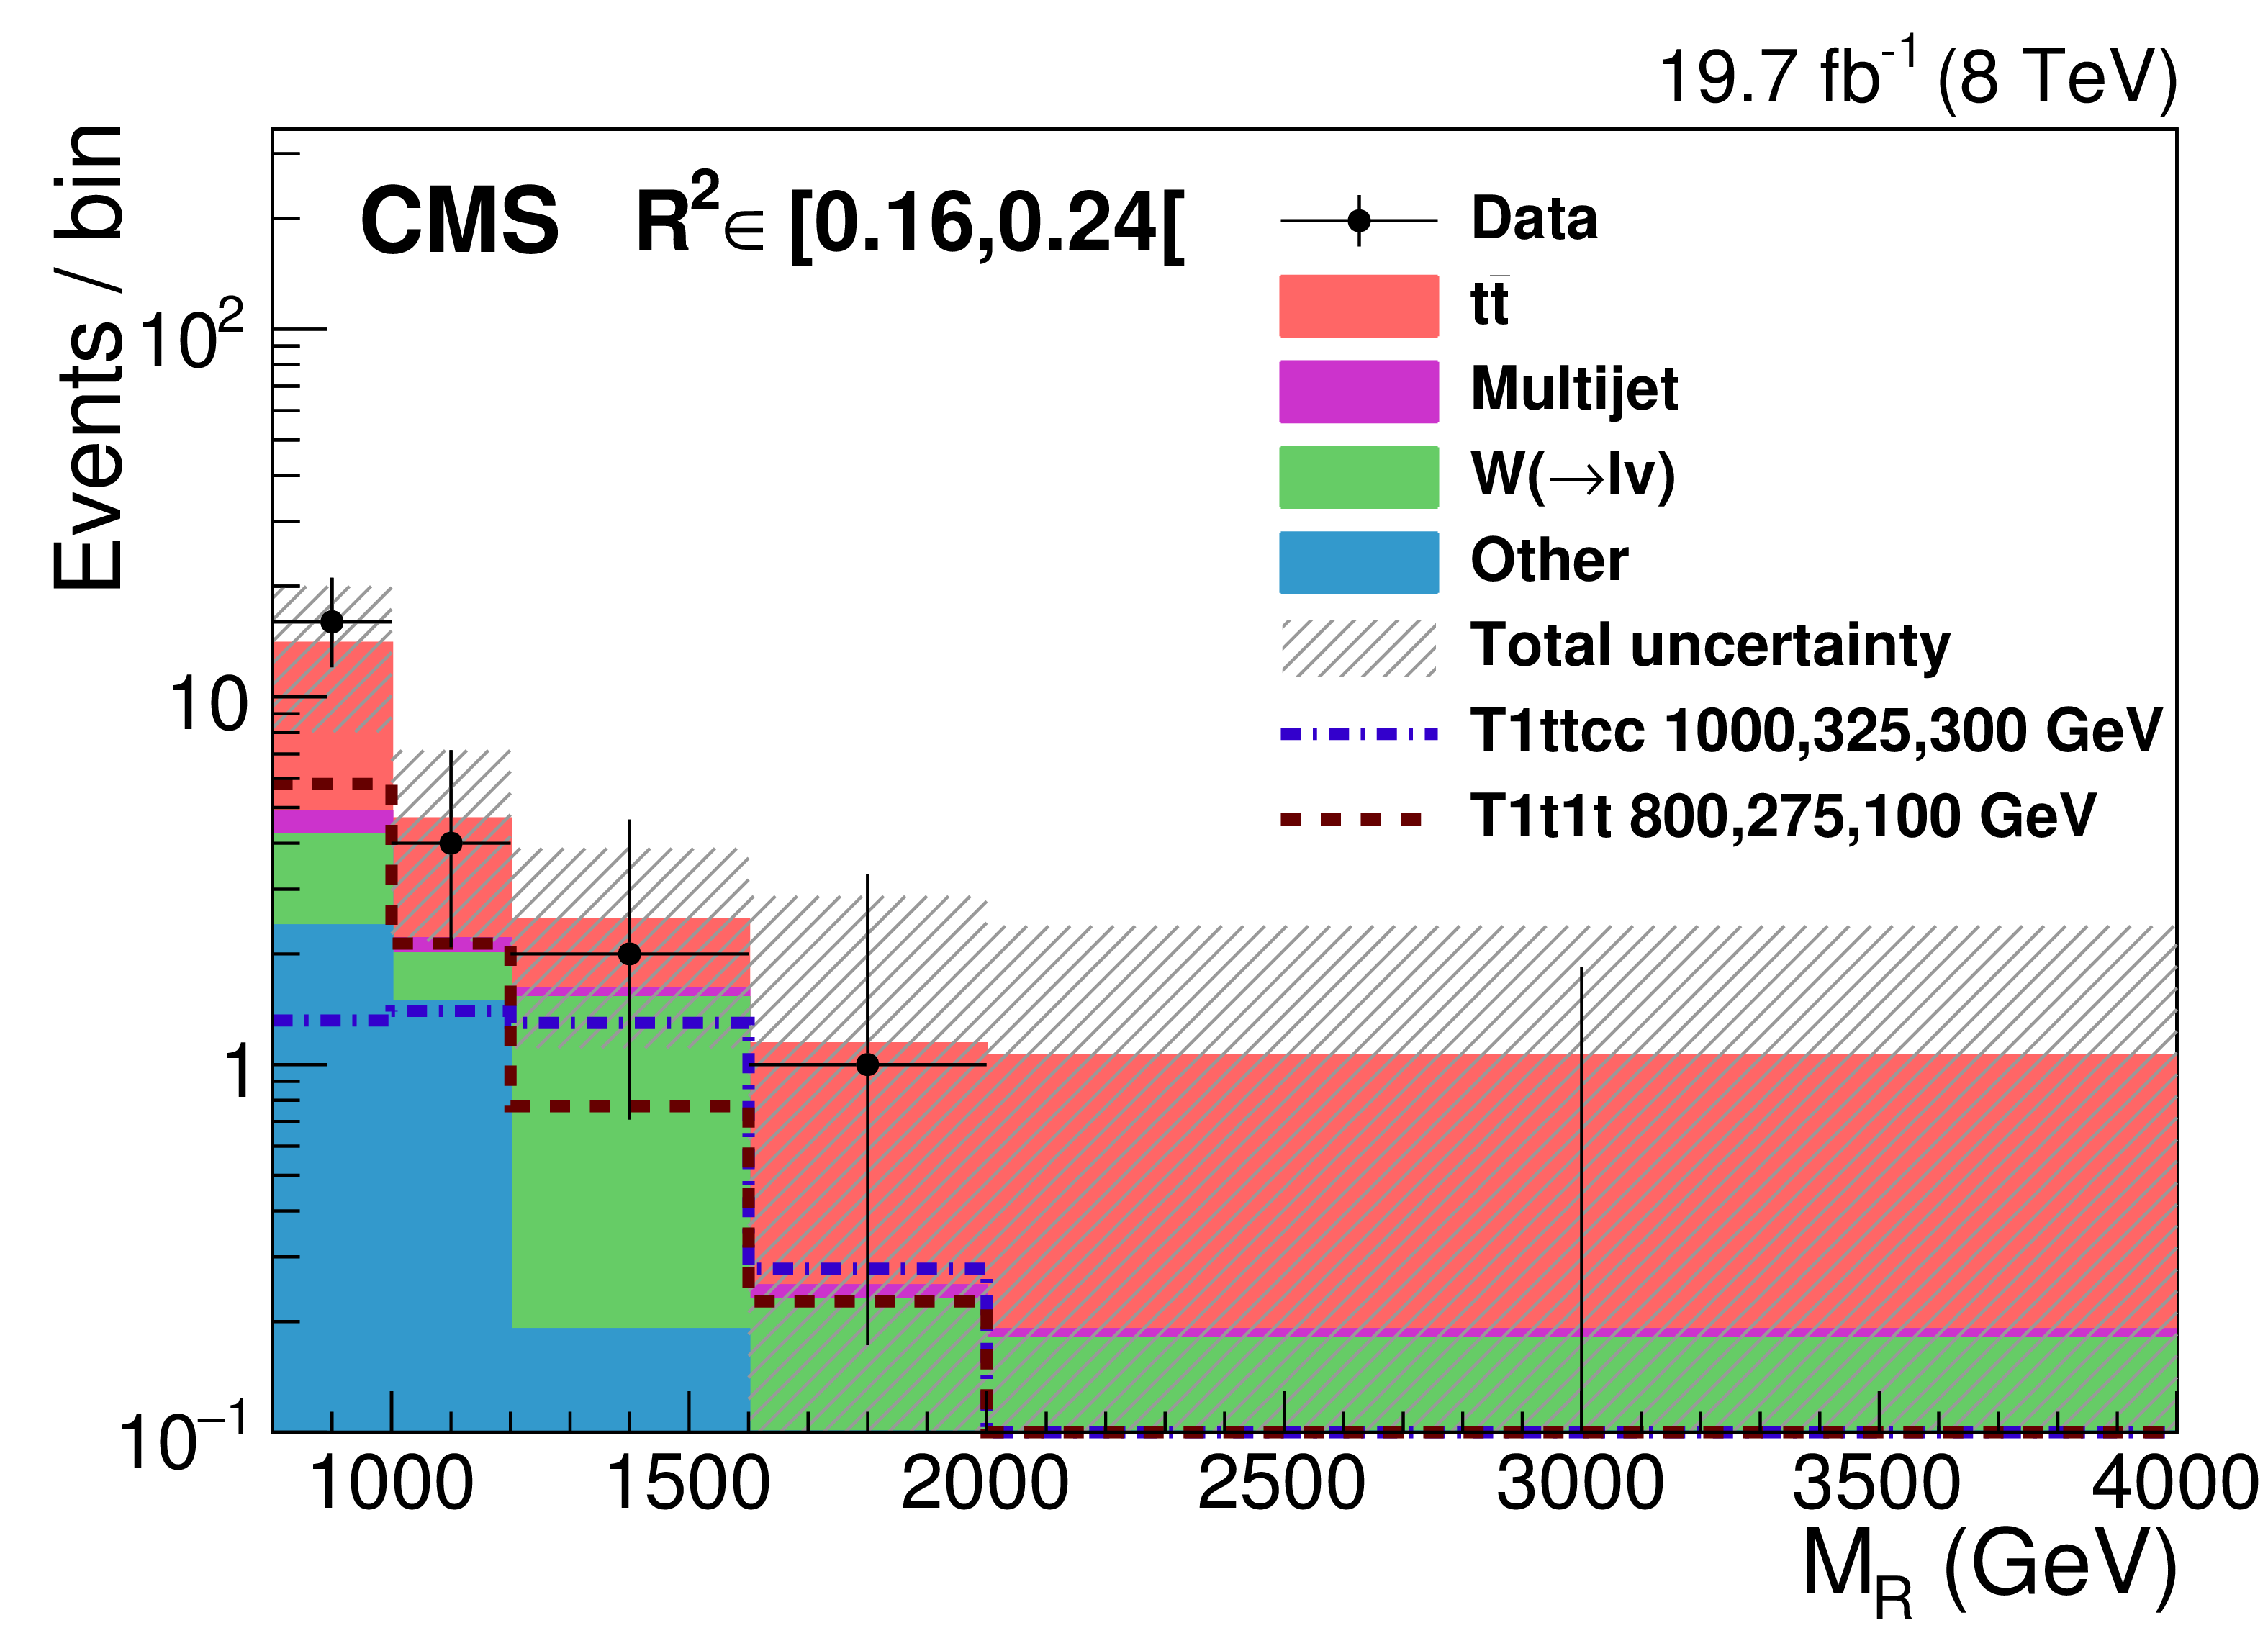
Figure 10-a:
Background predictions and observations. The results are shown in bins of $ {M_R} $ for each $R^2$ bin. The hatched band represents the total uncertainty in the background prediction. Overlaid are two signal distributions corresponding to the T1ttcc model with $m_{\tilde{ \mathrm{ g } } } = $ 1 TeV, $m_{\tilde{ mathrm{ t } } } = $ 325 GeV, and $m_{\tilde{\chi}^0_1 } = $ 300 GeV, and the T1t1t model with $m_{\tilde{ \mathrm{ g } } } = $ 800 GeV, $m_{\tilde{ mathrm{ t } } } = $ 275 GeV, and $m_{\tilde{\chi}^0_1 } = $ 100 GeV. |
png pdf |
Figure 10-b:
Background predictions and observations. The results are shown in bins of $ {M_R} $ for each $R^2$ bin. The hatched band represents the total uncertainty in the background prediction. Overlaid are two signal distributions corresponding to the T1ttcc model with $m_{\tilde{ \mathrm{ g } } } = $ 1 TeV, $m_{\tilde{ mathrm{ t } } } = $ 325 GeV, and $m_{\tilde{\chi}^0_1 } = $ 300 GeV, and the T1t1t model with $m_{\tilde{ \mathrm{ g } } } = $ 800 GeV, $m_{\tilde{ mathrm{ t } } } = $ 275 GeV, and $m_{\tilde{\chi}^0_1 } = $ 100 GeV. |
png pdf |
Figure 10-c:
Background predictions and observations. The results are shown in bins of $ {M_R} $ for each $R^2$ bin. The hatched band represents the total uncertainty in the background prediction. Overlaid are two signal distributions corresponding to the T1ttcc model with $m_{\tilde{ \mathrm{ g } } } = $ 1 TeV, $m_{\tilde{ mathrm{ t } } } = $ 325 GeV, and $m_{\tilde{\chi}^0_1 } = $ 300 GeV, and the T1t1t model with $m_{\tilde{ \mathrm{ g } } } = $ 800 GeV, $m_{\tilde{ mathrm{ t } } } = $ 275 GeV, and $m_{\tilde{\chi}^0_1 } = $ 100 GeV. |

png pdf |
Figure 10-d:
Background predictions and observations. The results are shown in bins of $ {M_R} $ for each $R^2$ bin. The hatched band represents the total uncertainty in the background prediction. Overlaid are two signal distributions corresponding to the T1ttcc model with $m_{\tilde{ \mathrm{ g } } } = $ 1 TeV, $m_{\tilde{ mathrm{ t } } } = $ 325 GeV, and $m_{\tilde{\chi}^0_1 } = $ 300 GeV, and the T1t1t model with $m_{\tilde{ \mathrm{ g } } } = $ 800 GeV, $m_{\tilde{ mathrm{ t } } } = $ 275 GeV, and $m_{\tilde{\chi}^0_1 } = $ 100 GeV. |

png pdf |
Figure 10-e:
Background predictions and observations. The results are shown in bins of $ {M_R} $ for each $R^2$ bin. The hatched band represents the total uncertainty in the background prediction. Overlaid are two signal distributions corresponding to the T1ttcc model with $m_{\tilde{ \mathrm{ g } } } = $ 1 TeV, $m_{\tilde{ mathrm{ t } } } = $ 325 GeV, and $m_{\tilde{\chi}^0_1 } = $ 300 GeV, and the T1t1t model with $m_{\tilde{ \mathrm{ g } } } = $ 800 GeV, $m_{\tilde{ mathrm{ t } } } = $ 275 GeV, and $m_{\tilde{\chi}^0_1 } = $ 100 GeV. |
png pdf |
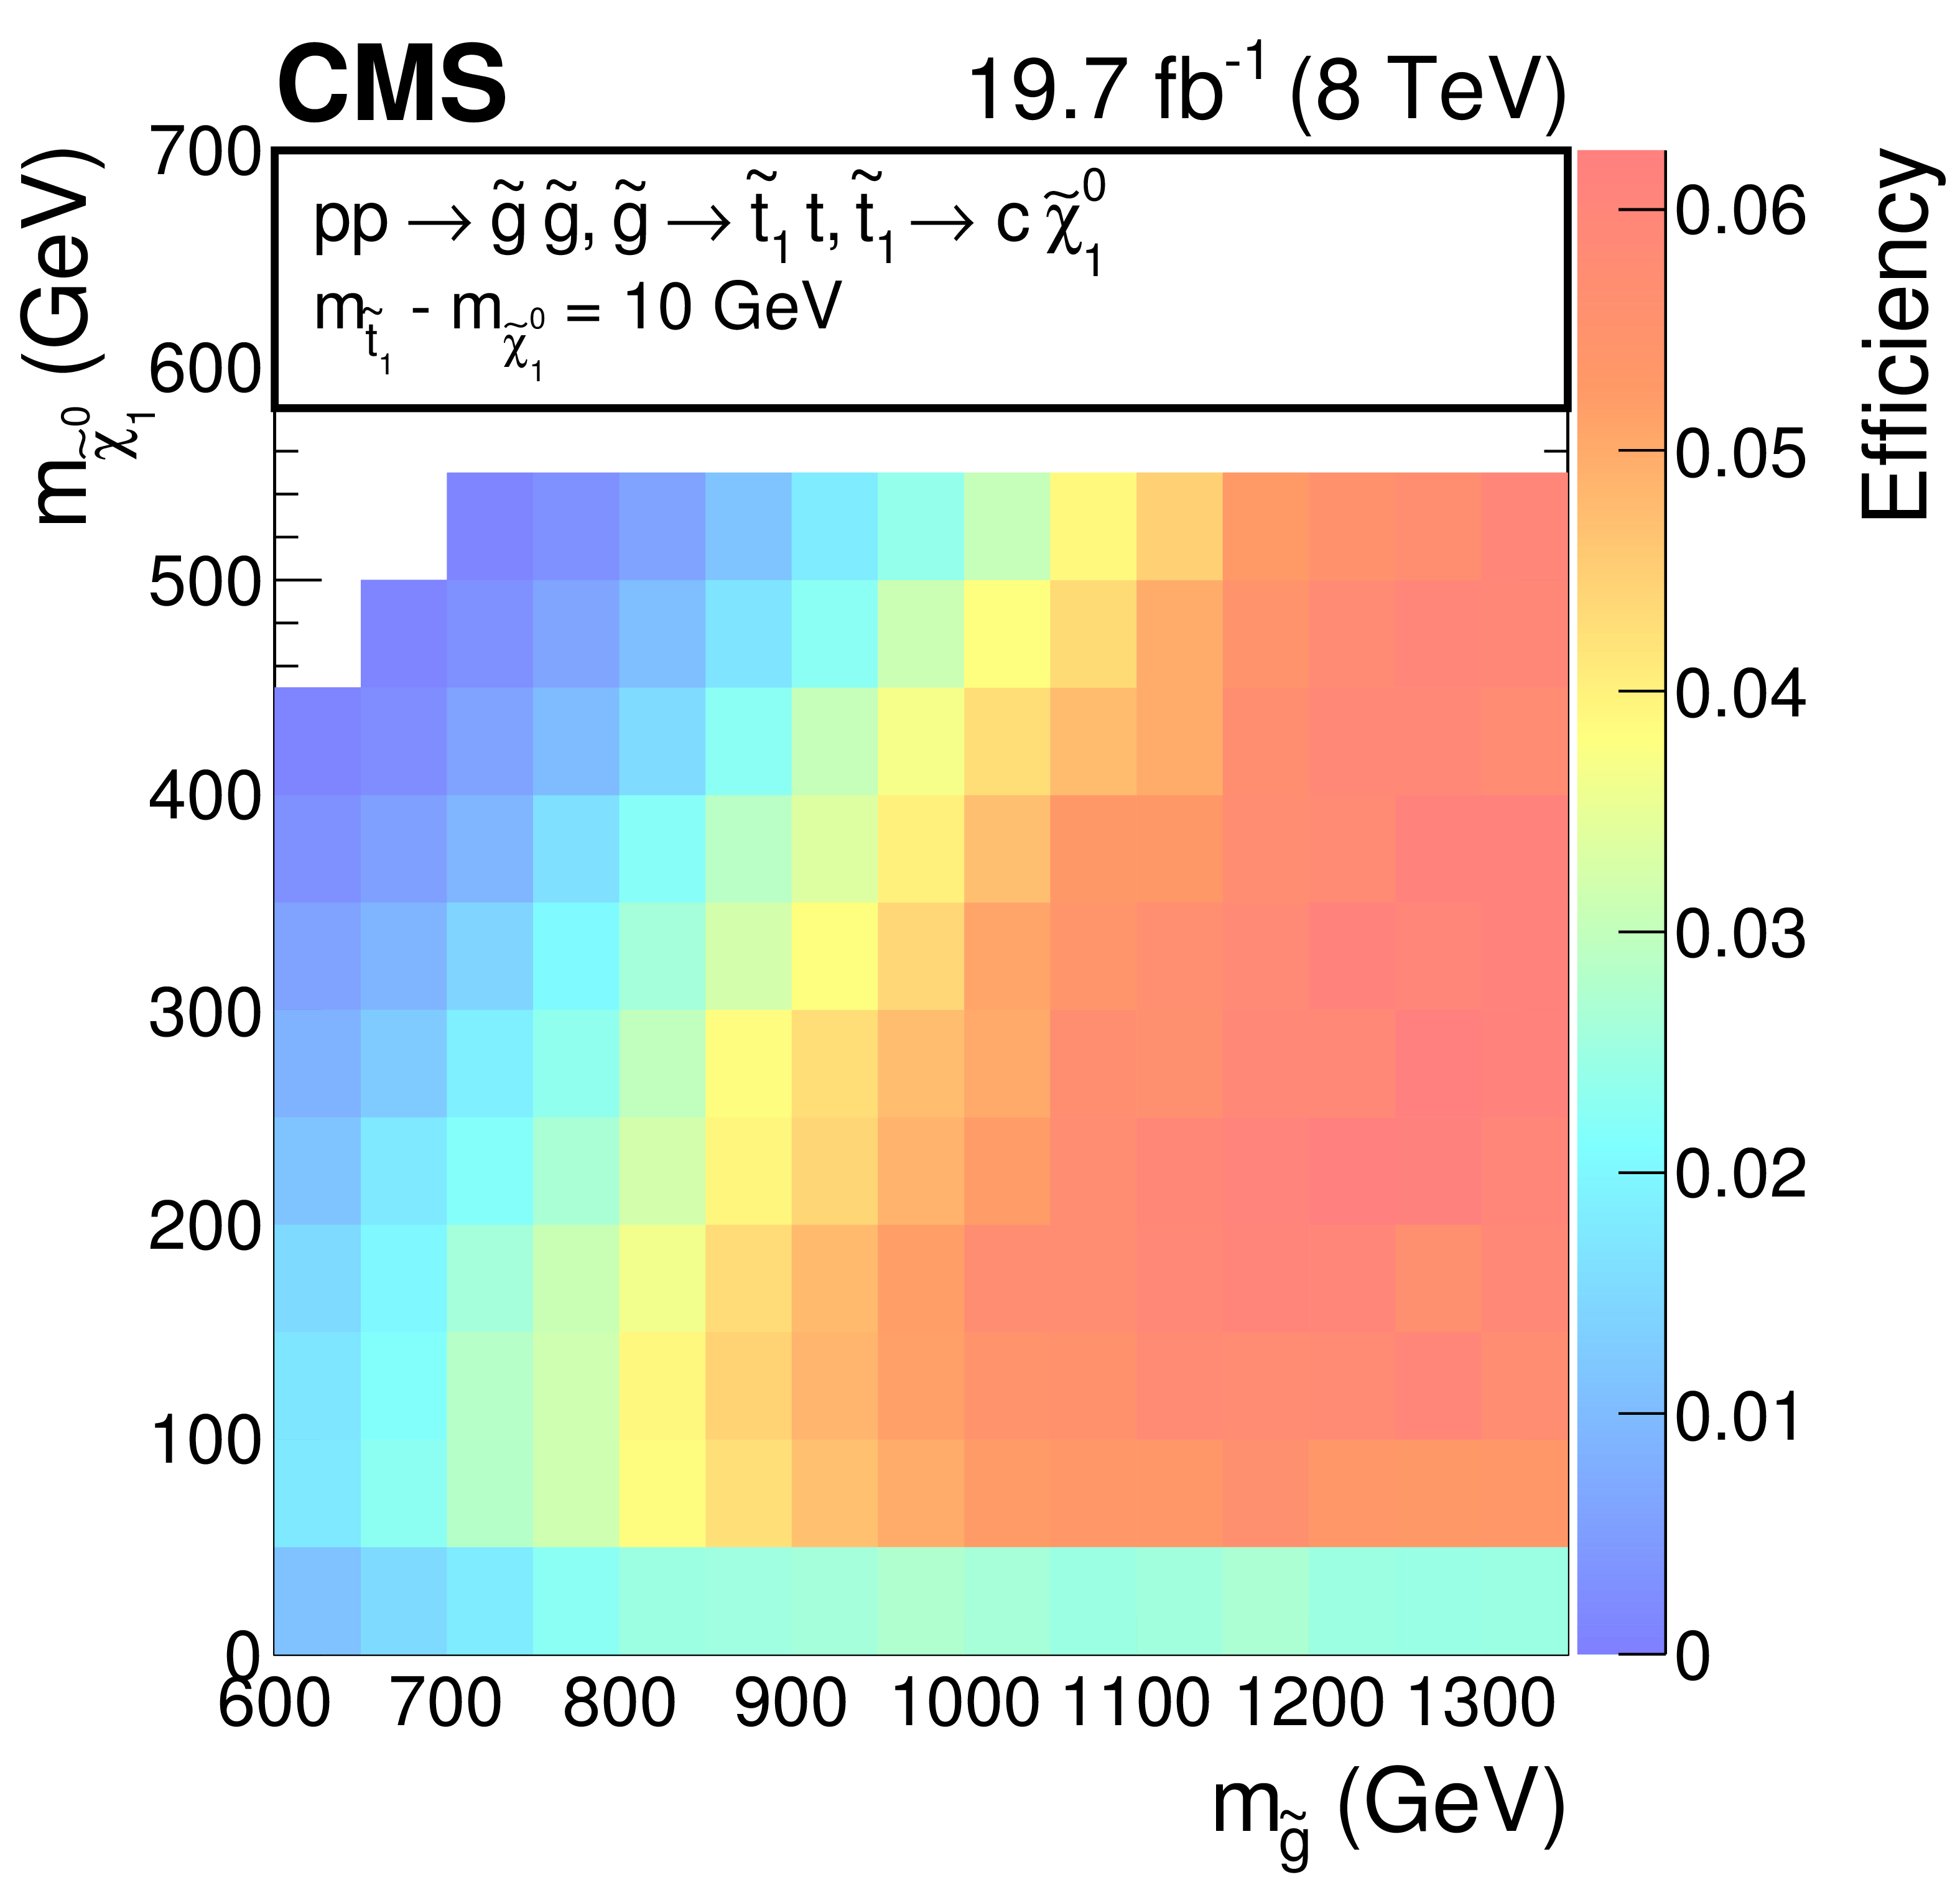
Figure 11-a:
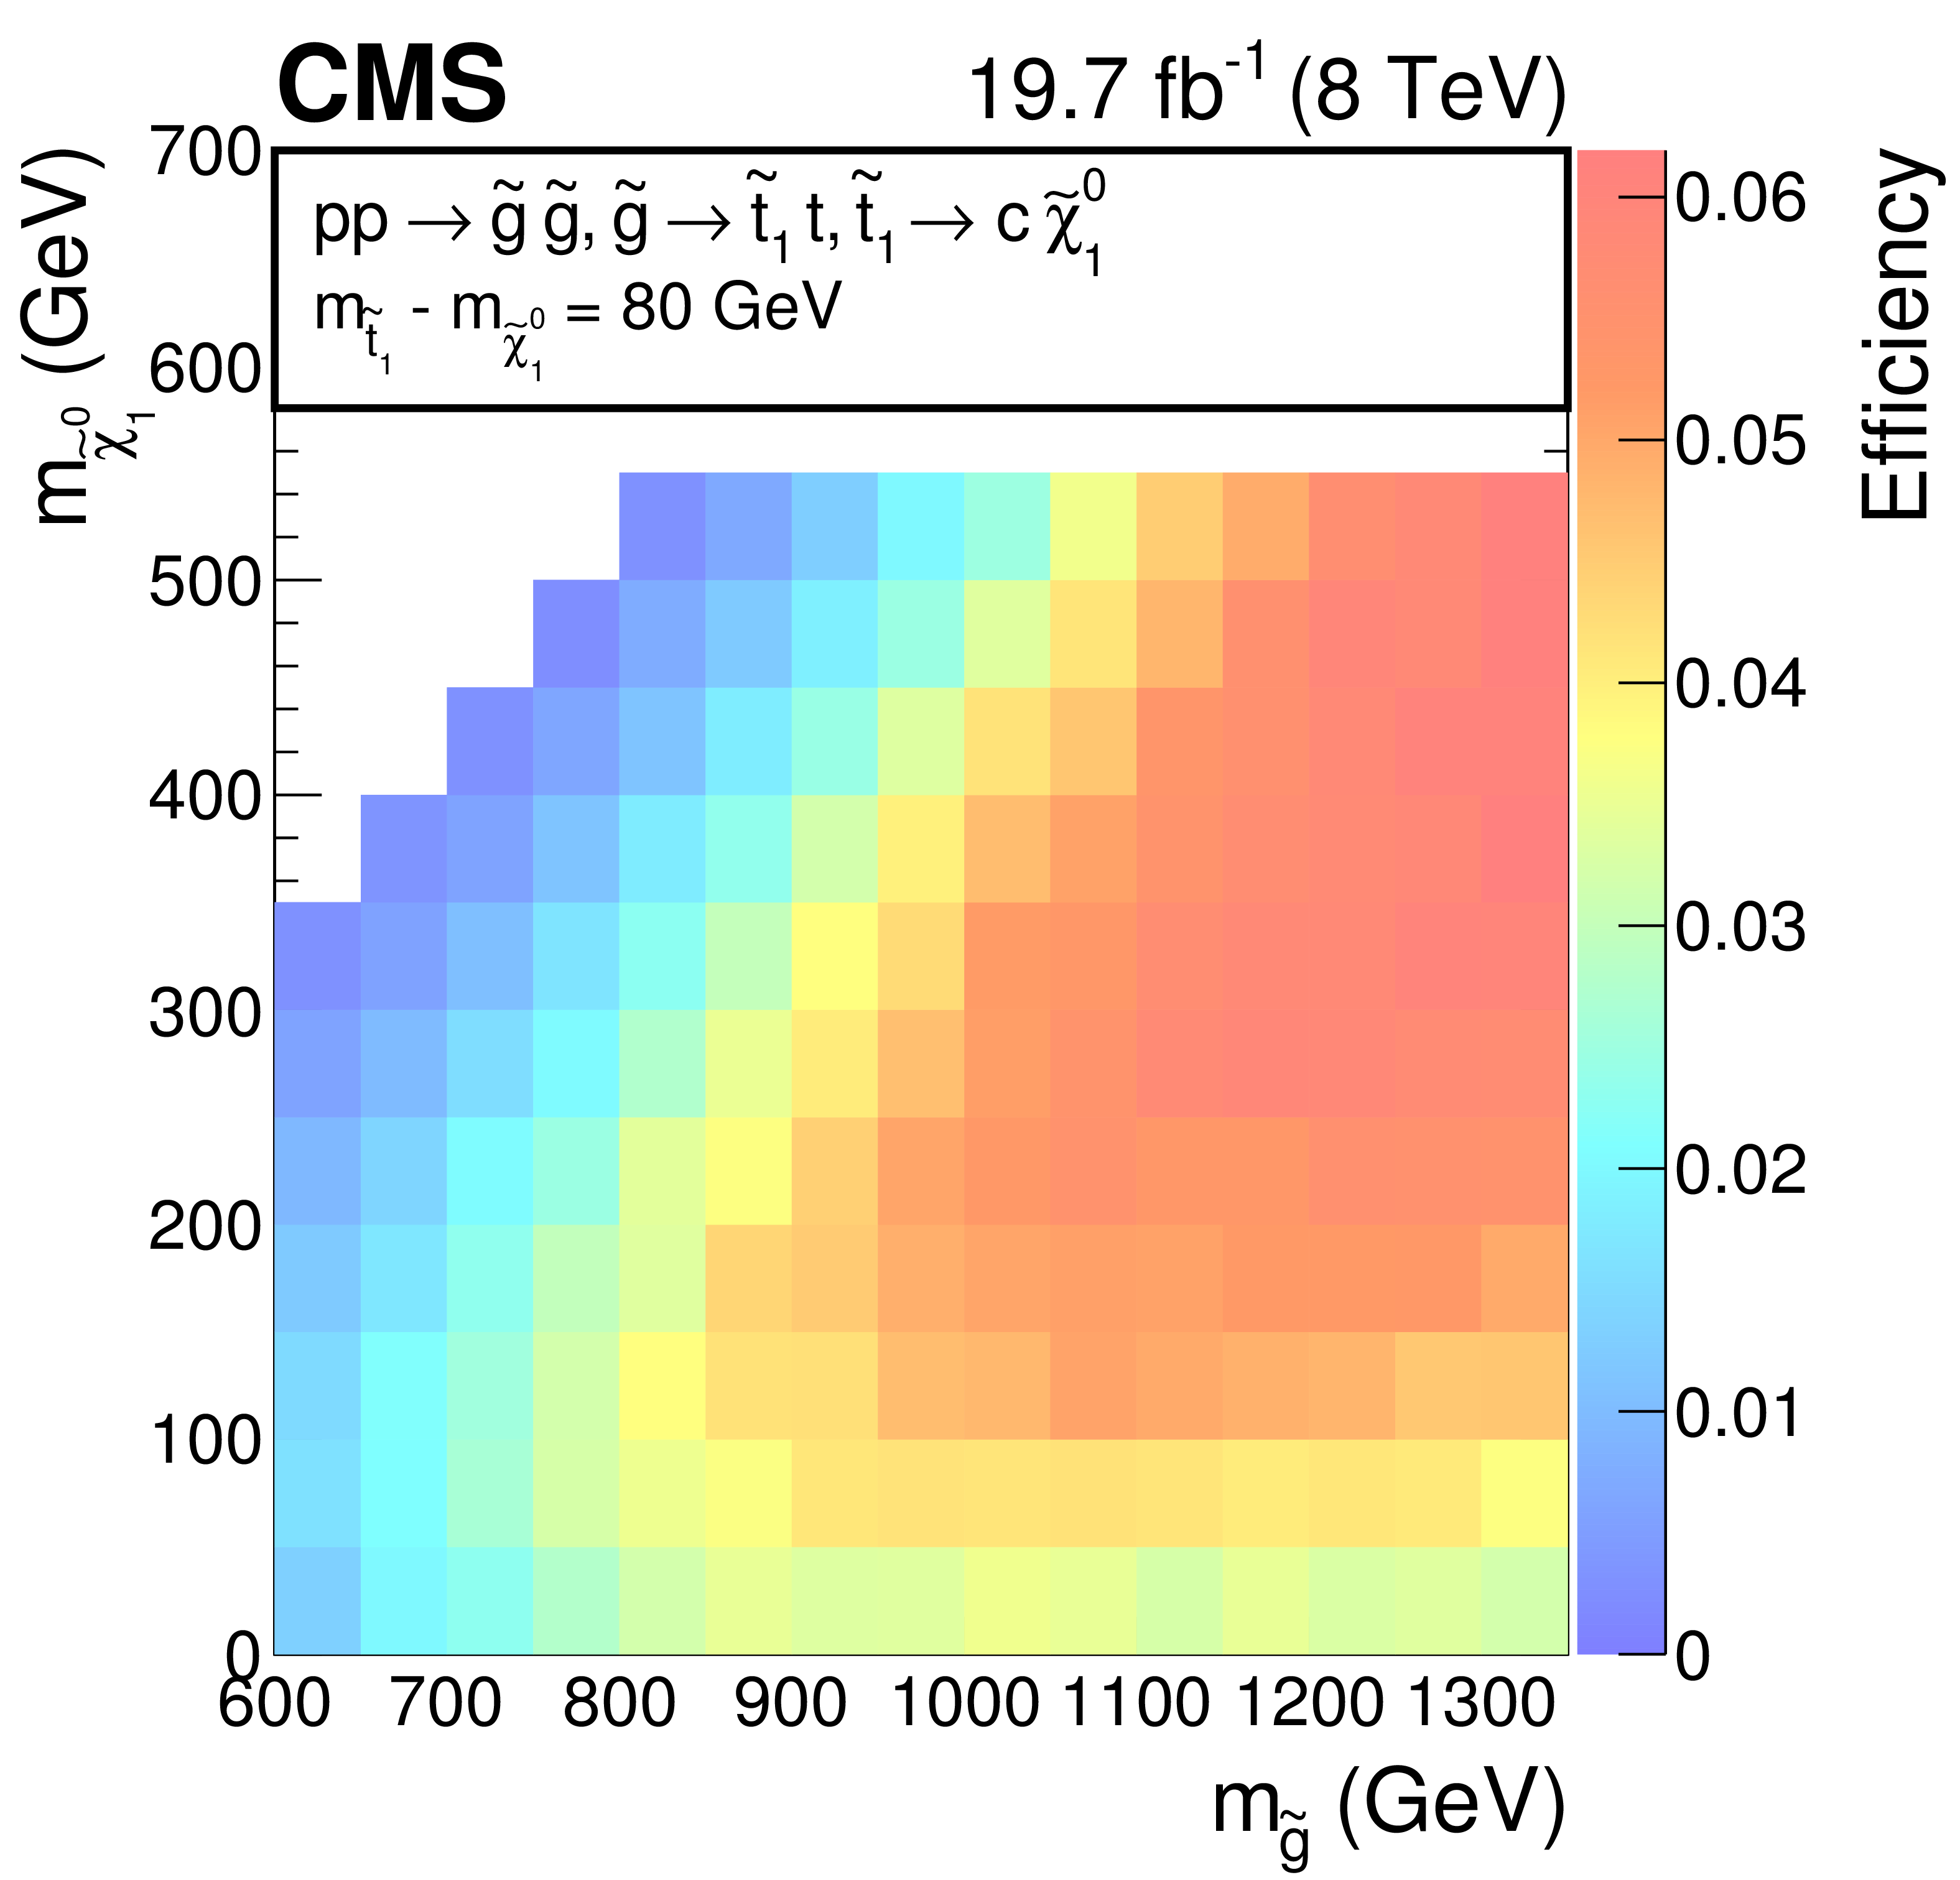
Signal efficiency for the T1ttcc and T1t1t simplified model spectra, as a function of the gluino and neutralino masses. Three mass splittings between top squark and LSP are considered for the T1ttcc model: 10, 25, and 80 GeV, shown on a, b, and c panels, respectively. The efficiency for the T1t1t model with a mass splitting of 175 GeV is shown on the d panel. |
png pdf |
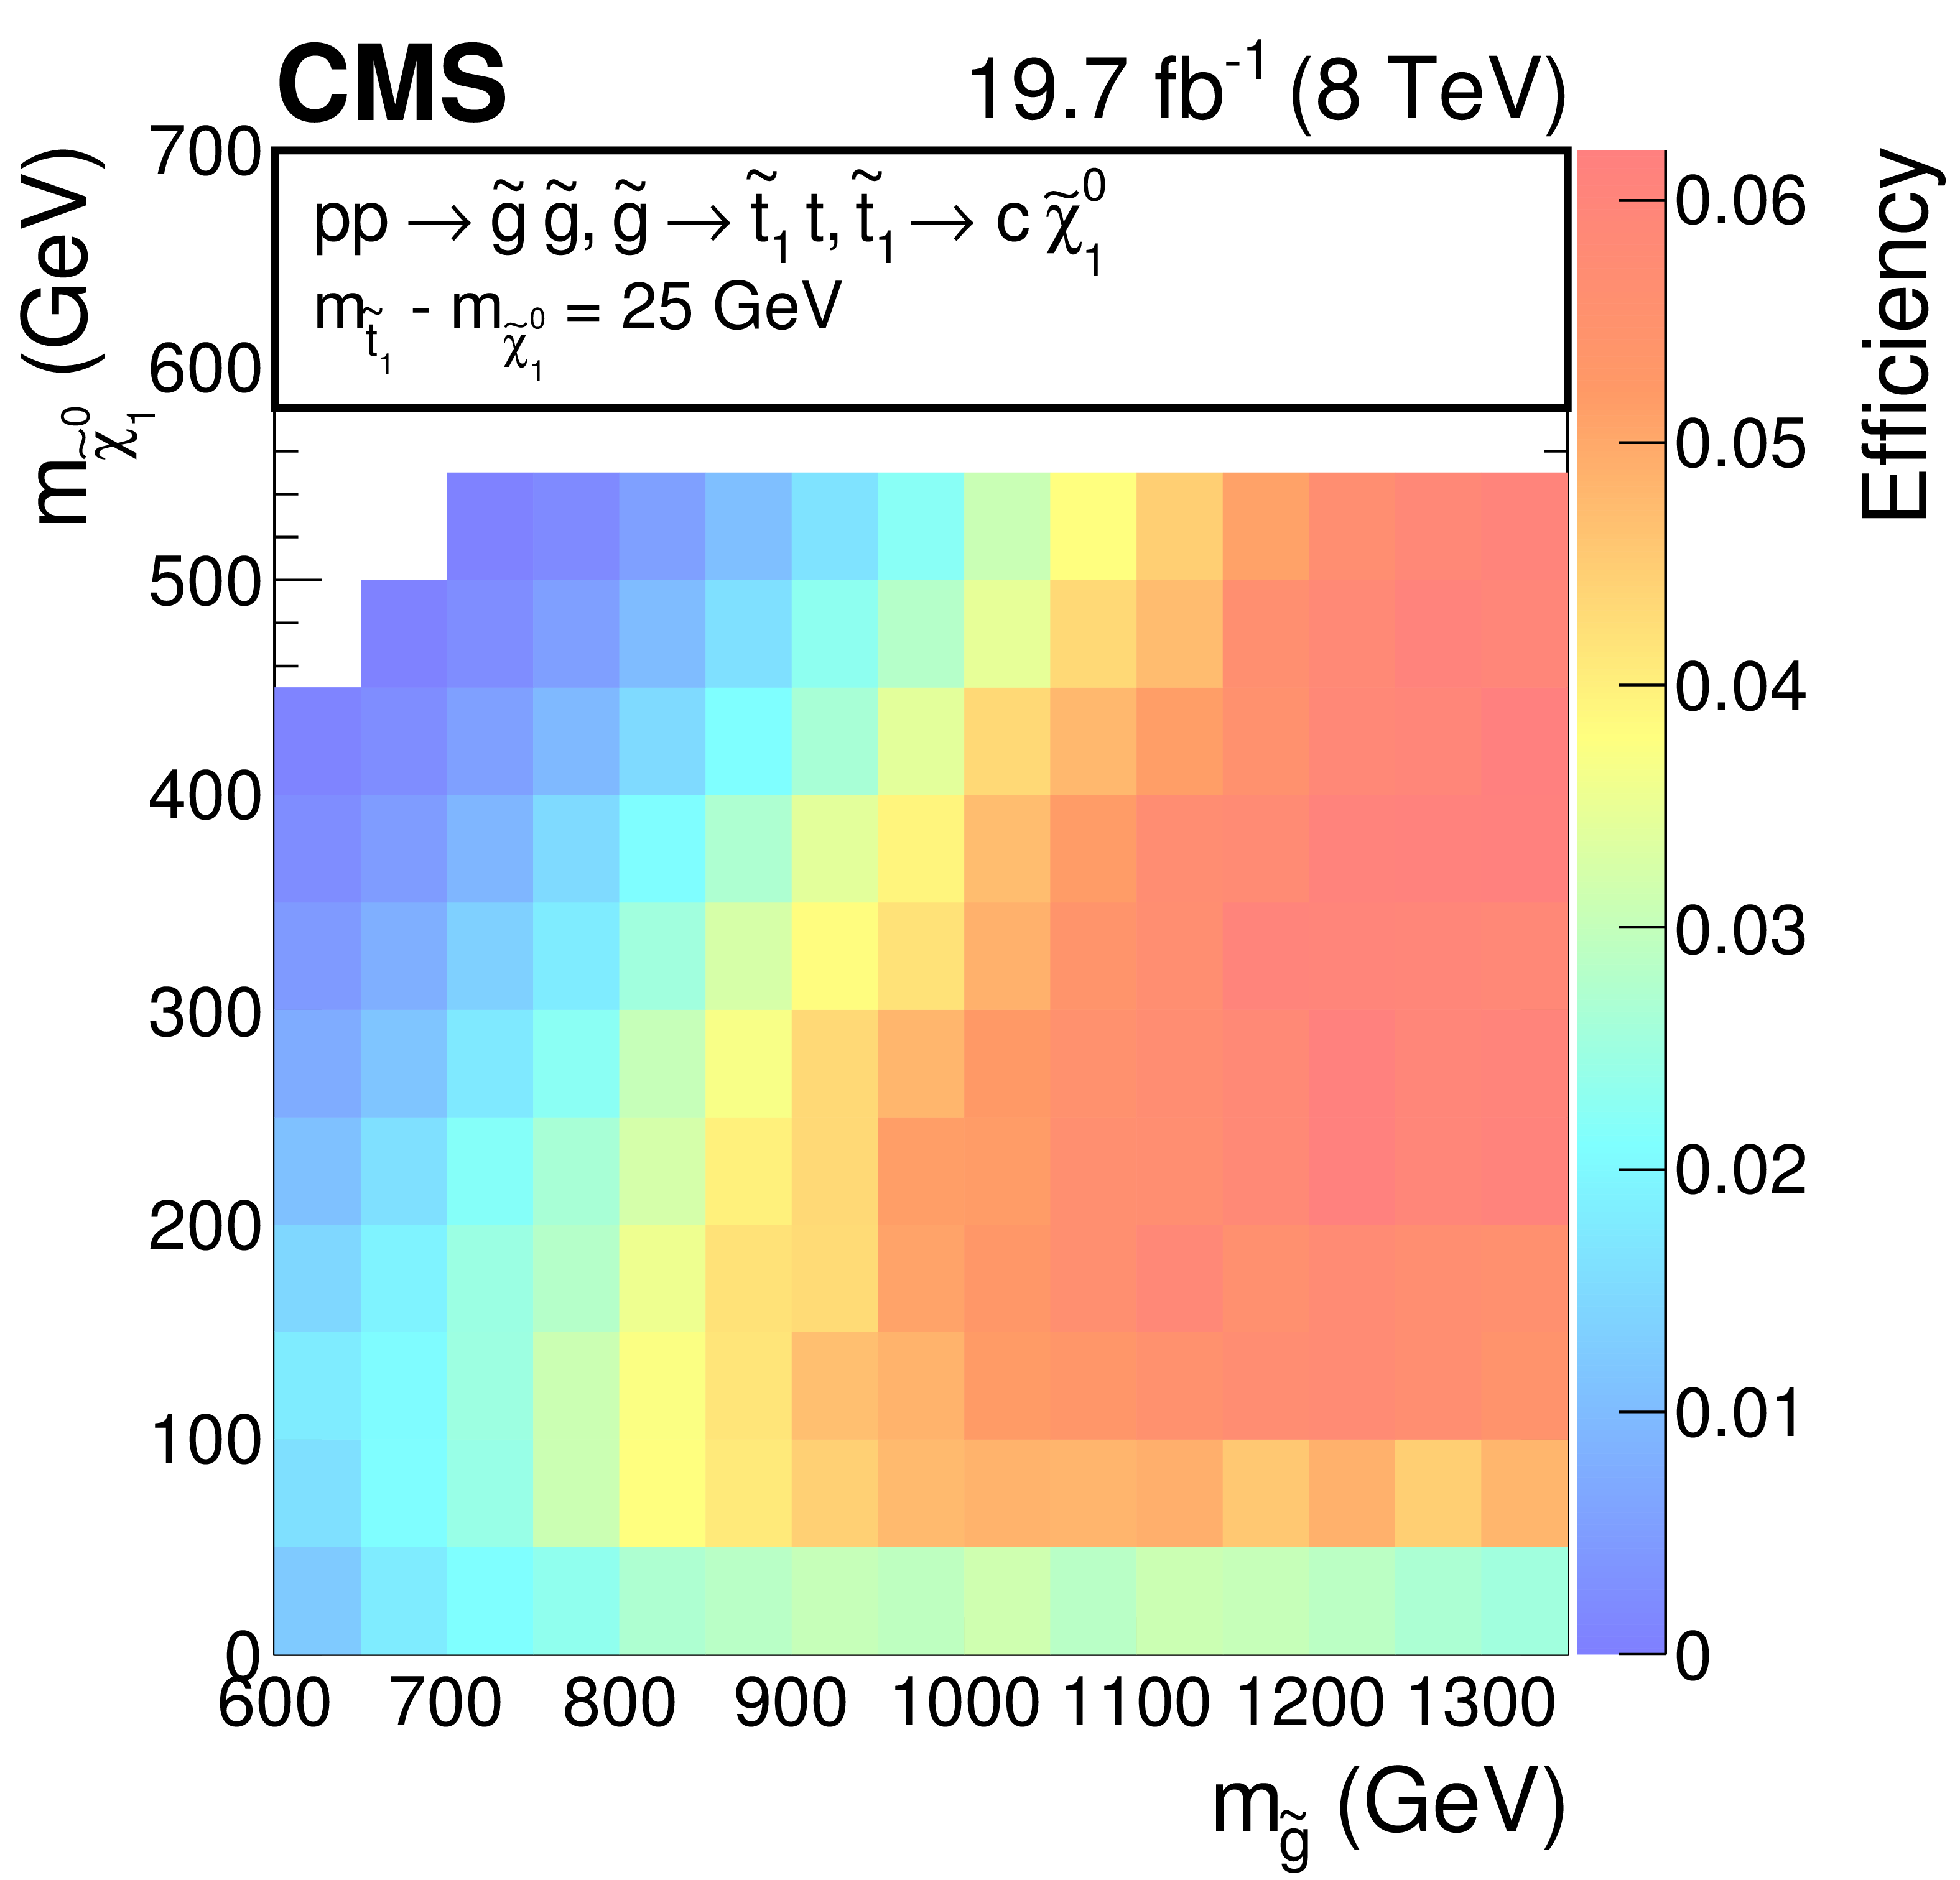
Figure 11-b:
Signal efficiency for the T1ttcc and T1t1t simplified model spectra, as a function of the gluino and neutralino masses. Three mass splittings between top squark and LSP are considered for the T1ttcc model: 10, 25, and 80 GeV, shown on a, b, and c panels, respectively. The efficiency for the T1t1t model with a mass splitting of 175 GeV is shown on the d panel. |
png pdf |
Figure 11-c:
Signal efficiency for the T1ttcc and T1t1t simplified model spectra, as a function of the gluino and neutralino masses. Three mass splittings between top squark and LSP are considered for the T1ttcc model: 10, 25, and 80 GeV, shown on a, b, and c panels, respectively. The efficiency for the T1t1t model with a mass splitting of 175 GeV is shown on the d panel. |

png pdf |
Figure 11-d:
Signal efficiency for the T1ttcc and T1t1t simplified model spectra, as a function of the gluino and neutralino masses. Three mass splittings between top squark and LSP are considered for the T1ttcc model: 10, 25, and 80 GeV, shown on a, b, and c panels, respectively. The efficiency for the T1t1t model with a mass splitting of 175 GeV is shown on the d panel. |
png pdf |
Figure 12-a:
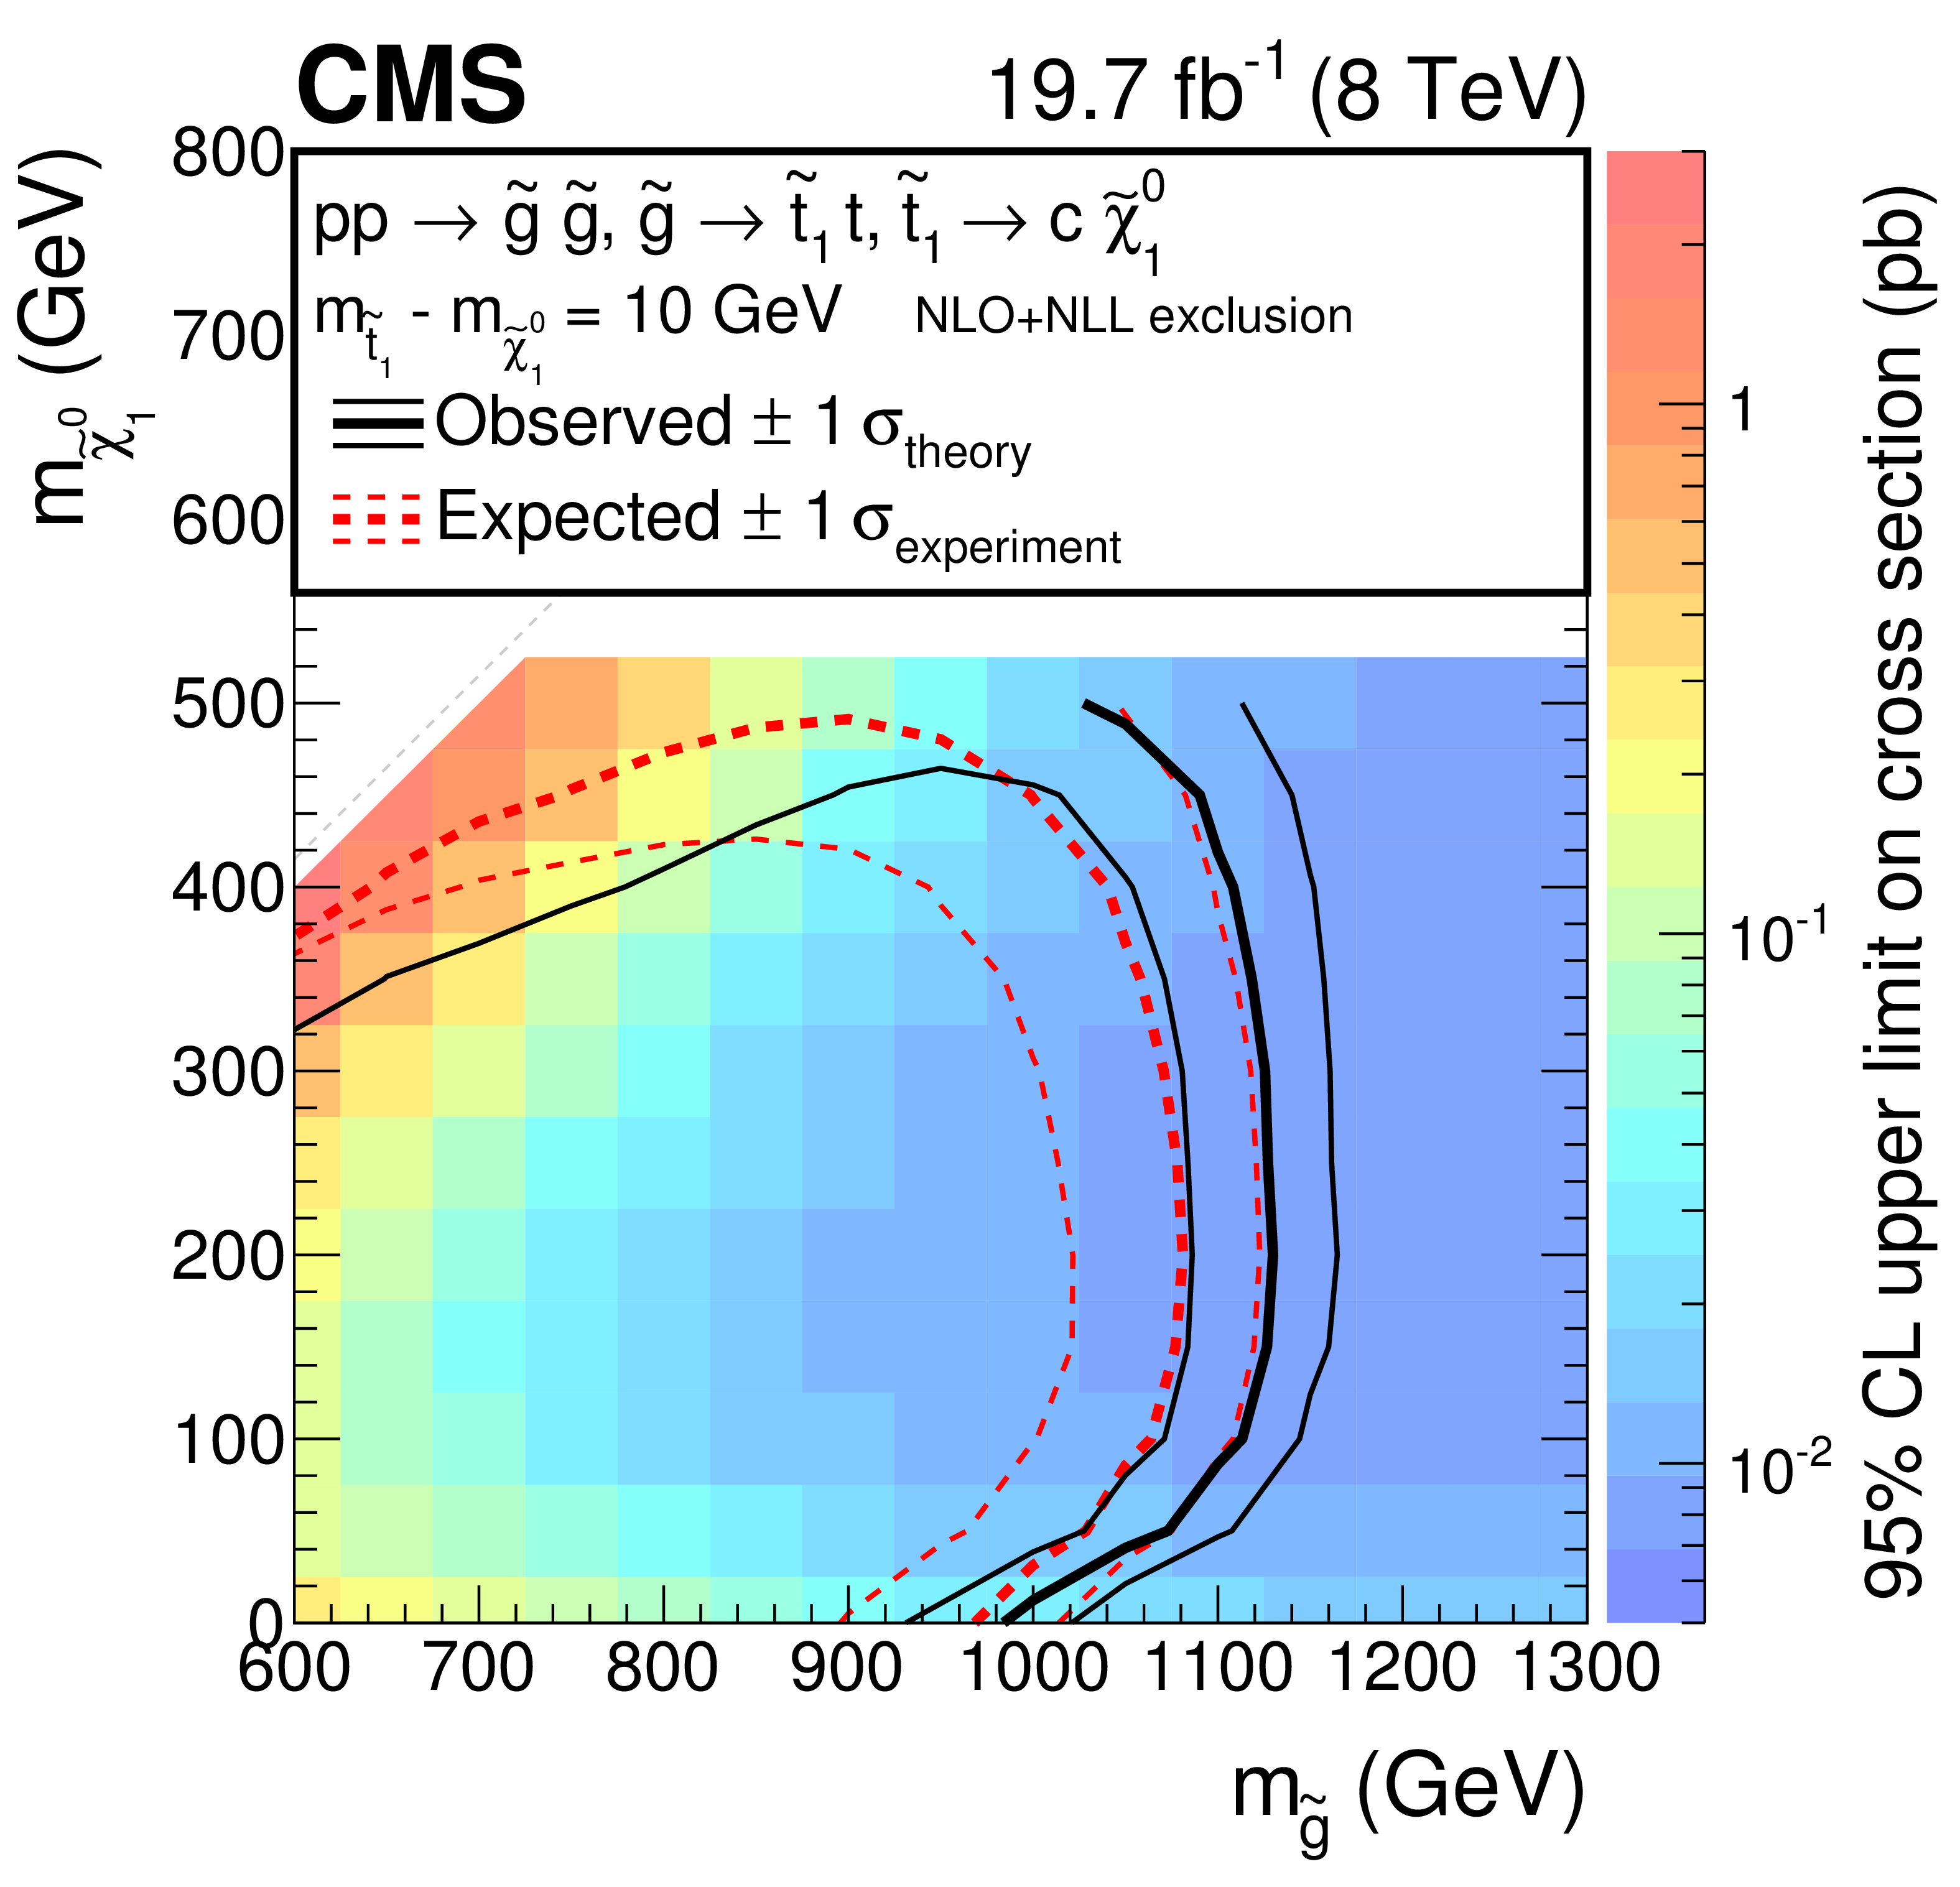
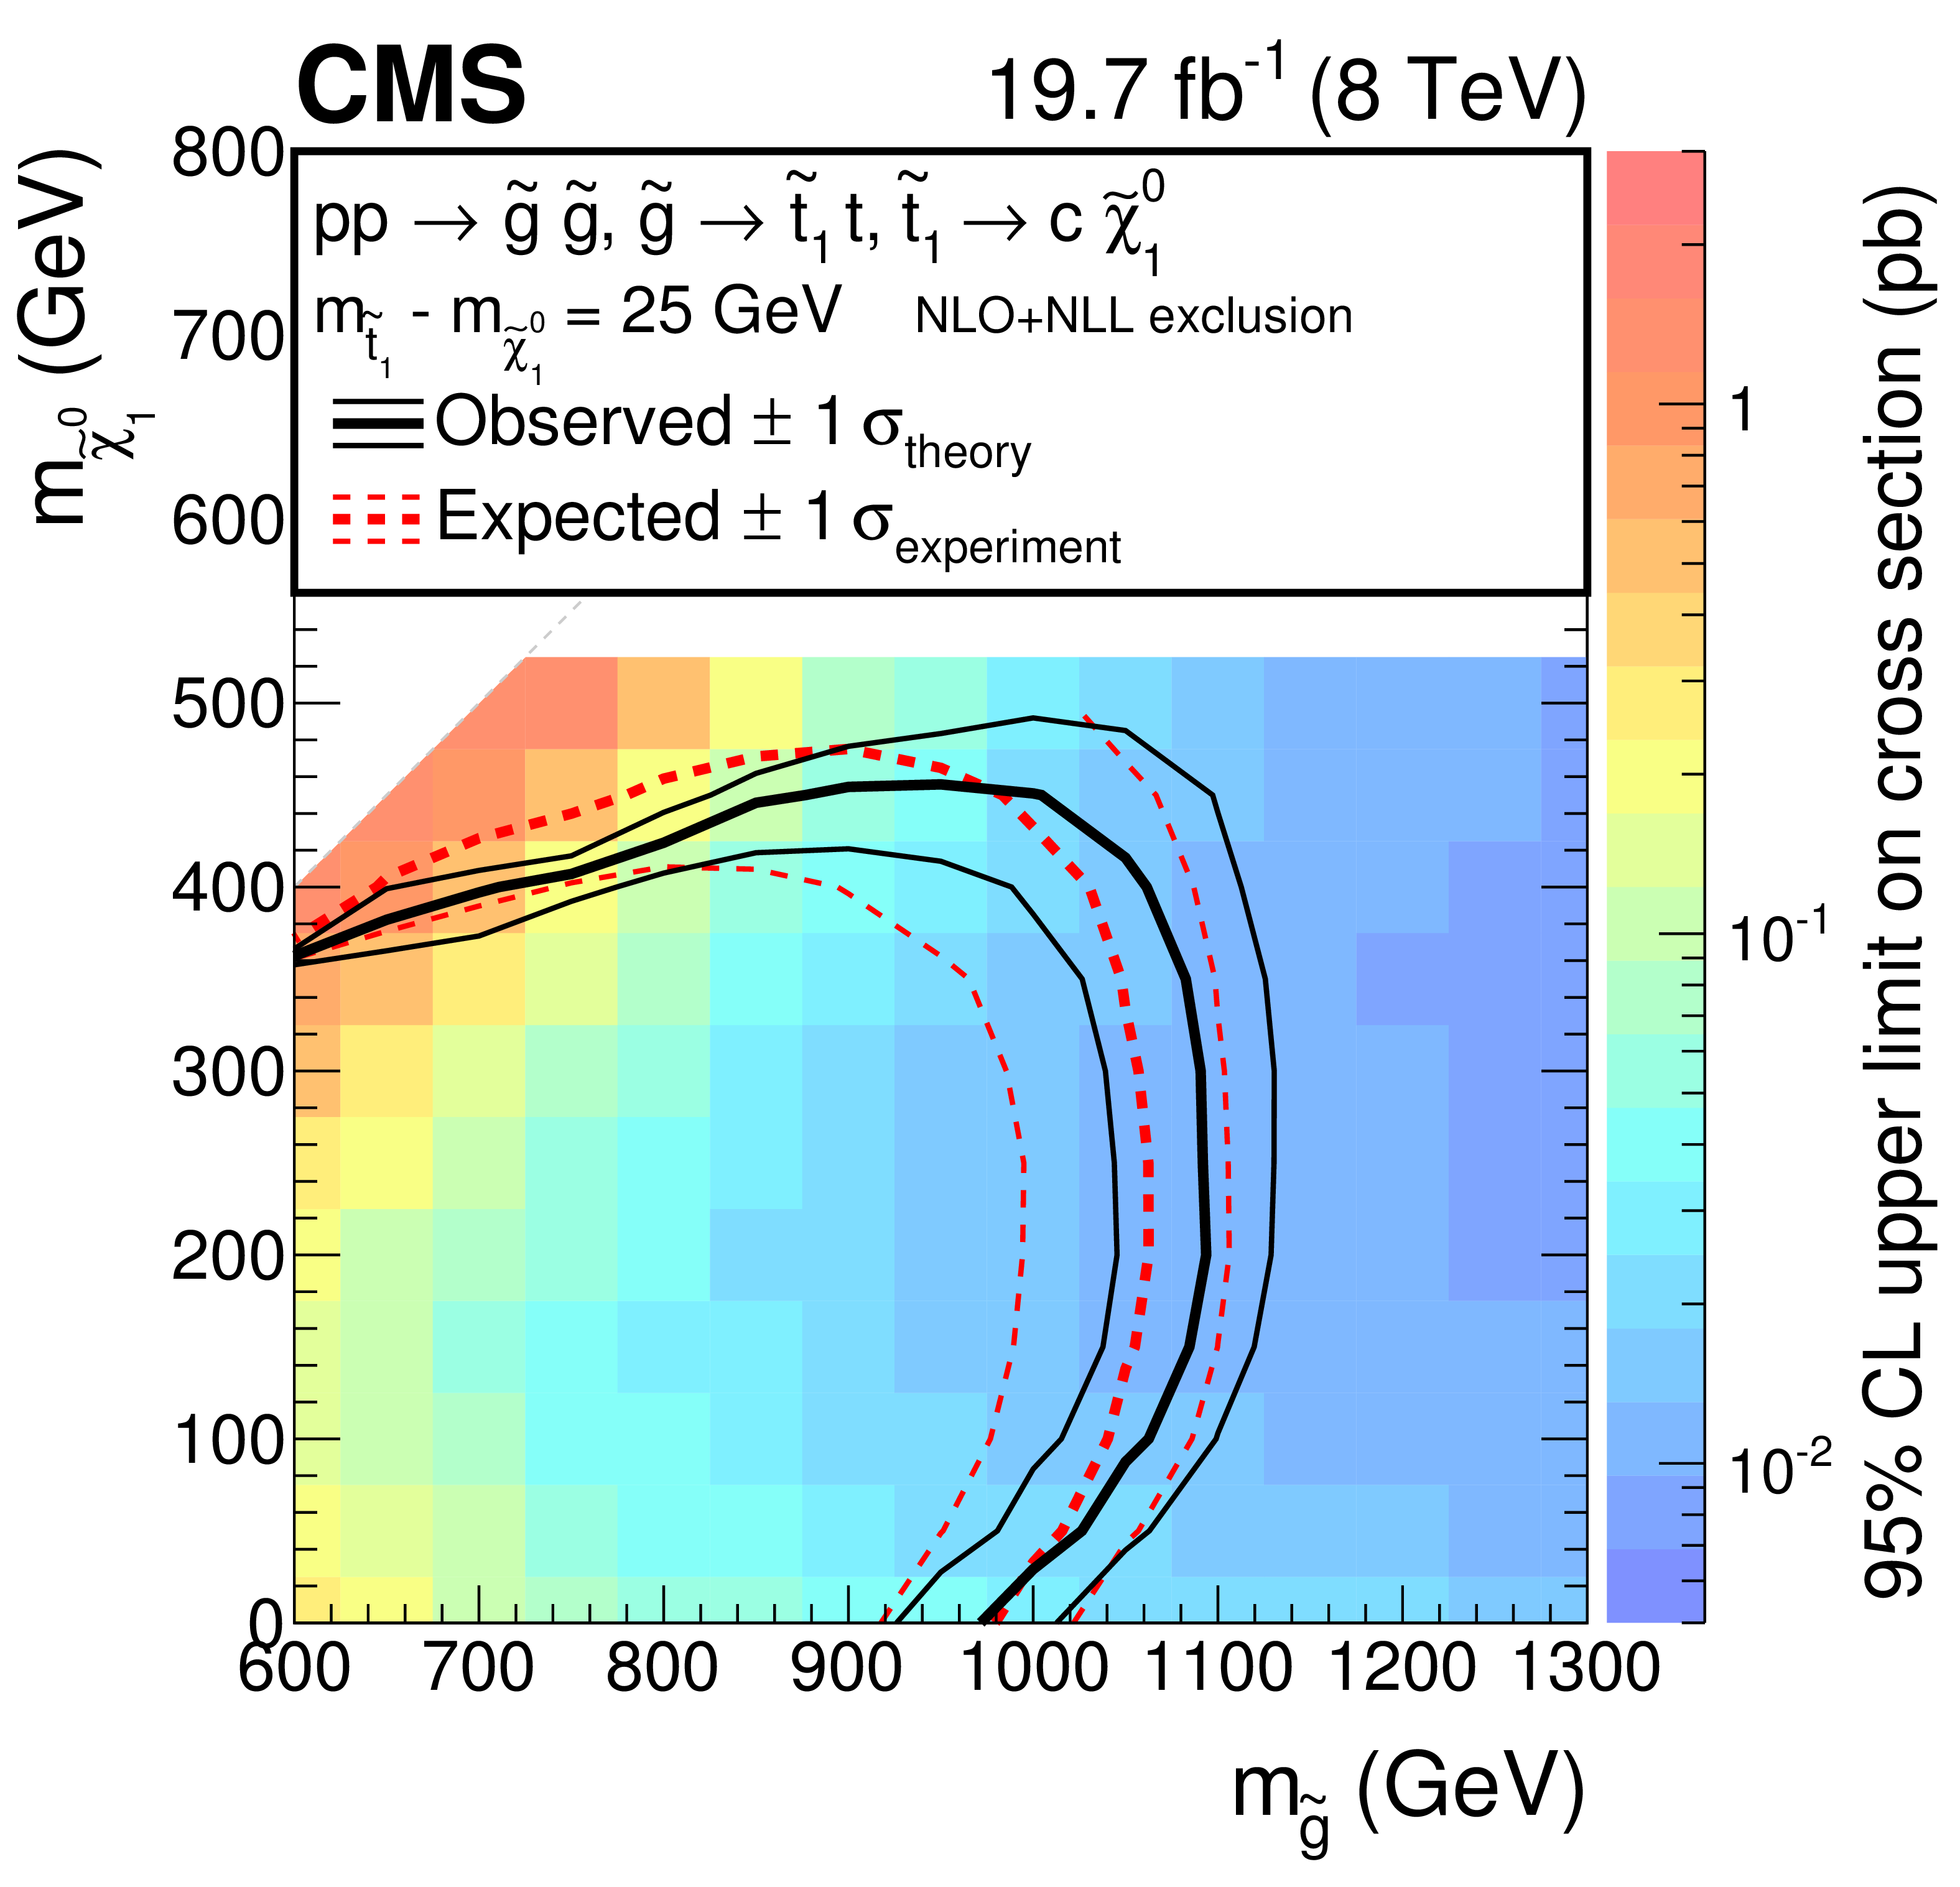
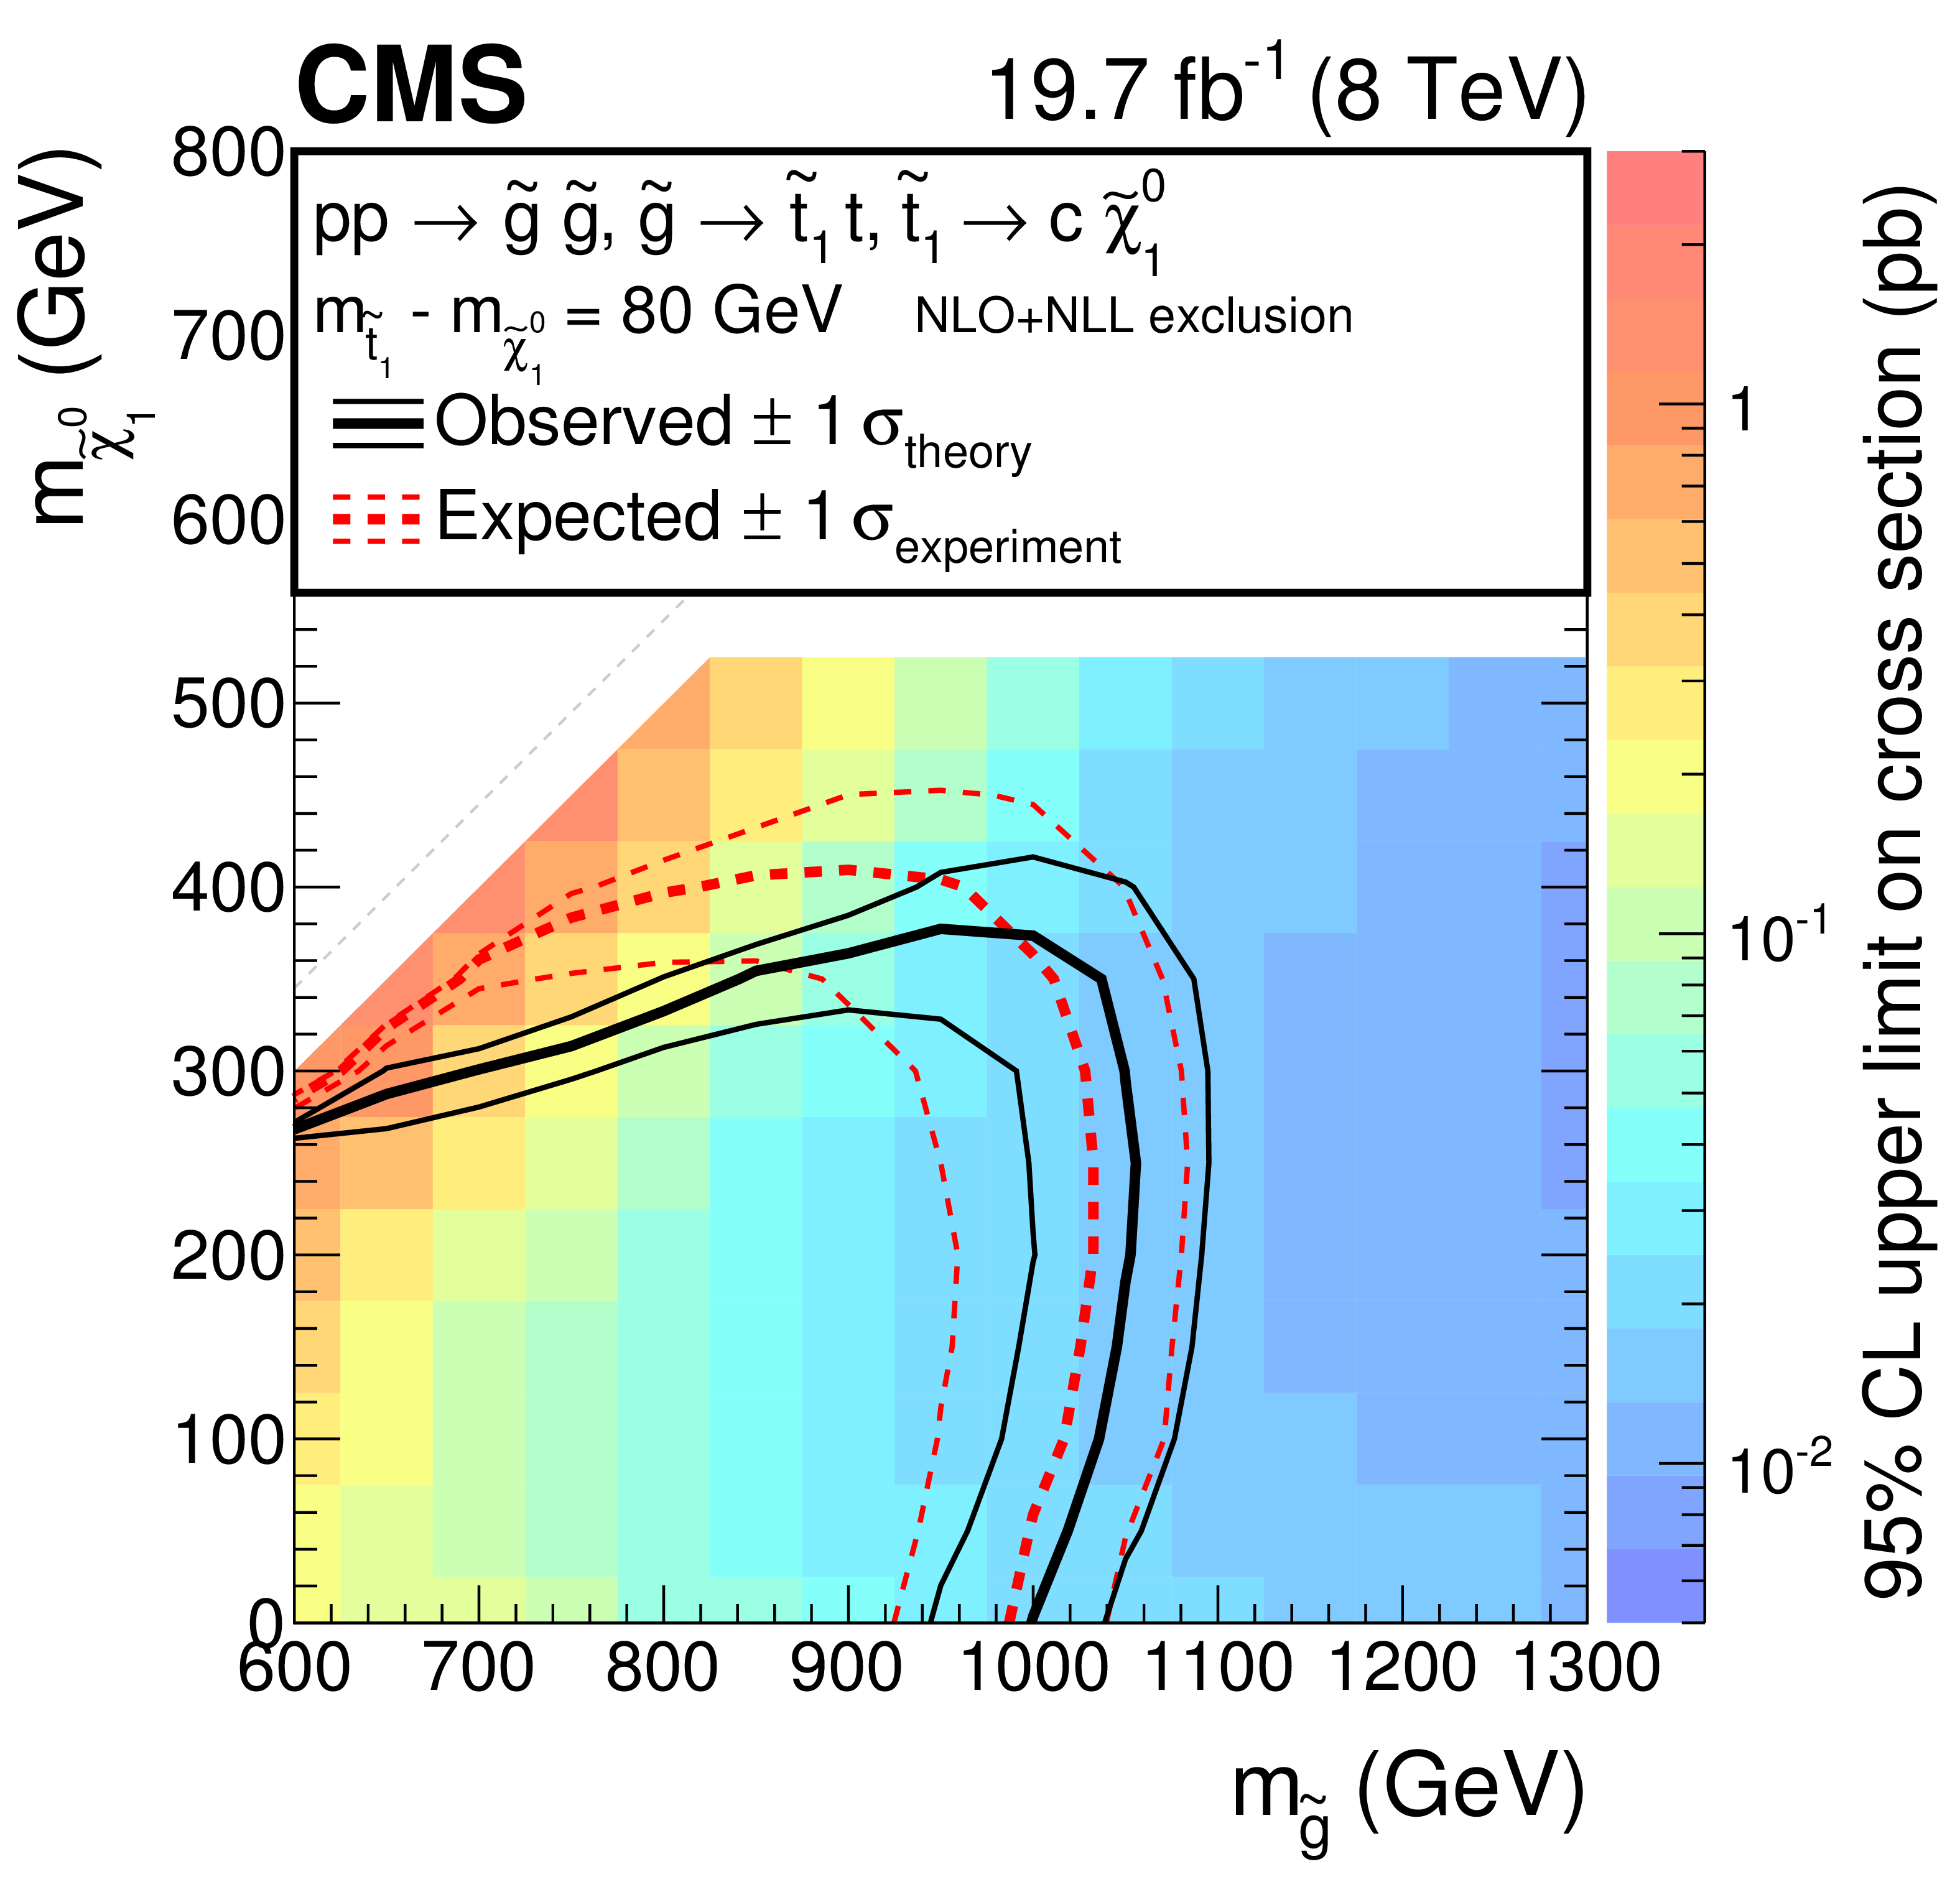
Observed upper limit (CLs method, 95% CL ) on the signal cross section as a function of the gluino and neutralino masses for the T1ttcc model with $\Delta m=10,$ 25, and 80 GeV (a, b and c panels) and for the T1t1t model with $\Delta m = $ 175 GeV (d). Also shown are the contours corresponding to the observed and expected lower limits, including their uncertainties, on the gluino and neutralino masses. |
png pdf |
Figure 12-b:
Observed upper limit (CLs method, 95% CL ) on the signal cross section as a function of the gluino and neutralino masses for the T1ttcc model with $\Delta m=10,$ 25, and 80 GeV (a, b and c panels) and for the T1t1t model with $\Delta m = $ 175 GeV (d). Also shown are the contours corresponding to the observed and expected lower limits, including their uncertainties, on the gluino and neutralino masses. |
png pdf |
Figure 12-c:
Observed upper limit (CLs method, 95% CL ) on the signal cross section as a function of the gluino and neutralino masses for the T1ttcc model with $\Delta m=10,$ 25, and 80 GeV (a, b and c panels) and for the T1t1t model with $\Delta m = $ 175 GeV (d). Also shown are the contours corresponding to the observed and expected lower limits, including their uncertainties, on the gluino and neutralino masses. |

png pdf |
Figure 12-d:
Observed upper limit (CLs method, 95% CL ) on the signal cross section as a function of the gluino and neutralino masses for the T1ttcc model with $\Delta m=10,$ 25, and 80 GeV (a, b and c panels) and for the T1t1t model with $\Delta m = $ 175 GeV (d). Also shown are the contours corresponding to the observed and expected lower limits, including their uncertainties, on the gluino and neutralino masses. |
| Tables | |
png pdf |
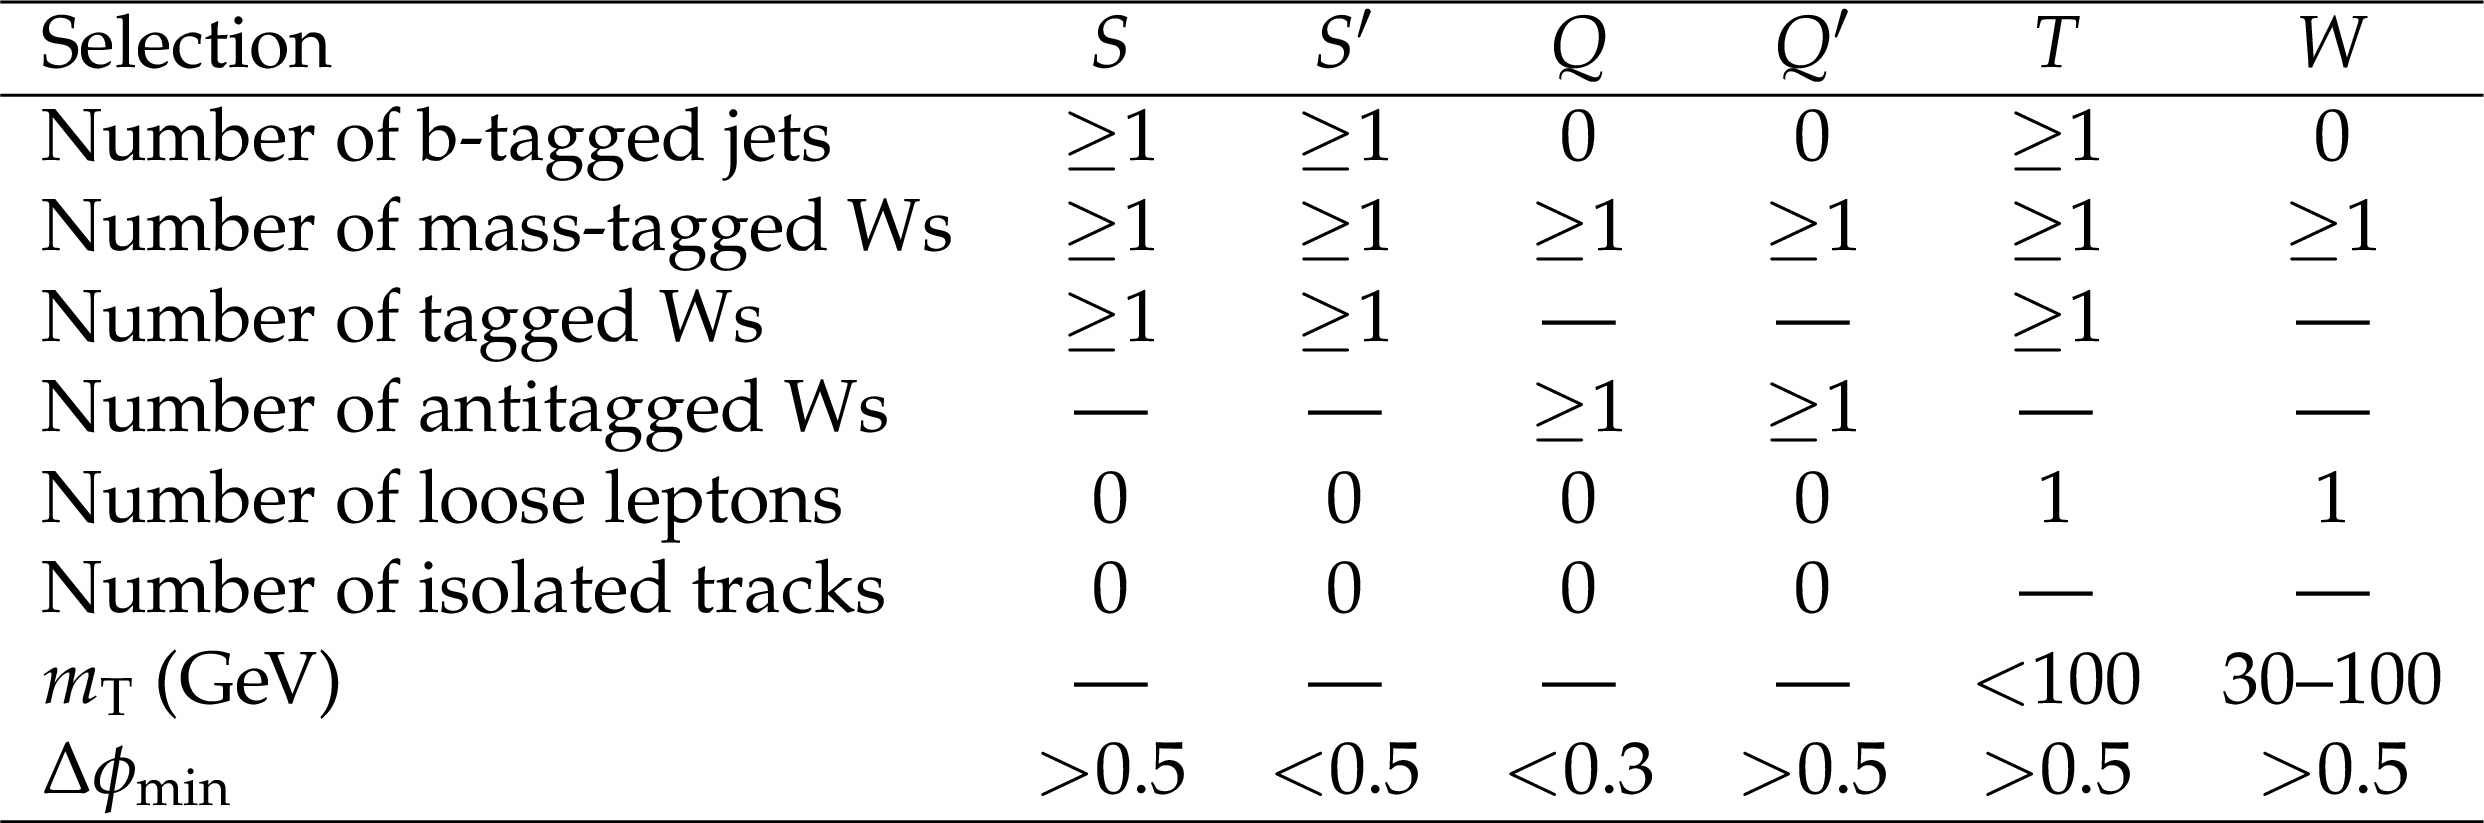
Table 1:
Summary of the selections used, in addition to the baseline selection, to define the signal region ($S$), the three control regions ($Q$, $T$, $W$), and the two regions ($S'$, $Q'$) used for the cross-checks described later in the text. |
png pdf |
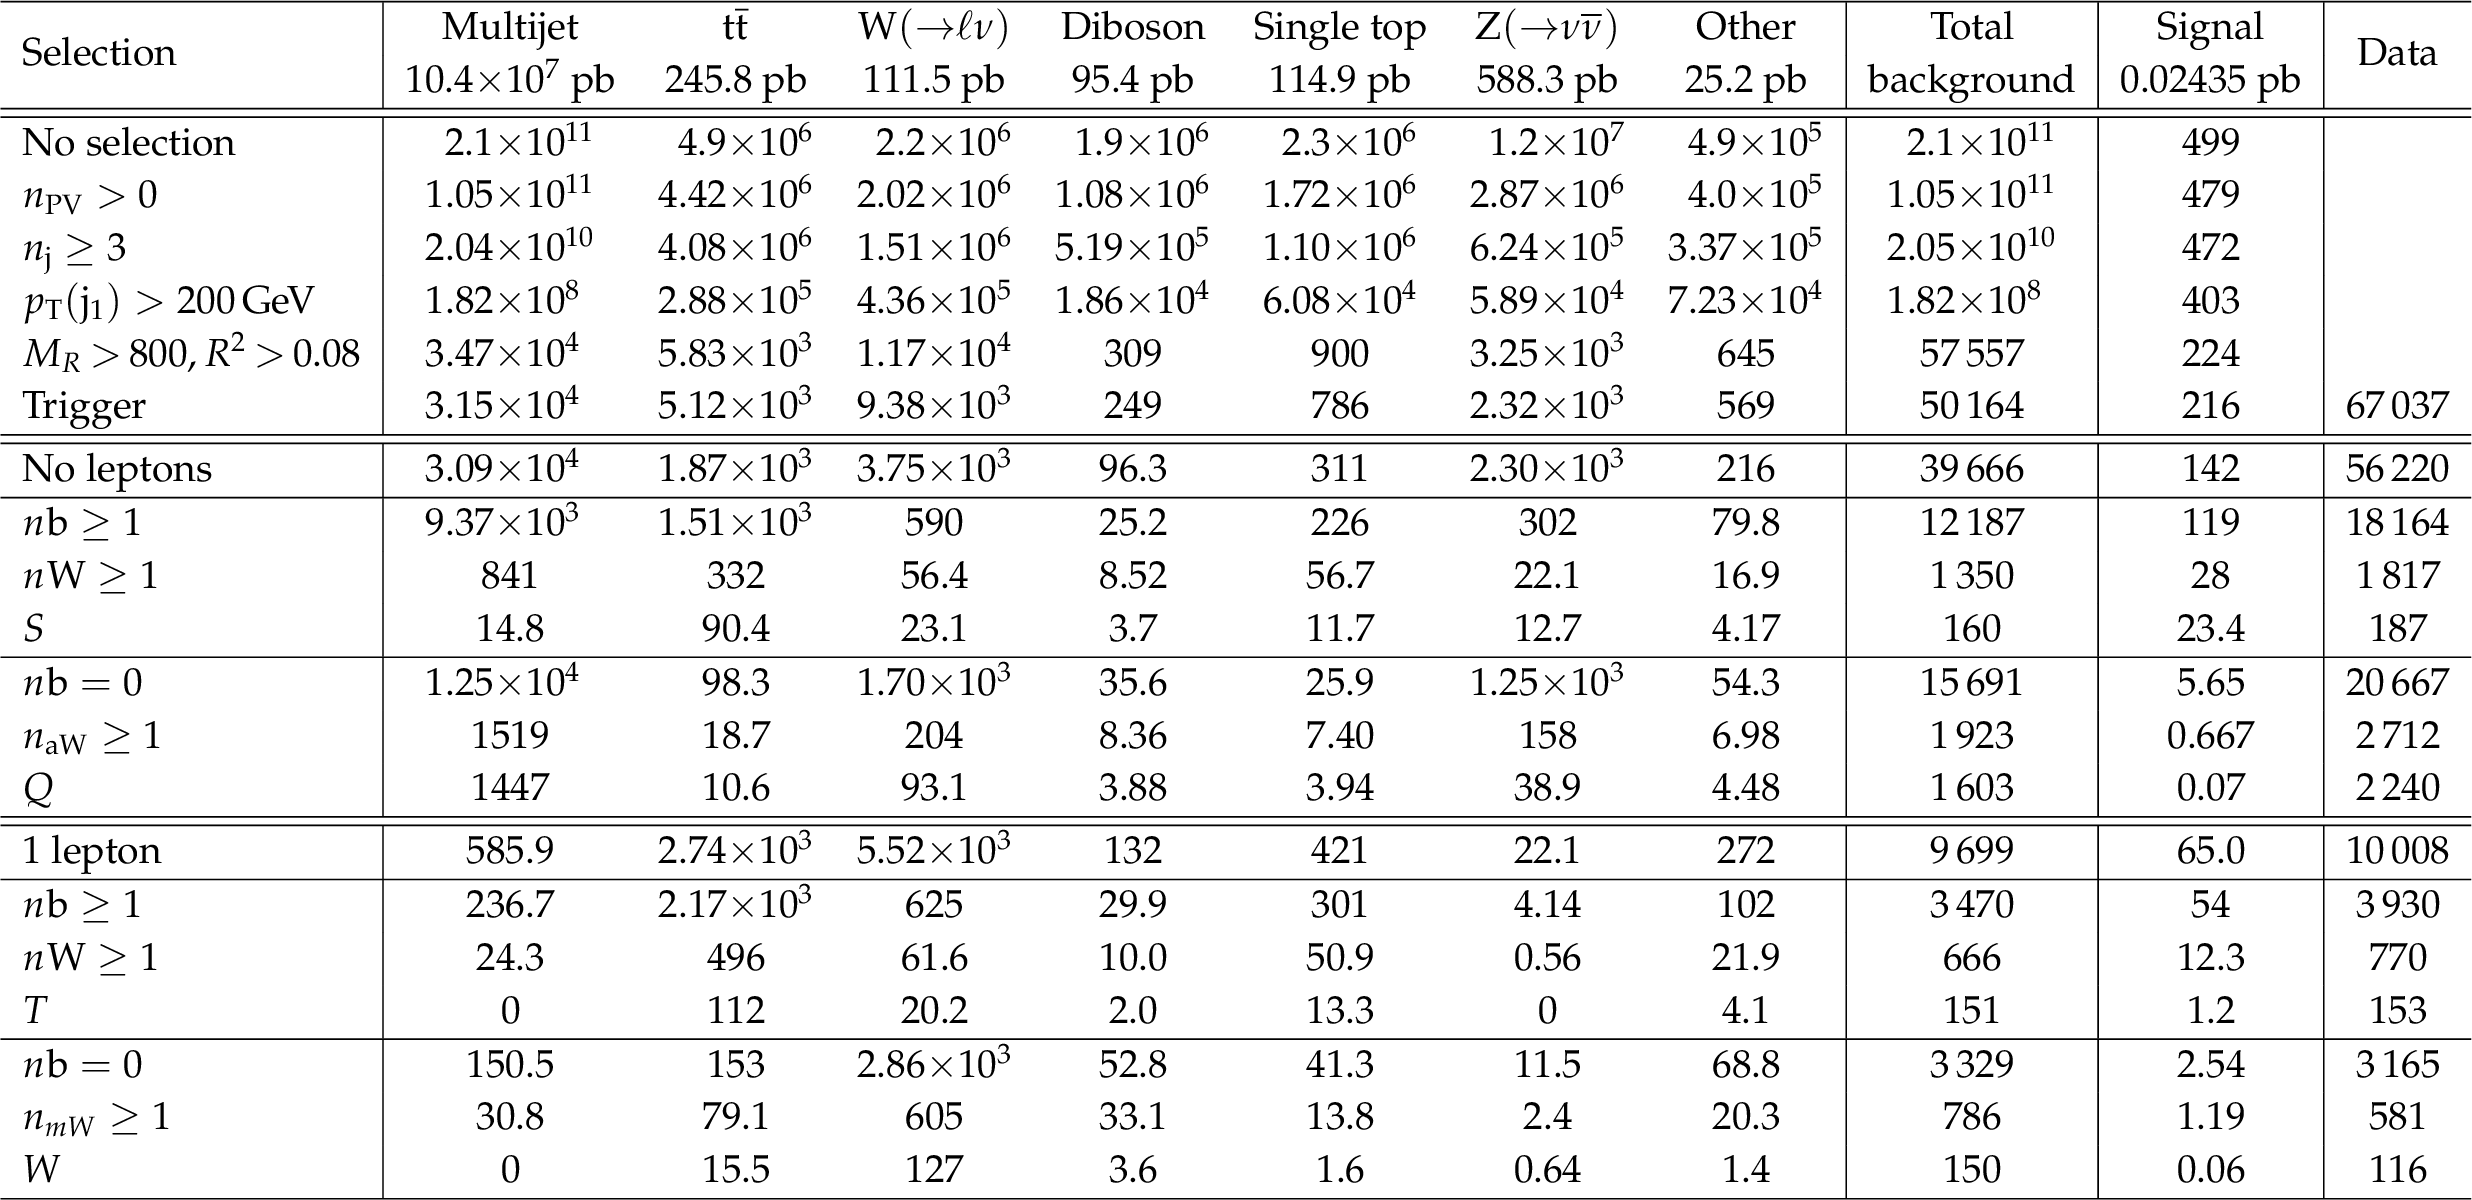
Table 2:
Event yields in simulated event samples and in data as event selection requirements are applied. The simulated event counts are normalized to an integrated luminosity of 19.7 fb$^{-1}$. ``Other'' refers to the sum of the small background components $\mathrm{ Z } /\gamma^* \rightarrow \ell \bar{\ell}+$jets, triboson, and $\mathrm{ t \bar{t} } \mathrm{V}$. The signal is the T1ttcc model with $m_{\tilde{ \mathrm{ g } } }= $ 1000 GeV, $m_{\tilde{ mathrm{ t } } _1}= $ 325 GeV, $m_{\tilde{\chi}^0_1 }= $ 300 GeV. The row corresponding to ``$n_\mathrm {PV} > $ 0 '' gives the event counts after applying the noise filters, pileup reweighting, top ${p_{\mathrm {T}}}$ reweighting for $\mathrm{ t \bar{t} } $, ISR reweighting for the signal, and the requirement of at least one primary vertex. The column listing the total number of background events also includes some processes that only contribute at the early stages of the event selection. The cross sections used for each sample are listed in the second line of the header. Several of the simulated background samples were produced with generator-level selections applied, which are not fully covered by the first selection levels listed in this table. |
png pdf |
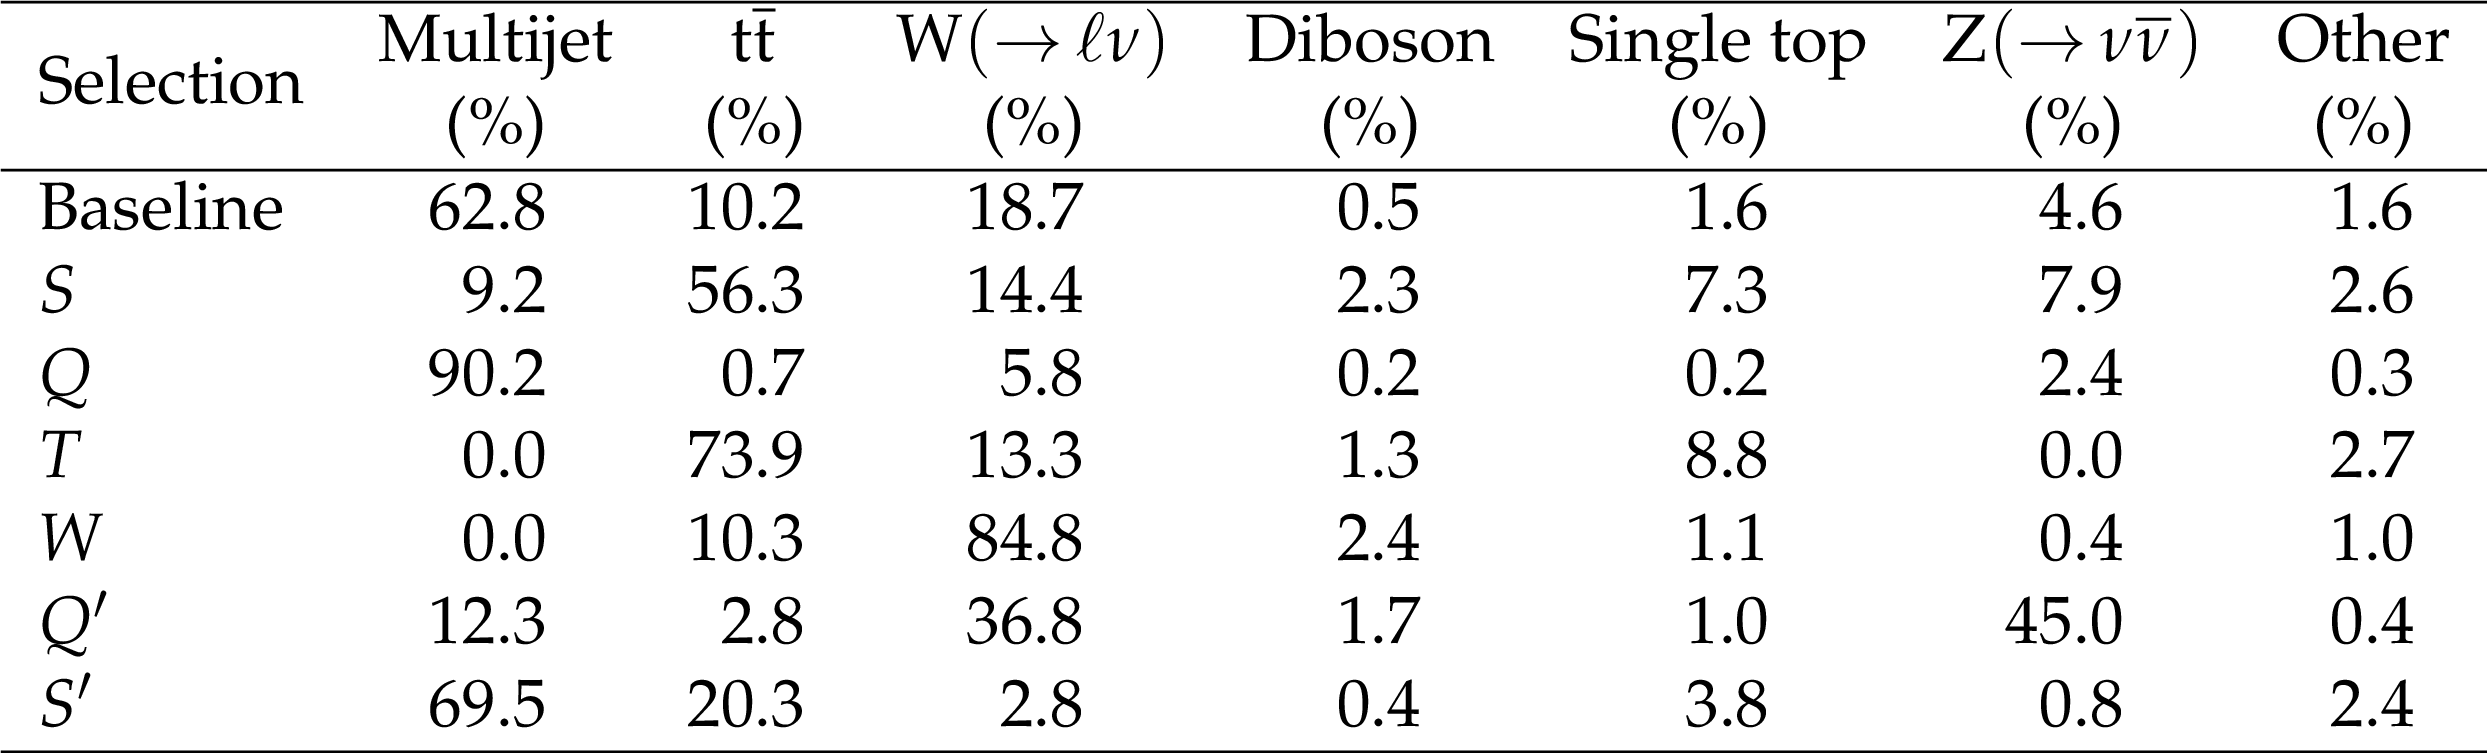
Table 3:
Background composition according to simulation after the baseline, $S$, $Q$, $T$, $W$, $Q'$ and $S'$ region selections. ``Other'' refers to the sum of the small background components $\mathrm{ Z } /\gamma^* \rightarrow \ell \bar{\ell}$, triboson, and $\mathrm{ t \bar{t} } \mathrm{V}$. |
png pdf |
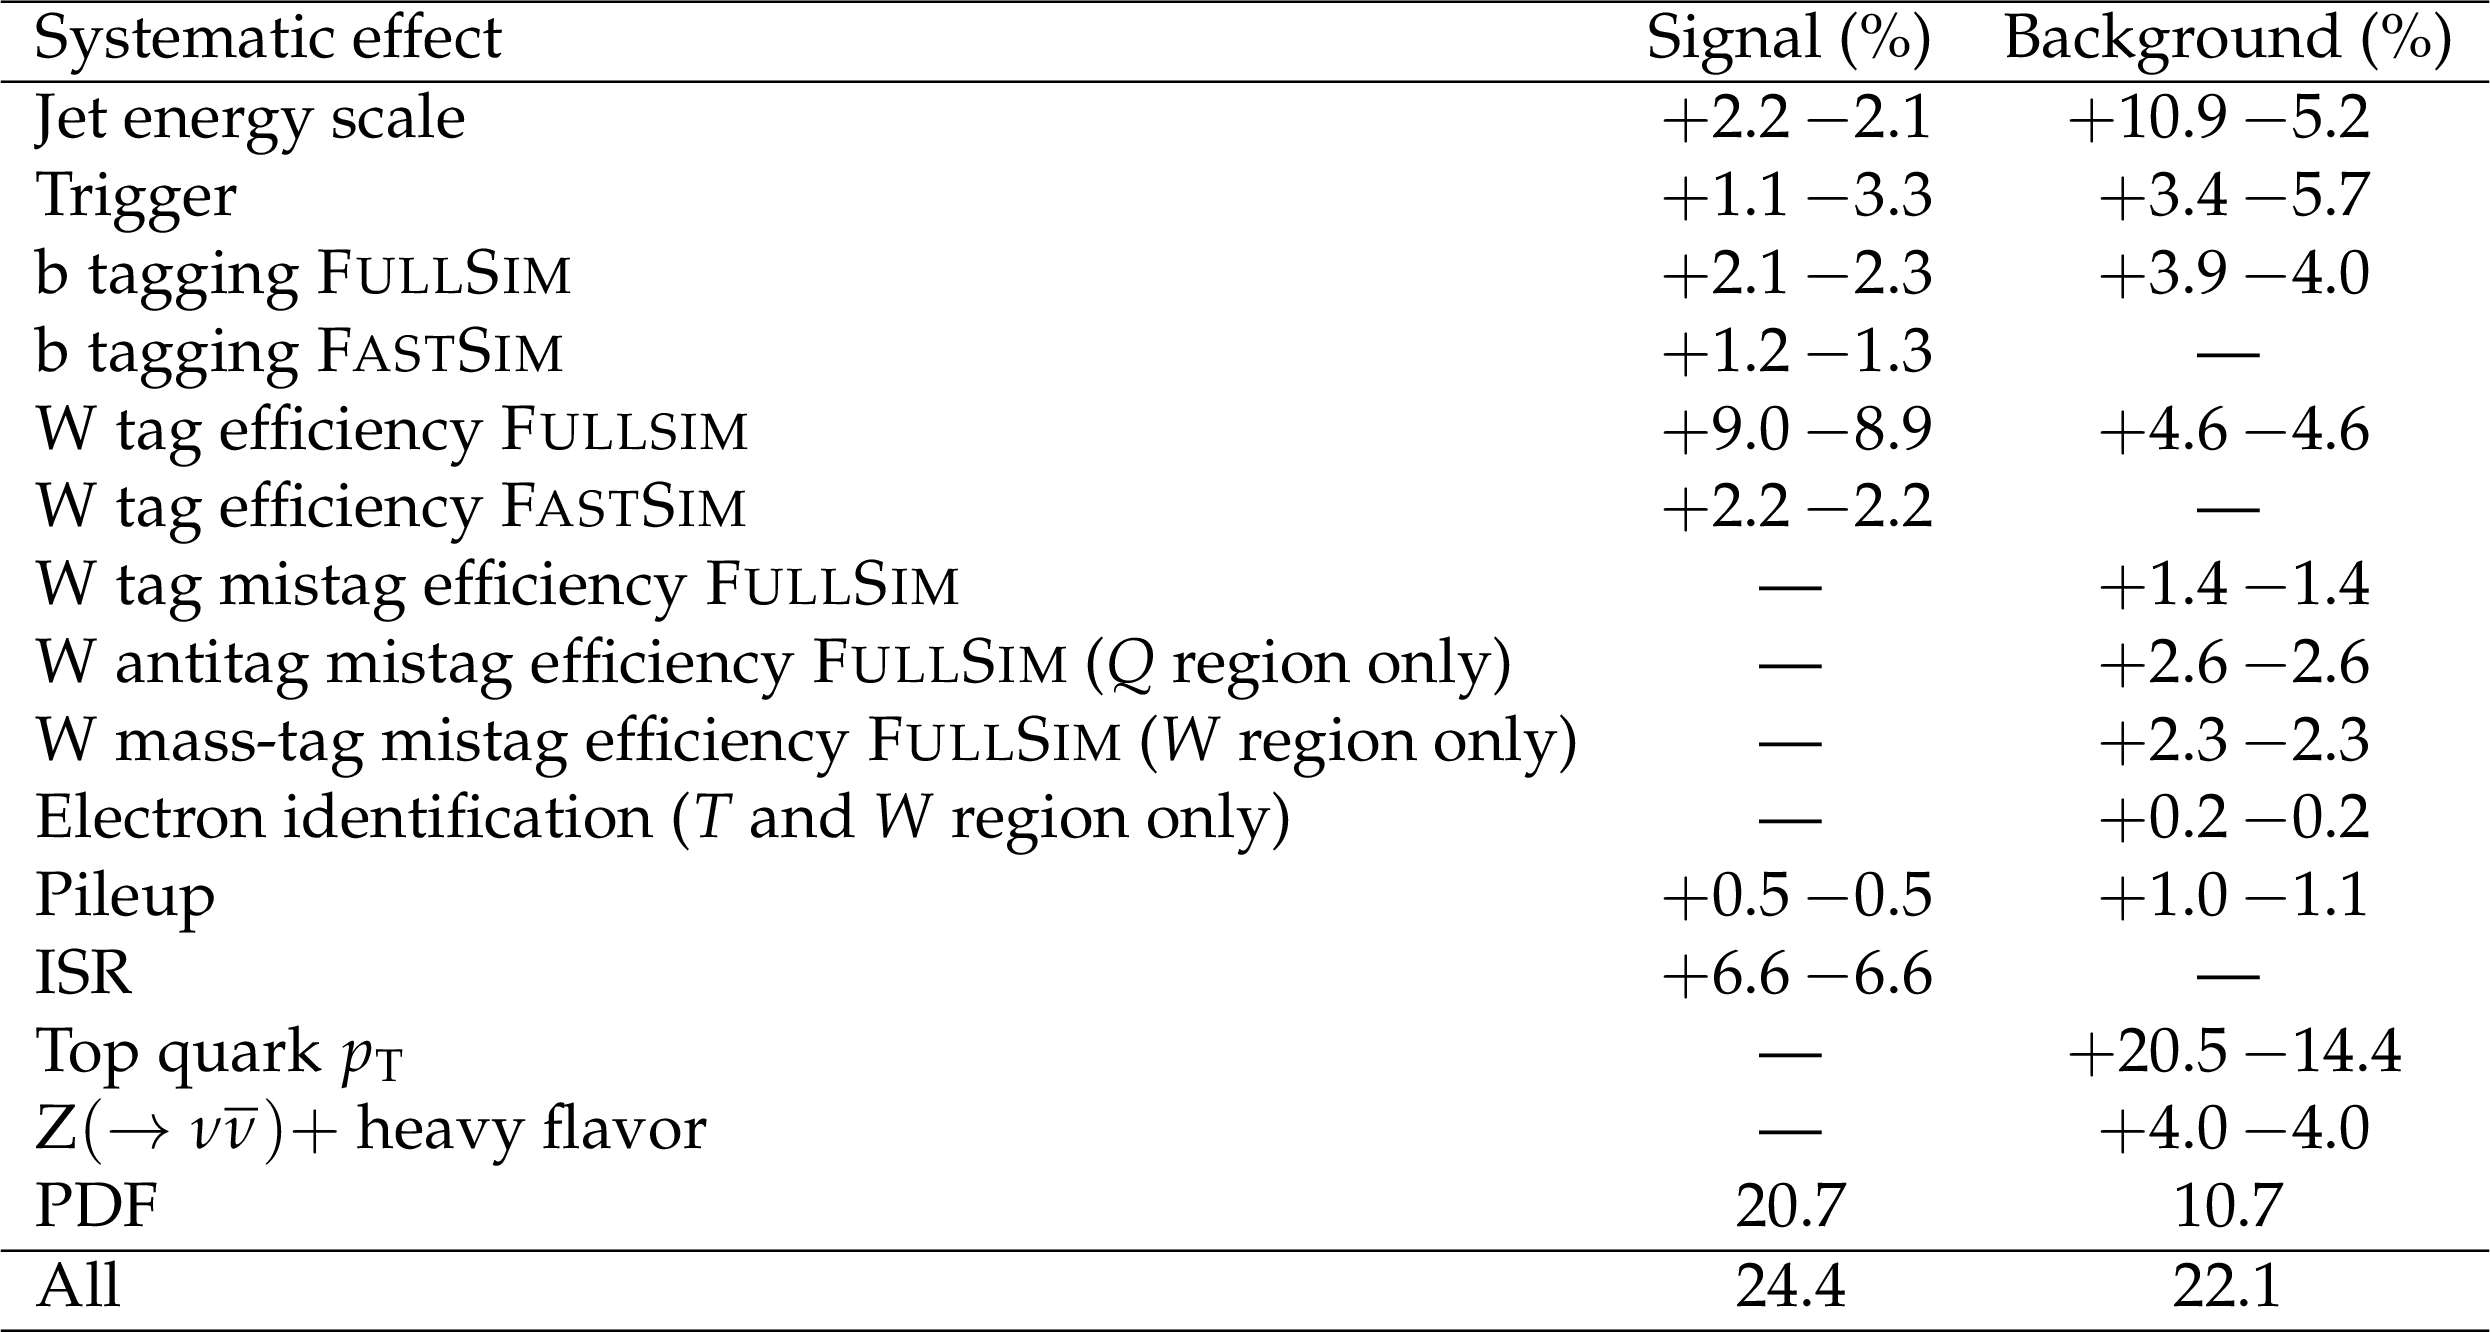
Table 4:
Summary of $\pm$1 standard deviation systematic uncertainties for the average signal efficiency over all mass assumptions in the T1ttcc model ($\Delta m= $ 25 GeV), and for the total background count in the signal region, unless indicated otherwise, as determined from simulation. |
png pdf |
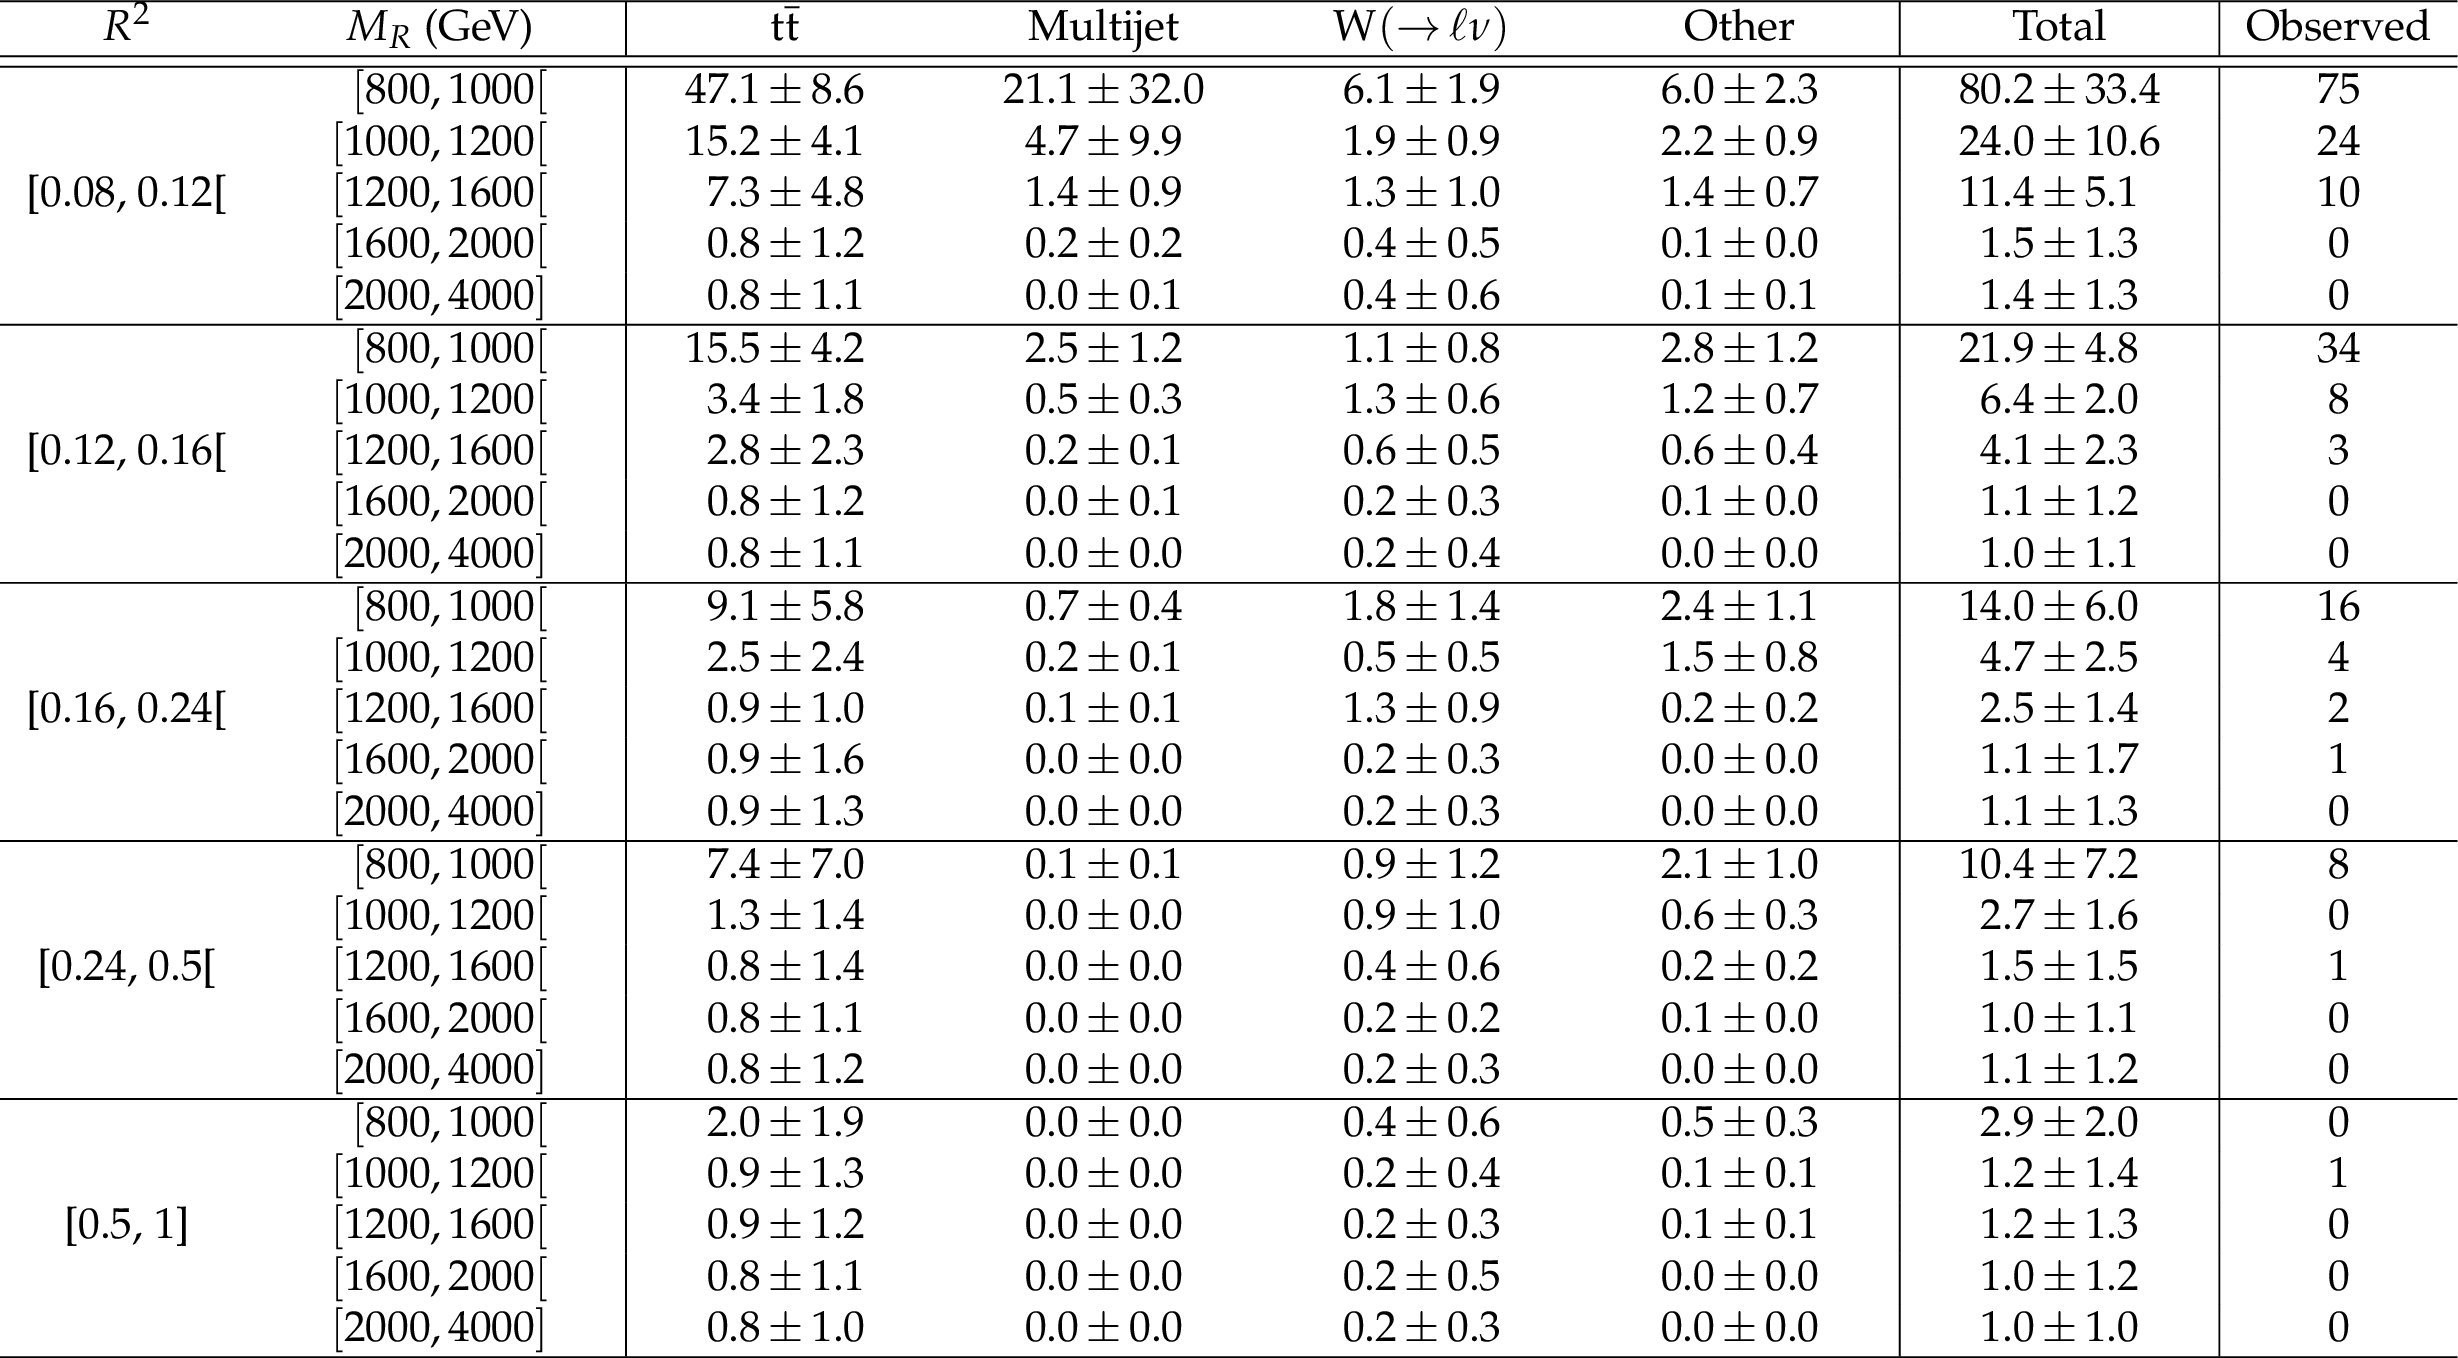
Table 5:
Event yields for the predicted backgrounds and for the data in each of the signal bins in $R^2$ and $ {M_R} $. The uncertainties in the predictions are the combined statistical and systematic uncertainties obtained using the sampling procedure described in the text. |
| Summary |
| We have presented a search for new physics in hadronic final states with at least one boosted W boson and a b-tagged jet using data binned at high values of the razor kinematic variables, $M_\mathrm{R}$ and $R^2$. The analysis uses 19.7 fb$^{-1}$ of 8 TeV proton-proton collision data collected by the CMS experiment. The SM backgrounds are estimated using control regions in data. Scale factors, derived from simulations, connect these control regions to the signal region. The observations are found to be consistent with the SM expectation, as shown in Fig. 10 and Table 5. The results, which are encapsulated in a binned likelihood, are interpreted in terms of supersymmetric models describing pair production of heavy gluinos decaying to boosted top quarks. Limits are set on the gluino and neutralino masses using the CLs criterion on the gluino-neutralino mass plane, as shown in Fig. 12. Assuming that the gluino always decays into a top squark and a top quark, this analysis excludes gluino masses up to 1.1 TeV for top squarks with a mass of up to about 450 GeV that decay exclusively to a charm quark and a neutralino. In this scenario, the mass difference considered between the top squark and the neutralino is less than 80 GeV. This analysis also excludes gluino masses of up to 700 GeV when the top squark decays solely to a top quark and a neutralino, and the mass difference between the top squark and the neutralino is around the top quark mass. |
| References | ||||
| 1 | J. Wess and B. Zumino | Supergauge transformations in four-dimensions | Nucl. Phys. B 70 (1974) 39 | |
| 2 | Y. A. Gol'fand and E. P. Likhtman | Extension of the algebra of Poincar$ \'e $ group generators and violation of P invariance | JEPTL 13 (1971)323 | |
| 3 | D. V. Volkov and V. P. Akulov | Possible universal neutrino interaction | JEPTL 16 (1972) 438 | |
| 4 | A. H. Chamseddine, R. L. Arnowitt, and P. Nath | Locally supersymmetric grand unification | PRL 49 (1982) 970 | |
| 5 | G. L. Kane, C. F. Kolda, L. Roszkowski, and J. D. Wells | Study of constrained minimal supersymmetry | PRD 49 (1994) 6173 | hep-ph/9312272 |
| 6 | P. Fayet | Supergauge invariant extension of the Higgs mechanism and a model for the electron and its neutrino | Nucl. Phys. B 90 (1975) 104 | |
| 7 | R. Barbieri, S. Ferrara, and C. A. Savoy | Gauge models with spontaneously broken local supersymmetry | PLB 119 (1982) 343 | |
| 8 | L. J. Hall, J. D. Lykken, and S. Weinberg | Supergravity as the messenger of supersymmetry breaking | PRD 27 (1983) 2359 | |
| 9 | P. Ramond | Dual theory for free fermions | PRD 3 (1971) 2415 | |
| 10 | R. Barbieri and D. Pappadopulo | S-particles at their naturalness limits | JHEP 10 (2009) 061 | 0906.4546 |
| 11 | M. Papucci, J. T. Ruderman, and A. Weiler | Natural SUSY endures | JHEP 09 (2012) 035 | 1110.6926 |
| 12 | ATLAS Collaboration | Search for direct third-generation squark pair production in final states with missing transverse momentum and two $ b $-jets in $ \sqrt{s} = $ 8 TeV pp collisions with the ATLAS detector | JHEP 10 (2013) 189 | 1308.2631 |
| 13 | ATLAS Collaboration | Search for direct top-squark pair production in final states with two leptons in pp collisions at $ \sqrt{s} = $ 8 TeV with the ATLAS detector | JHEP 06 (2014) 124 | 1403.4853 |
| 14 | ATLAS Collaboration | Search for direct pair production of the top squark in all-hadronic final states in proton-proton collisions at $ \sqrt{s} = $ 8 TeV with the ATLAS detector | JHEP 09 (2014) 015 | 1406.1122 |
| 15 | ATLAS Collaboration | Measurement of the $ t\bar{t} $ production cross-section using $ e\mu $ events with $ b $-tagged jets in pp collisions at $ \sqrt{s}=$ 7 and 8 TeV with the ATLAS detector | EPJC 74 (2014) 3109 | 1406.5375 |
| 16 | ATLAS Collaboration | Search for top squark pair production in final states with one isolated lepton, jets, and missing transverse momentum in $ \sqrt{s}=$ 8 TeV pp collisions with the ATLAS detector | JHEP 11 (2014) 118 | 1407.0583 |
| 17 | ATLAS Collaboration | Search for direct top squark pair production in events with a $ Z $ boson, $ b $-jets and missing transverse momentum in $ \sqrt{s} = $ 8 TeV pp collisions with the ATLAS detector | EPJC 74 (2014) 2883 | 1403.5222 |
| 18 | ATLAS Collaboration | Search for strong production of supersymmetric particles in final states with missing transverse momentum and at least three $ b $-jets at $ \sqrt{s} = $ 8 TeV proton-proton collisions with the ATLAS detector | JHEP 10 (2014) 024 | 1407.0600 |
| 19 | CMS Collaboration | Search for top-squark pair production in the single-lepton final state in pp collisions at $ \sqrt{s} = $ 8 TeV | EPJC 73 (2013) 2677 | CMS-SUS-13-011 1308.1586 |
| 20 | CMS Collaboration | Search for top squark and higgsino production using diphoton Higgs boson decays | PRL 112 (2014) 161802 | CMS-SUS-13-014 1312.3310 |
| 21 | CMS Collaboration | Search for top-squark pairs decaying into Higgs or Z bosons in pp collisions at $ \sqrt{s} = $ 8 TeV | PLB 736 (2014) 371 | CMS-SUS-13-024 1405.3886 |
| 22 | CMS Collaboration | Searches for supersymmetry using the $ \mathrm{M_{T2}} $ variable in hadronic events produced in pp collisions at 8 TeV | JHEP 05 (2015) 078 | CMS-SUS-13-019 1502.04358 |
| 23 | CMS Collaboration | Search for supersymmetry in events with soft leptons, low jet multiplicity, and missing transverse momentum in proton-proton collisions at $ \sqrt{s} = $ 8 TeV | Submitted to PLB | CMS-SUS-14-021 1512.08002 |
| 24 | S. P. Martin | Compressed supersymmetry and natural neutralino dark matter from top squark-mediated annihilation to top quarks | PRD 75 (2007) 115005 | hep-ph/0703097 |
| 25 | S. P. Martin | The top squark-mediated annihilation scenario and direct detection of dark matter in compressed supersymmetry | PRD 76 (2007) 095005 | 0707.2812 |
| 26 | M. Carena, A. Freitas, and C. E. M. Wagner | Light stop searches at the LHC in events with one hard photon or jet and missing energy | JHEP 10 (2008) 109 | 0808.2298 |
| 27 | CMS Collaboration | Searches for third-generation squark production in fully hadronic final states in proton-proton collisions at $ \sqrt{s} = $ 8 TeV | JHEP 06 (2015) 116 | CMS-SUS-14-001 1503.08037 |
| 28 | ATLAS Collaboration | Search for pair-produced third-generation squarks decaying via charm quarks or in compressed supersymmetric scenarios in pp collisions at $ \sqrt{s} = $ 8 TeV with the ATLAS detector | PRD 90 (2014) 052008 | 1407.0608 |
| 29 | LHC New Physics Working Group Collaboration | Simplified models for LHC new physics searches | JPG 39 (2012) 105005 | 1105.2838 |
| 30 | D. Alves, E. Izaguirre, and J. G. Wacker | Where the sidewalk ends: jets and missing energy search strategies for the 7$ TeV $ LHC | JHEP 10 (2011) 012 | 1102.5338 |
| 31 | J. Alwall, P. C. Schuster, and N. Toro | Simplified models for a first characterization of new physics at the LHC | PRD 79 (2009) 075020 | 0810.3921 |
| 32 | J. Alwall, M.-P. Le, M. Lisanti, and J. G. Wacker | Model-independent jets plus missing energy searches | PRD 79 (2009) 015005 | 0809.3264 |
| 33 | N. Arkani-Hamed et al. | MARMOSET: The path from LHC data to the new Standard Model via on-shell effective theories | hep-ph/0703088 | |
| 34 | CMS Collaboration | Interpretation of searches for supersymmetry with simplified models | PRD 88 (2013) 052017 | CMS-SUS-11-016 1301.2175 |
| 35 | S. D. Ellis, C. K. Vermilion, and J. R. Walsh | Techniques for improved heavy particle searches with jet substructure | PRD 80 (2009) 051501 | 0903.5081 |
| 36 | S. D. Ellis, C. K. Vermilion, and J. R. Walsh | Recombination algorithms and jet substructure: Pruning as a tool for heavy particle searches | PRD 81 (2010) 094023 | 0912.0033 |
| 37 | CMS Collaboration | Studies of jet mass in dijet and W/Z+jet events | JHEP 05 (2013) 090 | CMS-SMP-12-019 1303.4811 |
| 38 | J. Thaler and K. Van Tilburg | Identifying boosted objects with N-subjettiness | JHEP 03 (2011) 015 | 1011.2268 |
| 39 | C. Rogan | Kinematical variables towards new dynamics at the LHC | 1006.2727 | |
| 40 | CMS Collaboration | Inclusive search for supersymmetry using the razor variables in pp collisions at $ \sqrt{s} = $ 7 TeV | PRL 111 (2013) 081802 | CMS-SUS-11-024 1212.6961 |
| 41 | CMS Collaboration | Inclusive search for squarks and gluinos in pp collisions at $ \sqrt{s} = $ 7 TeV | PRD 85 (2012) 012004 | CMS-SUS-10-009 1107.1279 |
| 42 | CMS Collaboration | Search for supersymmetry with razor variables in pp collisions at $ \sqrt{s} = $ 7 TeV | PRD 90 (2014) 112001 | CMS-SUS-12-005 1405.3961 |
| 43 | CMS Collaboration | Search for supersymmetry using razor variables in events with $ \mathrm{ b } $b-tagged jets in pp collisions at $ \sqrt{s} = $ 8 TeV | PRD 91 (2015) 052018 | CMS-SUS-13-004 1502.00300 |
| 44 | CMS Collaboration | The CMS experiment at the CERN LHC | JINST 3 (2008) S08004 | CMS-00-001 |
| 45 | CMS Collaboration | Particle--flow event reconstruction in CMS and performance for jets, taus, and $ E_{\mathrm{T}}^{\text{miss}} $ | CDS | |
| 46 | CMS Collaboration | Commissioning of the particle--flow event reconstruction with the first LHC collisions recorded in the CMS detector | CDS | |
| 47 | J. Alwall et al. | MadGraph 5: Going beyond | JHEP 06 (2011) 128 | 1106.0522 |
| 48 | J. Alwall et al. | The automated computation of tree-level and next-to-leading order differential cross sections, and their matching to parton shower simulations | JHEP 07 (2014) 079 | 1405.0301 |
| 49 | J. Pumplin et al. | New generation of parton distributions with uncertainties from global QCD analysis | JHEP 07 (2002) 012 | hep-ph/0201195 |
| 50 | T. Sj\"ostrand, S. Mrenna, and P. Z. Skands | PYTHIA 6.4 physics and manual | JHEP 05 (2006) 026 | hep-ph/0603175 |
| 51 | S. Alioli, P. Nason, C. Oleari, and E. Re | NLO single-top production matched with shower in POWHEG: $ s $- and $ t $-channel contributions | JHEP 09 (2009) 111, , [Erratum: \DOI10.1007/JHEP02(2010)011] | 0907.4076 |
| 52 | E. Re | Single-top $ W $ $ t $-channel production matched with parton showers using the POWHEG method | EPJC 71 (2011) 1547 | 1009.2450 |
| 53 | H.-L. Lai et al. | New parton distributions for collider physics | PRD 82 (2010) 074024 | 1007.2241 |
| 54 | M. Kramer et al. | Supersymmetry production cross sections in pp collisions at $ \sqrt{s} = $ 7 TeV | 1206.2892 | |
| 55 | W. Beenakker, R. Hopker, M. Spira, and P. M. Zerwas | Squark and gluino production at hadron colliders | Nucl. Phys. B 492 (1997) 51 | hep-ph/9610490 |
| 56 | A. Kulesza and L. Motyka | Threshold resummation for squark-antisquark and gluino-pair production at the LHC | PRL 102 (2009) 111802 | 0807.2405 |
| 57 | A. Kulesza and L. Motyka | Soft gluon resummation for the production of gluino-gluino and squark-antisquark pairs at the LHC | PRD 80 (2009) 095004 | 0905.4749 |
| 58 | W. Beenakker et al. | Soft-gluon resummation for squark and gluino hadroproduction | JHEP 12 (2009) 041 | 0909.4418 |
| 59 | W. Beenakker et al. | Squark and gluino hadroproduction | Int. J. Mod. Phys. A 26 (2011) 2637 | 1105.1110 |
| 60 | CMS Collaboration | Study of the underlying event at forward rapidity in pp collisions at $ \sqrt{s} $ = 0.9, 2.76, and 7$ TeV $ | JHEP 04 (2013) 072 | CMS-FWD-11-003 1302.2394 |
| 61 | R. Field | Early LHC underlying event data: Findings and surprises | in Hadron collider physics. Proceedings, 22nd Conference, HCP 2010, Toronto, Canada, August 23-27, 2010 2010 | 1010.3558 |
| 62 | CTEQ Collaboration | Global QCD analysis of parton structure of the nucleon: CTEQ5 parton distributions | EPJC 12 (2000) 375 | hep-ph/9903282 |
| 63 | GEANT4 Collaboration | GEANT4---a simulation toolkit | NIMA 506 (2003) 250 | |
| 64 | CMS Collaboration | The fast simulation of the CMS detector at LHC | J. Phys. Conf. Ser. 331 (2011) 032049 | |
| 65 | CMS Collaboration | Missing transverse energy performance of the CMS detector | JINST 6 (2011) P09001 | CMS-JME-10-009 1106.5048 |
| 66 | CMS Collaboration | Performance of the CMS missing transverse momentum reconstruction in pp data at $ \sqrt{s} = $ 8 TeV | JINST 10 (2015) P02006 | CMS-JME-13-003 1411.0511 |
| 67 | CMS Collaboration | Pileup removal algorithms | CMS-PAS-JME-14-001 | CMS-PAS-JME-14-001 |
| 68 | M. Cacciari and G. P. Salam | Pileup subtraction using jet areas | PLB 659 (2008) 119 | 0707.1378 |
| 69 | M. Cacciari, G. P. Salam, and G. Soyez | The catchment area of jets | JHEP 04 (2008) 005 | 0802.1188 |
| 70 | M. Cacciari, G. P. Salam, and G. Soyez | FastJet user manual | EPJC 72 (2012) 1896 | 1111.6097 |
| 71 | M. Cacciari, G. P. Salam, and G. Soyez | The anti-$ k_t $ jet clustering algorithm | JHEP 04 (2008) 063 | 0802.1189 |
| 72 | CMS Collaboration | Determination of jet energy calibration and transverse momentum resolution in CMS | JINST 6 (2011) P11002 | CMS-JME-10-011 1107.4277 |
| 73 | CMS Collaboration | Identification of $ \mathrm{ b } $-quark jets with the CMS experiment | JINST 8 (2013) P04013 | CMS-BTV-12-001 1211.4462 |
| 74 | CMS Collaboration | Performance of $ \mathrm{ b } $ tagging at $ \sqrt{s} = $ 8 TeV in multijet, $ \mathrm{ t \bar{t} } $ and boosted topology events | CMS-PAS-BTV-13-001 | CMS-PAS-BTV-13-001 |
| 75 | CMS Collaboration | Search for massive resonances in dijet systems containing jets tagged as W or Z boson decays in pp collisions at $ \sqrt{s} = $ 8 TeV | JHEP 08 (2014) 173 | CMS-EXO-12-024 1405.1994 |
| 76 | Y. L. Dokshitzer, G. D. Leder, S. Moretti, and B. R. Webber | Better jet clustering algorithms | JHEP 08 (1997) 001 | hep-ph/9707323 |
| 77 | CMS Collaboration | Performance of electron reconstruction and selection with the CMS detector in proton-proton collisions at $ \sqrt{s} = $ 8 TeV | JINST 10 (2015) P06005 | CMS-EGM-13-001 1502.02701 |
| 78 | CMS Collaboration | Performance of CMS muon reconstruction in pp collision events at $ \sqrt{s} = $ 7 TeV | JINST 7 (2012) P10002 | CMS-MUO-10-004 1206.4071 |
| 79 | CMS Collaboration | Identification techniques for highly boosted W bosons that decay into hadrons | JHEP 12 (2014) 017 | CMS-JME-13-006 1410.4227 |
| 80 | T. Junk | Confidence level computation for combining searches with small statistics | NIMA 434 (1999) 435 | hep-ex/9902006 |
| 81 | A. L. Read | Presentation of search results: The $ \mathrm{CL_S} $ technique | JPG 28 (2002) 2693 | |
| 82 | ATLAS and CMS Collaborations | Procedure for the LHC Higgs boson search combination in Summer 2011 | CMS-NOTE-2011-005 | |
| 83 | NNPDF Collaboration | Parton distributions with QED corrections | Nucl. Phys. B 877 (2013) 290 | 1308.0598 |
| 84 | A. D. Martin, W. J. Stirling, R. S. Thorne, and G. Watt | Parton distributions for the LHC | EPJC 63 (2009) 189 | 0901.0002 |
| 85 | A. Buckley et al. | LHAPDF6: parton density access in the LHC precision era | EPJC 75 (2015) 132 | 1412.7420 |
| 86 | CMS Collaboration | Measurement of differential top-quark pair production cross sections in pp collisions at $ \sqrt{s} = $ 7 TeV | EPJC 73 (2013) 2339 | CMS-TOP-11-013 1211.2220 |
| 87 | CMS Collaboration | Measurement of the production cross sections for a Z boson and one or more b jets in pp collisions at $ \sqrt{s} = $ 7 TeV | JHEP 06 (2014) 120 | |
|
|
Compact Muon Solenoid LHC, CERN |
|

|

|

|

|

|