

Compact Muon Solenoid
LHC, CERN
| CMS-PAS-TOP-13-006 | ||
| Determination of the normalised invariant mass distribution of $\mathrm{t\bar{t}}$+jet and extraction of the top quark mass | ||
| CMS Collaboration | ||
| May 2016 | ||
| Abstract: A measurement of the top quark mass from top quark pair ($\mathrm{t\bar{t}}$) events produced in association with additional hard jets is performed in pp collisions at $\sqrt{s}= $ 8 TeV with the CMS detector using data recorded in 2012, corresponding to an integrated luminosity of 19.7 fb$^{-1}$. The mass is extracted from the normalised invariant mass distribution of the $\mathrm{t\bar{t}}$+jet system at reconstruction level as well as from the related normalised differential cross section. Both measurements are performed in the dileptonic decay channels ($\mathrm{e^+e^-}$, $\mu^+\mu^-$ and $\mathrm{e^{\pm}}\mu^{\pm}$) of the $\mathrm{t\bar{t}}$ quark pairs. | ||
| Links: CDS record (PDF) ; inSPIRE record ; CADI line (restricted) ; | ||
| Figures | |
png pdf |
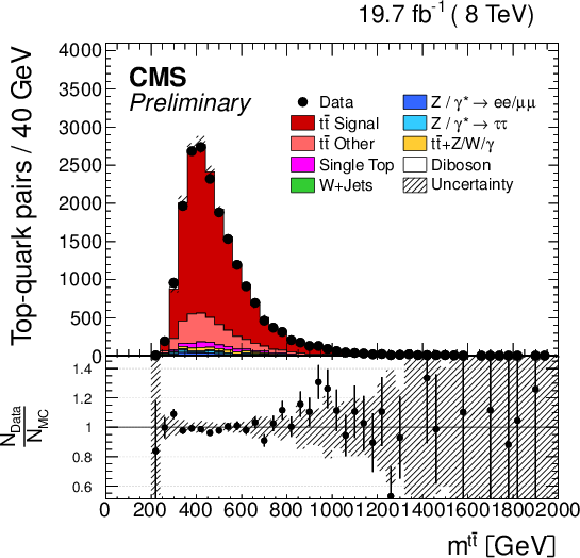
Figure 1-a:
Invariant mass of the ${\mathrm{ t \bar{t} } }$ system (a), transverse momentum of the leading additional jet (b) and $\rho _s$ (c) at reconstruction level for the combined dilepton channel. The ${\mathrm{ t \bar{t} } }$ sample is simulated using MadGraph and is assuming a top mass of $ {m_{\mathrm {t}}} = $ 172.5 GeV. The label `` ${\mathrm{ t \bar{t} } }$ signal'' refers to the events decaying dileptonically, while `` ${\mathrm{ t \bar{t} } }$ other'' refers to the other decay modes including ${\mathrm{ t \bar{t} } }$ decays into prompt $\tau $-leptons. The hatched regions correspond to all shape uncertainties of the simulation (cf. Section 5). |
png pdf |
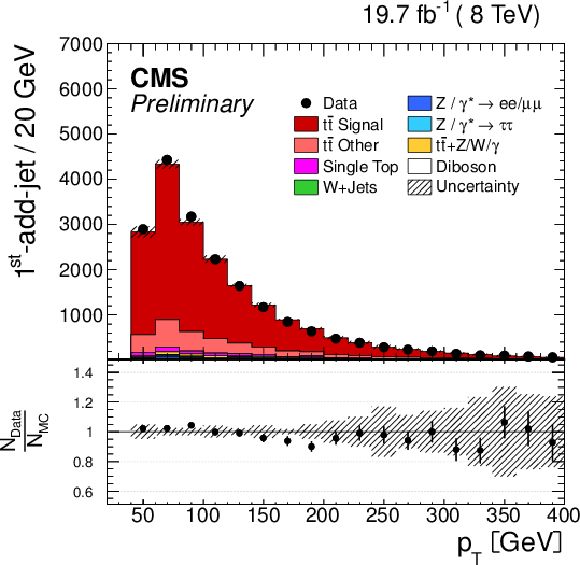
Figure 1-b:
Invariant mass of the ${\mathrm{ t \bar{t} } }$ system (a), transverse momentum of the leading additional jet (b) and $\rho _s$ (c) at reconstruction level for the combined dilepton channel. The ${\mathrm{ t \bar{t} } }$ sample is simulated using MadGraph and is assuming a top mass of $ {m_{\mathrm {t}}} = $ 172.5 GeV. The label `` ${\mathrm{ t \bar{t} } }$ signal'' refers to the events decaying dileptonically, while `` ${\mathrm{ t \bar{t} } }$ other'' refers to the other decay modes including ${\mathrm{ t \bar{t} } }$ decays into prompt $\tau $-leptons. The hatched regions correspond to all shape uncertainties of the simulation (cf. Section 5). |
png pdf |
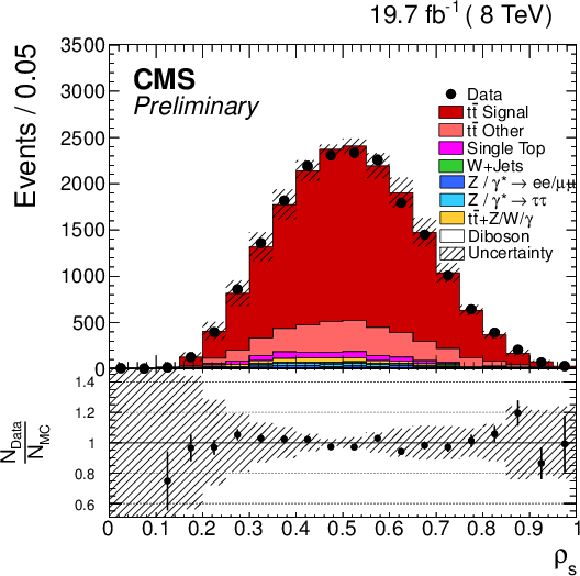
Figure 1-c:
Invariant mass of the ${\mathrm{ t \bar{t} } }$ system (a), transverse momentum of the leading additional jet (b) and $\rho _s$ (c) at reconstruction level for the combined dilepton channel. The ${\mathrm{ t \bar{t} } }$ sample is simulated using MadGraph and is assuming a top mass of $ {m_{\mathrm {t}}} = $ 172.5 GeV. The label `` ${\mathrm{ t \bar{t} } }$ signal'' refers to the events decaying dileptonically, while `` ${\mathrm{ t \bar{t} } }$ other'' refers to the other decay modes including ${\mathrm{ t \bar{t} } }$ decays into prompt $\tau $-leptons. The hatched regions correspond to all shape uncertainties of the simulation (cf. Section 5). |
png pdf |
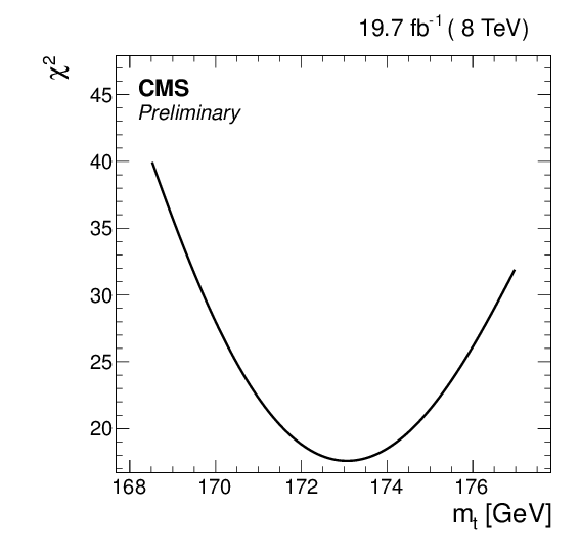
Figure 2:
Global $\chi ^2$ distribution obtained as the sum of the $\chi ^2_i$ distributions of the individual bins for the dilepton combined channel. The most probable top quark mass is extracted from the minimum, the statistical uncertainty from a $\chi ^{2}+1$ variation around the minimum. |
png pdf |
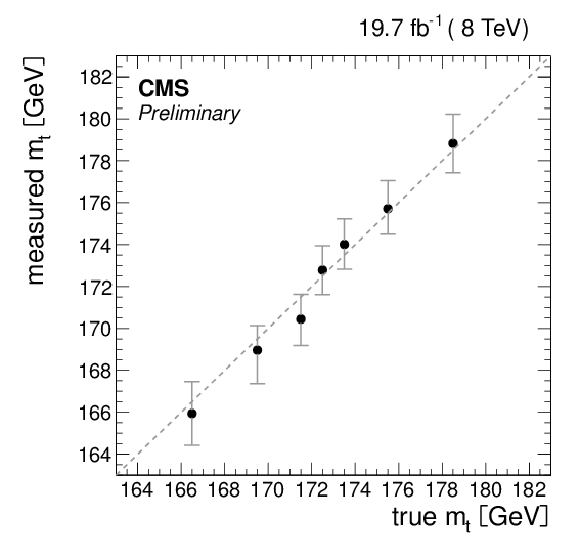
Figure 3:
Top quark mass obtained from pseudo data generated from each of the MadGraph samples with varied mass values. Neither a favoured mass value nor a bias towards higher or lower masses can be observed. |
png pdf |
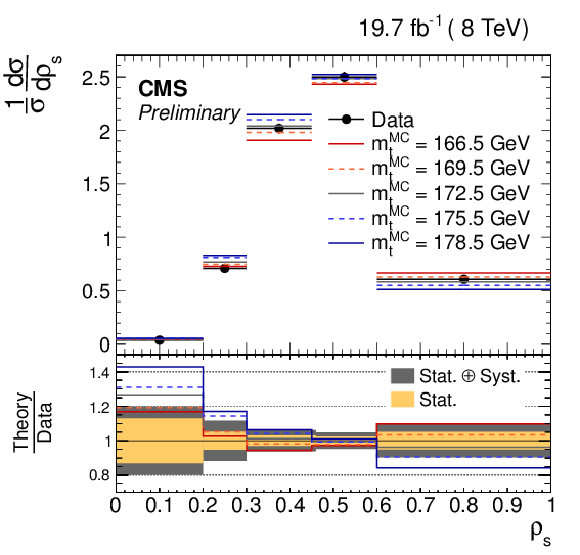
Figure 4:
Normalized differential ${\mathrm{ t \bar{t} } }$ cross section in the visible phase space after unfolding as a function of the observable $\rho _s$ in the dilepton channels, compared to the predictions from POWHEG $\mathrm{ t \bar{t} }$+jet simulated with a top quark mass of 172.5 GeV as well as $\pm$3 and 6 GeV variations with respect to the central value. The grey band represents the statistical uncertainty, the yellow band corresponds to the total systematic uncertainty. |
png pdf |
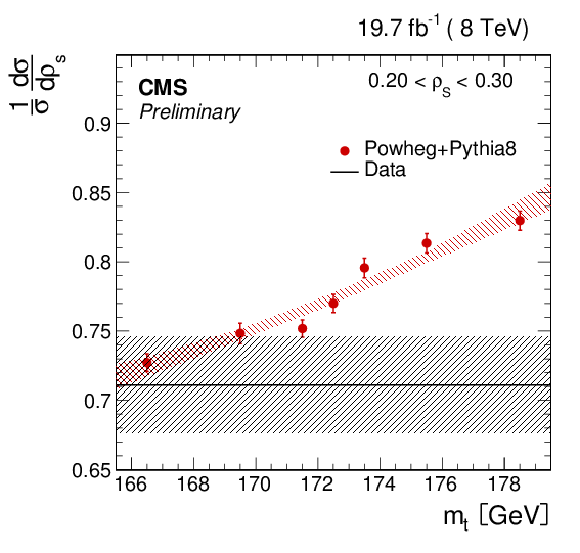
Figure 5-a:
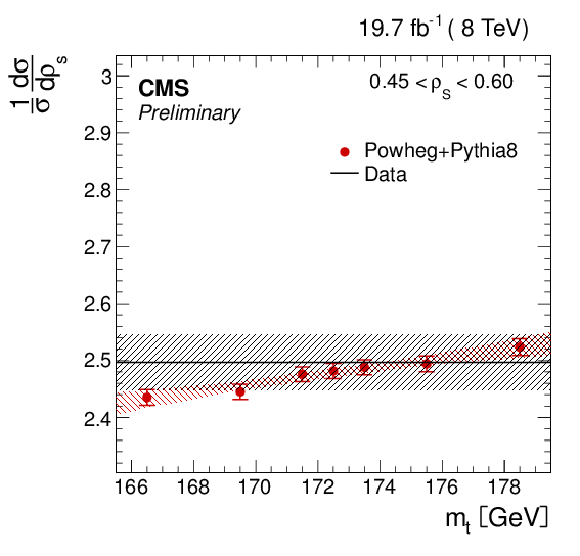
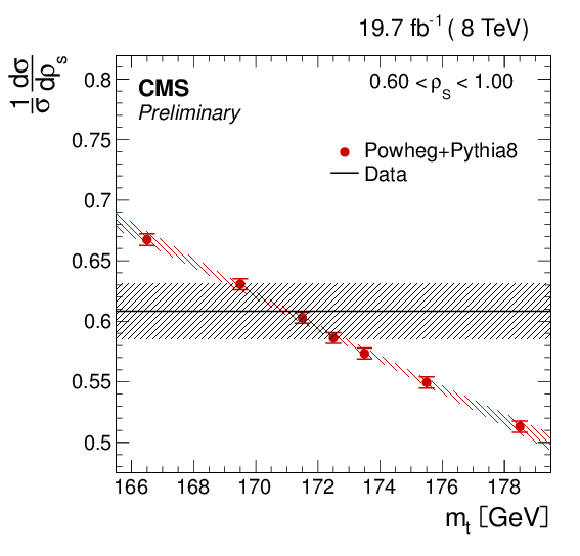
Distributions of the differential cross section for simulation and data for all mass samples in the different bins of the $\rho _s$ distribution, shown for the three dilepton final states combined. The error bands correspond to the statistical error on data and the confidence interval of the second order polynomial for the simulation. |
png pdf |
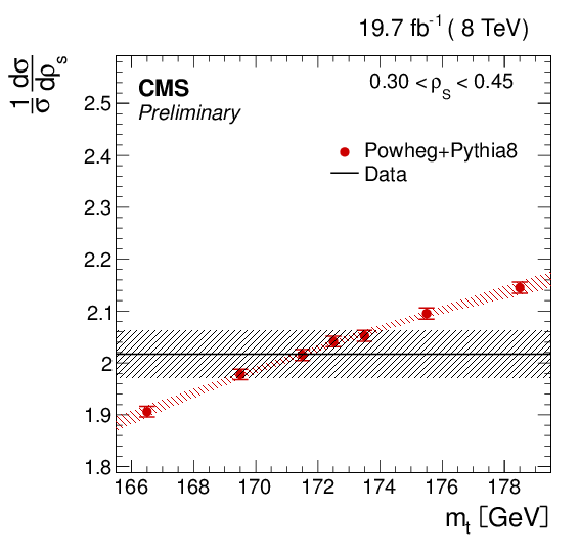
Figure 5-b:
Distributions of the differential cross section for simulation and data for all mass samples in the different bins of the $\rho _s$ distribution, shown for the three dilepton final states combined. The error bands correspond to the statistical error on data and the confidence interval of the second order polynomial for the simulation. |
png pdf |
Figure 5-c:
Distributions of the differential cross section for simulation and data for all mass samples in the different bins of the $\rho _s$ distribution, shown for the three dilepton final states combined. The error bands correspond to the statistical error on data and the confidence interval of the second order polynomial for the simulation. |
png pdf |
Figure 5-d:
Distributions of the differential cross section for simulation and data for all mass samples in the different bins of the $\rho _s$ distribution, shown for the three dilepton final states combined. The error bands correspond to the statistical error on data and the confidence interval of the second order polynomial for the simulation. |
png pdf |
Figure 6:
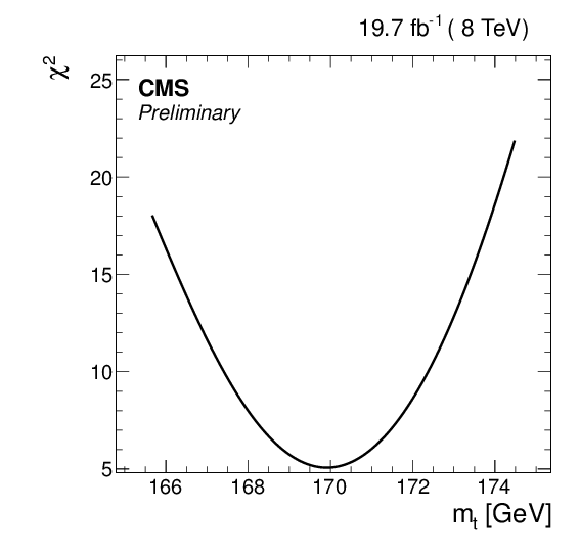
Global $\chi ^2$ distribution for the normalized differential cross section as a function of $\rho _s$ in the dilepton combined channel. |
png pdf |
Figure 7:
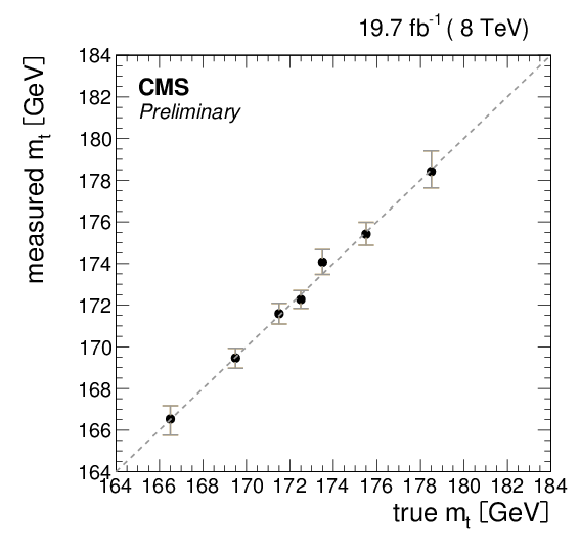
Top quark mass obtained by using each of the MadGraph samples with varied mass values as pseudo data, for the dilepton combined channel. |
| Tables | |
png pdf |
Table 1:
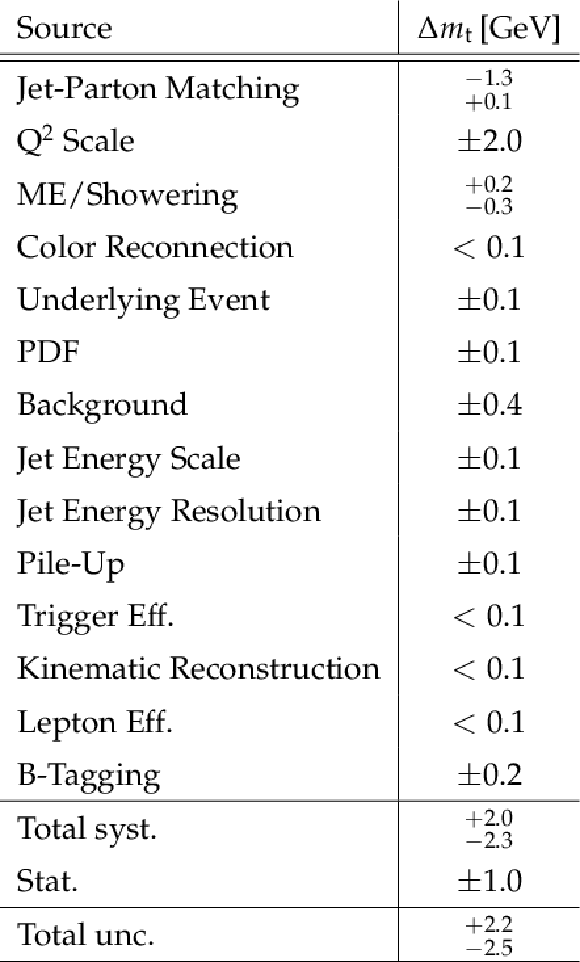
Breakdown of the systematic uncertainties for the top quark mass extracted from the normalized event yield for the dilepton combined channels. All systematic uncertainties are found to be statistically significant. For the asymmetric uncertainties due to scale variations, the first reported value corresponds to an increase of the corresponding scale and the second one to a decrease. |
png pdf |
Table 2:
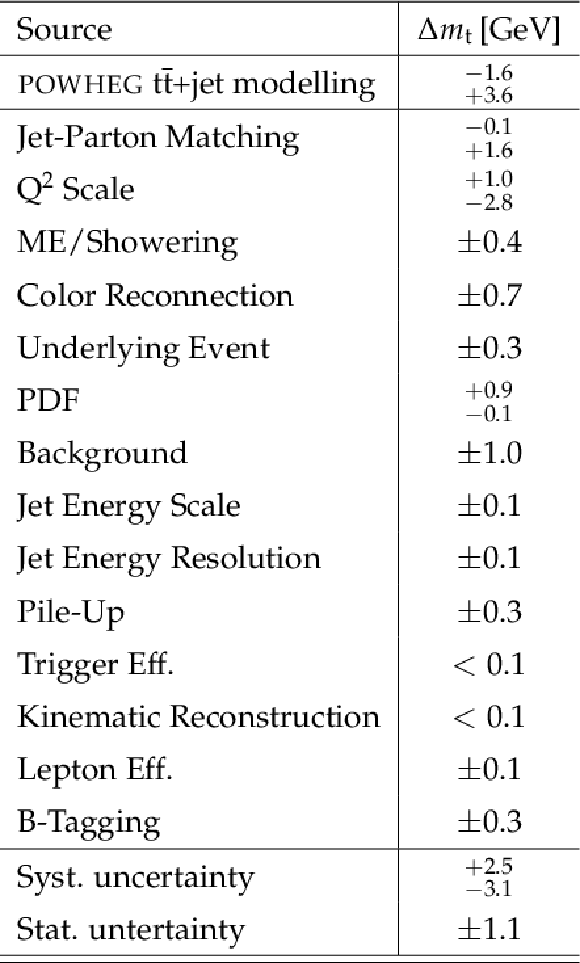
Breakdown of the systematic uncertainties for the top quark mass measured from the dileptonic channel. All systematic uncertainties are found to be statistically significant. For the asymmetric uncertainties due to scale variations, the first reported value corresponds to an increase of the corresponding scale and the second one to a decrease. |
| Summary |
|
The top quark mass is measured from the inverse of the invariant mass of the $\mathrm{t\bar{t}}$+jet system, an observable proposed in [3]. The mass extraction has been performed with a global template fit using the shape of the distribution at reconstruction level as well as using the normalised differential cross section in the visible phase space. The first approach avoids statistical correlations and uncertainties arising from the unfolding procedure, however it cannot be compared to predictions given at generator level, while the second eases the comparisons with theory models. The top quark mass obtained from the normalized differential $\mathrm{t\bar{t}}$+jet cross section using an NLO calculation interfaced with parton shower yields 169.9 $\pm$ 1.1 (stat) $^{+2.5}_{-3.1}$ (syst) $^{+3.6}_{-1.6}$ (theo) GeV. The precision is mostly limited by the systematic uncertainties arising from modelling sources and the theory uncertainties in the POWHEG $\mathrm{t\bar{t}}$+jet simulation. The result is in agreement within the uncertainties with other measurements performed following the same approach [4] as well as complementary measurements of the mass from the inclusive $\mathrm{ t \bar{t} }$ production cross section [39-41]. |
| References | ||||
| 1 | ATLAS, CDF, CMS, and D0 Collaborations | First combination of Tevatron and LHC measurements of the top-quark mass | 1403.4427 | |
| 2 | CMS Collaboration | Measurement of the top quark mass using proton-proton data at $ \sqrt{s} $ = 7 and 8 TeV | CMS-TOP-14-022 1509.04044 |
|
| 3 | S. Alioli et al. | A new observable to measure the top-quark mass at hadron colliders | Eur.Phys.J. C73 (2013) 2438 | 1303.6415 |
| 4 | ATLAS Collaboration | Determination of the top-quark pole mass using $ t\overline{t} $ + 1-jet events collected with the ATLAS experiment in 7 TeV pp collisions | JHEP 10 (2015) 121 | 1507.01769 |
| 5 | CMS Collaboration | The CMS experiment at the CERN LHC | JINST 03 (2008) S08004 | CMS-00-001 |
| 6 | CMS Collaboration | Measurement of Top Quark Pair Differential Cross Sections at sqrt(s) = 8 TeV | CMS-PAS-TOP-12-028 | CMS-PAS-TOP-12-028 |
| 7 | CMS Collaboration | Measurement of the Jet Multiplicity in dileptonic Top Quark Pair Events at 8 TeV | CDS | |
| 8 | P. Artoisenet et al. | Automatic spin-entangled decays of heavy resonances in Monte Carlo simulations | JHEP 03 (2013) 015 | 1212.3460 |
| 9 | J. Pumplin et al. | New generation of parton distributions with uncertainties from global QCD analysis | JHEP 07 (2002) 012 | hep-ph/0201195 |
| 10 | T. Sj\"ostrand, S. Mrenna, and P. Skands | PYTHIA 6.4 physics and manual | JHEP 05 (2006) 026 | hep-ph/0603175 |
| 11 | M. L. Mangano, M. Moretti, F. Piccinini, and M. Treccani | Matching matrix elements and shower evolution for top-quark production in hadronic collisions | JHEP 0701 (2007) 013 | hep-ph/0611129 |
| 12 | CMS Collaboration | Measurement of the underlying event activity at the LHC with $ \sqrt{s} $ =7 TeV and comparison with $ \sqrt{s} $ =0.9 TeV | JHEP 09 (2011) 109 | CMS-QCD-10-010 1107.0330 |
| 13 | S. Agostinelli et al. | $ \GEANTfour $ -- a simulation toolkit | NIMA 506 (2003) 250 | |
| 14 | N. Kidonakis | Two-loop soft anomalous dimensions for single top quark associated production with W- or H- | PRD82 (2010) 054018 | hep-ph/1005.4451 |
| 15 | J. M. Campbell, R. K. Ellis, and C. Williams | Vector boson pair production at the LHC | JHEP 1107 (2011) 018 | 1105.0020 |
| 16 | J. Campbell and R. Ellis | $ t\bar t W^{+-} $ production and decay at NLO | JHEP 07 (2012) 052 | 1204.5678 |
| 17 | W. Kilian, T. Ohl, and J. Reuter | WHIZARD: Simulating multi-particle processes at LHC and ILC | EPJC 71 (2011) 1742 | hep-ph/9905386 |
| 18 | K. Melnikov, M. Schulze, and A. Scharf | QCD corrections to top quark pair production in association with a photon at hadron colliders | PRD 83 (2011) 074013 | hep-ph/1102.1967 |
| 19 | R. Corke and T. Sjostrand | Interleaved Parton Showers and Tuning Prospects | JHEP 03 (2011) 032 | 1011.1759 |
| 20 | CMS Collaboration | Commissioning of the Particle-Flow Reconstruction in Minimum-Bias and Jet Events from pp Collisions at 7 TeV | CDS | |
| 21 | M. Cacciari, G. P. Salam, and G. Soyez | The Catchment Area of Jets | JHEP 04 (2008) 005 | 0802.1188 |
| 22 | CMS Collaboration | Determination of the jet energy scale in CMS with pp Collisions at $ \sqrt{s} $ = 7$ TeV $ | CDS | |
| 23 | M. Cacciari, G. P. Salam, and G. Soyez | The anti-$ k_t $ jet clustering algorithm | JHEP 04 (2008) 063 | hep-ph/0802.1189 |
| 24 | CMS Collaboration | Identification of b-quark jets with the CMS experiment | JINST 08 (2013) P04013 | hep-ex/1211.4462 |
| 25 | CMS Collaboration | Missing transverse energy performance of the CMS detector | JINST 06 (2011) P09001 | CMS-JME-10-009 1106.5048 |
| 26 | D0 Collaboration | Measurement of the top quark mass using dilepton events | PRL 80 (1998) 2063 | hep-ex/9706014 |
| 27 | CMS Collaboration | Measurement of differential top-quark pair production cross sections in pp collisions at $ \texorpdfstring $$ \sqrt{s} = $ 7 TeVsqrt(s) = 7 TeV | EPJC 73 (2013) 2339 | hep-ph/1211.2220 |
| 28 | CMS Collaboration | Measurement of jet multiplicity distributions in $ t\bar{t} $ production in pp collisions at $ \sqrt{s} $ = 7 TeV | EPJC 74 (Apr, 2014) 3014 | CMS-TOP-12-018 1404.3171 |
| 29 | CMS Collaboration | Measurement of the $ t\bar t $ production cross section and the top quark mass in the dilepton channel in pp collisions at $ \sqrt{s} $ = 7 TeV | JHEP 07 (2011) 049 | hep-ex/1105.5661 |
| 30 | CMS Collaboration | Determination of jet energy calibration and transverse momentum resolution in CMS | JINST 06 (2011) P11002 | CMS-JME-10-011 1107.4277 |
| 31 | CMS Collaboration | Jet energy resolution in CMS at $ \sqrt{s} $ = 7 TeV | CDS | |
| 32 | CMS Collaboration | Measurement of the $ t\bar{t} $ production cross section in the dilepton channel in $ pp $ collisions at $ \sqrt{s}=7 $ TeV | JHEP 1211 (2012) 067 | CMS-TOP-11-005 1208.2671 |
| 33 | TOTEM Collaboration | First measurement of the total proton-proton cross section at the LHC energy of $ \sqrt{s} $ =7 TeV | Europhys. Lett. 96 (2011) 21002 | hep-ex/1110.1395 |
| 34 | P. Z. Skands and D. Wicke | Non-perturbative QCD effects and the top mass at the Tevatron | EPJC 52 (2007) 133 | hep-ph/0703081 |
| 35 | P. Z. Skands | Tuning Monte Carlo generators: The Perugia tunes | PRD 82 (2010) 074018 | 1005.3457 |
| 36 | A. Hoecker and V. Kartvelishvili | SVD approach to data unfolding | NIMA 372 (1996) 469 | hep-ph/9509307 |
| 37 | V. Blobel | An unfolding method for high energy physics experiments | hep-ex/0208022 | |
| 38 | F. James | Statistical methods in experimental physics | World Scientific, $2^nd$ edition | |
| 39 | CMS Collaboration Collaboration | Measurement of the ttbar production cross section in the emu channel in pp collisions at 7 and 8 TeV | Technical Report CMS-PAS-TOP-13-004, CERN, Geneva | |
| 40 | R. Astalos et al. | Proceedings of the sixth international workshop on multiple partonic interactions at the Large Hadron Collider | 1506.05829 | |
| 41 | CMS Collaboration | Determination of the top-quark pole mass and strong coupling constant from the $ {\rm t bar{t}} $ production cross section in pp collisions at $ \sqrt{s} $ = 7 TeV | PLB 728 (2014) 496--517, , [Erratum: Phys. Lett.B728,526(2014)] | CMS-TOP-12-022 1307.1907 |

|
Compact Muon Solenoid LHC, CERN |

|

|

|

|

|

|