

Compact Muon Solenoid
LHC, CERN
| CMS-PAS-TOP-12-028 | ||
| Measurement of the differential top-quark pair production cross section in the dilepton channel in pp collisions at $ \sqrt{s} = $ 8 TeV | ||
| CMS Collaboration | ||
| 2013 | ||
| Abstract: Normalised differential top-quark pair production cross sections are measured in pp collisions at a centre-of-mass energy of 8 TeV at the LHC with the CMS detector using data recorded in 2012 corresponding to an integrated luminosity of 12.2 fb$^{-1}.$ The measurements are performed in the dilepton decay channels ($\mathrm{e^+e^-}$, $\mu^+\mu^-$, and $\mu^{\pm} \mathrm{e^{\mp}}$). The $\mathrm{t \bar t}$ production cross section is measured as a function of kinematic properties of the final-state charged leptons and jets associated to b quarks, as well as those of the top quarks and the $\mathrm{t \bar t}$ system. The data are compared with several predictions from perturbative QCD calculations up to approximate next-to-next-to-leading-order precision. No significant deviations from the standard model are observed. | ||
|
Links:
CDS record (PDF) ;
inSPIRE record ;
CADI line (restricted) ;
These preliminary results are superseded in this paper, EPJC 75 (2015) 542. The superseded preliminary plots can be found here. |
||
| Figures | |
png pdf |
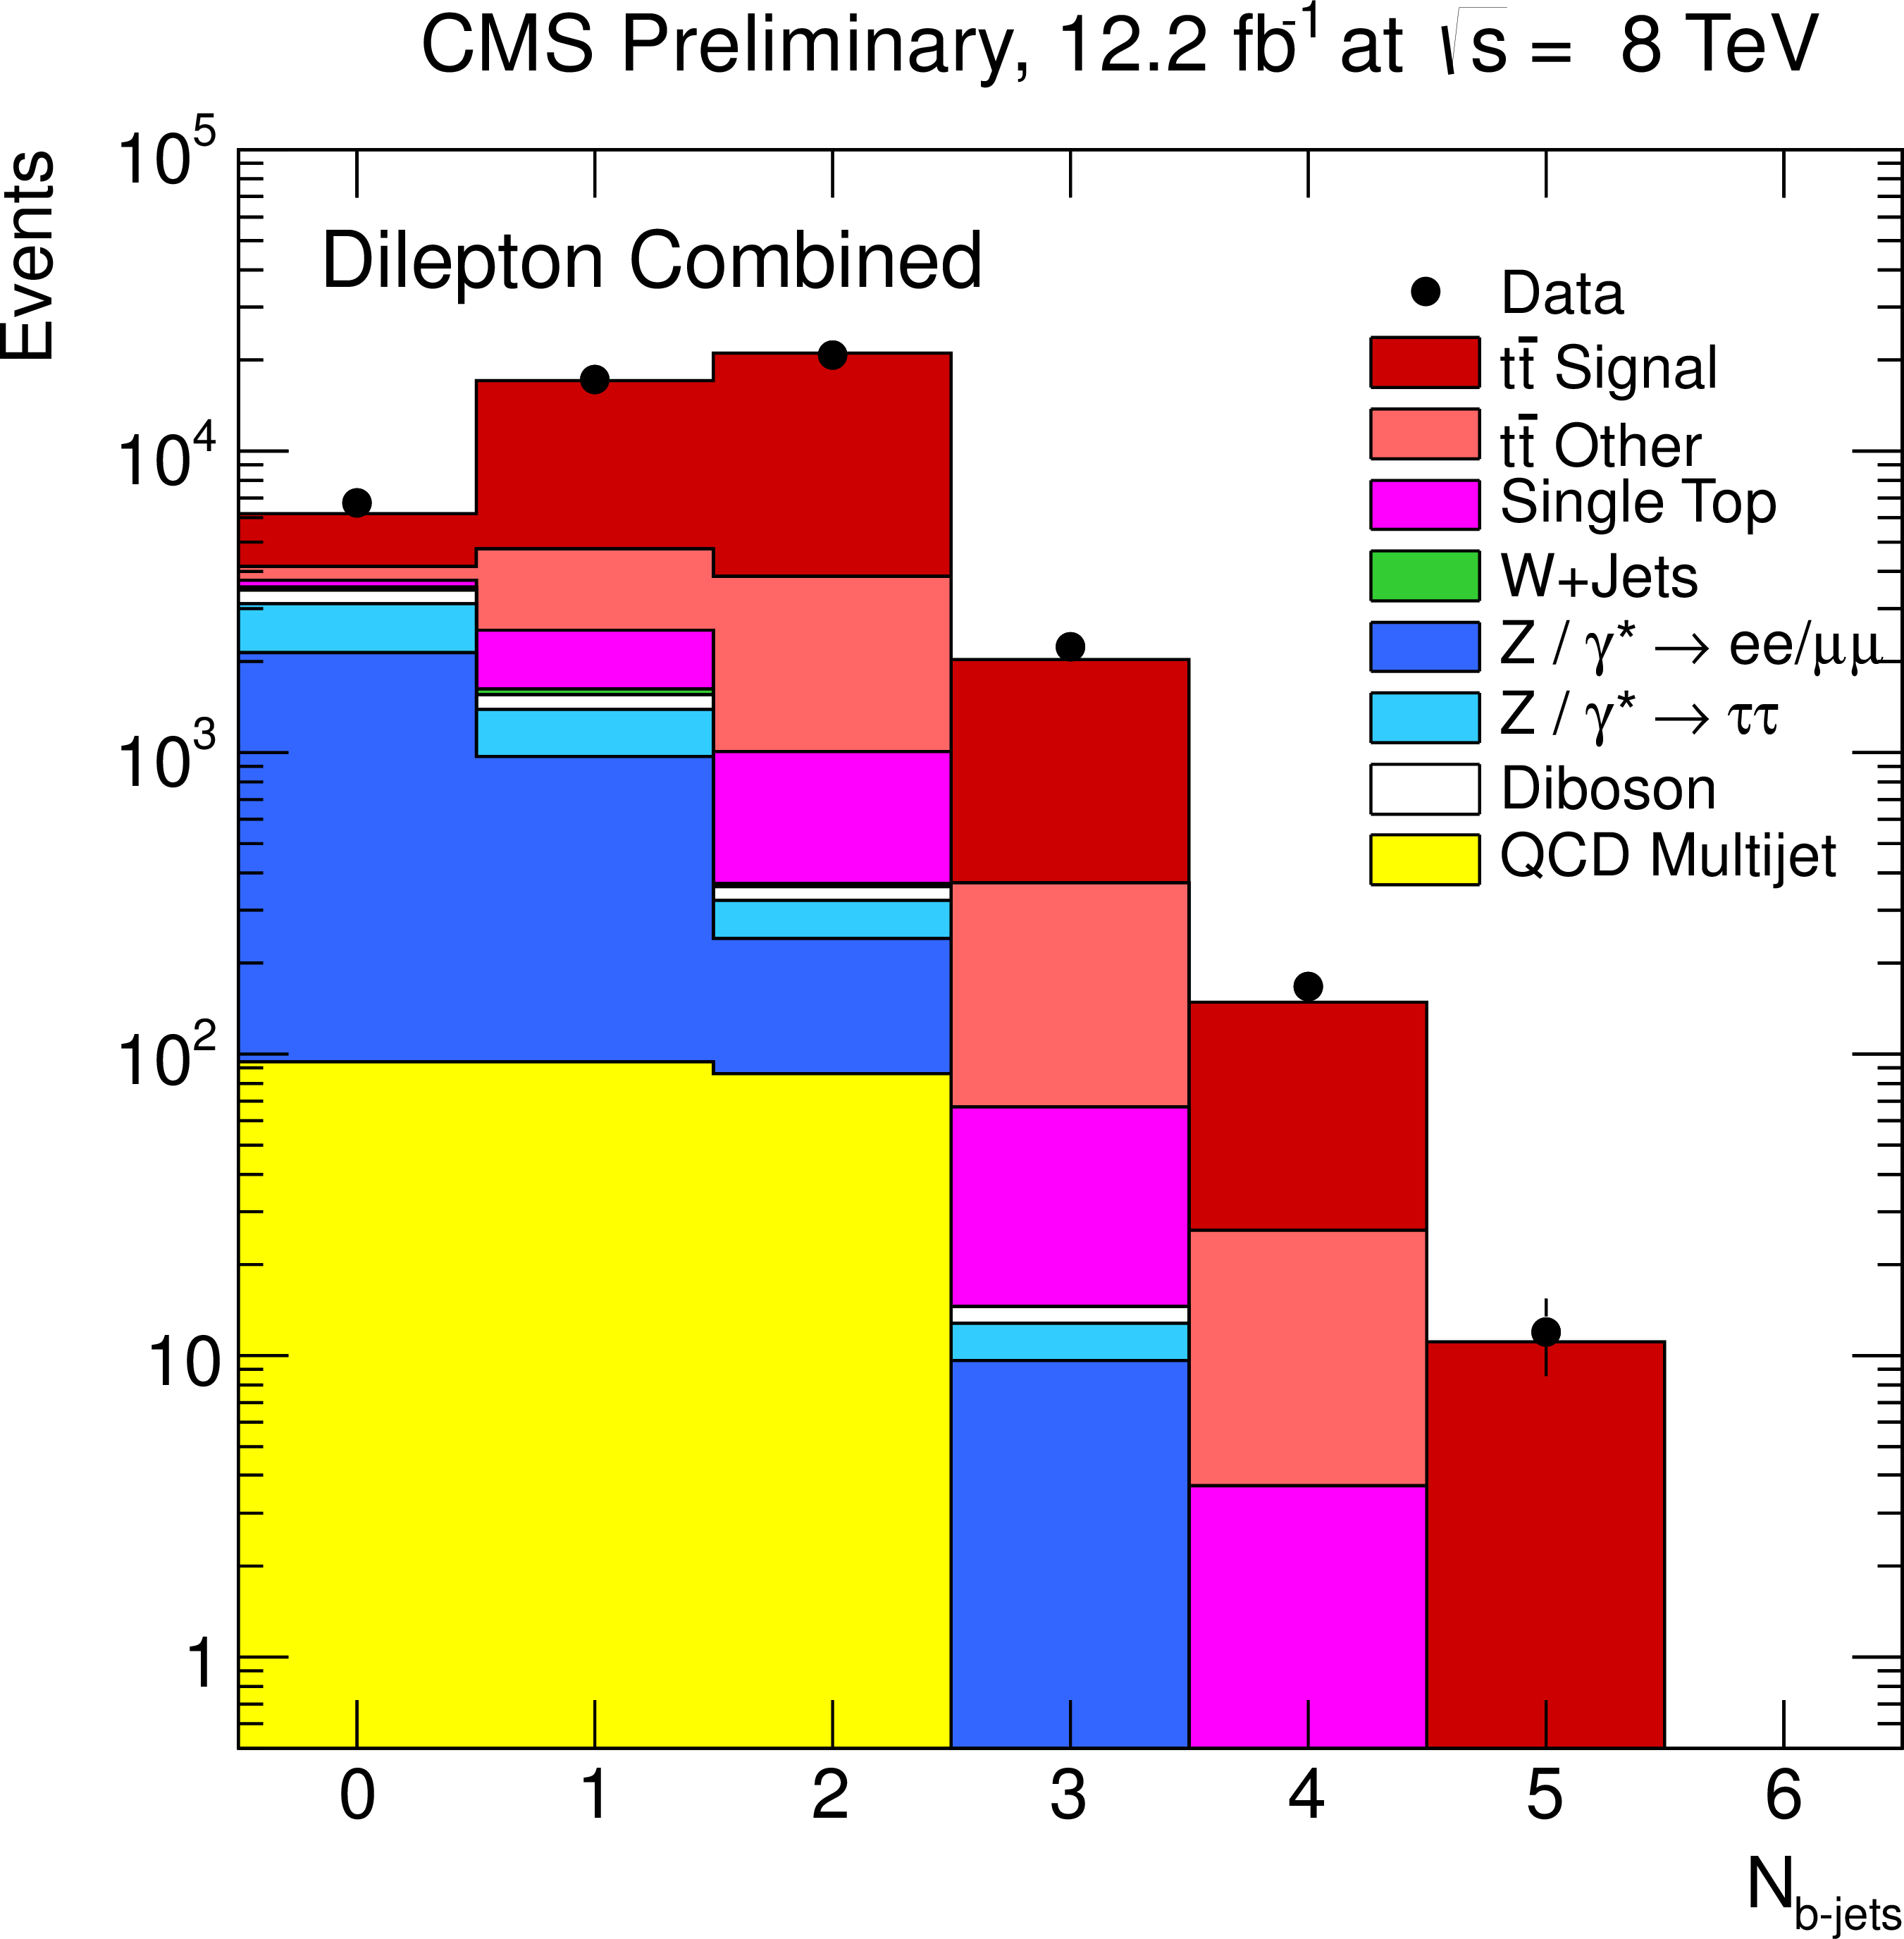
Figure 1-a:
Kinematic distributions after event selection for the dilepton channels. The (a) plot shows the multiplicity of the reconstructed b-tagged jets. The multiplicity of the reconstructed jets (b), the ${p_{\mathrm {T}}}$ of the highest ${p_{\mathrm {T}}}$ (leading) isolated leptons (c), and the ${p_{\mathrm {T}}}$ of the leading b jet (d) are shown after the b-tagging requirement. The normalisation of the Z/$\gamma ^{*}$+jets background is determined from data. |
png pdf |
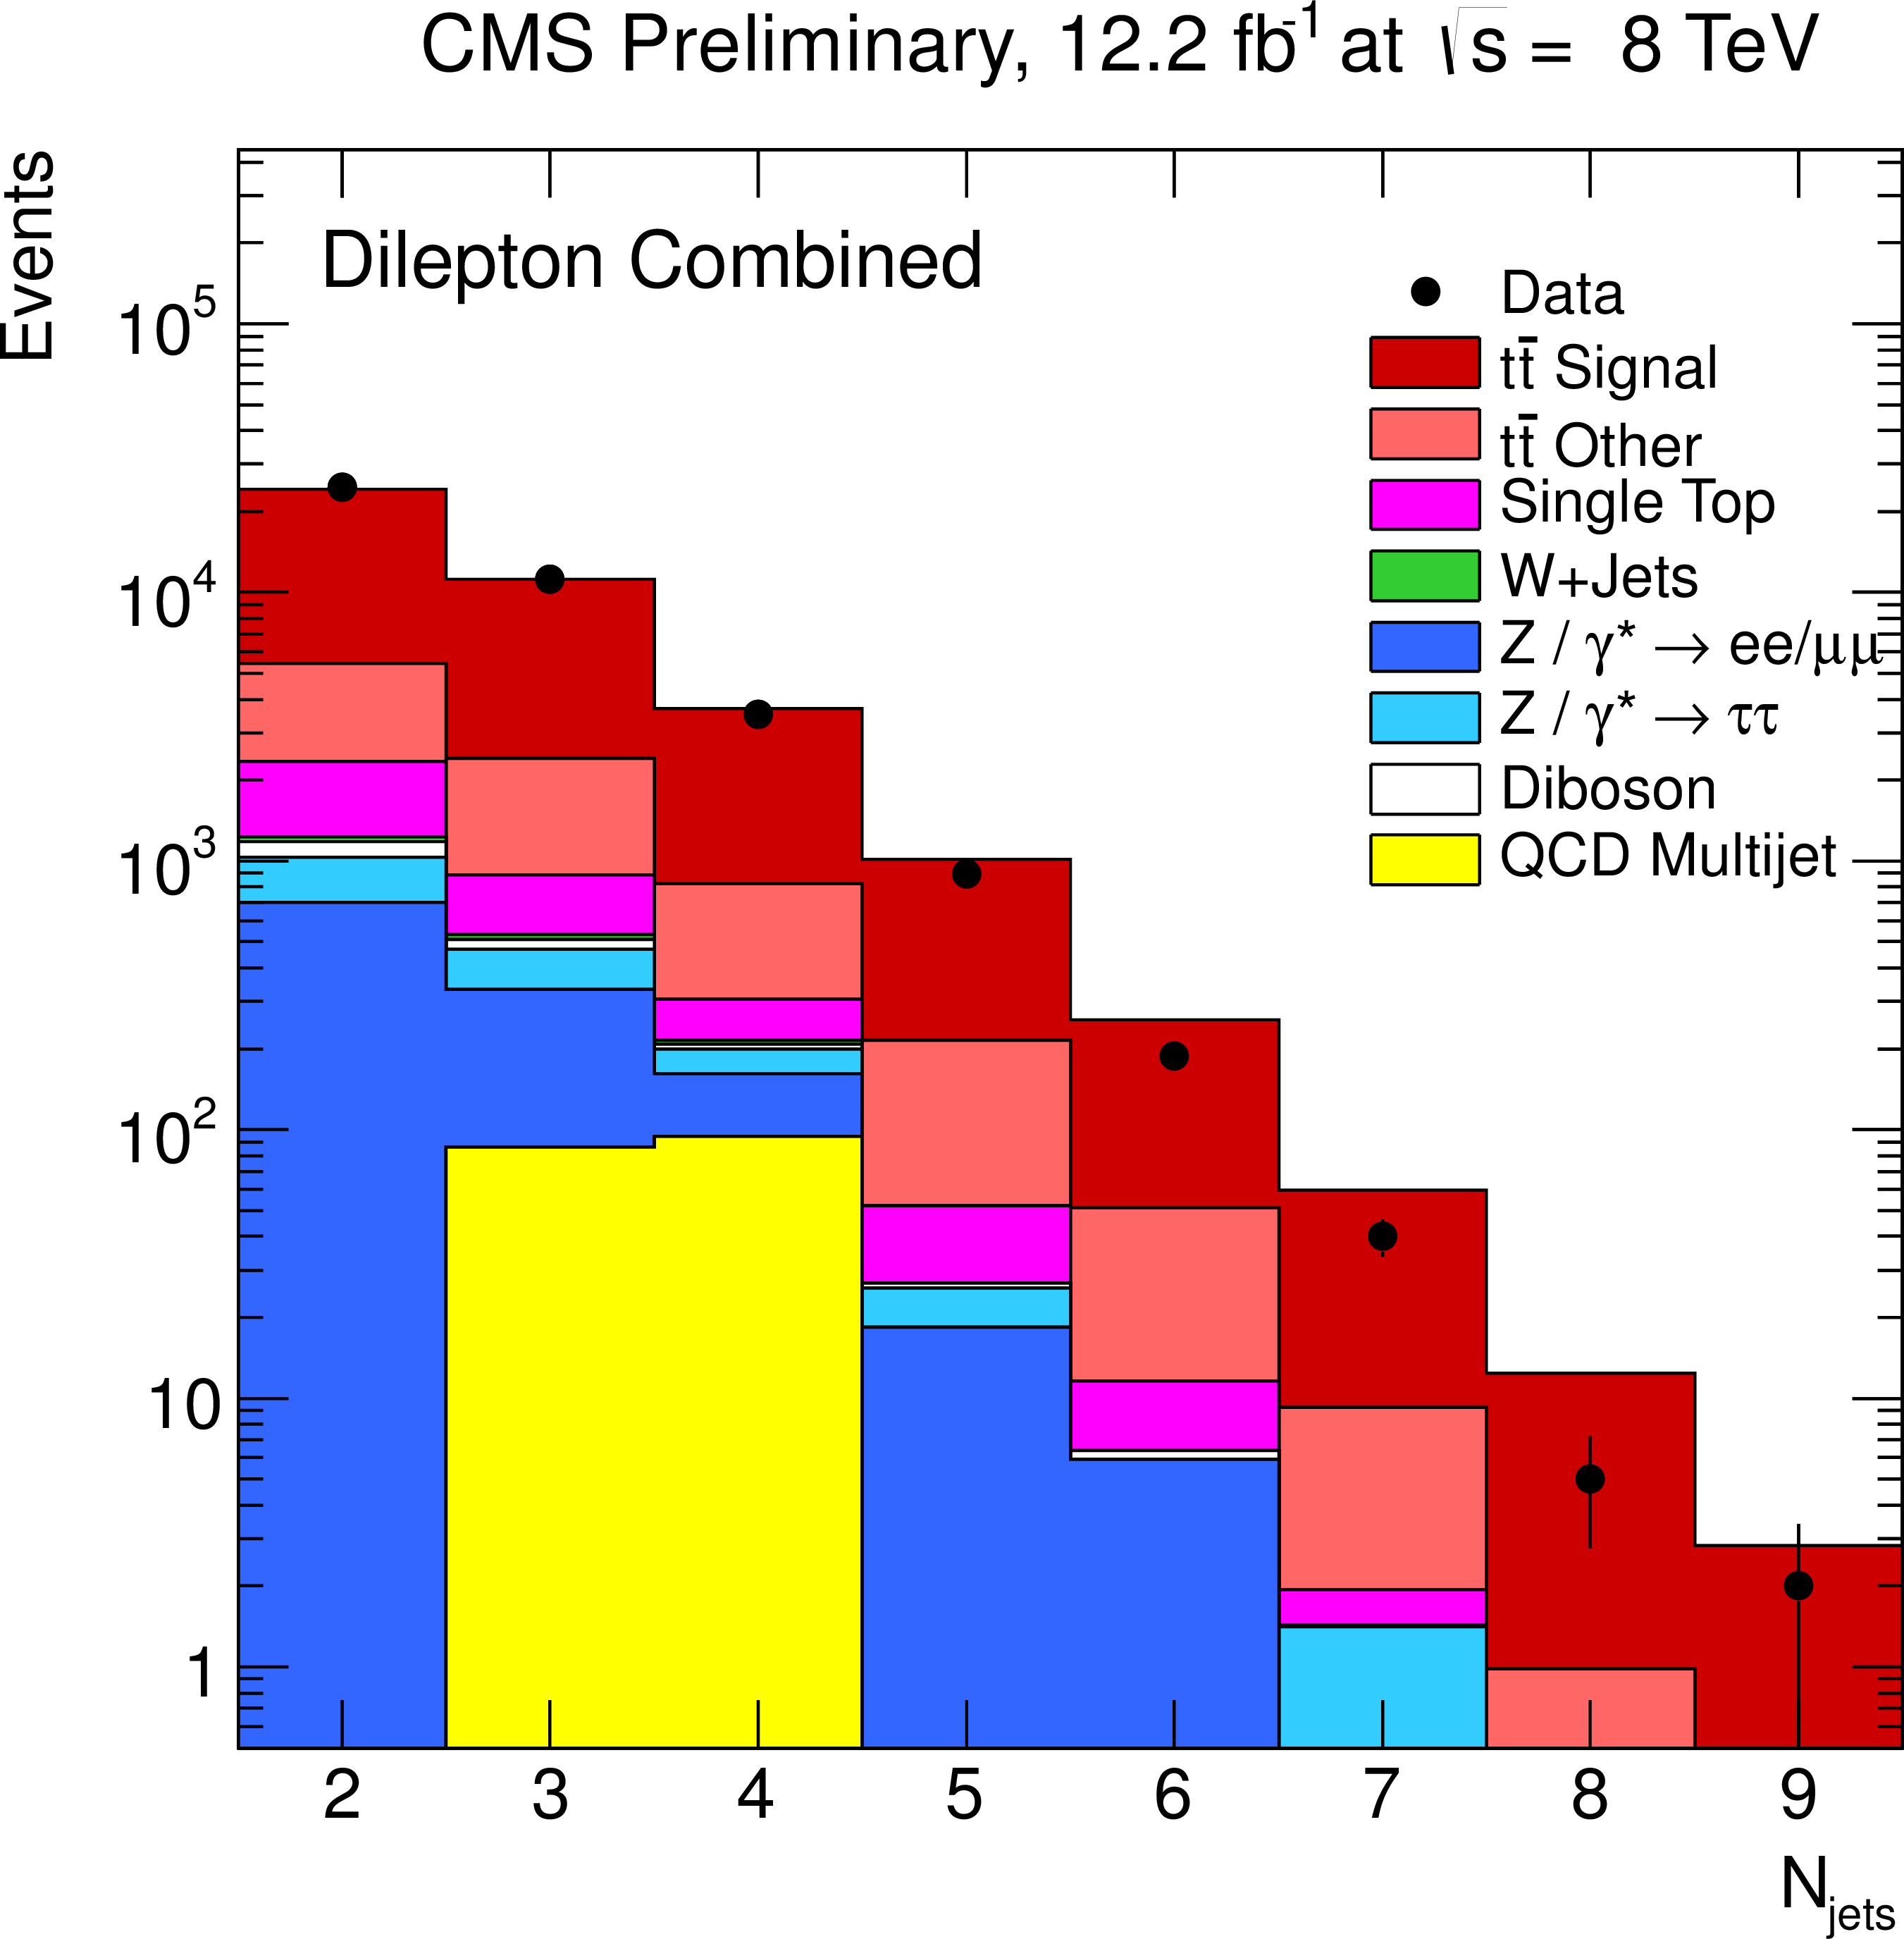
Figure 1-b:
Kinematic distributions after event selection for the dilepton channels. The (a) plot shows the multiplicity of the reconstructed b-tagged jets. The multiplicity of the reconstructed jets (b), the ${p_{\mathrm {T}}}$ of the highest ${p_{\mathrm {T}}}$ (leading) isolated leptons (c), and the ${p_{\mathrm {T}}}$ of the leading b jet (d) are shown after the b-tagging requirement. The normalisation of the Z/$\gamma ^{*}$+jets background is determined from data. |
png pdf |
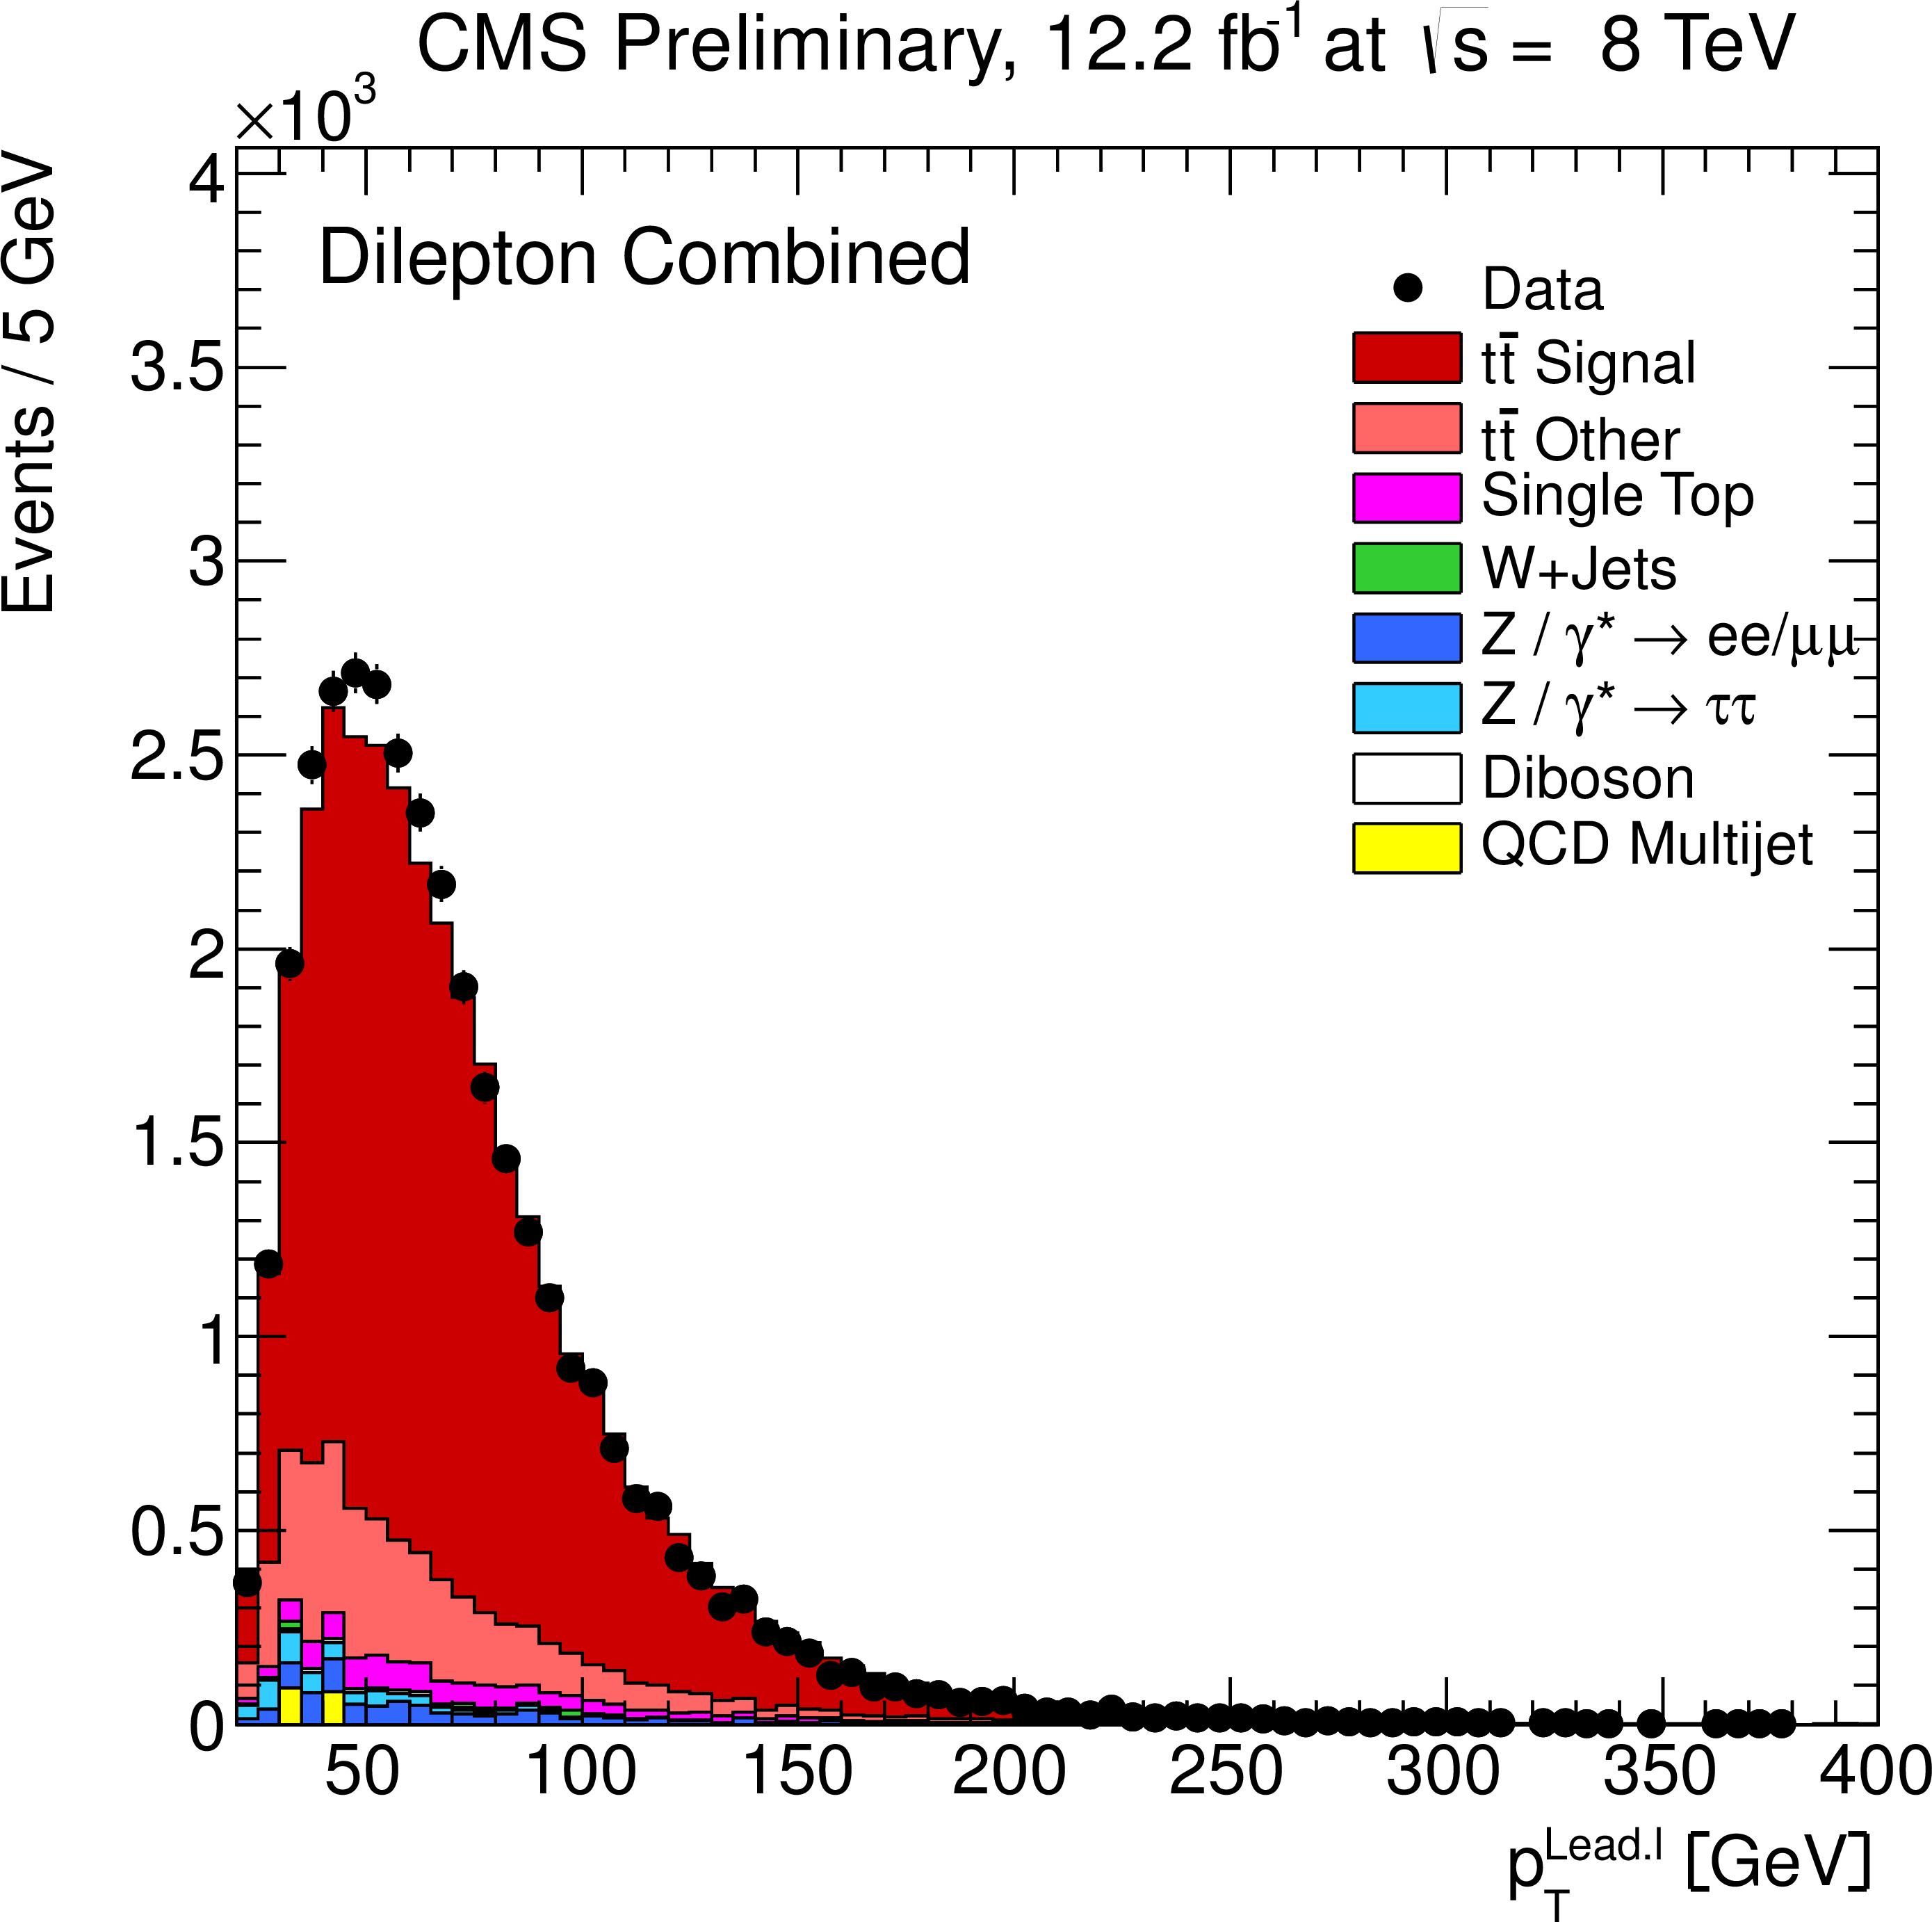
Figure 1-c:
Kinematic distributions after event selection for the dilepton channels. The (a) plot shows the multiplicity of the reconstructed b-tagged jets. The multiplicity of the reconstructed jets (b), the ${p_{\mathrm {T}}}$ of the highest ${p_{\mathrm {T}}}$ (leading) isolated leptons (c), and the ${p_{\mathrm {T}}}$ of the leading b jet (d) are shown after the b-tagging requirement. The normalisation of the Z/$\gamma ^{*}$+jets background is determined from data. |
png pdf |
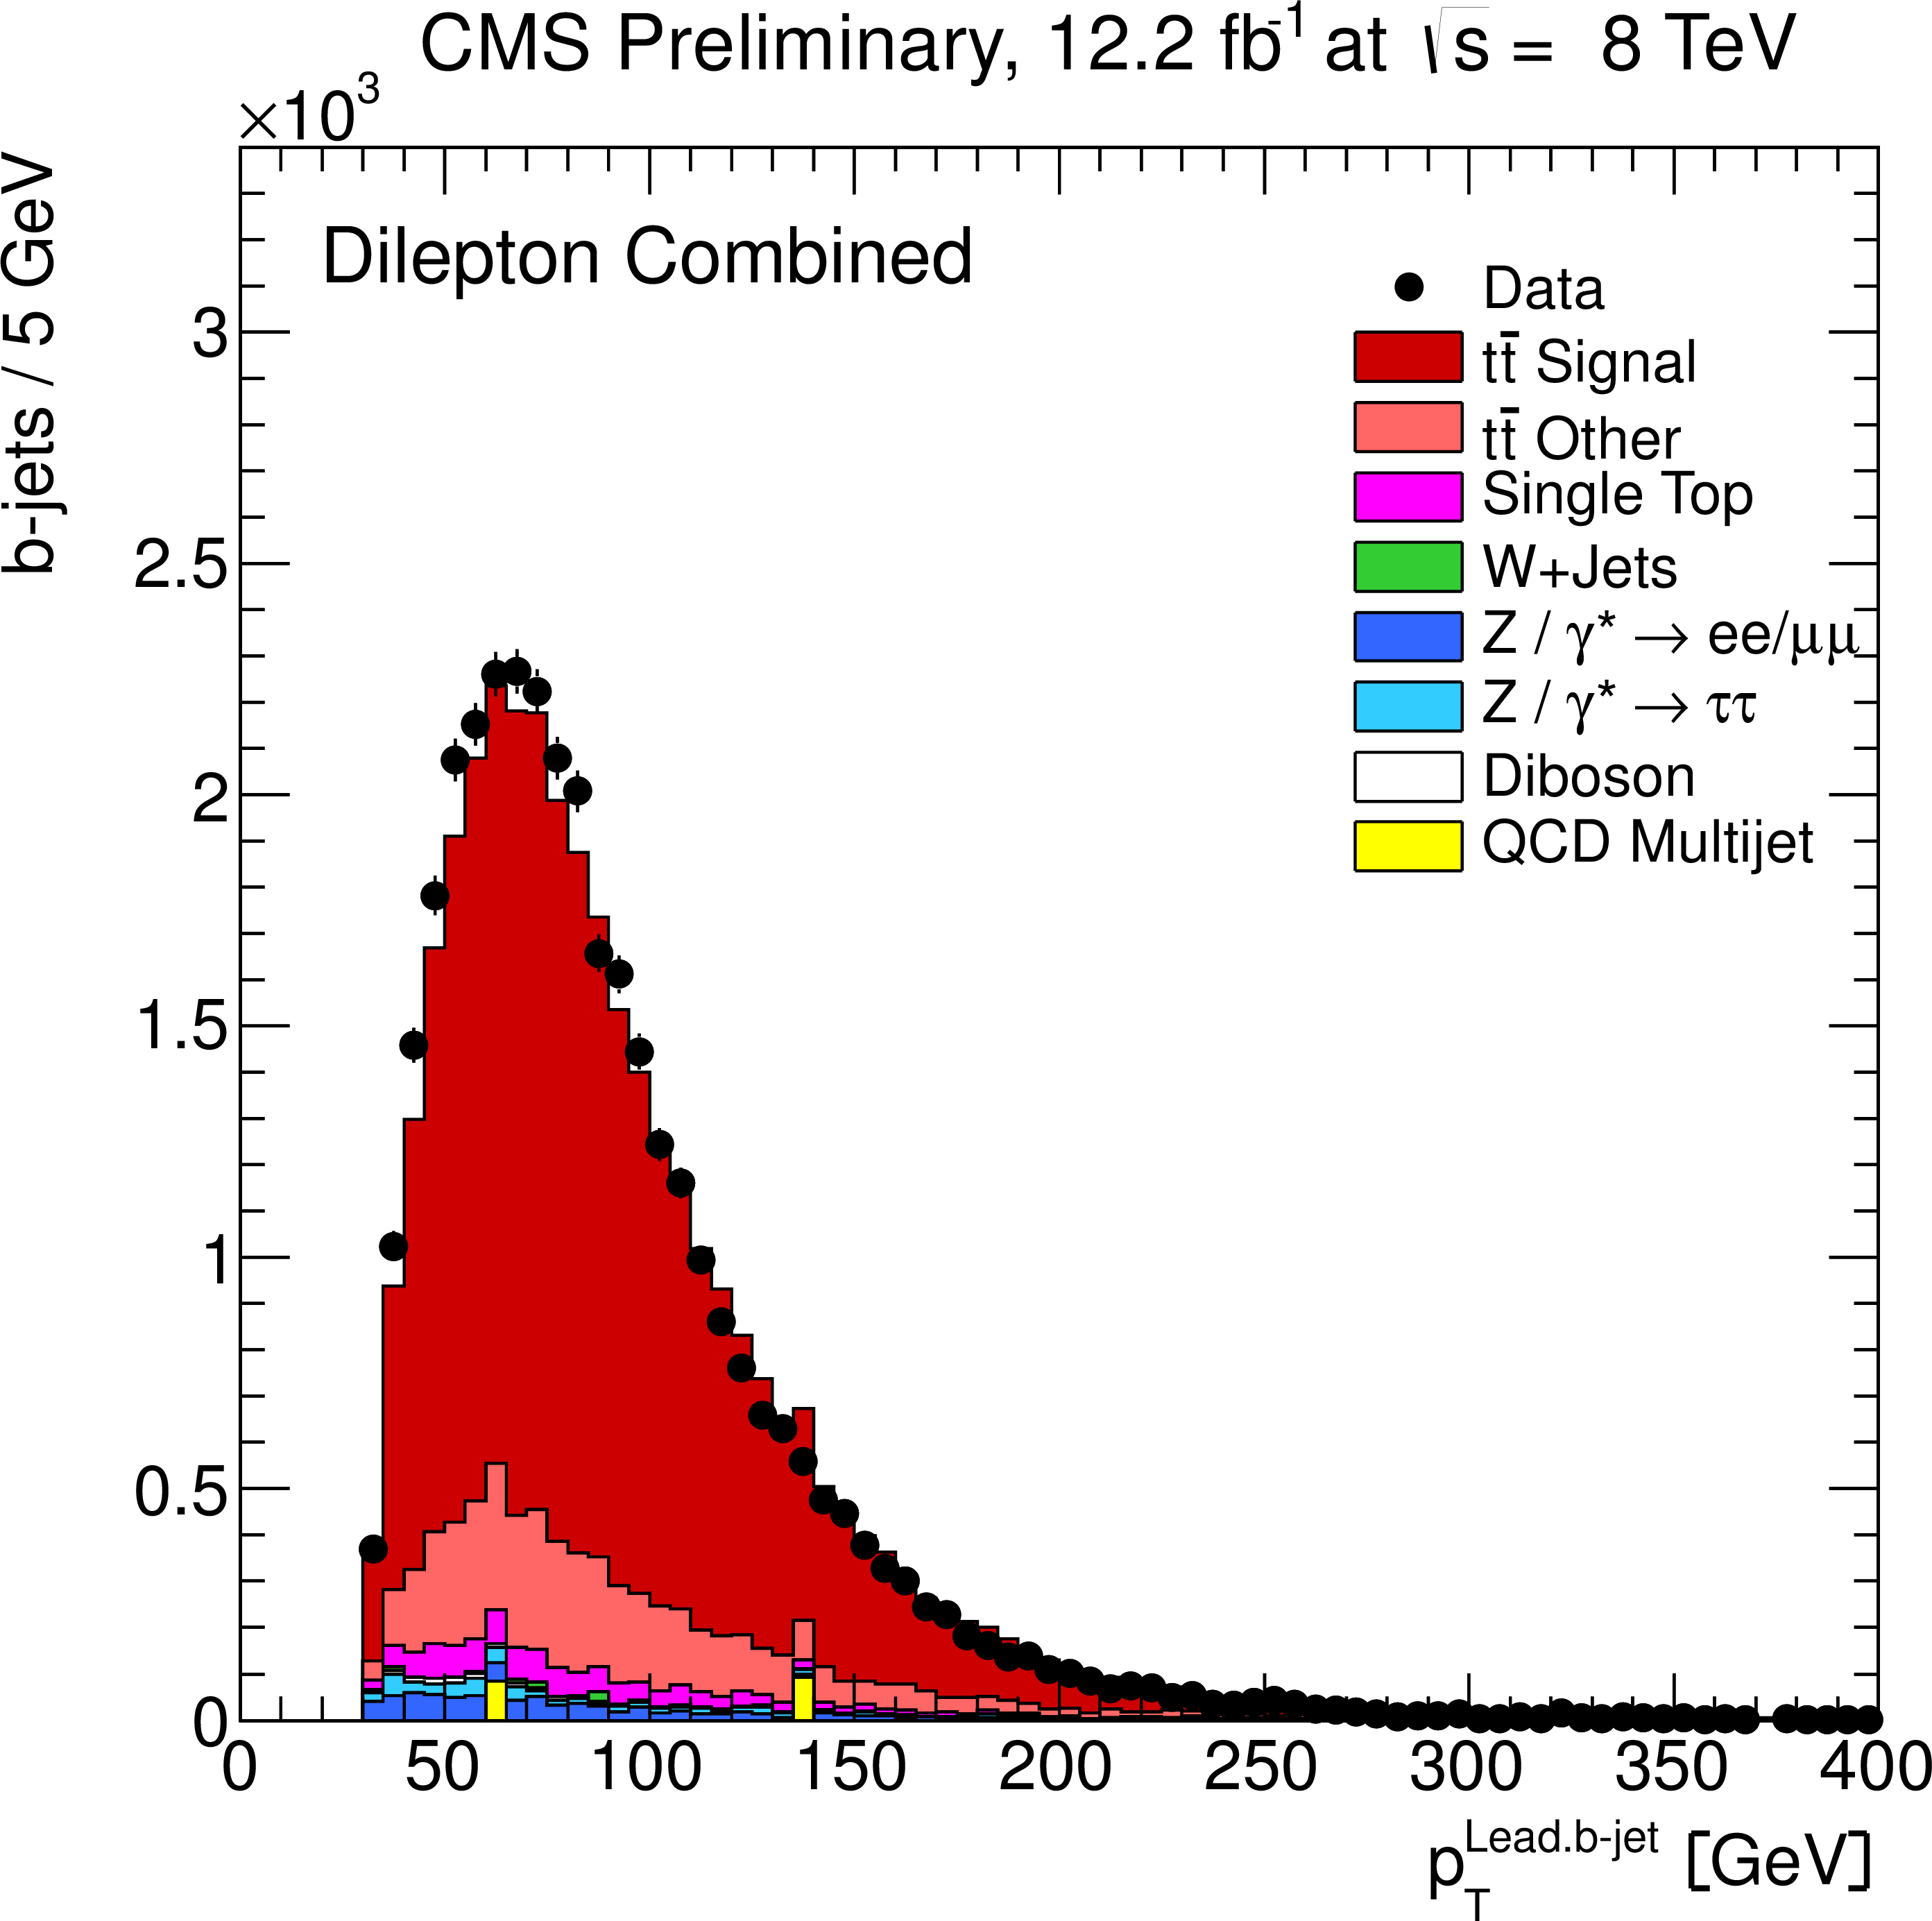
Figure 1-d:
Kinematic distributions after event selection for the dilepton channels. The (a) plot shows the multiplicity of the reconstructed b-tagged jets. The multiplicity of the reconstructed jets (b), the ${p_{\mathrm {T}}}$ of the highest ${p_{\mathrm {T}}}$ (leading) isolated leptons (c), and the ${p_{\mathrm {T}}}$ of the leading b jet (d) are shown after the b-tagging requirement. The normalisation of the Z/$\gamma ^{*}$+jets background is determined from data. |
png pdf |
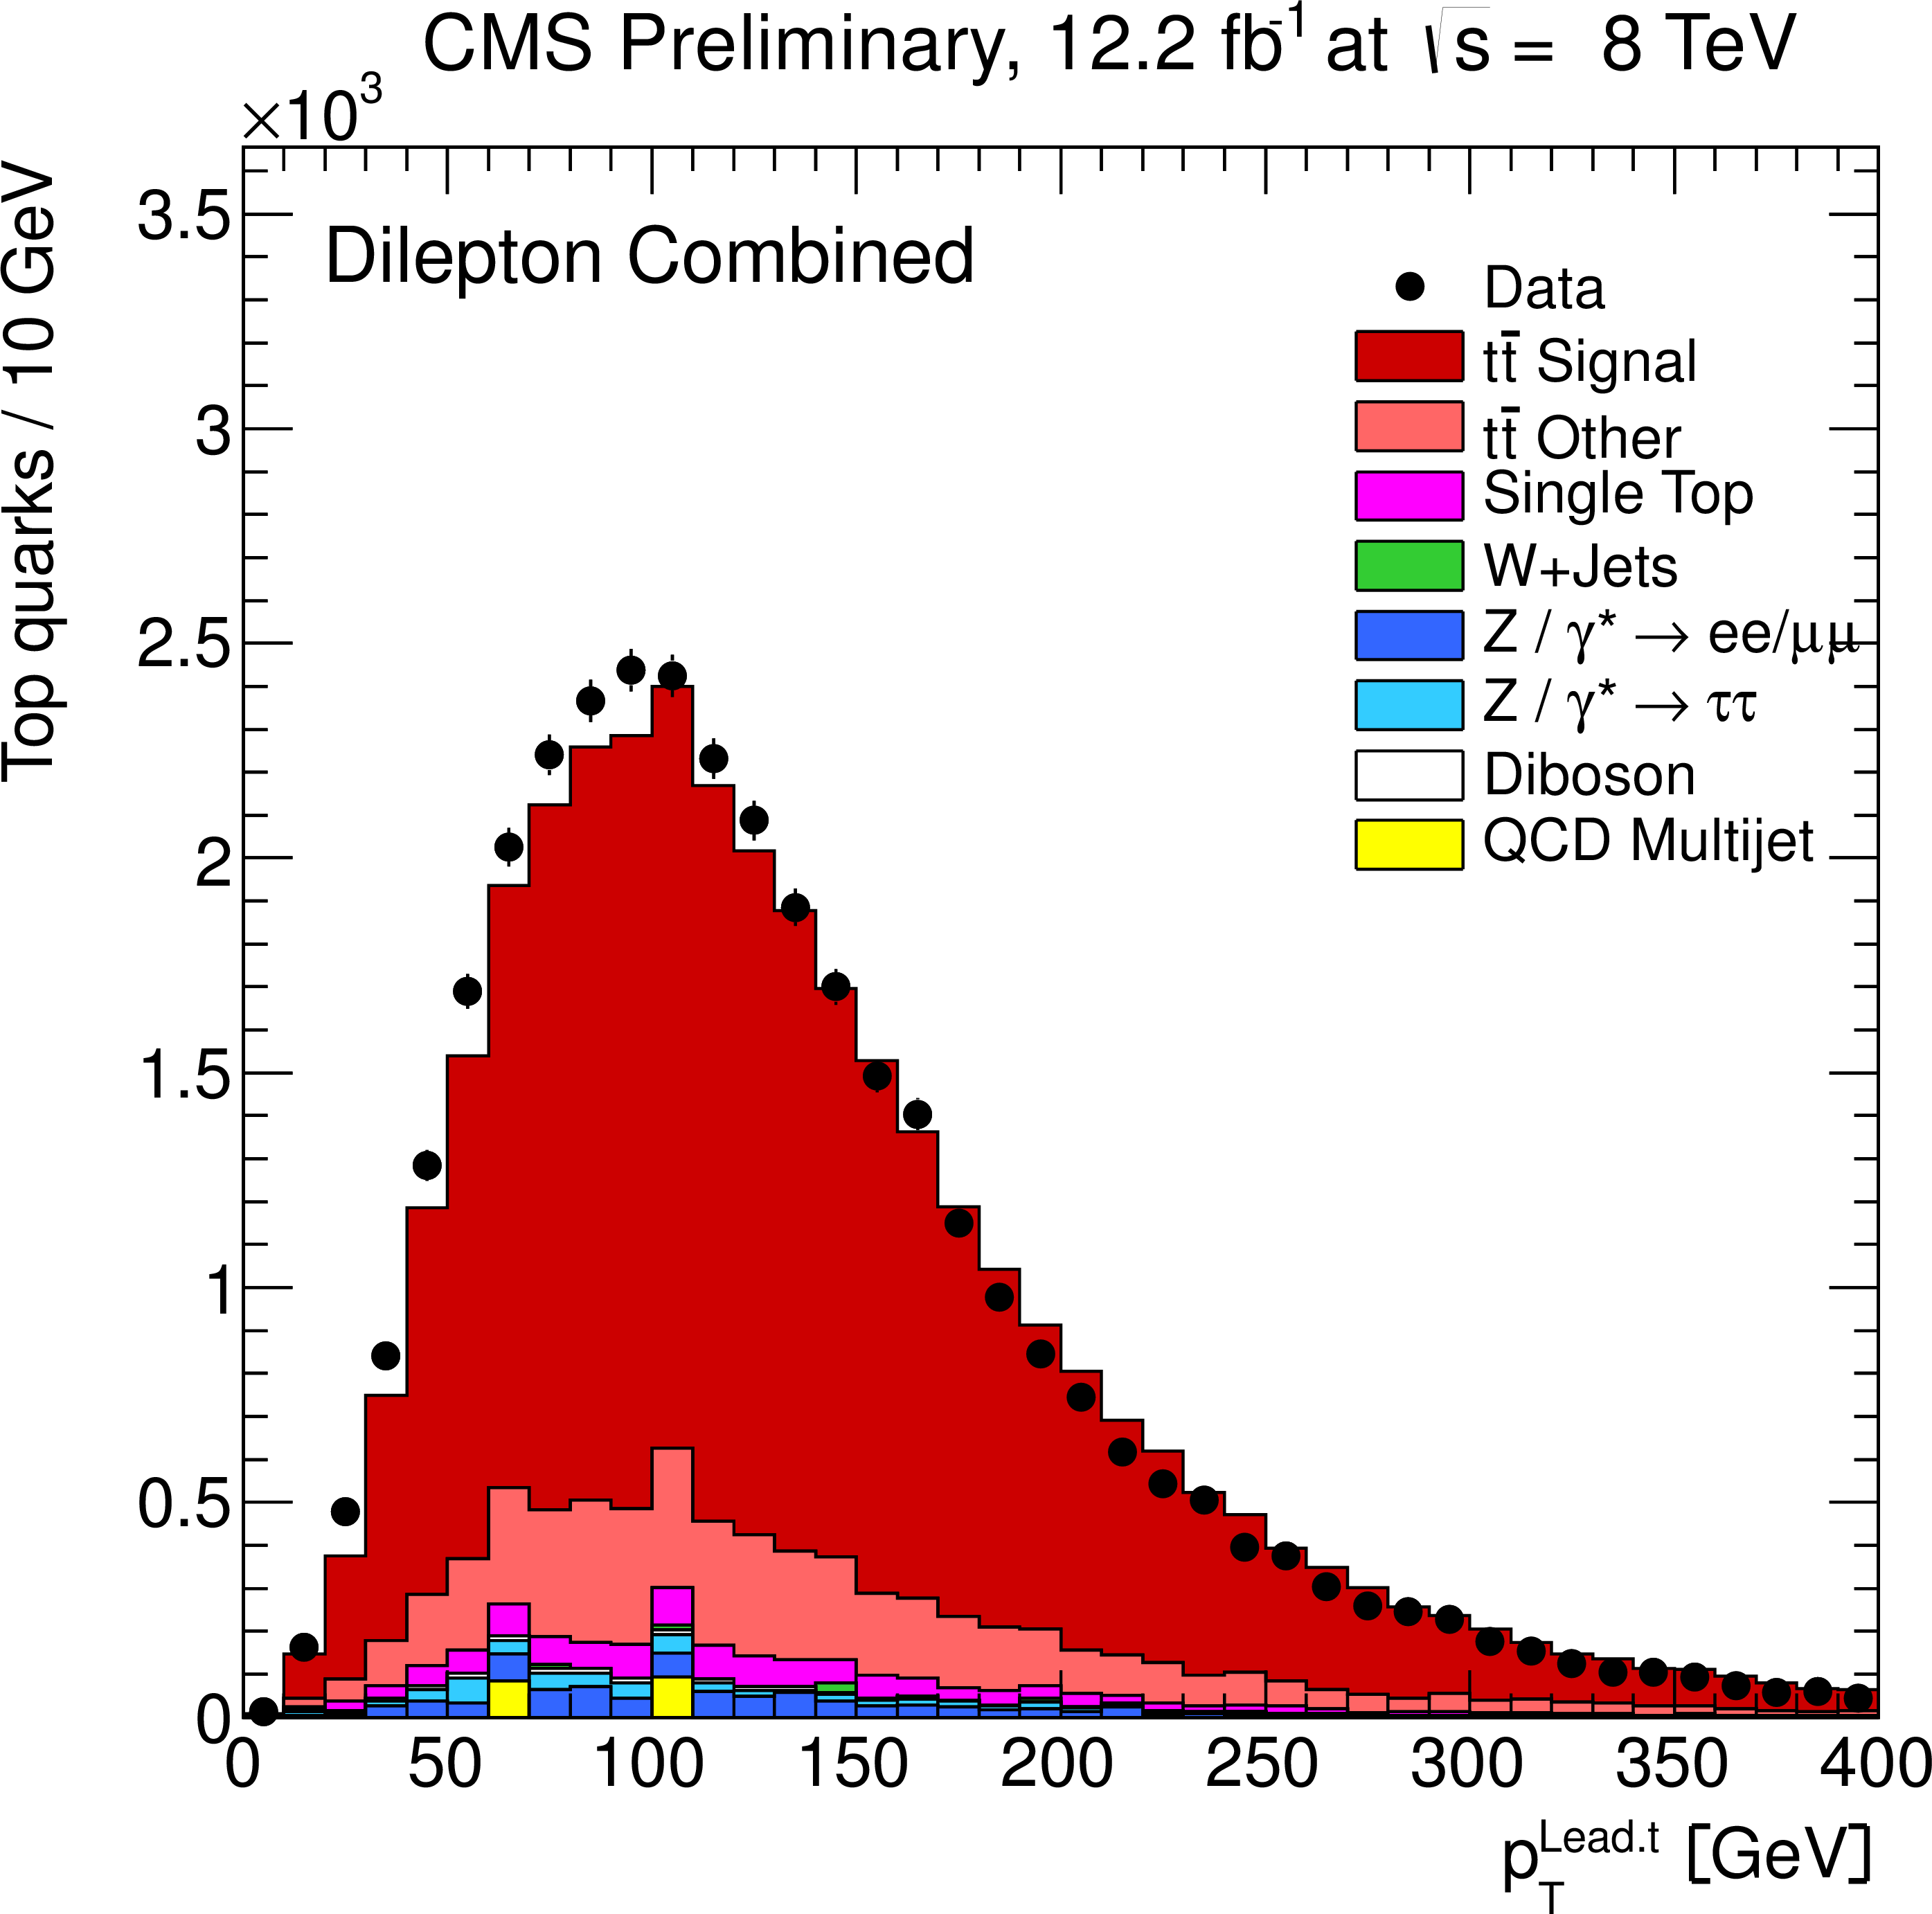
Figure 2-a:
Distribution of the leading top quark (a) and of ${\mathrm{ t \bar{t} } } $ quantities (b) as obtained from the kinematic reconstruction. The (a,b) plots show the transverse momenta, and the (c,s) plots show the rapidities. The normalisation of the Z/$\gamma ^{*}$+jets background is determined from data. |

png pdf |
Figure 2-b:
Distribution of the leading top quark (a) and of ${\mathrm{ t \bar{t} } } $ quantities (b) as obtained from the kinematic reconstruction. The (a,b) plots show the transverse momenta, and the (c,s) plots show the rapidities. The normalisation of the Z/$\gamma ^{*}$+jets background is determined from data. |
png pdf |
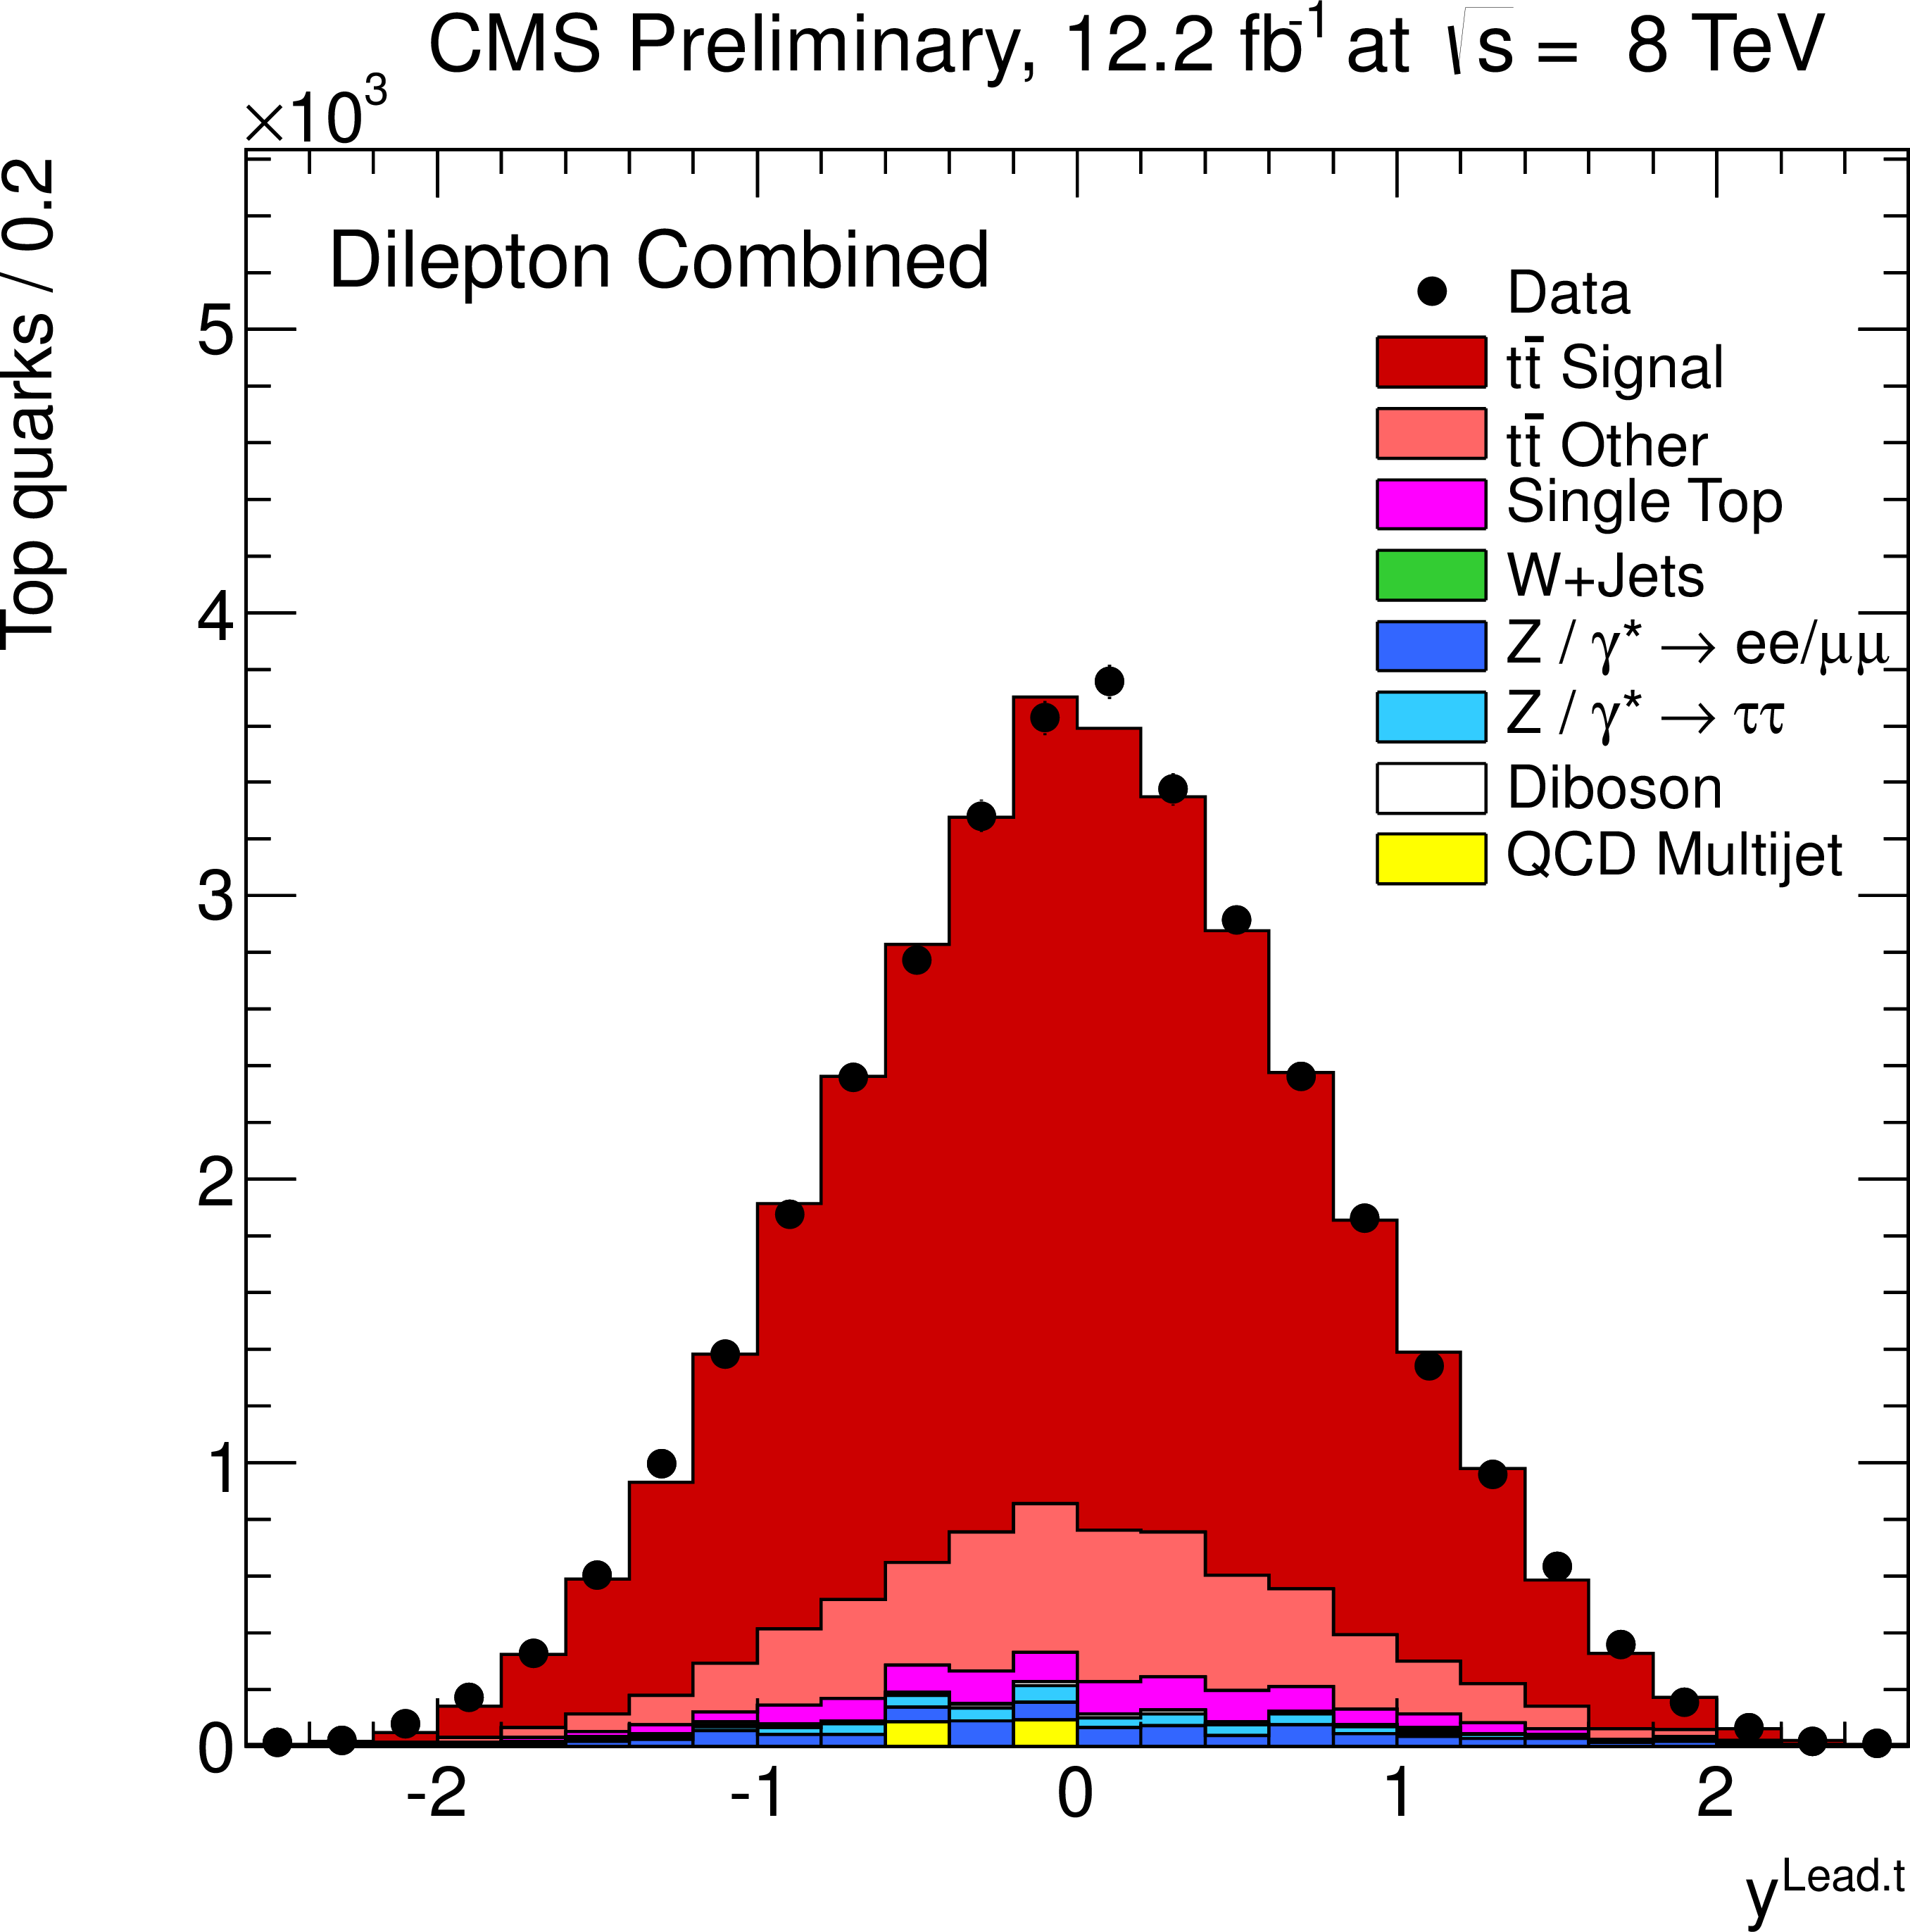
Figure 2-c:
Distribution of the leading top quark (a) and of ${\mathrm{ t \bar{t} } } $ quantities (b) as obtained from the kinematic reconstruction. The (a,b) plots show the transverse momenta, and the (c,s) plots show the rapidities. The normalisation of the Z/$\gamma ^{*}$+jets background is determined from data. |
png pdf |
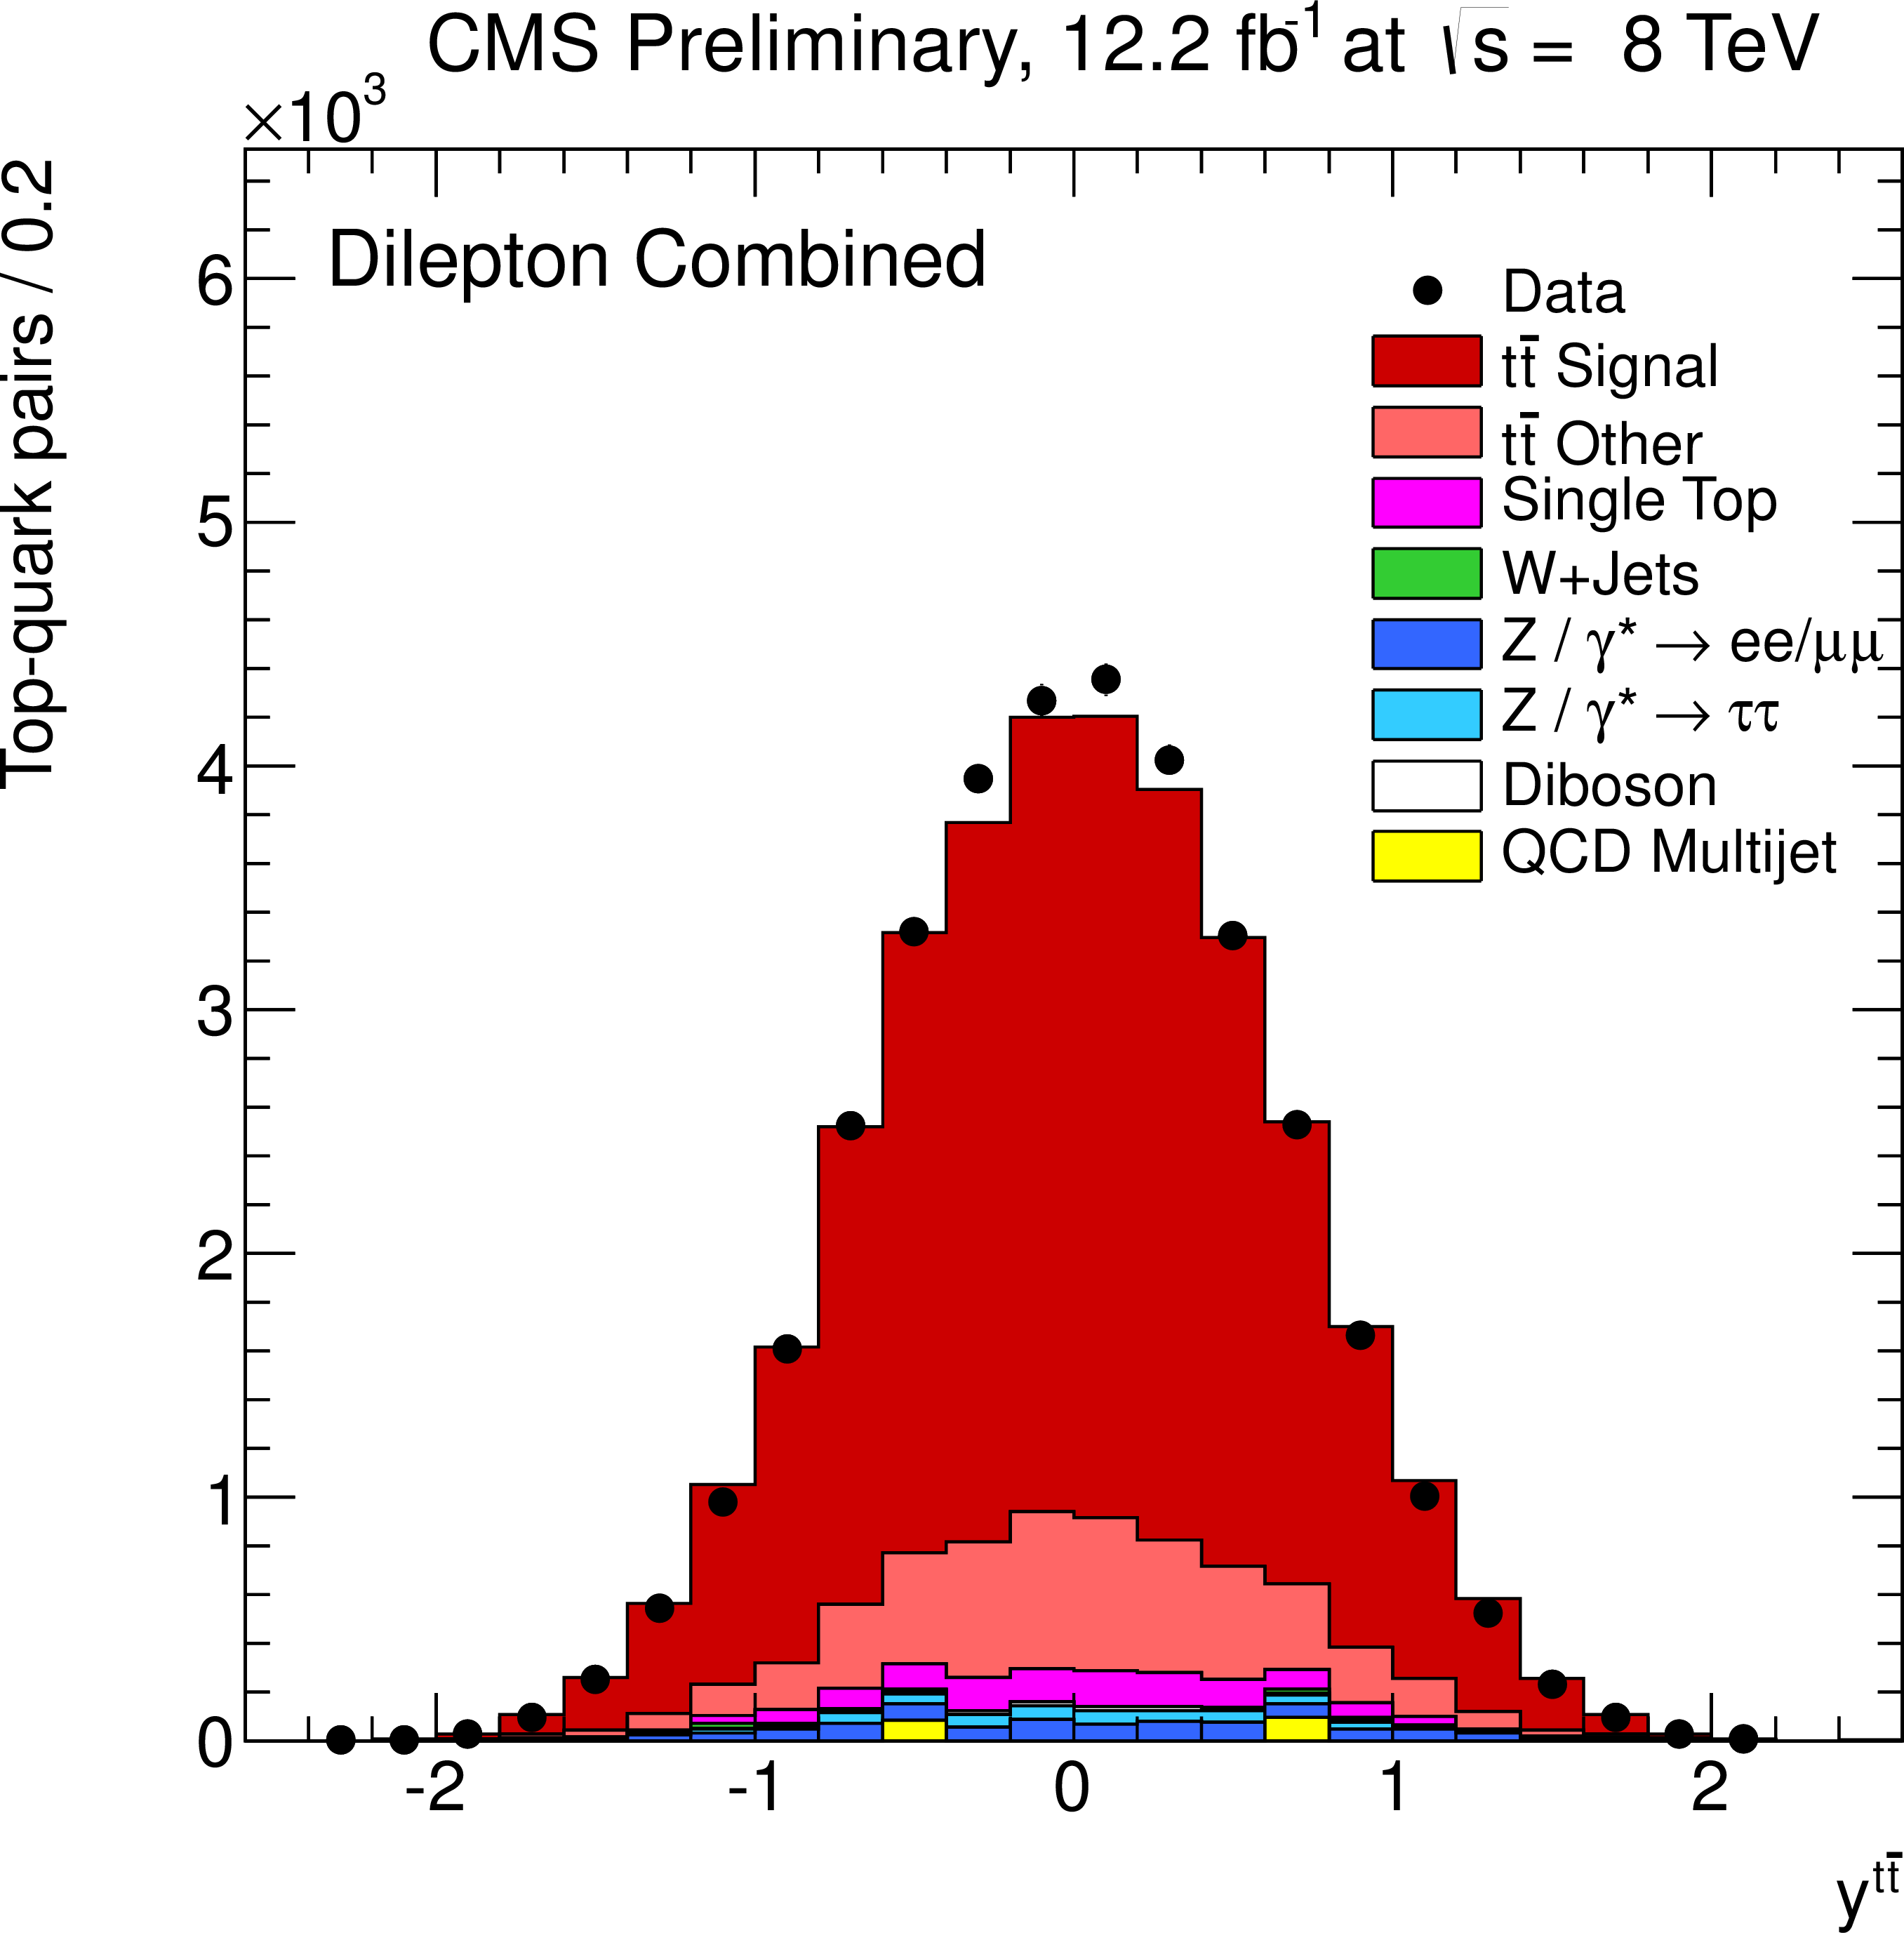
Figure 2-d:
Distribution of the leading top quark (a) and of ${\mathrm{ t \bar{t} } } $ quantities (b) as obtained from the kinematic reconstruction. The (a,b) plots show the transverse momenta, and the (c,s) plots show the rapidities. The normalisation of the Z/$\gamma ^{*}$+jets background is determined from data. |
png pdf |
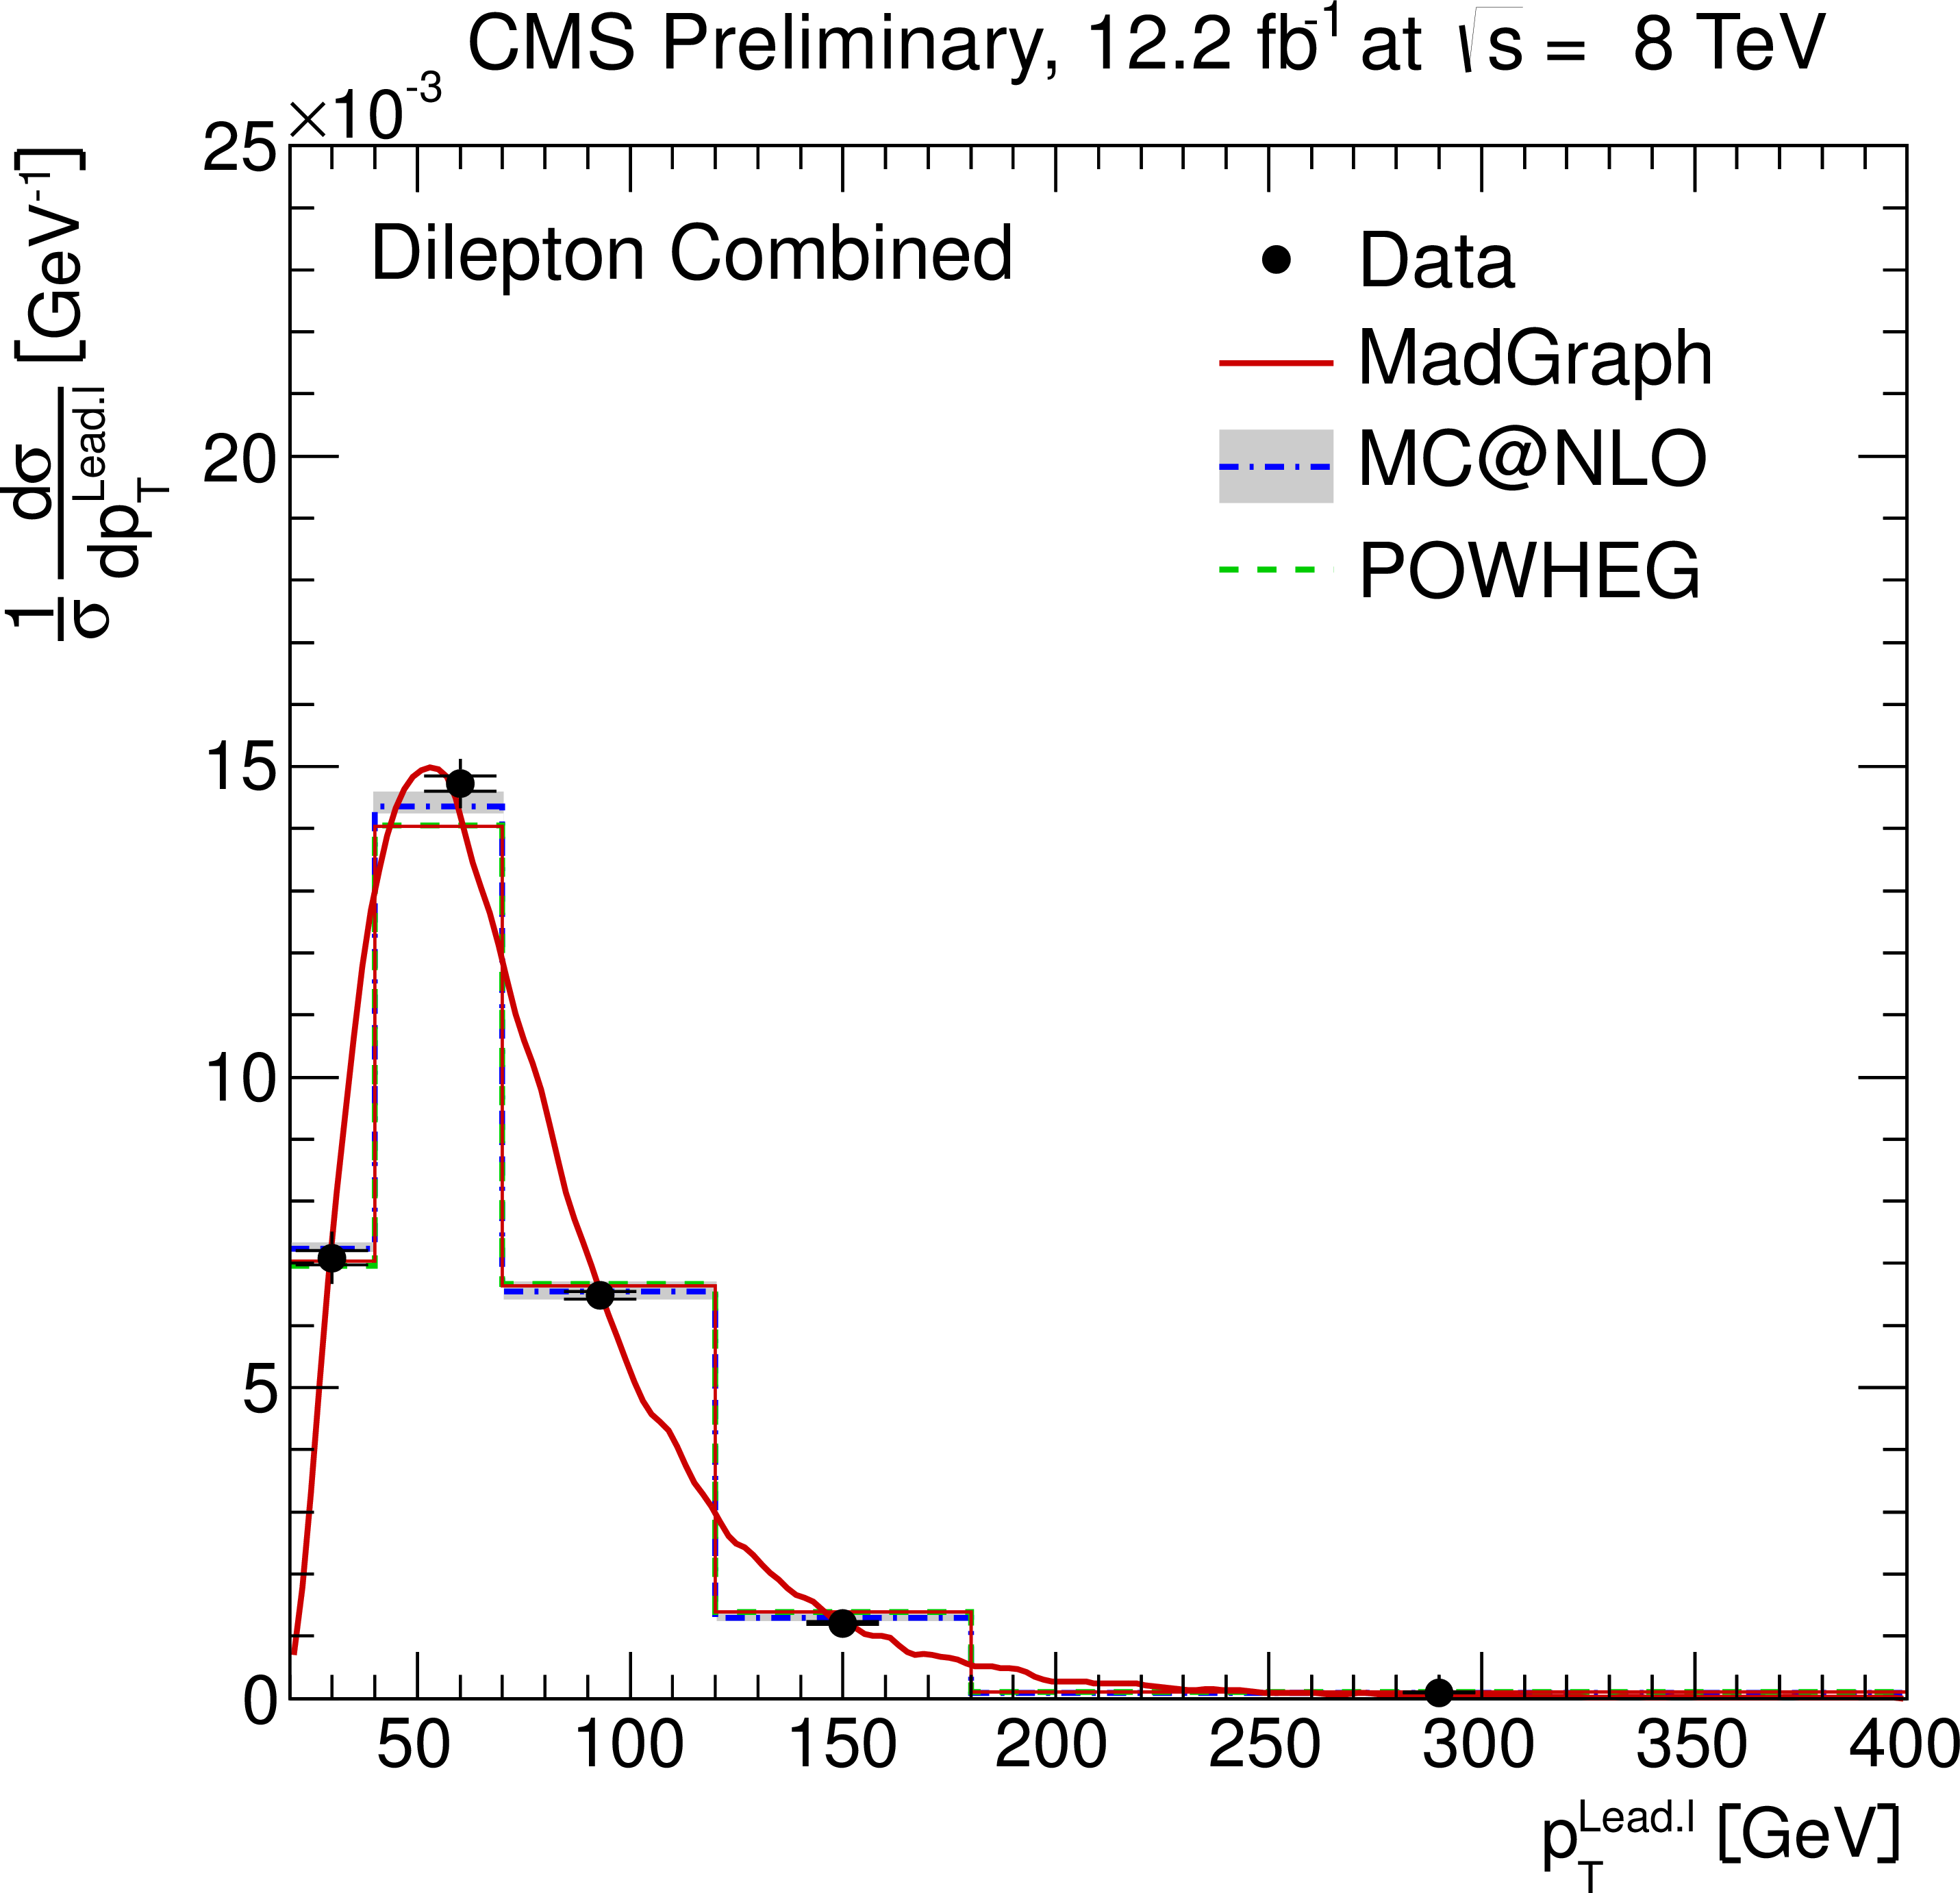
Figure 3-a:
Normalised differential ${\mathrm{ t \bar{t} } } $ production cross section as a function of the $ {p_{\mathrm {T}}} ^{\ell }$ (a,b) and $\eta ^{\ell }$ (c,d) of the leading and next-to-leading lepton, and the $ {p_{\mathrm {T}}} ^{\ell ^{+}\ell ^{-}}$ (e), and $m^{\ell ^{+}\ell ^{-}}$ (f) of the lepton pair. The superscript `$\ell $' refers to both $\ell ^{+}$ and $\ell ^{-}$. The inner (outer) error bars indicate the statistical (combined statistical and systematic) uncertainty. The measurements are compared to predictions from MadGraph +PYTHIA , POWHEG +PYTHIA , and MC@NLO+HERWIG. The MadGraph +PYTHIA prediction is shown both as a curve and as a binned histogram. |
png pdf |
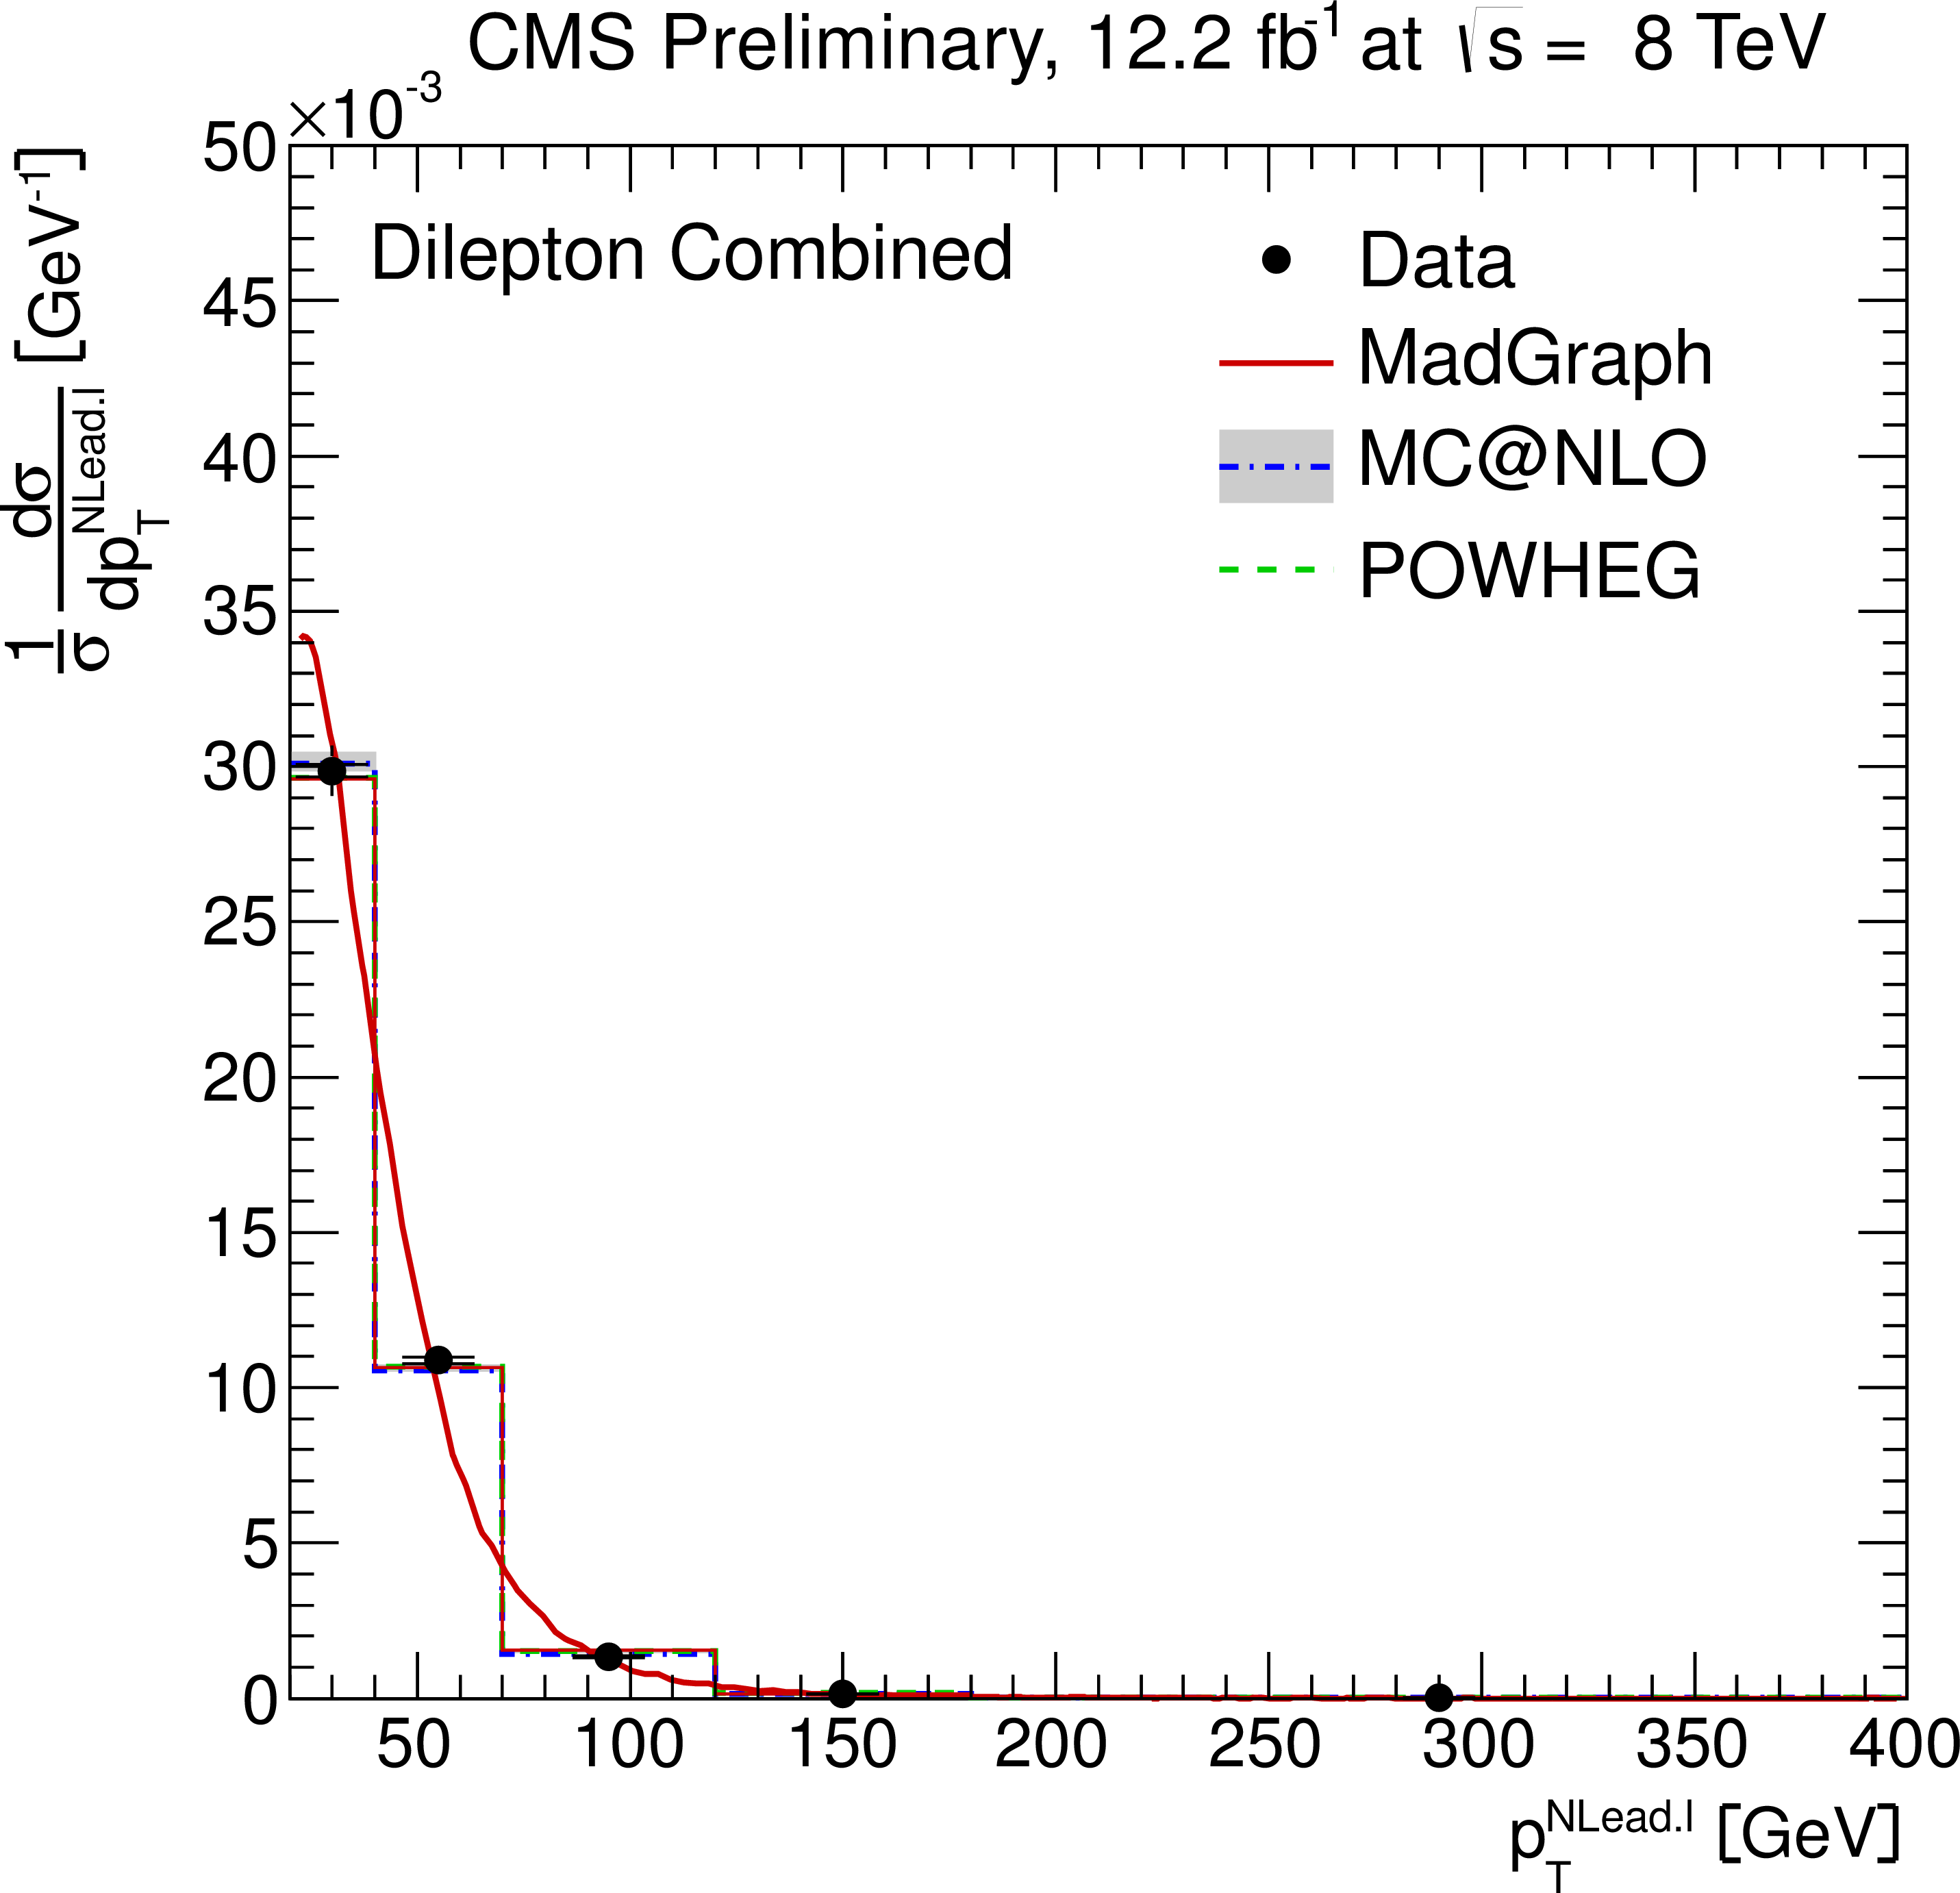
Figure 3-b:
Normalised differential ${\mathrm{ t \bar{t} } } $ production cross section as a function of the $ {p_{\mathrm {T}}} ^{\ell }$ (a,b) and $\eta ^{\ell }$ (c,d) of the leading and next-to-leading lepton, and the $ {p_{\mathrm {T}}} ^{\ell ^{+}\ell ^{-}}$ (e), and $m^{\ell ^{+}\ell ^{-}}$ (f) of the lepton pair. The superscript `$\ell $' refers to both $\ell ^{+}$ and $\ell ^{-}$. The inner (outer) error bars indicate the statistical (combined statistical and systematic) uncertainty. The measurements are compared to predictions from MadGraph +PYTHIA , POWHEG +PYTHIA , and MC@NLO+HERWIG. The MadGraph +PYTHIA prediction is shown both as a curve and as a binned histogram. |
png pdf |
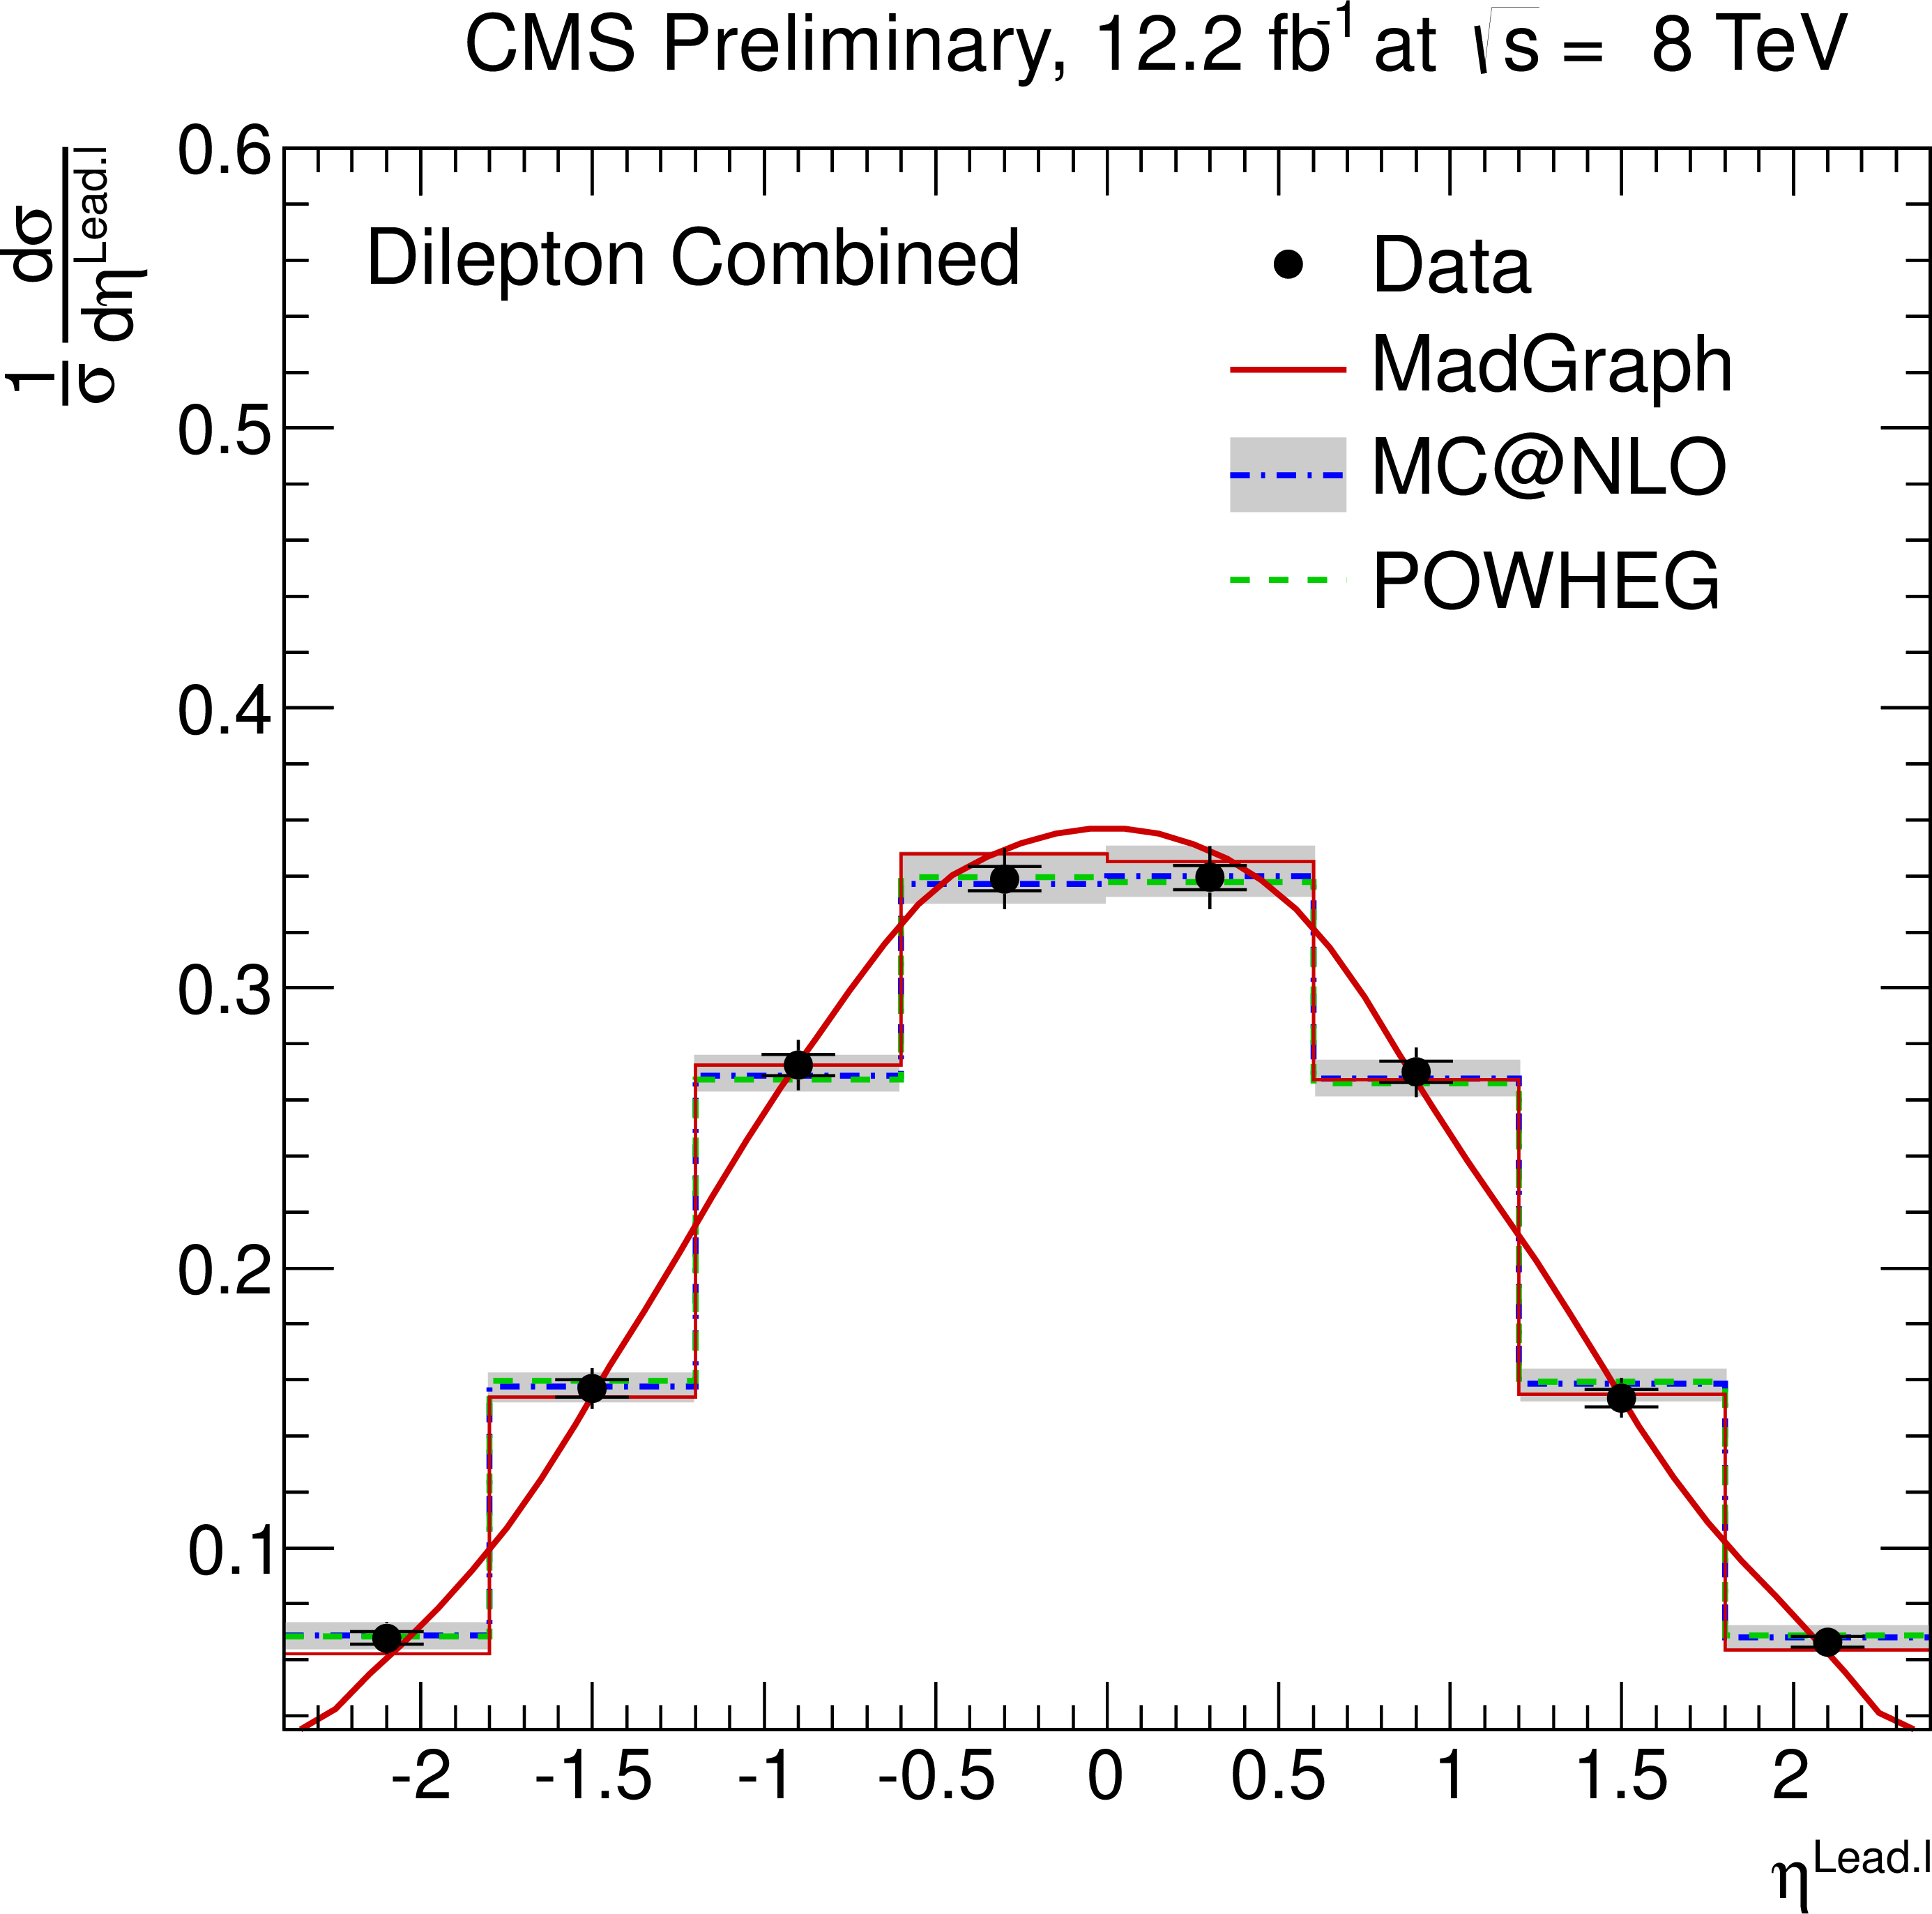
Figure 3-c:
Normalised differential ${\mathrm{ t \bar{t} } } $ production cross section as a function of the $ {p_{\mathrm {T}}} ^{\ell }$ (a,b) and $\eta ^{\ell }$ (c,d) of the leading and next-to-leading lepton, and the $ {p_{\mathrm {T}}} ^{\ell ^{+}\ell ^{-}}$ (e), and $m^{\ell ^{+}\ell ^{-}}$ (f) of the lepton pair. The superscript `$\ell $' refers to both $\ell ^{+}$ and $\ell ^{-}$. The inner (outer) error bars indicate the statistical (combined statistical and systematic) uncertainty. The measurements are compared to predictions from MadGraph +PYTHIA , POWHEG +PYTHIA , and MC@NLO+HERWIG. The MadGraph +PYTHIA prediction is shown both as a curve and as a binned histogram. |
png pdf |
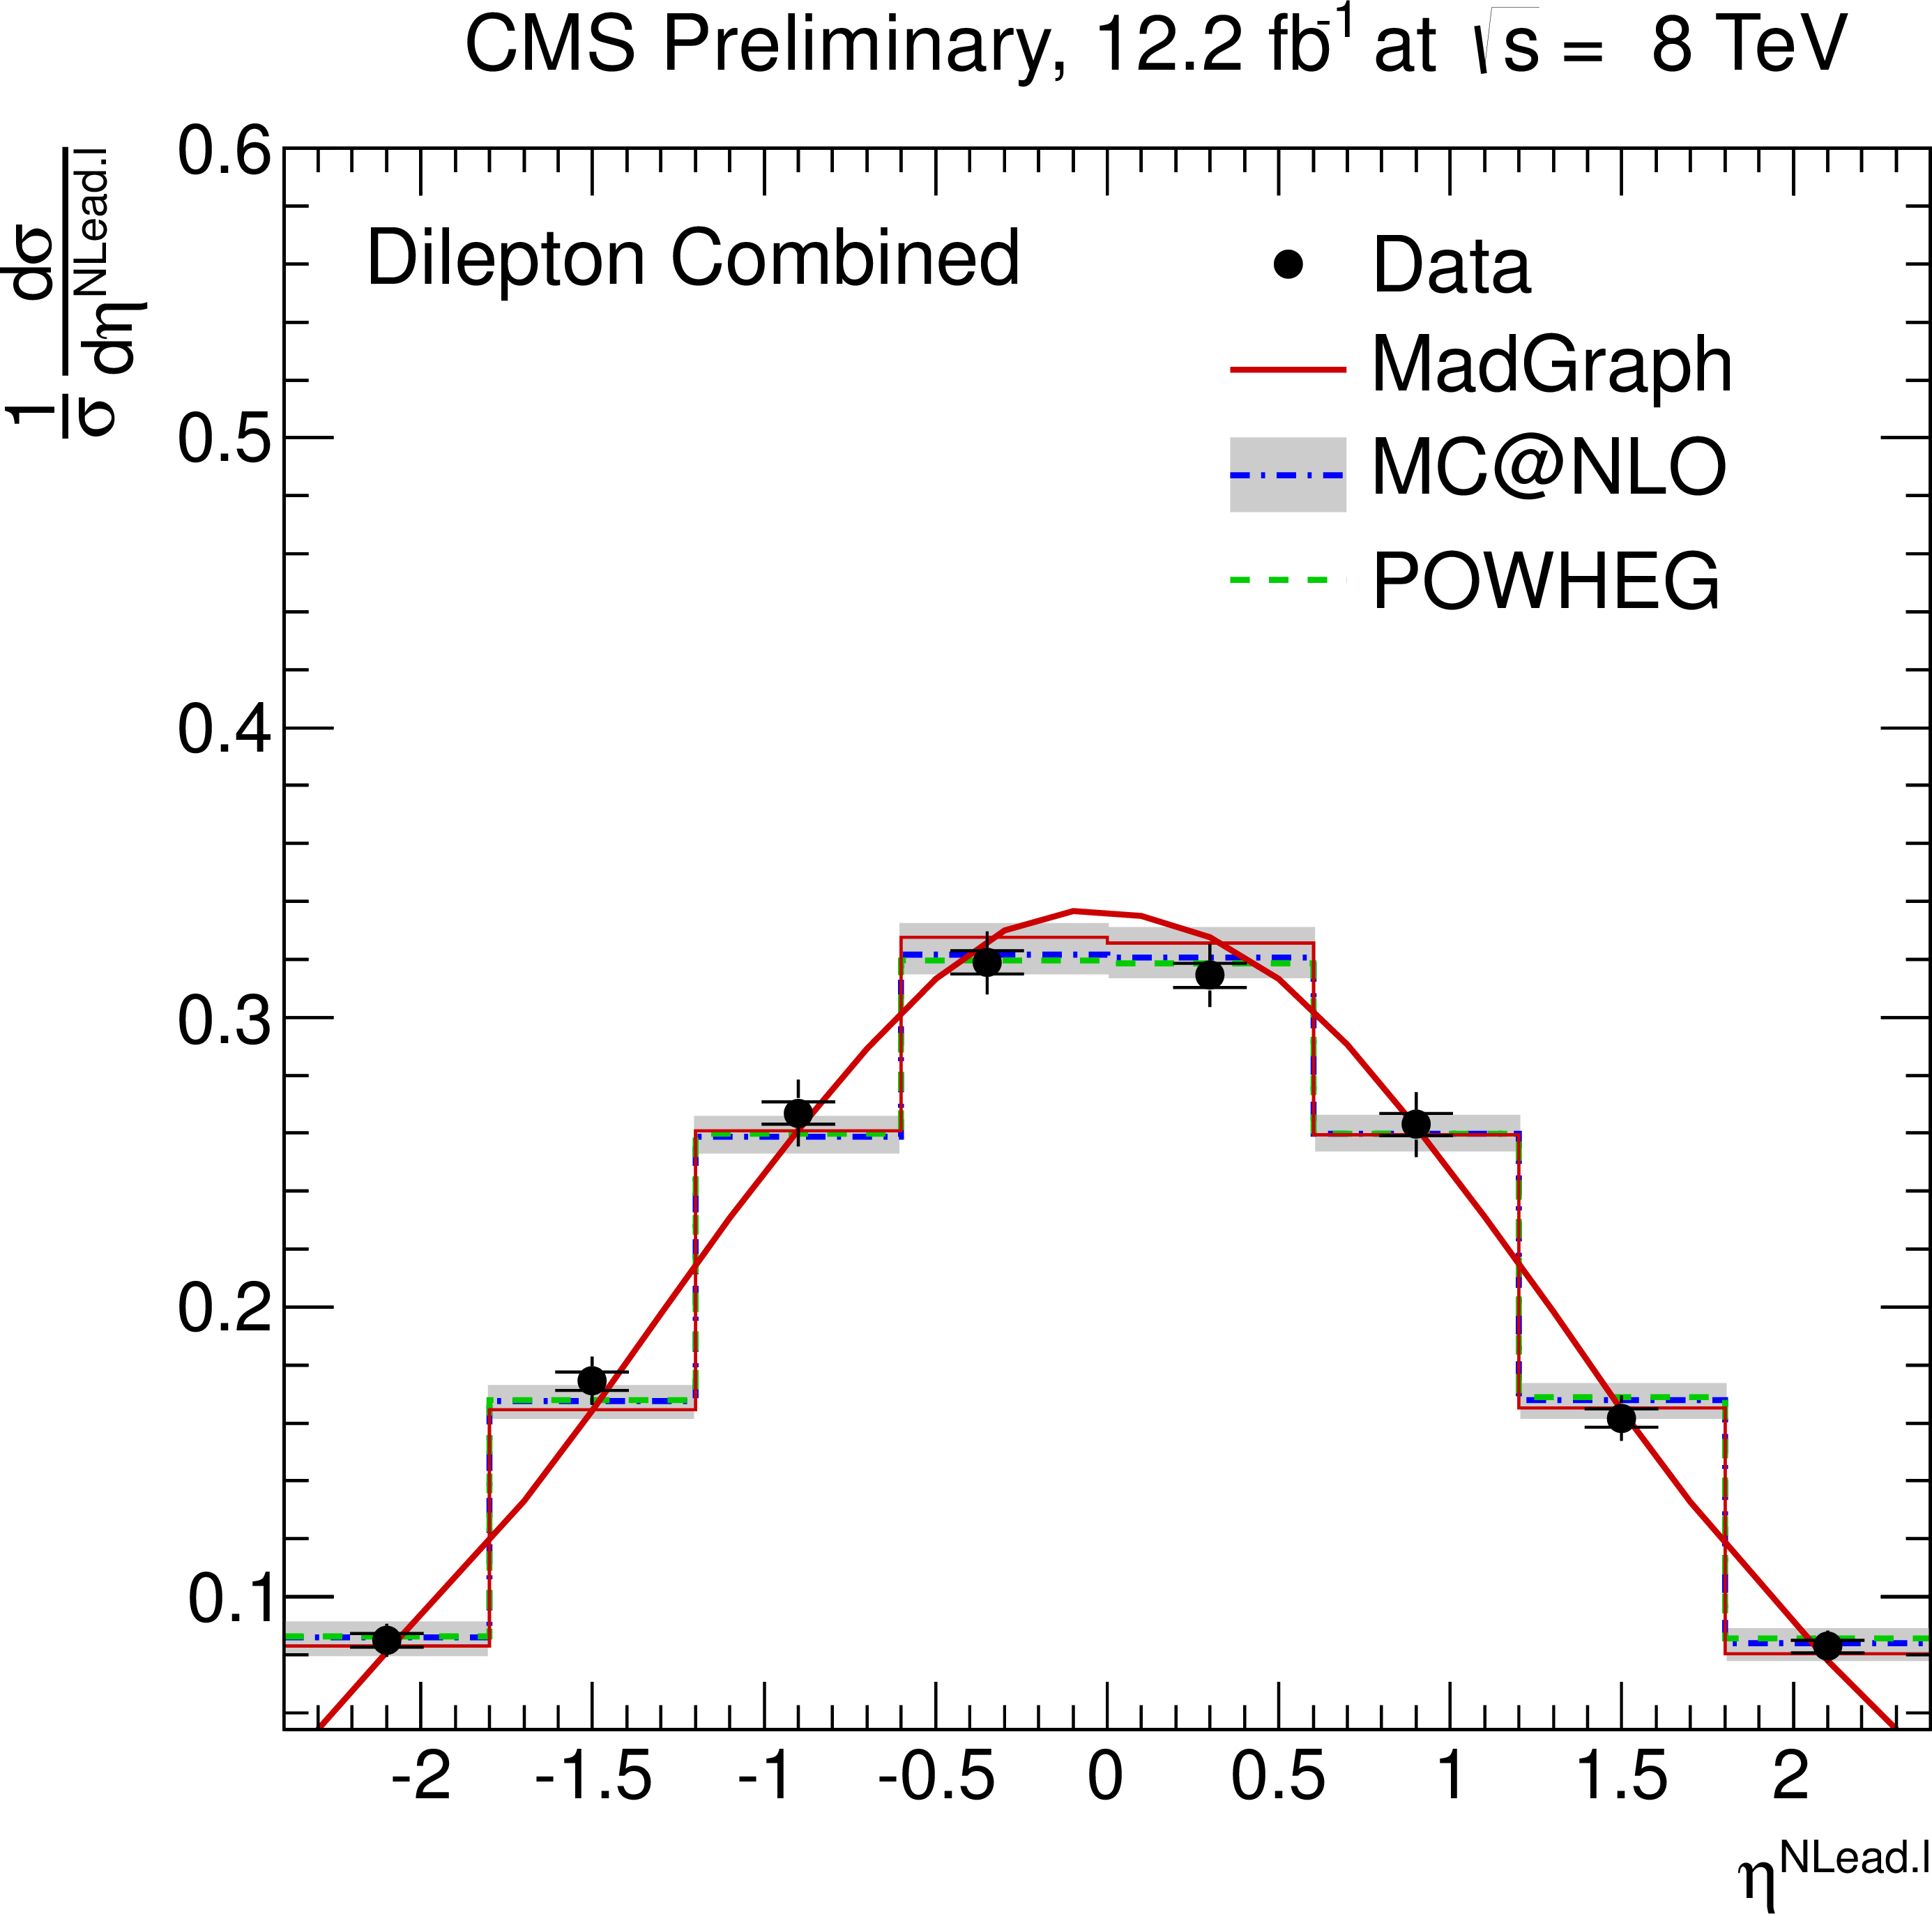
Figure 3-d:
Normalised differential ${\mathrm{ t \bar{t} } } $ production cross section as a function of the $ {p_{\mathrm {T}}} ^{\ell }$ (a,b) and $\eta ^{\ell }$ (c,d) of the leading and next-to-leading lepton, and the $ {p_{\mathrm {T}}} ^{\ell ^{+}\ell ^{-}}$ (e), and $m^{\ell ^{+}\ell ^{-}}$ (f) of the lepton pair. The superscript `$\ell $' refers to both $\ell ^{+}$ and $\ell ^{-}$. The inner (outer) error bars indicate the statistical (combined statistical and systematic) uncertainty. The measurements are compared to predictions from MadGraph +PYTHIA , POWHEG +PYTHIA , and MC@NLO+HERWIG. The MadGraph +PYTHIA prediction is shown both as a curve and as a binned histogram. |
png pdf |
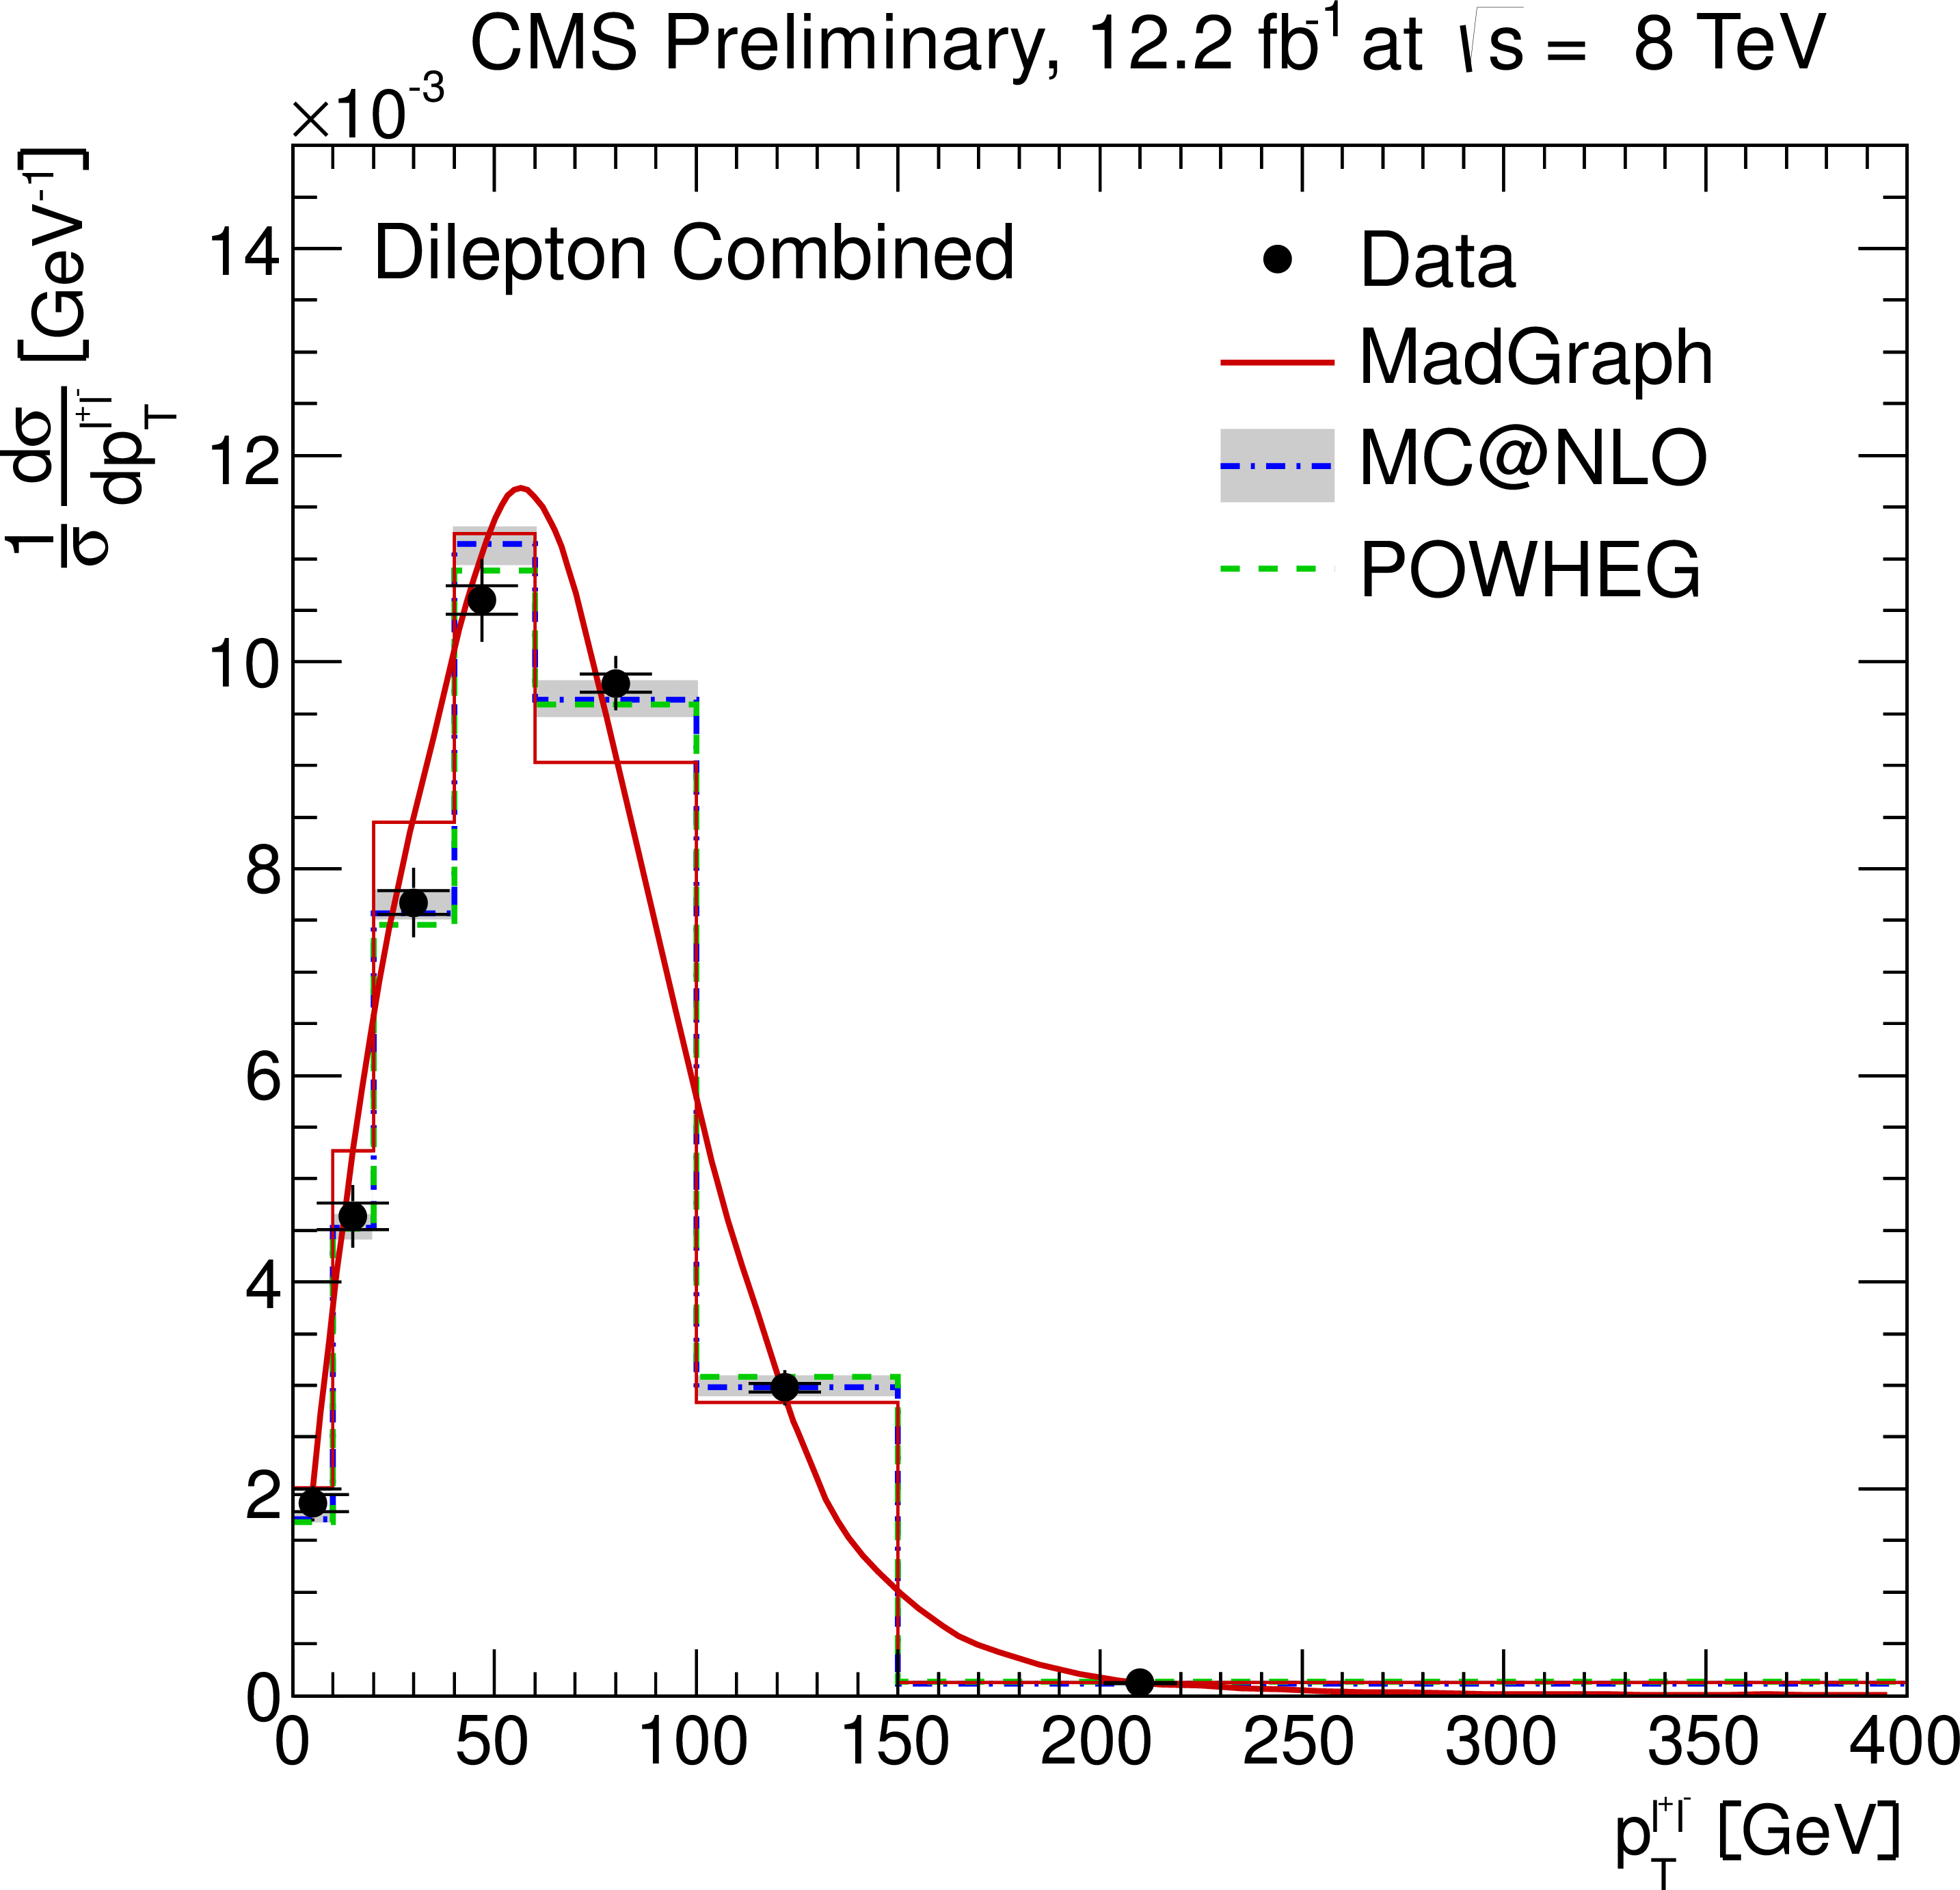
Figure 3-e:
Normalised differential ${\mathrm{ t \bar{t} } } $ production cross section as a function of the $ {p_{\mathrm {T}}} ^{\ell }$ (a,b) and $\eta ^{\ell }$ (c,d) of the leading and next-to-leading lepton, and the $ {p_{\mathrm {T}}} ^{\ell ^{+}\ell ^{-}}$ (e), and $m^{\ell ^{+}\ell ^{-}}$ (f) of the lepton pair. The superscript `$\ell $' refers to both $\ell ^{+}$ and $\ell ^{-}$. The inner (outer) error bars indicate the statistical (combined statistical and systematic) uncertainty. The measurements are compared to predictions from MadGraph +PYTHIA , POWHEG +PYTHIA , and MC@NLO+HERWIG. The MadGraph +PYTHIA prediction is shown both as a curve and as a binned histogram. |
png pdf |
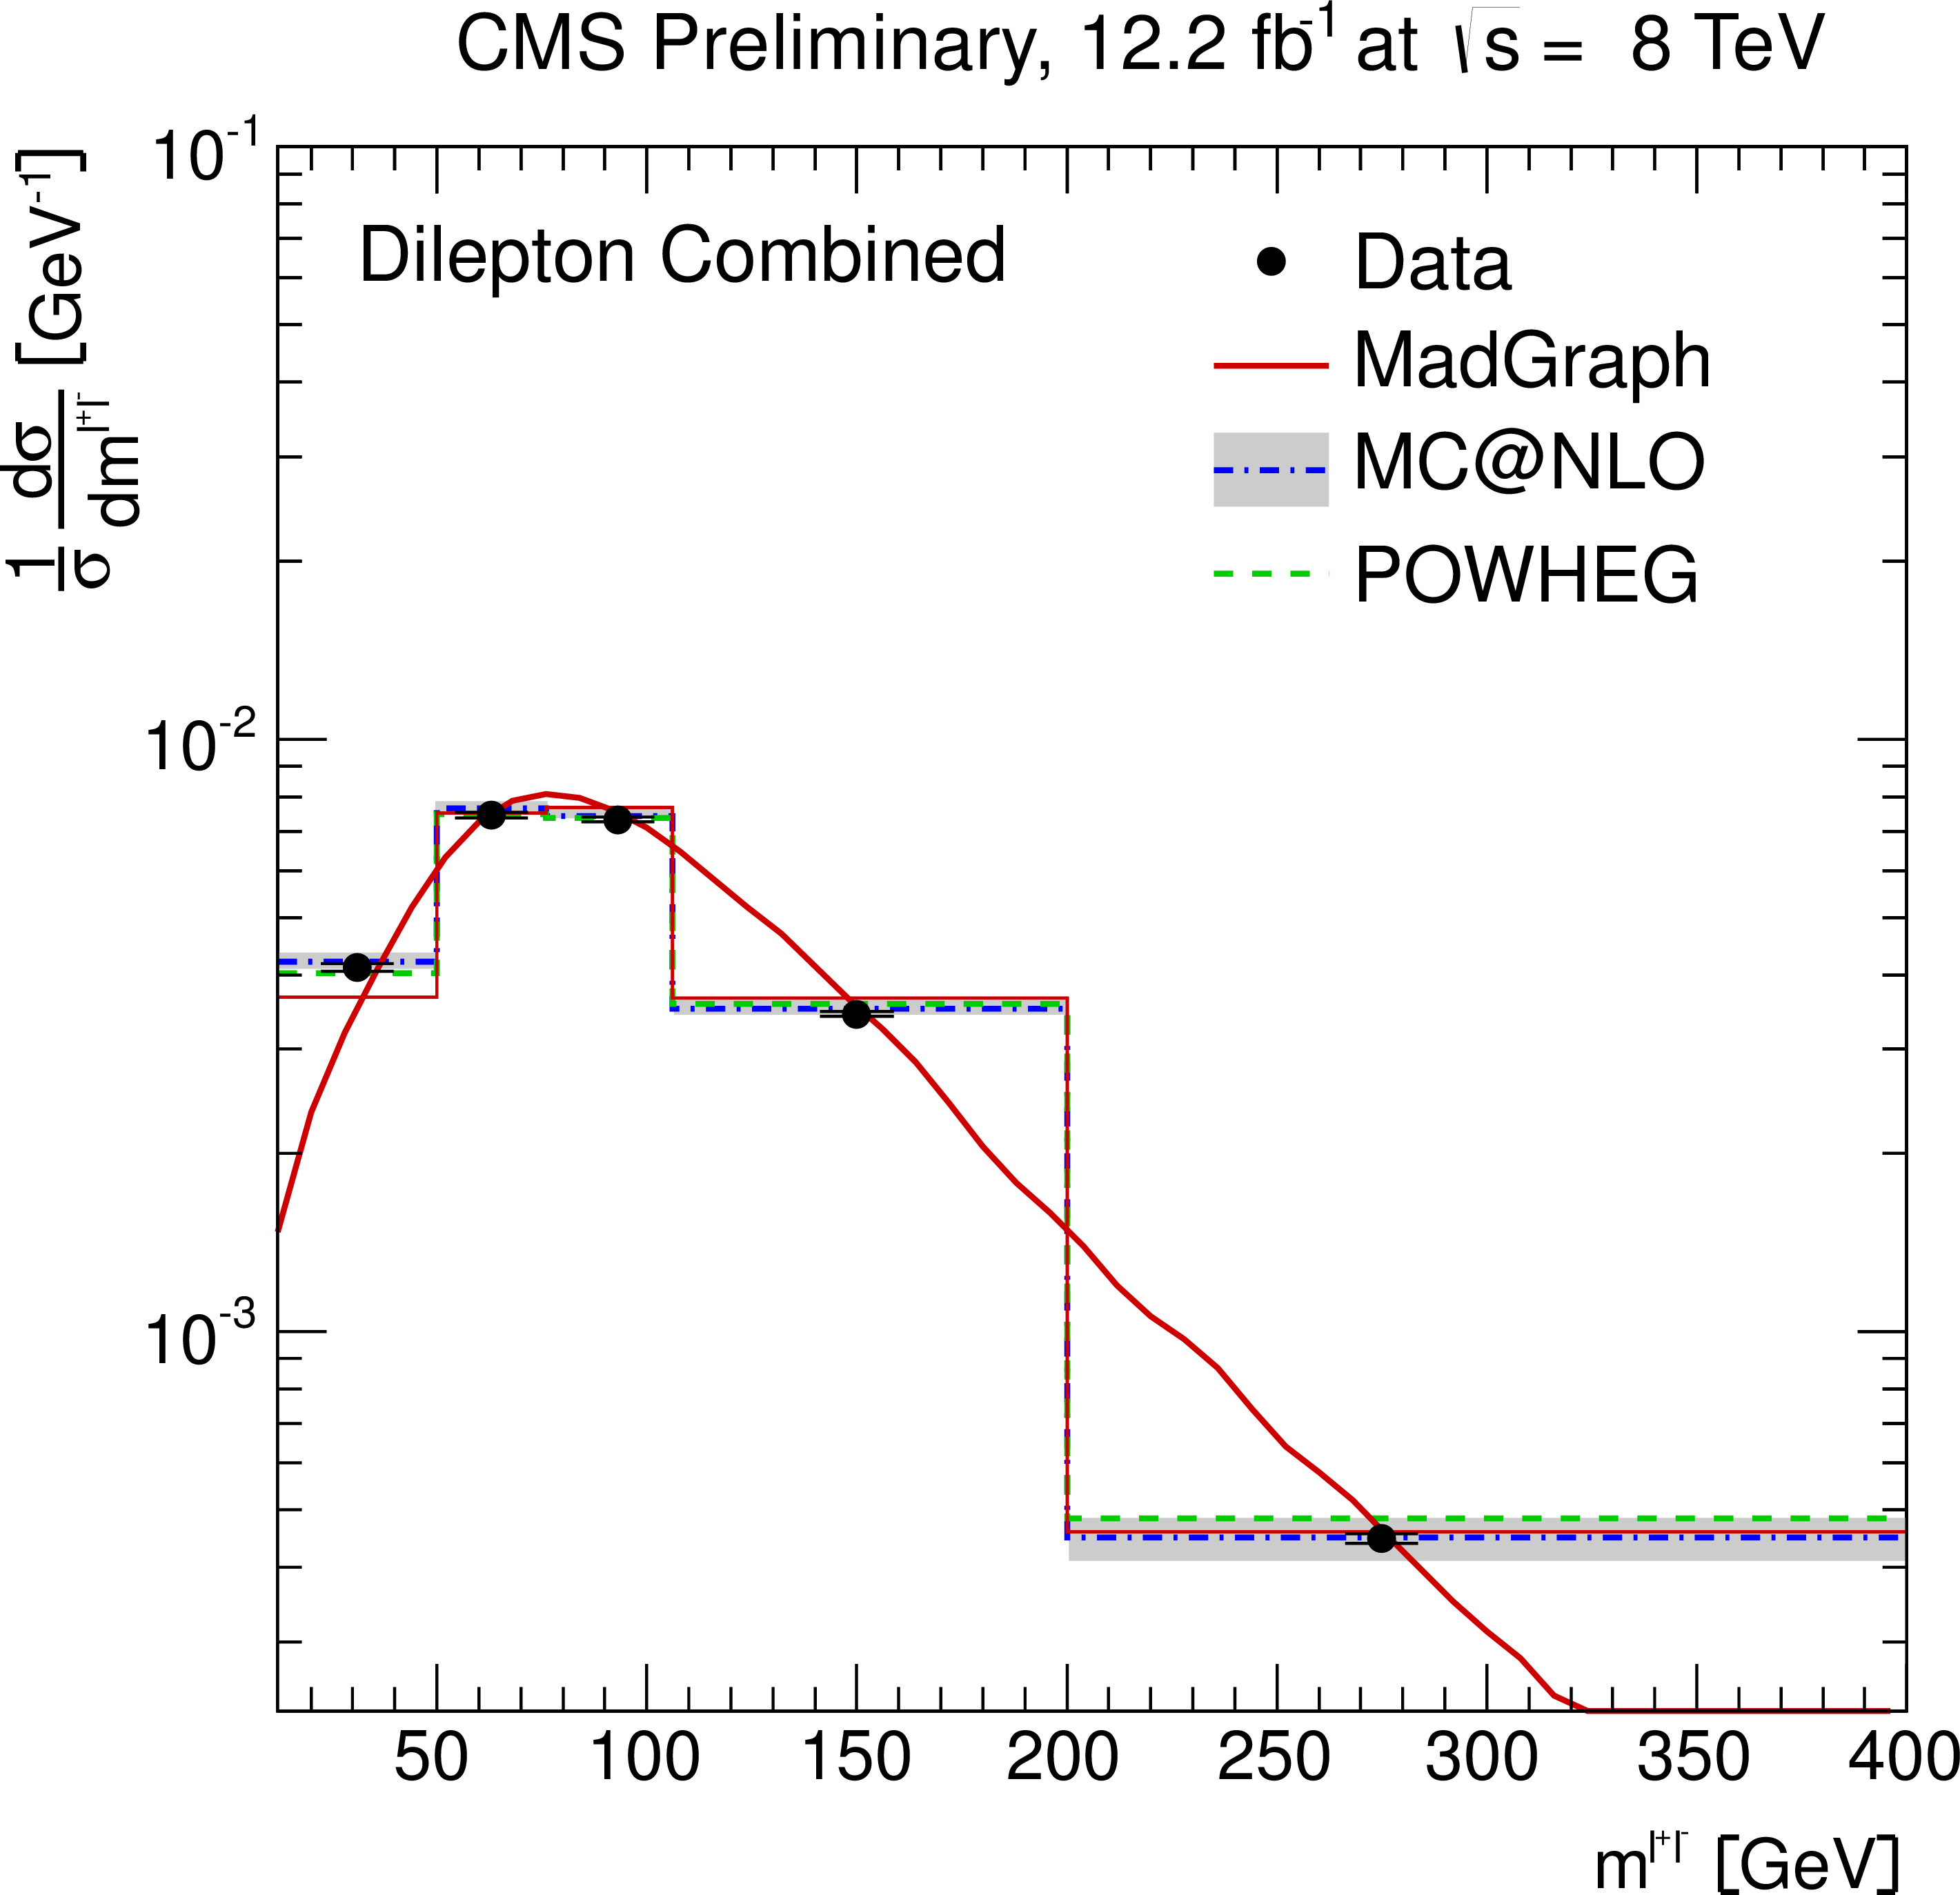
Figure 3-f:
Normalised differential ${\mathrm{ t \bar{t} } } $ production cross section as a function of the $ {p_{\mathrm {T}}} ^{\ell }$ (a,b) and $\eta ^{\ell }$ (c,d) of the leading and next-to-leading lepton, and the $ {p_{\mathrm {T}}} ^{\ell ^{+}\ell ^{-}}$ (e), and $m^{\ell ^{+}\ell ^{-}}$ (f) of the lepton pair. The superscript `$\ell $' refers to both $\ell ^{+}$ and $\ell ^{-}$. The inner (outer) error bars indicate the statistical (combined statistical and systematic) uncertainty. The measurements are compared to predictions from MadGraph +PYTHIA , POWHEG +PYTHIA , and MC@NLO+HERWIG. The MadGraph +PYTHIA prediction is shown both as a curve and as a binned histogram. |
png pdf |
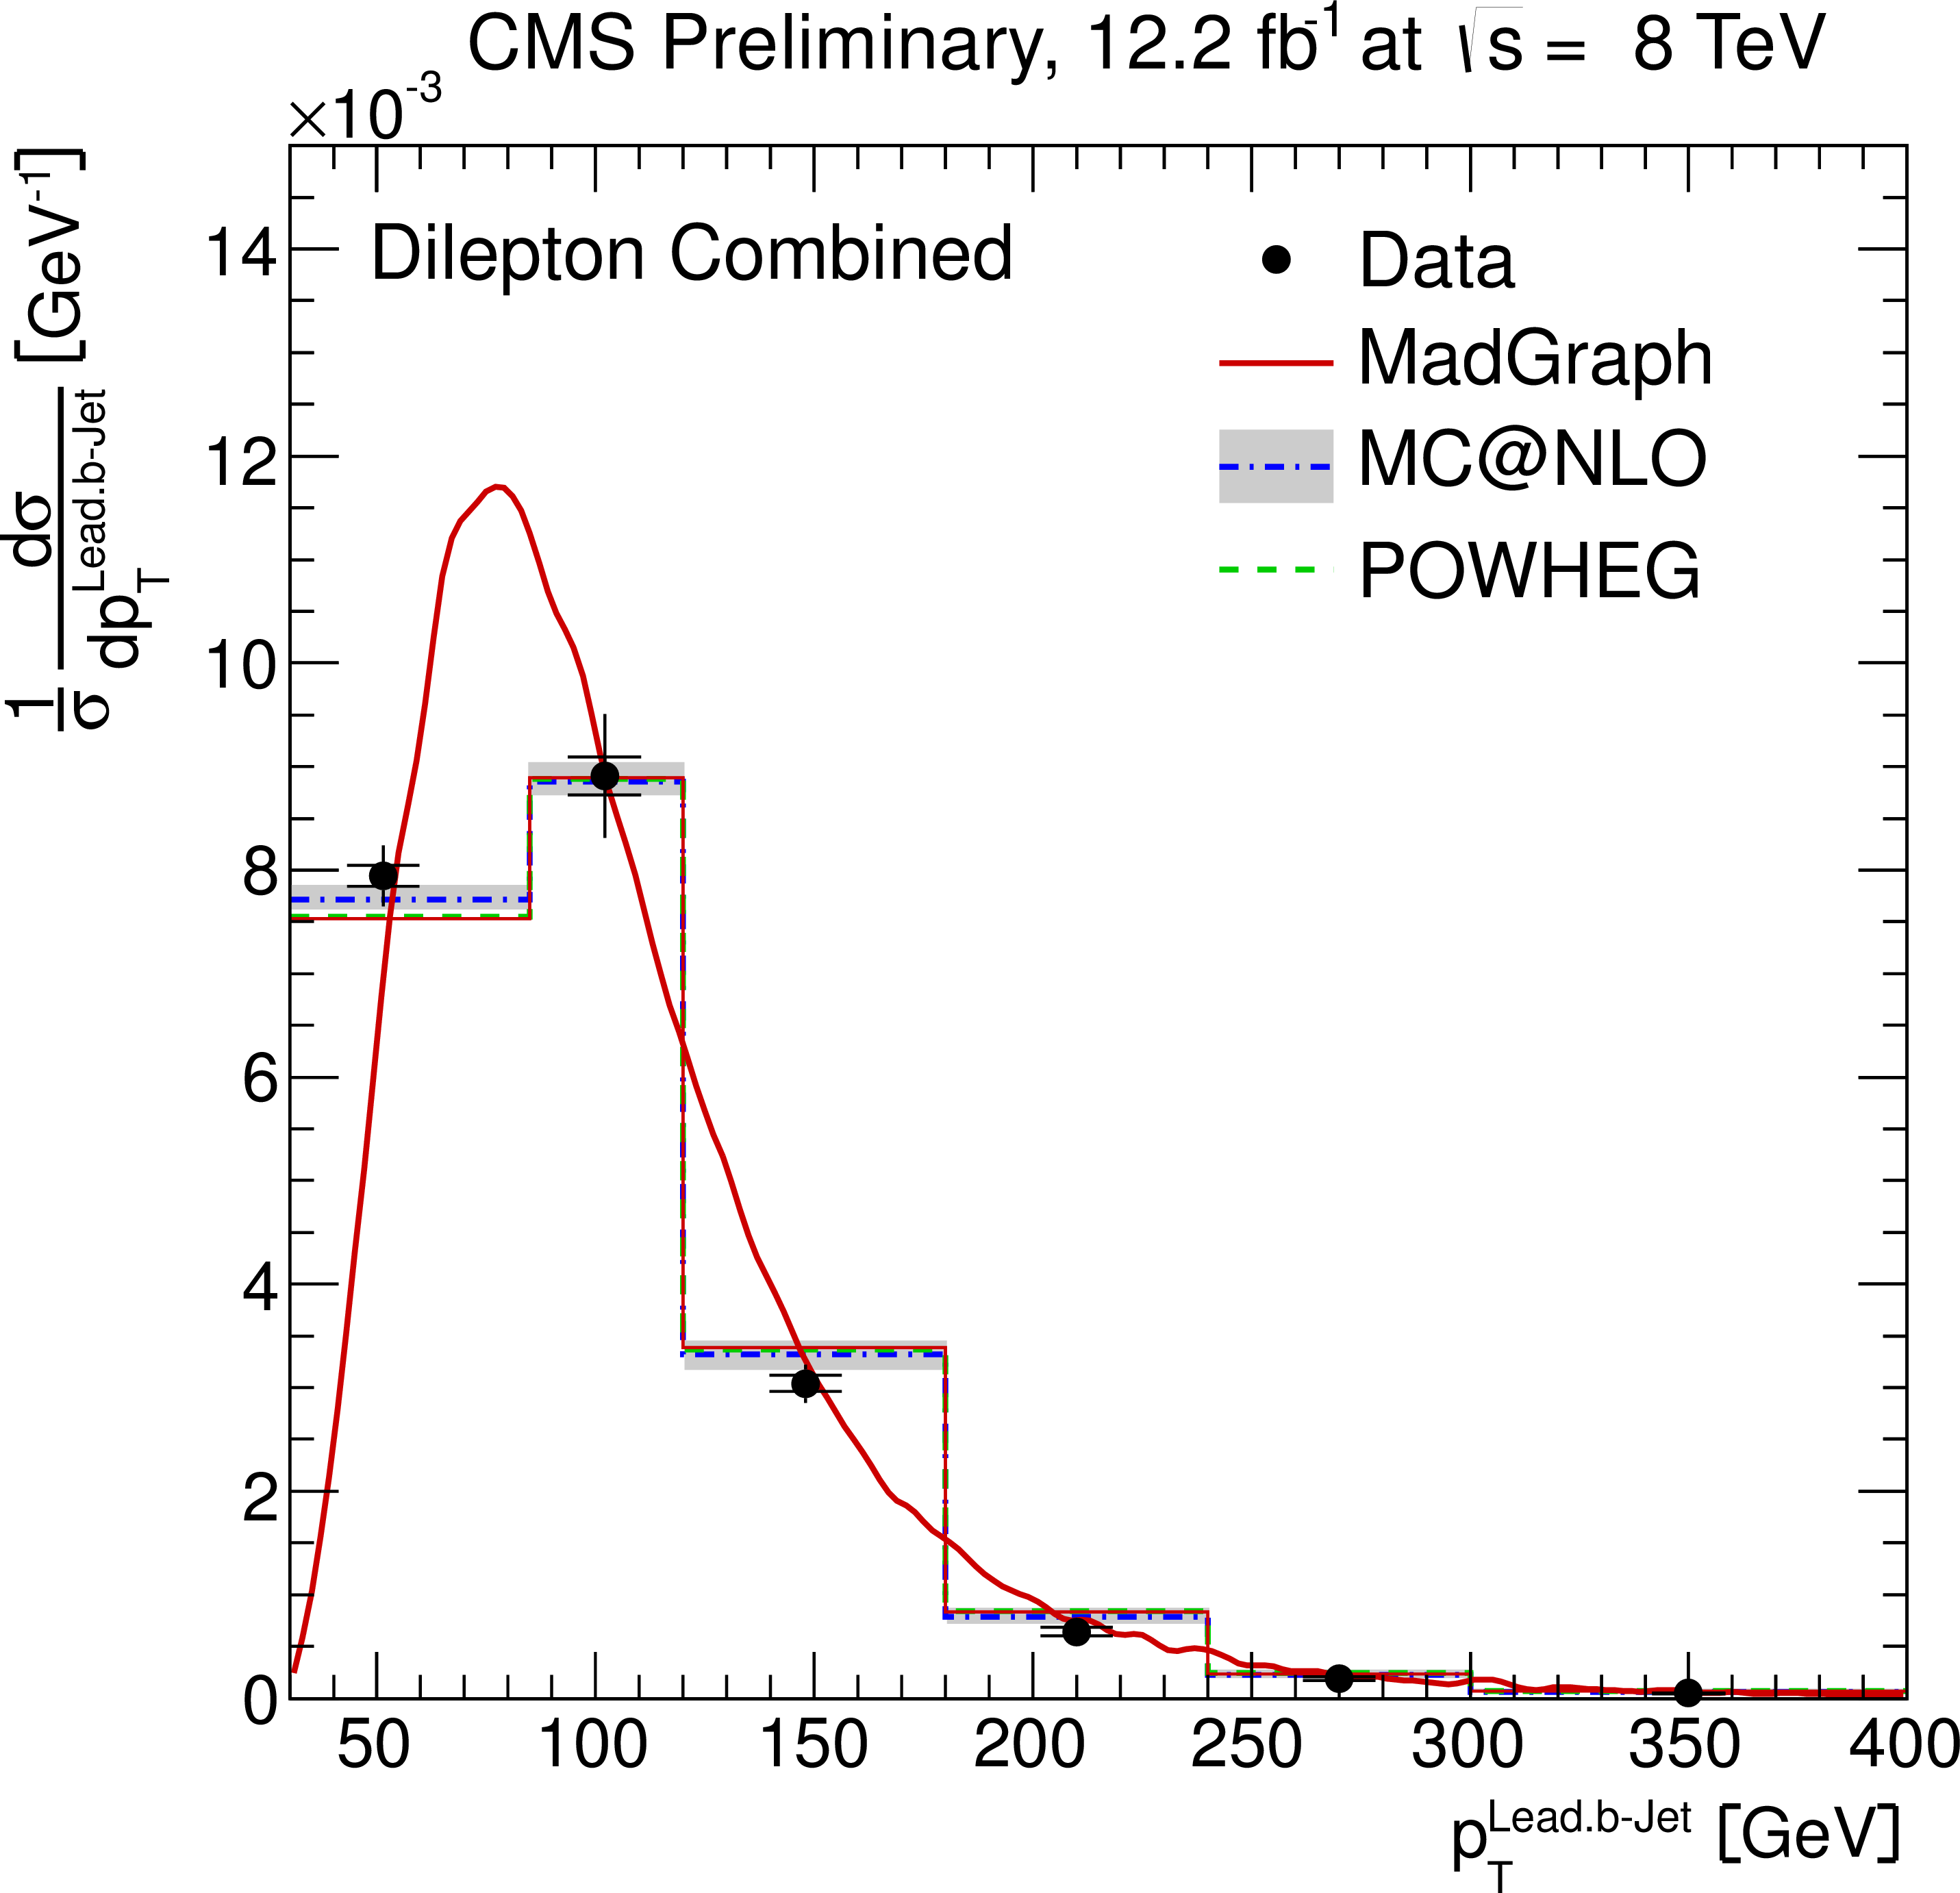
Figure 4-a:
Normalised differential ${\mathrm{ t \bar{t} } } $ production cross section as a function of the $ {p_{\mathrm {T}}} ^{\text {b}}$ (a,b) and $\eta ^{\text {b}}$ of the leading and next-to-leading b jet (c,d), and the invariant mass of the lepton and b jet $m^{\ell \rm {b}}$ (e). The superscript `b' refers to both b and b-bar jets. The inner (outer) error bars indicate the statistical (combined statistical and systematic) uncertainty. The measurements are compared to predictions from MadGraph +PYTHIA , POWHEG +PYTHIA , and MC@NLO+HERWIG. The MadGraph +PYTHIA prediction is shown both as a curve and as a binned histogram when available. |
png pdf |
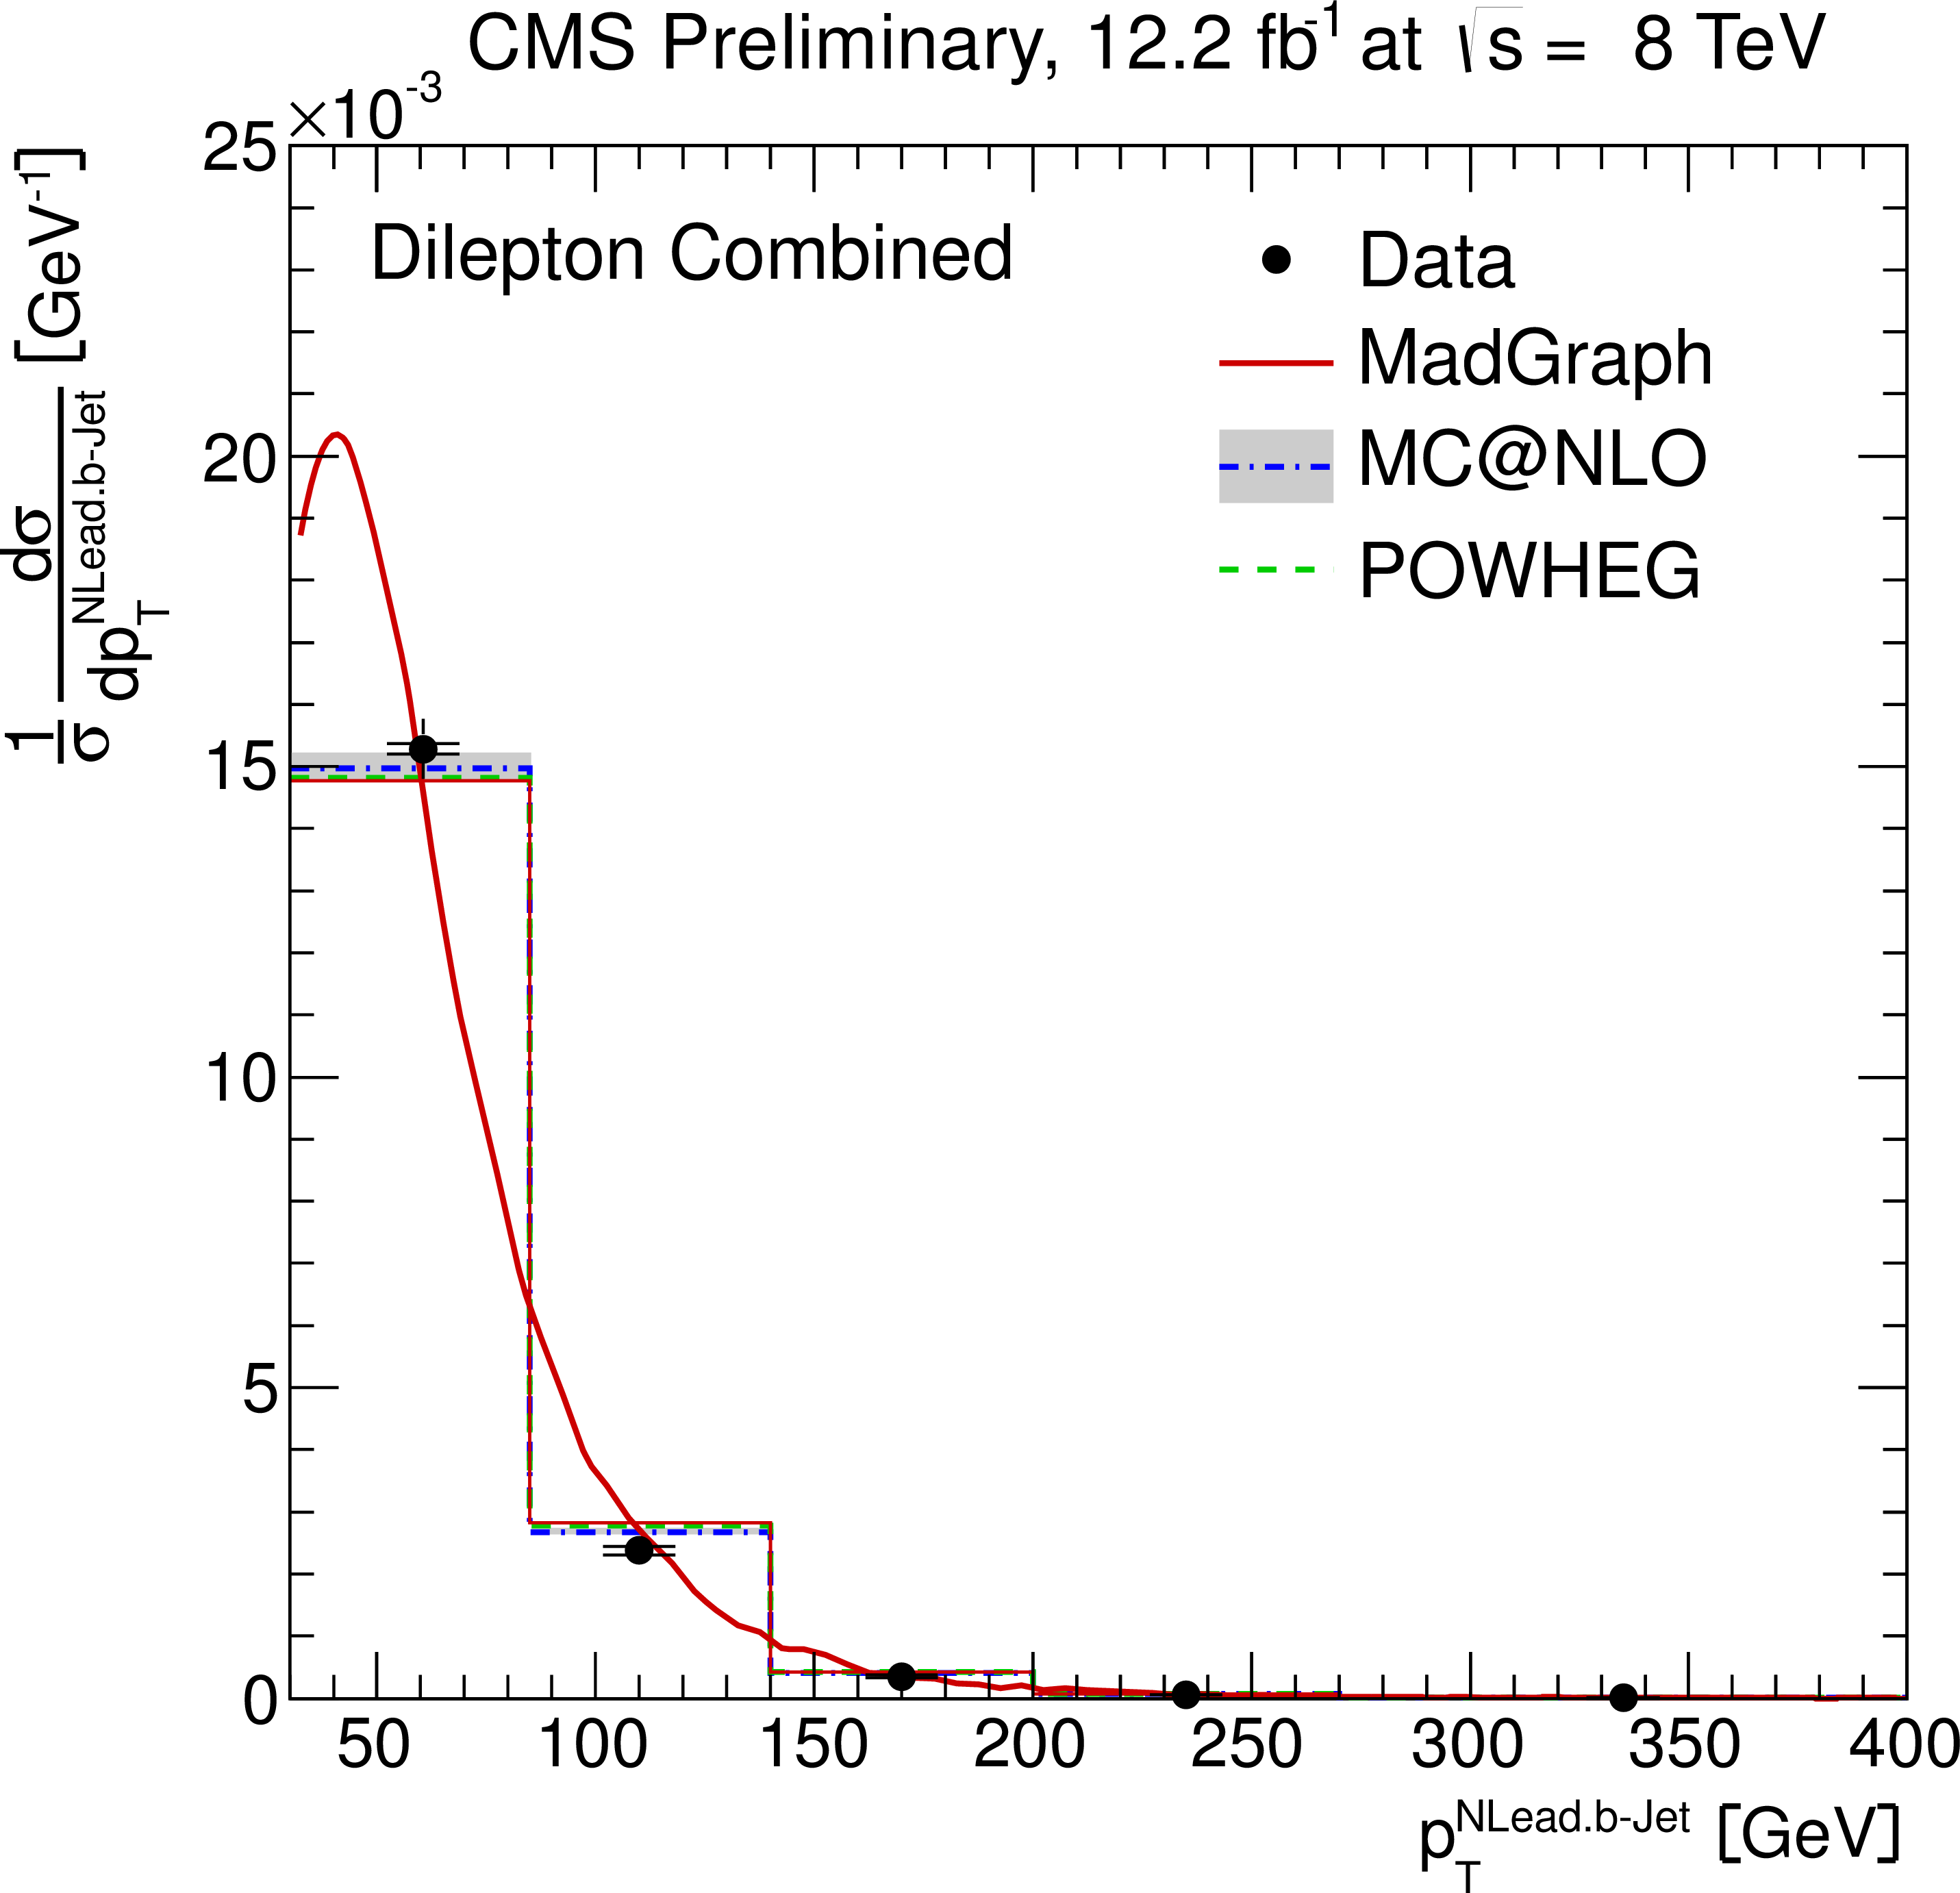
Figure 4-b:
Normalised differential ${\mathrm{ t \bar{t} } } $ production cross section as a function of the $ {p_{\mathrm {T}}} ^{\text {b}}$ (a,b) and $\eta ^{\text {b}}$ of the leading and next-to-leading b jet (c,d), and the invariant mass of the lepton and b jet $m^{\ell \rm {b}}$ (e). The superscript `b' refers to both b and b-bar jets. The inner (outer) error bars indicate the statistical (combined statistical and systematic) uncertainty. The measurements are compared to predictions from MadGraph +PYTHIA , POWHEG +PYTHIA , and MC@NLO+HERWIG. The MadGraph +PYTHIA prediction is shown both as a curve and as a binned histogram when available. |
png pdf |
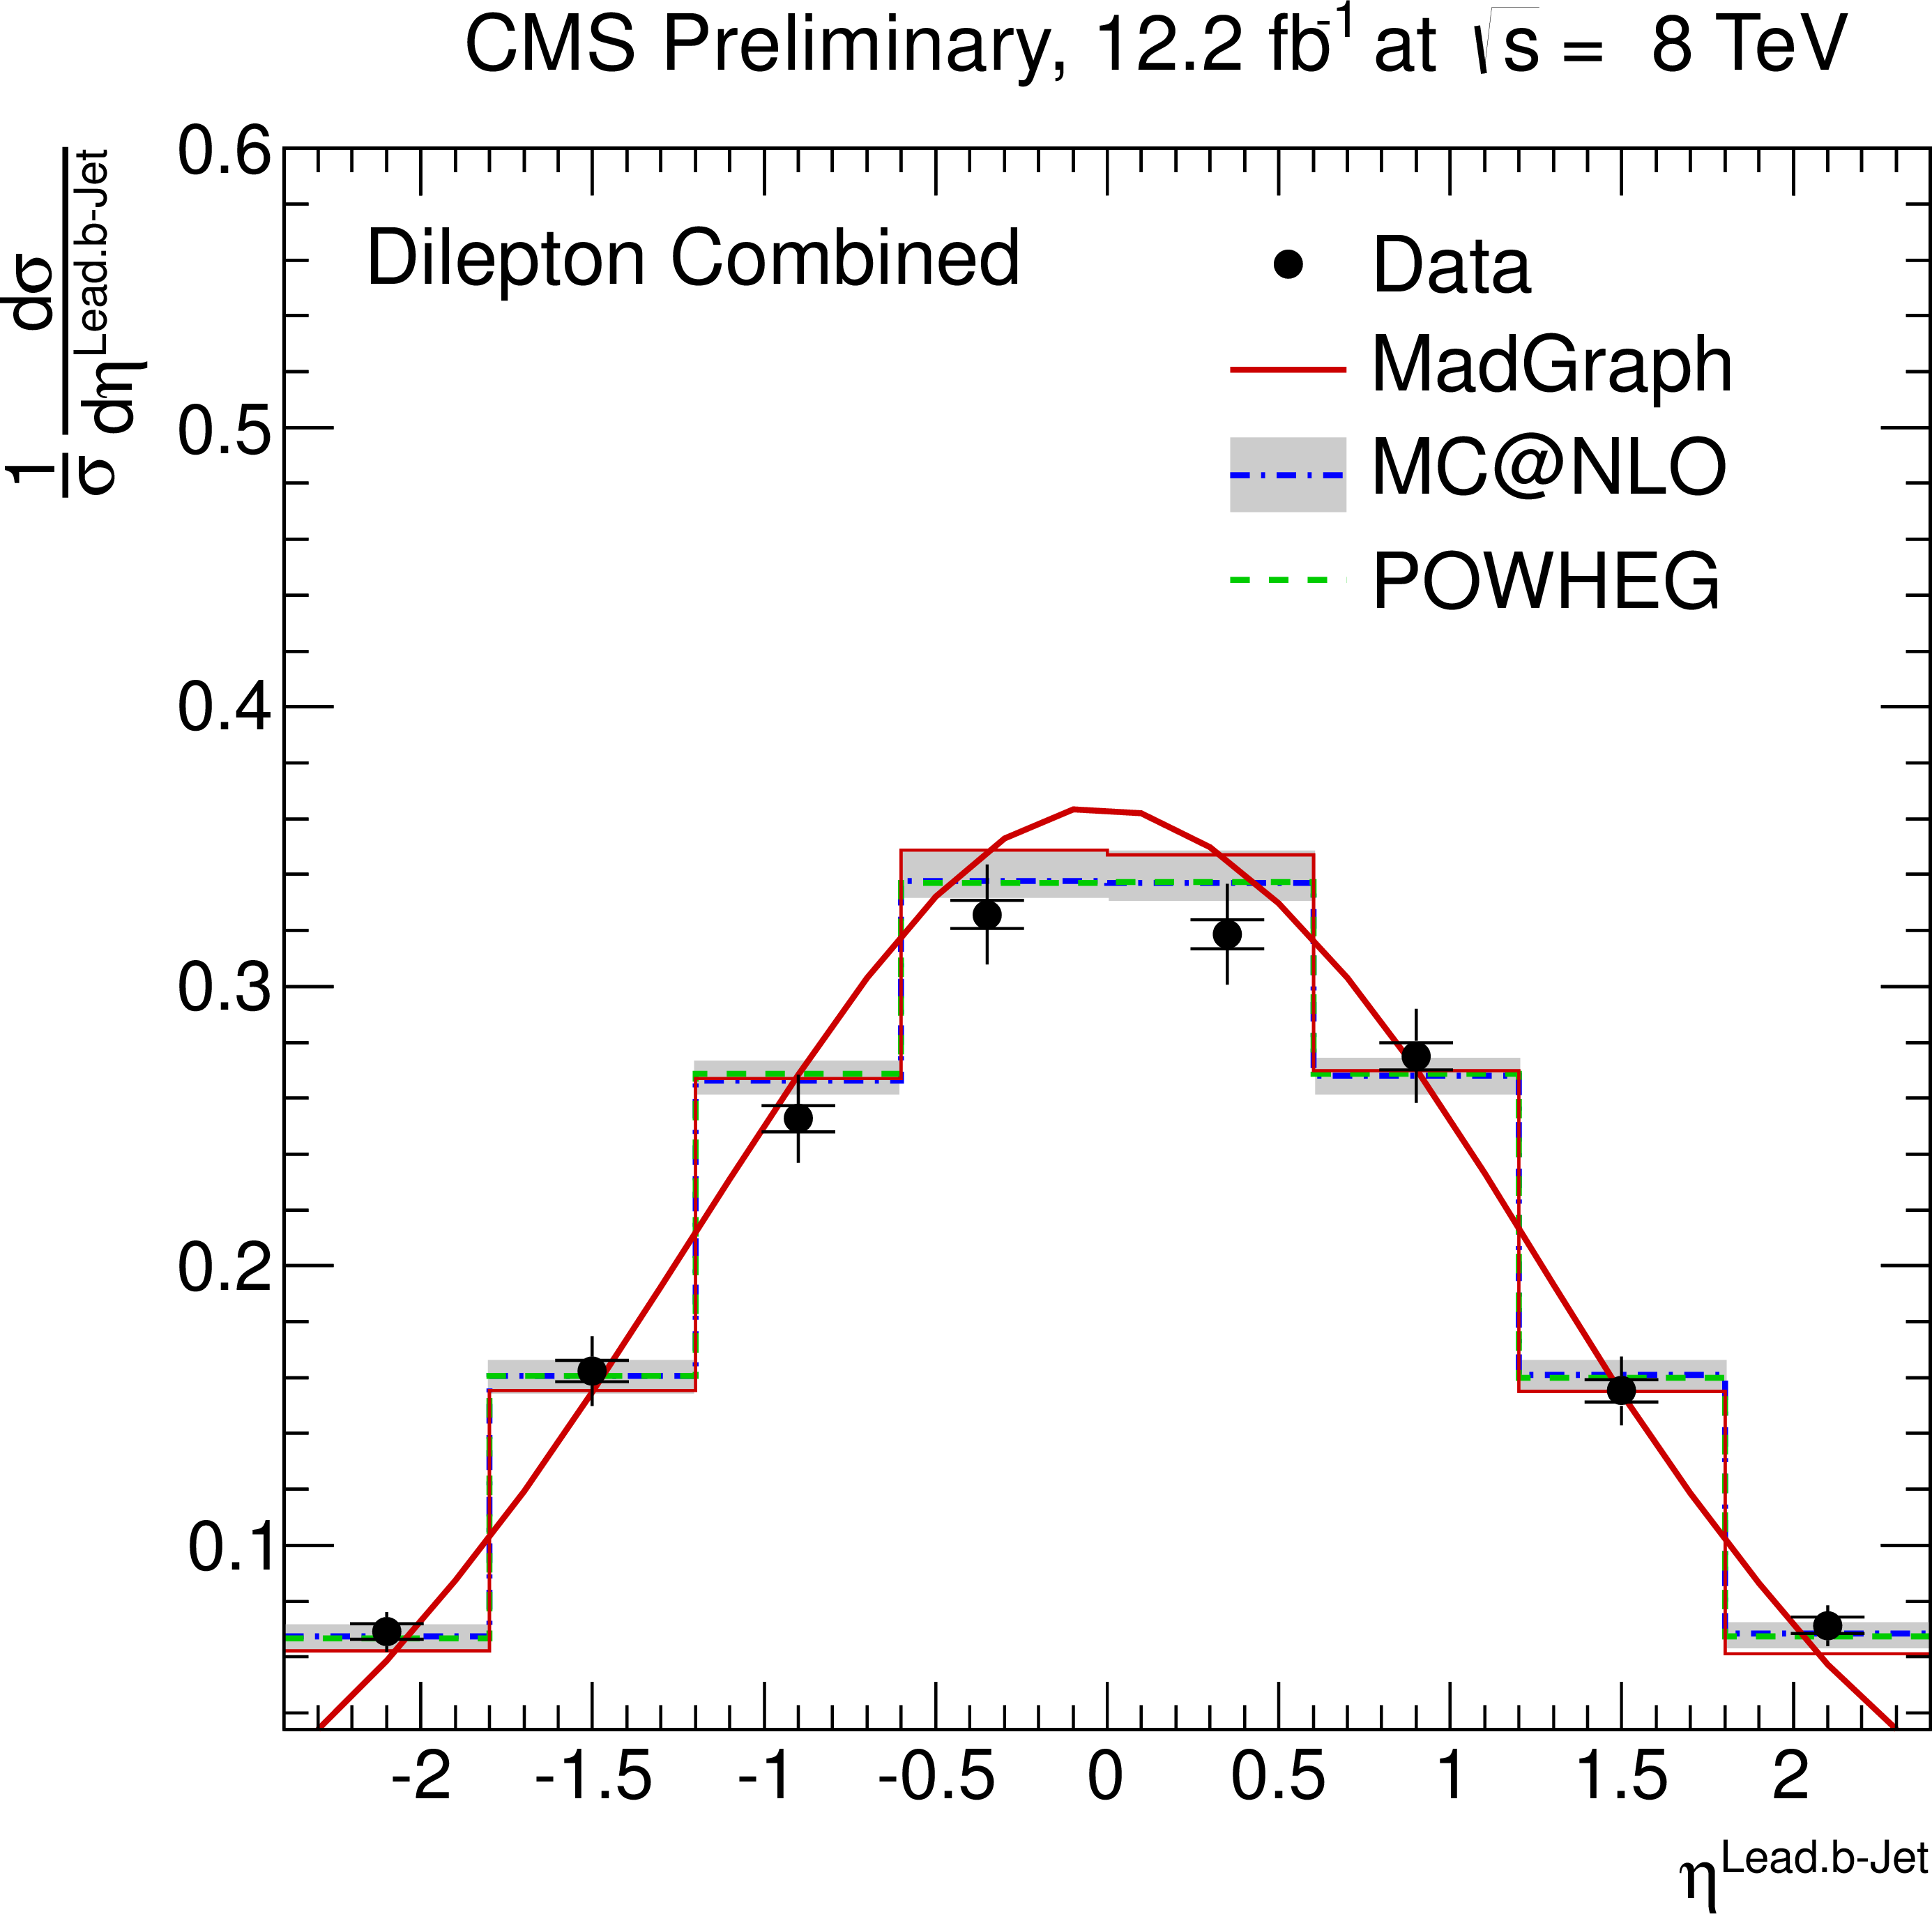
Figure 4-c:
Normalised differential ${\mathrm{ t \bar{t} } } $ production cross section as a function of the $ {p_{\mathrm {T}}} ^{\text {b}}$ (a,b) and $\eta ^{\text {b}}$ of the leading and next-to-leading b jet (c,d), and the invariant mass of the lepton and b jet $m^{\ell \rm {b}}$ (e). The superscript `b' refers to both b and b-bar jets. The inner (outer) error bars indicate the statistical (combined statistical and systematic) uncertainty. The measurements are compared to predictions from MadGraph +PYTHIA , POWHEG +PYTHIA , and MC@NLO+HERWIG. The MadGraph +PYTHIA prediction is shown both as a curve and as a binned histogram when available. |
png pdf |
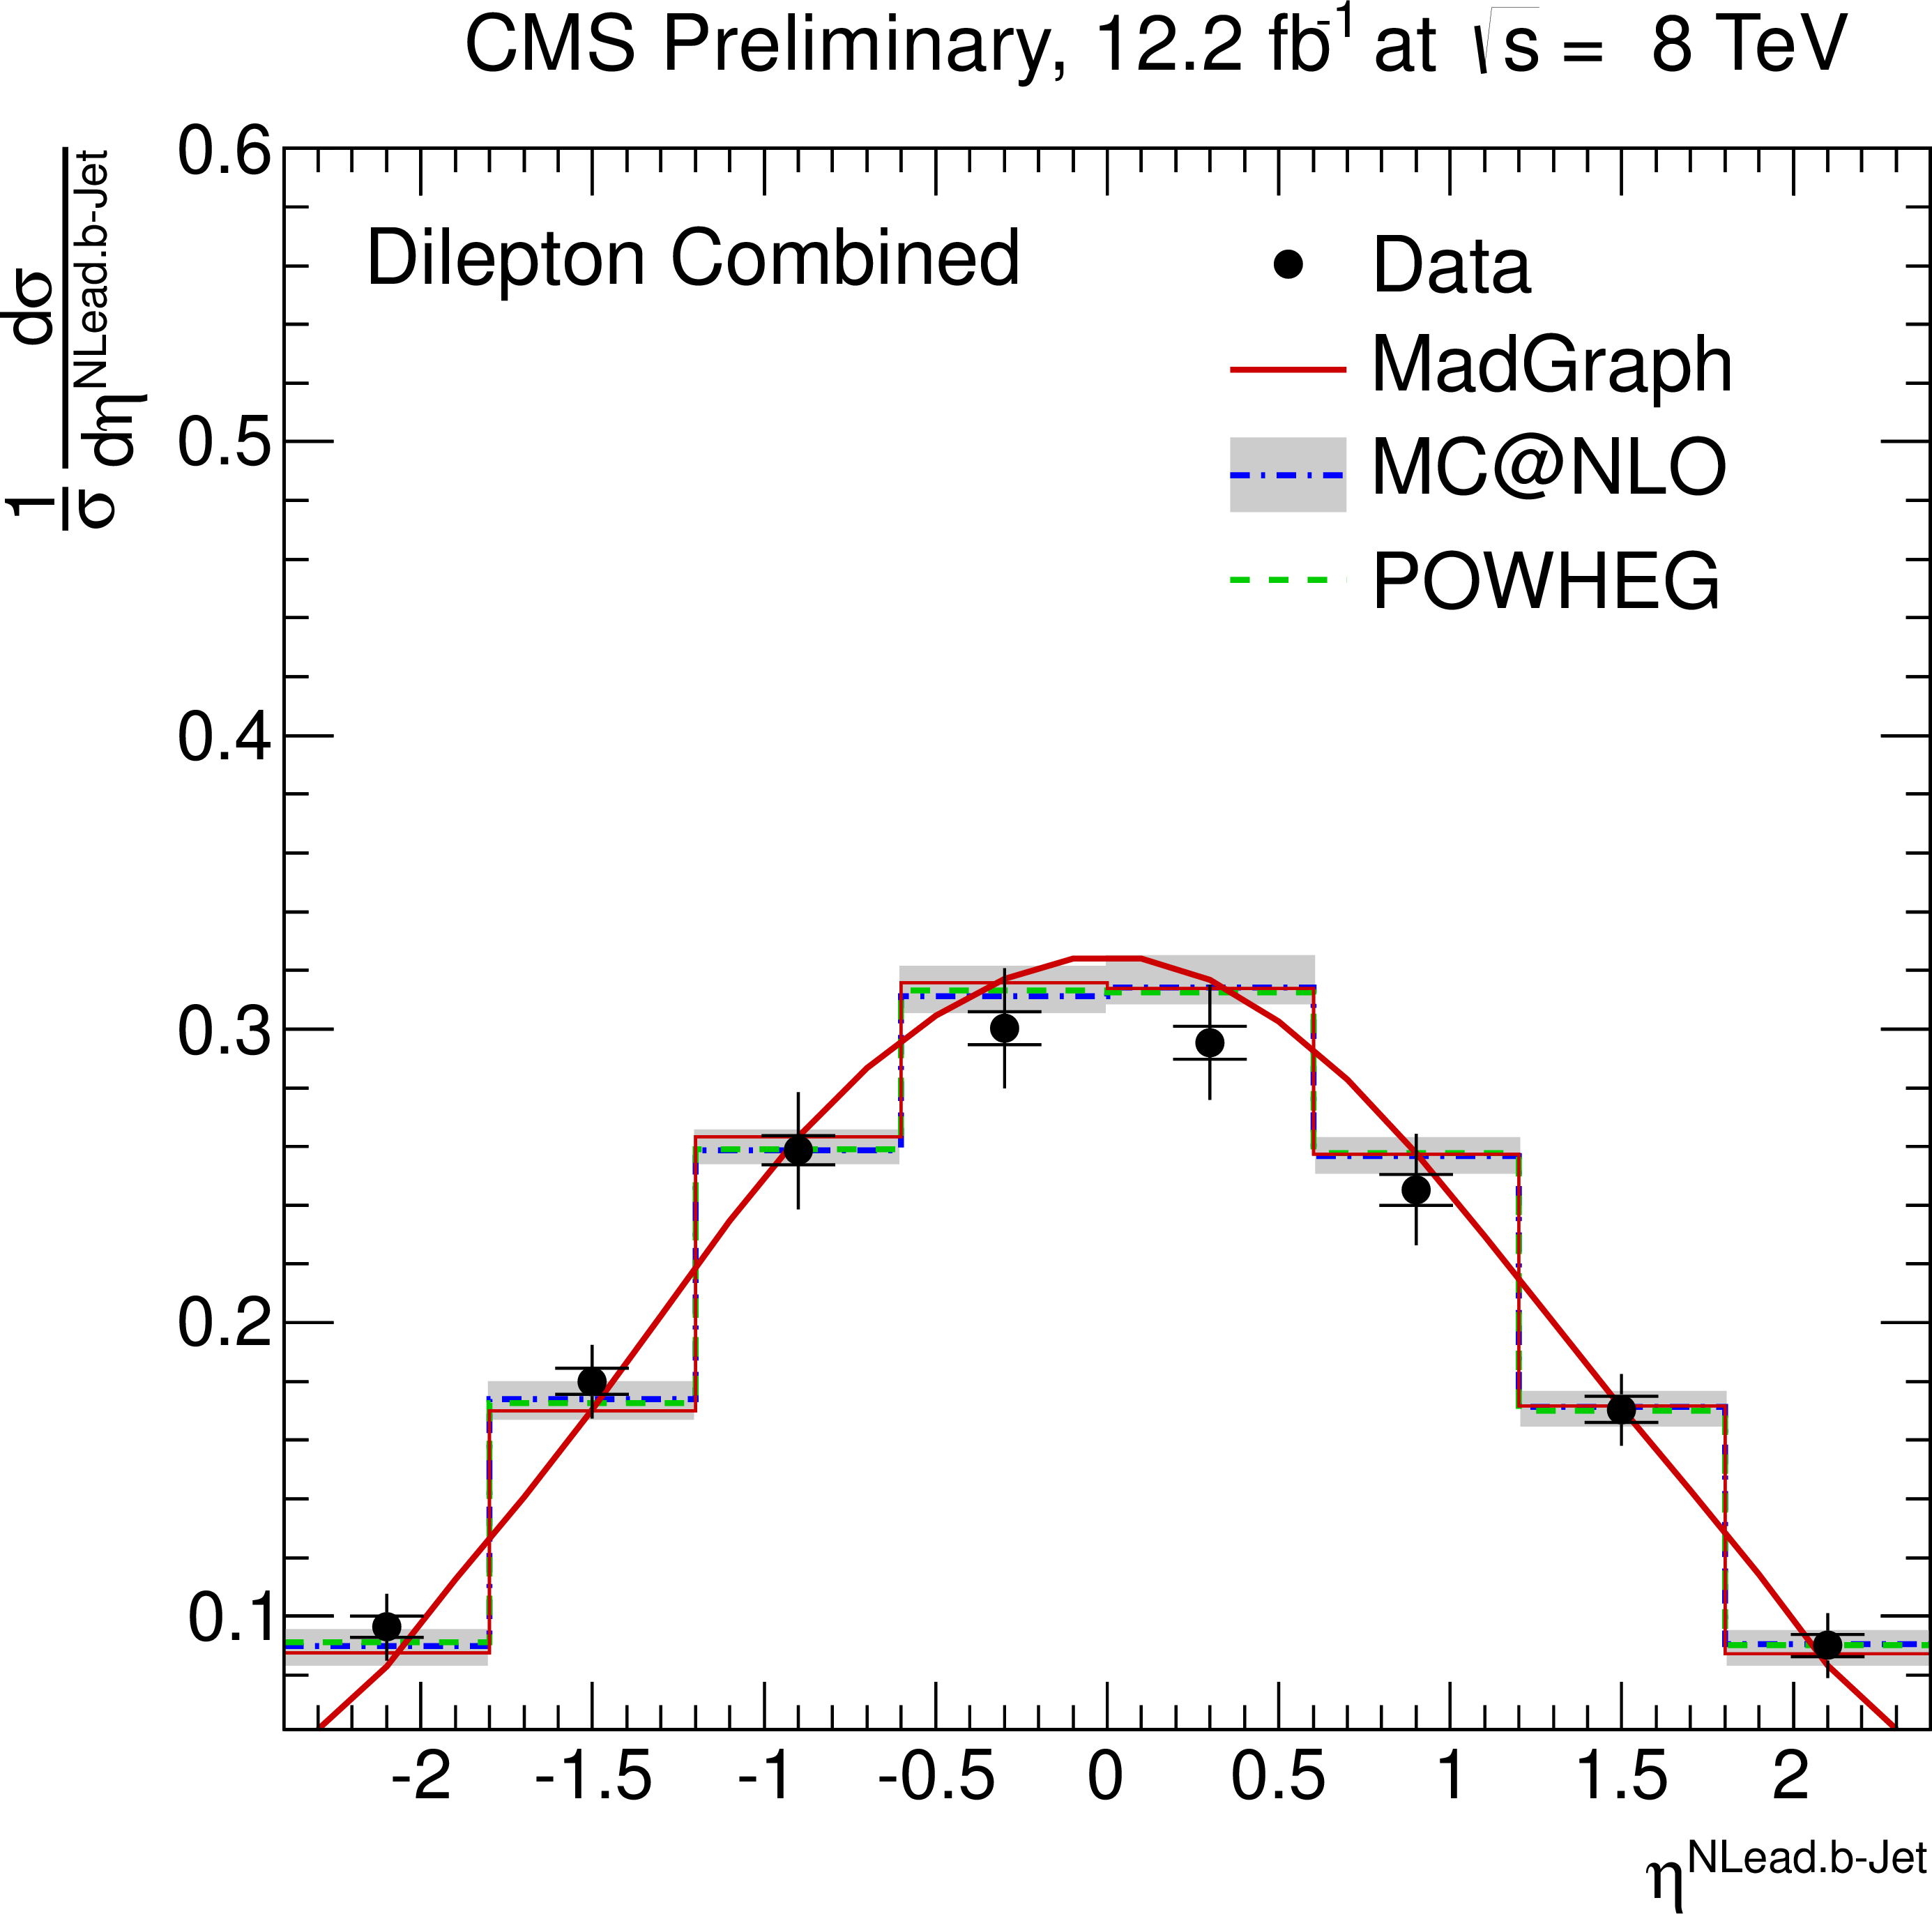
Figure 4-d:
Normalised differential ${\mathrm{ t \bar{t} } } $ production cross section as a function of the $ {p_{\mathrm {T}}} ^{\text {b}}$ (a,b) and $\eta ^{\text {b}}$ of the leading and next-to-leading b jet (c,d), and the invariant mass of the lepton and b jet $m^{\ell \rm {b}}$ (e). The superscript `b' refers to both b and b-bar jets. The inner (outer) error bars indicate the statistical (combined statistical and systematic) uncertainty. The measurements are compared to predictions from MadGraph +PYTHIA , POWHEG +PYTHIA , and MC@NLO+HERWIG. The MadGraph +PYTHIA prediction is shown both as a curve and as a binned histogram when available. |
png pdf |
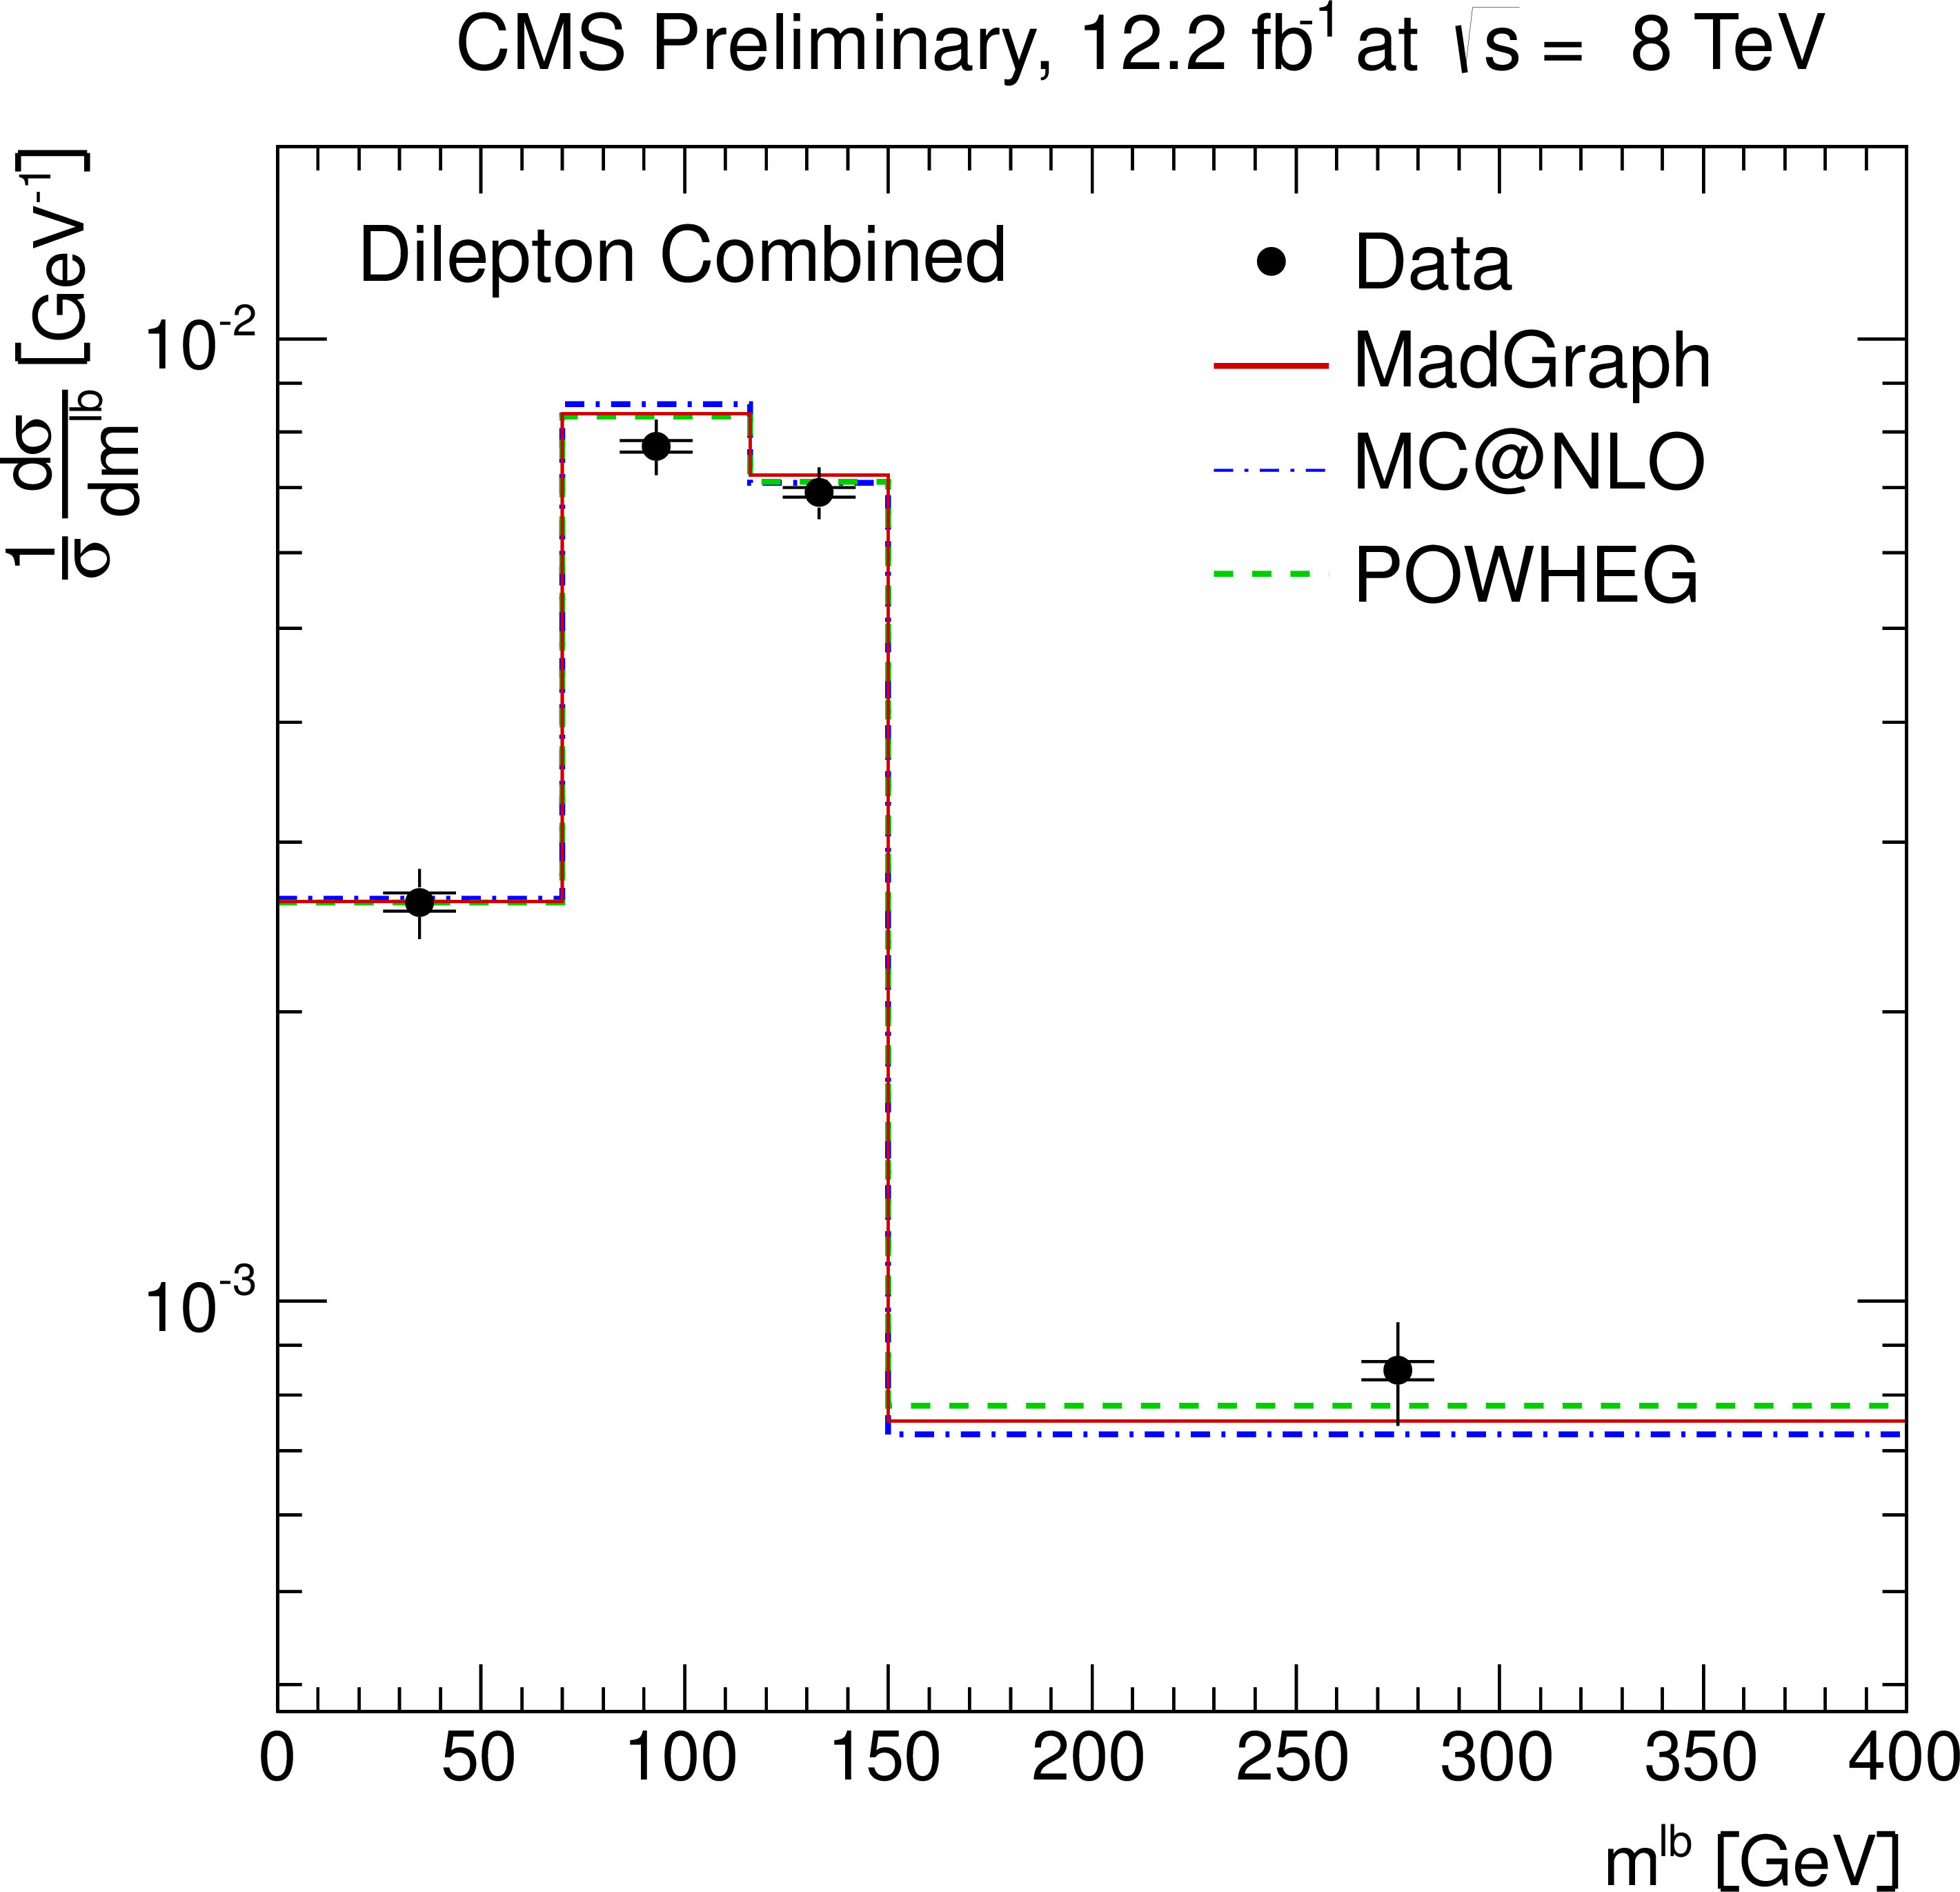
Figure 4-e:
Normalised differential ${\mathrm{ t \bar{t} } } $ production cross section as a function of the $ {p_{\mathrm {T}}} ^{\text {b}}$ (a,b) and $\eta ^{\text {b}}$ of the leading and next-to-leading b jet (c,d), and the invariant mass of the lepton and b jet $m^{\ell \rm {b}}$ (e). The superscript `b' refers to both b and b-bar jets. The inner (outer) error bars indicate the statistical (combined statistical and systematic) uncertainty. The measurements are compared to predictions from MadGraph +PYTHIA , POWHEG +PYTHIA , and MC@NLO+HERWIG. The MadGraph +PYTHIA prediction is shown both as a curve and as a binned histogram when available. |
png pdf |
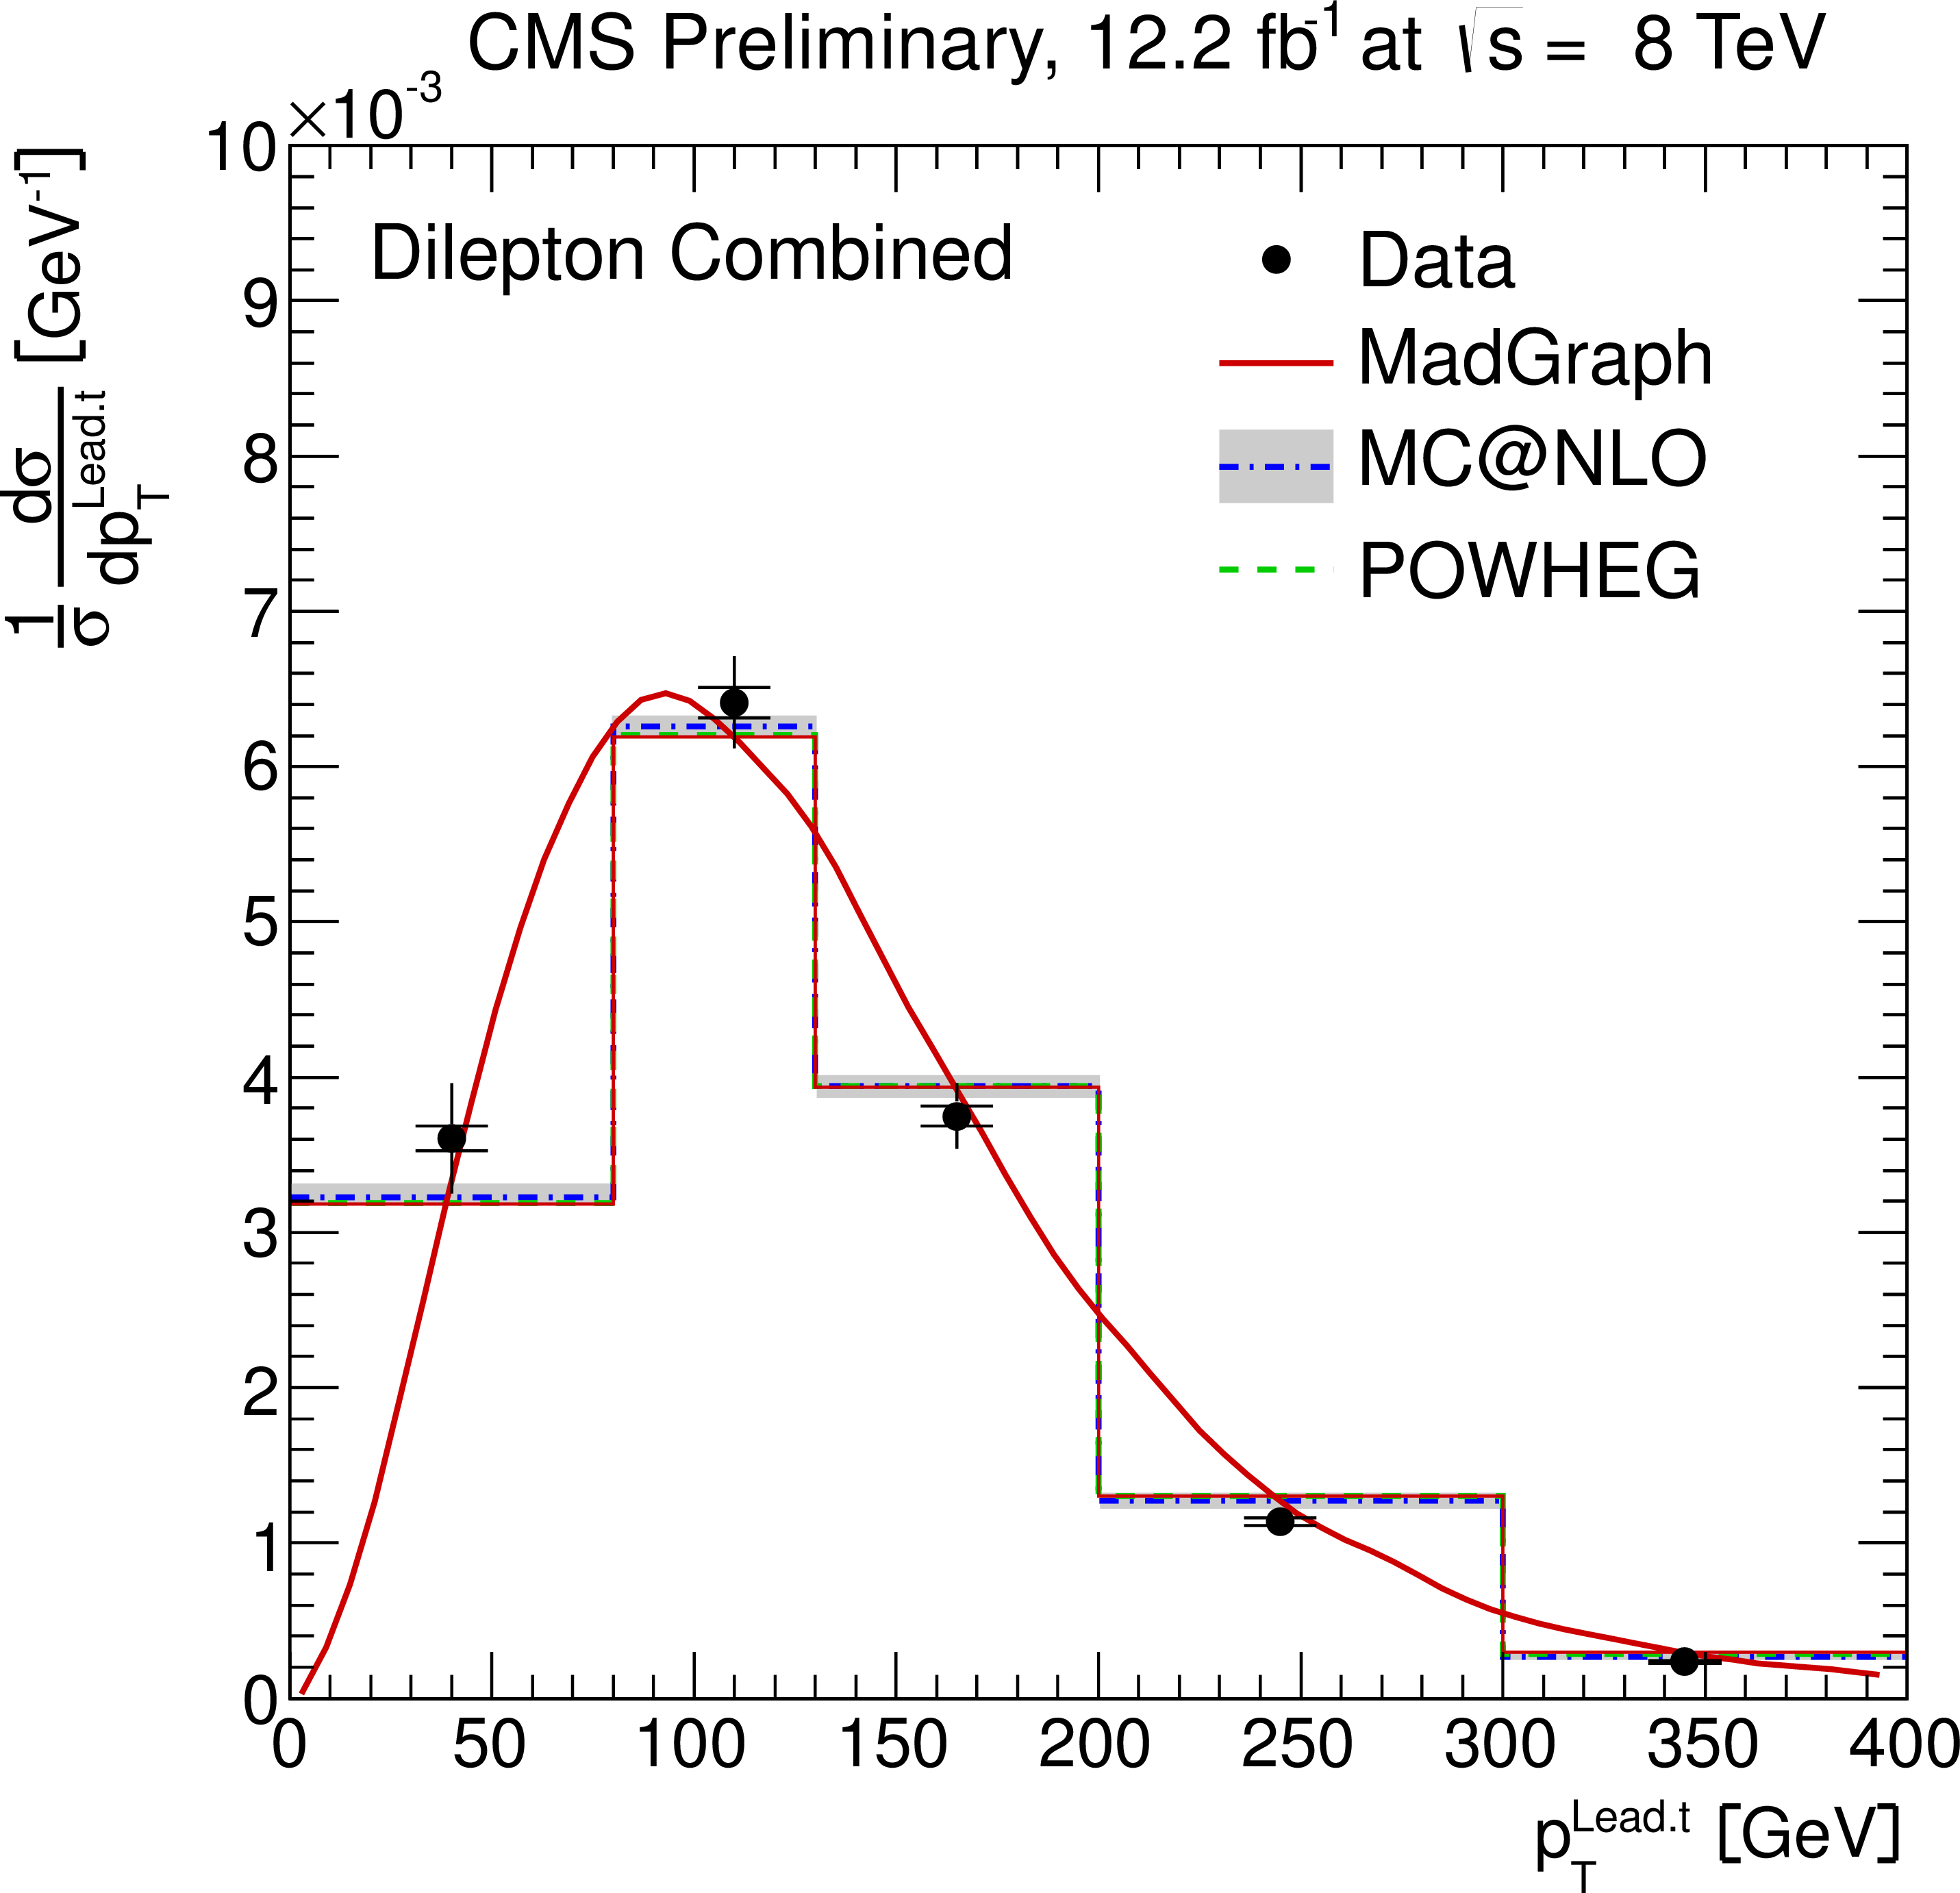
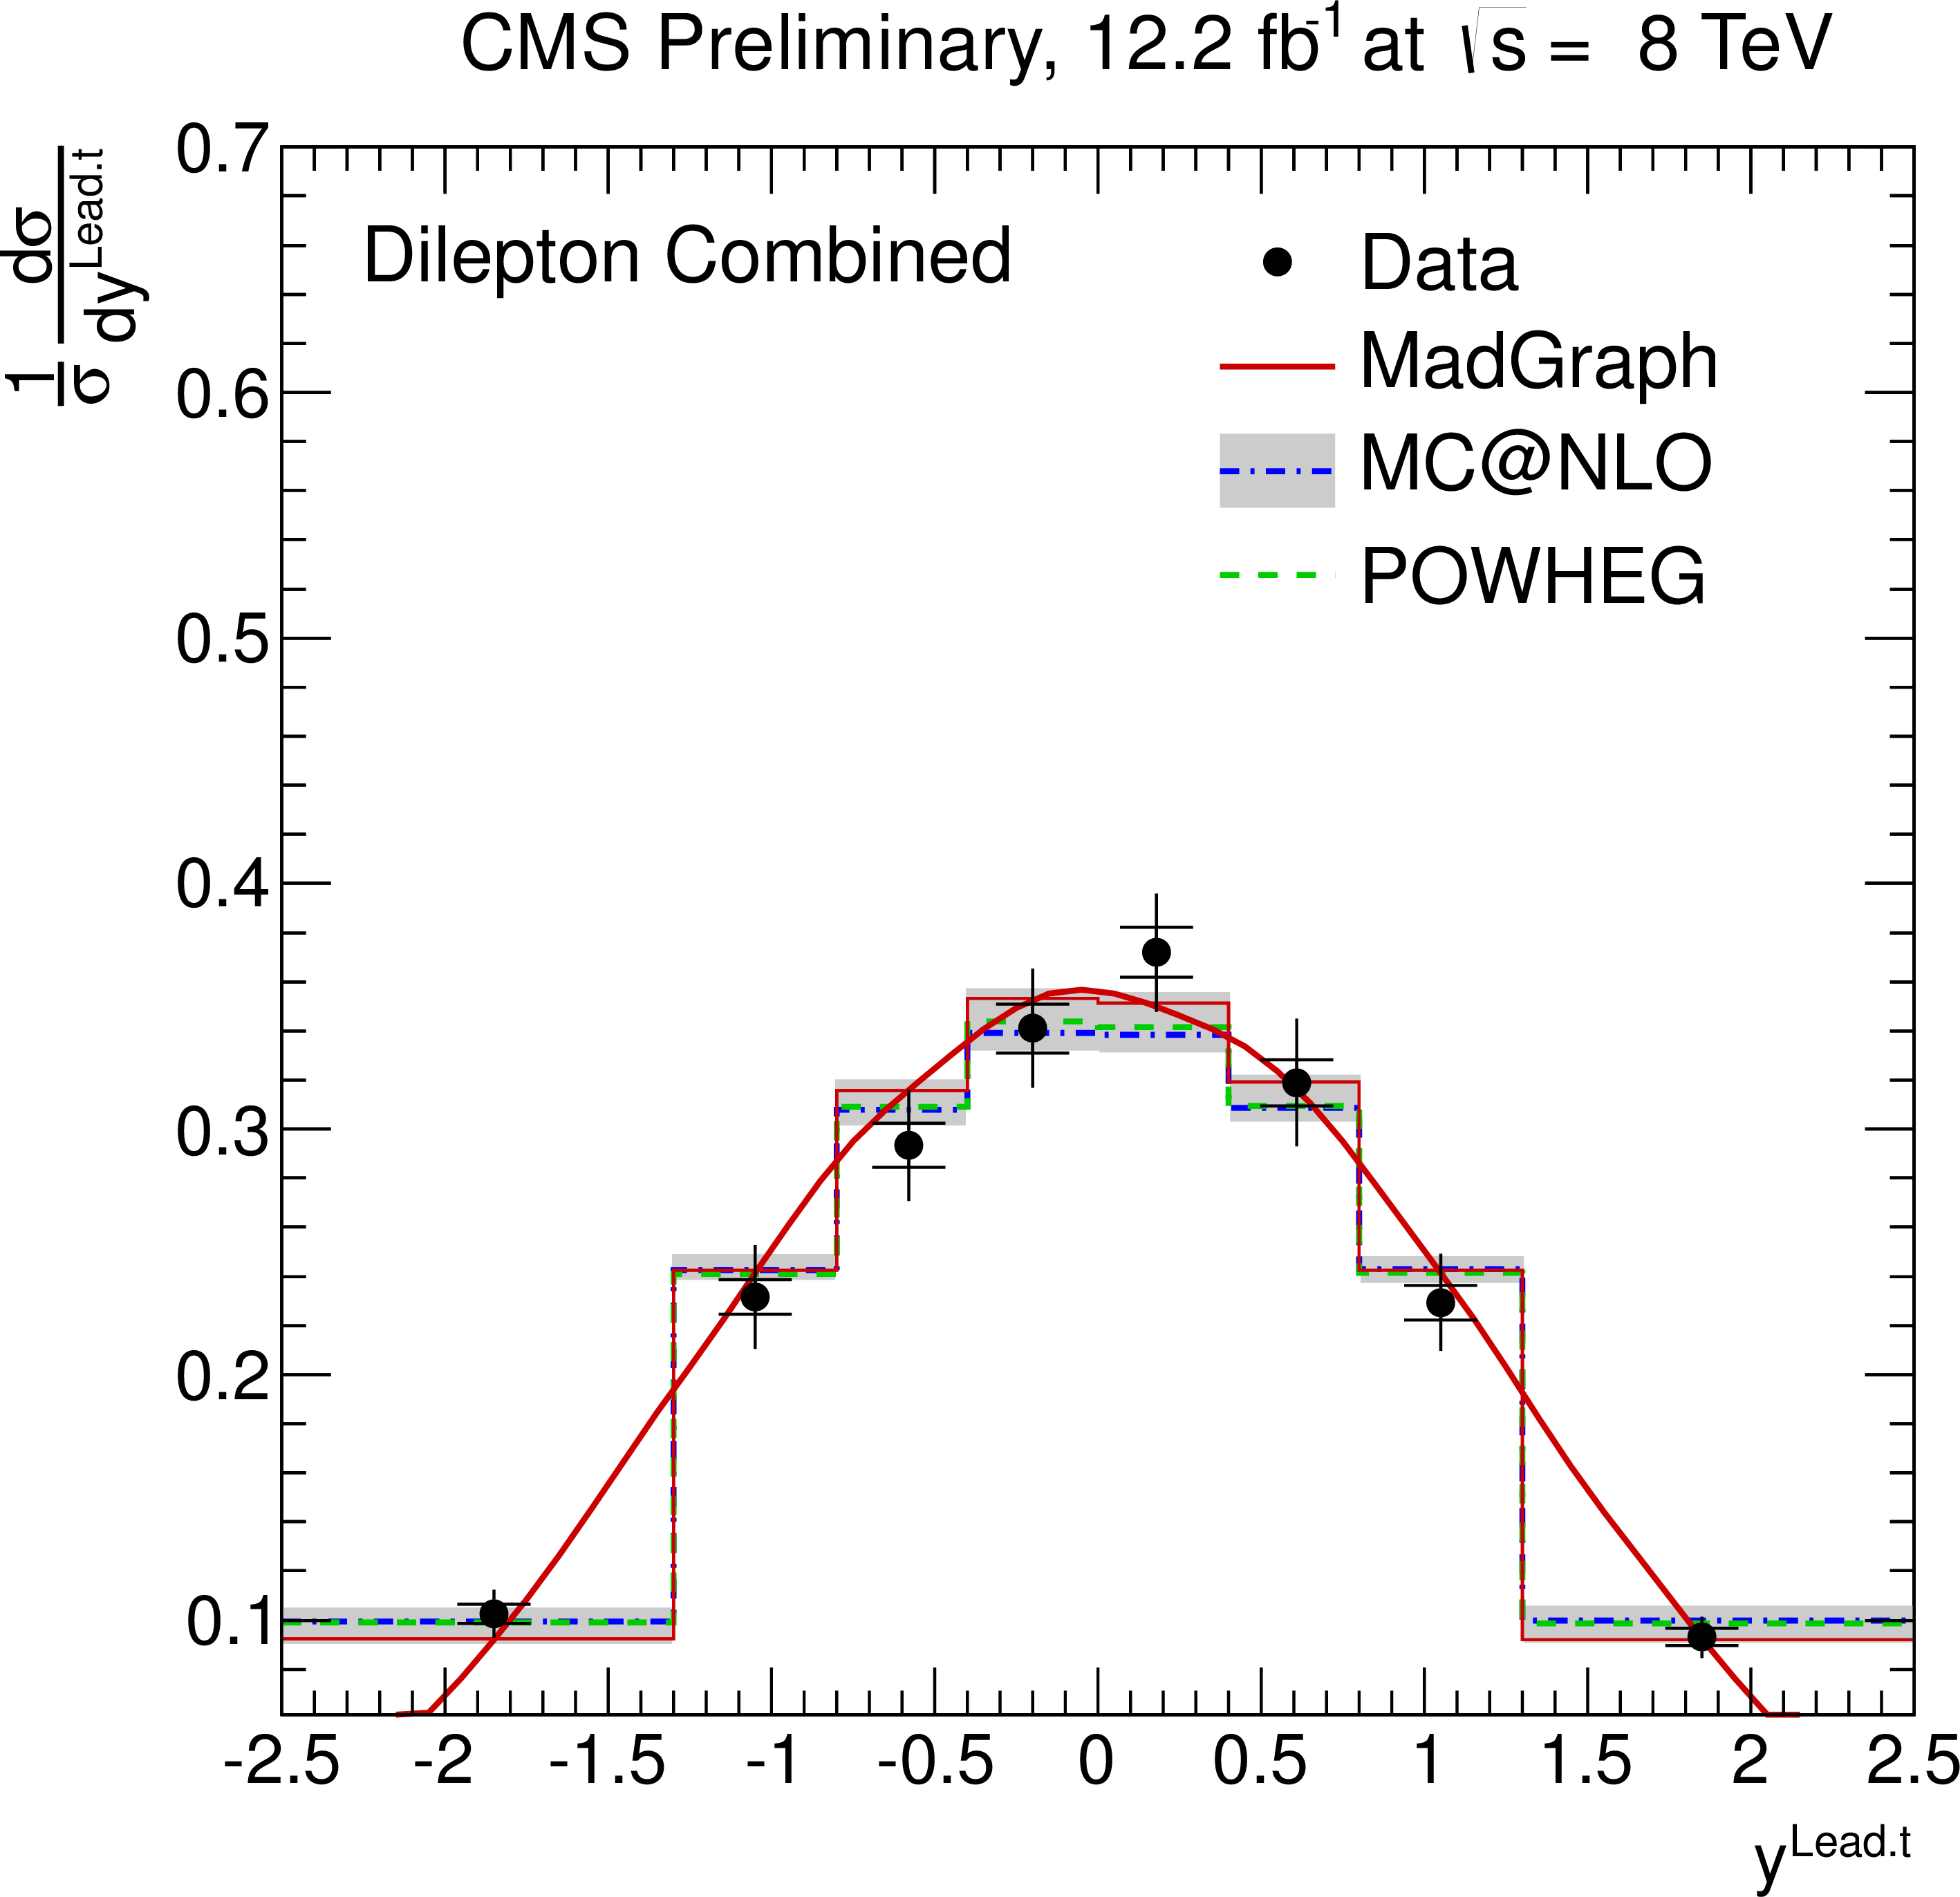
Figure 5-a:
Normalised differential ${\mathrm{ t \bar{t} } } $ production cross section as a function of the $ {p_{\mathrm {T}}} ^{\text {t}}$ (a,b) and $y^{\text {t}}$ (c,d) of the leading and next-to-leading top quarks or antiquarks. The inner (outer) error bars indicate the statistical (combined statistical and systematic) uncertainty. The measurements are compared to predictions from MadGraph +PYTHIA , POWHEG +PYTHIA , and MC@NLO+HERWIG. The MadGraph +PYTHIA prediction is shown both as a curve and as a binned histogram. |
png pdf |
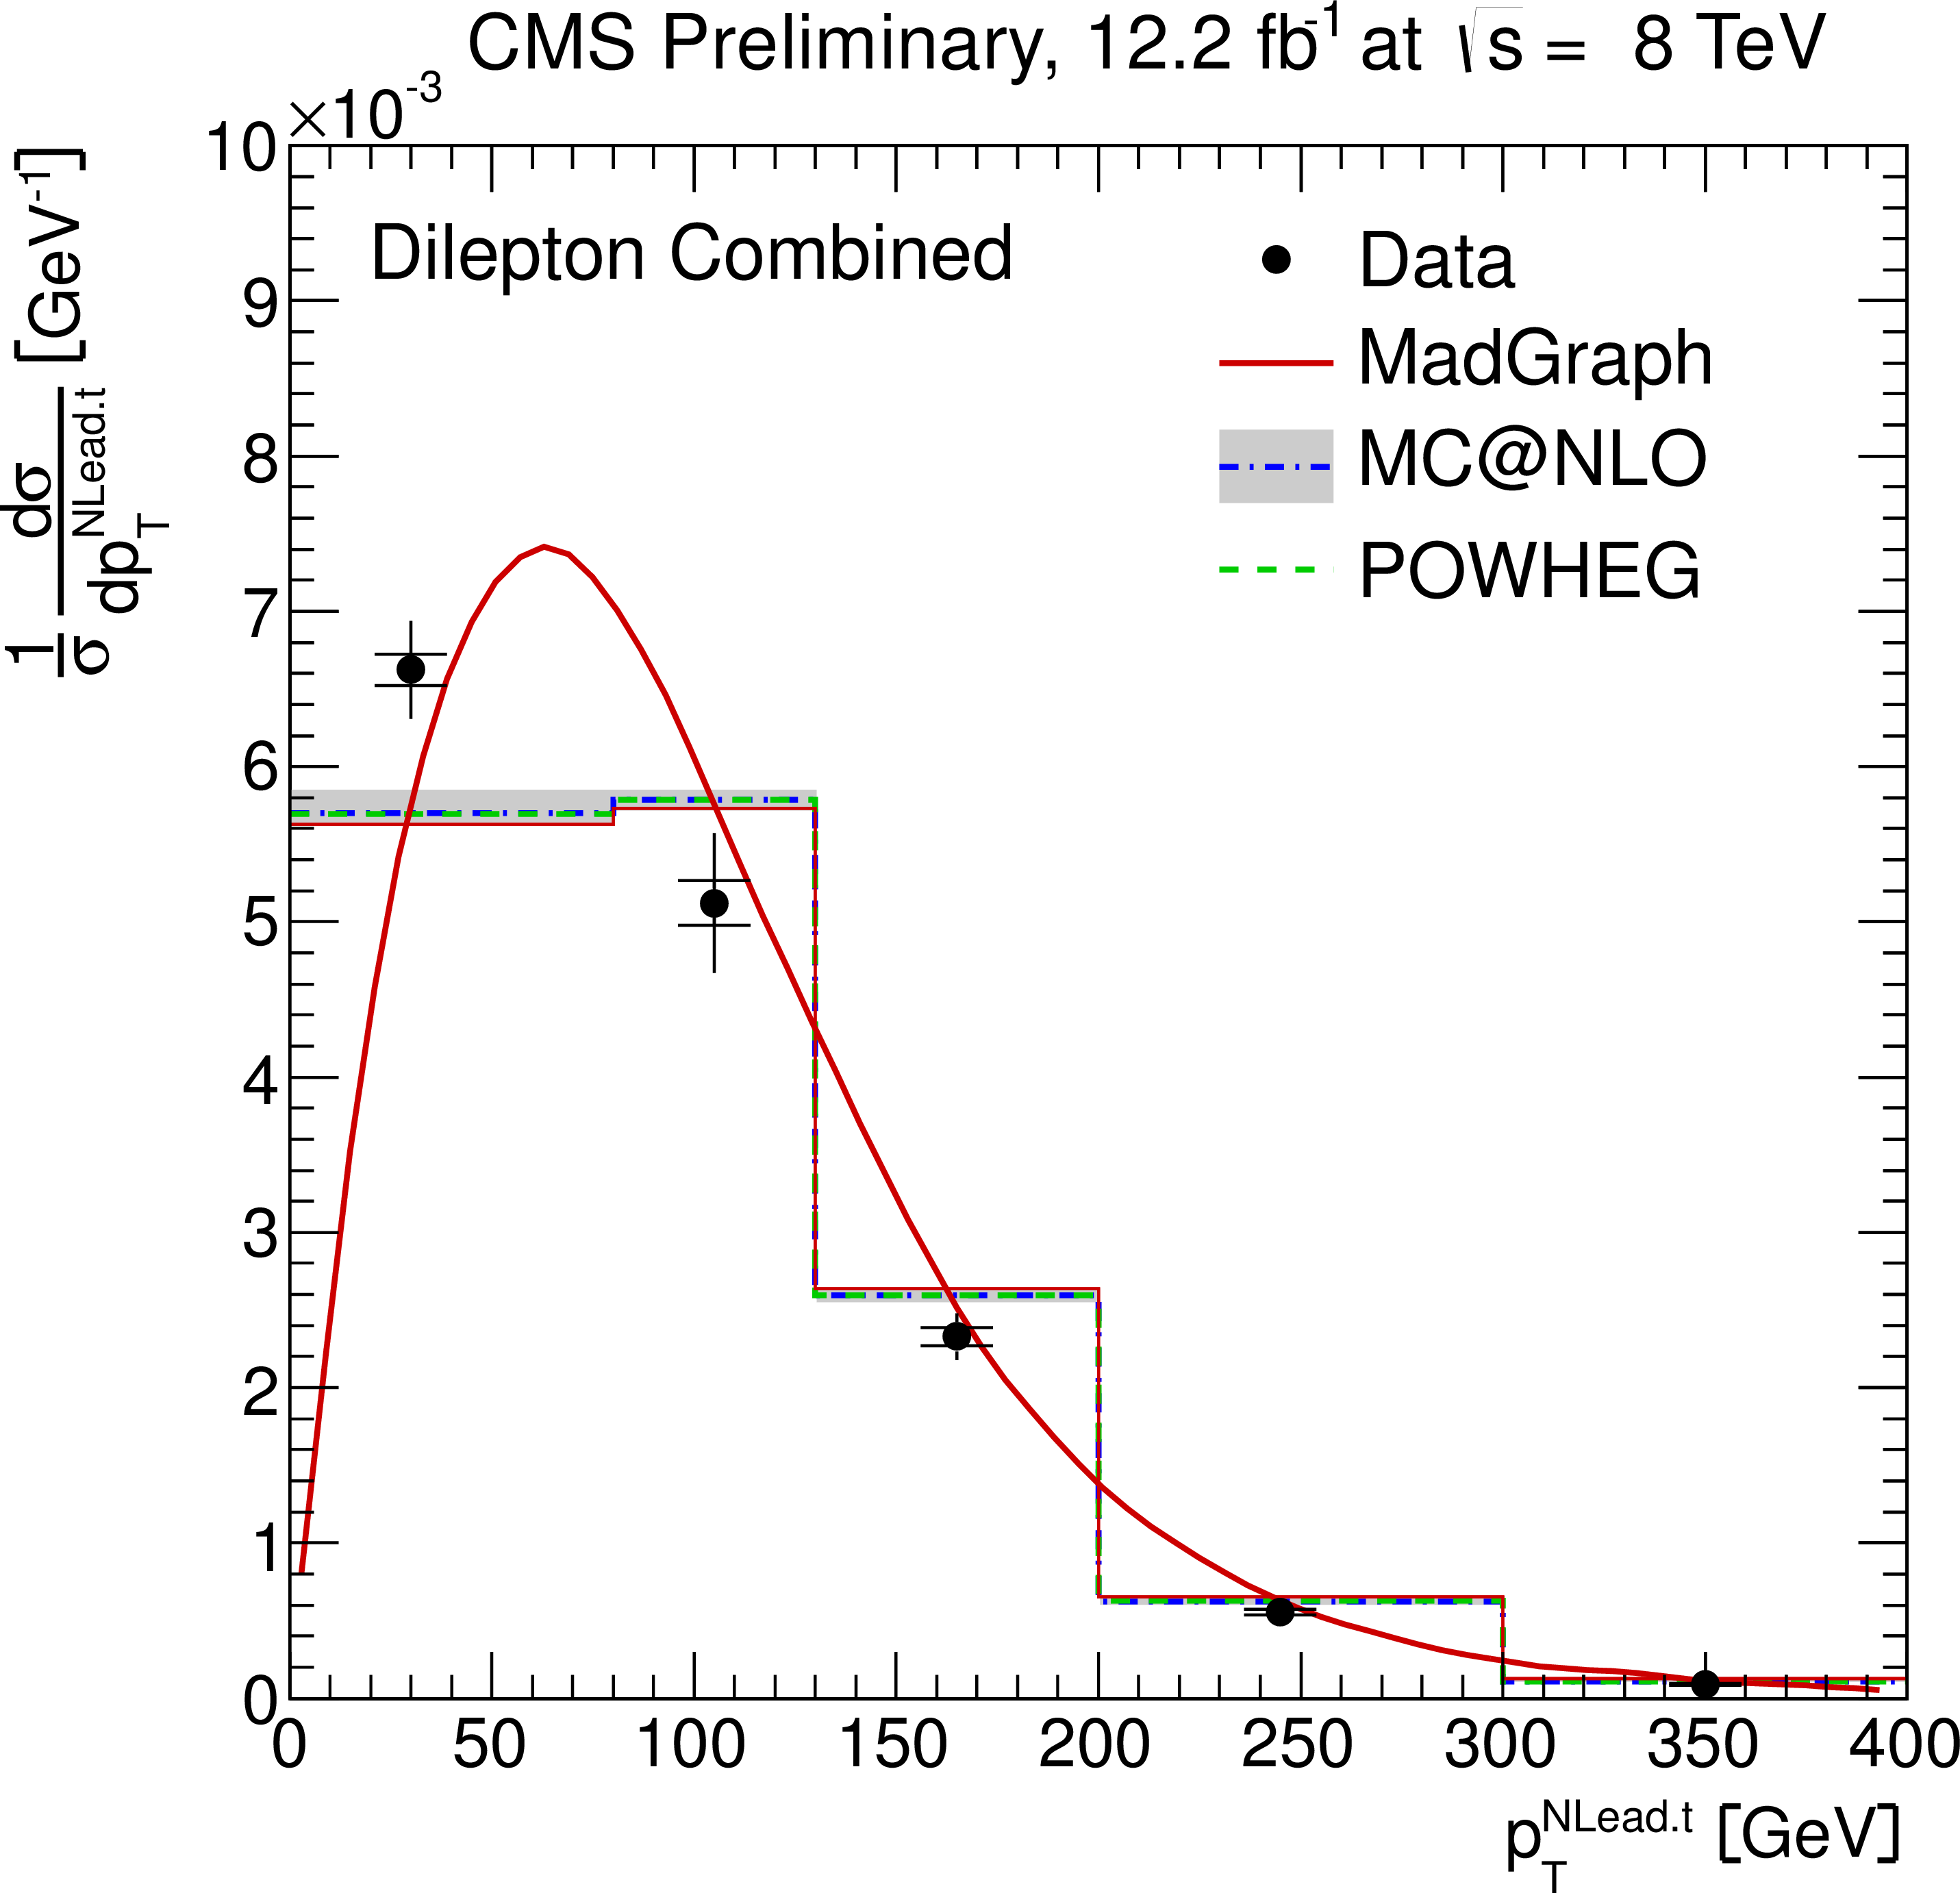
Figure 5-b:
Normalised differential ${\mathrm{ t \bar{t} } } $ production cross section as a function of the $ {p_{\mathrm {T}}} ^{\text {t}}$ (a,b) and $y^{\text {t}}$ (c,d) of the leading and next-to-leading top quarks or antiquarks. The inner (outer) error bars indicate the statistical (combined statistical and systematic) uncertainty. The measurements are compared to predictions from MadGraph +PYTHIA , POWHEG +PYTHIA , and MC@NLO+HERWIG. The MadGraph +PYTHIA prediction is shown both as a curve and as a binned histogram. |
png pdf |
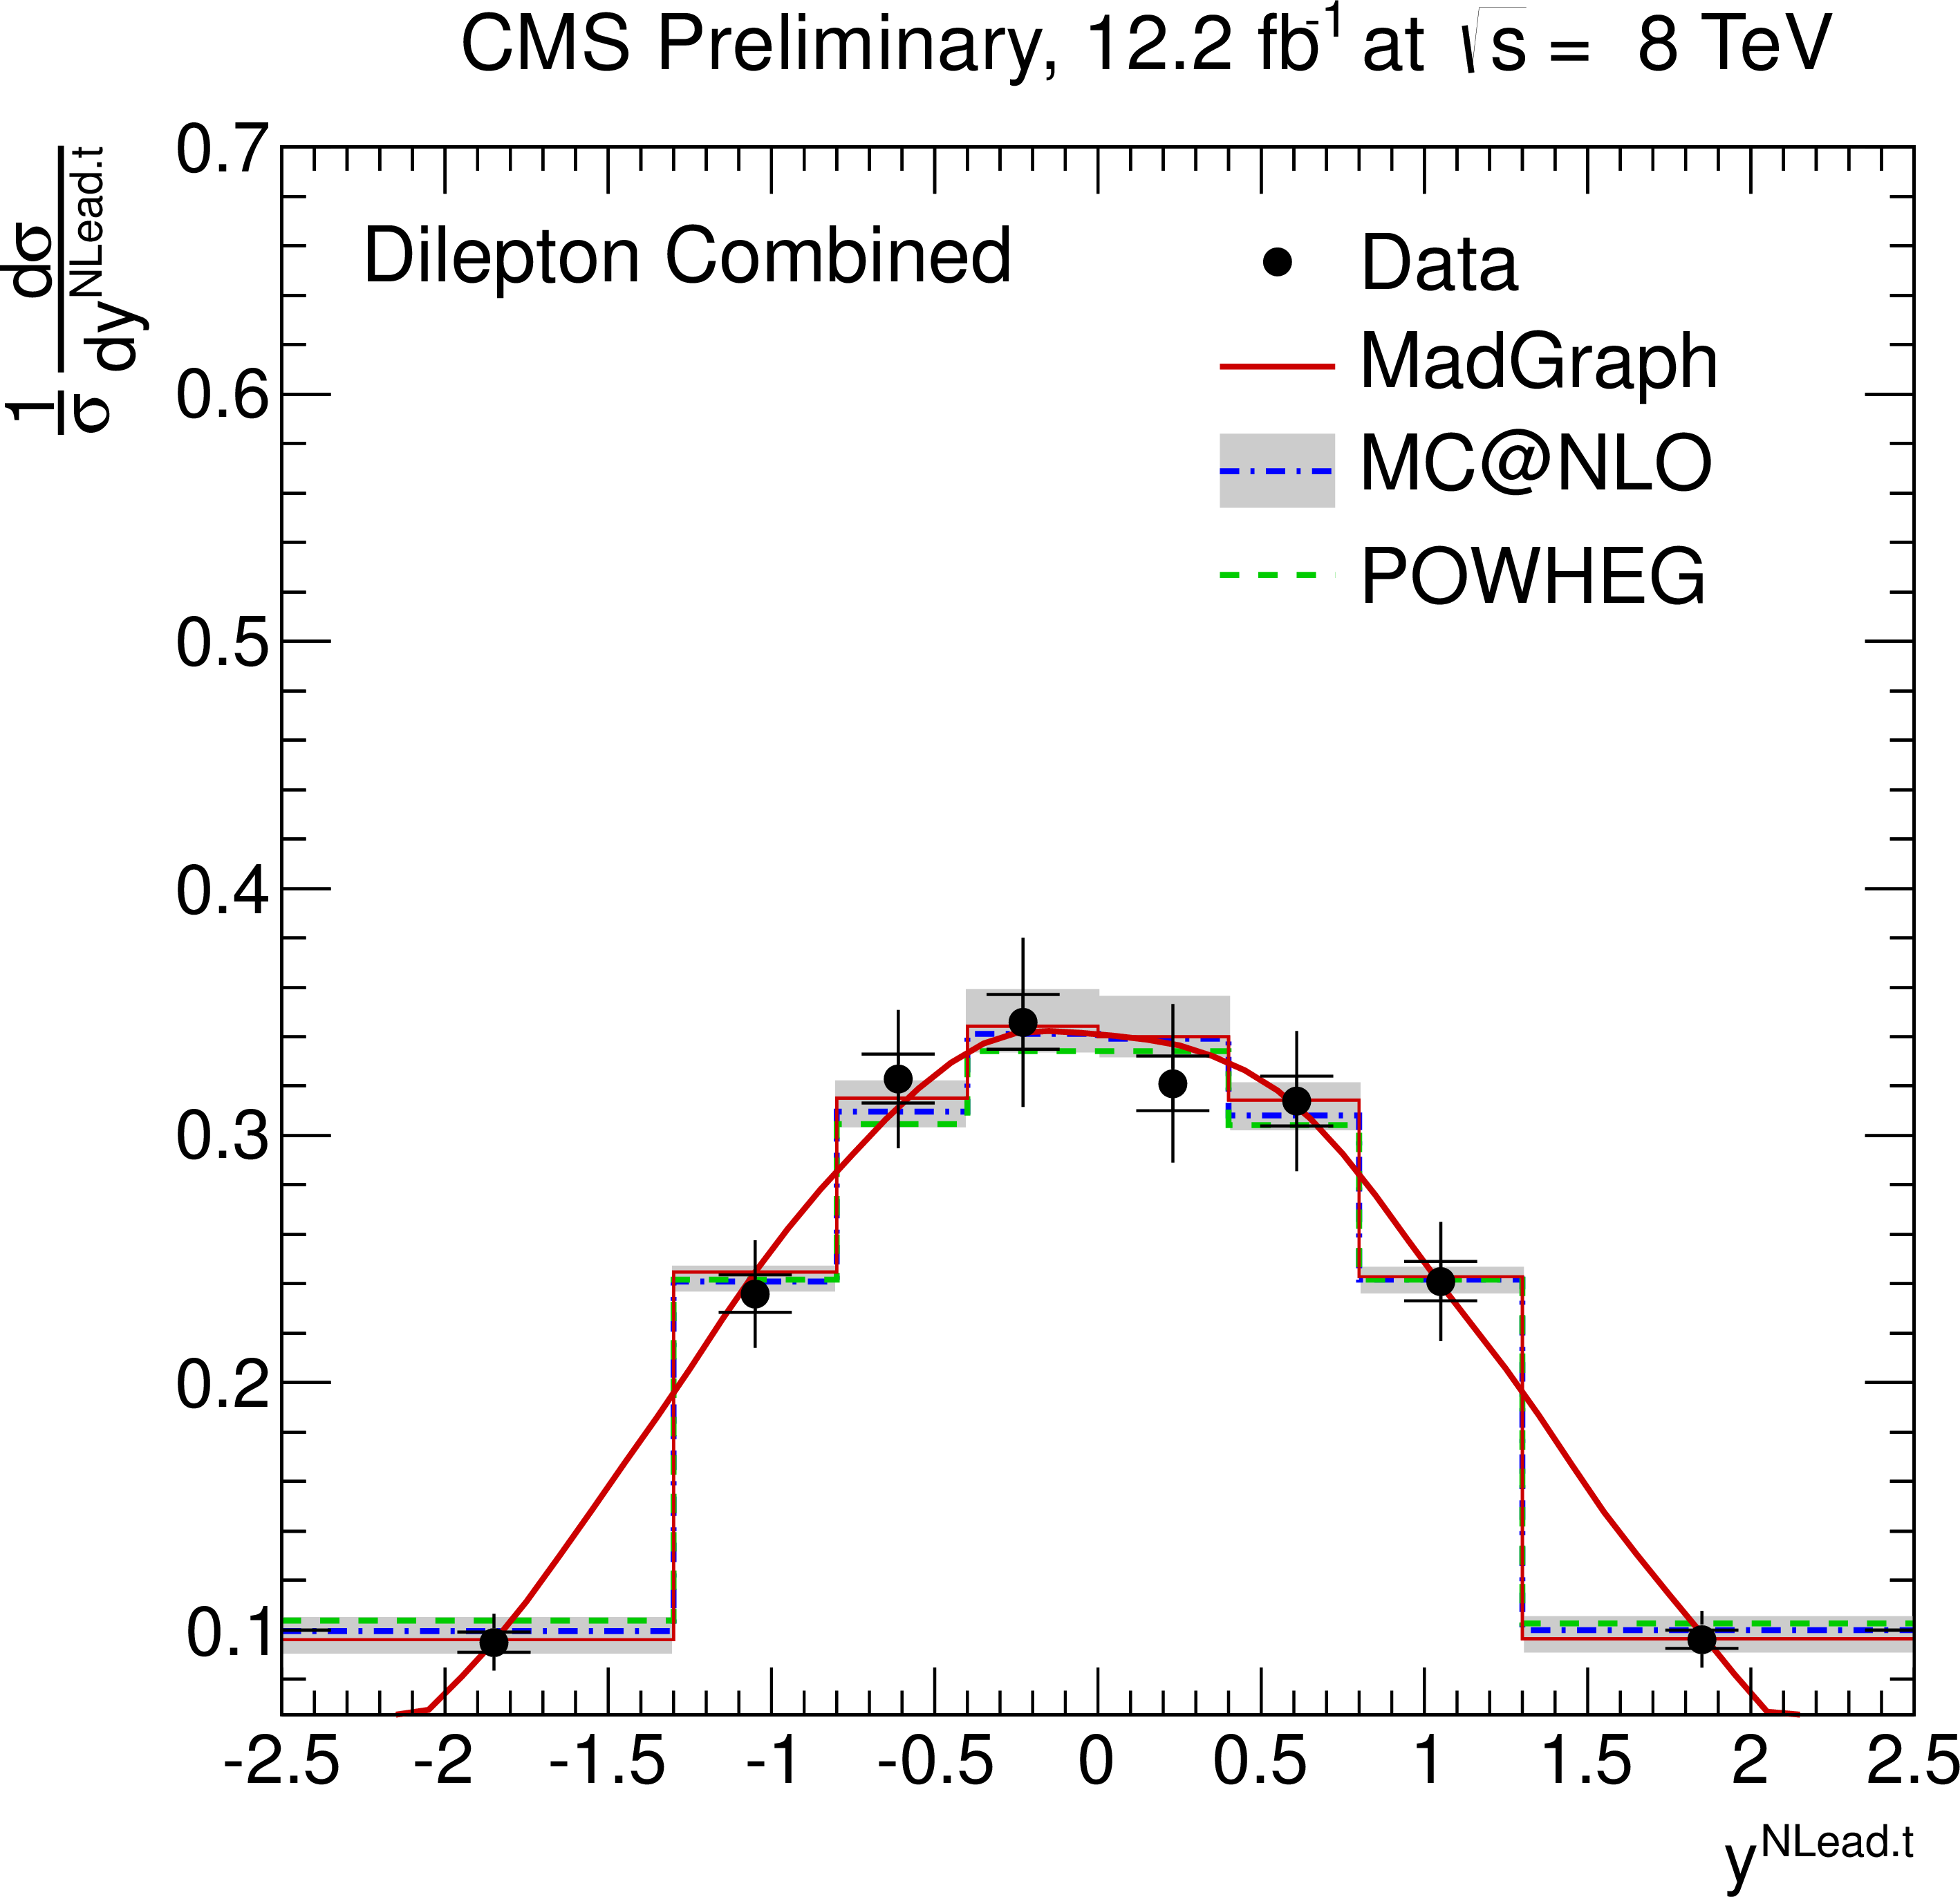
Figure 5-c:
Normalised differential ${\mathrm{ t \bar{t} } } $ production cross section as a function of the $ {p_{\mathrm {T}}} ^{\text {t}}$ (a,b) and $y^{\text {t}}$ (c,d) of the leading and next-to-leading top quarks or antiquarks. The inner (outer) error bars indicate the statistical (combined statistical and systematic) uncertainty. The measurements are compared to predictions from MadGraph +PYTHIA , POWHEG +PYTHIA , and MC@NLO+HERWIG. The MadGraph +PYTHIA prediction is shown both as a curve and as a binned histogram. |
png pdf |
Figure 5-d:
Normalised differential ${\mathrm{ t \bar{t} } } $ production cross section as a function of the $ {p_{\mathrm {T}}} ^{\text {t}}$ (a,b) and $y^{\text {t}}$ (c,d) of the leading and next-to-leading top quarks or antiquarks. The inner (outer) error bars indicate the statistical (combined statistical and systematic) uncertainty. The measurements are compared to predictions from MadGraph +PYTHIA , POWHEG +PYTHIA , and MC@NLO+HERWIG. The MadGraph +PYTHIA prediction is shown both as a curve and as a binned histogram. |
png pdf |
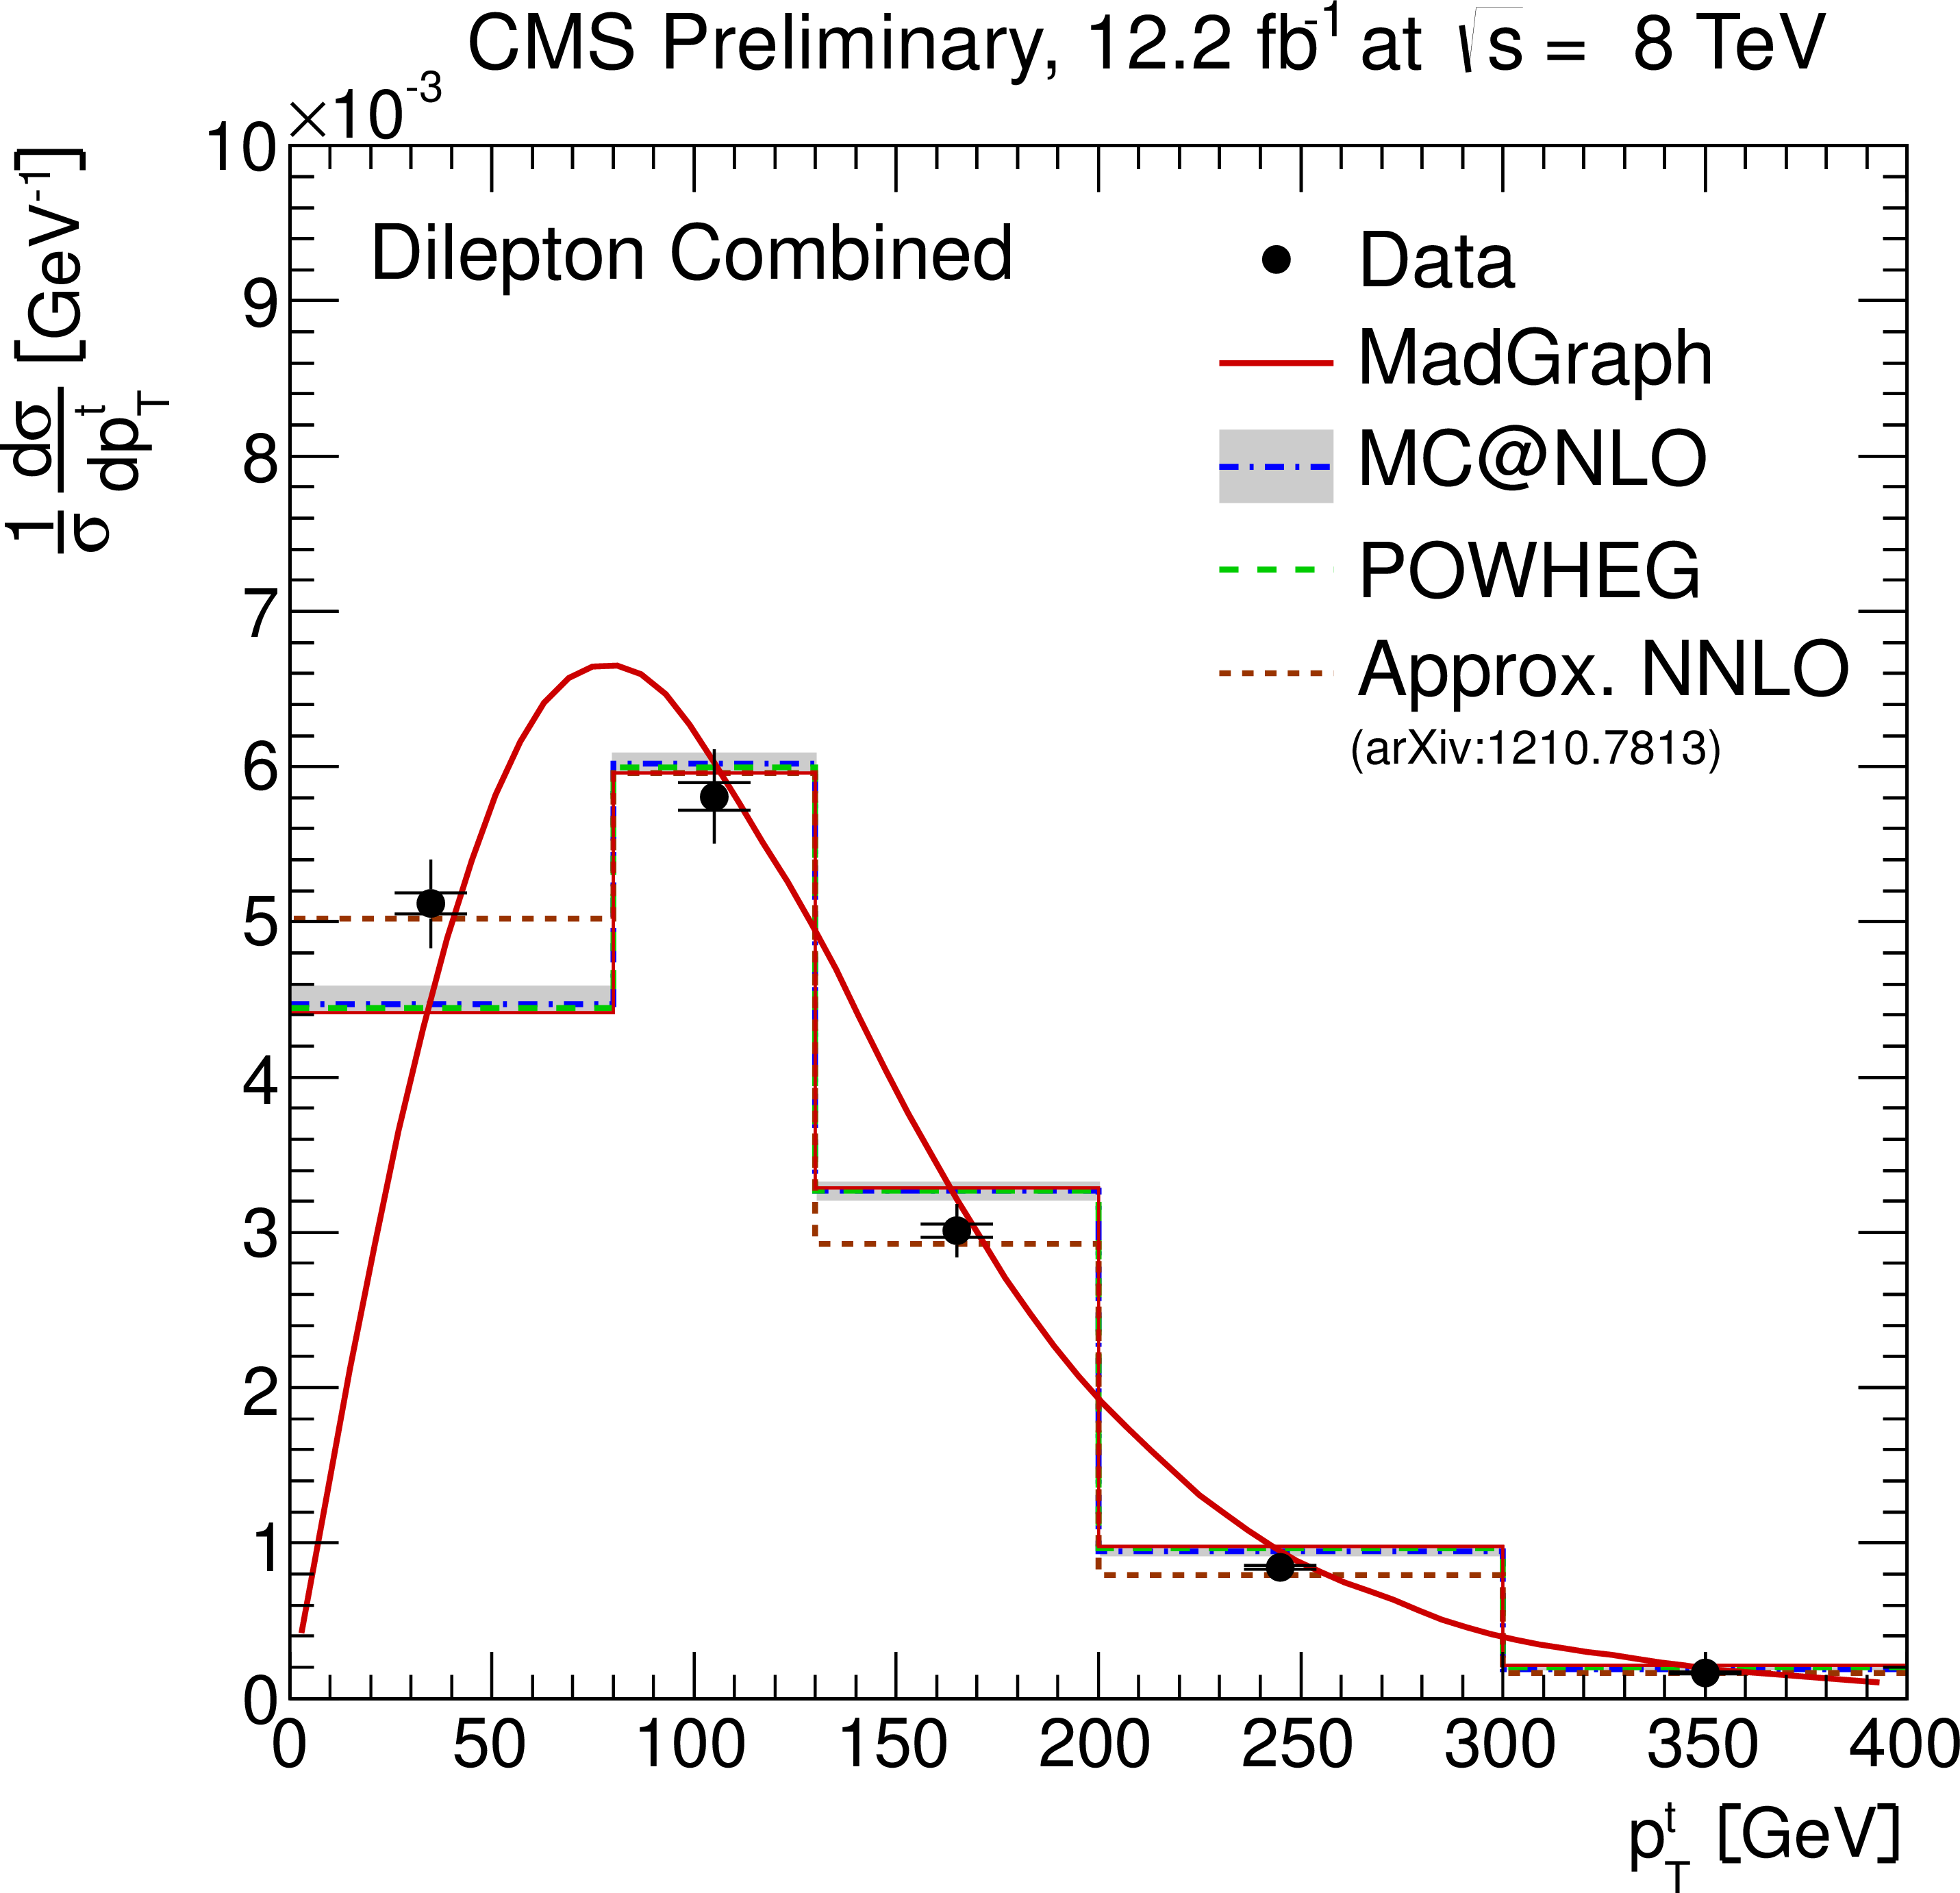
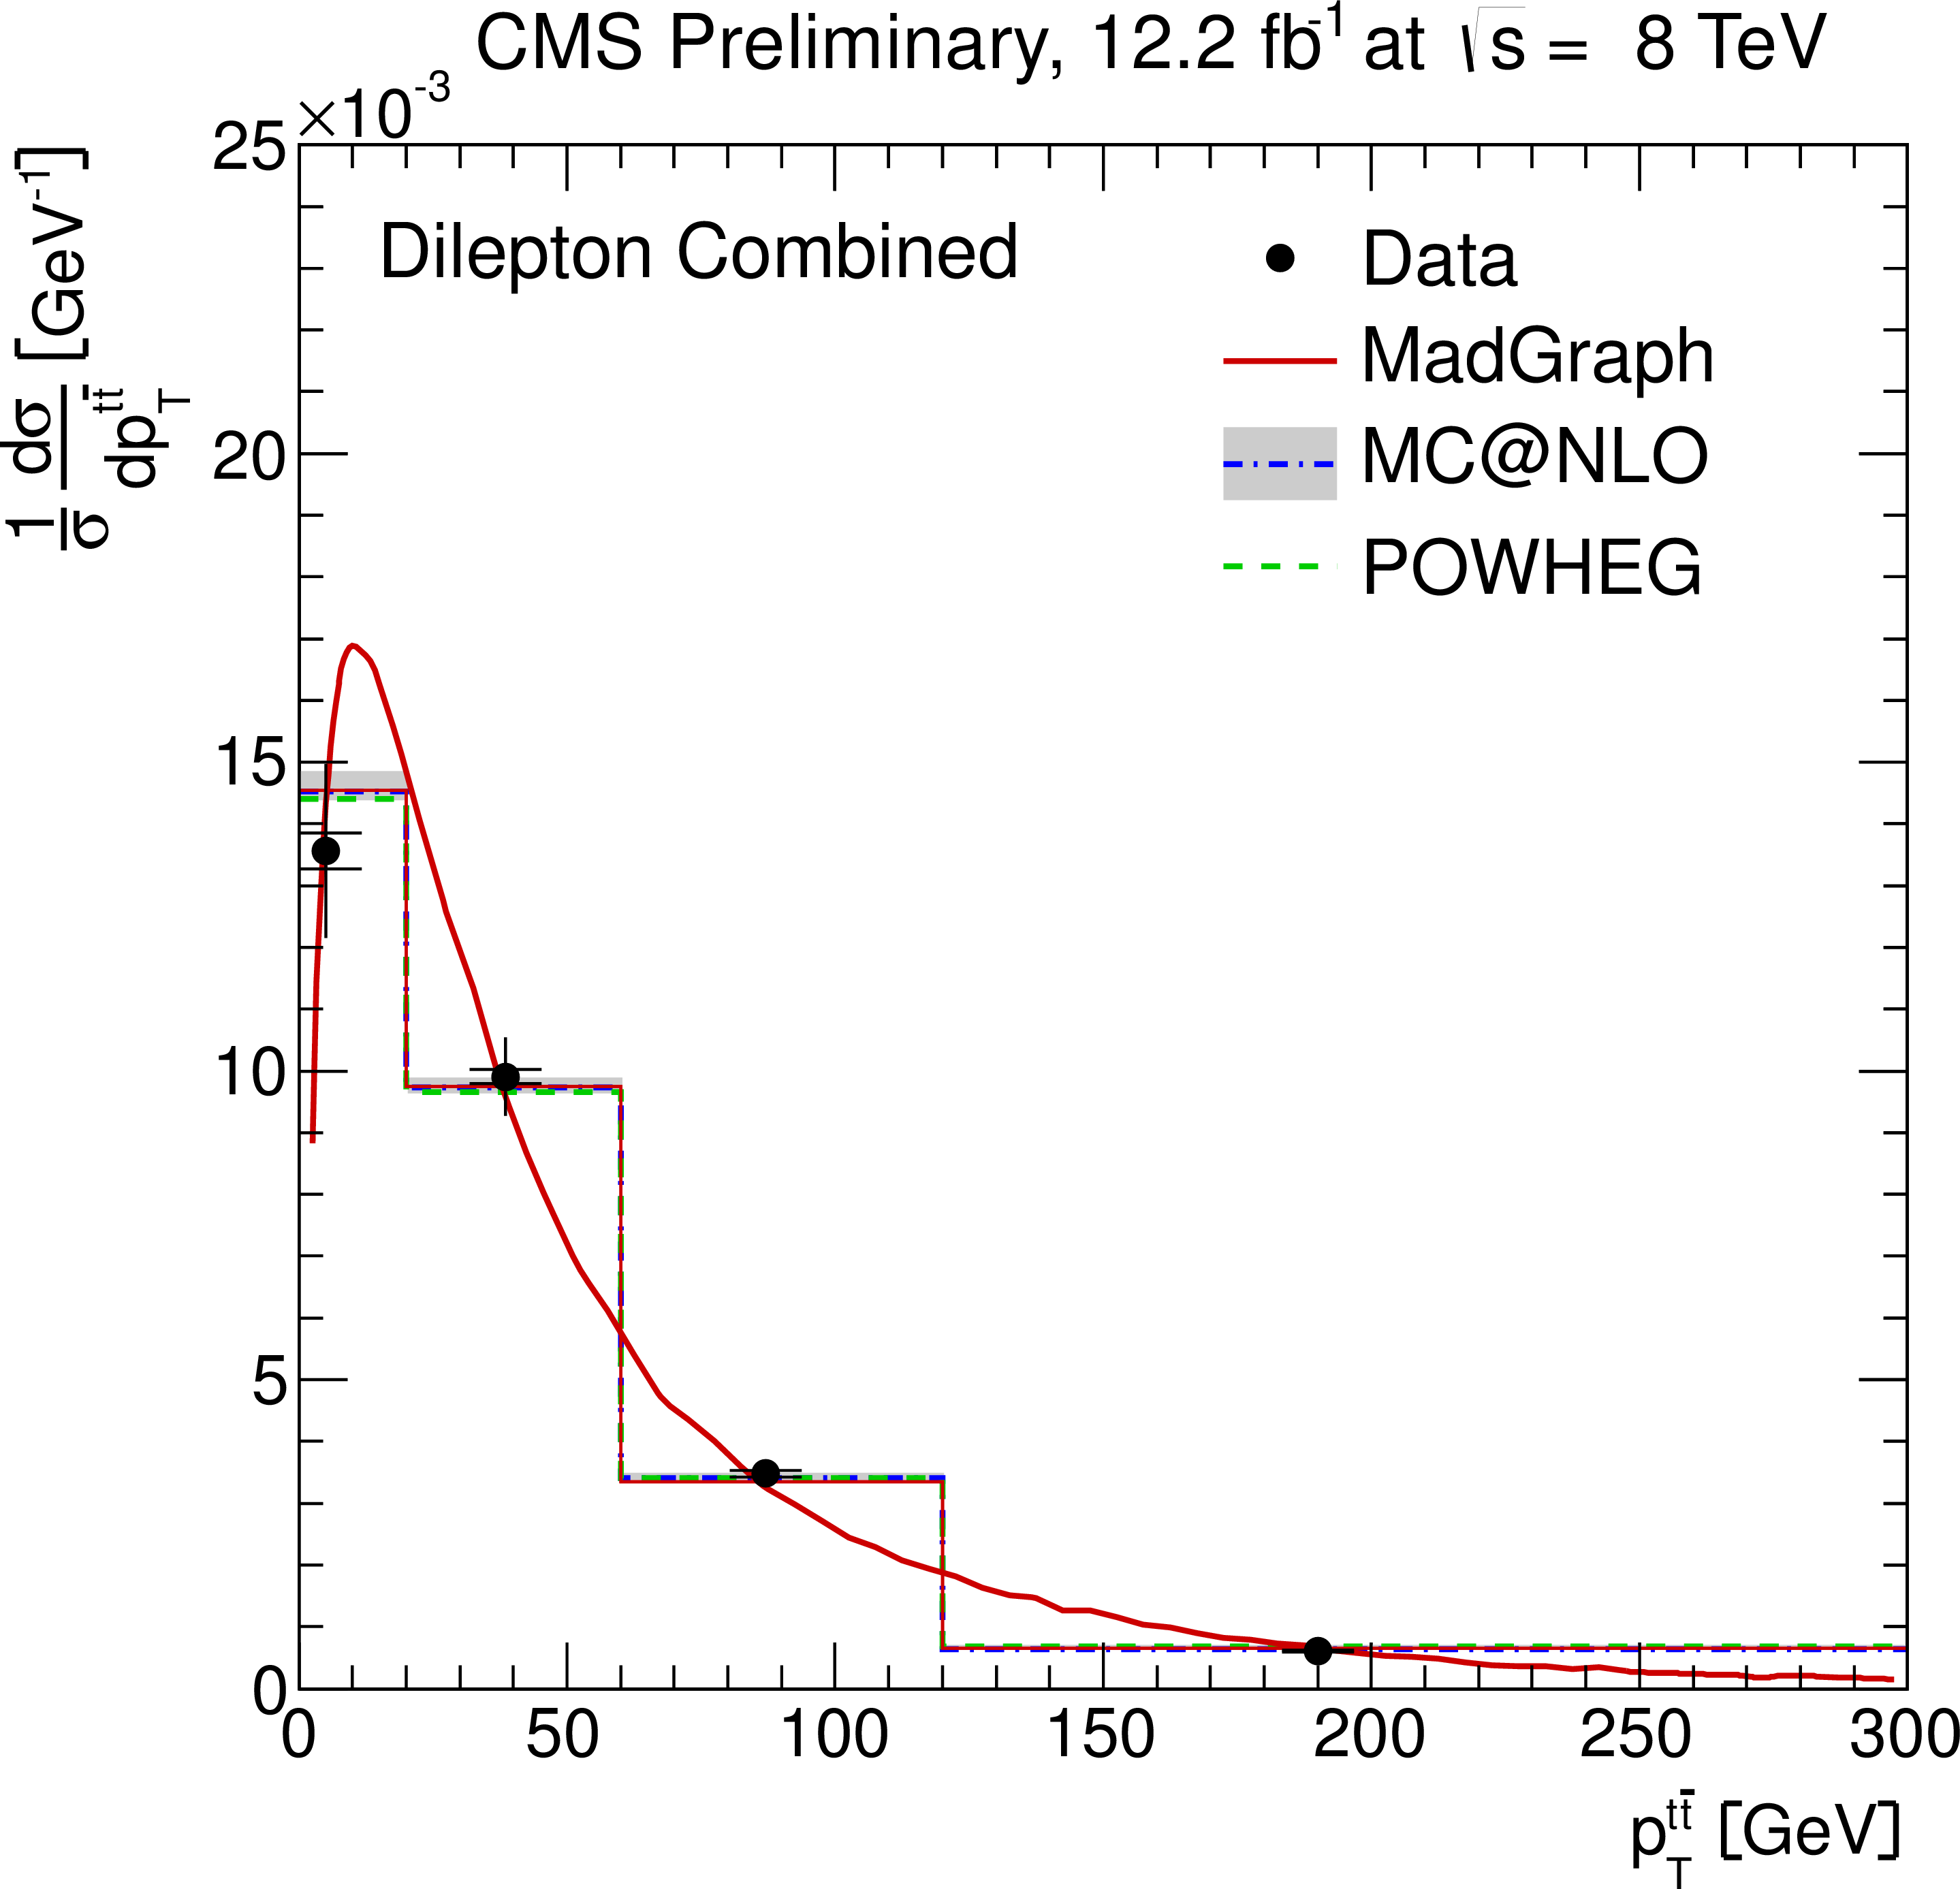
Figure 6-a:
Normalised differential ${\mathrm{ t \bar{t} } } $ production cross section as a function of the $ {p_{\mathrm {T}}} ^{\text {t}}$ (a) and $y^{\text {t}}$ (b) of the top quarks or antiquarks, the $ {p_{\mathrm {T}}} ^{ {\mathrm{ t \bar{t} } } }$ (c), $m^{ {\mathrm{ t \bar{t} } } }$ (d), and $y^{ {\mathrm{ t \bar{t} } } }$ (e) of the top-quark pairs. The inner (outer) error bars indicate the statistical (combined statistical and systematic) uncertainty. The measurements are compared to predictions from MadGraph +PYTHIA , POWHEG +PYTHIA , MC@NLO+HERWIG, and to an approximate NNLO calculation [8], when available. The MadGraph +PYTHIA prediction is shown both as a curve and as a binned histogram. |
png pdf |
Figure 6-b:
Normalised differential ${\mathrm{ t \bar{t} } } $ production cross section as a function of the $ {p_{\mathrm {T}}} ^{\text {t}}$ (a) and $y^{\text {t}}$ (b) of the top quarks or antiquarks, the $ {p_{\mathrm {T}}} ^{ {\mathrm{ t \bar{t} } } }$ (c), $m^{ {\mathrm{ t \bar{t} } } }$ (d), and $y^{ {\mathrm{ t \bar{t} } } }$ (e) of the top-quark pairs. The inner (outer) error bars indicate the statistical (combined statistical and systematic) uncertainty. The measurements are compared to predictions from MadGraph +PYTHIA , POWHEG +PYTHIA , MC@NLO+HERWIG, and to an approximate NNLO calculation [8], when available. The MadGraph +PYTHIA prediction is shown both as a curve and as a binned histogram. |
png pdf |
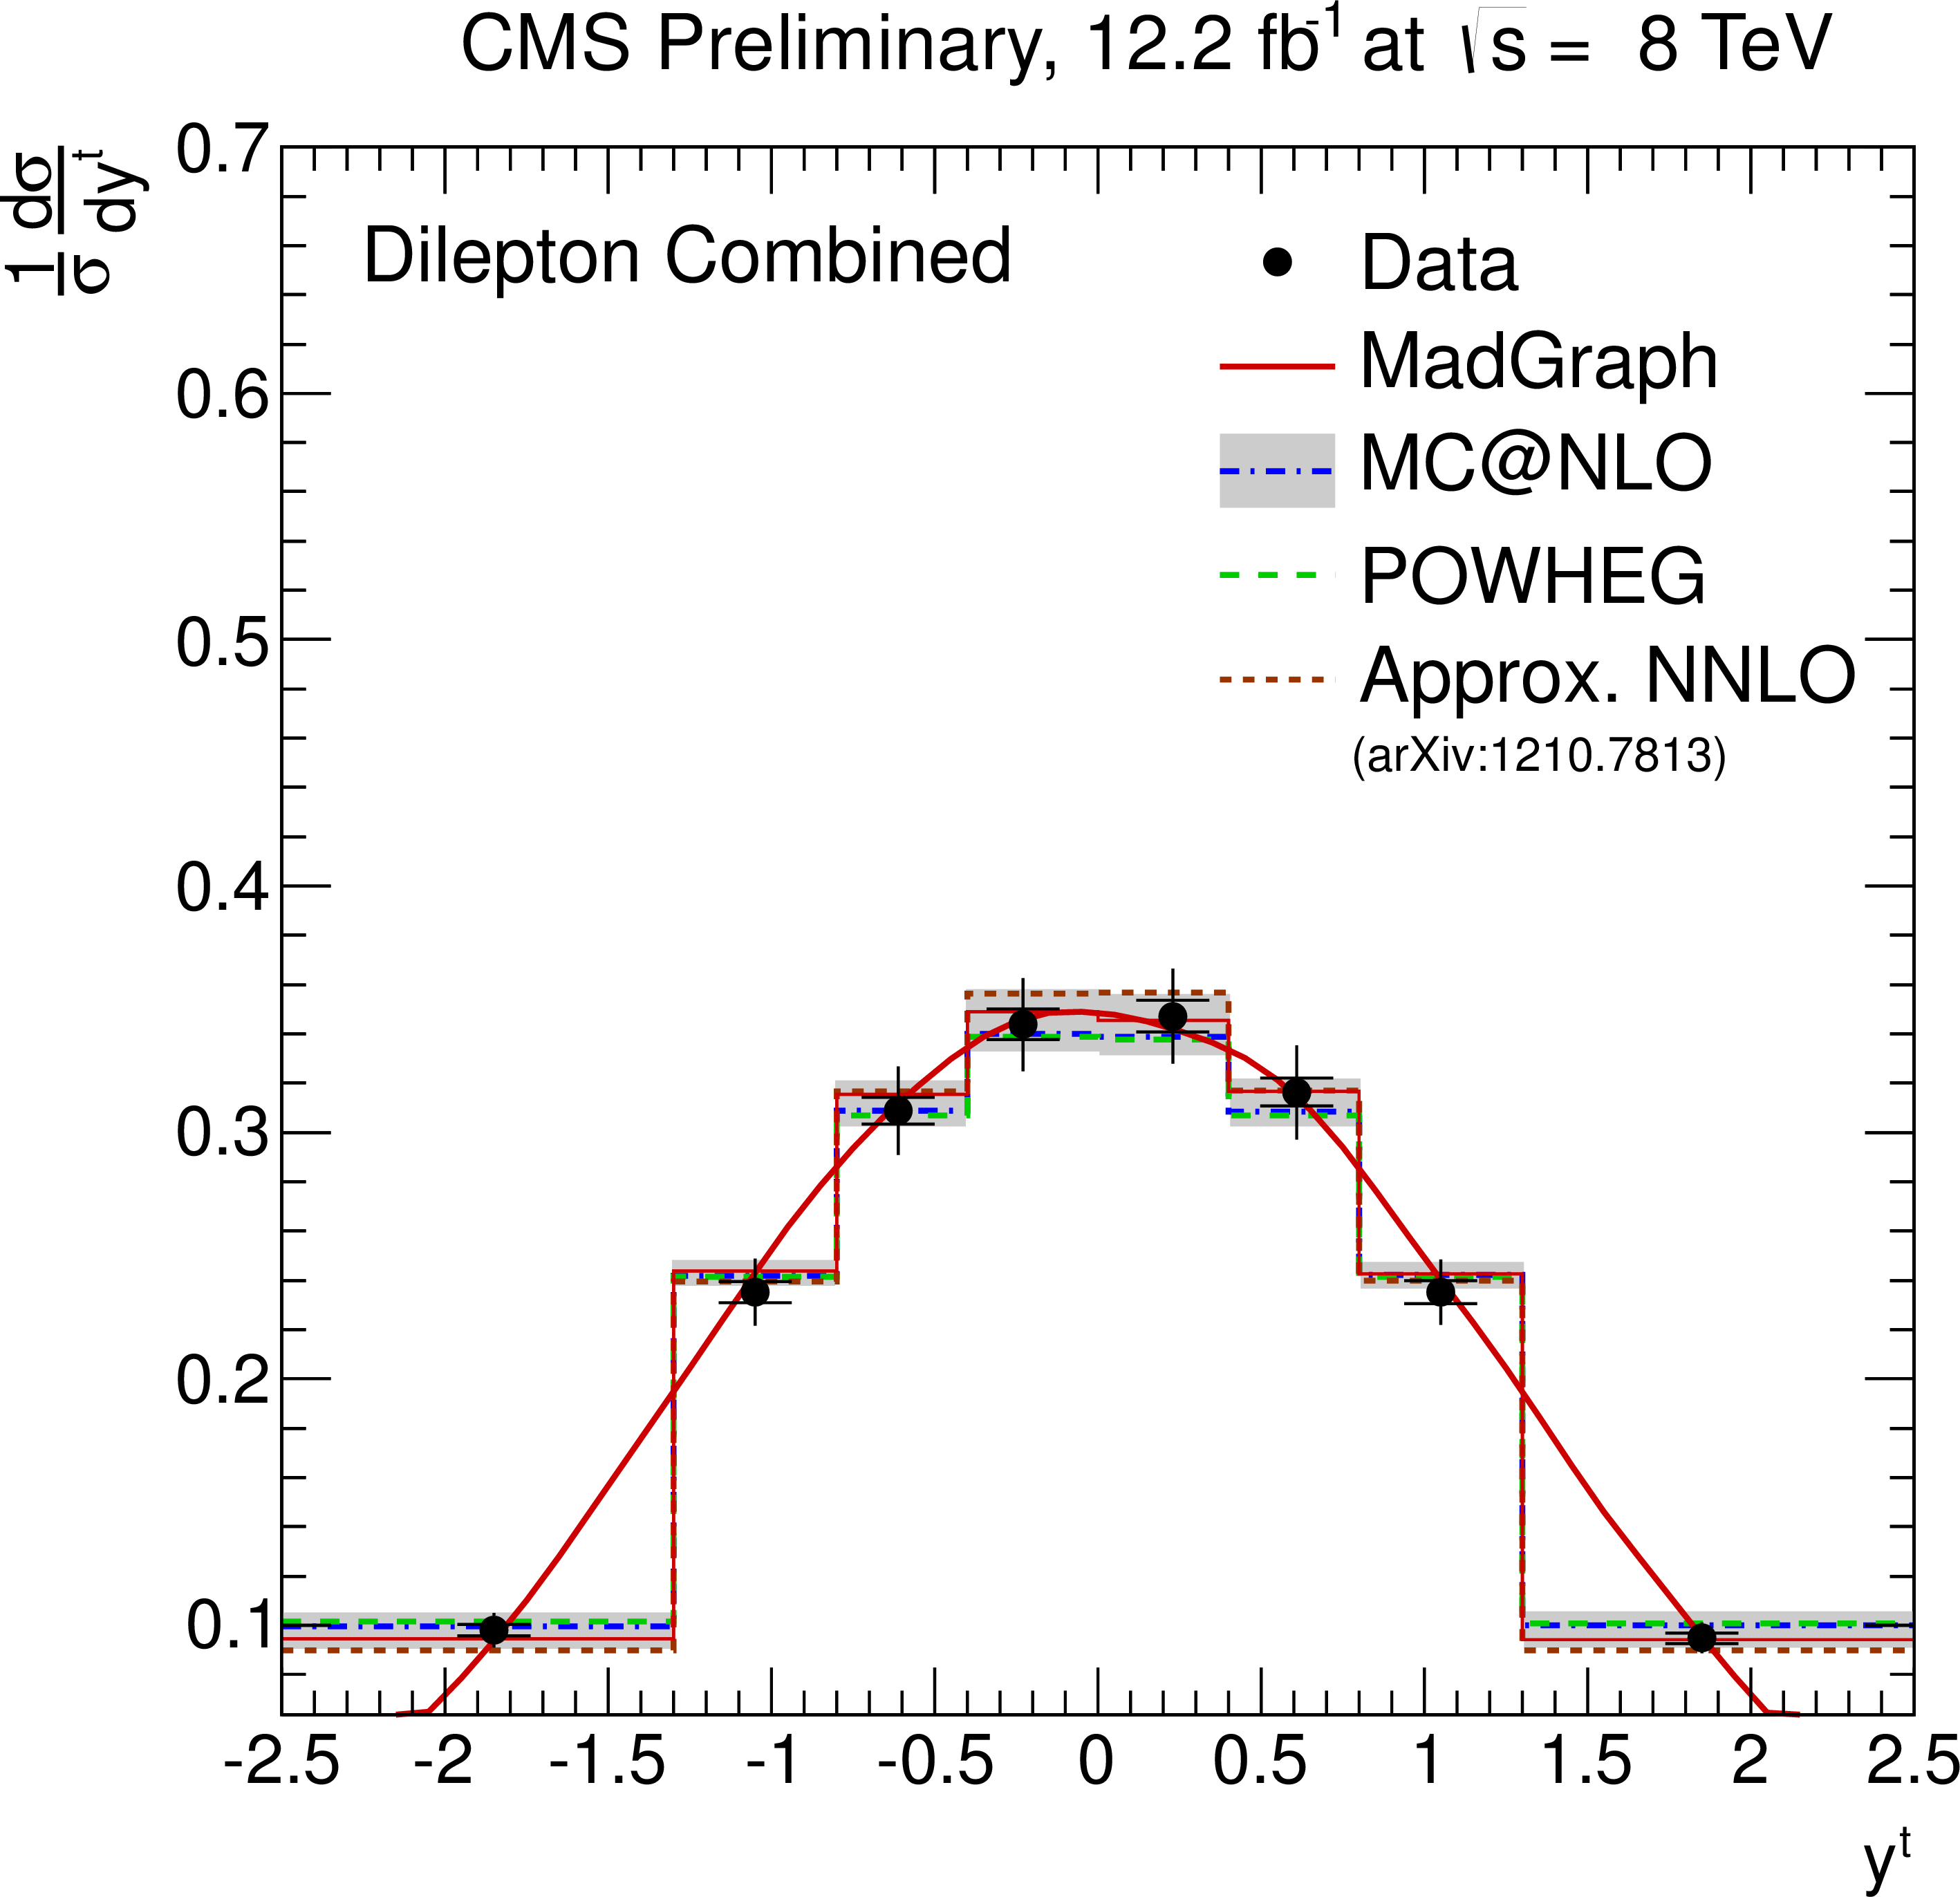
Figure 6-c:
Normalised differential ${\mathrm{ t \bar{t} } } $ production cross section as a function of the $ {p_{\mathrm {T}}} ^{\text {t}}$ (a) and $y^{\text {t}}$ (b) of the top quarks or antiquarks, the $ {p_{\mathrm {T}}} ^{ {\mathrm{ t \bar{t} } } }$ (c), $m^{ {\mathrm{ t \bar{t} } } }$ (d), and $y^{ {\mathrm{ t \bar{t} } } }$ (e) of the top-quark pairs. The inner (outer) error bars indicate the statistical (combined statistical and systematic) uncertainty. The measurements are compared to predictions from MadGraph +PYTHIA , POWHEG +PYTHIA , MC@NLO+HERWIG, and to an approximate NNLO calculation [8], when available. The MadGraph +PYTHIA prediction is shown both as a curve and as a binned histogram. |
png pdf |
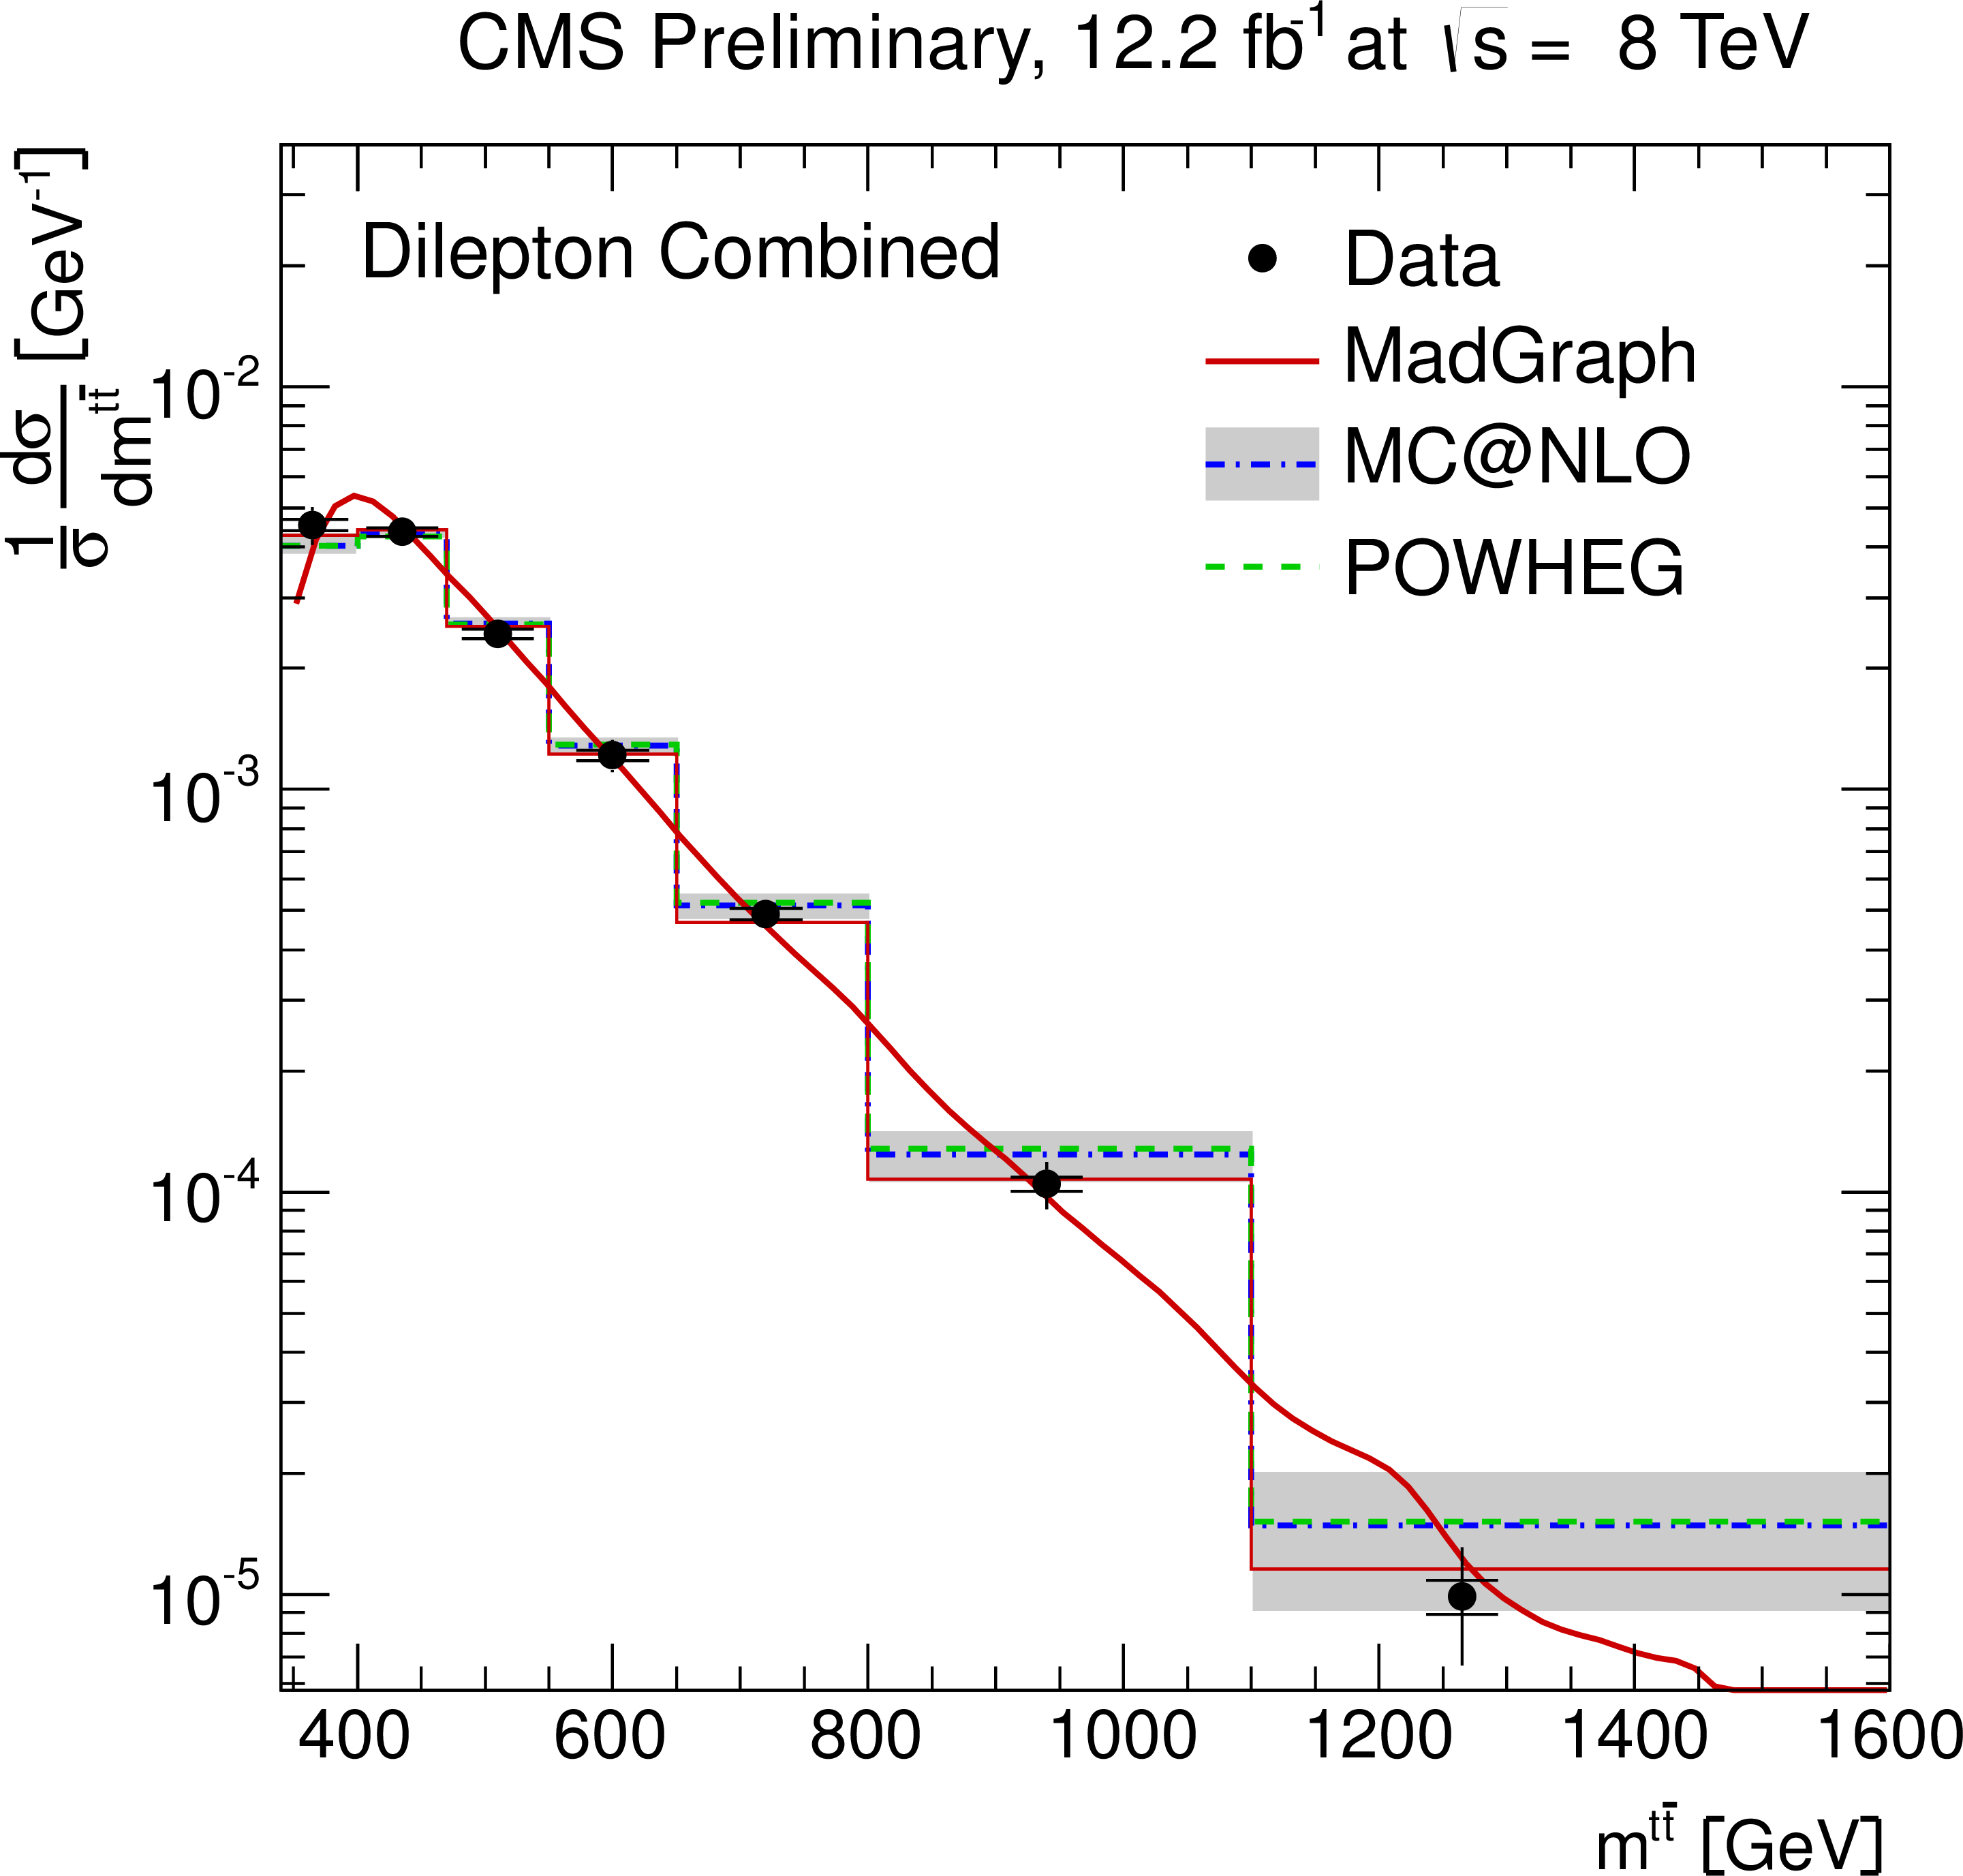
Figure 6-d:
Normalised differential ${\mathrm{ t \bar{t} } } $ production cross section as a function of the $ {p_{\mathrm {T}}} ^{\text {t}}$ (a) and $y^{\text {t}}$ (b) of the top quarks or antiquarks, the $ {p_{\mathrm {T}}} ^{ {\mathrm{ t \bar{t} } } }$ (c), $m^{ {\mathrm{ t \bar{t} } } }$ (d), and $y^{ {\mathrm{ t \bar{t} } } }$ (e) of the top-quark pairs. The inner (outer) error bars indicate the statistical (combined statistical and systematic) uncertainty. The measurements are compared to predictions from MadGraph +PYTHIA , POWHEG +PYTHIA , MC@NLO+HERWIG, and to an approximate NNLO calculation [8], when available. The MadGraph +PYTHIA prediction is shown both as a curve and as a binned histogram. |
png pdf |
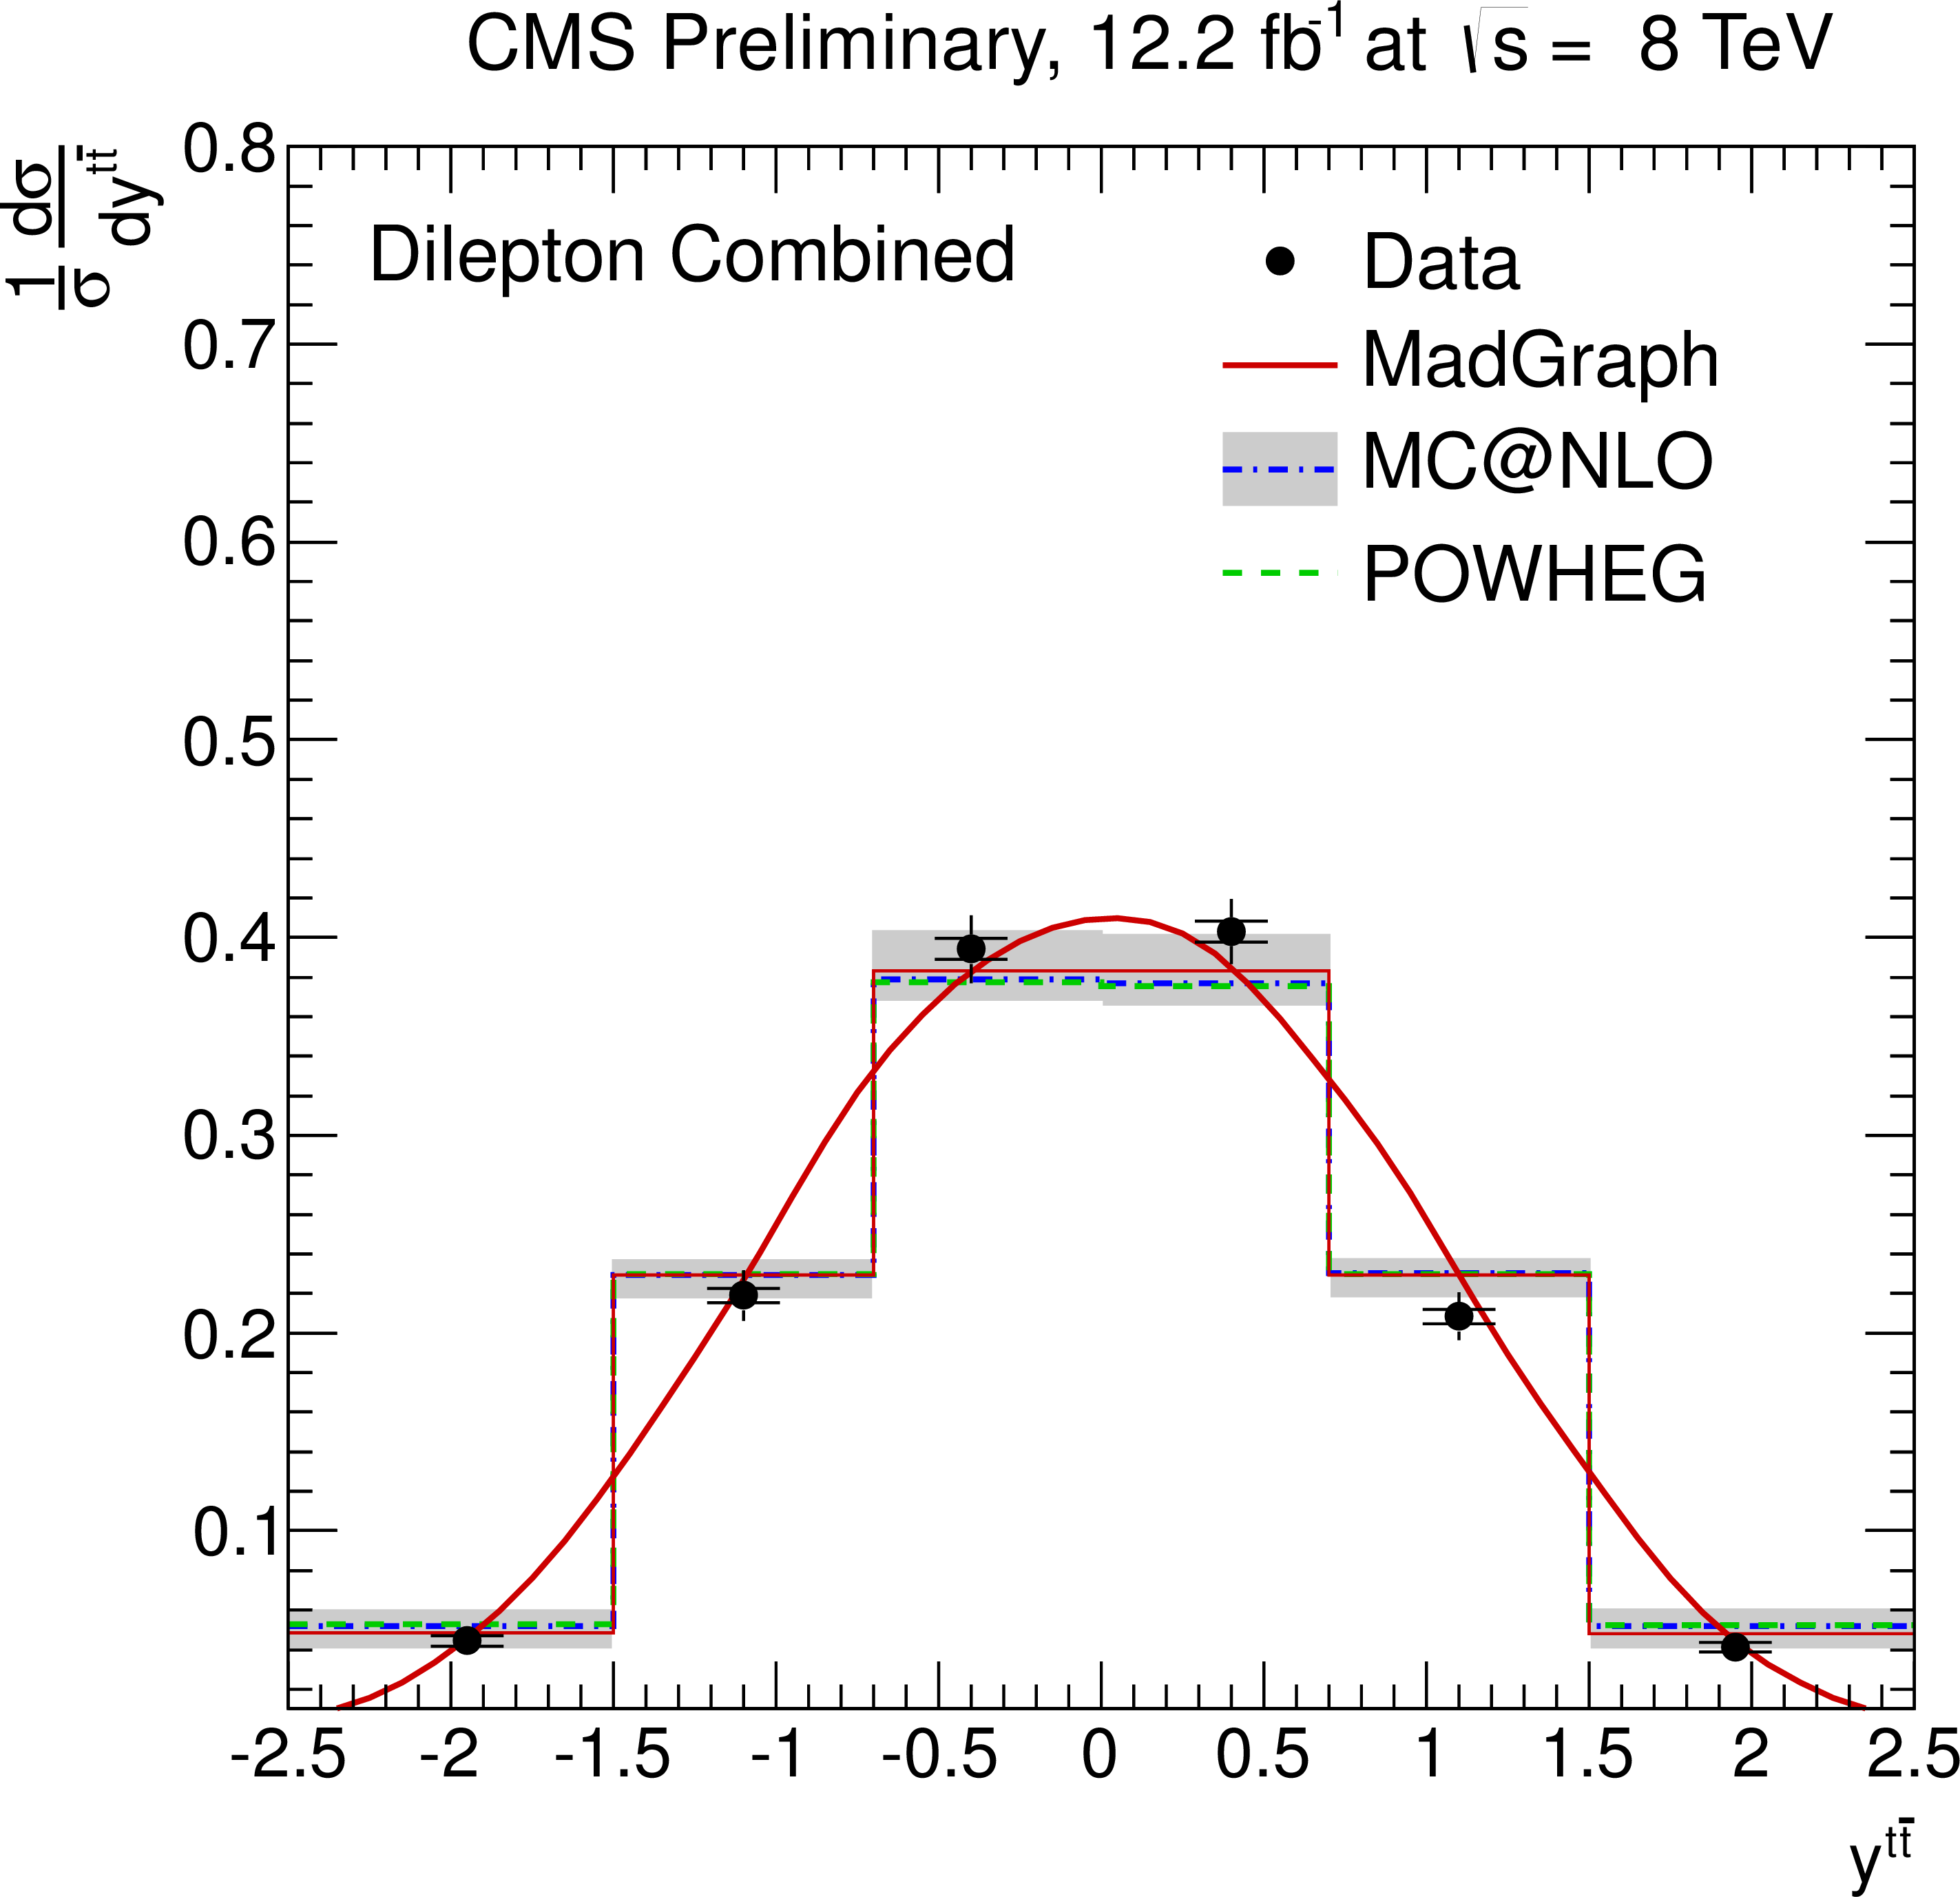
Figure 6-e:
Normalised differential ${\mathrm{ t \bar{t} } } $ production cross section as a function of the $ {p_{\mathrm {T}}} ^{\text {t}}$ (a) and $y^{\text {t}}$ (b) of the top quarks or antiquarks, the $ {p_{\mathrm {T}}} ^{ {\mathrm{ t \bar{t} } } }$ (c), $m^{ {\mathrm{ t \bar{t} } } }$ (d), and $y^{ {\mathrm{ t \bar{t} } } }$ (e) of the top-quark pairs. The inner (outer) error bars indicate the statistical (combined statistical and systematic) uncertainty. The measurements are compared to predictions from MadGraph +PYTHIA , POWHEG +PYTHIA , MC@NLO+HERWIG, and to an approximate NNLO calculation [8], when available. The MadGraph +PYTHIA prediction is shown both as a curve and as a binned histogram. |
| Summary |
|
A measurement of normalised differential top-quark pair production cross sections in pp collisions at $ \sqrt{s} = $ 8 TeV with the CMS detector is presented. The measurement is performed in the dilepton ($\mathrm{e^+e^-}$ , $\mu^+\mu^-$ , and $\mu^{\pm}\mathrm{e^{\mp}}$ ) $\mathrm{ t \bar{t} }$ decay channels. The normalised $\mathrm{ t \bar{t} } $ cross section is measured as a function of the transverse momentum, (pseudo)rapidity, and invariant mass of the final-state leading and next-to-leading leptons and b jets in the visible phase space, and of the top quarks (including the leading and next-to-leading top quarks) and $\mathrm{ t \bar{t} }$ system in the full phase space. The measurements are in agreement with each other and with standard model predictions. The prediction at approximate NNLO precision is found to give a particularly good description of the top-quark transverse momentum. |
| References | ||||
| 1 | ATLAS Collaboration Collaboration | Measurements of top quark pair relative differential cross-sections with ATLAS in pp collisions at $ \sqrt{s} $ = 7 TeV | EPJC 73 (2013) 2261 | hep-ex/1207.5644 |
| 2 | CMS Collaboration | Measurement of differential top-quark pair production cross sections in pp collisions at $ \texorpdfstring $$ \sqrt{s} = $ 7 TeVsqrt(s) = 7 TeV | To appear in EPJC | hep-ex/1211.2220 |
| 3 | J. Alwall et al. | MadGraph v5: going beyond | JHEP 06 (2011) 128 | 1106.0522 |
| 4 | S. Frixione and B. R. Webber | Matching NLO QCD computations and parton shower simulations | JHEP 06 (2002) 29 | hep-ph/0204244 |
| 5 | S. Alioli et al. | NLO single-top production matched with shower in POWHEG: $ s $- and $ t $-channel contributions | JHEP 09 (2009) 111 | 0907.4076 |
| 6 | S. Alioli et al. | A general framework for implementing NLO calculations in shower Monte Carlo programs: the POWHEG BOX | JHEP 06 (2010) 043 | 1002.2581 |
| 7 | E. Re | Single-top Wt-channel production matched with parton showers using the POWHEG method | EPJC 71 (2011) 1547 | 1009.2450 |
| 8 | N. Kidonakis | NNLL threshold resummation for top-pair and single-top production | hep-ph/1210.7813 | |
| 9 | J. Pumplin et al. | New generation of parton distributions with uncertainties from global QCD analysis | JHEP 07 (2002) 012 | hep-ph/0201195 |
| 10 | T. Sj\"ostrand, S. Mrenna, and P. Skands | PYTHIA 6.4 physics and manual | JHEP 05 (2006) 026 | hep-ph/0603175 |
| 11 | M. L. Mangano et al. | Matching matrix elements and shower evolution for top-quark production in hadronic collisions | JHEP 01 (2007) 013 | hep-ex/0611129 |
| 12 | S. Agostinelli et al. | $ \GEANTfour $ -- a simulation toolkit | NIMA 506 (2003) 250 | |
| 13 | A. D. Martin et al. | Parton distributions for the LHC | EPJc 63 (2009) 189 | 0901.0002 |
| 14 | G. Corcella et al. | HERWIG 6.5: An event generator for hadron emission reactions with interfering gluons (including supersymmetric processes) | JHEP 01 (2001) 010 | hep-ph/0011363 |
| 15 | R. Field | Min-bias and the underlying event at the LHC | Acta Physica Polonica B 42 (2011) 2631 | |
|
|
Compact Muon Solenoid LHC, CERN |
|

|

|

|

|

|