

Compact Muon Solenoid
LHC, CERN
| CMS-PAS-SUS-16-011 | ||
| Search for new physics in the one soft lepton final state using 2015 data at $\sqrt{s}=$ 13 TeV | ||
| CMS Collaboration | ||
| June 2016 | ||
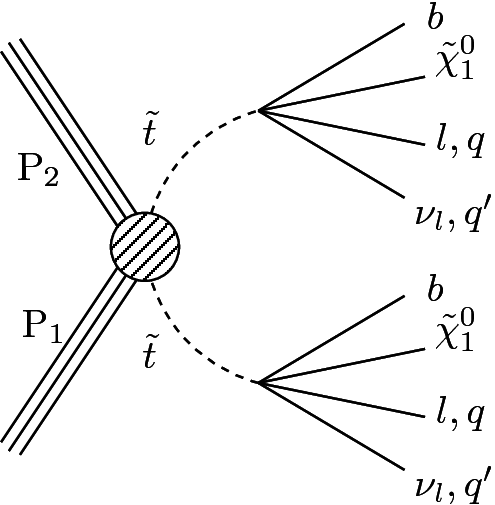
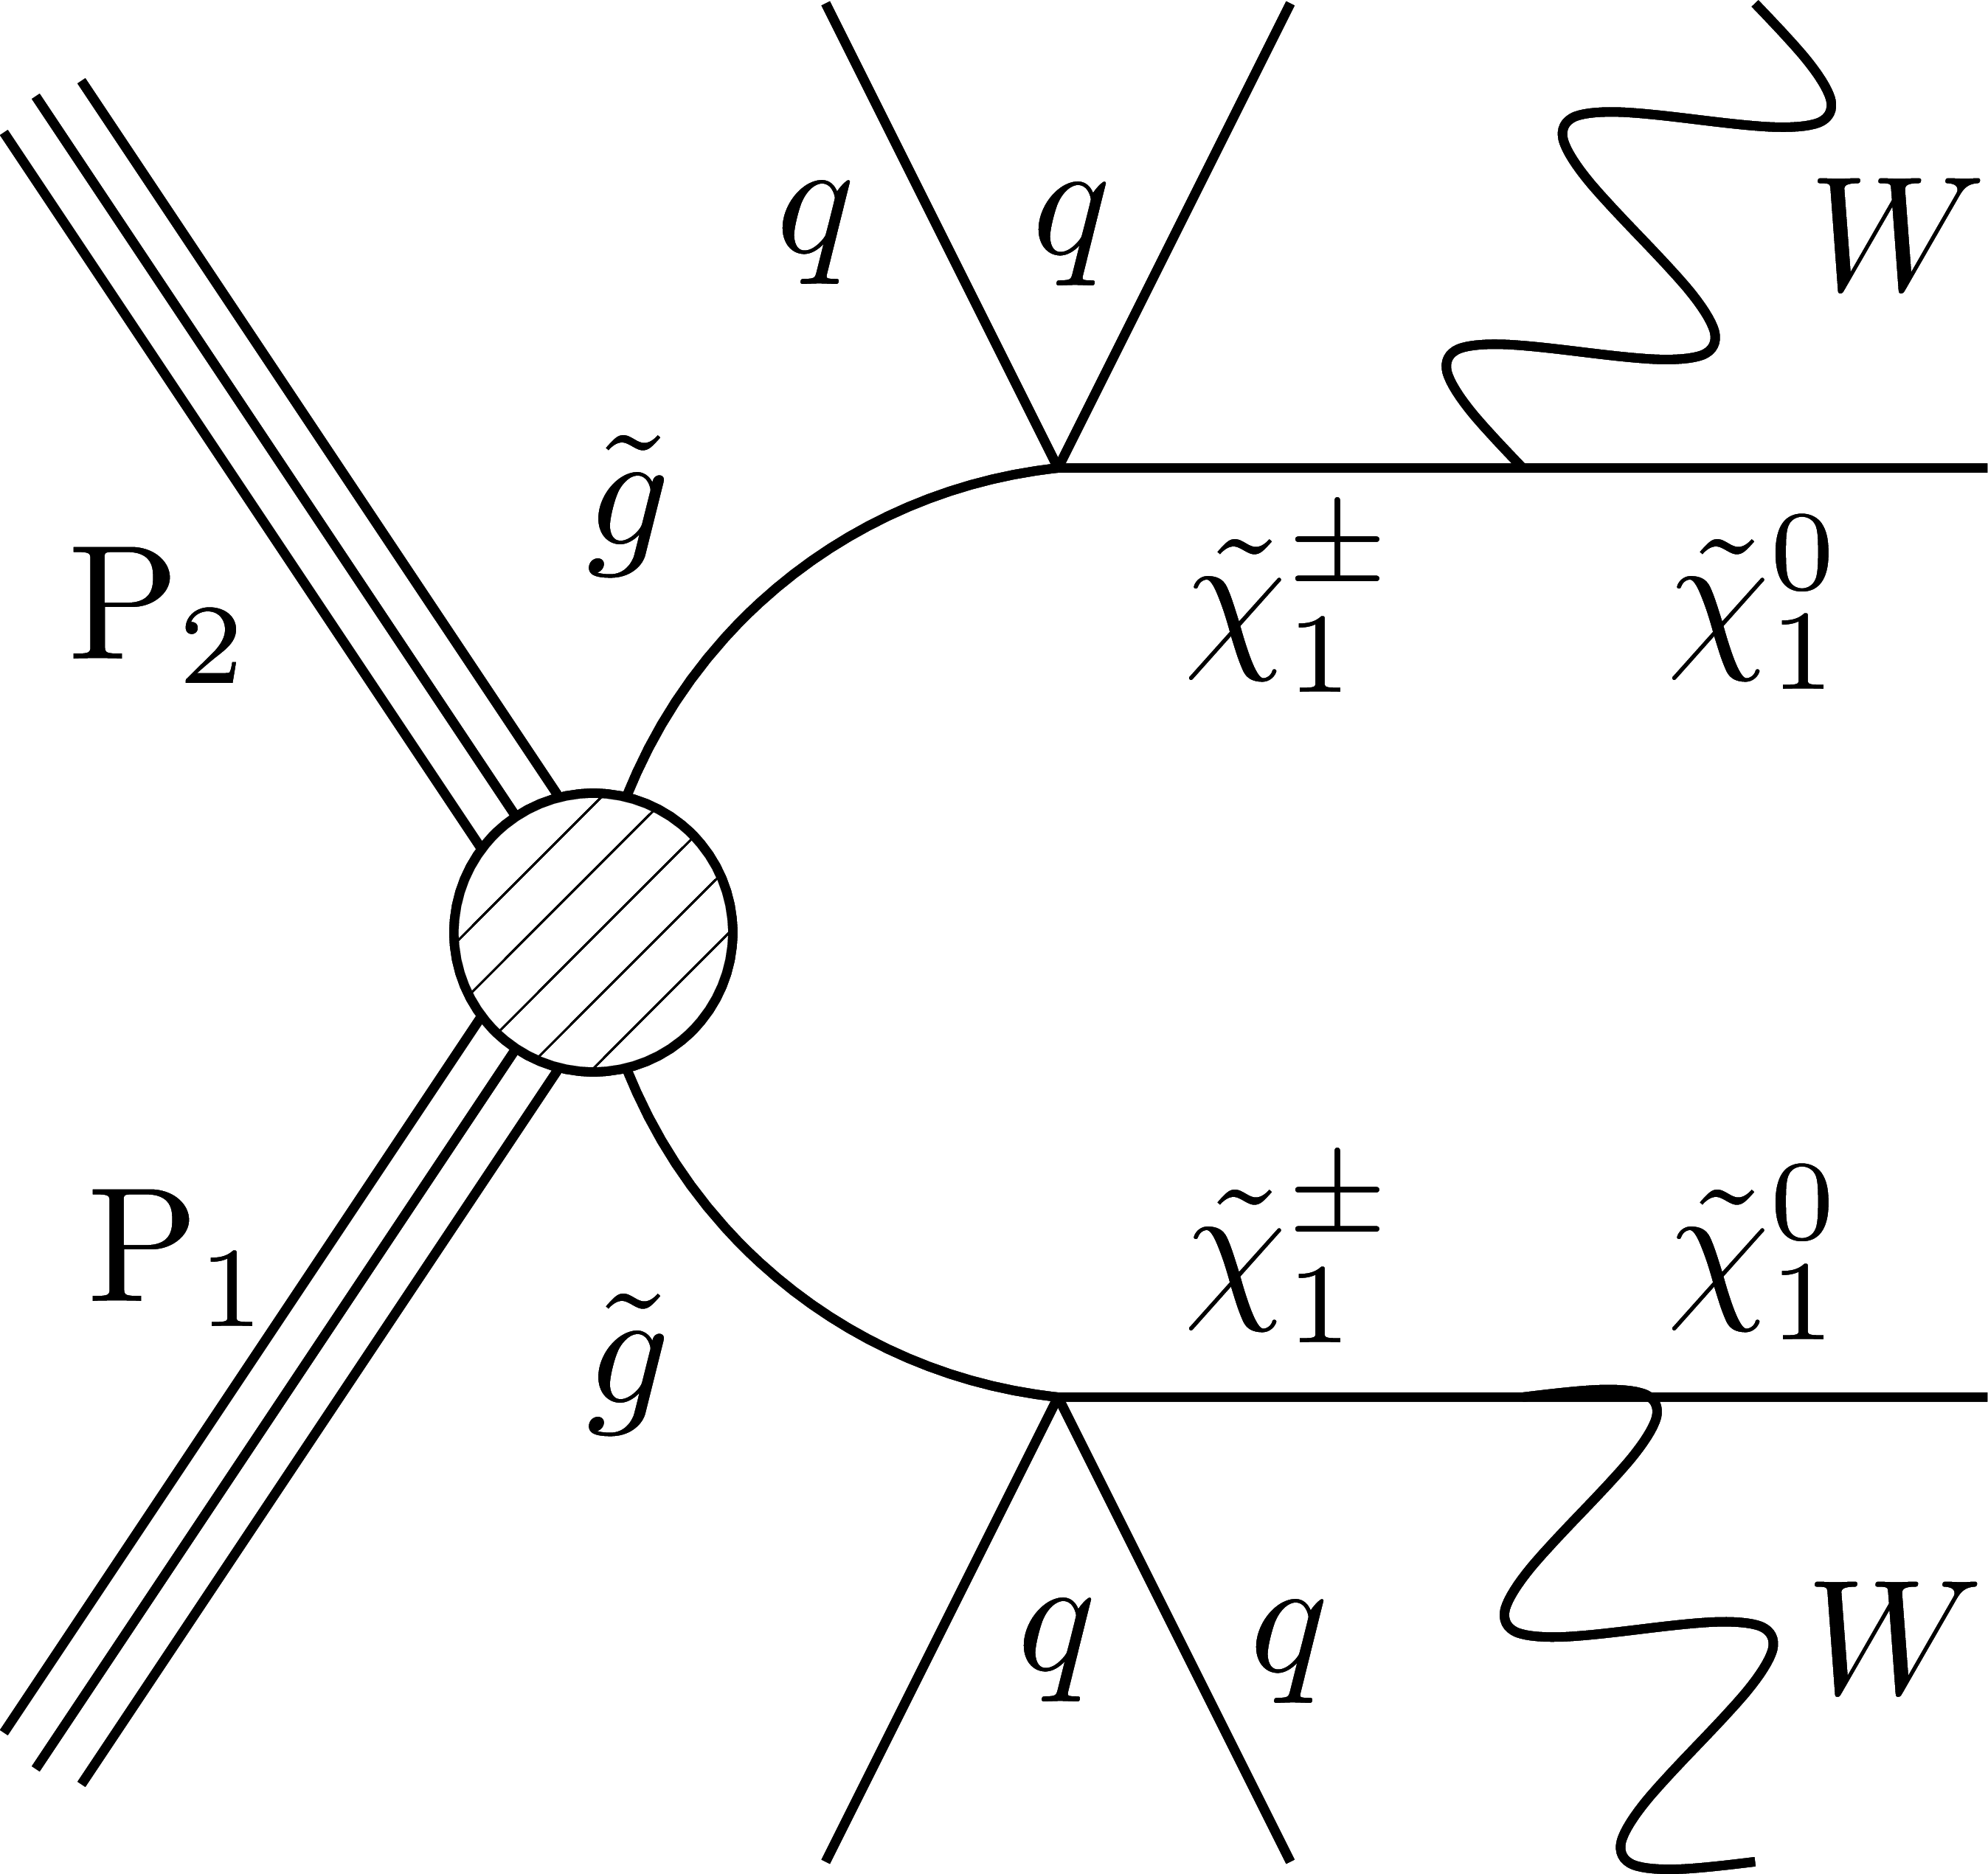
| Abstract: This note presents the results of a search for new physics using events with one soft lepton and large missing transverse momentum, inclusive in jet flavor and multiplicity. Results are based on a 2.3 fb$^{-1}$ data sample of $\sqrt{s} =$ 13 TeV proton-proton collisions collected with the CMS detector. No significant deviations from the standard model expectations are observed, and the results are used to set limits on models featuring compressed spectra. For pair production of top squarks decaying into four bodies, $\widetilde{t} \rightarrow b \widetilde\chi^{0} l (q) \nu (q^\prime)$, top squark masses below 340 GeV are excluded for $m_{\widetilde{t}} - m_{\widetilde\chi^{0}} =$ 50 GeV. For gluino pair production decaying to $\widetilde{g} \rightarrow q\bar{q} \widetilde\chi^{\pm}$ followed by $\widetilde\chi^{\pm} \rightarrow W^{*} \widetilde\chi^{0}$, with $m_{\widetilde\chi^{\pm}} - m_{\widetilde\chi^{0}} =$ 20 GeV, gluino masses in the range 900-1200 GeV are excluded for $\widetilde\chi^{0}$ masses in the range 100-800 GeV. | ||
| Links: CDS record (PDF) ; inSPIRE record ; CADI line (restricted) ; | ||
| Figures | |
png |
Figure 1-a:
Feynman diagrams illustrating the signal processes considered. The left diagram depicts the 4-body decay of the top squark, $\widetilde{t} \rightarrow b \tilde{ \chi }^{0} l (q) \nu (q\prime )$. The right diagram depicts gluino pair-production, where the gluinos always decay through a chargino to a W and LSP, $\widetilde{g} \rightarrow q\bar{q} \widetilde{\chi} ^{0} $. Both models can decay into final states with 0, 1, or 2 leptons. |
png pdf |
Figure 1-b:
Feynman diagrams illustrating the signal processes considered. The left diagram depicts the 4-body decay of the top squark, $\widetilde{t} \rightarrow b \tilde{ \chi }^{0} l (q) \nu (q\prime )$. The right diagram depicts gluino pair-production, where the gluinos always decay through a chargino to a W and LSP, $\widetilde{g} \rightarrow q\bar{q} \widetilde{\chi} ^{0} $. Both models can decay into final states with 0, 1, or 2 leptons. |
png pdf |
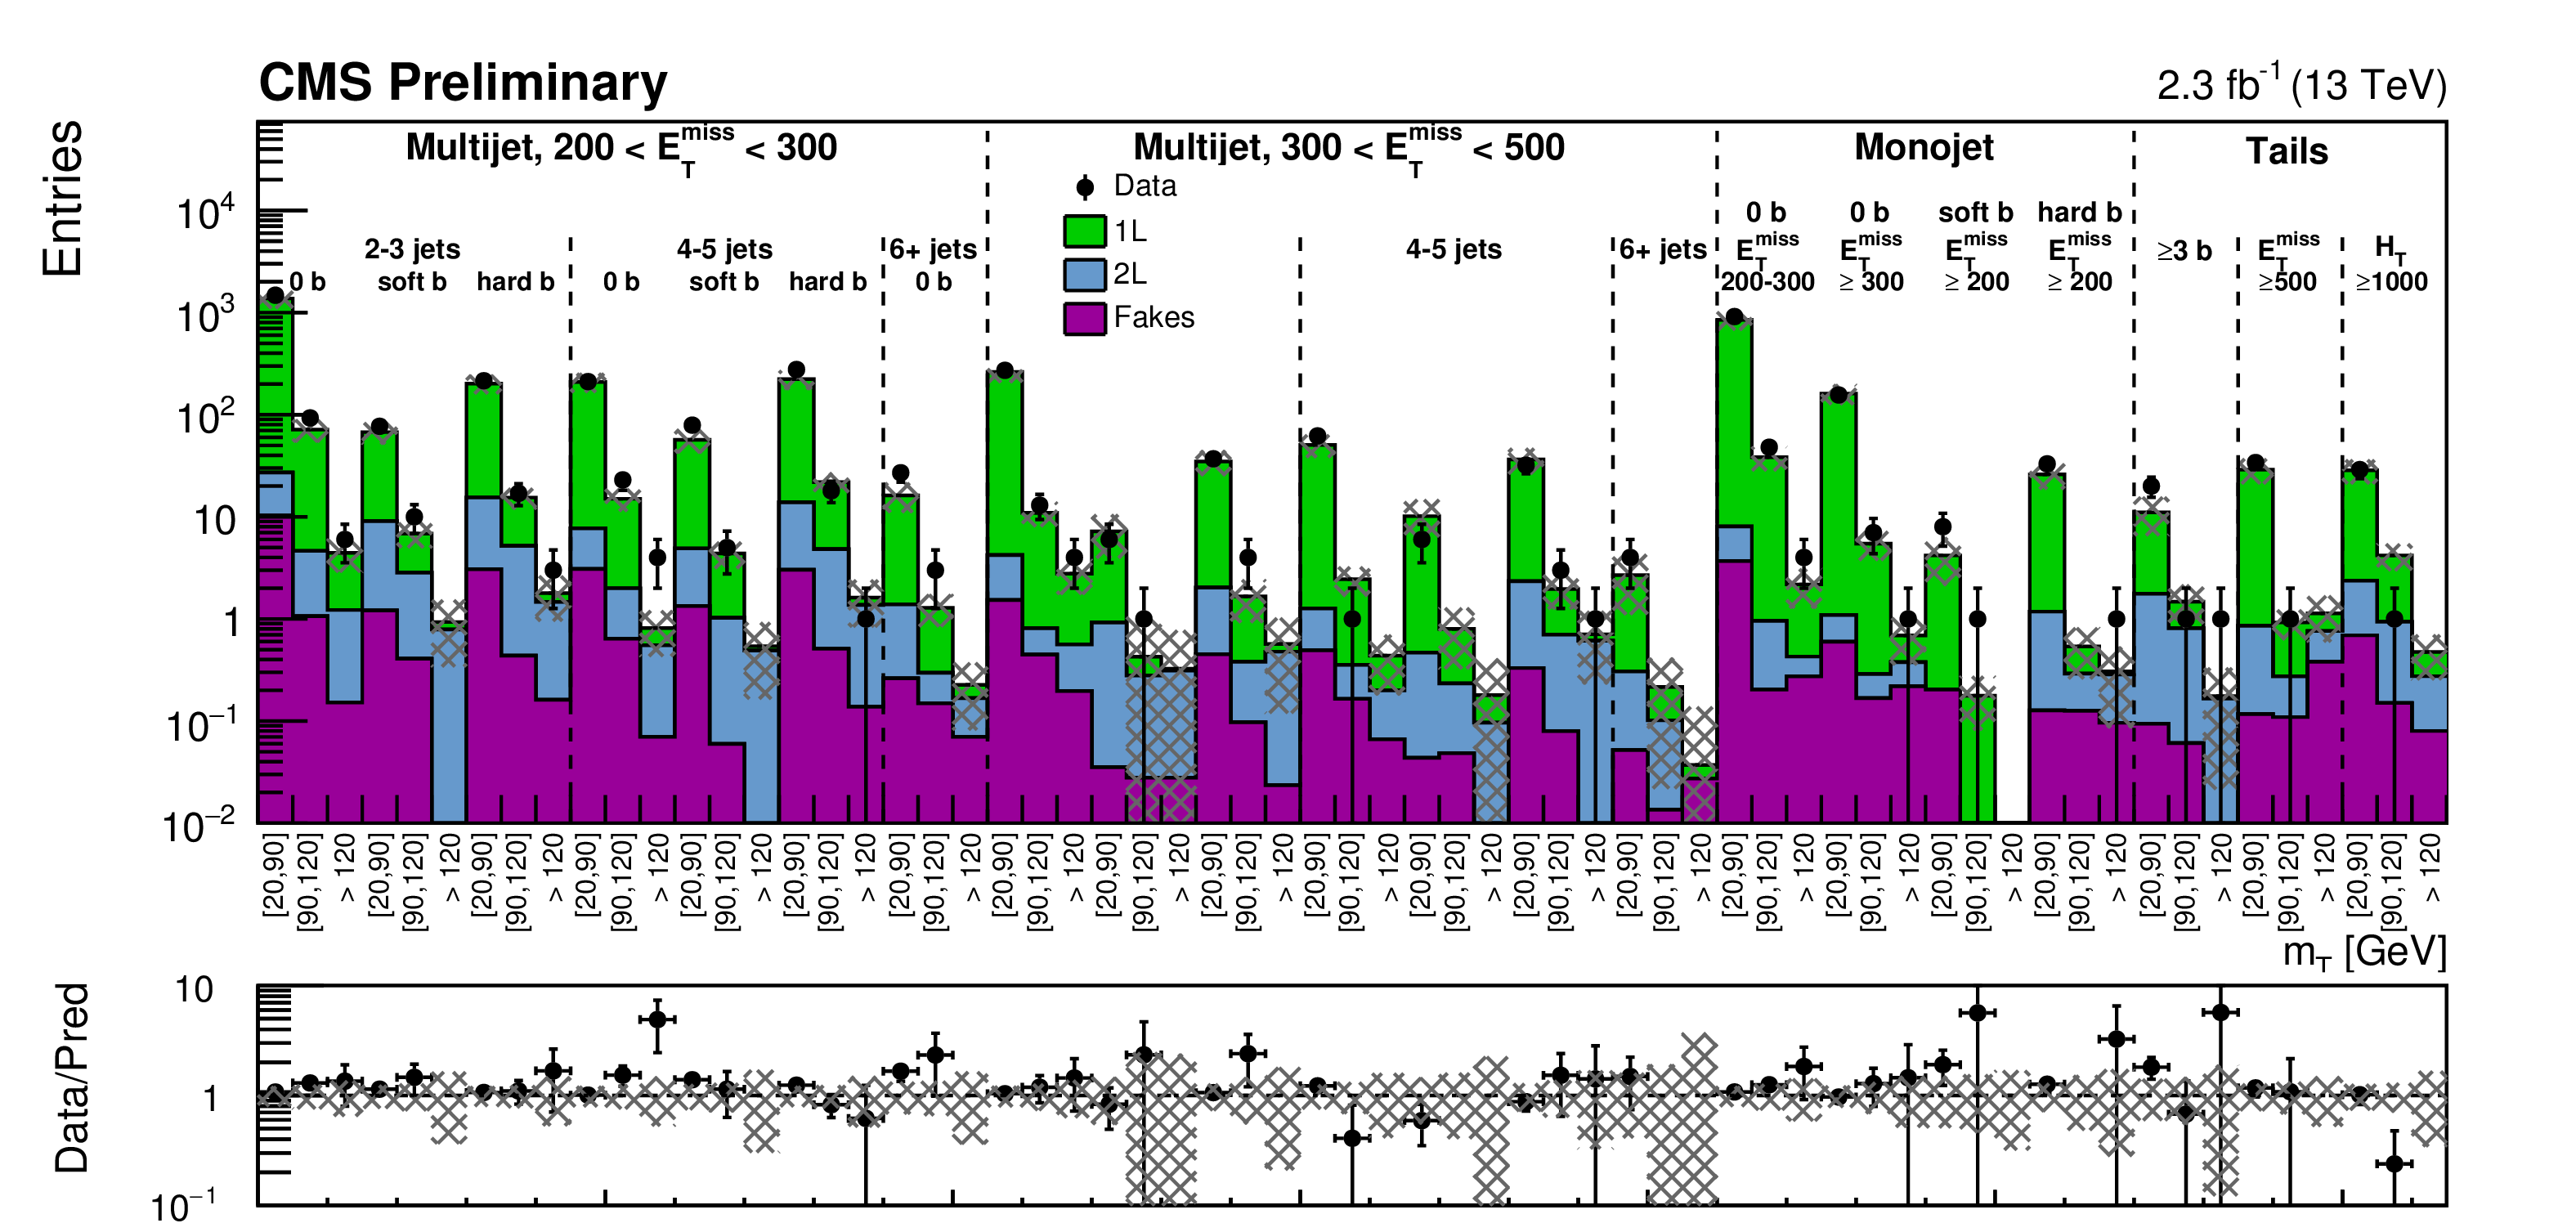
Figure 2-a:
Comparison of estimated background, pre-fit (a) and post-fit (b), and observed data events in each signal region. The ${m_{\mathrm {T}}}$ ranges are shown on the $x$-axis. The grey band in the pre-fit histogram includes the total uncertainty assigned to each background, while in the post-fit histogram it represents the uncertainty measured by the background-only fit. |
png pdf |
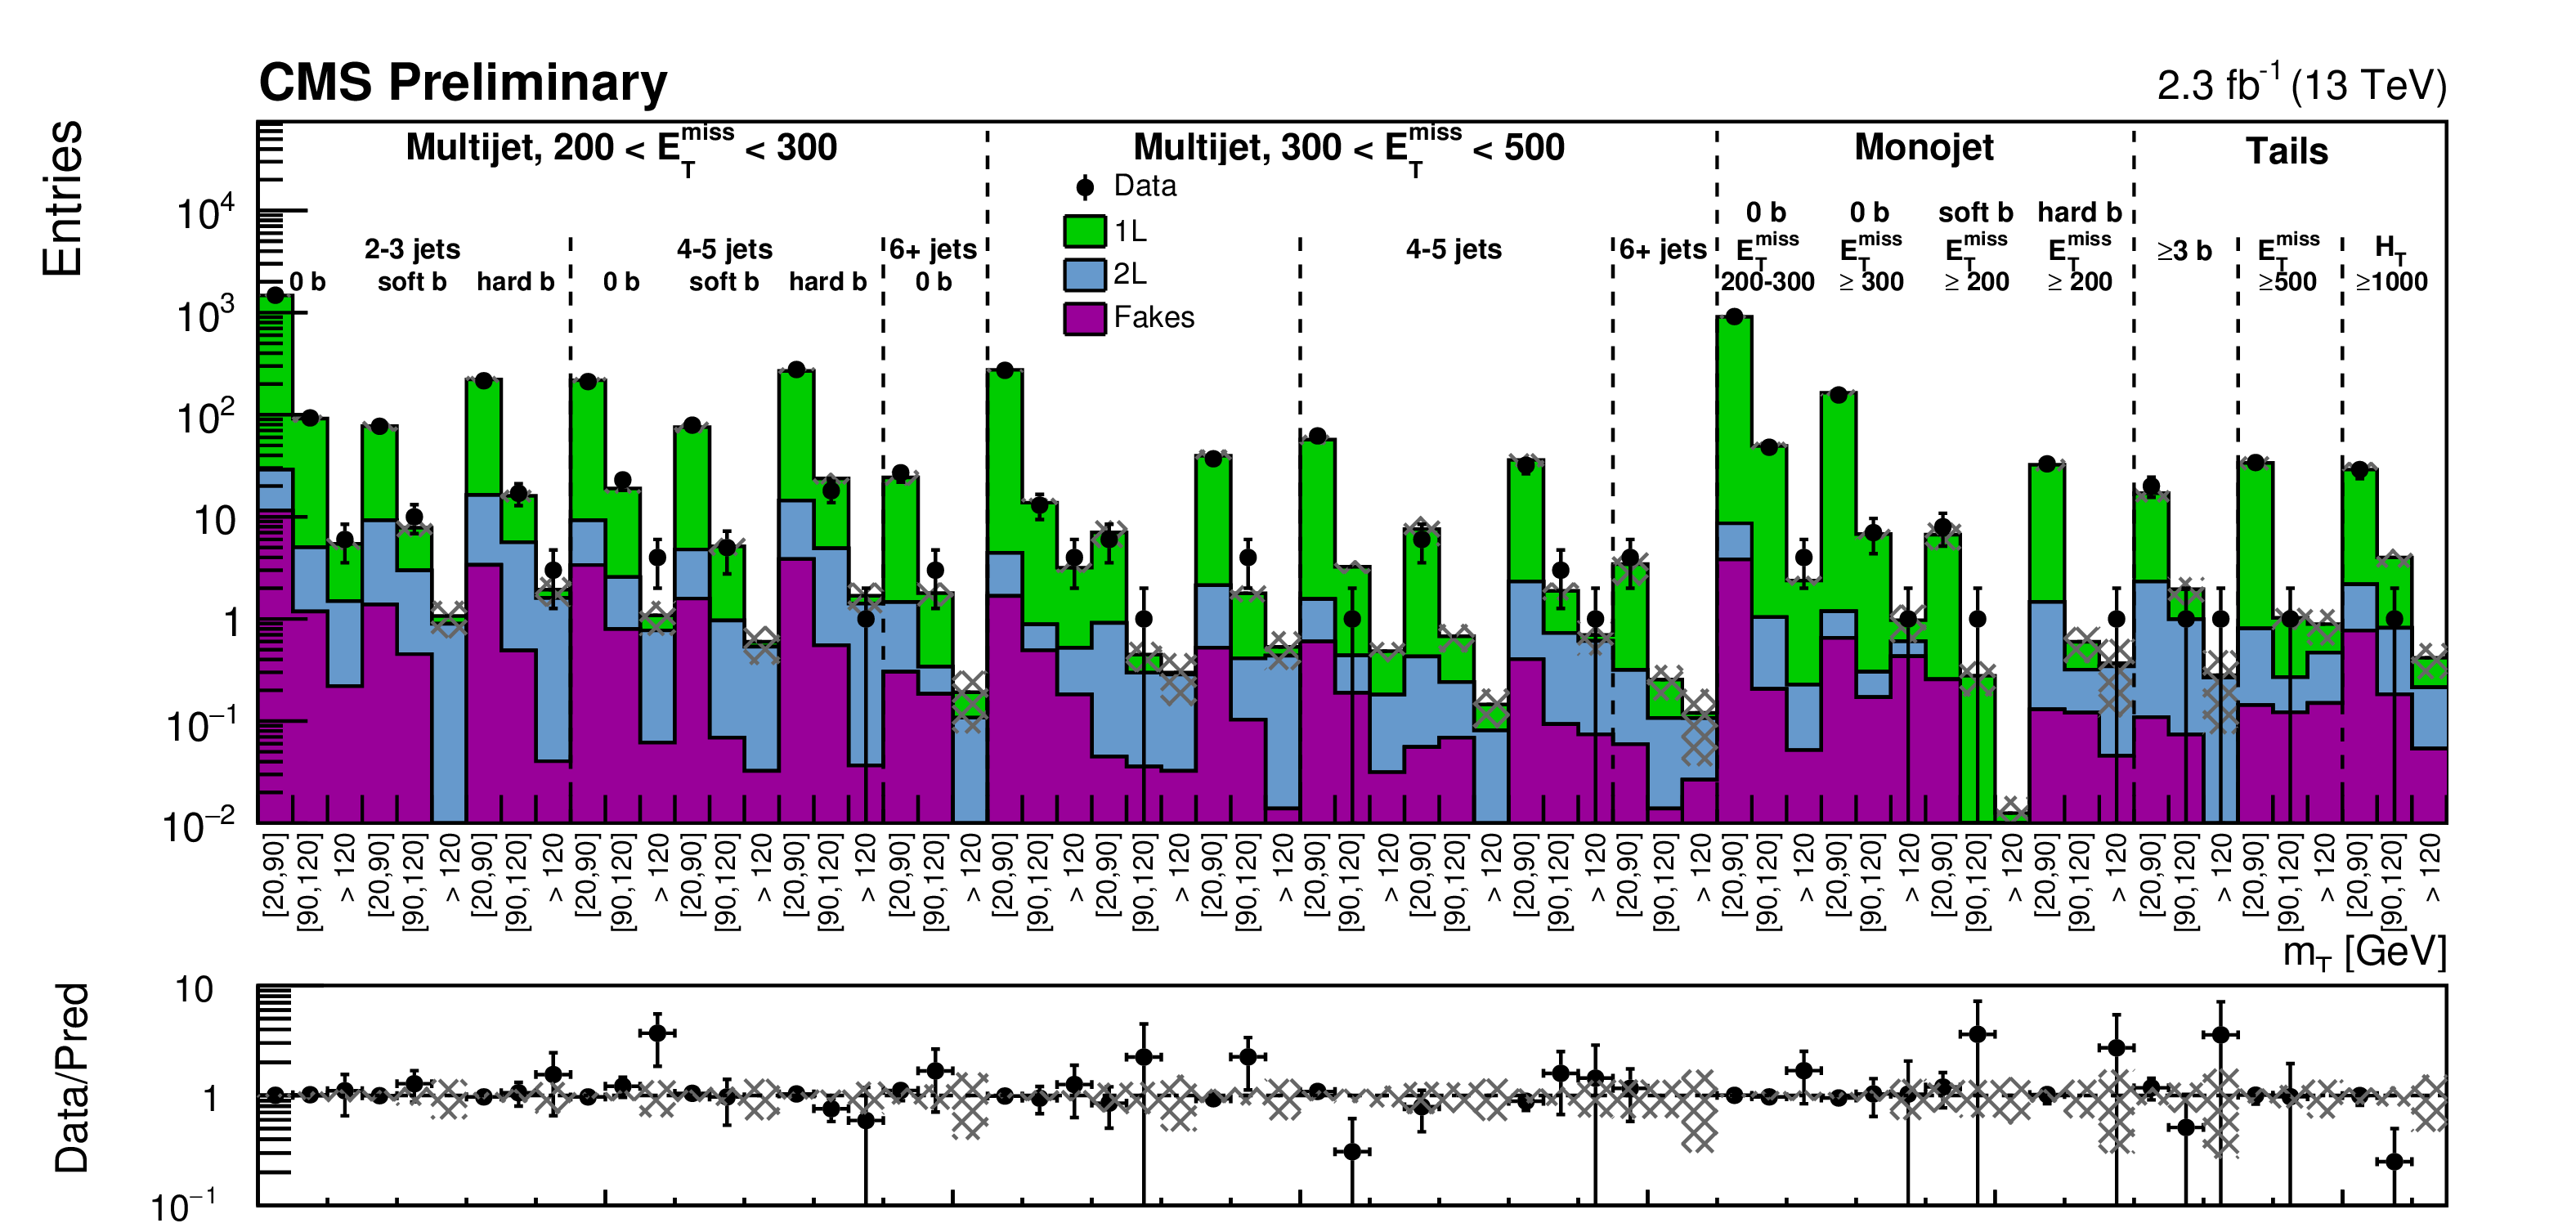
Figure 2-b:
Comparison of estimated background, pre-fit (a) and post-fit (b), and observed data events in each signal region. The ${m_{\mathrm {T}}}$ ranges are shown on the $x$-axis. The grey band in the pre-fit histogram includes the total uncertainty assigned to each background, while in the post-fit histogram it represents the uncertainty measured by the background-only fit. |
png pdf |
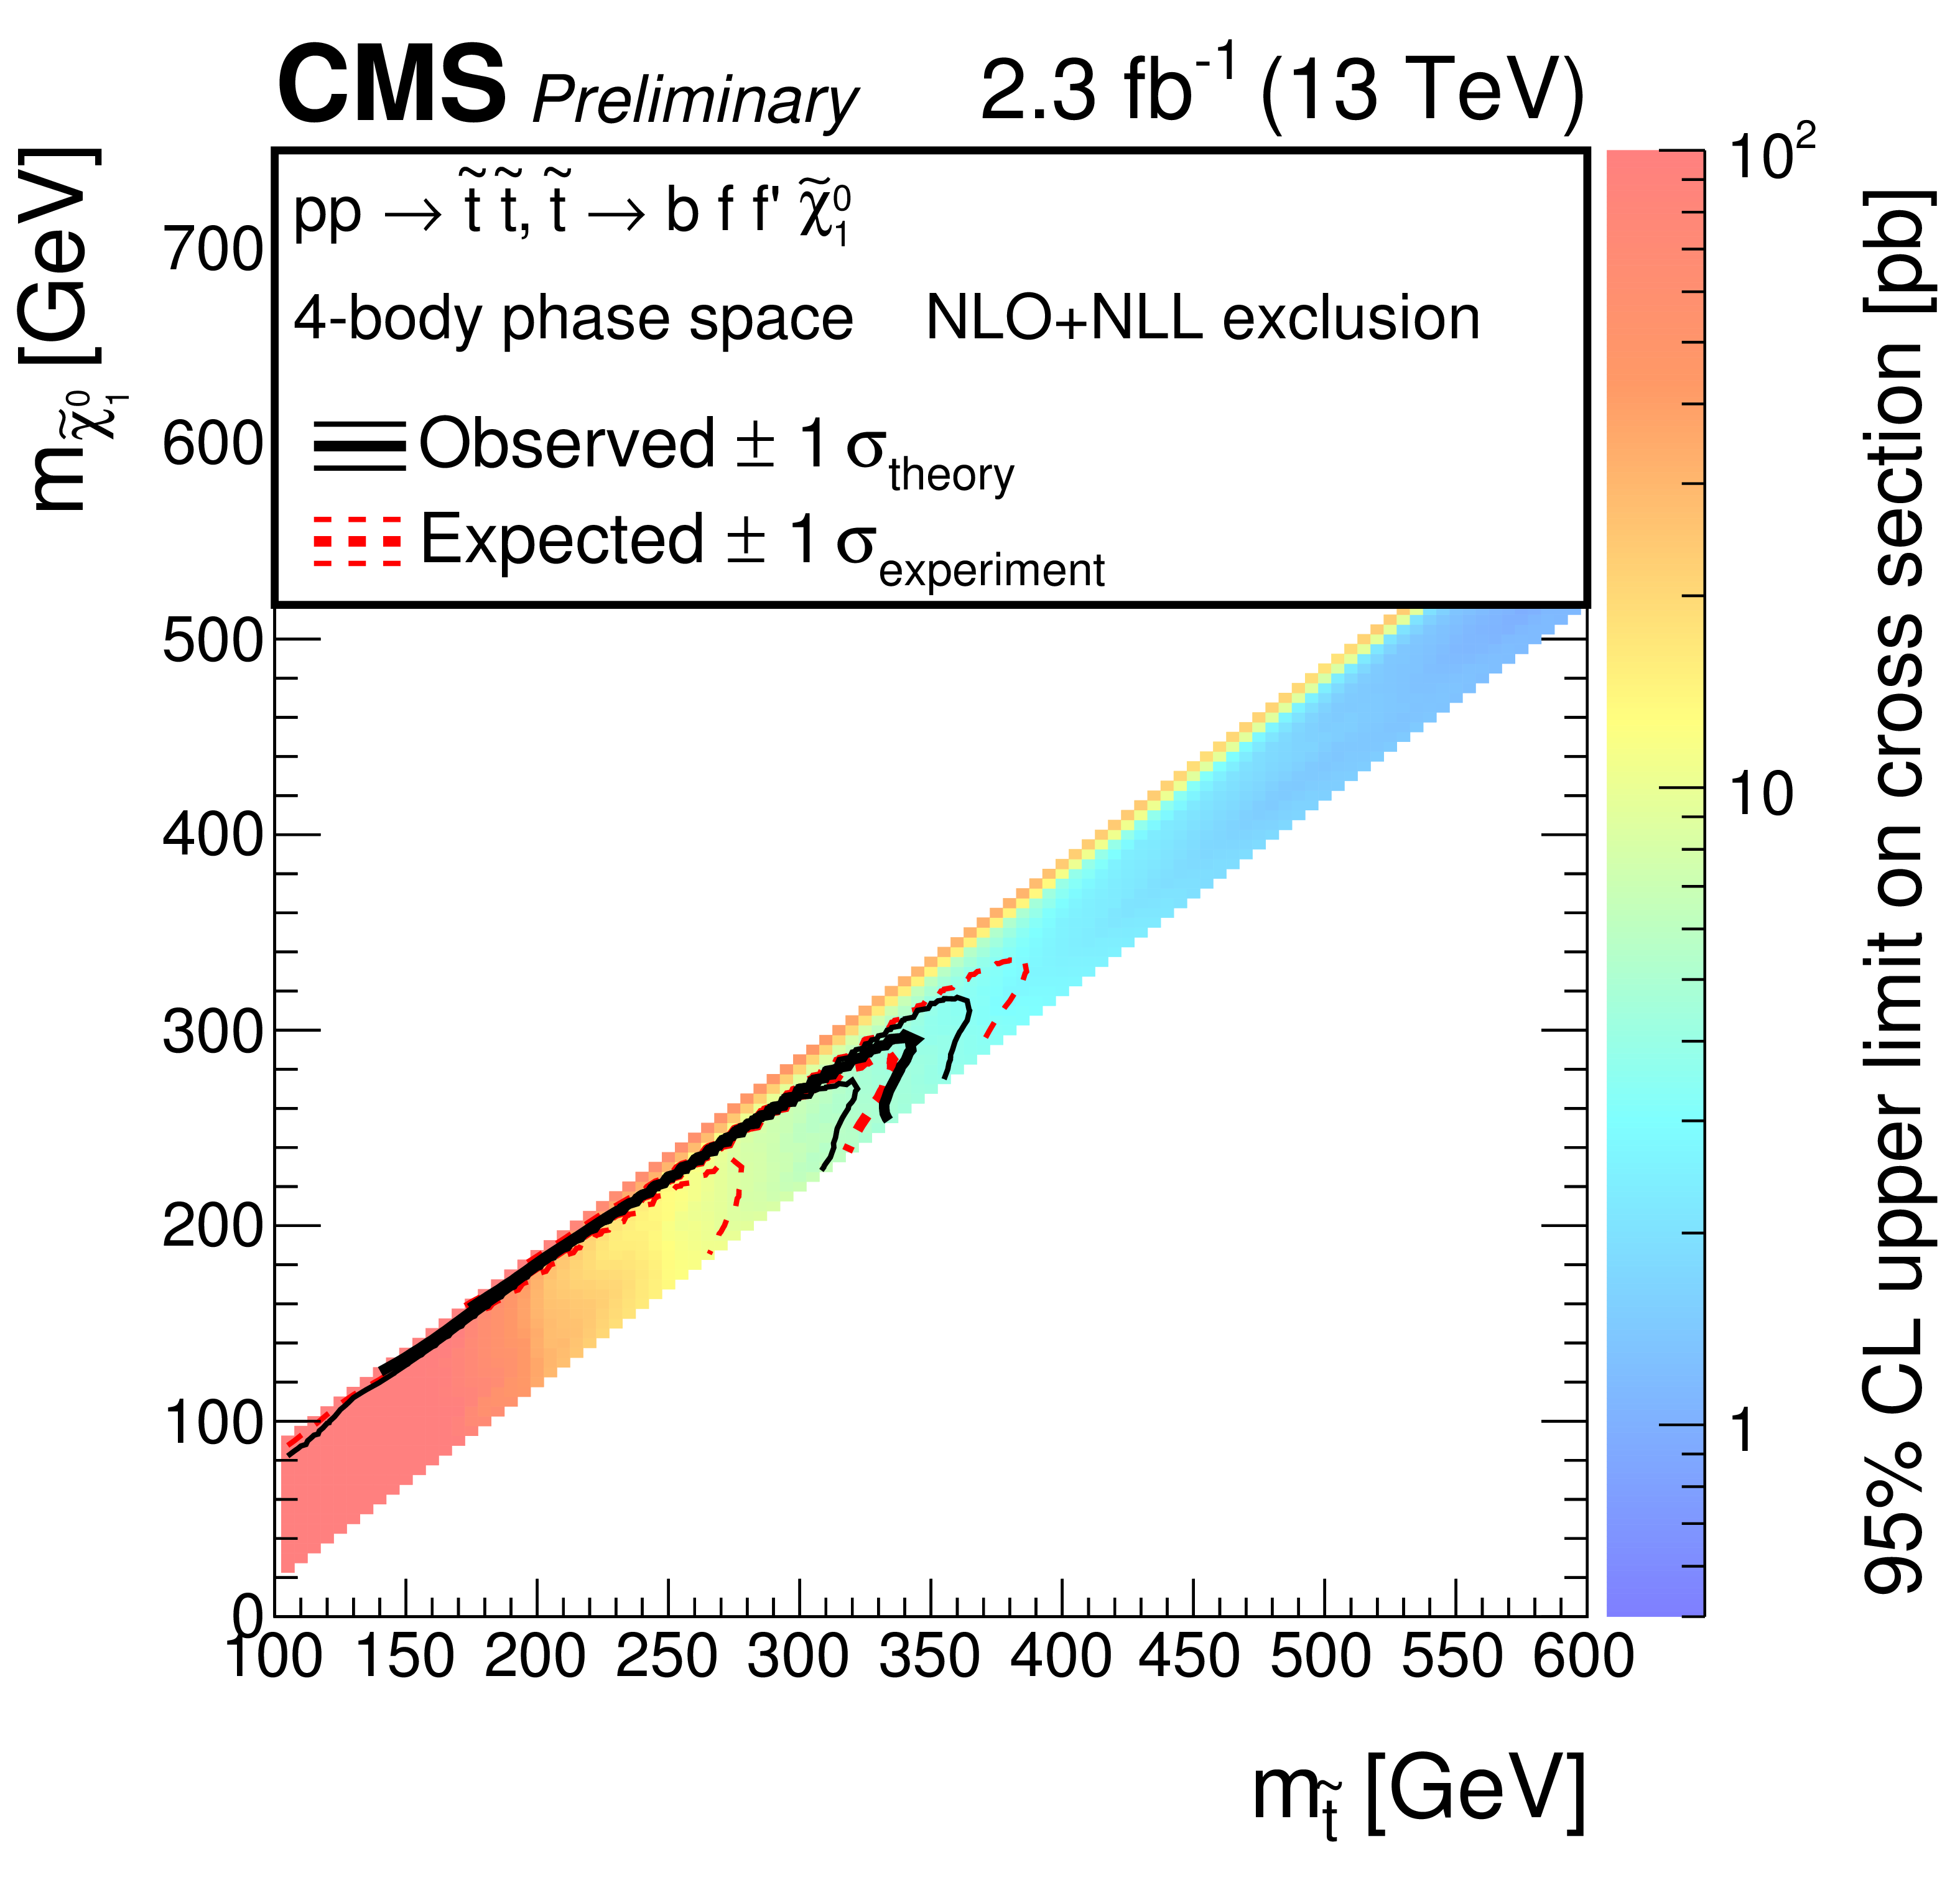
Figure 3-a:
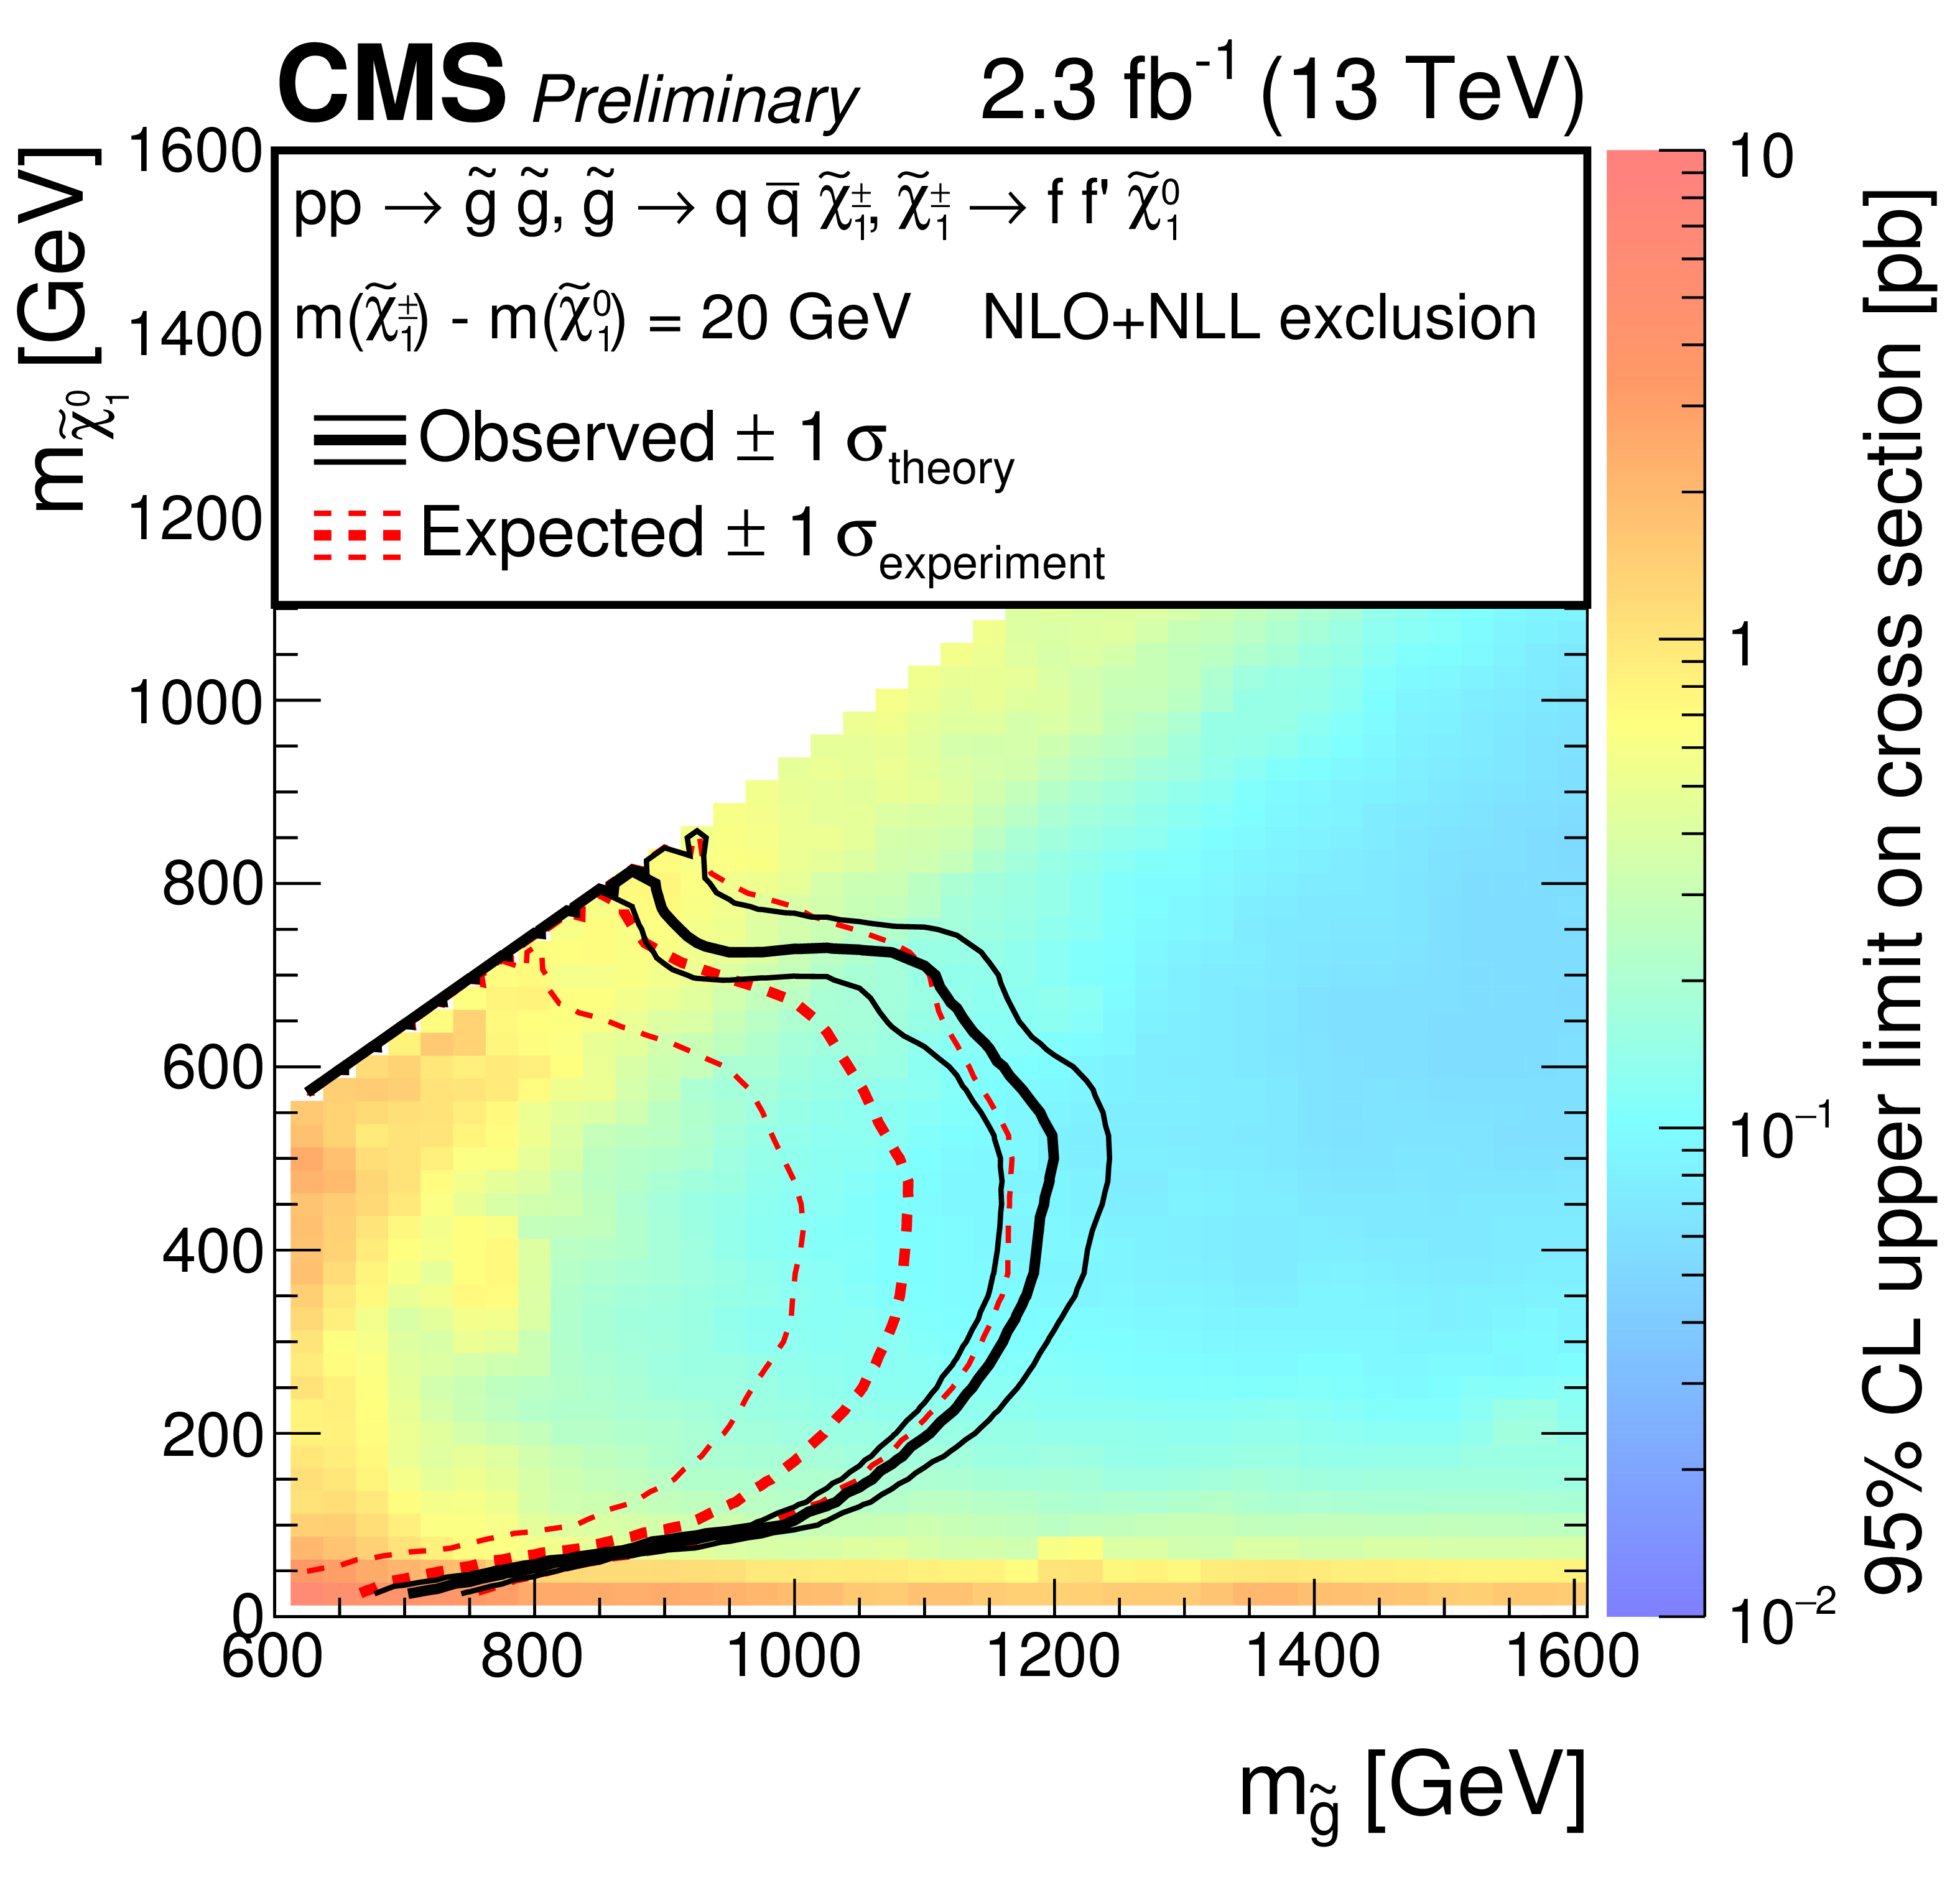
Exclusion limits at 95% CL for top squark (a) and gluino (b) production. The color axis indicates the excluded cross section, while the red and black lines show the expected and observed mass values for which the excluded cross-section is equal to the predicted cross section of the model. The area to the left and below the lines represents the exclusion region. |
png pdf |
Figure 3-b:
Exclusion limits at 95% CL for top squark (a) and gluino (b) production. The color axis indicates the excluded cross section, while the red and black lines show the expected and observed mass values for which the excluded cross-section is equal to the predicted cross section of the model. The area to the left and below the lines represents the exclusion region. |
png pdf |
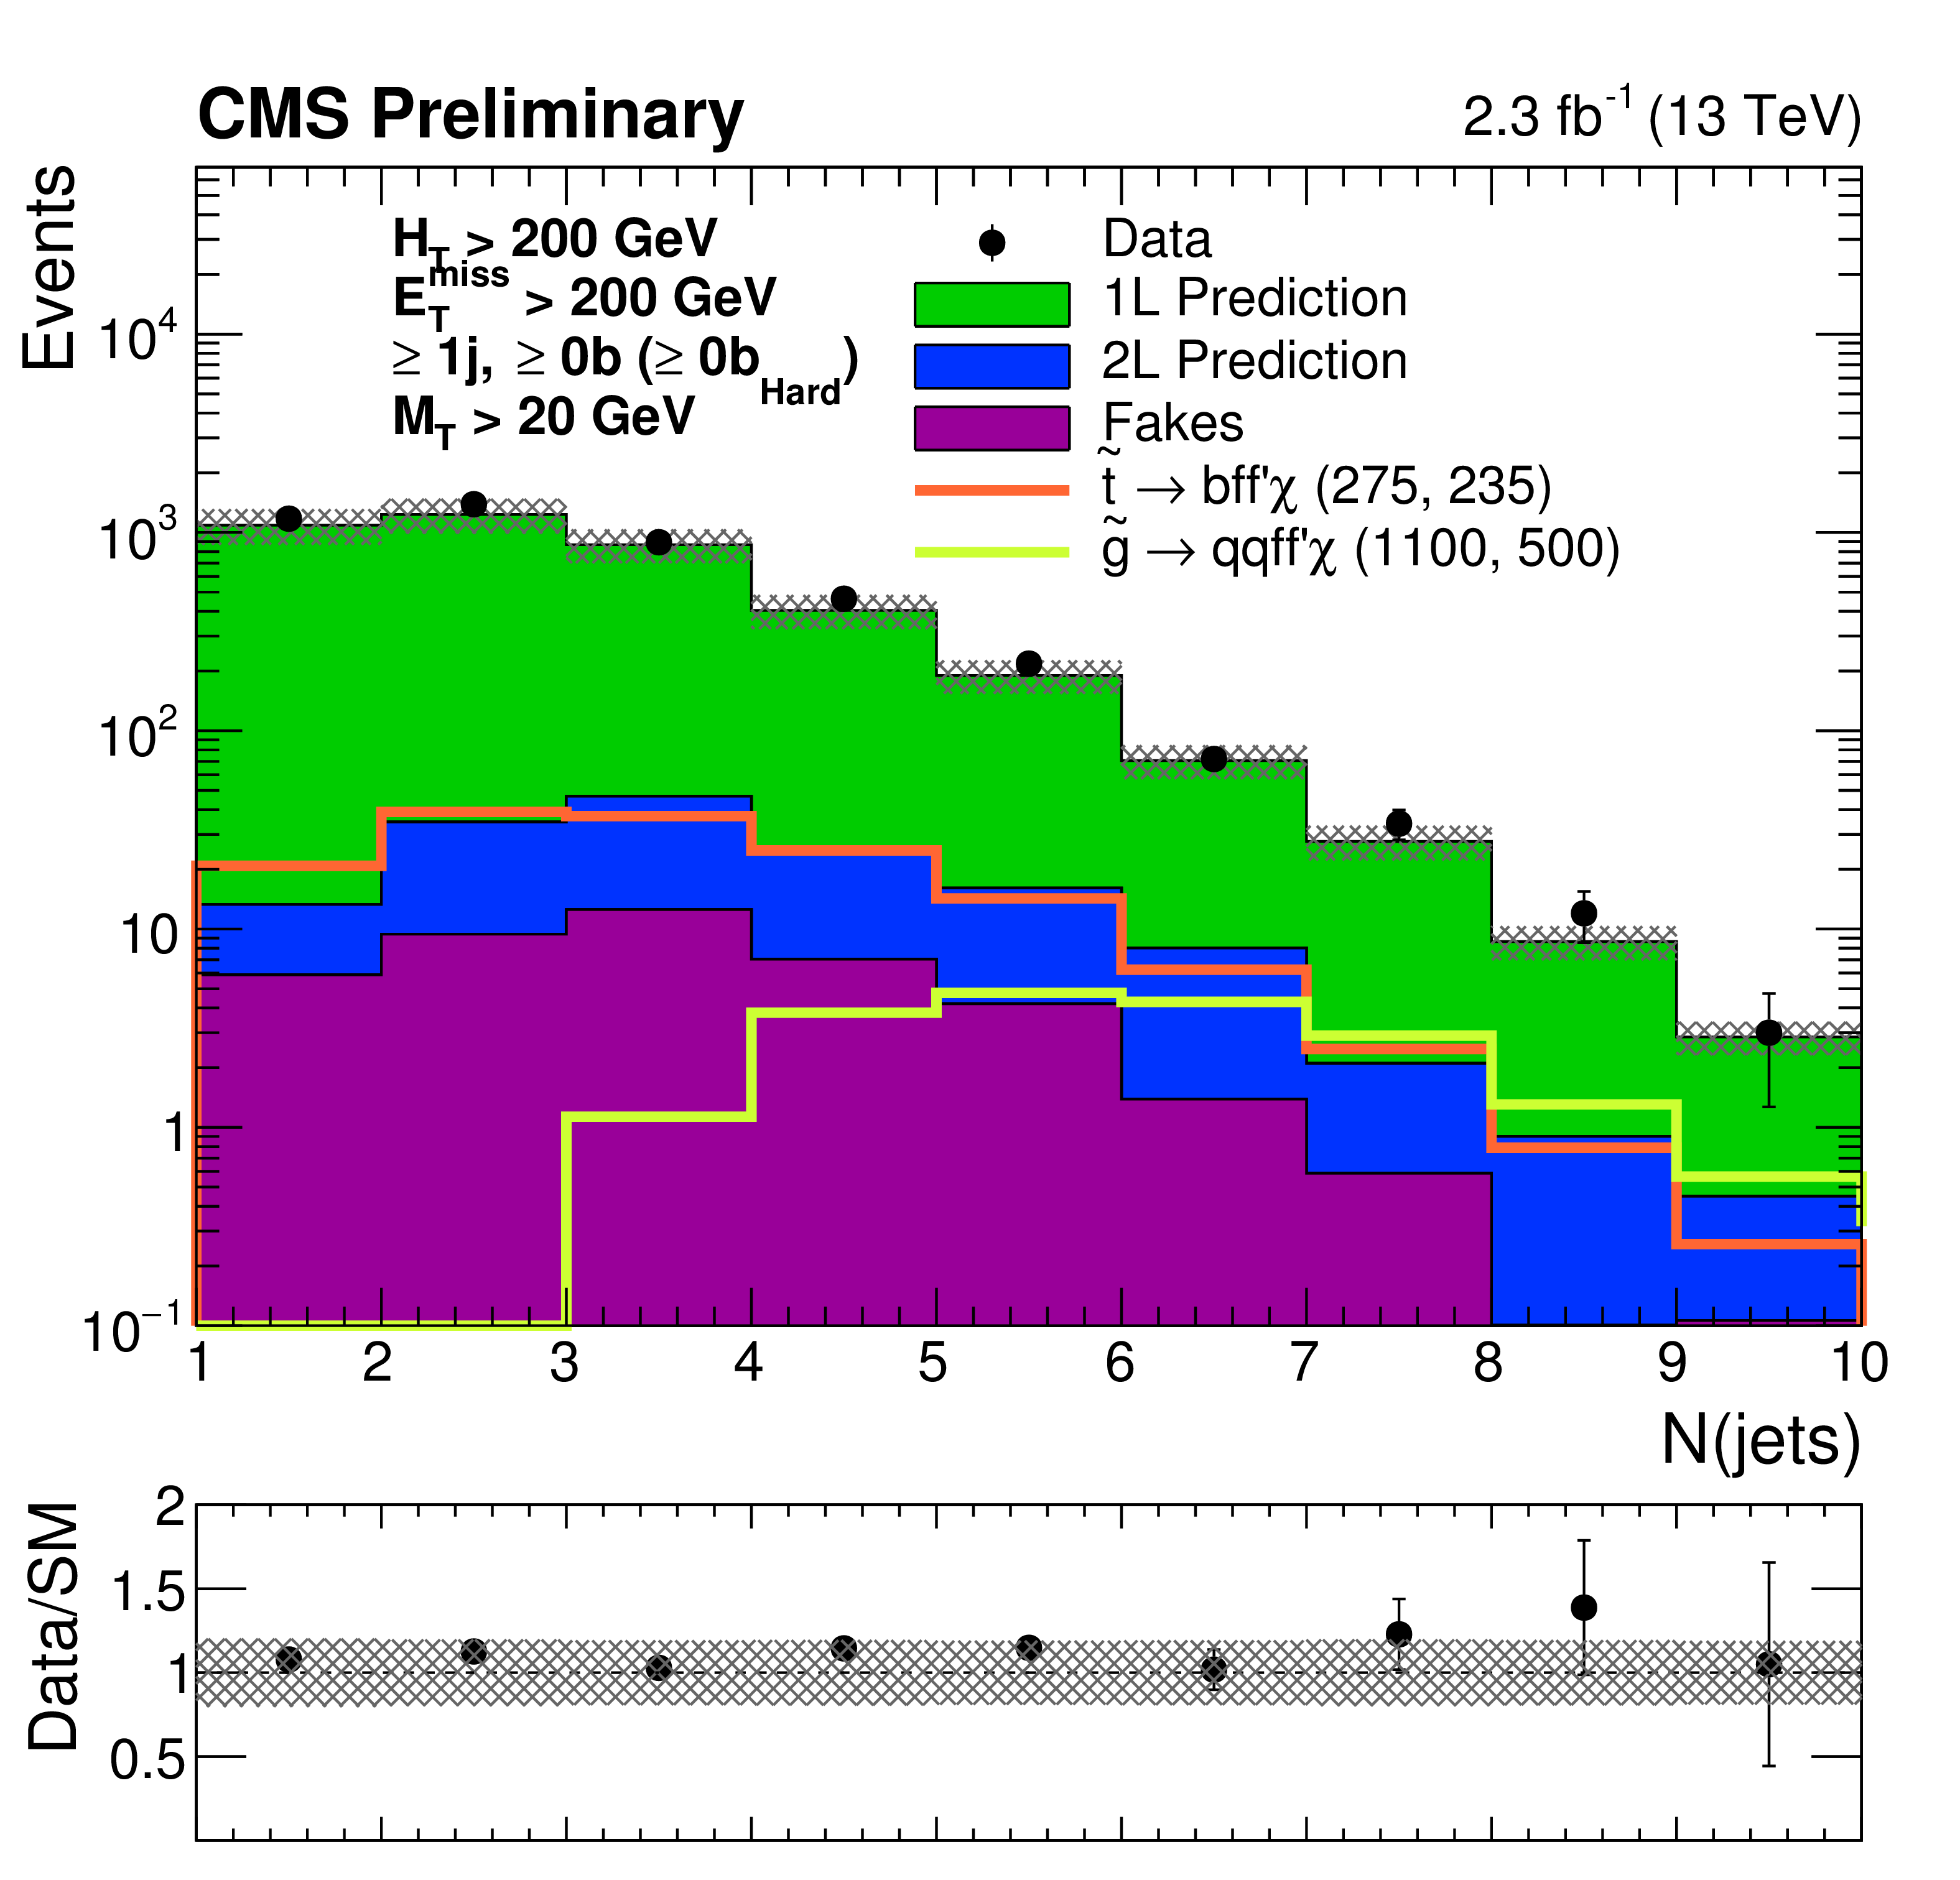
Figure 4-a:
Comparisons of estimated backgrounds and observed data events in the sum of all signal regions, as a function number of jets (a) heavy flavor category (b), ${E_{\mathrm {T}}^{\text {miss}}}$ (c), ${m_{\mathrm {T}}(\vec{\ell} , {\vec{p}_{ \mathrm {T}}^{ \mathrm {miss}}} )}$ (d). Each estimated background distribution is formed by summing the MC shapes for all signal regions, where each MC shape is first scaled to the predicted background (pre-fit) in that region. The grey band represents the statistical and systematic uncertainty on the estimates. |
png pdf |
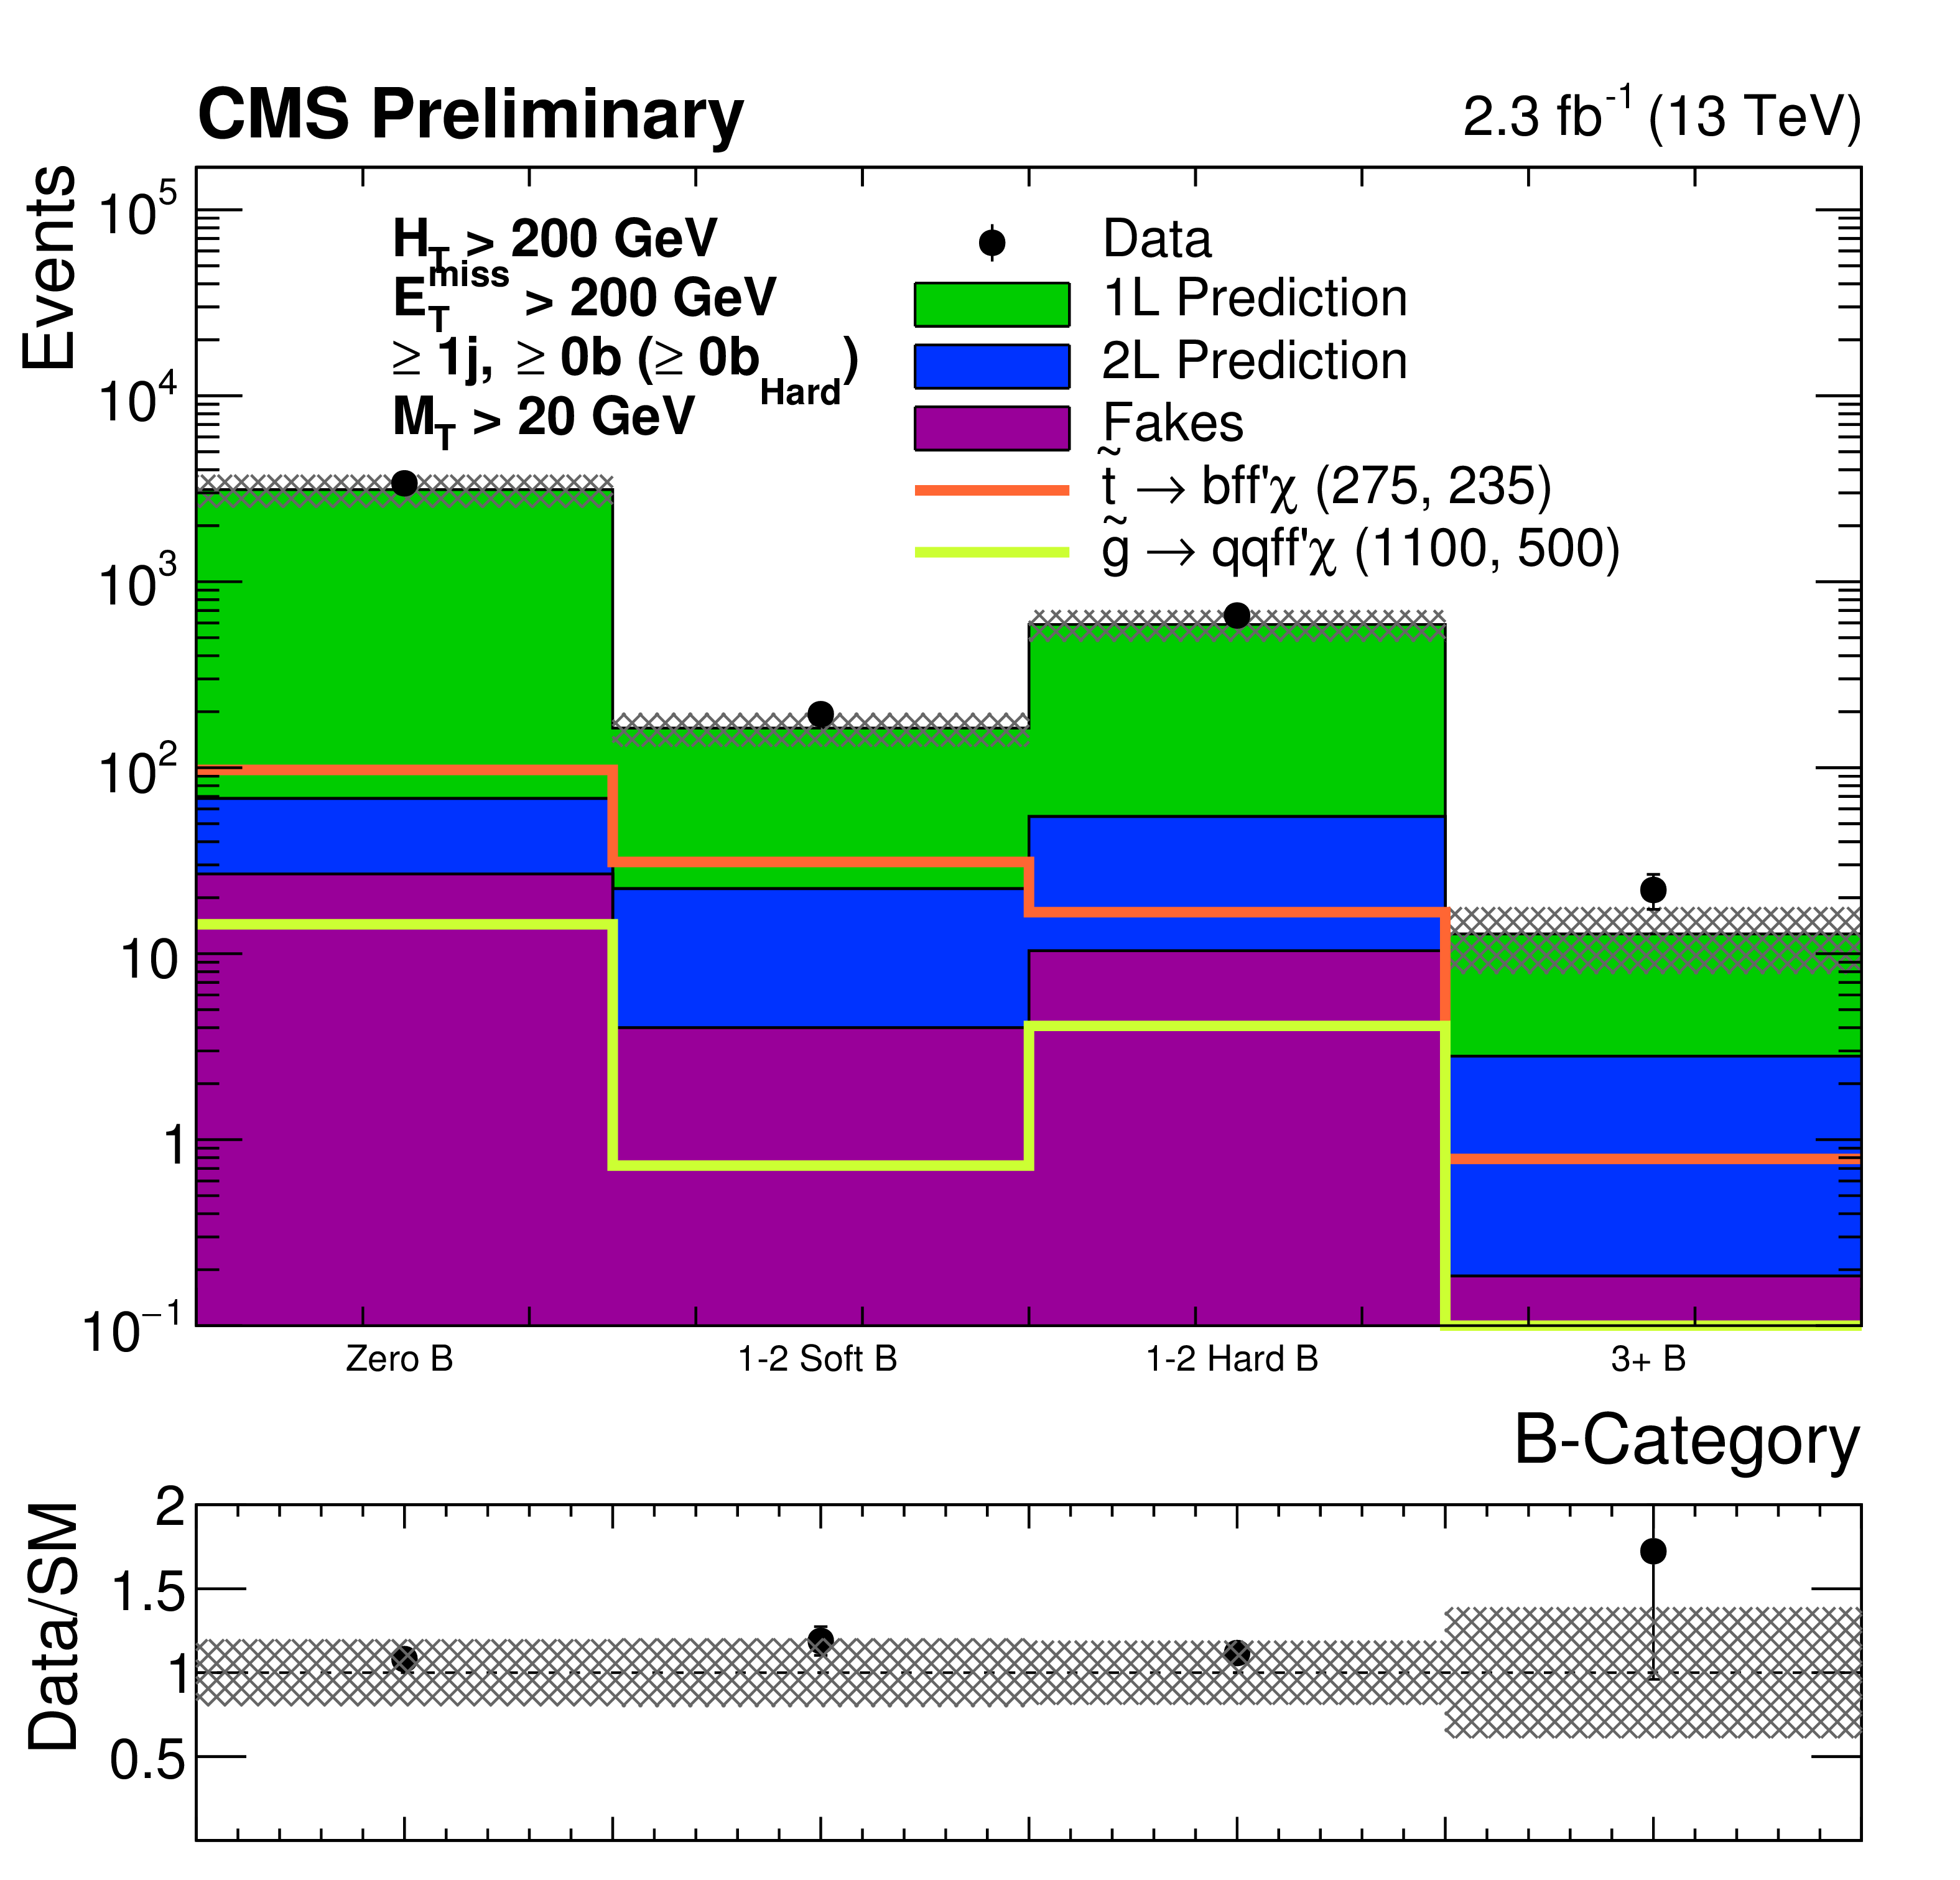
Figure 4-b:
Comparisons of estimated backgrounds and observed data events in the sum of all signal regions, as a function number of jets (a) heavy flavor category (b), ${E_{\mathrm {T}}^{\text {miss}}}$ (c), ${m_{\mathrm {T}}(\vec{\ell} , {\vec{p}_{ \mathrm {T}}^{ \mathrm {miss}}} )}$ (d). Each estimated background distribution is formed by summing the MC shapes for all signal regions, where each MC shape is first scaled to the predicted background (pre-fit) in that region. The grey band represents the statistical and systematic uncertainty on the estimates. |
png pdf |
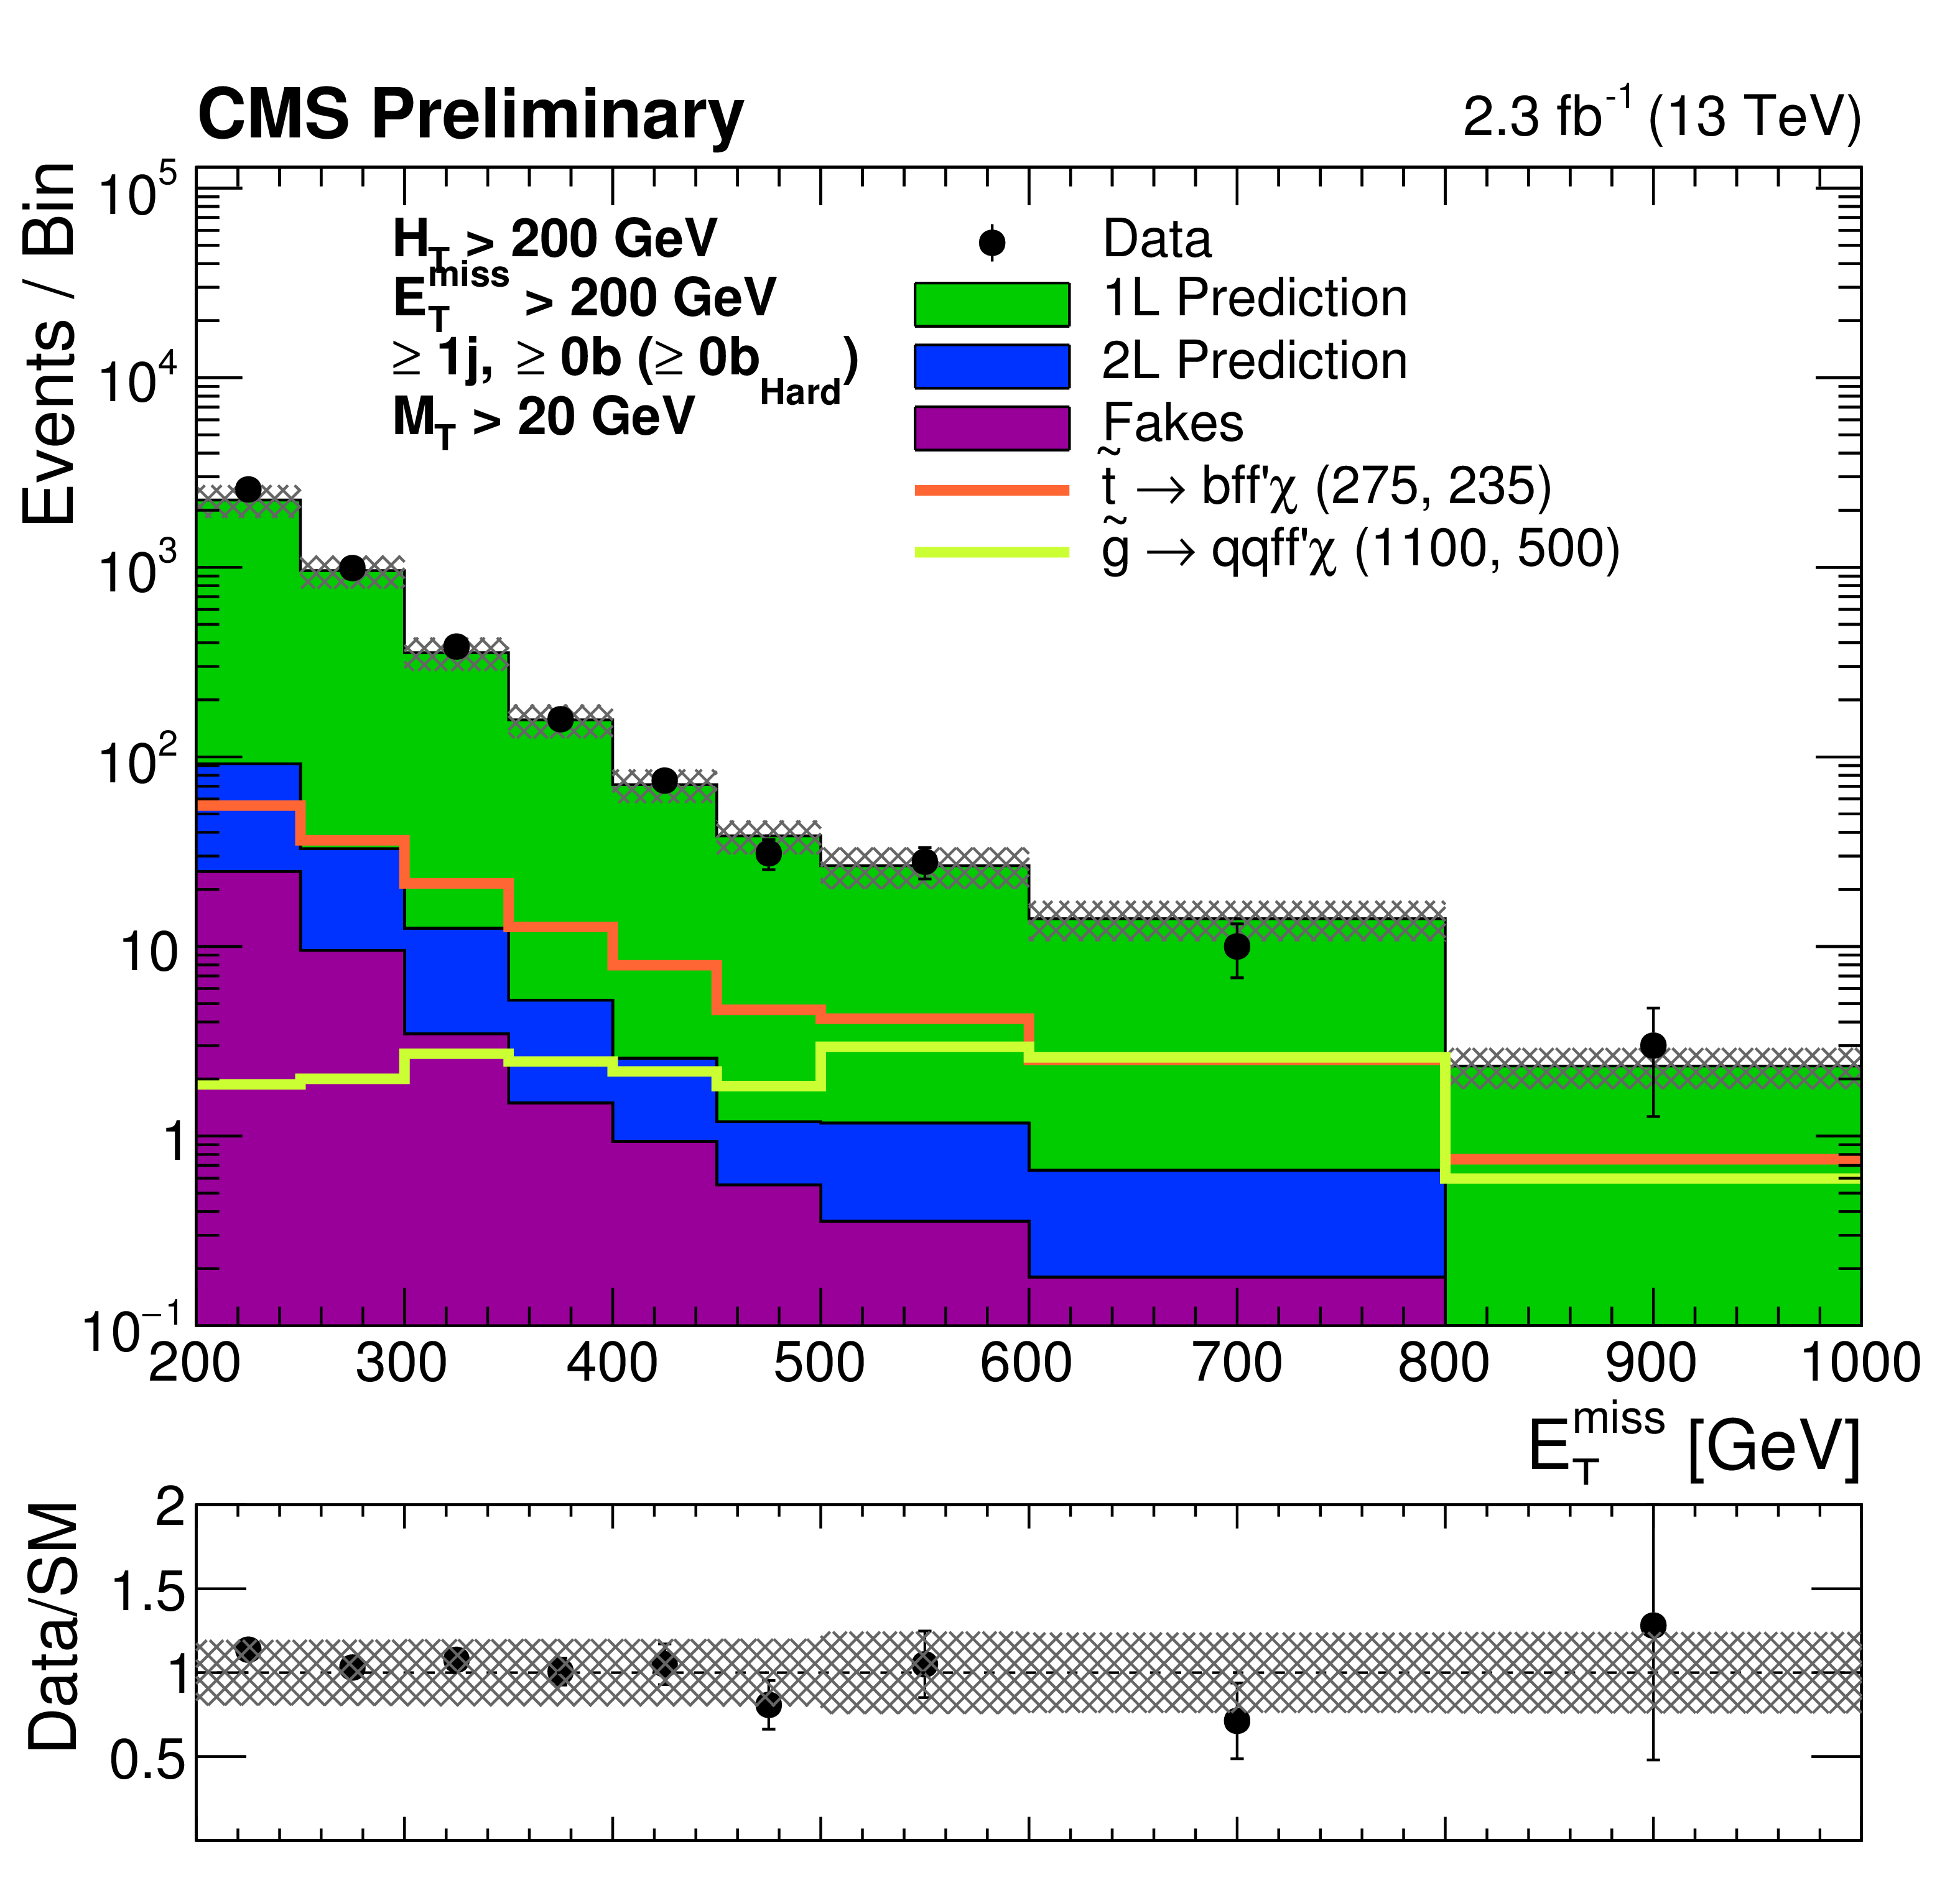
Figure 4-c:
Comparisons of estimated backgrounds and observed data events in the sum of all signal regions, as a function number of jets (a) heavy flavor category (b), ${E_{\mathrm {T}}^{\text {miss}}}$ (c), ${m_{\mathrm {T}}(\vec{\ell} , {\vec{p}_{ \mathrm {T}}^{ \mathrm {miss}}} )}$ (d). Each estimated background distribution is formed by summing the MC shapes for all signal regions, where each MC shape is first scaled to the predicted background (pre-fit) in that region. The grey band represents the statistical and systematic uncertainty on the estimates. |
png pdf |
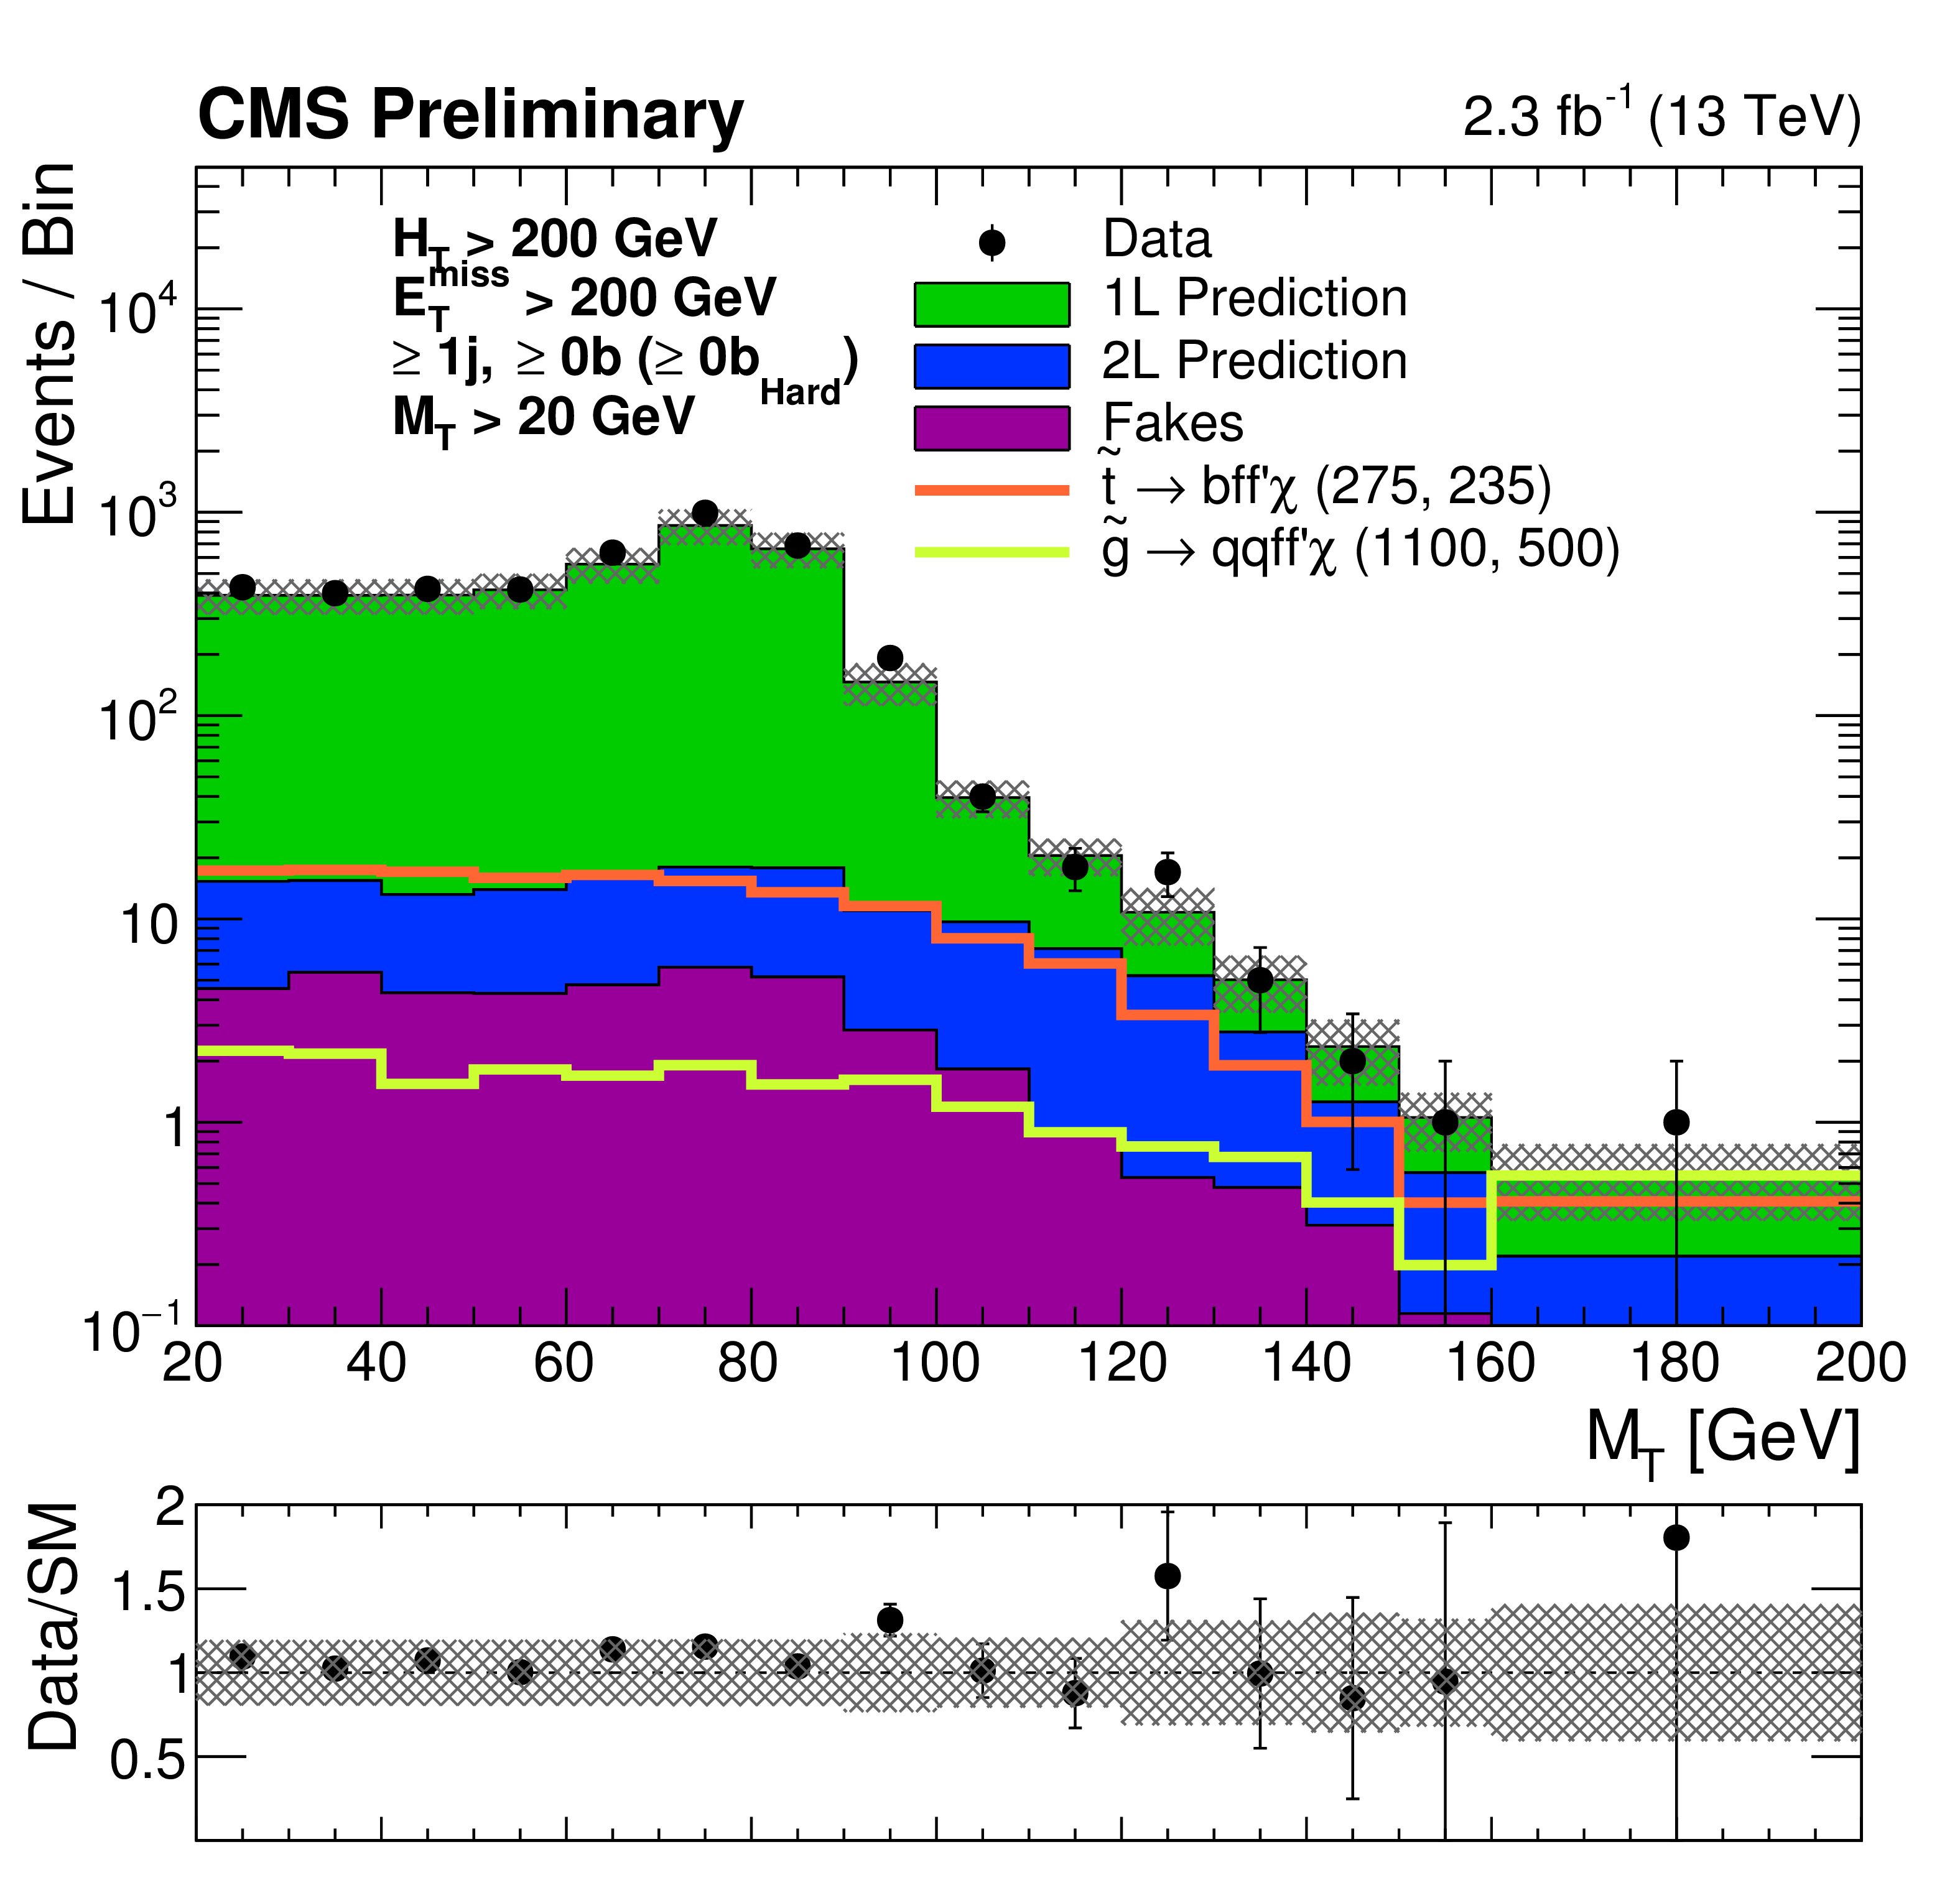
Figure 4-d:
Comparisons of estimated backgrounds and observed data events in the sum of all signal regions, as a function number of jets (a) heavy flavor category (b), ${E_{\mathrm {T}}^{\text {miss}}}$ (c), ${m_{\mathrm {T}}(\vec{\ell} , {\vec{p}_{ \mathrm {T}}^{ \mathrm {miss}}} )}$ (d). Each estimated background distribution is formed by summing the MC shapes for all signal regions, where each MC shape is first scaled to the predicted background (pre-fit) in that region. The grey band represents the statistical and systematic uncertainty on the estimates. |
| Tables | |
png pdf |
Table 1:
Ranges of typical values for different sources of systematic uncertainty on the background estimates. |

png pdf |
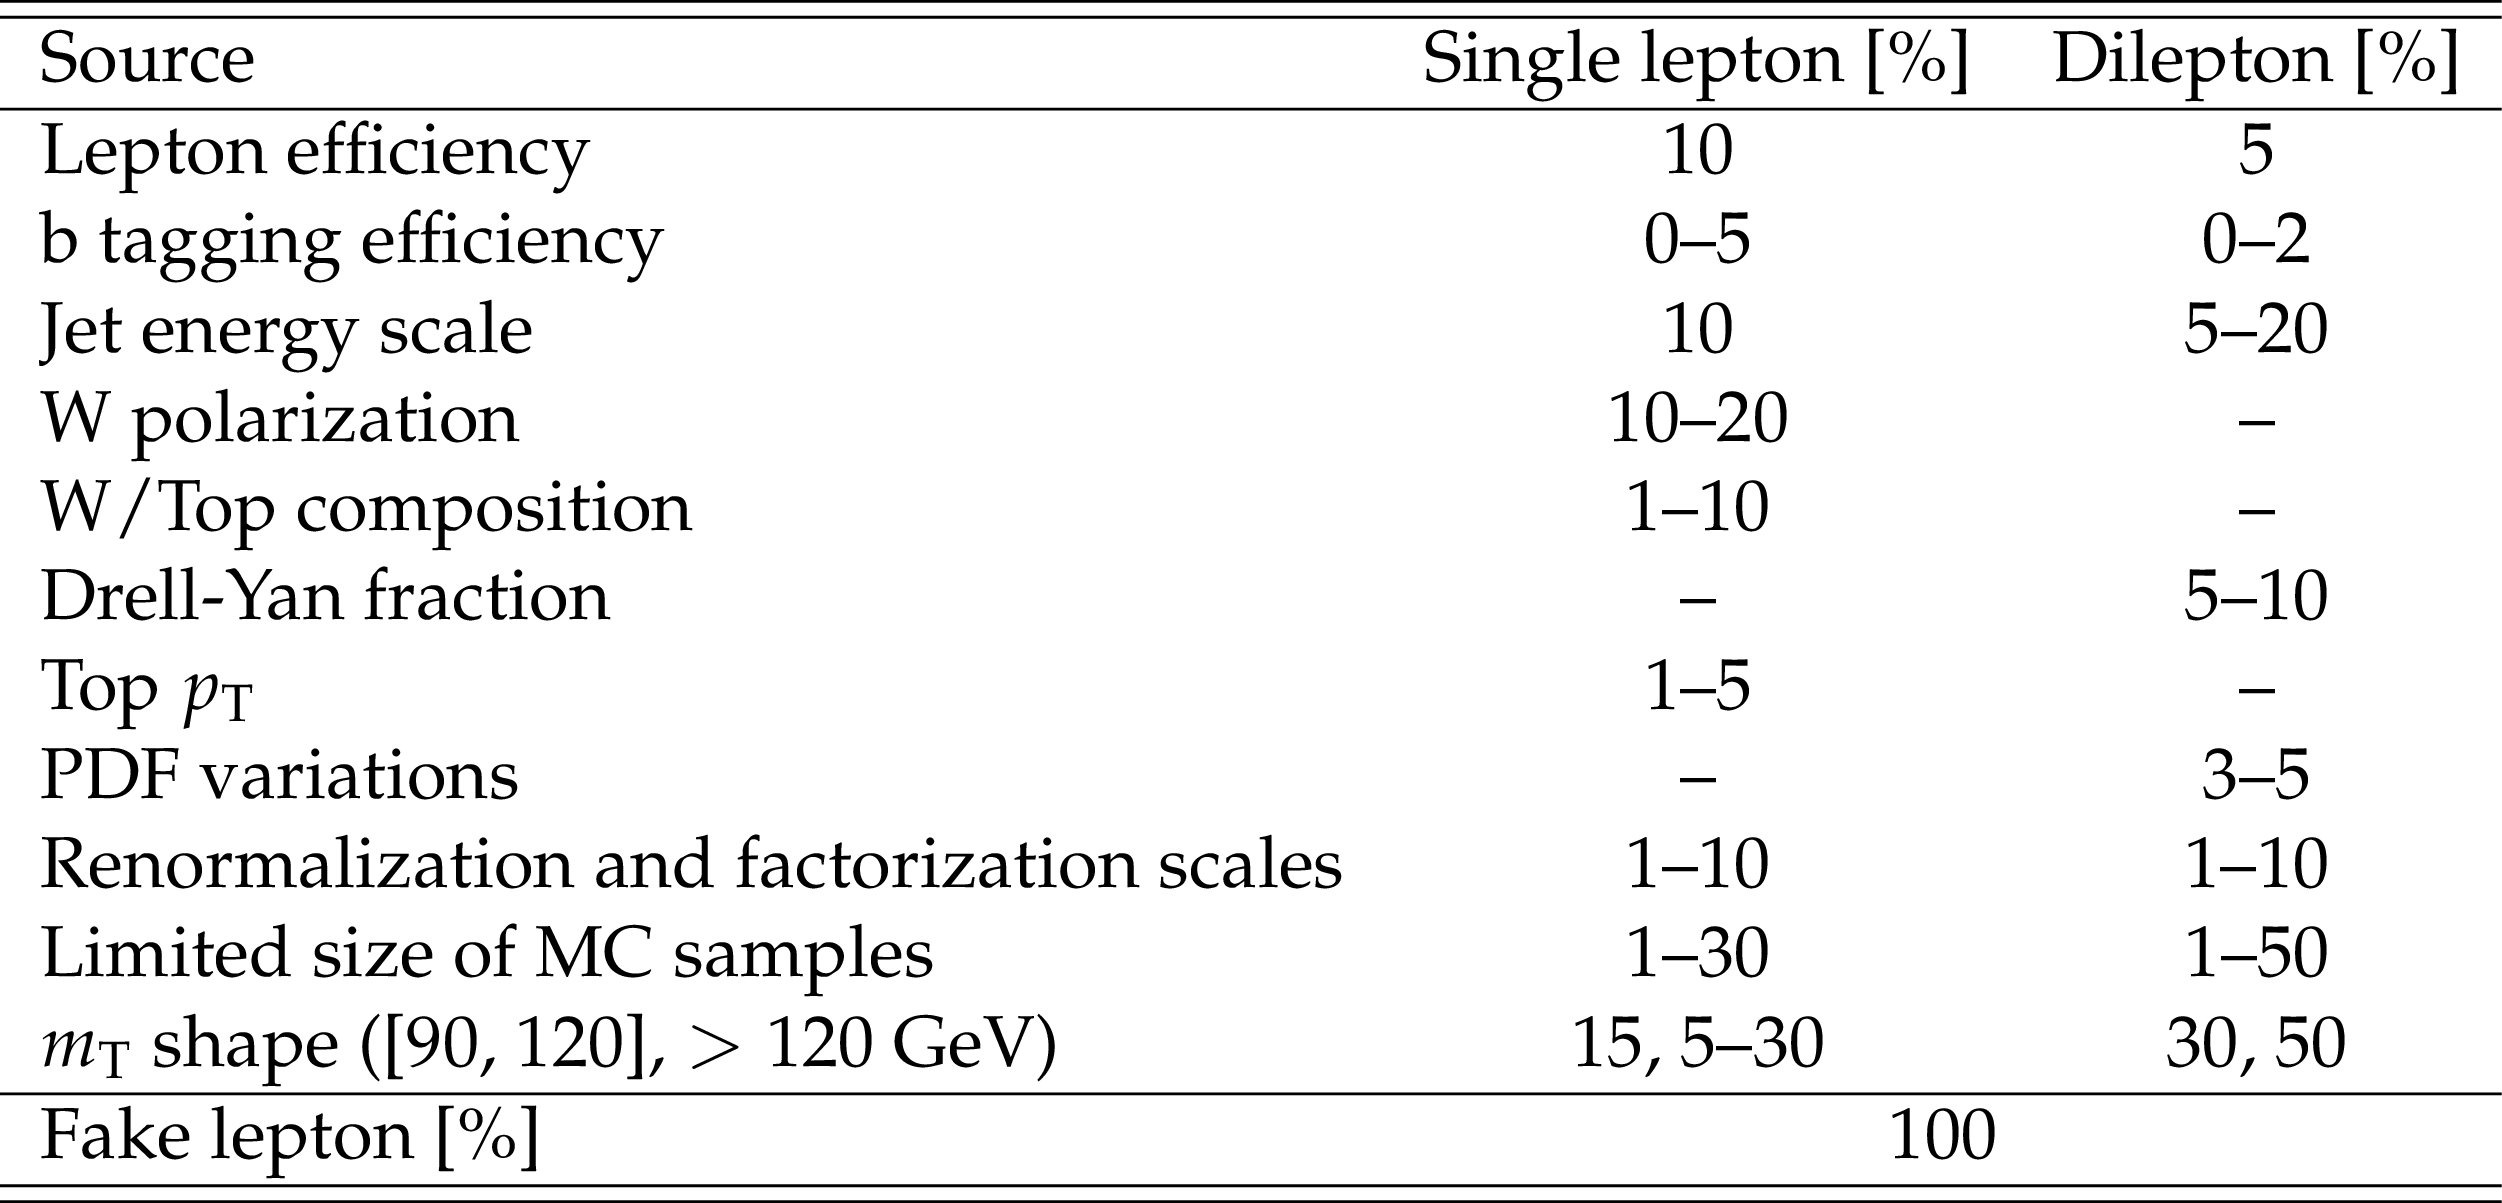
Table 2:
Ranges of typical values for different sources of systematic uncertainty on the signal yields. |
png pdf |
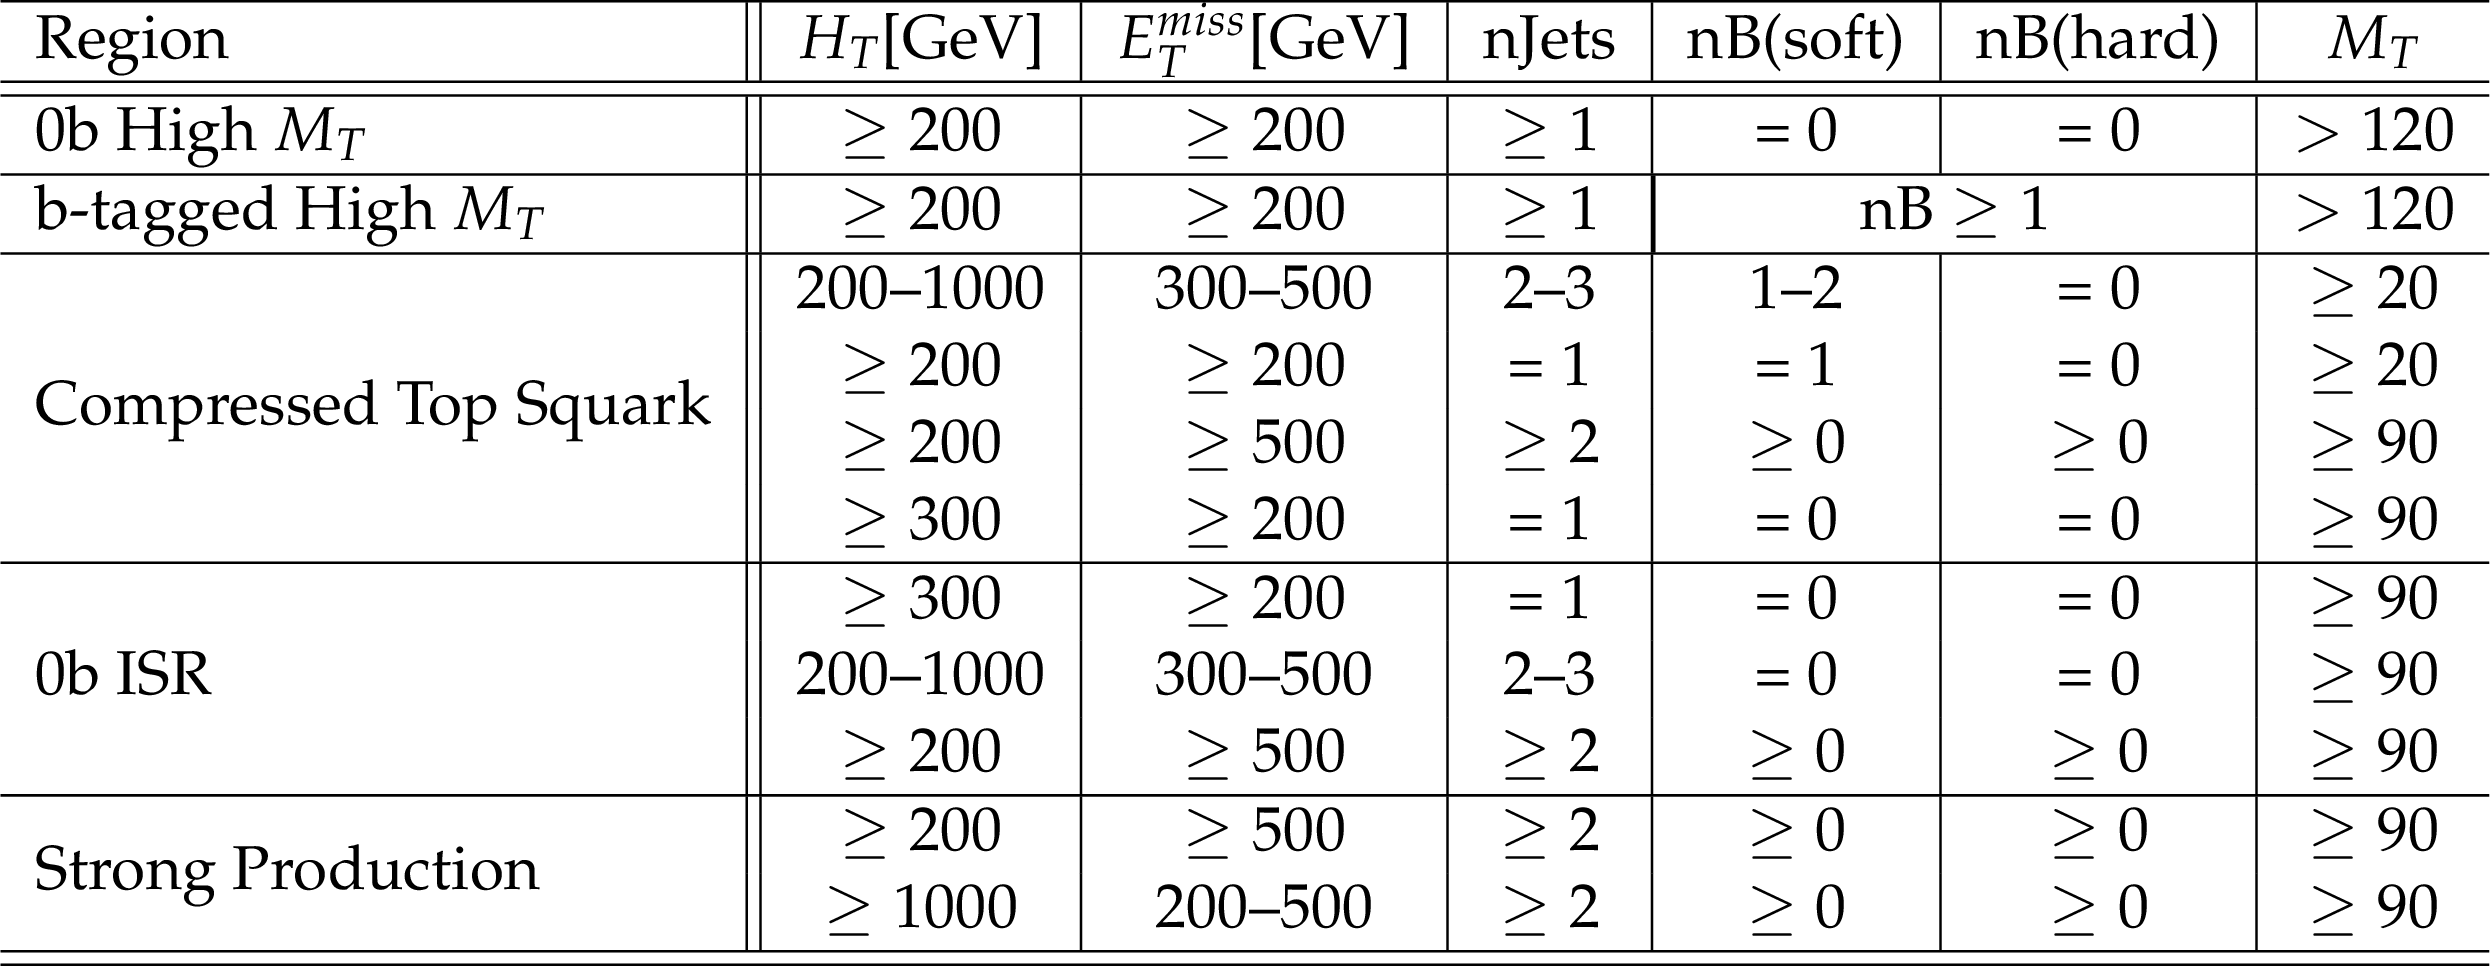
Table 3:
Definitions of aggregate signal regions. Each region is obtained by selecting all events that pass the logical OR of the listed selections. |
png pdf |
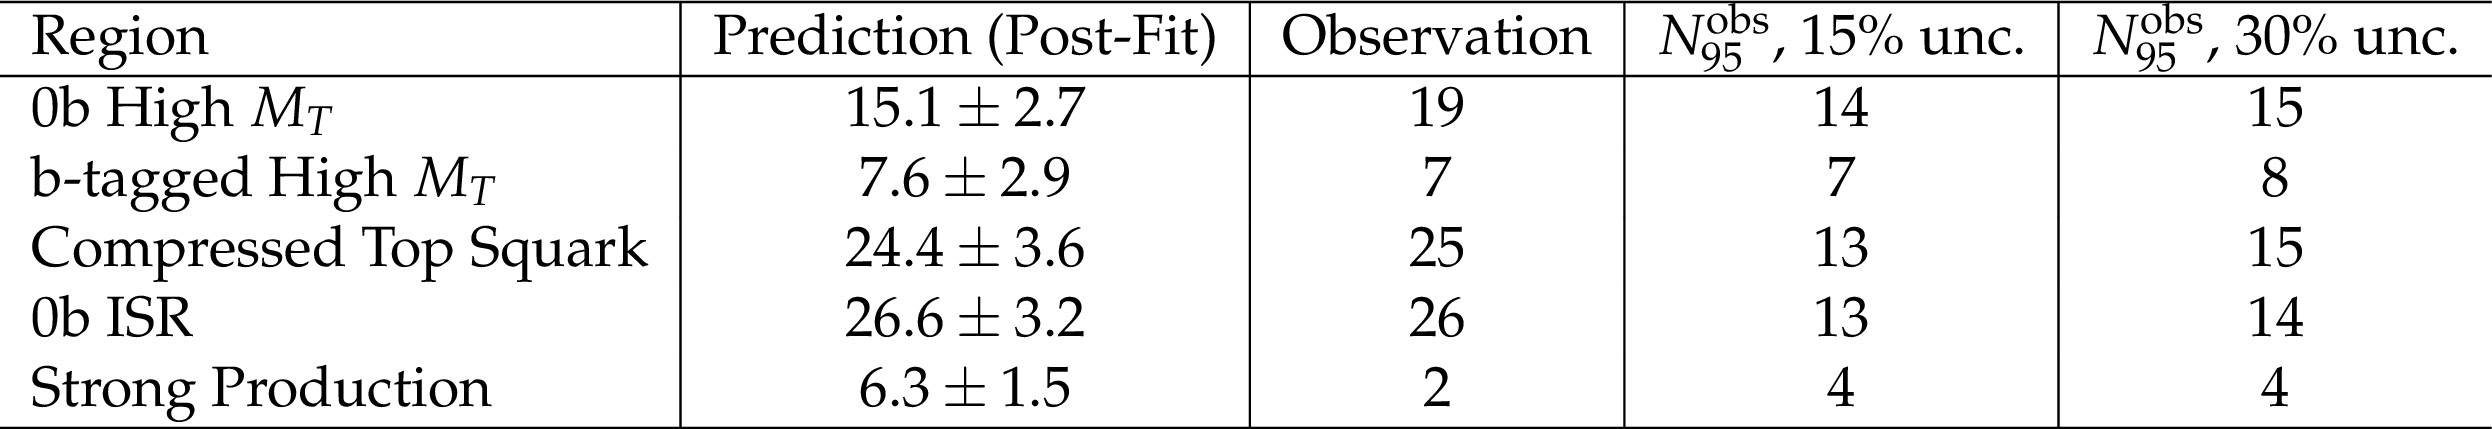
Table 4:
Post-fit predictions and observations for the aggregated regions defined in Table 3, together with the observed 95% CL limit on the number of signal events contributing to each region ($N_{95}^{\mathrm {obs}}$). A signal efficiency uncertainty of either 15 or 30% is assumed for calculating the limits. |
png pdf |
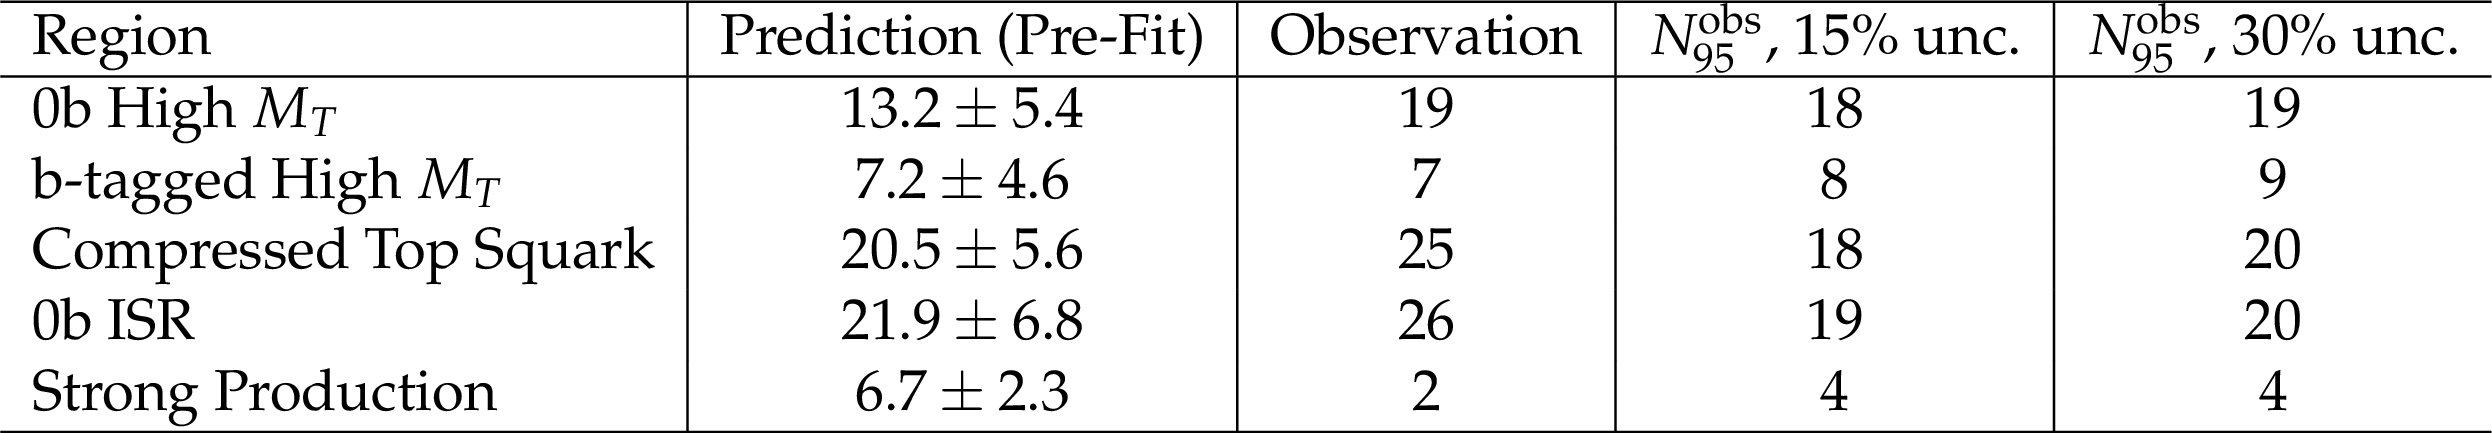
Table 5:
Pre-fit predictions and observations for the aggregated regions defined in Table 3, together with the observed 95% CL limit on the number of signal events contributing to each region ($N_{95}^{\mathrm {obs}}$). A signal efficiency uncertainty of either 15 or 30% is assumed for calculating the limits. |
png pdf |
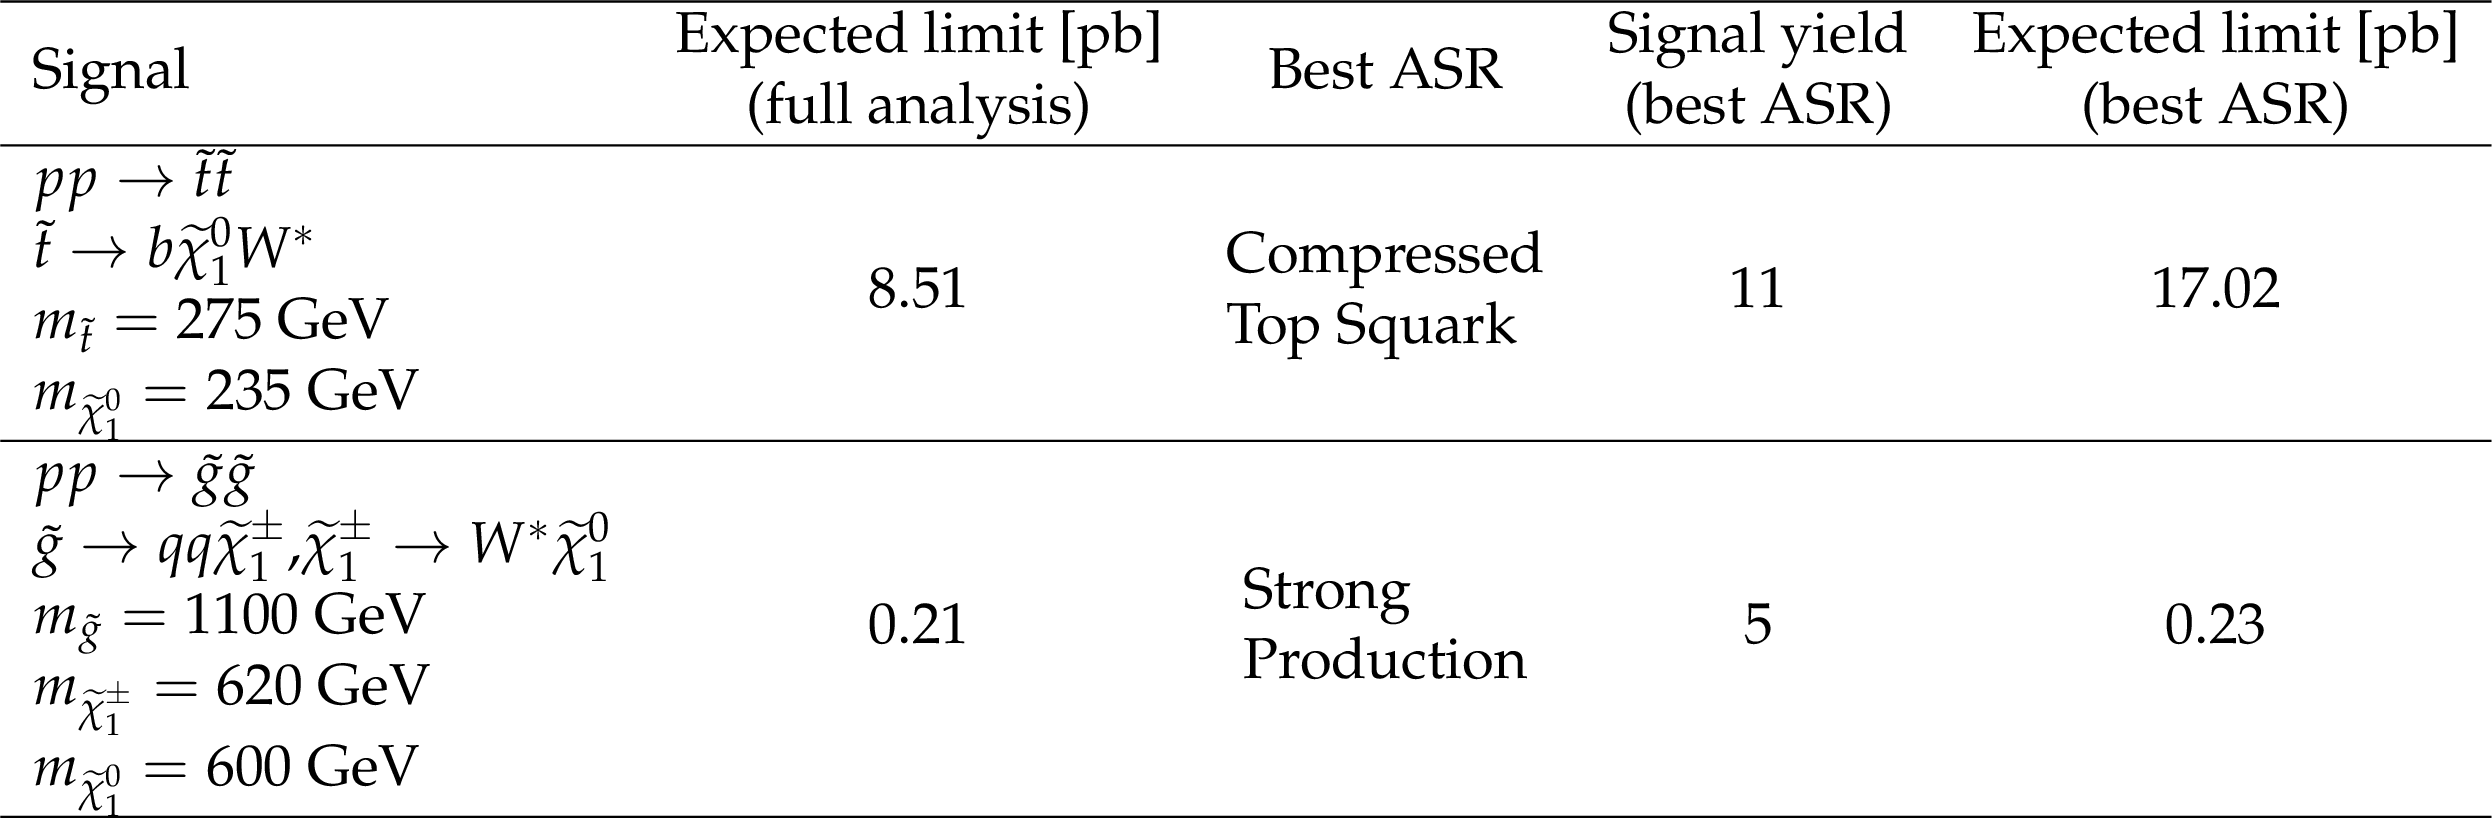
Table 6:
Expected upper limits on the cross section of different simplified models, as determined from the full analysis, are compared to the upper limits obtained using only the aggregate signal region with the best sensitivity to each considered signal model. A 15% uncertainty in the signal selection efficiency is assumed for calculating these limits. The signal yields expected for an integrated luminosity of 2.3 fb are also shown. |
| Summary |
| This note presents the results of a search for new physics using events with one soft lepton and large $E_{\mathrm{T}}^{\text{miss}}$, inclusive in jet flavor and multiplicity. Results are based on a 2.3 fb$^{-1}$ data sample of $\sqrt{s}=$ 13 TeV proton-proton collisions collected with the CMS detector. No significant deviations from the standard model expectations are observed, and the results are used to set limits on models featuring compressed spectra. For pair production of top squarks decaying into four bodies, $\widetilde{t} \rightarrow b \widetilde\chi^{0} l (q) \nu (q^\prime)$, top squark masses below 340 GeV are excluded for $m_{\widetilde{t}} - m_{\widetilde\chi^{0}} =$ 50 GeV. For gluino pair production decaying to $\widetilde{g} \rightarrow q\bar{q} \widetilde\chi^{\pm}$ followed by $\widetilde\chi^{\pm} \rightarrow W^{*} \widetilde\chi^{0}$, with $m_{\widetilde\chi^{\pm}} - m_{\widetilde\chi^{0}} = $ 20 GeV, gluino masses in the range 900-1200 GeV are excluded for $\widetilde\chi^{0}$ masses in the range 100-800 GeV. |
| References | ||||
| 1 | P. Ramond | Dual theory for free fermions | PRD 3 (1971) 2415 | |
| 2 | Y. A. Golfand and E. P. Likhtman | Extension of the algebra of Poincar$ \'e $ group generators and violation of P invariance | JEPTL 13 (1971)323 | |
| 3 | A. Neveu and J. H. Schwarz | Factorizable dual model of pions | Nucl. Phys. B 31 (1971) 86 | |
| 4 | D. V. Volkov and V. P. Akulov | Possible universal neutrino interaction | JEPTL 16 (1972)438 | |
| 5 | J. Wess and B. Zumino | A Lagrangian model invariant under supergauge transformations | PLB 49 (1974) 52 | |
| 6 | J. Wess and B. Zumino | Supergauge transformations in four dimensions | Nucl. Phys. B 70 (1974) 39 | |
| 7 | P. Fayet | Supergauge invariant extension of the Higgs mechanism and a model for the electron and its neutrino | Nucl. Phys. B 90 (1975) 104 | |
| 8 | H. P. Nilles | Supersymmetry, supergravity and particle physics | Phys. Rep. 110 (1984) 1 | |
| 9 | CMS Collaboration | Search for new physics with the MT2 variable in all-jets final states produced in pp collisions at sqrt(s) = 13 TeV | CMS-SUS-15-003 1603.04053 |
|
| 10 | CMS Collaboration | Search for supersymmetry in the multijet and missing transverse momentum final state in pp collisions at 13 TeV | Submitted to PLB | CMS-SUS-15-002 1602.06581 |
| 11 | ATLAS Collaboration | Search for new phenomena in final states with large jet multiplicities and missing transverse momentum with ATLAS using $ \sqrt{s} = 13 $ TeV proton--proton collisions | Submitted to PLB | 1602.06194 |
| 12 | ATLAS Collaboration | Search for squarks and gluinos in final states with jets and missing transverse momentum at $ \sqrt{s}= $ 13 TeV with the ATLAS detector | 1605.03814 | |
| 13 | CMS Collaboration | Search for supersymmetry in events with one lepton in proton-proton collisions at sqrt(s)=13 TeV with the CMS experiment | CMS-PAS-SUS-15-008 | CMS-PAS-SUS-15-008 |
| 14 | CMS Collaboration | Search for supersymmetry in pp collisions at sqrt(s)= 13 TeV in the single-lepton final state using the sum of masses of large radius jets | CMS-PAS-SUS-15-007 | CMS-PAS-SUS-15-007 |
| 15 | CMS Collaboration | Search for direct top squark pair production in the single lepton final state at sqrt(s) = 13 TeV | CMS-PAS-SUS-16-002 | CMS-PAS-SUS-16-002 |
| 16 | J. Alwall et al. | The automated computation of tree-level and next-to-leading order differential cross sections, and their matching to parton shower simulations | JHEP 07 (2014) 079 | 1405.0301 |
| 17 | S. Alioli, P. Nason, C. Oleari, and E. Re | NLO single-top production matched with shower in POWHEG: $ s $- and $ t $-channel contributions | JHEP 09 (2009) 111, , [Erratum: \DOI10.1007/JHEP02(2010)011] | 0907.4076 |
| 18 | E. Re | Single-top Wt-channel production matched with parton showers using the POWHEG method | EPJC 71 (2011) 1547 | 1009.2450 |
| 19 | J. Alwall et al. | MadGraph 5: going beyond | JHEP 06 (2011) 128 | 1106.0522 |
| 20 | T. Sjostrand, S. Mrenna, and P. Z. Skands | A Brief Introduction to PYTHIA 8.1 | CPC 178 (2008) 852--867 | 0710.3820 |
| 21 | R. Grber, M. M. Mhlleitner, E. Popenda, and A. Wlotzka | Light Stop Decays: Implications for LHC Searches | EPJC75 (2015) 420 | 1408.4662 |
| 22 | GEANT4 Collaboration | GEANT4---a simulation toolkit | NIMA 506 (2003) 250 | |
| 23 | S. Abdullin et al. | The fast simulation of the CMS detector at LHC | J. Phys. Conf. Ser. 331 (2011) 032049 | |
| 24 | CMS Collaboration | The CMS experiment at the CERN LHC | JINST 3 (2008) S08004 | CMS-00-001 |
| 25 | CMS Collaboration | Particle-Flow Event Reconstruction in CMS and Performance for Jets, Taus, and MET | Technical Report CMS-PAS-PFT-09-001, CERN | |
| 26 | CMS Collaboration | Commissioning of the Particle-flow Event Reconstruction with the first LHC collisions recorded in the CMS detector | CDS | |
| 27 | M. Cacciari, G. P. Salam, and G. Soyez | The anti-$ k_t $ jet clustering algorithm | JHEP 04 (2008) 063 | 0802.1189 |
| 28 | CMS Collaboration | Determination of jet energy calibration and transverse momentum resolution in CMS | JINST 6 (2011) P11002 | CMS-JME-10-011 1107.4277 |
| 29 | CMS Collaboration | Performance of b-Tagging Algorithms in 50ns Data at 13 TeV | CDS | |
| 30 | CMS Collaboration | Electron reconstruction and identification at sqrt(s) = 7 TeV | CDS | |
| 31 | CMS Collaboration | Search for SUSY in same-sign dilepton events at sqrt(s) = 13 TeV | CMS-PAS-SUS-15-008 | CMS-PAS-SUS-15-008 |
| 32 | A. L. Read | Presentation of search results: The CL$ _\mathrm{s} $ technique | JPG 28 (2002) 2693 | |
| 33 | T. Junk | Confidence level computation for combining searches with small statistics | NIMA 434 (1999) 435 | hep-ex/9902006 |
| 34 | G. Cowan, K. Cranmer, E. Gross, and O. Vitells | Asymptotic formulae for likelihood-based tests of new physics | EPJC 71 (2011) 1554 | 1007.1727 |
| 35 | ATLAS and CMS Collaborations | Procedure for the LHC Higgs boson search combination in summer 2011 | CMS-NOTE-2011-005 | |
| 36 | CMS Collaboration | Search for top-squark pair production in the single-lepton final state in pp collisions at $ \sqrt{s} = 8 $ TeV | EPJC 73 (2013) 2677 | CMS-SUS-13-011 1308.1586 |
| 37 | CMS Collaboration | CMS Luminosity Measurement for the 2015 Data Taking Period | CMS-PAS-LUM-15-001 | CMS-PAS-LUM-15-001 |
|
|
Compact Muon Solenoid LHC, CERN |
|

|

|

|

|

|