

Compact Muon Solenoid
LHC, CERN
 Visit us: CMS Public Website, CMS Physics ;
Contact us: CMS Publications Committee
Visit us: CMS Public Website, CMS Physics ;
Contact us: CMS Publications Committee
| CMS-PAS-HIN-26-008 | ||
| Measurement of angular and invariant-mass distributions of same-sign dimuons in jets in proton-proton collisions at $ \sqrt{s}= $ 5.02 TeV | ||
| CMS Collaboration | ||
| 2026-07-15 | ||
| Abstract: Collinear beauty quark production within jets provides a sensitive test of perturbative quantum chromodynamics (pQCD) and of the modeling of $ \mathrm{b}\bar{\mathrm{b}} $ branchings during parton shower evolution and fragmentation. Normalized distributions of the angular separation and invariant mass of same-sign muon pairs are measured in proton-proton collisions at $ \sqrt{s}= $ 5.02 TeV, using data corresponding to an integrated luminosity of 306 $ \mathrm{pb}^{-1} $ collected with the CMS detector at the CERN LHC in 2017. The measurement is performed for jets with $ p_\mathrm{T} > $ 100 GeV containing two same-sign muons, each with $ p_\mathrm{T} > $ 8 GeV. Same-sign muon pairs are used to select a high-purity sample of jets containing two beauty hadrons, primarily produced through $ \mathrm{g} \to \mathrm{b}\bar{\mathrm{b}} $ splittings. The same-sign topology arises mainly when one muon is produced directly from the decay of a b-hadron, and the other muon of the same charge is produced in a charm hadron decay originating from the other b hadron. The angular separation between the same-sign muons from the sequential decay of the B hadrons retains sensitivity to the underlying properties of the $ \mathrm{b}\bar{\mathrm{b}} $ pair through the measured $ \Delta R_{\mu\mu} $ and $ m_{\mu\mu} $ distributions. They are corrected to the stable particle-level and compared with event-generator predictions incorporating leading- and next-to-leading-order pQCD calculations interfaced with parton showers and the respective hadronization effects. The results provide new benchmarks for the modeling of collinear beauty production and establish a proton-proton baseline for future heavy-ion studies aiming at constraining possible medium-induced modifications. | ||
| Links: CDS record (PDF) ; CADI line (restricted) ; | ||
| Figures | |
png pdf |
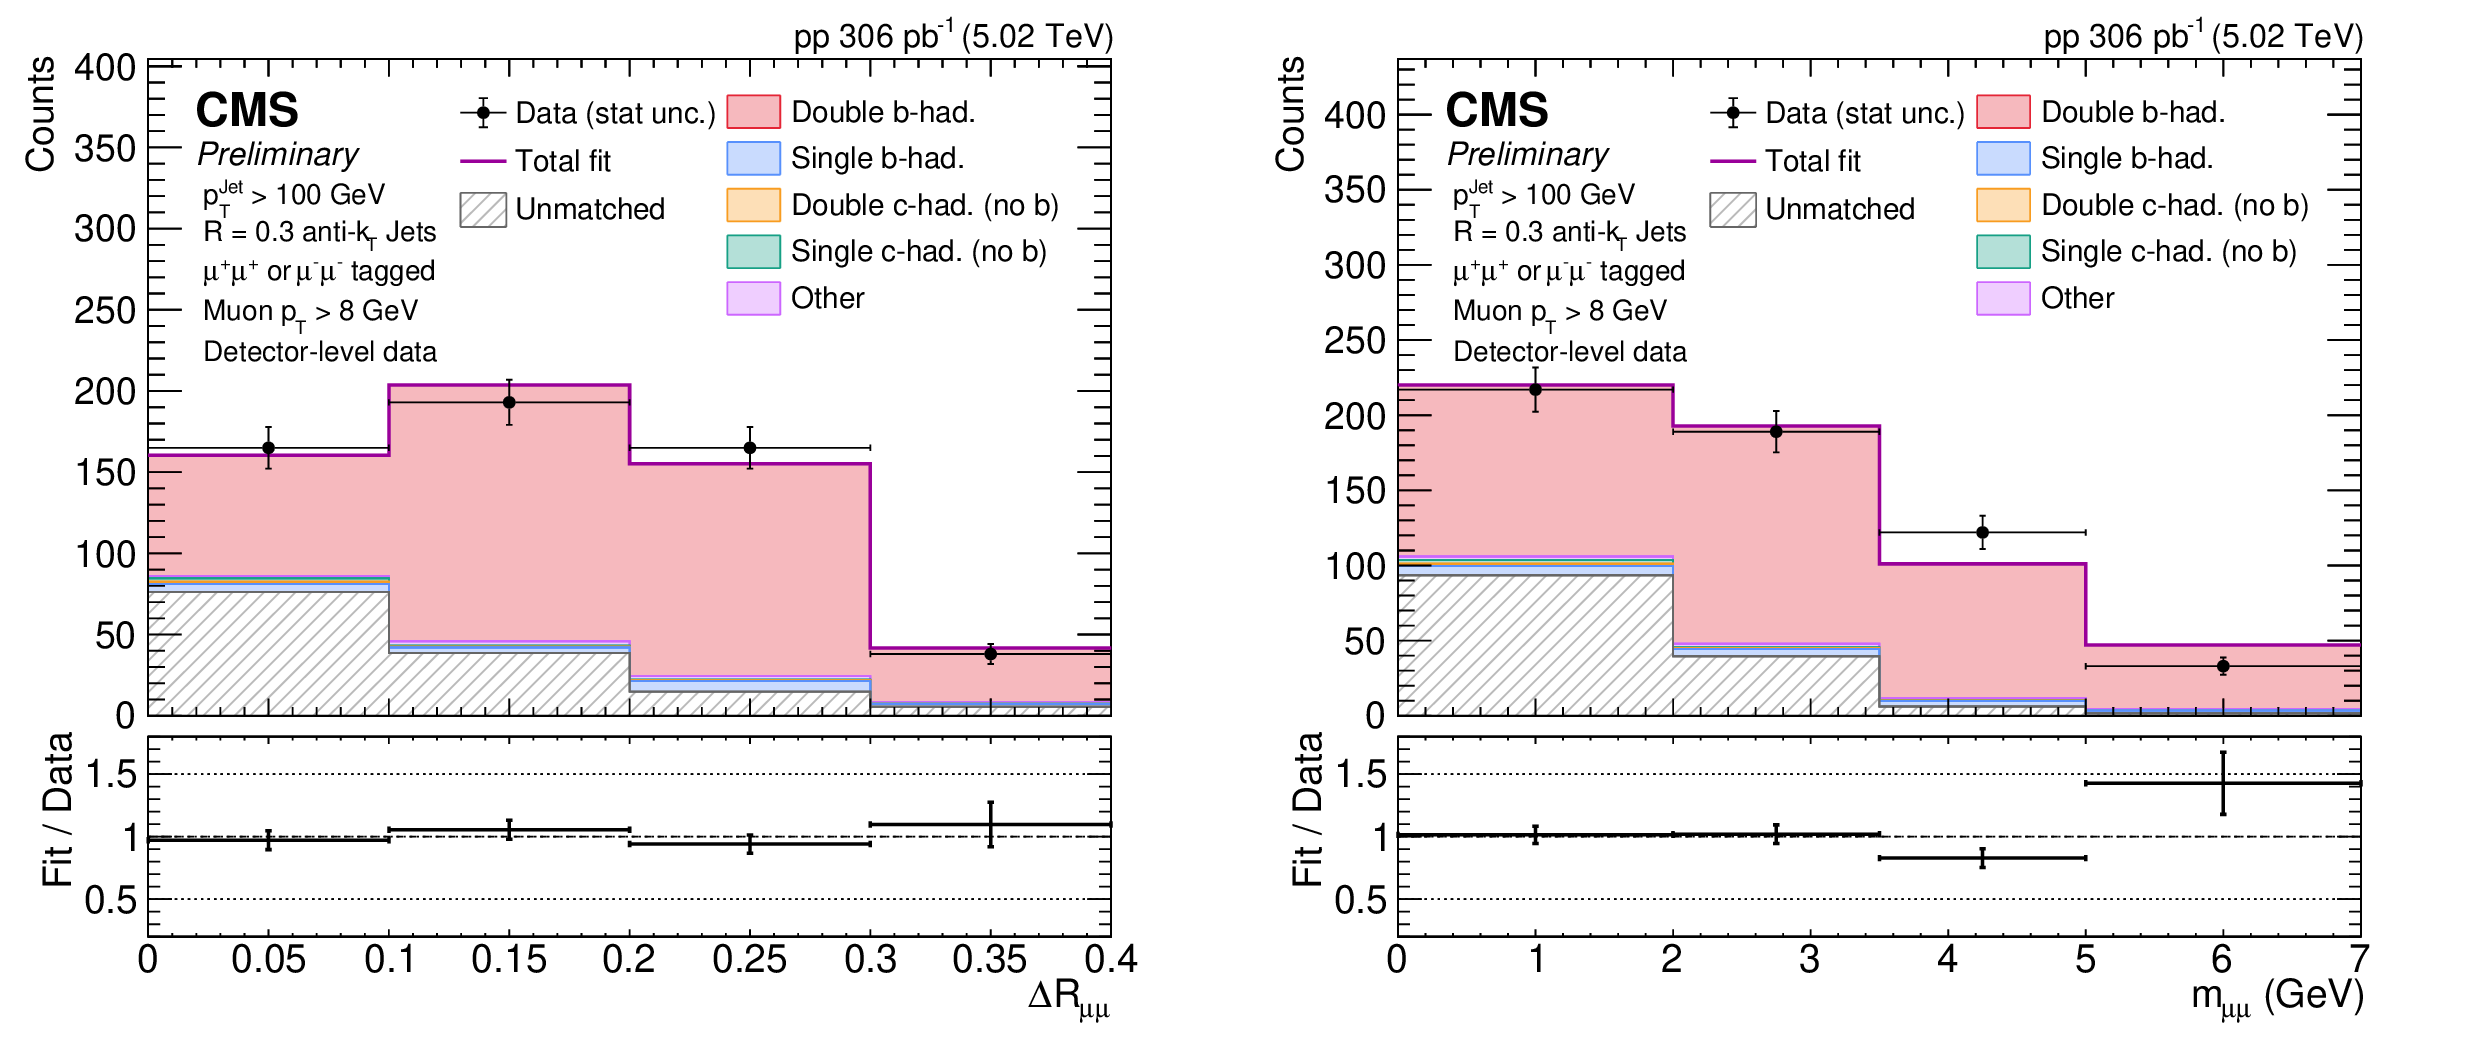
Figure 1:
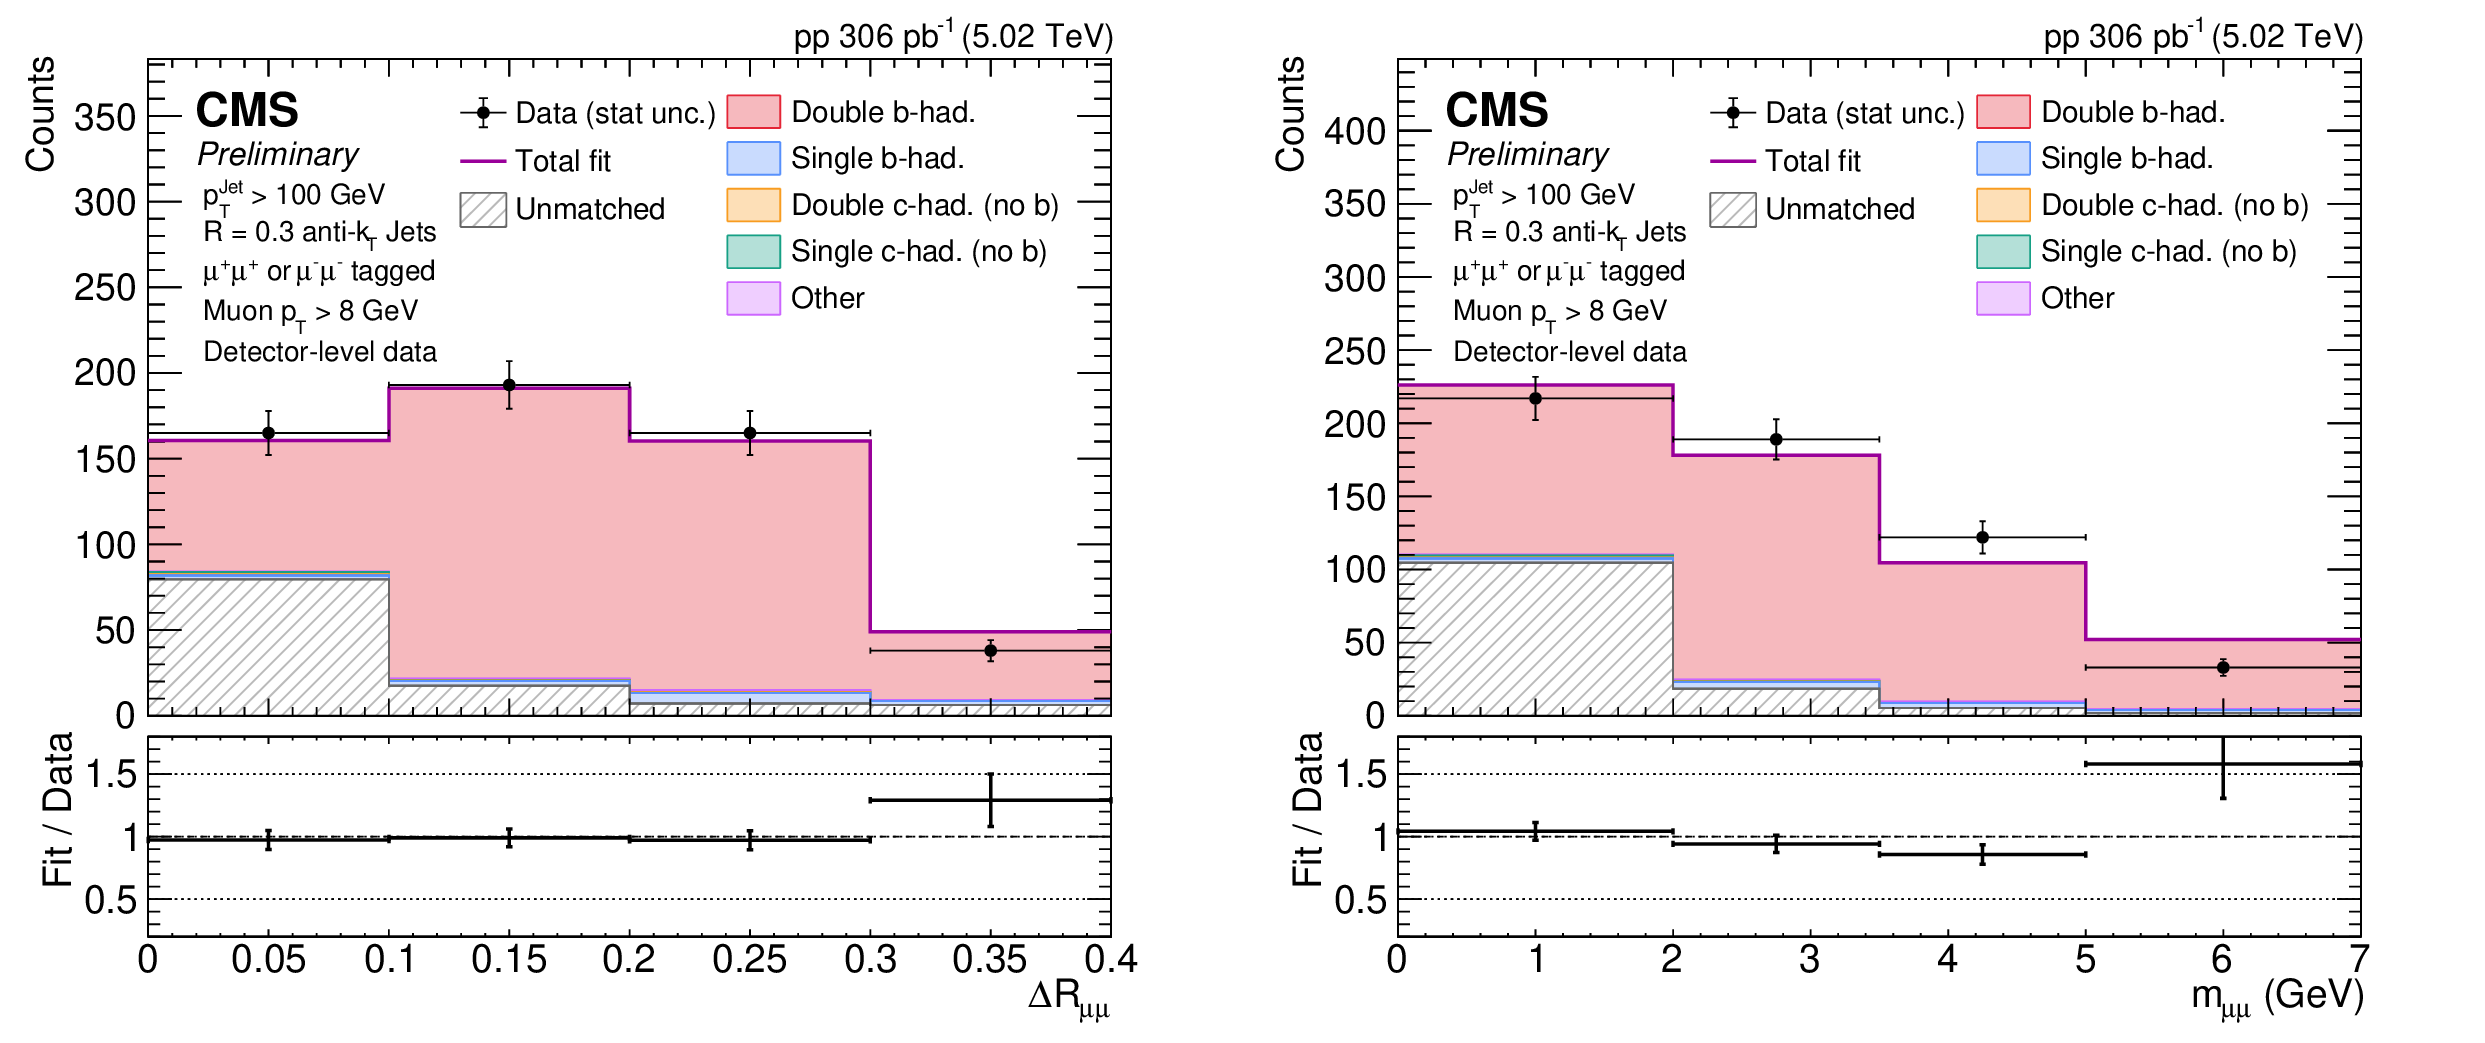
Reconstruction-level $ \Delta R_{\mu \mu} $ (left) and $ m_{\mu \mu} $ (right) distributions in data before subtraction of the unmatched dimuon contribution. The data are shown as black points and are compared with the fitted PYTHIA 8+ EVTGEN simulation. The estimated unmatched contribution, obtained from the template fit used in the purity correction, is shown as the hatched gray component. The generator-matched simulated contribution is further decomposed according to the generator-level heavy-flavor hadron content of the dimuon-tagged jet. |
png pdf |
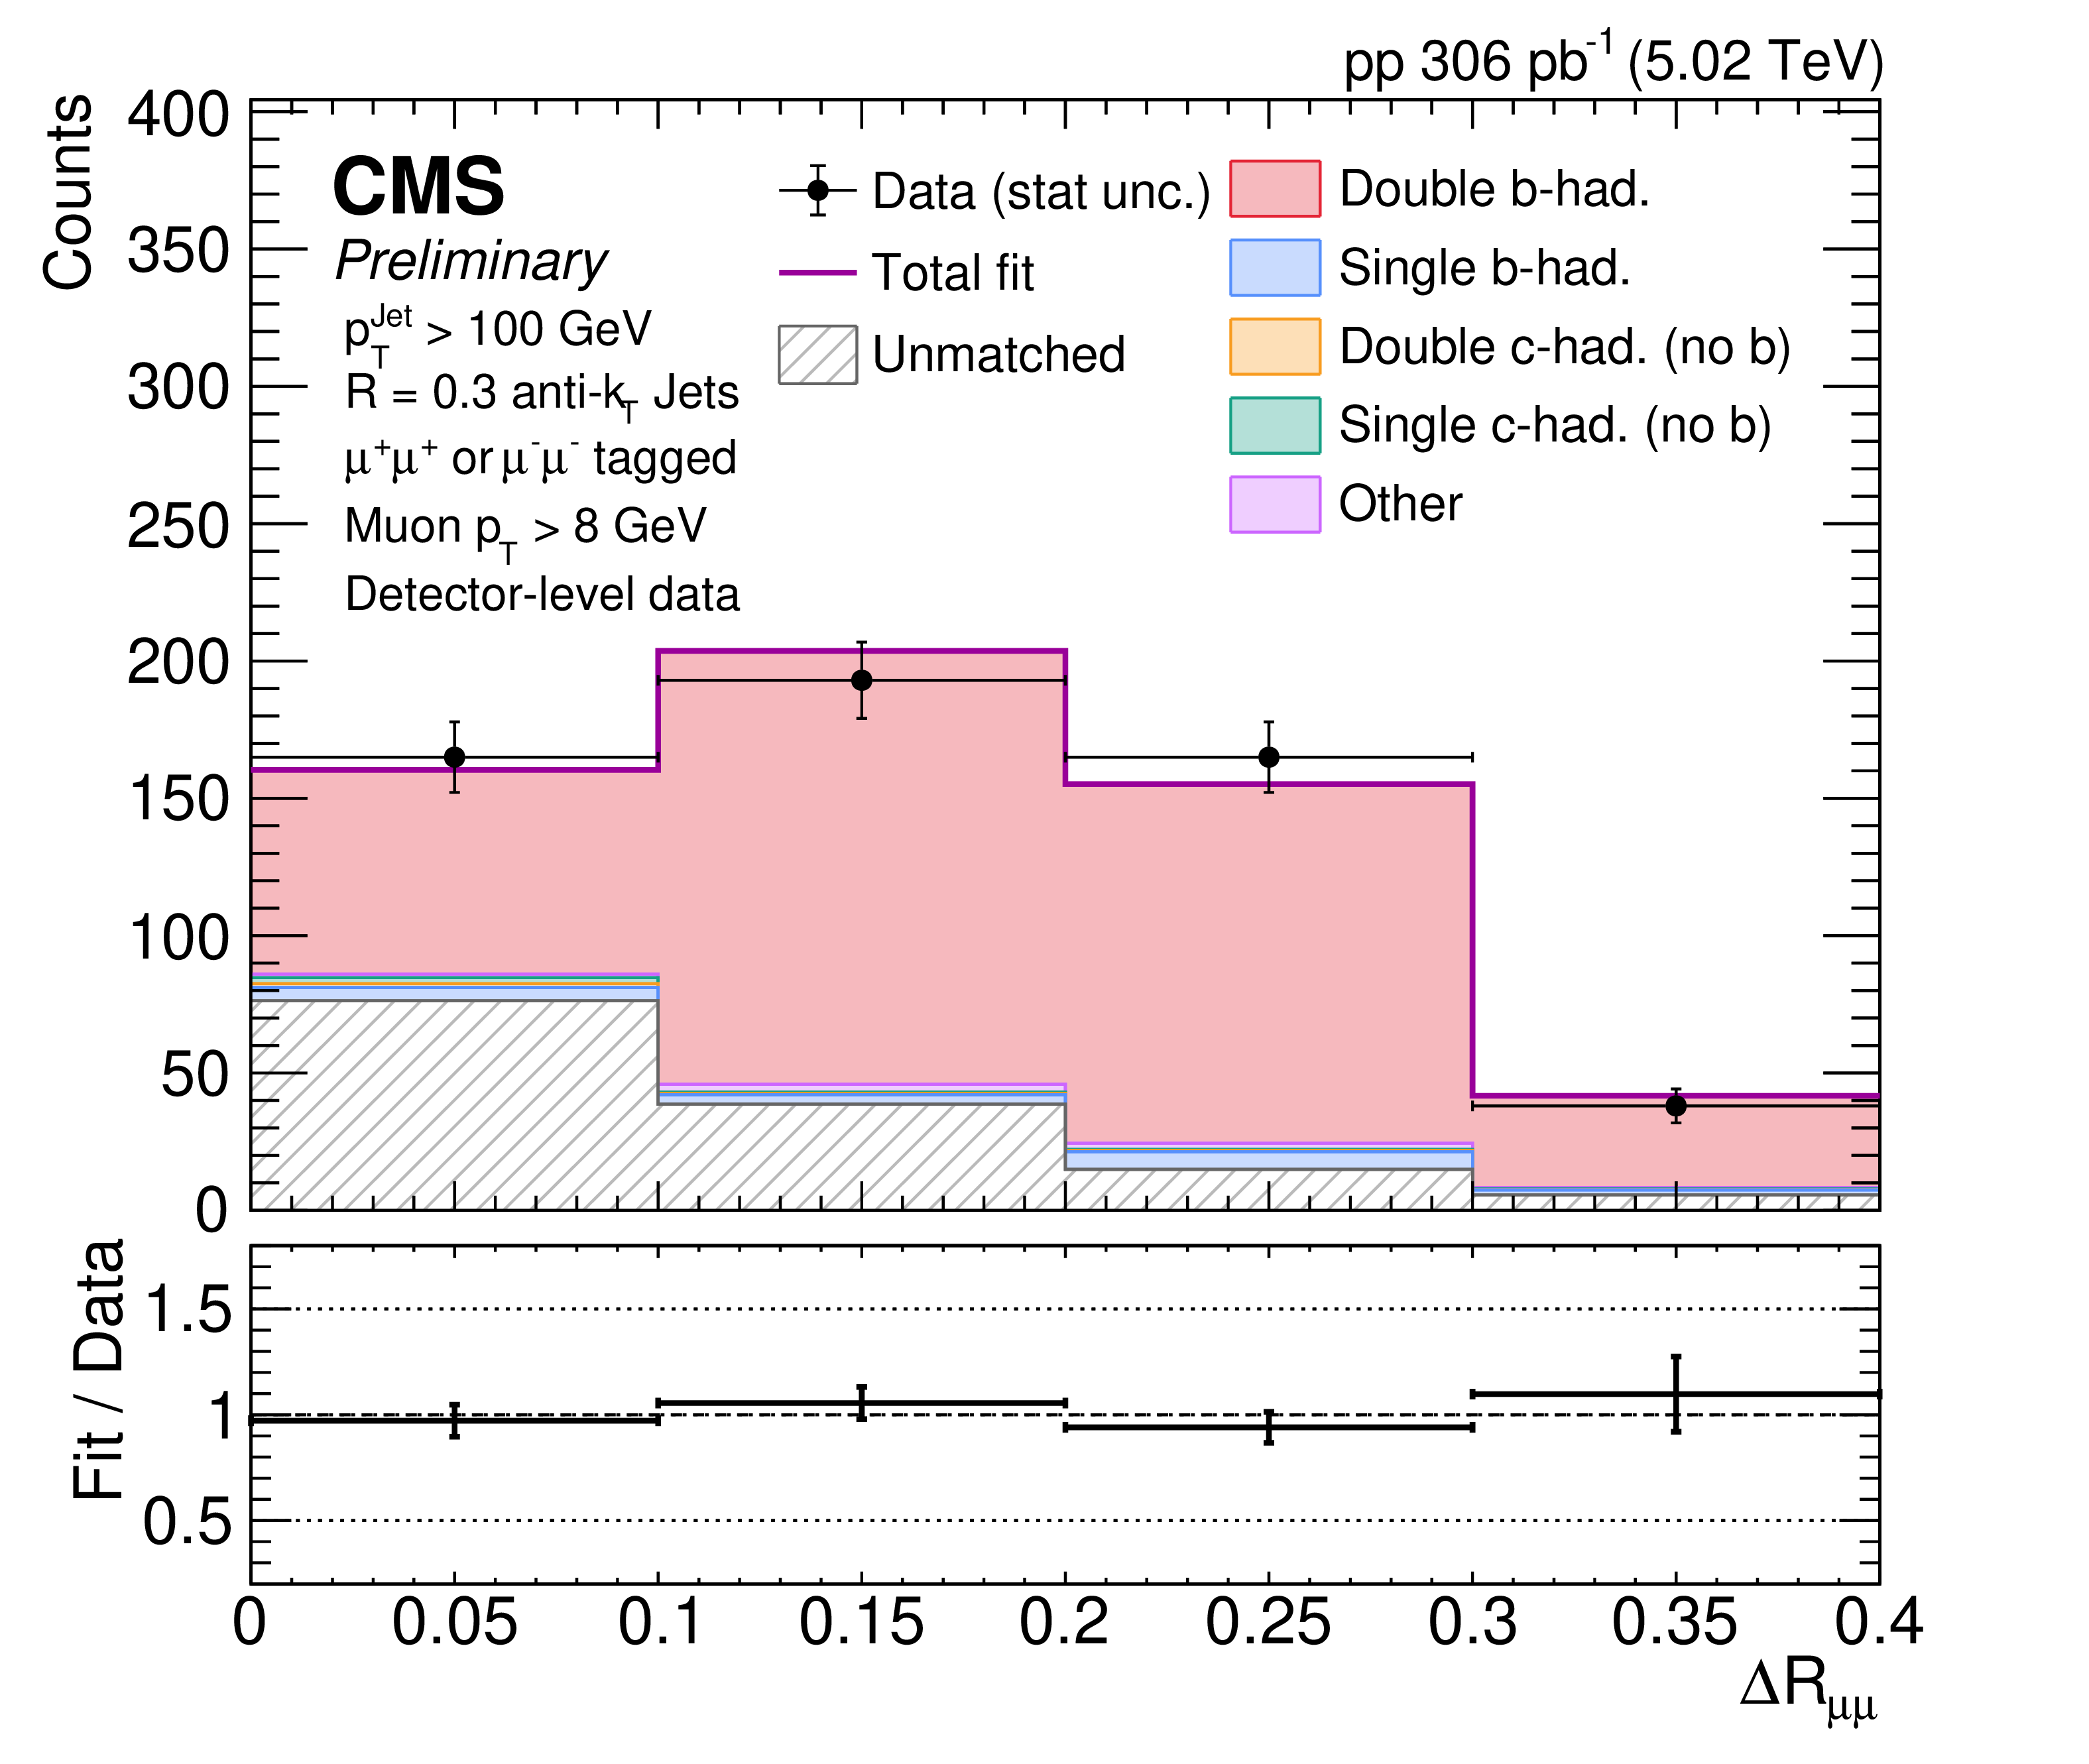
Figure 1-a:
Reconstruction-level $ \Delta R_{\mu \mu} $ (left) and $ m_{\mu \mu} $ (right) distributions in data before subtraction of the unmatched dimuon contribution. The data are shown as black points and are compared with the fitted PYTHIA 8+ EVTGEN simulation. The estimated unmatched contribution, obtained from the template fit used in the purity correction, is shown as the hatched gray component. The generator-matched simulated contribution is further decomposed according to the generator-level heavy-flavor hadron content of the dimuon-tagged jet. |
png pdf |
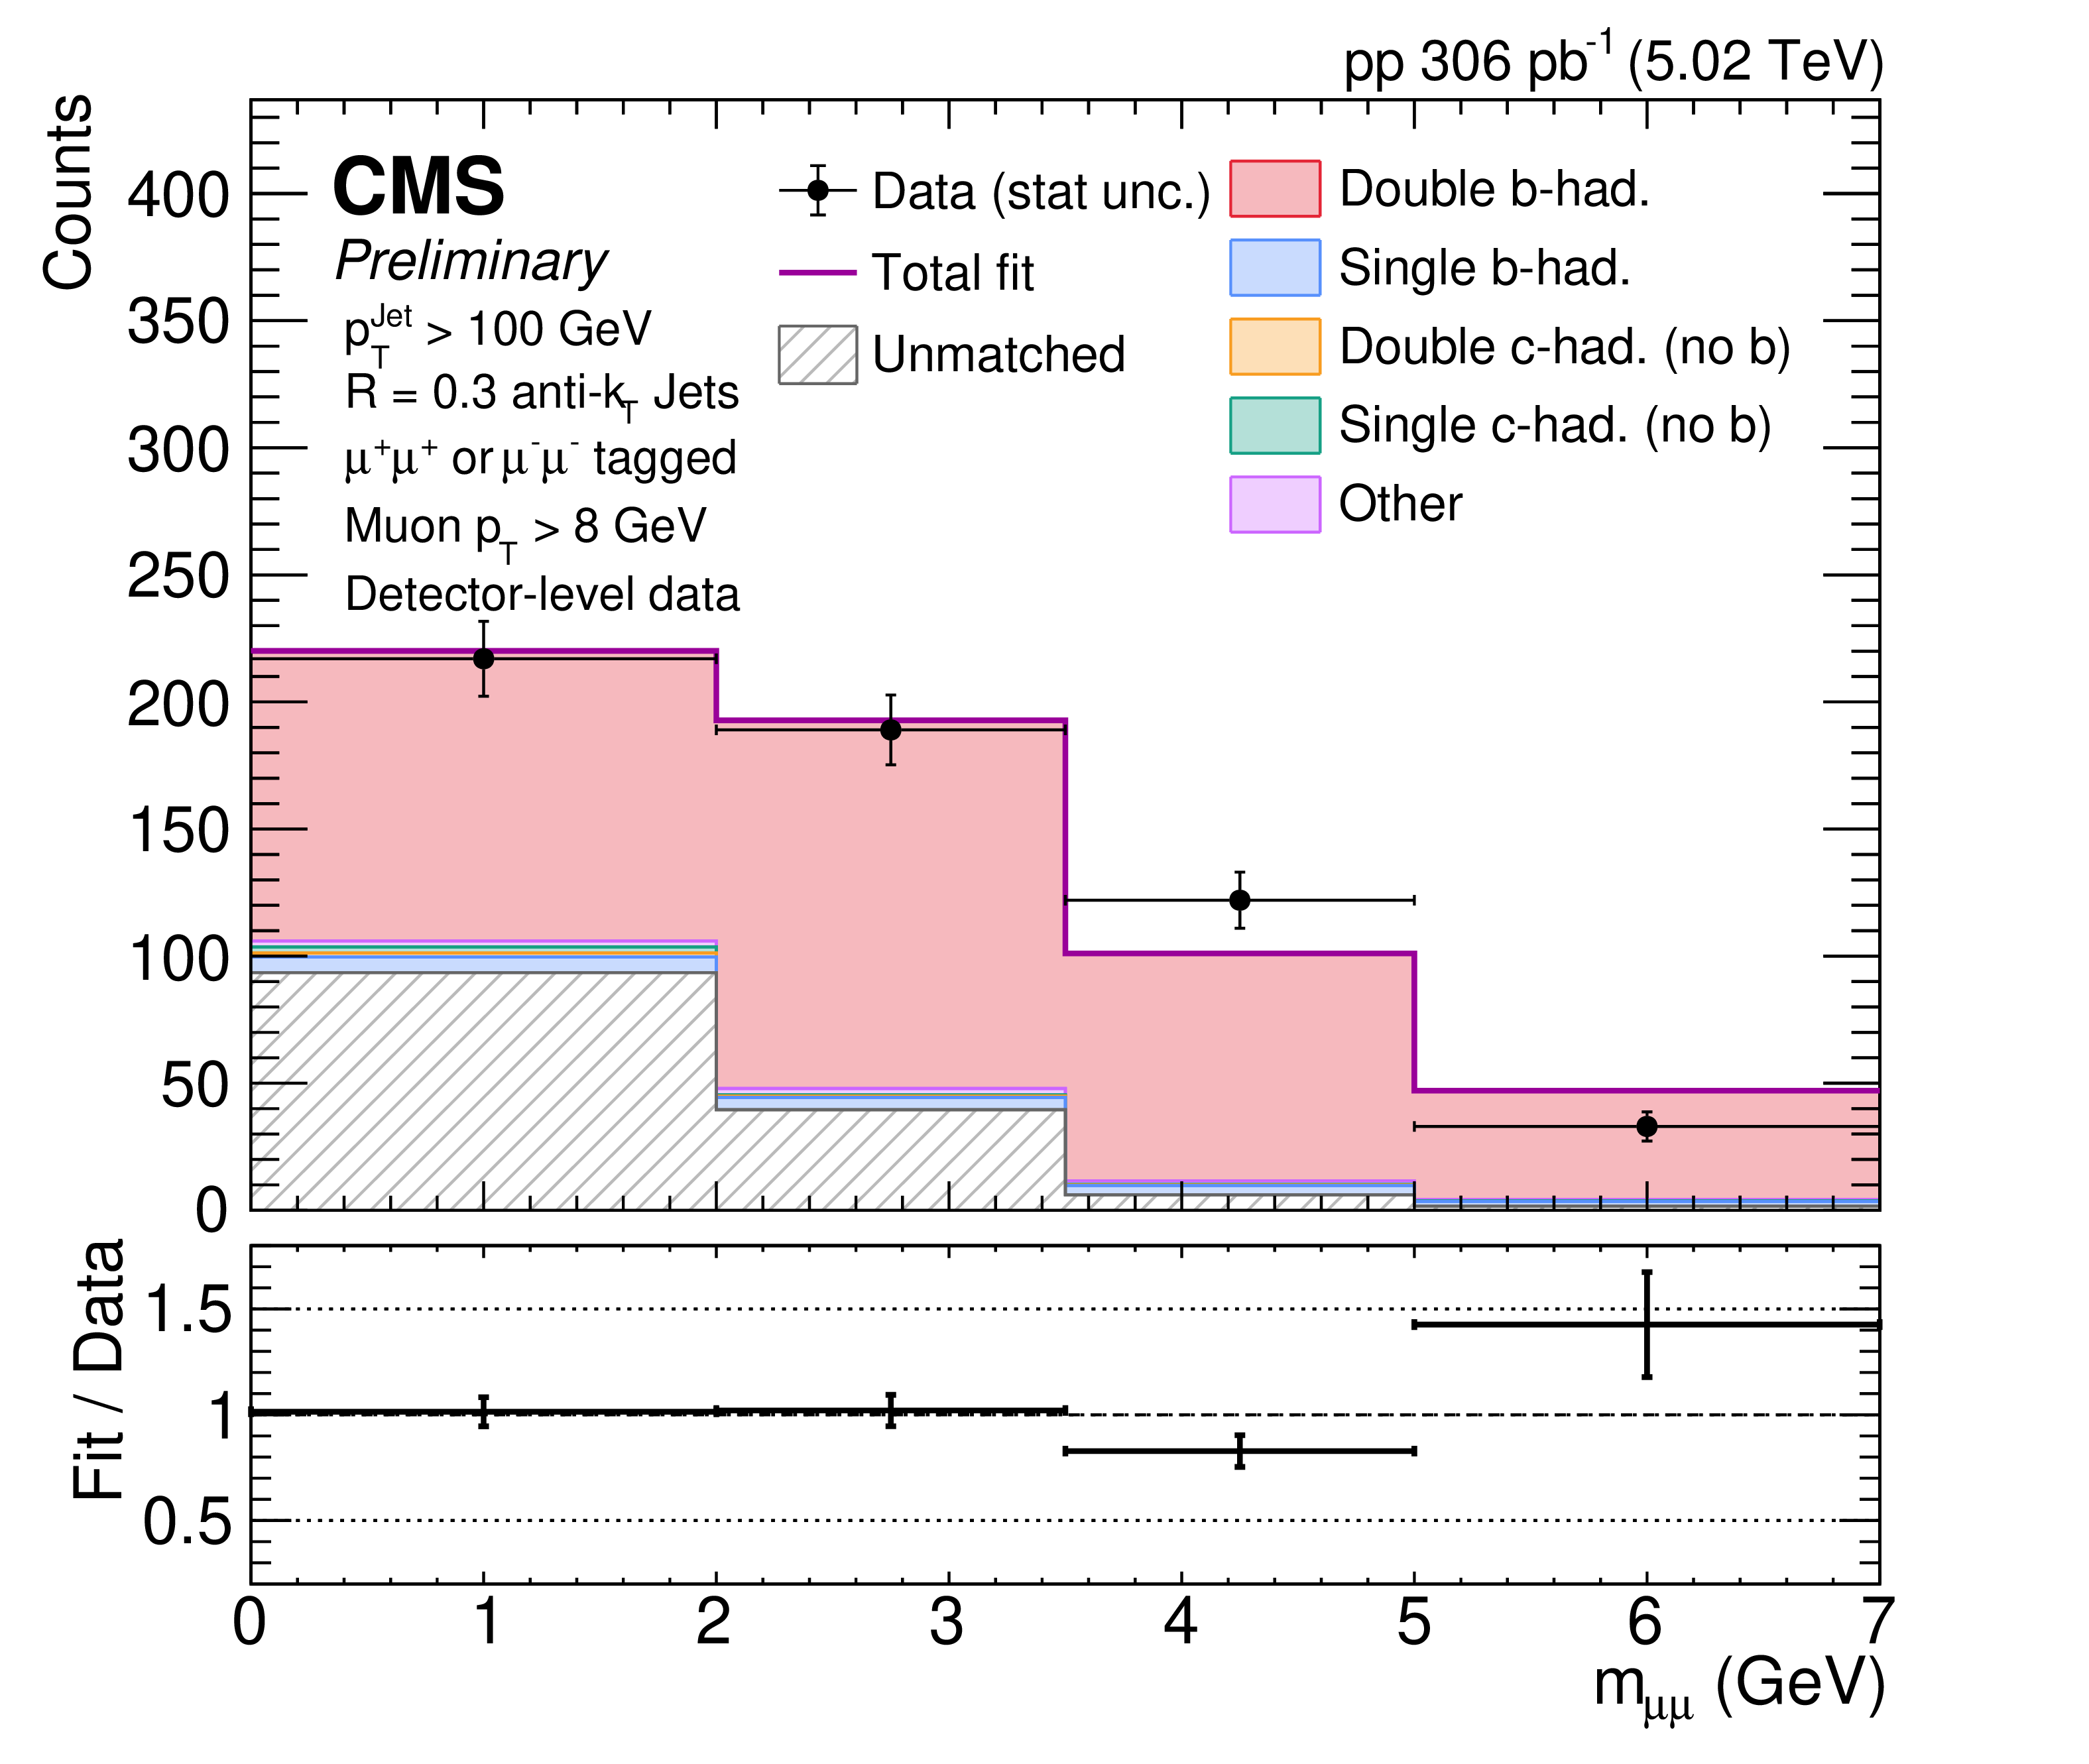
Figure 1-b:
Reconstruction-level $ \Delta R_{\mu \mu} $ (left) and $ m_{\mu \mu} $ (right) distributions in data before subtraction of the unmatched dimuon contribution. The data are shown as black points and are compared with the fitted PYTHIA 8+ EVTGEN simulation. The estimated unmatched contribution, obtained from the template fit used in the purity correction, is shown as the hatched gray component. The generator-matched simulated contribution is further decomposed according to the generator-level heavy-flavor hadron content of the dimuon-tagged jet. |
png pdf |
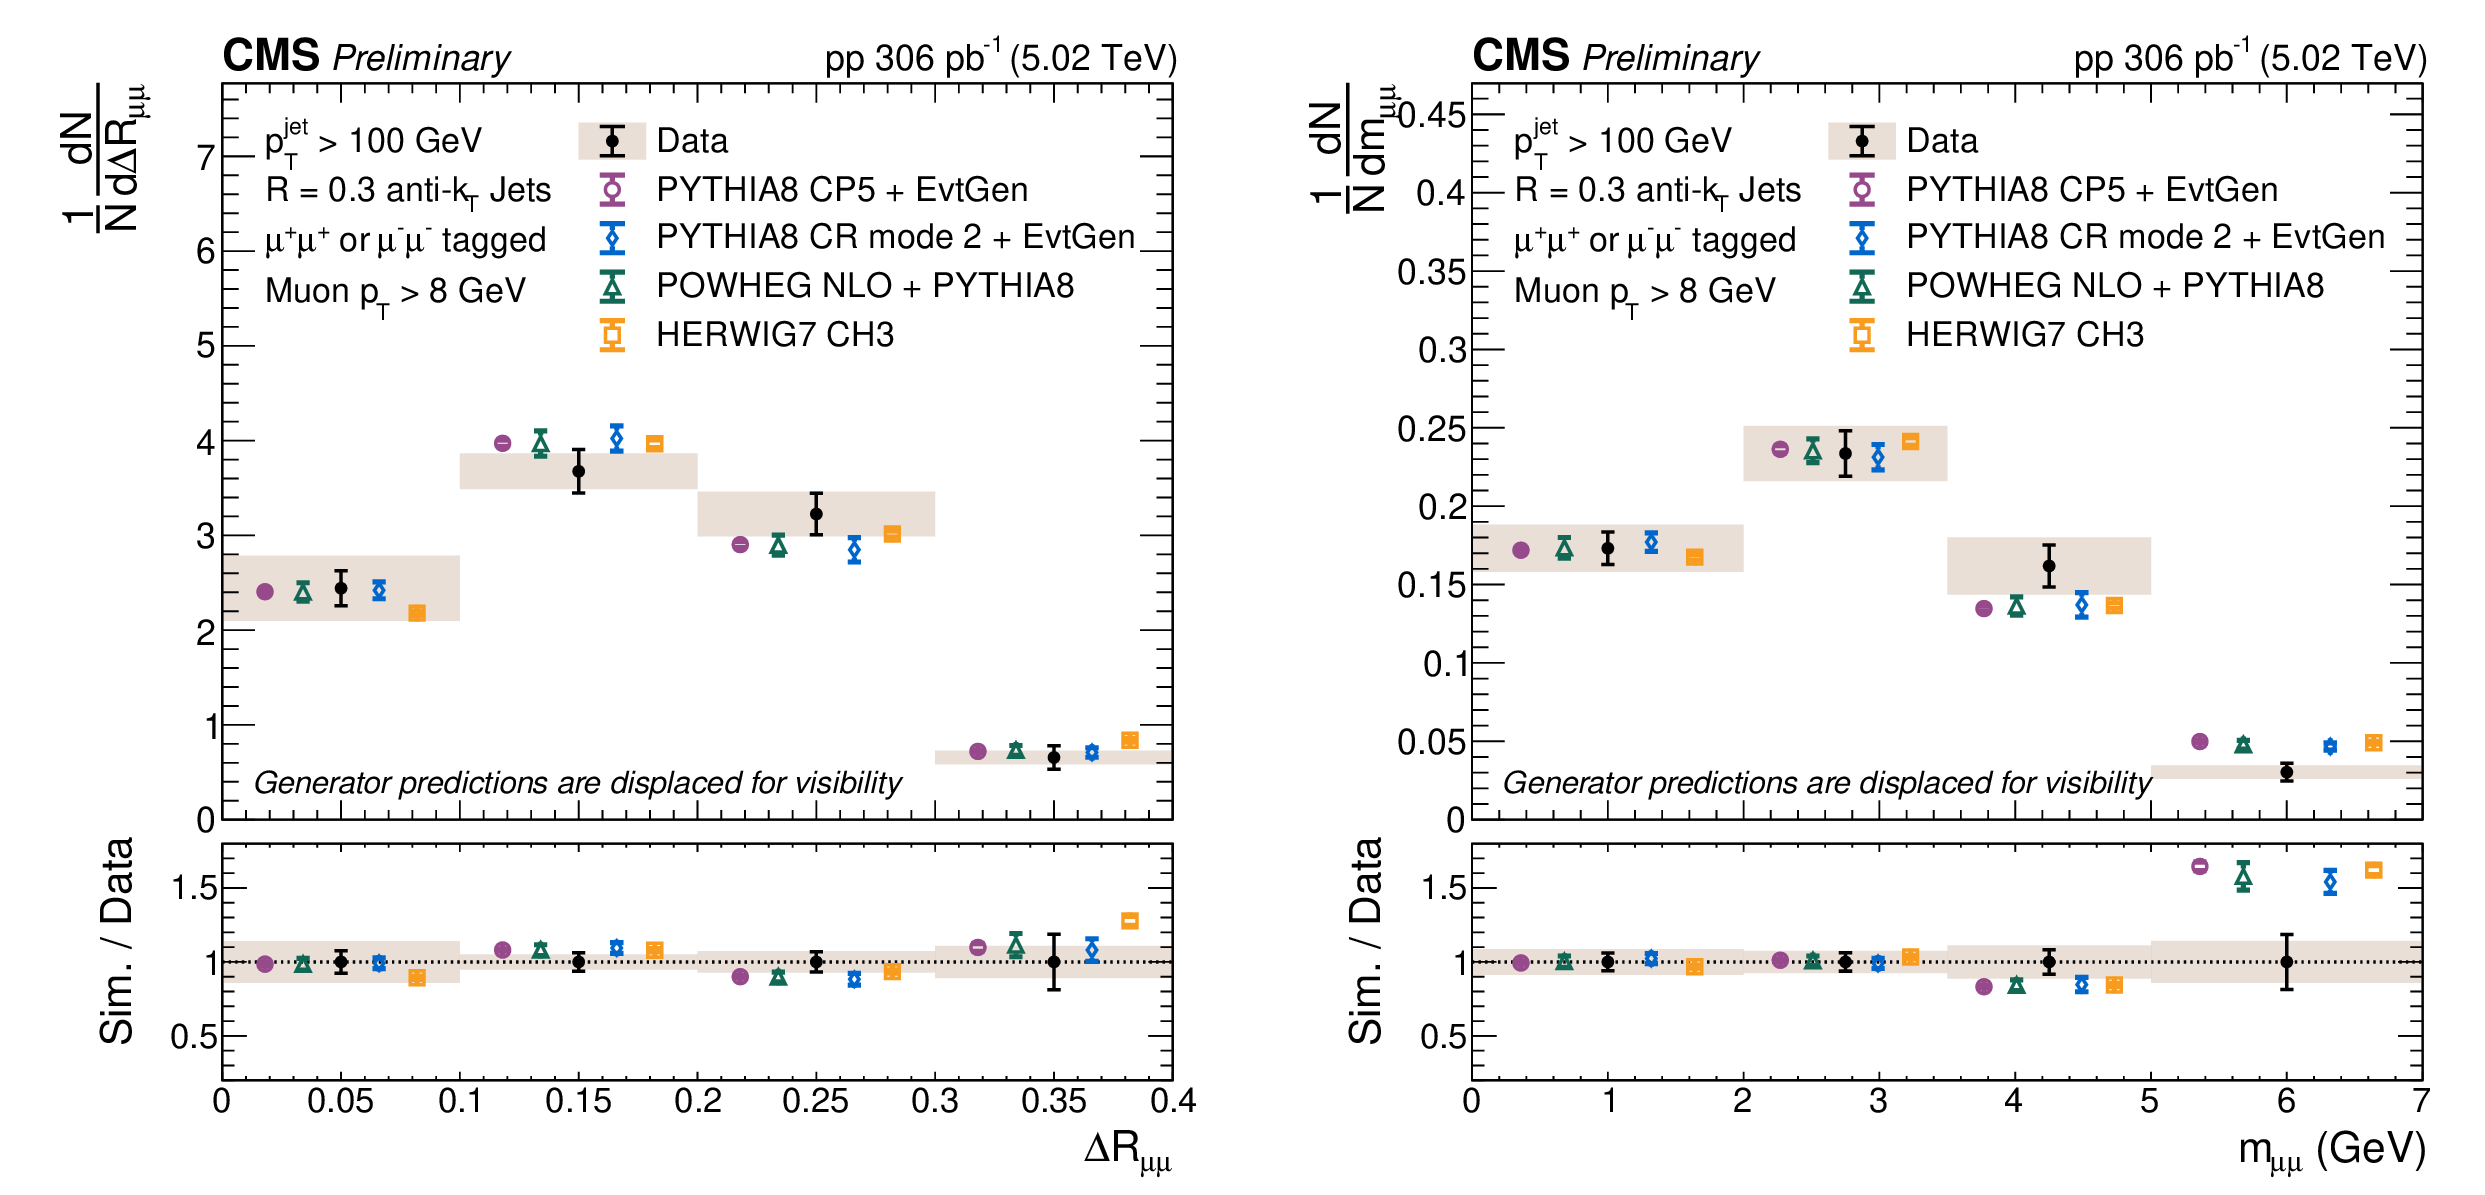
Figure 2:
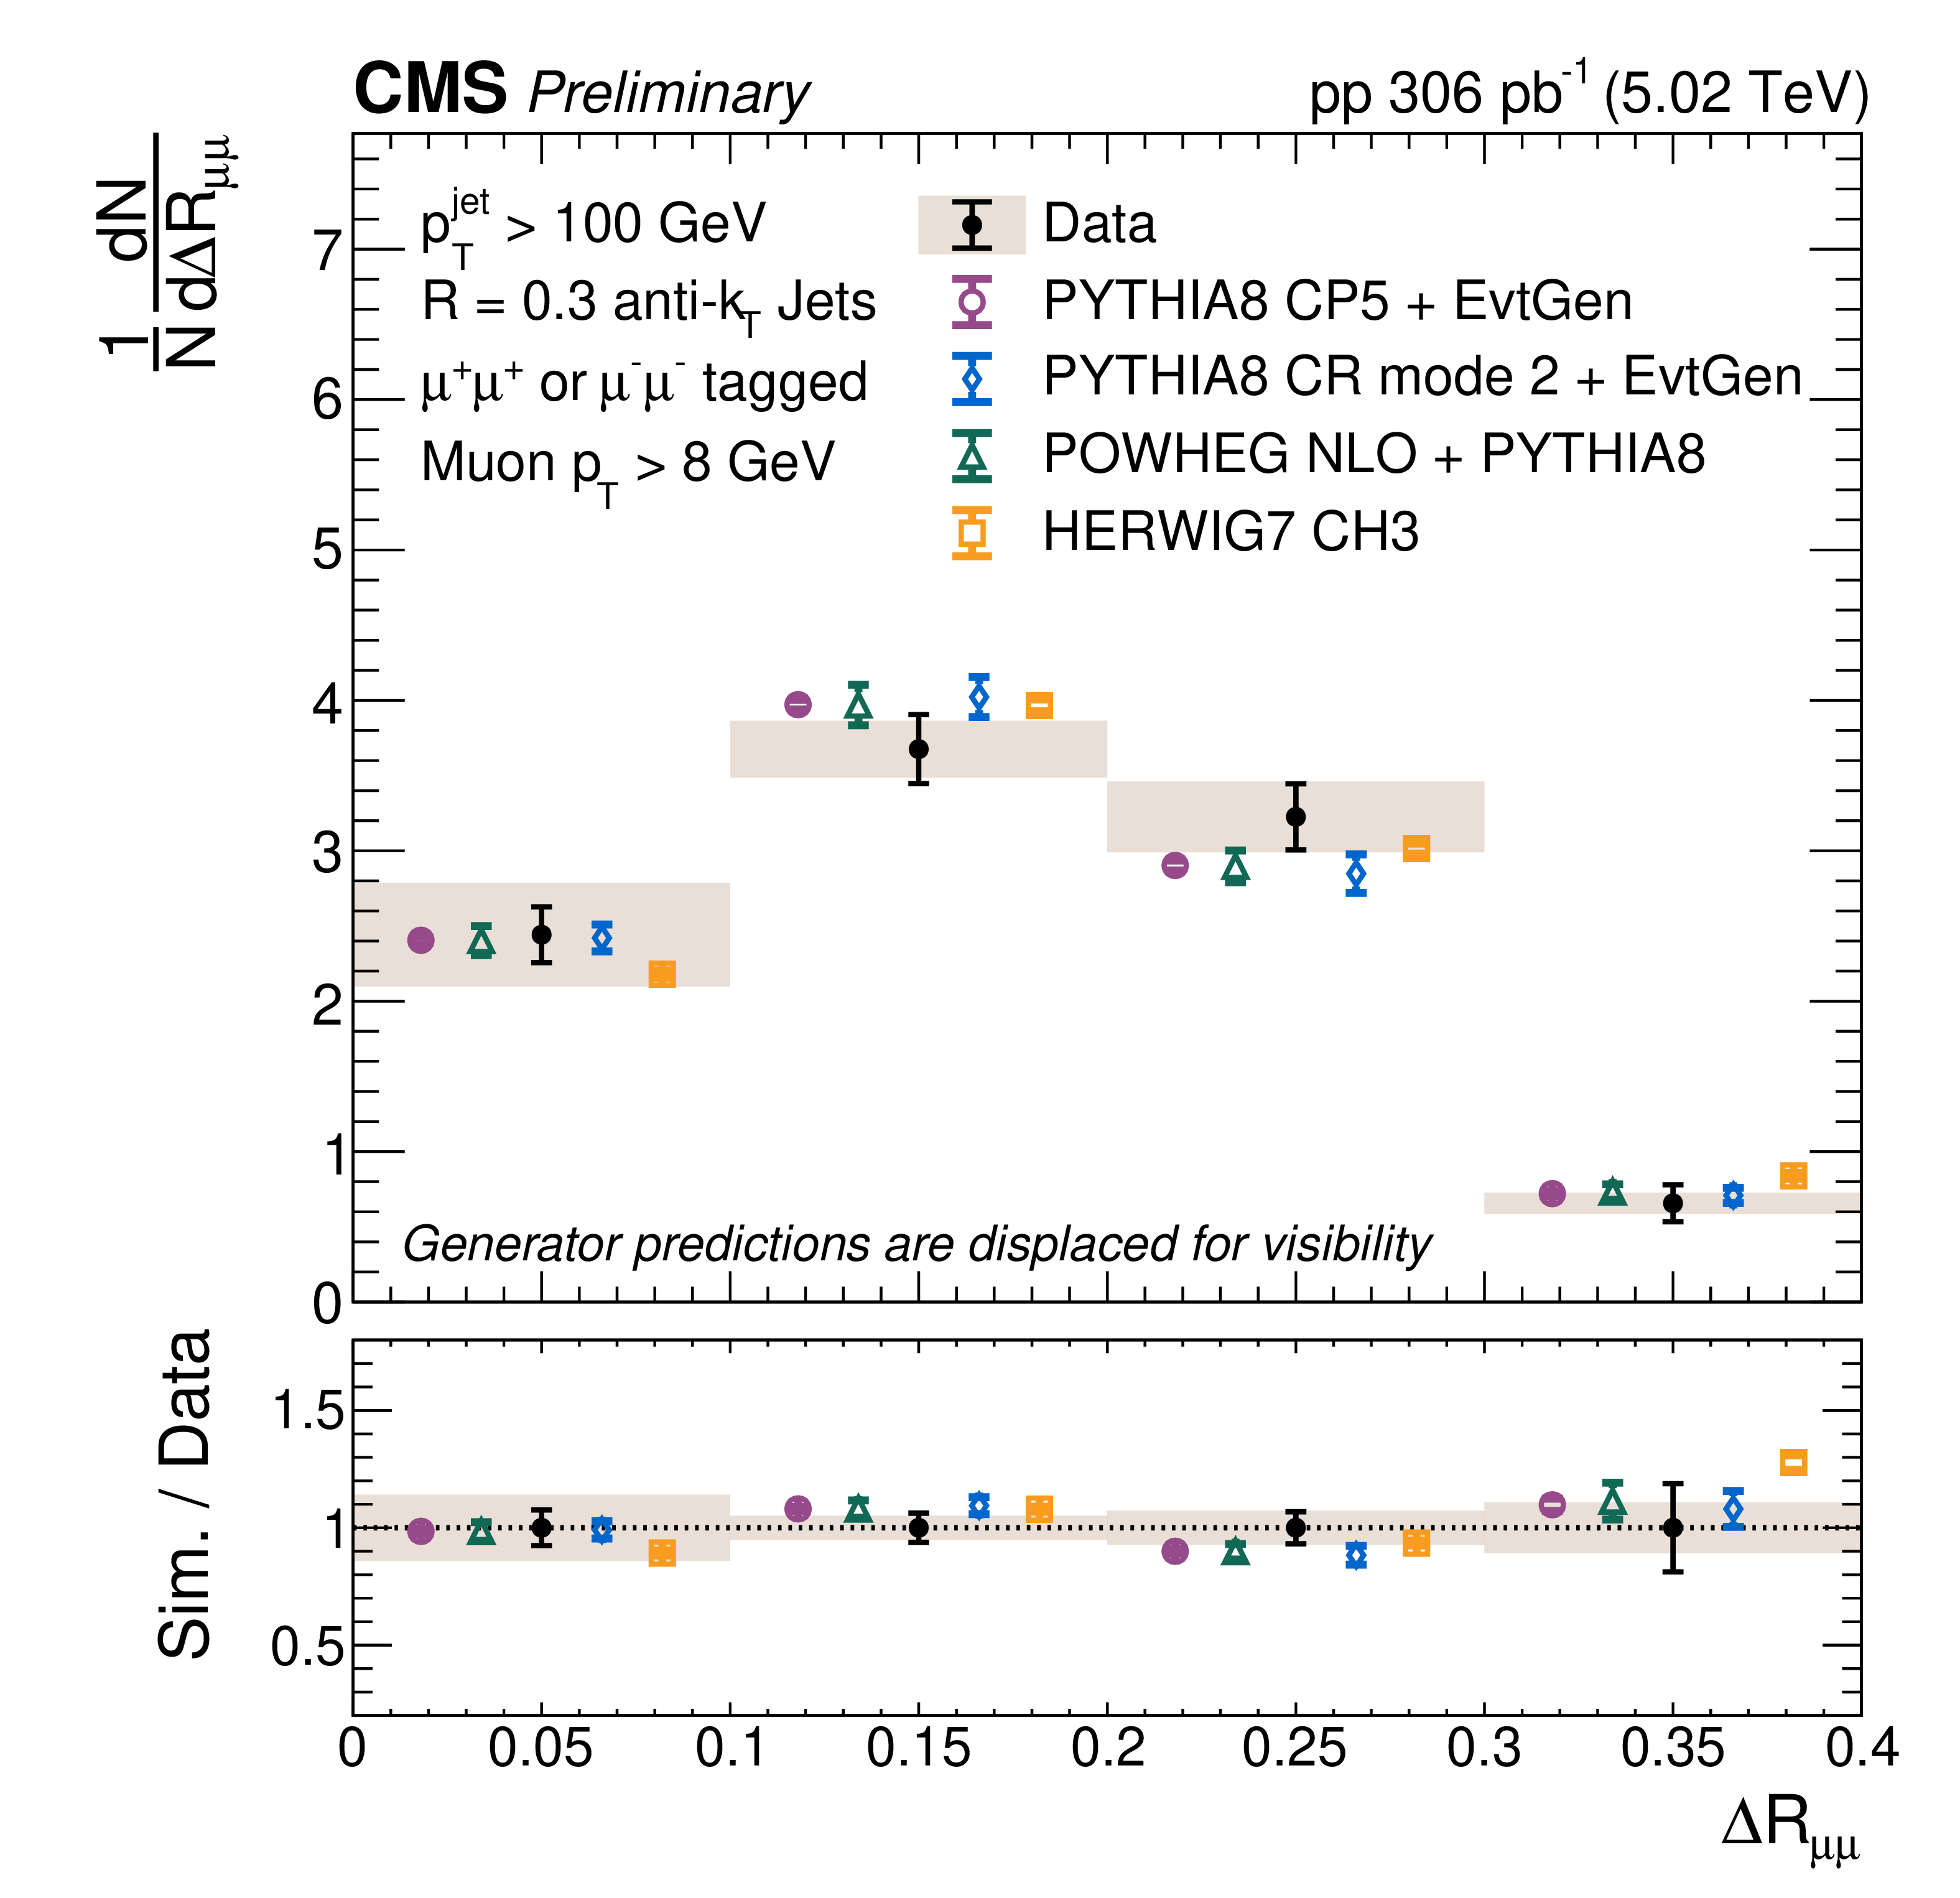
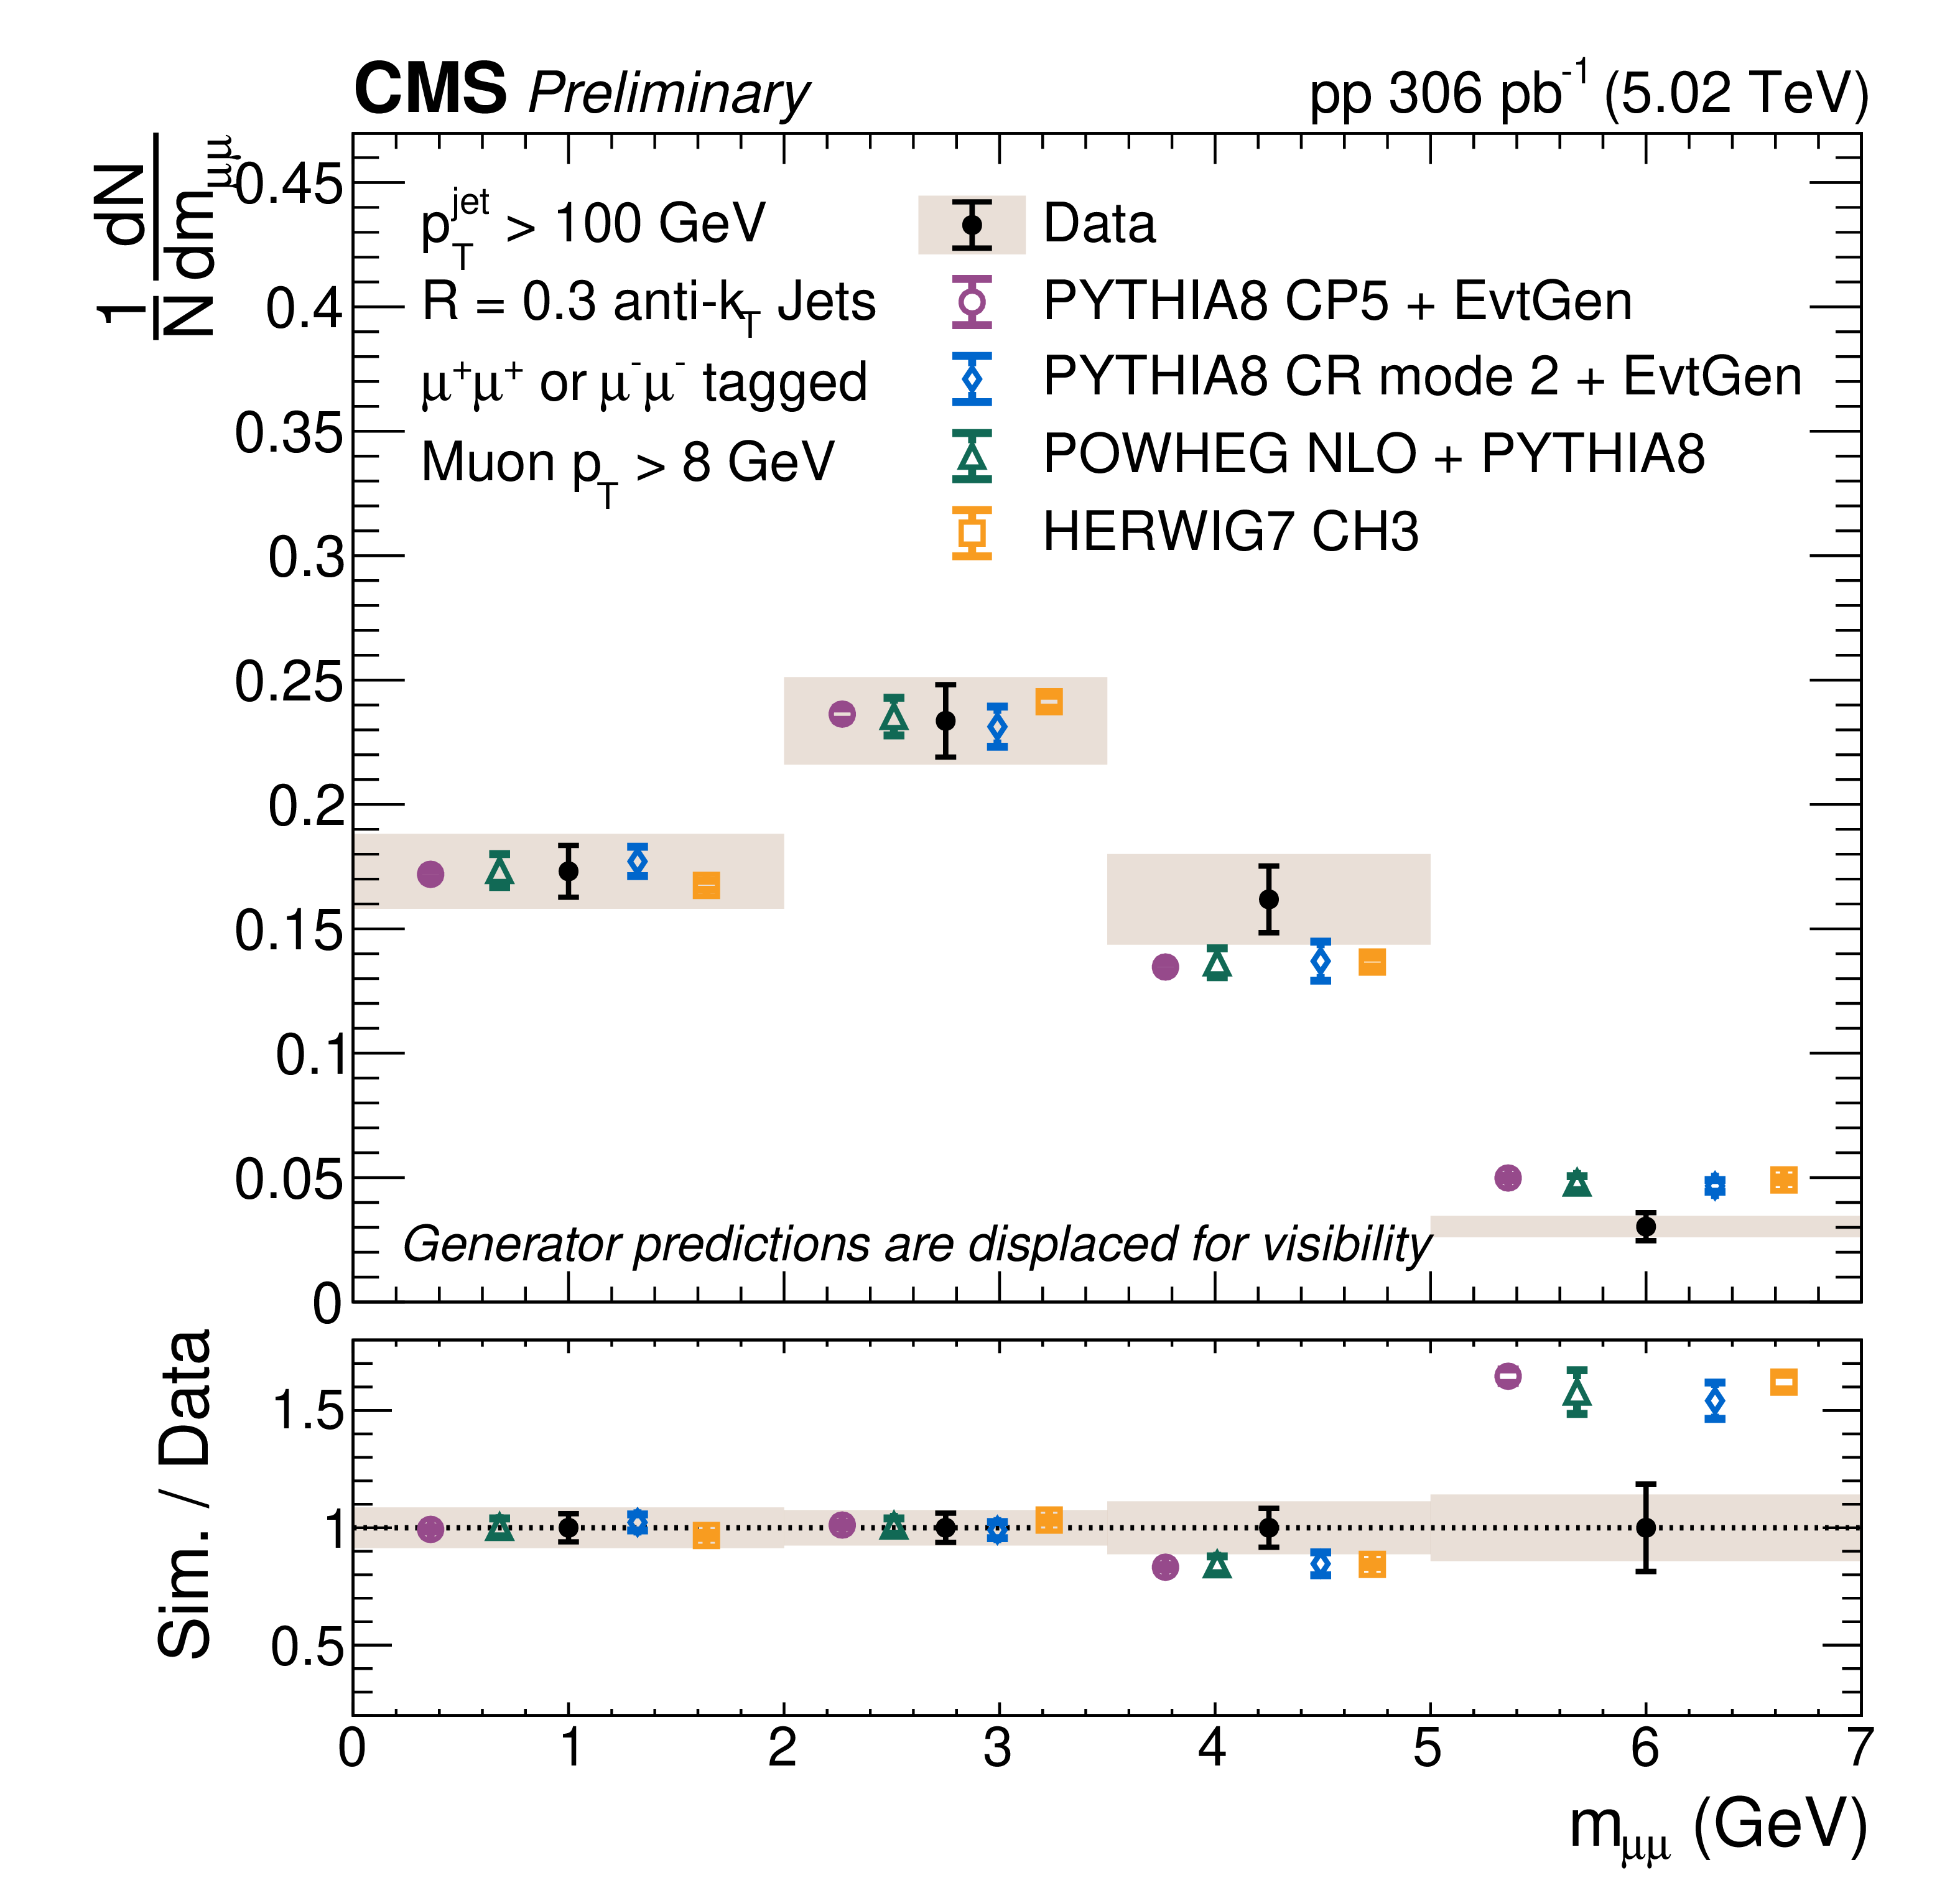
Fully corrected particle-level normalized yield densities of the dimuon opening angle $ \Delta R_{\mu\mu} $ (left) and invariant mass $ m_{\mu\mu} $ (right) for same-sign dimuon-tagged jets with $ p_{\mathrm{T}}^\mathrm{jet} > $ 100 GeV in proton--proton collisions at $ \sqrt{s}= $ 5.02 TeV. The measurements are compared with leading-order predictions from PYTHIA 8 with the CP5 tune and EVTGEN decays and from HERWIG 7 with the CH3 tune, a next-to-leading-order POWHEG calculation matched to the PYTHIA 8 parton shower, and a PYTHIA8+ EVTGEN simulation including colour correlations beyond leading $ N_{C} $ in the hadronization process [23]. The measured and predicted distributions are each normalized to the corresponding dimuon-tagged jet yield in the fiducial phase space. Statistical uncertainties are shown as vertical error bars, while shaded boxes denote the total systematic uncertainties. The lower panels show the ratios of the predictions to the measured central values. |
png pdf |
Figure 2-a:
Fully corrected particle-level normalized yield densities of the dimuon opening angle $ \Delta R_{\mu\mu} $ (left) and invariant mass $ m_{\mu\mu} $ (right) for same-sign dimuon-tagged jets with $ p_{\mathrm{T}}^\mathrm{jet} > $ 100 GeV in proton--proton collisions at $ \sqrt{s}= $ 5.02 TeV. The measurements are compared with leading-order predictions from PYTHIA 8 with the CP5 tune and EVTGEN decays and from HERWIG 7 with the CH3 tune, a next-to-leading-order POWHEG calculation matched to the PYTHIA 8 parton shower, and a PYTHIA8+ EVTGEN simulation including colour correlations beyond leading $ N_{C} $ in the hadronization process [23]. The measured and predicted distributions are each normalized to the corresponding dimuon-tagged jet yield in the fiducial phase space. Statistical uncertainties are shown as vertical error bars, while shaded boxes denote the total systematic uncertainties. The lower panels show the ratios of the predictions to the measured central values. |
png pdf |
Figure 2-b:
Fully corrected particle-level normalized yield densities of the dimuon opening angle $ \Delta R_{\mu\mu} $ (left) and invariant mass $ m_{\mu\mu} $ (right) for same-sign dimuon-tagged jets with $ p_{\mathrm{T}}^\mathrm{jet} > $ 100 GeV in proton--proton collisions at $ \sqrt{s}= $ 5.02 TeV. The measurements are compared with leading-order predictions from PYTHIA 8 with the CP5 tune and EVTGEN decays and from HERWIG 7 with the CH3 tune, a next-to-leading-order POWHEG calculation matched to the PYTHIA 8 parton shower, and a PYTHIA8+ EVTGEN simulation including colour correlations beyond leading $ N_{C} $ in the hadronization process [23]. The measured and predicted distributions are each normalized to the corresponding dimuon-tagged jet yield in the fiducial phase space. Statistical uncertainties are shown as vertical error bars, while shaded boxes denote the total systematic uncertainties. The lower panels show the ratios of the predictions to the measured central values. |
png pdf |
Figure 3:
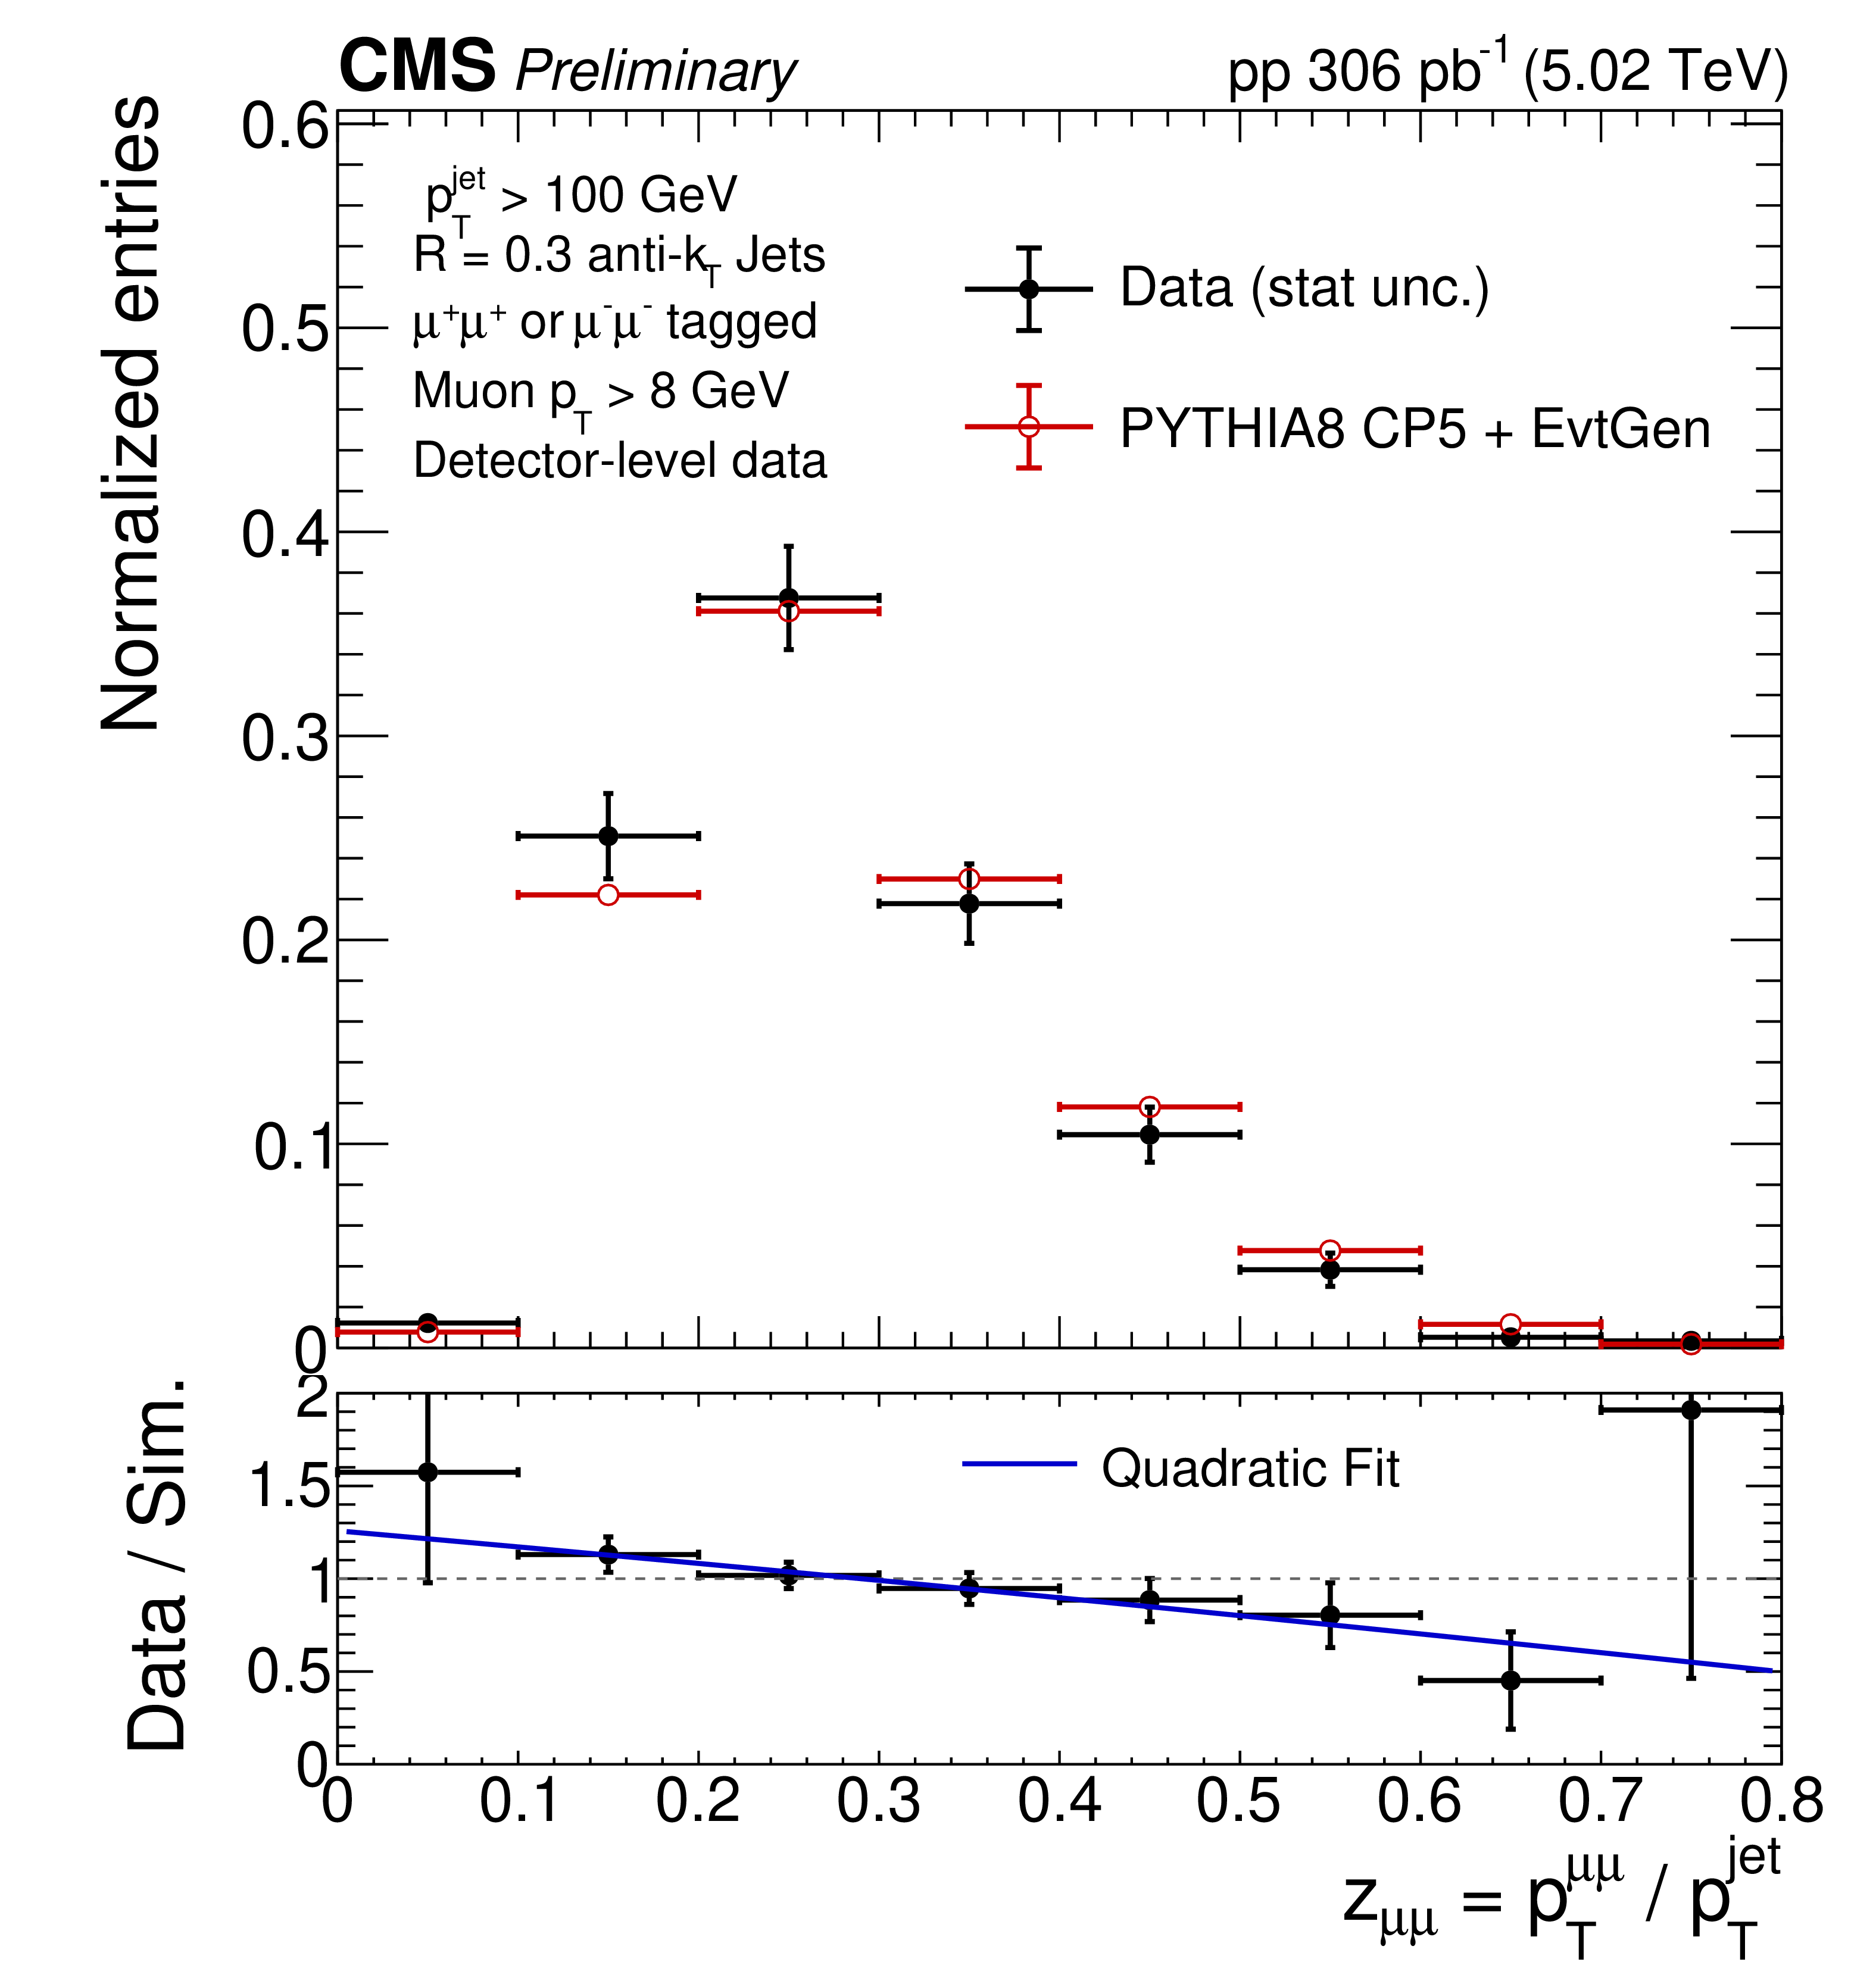
The unit normalized distributions of the dimuon momentum fraction $ {p_\mathrm{T}}_{\mu\mu} / {p_\mathrm{T}}_{\text{jet}} $ are shown. The ratio plot is fit with a quadratic, which is used to determine the weight for each dimuon. |
png pdf |
Figure 4:
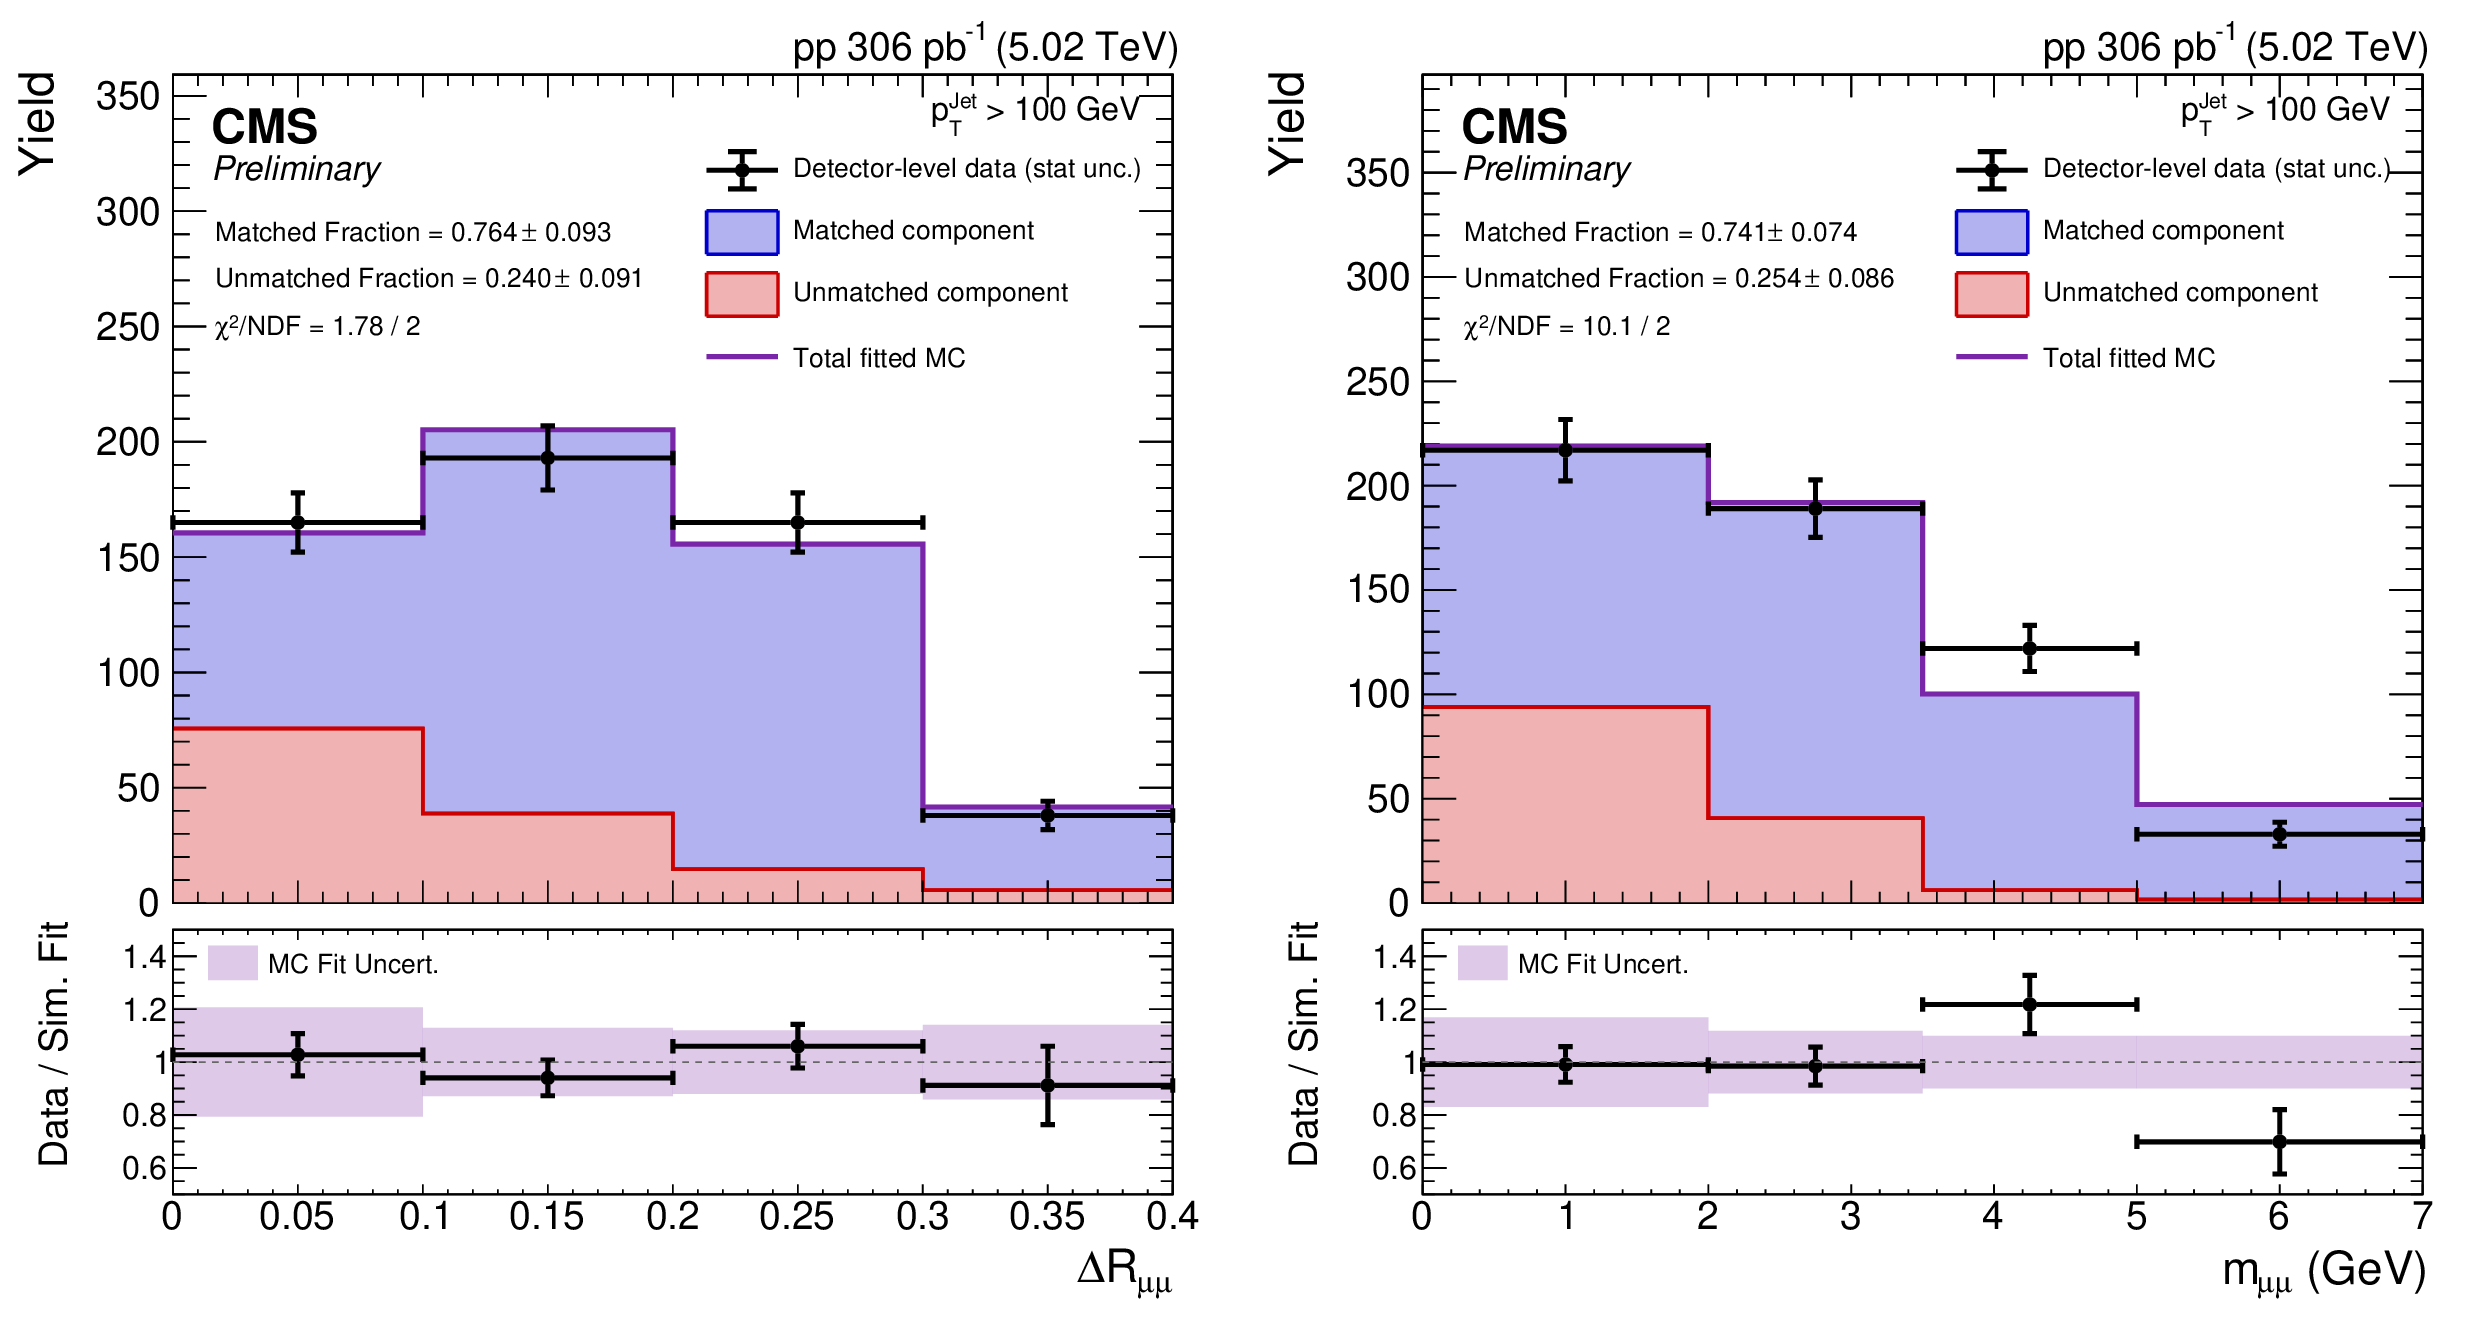
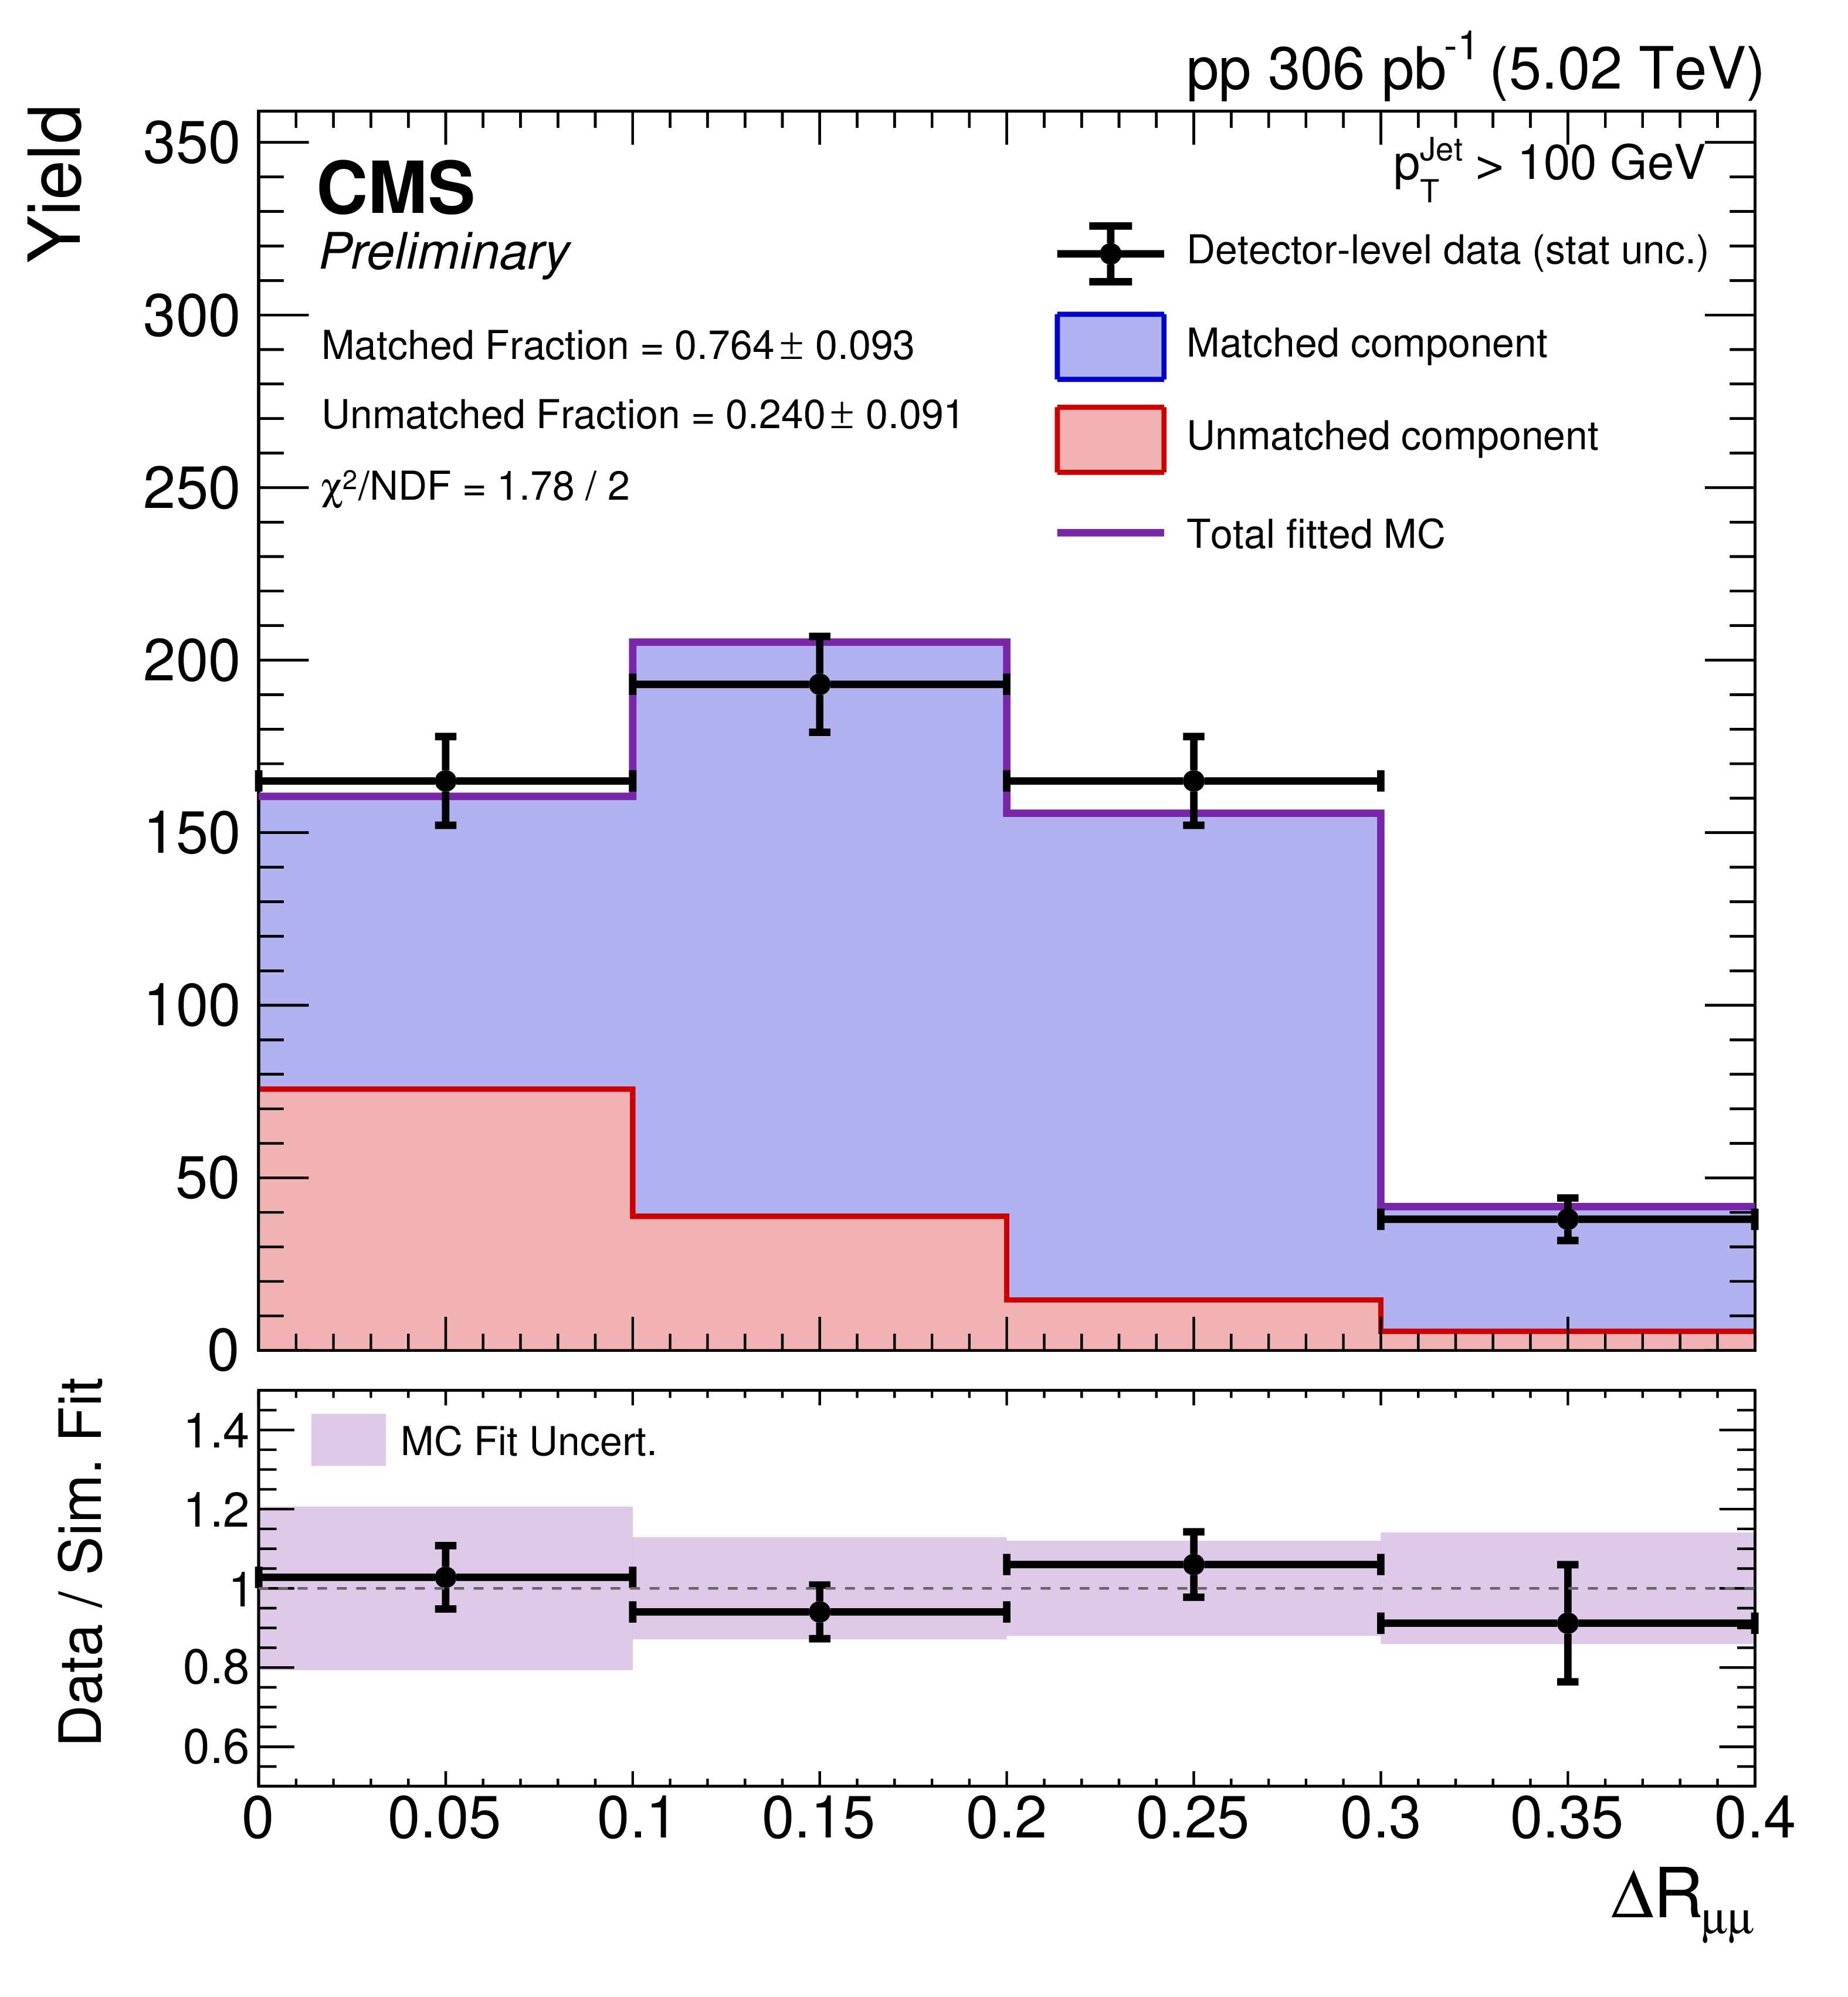
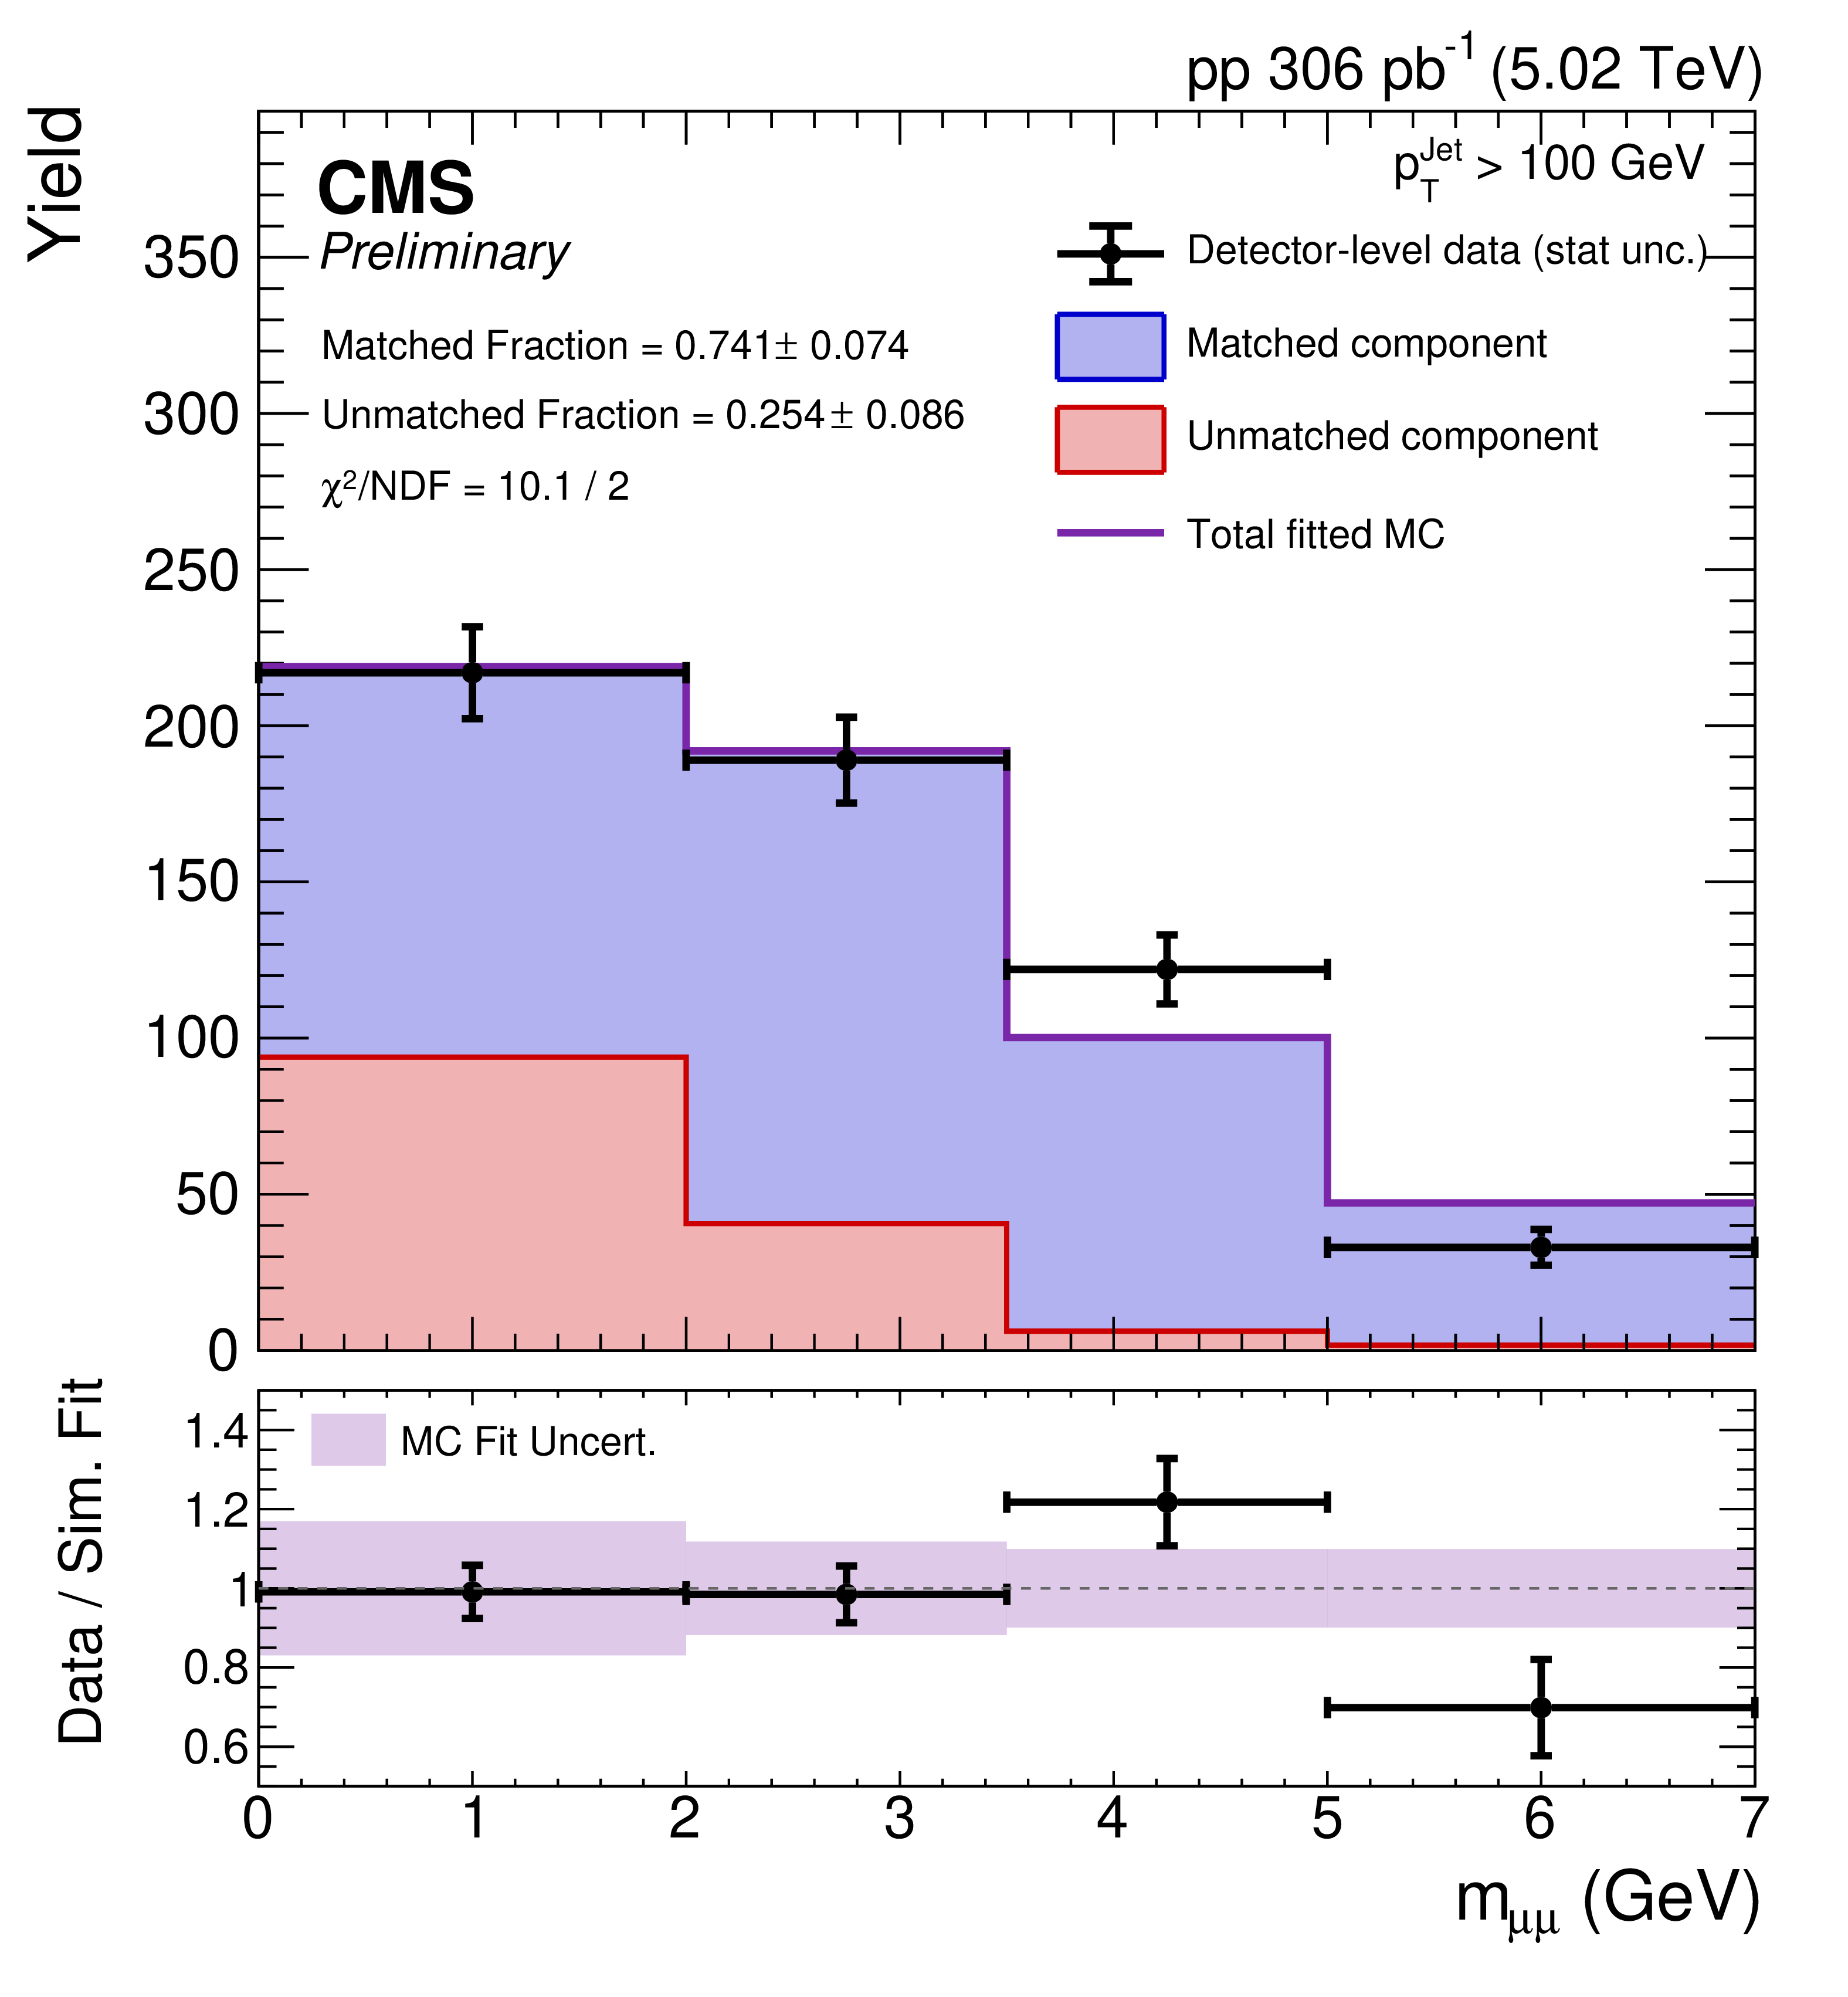
Same-sign dimuon data yield for $ \Delta R_{\mu\mu} $ (left) and $ m_{\mu\mu} $ (right) superimposed over scaled simulated matched (blue) and unmatched (red) templates. Their ratio is plotted alongside the fractional uncertainty of the overall simulation dimuon yield in each bin. |
png pdf |
Figure 4-a:
Same-sign dimuon data yield for $ \Delta R_{\mu\mu} $ (left) and $ m_{\mu\mu} $ (right) superimposed over scaled simulated matched (blue) and unmatched (red) templates. Their ratio is plotted alongside the fractional uncertainty of the overall simulation dimuon yield in each bin. |
png pdf |
Figure 4-b:
Same-sign dimuon data yield for $ \Delta R_{\mu\mu} $ (left) and $ m_{\mu\mu} $ (right) superimposed over scaled simulated matched (blue) and unmatched (red) templates. Their ratio is plotted alongside the fractional uncertainty of the overall simulation dimuon yield in each bin. |
png pdf |
Figure 5:
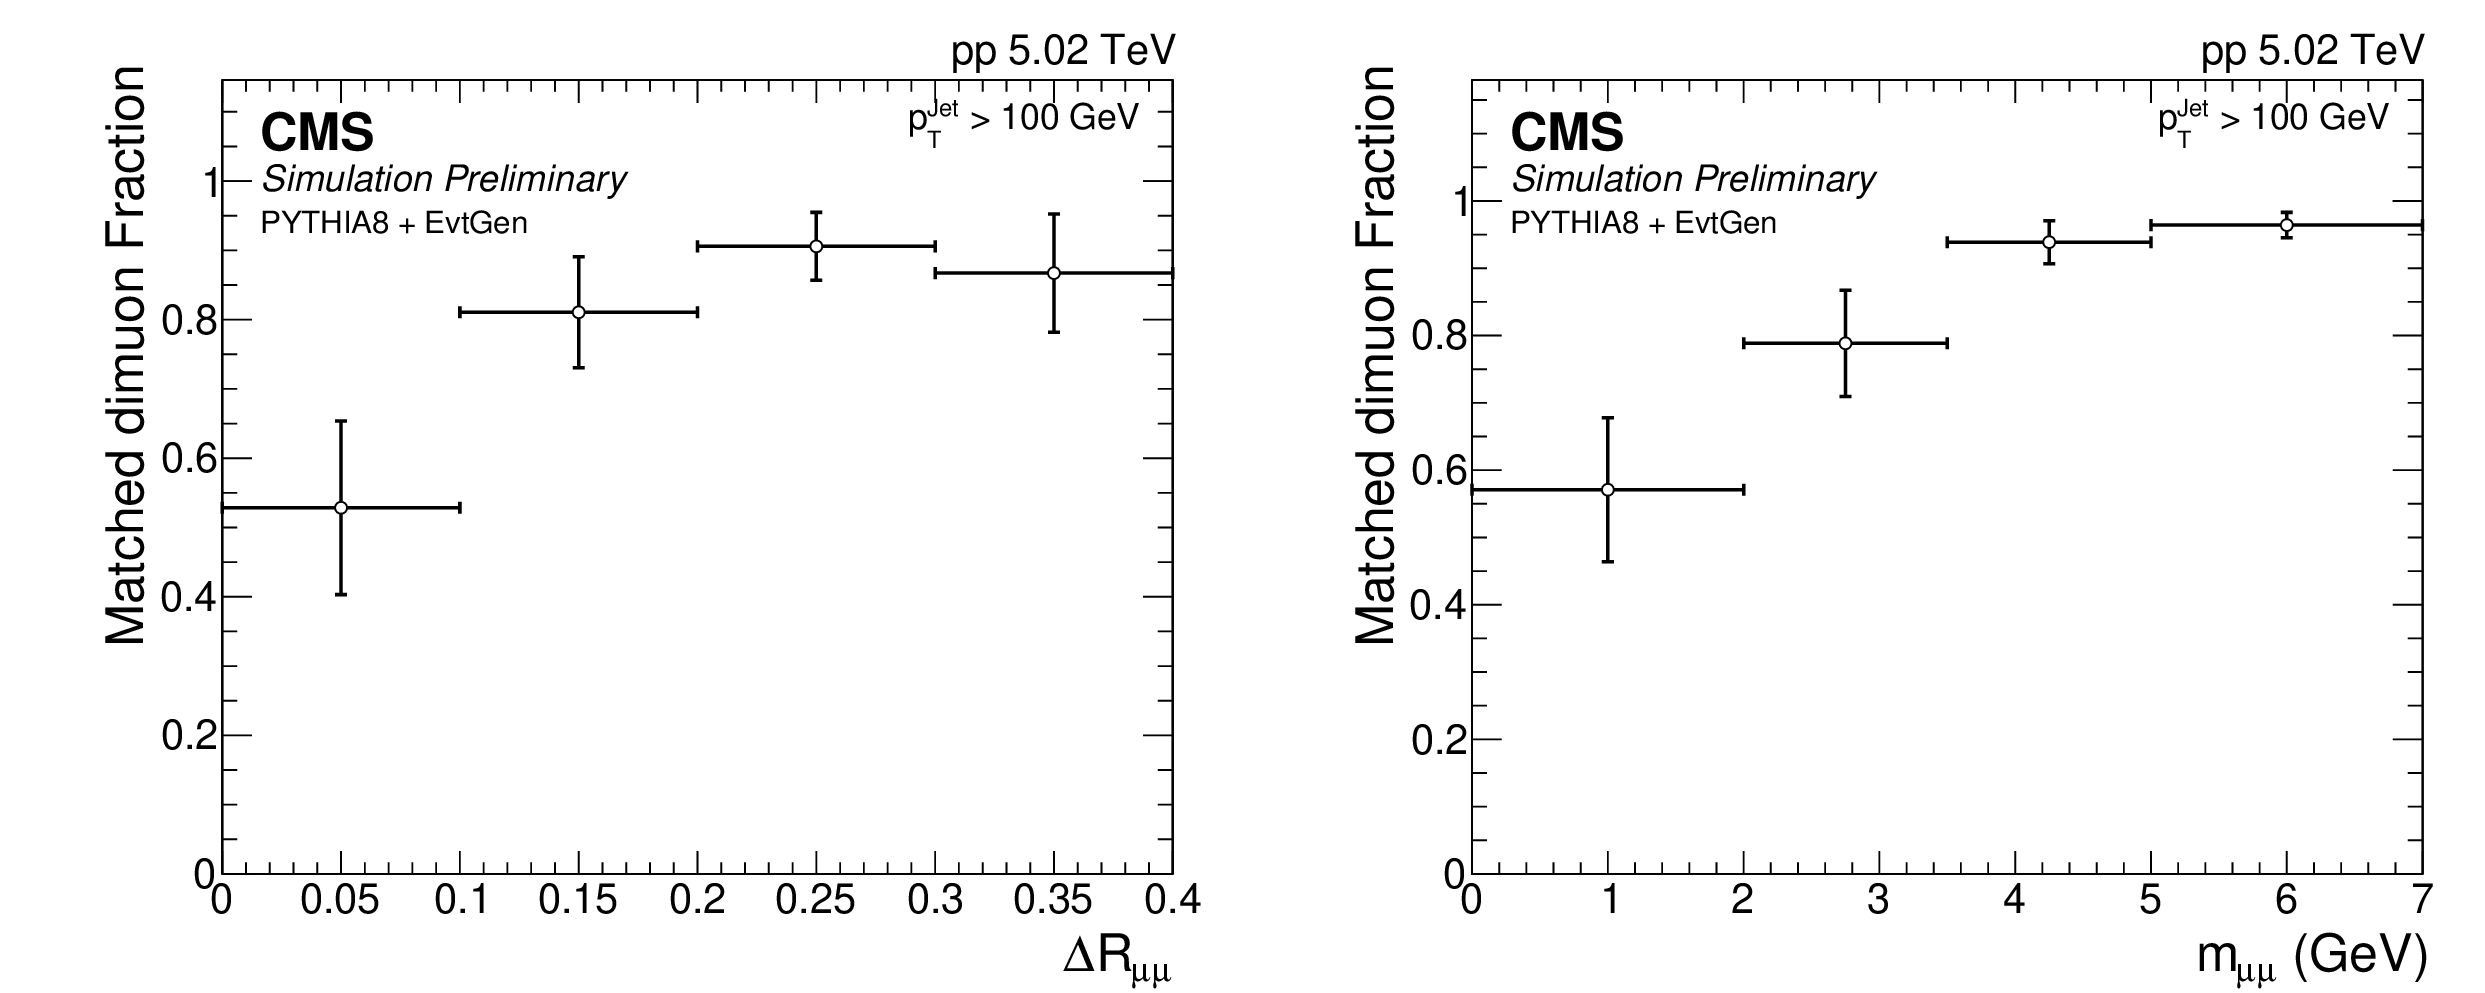
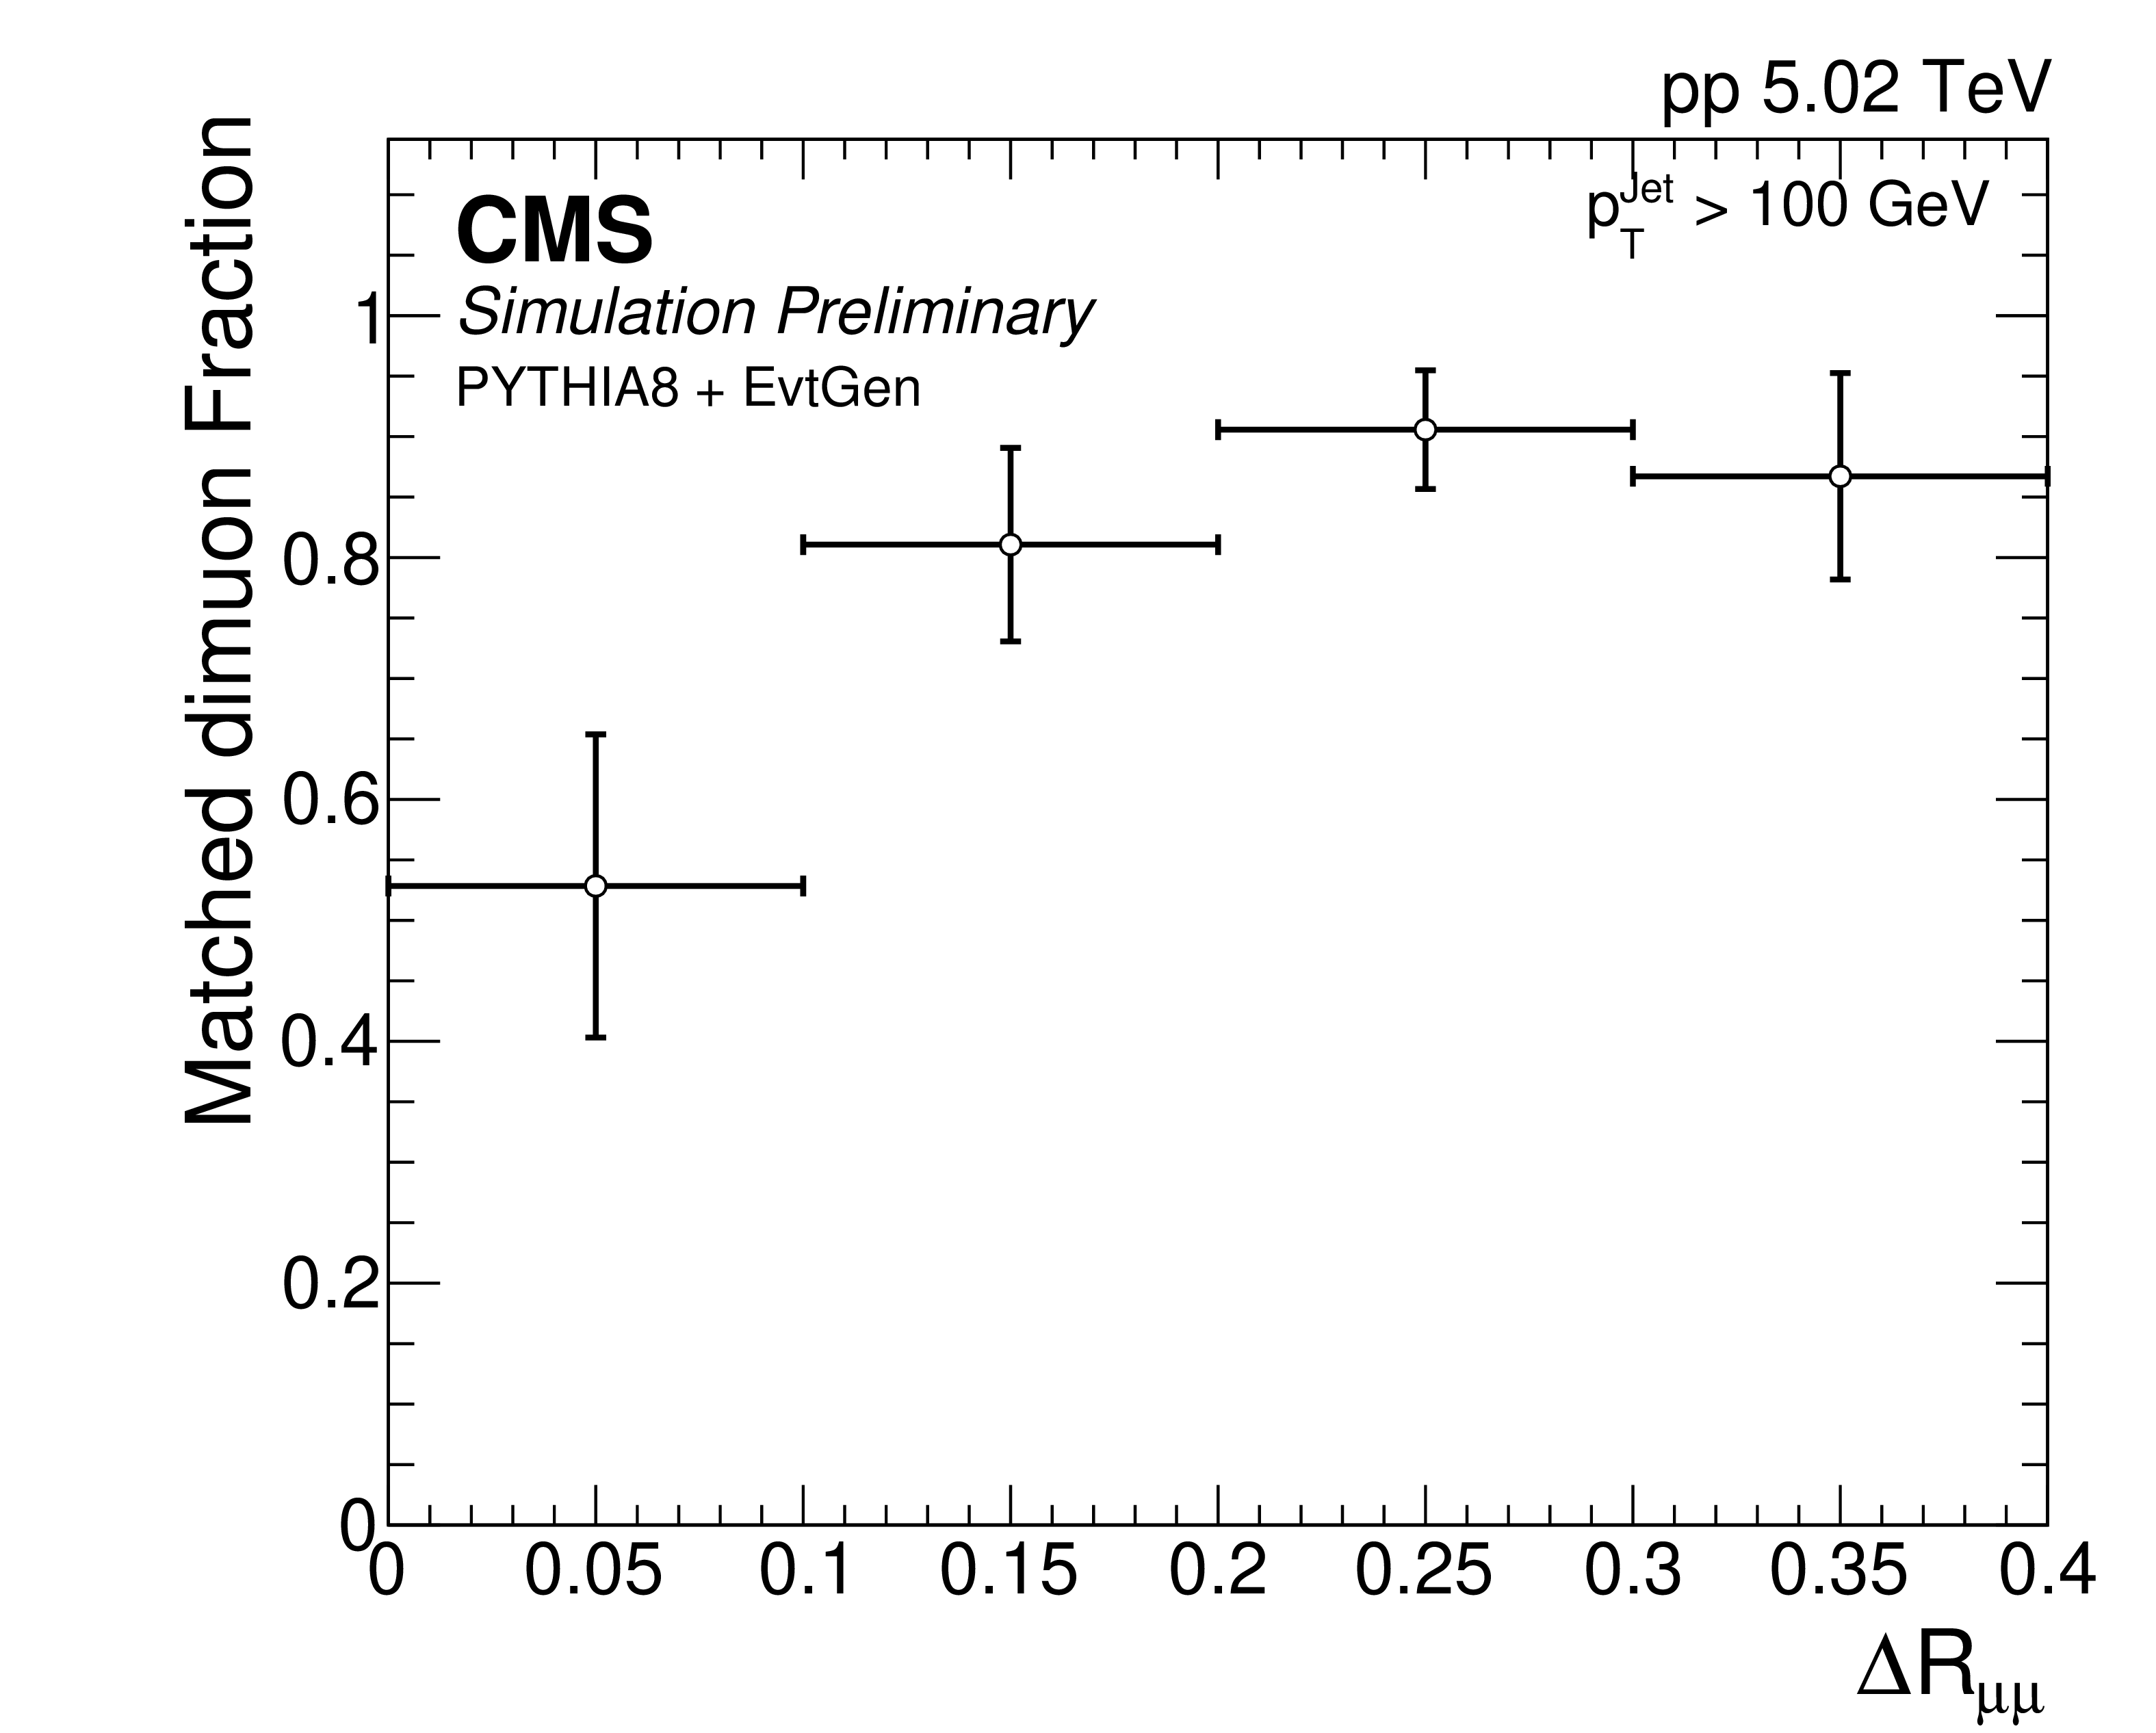
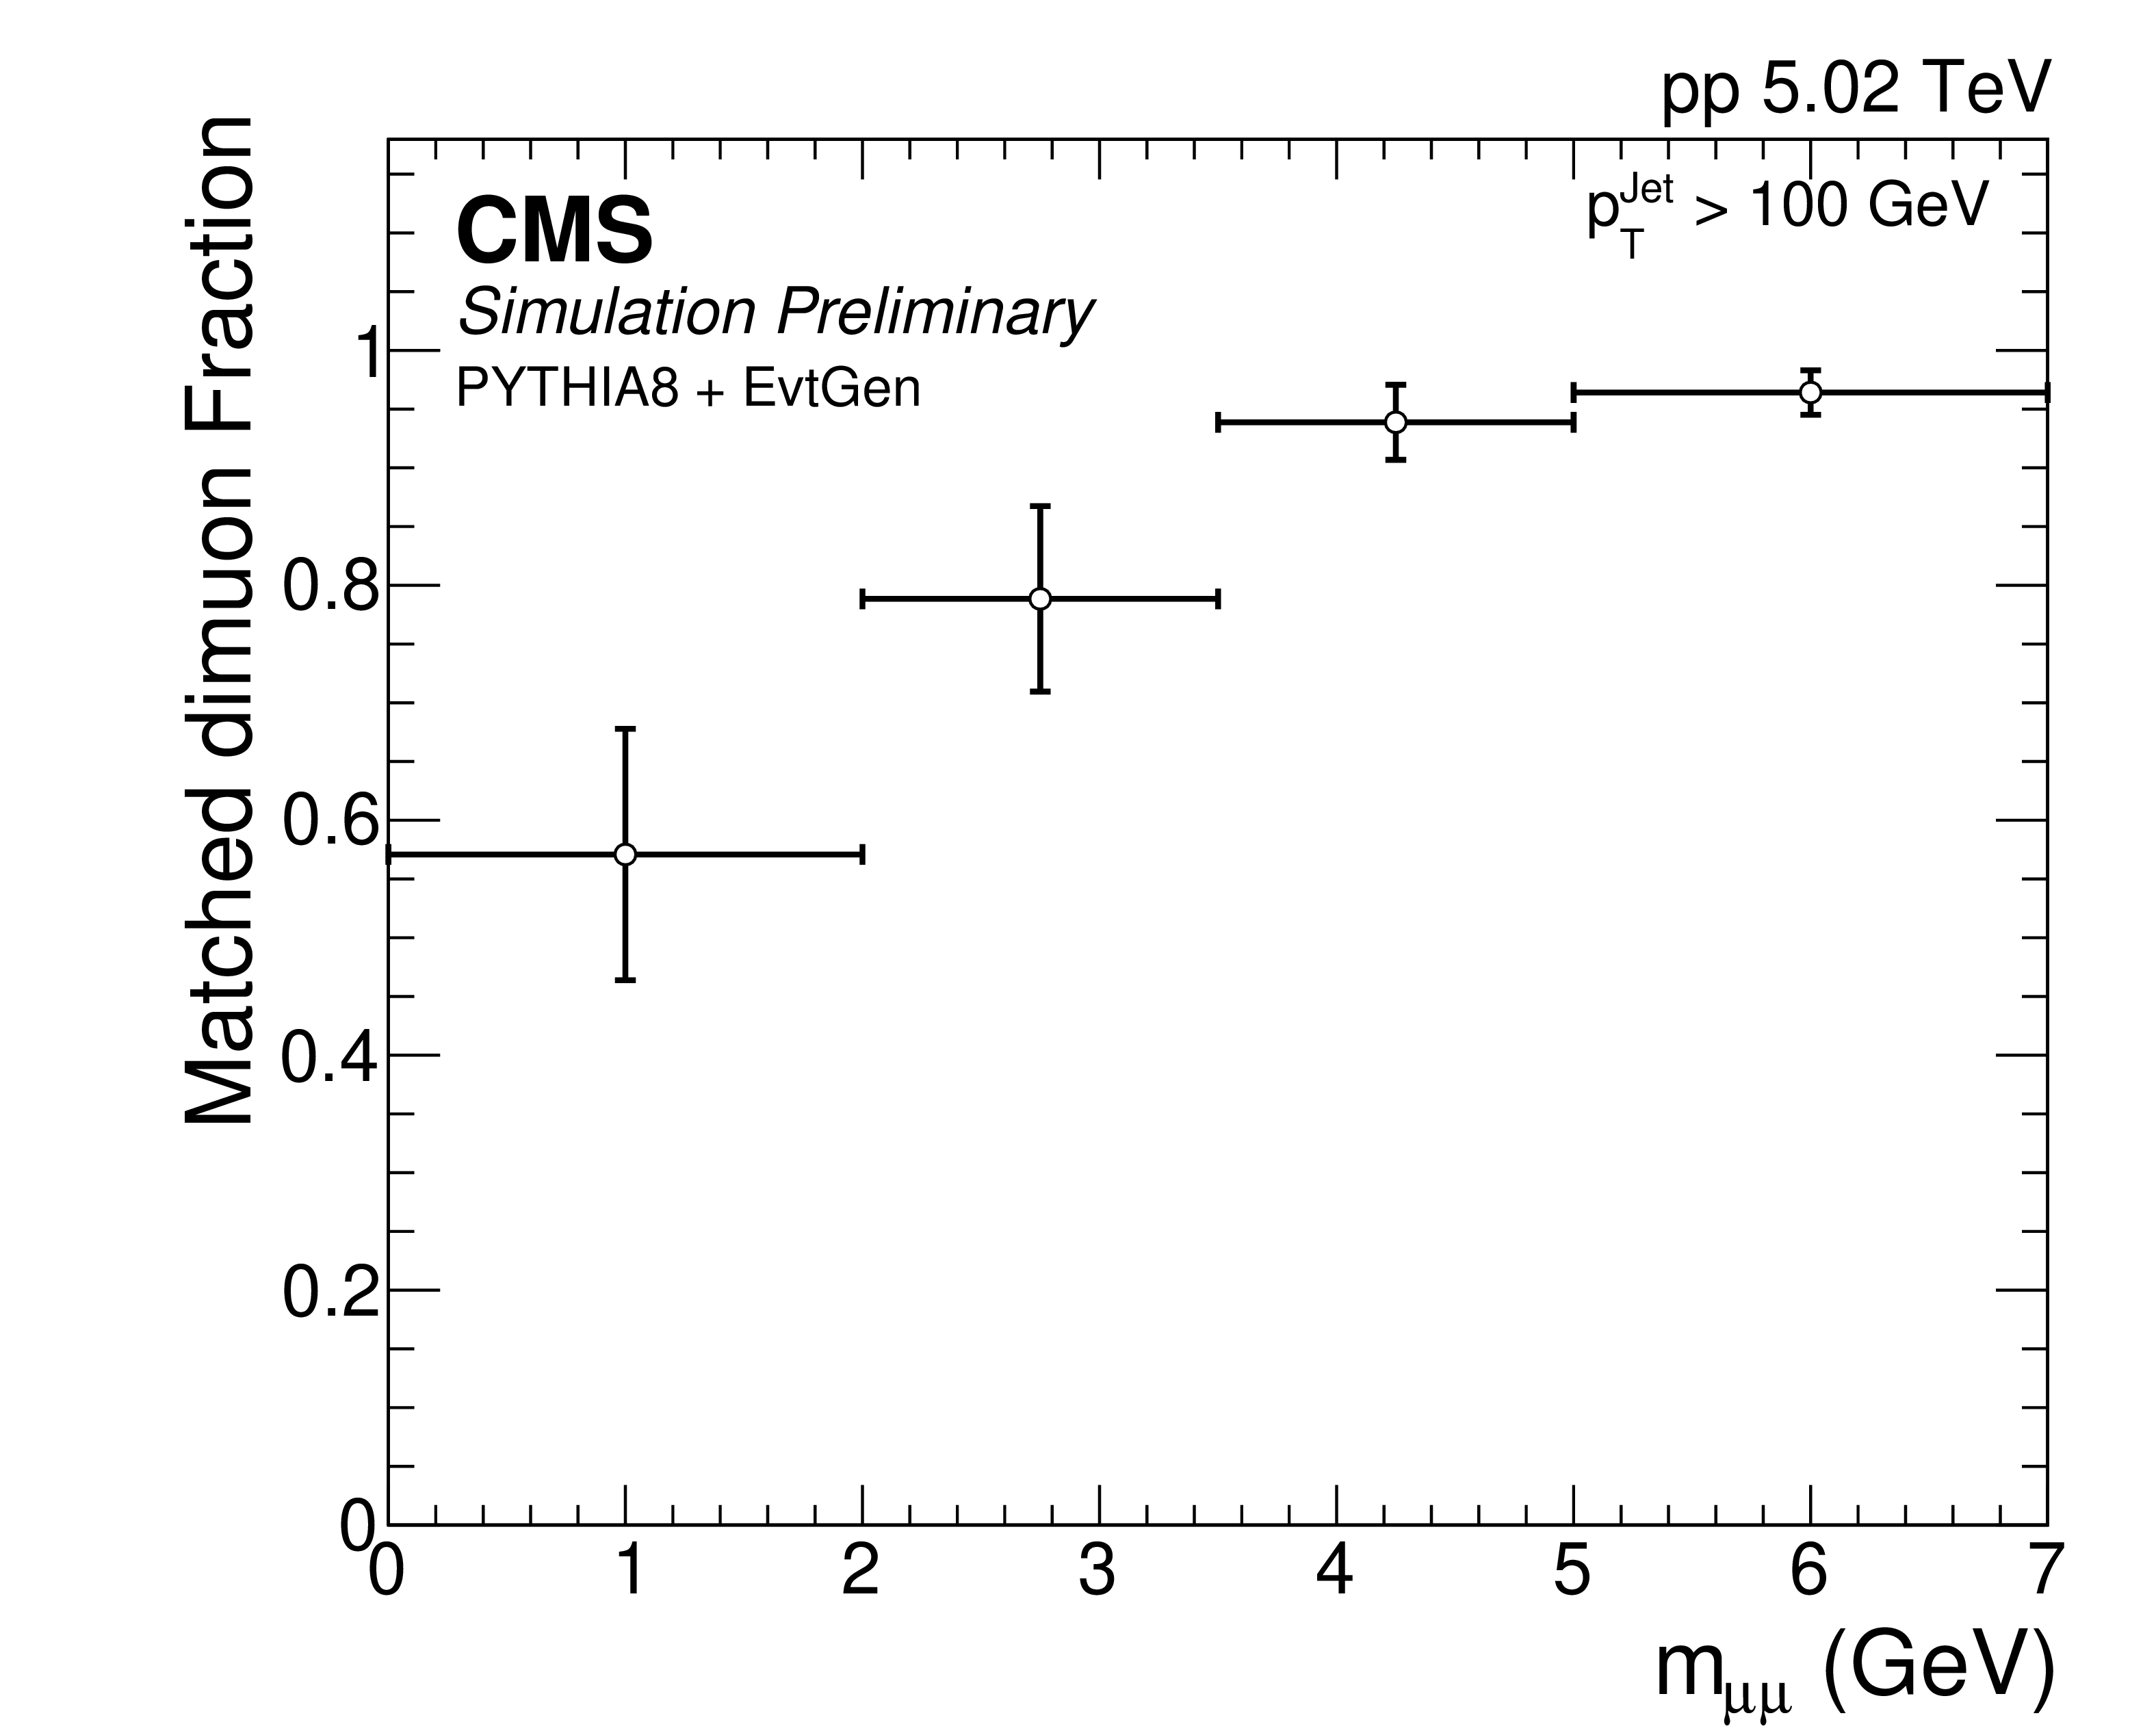
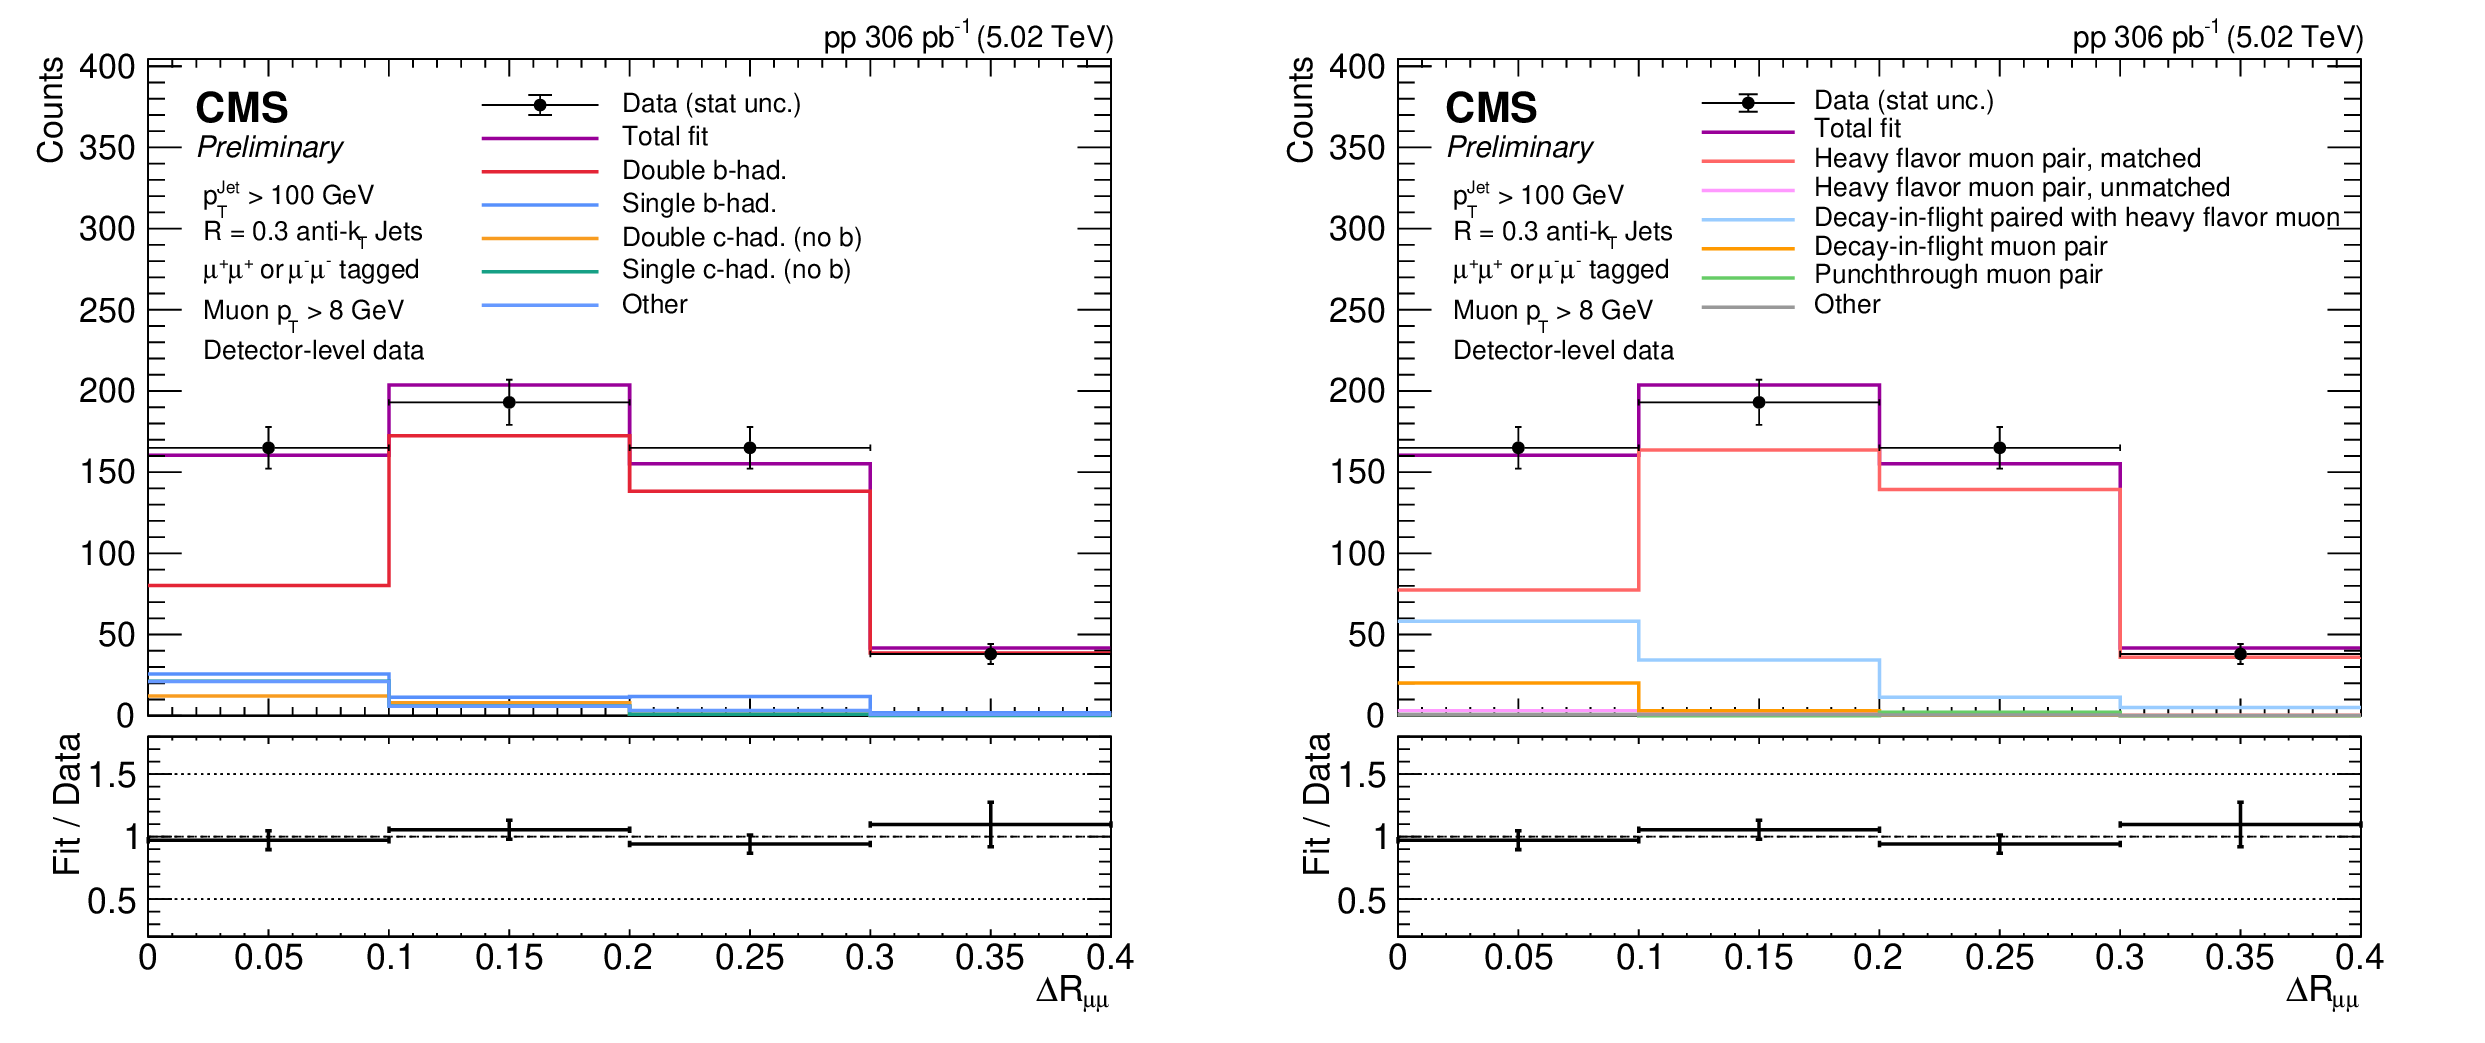
The purity for this measurement is defined as the matched yield / total MC yield, as determined by template fitting to the data distribution. The purity is shown for each bin in $ \Delta R_{\mu\mu} $ (left) and $ m_{\mu\mu} $ (right) for same-sign dimuon jets with $ p_{\mathrm{T}} > $ 100 GeV. The unmatched yield in each bin is determined by a template fitting routine described in Section 4. |
png pdf |
Figure 5-a:
The purity for this measurement is defined as the matched yield / total MC yield, as determined by template fitting to the data distribution. The purity is shown for each bin in $ \Delta R_{\mu\mu} $ (left) and $ m_{\mu\mu} $ (right) for same-sign dimuon jets with $ p_{\mathrm{T}} > $ 100 GeV. The unmatched yield in each bin is determined by a template fitting routine described in Section 4. |
png pdf |
Figure 5-b:
The purity for this measurement is defined as the matched yield / total MC yield, as determined by template fitting to the data distribution. The purity is shown for each bin in $ \Delta R_{\mu\mu} $ (left) and $ m_{\mu\mu} $ (right) for same-sign dimuon jets with $ p_{\mathrm{T}} > $ 100 GeV. The unmatched yield in each bin is determined by a template fitting routine described in Section 4. |
png pdf |
Figure 6:
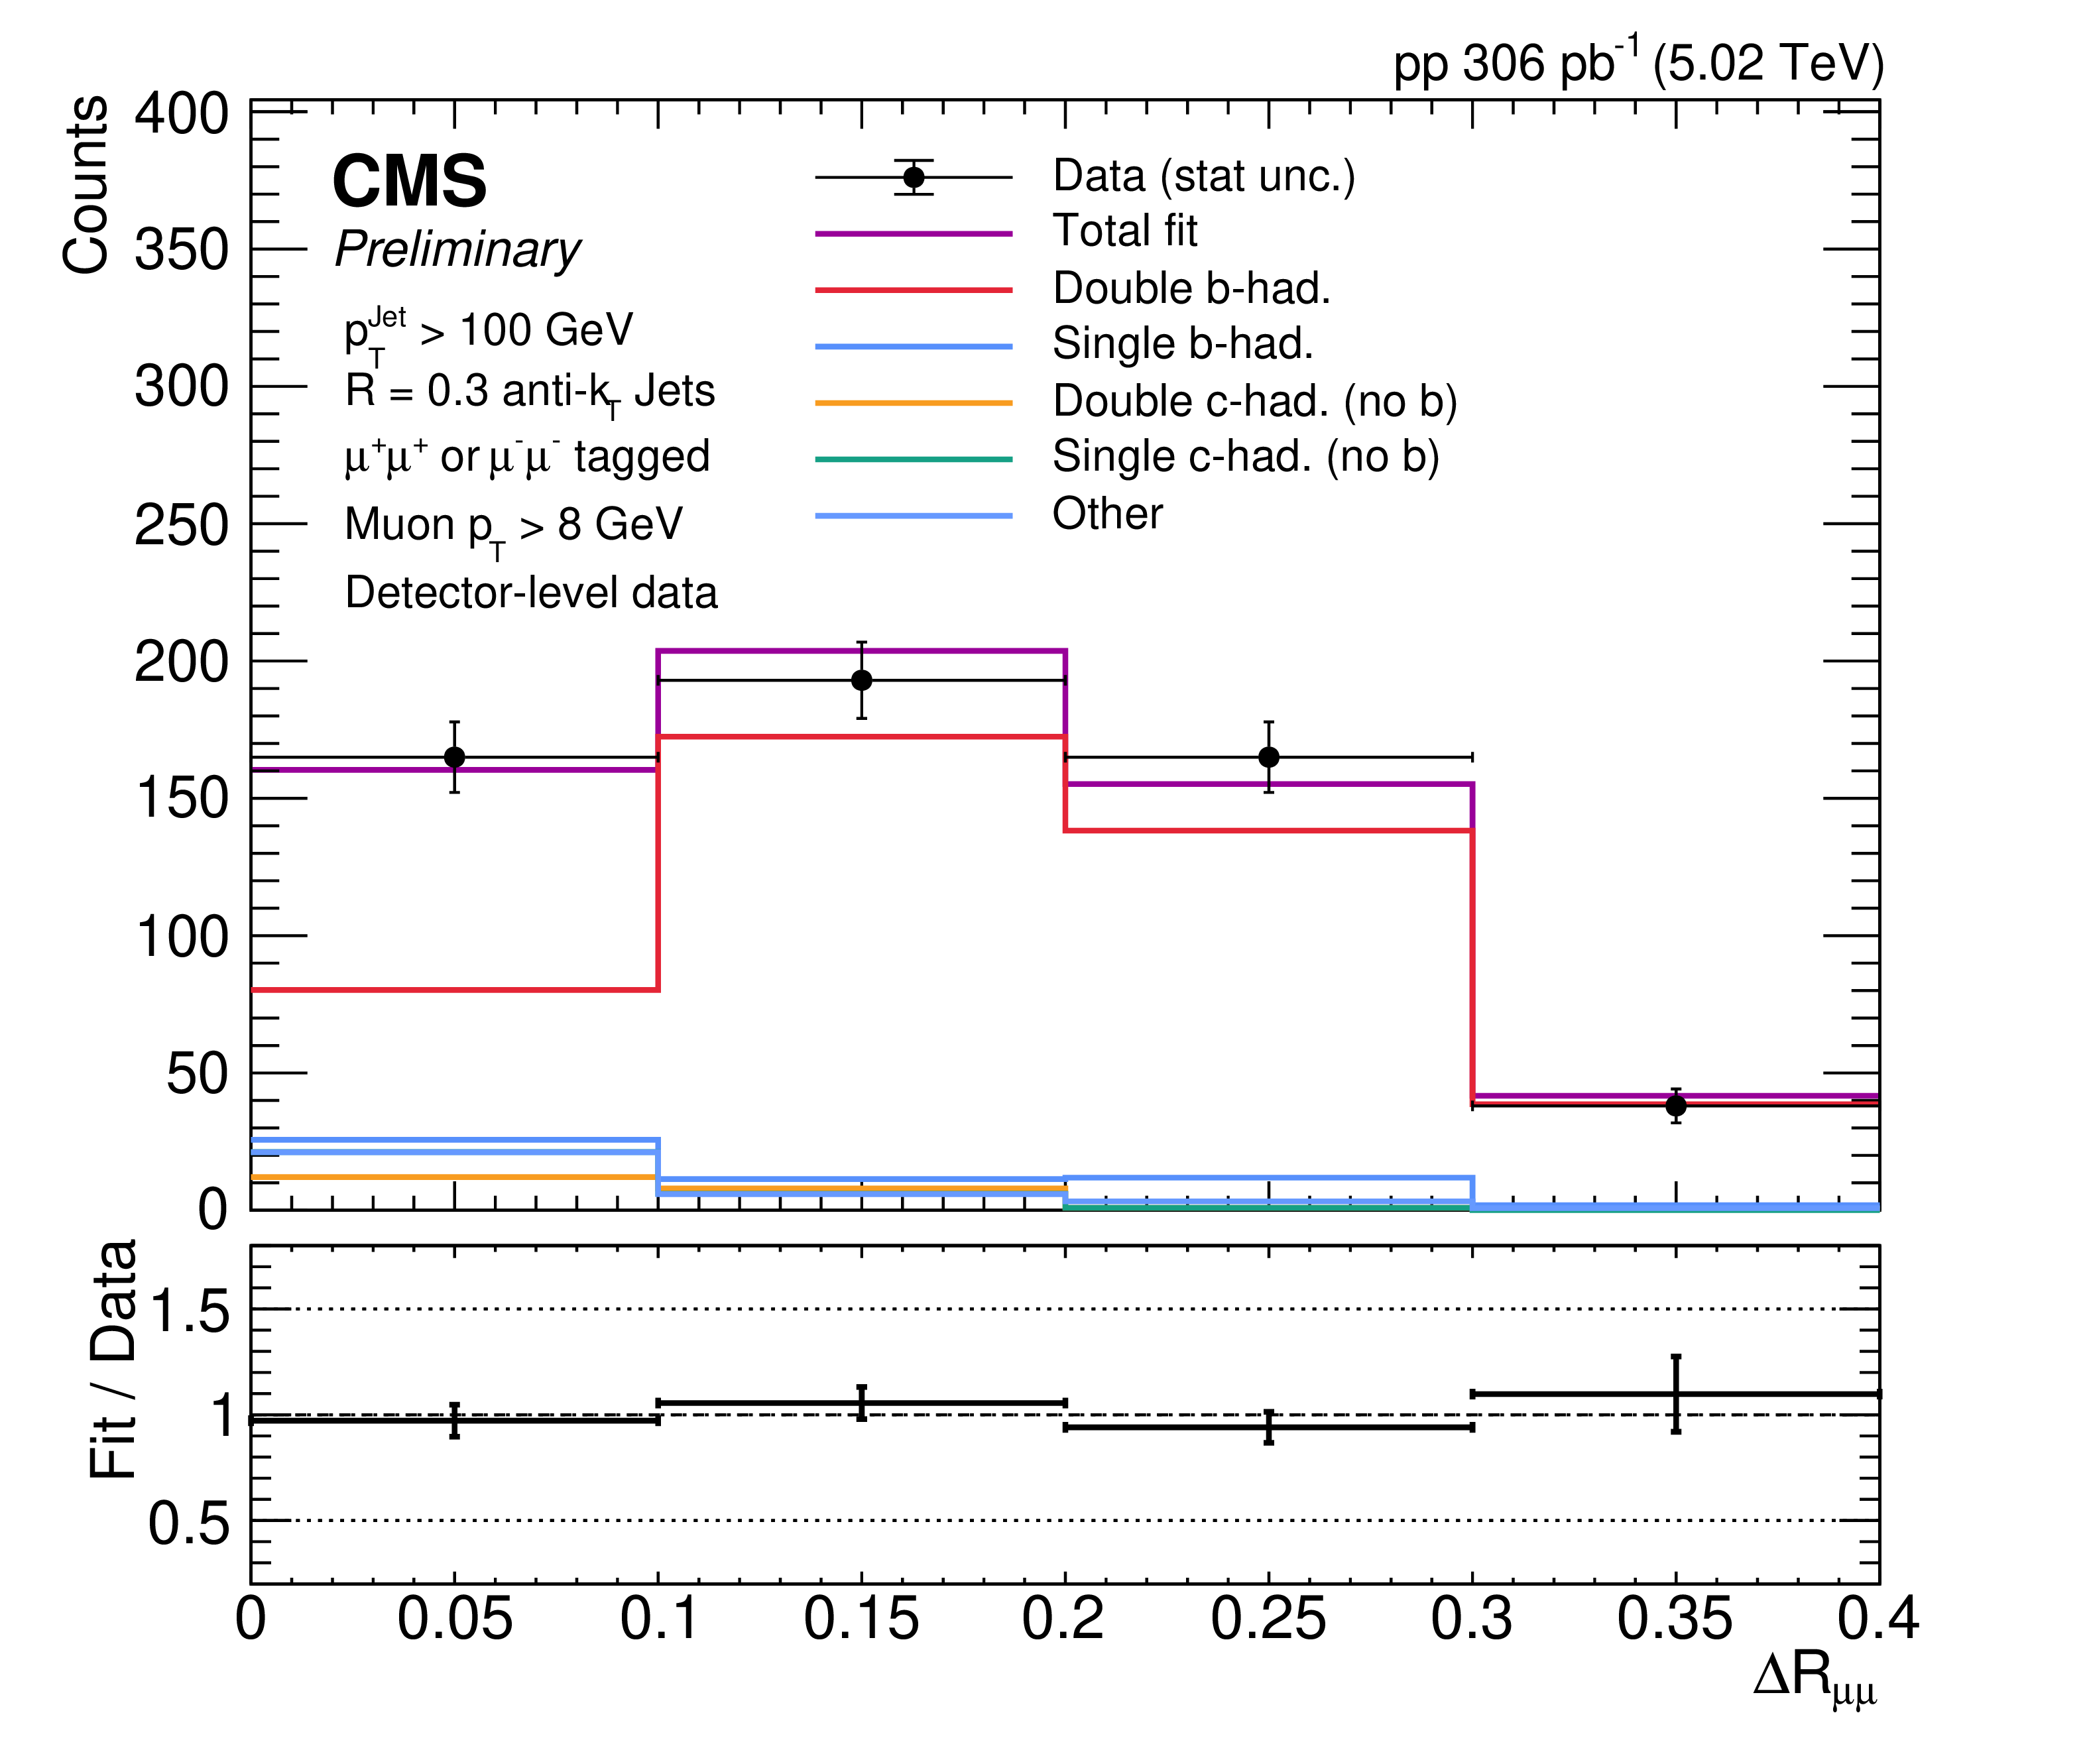
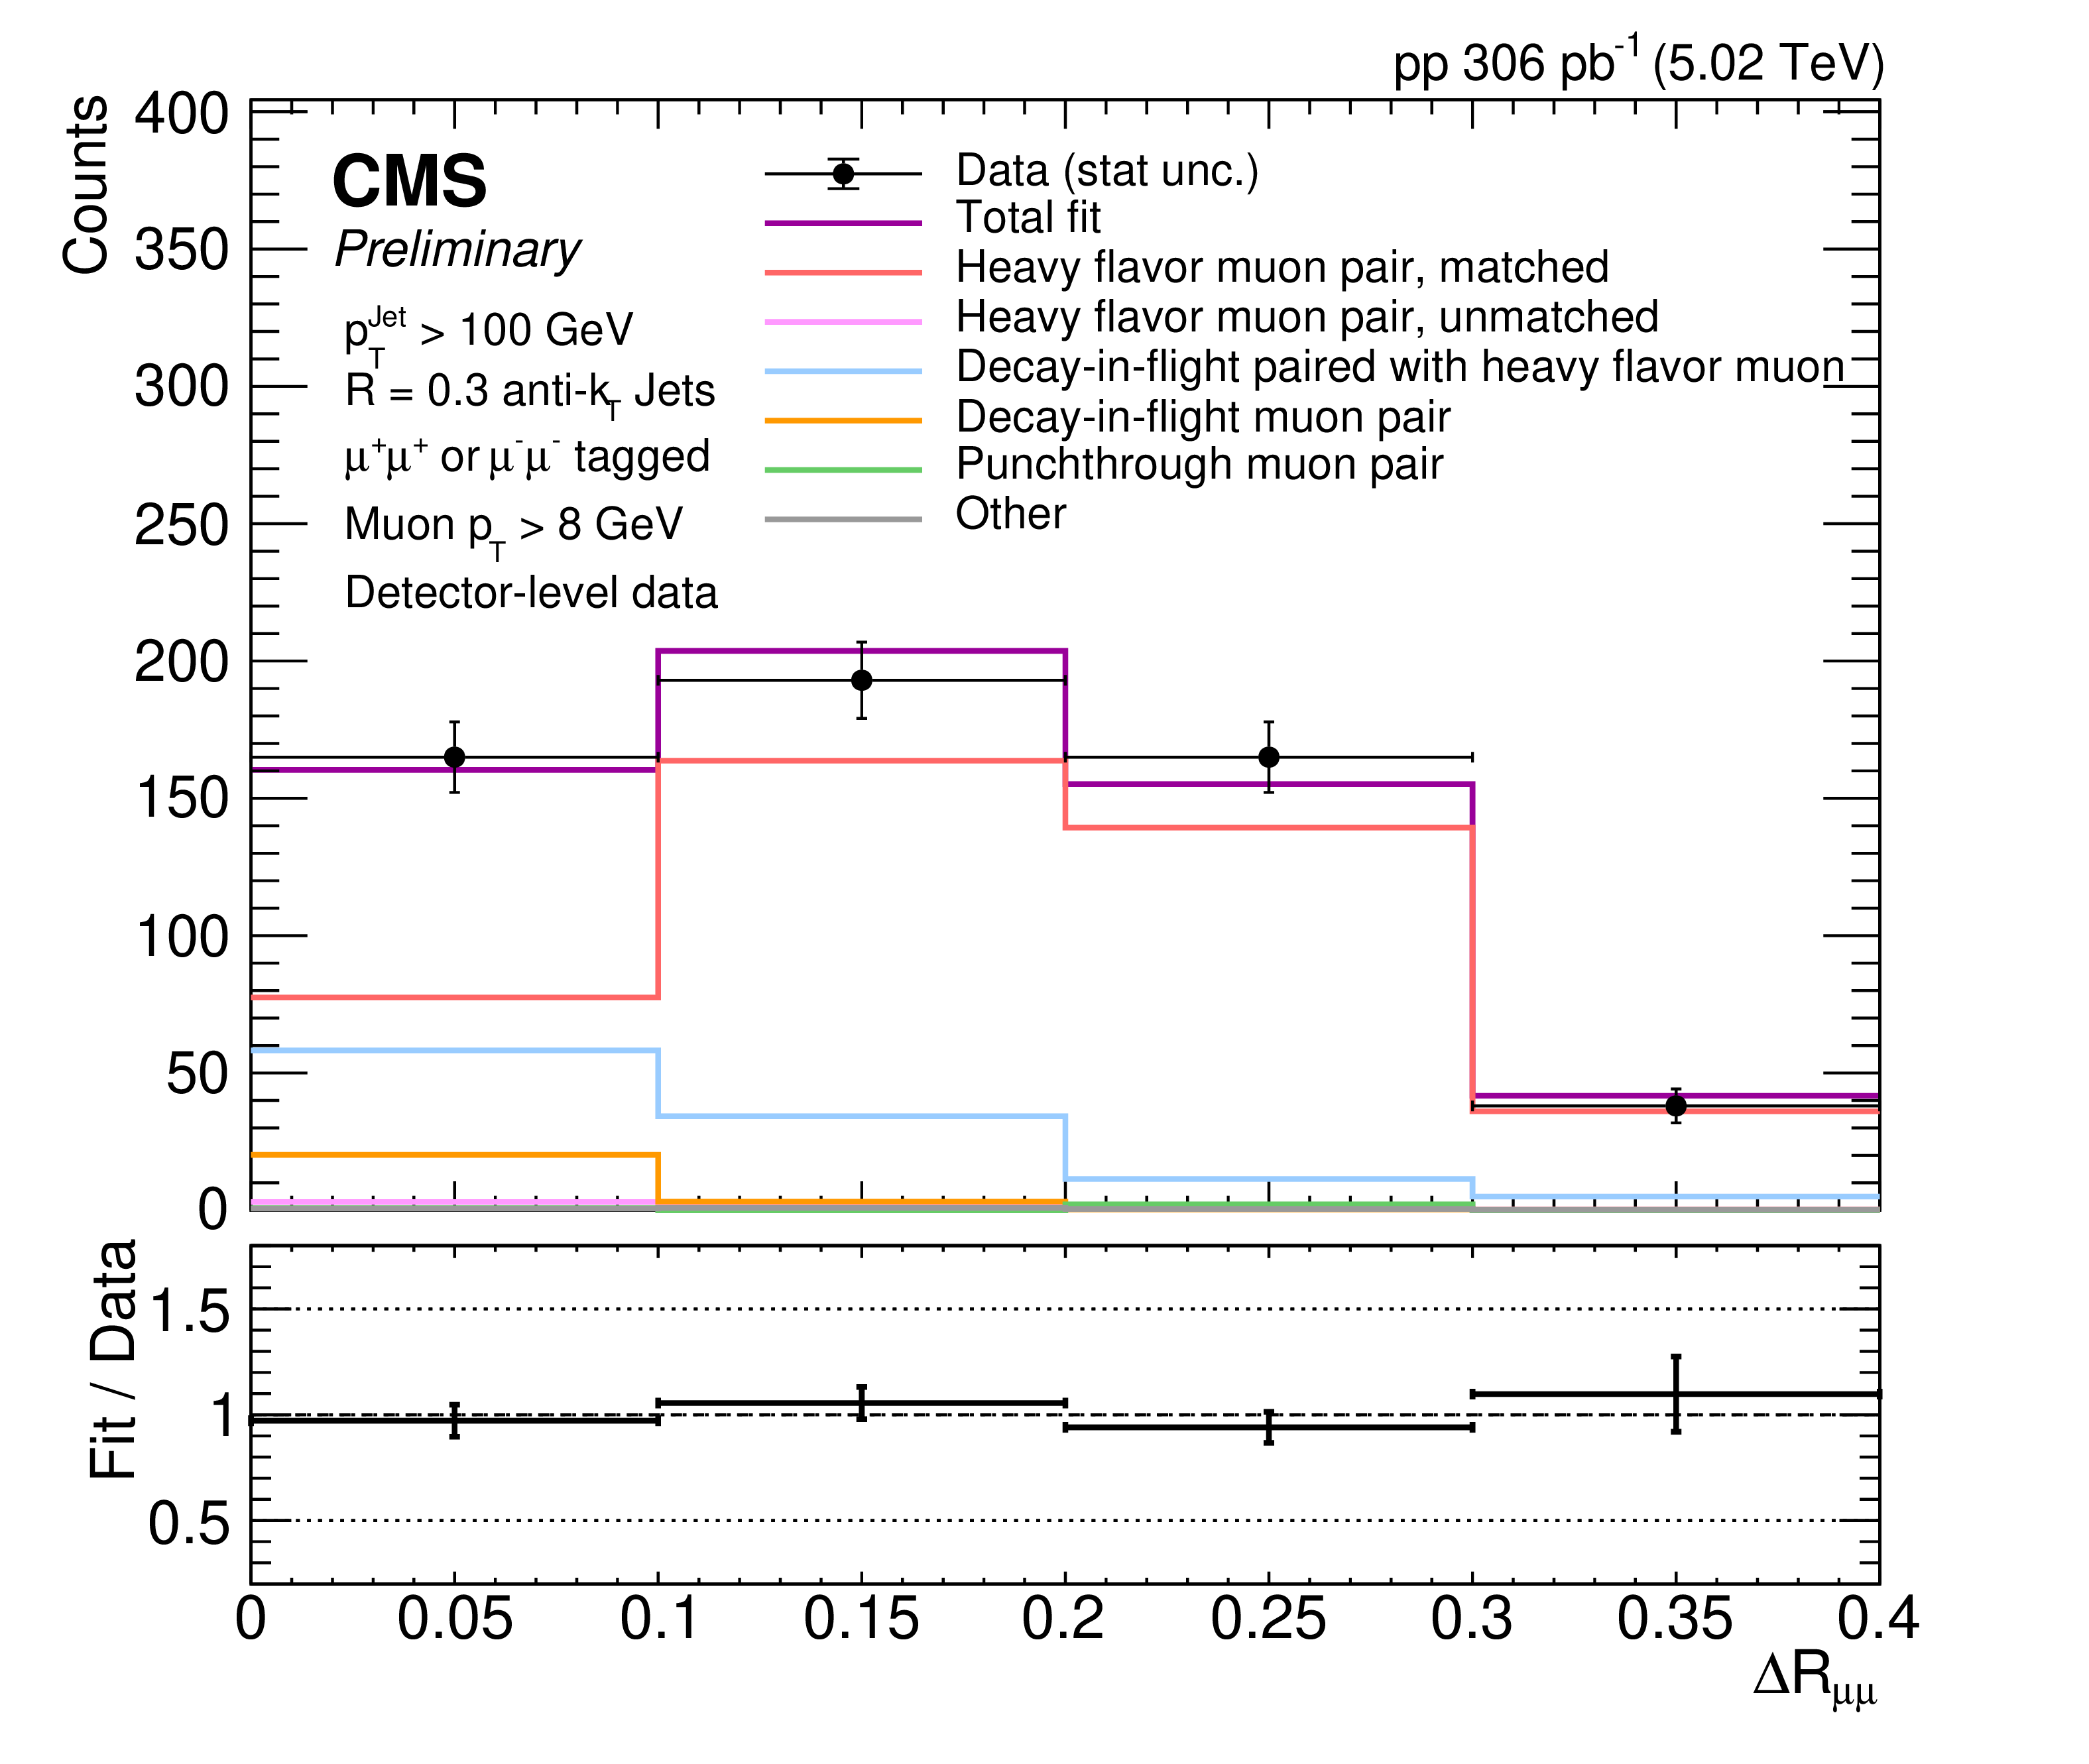
Uncorrected data-to-simulation comparison for the dimuon $ \Delta R_{\mu\mu} $ showing fitted unmatched and matched $ \Delta R_{\mu\mu} $ signal components (left), the overall truth-level jet flavor composition of the sample, including contributions from unmatched dimuon jets (middle), and the overall reconstructed muon simulation-type pair of the dimuon jets (right). |
png pdf |
Figure 6-a:
Uncorrected data-to-simulation comparison for the dimuon $ \Delta R_{\mu\mu} $ showing fitted unmatched and matched $ \Delta R_{\mu\mu} $ signal components (left), the overall truth-level jet flavor composition of the sample, including contributions from unmatched dimuon jets (middle), and the overall reconstructed muon simulation-type pair of the dimuon jets (right). |
png pdf |
Figure 6-b:
Uncorrected data-to-simulation comparison for the dimuon $ \Delta R_{\mu\mu} $ showing fitted unmatched and matched $ \Delta R_{\mu\mu} $ signal components (left), the overall truth-level jet flavor composition of the sample, including contributions from unmatched dimuon jets (middle), and the overall reconstructed muon simulation-type pair of the dimuon jets (right). |
png pdf |
Figure 7:
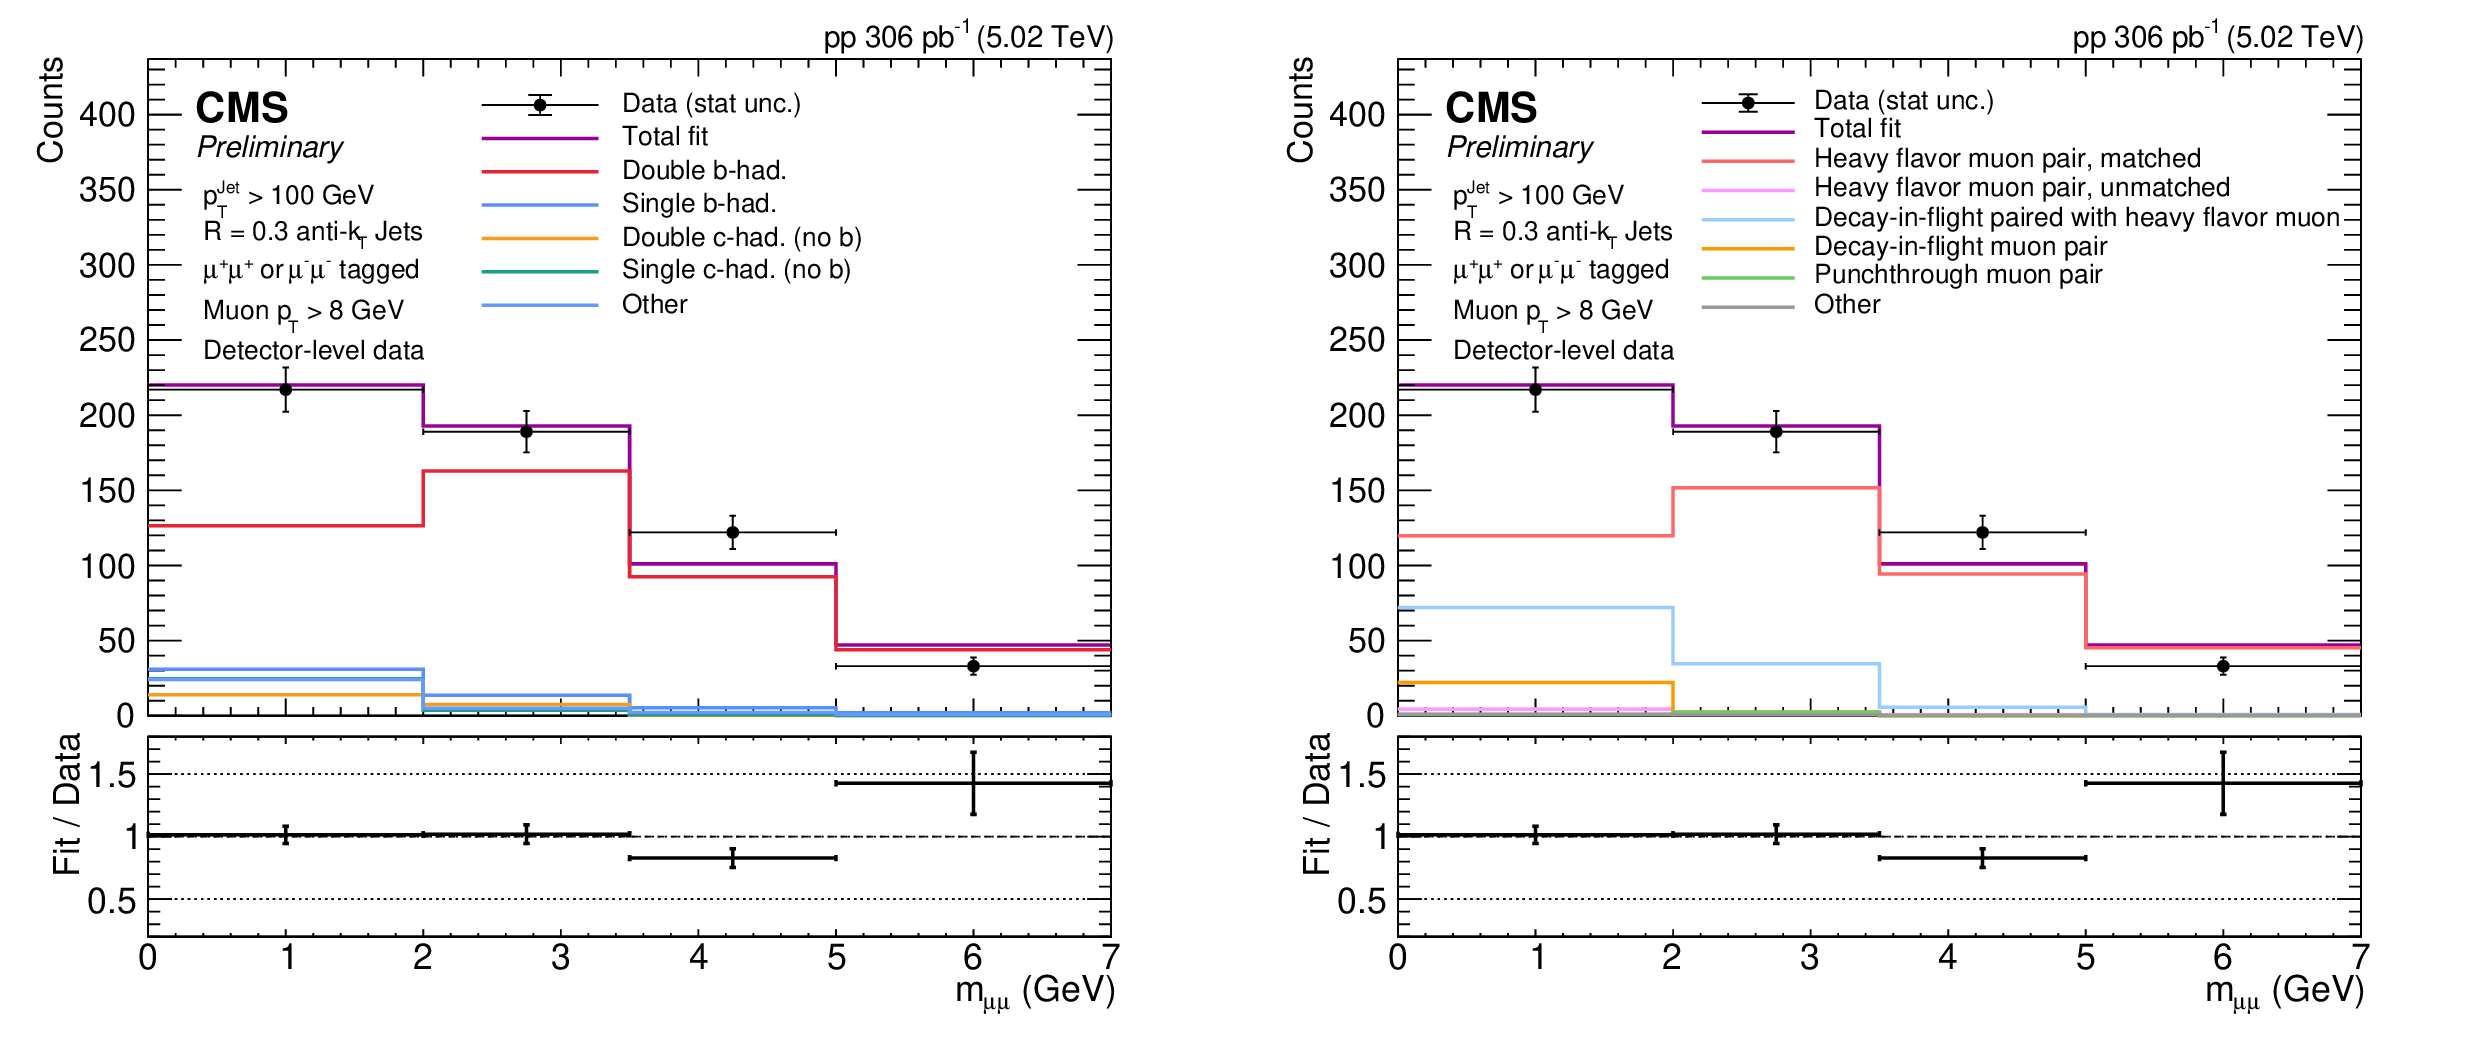
Uncorrected data-to-simulation comparison for the dimuon $ m_{\mu\mu} $ showing fitted unmatched and matched $ \Delta R_{\mu\mu} $ signal components (left), the overall truth-level jet flavor composition of the sample, including contributions from unmatched dimuon jets (middle), and the overall reconstructed muon simulation-type pair of the dimuon jets (right). |
png pdf |
Figure 7-a:
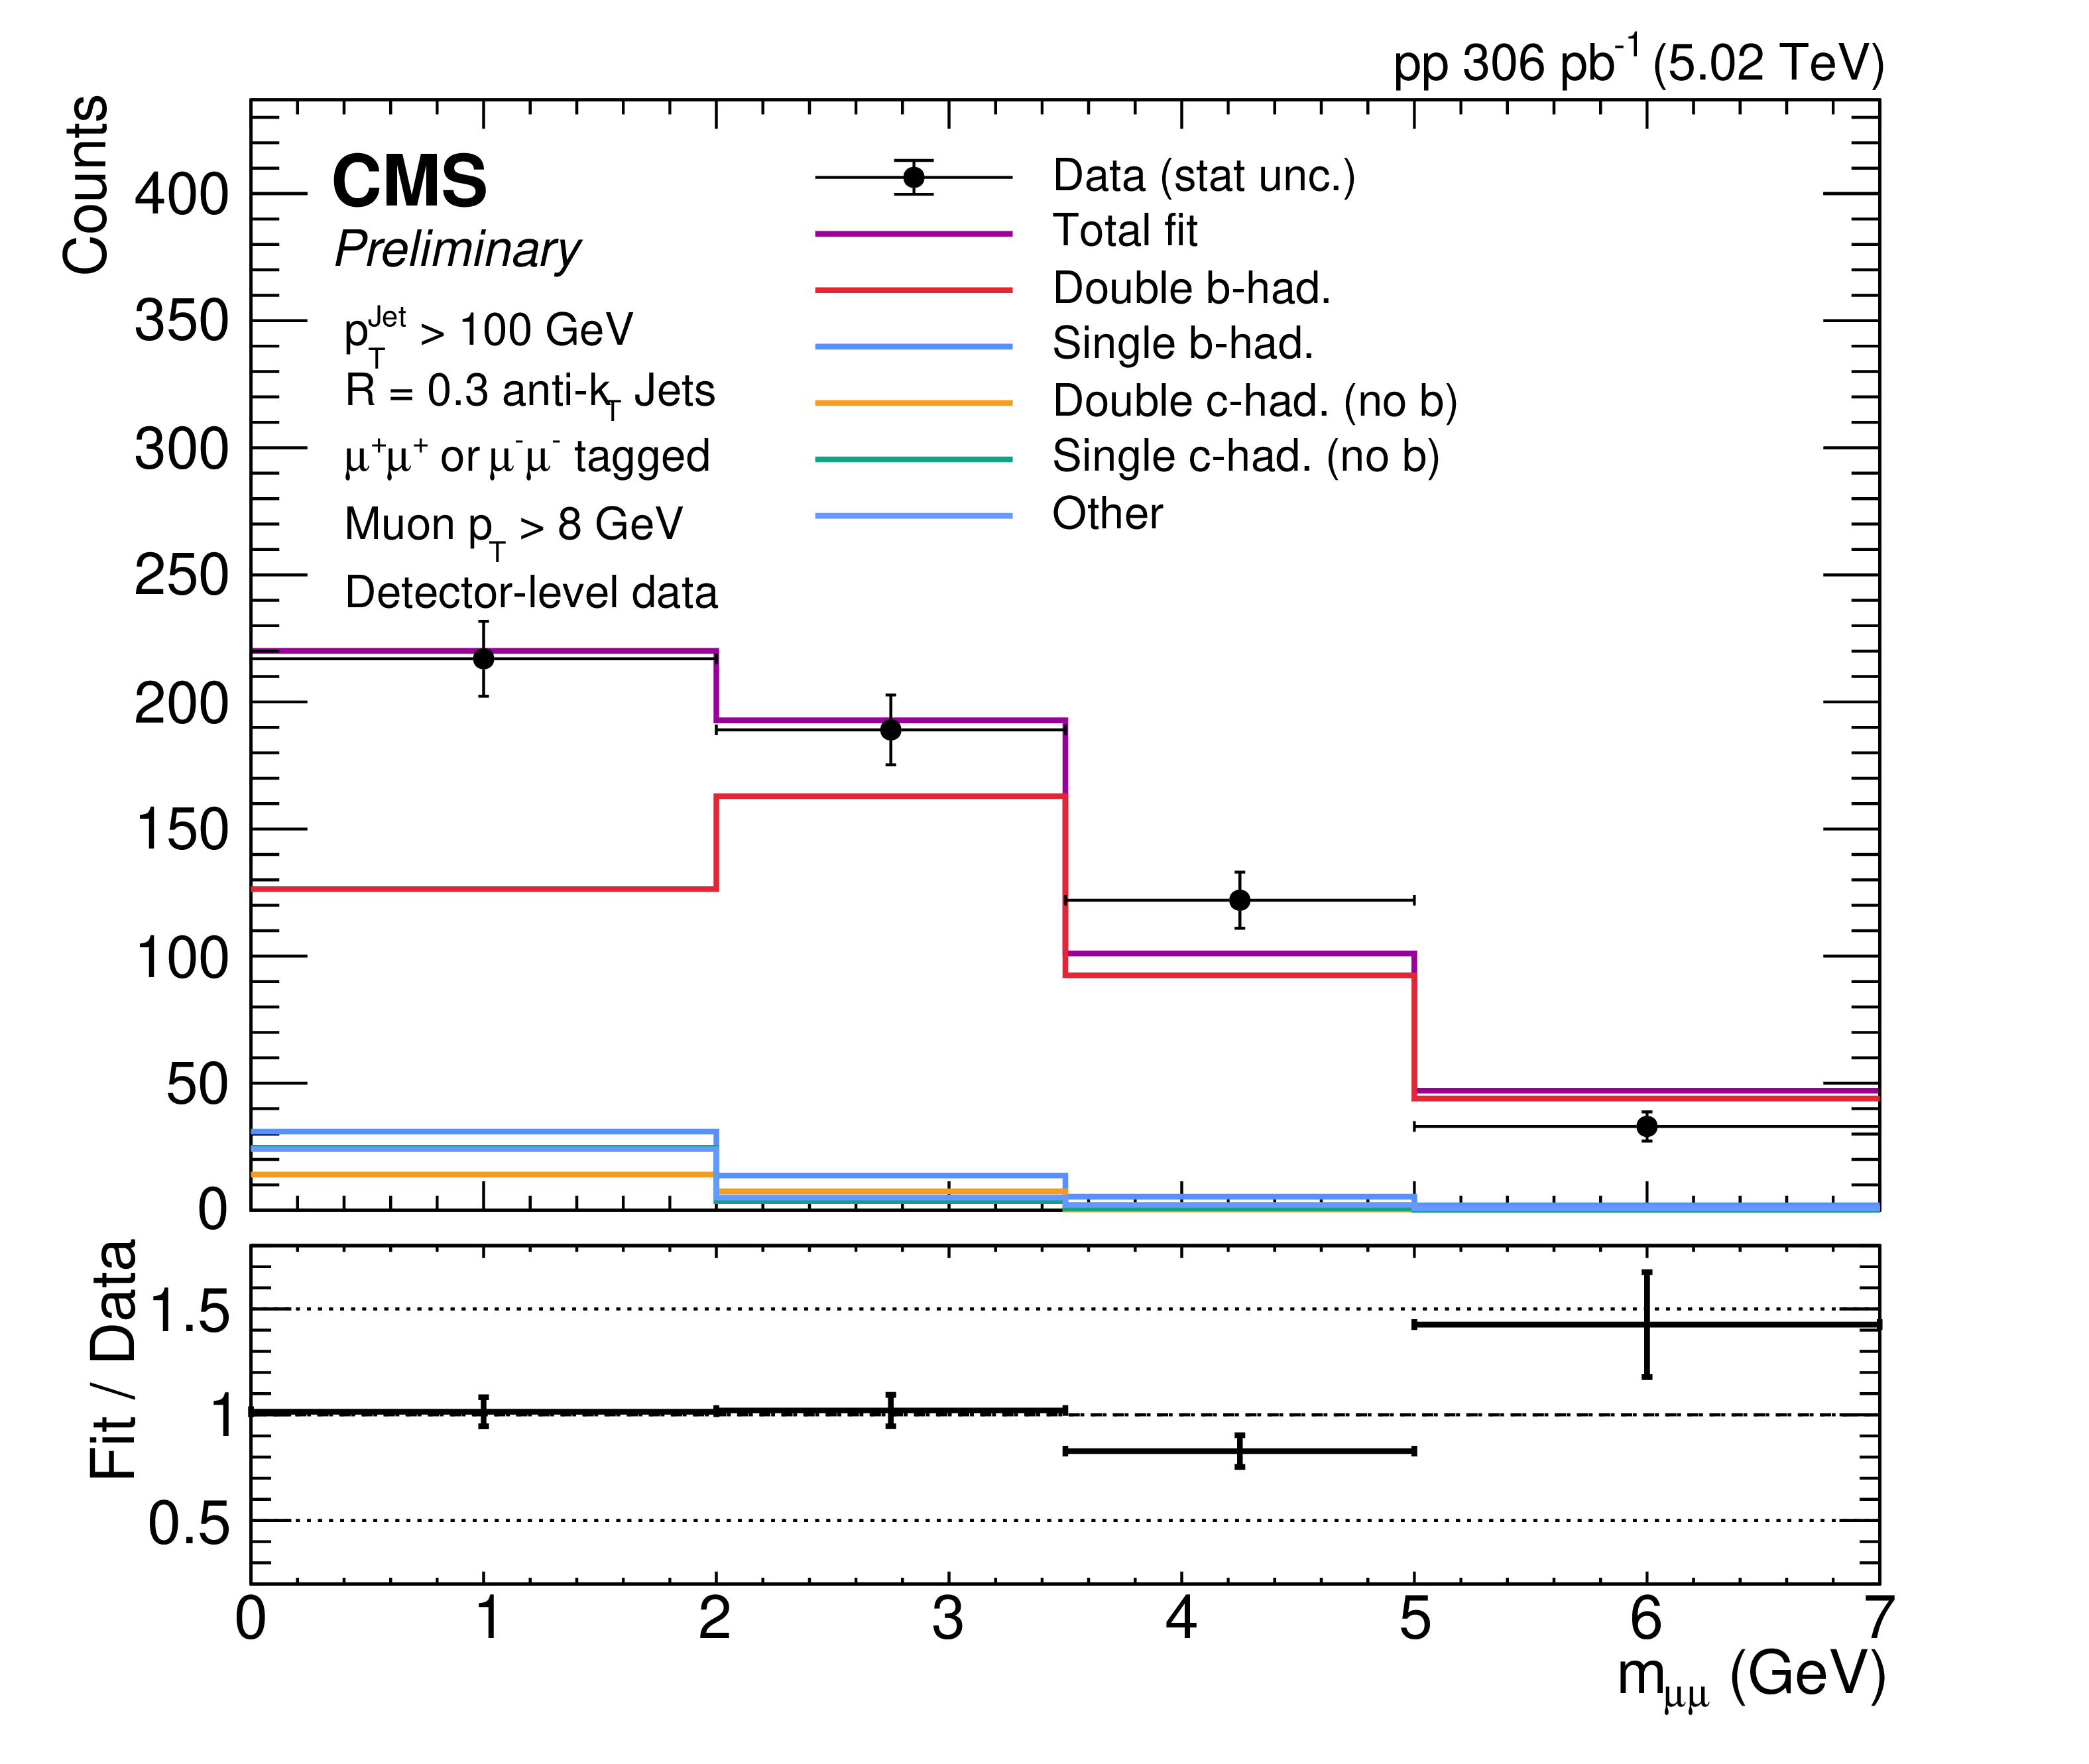
Uncorrected data-to-simulation comparison for the dimuon $ m_{\mu\mu} $ showing fitted unmatched and matched $ \Delta R_{\mu\mu} $ signal components (left), the overall truth-level jet flavor composition of the sample, including contributions from unmatched dimuon jets (middle), and the overall reconstructed muon simulation-type pair of the dimuon jets (right). |
png pdf |
Figure 7-b:
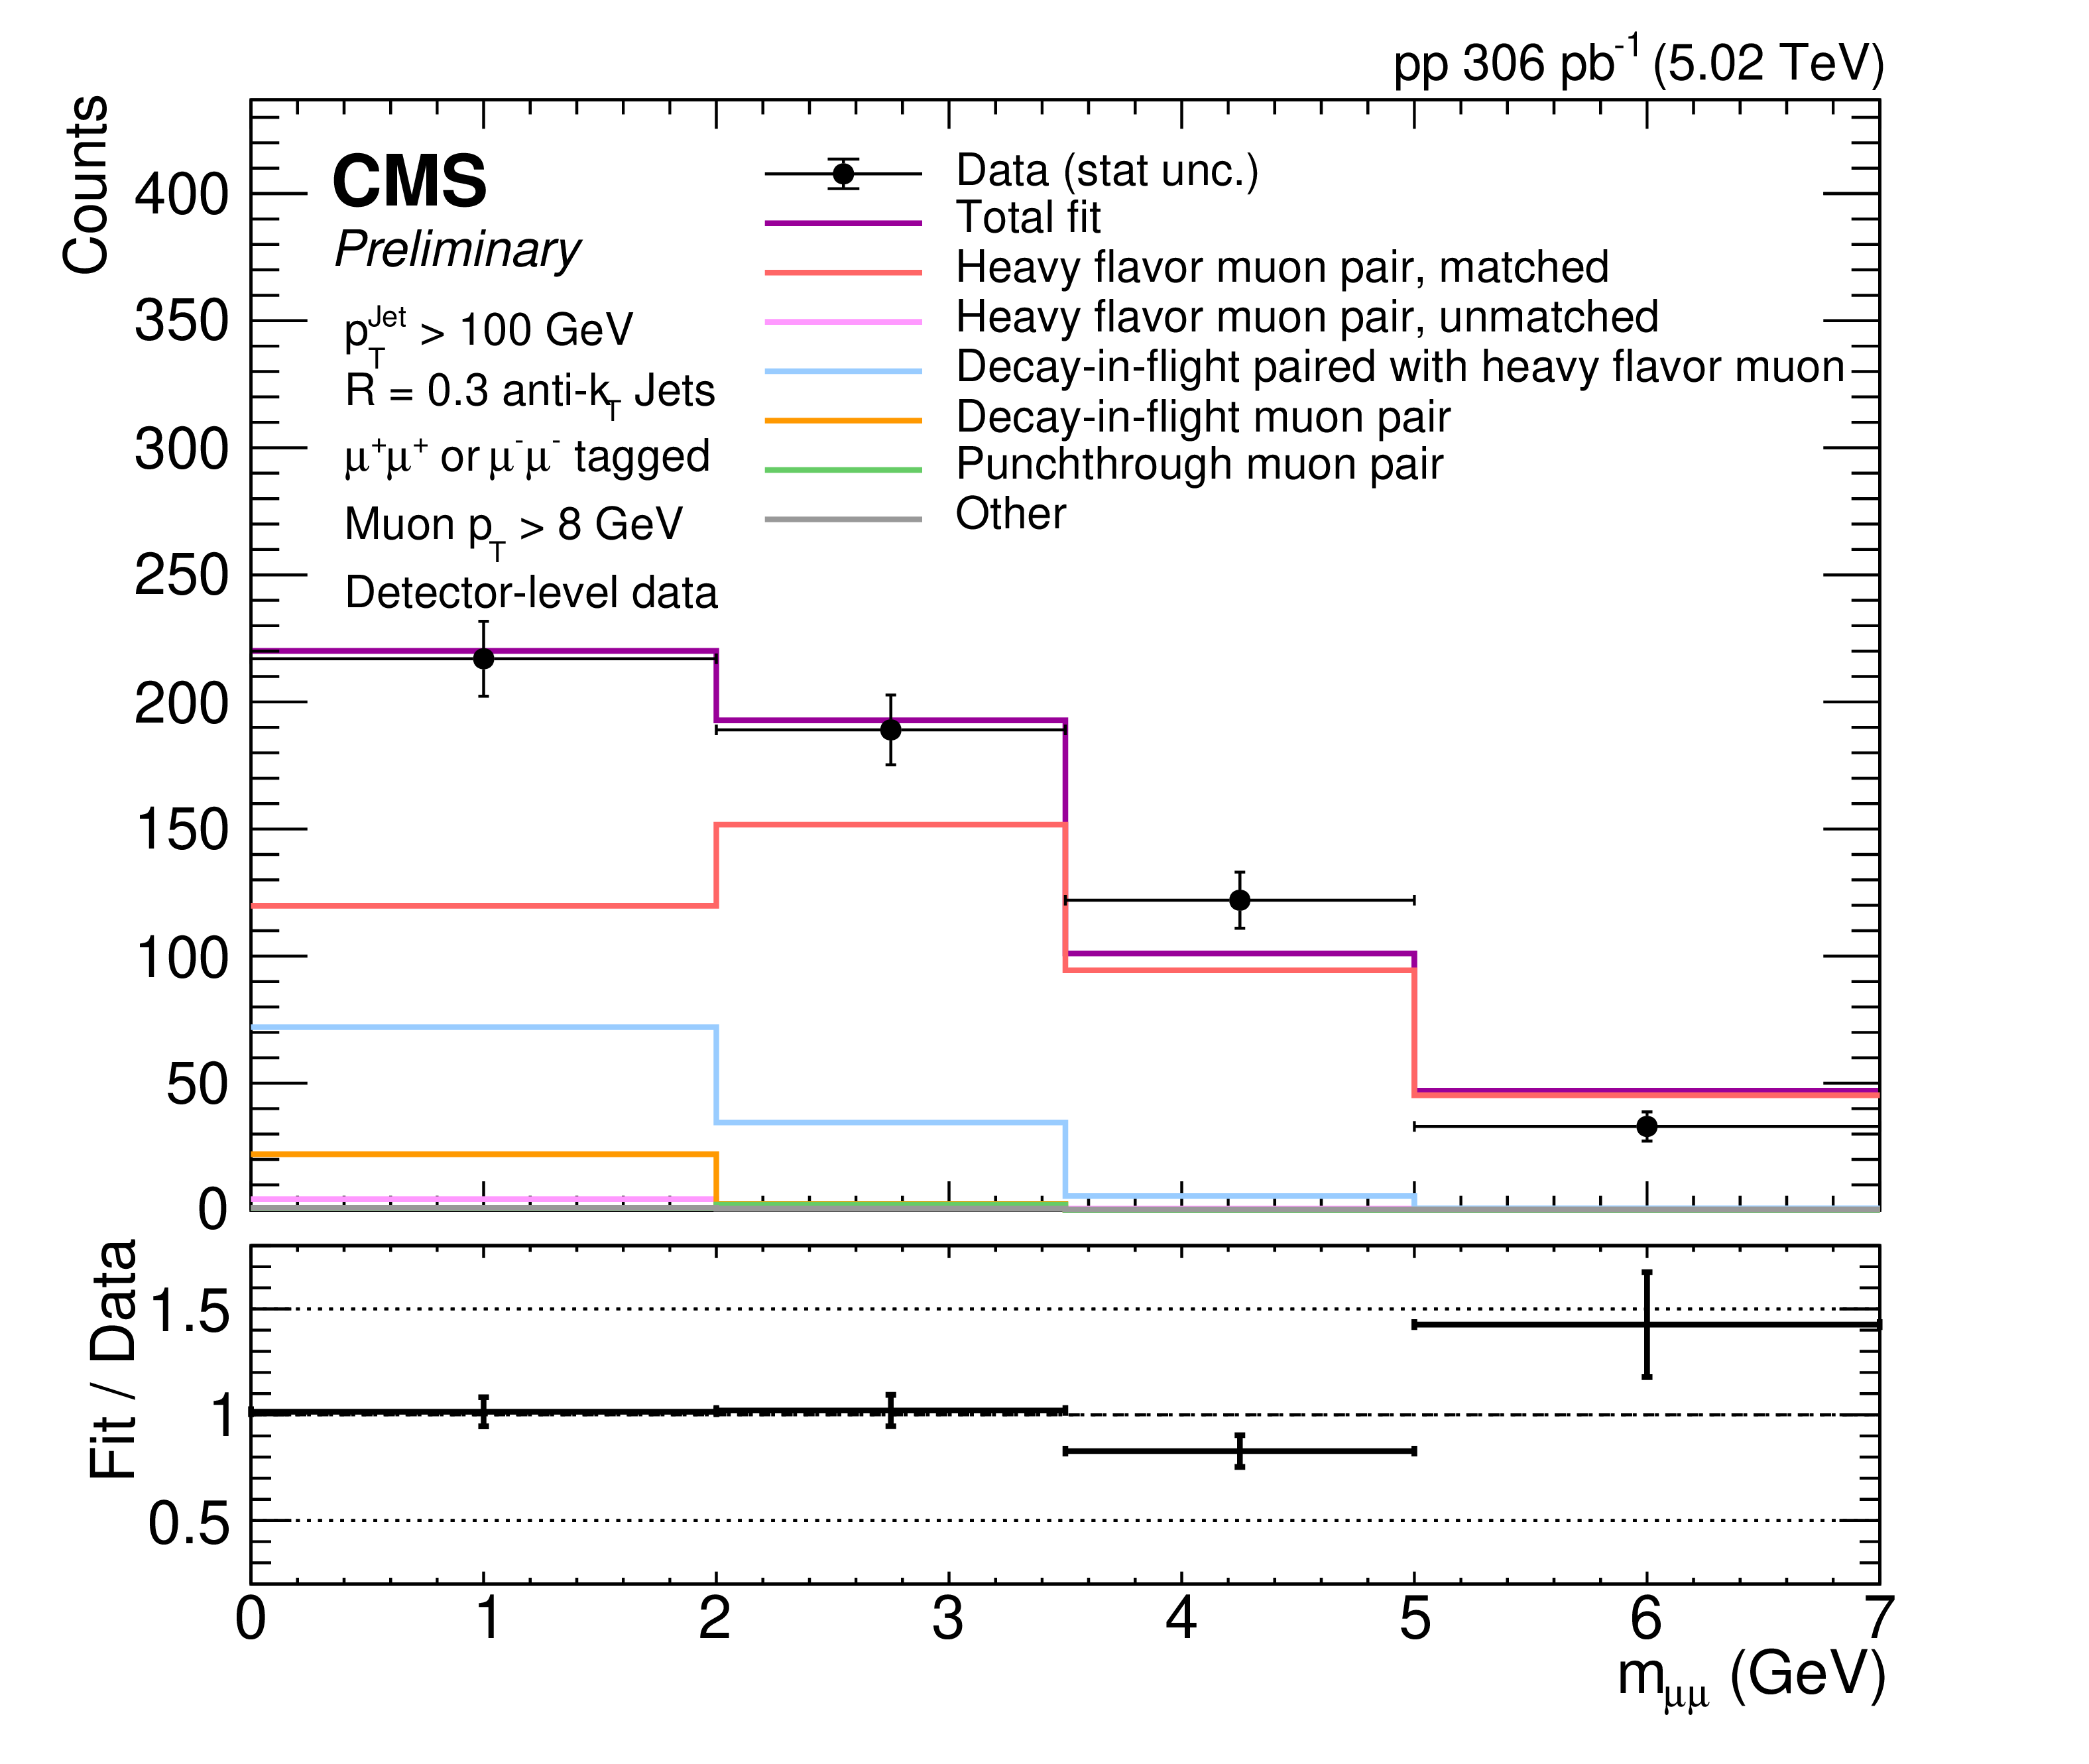
Uncorrected data-to-simulation comparison for the dimuon $ m_{\mu\mu} $ showing fitted unmatched and matched $ \Delta R_{\mu\mu} $ signal components (left), the overall truth-level jet flavor composition of the sample, including contributions from unmatched dimuon jets (middle), and the overall reconstructed muon simulation-type pair of the dimuon jets (right). |
png pdf |
Figure 8:
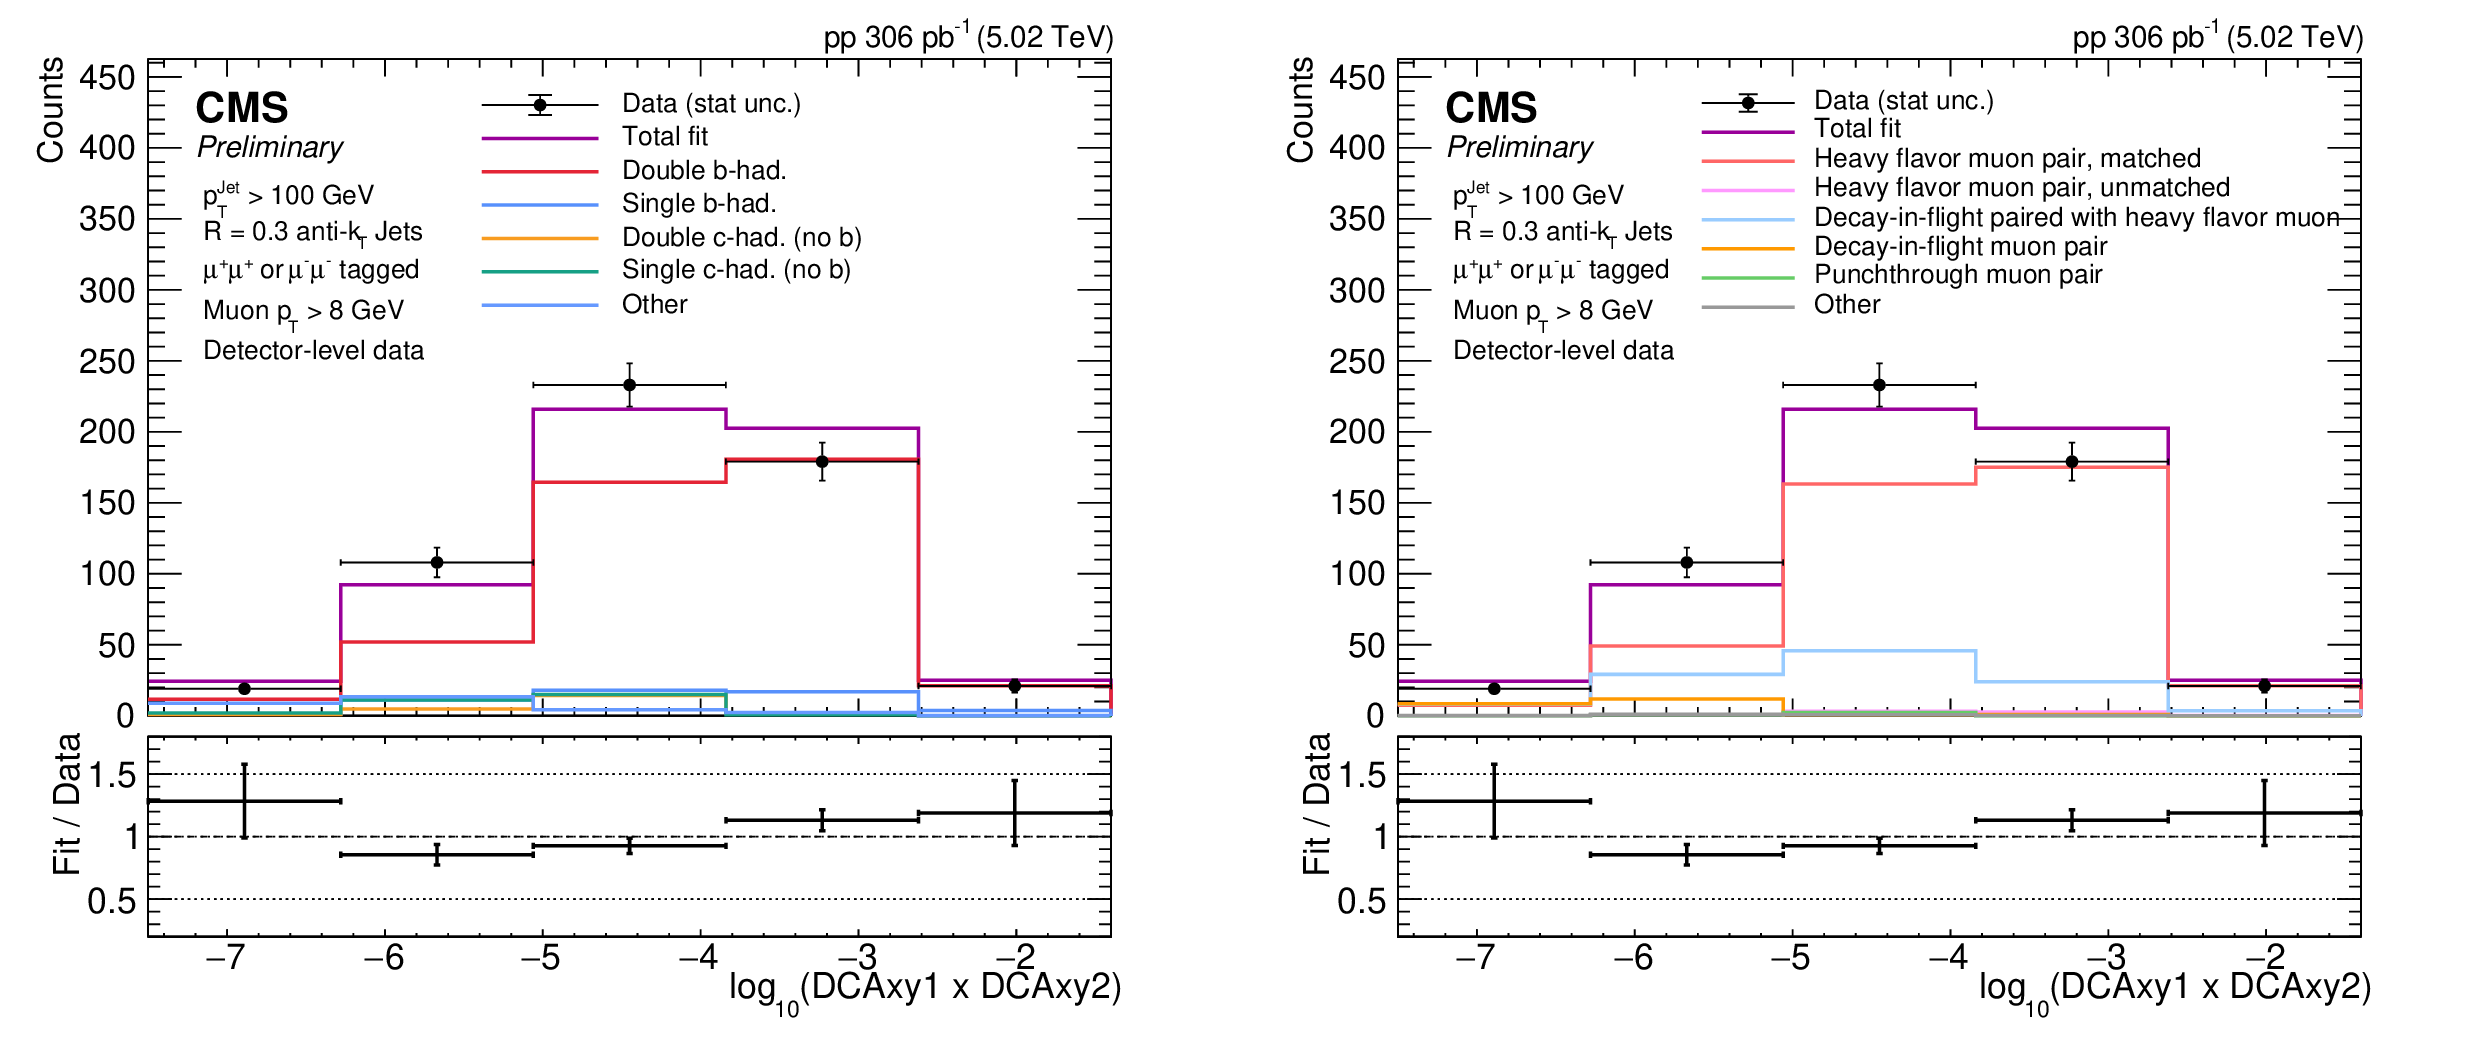
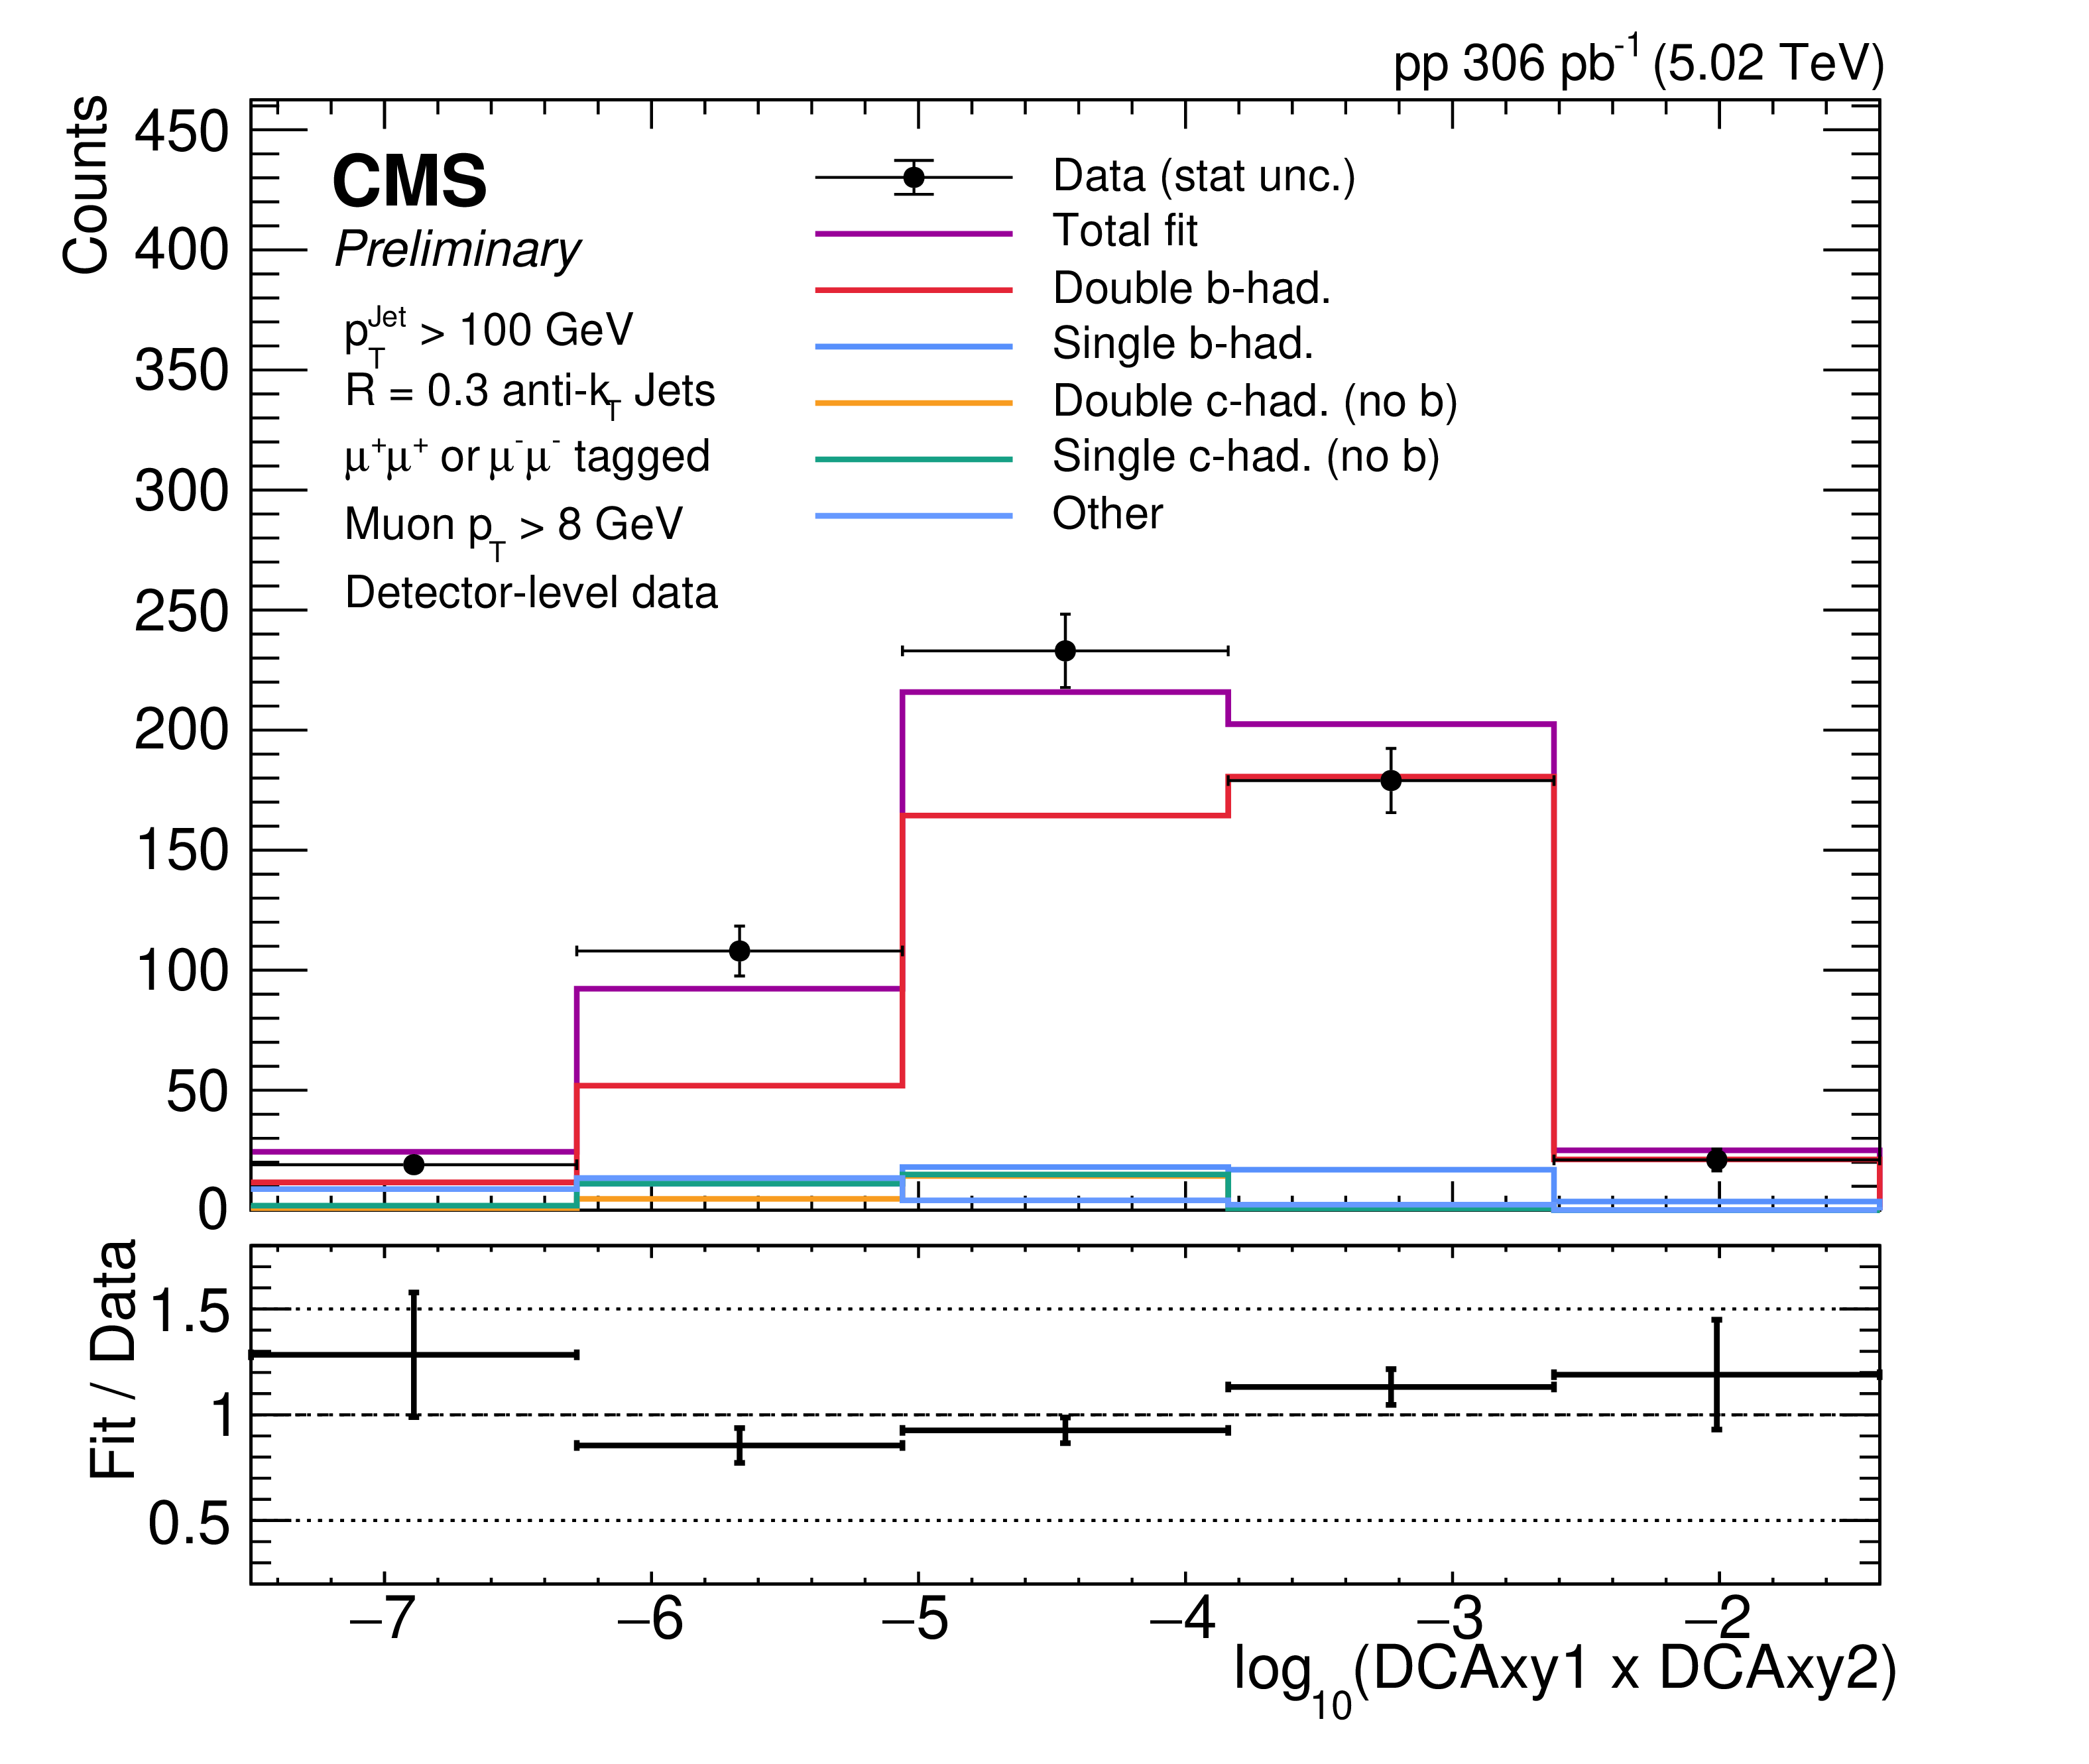
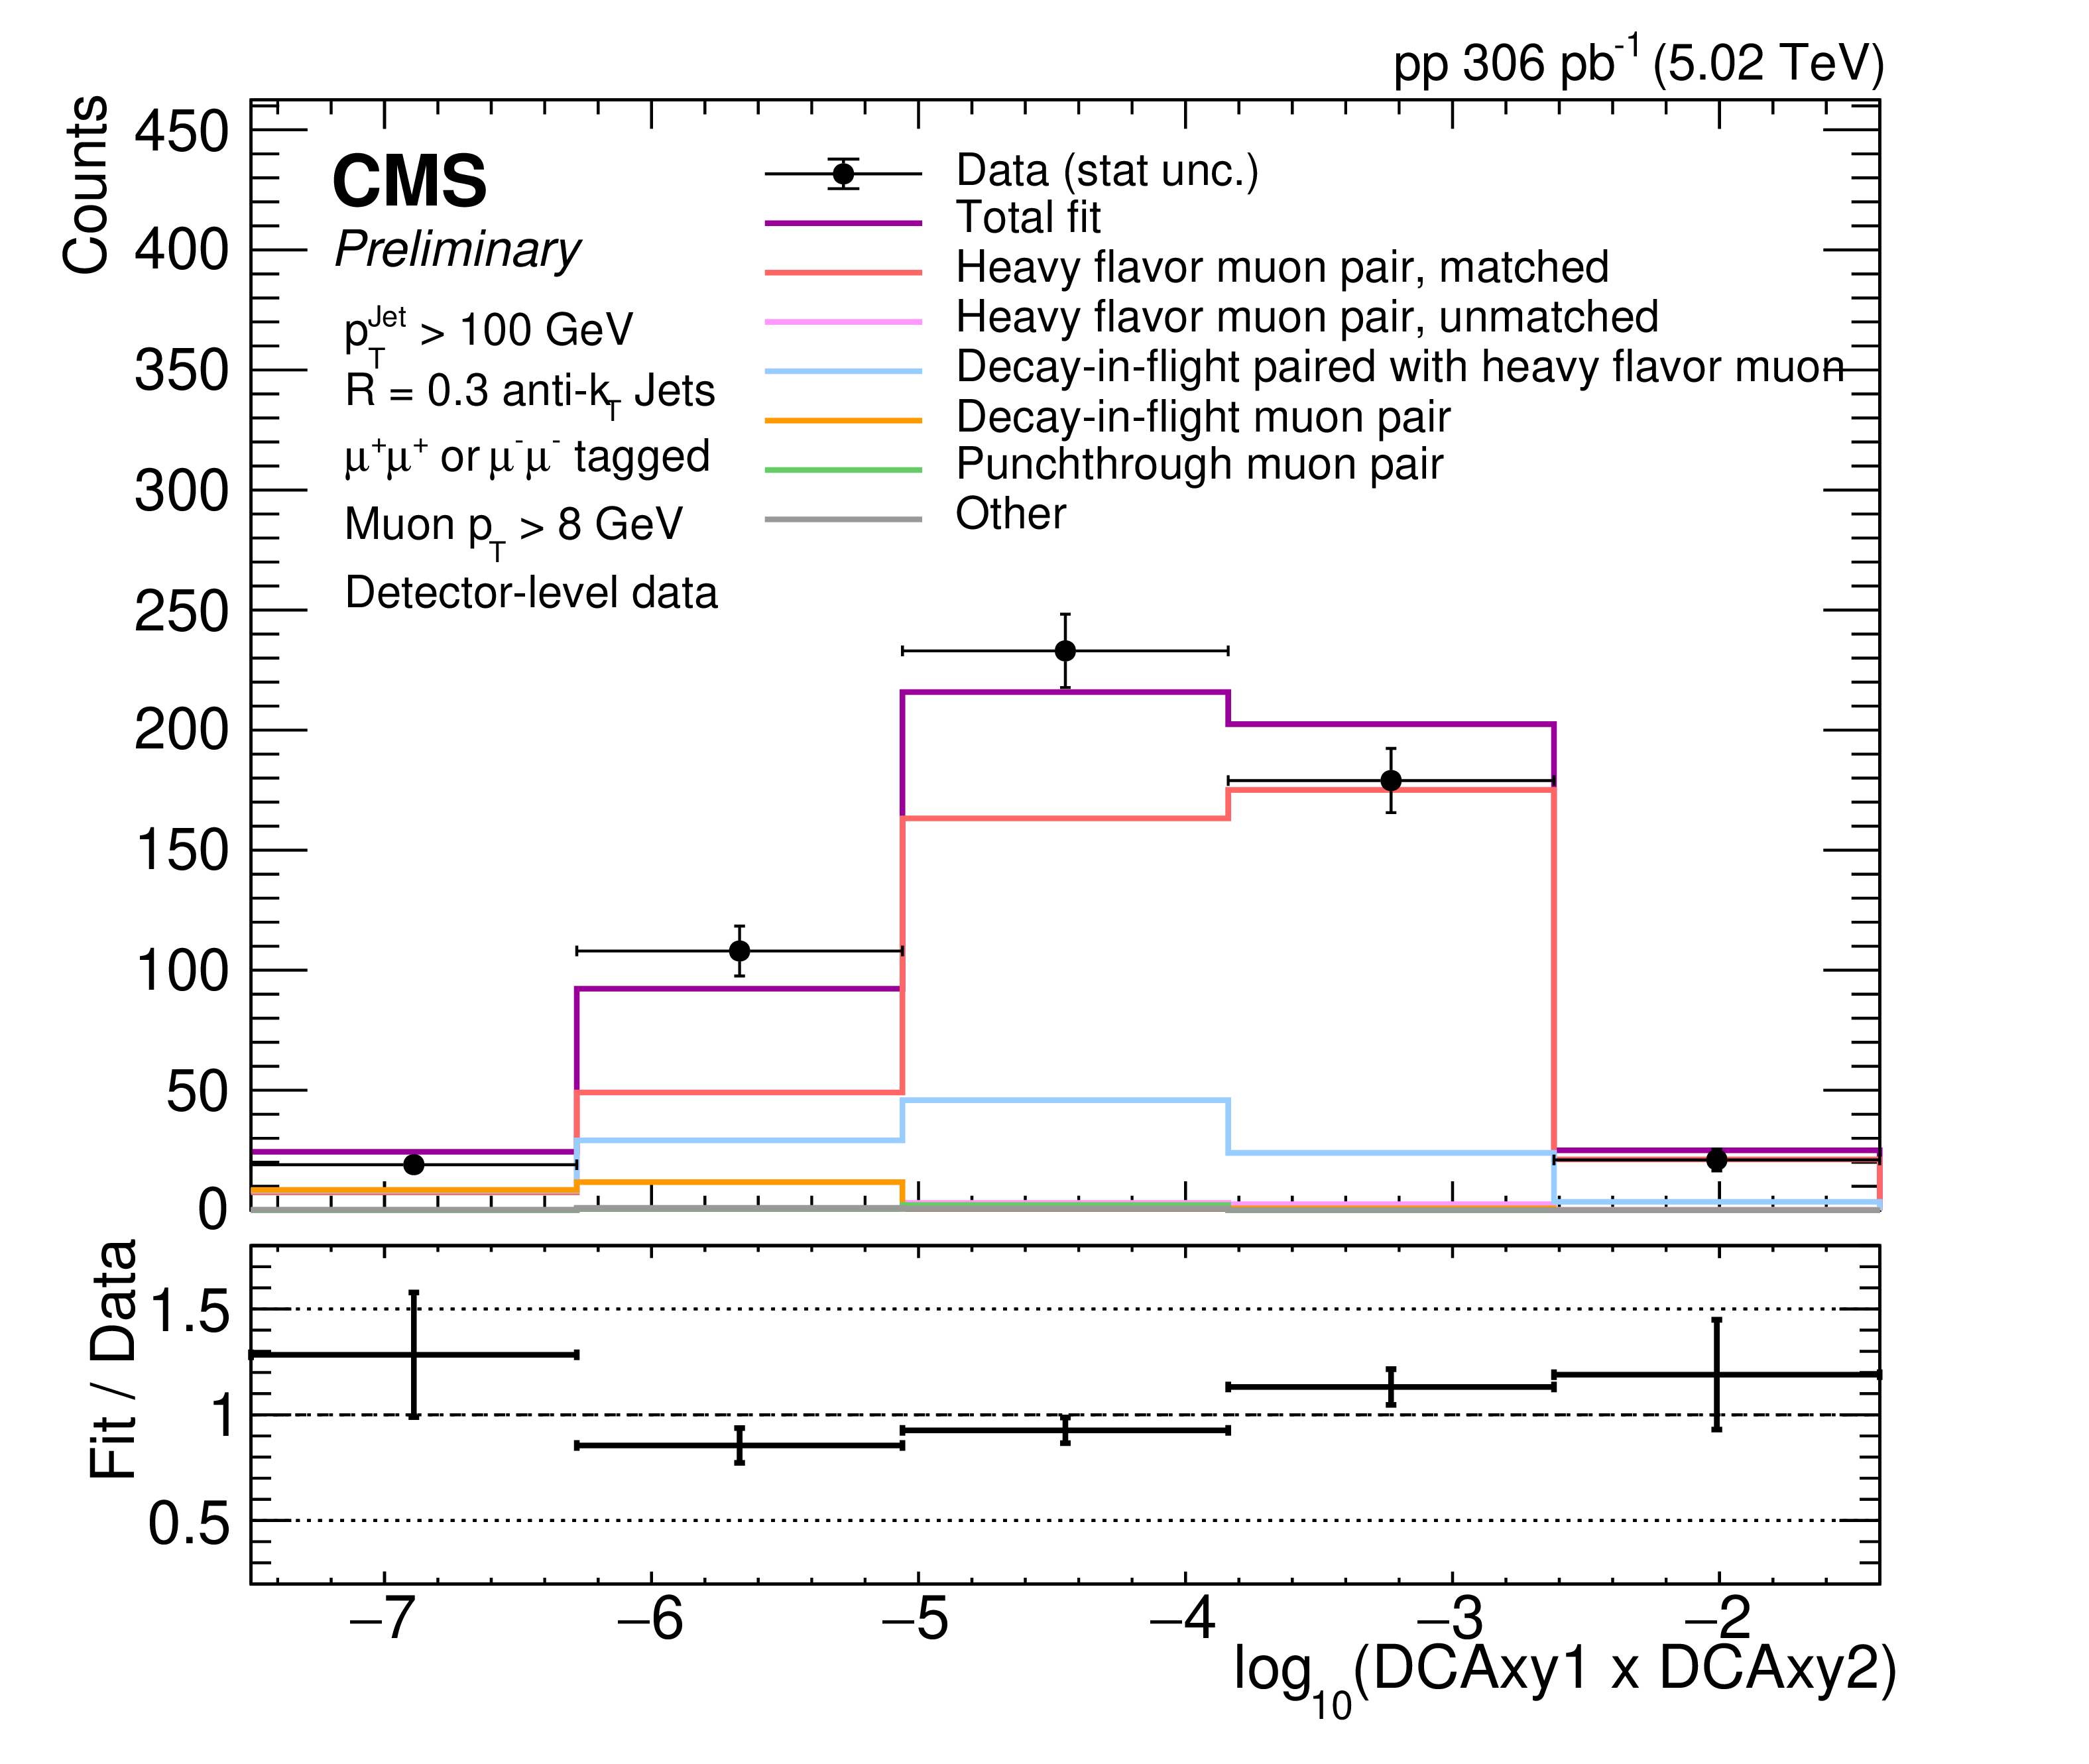
Uncorrected data-to-simulation comparison for the log of the product of each muon's transverse distance of closest approach (DCA) showing fitted unmatched and matched $ \Delta R_{\mu\mu} $ signal components (left), the overall truth-level jet flavor composition of the sample, including contributions from unmatched dimuon jets (middle), and the overall reconstructed muon simulation-type pair of the dimuon jets (right). |
png pdf |
Figure 8-a:
Uncorrected data-to-simulation comparison for the log of the product of each muon's transverse distance of closest approach (DCA) showing fitted unmatched and matched $ \Delta R_{\mu\mu} $ signal components (left), the overall truth-level jet flavor composition of the sample, including contributions from unmatched dimuon jets (middle), and the overall reconstructed muon simulation-type pair of the dimuon jets (right). |
png pdf |
Figure 8-b:
Uncorrected data-to-simulation comparison for the log of the product of each muon's transverse distance of closest approach (DCA) showing fitted unmatched and matched $ \Delta R_{\mu\mu} $ signal components (left), the overall truth-level jet flavor composition of the sample, including contributions from unmatched dimuon jets (middle), and the overall reconstructed muon simulation-type pair of the dimuon jets (right). |
png pdf |
Figure 9:
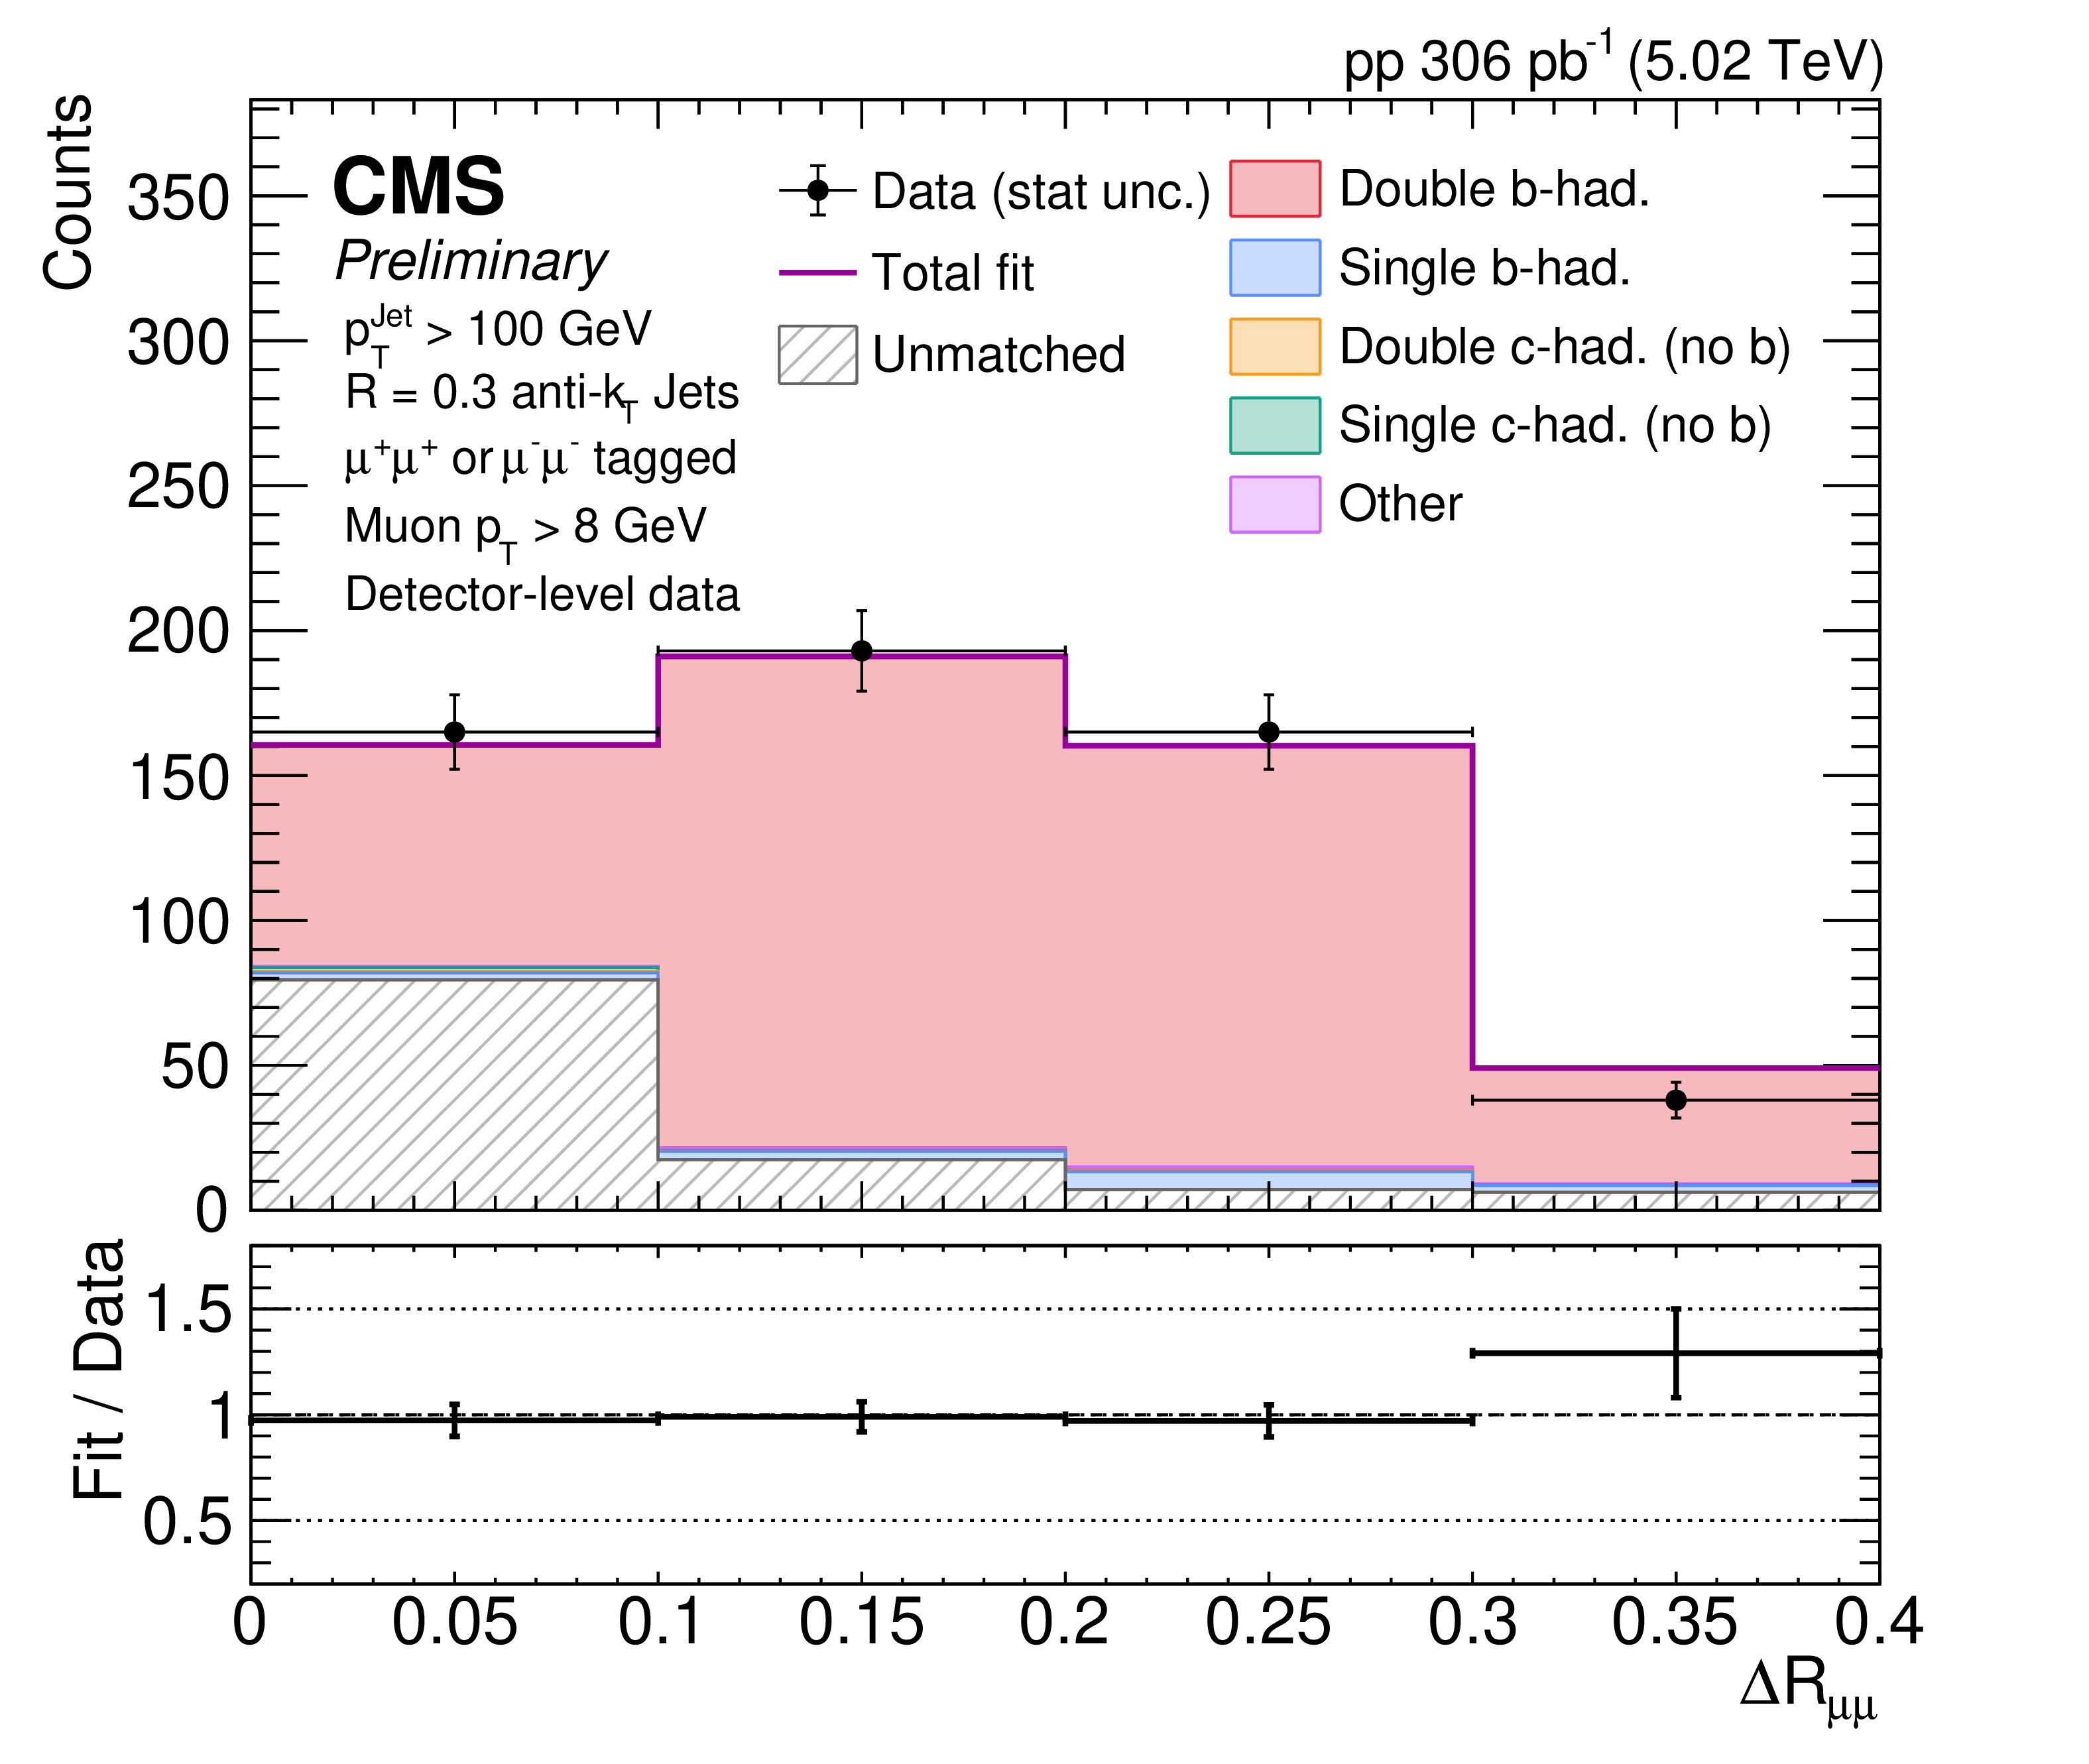
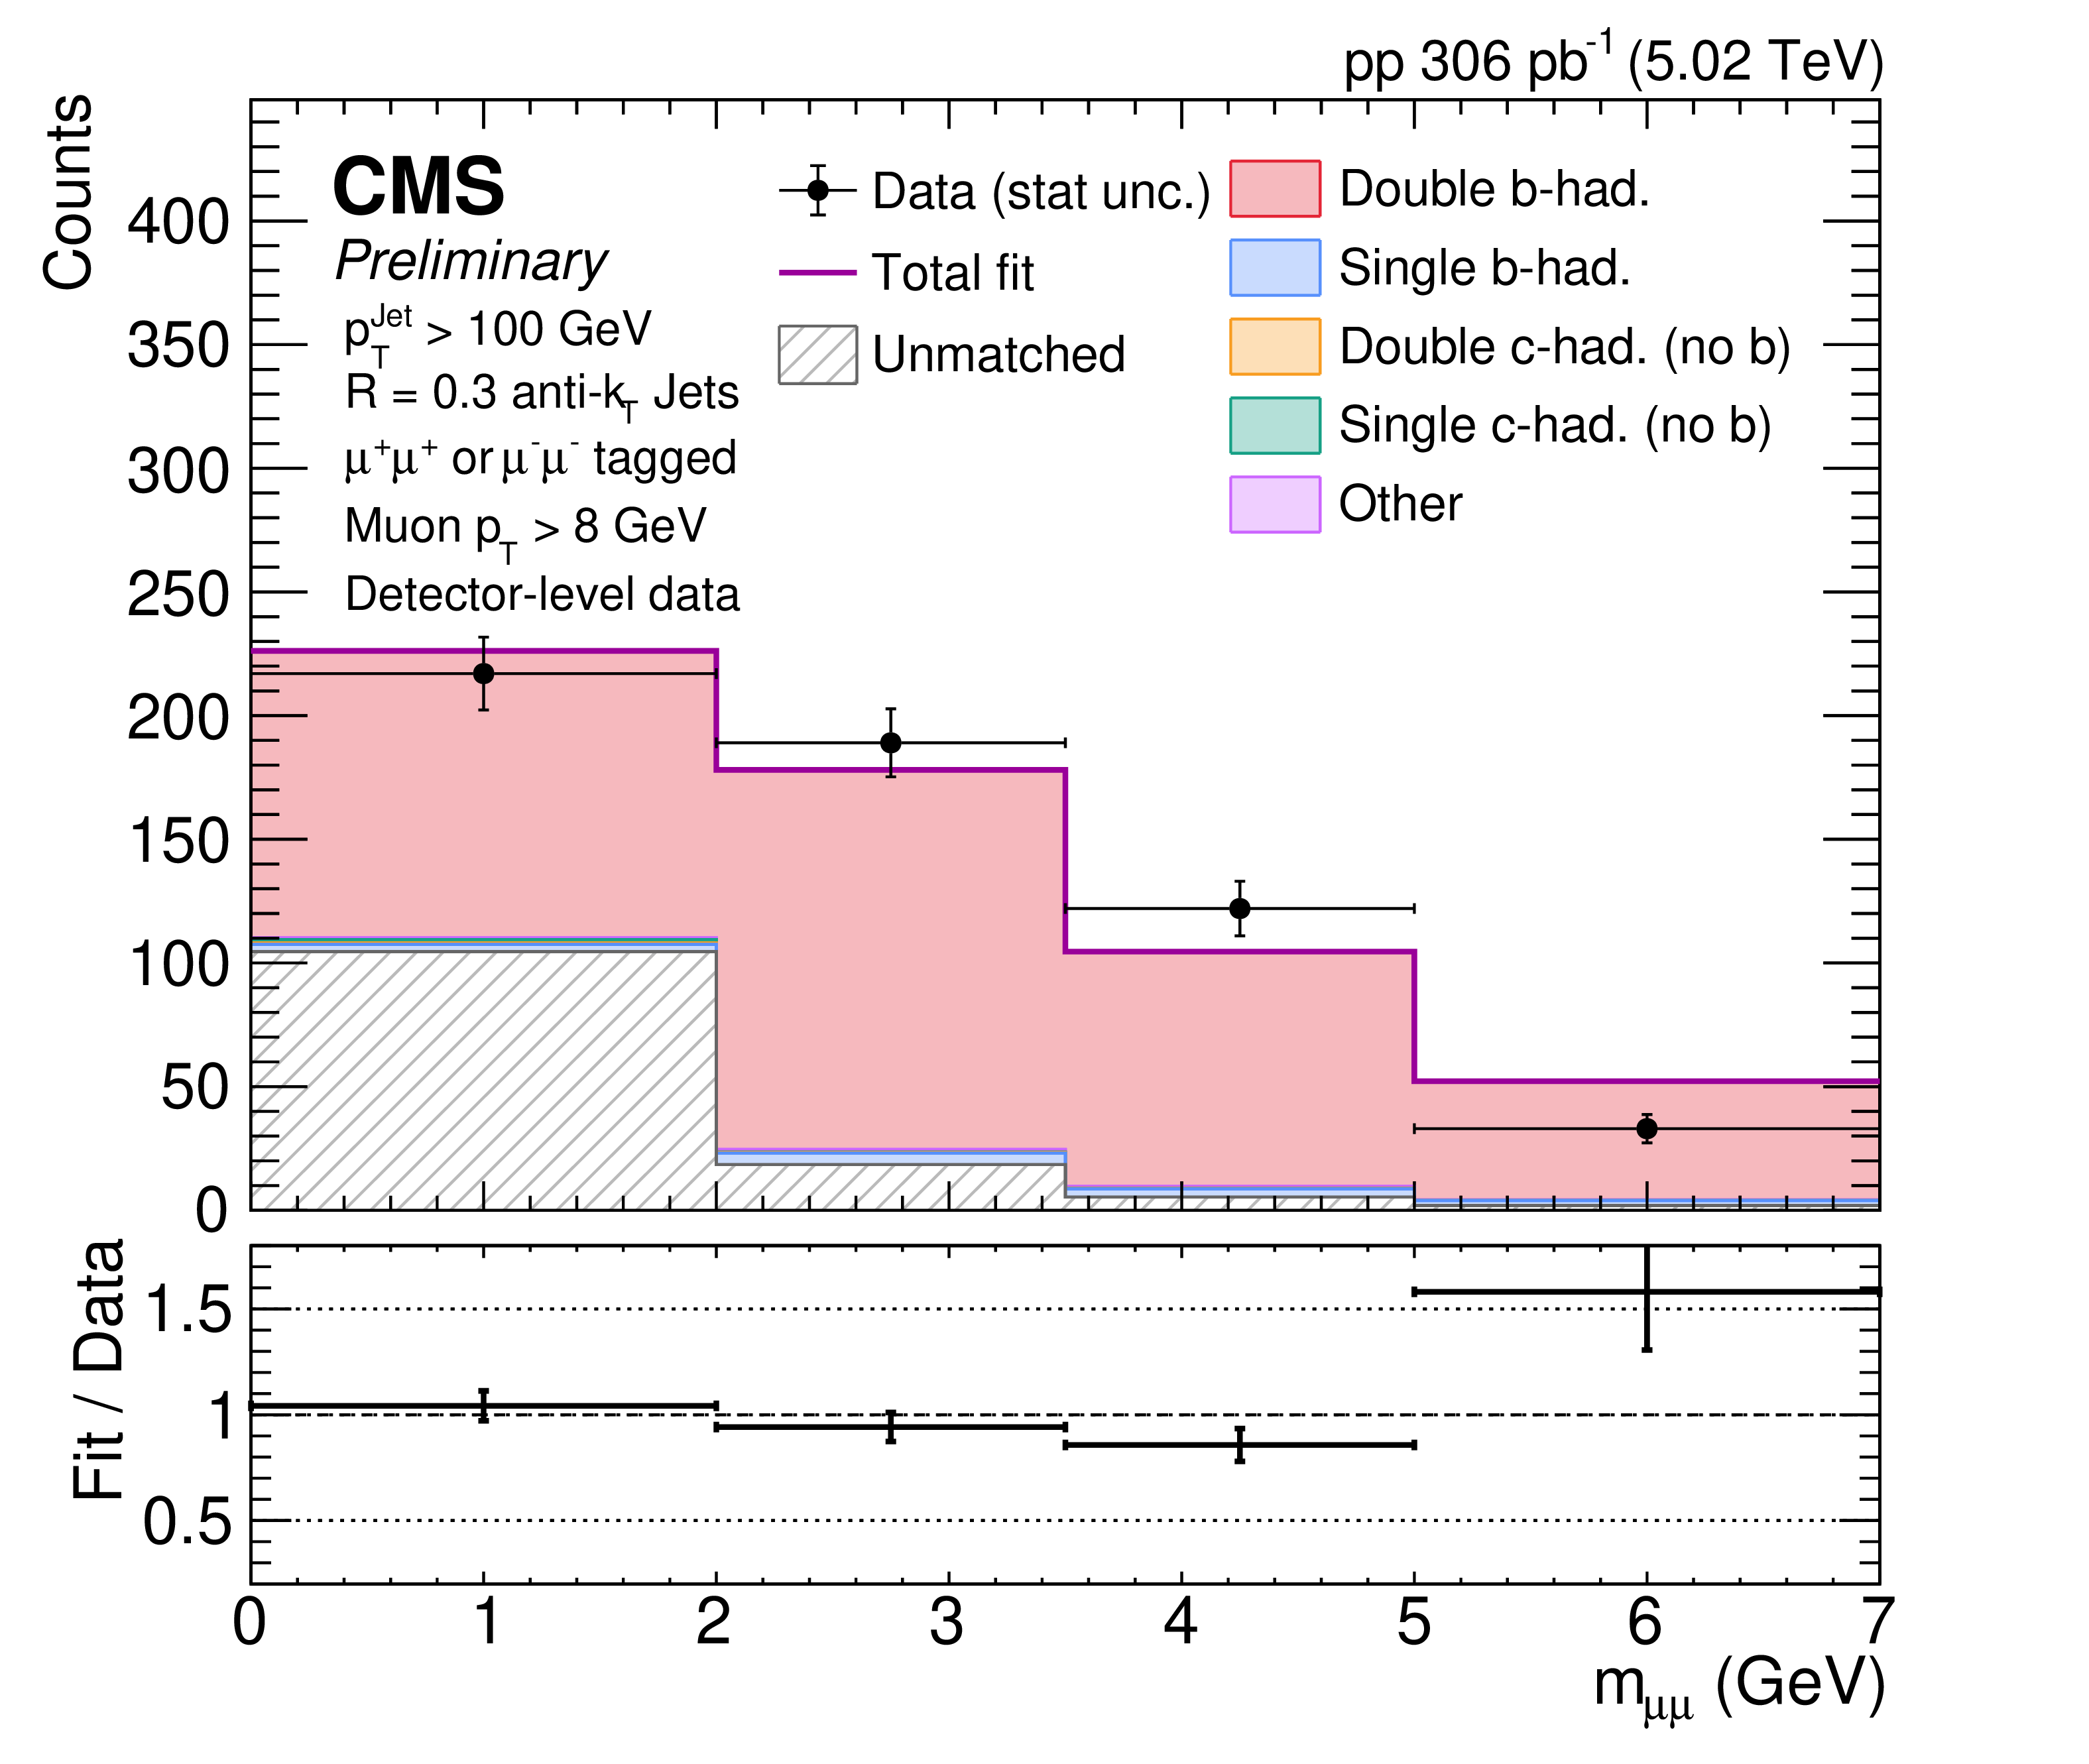
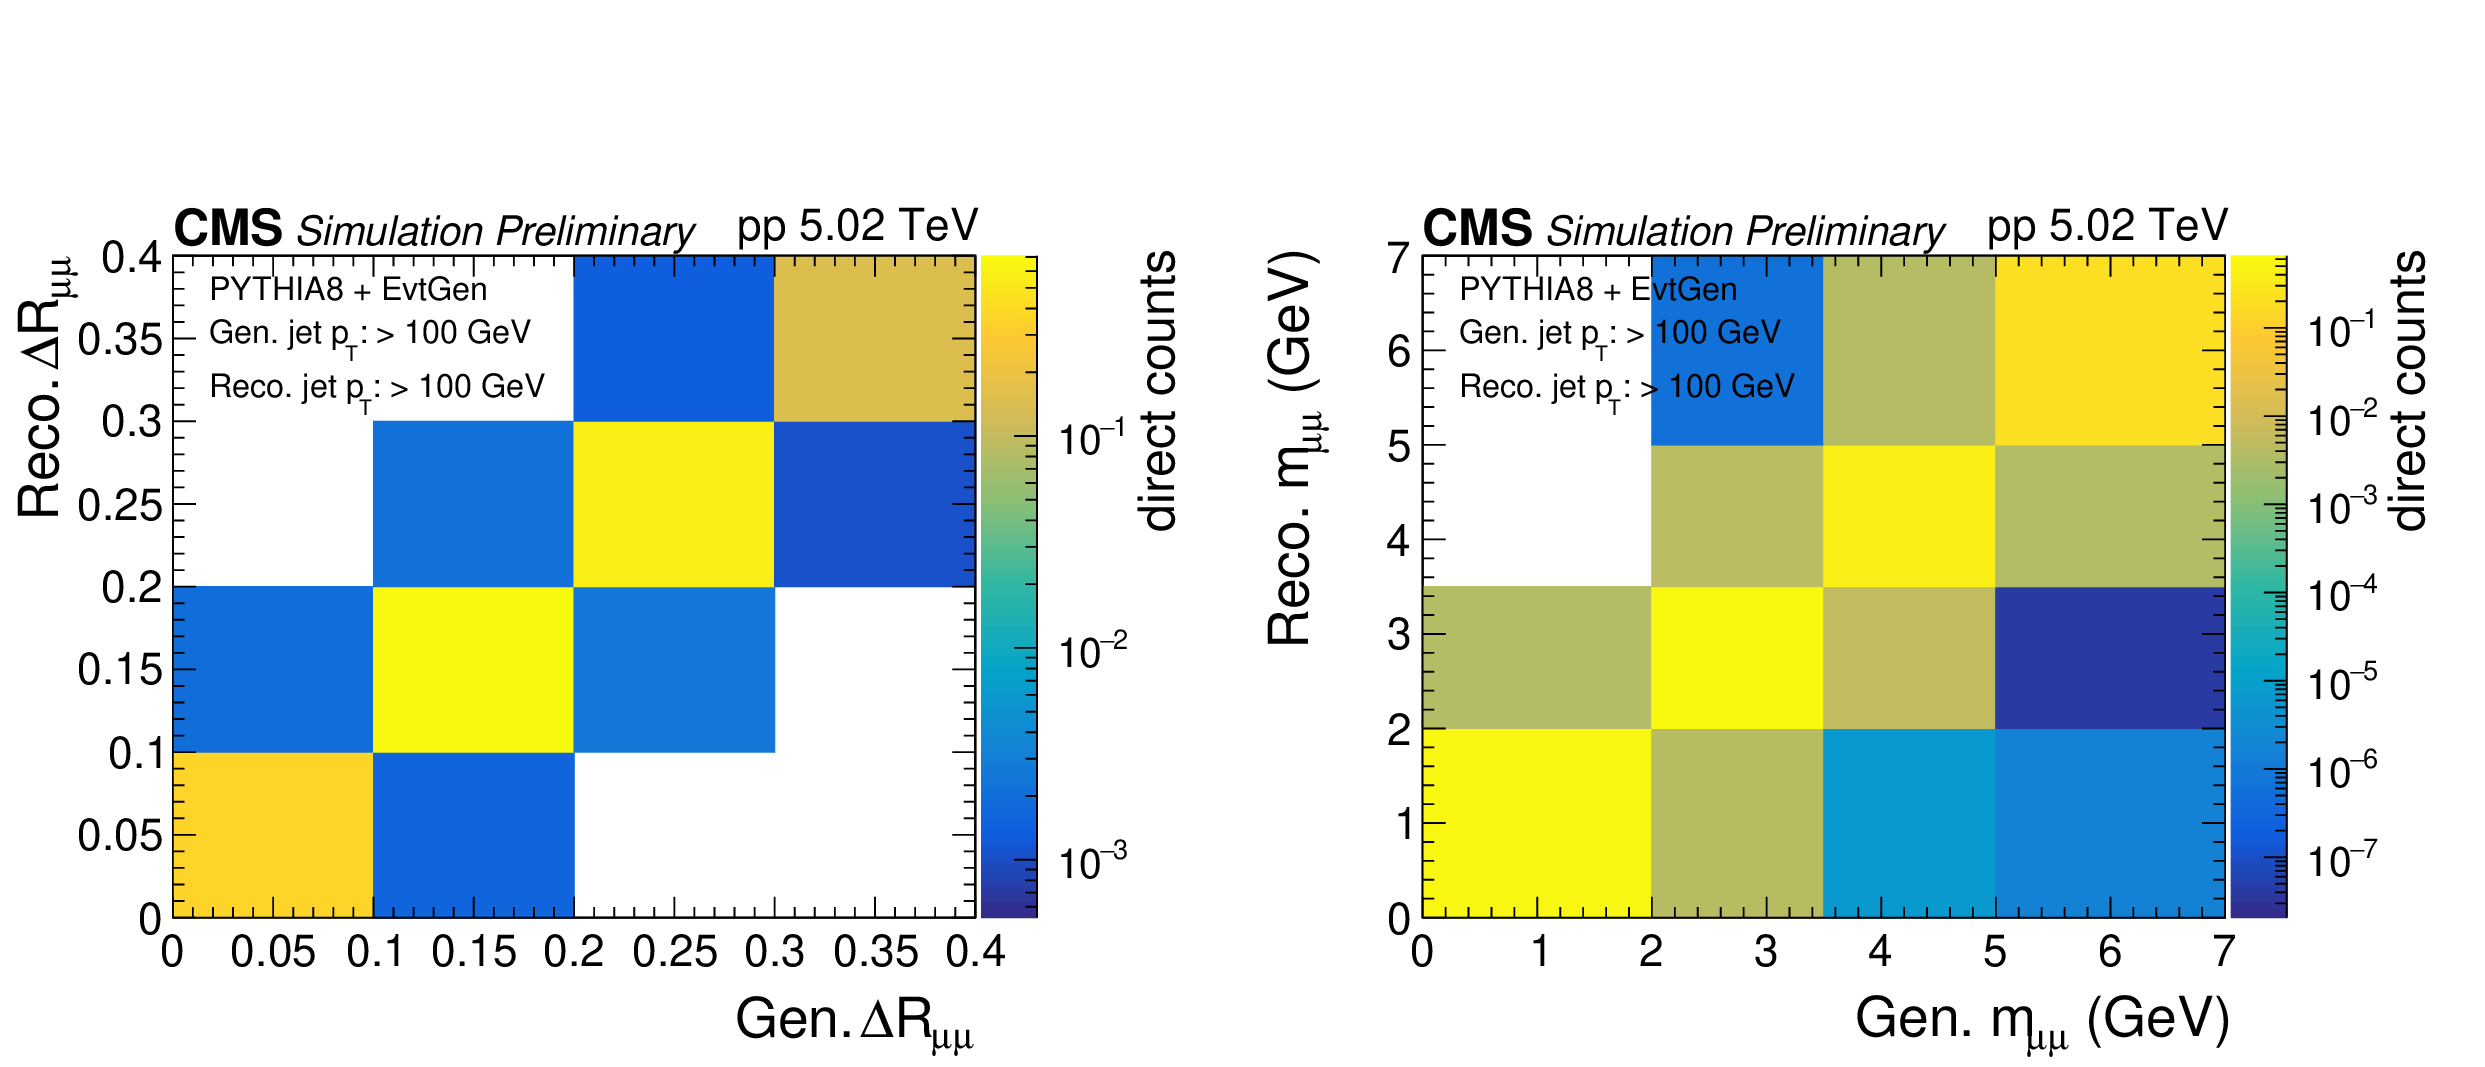
Reconstruction-level \(\Delta R_$ \mu \mu $\) (left) and \(m_$ \mu \mu $\) (right) distributions in data before subtraction of the unmatched dimuon contribution. The data are shown as black points and are compared with the fitted HERWIG simulation. The estimated unmatched contribution, obtained from the template fit used in the purity correction, is shown as the hatched gray component. The generator-matched simulated contribution is further decomposed according to the generator-level heavy-flavor hadron content of the dimuon-tagged jet. |
png pdf |
Figure 9-a:
Reconstruction-level \(\Delta R_$ \mu \mu $\) (left) and \(m_$ \mu \mu $\) (right) distributions in data before subtraction of the unmatched dimuon contribution. The data are shown as black points and are compared with the fitted HERWIG simulation. The estimated unmatched contribution, obtained from the template fit used in the purity correction, is shown as the hatched gray component. The generator-matched simulated contribution is further decomposed according to the generator-level heavy-flavor hadron content of the dimuon-tagged jet. |
png pdf |
Figure 9-b:
Reconstruction-level \(\Delta R_$ \mu \mu $\) (left) and \(m_$ \mu \mu $\) (right) distributions in data before subtraction of the unmatched dimuon contribution. The data are shown as black points and are compared with the fitted HERWIG simulation. The estimated unmatched contribution, obtained from the template fit used in the purity correction, is shown as the hatched gray component. The generator-matched simulated contribution is further decomposed according to the generator-level heavy-flavor hadron content of the dimuon-tagged jet. |
png pdf |
Figure 10:
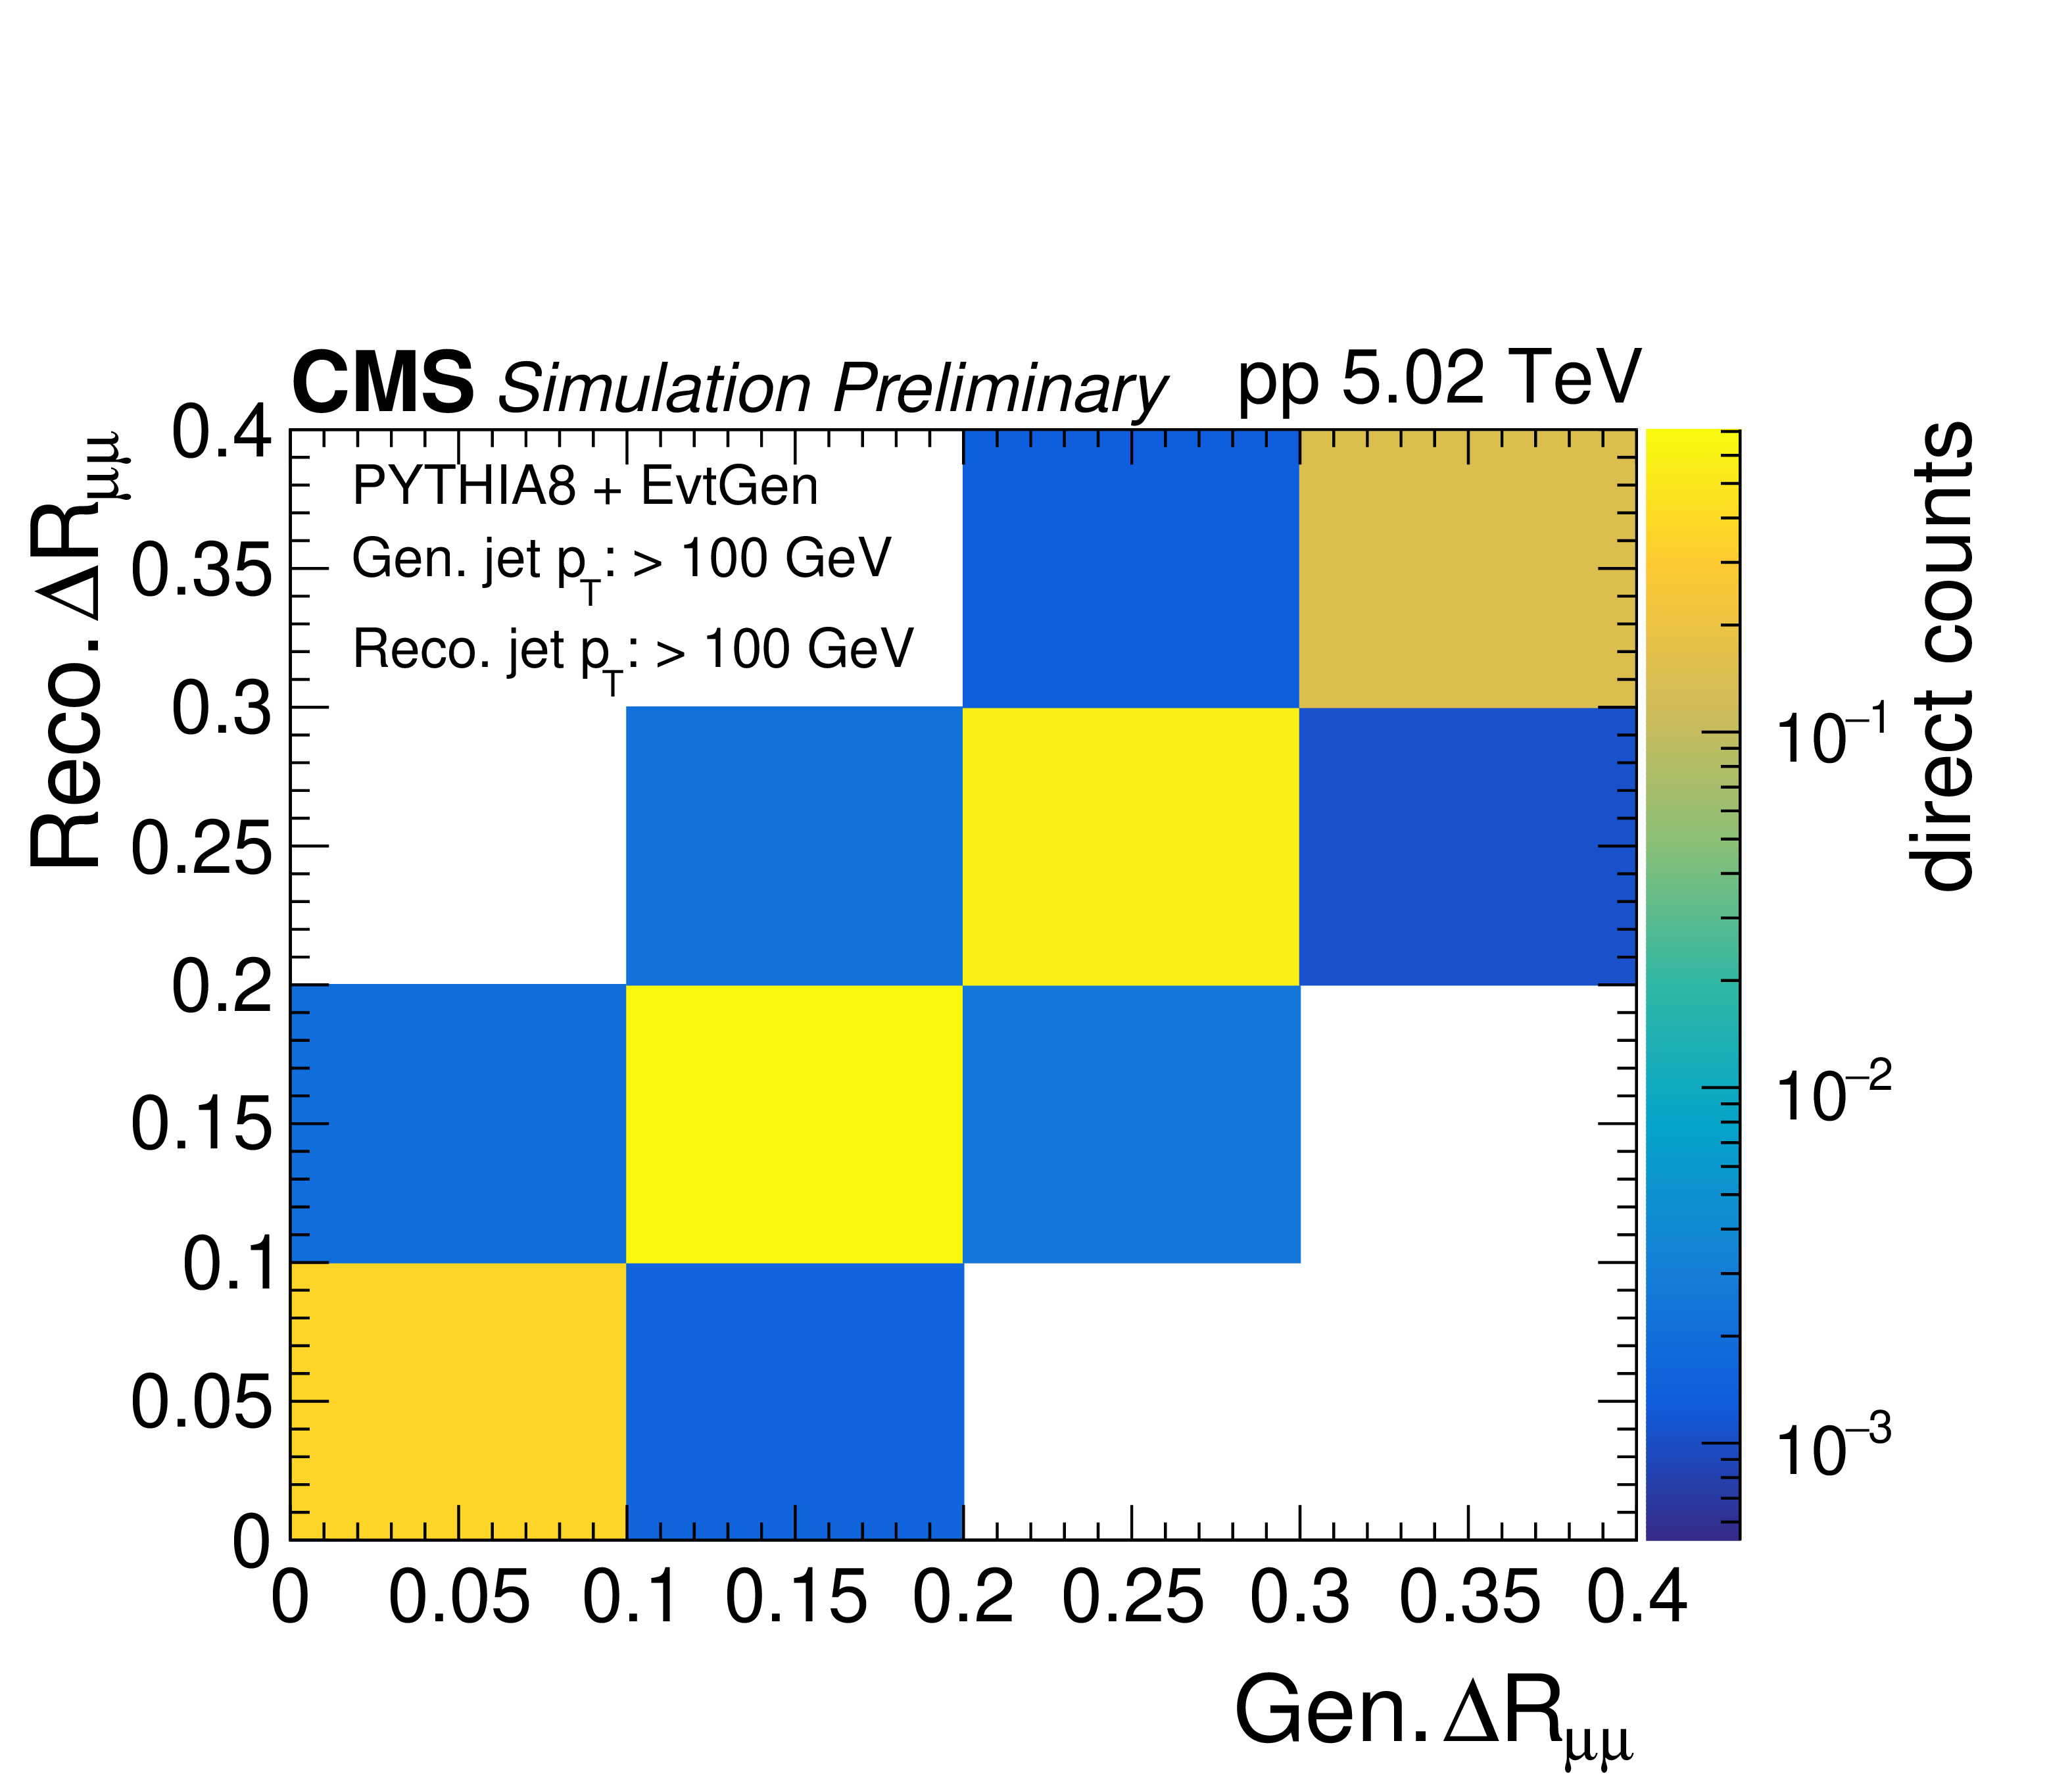
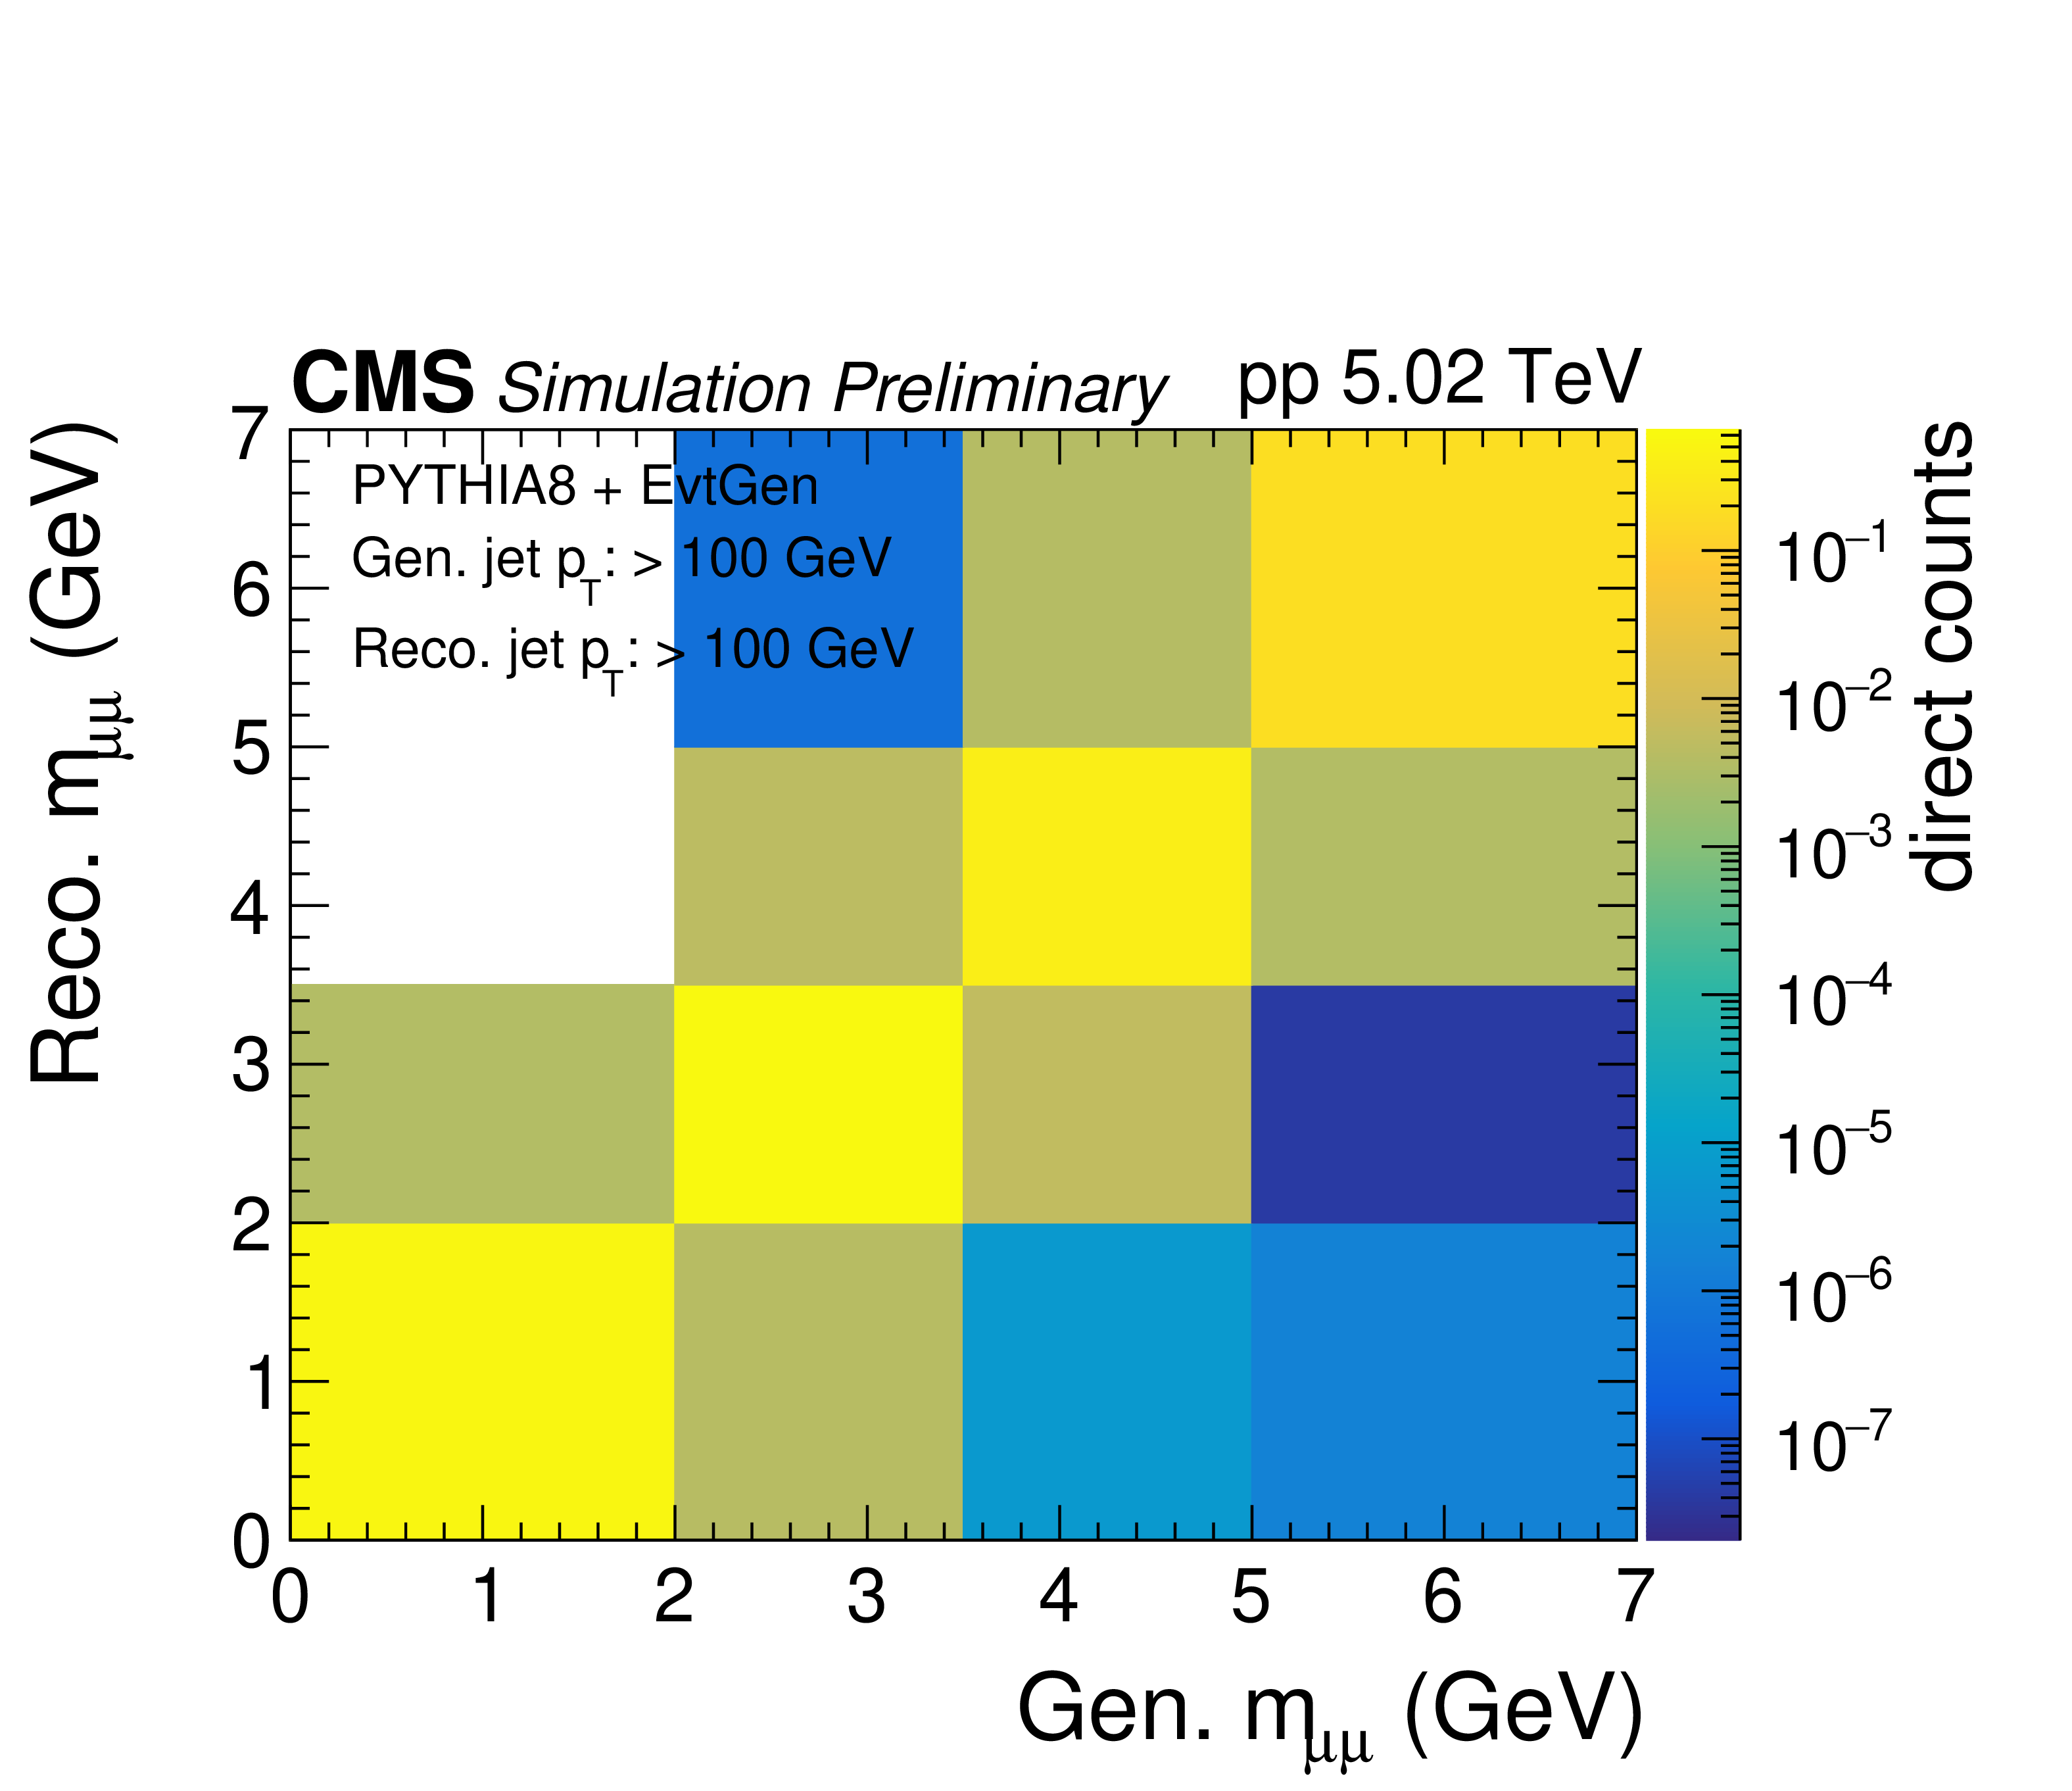
Response matrices for the same-sign dimuon $ \Delta R_{\mu\mu} $ (left) and $ m_{\mu\mu} $ (right) for simulated dimuon jets with reconstructed and truth-level $ p_{\mathrm{T}} > $ 100 GeV. |
png pdf |
Figure 10-a:
Response matrices for the same-sign dimuon $ \Delta R_{\mu\mu} $ (left) and $ m_{\mu\mu} $ (right) for simulated dimuon jets with reconstructed and truth-level $ p_{\mathrm{T}} > $ 100 GeV. |
png pdf |
Figure 10-b:
Response matrices for the same-sign dimuon $ \Delta R_{\mu\mu} $ (left) and $ m_{\mu\mu} $ (right) for simulated dimuon jets with reconstructed and truth-level $ p_{\mathrm{T}} > $ 100 GeV. |
png pdf |
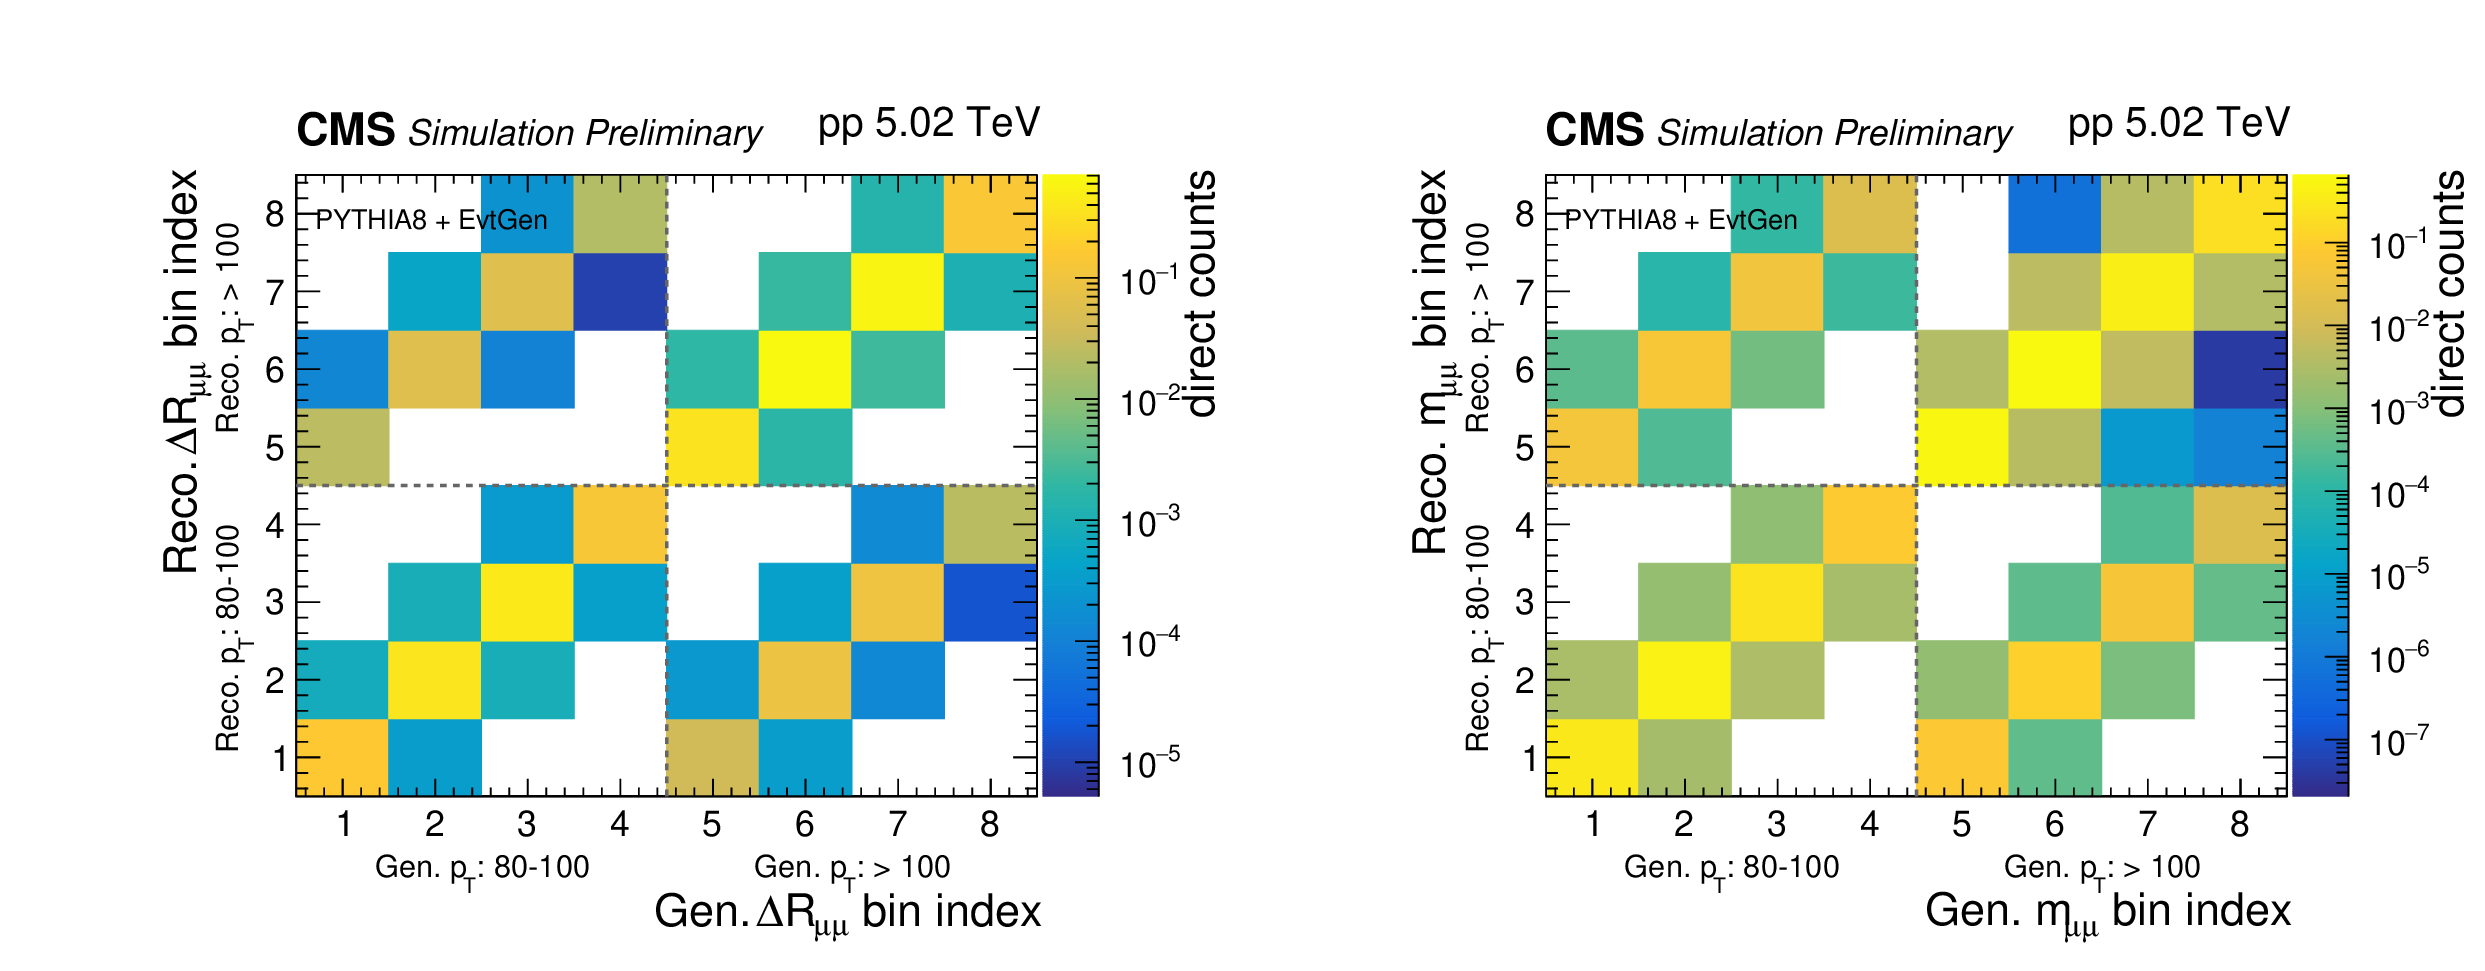
Figure 11:
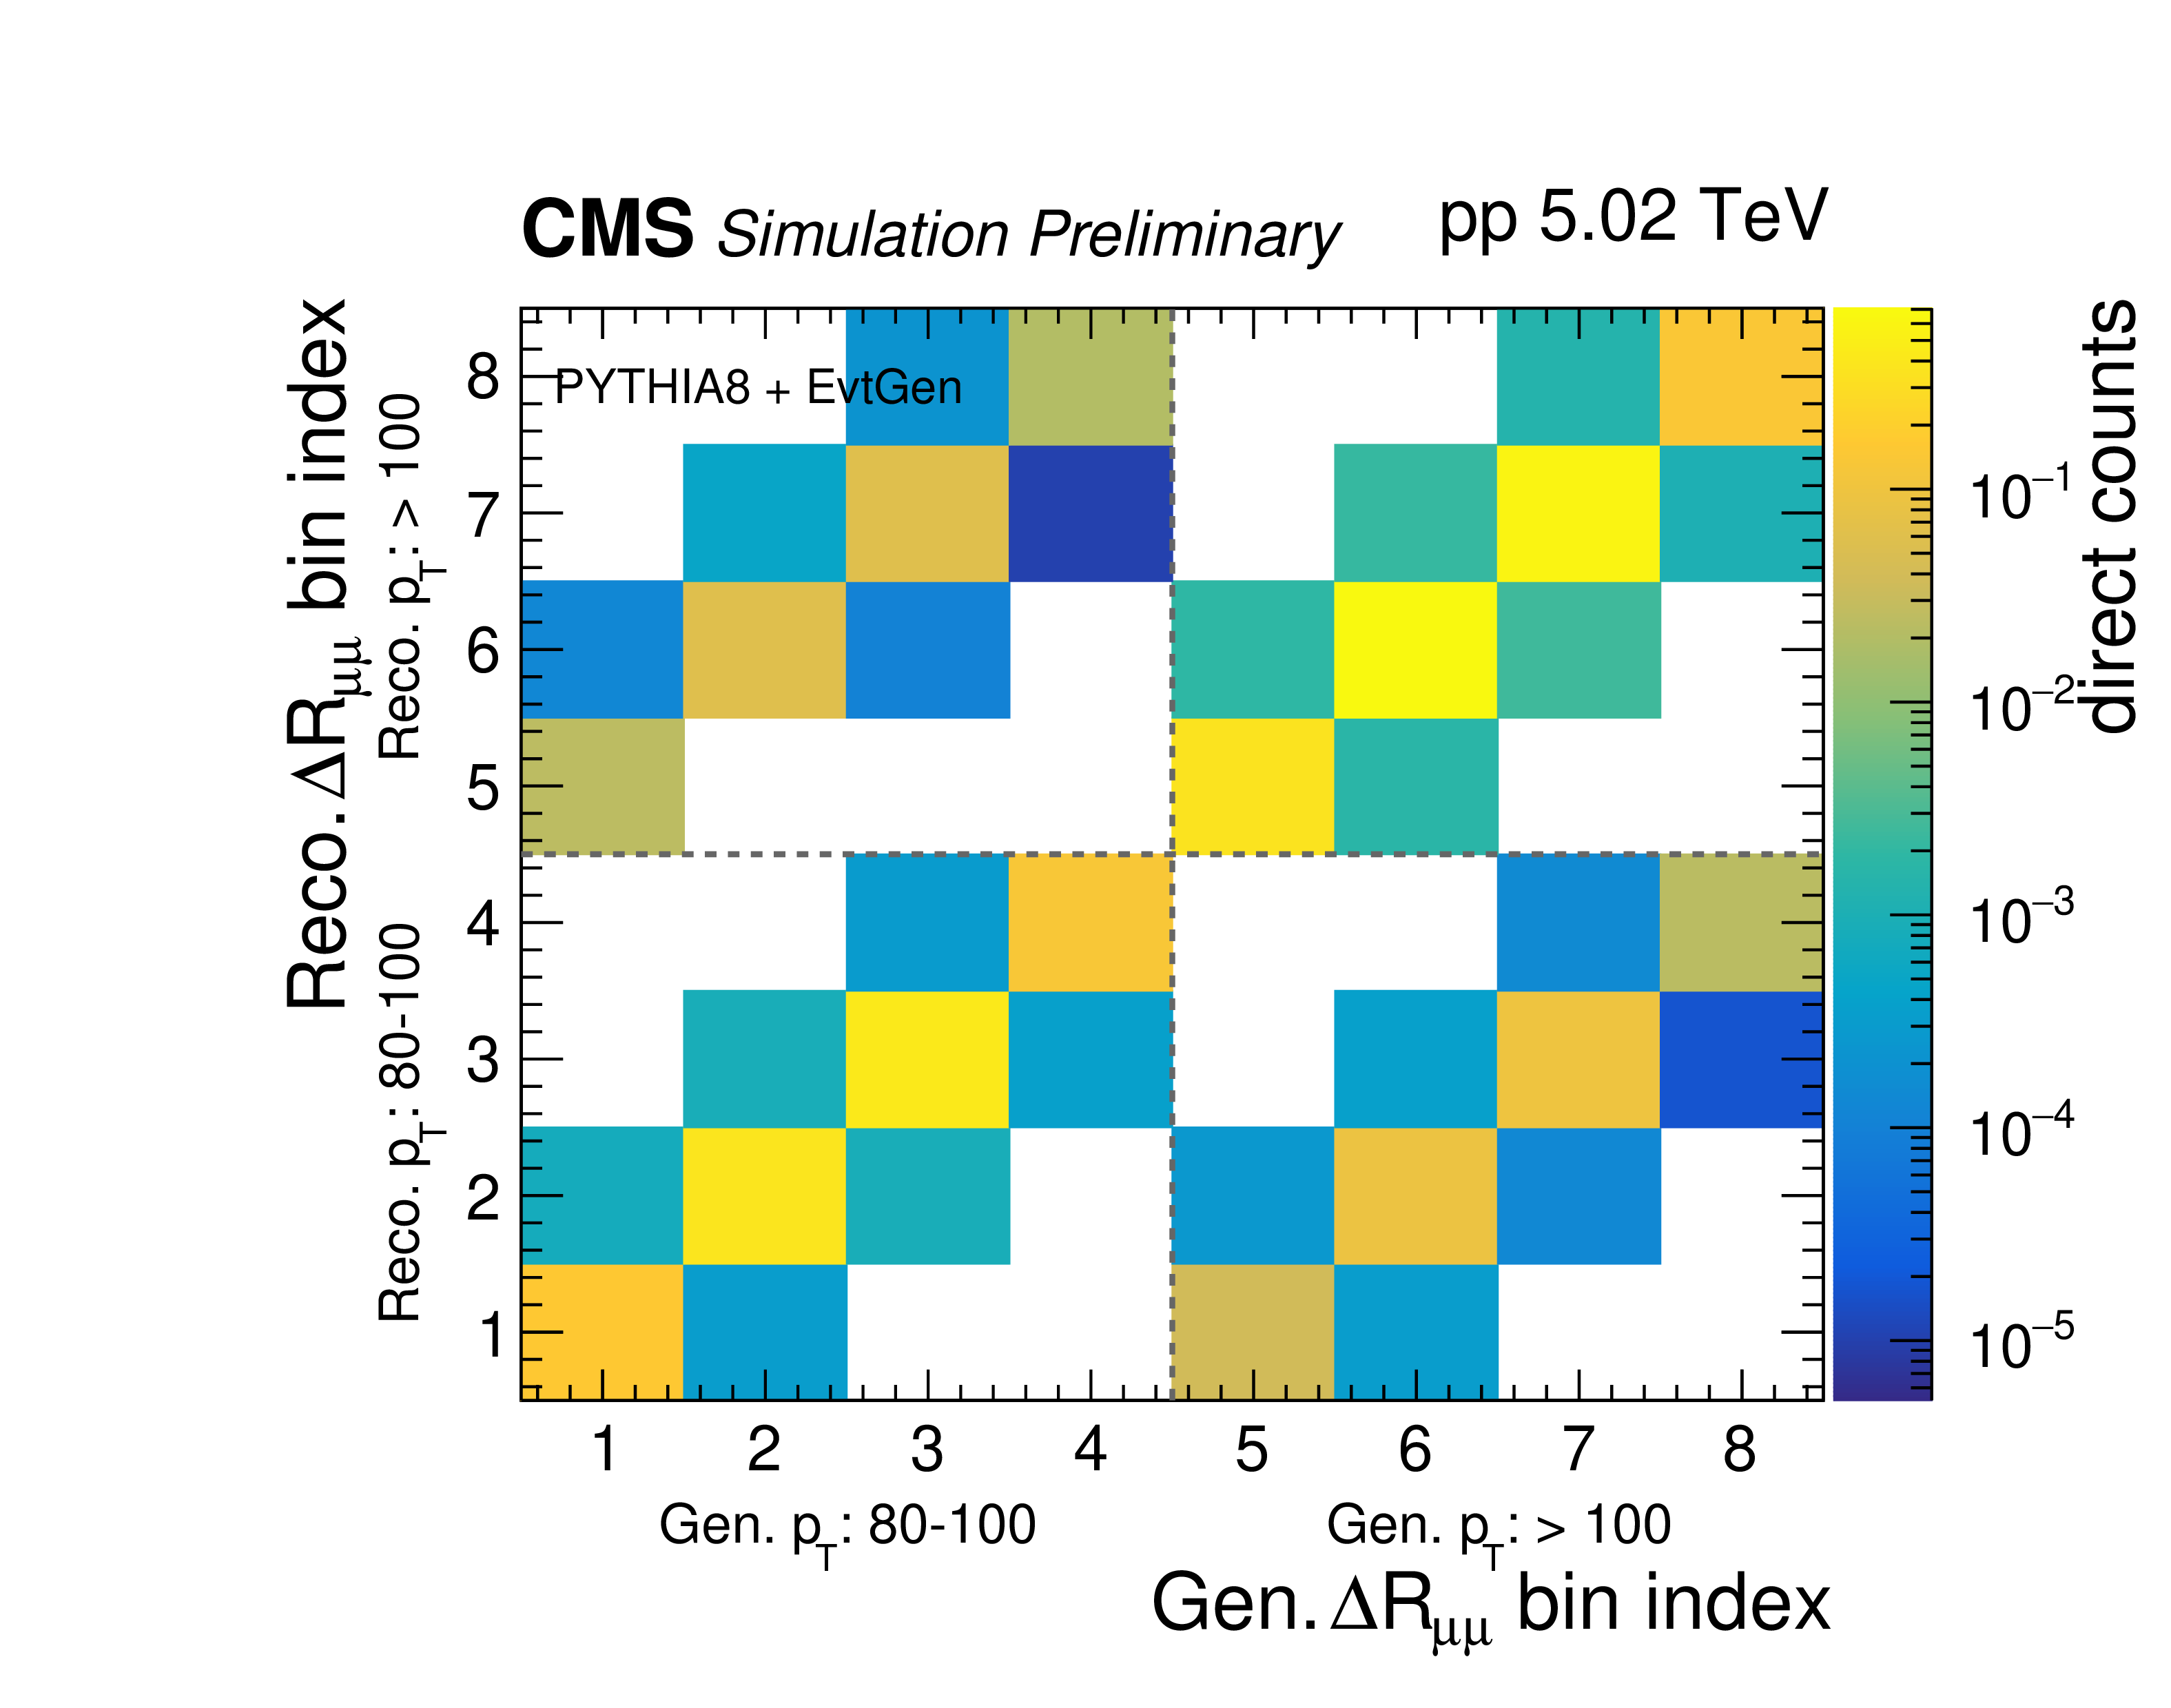
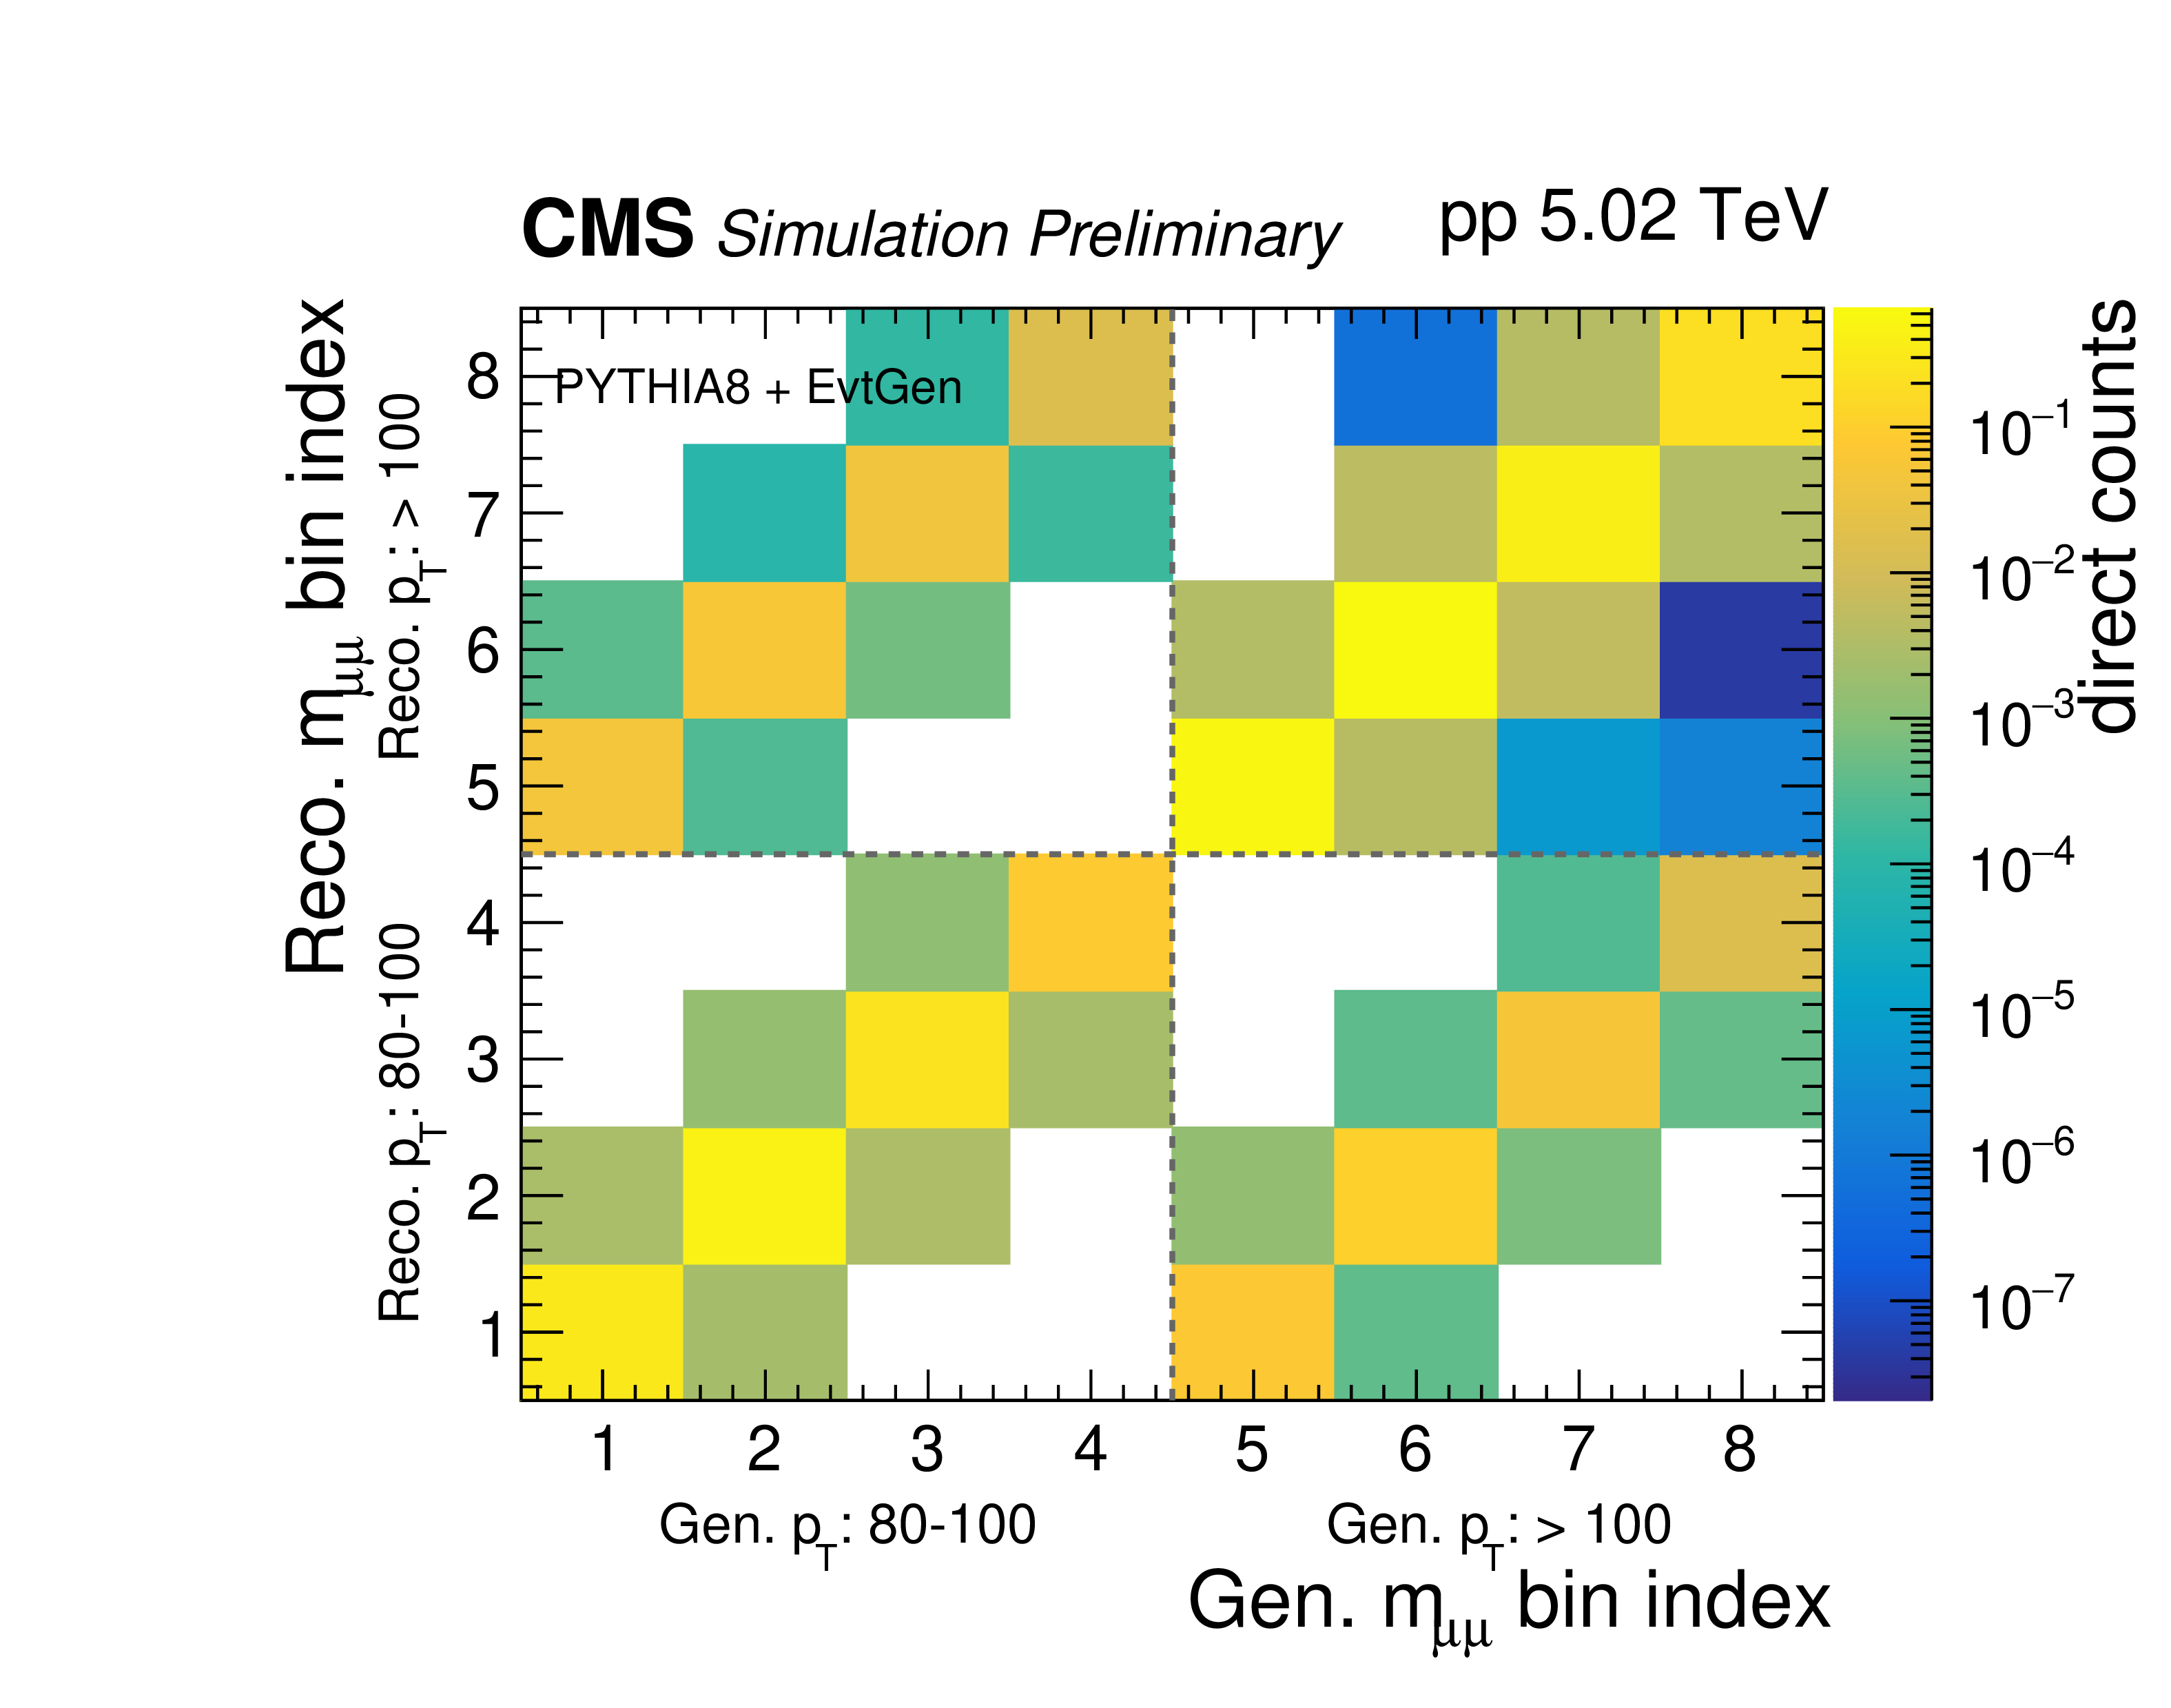
Full response matrices for same-sign dimuon $ \Delta R_{\mu\mu} $ (left) and $ m_{\mu\mu} $ (right) for all bins. |
png pdf |
Figure 11-a:
Full response matrices for same-sign dimuon $ \Delta R_{\mu\mu} $ (left) and $ m_{\mu\mu} $ (right) for all bins. |
png pdf |
Figure 11-b:
Full response matrices for same-sign dimuon $ \Delta R_{\mu\mu} $ (left) and $ m_{\mu\mu} $ (right) for all bins. |
png pdf |
Figure 12:
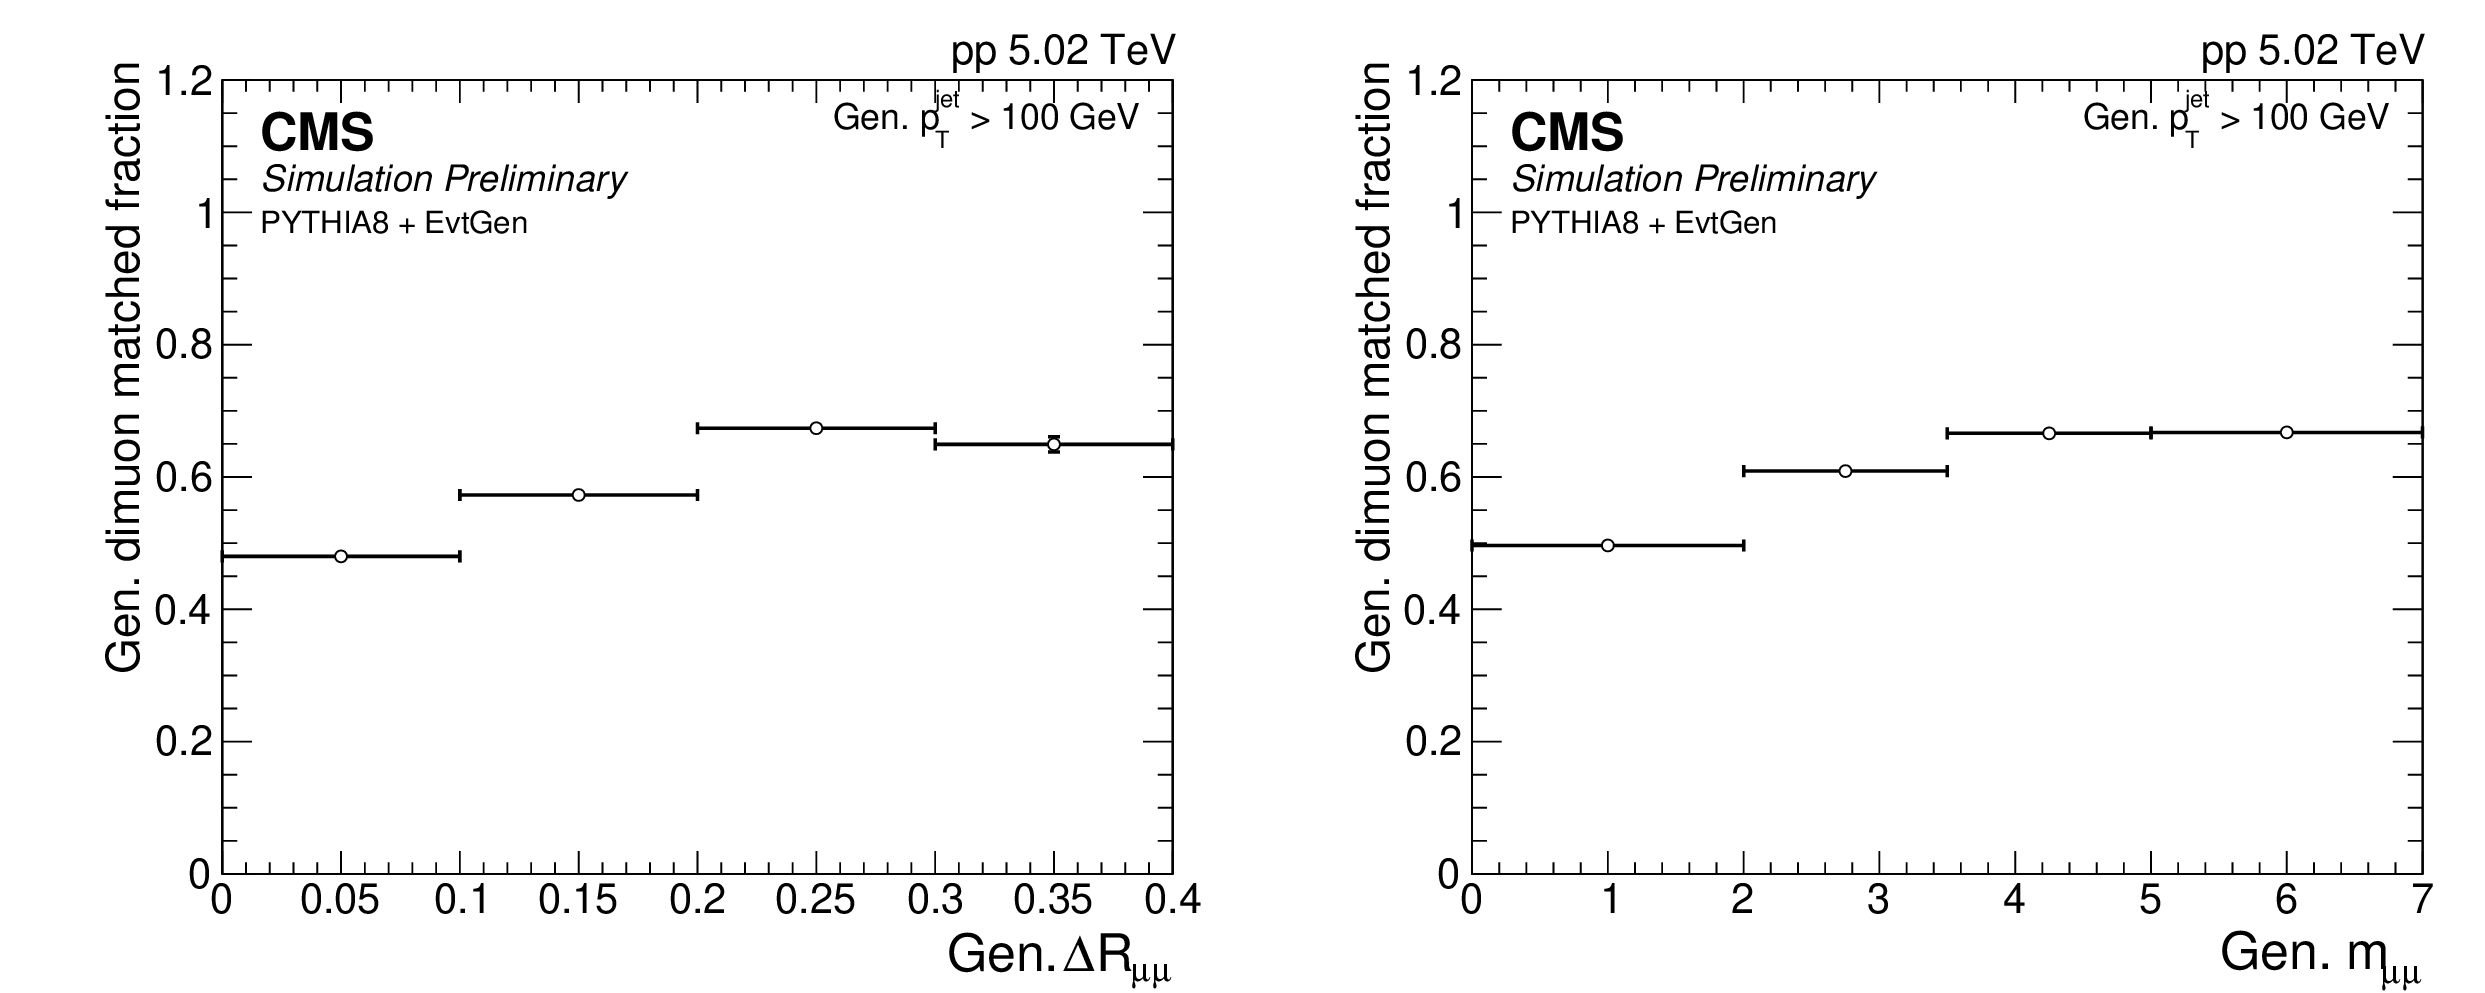
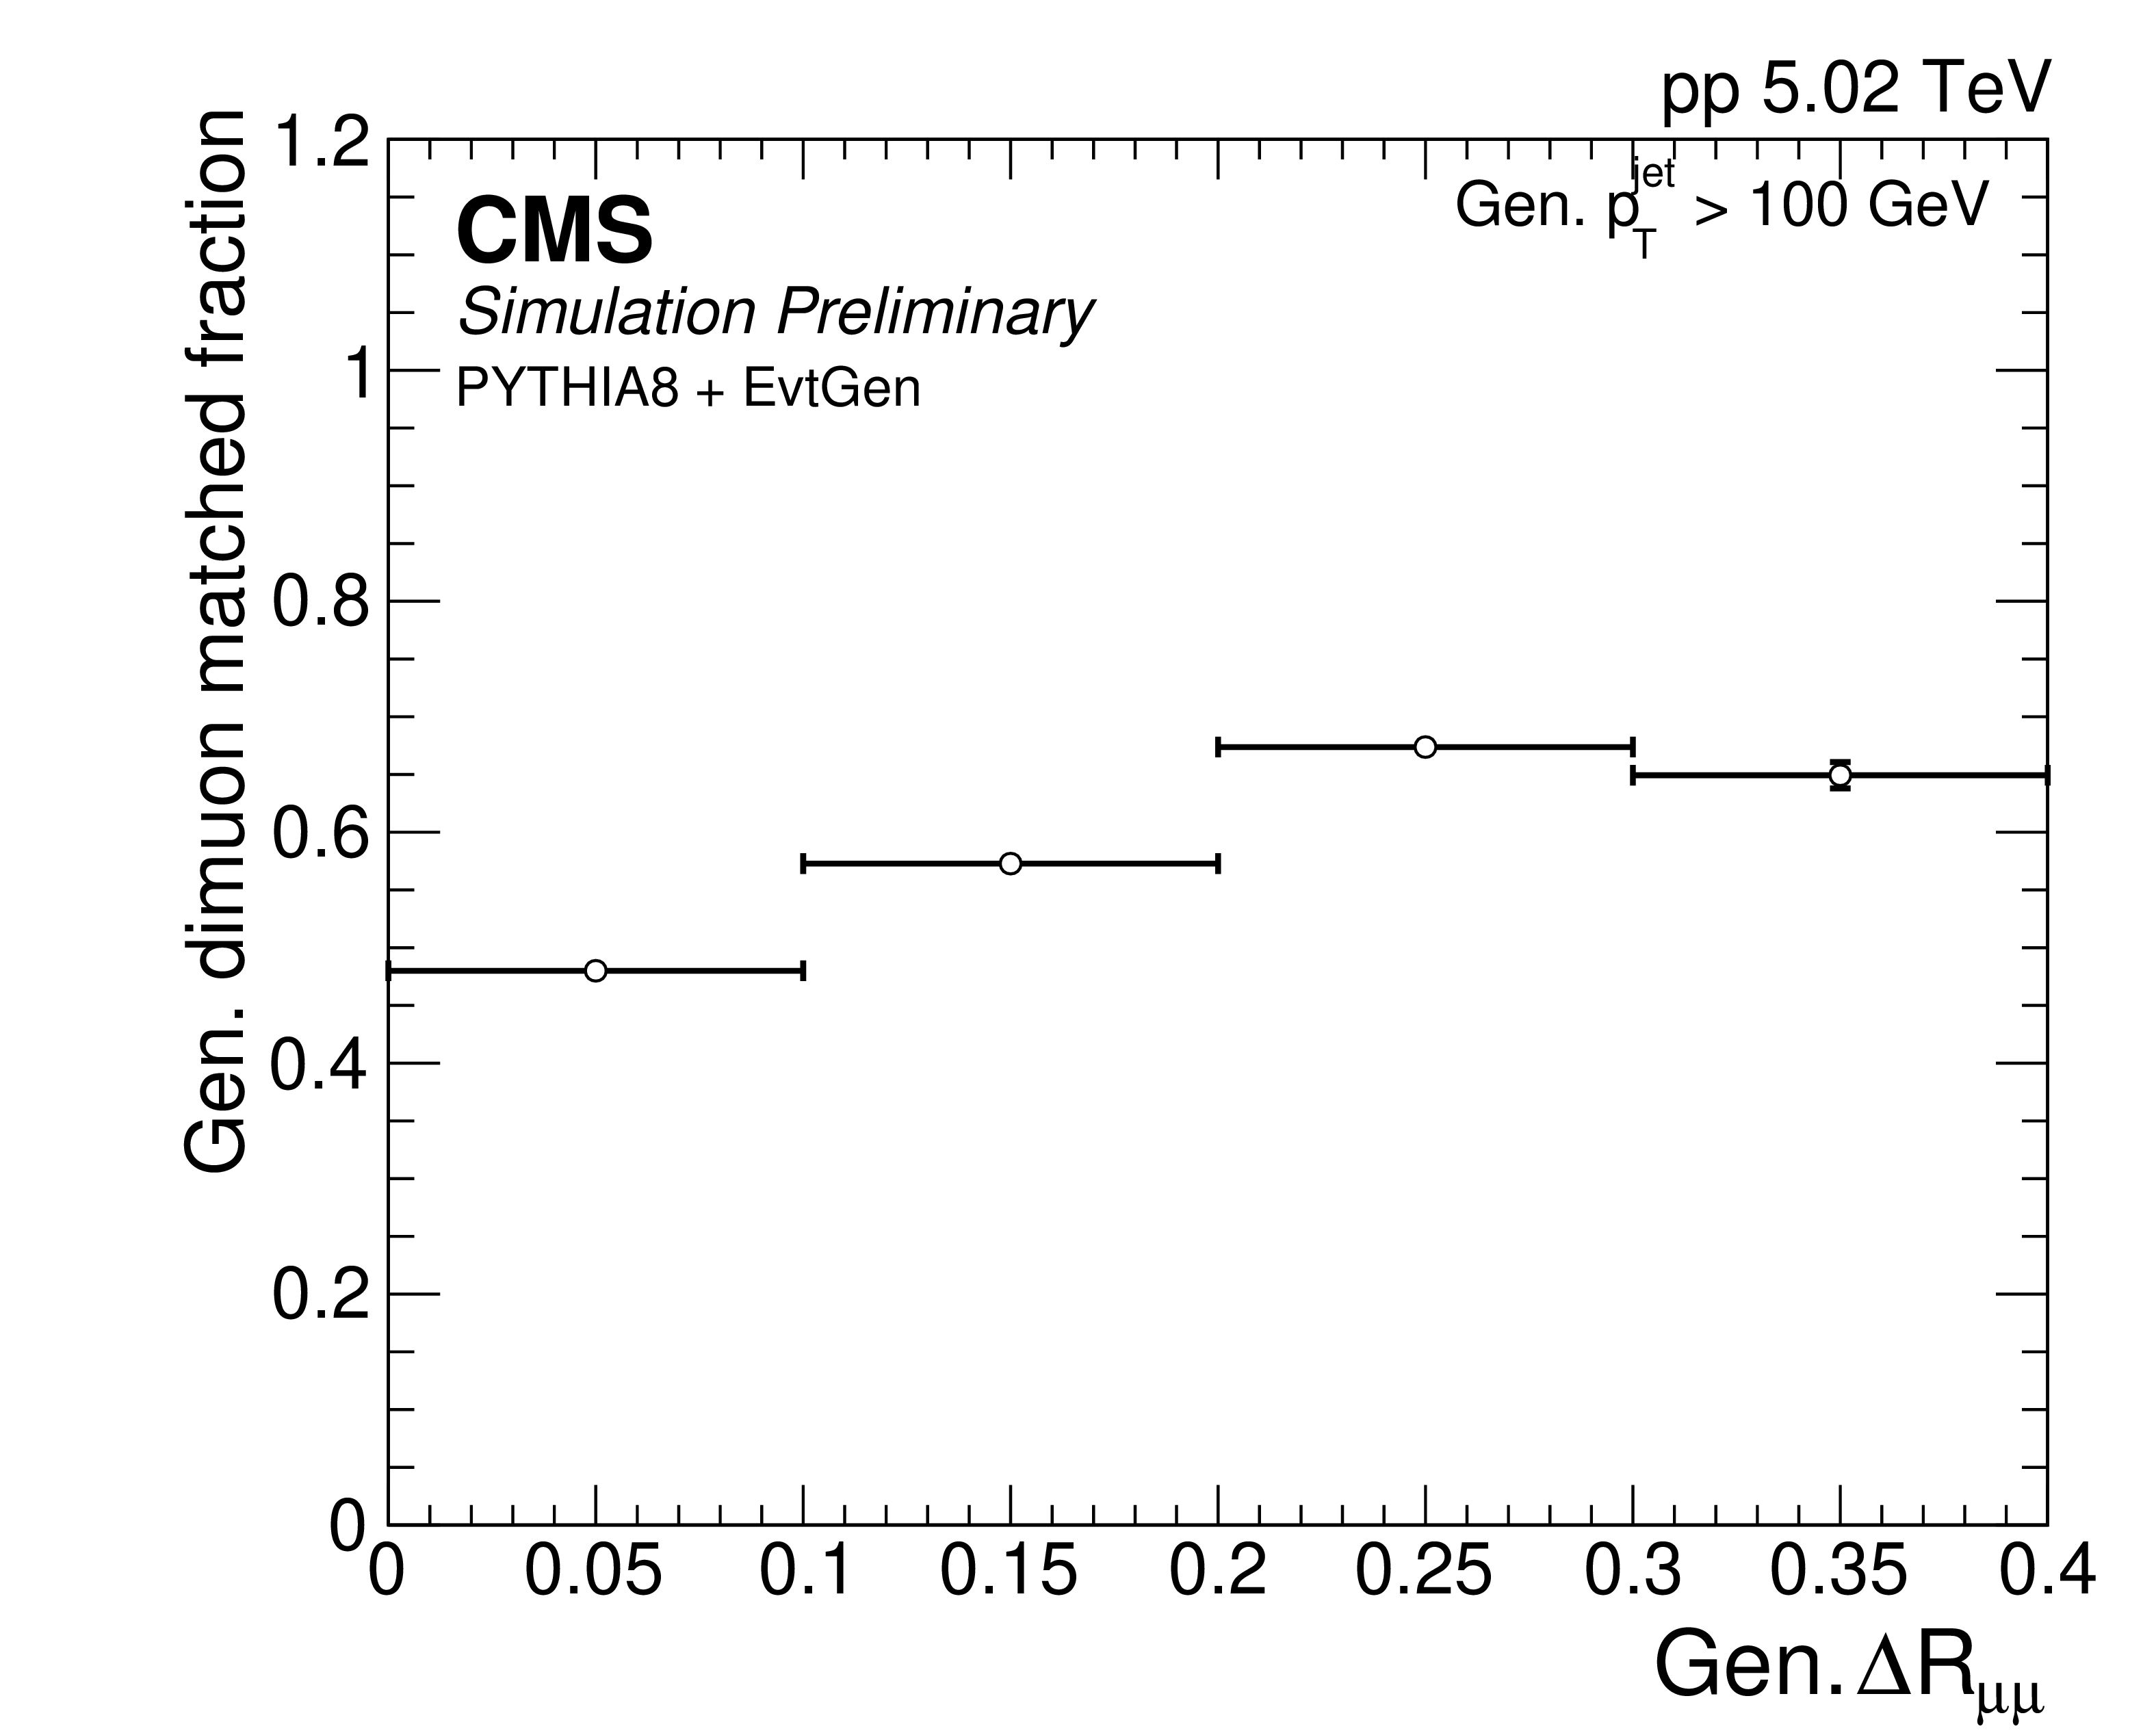
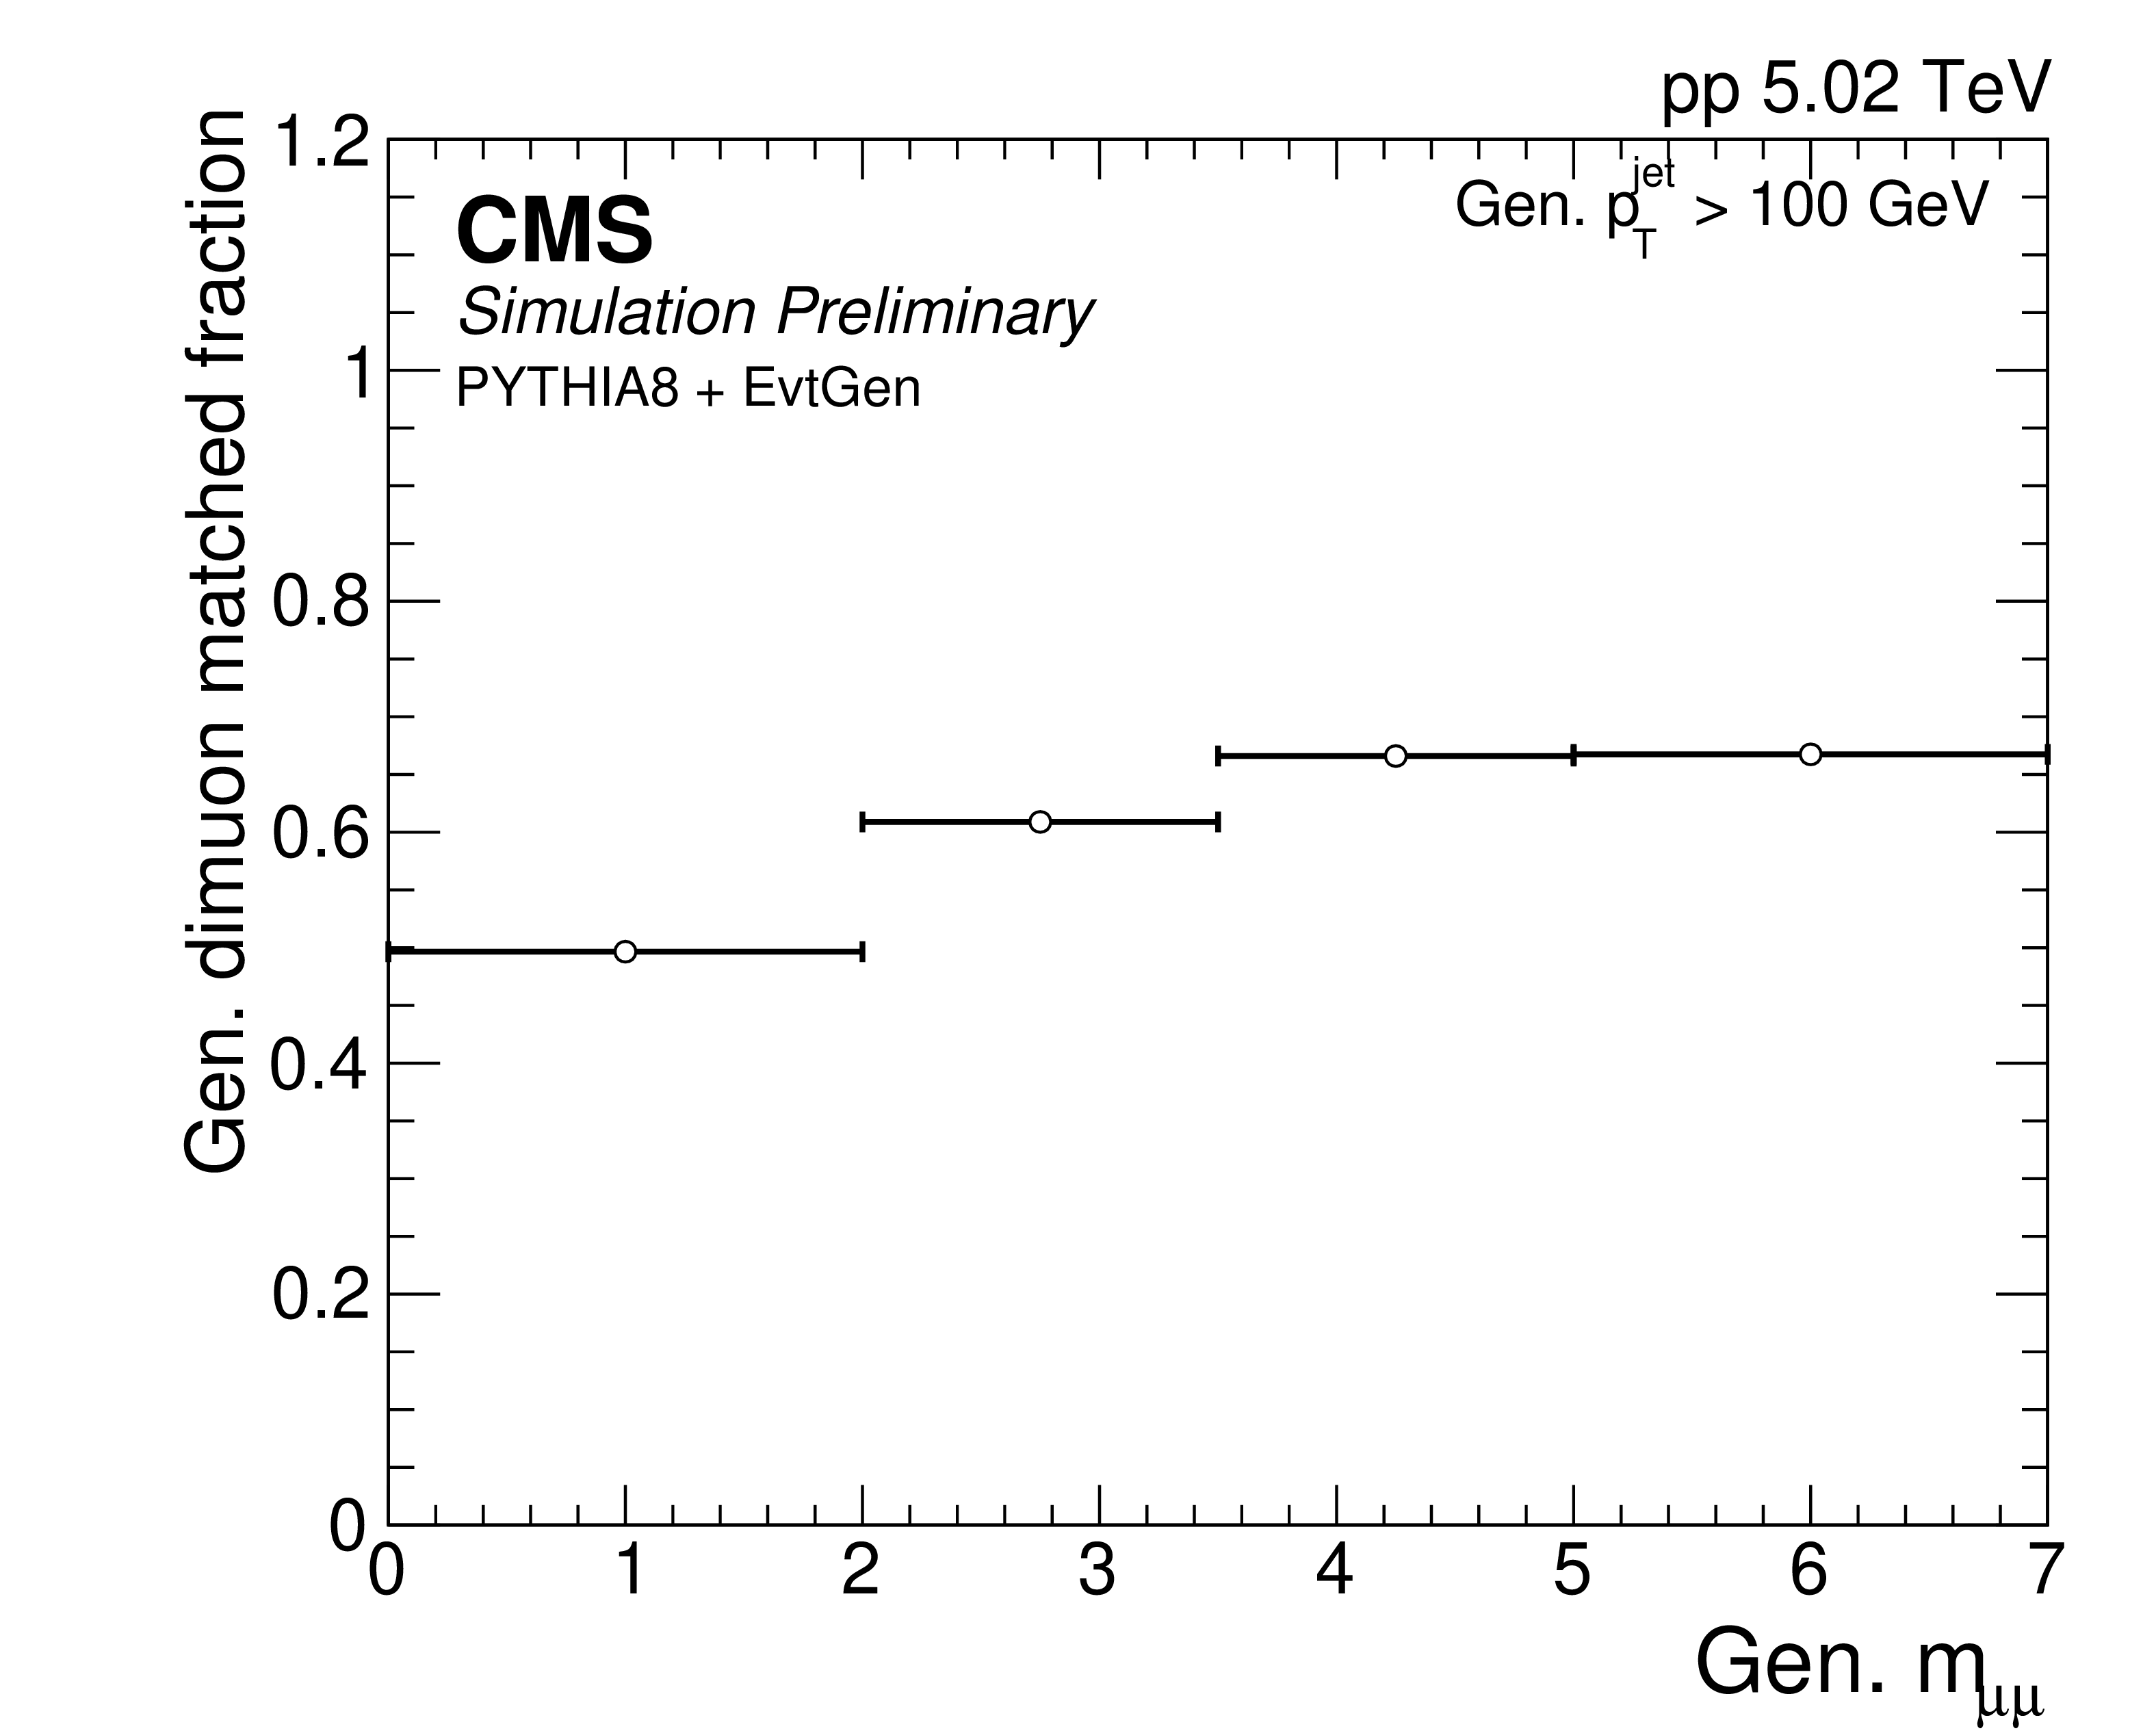
Dimuon reconstruction efficiency as a function of $ \Delta R_{\mu\mu} $ (left) and $ m_{\mu\mu} $ (right). |
png pdf |
Figure 12-a:
Dimuon reconstruction efficiency as a function of $ \Delta R_{\mu\mu} $ (left) and $ m_{\mu\mu} $ (right). |
png pdf |
Figure 12-b:
Dimuon reconstruction efficiency as a function of $ \Delta R_{\mu\mu} $ (left) and $ m_{\mu\mu} $ (right). |
png pdf |
Figure 13:
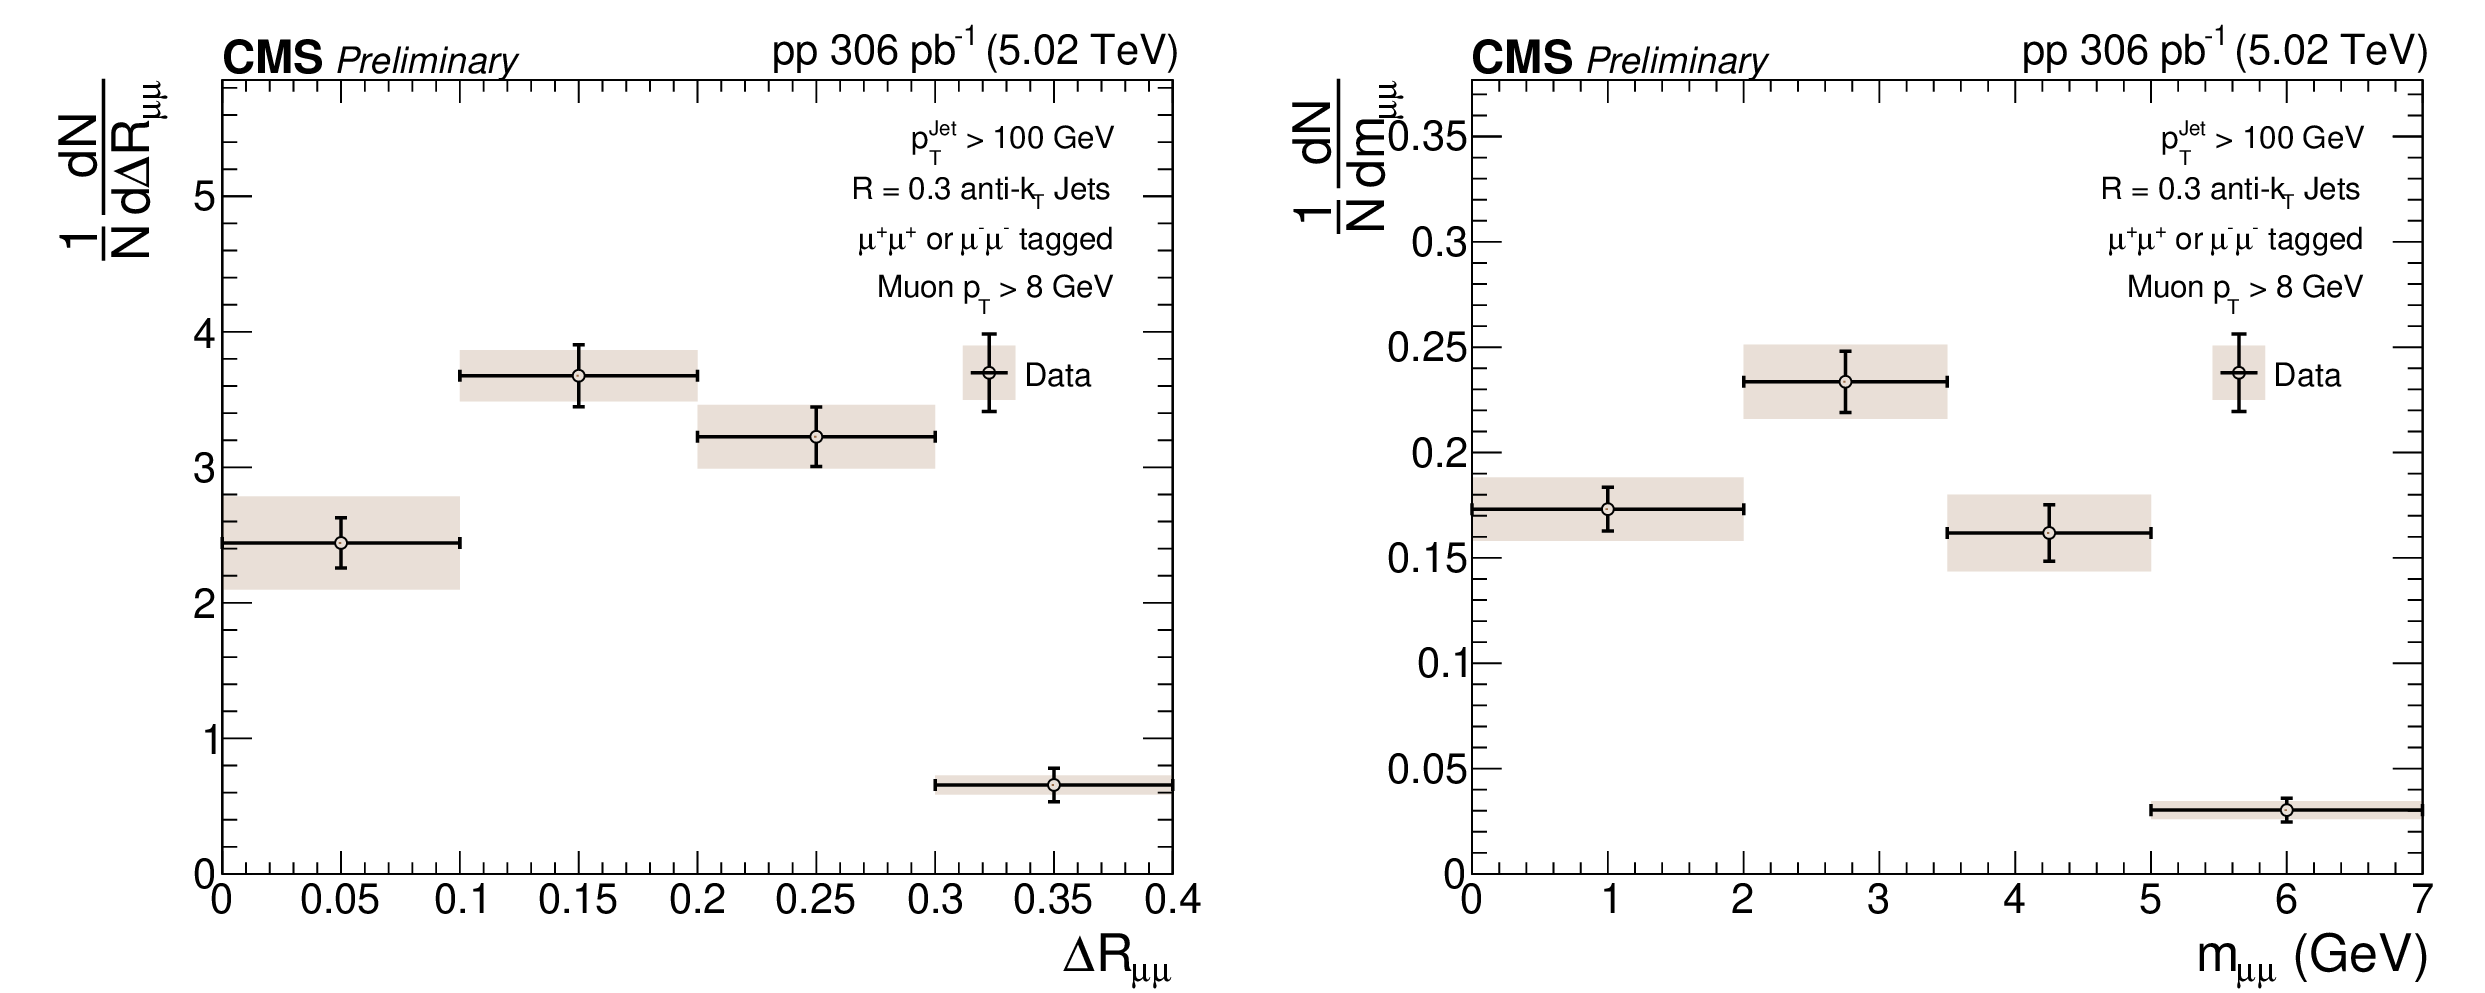
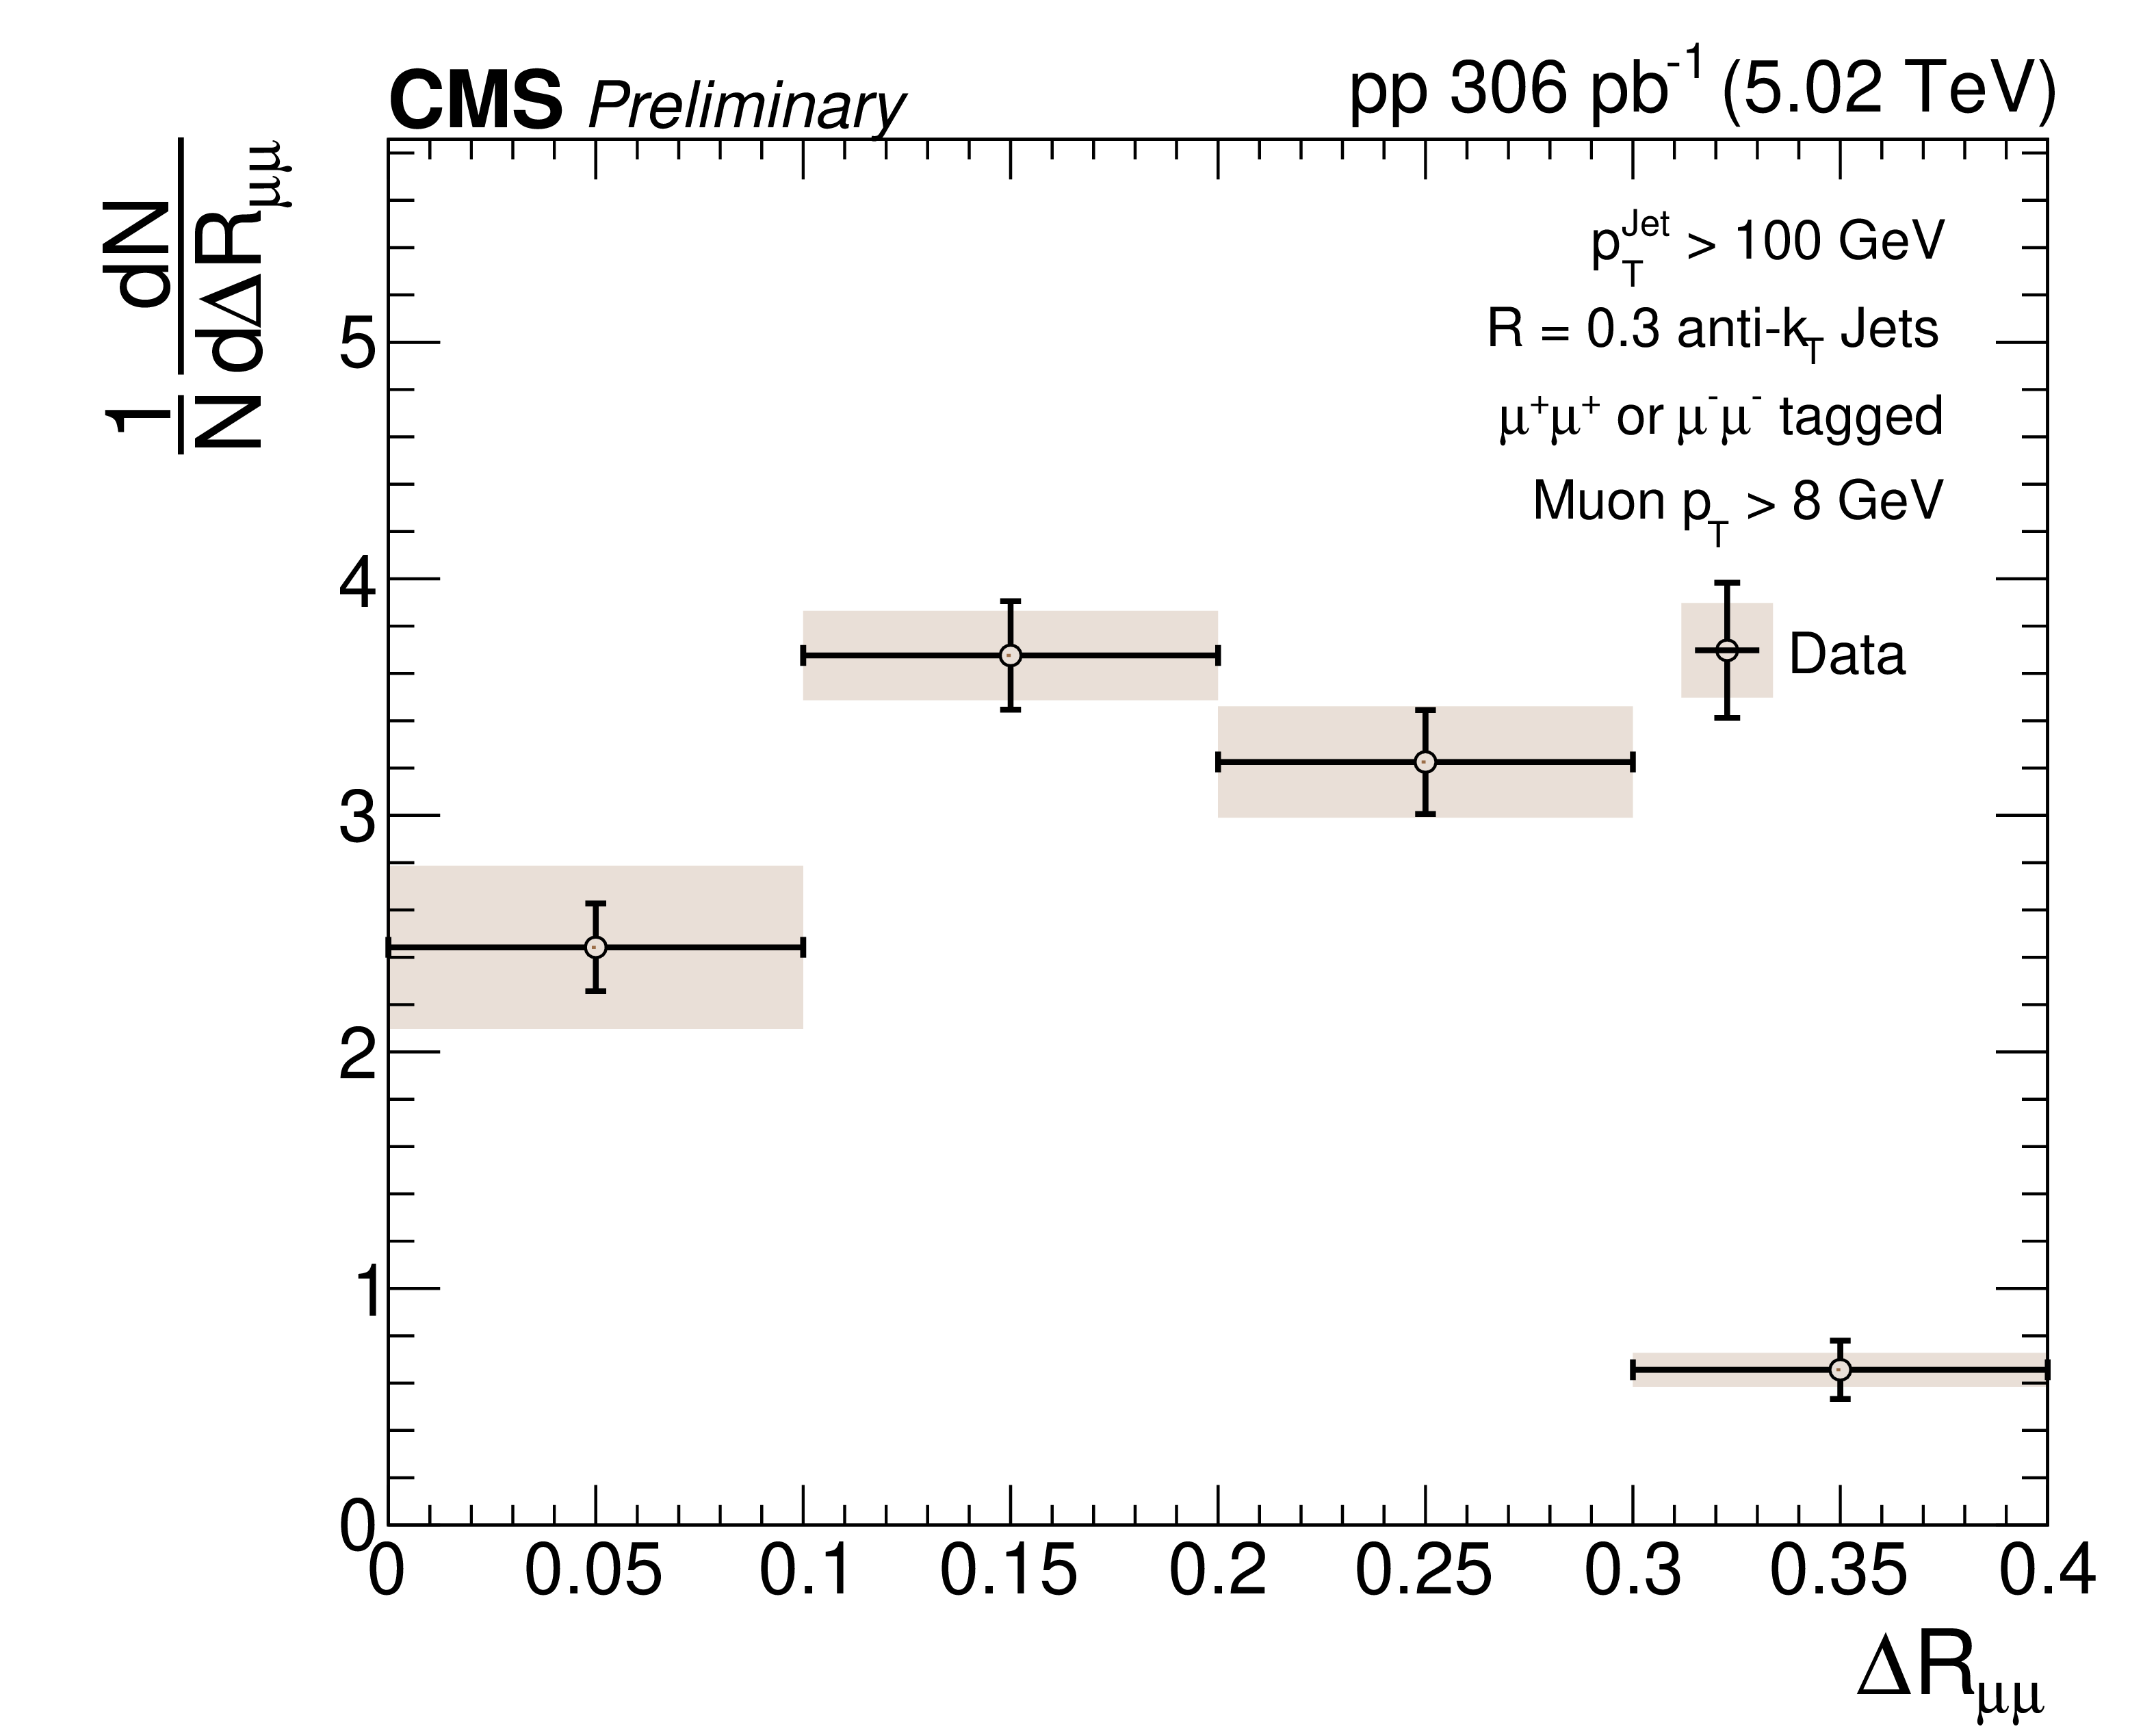
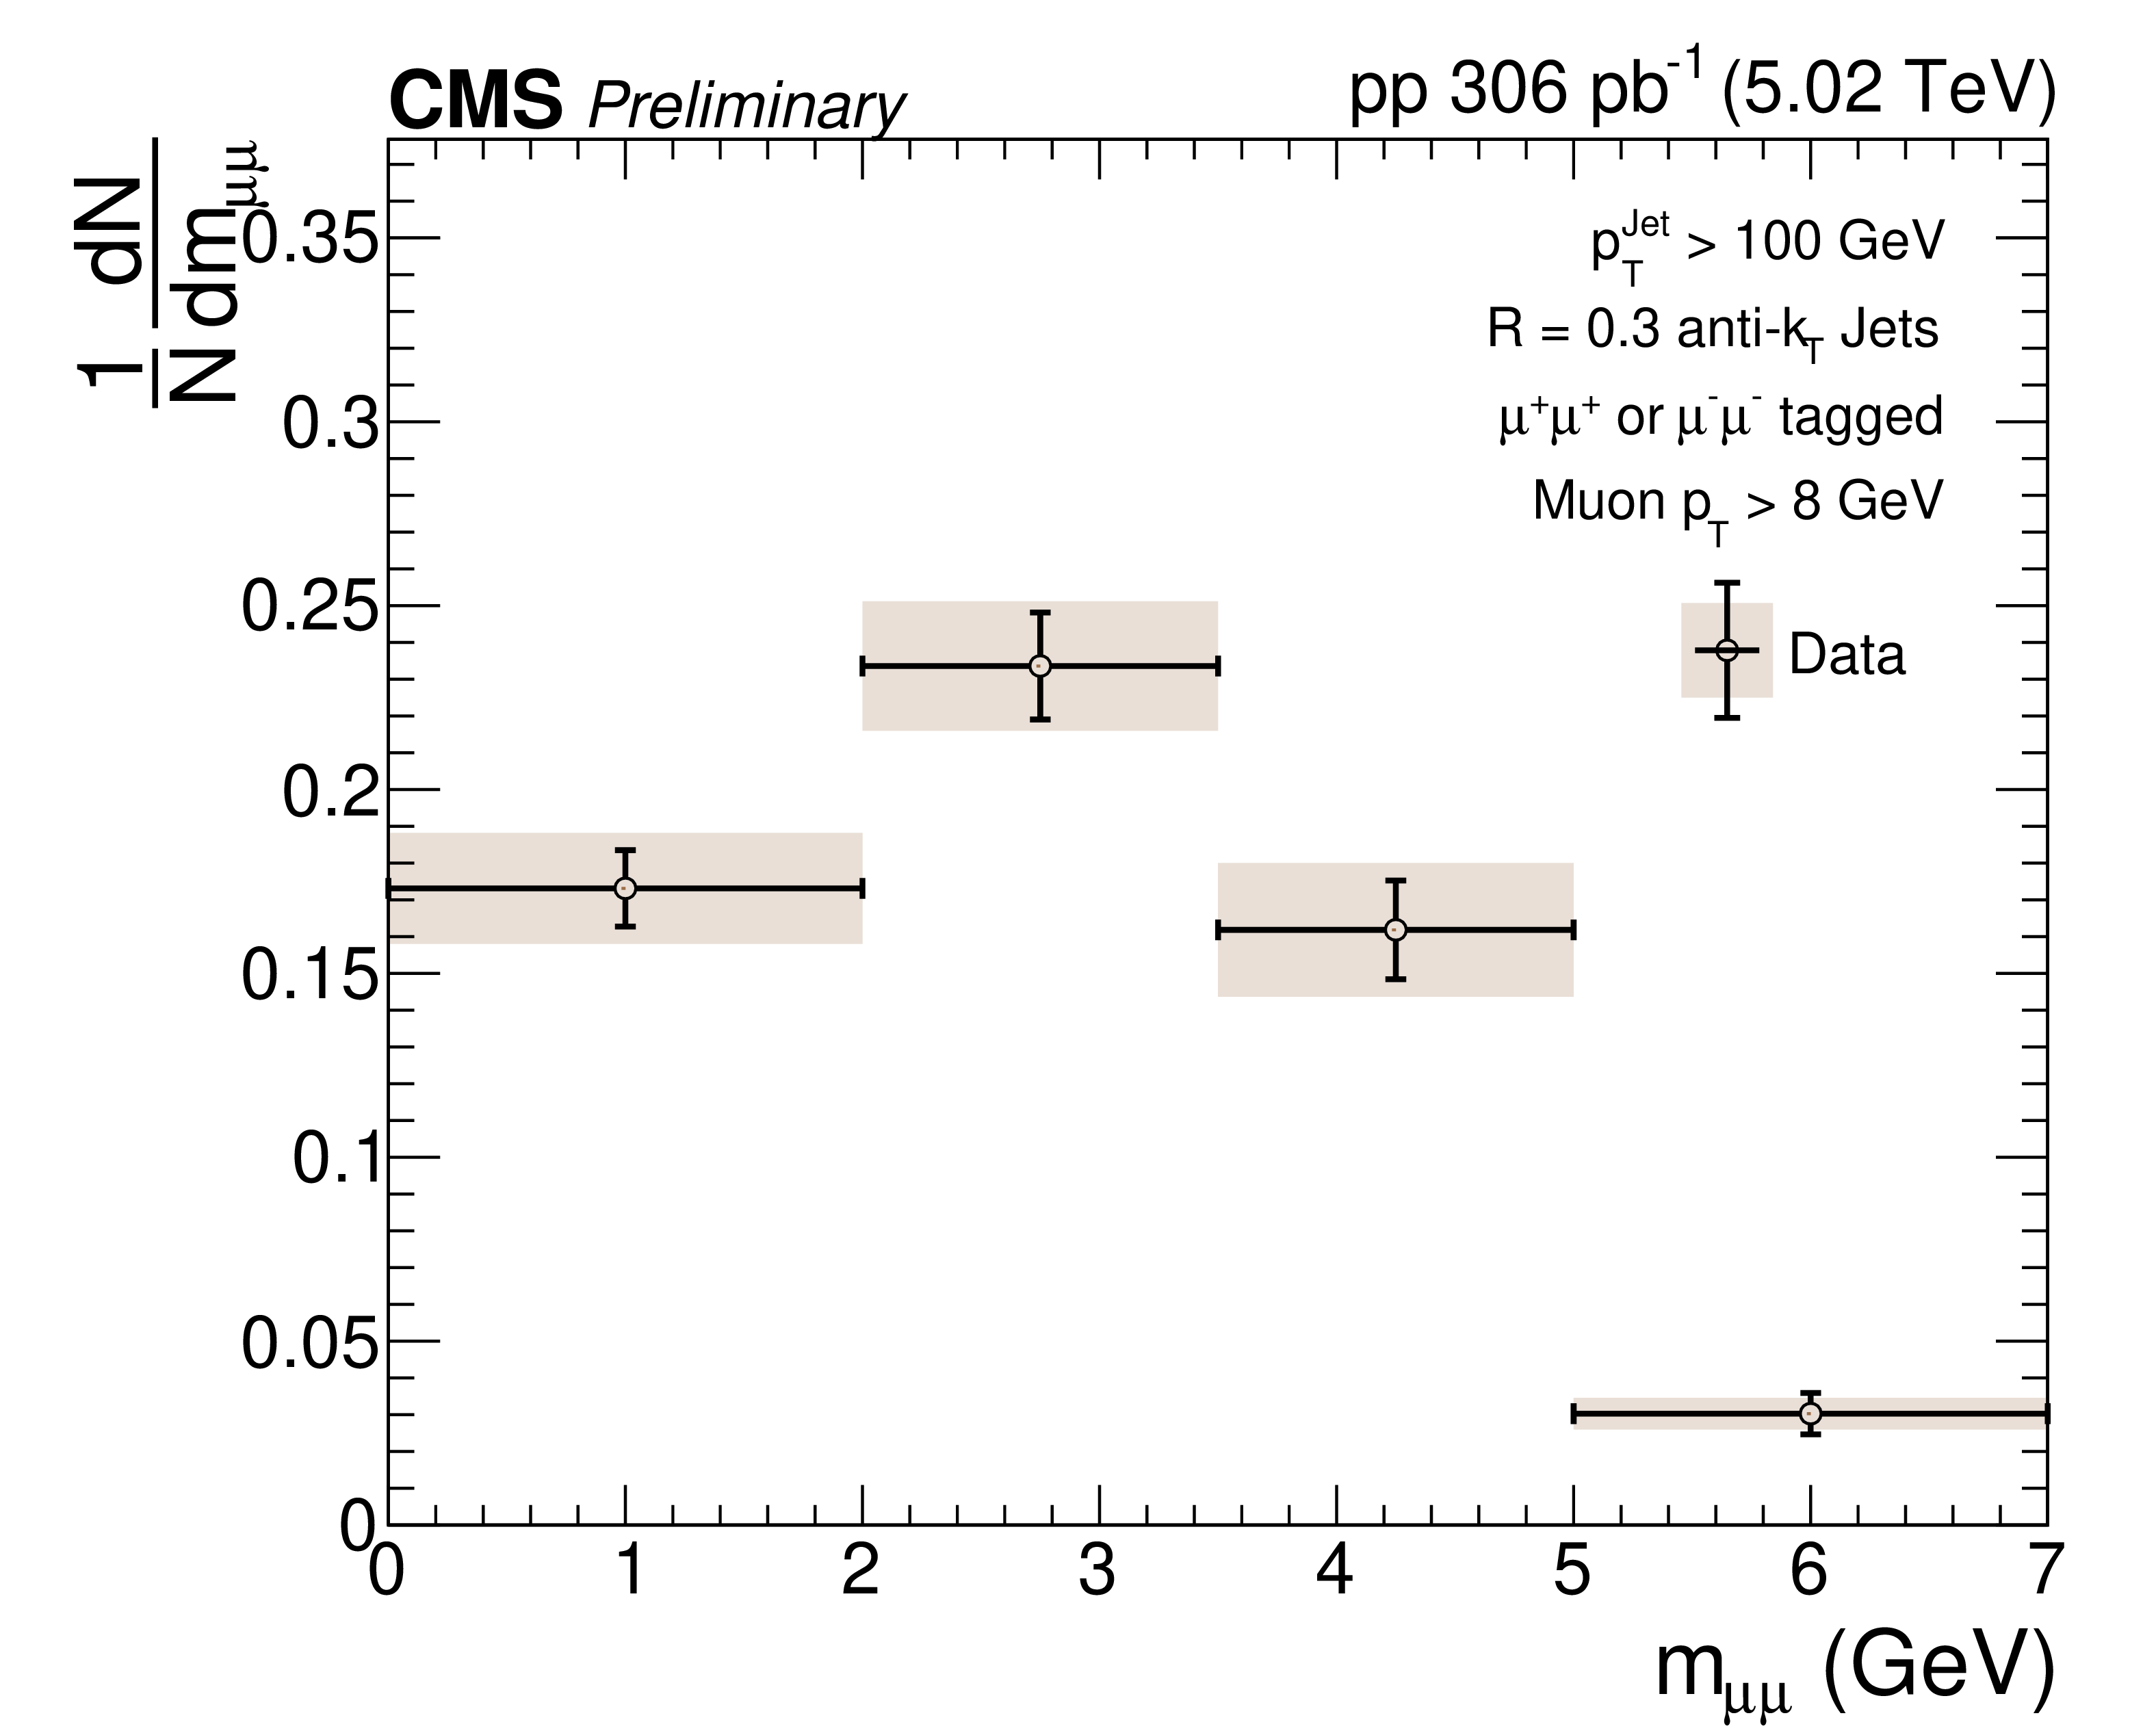
Normalized distributions of the $ \Delta R_{\mu\mu} $ (left) and the $ m_{\mu\mu} $ (right) of $ \Delta R_{\mu\mu} $ for same-sign dimuon-tagged jets with $ p_{\mathrm{T}} > $ 100 GeV. |
png pdf |
Figure 13-a:
Normalized distributions of the $ \Delta R_{\mu\mu} $ (left) and the $ m_{\mu\mu} $ (right) of $ \Delta R_{\mu\mu} $ for same-sign dimuon-tagged jets with $ p_{\mathrm{T}} > $ 100 GeV. |
png pdf |
Figure 13-b:
Normalized distributions of the $ \Delta R_{\mu\mu} $ (left) and the $ m_{\mu\mu} $ (right) of $ \Delta R_{\mu\mu} $ for same-sign dimuon-tagged jets with $ p_{\mathrm{T}} > $ 100 GeV. |
png pdf |
Figure 14:
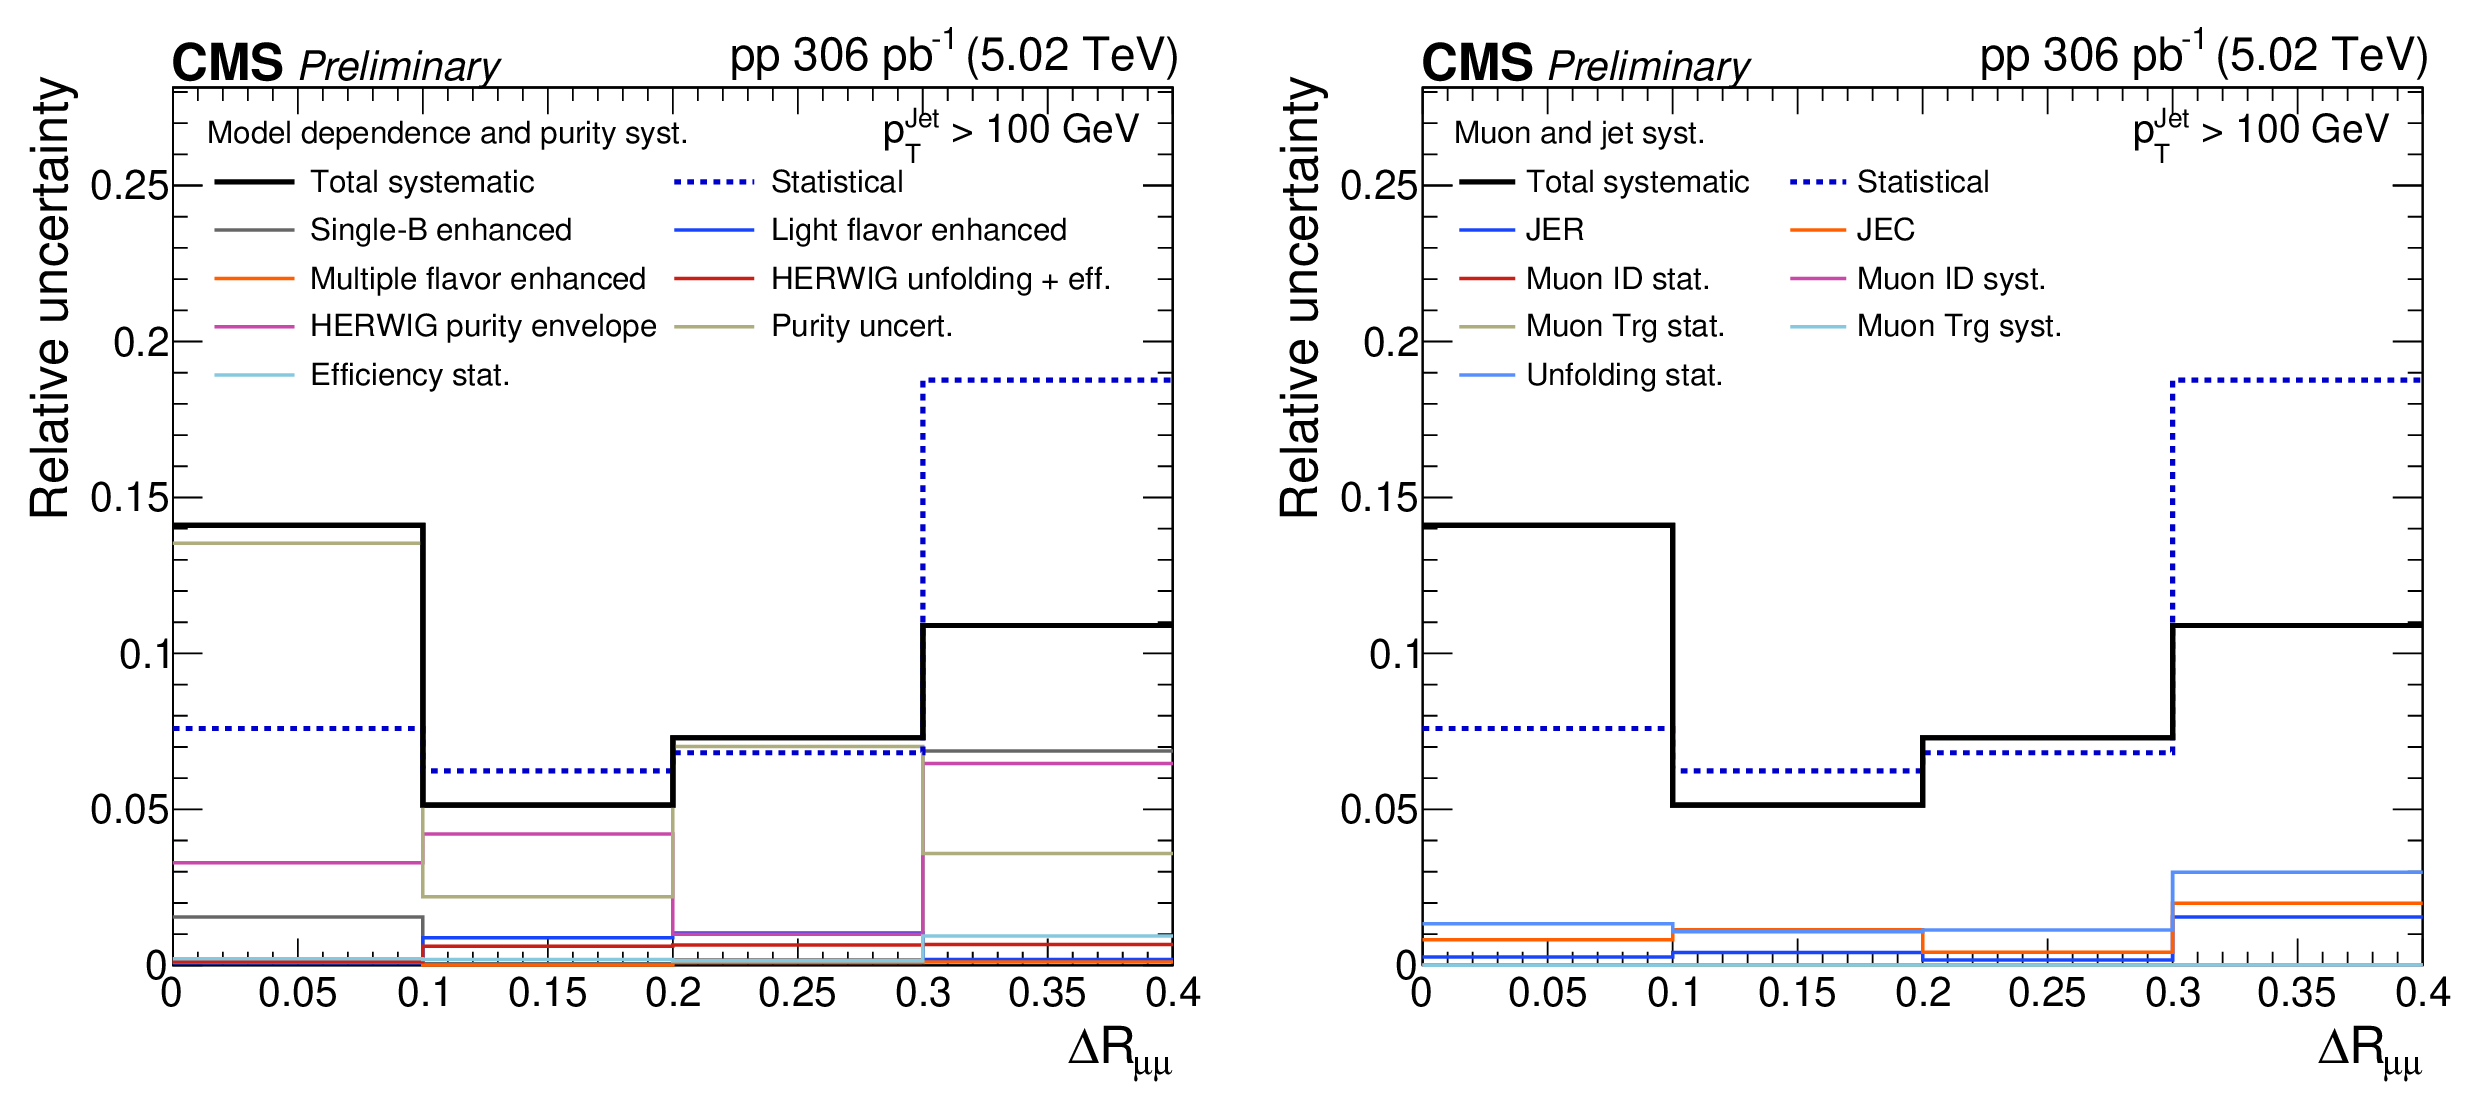
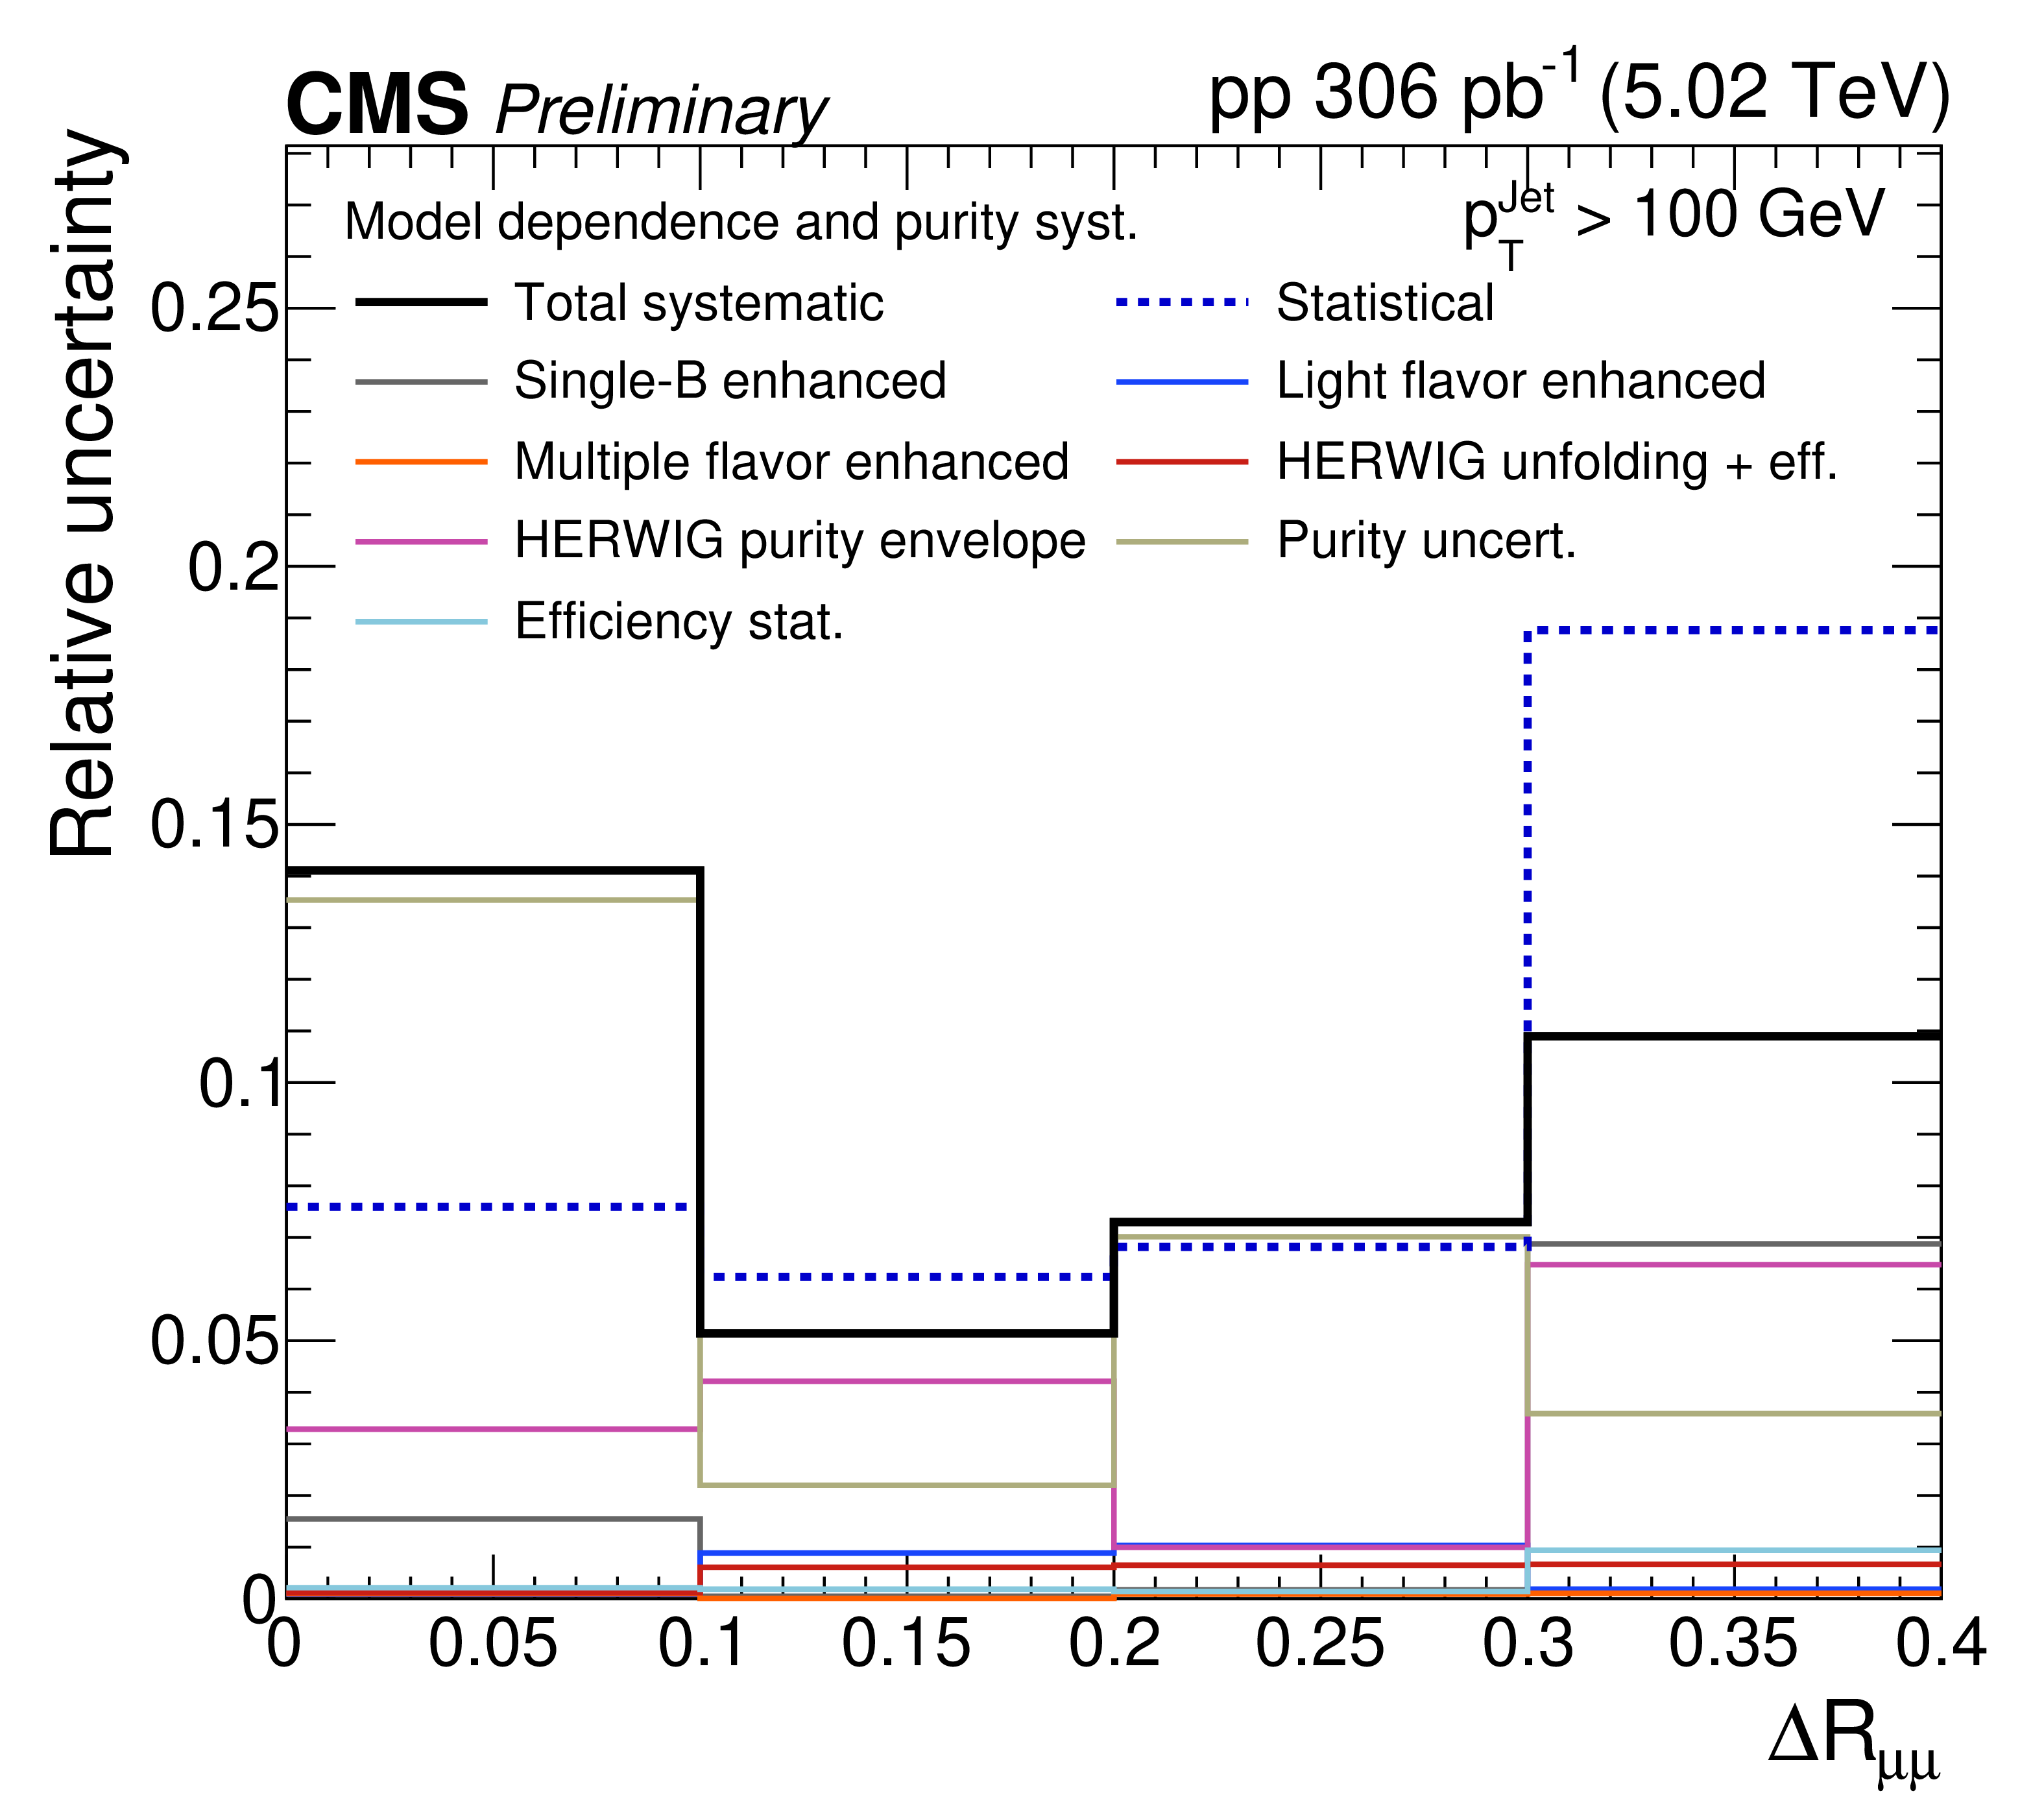
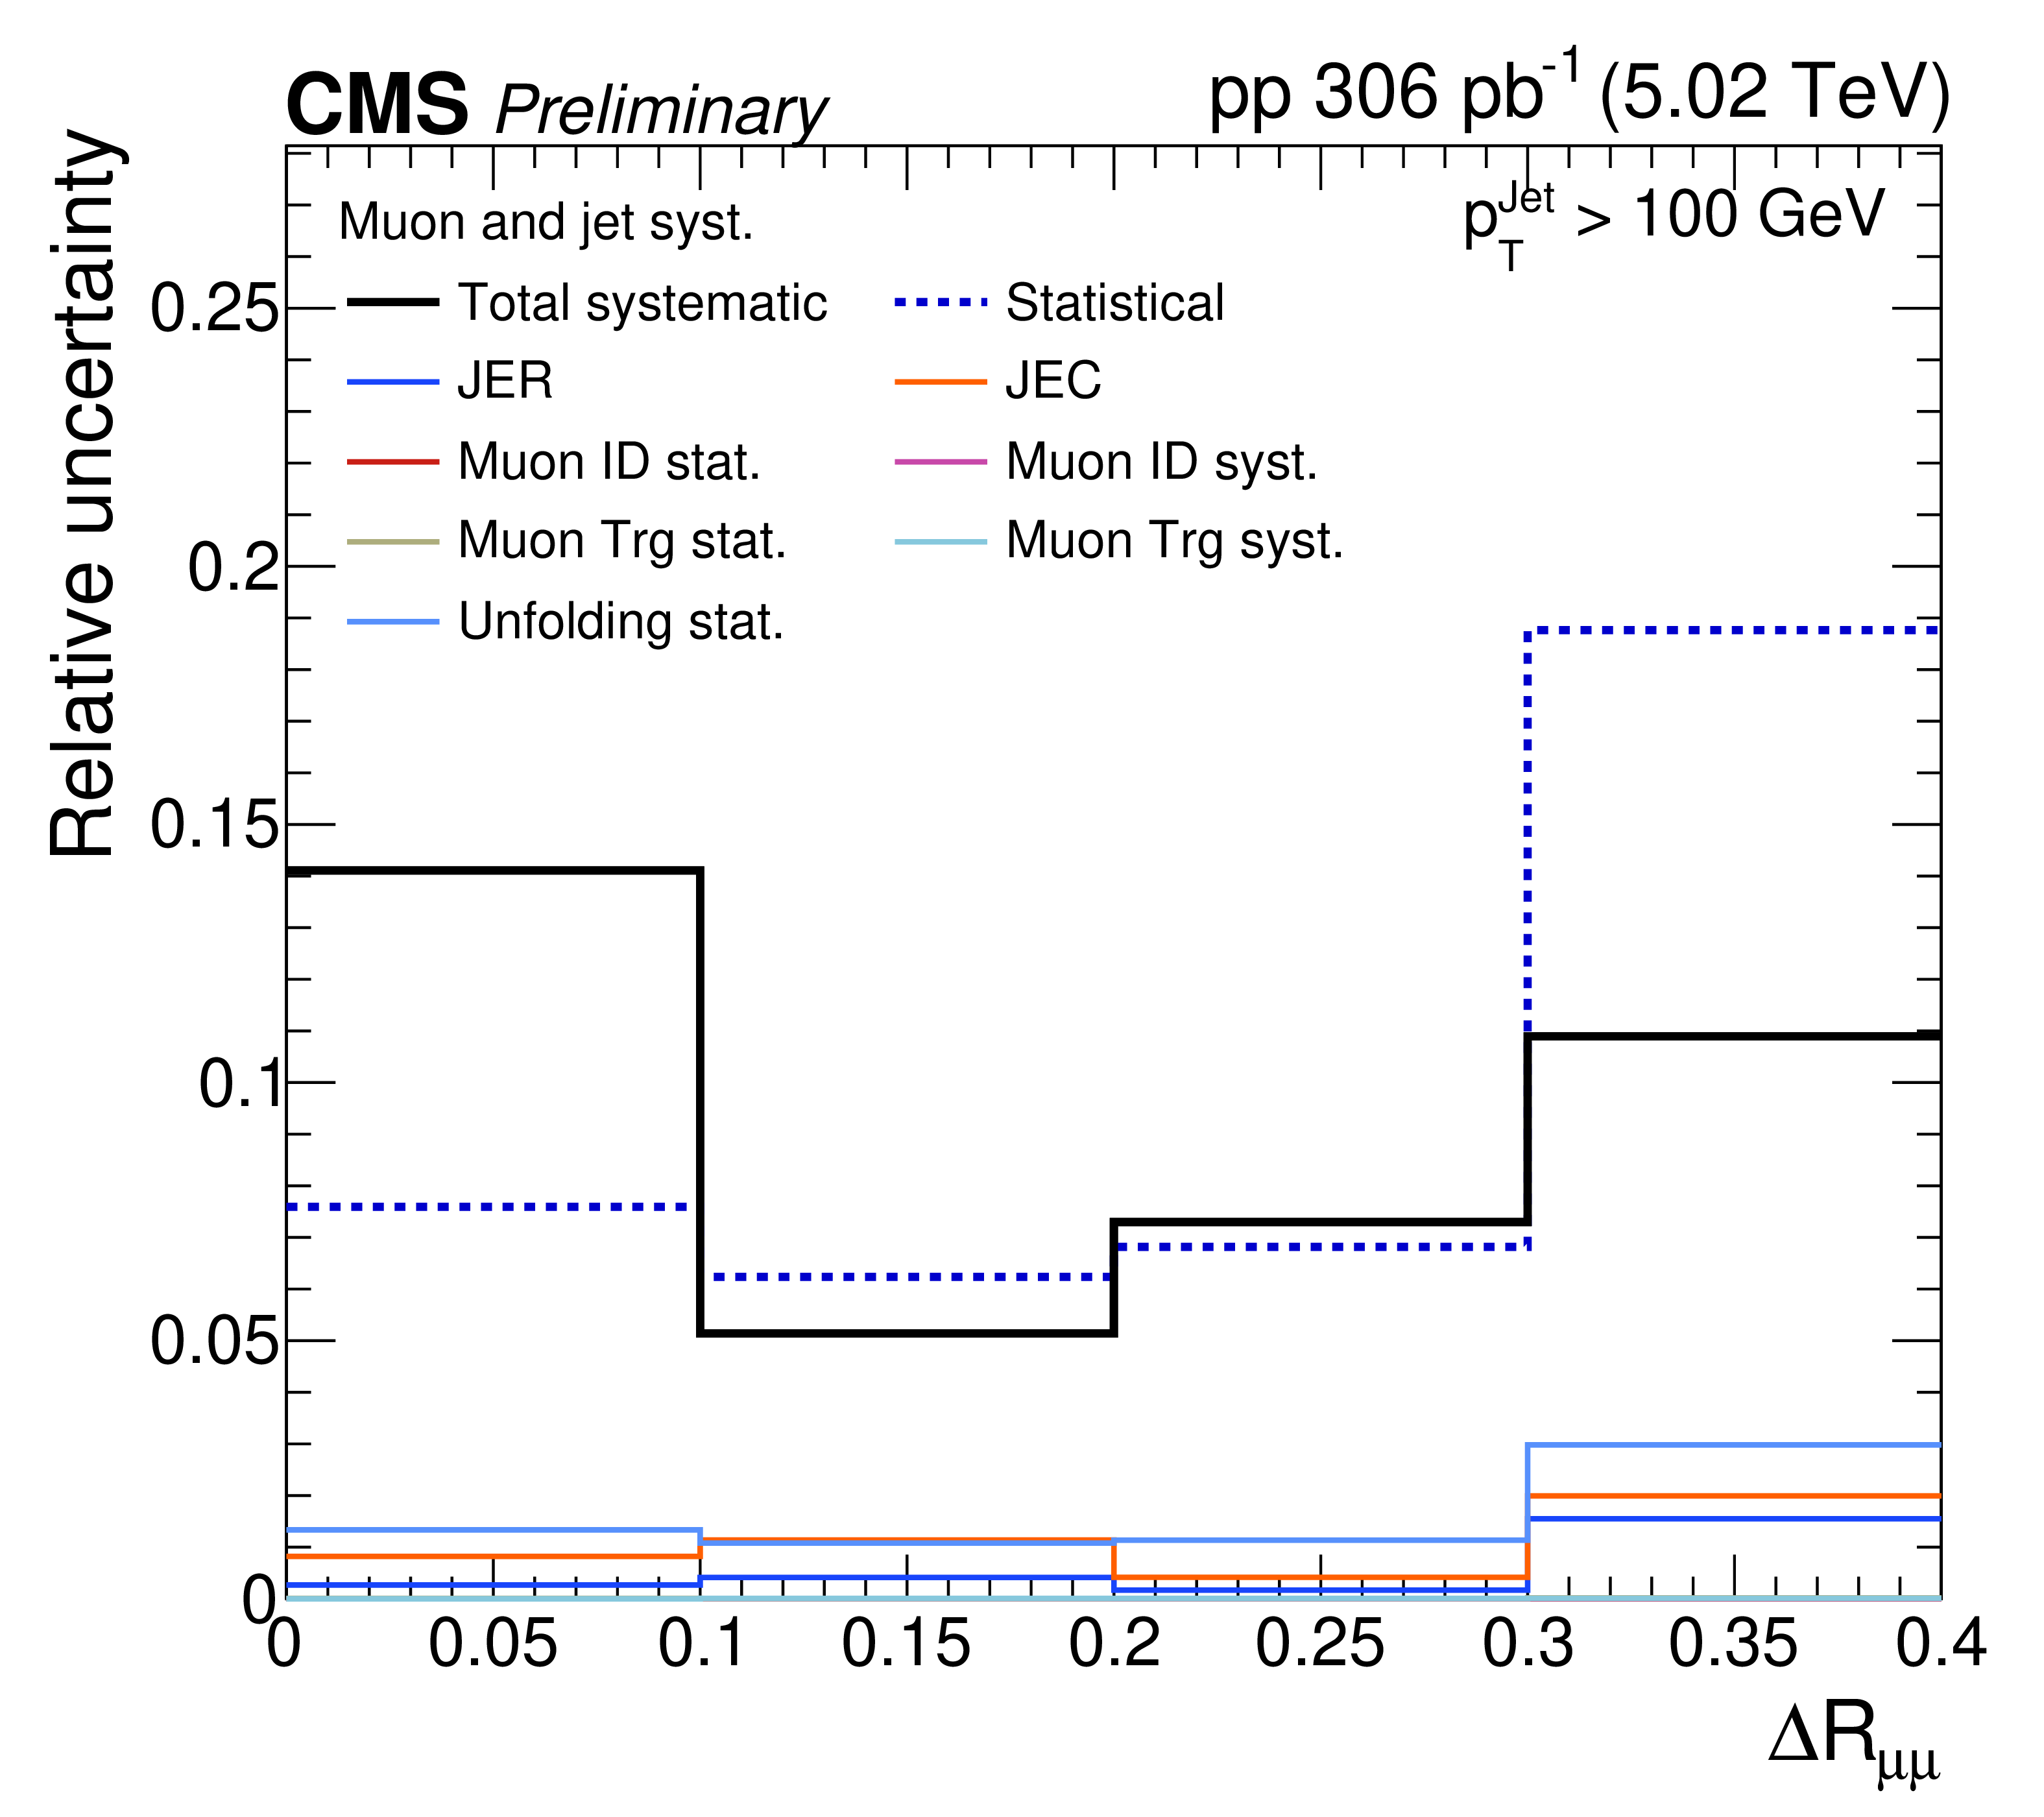
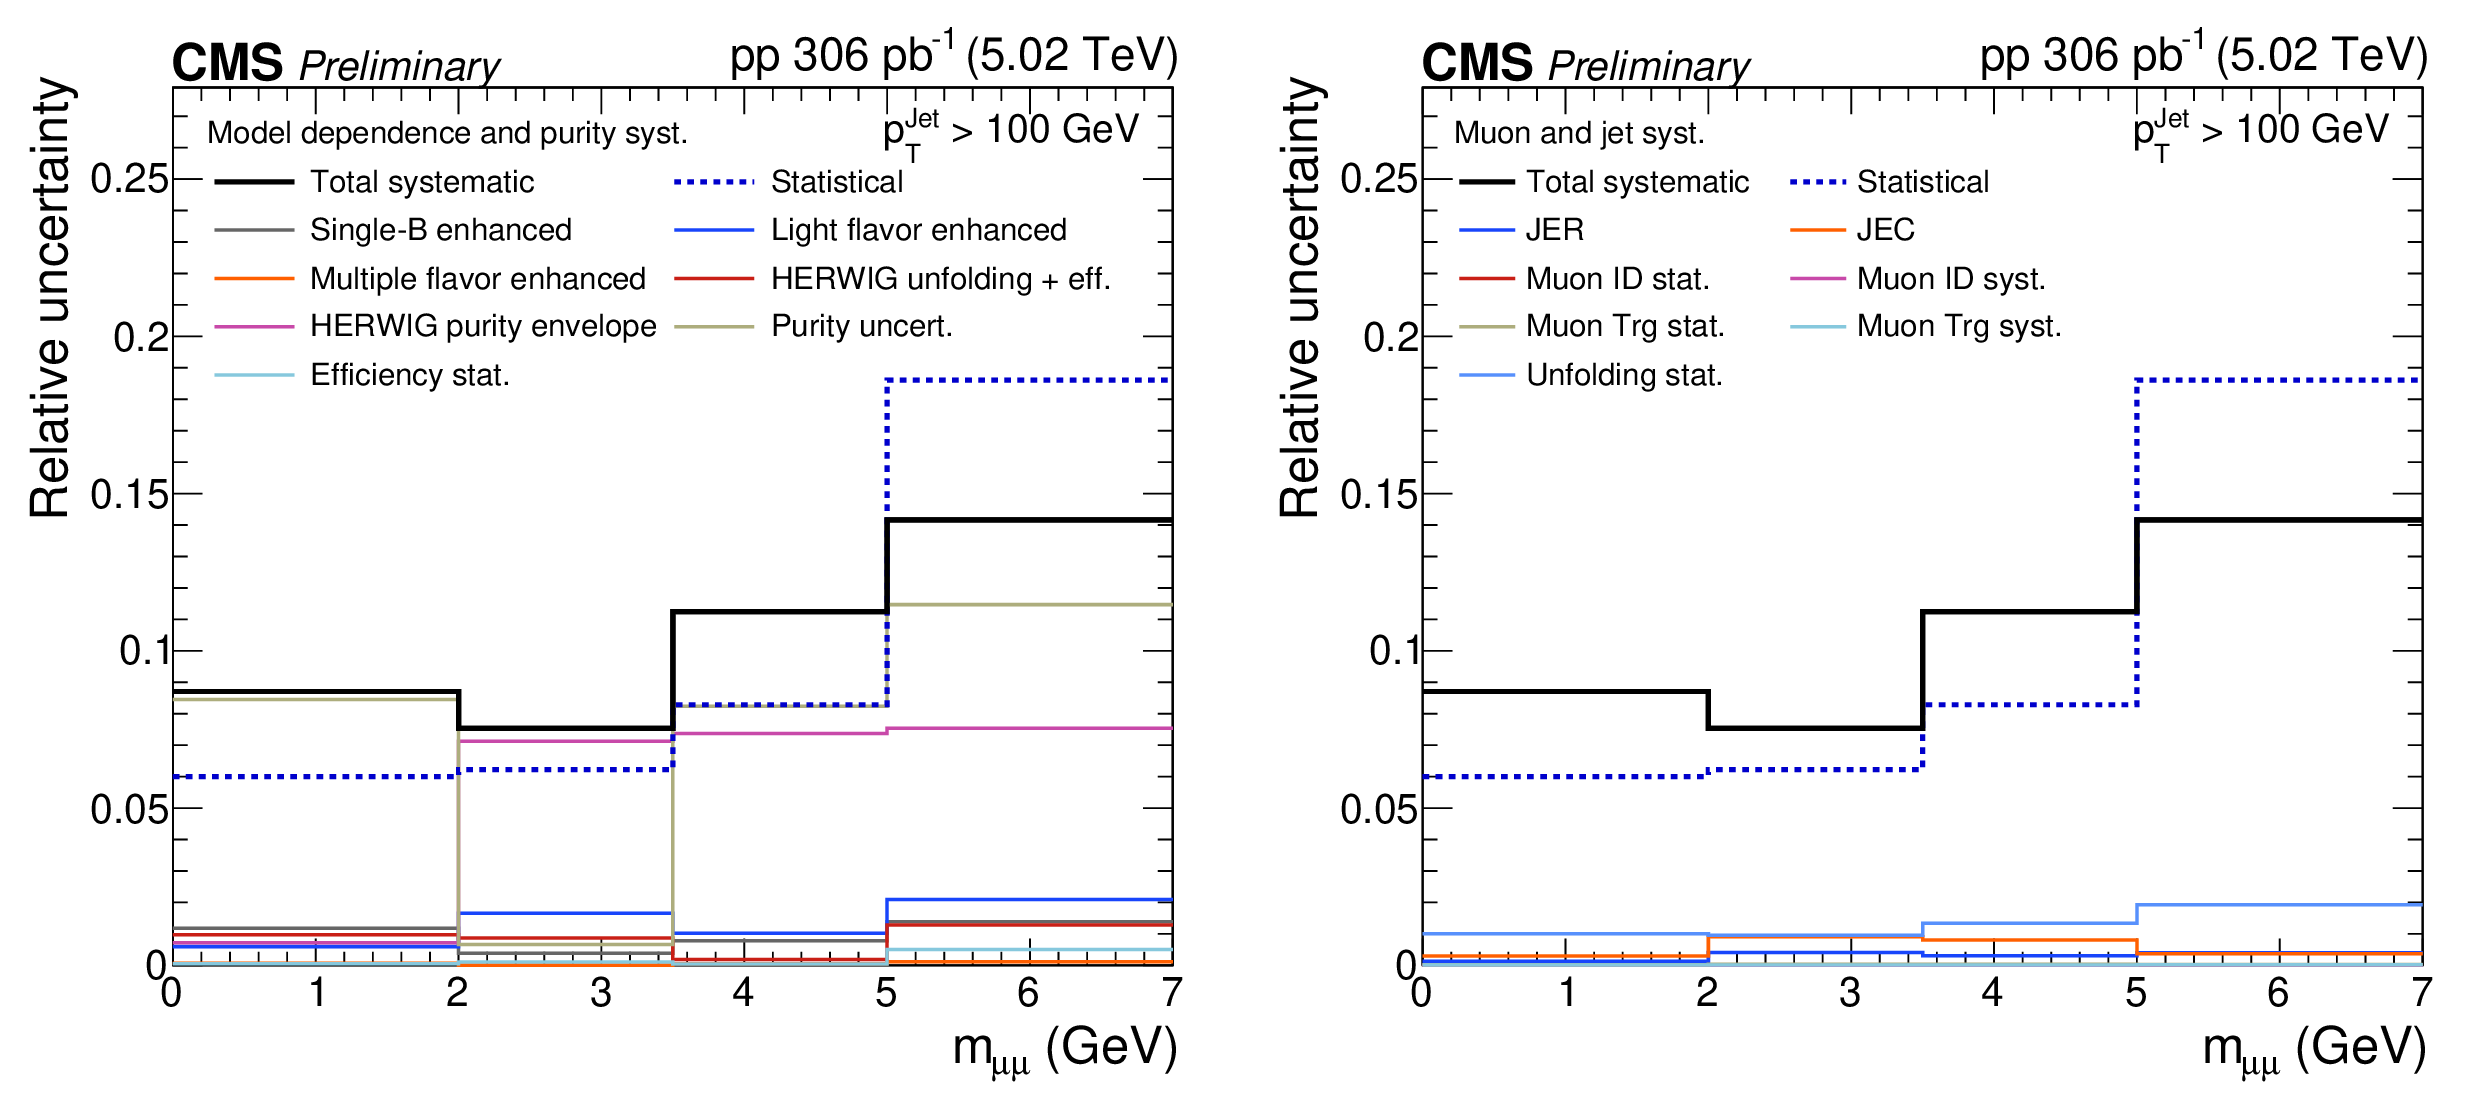
Systematic and statistical uncertainties as a fraction of the same-sign dimuon $ \Delta R_{\mu\mu} $ distribution magnitude. Total statistical and systematic uncertainties are the same across both plots. Purity statistical uncertainty, shower-modeling-dependent purity and unfolding/efficiency uncertainties, flavor, and efficiency uncertainties are shown (left). Muon tag-and-probe weights, JES, JER, and unfolding statistical uncertainties are shown (right). |
png pdf |
Figure 14-a:
Systematic and statistical uncertainties as a fraction of the same-sign dimuon $ \Delta R_{\mu\mu} $ distribution magnitude. Total statistical and systematic uncertainties are the same across both plots. Purity statistical uncertainty, shower-modeling-dependent purity and unfolding/efficiency uncertainties, flavor, and efficiency uncertainties are shown (left). Muon tag-and-probe weights, JES, JER, and unfolding statistical uncertainties are shown (right). |
png pdf |
Figure 14-b:
Systematic and statistical uncertainties as a fraction of the same-sign dimuon $ \Delta R_{\mu\mu} $ distribution magnitude. Total statistical and systematic uncertainties are the same across both plots. Purity statistical uncertainty, shower-modeling-dependent purity and unfolding/efficiency uncertainties, flavor, and efficiency uncertainties are shown (left). Muon tag-and-probe weights, JES, JER, and unfolding statistical uncertainties are shown (right). |
png pdf |
Figure 15:
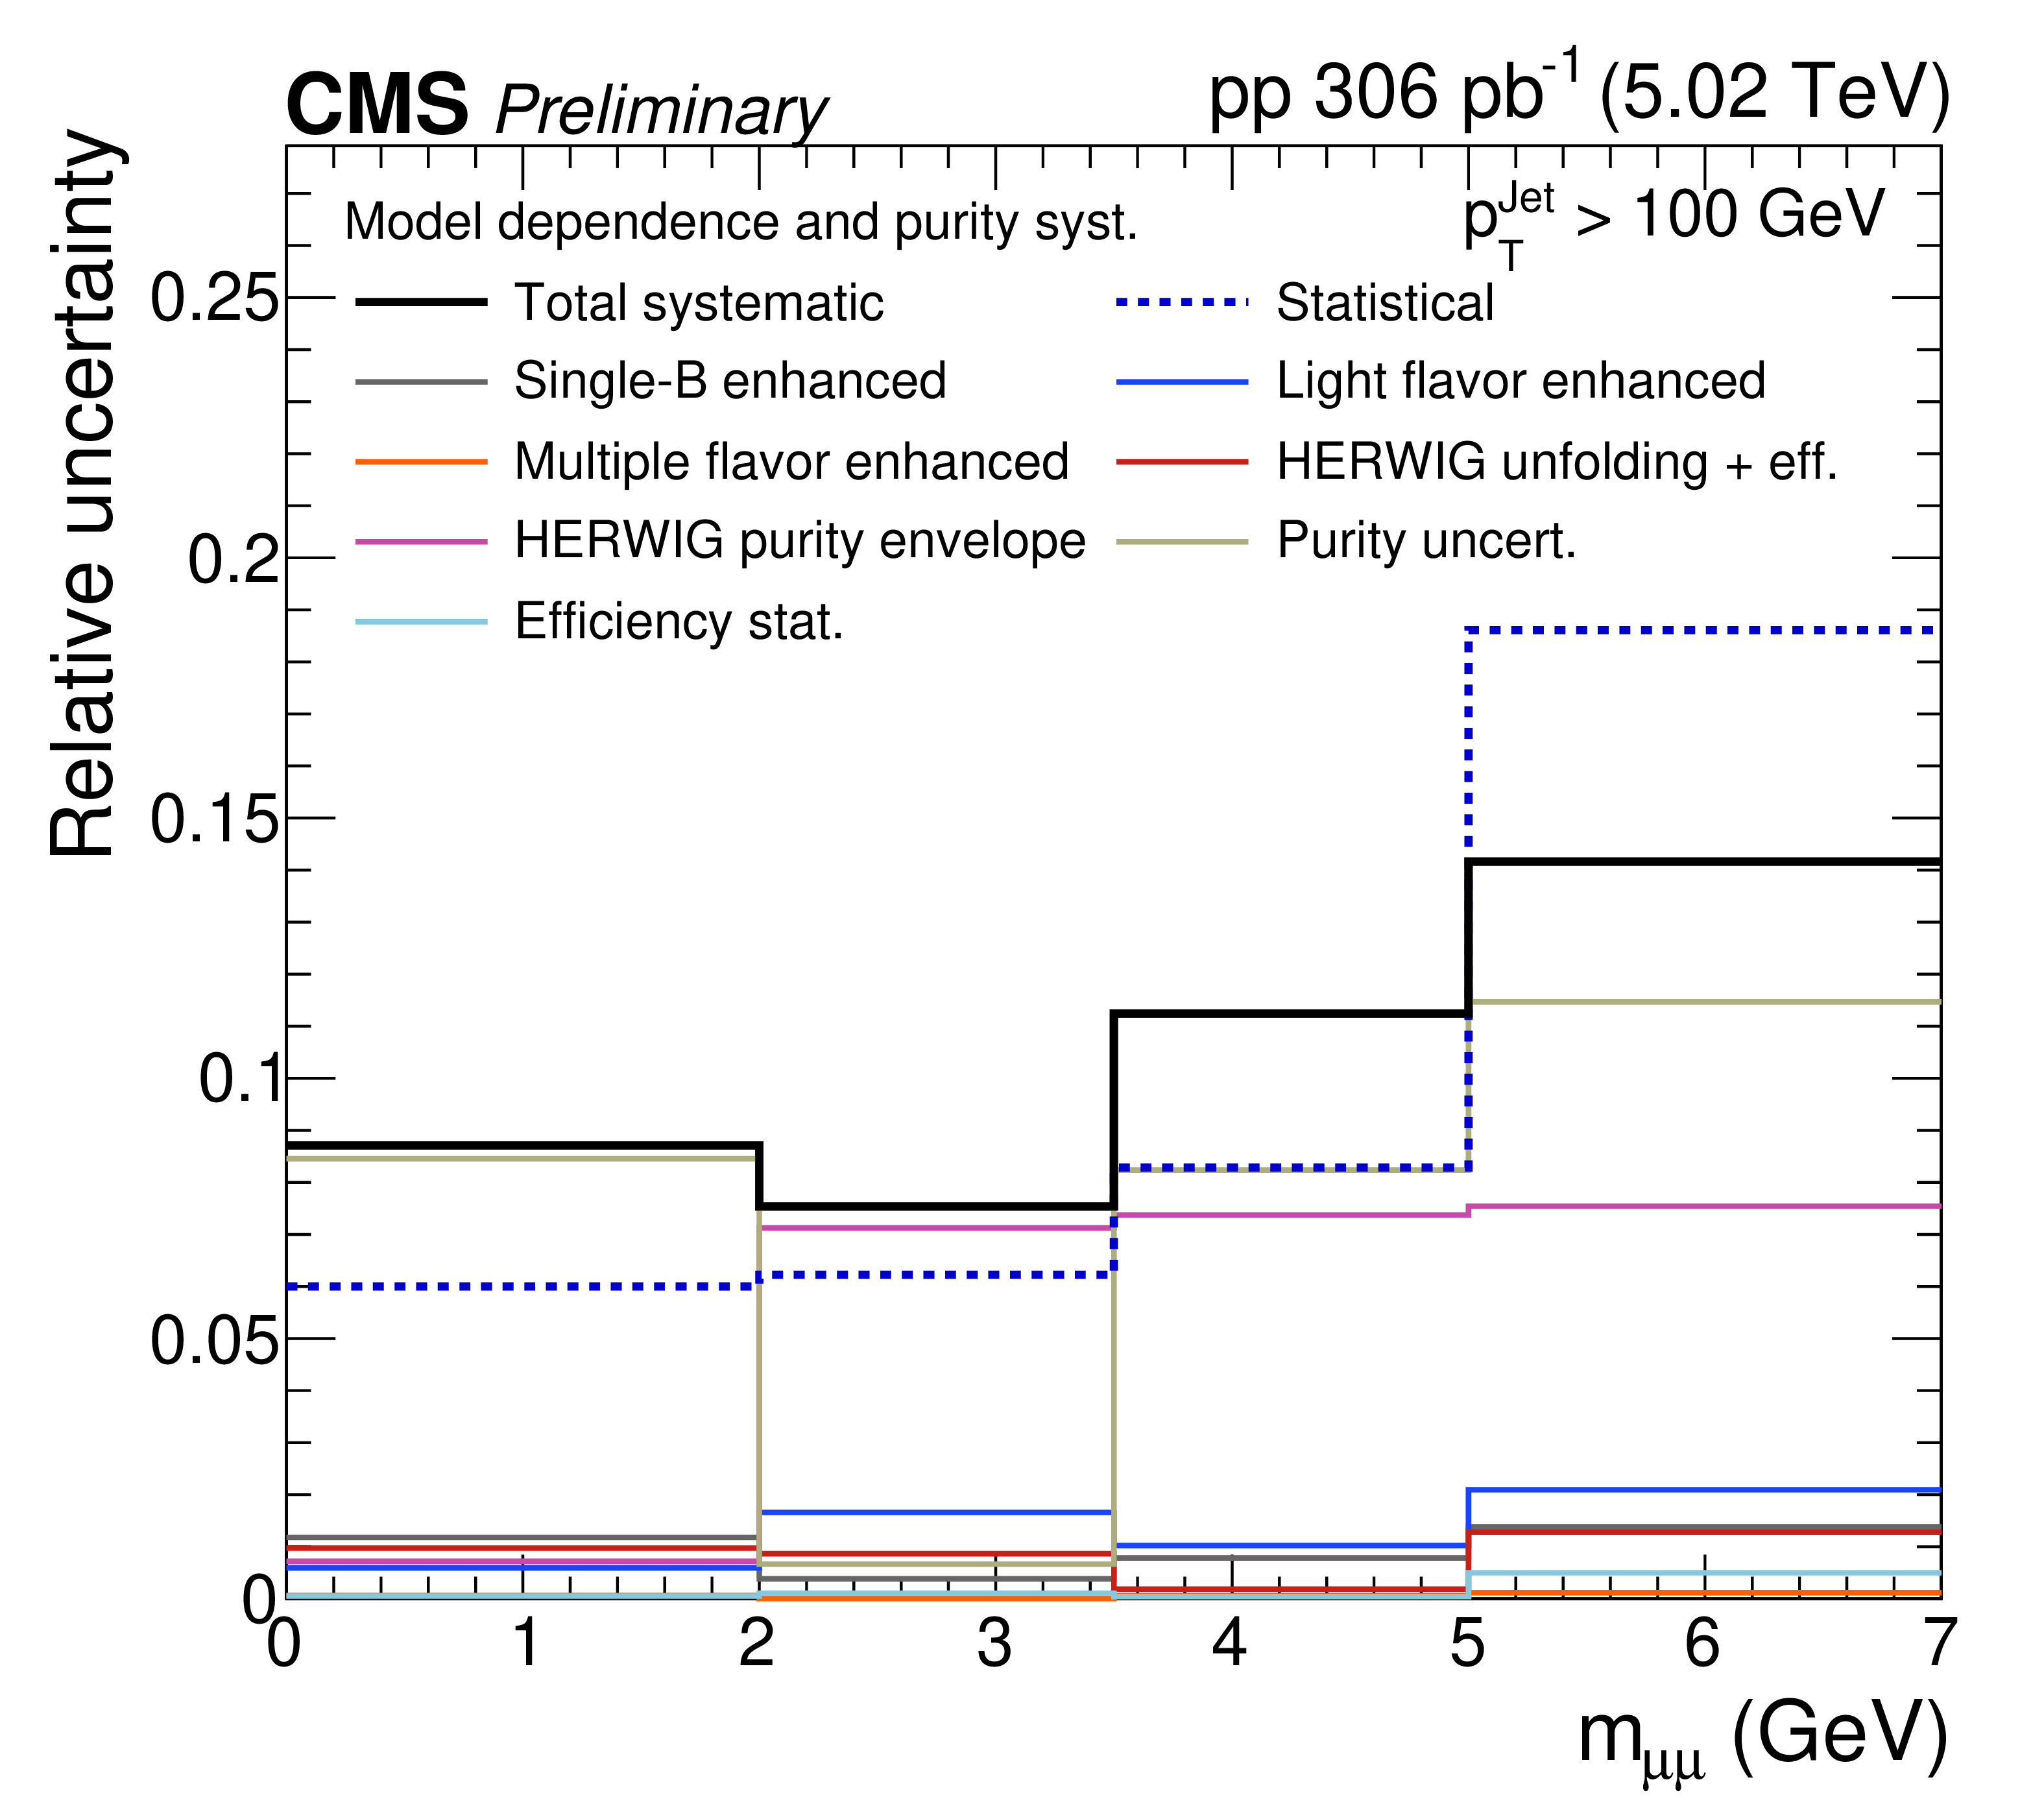
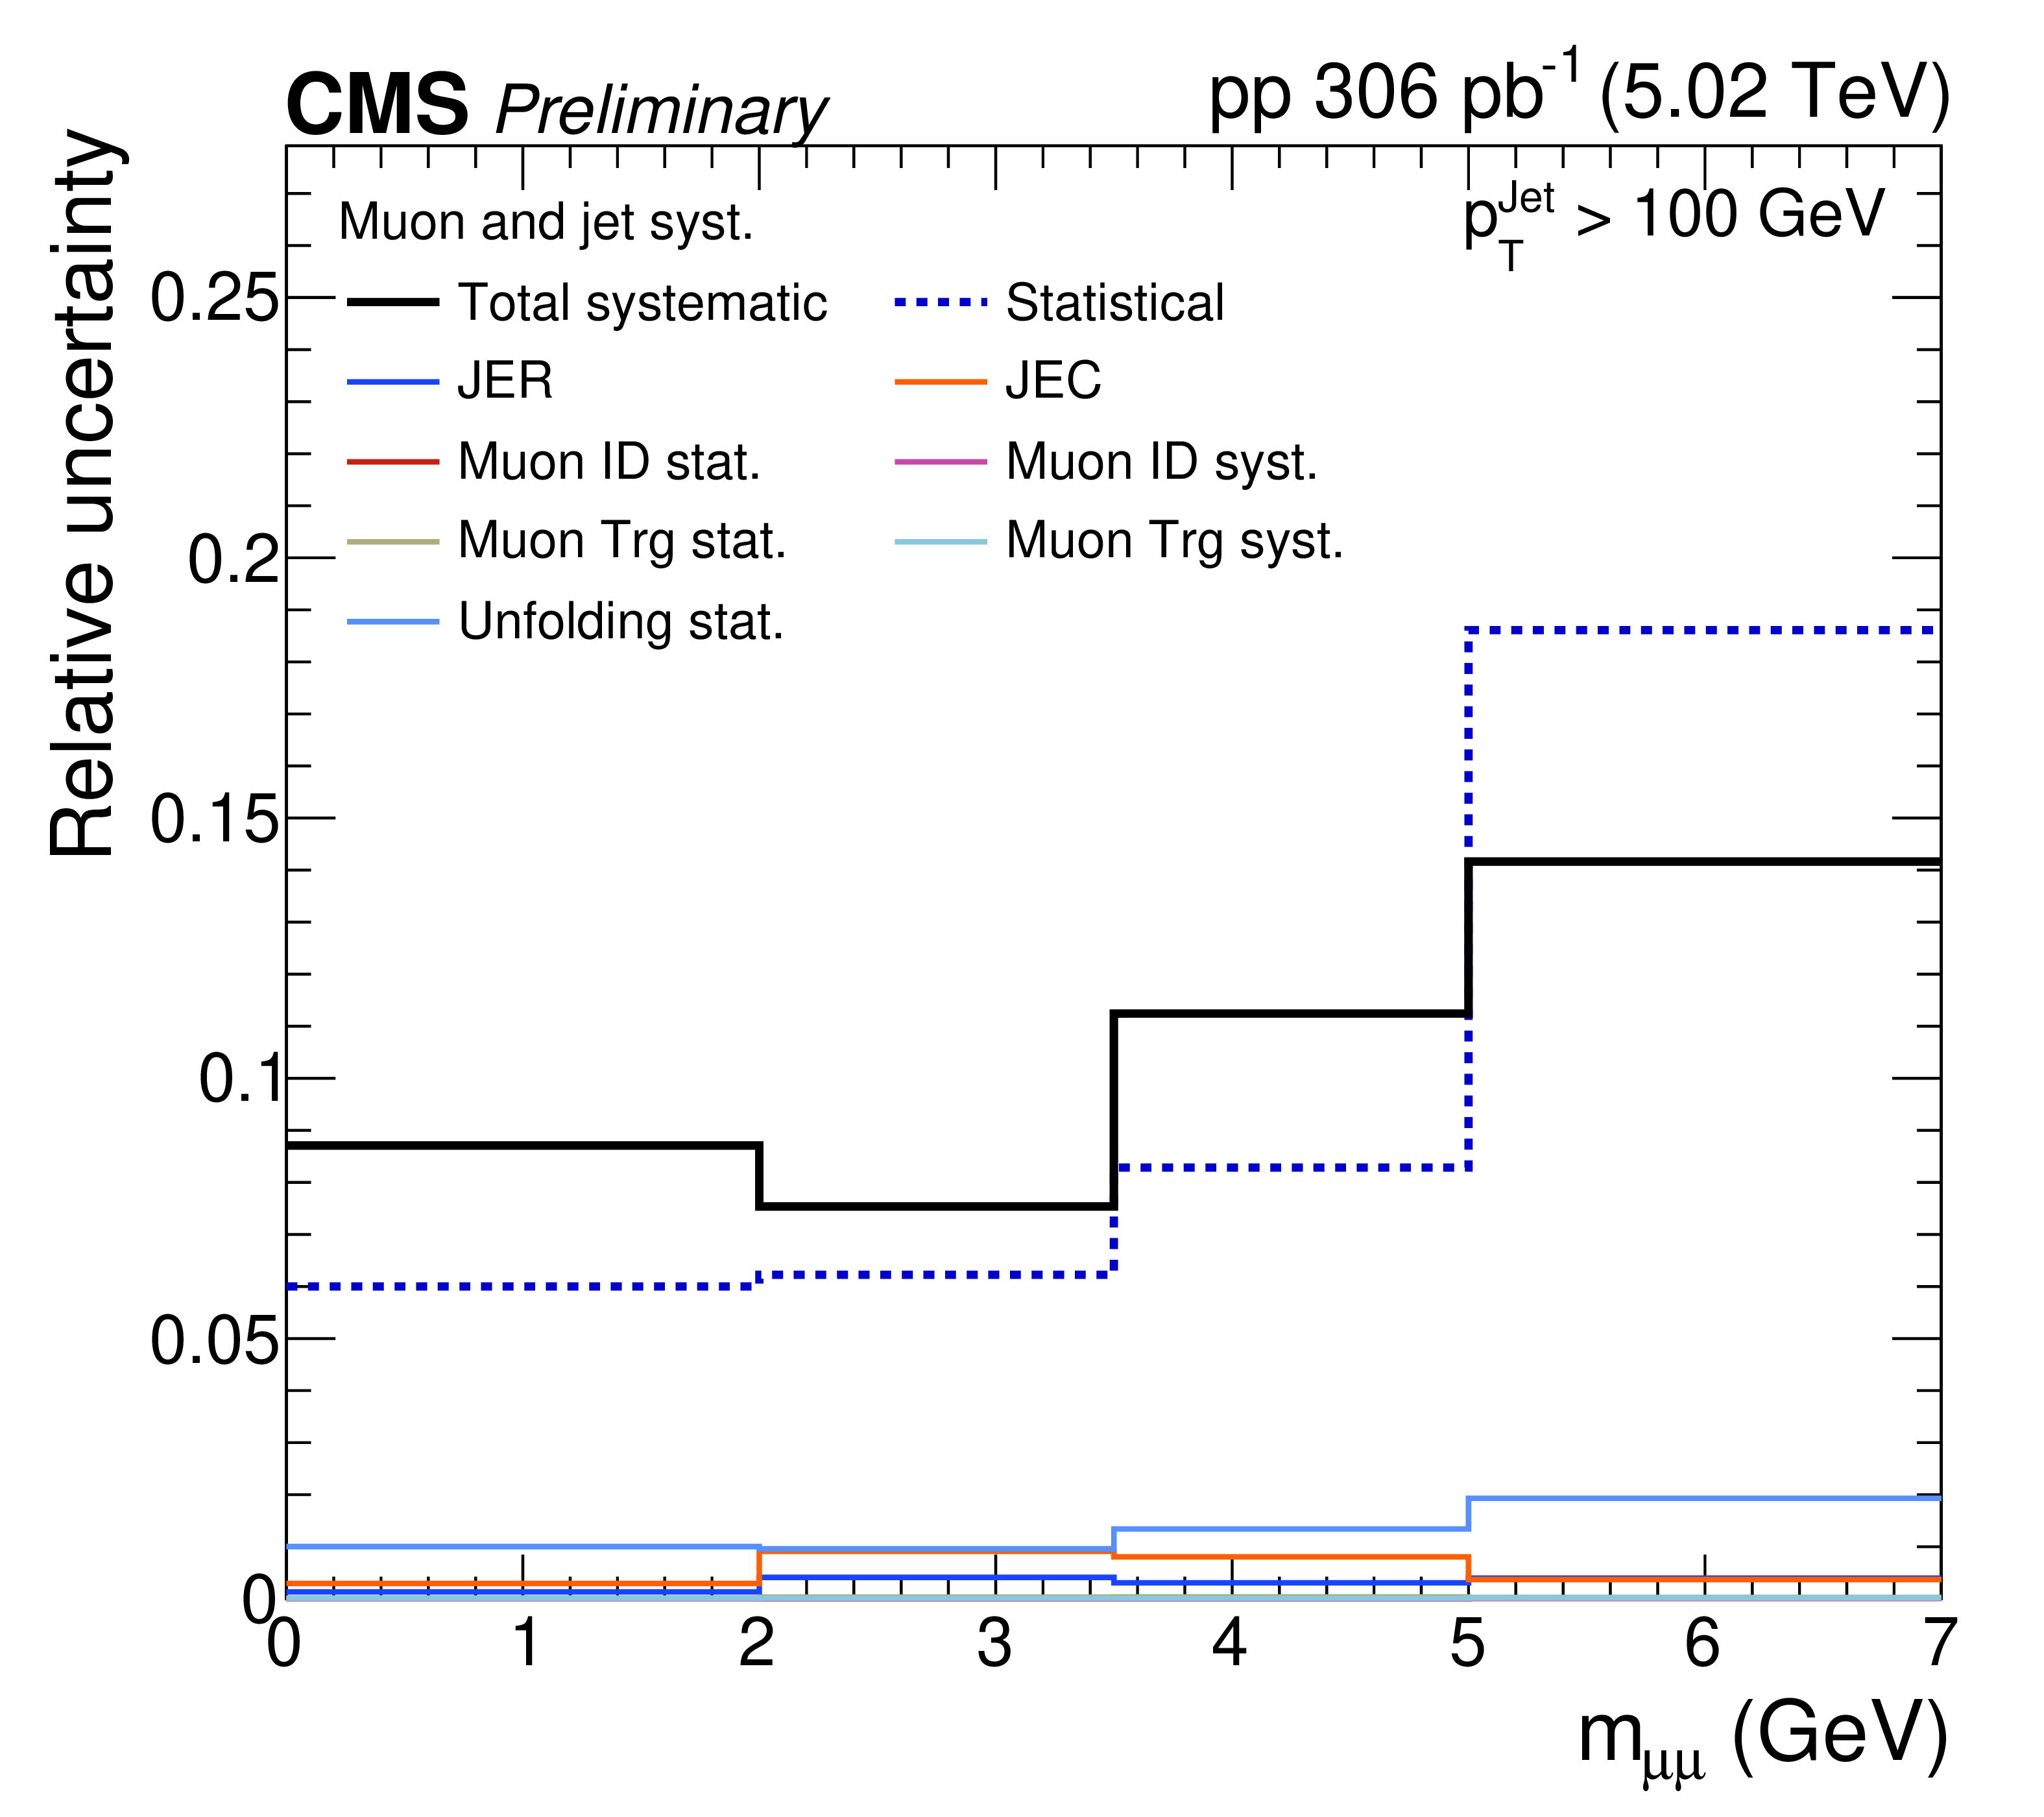
Systematic and statistical uncertainties as a fraction of the same-sign dimuon $ m_{\mu\mu} $ distribution magnitude. Total statistical and systematic uncertainties are the same across both plots. Purity statistical uncertainty, shower-modeling-dependent purity and unfolding/efficiency uncertainties, flavor, and efficiency uncertainties are shown (left). Muon tag-and-probe weights, JES, JER, and unfolding statistical uncertainties are shown (right). |
png pdf |
Figure 15-a:
Systematic and statistical uncertainties as a fraction of the same-sign dimuon $ m_{\mu\mu} $ distribution magnitude. Total statistical and systematic uncertainties are the same across both plots. Purity statistical uncertainty, shower-modeling-dependent purity and unfolding/efficiency uncertainties, flavor, and efficiency uncertainties are shown (left). Muon tag-and-probe weights, JES, JER, and unfolding statistical uncertainties are shown (right). |
png pdf |
Figure 15-b:
Systematic and statistical uncertainties as a fraction of the same-sign dimuon $ m_{\mu\mu} $ distribution magnitude. Total statistical and systematic uncertainties are the same across both plots. Purity statistical uncertainty, shower-modeling-dependent purity and unfolding/efficiency uncertainties, flavor, and efficiency uncertainties are shown (left). Muon tag-and-probe weights, JES, JER, and unfolding statistical uncertainties are shown (right). |
png pdf |
Figure 16:
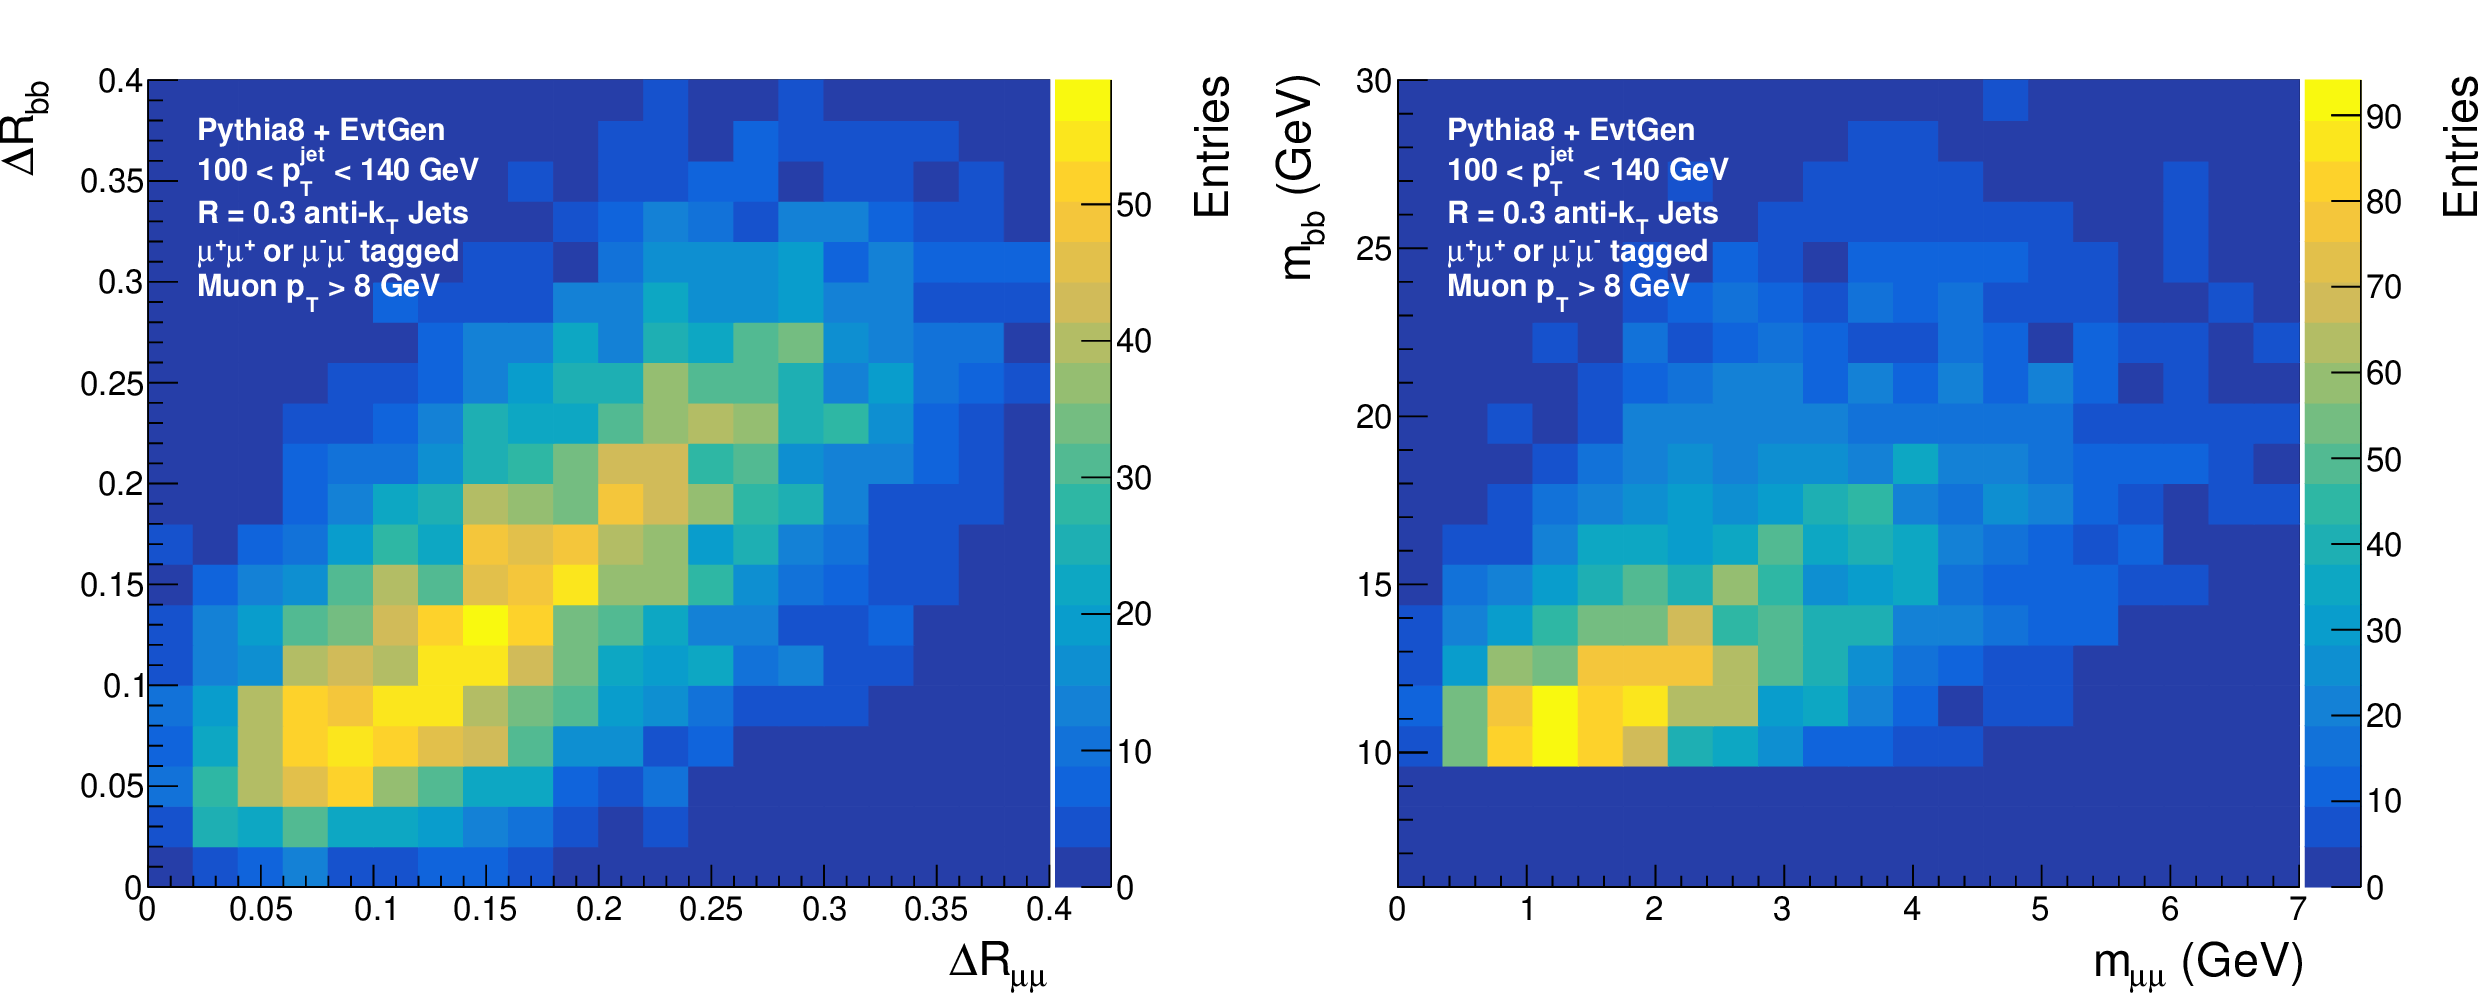
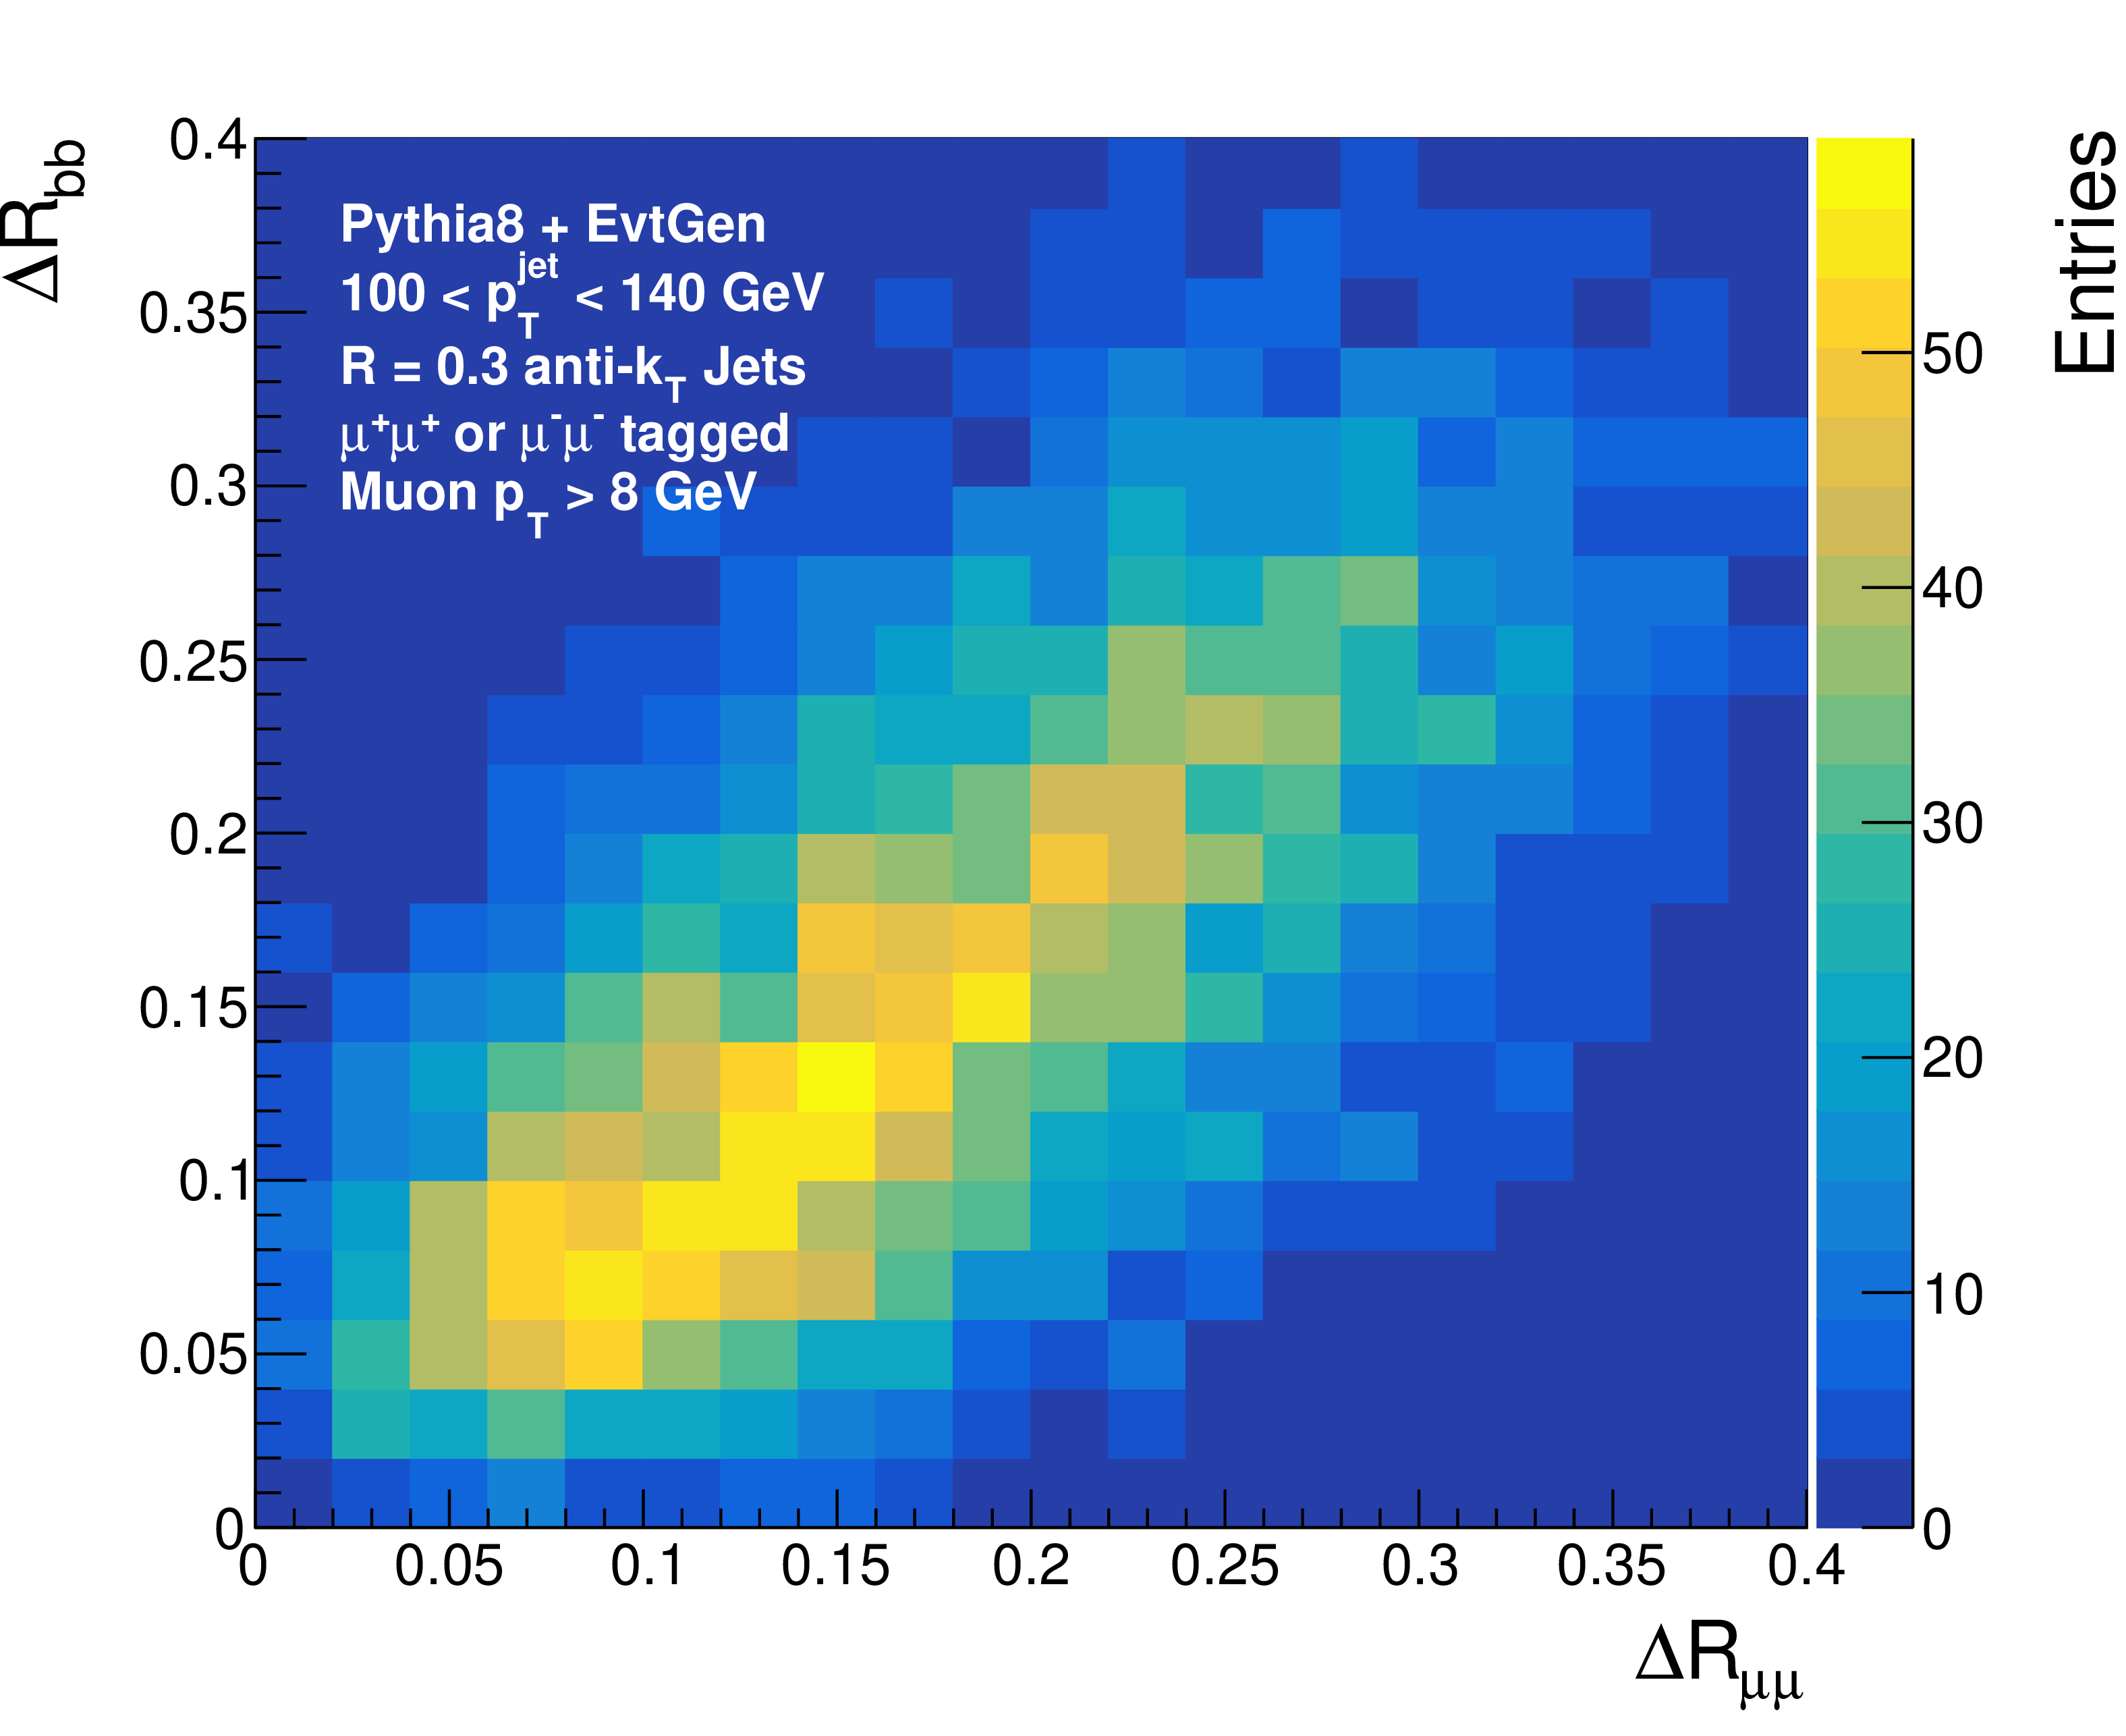
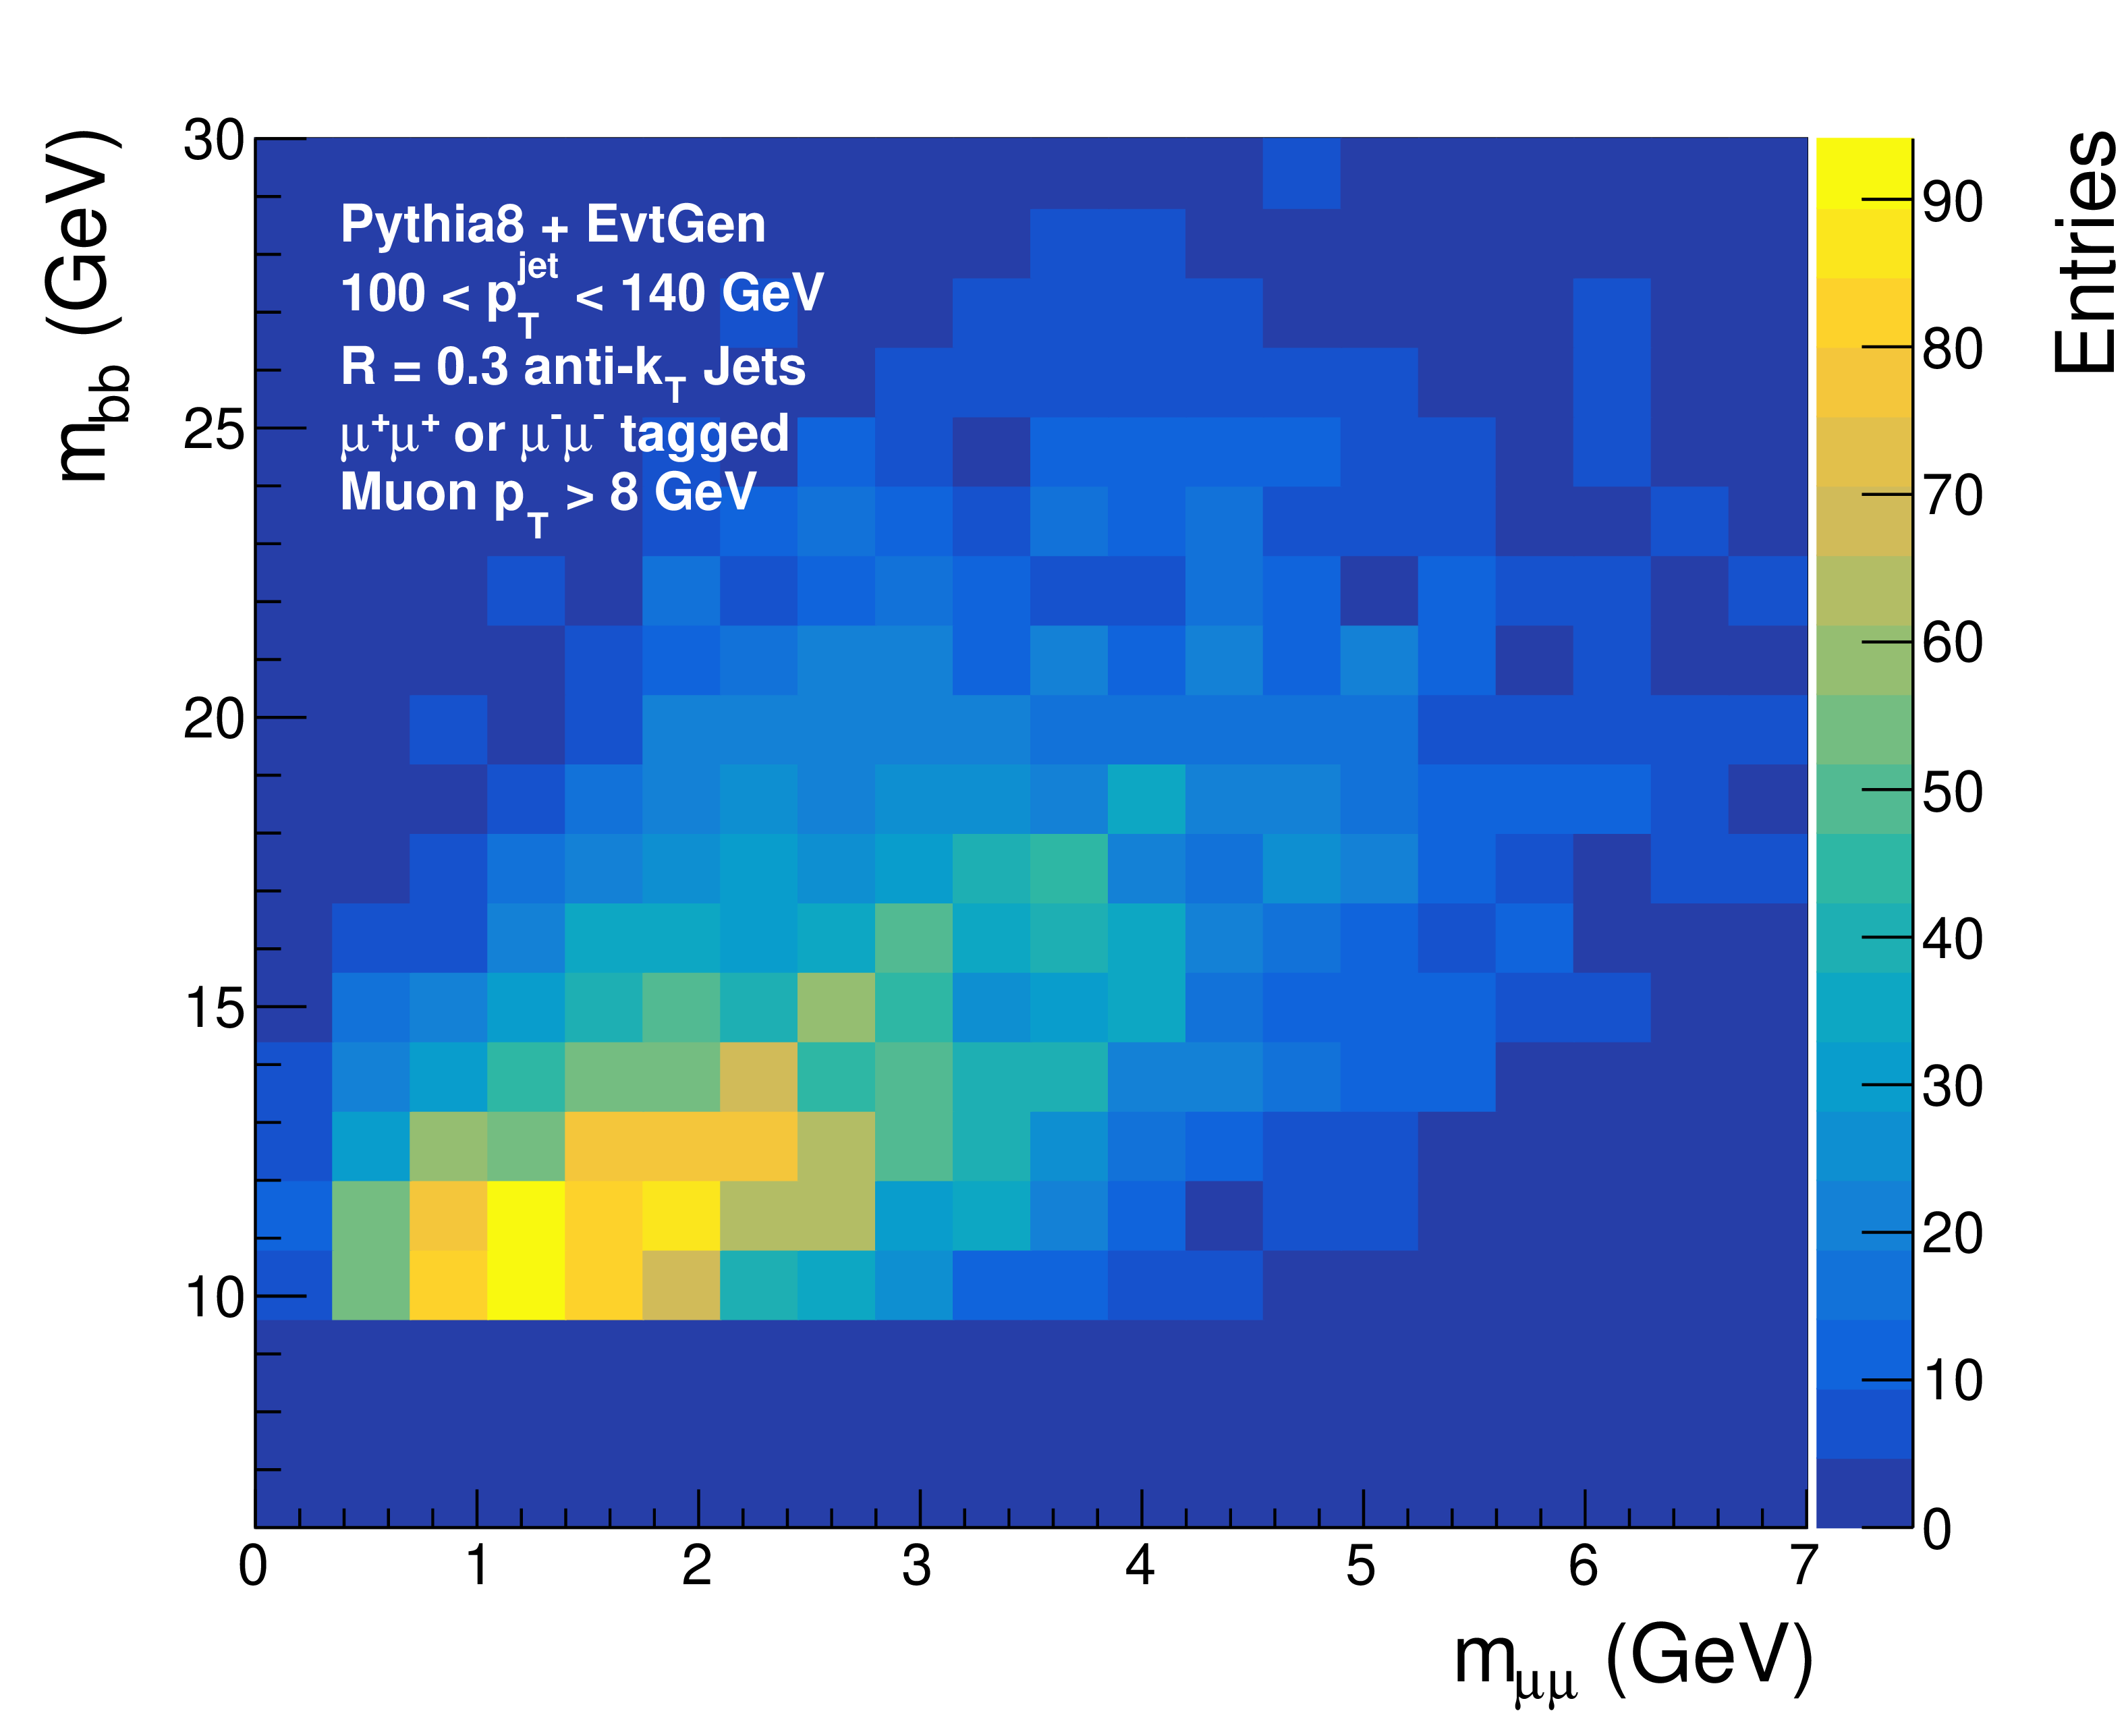
Correlations in PYTHIA 8+ EVTGEN simulation between the dimuon invariant mass and the invariant mass of the corresponding generator-level $ \mathrm{b}\overline{\mathrm{b}} $ pair (left), and between the dimuon and $ \mathrm{b}\overline{\mathrm{b}} $ angular separations (right). The invariant-mass correlation is substantially smeared by fragmentation and decay kinematics, whereas the angular separation retains a stronger correlation. |
png pdf |
Figure 16-a:
Correlations in PYTHIA 8+ EVTGEN simulation between the dimuon invariant mass and the invariant mass of the corresponding generator-level $ \mathrm{b}\overline{\mathrm{b}} $ pair (left), and between the dimuon and $ \mathrm{b}\overline{\mathrm{b}} $ angular separations (right). The invariant-mass correlation is substantially smeared by fragmentation and decay kinematics, whereas the angular separation retains a stronger correlation. |
png pdf |
Figure 16-b:
Correlations in PYTHIA 8+ EVTGEN simulation between the dimuon invariant mass and the invariant mass of the corresponding generator-level $ \mathrm{b}\overline{\mathrm{b}} $ pair (left), and between the dimuon and $ \mathrm{b}\overline{\mathrm{b}} $ angular separations (right). The invariant-mass correlation is substantially smeared by fragmentation and decay kinematics, whereas the angular separation retains a stronger correlation. |
| Summary |
| Measurements of the normalized dimuon invariant-mass and opening-angle distributions in same-sign dimuon-tagged jets have been presented for proton--proton collisions at $ \sqrt{s}= $ 5.02 TeV, using data corresponding to an integrated luminosity of 306 $ \text{pb}^{-1}$ collected with the CMS detector. The measurement is performed for jets with $ p_{\mathrm{T}}^{\mathrm{jet}} > $ 100 GeV containing two same-sign muons with $ p_{\mathrm{T}} > $ 8 GeV. The same-sign dimuon tagging technique selects a sample strongly enriched in jets containing two b hadrons while retaining sensitivity to very small angular separations. The distributions are described within the experimental uncertainties by predictions from PYTHIA 8, HERWIG 7, and POWHEG matched to the PYTHIA 8 parton shower. These results provide new differential constraints on collinear beauty production in the very small opening-angle region, complementing existing measurements while retaining direct control of the hard scale of the selected topology through the jet transverse-momentum requirement. This study also establishes a proton--proton reference for future studies of possible medium-induced modifications in heavy-ion collisions. |
| References | ||||
| 1 | P. Ilten, N. L. Rodd, J. Thaler, and M. Williams | Disentangling heavy flavor at colliders | PRD 96 (2017) 054019 | 1702.02947 |
| 2 | P. Gras et al. | Systematics of quark/gluon tagging | JHEP 07 (2017) 091 | 1704.03878 |
| 3 | ATLAS Collaboration | Properties of $ g\rightarrow b\bar{b} $ at small opening angles in $ pp $ collisions with the ATLAS detector at $ \sqrt{s}= $ 13 TeV | PRD 99 (2019) 052004 | 1812.09283 |
| 4 | CMS Collaboration | Measurement of the cross section and angular correlations for associated production of a Z boson with $ b $ hadrons in pp collisions at $ \sqrt{s} = $ 7 TeV | JHEP 12 (2013) 039 | CMS-EWK-11-015 1310.1349 |
| 5 | CMS Collaboration | Measurement of $ b\bar{b} $ angular correlations based on secondary vertex reconstruction at $ \sqrt{s}= $ 7 TeV | JHEP 03 (2011) 136 | CMS-BPH-10-010 1102.3194 |
| 6 | ATLAS Collaboration | Measurement of $ b $-hadron pair production with the ATLAS detector in proton-proton collisions at $ \sqrt{s}= $ 8 TeV | JHEP 11 (2017) 062 | 1705.03374 |
| 7 | Particle Data Group , F. Takahashi et al. | Review of particle physics | Int. J. Mod. Phys. A 41 (2026) 2630011 | |
| 8 | M. Attems et al. | The medium-modified $ g\to c\overline{c} $ splitting function in the BDMPS-Z formalism | JHEP 01 (2023) 080 | 2203.11241 |
| 9 | M. Attems et al. | Medium-enhanced $ c\bar{c} $ radiation | PRL 132 (2024) 212301 | 2209.13600 |
| 10 | CMS Collaboration | The CMS experiment at the CERN LHC | JINST 3 (2008) S08004 | |
| 11 | CMS Collaboration | Tracking performances for charged pions with Run-2 legacy data | CMS Detector Performance Note CMS-DP-2022-012, 2022 CDS |
|
| 12 | CMS Collaboration | The CMS trigger system | JINST 12 (2017) P01020 | CMS-TRG-12-001 1609.02366 |
| 13 | C. Collaboration | Luminosity measurement in proton-proton collisions at 5.02 TeV in 2017 at CMS | CMS Physics Analysis Summary, CERN, 2021 CMS-PAS-LUM-19-001 |
CMS-PAS-LUM-19-001 |
| 14 | C. Bierlich et al. | A comprehensive guide to the physics and usage of PYTHIA 8.3 | SciPost Phys. Codeb. 2022 (2022) 8 | 2203.11601 |
| 15 | D. J. Lange | The EVTGEN particle decay simulation package | NIM A 462 (2001) 152 | |
| 16 | J. Bellm et al. | HERWIG 7.0/HERWIG++ 3.0 release note | EPJC 76 (2016) 196 | 1512.01178 |
| 17 | CMS Collaboration | Performance of missing transverse momentum reconstruction in proton-proton collisions at $ \sqrt{s} = $ 13 TeV using the CMS detector | JINST 14 (2019) P07004 | CMS-JME-17-001 1903.06078 |
| 18 | CMS Collaboration | Particle-flow reconstruction and global event description with the CMS detector | JINST 12 (2017) P10003 | CMS-PRF-14-001 1706.04965 |
| 19 | M. Cacciari, G. P. Salam, and G. Soyez | FastJet User Manual | EPJC 72 (2012) 1896 | 1111.6097 |
| 20 | CMS Collaboration | Performance of CMS muon reconstruction from proton-proton to heavy ion collisions | JINST 19 (2024) P09012 | CMS-MUO-21-001 2404.17377 |
| 21 | L. Brenner et al. | Comparison of unfolding methods using roofitunfold | International Journal of Modern Physics A 35 (2020) 2050145 | |
| 22 | S. Alioli, P. Nason, C. Oleari, and E. Re | A general framework for implementing NLO calculations in shower Monte Carlo programs: the POWHEG BOX | JHEP 06 (2010) 043 | 1002.2581 |
| 23 | J. R. Christiansen and P. Z. Skands | String Formation Beyond Leading Colour | JHEP 08 (2015) 003 | 1505.01681 |
|
|
Compact Muon Solenoid LHC, CERN |

|

|

|

|

|

|