

Compact Muon Solenoid
LHC, CERN
| CMS-PAS-HIN-22-003 | ||
| Study of $ \chi_\mathrm{c} $ production in pPb collisions at $ \sqrt{\smash[b]{s_{\mathrm{NN}}}} = $ 8.16 TeV with the CMS experiment | ||
| CMS Collaboration | ||
| 28 April 2025 | ||
| Abstract: The production of prompt P-wave charmonium states $ \chi_\mathrm{c1} $(1P) and $ \chi_\mathrm{c2} $(2P) is studied in proton-lead (pPb) collisions at a center-of-mass energy per nucleon pair of $ \sqrt{\smash[b]{s_{\mathrm{NN}}}}= $ 8.16 TeV. The analysis is based on data with an integrated luminosity of 175 nb$ ^{-1} $ that were collected by CMS at the LHC. The $ \chi_\mathrm{c} $ states are measured via their decay $ \chi_\mathrm{c} \rightarrow \mathrm{J}\!/\!\psi \gamma $. The $ \mathrm{J}\!/\!\psi $ is then reconstructed through its decay to a muon pair, while the photon is reconstructed through its conversion to an electron-positron pair. The ratios of $ [\sigma (\chi_\mathrm{c1}) \times \mathrm{B}(\chi_\mathrm{c1} \rightarrow \mathrm{J}\!/\!\psi\gamma) + \sigma(\chi_\mathrm{c2})\times\mathrm{B}(\chi_\mathrm{c2} \rightarrow \mathrm{J}\!/\!\psi\gamma)] / \sigma(\mathrm{J}\!/\!\psi) $ and $ [\sigma (\chi_\mathrm{c2}) \times \mathrm{B}(\chi_\mathrm{c2} \rightarrow \mathrm{J}\!/\!\psi\gamma)] / [\sigma (\chi_\mathrm{c1}) \times \mathrm{B}(\chi_\mathrm{c1} \rightarrow \mathrm{J}\!/\!\psi\gamma)] $ are reported in the rapidity range $ |y(\mathrm{J}\!/\!\psi)| < $ 2.4 and in the transverse momentum range 6.5 $ < p_\mathrm{T}(\mathrm{J}\!/\!\psi) < $ 30 GeV. The $ \chi_\mathrm{c1} $-to-$ \mathrm{J}\!/\!\psi $ ratio is compatible with being constant as a function of rapidity and charged particle multiplicity in the event, and rises as a function of $ p_\mathrm{T} $. The $ \chi_\mathrm{c2} $-to-$ \chi_\mathrm{c1} $ ratio is flat versus charged multiplicity, rapidity, and $ p_\mathrm{T} $. Given that both ratios are consistent with the proton-proton (pp) results at similar energies, the findings rule out a strong additional suppression of the $ \chi_\mathrm{c} $ states relative to the $ \mathrm{J}\!/\!\psi $ states in pPb collisions. | ||
| Links: CDS record (PDF) ; CADI line (restricted) ; | ||
| Figures | |
png pdf |
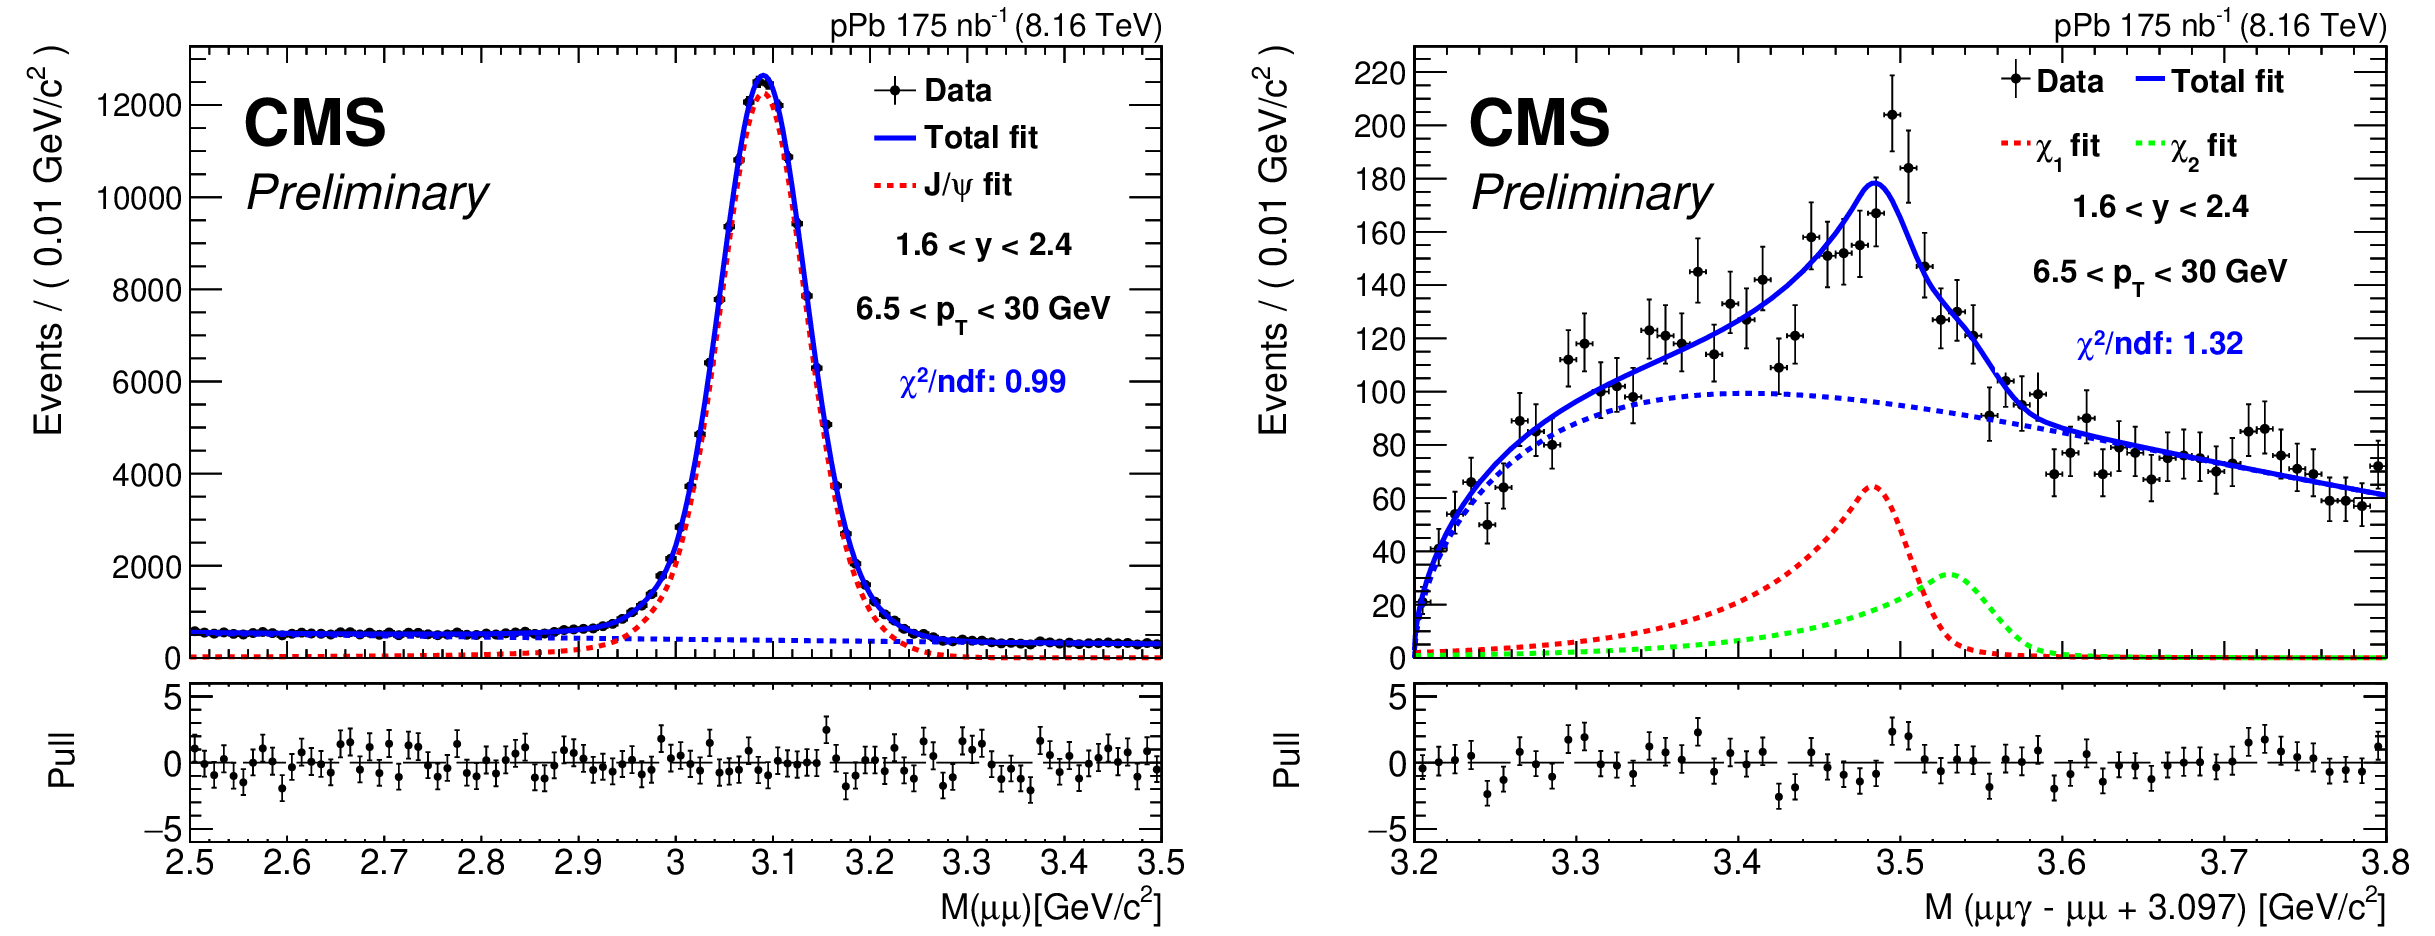
Figure 1:
Example of fits for $ \mathrm{J}/\psi $ (left) and $ \chi_\mathrm{c} $ (right) for the foward rapidity bin (1.6 $ < y_{\mathrm{lab, p}}(\mathrm{J}/\psi) < $ 2.4), integrated over $ p_{\mathrm{T}} $( $ \mathrm{J}/\psi $) and $ N_{\mathrm{tracks}} $. The overall fit is shown in blue; the dashed blue line is the background. On the right panel, the individual peak DCB functions are shown in red for $ \chi_\mathrm{c1} $ and green for $ \chi_\mathrm{c2} $. |
png pdf |
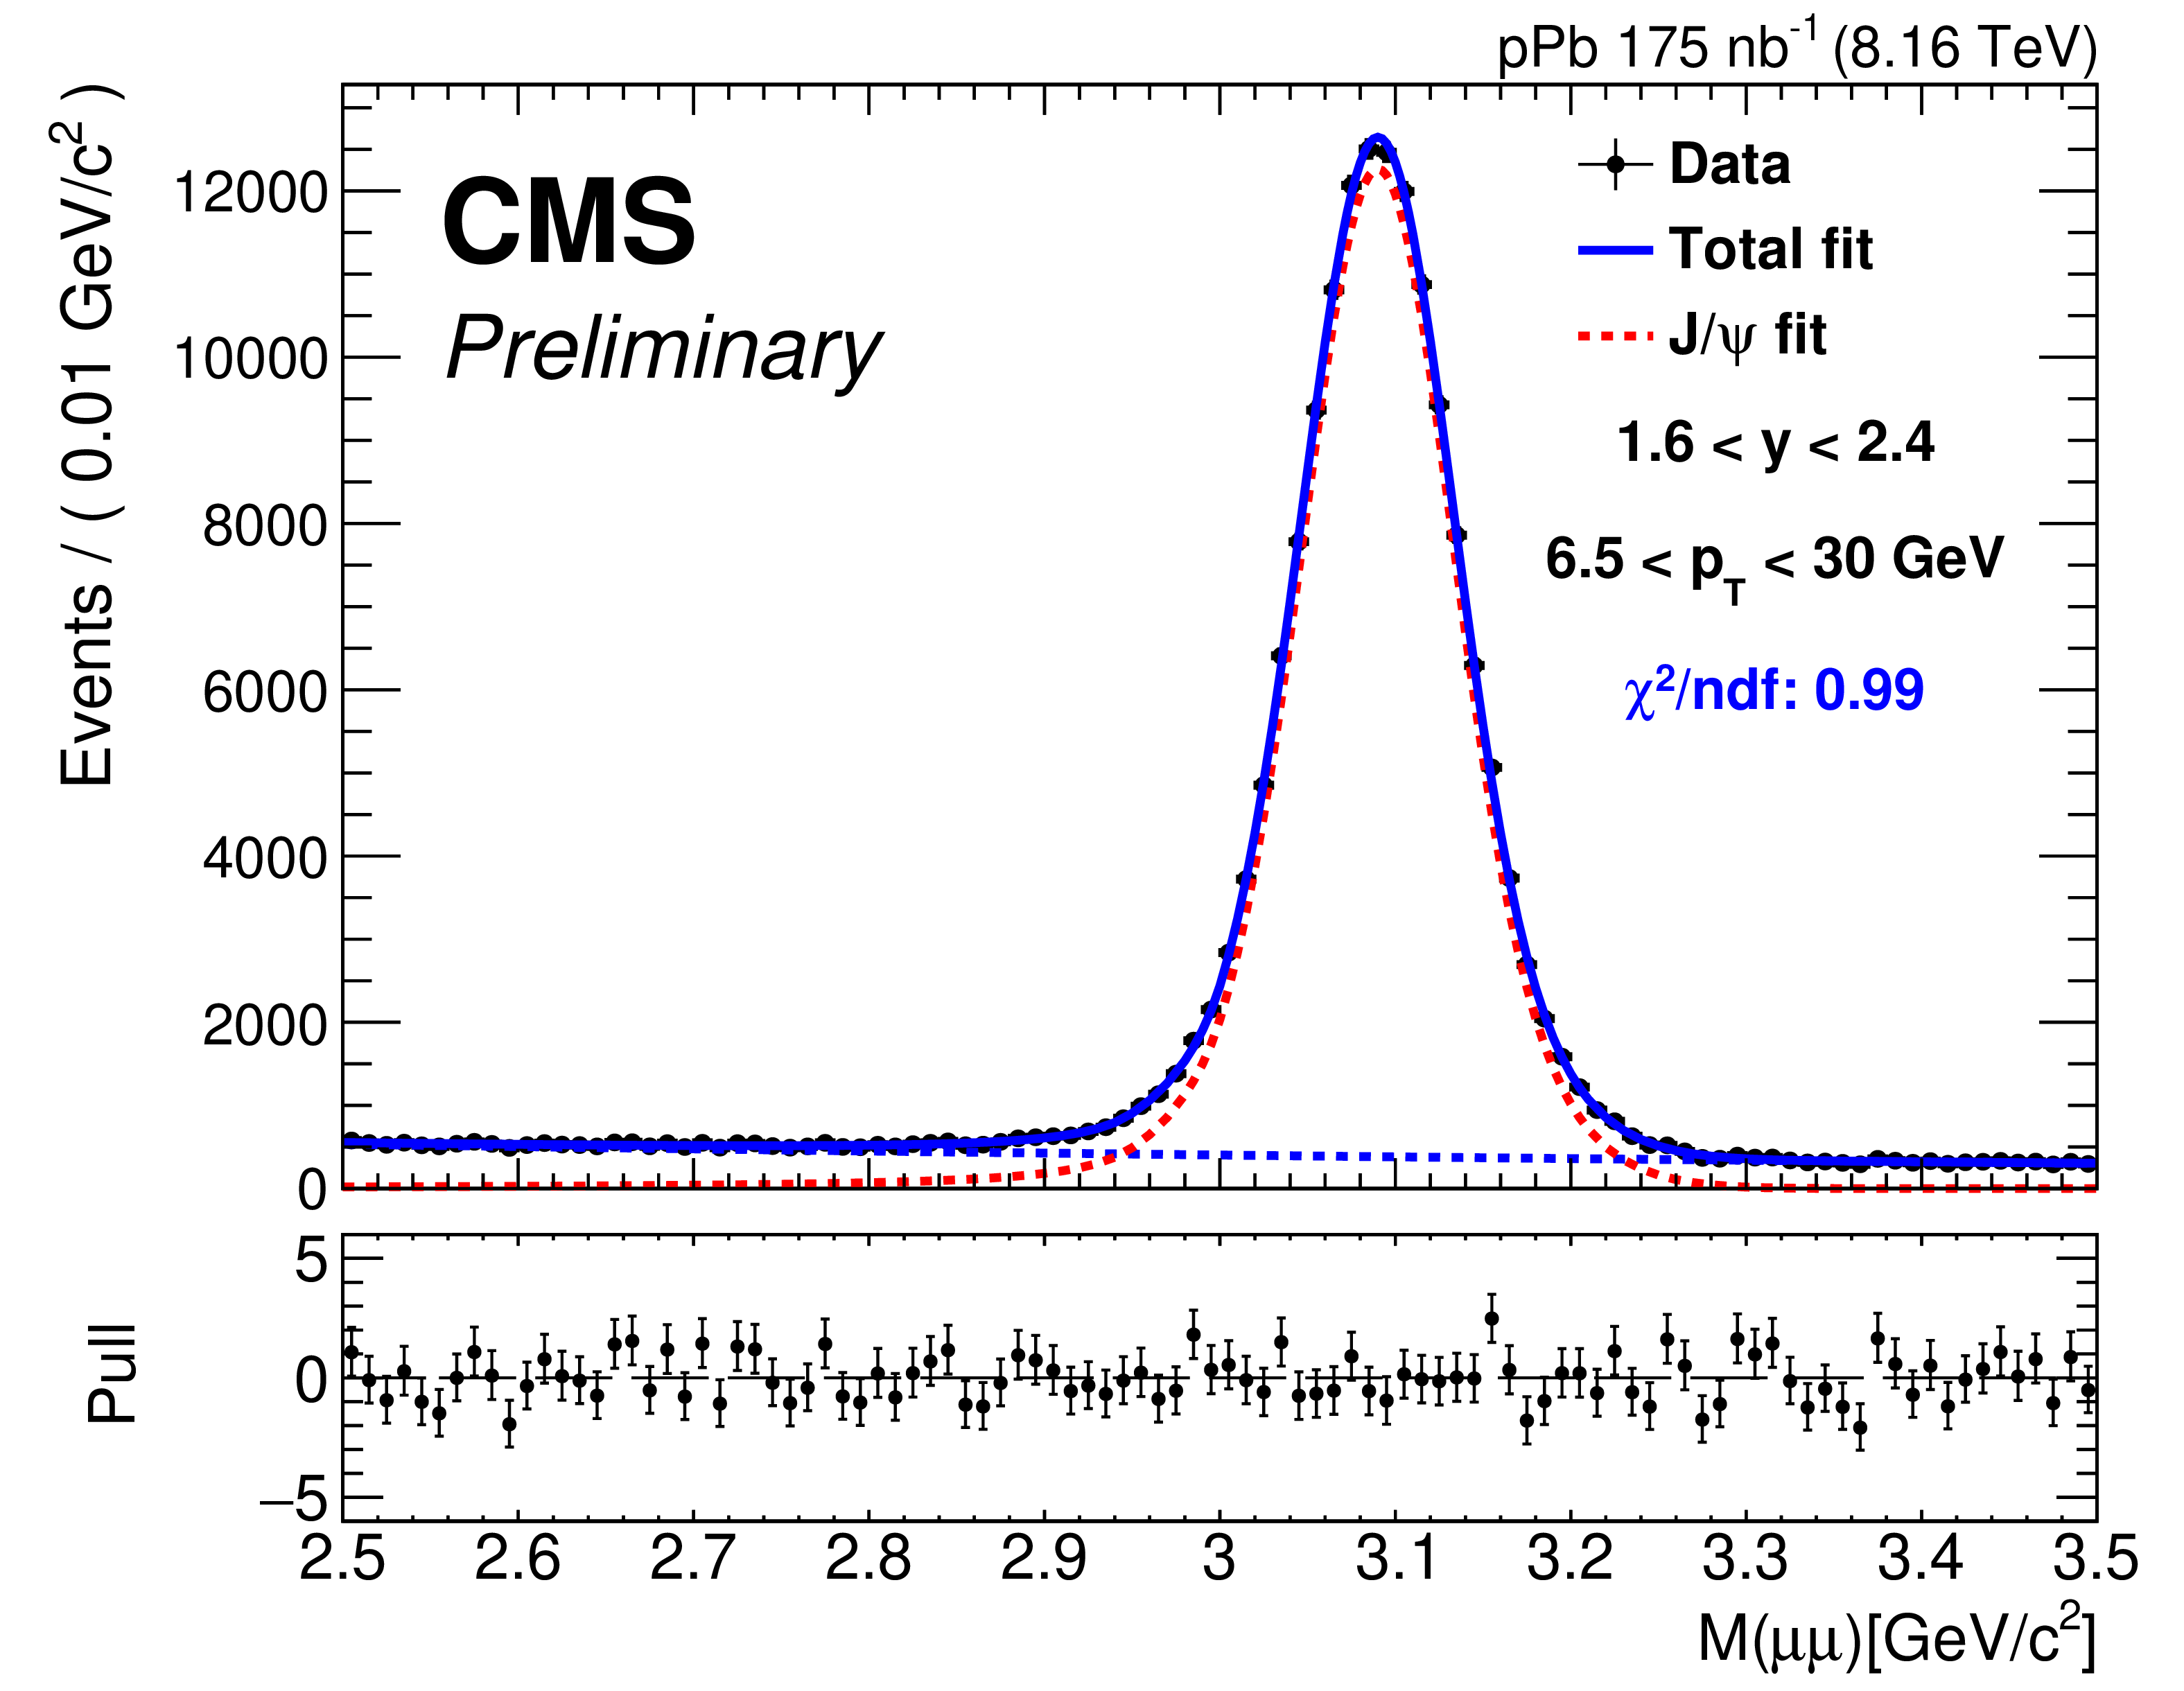
Figure 1-a:
Example of fits for $ \mathrm{J}/\psi $ (left) and $ \chi_\mathrm{c} $ (right) for the foward rapidity bin (1.6 $ < y_{\mathrm{lab, p}}(\mathrm{J}/\psi) < $ 2.4), integrated over $ p_{\mathrm{T}} $( $ \mathrm{J}/\psi $) and $ N_{\mathrm{tracks}} $. The overall fit is shown in blue; the dashed blue line is the background. On the right panel, the individual peak DCB functions are shown in red for $ \chi_\mathrm{c1} $ and green for $ \chi_\mathrm{c2} $. |
png pdf |
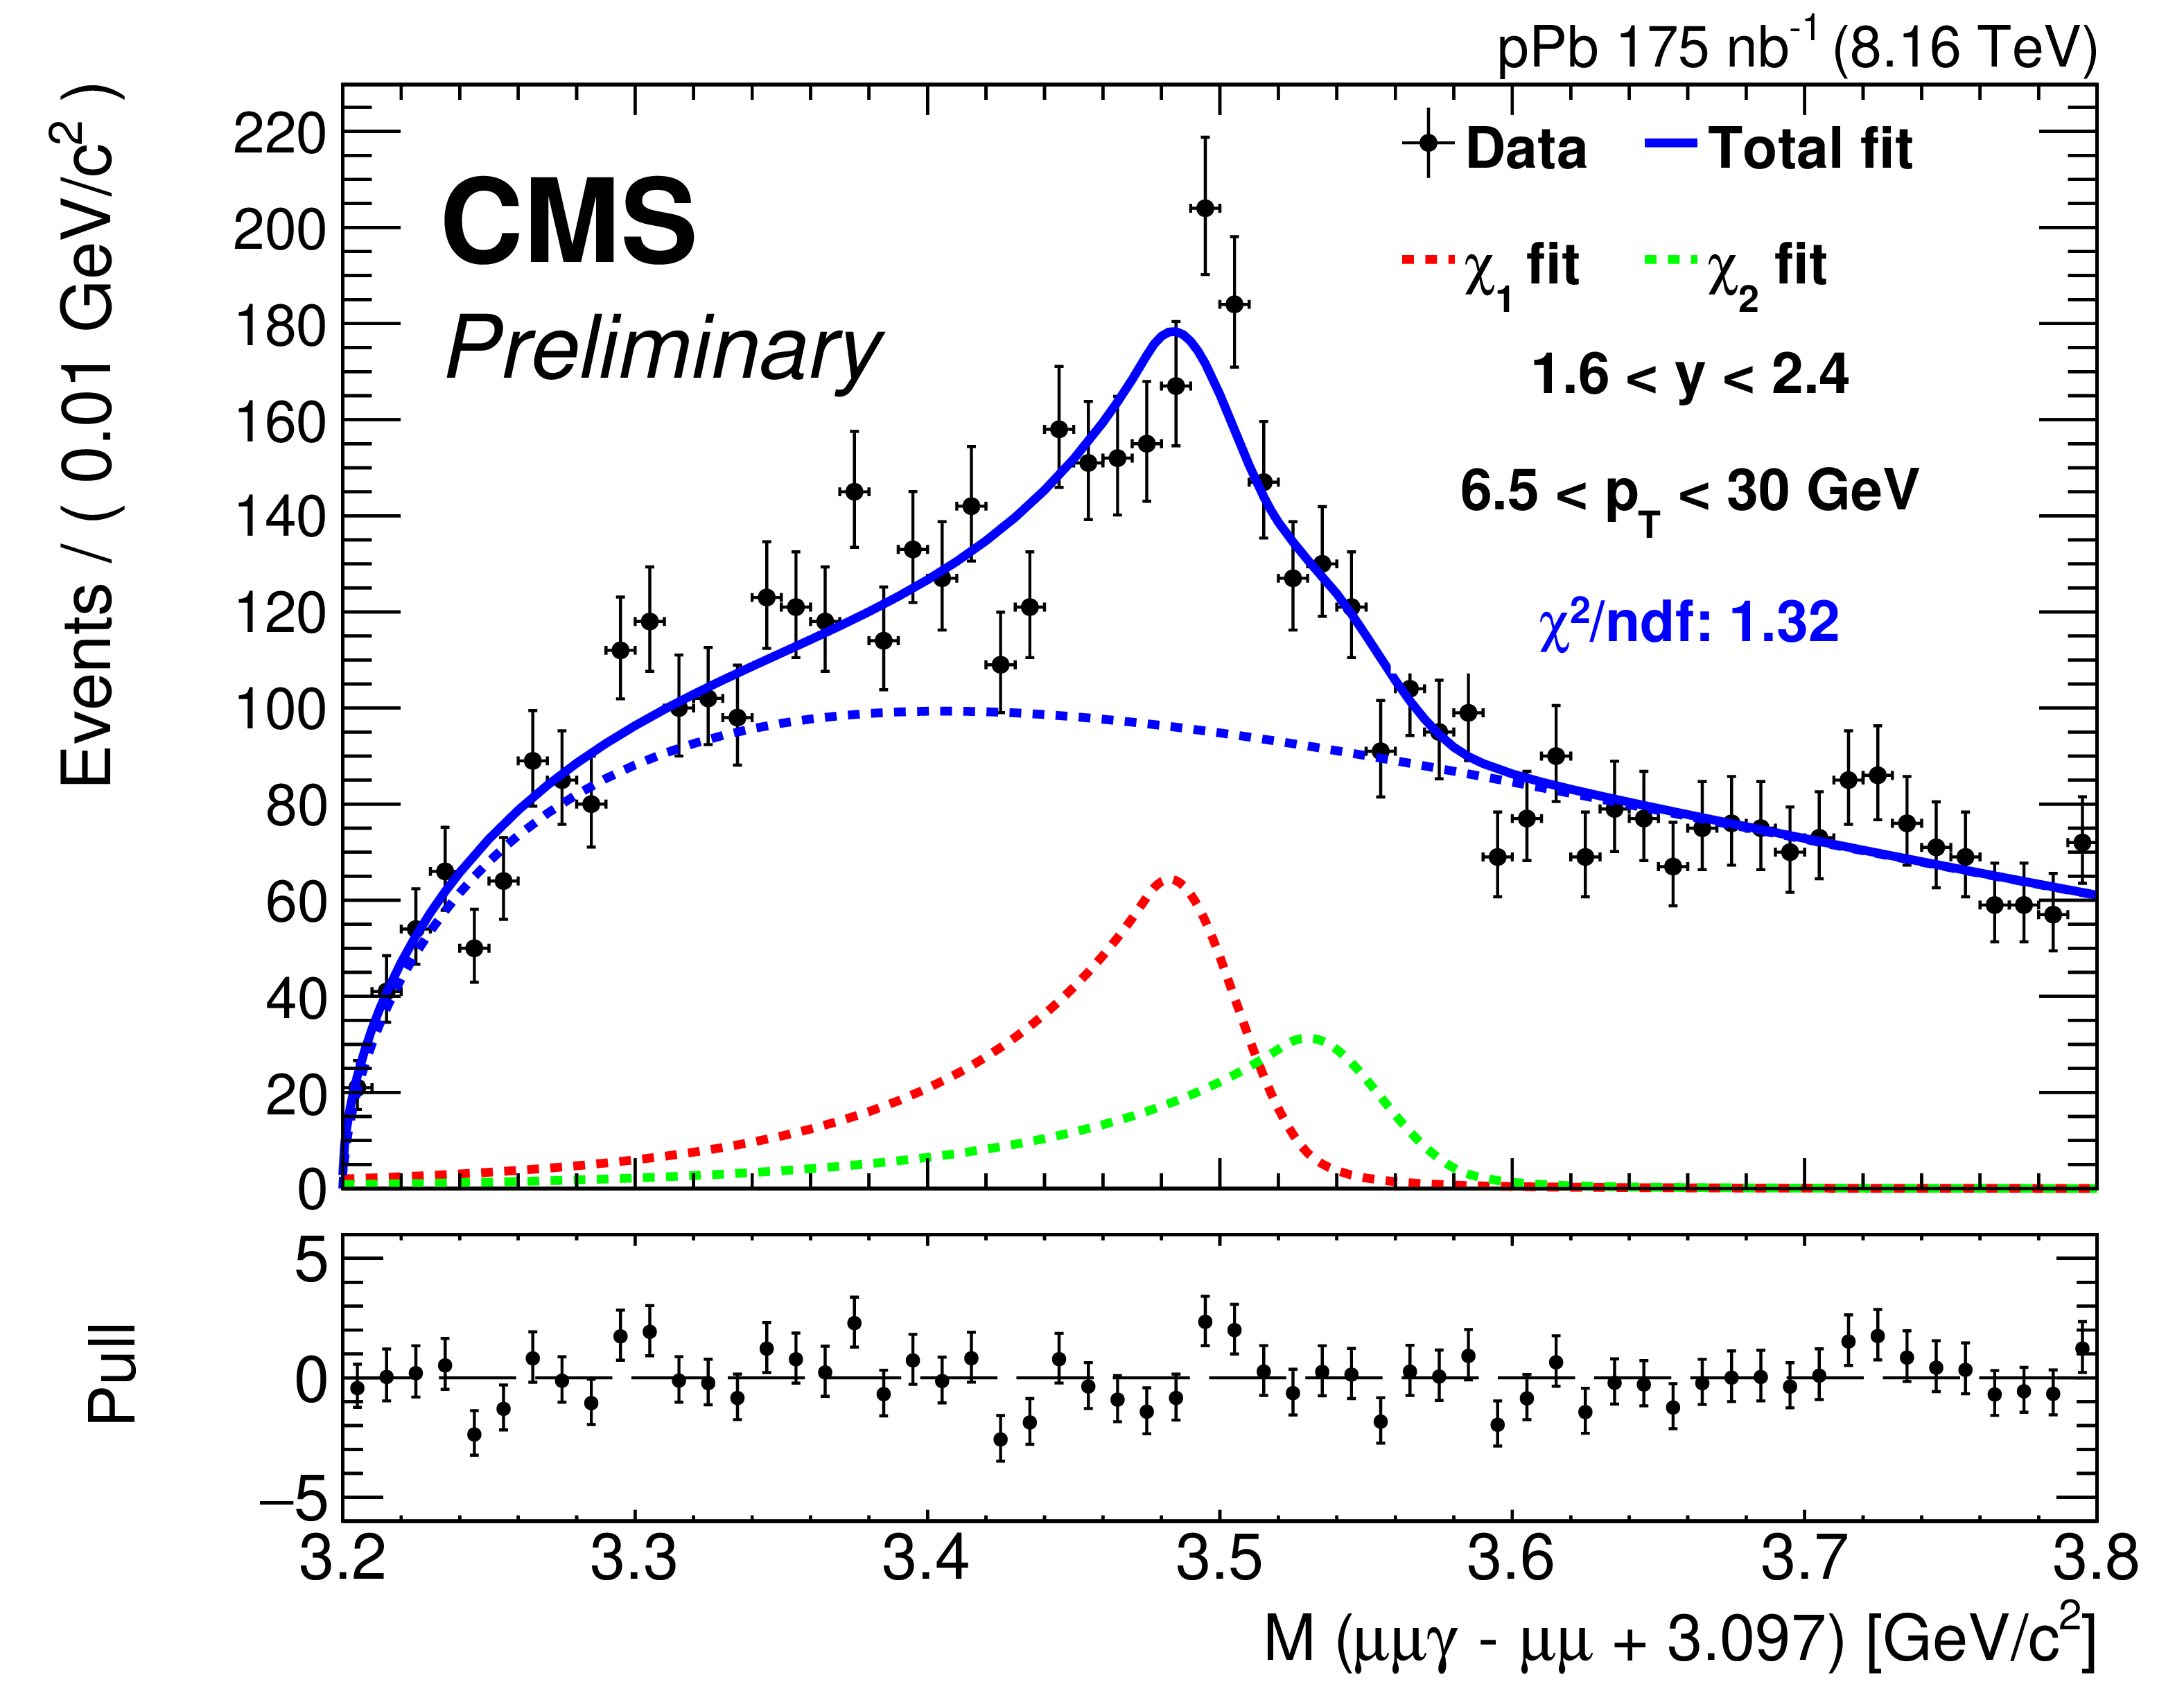
Figure 1-b:
Example of fits for $ \mathrm{J}/\psi $ (left) and $ \chi_\mathrm{c} $ (right) for the foward rapidity bin (1.6 $ < y_{\mathrm{lab, p}}(\mathrm{J}/\psi) < $ 2.4), integrated over $ p_{\mathrm{T}} $( $ \mathrm{J}/\psi $) and $ N_{\mathrm{tracks}} $. The overall fit is shown in blue; the dashed blue line is the background. On the right panel, the individual peak DCB functions are shown in red for $ \chi_\mathrm{c1} $ and green for $ \chi_\mathrm{c2} $. |
png pdf |
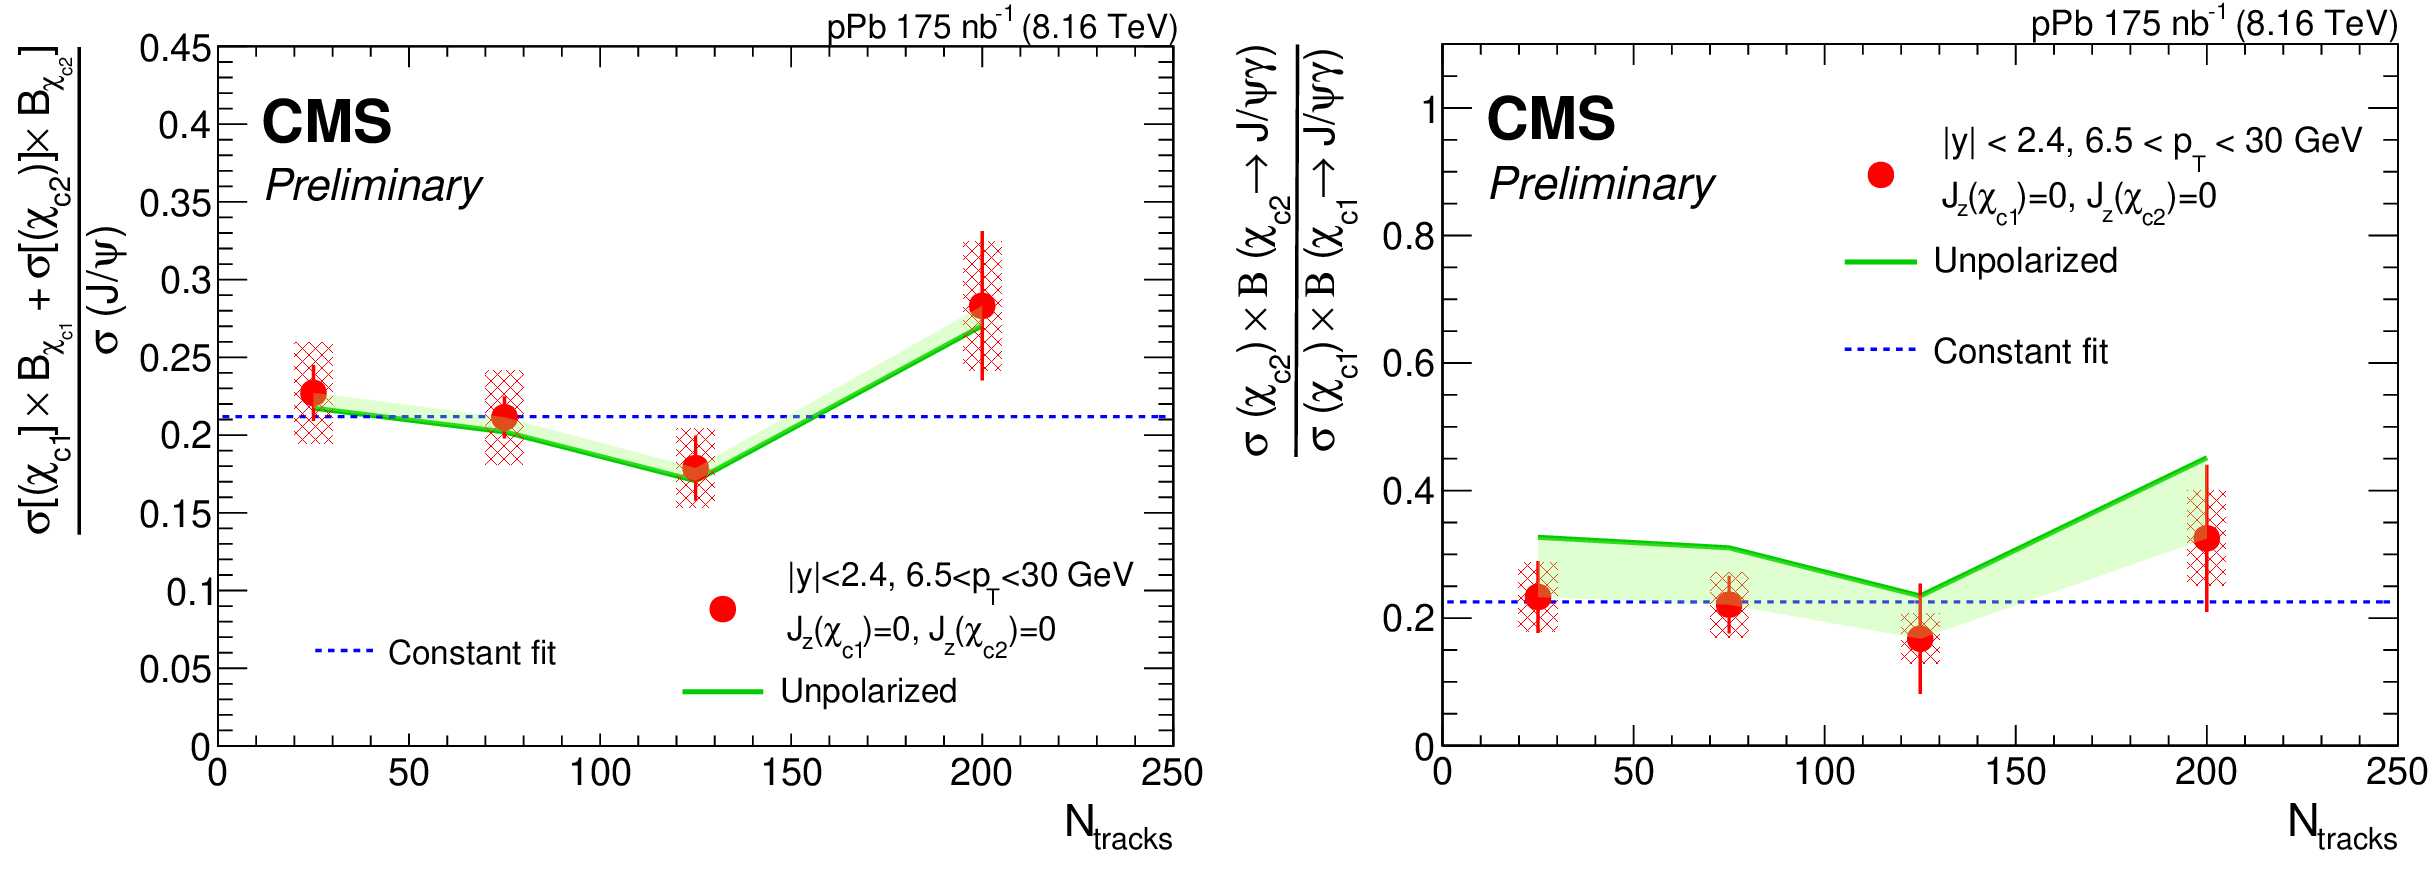
Figure 2:
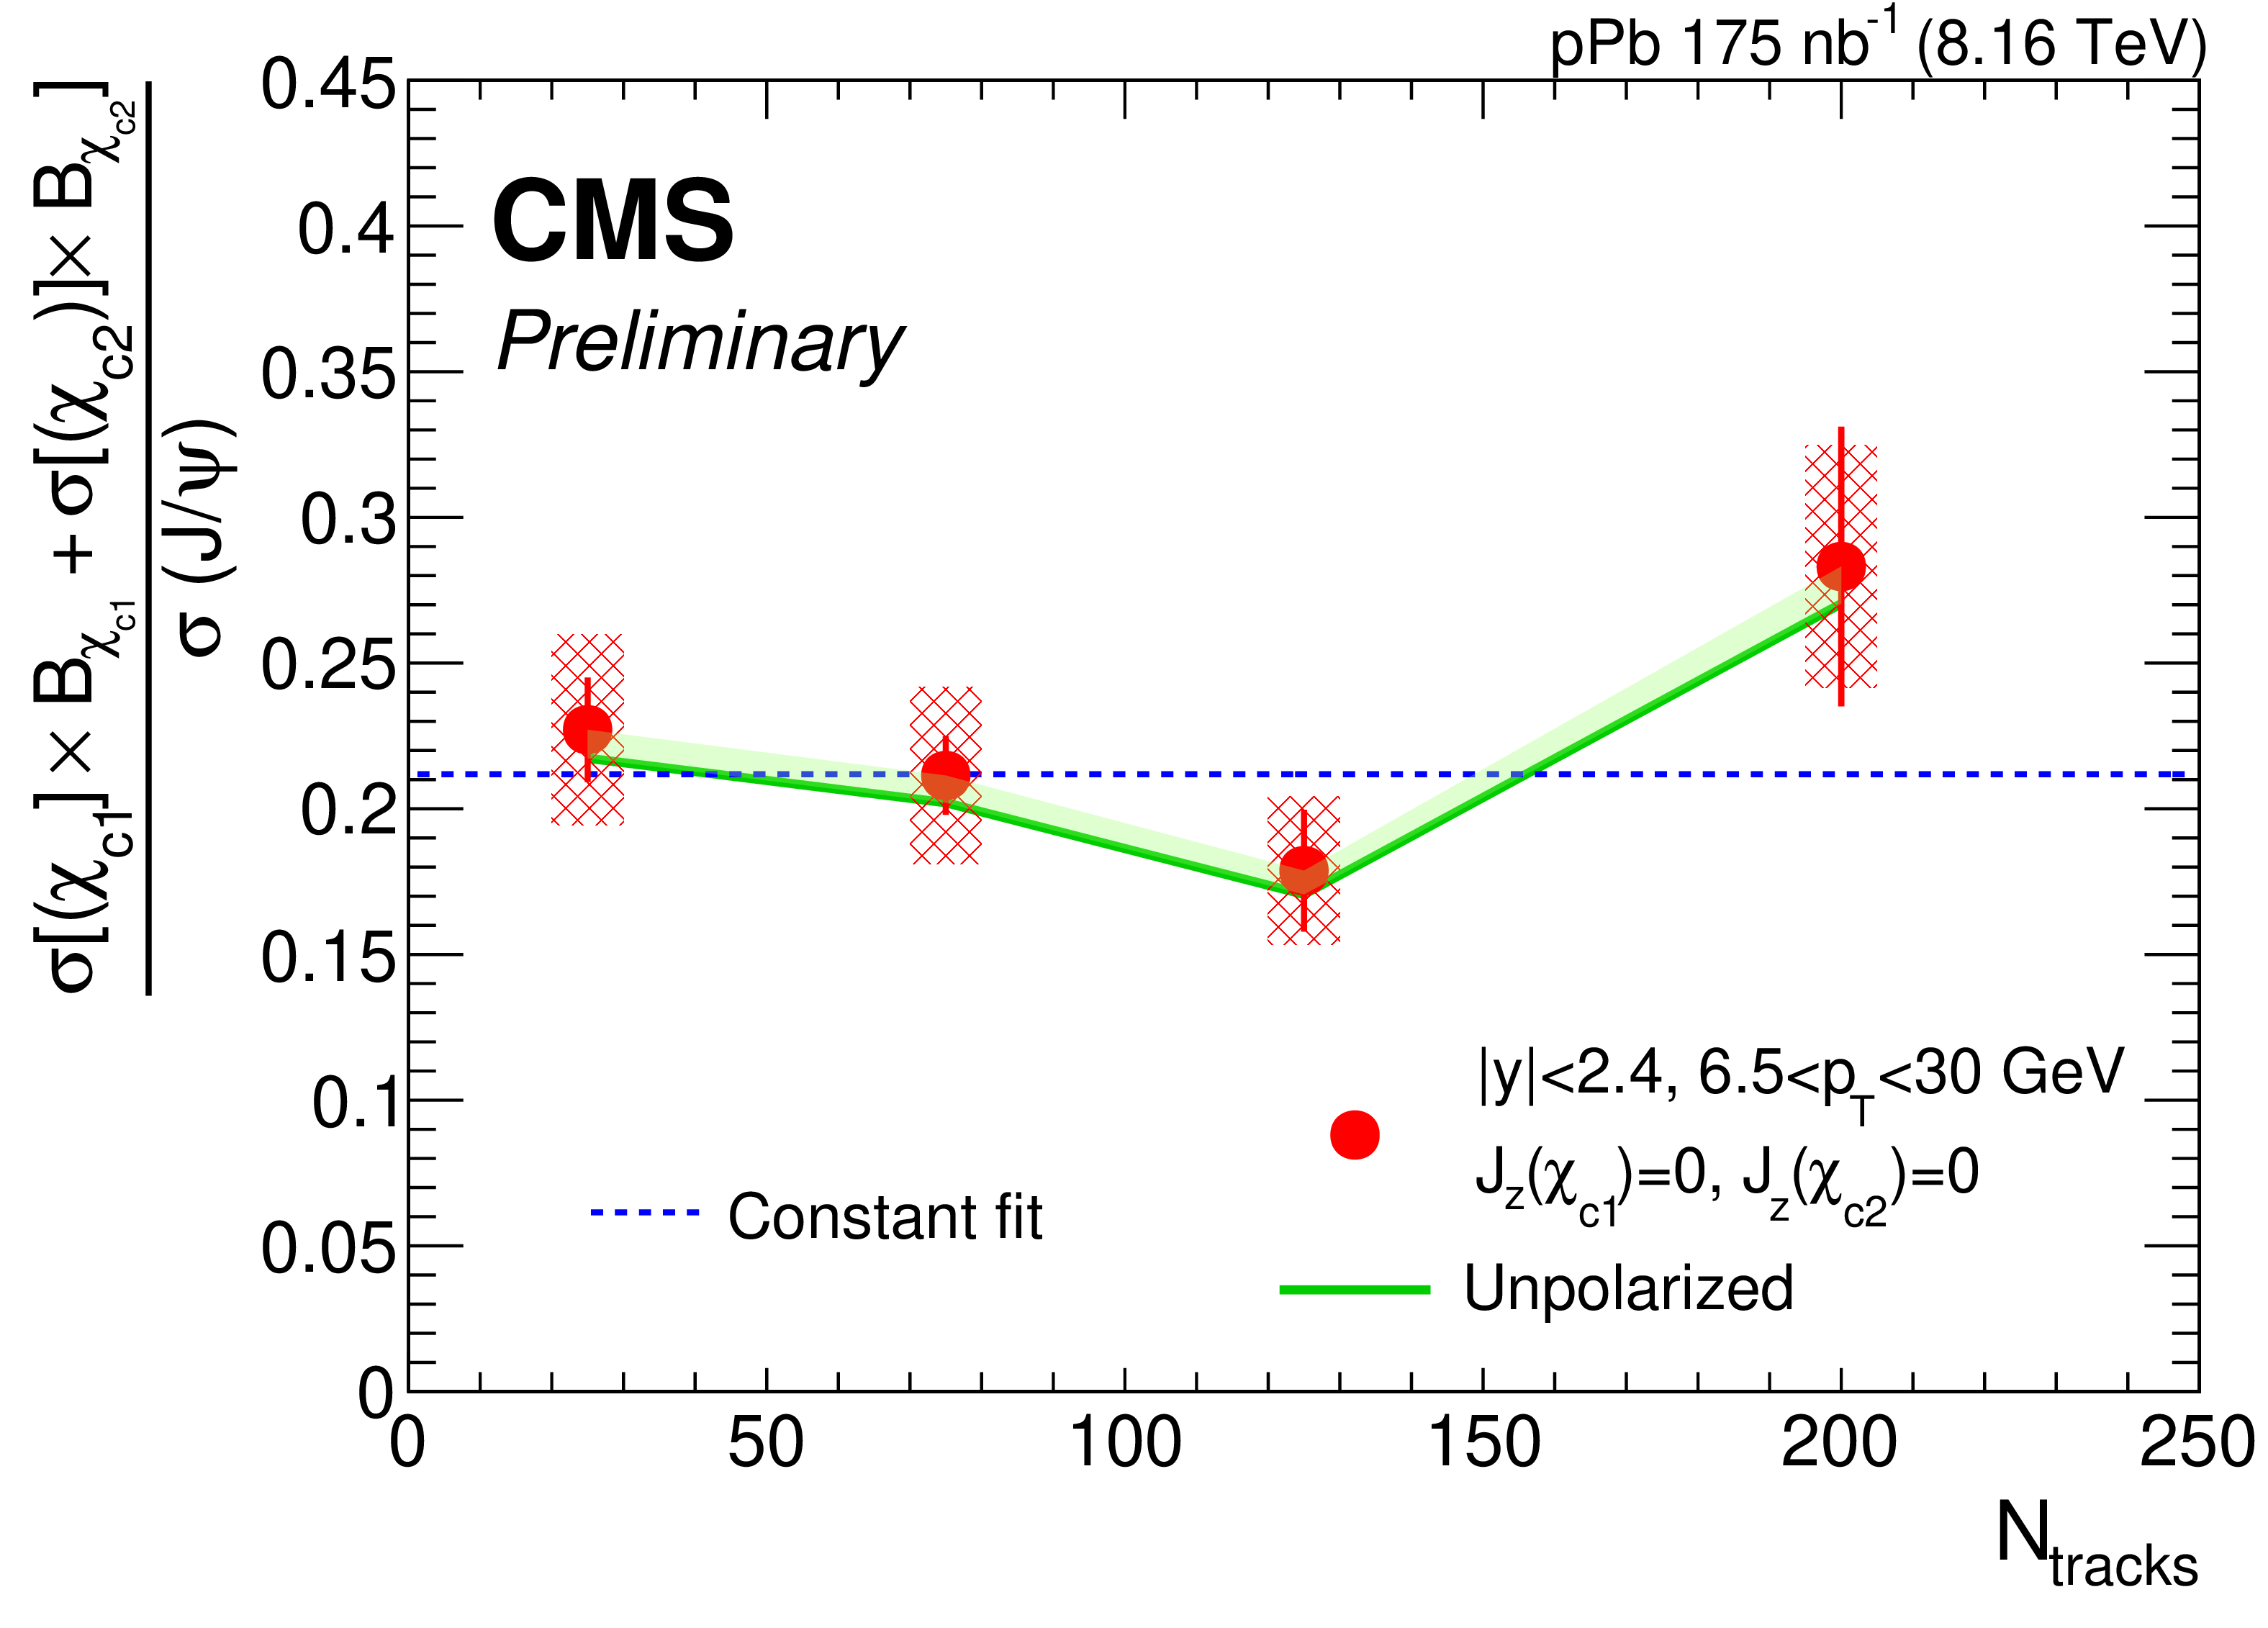
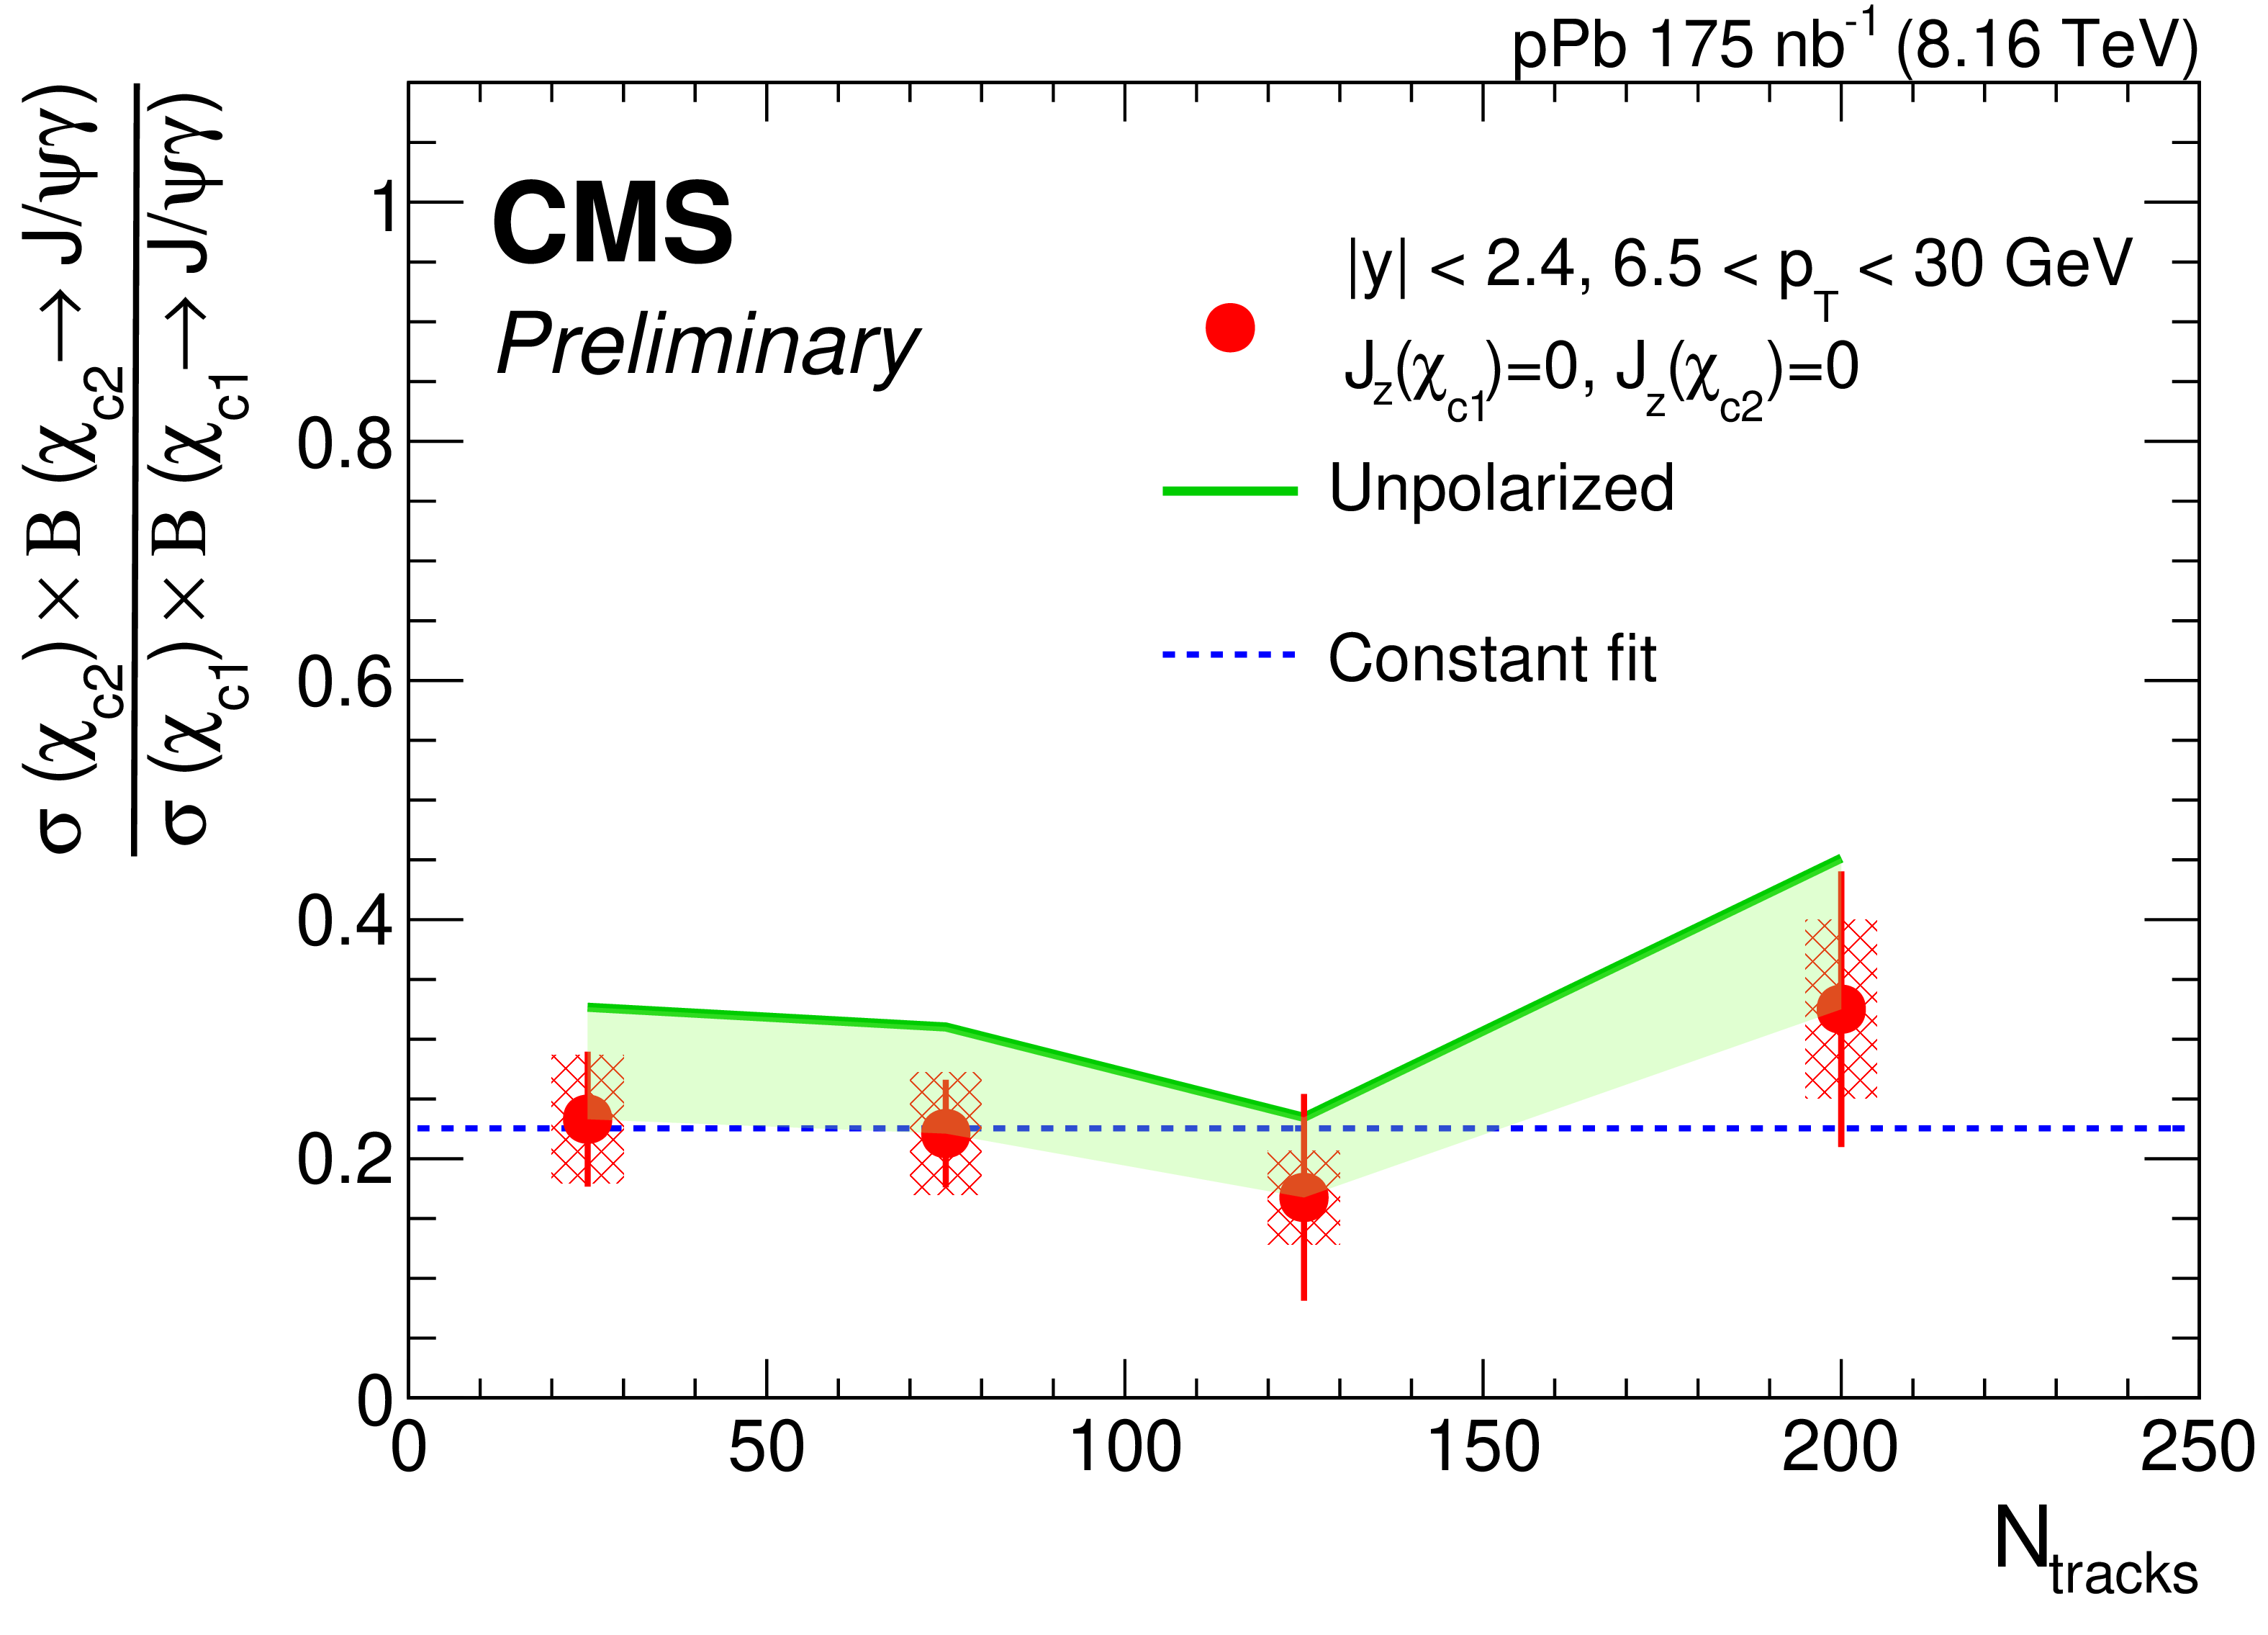
$ \chi_\mathrm{c} $-to-$ \mathrm{J}/\psi $ ratio (left) and $ \chi_\mathrm{c2} $-to-$ \chi_\mathrm{c1} $ ratio (right) as a function of $ N_{\mathrm{tracks}} $. The red points are for the $ J_{z}(\chi_\mathrm{c1})=0, J_{z}(\chi_\mathrm{c2})= $ 0 scenario, while the green line represents the unpolarized case. The light green band indicates the range of variation in the results due to different polarization conditions. The blue dashed line shows a constant fit to all data points. |
png pdf |
Figure 2-a:
$ \chi_\mathrm{c} $-to-$ \mathrm{J}/\psi $ ratio (left) and $ \chi_\mathrm{c2} $-to-$ \chi_\mathrm{c1} $ ratio (right) as a function of $ N_{\mathrm{tracks}} $. The red points are for the $ J_{z}(\chi_\mathrm{c1})=0, J_{z}(\chi_\mathrm{c2})= $ 0 scenario, while the green line represents the unpolarized case. The light green band indicates the range of variation in the results due to different polarization conditions. The blue dashed line shows a constant fit to all data points. |
png pdf |
Figure 2-b:
$ \chi_\mathrm{c} $-to-$ \mathrm{J}/\psi $ ratio (left) and $ \chi_\mathrm{c2} $-to-$ \chi_\mathrm{c1} $ ratio (right) as a function of $ N_{\mathrm{tracks}} $. The red points are for the $ J_{z}(\chi_\mathrm{c1})=0, J_{z}(\chi_\mathrm{c2})= $ 0 scenario, while the green line represents the unpolarized case. The light green band indicates the range of variation in the results due to different polarization conditions. The blue dashed line shows a constant fit to all data points. |
png pdf |
Figure 3:
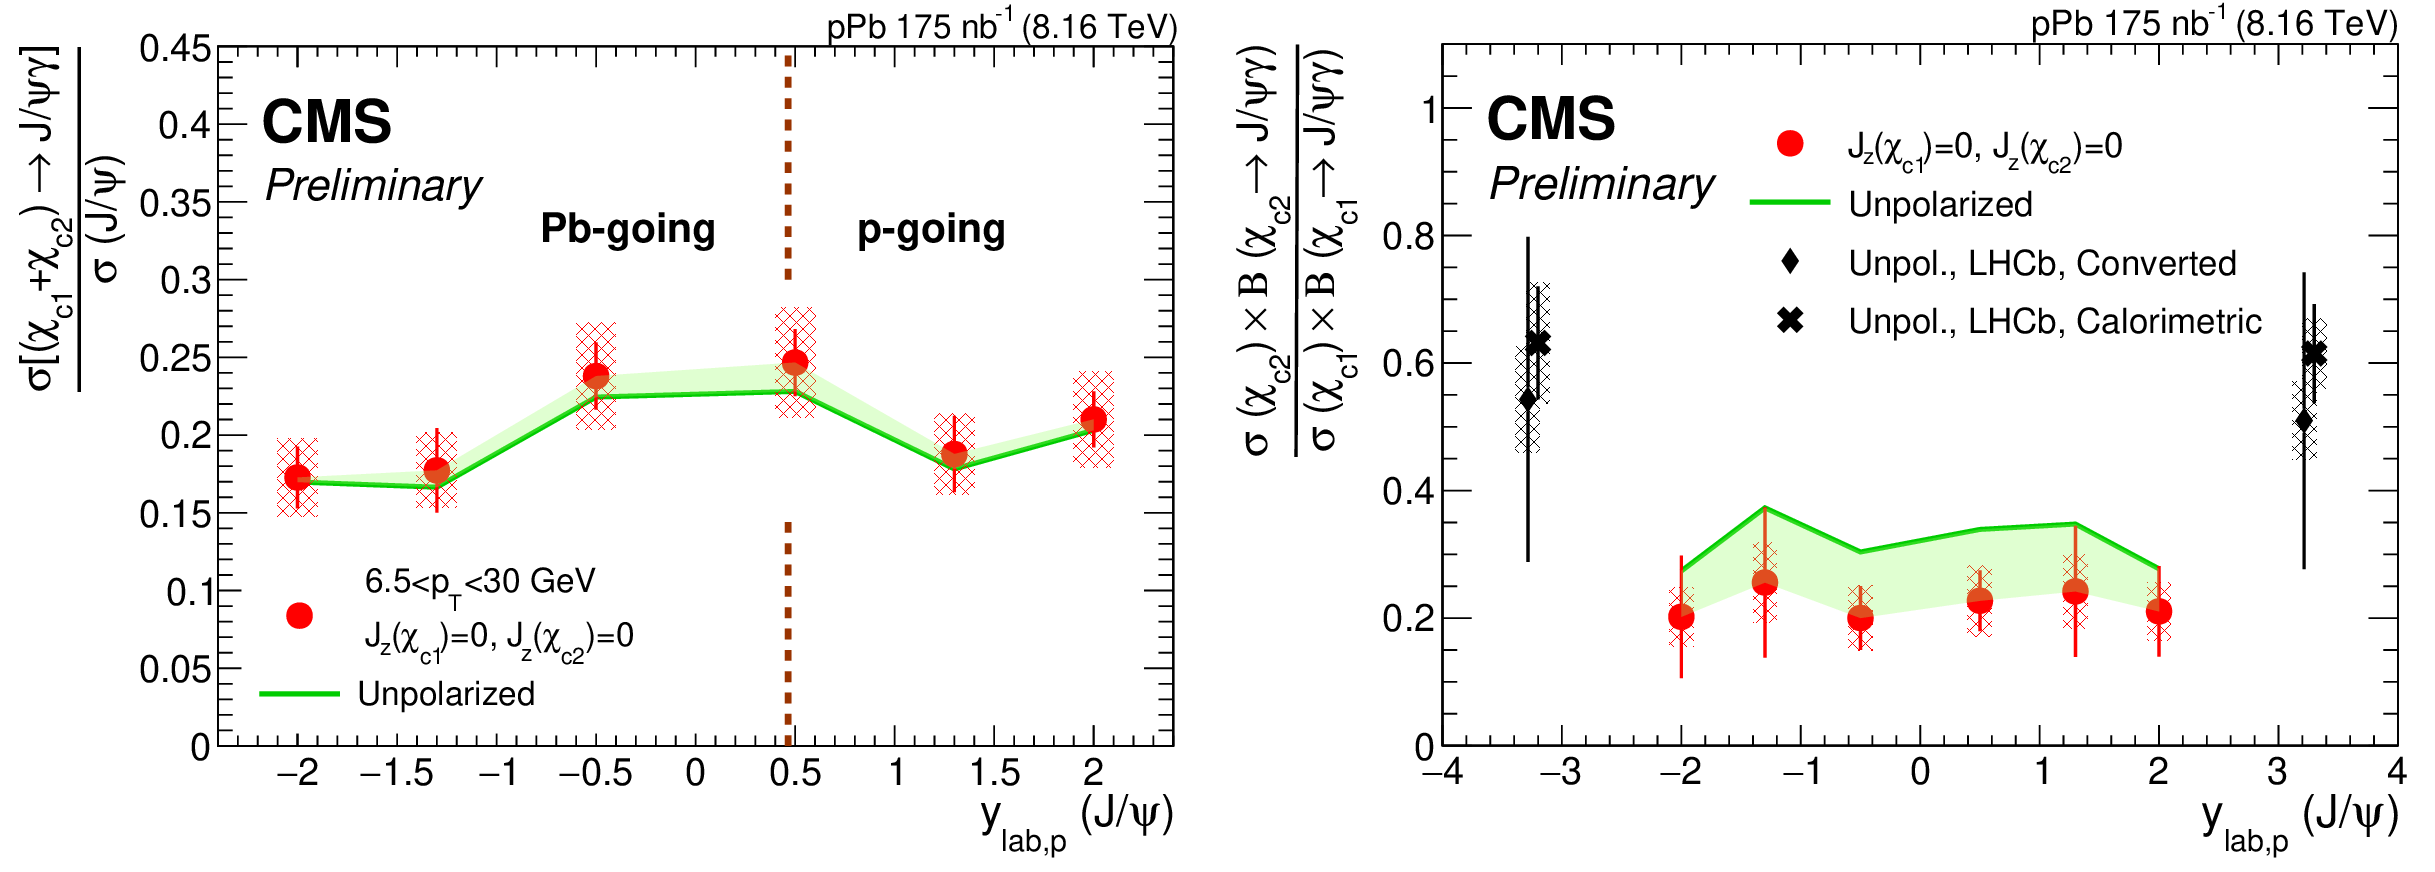
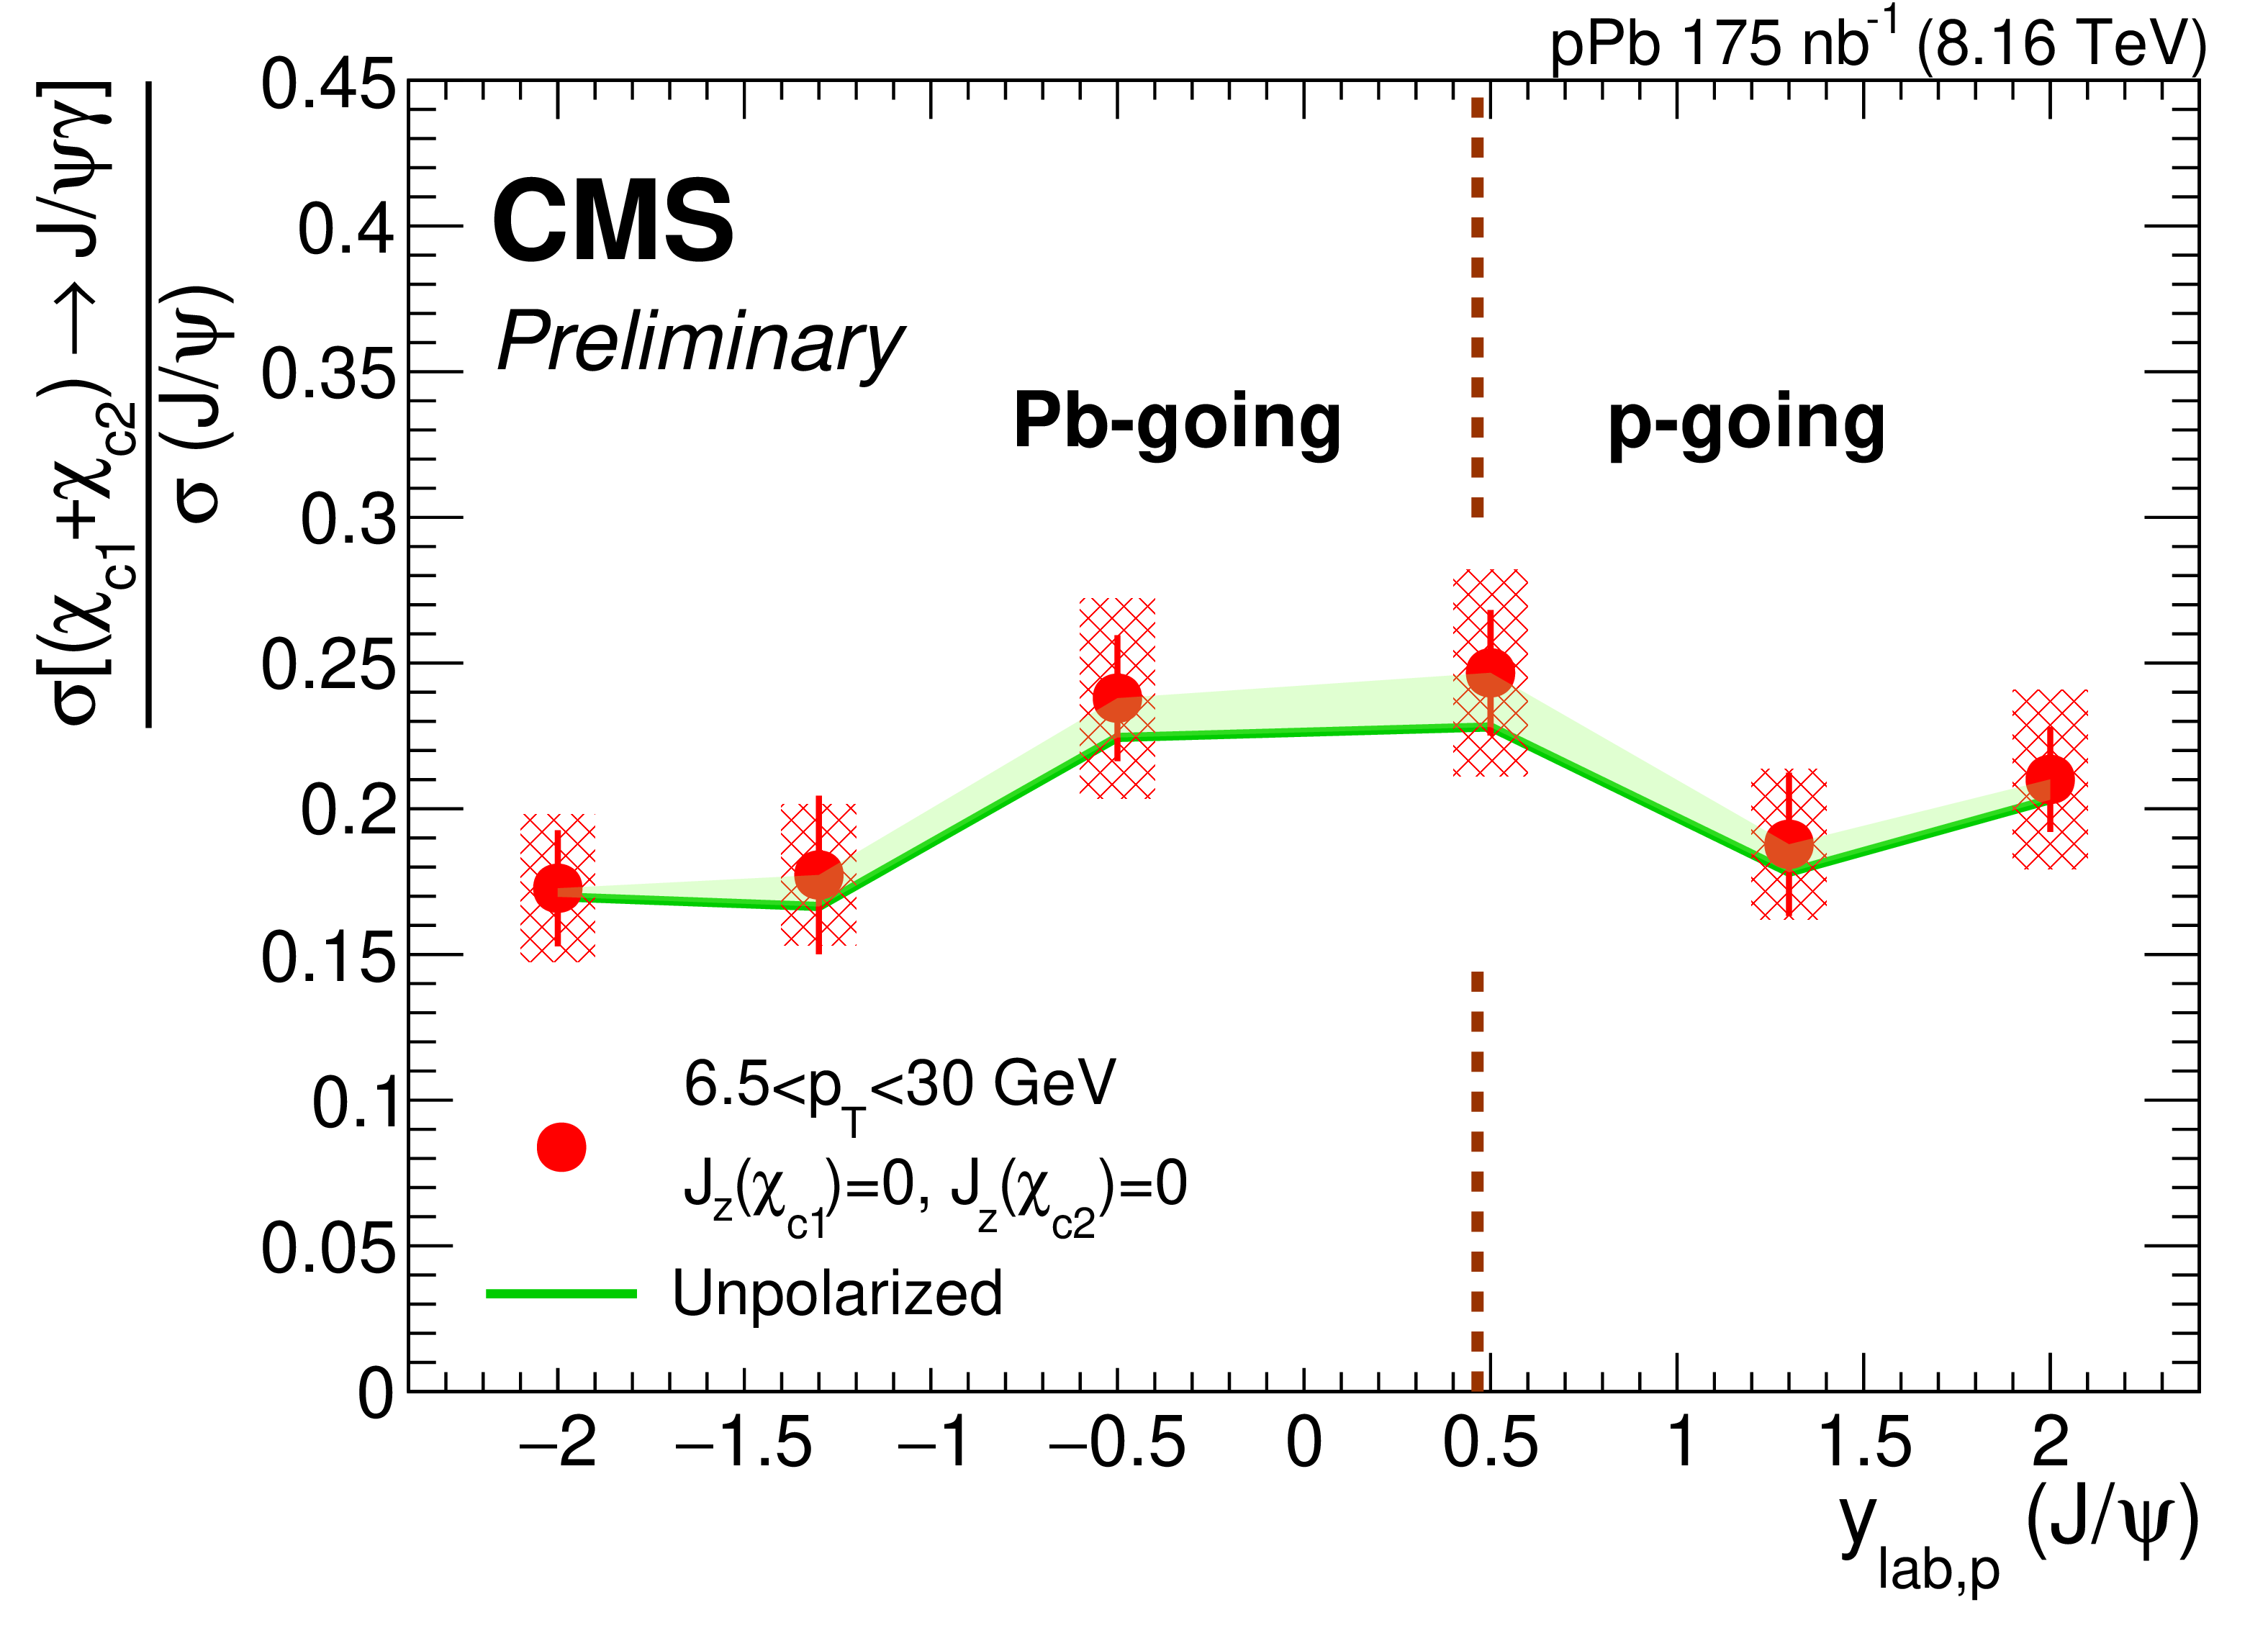
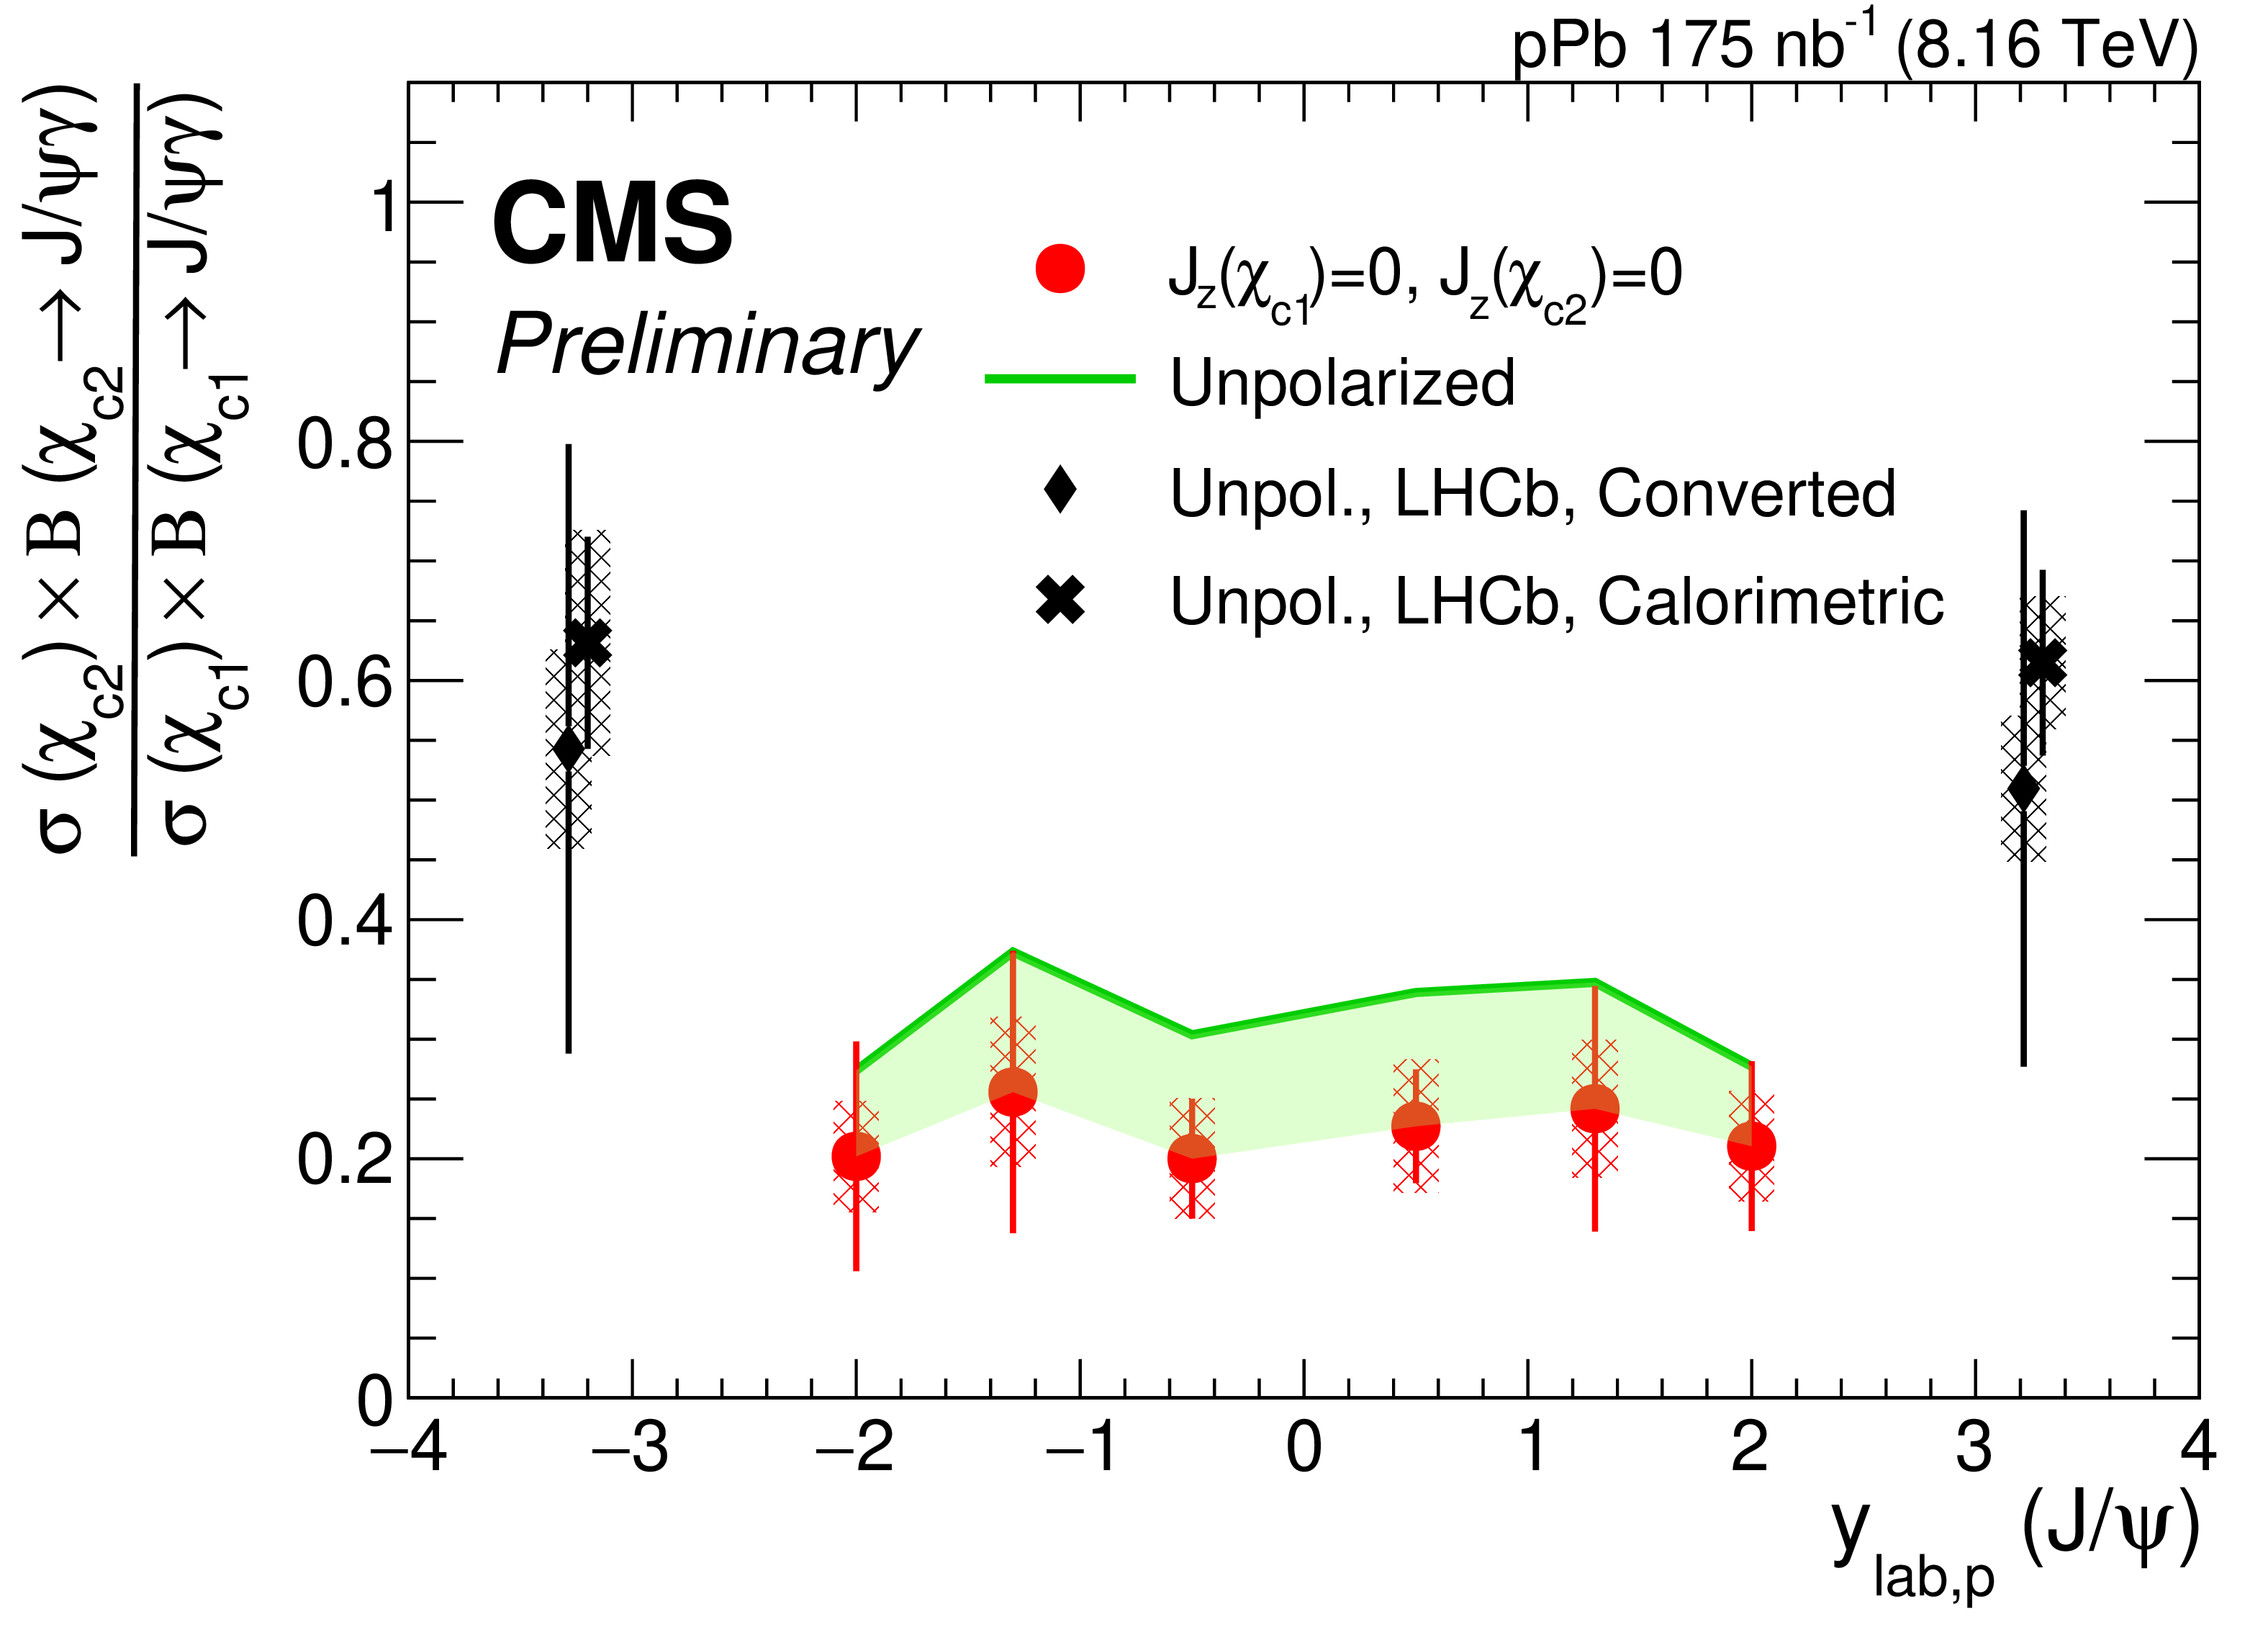
$ \chi_\mathrm{c} $-to-$ \mathrm{J}/\psi $ ratio (left) and $ \chi_\mathrm{c2} $-to-$ \chi_\mathrm{c1} $ ratio (right) as a function of rapidity $ y_{\mathrm{lab, p}} $. The rapidity is defined in the lab frame, with the p-going direction being positive. The center of mass is shown by the brown dashed line at $y_{\mathrm{CM} } = $ 0.465. The points correspond to the $ J_{z}(\chi_\mathrm{c1})=0, J_{z}(\chi_\mathrm{c2})= $ 0 polarization assumption, while the green line represents the data for the unpolarized case. The right plot includes the pPb LHCb measurement [16] (black). |
png pdf |
Figure 3-a:
$ \chi_\mathrm{c} $-to-$ \mathrm{J}/\psi $ ratio (left) and $ \chi_\mathrm{c2} $-to-$ \chi_\mathrm{c1} $ ratio (right) as a function of rapidity $ y_{\mathrm{lab, p}} $. The rapidity is defined in the lab frame, with the p-going direction being positive. The center of mass is shown by the brown dashed line at $y_{\mathrm{CM} } = $ 0.465. The points correspond to the $ J_{z}(\chi_\mathrm{c1})=0, J_{z}(\chi_\mathrm{c2})= $ 0 polarization assumption, while the green line represents the data for the unpolarized case. The right plot includes the pPb LHCb measurement [16] (black). |
png pdf |
Figure 3-b:
$ \chi_\mathrm{c} $-to-$ \mathrm{J}/\psi $ ratio (left) and $ \chi_\mathrm{c2} $-to-$ \chi_\mathrm{c1} $ ratio (right) as a function of rapidity $ y_{\mathrm{lab, p}} $. The rapidity is defined in the lab frame, with the p-going direction being positive. The center of mass is shown by the brown dashed line at $y_{\mathrm{CM} } = $ 0.465. The points correspond to the $ J_{z}(\chi_\mathrm{c1})=0, J_{z}(\chi_\mathrm{c2})= $ 0 polarization assumption, while the green line represents the data for the unpolarized case. The right plot includes the pPb LHCb measurement [16] (black). |
png pdf |
Figure 4:
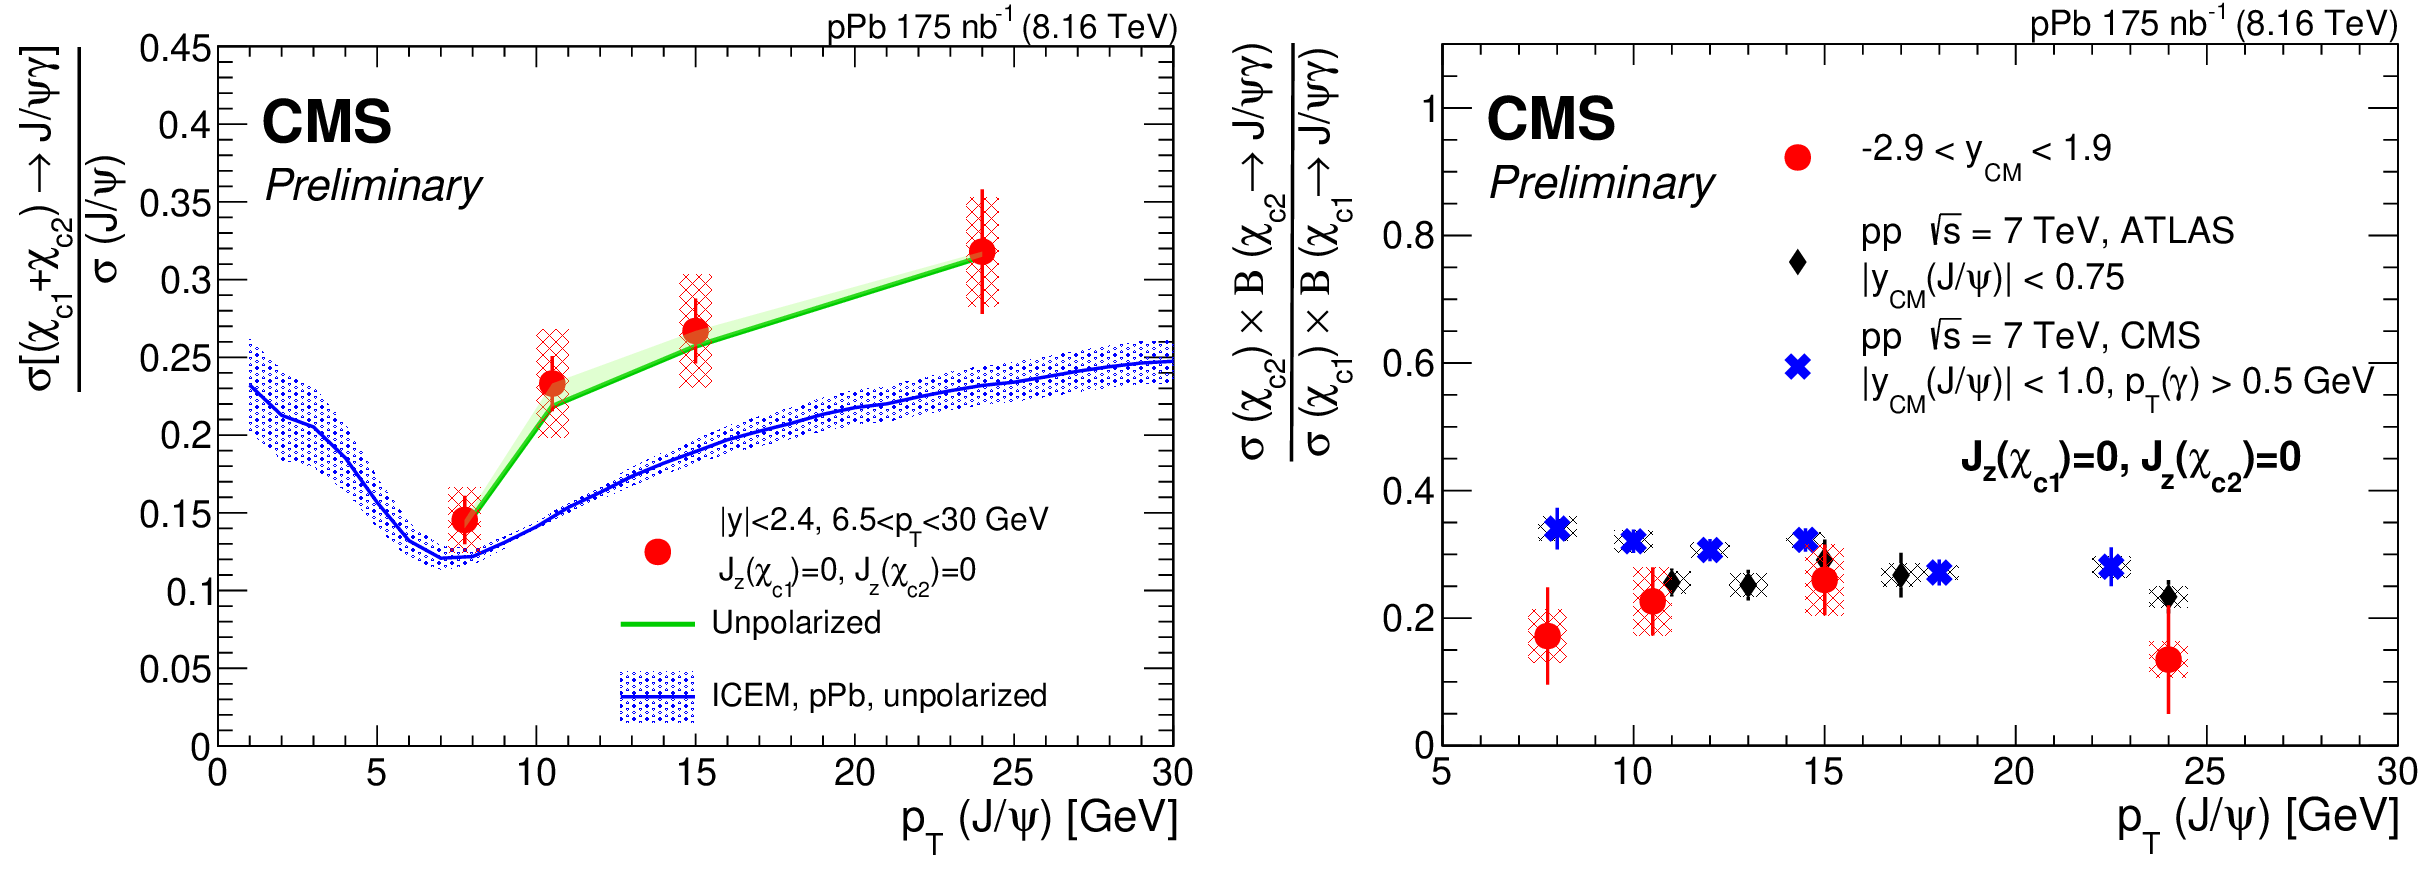
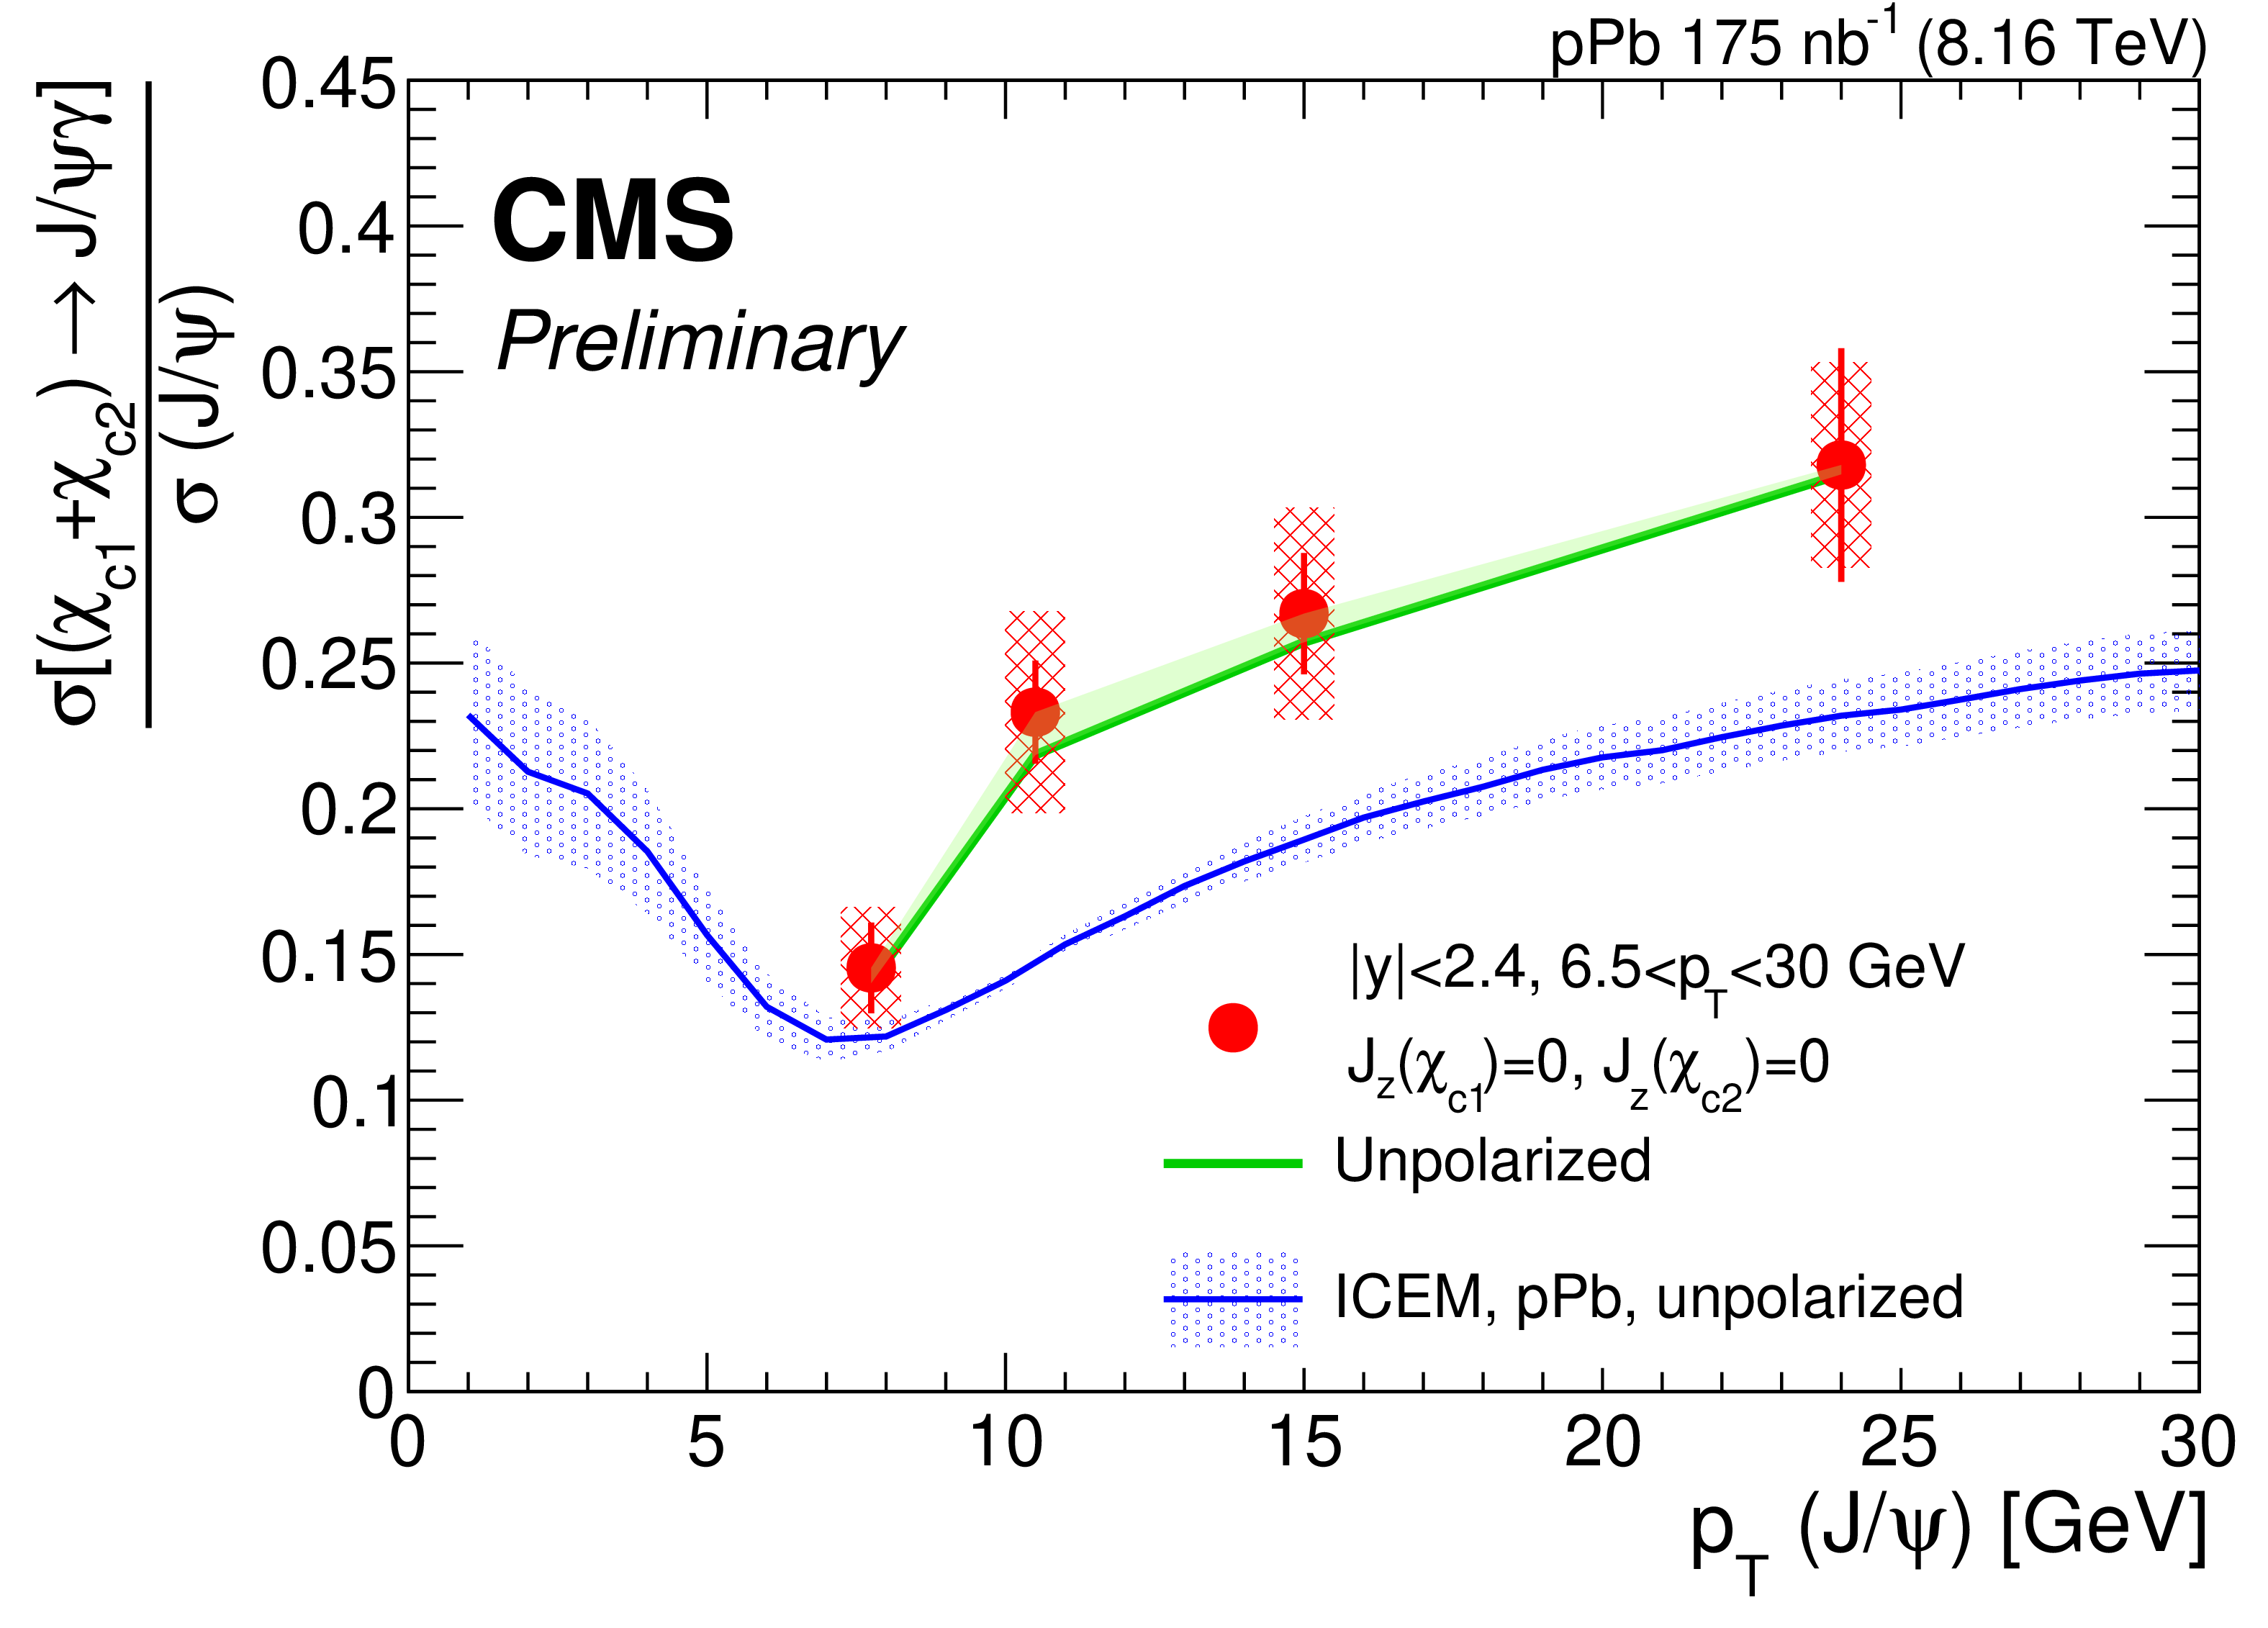
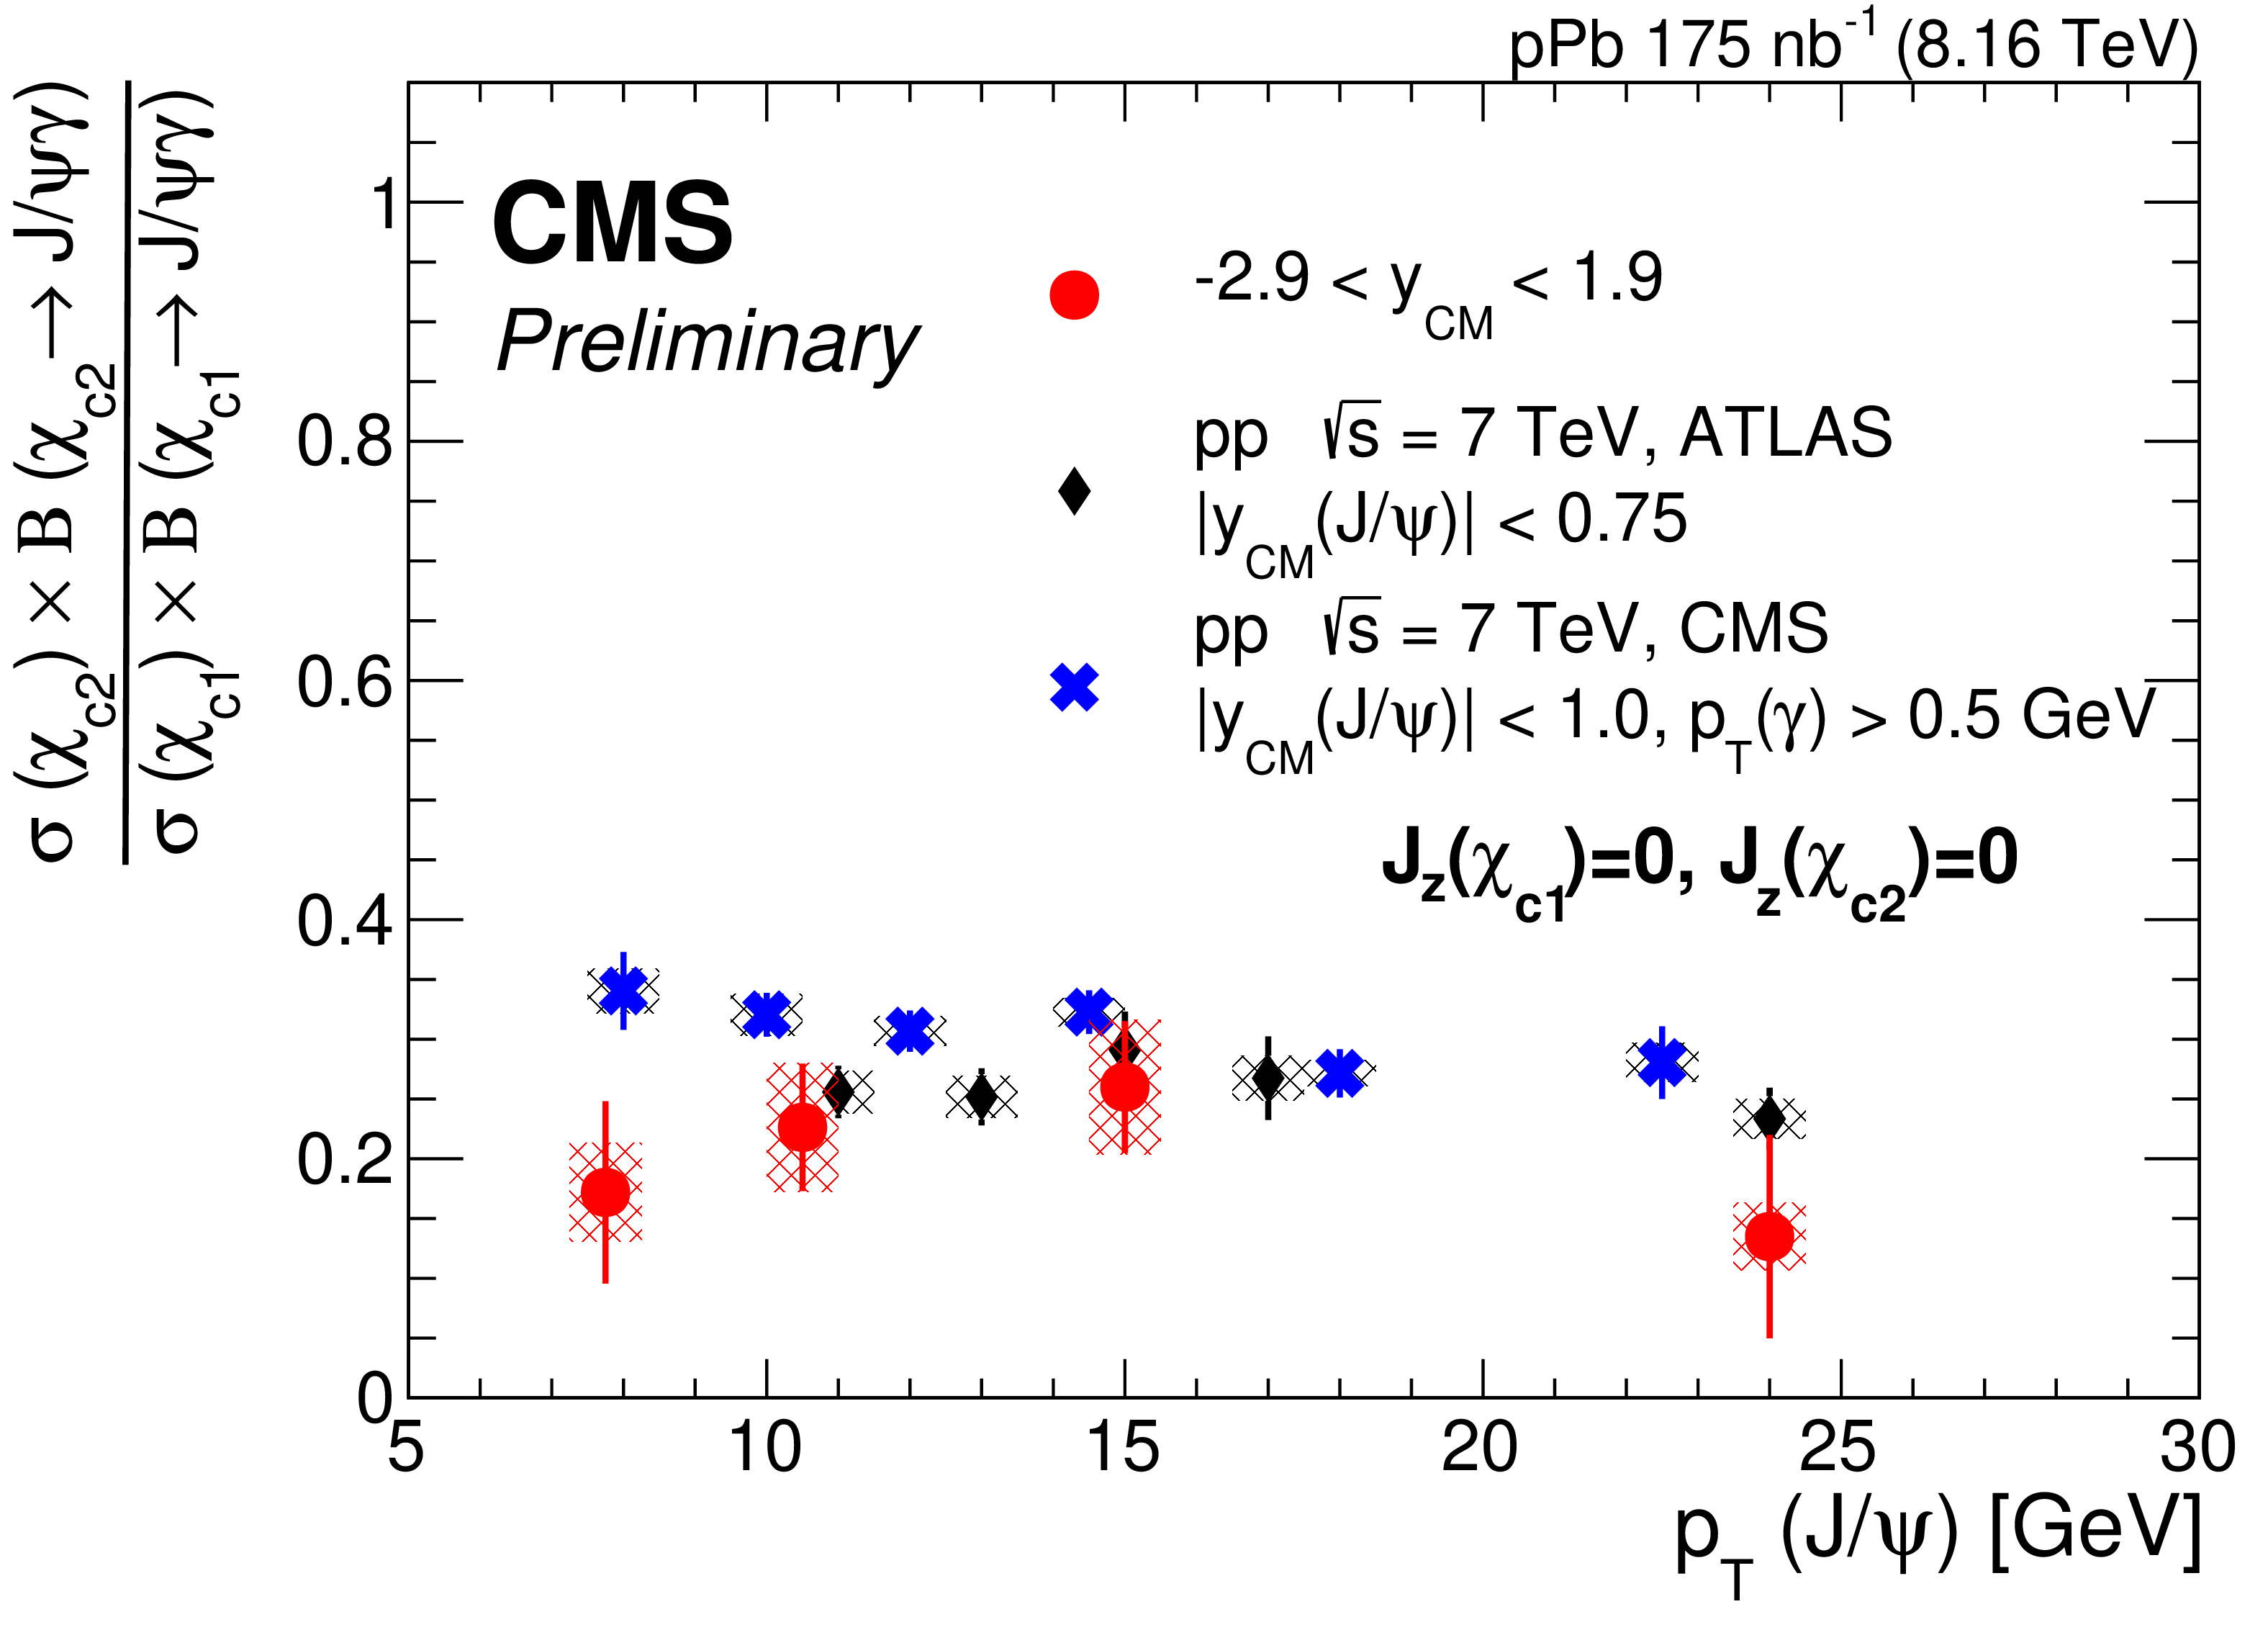
$ \chi_\mathrm{c} $-to-$ \mathrm{J}/\psi $ ratio (left) and $ \chi_\mathrm{c2} $-to-$ \chi_\mathrm{c1} $ ratio (right) as a function of $ p_{\mathrm{T}}(\mathrm{J}/\psi) $, shown in red points for the $ J_{z}(\chi_\mathrm{c1})=0, J_{z}(\chi_\mathrm{c2})= $ 0 polarization assumption. The green line shows the same result in the case of no polarization. The results are integrated over all the detector acceptance $ | y_{ \mathrm{lab} } | < $ 2.4, corresponding to $ -$2.9 $ < y_{$ \mathrm{CM} } < $ 1.9 and integrated over the charged-particle multiplicity range. A calculation of the $ \chi_\mathrm{c} $-to-$ \mathrm{J}/\psi $ ratio in the ICEM [46] is shown in the left plot for the unpolarized case (blue band). The $ \chi_\mathrm{c2} $-to-$ \chi_\mathrm{c1} $ ratio in the right plot is compared with existing pp measurements by ATLAS [18] (black diamonds) and CMS [20] (blue crosses). |
png pdf |
Figure 4-a:
$ \chi_\mathrm{c} $-to-$ \mathrm{J}/\psi $ ratio (left) and $ \chi_\mathrm{c2} $-to-$ \chi_\mathrm{c1} $ ratio (right) as a function of $ p_{\mathrm{T}}(\mathrm{J}/\psi) $, shown in red points for the $ J_{z}(\chi_\mathrm{c1})=0, J_{z}(\chi_\mathrm{c2})= $ 0 polarization assumption. The green line shows the same result in the case of no polarization. The results are integrated over all the detector acceptance $ | y_{ \mathrm{lab} } | < $ 2.4, corresponding to $ -$2.9 $ < y_{$ \mathrm{CM} } < $ 1.9 and integrated over the charged-particle multiplicity range. A calculation of the $ \chi_\mathrm{c} $-to-$ \mathrm{J}/\psi $ ratio in the ICEM [46] is shown in the left plot for the unpolarized case (blue band). The $ \chi_\mathrm{c2} $-to-$ \chi_\mathrm{c1} $ ratio in the right plot is compared with existing pp measurements by ATLAS [18] (black diamonds) and CMS [20] (blue crosses). |
png pdf |
Figure 4-b:
$ \chi_\mathrm{c} $-to-$ \mathrm{J}/\psi $ ratio (left) and $ \chi_\mathrm{c2} $-to-$ \chi_\mathrm{c1} $ ratio (right) as a function of $ p_{\mathrm{T}}(\mathrm{J}/\psi) $, shown in red points for the $ J_{z}(\chi_\mathrm{c1})=0, J_{z}(\chi_\mathrm{c2})= $ 0 polarization assumption. The green line shows the same result in the case of no polarization. The results are integrated over all the detector acceptance $ | y_{ \mathrm{lab} } | < $ 2.4, corresponding to $ -$2.9 $ < y_{$ \mathrm{CM} } < $ 1.9 and integrated over the charged-particle multiplicity range. A calculation of the $ \chi_\mathrm{c} $-to-$ \mathrm{J}/\psi $ ratio in the ICEM [46] is shown in the left plot for the unpolarized case (blue band). The $ \chi_\mathrm{c2} $-to-$ \chi_\mathrm{c1} $ ratio in the right plot is compared with existing pp measurements by ATLAS [18] (black diamonds) and CMS [20] (blue crosses). |
png pdf |
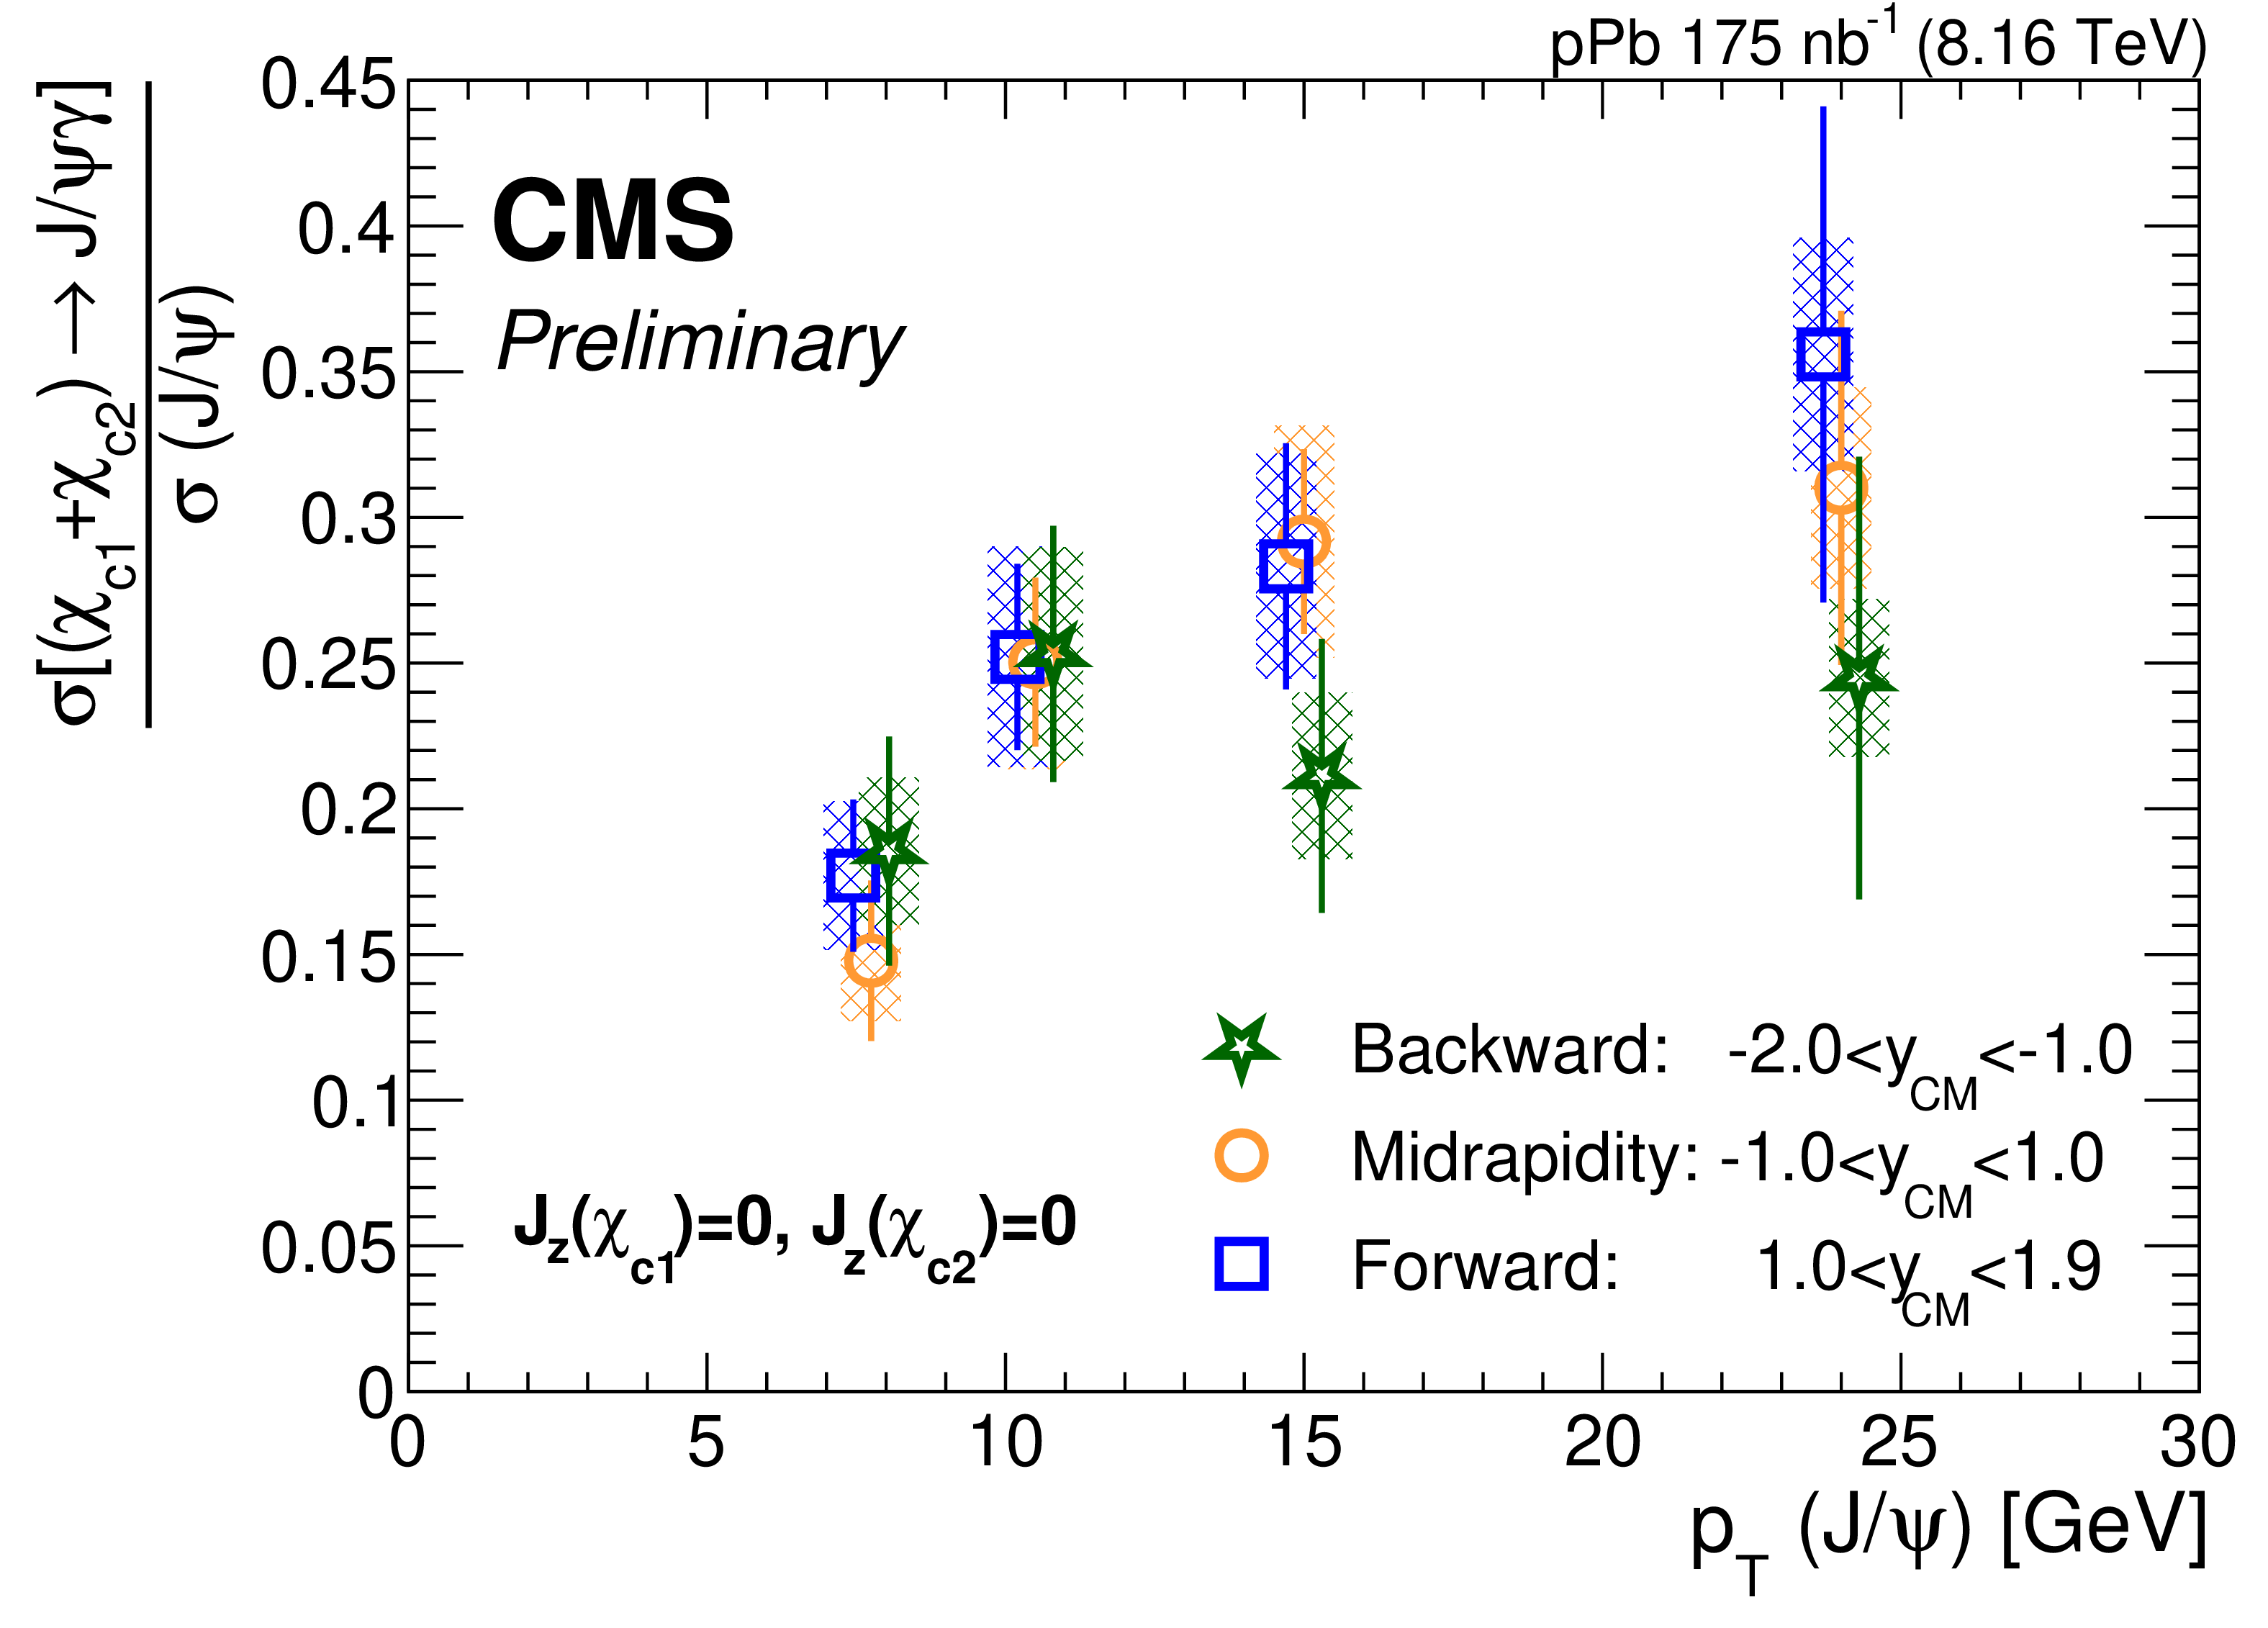
Figure 5:
$ \chi_\mathrm{c} $-to-$ \mathrm{J}/\psi $ ratio as a function of $ p_{\mathrm{T}}(\mathrm{J}/\psi) $ for three rapidity ranges defined in the center-of-mass frame: backward rapidity Pb-going direction $ -$2 $ < y_{\mathrm{CM}}(\mathrm{J}/\psi) < - $1 (green), midrapidity $ -$1 $ < y_{\mathrm{CM}}(\mathrm{J}/\psi) < $ 1 (orange), and forward rapidity p-going direction 1 $ < y_{\mathrm{CM}}(\mathrm{J}/\psi) < $ 1.9 (blue). |
png pdf |
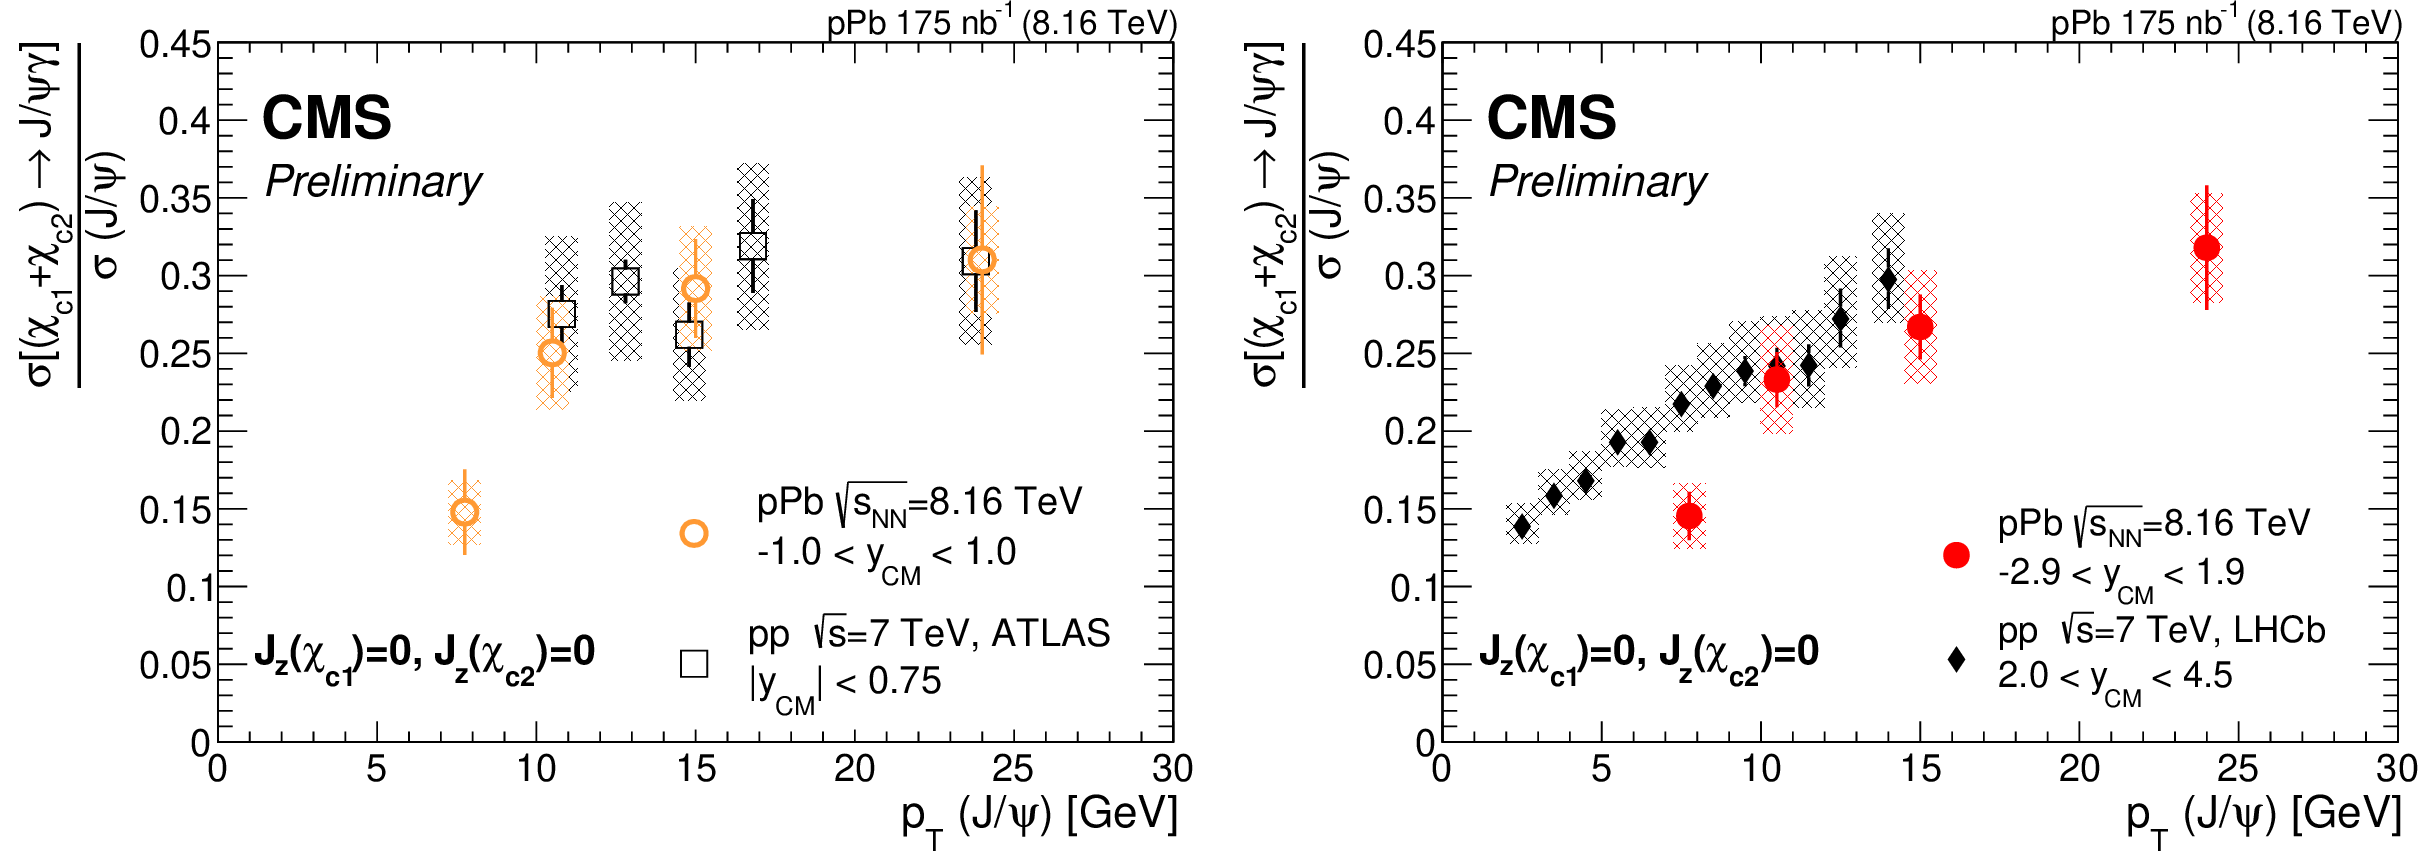
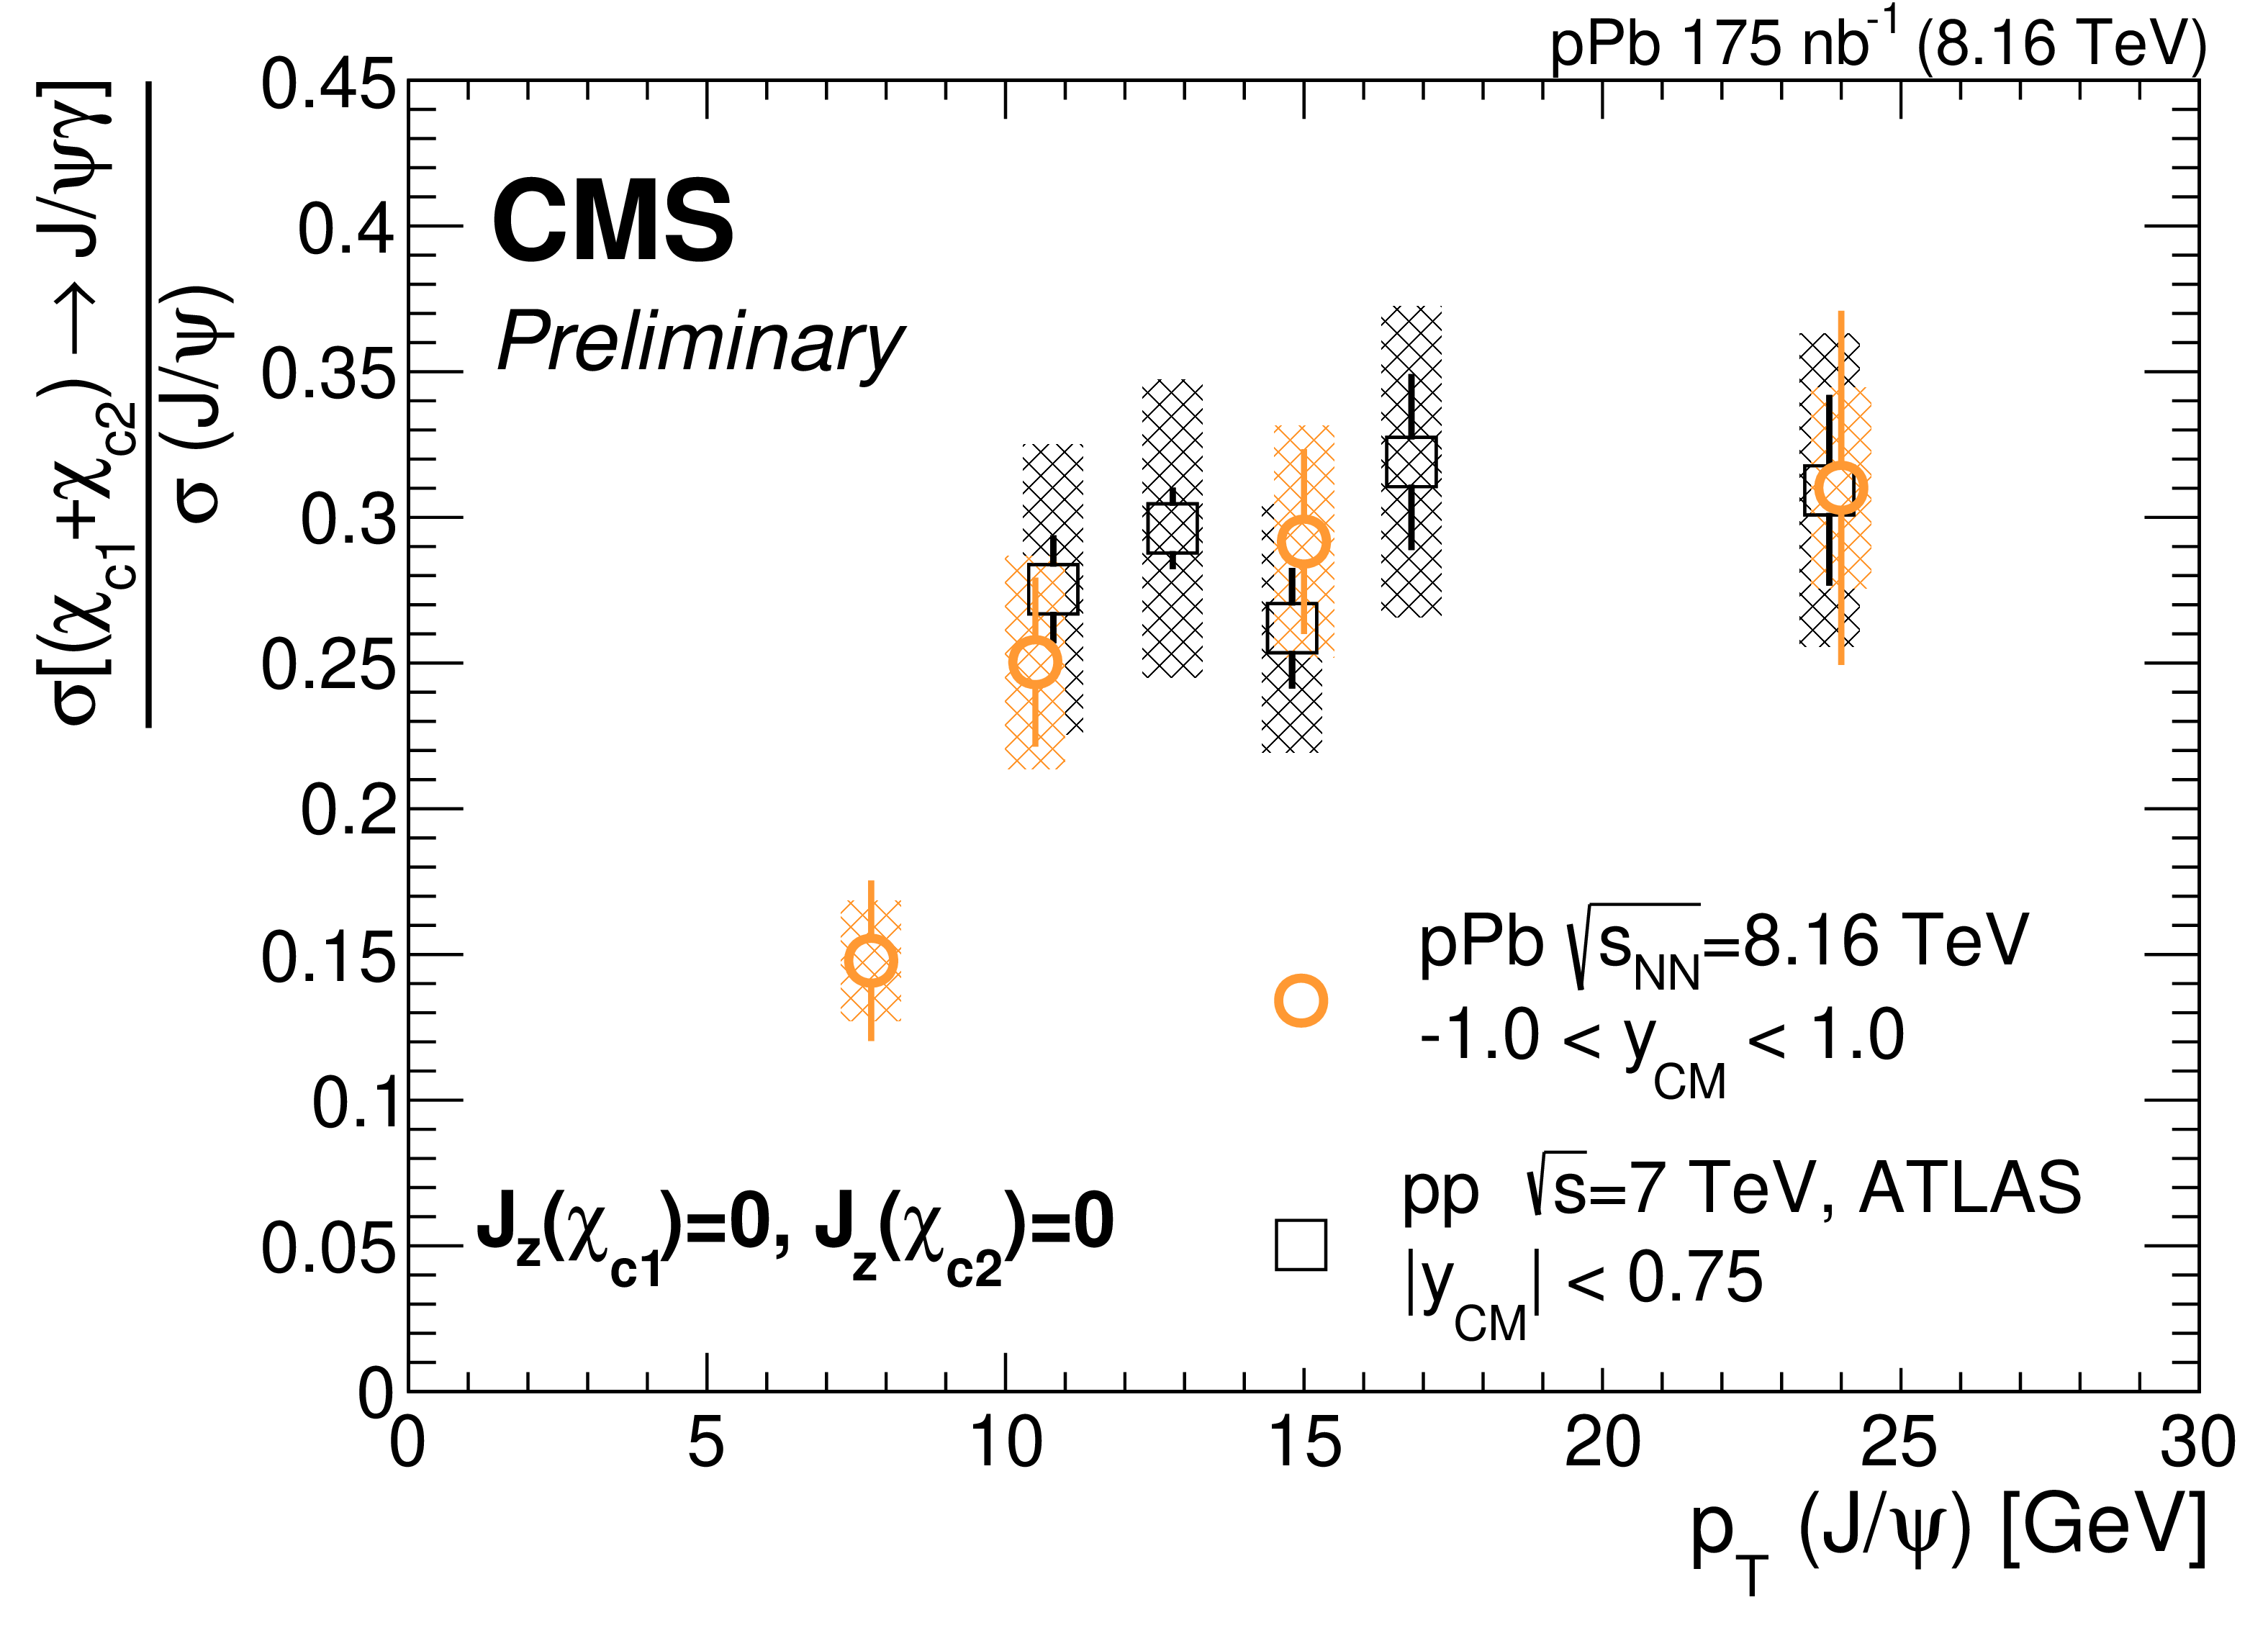
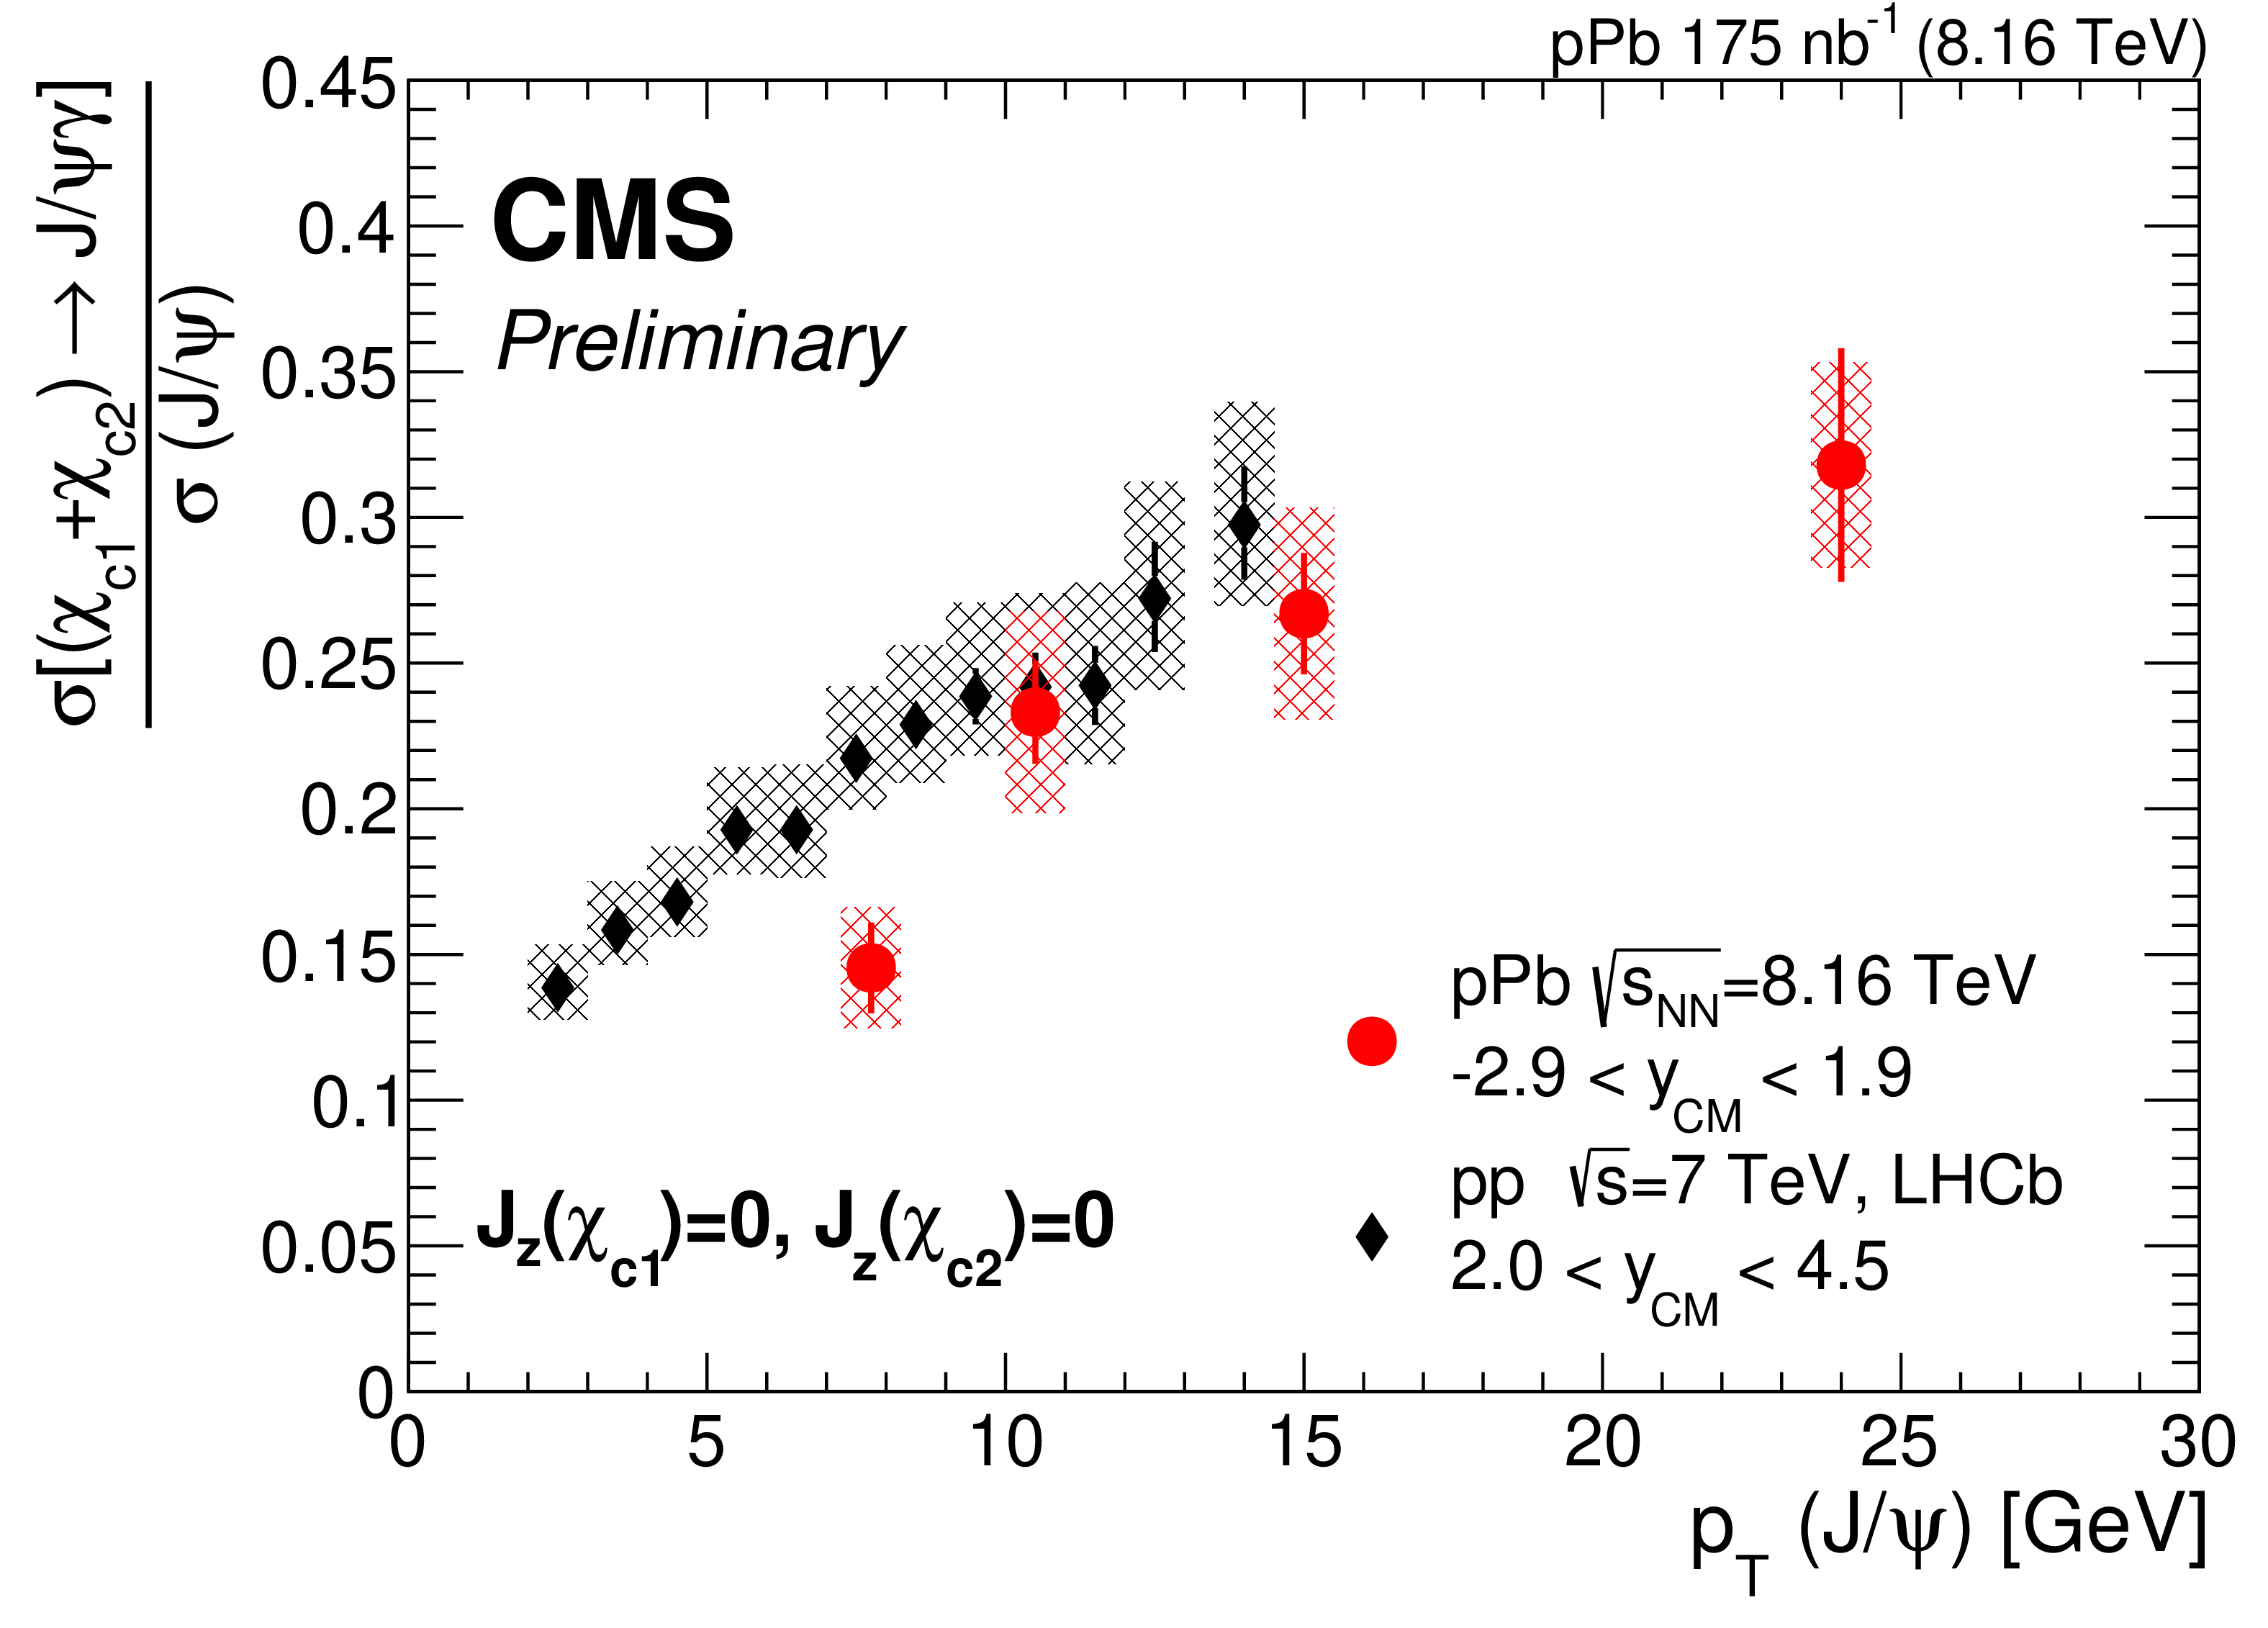
Figure 6:
Comparison of our result with previous results from pp collisions, assuming $ J_{z}(\chi_\mathrm{c1})=0, J_{z}(\chi_\mathrm{c2})= $ 0. Left: Comparison of our midrapidity $ p_{\mathrm{T}}(\mathrm{J}/\psi) $ measurement (orange) with the ATLAS results from pp collisions at $ \sqrt{s}= $ 7 TeV at $ |y_{\mathrm{CM}}(\mathrm{J}/\psi)| < $ 0.75 [48] (black). Right: Comparison of the rapidity integrated $ p_{\mathrm{T}}(\mathrm{J}/\psi) $ measurement (red) with the LHCb results from pp collisions at $ \sqrt{s}= $ 7 TeV at a rapidity of 2.0 $ < |y_{\mathrm{CM}}(\mathrm{J}/\psi)| < $ 4.5 [19] (black). |
png pdf |
Figure 6-a:
Comparison of our result with previous results from pp collisions, assuming $ J_{z}(\chi_\mathrm{c1})=0, J_{z}(\chi_\mathrm{c2})= $ 0. Left: Comparison of our midrapidity $ p_{\mathrm{T}}(\mathrm{J}/\psi) $ measurement (orange) with the ATLAS results from pp collisions at $ \sqrt{s}= $ 7 TeV at $ |y_{\mathrm{CM}}(\mathrm{J}/\psi)| < $ 0.75 [48] (black). Right: Comparison of the rapidity integrated $ p_{\mathrm{T}}(\mathrm{J}/\psi) $ measurement (red) with the LHCb results from pp collisions at $ \sqrt{s}= $ 7 TeV at a rapidity of 2.0 $ < |y_{\mathrm{CM}}(\mathrm{J}/\psi)| < $ 4.5 [19] (black). |
png pdf |
Figure 6-b:
Comparison of our result with previous results from pp collisions, assuming $ J_{z}(\chi_\mathrm{c1})=0, J_{z}(\chi_\mathrm{c2})= $ 0. Left: Comparison of our midrapidity $ p_{\mathrm{T}}(\mathrm{J}/\psi) $ measurement (orange) with the ATLAS results from pp collisions at $ \sqrt{s}= $ 7 TeV at $ |y_{\mathrm{CM}}(\mathrm{J}/\psi)| < $ 0.75 [48] (black). Right: Comparison of the rapidity integrated $ p_{\mathrm{T}}(\mathrm{J}/\psi) $ measurement (red) with the LHCb results from pp collisions at $ \sqrt{s}= $ 7 TeV at a rapidity of 2.0 $ < |y_{\mathrm{CM}}(\mathrm{J}/\psi)| < $ 4.5 [19] (black). |
| Tables | |
png pdf |
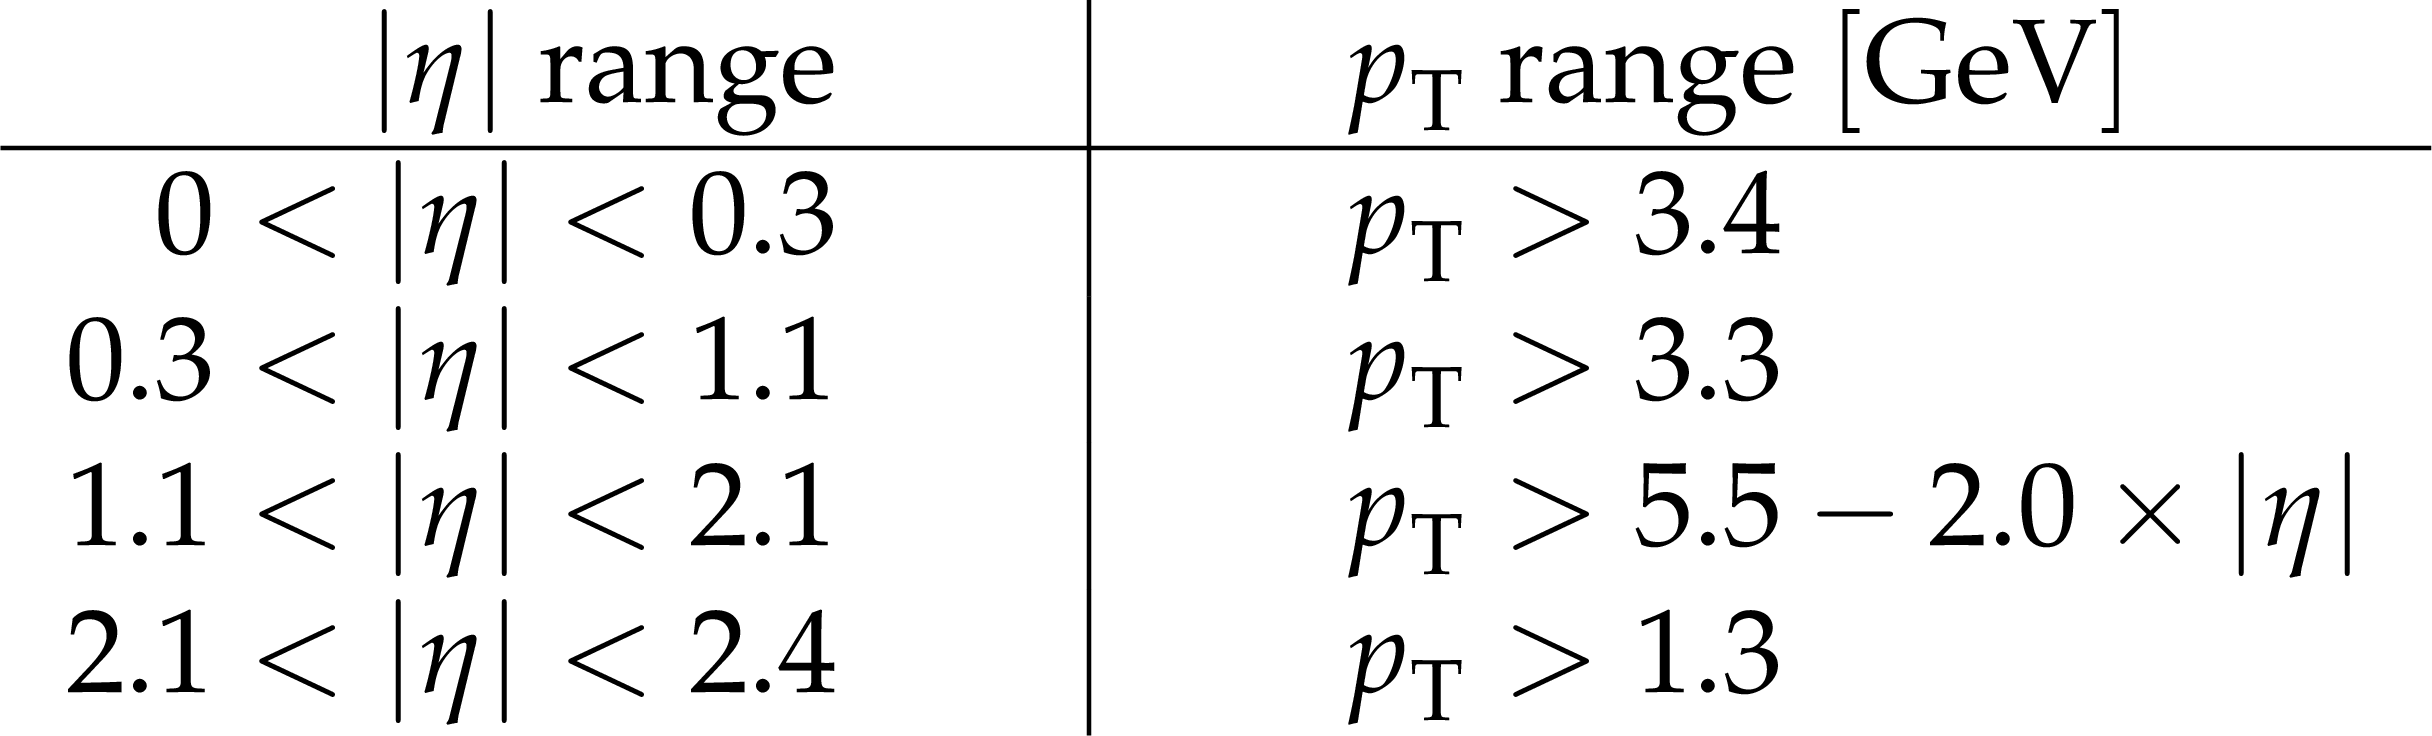
Table 1:
Muon $ |\eta| $ and $ p_{\mathrm{T}} $ acceptance used in the analysis. |
png pdf |
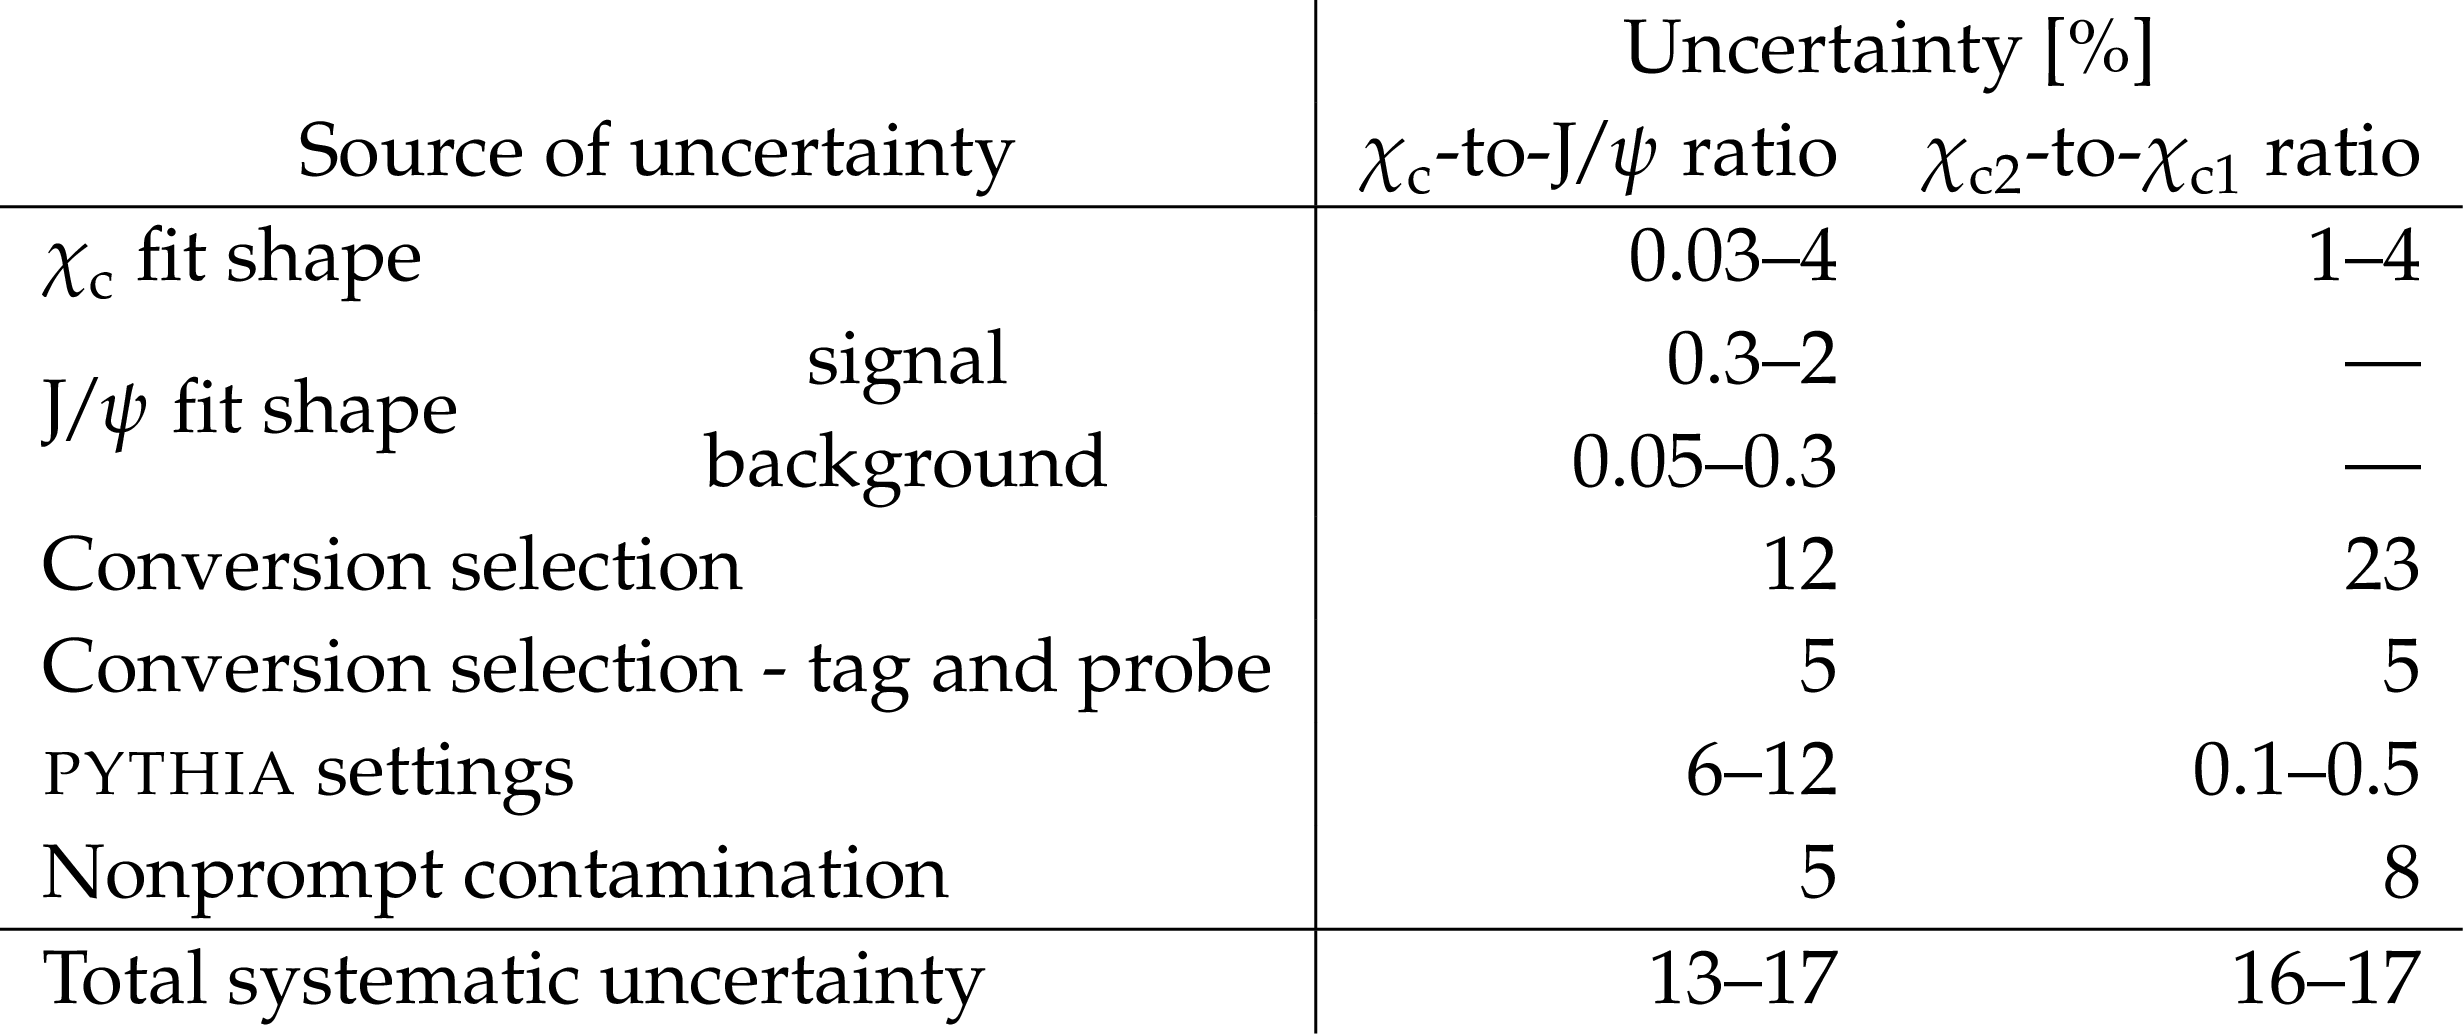
Table 2:
Overview of the systematic uncertainties. |
| Summary |
| We presented the ratio of $ [\sigma (\chi_\mathrm{c1}) \times \mathrm{B}(\chi_\mathrm{c1}\rightarrow{\mathrm{J}/\psi} \gamma) + \sigma(\chi_\mathrm{c2})\times\mathrm{B}(\chi_\mathrm{c1}\rightarrow{\mathrm{J}/\psi} \gamma)] / \sigma({\mathrm{J}/\psi} ) $ and $ [\sigma (\chi_\mathrm{c2}) \times \mathrm{B}(\chi_\mathrm{c2}\rightarrow{\mathrm{J}/\psi} \gamma)] / [\sigma (\chi_\mathrm{c1}) \times \mathrm{B}(\chi_\mathrm{c1}\rightarrow{\mathrm{J}/\psi} \gamma] $ in pPb collisions at $ \sqrt{\smash[b]{s_{\mathrm{NN}}}}= $ 8.16 TeV, reported as a function of charged-particle multiplicity $ N_{\mathrm{tracks}} $, rapidity $ y_{\mathrm{lab, p}}(\mathrm{J}/\psi) $, and transverse momentum $ p_{\mathrm{T}}(\mathrm{J}/\psi) $. The $ \chi_\mathrm{c1} $ and $ \chi_\mathrm{c2} $ states were reconstructed through the decay $ \chi_\mathrm{c} \to \mathrm{J}/\psi \, \gamma \to \mu^{+}\,\mu^{-} + \mathrm{e}^+\,\mathrm{e}^- $. The results were reported in the CMS detector acceptance region 6.5 $ < p_{\mathrm{T}}(\mathrm{J}/\psi) < $ 30 GeV and $ -$2.4 $ < y_{ \mathrm{lab, p} } (\mathrm{J}/\psi) < $ 2.4, corresponding approximately to $ -$2.9 $ < y_{ \mathrm{CM} } (\mathrm{J}/\psi) < $ 1.9 in the proton-nucleon center-of-mass system. The measured $ \chi_\mathrm{c} $-to-$ \mathrm{J}/\psi $ ratio was found to rise from 0.140 $ \pm $ 0.015 (stat) $ \pm $ 0.025 (syst) in the lowest-$ p_{\mathrm{T}} $ bin (6.5 - 9 GeV) to 0.315 $ \pm $ 0.040 (stat) $ \pm $ 0.048 (syst) in the highest-$ p_{\mathrm{T}} $ bin (18 - 30 GeV). The data were compared to a calculation from the ICEM model [46] which describes well the $ p_{\mathrm{T}} $-dependent trend but underpredicts the ratio across the reported range. The $ \chi_\mathrm{c} $-to-$ \mathrm{J}/\psi $ ratio was found to be insensitive to rapidity and $ N_{\mathrm{tracks}} $ within uncertainties. When integrated over the entire accessible $ p_{\mathrm{T}}(\mathrm{J}/\psi) $ range, the ratio is approximately 0.2. We observed no significant dependence of the $ \chi_\mathrm{c2} $-to-$ \chi_\mathrm{c1} $ ratio on $ N_{\mathrm{tracks}} $, $ p_{\mathrm{T}}(\mathrm{J}/\psi) $, or $ y_{\mathrm{lab, p}}(\mathrm{J}/\psi) $. Within uncertainties, we found no significant differences between our $ \chi_\mathrm{c2} $-to-$ \chi_\mathrm{c1} $ ratio results and those in existing pp studies. These findings indicate no strong relative modification between the $ \chi_\mathrm{c} $ states in pPb collisions. We found the $ \chi_\mathrm{c} $-to-$ \mathrm{J}/\psi $ ratio to be consistent with two previous pp measurements at $ \sqrt{\smash[b]{s}}= $ 7 TeV by ATLAS (midrapidity) and LHCb (forward rapidity). The similarity of the $ \chi_\mathrm{c} $-to-$ \mathrm{J}/\psi $ ratio to the pp results indicates no additional modification of $ \chi_\mathrm{c} $ states compared to $ \mathrm{J}/\psi $ in pPb collisions. The lack of dependence of the $ \chi_\mathrm{c} $-to-$ \mathrm{J}/\psi $ ratio on $ N_{\mathrm{tracks}} $, in contrast to the behavior observed in measurements of $ \psi(\mathrm{2S}) $ [49], suggests weaker modification effects for $ \chi_\mathrm{c} $ states compared to the $ \psi(\mathrm{2S}) $ state in pPb collision. |
| References | ||||
| 1 | A. Andronic et al. | Heavy-flavour and quarkonium production in the LHC era: from proton-proton to heavy-ion collisions | EPJC 76 (2016) 107 | 1506.03981 |
| 2 | R. Vogt | Shadowing and absorption effects on $ J/\psi $ production in $ dA $ collisions | Phys. Rev. C 7 (2005) 1 | |
| 3 | F. Arleo and S. Peigne | Heavy-quarkonium suppression in p-A collisions from parton energy loss in cold QCD matter | JHEP 03 (2013) 122 | 1212.0434 |
| 4 | E. G. Ferreiro | Excited charmonium suppression in proton-nucleus collisions as a consequence of comovers | PLB 749 (2015) 98 | 1411.0549 |
| 5 | A. Capella, A. Kaidalov, A. Kouider Akil, and C. Gerschel | J/psi and psi-prime suppression in heavy ion collisions | PLB 393 (1997) 431 | hep-ph/9607265 |
| 6 | LHCb Collaboration | Prompt and nonprompt J/$ \psi $ production and nuclear modification in $ p $Pb collisions at $ \sqrt{s_{\text{NN}}}= $ 8.16 TeV | PLB 774 (2017) 159 | 1706.07122 |
| 7 | PHENIX Collaboration | Measurement of the relative yields of $ \psi(2S) $ to $ \psi(1S) $ mesons produced at forward and backward rapidity in $ p+p $, $ p+ $Al, $ p+ $Au, and $ ^{3} $He$ + $Au collisions at $ \sqrt{s_{_{NN}}}= $ 200 GeV | Phys. Rev. C 95 (2017) 034904 | 1609.06550 |
| 8 | CMS Collaboration | Nuclear modification of $ \Upsilon $ states in pPb collisions at $ \sqrt {\smash [b]{s_{_{\mathrm {NN}}}}} $ = 5.02 TeV | PLB 835 (2022) 137397 | |
| 9 | ATLAS Collaboration | Measurement of quarkonium production in proton-lead and proton-proton collisions at 5.02 $ \mathrm {TeV} $ with the ATLAS detector | EPJC 78 (2018) 171 | 1709.03089 |
| 10 | ALICE Collaboration | Centrality dependence of $ \psi(2s) $ suppression in p-pb collisions at 5.02 tev | Journal of High Energy Physics 2016 (2016) 50 | |
| 11 | PHENIX Collaboration | Nuclear Modification of $ \psi^\prime, \chi_c $, and J/\ensuremath\psi Production in d+Au Collisions at $ \sqrt {\smash [b]{s_{_{\mathrm {NN}}}}} $=200 GeV | PRL 111 (2013) 202301 | 1305.5516 |
| 12 | LHCb Collaboration | Study of $ \Upsilon $ production in $ p $Pb collisions at $ \sqrt {\smash [b]{s_{_{\mathrm {NN}}}}}= $ 8.16 TeV | JHEP 11 (2018) 194 | 1810.07655 |
| 13 | H. Satz | Colour deconfinement and quarkonium binding | JPG, Nuclear and Particle Physics 32 (2006) R25 | |
| 14 | T. Matsui and H. Satz | $ J/\psi $ Suppression by Quark-Gluon Plasma Formation | PLB 178 (1986) 416 | |
| 15 | S. Gupta and H. Satz | Final state $ J/\psi $ suppression in nuclear collisions | AIP Conference Proceedings 272 (1992) 991 | |
| 16 | LHCb Collaboration | Measurement of prompt-production cross-section ratio $ \sigma(\chi_{c2})/\sigma(\chi_{c1}) $ in $ p $Pb collisions at $ \sqrt {\smash [b]{s_{_{\mathrm {NN}}}}} $ = 8.16 TeV | Phys. Rev. C 103 (2021) 064905 | 2103.07349 |
| 17 | LHCb Collaboration | Fraction of $ \chi_\mathrm{c} $ decays in prompt $ \mathrm{J}/\psi $ production measured in pPb collisions at $ \sqrt {\smash [b]{s_{_{\mathrm {NN}}}}} $ = 8.16 TeV | PRL 132 (2024) 102302 | |
| 18 | ATLAS Collaboration | Measurement of $ \chi_{c1} $ and $ \chi_{c2} $ production with $ \sqrt{s} $ = 7 TeV $ pp $ collisions at ATLAS | JHEP 07 (2014) 154 | 1404.7035 |
| 19 | LHCb Collaboration | Measurement of the ratio of prompt $ \chi_{c} $ to $ J/\psi $ production in $ pp $ collisions at $ \sqrt{s}= $ 7 TeV | PLB 718 (2012) 431 | 1204.1462 |
| 20 | CMS Collaboration | Measurement of the Relative Prompt Production Rate of $ \chi_{c2} $ and $ \chi_{c1} $ in $ pp $ Collisions at $ \sqrt{s}= $ 7 TeV | EPJC 72 (2012) 2251 | CMS-BPH-11-010 1210.0875 |
| 21 | LHCb Collaboration | Measurement of the cross-section ratio $ \sigma(\chi_{c2})/\sigma(\chi_{c1}) $ for prompt $ \chi_c $ production at $ \sqrt{s}= $ 7 TeV | PLB 714 (2012) 215 | 1202.1080 |
| 22 | CMS Collaboration | CMS luminosity measurement using 2016 proton-nucleus collisions at $ \sqrt{\smash[b]{s_{_{\mathrm{NN}}}}}= $ 8.16 TeV | CMS Physics Analysis Summary, 2018 CMS-PAS-LUM-17-002 |
CMS-PAS-LUM-17-002 |
| 23 | CMS Collaboration | Precision luminosity measurement in proton-proton collisions at $ \sqrt{s} = $ 13 TeV in 2015 and 2016 at CMS | EPJC 81 (2021) 800 | CMS-LUM-17-003 2104.01927 |
| 24 | CMS Collaboration | The CMS Experiment at the CERN LHC | JINST 3 (2008) S08004 | |
| 25 | CMS Collaboration | The CMS trigger system | JINST 12 (2017) P01020 | CMS-TRG-12-001 1609.02366 |
| 26 | CMS Collaboration | Particle-flow reconstruction and global event description with the cms detecto | JINST 12 (2017) P10003 | |
| 27 | CMS Collaboration | Performance of Photon Reconstruction and Identification with the CMS Detector in Proton-Proton Collisions at $ \sqrt{s} = $ 8 TeV | JINST 10 (2015) P08010 | CMS-EGM-14-001 1502.02702 |
| 28 | CMS Collaboration | Description and performance of track and primary-vertex reconstruction with the CMS tracker | JINST 9 (2014) P10009 | CMS-TRK-11-001 1405.6569 |
| 29 | T. Sjostrand et al. | An Introduction to PYTHIA 8.2 | Comput. Phys. Commun. 191 (2015) 159 | 1410.3012 |
| 30 | D. Lange | The EvtGen particle decay simulation package | NIM A 462 (2001) 152 | |
| 31 | N. Davidson, T. Przedzinski, and Z. Was | PHOTOS interface in C++: Technical and Physics Documentation | Comput. Phys. Commun. 199 (2016) 86 | 1011.0937 |
| 32 | T. Pierog et al. | EPOS LHC: test of collective hadronization with data measured at the CERN Large Hadron Collider | Phys. Rev. C 92 (2015) 034906 | 1306.0121 |
| 33 | GEANT4 Collaboration | GEANT 4---a simulation toolkit | NIM A 506 (2003) 250 | |
| 34 | CMS Collaboration | Performance of muon identification in pp collisions at $ \sqrt{s} $ = 7 TeV | CMS Physics Analysis Summary, 2010 CMS-PAS-MUO-10-002 |
|
| 35 | CMS Collaboration | Performance of the CMS muon detector and muon reconstruction with proton-proton collisions at $ \sqrt{s}= $ 13 TeV | JINST 13 (2018) P06015 | CMS-MUO-16-001 1804.04528 |
| 36 | Particle Data Group Collaboration | Review of Particle Physics | PTEP 2020 (2020) 083C01 | |
| 37 | M. J. Oreglia | A study of the reactions $ \psi^\prime \to \gamma \gamma \psi $ | PhD thesis, Stanford University, SLAC Report SLAC-R-236, see Appendix D, 1980 link |
|
| 38 | CMS Collaboration | Measurement of the production cross section ratio $ \sigma(\chi_{b2}{\rm (1P)}) / \sigma(\chi_{b1}{\rm (1P)}) $ in pp collisions at $ \sqrt{s} = $ 8\,TeV | PLB 743 (2015) 383 | CMS-BPH-13-005 1409.5761 |
| 39 | CMS Collaboration | Observation of the $ {\chi}_{b1}(3P) $ and $ {\chi}_{b2}(3P) $ and Measurement of their Masses | PRL 121 (2018) 092002 | CMS-BPH-17-008 1805.11192 |
| 40 | D. Martinez Santos and F. Dupertuis | Mass distributions marginalized over per-event errors | NIM A 764 (2014) 150 | 1312.5000 |
| 41 | CMS Collaboration | Constraints on the $ \chi_\mathrm{c1} $ versus $ \chi_\mathrm{c2} $ Polarizations in Proton-Proton Collisions at $ \sqrt{s} = $ 8 TeV | PRL 124 (2020) 162002 | CMS-BPH-13-001 1912.07706 |
| 42 | P. Faccioli, C. Lourenço, and T. Madlener | From prompt to direct J/$ \psi $ production: new insights on the $ \chi_{c1} $ and $ \chi_{c2} $ polarizations and feed-down contributions from a global-fit analysis of mid-rapidity LHC data | EPJC 80 (2020) 623 | 2006.15446 |
| 43 | CMS Collaboration | Measurement of the Prompt $ J/\psi $ and $ \psi $(2S) Polarizations in $ pp $ Collisions at $ \sqrt{s} $ = 7 TeV | PLB 727 (2013) 381 | CMS-BPH-13-003 1307.6070 |
| 44 | ALICE Collaboration | Measurement of the inclusive J/ $ \psi $ polarization at forward rapidity in pp collisions at $ \sqrt{s} = $ 8 TeV | EPJC 78 (2018) 562 | 1805.04374 |
| 45 | P. Faccioli, C. Lourenco, J. Seixas, and H. K. Wohri | Determination of $ \chi_c $ and $ \chi_b $ polarizations from dilepton angular distributions in radiative decays | PRD 83 (2011) 096001 | 1103.4882 |
| 46 | V. Cheung and R. Vogt | Private communication, calculation based on Production and polarization of prompt $ J/\psi $ in the improved color evaporation model using the $ k_T $-factorization approach | PRD 98 (2018) 114029 | 1808.02909 |
| 47 | K. J. Eskola, H. Paukkunen, and C. A. Salgado | EPS09: A New Generation of NLO and LO Nuclear Parton Distribution Functions | JHEP 04 (2009) 065 | 0902.4154 |
| 48 | ATLAS Collaboration | Measurement of $ \chi_{c1} $ and $ \chi_{c2} $ production with $ \sqrt{s} $ = 7 TeV $ pp $ collisions at ATLAS | JHEP 07 (2014) 154 | 1404.7035 |
| 49 | CMS Collaboration | Observation of the charged-particle multiplicity multiplicity dependence of $ \sigma_{\psi(2S)}/\sigma_{J/\psi} $ in pPb collisions at 8.16 TeV | Submitted to PRL | CMS-HIN-24-001 2503.02139 |
|
|
Compact Muon Solenoid LHC, CERN |
|

|

|

|

|

|