

Compact Muon Solenoid
LHC, CERN
| CMS-PAS-HIN-16-025 | ||
| Measurement of prompt and nonprompt charmonium suppression in PbPb collisions at 5.02 TeV | ||
| CMS Collaboration | ||
| July 2017 | ||
| Abstract: The nuclear modification factors of $\mathrm{J}/\psi$ and $ \psi (\text{2S}) $ mesons are measured in PbPb collisions at a centre-of-mass energy per nucleon pair of $\sqrt{s_{\mathrm{NN}}} = $ 5.02 TeV. The analysis is based on PbPb and pp data samples collected by CMS at the LHC in 2015, corresponding to integrated luminosities of 464 $\mu$fb$^{-1}$ and 28 pb$^{-1}$, respectively. The measurements are performed in the $|y| < $ 2.4 rapidity range as a function of centrality, rapidity and transverse momentum ($p_\text{T}$), from $p_\text{T}=$ 3 GeV/$c$ in the most forward region and up to $p_\text{T}= $ 50 GeV/$c$. Both prompt $\mathrm{J}/\psi$ and nonprompt $\mathrm{J}/\psi$ (coming from b-hadron decays) are observed to be gradually suppressed with centrality, with a magnitude similar to the one observed at $\sqrt{s_{\mathrm{NN}}} = $ 2.76 TeV. No dependence on rapidity is observed, while prompt and nonprompt $\mathrm{J}/\psi$ are less suppressed at the lower and higher explored $p_\text{T}$. The prompt $ \psi (\text{2S}) $ is found to be more suppressed than the prompt $\mathrm{J}/\psi$ in the entire $p_\text{T}$ range. | ||
|
Links:
CDS record (PDF) ;
inSPIRE record ;
CADI line (restricted) ;
These preliminary results are superseded in this paper, EPJC 78 (2018) 509. The superseded preliminary plots can be found here. |
||
| Figures | Summary | Additional Figures | References | CMS Publications |
|---|
| Figures | |
png pdf |
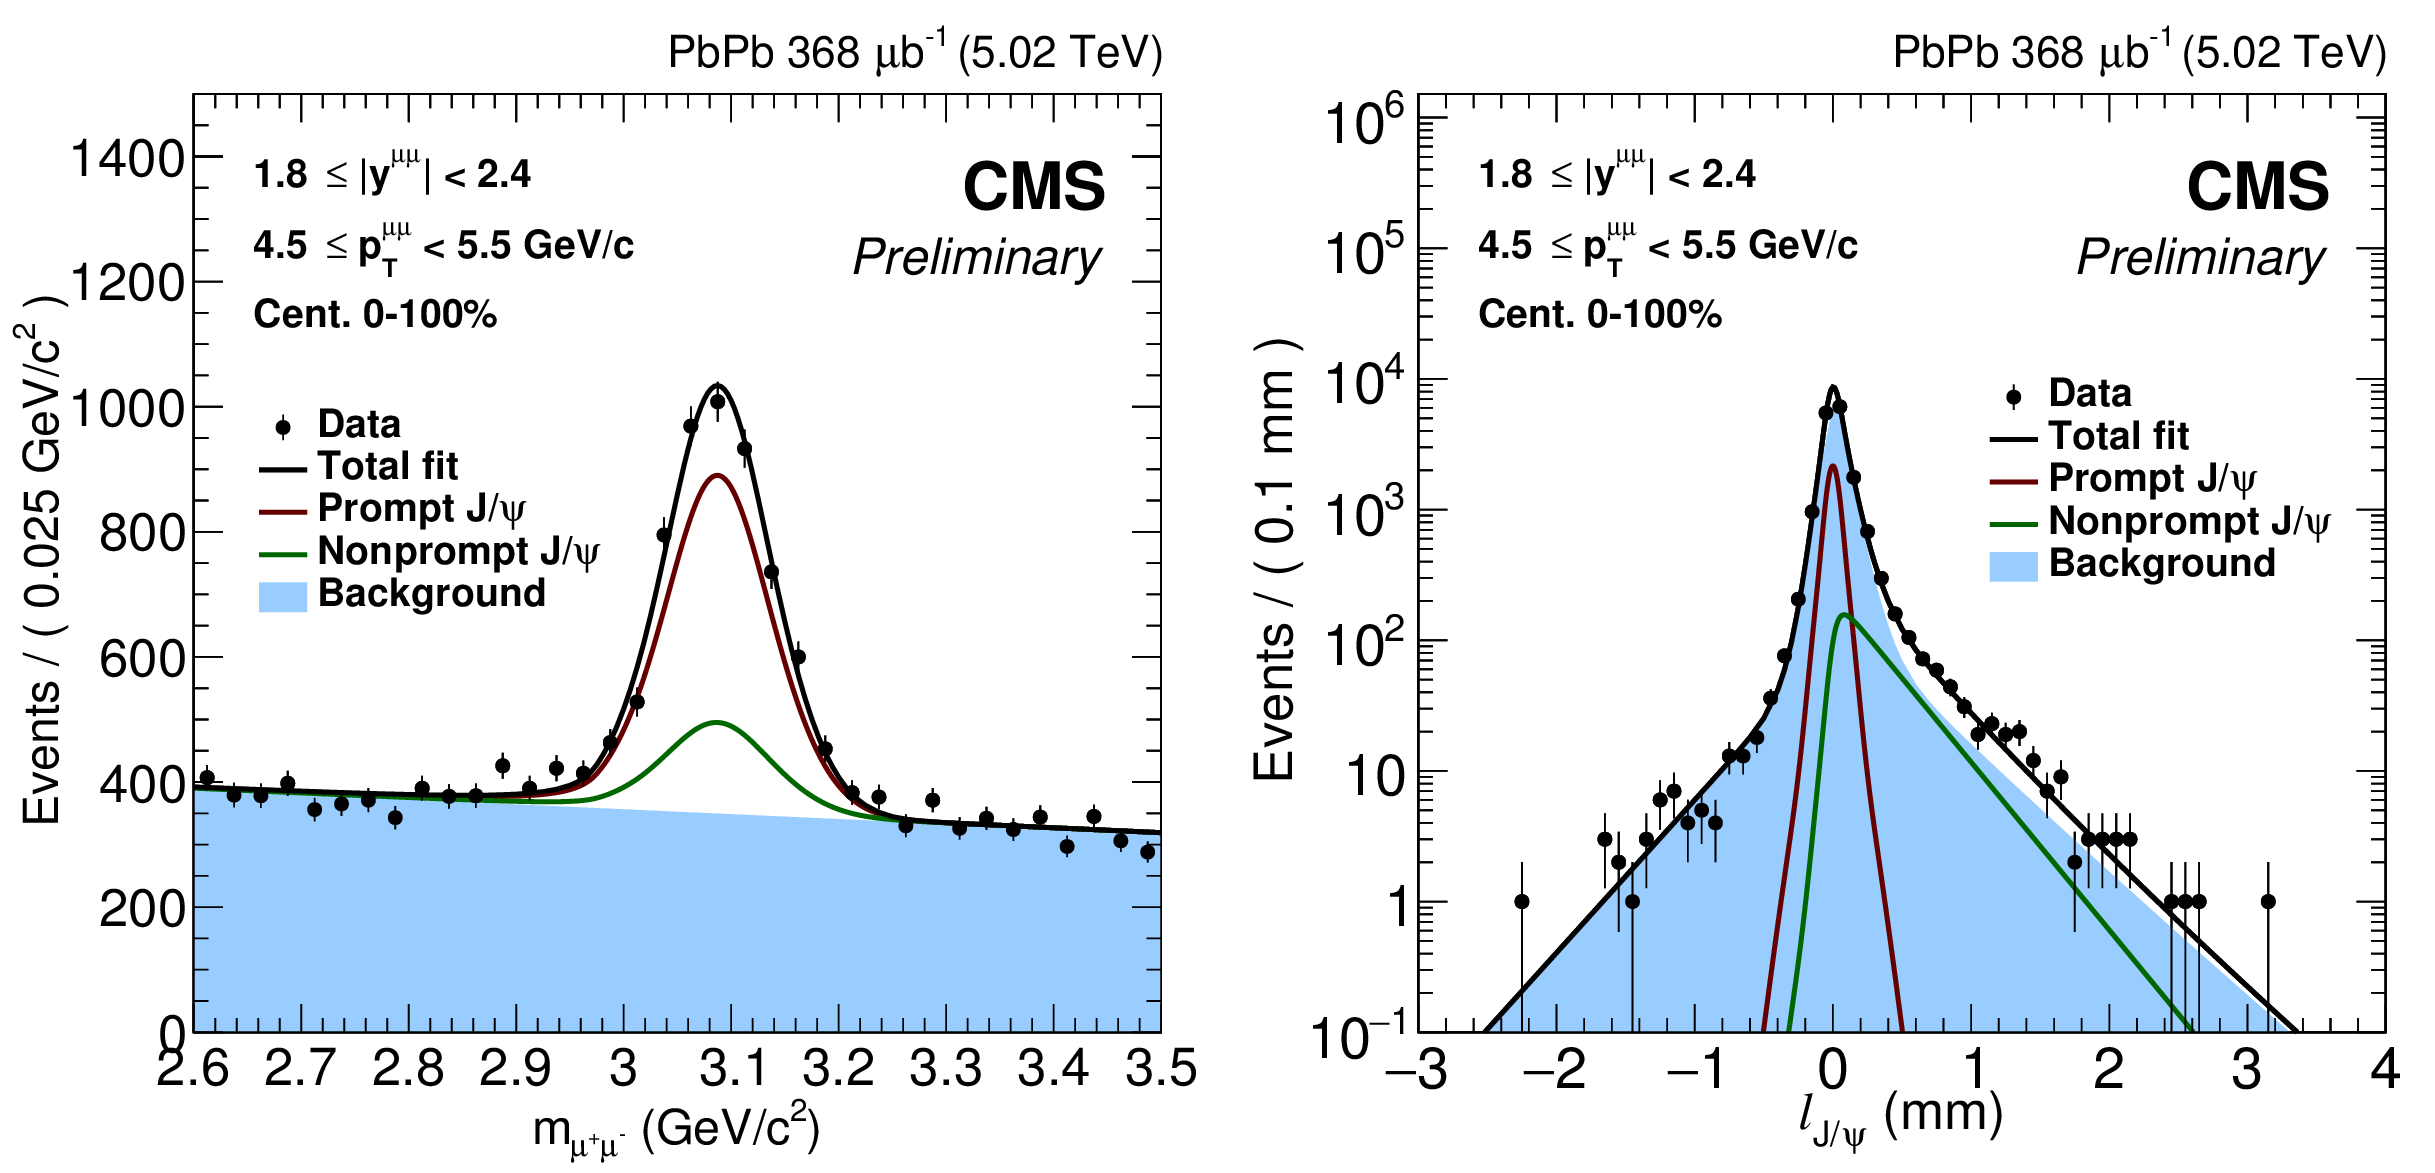
Figure 1:
Invariant-mass spectrum of ${\mu ^+\mu ^-}$ pairs (left) and pseudo-proper decay length distribution (right) in PbPb collisions for 1.8 $ < {| y | } < $ 2.4, 4.5 $ < {p_{\mathrm {T}}} < $ 5.5 GeV/$c$, all centralities. Also shown is the result of the fit described in the text. |
png pdf |
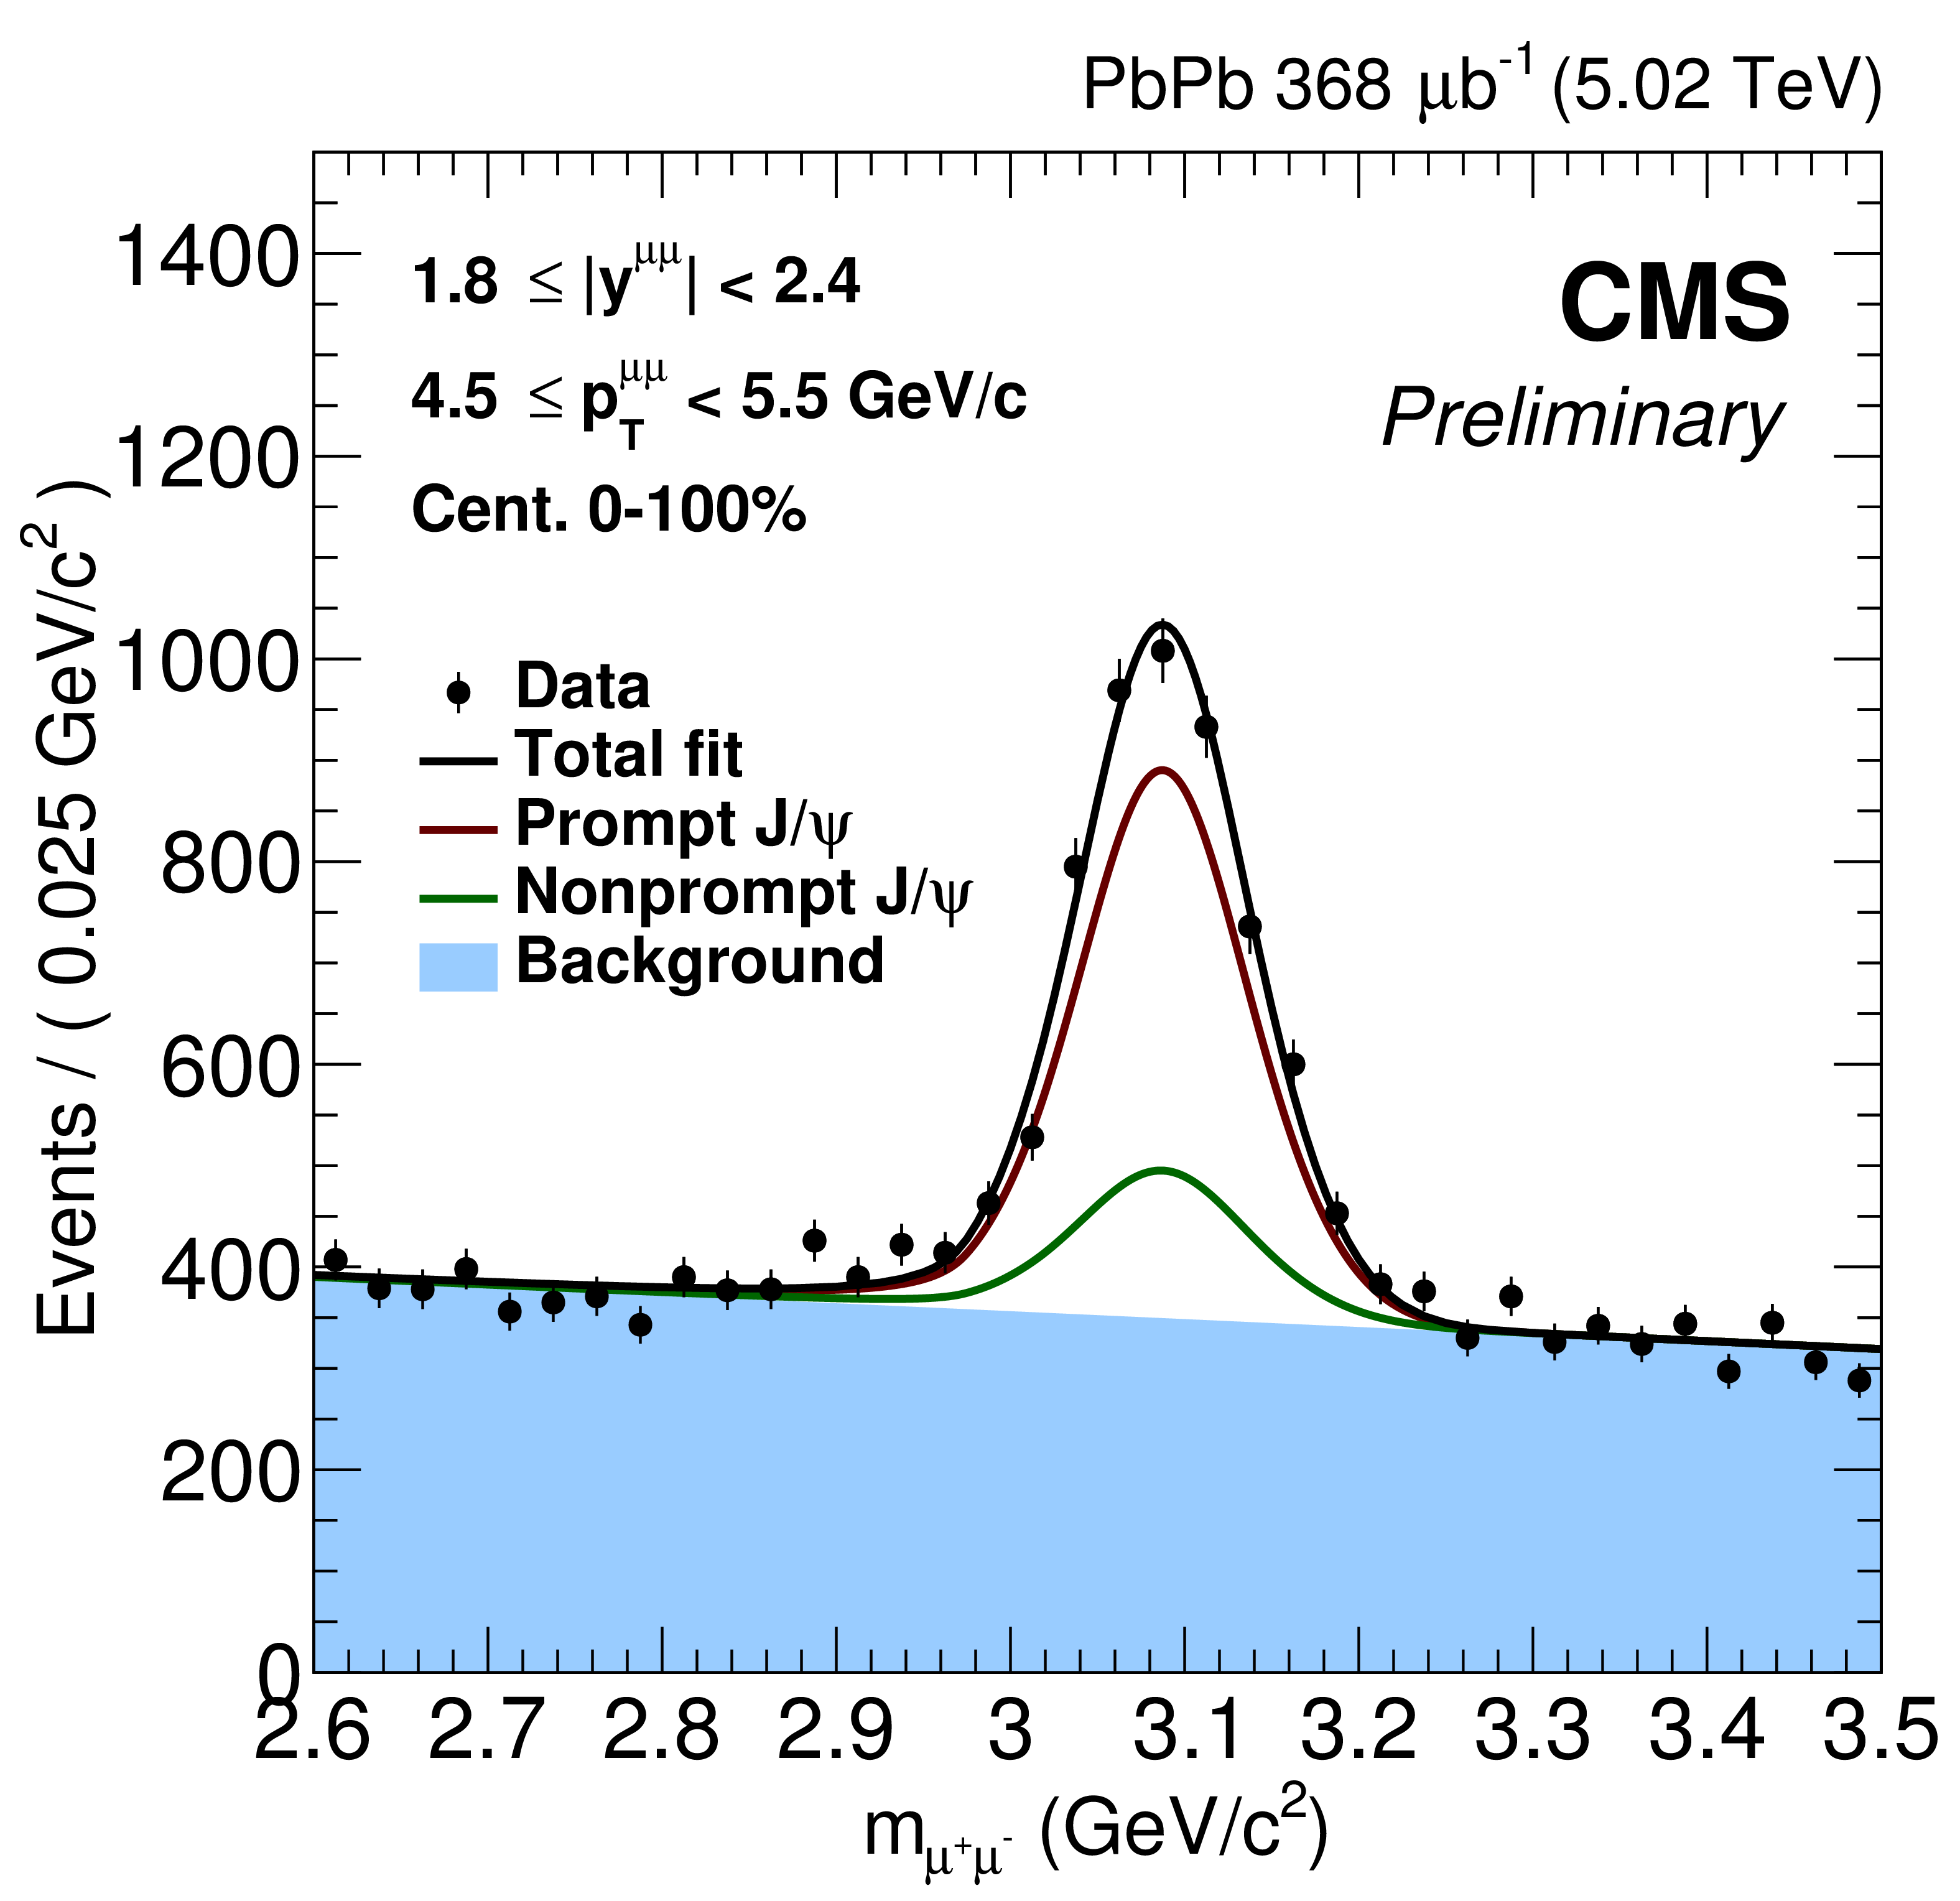
Figure 1-a:
Invariant-mass spectrum of ${\mu ^+\mu ^-}$ pairs in PbPb collisions for 1.8 $ < {| y | } < $ 2.4, 4.5 $ < {p_{\mathrm {T}}} < $ 5.5 GeV/$c$, all centralities. Also shown is the result of the fit described in the text. |

png pdf |
Figure 1-b:
Pseudo-proper decay length distribution in PbPb collisions for 1.8 $ < {| y | } < $ 2.4, 4.5 $ < {p_{\mathrm {T}}} < $ 5.5 GeV/$c$, all centralities. Also shown is the result of the fit described in the text. |
png pdf |
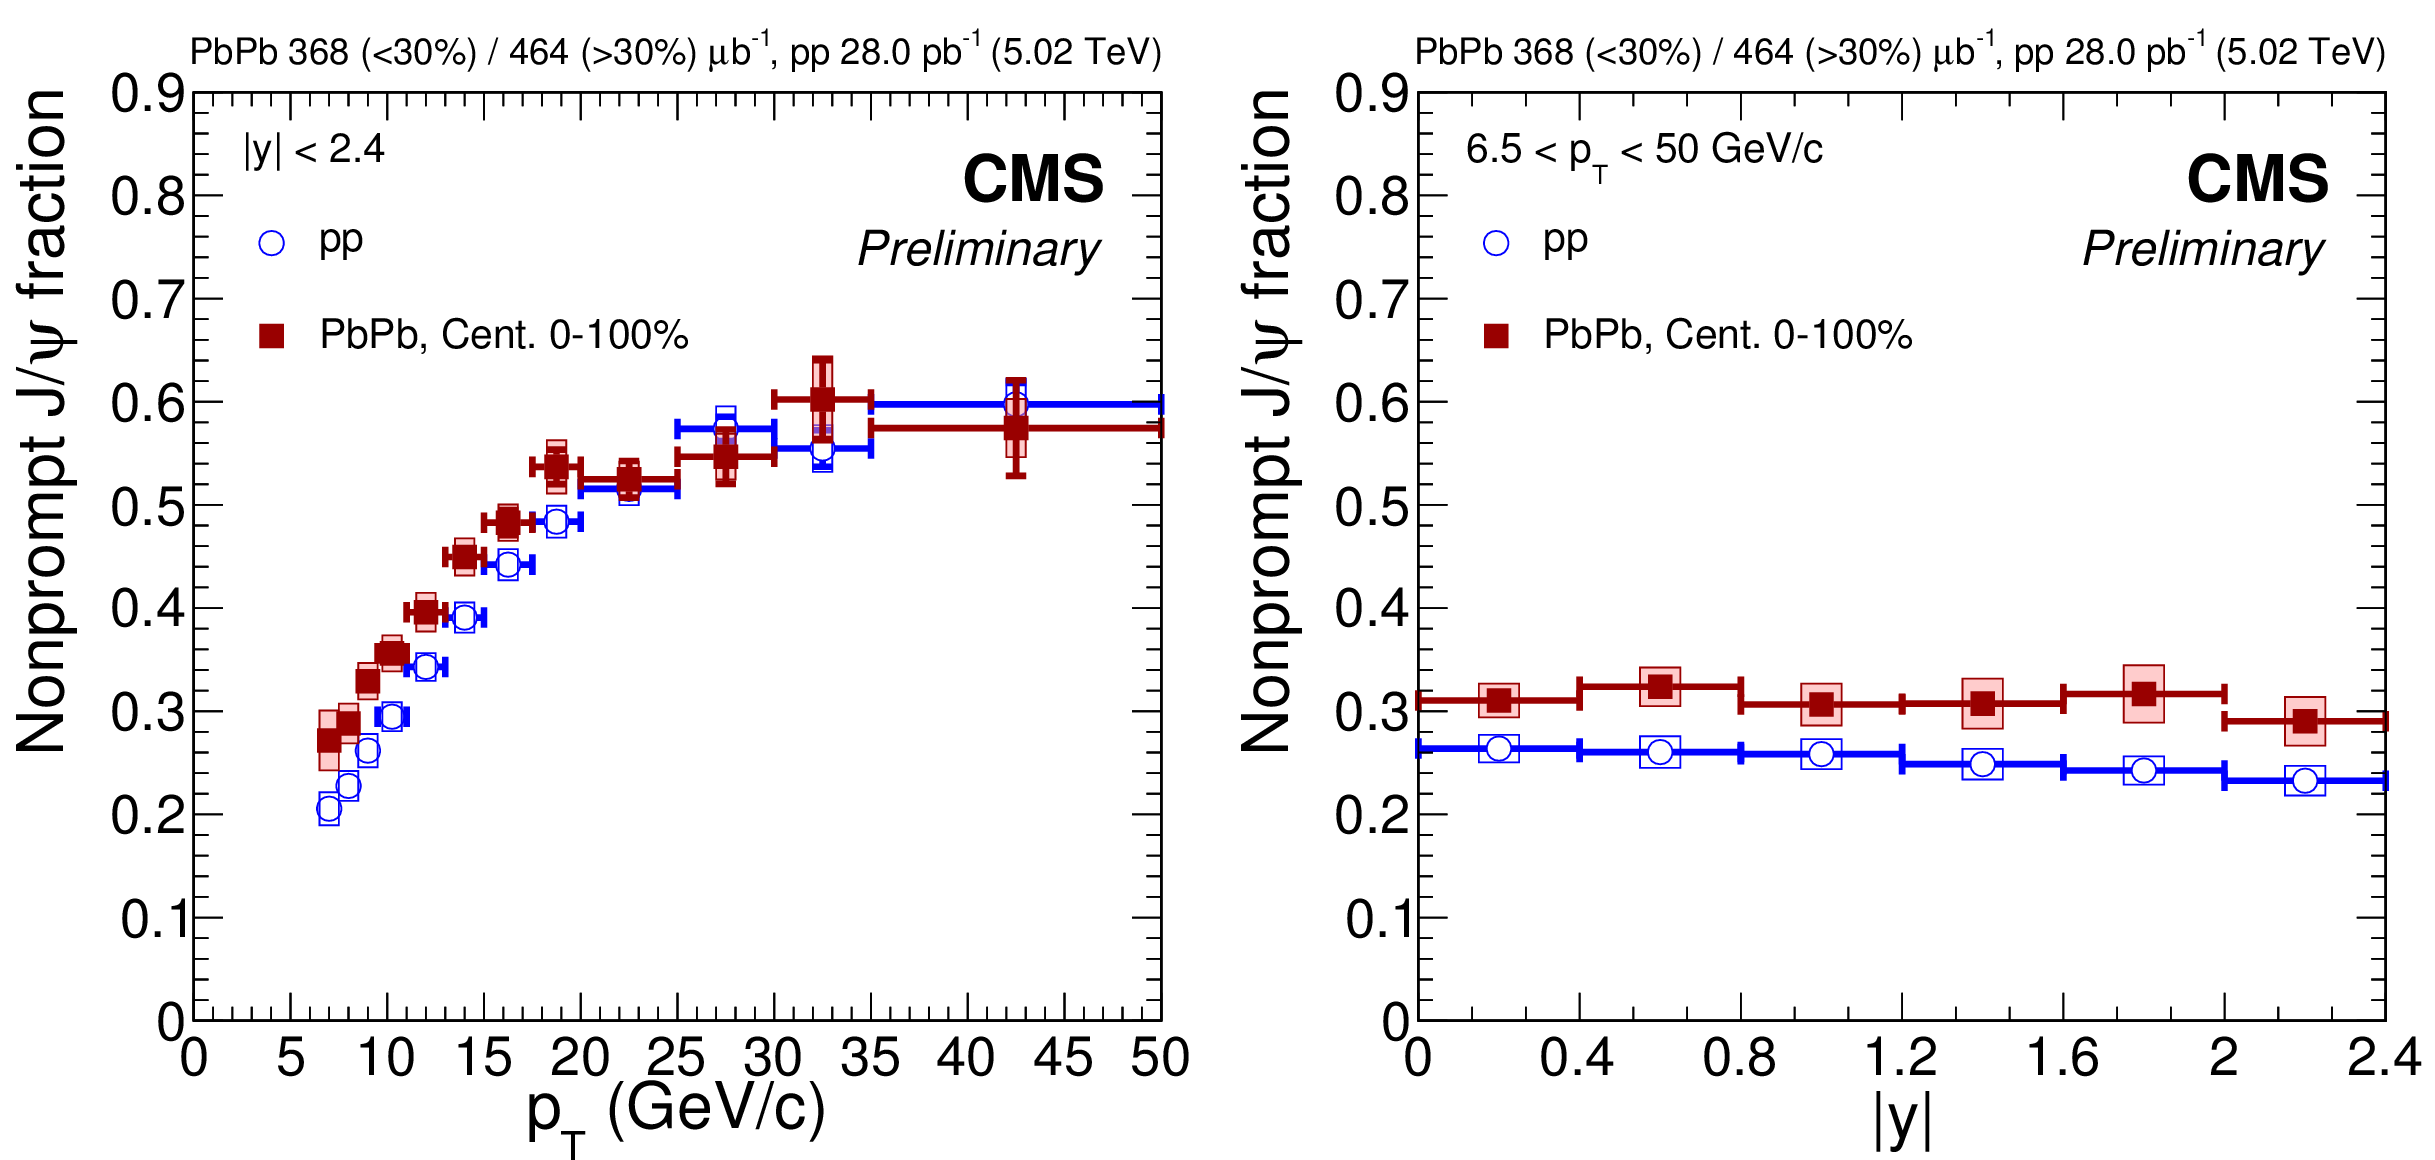
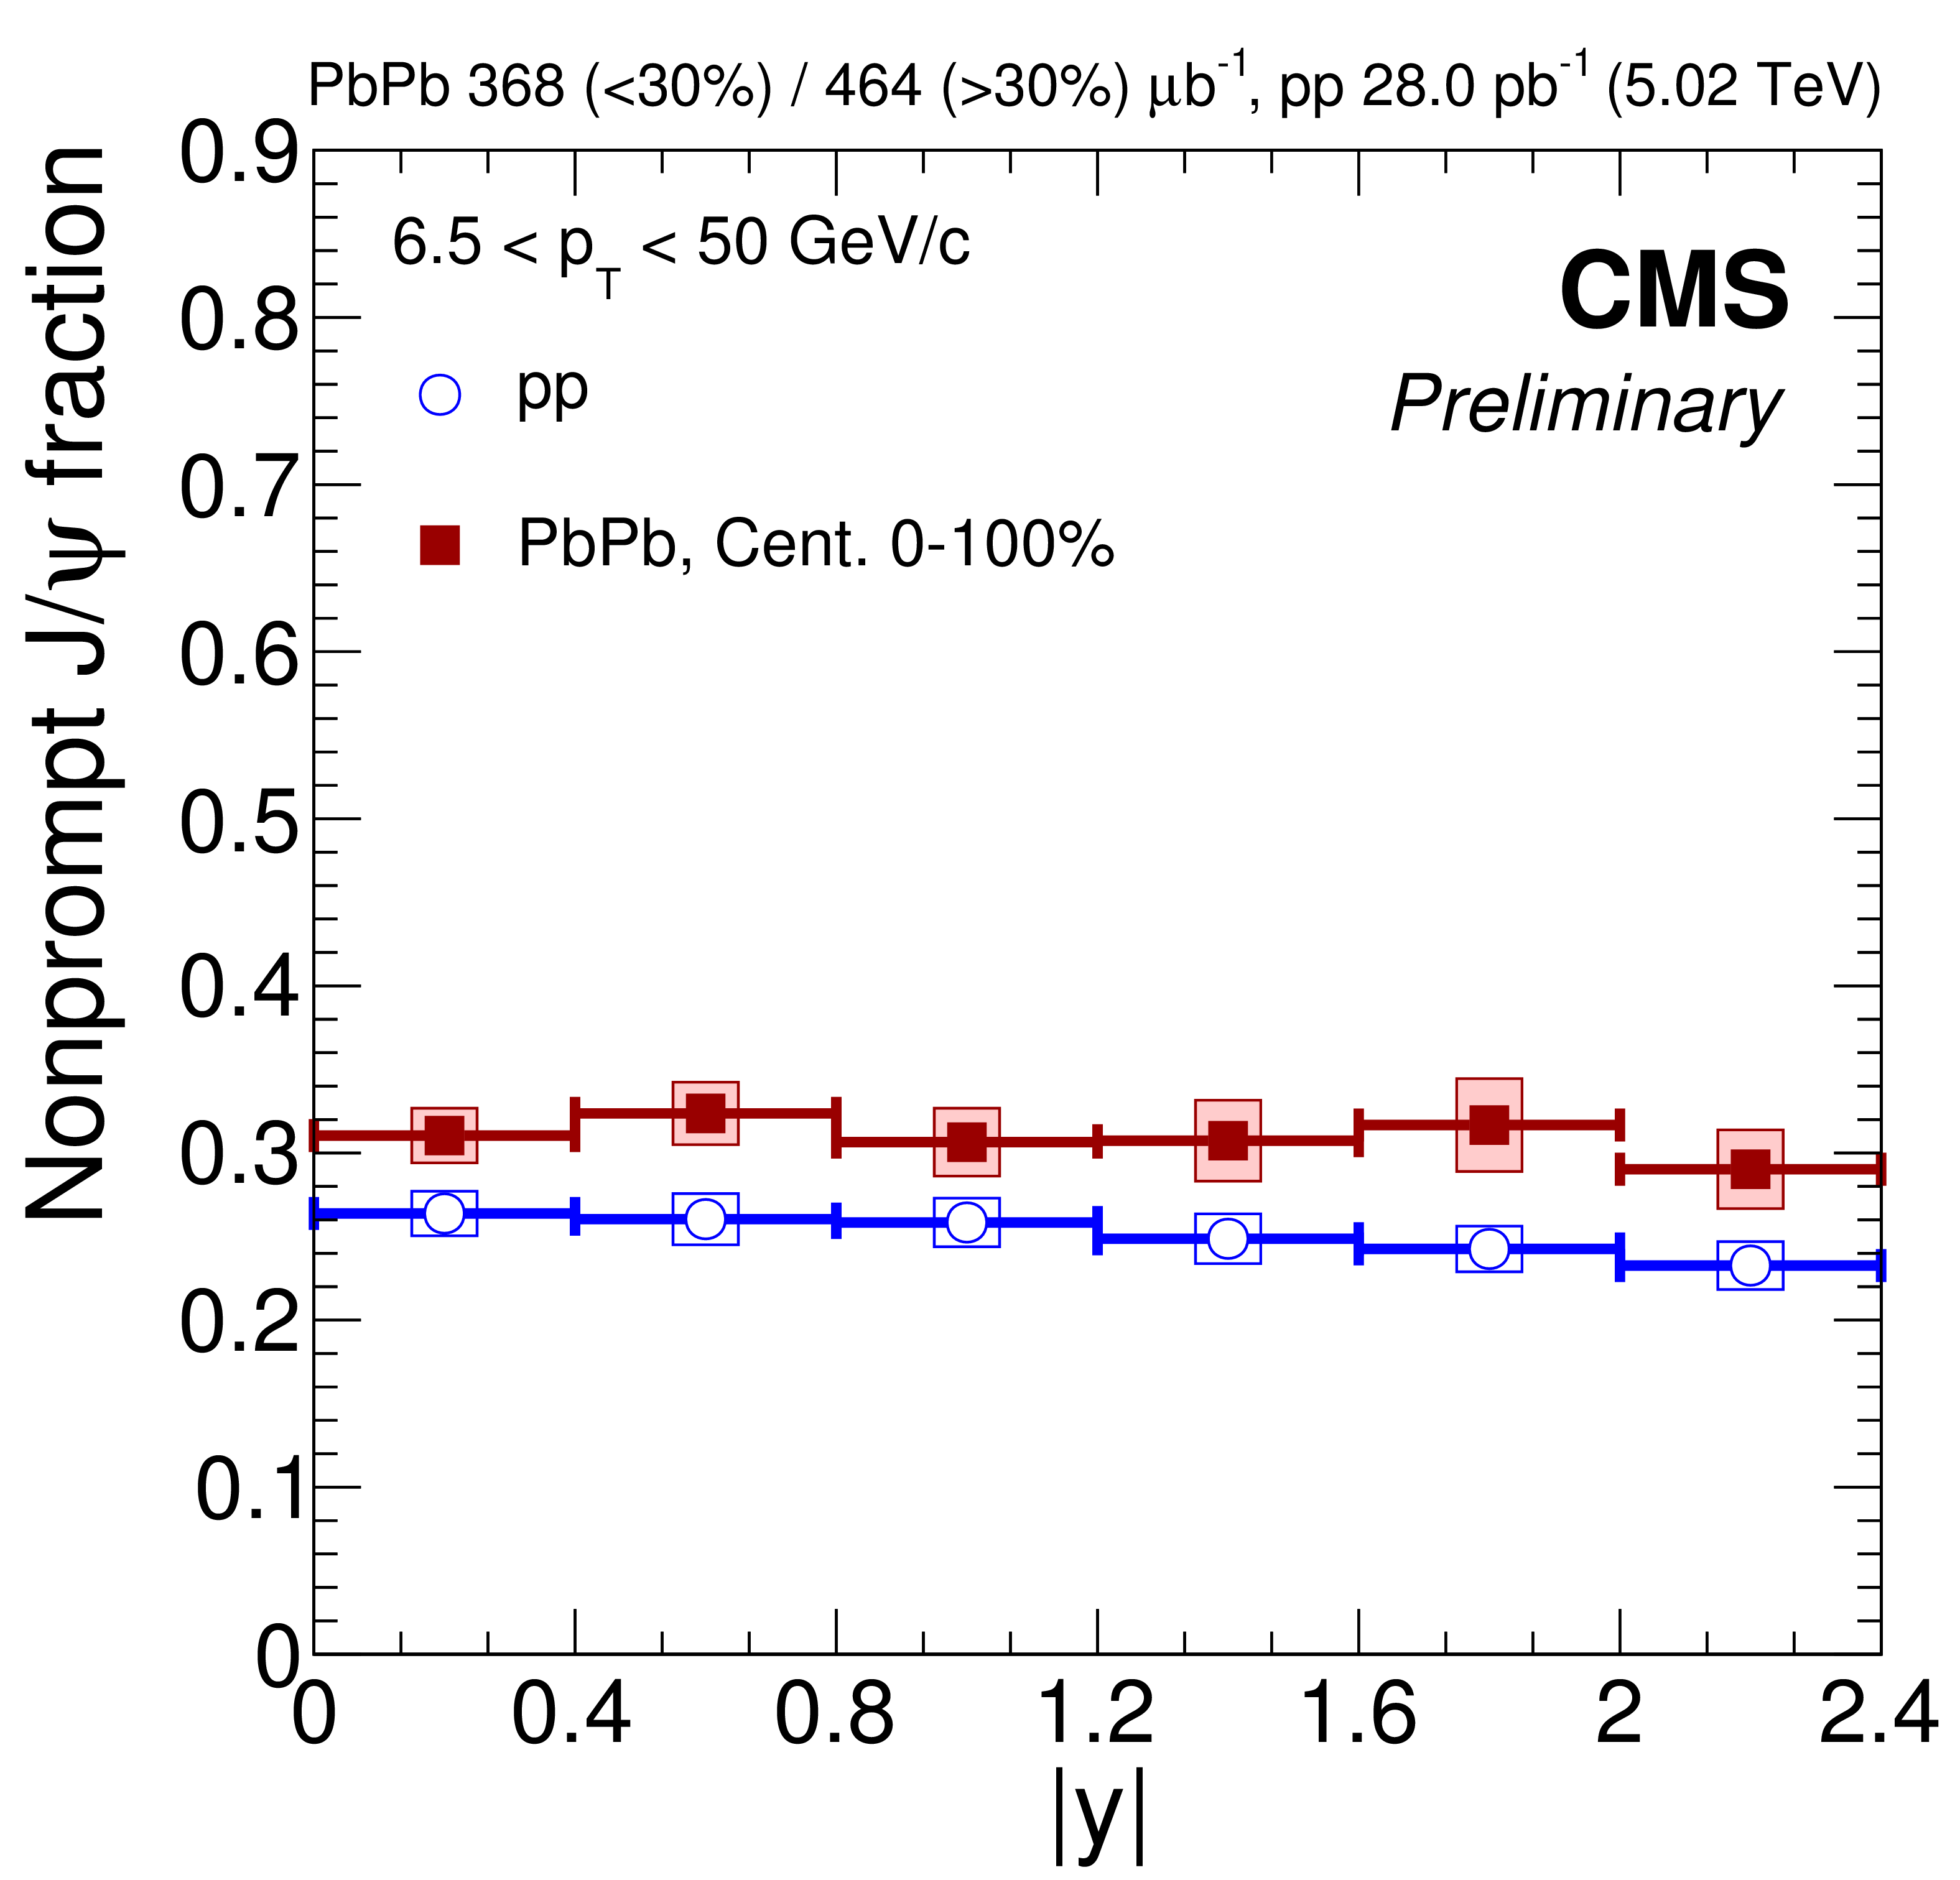
Figure 2:
Nonprompt $\mathrm{J}/\psi$ fractions in pp collisions as a function of $ {p_{\mathrm {T}}} $ (left) and rapidity (right) for pp and PbPb collisions. The bars (boxes) represent statistical (systematic) point-by-point uncertainties. |
png pdf |
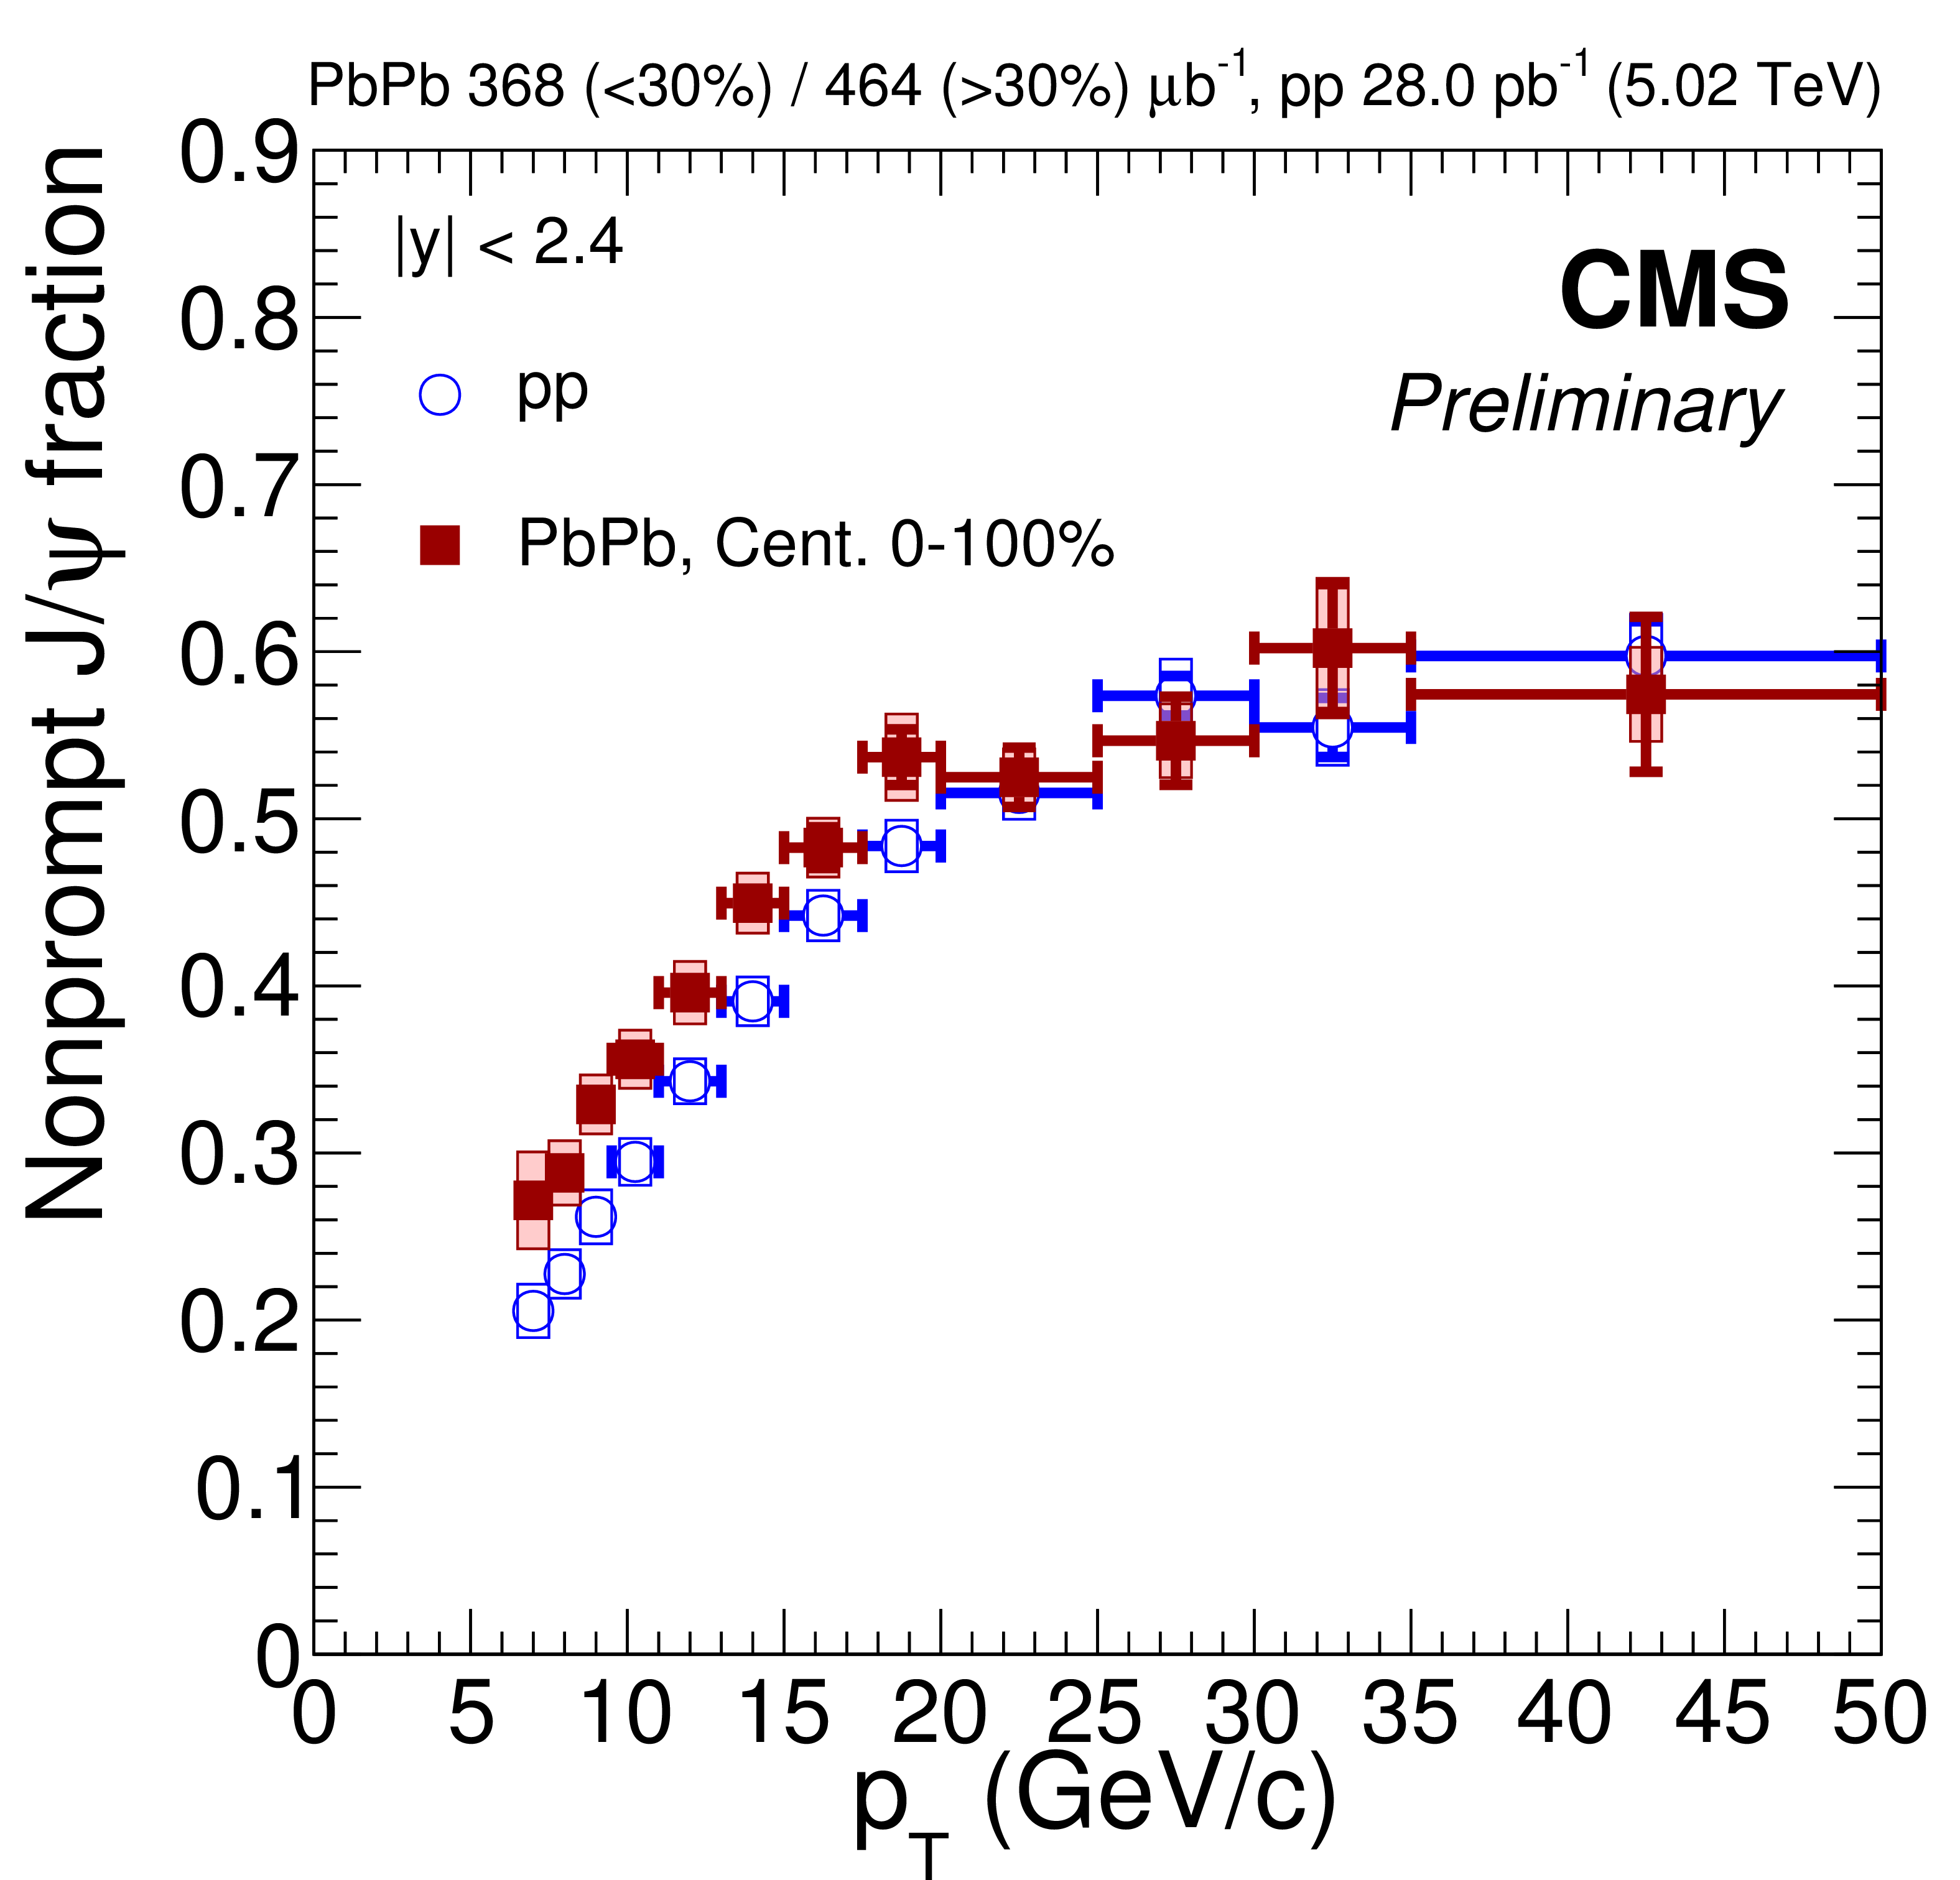
Figure 2-a:
Nonprompt $\mathrm{J}/\psi$ fractions in pp collisions as a function of $ {p_{\mathrm {T}}} $ for pp and PbPb collisions. The bars (boxes) represent statistical (systematic) point-by-point uncertainties. |
png pdf |
Figure 2-b:
Nonprompt $\mathrm{J}/\psi$ fractions in pp collisions as a function of rapidity for pp and PbPb collisions. The bars (boxes) represent statistical (systematic) point-by-point uncertainties. |
png pdf |
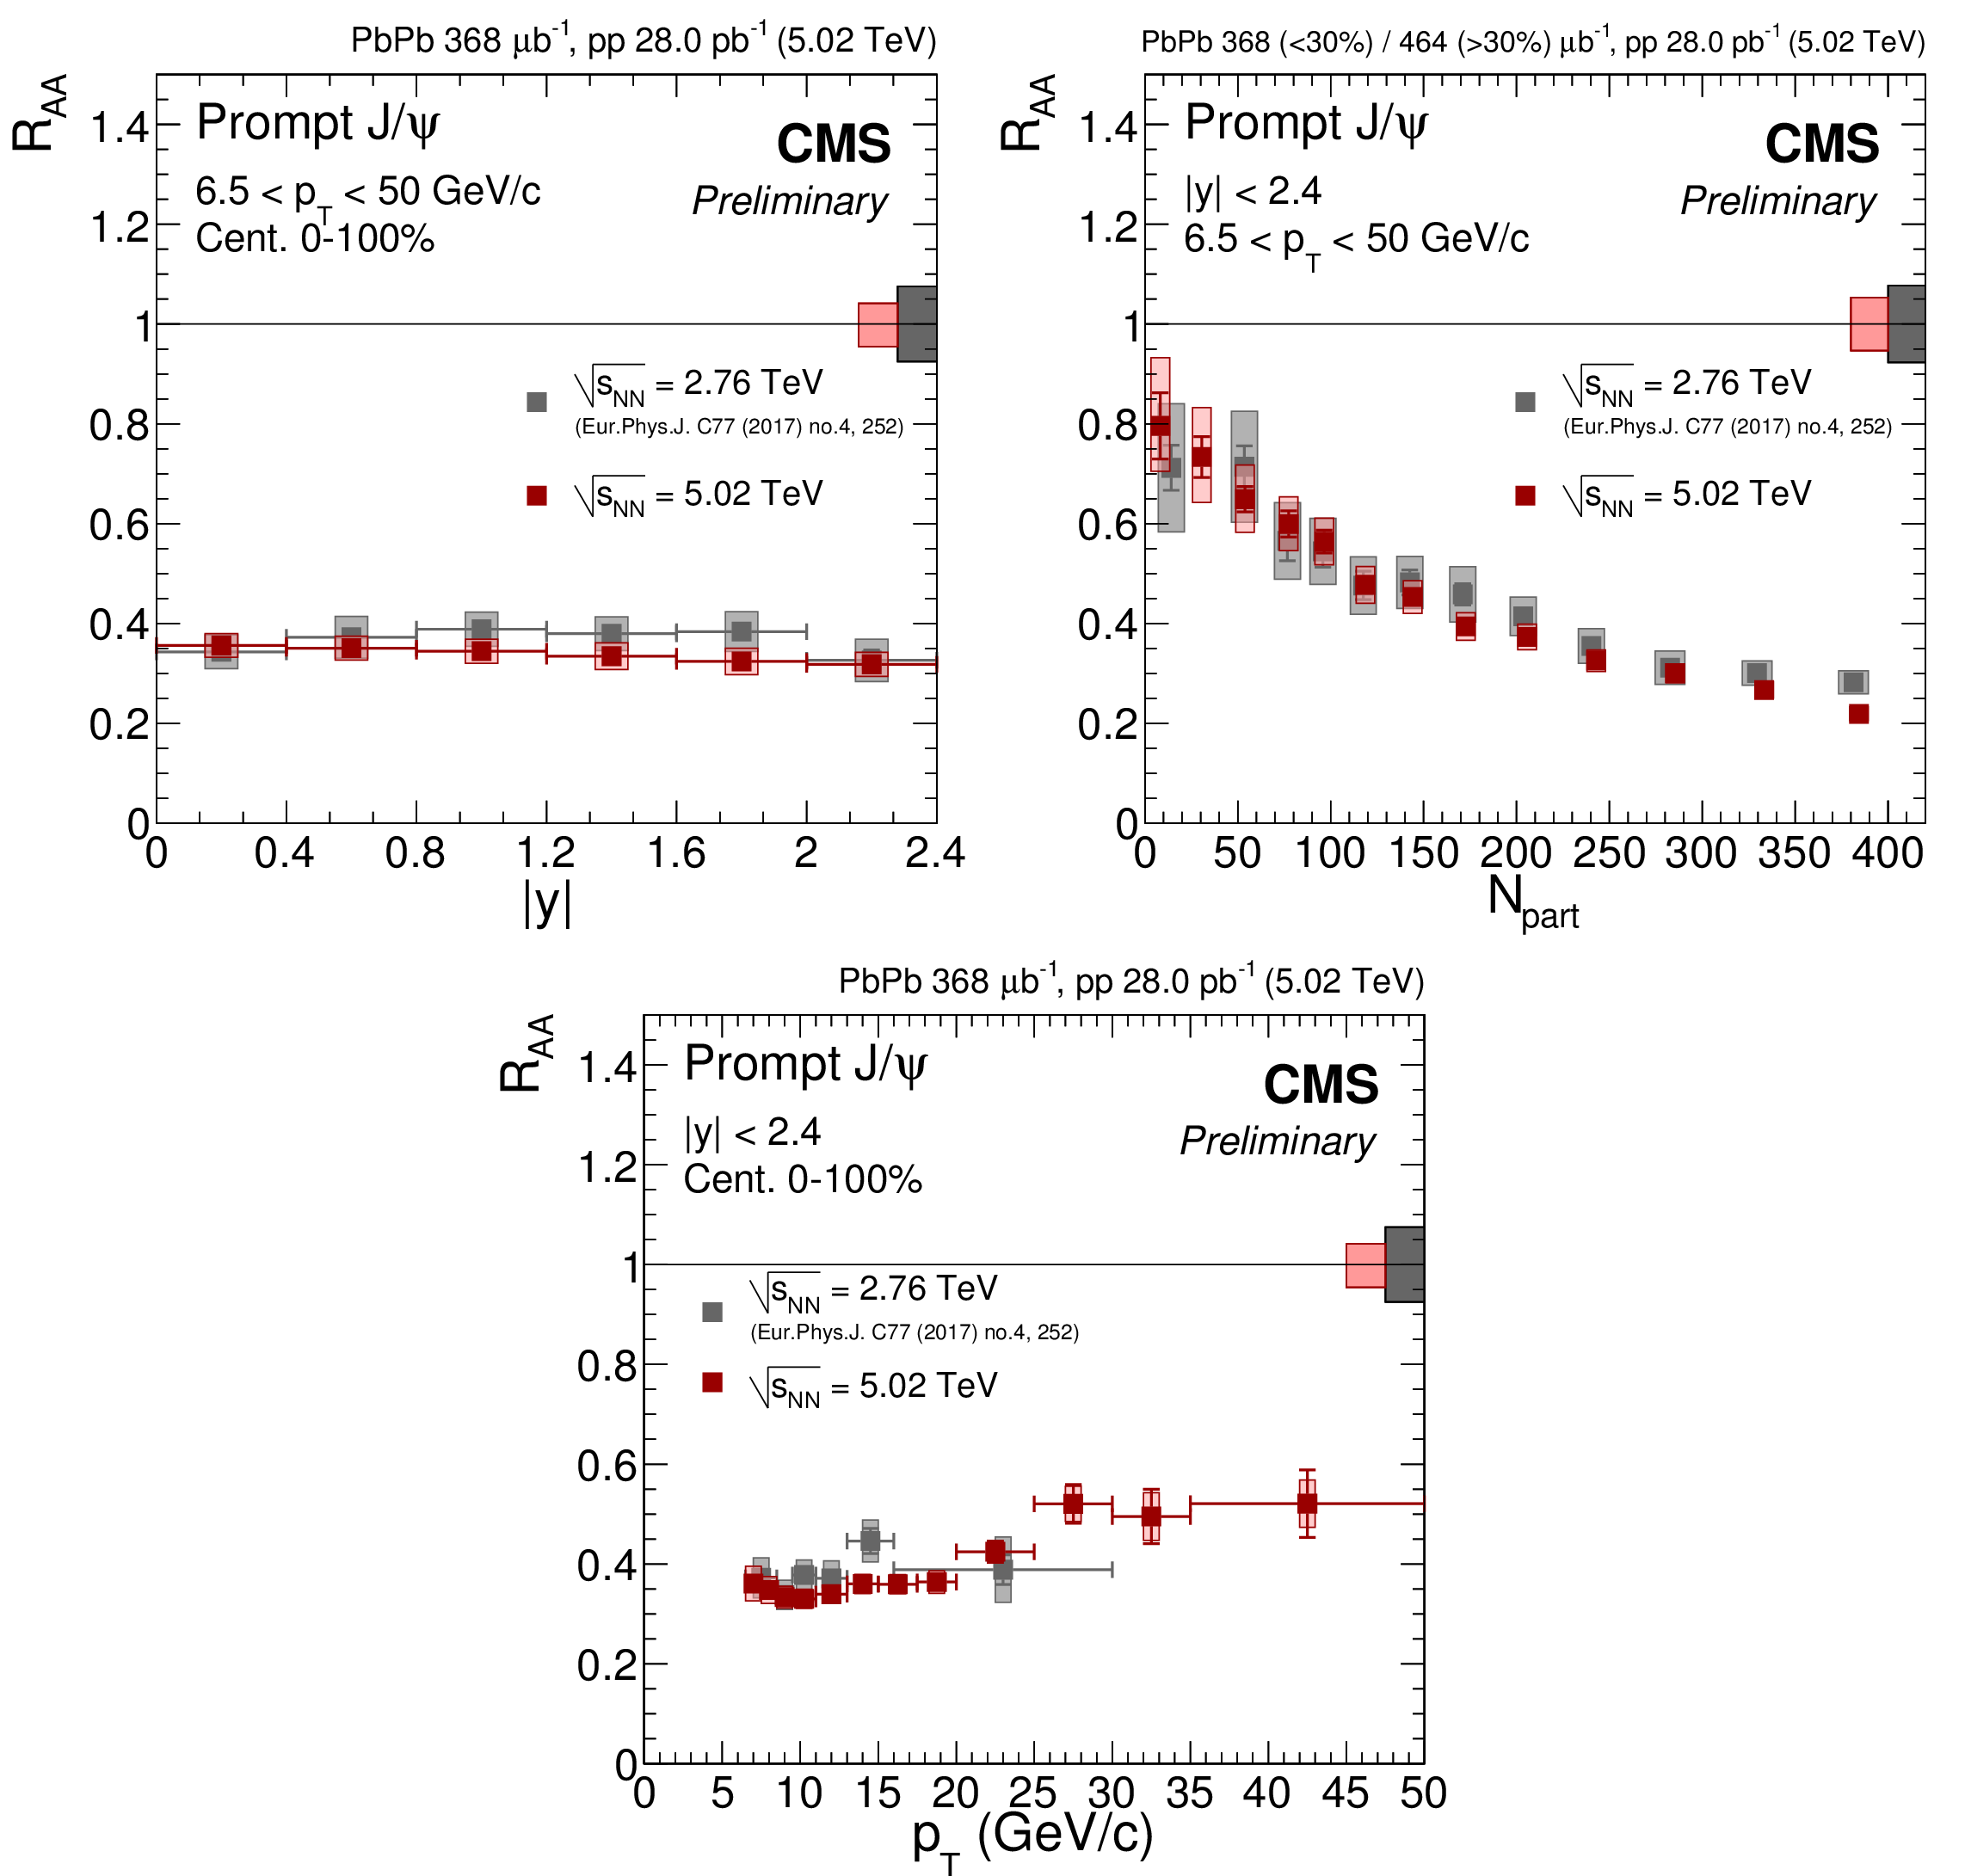
Figure 3:
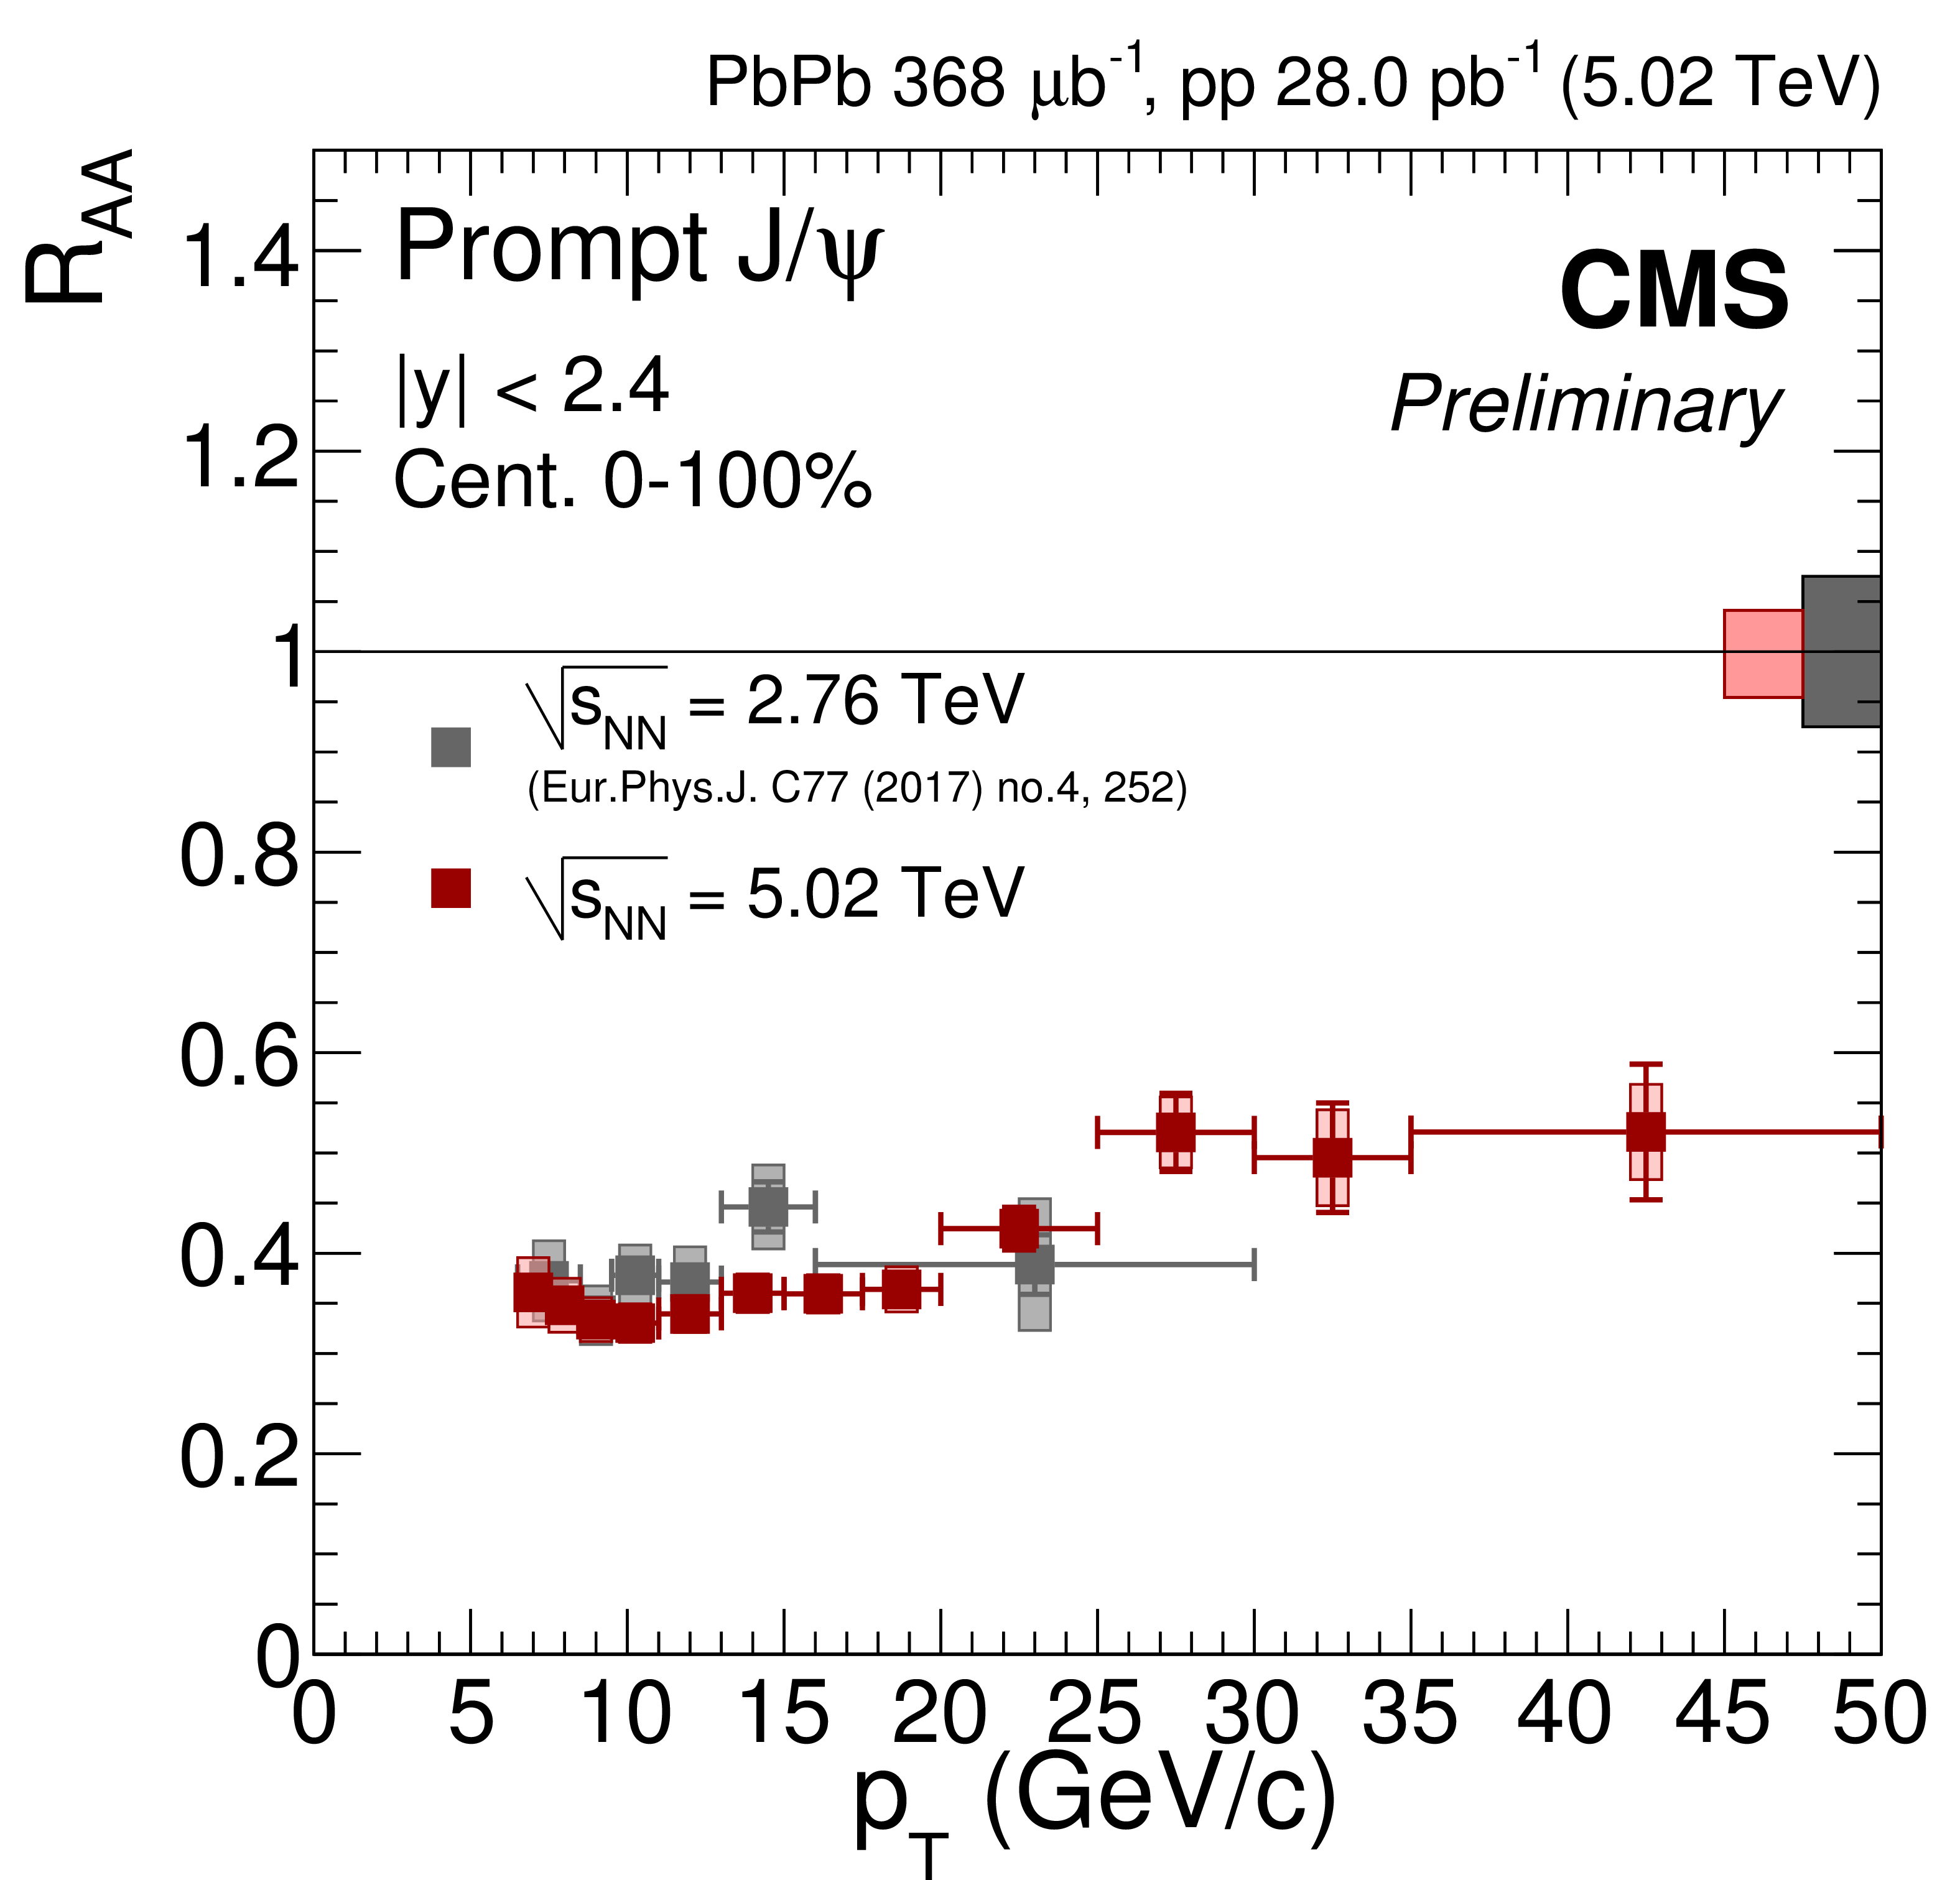
Nuclear modification factor of prompt $\mathrm{J}/\psi$ as a function of rapidity (top left), centrality (top right) and $ {p_{\mathrm {T}}} $ (bottom) at $\sqrt {s_{\mathrm {NN}}} = $ 5.02 TeV. Results obtained at $\sqrt {s_{\mathrm {NN}}} = $ 2.76 TeV are overlaid for comparison [10]. The bars (boxes) represent statistical (systematic) point-by-point uncertainties. The boxes plotted at $ {R_{AA}} =$ 1 indicate the scale of the global relative uncertainties. |
png pdf |
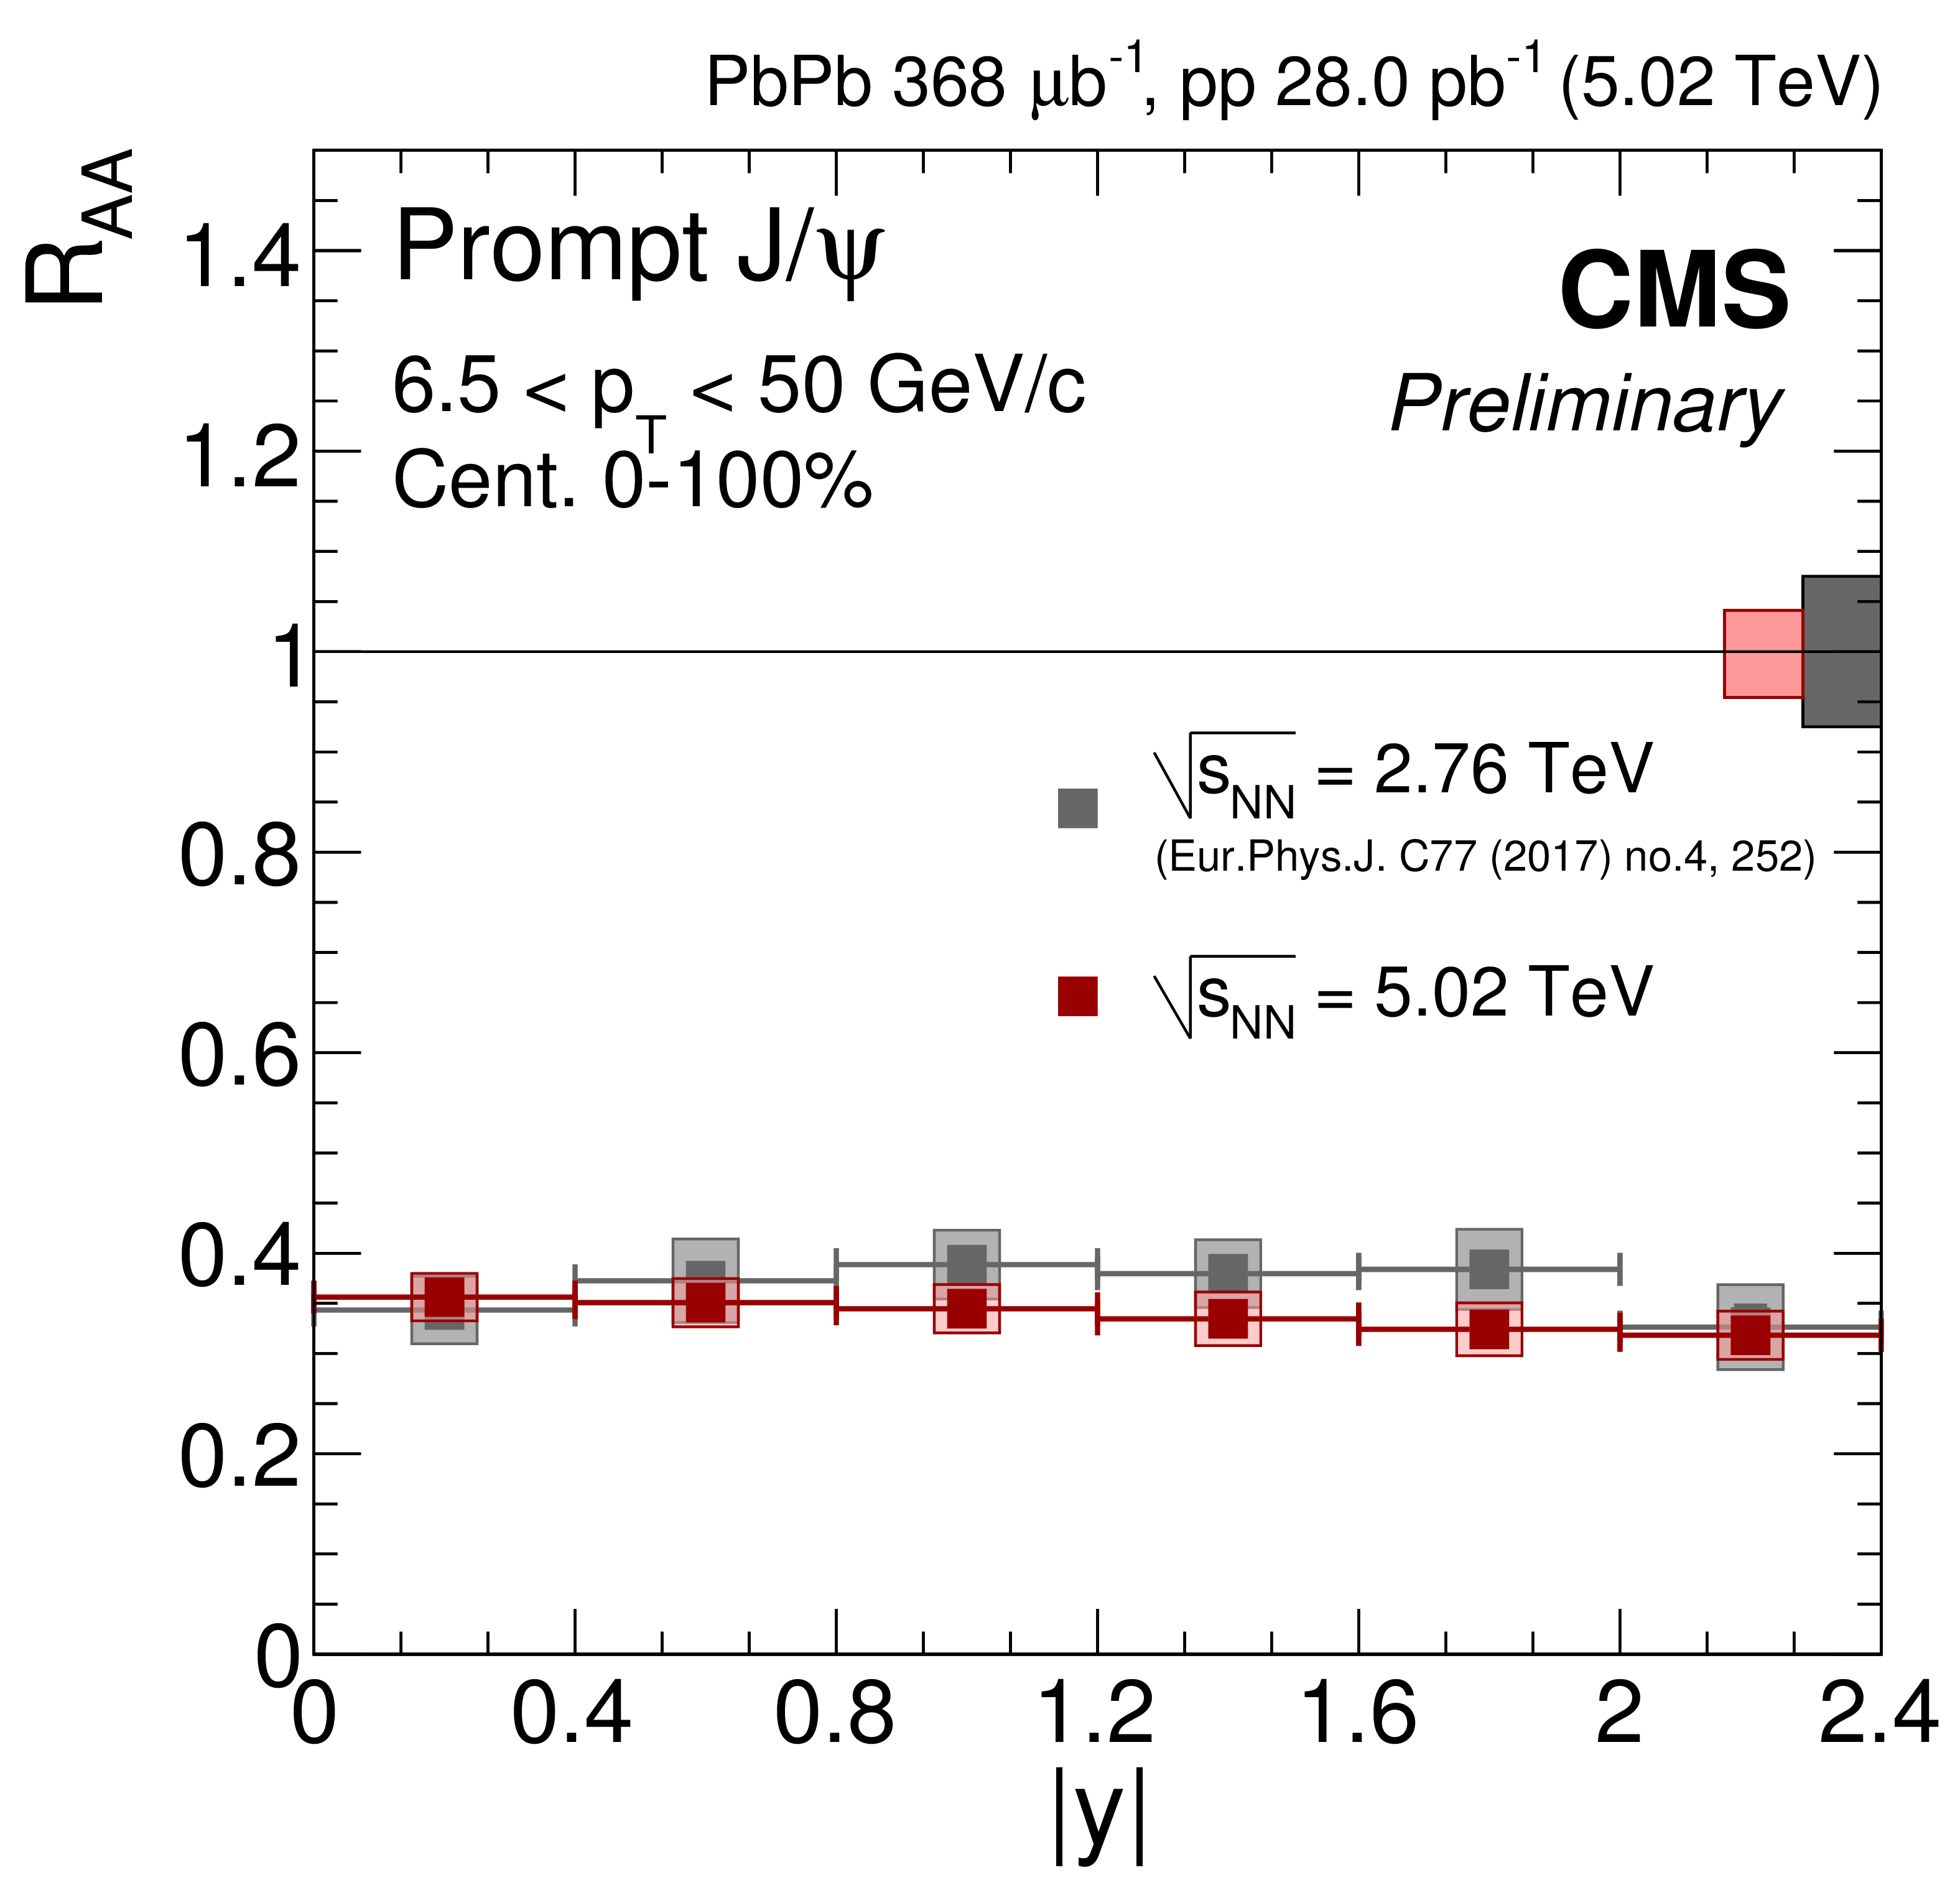
Figure 3-a:
Nuclear modification factor of prompt $\mathrm{J}/\psi$ as a function of rapidity at $\sqrt {s_{\mathrm {NN}}} = $ 5.02 TeV. Results obtained at $\sqrt {s_{\mathrm {NN}}} = $ 2.76 TeV are overlaid for comparison [10]. The bars (boxes) represent statistical (systematic) point-by-point uncertainties. The boxes plotted at $ {R_{AA}} =$ 1 indicate the scale of the global relative uncertainties. |
png pdf |
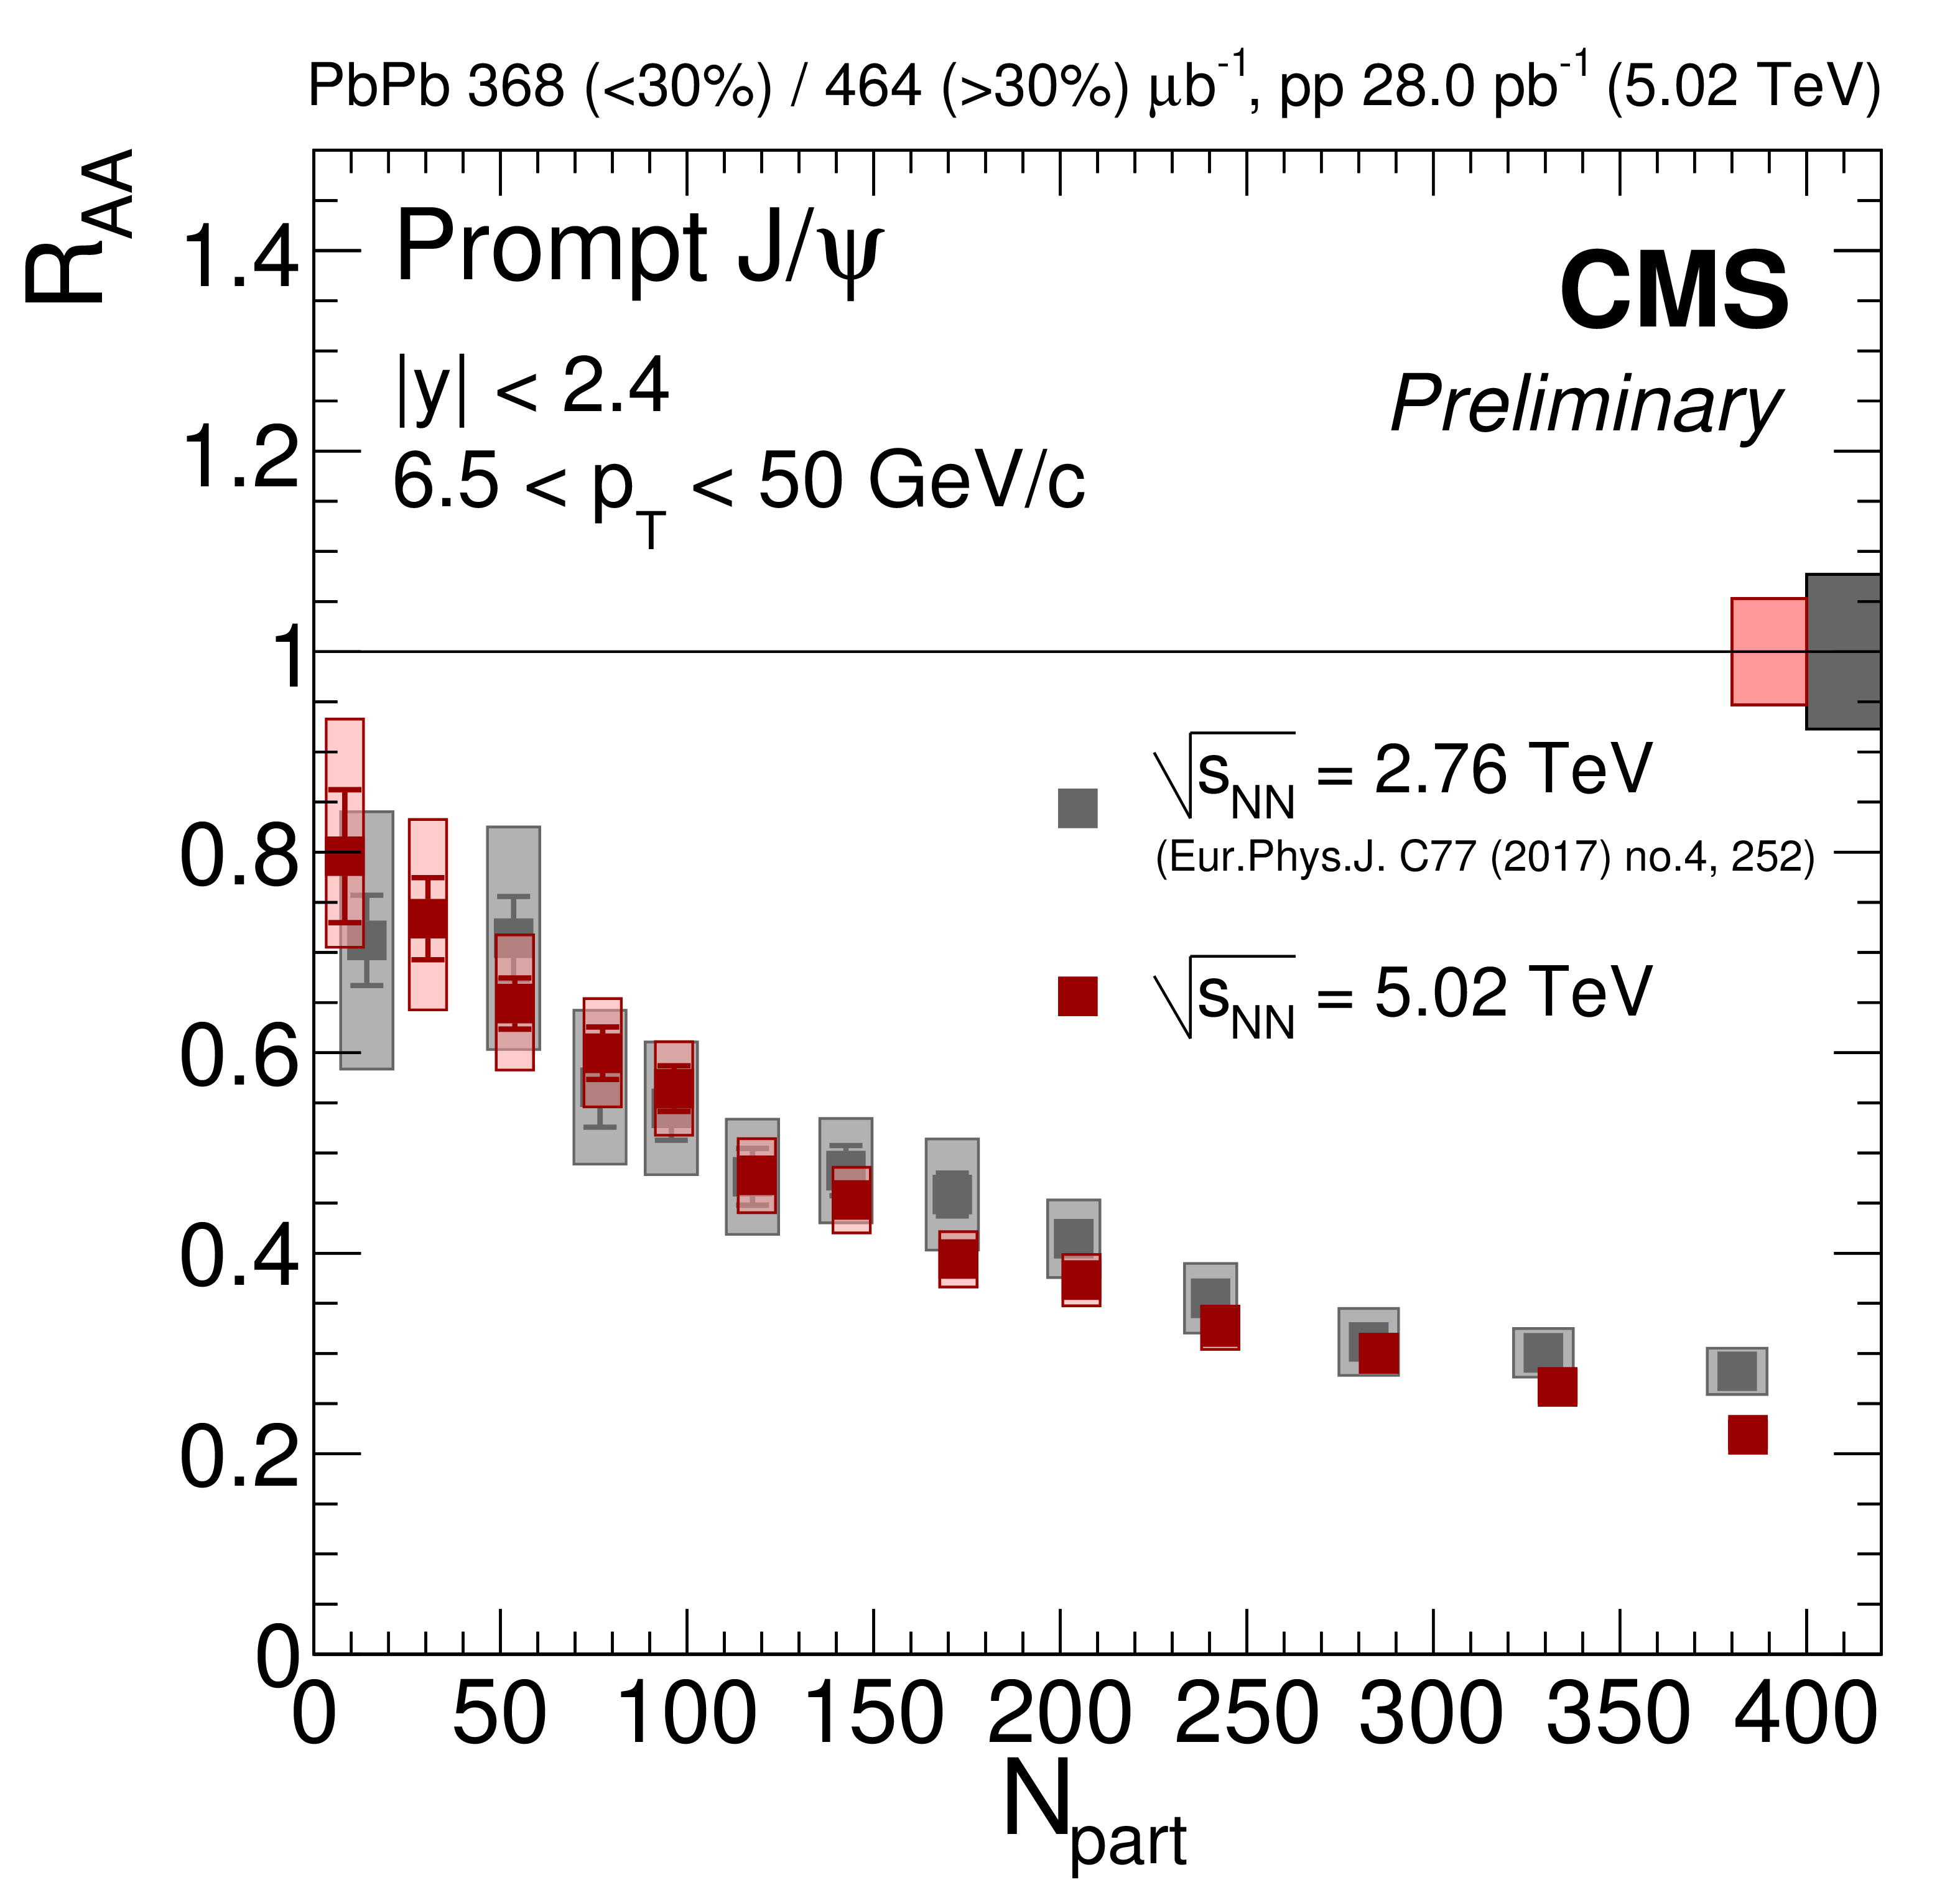
Figure 3-b:
Nuclear modification factor of prompt $\mathrm{J}/\psi$ as a function of centrality at $\sqrt {s_{\mathrm {NN}}} = $ 5.02 TeV. Results obtained at $\sqrt {s_{\mathrm {NN}}} = $ 2.76 TeV are overlaid for comparison [10]. The bars (boxes) represent statistical (systematic) point-by-point uncertainties. The boxes plotted at $ {R_{AA}} =$ 1 indicate the scale of the global relative uncertainties. |
png pdf |
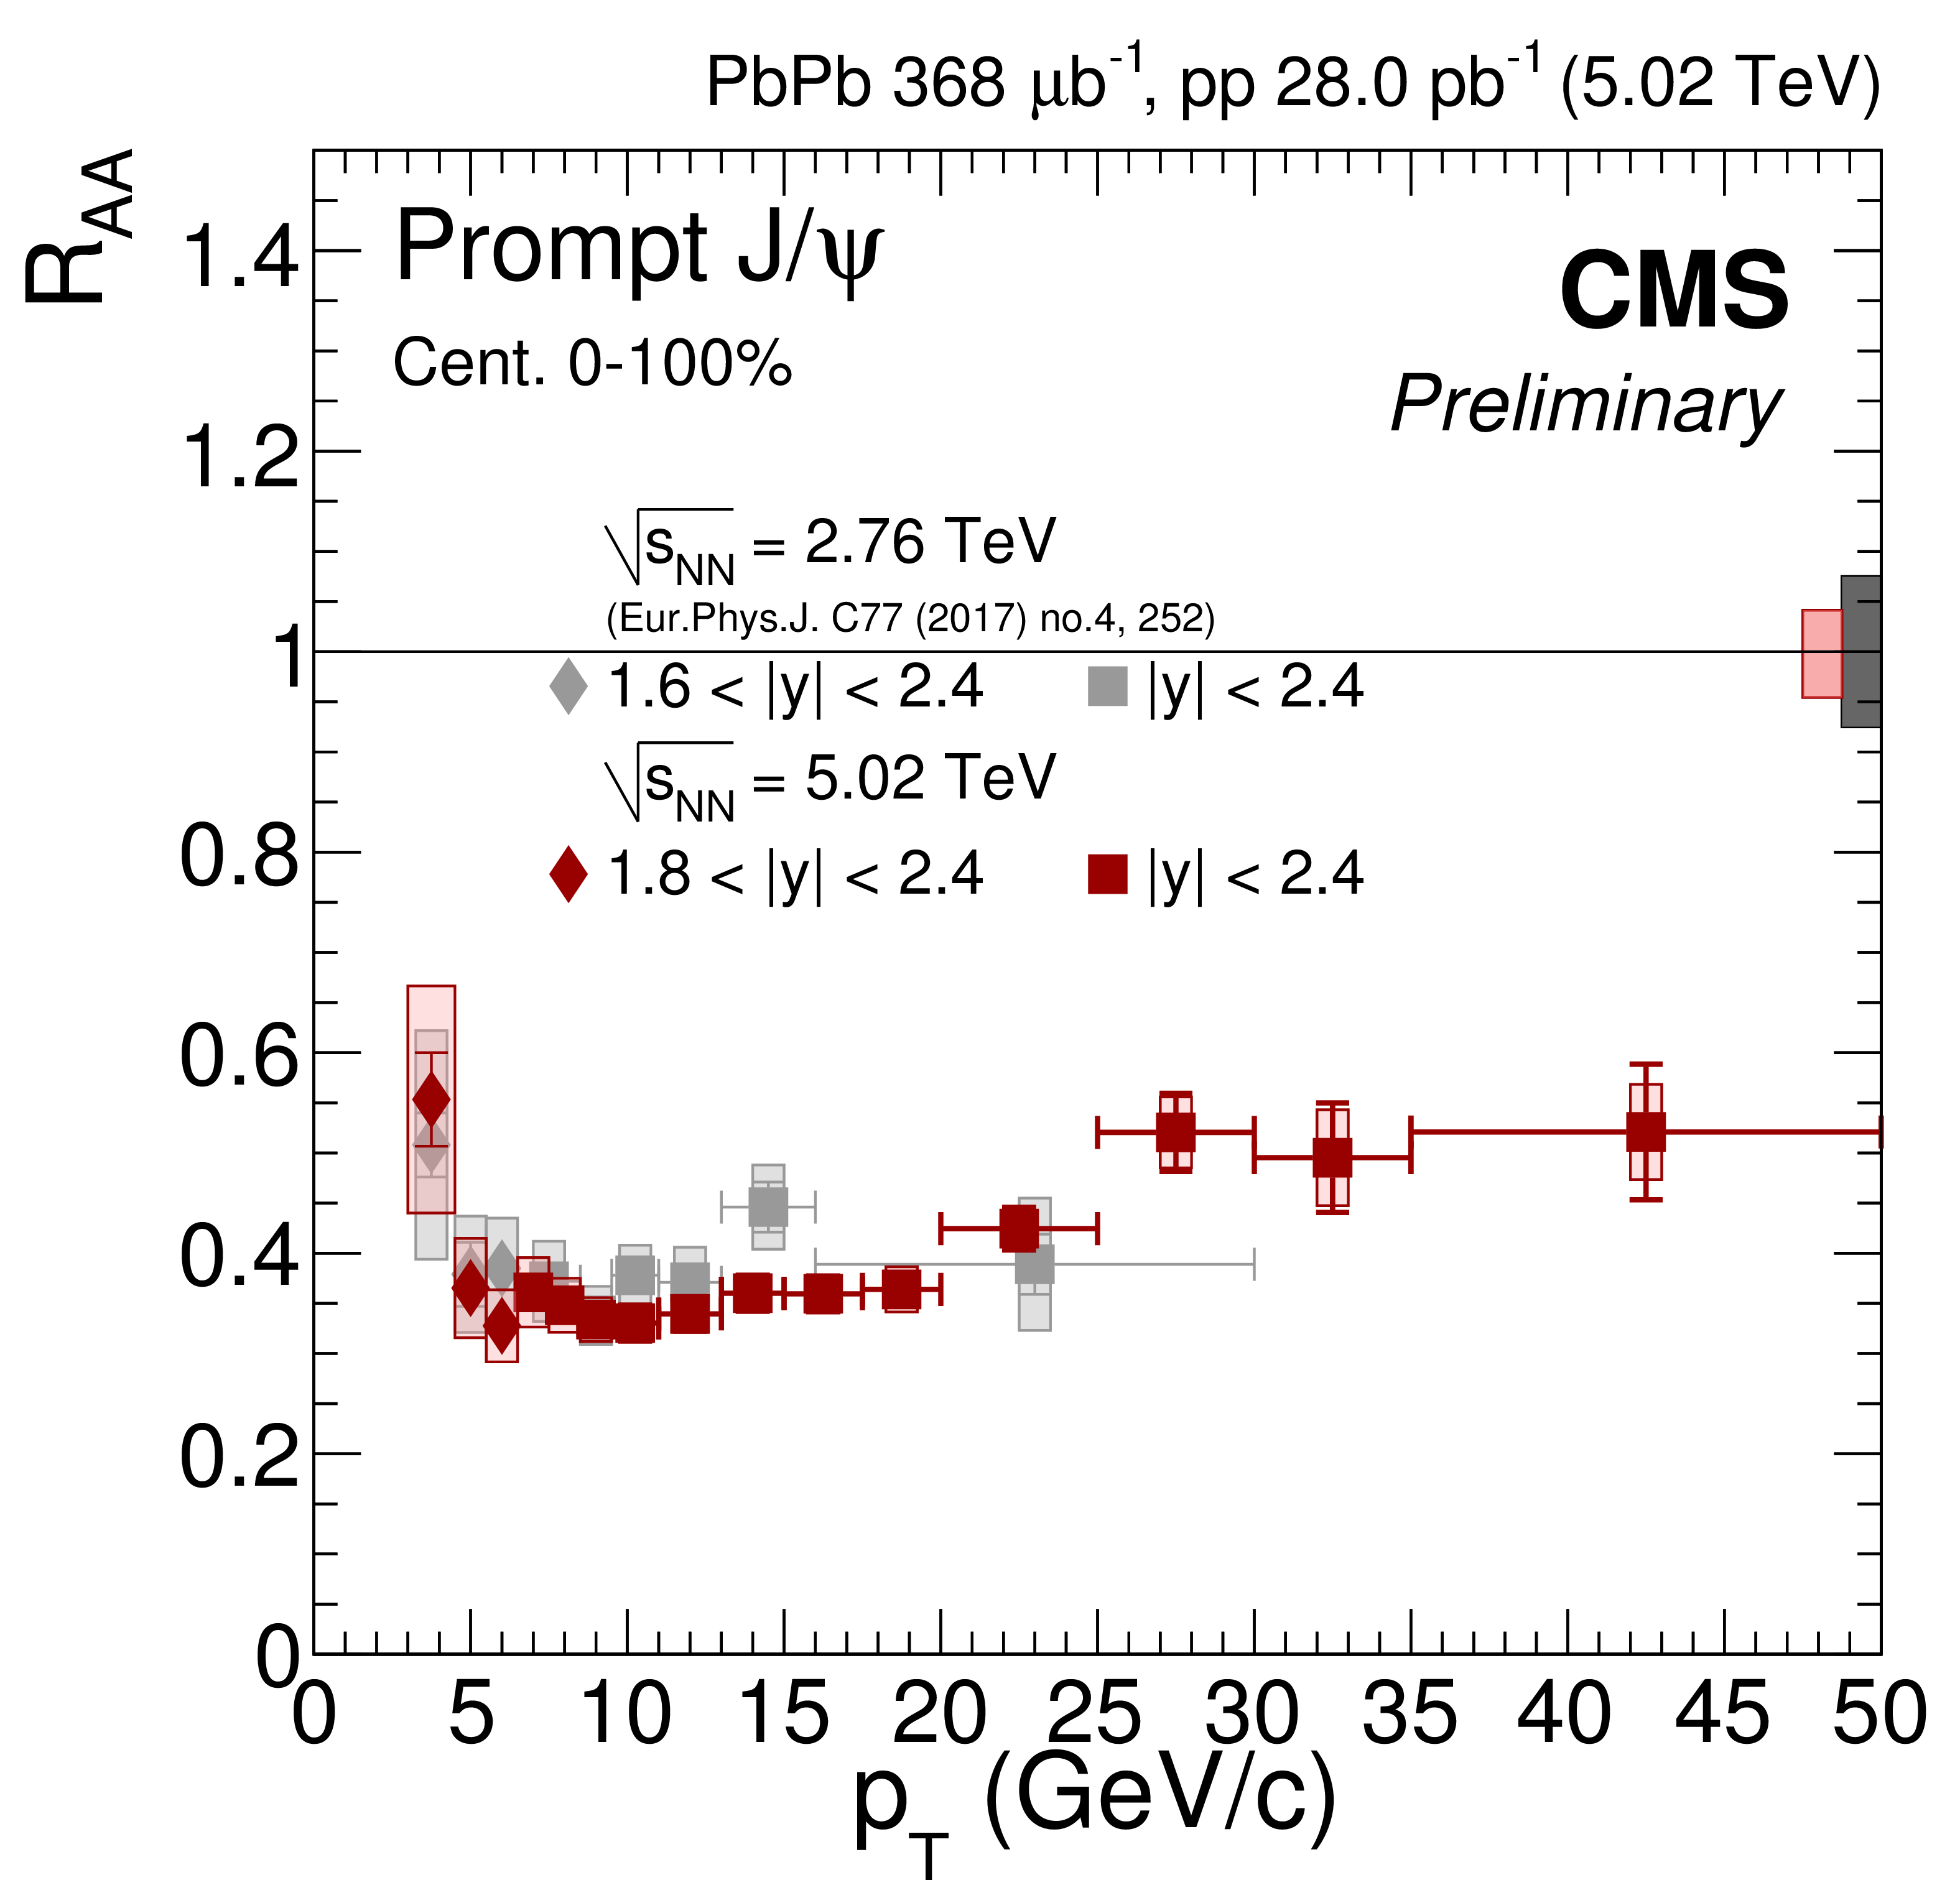
Figure 3-c:
Nuclear modification factor of prompt $\mathrm{J}/\psi$ as a function of $ {p_{\mathrm {T}}} $ at $\sqrt {s_{\mathrm {NN}}} = $ 5.02 TeV. Results obtained at $\sqrt {s_{\mathrm {NN}}} = $ 2.76 TeV are overlaid for comparison [10]. The bars (boxes) represent statistical (systematic) point-by-point uncertainties. The boxes plotted at $ {R_{AA}} =$ 1 indicate the scale of the global relative uncertainties. |
png pdf |
Figure 4:
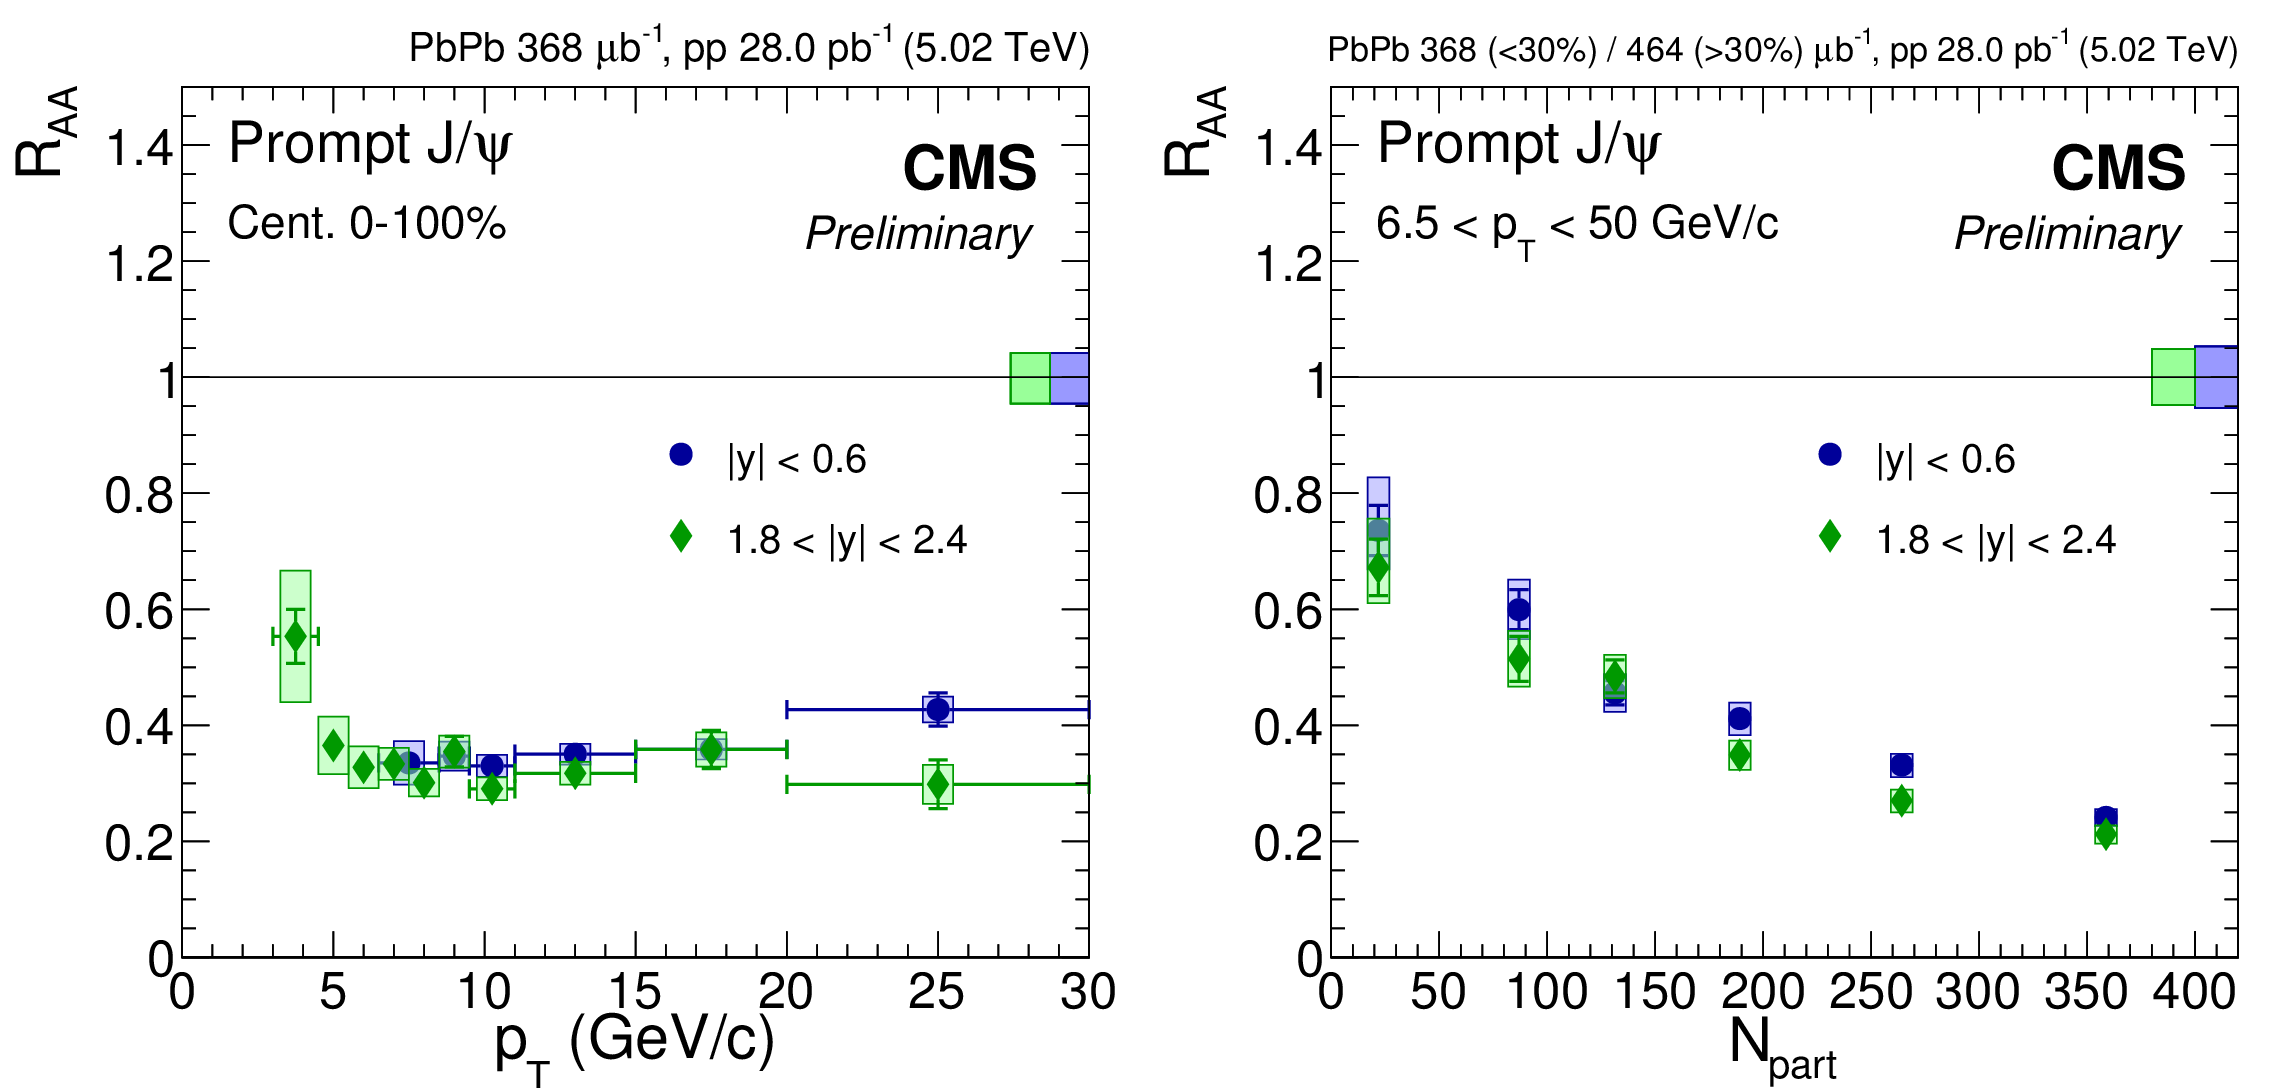
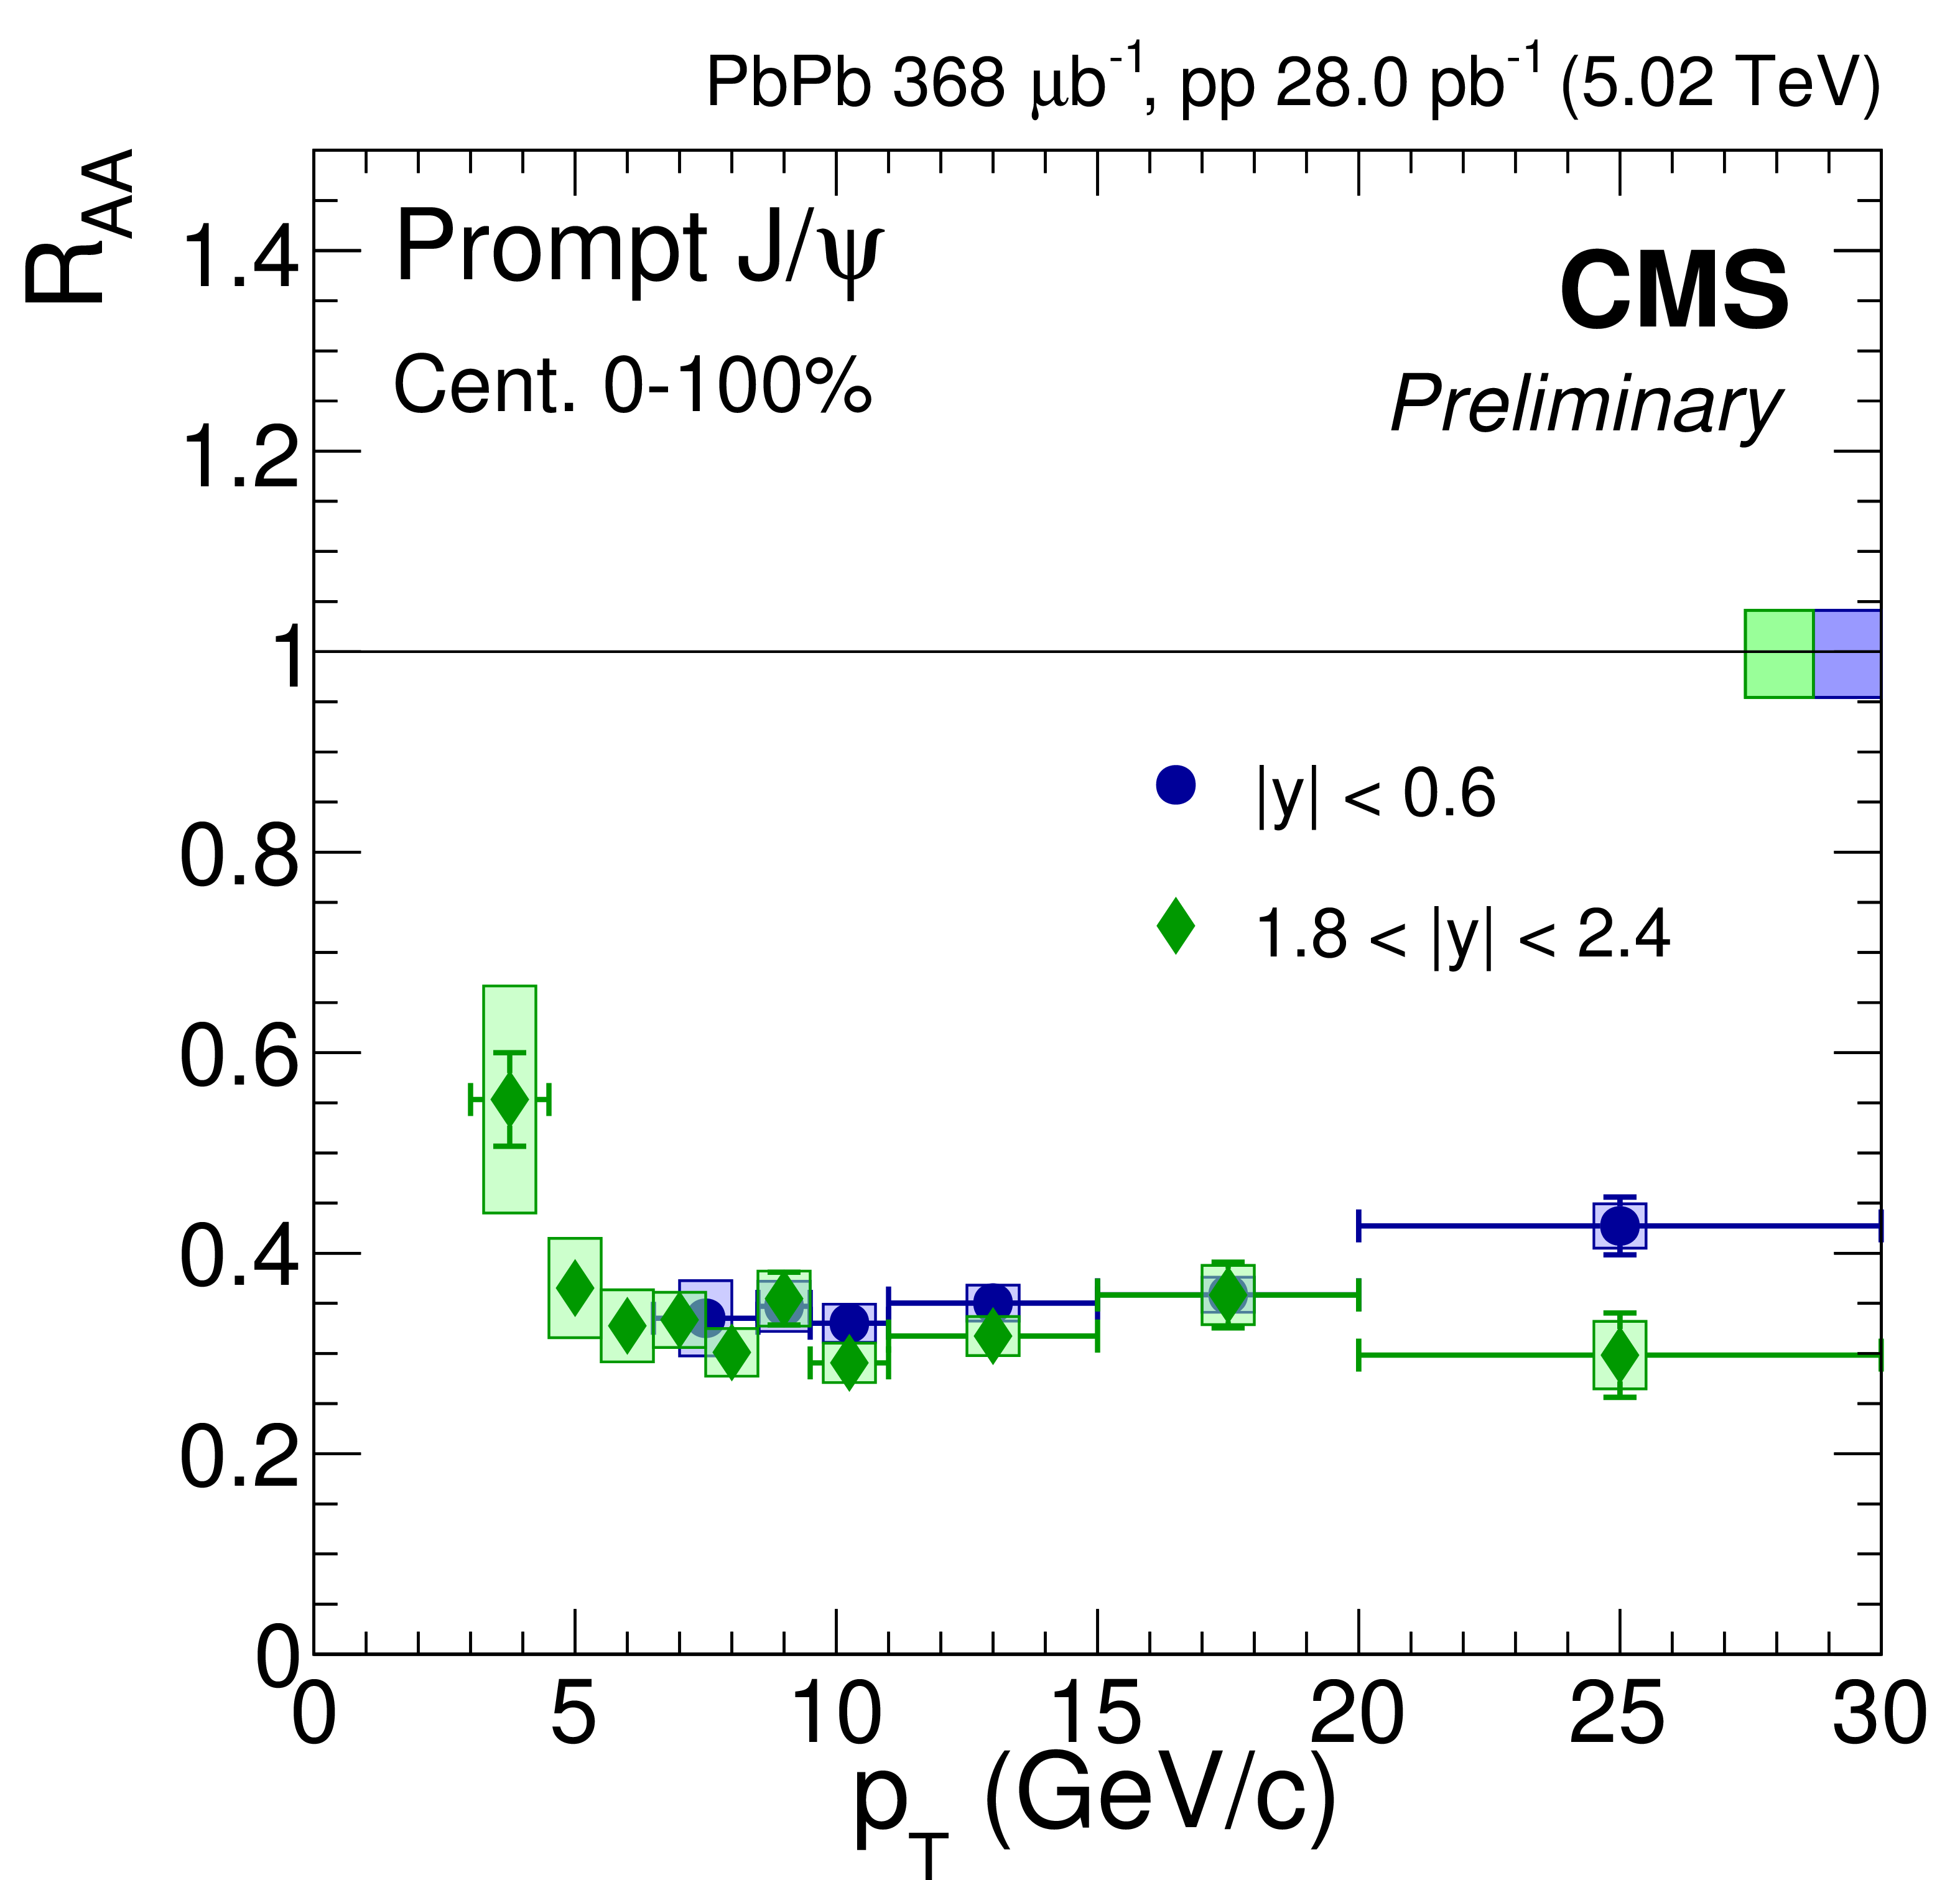
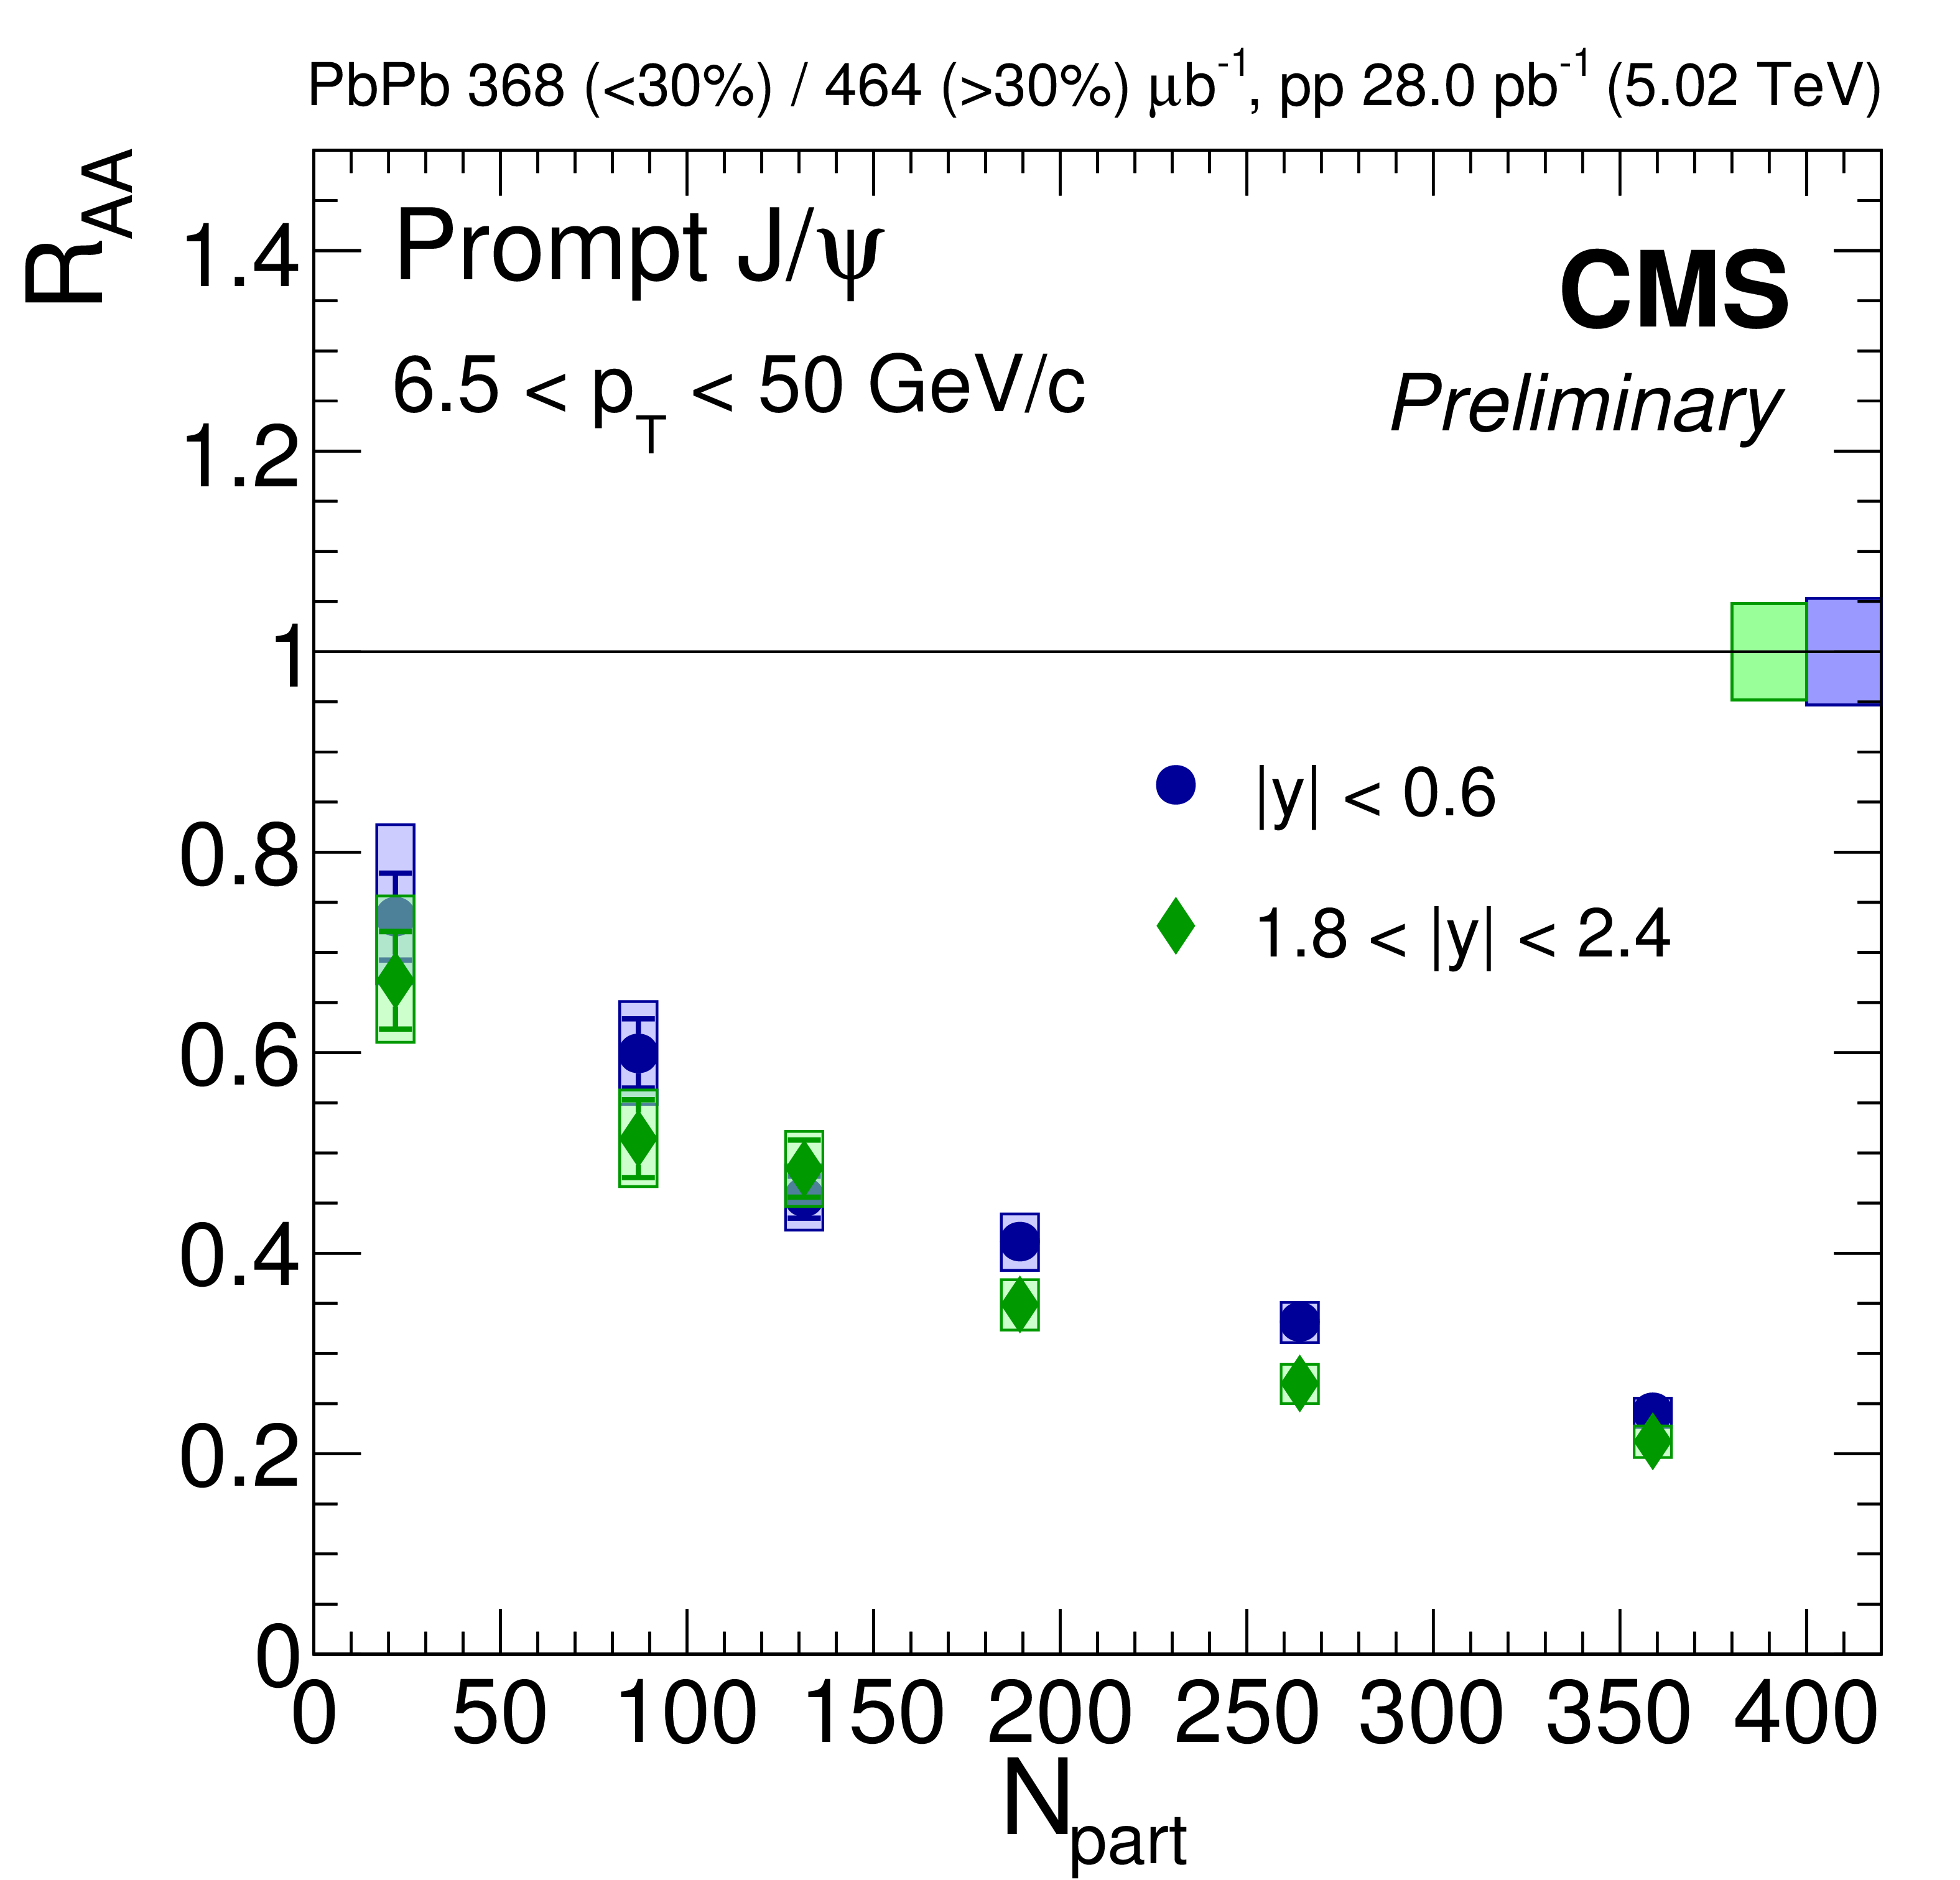
Nuclear modification factor of prompt $\mathrm{J}/\psi$ as a function of $ {p_{\mathrm {T}}} $ (left) and centrality (right), in the mid and most forward rapidity intervals. The bars (boxes) represent statistical (systematic) point-by-point uncertainties. The boxes plotted at $ {R_{AA}} = $ 1 indicate the scale of the global relative uncertainties. |
png pdf |
Figure 4-a:
Nuclear modification factor of prompt $\mathrm{J}/\psi$ as a function of $ {p_{\mathrm {T}}} $, in the mid and most forward rapidity intervals. The bars (boxes) represent statistical (systematic) point-by-point uncertainties. The boxes plotted at $ {R_{AA}} = $ 1 indicate the scale of the global relative uncertainties. |
png pdf |
Figure 4-b:
Nuclear modification factor of prompt $\mathrm{J}/\psi$ as a function of centrality, in the mid and most forward rapidity intervals. The bars (boxes) represent statistical (systematic) point-by-point uncertainties. The boxes plotted at $ {R_{AA}} = $ 1 indicate the scale of the global relative uncertainties. |
png pdf |
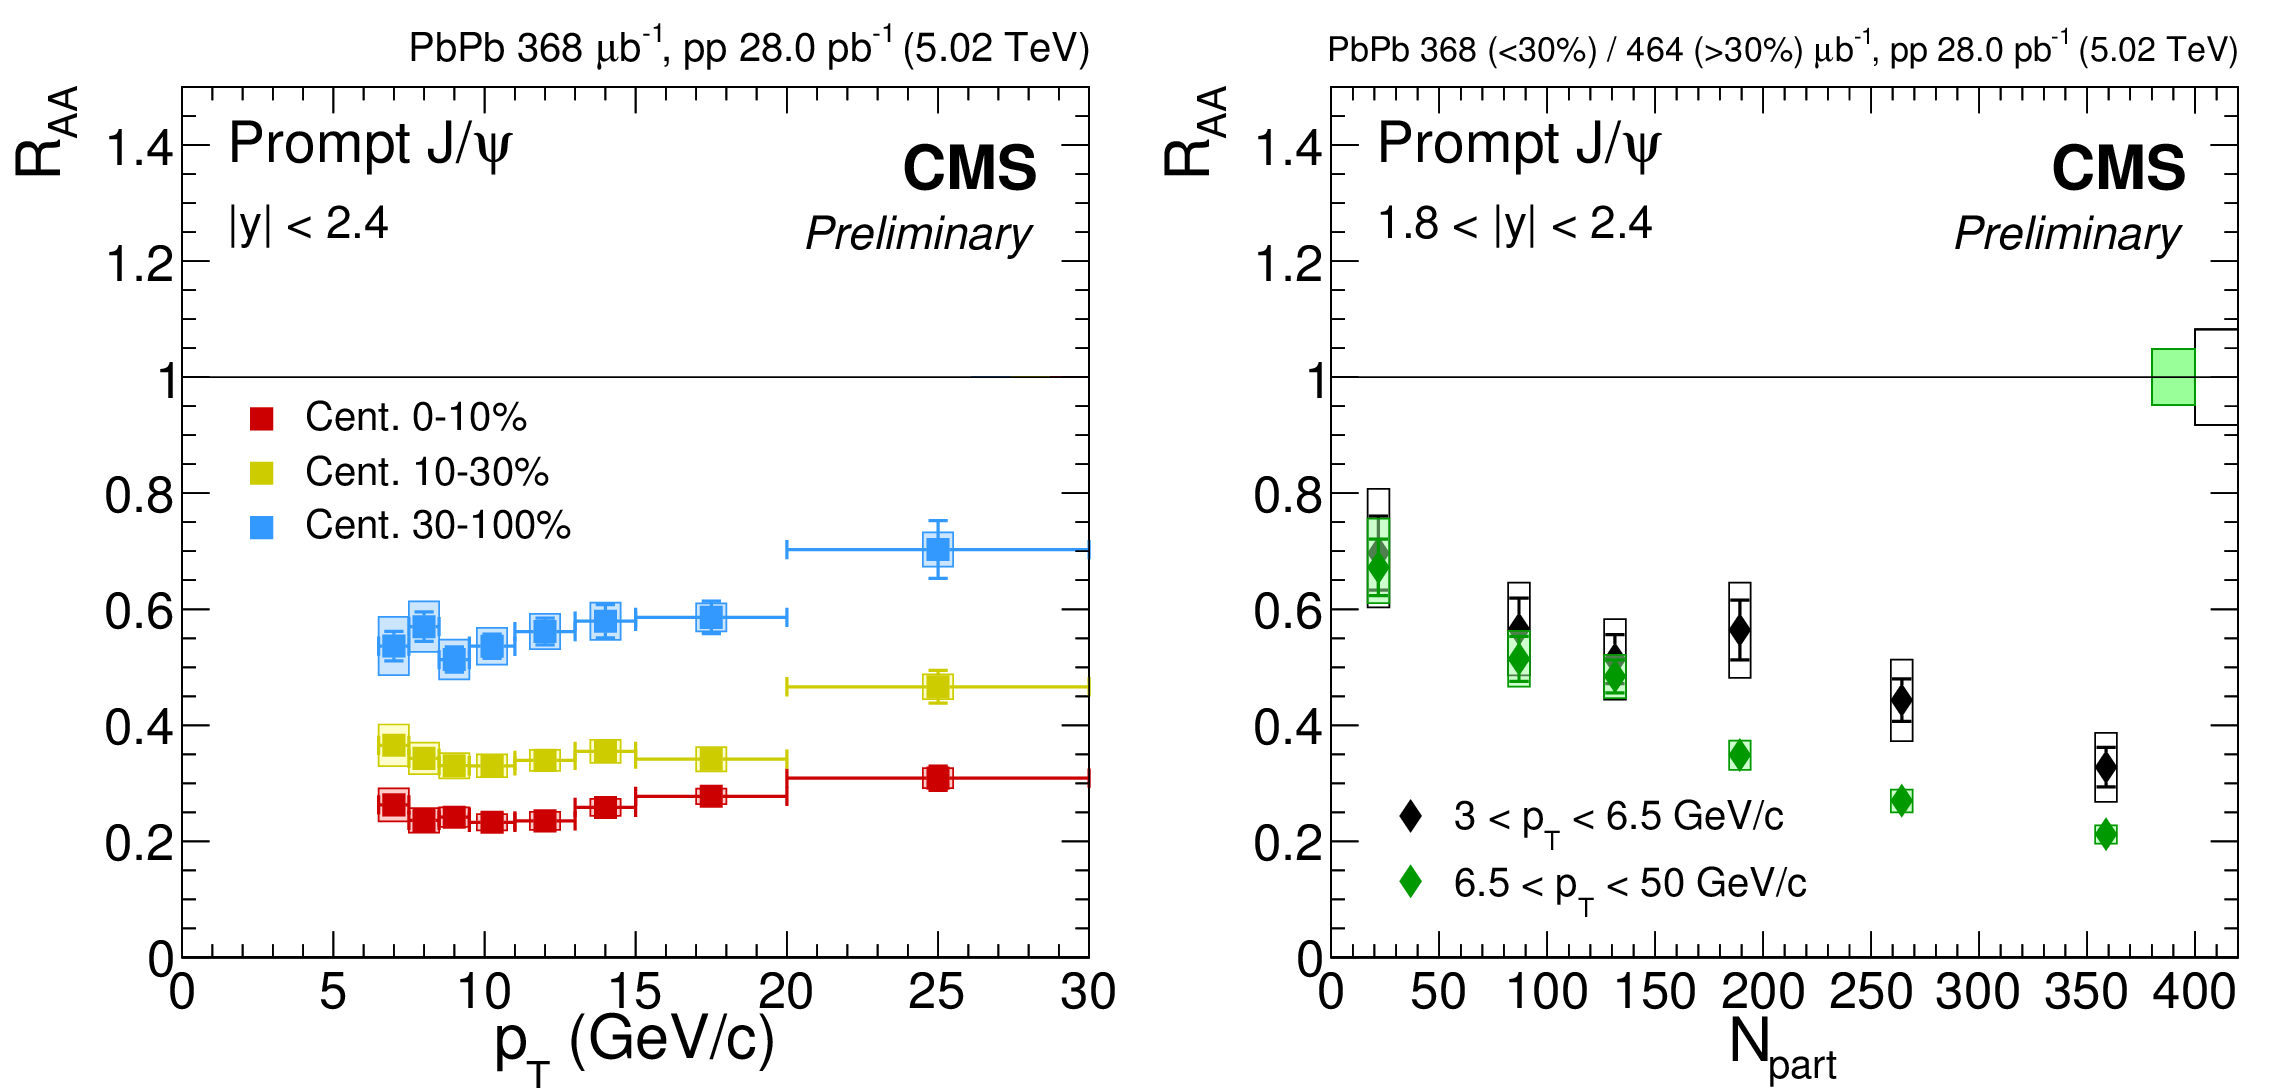
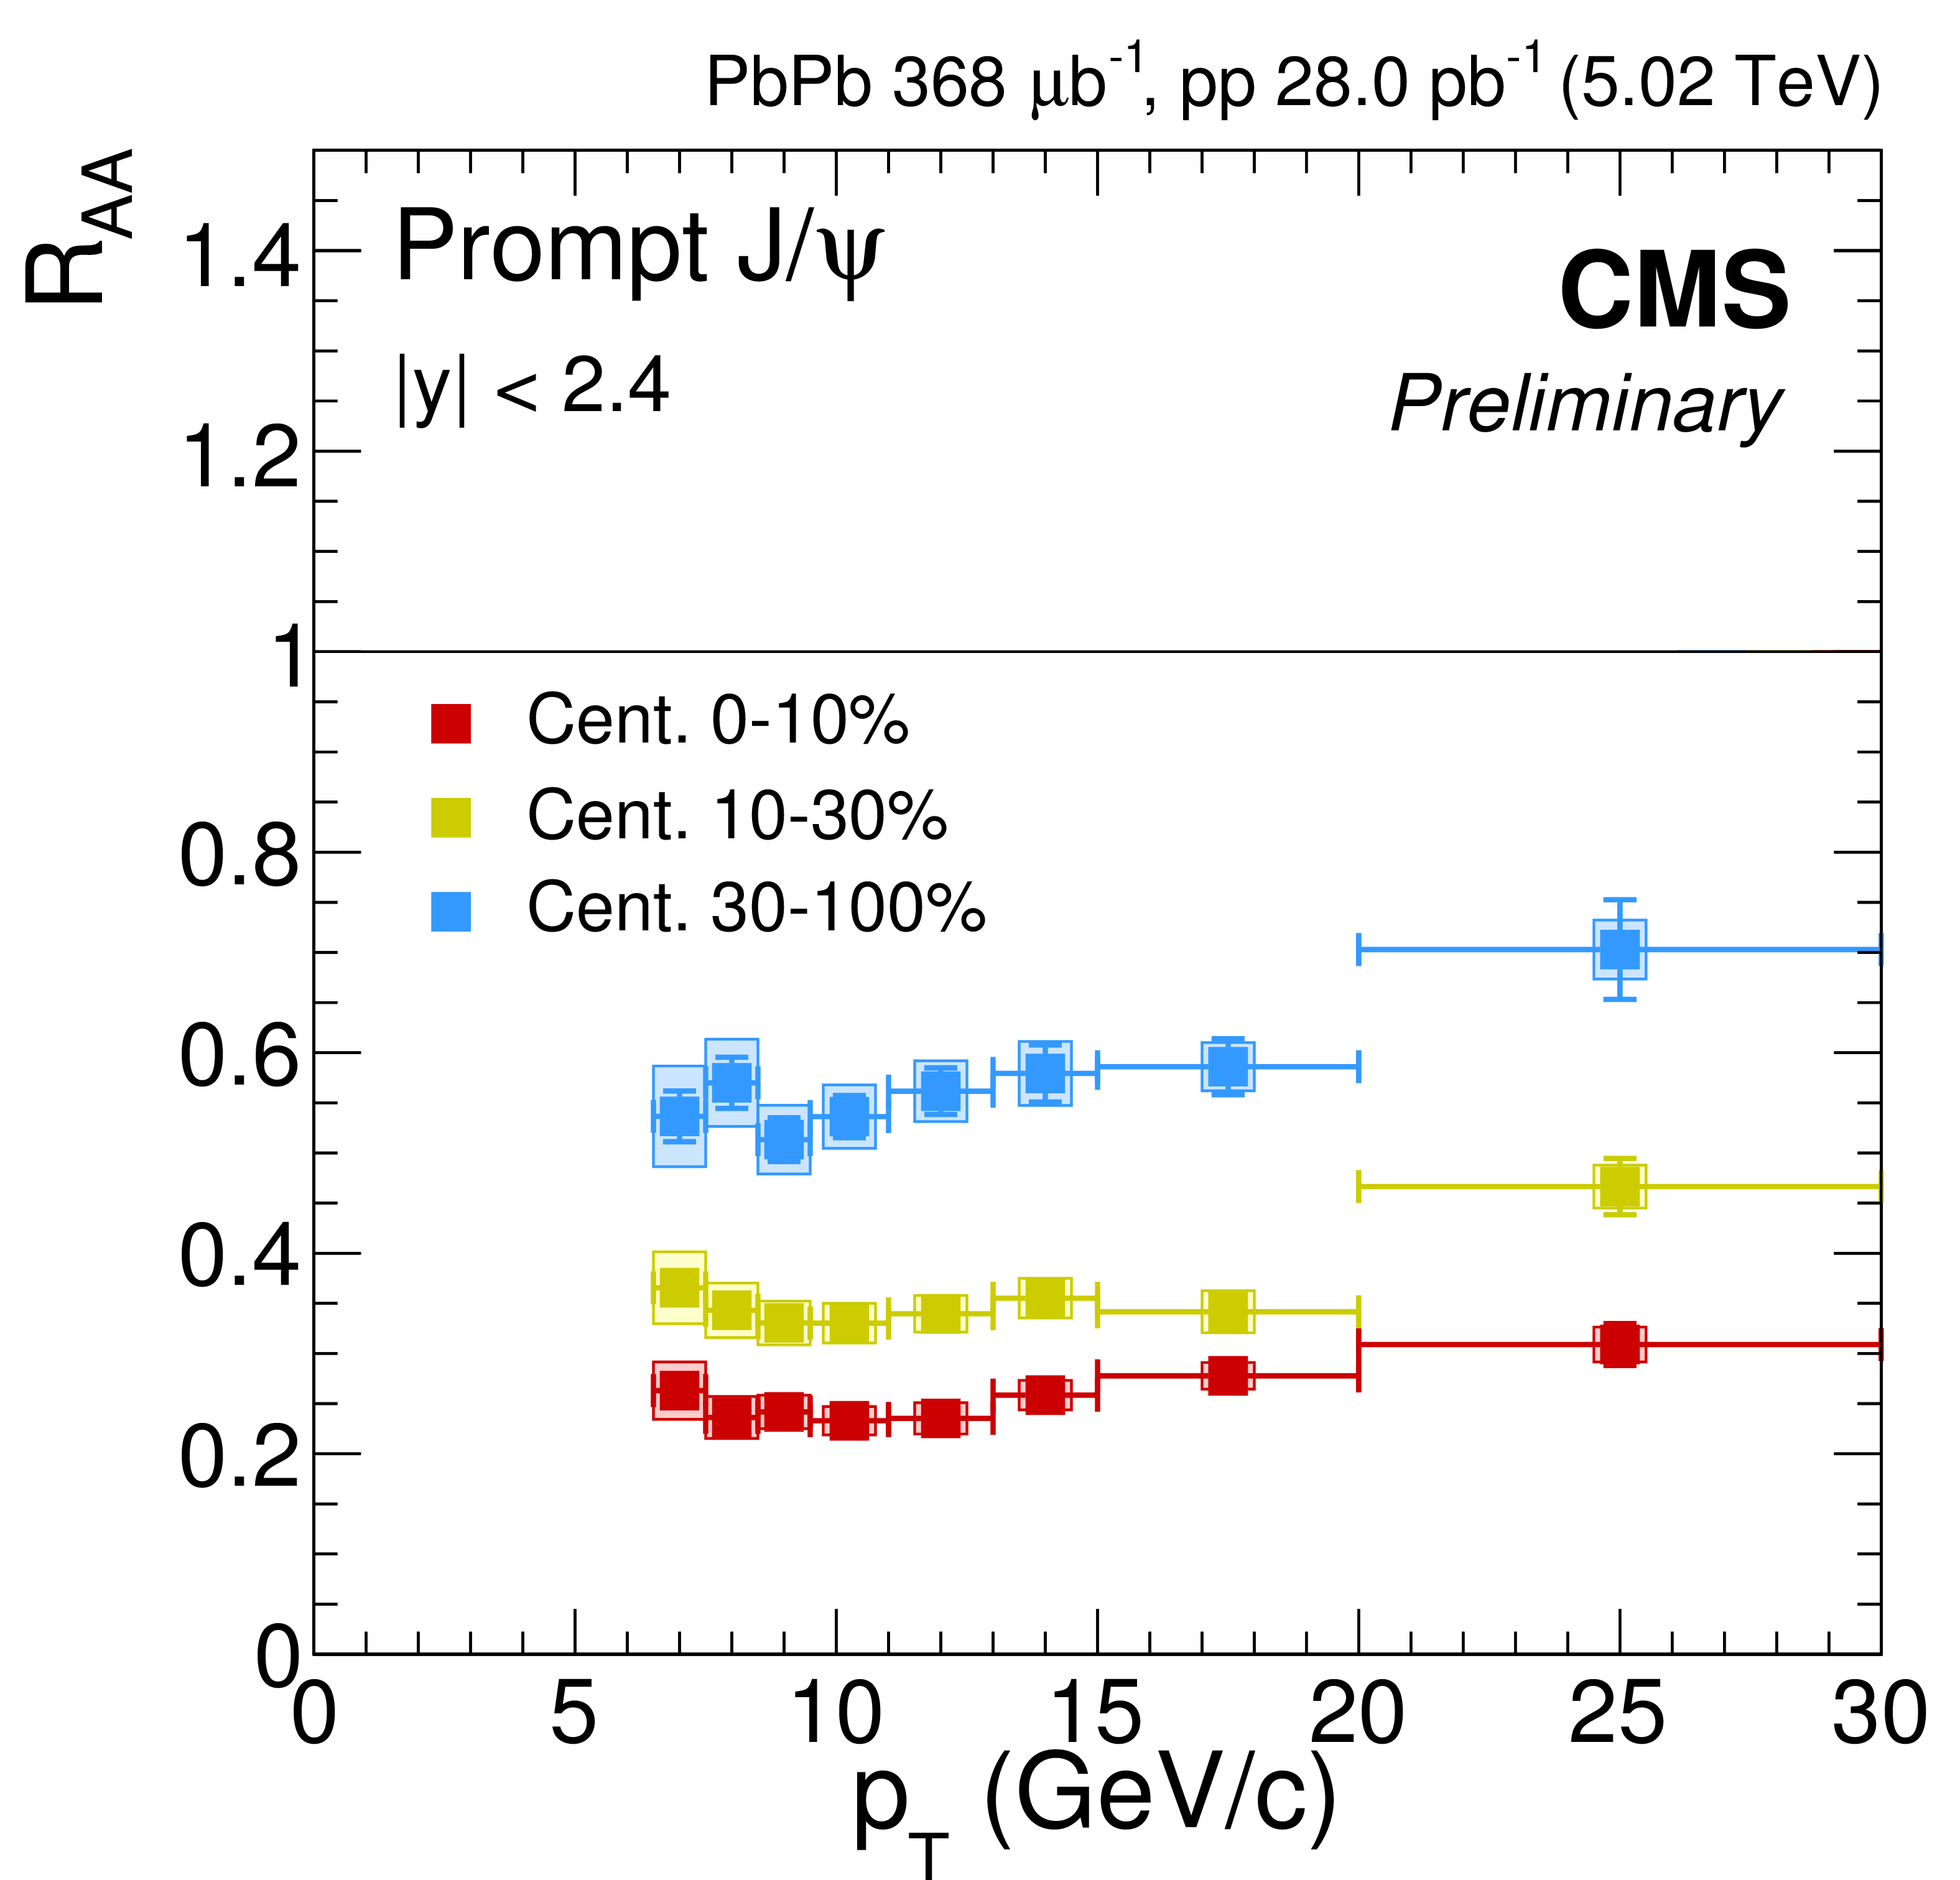
Figure 5:
Nuclear modification factor of prompt $\mathrm{J}/\psi$. Left: as a function of $ {p_{\mathrm {T}}} $ in three centrality bins. Right: as a function of centrality at moderate and high $ {p_{\mathrm {T}}} $, in the forward 1.8 $ < {| y | }< $ 2.4 range. The bars (boxes) represent statistical (systematic) point-by-point uncertainties. The boxes plotted at $ {R_{AA}} =1$ indicate the scale of the global relative uncertainties. |
png pdf |
Figure 5-a:
Nuclear modification factor of prompt $\mathrm{J}/\psi$ as a function of $ {p_{\mathrm {T}}} $ in three centrality bins. The bars (boxes) represent statistical (systematic) point-by-point uncertainties. The boxes plotted at $ {R_{AA}} =1$ indicate the scale of the global relative uncertainties. |

png pdf |
Figure 5-b:
Nuclear modification factor of prompt $\mathrm{J}/\psi$ as a function of centrality at moderate and high $ {p_{\mathrm {T}}} $, in the forward 1.8 $ < {| y | }< $ 2.4 range. The bars (boxes) represent statistical (systematic) point-by-point uncertainties. The boxes plotted at $ {R_{AA}} =1$ indicate the scale of the global relative uncertainties. |

png pdf |
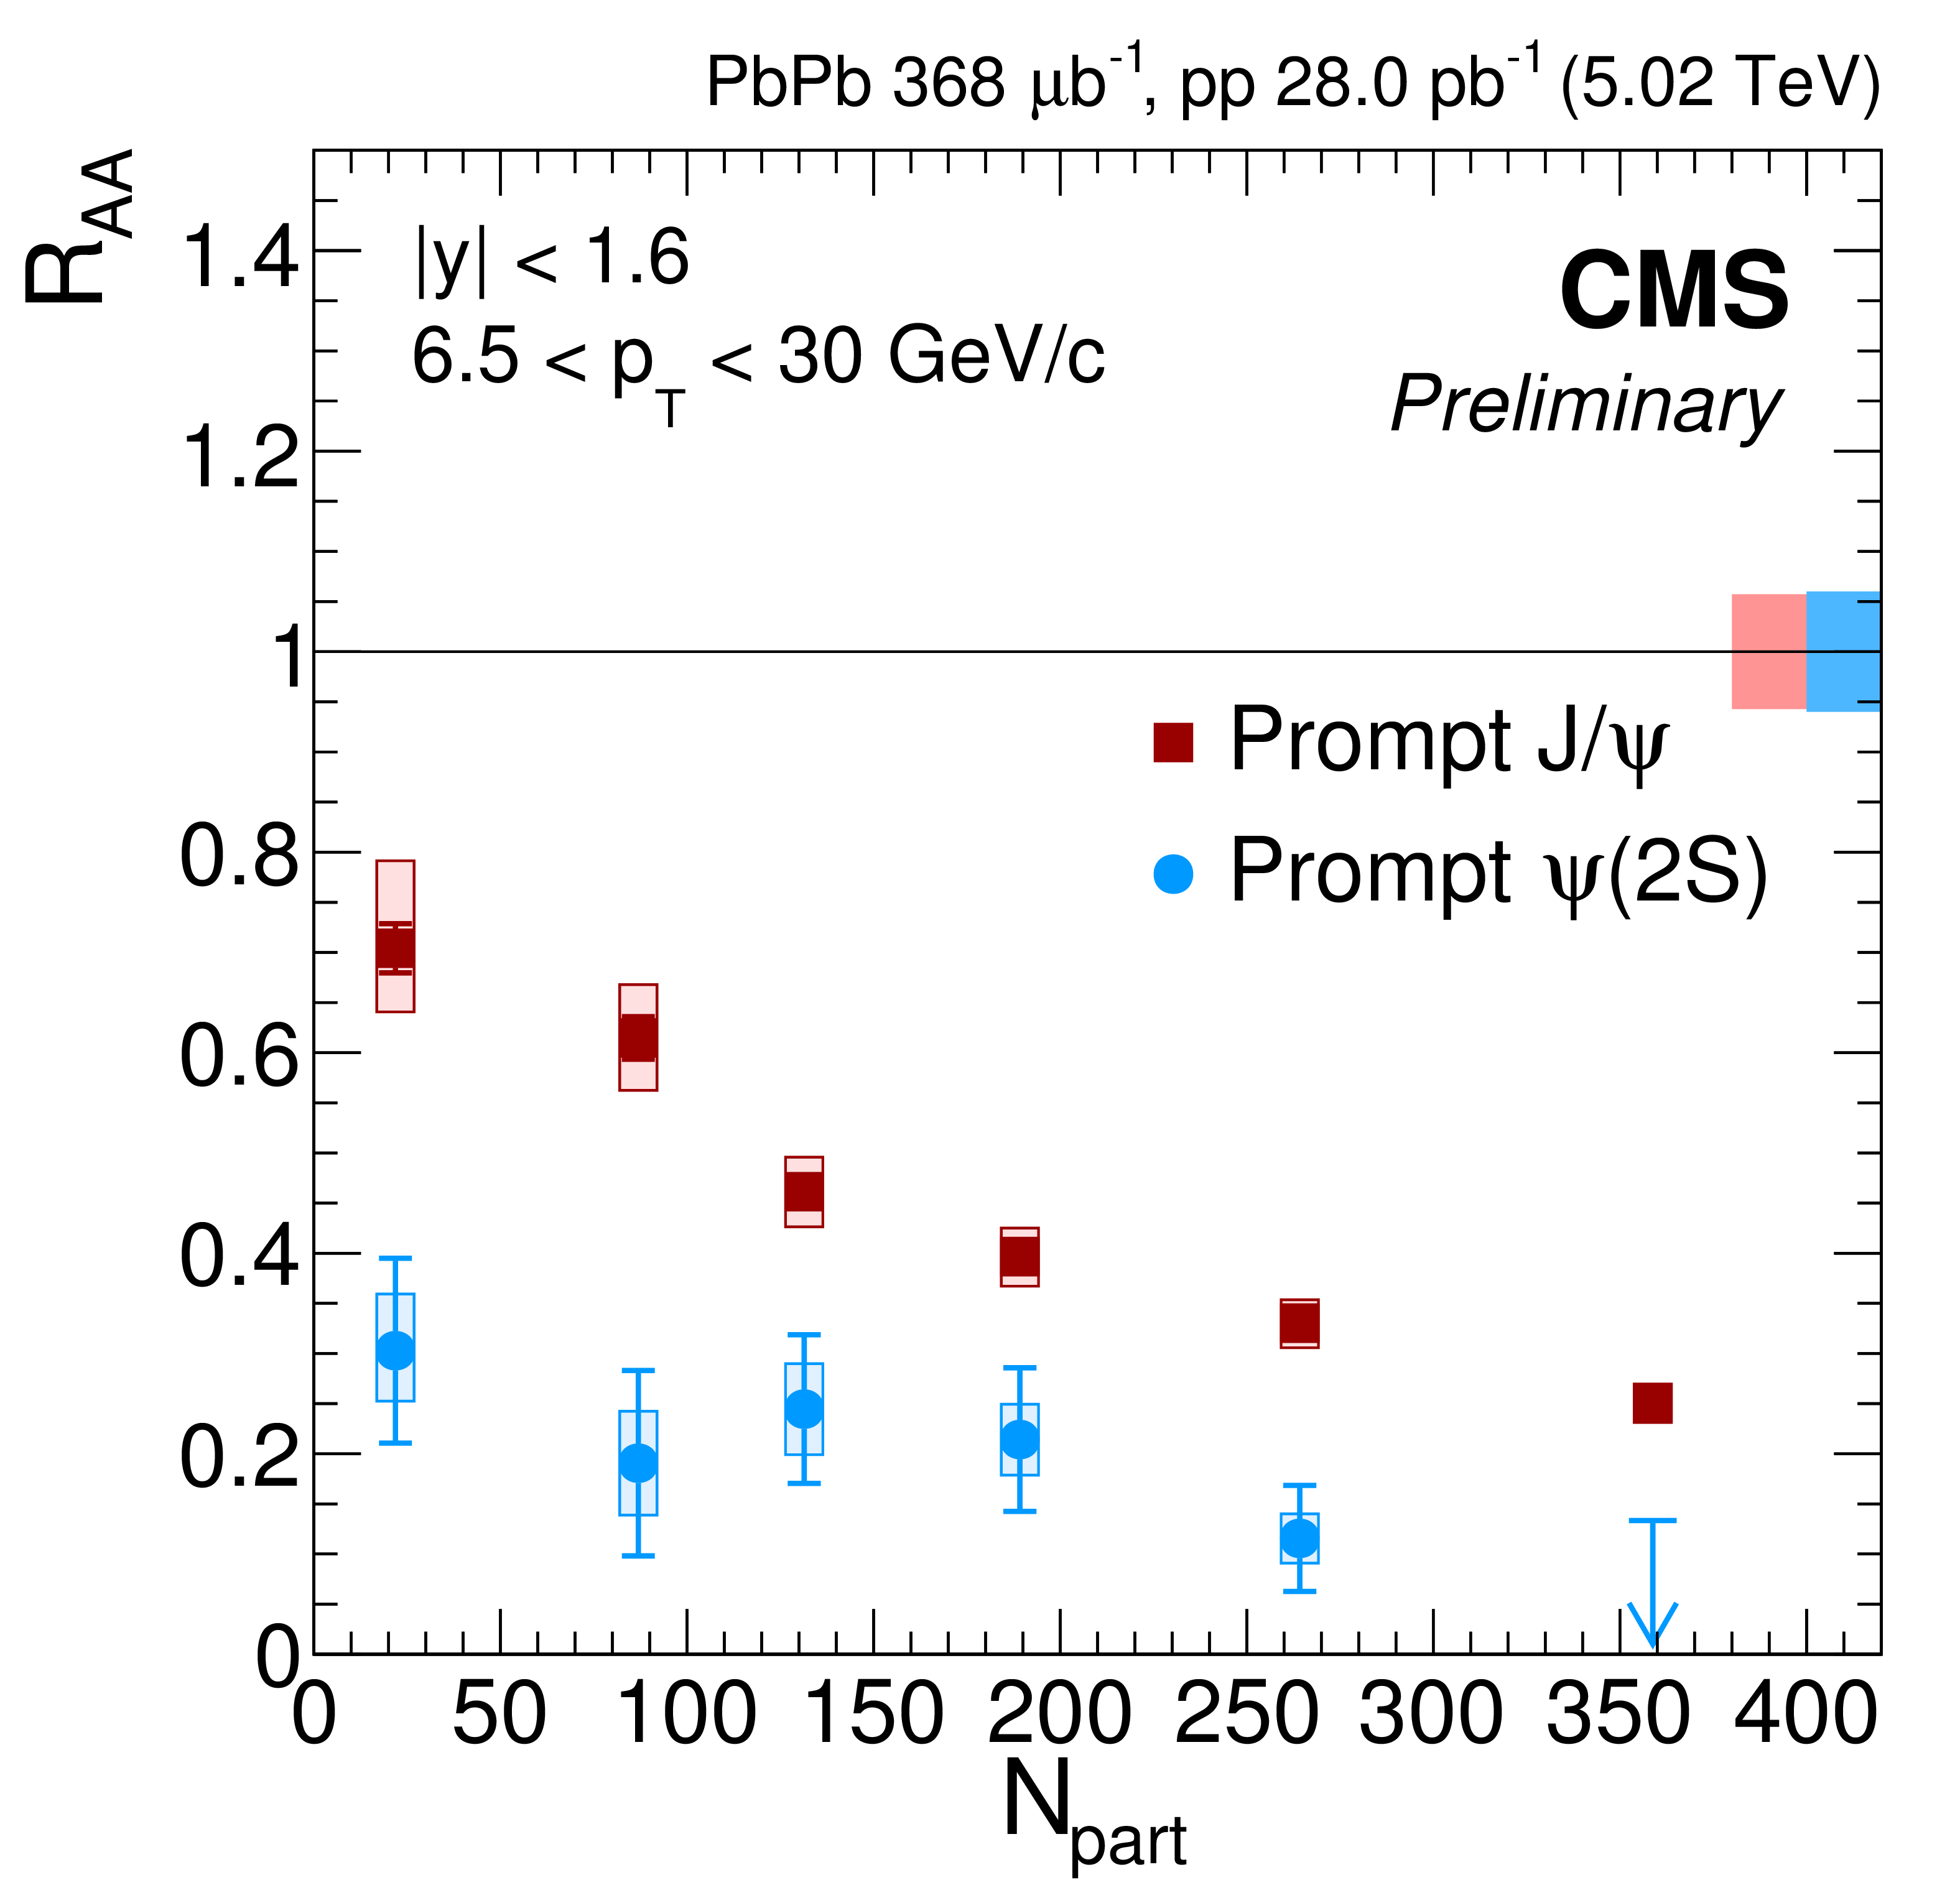
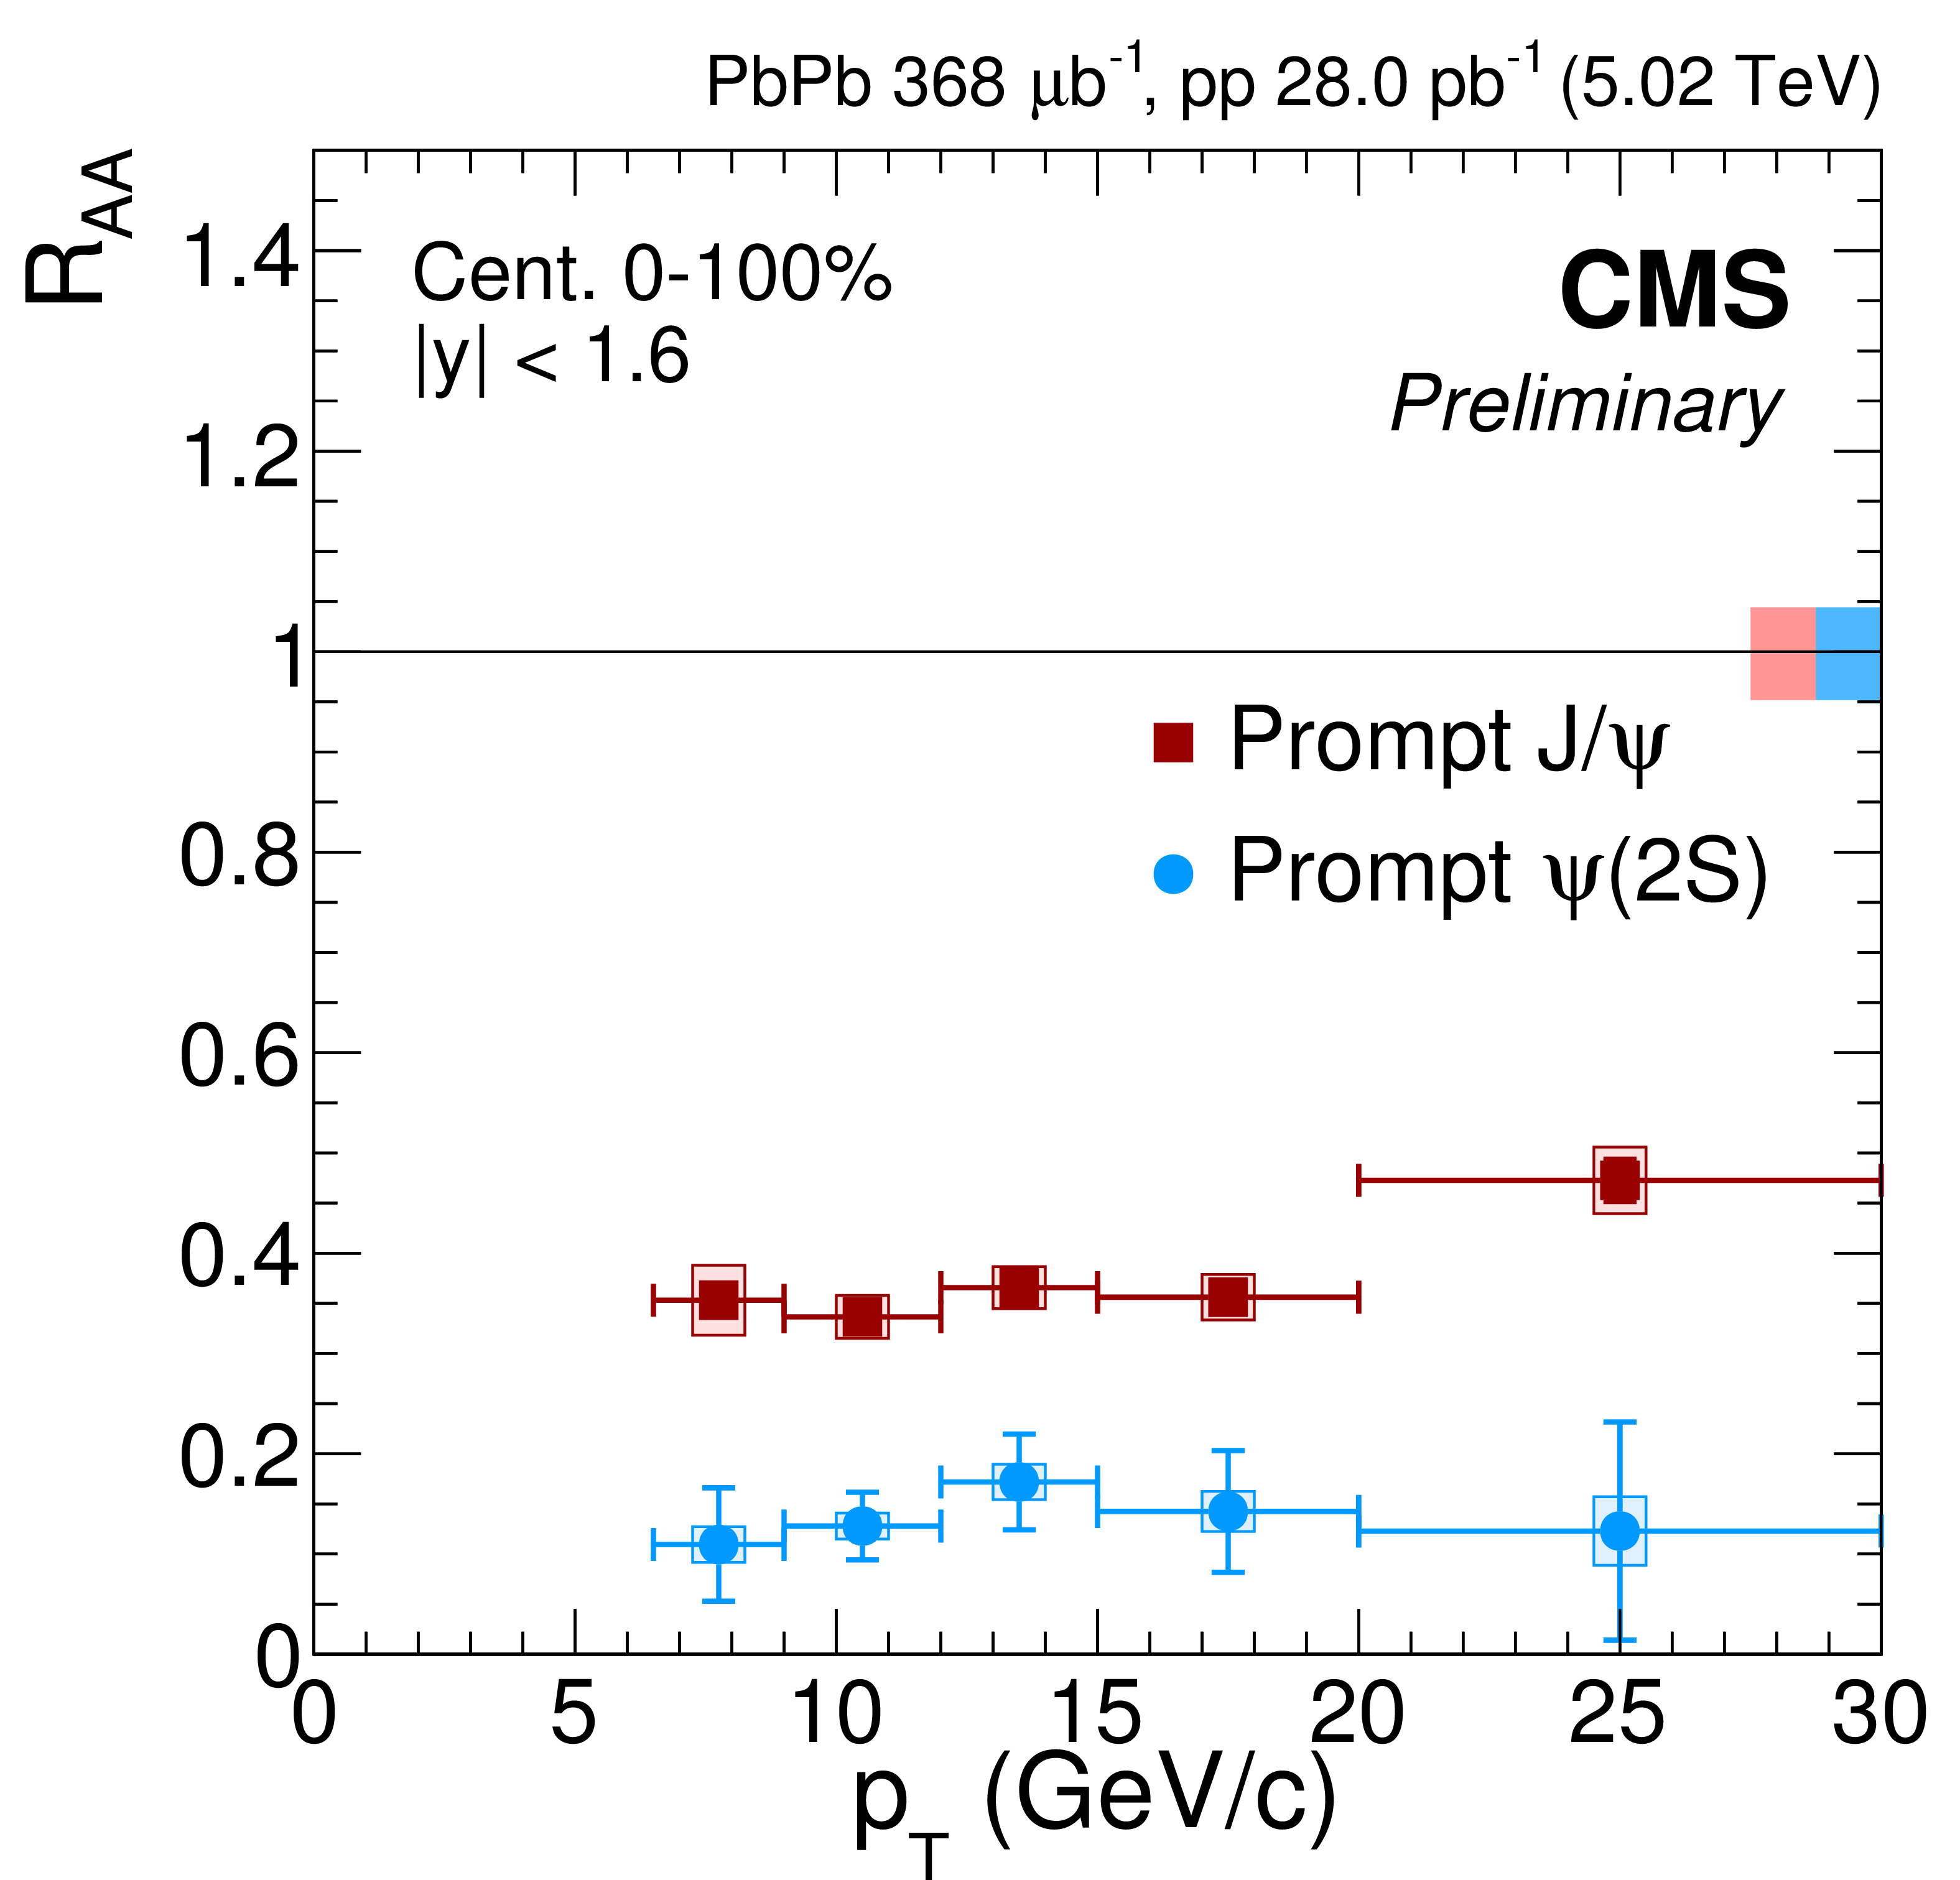
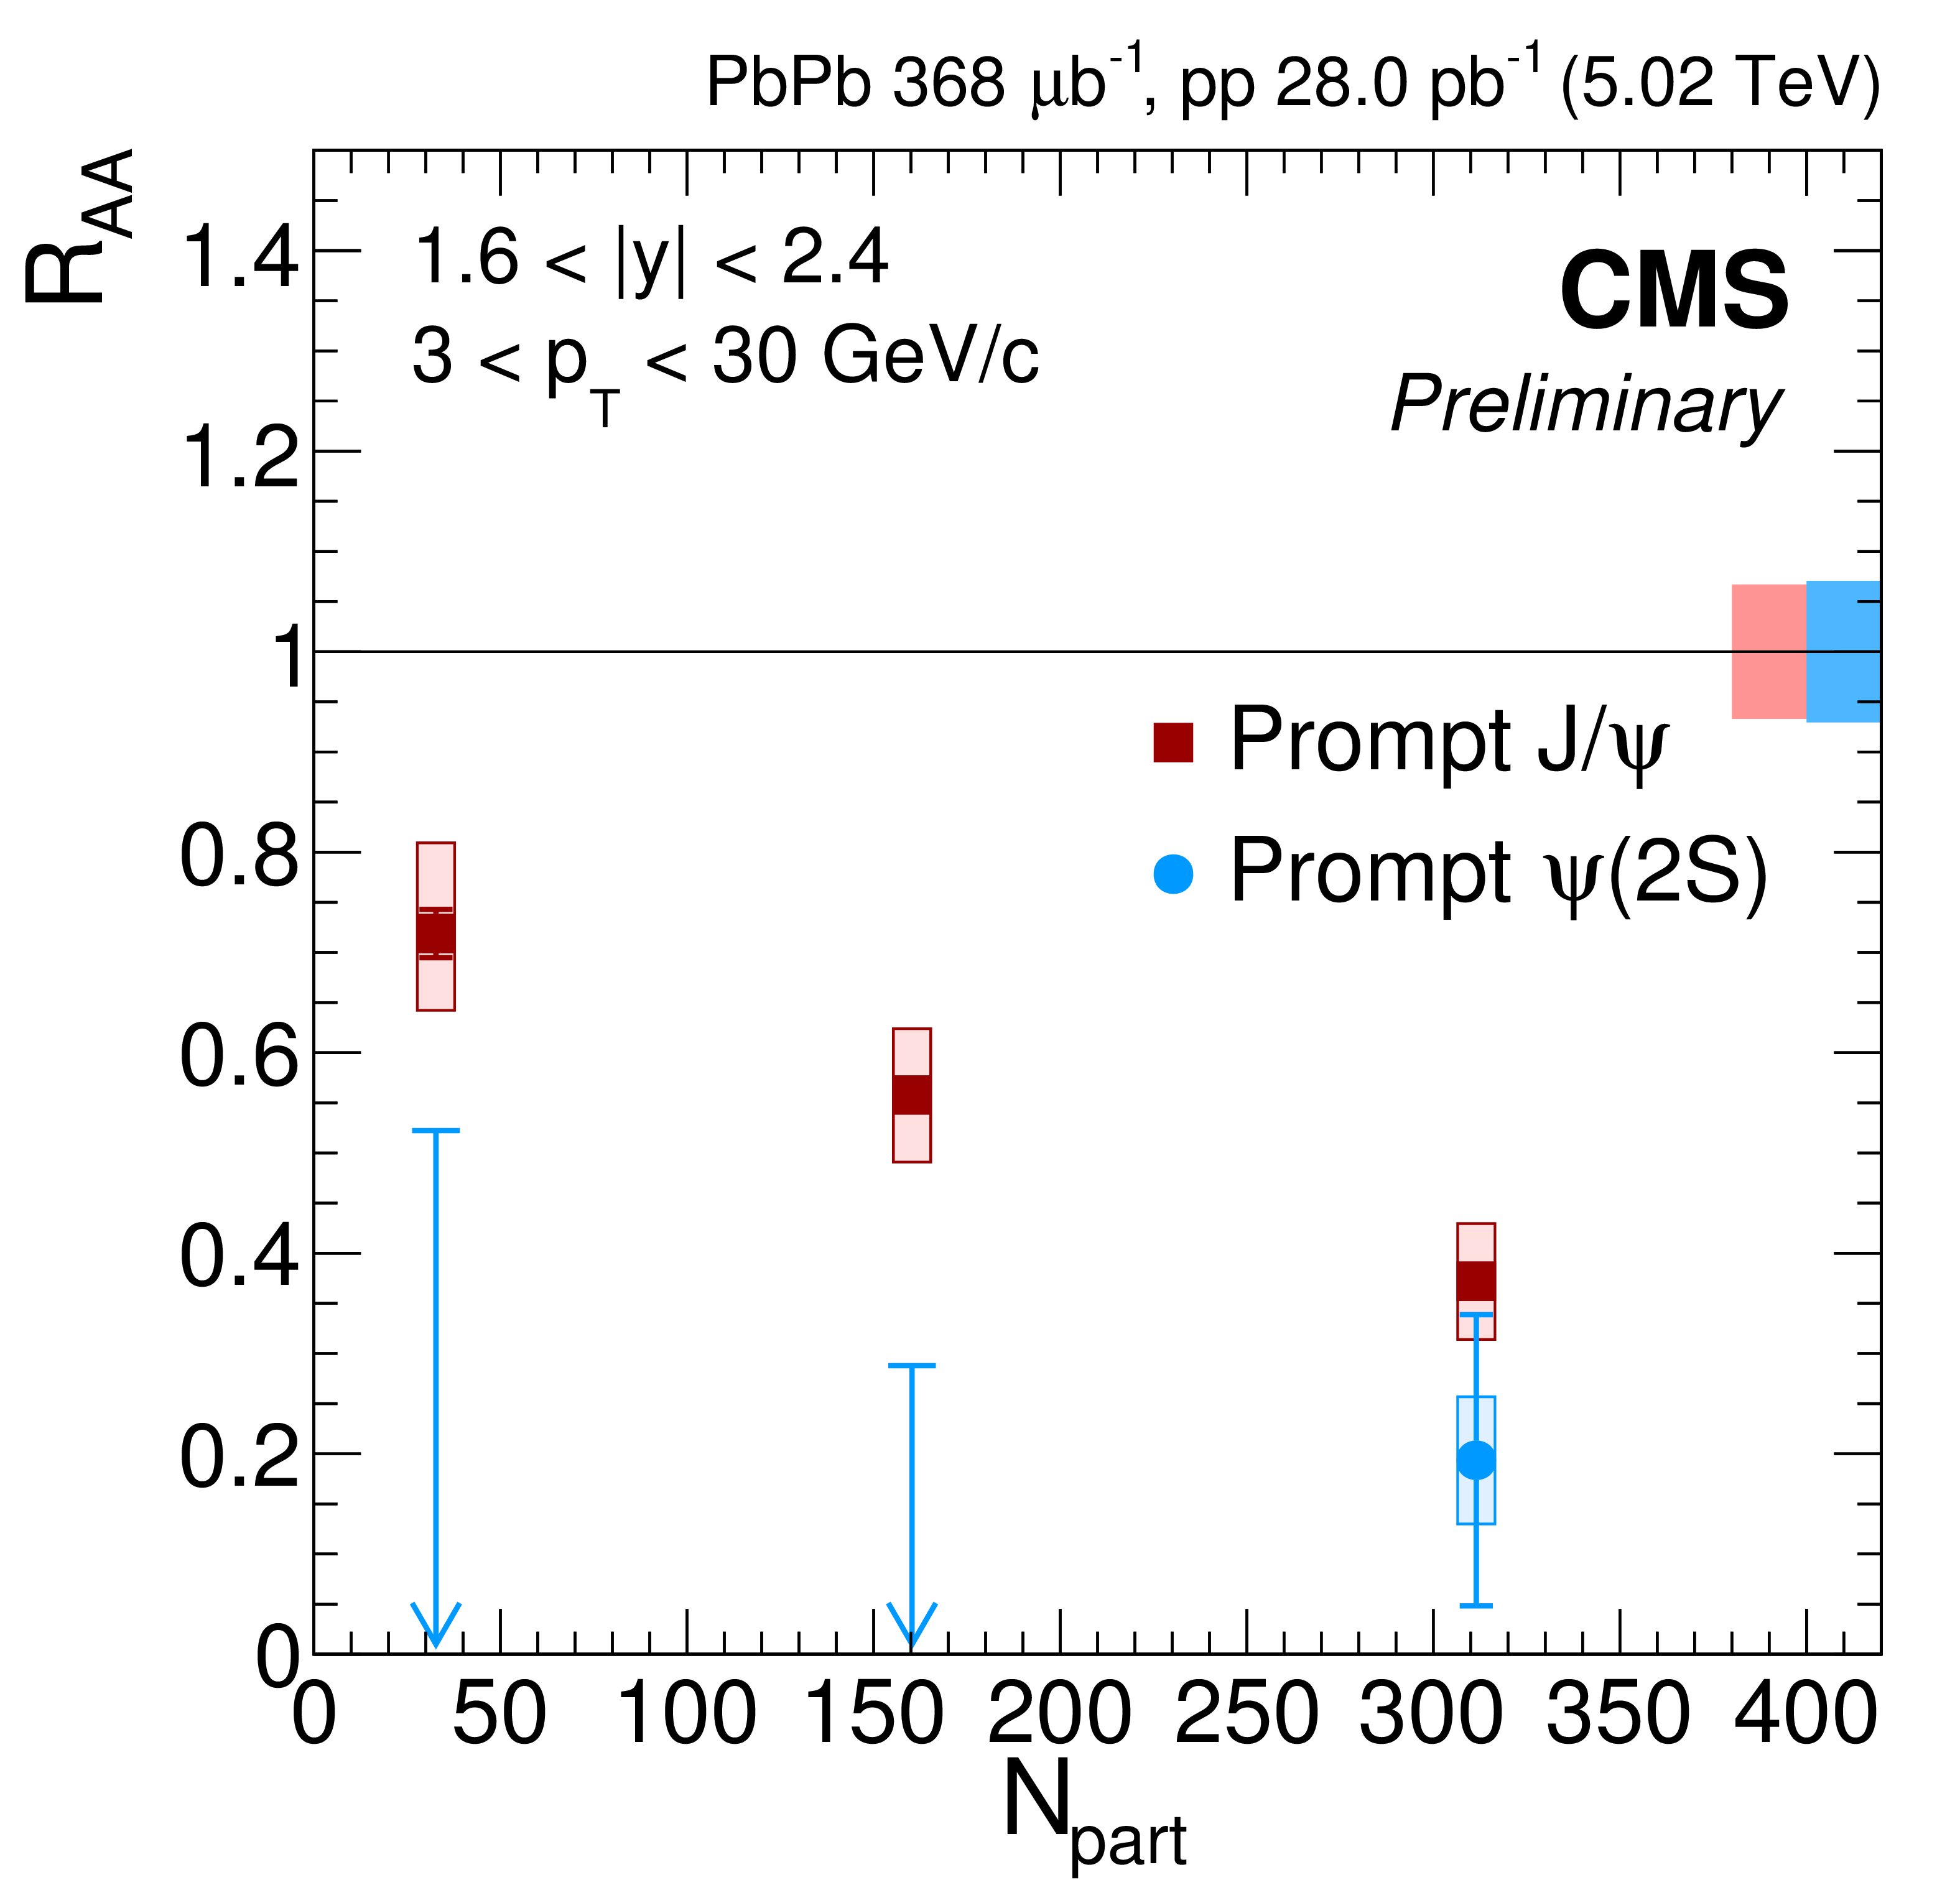
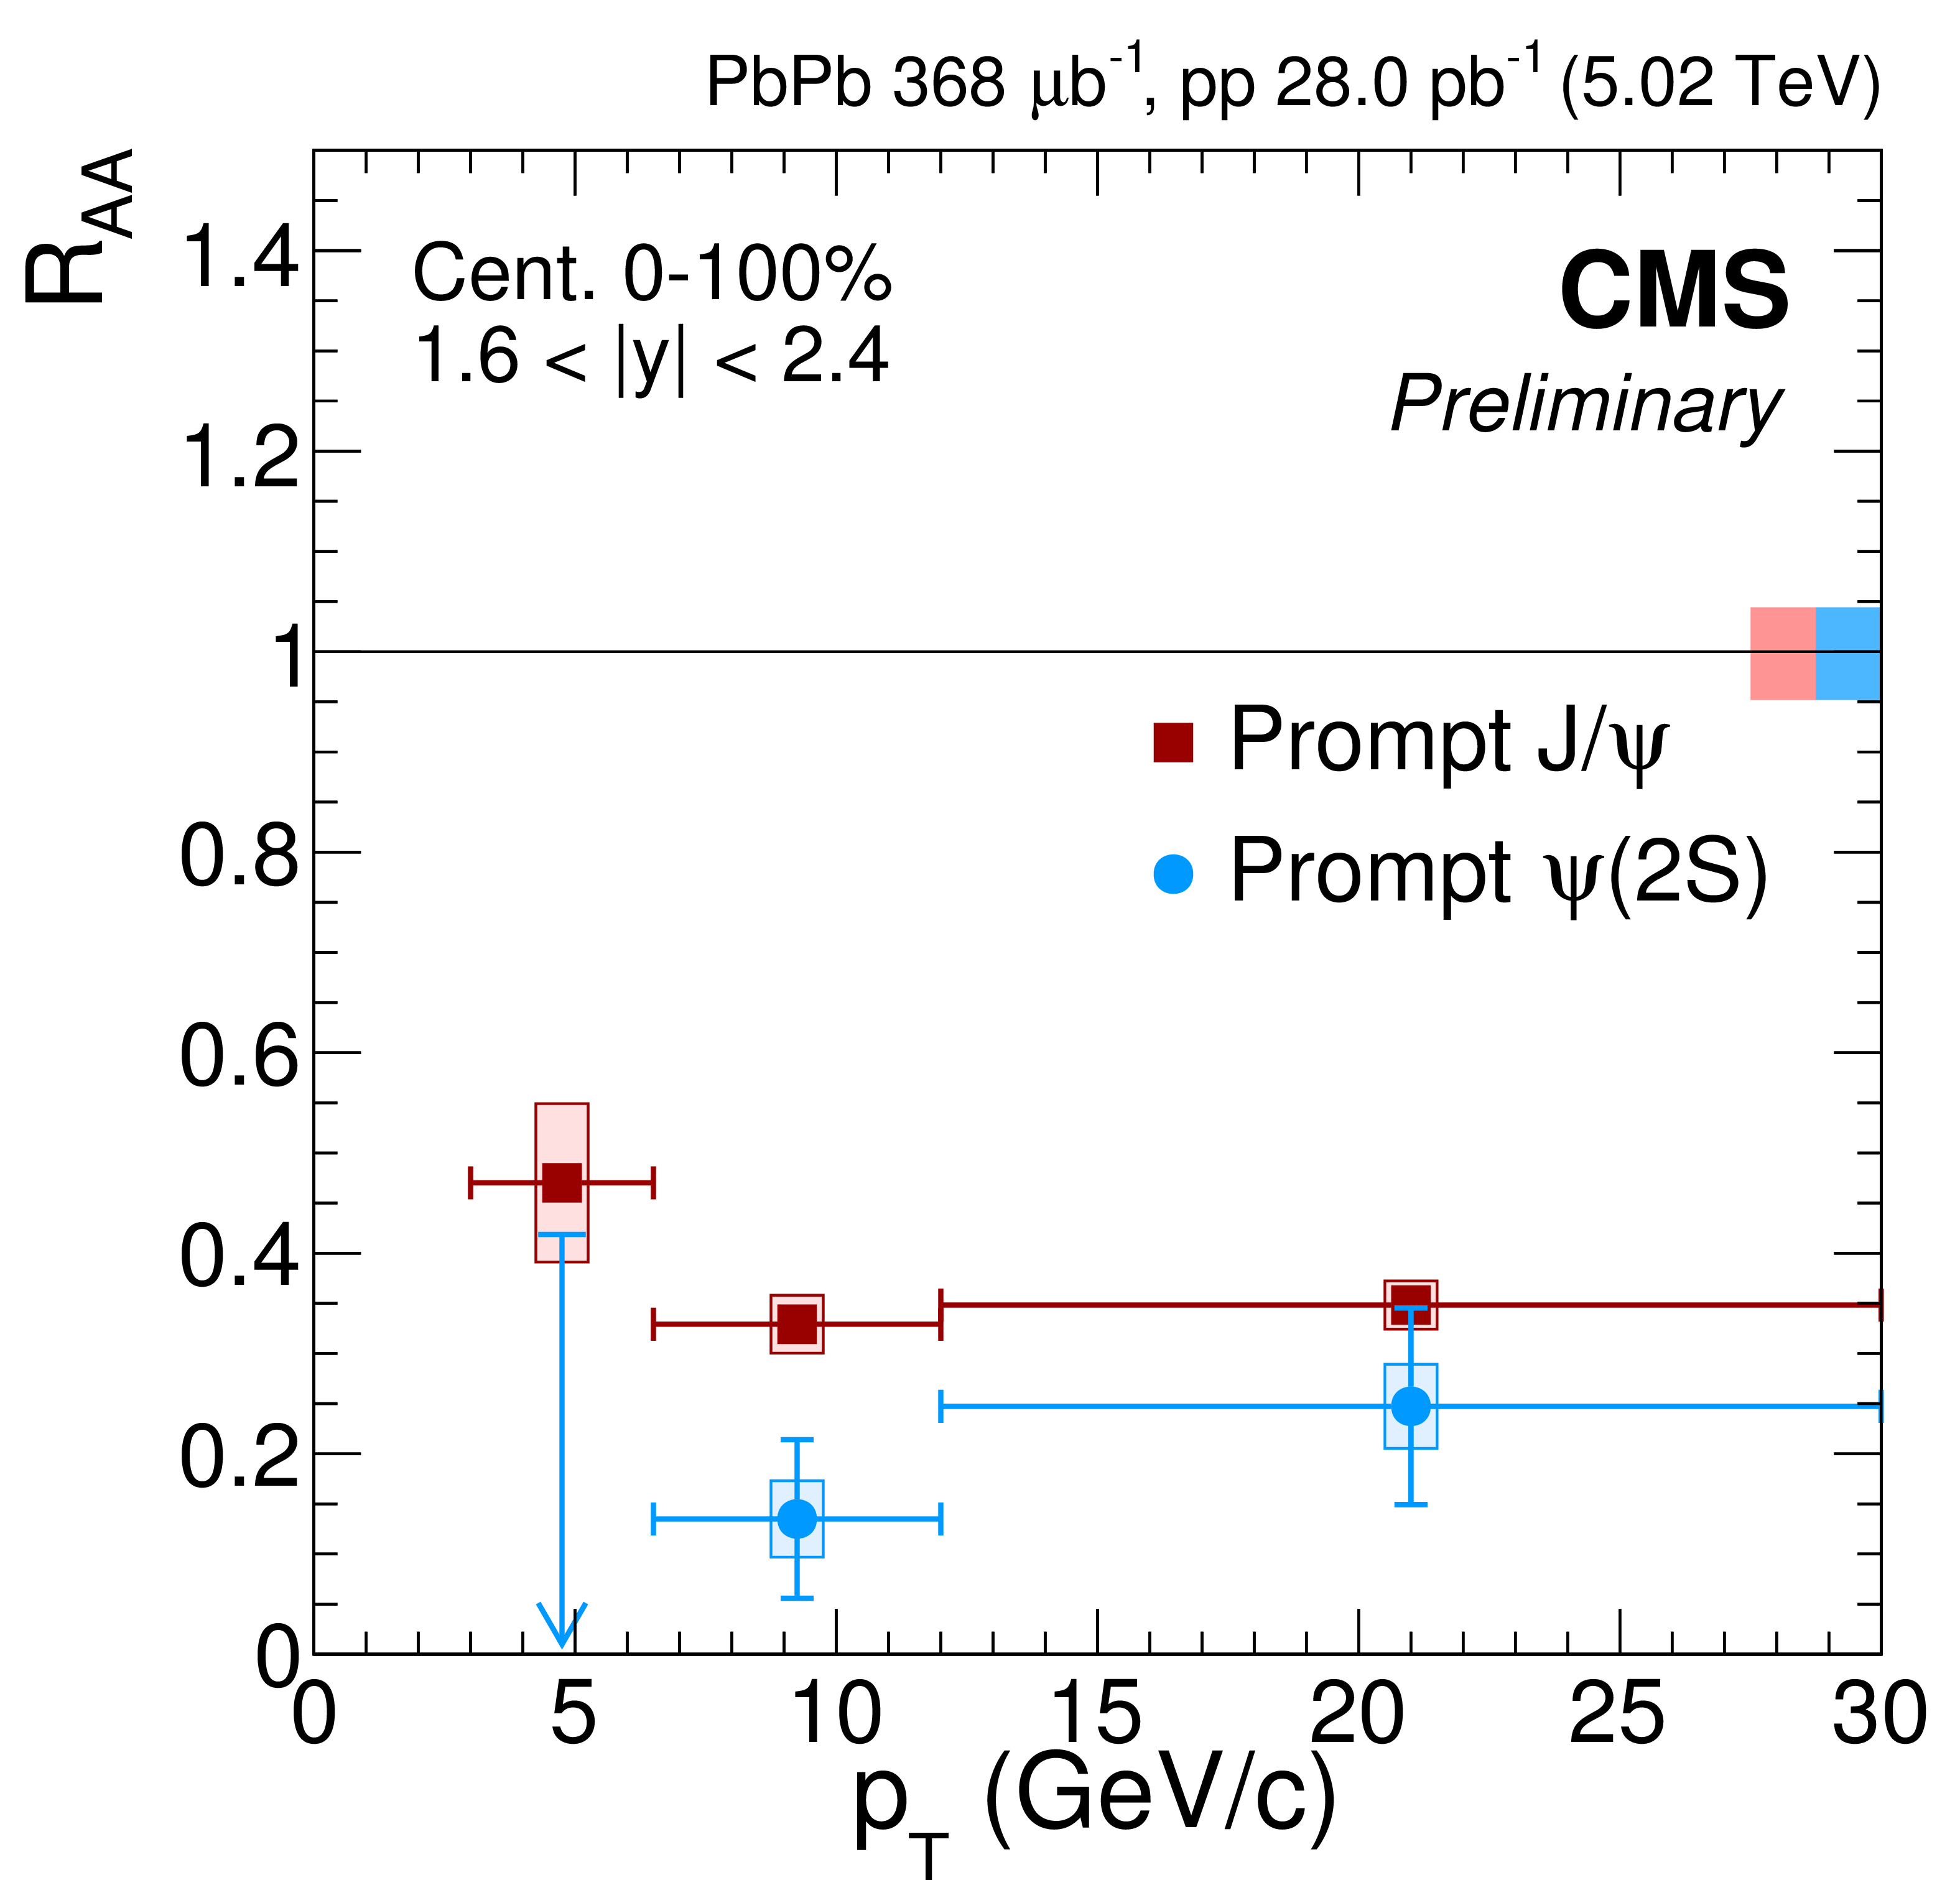
Figure 6:
The nuclear modification factor for the prompt $\mathrm{J}/\psi$ and ${\psi \text {(2S)}}$ as a function of centrality (left) and $ {p_{\mathrm {T}}} $ (right), at central (top, starting at $ {p_{\mathrm {T}}} = $ 6.5 GeV/$c$) and forward (bottom, starting at $ {p_{\mathrm {T}}} = $ 3.0 GeV/$c$) rapidity. The vertical arrows represent 95% confidence intervals. The bars (boxes) represent statistical (systematic) point-by-point uncertainties. The boxes plotted at $ {R_{AA}} = $ 1 indicate the scale of the global relative uncertainties. |
png pdf |
Figure 6-a:
The nuclear modification factor for the prompt $\mathrm{J}/\psi$ and ${\psi \text {(2S)}}$ as a function of centrality, at central (starting at $ {p_{\mathrm {T}}} = $ 6.5 GeV/$c$) rapidity. The vertical arrows represent 95% confidence intervals. The bars (boxes) represent statistical (systematic) point-by-point uncertainties. The boxes plotted at $ {R_{AA}} = $ 1 indicate the scale of the global relative uncertainties. |
png pdf |
Figure 6-b:
The nuclear modification factor for the prompt $\mathrm{J}/\psi$ and ${\psi \text {(2S)}}$ as a function of $ {p_{\mathrm {T}}} $, at central (starting at $ {p_{\mathrm {T}}} = $ 6.5 GeV/$c$) rapidity. The vertical arrows represent 95% confidence intervals. The bars (boxes) represent statistical (systematic) point-by-point uncertainties. The boxes plotted at $ {R_{AA}} = $ 1 indicate the scale of the global relative uncertainties. |
png pdf |
Figure 6-c:
The nuclear modification factor for the prompt $\mathrm{J}/\psi$ and ${\psi \text {(2S)}}$ as a function of centrality, at forward (starting at $ {p_{\mathrm {T}}} = $ 3.0 GeV/$c$) rapidity. The vertical arrows represent 95% confidence intervals. The bars (boxes) represent statistical (systematic) point-by-point uncertainties. The boxes plotted at $ {R_{AA}} = $ 1 indicate the scale of the global relative uncertainties. |
png pdf |
Figure 6-d:
The nuclear modification factor for the prompt $\mathrm{J}/\psi$ and ${\psi \text {(2S)}}$ as a function of $ {p_{\mathrm {T}}} $, at forward (starting at $ {p_{\mathrm {T}}} = $ 3.0 GeV/$c$) rapidity. The vertical arrows represent 95% confidence intervals. The bars (boxes) represent statistical (systematic) point-by-point uncertainties. The boxes plotted at $ {R_{AA}} = $ 1 indicate the scale of the global relative uncertainties. |
png pdf |
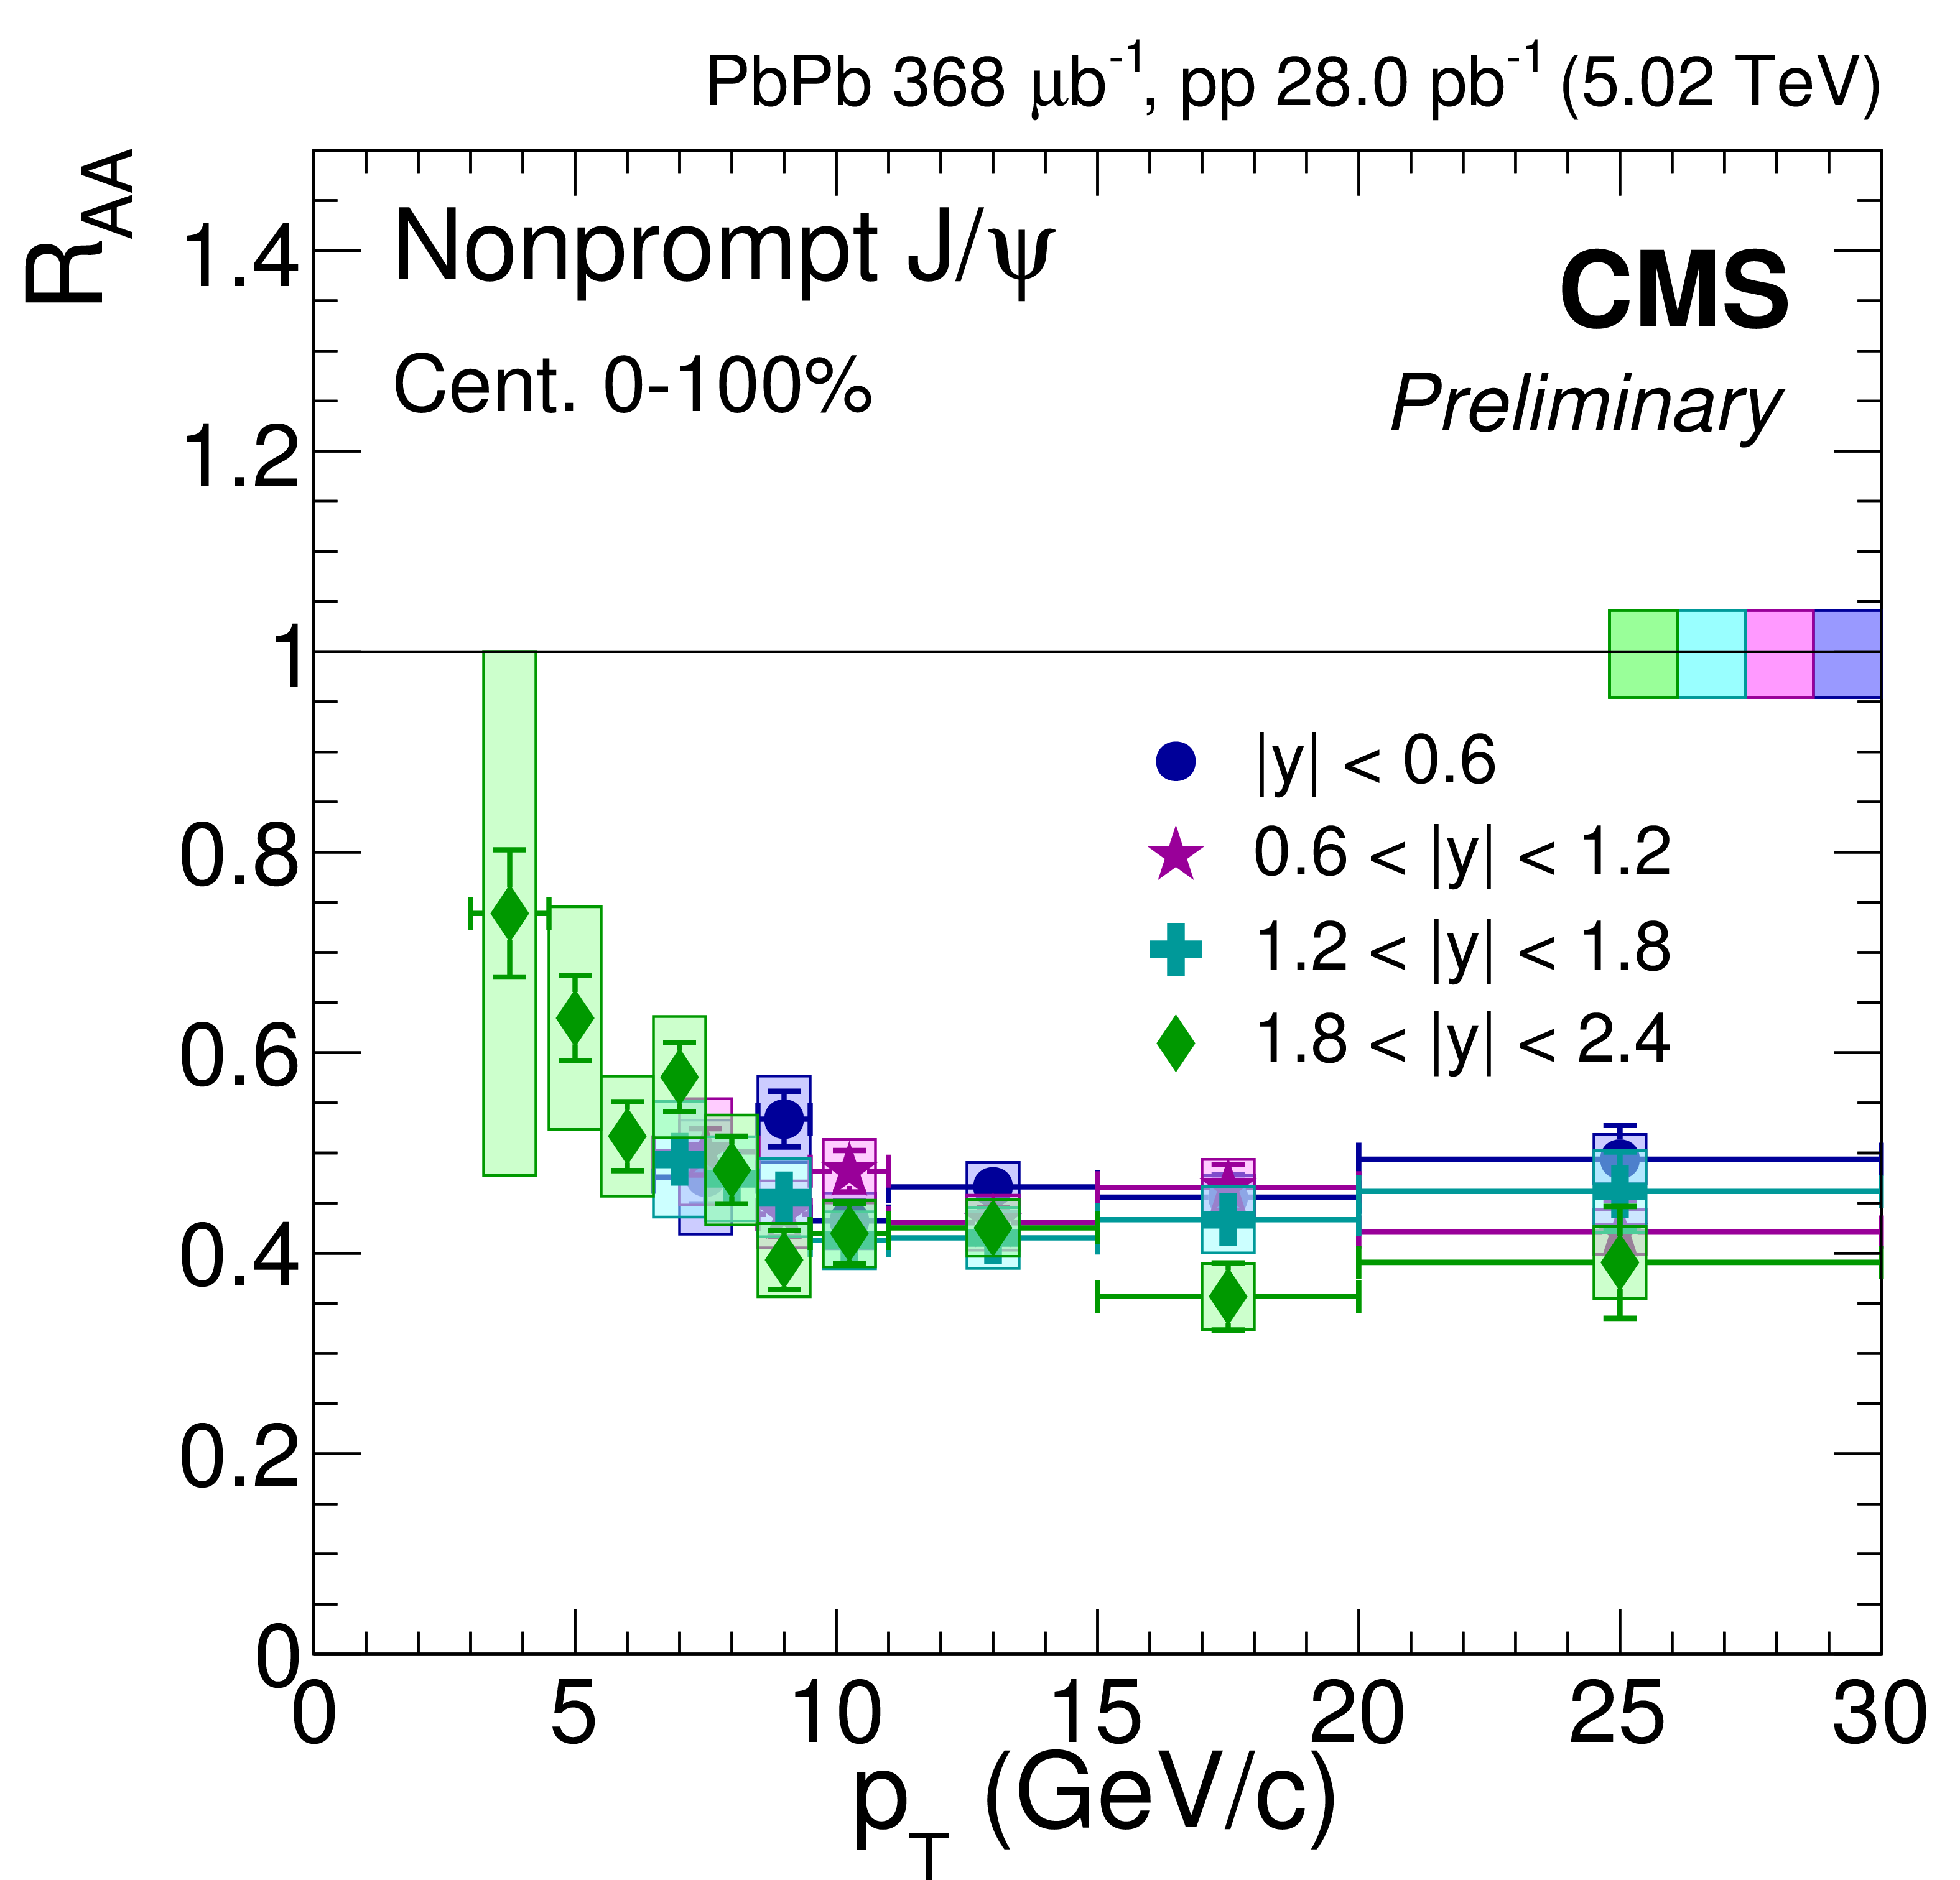
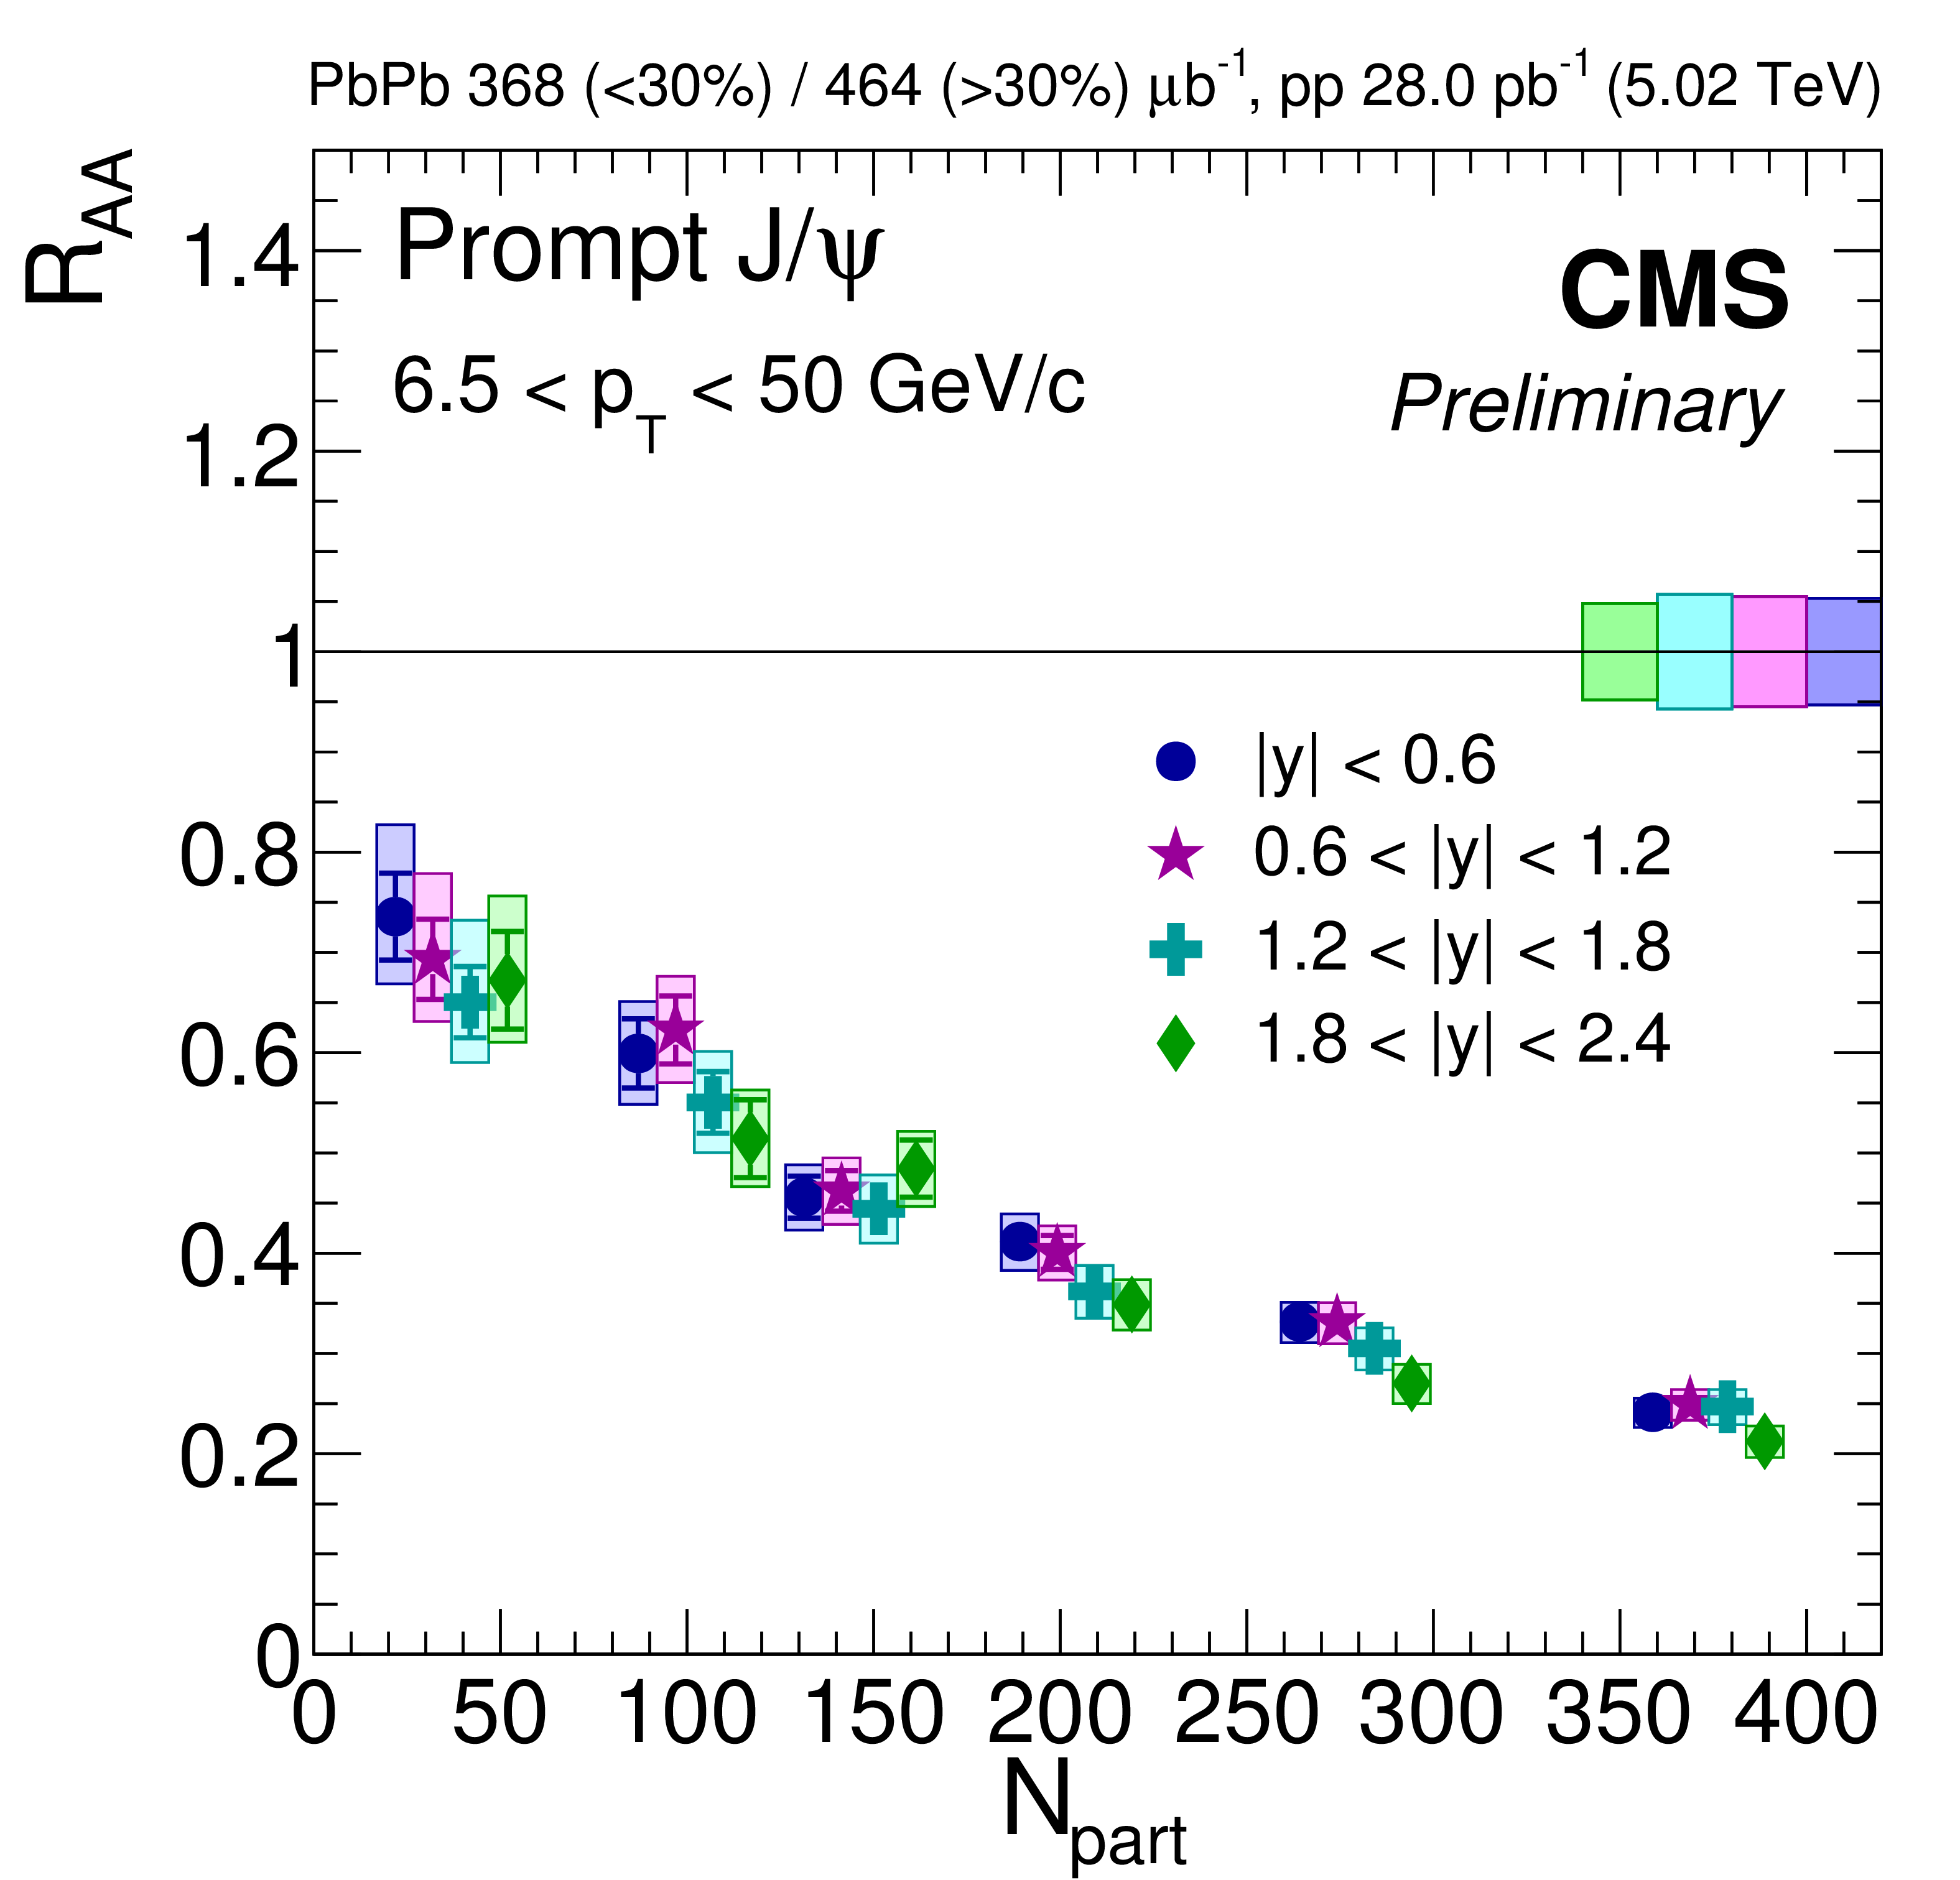
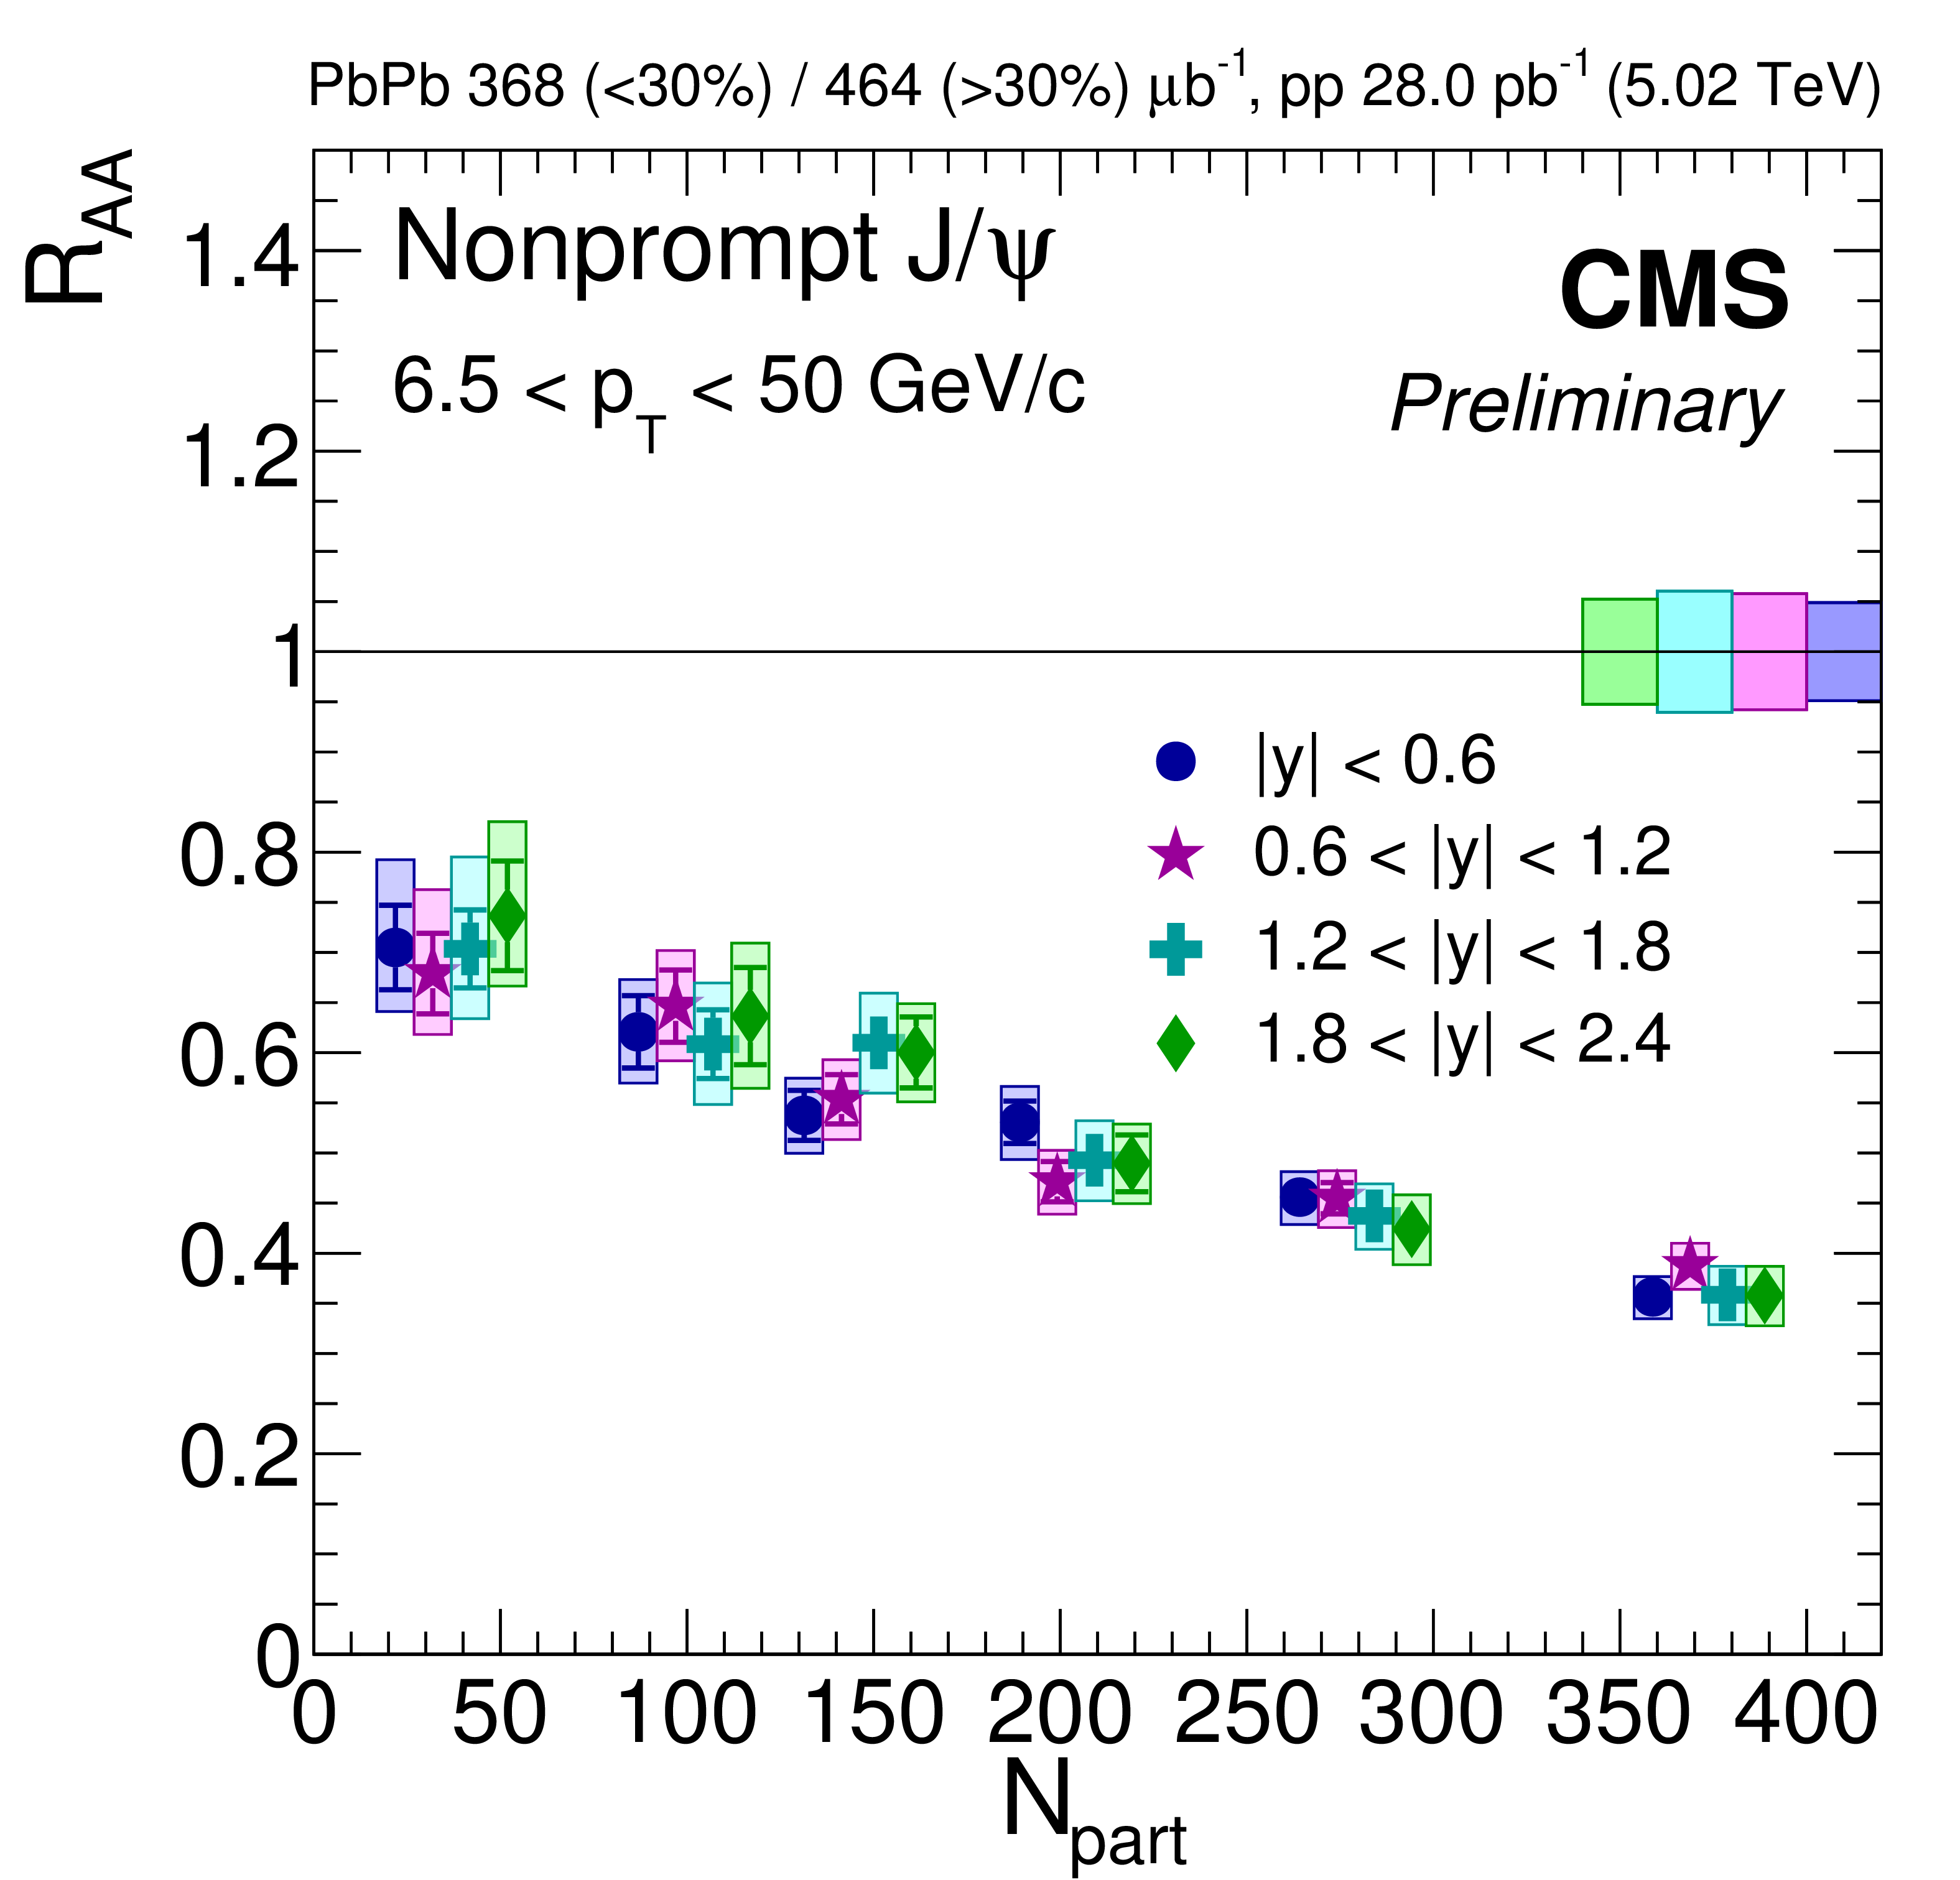
Figure 7:
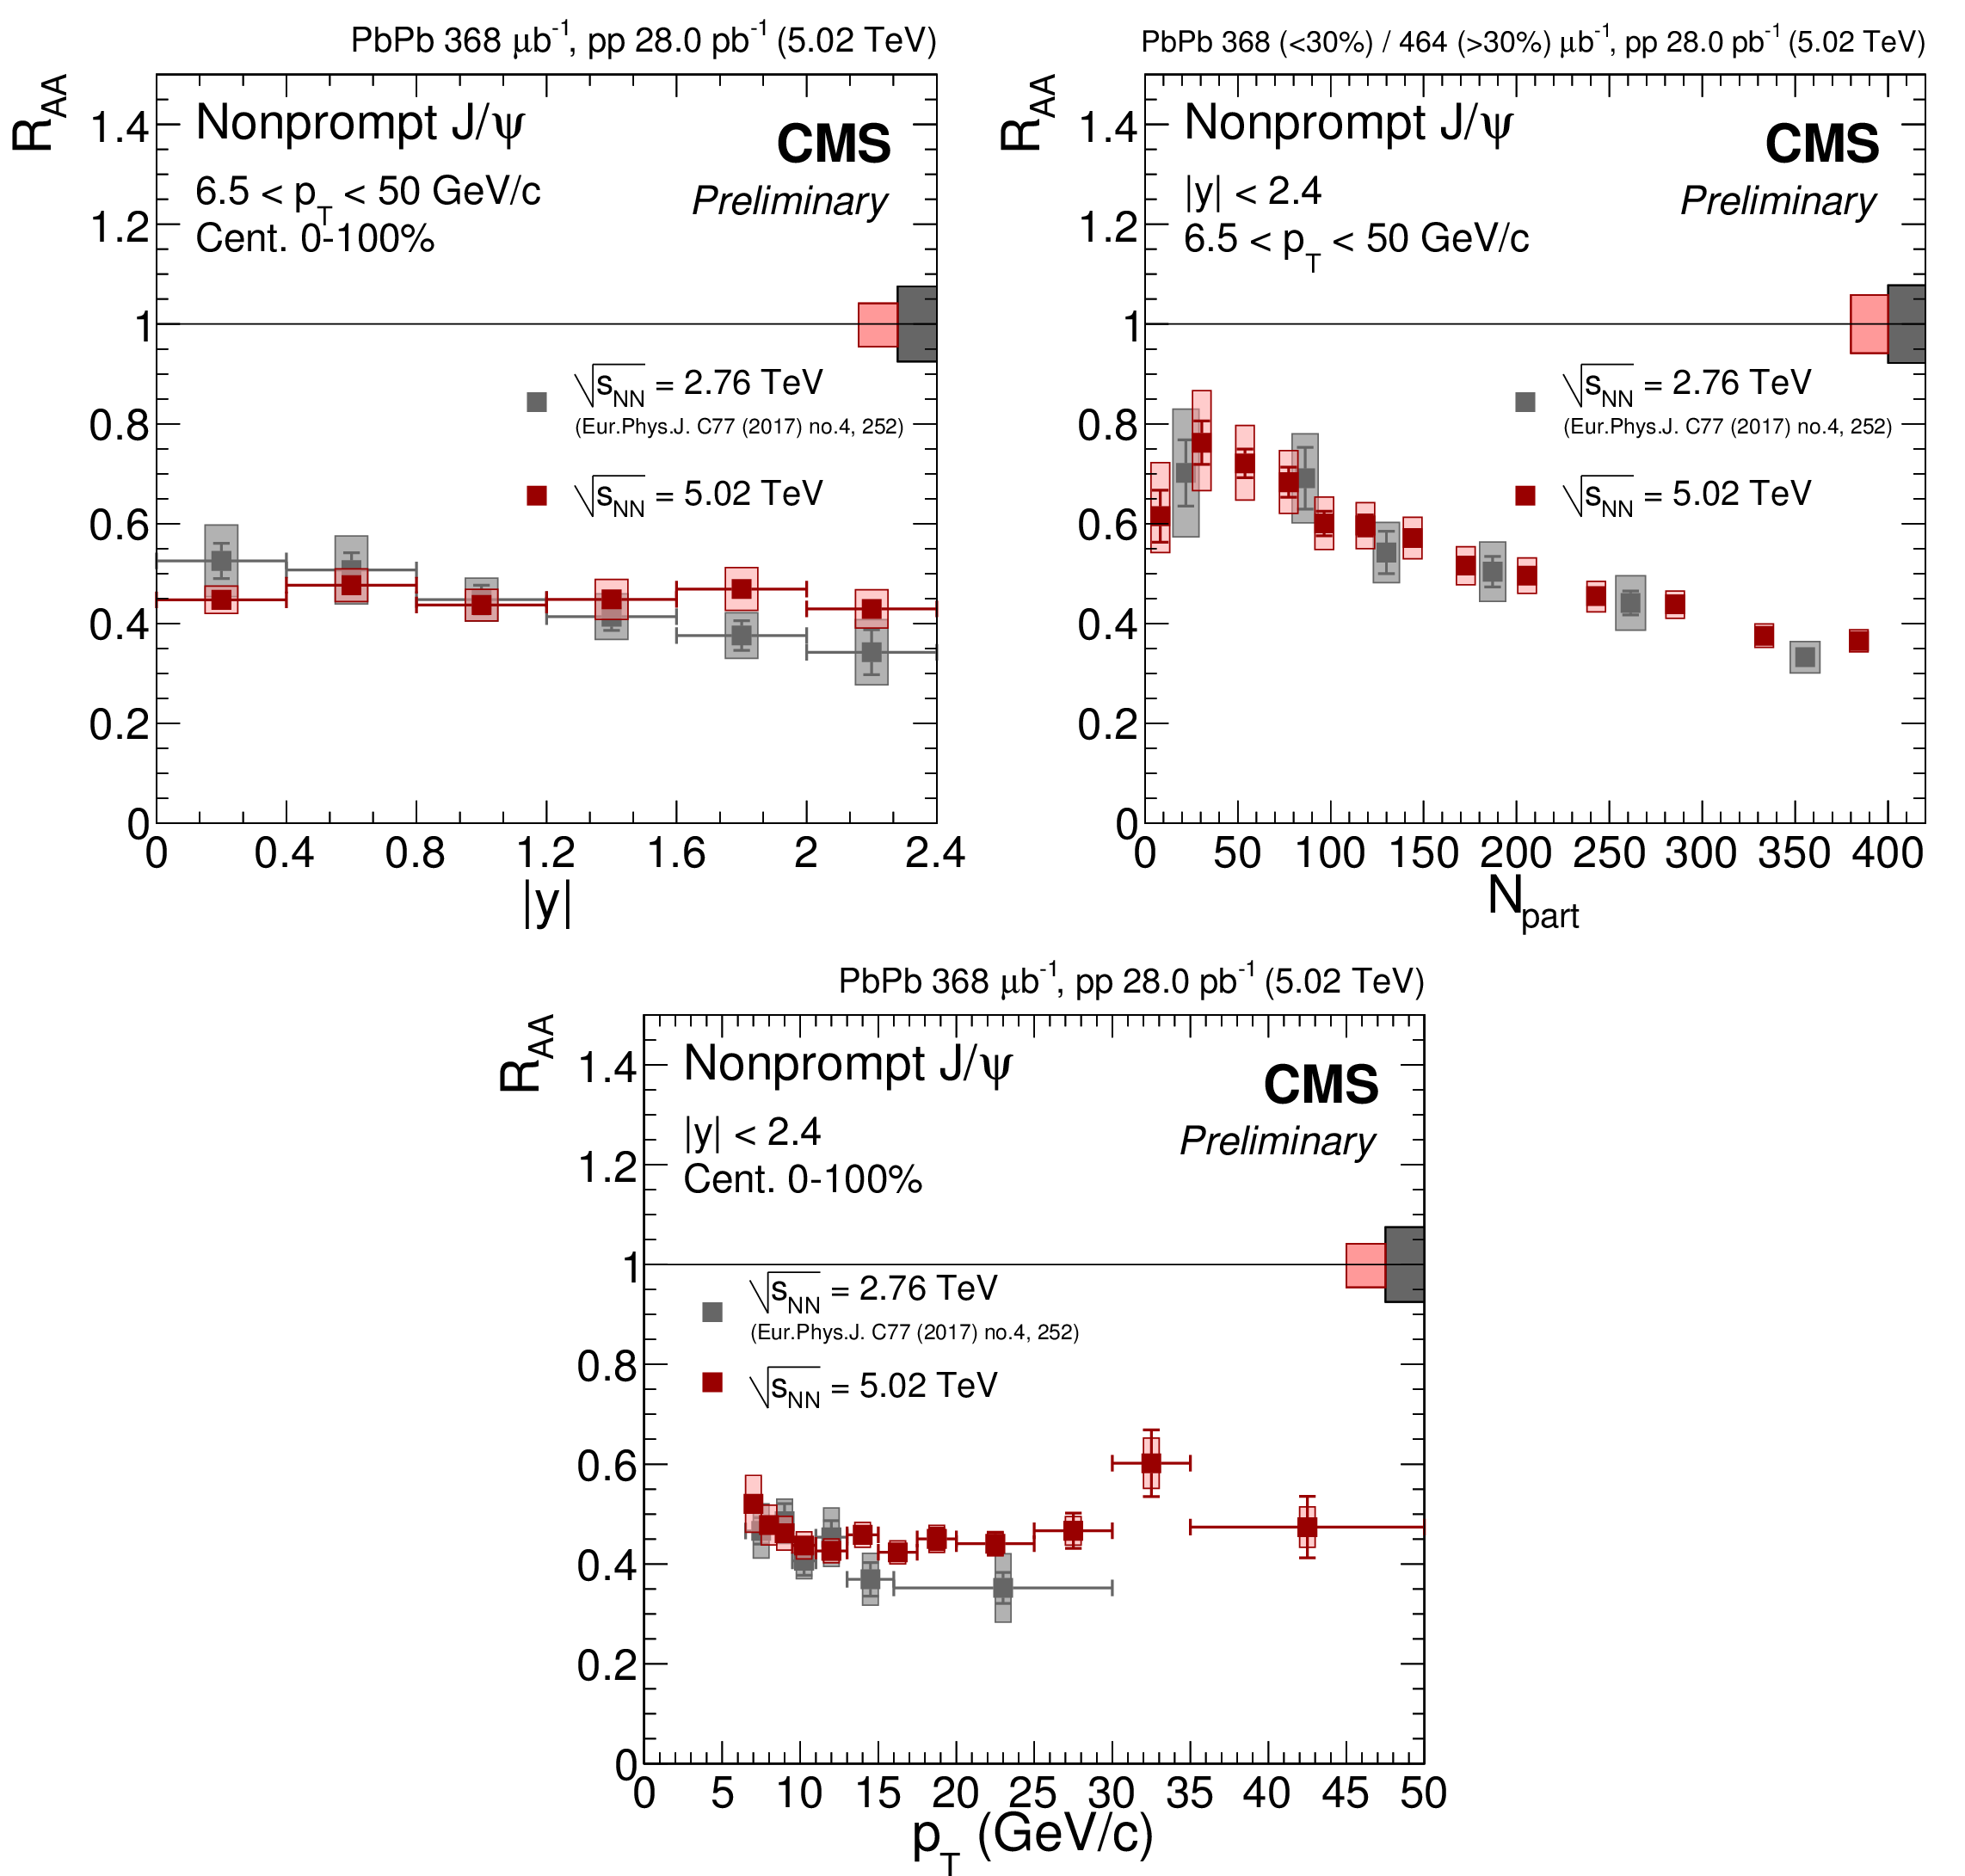
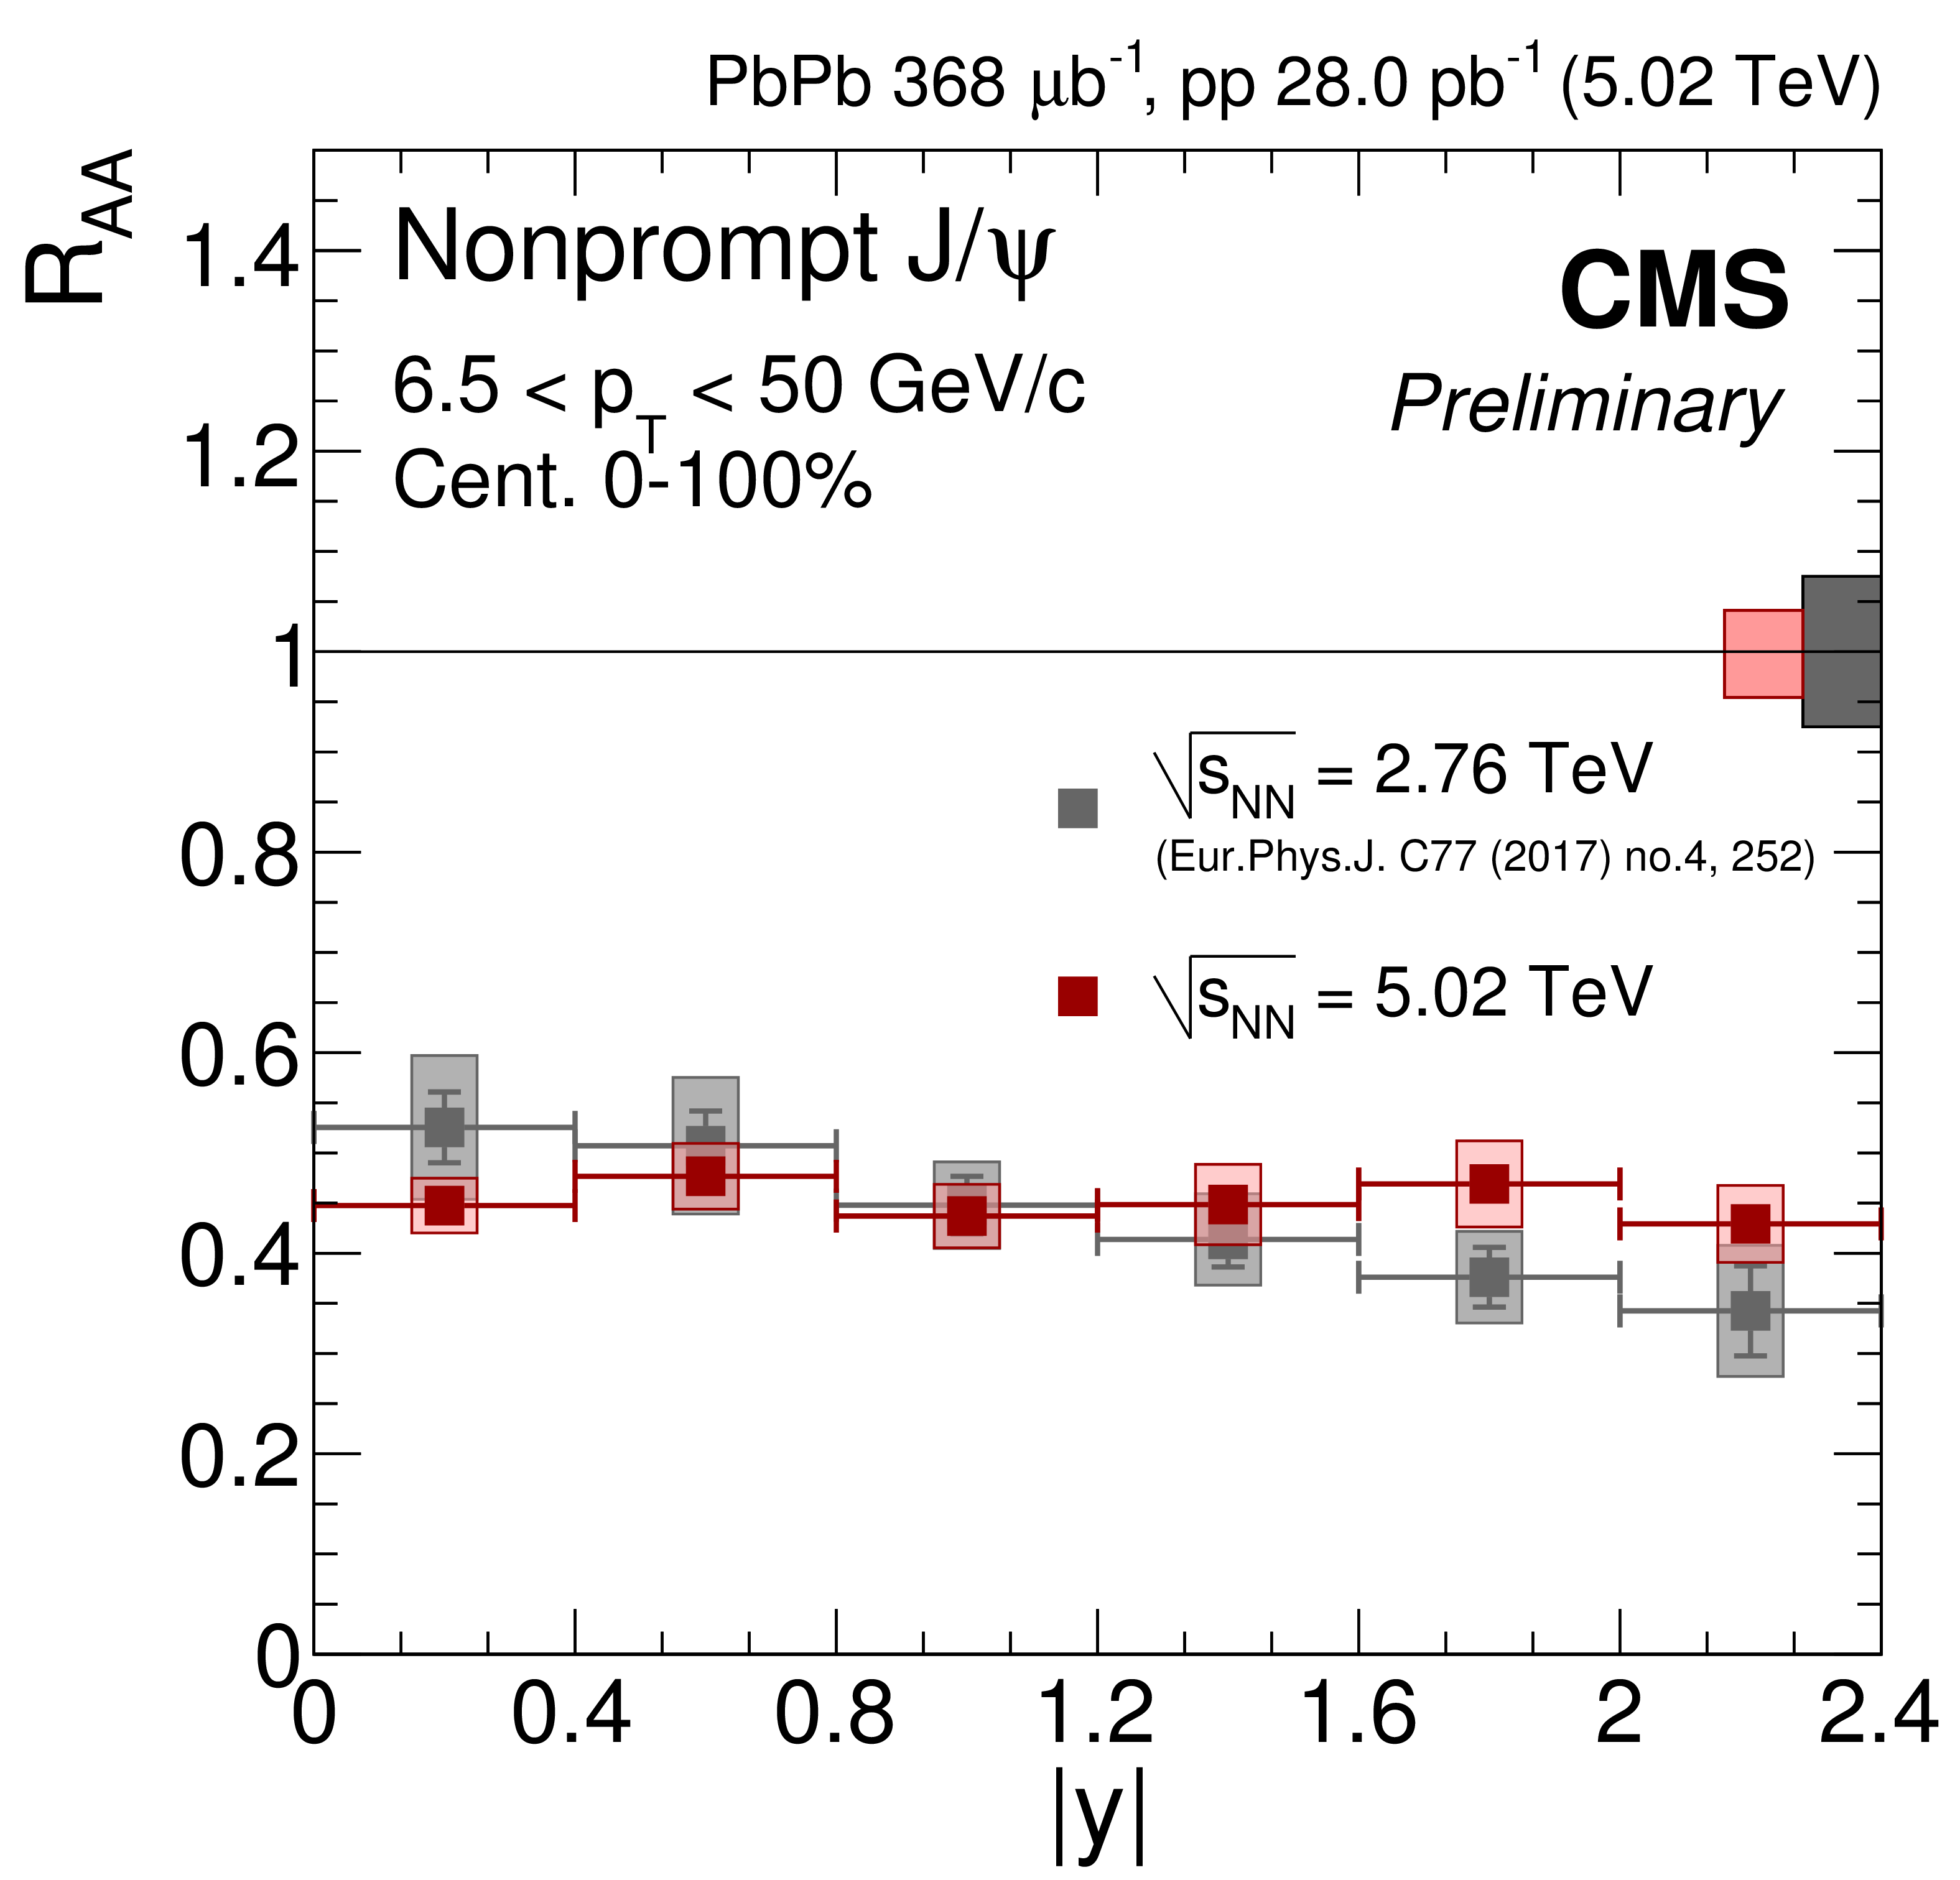
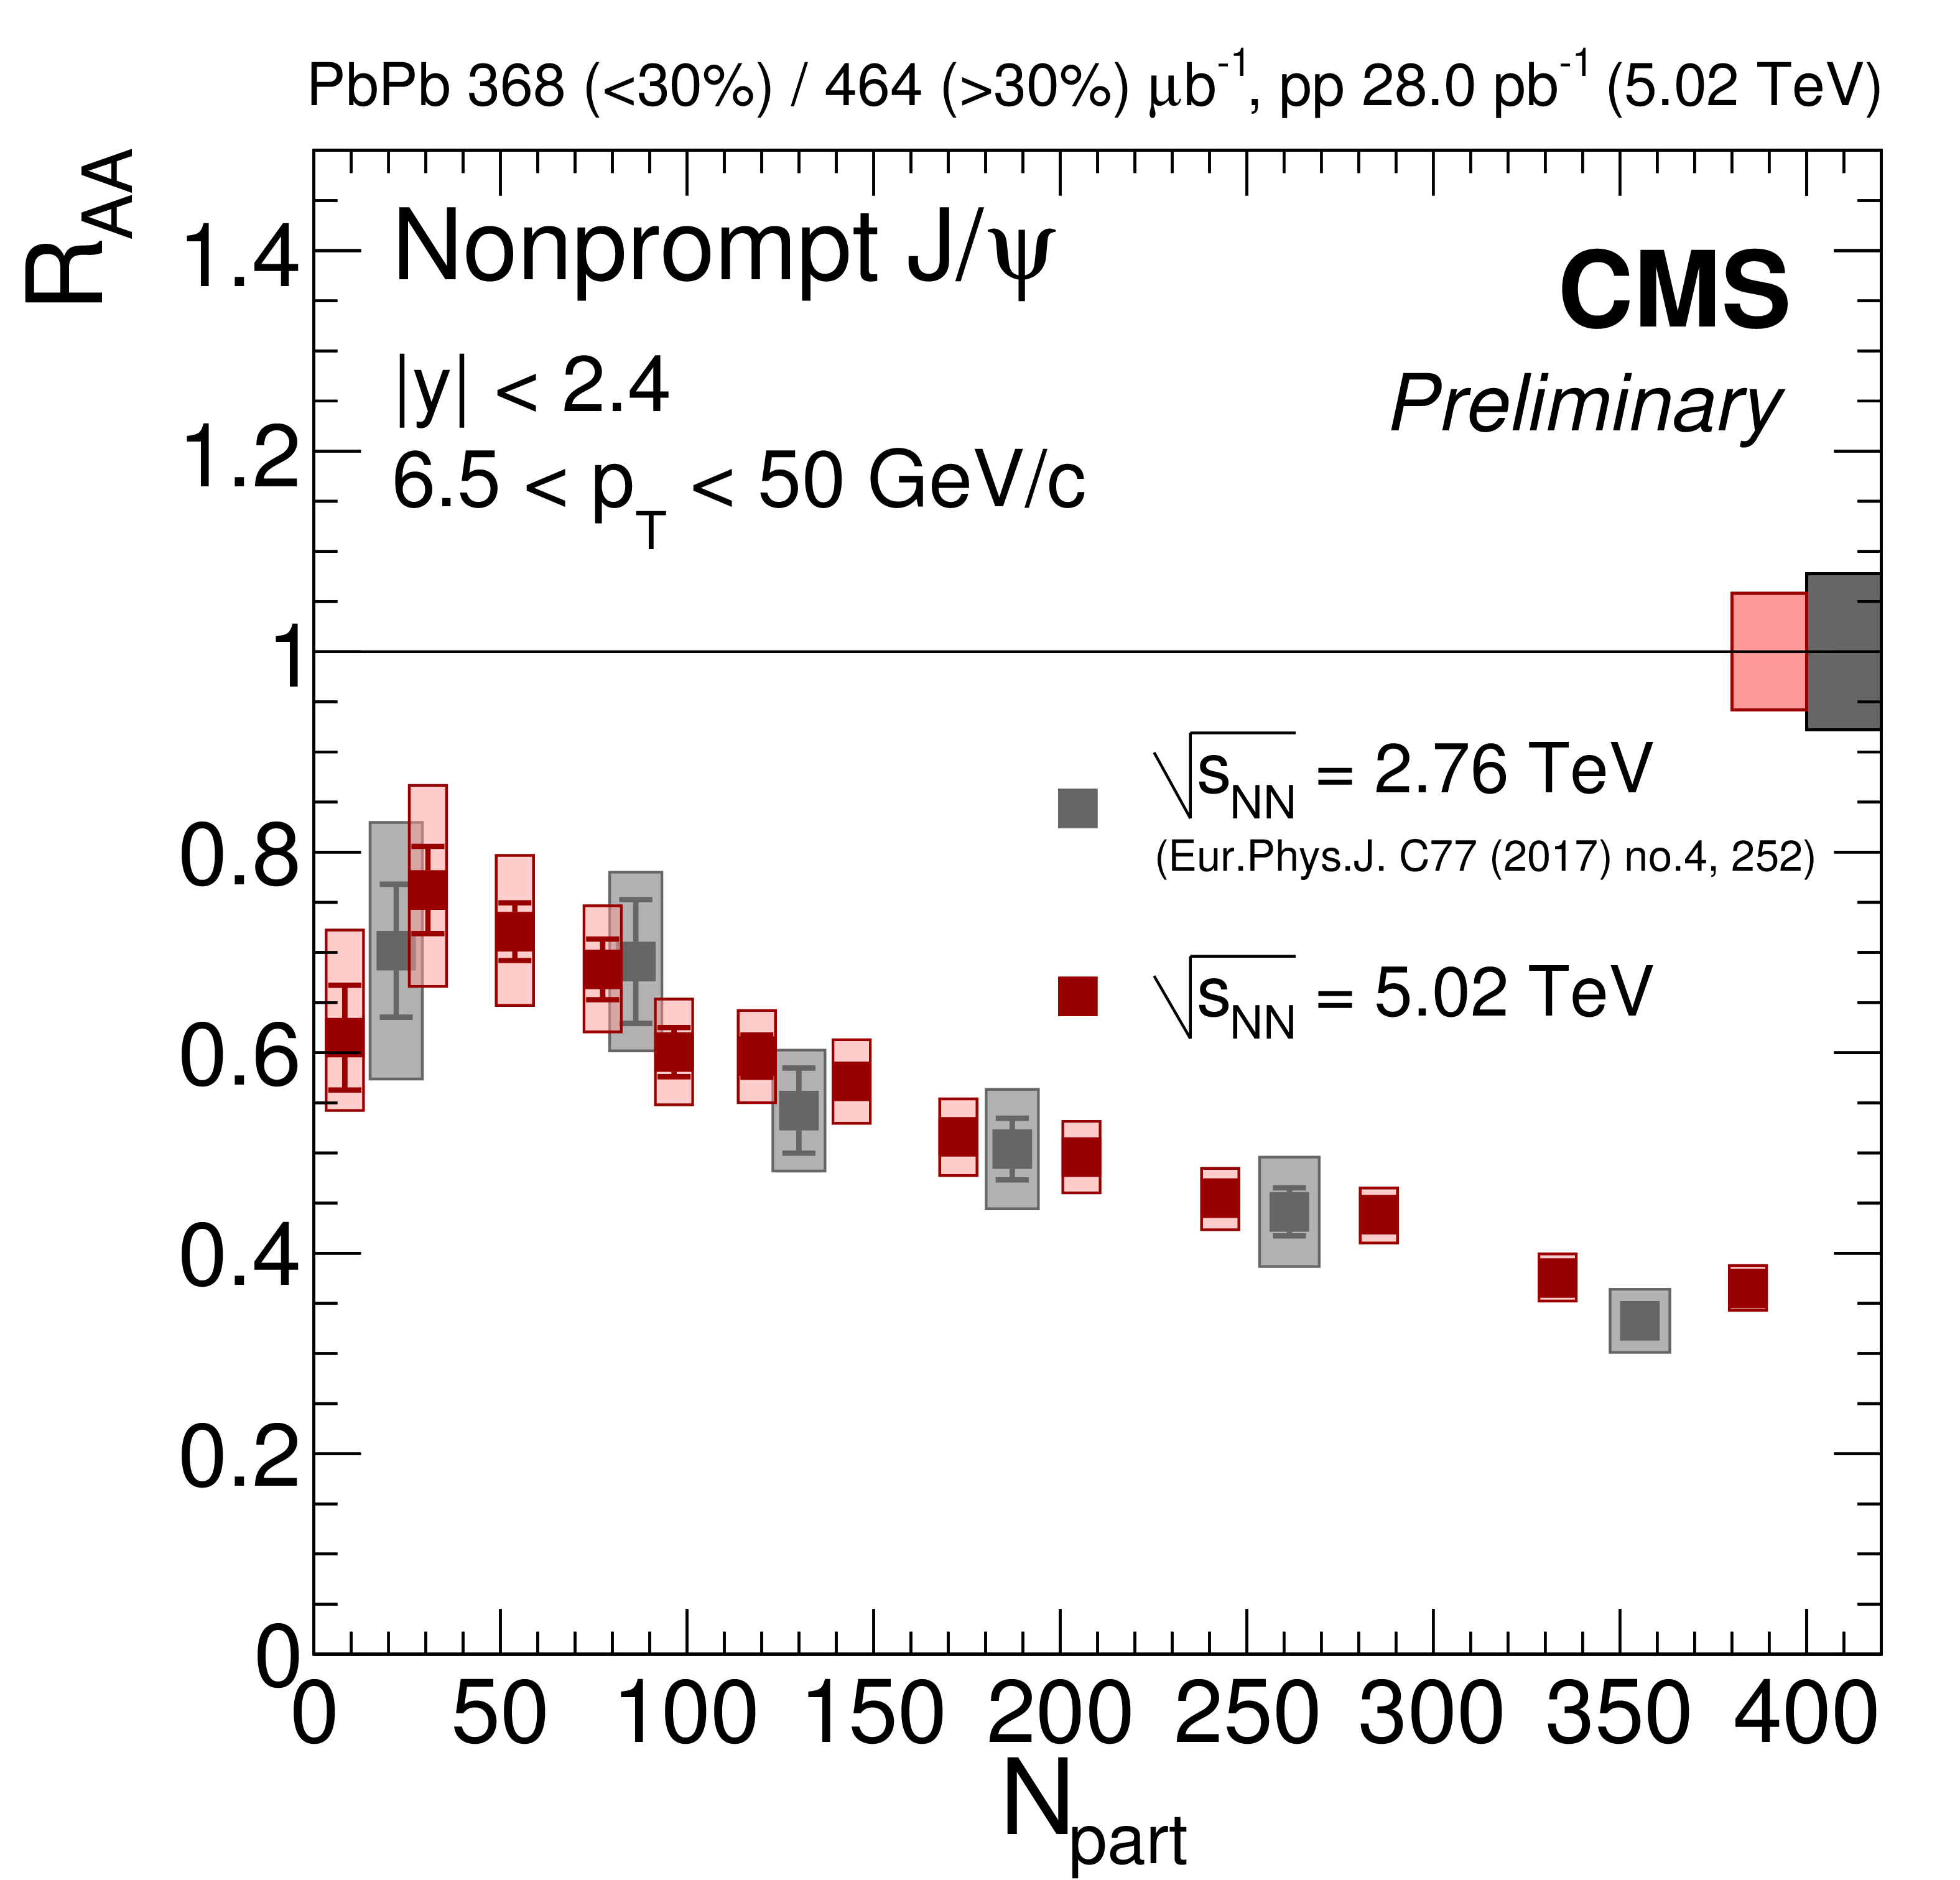
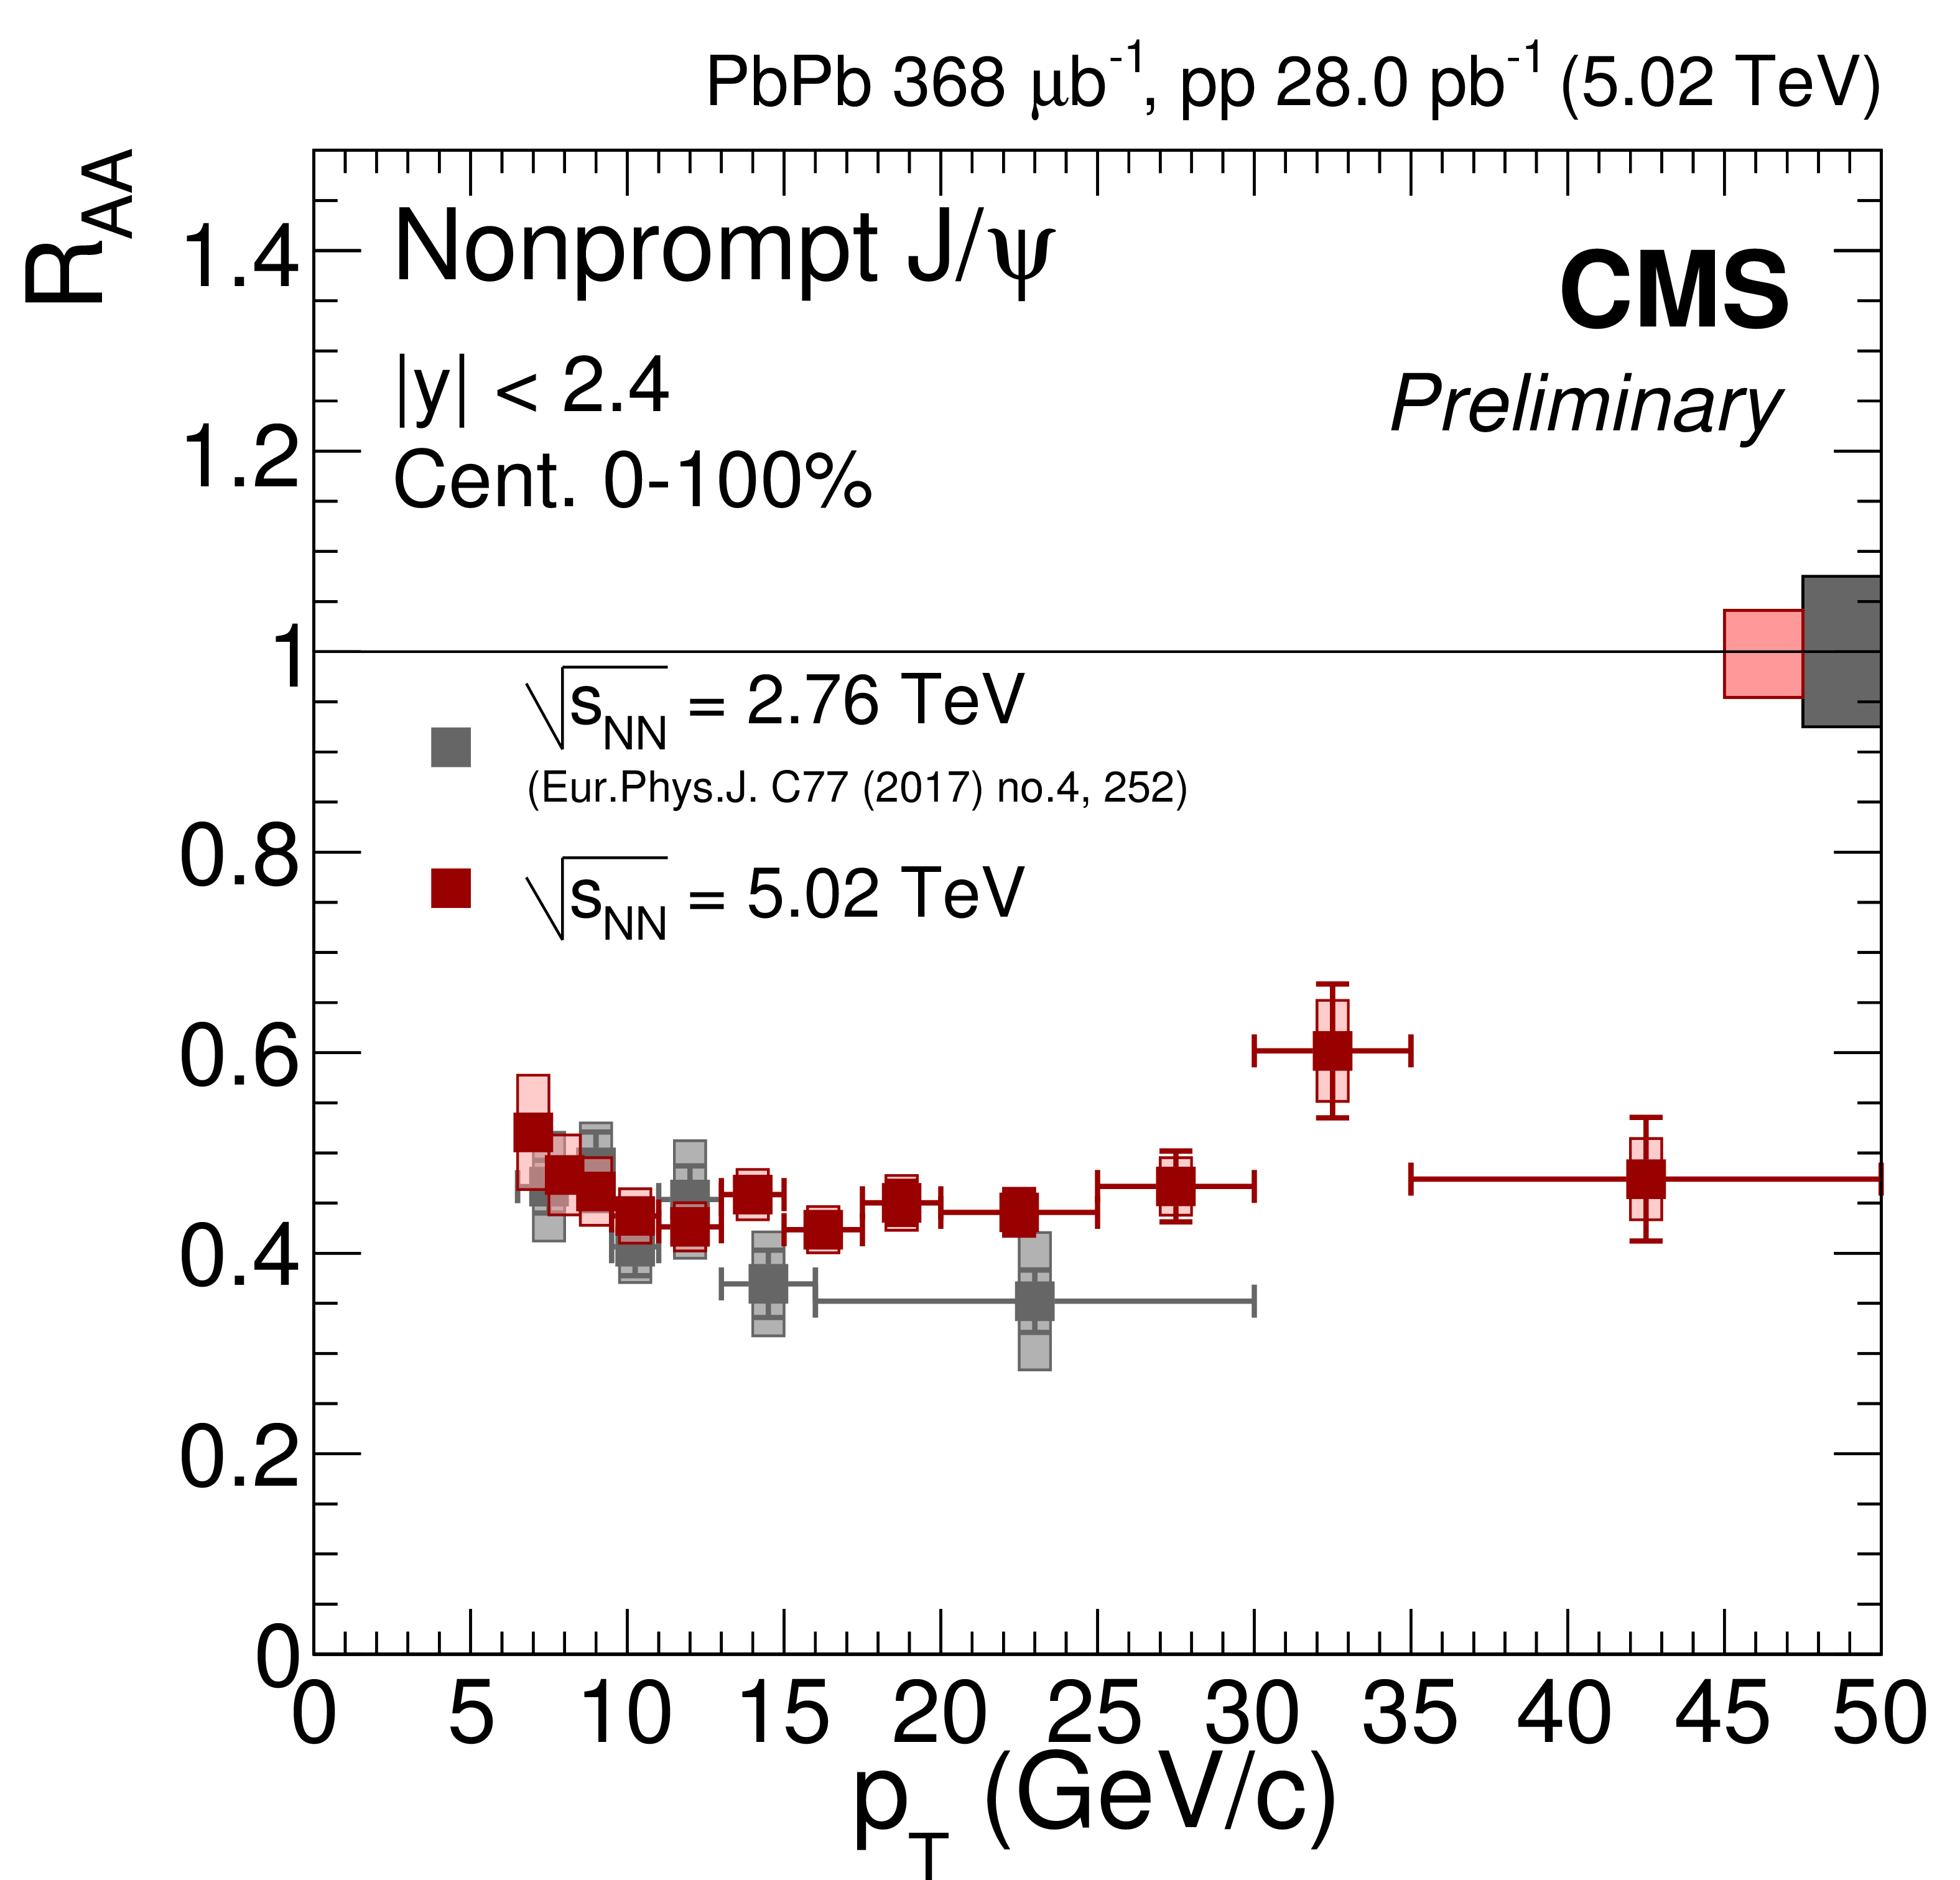
Nuclear modification factor as a function of rapidity (top left), centrality (top right) and $ {p_{\mathrm {T}}} $ (bottom) for the nonprompt $\mathrm{J}/\psi$ at $\sqrt {s_{\mathrm {NN}}} = $ 5.02 TeV. Results obtained at $\sqrt {s_{\mathrm {NN}}} = $ 2.76 TeV are overlaid for comparison [10]. The bars (boxes) represent statistical (systematic) point-by-point uncertainties. The boxes plotted at $ {R_{AA}} = $ 1 indicate the scale of the global relative uncertainties. |
png pdf |
Figure 7-a:
Nuclear modification factor as a function of rapidity for the nonprompt $\mathrm{J}/\psi$ at $\sqrt {s_{\mathrm {NN}}} = $ 5.02 TeV. Results obtained at $\sqrt {s_{\mathrm {NN}}} = $ 2.76 TeV are overlaid for comparison [10]. The bars (boxes) represent statistical (systematic) point-by-point uncertainties. The boxes plotted at $ {R_{AA}} = $ 1 indicate the scale of the global relative uncertainties. |
png pdf |
Figure 7-b:
Nuclear modification factor as a function of centrality for the nonprompt $\mathrm{J}/\psi$ at $\sqrt {s_{\mathrm {NN}}} = $ 5.02 TeV. Results obtained at $\sqrt {s_{\mathrm {NN}}} = $ 2.76 TeV are overlaid for comparison [10]. The bars (boxes) represent statistical (systematic) point-by-point uncertainties. The boxes plotted at $ {R_{AA}} = $ 1 indicate the scale of the global relative uncertainties. |
png pdf |
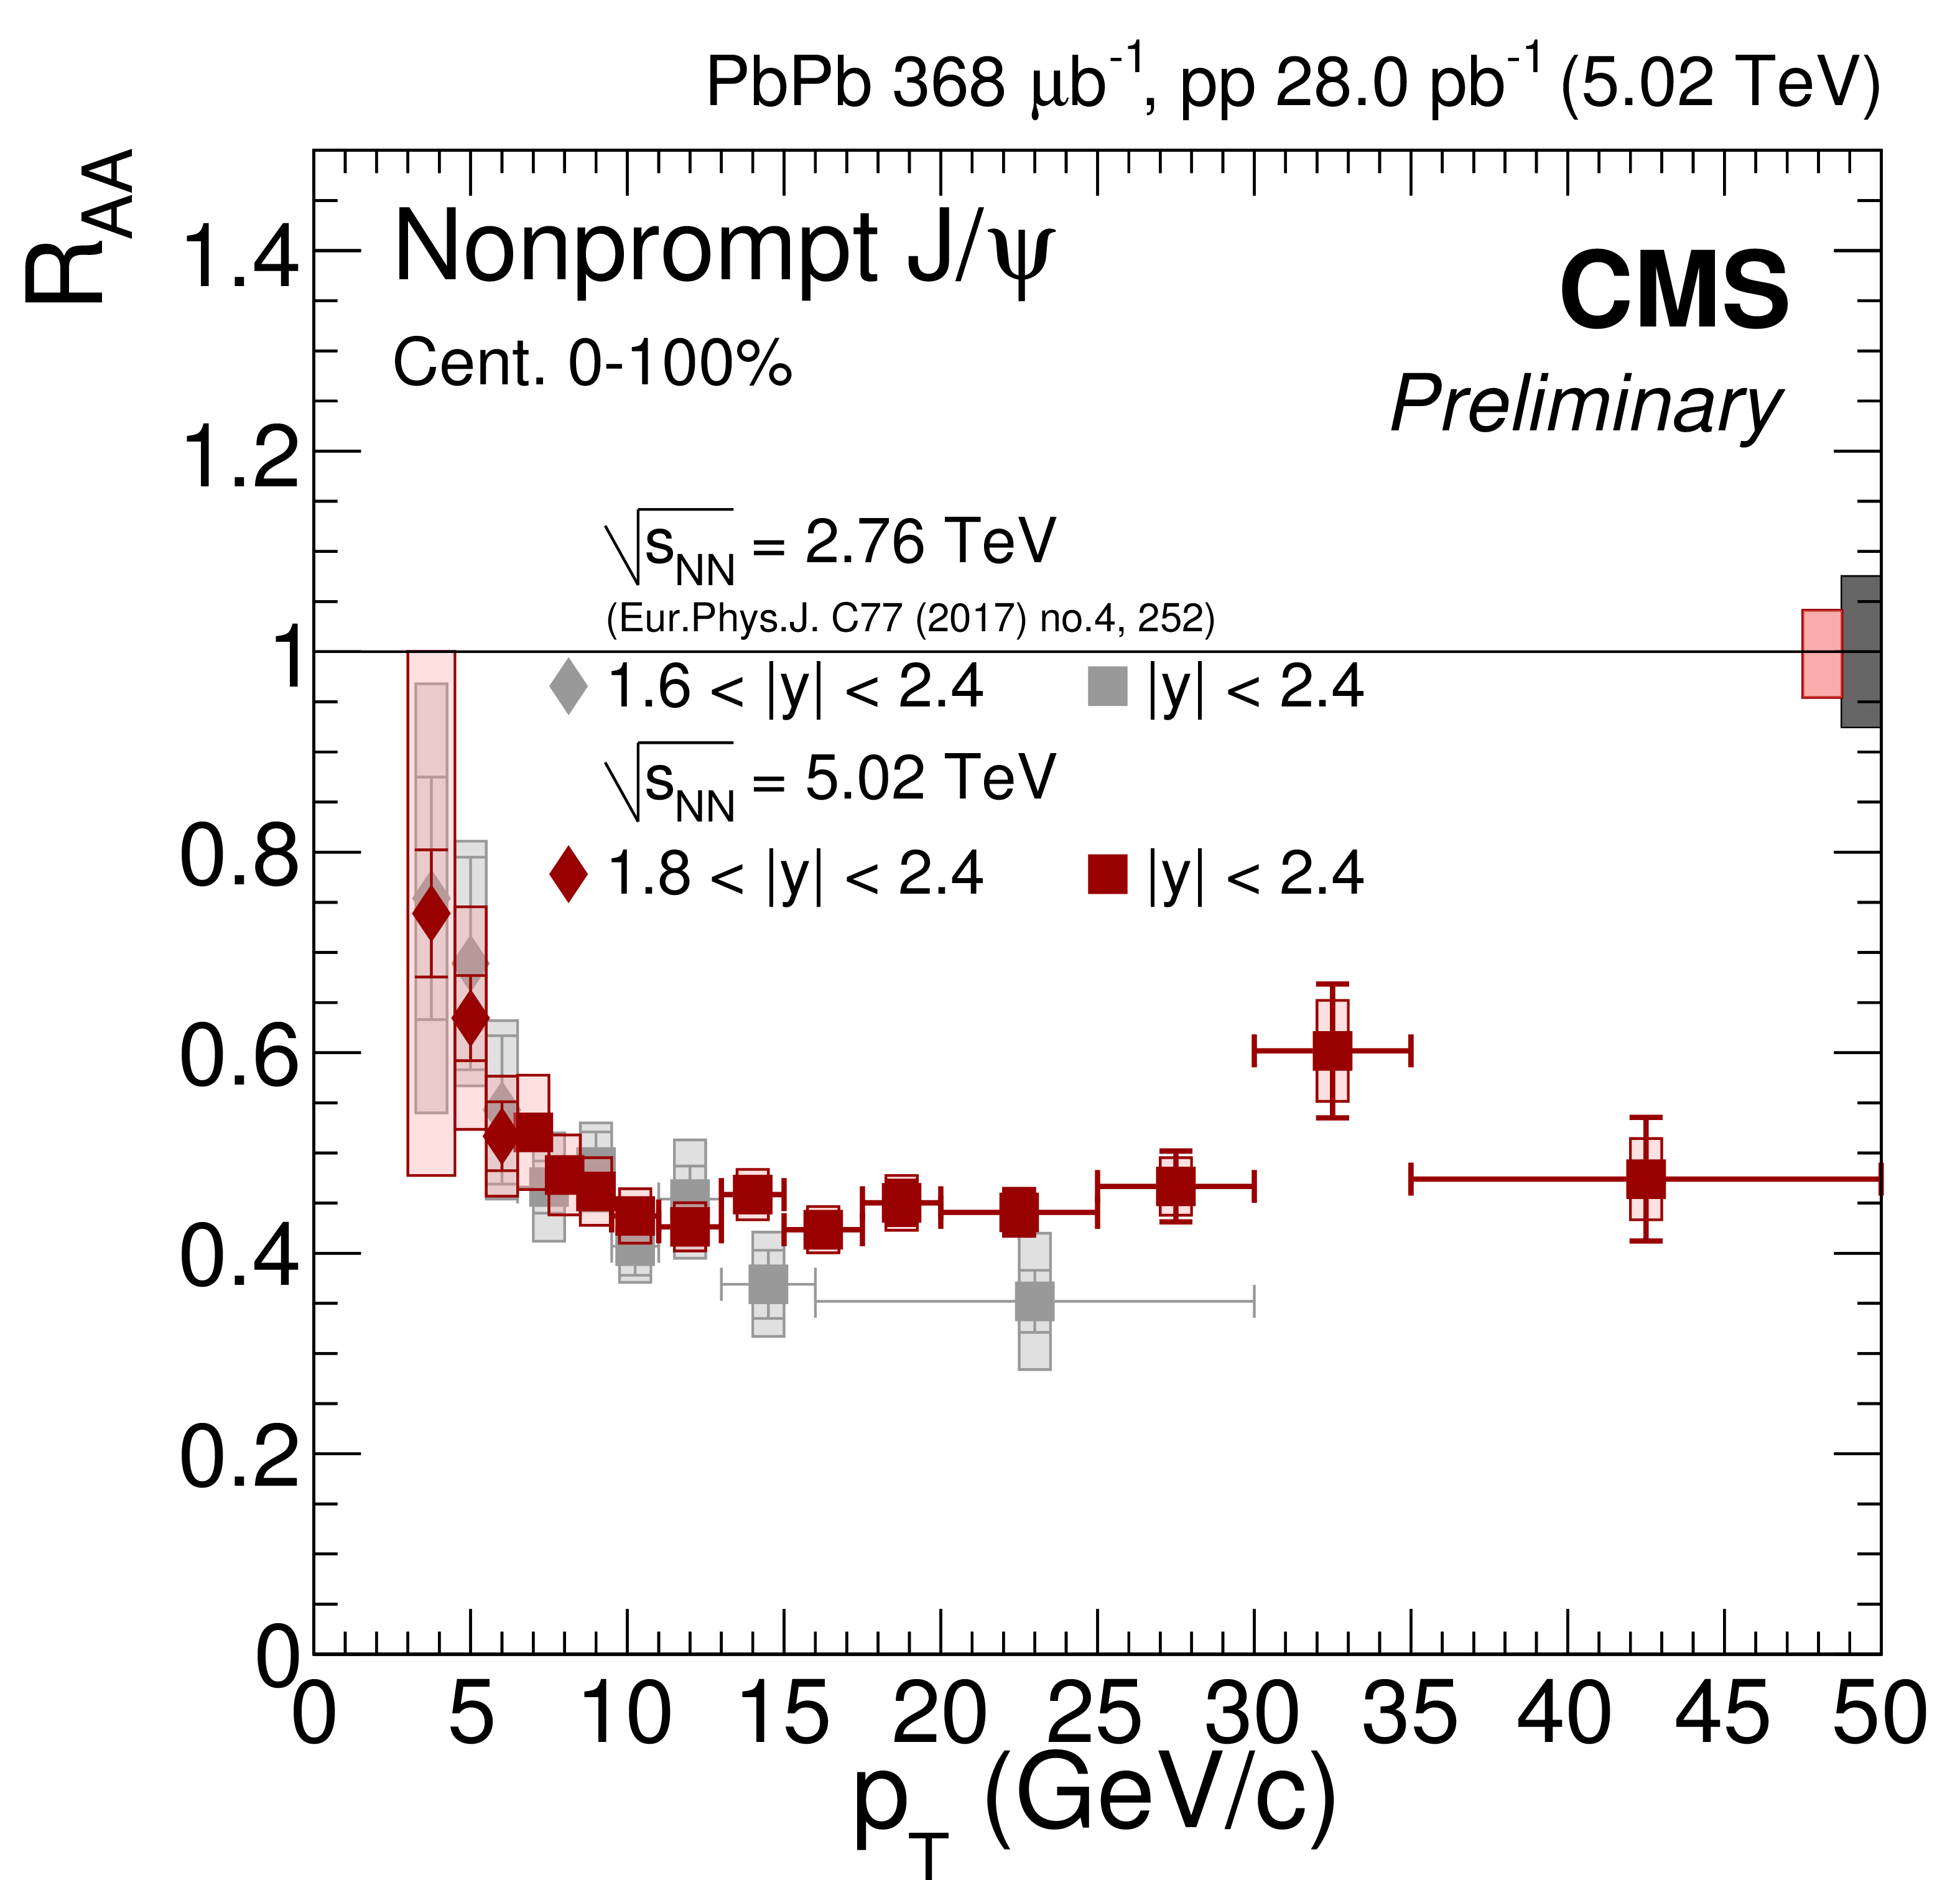
Figure 7-c:
Nuclear modification factor as a function of $ {p_{\mathrm {T}}} $ for the nonprompt $\mathrm{J}/\psi$ at $\sqrt {s_{\mathrm {NN}}} = $ 5.02 TeV. Results obtained at $\sqrt {s_{\mathrm {NN}}} = $ 2.76 TeV are overlaid for comparison [10]. The bars (boxes) represent statistical (systematic) point-by-point uncertainties. The boxes plotted at $ {R_{AA}} = $ 1 indicate the scale of the global relative uncertainties. |

png pdf |
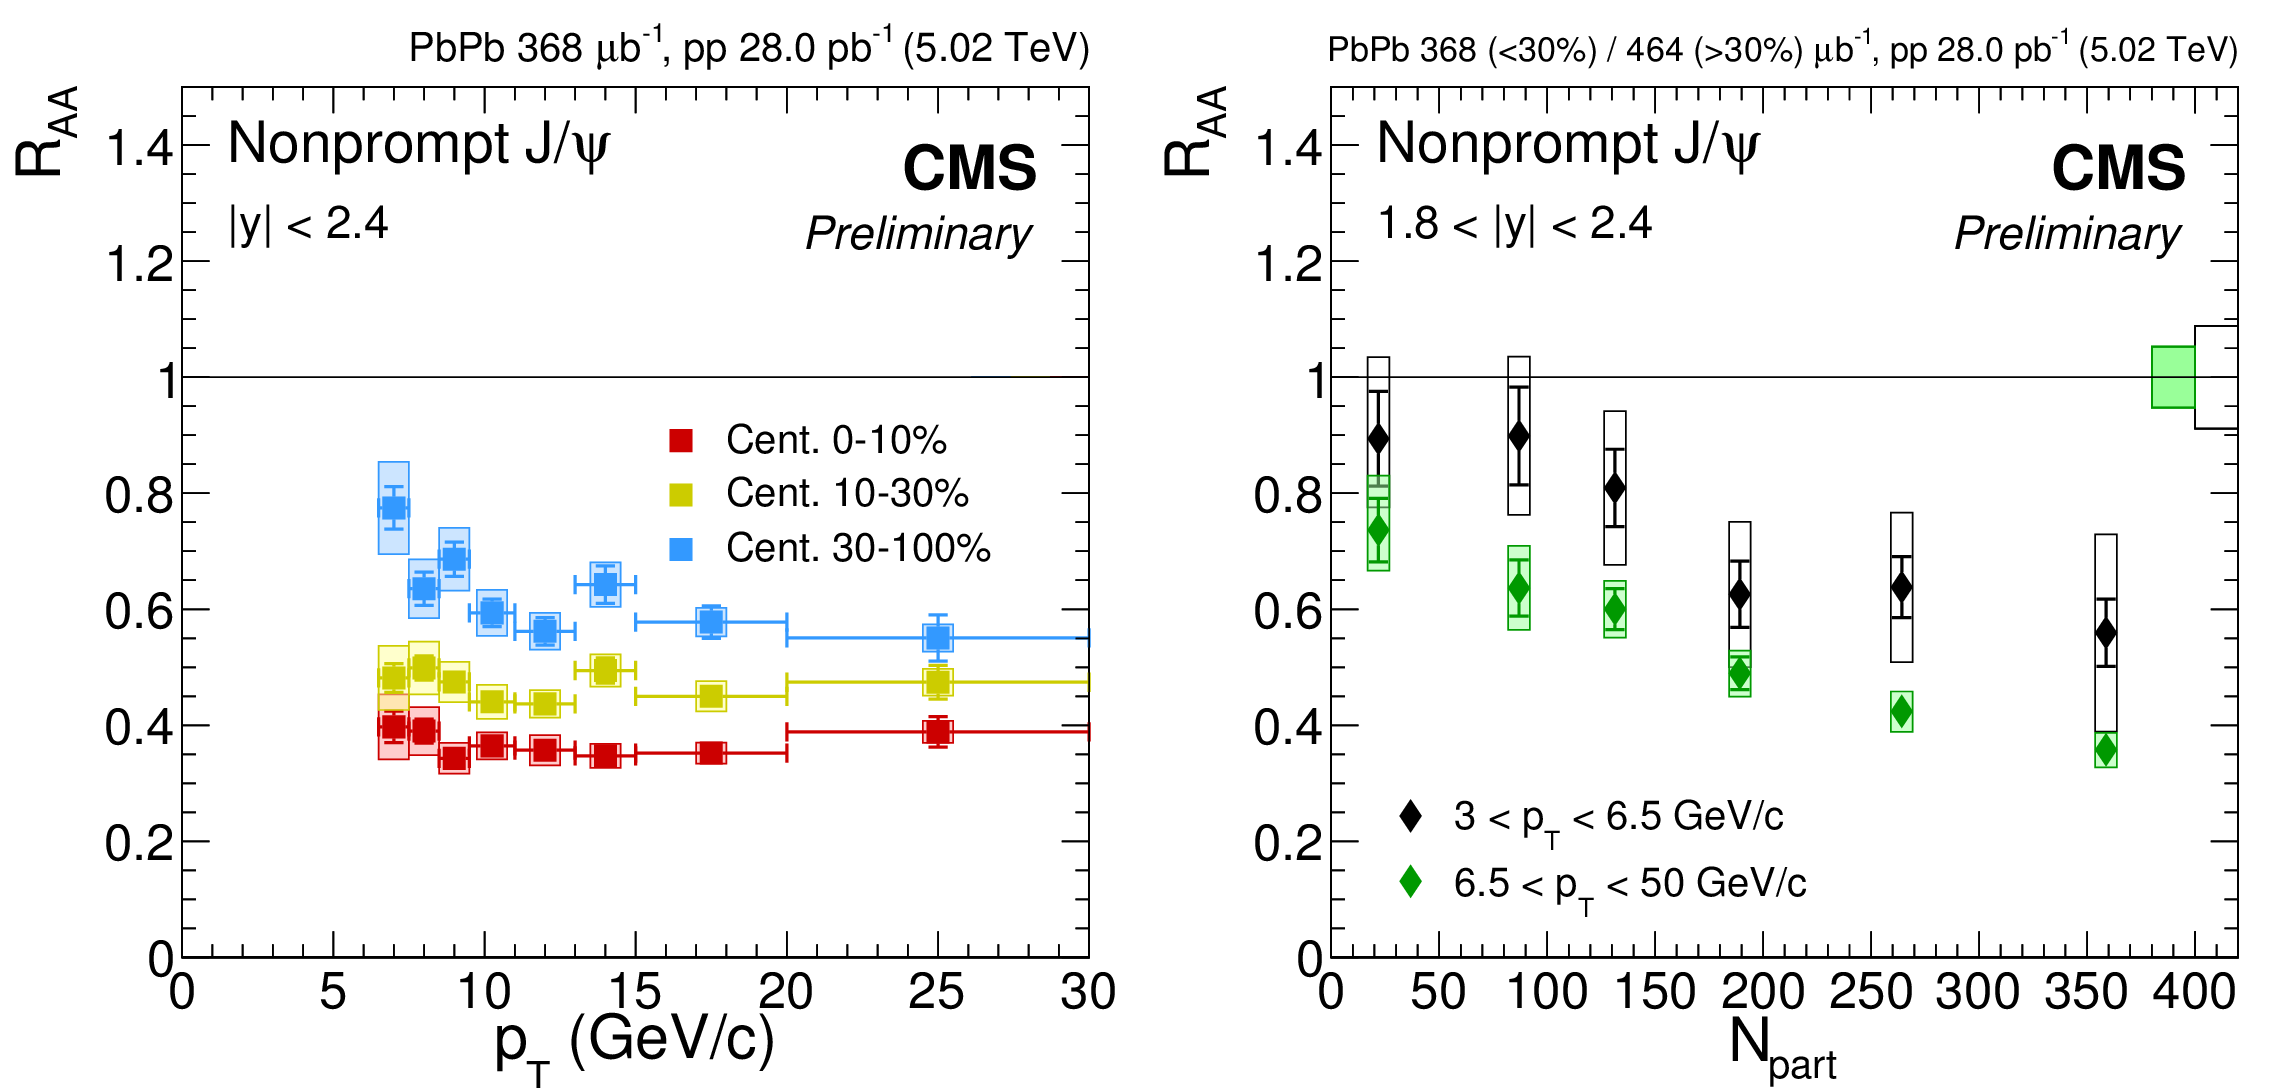
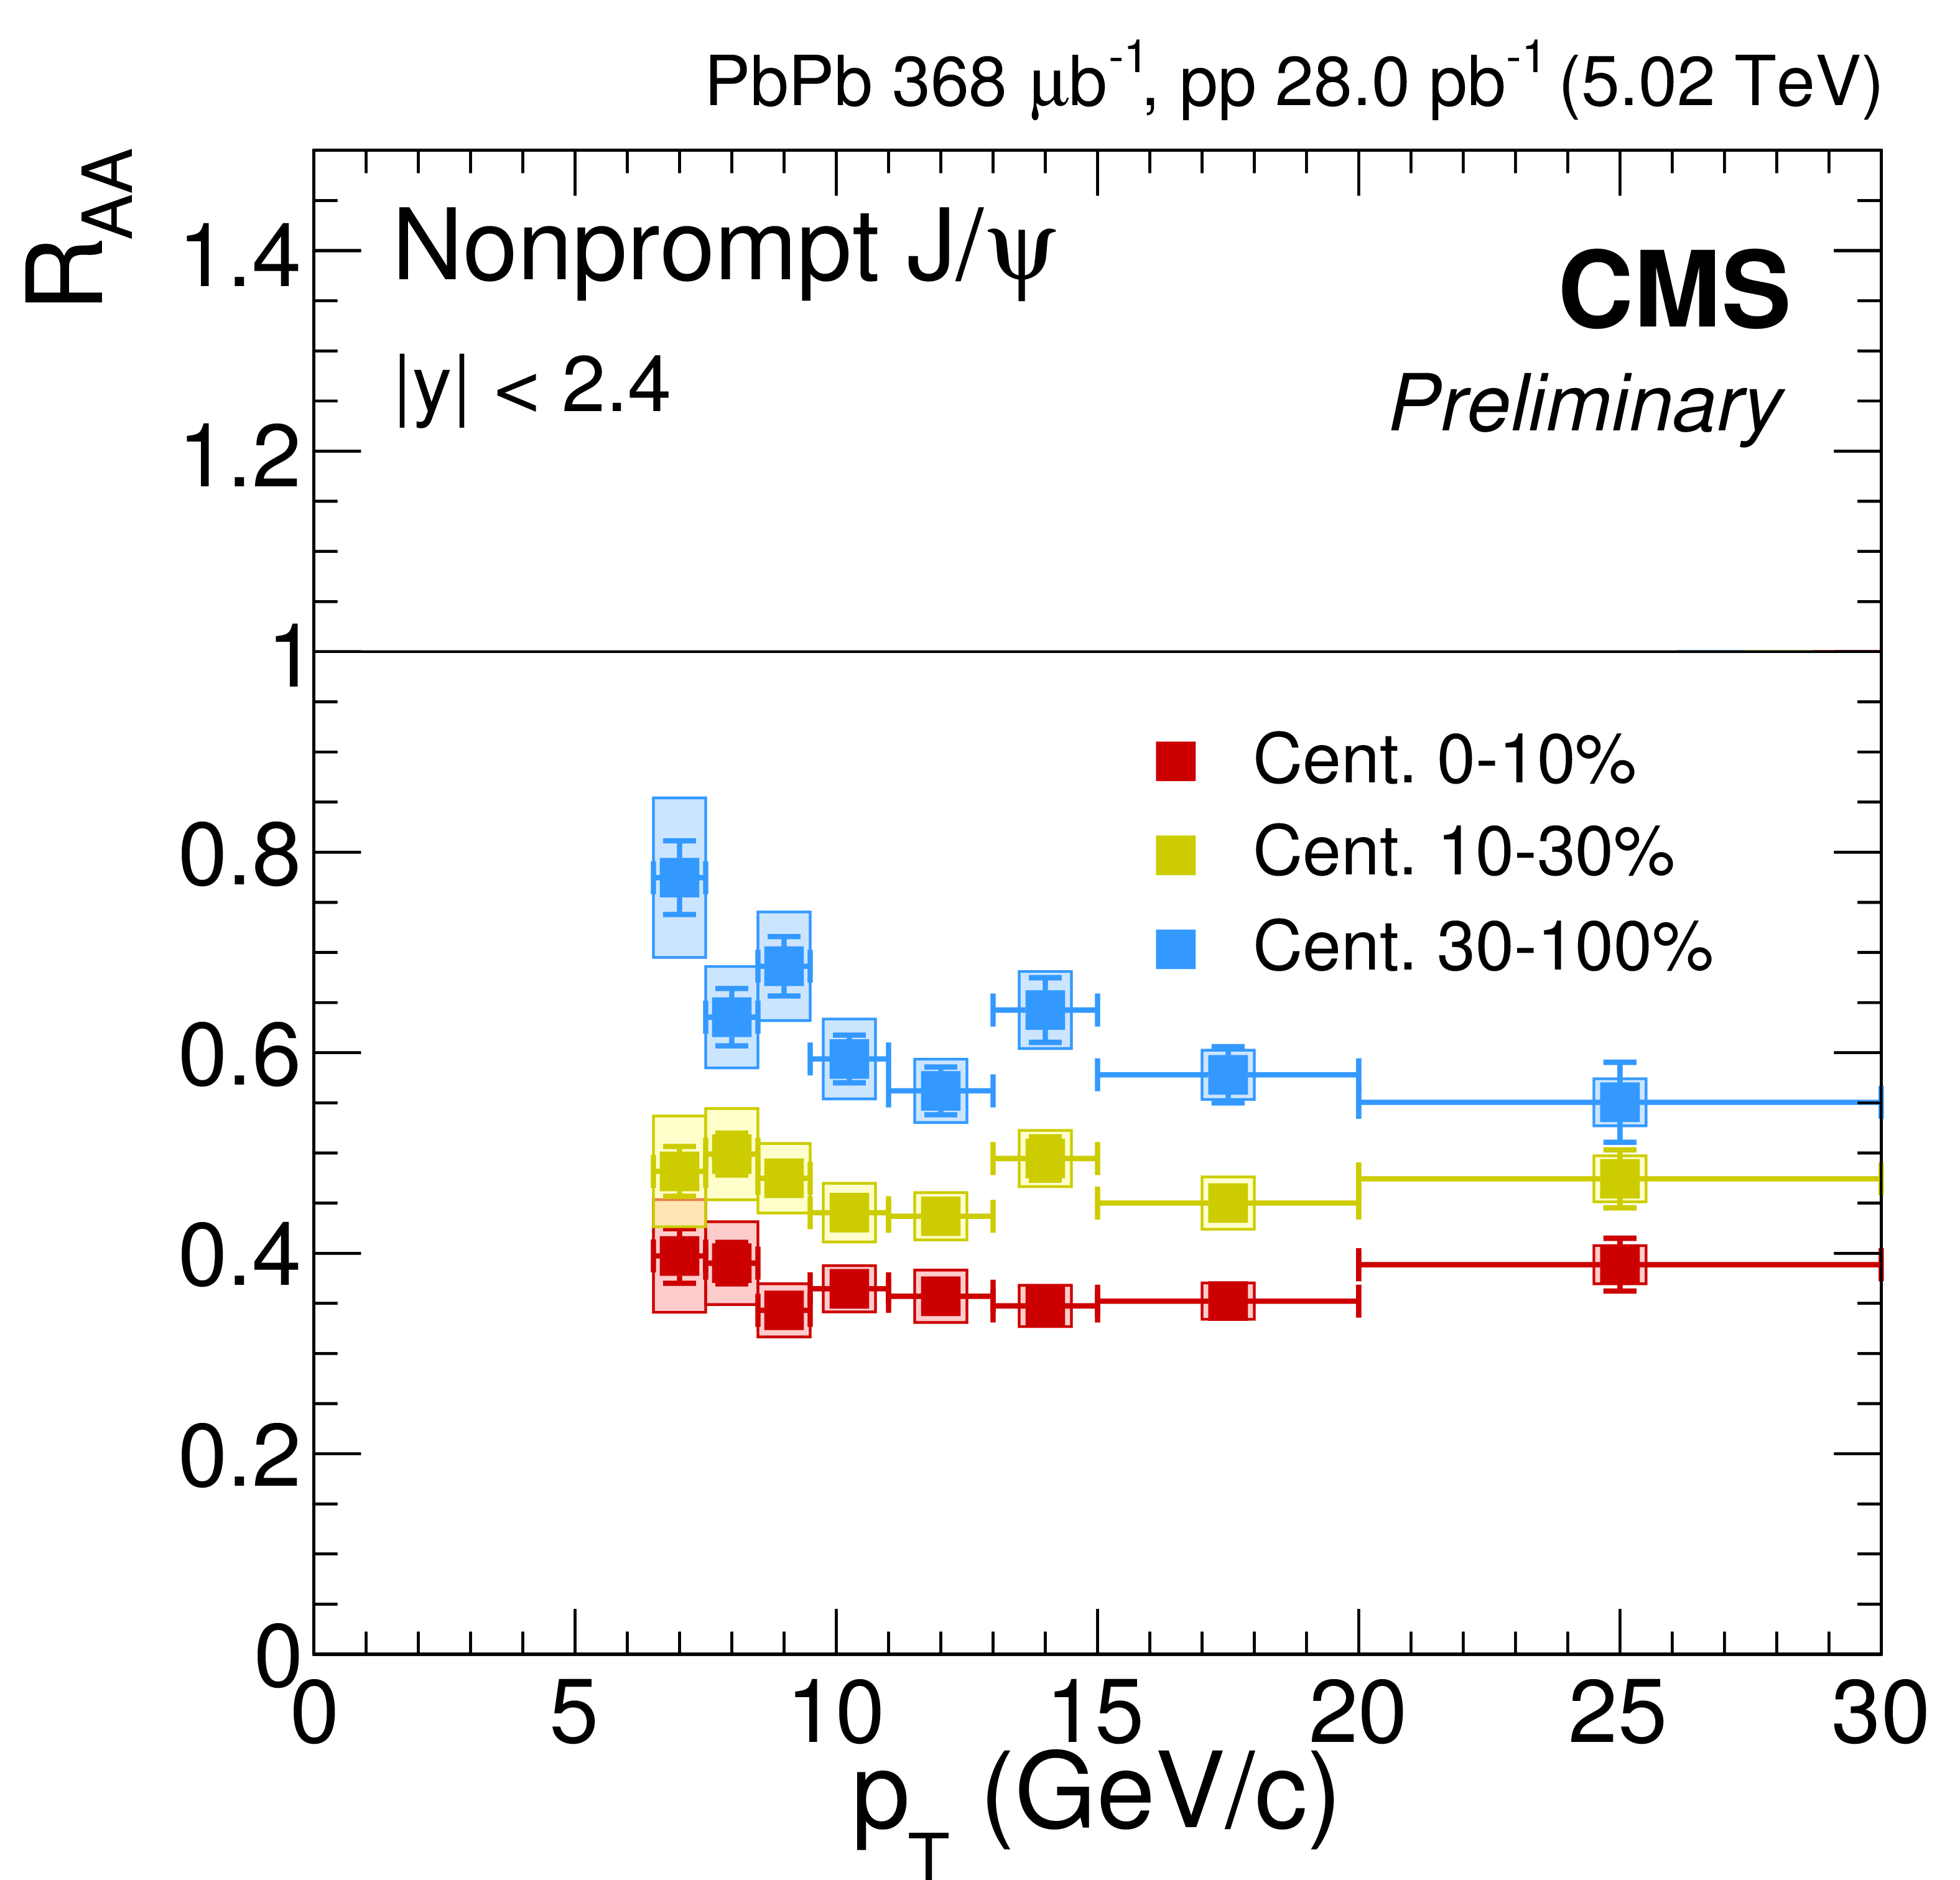
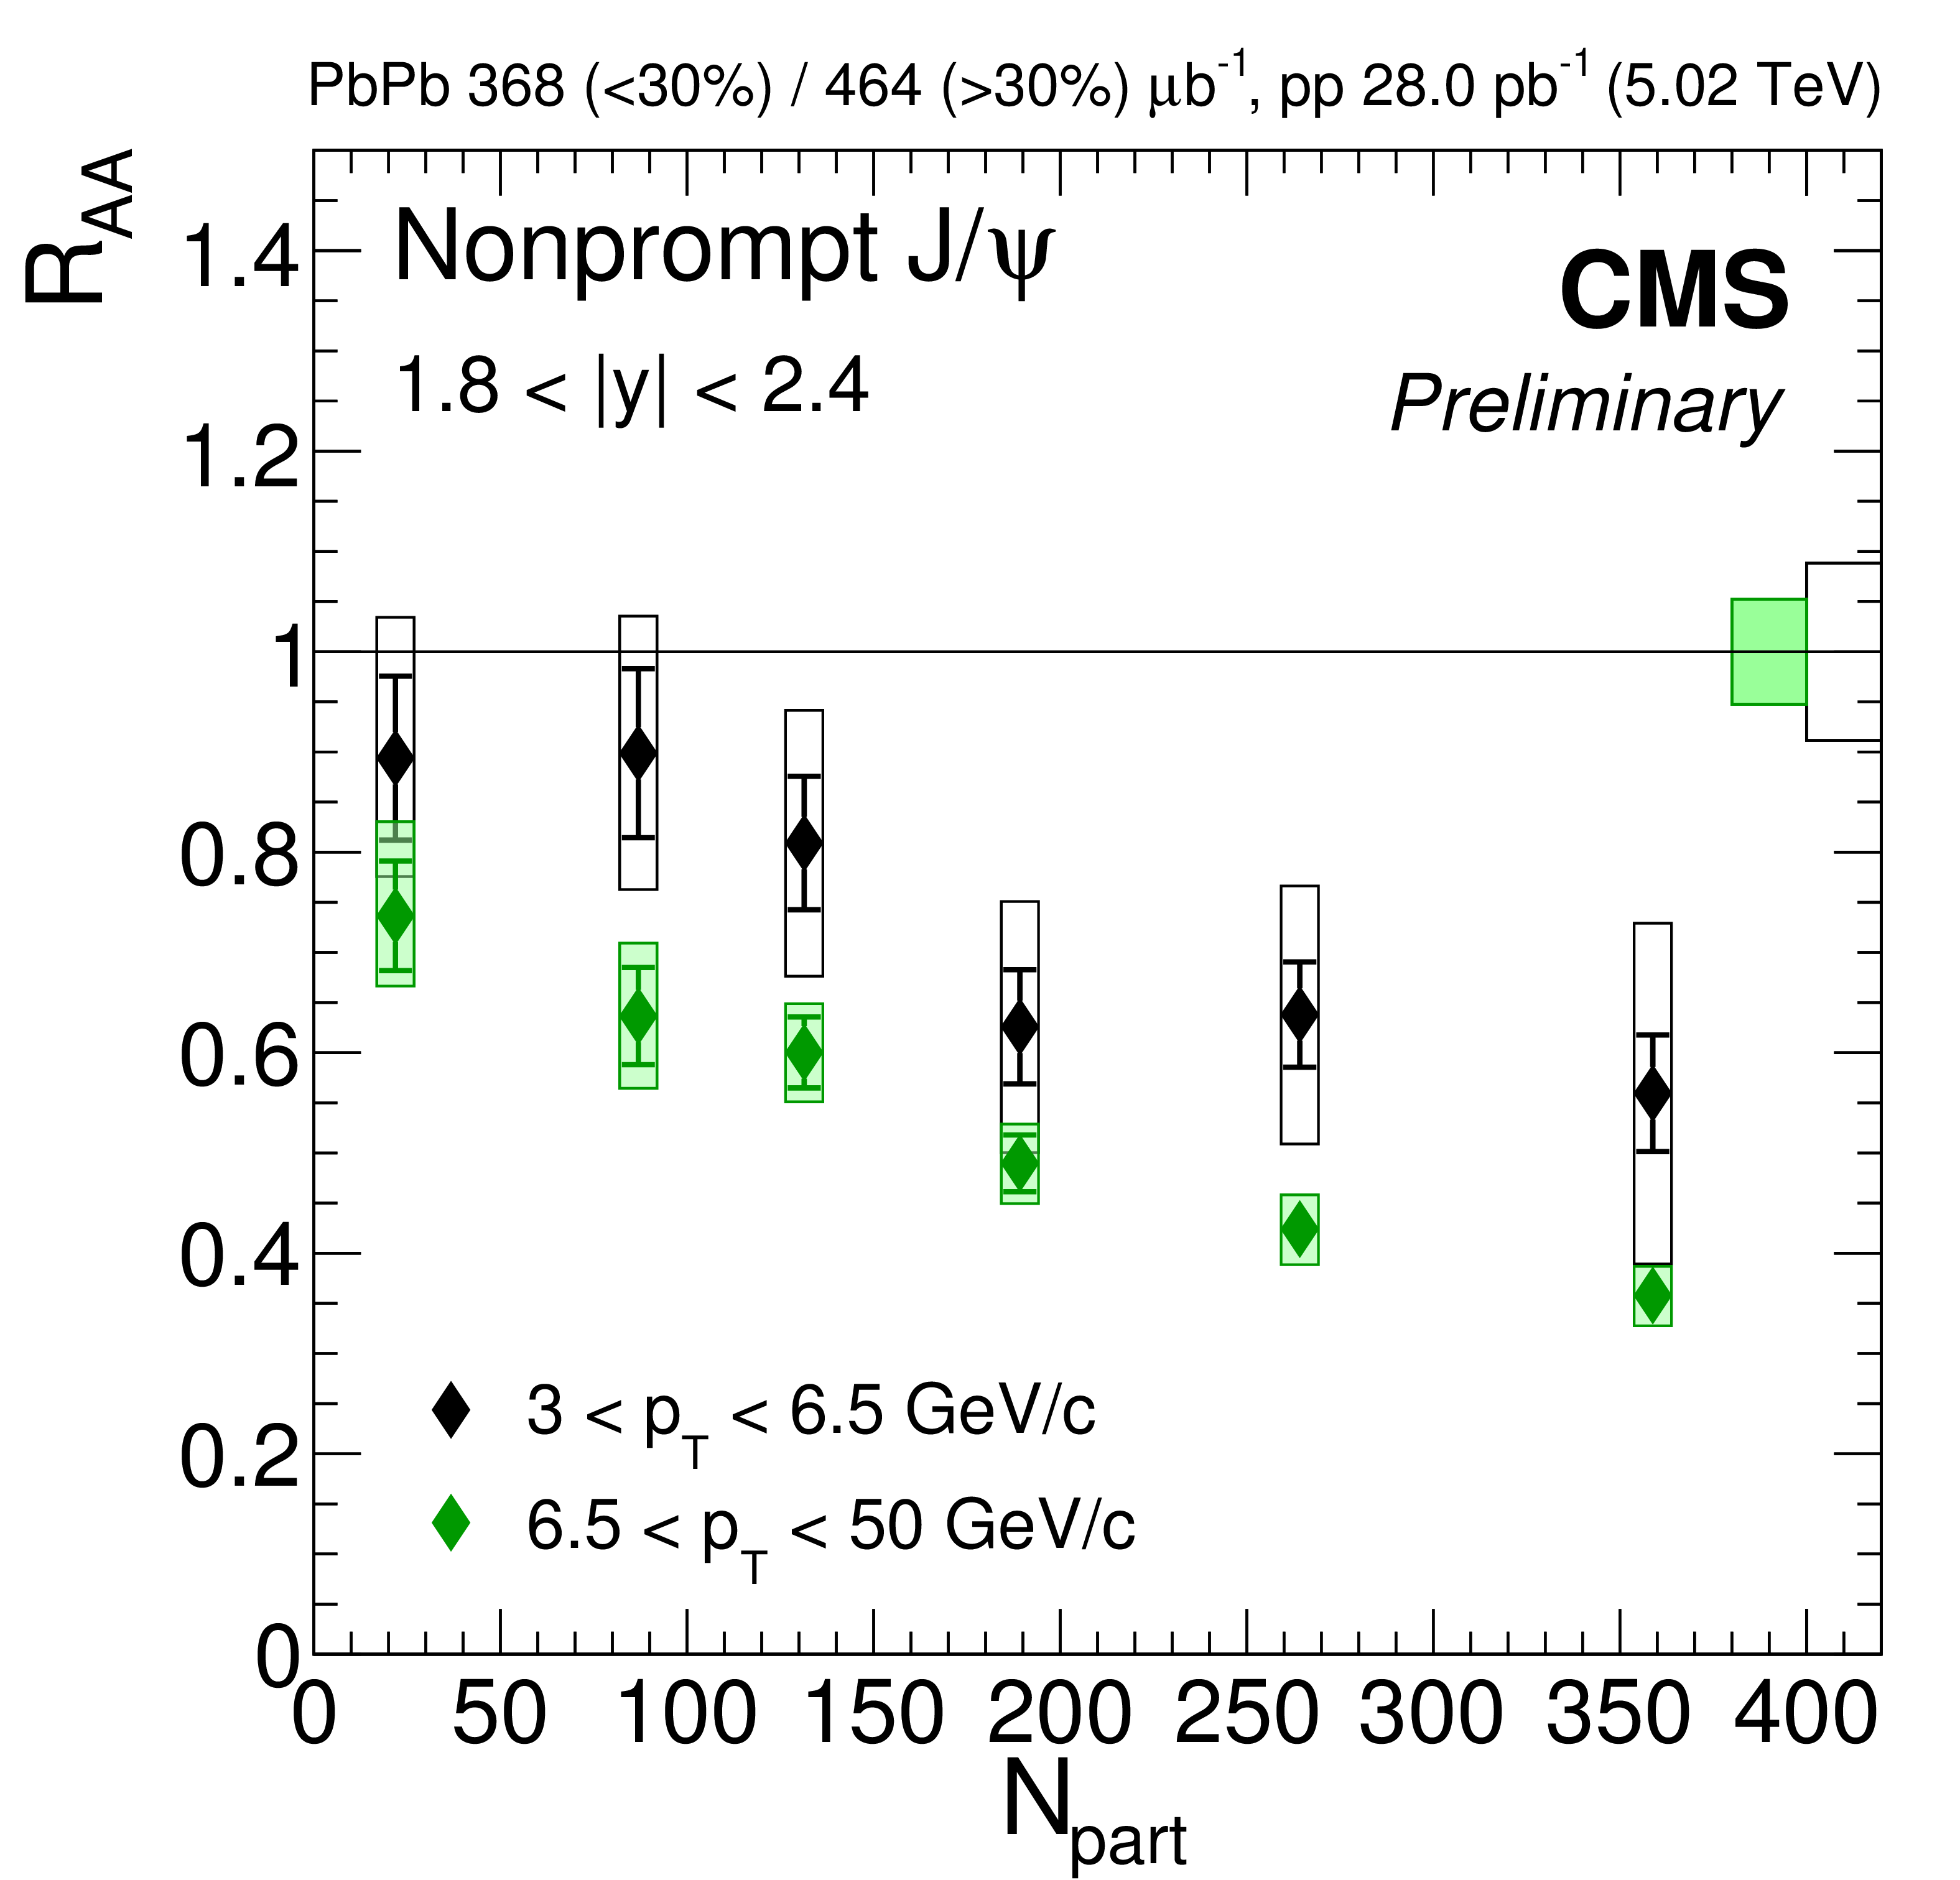
Figure 8:
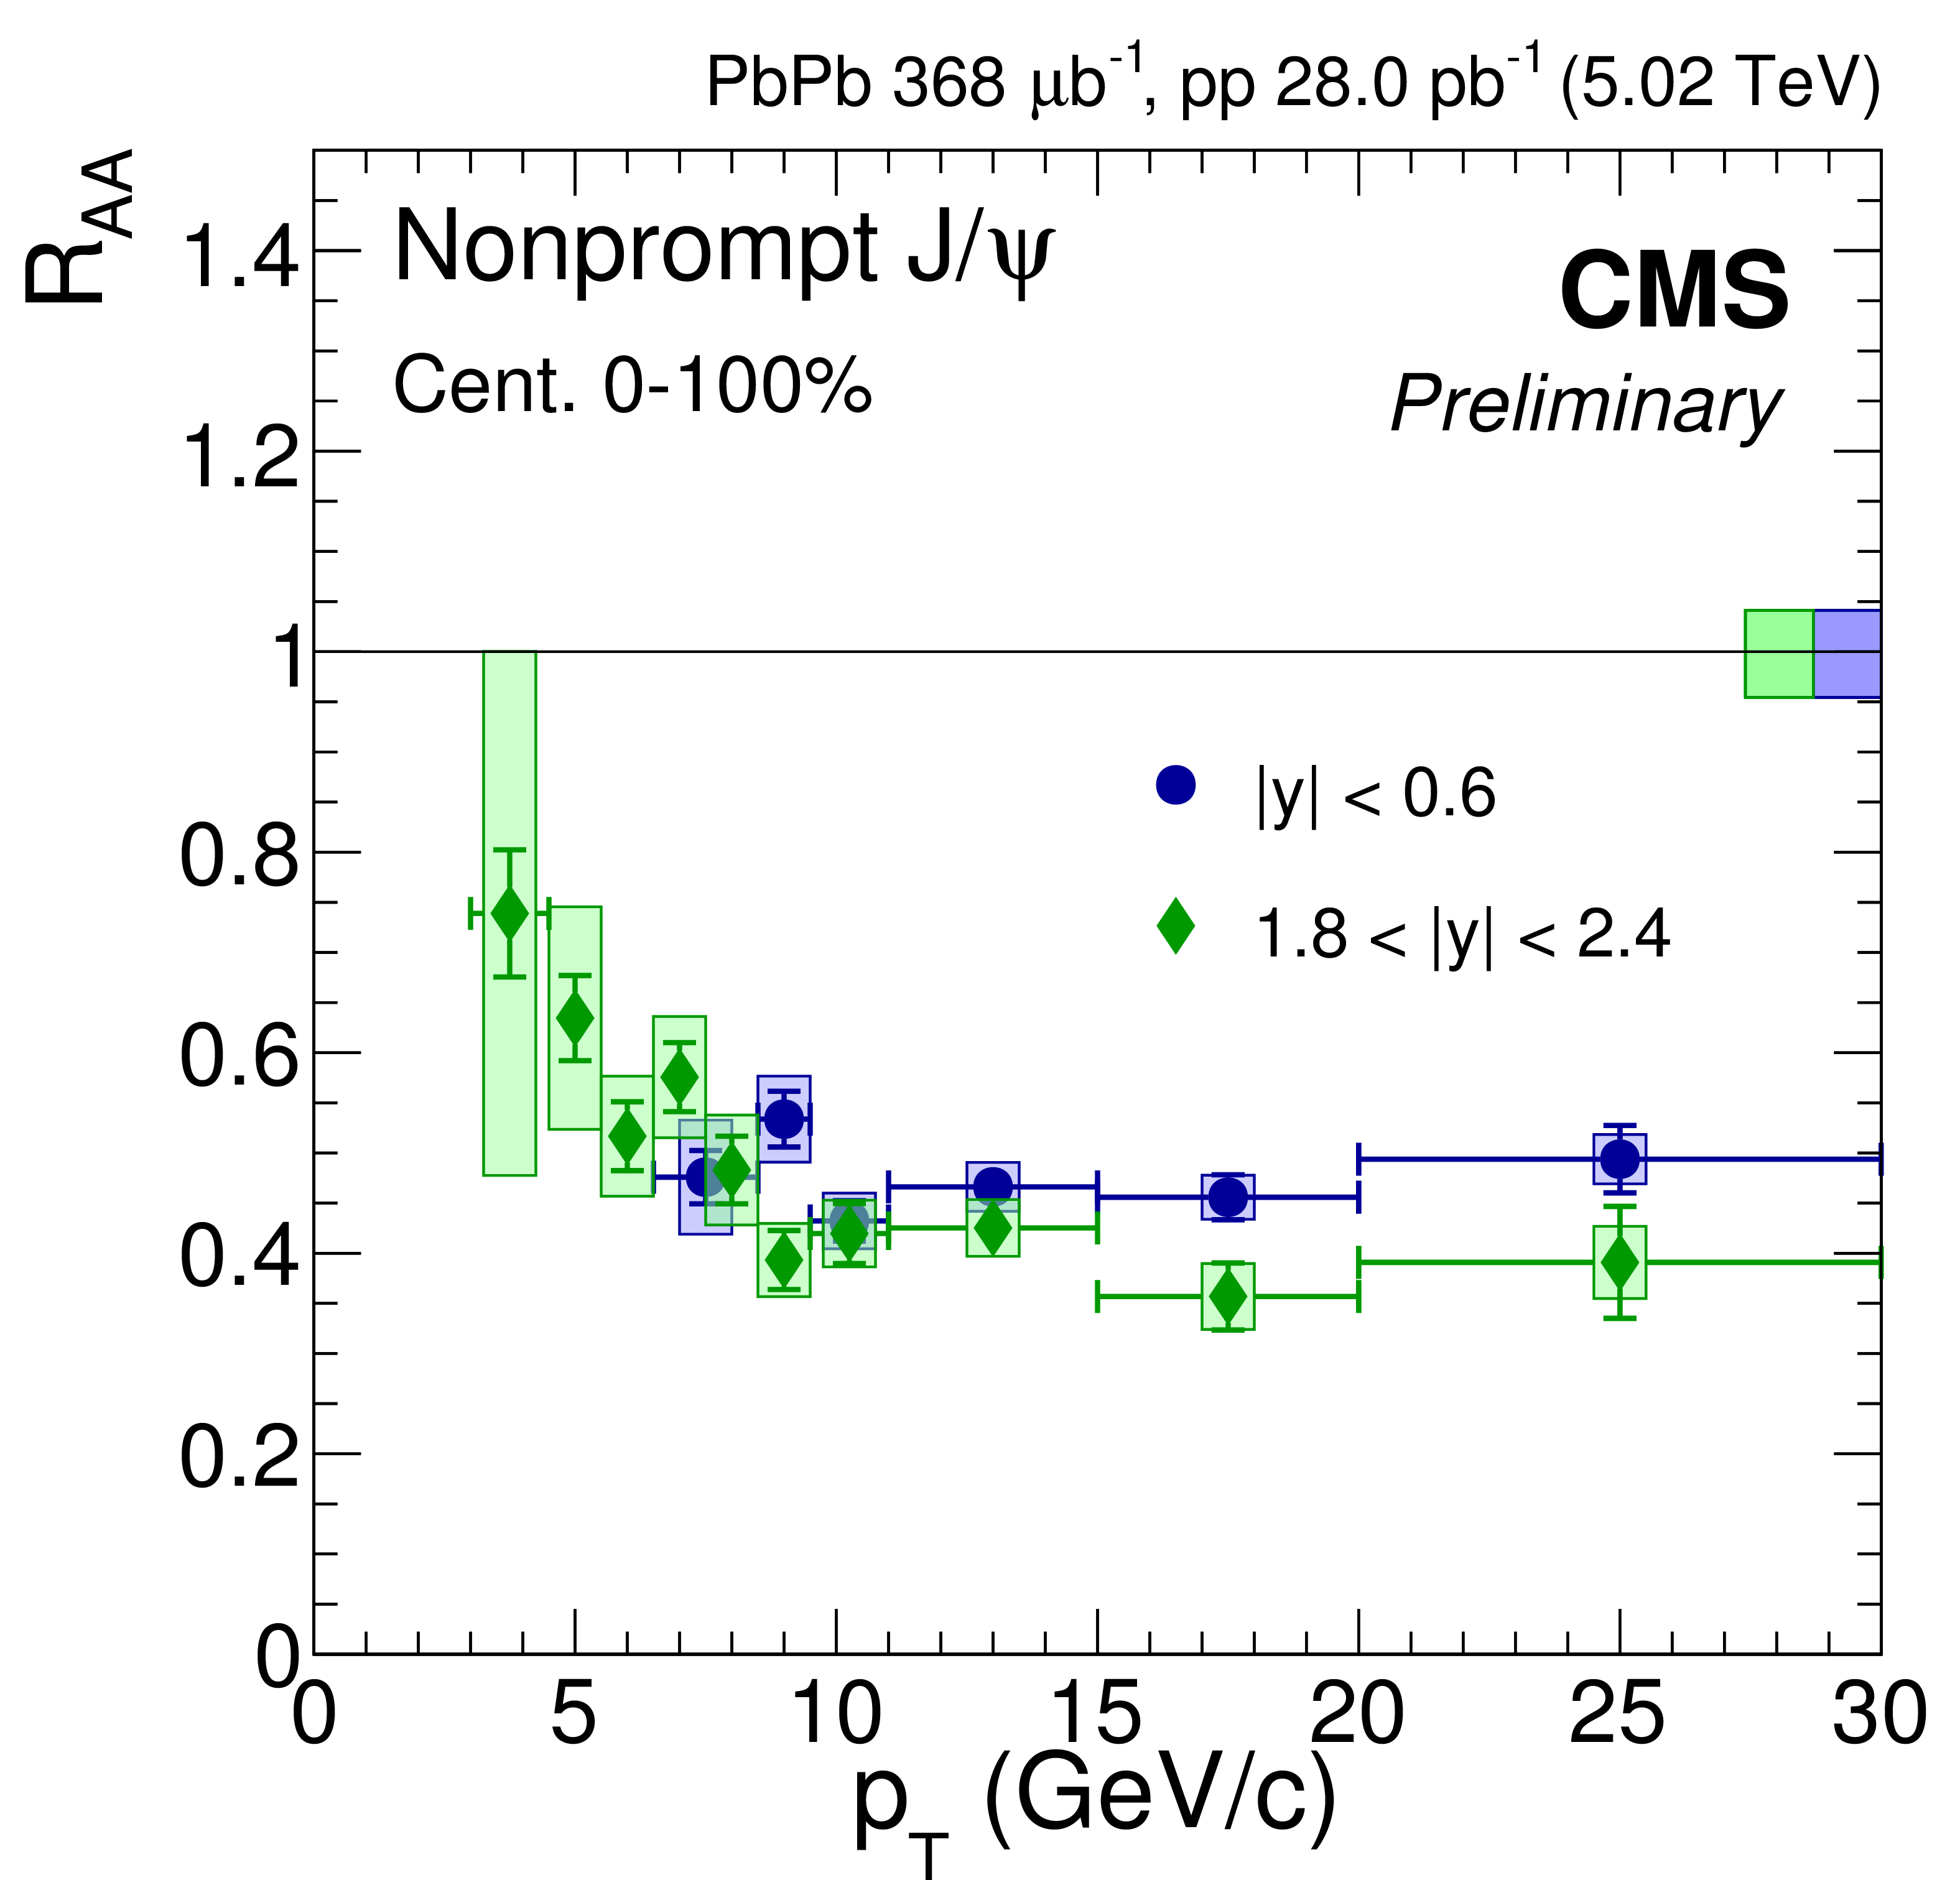
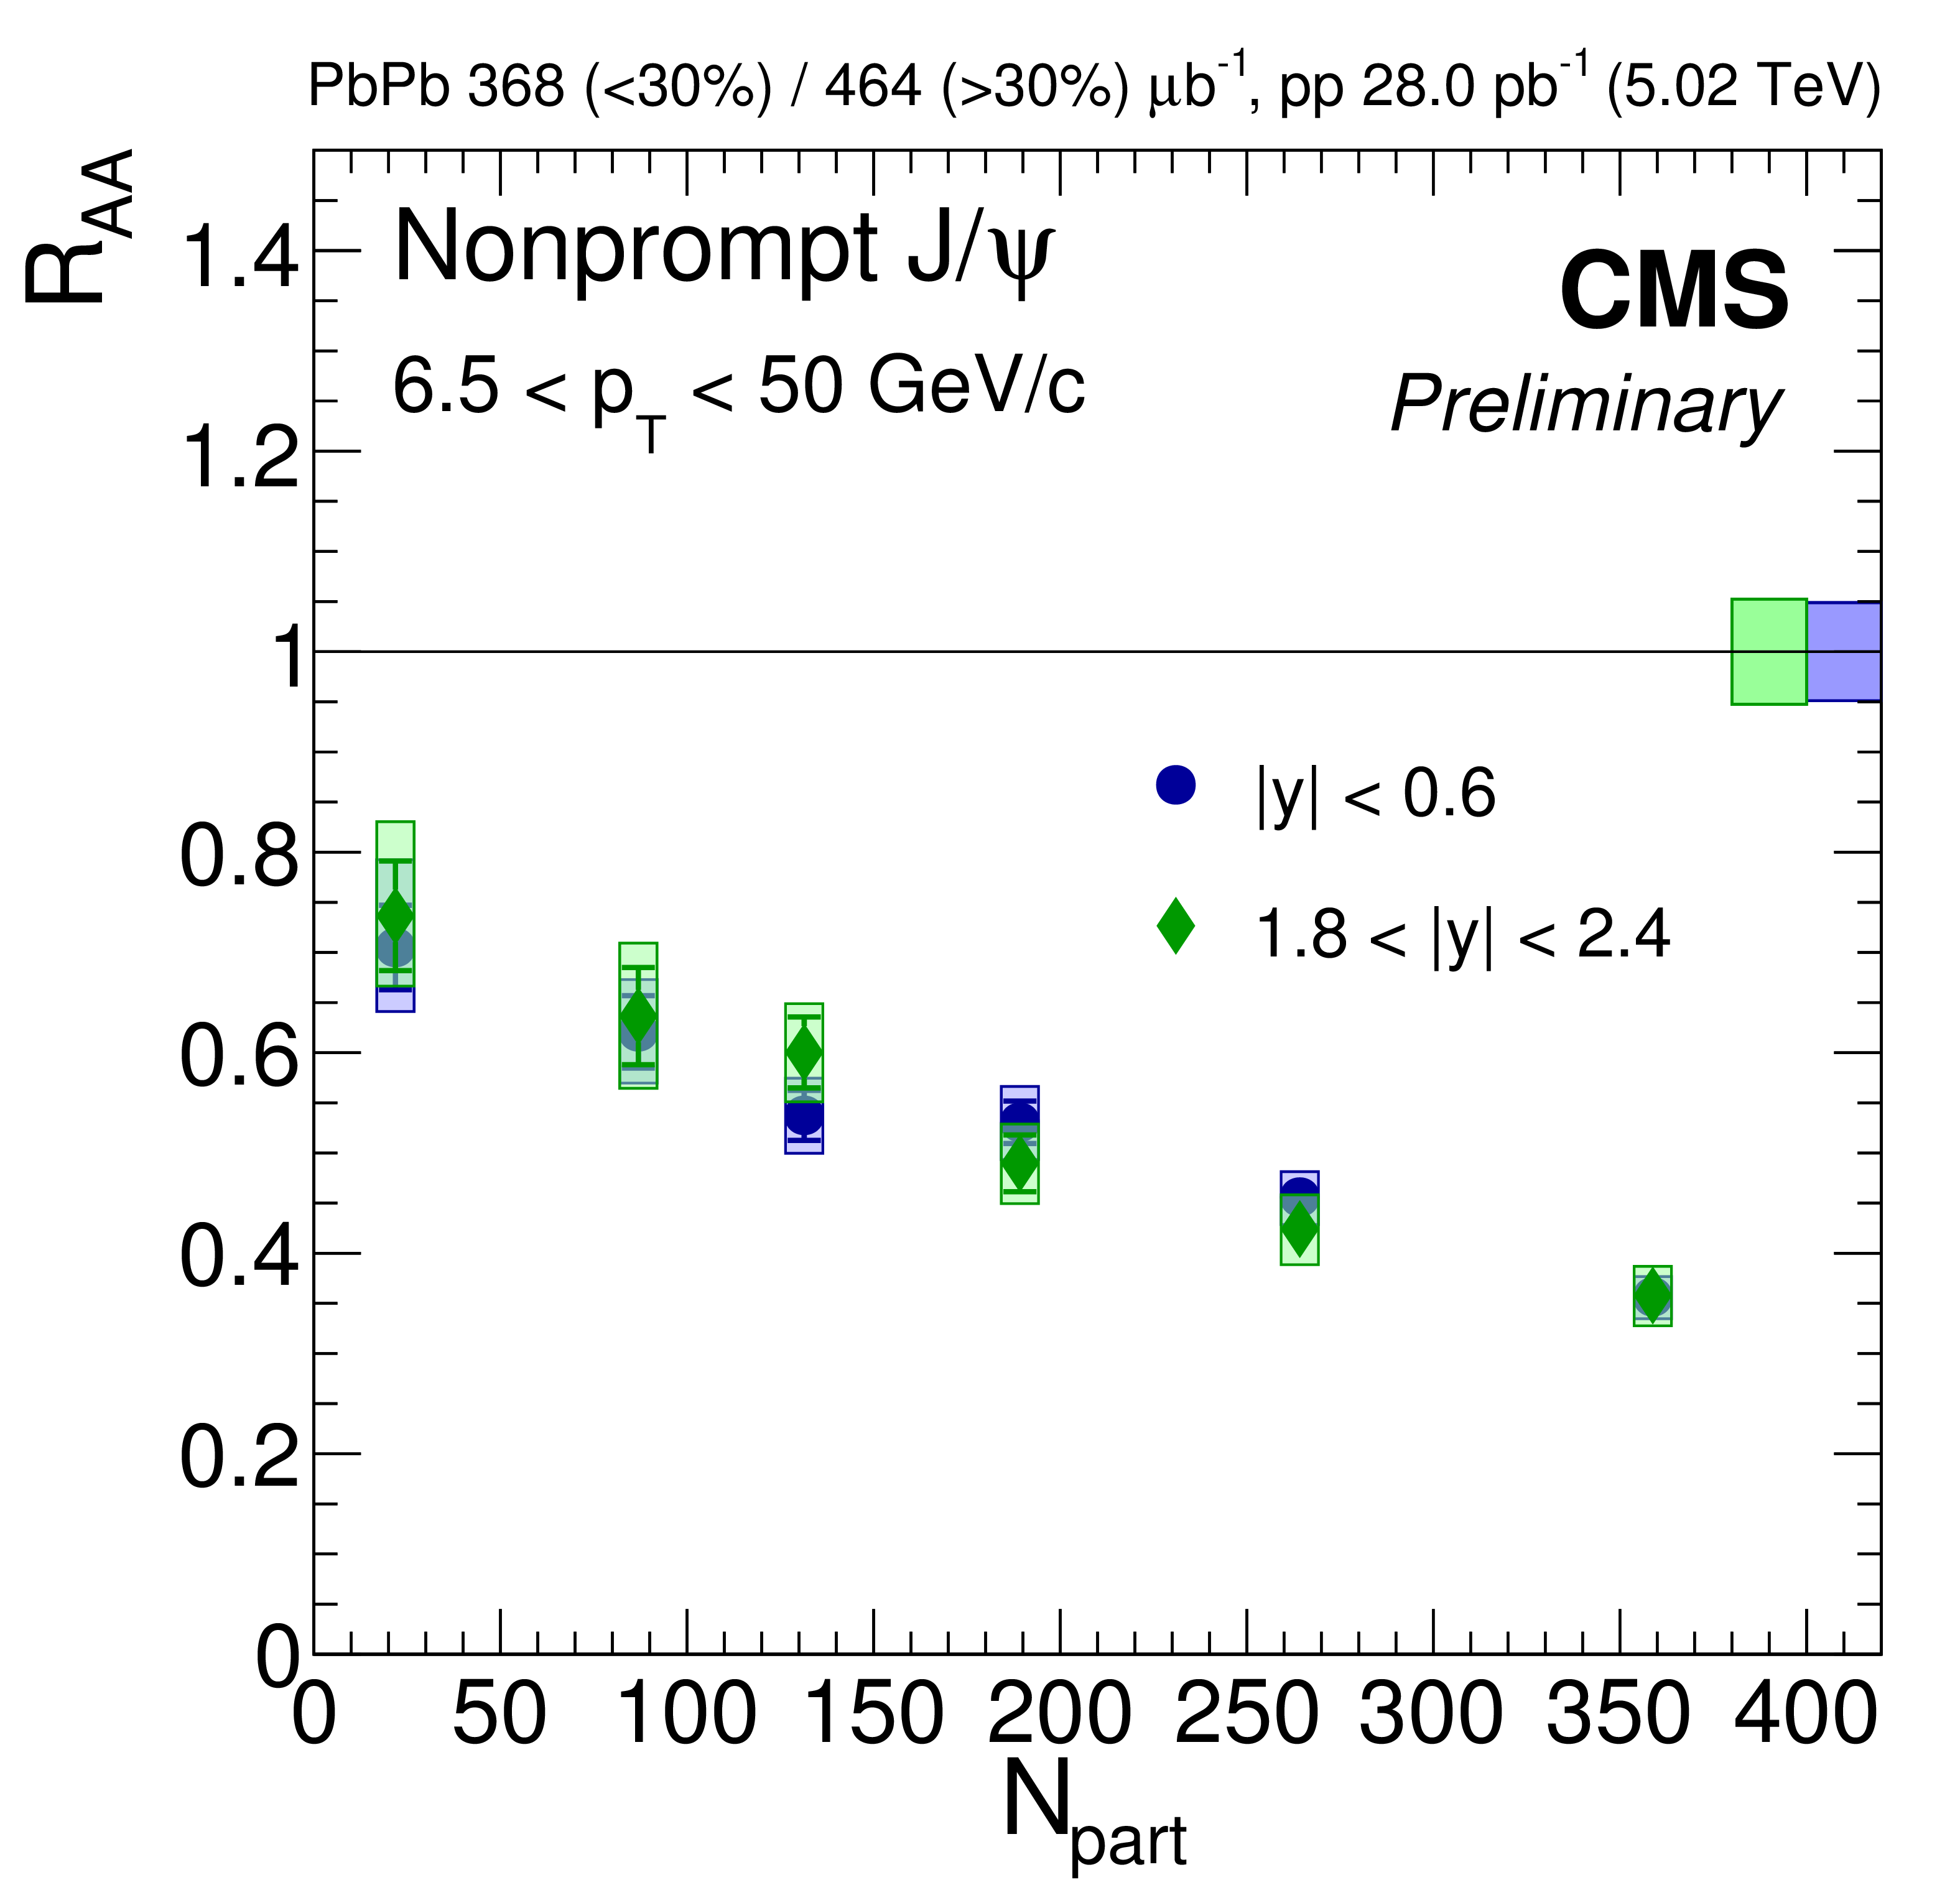
Nuclear modification factor of nonprompt $\mathrm{J}/\psi$ as a function of $ {p_{\mathrm {T}}} $ (left) and centrality (right) and in the mid and most forward rapidity intervals. The bars (boxes) represent statistical (systematic) point-by-point uncertainties. The boxes plotted at $ {R_{AA}} = $ 1 indicate the scale of the global relative uncertainties. |
png pdf |
Figure 8-a:
Nuclear modification factor of nonprompt $\mathrm{J}/\psi$ as a function of $ {p_{\mathrm {T}}} $ and in the mid and most forward rapidity intervals. The bars (boxes) represent statistical (systematic) point-by-point uncertainties. The boxes plotted at $ {R_{AA}} = $ 1 indicate the scale of the global relative uncertainties. |
png pdf |
Figure 8-b:
Nuclear modification factor of nonprompt $\mathrm{J}/\psi$ as a function of centrality and in the mid and most forward rapidity intervals. The bars (boxes) represent statistical (systematic) point-by-point uncertainties. The boxes plotted at $ {R_{AA}} = $ 1 indicate the scale of the global relative uncertainties. |
png pdf |
Figure 9:
The nuclear modification factor as a function of $ {p_{\mathrm {T}}} $ for the nonprompt $\mathrm{J}/\psi$ in two centrality bins. The bars (boxes) represent statistical (systematic) point-by-point uncertainties. The boxes plotted at $ {R_{AA}} = $ 1 indicate the scale of the global relative uncertainties. |
png pdf |
Figure 9-a:
The nuclear modification factor as a function of $ {p_{\mathrm {T}}} $ for the nonprompt $\mathrm{J}/\psi$ in centrality bin $| y | < $ 2,4. The bars (boxes) represent statistical (systematic) point-by-point uncertainties. The boxes plotted at $ {R_{AA}} = $ 1 indicate the scale of the global relative uncertainties. |
png pdf |
Figure 9-b:
The nuclear modification factor as a function of $ {p_{\mathrm {T}}} $ for the nonprompt $\mathrm{J}/\psi$ in centrality bin 1.8 $ < | y | < $ 2.4. The bars (boxes) represent statistical (systematic) point-by-point uncertainties. The boxes plotted at $ {R_{AA}} = $ 1 indicate the scale of the global relative uncertainties. |
| Summary |
|
Prompt and nonprompt $\mathrm{J}/\psi$ production has been studied in pp and PbPb collisions at ${\sqrt{s_{_{\text{NN}}}}} = $ 5.02 TeV, as a function of rapidity, transverse momentum and collision centrality in different kinematic and centrality ranges. Two observables were measured: nonprompt $\mathrm{J}/\psi$ fractions and prompt and nonprompt $\mathrm{J}/\psi$ nuclear modification factors ${R_{AA}}$. The latter show a strong centrality dependence, with an increasing suppression towards central events. No significant rapidity dependence, and a smaller suppression at the lowest and highest $ p_{\mathrm{T}}$ ranges are observed for both prompt and nonprompt $\mathrm{J}/\psi$. Double differential measurements confirm this observation, also hinting to a larger $ p_{\mathrm{T}} $ dependence in peripheral events. The measurements are consistent with previous results at ${\sqrt{s_{_{\text{NN}}}}} = $ 2.76 TeV. The prompt ${\psi\text{(2S)}} $ ${R_{AA}} $ has also been measured in PbPb collisions at ${\sqrt{s_{_{\text{NN}}}}} = $ 5.02 TeV, as a function transverse momentum and collision centrality in two different rapidity ranges. The results show that the ${\psi\text{(2S)}} $ is more suppressed than the $\mathrm{J}/\psi$ mesons for all the kinematical ranges studied. No $ p_{\mathrm{T}} $ dependence is observed within the current uncertainties. Hints of an increasing suppression with collision centrality are also observed. |
| Additional Figures | |
png pdf |
Additional Figure 1:
Nuclear modification factor of five prompt quarmonia as a function of $ {p_{\mathrm {T}}} $ at $\sqrt {s_{\mathrm {NN}}} = $ 5.02TeV, integrated over centrality. |
png pdf |
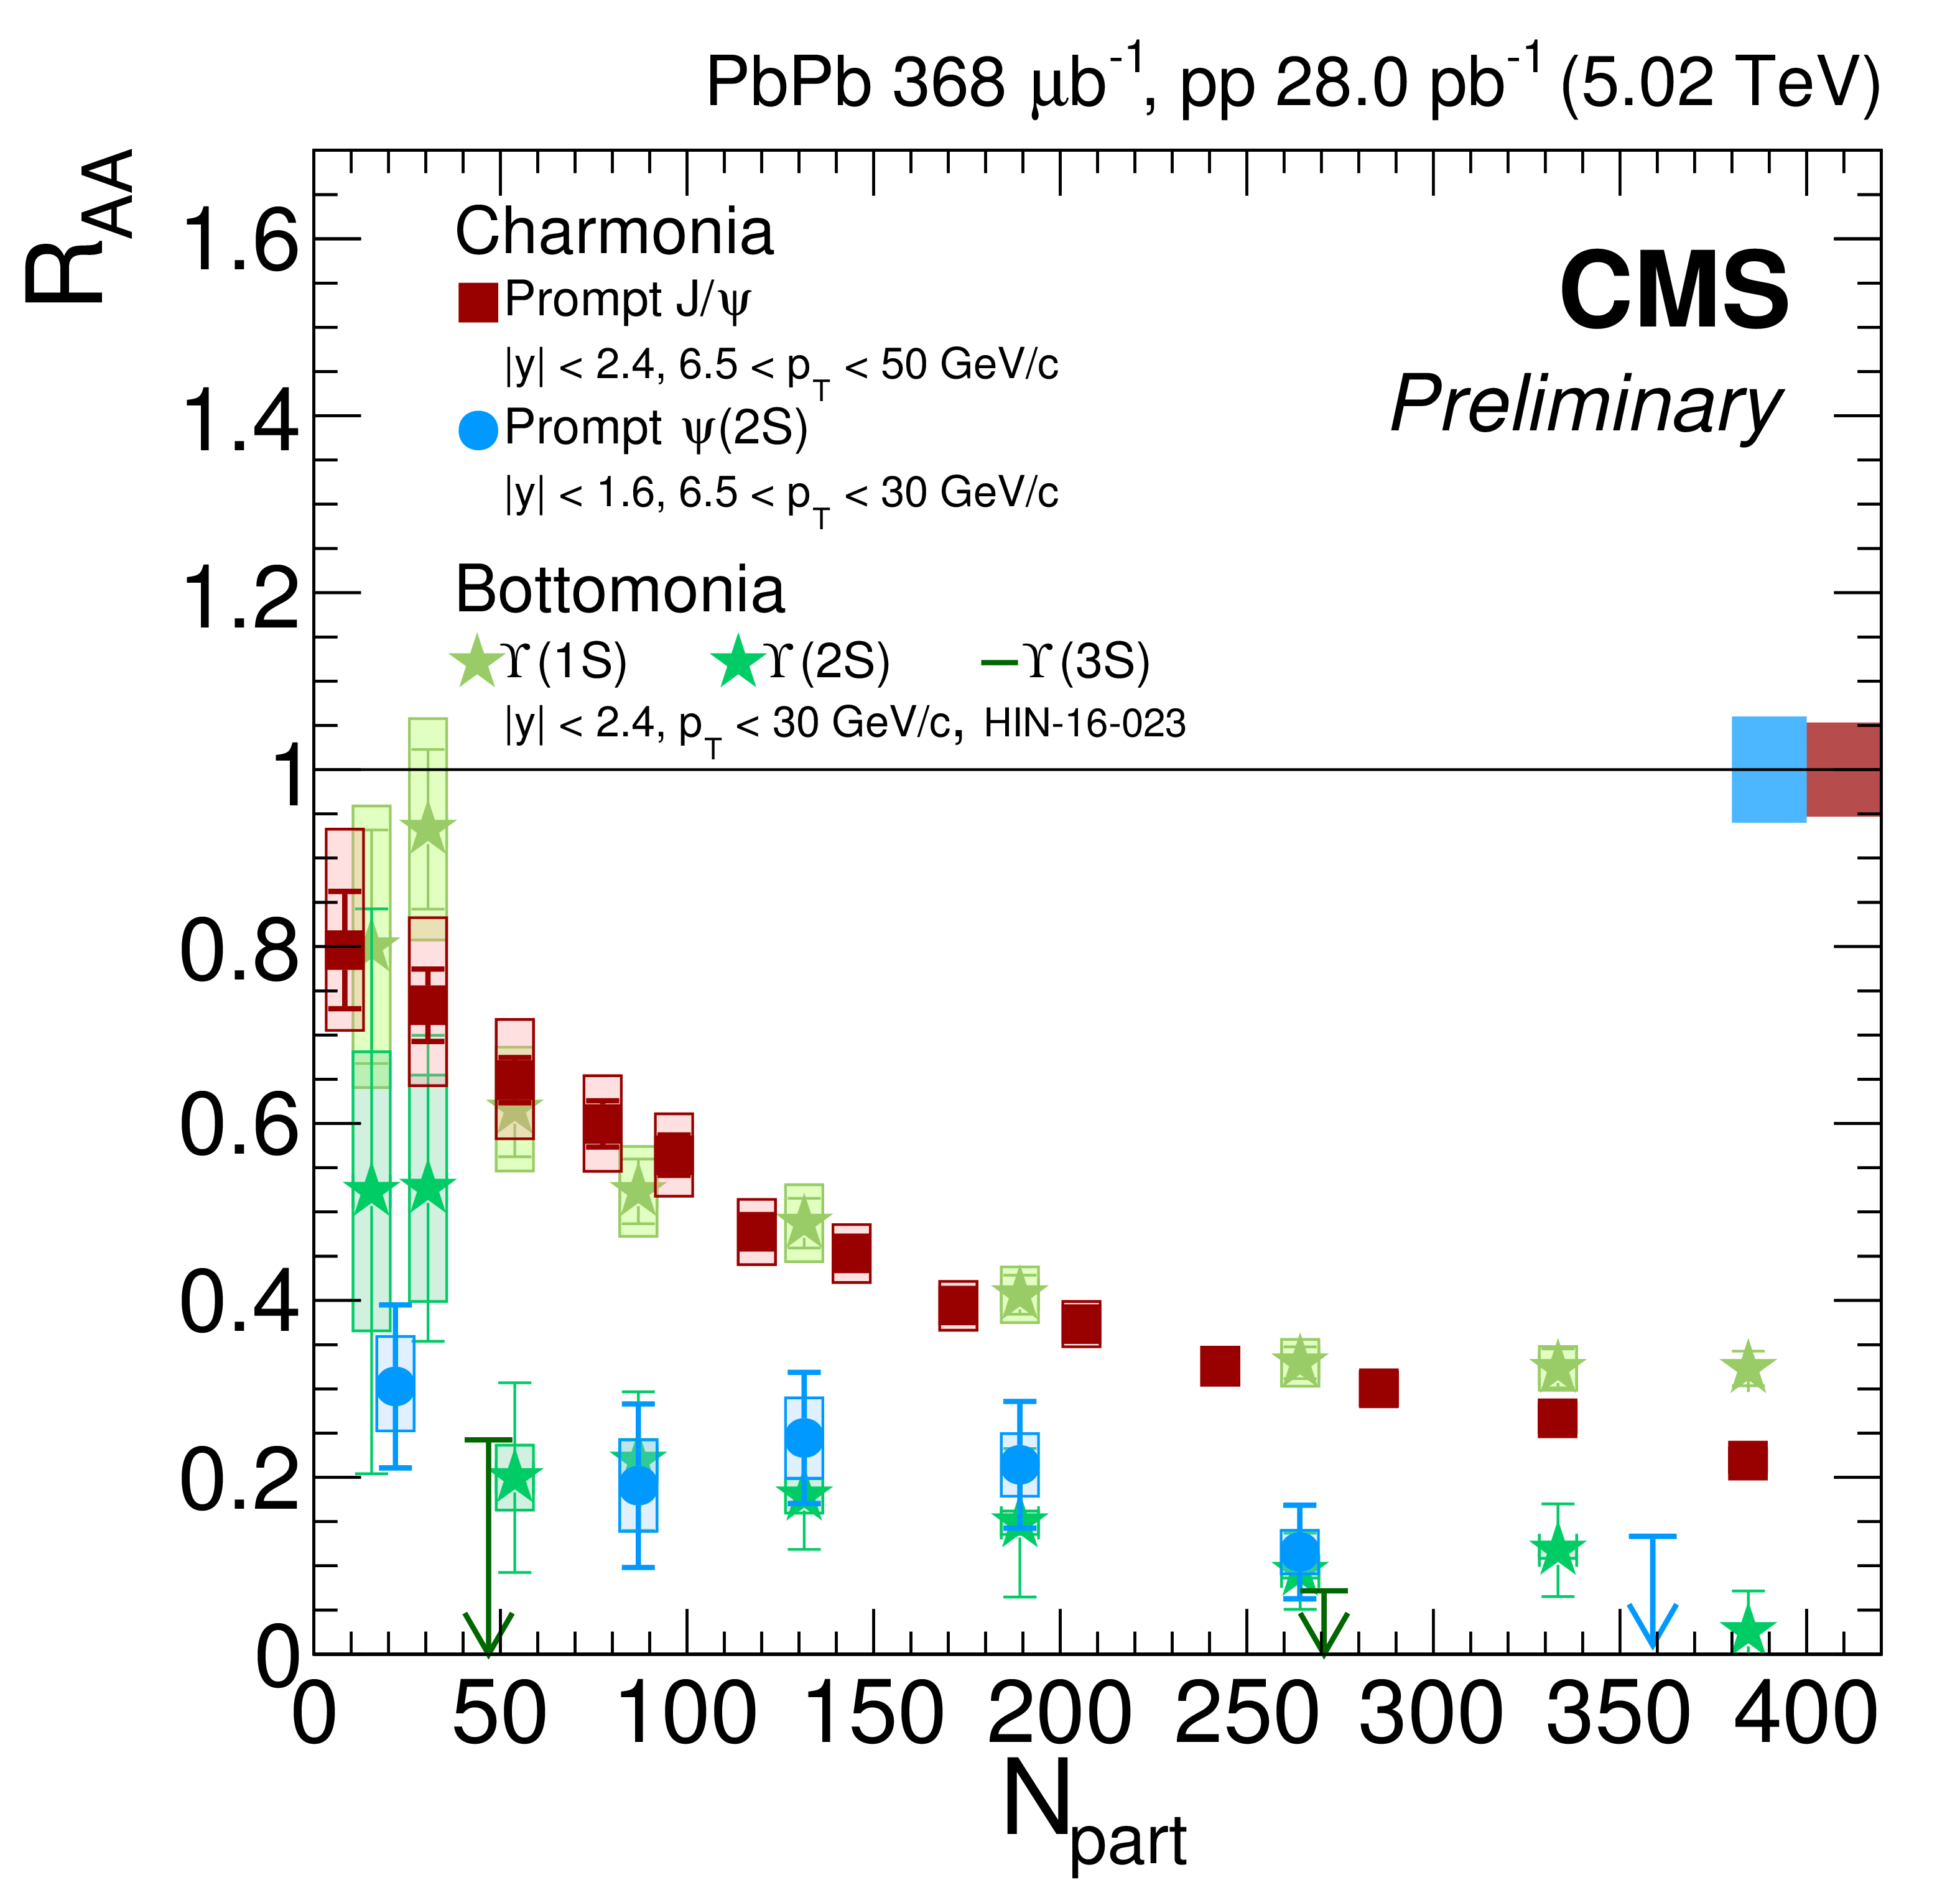
Additional Figure 2:
Nuclear modification factor of five prompt quarmonia as a function of centrality at $\sqrt {s_{\mathrm {NN}}} = $ 5.02 TeV. While bottomonium measurements are inclusive in $ {p_{\mathrm {T}}} $ , they start at $ {p_{\mathrm {T}}} = $ 6.5 GeV/$c$ for charmonia. |
png pdf |
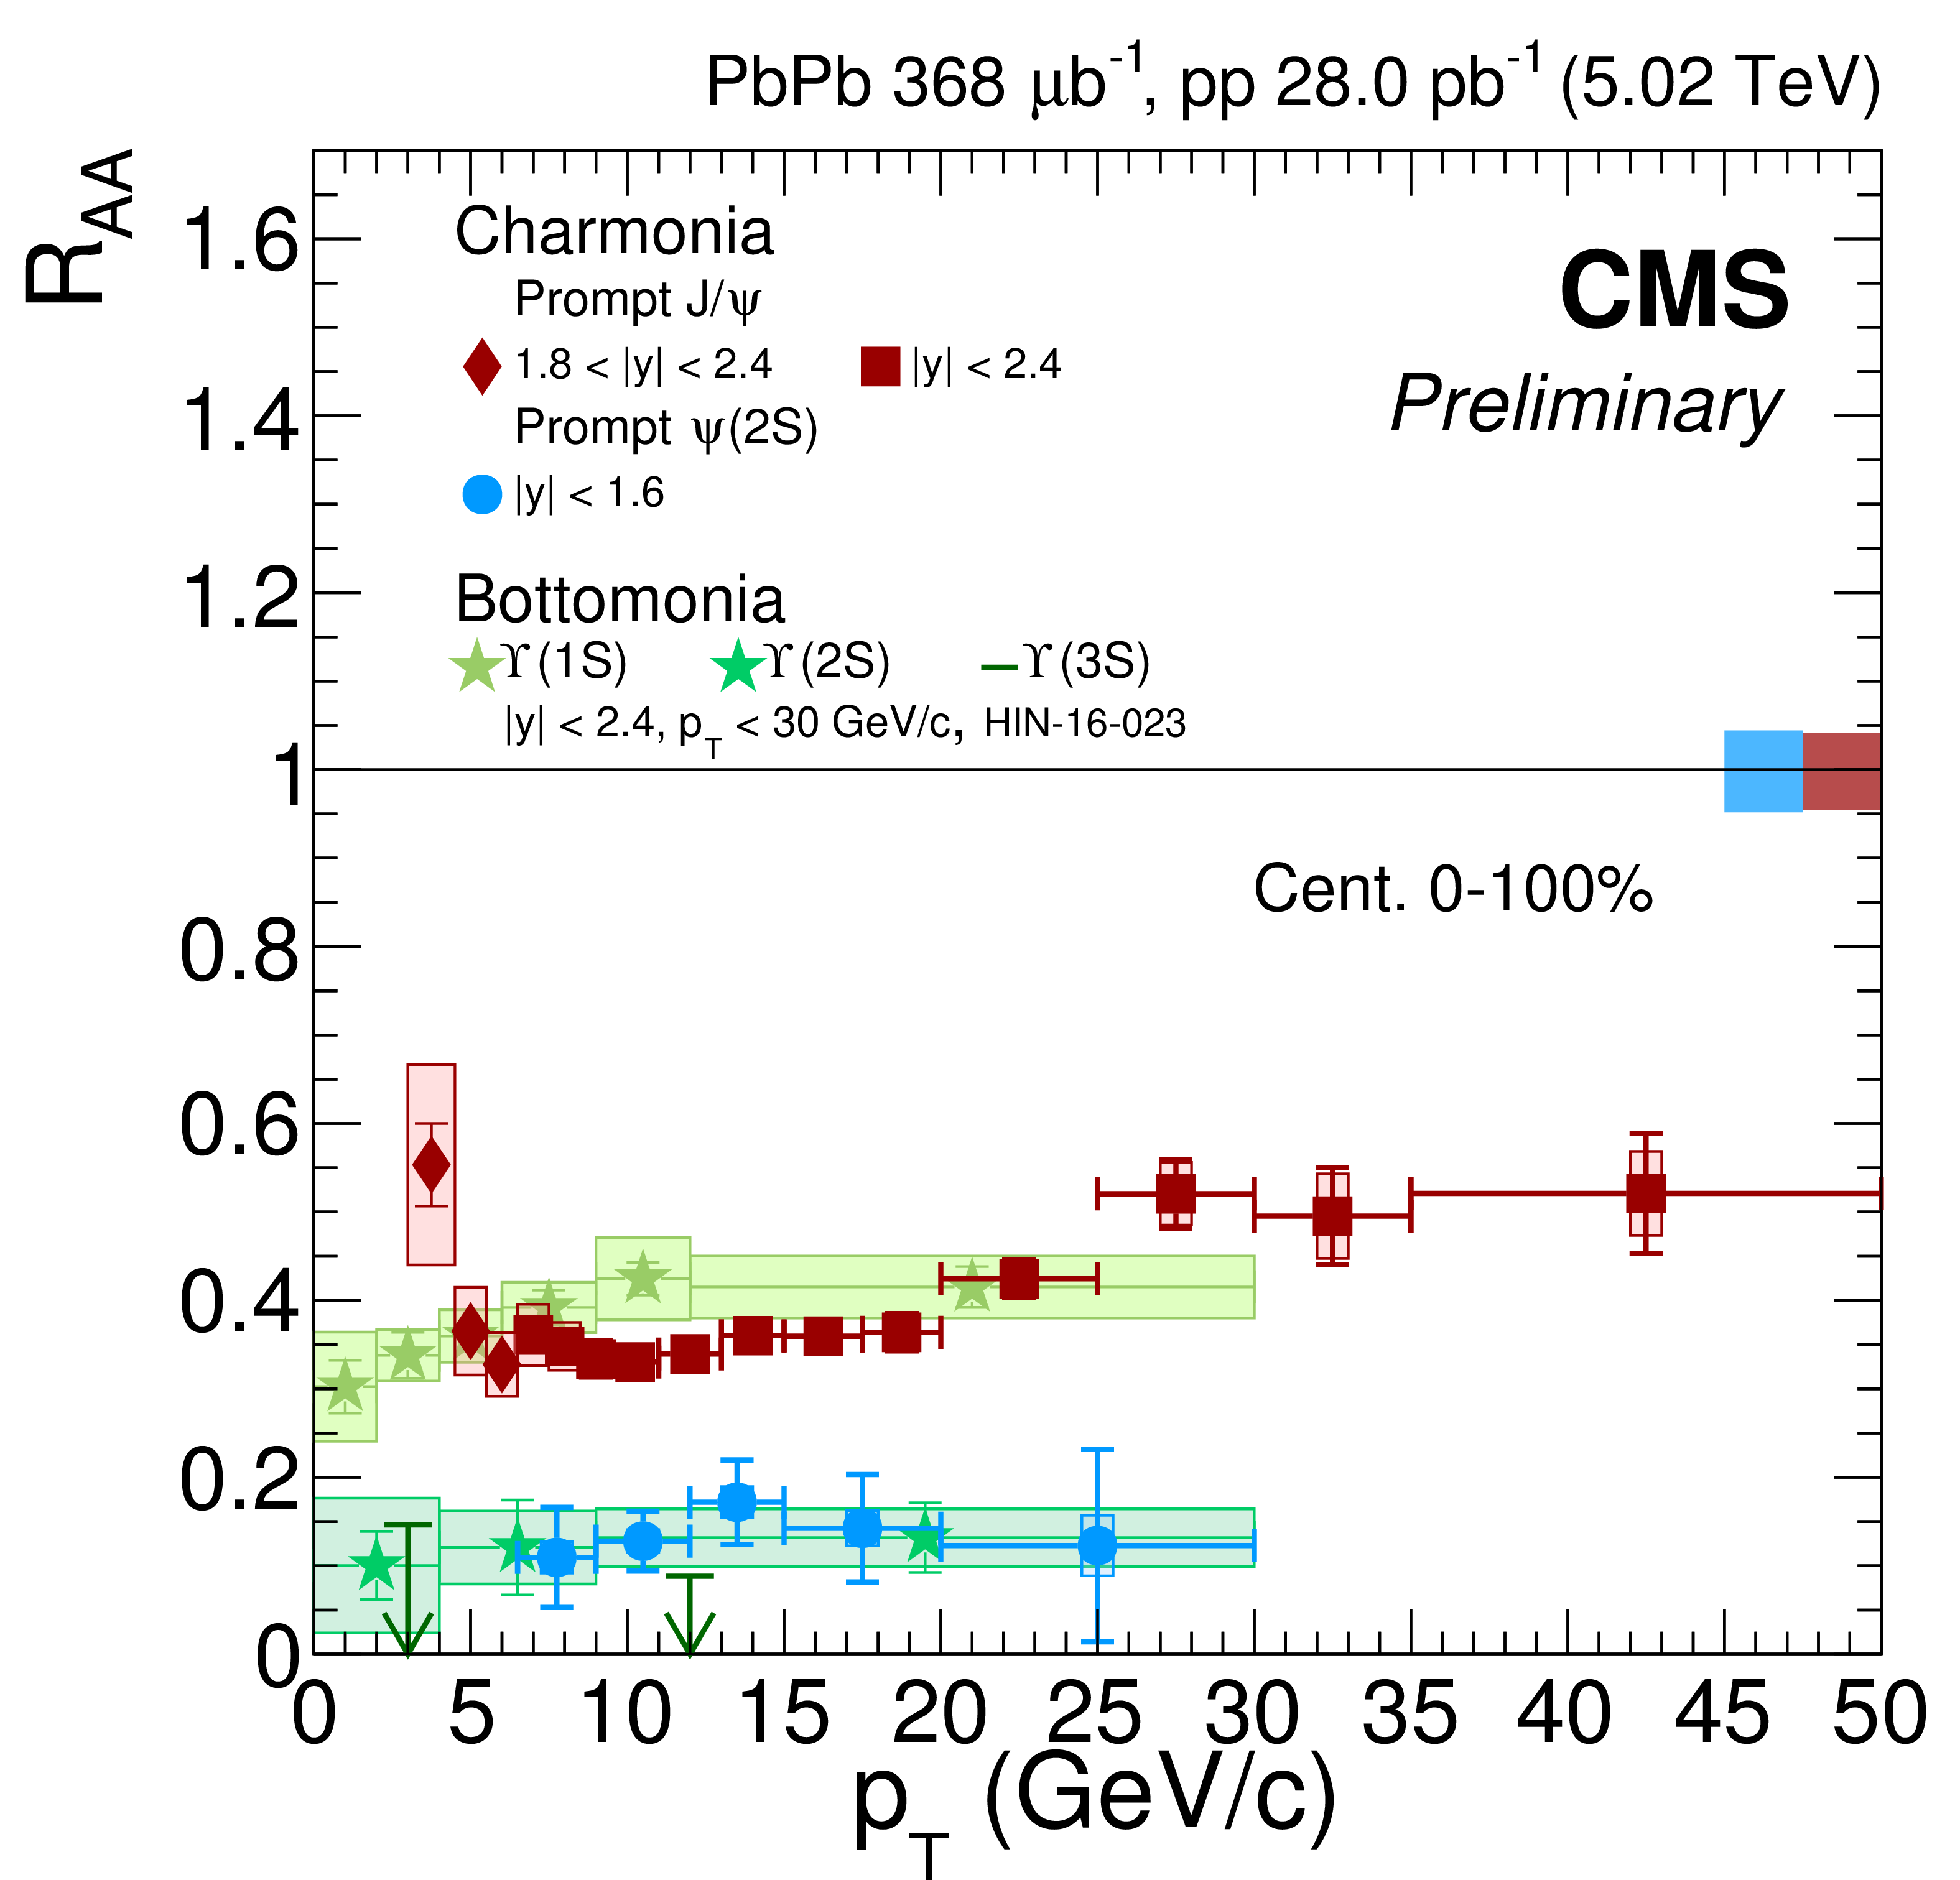
Additional Figure 3:
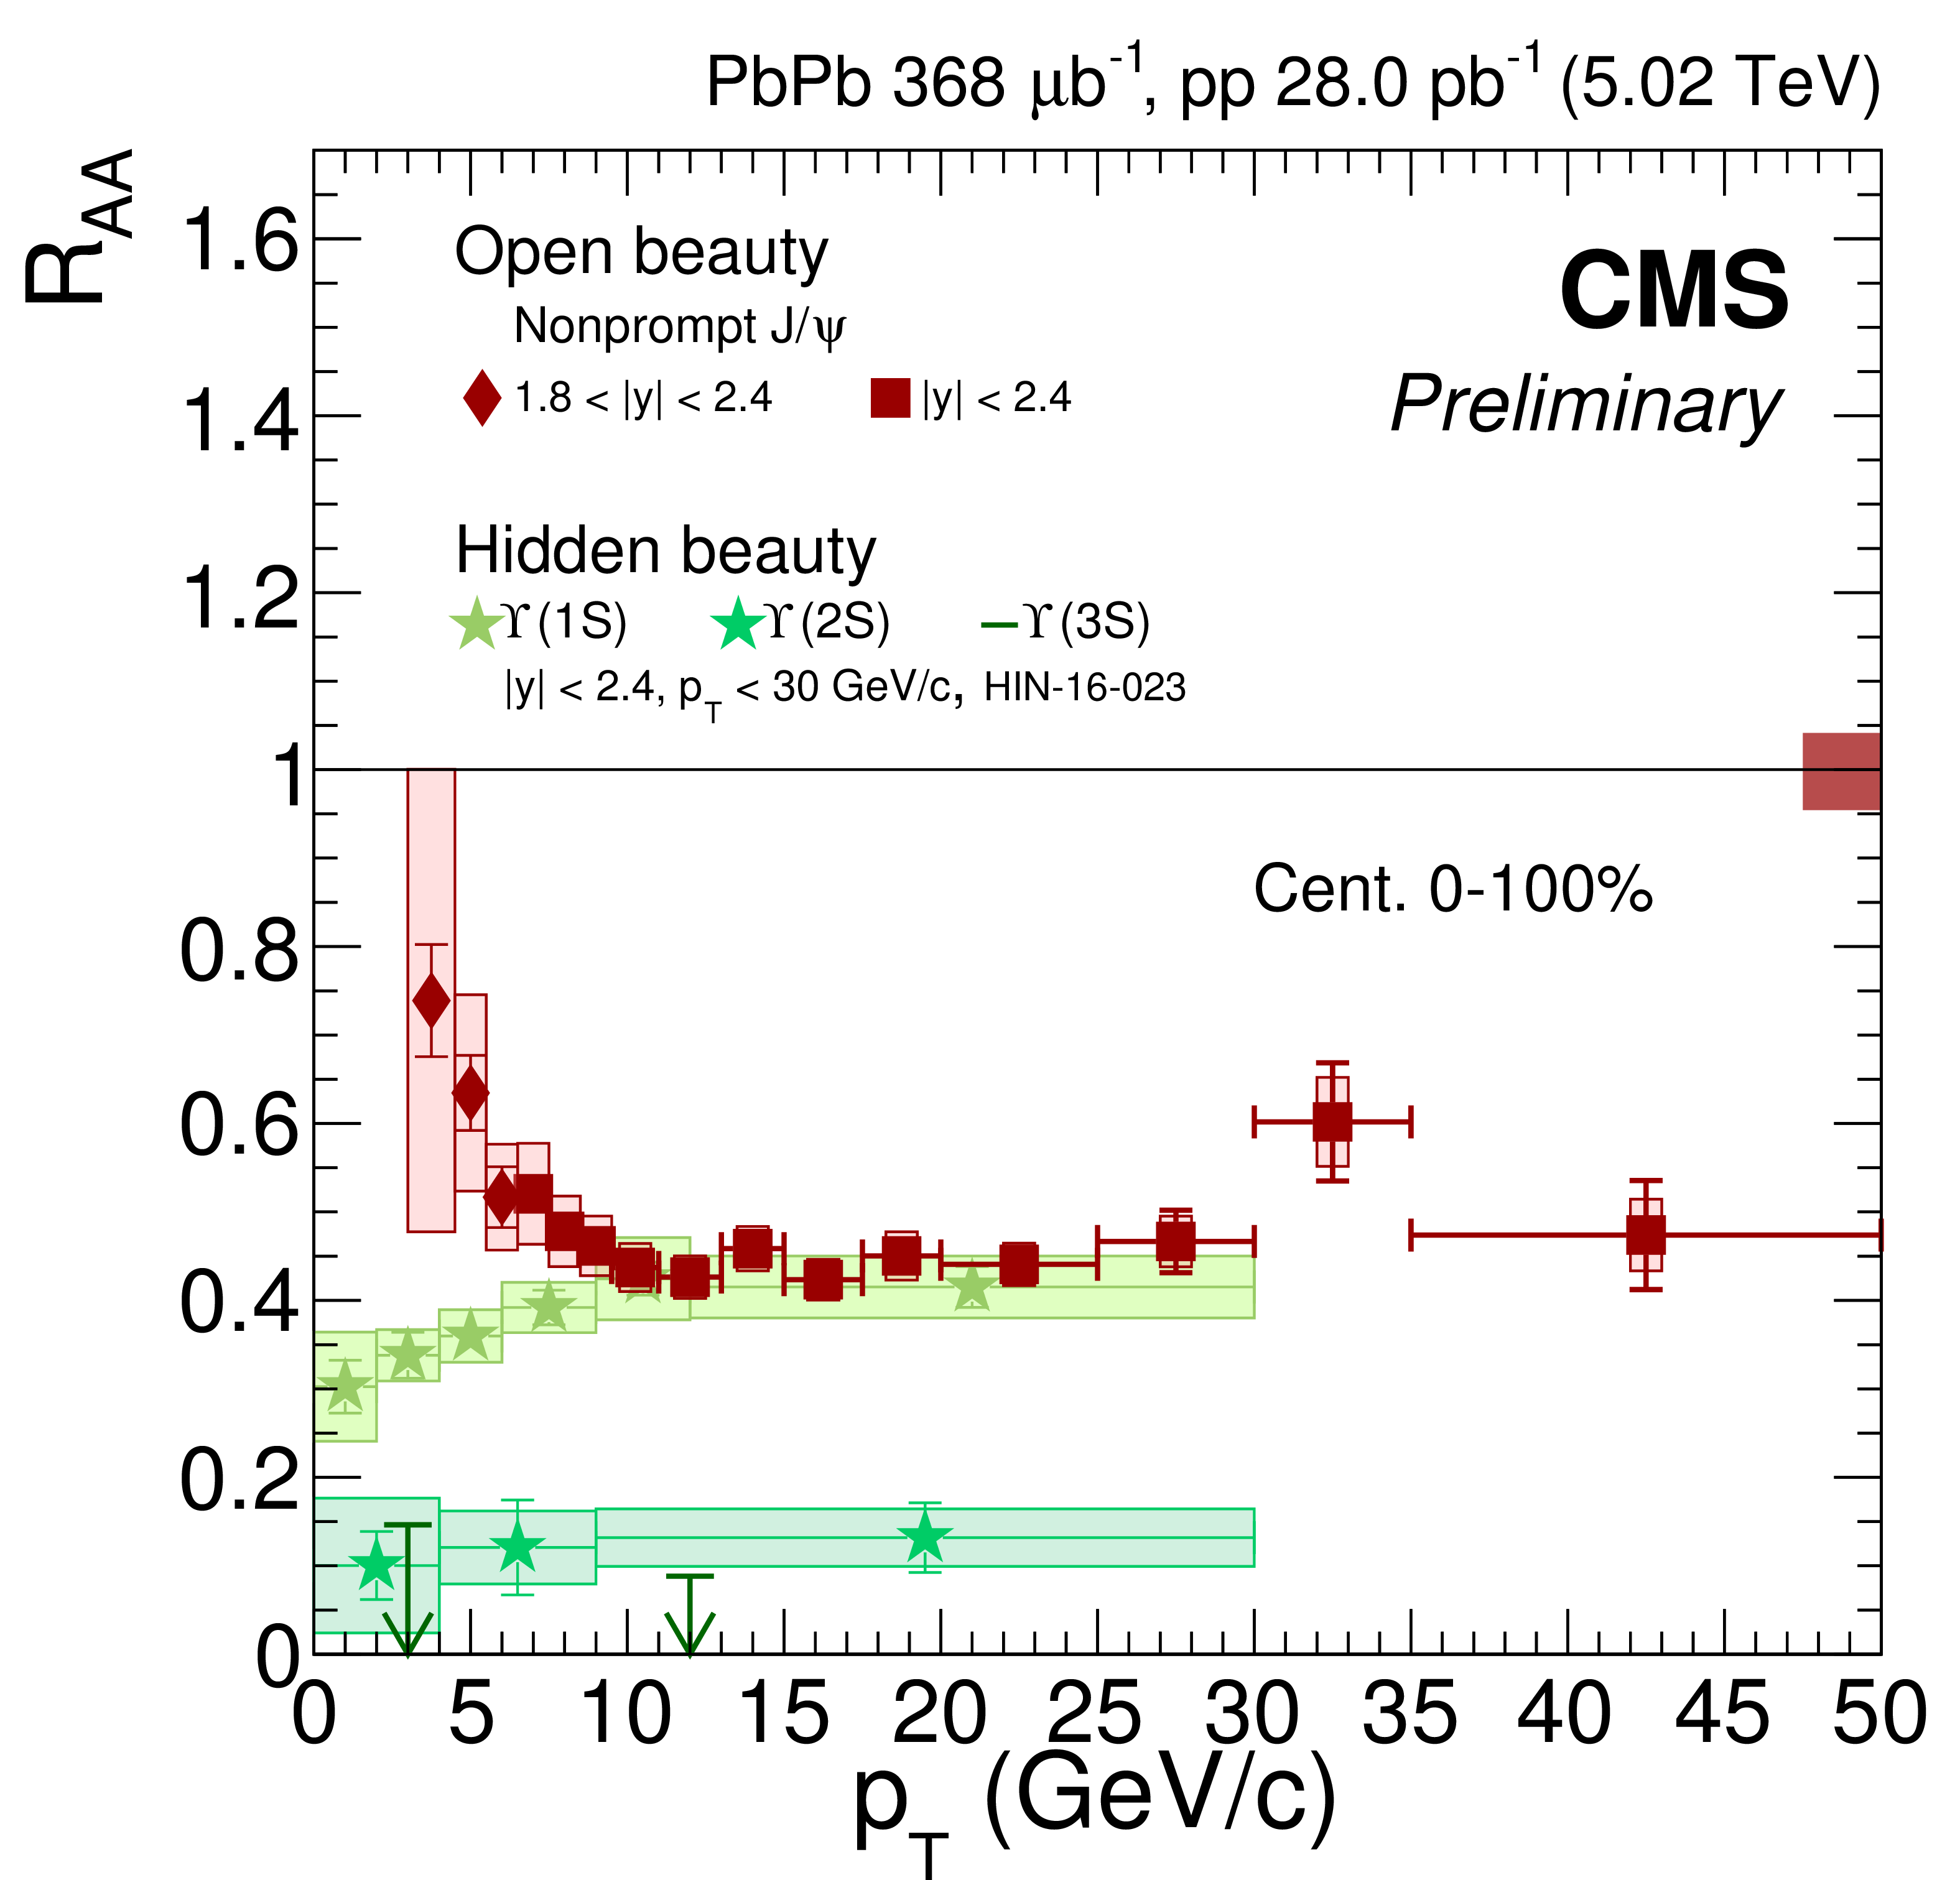
Nuclear modification factor of nonprompt $ \mathrm{J}/\psi $ (open beauty) and bottomonia (hidden beauty) as a function of $ {p_{\mathrm {T}}} $ at $\sqrt {s_{\mathrm {NN}}} = $ 5.02 TeV, integrated over centrality. |
png pdf |
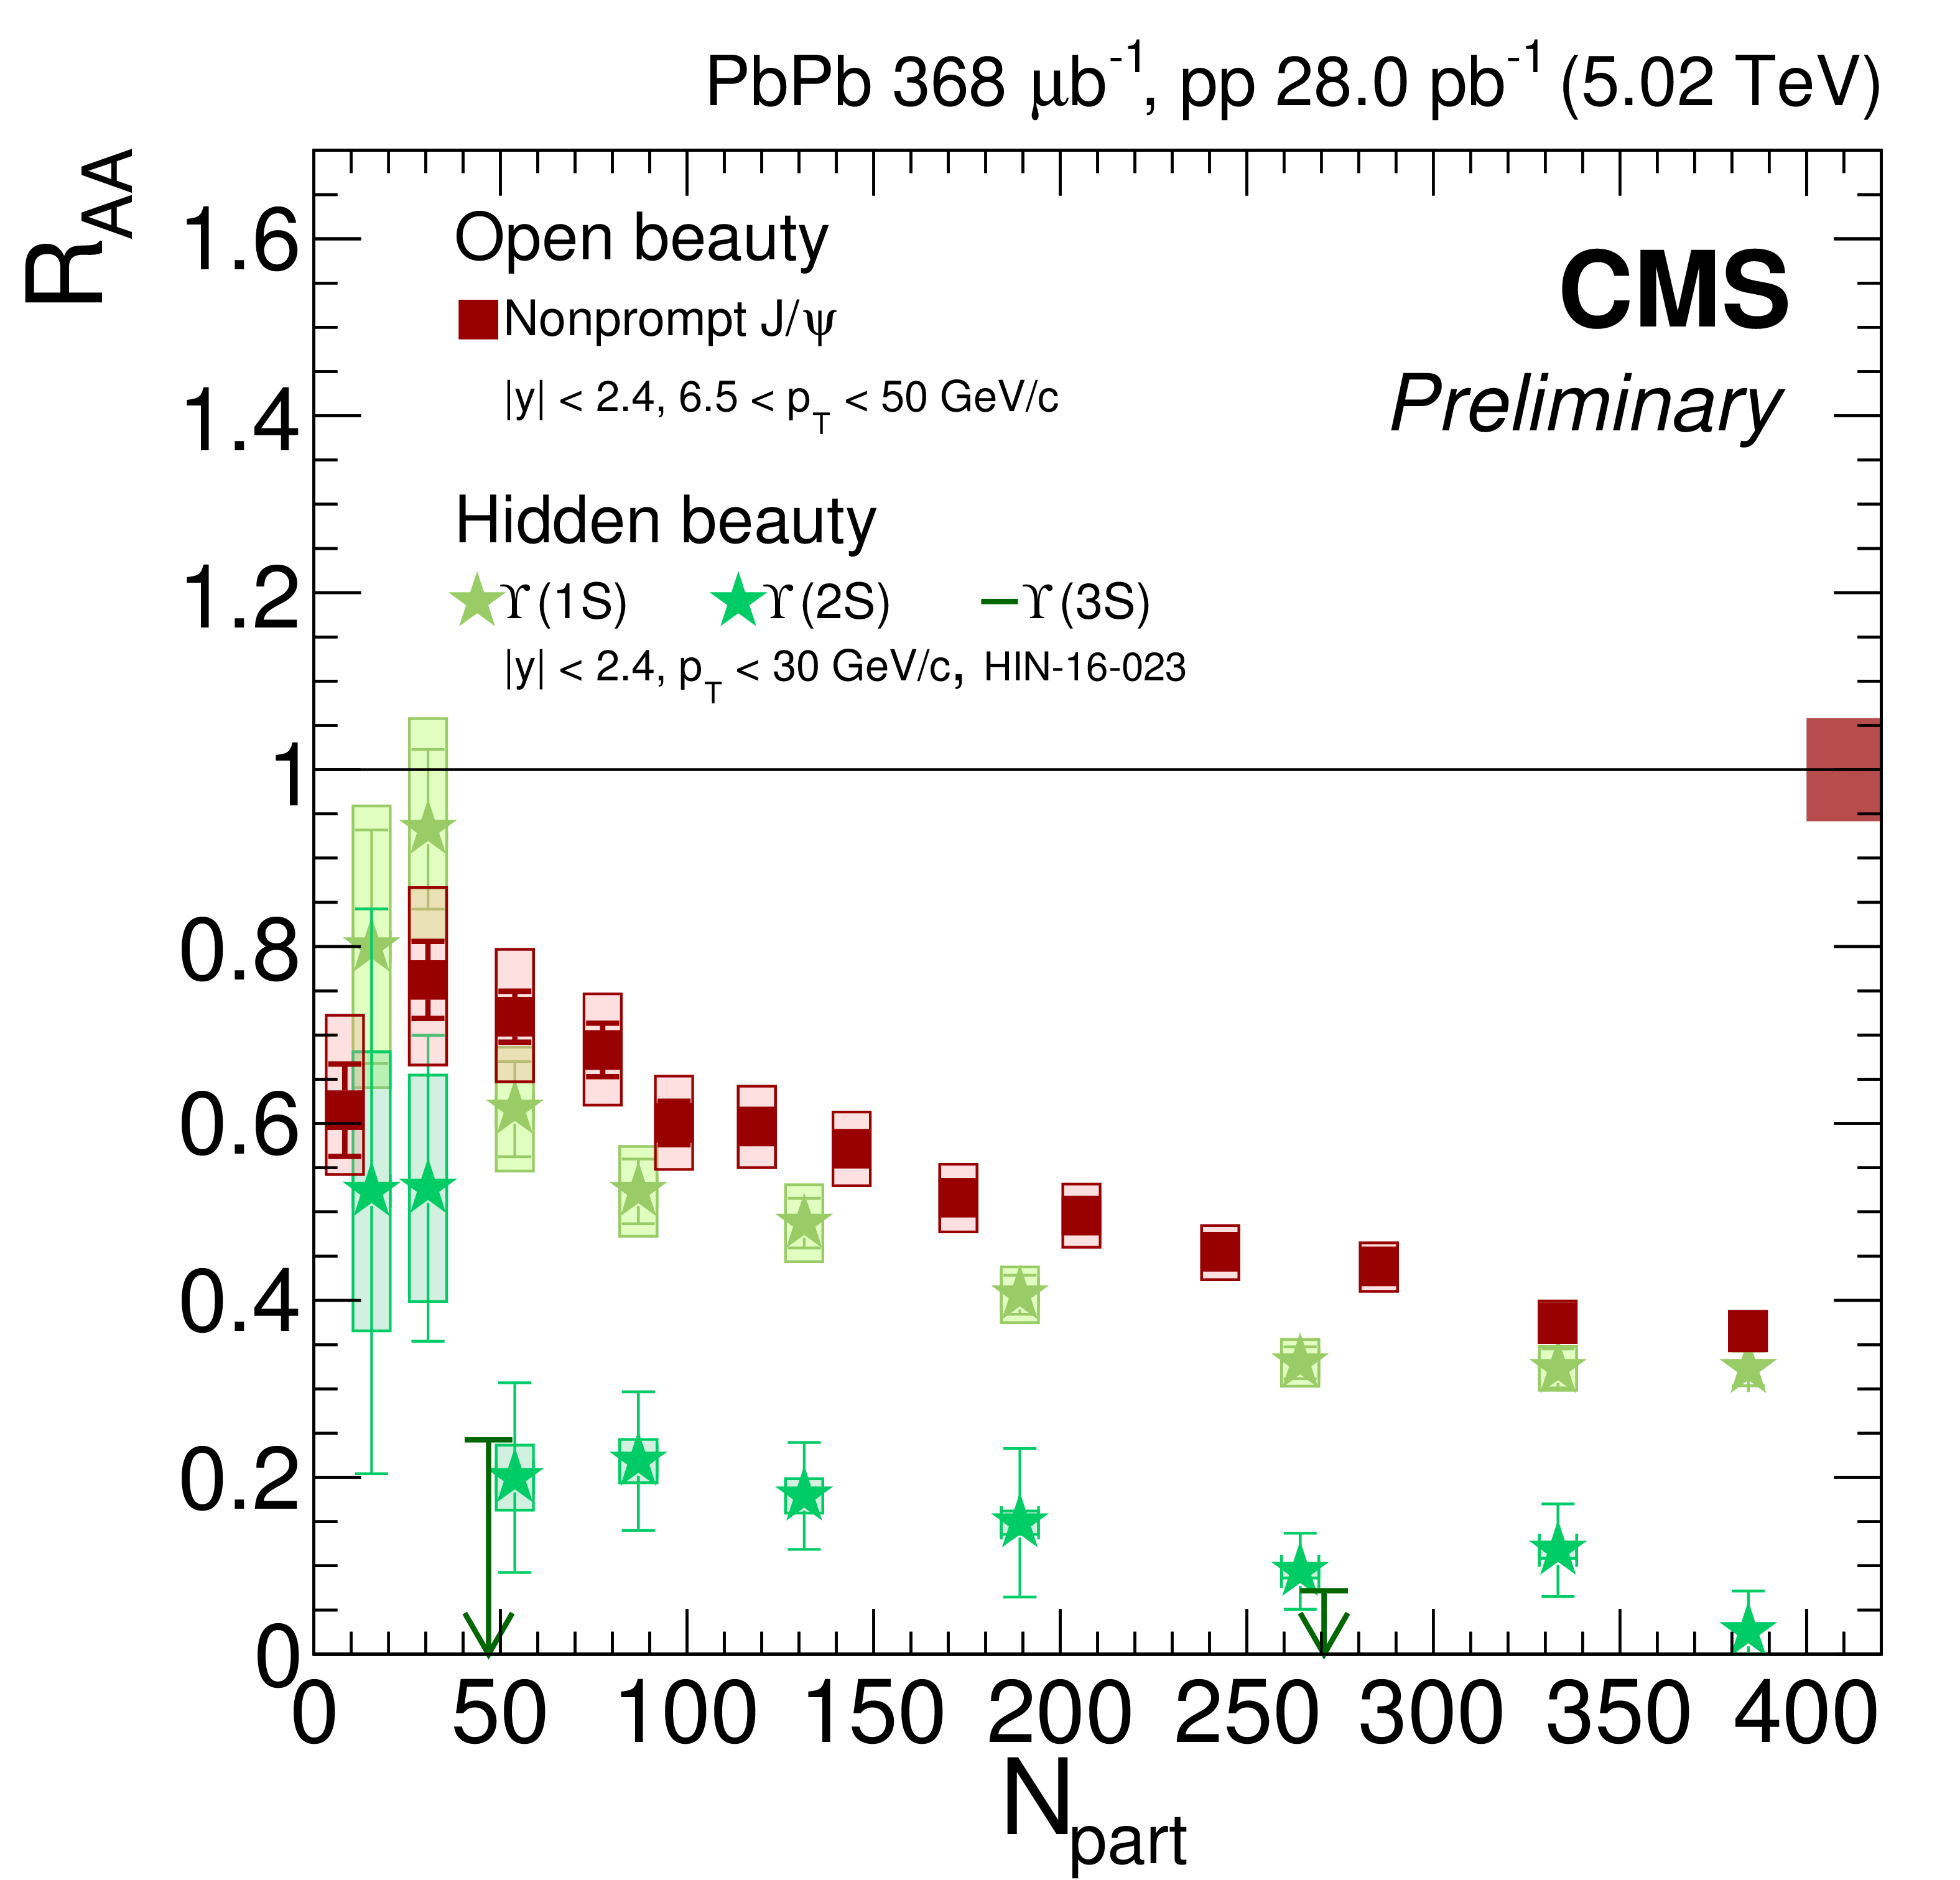
Additional Figure 4:
Nuclear modification factor of nonprompt $ \mathrm{J}/\psi $ (open beauty) and bottomonia (hidden beauty) as a function of centrality at $\sqrt {s_{\mathrm {NN}}} = $ 5.02 TeV. While bottomonium measurements are inclusive in $ {p_{\mathrm {T}}} $ , they start at $ {p_{\mathrm {T}}} = $ 6.5 GeV/$c$ for nonprompt $ \mathrm{J}/\psi $ . |

png pdf |
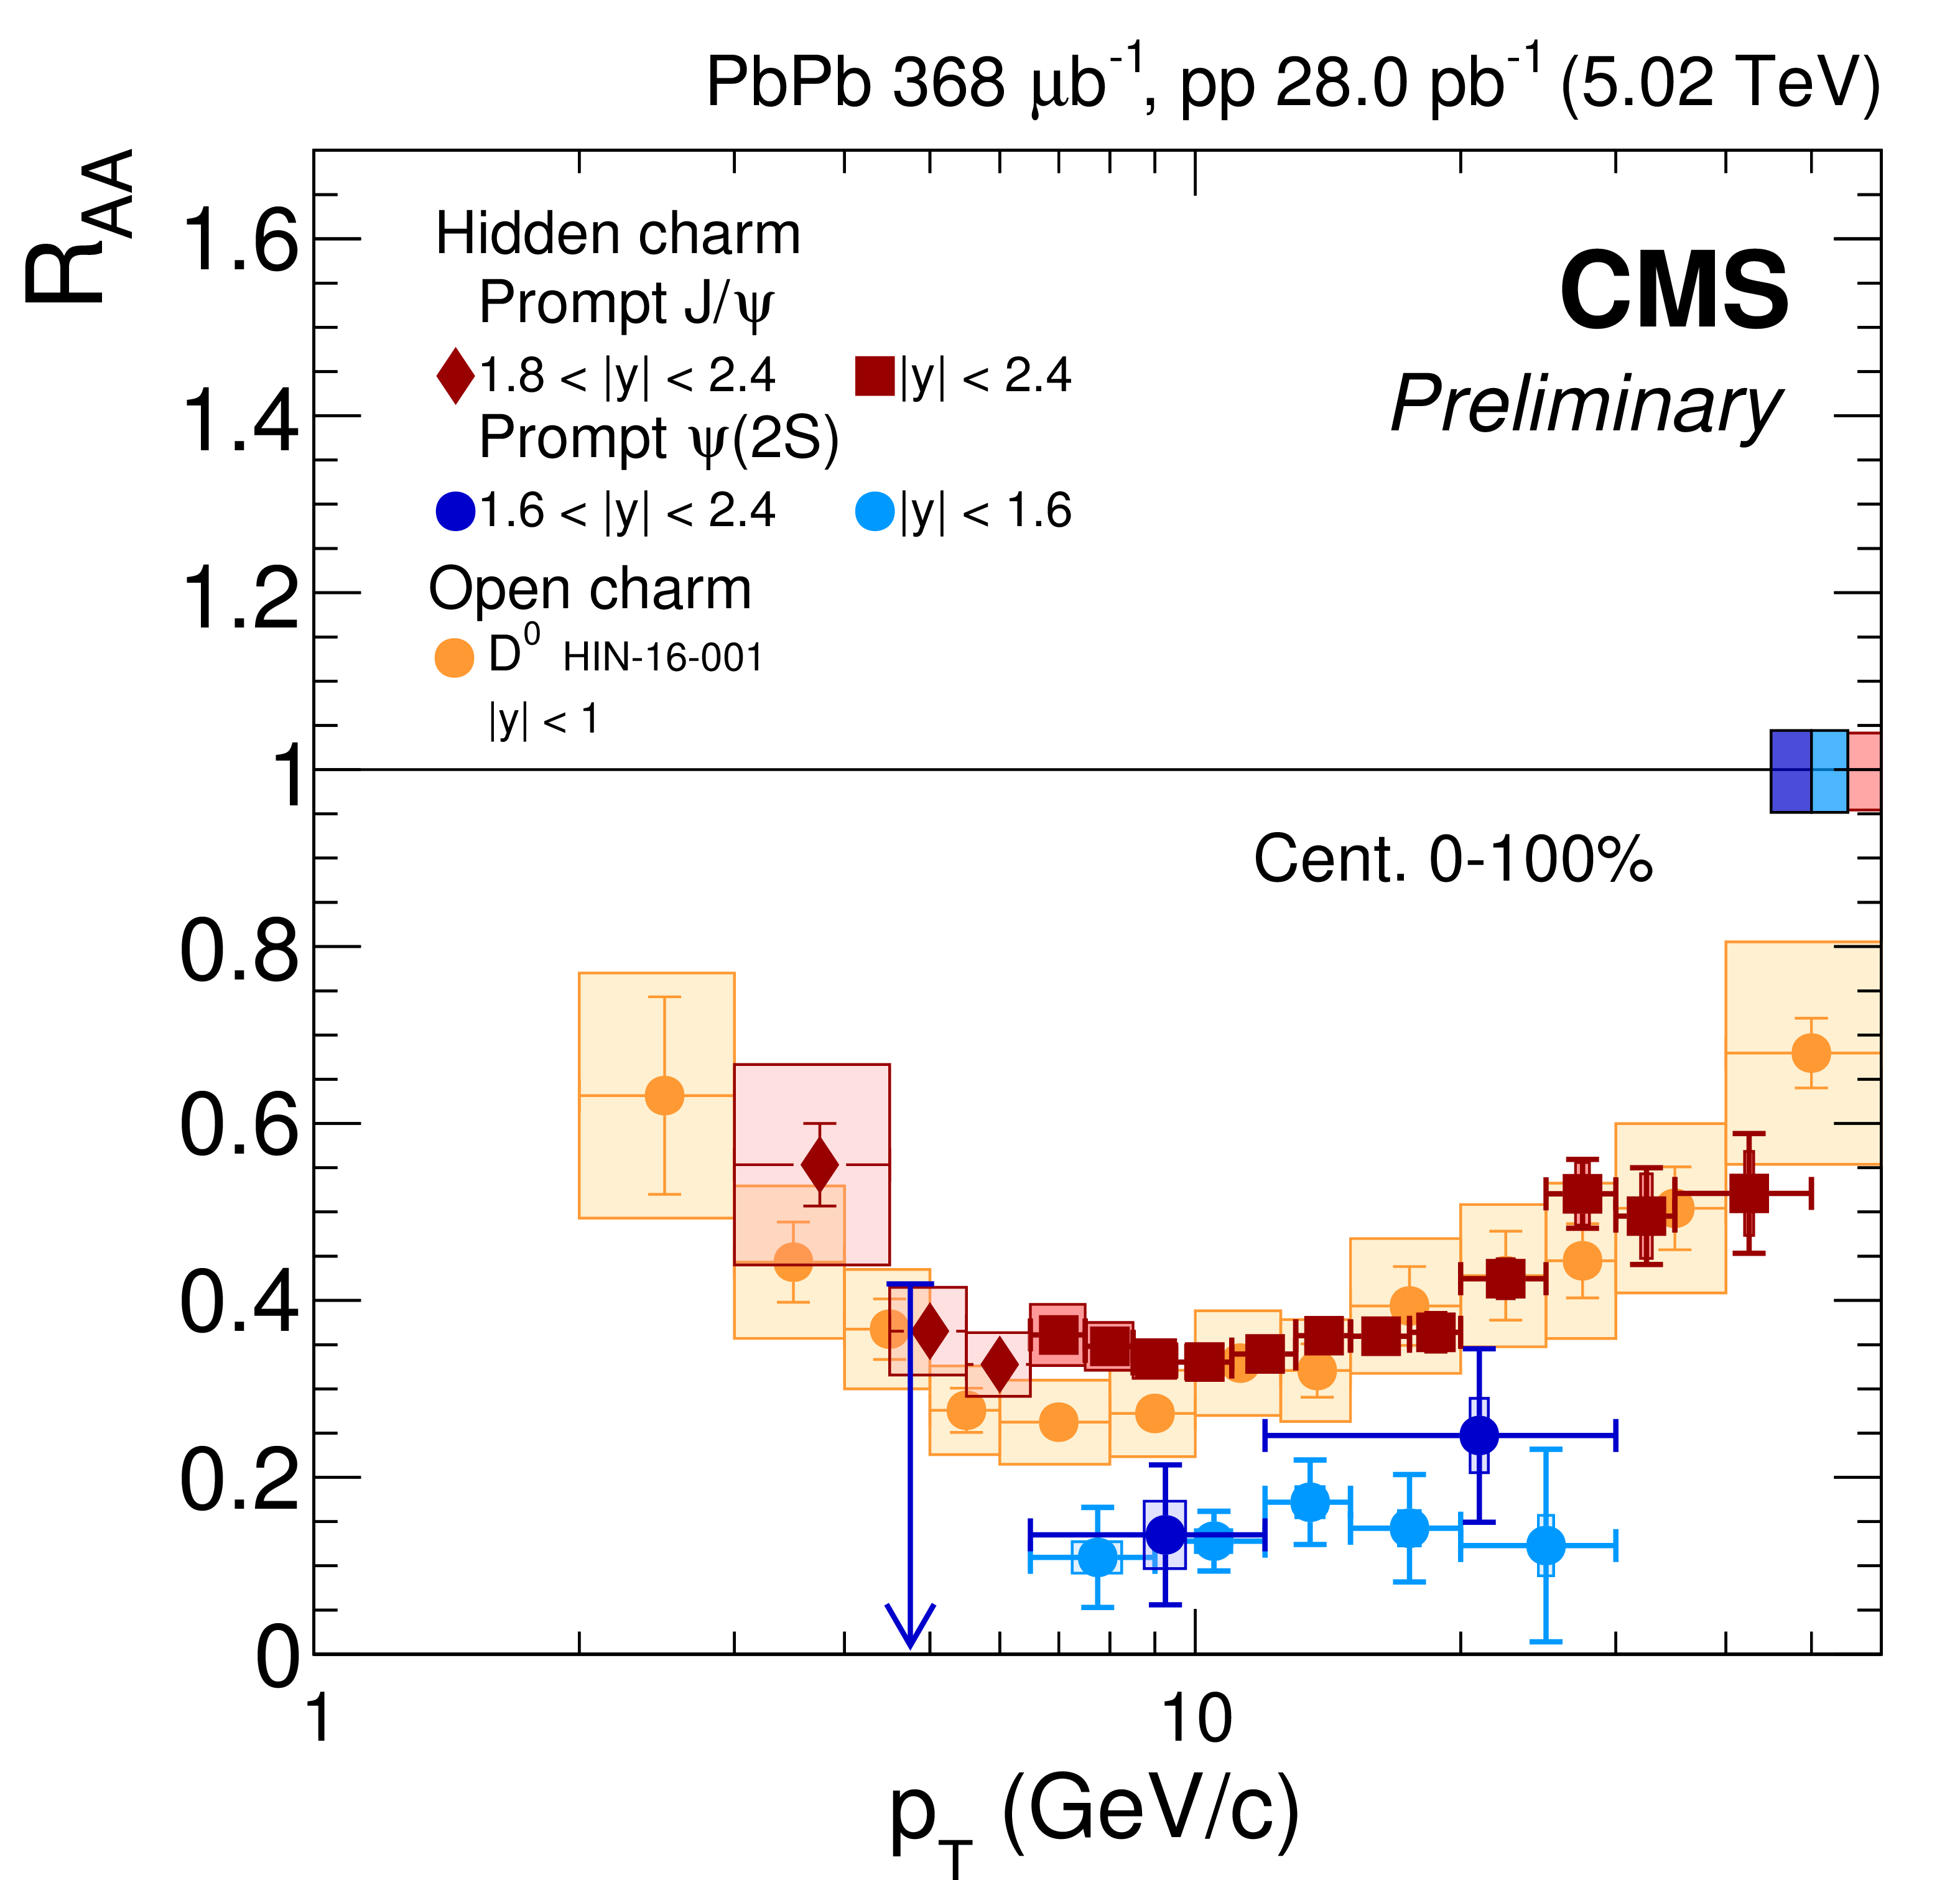
Additional Figure 5:
Nuclear modification factor of prompt $ \mathrm{J}/\psi $ (hidden charm) and D mesons (open charm) as a function of $ {p_{\mathrm {T}}} $ at $\sqrt {s_{\mathrm {NN}}} = $ 5.02 TeV, integrated over centrality. |
png pdf |
Additional Figure 6:
Nuclear modification factor of prompt $ \mathrm{J}/\psi $ (hidden charm) and D mesons (open charm) as a function of $ {p_{\mathrm {T}}} $ at $\sqrt {s_{\mathrm {NN}}} = $ 5.02 TeV, integrated over centrality. |
png pdf |
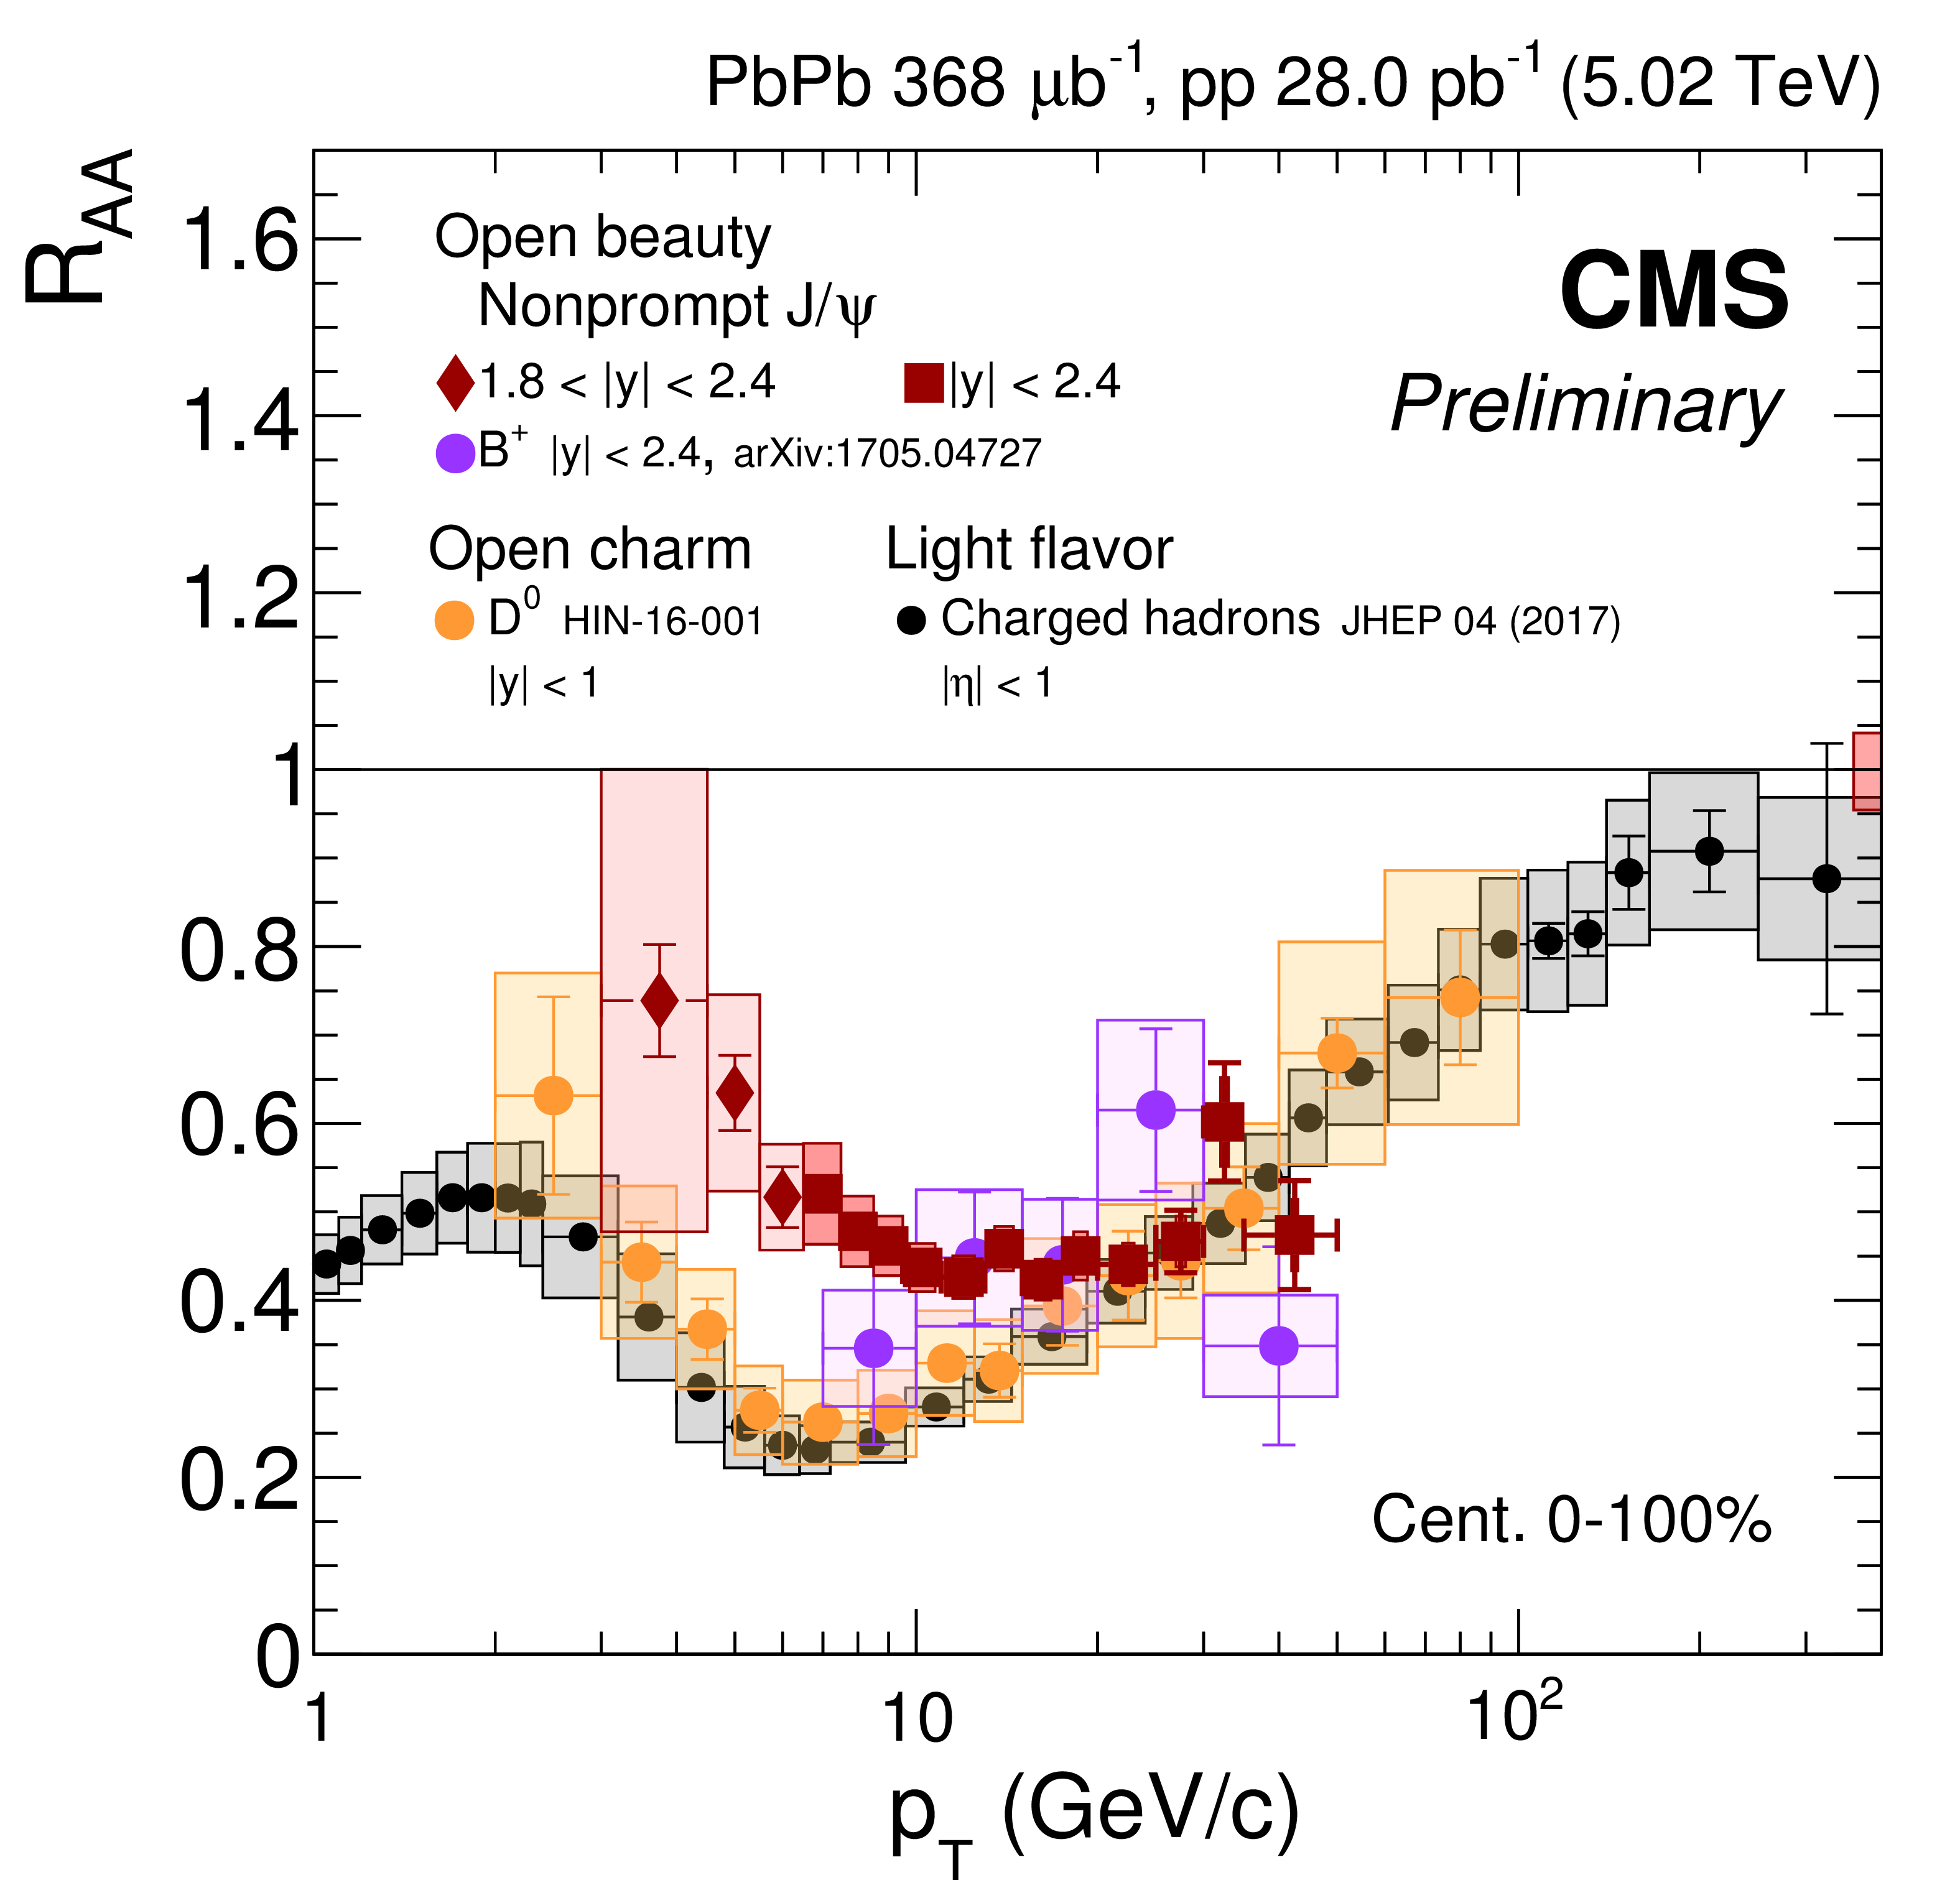
Additional Figure 7:
Nuclear modification factor of nonprompt $ \mathrm{J}/\psi $ and B mesons (open beauty), of Dmesons (open charm), and of charged hadrons as a function of $ {p_{\mathrm {T}}} $ at $\sqrt {s_{\mathrm {NN}}} = $ 5.02 TeV, integrated over centrality. |
png pdf |
Additional Figure 8:
Nuclear modification factor of prompt $ \mathrm{J}/\psi $ as a function of $ {p_{\mathrm {T}}} $ at $\sqrt {s_{\mathrm {NN}}} = $ 5.02 TeV. The low $ {p_{\mathrm {T}}} $ measurements obtained at forward rapidity are overlaid to those at $|y| < $ 2.4. Results obtained at $\sqrt {s_{\mathrm {NN}}} = $ 2.76 TeV are overlaid for comparison. The bars (boxes) represent statistical (systematic) point-by-point uncertainties. The boxes plotted at $ {R_{AA}} =$ 1 indicate the scale of the global relative uncertainties. |
png pdf |
Additional Figure 9:
Nuclear modification factor of nonprompt $ \mathrm{J}/\psi $ as a function of $ {p_{\mathrm {T}}} $ at $\sqrt {s_{\mathrm {NN}}} = $ 5.02 TeV. The low $ {p_{\mathrm {T}}} $ measurements obtained at forward rapidity are overlaid to those at $|y| < $ 2.4. Results obtained at $\sqrt {s_{\mathrm {NN}}} = $ 2.76 TeV are overlaid for comparison. The bars (boxes) represent statistical (systematic) point-by-point uncertainties. The boxes plotted at $ {R_{AA}} = $ 1 indicate the scale of the global relative uncertainties. |
png pdf |
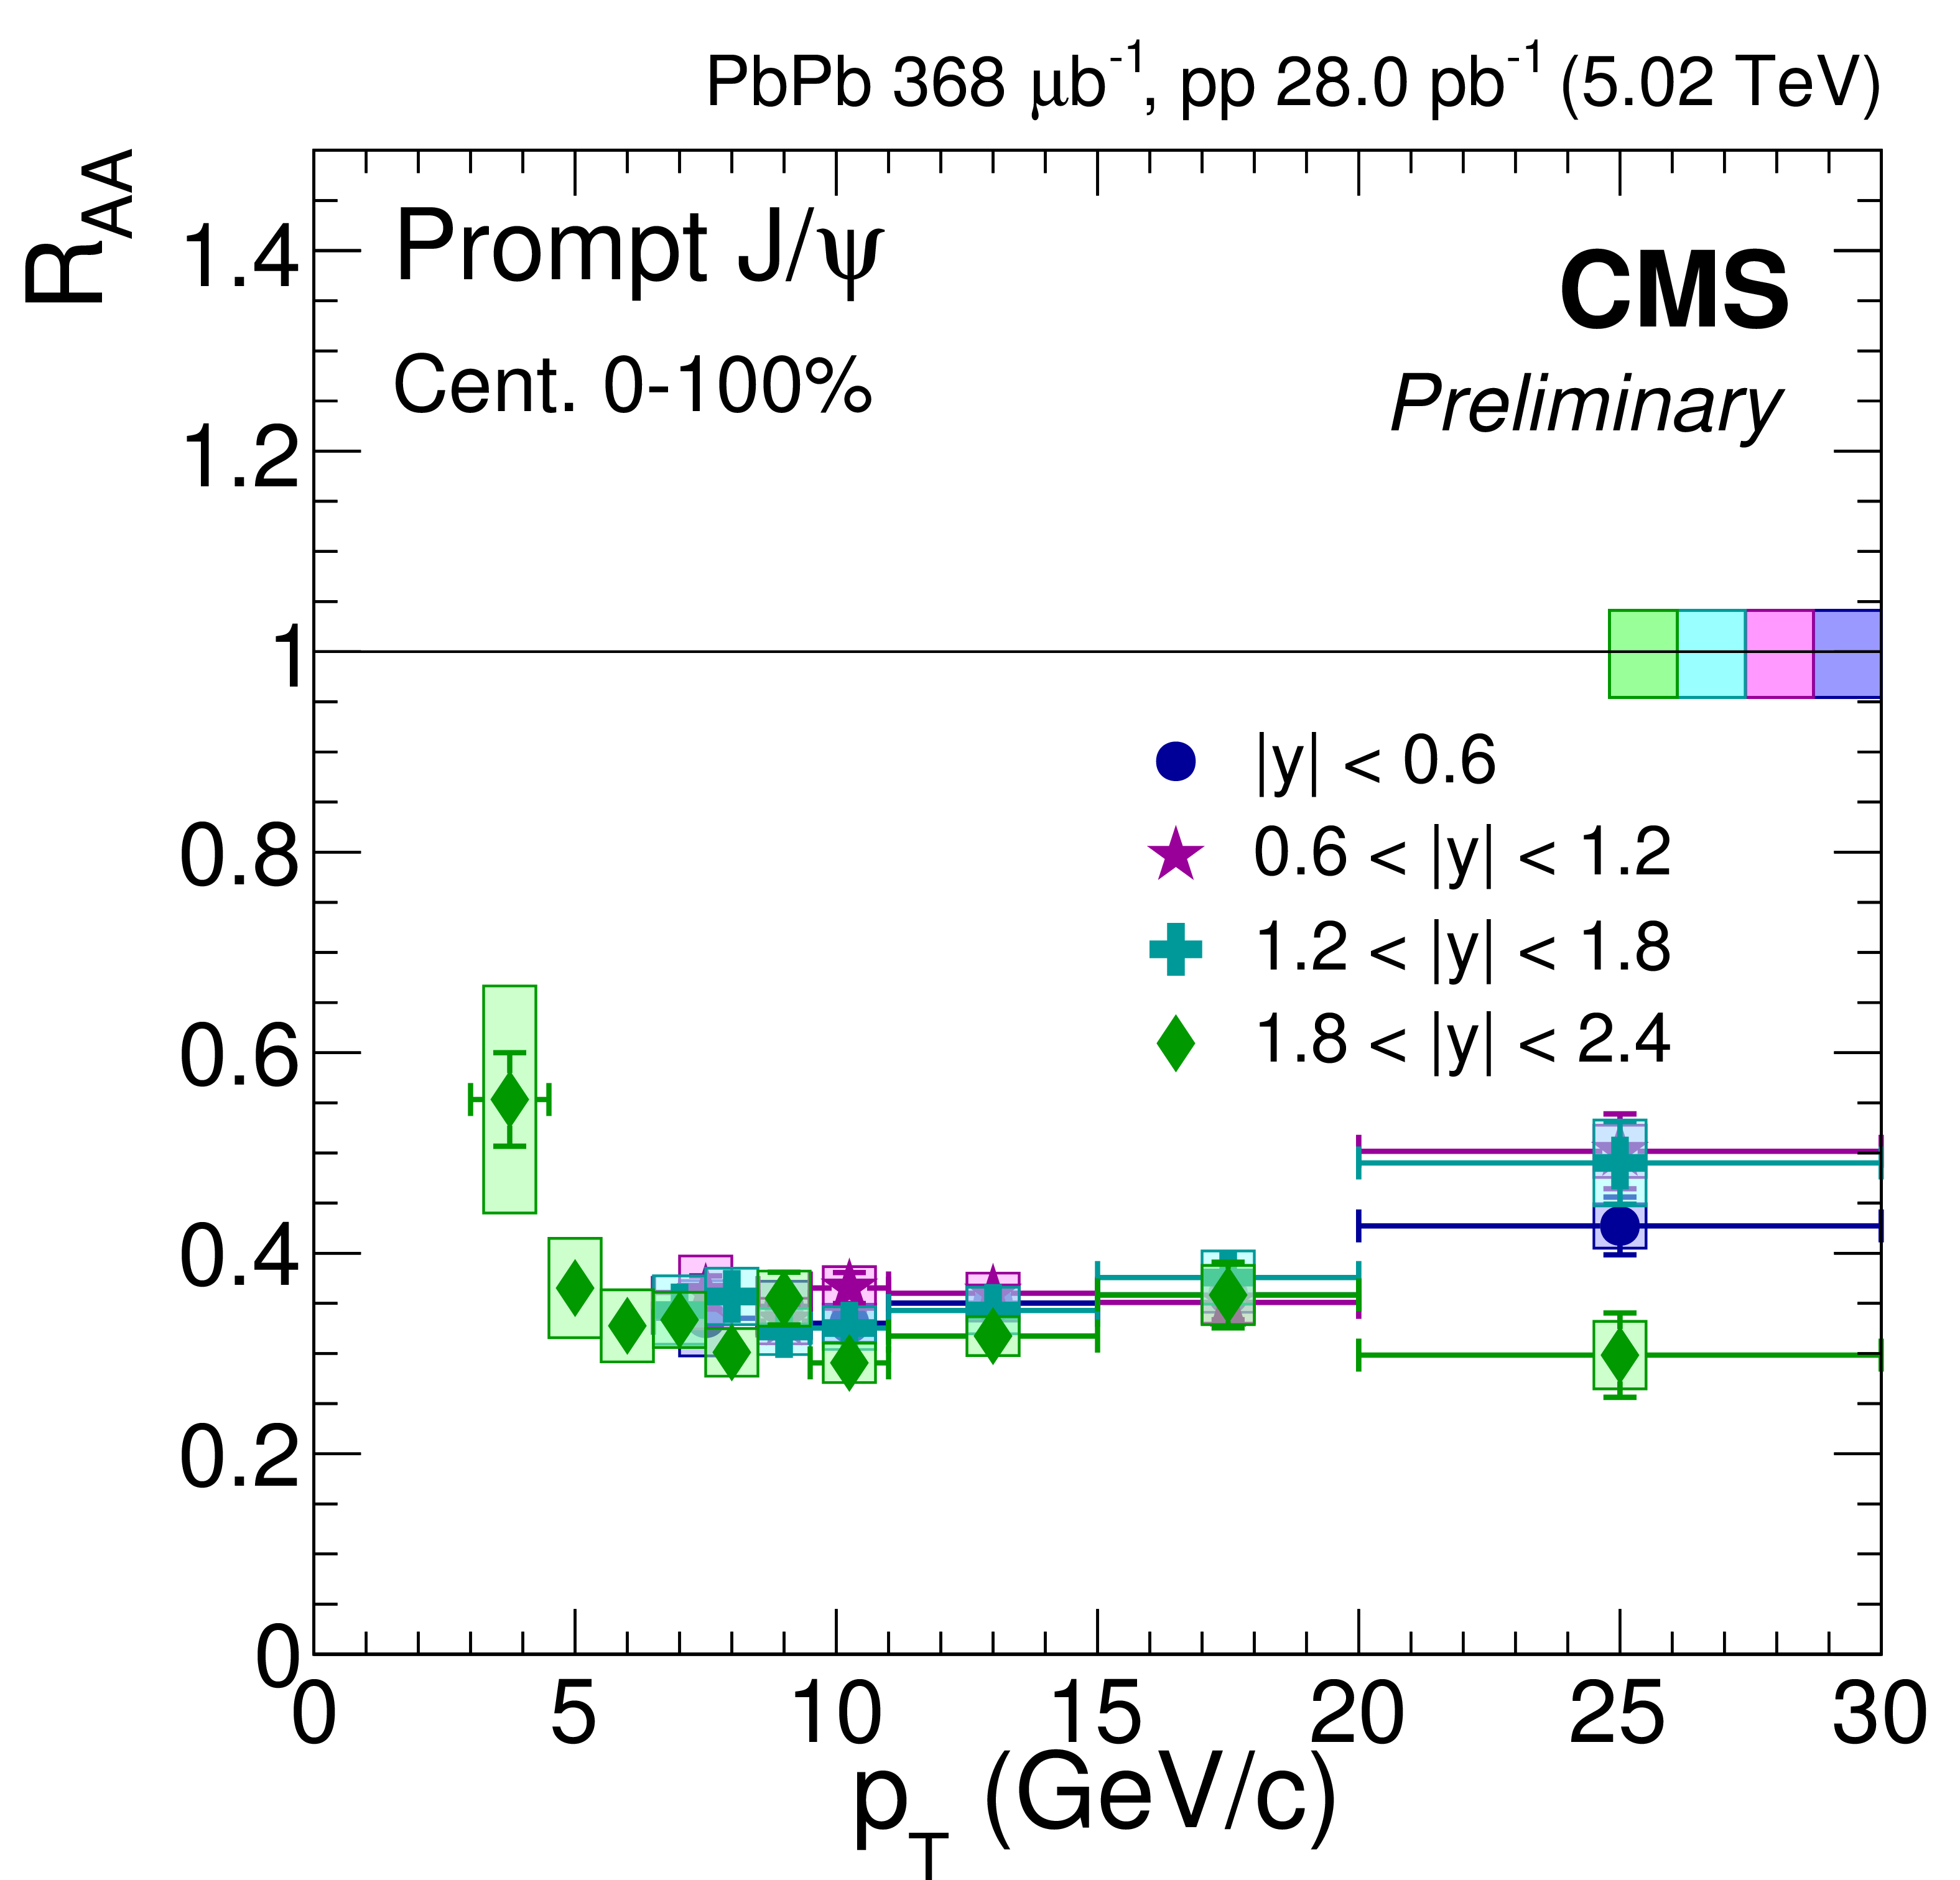
Additional Figure 10:
Nuclear modification factor of prompt $ \mathrm{J}/\psi $ as a function of $ {p_{\mathrm {T}}} $ in four rapidity intervals. The bars (boxes) represent statistical (systematic) point-by-point uncertainties. The boxes plotted at $ {R_{AA}} = $ 1 indicate the scale of the global relative uncertainties. |
png pdf |
Additional Figure 11:
Nuclear modification factor of nonprompt $ \mathrm{J}/\psi $ as a function of $ {p_{\mathrm {T}}} $ in four rapidity intervals. The bars (boxes) represent statistical (systematic) point-by-point uncertainties. The boxes plotted at $ {R_{AA}} = $ 1 indicate the scale of the global relative uncertainties. |
png pdf |
Additional Figure 12:
Nuclear modification factor of prompt $ \mathrm{J}/\psi $ as a function of centrality in four rapidity intervals. Data points are slightly shifted horizontally for better visibility. The bars (boxes) represent statistical (systematic) point-by-point uncertainties. The boxes plotted at $ {R_{AA}} = $ 1 indicate the scale of the global relative uncertainties. |
png pdf |
Additional Figure 13:
Nuclear modification factor of nonprompt $ \mathrm{J}/\psi $ as a function of centrality in four rapidity intervals. Data points are slightly shifted horizontally for better visibility. The bars (boxes) represent statistical (systematic) point-by-point uncertainties. The boxes plotted at $ {R_{AA}} = $ 1 indicate the scale of the global relative uncertainties. |
| References | ||||
| 1 | T. Matsui and H. Satz | $ \mathrm{J}/\psi $ suppression by quark-gluon plasma formation | PLB 178 (1986) 416 | |
| 2 | NA50 Collaboration | A new measurement of $ \mathrm{J}/\psi $ suppression in PbPb collisions at 158 GeV per nucleon | EPJC 39 (2005) 335 | hep-ex/0412036 |
| 3 | PHENIX Collaboration | $ \mathrm{J}/\psi $ production versus centrality, transverse momentum, and rapidity in AuAu collisions at $ \sqrt{s}_{\mathrm{NN}} = $ 200 GeV | PRL 98 (2007) 232301 | nucl-ex/0611020 |
| 4 | CMS Collaboration | Observation of sequential $ \Upsilon $ suppression in PbPb collisions | PRL 109 (2012) 222301 | CMS-HIN-11-011 1208.2826 |
| 5 | ALICE Collaboration | Suppression of $ \Upsilon (\mathrm{1S}) $ at forward rapidity in Pb-Pb collisions at $ \sqrt{s_{\rm NN}} = $ 2.76 TeV | PLB 738 (2014) 361 | 1405.4493 |
| 6 | P. Braun-Munzinger and J. Stachel | (Non) thermal aspects of charmonium production and a new look at $ \mathrm{J}/\psi $ suppression | PLB 490 (2000) 196 | nucl-th/0007059 |
| 7 | R. L. Thews, M. Schroedter, and J. Rafelski | Enhanced $ \mathrm{J}/\psi $ production in deconfined quark matter | PRC 63 (2001) 054905 | hep-ph/0007323 |
| 8 | ALICE Collaboration | $ \mathrm{J}/\psi $ suppression at forward rapidity in PbPb collisions at $ \sqrt{s}_{\mathrm{NN}} = $ 2.76 TeV | PRL 109 (2012) 072301 | 1202.1383 |
| 9 | ALICE Collaboration | $ \mathrm{J}/\psi $ suppression at forward rapidity in pb-pb collisions at $ \mathbf{\sqrt{s_{{\rm nn}}}} = $ 5.02 $ TeV | 1606.08197 | |
| 10 | CMS Collaboration | Suppression and azimuthal anisotropy of prompt and nonprompt $ {\mathrm{J}}/\psi $ production in PbPb collisions at $ \sqrt{{s_{_{\text {NN}}}}} = $ 2.76 TeV | EPJC 77 (2017) 252 | CMS-HIN-14-005 1610.00613 |
| 11 | M. Strickland | Thermal $ \Upsilon_{1S} $ and $ \chi_{b1} $ suppression in $ \sqrt{s_{NN}}= $ 2.76 TeV Pb-Pb collisions at the LHC | PRL 107 (2011) 132301 | 1106.2571 |
| 12 | X. Du and R. Rapp | Sequential Regeneration of Charmonia in Heavy-Ion Collisions | Nucl. Phys. A943 (2015) 147 | 1504.00670 |
| 13 | M. Spousta | On similarity of jet quenching and charmonia suppression | PLB 767 (2017) 10 | 1606.00903 |
| 14 | F. Arleo | Quenching of Hadron Spectra in Heavy Ion Collisions at the LHC | 1703.10852 | |
| 15 | LHCb Collaboration | Measurement of $ \mathrm{J}/\psi $ production in pp collisions at $ \sqrt{s} = $ 7 TeV | EPJC 71 (2011) 1645 | 1103.0423 |
| 16 | CMS Collaboration | Prompt and non-prompt $ \mathrm{J}/\psi $ production in pp collisions at $ \sqrt{s} = $ 7 TeV | EPJC 71 (2011) 1575 | CMS-BPH-10-002 1011.4193 |
| 17 | ATLAS Collaboration | Measurement of the differential cross-sections of inclusive, prompt and non-prompt $ \mathrm{J}/\psi $ production in pp collisions at $ \sqrt{s} = $ 7 TeV | Nucl. Phys. B 850 (2011) 387 | 1104.3038 |
| 18 | CMS Collaboration | Performance of CMS muon reconstruction in pp collision events at $ \sqrt{s} = $ 7 TeV | JINST 7 (2012) P10002 | CMS-MUO-10-004 1206.4071 |
| 19 | CMS Collaboration | The CMS experiment at the CERN LHC | JINST 3 (2008) S08004 | CMS-00-001 |
| 20 | CMS Collaboration | Dependence on pseudorapidity and centrality of charged hadron production in PbPb collisions at $ \sqrt{s}_{\mathrm{NN}} = $ 2.76 TeV | JHEP 08 (2011) 141 | CMS-HIN-10-001 1107.4800 |
| 21 | M. L. Miller, K. Reygers, S. J. Sanders, and P. Steinberg | Glauber modeling in high-energy nuclear collisions | Ann. Rev. Nucl. Part. Sci. 57 (2007) 205 | nucl-ex/0701025 |
| 22 | CMS Collaboration | Charged-particle nuclear modification factors in PbPb and pPb collisions at $ \sqrt{s_{\mathrm{N}\mathrm{N}}}= $ 5.02 TeV | JHEP 04 (2017) 039 | CMS-HIN-15-015 1611.01664 |
| 23 | T. Sj\"ostrand et al. | An Introduction to PYTHIA 8.2 | CPC 191 (2015) 159 | arXiv:1410.3012 |
| 24 | D. J. Lange | The EvtGen particle decay simulation package | NIMA 462 (2001) 152 | |
| 25 | I. P. Lokhtin and A. M. Snigirev | A model of jet quenching in ultrarelativistic heavy ion collisions and high-$ p_{\mathrm{T}} $ hadron spectra at RHIC | EPJC 45 (2006) 211 | hep-ph/0506189 |
| 26 | GEANT Collaboration | GEANT4 --- A simulation toolkit | NIMA 506 (2003) 250 | |
| 27 | M. J. Oreglia | A Study of the Reactions $ \psi' \rightarrow \gamma \gamma \psi $ | Ph.D. Thesis (1980) Appendix D | |
| 28 | M. Pivk and F. Le Diberder | $ _{s} $Plot: a statistical tool to unfold data distributions | physics/0402083 | |
| 29 | CMS Collaboration | Suppression of non-prompt $ \mathrm{J}/\psi$, prompt $ \mathrm{J}/\psi$, and $ \Upsilon (\text{1S}) $ in PbPb collisions at $ \sqrt{s}_{NN} = $ 2.76 TeV | JHEP 05 (2012) 063 | CMS-HIN-10-006 1201.5069 |
| 30 | CMS Collaboration | CMS Luminosity Calibration for the pp Reference Run at $ \sqrt{s}= $ 5.02 TeV | CMS-PAS-LUM-16-001 | CMS-PAS-LUM-16-001 |
| 31 | CMS Collaboration | Relative modification of prompt $ \psi (\text{2s})$ and $ \mathrm{J}/\psi $ yields from pp to PbPb collisions at $ \sqrt{s_{\mathrm{NN}}} = $ 5.02 TeV | PRL 118 (2017), no. 16, 162301 | CMS-HIN-16-004 1611.01438 |
|
|
Compact Muon Solenoid LHC, CERN |
|

|

|

|

|

|