

Compact Muon Solenoid
LHC, CERN
| CMS-PAS-HIN-16-007 | ||
| $\mathrm{D}^{0}$ meson $v_{n}$ harmonics in PbPb collisions at 5.02 TeV | ||
| CMS Collaboration | ||
| September 2016 | ||
| Abstract: The Fourier coefficients $v_{2}$ and $v_{3}$, which reflect the azimuthal anisotropy of $\mathrm{D}^{0}$ meson, is measured with scalar-product method in PbPb collisions at $ \sqrt{s_\mathrm{NN}} = $ 5.02 TeV with CMS. The measurement is done in a wide $p_{\mathrm{T}}$ range up to 40 GeV/$c$, for centrality classes 0-10%, 10-30% and 30-50%. It is the first measurement on $\mathrm{D}^{0}$ $v_{3}$ and the uncertainties on $\mathrm{D}^{0}$ $v_{2}$ are significantly improved compared with previous measurements. The measured $\mathrm{D}^{0}$ $v_{n}$ (n = 2, 3) is consistent with charged particle $v_{n}$ in central collisions, and begins to be lower than charged particles $v_{n}$ in $p_{\mathrm{T}}$ range 1 to 6 GeV/$c$ for more peripheral collisions. In high $p_{\mathrm{T}}$ range, non-zero $\mathrm{D}^{0}$ $v_{2}$ is also observed, which indicates the path length dependent energy loss of charm quark. | ||
|
Links:
CDS record (PDF) ;
inSPIRE record ;
CADI line (restricted) ;
These preliminary results are superseded in this paper, PRL 120 (2018) 202301. The superseded preliminary plots can be found here. |
||
| Figures & Tables | Summary | Additional Figures | References | CMS Publications |
|---|
| Figures | |
png pdf |
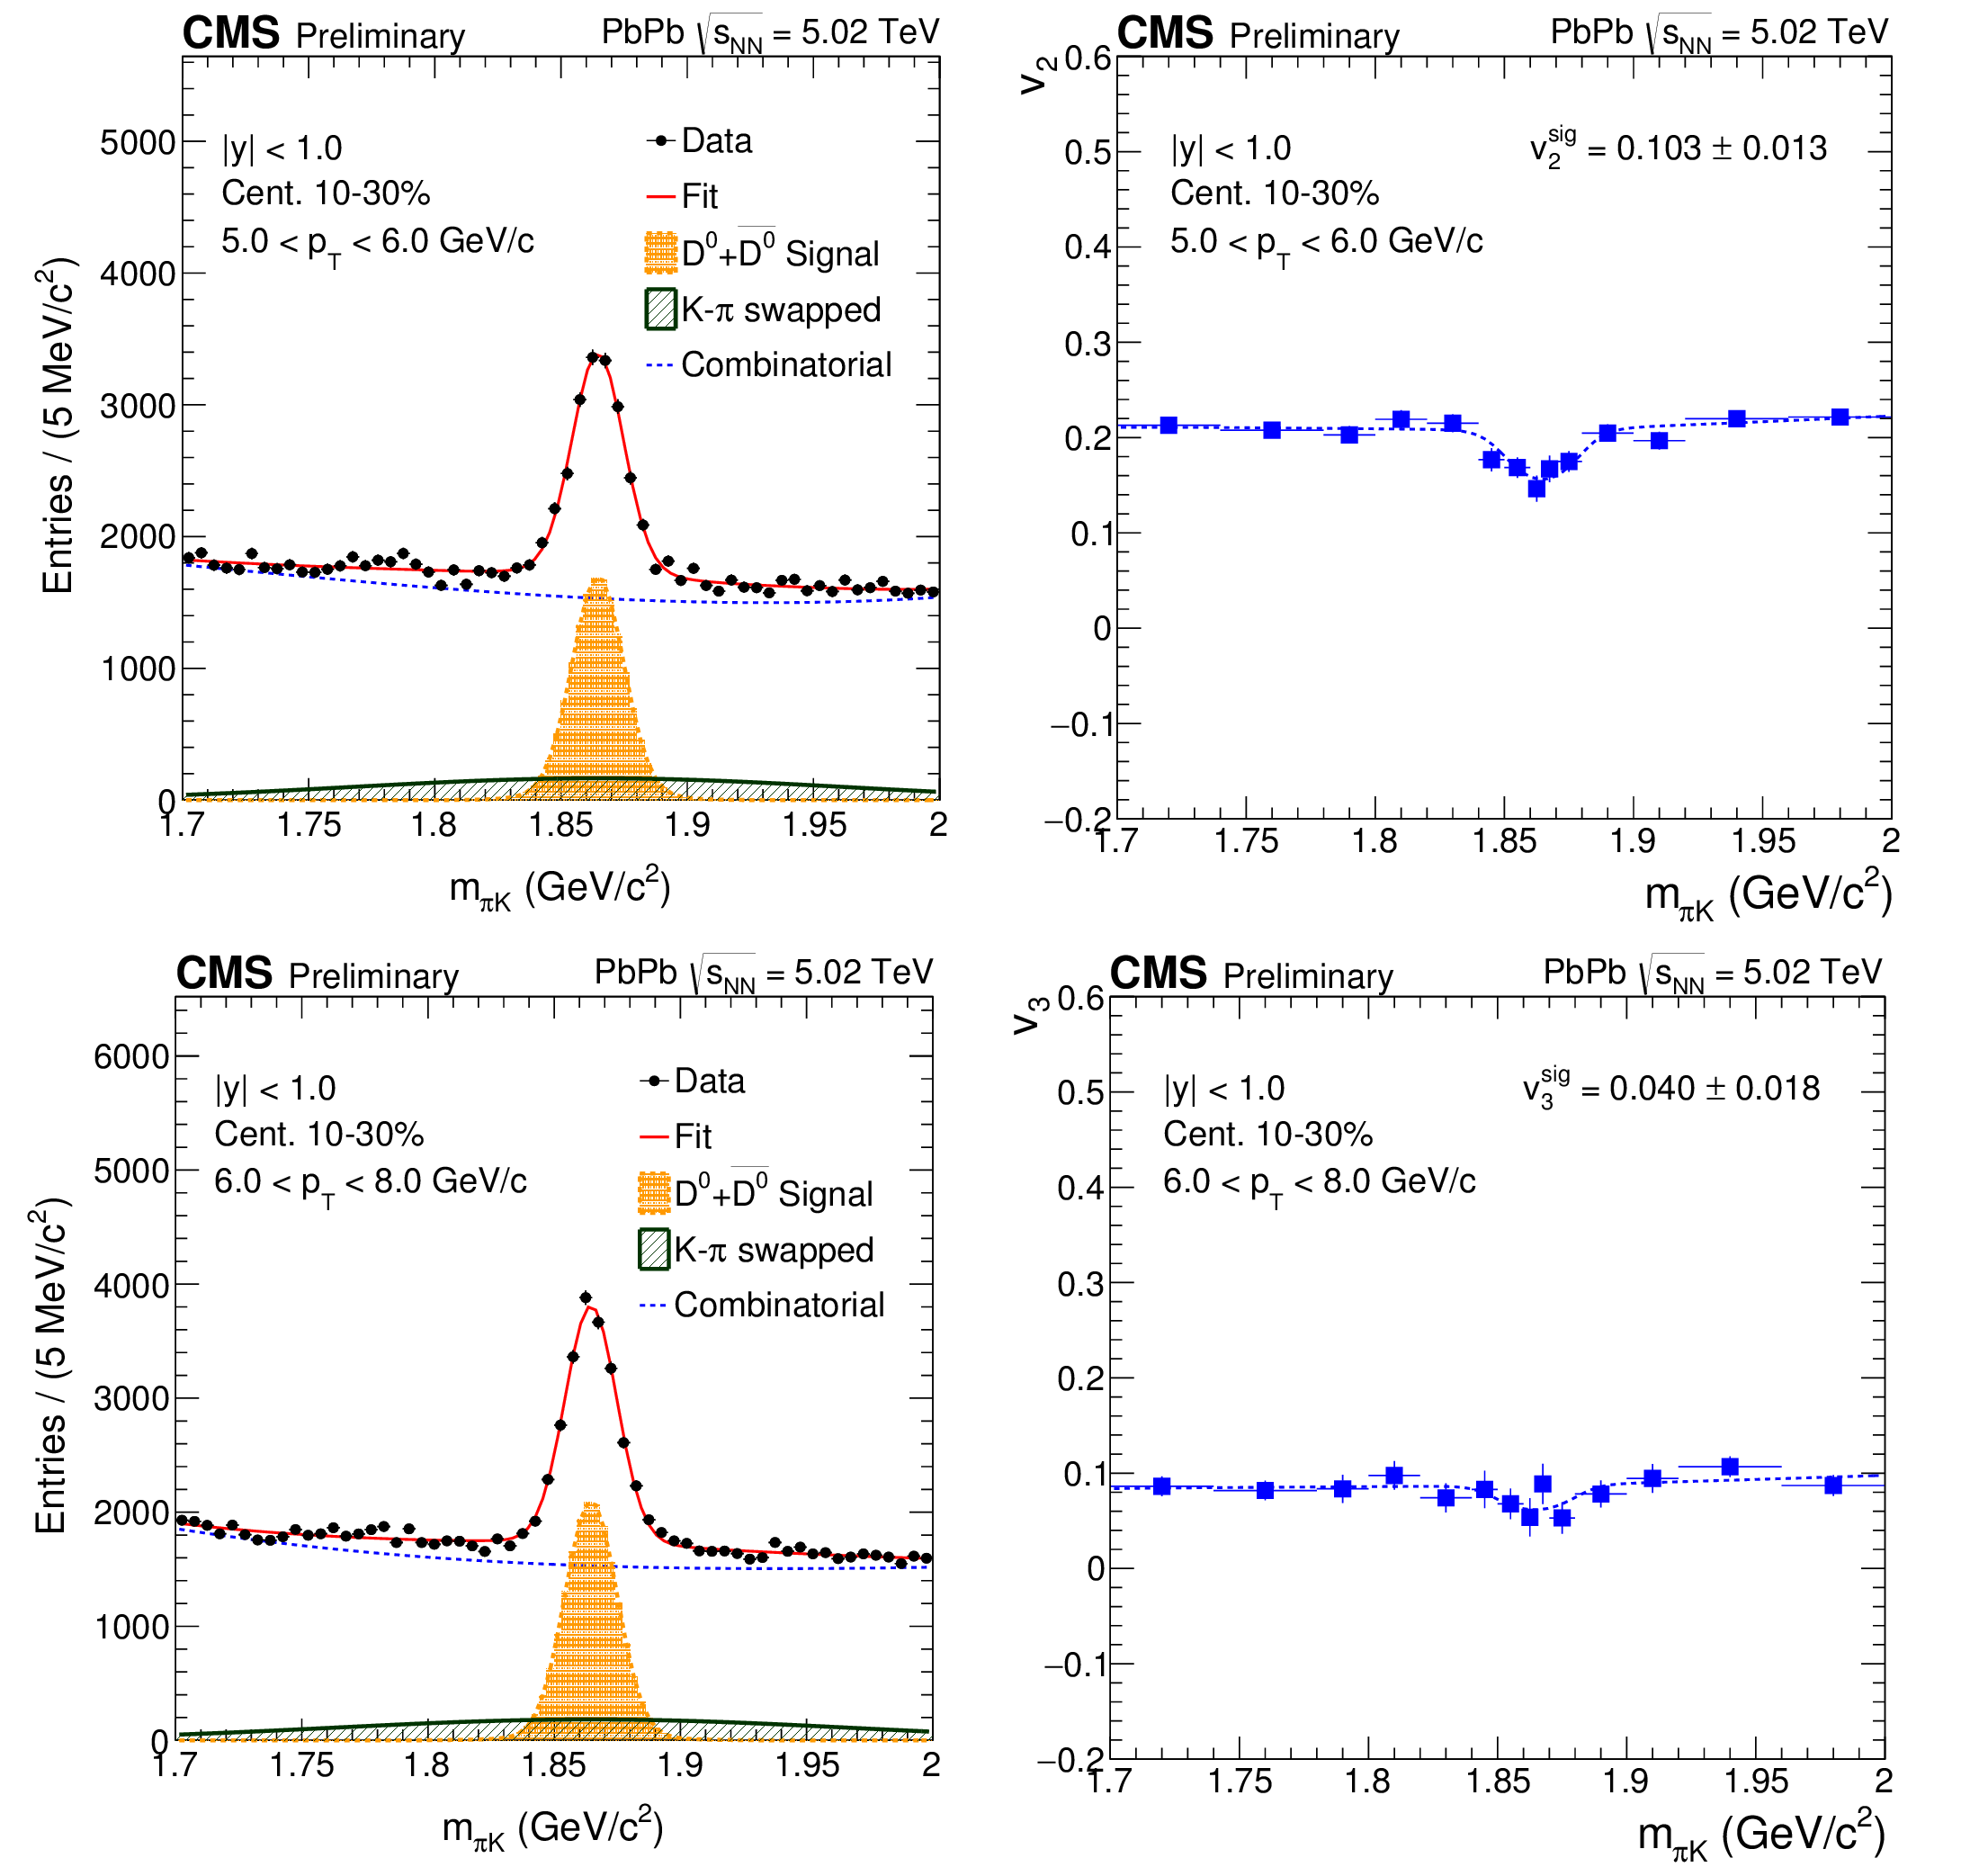
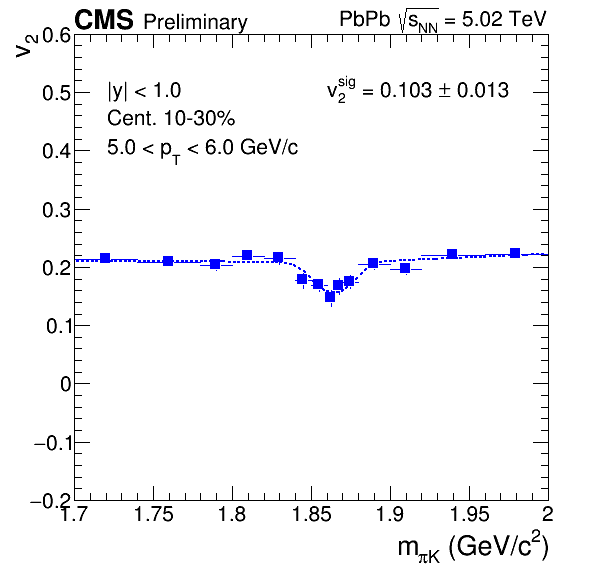
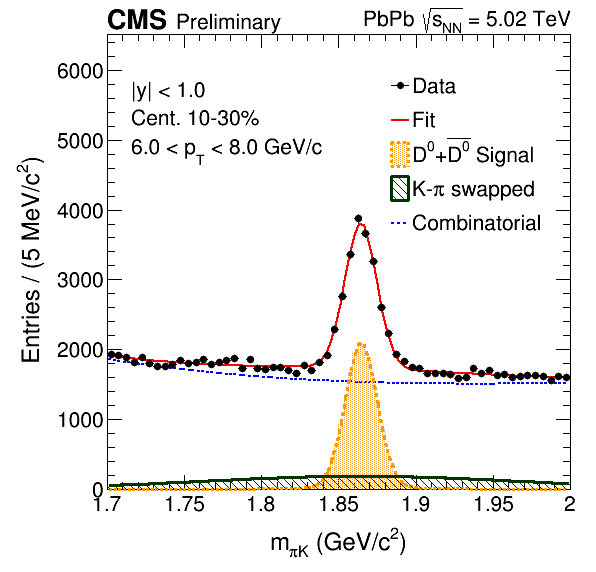
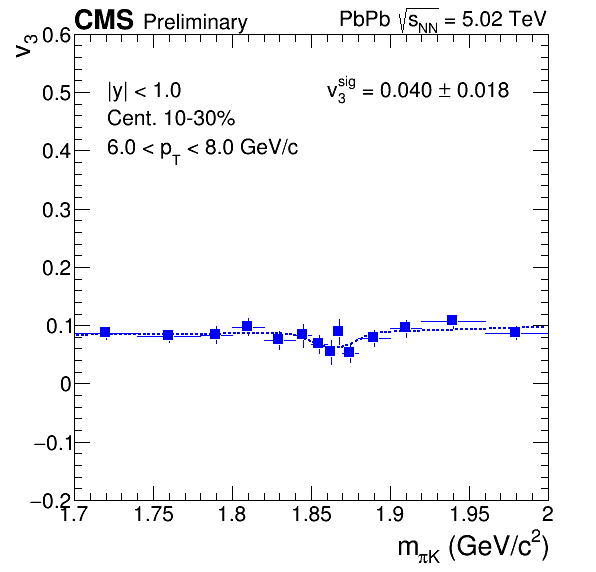
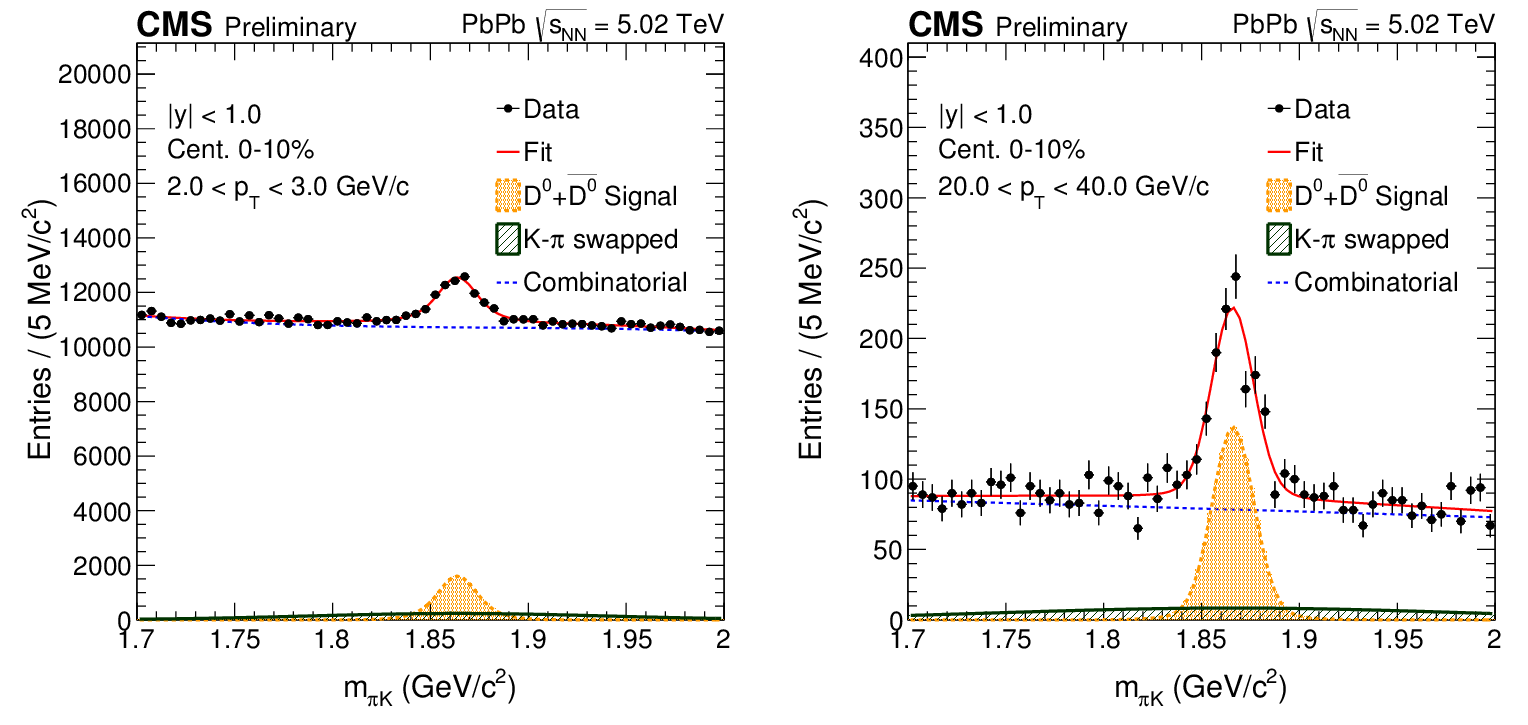
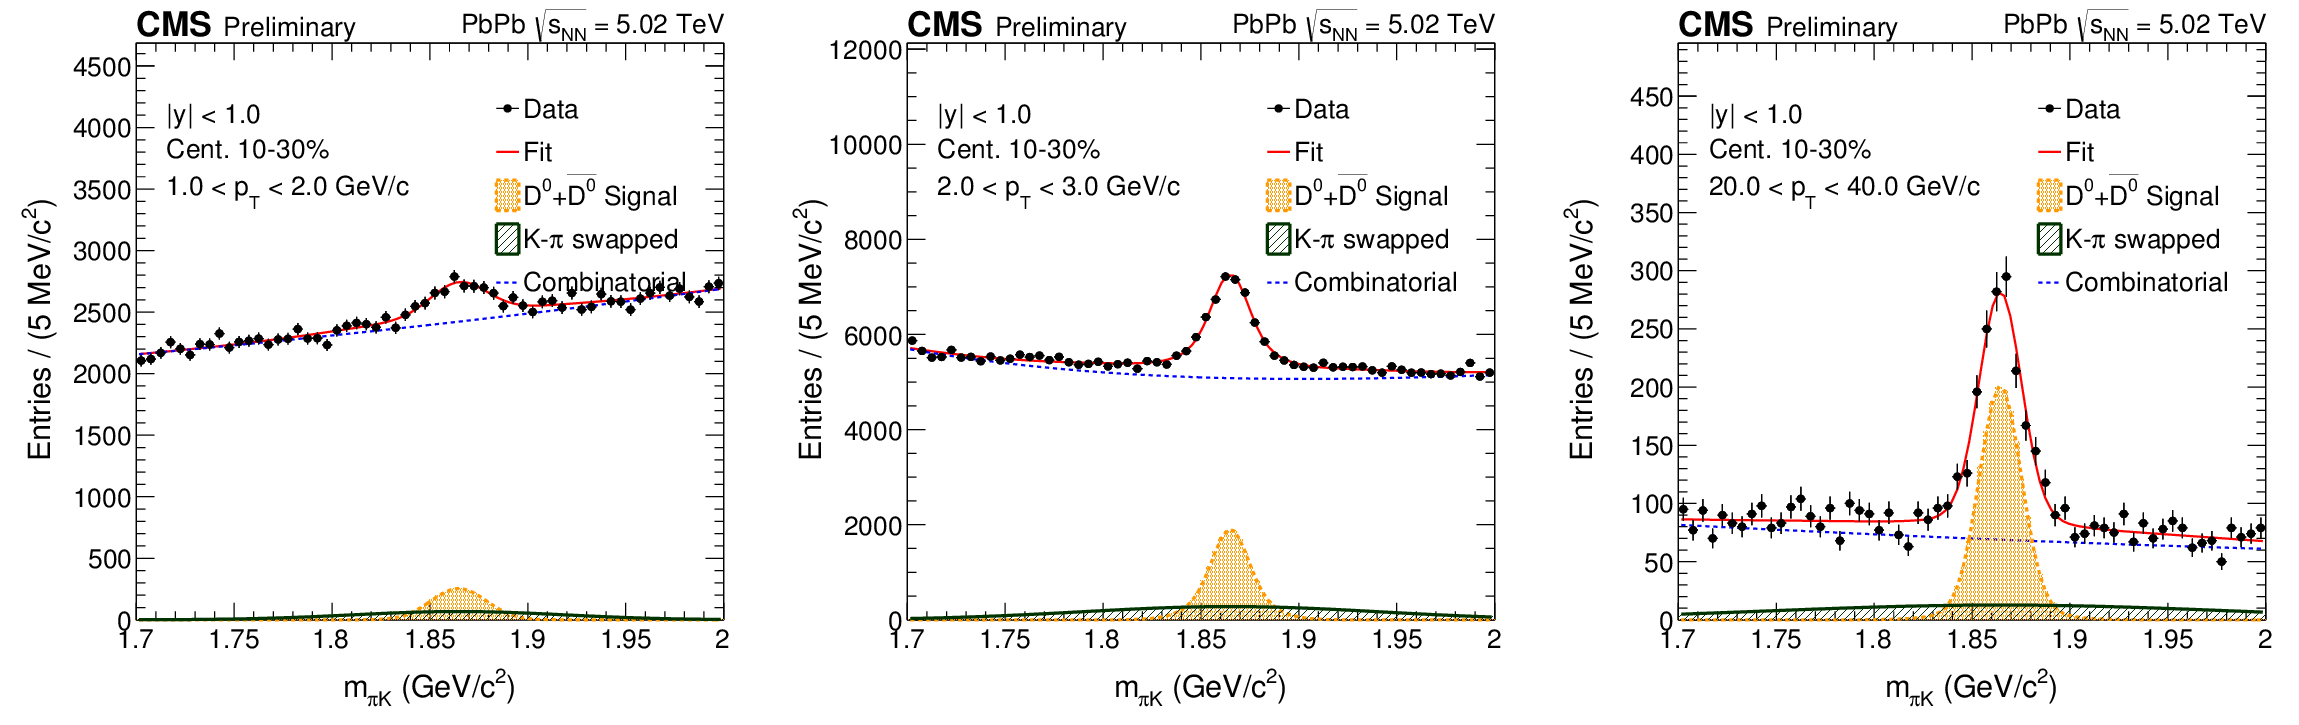
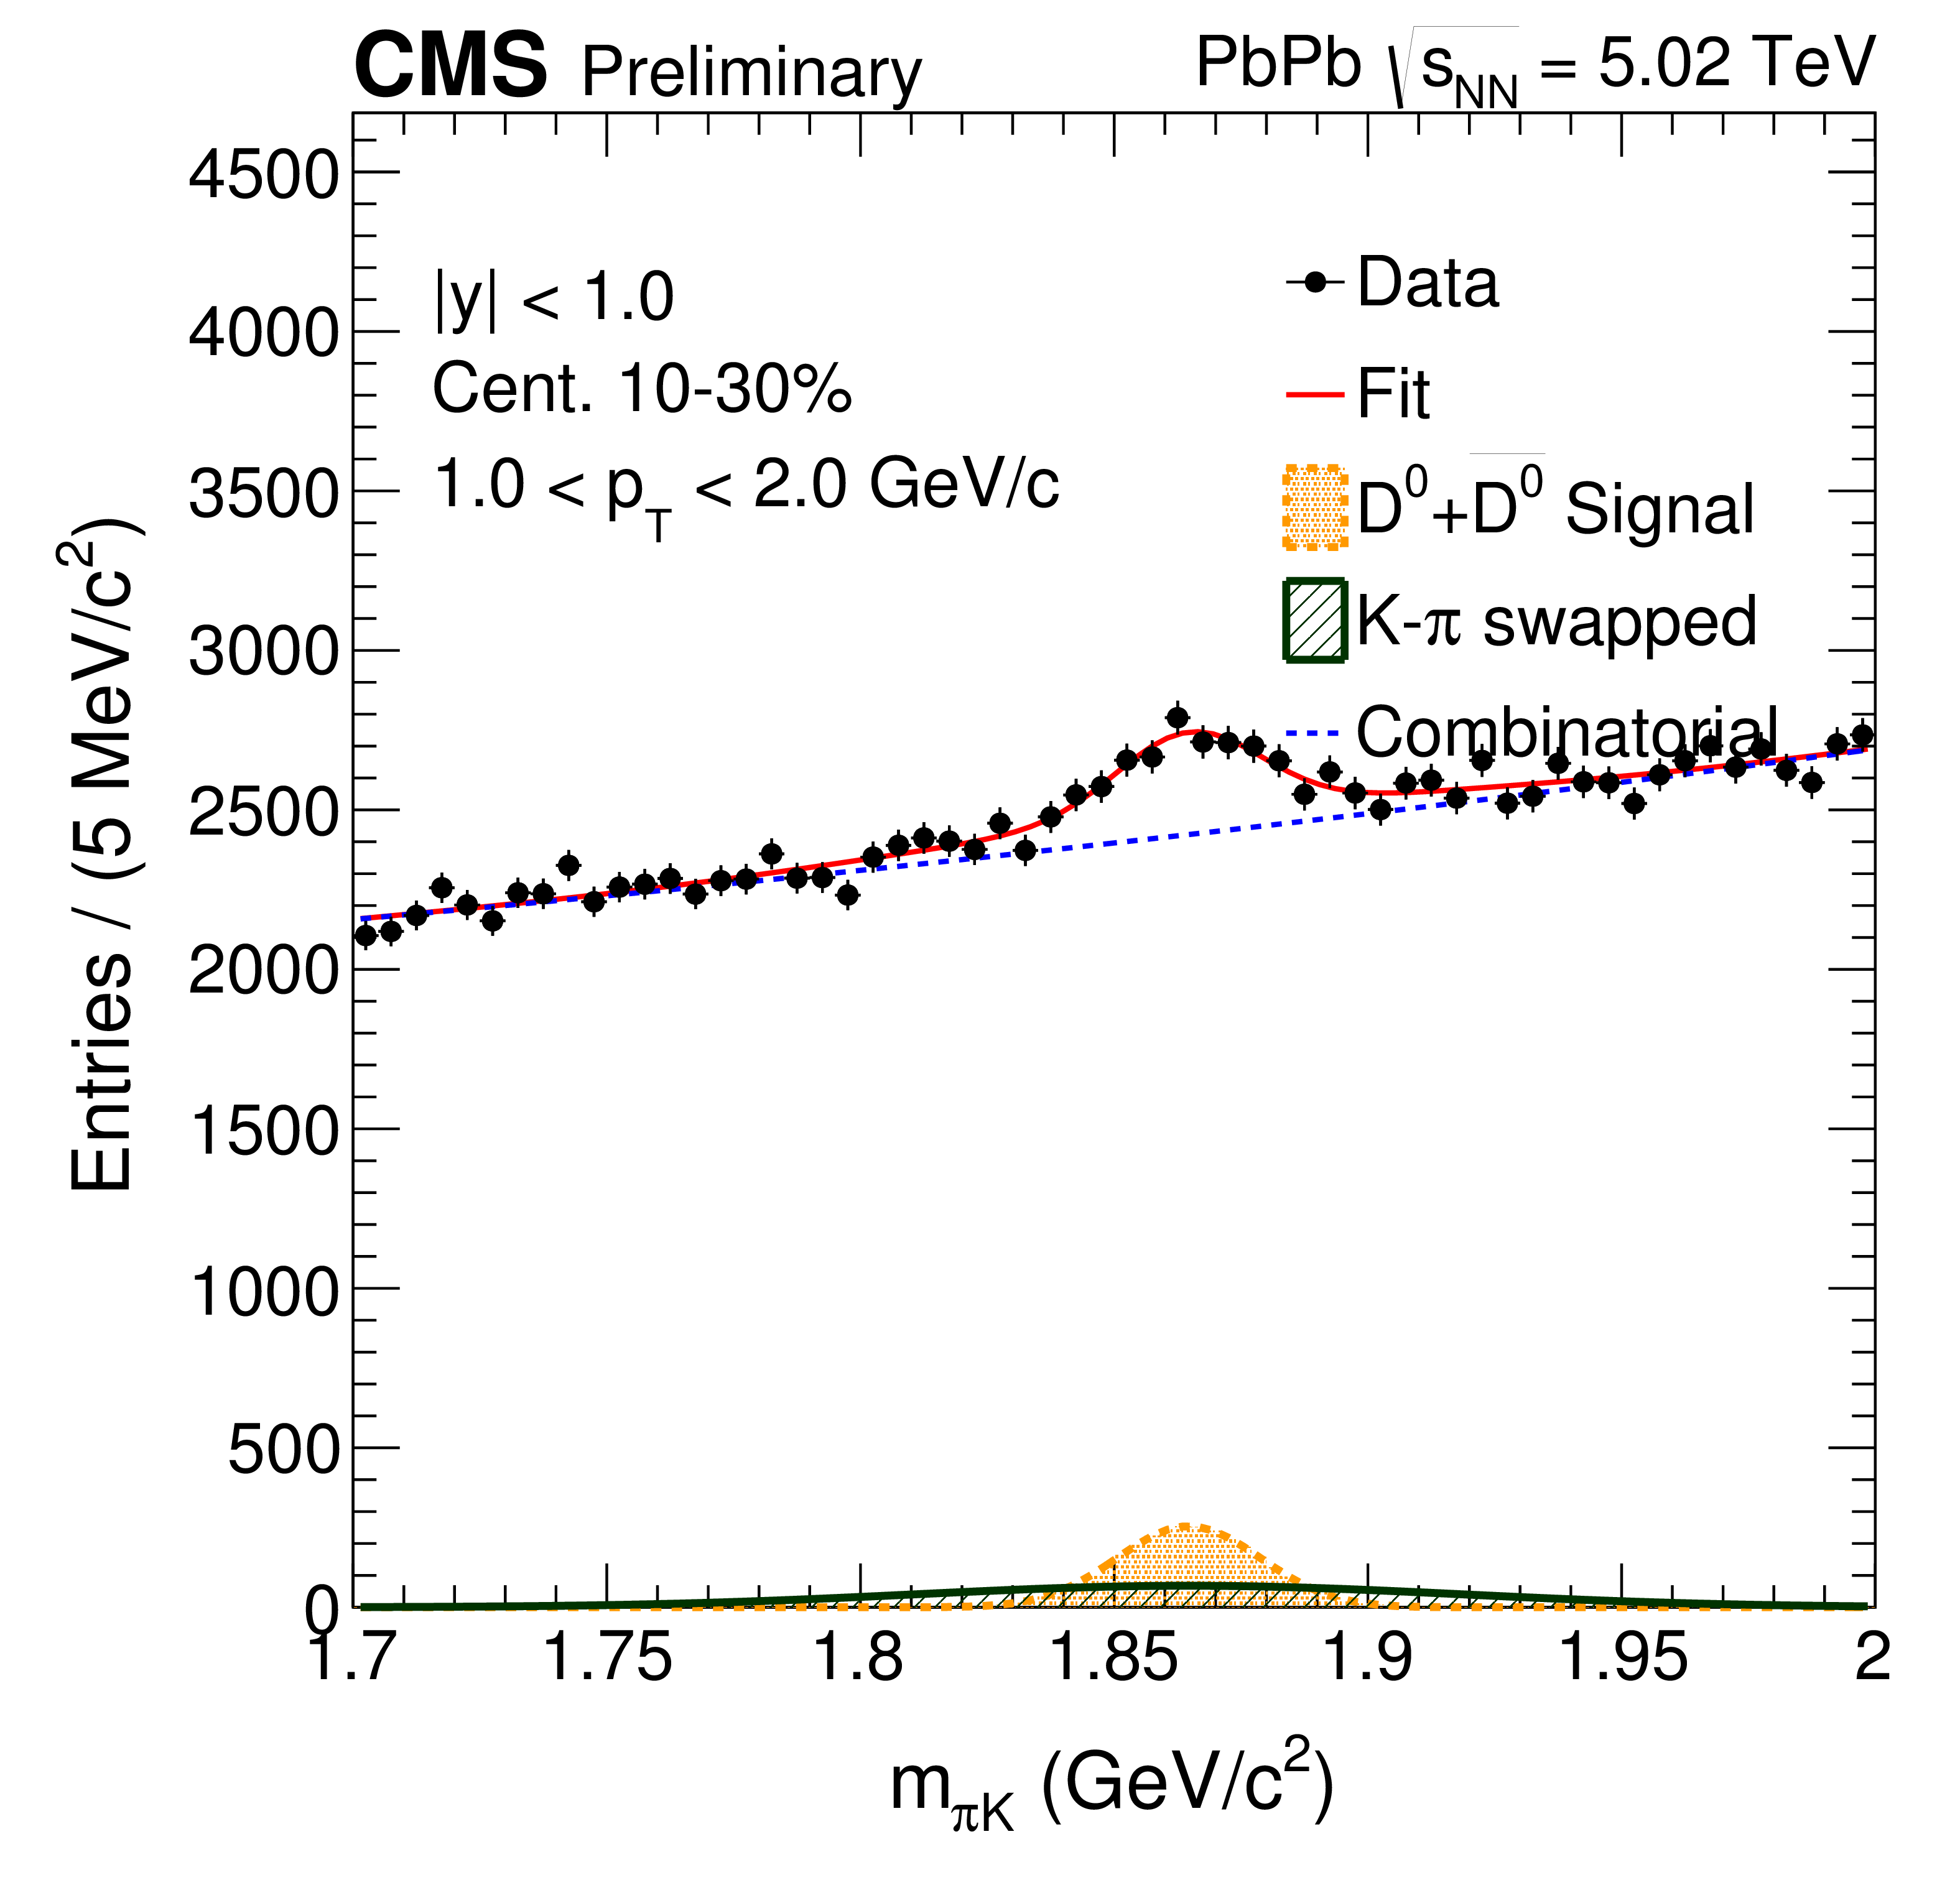
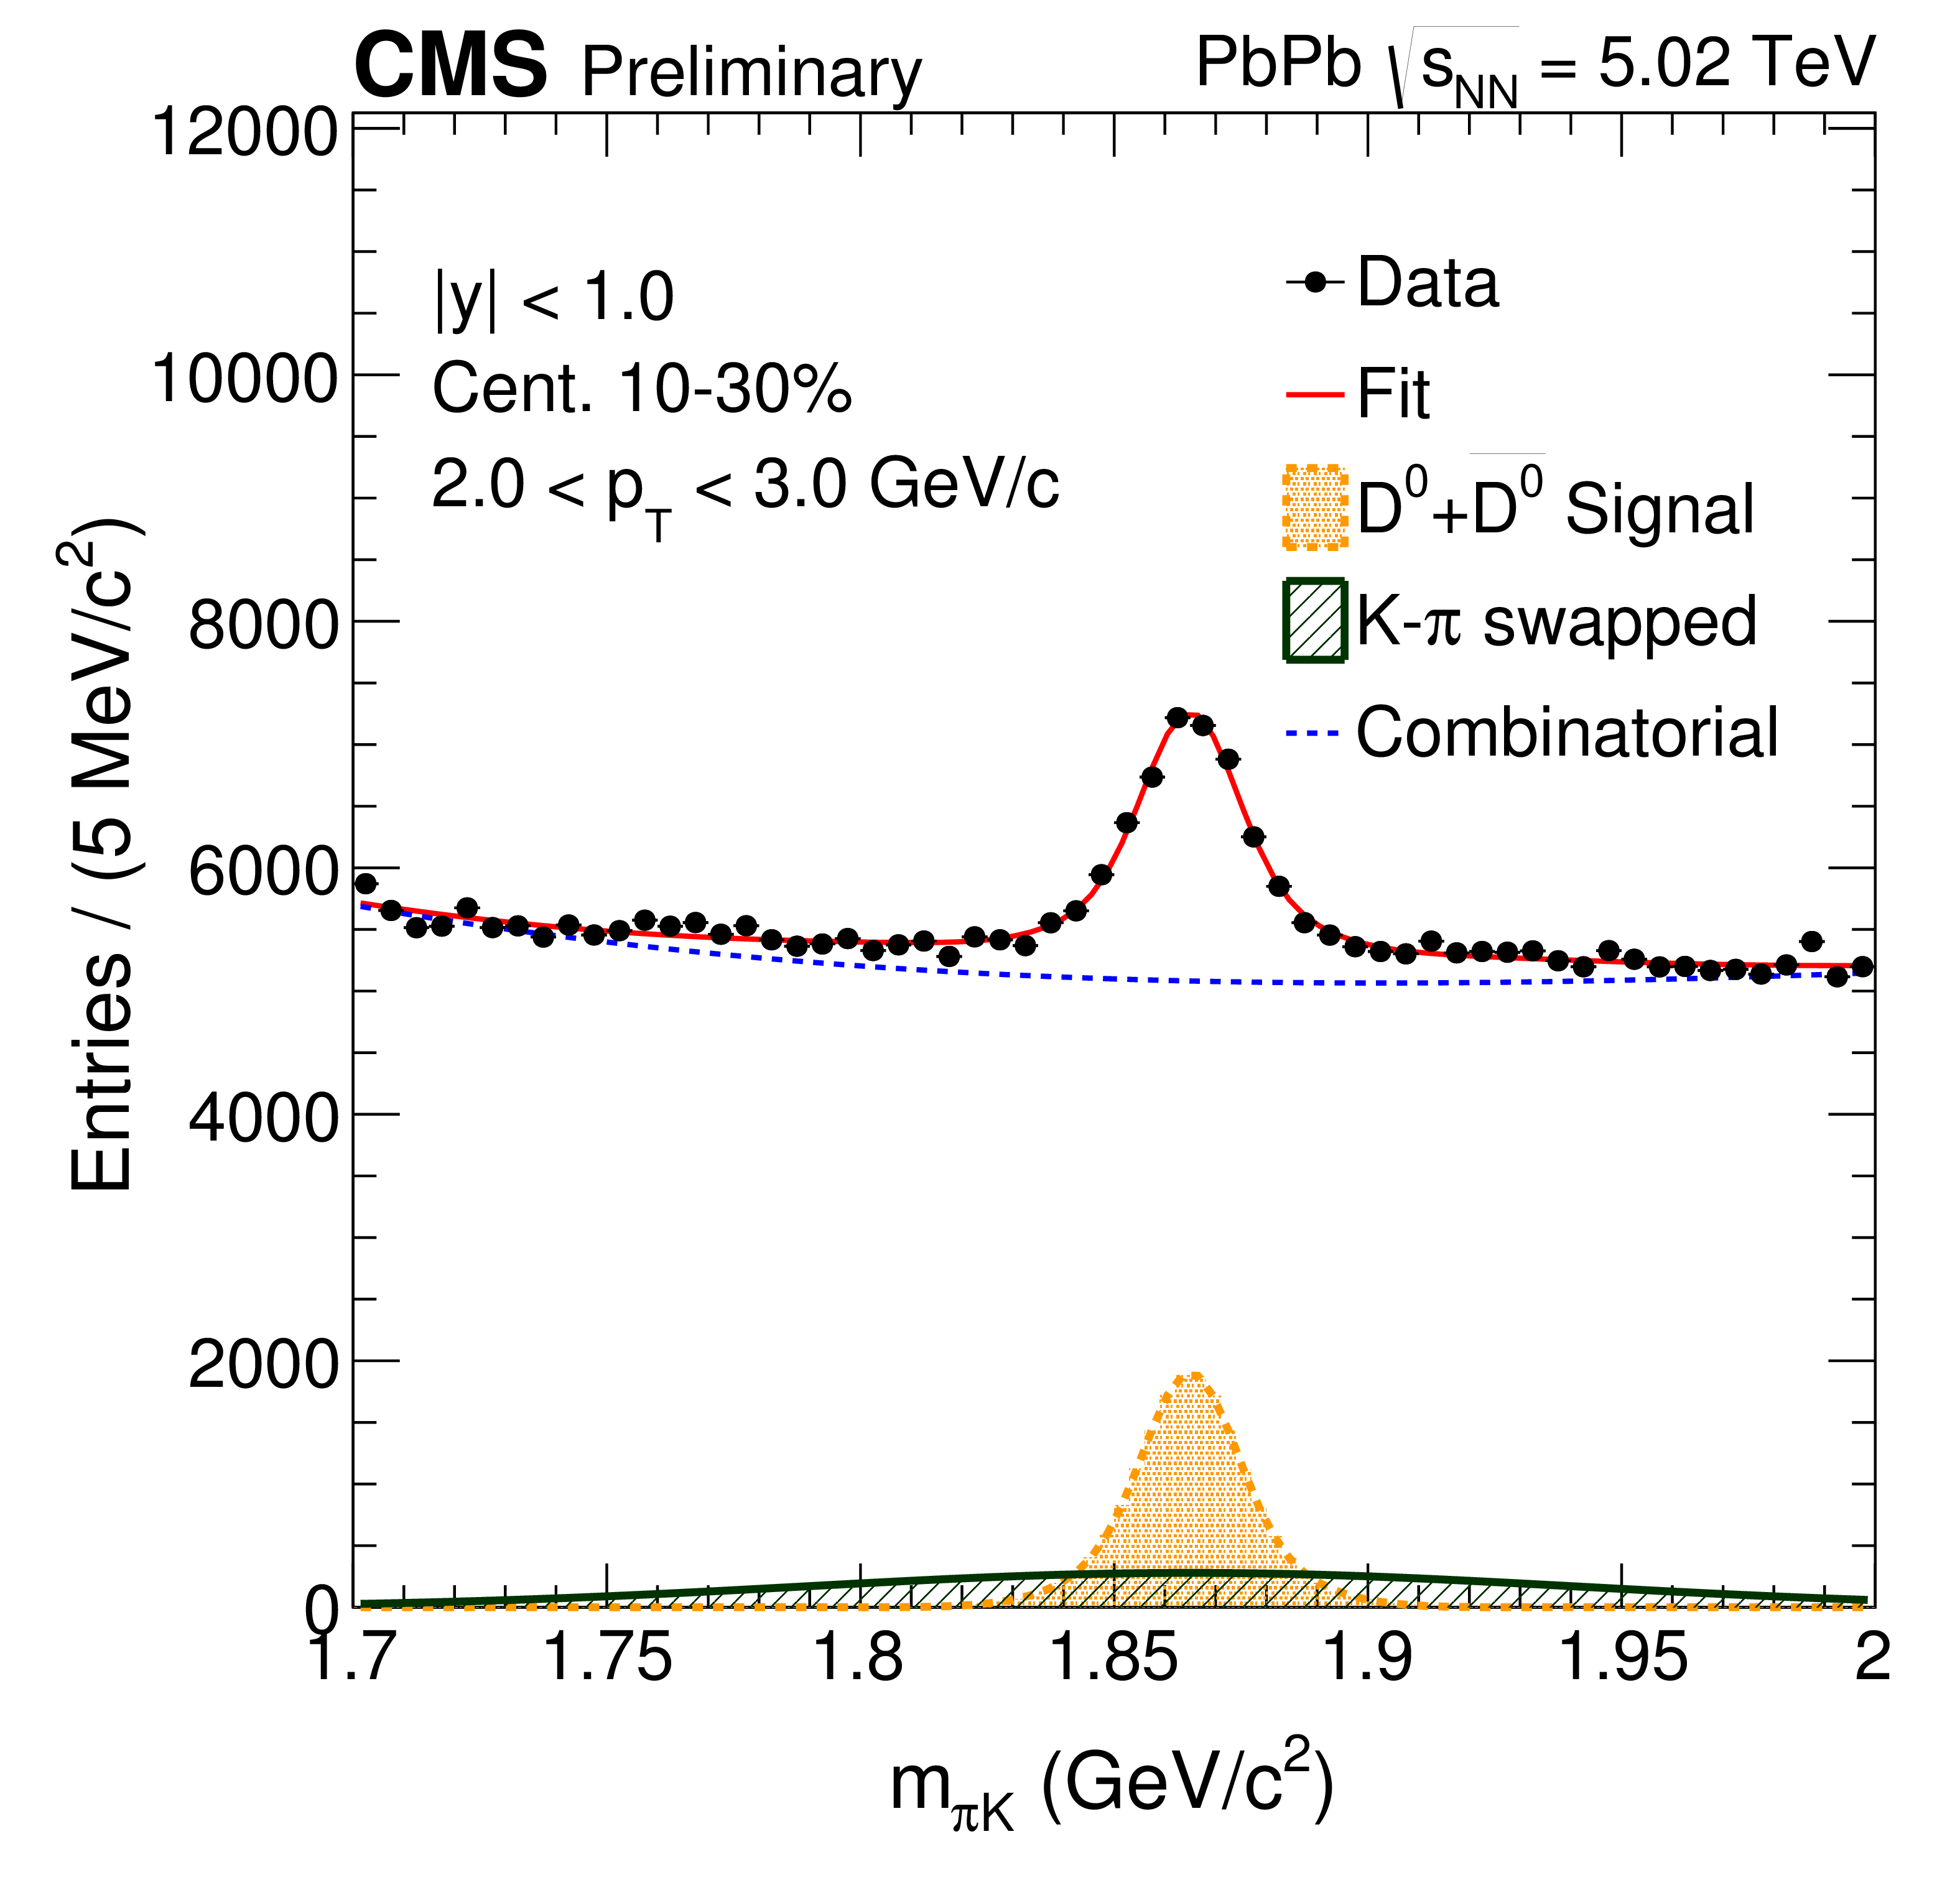
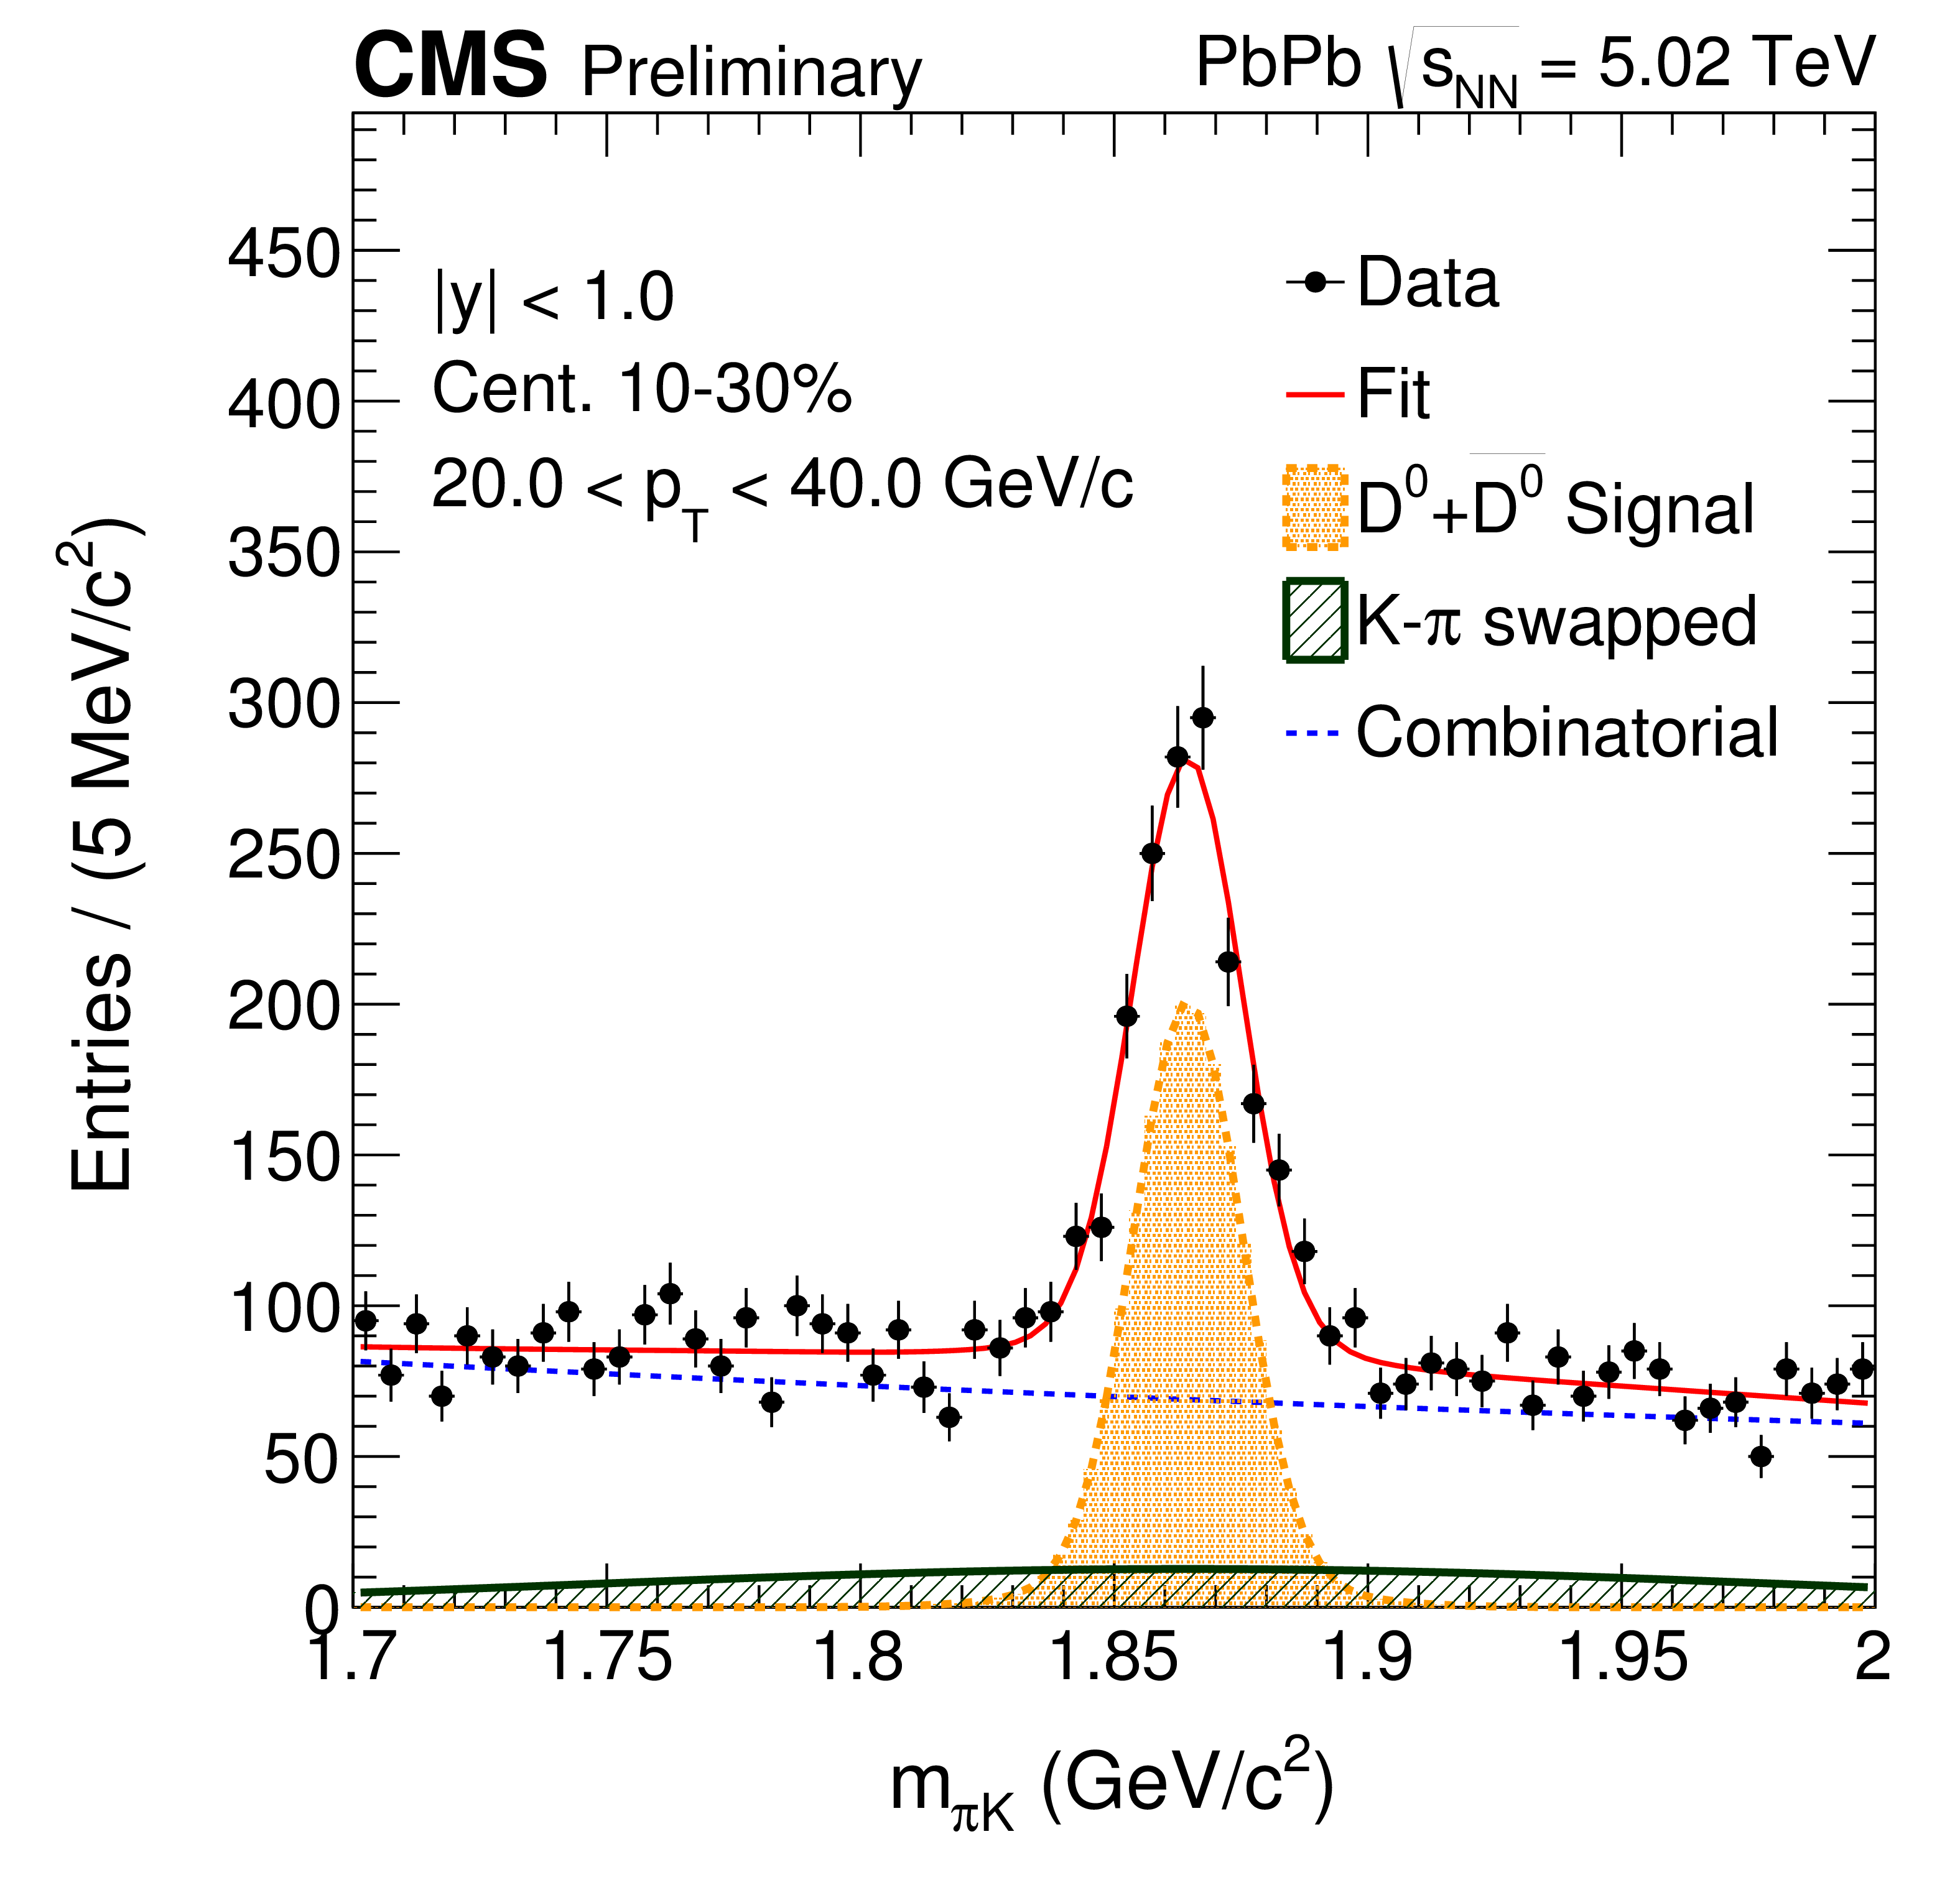
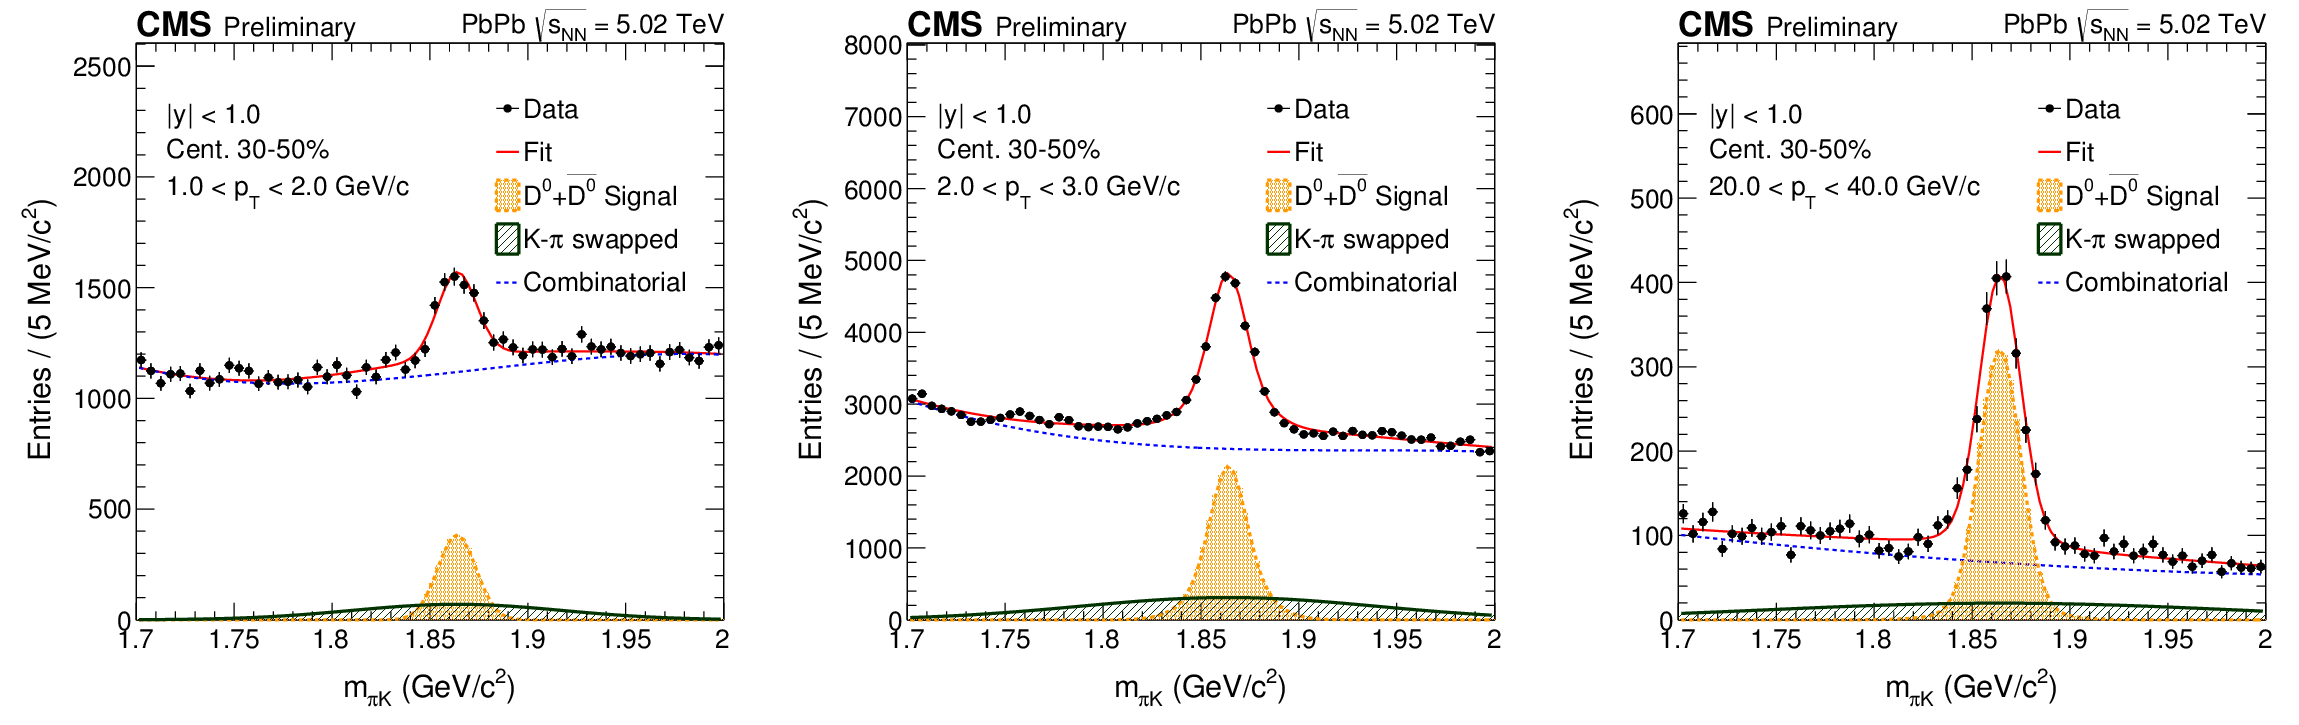
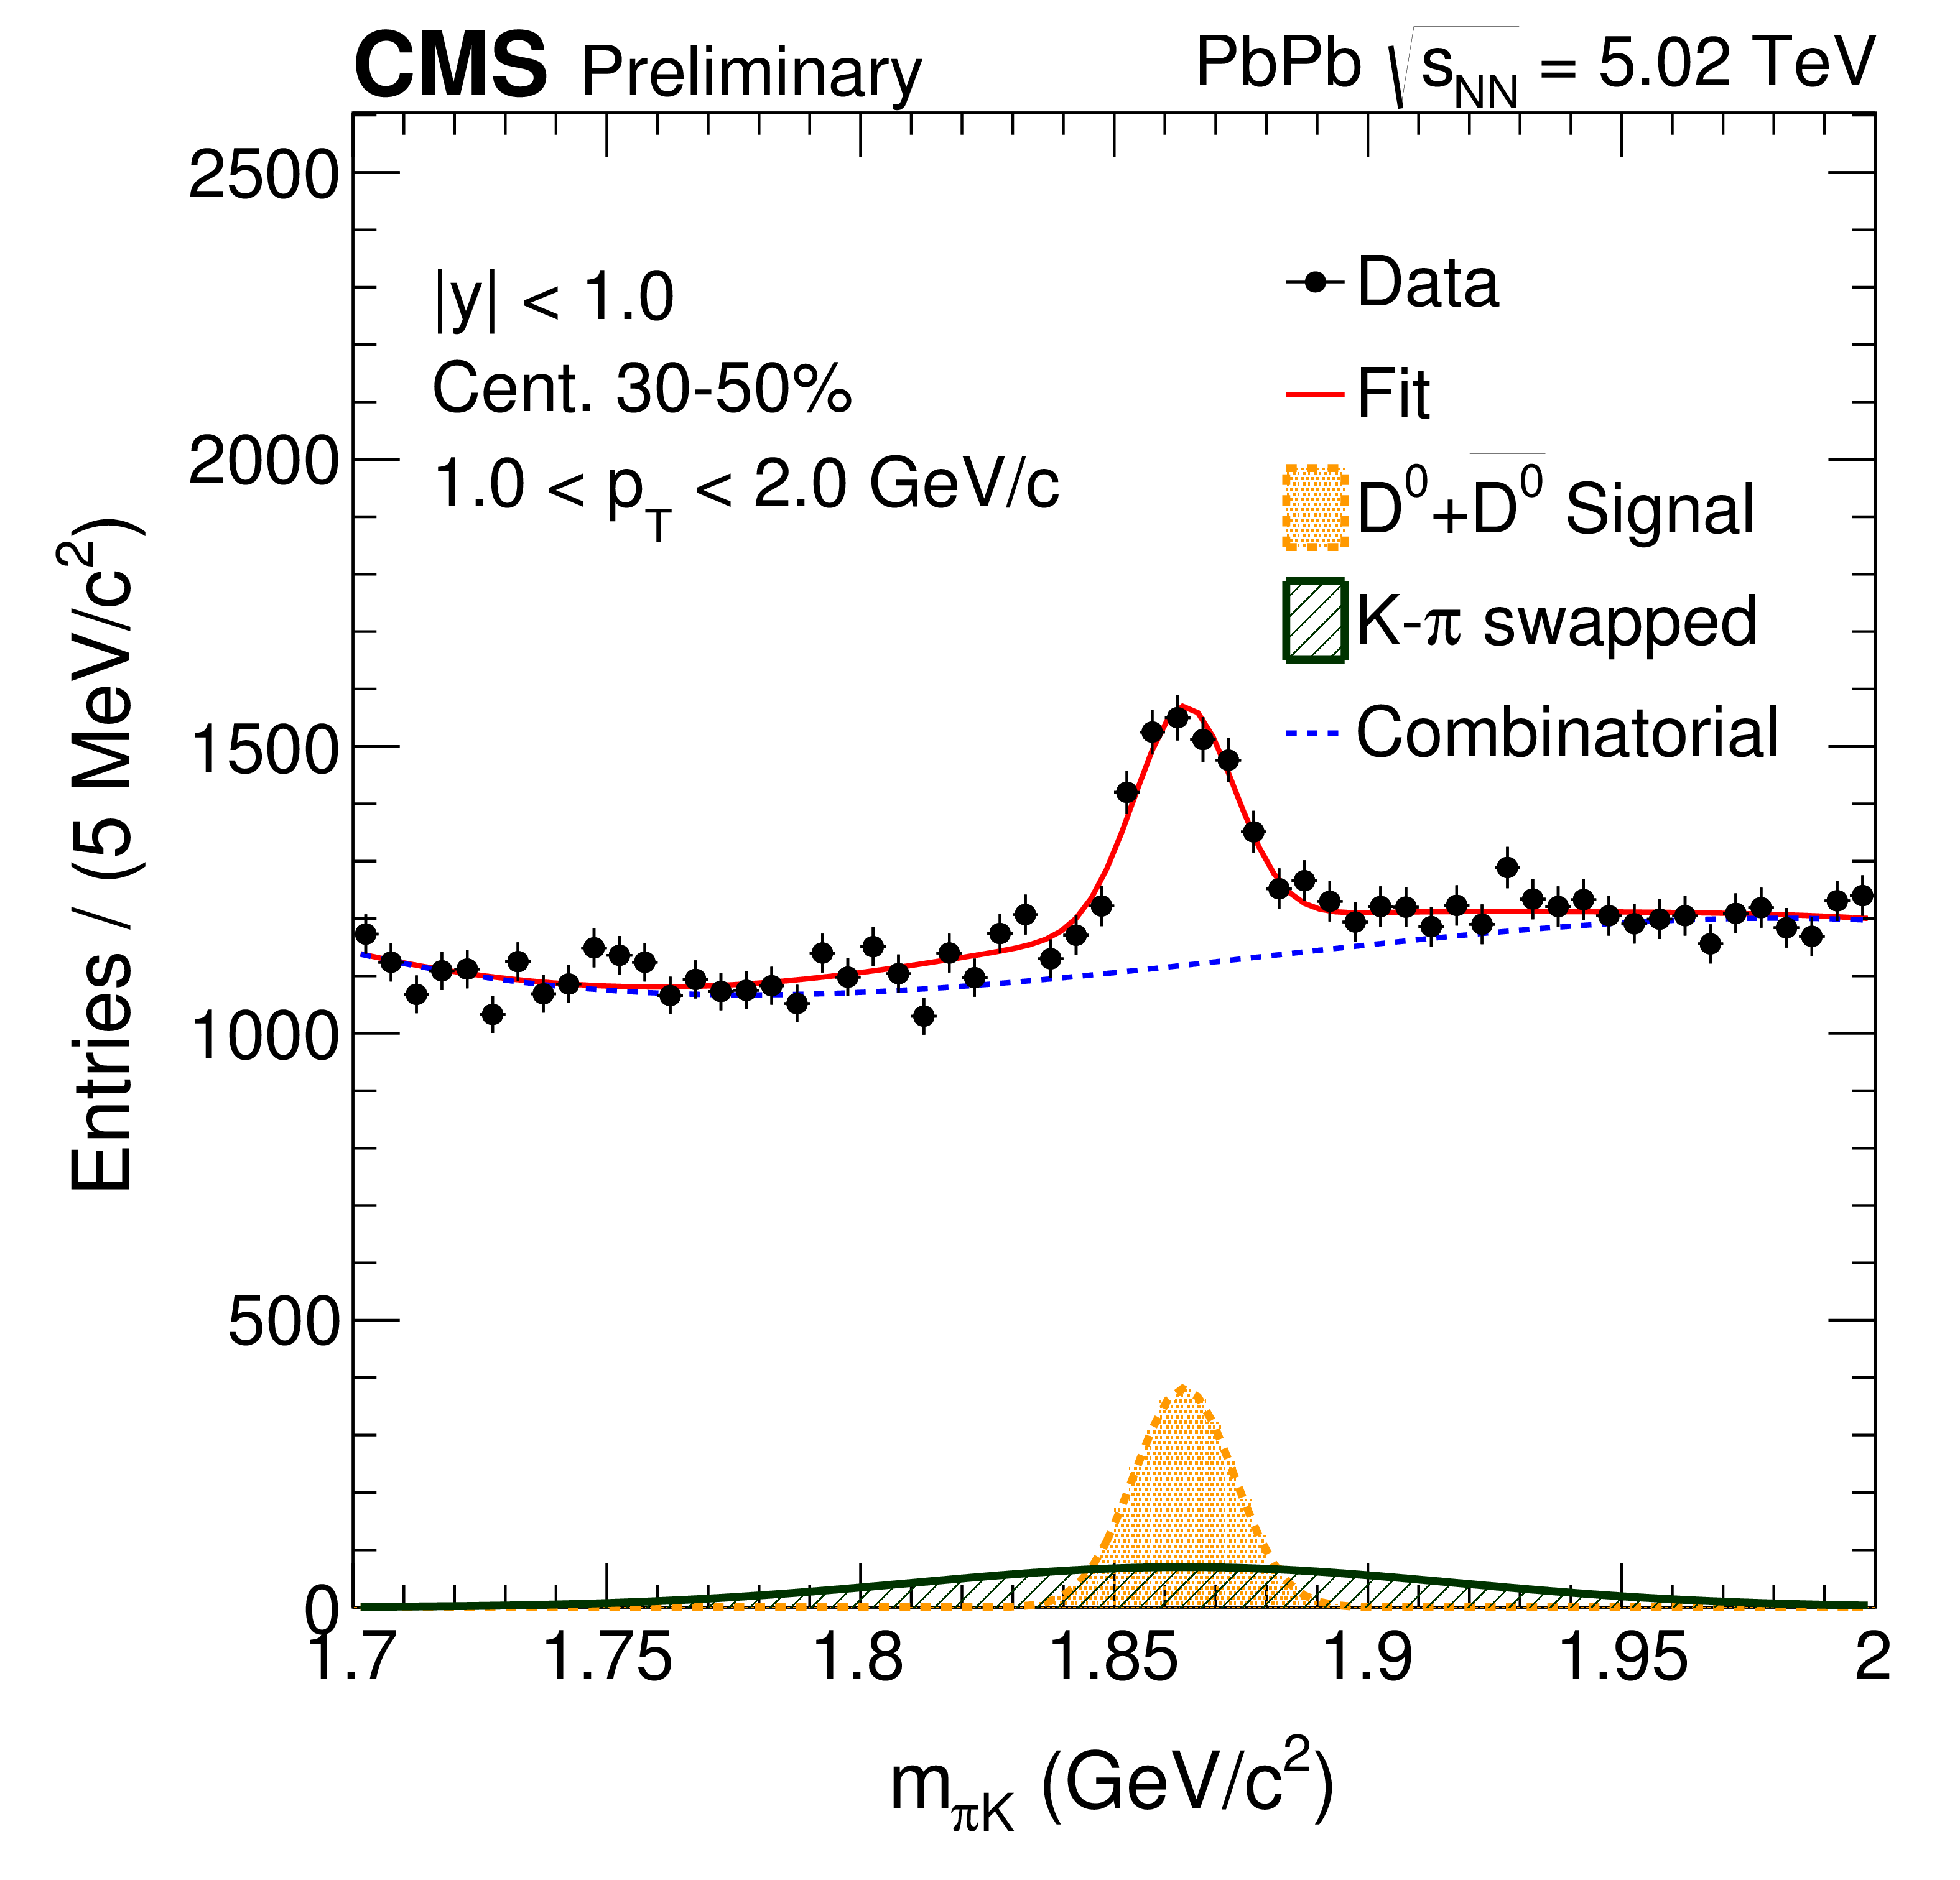
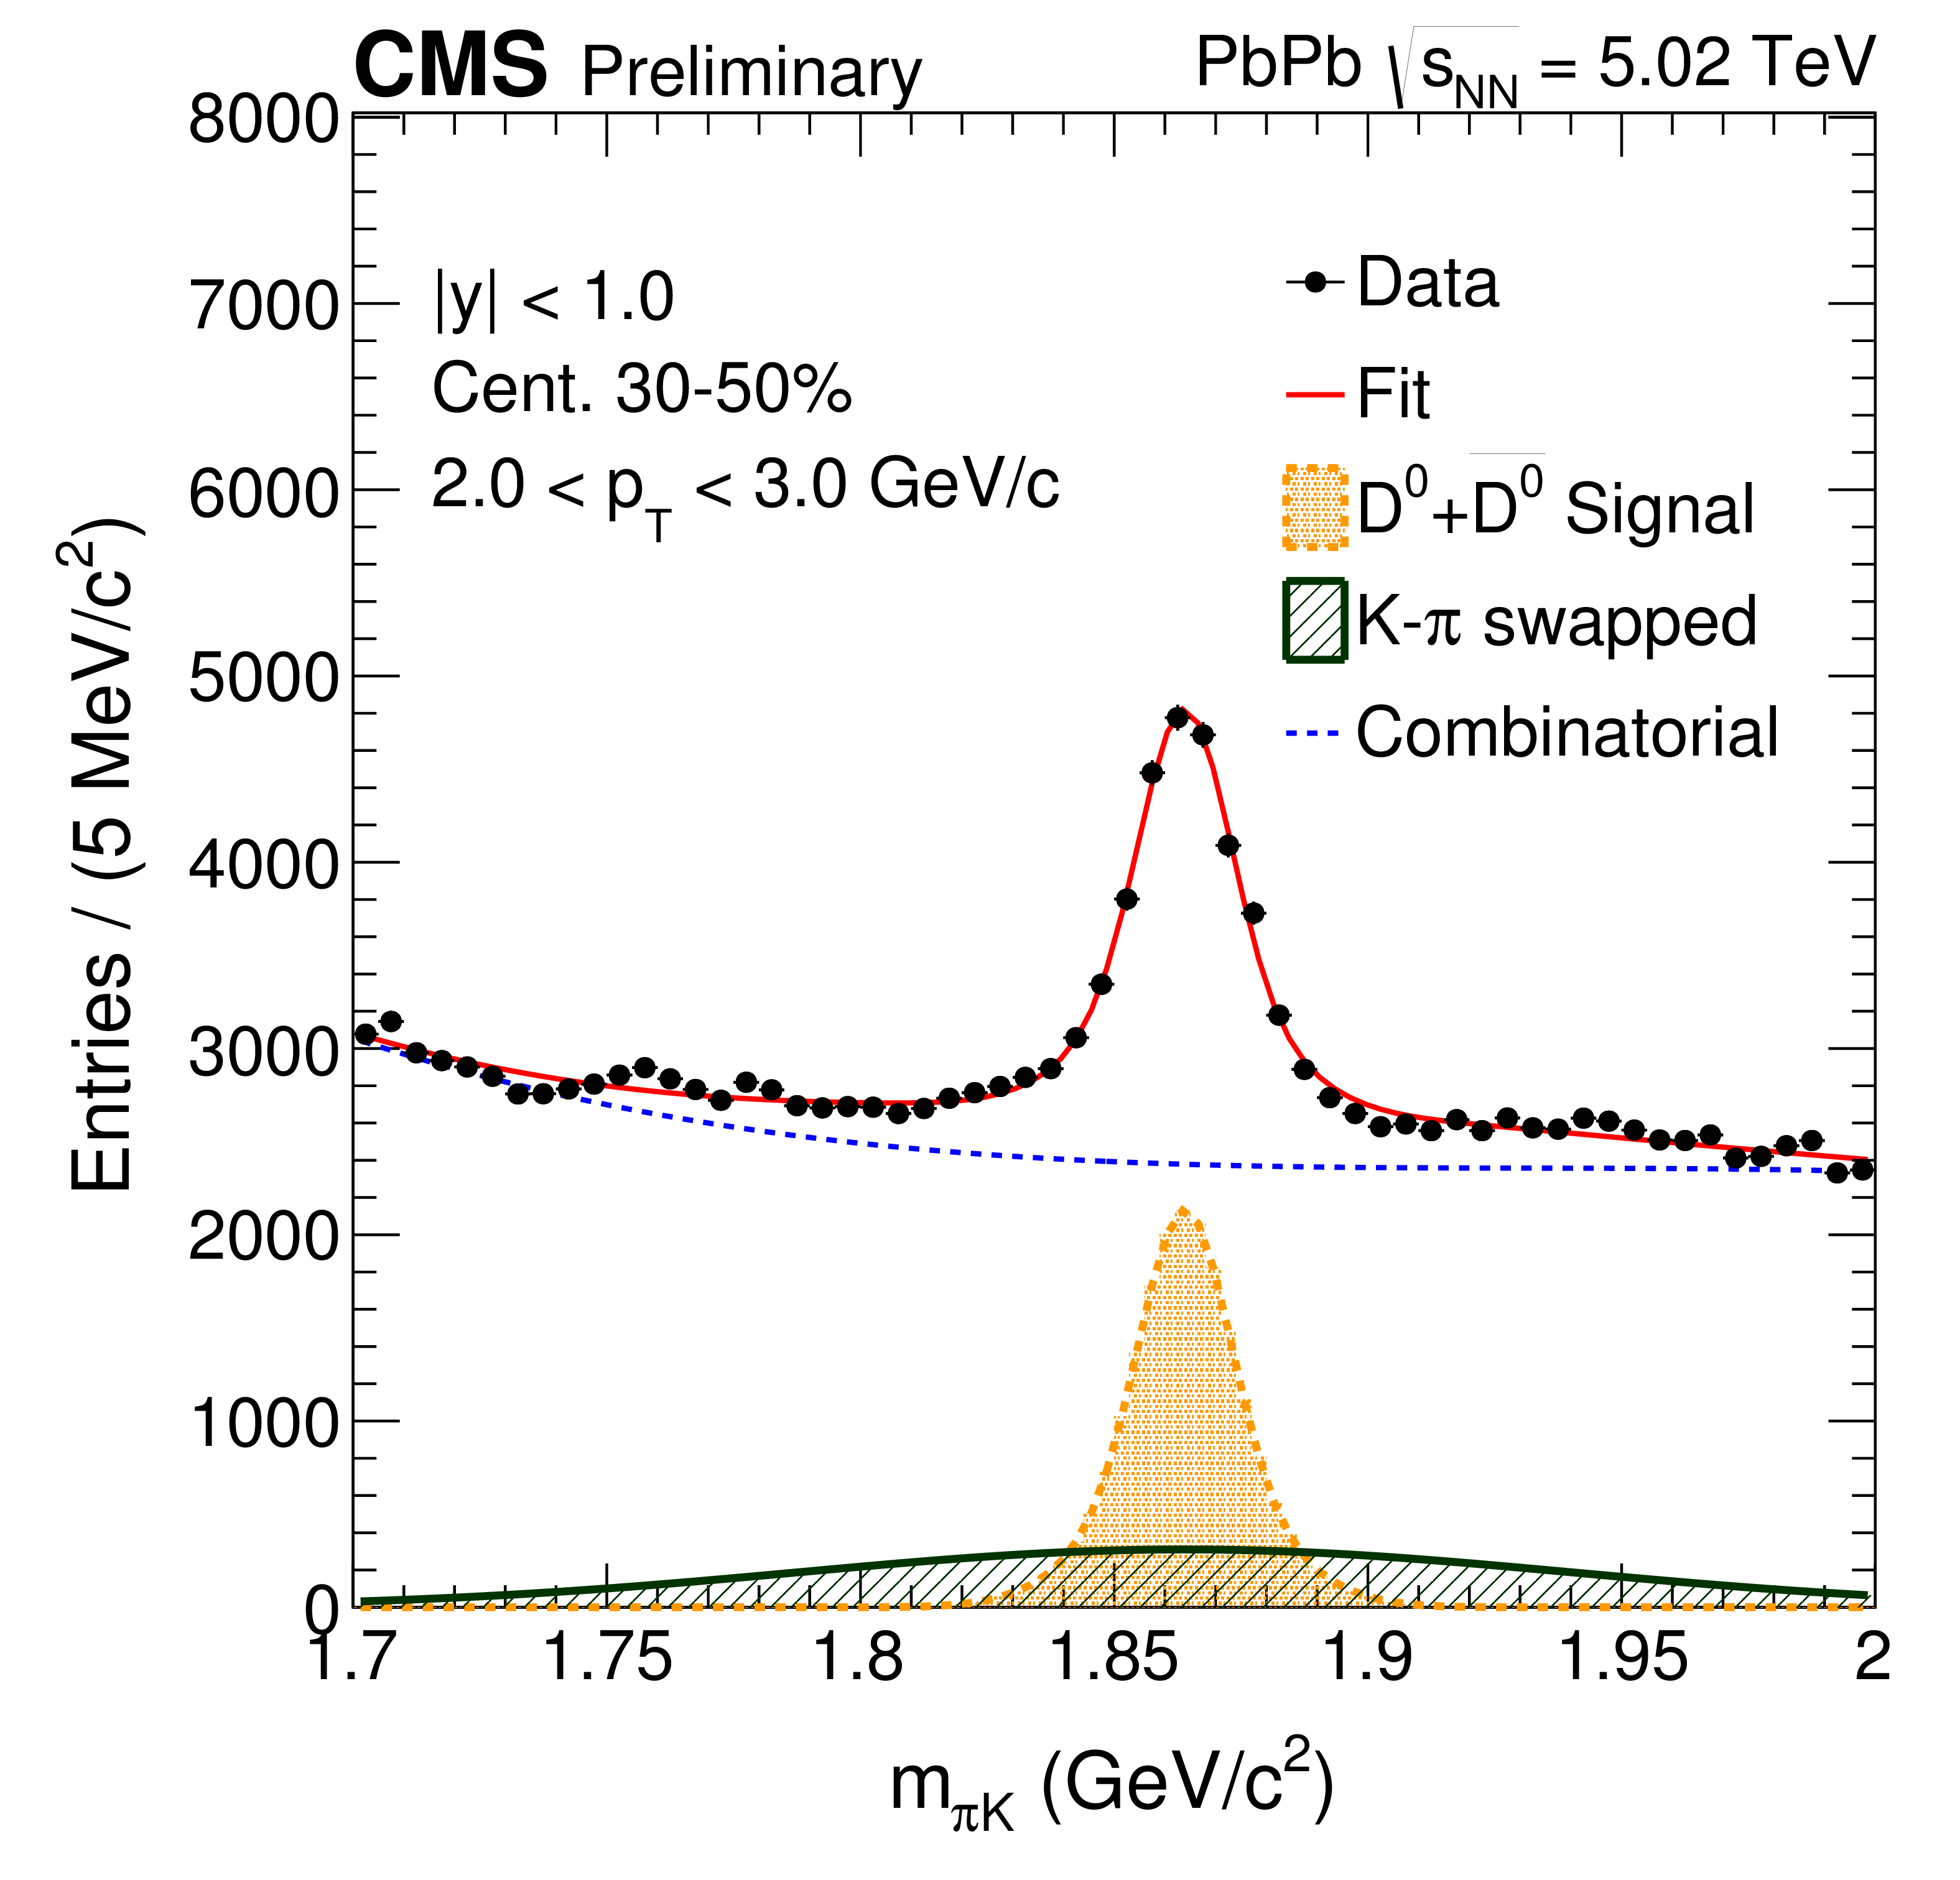
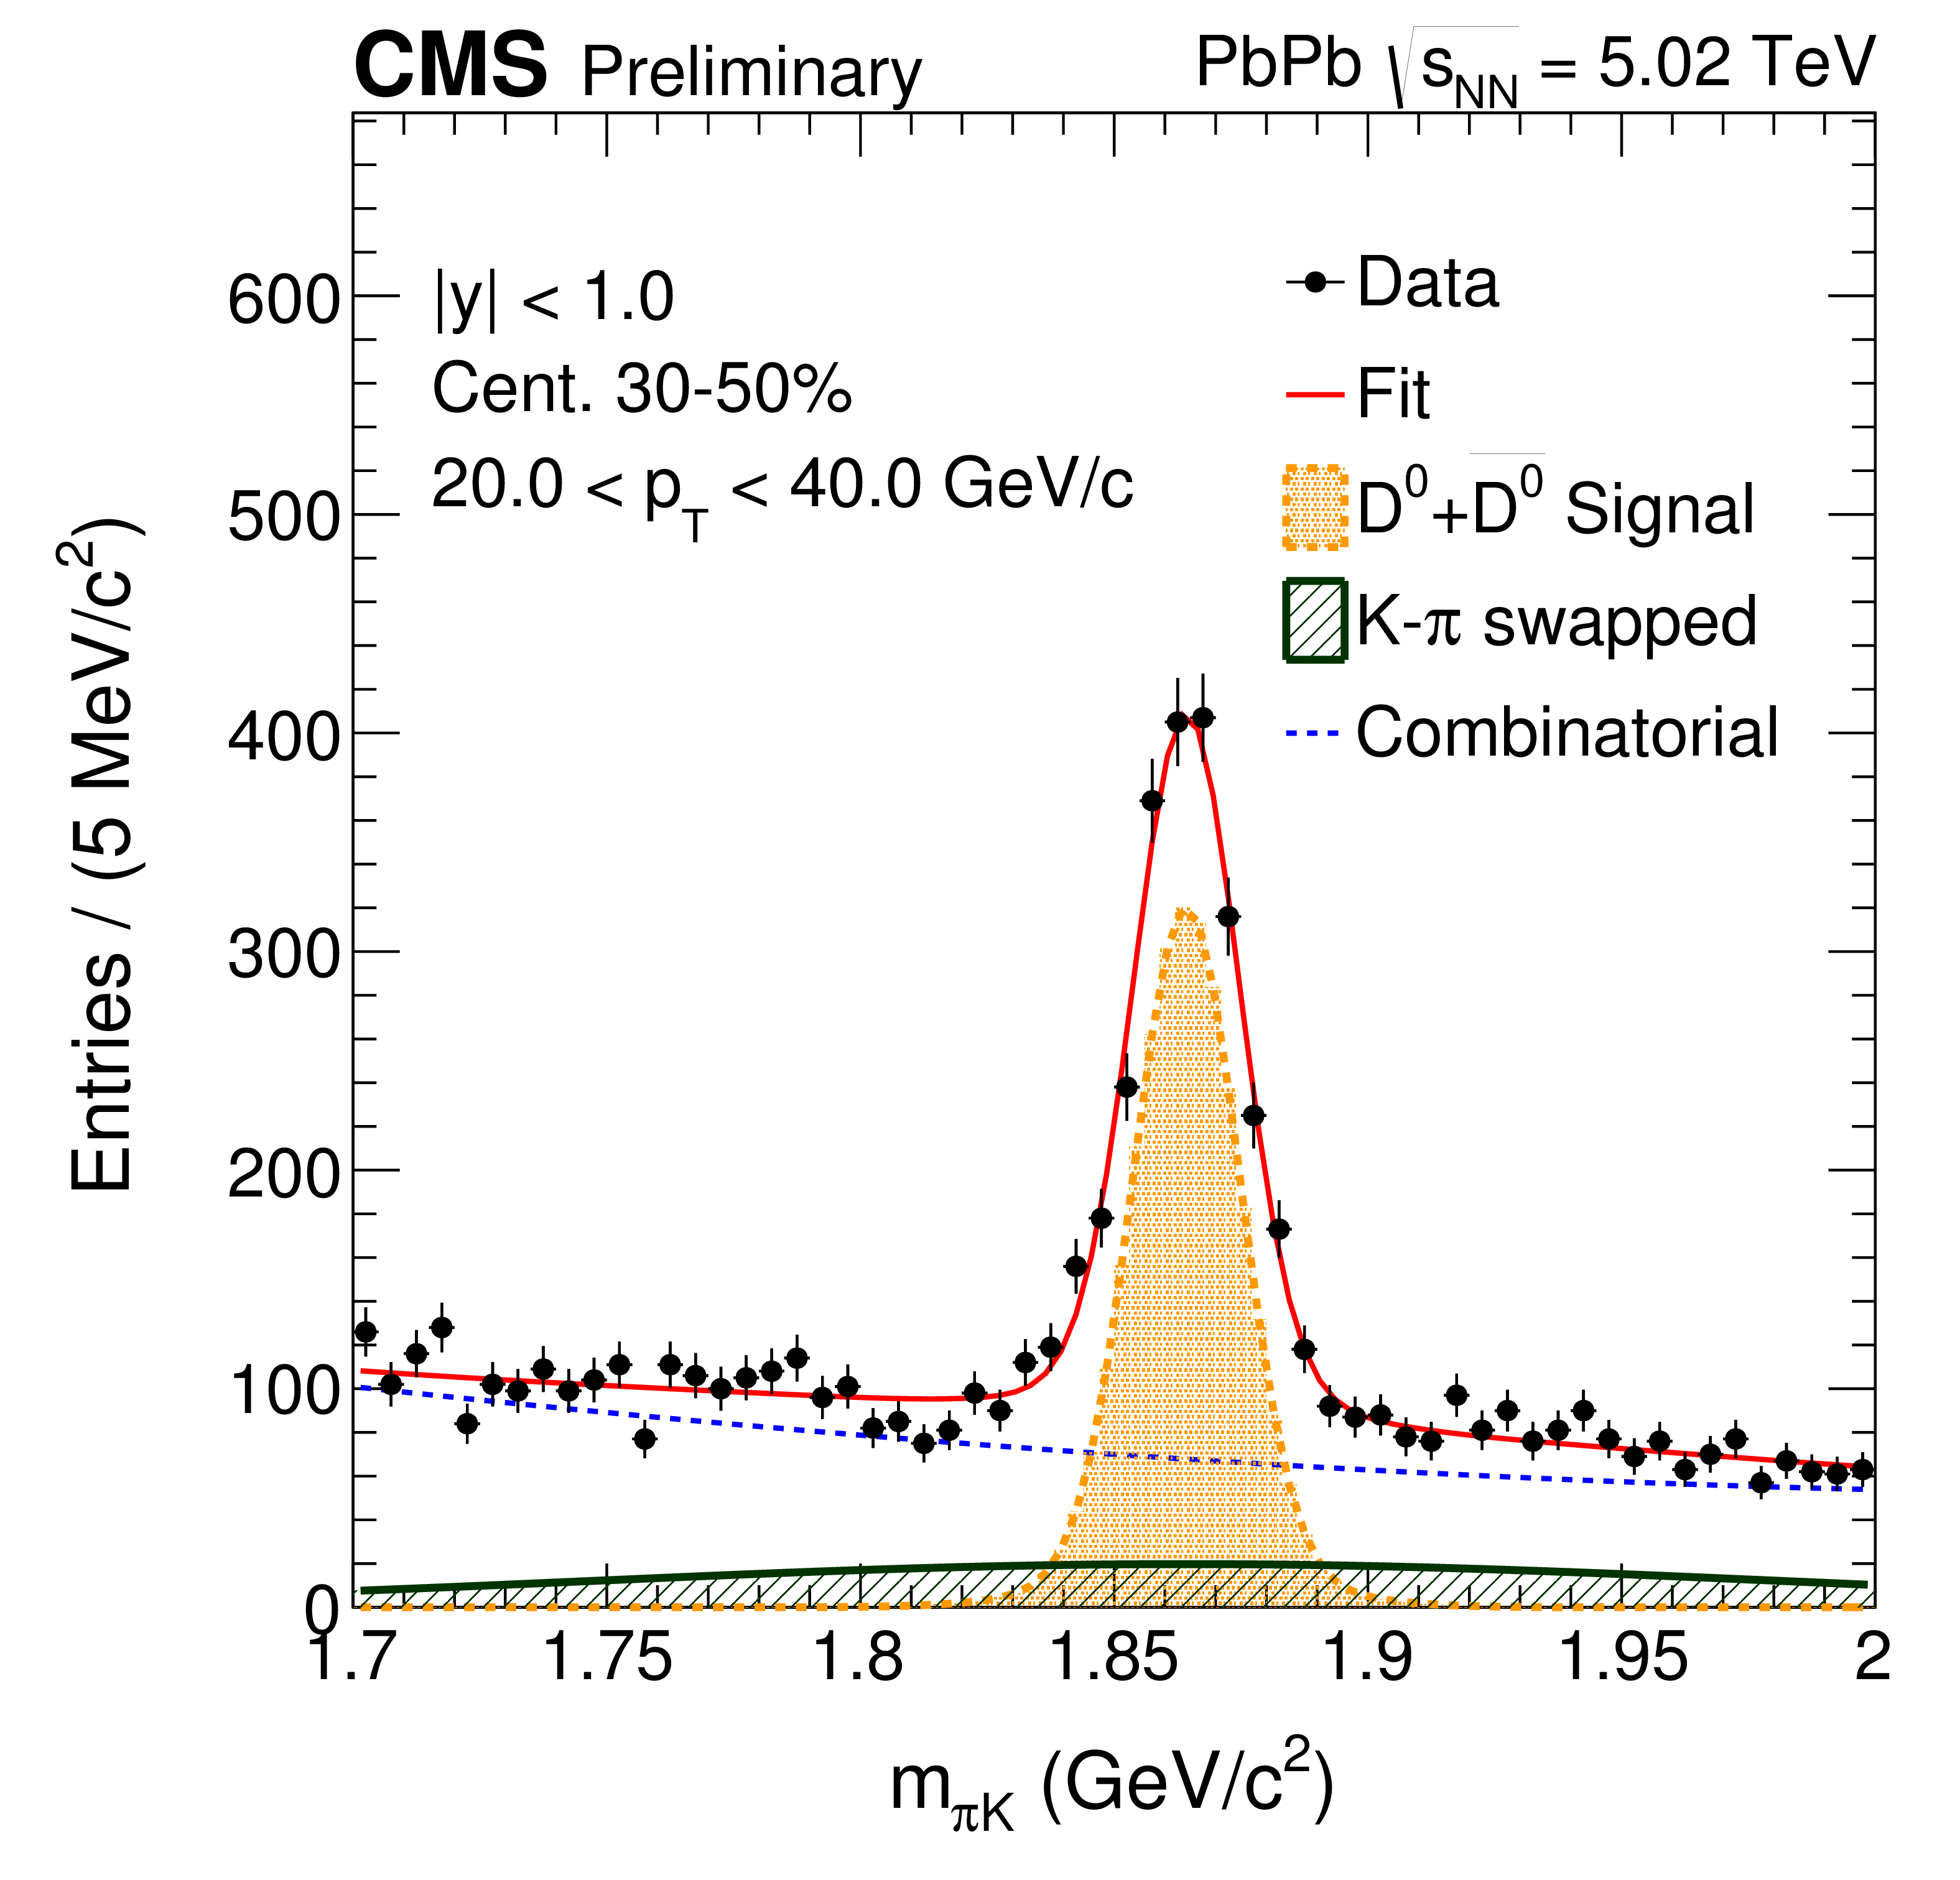
Figure 1:
Examples of simultaneous fit on mass spectrum and $v_{2}$ (top) or $v_{3}$ (bottom) as a function of invariant mass in selected ${p_{\mathrm {T}}}$ intervals. |
png pdf |
Figure 1-a:
Example of simultaneous fit on mass spectrum and $v_{2}$ as a function of invariant mass in selected ${p_{\mathrm {T}}}$ intervals. |
png pdf |
Figure 1-b:
Example of simultaneous fit on mass spectrum and $v_{2}$ as a function of invariant mass in selected ${p_{\mathrm {T}}}$ intervals. |
png pdf |
Figure 1-c:
Example of simultaneous fit on mass spectrum and $v_{3}$ as a function of invariant mass in selected ${p_{\mathrm {T}}}$ intervals. |
png pdf |
Figure 1-d:
Example of simultaneous fit on mass spectrum and $v_{3}$ as a function of invariant mass in selected ${p_{\mathrm {T}}}$ intervals. |
png pdf |
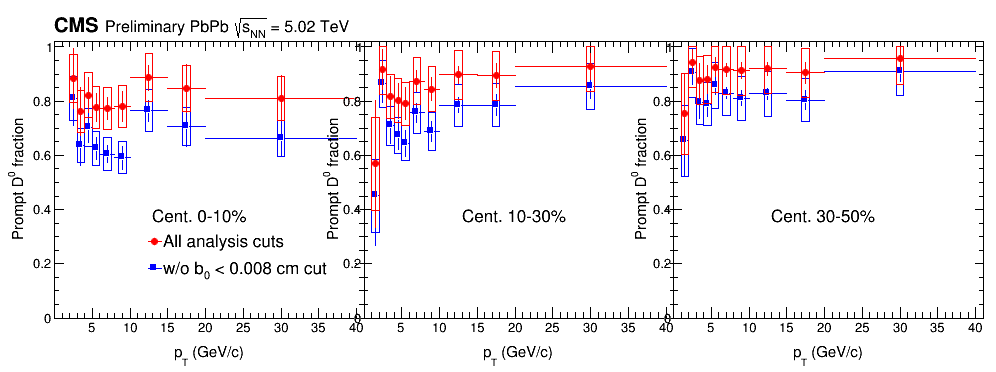
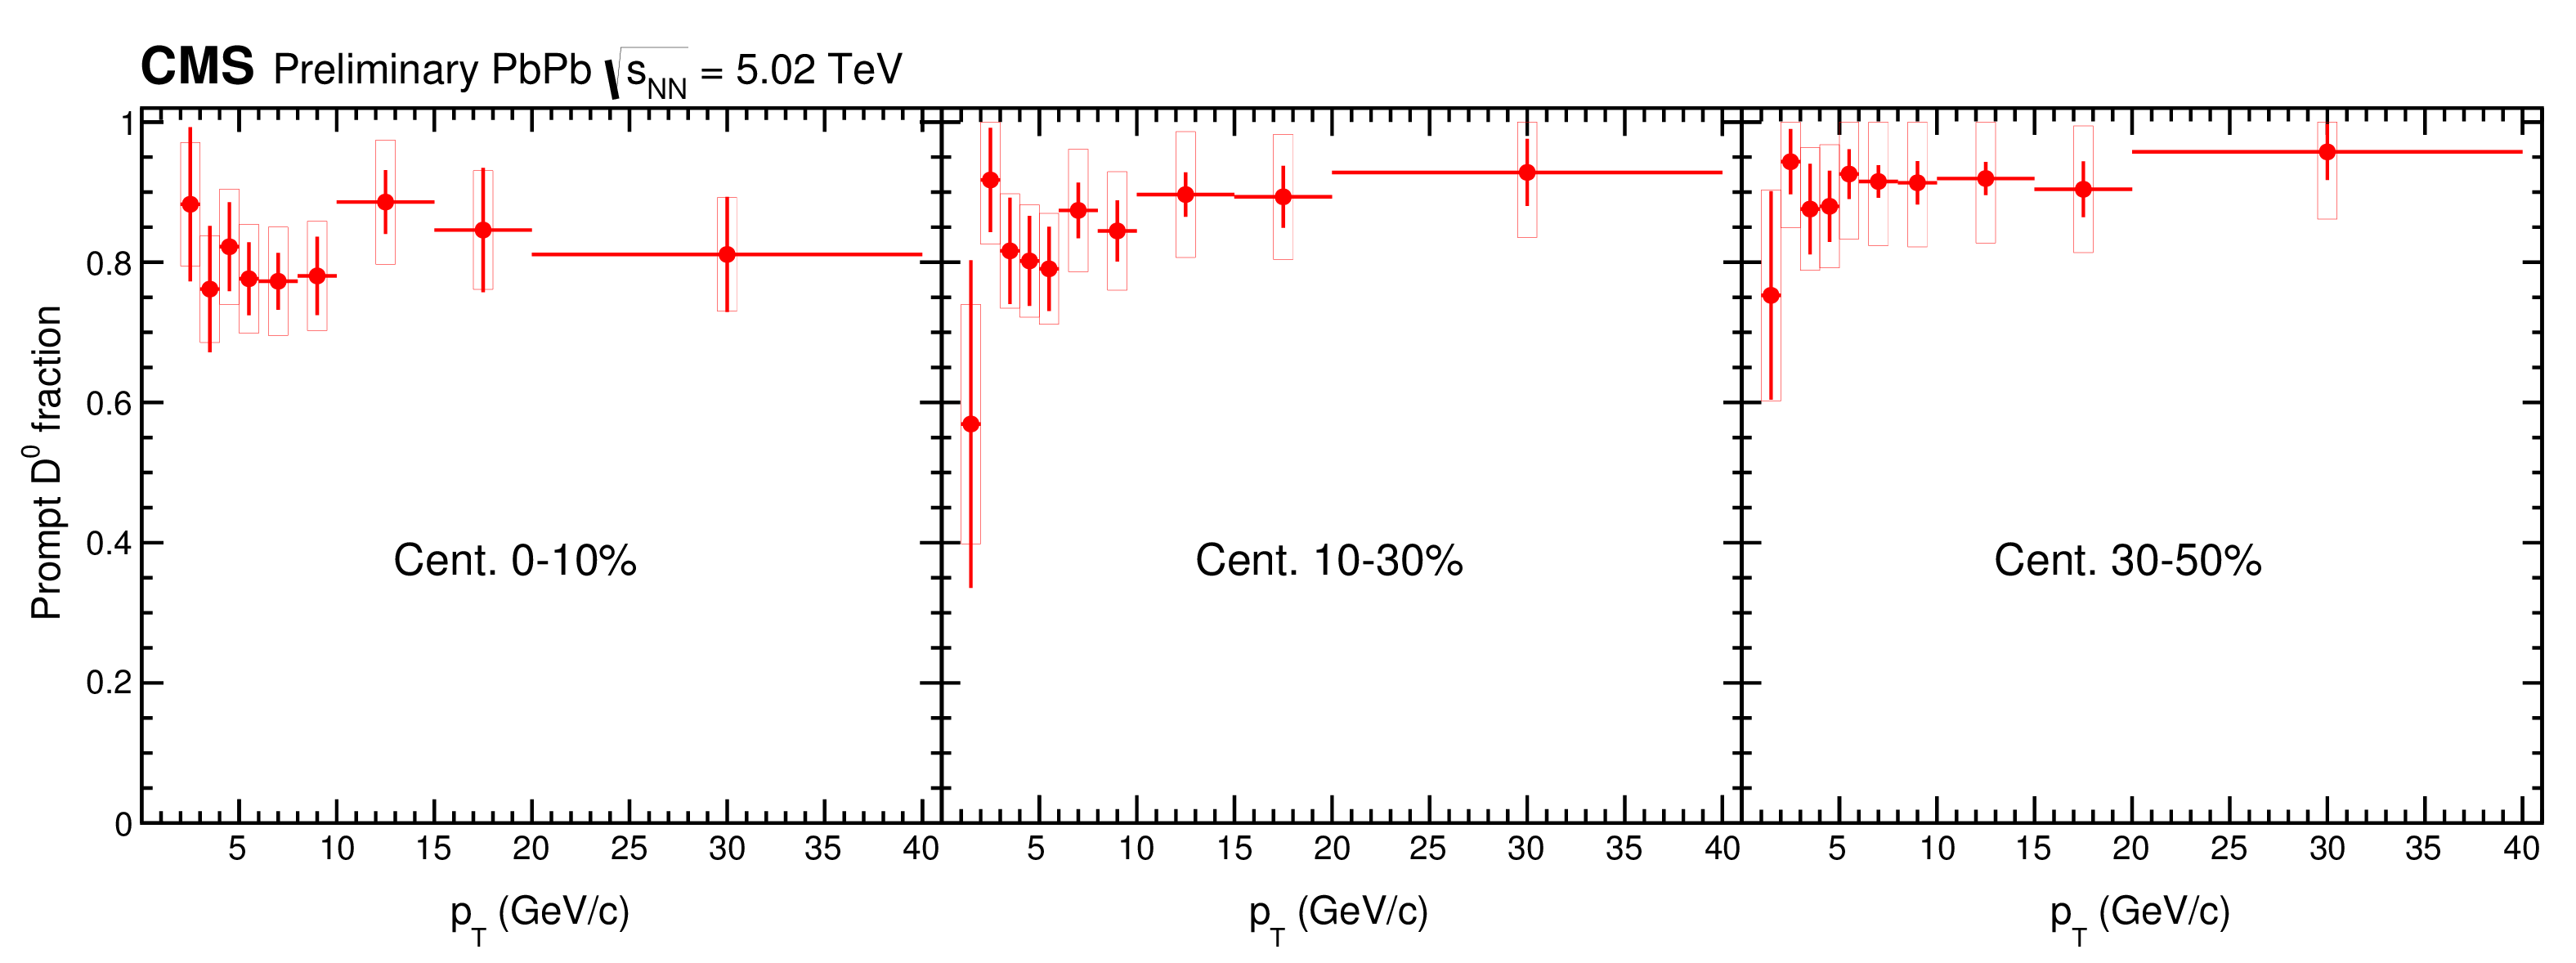
Figure 2:
Prompt ${\mathrm {D}^{0}}$ fractions in raw ${\mathrm {D}^{0}}$ yield as function of ${p_{\mathrm {T}}}$ for centrality classes 0-10% (left), 10-30% (middle) and 30-50% (right) with all analysis cuts (red circles) and without $b_{0} < $ 0.008 cm cut (blue squares). |
png pdf |
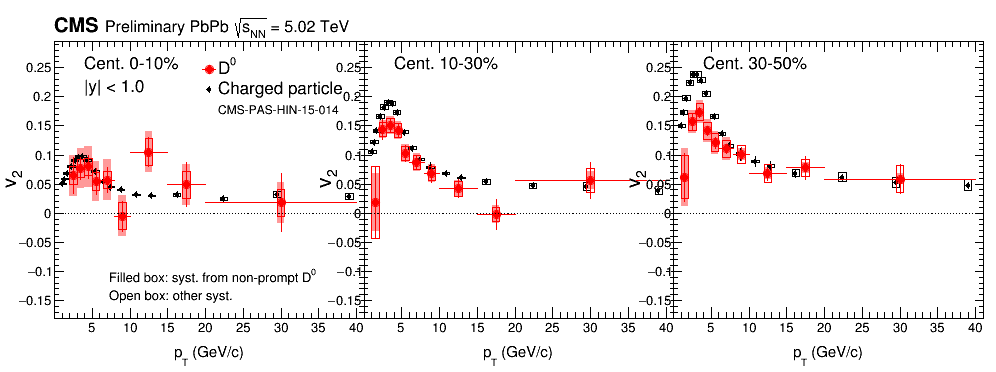
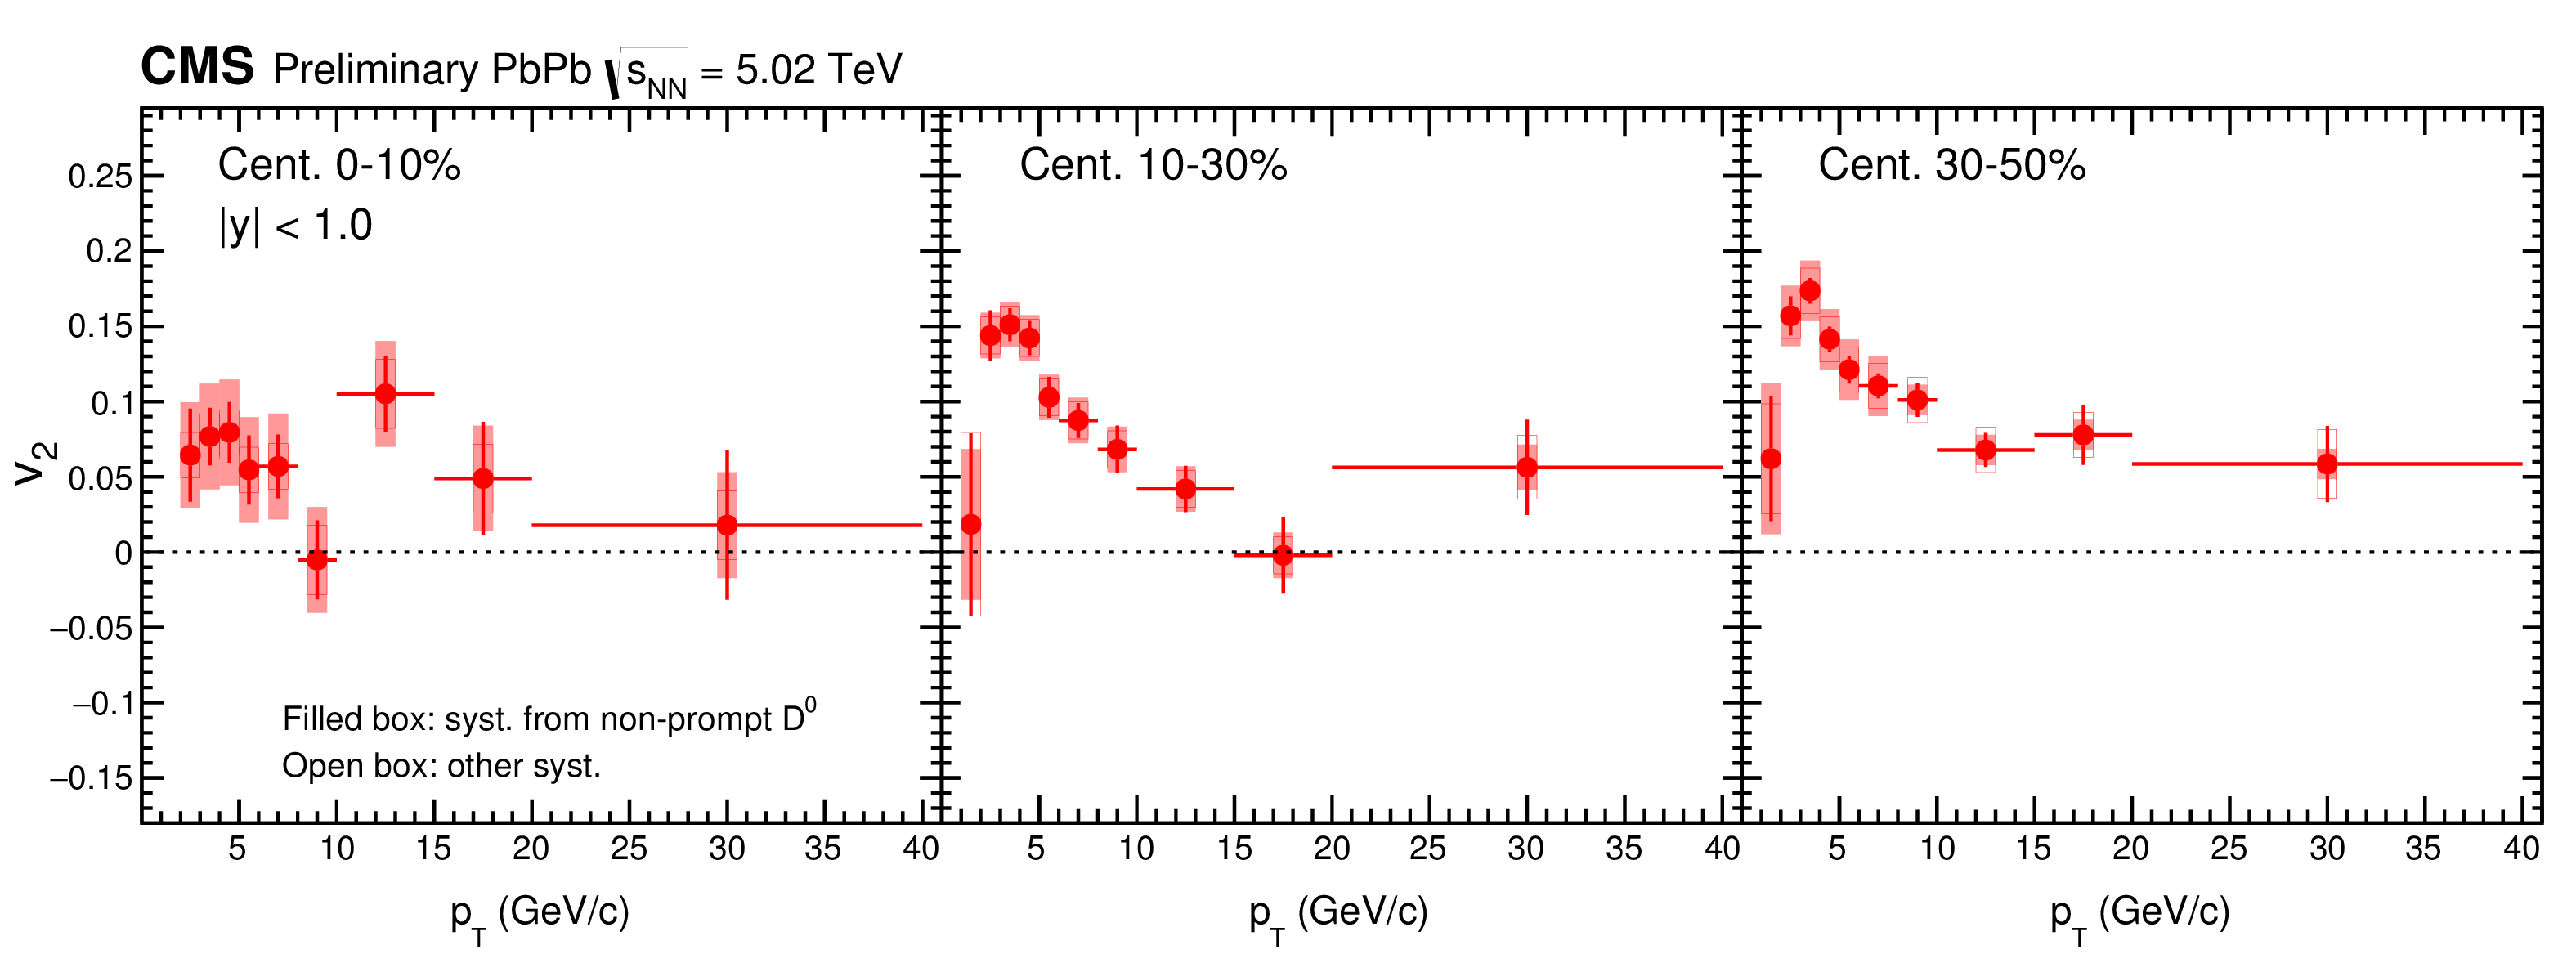
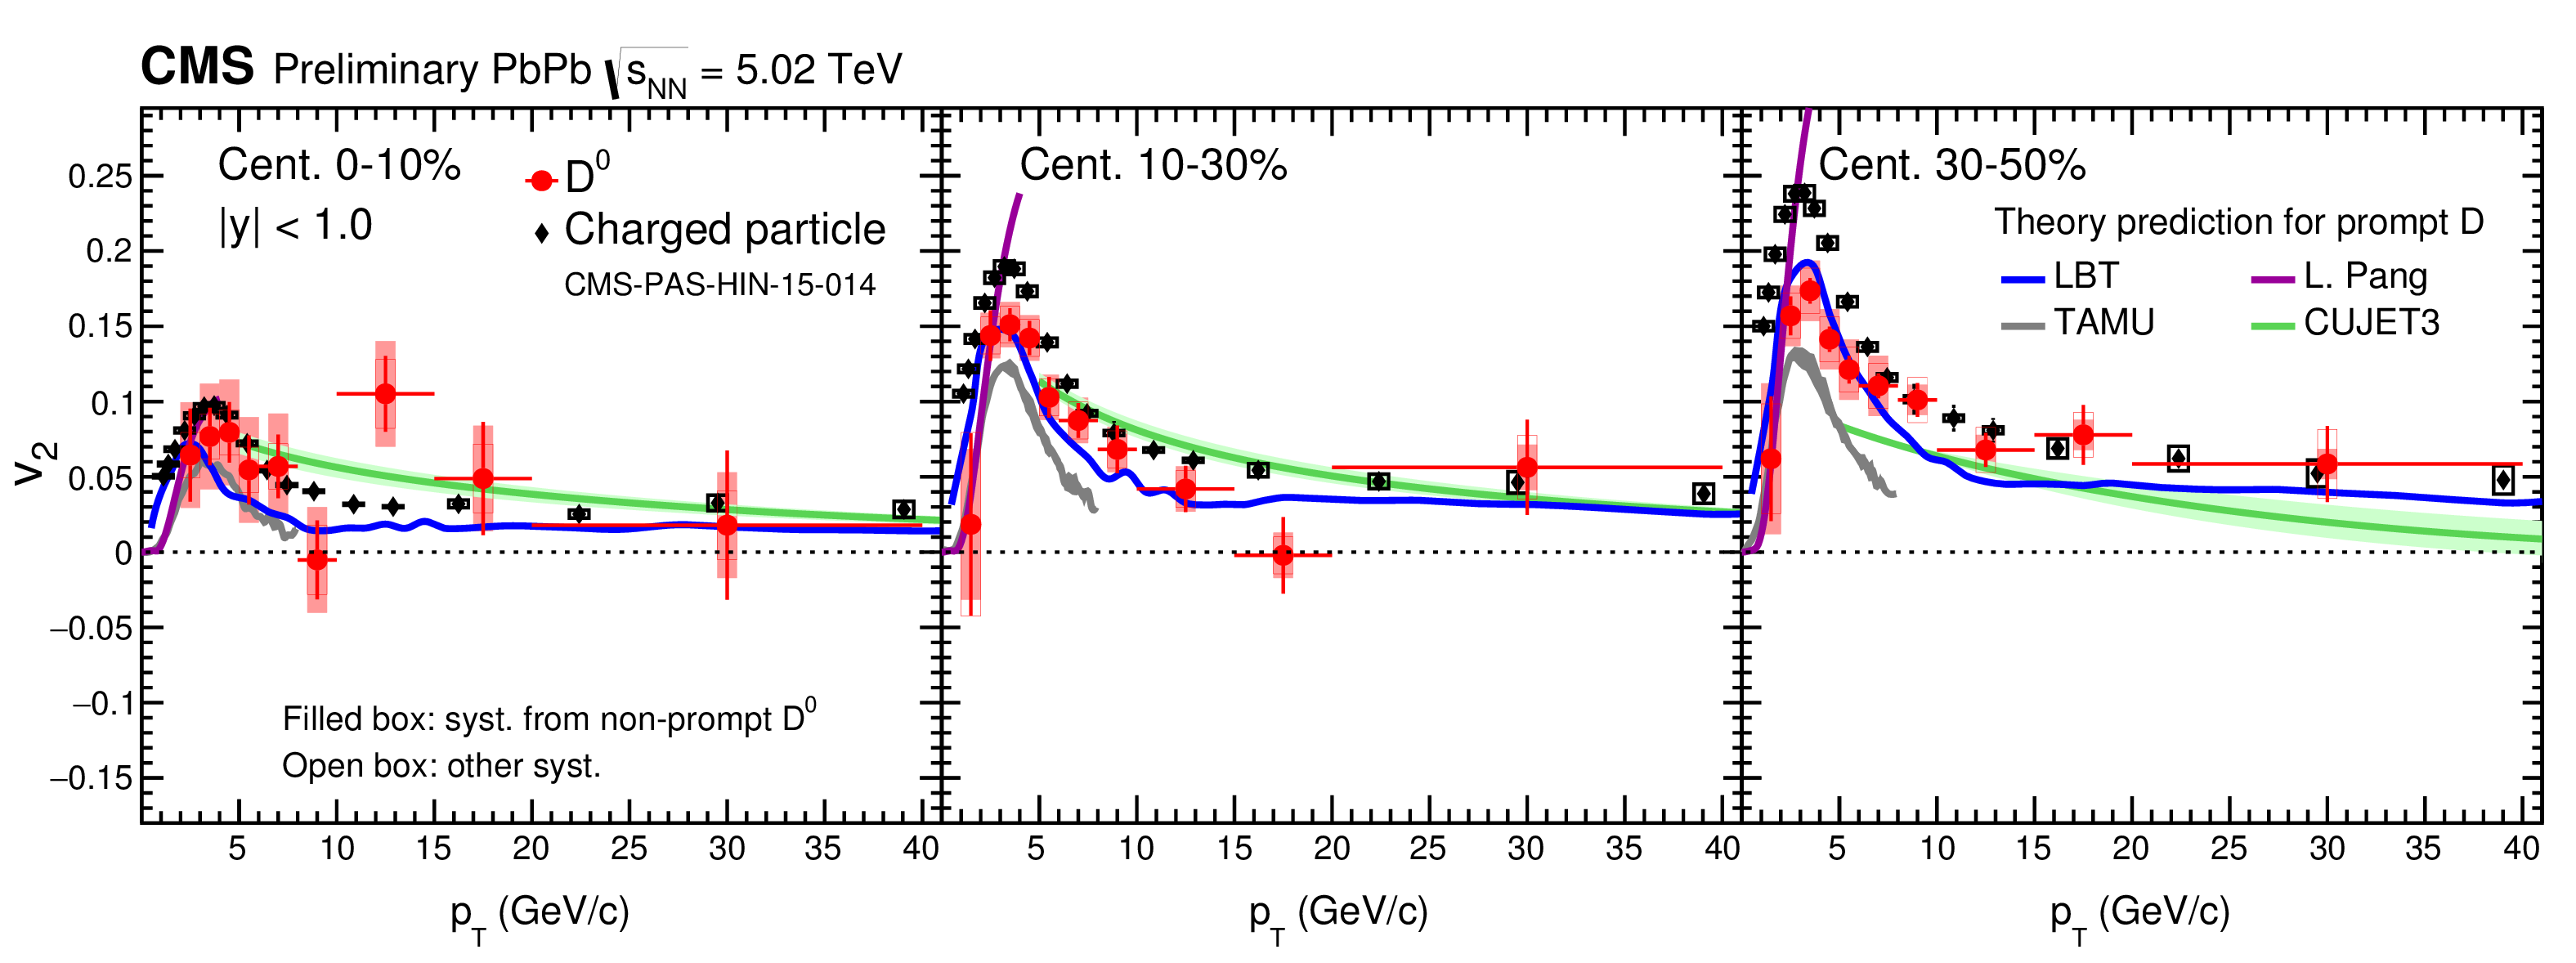
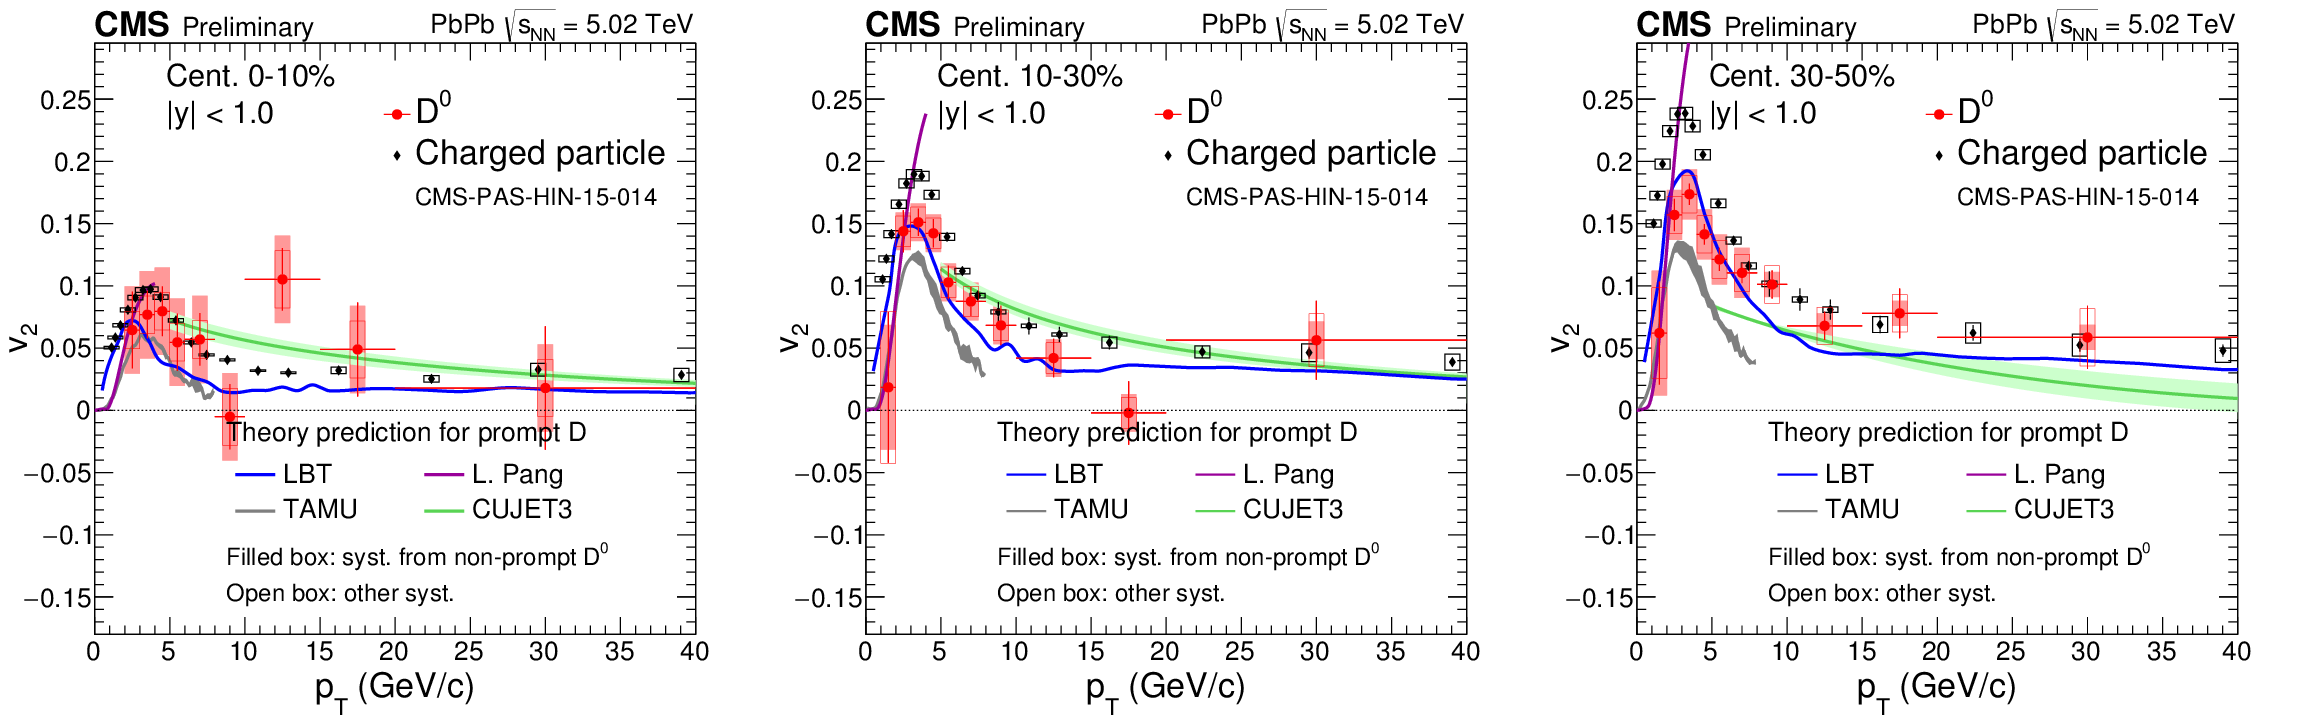
Figure 3:
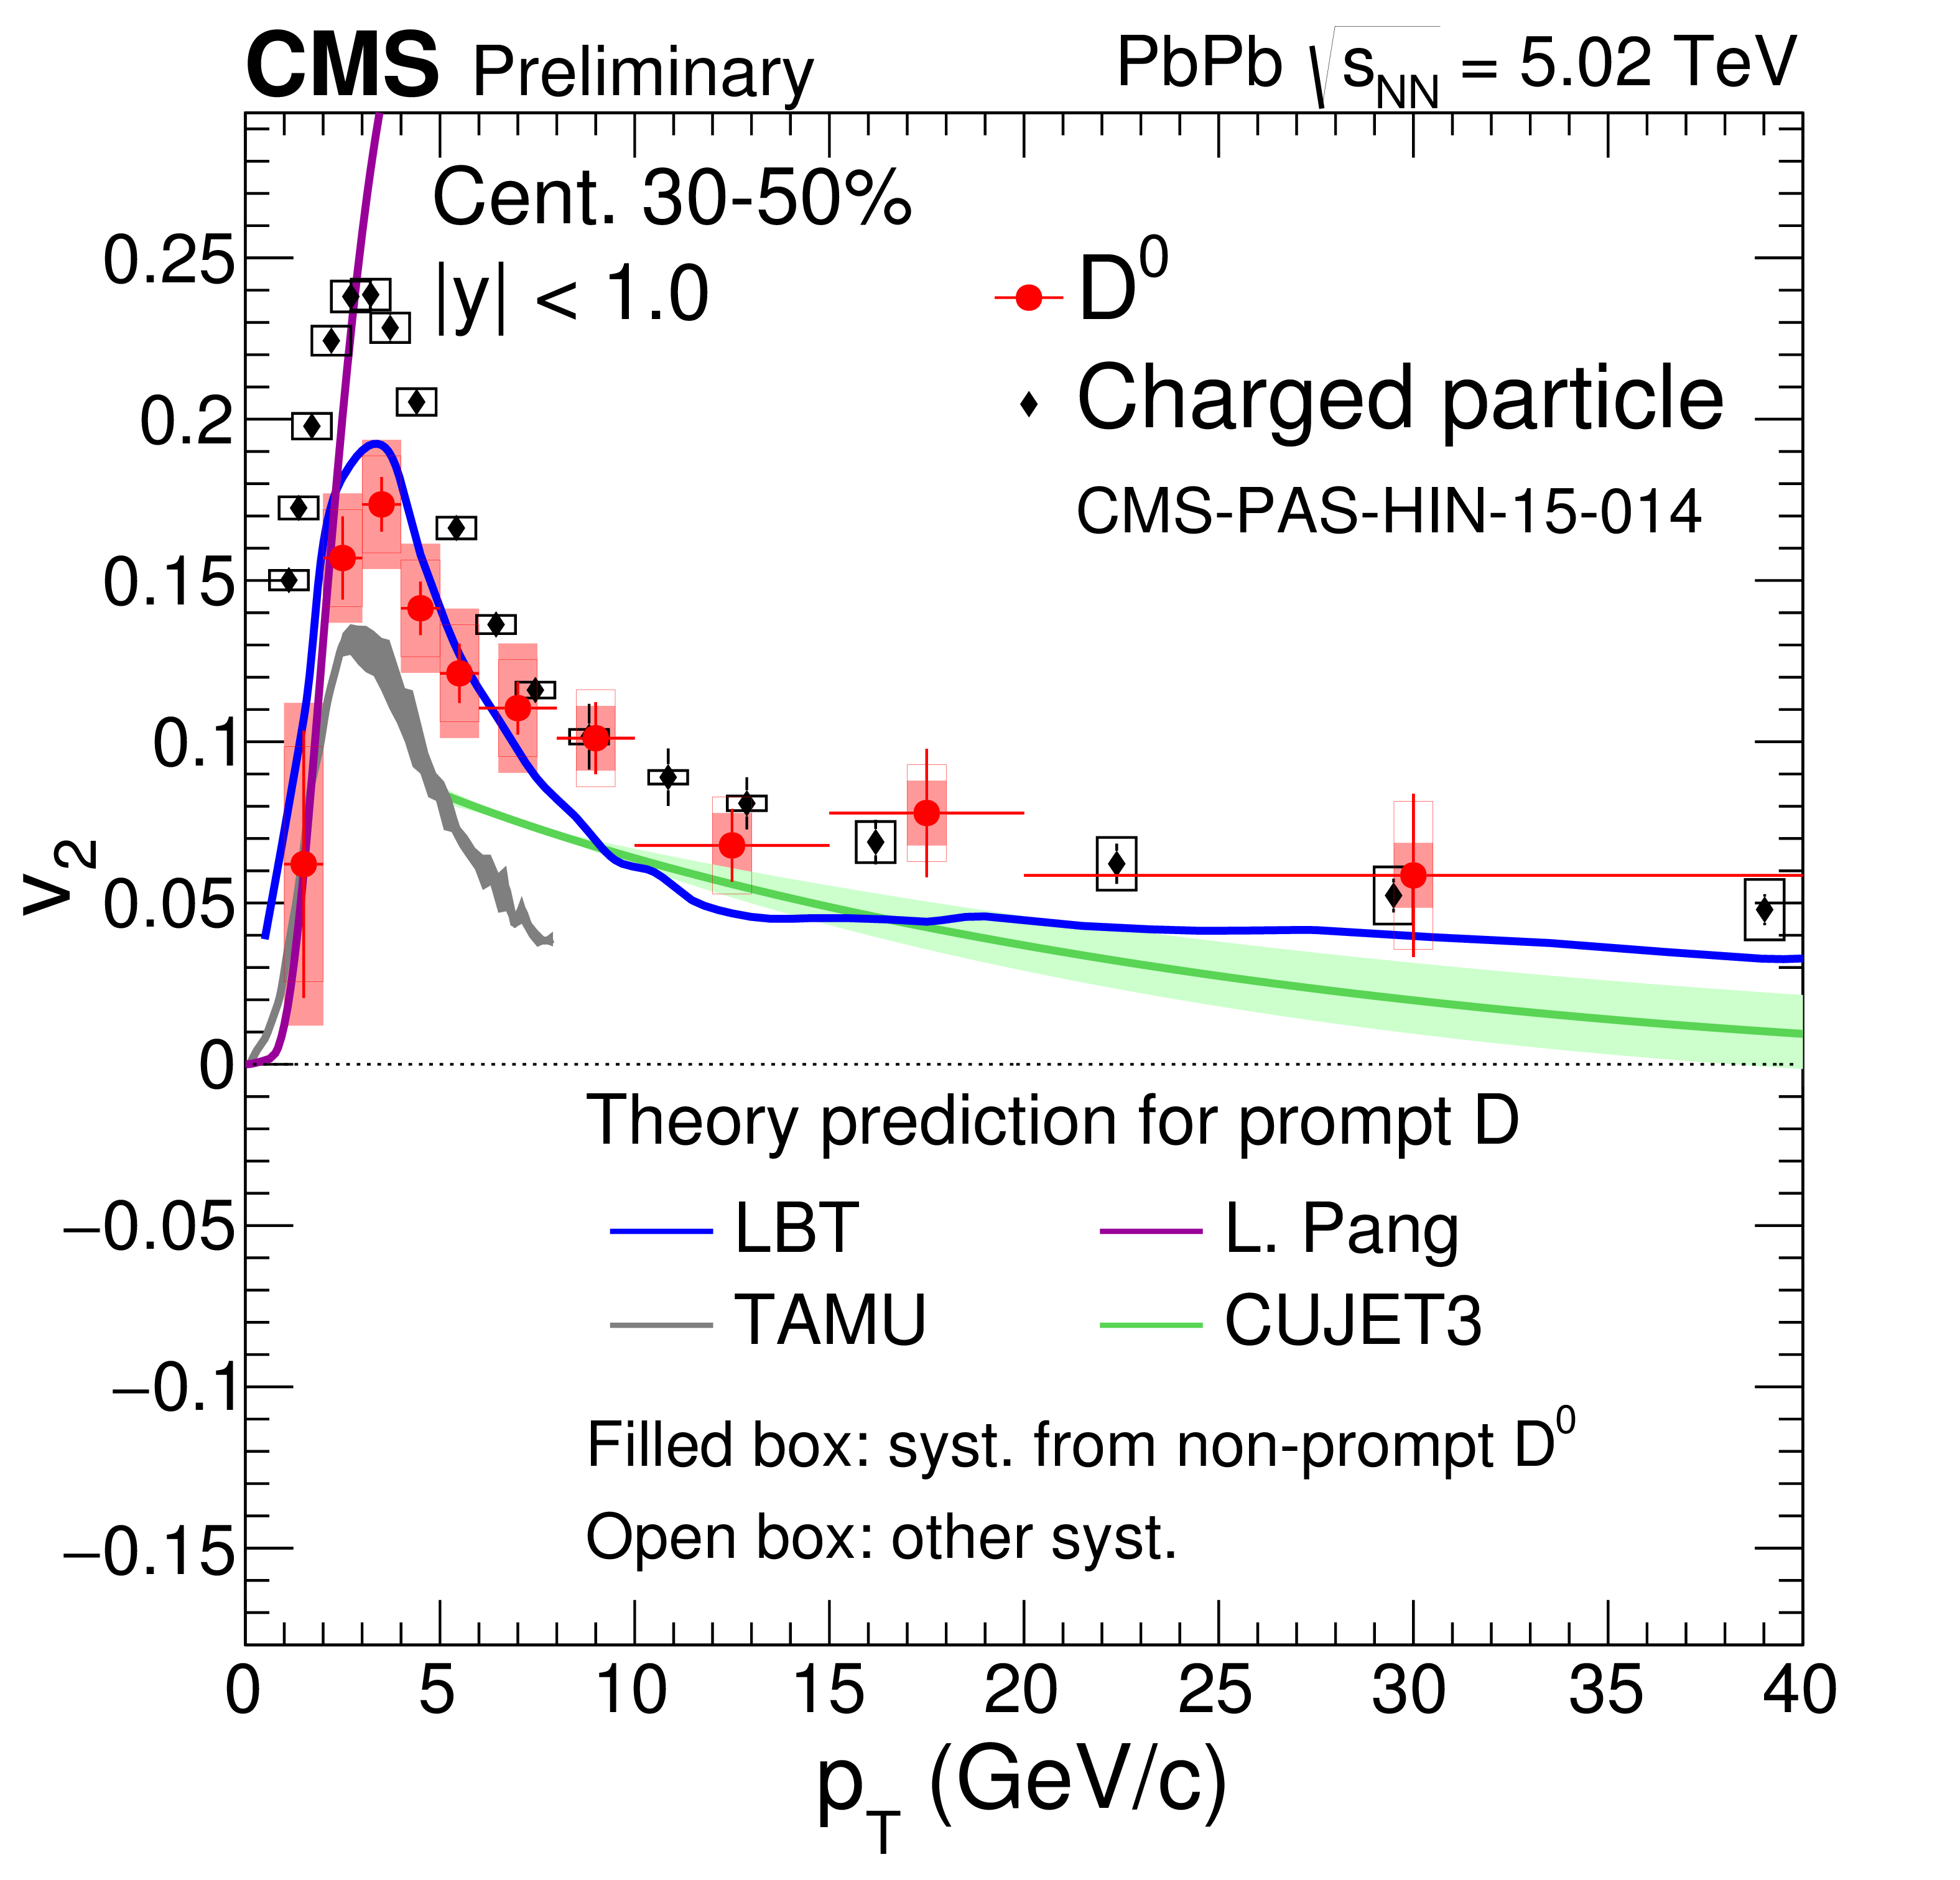
Prompt ${\mathrm {D}^{0}}$ $v_{2}$ for centrality 0-10% (left), 10-30% (middle) and 30-50% (right). Charged particle $v_{2}$ [21] in the same centrality class is also plotted for comparison. |
png pdf |
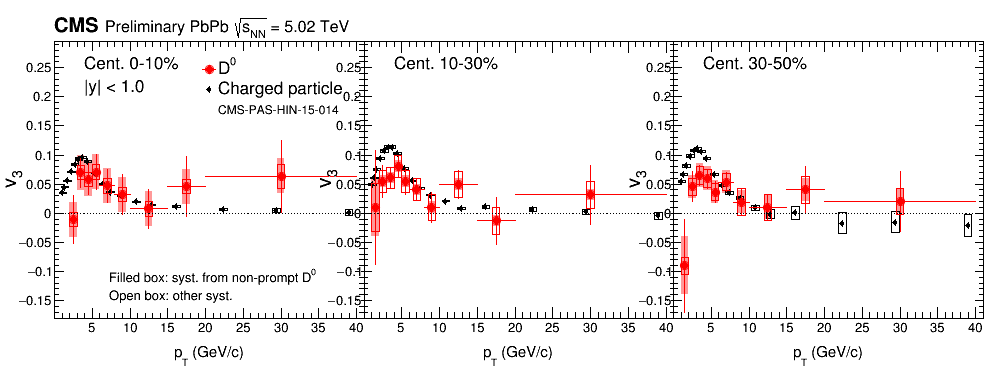
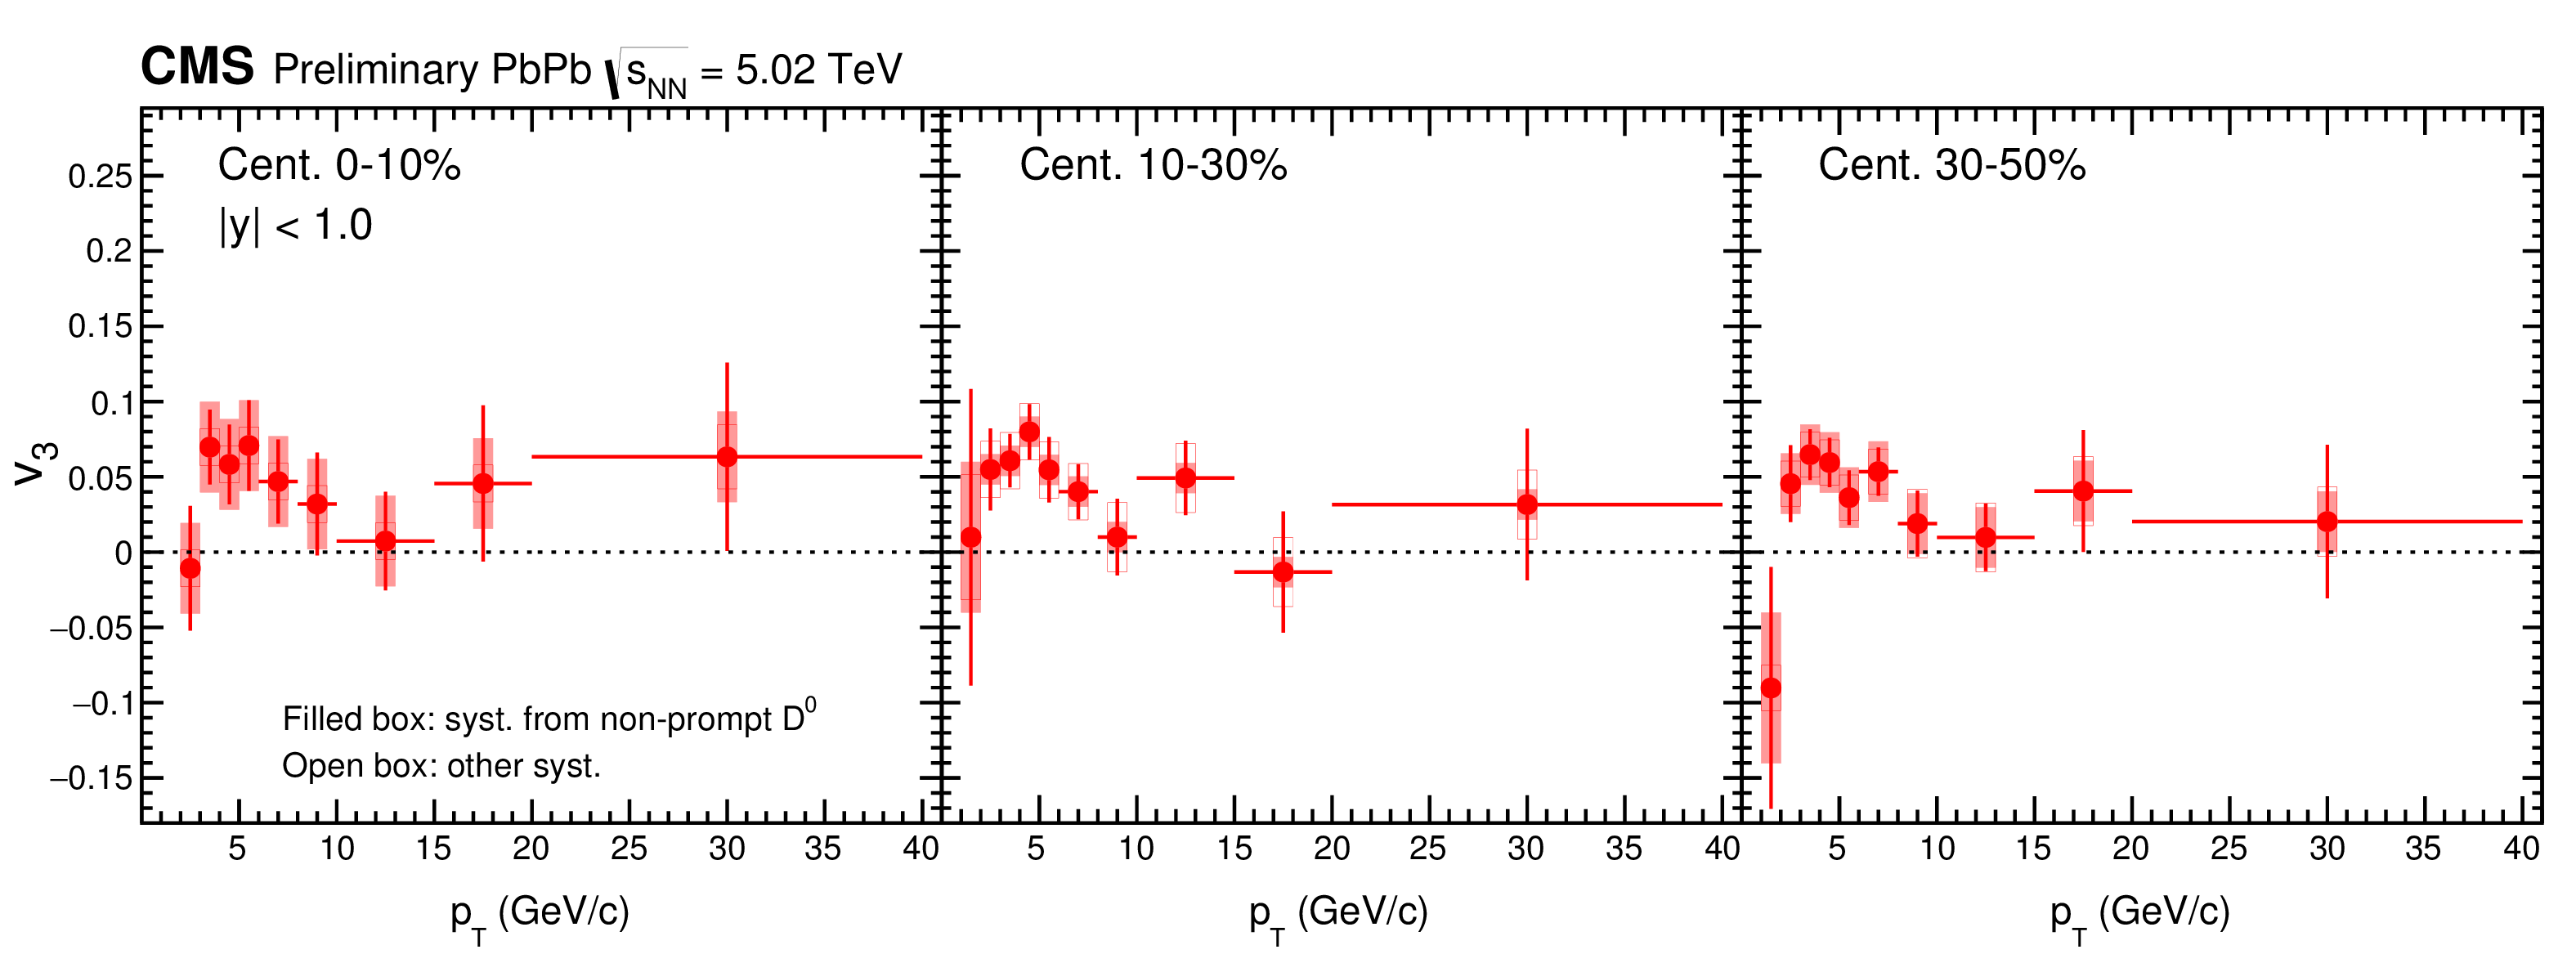
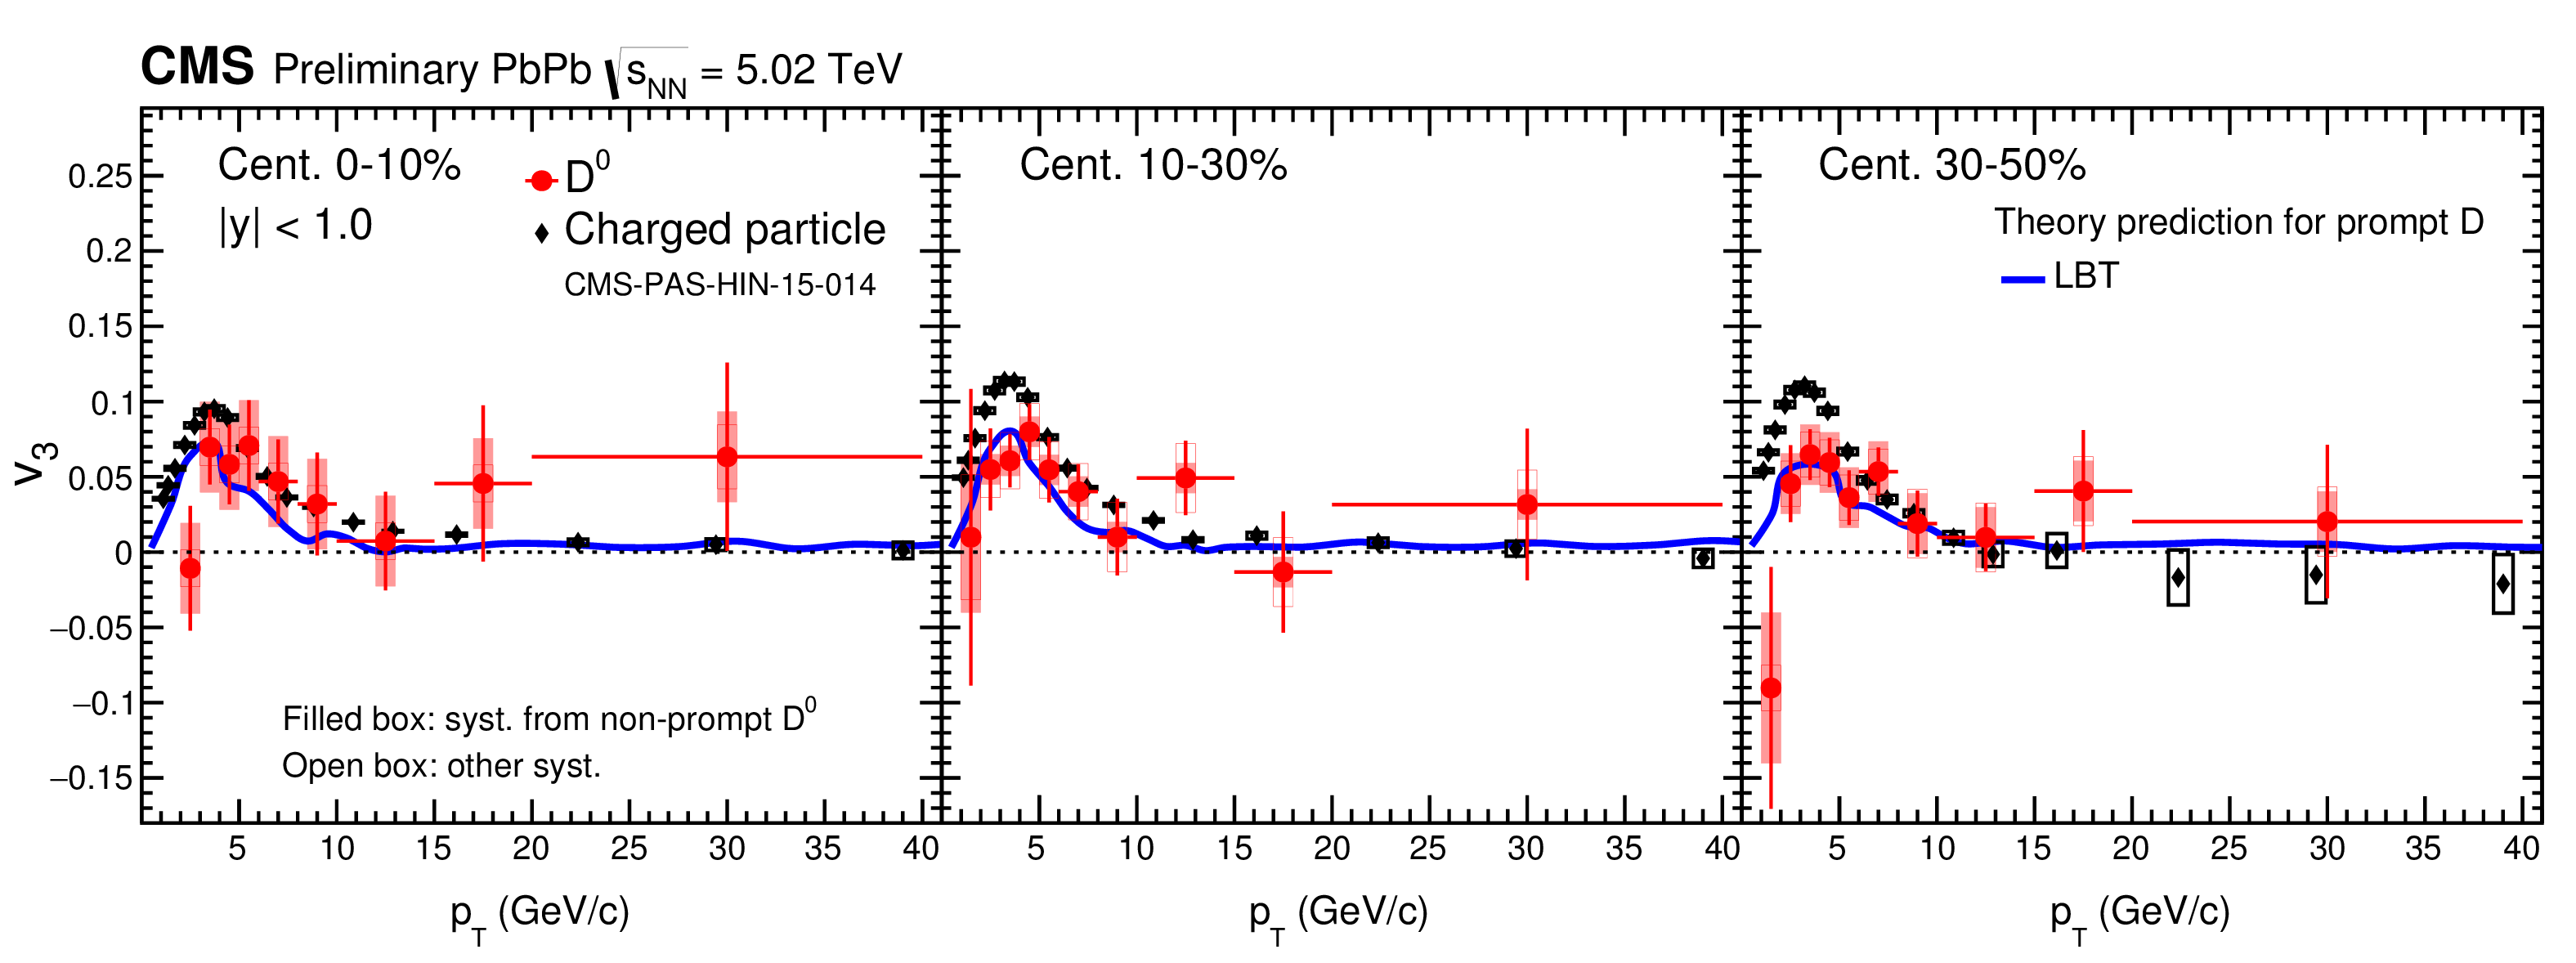
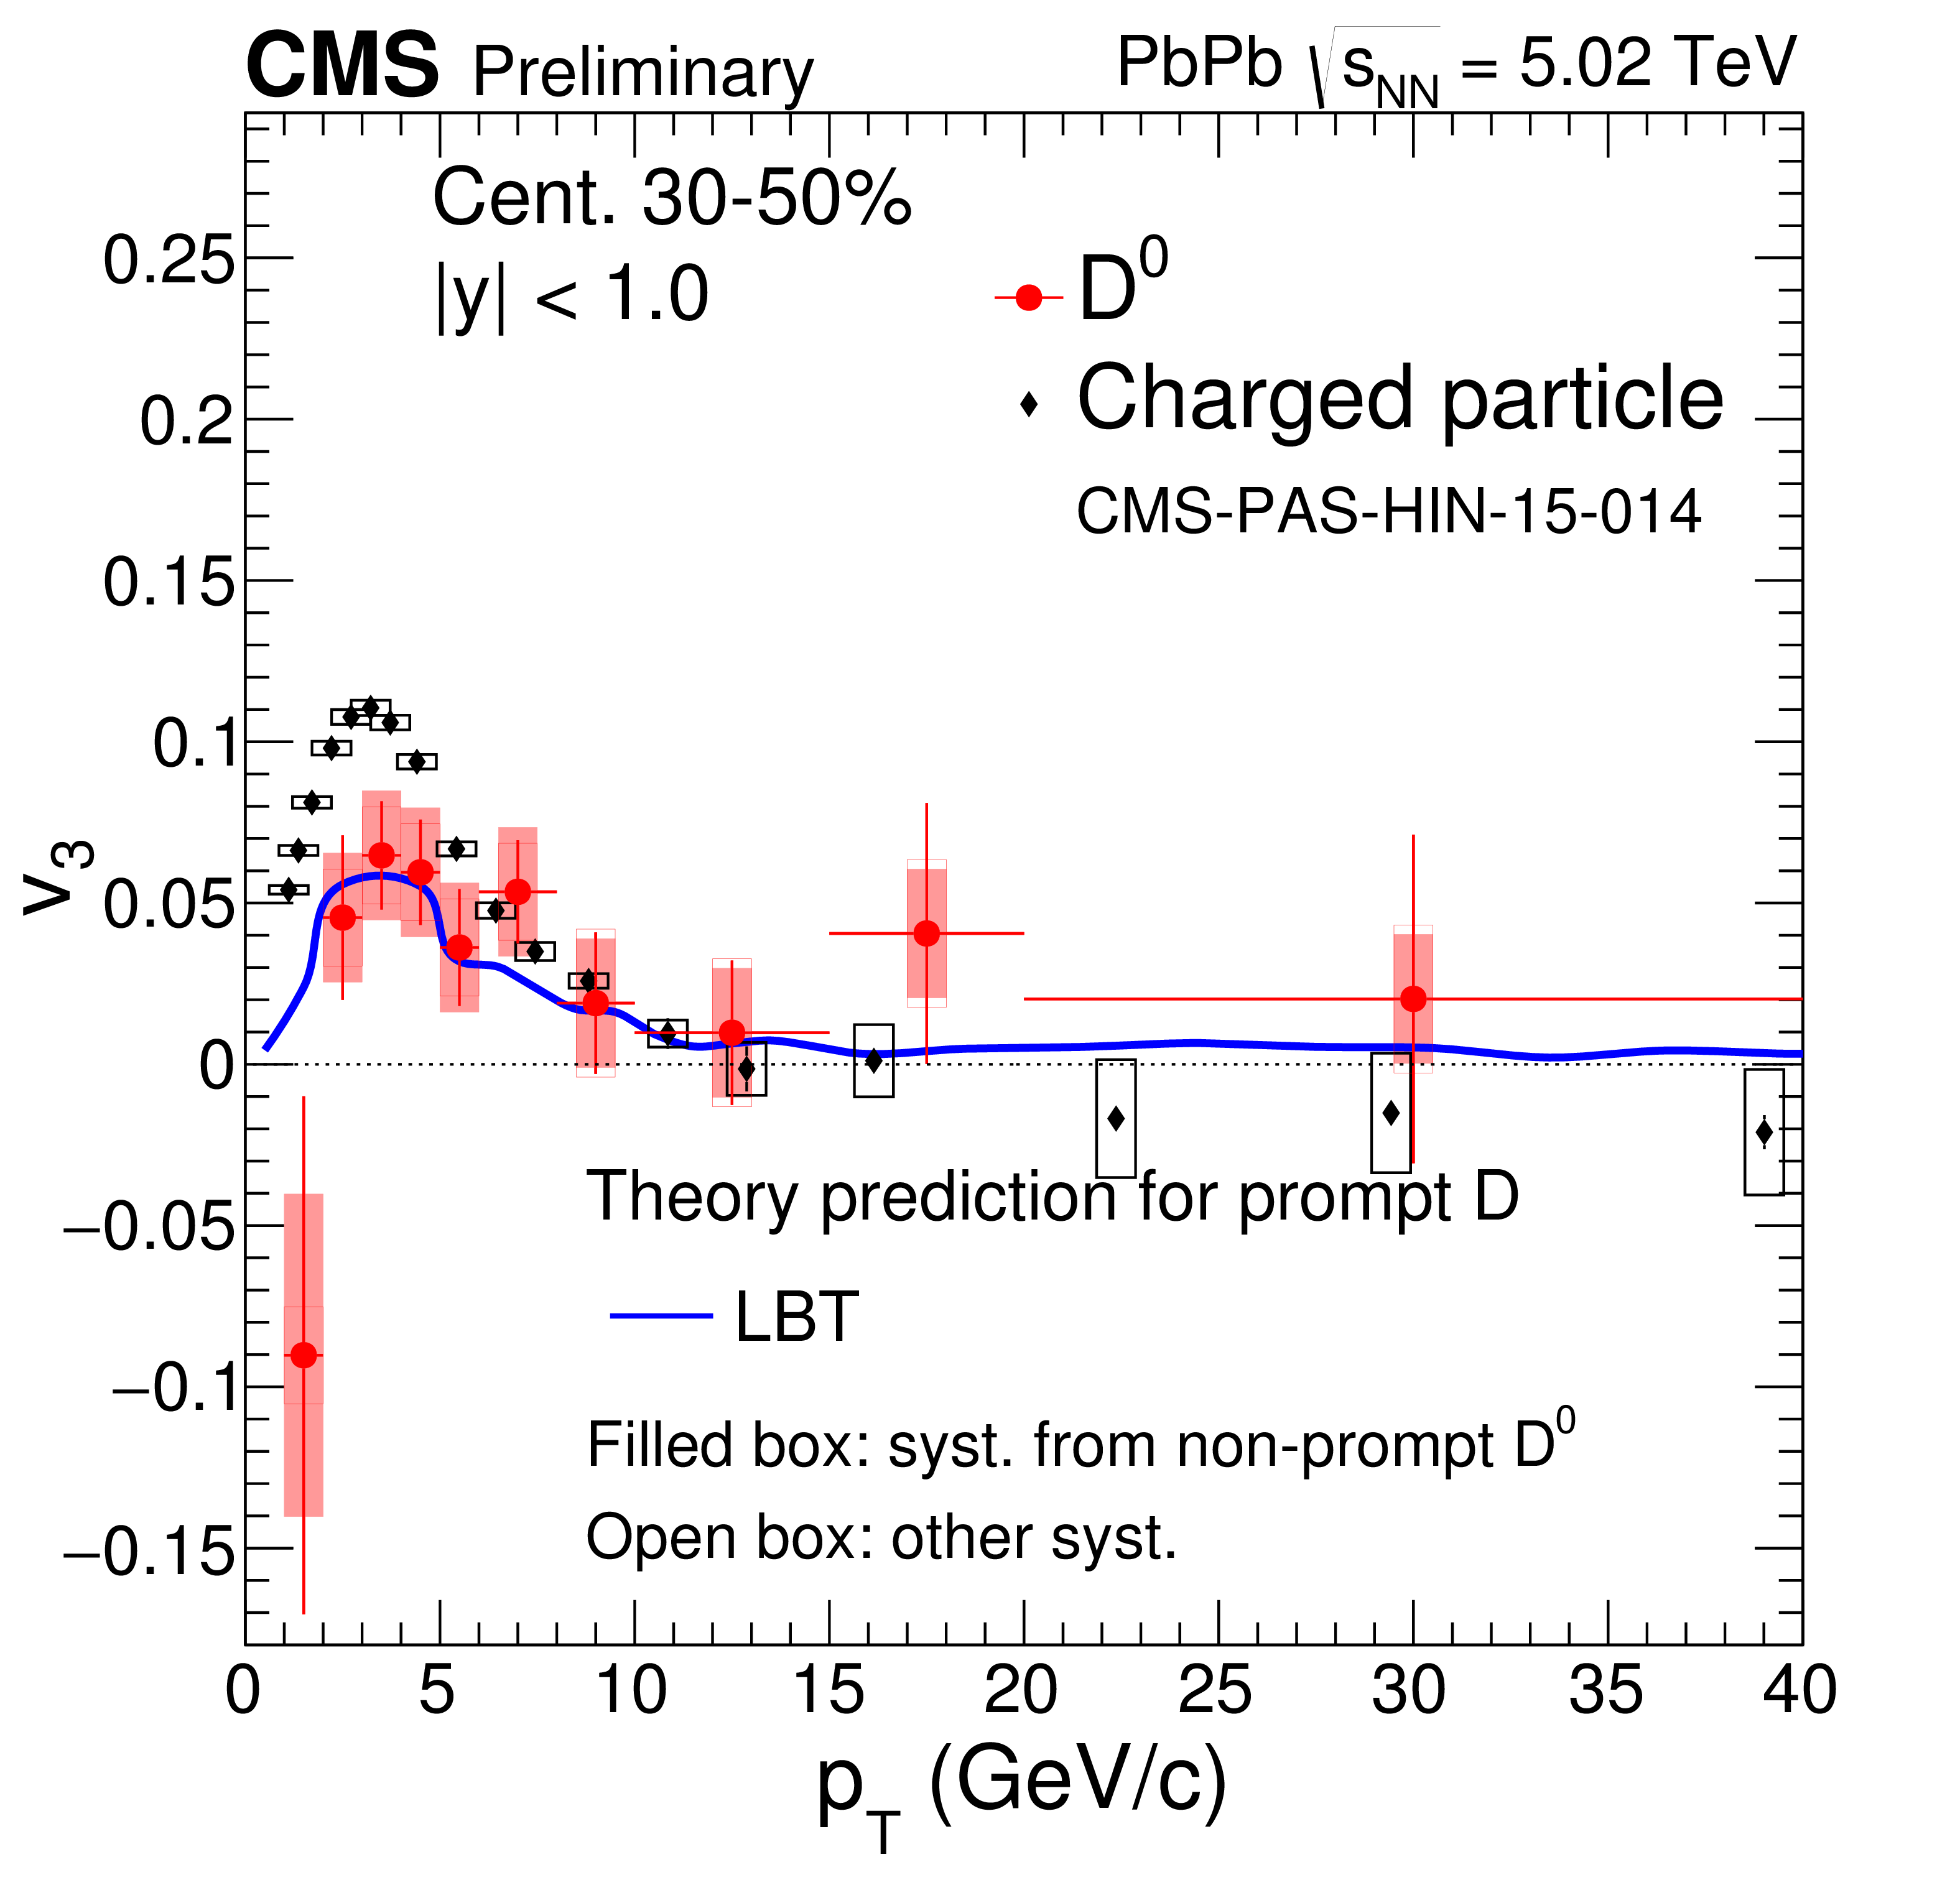
Figure 4:
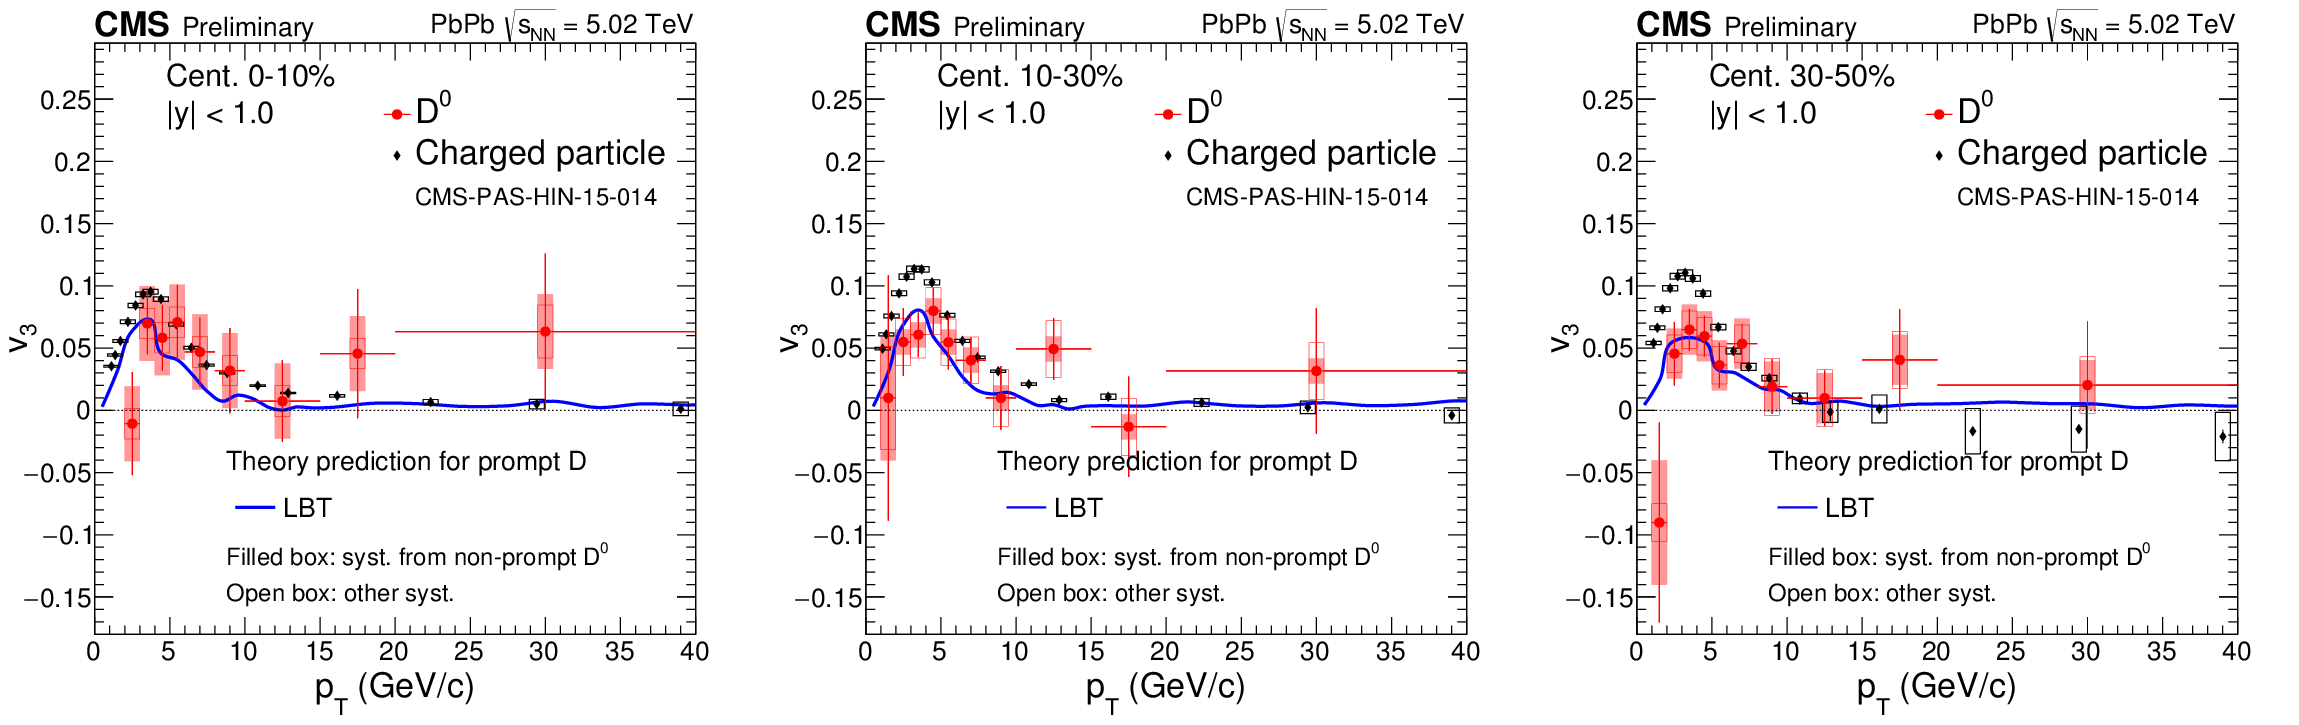
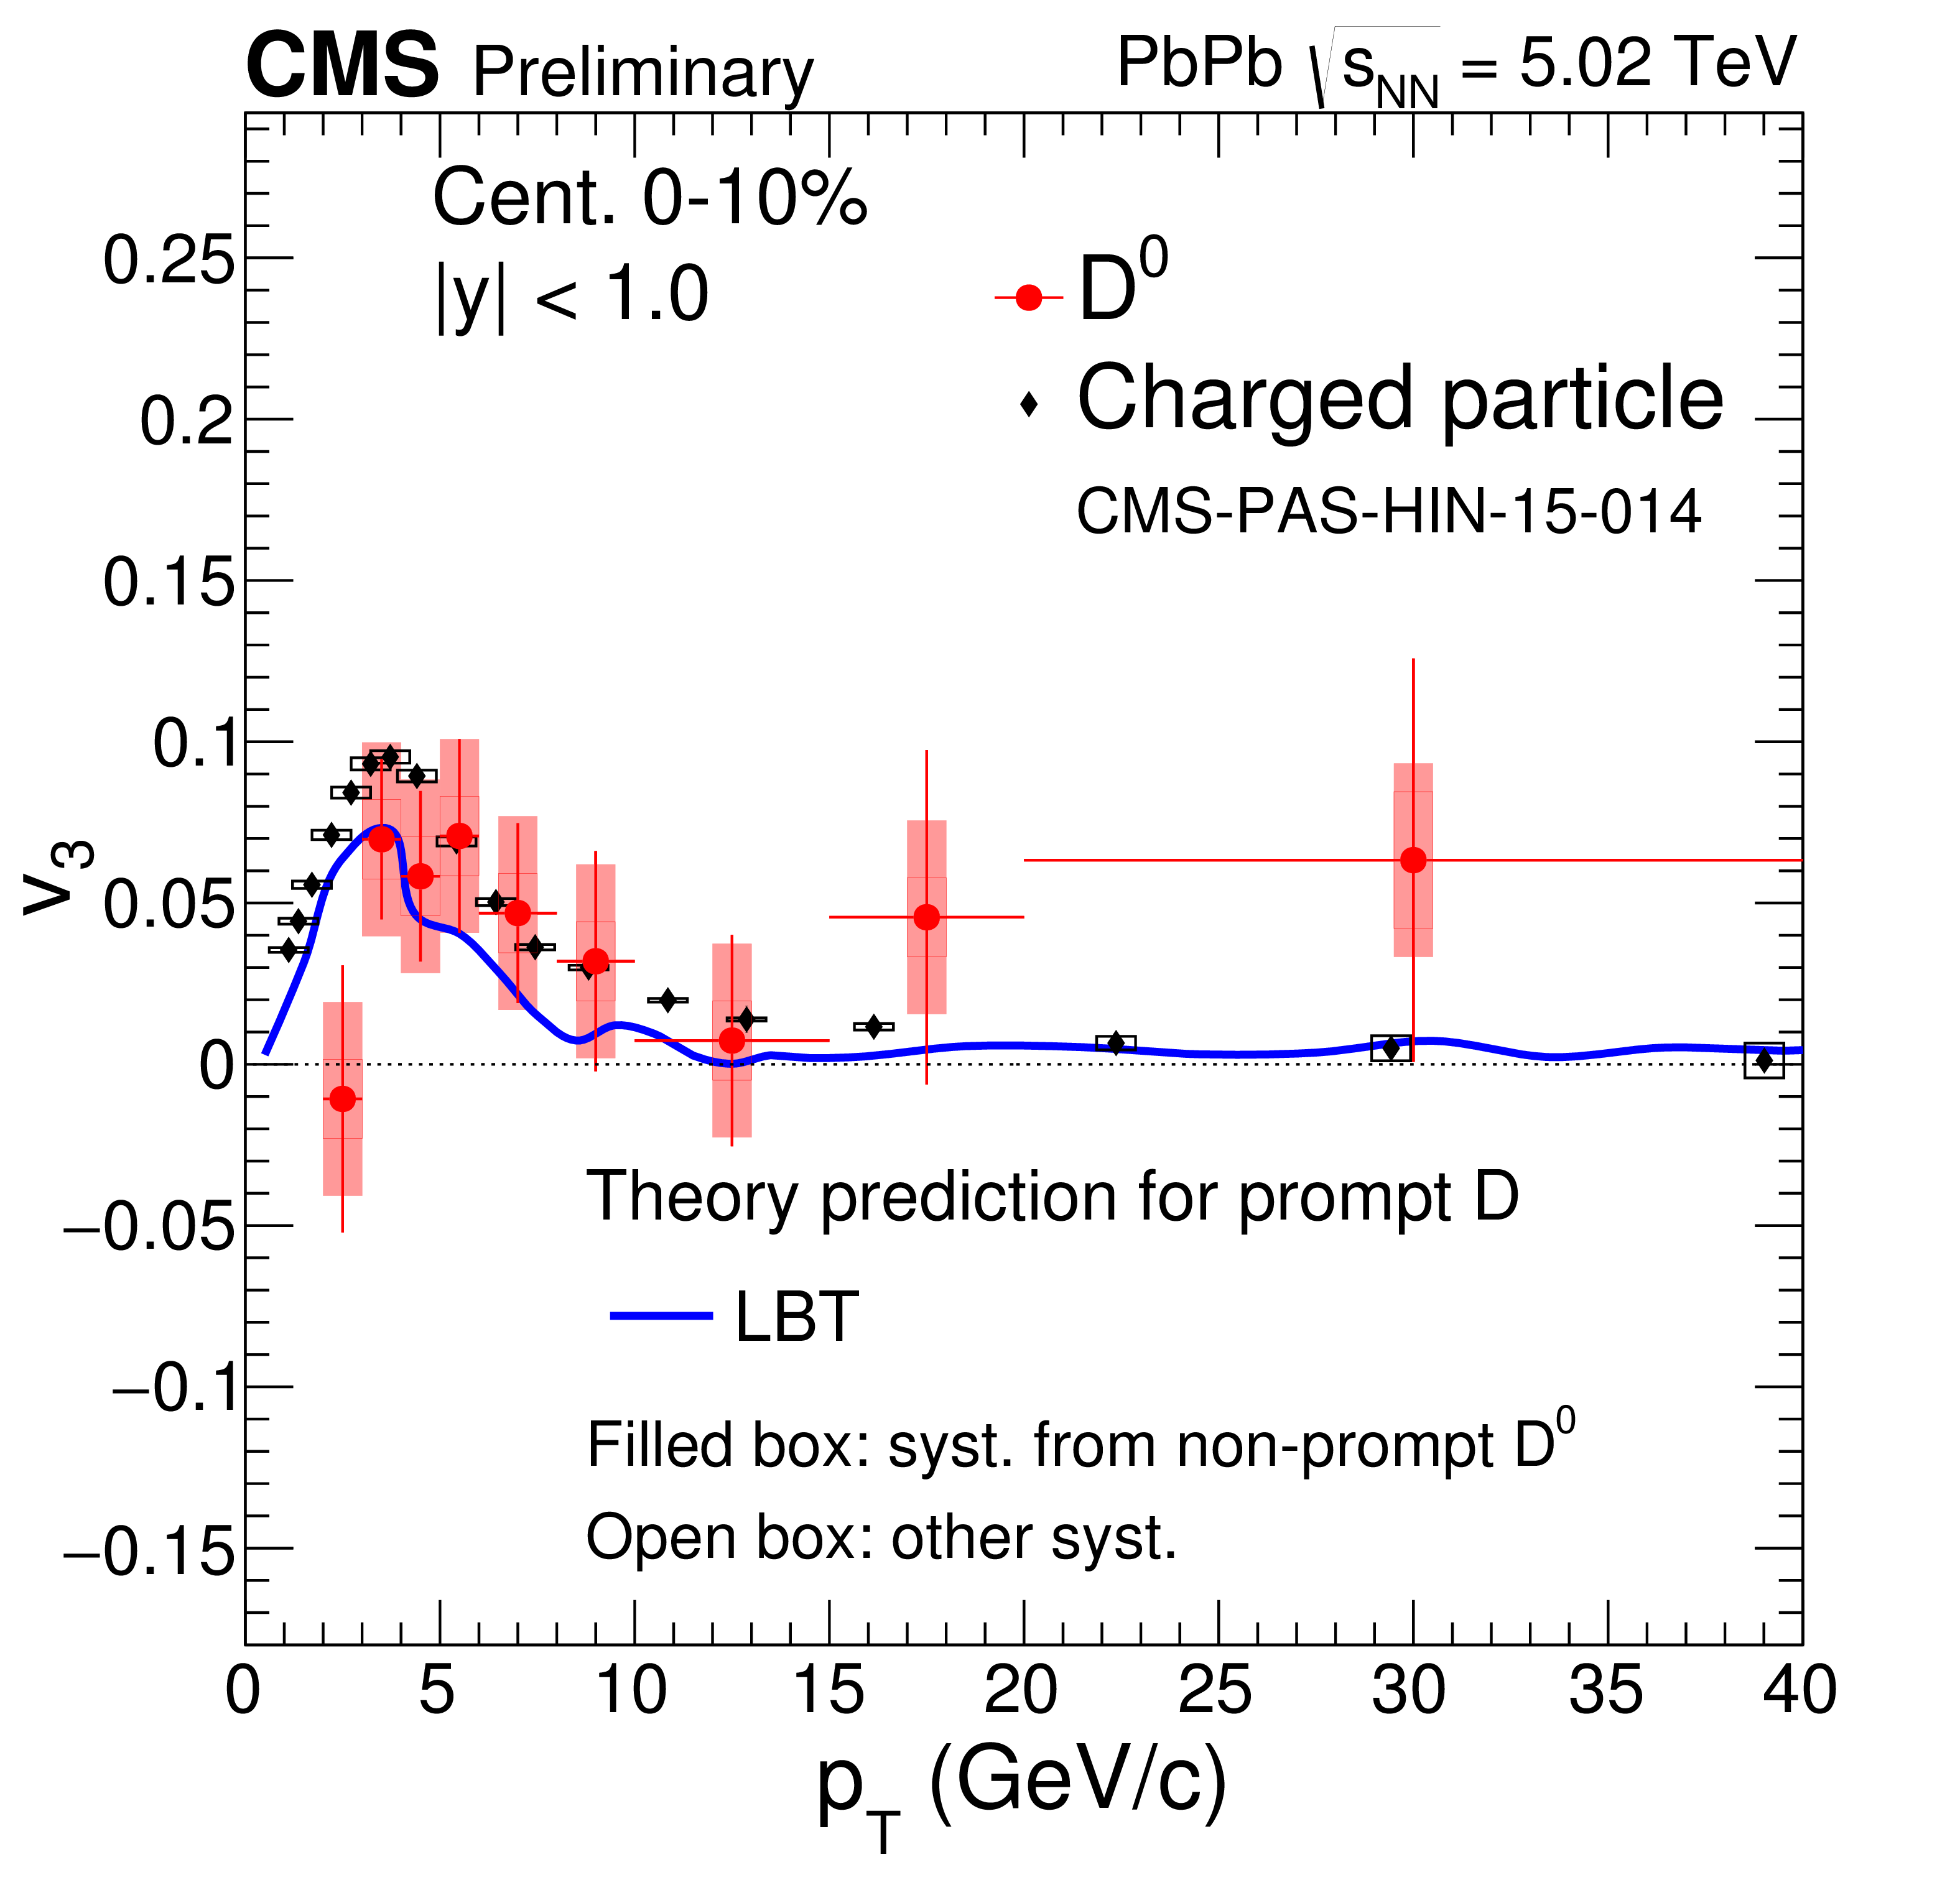
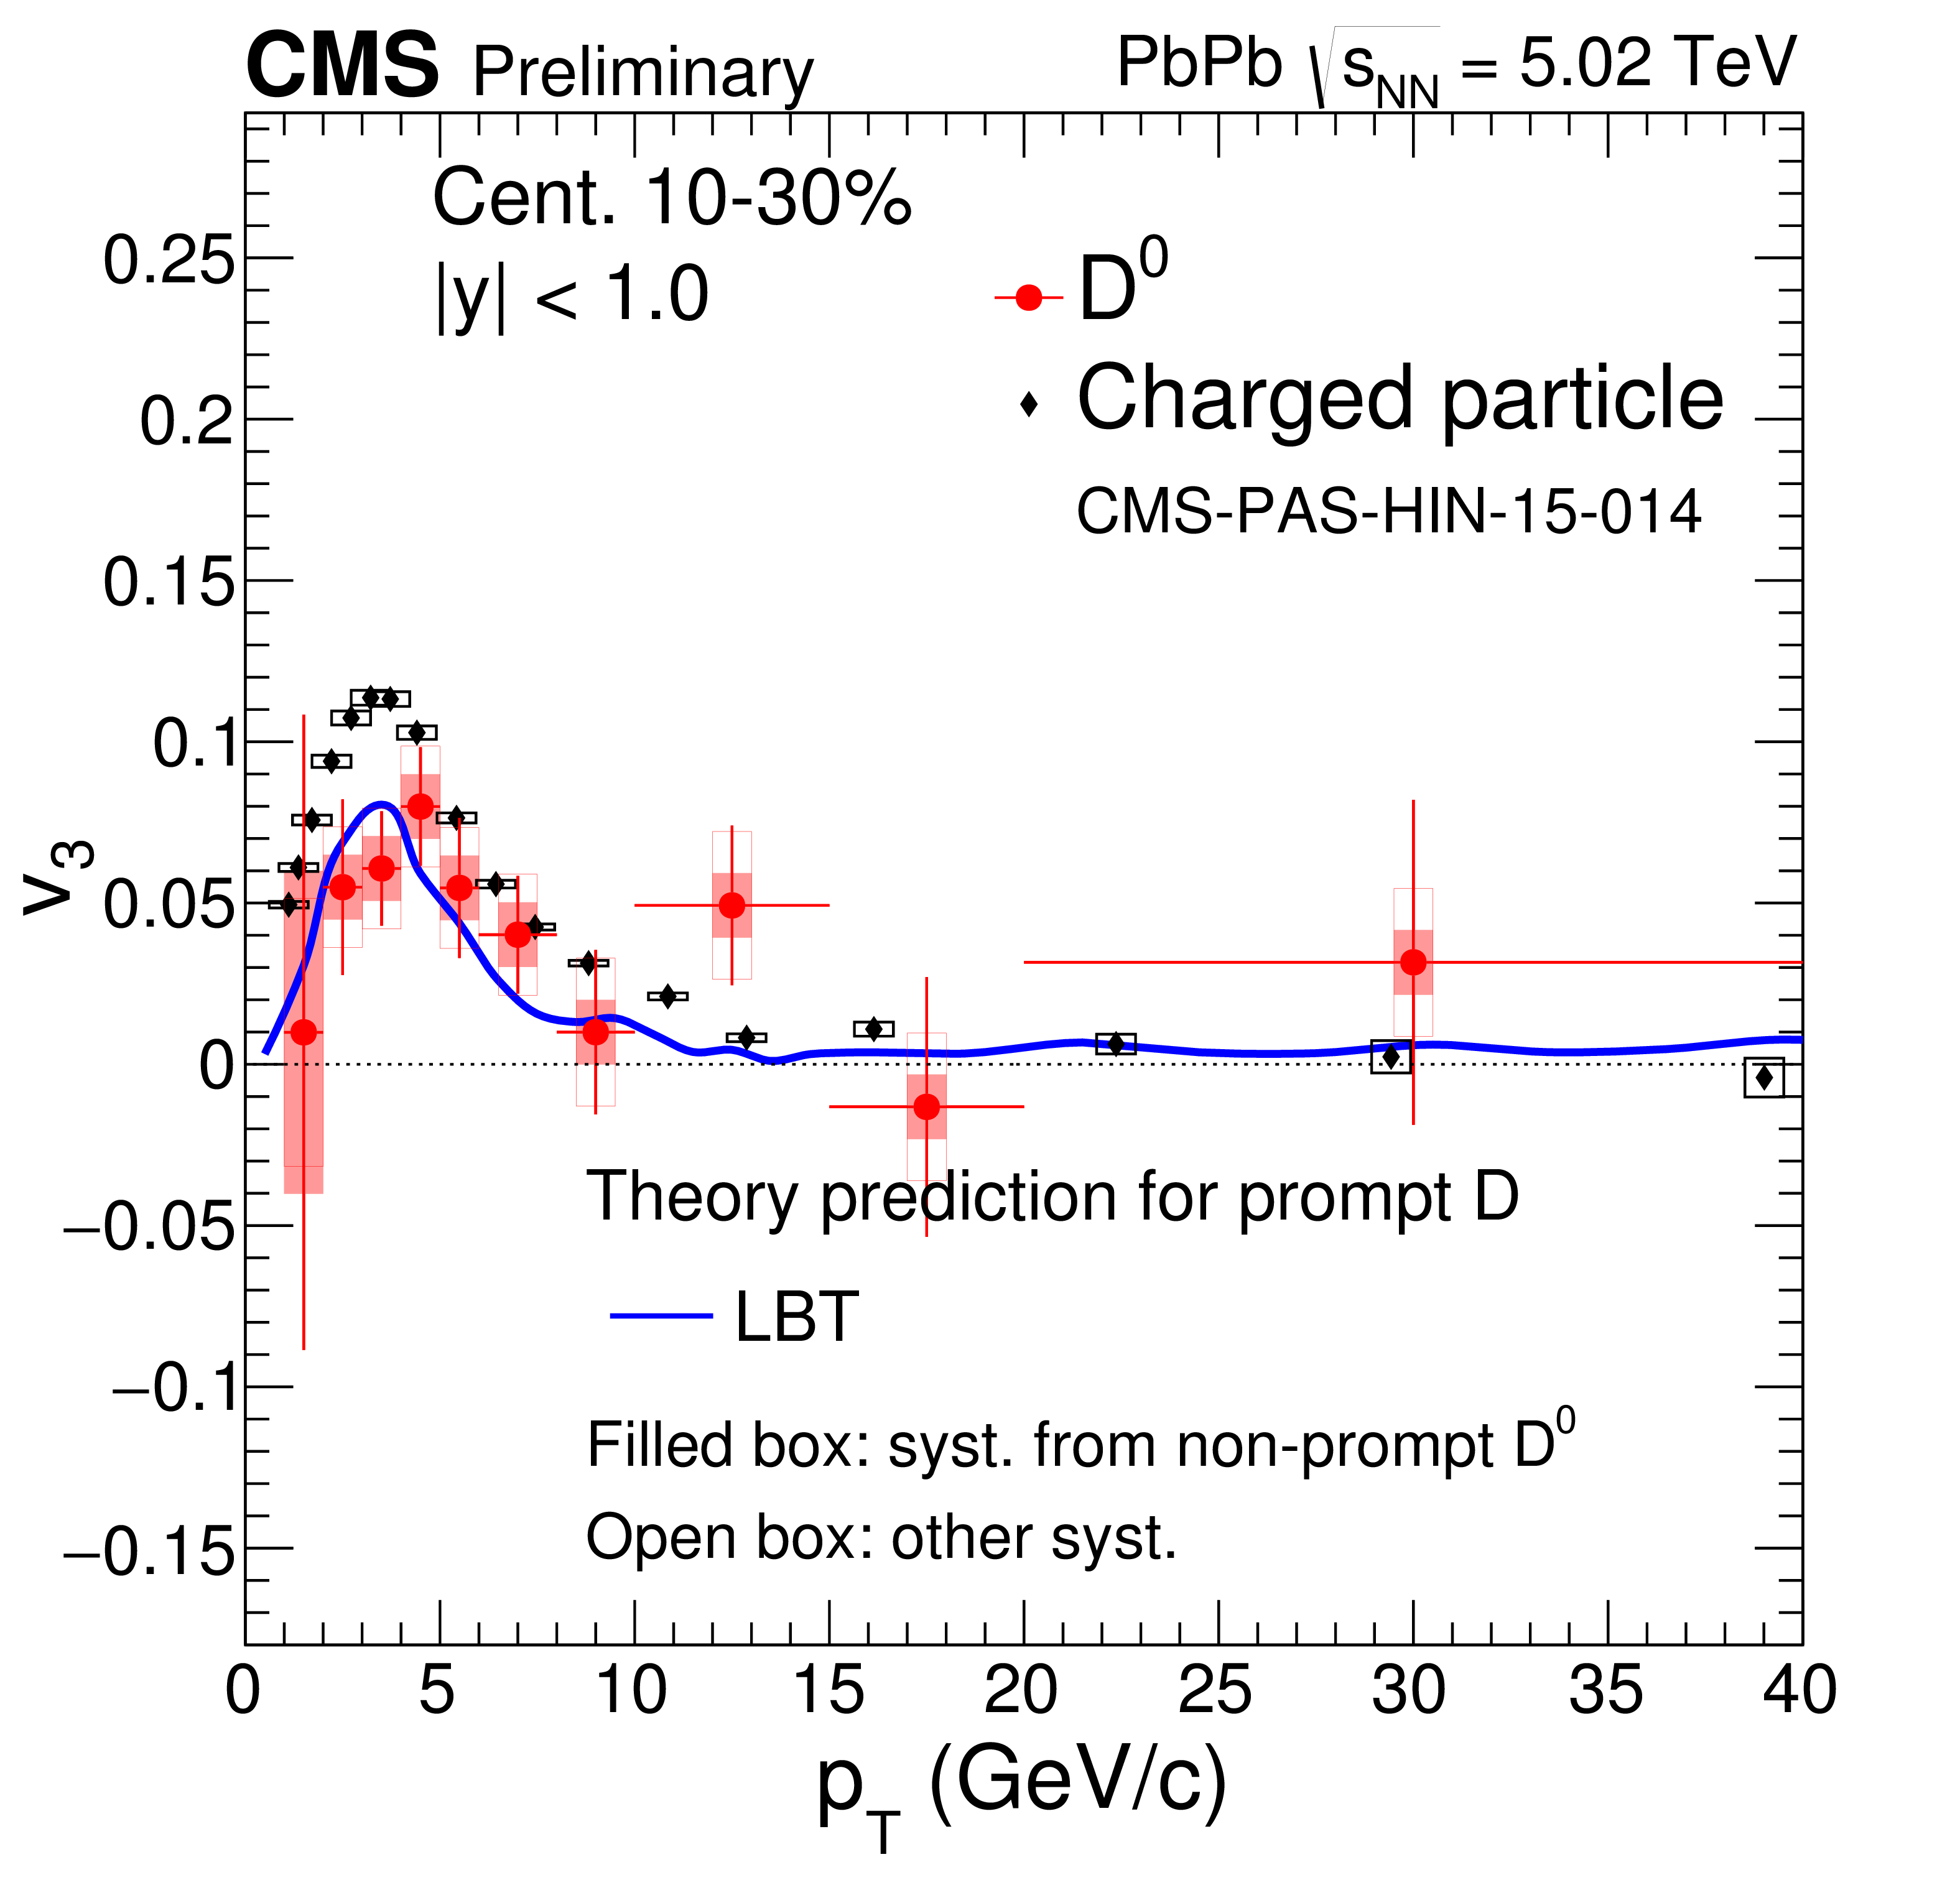
Prompt ${\mathrm {D}^{0}}$ $v_{3}$ for centrality 0-10% (left), 10-30% (middle) and 30-50% (right). Charged particle $v_{3}$ [21] in the same centrality class is also plotted for comparison. |
| Tables | |
png pdf |
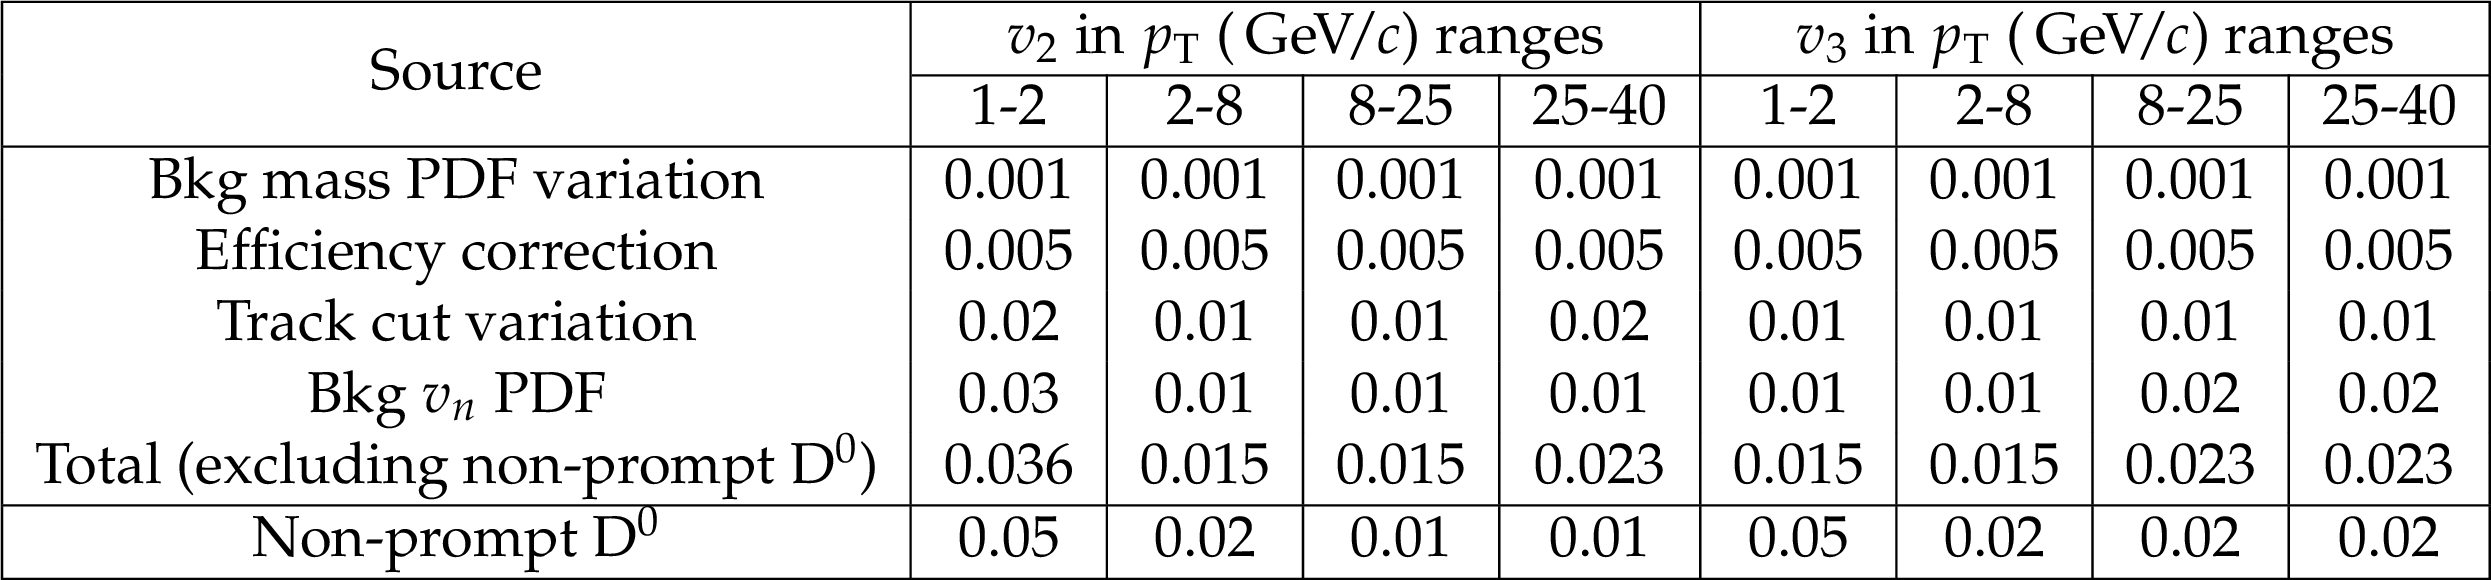
Table 1:
Summary of systematic uncertainties for $v_{2}$ and $v_{3}$ for centrality class 30-50%. Absolute uncertainties are assigned. |
| Summary |
| In summary, azimuthal anisotropy $v_2$ and $v_3$ of $\mathrm{D}^0$ is measured with scalar-product method in PbPb collisions at $ \sqrt{s_\mathrm{NN}} = $ 5.02 TeV with CMS, which is the first measurement on $v_3$ of $\mathrm{D}^0$. To extract $v_2$ and $v_3$ of prompt $\mathrm{D}^0$, the systematic uncertainties from non-prompt $\mathrm{D}^0$ are studied in a data driven method. Prompt $\mathrm{D}^0$ $v_2$ is found to be positive in studied $p_{\mathrm{T}}$ range 1 to 40 GeV/$c$, and prompt $\mathrm{D}^0$ $v_3$ is also found to be positive in $p_{\mathrm{T}}$ range around 1 to 8 GeV/c. The measured prompt $\mathrm{D}^0$ $v_n$ ($n =$ 2, 3) is consistent with charged particle $v_n$ in central collisions, and is lower than $v_n$ of charged particles in $p_{\mathrm{T}}$ range 1 to 6 GeV/$c$ for more peripheral collisions. |
| Additional Figures | |
png pdf |
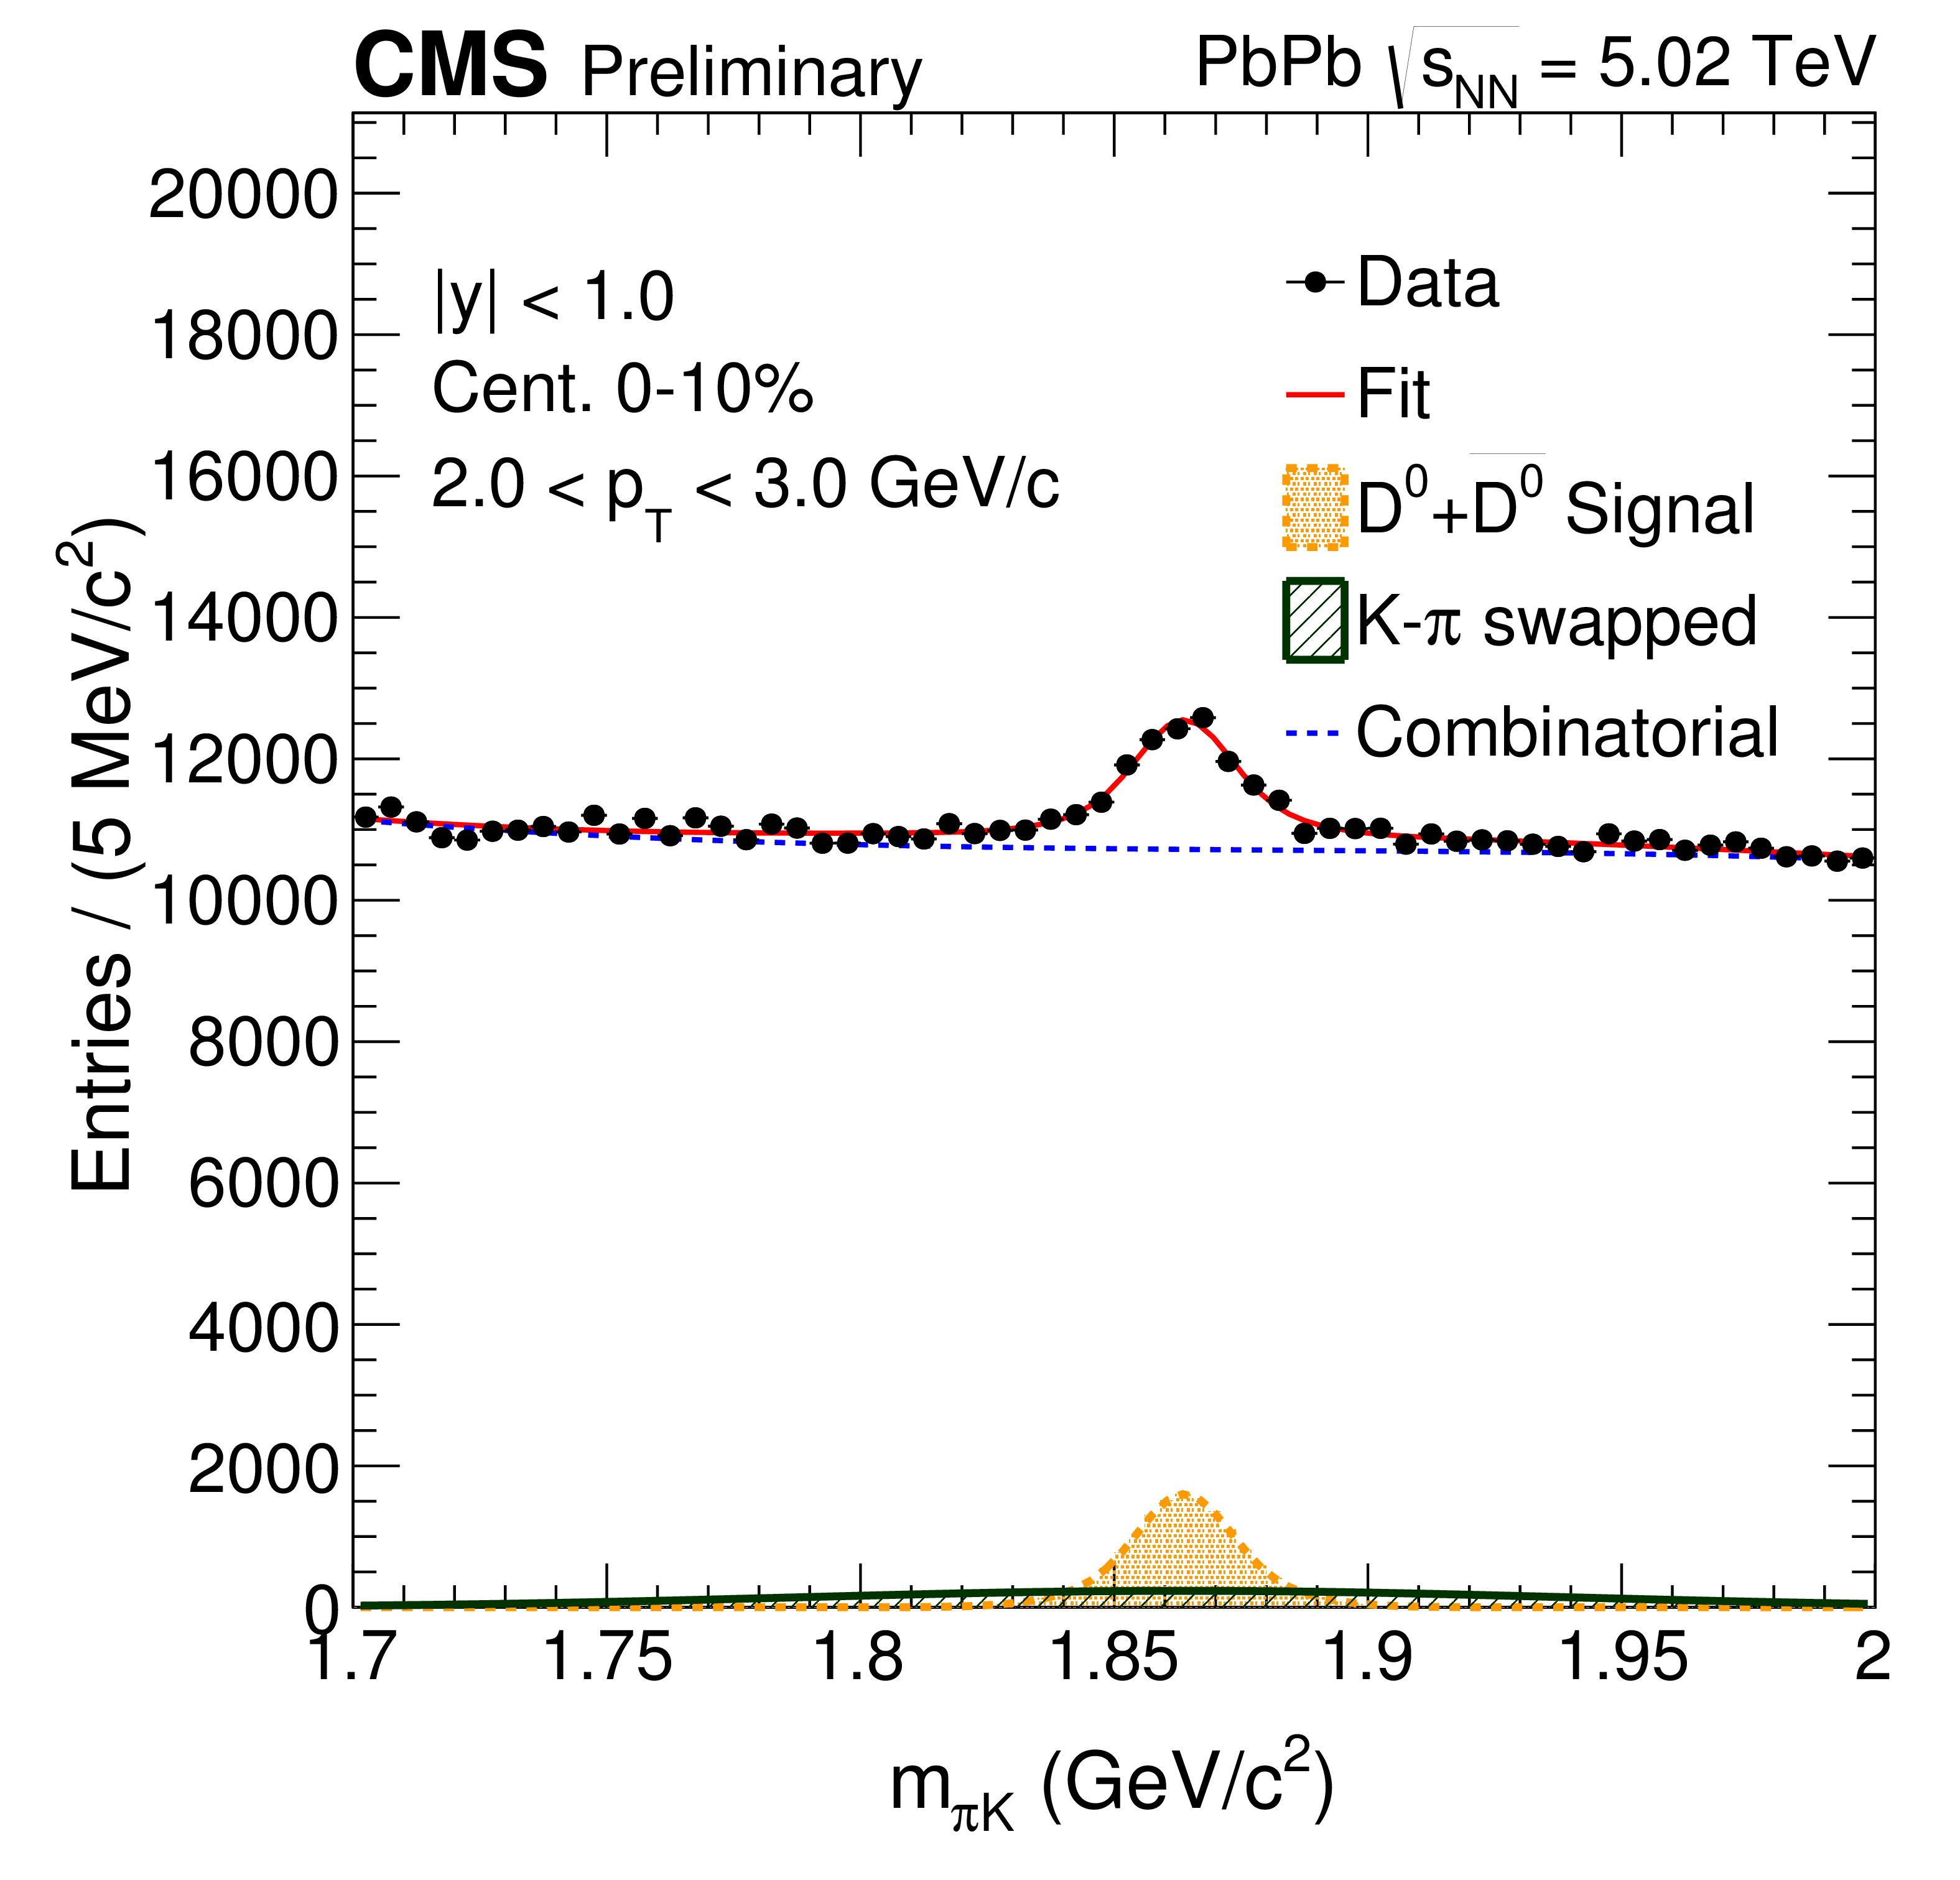
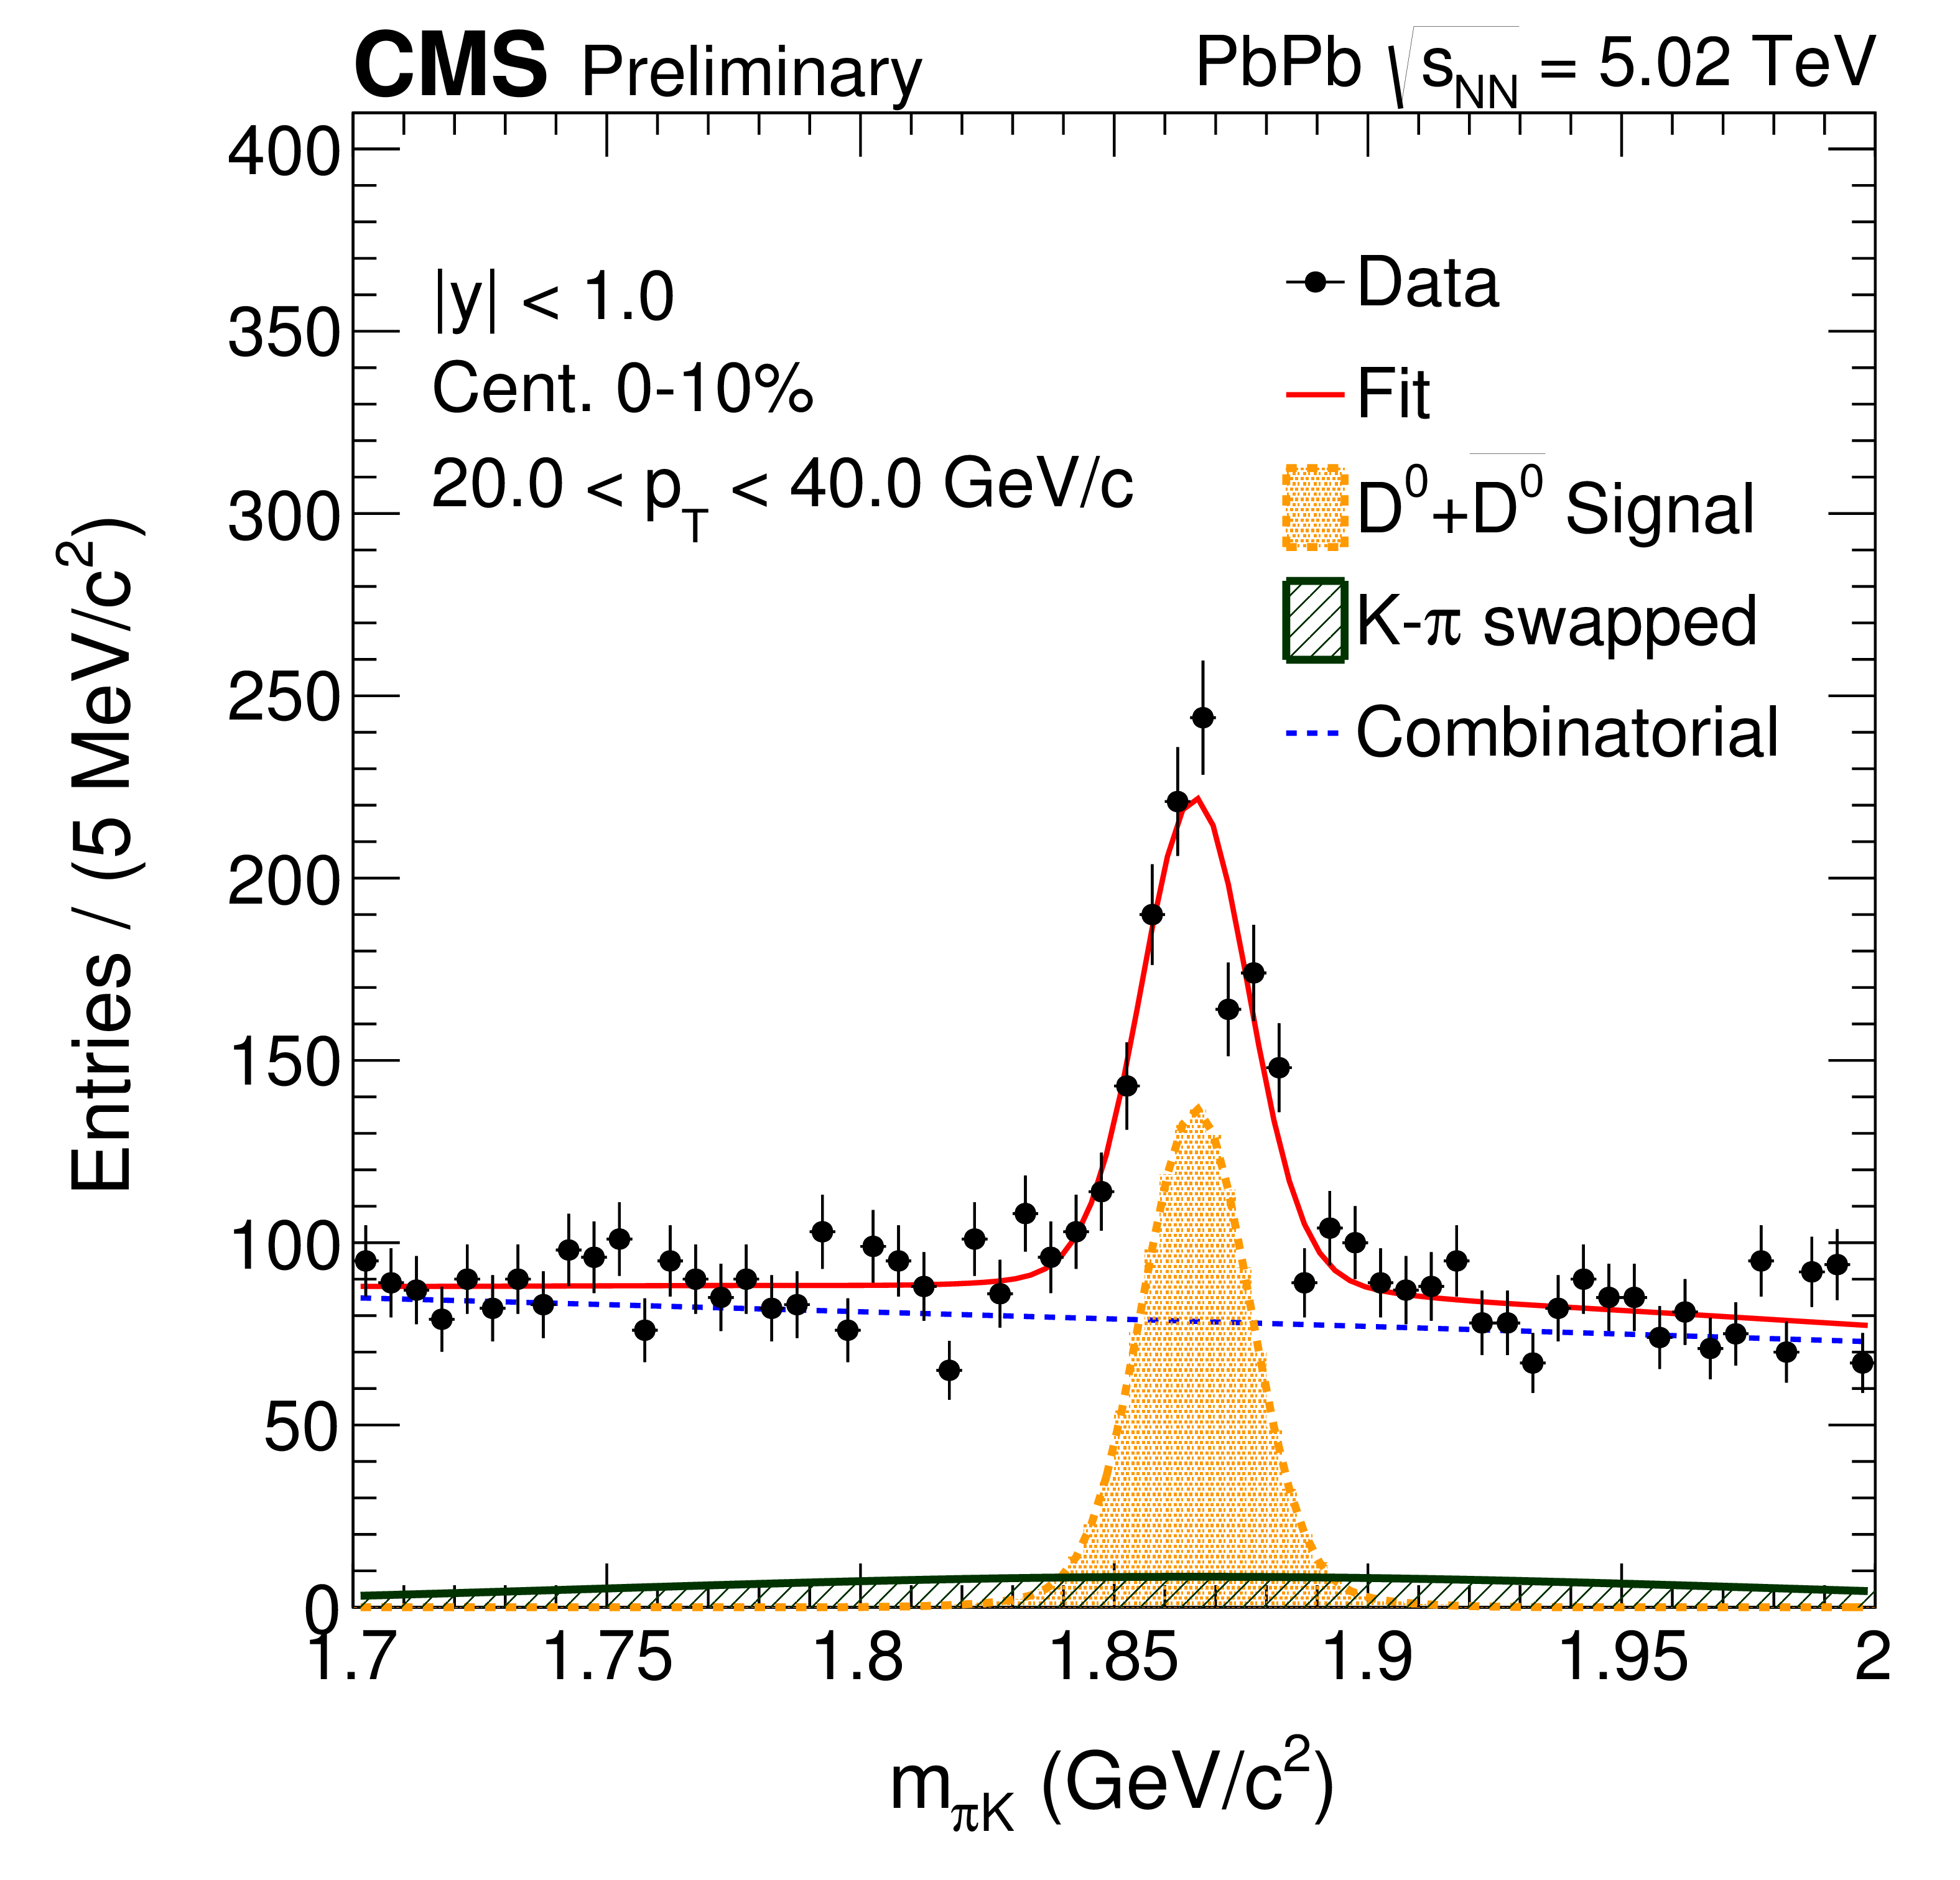
Additional Figure 1:
Mass spectrum fit in ${p_{\mathrm {T}}}$ intervals 2-3 GeV/$c$ (a) and 20-40 GeV/$c$ (b) for centrality 0-10%. |
png pdf |
Additional Figure 1-a:
Mass spectrum fit in ${p_{\mathrm {T}}}$ interval 2-3 GeV/$c$ for centrality 0-10%. |
png pdf |
Additional Figure 1-b:
Mass spectrum fit in ${p_{\mathrm {T}}}$ interval 20-40 GeV/$c$ for centrality 0-10%. |
png pdf |
Additional Figure 2:
Mass spectrum fit in ${p_{\mathrm {T}}}$ intervals 1-2 GeV/$c$ (a), 2-3 GeV/$c$ (b) and 20-40 GeV/$c$ (c) for centrality 10-30%. |
png pdf |
Additional Figure 2-a:
Mass spectrum fit in ${p_{\mathrm {T}}}$ interval 1-2 GeV/$c$ for centrality 10-30%. |
png pdf |
Additional Figure 2-b:
Mass spectrum fit in ${p_{\mathrm {T}}}$ interval 2-3 GeV/$c$ for centrality 10-30%. |
png pdf |
Additional Figure 2-c:
Mass spectrum fit in ${p_{\mathrm {T}}}$ interval 20-40 GeV/$c$ for centrality 10-30%. |
png pdf |
Additional Figure 3:
Mass spectrum fit in ${p_{\mathrm {T}}}$ intervals 1-2 GeV/$c$ (a), 2-3 GeV/$c$ (b) and 20-40 GeV/$c$ (c) for centrality 30-50%. |
png pdf |
Additional Figure 3-a:
Mass spectrum fit in ${p_{\mathrm {T}}}$ interval 1-2 GeV/$c$ for centrality 30-50%. |
png pdf |
Additional Figure 3-b:
Mass spectrum fit in ${p_{\mathrm {T}}}$ interval 2-3 GeV/$c$ for centrality 30-50%. |
png pdf |
Additional Figure 3-c:
Mass spectrum fit in ${p_{\mathrm {T}}}$ interval 20-40 GeV/$c$ for centrality 30-50%. |
png pdf |
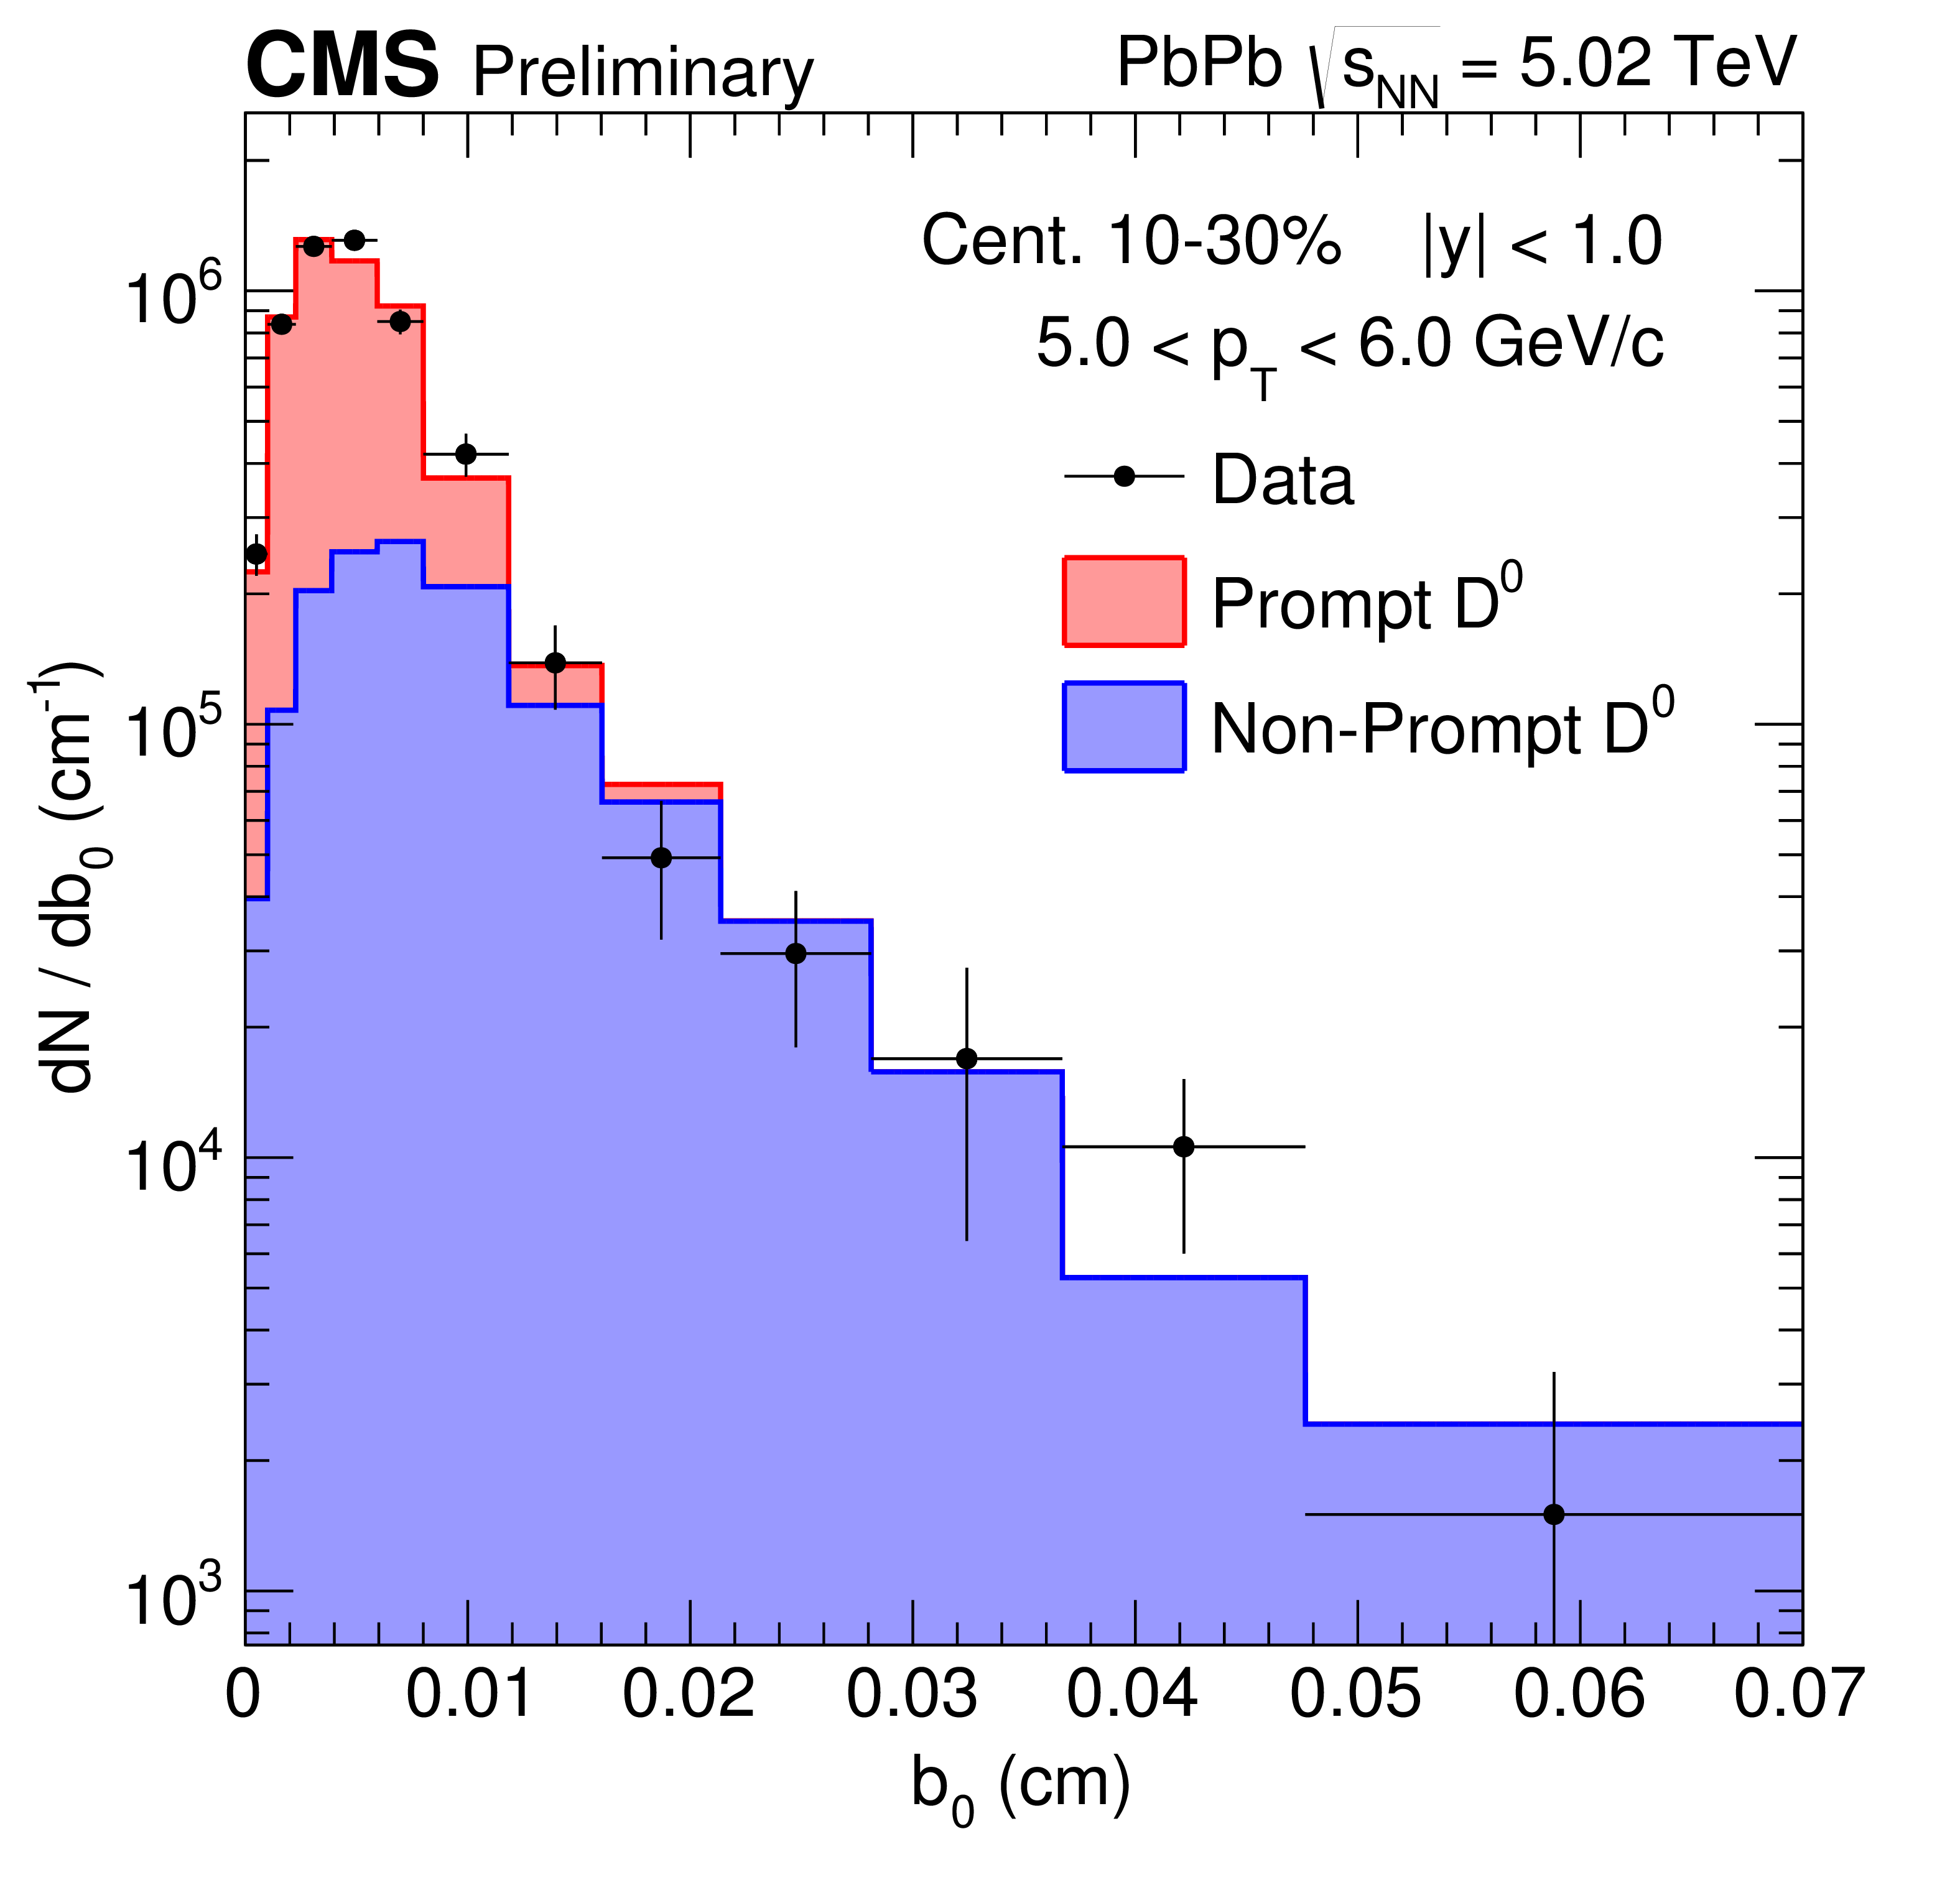
Additional Figure 4:
Example of template fit on impact parameter distributions to evaluate prompt ${\mathrm {D}^{0}}$ fraction in PbPb collisions in ${p_{\mathrm {T}}}$ interval 5-6 GeV/$c$ for centrality 10-30%. |
png pdf |
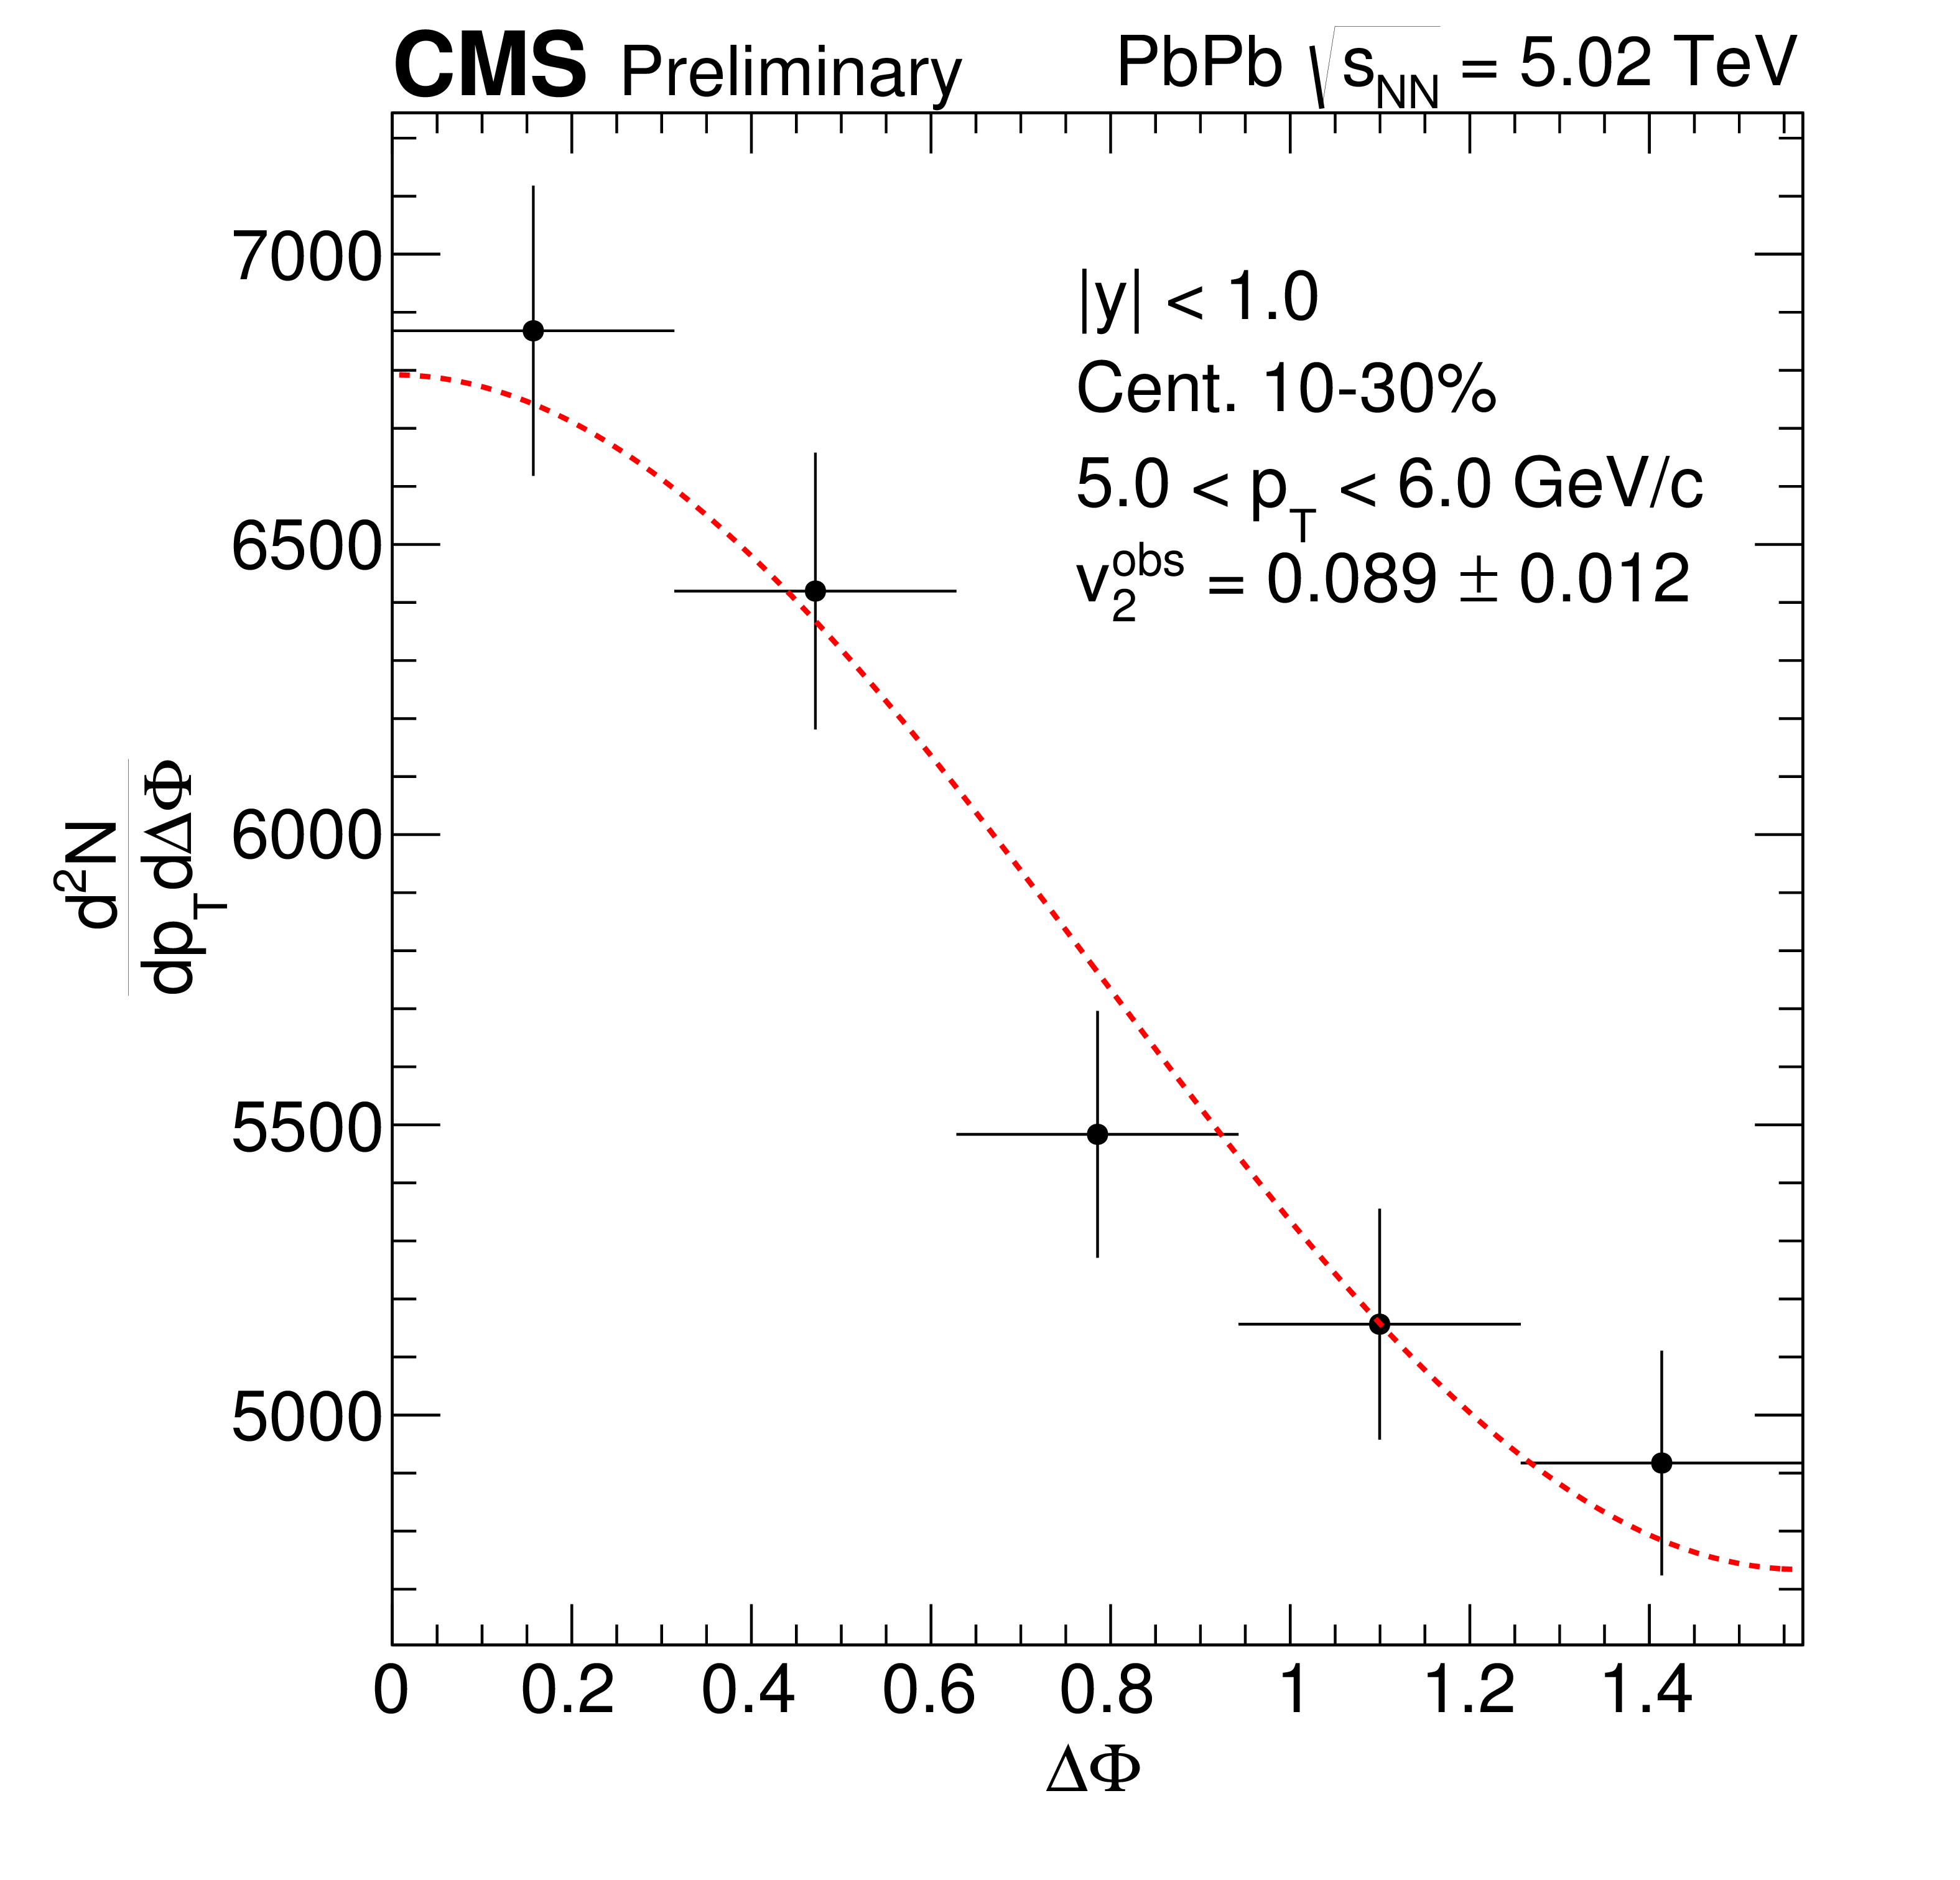
Additional Figure 5:
Example of $\mathrm{d}^{2}N$/($\mathrm{d} {p_{\mathrm {T}}} \mathrm{d} \Delta \phi $) fit for $v_{2}^{obs}$ with $\Delta \phi $ bins method in ${p_{\mathrm {T}}}$ interval 5-6 GeV/$c$ for centrality 10-30%. |
png pdf |
Additional Figure 6:
Prompt ${\mathrm {D}^{0}}$ fractions for centrality 0-10% (left), 10-30% (middle) and 30-50% (right) with all analysis cuts. |
png pdf |
Additional Figure 7:
Prompt ${\mathrm {D}^{0}}$ $v_{2}$ for centrality 0-10% (left), 10-30% (middle) and 30-50% (right). |
png pdf |
Additional Figure 8:
Prompt ${\mathrm {D}^{0}}$ $v_{3}$ for centrality 0-10% (left), 10-30% (middle) and 30-50% (right). |
png pdf |
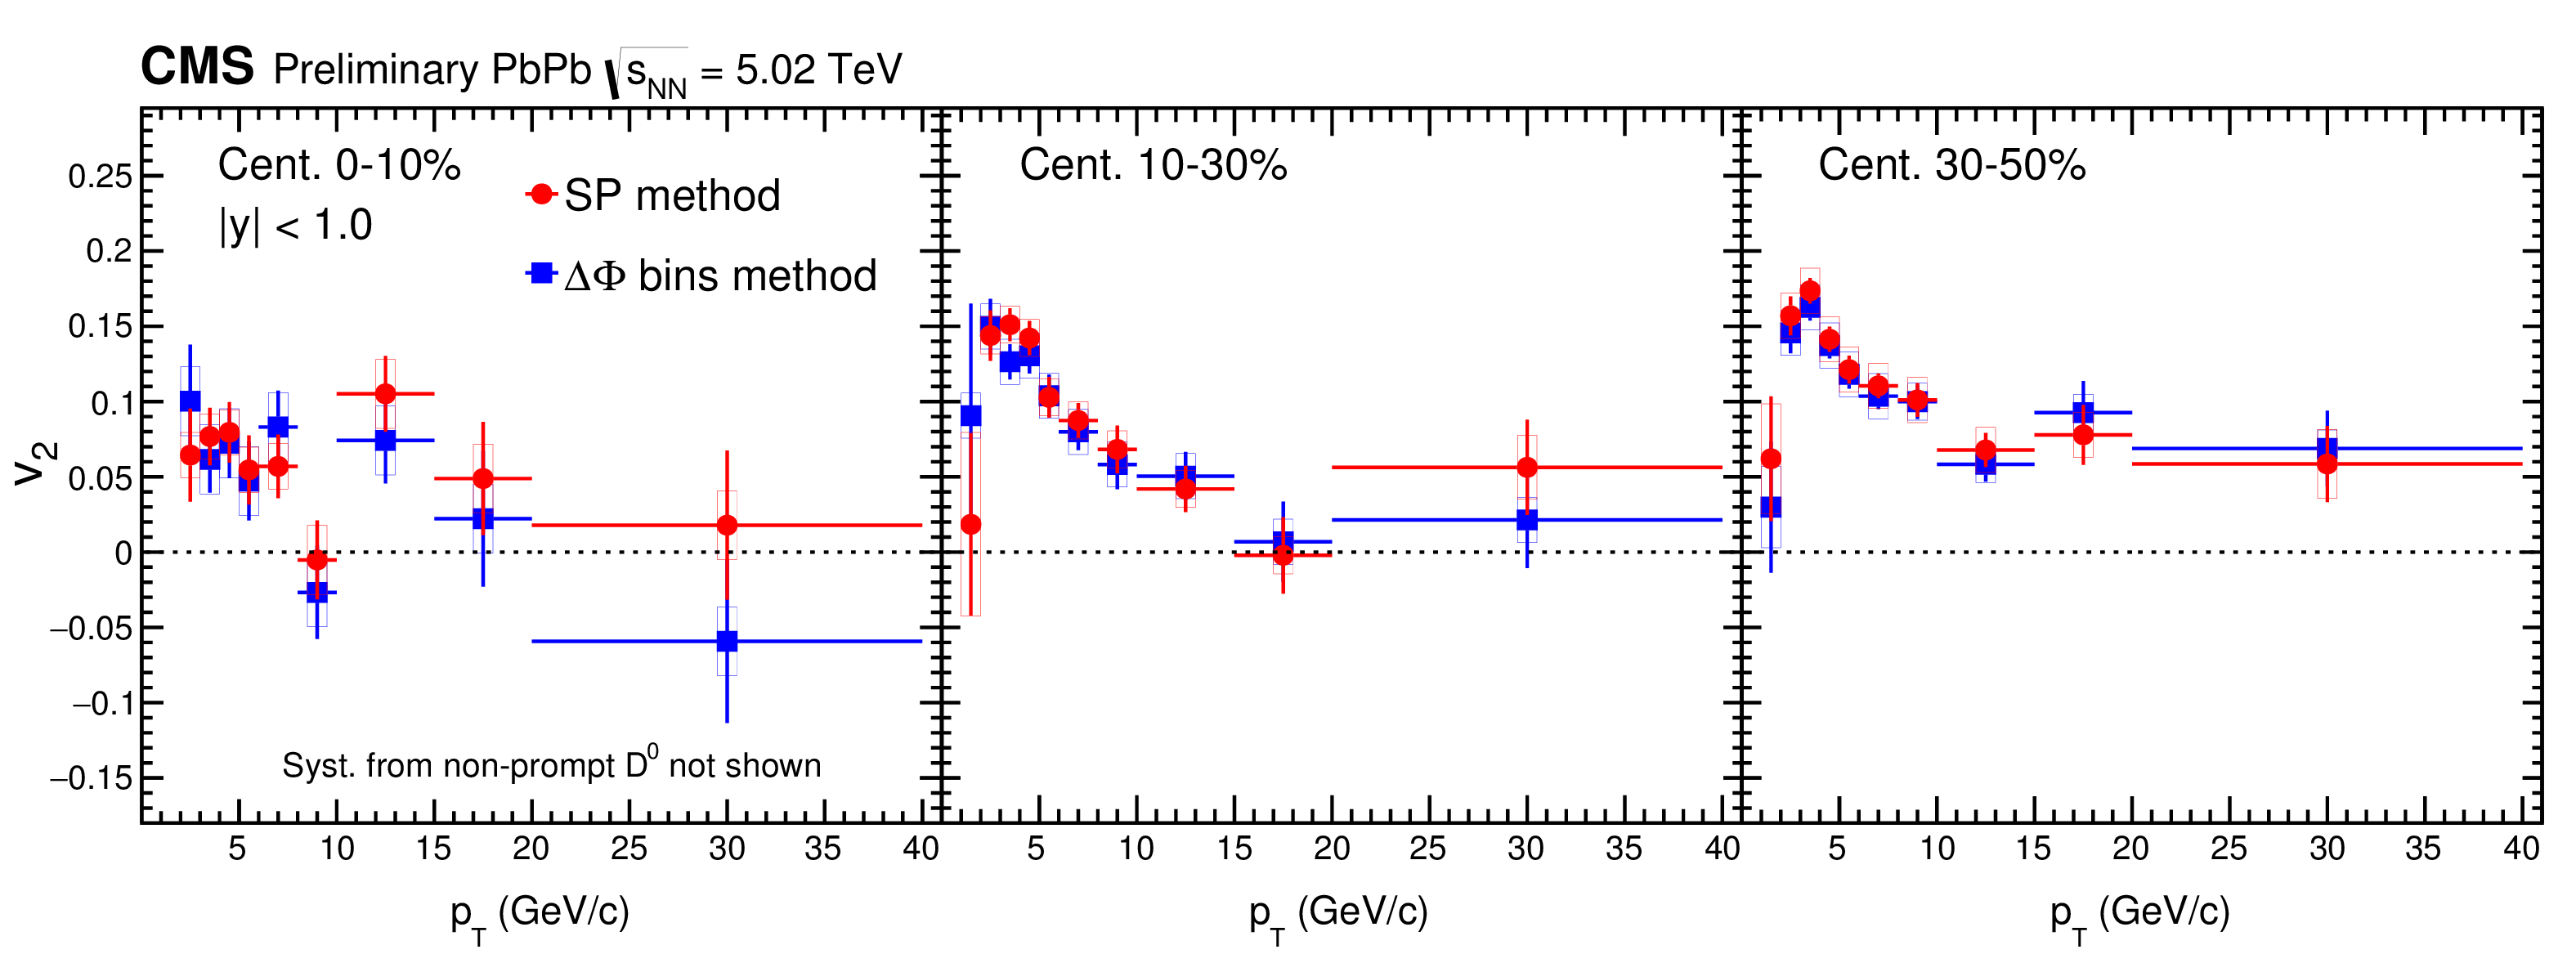
Additional Figure 9:
${\mathrm {D}^{0}}$ $v_{2}$ from SP method and $\Delta \phi $ bins method for centrality 0-10% (left), 10-30% (middle) and 30-50% (right). |
png pdf |
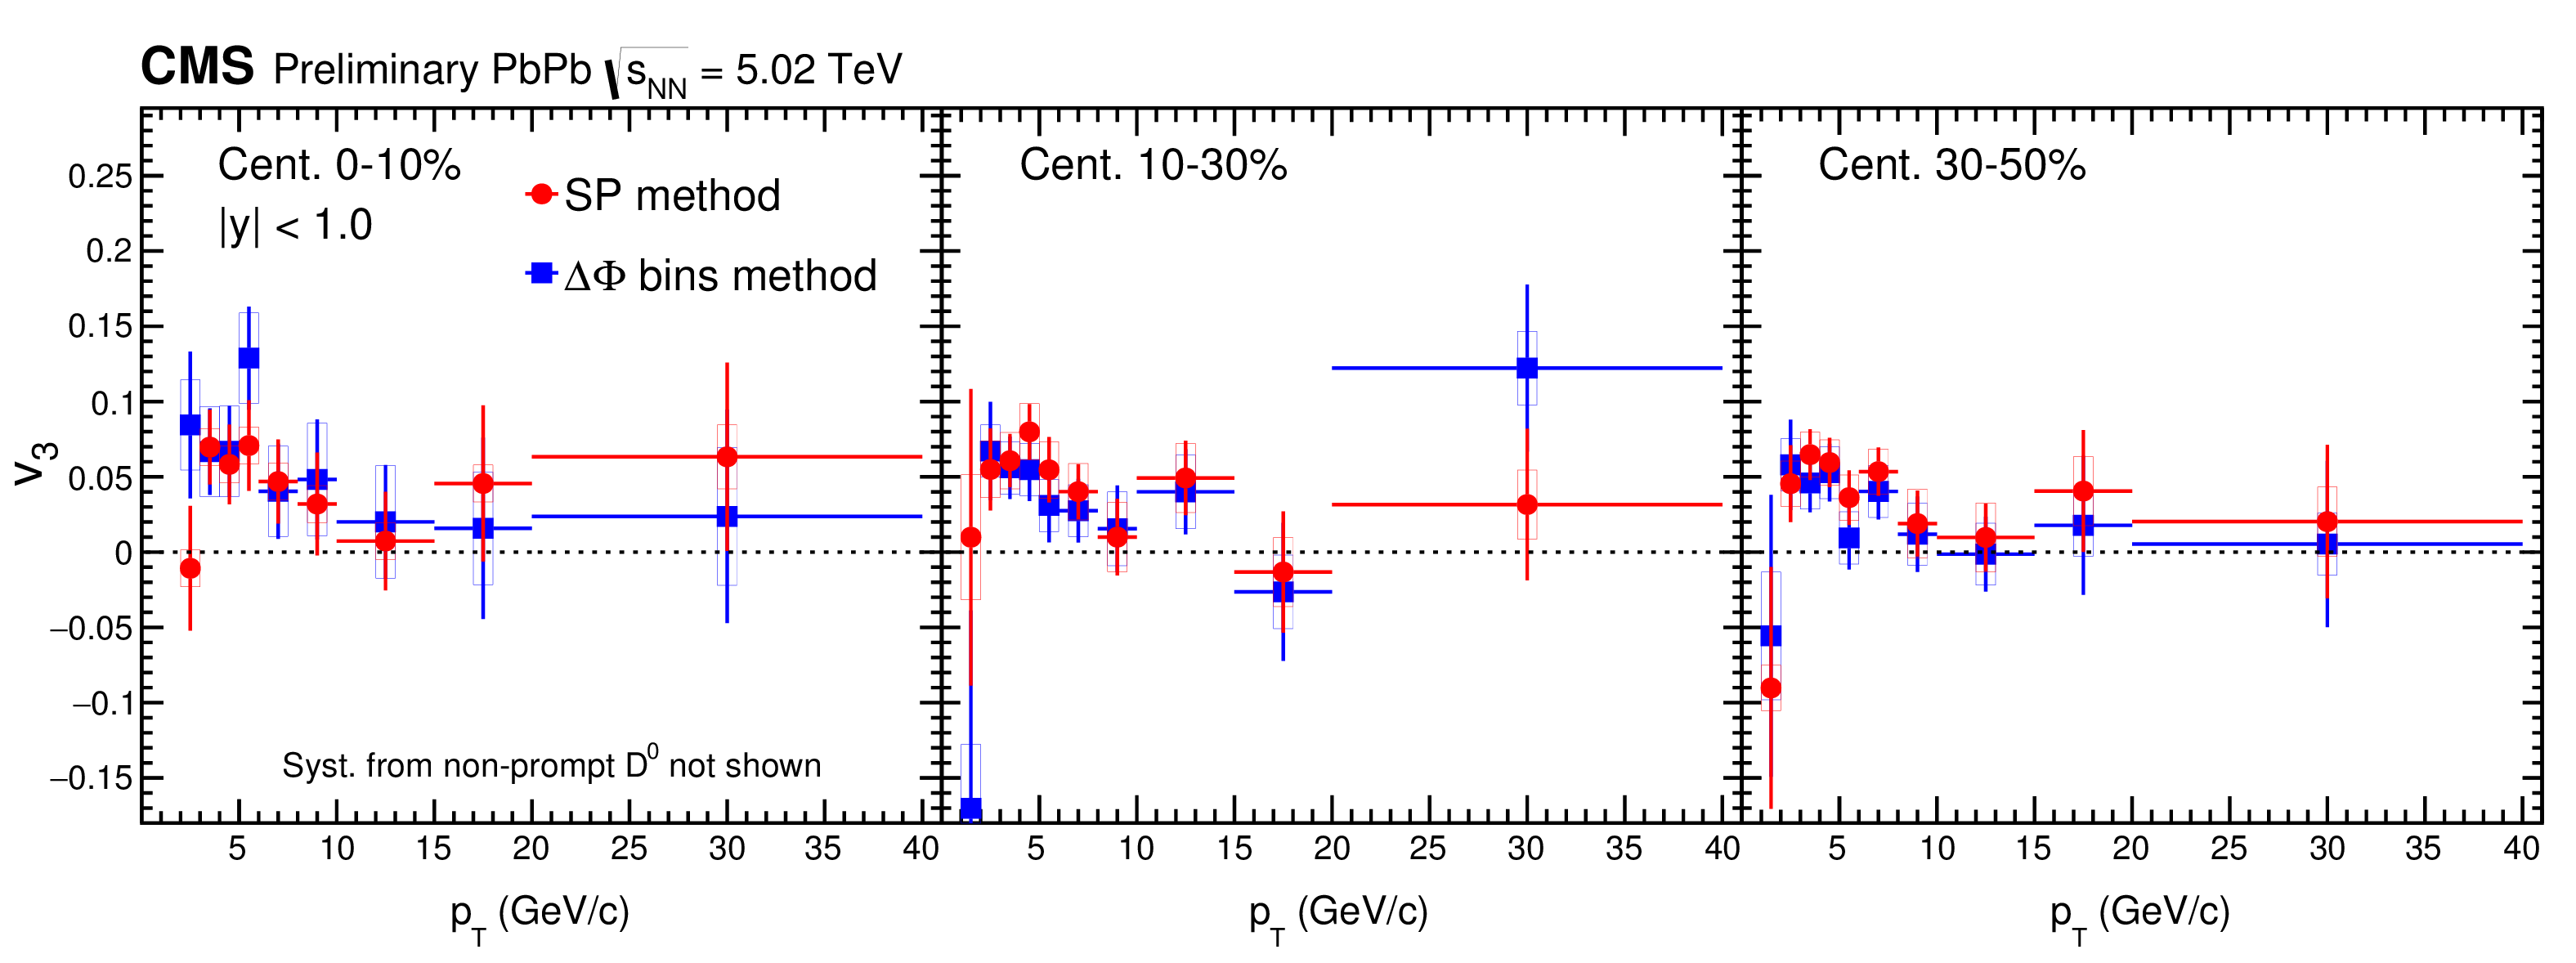
Additional Figure 10:
${\mathrm {D}^{0}}$ $v_{3}$ from SP method and $\Delta \phi $ bins method for centrality 0-10% (left), 10-30% (middle) and 30-50% (right). |
png pdf |
Additional Figure 11:
Prompt ${\mathrm {D}^{0}}$ $v_{2}$ for centrality 0-10% (left), 10-30% (middle) and 30-50% (right). Calculations from theoretical models (PRC 94 014909 (2016), PLB 735 (2014) 445, JHEP 1602 (2016) 169 and PRD 91 074027 (2015)) are plotted for comparison. Charged particle $v_{2}$ in the same centrality class is also plotted for comparison. |
png pdf |
Additional Figure 12:
Prompt ${\mathrm {D}^{0}}$ $v_{3}$ for centrality 0-10% (left), 10-30% (middle) and 30-50% (right). Calculations from LBT model (PRC 94 014909 (2016)) are plotted for comparison. Charged particle $v_{3}$ in the same centrality class is also plotted for comparison. |
png pdf |
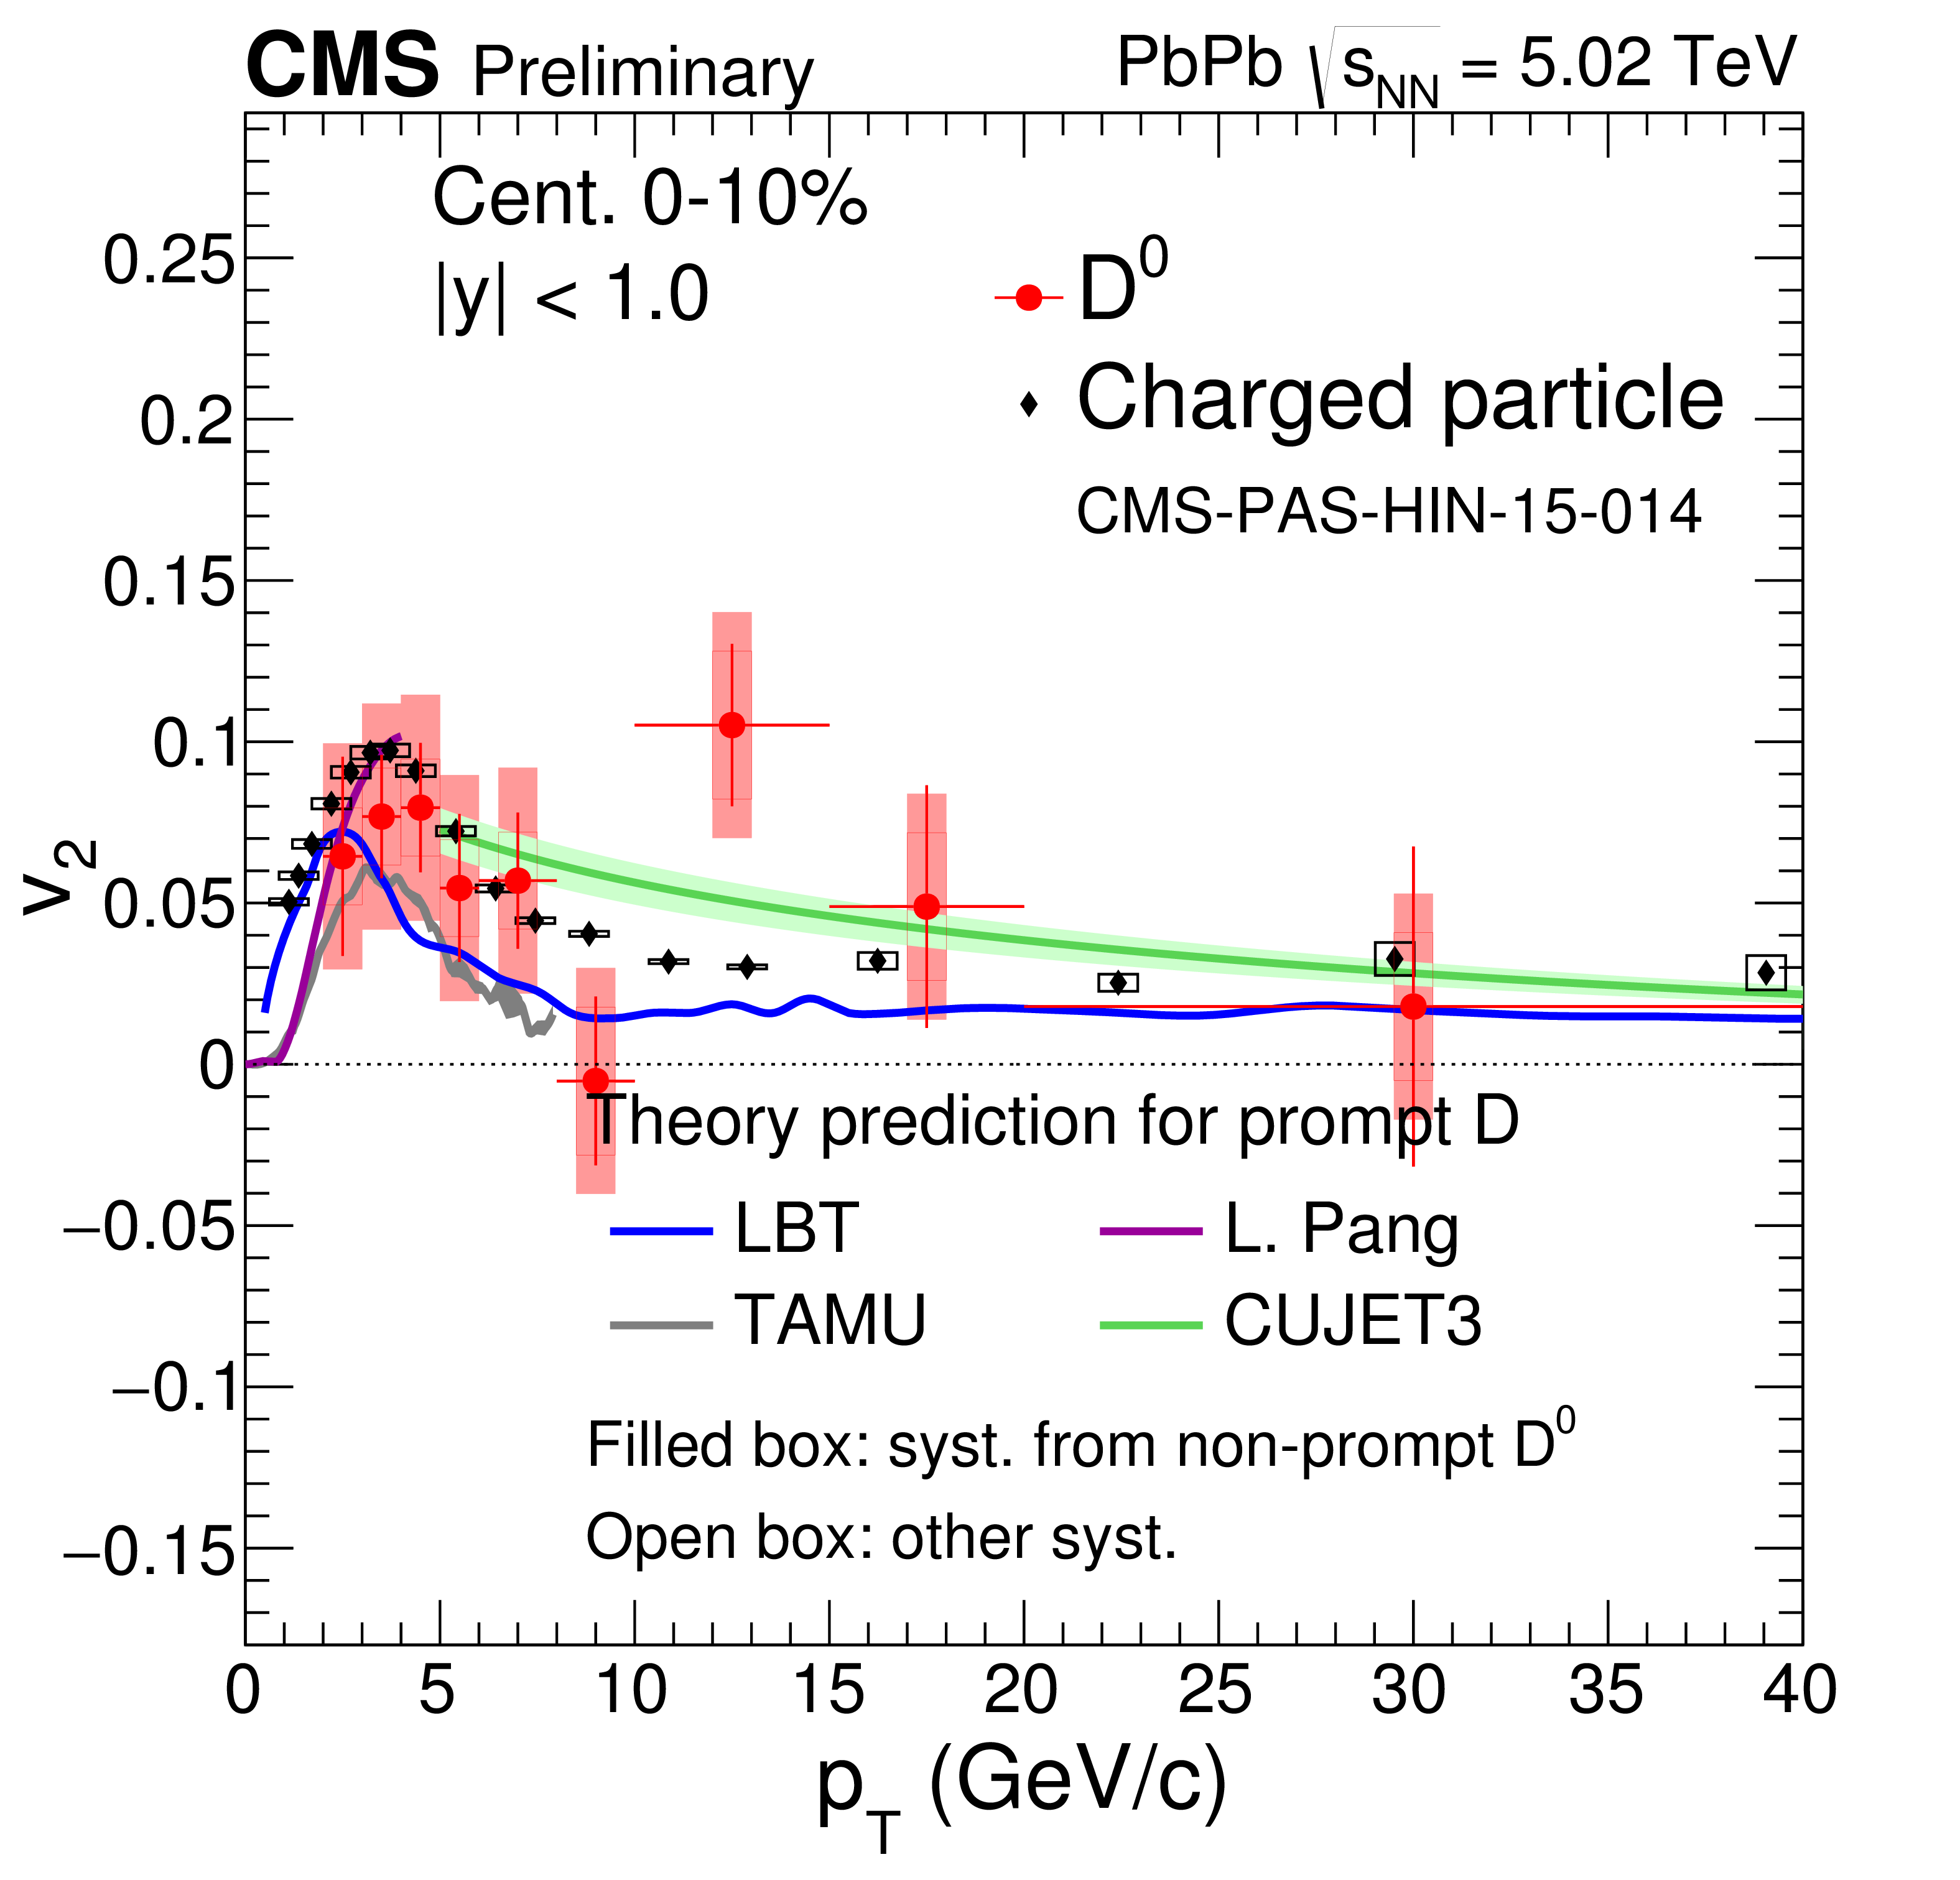
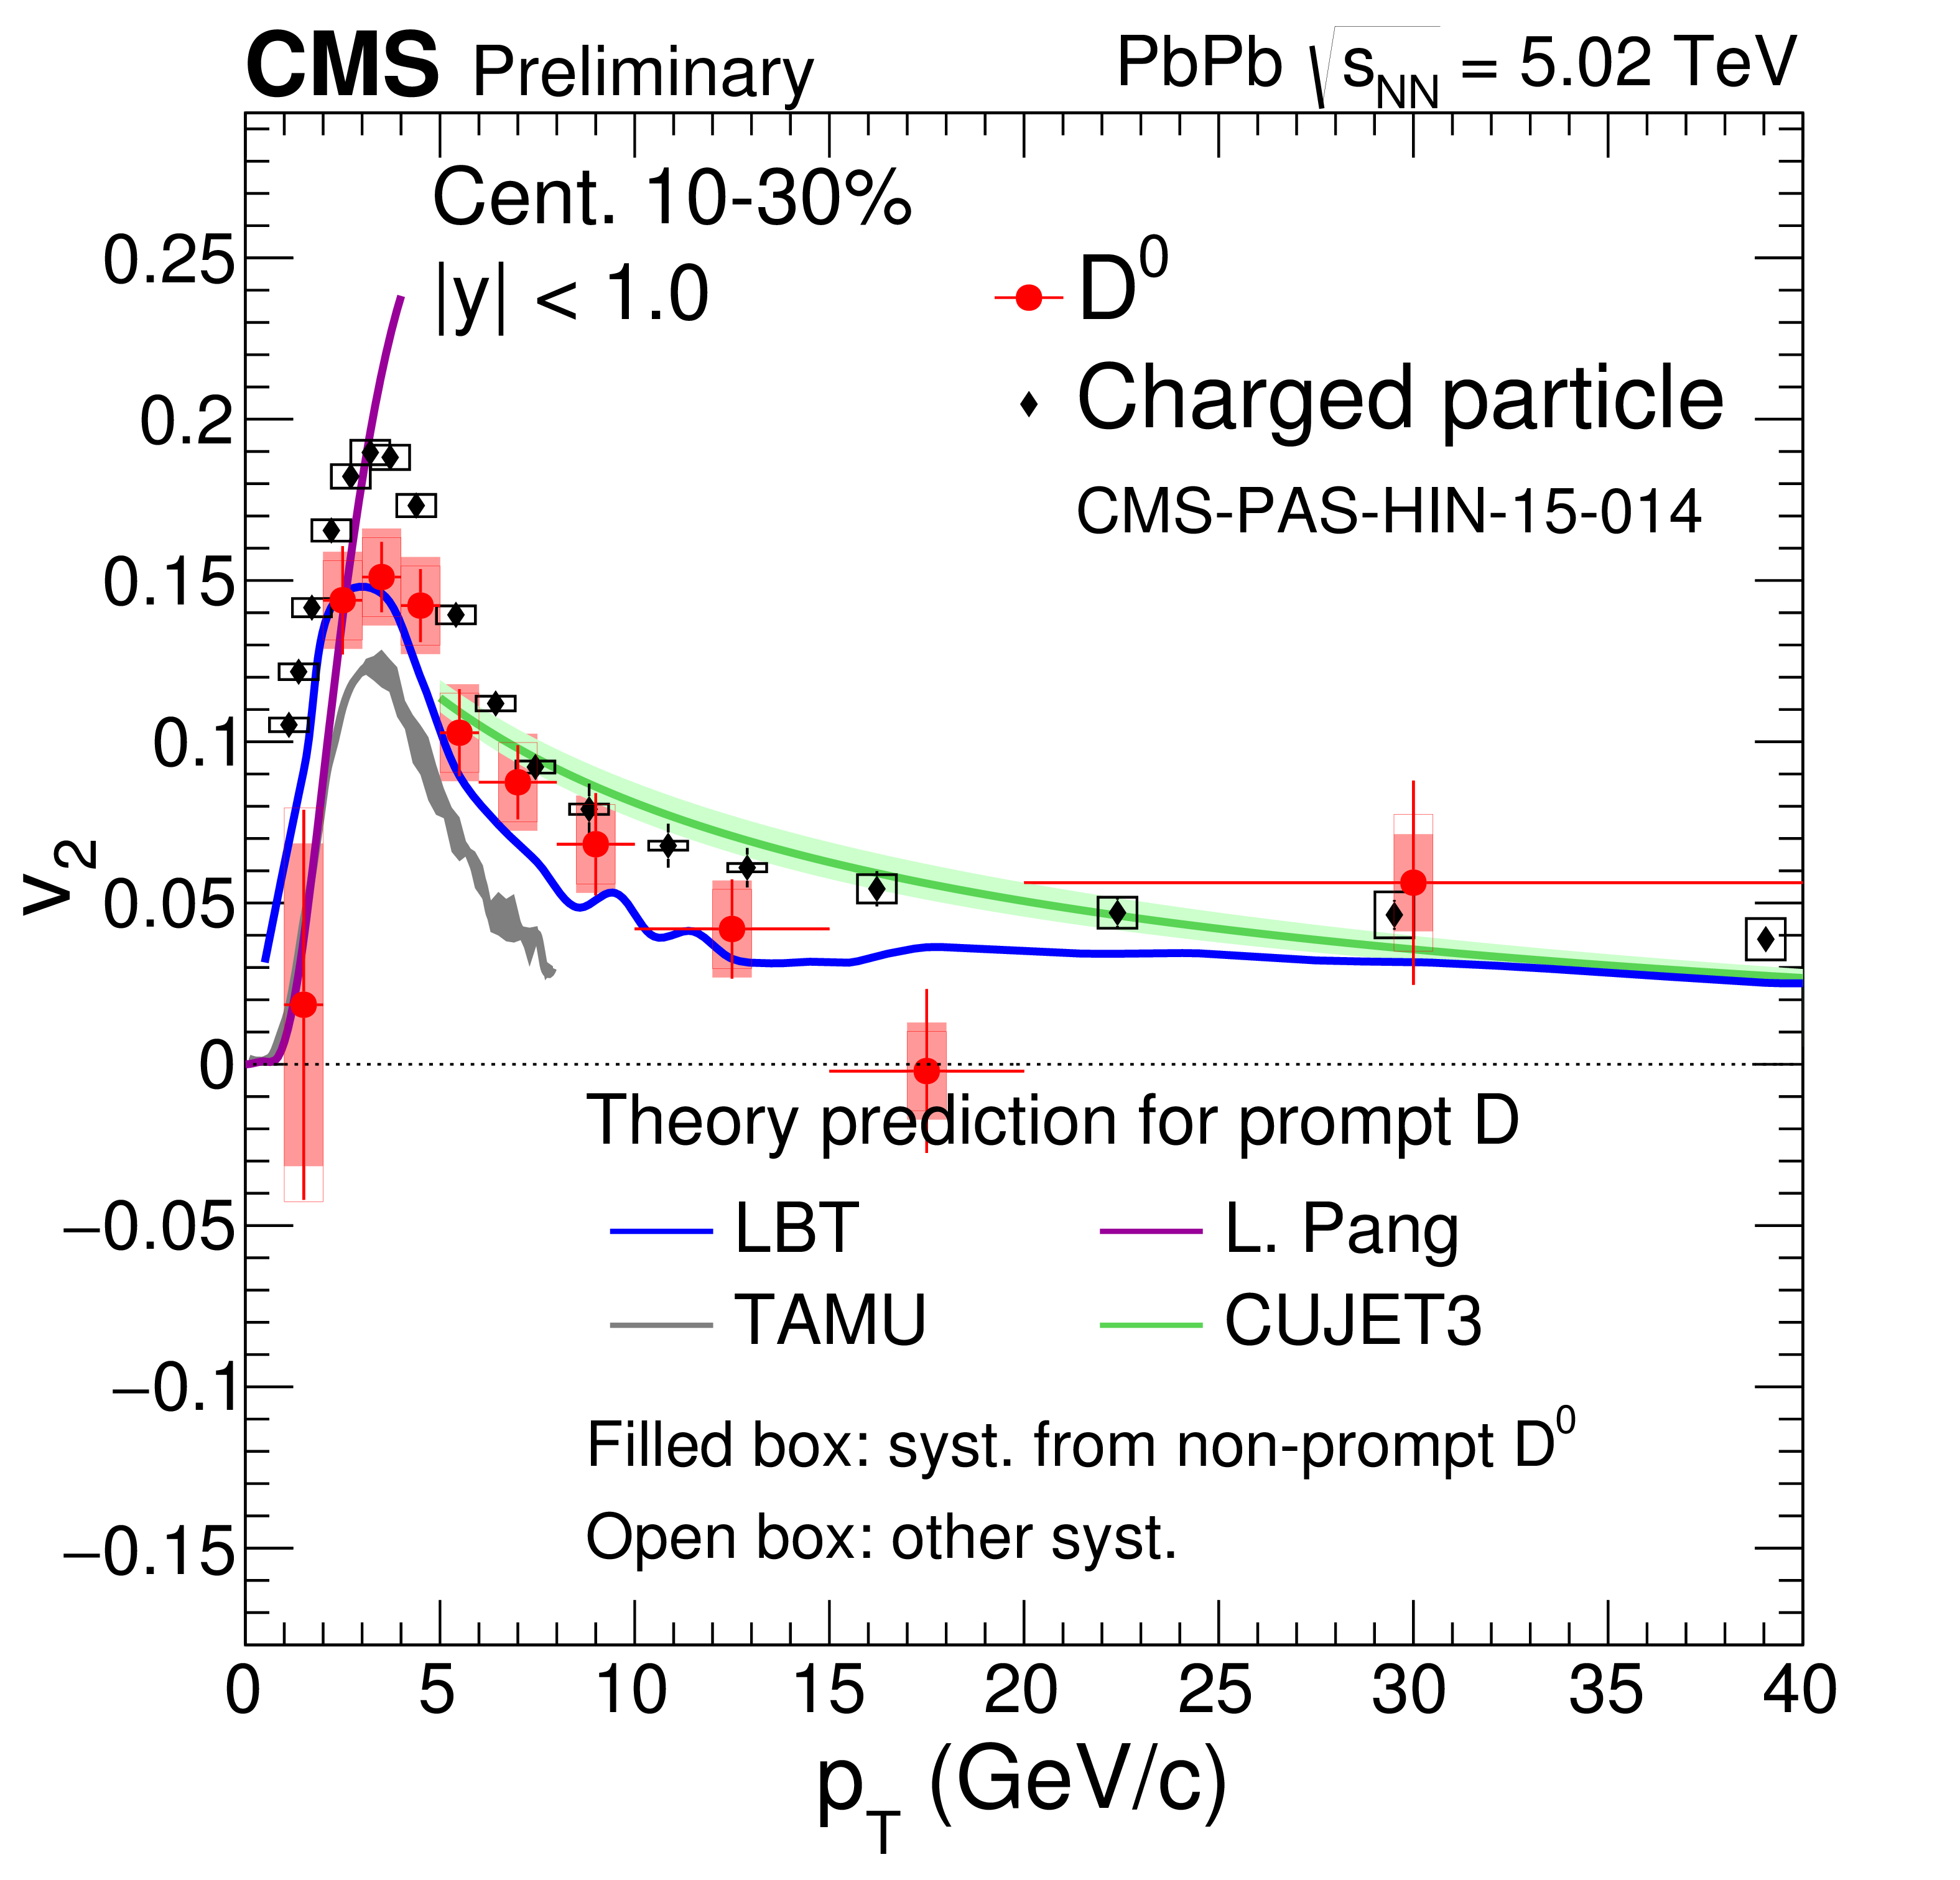
Additional Figure 13:
Prompt ${\mathrm {D}^{0}}$ $v_{2}$ for centrality 0-10% (a), 10-30% (b) and 30-50% (c). Calculations from theoretical models (PRC 94 014909 (2016), PLB 735 (2014) 445, JHEP 1602 (2016) 169 and PRD 91 074027 (2015)) are plotted for comparison. Charged particle $v_{2}$ in the same centrality class is also plotted for comparison. |
png pdf |
Additional Figure 13-a:
Prompt ${\mathrm {D}^{0}}$ $v_{2}$ for centrality 0-10%. Calculations from theoretical models (PRC 94 014909 (2016), PLB 735 (2014) 445, JHEP 1602 (2016) 169 and PRD 91 074027 (2015)) are plotted for comparison. Charged particle $v_{2}$ in the same centrality class is also plotted for comparison. |
png pdf |
Additional Figure 13-b:
Prompt ${\mathrm {D}^{0}}$ $v_{2}$ for centrality 10-30%. Calculations from theoretical models (PRC 94 014909 (2016), PLB 735 (2014) 445, JHEP 1602 (2016) 169 and PRD 91 074027 (2015)) are plotted for comparison. Charged particle $v_{2}$ in the same centrality class is also plotted for comparison. |
png pdf |
Additional Figure 13-c:
Prompt ${\mathrm {D}^{0}}$ $v_{2}$ for centrality 30-50%. Calculations from theoretical models (PRC 94 014909 (2016), PLB 735 (2014) 445, JHEP 1602 (2016) 169 and PRD 91 074027 (2015)) are plotted for comparison. Charged particle $v_{2}$ in the same centrality class is also plotted for comparison. |
png pdf |
Additional Figure 14:
Prompt ${\mathrm {D}^{0}}$ $v_{3}$ for centrality 0-10% (a), 10-30% (b) and 30-50% (c). Calculations from LBT model (PRC 94 014909 (2016)) are plotted for comparison. Charged particle $v_{3}$ in the same centrality class is also plotted for comparison. |
png pdf |
Additional Figure 14-a:
Prompt ${\mathrm {D}^{0}}$ $v_{3}$ for centrality 0-10%. Calculations from LBT model (PRC 94 014909 (2016)) are plotted for comparison. Charged particle $v_{3}$ in the same centrality class is also plotted for comparison. |
png pdf |
Additional Figure 14-b:
Prompt ${\mathrm {D}^{0}}$ $v_{3}$ for centrality 10-30%. Calculations from LBT model (PRC 94 014909 (2016)) are plotted for comparison. Charged particle $v_{3}$ in the same centrality class is also plotted for comparison. |
png pdf |
Additional Figure 14-c:
Prompt ${\mathrm {D}^{0}}$ $v_{3}$ for centrality 30-50%. Calculations from LBT model (PRC 94 014909 (2016)) are plotted for comparison. Charged particle $v_{3}$ in the same centrality class is also plotted for comparison. |
png pdf |
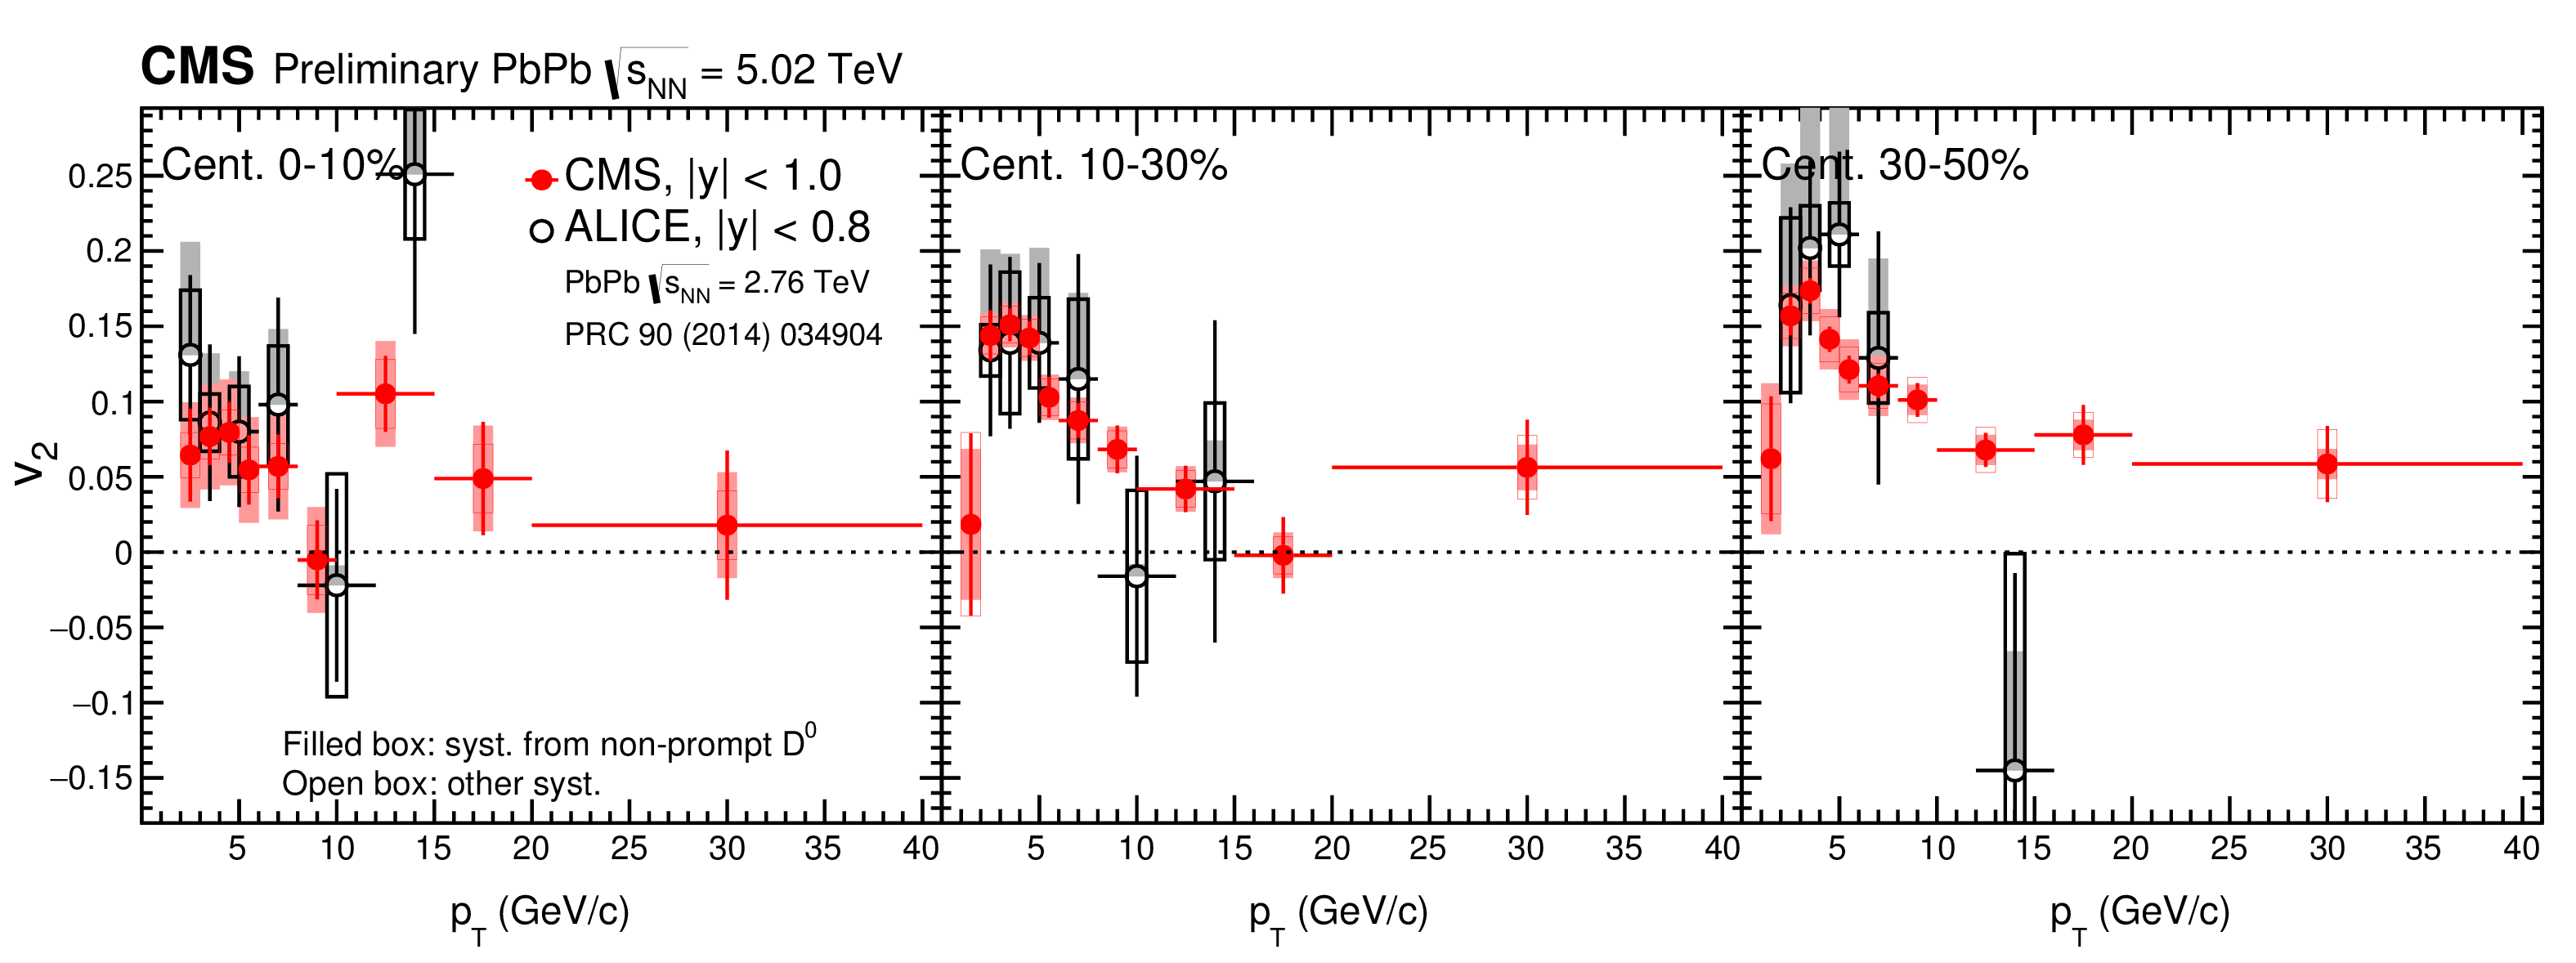
Additional Figure 15:
Prompt ${\mathrm {D}^{0}}$ $v_{2}$ compared with ALICE results (PRC 90 (2014) 034904) for centrality 0-10% (left), 10-30% (middle) and 30-50% (right). |
| References | ||||
| 1 | Y. L. Dokshitzer and D. E. Kharzeev | Heavy quark colorimetry of QCD matter | PLB519 (2001) 199--206 | hep-ph/0106202 |
| 2 | M. Gyulassy, I. Vitev, and X.-N. Wang | High $ {\mathit{p}}_{\mathit{T}} $ Azimuthal Asymmetry in Noncentral $ \mathit{A}+\mathit{A} $ at RHIC | PRL 86 (Mar, 2001) 2537--2540 | |
| 3 | E. V. Shuryak | Azimuthal asymmetry at large $ {p}_{t} $ seem to be too large for a pure ``jet quenching'' | PRC 66 (Aug, 2002) 027902 | |
| 4 | CMS Collaboration | Prompt and non-ptompt $ J/\psi R_{AA} $ with 150 $ \mu b^{-1} $ integrated PbPb luminosity at $ \sqrt{s_{NN}} = $ 2.76 TeV | CDS | |
| 5 | CMS Collaboration | Evidence of b-Jet Quenching in PbPb Collisions at $ \sqrt{s_{NN}}=$ 2.76 TeV | Phys.Rev.Lett. 113 (2014), no. 13, 132301 | CMS-HIN-12-003 1312.4198 |
| 6 | CMS Collaboration | Transverse momentum spectra of inclusive b jets in pPb collisions at $ \sqrt{s_{NN}} = $ 5.02 TeV | PLB754 (2016) 59--80 | CMS-HIN-14-007 1510.03373 |
| 7 | CMS Collaboration | Study of B meson production in pPb collisions at $ \sqrt(s_NN) = $ 5.02 TeV | CMS-HIN-14-004 1508.06678 |
|
| 8 | ALICE Collaboration | Suppression of high transverse momentum D mesons in central Pb-Pb collisions at $ \sqrt{s_{NN}}= $ 2.76 TeV | JHEP 09 (2012) 112 | 1203.2160 |
| 9 | ALICE Collaboration | Centrality dependence of high-p$ _{T} $ D meson suppression in Pb-Pb collisions at $ \sqrt{s_{NN}}= $ 2.76 TeV | JHEP 11 (2015) 205 | 1506.06604 |
| 10 | ALICE Collaboration | Transverse momentum dependence of D-meson production in Pb-Pb collisions at $ \sqrt{s_{NN}}= $ 2.76 TeV | JHEP 03 (2016) 081 | 1509.06888 |
| 11 | CMS Collaboration Collaboration | Nuclear Modification Factor of prompt $ {D}^{\rm 0} $ in PbPb Collisions at $ \sqrt{s_{_{\text{NN}}}} $ = 2.76 TeV | Technical Report CMS-PAS-HIN-15-005, CERN, Geneva | |
| 12 | ALICE Collaboration | Measurement of prompt $ D $-meson production in $ p-Pb $ collisions at $ \sqrt{s_{NN}} $ = 5.02 TeV | PRL 113 (2014), no. 23, 232301 | 1405.3452 |
| 13 | CMS Collaboration Collaboration | $ \mathrm{D}^0 $ meson nuclear modification factor in PbPb collisions at $ \sqrt{s_\mathrm{NN}} = $ 5.02 TeV | Technical Report CMS-PAS-HIN-16-001, CERN, Geneva | |
| 14 | CMS Collaboration | The CMS experiment at the CERN LHC | JINST 3 (2008) S08004 | CMS-00-001 |
| 15 | GEANT4 Collaboration | GEANT4---a simulation toolkit | NIM506 (2003) 250 | |
| 16 | Particle Data Group Collaboration | Review of Particle Physics (RPP) | Phys.Rev. D86 (2012) 010001 | |
| 17 | STAR Collaboration | Elliptic flow from two and four particle correlations in Au+Au collisions at $ \sqrt{s_{NN}}= $ 130 GeV | Phys.Rev. C66 (2002) 034904 | nucl-ex/0206001 |
| 18 | M. Luzum and J.-Y. Ollitrault | Eliminating experimental bias in anisotropic-flow measurements of high-energy nuclear collisions | Phys.Rev. C87 (2013), no. 4, 044907 | 1209.2323 |
| 19 | E877 Collaboration | Proton and pion production relative to the reaction plane in Au + Au collisions at 11-A-GeV/c | PRC56 (1997) 3254--3264 | nucl-ex/9707002 |
| 20 | M. Cacciari, M. Greco, P. Nason | The $ p_T $ Spectrum in Heavy-Flavour Hadroproduction | JHEP 007, 9805 (1998) | |
| 21 | CMS Collaboration Collaboration | High-$ p_\mathrm{T} $ track $ v_{n} $ harmonics in PbPb collisions at 5.02 TeV | Technical Report CMS-PAS-HIN-15-014, CERN, Geneva | |
|
|
Compact Muon Solenoid LHC, CERN |
|

|

|

|

|

|