

Compact Muon Solenoid
LHC, CERN
| CMS-PAS-HIG-17-016 | ||
| Search for the $ \mathrm{tH(H \to b\bar{b})}$ process in pp collisions at $\sqrt{s}=$ 13 TeV and study of Higgs boson couplings | ||
| CMS Collaboration | ||
| June 2018 | ||
| Abstract: A search for the production of a Higgs boson in association with a single top quark (tH) is presented. The analysis focuses on Higgs boson decays to bottom quark-antiquark pairs and leptonic top quark decays. The full data set of pp collisions recorded by the CMS detector in 2016 at a center-of-mass energy of 13 TeV, corresponding to an integrated luminosity of 35.9 fb$^{-1}$, is analyzed. A multivariate classifier is used to discriminate signal candidates from the overwhelming background processes. Several scenarios for varied strength of the coupling of the Higgs boson to top quarks and to vector bosons are examined and limits on the combined cross section for Higgs boson production, either in association with a pair of top quarks or a single top quark, are derived. In addition, limits on the signal strength of Higgs boson production in association with a single top quark are set for two specific cases. The observed (expected) limit for tH production in the standard model is 89.5 (41.4) times the predicted cross section. In case of an inverted top-Higgs coupling, the observed (expected) limit is 5.83 (2.94) times the prediction. | ||
| Links: CDS record (PDF) ; inSPIRE record ; CADI line (restricted) ; | ||
| Figures | |
png pdf |
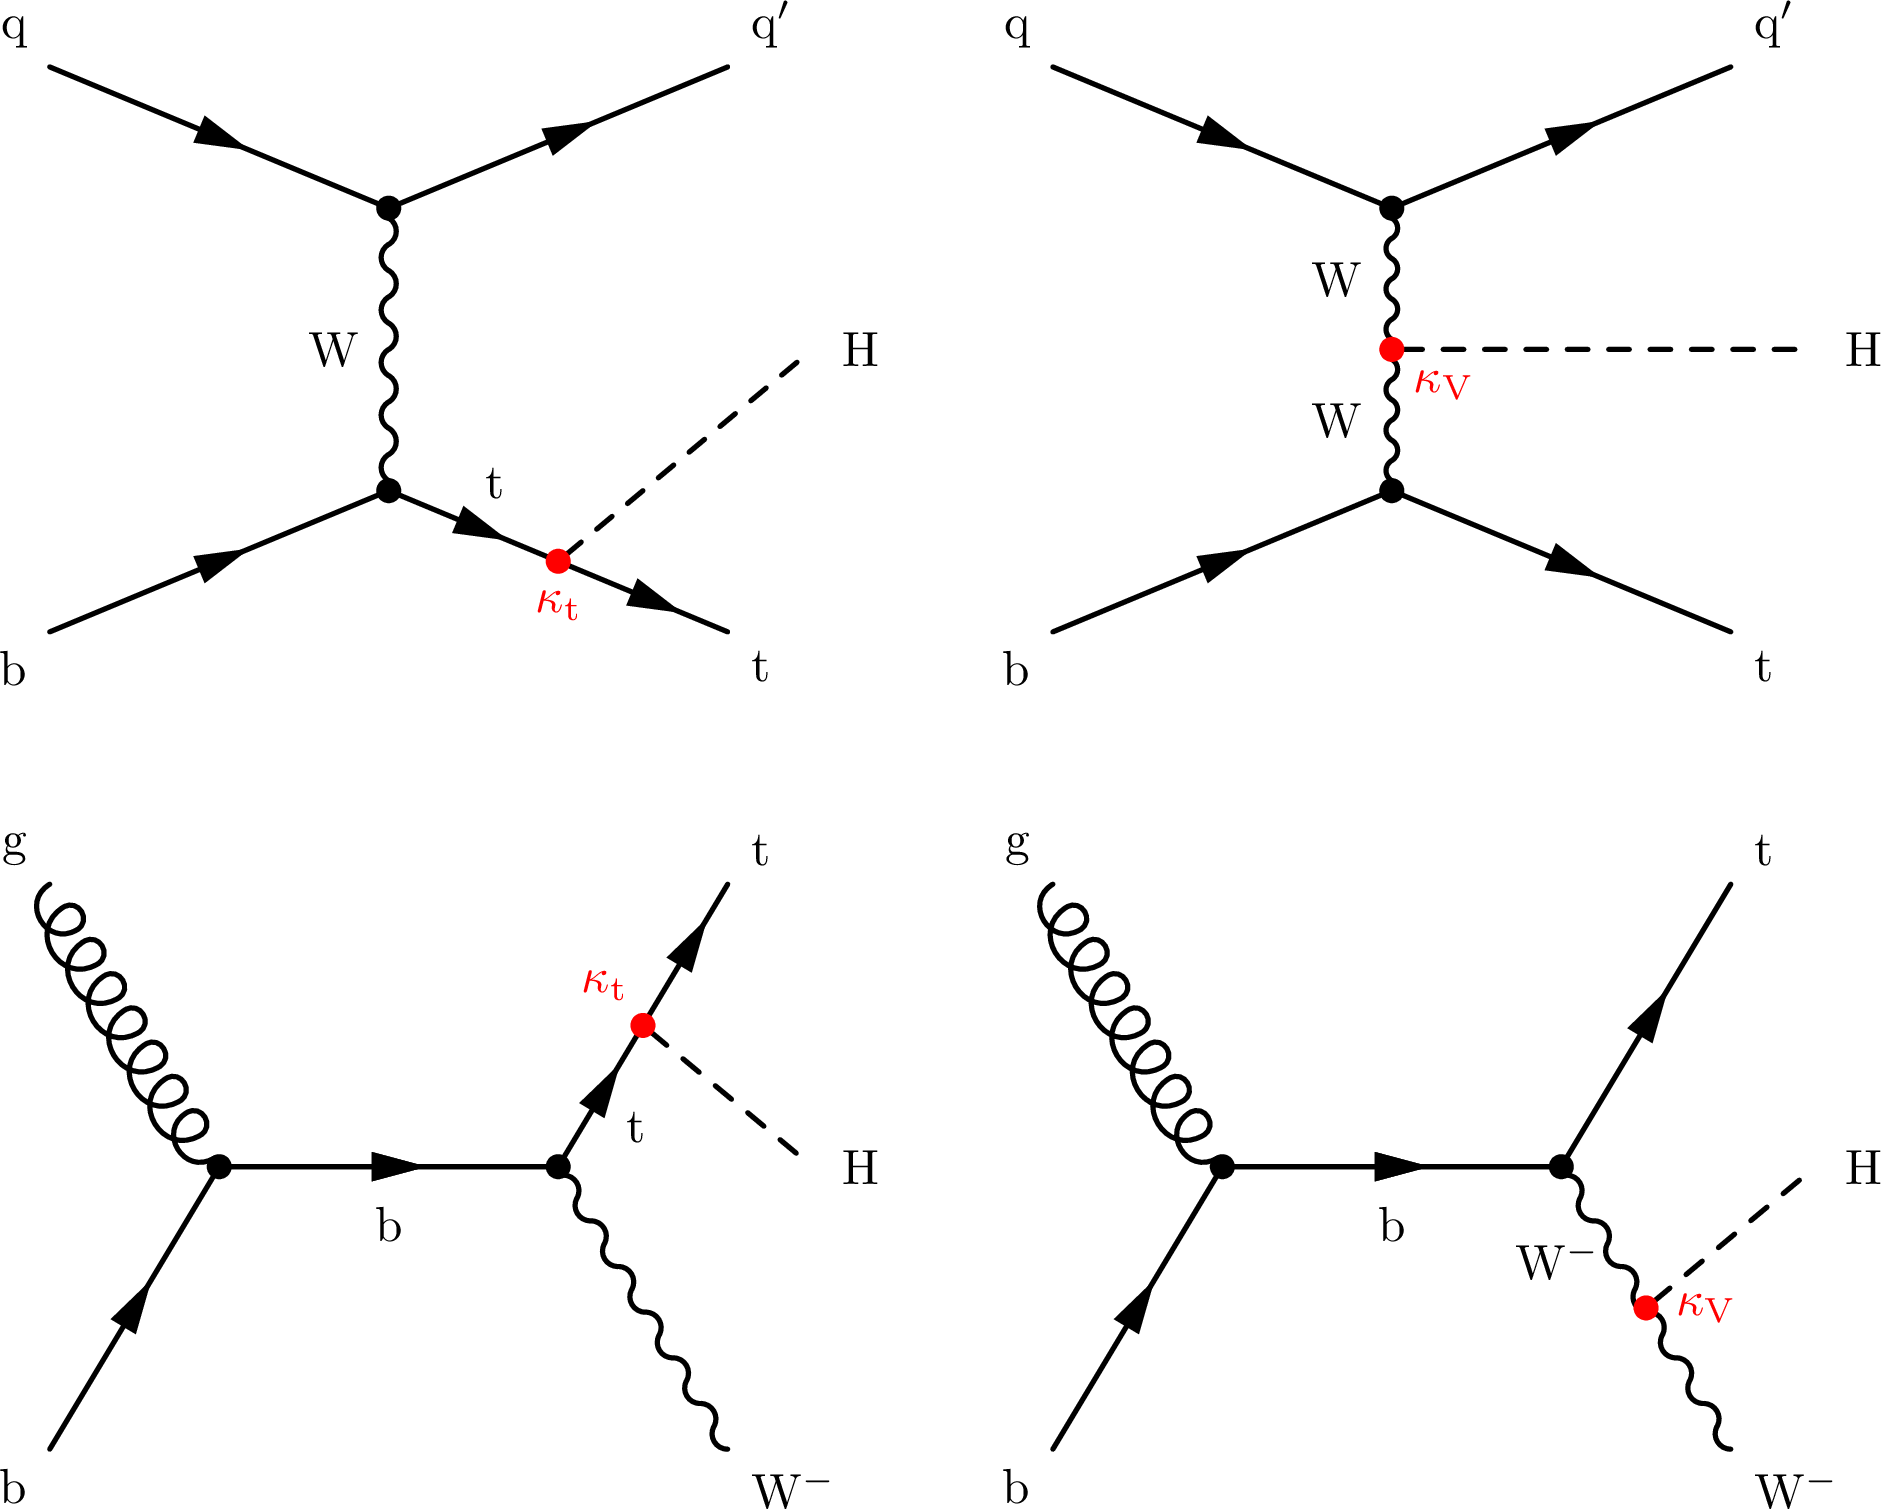
Figure 1:
Representative Feynman diagrams for the associated production of single top quarks and Higgs bosons in the $t$ channel (top row) and in the tW channel (bottom row). The Higgs boson can couple either to the top quark or the W boson in both processes. |
png pdf |
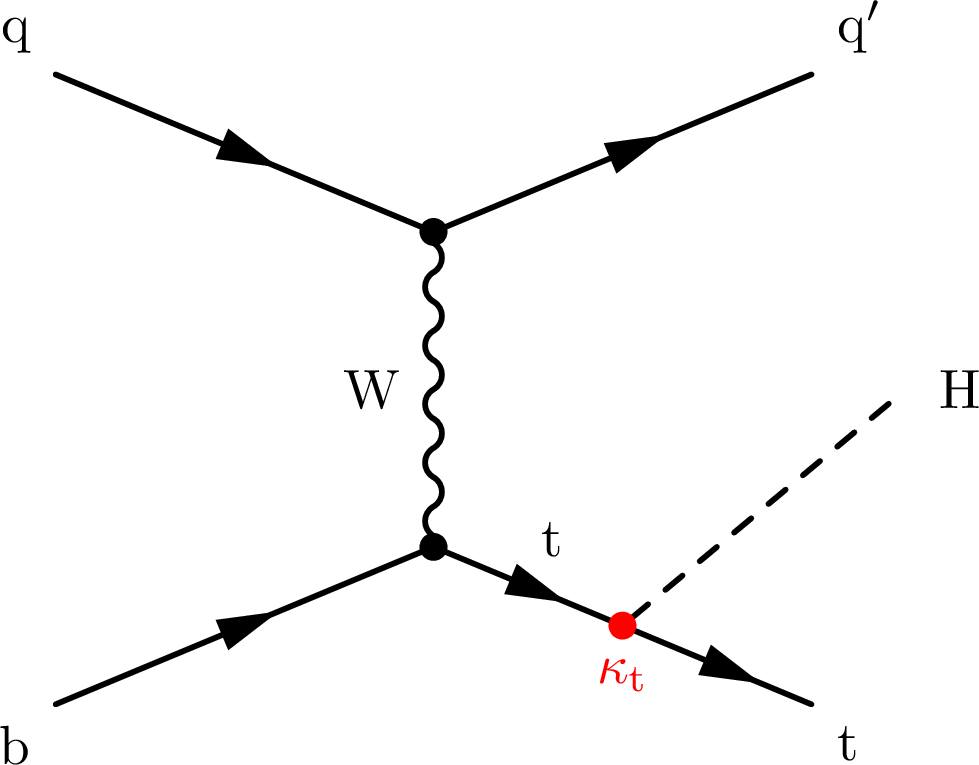
Figure 1-a:
Representative Feynman diagrams for the associated production of single top quarks and Higgs bosons in the $t$ channel (top row) and in the tW channel (bottom row). The Higgs boson can couple either to the top quark or the W boson in both processes. |
png pdf |
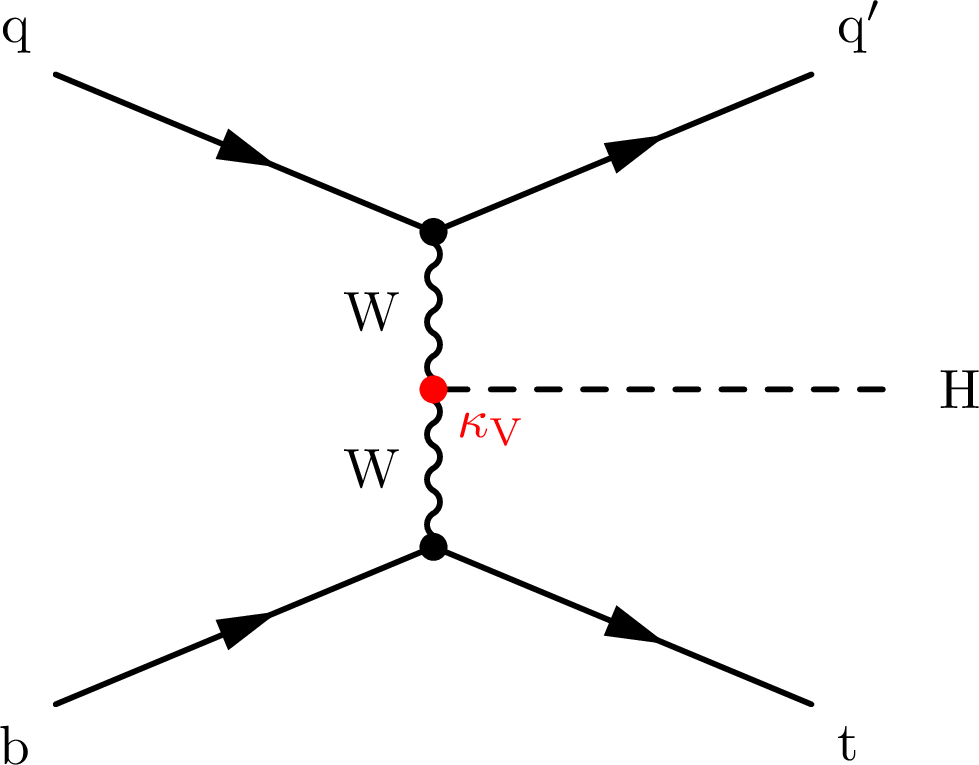
Figure 1-b:
Representative Feynman diagrams for the associated production of single top quarks and Higgs bosons in the $t$ channel (top row) and in the tW channel (bottom row). The Higgs boson can couple either to the top quark or the W boson in both processes. |
png pdf |
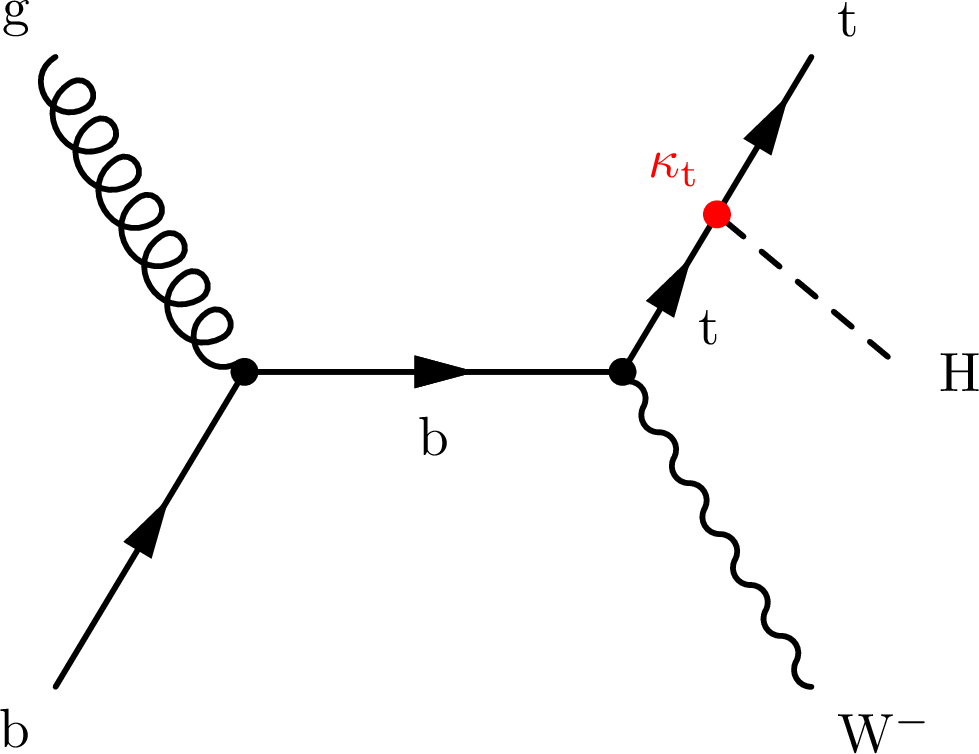
Figure 1-c:
Representative Feynman diagrams for the associated production of single top quarks and Higgs bosons in the $t$ channel (top row) and in the tW channel (bottom row). The Higgs boson can couple either to the top quark or the W boson in both processes. |
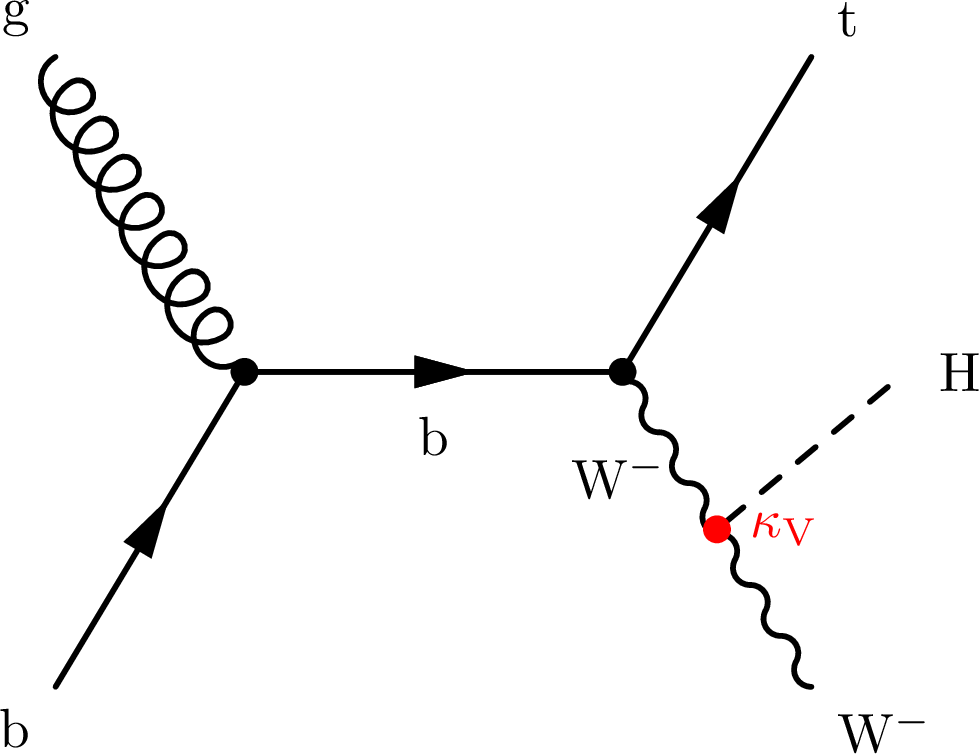
png pdf |
Figure 1-d:
Representative Feynman diagrams for the associated production of single top quarks and Higgs bosons in the $t$ channel (top row) and in the tW channel (bottom row). The Higgs boson can couple either to the top quark or the W boson in both processes. |
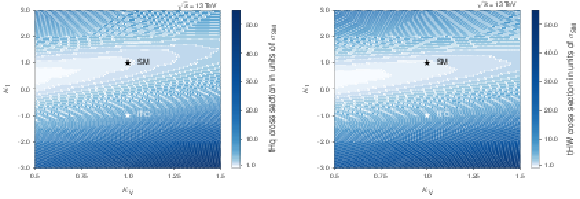
png pdf |
Figure 2:
Cross sections in the ${\kappa}_\text {t}-{\kappa}_\text {V}$ plane at 13 TeV for tHq (left) and tHW (right) production. Right figure adapted from [12]. |
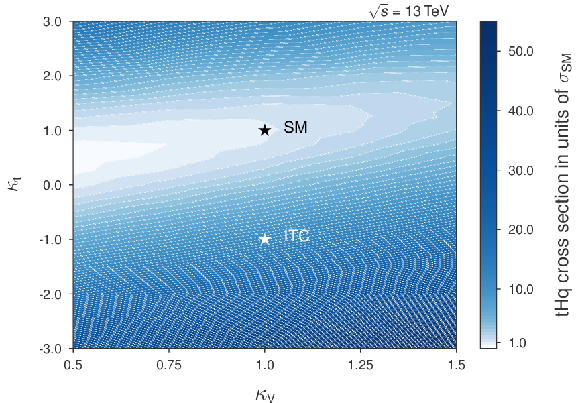
png pdf |
Figure 2-a:
Cross sections in the ${\kappa}_\text {t}-{\kappa}_\text {V}$ plane at 13 TeV for tHq (left) and tHW (right) production. Right figure adapted from [12]. |
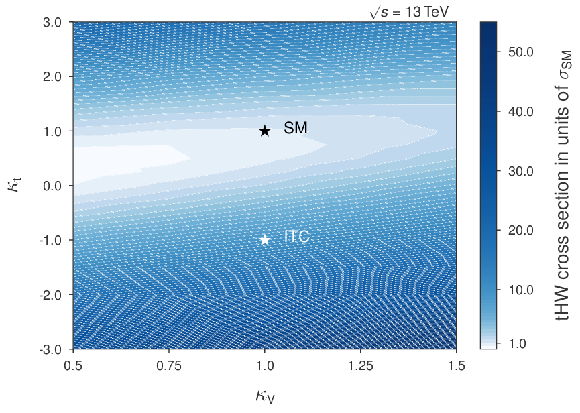
png pdf |
Figure 2-b:
Cross sections in the ${\kappa}_\text {t}-{\kappa}_\text {V}$ plane at 13 TeV for tHq (left) and tHW (right) production. Right figure adapted from [12]. |
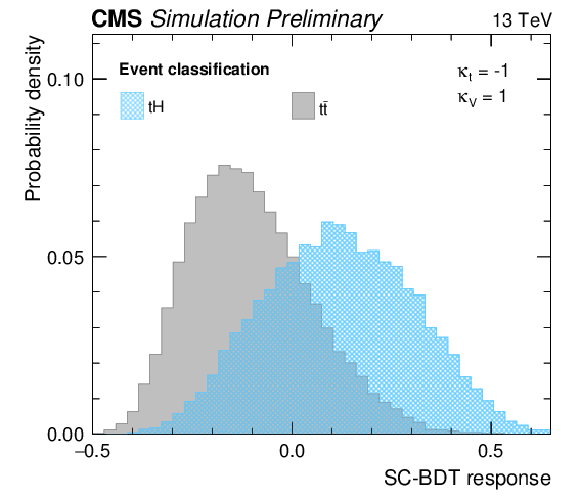
png pdf |
Figure 3:
Output values of the SC-BDT. |
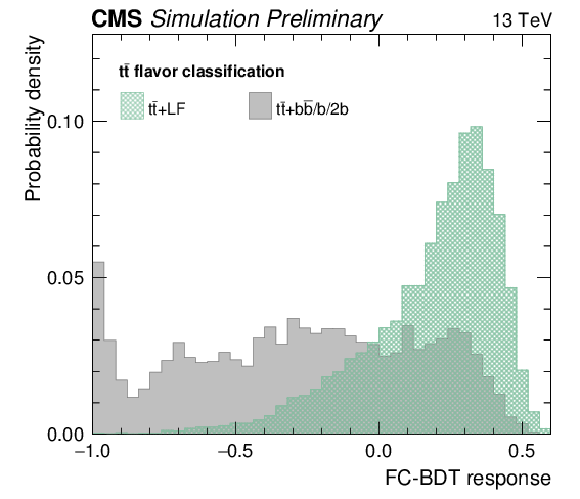
png pdf |
Figure 4:
Response values of the FC-BDT. The background consists of ${{\mathrm {t}\overline {\mathrm {t}}}} $+$\mathrm {b\bar{b}}$, ${{\mathrm {t}\overline {\mathrm {t}}}} $+$\mathrm {1\bar{b}}$ and ${{\mathrm {t}\overline {\mathrm {t}}}} $+$\mathrm {2\bar{b}}$ events. |
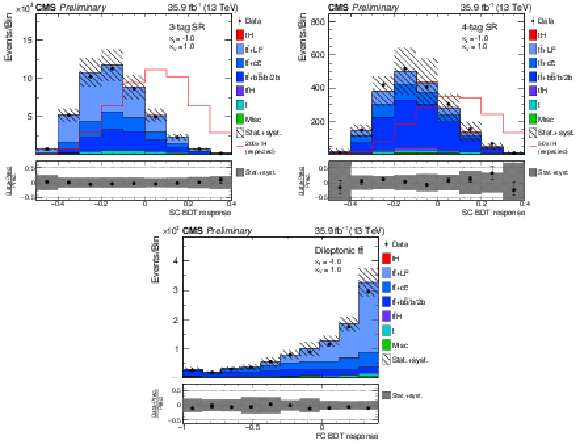
png pdf |
Figure 5:
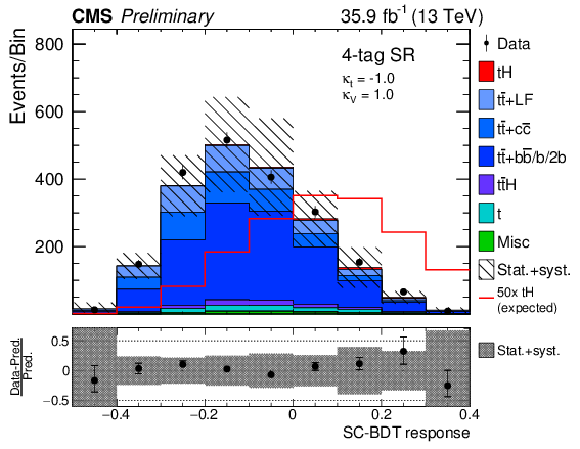
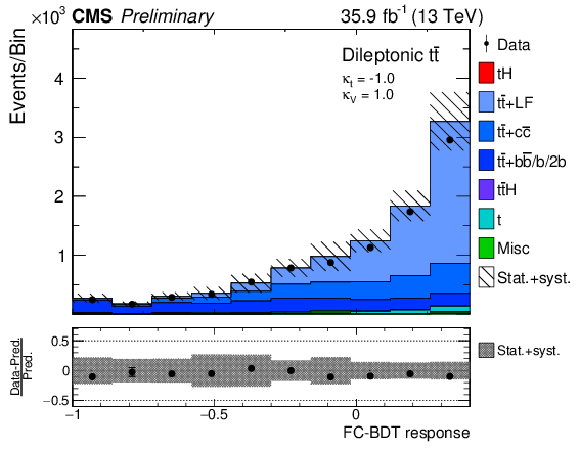
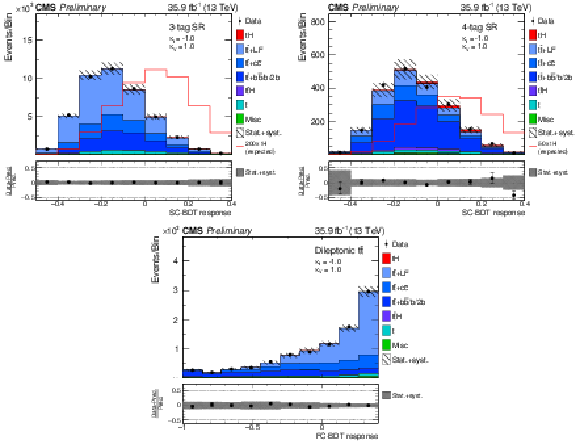
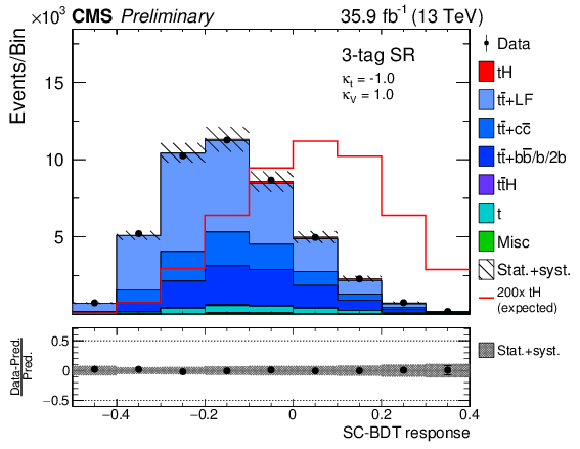
Prefit distributions of the output of the SC-BDT in the 3-tag and 4-tag regions, as well as the output of the FC-BDT in the dileptonic region. The red lines indicate the expected signal contributions scaled by the factors given in the legends. Underflow and overflow events are included in the first and last bin, respectively. |
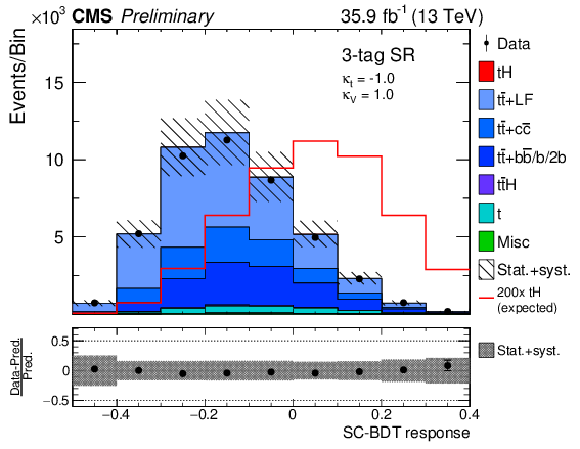
png pdf |
Figure 5-a:
Prefit distributions of the output of the SC-BDT in the 3-tag and 4-tag regions, as well as the output of the FC-BDT in the dileptonic region. The red lines indicate the expected signal contributions scaled by the factors given in the legends. Underflow and overflow events are included in the first and last bin, respectively. |
png pdf |
Figure 5-b:
Prefit distributions of the output of the SC-BDT in the 3-tag and 4-tag regions, as well as the output of the FC-BDT in the dileptonic region. The red lines indicate the expected signal contributions scaled by the factors given in the legends. Underflow and overflow events are included in the first and last bin, respectively. |
png pdf |
Figure 5-c:
Prefit distributions of the output of the SC-BDT in the 3-tag and 4-tag regions, as well as the output of the FC-BDT in the dileptonic region. The red lines indicate the expected signal contributions scaled by the factors given in the legends. Underflow and overflow events are included in the first and last bin, respectively. |
png pdf |
Figure 6:
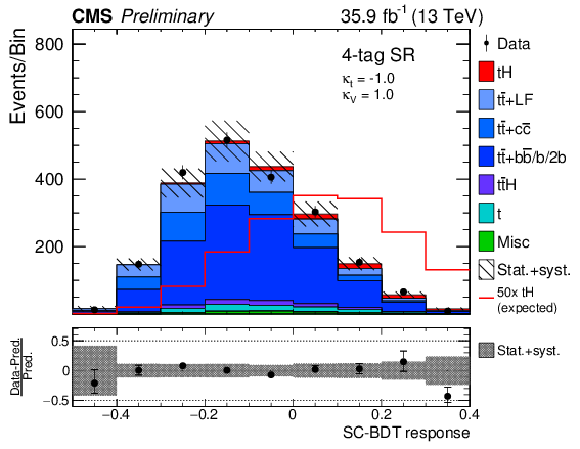
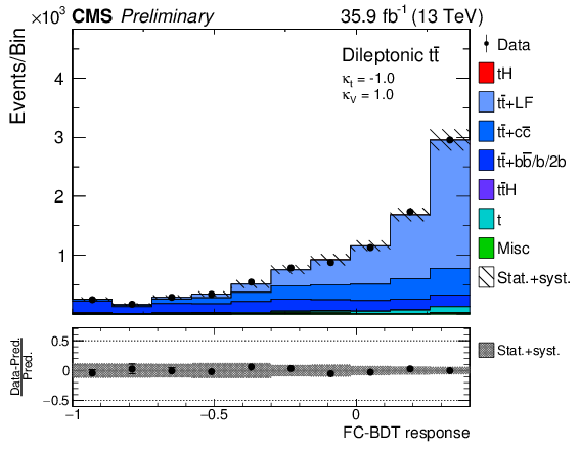
Postfit distributions of the output of the SC-BDT in the 3-tag and 4-tag regions, as well as the output of the FC-BDT in the dileptonic region, corresponding to the limit setting on tH production in the ITC case. The red lines indicate the expected signal contributions scaled by the factors given in the legends. Underflow and overflow events are included in the first and last bin, respectively. |
png pdf |
Figure 6-a:
Postfit distributions of the output of the SC-BDT in the 3-tag and 4-tag regions, as well as the output of the FC-BDT in the dileptonic region, corresponding to the limit setting on tH production in the ITC case. The red lines indicate the expected signal contributions scaled by the factors given in the legends. Underflow and overflow events are included in the first and last bin, respectively. |
png pdf |
Figure 6-b:
Postfit distributions of the output of the SC-BDT in the 3-tag and 4-tag regions, as well as the output of the FC-BDT in the dileptonic region, corresponding to the limit setting on tH production in the ITC case. The red lines indicate the expected signal contributions scaled by the factors given in the legends. Underflow and overflow events are included in the first and last bin, respectively. |
png pdf |
Figure 6-c:
Postfit distributions of the output of the SC-BDT in the 3-tag and 4-tag regions, as well as the output of the FC-BDT in the dileptonic region, corresponding to the limit setting on tH production in the ITC case. The red lines indicate the expected signal contributions scaled by the factors given in the legends. Underflow and overflow events are included in the first and last bin, respectively. |
png pdf |
Figure 7:
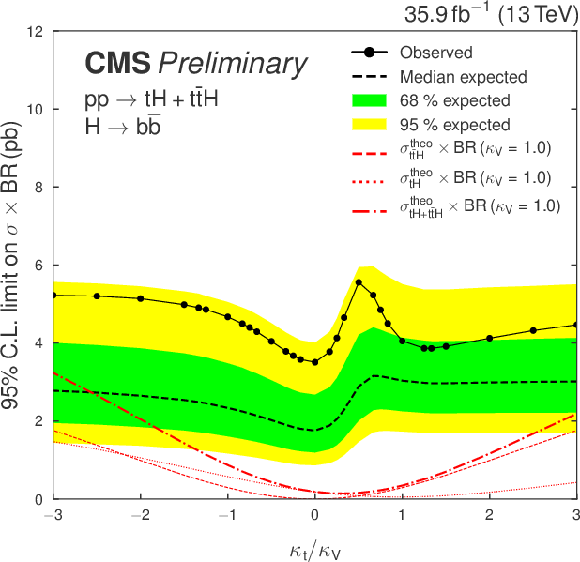
Upper limits on $\mathrm {tH} + \mathrm {t\bar{t}H}$ scenarios with different $\kappa _\text {t}/\kappa _\text {V}$ ratios. The red lines show the theory predictions and the inner (green) band and the outer (yellow) band indicate the regions containing 68 and 95%, respectively, of the distribution of limits expected under the background-only hypothesis. None of the inspected points can be excluded. |
| Tables | |
png pdf |
Table 1:
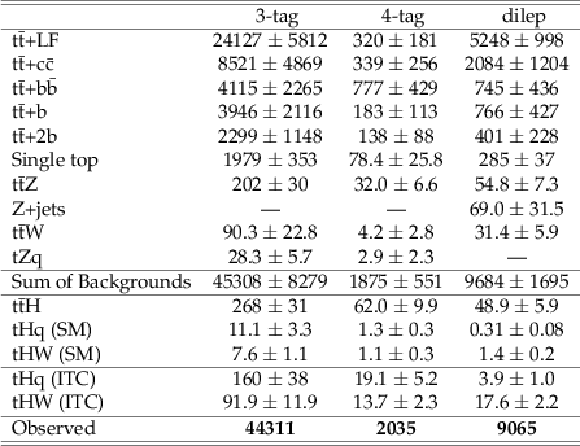
Event yields for tHq and tHW signal (for the SM and ITC scenarios) as well as the various background processes in the two signal regions and in the dileptonic region. The uncertainties include both systematic and statistical uncertainties. Additionally, the numbers of observed events in data are shown. |
png pdf |
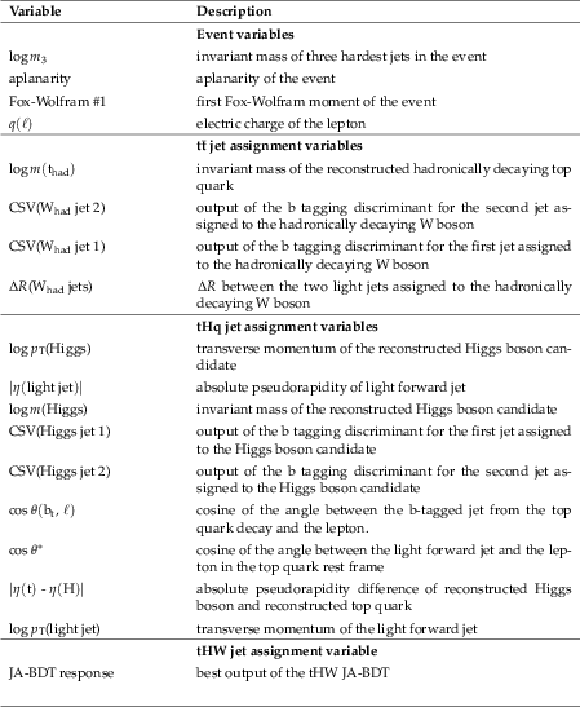
Table 2:
Classification variable description |
png pdf |
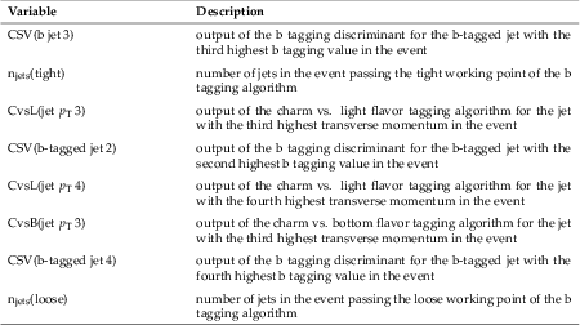
Table 3:
Input variables used in the training of the FC-BDT. The variables are sorted by their importance in the training within each category. |
png pdf |
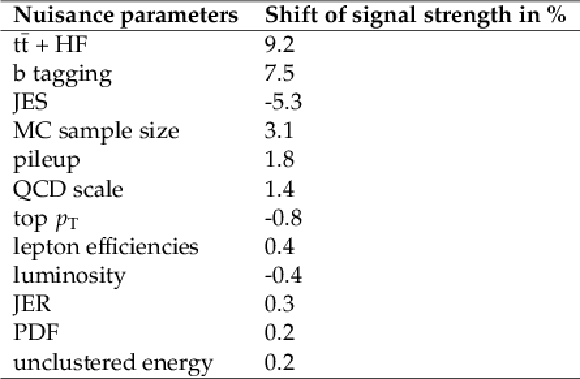
Table 4:
Shift of signal strength |
| Summary |
| A search for Higgs boson production in association with single top quarks (tH) in the $t$- and the tW-channel production mode has been presented in this document with a focus on possible variations in the coupling between the Higgs boson and the top quark or the W boson to search for deviations from the standard model. The full 2016 dataset of the CMS detector with an integrated luminosity of 35.9 fb$^{-1}$ at a center-of-mass energy of 13\, TeV has been analyzed. The observed (expected) upper limits for tH production are found to be $89.5\times \sigma_{\mathrm{SM}}$ ($41.4\times\sigma_{\mathrm{SM}}$) for the standard model scenario and $5.83\times \sigma_{\mathrm{ITC}}$ ($2.94\times\sigma_{\mathrm{ITC}}$) for the inverted top coupling scenario, where $\sigma_{\mathrm{SM}}$ and $\sigma_{\mathrm{ITC}}$ are the predicted cross sections in these two scenarios. In addition, the upper limits on the combined cross section for tH production and the production of a Higgs boson in association with a pair of top quark and antiquark for various values of the ratio of the coupling strength factors $\kappa_\text{t}/\kappa_\text{V}$ are determined. With the available data set, it is not possible to exclude any of the scenarios with this analysis. |
| References | ||||
| 1 | CMS Collaboration | Observation of a new boson at a mass of 125 GeV with the CMS experiment at the LHC | JHEP 06 (2013) 081 | |
| 2 | ATLAS Collaboration | Observation of a new particle in the search for the Standard Model Higgs boson with the ATLAS detector at the LHC | PLB 716 (2012) 1 | 1207.7214 |
| 3 | CMS Collaboration | Observation of $ \mathrm{t\overline{t}} $H production | Submitted to PRLett | CMS-HIG-17-035 1804.02610 |
| 4 | S. Biswas, E. Gabrielli, and B. Mele | Single top and Higgs associated production as a probe of the Htt coupling sign at the LHC | JHEP 01 (2013) 088 | 1211.0499 |
| 5 | B. Hespel, F. Maltoni, and E. Vryonidou | Higgs and Z boson associated production via gluon fusion in the SM and the 2HDM | JHEP 06 (2015) 065 | 1503.01656 |
| 6 | CMS Collaboration | Precise determination of the mass of the Higgs boson and tests of compatibility of its couplings with the standard model predictions using proton collisions at 7 and 8 TeV | EPJC 75 (2015), no. 5, 212 | CMS-HIG-14-009 1412.8662 |
| 7 | ATLAS and CMS Collaborations | Measurements of the Higgs boson production and decay rates and constraints on its couplings from a combined ATLAS and CMS analysis of the LHC pp collision data at $ \sqrt{s}= $ 7 and 8 TeV | JHEP 08 (2016) 045 | 1606.02266 |
| 8 | CMS Collaboration | Combined measurements of the Higgs boson's couplings at $ \sqrt{s}= $ 13 TeV | CMS-PAS-HIG-17-031 | CMS-PAS-HIG-17-031 |
| 9 | J. Ellis and T. You | Updated Global Analysis of Higgs Couplings | JHEP 06 (2013) 103 | 1303.3879 |
| 10 | F. Demartin, F. Maltoni, K. Mawatari, and M. Zaro | Higgs production in association with a single top quark at the LHC | EPJC 75 (2015), no. 6, 267 | |
| 11 | J. Alwall et al. | The automated computation of tree-level and next-to-leading order differential cross sections, and their matching to parton shower simulations | JHEP 07 (2014) 079 | 1405.0301 |
| 12 | F. Demartin et al. | tWH associated production at the LHC | EPJC 77 (2017), no. 1, 34 | |
| 13 | NNPDF Collaboration | Parton distributions for the LHC Run II | JHEP 04 (2015) 040 | 1410.8849 |
| 14 | T. Sjostrand et al. | An Introduction to PYTHIA 8.2 | CPC 191 (2015) 159--177 | 1410.3012 |
| 15 | P. Nason | A New Method for Combining NLO QCD with Shower Monte Carlo Algorithms | JHEP 11 (2004) 040 | hep-ph/0409146 |
| 16 | S. Frixione, P. Nason, and C. Oleari | Matching NLO QCD computations with Parton Shower simulations: the POWHEG method | JHEP 11 (2007) 070 | 0709.2092 |
| 17 | S. Alioli, P. Nason, C. Oleari, and E. Re | A general framework for implementing NLO calculations in shower Monte Carlo programs: the POWHEG BOX | JHEP 06 (2010) 043 | 1002.2581 |
| 18 | R. Frederix and S. Frixione | Merging meets matching in MC@NLO | JHEP 12 (2012) 061 | 1209.6215 |
| 19 | GEANT4 Collaboration | GEANT4: A Simulation toolkit | NIMA 506 (2003) 250 | |
| 20 | J. Allison et al. | Geant4 developments and applications | IEEE Transactions on Nuclear Science 53 (2006), no. 1, 270 | |
| 21 | CMS Collaboration | Particle-flow reconstruction and global event description with the cms detector | JINST 12 (2017) P10003 | CMS-PRF-14-001 1706.04965 |
| 22 | M. Cacciari, G. P. Salam, and G. Soyez | The anti-$ k_t $ jet clustering algorithm | JHEP 04 (2008) 063 | 0802.1189 |
| 23 | CMS Collaboration | Jet energy scale and resolution in the CMS experiment in pp collisions at 8 TeV | JINST 12 (2017), no. 02, P02014 | CMS-JME-13-004 1607.03663 |
| 24 | CMS Collaboration | Identification of heavy-flavour jets with the CMS detector in pp collisions at 13 TeV | Submitted to \it JINST | CMS-BTV-16-002 1712.07158 |
| 25 | A. Hoecker et al. | TMVA - Toolkit for Multivariate Data Analysis | physics/0703039 | |
| 26 | CMS Collaboration | CMS Luminosity Measurement for the 2016 Data Taking Period | CMS-PAS-LUM-17-001 | CMS-PAS-LUM-17-001 |
| 27 | CMS Collaboration | Performance of the CMS missing transverse momentum reconstruction in pp data at $ \sqrt{s} = $ 8 TeV | JINST 10 (2015), no. 02, P02006 | CMS-JME-13-003 1411.0511 |
| 28 | CMS Collaboration | Search for $ \mathrm{t\overline{t}} $H production in the H$ \mathrm{b\overline{b}} $ decay channel with leptonic $ \mathrm{t\overline{t}} $ decays in proton-proton collisions at $ \sqrt{s}= $ 13 TeV | Submitted to JHEP | CMS-HIG-17-026 1804.03682 |
| 29 | CMS Collaboration | Measurement of the differential cross section for top quark pair production in pp collisions at $ \sqrt{s} = $ 8 TeV | EPJC 75 (2015), no. 11, 542 | CMS-TOP-12-028 1505.04480 |
| 30 | G. Cowan, K. Cranmer, E. Gross, and O. Vitells | Asymptotic formulae for likelihood-based tests of new physics | EPJC 71 (2011) 1554 | 1007.1727 |

|
Compact Muon Solenoid LHC, CERN |

|

|

|

|

|

|