

Compact Muon Solenoid
LHC, CERN
| CMS-PAS-HIG-17-010 | ||
| Inclusive search for the standard model Higgs boson produced in pp collisions at $\sqrt{s}= $ 13 TeV using $ \mathrm{H}\rightarrow \mathrm{b\bar{\mathrm{b}}}$ decays | ||
| CMS Collaboration | ||
| May 2017 | ||
| Abstract: A search for the standard model Higgs boson produced with high transverse momentum decaying to a bottom quark-antiquark pair has been performed using a data set of pp collisions at $\sqrt{s}= $ 13 TeV collected with the CMS experiment at the LHC. The data sample corresponds to an integrated luminosity of 35.9 fb$^{-1}$. A high-transverse-momentum Higgs boson decaying to $\mathrm{b\bar{\mathrm{b}}}$ is reconstructed as a single jet and identified based on jet substructure and dedicated b-tagging techniques. The analysis strategy is validated with $ \mathrm{Z}\rightarrow \mathrm{b\bar{\mathrm{b}}} $ decays. The $ \mathrm{Z}\rightarrow \mathrm{b\bar{\mathrm{b}}}$ process is observed with a local significance of 5.1 standard deviations for the first time in the single jet topology. For a Higgs boson mass of 125 GeV, an excess of events is observed above the expected background with a local significance of 1.5 standard deviations. The measured cross section of $ \mathrm{H}(\mathrm{b\bar{\mathrm{b}}})$ production for ${p_\mathrm{T}}> $ 450 GeV is 74$_{-49}^{+51}$ fb. | ||
|
Links:
CDS record (PDF) ;
inSPIRE record ;
CADI line (restricted) ;
These preliminary results are superseded in this paper, PRL 120 (2018) 071802. The superseded preliminary plots can be found here. |
||
| Figures & Tables | Summary | Additional Figures | References | CMS Publications |
|---|
| Figures | |
png pdf |
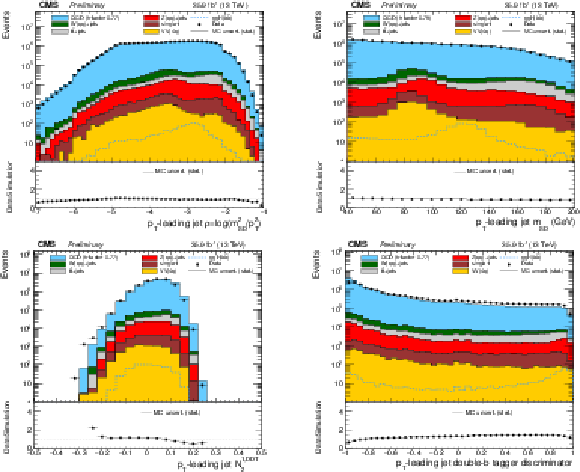
Figure 1:
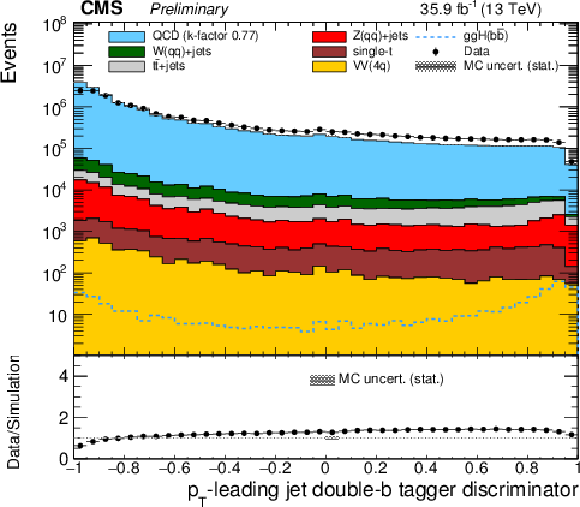
Data to simulation comparison of the $\rho $ (top-left), $ {m_{\mathrm {SD}}} $ (top-right), $ {\mathrm {N}_{\mathrm {2}}^{\mathrm {1,DDT}}} $ (bottom-left) and double-b tagger (bottom-right) variables, after the requirement on the jet $ {p_{\mathrm {T}}} $ and the online selection. |
png pdf |
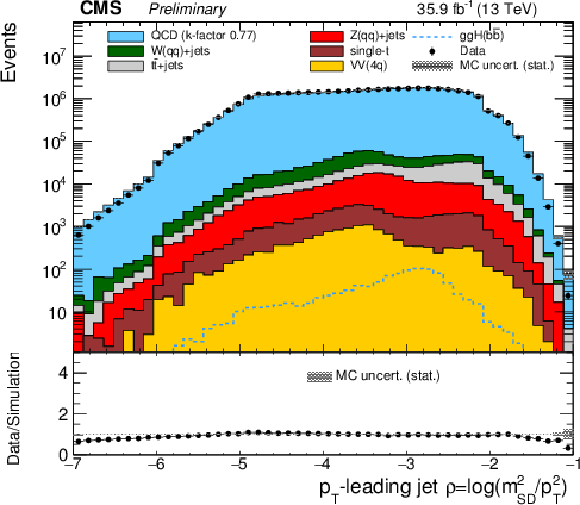
Figure 1-a:
Data to simulation comparison of the $\rho $ variable, after the requirement on the jet $ {p_{\mathrm {T}}} $ and the online selection. |
png pdf |
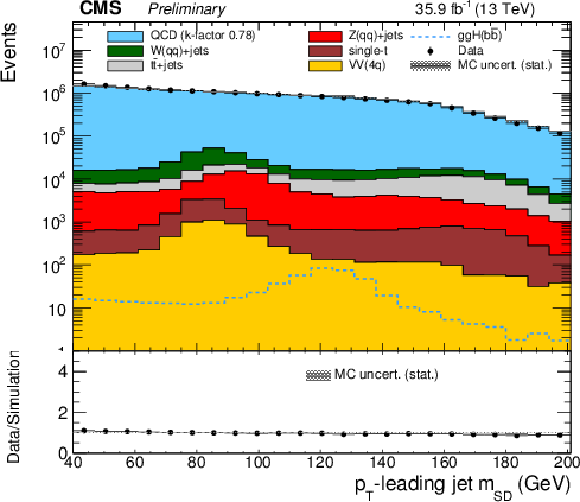
Figure 1-b:
Data to simulation comparison of the $ {m_{\mathrm {SD}}} $ variable, after the requirement on the jet $ {p_{\mathrm {T}}} $ and the online selection. |
png pdf |
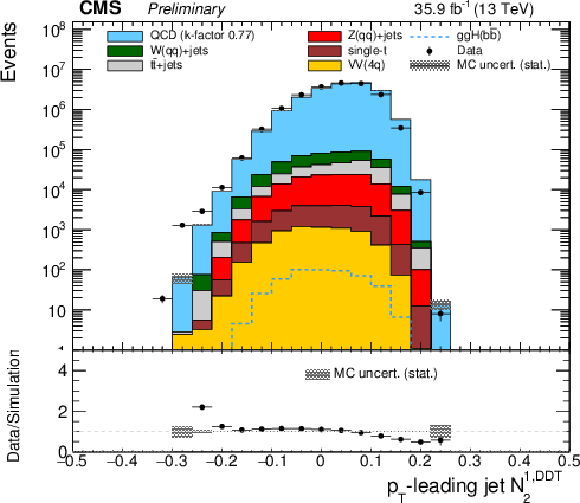
Figure 1-c:
Data to simulation comparison of the $ {\mathrm {N}_{\mathrm {2}}^{\mathrm {1,DDT}}} $ variable, after the requirement on the jet $ {p_{\mathrm {T}}} $ and the online selection. |
png pdf |
Figure 1-d:
Data to simulation comparison of the double-b tagger variable, after the requirement on the jet $ {p_{\mathrm {T}}} $ and the online selection. |
png pdf |
Figure 2:
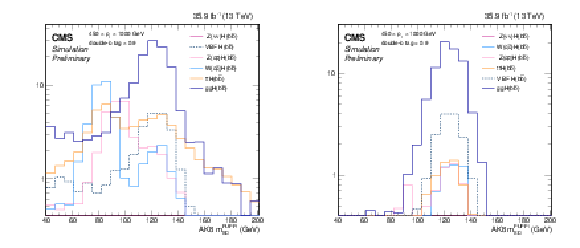
The ${m_{\mathrm {SD}}}$ distribution for simulated signal events after all the selection criteria in both the passing and failing regions. The yield for each process is normalized to its cross section. |
png pdf |
Figure 2-a:
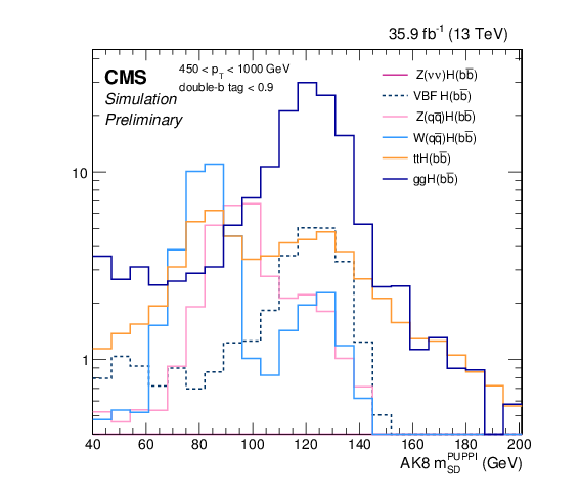
The ${m_{\mathrm {SD}}}$ distribution for simulated signal events after all the selection criteria in the passing region. The yield for each process is normalized to its cross section. |
png pdf |
Figure 2-b:
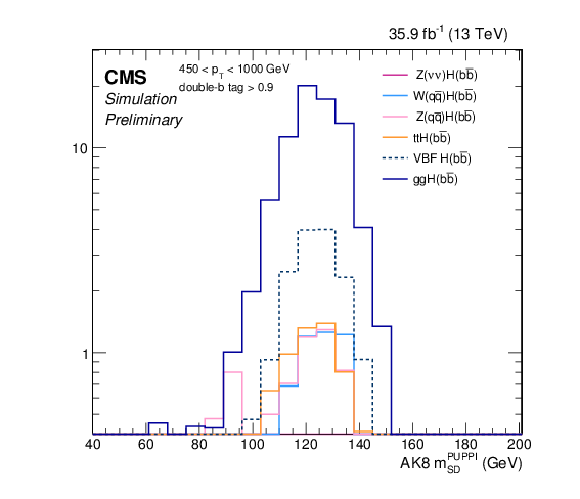
The ${m_{\mathrm {SD}}}$ distribution for simulated signal events after all the selection criteria in the failing region. The yield for each process is normalized to its cross section. |
png pdf |
Figure 3:
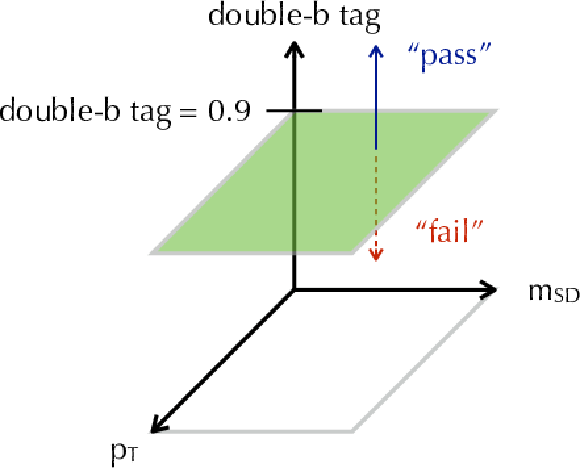
double-b tagger vs. jet ${p_{\mathrm {T}}}$ and $ {m_{\mathrm {SD}}} $ |
png pdf |
Figure 4:
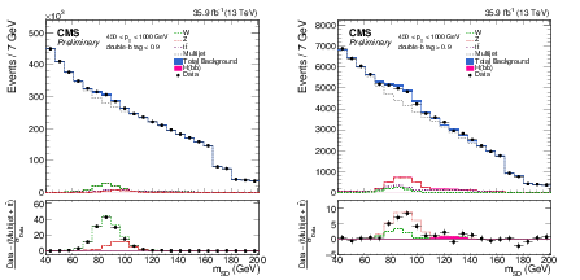
Post-fit $ {m_{\mathrm {SD}}} $ distributions in data for the pass and fail regions and combined $ {p_{\mathrm {T}}} $ categories by using a polynomial 2nd order in $\rho $ and 1st order in $ {p_{\mathrm {T}}} $. The features at 166 GeV and 180 GeV in the $ {m_{\mathrm {SD}}} $ distribution are due to the kinematic selection on $\rho $, which affects each $ {p_{\mathrm {T}}} $ category differently. |
png pdf |
Figure 4-a:
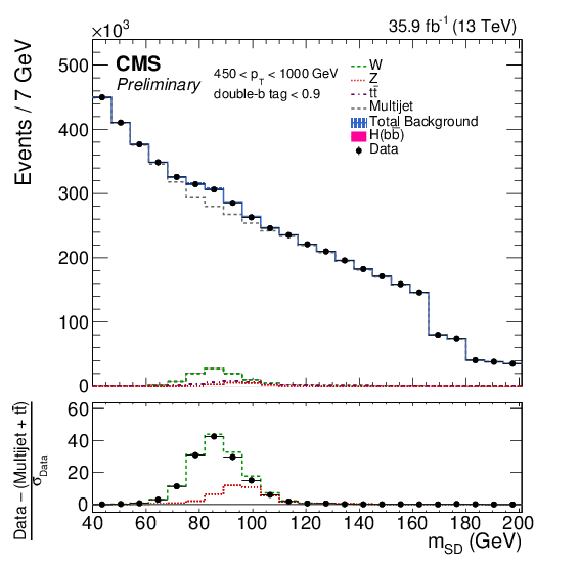
Post-fit $ {m_{\mathrm {SD}}} $ distribution in data for the pass fail region and combined $ {p_{\mathrm {T}}} $ categories by using a polynomial 2nd order in $\rho $ and 1st order in $ {p_{\mathrm {T}}} $. The features at 166 GeV and 180 GeV in the $ {m_{\mathrm {SD}}} $ distribution are due to the kinematic selection on $\rho $, which affects each $ {p_{\mathrm {T}}} $ category differently. |
png pdf |
Figure 4-b:
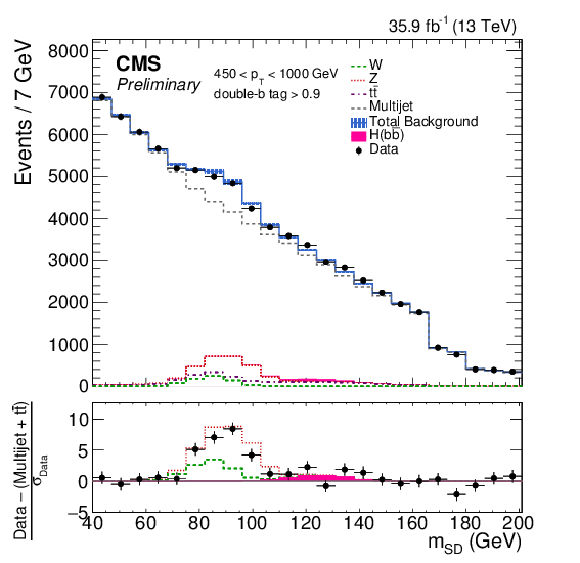
Post-fit $ {m_{\mathrm {SD}}} $ distributions in data for the pass and fail regions and combined $ {p_{\mathrm {T}}} $ categories by using a polynomial 2nd order in $\rho $ and 1st order in $ {p_{\mathrm {T}}} $. The features at 166 GeV and 180 GeV in the $ {m_{\mathrm {SD}}} $ distribution are due to the kinematic selection on $\rho $, which affects each $ {p_{\mathrm {T}}} $ category differently. |
png pdf |
Figure 5:
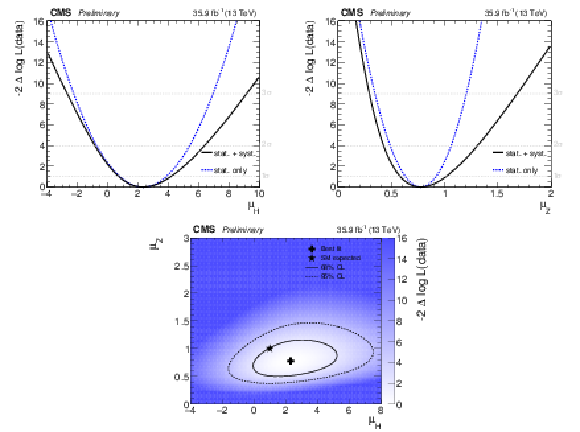
Profile likelihood test statistic $-2\Delta \log\mathcal {L}$ scan in data as a function of the H signal strength $\mu _\mathrm{ H } $ (upper left), Z signal strength $\mu _\mathrm{ Z } $ (upper right), and both signal strengths ($\mu _\mathrm{ H } ,\mu _\mathrm{ Z } $) (lower). |
png pdf |
Figure 5-a:
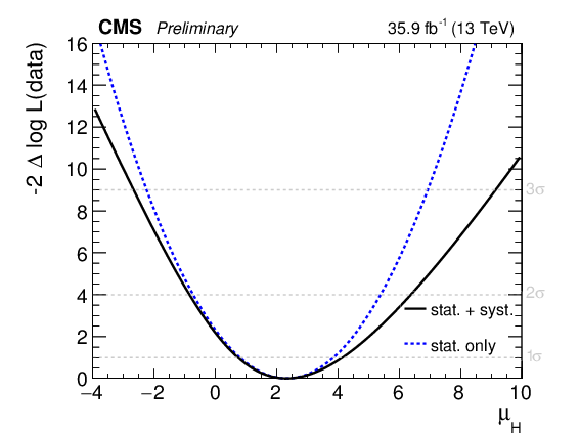
Profile likelihood test statistic $-2\Delta \log\mathcal {L}$ scan in data as a function of the H signal strength $\mu _\mathrm{ H } $. |
png pdf |
Figure 5-b:
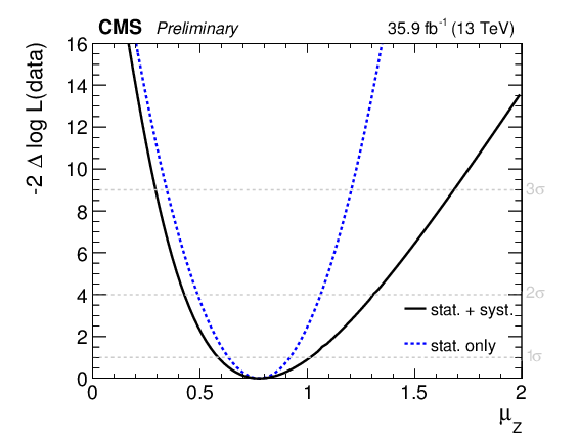
Profile likelihood test statistic $-2\Delta \log\mathcal {L}$ scan in data as a function of the Z signal strength $\mu _\mathrm{ Z } $. |
png pdf |
Figure 5-c:
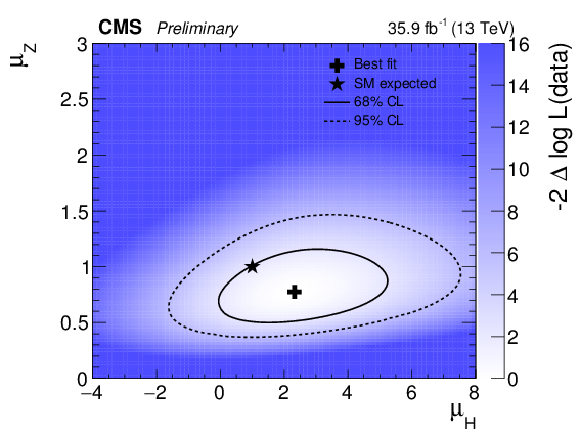
Profile likelihood test statistic $-2\Delta \log\mathcal {L}$ scan in data as a function of both signal strengths ($\mu _\mathrm{ H } ,\mu _\mathrm{ Z } $). |
| Tables | |
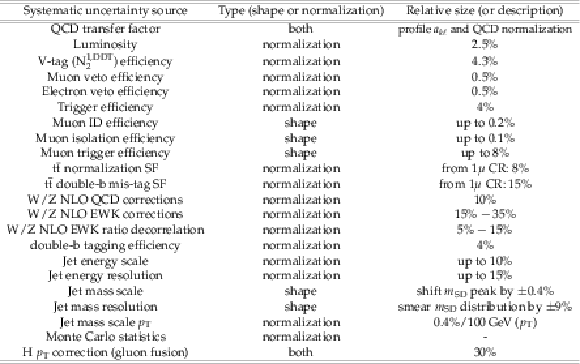
png pdf |
Table 1:
Systematic uncertainties and their relative size. |

png pdf |
Table 2:
Fitted signal strength and observed significance of the Higgs and Z signals. |
| Summary |
|
An inclusive search for the standard model Higgs boson decaying to bottom quark-antiquark pairs with $p_{\mathrm{T}} > $ 450 GeV and reconstructed as a single jet has been presented using a data sample of proton-proton collisions collected by CMS corresponding to 35.9 fb$^{-1}$ at $ \sqrt{s} = $ 13 TeV. The Higgs jets are reconstructed with the anti-$k_{\mathrm{T}}$ algorithm with radius $R= $ 0.8 and identified with the CMS double-b tag algorithm. The signal is then extracted on top of the falling QCD soft drop mass distribution (including contributions from W, Z, and top background processes) using an entirely data-driven QCD background prediction. The analysis strategy is validated by extracting the signal strength of the Z+jets process. The Z+jets process is observed for the first time in the single-jet topology with a significance of 5.1$\sigma$. The Higgs production is measured with a signal strength parameter of $\mu_\mathrm{ H }= $ 2.3$_{-{1.6} }^{+{1.8} }$ and an observed significance of 1.5$\sigma$ (0.7$\sigma$ expected for the standard model Higgs) when including Higgs $p_{\mathrm{T}}$ spectrum corrections accounting for NLO and finite top mass effects. The measured cross section of the $\mathrm{ H }(\mathrm{ b \bar{b} })$ production for $p_{\mathrm{T}} > $ 450 GeV is 74$_{-{49} }^{+{51} } $ fb, which is consistent with the SM expectation within the uncertainty. |
| Additional Figures | |
png pdf |
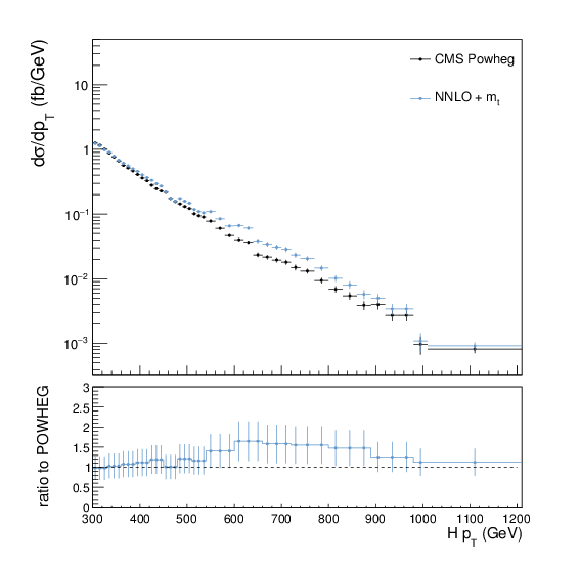
Additional Figure 1:
Generator level Higgs $ {p_{\mathrm {T}}} $ distribution for the gluon fusion production mode. The CMS default POWHEG sample and the corrected spectrum to account for both higher order and finite top mass effects are compared. |
png pdf |
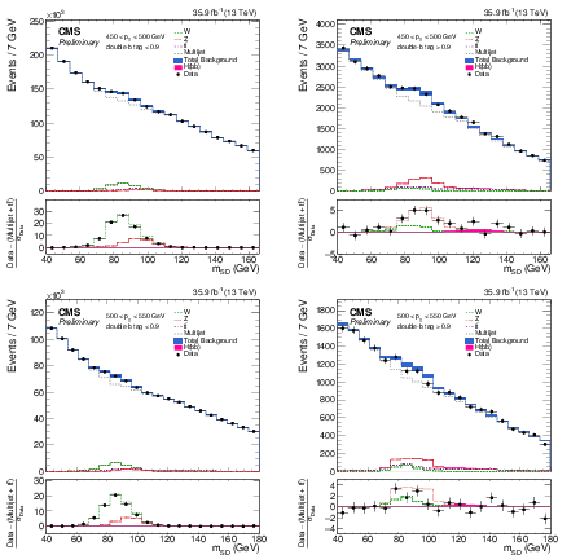
Additional Figure 2:
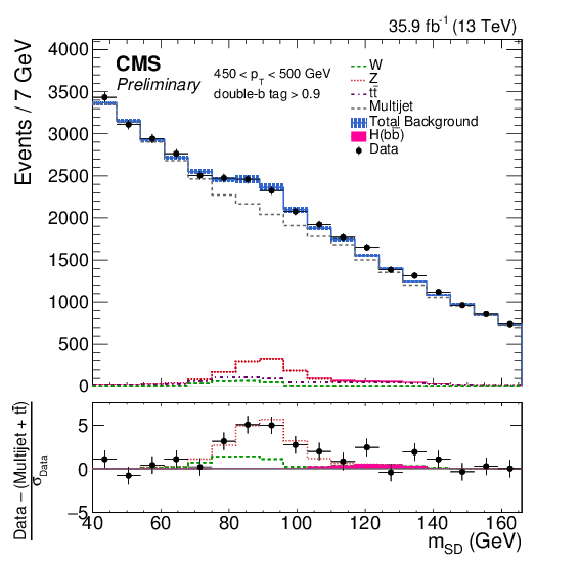
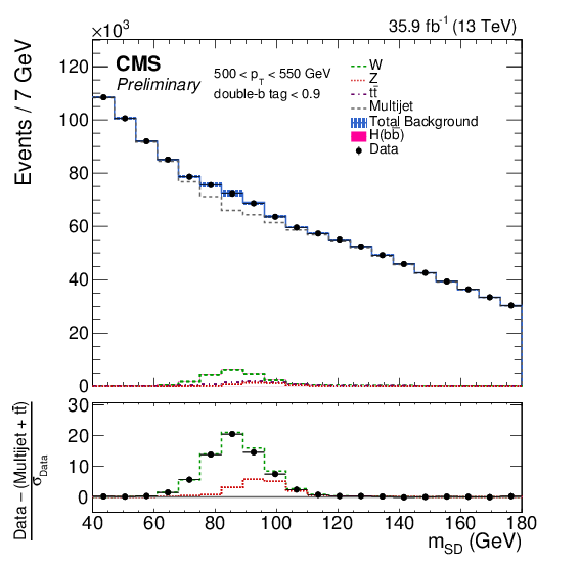
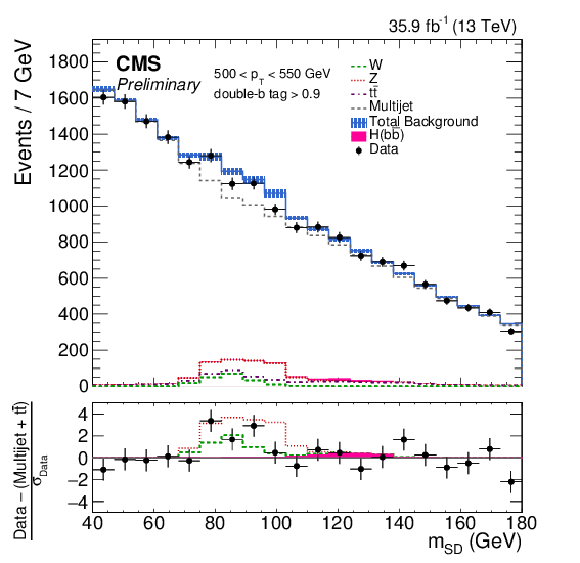
Soft drop jet mass ($ {m_{\mathrm {SD}}} $) distribution for the different $ {p_{\mathrm {T}}} $ categories of the fit from 450-550 GeV (450-500, 500-550 from top to bottom). Data are shown as the black points. The QCD background prediction, including uncertainties, is shown in the gray boxes. Contributions from the W, Z, and H boson signal are indicated as well. In the bottom panel, the ratio of the data, after the subtraction of multijet and $ {\mathrm{ t } {}\mathrm{ \bar{t} } } $ backgrounds, to its uncertainty is shown. The scale on the x-axis differs for each $ {p_{\mathrm {T}}} $ category due to the kinematic selection on $\rho $. |
png pdf |
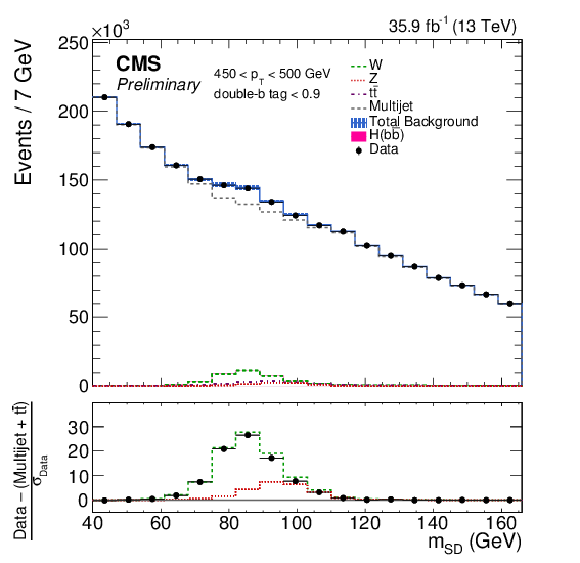
Additional Figure 2-a:
Soft drop jet mass ($ {m_{\mathrm {SD}}} $) distribution for the $ {p_{\mathrm {T}}} $ category of the fit from 450-550 GeV, double b-tag $>$ 0.9. Data are shown as the black points. The QCD background prediction, including uncertainties, is shown in the gray boxes. Contributions from the W, Z, and H boson signal are indicated as well. In the bottom panel, the ratio of the data, after the subtraction of multijet and $ {\mathrm{ t } {}\mathrm{ \bar{t} } } $ backgrounds, to its uncertainty is shown. The scale on the x-axis differs for each $ {p_{\mathrm {T}}} $ category due to the kinematic selection on $\rho $. |
png pdf |
Additional Figure 2-b:
Soft drop jet mass ($ {m_{\mathrm {SD}}} $) distribution for the $ {p_{\mathrm {T}}} $ category of the fit from 450-550 GeV, double b-tag $<$ 0.9. Data are shown as the black points. The QCD background prediction, including uncertainties, is shown in the gray boxes. Contributions from the W, Z, and H boson signal are indicated as well. In the bottom panel, the ratio of the data, after the subtraction of multijet and $ {\mathrm{ t } {}\mathrm{ \bar{t} } } $ backgrounds, to its uncertainty is shown. The scale on the x-axis differs for each $ {p_{\mathrm {T}}} $ category due to the kinematic selection on $\rho $. |
png pdf |
Additional Figure 2-c:
Soft drop jet mass ($ {m_{\mathrm {SD}}} $) distribution for the $ {p_{\mathrm {T}}} $ category of the fit from 500-550 GeV, double b-tag $>$ 0.9. Data are shown as the black points. The QCD background prediction, including uncertainties, is shown in the gray boxes. Contributions from the W, Z, and H boson signal are indicated as well. In the bottom panel, the ratio of the data, after the subtraction of multijet and $ {\mathrm{ t } {}\mathrm{ \bar{t} } } $ backgrounds, to its uncertainty is shown. The scale on the x-axis differs for each $ {p_{\mathrm {T}}} $ category due to the kinematic selection on $\rho $. |
png pdf |
Additional Figure 2-d:
Soft drop jet mass ($ {m_{\mathrm {SD}}} $) distribution for the $ {p_{\mathrm {T}}} $ category of the fit from 500-550 GeV, double b-tag $<$ 0.9. Data are shown as the black points. The QCD background prediction, including uncertainties, is shown in the gray boxes. Contributions from the W, Z, and H boson signal are indicated as well. In the bottom panel, the ratio of the data, after the subtraction of multijet and $ {\mathrm{ t } {}\mathrm{ \bar{t} } } $ backgrounds, to its uncertainty is shown. The scale on the x-axis differs for each $ {p_{\mathrm {T}}} $ category due to the kinematic selection on $\rho $. |
png pdf |
Additional Figure 3:
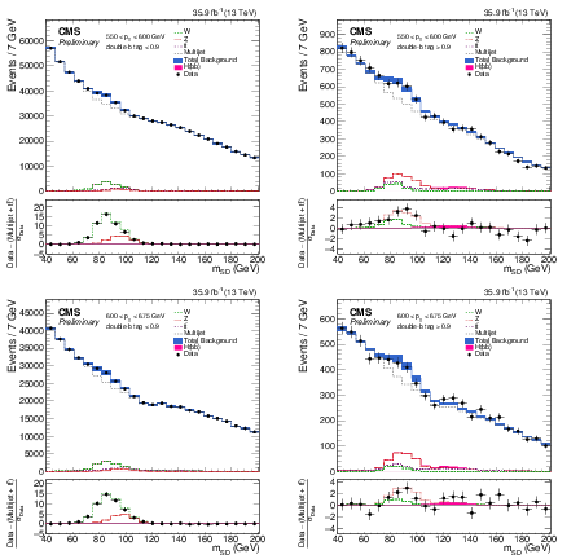
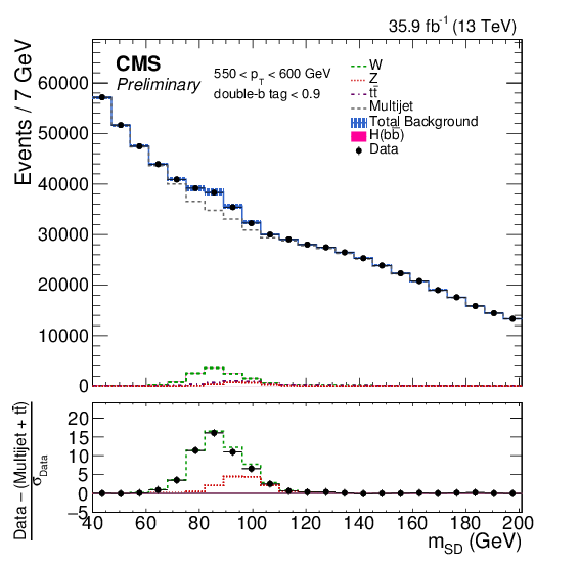
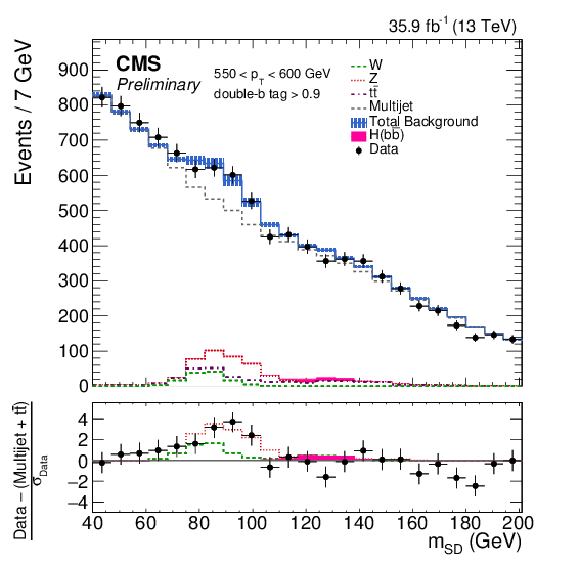
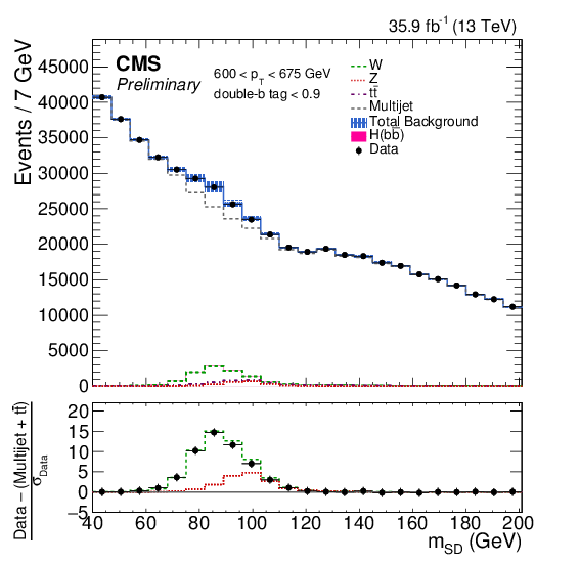
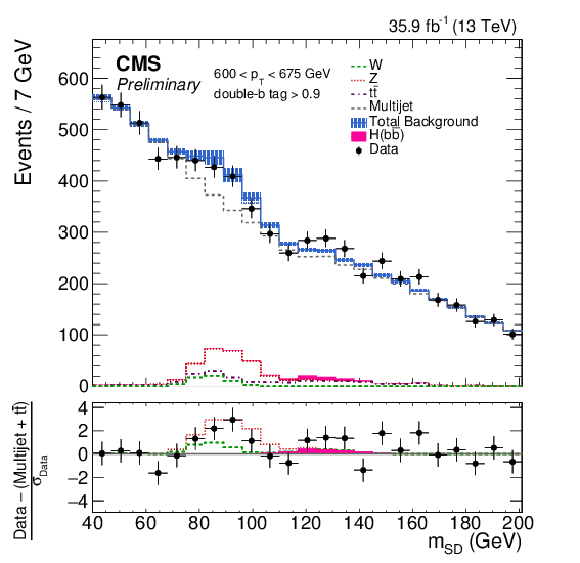
Soft drop jet mass ($ {m_{\mathrm {SD}}} $) distribution for the different $ {p_{\mathrm {T}}} $ categories of the fit from 550-675 GeV (550-600, 600-675 from top to bottom). Data are shown as the black points. The QCD background prediction, including uncertainties, is shown in the gray boxes. Contributions from the W, Z, and H boson signal are indicated as well. In the bottom panel, the ratio of the data, after the subtraction of multijet and $ {\mathrm{ t } {}\mathrm{ \bar{t} } } $ backgrounds, to its uncertainty is shown. The scale on the x-axis differs for each $ {p_{\mathrm {T}}} $ category due to the kinematic selection on $\rho $. |
png pdf |
Additional Figure 3-a:
Soft drop jet mass ($ {m_{\mathrm {SD}}} $) distribution for the $ {p_{\mathrm {T}}} $ category of the fit from 550-600 GeV, double b-tag $<$ 0.9. Data are shown as the black points. The QCD background prediction, including uncertainties, is shown in the gray boxes. Contributions from the W, Z, and H boson signal are indicated as well. In the bottom panel, the ratio of the data, after the subtraction of multijet and $ {\mathrm{ t } {}\mathrm{ \bar{t} } } $ backgrounds, to its uncertainty is shown. The scale on the x-axis differs for each $ {p_{\mathrm {T}}} $ category due to the kinematic selection on $\rho $. |
png pdf |
Additional Figure 3-b:
Soft drop jet mass ($ {m_{\mathrm {SD}}} $) distribution for the $ {p_{\mathrm {T}}} $ category of the fit from 600-675 GeV, double b-tag $>$ 0.9. Data are shown as the black points. The QCD background prediction, including uncertainties, is shown in the gray boxes. Contributions from the W, Z, and H boson signal are indicated as well. In the bottom panel, the ratio of the data, after the subtraction of multijet and $ {\mathrm{ t } {}\mathrm{ \bar{t} } } $ backgrounds, to its uncertainty is shown. The scale on the x-axis differs for each $ {p_{\mathrm {T}}} $ category due to the kinematic selection on $\rho $. |
png pdf |
Additional Figure 3-c:
Soft drop jet mass ($ {m_{\mathrm {SD}}} $) distribution for the $ {p_{\mathrm {T}}} $ category of the fit from 550-600 GeV, double b-tag $<$ 0.9. Data are shown as the black points. The QCD background prediction, including uncertainties, is shown in the gray boxes. Contributions from the W, Z, and H boson signal are indicated as well. In the bottom panel, the ratio of the data, after the subtraction of multijet and $ {\mathrm{ t } {}\mathrm{ \bar{t} } } $ backgrounds, to its uncertainty is shown. The scale on the x-axis differs for each $ {p_{\mathrm {T}}} $ category due to the kinematic selection on $\rho $. |
png pdf |
Additional Figure 3-d:
Soft drop jet mass ($ {m_{\mathrm {SD}}} $) distribution for the $ {p_{\mathrm {T}}} $ category of the fit from 600-675 GeV, double b-tag $>$ 0.9. Data are shown as the black points. The QCD background prediction, including uncertainties, is shown in the gray boxes. Contributions from the W, Z, and H boson signal are indicated as well. In the bottom panel, the ratio of the data, after the subtraction of multijet and $ {\mathrm{ t } {}\mathrm{ \bar{t} } } $ backgrounds, to its uncertainty is shown. The scale on the x-axis differs for each $ {p_{\mathrm {T}}} $ category due to the kinematic selection on $\rho $. |
png pdf |
Additional Figure 4:
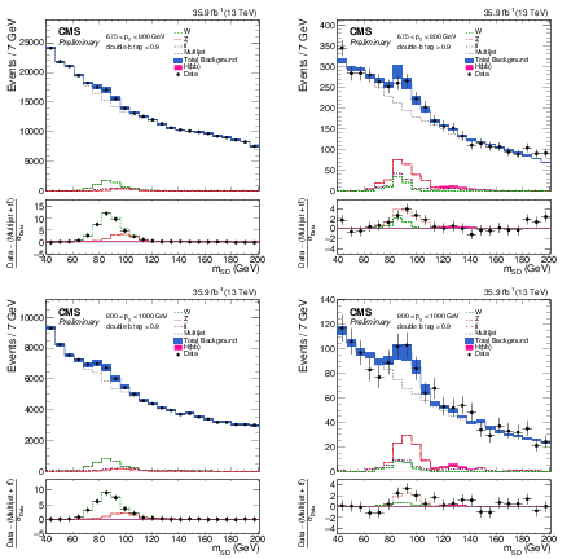
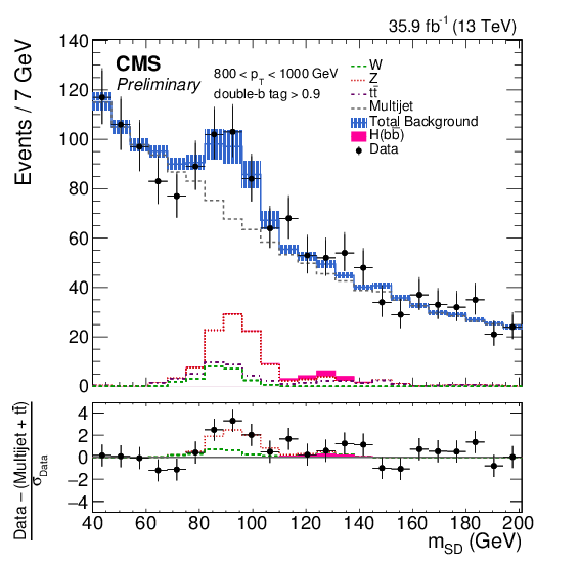
Soft drop jet mass ($ {m_{\mathrm {SD}}} $) distribution for the different $ {p_{\mathrm {T}}} $ categories of the fit from 675-1000 GeV (675-800,800-1000 from top to bottom). Data are shown as the black points. The QCD background prediction, including uncertainties, is shown in the gray boxes. Contributions from the W, Z, and H boson signal are indicated as well. In the bottom panel, the ratio of the data, after the subtraction of multijet and $ {\mathrm{ t } {}\mathrm{ \bar{t} } } $ backgrounds, to its uncertainty is shown. The scale on the x-axis differs for each $ {p_{\mathrm {T}}} $ category due to the kinematic selection on $\rho $. |
png pdf |
Additional Figure 4-a:
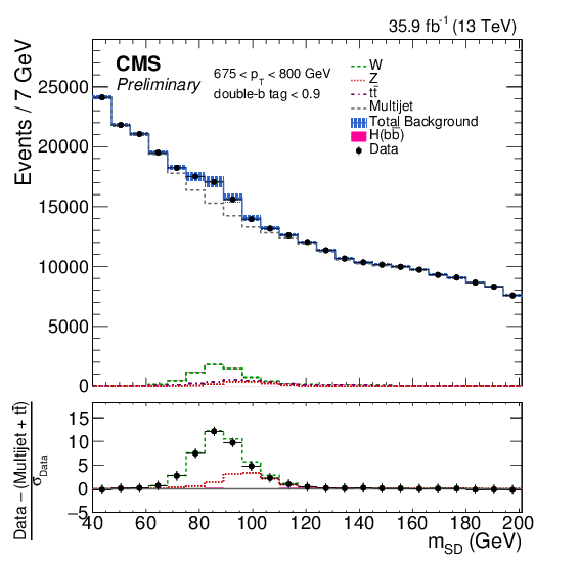
Soft drop jet mass ($ {m_{\mathrm {SD}}} $) distribution for the different $ {p_{\mathrm {T}}} $ category of the fit from 675-800 GeV, double b-tag $<$ 0.9. Data are shown as the black points. The QCD background prediction, including uncertainties, is shown in the gray boxes. Contributions from the W, Z, and H boson signal are indicated as well. In the bottom panel, the ratio of the data, after the subtraction of multijet and $ {\mathrm{ t } {}\mathrm{ \bar{t} } } $ backgrounds, to its uncertainty is shown. The scale on the x-axis differs for each $ {p_{\mathrm {T}}} $ category due to the kinematic selection on $\rho $. |
png pdf |
Additional Figure 4-b:
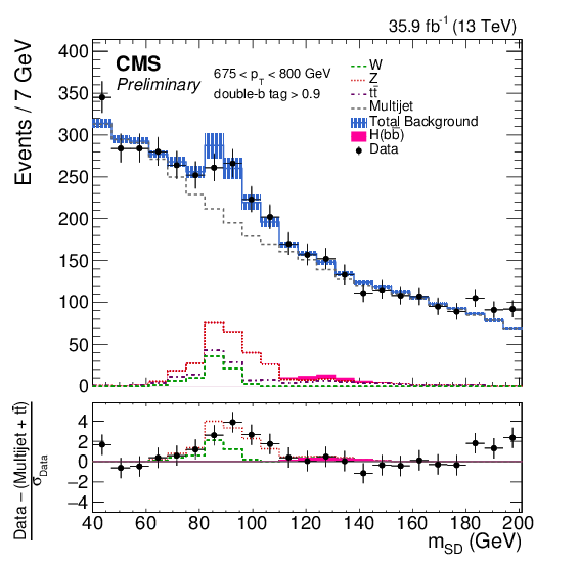
Soft drop jet mass ($ {m_{\mathrm {SD}}} $) distribution for the different $ {p_{\mathrm {T}}} $ category of the fit from 675-800 GeV, double b-tag $>$ 0.9. Data are shown as the black points. The QCD background prediction, including uncertainties, is shown in the gray boxes. Contributions from the W, Z, and H boson signal are indicated as well. In the bottom panel, the ratio of the data, after the subtraction of multijet and $ {\mathrm{ t } {}\mathrm{ \bar{t} } } $ backgrounds, to its uncertainty is shown. The scale on the x-axis differs for each $ {p_{\mathrm {T}}} $ category due to the kinematic selection on $\rho $. |
png pdf |
Additional Figure 4-c:
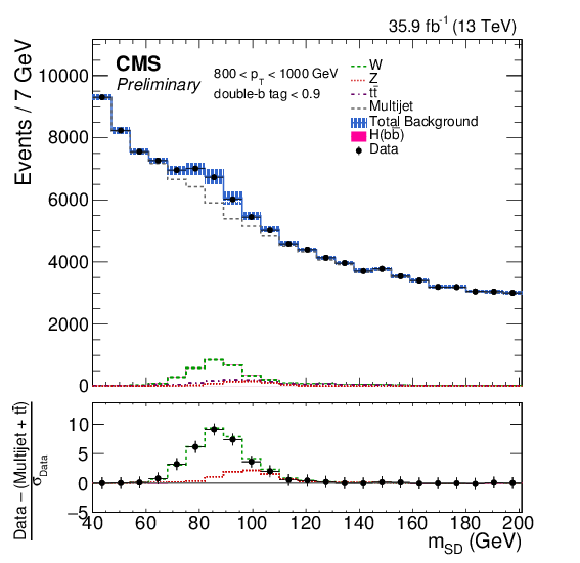
Soft drop jet mass ($ {m_{\mathrm {SD}}} $) distribution for the different $ {p_{\mathrm {T}}} $ category of the fit from 800-1000 GeV, double b-tag $<$ 0.9. Data are shown as the black points. The QCD background prediction, including uncertainties, is shown in the gray boxes. Contributions from the W, Z, and H boson signal are indicated as well. In the bottom panel, the ratio of the data, after the subtraction of multijet and $ {\mathrm{ t } {}\mathrm{ \bar{t} } } $ backgrounds, to its uncertainty is shown. The scale on the x-axis differs for each $ {p_{\mathrm {T}}} $ category due to the kinematic selection on $\rho $. |
png pdf |
Additional Figure 4-d:
Soft drop jet mass ($ {m_{\mathrm {SD}}} $) distribution for the different $ {p_{\mathrm {T}}} $ category of the fit from 800-1000 GeV, double b-tag $>$ 0.9. Data are shown as the black points. The QCD background prediction, including uncertainties, is shown in the gray boxes. Contributions from the W, Z, and H boson signal are indicated as well. In the bottom panel, the ratio of the data, after the subtraction of multijet and $ {\mathrm{ t } {}\mathrm{ \bar{t} } } $ backgrounds, to its uncertainty is shown. The scale on the x-axis differs for each $ {p_{\mathrm {T}}} $ category due to the kinematic selection on $\rho $. |
png pdf |
Additional Figure 5:
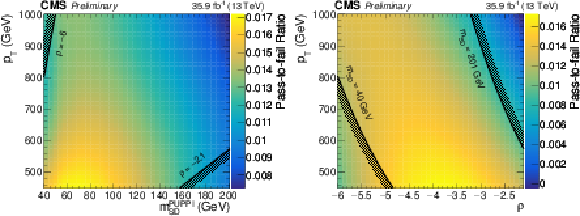
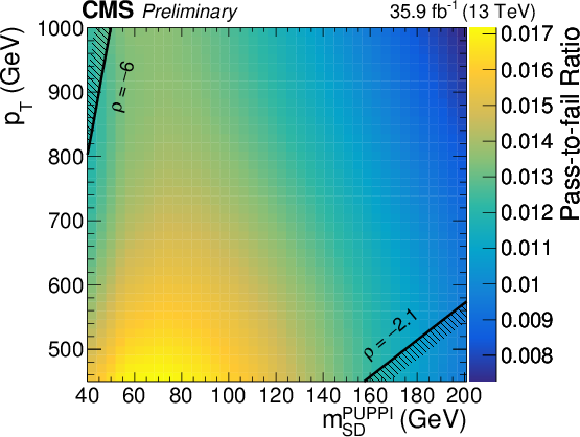
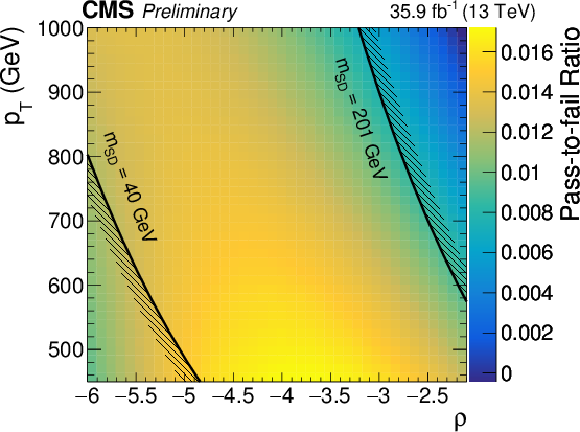
The two-dimensional polynomial transfer factor $\mathcal {F}$ is shown as function of $ {m_{\mathrm {SD}}} $ and $ {p_{\mathrm {T}}} $ (left) and $\rho $ and $ {p_{\mathrm {T}}} $ (right). |
png pdf |
Additional Figure 5-a:
The two-dimensional polynomial transfer factor $\mathcal {F}$ is shown as function of $ {m_{\mathrm {SD}}} $ and $ {p_{\mathrm {T}}} $. |
png pdf |
Additional Figure 5-b:
The two-dimensional polynomial transfer factor $\mathcal {F}$ is shown as function of $\rho $ and $ {p_{\mathrm {T}}} $. |
png pdf |
Additional Figure 6:
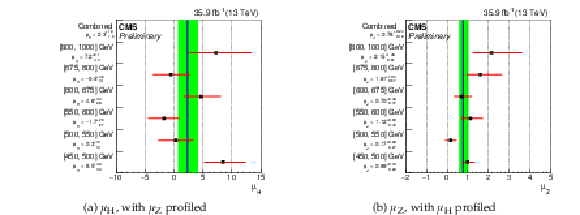
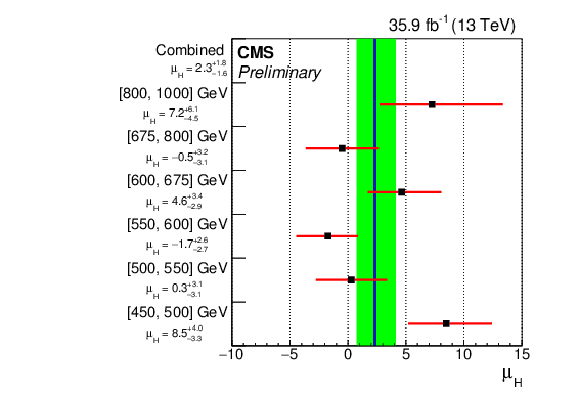
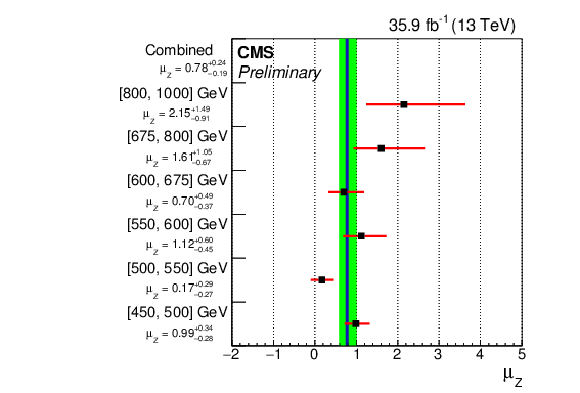
Fitted signal strengths for the Higgs and Z boson signals for each $ {p_{\mathrm {T}}} $ category by floating the Z and H signal strength parameter respectively. |
png pdf |
Additional Figure 6-a:
Fitted signal strengths for the Higgs signal for each $ {p_{\mathrm {T}}} $ category by floating the Z and H signal strength parameter respectively. |
png pdf |
Additional Figure 6-b:
Fitted signal strengths for the Z boson signal for each $ {p_{\mathrm {T}}} $ category by floating the Z and H signal strength parameter respectively. |
png pdf |
Additional Figure 7:
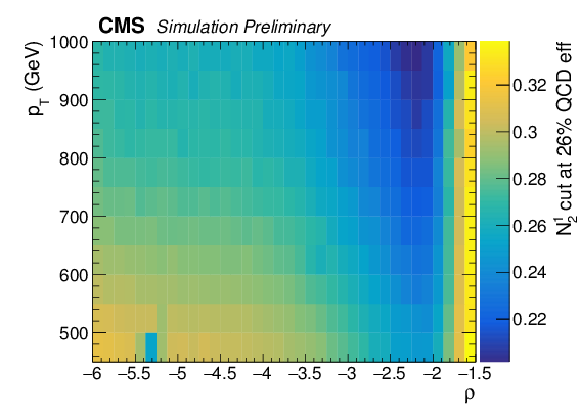
$ {N_{\mathrm {2}}^{\mathrm {1,DDT}}} $ transformation map as a function of the jet $\rho $ and $ {p_{\mathrm {T}}} $. The map corresponds to the 26% quantile of the N$_{\rm 2}^{\rm 1}$ distribution in simulated QCD multijet events. The N$_{\rm 2}^{\rm 1}$ distribution is mostly insensitive to the jet $\rho $ and $ {p_{\mathrm {T}}} $ in the kinematic phase space considered for this analysis ($-6 < \rho < 2.1$) and further decorrelated yielding the $ {N_{\mathrm {2}}^{\mathrm {1,DDT}}} $ variable. |
png pdf |
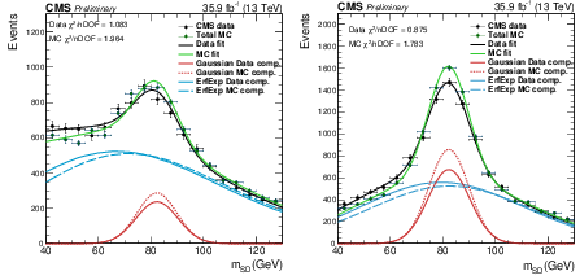
Additional Figure 8:
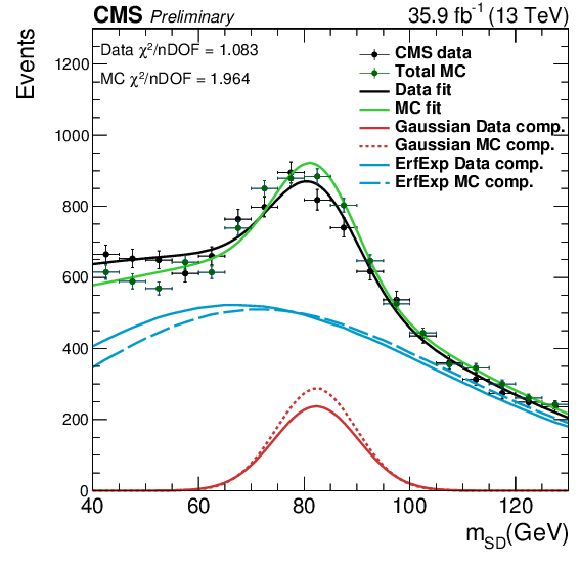
Soft-drop jet mass distribution that pass (left) and fail (right) the $ {N_{\mathrm {2}}^{\mathrm {1,DDT}}} $ selection in the semileptonic $ {\mathrm{ t } {}\mathrm{ \bar{t} } } $ sample. Results of fits to data and simulation are shown. |
png pdf |
Additional Figure 8-a:
Soft-drop jet mass distribution that pass the $ {N_{\mathrm {2}}^{\mathrm {1,DDT}}} $ selection in the semileptonic $ {\mathrm{ t } {}\mathrm{ \bar{t} } } $ sample. Results of fits to data and simulation are shown. |
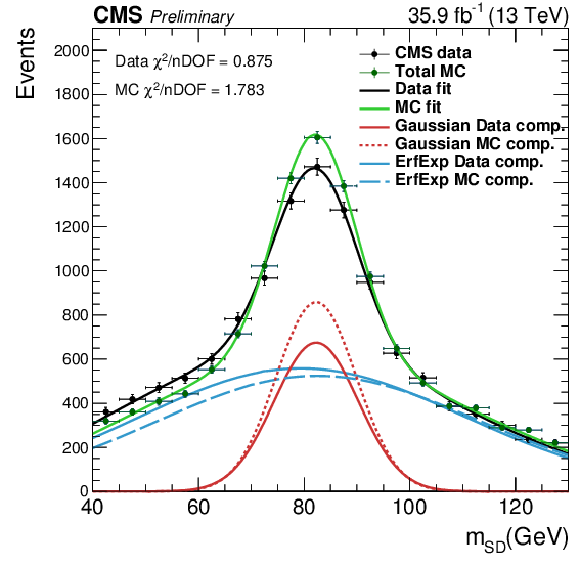
png pdf |
Additional Figure 8-b:
Soft-drop jet mass distribution that fail the $ {N_{\mathrm {2}}^{\mathrm {1,DDT}}} $ selection in the semileptonic $ {\mathrm{ t } {}\mathrm{ \bar{t} } } $ sample. Results of fits to data and simulation are shown. |
png pdf |
Additional Figure 9:
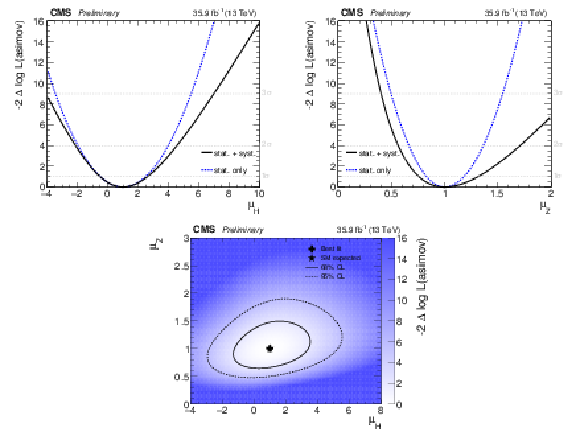
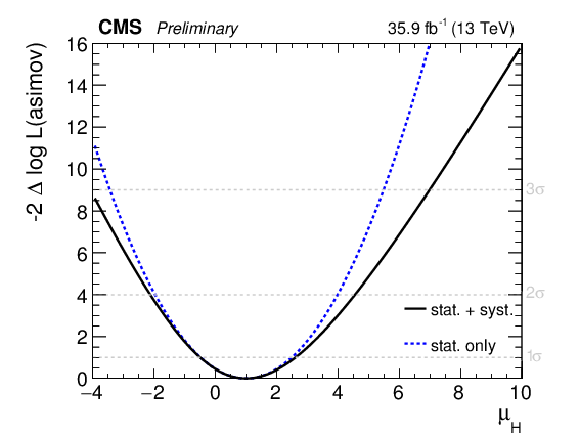
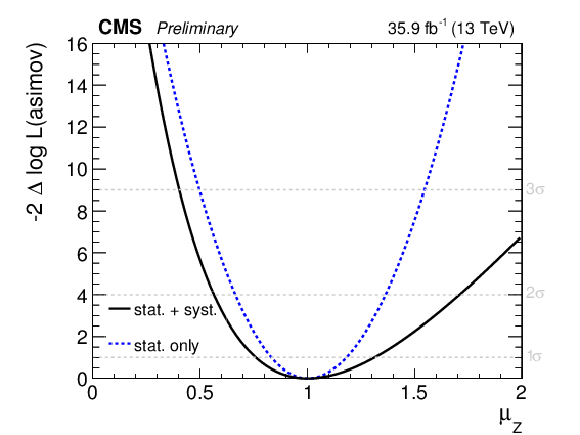
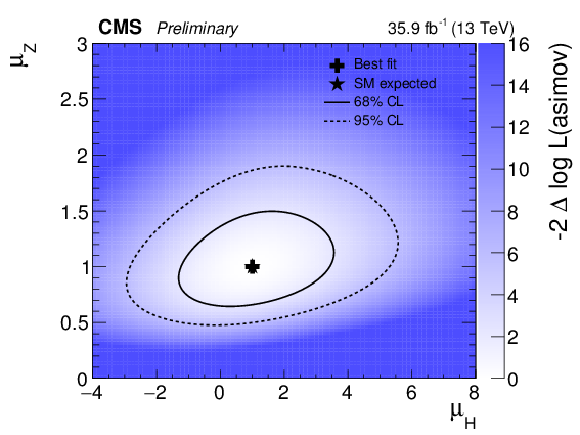
Profile likelihood test statistic $-2\Delta \log\mathcal {L}$ scan on the post-fit Asimov dataset as a function of the H signal strength $\mu _\mathrm{ H } $ (upper left), Z signal strength $\mu _\mathrm{ Z } $ (upper right), and both signal strengths $(\mu _\mathrm{ H },\mu _\mathrm{ Z })$ (lower). |
png pdf |
Additional Figure 9-a:
Profile likelihood test statistic $-2\Delta \log\mathcal {L}$ scan on the post-fit Asimov dataset as a function of the H signal strength $\mu _\mathrm{ H } $. |
png pdf |
Additional Figure 9-b:
Profile likelihood test statistic $-2\Delta \log\mathcal {L}$ scan on the post-fit Asimov dataset as a function of the Z signal strength $\mu _\mathrm{ Z } $. |
png pdf |
Additional Figure 9-c:
Profile likelihood test statistic $-2\Delta \log\mathcal {L}$ scan on the post-fit Asimov dataset as a function of the both H and Z signal strengths $(\mu _\mathrm{ H },\mu _\mathrm{ Z })$. |
| References | ||||
| 1 | A. Salam and J. C. Ward | On a Gauge Theory of Elementary Interactions | Nuovo Cim. 19 (1961) 165--170 | |
| 2 | S. Glashow | Partial Symmetries of Weak Interactions | Nucl. Phys. 22 (1961) 579--588 | |
| 3 | S. Weinberg | A Model of Leptons | PRL 19 (1967) 1264--1266 | |
| 4 | F. Englert and R. Brout | Broken Symmetry and the Mass of Gauge Vector Mesons | PRL 13 (1964) 321--323 | |
| 5 | P. W. Higgs | Broken Symmetries and the Masses of Gauge Bosons | PRL 13 (1964) 508--509 | |
| 6 | G. S. Guralnik, C. R. Hagen, and T. W. B. Kibble | Global Conservation Laws and Massless Particless | PRL 13 (1964) 585--587 | |
| 7 | CMS Collaboration | Observation of a new boson at a mass of 125 GeV with the CMS experiment at the LHC | PLB 716 (2012) 30--61 | CMS-HIG-12-028 1207.7235 |
| 8 | ATLAS Collaboration | Observation of a new particle in the search for the Standard Model Higgs boson with the ATLAS detector at the LHC | PLB 716 (2012) 1--29 | 1207.7214 |
| 9 | The ATLAS and CMS Collaborations Collaboration | Measurements of the Higgs boson production and decay rates and constraints on its couplings from a combined ATLAS and CMS analysis of the LHC pp collision data at $ \sqrt{s} $ = 7 and 8 TeV | Technical Report ATLAS-CONF-2015-044,CMS-PAS-HIG-15-002, CERN, Geneva | |
| 10 | LHC Higgs Cross Section Working Group Collaboration | Handbook of LHC Higgs Cross Sections: 4. Deciphering the Nature of the Higgs Sector | 1610.07922 | |
| 11 | J. M. Butterworth, A. R. Davison, M. Rubin, and G. P. Salam | Jet substructure as a new Higgs search channel at the LHC | PRL 100 (2008) 242001 | 0802.2470 |
| 12 | C. Grojean, E. Salvioni, M. Schlaffer, and A. Weiler | Very boosted Higgs in gluon fusion | JHEP 05 (2014) 022 | 1312.3317 |
| 13 | CMS Collaboration | The CMS experiment at the CERN LHC | JINST 3 (2008) S08004 | CMS-00-001 |
| 14 | GEANT4 Collaboration | GEANT4---a simulation toolkit | NIMA 506 (2003) 250 | |
| 15 | S. Frixione, P. Nason, and C. Oleari | Matching NLO QCD computations with parton shower simulations: the POWHEG method | JHEP 11 (2007) 070 | 0709.2092 |
| 16 | G. Luisoni, P. Nason, C. Oleari, and F. Tramontano | $ HW^{\pm} $/HZ + 0 and 1 jet at NLO with the POWHEG BOX interfaced to GoSam and their merging within MiNLO | JHEP 10 (2013) 083 | 1306.2542 |
| 17 | J. Alwall et al. | The automated computation of tree-level and next-to-leading order differential cross sections, and their matching to parton shower simulations | JHEP 07 (2014) 079 | 1405.0301 |
| 18 | J. Alwall et al. | Comparative study of various algorithms for the merging of parton showers and matrix elements in hadronic collisions | EPJC 53 (2008) 473--500 | 0706.2569 |
| 19 | P. Nason | A new method for combining NLO QCD with shower Monte Carlo algorithms | JHEP 11 (2004) 040 | hep-ph/0409146 |
| 20 | S. Frixione, P. Nason, and C. Oleari | Matching NLO QCD computations with Parton Shower simulations: the POWHEG method | JHEP 11 (2007) 070 | 0709.2092 |
| 21 | S. Alioli, P. Nason, C. Oleari, and E. Re | A general framework for implementing NLO calculations in shower Monte Carlo programs: the POWHEG BOX | JHEP 06 (2010) 043 | 1002.2581 |
| 22 | Sjostrand, Torbjorn and Mrenna, Stephen and Skands, Peter | PYTHIA 6.4 physics and manual | JHEP 05 (2006) 026 | hep-ph/0603175 |
| 23 | T. Sjostrand, S. Mrenna, and P. Z. Skands | A Brief Introduction to PYTHIA 8.1 | CPC 178 (2008) 852--867 | 0710.3820 |
| 24 | CMS Collaboration | Event generator tunes obtained from underlying event and multiparton scattering measurements | EPJC 76 (2016), no. 3, 155 | CMS-GEN-14-001 1512.00815 |
| 25 | P. Skands, S. Carrazza, and J. Rojo | Tuning PYTHIA 8.1: the Monash 2013 Tune | EPJC 74 (2014) 3024 | 1404.5630 |
| 26 | J. M. Campbell and R. K. Ellis | MCFM for the Tevatron and the LHC | NPPS 205-206 (2010) 10 | 1007.3492 |
| 27 | M. Czakon, P. Fiedler, and A. Mitov | Total Top-Quark Pair-Production Cross Section at Hadron Colliders Through O($ \alpha_S^4 $) | PRL 110 (2013) 252004 | 1303.6254 |
| 28 | S. Kallweit et al. | NLO electroweak automation and precise predictions for W+multijet production at the LHC | JHEP 04 (2015) 012 | 1412.5157 |
| 29 | S. Kallweit et al. | NLO QCD+EW predictions for V + jets including off-shell vector-boson decays and multijet merging | JHEP 04 (2016) 021 | 1511.08692 |
| 30 | S. Kallweit et al. | NLO QCD+EW automation and precise predictions for V+multijet production | in Proceedings, 50th Rencontres de Moriond, QCD and high energy interactions, 2015 | 1505.05704 |
| 31 | J. M. Lindert et al. | Precise predictions for V+jets dark matter backgrounds | 1705.04664 | |
| 32 | NNPDF Collaboration | Parton distributions for the LHC Run II | JHEP 04 (2015) 040 | 1410.8849 |
| 33 | U. Baur and E. W. N. Glover | Higgs Boson Production at Large Transverse Momentum in Hadronic Collisions | Nucl. Phys. B339 (1990) 38--66 | |
| 34 | D. de Florian, G. Ferrera, M. Grazzini, and D. Tommasini | Higgs boson production at the LHC: transverse momentum resummation effects in the H$ \rightarrow $2gamma, H$ \rightarrow $WW$ \rightarrow $lnulnu and H$ \rightarrow $ZZ$ \rightarrow $4l decay modes | JHEP 06 (2012) 132 | 1203.6321 |
| 35 | M. Grazzini and H. Sargsyan | Heavy-quark mass effects in Higgs boson production at the LHC | JHEP 09 (2013) 129 | 1306.4581 |
| 36 | E. Bagnaschi and A. Vicini | The Higgs transverse momentum distribution in gluon fusion as a multiscale problem | JHEP 01 (2016) 056 | 1505.00735 |
| 37 | R. Boughezal et al. | Higgs boson production in association with a jet at next-to-next-to-leading order in perturbative QCD | JHEP 06 (2013) 072 | |
| 38 | R. Boughezal et al. | Higgs boson production in association with a jet at NNLO using jettiness subtraction | PLB 748 (2015) 5--8 | 1505.03893 |
| 39 | R. Boughezal et al. | Color singlet production at NNLO in MCFM | 1605.08011 | |
| 40 | X. Chen, T. Gehrmann, N. Glover, and M. Jaquier | Higgs plus one jet production at NNLO | in Proceedings, 12th International Symposium on Radiative Corrections (Radcor 2015) and LoopFest XIV (Radiative Corrections for the LHC and Future Colliders), Los Angeles, 2016 | 1604.04085 |
| 41 | T. Neumann and C. Williams | The Higgs boson at high $ p_T $ | PRD 95 (2017), no. 1, 014004 | 1609.00367 |
| 42 | M. Buschmann et al. | Mass Effects in the Higgs-Gluon Coupling: Boosted vs Off-Shell Production | JHEP 02 (2015) 038 | 1410.5806 |
| 43 | R. Frederix, S. Frixione, E. Vryonidou, and M. Wiesemann | Heavy-quark mass effects in Higgs plus jets production | JHEP 08 (2016) 006 | 1604.03017 |
| 44 | V. Hirschi and O. Mattelaer | Automated event generation for loop-induced processes | JHEP 10 (2015) 146 | 1507.00020 |
| 45 | N. Greiner et al. | Phenomenological analysis of Higgs boson production through gluon fusion in association with jets | JHEP 01 (2016) 169 | 1506.01016 |
| 46 | X. Chen, T. Gehrmann, E. W. N. Glover, and M. Jaquier | Precise QCD predictions for the production of Higgs + jet final states | PLB 740 (2015) 147--150 | 1408.5325 |
| 47 | R. Boughezal et al. | Higgs boson production in association with a jet at next-to-next-to-leading order | PRL 115 (2015), no. 8, 082003 | 1504.07922 |
| 48 | M. Cacciari et al. | Fully Differential Vector-Boson-Fusion Higgs Production at Next-to-Next-to-Leading Order | PRL 115 (2015), no. 8, 082002 | 1506.02660 |
| 49 | CMS Collaboration | Commissioning of the Particle-flow Event Reconstruction with the first LHC collisions recorded in the CMS detector | CDS | |
| 50 | M. Cacciari, G. P. Salam, and G. Soyez | The anti-$ k_{t} $ jet clustering algorithm | JHEP 04 (2008) 063 | 0802.1189 |
| 51 | D. Bertolini, P. Harris, M. Low, and N. Tran | Pileup Per Particle Identification | JHEP 10 (2014) 059 | 1407.6013 |
| 52 | D. Krohn, J. Thaler, and L.-T. Wang | Jet Trimming | JHEP 02 (2010) 084 | 0912.1342 |
| 53 | M. Dasgupta, A. Fregoso, S. Marzani, and G. P. Salam | Towards an understanding of jet substructure | JHEP 09 (2013) 029 | 1307.0007 |
| 54 | A. J. Larkoski, S. Marzani, G. Soyez, and J. Thaler | Soft Drop | JHEP 05 (2014) 146 | 1402.2657 |
| 55 | CMS Collaboration | Jet algorithms performance in 13 TeV data | ||
| 56 | I. Moult, L. Necib, and J. Thaler | New Angles on Energy Correlation Functions | JHEP 12 (2016) 153 | 1609.07483 |
| 57 | A. J. Larkoski, G. P. Salam, and J. Thaler | Energy Correlation Functions for Jet Substructure | JHEP 06 (2013) 108 | 1305.0007 |
| 58 | J. Thaler and K. Van Tilburg | Identifying Boosted Objects with N-subjettiness | JHEP 03 (2011) 015 | 1011.2268 |
| 59 | CMS Collaboration Collaboration | Identification of double-b quark jets in boosted event topologies | Technical Report CMS-PAS-BTV-15-002, CERN, Geneva | |
| 60 | CMS Collaboration | Determination of jet energy calibration and transverse momentum resolution in CMS | JINST 6 (2011) 11002 | CMS-JME-10-011 1107.4277 |
| 61 | CMS Collaboration | CMS Luminosity Measurement for the 2015 Data Taking Period | CMS-PAS-LUM-15-001 | CMS-PAS-LUM-15-001 |

|
Compact Muon Solenoid LHC, CERN |

|

|

|

|

|

|